UNITED STATES
SECURITIES AND EXCHANGE COMMISSION
Washington, D.C. 20549
FORM N-CSR
CERTIFIED SHAREHOLDER REPORT OF REGISTERED
MANAGEMENT INVESTMENT COMPANIES
Investment Company Act file number 811-3785
Fidelity Advisor Series I
(Exact name of registrant as specified in charter)
245 Summer St., Boston, Massachusetts 02210
(Address of principal executive offices) (Zip code)
Scott C. Goebel, Secretary
245 Summer St.
Boston, Massachusetts 02210
(Name and address of agent for service)
Registrant's telephone number, including area code: 617-563-7000
|
Date of fiscal year end: |
November 30 |
|
|
|
|
Date of reporting period: |
November 30, 2013 |
This report on Form N-CSR relates solely to the Registrant's Fidelity Advisor Dividend Growth Fund, Fidelity Advisor Equity Growth Fund, Fidelity Advisor Equity Income Fund, Fidelity Advisor Equity Value Fund, Fidelity Advisor Growth & Income Fund, Fidelity Advisor Growth Opportunities Fund, Fidelity Advisor Large Cap Fund, Fidelity Advisor Series Growth Opportunities Fund, Fidelity Advisor Series Small Cap Fund, Fidelity Advisor Small Cap Fund, Fidelity Advisor Stock Selector Mid Cap Fund, and Fidelity Advisor Value Strategies Fund series (each, a "Fund" and collectively, the "Funds").
Item 1. Reports to Stockholders
(Fidelity Investment logo)(registered trademark)
Fidelity Advisor®
Dividend Growth
Fund - Class A, Class T, Class B
and Class C
Annual Report
November 30, 2013
(Fidelity Cover Art)
Contents
|
Performance |
How the fund has done over time. |
|
|
Management's Discussion of Fund Performance |
The Portfolio Manager's review of fund performance and strategy. |
|
|
Shareholder Expense Example |
An example of shareholder expenses. |
|
|
Investment Changes |
A summary of major shifts in the fund's investments over the past six months. |
|
|
Investments |
A complete list of the fund's investments with their market values. |
|
|
Financial Statements |
Statements of assets and liabilities, operations, and changes in net assets, as well as financial highlights. |
|
|
Notes |
Notes to the financial statements. |
|
|
Report of Independent Registered Public Accounting Firm |
|
|
|
Trustees and Officers |
|
|
|
Distributions |
|
|
|
Board Approval of Investment Advisory Contracts and Management Fees |
|
To view a fund's proxy voting guidelines and proxy voting record for the 12-month period ended June 30, visit http://www.fidelity.com/proxyvotingresults or visit the Securities and Exchange Commission's (SEC) web site at http://www.sec.gov. You may also call 1-877-208-0098 to request a free copy of the proxy voting guidelines.
Standard & Poor's, S&P and S&P 500 are registered service marks of The McGraw-Hill Companies, Inc. and have been licensed for use by Fidelity Distributors Corporation.
Other third-party marks appearing herein are the property of their respective owners.
All other marks appearing herein are registered or unregistered trademarks or service marks of FMR LLC or an affiliated company. © 2014 FMR LLC. All rights reserved.
Annual Report
This report and the financial statements contained herein are submitted for the general information of the shareholders of the fund. This report is not authorized for distribution to prospective investors in the fund unless preceded or accompanied by an effective prospectus.
A fund files its complete schedule of portfolio holdings with the SEC for the first and third quarters of each fiscal year on Form N-Q. Forms N-Q are available on the SEC's web site at http://www.sec.gov. A fund's Forms N-Q may be reviewed and copied at the SEC's Public Reference Room in Washington, DC. Information regarding the operation of the SEC's Public Reference Room may be obtained by calling 1-800-SEC-0330. For a complete list of a fund's portfolio holdings, view the most recent holdings listing, semiannual report, or annual report on Fidelity's web site at http://www.fidelity.com, http://www.advisor.fidelity.com, or http://www.401k.com, as applicable.
NOT FDIC INSURED • MAY LOSE VALUE • NO BANK GUARANTEE
Neither the fund nor Fidelity Distributors Corporation is a bank.
Annual Report
Performance: The Bottom Line
Average annual total return reflects the change in the value of an investment, assuming reinvestment of the class' distributions from dividend income and capital gains (the profits earned upon the sale of securities that have grown in value, if any) and assuming a constant rate of performance each year. The $10,000 table and the fund's returns do not reflect the deduction of taxes that a shareholder would pay on fund distributions or the redemption of fund shares. During periods of reimbursement by Fidelity, a fund's total return will be greater than it would be had the reimbursement not occurred. How a fund did yesterday is no guarantee of how it will do tomorrow. Returns reflect the conversion of Class B shares to Class A shares after a maximum of seven years.
Average Annual Total Returns
|
Periods ended November 30, 2013 |
Past 1 |
Past 5 |
Past 10 |
|
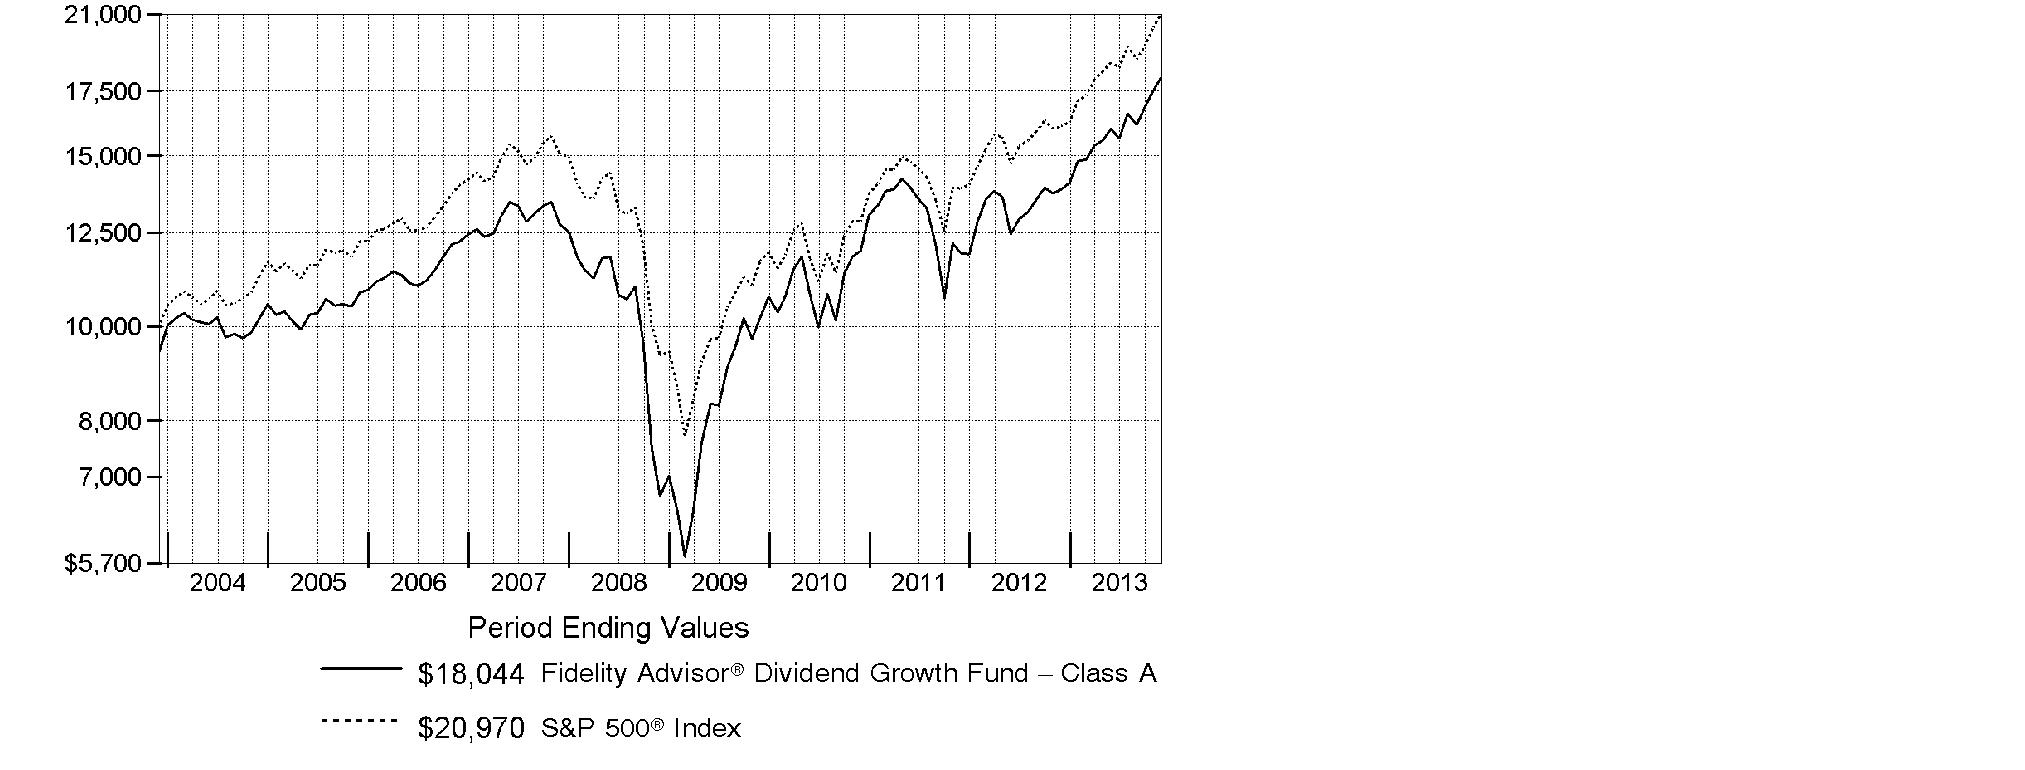
Class A (incl. 5.75% sales charge) |
22.77% |
20.53% |
6.08% |
|
Class T (incl. 3.50% sales charge) |
25.50% |
20.83% |
6.11% |
|
Class B (incl. contingent deferred sales charge) A |
24.25% |
20.83% |
6.13% |
|
Class C (incl. contingent deferred sales charge) B |
28.36% |
21.09% |
5.93% |
A Class B shares' contingent deferred sales charges included in the past one year, past five years, and past ten years total return figures are 5%, 2%, and 0%, respectively.
B Class C shares' contingent deferred sales charges included in the past one year, past five years, and past ten years total return figures are 1%, 0%, and 0%, respectively.
Annual Report
$10,000 Over 10 Years
Let's say hypothetically that $10,000 was invested in Fidelity Advisor® Dividend Growth Fund - Class A on November 30, 2003, and the current 5.75% sales charge was paid. The chart shows how the value of your investment would have changed, and also shows how the S&P 500® Index performed over the same period.
Annual Report
Management's Discussion of Fund Performance
Market Recap: With the current bull run nearing the five-year mark, equity benchmarks ripped up old records during the 12 months ending November 30, 2013. Gains were fueled by strengthening U.S. economic data, as well as generally improving economies and accommodative monetary policies worldwide. The broad S&P 500® Index reached new peaks in its 30.30% climb for the period, and the blue-chip Dow Jones Industrial AverageSM surpassed historic milestones en route to a 26.63% gain. The Nasdaq Composite Index®, up 36.73% amid a resurgence in growth-oriented stocks, closed above 4,000 for the first time since 2000. Shedding anxiety over the 2012 U.S. presidential election - and apparently confident that the federal debt-ceiling debate would be resolved - markets rose from period start through late May. News that the U.S. Federal Reserve was considering an end to its stimulative bond-buying kept stocks in flux over the summer but, by September, the Fed had set aside any imminent tapering. Despite jitters over a potential U.S. military strike in Syria and, later, an October budget impasse that briefly shuttered the federal government, volatility was subdued heading into the holidays, with investor optimism helping many markets home in on all-time highs at period end. Elsewhere, non-U.S. developed-market equities saw similar results, with the MSCI® EAFE® Index adding 24.97%.
Comments from Lawrence Rakers, Portfolio Manager of Fidelity Advisor® Dividend Growth Fund: For the year, the fund's Class A, Class T, Class B and Class C shares returned 30.26%, 30.05%, 29.25% and 29.36%, respectively (excluding sales charges), slightly trailing the S&P 500®. Versus the index, three of the four largest contributors were lagging mega-cap benchmark components the fund didn't own: energy major Exxon Mobil, information technology services provider IBM and telecommunication services giant AT&T. Two smaller-cap positions that helped were development-stage biotechnology company Alnylam Pharmaceuticals and marketing services provider MDC Partners. Conversely, materials hurt the fund's relative results the most. Here, two Canadian metals miners were the biggest detractors: Ivanplats - which changed its name to Ivanhoe Mines - and Turquoise Hill Resources, the latter of which I reduced exposure to by period end. Investments here were hurt in part by a declining Canadian dollar. Elsewhere, performance was curbed by Ireland-based mobile marketing firm Velti, which filed for bankruptcy. The fund did not own Velti's common stock at period end but retained a private placement here. Many stocks I've mentioned in this report were not in the index.
Note to shareholders: On January 1, 2014, Ramona Persaud will become Portfolio Manager of the fund, succeeding Larry Rakers.
The views expressed above reflect those of the portfolio manager(s) only through the end of the period as stated on the cover of this report and do not necessarily represent the views of Fidelity or any other person in the Fidelity organization. Any such views are subject to change at any time based upon market or other conditions and Fidelity disclaims any responsibility to update such views. These views may not be relied on as investment advice and, because investment decisions for a Fidelity fund are based on numerous factors, may not be relied on as an indication of trading intent on behalf of any Fidelity fund.
Annual Report
Shareholder Expense Example
As a shareholder of the Fund, you incur two types of costs: (1) transaction costs, including sales charges (loads) on purchase payments or redemption proceeds, and (2) ongoing costs, including management fees, distribution and/or service (12b-1) fees and other Fund expenses. This Example is intended to help you understand your ongoing costs (in dollars) of investing in the Fund and to compare these costs with the ongoing costs of investing in other mutual funds.
The actual expense Example is based on an investment of $1,000 invested at the beginning of the period and held for the entire period (June 1, 2013 to November 30, 2013) for Class A, Class T, Class B, Class C and Institutional Class and for the period (August 13, 2013 to November 30, 2013) for Class Z. The hypothetical expense Example is based on an investment of $1,000 invested for the one-half year period (June 1, 2013 to November 30, 2013).
Actual Expenses
The first line of the accompanying table for each class of the Fund provides information about actual account values and actual expenses. You may use the information in this line, together with the amount you invested, to estimate the expenses that you paid over the period. Simply divide your account value by $1,000.00 (for example, an $8,600 account value divided by $1,000.00 = 8.6), then multiply the result by the number in the first line for a class of the Fund under the heading entitled "Expenses Paid During Period" to estimate the expenses you paid on your account during this period. In addition, the Fund, as a shareholder in the underlying Fidelity Central Funds, will indirectly bear its pro-rata share of the fees and expenses incurred by the underlying Fidelity Central Funds. These fees and expenses are not included in the Fund's annualized expense ratio used to calculate the expense estimate in the table below.
Hypothetical Example for Comparison Purposes
The second line of the accompanying table for each class of the Fund provides information about hypothetical account values and hypothetical expenses based on a Class' actual expense ratio and an assumed rate of return of 5% per year before expenses, which is not the Class' actual return. The hypothetical account values and expenses may not be used to estimate the actual ending account balance or expenses you paid for the period. You may use this information to compare the ongoing costs of investing in the Fund and other funds. To do so, compare this 5% hypothetical example with the 5% hypothetical examples that appear in the shareholder reports of the other funds. In addition, the Fund, as a shareholder in the underlying Fidelity Central Funds, will indirectly bear its pro-rata share of the fees and expenses incurred by the underlying Fidelity Central Funds. These fees and expenses are not included in the Fund's annualized expense ratio used to calculate the expense estimate in the table below.
Please note that the expenses shown in the table are meant to highlight your ongoing costs only and do not reflect any transaction costs. Therefore, the second line of the table is useful in comparing ongoing costs only, and will not help you determine the relative total costs of owning different funds. In addition, if these transactional costs were included, your costs would have been higher.
Annual Report
|
|
Annualized |
Beginning |
Ending |
Expenses Paid |
|
Class A |
.96% |
|
|
|
|
Actual |
|
$ 1,000.00 |
$ 1,129.10 |
$ 5.12 C |
|
HypotheticalA |
|
$ 1,000.00 |
$ 1,020.26 |
$ 4.86 D |
|
Class T |
1.18% |
|
|
|
|
Actual |
|
$ 1,000.00 |
$ 1,128.30 |
$ 6.30 C |
|
HypotheticalA |
|
$ 1,000.00 |
$ 1,019.15 |
$ 5.97 D |
|
Class B |
1.77% |
|
|
|
|
Actual |
|
$ 1,000.00 |
$ 1,124.20 |
$ 9.43 C |
|
HypotheticalA |
|
$ 1,000.00 |
$ 1,016.19 |
$ 8.95 D |
|
Class C |
1.70% |
|
|
|
|
Actual |
|
$ 1,000.00 |
$ 1,125.20 |
$ 9.06 C |
|
HypotheticalA |
|
$ 1,000.00 |
$ 1,016.55 |
$ 8.59 D |
|
Institutional Class |
.69% |
|
|
|
|
Actual |
|
$ 1,000.00 |
$ 1,130.70 |
$ 3.69 C |
|
HypotheticalA |
|
$ 1,000.00 |
$ 1,021.61 |
$ 3.50 D |
|
Class Z |
.54% |
|
|
|
|
Actual |
|
$ 1,000.00 |
$ 1,080.20 |
$ 1.69 C |
|
HypotheticalA |
|
$ 1,000.00 |
$ 1,022.36 |
$ 2.74 D |
A 5% return per year before expenses
B Annualized expense ratio reflects expenses net of applicable fee waivers.
C Actual expenses are equal to each Class' annualized expense ratio, multiplied by the average account value over the period, multiplied by 183/365 (to reflect the one-half year period) for Class A, Class T, Class B, Class C and Institutional Class and multiplied by 110/365 (to reflect the period August 13, 2013 to November 30, 2013) for Class Z.
D Hypothetical expenses are equal to each Class' annualized expense ratio, multiplied by the average account value over the period, multiplied by 183/365 (to reflect the one-half year period).
Annual Report
Investment Changes (Unaudited)
|
Top Ten Stocks as of November 30, 2013 |
||
|
|
% of fund's |
% of fund's net assets |
|
Apple, Inc. |
3.2 |
2.3 |
|
Google, Inc. Class A |
1.9 |
1.6 |
|
Microsoft Corp. |
1.8 |
0.7 |
|
General Electric Co. |
1.8 |
1.6 |
|
JPMorgan Chase & Co. |
1.8 |
1.2 |
|
Citigroup, Inc. |
1.5 |
1.6 |
|
Wells Fargo & Co. |
1.4 |
1.7 |
|
Bank of America Corp. |
1.3 |
1.2 |
|
Comcast Corp. Class A |
1.1 |
0.8 |
|
Visa, Inc. Class A |
1.0 |
1.0 |
|
|
16.8 |
|
|
Top Five Market Sectors as of November 30, 2013 |
||
|
|
% of fund's |
% of fund's net assets |
|
Information Technology |
17.9 |
16.9 |
|
Financials |
15.5 |
16.0 |
|
Consumer Discretionary |
14.2 |
12.6 |
|
Health Care |
13.4 |
13.7 |
|
Industrials |
11.9 |
12.1 |
|
Asset Allocation (% of fund's net assets) |
|||||||
|
As of November 30, 2013* |
As of May 31, 2013** |
||||||
 |
Stocks 98.6% |
|
|
Stocks 98.6% |
|
||
 |
Bonds 0.0% |
|
 |
Bonds 0.1% |
|
||
 |
Convertible |
|
|
Convertible |
|
||
 |
Short-Term |
|
|
Short-Term |
|
||
|
* Foreign investments |
18.1% |
|
** Foreign investments |
19.3% |
|
||

Annual Report
Investments November 30, 2013
Showing Percentage of Net Assets
|
Common Stocks - 98.4% |
|||
|
Shares |
Value (000s) |
||
|
CONSUMER DISCRETIONARY - 14.0% |
|||
|
Auto Components - 0.5% |
|||
|
Delphi Automotive PLC |
36,876 |
$ 2,159 |
|
|
Johnson Controls, Inc. |
71,476 |
3,610 |
|
|
|
5,769 |
||
|
Automobiles - 0.5% |
|||
|
Ford Motor Co. |
251,818 |
4,301 |
|
|
Harley-Davidson, Inc. |
17,401 |
1,166 |
|
|
|
5,467 |
||
|
Diversified Consumer Services - 0.9% |
|||
|
Anhanguera Educacional Participacoes SA |
276,700 |
1,842 |
|
|
H&R Block, Inc. |
202,764 |
5,655 |
|
|
Kroton Educacional SA |
91,300 |
1,535 |
|
|
|
9,032 |
||
|
Hotels, Restaurants & Leisure - 2.2% |
|||
|
Brinker International, Inc. |
170,092 |
7,999 |
|
|
Las Vegas Sands Corp. |
31,340 |
2,246 |
|
|
McDonald's Corp. |
9,800 |
954 |
|
|
Red Robin Gourmet Burgers, Inc. (a) |
17,900 |
1,427 |
|
|
Sonic Corp. (a) |
70,400 |
1,393 |
|
|
Wyndham Worldwide Corp. |
62,552 |
4,486 |
|
|
Yum! Brands, Inc. |
56,253 |
4,370 |
|
|
|
22,875 |
||
|
Household Durables - 0.2% |
|||
|
Taylor Wimpey PLC |
406,364 |
707 |
|
|
Whirlpool Corp. |
11,670 |
1,783 |
|
|
|
2,490 |
||
|
Leisure Equipment & Products - 0.2% |
|||
|
Polaris Industries, Inc. |
14,700 |
1,962 |
|
|
Media - 4.9% |
|||
|
Antena 3 de Television SA (d) |
119,189 |
1,833 |
|
|
CBS Corp. Class B |
148,282 |
8,683 |
|
|
Comcast Corp. Class A |
232,575 |
11,599 |
|
|
Ipsos SA |
27,584 |
1,150 |
|
|
MDC Partners, Inc. Class A (sub. vtg.) |
132,201 |
3,009 |
|
|
Omnicom Group, Inc. |
35,811 |
2,559 |
|
|
Smiles SA |
23,750 |
334 |
|
|
The Walt Disney Co. |
78,970 |
5,571 |
|
|
Time Warner, Inc. |
73,011 |
4,798 |
|
|
Twenty-First Century Fox, Inc. Class A |
155,371 |
5,203 |
|
|
Common Stocks - continued |
|||
|
Shares |
Value (000s) |
||
|
CONSUMER DISCRETIONARY - continued |
|||
|
Media - continued |
|||
|
Valassis Communications, Inc. |
17,865 |
$ 525 |
|
|
Viacom, Inc. Class B (non-vtg.) |
76,808 |
6,158 |
|
|
|
51,422 |
||
|
Specialty Retail - 3.8% |
|||
|
American Eagle Outfitters, Inc. |
148,505 |
2,416 |
|
|
Best Buy Co., Inc. |
31,954 |
1,296 |
|
|
CST Brands, Inc. |
1 |
0* |
|
|
Foot Locker, Inc. |
43,901 |
1,707 |
|
|
GNC Holdings, Inc. |
9,100 |
548 |
|
|
Home Depot, Inc. |
116,237 |
9,377 |
|
|
Kingfisher PLC |
156,180 |
961 |
|
|
L Brands, Inc. |
35,840 |
2,329 |
|
|
Lewis Group Ltd. |
23,800 |
152 |
|
|
Lowe's Companies, Inc. |
127,114 |
6,035 |
|
|
Office Depot, Inc. (a) |
274,901 |
1,495 |
|
|
Rent-A-Center, Inc. |
74,082 |
2,523 |
|
|
Ross Stores, Inc. |
20,765 |
1,588 |
|
|
Signet Jewelers Ltd. |
14,000 |
1,076 |
|
|
Staples, Inc. |
328,877 |
5,107 |
|
|
TJX Companies, Inc. |
62,001 |
3,899 |
|
|
|
40,509 |
||
|
Textiles, Apparel & Luxury Goods - 0.8% |
|||
|
Coach, Inc. |
18,884 |
1,093 |
|
|
Kering SA |
7,300 |
1,619 |
|
|
NIKE, Inc. Class B |
45,155 |
3,574 |
|
|
VF Corp. |
11,250 |
2,639 |
|
|
|
8,925 |
||
|
TOTAL CONSUMER DISCRETIONARY |
148,451 |
||
|
CONSUMER STAPLES - 10.1% |
|||
|
Beverages - 2.3% |
|||
|
Anheuser-Busch InBev SA NV |
21,500 |
2,192 |
|
|
Coca-Cola Enterprises, Inc. |
32,610 |
1,368 |
|
|
Cott Corp. |
241,020 |
2,021 |
|
|
Dr. Pepper Snapple Group, Inc. |
82,371 |
3,975 |
|
|
Molson Coors Brewing Co. Class B |
14,699 |
774 |
|
|
Monster Beverage Corp. (a) |
59,487 |
3,520 |
|
|
The Coca-Cola Co. |
264,275 |
10,621 |
|
|
|
24,471 |
||
|
Common Stocks - continued |
|||
|
Shares |
Value (000s) |
||
|
CONSUMER STAPLES - continued |
|||
|
Food & Staples Retailing - 2.2% |
|||
|
Alimentation Couche-Tard, Inc. Class B (sub. vtg.) |
53,500 |
$ 3,927 |
|
|
CVS Caremark Corp. |
114,524 |
7,669 |
|
|
Kroger Co. |
106,466 |
4,445 |
|
|
Rami Levi Chain Stores Hashikma Marketing 2006 Ltd. |
21,893 |
1,108 |
|
|
Walgreen Co. |
104,033 |
6,159 |
|
|
|
23,308 |
||
|
Food Products - 1.9% |
|||
|
Amira Nature Foods Ltd. (a)(d) |
41,029 |
650 |
|
|
Archer Daniels Midland Co. |
70,000 |
2,818 |
|
|
Bunge Ltd. |
36,660 |
2,937 |
|
|
Green Mountain Coffee Roasters, Inc. |
30,477 |
2,054 |
|
|
Greencore Group PLC |
235,804 |
743 |
|
|
Hilton Food Group PLC |
81,531 |
568 |
|
|
Ingredion, Inc. |
35,931 |
2,485 |
|
|
Kellogg Co. |
41,318 |
2,506 |
|
|
Mead Johnson Nutrition Co. Class A |
15,891 |
1,343 |
|
|
Mondelez International, Inc. |
115,900 |
3,886 |
|
|
|
19,990 |
||
|
Household Products - 1.5% |
|||
|
Energizer Holdings, Inc. |
36,875 |
4,069 |
|
|
Procter & Gamble Co. |
111,428 |
9,384 |
|
|
Svenska Cellulosa AB (SCA) (B Shares) |
77,200 |
2,254 |
|
|
|
15,707 |
||
|
Personal Products - 0.1% |
|||
|
Herbalife Ltd. |
16,400 |
1,143 |
|
|
Tobacco - 2.1% |
|||
|
British American Tobacco PLC (United Kingdom) |
20,100 |
1,069 |
|
|
Imperial Tobacco Group PLC |
48,945 |
1,861 |
|
|
Japan Tobacco, Inc. |
127,100 |
4,293 |
|
|
Lorillard, Inc. |
84,654 |
4,345 |
|
|
Philip Morris International, Inc. |
123,423 |
10,558 |
|
|
|
22,126 |
||
|
TOTAL CONSUMER STAPLES |
106,745 |
||
|
ENERGY - 9.3% |
|||
|
Energy Equipment & Services - 3.2% |
|||
|
BW Offshore Ltd. |
927,388 |
1,205 |
|
|
Cameron International Corp. (a) |
60,626 |
3,358 |
|
|
Common Stocks - continued |
|||
|
Shares |
Value (000s) |
||
|
ENERGY - continued |
|||
|
Energy Equipment & Services - continued |
|||
|
Ensco PLC Class A |
95,950 |
$ 5,669 |
|
|
Essential Energy Services Ltd. |
379,600 |
1,118 |
|
|
Halliburton Co. |
74,857 |
3,943 |
|
|
National Oilwell Varco, Inc. |
84,686 |
6,902 |
|
|
Noble Corp. |
47,079 |
1,795 |
|
|
Schlumberger Ltd. |
72,206 |
6,384 |
|
|
ShawCor Ltd. Class A |
15,100 |
563 |
|
|
Vantage Drilling Co. (a) |
795,092 |
1,487 |
|
|
Xtreme Drilling & Coil Services Corp. (a) |
256,400 |
833 |
|
|
Xtreme Drilling & Coil Services Corp. (a)(e) |
132,500 |
430 |
|
|
|
33,687 |
||
|
Oil, Gas & Consumable Fuels - 6.1% |
|||
|
Access Midstream Partners LP |
50,191 |
2,819 |
|
|
Anadarko Petroleum Corp. |
63,559 |
5,645 |
|
|
Ardmore Shipping Corp. |
29,683 |
380 |
|
|
BPZ Energy, Inc. (a) |
319,601 |
671 |
|
|
Cabot Oil & Gas Corp. |
30,508 |
1,051 |
|
|
Cimarex Energy Co. |
20,841 |
1,971 |
|
|
Cobalt International Energy, Inc. (a) |
76,207 |
1,694 |
|
|
Concho Resources, Inc. (a) |
12,440 |
1,293 |
|
|
ConocoPhillips Co. |
71,558 |
5,209 |
|
|
Double Eagle Petroleum Co. (a) |
89,373 |
202 |
|
|
Emerald Oil, Inc. warrants 2/4/16 (a) |
16,536 |
0 |
|
|
Energen Corp. |
30,004 |
2,165 |
|
|
EOG Resources, Inc. |
11,054 |
1,824 |
|
|
EQT Corp. |
27,102 |
2,307 |
|
|
InterOil Corp. (a)(d) |
30,409 |
2,688 |
|
|
Marathon Oil Corp. |
34,140 |
1,230 |
|
|
Markwest Energy Partners LP |
44,610 |
3,081 |
|
|
MPLX LP |
28,058 |
1,070 |
|
|
Noble Energy, Inc. |
22,387 |
1,572 |
|
|
Northern Oil & Gas, Inc. (a)(d) |
231,694 |
3,696 |
|
|
Occidental Petroleum Corp. |
65,944 |
6,262 |
|
|
Peabody Energy Corp. |
124,861 |
2,272 |
|
|
Phillips 66 Co. |
39,570 |
2,754 |
|
|
Phillips 66 Partners LP |
38,405 |
1,265 |
|
|
Rosetta Resources, Inc. (a) |
16,428 |
831 |
|
|
Southcross Energy Partners LP |
50,160 |
972 |
|
|
Suncor Energy, Inc. |
111,980 |
3,886 |
|
|
TAG Oil Ltd. (a) |
473,900 |
1,570 |
|
|
Common Stocks - continued |
|||
|
Shares |
Value (000s) |
||
|
ENERGY - continued |
|||
|
Oil, Gas & Consumable Fuels - continued |
|||
|
TAG Oil Ltd. (e) |
15,900 |
$ 53 |
|
|
The Williams Companies, Inc. |
116,074 |
4,088 |
|
|
|
64,521 |
||
|
TOTAL ENERGY |
98,208 |
||
|
FINANCIALS - 15.5% |
|||
|
Capital Markets - 2.5% |
|||
|
AllianceBernstein Holding LP |
84,005 |
1,864 |
|
|
Ameriprise Financial, Inc. |
13,448 |
1,456 |
|
|
BlackRock, Inc. Class A |
9,899 |
2,997 |
|
|
GP Investments Ltd. Class A (depositary receipt) (a) |
24,460 |
42 |
|
|
Invesco Ltd. |
79,284 |
2,763 |
|
|
KKR & Co. LP |
114,274 |
2,712 |
|
|
Monex Group, Inc. |
349,400 |
1,412 |
|
|
Morgan Stanley |
99,414 |
3,112 |
|
|
Oaktree Capital Group LLC Class A |
33,200 |
1,850 |
|
|
The Blackstone Group LP |
112,850 |
3,225 |
|
|
UBS AG (NY Shares) |
284,442 |
5,404 |
|
|
|
26,837 |
||
|
Commercial Banks - 2.8% |
|||
|
Barclays PLC sponsored ADR |
247,600 |
4,402 |
|
|
KBC Groupe SA |
17,062 |
974 |
|
|
Nordea Bank AB |
141,600 |
1,830 |
|
|
PNC Financial Services Group, Inc. |
36,140 |
2,781 |
|
|
U.S. Bancorp |
121,057 |
4,748 |
|
|
Wells Fargo & Co. |
342,450 |
15,075 |
|
|
|
29,810 |
||
|
Consumer Finance - 0.9% |
|||
|
Capital One Financial Corp. |
86,042 |
6,163 |
|
|
SLM Corp. |
111,707 |
2,977 |
|
|
|
9,140 |
||
|
Diversified Financial Services - 5.5% |
|||
|
ASAC II LP (f) |
298,480 |
3,422 |
|
|
Bank of America Corp. |
888,873 |
14,062 |
|
|
Citigroup, Inc. |
305,473 |
16,166 |
|
|
JPMorgan Chase & Co. |
328,943 |
18,822 |
|
|
Common Stocks - continued |
|||
|
Shares |
Value (000s) |
||
|
FINANCIALS - continued |
|||
|
Diversified Financial Services - continued |
|||
|
McGraw-Hill Companies, Inc. |
53,808 |
$ 4,009 |
|
|
PICO Holdings, Inc. (a) |
77,781 |
1,885 |
|
|
|
58,366 |
||
|
Insurance - 2.9% |
|||
|
ACE Ltd. |
24,994 |
2,569 |
|
|
AFLAC, Inc. |
30,332 |
2,013 |
|
|
Allied World Assurance Co. Holdings Ltd. |
9,888 |
1,114 |
|
|
Arthur J. Gallagher & Co. |
18,265 |
850 |
|
|
Assured Guaranty Ltd. |
204,251 |
4,796 |
|
|
Axis Capital Holdings Ltd. |
11,500 |
565 |
|
|
Everest Re Group Ltd. |
8,534 |
1,338 |
|
|
Fidelity National Financial, Inc. Class A |
139,204 |
4,047 |
|
|
Marsh & McLennan Companies, Inc. |
32,700 |
1,552 |
|
|
MetLife, Inc. |
79,620 |
4,155 |
|
|
Prudential PLC |
30,243 |
645 |
|
|
The Chubb Corp. |
33,094 |
3,192 |
|
|
The Travelers Companies, Inc. |
43,732 |
3,968 |
|
|
|
30,804 |
||
|
Real Estate Investment Trusts - 0.7% |
|||
|
American Tower Corp. |
20,619 |
1,604 |
|
|
Beni Stabili SpA SIIQ |
411,824 |
279 |
|
|
Cousins Properties, Inc. |
14,676 |
157 |
|
|
Prologis, Inc. |
27,557 |
1,045 |
|
|
Simon Property Group, Inc. |
16,487 |
2,471 |
|
|
Weyerhaeuser Co. |
69,876 |
2,105 |
|
|
|
7,661 |
||
|
Real Estate Management & Development - 0.1% |
|||
|
CBRE Group, Inc. (a) |
15,695 |
380 |
|
|
CSI Properties Ltd. |
11,320,000 |
460 |
|
|
|
840 |
||
|
Thrifts & Mortgage Finance - 0.1% |
|||
|
WSFS Financial Corp. |
13,500 |
1,025 |
|
|
TOTAL FINANCIALS |
164,483 |
||
|
HEALTH CARE - 13.4% |
|||
|
Biotechnology - 3.4% |
|||
|
Alexion Pharmaceuticals, Inc. (a) |
7,791 |
970 |
|
|
Alnylam Pharmaceuticals, Inc. (a) |
63,300 |
3,874 |
|
|
Common Stocks - continued |
|||
|
Shares |
Value (000s) |
||
|
HEALTH CARE - continued |
|||
|
Biotechnology - continued |
|||
|
Amgen, Inc. |
81,057 |
$ 9,247 |
|
|
Biogen Idec, Inc. (a) |
16,000 |
4,656 |
|
|
Gilead Sciences, Inc. (a) |
121,372 |
9,080 |
|
|
Grifols SA ADR |
86,375 |
2,966 |
|
|
Infinity Pharmaceuticals, Inc. (a) |
34,698 |
507 |
|
|
Isis Pharmaceuticals, Inc. (a) |
35,800 |
1,388 |
|
|
KaloBios Pharmaceuticals, Inc. (e) |
49,556 |
210 |
|
|
Theravance, Inc. (a) |
70,901 |
2,677 |
|
|
|
35,575 |
||
|
Health Care Equipment & Supplies - 1.5% |
|||
|
Abbott Laboratories |
18,100 |
691 |
|
|
Ansell Ltd. |
38,203 |
706 |
|
|
Boston Scientific Corp. (a) |
207,562 |
2,404 |
|
|
Covidien PLC |
35,073 |
2,394 |
|
|
Genmark Diagnostics, Inc. (a) |
114,606 |
1,364 |
|
|
Hill-Rom Holdings, Inc. |
32,767 |
1,357 |
|
|
Stryker Corp. |
45,180 |
3,362 |
|
|
The Cooper Companies, Inc. |
20,852 |
2,747 |
|
|
Zimmer Holdings, Inc. |
13,042 |
1,192 |
|
|
|
16,217 |
||
|
Health Care Providers & Services - 2.9% |
|||
|
AmerisourceBergen Corp. |
50,695 |
3,576 |
|
|
AmSurg Corp. (a) |
25,268 |
1,221 |
|
|
Cardinal Health, Inc. |
56,722 |
3,664 |
|
|
DaVita, Inc. (a) |
28,788 |
1,714 |
|
|
Emeritus Corp. (a) |
50,963 |
1,147 |
|
|
Express Scripts Holding Co. (a) |
73,201 |
4,930 |
|
|
McKesson Corp. |
40,206 |
6,670 |
|
|
Qualicorp SA (a) |
55,300 |
517 |
|
|
Quest Diagnostics, Inc. |
8,884 |
541 |
|
|
UnitedHealth Group, Inc. |
86,434 |
6,438 |
|
|
|
30,418 |
||
|
Life Sciences Tools & Services - 0.5% |
|||
|
Agilent Technologies, Inc. |
28,430 |
1,523 |
|
|
Lonza Group AG |
12,612 |
1,175 |
|
|
Thermo Fisher Scientific, Inc. |
28,713 |
2,896 |
|
|
|
5,594 |
||
|
Pharmaceuticals - 5.1% |
|||
|
AbbVie, Inc. |
144,770 |
7,014 |
|
|
Common Stocks - continued |
|||
|
Shares |
Value (000s) |
||
|
HEALTH CARE - continued |
|||
|
Pharmaceuticals - continued |
|||
|
Actavis PLC (a) |
36,942 |
$ 6,024 |
|
|
Bayer AG |
14,800 |
1,975 |
|
|
Biodelivery Sciences International, Inc. (a) |
209,414 |
1,005 |
|
|
Cadence Pharmaceuticals, Inc. (a) |
160,110 |
1,444 |
|
|
Horizon Pharma, Inc. (a) |
330,551 |
2,386 |
|
|
Horizon Pharma, Inc.: |
|
|
|
|
warrants 2/28/17 (a) |
27,294 |
82 |
|
|
warrants 9/25/17 (a) |
109,700 |
309 |
|
|
Johnson & Johnson |
93,892 |
8,888 |
|
|
Novartis AG sponsored ADR |
4,279 |
339 |
|
|
Novo Nordisk A/S Series B |
13,945 |
2,493 |
|
|
Perrigo Co. |
28,092 |
4,379 |
|
|
Pfizer, Inc. |
160,304 |
5,086 |
|
|
Sanofi SA |
68,393 |
7,226 |
|
|
Teva Pharmaceutical Industries Ltd. sponsored ADR |
74,849 |
3,051 |
|
|
Valeant Pharmaceuticals International, Inc. (Canada) (a) |
23,900 |
2,620 |
|
|
Zoetis, Inc. Class A |
1 |
0* |
|
|
|
54,321 |
||
|
TOTAL HEALTH CARE |
142,125 |
||
|
INDUSTRIALS - 11.8% |
|||
|
Aerospace & Defense - 1.8% |
|||
|
General Dynamics Corp. |
12,759 |
1,169 |
|
|
Honeywell International, Inc. |
63,581 |
5,628 |
|
|
Meggitt PLC |
237,051 |
1,936 |
|
|
The Boeing Co. |
11,255 |
1,511 |
|
|
United Technologies Corp. |
80,571 |
8,932 |
|
|
|
19,176 |
||
|
Air Freight & Logistics - 0.7% |
|||
|
FedEx Corp. |
27,226 |
3,776 |
|
|
United Parcel Service, Inc. Class B |
33,481 |
3,428 |
|
|
|
7,204 |
||
|
Building Products - 0.7% |
|||
|
A.O. Smith Corp. |
35,466 |
1,920 |
|
|
Masco Corp. |
229,353 |
5,142 |
|
|
|
7,062 |
||
|
Common Stocks - continued |
|||
|
Shares |
Value (000s) |
||
|
INDUSTRIALS - continued |
|||
|
Commercial Services & Supplies - 0.6% |
|||
|
Iron Mountain, Inc. |
44,791 |
$ 1,260 |
|
|
KAR Auction Services, Inc. |
61,100 |
1,686 |
|
|
Republic Services, Inc. |
48,140 |
1,681 |
|
|
Swisher Hygiene, Inc. (a) |
53,031 |
28 |
|
|
Waste Management, Inc. |
32,458 |
1,483 |
|
|
|
6,138 |
||
|
Construction & Engineering - 0.4% |
|||
|
URS Corp. |
77,170 |
4,011 |
|
|
Electrical Equipment - 1.6% |
|||
|
AMETEK, Inc. |
30,332 |
1,493 |
|
|
Eaton Corp. PLC |
42,653 |
3,099 |
|
|
EnerSys |
16,926 |
1,208 |
|
|
Generac Holdings, Inc. |
59,506 |
3,169 |
|
|
Hubbell, Inc. Class B |
12,024 |
1,298 |
|
|
Prysmian SpA |
104,262 |
2,723 |
|
|
Regal-Beloit Corp. |
27,087 |
1,993 |
|
|
Roper Industries, Inc. |
12,561 |
1,629 |
|
|
|
16,612 |
||
|
Industrial Conglomerates - 2.1% |
|||
|
Danaher Corp. |
18,500 |
1,384 |
|
|
General Electric Co. |
707,210 |
18,854 |
|
|
Koninklijke Philips Electronics NV |
68,500 |
2,450 |
|
|
|
22,688 |
||
|
Machinery - 2.0% |
|||
|
Andritz AG |
18,598 |
1,179 |
|
|
Cummins, Inc. |
20,890 |
2,765 |
|
|
Global Brass & Copper Holdings, Inc. |
55,502 |
916 |
|
|
Illinois Tool Works, Inc. |
25,600 |
2,037 |
|
|
Ingersoll-Rand PLC |
62,752 |
4,482 |
|
|
Manitowoc Co., Inc. |
144,603 |
2,977 |
|
|
Pentair Ltd. |
39,073 |
2,763 |
|
|
Stanley Black & Decker, Inc. |
45,656 |
3,716 |
|
|
Weg SA |
37,100 |
504 |
|
|
|
21,339 |
||
|
Marine - 0.0% |
|||
|
Ultrapetrol (Bahamas) Ltd. (a) |
164,775 |
559 |
|
|
Professional Services - 0.6% |
|||
|
Dun & Bradstreet Corp. |
41,796 |
4,884 |
|
|
Common Stocks - continued |
|||
|
Shares |
Value (000s) |
||
|
INDUSTRIALS - continued |
|||
|
Professional Services - continued |
|||
|
Huron Consulting Group, Inc. (a) |
12,334 |
$ 733 |
|
|
Michael Page International PLC |
151,879 |
1,180 |
|
|
|
6,797 |
||
|
Road & Rail - 1.2% |
|||
|
Con-way, Inc. |
26,800 |
1,109 |
|
|
CSX Corp. |
99,662 |
2,718 |
|
|
Norfolk Southern Corp. |
20,642 |
1,810 |
|
|
Union Pacific Corp. |
45,415 |
7,359 |
|
|
|
12,996 |
||
|
Trading Companies & Distributors - 0.1% |
|||
|
Houston Wire & Cable Co. |
73,887 |
997 |
|
|
TOTAL INDUSTRIALS |
125,579 |
||
|
INFORMATION TECHNOLOGY - 17.8% |
|||
|
Communications Equipment - 1.9% |
|||
|
Cisco Systems, Inc. |
451,979 |
9,605 |
|
|
QUALCOMM, Inc. |
144,528 |
10,634 |
|
|
|
20,239 |
||
|
Computers & Peripherals - 3.8% |
|||
|
Apple, Inc. |
61,952 |
34,447 |
|
|
Electronics for Imaging, Inc. (a) |
44,198 |
1,750 |
|
|
EMC Corp. |
120,328 |
2,870 |
|
|
Western Digital Corp. |
10,415 |
782 |
|
|
|
39,849 |
||
|
Electronic Equipment & Components - 0.6% |
|||
|
Corning, Inc. |
102,112 |
1,744 |
|
|
National Instruments Corp. |
16,854 |
527 |
|
|
TE Connectivity Ltd. |
81,622 |
4,303 |
|
|
|
6,574 |
||
|
Internet Software & Services - 2.3% |
|||
|
Demandware, Inc. (a) |
18,065 |
1,024 |
|
|
Google, Inc. Class A (a) |
18,432 |
19,530 |
|
|
Mail.Ru Group Ltd.: |
|
|
|
|
GDR (e) |
1,900 |
79 |
|
|
GDR (Reg. S) |
24,469 |
1,012 |
|
|
Velti PLC (f) |
192,692 |
16 |
|
|
Yahoo!, Inc. (a) |
68,605 |
2,537 |
|
|
|
24,198 |
||
|
Common Stocks - continued |
|||
|
Shares |
Value (000s) |
||
|
INFORMATION TECHNOLOGY - continued |
|||
|
IT Services - 3.3% |
|||
|
Accenture PLC Class A |
50,938 |
$ 3,946 |
|
|
Amdocs Ltd. |
38,282 |
1,549 |
|
|
Cognizant Technology Solutions Corp. Class A (a) |
53,782 |
5,050 |
|
|
Computer Sciences Corp. |
9,021 |
475 |
|
|
EPAM Systems, Inc. (a) |
6,474 |
230 |
|
|
ExlService Holdings, Inc. (a) |
28,683 |
756 |
|
|
Fidelity National Information Services, Inc. |
58,748 |
2,977 |
|
|
MasterCard, Inc. Class A |
7,042 |
5,358 |
|
|
Total System Services, Inc. |
114,908 |
3,568 |
|
|
Visa, Inc. Class A |
54,271 |
11,042 |
|
|
|
34,951 |
||
|
Office Electronics - 0.5% |
|||
|
Xerox Corp. |
444,973 |
5,064 |
|
|
Semiconductors & Semiconductor Equipment - 1.5% |
|||
|
Altera Corp. |
20,056 |
647 |
|
|
ASML Holding NV |
13,697 |
1,279 |
|
|
Avago Technologies Ltd. |
101,106 |
4,522 |
|
|
LTX-Credence Corp. (a) |
139,393 |
1,006 |
|
|
Maxim Integrated Products, Inc. |
39,436 |
1,123 |
|
|
Monolithic Power Systems, Inc. |
17,660 |
590 |
|
|
NXP Semiconductors NV (a) |
38,247 |
1,625 |
|
|
Samsung Electronics Co. Ltd. |
2,586 |
3,651 |
|
|
Skyworks Solutions, Inc. (a) |
70,090 |
1,864 |
|
|
|
16,307 |
||
|
Software - 3.9% |
|||
|
Activision Blizzard, Inc. |
201,233 |
3,463 |
|
|
Adobe Systems, Inc. (a) |
17,338 |
984 |
|
|
Citrix Systems, Inc. (a) |
27,561 |
1,635 |
|
|
Comverse, Inc. |
17,352 |
581 |
|
|
Constellation Software, Inc. |
9,700 |
1,723 |
|
|
Electronic Arts, Inc. (a) |
109,986 |
2,439 |
|
|
Intuit, Inc. |
20,285 |
1,506 |
|
|
Microsoft Corp. |
505,633 |
19,280 |
|
|
Oracle Corp. |
253,618 |
8,950 |
|
|
Symantec Corp. |
47,770 |
1,074 |
|
|
|
41,635 |
||
|
TOTAL INFORMATION TECHNOLOGY |
188,817 |
||
|
Common Stocks - continued |
|||
|
Shares |
Value (000s) |
||
|
MATERIALS - 3.4% |
|||
|
Chemicals - 2.1% |
|||
|
Axiall Corp. |
46,703 |
$ 2,116 |
|
|
Cabot Corp. |
79,138 |
3,862 |
|
|
Chemtura Corp. (a) |
15,101 |
399 |
|
|
Eastman Chemical Co. |
32,307 |
2,489 |
|
|
LyondellBasell Industries NV Class A |
36,196 |
2,794 |
|
|
Monsanto Co. |
39,101 |
4,431 |
|
|
Potash Corp. of Saskatchewan, Inc. |
43,200 |
1,368 |
|
|
PPG Industries, Inc. |
8,672 |
1,596 |
|
|
Royal DSM NV |
11,000 |
863 |
|
|
RPM International, Inc. |
47,109 |
1,866 |
|
|
|
21,784 |
||
|
Construction Materials - 0.1% |
|||
|
Vulcan Materials Co. |
13,941 |
786 |
|
|
Containers & Packaging - 0.2% |
|||
|
Nampak Ltd. |
301,028 |
1,160 |
|
|
Rock-Tenn Co. Class A |
15,404 |
1,454 |
|
|
|
2,614 |
||
|
Metals & Mining - 0.8% |
|||
|
Freeport-McMoRan Copper & Gold, Inc. |
136,655 |
4,741 |
|
|
Ivanhoe Mine Ltd. (a)(e) |
746,308 |
1,475 |
|
|
Randgold Resources Ltd. sponsored ADR |
22,500 |
1,592 |
|
|
Turquoise Hill Resources Ltd. (a)(d) |
123,222 |
508 |
|
|
|
8,316 |
||
|
Paper & Forest Products - 0.2% |
|||
|
Boise Cascade Co. |
35,400 |
908 |
|
|
International Paper Co. |
38,074 |
1,776 |
|
|
|
2,684 |
||
|
TOTAL MATERIALS |
36,184 |
||
|
TELECOMMUNICATION SERVICES - 1.0% |
|||
|
Diversified Telecommunication Services - 0.1% |
|||
|
CenturyLink, Inc. |
42,127 |
1,293 |
|
|
Wireless Telecommunication Services - 0.9% |
|||
|
Mobile TeleSystems OJSC sponsored ADR |
72,934 |
1,537 |
|
|
SBA Communications Corp. Class A (a) |
15,597 |
1,328 |
|
|
SoftBank Corp. |
21,100 |
1,707 |
|
|
T-Mobile U.S., Inc. (a) |
41,100 |
1,069 |
|
|
Common Stocks - continued |
|||
|
Shares |
Value (000s) |
||
|
TELECOMMUNICATION SERVICES - continued |
|||
|
Wireless Telecommunication Services - continued |
|||
|
Telephone & Data Systems, Inc. |
38,908 |
$ 1,082 |
|
|
Vodafone Group PLC |
585,200 |
2,170 |
|
|
|
8,893 |
||
|
TOTAL TELECOMMUNICATION SERVICES |
10,186 |
||
|
UTILITIES - 2.1% |
|||
|
Electric Utilities - 0.9% |
|||
|
Edison International |
54,007 |
2,496 |
|
|
ITC Holdings Corp. |
31,838 |
2,881 |
|
|
NextEra Energy, Inc. |
20,741 |
1,754 |
|
|
Northeast Utilities |
24,672 |
1,014 |
|
|
Xcel Energy, Inc. |
46,644 |
1,307 |
|
|
|
9,452 |
||
|
Gas Utilities - 0.3% |
|||
|
BW LPG Ltd. (a) |
136,320 |
1,101 |
|
|
National Fuel Gas Co. |
33,087 |
2,233 |
|
|
|
3,334 |
||
|
Independent Power Producers & Energy Traders - 0.3% |
|||
|
The AES Corp. |
248,779 |
3,625 |
|
|
Multi-Utilities - 0.6% |
|||
|
CenterPoint Energy, Inc. |
28,639 |
671 |
|
|
CMS Energy Corp. |
12,950 |
344 |
|
|
PG&E Corp. |
58,700 |
2,370 |
|
|
Sempra Energy |
29,654 |
2,623 |
|
|
|
6,008 |
||
|
TOTAL UTILITIES |
22,419 |
||
|
TOTAL COMMON STOCKS (Cost $830,774) |
|
||
|
Preferred Stocks - 0.3% |
|||
|
|
|
|
|
|
Convertible Preferred Stocks - 0.1% |
|||
|
INFORMATION TECHNOLOGY - 0.1% |
|||
|
Software - 0.1% |
|||
|
Mobileye NV Series F (a)(f) |
32,777 |
1,144 |
|
|
Preferred Stocks - continued |
|||
|
Shares |
Value (000s) |
||
|
Nonconvertible Preferred Stocks - 0.2% |
|||
|
CONSUMER DISCRETIONARY - 0.2% |
|||
|
Automobiles - 0.2% |
|||
|
Volkswagen AG |
9,100 |
$ 2,415 |
|
|
TOTAL PREFERRED STOCKS (Cost $3,175) |
|
||
|
Convertible Bonds - 0.2% |
||||
|
|
Principal |
|
||
|
ENERGY - 0.1% |
||||
|
Energy Equipment & Services - 0.0% |
||||
|
Cal Dive International, Inc. 5% 7/15/17 (e) |
|
$ 89 |
90 |
|
|
Oil, Gas & Consumable Fuels - 0.1% |
||||
|
Amyris, Inc. 3% 2/27/17 |
|
791 |
576 |
|
|
BPZ Energy, Inc. 8.5% 10/1/17 |
|
600 |
557 |
|
|
|
1,133 |
|||
|
TOTAL ENERGY |
1,223 |
|||
|
INDUSTRIALS - 0.1% |
||||
|
Building Products - 0.1% |
||||
|
Aspen Aerogels, Inc. 8% 6/1/14 (f) |
|
451 |
451 |
|
|
TOTAL CONVERTIBLE BONDS (Cost $1,873) |
|
|||
|
Money Market Funds - 1.6% |
|||
|
Shares |
Value (000s) |
||
|
Fidelity Cash Central Fund, 0.10% (b) |
13,852,894 |
$ 13,853 |
|
|
Fidelity Securities Lending Cash Central Fund, 0.10% (b)(c) |
3,384,950 |
3,385 |
|
|
TOTAL MONEY MARKET FUNDS (Cost $17,238) |
|
||
|
TOTAL INVESTMENT PORTFOLIO - 100.5% (Cost $853,060) |
1,065,668 |
||
|
NET OTHER ASSETS (LIABILITIES) - (0.5)% |
(5,132) |
||
|
NET ASSETS - 100% |
$ 1,060,536 |
||
|
Legend |
|
(a) Non-income producing |
|
(b) Affiliated fund that is generally available only to investment companies and other accounts managed by Fidelity Investments. The rate quoted is the annualized seven-day yield of the fund at period end. A complete unaudited listing of the fund's holdings as of its most recent quarter end is available upon request. In addition, each Fidelity Central Fund's financial statements are available on the SEC's website or upon request. |
|
(c) Investment made with cash collateral received from securities on loan. |
|
(d) Security or a portion of the security is on loan at period end. |
|
(e) Security exempt from registration under Rule 144A of the Securities Act of 1933. These securities may be resold in transactions exempt from registration, normally to qualified institutional buyers. At the end of the period, the value of these securities amounted to $2,337,000 or 0.2% of net assets. |
|
(f) Restricted securities - Investment in securities not registered under the Securities Act of 1933 (excluding 144A issues). At the end of the period, the value of restricted securities (excluding 144A issues) amounted to $5,033,000 or 0.5% of net assets. |
|
Additional information on each restricted holding is as follows: |
|
Security |
Acquisition |
Acquisition |
|
ASAC II LP |
10/10/13 |
$ 2,985 |
|
Aspen Aerogels, Inc. 8% 6/1/14 |
6/1/11 - 12/31/12 |
$ 451 |
|
Mobileye NV Series F |
8/15/13 |
$ 1,144 |
|
Velti PLC |
4/19/13 |
$ 289 |
* Amount represents less than $1,000.
See accompanying notes which are an integral part of the financial statements.
Annual Report
Investments - continued
|
Affiliated Central Funds |
|
Information regarding fiscal year to date income earned by the Fund from investments in Fidelity Central Funds is as follows: |
|
Fund |
Income earned |
|
Fidelity Cash Central Fund |
$ 8 |
|
Fidelity Securities Lending Cash Central Fund |
467 |
|
Total |
$ 475 |
|
Other Information |
|
The following is a summary of the inputs used, as of November 30, 2013, involving the Fund's assets and liabilities carried at fair value. The inputs or methodology used for valuing securities may not be an indication of the risk associated with investing in those securities. For more information on valuation inputs, and their aggregation into the levels used in the table below, please refer to the Investment Valuation section in the accompanying Notes to Financial Statements. |
|
Valuation Inputs at Reporting Date: |
||||
|
Description |
Total |
Level 1 |
Level 2 |
Level 3 |
|
Investments in Securities: |
||||
|
Equities: |
||||
|
Consumer Discretionary |
$ 150,866 |
$ 150,866 |
$ - |
$ - |
|
Consumer Staples |
106,745 |
103,484 |
3,261 |
- |
|
Energy |
98,208 |
98,208 |
- |
- |
|
Financials |
164,483 |
160,416 |
645 |
3,422 |
|
Health Care |
142,125 |
132,015 |
10,110 |
- |
|
Industrials |
125,579 |
123,129 |
2,450 |
- |
|
Information Technology |
189,961 |
188,801 |
16 |
1,144 |
|
Materials |
36,184 |
36,184 |
- |
- |
|
Telecommunication Services |
10,186 |
8,016 |
2,170 |
- |
|
Utilities |
22,419 |
22,419 |
- |
- |
|
Corporate Bonds |
1,674 |
- |
1,223 |
451 |
|
Money Market Funds |
17,238 |
17,238 |
- |
- |
|
Total Investments in Securities: |
$ 1,065,668 |
$ 1,040,776 |
$ 19,875 |
$ 5,017 |
|
Distribution of investments by country or territory of incorporation, as a percentage of total net assets, is as follows (Unaudited): |
|
United States of America |
81.9% |
|
Canada |
2.7% |
|
United Kingdom |
2.1% |
|
Ireland |
2.0% |
|
Bermuda |
1.5% |
|
Switzerland |
1.3% |
|
France |
1.0% |
|
Others (Individually Less Than 1%) |
7.5% |
|
|
100.0% |
See accompanying notes which are an integral part of the financial statements.
Annual Report
Financial Statements
Statement of Assets and Liabilities
|
Amounts in thousands (except per-share amounts) |
November 30, 2013 |
|
|
|
|
|
|
Assets |
|
|
|
Investment in securities, at value (including securities loaned of $3,277) - See accompanying schedule: Unaffiliated issuers (cost $835,822) |
$ 1,048,430 |
|
|
Fidelity Central Funds (cost $17,238) |
17,238 |
|
|
Total Investments (cost $853,060) |
|
$ 1,065,668 |
|
Cash |
|
62 |
|
Foreign currency held at value (cost $62) |
|
62 |
|
Receivable for investments sold |
|
7,053 |
|
Receivable for fund shares sold |
|
496 |
|
Dividends receivable |
|
1,520 |
|
Interest receivable |
|
51 |
|
Distributions receivable from Fidelity Central Funds |
|
18 |
|
Prepaid expenses |
|
3 |
|
Other receivables |
|
2 |
|
Total assets |
|
1,074,935 |
|
|
|
|
|
Liabilities |
|
|
|
Payable for investments purchased |
$ 5,959 |
|
|
Payable for fund shares redeemed |
4,061 |
|
|
Accrued management fee |
329 |
|
|
Distribution and service plan fees payable |
373 |
|
|
Other affiliated payables |
213 |
|
|
Other payables and accrued expenses |
79 |
|
|
Collateral on securities loaned, at value |
3,385 |
|
|
Total liabilities |
|
14,399 |
|
|
|
|
|
Net Assets |
|
$ 1,060,536 |
|
Net Assets consist of: |
|
|
|
Paid in capital |
|
$ 848,860 |
|
Undistributed net investment income |
|
3,162 |
|
Accumulated undistributed net realized gain (loss) on investments and foreign currency transactions |
|
(4,094) |
|
Net unrealized appreciation (depreciation) on investments and assets and liabilities in foreign currencies |
|
212,608 |
|
Net Assets |
|
$ 1,060,536 |
See accompanying notes which are an integral part of the financial statements.
Annual Report
Financial Statements - continued
Statement of Assets and Liabilities - continued
|
Amounts in thousands (except per-share amounts) |
November 30, 2013 |
|
|
|
|
|
|
Calculation of Maximum Offering Price Class A: |
|
$ 17.23 |
|
|
|
|
|
Maximum offering price per share (100/94.25 of $17.23) |
|
$ 18.28 |
|
Class T: |
|
$ 17.15 |
|
|
|
|
|
Maximum offering price per share (100/96.50 of $17.15) |
|
$ 17.77 |
|
Class B: |
|
$ 16.57 |
|
|
|
|
|
Class C: |
|
$ 16.54 |
|
|
|
|
|
Institutional Class: |
|
$ 17.91 |
|
|
|
|
|
Class Z: |
|
$ 17.92 |
A Redemption price per share is equal to net asset value less any applicable contingent deferred sales charge.
See accompanying notes which are an integral part of the financial statements.
Annual Report
Statement of Operations
|
Amounts in thousands |
Year ended November 30, 2013 |
|
|
|
|
|
|
Investment Income |
|
|
|
Dividends |
|
$ 16,427 |
|
Interest |
|
494 |
|
Income from Fidelity Central Funds |
|
475 |
|
Total income |
|
17,396 |
|
|
|
|
|
Expenses |
|
|
|
Management fee |
$ 5,243 |
|
|
Performance adjustment |
(1,346) |
|
|
Transfer agent fees |
2,165 |
|
|
Distribution and service plan fees |
4,080 |
|
|
Accounting and security lending fees |
319 |
|
|
Custodian fees and expenses |
211 |
|
|
Independent trustees' compensation |
5 |
|
|
Registration fees |
100 |
|
|
Audit |
69 |
|
|
Legal |
5 |
|
|
Miscellaneous |
8 |
|
|
Total expenses before reductions |
10,859 |
|
|
Expense reductions |
(121) |
10,738 |
|
Net investment income (loss) |
|
6,658 |
|
Realized and Unrealized Gain (Loss) Net realized gain (loss) on: |
|
|
|
Investment securities: |
|
|
|
Unaffiliated issuers |
96,965 |
|
|
Foreign currency transactions |
(28) |
|
|
Total net realized gain (loss) |
|
96,937 |
|
Change in net unrealized appreciation (depreciation) on: Investment securities |
145,249 |
|
|
Assets and liabilities in foreign currencies |
4 |
|
|
Total change in net unrealized appreciation (depreciation) |
|
145,253 |
|
Net gain (loss) |
|
242,190 |
|
Net increase (decrease) in net assets resulting from operations |
|
$ 248,848 |
See accompanying notes which are an integral part of the financial statements.
Annual Report
Financial Statements - continued
Statement of Changes in Net Assets
|
Amounts in thousands |
Year ended |
Year ended |
|
Increase (Decrease) in Net Assets |
|
|
|
Operations |
|
|
|
Net investment income (loss) |
$ 6,658 |
$ 3,116 |
|
Net realized gain (loss) |
96,937 |
39,284 |
|
Change in net unrealized appreciation (depreciation) |
145,253 |
84,266 |
|
Net increase (decrease) in net assets resulting |
248,848 |
126,666 |
|
Distributions to shareholders from net investment income |
(5,093) |
- |
|
Share transactions - net increase (decrease) |
(30,529) |
(97,081) |
|
Total increase (decrease) in net assets |
213,226 |
29,585 |
|
|
|
|
|
Net Assets |
|
|
|
Beginning of period |
847,310 |
817,725 |
|
End of period (including undistributed net investment income of $3,162 and undistributed net investment income of $2,813, respectively) |
$ 1,060,536 |
$ 847,310 |
See accompanying notes which are an integral part of the financial statements.
Annual Report
Financial Highlights - Class A
|
Years ended November 30, |
2013 |
2012 |
2011 |
2010 |
2009 |
|
Selected Per-Share Data |
|
|
|
|
|
|
Net asset value, beginning of period |
$ 13.33 |
$ 11.45 |
$ 11.58 |
$ 9.95 |
$ 6.64 |
|
Income from Investment Operations |
|
|
|
|
|
|
Net investment income (loss) C |
.13 |
.07 |
.02 |
.03 F |
.04 |
|
Net realized and unrealized gain (loss) |
3.87 |
1.81 |
(.09) |
1.66 |
3.41 |
|
Total from investment operations |
4.00 |
1.88 |
(.07) |
1.69 |
3.45 |
|
Distributions from net investment income |
(.10) |
- |
- |
(.02) |
(.14) |
|
Distributions from net realized gain |
- |
- |
(.06) |
(.05) |
- |
|
Total distributions |
(.10) |
- |
(.06) |
(.06) H |
(.14) |
|
Net asset value, end of period |
$ 17.23 |
$ 13.33 |
$ 11.45 |
$ 11.58 |
$ 9.95 |
|
Total Return A, B |
30.26% |
16.42% |
(.63)% |
17.09% |
52.97% |
|
Ratios to Average Net Assets D, G |
|
|
|
|
|
|
Expenses before reductions |
.98% |
1.21% |
1.36% |
1.36% |
1.08% |
|
Expenses net of fee waivers, if any |
.98% |
1.21% |
1.33% |
1.25% |
1.08% |
|
Expenses net of all reductions |
.97% |
1.20% |
1.33% |
1.24% |
1.08% |
|
Net investment income (loss) |
.87% |
.53% |
.16% |
.24% F |
.56% |
|
Supplemental Data |
|
|
|
|
|
|
Net assets, end of period (in millions) |
$ 369 |
$ 301 |
$ 295 |
$ 285 |
$ 240 |
|
Portfolio turnover rate E |
70% |
64% |
68% |
80% |
88% |
A Total returns would have been lower if certain expenses had not been reduced during the applicable periods shown.
B Total returns do not include the effect of the sales charges.
C Calculated based on average shares outstanding during the period.
D Fees and expenses of any underlying Fidelity Central Funds are not included in the Fund's expense ratio. The Fund indirectly bears its proportionate share of the expenses of any underlying Fidelity Central Funds.
E Amount does not include the portfolio activity of any underlying Fidelity Central Funds.
F Investment income per share reflects a large, non-recurring dividend which amounted to $.02 per share. Excluding this non-recurring dividend, the ratio of net investment income (loss) to average net assets would have been .10%.
G Expense ratios reflect operating expenses of the class. Expenses before reductions do not reflect amounts reimbursed by the investment adviser or reductions from brokerage service arrangements or reductions from other expense offset arrangements and do not represent the amount paid by the class during periods when reimbursements or reductions occur. Expenses net of fee waivers reflect expenses after reimbursement by the investment adviser but prior to reductions from brokerage service arrangements or other expense offset arrangements. Expenses net of all reductions represent the net expenses paid by the class.
H Total distributions of $.06 per share is comprised of distributions from net investment income of $.018 and distributions from net realized gain of $.045 per share.
See accompanying notes which are an integral part of the financial statements.
Annual Report
Financial Highlights - Class T
|
Years ended November 30, |
2013 |
2012 |
2011 |
2010 |
2009 |
|
Selected Per-Share Data |
|
|
|
|
|
|
Net asset value, beginning of period |
$ 13.26 |
$ 11.42 |
$ 11.55 |
$ 9.92 |
$ 6.60 |
|
Income from Investment Operations |
|
|
|
|
|
|
Net investment income (loss) C |
.10 |
.04 |
(.01) |
- F, H |
.03 |
|
Net realized and unrealized gain (loss) |
3.86 |
1.80 |
(.09) |
1.67 |
3.39 |
|
Total from investment operations |
3.96 |
1.84 |
(.10) |
1.67 |
3.42 |
|
Distributions from net investment income |
(.07) |
- |
- |
- |
(.10) |
|
Distributions from net realized gain |
- |
- |
(.03) |
(.04) |
- |
|
Total distributions |
(.07) |
- |
(.03) |
(.04) |
(.10) |
|
Net asset value, end of period |
$ 17.15 |
$ 13.26 |
$ 11.42 |
$ 11.55 |
$ 9.92 |
|
Total Return A, B |
30.05% |
16.11% |
(.90)% |
16.88% |
52.60% |
|
Ratios to Average Net Assets D, G |
|
|
|
|
|
|
Expenses before reductions |
1.20% |
1.42% |
1.57% |
1.57% |
1.31% |
|
Expenses net of fee waivers, if any |
1.20% |
1.42% |
1.55% |
1.50% |
1.31% |
|
Expenses net of all reductions |
1.19% |
1.42% |
1.54% |
1.49% |
1.30% |
|
Net investment income (loss) |
.65% |
.32% |
(.06)% |
(.01)% F |
.34% |
|
Supplemental Data |
|
|
|
|
|
|
Net assets, end of period (in millions) |
$ 375 |
$ 304 |
$ 294 |
$ 322 |
$ 305 |
|
Portfolio turnover rate E |
70% |
64% |
68% |
80% |
88% |
A Total returns would have been lower if certain expenses had not been reduced during the applicable periods shown.
B Total returns do not include the effect of the sales charges.
C Calculated based on average shares outstanding during the period.
D Fees and expenses of any underlying Fidelity Central Funds are not included in the Fund's expense ratio. The Fund indirectly bears its proportionate share of the expenses of any underlying Fidelity Central Funds.
E Amount does not include the portfolio activity of any underlying Fidelity Central Funds.
F Investment income per share reflects a large, non-recurring dividend which amounted to $.02 per share. Excluding this non-recurring dividend, the ratio of net investment income (loss) to average net assets would have been (.15) %.
G Expense ratios reflect operating expenses of the class. Expenses before reductions do not reflect amounts reimbursed by the investment adviser or reductions from brokerage service arrangements or reductions from other expense offset arrangements and do not represent the amount paid by the class during periods when reimbursements or reductions occur. Expenses net of fee waivers reflect expenses after reimbursement by the investment adviser but prior to reductions from brokerage service arrangements or other expense offset arrangements. Expenses net of all reductions represent the net expenses paid by the class.
H Amount represents less than $.01 per share.
See accompanying notes which are an integral part of the financial statements.
Annual Report
Financial Highlights - Class B
|
Years ended November 30, |
2013 |
2012 |
2011 |
2010 |
2009 |
|
Selected Per-Share Data |
|
|
|
|
|
|
Net asset value, beginning of period |
$ 12.82 |
$ 11.11 |
$ 11.26 |
$ 9.68 |
$ 6.42 |
|
Income from Investment Operations |
|
|
|
|
|
|
Net investment income (loss) C |
.01 |
(.03) |
(.07) |
(.05) F |
(.01) |
|
Net realized and unrealized gain (loss) |
3.74 |
1.74 |
(.08) |
1.63 |
3.31 |
|
Total from investment operations |
3.75 |
1.71 |
(.15) |
1.58 |
3.30 |
|
Distributions from net investment income |
- |
- |
- |
- |
(.04) |
|
Net asset value, end of period |
$ 16.57 |
$ 12.82 |
$ 11.11 |
$ 11.26 |
$ 9.68 |
|
Total Return A, B |
29.25% |
15.39% |
(1.33)% |
16.32% |
51.61% |
|
Ratios to Average Net Assets D, G |
|
|
|
|
|
|
Expenses before reductions |
1.79% |
1.99% |
2.14% |
2.13% |
1.81% |
|
Expenses net of fee waivers, if any |
1.79% |
1.99% |
2.09% |
2.00% |
1.81% |
|
Expenses net of all reductions |
1.78% |
1.99% |
2.09% |
2.00% |
1.80% |
|
Net investment income (loss) |
.06% |
(.25)% |
(.61)% |
(.51)% F |
(.17)% |
|
Supplemental Data |
|
|
|
|
|
|
Net assets, end of period (in millions) |
$ 15 |
$ 17 |
$ 22 |
$ 43 |
$ 69 |
|
Portfolio turnover rate E |
70% |
64% |
68% |
80% |
88% |
A Total returns would have been lower if certain expenses had not been reduced during the applicable periods shown.
B Total returns do not include the effect of the contingent deferred sales charge.
C Calculated based on average shares outstanding during the period.
D Fees and expenses of any underlying Fidelity Central Funds are not included in the Fund's expense ratio. The Fund indirectly bears its proportionate share of the expenses of any underlying Fidelity Central Funds.
E Amount does not include the portfolio activity of any underlying Fidelity Central Funds.
F Investment income per share reflects a large, non-recurring dividend which amounted to $.02 per share. Excluding this non-recurring dividend, the ratio of net investment income (loss) to average net assets would have been (.66) %.
G Expense ratios reflect operating expenses of the class. Expenses before reductions do not reflect amounts reimbursed by the investment adviser or reductions from brokerage service arrangements or reductions from other expense offset arrangements and do not represent the amount paid by the class during periods when reimbursements or reductions occur. Expenses net of fee waivers reflect expenses after reimbursement by the investment adviser but prior to reductions from brokerage service arrangements or other expense offset arrangements. Expenses net of all reductions represent the net expenses paid by the class.
See accompanying notes which are an integral part of the financial statements.
Annual Report
Financial Highlights - Class C
|
Years ended November 30, |
2013 |
2012 |
2011 |
2010 |
2009 |
|
Selected Per-Share Data |
|
|
|
|
|
|
Net asset value, beginning of period |
$ 12.79 |
$ 11.07 |
$ 11.22 |
$ 9.65 |
$ 6.41 |
|
Income from Investment Operations |
|
|
|
|
|
|
Net investment income (loss) C |
.02 |
(.02) |
(.07) |
(.05) F |
(.01) |
|
Net realized and unrealized gain (loss) |
3.73 |
1.74 |
(.08) |
1.62 |
3.30 |
|
Total from investment operations |
3.75 |
1.72 |
(.15) |
1.57 |
3.29 |
|
Distributions from net investment income |
- H |
- |
- |
- |
(.05) |
|
Distributions from net realized gain |
- |
- |
- |
- H |
- |
|
Total distributions |
- H |
- |
- |
- H |
(.05) |
|
Net asset value, end of period |
$ 16.54 |
$ 12.79 |
$ 11.07 |
$ 11.22 |
$ 9.65 |
|
Total Return A, B |
29.36% |
15.54% |
(1.34)% |
16.31% |
51.79% |
|
Ratios to Average Net Assets D, G |
|
|
|
|
|
|
Expenses before reductions |
1.72% |
1.94% |
2.08% |
2.08% |
1.81% |
|
Expenses net of fee waivers, if any |
1.72% |
1.94% |
2.06% |
2.00% |
1.81% |
|
Expenses net of all reductions |
1.71% |
1.93% |
2.05% |
1.99% |
1.81% |
|
Net investment income (loss) |
.13% |
(.20)% |
(.57)% |
(.51)% F |
(.17)% |
|
Supplemental Data |
|
|
|
|
|
|
Net assets, end of period (in millions) |
$ 160 |
$ 123 |
$ 124 |
$ 129 |
$ 125 |
|
Portfolio turnover rate E |
70% |
64% |
68% |
80% |
88% |
A Total returns would have been lower if certain expenses had not been reduced during the applicable periods shown.
B Total returns do not include the effect of the contingent deferred sales charge.
C Calculated based on average shares outstanding during the period.
D Fees and expenses of any underlying Fidelity Central Funds are not included in the Fund's expense ratio. The Fund indirectly bears its proportionate share of the expenses of any underlying Fidelity Central Funds.
E Amount does not include the portfolio activity of any underlying Fidelity Central Funds.
F Investment income per share reflects a large, non-recurring dividend which amounted to $.02 per share. Excluding this non-recurring dividend, the ratio of net investment income (loss) to average net assets would have been (.65) %.
G Expense ratios reflect operating expenses of the class. Expenses before reductions do not reflect amounts reimbursed by the investment adviser or reductions from brokerage service arrangements or reductions from other expense offset arrangements and do not represent the amount paid by the class during periods when reimbursements or reductions occur. Expenses net of fee waivers reflect expenses after reimbursement by the investment adviser but prior to reductions from brokerage service arrangements or other expense offset arrangements. Expenses net of all reductions represent the net expenses paid by the class.
H Amount represents less than $.01 per share.
See accompanying notes which are an integral part of the financial statements.
Annual Report
Financial Highlights - Institutional Class
|
Years ended November 30, |
2013 |
2012 |
2011 |
2010 |
2009 |
|
Selected Per-Share Data |
|
|
|
|
|
|
Net asset value, beginning of period |
$ 13.86 |
$ 11.88 |
$ 12.00 |
$ 10.31 |
$ 6.73 |
|
Income from Investment Operations |
|
|
|
|
|
|
Net investment income (loss) B |
.18 |
.11 |
.06 |
.05 E |
.08 |
|
Net realized and unrealized gain (loss) |
4.02 |
1.87 |
(.09) |
1.74 |
3.52 |
|
Total from investment operations |
4.20 |
1.98 |
(.03) |
1.79 |
3.60 |
|
Distributions from net investment income |
(.15) |
- |
(.02) |
(.06) |
(.02) |
|
Distributions from net realized gain |
- |
- |
(.07) |
(.04) |
- |
|
Total distributions |
(.15) |
- |
(.09) |
(.10) |
(.02) |
|
Net asset value, end of period |
$ 17.91 |
$ 13.86 |
$ 11.88 |
$ 12.00 |
$ 10.31 |
|
Total Return A |
30.63% |
16.67% |
(.33)% |
17.47% |
53.57% |
|
Ratios to Average Net Assets C, F |
|
|
|
|
|
|
Expenses before reductions |
.70% |
.91% |
1.04% |
1.03% |
.70% |
|
Expenses net of fee waivers, if any |
.70% |
.91% |
1.03% |
1.00% |
.70% |
|
Expenses net of all reductions |
.69% |
.90% |
1.02% |
.99% |
.69% |
|
Net investment income (loss) |
1.15% |
.83% |
.46% |
.49% E |
.94% |
|
Supplemental Data |
|
|
|
|
|
|
Net assets, end of period (in millions) |
$ 135 |
$ 103 |
$ 83 |
$ 73 |
$ 66 |
|
Portfolio turnover rate D |
70% |
64% |
68% |
80% |
88% |
A Total returns would have been lower if certain expenses had not been reduced during the applicable periods shown.
B Calculated based on average shares outstanding during the period.
C Fees and expenses of any underlying Fidelity Central Funds are not included in the Fund's expense ratio. The Fund indirectly bears its proportionate share of the expenses of any underlying Fidelity Central Funds.
D Amount does not include the portfolio activity of any underlying Fidelity Central Funds.
E Investment income per share reflects a large, non-recurring dividend which amounted to $.02 per share. Excluding this non-recurring dividend, the ratio of net investment income (loss) to average net assets would have been .35%.
F Expense ratios reflect operating expenses of the class. Expenses before reductions do not reflect amounts reimbursed by the investment adviser or reductions from brokerage service arrangements or reductions from other expense offset arrangements and do not represent the amount paid by the class during periods when reimbursements or reductions occur. Expenses net of fee waivers reflect expenses after reimbursement by the investment adviser but prior to reductions from brokerage service arrangements or other expense offset arrangements. Expenses net of all reductions represent the net expenses paid by the class.
See accompanying notes which are an integral part of the financial statements.
Annual Report
Financial Highlights - Class Z
|
Year ended November 30, |
2013 G |
|
Selected Per-Share Data |
|
|
Net asset value, beginning of period |
$ 16.59 |
|
Income from Investment Operations |
|
|
Net investment income (loss) D |
.06 |
|
Net realized and unrealized gain (loss) |
1.27 |
|
Total from investment operations |
1.33 |
|
Net asset value, end of period |
$ 17.92 |
|
Total Return B, C |
8.02% |
|
Ratios to Average Net Assets E, H |
|
|
Expenses before reductions |
.54% A |
|
Expenses net of fee waivers, if any |
.54% A |
|
Expenses net of all reductions |
.52% A |
|
Net investment income (loss) |
1.26% A |
|
Supplemental Data |
|
|
Net assets, end of period (in millions) |
$ 7 |
|
Portfolio turnover rate F |
70% |
A Annualized
B Total returns for periods of less than one year are not annualized.
C Total returns would have been lower if certain expenses had not been reduced during the applicable periods shown.
D Calculated based on average shares outstanding during the period.
E Fees and expenses of any underlying Fidelity Central Funds are not included in the Fund's expense ratio. The Fund indirectly bears its proportionate share of the expenses of any underlying Fidelity Central Funds.
F Amount does not include the portfolio activity of any underlying Fidelity Central Funds.
G For the period August 13, 2013 (commencement of sale of shares) to November 30, 2013.
H Expense ratios reflect operating expenses of the class. Expenses before reductions do not reflect amounts reimbursed by the investment adviser or reductions from brokerage service arrangements or reductions from other expense offset arrangements and do not represent the amount paid by the class during periods when reimbursements or reductions occur. Expense ratios before reductions for start-up periods may not be representative of longer-term operating periods. Expenses net of fee waivers reflect expenses after reimbursement by the investment adviser but prior to reductions from brokerage service arrangements or other expense offset arrangements. Expenses net of all reductions represent the net expenses paid by the class.
See accompanying notes which are an integral part of the financial statements.
Annual Report
Notes to Financial Statements
For the period ended November 30, 2013
(Amounts in thousands except percentages)
1. Organization.
Fidelity Advisor® Dividend Growth Fund (the Fund) is a fund of Fidelity Advisor Series I (the Trust) and is authorized to issue an unlimited number of shares. The Trust is registered under the Investment Company Act of 1940, as amended (the 1940 Act), as an open-end management investment company organized as a Massachusetts business trust. The Fund commenced sale of Class Z on August 13, 2013. The Fund offers Class A, Class T, Class C, Institutional Class and Class Z shares, each of which, along with Class B shares, has equal rights as to assets and voting privileges. Class B shares are closed to new accounts and additional purchases, except for exchanges and reinvestments. Each class has exclusive voting rights with respect to matters that affect that class. Class B shares will automatically convert to Class A shares after a holding period of seven years from the initial date of purchase.
2. Investments in Fidelity Central Funds.
The Fund invests in Fidelity Central Funds, which are open-end investment companies generally available only to other investment companies and accounts managed by the investment adviser and its affiliates. The Fund's Schedule of Investments lists each of the Fidelity Central Funds held as of period end, if any, as an investment of the Fund, but does not include the underlying holdings of each Fidelity Central Fund. As an Investing Fund, the Fund indirectly bears its proportionate share of the expenses of the underlying Fidelity Central Funds.
The Money Market Central Funds seek preservation of capital and current income and are managed by Fidelity Investments Money Management, Inc. (FIMM), an affiliate of the investment adviser. Annualized expenses of the Money Market Central Funds as of their most recent shareholder report date are less than .01%.
A complete unaudited list of holdings for each Fidelity Central Fund is available upon request or at the Securities and Exchange Commission (the SEC) website at www.sec.gov. In addition, the financial statements of the Fidelity Central Funds, which are not covered by the Fund's Report of Independent Registered Public Accounting Firm, are available on the SEC website or upon request.
3. Significant Accounting Policies.
The financial statements have been prepared in conformity with accounting principles generally accepted in the United States of America (GAAP), which require management to make certain estimates and assumptions at the date of the financial statements. Actual results could differ from those estimates. Subsequent events, if any, through the date that the financial statements were issued have been evaluated in the preparation of
Annual Report
3. Significant Accounting Policies - continued
the financial statements. The following summarizes the significant accounting policies of the Fund:
Investment Valuation. Investments are valued as of 4:00 p.m. Eastern time on the last calendar day of the period. In accordance with valuation policies and procedures approved by the Board of Trustees (the Board), the Fund attempts to obtain prices from one or more third party pricing vendors or brokers to value its investments. When current market prices, quotations or currency exchange rates are not readily available or reliable, investments will be fair valued in good faith by the Fidelity Management & Research Company (FMR) Fair Value Committee (the Committee), in accordance with procedures adopted by the Board. Factors used in determining fair value vary by investment type and may include market or investment specific events, changes in interest rates and credit quality. The frequency with which these procedures are used cannot be predicted and they may be utilized to a significant extent. The Committee oversees the Fund's valuation policies and procedures and is responsible for approving and reporting to the Board all fair value determinations.
The Fund categorizes the inputs to valuation techniques used to value its investments into a disclosure hierarchy consisting of three levels as shown below:
Level 1 - quoted prices in active markets for identical investments
Level 2 - other significant observable inputs (including quoted prices for similar investments, interest rates, prepayment speeds, etc.)
Level 3 - unobservable inputs (including the Fund's own assumptions based on the best information available)
Valuation techniques used to value the Fund's investments by major category are as follows:
Equity securities, including restricted securities, for which market quotations are readily available, are valued at the last reported sale price or official closing price as reported by a third party pricing vendor on the primary market or exchange on which they are traded and are categorized as Level 1 in the hierarchy. In the event there were no sales during the day or closing prices are not available, securities are valued at the last quoted bid price or may be valued using the last available price and are generally categorized as Level 2 in the hierarchy. For foreign equity securities, when market or security specific events arise, comparisons to the valuation of American Depositary Receipts (ADRs), futures contracts, Exchange-Traded Funds (ETFs) and certain indexes as well as quoted prices for similar securities may be used and would be categorized as Level 2 in the hierarchy. Utilizing these techniques may result in transfers between Level 1 and Level 2. For equity securities, including restricted securities, where observable inputs are
Annual Report
Notes to Financial Statements - continued
(Amounts in thousands except percentages)
3. Significant Accounting Policies - continued
Investment Valuation - continued
limited, assumptions about market activity and risk are used and these securities may be categorized as Level 3 in the hierarchy.
Debt securities, including restricted securities, are valued based on evaluated prices received from third party pricing vendors or from brokers who make markets in such securities. For corporate bonds, pricing vendors utilize matrix pricing which considers yield or price of bonds of comparable quality, coupon, maturity and type as well as broker-supplied prices. When independent prices are unavailable or unreliable, debt securities may be valued utilizing pricing methodologies which consider similar factors that would be used by third party pricing vendors. Debt securities are generally categorized as Level 2 in the hierarchy but may be Level 3 depending on the circumstances.
Investments in open-end mutual funds, including the Fidelity Central Funds, are valued at their closing net asset value (NAV) each business day and are categorized as Level 1 in the hierarchy.
Changes in valuation techniques may result in transfers in or out of an assigned level within the disclosure hierarchy. The aggregate value of investments by input level, as of November 30, 2013, is included at the end of the Fund's Schedule of Investments.
Foreign Currency. The Fund may use foreign currency contracts to facilitate transactions in foreign-denominated securities. Gains and losses from these transactions may arise from changes in the value of the foreign currency or if the counterparties do not perform under the contracts' terms.
Foreign-denominated assets, including investment securities, and liabilities are translated into U.S. dollars at the exchange rates at period end. Purchases and sales of investment securities, income and dividends received and expenses denominated in foreign currencies are translated into U.S. dollars at the exchange rate in effect on the transaction date.
The effects of exchange rate fluctuations on investments are included with the net realized and unrealized gain (loss) on investment securities. Other foreign currency transactions resulting in realized and unrealized gain (loss) are disclosed separately.
Investment Transactions and Income. For financial reporting purposes, the Fund's investment holdings and NAV include trades executed through the end of the last business day of the period. The NAV per share for processing shareholder transactions is calculated as of the close of business of the New York Stock Exchange (NYSE), normally 4:00 p.m. Eastern time and includes trades executed through the end of the prior business day. Gains and losses on securities sold are determined on the basis of identified cost and may include proceeds received from litigation. Dividend income is recorded on
Annual Report
3. Significant Accounting Policies - continued
Investment Transactions and Income - continued
the ex-dividend date, except for certain dividends from foreign securities where the ex-dividend date may have passed, which are recorded as soon as the Fund is informed of the ex-dividend date. Non-cash dividends included in dividend income, if any, are recorded at the fair market value of the securities received. Distributions received on securities that represent a return of capital or capital gain are recorded as a reduction of cost of investments and/or as a realized gain. Subsequent to ex-dividend date the Fund determines the components of these distributions, based upon receipt of tax filings or other correspondence relating to the underlying investment. Interest income and distributions from the Fidelity Central Funds are accrued as earned. Interest income includes coupon interest and amortization of premium and accretion of discount on debt securities. Investment income is recorded net of foreign taxes withheld where recovery of such taxes is uncertain.
Class Allocations and Expenses. Investment income, realized and unrealized capital gains and losses, common expenses of the Fund, and certain fund-level expense reductions, if any, are allocated daily on a pro-rata basis to each class based on the relative net assets of each class to the total net assets of the Fund. Each class differs with respect to transfer agent and distribution and service plan fees incurred. Certain expense reductions may also differ by class. For the reporting period, the allocated portion of income and expenses to each class as a percent of its average net assets may vary due to the timing of recording these transactions in relation to fluctuating net assets of the classes. Expenses directly attributable to a fund are charged to that fund. Expenses attributable to more than one fund are allocated among the respective funds on the basis of relative net assets or other appropriate methods. Expense estimates are accrued in the period to which they relate and adjustments are made when actual amounts are known.
Income Tax Information and Distributions to Shareholders. Each year, the Fund intends to qualify as a regulated investment company under Subchapter M of the Internal Revenue Code, including distributing substantially all of its taxable income and realized gains. As a result, no provision for U.S. Federal income taxes is required. As of November 30, 2013, the Fund did not have any unrecognized tax benefits in the financial statements; nor is the Fund aware of any tax positions for which it is reasonably possible that the total amounts of unrecognized tax benefits will significantly change in the next twelve months. The Fund files a U.S. federal tax return, in addition to state and local tax returns as required. The Fund's federal income tax returns are subject to examination by the Internal Revenue Service (IRS) for a period of three fiscal years after they are filed. State and local tax returns may be subject to examination for an additional fiscal year depending on the jurisdiction. Foreign taxes are provided for based on the Fund's
Annual Report
Notes to Financial Statements - continued
(Amounts in thousands except percentages)
3. Significant Accounting Policies - continued
Income Tax Information and Distributions to Shareholders - continued
understanding of the tax rules and rates that exist in the foreign markets in which it invests.
Distributions are declared and recorded on the ex-dividend date. Income dividends and capital gain distributions are declared separately for each class. Income and capital gain distributions are determined in accordance with income tax regulations, which may differ from GAAP. These differences resulted in distribution reclassifications. In addition, the Fund claimed a portion of the payment made to redeeming shareholders as a distribution for income tax purposes.
Capital accounts within the financial statements are adjusted for permanent book-tax differences. These adjustments have no impact on net assets or the results of operations. Temporary book-tax differences will reverse in a subsequent period.
Book-tax differences are primarily due to foreign currency transactions, passive foreign investment companies (PFIC), market discount, partnerships, capital loss carryforwards and losses deferred due to wash sales.
The federal tax cost of investment securities and unrealized appreciation (depreciation) as of period end were as follows:
|
Gross unrealized appreciation |
$ 227,099 |
|
Gross unrealized depreciation |
(19,049) |
|
Net unrealized appreciation (depreciation) on securities and other investments |
$ 208,050 |
|
|
|
|
Tax Cost |
$ 857,618 |
The tax-based components of distributable earnings as of period end were as follows:
|
Undistributed ordinary income |
$ 3,308 |
|
Undistributed gains |
$ 317 |
|
Net unrealized appreciation (depreciation) |
$ 208,050 |
The tax character of distributions paid was as follows:
|
|
November 30, 2013 |
November 30, 2012 |
|
Ordinary Income |
$ 5,093 |
$ - |
Annual Report
3. Significant Accounting Policies - continued
Restricted Securities. The Fund may invest in securities that are subject to legal or contractual restrictions on resale. These securities generally may be resold in transactions exempt from registration or to the public if the securities are registered. Disposal of these securities may involve time-consuming negotiations and expense, and prompt sale at an acceptable price may be difficult. Information regarding restricted securities is included at the end of the Fund's Schedule of Investments.
4. Purchases and Sales of Investments.
Purchases and sales of securities, other than short-term securities, aggregated $655,325 and $689,639, respectively.
5. Fees and Other Transactions with Affiliates.
Management Fee. Fidelity Management & Research Company (the investment adviser) and its affiliates provide the Fund with investment management related services for which the Fund pays a monthly management fee. The management fee is the sum of an individual fund fee rate that is based on an annual rate of .30% of the Fund's average net assets and an annualized group fee rate that averaged .25% during the period. The group fee rate is based upon the average net assets of all the mutual funds advised by the investment adviser, including any mutual funds previously advised by the investment adviser that are currently advised by Fidelity SelectCo, LLC, an affiliate of the investment adviser. The group fee rate decreases as assets under management increase and increases as assets under management decrease. In addition, the management fee is subject to a performance adjustment (up to a maximum of ± .20% of the Fund's average net assets over a 36 month performance period). The upward or downward adjustment to the management fee is based on the relative investment performance of the Institutional Class of the Fund as compared to an appropriate benchmark index over the same 36 month performance period. For the reporting period, the total annual management fee rate, including the performance adjustment, was .41% of the Fund's average net assets. The performance adjustment included in the management fee rate may be higher or lower than the maximum performance adjustment rate due to the difference between the average net assets for the reporting and performance periods.
Distribution and Service Plan Fees. In accordance with Rule 12b-1 of the 1940 Act, the Fund has adopted separate Distribution and Service Plans for each class of shares. Certain classes pay Fidelity Distributors Corporation (FDC), an affiliate of the investment adviser, separate Distribution and Service Fees, each of which is based on an annual percentage of each class' average net assets. In addition, FDC may pay financial intermediaries for selling shares of the Fund and providing shareholder support services.
Annual Report
Notes to Financial Statements - continued
(Amounts in thousands except percentages)
5. Fees and Other Transactions with Affiliates - continued
Distribution and Service Plan Fees - continued
For the period, the Distribution and Service Fee rates, total fees and amounts retained by FDC were as follows:
|
|
Distribution |
Service |
Total Fees |
Retained |
|
Class A |
-% |
.25% |
$ 840 |
$ 14 |
|
Class T |
.25% |
.25% |
1,688 |
9 |
|
Class B |
.75% |
.25% |
154 |
117 |
|
Class C |
.75% |
.25% |
1,398 |
110 |
|
|
|
|
$ 4,080 |
$ 250 |
Sales Load. FDC may receive a front-end sales charge of up to 5.75% for selling Class A shares and 3.50% for selling Class T shares, some of which is paid to financial intermediaries for selling shares of the Fund. Depending on the holding period, FDC may receive contingent deferred sales charges levied on Class A, Class T, Class B, and Class C redemptions. The deferred sales charges range from 5.00% to 1.00% for Class B shares, 1.00% for Class C shares, 1.00% for certain purchases of Class A shares and .25% for certain purchases of Class T shares.
For the period, sales charge amounts retained by FDC were as follows:
|
|
Retained |
|
Class A |
$ 81 |
|
Class T |
24 |
|
Class B* |
14 |
|
Class C* |
7 |
|
|
$ 126 |
* When Class B and Class C shares are initially sold, FDC pays commissions from its own resources to financial intermediaries through which the sales
are made.
Transfer Agent Fees. Fidelity Investments Institutional Operations Company, Inc., (FIIOC), an affiliate of the investment adviser, is the transfer, dividend disbursing and shareholder servicing agent for each class of the Fund. FIIOC receives account fees and asset-based fees that vary according to the account size and type of account of the shareholders of the respective classes of the Fund, except for Class Z. FIIOC receives an asset-based fee of Class Z's average net assets. FIIOC pays for typesetting, printing and mailing of shareholder reports, except proxy statements.
Annual Report
5. Fees and Other Transactions with Affiliates - continued
Transfer Agent Fees - continued
For the period, transfer agent fees for each applicable class were as follows:
|
|
Amount |
% of |
|
Class A |
$ 814 |
.24 |
|
Class T |
727 |
.22 |
|
Class B |
46 |
.30 |
|
Class C |
327 |
.23 |
|
Institutional Class |
251 |
.21 |
|
Class Z |
-* |
.05** |
|
|
$ 2,165 |
|
* Amount represents one hundred and forty three dollars
** Annualized
Accounting and Security Lending Fees. Fidelity Service Company, Inc. (FSC), an affiliate of the investment adviser, maintains the Fund's accounting records. The accounting fee is based on the level of average net assets for each month. Under a separate contract, FSC administers the security lending program. The security lending fee is based on the number and duration of lending transactions.
Brokerage Commissions. The Fund placed a portion of its portfolio transactions with brokerage firms which are affiliates of the investment adviser. Brokerage commissions are included in net realized gain (loss) and change in net unrealized appreciation (depreciation) in the Statement of Operations. The commissions paid to these affiliated firms were $21 for the period.
6. Committed Line of Credit.
The Fund participates with other funds managed by the investment adviser or an affiliate in a $4.25 billion credit facility (the "line of credit") to be utilized for temporary or emergency purposes to fund shareholder redemptions or for other short-term liquidity purposes. The Fund has agreed to pay commitment fees on its pro-rata portion of the line of credit, which amounted to $2 and is reflected in Miscellaneous expenses on the Statement of Operations. During the period, there were no borrowings on this line of credit.
7. Security Lending.
The Fund lends portfolio securities through a lending agent from time to time in order to earn additional income. For equity securities, a lending agent is used and may loan
Annual Report
Notes to Financial Statements - continued
(Amounts in thousands except percentages)
7. Security Lending - continued
securities to certain qualified borrowers, including Fidelity Capital Markets (FCM), a broker-dealer affiliated with the Fund. On the settlement date of the loan, the Fund receives collateral (in the form of U.S. Treasury obligations, letters of credit and/or cash) against the loaned securities and maintains collateral in an amount not less than 100% of the market value of the loaned securities during the period of the loan. The market value of the loaned securities is determined at the close of business of the Fund and any additional required collateral is delivered to the Fund on the next business day. If the borrower defaults on its obligation to return the securities loaned because of insolvency or other reasons, the Fund may apply collateral received from the borrower against the obligation. The Fund may experience delays and costs in recovering the securities loaned. Any cash collateral received is invested in the Fidelity Securities Lending Cash Central Fund. The value of loaned securities and cash collateral at period end are disclosed on the Fund's Statement of Assets and Liabilities. The value of securities loaned to FCM at period end was $619. Security lending income represents the income earned on investing cash collateral, less rebates paid to borrowers, plus any premium payments received for lending certain types of securities. Security lending income is presented in the Statement of Operations as a component of income from Fidelity Central Funds. Total security lending income during the period amounted to $467, including $12 from securities loaned to FCM.
8. Expense Reductions.
The investment adviser voluntarily agreed to reimburse a portion of the Fund's Class A, Class T, Class B, Class C and Institutional Class operating expenses.
The following classes were in reimbursement during the period:
|
|
Reimbursement |
|
|
|
|
Class A |
$ 5 |
|
Class T |
5 |
|
Class B |
-* |
|
Class C |
2 |
|
Institutional Class |
2 |
|
|
$ 14 |
* Amount represents two hundred and three dollars
Commissions paid to certain brokers with whom the investment adviser, or its affiliates, places trades on behalf of the Fund include an amount in addition to trade execution, which may be rebated back to the Fund to offset certain expenses. This amount totaled $107 for the period.
Annual Report
9. Distributions to Shareholders.
Distributions to shareholders of each class were as follows:
|
Years ended November 30, |
2013 |
2012 |
|
From net investment income |
|
|
|
Class A |
$ 2,287 |
$ - |
|
Class T |
1,666 |
- |
|
Class C |
38 |
- |
|
Institutional Class |
1,102 |
- |
|
Total |
$ 5,093 |
$ - |
10. Share Transactions.
Transactions for each class of shares were as follows:
|
|
Shares |
Dollars |
||
|
Years ended November 30, |
2013 A |
2012 |
2013 A |
2012 |
|
Class A |
|
|
|
|
|
Shares sold |
3,250 |
4,097 |
$ 49,173 |
$ 51,727 |
|
Reinvestment of distributions |
152 |
- |
2,006 |
- |
|
Shares redeemed |
(4,572) |
(7,320) |
(69,790) |
(93,009) |
|
Net increase (decrease) |
(1,170) |
(3,223) |
$ (18,611) |
$ (41,282) |
|
Class T |
|
|
|
|
|
Shares sold |
4,665 |
4,903 |
$ 69,969 |
$ 61,627 |
|
Reinvestment of distributions |
122 |
- |
1,600 |
- |
|
Shares redeemed |
(5,859) |
(7,690) |
(87,860) |
(96,565) |
|
Net increase (decrease) |
(1,072) |
(2,787) |
$ (16,291) |
$ (34,938) |
|
Class B |
|
|
|
|
|
Shares sold |
81 |
64 |
$ 1,199 |
$ 775 |
|
Reinvestment of distributions |
- |
- |
- |
- |
|
Shares redeemed |
(486) |
(764) |
(7,004) |
(9,292) |
|
Net increase (decrease) |
(405) |
(700) |
$ (5,805) |
$ (8,517) |
|
Class C |
|
|
|
|
|
Shares sold |
1,435 |
1,124 |
$ 21,000 |
$ 13,734 |
|
Reinvestment of distributions |
3 |
- |
32 |
- |
|
Shares redeemed |
(1,415) |
(2,672) |
(20,479) |
(32,129) |
|
Net increase (decrease) |
23 |
(1,548) |
$ 553 |
$ (18,395) |
|
Institutional Class |
|
|
|
|
|
Shares sold |
1,599 |
2,225 |
$ 25,325 |
$ 29,308 |
|
Reinvestment of distributions |
75 |
- |
1,032 |
- |
|
Shares redeemed |
(1,526) |
(1,777) |
(24,057) |
(23,257) |
|
Net increase (decrease) |
148 |
448 |
$ 2,300 |
$ 6,051 |
Annual Report
Notes to Financial Statements - continued
(Amounts in thousands except percentages)
10. Share Transactions - continued
|
|
Shares |
Dollars |
||
|
Years ended November 30, |
2013 A |
2012 |
2013 A |
2012 |
|
Class Z |
|
|
|
|
|
Shares sold |
420 |
- |
$ 7,441 |
$ - |
|
Reinvestment of distributions |
- |
- |
- |
- |
|
Shares redeemed |
(7) |
- |
(116) |
- |
|
Net increase (decrease) |
413 |
- |
$ 7,325 |
$ - |
A Share transactions for Class Z are for the period August 13, 2013 (commencement of sale of shares) to November 30, 2013.
11. Other.
The Fund's organizational documents provide former and current trustees and officers with a limited indemnification against liabilities arising in connection with the performance of their duties to the Fund. In the normal course of business, the Fund may also enter into contracts that provide general indemnifications. The Fund's maximum exposure under these arrangements is unknown as this would be dependent on future claims that may be made against the Fund. The risk of material loss from such claims is considered remote.
Annual Report
Report of Independent Registered Public Accounting Firm
To the Trustees of Fidelity Advisor Series I and the Shareholders of Fidelity Advisor Dividend Growth Fund:
In our opinion, the accompanying statement of assets and liabilities, including the schedule of investments, and the related statements of operations and of changes in net assets and the financial highlights present fairly, in all material respects, the financial position of Fidelity Advisor Dividend Growth Fund (a fund of Fidelity Advisor Series I) at November 30, 2013, the results of its operations for the year then ended, the changes in its net assets for each of the two years in the period then ended and the financial highlights for each of the periods indicated, in conformity with accounting principles generally accepted in the United States of America. These financial statements and financial highlights (hereafter referred to as "financial statements") are the responsibility of the Fidelity Advisor Dividend Growth Fund's management. Our responsibility is to express an opinion on these financial statements based on our audits. We conducted our audits of these financial statements in accordance with the standards of the Public Company Accounting Oversight Board (United States). Those standards require that we plan and perform the audit to obtain reasonable assurance about whether the financial statements are free of material misstatement. An audit includes examining, on a test basis, evidence supporting the amounts and disclosures in the financial statements, assessing the accounting principles used and significant estimates made by management, and evaluating the overall financial statement presentation. We believe that our audits, which included confirmation of securities at November 30, 2013 by correspondence with the custodian and brokers, provide a reasonable basis for our opinion.
PricewaterhouseCoopers LLP
Boston, Massachusetts
January 17, 2014
Annual Report
Trustees and Officers
The Trustees, Member of the Advisory Board, and officers of the trust and fund, as applicable, are listed below. The Board of Trustees governs the fund and is responsible for protecting the interests of shareholders. The Trustees are experienced executives who meet periodically throughout the year to oversee the fund's activities, review contractual arrangements with companies that provide services to the fund, oversee management of the risks associated with such activities and contractual arrangements, and review the fund's performance. Except for James C. Curvey, Ned C. Lautenbach, Ronald P. O'Hanley, and William S. Stavropoulos, each of the Trustees oversees 173 funds. Mr. Curvey oversees 396 funds. Mr. Lautenbach, Mr. O'Hanley, and Mr. Stavropoulos each oversees 247 funds.
The Trustees hold office without limit in time except that (a) any Trustee may resign; (b) any Trustee may be removed by written instrument, signed by at least two-thirds of the number of Trustees prior to such removal; (c) any Trustee who requests to be retired or who has become incapacitated by illness or injury may be retired by written instrument signed by a majority of the other Trustees; and (d) any Trustee may be removed at any special meeting of shareholders by a two-thirds vote of the outstanding voting securities of the trust. Each Trustee who is not an interested person (as defined in the 1940 Act) of the trust and the fund (Independent Trustee), shall retire not later than the last day of the calendar year in which his or her 75th birthday occurs. The Independent Trustees may waive this mandatory retirement age policy with respect to individual Trustees. The officers and Advisory Board Member hold office without limit in time, except that any officer and Advisory Board Member may resign or may be removed by a vote of a majority of the Trustees at any regular meeting or any special meeting of the Trustees. Except as indicated, each individual has held the office shown or other offices in the same company for the past five years.
Experience, Skills, Attributes, and Qualifications of the Fund's Trustees. The Governance and Nominating Committee has adopted a statement of policy that describes the experience, qualifications, attributes, and skills that are necessary and desirable for potential Independent Trustee candidates (Statement of Policy). The Board believes that each Trustee satisfied at the time he or she was initially elected or appointed a Trustee, and continues to satisfy, the standards contemplated by the Statement of Policy. The Governance and Nominating Committee also engages professional search firms to help identify potential Independent Trustee candidates who have the experience, qualifications, attributes, and skills consistent with the Statement of Policy. From time to time, additional criteria based on the composition and skills of the current Independent Trustees, as well as experience or skills that may be appropriate in light of future changes to board composition, business conditions, and regulatory or other developments, have also been considered by the professional search firms and the Governance and Nominating Committee. In addition, the Board takes into account the Trustees' commitment and participation in Board and committee meetings, as well as their leadership of standing and ad hoc committees throughout their tenure.
Annual Report
In determining that a particular Trustee was and continues to be qualified to serve as a Trustee, the Board has considered a variety of criteria, none of which, in isolation, was controlling. The Board believes that, collectively, the Trustees have balanced and diverse experience, qualifications, attributes, and skills, which allow the Board to operate effectively in governing the fund and protecting the interests of shareholders. Information about the specific experience, skills, attributes, and qualifications of each Trustee, which in each case led to the Board's conclusion that the Trustee should serve (or continue to serve) as a trustee of the fund, is provided below.
Board Structure and Oversight Function. James C. Curvey is an interested person (as defined in the 1940 Act) and currently serves as Chairman. The Trustees have determined that an interested Chairman is appropriate and benefits shareholders because an interested Chairman has a personal and professional stake in the quality and continuity of services provided to the fund. Independent Trustees exercise their informed business judgment to appoint an individual of their choosing to serve as Chairman, regardless of whether the Trustee happens to be independent or a member of management. The Independent Trustees have determined that they can act independently and effectively without having an Independent Trustee serve as Chairman and that a key structural component for assuring that they are in a position to do so is for the Independent Trustees to constitute a substantial majority for the Board. The Independent Trustees also regularly meet in executive session. Ned C. Lautenbach serves as Chairman of the Independent Trustees and as such (i) acts as a liaison between the Independent Trustees and management with respect to matters important to the Independent Trustees and (ii) with management prepares agendas for Board meetings.
Fidelity funds are overseen by different Boards of Trustees. The fund's Board oversees Fidelity's equity and high income funds and another Board oversees Fidelity's investment-grade bond, money market, and asset allocation funds. The asset allocation funds may invest in Fidelity funds overseen by the fund's Board. The use of separate Boards, each with its own committee structure, allows the Trustees of each group of Fidelity funds to focus on the unique issues of the funds they oversee, including common research, investment, and operational issues. On occasion, the separate Boards establish joint committees to address issues of overlapping consequences for the Fidelity funds overseen by each Board.
The Trustees operate using a system of committees to facilitate the timely and efficient consideration of all matters of importance to the Trustees, the fund, and fund shareholders and to facilitate compliance with legal and regulatory requirements and oversight of the fund's activities and associated risks. The Board, acting through its committees, has charged FMR and its affiliates with (i) identifying events or circumstances the occurrence of which could have demonstrably adverse effects on the fund's business and/or reputation; (ii) implementing processes and controls to lessen the possibility that such events or circumstances occur or to mitigate the effects of such events or circumstances if they do occur; and (iii) creating and maintaining a system designed to evaluate continuously business and market conditions in order to facilitate the identification and implementation processes described in (i) and (ii) above. Because the day-to-day operations and activities of the fund are carried out by or through FMR, its affiliates and other service providers, the fund's exposure to risks is mitigated but not eliminated by the processes overseen by the Trustees. While each of the Board's committees has responsibility for overseeing different aspects of the fund's activities, oversight is exercised primarily through the Operations, Audit, and Compliance Committees. In addition, the Independent Trustees have worked with FMR to enhance the Board's oversight of investment and financial risks, legal and regulatory risks, technology risks, and operational risks, including the development of additional risk reporting to the Board. For example, a working group comprised of Independent Trustees and FMR has worked and continues to work to review the Fidelity funds' valuation-related activities, reporting and risk management. Appropriate personnel, including but not limited to the fund's Chief Compliance Officer (CCO), FMR's internal auditor, the independent accountants, the fund's Treasurer and portfolio management personnel, make periodic reports to the Board's committees, as appropriate, including an annual review of FMR's risk management program for the Fidelity funds. The responsibilities of each standing committee, including their oversight responsibilities, are described further under "Standing Committees of the Fund's Trustees."
Annual Report
Trustees and Officers - continued
The fund's Statement of Additional Information (SAI) includes more information about the Trustees. To request a free copy, call Fidelity at 1-877-208-0098.
Interested Trustees*:
Correspondence intended for each Trustee who is an interested person may be sent to Fidelity Investments, 245 Summer Street, Boston, Massachusetts 02210.
|
Name, Year of Birth; Principal Occupations and Other Relevant Experience+ |
|
|
James C. Curvey (1935) |
|
|
Year of Election or Appointment: 2007 Trustee Chairman of the Board of Trustees |
|
|
|
Mr. Curvey also serves as Trustee of other Fidelity funds. Mr. Curvey is a Director of Fidelity Investments Money Management, Inc. (2009-present), Director of Fidelity Research & Analysis Co. (2009-present) and Director of FMR and FMR Co., Inc. (2007-present). Mr. Curvey is also Vice Chairman (2007-present) and Director of FMR LLC. In addition, Mr. Curvey serves as an Overseer for the Boston Symphony Orchestra and a member of the Trustees of Villanova University. Previously, Mr. Curvey was the Vice Chairman (2006-2007) and Director (2000-2007) of FMR Corp. |
|
Ronald P. O'Hanley (1957) |
|
|
Year of Election or Appointment: 2011 Trustee |
|
|
|
Mr. O'Hanley also serves as Trustee of other Fidelity funds. He is Director of Fidelity SelectCo, LLC (2013-present), FMR Co., Inc. (2010-present), Director of Fidelity Investments Money Management, Inc. (2010-present), Director of Fidelity Research & Analysis Company (2010-present), President of Fidelity Asset Management and Corporate Services and a Member of Fidelity's Executive Committee (2010-present). Previously, Mr. O'Hanley served as President and Chief Executive Officer of BNY Mellon Asset Management (2007-2010). Mr. O'Hanley also served as Vice Chairman of Bank New York Mellon Corp. and a member of that firm's Executive Committee. Prior to the 2007 merger of The Bank of New York and Mellon Financial Corporation, he was Vice Chairman of Mellon Financial Corporation and President and Chief Executive Officer of Mellon Asset Management. He joined Mellon in February 1997. Mr. O'Hanley currently serves as Chairman of the Boston Public Library Foundation Board of Directors and sits on the Board of Directors of Beth Israel Deaconess Medical Center, the Board of Trustees of the Marine Biological Laboratory and the Advisory Board of the Maxwell School of Citizenship and Public Administration at Syracuse University. Mr. O'Hanley also chairs the Council on Asset Management for the Financial Services Roundtable and is a member of the Board of Directors of Institutional Investor's U.S. Institute. |
* Trustees have been determined to be "Interested Trustees" by virtue of, among other things, their affiliation with the trust or various entities under common control with FMR.
+ The information above includes each Trustee's principal occupation during the last five years and other information relating to the experience, attributes, and skills relevant to each Trustee's qualifications to serve as a Trustee, which led to the conclusion that each Trustee should serve as a Trustee for the fund.
Annual Report
Trustees and Officers - continued
Independent Trustees:
Correspondence intended for each Independent Trustee (that is, the Trustees other than the Interested Trustees) may be sent to Fidelity Investments, P.O. Box 55235, Boston, Massachusetts 02205-5235.
|
Name, Year of Birth; Principal Occupations and Other Relevant Experience+ |
|
|
Dennis J. Dirks (1948) |
|
|
Year of Election or Appointment: 2005 Trustee |
|
|
|
Mr. Dirks also serves as Trustee of other Fidelity funds. Prior to his retirement in May 2003, Mr. Dirks was Chief Operating Officer and a member of the Board of The Depository Trust & Clearing Corporation (DTCC). He also served as President, Chief Operating Officer, and Board member of The Depository Trust Company (DTC) and President and Board member of the National Securities Clearing Corporation (NSCC). In addition, Mr. Dirks served as Chief Executive Officer and Board member of the Government Securities Clearing Corporation, Chief Executive Officer and Board member of the Mortgage-Backed Securities Clearing Corporation, as a Trustee and a member of the Finance Committee of Manhattan College (2005-2008), and as a Trustee and a member of the Finance Committee of AHRC of Nassau County (2006-2008). Mr. Dirks is a member of the Independent Directors Council (IDC) Governing Council (2010-present) and Board of Directors for The Brookville Center for Children's Services, Inc. (2009-present). |
|
Alan J. Lacy (1953) |
|
|
Year of Election or Appointment: 2008 Trustee |
|
|
|
Mr. Lacy also serves as Trustee of other Fidelity funds. Mr. Lacy serves as Senior Adviser (2007-present) of Oak Hill Capital Partners, L.P. (private equity). Mr. Lacy also served as Chief Executive Officer (2000-2005) and Vice Chairman (2005-2006) of Sears Holdings Corporation and Sears, Roebuck and Co. (retail). In addition, Mr. Lacy serves as a member of the Board of Directors of Dave & Buster's Entertainment, Inc. (restaurant and entertainment complexes, 2010-present), Earth Fare, Inc. (retail grocery, 2012-present), The Hillman Companies, Inc. (hardware wholesalers, 2010-present), and Bristol-Myers Squibb Company (global pharmaceuticals, 2008-present). Mr. Lacy is a member of the Board of Trustees of The National Parks Conservation Association (2006-present). Previously, Mr. Lacy served as Chairman of the Board of Trustees of the National Parks Conservation Association (2008-2011) and as a member of the Board of Directors for the Western Union Company (global money transfer, 2006-2011). |
|
Ned C. Lautenbach (1944) |
|
|
Year of Election or Appointment: 2000 Trustee Chairman of the Independent Trustees |
|
|
|
Mr. Lautenbach also serves as Trustee of other Fidelity funds. Mr. Lautenbach currently serves as the Lead Director of the Eaton Corporation Board of Directors (diversified industrial, 1997-present). Mr. Lautenbach is Chairman of the Board of Directors of the Philharmonic Center for the Arts in Naples, Florida (2012-present) and a member of the Council on Foreign Relations (1994-present). Previously, Mr. Lautenbach was a Partner/Advisory Partner at Clayton, Dubilier & Rice, LLC (private equity investment, 1998-2010), as well as a Director of Sony Corporation (2006-2007). |
|
Joseph Mauriello (1944) |
|
|
Year of Election or Appointment: 2008 Trustee |
|
|
|
Mr. Mauriello also serves as Trustee of other Fidelity funds. Prior to his retirement in January 2006, Mr. Mauriello served in numerous senior management positions including Deputy Chairman and Chief Operating Officer (2004-2005), and Vice Chairman of Financial Services (2002-2004) of KPMG LLP US (professional services, 1965-2005). Mr. Mauriello currently serves as a member of the Board of Directors of XL Group plc. (global insurance and re-insurance, 2006-present). Previously, Mr. Mauriello served as a Director of the Hamilton Funds of the Bank of New York (2006-2007) and of Arcadia Resources Inc. (health care services and products, 2007-2012). |
|
Robert W. Selander (1950) |
|
|
Year of Election or Appointment: 2011 Trustee |
|
|
|
Mr. Selander also serves as Trustee of other Fidelity funds. Previously, Mr. Selander served as a Member of the Advisory Board of other Fidelity funds (2011), and Executive Vice Chairman (2010), Chief Executive Officer (2009-2010), and President and Chief Executive Officer (1997-2009) of Mastercard, Inc. |
|
Cornelia M. Small (1944) |
|
|
Year of Election or Appointment: 2005 Trustee |
|
|
|
Ms. Small also serves as Trustee of other Fidelity funds. Ms. Small is a member of the Board of Directors (2009-present) and Chair of the Investment Committee (2010-present) of the Teagle Foundation. Ms. Small also serves on the Investment Committee of the Berkshire Taconic Community Foundation (2008-present). Previously, Ms. Small served as Chairperson (2002-2008) and a member of the Investment Committee and Chairperson (2008-2012) and a member of the Board of Trustees of Smith College. In addition, Ms. Small served as Chief Investment Officer, Director of Global Equity Investments, and a member of the Board of Directors of Scudder, Stevens & Clark and Scudder Kemper Investments. |
|
William S. Stavropoulos (1939) |
|
|
Year of Election or Appointment: 2002 Trustee Vice Chairman of the Independent Trustees |
|
|
|
Mr. Stavropoulos also serves as Trustee of other Fidelity funds. Mr. Stavropoulos serves as President and Founder of the Michigan Baseball Foundation, the Great Lakes Loons (2007-present). Mr. Stavropoulos is Chairman Emeritus of the Board of Directors of The Dow Chemical Company, where he previously served in numerous senior management positions, including President, CEO (1995-2000; 2002-2004), Chairman of the Executive Committee (2000-2006), and as a member of the Board of Directors (1990-2006). Currently, Mr. Stavropoulos is Chairman of the Board of Directors of Univar Inc. (global distributor of commodity and specialty chemicals), a Director of Teradata Corporation (data warehousing and technology solutions), and Maersk Inc. (industrial conglomerate), and a member of the Advisory Board for Metalmark Capital LLC (private equity investment, 2005-present). Mr. Stavropoulos is an operating advisor to Clayton, Dubilier & Rice, LLC (private equity investment). In addition, Mr. Stavropoulos is a member of the University of Notre Dame Advisory Council for the College of Science, a Trustee of the Rollin L. Gerstacker Foundation, and a Director of the Naples Philharmonic Center for the Arts. Previously, Mr. Stavropoulos served as a Director of Chemical Financial Corporation (bank holding company, 1993-2012) and Tyco International, Ltd. (multinational manufacturing and services, 2007-2012). |
|
David M. Thomas (1949) |
|
|
Year of Election or Appointment: 2008 Trustee |
|
|
|
Mr. Thomas also serves as Trustee of other Fidelity funds. Mr. Thomas serves as Non-Executive Chairman of the Board of Directors of Fortune Brands Home and Security (home and security products, 2011-present), and as a member of the Board of Directors of Interpublic Group of Companies, Inc. (marketing communication, 2004-present). Previously, Mr. Thomas served as Executive Chairman (2005-2006) and Chairman and Chief Executive Officer (2000-2005) of IMS Health, Inc. (pharmaceutical and healthcare information solutions), and a Director of Fortune Brands, Inc. (consumer products, 2000-2011). |
+ The information above includes each Trustee's principal occupation during the last five years and other information relating to the experience, attributes, and skills relevant to each Trustee's qualifications to serve as a Trustee, which led to the conclusion that each Trustee should serve as a Trustee for the fund.
Advisory Board Member and Officers:
Correspondence intended for each officer and Peter S. Lynch may be sent to Fidelity Investments, 245 Summer Street, Boston, Massachusetts 02210. Officers appear below in alphabetical order.
|
Name, Year of Birth; Principal Occupation |
|
|
Peter S. Lynch (1944) |
|
|
Year of Election or Appointment: 2003 Member of the Advisory Board |
|
|
|
Mr. Lynch also serves as Member of the Advisory Board of other Fidelity funds. Mr. Lynch is Vice Chairman and a Director of FMR and FMR Co., Inc. In addition, Mr. Lynch serves as a Trustee of Boston College and as the Chairman of the Inner-City Scholarship Fund. Previously, Mr. Lynch served on the Special Olympics International Board of Directors (1997-2006). |
|
Elizabeth Paige Baumann (1968) |
|
|
Year of Election or Appointment: 2012 Anti-Money Laundering (AML) Officer |
|
|
|
Ms. Baumann also serves as AML Officer of other funds. She is Chief AML Officer of FMR LLC (2012-present) and is an employee of Fidelity Investments. Previously, Ms. Baumann served as Vice President and Deputy Anti-Money Laundering Officer (2007-2012). |
|
William C. Coffey (1969) |
|
|
Year of Election or Appointment: 2009 Assistant Secretary |
|
|
|
Mr. Coffey also serves as Assistant Secretary of other funds. He is Senior Vice President and Deputy General Counsel of FMR LLC (2010-present), and is an employee of Fidelity Investments. Previously, Mr. Coffey served as Vice President and Associate General Counsel of FMR LLC (2005-2009). |
|
Jonathan Davis (1968) |
|
|
Year of Election or Appointment: 2010 Assistant Treasurer |
|
|
|
Mr. Davis also serves as Assistant Treasurer of other funds. Mr. Davis is an employee of Fidelity Investments. Previously, Mr. Davis served as Vice President and Associate General Counsel of FMR LLC (2003-2010). |
|
Adrien E. Deberghes (1967) |
|
|
Year of Election or Appointment: 2008 Deputy Treasurer |
|
|
|
Mr. Deberghes also serves as an officer of other funds. He is an employee of Fidelity Investments (2008-present). Prior to joining Fidelity Investments, Mr. Deberghes was Senior Vice President of Mutual Fund Administration at State Street Corporation (2007-2008), Senior Director of Mutual Fund Administration at Investors Bank & Trust (2005-2007), and Director of Finance for Dunkin' Brands (2000-2005). |
|
Stephanie J. Dorsey (1969) |
|
|
Year of Election or Appointment: 2010 Assistant Treasurer |
|
|
|
Ms. Dorsey also serves as an officer of other funds. She is an employee of Fidelity Investments (2008-present) and has served in other fund officer roles. Prior to joining Fidelity Investments, Ms. Dorsey served as Treasurer (2004-2008) of the JPMorgan Mutual Funds and Vice President (2004-2008) of JPMorgan Chase Bank. |
|
Scott C. Goebel (1968) |
|
|
Year of Election or Appointment: 2008 Secretary and Chief Legal Officer (CLO) |
|
|
|
Mr. Goebel serves as Secretary and CLO of other funds. Mr. Goebel also serves as Secretary of Fidelity Investments Money Management, Inc. (FIMM) (2010-present) and Fidelity Research and Analysis Company (FRAC) (2010-present); General Counsel, Secretary, and Senior Vice President of FMR (2008-present) and FMR Co., Inc. (2008-present); Chief Legal Officer of Fidelity Management & Research (Hong Kong) Limited (2008-present) and Assistant Secretary of Fidelity Management & Research (Japan) Inc. (2008-present), and Fidelity Management & Research (U.K.) Inc. (2008-present). Previously, Mr. Goebel served as Secretary and CLO of other Fidelity funds (2008-2013), Assistant Secretary of FIMM (2008-2010), FRAC (2008-2010), and certain funds (2007-2008); and as Vice President and Secretary of Fidelity Distributors Corporation (FDC) (2005-2007). Mr. Goebel has been employed by FMR LLC or an affiliate since 2001. |
|
Joseph A. Hanlon (1968) |
|
|
Year of Election or Appointment: 2012 Chief Compliance Officer |
|
|
|
Mr. Hanlon also serves as Chief Compliance Officer of other funds. Mr. Hanlon serves as Compliance Officer of FMR, FMR Co., Inc., Fidelity Investments Money Management, Inc. (FIMM), Fidelity Research and Analysis Company (FRAC), and Fidelity Management & Research (Hong Kong) (2009-present), as Senior Vice President of the Fidelity Asset Management Division (2009-present), and is an employee of Fidelity Investments. Previously, Mr. Hanlon served as Compliance Officer of Fidelity Management & Research (Japan) Inc. (2009-2013), Strategic Advisers, Inc. (2009-2013), and Fidelity Management & Research (U.K.) Inc. (2009-2013). |
|
Bruce T. Herring (1965) |
|
|
Year of Election or Appointment: 2006 Vice President of certain Equity Funds |
|
|
|
Mr. Herring also serves as Vice President of other funds. He serves as Chief Investment Officer of Fidelity Global Asset Allocation (GAA) (2013-present), Group Chief Investment Officer of FMR, and President of Fidelity Research & Analysis Company (2010-present). Previously, Mr. Herring served as Chief Investment Officer and Director of Fidelity Management & Research (U.K.) Inc. (2010-2013), Vice President (2005-2006) and Senior Vice President (2006-2007) of Fidelity Management & Research Company, Vice President of FMR Co., Inc. (2001-2007), and as a portfolio manager for Fidelity U.S. Equity Funds. |
|
Brian B. Hogan (1964) |
|
|
Year of Election or Appointment: 2009 Vice President |
|
|
|
Mr. Hogan also serves as Vice President of other funds. Mr. Hogan serves as President of FMR's Equity Division (2009-present). Previously, Mr. Hogan served as Senior Vice President, Equity Research of FMR (2006-2009) and as a portfolio manager. |
|
Chris Maher (1972) |
|
|
Year of Election or Appointment: 2013 Assistant Treasurer |
|
|
|
Mr. Maher serves as Assistant Treasurer of other funds. Mr. Maher is Vice President of Valuation Oversight and is an employee of Fidelity Investments. Previously, Mr. Maher served as Vice President of Asset Management Compliance (2013), Vice President of FMR's Program Management Group (2010-2013), and Vice President of Valuation Oversight (2008-2010). |
|
Christine Reynolds (1958) |
|
|
Year of Election or Appointment: 2008 Chief Financial Officer |
|
|
|
Ms. Reynolds also serves as Chief Financial Officer of other funds. Ms. Reynolds became President of Fidelity Pricing and Cash Management Services (FPCMS) in August 2008. Ms. Reynolds served as Chief Operating Officer of FPCMS (2007-2008). Previously, Ms. Reynolds served as President, Treasurer, and Anti-Money Laundering officer of the Fidelity funds (2004-2007). |
|
Kenneth B. Robins (1969) |
|
|
Year of Election or Appointment: 2008 President and Treasurer |
|
|
|
Mr. Robins also serves as an officer of other funds. Mr. Robins serves as Executive Vice President of Fidelity Investments Money Management, Inc. (FIMM) (2013-present) and is an employee of Fidelity Investments (2004-present). Previously, Mr. Robins served in other fund officer roles. |
|
Gary W. Ryan (1958) |
|
|
Year of Election or Appointment: 2005 Assistant Treasurer |
|
|
|
Mr. Ryan also serves as Assistant Treasurer of other funds. Mr. Ryan is an employee of Fidelity Investments and has served in other fund officer roles. Previously, Mr. Ryan served as Vice President of Fund Reporting in Fidelity Pricing and Cash Management Services (FPCMS) (1999-2005). |
|
Stephen Sadoski (1971) |
|
|
Year of Election or Appointment: 2012 Deputy Treasurer |
|
|
|
Mr. Sadoski also serves as Deputy Treasurer of other funds. He is an employee of Fidelity Investments (2012-present) and has served in another fund officer role. Prior to joining Fidelity Investments, Mr. Sadoski served as an assistant chief accountant in the Division of Investment Management of the Securities and Exchange Commission (SEC) (2009-2012) and as a senior manager at Deloitte & Touche LLP (1997-2009). |
|
Stacie M. Smith (1974) |
|
|
Year of Election or Appointment: 2013 Deputy Treasurer |
|
|
|
Ms. Smith also serves as an officer of other funds. She is an employee of Fidelity Investments (2009-present) and has served in other fund officer roles. Prior to joining Fidelity Investments, Ms. Smith served as Senior Audit Manager of Ernst & Young LLP (1996-2009). |
|
Renee Stagnone (1975) |
|
|
Year of Election or Appointment: 2013 Deputy Treasurer |
|
|
|
Ms. Stagnone also serves as Deputy Treasurer of other funds. Ms. Stagnone is an employee of Fidelity Investments. |
|
Joseph F. Zambello (1957) |
|
|
Year of Election or Appointment: 2011 Deputy Treasurer |
|
|
|
Mr. Zambello also serves as Deputy Treasurer of other funds. Mr. Zambello is an employee of Fidelity Investments. Previously, Mr. Zambello served as Vice President of FMR's Program Management Group (2009-2011) and Vice President of the Transfer Agent Oversight Group (2005-2009). |
Annual Report
Distributions (Unaudited)
The Board of Trustees of Advisor Dividend Growth Fund voted to pay to shareholders of record at the opening of business on record date, the following distributions per share derived from capital gains realized from sales of portfolio securities, and dividends derived from net investment income:
|
|
Pay Date |
Record Date |
Dividends |
Capital Gains |
|
Class A |
12/16/2013 |
12/13/2013 |
$0.089 |
$0.000 |
|
|
01/13/2014 |
01/10/2014 |
$0.000 |
$0.007 |
|
Class T |
12/16/2013 |
12/13/2013 |
$0.055 |
$0.000 |
|
|
01/13/2014 |
01/10/2014 |
$0.000 |
$0.007 |
|
Class B |
12/16/2013 |
12/13/2013 |
$0.000 |
$0.000 |
|
|
01/13/2014 |
01/10/2014 |
$0.000 |
$0.007 |
|
Class C |
12/16/2013 |
12/13/2013 |
$0.000 |
$0.000 |
|
|
01/13/2014 |
01/10/2014 |
$0.000 |
$0.007 |
The fund hereby designates as a capital gain dividend with respect to the taxable year ended November 30 2013, $412,791, or, if subsequently determined to be different, the net capital gain of such year.
Class A designates 81%; Class T designates 100%; and Class C designates 100% of the dividends distributed during the fiscal year as qualifying for the dividends-received deduction for corporate shareholders.
Class A, Class T, and Class C designates 100% of dividends distributed during the fiscal year as amounts which may be taken into account as a dividend for purposes of the maximum rate under section 1(h)(11) of the Internal Revenue Code.
The fund will notify shareholders in January 2014 of amounts for use in preparing 2013 income tax returns.
Annual Report
Board Approval of Investment Advisory Contracts and Management Fees
Fidelity Advisor Dividend Growth Fund
Each year, the Board of Trustees, including the Independent Trustees (together, the Board), votes on the renewal of the management contract and sub-advisory agreements (together, the Advisory Contracts) for the fund. The Board, assisted by the advice of fund counsel and Independent Trustees' counsel, requests and considers a broad range of information relevant to the renewal of the Advisory Contracts throughout the year.
The Board meets regularly and, at each of its meetings, covers an extensive agenda of topics and materials and considers factors that are relevant to its annual consideration of the renewal of the fund's Advisory Contracts, including the services and support provided to the fund and its shareholders. The Board has established various standing committees, each composed of and chaired by Independent Trustees with varying backgrounds, to which the Board has assigned specific subject matter responsibilities in order to enhance effective decision-making by the Board. The Board, acting directly and through its Committees, requests and receives information concerning the annual consideration of the renewal of the fund's Advisory Contracts. The Board also meets as needed to consider matters specifically related to the Board's annual consideration of the renewal of Advisory Contracts. Members of the Board may also meet with trustees of other Fidelity funds through ad hoc joint committees to discuss certain matters relevant to the Fidelity funds.
At its July 2013 meeting, the Board, including the Independent Trustees, unanimously determined to renew the fund's Advisory Contracts. In reaching its determination, the Board considered all factors it believed relevant, including (i) the nature, extent, and quality of the services to be provided to the fund and its shareholders (including the investment performance of the fund); (ii) the competitiveness of the fund's management fee and total expense ratio relative to peer funds; (iii) the total costs of the services to be provided by and the profits to be realized by Fidelity from its relationship with the fund; (iv) the extent to which economies of scale exist and would be realized as the fund grows; and (v) whether fee levels reflect these economies of scale, if any, for the benefit of fund shareholders.
In considering whether to renew the Advisory Contracts for the fund, the Board reached a determination, with the assistance of fund counsel and Independent Trustees' counsel and through the exercise of its business judgment, that the renewal of the Advisory Contracts was in the best interests of the fund and its shareholders and that the compensation payable under the Advisory Contracts was fair and reasonable. The Board's decision to renew the Advisory Contracts was not based on any single factor, but rather was based on a comprehensive consideration of all the information provided to the Board at its meetings throughout the year. The Board, in reaching its determination to renew the Advisory Contracts, was aware that shareholders in the fund have a broad range of investment choices available to them, including a wide choice among mutual funds offered by Fidelity's competitors, and that the fund's shareholders, who have the opportunity to review and weigh the disclosure provided by the fund in its prospectus and other public disclosures, have chosen to invest in this fund, which is a part of the Fidelity family of funds.
Annual Report
Board Approval of Investment Advisory Contracts and
Management Fees - continued
Nature, Extent, and Quality of Services Provided. The Board considered the staffing within the investment adviser, Fidelity Management & Research Company (FMR), and the sub-advisers (together, the Investment Advisers) as it relates to the fund, including the backgrounds of the fund's investment personnel, and also considered the fund's investment objective, strategies, and related investment philosophy. The Independent Trustees also had discussions with senior management of Fidelity's investment operations and investment groups. The Board considered the structure of the portfolio manager compensation program and whether this structure provides appropriate incentives to act in the best interests of the fund.
Resources Dedicated to Investment Management and Support Services. The Board and the Fund Oversight and Research Committees reviewed the general qualifications and capabilities of the Investment Advisers' investment staff, including its size, education, experience, and resources, as well as the Investment Advisers' approach to recruiting, training, managing, and compensating investment personnel. The Board noted that FMR has continued to increase the resources devoted to non-U.S. offices, including expansion of Fidelity's global investment organization. The Board also noted that Fidelity's analysts have extensive resources, tools and capabilities that allow them to conduct sophisticated quantitative and fundamental analysis, as well as credit analysis of issuers, counterparties and guarantors. Further, the Board believes that Fidelity's investment professionals have sufficient access to global information and data so as to provide competitive investment results over time, and that those professionals also have access to sophisticated tools that permit them to assess portfolio construction and risk and performance attribution characteristics continuously, as well as to transmit new information and research conclusions rapidly around the world. Additionally, in its deliberations, the Board considered the Investment Advisers' trading and risk management capabilities and resources, which are an integral part of the investment management process.
Shareholder and Administrative Services. The Board considered (i) the nature, extent, quality, and cost of advisory, administrative, and shareholder services performed by the Investment Advisers and their affiliates under the Advisory Contracts and under separate agreements covering transfer agency, pricing and bookkeeping, and securities lending services for the fund; (ii) the nature and extent of the supervision of third party service providers, principally custodians and subcustodians; and (iii) the resources devoted to, and the record of compliance with, the fund's compliance policies and procedures. The Board also reviewed the allocation of fund brokerage, including allocations to brokers affiliated with the Investment Advisers, the use of brokerage commissions to pay fund expenses, and the use of "soft" commission dollars to pay for research services.
Annual Report
The Board noted that the growth of fund assets over time across the complex allows Fidelity to reinvest in the development of services designed to enhance the value or convenience of the Fidelity funds as investment vehicles. These services include 24-hour access to account information and market information through telephone representatives and over the Internet, investor education materials and asset allocation tools, and the expanded availability of Fidelity Investor Centers.
Investment in a Large Fund Family. The Board considered the benefits to shareholders of investing in a Fidelity fund, including the benefits of investing in a fund that is part of a large family of funds offering a variety of investment disciplines and providing a large variety of mutual fund investor services. The Board noted that Fidelity had taken, or had made recommendations that resulted in the Fidelity funds taking, a number of actions over the previous year that benefited particular funds, including (i) continuing to dedicate additional resources to investment research and to the support of the senior management team that oversees asset management; (ii) persisting in efforts to enhance Fidelity's global research capabilities; (iii) launching new funds and making other enhancements to meet client needs for global and income-oriented solutions; (iv) continuing to launch dedicated lower cost underlying funds to meet portfolio construction needs related to expanding underlying fund options for Fidelity funds of funds, specifically for the Freedom Fund product lines; (v) rationalizing product lines and gaining increased efficiencies through the mergers of several funds into other funds; (vi) strengthening Fidelity's index fund offerings by reducing investment minimums and adopting or lowering existing expense caps for certain funds and classes; (vii) enhancing Global Asset Allocation product offerings by launching new funds and strategies, including "open architecture" target date funds that utilize affiliated and unaffiliated sub-advisers; (viii) modifying the eligibility criteria for Institutional Class shares of Advisor funds to increase their marketability to a portion of the defined contribution plan market; (ix) creating a new low-cost retirement share class for certain Advisor funds to appeal to large retirement plans; (x) transitioning the management of certain Fidelity commodity funds to Geode Capital Management LLC, a registered commodity pool operator, while retaining administrative responsibilities for the funds; (xi) reorganizing a number of funds; and (xii) taking steps toward establishing a new Fidelity adviser to manage sector-based funds and products.
Investment Performance. The Board considered whether the fund has operated in accordance with its investment objective, as well as its record of compliance with its investment restrictions and its performance history.
The Board took into account discussions with the Investment Advisers about fund investment performance that occur at Board meetings throughout the year. In this regard the Board noted that as part of regularly scheduled fund reviews and other reports to the Board on fund performance, the Board periodically considers annualized return information for the fund, for different time periods, measured against a securities market index ("benchmark index") and a peer group of mutual funds with similar objectives ("peer group"). In its evaluation of fund investment performance, the Board gave particular attention to information indicating changes in performance of certain Fidelity funds for specific time periods and the Investment Advisers' explanations for any overperformance or, in the case of the fund, underperformance.
Annual Report
Board Approval of Investment Advisory Contracts and
Management Fees - continued
In addition to reviewing absolute and relative fund performance, the Independent Trustees periodically consider the appropriateness of fund performance metrics in evaluating the results achieved. In general, the Independent Trustees believe that fund performance should be evaluated based on net performance (after fees and expenses) of both the highest performing and lowest performing classes, where applicable, compared to appropriate benchmark indices, over appropriate time periods which may include full market cycles, and compared to peer groups, as applicable, over the same periods, taking into account relevant factors including the following: general market conditions; issuer-specific information; tactical opportunities for investment; and fund cash flows and other factors.
The Independent Trustees recognize that shareholders evaluate performance on a net basis over their own holding periods, for which one-, three-, and five-year periods are used as a proxy. For this reason, the performance information reviewed by the Board also included net cumulative calendar year total return information for the fund and an appropriate benchmark index and peer group for the most recent one-, three-, and five-year periods, as shown below. Returns are shown compared to the 25th percentile (top of box) and 75th percentile (bottom of box) of the peer universe.
Annual Report
Fidelity Advisor Dividend Growth Fund

The Board has discussed the fund's performance with FMR, including the fund's underperformance based on more recent periods ended after 2012 (which periods are not shown in the chart above) but prior to the date of the Board's approval of the renewal of the Advisory Contracts, and has engaged with FMR to consider what steps might be taken to remediate the fund's more recent underperformance.
The Board also considered that the fund's management fee is subject to upward or downward adjustment depending upon whether, and to what extent, the fund's investment performance for the performance period exceeds, or is exceeded by, a securities index, thus leading to a performance adjustment for the same period. The Board noted that the performance adjustment provides FMR with a strong economic incentive to seek to achieve superior performance for the fund's shareholders and helps to more closely align the interests of FMR and the fund's shareholders.
Based on its review, the Board concluded that the nature, extent, and quality of services provided to the fund under the Advisory Contracts should benefit the fund's shareholders.
Competitiveness of Management Fee and Total Expense Ratio. The Board considered the fund's management fee and total expense ratio compared to "mapped groups" of competitive funds and classes. Fidelity creates "mapped groups" by combining similar Lipper investment objective categories that have comparable management fee characteristics. Combining Lipper investment objective categories aids the Board's management fee and total expense ratio comparisons by broadening the competitive group used for comparison and by reducing the number of universes to which various Fidelity funds are compared.
Annual Report
Board Approval of Investment Advisory Contracts and
Management Fees - continued
Management Fee. The Board considered two proprietary management fee comparisons for the 12-month periods shown in the chart below. The group of Lipper funds used by the Board for management fee comparisons is referred to below as the "Total Mapped Group." The Total Mapped Group comparison focuses on a fund's standing in terms of gross management fees before expense reimbursements or caps, and without giving effect to the fund's performance adjustment, relative to the total universe of funds with comparable investment mandates, regardless of whether their management fee structures also are comparable. Funds with comparable investment mandates offer exposure to similar types of securities. Funds with comparable management fee structures have similar management fee contractual arrangements (e.g., flat rate charged for advisory services, all-inclusive fee rate, etc.). "TMG %" represents the percentage of funds in the Total Mapped Group that had management fees that were lower than the fund's. For example, a TMG % of 11% means that 89% of the funds in the Total Mapped Group had higher management fees than the fund. The "Asset-Size Peer Group" (ASPG) comparison focuses on a fund's standing relative to a subset of non-Fidelity funds within the Total Mapped Group that are similar in size and management fee structure. The ASPG represents at least 15% of the funds in the Total Mapped Group with comparable asset size and management fee structures, subject to a minimum of 50 funds (or all funds in the Total Mapped Group if fewer than 50). Additional information, such as the ASPG quartile in which the fund's management fee ranked and the impact of the fund's performance adjustment, is also included in the chart and considered by the Board.
Fidelity Advisor Dividend Growth Fund

Annual Report
The Board noted that the fund's management fee ranked below the median of its Total Mapped Group and below the median of its ASPG for 2012. The Board also noted the effect of the fund's positive performance adjustment on the fund's management fee ranking.
Based on its review, the Board concluded that the fund's management fee is fair and reasonable in light of the services that the fund receives and the other factors considered.
Total Expense Ratio. In its review of each class's total expense ratio, the Board considered the fund's management fee as well as other fund or class expenses, as applicable, such as transfer agent fees, pricing and bookkeeping fees, fund-paid 12b-1 fees, and custodial, legal, and audit fees. The Board also noted the effects of any waivers and reimbursements on fees and expenses, as well as the impact of the fund's performance adjustment. As part of its review, the Board also considered the current and historical total expense ratios of each class of the fund compared to competitive fund median expenses. Each class of the fund is compared to those funds and classes in the Total Mapped Group (used by the Board for management fee comparisons) that have a similar sales load structure.
The Board noted that the total expense ratio of each of Class A, Class B, Class C, and Institutional Class ranked below its competitive median for 2012 and the total expense ratio of Class T ranked above its competitive median for 2012. The Board considered that, in general, various factors can affect total expense ratios. The Board noted that the total expense ratio of Class T was above the competitive median primarily because of higher 12b-1 fees on Class T. Class T has a higher 12b-1 fee, but a lower front-end sales charge, than traditionally priced front-end sales charge classes. The Board considered that Class T is primarily sold load-waived in the retirement plan market where its 0.50% 12b-1 fee is comparable to competing no-load, higher 12b-1 fee classes designed specifically for retirement plans. The Board noted that the fund offers multiple classes, each of which has a different sales load and 12b-1 fee structure, and that the multiple structures are intended to offer a range of pricing options for the intermediary market. The Board also noted that the total expense ratios of the classes vary primarily by the level of their 12b-1 fees, although differences in transfer agent fees may also cause expenses to vary from class to class.
Fees Charged to Other Fidelity Clients. The Board also considered Fidelity fee structures and other information with respect to clients of FMR and its affiliates, such as other mutual funds advised or subadvised by FMR or its affiliates, pension plan clients, and other institutional clients. The Board noted the findings of the 2013 ad hoc joint committee (created with the board of other Fidelity funds), which reviewed and compared Fidelity's institutional investment advisory business with its business of providing services to the Fidelity funds, including the differences in services provided, fees charged, and costs incurred, as well as competition in their respective marketplaces.
Annual Report
Board Approval of Investment Advisory Contracts and
Management Fees - continued
Based on its review of total expense ratios and fees charged to other Fidelity clients, the Board concluded that the total expense ratio of each class of the fund was reasonable, although Class T was above the median of the universe presented for comparison, in light of the services that the fund and its shareholders receive and the other factors considered.
Costs of the Services and Profitability. The Board considered the revenues earned and the expenses incurred by Fidelity in conducting the business of developing, marketing, distributing, managing, administering and servicing the fund and servicing the fund's shareholders. The Board also considered the level of Fidelity's profits in respect of all the Fidelity funds.
On an annual basis, FMR presents to the Board Fidelity's profitability for the fund. Fidelity calculates the profitability for each fund, as well as aggregate profitability for groups of Fidelity funds and all Fidelity funds, using a series of detailed revenue and cost allocation methodologies which originate with the books and records of Fidelity on which Fidelity's audited financial statements are based. The Audit Committee of the Board reviews any significant changes from the prior year's methodologies.
PricewaterhouseCoopers LLP (PwC), independent registered public accounting firm and auditor to Fidelity and certain Fidelity funds, has been engaged annually by the Board as part of the Board's assessment of Fidelity's profitability analysis. PwC's engagement includes the review and assessment of the methodologies used by Fidelity in determining the revenues and expenses attributable to Fidelity's mutual fund business, and completion of agreed-upon procedures surrounding the mathematical accuracy of fund profitability and its conformity to allocation methodologies. After considering PwC's reports issued under the engagement and information provided by Fidelity, the Board concluded that while other allocation methods may also be reasonable, Fidelity's profitability methodologies are reasonable in all material respects.
The Board also reviewed Fidelity's non-fund businesses and fall-out benefits related to the mutual fund business as well as cases where Fidelity's affiliates may benefit from or be related to the fund's business.
The Board considered the costs of the services provided by and the profits realized by Fidelity in connection with the operation of the fund and was satisfied that the profitability was not excessive in the circumstances.
Economies of Scale. The Board considered whether there have been economies of scale in respect of the management of the Fidelity funds, whether the Fidelity funds (including the fund) have appropriately benefited from any such economies of scale, and whether there is potential for realization of any further economies of scale. The Board considered the extent to which the fund will benefit from economies of scale through increased services to the fund, through waivers or reimbursements, or through fee or expense reductions. The Board also noted that in 2009, it and the board of other Fidelity funds created an ad hoc committee (the Economies of Scale Committee) to analyze whether FMR attains economies of scale in respect of the management and servicing of the Fidelity funds, whether the Fidelity funds have appropriately benefited from such economies of scale, and whether there is potential for realization of any further economies of scale.
Annual Report
The Board recognized that the fund's management contract incorporates a "group fee" structure, which provides for lower group fee rates as total fund assets under FMR's management increase, and for higher group fee rates as total fund assets under FMR's management decrease. FMR calculates the group fee rates based on a tiered asset "breakpoint" schedule that varies based on asset class. The Board considered that the group fee is designed to deliver the benefits of economies of scale to fund shareholders when total Fidelity fund assets increase, even if assets of any particular fund are unchanged or have declined, because some portion of Fidelity's costs are attributable to services provided to all Fidelity funds, and all funds benefit if those costs can be allocated among more assets. The Board concluded that, given the group fee structure, fund shareholders will benefit from lower management fees as assets under FMR's management increase at the fund complex level, regardless of whether Fidelity achieves any such economies of scale.
The Board concluded, taking into account the analysis of the Economies of Scale Committee, that economies of scale, if any, are being appropriately shared between fund shareholders and Fidelity.
Amendment to Description of Group Fee Rate. At its July 2013 meeting, the Board voted to approve an amendment to the fund's management contract to modify the description of the "group fee rate" effective August 1, 2013. The Board noted that under the prior description in the contract, the group fee rate was based on the average net assets of all registered investment companies with which FMR has management contracts. Under the contract's tiered asset breakpoint schedule, the group fee rate is lower as total fund assets under FMR's management increase, and higher as total fund assets under FMR's management decrease. The Board considered that the prior description would have excluded the assets of 64 Fidelity sector funds from the group fee rate calculation once Fidelity SelectCo, LLC, an affiliate of FMR, assumed management responsibilities for those funds. The Board noted that modifying the description of the group fee rate to continue to include the assets of those 64 funds for purposes of determining group fee rate breakpoints would avoid an immediate adverse impact on the group fee rate for any fund.
Annual Report
Board Approval of Investment Advisory Contracts and
Management Fees - continued
Additional Information Requested by the Board. In order to develop fully the factual basis for consideration of the Fidelity funds' Advisory Contracts, the Board requested and received additional information on certain topics, including: (i) fund performance trends and Fidelity's long-term strategies for certain funds; (ii) the potential to further rationalize the Fidelity fund lineup with the possibility of achieving savings for the funds and Fidelity; (iii) the methodology with respect to competitive fund data and peer group classifications; (iv) the arrangements with, and performance of, certain sub-advisers on behalf of the Fidelity funds, as well as certain proposed participating affiliate arrangements; (v) the realization of fall-out benefits in certain Fidelity business units; (vi) Fidelity's group fee structures, including the rationale for the individual fee rates of certain categories of funds and the definition of group assets; (vii) trends regarding industry use of performance fee structures and the performance adjustment methodologies applicable to the Fidelity funds; (viii) additional competitive analysis regarding the total expenses for certain classes; and (ix) fund profitability methodology, including Fidelity's cost allocation methodology, and the impact of certain factors on fund profitability results.
Based on its evaluation of all of the conclusions noted above, and after considering all factors it believed relevant, the Board ultimately concluded that the advisory fee structures are fair and reasonable, and that the fund's Advisory Contracts should be renewed.
Annual Report
Investment Adviser
Fidelity Management & Research Company
Boston, MA
Investment Sub-Advisers
FMR Co., Inc.
Fidelity Management & Research
(U.K.) Inc.
Fidelity Management & Research
(Hong Kong) Limited
Fidelity Management & Research
(Japan) Inc.
General Distributor
Fidelity Distributors Corporation
Smithfield, RI
Transfer and Service Agents
Fidelity Investments Institutional
Operations Company, Inc.
Boston, MA
Fidelity Service Company, Inc.
Boston, MA
Custodian
State Street Bank and Trust Company
Quincy, MA
(Fidelity Investment logo)(registered trademark)
ADGF-UANN-0114 1.786675.110
(Fidelity Investment logo)(registered trademark)
Fidelity Advisor®
Dividend Growth
Fund - Institutional Class
Annual Report
November 30, 2013
(Fidelity Cover Art)
Contents
|
Performance |
How the fund has done over time. |
|
|
Management's Discussion of Fund Performance |
The Portfolio Manager's review of fund performance and strategy. |
|
|
Shareholder Expense Example |
An example of shareholder expenses. |
|
|
Investment Changes |
A summary of major shifts in the fund's investments over the past six months. |
|
|
Investments |
A complete list of the fund's investments with their market values. |
|
|
Financial Statements |
Statements of assets and liabilities, operations, and changes in net assets, as well as financial highlights. |
|
|
Notes |
Notes to the financial statements. |
|
|
Report of Independent Registered Public Accounting Firm |
|
|
|
Trustees and Officers |
|
|
|
Distributions |
|
|
|
Board Approval of Investment Advisory Contracts and Management Fees |
|
To view a fund's proxy voting guidelines and proxy voting record for the 12-month period ended June 30, visit http://www.fidelity.com/proxyvotingresults or visit the Securities and Exchange Commission's (SEC) web site at http://www.sec.gov. You may also call 1-877-208-0098 to request a free copy of the proxy voting guidelines.
Standard & Poor's, S&P and S&P 500 are registered service marks of The McGraw-Hill Companies, Inc. and have been licensed for use by Fidelity Distributors Corporation.
Other third-party marks appearing herein are the property of their respective owners.
All other marks appearing herein are registered or unregistered trademarks or service marks of FMR LLC or an affiliated company. © 2014 FMR LLC. All rights reserved.
Annual Report
This report and the financial statements contained herein are submitted for the general information of the shareholders of the fund. This report is not authorized for distribution to prospective investors in the fund unless preceded or accompanied by an effective prospectus.
A fund files its complete schedule of portfolio holdings with the SEC for the first and third quarters of each fiscal year on Form N-Q. Forms N-Q are available on the SEC's web site at http://www.sec.gov. A fund's Forms N-Q may be reviewed and copied at the SEC's Public Reference Room in Washington, DC. Information regarding the operation of the SEC's Public Reference Room may be obtained by calling 1-800-SEC-0330. For a complete list of a fund's portfolio holdings, view the most recent holdings listing, semiannual report, or annual report on Fidelity's web site at http://www.fidelity.com, http://www.advisor.fidelity.com, or http://www.401k.com, as applicable.
NOT FDIC INSURED • MAY LOSE VALUE • NO BANK GUARANTEE
Neither the fund nor Fidelity Distributors Corporation is a bank.
Annual Report
Performance: The Bottom Line
Average annual total return reflects the change in the value of an investment, assuming reinvestment of the class' distributions from dividend income and capital gains (the profits earned upon the sale of securities that have grown in value, if any) and assuming a constant rate of performance each year. The $10,000 table and the fund's returns do not reflect the deduction of taxes that a shareholder would pay on fund distributions or the redemption of fund shares. During periods of reimbursement by Fidelity, a fund's total return will be greater than it would be had the reimbursement not occurred. How a fund did yesterday is no guarantee of how it will do tomorrow.
Average Annual Total Returns
|
Periods ended November 30, 2013 |
Past 1 |
Past 5 |
Past 10 |
|
Institutional Class |
30.63% |
22.34% |
7.05% |
$10,000 Over 10 Years
Let's say hypothetically that $10,000 was invested in Fidelity Advisor® Dividend Growth Fund - Institutional Class on November 30, 2003. The chart shows how the value of your investment would have changed, and also shows how the S&P 500 ® Index performed over the same period.
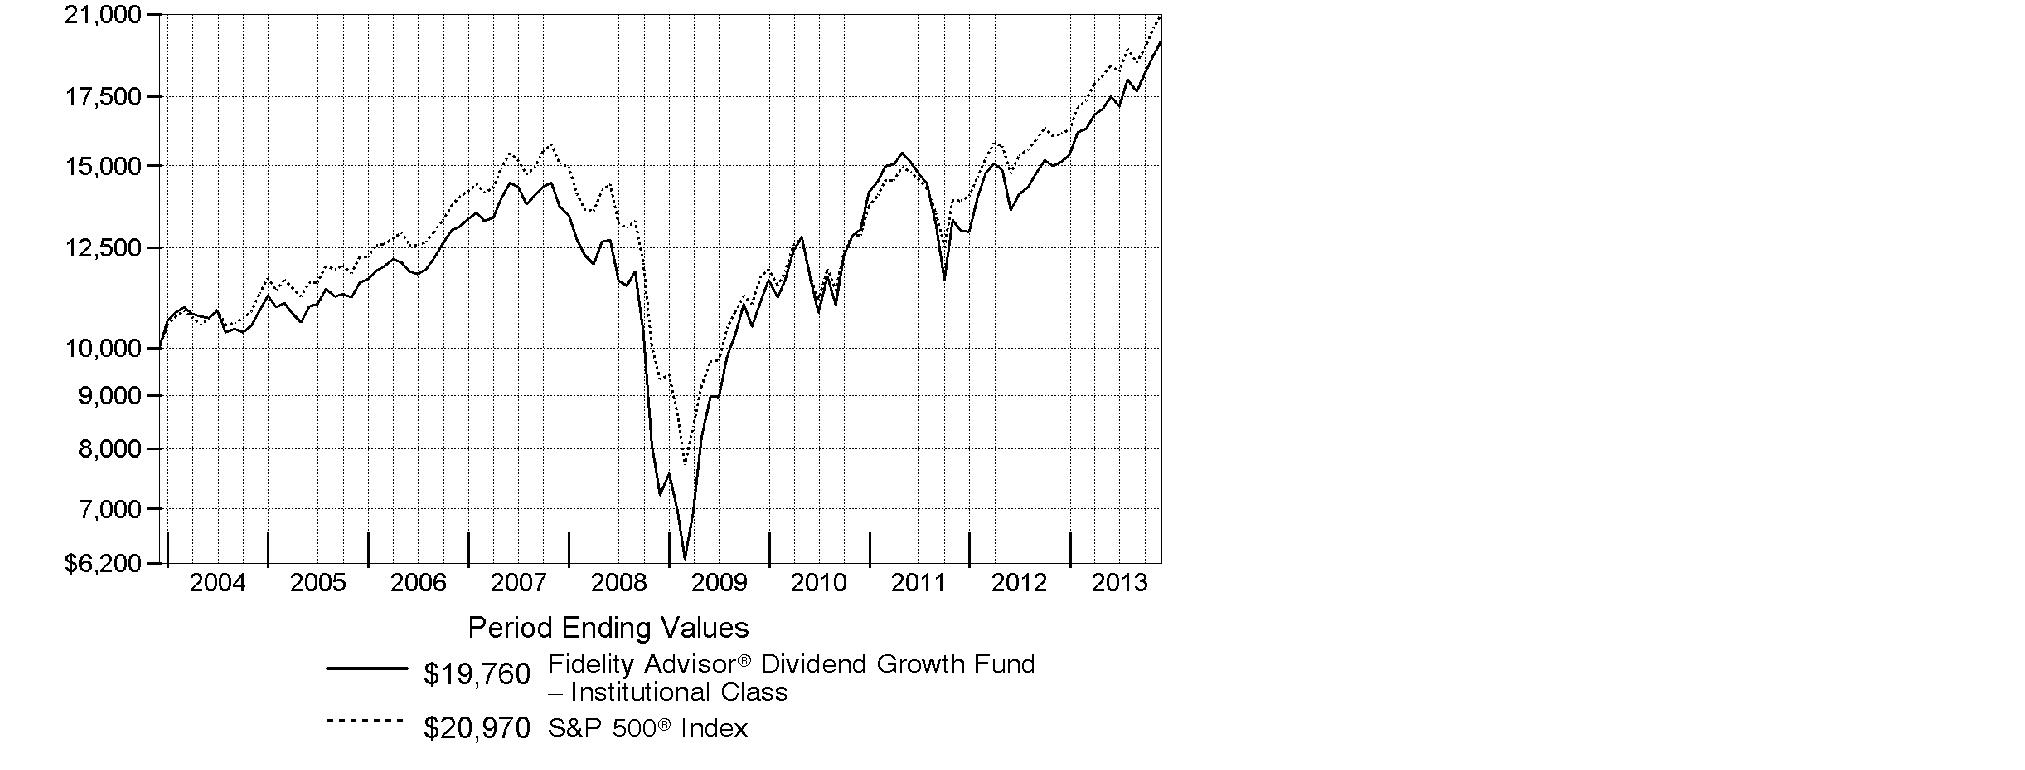
Annual Report
Management's Discussion of Fund Performance
Market Recap: With the current bull run nearing the five-year mark, equity benchmarks ripped up old records during the 12 months ending November 30, 2013. Gains were fueled by strengthening U.S. economic data, as well as generally improving economies and accommodative monetary policies worldwide. The broad S&P 500® Index reached new peaks in its 30.30% climb for the period, and the blue-chip Dow Jones Industrial AverageSM surpassed historic milestones en route to a 26.63% gain. The Nasdaq Composite Index®, up 36.73% amid a resurgence in growth-oriented stocks, closed above 4,000 for the first time since 2000. Shedding anxiety over the 2012 U.S. presidential election - and apparently confident that the federal debt-ceiling debate would be resolved - markets rose from period start through late May. News that the U.S. Federal Reserve was considering an end to its stimulative bond-buying kept stocks in flux over the summer but, by September, the Fed had set aside any imminent tapering. Despite jitters over a potential U.S. military strike in Syria and, later, an October budget impasse that briefly shuttered the federal government, volatility was subdued heading into the holidays, with investor optimism helping many markets home in on all-time highs at period end. Elsewhere, non-U.S. developed-market equities saw similar results, with the MSCI® EAFE® Index adding 24.97%.
Comments from Lawrence Rakers, Portfolio Manager of Fidelity Advisor® Dividend Growth Fund: For the year, the fund's Institutional Class shares returned 30.63%, modestly ahead of the S&P 500®. Versus the index, three of the four largest contributors were lagging mega-cap benchmark components the fund didn't own: energy major Exxon Mobil, information technology services provider IBM and telecommunication services giant AT&T. Two smaller-cap positions that helped were development-stage biotechnology company Alnylam Pharmaceuticals and marketing services provider MDC Partners. Conversely, materials hurt the fund's relative results the most. Here, two Canadian metals miners were the biggest detractors: Ivanplats - which changed its name to Ivanhoe Mines - and Turquoise Hill Resources, the latter of which I reduced exposure to by period end. Investments here were hurt in part by a declining Canadian dollar. Elsewhere, performance was curbed by Ireland-based mobile marketing firm Velti, which filed for bankruptcy. The fund did not own Velti's common stock at period end but retained a private placement here. Many stocks I've mentioned in this report were not in the index.
Note to shareholders: On January 1, 2014, Ramona Persaud will become Portfolio Manager of the fund, succeeding Larry Rakers.
The views expressed above reflect those of the portfolio manager(s) only through the end of the period as stated on the cover of this report and do not necessarily represent the views of Fidelity or any other person in the Fidelity organization. Any such views are subject to change at any time based upon market or other conditions and Fidelity disclaims any responsibility to update such views. These views may not be relied on as investment advice and, because investment decisions for a Fidelity fund are based on numerous factors, may not be relied on as an indication of trading intent on behalf of any Fidelity fund.
Annual Report
Shareholder Expense Example
As a shareholder of the Fund, you incur two types of costs: (1) transaction costs, including sales charges (loads) on purchase payments or redemption proceeds, and (2) ongoing costs, including management fees, distribution and/or service (12b-1) fees and other Fund expenses. This Example is intended to help you understand your ongoing costs (in dollars) of investing in the Fund and to compare these costs with the ongoing costs of investing in other mutual funds.
The actual expense Example is based on an investment of $1,000 invested at the beginning of the period and held for the entire period (June 1, 2013 to November 30, 2013) for Class A, Class T, Class B, Class C and Institutional Class and for the period (August 13, 2013 to November 30, 2013) for Class Z. The hypothetical expense Example is based on an investment of $1,000 invested for the one-half year period (June 1, 2013 to November 30, 2013).
Actual Expenses
The first line of the accompanying table for each class of the Fund provides information about actual account values and actual expenses. You may use the information in this line, together with the amount you invested, to estimate the expenses that you paid over the period. Simply divide your account value by $1,000.00 (for example, an $8,600 account value divided by $1,000.00 = 8.6), then multiply the result by the number in the first line for a class of the Fund under the heading entitled "Expenses Paid During Period" to estimate the expenses you paid on your account during this period. In addition, the Fund, as a shareholder in the underlying Fidelity Central Funds, will indirectly bear its pro-rata share of the fees and expenses incurred by the underlying Fidelity Central Funds. These fees and expenses are not included in the Fund's annualized expense ratio used to calculate the expense estimate in the table below.
Hypothetical Example for Comparison Purposes
The second line of the accompanying table for each class of the Fund provides information about hypothetical account values and hypothetical expenses based on a Class' actual expense ratio and an assumed rate of return of 5% per year before expenses, which is not the Class' actual return. The hypothetical account values and expenses may not be used to estimate the actual ending account balance or expenses you paid for the period. You may use this information to compare the ongoing costs of investing in the Fund and other funds. To do so, compare this 5% hypothetical example with the 5% hypothetical examples that appear in the shareholder reports of the other funds. In addition, the Fund, as a shareholder in the underlying Fidelity Central Funds, will indirectly bear its pro-rata share of the fees and expenses incurred by the underlying Fidelity Central Funds. These fees and expenses are not included in the Fund's annualized expense ratio used to calculate the expense estimate in the table below.
Please note that the expenses shown in the table are meant to highlight your ongoing costs only and do not reflect any transaction costs. Therefore, the second line of the table is useful in comparing ongoing costs only, and will not help you determine the relative total costs of owning different funds. In addition, if these transactional costs were included, your costs would have been higher.
Annual Report
Shareholder Expense Example - continued
|
|
Annualized |
Beginning |
Ending |
Expenses Paid |
|
Class A |
.96% |
|
|
|
|
Actual |
|
$ 1,000.00 |
$ 1,129.10 |
$ 5.12 C |
|
HypotheticalA |
|
$ 1,000.00 |
$ 1,020.26 |
$ 4.86 D |
|
Class T |
1.18% |
|
|
|
|
Actual |
|
$ 1,000.00 |
$ 1,128.30 |
$ 6.30 C |
|
HypotheticalA |
|
$ 1,000.00 |
$ 1,019.15 |
$ 5.97 D |
|
Class B |
1.77% |
|
|
|
|
Actual |
|
$ 1,000.00 |
$ 1,124.20 |
$ 9.43 C |
|
HypotheticalA |
|
$ 1,000.00 |
$ 1,016.19 |
$ 8.95 D |
|
Class C |
1.70% |
|
|
|
|
Actual |
|
$ 1,000.00 |
$ 1,125.20 |
$ 9.06 C |
|
HypotheticalA |
|
$ 1,000.00 |
$ 1,016.55 |
$ 8.59 D |
|
Institutional Class |
.69% |
|
|
|
|
Actual |
|
$ 1,000.00 |
$ 1,130.70 |
$ 3.69 C |
|
HypotheticalA |
|
$ 1,000.00 |
$ 1,021.61 |
$ 3.50 D |
|
Class Z |
.54% |
|
|
|
|
Actual |
|
$ 1,000.00 |
$ 1,080.20 |
$ 1.69 C |
|
HypotheticalA |
|
$ 1,000.00 |
$ 1,022.36 |
$ 2.74 D |
A 5% return per year before expenses
B Annualized expense ratio reflects expenses net of applicable fee waivers.
C Actual expenses are equal to each Class' annualized expense ratio, multiplied by the average account value over the period, multiplied by 183/365 (to reflect the one-half year period) for Class A, Class T, Class B, Class C and Institutional Class and multiplied by 110/365 (to reflect the period August 13, 2013 to November 30, 2013) for Class Z.
D Hypothetical expenses are equal to each Class' annualized expense ratio, multiplied by the average account value over the period, multiplied by 183/365 (to reflect the one-half year period).
Annual Report
Investment Changes (Unaudited)
|
Top Ten Stocks as of November 30, 2013 |
||
|
|
% of fund's |
% of fund's net assets |
|
Apple, Inc. |
3.2 |
2.3 |
|
Google, Inc. Class A |
1.9 |
1.6 |
|
Microsoft Corp. |
1.8 |
0.7 |
|
General Electric Co. |
1.8 |
1.6 |
|
JPMorgan Chase & Co. |
1.8 |
1.2 |
|
Citigroup, Inc. |
1.5 |
1.6 |
|
Wells Fargo & Co. |
1.4 |
1.7 |
|
Bank of America Corp. |
1.3 |
1.2 |
|
Comcast Corp. Class A |
1.1 |
0.8 |
|
Visa, Inc. Class A |
1.0 |
1.0 |
|
|
16.8 |
|
|
Top Five Market Sectors as of November 30, 2013 |
||
|
|
% of fund's |
% of fund's net assets |
|
Information Technology |
17.9 |
16.9 |
|
Financials |
15.5 |
16.0 |
|
Consumer Discretionary |
14.2 |
12.6 |
|
Health Care |
13.4 |
13.7 |
|
Industrials |
11.9 |
12.1 |
|
Asset Allocation (% of fund's net assets) |
|||||||
|
As of November 30, 2013* |
As of May 31, 2013** |
||||||
 |
Stocks 98.6% |
|
|
Stocks 98.6% |
|
||
 |
Bonds 0.0% |
|
 |
Bonds 0.1% |
|
||
 |
Convertible |
|
|
Convertible |
|
||
 |
Short-Term |
|
|
Short-Term |
|
||
|
* Foreign investments |
18.1% |
|
** Foreign investments |
19.3% |
|
||

Annual Report
Investments November 30, 2013
Showing Percentage of Net Assets
|
Common Stocks - 98.4% |
|||
|
Shares |
Value (000s) |
||
|
CONSUMER DISCRETIONARY - 14.0% |
|||
|
Auto Components - 0.5% |
|||
|
Delphi Automotive PLC |
36,876 |
$ 2,159 |
|
|
Johnson Controls, Inc. |
71,476 |
3,610 |
|
|
|
5,769 |
||
|
Automobiles - 0.5% |
|||
|
Ford Motor Co. |
251,818 |
4,301 |
|
|
Harley-Davidson, Inc. |
17,401 |
1,166 |
|
|
|
5,467 |
||
|
Diversified Consumer Services - 0.9% |
|||
|
Anhanguera Educacional Participacoes SA |
276,700 |
1,842 |
|
|
H&R Block, Inc. |
202,764 |
5,655 |
|
|
Kroton Educacional SA |
91,300 |
1,535 |
|
|
|
9,032 |
||
|
Hotels, Restaurants & Leisure - 2.2% |
|||
|
Brinker International, Inc. |
170,092 |
7,999 |
|
|
Las Vegas Sands Corp. |
31,340 |
2,246 |
|
|
McDonald's Corp. |
9,800 |
954 |
|
|
Red Robin Gourmet Burgers, Inc. (a) |
17,900 |
1,427 |
|
|
Sonic Corp. (a) |
70,400 |
1,393 |
|
|
Wyndham Worldwide Corp. |
62,552 |
4,486 |
|
|
Yum! Brands, Inc. |
56,253 |
4,370 |
|
|
|
22,875 |
||
|
Household Durables - 0.2% |
|||
|
Taylor Wimpey PLC |
406,364 |
707 |
|
|
Whirlpool Corp. |
11,670 |
1,783 |
|
|
|
2,490 |
||
|
Leisure Equipment & Products - 0.2% |
|||
|
Polaris Industries, Inc. |
14,700 |
1,962 |
|
|
Media - 4.9% |
|||
|
Antena 3 de Television SA (d) |
119,189 |
1,833 |
|
|
CBS Corp. Class B |
148,282 |
8,683 |
|
|
Comcast Corp. Class A |
232,575 |
11,599 |
|
|
Ipsos SA |
27,584 |
1,150 |
|
|
MDC Partners, Inc. Class A (sub. vtg.) |
132,201 |
3,009 |
|
|
Omnicom Group, Inc. |
35,811 |
2,559 |
|
|
Smiles SA |
23,750 |
334 |
|
|
The Walt Disney Co. |
78,970 |
5,571 |
|
|
Time Warner, Inc. |
73,011 |
4,798 |
|
|
Twenty-First Century Fox, Inc. Class A |
155,371 |
5,203 |
|
|
Common Stocks - continued |
|||
|
Shares |
Value (000s) |
||
|
CONSUMER DISCRETIONARY - continued |
|||
|
Media - continued |
|||
|
Valassis Communications, Inc. |
17,865 |
$ 525 |
|
|
Viacom, Inc. Class B (non-vtg.) |
76,808 |
6,158 |
|
|
|
51,422 |
||
|
Specialty Retail - 3.8% |
|||
|
American Eagle Outfitters, Inc. |
148,505 |
2,416 |
|
|
Best Buy Co., Inc. |
31,954 |
1,296 |
|
|
CST Brands, Inc. |
1 |
0* |
|
|
Foot Locker, Inc. |
43,901 |
1,707 |
|
|
GNC Holdings, Inc. |
9,100 |
548 |
|
|
Home Depot, Inc. |
116,237 |
9,377 |
|
|
Kingfisher PLC |
156,180 |
961 |
|
|
L Brands, Inc. |
35,840 |
2,329 |
|
|
Lewis Group Ltd. |
23,800 |
152 |
|
|
Lowe's Companies, Inc. |
127,114 |
6,035 |
|
|
Office Depot, Inc. (a) |
274,901 |
1,495 |
|
|
Rent-A-Center, Inc. |
74,082 |
2,523 |
|
|
Ross Stores, Inc. |
20,765 |
1,588 |
|
|
Signet Jewelers Ltd. |
14,000 |
1,076 |
|
|
Staples, Inc. |
328,877 |
5,107 |
|
|
TJX Companies, Inc. |
62,001 |
3,899 |
|
|
|
40,509 |
||
|
Textiles, Apparel & Luxury Goods - 0.8% |
|||
|
Coach, Inc. |
18,884 |
1,093 |
|
|
Kering SA |
7,300 |
1,619 |
|
|
NIKE, Inc. Class B |
45,155 |
3,574 |
|
|
VF Corp. |
11,250 |
2,639 |
|
|
|
8,925 |
||
|
TOTAL CONSUMER DISCRETIONARY |
148,451 |
||
|
CONSUMER STAPLES - 10.1% |
|||
|
Beverages - 2.3% |
|||
|
Anheuser-Busch InBev SA NV |
21,500 |
2,192 |
|
|
Coca-Cola Enterprises, Inc. |
32,610 |
1,368 |
|
|
Cott Corp. |
241,020 |
2,021 |
|
|
Dr. Pepper Snapple Group, Inc. |
82,371 |
3,975 |
|
|
Molson Coors Brewing Co. Class B |
14,699 |
774 |
|
|
Monster Beverage Corp. (a) |
59,487 |
3,520 |
|
|
The Coca-Cola Co. |
264,275 |
10,621 |
|
|
|
24,471 |
||
|
Common Stocks - continued |
|||
|
Shares |
Value (000s) |
||
|
CONSUMER STAPLES - continued |
|||
|
Food & Staples Retailing - 2.2% |
|||
|
Alimentation Couche-Tard, Inc. Class B (sub. vtg.) |
53,500 |
$ 3,927 |
|
|
CVS Caremark Corp. |
114,524 |
7,669 |
|
|
Kroger Co. |
106,466 |
4,445 |
|
|
Rami Levi Chain Stores Hashikma Marketing 2006 Ltd. |
21,893 |
1,108 |
|
|
Walgreen Co. |
104,033 |
6,159 |
|
|
|
23,308 |
||
|
Food Products - 1.9% |
|||
|
Amira Nature Foods Ltd. (a)(d) |
41,029 |
650 |
|
|
Archer Daniels Midland Co. |
70,000 |
2,818 |
|
|
Bunge Ltd. |
36,660 |
2,937 |
|
|
Green Mountain Coffee Roasters, Inc. |
30,477 |
2,054 |
|
|
Greencore Group PLC |
235,804 |
743 |
|
|
Hilton Food Group PLC |
81,531 |
568 |
|
|
Ingredion, Inc. |
35,931 |
2,485 |
|
|
Kellogg Co. |
41,318 |
2,506 |
|
|
Mead Johnson Nutrition Co. Class A |
15,891 |
1,343 |
|
|
Mondelez International, Inc. |
115,900 |
3,886 |
|
|
|
19,990 |
||
|
Household Products - 1.5% |
|||
|
Energizer Holdings, Inc. |
36,875 |
4,069 |
|
|
Procter & Gamble Co. |
111,428 |
9,384 |
|
|
Svenska Cellulosa AB (SCA) (B Shares) |
77,200 |
2,254 |
|
|
|
15,707 |
||
|
Personal Products - 0.1% |
|||
|
Herbalife Ltd. |
16,400 |
1,143 |
|
|
Tobacco - 2.1% |
|||
|
British American Tobacco PLC (United Kingdom) |
20,100 |
1,069 |
|
|
Imperial Tobacco Group PLC |
48,945 |
1,861 |
|
|
Japan Tobacco, Inc. |
127,100 |
4,293 |
|
|
Lorillard, Inc. |
84,654 |
4,345 |
|
|
Philip Morris International, Inc. |
123,423 |
10,558 |
|
|
|
22,126 |
||
|
TOTAL CONSUMER STAPLES |
106,745 |
||
|
ENERGY - 9.3% |
|||
|
Energy Equipment & Services - 3.2% |
|||
|
BW Offshore Ltd. |
927,388 |
1,205 |
|
|
Cameron International Corp. (a) |
60,626 |
3,358 |
|
|
Common Stocks - continued |
|||
|
Shares |
Value (000s) |
||
|
ENERGY - continued |
|||
|
Energy Equipment & Services - continued |
|||
|
Ensco PLC Class A |
95,950 |
$ 5,669 |
|
|
Essential Energy Services Ltd. |
379,600 |
1,118 |
|
|
Halliburton Co. |
74,857 |
3,943 |
|
|
National Oilwell Varco, Inc. |
84,686 |
6,902 |
|
|
Noble Corp. |
47,079 |
1,795 |
|
|
Schlumberger Ltd. |
72,206 |
6,384 |
|
|
ShawCor Ltd. Class A |
15,100 |
563 |
|
|
Vantage Drilling Co. (a) |
795,092 |
1,487 |
|
|
Xtreme Drilling & Coil Services Corp. (a) |
256,400 |
833 |
|
|
Xtreme Drilling & Coil Services Corp. (a)(e) |
132,500 |
430 |
|
|
|
33,687 |
||
|
Oil, Gas & Consumable Fuels - 6.1% |
|||
|
Access Midstream Partners LP |
50,191 |
2,819 |
|
|
Anadarko Petroleum Corp. |
63,559 |
5,645 |
|
|
Ardmore Shipping Corp. |
29,683 |
380 |
|
|
BPZ Energy, Inc. (a) |
319,601 |
671 |
|
|
Cabot Oil & Gas Corp. |
30,508 |
1,051 |
|
|
Cimarex Energy Co. |
20,841 |
1,971 |
|
|
Cobalt International Energy, Inc. (a) |
76,207 |
1,694 |
|
|
Concho Resources, Inc. (a) |
12,440 |
1,293 |
|
|
ConocoPhillips Co. |
71,558 |
5,209 |
|
|
Double Eagle Petroleum Co. (a) |
89,373 |
202 |
|
|
Emerald Oil, Inc. warrants 2/4/16 (a) |
16,536 |
0 |
|
|
Energen Corp. |
30,004 |
2,165 |
|
|
EOG Resources, Inc. |
11,054 |
1,824 |
|
|
EQT Corp. |
27,102 |
2,307 |
|
|
InterOil Corp. (a)(d) |
30,409 |
2,688 |
|
|
Marathon Oil Corp. |
34,140 |
1,230 |
|
|
Markwest Energy Partners LP |
44,610 |
3,081 |
|
|
MPLX LP |
28,058 |
1,070 |
|
|
Noble Energy, Inc. |
22,387 |
1,572 |
|
|
Northern Oil & Gas, Inc. (a)(d) |
231,694 |
3,696 |
|
|
Occidental Petroleum Corp. |
65,944 |
6,262 |
|
|
Peabody Energy Corp. |
124,861 |
2,272 |
|
|
Phillips 66 Co. |
39,570 |
2,754 |
|
|
Phillips 66 Partners LP |
38,405 |
1,265 |
|
|
Rosetta Resources, Inc. (a) |
16,428 |
831 |
|
|
Southcross Energy Partners LP |
50,160 |
972 |
|
|
Suncor Energy, Inc. |
111,980 |
3,886 |
|
|
TAG Oil Ltd. (a) |
473,900 |
1,570 |
|
|
Common Stocks - continued |
|||
|
Shares |
Value (000s) |
||
|
ENERGY - continued |
|||
|
Oil, Gas & Consumable Fuels - continued |
|||
|
TAG Oil Ltd. (e) |
15,900 |
$ 53 |
|
|
The Williams Companies, Inc. |
116,074 |
4,088 |
|
|
|
64,521 |
||
|
TOTAL ENERGY |
98,208 |
||
|
FINANCIALS - 15.5% |
|||
|
Capital Markets - 2.5% |
|||
|
AllianceBernstein Holding LP |
84,005 |
1,864 |
|
|
Ameriprise Financial, Inc. |
13,448 |
1,456 |
|
|
BlackRock, Inc. Class A |
9,899 |
2,997 |
|
|
GP Investments Ltd. Class A (depositary receipt) (a) |
24,460 |
42 |
|
|
Invesco Ltd. |
79,284 |
2,763 |
|
|
KKR & Co. LP |
114,274 |
2,712 |
|
|
Monex Group, Inc. |
349,400 |
1,412 |
|
|
Morgan Stanley |
99,414 |
3,112 |
|
|
Oaktree Capital Group LLC Class A |
33,200 |
1,850 |
|
|
The Blackstone Group LP |
112,850 |
3,225 |
|
|
UBS AG (NY Shares) |
284,442 |
5,404 |
|
|
|
26,837 |
||
|
Commercial Banks - 2.8% |
|||
|
Barclays PLC sponsored ADR |
247,600 |
4,402 |
|
|
KBC Groupe SA |
17,062 |
974 |
|
|
Nordea Bank AB |
141,600 |
1,830 |
|
|
PNC Financial Services Group, Inc. |
36,140 |
2,781 |
|
|
U.S. Bancorp |
121,057 |
4,748 |
|
|
Wells Fargo & Co. |
342,450 |
15,075 |
|
|
|
29,810 |
||
|
Consumer Finance - 0.9% |
|||
|
Capital One Financial Corp. |
86,042 |
6,163 |
|
|
SLM Corp. |
111,707 |
2,977 |
|
|
|
9,140 |
||
|
Diversified Financial Services - 5.5% |
|||
|
ASAC II LP (f) |
298,480 |
3,422 |
|
|
Bank of America Corp. |
888,873 |
14,062 |
|
|
Citigroup, Inc. |
305,473 |
16,166 |
|
|
JPMorgan Chase & Co. |
328,943 |
18,822 |
|
|
Common Stocks - continued |
|||
|
Shares |
Value (000s) |
||
|
FINANCIALS - continued |
|||
|
Diversified Financial Services - continued |
|||
|
McGraw-Hill Companies, Inc. |
53,808 |
$ 4,009 |
|
|
PICO Holdings, Inc. (a) |
77,781 |
1,885 |
|
|
|
58,366 |
||
|
Insurance - 2.9% |
|||
|
ACE Ltd. |
24,994 |
2,569 |
|
|
AFLAC, Inc. |
30,332 |
2,013 |
|
|
Allied World Assurance Co. Holdings Ltd. |
9,888 |
1,114 |
|
|
Arthur J. Gallagher & Co. |
18,265 |
850 |
|
|
Assured Guaranty Ltd. |
204,251 |
4,796 |
|
|
Axis Capital Holdings Ltd. |
11,500 |
565 |
|
|
Everest Re Group Ltd. |
8,534 |
1,338 |
|
|
Fidelity National Financial, Inc. Class A |
139,204 |
4,047 |
|
|
Marsh & McLennan Companies, Inc. |
32,700 |
1,552 |
|
|
MetLife, Inc. |
79,620 |
4,155 |
|
|
Prudential PLC |
30,243 |
645 |
|
|
The Chubb Corp. |
33,094 |
3,192 |
|
|
The Travelers Companies, Inc. |
43,732 |
3,968 |
|
|
|
30,804 |
||
|
Real Estate Investment Trusts - 0.7% |
|||
|
American Tower Corp. |
20,619 |
1,604 |
|
|
Beni Stabili SpA SIIQ |
411,824 |
279 |
|
|
Cousins Properties, Inc. |
14,676 |
157 |
|
|
Prologis, Inc. |
27,557 |
1,045 |
|
|
Simon Property Group, Inc. |
16,487 |
2,471 |
|
|
Weyerhaeuser Co. |
69,876 |
2,105 |
|
|
|
7,661 |
||
|
Real Estate Management & Development - 0.1% |
|||
|
CBRE Group, Inc. (a) |
15,695 |
380 |
|
|
CSI Properties Ltd. |
11,320,000 |
460 |
|
|
|
840 |
||
|
Thrifts & Mortgage Finance - 0.1% |
|||
|
WSFS Financial Corp. |
13,500 |
1,025 |
|
|
TOTAL FINANCIALS |
164,483 |
||
|
HEALTH CARE - 13.4% |
|||
|
Biotechnology - 3.4% |
|||
|
Alexion Pharmaceuticals, Inc. (a) |
7,791 |
970 |
|
|
Alnylam Pharmaceuticals, Inc. (a) |
63,300 |
3,874 |
|
|
Common Stocks - continued |
|||
|
Shares |
Value (000s) |
||
|
HEALTH CARE - continued |
|||
|
Biotechnology - continued |
|||
|
Amgen, Inc. |
81,057 |
$ 9,247 |
|
|
Biogen Idec, Inc. (a) |
16,000 |
4,656 |
|
|
Gilead Sciences, Inc. (a) |
121,372 |
9,080 |
|
|
Grifols SA ADR |
86,375 |
2,966 |
|
|
Infinity Pharmaceuticals, Inc. (a) |
34,698 |
507 |
|
|
Isis Pharmaceuticals, Inc. (a) |
35,800 |
1,388 |
|
|
KaloBios Pharmaceuticals, Inc. (e) |
49,556 |
210 |
|
|
Theravance, Inc. (a) |
70,901 |
2,677 |
|
|
|
35,575 |
||
|
Health Care Equipment & Supplies - 1.5% |
|||
|
Abbott Laboratories |
18,100 |
691 |
|
|
Ansell Ltd. |
38,203 |
706 |
|
|
Boston Scientific Corp. (a) |
207,562 |
2,404 |
|
|
Covidien PLC |
35,073 |
2,394 |
|
|
Genmark Diagnostics, Inc. (a) |
114,606 |
1,364 |
|
|
Hill-Rom Holdings, Inc. |
32,767 |
1,357 |
|
|
Stryker Corp. |
45,180 |
3,362 |
|
|
The Cooper Companies, Inc. |
20,852 |
2,747 |
|
|
Zimmer Holdings, Inc. |
13,042 |
1,192 |
|
|
|
16,217 |
||
|
Health Care Providers & Services - 2.9% |
|||
|
AmerisourceBergen Corp. |
50,695 |
3,576 |
|
|
AmSurg Corp. (a) |
25,268 |
1,221 |
|
|
Cardinal Health, Inc. |
56,722 |
3,664 |
|
|
DaVita, Inc. (a) |
28,788 |
1,714 |
|
|
Emeritus Corp. (a) |
50,963 |
1,147 |
|
|
Express Scripts Holding Co. (a) |
73,201 |
4,930 |
|
|
McKesson Corp. |
40,206 |
6,670 |
|
|
Qualicorp SA (a) |
55,300 |
517 |
|
|
Quest Diagnostics, Inc. |
8,884 |
541 |
|
|
UnitedHealth Group, Inc. |
86,434 |
6,438 |
|
|
|
30,418 |
||
|
Life Sciences Tools & Services - 0.5% |
|||
|
Agilent Technologies, Inc. |
28,430 |
1,523 |
|
|
Lonza Group AG |
12,612 |
1,175 |
|
|
Thermo Fisher Scientific, Inc. |
28,713 |
2,896 |
|
|
|
5,594 |
||
|
Pharmaceuticals - 5.1% |
|||
|
AbbVie, Inc. |
144,770 |
7,014 |
|
|
Common Stocks - continued |
|||
|
Shares |
Value (000s) |
||
|
HEALTH CARE - continued |
|||
|
Pharmaceuticals - continued |
|||
|
Actavis PLC (a) |
36,942 |
$ 6,024 |
|
|
Bayer AG |
14,800 |
1,975 |
|
|
Biodelivery Sciences International, Inc. (a) |
209,414 |
1,005 |
|
|
Cadence Pharmaceuticals, Inc. (a) |
160,110 |
1,444 |
|
|
Horizon Pharma, Inc. (a) |
330,551 |
2,386 |
|
|
Horizon Pharma, Inc.: |
|
|
|
|
warrants 2/28/17 (a) |
27,294 |
82 |
|
|
warrants 9/25/17 (a) |
109,700 |
309 |
|
|
Johnson & Johnson |
93,892 |
8,888 |
|
|
Novartis AG sponsored ADR |
4,279 |
339 |
|
|
Novo Nordisk A/S Series B |
13,945 |
2,493 |
|
|
Perrigo Co. |
28,092 |
4,379 |
|
|
Pfizer, Inc. |
160,304 |
5,086 |
|
|
Sanofi SA |
68,393 |
7,226 |
|
|
Teva Pharmaceutical Industries Ltd. sponsored ADR |
74,849 |
3,051 |
|
|
Valeant Pharmaceuticals International, Inc. (Canada) (a) |
23,900 |
2,620 |
|
|
Zoetis, Inc. Class A |
1 |
0* |
|
|
|
54,321 |
||
|
TOTAL HEALTH CARE |
142,125 |
||
|
INDUSTRIALS - 11.8% |
|||
|
Aerospace & Defense - 1.8% |
|||
|
General Dynamics Corp. |
12,759 |
1,169 |
|
|
Honeywell International, Inc. |
63,581 |
5,628 |
|
|
Meggitt PLC |
237,051 |
1,936 |
|
|
The Boeing Co. |
11,255 |
1,511 |
|
|
United Technologies Corp. |
80,571 |
8,932 |
|
|
|
19,176 |
||
|
Air Freight & Logistics - 0.7% |
|||
|
FedEx Corp. |
27,226 |
3,776 |
|
|
United Parcel Service, Inc. Class B |
33,481 |
3,428 |
|
|
|
7,204 |
||
|
Building Products - 0.7% |
|||
|
A.O. Smith Corp. |
35,466 |
1,920 |
|
|
Masco Corp. |
229,353 |
5,142 |
|
|
|
7,062 |
||
|
Common Stocks - continued |
|||
|
Shares |
Value (000s) |
||
|
INDUSTRIALS - continued |
|||
|
Commercial Services & Supplies - 0.6% |
|||
|
Iron Mountain, Inc. |
44,791 |
$ 1,260 |
|
|
KAR Auction Services, Inc. |
61,100 |
1,686 |
|
|
Republic Services, Inc. |
48,140 |
1,681 |
|
|
Swisher Hygiene, Inc. (a) |
53,031 |
28 |
|
|
Waste Management, Inc. |
32,458 |
1,483 |
|
|
|
6,138 |
||
|
Construction & Engineering - 0.4% |
|||
|
URS Corp. |
77,170 |
4,011 |
|
|
Electrical Equipment - 1.6% |
|||
|
AMETEK, Inc. |
30,332 |
1,493 |
|
|
Eaton Corp. PLC |
42,653 |
3,099 |
|
|
EnerSys |
16,926 |
1,208 |
|
|
Generac Holdings, Inc. |
59,506 |
3,169 |
|
|
Hubbell, Inc. Class B |
12,024 |
1,298 |
|
|
Prysmian SpA |
104,262 |
2,723 |
|
|
Regal-Beloit Corp. |
27,087 |
1,993 |
|
|
Roper Industries, Inc. |
12,561 |
1,629 |
|
|
|
16,612 |
||
|
Industrial Conglomerates - 2.1% |
|||
|
Danaher Corp. |
18,500 |
1,384 |
|
|
General Electric Co. |
707,210 |
18,854 |
|
|
Koninklijke Philips Electronics NV |
68,500 |
2,450 |
|
|
|
22,688 |
||
|
Machinery - 2.0% |
|||
|
Andritz AG |
18,598 |
1,179 |
|
|
Cummins, Inc. |
20,890 |
2,765 |
|
|
Global Brass & Copper Holdings, Inc. |
55,502 |
916 |
|
|
Illinois Tool Works, Inc. |
25,600 |
2,037 |
|
|
Ingersoll-Rand PLC |
62,752 |
4,482 |
|
|
Manitowoc Co., Inc. |
144,603 |
2,977 |
|
|
Pentair Ltd. |
39,073 |
2,763 |
|
|
Stanley Black & Decker, Inc. |
45,656 |
3,716 |
|
|
Weg SA |
37,100 |
504 |
|
|
|
21,339 |
||
|
Marine - 0.0% |
|||
|
Ultrapetrol (Bahamas) Ltd. (a) |
164,775 |
559 |
|
|
Professional Services - 0.6% |
|||
|
Dun & Bradstreet Corp. |
41,796 |
4,884 |
|
|
Common Stocks - continued |
|||
|
Shares |
Value (000s) |
||
|
INDUSTRIALS - continued |
|||
|
Professional Services - continued |
|||
|
Huron Consulting Group, Inc. (a) |
12,334 |
$ 733 |
|
|
Michael Page International PLC |
151,879 |
1,180 |
|
|
|
6,797 |
||
|
Road & Rail - 1.2% |
|||
|
Con-way, Inc. |
26,800 |
1,109 |
|
|
CSX Corp. |
99,662 |
2,718 |
|
|
Norfolk Southern Corp. |
20,642 |
1,810 |
|
|
Union Pacific Corp. |
45,415 |
7,359 |
|
|
|
12,996 |
||
|
Trading Companies & Distributors - 0.1% |
|||
|
Houston Wire & Cable Co. |
73,887 |
997 |
|
|
TOTAL INDUSTRIALS |
125,579 |
||
|
INFORMATION TECHNOLOGY - 17.8% |
|||
|
Communications Equipment - 1.9% |
|||
|
Cisco Systems, Inc. |
451,979 |
9,605 |
|
|
QUALCOMM, Inc. |
144,528 |
10,634 |
|
|
|
20,239 |
||
|
Computers & Peripherals - 3.8% |
|||
|
Apple, Inc. |
61,952 |
34,447 |
|
|
Electronics for Imaging, Inc. (a) |
44,198 |
1,750 |
|
|
EMC Corp. |
120,328 |
2,870 |
|
|
Western Digital Corp. |
10,415 |
782 |
|
|
|
39,849 |
||
|
Electronic Equipment & Components - 0.6% |
|||
|
Corning, Inc. |
102,112 |
1,744 |
|
|
National Instruments Corp. |
16,854 |
527 |
|
|
TE Connectivity Ltd. |
81,622 |
4,303 |
|
|
|
6,574 |
||
|
Internet Software & Services - 2.3% |
|||
|
Demandware, Inc. (a) |
18,065 |
1,024 |
|
|
Google, Inc. Class A (a) |
18,432 |
19,530 |
|
|
Mail.Ru Group Ltd.: |
|
|
|
|
GDR (e) |
1,900 |
79 |
|
|
GDR (Reg. S) |
24,469 |
1,012 |
|
|
Velti PLC (f) |
192,692 |
16 |
|
|
Yahoo!, Inc. (a) |
68,605 |
2,537 |
|
|
|
24,198 |
||
|
Common Stocks - continued |
|||
|
Shares |
Value (000s) |
||
|
INFORMATION TECHNOLOGY - continued |
|||
|
IT Services - 3.3% |
|||
|
Accenture PLC Class A |
50,938 |
$ 3,946 |
|
|
Amdocs Ltd. |
38,282 |
1,549 |
|
|
Cognizant Technology Solutions Corp. Class A (a) |
53,782 |
5,050 |
|
|
Computer Sciences Corp. |
9,021 |
475 |
|
|
EPAM Systems, Inc. (a) |
6,474 |
230 |
|
|
ExlService Holdings, Inc. (a) |
28,683 |
756 |
|
|
Fidelity National Information Services, Inc. |
58,748 |
2,977 |
|
|
MasterCard, Inc. Class A |
7,042 |
5,358 |
|
|
Total System Services, Inc. |
114,908 |
3,568 |
|
|
Visa, Inc. Class A |
54,271 |
11,042 |
|
|
|
34,951 |
||
|
Office Electronics - 0.5% |
|||
|
Xerox Corp. |
444,973 |
5,064 |
|
|
Semiconductors & Semiconductor Equipment - 1.5% |
|||
|
Altera Corp. |
20,056 |
647 |
|
|
ASML Holding NV |
13,697 |
1,279 |
|
|
Avago Technologies Ltd. |
101,106 |
4,522 |
|
|
LTX-Credence Corp. (a) |
139,393 |
1,006 |
|
|
Maxim Integrated Products, Inc. |
39,436 |
1,123 |
|
|
Monolithic Power Systems, Inc. |
17,660 |
590 |
|
|
NXP Semiconductors NV (a) |
38,247 |
1,625 |
|
|
Samsung Electronics Co. Ltd. |
2,586 |
3,651 |
|
|
Skyworks Solutions, Inc. (a) |
70,090 |
1,864 |
|
|
|
16,307 |
||
|
Software - 3.9% |
|||
|
Activision Blizzard, Inc. |
201,233 |
3,463 |
|
|
Adobe Systems, Inc. (a) |
17,338 |
984 |
|
|
Citrix Systems, Inc. (a) |
27,561 |
1,635 |
|
|
Comverse, Inc. |
17,352 |
581 |
|
|
Constellation Software, Inc. |
9,700 |
1,723 |
|
|
Electronic Arts, Inc. (a) |
109,986 |
2,439 |
|
|
Intuit, Inc. |
20,285 |
1,506 |
|
|
Microsoft Corp. |
505,633 |
19,280 |
|
|
Oracle Corp. |
253,618 |
8,950 |
|
|
Symantec Corp. |
47,770 |
1,074 |
|
|
|
41,635 |
||
|
TOTAL INFORMATION TECHNOLOGY |
188,817 |
||
|
Common Stocks - continued |
|||
|
Shares |
Value (000s) |
||
|
MATERIALS - 3.4% |
|||
|
Chemicals - 2.1% |
|||
|
Axiall Corp. |
46,703 |
$ 2,116 |
|
|
Cabot Corp. |
79,138 |
3,862 |
|
|
Chemtura Corp. (a) |
15,101 |
399 |
|
|
Eastman Chemical Co. |
32,307 |
2,489 |
|
|
LyondellBasell Industries NV Class A |
36,196 |
2,794 |
|
|
Monsanto Co. |
39,101 |
4,431 |
|
|
Potash Corp. of Saskatchewan, Inc. |
43,200 |
1,368 |
|
|
PPG Industries, Inc. |
8,672 |
1,596 |
|
|
Royal DSM NV |
11,000 |
863 |
|
|
RPM International, Inc. |
47,109 |
1,866 |
|
|
|
21,784 |
||
|
Construction Materials - 0.1% |
|||
|
Vulcan Materials Co. |
13,941 |
786 |
|
|
Containers & Packaging - 0.2% |
|||
|
Nampak Ltd. |
301,028 |
1,160 |
|
|
Rock-Tenn Co. Class A |
15,404 |
1,454 |
|
|
|
2,614 |
||
|
Metals & Mining - 0.8% |
|||
|
Freeport-McMoRan Copper & Gold, Inc. |
136,655 |
4,741 |
|
|
Ivanhoe Mine Ltd. (a)(e) |
746,308 |
1,475 |
|
|
Randgold Resources Ltd. sponsored ADR |
22,500 |
1,592 |
|
|
Turquoise Hill Resources Ltd. (a)(d) |
123,222 |
508 |
|
|
|
8,316 |
||
|
Paper & Forest Products - 0.2% |
|||
|
Boise Cascade Co. |
35,400 |
908 |
|
|
International Paper Co. |
38,074 |
1,776 |
|
|
|
2,684 |
||
|
TOTAL MATERIALS |
36,184 |
||
|
TELECOMMUNICATION SERVICES - 1.0% |
|||
|
Diversified Telecommunication Services - 0.1% |
|||
|
CenturyLink, Inc. |
42,127 |
1,293 |
|
|
Wireless Telecommunication Services - 0.9% |
|||
|
Mobile TeleSystems OJSC sponsored ADR |
72,934 |
1,537 |
|
|
SBA Communications Corp. Class A (a) |
15,597 |
1,328 |
|
|
SoftBank Corp. |
21,100 |
1,707 |
|
|
T-Mobile U.S., Inc. (a) |
41,100 |
1,069 |
|
|
Common Stocks - continued |
|||
|
Shares |
Value (000s) |
||
|
TELECOMMUNICATION SERVICES - continued |
|||
|
Wireless Telecommunication Services - continued |
|||
|
Telephone & Data Systems, Inc. |
38,908 |
$ 1,082 |
|
|
Vodafone Group PLC |
585,200 |
2,170 |
|
|
|
8,893 |
||
|
TOTAL TELECOMMUNICATION SERVICES |
10,186 |
||
|
UTILITIES - 2.1% |
|||
|
Electric Utilities - 0.9% |
|||
|
Edison International |
54,007 |
2,496 |
|
|
ITC Holdings Corp. |
31,838 |
2,881 |
|
|
NextEra Energy, Inc. |
20,741 |
1,754 |
|
|
Northeast Utilities |
24,672 |
1,014 |
|
|
Xcel Energy, Inc. |
46,644 |
1,307 |
|
|
|
9,452 |
||
|
Gas Utilities - 0.3% |
|||
|
BW LPG Ltd. (a) |
136,320 |
1,101 |
|
|
National Fuel Gas Co. |
33,087 |
2,233 |
|
|
|
3,334 |
||
|
Independent Power Producers & Energy Traders - 0.3% |
|||
|
The AES Corp. |
248,779 |
3,625 |
|
|
Multi-Utilities - 0.6% |
|||
|
CenterPoint Energy, Inc. |
28,639 |
671 |
|
|
CMS Energy Corp. |
12,950 |
344 |
|
|
PG&E Corp. |
58,700 |
2,370 |
|
|
Sempra Energy |
29,654 |
2,623 |
|
|
|
6,008 |
||
|
TOTAL UTILITIES |
22,419 |
||
|
TOTAL COMMON STOCKS (Cost $830,774) |
|
||
|
Preferred Stocks - 0.3% |
|||
|
|
|
|
|
|
Convertible Preferred Stocks - 0.1% |
|||
|
INFORMATION TECHNOLOGY - 0.1% |
|||
|
Software - 0.1% |
|||
|
Mobileye NV Series F (a)(f) |
32,777 |
1,144 |
|
|
Preferred Stocks - continued |
|||
|
Shares |
Value (000s) |
||
|
Nonconvertible Preferred Stocks - 0.2% |
|||
|
CONSUMER DISCRETIONARY - 0.2% |
|||
|
Automobiles - 0.2% |
|||
|
Volkswagen AG |
9,100 |
$ 2,415 |
|
|
TOTAL PREFERRED STOCKS (Cost $3,175) |
|
||
|
Convertible Bonds - 0.2% |
||||
|
|
Principal |
|
||
|
ENERGY - 0.1% |
||||
|
Energy Equipment & Services - 0.0% |
||||
|
Cal Dive International, Inc. 5% 7/15/17 (e) |
|
$ 89 |
90 |
|
|
Oil, Gas & Consumable Fuels - 0.1% |
||||
|
Amyris, Inc. 3% 2/27/17 |
|
791 |
576 |
|
|
BPZ Energy, Inc. 8.5% 10/1/17 |
|
600 |
557 |
|
|
|
1,133 |
|||
|
TOTAL ENERGY |
1,223 |
|||
|
INDUSTRIALS - 0.1% |
||||
|
Building Products - 0.1% |
||||
|
Aspen Aerogels, Inc. 8% 6/1/14 (f) |
|
451 |
451 |
|
|
TOTAL CONVERTIBLE BONDS (Cost $1,873) |
|
|||
|
Money Market Funds - 1.6% |
|||
|
Shares |
Value (000s) |
||
|
Fidelity Cash Central Fund, 0.10% (b) |
13,852,894 |
$ 13,853 |
|
|
Fidelity Securities Lending Cash Central Fund, 0.10% (b)(c) |
3,384,950 |
3,385 |
|
|
TOTAL MONEY MARKET FUNDS (Cost $17,238) |
|
||
|
TOTAL INVESTMENT PORTFOLIO - 100.5% (Cost $853,060) |
1,065,668 |
||
|
NET OTHER ASSETS (LIABILITIES) - (0.5)% |
(5,132) |
||
|
NET ASSETS - 100% |
$ 1,060,536 |
||
|
Legend |
|
(a) Non-income producing |
|
(b) Affiliated fund that is generally available only to investment companies and other accounts managed by Fidelity Investments. The rate quoted is the annualized seven-day yield of the fund at period end. A complete unaudited listing of the fund's holdings as of its most recent quarter end is available upon request. In addition, each Fidelity Central Fund's financial statements are available on the SEC's website or upon request. |
|
(c) Investment made with cash collateral received from securities on loan. |
|
(d) Security or a portion of the security is on loan at period end. |
|
(e) Security exempt from registration under Rule 144A of the Securities Act of 1933. These securities may be resold in transactions exempt from registration, normally to qualified institutional buyers. At the end of the period, the value of these securities amounted to $2,337,000 or 0.2% of net assets. |
|
(f) Restricted securities - Investment in securities not registered under the Securities Act of 1933 (excluding 144A issues). At the end of the period, the value of restricted securities (excluding 144A issues) amounted to $5,033,000 or 0.5% of net assets. |
|
Additional information on each restricted holding is as follows: |
|
Security |
Acquisition |
Acquisition |
|
ASAC II LP |
10/10/13 |
$ 2,985 |
|
Aspen Aerogels, Inc. 8% 6/1/14 |
6/1/11 - 12/31/12 |
$ 451 |
|
Mobileye NV Series F |
8/15/13 |
$ 1,144 |
|
Velti PLC |
4/19/13 |
$ 289 |
* Amount represents less than $1,000.
See accompanying notes which are an integral part of the financial statements.
Annual Report
|
Affiliated Central Funds |
|
Information regarding fiscal year to date income earned by the Fund from investments in Fidelity Central Funds is as follows: |
|
Fund |
Income earned |
|
Fidelity Cash Central Fund |
$ 8 |
|
Fidelity Securities Lending Cash Central Fund |
467 |
|
Total |
$ 475 |
|
Other Information |
|
The following is a summary of the inputs used, as of November 30, 2013, involving the Fund's assets and liabilities carried at fair value. The inputs or methodology used for valuing securities may not be an indication of the risk associated with investing in those securities. For more information on valuation inputs, and their aggregation into the levels used in the table below, please refer to the Investment Valuation section in the accompanying Notes to Financial Statements. |
|
Valuation Inputs at Reporting Date: |
||||
|
Description |
Total |
Level 1 |
Level 2 |
Level 3 |
|
Investments in Securities: |
||||
|
Equities: |
||||
|
Consumer Discretionary |
$ 150,866 |
$ 150,866 |
$ - |
$ - |
|
Consumer Staples |
106,745 |
103,484 |
3,261 |
- |
|
Energy |
98,208 |
98,208 |
- |
- |
|
Financials |
164,483 |
160,416 |
645 |
3,422 |
|
Health Care |
142,125 |
132,015 |
10,110 |
- |
|
Industrials |
125,579 |
123,129 |
2,450 |
- |
|
Information Technology |
189,961 |
188,801 |
16 |
1,144 |
|
Materials |
36,184 |
36,184 |
- |
- |
|
Telecommunication Services |
10,186 |
8,016 |
2,170 |
- |
|
Utilities |
22,419 |
22,419 |
- |
- |
|
Corporate Bonds |
1,674 |
- |
1,223 |
451 |
|
Money Market Funds |
17,238 |
17,238 |
- |
- |
|
Total Investments in Securities: |
$ 1,065,668 |
$ 1,040,776 |
$ 19,875 |
$ 5,017 |
|
Distribution of investments by country or territory of incorporation, as a percentage of total net assets, is as follows (Unaudited): |
|
United States of America |
81.9% |
|
Canada |
2.7% |
|
United Kingdom |
2.1% |
|
Ireland |
2.0% |
|
Bermuda |
1.5% |
|
Switzerland |
1.3% |
|
France |
1.0% |
|
Others (Individually Less Than 1%) |
7.5% |
|
|
100.0% |
See accompanying notes which are an integral part of the financial statements.
Annual Report
Financial Statements
Statement of Assets and Liabilities
|
Amounts in thousands (except per-share amounts) |
November 30, 2013 |
|
|
|
|
|
|
Assets |
|
|
|
Investment in securities, at value (including securities loaned of $3,277) - See accompanying schedule: Unaffiliated issuers (cost $835,822) |
$ 1,048,430 |
|
|
Fidelity Central Funds (cost $17,238) |
17,238 |
|
|
Total Investments (cost $853,060) |
|
$ 1,065,668 |
|
Cash |
|
62 |
|
Foreign currency held at value (cost $62) |
|
62 |
|
Receivable for investments sold |
|
7,053 |
|
Receivable for fund shares sold |
|
496 |
|
Dividends receivable |
|
1,520 |
|
Interest receivable |
|
51 |
|
Distributions receivable from Fidelity Central Funds |
|
18 |
|
Prepaid expenses |
|
3 |
|
Other receivables |
|
2 |
|
Total assets |
|
1,074,935 |
|
|
|
|
|
Liabilities |
|
|
|
Payable for investments purchased |
$ 5,959 |
|
|
Payable for fund shares redeemed |
4,061 |
|
|
Accrued management fee |
329 |
|
|
Distribution and service plan fees payable |
373 |
|
|
Other affiliated payables |
213 |
|
|
Other payables and accrued expenses |
79 |
|
|
Collateral on securities loaned, at value |
3,385 |
|
|
Total liabilities |
|
14,399 |
|
|
|
|
|
Net Assets |
|
$ 1,060,536 |
|
Net Assets consist of: |
|
|
|
Paid in capital |
|
$ 848,860 |
|
Undistributed net investment income |
|
3,162 |
|
Accumulated undistributed net realized gain (loss) on investments and foreign currency transactions |
|
(4,094) |
|
Net unrealized appreciation (depreciation) on investments and assets and liabilities in foreign currencies |
|
212,608 |
|
Net Assets |
|
$ 1,060,536 |
See accompanying notes which are an integral part of the financial statements.
Annual Report
Statement of Assets and Liabilities - continued
|
Amounts in thousands (except per-share amounts) |
November 30, 2013 |
|
|
|
|
|
|
Calculation of Maximum Offering Price Class A: |
|
$ 17.23 |
|
|
|
|
|
Maximum offering price per share (100/94.25 of $17.23) |
|
$ 18.28 |
|
Class T: |
|
$ 17.15 |
|
|
|
|
|
Maximum offering price per share (100/96.50 of $17.15) |
|
$ 17.77 |
|
Class B: |
|
$ 16.57 |
|
|
|
|
|
Class C: |
|
$ 16.54 |
|
|
|
|
|
Institutional Class: |
|
$ 17.91 |
|
|
|
|
|
Class Z: |
|
$ 17.92 |
A Redemption price per share is equal to net asset value less any applicable contingent deferred sales charge.
See accompanying notes which are an integral part of the financial statements.
Annual Report
Financial Statements - continued
Statement of Operations
|
Amounts in thousands |
Year ended November 30, 2013 |
|
|
|
|
|
|
Investment Income |
|
|
|
Dividends |
|
$ 16,427 |
|
Interest |
|
494 |
|
Income from Fidelity Central Funds |
|
475 |
|
Total income |
|
17,396 |
|
|
|
|
|
Expenses |
|
|
|
Management fee |
$ 5,243 |
|
|
Performance adjustment |
(1,346) |
|
|
Transfer agent fees |
2,165 |
|
|
Distribution and service plan fees |
4,080 |
|
|
Accounting and security lending fees |
319 |
|
|
Custodian fees and expenses |
211 |
|
|
Independent trustees' compensation |
5 |
|
|
Registration fees |
100 |
|
|
Audit |
69 |
|
|
Legal |
5 |
|
|
Miscellaneous |
8 |
|
|
Total expenses before reductions |
10,859 |
|
|
Expense reductions |
(121) |
10,738 |
|
Net investment income (loss) |
|
6,658 |
|
Realized and Unrealized Gain (Loss) Net realized gain (loss) on: |
|
|
|
Investment securities: |
|
|
|
Unaffiliated issuers |
96,965 |
|
|
Foreign currency transactions |
(28) |
|
|
Total net realized gain (loss) |
|
96,937 |
|
Change in net unrealized appreciation (depreciation) on: Investment securities |
145,249 |
|
|
Assets and liabilities in foreign currencies |
4 |
|
|
Total change in net unrealized appreciation (depreciation) |
|
145,253 |
|
Net gain (loss) |
|
242,190 |
|
Net increase (decrease) in net assets resulting from operations |
|
$ 248,848 |
See accompanying notes which are an integral part of the financial statements.
Annual Report
Statement of Changes in Net Assets
|
Amounts in thousands |
Year ended |
Year ended |
|
Increase (Decrease) in Net Assets |
|
|
|
Operations |
|
|
|
Net investment income (loss) |
$ 6,658 |
$ 3,116 |
|
Net realized gain (loss) |
96,937 |
39,284 |
|
Change in net unrealized appreciation (depreciation) |
145,253 |
84,266 |
|
Net increase (decrease) in net assets resulting |
248,848 |
126,666 |
|
Distributions to shareholders from net investment income |
(5,093) |
- |
|
Share transactions - net increase (decrease) |
(30,529) |
(97,081) |
|
Total increase (decrease) in net assets |
213,226 |
29,585 |
|
|
|
|
|
Net Assets |
|
|
|
Beginning of period |
847,310 |
817,725 |
|
End of period (including undistributed net investment income of $3,162 and undistributed net investment income of $2,813, respectively) |
$ 1,060,536 |
$ 847,310 |
See accompanying notes which are an integral part of the financial statements.
Annual Report
Financial Highlights - Class A
|
Years ended November 30, |
2013 |
2012 |
2011 |
2010 |
2009 |
|
Selected Per-Share Data |
|
|
|
|
|
|
Net asset value, beginning of period |
$ 13.33 |
$ 11.45 |
$ 11.58 |
$ 9.95 |
$ 6.64 |
|
Income from Investment Operations |
|
|
|
|
|
|
Net investment income (loss) C |
.13 |
.07 |
.02 |
.03 F |
.04 |
|
Net realized and unrealized gain (loss) |
3.87 |
1.81 |
(.09) |
1.66 |
3.41 |
|
Total from investment operations |
4.00 |
1.88 |
(.07) |
1.69 |
3.45 |
|
Distributions from net investment income |
(.10) |
- |
- |
(.02) |
(.14) |
|
Distributions from net realized gain |
- |
- |
(.06) |
(.05) |
- |
|
Total distributions |
(.10) |
- |
(.06) |
(.06) H |
(.14) |
|
Net asset value, end of period |
$ 17.23 |
$ 13.33 |
$ 11.45 |
$ 11.58 |
$ 9.95 |
|
Total Return A, B |
30.26% |
16.42% |
(.63)% |
17.09% |
52.97% |
|
Ratios to Average Net Assets D, G |
|
|
|
|
|
|
Expenses before reductions |
.98% |
1.21% |
1.36% |
1.36% |
1.08% |
|
Expenses net of fee waivers, if any |
.98% |
1.21% |
1.33% |
1.25% |
1.08% |
|
Expenses net of all reductions |
.97% |
1.20% |
1.33% |
1.24% |
1.08% |
|
Net investment income (loss) |
.87% |
.53% |
.16% |
.24% F |
.56% |
|
Supplemental Data |
|
|
|
|
|
|
Net assets, end of period (in millions) |
$ 369 |
$ 301 |
$ 295 |
$ 285 |
$ 240 |
|
Portfolio turnover rate E |
70% |
64% |
68% |
80% |
88% |
A Total returns would have been lower if certain expenses had not been reduced during the applicable periods shown.
B Total returns do not include the effect of the sales charges.
C Calculated based on average shares outstanding during the period.
D Fees and expenses of any underlying Fidelity Central Funds are not included in the Fund's expense ratio. The Fund indirectly bears its proportionate share of the expenses of any underlying Fidelity Central Funds.
E Amount does not include the portfolio activity of any underlying Fidelity Central Funds.
F Investment income per share reflects a large, non-recurring dividend which amounted to $.02 per share. Excluding this non-recurring dividend, the ratio of net investment income (loss) to average net assets would have been .10%.
G Expense ratios reflect operating expenses of the class. Expenses before reductions do not reflect amounts reimbursed by the investment adviser or reductions from brokerage service arrangements or reductions from other expense offset arrangements and do not represent the amount paid by the class during periods when reimbursements or reductions occur. Expenses net of fee waivers reflect expenses after reimbursement by the investment adviser but prior to reductions from brokerage service arrangements or other expense offset arrangements. Expenses net of all reductions represent the net expenses paid by the class.
H Total distributions of $.06 per share is comprised of distributions from net investment income of $.018 and distributions from net realized gain of $.045 per share.
See accompanying notes which are an integral part of the financial statements.
Annual Report
Financial Highlights - Class T
|
Years ended November 30, |
2013 |
2012 |
2011 |
2010 |
2009 |
|
Selected Per-Share Data |
|
|
|
|
|
|
Net asset value, beginning of period |
$ 13.26 |
$ 11.42 |
$ 11.55 |
$ 9.92 |
$ 6.60 |
|
Income from Investment Operations |
|
|
|
|
|
|
Net investment income (loss) C |
.10 |
.04 |
(.01) |
- F, H |
.03 |
|
Net realized and unrealized gain (loss) |
3.86 |
1.80 |
(.09) |
1.67 |
3.39 |
|
Total from investment operations |
3.96 |
1.84 |
(.10) |
1.67 |
3.42 |
|
Distributions from net investment income |
(.07) |
- |
- |
- |
(.10) |
|
Distributions from net realized gain |
- |
- |
(.03) |
(.04) |
- |
|
Total distributions |
(.07) |
- |
(.03) |
(.04) |
(.10) |
|
Net asset value, end of period |
$ 17.15 |
$ 13.26 |
$ 11.42 |
$ 11.55 |
$ 9.92 |
|
Total Return A, B |
30.05% |
16.11% |
(.90)% |
16.88% |
52.60% |
|
Ratios to Average Net Assets D, G |
|
|
|
|
|
|
Expenses before reductions |
1.20% |
1.42% |
1.57% |
1.57% |
1.31% |
|
Expenses net of fee waivers, if any |
1.20% |
1.42% |
1.55% |
1.50% |
1.31% |
|
Expenses net of all reductions |
1.19% |
1.42% |
1.54% |
1.49% |
1.30% |
|
Net investment income (loss) |
.65% |
.32% |
(.06)% |
(.01)% F |
.34% |
|
Supplemental Data |
|
|
|
|
|
|
Net assets, end of period (in millions) |
$ 375 |
$ 304 |
$ 294 |
$ 322 |
$ 305 |
|
Portfolio turnover rate E |
70% |
64% |
68% |
80% |
88% |
A Total returns would have been lower if certain expenses had not been reduced during the applicable periods shown.
B Total returns do not include the effect of the sales charges.
C Calculated based on average shares outstanding during the period.
D Fees and expenses of any underlying Fidelity Central Funds are not included in the Fund's expense ratio. The Fund indirectly bears its proportionate share of the expenses of any underlying Fidelity Central Funds.
E Amount does not include the portfolio activity of any underlying Fidelity Central Funds.
F Investment income per share reflects a large, non-recurring dividend which amounted to $.02 per share. Excluding this non-recurring dividend, the ratio of net investment income (loss) to average net assets would have been (.15) %.
G Expense ratios reflect operating expenses of the class. Expenses before reductions do not reflect amounts reimbursed by the investment adviser or reductions from brokerage service arrangements or reductions from other expense offset arrangements and do not represent the amount paid by the class during periods when reimbursements or reductions occur. Expenses net of fee waivers reflect expenses after reimbursement by the investment adviser but prior to reductions from brokerage service arrangements or other expense offset arrangements. Expenses net of all reductions represent the net expenses paid by the class.
H Amount represents less than $.01 per share.
See accompanying notes which are an integral part of the financial statements.
Annual Report
Financial Highlights - Class B
|
Years ended November 30, |
2013 |
2012 |
2011 |
2010 |
2009 |
|
Selected Per-Share Data |
|
|
|
|
|
|
Net asset value, beginning of period |
$ 12.82 |
$ 11.11 |
$ 11.26 |
$ 9.68 |
$ 6.42 |
|
Income from Investment Operations |
|
|
|
|
|
|
Net investment income (loss) C |
.01 |
(.03) |
(.07) |
(.05) F |
(.01) |
|
Net realized and unrealized gain (loss) |
3.74 |
1.74 |
(.08) |
1.63 |
3.31 |
|
Total from investment operations |
3.75 |
1.71 |
(.15) |
1.58 |
3.30 |
|
Distributions from net investment income |
- |
- |
- |
- |
(.04) |
|
Net asset value, end of period |
$ 16.57 |
$ 12.82 |
$ 11.11 |
$ 11.26 |
$ 9.68 |
|
Total Return A, B |
29.25% |
15.39% |
(1.33)% |
16.32% |
51.61% |
|
Ratios to Average Net Assets D, G |
|
|
|
|
|
|
Expenses before reductions |
1.79% |
1.99% |
2.14% |
2.13% |
1.81% |
|
Expenses net of fee waivers, if any |
1.79% |
1.99% |
2.09% |
2.00% |
1.81% |
|
Expenses net of all reductions |
1.78% |
1.99% |
2.09% |
2.00% |
1.80% |
|
Net investment income (loss) |
.06% |
(.25)% |
(.61)% |
(.51)% F |
(.17)% |
|
Supplemental Data |
|
|
|
|
|
|
Net assets, end of period (in millions) |
$ 15 |
$ 17 |
$ 22 |
$ 43 |
$ 69 |
|
Portfolio turnover rate E |
70% |
64% |
68% |
80% |
88% |
A Total returns would have been lower if certain expenses had not been reduced during the applicable periods shown.
B Total returns do not include the effect of the contingent deferred sales charge.
C Calculated based on average shares outstanding during the period.
D Fees and expenses of any underlying Fidelity Central Funds are not included in the Fund's expense ratio. The Fund indirectly bears its proportionate share of the expenses of any underlying Fidelity Central Funds.
E Amount does not include the portfolio activity of any underlying Fidelity Central Funds.
F Investment income per share reflects a large, non-recurring dividend which amounted to $.02 per share. Excluding this non-recurring dividend, the ratio of net investment income (loss) to average net assets would have been (.66) %.
G Expense ratios reflect operating expenses of the class. Expenses before reductions do not reflect amounts reimbursed by the investment adviser or reductions from brokerage service arrangements or reductions from other expense offset arrangements and do not represent the amount paid by the class during periods when reimbursements or reductions occur. Expenses net of fee waivers reflect expenses after reimbursement by the investment adviser but prior to reductions from brokerage service arrangements or other expense offset arrangements. Expenses net of all reductions represent the net expenses paid by the class.
See accompanying notes which are an integral part of the financial statements.
Annual Report
Financial Highlights - Class C
|
Years ended November 30, |
2013 |
2012 |
2011 |
2010 |
2009 |
|
Selected Per-Share Data |
|
|
|
|
|
|
Net asset value, beginning of period |
$ 12.79 |
$ 11.07 |
$ 11.22 |
$ 9.65 |
$ 6.41 |
|
Income from Investment Operations |
|
|
|
|
|
|
Net investment income (loss) C |
.02 |
(.02) |
(.07) |
(.05) F |
(.01) |
|
Net realized and unrealized gain (loss) |
3.73 |
1.74 |
(.08) |
1.62 |
3.30 |
|
Total from investment operations |
3.75 |
1.72 |
(.15) |
1.57 |
3.29 |
|
Distributions from net investment income |
- H |
- |
- |
- |
(.05) |
|
Distributions from net realized gain |
- |
- |
- |
- H |
- |
|
Total distributions |
- H |
- |
- |
- H |
(.05) |
|
Net asset value, end of period |
$ 16.54 |
$ 12.79 |
$ 11.07 |
$ 11.22 |
$ 9.65 |
|
Total Return A, B |
29.36% |
15.54% |
(1.34)% |
16.31% |
51.79% |
|
Ratios to Average Net Assets D, G |
|
|
|
|
|
|
Expenses before reductions |
1.72% |
1.94% |
2.08% |
2.08% |
1.81% |
|
Expenses net of fee waivers, if any |
1.72% |
1.94% |
2.06% |
2.00% |
1.81% |
|
Expenses net of all reductions |
1.71% |
1.93% |
2.05% |
1.99% |
1.81% |
|
Net investment income (loss) |
.13% |
(.20)% |
(.57)% |
(.51)% F |
(.17)% |
|
Supplemental Data |
|
|
|
|
|
|
Net assets, end of period (in millions) |
$ 160 |
$ 123 |
$ 124 |
$ 129 |
$ 125 |
|
Portfolio turnover rate E |
70% |
64% |
68% |
80% |
88% |
A Total returns would have been lower if certain expenses had not been reduced during the applicable periods shown.
B Total returns do not include the effect of the contingent deferred sales charge.
C Calculated based on average shares outstanding during the period.
D Fees and expenses of any underlying Fidelity Central Funds are not included in the Fund's expense ratio. The Fund indirectly bears its proportionate share of the expenses of any underlying Fidelity Central Funds.
E Amount does not include the portfolio activity of any underlying Fidelity Central Funds.
F Investment income per share reflects a large, non-recurring dividend which amounted to $.02 per share. Excluding this non-recurring dividend, the ratio of net investment income (loss) to average net assets would have been (.65) %.
G Expense ratios reflect operating expenses of the class. Expenses before reductions do not reflect amounts reimbursed by the investment adviser or reductions from brokerage service arrangements or reductions from other expense offset arrangements and do not represent the amount paid by the class during periods when reimbursements or reductions occur. Expenses net of fee waivers reflect expenses after reimbursement by the investment adviser but prior to reductions from brokerage service arrangements or other expense offset arrangements. Expenses net of all reductions represent the net expenses paid by the class.
H Amount represents less than $.01 per share.
See accompanying notes which are an integral part of the financial statements.
Annual Report
Financial Highlights - Institutional Class
|
Years ended November 30, |
2013 |
2012 |
2011 |
2010 |
2009 |
|
Selected Per-Share Data |
|
|
|
|
|
|
Net asset value, beginning of period |
$ 13.86 |
$ 11.88 |
$ 12.00 |
$ 10.31 |
$ 6.73 |
|
Income from Investment Operations |
|
|
|
|
|
|
Net investment income (loss) B |
.18 |
.11 |
.06 |
.05 E |
.08 |
|
Net realized and unrealized gain (loss) |
4.02 |
1.87 |
(.09) |
1.74 |
3.52 |
|
Total from investment operations |
4.20 |
1.98 |
(.03) |
1.79 |
3.60 |
|
Distributions from net investment income |
(.15) |
- |
(.02) |
(.06) |
(.02) |
|
Distributions from net realized gain |
- |
- |
(.07) |
(.04) |
- |
|
Total distributions |
(.15) |
- |
(.09) |
(.10) |
(.02) |
|
Net asset value, end of period |
$ 17.91 |
$ 13.86 |
$ 11.88 |
$ 12.00 |
$ 10.31 |
|
Total Return A |
30.63% |
16.67% |
(.33)% |
17.47% |
53.57% |
|
Ratios to Average Net Assets C, F |
|
|
|
|
|
|
Expenses before reductions |
.70% |
.91% |
1.04% |
1.03% |
.70% |
|
Expenses net of fee waivers, if any |
.70% |
.91% |
1.03% |
1.00% |
.70% |
|
Expenses net of all reductions |
.69% |
.90% |
1.02% |
.99% |
.69% |
|
Net investment income (loss) |
1.15% |
.83% |
.46% |
.49% E |
.94% |
|
Supplemental Data |
|
|
|
|
|
|
Net assets, end of period (in millions) |
$ 135 |
$ 103 |
$ 83 |
$ 73 |
$ 66 |
|
Portfolio turnover rate D |
70% |
64% |
68% |
80% |
88% |
A Total returns would have been lower if certain expenses had not been reduced during the applicable periods shown.
B Calculated based on average shares outstanding during the period.
C Fees and expenses of any underlying Fidelity Central Funds are not included in the Fund's expense ratio. The Fund indirectly bears its proportionate share of the expenses of any underlying Fidelity Central Funds.
D Amount does not include the portfolio activity of any underlying Fidelity Central Funds.
E Investment income per share reflects a large, non-recurring dividend which amounted to $.02 per share. Excluding this non-recurring dividend, the ratio of net investment income (loss) to average net assets would have been .35%.
F Expense ratios reflect operating expenses of the class. Expenses before reductions do not reflect amounts reimbursed by the investment adviser or reductions from brokerage service arrangements or reductions from other expense offset arrangements and do not represent the amount paid by the class during periods when reimbursements or reductions occur. Expenses net of fee waivers reflect expenses after reimbursement by the investment adviser but prior to reductions from brokerage service arrangements or other expense offset arrangements. Expenses net of all reductions represent the net expenses paid by the class.
See accompanying notes which are an integral part of the financial statements.
Annual Report
Financial Highlights - Class Z
|
Year ended November 30, |
2013 G |
|
Selected Per-Share Data |
|
|
Net asset value, beginning of period |
$ 16.59 |
|
Income from Investment Operations |
|
|
Net investment income (loss) D |
.06 |
|
Net realized and unrealized gain (loss) |
1.27 |
|
Total from investment operations |
1.33 |
|
Net asset value, end of period |
$ 17.92 |
|
Total Return B, C |
8.02% |
|
Ratios to Average Net Assets E, H |
|
|
Expenses before reductions |
.54% A |
|
Expenses net of fee waivers, if any |
.54% A |
|
Expenses net of all reductions |
.52% A |
|
Net investment income (loss) |
1.26% A |
|
Supplemental Data |
|
|
Net assets, end of period (in millions) |
$ 7 |
|
Portfolio turnover rate F |
70% |
A Annualized
B Total returns for periods of less than one year are not annualized.
C Total returns would have been lower if certain expenses had not been reduced during the applicable periods shown.
D Calculated based on average shares outstanding during the period.
E Fees and expenses of any underlying Fidelity Central Funds are not included in the Fund's expense ratio. The Fund indirectly bears its proportionate share of the expenses of any underlying Fidelity Central Funds.
F Amount does not include the portfolio activity of any underlying Fidelity Central Funds.
G For the period August 13, 2013 (commencement of sale of shares) to November 30, 2013.
H Expense ratios reflect operating expenses of the class. Expenses before reductions do not reflect amounts reimbursed by the investment adviser or reductions from brokerage service arrangements or reductions from other expense offset arrangements and do not represent the amount paid by the class during periods when reimbursements or reductions occur. Expense ratios before reductions for start-up periods may not be representative of longer-term operating periods. Expenses net of fee waivers reflect expenses after reimbursement by the investment adviser but prior to reductions from brokerage service arrangements or other expense offset arrangements. Expenses net of all reductions represent the net expenses paid by the class.
See accompanying notes which are an integral part of the financial statements.
Annual Report
Notes to Financial Statements
For the period ended November 30, 2013
(Amounts in thousands except percentages)
1. Organization.
Fidelity Advisor® Dividend Growth Fund (the Fund) is a fund of Fidelity Advisor Series I (the Trust) and is authorized to issue an unlimited number of shares. The Trust is registered under the Investment Company Act of 1940, as amended (the 1940 Act), as an open-end management investment company organized as a Massachusetts business trust. The Fund commenced sale of Class Z on August 13, 2013. The Fund offers Class A, Class T, Class C, Institutional Class and Class Z shares, each of which, along with Class B shares, has equal rights as to assets and voting privileges. Class B shares are closed to new accounts and additional purchases, except for exchanges and reinvestments. Each class has exclusive voting rights with respect to matters that affect that class. Class B shares will automatically convert to Class A shares after a holding period of seven years from the initial date of purchase.
2. Investments in Fidelity Central Funds.
The Fund invests in Fidelity Central Funds, which are open-end investment companies generally available only to other investment companies and accounts managed by the investment adviser and its affiliates. The Fund's Schedule of Investments lists each of the Fidelity Central Funds held as of period end, if any, as an investment of the Fund, but does not include the underlying holdings of each Fidelity Central Fund. As an Investing Fund, the Fund indirectly bears its proportionate share of the expenses of the underlying Fidelity Central Funds.
The Money Market Central Funds seek preservation of capital and current income and are managed by Fidelity Investments Money Management, Inc. (FIMM), an affiliate of the investment adviser. Annualized expenses of the Money Market Central Funds as of their most recent shareholder report date are less than .01%.
A complete unaudited list of holdings for each Fidelity Central Fund is available upon request or at the Securities and Exchange Commission (the SEC) website at www.sec.gov. In addition, the financial statements of the Fidelity Central Funds, which are not covered by the Fund's Report of Independent Registered Public Accounting Firm, are available on the SEC website or upon request.
3. Significant Accounting Policies.
The financial statements have been prepared in conformity with accounting principles generally accepted in the United States of America (GAAP), which require management to make certain estimates and assumptions at the date of the financial statements. Actual results could differ from those estimates. Subsequent events, if any, through the date that the financial statements were issued have been evaluated in the preparation of
Annual Report
3. Significant Accounting Policies - continued
the financial statements. The following summarizes the significant accounting policies of the Fund:
Investment Valuation. Investments are valued as of 4:00 p.m. Eastern time on the last calendar day of the period. In accordance with valuation policies and procedures approved by the Board of Trustees (the Board), the Fund attempts to obtain prices from one or more third party pricing vendors or brokers to value its investments. When current market prices, quotations or currency exchange rates are not readily available or reliable, investments will be fair valued in good faith by the Fidelity Management & Research Company (FMR) Fair Value Committee (the Committee), in accordance with procedures adopted by the Board. Factors used in determining fair value vary by investment type and may include market or investment specific events, changes in interest rates and credit quality. The frequency with which these procedures are used cannot be predicted and they may be utilized to a significant extent. The Committee oversees the Fund's valuation policies and procedures and is responsible for approving and reporting to the Board all fair value determinations.
The Fund categorizes the inputs to valuation techniques used to value its investments into a disclosure hierarchy consisting of three levels as shown below:
Level 1 - quoted prices in active markets for identical investments
Level 2 - other significant observable inputs (including quoted prices for similar investments, interest rates, prepayment speeds, etc.)
Level 3 - unobservable inputs (including the Fund's own assumptions based on the best information available)
Valuation techniques used to value the Fund's investments by major category are as follows:
Equity securities, including restricted securities, for which market quotations are readily available, are valued at the last reported sale price or official closing price as reported by a third party pricing vendor on the primary market or exchange on which they are traded and are categorized as Level 1 in the hierarchy. In the event there were no sales during the day or closing prices are not available, securities are valued at the last quoted bid price or may be valued using the last available price and are generally categorized as Level 2 in the hierarchy. For foreign equity securities, when market or security specific events arise, comparisons to the valuation of American Depositary Receipts (ADRs), futures contracts, Exchange-Traded Funds (ETFs) and certain indexes as well as quoted prices for similar securities may be used and would be categorized as Level 2 in the hierarchy. Utilizing these techniques may result in transfers between Level 1 and Level 2. For equity securities, including restricted securities, where observable inputs are
Annual Report
Notes to Financial Statements - continued
(Amounts in thousands except percentages)
3. Significant Accounting Policies - continued
Investment Valuation - continued
limited, assumptions about market activity and risk are used and these securities may be categorized as Level 3 in the hierarchy.
Debt securities, including restricted securities, are valued based on evaluated prices received from third party pricing vendors or from brokers who make markets in such securities. For corporate bonds, pricing vendors utilize matrix pricing which considers yield or price of bonds of comparable quality, coupon, maturity and type as well as broker-supplied prices. When independent prices are unavailable or unreliable, debt securities may be valued utilizing pricing methodologies which consider similar factors that would be used by third party pricing vendors. Debt securities are generally categorized as Level 2 in the hierarchy but may be Level 3 depending on the circumstances.
Investments in open-end mutual funds, including the Fidelity Central Funds, are valued at their closing net asset value (NAV) each business day and are categorized as Level 1 in the hierarchy.
Changes in valuation techniques may result in transfers in or out of an assigned level within the disclosure hierarchy. The aggregate value of investments by input level, as of November 30, 2013, is included at the end of the Fund's Schedule of Investments.
Foreign Currency. The Fund may use foreign currency contracts to facilitate transactions in foreign-denominated securities. Gains and losses from these transactions may arise from changes in the value of the foreign currency or if the counterparties do not perform under the contracts' terms.
Foreign-denominated assets, including investment securities, and liabilities are translated into U.S. dollars at the exchange rates at period end. Purchases and sales of investment securities, income and dividends received and expenses denominated in foreign currencies are translated into U.S. dollars at the exchange rate in effect on the transaction date.
The effects of exchange rate fluctuations on investments are included with the net realized and unrealized gain (loss) on investment securities. Other foreign currency transactions resulting in realized and unrealized gain (loss) are disclosed separately.
Investment Transactions and Income. For financial reporting purposes, the Fund's investment holdings and NAV include trades executed through the end of the last business day of the period. The NAV per share for processing shareholder transactions is calculated as of the close of business of the New York Stock Exchange (NYSE), normally 4:00 p.m. Eastern time and includes trades executed through the end of the prior business day. Gains and losses on securities sold are determined on the basis of identified cost and may include proceeds received from litigation. Dividend income is recorded on
Annual Report
3. Significant Accounting Policies - continued
Investment Transactions and Income - continued
the ex-dividend date, except for certain dividends from foreign securities where the ex-dividend date may have passed, which are recorded as soon as the Fund is informed of the ex-dividend date. Non-cash dividends included in dividend income, if any, are recorded at the fair market value of the securities received. Distributions received on securities that represent a return of capital or capital gain are recorded as a reduction of cost of investments and/or as a realized gain. Subsequent to ex-dividend date the Fund determines the components of these distributions, based upon receipt of tax filings or other correspondence relating to the underlying investment. Interest income and distributions from the Fidelity Central Funds are accrued as earned. Interest income includes coupon interest and amortization of premium and accretion of discount on debt securities. Investment income is recorded net of foreign taxes withheld where recovery of such taxes is uncertain.
Class Allocations and Expenses. Investment income, realized and unrealized capital gains and losses, common expenses of the Fund, and certain fund-level expense reductions, if any, are allocated daily on a pro-rata basis to each class based on the relative net assets of each class to the total net assets of the Fund. Each class differs with respect to transfer agent and distribution and service plan fees incurred. Certain expense reductions may also differ by class. For the reporting period, the allocated portion of income and expenses to each class as a percent of its average net assets may vary due to the timing of recording these transactions in relation to fluctuating net assets of the classes. Expenses directly attributable to a fund are charged to that fund. Expenses attributable to more than one fund are allocated among the respective funds on the basis of relative net assets or other appropriate methods. Expense estimates are accrued in the period to which they relate and adjustments are made when actual amounts are known.
Income Tax Information and Distributions to Shareholders. Each year, the Fund intends to qualify as a regulated investment company under Subchapter M of the Internal Revenue Code, including distributing substantially all of its taxable income and realized gains. As a result, no provision for U.S. Federal income taxes is required. As of November 30, 2013, the Fund did not have any unrecognized tax benefits in the financial statements; nor is the Fund aware of any tax positions for which it is reasonably possible that the total amounts of unrecognized tax benefits will significantly change in the next twelve months. The Fund files a U.S. federal tax return, in addition to state and local tax returns as required. The Fund's federal income tax returns are subject to examination by the Internal Revenue Service (IRS) for a period of three fiscal years after they are filed. State and local tax returns may be subject to examination for an additional fiscal year depending on the jurisdiction. Foreign taxes are provided for based on the Fund's
Annual Report
Notes to Financial Statements - continued
(Amounts in thousands except percentages)
3. Significant Accounting Policies - continued
Income Tax Information and Distributions to Shareholders - continued
understanding of the tax rules and rates that exist in the foreign markets in which it invests.
Distributions are declared and recorded on the ex-dividend date. Income dividends and capital gain distributions are declared separately for each class. Income and capital gain distributions are determined in accordance with income tax regulations, which may differ from GAAP. These differences resulted in distribution reclassifications. In addition, the Fund claimed a portion of the payment made to redeeming shareholders as a distribution for income tax purposes.
Capital accounts within the financial statements are adjusted for permanent book-tax differences. These adjustments have no impact on net assets or the results of operations. Temporary book-tax differences will reverse in a subsequent period.
Book-tax differences are primarily due to foreign currency transactions, passive foreign investment companies (PFIC), market discount, partnerships, capital loss carryforwards and losses deferred due to wash sales.
The federal tax cost of investment securities and unrealized appreciation (depreciation) as of period end were as follows:
|
Gross unrealized appreciation |
$ 227,099 |
|
Gross unrealized depreciation |
(19,049) |
|
Net unrealized appreciation (depreciation) on securities and other investments |
$ 208,050 |
|
|
|
|
Tax Cost |
$ 857,618 |
The tax-based components of distributable earnings as of period end were as follows:
|
Undistributed ordinary income |
$ 3,308 |
|
Undistributed gains |
$ 317 |
|
Net unrealized appreciation (depreciation) |
$ 208,050 |
The tax character of distributions paid was as follows:
|
|
November 30, 2013 |
November 30, 2012 |
|
Ordinary Income |
$ 5,093 |
$ - |
Annual Report
3. Significant Accounting Policies - continued
Restricted Securities. The Fund may invest in securities that are subject to legal or contractual restrictions on resale. These securities generally may be resold in transactions exempt from registration or to the public if the securities are registered. Disposal of these securities may involve time-consuming negotiations and expense, and prompt sale at an acceptable price may be difficult. Information regarding restricted securities is included at the end of the Fund's Schedule of Investments.
4. Purchases and Sales of Investments.
Purchases and sales of securities, other than short-term securities, aggregated $655,325 and $689,639, respectively.
5. Fees and Other Transactions with Affiliates.
Management Fee. Fidelity Management & Research Company (the investment adviser) and its affiliates provide the Fund with investment management related services for which the Fund pays a monthly management fee. The management fee is the sum of an individual fund fee rate that is based on an annual rate of .30% of the Fund's average net assets and an annualized group fee rate that averaged .25% during the period. The group fee rate is based upon the average net assets of all the mutual funds advised by the investment adviser, including any mutual funds previously advised by the investment adviser that are currently advised by Fidelity SelectCo, LLC, an affiliate of the investment adviser. The group fee rate decreases as assets under management increase and increases as assets under management decrease. In addition, the management fee is subject to a performance adjustment (up to a maximum of ± .20% of the Fund's average net assets over a 36 month performance period). The upward or downward adjustment to the management fee is based on the relative investment performance of the Institutional Class of the Fund as compared to an appropriate benchmark index over the same 36 month performance period. For the reporting period, the total annual management fee rate, including the performance adjustment, was .41% of the Fund's average net assets. The performance adjustment included in the management fee rate may be higher or lower than the maximum performance adjustment rate due to the difference between the average net assets for the reporting and performance periods.
Distribution and Service Plan Fees. In accordance with Rule 12b-1 of the 1940 Act, the Fund has adopted separate Distribution and Service Plans for each class of shares. Certain classes pay Fidelity Distributors Corporation (FDC), an affiliate of the investment adviser, separate Distribution and Service Fees, each of which is based on an annual percentage of each class' average net assets. In addition, FDC may pay financial intermediaries for selling shares of the Fund and providing shareholder support services.
Annual Report
Notes to Financial Statements - continued
(Amounts in thousands except percentages)
5. Fees and Other Transactions with Affiliates - continued
Distribution and Service Plan Fees - continued
For the period, the Distribution and Service Fee rates, total fees and amounts retained by FDC were as follows:
|
|
Distribution |
Service |
Total Fees |
Retained |
|
Class A |
-% |
.25% |
$ 840 |
$ 14 |
|
Class T |
.25% |
.25% |
1,688 |
9 |
|
Class B |
.75% |
.25% |
154 |
117 |
|
Class C |
.75% |
.25% |
1,398 |
110 |
|
|
|
|
$ 4,080 |
$ 250 |
Sales Load. FDC may receive a front-end sales charge of up to 5.75% for selling Class A shares and 3.50% for selling Class T shares, some of which is paid to financial intermediaries for selling shares of the Fund. Depending on the holding period, FDC may receive contingent deferred sales charges levied on Class A, Class T, Class B, and Class C redemptions. The deferred sales charges range from 5.00% to 1.00% for Class B shares, 1.00% for Class C shares, 1.00% for certain purchases of Class A shares and .25% for certain purchases of Class T shares.
For the period, sales charge amounts retained by FDC were as follows:
|
|
Retained |
|
Class A |
$ 81 |
|
Class T |
24 |
|
Class B* |
14 |
|
Class C* |
7 |
|
|
$ 126 |
* When Class B and Class C shares are initially sold, FDC pays commissions from its own resources to financial intermediaries through which the sales
are made.
Transfer Agent Fees. Fidelity Investments Institutional Operations Company, Inc., (FIIOC), an affiliate of the investment adviser, is the transfer, dividend disbursing and shareholder servicing agent for each class of the Fund. FIIOC receives account fees and asset-based fees that vary according to the account size and type of account of the shareholders of the respective classes of the Fund, except for Class Z. FIIOC receives an asset-based fee of Class Z's average net assets. FIIOC pays for typesetting, printing and mailing of shareholder reports, except proxy statements.
Annual Report
5. Fees and Other Transactions with Affiliates - continued
Transfer Agent Fees - continued
For the period, transfer agent fees for each applicable class were as follows:
|
|
Amount |
% of |
|
Class A |
$ 814 |
.24 |
|
Class T |
727 |
.22 |
|
Class B |
46 |
.30 |
|
Class C |
327 |
.23 |
|
Institutional Class |
251 |
.21 |
|
Class Z |
-* |
.05** |
|
|
$ 2,165 |
|
* Amount represents one hundred and forty three dollars
** Annualized
Accounting and Security Lending Fees. Fidelity Service Company, Inc. (FSC), an affiliate of the investment adviser, maintains the Fund's accounting records. The accounting fee is based on the level of average net assets for each month. Under a separate contract, FSC administers the security lending program. The security lending fee is based on the number and duration of lending transactions.
Brokerage Commissions. The Fund placed a portion of its portfolio transactions with brokerage firms which are affiliates of the investment adviser. Brokerage commissions are included in net realized gain (loss) and change in net unrealized appreciation (depreciation) in the Statement of Operations. The commissions paid to these affiliated firms were $21 for the period.
6. Committed Line of Credit.
The Fund participates with other funds managed by the investment adviser or an affiliate in a $4.25 billion credit facility (the "line of credit") to be utilized for temporary or emergency purposes to fund shareholder redemptions or for other short-term liquidity purposes. The Fund has agreed to pay commitment fees on its pro-rata portion of the line of credit, which amounted to $2 and is reflected in Miscellaneous expenses on the Statement of Operations. During the period, there were no borrowings on this line of credit.
7. Security Lending.
The Fund lends portfolio securities through a lending agent from time to time in order to earn additional income. For equity securities, a lending agent is used and may loan
Annual Report
Notes to Financial Statements - continued
(Amounts in thousands except percentages)
7. Security Lending - continued
securities to certain qualified borrowers, including Fidelity Capital Markets (FCM), a broker-dealer affiliated with the Fund. On the settlement date of the loan, the Fund receives collateral (in the form of U.S. Treasury obligations, letters of credit and/or cash) against the loaned securities and maintains collateral in an amount not less than 100% of the market value of the loaned securities during the period of the loan. The market value of the loaned securities is determined at the close of business of the Fund and any additional required collateral is delivered to the Fund on the next business day. If the borrower defaults on its obligation to return the securities loaned because of insolvency or other reasons, the Fund may apply collateral received from the borrower against the obligation. The Fund may experience delays and costs in recovering the securities loaned. Any cash collateral received is invested in the Fidelity Securities Lending Cash Central Fund. The value of loaned securities and cash collateral at period end are disclosed on the Fund's Statement of Assets and Liabilities. The value of securities loaned to FCM at period end was $619. Security lending income represents the income earned on investing cash collateral, less rebates paid to borrowers, plus any premium payments received for lending certain types of securities. Security lending income is presented in the Statement of Operations as a component of income from Fidelity Central Funds. Total security lending income during the period amounted to $467, including $12 from securities loaned to FCM.
8. Expense Reductions.
The investment adviser voluntarily agreed to reimburse a portion of the Fund's Class A, Class T, Class B, Class C and Institutional Class operating expenses.
The following classes were in reimbursement during the period:
|
|
Reimbursement |
|
|
|
|
Class A |
$ 5 |
|
Class T |
5 |
|
Class B |
-* |
|
Class C |
2 |
|
Institutional Class |
2 |
|
|
$ 14 |
* Amount represents two hundred and three dollars
Commissions paid to certain brokers with whom the investment adviser, or its affiliates, places trades on behalf of the Fund include an amount in addition to trade execution, which may be rebated back to the Fund to offset certain expenses. This amount totaled $107 for the period.
Annual Report
9. Distributions to Shareholders.
Distributions to shareholders of each class were as follows:
|
Years ended November 30, |
2013 |
2012 |
|
From net investment income |
|
|
|
Class A |
$ 2,287 |
$ - |
|
Class T |
1,666 |
- |
|
Class C |
38 |
- |
|
Institutional Class |
1,102 |
- |
|
Total |
$ 5,093 |
$ - |
10. Share Transactions.
Transactions for each class of shares were as follows:
|
|
Shares |
Dollars |
||
|
Years ended November 30, |
2013 A |
2012 |
2013 A |
2012 |
|
Class A |
|
|
|
|
|
Shares sold |
3,250 |
4,097 |
$ 49,173 |
$ 51,727 |
|
Reinvestment of distributions |
152 |
- |
2,006 |
- |
|
Shares redeemed |
(4,572) |
(7,320) |
(69,790) |
(93,009) |
|
Net increase (decrease) |
(1,170) |
(3,223) |
$ (18,611) |
$ (41,282) |
|
Class T |
|
|
|
|
|
Shares sold |
4,665 |
4,903 |
$ 69,969 |
$ 61,627 |
|
Reinvestment of distributions |
122 |
- |
1,600 |
- |
|
Shares redeemed |
(5,859) |
(7,690) |
(87,860) |
(96,565) |
|
Net increase (decrease) |
(1,072) |
(2,787) |
$ (16,291) |
$ (34,938) |
|
Class B |
|
|
|
|
|
Shares sold |
81 |
64 |
$ 1,199 |
$ 775 |
|
Reinvestment of distributions |
- |
- |
- |
- |
|
Shares redeemed |
(486) |
(764) |
(7,004) |
(9,292) |
|
Net increase (decrease) |
(405) |
(700) |
$ (5,805) |
$ (8,517) |
|
Class C |
|
|
|
|
|
Shares sold |
1,435 |
1,124 |
$ 21,000 |
$ 13,734 |
|
Reinvestment of distributions |
3 |
- |
32 |
- |
|
Shares redeemed |
(1,415) |
(2,672) |
(20,479) |
(32,129) |
|
Net increase (decrease) |
23 |
(1,548) |
$ 553 |
$ (18,395) |
|
Institutional Class |
|
|
|
|
|
Shares sold |
1,599 |
2,225 |
$ 25,325 |
$ 29,308 |
|
Reinvestment of distributions |
75 |
- |
1,032 |
- |
|
Shares redeemed |
(1,526) |
(1,777) |
(24,057) |
(23,257) |
|
Net increase (decrease) |
148 |
448 |
$ 2,300 |
$ 6,051 |
Annual Report
Notes to Financial Statements - continued
(Amounts in thousands except percentages)
10. Share Transactions - continued
|
|
Shares |
Dollars |
||
|
Years ended November 30, |
2013 A |
2012 |
2013 A |
2012 |
|
Class Z |
|
|
|
|
|
Shares sold |
420 |
- |
$ 7,441 |
$ - |
|
Reinvestment of distributions |
- |
- |
- |
- |
|
Shares redeemed |
(7) |
- |
(116) |
- |
|
Net increase (decrease) |
413 |
- |
$ 7,325 |
$ - |
A Share transactions for Class Z are for the period August 13, 2013 (commencement of sale of shares) to November 30, 2013.
11. Other.
The Fund's organizational documents provide former and current trustees and officers with a limited indemnification against liabilities arising in connection with the performance of their duties to the Fund. In the normal course of business, the Fund may also enter into contracts that provide general indemnifications. The Fund's maximum exposure under these arrangements is unknown as this would be dependent on future claims that may be made against the Fund. The risk of material loss from such claims is considered remote.
Annual Report
Report of Independent Registered Public Accounting Firm
To the Trustees of Fidelity Advisor Series I and the Shareholders of Fidelity Advisor Dividend Growth Fund:
In our opinion, the accompanying statement of assets and liabilities, including the schedule of investments, and the related statements of operations and of changes in net assets and the financial highlights present fairly, in all material respects, the financial position of Fidelity Advisor Dividend Growth Fund (a fund of Fidelity Advisor Series I) at November 30, 2013, the results of its operations for the year then ended, the changes in its net assets for each of the two years in the period then ended and the financial highlights for each of the periods indicated, in conformity with accounting principles generally accepted in the United States of America. These financial statements and financial highlights (hereafter referred to as "financial statements") are the responsibility of the Fidelity Advisor Dividend Growth Fund's management. Our responsibility is to express an opinion on these financial statements based on our audits. We conducted our audits of these financial statements in accordance with the standards of the Public Company Accounting Oversight Board (United States). Those standards require that we plan and perform the audit to obtain reasonable assurance about whether the financial statements are free of material misstatement. An audit includes examining, on a test basis, evidence supporting the amounts and disclosures in the financial statements, assessing the accounting principles used and significant estimates made by management, and evaluating the overall financial statement presentation. We believe that our audits, which included confirmation of securities at November 30, 2013 by correspondence with the custodian and brokers, provide a reasonable basis for our opinion.
PricewaterhouseCoopers LLP
Boston, Massachusetts
January 17, 2014
Annual Report
Trustees and Officers
The Trustees, Member of the Advisory Board, and officers of the trust and fund, as applicable, are listed below. The Board of Trustees governs the fund and is responsible for protecting the interests of shareholders. The Trustees are experienced executives who meet periodically throughout the year to oversee the fund's activities, review contractual arrangements with companies that provide services to the fund, oversee management of the risks associated with such activities and contractual arrangements, and review the fund's performance. Except for James C. Curvey, Ned C. Lautenbach, Ronald P. O'Hanley, and William S. Stavropoulos, each of the Trustees oversees 173 funds. Mr. Curvey oversees 396 funds. Mr. Lautenbach, Mr. O'Hanley, and Mr. Stavropoulos each oversees 247 funds.
The Trustees hold office without limit in time except that (a) any Trustee may resign; (b) any Trustee may be removed by written instrument, signed by at least two-thirds of the number of Trustees prior to such removal; (c) any Trustee who requests to be retired or who has become incapacitated by illness or injury may be retired by written instrument signed by a majority of the other Trustees; and (d) any Trustee may be removed at any special meeting of shareholders by a two-thirds vote of the outstanding voting securities of the trust. Each Trustee who is not an interested person (as defined in the 1940 Act) of the trust and the fund (Independent Trustee), shall retire not later than the last day of the calendar year in which his or her 75th birthday occurs. The Independent Trustees may waive this mandatory retirement age policy with respect to individual Trustees. The officers and Advisory Board Member hold office without limit in time, except that any officer and Advisory Board Member may resign or may be removed by a vote of a majority of the Trustees at any regular meeting or any special meeting of the Trustees. Except as indicated, each individual has held the office shown or other offices in the same company for the past five years.
Experience, Skills, Attributes, and Qualifications of the Fund's Trustees. The Governance and Nominating Committee has adopted a statement of policy that describes the experience, qualifications, attributes, and skills that are necessary and desirable for potential Independent Trustee candidates (Statement of Policy). The Board believes that each Trustee satisfied at the time he or she was initially elected or appointed a Trustee, and continues to satisfy, the standards contemplated by the Statement of Policy. The Governance and Nominating Committee also engages professional search firms to help identify potential Independent Trustee candidates who have the experience, qualifications, attributes, and skills consistent with the Statement of Policy. From time to time, additional criteria based on the composition and skills of the current Independent Trustees, as well as experience or skills that may be appropriate in light of future changes to board composition, business conditions, and regulatory or other developments, have also been considered by the professional search firms and the Governance and Nominating Committee. In addition, the Board takes into account the Trustees' commitment and participation in Board and committee meetings, as well as their leadership of standing and ad hoc committees throughout their tenure.
Annual Report
In determining that a particular Trustee was and continues to be qualified to serve as a Trustee, the Board has considered a variety of criteria, none of which, in isolation, was controlling. The Board believes that, collectively, the Trustees have balanced and diverse experience, qualifications, attributes, and skills, which allow the Board to operate effectively in governing the fund and protecting the interests of shareholders. Information about the specific experience, skills, attributes, and qualifications of each Trustee, which in each case led to the Board's conclusion that the Trustee should serve (or continue to serve) as a trustee of the fund, is provided below.
Board Structure and Oversight Function. James C. Curvey is an interested person (as defined in the 1940 Act) and currently serves as Chairman. The Trustees have determined that an interested Chairman is appropriate and benefits shareholders because an interested Chairman has a personal and professional stake in the quality and continuity of services provided to the fund. Independent Trustees exercise their informed business judgment to appoint an individual of their choosing to serve as Chairman, regardless of whether the Trustee happens to be independent or a member of management. The Independent Trustees have determined that they can act independently and effectively without having an Independent Trustee serve as Chairman and that a key structural component for assuring that they are in a position to do so is for the Independent Trustees to constitute a substantial majority for the Board. The Independent Trustees also regularly meet in executive session. Ned C. Lautenbach serves as Chairman of the Independent Trustees and as such (i) acts as a liaison between the Independent Trustees and management with respect to matters important to the Independent Trustees and (ii) with management prepares agendas for Board meetings.
Fidelity funds are overseen by different Boards of Trustees. The fund's Board oversees Fidelity's equity and high income funds and another Board oversees Fidelity's investment-grade bond, money market, and asset allocation funds. The asset allocation funds may invest in Fidelity funds overseen by the fund's Board. The use of separate Boards, each with its own committee structure, allows the Trustees of each group of Fidelity funds to focus on the unique issues of the funds they oversee, including common research, investment, and operational issues. On occasion, the separate Boards establish joint committees to address issues of overlapping consequences for the Fidelity funds overseen by each Board.
The Trustees operate using a system of committees to facilitate the timely and efficient consideration of all matters of importance to the Trustees, the fund, and fund shareholders and to facilitate compliance with legal and regulatory requirements and oversight of the fund's activities and associated risks. The Board, acting through its committees, has charged FMR and its affiliates with (i) identifying events or circumstances the occurrence of which could have demonstrably adverse effects on the fund's business and/or reputation; (ii) implementing processes and controls to lessen the possibility that such events or circumstances occur or to mitigate the effects of such events or circumstances if they do occur; and (iii) creating and maintaining a system designed to evaluate continuously business and market conditions in order to facilitate the identification and implementation processes described in (i) and (ii) above. Because the day-to-day operations and activities of the fund are carried out by or through FMR, its affiliates and other service providers, the fund's exposure to risks is mitigated but not eliminated by the processes overseen by the Trustees. While each of the Board's committees has responsibility for overseeing different aspects of the fund's activities, oversight is exercised primarily through the Operations, Audit, and Compliance Committees. In addition, the Independent Trustees have worked with FMR to enhance the Board's oversight of investment and financial risks, legal and regulatory risks, technology risks, and operational risks, including the development of additional risk reporting to the Board. For example, a working group comprised of Independent Trustees and FMR has worked and continues to work to review the Fidelity funds' valuation-related activities, reporting and risk management. Appropriate personnel, including but not limited to the fund's Chief Compliance Officer (CCO), FMR's internal auditor, the independent accountants, the fund's Treasurer and portfolio management personnel, make periodic reports to the Board's committees, as appropriate, including an annual review of FMR's risk management program for the Fidelity funds. The responsibilities of each standing committee, including their oversight responsibilities, are described further under "Standing Committees of the Fund's Trustees."
Annual Report
Trustees and Officers - continued
The fund's Statement of Additional Information (SAI) includes more information about the Trustees. To request a free copy, call Fidelity at 1-877-208-0098.
Interested Trustees*:
Correspondence intended for each Trustee who is an interested person may be sent to Fidelity Investments, 245 Summer Street, Boston, Massachusetts 02210.
|
Name, Year of Birth; Principal Occupations and Other Relevant Experience+ |
|
|
James C. Curvey (1935) |
|
|
Year of Election or Appointment: 2007 Trustee Chairman of the Board of Trustees |
|
|
|
Mr. Curvey also serves as Trustee of other Fidelity funds. Mr. Curvey is a Director of Fidelity Investments Money Management, Inc. (2009-present), Director of Fidelity Research & Analysis Co. (2009-present) and Director of FMR and FMR Co., Inc. (2007-present). Mr. Curvey is also Vice Chairman (2007-present) and Director of FMR LLC. In addition, Mr. Curvey serves as an Overseer for the Boston Symphony Orchestra and a member of the Trustees of Villanova University. Previously, Mr. Curvey was the Vice Chairman (2006-2007) and Director (2000-2007) of FMR Corp. |
|
Ronald P. O'Hanley (1957) |
|
|
Year of Election or Appointment: 2011 Trustee |
|
|
|
Mr. O'Hanley also serves as Trustee of other Fidelity funds. He is Director of Fidelity SelectCo, LLC (2013-present), FMR Co., Inc. (2010-present), Director of Fidelity Investments Money Management, Inc. (2010-present), Director of Fidelity Research & Analysis Company (2010-present), President of Fidelity Asset Management and Corporate Services and a Member of Fidelity's Executive Committee (2010-present). Previously, Mr. O'Hanley served as President and Chief Executive Officer of BNY Mellon Asset Management (2007-2010). Mr. O'Hanley also served as Vice Chairman of Bank New York Mellon Corp. and a member of that firm's Executive Committee. Prior to the 2007 merger of The Bank of New York and Mellon Financial Corporation, he was Vice Chairman of Mellon Financial Corporation and President and Chief Executive Officer of Mellon Asset Management. He joined Mellon in February 1997. Mr. O'Hanley currently serves as Chairman of the Boston Public Library Foundation Board of Directors and sits on the Board of Directors of Beth Israel Deaconess Medical Center, the Board of Trustees of the Marine Biological Laboratory and the Advisory Board of the Maxwell School of Citizenship and Public Administration at Syracuse University. Mr. O'Hanley also chairs the Council on Asset Management for the Financial Services Roundtable and is a member of the Board of Directors of Institutional Investor's U.S. Institute. |
* Trustees have been determined to be "Interested Trustees" by virtue of, among other things, their affiliation with the trust or various entities under common control with FMR.
+ The information above includes each Trustee's principal occupation during the last five years and other information relating to the experience, attributes, and skills relevant to each Trustee's qualifications to serve as a Trustee, which led to the conclusion that each Trustee should serve as a Trustee for the fund.
Annual Report
Trustees and Officers - continued
Independent Trustees:
Correspondence intended for each Independent Trustee (that is, the Trustees other than the Interested Trustees) may be sent to Fidelity Investments, P.O. Box 55235, Boston, Massachusetts 02205-5235.
|
Name, Year of Birth; Principal Occupations and Other Relevant Experience+ |
|
|
Dennis J. Dirks (1948) |
|
|
Year of Election or Appointment: 2005 Trustee |
|
|
|
Mr. Dirks also serves as Trustee of other Fidelity funds. Prior to his retirement in May 2003, Mr. Dirks was Chief Operating Officer and a member of the Board of The Depository Trust & Clearing Corporation (DTCC). He also served as President, Chief Operating Officer, and Board member of The Depository Trust Company (DTC) and President and Board member of the National Securities Clearing Corporation (NSCC). In addition, Mr. Dirks served as Chief Executive Officer and Board member of the Government Securities Clearing Corporation, Chief Executive Officer and Board member of the Mortgage-Backed Securities Clearing Corporation, as a Trustee and a member of the Finance Committee of Manhattan College (2005-2008), and as a Trustee and a member of the Finance Committee of AHRC of Nassau County (2006-2008). Mr. Dirks is a member of the Independent Directors Council (IDC) Governing Council (2010-present) and Board of Directors for The Brookville Center for Children's Services, Inc. (2009-present). |
|
Alan J. Lacy (1953) |
|
|
Year of Election or Appointment: 2008 Trustee |
|
|
|
Mr. Lacy also serves as Trustee of other Fidelity funds. Mr. Lacy serves as Senior Adviser (2007-present) of Oak Hill Capital Partners, L.P. (private equity). Mr. Lacy also served as Chief Executive Officer (2000-2005) and Vice Chairman (2005-2006) of Sears Holdings Corporation and Sears, Roebuck and Co. (retail). In addition, Mr. Lacy serves as a member of the Board of Directors of Dave & Buster's Entertainment, Inc. (restaurant and entertainment complexes, 2010-present), Earth Fare, Inc. (retail grocery, 2012-present), The Hillman Companies, Inc. (hardware wholesalers, 2010-present), and Bristol-Myers Squibb Company (global pharmaceuticals, 2008-present). Mr. Lacy is a member of the Board of Trustees of The National Parks Conservation Association (2006-present). Previously, Mr. Lacy served as Chairman of the Board of Trustees of the National Parks Conservation Association (2008-2011) and as a member of the Board of Directors for the Western Union Company (global money transfer, 2006-2011). |
|
Ned C. Lautenbach (1944) |
|
|
Year of Election or Appointment: 2000 Trustee Chairman of the Independent Trustees |
|
|
|
Mr. Lautenbach also serves as Trustee of other Fidelity funds. Mr. Lautenbach currently serves as the Lead Director of the Eaton Corporation Board of Directors (diversified industrial, 1997-present). Mr. Lautenbach is Chairman of the Board of Directors of the Philharmonic Center for the Arts in Naples, Florida (2012-present) and a member of the Council on Foreign Relations (1994-present). Previously, Mr. Lautenbach was a Partner/Advisory Partner at Clayton, Dubilier & Rice, LLC (private equity investment, 1998-2010), as well as a Director of Sony Corporation (2006-2007). |
|
Joseph Mauriello (1944) |
|
|
Year of Election or Appointment: 2008 Trustee |
|
|
|
Mr. Mauriello also serves as Trustee of other Fidelity funds. Prior to his retirement in January 2006, Mr. Mauriello served in numerous senior management positions including Deputy Chairman and Chief Operating Officer (2004-2005), and Vice Chairman of Financial Services (2002-2004) of KPMG LLP US (professional services, 1965-2005). Mr. Mauriello currently serves as a member of the Board of Directors of XL Group plc. (global insurance and re-insurance, 2006-present). Previously, Mr. Mauriello served as a Director of the Hamilton Funds of the Bank of New York (2006-2007) and of Arcadia Resources Inc. (health care services and products, 2007-2012). |
|
Robert W. Selander (1950) |
|
|
Year of Election or Appointment: 2011 Trustee |
|
|
|
Mr. Selander also serves as Trustee of other Fidelity funds. Previously, Mr. Selander served as a Member of the Advisory Board of other Fidelity funds (2011), and Executive Vice Chairman (2010), Chief Executive Officer (2009-2010), and President and Chief Executive Officer (1997-2009) of Mastercard, Inc. |
|
Cornelia M. Small (1944) |
|
|
Year of Election or Appointment: 2005 Trustee |
|
|
|
Ms. Small also serves as Trustee of other Fidelity funds. Ms. Small is a member of the Board of Directors (2009-present) and Chair of the Investment Committee (2010-present) of the Teagle Foundation. Ms. Small also serves on the Investment Committee of the Berkshire Taconic Community Foundation (2008-present). Previously, Ms. Small served as Chairperson (2002-2008) and a member of the Investment Committee and Chairperson (2008-2012) and a member of the Board of Trustees of Smith College. In addition, Ms. Small served as Chief Investment Officer, Director of Global Equity Investments, and a member of the Board of Directors of Scudder, Stevens & Clark and Scudder Kemper Investments. |
|
William S. Stavropoulos (1939) |
|
|
Year of Election or Appointment: 2002 Trustee Vice Chairman of the Independent Trustees |
|
|
|
Mr. Stavropoulos also serves as Trustee of other Fidelity funds. Mr. Stavropoulos serves as President and Founder of the Michigan Baseball Foundation, the Great Lakes Loons (2007-present). Mr. Stavropoulos is Chairman Emeritus of the Board of Directors of The Dow Chemical Company, where he previously served in numerous senior management positions, including President, CEO (1995-2000; 2002-2004), Chairman of the Executive Committee (2000-2006), and as a member of the Board of Directors (1990-2006). Currently, Mr. Stavropoulos is Chairman of the Board of Directors of Univar Inc. (global distributor of commodity and specialty chemicals), a Director of Teradata Corporation (data warehousing and technology solutions), and Maersk Inc. (industrial conglomerate), and a member of the Advisory Board for Metalmark Capital LLC (private equity investment, 2005-present). Mr. Stavropoulos is an operating advisor to Clayton, Dubilier & Rice, LLC (private equity investment). In addition, Mr. Stavropoulos is a member of the University of Notre Dame Advisory Council for the College of Science, a Trustee of the Rollin L. Gerstacker Foundation, and a Director of the Naples Philharmonic Center for the Arts. Previously, Mr. Stavropoulos served as a Director of Chemical Financial Corporation (bank holding company, 1993-2012) and Tyco International, Ltd. (multinational manufacturing and services, 2007-2012). |
|
David M. Thomas (1949) |
|
|
Year of Election or Appointment: 2008 Trustee |
|
|
|
Mr. Thomas also serves as Trustee of other Fidelity funds. Mr. Thomas serves as Non-Executive Chairman of the Board of Directors of Fortune Brands Home and Security (home and security products, 2011-present), and as a member of the Board of Directors of Interpublic Group of Companies, Inc. (marketing communication, 2004-present). Previously, Mr. Thomas served as Executive Chairman (2005-2006) and Chairman and Chief Executive Officer (2000-2005) of IMS Health, Inc. (pharmaceutical and healthcare information solutions), and a Director of Fortune Brands, Inc. (consumer products, 2000-2011). |
+ The information above includes each Trustee's principal occupation during the last five years and other information relating to the experience, attributes, and skills relevant to each Trustee's qualifications to serve as a Trustee, which led to the conclusion that each Trustee should serve as a Trustee for the fund.
Advisory Board Member and Officers:
Correspondence intended for each officer and Peter S. Lynch may be sent to Fidelity Investments, 245 Summer Street, Boston, Massachusetts 02210. Officers appear below in alphabetical order.
|
Name, Year of Birth; Principal Occupation |
|
|
Peter S. Lynch (1944) |
|
|
Year of Election or Appointment: 2003 Member of the Advisory Board |
|
|
|
Mr. Lynch also serves as Member of the Advisory Board of other Fidelity funds. Mr. Lynch is Vice Chairman and a Director of FMR and FMR Co., Inc. In addition, Mr. Lynch serves as a Trustee of Boston College and as the Chairman of the Inner-City Scholarship Fund. Previously, Mr. Lynch served on the Special Olympics International Board of Directors (1997-2006). |
|
Elizabeth Paige Baumann (1968) |
|
|
Year of Election or Appointment: 2012 Anti-Money Laundering (AML) Officer |
|
|
|
Ms. Baumann also serves as AML Officer of other funds. She is Chief AML Officer of FMR LLC (2012-present) and is an employee of Fidelity Investments. Previously, Ms. Baumann served as Vice President and Deputy Anti-Money Laundering Officer (2007-2012). |
|
William C. Coffey (1969) |
|
|
Year of Election or Appointment: 2009 Assistant Secretary |
|
|
|
Mr. Coffey also serves as Assistant Secretary of other funds. He is Senior Vice President and Deputy General Counsel of FMR LLC (2010-present), and is an employee of Fidelity Investments. Previously, Mr. Coffey served as Vice President and Associate General Counsel of FMR LLC (2005-2009). |
|
Jonathan Davis (1968) |
|
|
Year of Election or Appointment: 2010 Assistant Treasurer |
|
|
|
Mr. Davis also serves as Assistant Treasurer of other funds. Mr. Davis is an employee of Fidelity Investments. Previously, Mr. Davis served as Vice President and Associate General Counsel of FMR LLC (2003-2010). |
|
Adrien E. Deberghes (1967) |
|
|
Year of Election or Appointment: 2008 Deputy Treasurer |
|
|
|
Mr. Deberghes also serves as an officer of other funds. He is an employee of Fidelity Investments (2008-present). Prior to joining Fidelity Investments, Mr. Deberghes was Senior Vice President of Mutual Fund Administration at State Street Corporation (2007-2008), Senior Director of Mutual Fund Administration at Investors Bank & Trust (2005-2007), and Director of Finance for Dunkin' Brands (2000-2005). |
|
Stephanie J. Dorsey (1969) |
|
|
Year of Election or Appointment: 2010 Assistant Treasurer |
|
|
|
Ms. Dorsey also serves as an officer of other funds. She is an employee of Fidelity Investments (2008-present) and has served in other fund officer roles. Prior to joining Fidelity Investments, Ms. Dorsey served as Treasurer (2004-2008) of the JPMorgan Mutual Funds and Vice President (2004-2008) of JPMorgan Chase Bank. |
|
Scott C. Goebel (1968) |
|
|
Year of Election or Appointment: 2008 Secretary and Chief Legal Officer (CLO) |
|
|
|
Mr. Goebel serves as Secretary and CLO of other funds. Mr. Goebel also serves as Secretary of Fidelity Investments Money Management, Inc. (FIMM) (2010-present) and Fidelity Research and Analysis Company (FRAC) (2010-present); General Counsel, Secretary, and Senior Vice President of FMR (2008-present) and FMR Co., Inc. (2008-present); Chief Legal Officer of Fidelity Management & Research (Hong Kong) Limited (2008-present) and Assistant Secretary of Fidelity Management & Research (Japan) Inc. (2008-present), and Fidelity Management & Research (U.K.) Inc. (2008-present). Previously, Mr. Goebel served as Secretary and CLO of other Fidelity funds (2008-2013), Assistant Secretary of FIMM (2008-2010), FRAC (2008-2010), and certain funds (2007-2008); and as Vice President and Secretary of Fidelity Distributors Corporation (FDC) (2005-2007). Mr. Goebel has been employed by FMR LLC or an affiliate since 2001. |
|
Joseph A. Hanlon (1968) |
|
|
Year of Election or Appointment: 2012 Chief Compliance Officer |
|
|
|
Mr. Hanlon also serves as Chief Compliance Officer of other funds. Mr. Hanlon serves as Compliance Officer of FMR, FMR Co., Inc., Fidelity Investments Money Management, Inc. (FIMM), Fidelity Research and Analysis Company (FRAC), and Fidelity Management & Research (Hong Kong) (2009-present), as Senior Vice President of the Fidelity Asset Management Division (2009-present), and is an employee of Fidelity Investments. Previously, Mr. Hanlon served as Compliance Officer of Fidelity Management & Research (Japan) Inc. (2009-2013), Strategic Advisers, Inc. (2009-2013), and Fidelity Management & Research (U.K.) Inc. (2009-2013). |
|
Bruce T. Herring (1965) |
|
|
Year of Election or Appointment: 2006 Vice President of certain Equity Funds |
|
|
|
Mr. Herring also serves as Vice President of other funds. He serves as Chief Investment Officer of Fidelity Global Asset Allocation (GAA) (2013-present), Group Chief Investment Officer of FMR, and President of Fidelity Research & Analysis Company (2010-present). Previously, Mr. Herring served as Chief Investment Officer and Director of Fidelity Management & Research (U.K.) Inc. (2010-2013), Vice President (2005-2006) and Senior Vice President (2006-2007) of Fidelity Management & Research Company, Vice President of FMR Co., Inc. (2001-2007), and as a portfolio manager for Fidelity U.S. Equity Funds. |
|
Brian B. Hogan (1964) |
|
|
Year of Election or Appointment: 2009 Vice President |
|
|
|
Mr. Hogan also serves as Vice President of other funds. Mr. Hogan serves as President of FMR's Equity Division (2009-present). Previously, Mr. Hogan served as Senior Vice President, Equity Research of FMR (2006-2009) and as a portfolio manager. |
|
Chris Maher (1972) |
|
|
Year of Election or Appointment: 2013 Assistant Treasurer |
|
|
|
Mr. Maher serves as Assistant Treasurer of other funds. Mr. Maher is Vice President of Valuation Oversight and is an employee of Fidelity Investments. Previously, Mr. Maher served as Vice President of Asset Management Compliance (2013), Vice President of FMR's Program Management Group (2010-2013), and Vice President of Valuation Oversight (2008-2010). |
|
Christine Reynolds (1958) |
|
|
Year of Election or Appointment: 2008 Chief Financial Officer |
|
|
|
Ms. Reynolds also serves as Chief Financial Officer of other funds. Ms. Reynolds became President of Fidelity Pricing and Cash Management Services (FPCMS) in August 2008. Ms. Reynolds served as Chief Operating Officer of FPCMS (2007-2008). Previously, Ms. Reynolds served as President, Treasurer, and Anti-Money Laundering officer of the Fidelity funds (2004-2007). |
|
Kenneth B. Robins (1969) |
|
|
Year of Election or Appointment: 2008 President and Treasurer |
|
|
|
Mr. Robins also serves as an officer of other funds. Mr. Robins serves as Executive Vice President of Fidelity Investments Money Management, Inc. (FIMM) (2013-present) and is an employee of Fidelity Investments (2004-present). Previously, Mr. Robins served in other fund officer roles. |
|
Gary W. Ryan (1958) |
|
|
Year of Election or Appointment: 2005 Assistant Treasurer |
|
|
|
Mr. Ryan also serves as Assistant Treasurer of other funds. Mr. Ryan is an employee of Fidelity Investments and has served in other fund officer roles. Previously, Mr. Ryan served as Vice President of Fund Reporting in Fidelity Pricing and Cash Management Services (FPCMS) (1999-2005). |
|
Stephen Sadoski (1971) |
|
|
Year of Election or Appointment: 2012 Deputy Treasurer |
|
|
|
Mr. Sadoski also serves as Deputy Treasurer of other funds. He is an employee of Fidelity Investments (2012-present) and has served in another fund officer role. Prior to joining Fidelity Investments, Mr. Sadoski served as an assistant chief accountant in the Division of Investment Management of the Securities and Exchange Commission (SEC) (2009-2012) and as a senior manager at Deloitte & Touche LLP (1997-2009). |
|
Stacie M. Smith (1974) |
|
|
Year of Election or Appointment: 2013 Deputy Treasurer |
|
|
|
Ms. Smith also serves as an officer of other funds. She is an employee of Fidelity Investments (2009-present) and has served in other fund officer roles. Prior to joining Fidelity Investments, Ms. Smith served as Senior Audit Manager of Ernst & Young LLP (1996-2009). |
|
Renee Stagnone (1975) |
|
|
Year of Election or Appointment: 2013 Deputy Treasurer |
|
|
|
Ms. Stagnone also serves as Deputy Treasurer of other funds. Ms. Stagnone is an employee of Fidelity Investments. |
|
Joseph F. Zambello (1957) |
|
|
Year of Election or Appointment: 2011 Deputy Treasurer |
|
|
|
Mr. Zambello also serves as Deputy Treasurer of other funds. Mr. Zambello is an employee of Fidelity Investments. Previously, Mr. Zambello served as Vice President of FMR's Program Management Group (2009-2011) and Vice President of the Transfer Agent Oversight Group (2005-2009). |
Annual Report
Distributions (Unaudited)
The Board of Trustees of Advisor Dividend Growth Fund voted to pay to shareholders of record at the opening of business on record date, the following distributions per share derived from capital gains realized from sales of portfolio securities, and dividends derived from net investment income:
|
|
Pay Date |
Record Date |
Dividends |
Capital Gains |
|
Institutional Class |
12/16/13 |
12/13/13 |
$0.142 |
$0.000 |
|
|
01/13/14 |
01/10/14 |
$0.000 |
$0.007 |
The fund hereby designates as a capital gain dividend with respect to the taxable year ended November 30 2013, $412,791, or, if subsequently determined to be different, the net capital gain of such year.
Institutional Class designates 56% of the dividends distributed during the fiscal year as qualifying for the dividends-received deduction for corporate shareholders.
Institutional Class designates 100% of dividends distributed during the fiscal year as amounts which may be taken into account as a dividend for purposes of the maximum rate under section 1(h)(11) of the Internal Revenue Code.
The fund will notify shareholders in January 2014 of amounts for use in preparing 2013 income tax returns.
Annual Report
Board Approval of Investment Advisory Contracts and Management Fees
Fidelity Advisor Dividend Growth Fund
Each year, the Board of Trustees, including the Independent Trustees (together, the Board), votes on the renewal of the management contract and sub-advisory agreements (together, the Advisory Contracts) for the fund. The Board, assisted by the advice of fund counsel and Independent Trustees' counsel, requests and considers a broad range of information relevant to the renewal of the Advisory Contracts throughout the year.
The Board meets regularly and, at each of its meetings, covers an extensive agenda of topics and materials and considers factors that are relevant to its annual consideration of the renewal of the fund's Advisory Contracts, including the services and support provided to the fund and its shareholders. The Board has established various standing committees, each composed of and chaired by Independent Trustees with varying backgrounds, to which the Board has assigned specific subject matter responsibilities in order to enhance effective decision-making by the Board. The Board, acting directly and through its Committees, requests and receives information concerning the annual consideration of the renewal of the fund's Advisory Contracts. The Board also meets as needed to consider matters specifically related to the Board's annual consideration of the renewal of Advisory Contracts. Members of the Board may also meet with trustees of other Fidelity funds through ad hoc joint committees to discuss certain matters relevant to the Fidelity funds.
At its July 2013 meeting, the Board, including the Independent Trustees, unanimously determined to renew the fund's Advisory Contracts. In reaching its determination, the Board considered all factors it believed relevant, including (i) the nature, extent, and quality of the services to be provided to the fund and its shareholders (including the investment performance of the fund); (ii) the competitiveness of the fund's management fee and total expense ratio relative to peer funds; (iii) the total costs of the services to be provided by and the profits to be realized by Fidelity from its relationship with the fund; (iv) the extent to which economies of scale exist and would be realized as the fund grows; and (v) whether fee levels reflect these economies of scale, if any, for the benefit of fund shareholders.
In considering whether to renew the Advisory Contracts for the fund, the Board reached a determination, with the assistance of fund counsel and Independent Trustees' counsel and through the exercise of its business judgment, that the renewal of the Advisory Contracts was in the best interests of the fund and its shareholders and that the compensation payable under the Advisory Contracts was fair and reasonable. The Board's decision to renew the Advisory Contracts was not based on any single factor, but rather was based on a comprehensive consideration of all the information provided to the Board at its meetings throughout the year. The Board, in reaching its determination to renew the Advisory Contracts, was aware that shareholders in the fund have a broad range of investment choices available to them, including a wide choice among mutual funds offered by Fidelity's competitors, and that the fund's shareholders, who have the opportunity to review and weigh the disclosure provided by the fund in its prospectus and other public disclosures, have chosen to invest in this fund, which is a part of the Fidelity family of funds.
Annual Report
Board Approval of Investment Advisory Contracts and
Management Fees - continued
Nature, Extent, and Quality of Services Provided. The Board considered the staffing within the investment adviser, Fidelity Management & Research Company (FMR), and the sub-advisers (together, the Investment Advisers) as it relates to the fund, including the backgrounds of the fund's investment personnel, and also considered the fund's investment objective, strategies, and related investment philosophy. The Independent Trustees also had discussions with senior management of Fidelity's investment operations and investment groups. The Board considered the structure of the portfolio manager compensation program and whether this structure provides appropriate incentives to act in the best interests of the fund.
Resources Dedicated to Investment Management and Support Services. The Board and the Fund Oversight and Research Committees reviewed the general qualifications and capabilities of the Investment Advisers' investment staff, including its size, education, experience, and resources, as well as the Investment Advisers' approach to recruiting, training, managing, and compensating investment personnel. The Board noted that FMR has continued to increase the resources devoted to non-U.S. offices, including expansion of Fidelity's global investment organization. The Board also noted that Fidelity's analysts have extensive resources, tools and capabilities that allow them to conduct sophisticated quantitative and fundamental analysis, as well as credit analysis of issuers, counterparties and guarantors. Further, the Board believes that Fidelity's investment professionals have sufficient access to global information and data so as to provide competitive investment results over time, and that those professionals also have access to sophisticated tools that permit them to assess portfolio construction and risk and performance attribution characteristics continuously, as well as to transmit new information and research conclusions rapidly around the world. Additionally, in its deliberations, the Board considered the Investment Advisers' trading and risk management capabilities and resources, which are an integral part of the investment management process.
Shareholder and Administrative Services. The Board considered (i) the nature, extent, quality, and cost of advisory, administrative, and shareholder services performed by the Investment Advisers and their affiliates under the Advisory Contracts and under separate agreements covering transfer agency, pricing and bookkeeping, and securities lending services for the fund; (ii) the nature and extent of the supervision of third party service providers, principally custodians and subcustodians; and (iii) the resources devoted to, and the record of compliance with, the fund's compliance policies and procedures. The Board also reviewed the allocation of fund brokerage, including allocations to brokers affiliated with the Investment Advisers, the use of brokerage commissions to pay fund expenses, and the use of "soft" commission dollars to pay for research services.
Annual Report
The Board noted that the growth of fund assets over time across the complex allows Fidelity to reinvest in the development of services designed to enhance the value or convenience of the Fidelity funds as investment vehicles. These services include 24-hour access to account information and market information through telephone representatives and over the Internet, investor education materials and asset allocation tools, and the expanded availability of Fidelity Investor Centers.
Investment in a Large Fund Family. The Board considered the benefits to shareholders of investing in a Fidelity fund, including the benefits of investing in a fund that is part of a large family of funds offering a variety of investment disciplines and providing a large variety of mutual fund investor services. The Board noted that Fidelity had taken, or had made recommendations that resulted in the Fidelity funds taking, a number of actions over the previous year that benefited particular funds, including (i) continuing to dedicate additional resources to investment research and to the support of the senior management team that oversees asset management; (ii) persisting in efforts to enhance Fidelity's global research capabilities; (iii) launching new funds and making other enhancements to meet client needs for global and income-oriented solutions; (iv) continuing to launch dedicated lower cost underlying funds to meet portfolio construction needs related to expanding underlying fund options for Fidelity funds of funds, specifically for the Freedom Fund product lines; (v) rationalizing product lines and gaining increased efficiencies through the mergers of several funds into other funds; (vi) strengthening Fidelity's index fund offerings by reducing investment minimums and adopting or lowering existing expense caps for certain funds and classes; (vii) enhancing Global Asset Allocation product offerings by launching new funds and strategies, including "open architecture" target date funds that utilize affiliated and unaffiliated sub-advisers; (viii) modifying the eligibility criteria for Institutional Class shares of Advisor funds to increase their marketability to a portion of the defined contribution plan market; (ix) creating a new low-cost retirement share class for certain Advisor funds to appeal to large retirement plans; (x) transitioning the management of certain Fidelity commodity funds to Geode Capital Management LLC, a registered commodity pool operator, while retaining administrative responsibilities for the funds; (xi) reorganizing a number of funds; and (xii) taking steps toward establishing a new Fidelity adviser to manage sector-based funds and products.
Investment Performance. The Board considered whether the fund has operated in accordance with its investment objective, as well as its record of compliance with its investment restrictions and its performance history.
The Board took into account discussions with the Investment Advisers about fund investment performance that occur at Board meetings throughout the year. In this regard the Board noted that as part of regularly scheduled fund reviews and other reports to the Board on fund performance, the Board periodically considers annualized return information for the fund, for different time periods, measured against a securities market index ("benchmark index") and a peer group of mutual funds with similar objectives ("peer group"). In its evaluation of fund investment performance, the Board gave particular attention to information indicating changes in performance of certain Fidelity funds for specific time periods and the Investment Advisers' explanations for any overperformance or, in the case of the fund, underperformance.
Annual Report
Board Approval of Investment Advisory Contracts and
Management Fees - continued
In addition to reviewing absolute and relative fund performance, the Independent Trustees periodically consider the appropriateness of fund performance metrics in evaluating the results achieved. In general, the Independent Trustees believe that fund performance should be evaluated based on net performance (after fees and expenses) of both the highest performing and lowest performing classes, where applicable, compared to appropriate benchmark indices, over appropriate time periods which may include full market cycles, and compared to peer groups, as applicable, over the same periods, taking into account relevant factors including the following: general market conditions; issuer-specific information; tactical opportunities for investment; and fund cash flows and other factors.
The Independent Trustees recognize that shareholders evaluate performance on a net basis over their own holding periods, for which one-, three-, and five-year periods are used as a proxy. For this reason, the performance information reviewed by the Board also included net cumulative calendar year total return information for the fund and an appropriate benchmark index and peer group for the most recent one-, three-, and five-year periods, as shown below. Returns are shown compared to the 25th percentile (top of box) and 75th percentile (bottom of box) of the peer universe.
Annual Report
Fidelity Advisor Dividend Growth Fund

The Board has discussed the fund's performance with FMR, including the fund's underperformance based on more recent periods ended after 2012 (which periods are not shown in the chart above) but prior to the date of the Board's approval of the renewal of the Advisory Contracts, and has engaged with FMR to consider what steps might be taken to remediate the fund's more recent underperformance.
The Board also considered that the fund's management fee is subject to upward or downward adjustment depending upon whether, and to what extent, the fund's investment performance for the performance period exceeds, or is exceeded by, a securities index, thus leading to a performance adjustment for the same period. The Board noted that the performance adjustment provides FMR with a strong economic incentive to seek to achieve superior performance for the fund's shareholders and helps to more closely align the interests of FMR and the fund's shareholders.
Based on its review, the Board concluded that the nature, extent, and quality of services provided to the fund under the Advisory Contracts should benefit the fund's shareholders.
Competitiveness of Management Fee and Total Expense Ratio. The Board considered the fund's management fee and total expense ratio compared to "mapped groups" of competitive funds and classes. Fidelity creates "mapped groups" by combining similar Lipper investment objective categories that have comparable management fee characteristics. Combining Lipper investment objective categories aids the Board's management fee and total expense ratio comparisons by broadening the competitive group used for comparison and by reducing the number of universes to which various Fidelity funds are compared.
Annual Report
Board Approval of Investment Advisory Contracts and
Management Fees - continued
Management Fee. The Board considered two proprietary management fee comparisons for the 12-month periods shown in the chart below. The group of Lipper funds used by the Board for management fee comparisons is referred to below as the "Total Mapped Group." The Total Mapped Group comparison focuses on a fund's standing in terms of gross management fees before expense reimbursements or caps, and without giving effect to the fund's performance adjustment, relative to the total universe of funds with comparable investment mandates, regardless of whether their management fee structures also are comparable. Funds with comparable investment mandates offer exposure to similar types of securities. Funds with comparable management fee structures have similar management fee contractual arrangements (e.g., flat rate charged for advisory services, all-inclusive fee rate, etc.). "TMG %" represents the percentage of funds in the Total Mapped Group that had management fees that were lower than the fund's. For example, a TMG % of 11% means that 89% of the funds in the Total Mapped Group had higher management fees than the fund. The "Asset-Size Peer Group" (ASPG) comparison focuses on a fund's standing relative to a subset of non-Fidelity funds within the Total Mapped Group that are similar in size and management fee structure. The ASPG represents at least 15% of the funds in the Total Mapped Group with comparable asset size and management fee structures, subject to a minimum of 50 funds (or all funds in the Total Mapped Group if fewer than 50). Additional information, such as the ASPG quartile in which the fund's management fee ranked and the impact of the fund's performance adjustment, is also included in the chart and considered by the Board.
Fidelity Advisor Dividend Growth Fund

Annual Report
The Board noted that the fund's management fee ranked below the median of its Total Mapped Group and below the median of its ASPG for 2012. The Board also noted the effect of the fund's positive performance adjustment on the fund's management fee ranking.
Based on its review, the Board concluded that the fund's management fee is fair and reasonable in light of the services that the fund receives and the other factors considered.
Total Expense Ratio. In its review of each class's total expense ratio, the Board considered the fund's management fee as well as other fund or class expenses, as applicable, such as transfer agent fees, pricing and bookkeeping fees, fund-paid 12b-1 fees, and custodial, legal, and audit fees. The Board also noted the effects of any waivers and reimbursements on fees and expenses, as well as the impact of the fund's performance adjustment. As part of its review, the Board also considered the current and historical total expense ratios of each class of the fund compared to competitive fund median expenses. Each class of the fund is compared to those funds and classes in the Total Mapped Group (used by the Board for management fee comparisons) that have a similar sales load structure.
The Board noted that the total expense ratio of each of Class A, Class B, Class C, and Institutional Class ranked below its competitive median for 2012 and the total expense ratio of Class T ranked above its competitive median for 2012. The Board considered that, in general, various factors can affect total expense ratios. The Board noted that the total expense ratio of Class T was above the competitive median primarily because of higher 12b-1 fees on Class T. Class T has a higher 12b-1 fee, but a lower front-end sales charge, than traditionally priced front-end sales charge classes. The Board considered that Class T is primarily sold load-waived in the retirement plan market where its 0.50% 12b-1 fee is comparable to competing no-load, higher 12b-1 fee classes designed specifically for retirement plans. The Board noted that the fund offers multiple classes, each of which has a different sales load and 12b-1 fee structure, and that the multiple structures are intended to offer a range of pricing options for the intermediary market. The Board also noted that the total expense ratios of the classes vary primarily by the level of their 12b-1 fees, although differences in transfer agent fees may also cause expenses to vary from class to class.
Fees Charged to Other Fidelity Clients. The Board also considered Fidelity fee structures and other information with respect to clients of FMR and its affiliates, such as other mutual funds advised or subadvised by FMR or its affiliates, pension plan clients, and other institutional clients. The Board noted the findings of the 2013 ad hoc joint committee (created with the board of other Fidelity funds), which reviewed and compared Fidelity's institutional investment advisory business with its business of providing services to the Fidelity funds, including the differences in services provided, fees charged, and costs incurred, as well as competition in their respective marketplaces.
Annual Report
Board Approval of Investment Advisory Contracts and
Management Fees - continued
Based on its review of total expense ratios and fees charged to other Fidelity clients, the Board concluded that the total expense ratio of each class of the fund was reasonable, although Class T was above the median of the universe presented for comparison, in light of the services that the fund and its shareholders receive and the other factors considered.
Costs of the Services and Profitability. The Board considered the revenues earned and the expenses incurred by Fidelity in conducting the business of developing, marketing, distributing, managing, administering and servicing the fund and servicing the fund's shareholders. The Board also considered the level of Fidelity's profits in respect of all the Fidelity funds.
On an annual basis, FMR presents to the Board Fidelity's profitability for the fund. Fidelity calculates the profitability for each fund, as well as aggregate profitability for groups of Fidelity funds and all Fidelity funds, using a series of detailed revenue and cost allocation methodologies which originate with the books and records of Fidelity on which Fidelity's audited financial statements are based. The Audit Committee of the Board reviews any significant changes from the prior year's methodologies.
PricewaterhouseCoopers LLP (PwC), independent registered public accounting firm and auditor to Fidelity and certain Fidelity funds, has been engaged annually by the Board as part of the Board's assessment of Fidelity's profitability analysis. PwC's engagement includes the review and assessment of the methodologies used by Fidelity in determining the revenues and expenses attributable to Fidelity's mutual fund business, and completion of agreed-upon procedures surrounding the mathematical accuracy of fund profitability and its conformity to allocation methodologies. After considering PwC's reports issued under the engagement and information provided by Fidelity, the Board concluded that while other allocation methods may also be reasonable, Fidelity's profitability methodologies are reasonable in all material respects.
The Board also reviewed Fidelity's non-fund businesses and fall-out benefits related to the mutual fund business as well as cases where Fidelity's affiliates may benefit from or be related to the fund's business.
The Board considered the costs of the services provided by and the profits realized by Fidelity in connection with the operation of the fund and was satisfied that the profitability was not excessive in the circumstances.
Economies of Scale. The Board considered whether there have been economies of scale in respect of the management of the Fidelity funds, whether the Fidelity funds (including the fund) have appropriately benefited from any such economies of scale, and whether there is potential for realization of any further economies of scale. The Board considered the extent to which the fund will benefit from economies of scale through increased services to the fund, through waivers or reimbursements, or through fee or expense reductions. The Board also noted that in 2009, it and the board of other Fidelity funds created an ad hoc committee (the Economies of Scale Committee) to analyze whether FMR attains economies of scale in respect of the management and servicing of the Fidelity funds, whether the Fidelity funds have appropriately benefited from such economies of scale, and whether there is potential for realization of any further economies of scale.
Annual Report
The Board recognized that the fund's management contract incorporates a "group fee" structure, which provides for lower group fee rates as total fund assets under FMR's management increase, and for higher group fee rates as total fund assets under FMR's management decrease. FMR calculates the group fee rates based on a tiered asset "breakpoint" schedule that varies based on asset class. The Board considered that the group fee is designed to deliver the benefits of economies of scale to fund shareholders when total Fidelity fund assets increase, even if assets of any particular fund are unchanged or have declined, because some portion of Fidelity's costs are attributable to services provided to all Fidelity funds, and all funds benefit if those costs can be allocated among more assets. The Board concluded that, given the group fee structure, fund shareholders will benefit from lower management fees as assets under FMR's management increase at the fund complex level, regardless of whether Fidelity achieves any such economies of scale.
The Board concluded, taking into account the analysis of the Economies of Scale Committee, that economies of scale, if any, are being appropriately shared between fund shareholders and Fidelity.
Amendment to Description of Group Fee Rate. At its July 2013 meeting, the Board voted to approve an amendment to the fund's management contract to modify the description of the "group fee rate" effective August 1, 2013. The Board noted that under the prior description in the contract, the group fee rate was based on the average net assets of all registered investment companies with which FMR has management contracts. Under the contract's tiered asset breakpoint schedule, the group fee rate is lower as total fund assets under FMR's management increase, and higher as total fund assets under FMR's management decrease. The Board considered that the prior description would have excluded the assets of 64 Fidelity sector funds from the group fee rate calculation once Fidelity SelectCo, LLC, an affiliate of FMR, assumed management responsibilities for those funds. The Board noted that modifying the description of the group fee rate to continue to include the assets of those 64 funds for purposes of determining group fee rate breakpoints would avoid an immediate adverse impact on the group fee rate for any fund.
Annual Report
Board Approval of Investment Advisory Contracts and
Management Fees - continued
Additional Information Requested by the Board. In order to develop fully the factual basis for consideration of the Fidelity funds' Advisory Contracts, the Board requested and received additional information on certain topics, including: (i) fund performance trends and Fidelity's long-term strategies for certain funds; (ii) the potential to further rationalize the Fidelity fund lineup with the possibility of achieving savings for the funds and Fidelity; (iii) the methodology with respect to competitive fund data and peer group classifications; (iv) the arrangements with, and performance of, certain sub-advisers on behalf of the Fidelity funds, as well as certain proposed participating affiliate arrangements; (v) the realization of fall-out benefits in certain Fidelity business units; (vi) Fidelity's group fee structures, including the rationale for the individual fee rates of certain categories of funds and the definition of group assets; (vii) trends regarding industry use of performance fee structures and the performance adjustment methodologies applicable to the Fidelity funds; (viii) additional competitive analysis regarding the total expenses for certain classes; and (ix) fund profitability methodology, including Fidelity's cost allocation methodology, and the impact of certain factors on fund profitability results.
Based on its evaluation of all of the conclusions noted above, and after considering all factors it believed relevant, the Board ultimately concluded that the advisory fee structures are fair and reasonable, and that the fund's Advisory Contracts should be renewed.
Annual Report
Investment Adviser
Fidelity Management & Research Company
Boston, MA
Investment Sub-Advisers
FMR Co., Inc.
Fidelity Management & Research
(U.K.) Inc.
Fidelity Management & Research
(Hong Kong) Limited
Fidelity Management & Research
(Japan) Inc.
General Distributor
Fidelity Distributors Corporation
Smithfield, RI
Transfer and Service Agents
Fidelity Investments Institutional
Operations Company, Inc.
Boston, MA
Fidelity Service Company, Inc.
Boston, MA
Custodian
State Street Bank and Trust Company
Quincy, MA
(Fidelity Investment logo)(registered trademark)
ADGFI-UANN-0114 1.786676.110
(Fidelity Investment logo)(registered trademark)
Fidelity Advisor®
Dividend Growth
Fund - Class Z
Annual Report
November 30, 2013
(Fidelity Cover Art)
Contents
|
Performance |
How the fund has done over time. |
|
|
Management's Discussion of Fund Performance |
The Portfolio Manager's review of fund performance and strategy. |
|
|
Shareholder Expense Example |
An example of shareholder expenses. |
|
|
Investment Changes |
A summary of major shifts in the fund's investments over the past six months. |
|
|
Investments |
A complete list of the fund's investments with their market values. |
|
|
Financial Statements |
Statements of assets and liabilities, operations, and changes in net assets, as well as financial highlights. |
|
|
Notes |
Notes to the financial statements. |
|
|
Report of Independent Registered Public Accounting Firm |
|
|
|
Trustees and Officers |
|
|
|
Distributions |
|
|
|
Board Approval of Investment Advisory Contracts and Management Fees |
|
To view a fund's proxy voting guidelines and proxy voting record for the 12-month period ended June 30, visit http://www.fidelity.com/proxyvotingresults or visit the Securities and Exchange Commission's (SEC) web site at http://www.sec.gov. You may also call 1-877-208-0098 to request a free copy of the proxy voting guidelines.
Standard & Poor's, S&P and S&P 500 are registered service marks of The McGraw-Hill Companies, Inc. and have been licensed for use by Fidelity Distributors Corporation.
Other third-party marks appearing herein are the property of their respective owners.
All other marks appearing herein are registered or unregistered trademarks or service marks of FMR LLC or an affiliated company. © 2014 FMR LLC. All rights reserved.
Annual Report
This report and the financial statements contained herein are submitted for the general information of the shareholders of the fund. This report is not authorized for distribution to prospective investors in the fund unless preceded or accompanied by an effective prospectus.
A fund files its complete schedule of portfolio holdings with the SEC for the first and third quarters of each fiscal year on Form N-Q. Forms N-Q are available on the SEC's web site at http://www.sec.gov. A fund's Forms N-Q may be reviewed and copied at the SEC's Public Reference Room in Washington, DC. Information regarding the operation of the SEC's Public Reference Room may be obtained by calling 1-800-SEC-0330. For a complete list of a fund's portfolio holdings, view the most recent holdings listing, semiannual report, or annual report on Fidelity's web site at http://www.fidelity.com, http://www.advisor.fidelity.com, or http://www.401k.com, as applicable.
NOT FDIC INSURED • MAY LOSE VALUE • NO BANK GUARANTEE
Neither the fund nor Fidelity Distributors Corporation is a bank.
Annual Report
Performance: The Bottom Line
Average annual total return reflects the change in the value of an investment, assuming reinvestment of the class' distributions from dividend income and capital gains (the profits earned upon the sale of securities that have grown in value, if any) and assuming a constant rate of performance each year. The $10,000 table and the fund's returns do not reflect the deduction of taxes that a shareholder would pay on fund distributions or the redemption of fund shares. During periods of reimbursement by Fidelity, a fund's total return will be greater than it would be had the reimbursement not occurred. How a fund did yesterday is no guarantee of how it will do tomorrow.
Average Annual Total Returns
|
Periods ended November 30, 2013 |
Past 1 |
Past 5 |
Past 10 |
|
Class Z A |
30.70% |
22.35% |
7.05% |
A The initial offering of Class Z shares took place on August 13, 2013. Returns prior to August 13, 2013 are those of Institutional Class.
$10,000 Over 10 Years
Let's say hypothetically that $10,000 was invested in Fidelity Advisor® Dividend Growth Fund - Class Z on November 30, 2003. The chart shows how the value of your investment would have changed, and also shows how the S&P 500 ® Index performed over the same period. See footnote A above for additional information regarding the performance of Class Z.
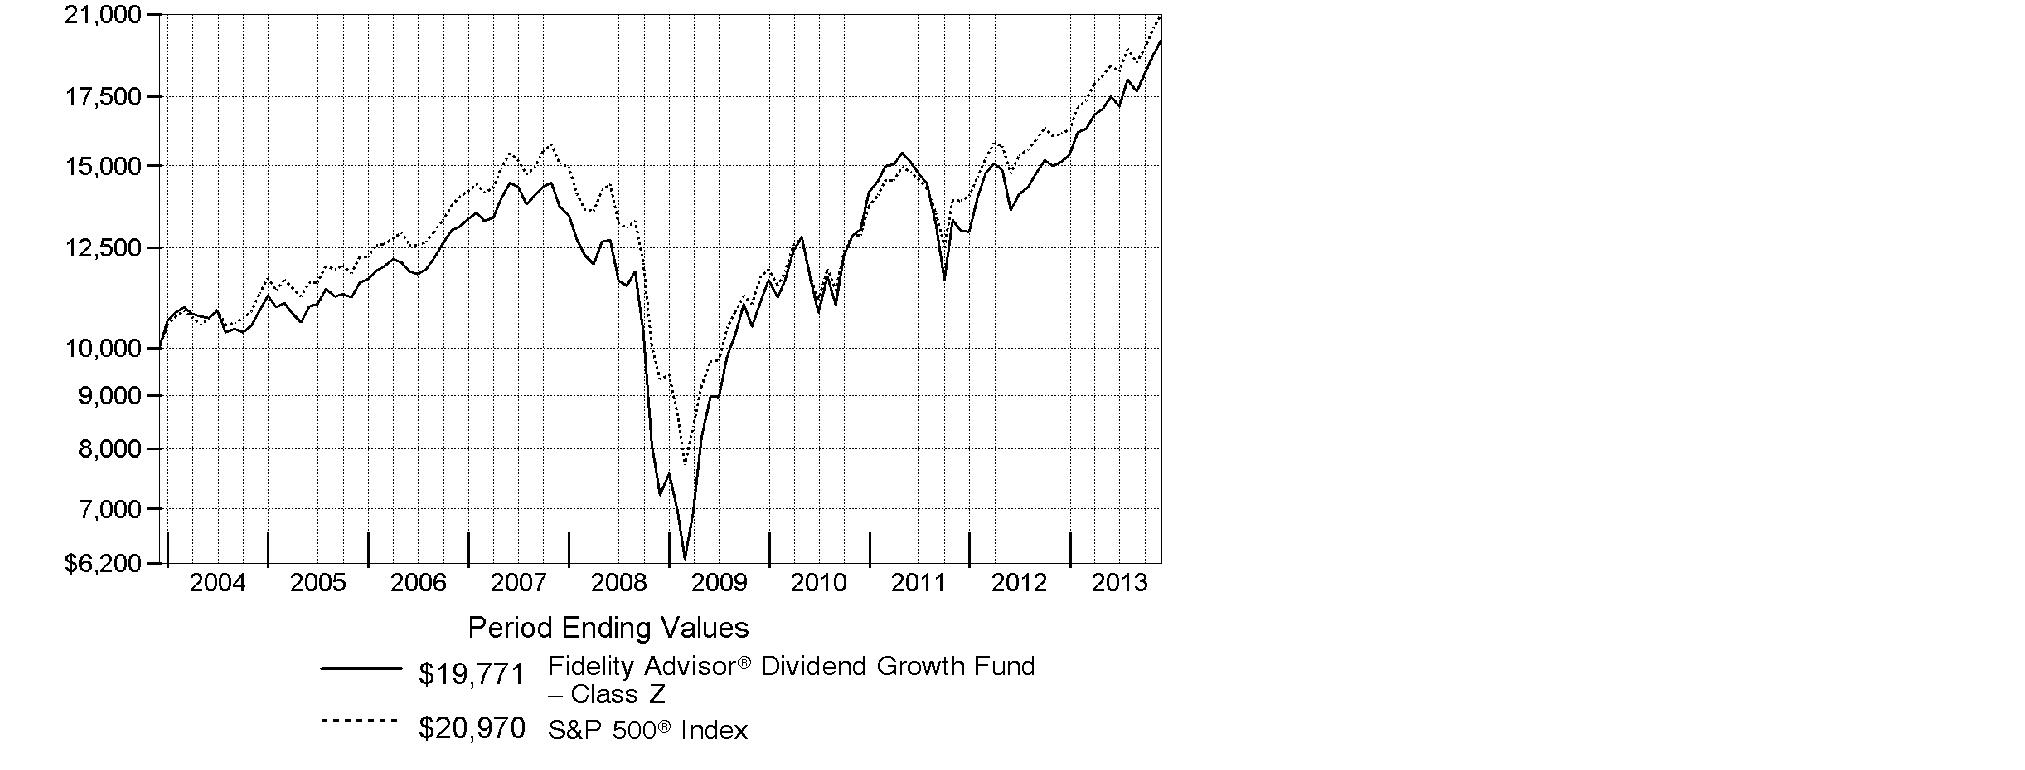
Annual Report
Management's Discussion of Fund Performance
Market Recap: With the current bull run nearing the five-year mark, equity benchmarks ripped up old records during the 12 months ending November 30, 2013. Gains were fueled by strengthening U.S. economic data, as well as generally improving economies and accommodative monetary policies worldwide. The broad S&P 500® Index reached new peaks in its 30.30% climb for the period, and the blue-chip Dow Jones Industrial AverageSM surpassed historic milestones en route to a 26.63% gain. The Nasdaq Composite Index®, up 36.73% amid a resurgence in growth-oriented stocks, closed above 4,000 for the first time since 2000. Shedding anxiety over the 2012 U.S. presidential election - and apparently confident that the federal debt-ceiling debate would be resolved - markets rose from period start through late May. News that the U.S. Federal Reserve was considering an end to its stimulative bond-buying kept stocks in flux over the summer but, by September, the Fed had set aside any imminent tapering. Despite jitters over a potential U.S. military strike in Syria and, later, an October budget impasse that briefly shuttered the federal government, volatility was subdued heading into the holidays, with investor optimism helping many markets home in on all-time highs at period end. Elsewhere, non-U.S. developed-market equities saw similar results, with the MSCI® EAFE® Index adding 24.97%.
Comments from Lawrence Rakers, Portfolio Manager of Fidelity Advisor® Dividend Growth Fund: For the year, the fund's Class Z shares finished modestly ahead of the S&P 500®. (For specific class-level results, please refer to the performance section of this shareholder report.) Versus the index, three of the four largest contributors were lagging mega-cap benchmark components the fund didn't own: energy major Exxon Mobil, information technology services provider IBM and telecommunication services giant AT&T. Two smaller-cap positions that helped were development-stage biotechnology company Alnylam Pharmaceuticals and marketing services provider MDC Partners. Conversely, materials hurt the fund's relative results the most. Here, two Canadian metals miners were the biggest detractors: Ivanplats - which changed its name to Ivanhoe Mines - and Turquoise Hill Resources, the latter of which I reduced exposure to by period end. Investments here were hurt in part by a declining Canadian dollar. Elsewhere, performance was curbed by Ireland-based mobile marketing firm Velti, which filed for bankruptcy. The fund did not own Velti's common stock at period end but retained a private placement here. Many stocks I've mentioned in this report were not in the index.
Note to shareholders: On January 1, 2014, Ramona Persaud will become Portfolio Manager of the fund, succeeding Larry Rakers.
The views expressed above reflect those of the portfolio manager(s) only through the end of the period as stated on the cover of this report and do not necessarily represent the views of Fidelity or any other person in the Fidelity organization. Any such views are subject to change at any time based upon market or other conditions and Fidelity disclaims any responsibility to update such views. These views may not be relied on as investment advice and, because investment decisions for a Fidelity fund are based on numerous factors, may not be relied on as an indication of trading intent on behalf of any Fidelity fund.
Annual Report
Shareholder Expense Example
As a shareholder of the Fund, you incur two types of costs: (1) transaction costs, including sales charges (loads) on purchase payments or redemption proceeds, and (2) ongoing costs, including management fees, distribution and/or service (12b-1) fees and other Fund expenses. This Example is intended to help you understand your ongoing costs (in dollars) of investing in the Fund and to compare these costs with the ongoing costs of investing in other mutual funds.
The actual expense Example is based on an investment of $1,000 invested at the beginning of the period and held for the entire period (June 1, 2013 to November 30, 2013) for Class A, Class T, Class B, Class C and Institutional Class and for the period (August 13, 2013 to November 30, 2013) for Class Z. The hypothetical expense Example is based on an investment of $1,000 invested for the one-half year period (June 1, 2013 to November 30, 2013).
Actual Expenses
The first line of the accompanying table for each class of the Fund provides information about actual account values and actual expenses. You may use the information in this line, together with the amount you invested, to estimate the expenses that you paid over the period. Simply divide your account value by $1,000.00 (for example, an $8,600 account value divided by $1,000.00 = 8.6), then multiply the result by the number in the first line for a class of the Fund under the heading entitled "Expenses Paid During Period" to estimate the expenses you paid on your account during this period. In addition, the Fund, as a shareholder in the underlying Fidelity Central Funds, will indirectly bear its pro-rata share of the fees and expenses incurred by the underlying Fidelity Central Funds. These fees and expenses are not included in the Fund's annualized expense ratio used to calculate the expense estimate in the table below.
Hypothetical Example for Comparison Purposes
The second line of the accompanying table for each class of the Fund provides information about hypothetical account values and hypothetical expenses based on a Class' actual expense ratio and an assumed rate of return of 5% per year before expenses, which is not the Class' actual return. The hypothetical account values and expenses may not be used to estimate the actual ending account balance or expenses you paid for the period. You may use this information to compare the ongoing costs of investing in the Fund and other funds. To do so, compare this 5% hypothetical example with the 5% hypothetical examples that appear in the shareholder reports of the other funds. In addition, the Fund, as a shareholder in the underlying Fidelity Central Funds, will indirectly bear its pro-rata share of the fees and expenses incurred by the underlying Fidelity Central Funds. These fees and expenses are not included in the Fund's annualized expense ratio used to calculate the expense estimate in the table below.
Please note that the expenses shown in the table are meant to highlight your ongoing costs only and do not reflect any transaction costs. Therefore, the second line of the table is useful in comparing ongoing costs only, and will not help you determine the relative total costs of owning different funds. In addition, if these transactional costs were included, your costs would have been higher.
Annual Report
|
|
Annualized |
Beginning |
Ending |
Expenses Paid |
|
Class A |
.96% |
|
|
|
|
Actual |
|
$ 1,000.00 |
$ 1,129.10 |
$ 5.12 C |
|
HypotheticalA |
|
$ 1,000.00 |
$ 1,020.26 |
$ 4.86 D |
|
Class T |
1.18% |
|
|
|
|
Actual |
|
$ 1,000.00 |
$ 1,128.30 |
$ 6.30 C |
|
HypotheticalA |
|
$ 1,000.00 |
$ 1,019.15 |
$ 5.97 D |
|
Class B |
1.77% |
|
|
|
|
Actual |
|
$ 1,000.00 |
$ 1,124.20 |
$ 9.43 C |
|
HypotheticalA |
|
$ 1,000.00 |
$ 1,016.19 |
$ 8.95 D |
|
Class C |
1.70% |
|
|
|
|
Actual |
|
$ 1,000.00 |
$ 1,125.20 |
$ 9.06 C |
|
HypotheticalA |
|
$ 1,000.00 |
$ 1,016.55 |
$ 8.59 D |
|
Institutional Class |
.69% |
|
|
|
|
Actual |
|
$ 1,000.00 |
$ 1,130.70 |
$ 3.69 C |
|
HypotheticalA |
|
$ 1,000.00 |
$ 1,021.61 |
$ 3.50 D |
|
Class Z |
.54% |
|
|
|
|
Actual |
|
$ 1,000.00 |
$ 1,080.20 |
$ 1.69 C |
|
HypotheticalA |
|
$ 1,000.00 |
$ 1,022.36 |
$ 2.74 D |
A 5% return per year before expenses
B Annualized expense ratio reflects expenses net of applicable fee waivers.
C Actual expenses are equal to each Class' annualized expense ratio, multiplied by the average account value over the period, multiplied by 183/365 (to reflect the one-half year period) for Class A, Class T, Class B, Class C and Institutional Class and multiplied by 110/365 (to reflect the period August 13, 2013 to November 30, 2013) for Class Z.
D Hypothetical expenses are equal to each Class' annualized expense ratio, multiplied by the average account value over the period, multiplied by 183/365 (to reflect the one-half year period).
Annual Report
Investment Changes (Unaudited)
|
Top Ten Stocks as of November 30, 2013 |
||
|
|
% of fund's |
% of fund's net assets |
|
Apple, Inc. |
3.2 |
2.3 |
|
Google, Inc. Class A |
1.9 |
1.6 |
|
Microsoft Corp. |
1.8 |
0.7 |
|
General Electric Co. |
1.8 |
1.6 |
|
JPMorgan Chase & Co. |
1.8 |
1.2 |
|
Citigroup, Inc. |
1.5 |
1.6 |
|
Wells Fargo & Co. |
1.4 |
1.7 |
|
Bank of America Corp. |
1.3 |
1.2 |
|
Comcast Corp. Class A |
1.1 |
0.8 |
|
Visa, Inc. Class A |
1.0 |
1.0 |
|
|
16.8 |
|
|
Top Five Market Sectors as of November 30, 2013 |
||
|
|
% of fund's |
% of fund's net assets |
|
Information Technology |
17.9 |
16.9 |
|
Financials |
15.5 |
16.0 |
|
Consumer Discretionary |
14.2 |
12.6 |
|
Health Care |
13.4 |
13.7 |
|
Industrials |
11.9 |
12.1 |
|
Asset Allocation (% of fund's net assets) |
|||||||
|
As of November 30, 2013* |
As of May 31, 2013** |
||||||
 |
Stocks 98.6% |
|
|
Stocks 98.6% |
|
||
 |
Bonds 0.0% |
|
 |
Bonds 0.1% |
|
||
 |
Convertible |
|
|
Convertible |
|
||
 |
Short-Term |
|
|
Short-Term |
|
||
|
* Foreign investments |
18.1% |
|
** Foreign investments |
19.3% |
|
||

Annual Report
Investments November 30, 2013
Showing Percentage of Net Assets
|
Common Stocks - 98.4% |
|||
|
Shares |
Value (000s) |
||
|
CONSUMER DISCRETIONARY - 14.0% |
|||
|
Auto Components - 0.5% |
|||
|
Delphi Automotive PLC |
36,876 |
$ 2,159 |
|
|
Johnson Controls, Inc. |
71,476 |
3,610 |
|
|
|
5,769 |
||
|
Automobiles - 0.5% |
|||
|
Ford Motor Co. |
251,818 |
4,301 |
|
|
Harley-Davidson, Inc. |
17,401 |
1,166 |
|
|
|
5,467 |
||
|
Diversified Consumer Services - 0.9% |
|||
|
Anhanguera Educacional Participacoes SA |
276,700 |
1,842 |
|
|
H&R Block, Inc. |
202,764 |
5,655 |
|
|
Kroton Educacional SA |
91,300 |
1,535 |
|
|
|
9,032 |
||
|
Hotels, Restaurants & Leisure - 2.2% |
|||
|
Brinker International, Inc. |
170,092 |
7,999 |
|
|
Las Vegas Sands Corp. |
31,340 |
2,246 |
|
|
McDonald's Corp. |
9,800 |
954 |
|
|
Red Robin Gourmet Burgers, Inc. (a) |
17,900 |
1,427 |
|
|
Sonic Corp. (a) |
70,400 |
1,393 |
|
|
Wyndham Worldwide Corp. |
62,552 |
4,486 |
|
|
Yum! Brands, Inc. |
56,253 |
4,370 |
|
|
|
22,875 |
||
|
Household Durables - 0.2% |
|||
|
Taylor Wimpey PLC |
406,364 |
707 |
|
|
Whirlpool Corp. |
11,670 |
1,783 |
|
|
|
2,490 |
||
|
Leisure Equipment & Products - 0.2% |
|||
|
Polaris Industries, Inc. |
14,700 |
1,962 |
|
|
Media - 4.9% |
|||
|
Antena 3 de Television SA (d) |
119,189 |
1,833 |
|
|
CBS Corp. Class B |
148,282 |
8,683 |
|
|
Comcast Corp. Class A |
232,575 |
11,599 |
|
|
Ipsos SA |
27,584 |
1,150 |
|
|
MDC Partners, Inc. Class A (sub. vtg.) |
132,201 |
3,009 |
|
|
Omnicom Group, Inc. |
35,811 |
2,559 |
|
|
Smiles SA |
23,750 |
334 |
|
|
The Walt Disney Co. |
78,970 |
5,571 |
|
|
Time Warner, Inc. |
73,011 |
4,798 |
|
|
Twenty-First Century Fox, Inc. Class A |
155,371 |
5,203 |
|
|
Common Stocks - continued |
|||
|
Shares |
Value (000s) |
||
|
CONSUMER DISCRETIONARY - continued |
|||
|
Media - continued |
|||
|
Valassis Communications, Inc. |
17,865 |
$ 525 |
|
|
Viacom, Inc. Class B (non-vtg.) |
76,808 |
6,158 |
|
|
|
51,422 |
||
|
Specialty Retail - 3.8% |
|||
|
American Eagle Outfitters, Inc. |
148,505 |
2,416 |
|
|
Best Buy Co., Inc. |
31,954 |
1,296 |
|
|
CST Brands, Inc. |
1 |
0* |
|
|
Foot Locker, Inc. |
43,901 |
1,707 |
|
|
GNC Holdings, Inc. |
9,100 |
548 |
|
|
Home Depot, Inc. |
116,237 |
9,377 |
|
|
Kingfisher PLC |
156,180 |
961 |
|
|
L Brands, Inc. |
35,840 |
2,329 |
|
|
Lewis Group Ltd. |
23,800 |
152 |
|
|
Lowe's Companies, Inc. |
127,114 |
6,035 |
|
|
Office Depot, Inc. (a) |
274,901 |
1,495 |
|
|
Rent-A-Center, Inc. |
74,082 |
2,523 |
|
|
Ross Stores, Inc. |
20,765 |
1,588 |
|
|
Signet Jewelers Ltd. |
14,000 |
1,076 |
|
|
Staples, Inc. |
328,877 |
5,107 |
|
|
TJX Companies, Inc. |
62,001 |
3,899 |
|
|
|
40,509 |
||
|
Textiles, Apparel & Luxury Goods - 0.8% |
|||
|
Coach, Inc. |
18,884 |
1,093 |
|
|
Kering SA |
7,300 |
1,619 |
|
|
NIKE, Inc. Class B |
45,155 |
3,574 |
|
|
VF Corp. |
11,250 |
2,639 |
|
|
|
8,925 |
||
|
TOTAL CONSUMER DISCRETIONARY |
148,451 |
||
|
CONSUMER STAPLES - 10.1% |
|||
|
Beverages - 2.3% |
|||
|
Anheuser-Busch InBev SA NV |
21,500 |
2,192 |
|
|
Coca-Cola Enterprises, Inc. |
32,610 |
1,368 |
|
|
Cott Corp. |
241,020 |
2,021 |
|
|
Dr. Pepper Snapple Group, Inc. |
82,371 |
3,975 |
|
|
Molson Coors Brewing Co. Class B |
14,699 |
774 |
|
|
Monster Beverage Corp. (a) |
59,487 |
3,520 |
|
|
The Coca-Cola Co. |
264,275 |
10,621 |
|
|
|
24,471 |
||
|
Common Stocks - continued |
|||
|
Shares |
Value (000s) |
||
|
CONSUMER STAPLES - continued |
|||
|
Food & Staples Retailing - 2.2% |
|||
|
Alimentation Couche-Tard, Inc. Class B (sub. vtg.) |
53,500 |
$ 3,927 |
|
|
CVS Caremark Corp. |
114,524 |
7,669 |
|
|
Kroger Co. |
106,466 |
4,445 |
|
|
Rami Levi Chain Stores Hashikma Marketing 2006 Ltd. |
21,893 |
1,108 |
|
|
Walgreen Co. |
104,033 |
6,159 |
|
|
|
23,308 |
||
|
Food Products - 1.9% |
|||
|
Amira Nature Foods Ltd. (a)(d) |
41,029 |
650 |
|
|
Archer Daniels Midland Co. |
70,000 |
2,818 |
|
|
Bunge Ltd. |
36,660 |
2,937 |
|
|
Green Mountain Coffee Roasters, Inc. |
30,477 |
2,054 |
|
|
Greencore Group PLC |
235,804 |
743 |
|
|
Hilton Food Group PLC |
81,531 |
568 |
|
|
Ingredion, Inc. |
35,931 |
2,485 |
|
|
Kellogg Co. |
41,318 |
2,506 |
|
|
Mead Johnson Nutrition Co. Class A |
15,891 |
1,343 |
|
|
Mondelez International, Inc. |
115,900 |
3,886 |
|
|
|
19,990 |
||
|
Household Products - 1.5% |
|||
|
Energizer Holdings, Inc. |
36,875 |
4,069 |
|
|
Procter & Gamble Co. |
111,428 |
9,384 |
|
|
Svenska Cellulosa AB (SCA) (B Shares) |
77,200 |
2,254 |
|
|
|
15,707 |
||
|
Personal Products - 0.1% |
|||
|
Herbalife Ltd. |
16,400 |
1,143 |
|
|
Tobacco - 2.1% |
|||
|
British American Tobacco PLC (United Kingdom) |
20,100 |
1,069 |
|
|
Imperial Tobacco Group PLC |
48,945 |
1,861 |
|
|
Japan Tobacco, Inc. |
127,100 |
4,293 |
|
|
Lorillard, Inc. |
84,654 |
4,345 |
|
|
Philip Morris International, Inc. |
123,423 |
10,558 |
|
|
|
22,126 |
||
|
TOTAL CONSUMER STAPLES |
106,745 |
||
|
ENERGY - 9.3% |
|||
|
Energy Equipment & Services - 3.2% |
|||
|
BW Offshore Ltd. |
927,388 |
1,205 |
|
|
Cameron International Corp. (a) |
60,626 |
3,358 |
|
|
Common Stocks - continued |
|||
|
Shares |
Value (000s) |
||
|
ENERGY - continued |
|||
|
Energy Equipment & Services - continued |
|||
|
Ensco PLC Class A |
95,950 |
$ 5,669 |
|
|
Essential Energy Services Ltd. |
379,600 |
1,118 |
|
|
Halliburton Co. |
74,857 |
3,943 |
|
|
National Oilwell Varco, Inc. |
84,686 |
6,902 |
|
|
Noble Corp. |
47,079 |
1,795 |
|
|
Schlumberger Ltd. |
72,206 |
6,384 |
|
|
ShawCor Ltd. Class A |
15,100 |
563 |
|
|
Vantage Drilling Co. (a) |
795,092 |
1,487 |
|
|
Xtreme Drilling & Coil Services Corp. (a) |
256,400 |
833 |
|
|
Xtreme Drilling & Coil Services Corp. (a)(e) |
132,500 |
430 |
|
|
|
33,687 |
||
|
Oil, Gas & Consumable Fuels - 6.1% |
|||
|
Access Midstream Partners LP |
50,191 |
2,819 |
|
|
Anadarko Petroleum Corp. |
63,559 |
5,645 |
|
|
Ardmore Shipping Corp. |
29,683 |
380 |
|
|
BPZ Energy, Inc. (a) |
319,601 |
671 |
|
|
Cabot Oil & Gas Corp. |
30,508 |
1,051 |
|
|
Cimarex Energy Co. |
20,841 |
1,971 |
|
|
Cobalt International Energy, Inc. (a) |
76,207 |
1,694 |
|
|
Concho Resources, Inc. (a) |
12,440 |
1,293 |
|
|
ConocoPhillips Co. |
71,558 |
5,209 |
|
|
Double Eagle Petroleum Co. (a) |
89,373 |
202 |
|
|
Emerald Oil, Inc. warrants 2/4/16 (a) |
16,536 |
0 |
|
|
Energen Corp. |
30,004 |
2,165 |
|
|
EOG Resources, Inc. |
11,054 |
1,824 |
|
|
EQT Corp. |
27,102 |
2,307 |
|
|
InterOil Corp. (a)(d) |
30,409 |
2,688 |
|
|
Marathon Oil Corp. |
34,140 |
1,230 |
|
|
Markwest Energy Partners LP |
44,610 |
3,081 |
|
|
MPLX LP |
28,058 |
1,070 |
|
|
Noble Energy, Inc. |
22,387 |
1,572 |
|
|
Northern Oil & Gas, Inc. (a)(d) |
231,694 |
3,696 |
|
|
Occidental Petroleum Corp. |
65,944 |
6,262 |
|
|
Peabody Energy Corp. |
124,861 |
2,272 |
|
|
Phillips 66 Co. |
39,570 |
2,754 |
|
|
Phillips 66 Partners LP |
38,405 |
1,265 |
|
|
Rosetta Resources, Inc. (a) |
16,428 |
831 |
|
|
Southcross Energy Partners LP |
50,160 |
972 |
|
|
Suncor Energy, Inc. |
111,980 |
3,886 |
|
|
TAG Oil Ltd. (a) |
473,900 |
1,570 |
|
|
Common Stocks - continued |
|||
|
Shares |
Value (000s) |
||
|
ENERGY - continued |
|||
|
Oil, Gas & Consumable Fuels - continued |
|||
|
TAG Oil Ltd. (e) |
15,900 |
$ 53 |
|
|
The Williams Companies, Inc. |
116,074 |
4,088 |
|
|
|
64,521 |
||
|
TOTAL ENERGY |
98,208 |
||
|
FINANCIALS - 15.5% |
|||
|
Capital Markets - 2.5% |
|||
|
AllianceBernstein Holding LP |
84,005 |
1,864 |
|
|
Ameriprise Financial, Inc. |
13,448 |
1,456 |
|
|
BlackRock, Inc. Class A |
9,899 |
2,997 |
|
|
GP Investments Ltd. Class A (depositary receipt) (a) |
24,460 |
42 |
|
|
Invesco Ltd. |
79,284 |
2,763 |
|
|
KKR & Co. LP |
114,274 |
2,712 |
|
|
Monex Group, Inc. |
349,400 |
1,412 |
|
|
Morgan Stanley |
99,414 |
3,112 |
|
|
Oaktree Capital Group LLC Class A |
33,200 |
1,850 |
|
|
The Blackstone Group LP |
112,850 |
3,225 |
|
|
UBS AG (NY Shares) |
284,442 |
5,404 |
|
|
|
26,837 |
||
|
Commercial Banks - 2.8% |
|||
|
Barclays PLC sponsored ADR |
247,600 |
4,402 |
|
|
KBC Groupe SA |
17,062 |
974 |
|
|
Nordea Bank AB |
141,600 |
1,830 |
|
|
PNC Financial Services Group, Inc. |
36,140 |
2,781 |
|
|
U.S. Bancorp |
121,057 |
4,748 |
|
|
Wells Fargo & Co. |
342,450 |
15,075 |
|
|
|
29,810 |
||
|
Consumer Finance - 0.9% |
|||
|
Capital One Financial Corp. |
86,042 |
6,163 |
|
|
SLM Corp. |
111,707 |
2,977 |
|
|
|
9,140 |
||
|
Diversified Financial Services - 5.5% |
|||
|
ASAC II LP (f) |
298,480 |
3,422 |
|
|
Bank of America Corp. |
888,873 |
14,062 |
|
|
Citigroup, Inc. |
305,473 |
16,166 |
|
|
JPMorgan Chase & Co. |
328,943 |
18,822 |
|
|
Common Stocks - continued |
|||
|
Shares |
Value (000s) |
||
|
FINANCIALS - continued |
|||
|
Diversified Financial Services - continued |
|||
|
McGraw-Hill Companies, Inc. |
53,808 |
$ 4,009 |
|
|
PICO Holdings, Inc. (a) |
77,781 |
1,885 |
|
|
|
58,366 |
||
|
Insurance - 2.9% |
|||
|
ACE Ltd. |
24,994 |
2,569 |
|
|
AFLAC, Inc. |
30,332 |
2,013 |
|
|
Allied World Assurance Co. Holdings Ltd. |
9,888 |
1,114 |
|
|
Arthur J. Gallagher & Co. |
18,265 |
850 |
|
|
Assured Guaranty Ltd. |
204,251 |
4,796 |
|
|
Axis Capital Holdings Ltd. |
11,500 |
565 |
|
|
Everest Re Group Ltd. |
8,534 |
1,338 |
|
|
Fidelity National Financial, Inc. Class A |
139,204 |
4,047 |
|
|
Marsh & McLennan Companies, Inc. |
32,700 |
1,552 |
|
|
MetLife, Inc. |
79,620 |
4,155 |
|
|
Prudential PLC |
30,243 |
645 |
|
|
The Chubb Corp. |
33,094 |
3,192 |
|
|
The Travelers Companies, Inc. |
43,732 |
3,968 |
|
|
|
30,804 |
||
|
Real Estate Investment Trusts - 0.7% |
|||
|
American Tower Corp. |
20,619 |
1,604 |
|
|
Beni Stabili SpA SIIQ |
411,824 |
279 |
|
|
Cousins Properties, Inc. |
14,676 |
157 |
|
|
Prologis, Inc. |
27,557 |
1,045 |
|
|
Simon Property Group, Inc. |
16,487 |
2,471 |
|
|
Weyerhaeuser Co. |
69,876 |
2,105 |
|
|
|
7,661 |
||
|
Real Estate Management & Development - 0.1% |
|||
|
CBRE Group, Inc. (a) |
15,695 |
380 |
|
|
CSI Properties Ltd. |
11,320,000 |
460 |
|
|
|
840 |
||
|
Thrifts & Mortgage Finance - 0.1% |
|||
|
WSFS Financial Corp. |
13,500 |
1,025 |
|
|
TOTAL FINANCIALS |
164,483 |
||
|
HEALTH CARE - 13.4% |
|||
|
Biotechnology - 3.4% |
|||
|
Alexion Pharmaceuticals, Inc. (a) |
7,791 |
970 |
|
|
Alnylam Pharmaceuticals, Inc. (a) |
63,300 |
3,874 |
|
|
Common Stocks - continued |
|||
|
Shares |
Value (000s) |
||
|
HEALTH CARE - continued |
|||
|
Biotechnology - continued |
|||
|
Amgen, Inc. |
81,057 |
$ 9,247 |
|
|
Biogen Idec, Inc. (a) |
16,000 |
4,656 |
|
|
Gilead Sciences, Inc. (a) |
121,372 |
9,080 |
|
|
Grifols SA ADR |
86,375 |
2,966 |
|
|
Infinity Pharmaceuticals, Inc. (a) |
34,698 |
507 |
|
|
Isis Pharmaceuticals, Inc. (a) |
35,800 |
1,388 |
|
|
KaloBios Pharmaceuticals, Inc. (e) |
49,556 |
210 |
|
|
Theravance, Inc. (a) |
70,901 |
2,677 |
|
|
|
35,575 |
||
|
Health Care Equipment & Supplies - 1.5% |
|||
|
Abbott Laboratories |
18,100 |
691 |
|
|
Ansell Ltd. |
38,203 |
706 |
|
|
Boston Scientific Corp. (a) |
207,562 |
2,404 |
|
|
Covidien PLC |
35,073 |
2,394 |
|
|
Genmark Diagnostics, Inc. (a) |
114,606 |
1,364 |
|
|
Hill-Rom Holdings, Inc. |
32,767 |
1,357 |
|
|
Stryker Corp. |
45,180 |
3,362 |
|
|
The Cooper Companies, Inc. |
20,852 |
2,747 |
|
|
Zimmer Holdings, Inc. |
13,042 |
1,192 |
|
|
|
16,217 |
||
|
Health Care Providers & Services - 2.9% |
|||
|
AmerisourceBergen Corp. |
50,695 |
3,576 |
|
|
AmSurg Corp. (a) |
25,268 |
1,221 |
|
|
Cardinal Health, Inc. |
56,722 |
3,664 |
|
|
DaVita, Inc. (a) |
28,788 |
1,714 |
|
|
Emeritus Corp. (a) |
50,963 |
1,147 |
|
|
Express Scripts Holding Co. (a) |
73,201 |
4,930 |
|
|
McKesson Corp. |
40,206 |
6,670 |
|
|
Qualicorp SA (a) |
55,300 |
517 |
|
|
Quest Diagnostics, Inc. |
8,884 |
541 |
|
|
UnitedHealth Group, Inc. |
86,434 |
6,438 |
|
|
|
30,418 |
||
|
Life Sciences Tools & Services - 0.5% |
|||
|
Agilent Technologies, Inc. |
28,430 |
1,523 |
|
|
Lonza Group AG |
12,612 |
1,175 |
|
|
Thermo Fisher Scientific, Inc. |
28,713 |
2,896 |
|
|
|
5,594 |
||
|
Pharmaceuticals - 5.1% |
|||
|
AbbVie, Inc. |
144,770 |
7,014 |
|
|
Common Stocks - continued |
|||
|
Shares |
Value (000s) |
||
|
HEALTH CARE - continued |
|||
|
Pharmaceuticals - continued |
|||
|
Actavis PLC (a) |
36,942 |
$ 6,024 |
|
|
Bayer AG |
14,800 |
1,975 |
|
|
Biodelivery Sciences International, Inc. (a) |
209,414 |
1,005 |
|
|
Cadence Pharmaceuticals, Inc. (a) |
160,110 |
1,444 |
|
|
Horizon Pharma, Inc. (a) |
330,551 |
2,386 |
|
|
Horizon Pharma, Inc.: |
|
|
|
|
warrants 2/28/17 (a) |
27,294 |
82 |
|
|
warrants 9/25/17 (a) |
109,700 |
309 |
|
|
Johnson & Johnson |
93,892 |
8,888 |
|
|
Novartis AG sponsored ADR |
4,279 |
339 |
|
|
Novo Nordisk A/S Series B |
13,945 |
2,493 |
|
|
Perrigo Co. |
28,092 |
4,379 |
|
|
Pfizer, Inc. |
160,304 |
5,086 |
|
|
Sanofi SA |
68,393 |
7,226 |
|
|
Teva Pharmaceutical Industries Ltd. sponsored ADR |
74,849 |
3,051 |
|
|
Valeant Pharmaceuticals International, Inc. (Canada) (a) |
23,900 |
2,620 |
|
|
Zoetis, Inc. Class A |
1 |
0* |
|
|
|
54,321 |
||
|
TOTAL HEALTH CARE |
142,125 |
||
|
INDUSTRIALS - 11.8% |
|||
|
Aerospace & Defense - 1.8% |
|||
|
General Dynamics Corp. |
12,759 |
1,169 |
|
|
Honeywell International, Inc. |
63,581 |
5,628 |
|
|
Meggitt PLC |
237,051 |
1,936 |
|
|
The Boeing Co. |
11,255 |
1,511 |
|
|
United Technologies Corp. |
80,571 |
8,932 |
|
|
|
19,176 |
||
|
Air Freight & Logistics - 0.7% |
|||
|
FedEx Corp. |
27,226 |
3,776 |
|
|
United Parcel Service, Inc. Class B |
33,481 |
3,428 |
|
|
|
7,204 |
||
|
Building Products - 0.7% |
|||
|
A.O. Smith Corp. |
35,466 |
1,920 |
|
|
Masco Corp. |
229,353 |
5,142 |
|
|
|
7,062 |
||
|
Common Stocks - continued |
|||
|
Shares |
Value (000s) |
||
|
INDUSTRIALS - continued |
|||
|
Commercial Services & Supplies - 0.6% |
|||
|
Iron Mountain, Inc. |
44,791 |
$ 1,260 |
|
|
KAR Auction Services, Inc. |
61,100 |
1,686 |
|
|
Republic Services, Inc. |
48,140 |
1,681 |
|
|
Swisher Hygiene, Inc. (a) |
53,031 |
28 |
|
|
Waste Management, Inc. |
32,458 |
1,483 |
|
|
|
6,138 |
||
|
Construction & Engineering - 0.4% |
|||
|
URS Corp. |
77,170 |
4,011 |
|
|
Electrical Equipment - 1.6% |
|||
|
AMETEK, Inc. |
30,332 |
1,493 |
|
|
Eaton Corp. PLC |
42,653 |
3,099 |
|
|
EnerSys |
16,926 |
1,208 |
|
|
Generac Holdings, Inc. |
59,506 |
3,169 |
|
|
Hubbell, Inc. Class B |
12,024 |
1,298 |
|
|
Prysmian SpA |
104,262 |
2,723 |
|
|
Regal-Beloit Corp. |
27,087 |
1,993 |
|
|
Roper Industries, Inc. |
12,561 |
1,629 |
|
|
|
16,612 |
||
|
Industrial Conglomerates - 2.1% |
|||
|
Danaher Corp. |
18,500 |
1,384 |
|
|
General Electric Co. |
707,210 |
18,854 |
|
|
Koninklijke Philips Electronics NV |
68,500 |
2,450 |
|
|
|
22,688 |
||
|
Machinery - 2.0% |
|||
|
Andritz AG |
18,598 |
1,179 |
|
|
Cummins, Inc. |
20,890 |
2,765 |
|
|
Global Brass & Copper Holdings, Inc. |
55,502 |
916 |
|
|
Illinois Tool Works, Inc. |
25,600 |
2,037 |
|
|
Ingersoll-Rand PLC |
62,752 |
4,482 |
|
|
Manitowoc Co., Inc. |
144,603 |
2,977 |
|
|
Pentair Ltd. |
39,073 |
2,763 |
|
|
Stanley Black & Decker, Inc. |
45,656 |
3,716 |
|
|
Weg SA |
37,100 |
504 |
|
|
|
21,339 |
||
|
Marine - 0.0% |
|||
|
Ultrapetrol (Bahamas) Ltd. (a) |
164,775 |
559 |
|
|
Professional Services - 0.6% |
|||
|
Dun & Bradstreet Corp. |
41,796 |
4,884 |
|
|
Common Stocks - continued |
|||
|
Shares |
Value (000s) |
||
|
INDUSTRIALS - continued |
|||
|
Professional Services - continued |
|||
|
Huron Consulting Group, Inc. (a) |
12,334 |
$ 733 |
|
|
Michael Page International PLC |
151,879 |
1,180 |
|
|
|
6,797 |
||
|
Road & Rail - 1.2% |
|||
|
Con-way, Inc. |
26,800 |
1,109 |
|
|
CSX Corp. |
99,662 |
2,718 |
|
|
Norfolk Southern Corp. |
20,642 |
1,810 |
|
|
Union Pacific Corp. |
45,415 |
7,359 |
|
|
|
12,996 |
||
|
Trading Companies & Distributors - 0.1% |
|||
|
Houston Wire & Cable Co. |
73,887 |
997 |
|
|
TOTAL INDUSTRIALS |
125,579 |
||
|
INFORMATION TECHNOLOGY - 17.8% |
|||
|
Communications Equipment - 1.9% |
|||
|
Cisco Systems, Inc. |
451,979 |
9,605 |
|
|
QUALCOMM, Inc. |
144,528 |
10,634 |
|
|
|
20,239 |
||
|
Computers & Peripherals - 3.8% |
|||
|
Apple, Inc. |
61,952 |
34,447 |
|
|
Electronics for Imaging, Inc. (a) |
44,198 |
1,750 |
|
|
EMC Corp. |
120,328 |
2,870 |
|
|
Western Digital Corp. |
10,415 |
782 |
|
|
|
39,849 |
||
|
Electronic Equipment & Components - 0.6% |
|||
|
Corning, Inc. |
102,112 |
1,744 |
|
|
National Instruments Corp. |
16,854 |
527 |
|
|
TE Connectivity Ltd. |
81,622 |
4,303 |
|
|
|
6,574 |
||
|
Internet Software & Services - 2.3% |
|||
|
Demandware, Inc. (a) |
18,065 |
1,024 |
|
|
Google, Inc. Class A (a) |
18,432 |
19,530 |
|
|
Mail.Ru Group Ltd.: |
|
|
|
|
GDR (e) |
1,900 |
79 |
|
|
GDR (Reg. S) |
24,469 |
1,012 |
|
|
Velti PLC (f) |
192,692 |
16 |
|
|
Yahoo!, Inc. (a) |
68,605 |
2,537 |
|
|
|
24,198 |
||
|
Common Stocks - continued |
|||
|
Shares |
Value (000s) |
||
|
INFORMATION TECHNOLOGY - continued |
|||
|
IT Services - 3.3% |
|||
|
Accenture PLC Class A |
50,938 |
$ 3,946 |
|
|
Amdocs Ltd. |
38,282 |
1,549 |
|
|
Cognizant Technology Solutions Corp. Class A (a) |
53,782 |
5,050 |
|
|
Computer Sciences Corp. |
9,021 |
475 |
|
|
EPAM Systems, Inc. (a) |
6,474 |
230 |
|
|
ExlService Holdings, Inc. (a) |
28,683 |
756 |
|
|
Fidelity National Information Services, Inc. |
58,748 |
2,977 |
|
|
MasterCard, Inc. Class A |
7,042 |
5,358 |
|
|
Total System Services, Inc. |
114,908 |
3,568 |
|
|
Visa, Inc. Class A |
54,271 |
11,042 |
|
|
|
34,951 |
||
|
Office Electronics - 0.5% |
|||
|
Xerox Corp. |
444,973 |
5,064 |
|
|
Semiconductors & Semiconductor Equipment - 1.5% |
|||
|
Altera Corp. |
20,056 |
647 |
|
|
ASML Holding NV |
13,697 |
1,279 |
|
|
Avago Technologies Ltd. |
101,106 |
4,522 |
|
|
LTX-Credence Corp. (a) |
139,393 |
1,006 |
|
|
Maxim Integrated Products, Inc. |
39,436 |
1,123 |
|
|
Monolithic Power Systems, Inc. |
17,660 |
590 |
|
|
NXP Semiconductors NV (a) |
38,247 |
1,625 |
|
|
Samsung Electronics Co. Ltd. |
2,586 |
3,651 |
|
|
Skyworks Solutions, Inc. (a) |
70,090 |
1,864 |
|
|
|
16,307 |
||
|
Software - 3.9% |
|||
|
Activision Blizzard, Inc. |
201,233 |
3,463 |
|
|
Adobe Systems, Inc. (a) |
17,338 |
984 |
|
|
Citrix Systems, Inc. (a) |
27,561 |
1,635 |
|
|
Comverse, Inc. |
17,352 |
581 |
|
|
Constellation Software, Inc. |
9,700 |
1,723 |
|
|
Electronic Arts, Inc. (a) |
109,986 |
2,439 |
|
|
Intuit, Inc. |
20,285 |
1,506 |
|
|
Microsoft Corp. |
505,633 |
19,280 |
|
|
Oracle Corp. |
253,618 |
8,950 |
|
|
Symantec Corp. |
47,770 |
1,074 |
|
|
|
41,635 |
||
|
TOTAL INFORMATION TECHNOLOGY |
188,817 |
||
|
Common Stocks - continued |
|||
|
Shares |
Value (000s) |
||
|
MATERIALS - 3.4% |
|||
|
Chemicals - 2.1% |
|||
|
Axiall Corp. |
46,703 |
$ 2,116 |
|
|
Cabot Corp. |
79,138 |
3,862 |
|
|
Chemtura Corp. (a) |
15,101 |
399 |
|
|
Eastman Chemical Co. |
32,307 |
2,489 |
|
|
LyondellBasell Industries NV Class A |
36,196 |
2,794 |
|
|
Monsanto Co. |
39,101 |
4,431 |
|
|
Potash Corp. of Saskatchewan, Inc. |
43,200 |
1,368 |
|
|
PPG Industries, Inc. |
8,672 |
1,596 |
|
|
Royal DSM NV |
11,000 |
863 |
|
|
RPM International, Inc. |
47,109 |
1,866 |
|
|
|
21,784 |
||
|
Construction Materials - 0.1% |
|||
|
Vulcan Materials Co. |
13,941 |
786 |
|
|
Containers & Packaging - 0.2% |
|||
|
Nampak Ltd. |
301,028 |
1,160 |
|
|
Rock-Tenn Co. Class A |
15,404 |
1,454 |
|
|
|
2,614 |
||
|
Metals & Mining - 0.8% |
|||
|
Freeport-McMoRan Copper & Gold, Inc. |
136,655 |
4,741 |
|
|
Ivanhoe Mine Ltd. (a)(e) |
746,308 |
1,475 |
|
|
Randgold Resources Ltd. sponsored ADR |
22,500 |
1,592 |
|
|
Turquoise Hill Resources Ltd. (a)(d) |
123,222 |
508 |
|
|
|
8,316 |
||
|
Paper & Forest Products - 0.2% |
|||
|
Boise Cascade Co. |
35,400 |
908 |
|
|
International Paper Co. |
38,074 |
1,776 |
|
|
|
2,684 |
||
|
TOTAL MATERIALS |
36,184 |
||
|
TELECOMMUNICATION SERVICES - 1.0% |
|||
|
Diversified Telecommunication Services - 0.1% |
|||
|
CenturyLink, Inc. |
42,127 |
1,293 |
|
|
Wireless Telecommunication Services - 0.9% |
|||
|
Mobile TeleSystems OJSC sponsored ADR |
72,934 |
1,537 |
|
|
SBA Communications Corp. Class A (a) |
15,597 |
1,328 |
|
|
SoftBank Corp. |
21,100 |
1,707 |
|
|
T-Mobile U.S., Inc. (a) |
41,100 |
1,069 |
|
|
Common Stocks - continued |
|||
|
Shares |
Value (000s) |
||
|
TELECOMMUNICATION SERVICES - continued |
|||
|
Wireless Telecommunication Services - continued |
|||
|
Telephone & Data Systems, Inc. |
38,908 |
$ 1,082 |
|
|
Vodafone Group PLC |
585,200 |
2,170 |
|
|
|
8,893 |
||
|
TOTAL TELECOMMUNICATION SERVICES |
10,186 |
||
|
UTILITIES - 2.1% |
|||
|
Electric Utilities - 0.9% |
|||
|
Edison International |
54,007 |
2,496 |
|
|
ITC Holdings Corp. |
31,838 |
2,881 |
|
|
NextEra Energy, Inc. |
20,741 |
1,754 |
|
|
Northeast Utilities |
24,672 |
1,014 |
|
|
Xcel Energy, Inc. |
46,644 |
1,307 |
|
|
|
9,452 |
||
|
Gas Utilities - 0.3% |
|||
|
BW LPG Ltd. (a) |
136,320 |
1,101 |
|
|
National Fuel Gas Co. |
33,087 |
2,233 |
|
|
|
3,334 |
||
|
Independent Power Producers & Energy Traders - 0.3% |
|||
|
The AES Corp. |
248,779 |
3,625 |
|
|
Multi-Utilities - 0.6% |
|||
|
CenterPoint Energy, Inc. |
28,639 |
671 |
|
|
CMS Energy Corp. |
12,950 |
344 |
|
|
PG&E Corp. |
58,700 |
2,370 |
|
|
Sempra Energy |
29,654 |
2,623 |
|
|
|
6,008 |
||
|
TOTAL UTILITIES |
22,419 |
||
|
TOTAL COMMON STOCKS (Cost $830,774) |
|
||
|
Preferred Stocks - 0.3% |
|||
|
|
|
|
|
|
Convertible Preferred Stocks - 0.1% |
|||
|
INFORMATION TECHNOLOGY - 0.1% |
|||
|
Software - 0.1% |
|||
|
Mobileye NV Series F (a)(f) |
32,777 |
1,144 |
|
|
Preferred Stocks - continued |
|||
|
Shares |
Value (000s) |
||
|
Nonconvertible Preferred Stocks - 0.2% |
|||
|
CONSUMER DISCRETIONARY - 0.2% |
|||
|
Automobiles - 0.2% |
|||
|
Volkswagen AG |
9,100 |
$ 2,415 |
|
|
TOTAL PREFERRED STOCKS (Cost $3,175) |
|
||
|
Convertible Bonds - 0.2% |
||||
|
|
Principal |
|
||
|
ENERGY - 0.1% |
||||
|
Energy Equipment & Services - 0.0% |
||||
|
Cal Dive International, Inc. 5% 7/15/17 (e) |
|
$ 89 |
90 |
|
|
Oil, Gas & Consumable Fuels - 0.1% |
||||
|
Amyris, Inc. 3% 2/27/17 |
|
791 |
576 |
|
|
BPZ Energy, Inc. 8.5% 10/1/17 |
|
600 |
557 |
|
|
|
1,133 |
|||
|
TOTAL ENERGY |
1,223 |
|||
|
INDUSTRIALS - 0.1% |
||||
|
Building Products - 0.1% |
||||
|
Aspen Aerogels, Inc. 8% 6/1/14 (f) |
|
451 |
451 |
|
|
TOTAL CONVERTIBLE BONDS (Cost $1,873) |
|
|||
|
Money Market Funds - 1.6% |
|||
|
Shares |
Value (000s) |
||
|
Fidelity Cash Central Fund, 0.10% (b) |
13,852,894 |
$ 13,853 |
|
|
Fidelity Securities Lending Cash Central Fund, 0.10% (b)(c) |
3,384,950 |
3,385 |
|
|
TOTAL MONEY MARKET FUNDS (Cost $17,238) |
|
||
|
TOTAL INVESTMENT PORTFOLIO - 100.5% (Cost $853,060) |
1,065,668 |
||
|
NET OTHER ASSETS (LIABILITIES) - (0.5)% |
(5,132) |
||
|
NET ASSETS - 100% |
$ 1,060,536 |
||
|
Legend |
|
(a) Non-income producing |
|
(b) Affiliated fund that is generally available only to investment companies and other accounts managed by Fidelity Investments. The rate quoted is the annualized seven-day yield of the fund at period end. A complete unaudited listing of the fund's holdings as of its most recent quarter end is available upon request. In addition, each Fidelity Central Fund's financial statements are available on the SEC's website or upon request. |
|
(c) Investment made with cash collateral received from securities on loan. |
|
(d) Security or a portion of the security is on loan at period end. |
|
(e) Security exempt from registration under Rule 144A of the Securities Act of 1933. These securities may be resold in transactions exempt from registration, normally to qualified institutional buyers. At the end of the period, the value of these securities amounted to $2,337,000 or 0.2% of net assets. |
|
(f) Restricted securities - Investment in securities not registered under the Securities Act of 1933 (excluding 144A issues). At the end of the period, the value of restricted securities (excluding 144A issues) amounted to $5,033,000 or 0.5% of net assets. |
|
Additional information on each restricted holding is as follows: |
|
Security |
Acquisition |
Acquisition |
|
ASAC II LP |
10/10/13 |
$ 2,985 |
|
Aspen Aerogels, Inc. 8% 6/1/14 |
6/1/11 - 12/31/12 |
$ 451 |
|
Mobileye NV Series F |
8/15/13 |
$ 1,144 |
|
Velti PLC |
4/19/13 |
$ 289 |
* Amount represents less than $1,000.
See accompanying notes which are an integral part of the financial statements.
Annual Report
Investments - continued
|
Affiliated Central Funds |
|
Information regarding fiscal year to date income earned by the Fund from investments in Fidelity Central Funds is as follows: |
|
Fund |
Income earned |
|
Fidelity Cash Central Fund |
$ 8 |
|
Fidelity Securities Lending Cash Central Fund |
467 |
|
Total |
$ 475 |
|
Other Information |
|
The following is a summary of the inputs used, as of November 30, 2013, involving the Fund's assets and liabilities carried at fair value. The inputs or methodology used for valuing securities may not be an indication of the risk associated with investing in those securities. For more information on valuation inputs, and their aggregation into the levels used in the table below, please refer to the Investment Valuation section in the accompanying Notes to Financial Statements. |
|
Valuation Inputs at Reporting Date: |
||||
|
Description |
Total |
Level 1 |
Level 2 |
Level 3 |
|
Investments in Securities: |
||||
|
Equities: |
||||
|
Consumer Discretionary |
$ 150,866 |
$ 150,866 |
$ - |
$ - |
|
Consumer Staples |
106,745 |
103,484 |
3,261 |
- |
|
Energy |
98,208 |
98,208 |
- |
- |
|
Financials |
164,483 |
160,416 |
645 |
3,422 |
|
Health Care |
142,125 |
132,015 |
10,110 |
- |
|
Industrials |
125,579 |
123,129 |
2,450 |
- |
|
Information Technology |
189,961 |
188,801 |
16 |
1,144 |
|
Materials |
36,184 |
36,184 |
- |
- |
|
Telecommunication Services |
10,186 |
8,016 |
2,170 |
- |
|
Utilities |
22,419 |
22,419 |
- |
- |
|
Corporate Bonds |
1,674 |
- |
1,223 |
451 |
|
Money Market Funds |
17,238 |
17,238 |
- |
- |
|
Total Investments in Securities: |
$ 1,065,668 |
$ 1,040,776 |
$ 19,875 |
$ 5,017 |
|
Distribution of investments by country or territory of incorporation, as a percentage of total net assets, is as follows (Unaudited): |
|
United States of America |
81.9% |
|
Canada |
2.7% |
|
United Kingdom |
2.1% |
|
Ireland |
2.0% |
|
Bermuda |
1.5% |
|
Switzerland |
1.3% |
|
France |
1.0% |
|
Others (Individually Less Than 1%) |
7.5% |
|
|
100.0% |
See accompanying notes which are an integral part of the financial statements.
Annual Report
Financial Statements
Statement of Assets and Liabilities
|
Amounts in thousands (except per-share amounts) |
November 30, 2013 |
|
|
|
|
|
|
Assets |
|
|
|
Investment in securities, at value (including securities loaned of $3,277) - See accompanying schedule: Unaffiliated issuers (cost $835,822) |
$ 1,048,430 |
|
|
Fidelity Central Funds (cost $17,238) |
17,238 |
|
|
Total Investments (cost $853,060) |
|
$ 1,065,668 |
|
Cash |
|
62 |
|
Foreign currency held at value (cost $62) |
|
62 |
|
Receivable for investments sold |
|
7,053 |
|
Receivable for fund shares sold |
|
496 |
|
Dividends receivable |
|
1,520 |
|
Interest receivable |
|
51 |
|
Distributions receivable from Fidelity Central Funds |
|
18 |
|
Prepaid expenses |
|
3 |
|
Other receivables |
|
2 |
|
Total assets |
|
1,074,935 |
|
|
|
|
|
Liabilities |
|
|
|
Payable for investments purchased |
$ 5,959 |
|
|
Payable for fund shares redeemed |
4,061 |
|
|
Accrued management fee |
329 |
|
|
Distribution and service plan fees payable |
373 |
|
|
Other affiliated payables |
213 |
|
|
Other payables and accrued expenses |
79 |
|
|
Collateral on securities loaned, at value |
3,385 |
|
|
Total liabilities |
|
14,399 |
|
|
|
|
|
Net Assets |
|
$ 1,060,536 |
|
Net Assets consist of: |
|
|
|
Paid in capital |
|
$ 848,860 |
|
Undistributed net investment income |
|
3,162 |
|
Accumulated undistributed net realized gain (loss) on investments and foreign currency transactions |
|
(4,094) |
|
Net unrealized appreciation (depreciation) on investments and assets and liabilities in foreign currencies |
|
212,608 |
|
Net Assets |
|
$ 1,060,536 |
See accompanying notes which are an integral part of the financial statements.
Annual Report
Financial Statements - continued
Statement of Assets and Liabilities - continued
|
Amounts in thousands (except per-share amounts) |
November 30, 2013 |
|
|
|
|
|
|
Calculation of Maximum Offering Price Class A: |
|
$ 17.23 |
|
|
|
|
|
Maximum offering price per share (100/94.25 of $17.23) |
|
$ 18.28 |
|
Class T: |
|
$ 17.15 |
|
|
|
|
|
Maximum offering price per share (100/96.50 of $17.15) |
|
$ 17.77 |
|
Class B: |
|
$ 16.57 |
|
|
|
|
|
Class C: |
|
$ 16.54 |
|
|
|
|
|
Institutional Class: |
|
$ 17.91 |
|
|
|
|
|
Class Z: |
|
$ 17.92 |
A Redemption price per share is equal to net asset value less any applicable contingent deferred sales charge.
See accompanying notes which are an integral part of the financial statements.
Annual Report
Statement of Operations
|
Amounts in thousands |
Year ended November 30, 2013 |
|
|
|
|
|
|
Investment Income |
|
|
|
Dividends |
|
$ 16,427 |
|
Interest |
|
494 |
|
Income from Fidelity Central Funds |
|
475 |
|
Total income |
|
17,396 |
|
|
|
|
|
Expenses |
|
|
|
Management fee |
$ 5,243 |
|
|
Performance adjustment |
(1,346) |
|
|
Transfer agent fees |
2,165 |
|
|
Distribution and service plan fees |
4,080 |
|
|
Accounting and security lending fees |
319 |
|
|
Custodian fees and expenses |
211 |
|
|
Independent trustees' compensation |
5 |
|
|
Registration fees |
100 |
|
|
Audit |
69 |
|
|
Legal |
5 |
|
|
Miscellaneous |
8 |
|
|
Total expenses before reductions |
10,859 |
|
|
Expense reductions |
(121) |
10,738 |
|
Net investment income (loss) |
|
6,658 |
|
Realized and Unrealized Gain (Loss) Net realized gain (loss) on: |
|
|
|
Investment securities: |
|
|
|
Unaffiliated issuers |
96,965 |
|
|
Foreign currency transactions |
(28) |
|
|
Total net realized gain (loss) |
|
96,937 |
|
Change in net unrealized appreciation (depreciation) on: Investment securities |
145,249 |
|
|
Assets and liabilities in foreign currencies |
4 |
|
|
Total change in net unrealized appreciation (depreciation) |
|
145,253 |
|
Net gain (loss) |
|
242,190 |
|
Net increase (decrease) in net assets resulting from operations |
|
$ 248,848 |
See accompanying notes which are an integral part of the financial statements.
Annual Report
Financial Statements - continued
Statement of Changes in Net Assets
|
Amounts in thousands |
Year ended |
Year ended |
|
Increase (Decrease) in Net Assets |
|
|
|
Operations |
|
|
|
Net investment income (loss) |
$ 6,658 |
$ 3,116 |
|
Net realized gain (loss) |
96,937 |
39,284 |
|
Change in net unrealized appreciation (depreciation) |
145,253 |
84,266 |
|
Net increase (decrease) in net assets resulting |
248,848 |
126,666 |
|
Distributions to shareholders from net investment income |
(5,093) |
- |
|
Share transactions - net increase (decrease) |
(30,529) |
(97,081) |
|
Total increase (decrease) in net assets |
213,226 |
29,585 |
|
|
|
|
|
Net Assets |
|
|
|
Beginning of period |
847,310 |
817,725 |
|
End of period (including undistributed net investment income of $3,162 and undistributed net investment income of $2,813, respectively) |
$ 1,060,536 |
$ 847,310 |
See accompanying notes which are an integral part of the financial statements.
Annual Report
Financial Highlights - Class A
|
Years ended November 30, |
2013 |
2012 |
2011 |
2010 |
2009 |
|
Selected Per-Share Data |
|
|
|
|
|
|
Net asset value, beginning of period |
$ 13.33 |
$ 11.45 |
$ 11.58 |
$ 9.95 |
$ 6.64 |
|
Income from Investment Operations |
|
|
|
|
|
|
Net investment income (loss) C |
.13 |
.07 |
.02 |
.03 F |
.04 |
|
Net realized and unrealized gain (loss) |
3.87 |
1.81 |
(.09) |
1.66 |
3.41 |
|
Total from investment operations |
4.00 |
1.88 |
(.07) |
1.69 |
3.45 |
|
Distributions from net investment income |
(.10) |
- |
- |
(.02) |
(.14) |
|
Distributions from net realized gain |
- |
- |
(.06) |
(.05) |
- |
|
Total distributions |
(.10) |
- |
(.06) |
(.06) H |
(.14) |
|
Net asset value, end of period |
$ 17.23 |
$ 13.33 |
$ 11.45 |
$ 11.58 |
$ 9.95 |
|
Total Return A, B |
30.26% |
16.42% |
(.63)% |
17.09% |
52.97% |
|
Ratios to Average Net Assets D, G |
|
|
|
|
|
|
Expenses before reductions |
.98% |
1.21% |
1.36% |
1.36% |
1.08% |
|
Expenses net of fee waivers, if any |
.98% |
1.21% |
1.33% |
1.25% |
1.08% |
|
Expenses net of all reductions |
.97% |
1.20% |
1.33% |
1.24% |
1.08% |
|
Net investment income (loss) |
.87% |
.53% |
.16% |
.24% F |
.56% |
|
Supplemental Data |
|
|
|
|
|
|
Net assets, end of period (in millions) |
$ 369 |
$ 301 |
$ 295 |
$ 285 |
$ 240 |
|
Portfolio turnover rate E |
70% |
64% |
68% |
80% |
88% |
A Total returns would have been lower if certain expenses had not been reduced during the applicable periods shown.
B Total returns do not include the effect of the sales charges.
C Calculated based on average shares outstanding during the period.
D Fees and expenses of any underlying Fidelity Central Funds are not included in the Fund's expense ratio. The Fund indirectly bears its proportionate share of the expenses of any underlying Fidelity Central Funds.
E Amount does not include the portfolio activity of any underlying Fidelity Central Funds.
F Investment income per share reflects a large, non-recurring dividend which amounted to $.02 per share. Excluding this non-recurring dividend, the ratio of net investment income (loss) to average net assets would have been .10%.
G Expense ratios reflect operating expenses of the class. Expenses before reductions do not reflect amounts reimbursed by the investment adviser or reductions from brokerage service arrangements or reductions from other expense offset arrangements and do not represent the amount paid by the class during periods when reimbursements or reductions occur. Expenses net of fee waivers reflect expenses after reimbursement by the investment adviser but prior to reductions from brokerage service arrangements or other expense offset arrangements. Expenses net of all reductions represent the net expenses paid by the class.
H Total distributions of $.06 per share is comprised of distributions from net investment income of $.018 and distributions from net realized gain of $.045 per share.
See accompanying notes which are an integral part of the financial statements.
Annual Report
Financial Highlights - Class T
|
Years ended November 30, |
2013 |
2012 |
2011 |
2010 |
2009 |
|
Selected Per-Share Data |
|
|
|
|
|
|
Net asset value, beginning of period |
$ 13.26 |
$ 11.42 |
$ 11.55 |
$ 9.92 |
$ 6.60 |
|
Income from Investment Operations |
|
|
|
|
|
|
Net investment income (loss) C |
.10 |
.04 |
(.01) |
- F, H |
.03 |
|
Net realized and unrealized gain (loss) |
3.86 |
1.80 |
(.09) |
1.67 |
3.39 |
|
Total from investment operations |
3.96 |
1.84 |
(.10) |
1.67 |
3.42 |
|
Distributions from net investment income |
(.07) |
- |
- |
- |
(.10) |
|
Distributions from net realized gain |
- |
- |
(.03) |
(.04) |
- |
|
Total distributions |
(.07) |
- |
(.03) |
(.04) |
(.10) |
|
Net asset value, end of period |
$ 17.15 |
$ 13.26 |
$ 11.42 |
$ 11.55 |
$ 9.92 |
|
Total Return A, B |
30.05% |
16.11% |
(.90)% |
16.88% |
52.60% |
|
Ratios to Average Net Assets D, G |
|
|
|
|
|
|
Expenses before reductions |
1.20% |
1.42% |
1.57% |
1.57% |
1.31% |
|
Expenses net of fee waivers, if any |
1.20% |
1.42% |
1.55% |
1.50% |
1.31% |
|
Expenses net of all reductions |
1.19% |
1.42% |
1.54% |
1.49% |
1.30% |
|
Net investment income (loss) |
.65% |
.32% |
(.06)% |
(.01)% F |
.34% |
|
Supplemental Data |
|
|
|
|
|
|
Net assets, end of period (in millions) |
$ 375 |
$ 304 |
$ 294 |
$ 322 |
$ 305 |
|
Portfolio turnover rate E |
70% |
64% |
68% |
80% |
88% |
A Total returns would have been lower if certain expenses had not been reduced during the applicable periods shown.
B Total returns do not include the effect of the sales charges.
C Calculated based on average shares outstanding during the period.
D Fees and expenses of any underlying Fidelity Central Funds are not included in the Fund's expense ratio. The Fund indirectly bears its proportionate share of the expenses of any underlying Fidelity Central Funds.
E Amount does not include the portfolio activity of any underlying Fidelity Central Funds.
F Investment income per share reflects a large, non-recurring dividend which amounted to $.02 per share. Excluding this non-recurring dividend, the ratio of net investment income (loss) to average net assets would have been (.15) %.
G Expense ratios reflect operating expenses of the class. Expenses before reductions do not reflect amounts reimbursed by the investment adviser or reductions from brokerage service arrangements or reductions from other expense offset arrangements and do not represent the amount paid by the class during periods when reimbursements or reductions occur. Expenses net of fee waivers reflect expenses after reimbursement by the investment adviser but prior to reductions from brokerage service arrangements or other expense offset arrangements. Expenses net of all reductions represent the net expenses paid by the class.
H Amount represents less than $.01 per share.
See accompanying notes which are an integral part of the financial statements.
Annual Report
Financial Highlights - Class B
|
Years ended November 30, |
2013 |
2012 |
2011 |
2010 |
2009 |
|
Selected Per-Share Data |
|
|
|
|
|
|
Net asset value, beginning of period |
$ 12.82 |
$ 11.11 |
$ 11.26 |
$ 9.68 |
$ 6.42 |
|
Income from Investment Operations |
|
|
|
|
|
|
Net investment income (loss) C |
.01 |
(.03) |
(.07) |
(.05) F |
(.01) |
|
Net realized and unrealized gain (loss) |
3.74 |
1.74 |
(.08) |
1.63 |
3.31 |
|
Total from investment operations |
3.75 |
1.71 |
(.15) |
1.58 |
3.30 |
|
Distributions from net investment income |
- |
- |
- |
- |
(.04) |
|
Net asset value, end of period |
$ 16.57 |
$ 12.82 |
$ 11.11 |
$ 11.26 |
$ 9.68 |
|
Total Return A, B |
29.25% |
15.39% |
(1.33)% |
16.32% |
51.61% |
|
Ratios to Average Net Assets D, G |
|
|
|
|
|
|
Expenses before reductions |
1.79% |
1.99% |
2.14% |
2.13% |
1.81% |
|
Expenses net of fee waivers, if any |
1.79% |
1.99% |
2.09% |
2.00% |
1.81% |
|
Expenses net of all reductions |
1.78% |
1.99% |
2.09% |
2.00% |
1.80% |
|
Net investment income (loss) |
.06% |
(.25)% |
(.61)% |
(.51)% F |
(.17)% |
|
Supplemental Data |
|
|
|
|
|
|
Net assets, end of period (in millions) |
$ 15 |
$ 17 |
$ 22 |
$ 43 |
$ 69 |
|
Portfolio turnover rate E |
70% |
64% |
68% |
80% |
88% |
A Total returns would have been lower if certain expenses had not been reduced during the applicable periods shown.
B Total returns do not include the effect of the contingent deferred sales charge.
C Calculated based on average shares outstanding during the period.
D Fees and expenses of any underlying Fidelity Central Funds are not included in the Fund's expense ratio. The Fund indirectly bears its proportionate share of the expenses of any underlying Fidelity Central Funds.
E Amount does not include the portfolio activity of any underlying Fidelity Central Funds.
F Investment income per share reflects a large, non-recurring dividend which amounted to $.02 per share. Excluding this non-recurring dividend, the ratio of net investment income (loss) to average net assets would have been (.66) %.
G Expense ratios reflect operating expenses of the class. Expenses before reductions do not reflect amounts reimbursed by the investment adviser or reductions from brokerage service arrangements or reductions from other expense offset arrangements and do not represent the amount paid by the class during periods when reimbursements or reductions occur. Expenses net of fee waivers reflect expenses after reimbursement by the investment adviser but prior to reductions from brokerage service arrangements or other expense offset arrangements. Expenses net of all reductions represent the net expenses paid by the class.
See accompanying notes which are an integral part of the financial statements.
Annual Report
Financial Highlights - Class C
|
Years ended November 30, |
2013 |
2012 |
2011 |
2010 |
2009 |
|
Selected Per-Share Data |
|
|
|
|
|
|
Net asset value, beginning of period |
$ 12.79 |
$ 11.07 |
$ 11.22 |
$ 9.65 |
$ 6.41 |
|
Income from Investment Operations |
|
|
|
|
|
|
Net investment income (loss) C |
.02 |
(.02) |
(.07) |
(.05) F |
(.01) |
|
Net realized and unrealized gain (loss) |
3.73 |
1.74 |
(.08) |
1.62 |
3.30 |
|
Total from investment operations |
3.75 |
1.72 |
(.15) |
1.57 |
3.29 |
|
Distributions from net investment income |
- H |
- |
- |
- |
(.05) |
|
Distributions from net realized gain |
- |
- |
- |
- H |
- |
|
Total distributions |
- H |
- |
- |
- H |
(.05) |
|
Net asset value, end of period |
$ 16.54 |
$ 12.79 |
$ 11.07 |
$ 11.22 |
$ 9.65 |
|
Total Return A, B |
29.36% |
15.54% |
(1.34)% |
16.31% |
51.79% |
|
Ratios to Average Net Assets D, G |
|
|
|
|
|
|
Expenses before reductions |
1.72% |
1.94% |
2.08% |
2.08% |
1.81% |
|
Expenses net of fee waivers, if any |
1.72% |
1.94% |
2.06% |
2.00% |
1.81% |
|
Expenses net of all reductions |
1.71% |
1.93% |
2.05% |
1.99% |
1.81% |
|
Net investment income (loss) |
.13% |
(.20)% |
(.57)% |
(.51)% F |
(.17)% |
|
Supplemental Data |
|
|
|
|
|
|
Net assets, end of period (in millions) |
$ 160 |
$ 123 |
$ 124 |
$ 129 |
$ 125 |
|
Portfolio turnover rate E |
70% |
64% |
68% |
80% |
88% |
A Total returns would have been lower if certain expenses had not been reduced during the applicable periods shown.
B Total returns do not include the effect of the contingent deferred sales charge.
C Calculated based on average shares outstanding during the period.
D Fees and expenses of any underlying Fidelity Central Funds are not included in the Fund's expense ratio. The Fund indirectly bears its proportionate share of the expenses of any underlying Fidelity Central Funds.
E Amount does not include the portfolio activity of any underlying Fidelity Central Funds.
F Investment income per share reflects a large, non-recurring dividend which amounted to $.02 per share. Excluding this non-recurring dividend, the ratio of net investment income (loss) to average net assets would have been (.65) %.
G Expense ratios reflect operating expenses of the class. Expenses before reductions do not reflect amounts reimbursed by the investment adviser or reductions from brokerage service arrangements or reductions from other expense offset arrangements and do not represent the amount paid by the class during periods when reimbursements or reductions occur. Expenses net of fee waivers reflect expenses after reimbursement by the investment adviser but prior to reductions from brokerage service arrangements or other expense offset arrangements. Expenses net of all reductions represent the net expenses paid by the class.
H Amount represents less than $.01 per share.
See accompanying notes which are an integral part of the financial statements.
Annual Report
Financial Highlights - Institutional Class
|
Years ended November 30, |
2013 |
2012 |
2011 |
2010 |
2009 |
|
Selected Per-Share Data |
|
|
|
|
|
|
Net asset value, beginning of period |
$ 13.86 |
$ 11.88 |
$ 12.00 |
$ 10.31 |
$ 6.73 |
|
Income from Investment Operations |
|
|
|
|
|
|
Net investment income (loss) B |
.18 |
.11 |
.06 |
.05 E |
.08 |
|
Net realized and unrealized gain (loss) |
4.02 |
1.87 |
(.09) |
1.74 |
3.52 |
|
Total from investment operations |
4.20 |
1.98 |
(.03) |
1.79 |
3.60 |
|
Distributions from net investment income |
(.15) |
- |
(.02) |
(.06) |
(.02) |
|
Distributions from net realized gain |
- |
- |
(.07) |
(.04) |
- |
|
Total distributions |
(.15) |
- |
(.09) |
(.10) |
(.02) |
|
Net asset value, end of period |
$ 17.91 |
$ 13.86 |
$ 11.88 |
$ 12.00 |
$ 10.31 |
|
Total Return A |
30.63% |
16.67% |
(.33)% |
17.47% |
53.57% |
|
Ratios to Average Net Assets C, F |
|
|
|
|
|
|
Expenses before reductions |
.70% |
.91% |
1.04% |
1.03% |
.70% |
|
Expenses net of fee waivers, if any |
.70% |
.91% |
1.03% |
1.00% |
.70% |
|
Expenses net of all reductions |
.69% |
.90% |
1.02% |
.99% |
.69% |
|
Net investment income (loss) |
1.15% |
.83% |
.46% |
.49% E |
.94% |
|
Supplemental Data |
|
|
|
|
|
|
Net assets, end of period (in millions) |
$ 135 |
$ 103 |
$ 83 |
$ 73 |
$ 66 |
|
Portfolio turnover rate D |
70% |
64% |
68% |
80% |
88% |
A Total returns would have been lower if certain expenses had not been reduced during the applicable periods shown.
B Calculated based on average shares outstanding during the period.
C Fees and expenses of any underlying Fidelity Central Funds are not included in the Fund's expense ratio. The Fund indirectly bears its proportionate share of the expenses of any underlying Fidelity Central Funds.
D Amount does not include the portfolio activity of any underlying Fidelity Central Funds.
E Investment income per share reflects a large, non-recurring dividend which amounted to $.02 per share. Excluding this non-recurring dividend, the ratio of net investment income (loss) to average net assets would have been .35%.
F Expense ratios reflect operating expenses of the class. Expenses before reductions do not reflect amounts reimbursed by the investment adviser or reductions from brokerage service arrangements or reductions from other expense offset arrangements and do not represent the amount paid by the class during periods when reimbursements or reductions occur. Expenses net of fee waivers reflect expenses after reimbursement by the investment adviser but prior to reductions from brokerage service arrangements or other expense offset arrangements. Expenses net of all reductions represent the net expenses paid by the class.
See accompanying notes which are an integral part of the financial statements.
Annual Report
Financial Highlights - Class Z
|
Year ended November 30, |
2013 G |
|
Selected Per-Share Data |
|
|
Net asset value, beginning of period |
$ 16.59 |
|
Income from Investment Operations |
|
|
Net investment income (loss) D |
.06 |
|
Net realized and unrealized gain (loss) |
1.27 |
|
Total from investment operations |
1.33 |
|
Net asset value, end of period |
$ 17.92 |
|
Total Return B, C |
8.02% |
|
Ratios to Average Net Assets E, H |
|
|
Expenses before reductions |
.54% A |
|
Expenses net of fee waivers, if any |
.54% A |
|
Expenses net of all reductions |
.52% A |
|
Net investment income (loss) |
1.26% A |
|
Supplemental Data |
|
|
Net assets, end of period (in millions) |
$ 7 |
|
Portfolio turnover rate F |
70% |
A Annualized
B Total returns for periods of less than one year are not annualized.
C Total returns would have been lower if certain expenses had not been reduced during the applicable periods shown.
D Calculated based on average shares outstanding during the period.
E Fees and expenses of any underlying Fidelity Central Funds are not included in the Fund's expense ratio. The Fund indirectly bears its proportionate share of the expenses of any underlying Fidelity Central Funds.
F Amount does not include the portfolio activity of any underlying Fidelity Central Funds.
G For the period August 13, 2013 (commencement of sale of shares) to November 30, 2013.
H Expense ratios reflect operating expenses of the class. Expenses before reductions do not reflect amounts reimbursed by the investment adviser or reductions from brokerage service arrangements or reductions from other expense offset arrangements and do not represent the amount paid by the class during periods when reimbursements or reductions occur. Expense ratios before reductions for start-up periods may not be representative of longer-term operating periods. Expenses net of fee waivers reflect expenses after reimbursement by the investment adviser but prior to reductions from brokerage service arrangements or other expense offset arrangements. Expenses net of all reductions represent the net expenses paid by the class.
See accompanying notes which are an integral part of the financial statements.
Annual Report
Notes to Financial Statements
For the period ended November 30, 2013
(Amounts in thousands except percentages)
1. Organization.
Fidelity Advisor® Dividend Growth Fund (the Fund) is a fund of Fidelity Advisor Series I (the Trust) and is authorized to issue an unlimited number of shares. The Trust is registered under the Investment Company Act of 1940, as amended (the 1940 Act), as an open-end management investment company organized as a Massachusetts business trust. The Fund commenced sale of Class Z on August 13, 2013. The Fund offers Class A, Class T, Class C, Institutional Class and Class Z shares, each of which, along with Class B shares, has equal rights as to assets and voting privileges. Class B shares are closed to new accounts and additional purchases, except for exchanges and reinvestments. Each class has exclusive voting rights with respect to matters that affect that class. Class B shares will automatically convert to Class A shares after a holding period of seven years from the initial date of purchase.
2. Investments in Fidelity Central Funds.
The Fund invests in Fidelity Central Funds, which are open-end investment companies generally available only to other investment companies and accounts managed by the investment adviser and its affiliates. The Fund's Schedule of Investments lists each of the Fidelity Central Funds held as of period end, if any, as an investment of the Fund, but does not include the underlying holdings of each Fidelity Central Fund. As an Investing Fund, the Fund indirectly bears its proportionate share of the expenses of the underlying Fidelity Central Funds.
The Money Market Central Funds seek preservation of capital and current income and are managed by Fidelity Investments Money Management, Inc. (FIMM), an affiliate of the investment adviser. Annualized expenses of the Money Market Central Funds as of their most recent shareholder report date are less than .01%.
A complete unaudited list of holdings for each Fidelity Central Fund is available upon request or at the Securities and Exchange Commission (the SEC) website at www.sec.gov. In addition, the financial statements of the Fidelity Central Funds, which are not covered by the Fund's Report of Independent Registered Public Accounting Firm, are available on the SEC website or upon request.
3. Significant Accounting Policies.
The financial statements have been prepared in conformity with accounting principles generally accepted in the United States of America (GAAP), which require management to make certain estimates and assumptions at the date of the financial statements. Actual results could differ from those estimates. Subsequent events, if any, through the date that the financial statements were issued have been evaluated in the preparation of
Annual Report
3. Significant Accounting Policies - continued
the financial statements. The following summarizes the significant accounting policies of the Fund:
Investment Valuation. Investments are valued as of 4:00 p.m. Eastern time on the last calendar day of the period. In accordance with valuation policies and procedures approved by the Board of Trustees (the Board), the Fund attempts to obtain prices from one or more third party pricing vendors or brokers to value its investments. When current market prices, quotations or currency exchange rates are not readily available or reliable, investments will be fair valued in good faith by the Fidelity Management & Research Company (FMR) Fair Value Committee (the Committee), in accordance with procedures adopted by the Board. Factors used in determining fair value vary by investment type and may include market or investment specific events, changes in interest rates and credit quality. The frequency with which these procedures are used cannot be predicted and they may be utilized to a significant extent. The Committee oversees the Fund's valuation policies and procedures and is responsible for approving and reporting to the Board all fair value determinations.
The Fund categorizes the inputs to valuation techniques used to value its investments into a disclosure hierarchy consisting of three levels as shown below:
Level 1 - quoted prices in active markets for identical investments
Level 2 - other significant observable inputs (including quoted prices for similar investments, interest rates, prepayment speeds, etc.)
Level 3 - unobservable inputs (including the Fund's own assumptions based on the best information available)
Valuation techniques used to value the Fund's investments by major category are as follows:
Equity securities, including restricted securities, for which market quotations are readily available, are valued at the last reported sale price or official closing price as reported by a third party pricing vendor on the primary market or exchange on which they are traded and are categorized as Level 1 in the hierarchy. In the event there were no sales during the day or closing prices are not available, securities are valued at the last quoted bid price or may be valued using the last available price and are generally categorized as Level 2 in the hierarchy. For foreign equity securities, when market or security specific events arise, comparisons to the valuation of American Depositary Receipts (ADRs), futures contracts, Exchange-Traded Funds (ETFs) and certain indexes as well as quoted prices for similar securities may be used and would be categorized as Level 2 in the hierarchy. Utilizing these techniques may result in transfers between Level 1 and Level 2. For equity securities, including restricted securities, where observable inputs are
Annual Report
Notes to Financial Statements - continued
(Amounts in thousands except percentages)
3. Significant Accounting Policies - continued
Investment Valuation - continued
limited, assumptions about market activity and risk are used and these securities may be categorized as Level 3 in the hierarchy.
Debt securities, including restricted securities, are valued based on evaluated prices received from third party pricing vendors or from brokers who make markets in such securities. For corporate bonds, pricing vendors utilize matrix pricing which considers yield or price of bonds of comparable quality, coupon, maturity and type as well as broker-supplied prices. When independent prices are unavailable or unreliable, debt securities may be valued utilizing pricing methodologies which consider similar factors that would be used by third party pricing vendors. Debt securities are generally categorized as Level 2 in the hierarchy but may be Level 3 depending on the circumstances.
Investments in open-end mutual funds, including the Fidelity Central Funds, are valued at their closing net asset value (NAV) each business day and are categorized as Level 1 in the hierarchy.
Changes in valuation techniques may result in transfers in or out of an assigned level within the disclosure hierarchy. The aggregate value of investments by input level, as of November 30, 2013, is included at the end of the Fund's Schedule of Investments.
Foreign Currency. The Fund may use foreign currency contracts to facilitate transactions in foreign-denominated securities. Gains and losses from these transactions may arise from changes in the value of the foreign currency or if the counterparties do not perform under the contracts' terms.
Foreign-denominated assets, including investment securities, and liabilities are translated into U.S. dollars at the exchange rates at period end. Purchases and sales of investment securities, income and dividends received and expenses denominated in foreign currencies are translated into U.S. dollars at the exchange rate in effect on the transaction date.
The effects of exchange rate fluctuations on investments are included with the net realized and unrealized gain (loss) on investment securities. Other foreign currency transactions resulting in realized and unrealized gain (loss) are disclosed separately.
Investment Transactions and Income. For financial reporting purposes, the Fund's investment holdings and NAV include trades executed through the end of the last business day of the period. The NAV per share for processing shareholder transactions is calculated as of the close of business of the New York Stock Exchange (NYSE), normally 4:00 p.m. Eastern time and includes trades executed through the end of the prior business day. Gains and losses on securities sold are determined on the basis of identified cost and may include proceeds received from litigation. Dividend income is recorded on
Annual Report
3. Significant Accounting Policies - continued
Investment Transactions and Income - continued
the ex-dividend date, except for certain dividends from foreign securities where the ex-dividend date may have passed, which are recorded as soon as the Fund is informed of the ex-dividend date. Non-cash dividends included in dividend income, if any, are recorded at the fair market value of the securities received. Distributions received on securities that represent a return of capital or capital gain are recorded as a reduction of cost of investments and/or as a realized gain. Subsequent to ex-dividend date the Fund determines the components of these distributions, based upon receipt of tax filings or other correspondence relating to the underlying investment. Interest income and distributions from the Fidelity Central Funds are accrued as earned. Interest income includes coupon interest and amortization of premium and accretion of discount on debt securities. Investment income is recorded net of foreign taxes withheld where recovery of such taxes is uncertain.
Class Allocations and Expenses. Investment income, realized and unrealized capital gains and losses, common expenses of the Fund, and certain fund-level expense reductions, if any, are allocated daily on a pro-rata basis to each class based on the relative net assets of each class to the total net assets of the Fund. Each class differs with respect to transfer agent and distribution and service plan fees incurred. Certain expense reductions may also differ by class. For the reporting period, the allocated portion of income and expenses to each class as a percent of its average net assets may vary due to the timing of recording these transactions in relation to fluctuating net assets of the classes. Expenses directly attributable to a fund are charged to that fund. Expenses attributable to more than one fund are allocated among the respective funds on the basis of relative net assets or other appropriate methods. Expense estimates are accrued in the period to which they relate and adjustments are made when actual amounts are known.
Income Tax Information and Distributions to Shareholders. Each year, the Fund intends to qualify as a regulated investment company under Subchapter M of the Internal Revenue Code, including distributing substantially all of its taxable income and realized gains. As a result, no provision for U.S. Federal income taxes is required. As of November 30, 2013, the Fund did not have any unrecognized tax benefits in the financial statements; nor is the Fund aware of any tax positions for which it is reasonably possible that the total amounts of unrecognized tax benefits will significantly change in the next twelve months. The Fund files a U.S. federal tax return, in addition to state and local tax returns as required. The Fund's federal income tax returns are subject to examination by the Internal Revenue Service (IRS) for a period of three fiscal years after they are filed. State and local tax returns may be subject to examination for an additional fiscal year depending on the jurisdiction. Foreign taxes are provided for based on the Fund's
Annual Report
Notes to Financial Statements - continued
(Amounts in thousands except percentages)
3. Significant Accounting Policies - continued
Income Tax Information and Distributions to Shareholders - continued
understanding of the tax rules and rates that exist in the foreign markets in which it invests.
Distributions are declared and recorded on the ex-dividend date. Income dividends and capital gain distributions are declared separately for each class. Income and capital gain distributions are determined in accordance with income tax regulations, which may differ from GAAP. These differences resulted in distribution reclassifications. In addition, the Fund claimed a portion of the payment made to redeeming shareholders as a distribution for income tax purposes.
Capital accounts within the financial statements are adjusted for permanent book-tax differences. These adjustments have no impact on net assets or the results of operations. Temporary book-tax differences will reverse in a subsequent period.
Book-tax differences are primarily due to foreign currency transactions, passive foreign investment companies (PFIC), market discount, partnerships, capital loss carryforwards and losses deferred due to wash sales.
The federal tax cost of investment securities and unrealized appreciation (depreciation) as of period end were as follows:
|
Gross unrealized appreciation |
$ 227,099 |
|
Gross unrealized depreciation |
(19,049) |
|
Net unrealized appreciation (depreciation) on securities and other investments |
$ 208,050 |
|
|
|
|
Tax Cost |
$ 857,618 |
The tax-based components of distributable earnings as of period end were as follows:
|
Undistributed ordinary income |
$ 3,308 |
|
Undistributed gains |
$ 317 |
|
Net unrealized appreciation (depreciation) |
$ 208,050 |
The tax character of distributions paid was as follows:
|
|
November 30, 2013 |
November 30, 2012 |
|
Ordinary Income |
$ 5,093 |
$ - |
Annual Report
3. Significant Accounting Policies - continued
Restricted Securities. The Fund may invest in securities that are subject to legal or contractual restrictions on resale. These securities generally may be resold in transactions exempt from registration or to the public if the securities are registered. Disposal of these securities may involve time-consuming negotiations and expense, and prompt sale at an acceptable price may be difficult. Information regarding restricted securities is included at the end of the Fund's Schedule of Investments.
4. Purchases and Sales of Investments.
Purchases and sales of securities, other than short-term securities, aggregated $655,325 and $689,639, respectively.
5. Fees and Other Transactions with Affiliates.
Management Fee. Fidelity Management & Research Company (the investment adviser) and its affiliates provide the Fund with investment management related services for which the Fund pays a monthly management fee. The management fee is the sum of an individual fund fee rate that is based on an annual rate of .30% of the Fund's average net assets and an annualized group fee rate that averaged .25% during the period. The group fee rate is based upon the average net assets of all the mutual funds advised by the investment adviser, including any mutual funds previously advised by the investment adviser that are currently advised by Fidelity SelectCo, LLC, an affiliate of the investment adviser. The group fee rate decreases as assets under management increase and increases as assets under management decrease. In addition, the management fee is subject to a performance adjustment (up to a maximum of ± .20% of the Fund's average net assets over a 36 month performance period). The upward or downward adjustment to the management fee is based on the relative investment performance of the Institutional Class of the Fund as compared to an appropriate benchmark index over the same 36 month performance period. For the reporting period, the total annual management fee rate, including the performance adjustment, was .41% of the Fund's average net assets. The performance adjustment included in the management fee rate may be higher or lower than the maximum performance adjustment rate due to the difference between the average net assets for the reporting and performance periods.
Distribution and Service Plan Fees. In accordance with Rule 12b-1 of the 1940 Act, the Fund has adopted separate Distribution and Service Plans for each class of shares. Certain classes pay Fidelity Distributors Corporation (FDC), an affiliate of the investment adviser, separate Distribution and Service Fees, each of which is based on an annual percentage of each class' average net assets. In addition, FDC may pay financial intermediaries for selling shares of the Fund and providing shareholder support services.
Annual Report
Notes to Financial Statements - continued
(Amounts in thousands except percentages)
5. Fees and Other Transactions with Affiliates - continued
Distribution and Service Plan Fees - continued
For the period, the Distribution and Service Fee rates, total fees and amounts retained by FDC were as follows:
|
|
Distribution |
Service |
Total Fees |
Retained |
|
Class A |
-% |
.25% |
$ 840 |
$ 14 |
|
Class T |
.25% |
.25% |
1,688 |
9 |
|
Class B |
.75% |
.25% |
154 |
117 |
|
Class C |
.75% |
.25% |
1,398 |
110 |
|
|
|
|
$ 4,080 |
$ 250 |
Sales Load. FDC may receive a front-end sales charge of up to 5.75% for selling Class A shares and 3.50% for selling Class T shares, some of which is paid to financial intermediaries for selling shares of the Fund. Depending on the holding period, FDC may receive contingent deferred sales charges levied on Class A, Class T, Class B, and Class C redemptions. The deferred sales charges range from 5.00% to 1.00% for Class B shares, 1.00% for Class C shares, 1.00% for certain purchases of Class A shares and .25% for certain purchases of Class T shares.
For the period, sales charge amounts retained by FDC were as follows:
|
|
Retained |
|
Class A |
$ 81 |
|
Class T |
24 |
|
Class B* |
14 |
|
Class C* |
7 |
|
|
$ 126 |
* When Class B and Class C shares are initially sold, FDC pays commissions from its own resources to financial intermediaries through which the sales
are made.
Transfer Agent Fees. Fidelity Investments Institutional Operations Company, Inc., (FIIOC), an affiliate of the investment adviser, is the transfer, dividend disbursing and shareholder servicing agent for each class of the Fund. FIIOC receives account fees and asset-based fees that vary according to the account size and type of account of the shareholders of the respective classes of the Fund, except for Class Z. FIIOC receives an asset-based fee of Class Z's average net assets. FIIOC pays for typesetting, printing and mailing of shareholder reports, except proxy statements.
Annual Report
5. Fees and Other Transactions with Affiliates - continued
Transfer Agent Fees - continued
For the period, transfer agent fees for each applicable class were as follows:
|
|
Amount |
% of |
|
Class A |
$ 814 |
.24 |
|
Class T |
727 |
.22 |
|
Class B |
46 |
.30 |
|
Class C |
327 |
.23 |
|
Institutional Class |
251 |
.21 |
|
Class Z |
-* |
.05** |
|
|
$ 2,165 |
|
* Amount represents one hundred and forty three dollars
** Annualized
Accounting and Security Lending Fees. Fidelity Service Company, Inc. (FSC), an affiliate of the investment adviser, maintains the Fund's accounting records. The accounting fee is based on the level of average net assets for each month. Under a separate contract, FSC administers the security lending program. The security lending fee is based on the number and duration of lending transactions.
Brokerage Commissions. The Fund placed a portion of its portfolio transactions with brokerage firms which are affiliates of the investment adviser. Brokerage commissions are included in net realized gain (loss) and change in net unrealized appreciation (depreciation) in the Statement of Operations. The commissions paid to these affiliated firms were $21 for the period.
6. Committed Line of Credit.
The Fund participates with other funds managed by the investment adviser or an affiliate in a $4.25 billion credit facility (the "line of credit") to be utilized for temporary or emergency purposes to fund shareholder redemptions or for other short-term liquidity purposes. The Fund has agreed to pay commitment fees on its pro-rata portion of the line of credit, which amounted to $2 and is reflected in Miscellaneous expenses on the Statement of Operations. During the period, there were no borrowings on this line of credit.
7. Security Lending.
The Fund lends portfolio securities through a lending agent from time to time in order to earn additional income. For equity securities, a lending agent is used and may loan
Annual Report
Notes to Financial Statements - continued
(Amounts in thousands except percentages)
7. Security Lending - continued
securities to certain qualified borrowers, including Fidelity Capital Markets (FCM), a broker-dealer affiliated with the Fund. On the settlement date of the loan, the Fund receives collateral (in the form of U.S. Treasury obligations, letters of credit and/or cash) against the loaned securities and maintains collateral in an amount not less than 100% of the market value of the loaned securities during the period of the loan. The market value of the loaned securities is determined at the close of business of the Fund and any additional required collateral is delivered to the Fund on the next business day. If the borrower defaults on its obligation to return the securities loaned because of insolvency or other reasons, the Fund may apply collateral received from the borrower against the obligation. The Fund may experience delays and costs in recovering the securities loaned. Any cash collateral received is invested in the Fidelity Securities Lending Cash Central Fund. The value of loaned securities and cash collateral at period end are disclosed on the Fund's Statement of Assets and Liabilities. The value of securities loaned to FCM at period end was $619. Security lending income represents the income earned on investing cash collateral, less rebates paid to borrowers, plus any premium payments received for lending certain types of securities. Security lending income is presented in the Statement of Operations as a component of income from Fidelity Central Funds. Total security lending income during the period amounted to $467, including $12 from securities loaned to FCM.
8. Expense Reductions.
The investment adviser voluntarily agreed to reimburse a portion of the Fund's Class A, Class T, Class B, Class C and Institutional Class operating expenses.
The following classes were in reimbursement during the period:
|
|
Reimbursement |
|
|
|
|
Class A |
$ 5 |
|
Class T |
5 |
|
Class B |
-* |
|
Class C |
2 |
|
Institutional Class |
2 |
|
|
$ 14 |
* Amount represents two hundred and three dollars
Commissions paid to certain brokers with whom the investment adviser, or its affiliates, places trades on behalf of the Fund include an amount in addition to trade execution, which may be rebated back to the Fund to offset certain expenses. This amount totaled $107 for the period.
Annual Report
9. Distributions to Shareholders.
Distributions to shareholders of each class were as follows:
|
Years ended November 30, |
2013 |
2012 |
|
From net investment income |
|
|
|
Class A |
$ 2,287 |
$ - |
|
Class T |
1,666 |
- |
|
Class C |
38 |
- |
|
Institutional Class |
1,102 |
- |
|
Total |
$ 5,093 |
$ - |
10. Share Transactions.
Transactions for each class of shares were as follows:
|
|
Shares |
Dollars |
||
|
Years ended November 30, |
2013 A |
2012 |
2013 A |
2012 |
|
Class A |
|
|
|
|
|
Shares sold |
3,250 |
4,097 |
$ 49,173 |
$ 51,727 |
|
Reinvestment of distributions |
152 |
- |
2,006 |
- |
|
Shares redeemed |
(4,572) |
(7,320) |
(69,790) |
(93,009) |
|
Net increase (decrease) |
(1,170) |
(3,223) |
$ (18,611) |
$ (41,282) |
|
Class T |
|
|
|
|
|
Shares sold |
4,665 |
4,903 |
$ 69,969 |
$ 61,627 |
|
Reinvestment of distributions |
122 |
- |
1,600 |
- |
|
Shares redeemed |
(5,859) |
(7,690) |
(87,860) |
(96,565) |
|
Net increase (decrease) |
(1,072) |
(2,787) |
$ (16,291) |
$ (34,938) |
|
Class B |
|
|
|
|
|
Shares sold |
81 |
64 |
$ 1,199 |
$ 775 |
|
Reinvestment of distributions |
- |
- |
- |
- |
|
Shares redeemed |
(486) |
(764) |
(7,004) |
(9,292) |
|
Net increase (decrease) |
(405) |
(700) |
$ (5,805) |
$ (8,517) |
|
Class C |
|
|
|
|
|
Shares sold |
1,435 |
1,124 |
$ 21,000 |
$ 13,734 |
|
Reinvestment of distributions |
3 |
- |
32 |
- |
|
Shares redeemed |
(1,415) |
(2,672) |
(20,479) |
(32,129) |
|
Net increase (decrease) |
23 |
(1,548) |
$ 553 |
$ (18,395) |
|
Institutional Class |
|
|
|
|
|
Shares sold |
1,599 |
2,225 |
$ 25,325 |
$ 29,308 |
|
Reinvestment of distributions |
75 |
- |
1,032 |
- |
|
Shares redeemed |
(1,526) |
(1,777) |
(24,057) |
(23,257) |
|
Net increase (decrease) |
148 |
448 |
$ 2,300 |
$ 6,051 |
Annual Report
Notes to Financial Statements - continued
(Amounts in thousands except percentages)
10. Share Transactions - continued
|
|
Shares |
Dollars |
||
|
Years ended November 30, |
2013 A |
2012 |
2013 A |
2012 |
|
Class Z |
|
|
|
|
|
Shares sold |
420 |
- |
$ 7,441 |
$ - |
|
Reinvestment of distributions |
- |
- |
- |
- |
|
Shares redeemed |
(7) |
- |
(116) |
- |
|
Net increase (decrease) |
413 |
- |
$ 7,325 |
$ - |
A Share transactions for Class Z are for the period August 13, 2013 (commencement of sale of shares) to November 30, 2013.
11. Other.
The Fund's organizational documents provide former and current trustees and officers with a limited indemnification against liabilities arising in connection with the performance of their duties to the Fund. In the normal course of business, the Fund may also enter into contracts that provide general indemnifications. The Fund's maximum exposure under these arrangements is unknown as this would be dependent on future claims that may be made against the Fund. The risk of material loss from such claims is considered remote.
Annual Report
Report of Independent Registered Public Accounting Firm
To the Trustees of Fidelity Advisor Series I and the Shareholders of Fidelity Advisor Dividend Growth Fund:
In our opinion, the accompanying statement of assets and liabilities, including the schedule of investments, and the related statements of operations and of changes in net assets and the financial highlights present fairly, in all material respects, the financial position of Fidelity Advisor Dividend Growth Fund (a fund of Fidelity Advisor Series I) at November 30, 2013, the results of its operations for the year then ended, the changes in its net assets for each of the two years in the period then ended and the financial highlights for each of the periods indicated, in conformity with accounting principles generally accepted in the United States of America. These financial statements and financial highlights (hereafter referred to as "financial statements") are the responsibility of the Fidelity Advisor Dividend Growth Fund's management. Our responsibility is to express an opinion on these financial statements based on our audits. We conducted our audits of these financial statements in accordance with the standards of the Public Company Accounting Oversight Board (United States). Those standards require that we plan and perform the audit to obtain reasonable assurance about whether the financial statements are free of material misstatement. An audit includes examining, on a test basis, evidence supporting the amounts and disclosures in the financial statements, assessing the accounting principles used and significant estimates made by management, and evaluating the overall financial statement presentation. We believe that our audits, which included confirmation of securities at November 30, 2013 by correspondence with the custodian and brokers, provide a reasonable basis for our opinion.
PricewaterhouseCoopers LLP
Boston, Massachusetts
January 17, 2014
Annual Report
Trustees and Officers
The Trustees, Member of the Advisory Board, and officers of the trust and fund, as applicable, are listed below. The Board of Trustees governs the fund and is responsible for protecting the interests of shareholders. The Trustees are experienced executives who meet periodically throughout the year to oversee the fund's activities, review contractual arrangements with companies that provide services to the fund, oversee management of the risks associated with such activities and contractual arrangements, and review the fund's performance. Except for James C. Curvey, Ned C. Lautenbach, Ronald P. O'Hanley, and William S. Stavropoulos, each of the Trustees oversees 173 funds. Mr. Curvey oversees 396 funds. Mr. Lautenbach, Mr. O'Hanley, and Mr. Stavropoulos each oversees 247 funds.
The Trustees hold office without limit in time except that (a) any Trustee may resign; (b) any Trustee may be removed by written instrument, signed by at least two-thirds of the number of Trustees prior to such removal; (c) any Trustee who requests to be retired or who has become incapacitated by illness or injury may be retired by written instrument signed by a majority of the other Trustees; and (d) any Trustee may be removed at any special meeting of shareholders by a two-thirds vote of the outstanding voting securities of the trust. Each Trustee who is not an interested person (as defined in the 1940 Act) of the trust and the fund (Independent Trustee), shall retire not later than the last day of the calendar year in which his or her 75th birthday occurs. The Independent Trustees may waive this mandatory retirement age policy with respect to individual Trustees. The officers and Advisory Board Member hold office without limit in time, except that any officer and Advisory Board Member may resign or may be removed by a vote of a majority of the Trustees at any regular meeting or any special meeting of the Trustees. Except as indicated, each individual has held the office shown or other offices in the same company for the past five years.
Experience, Skills, Attributes, and Qualifications of the Fund's Trustees. The Governance and Nominating Committee has adopted a statement of policy that describes the experience, qualifications, attributes, and skills that are necessary and desirable for potential Independent Trustee candidates (Statement of Policy). The Board believes that each Trustee satisfied at the time he or she was initially elected or appointed a Trustee, and continues to satisfy, the standards contemplated by the Statement of Policy. The Governance and Nominating Committee also engages professional search firms to help identify potential Independent Trustee candidates who have the experience, qualifications, attributes, and skills consistent with the Statement of Policy. From time to time, additional criteria based on the composition and skills of the current Independent Trustees, as well as experience or skills that may be appropriate in light of future changes to board composition, business conditions, and regulatory or other developments, have also been considered by the professional search firms and the Governance and Nominating Committee. In addition, the Board takes into account the Trustees' commitment and participation in Board and committee meetings, as well as their leadership of standing and ad hoc committees throughout their tenure.
Annual Report
In determining that a particular Trustee was and continues to be qualified to serve as a Trustee, the Board has considered a variety of criteria, none of which, in isolation, was controlling. The Board believes that, collectively, the Trustees have balanced and diverse experience, qualifications, attributes, and skills, which allow the Board to operate effectively in governing the fund and protecting the interests of shareholders. Information about the specific experience, skills, attributes, and qualifications of each Trustee, which in each case led to the Board's conclusion that the Trustee should serve (or continue to serve) as a trustee of the fund, is provided below.
Board Structure and Oversight Function. James C. Curvey is an interested person (as defined in the 1940 Act) and currently serves as Chairman. The Trustees have determined that an interested Chairman is appropriate and benefits shareholders because an interested Chairman has a personal and professional stake in the quality and continuity of services provided to the fund. Independent Trustees exercise their informed business judgment to appoint an individual of their choosing to serve as Chairman, regardless of whether the Trustee happens to be independent or a member of management. The Independent Trustees have determined that they can act independently and effectively without having an Independent Trustee serve as Chairman and that a key structural component for assuring that they are in a position to do so is for the Independent Trustees to constitute a substantial majority for the Board. The Independent Trustees also regularly meet in executive session. Ned C. Lautenbach serves as Chairman of the Independent Trustees and as such (i) acts as a liaison between the Independent Trustees and management with respect to matters important to the Independent Trustees and (ii) with management prepares agendas for Board meetings.
Fidelity funds are overseen by different Boards of Trustees. The fund's Board oversees Fidelity's equity and high income funds and another Board oversees Fidelity's investment-grade bond, money market, and asset allocation funds. The asset allocation funds may invest in Fidelity funds overseen by the fund's Board. The use of separate Boards, each with its own committee structure, allows the Trustees of each group of Fidelity funds to focus on the unique issues of the funds they oversee, including common research, investment, and operational issues. On occasion, the separate Boards establish joint committees to address issues of overlapping consequences for the Fidelity funds overseen by each Board.
The Trustees operate using a system of committees to facilitate the timely and efficient consideration of all matters of importance to the Trustees, the fund, and fund shareholders and to facilitate compliance with legal and regulatory requirements and oversight of the fund's activities and associated risks. The Board, acting through its committees, has charged FMR and its affiliates with (i) identifying events or circumstances the occurrence of which could have demonstrably adverse effects on the fund's business and/or reputation; (ii) implementing processes and controls to lessen the possibility that such events or circumstances occur or to mitigate the effects of such events or circumstances if they do occur; and (iii) creating and maintaining a system designed to evaluate continuously business and market conditions in order to facilitate the identification and implementation processes described in (i) and (ii) above. Because the day-to-day operations and activities of the fund are carried out by or through FMR, its affiliates and other service providers, the fund's exposure to risks is mitigated but not eliminated by the processes overseen by the Trustees. While each of the Board's committees has responsibility for overseeing different aspects of the fund's activities, oversight is exercised primarily through the Operations, Audit, and Compliance Committees. In addition, the Independent Trustees have worked with FMR to enhance the Board's oversight of investment and financial risks, legal and regulatory risks, technology risks, and operational risks, including the development of additional risk reporting to the Board. For example, a working group comprised of Independent Trustees and FMR has worked and continues to work to review the Fidelity funds' valuation-related activities, reporting and risk management. Appropriate personnel, including but not limited to the fund's Chief Compliance Officer (CCO), FMR's internal auditor, the independent accountants, the fund's Treasurer and portfolio management personnel, make periodic reports to the Board's committees, as appropriate, including an annual review of FMR's risk management program for the Fidelity funds. The responsibilities of each standing committee, including their oversight responsibilities, are described further under "Standing Committees of the Fund's Trustees."
Annual Report
Trustees and Officers - continued
The fund's Statement of Additional Information (SAI) includes more information about the Trustees. To request a free copy, call Fidelity at 1-877-208-0098.
Interested Trustees*:
Correspondence intended for each Trustee who is an interested person may be sent to Fidelity Investments, 245 Summer Street, Boston, Massachusetts 02210.
|
Name, Year of Birth; Principal Occupations and Other Relevant Experience+ |
|
|
James C. Curvey (1935) |
|
|
Year of Election or Appointment: 2007 Trustee Chairman of the Board of Trustees |
|
|
|
Mr. Curvey also serves as Trustee of other Fidelity funds. Mr. Curvey is a Director of Fidelity Investments Money Management, Inc. (2009-present), Director of Fidelity Research & Analysis Co. (2009-present) and Director of FMR and FMR Co., Inc. (2007-present). Mr. Curvey is also Vice Chairman (2007-present) and Director of FMR LLC. In addition, Mr. Curvey serves as an Overseer for the Boston Symphony Orchestra and a member of the Trustees of Villanova University. Previously, Mr. Curvey was the Vice Chairman (2006-2007) and Director (2000-2007) of FMR Corp. |
|
Ronald P. O'Hanley (1957) |
|
|
Year of Election or Appointment: 2011 Trustee |
|
|
|
Mr. O'Hanley also serves as Trustee of other Fidelity funds. He is Director of Fidelity SelectCo, LLC (2013-present), FMR Co., Inc. (2010-present), Director of Fidelity Investments Money Management, Inc. (2010-present), Director of Fidelity Research & Analysis Company (2010-present), President of Fidelity Asset Management and Corporate Services and a Member of Fidelity's Executive Committee (2010-present). Previously, Mr. O'Hanley served as President and Chief Executive Officer of BNY Mellon Asset Management (2007-2010). Mr. O'Hanley also served as Vice Chairman of Bank New York Mellon Corp. and a member of that firm's Executive Committee. Prior to the 2007 merger of The Bank of New York and Mellon Financial Corporation, he was Vice Chairman of Mellon Financial Corporation and President and Chief Executive Officer of Mellon Asset Management. He joined Mellon in February 1997. Mr. O'Hanley currently serves as Chairman of the Boston Public Library Foundation Board of Directors and sits on the Board of Directors of Beth Israel Deaconess Medical Center, the Board of Trustees of the Marine Biological Laboratory and the Advisory Board of the Maxwell School of Citizenship and Public Administration at Syracuse University. Mr. O'Hanley also chairs the Council on Asset Management for the Financial Services Roundtable and is a member of the Board of Directors of Institutional Investor's U.S. Institute. |
* Trustees have been determined to be "Interested Trustees" by virtue of, among other things, their affiliation with the trust or various entities under common control with FMR.
+ The information above includes each Trustee's principal occupation during the last five years and other information relating to the experience, attributes, and skills relevant to each Trustee's qualifications to serve as a Trustee, which led to the conclusion that each Trustee should serve as a Trustee for the fund.
Annual Report
Trustees and Officers - continued
Independent Trustees:
Correspondence intended for each Independent Trustee (that is, the Trustees other than the Interested Trustees) may be sent to Fidelity Investments, P.O. Box 55235, Boston, Massachusetts 02205-5235.
|
Name, Year of Birth; Principal Occupations and Other Relevant Experience+ |
|
|
Dennis J. Dirks (1948) |
|
|
Year of Election or Appointment: 2005 Trustee |
|
|
|
Mr. Dirks also serves as Trustee of other Fidelity funds. Prior to his retirement in May 2003, Mr. Dirks was Chief Operating Officer and a member of the Board of The Depository Trust & Clearing Corporation (DTCC). He also served as President, Chief Operating Officer, and Board member of The Depository Trust Company (DTC) and President and Board member of the National Securities Clearing Corporation (NSCC). In addition, Mr. Dirks served as Chief Executive Officer and Board member of the Government Securities Clearing Corporation, Chief Executive Officer and Board member of the Mortgage-Backed Securities Clearing Corporation, as a Trustee and a member of the Finance Committee of Manhattan College (2005-2008), and as a Trustee and a member of the Finance Committee of AHRC of Nassau County (2006-2008). Mr. Dirks is a member of the Independent Directors Council (IDC) Governing Council (2010-present) and Board of Directors for The Brookville Center for Children's Services, Inc. (2009-present). |
|
Alan J. Lacy (1953) |
|
|
Year of Election or Appointment: 2008 Trustee |
|
|
|
Mr. Lacy also serves as Trustee of other Fidelity funds. Mr. Lacy serves as Senior Adviser (2007-present) of Oak Hill Capital Partners, L.P. (private equity). Mr. Lacy also served as Chief Executive Officer (2000-2005) and Vice Chairman (2005-2006) of Sears Holdings Corporation and Sears, Roebuck and Co. (retail). In addition, Mr. Lacy serves as a member of the Board of Directors of Dave & Buster's Entertainment, Inc. (restaurant and entertainment complexes, 2010-present), Earth Fare, Inc. (retail grocery, 2012-present), The Hillman Companies, Inc. (hardware wholesalers, 2010-present), and Bristol-Myers Squibb Company (global pharmaceuticals, 2008-present). Mr. Lacy is a member of the Board of Trustees of The National Parks Conservation Association (2006-present). Previously, Mr. Lacy served as Chairman of the Board of Trustees of the National Parks Conservation Association (2008-2011) and as a member of the Board of Directors for the Western Union Company (global money transfer, 2006-2011). |
|
Ned C. Lautenbach (1944) |
|
|
Year of Election or Appointment: 2000 Trustee Chairman of the Independent Trustees |
|
|
|
Mr. Lautenbach also serves as Trustee of other Fidelity funds. Mr. Lautenbach currently serves as the Lead Director of the Eaton Corporation Board of Directors (diversified industrial, 1997-present). Mr. Lautenbach is Chairman of the Board of Directors of the Philharmonic Center for the Arts in Naples, Florida (2012-present) and a member of the Council on Foreign Relations (1994-present). Previously, Mr. Lautenbach was a Partner/Advisory Partner at Clayton, Dubilier & Rice, LLC (private equity investment, 1998-2010), as well as a Director of Sony Corporation (2006-2007). |
|
Joseph Mauriello (1944) |
|
|
Year of Election or Appointment: 2008 Trustee |
|
|
|
Mr. Mauriello also serves as Trustee of other Fidelity funds. Prior to his retirement in January 2006, Mr. Mauriello served in numerous senior management positions including Deputy Chairman and Chief Operating Officer (2004-2005), and Vice Chairman of Financial Services (2002-2004) of KPMG LLP US (professional services, 1965-2005). Mr. Mauriello currently serves as a member of the Board of Directors of XL Group plc. (global insurance and re-insurance, 2006-present). Previously, Mr. Mauriello served as a Director of the Hamilton Funds of the Bank of New York (2006-2007) and of Arcadia Resources Inc. (health care services and products, 2007-2012). |
|
Robert W. Selander (1950) |
|
|
Year of Election or Appointment: 2011 Trustee |
|
|
|
Mr. Selander also serves as Trustee of other Fidelity funds. Previously, Mr. Selander served as a Member of the Advisory Board of other Fidelity funds (2011), and Executive Vice Chairman (2010), Chief Executive Officer (2009-2010), and President and Chief Executive Officer (1997-2009) of Mastercard, Inc. |
|
Cornelia M. Small (1944) |
|
|
Year of Election or Appointment: 2005 Trustee |
|
|
|
Ms. Small also serves as Trustee of other Fidelity funds. Ms. Small is a member of the Board of Directors (2009-present) and Chair of the Investment Committee (2010-present) of the Teagle Foundation. Ms. Small also serves on the Investment Committee of the Berkshire Taconic Community Foundation (2008-present). Previously, Ms. Small served as Chairperson (2002-2008) and a member of the Investment Committee and Chairperson (2008-2012) and a member of the Board of Trustees of Smith College. In addition, Ms. Small served as Chief Investment Officer, Director of Global Equity Investments, and a member of the Board of Directors of Scudder, Stevens & Clark and Scudder Kemper Investments. |
|
William S. Stavropoulos (1939) |
|
|
Year of Election or Appointment: 2002 Trustee Vice Chairman of the Independent Trustees |
|
|
|
Mr. Stavropoulos also serves as Trustee of other Fidelity funds. Mr. Stavropoulos serves as President and Founder of the Michigan Baseball Foundation, the Great Lakes Loons (2007-present). Mr. Stavropoulos is Chairman Emeritus of the Board of Directors of The Dow Chemical Company, where he previously served in numerous senior management positions, including President, CEO (1995-2000; 2002-2004), Chairman of the Executive Committee (2000-2006), and as a member of the Board of Directors (1990-2006). Currently, Mr. Stavropoulos is Chairman of the Board of Directors of Univar Inc. (global distributor of commodity and specialty chemicals), a Director of Teradata Corporation (data warehousing and technology solutions), and Maersk Inc. (industrial conglomerate), and a member of the Advisory Board for Metalmark Capital LLC (private equity investment, 2005-present). Mr. Stavropoulos is an operating advisor to Clayton, Dubilier & Rice, LLC (private equity investment). In addition, Mr. Stavropoulos is a member of the University of Notre Dame Advisory Council for the College of Science, a Trustee of the Rollin L. Gerstacker Foundation, and a Director of the Naples Philharmonic Center for the Arts. Previously, Mr. Stavropoulos served as a Director of Chemical Financial Corporation (bank holding company, 1993-2012) and Tyco International, Ltd. (multinational manufacturing and services, 2007-2012). |
|
David M. Thomas (1949) |
|
|
Year of Election or Appointment: 2008 Trustee |
|
|
|
Mr. Thomas also serves as Trustee of other Fidelity funds. Mr. Thomas serves as Non-Executive Chairman of the Board of Directors of Fortune Brands Home and Security (home and security products, 2011-present), and as a member of the Board of Directors of Interpublic Group of Companies, Inc. (marketing communication, 2004-present). Previously, Mr. Thomas served as Executive Chairman (2005-2006) and Chairman and Chief Executive Officer (2000-2005) of IMS Health, Inc. (pharmaceutical and healthcare information solutions), and a Director of Fortune Brands, Inc. (consumer products, 2000-2011). |
+ The information above includes each Trustee's principal occupation during the last five years and other information relating to the experience, attributes, and skills relevant to each Trustee's qualifications to serve as a Trustee, which led to the conclusion that each Trustee should serve as a Trustee for the fund.
Advisory Board Member and Officers:
Correspondence intended for each officer and Peter S. Lynch may be sent to Fidelity Investments, 245 Summer Street, Boston, Massachusetts 02210. Officers appear below in alphabetical order.
|
Name, Year of Birth; Principal Occupation |
|
|
Peter S. Lynch (1944) |
|
|
Year of Election or Appointment: 2003 Member of the Advisory Board |
|
|
|
Mr. Lynch also serves as Member of the Advisory Board of other Fidelity funds. Mr. Lynch is Vice Chairman and a Director of FMR and FMR Co., Inc. In addition, Mr. Lynch serves as a Trustee of Boston College and as the Chairman of the Inner-City Scholarship Fund. Previously, Mr. Lynch served on the Special Olympics International Board of Directors (1997-2006). |
|
Elizabeth Paige Baumann (1968) |
|
|
Year of Election or Appointment: 2012 Anti-Money Laundering (AML) Officer |
|
|
|
Ms. Baumann also serves as AML Officer of other funds. She is Chief AML Officer of FMR LLC (2012-present) and is an employee of Fidelity Investments. Previously, Ms. Baumann served as Vice President and Deputy Anti-Money Laundering Officer (2007-2012). |
|
William C. Coffey (1969) |
|
|
Year of Election or Appointment: 2009 Assistant Secretary |
|
|
|
Mr. Coffey also serves as Assistant Secretary of other funds. He is Senior Vice President and Deputy General Counsel of FMR LLC (2010-present), and is an employee of Fidelity Investments. Previously, Mr. Coffey served as Vice President and Associate General Counsel of FMR LLC (2005-2009). |
|
Jonathan Davis (1968) |
|
|
Year of Election or Appointment: 2010 Assistant Treasurer |
|
|
|
Mr. Davis also serves as Assistant Treasurer of other funds. Mr. Davis is an employee of Fidelity Investments. Previously, Mr. Davis served as Vice President and Associate General Counsel of FMR LLC (2003-2010). |
|
Adrien E. Deberghes (1967) |
|
|
Year of Election or Appointment: 2008 Deputy Treasurer |
|
|
|
Mr. Deberghes also serves as an officer of other funds. He is an employee of Fidelity Investments (2008-present). Prior to joining Fidelity Investments, Mr. Deberghes was Senior Vice President of Mutual Fund Administration at State Street Corporation (2007-2008), Senior Director of Mutual Fund Administration at Investors Bank & Trust (2005-2007), and Director of Finance for Dunkin' Brands (2000-2005). |
|
Stephanie J. Dorsey (1969) |
|
|
Year of Election or Appointment: 2010 Assistant Treasurer |
|
|
|
Ms. Dorsey also serves as an officer of other funds. She is an employee of Fidelity Investments (2008-present) and has served in other fund officer roles. Prior to joining Fidelity Investments, Ms. Dorsey served as Treasurer (2004-2008) of the JPMorgan Mutual Funds and Vice President (2004-2008) of JPMorgan Chase Bank. |
|
Scott C. Goebel (1968) |
|
|
Year of Election or Appointment: 2008 Secretary and Chief Legal Officer (CLO) |
|
|
|
Mr. Goebel serves as Secretary and CLO of other funds. Mr. Goebel also serves as Secretary of Fidelity Investments Money Management, Inc. (FIMM) (2010-present) and Fidelity Research and Analysis Company (FRAC) (2010-present); General Counsel, Secretary, and Senior Vice President of FMR (2008-present) and FMR Co., Inc. (2008-present); Chief Legal Officer of Fidelity Management & Research (Hong Kong) Limited (2008-present) and Assistant Secretary of Fidelity Management & Research (Japan) Inc. (2008-present), and Fidelity Management & Research (U.K.) Inc. (2008-present). Previously, Mr. Goebel served as Secretary and CLO of other Fidelity funds (2008-2013), Assistant Secretary of FIMM (2008-2010), FRAC (2008-2010), and certain funds (2007-2008); and as Vice President and Secretary of Fidelity Distributors Corporation (FDC) (2005-2007). Mr. Goebel has been employed by FMR LLC or an affiliate since 2001. |
|
Joseph A. Hanlon (1968) |
|
|
Year of Election or Appointment: 2012 Chief Compliance Officer |
|
|
|
Mr. Hanlon also serves as Chief Compliance Officer of other funds. Mr. Hanlon serves as Compliance Officer of FMR, FMR Co., Inc., Fidelity Investments Money Management, Inc. (FIMM), Fidelity Research and Analysis Company (FRAC), and Fidelity Management & Research (Hong Kong) (2009-present), as Senior Vice President of the Fidelity Asset Management Division (2009-present), and is an employee of Fidelity Investments. Previously, Mr. Hanlon served as Compliance Officer of Fidelity Management & Research (Japan) Inc. (2009-2013), Strategic Advisers, Inc. (2009-2013), and Fidelity Management & Research (U.K.) Inc. (2009-2013). |
|
Bruce T. Herring (1965) |
|
|
Year of Election or Appointment: 2006 Vice President of certain Equity Funds |
|
|
|
Mr. Herring also serves as Vice President of other funds. He serves as Chief Investment Officer of Fidelity Global Asset Allocation (GAA) (2013-present), Group Chief Investment Officer of FMR, and President of Fidelity Research & Analysis Company (2010-present). Previously, Mr. Herring served as Chief Investment Officer and Director of Fidelity Management & Research (U.K.) Inc. (2010-2013), Vice President (2005-2006) and Senior Vice President (2006-2007) of Fidelity Management & Research Company, Vice President of FMR Co., Inc. (2001-2007), and as a portfolio manager for Fidelity U.S. Equity Funds. |
|
Brian B. Hogan (1964) |
|
|
Year of Election or Appointment: 2009 Vice President |
|
|
|
Mr. Hogan also serves as Vice President of other funds. Mr. Hogan serves as President of FMR's Equity Division (2009-present). Previously, Mr. Hogan served as Senior Vice President, Equity Research of FMR (2006-2009) and as a portfolio manager. |
|
Chris Maher (1972) |
|
|
Year of Election or Appointment: 2013 Assistant Treasurer |
|
|
|
Mr. Maher serves as Assistant Treasurer of other funds. Mr. Maher is Vice President of Valuation Oversight and is an employee of Fidelity Investments. Previously, Mr. Maher served as Vice President of Asset Management Compliance (2013), Vice President of FMR's Program Management Group (2010-2013), and Vice President of Valuation Oversight (2008-2010). |
|
Christine Reynolds (1958) |
|
|
Year of Election or Appointment: 2008 Chief Financial Officer |
|
|
|
Ms. Reynolds also serves as Chief Financial Officer of other funds. Ms. Reynolds became President of Fidelity Pricing and Cash Management Services (FPCMS) in August 2008. Ms. Reynolds served as Chief Operating Officer of FPCMS (2007-2008). Previously, Ms. Reynolds served as President, Treasurer, and Anti-Money Laundering officer of the Fidelity funds (2004-2007). |
|
Kenneth B. Robins (1969) |
|
|
Year of Election or Appointment: 2008 President and Treasurer |
|
|
|
Mr. Robins also serves as an officer of other funds. Mr. Robins serves as Executive Vice President of Fidelity Investments Money Management, Inc. (FIMM) (2013-present) and is an employee of Fidelity Investments (2004-present). Previously, Mr. Robins served in other fund officer roles. |
|
Gary W. Ryan (1958) |
|
|
Year of Election or Appointment: 2005 Assistant Treasurer |
|
|
|
Mr. Ryan also serves as Assistant Treasurer of other funds. Mr. Ryan is an employee of Fidelity Investments and has served in other fund officer roles. Previously, Mr. Ryan served as Vice President of Fund Reporting in Fidelity Pricing and Cash Management Services (FPCMS) (1999-2005). |
|
Stephen Sadoski (1971) |
|
|
Year of Election or Appointment: 2012 Deputy Treasurer |
|
|
|
Mr. Sadoski also serves as Deputy Treasurer of other funds. He is an employee of Fidelity Investments (2012-present) and has served in another fund officer role. Prior to joining Fidelity Investments, Mr. Sadoski served as an assistant chief accountant in the Division of Investment Management of the Securities and Exchange Commission (SEC) (2009-2012) and as a senior manager at Deloitte & Touche LLP (1997-2009). |
|
Stacie M. Smith (1974) |
|
|
Year of Election or Appointment: 2013 Deputy Treasurer |
|
|
|
Ms. Smith also serves as an officer of other funds. She is an employee of Fidelity Investments (2009-present) and has served in other fund officer roles. Prior to joining Fidelity Investments, Ms. Smith served as Senior Audit Manager of Ernst & Young LLP (1996-2009). |
|
Renee Stagnone (1975) |
|
|
Year of Election or Appointment: 2013 Deputy Treasurer |
|
|
|
Ms. Stagnone also serves as Deputy Treasurer of other funds. Ms. Stagnone is an employee of Fidelity Investments. |
|
Joseph F. Zambello (1957) |
|
|
Year of Election or Appointment: 2011 Deputy Treasurer |
|
|
|
Mr. Zambello also serves as Deputy Treasurer of other funds. Mr. Zambello is an employee of Fidelity Investments. Previously, Mr. Zambello served as Vice President of FMR's Program Management Group (2009-2011) and Vice President of the Transfer Agent Oversight Group (2005-2009). |
Annual Report
Distributions (Unaudited)
The Board of Trustees of Fidelity Advisor Dividend Growth Fund voted to pay to shareholders of record at the opening of business on record date, the following distributions per share derived from capital gains realized from sales of portfolio securities, and dividends derived from net investment income:
|
|
Pay Date |
Record Date |
Dividends |
Capital Gains |
|
Class Z |
12/16/13 |
12/13/13 |
$0.166 |
$0.000 |
|
|
1/13/14 |
1/10/14 |
$0.000 |
$0.007 |
The fund hereby designates as a capital gain dividend with respect to the taxable year ended November 30 2013, $412,791, or, if subsequently determined to be different, the net capital gain of such year.
The fund will notify shareholders in January 2014 of amounts for use in preparing 2013 income tax returns.
Annual Report
Board Approval of Investment Advisory Contracts and Management Fees
Fidelity Advisor Dividend Growth Fund
Each year, the Board of Trustees, including the Independent Trustees (together, the Board), votes on the renewal of the management contract and sub-advisory agreements (together, the Advisory Contracts) for the fund. The Board, assisted by the advice of fund counsel and Independent Trustees' counsel, requests and considers a broad range of information relevant to the renewal of the Advisory Contracts throughout the year.
The Board meets regularly and, at each of its meetings, covers an extensive agenda of topics and materials and considers factors that are relevant to its annual consideration of the renewal of the fund's Advisory Contracts, including the services and support provided to the fund and its shareholders. The Board has established various standing committees, each composed of and chaired by Independent Trustees with varying backgrounds, to which the Board has assigned specific subject matter responsibilities in order to enhance effective decision-making by the Board. The Board, acting directly and through its Committees, requests and receives information concerning the annual consideration of the renewal of the fund's Advisory Contracts. The Board also meets as needed to consider matters specifically related to the Board's annual consideration of the renewal of Advisory Contracts. Members of the Board may also meet with trustees of other Fidelity funds through ad hoc joint committees to discuss certain matters relevant to the Fidelity funds.
At its July 2013 meeting, the Board, including the Independent Trustees, unanimously determined to renew the fund's Advisory Contracts. In reaching its determination, the Board considered all factors it believed relevant, including (i) the nature, extent, and quality of the services to be provided to the fund and its shareholders (including the investment performance of the fund); (ii) the competitiveness of the fund's management fee and total expense ratio relative to peer funds; (iii) the total costs of the services to be provided by and the profits to be realized by Fidelity from its relationship with the fund; (iv) the extent to which economies of scale exist and would be realized as the fund grows; and (v) whether fee levels reflect these economies of scale, if any, for the benefit of fund shareholders.
In considering whether to renew the Advisory Contracts for the fund, the Board reached a determination, with the assistance of fund counsel and Independent Trustees' counsel and through the exercise of its business judgment, that the renewal of the Advisory Contracts was in the best interests of the fund and its shareholders and that the compensation payable under the Advisory Contracts was fair and reasonable. The Board's decision to renew the Advisory Contracts was not based on any single factor, but rather was based on a comprehensive consideration of all the information provided to the Board at its meetings throughout the year. The Board, in reaching its determination to renew the Advisory Contracts, was aware that shareholders in the fund have a broad range of investment choices available to them, including a wide choice among mutual funds offered by Fidelity's competitors, and that the fund's shareholders, who have the opportunity to review and weigh the disclosure provided by the fund in its prospectus and other public disclosures, have chosen to invest in this fund, which is a part of the Fidelity family of funds.
Annual Report
Board Approval of Investment Advisory Contracts and
Management Fees - continued
Nature, Extent, and Quality of Services Provided. The Board considered the staffing within the investment adviser, Fidelity Management & Research Company (FMR), and the sub-advisers (together, the Investment Advisers) as it relates to the fund, including the backgrounds of the fund's investment personnel, and also considered the fund's investment objective, strategies, and related investment philosophy. The Independent Trustees also had discussions with senior management of Fidelity's investment operations and investment groups. The Board considered the structure of the portfolio manager compensation program and whether this structure provides appropriate incentives to act in the best interests of the fund.
Resources Dedicated to Investment Management and Support Services. The Board and the Fund Oversight and Research Committees reviewed the general qualifications and capabilities of the Investment Advisers' investment staff, including its size, education, experience, and resources, as well as the Investment Advisers' approach to recruiting, training, managing, and compensating investment personnel. The Board noted that FMR has continued to increase the resources devoted to non-U.S. offices, including expansion of Fidelity's global investment organization. The Board also noted that Fidelity's analysts have extensive resources, tools and capabilities that allow them to conduct sophisticated quantitative and fundamental analysis, as well as credit analysis of issuers, counterparties and guarantors. Further, the Board believes that Fidelity's investment professionals have sufficient access to global information and data so as to provide competitive investment results over time, and that those professionals also have access to sophisticated tools that permit them to assess portfolio construction and risk and performance attribution characteristics continuously, as well as to transmit new information and research conclusions rapidly around the world. Additionally, in its deliberations, the Board considered the Investment Advisers' trading and risk management capabilities and resources, which are an integral part of the investment management process.
Shareholder and Administrative Services. The Board considered (i) the nature, extent, quality, and cost of advisory, administrative, and shareholder services performed by the Investment Advisers and their affiliates under the Advisory Contracts and under separate agreements covering transfer agency, pricing and bookkeeping, and securities lending services for the fund; (ii) the nature and extent of the supervision of third party service providers, principally custodians and subcustodians; and (iii) the resources devoted to, and the record of compliance with, the fund's compliance policies and procedures. The Board also reviewed the allocation of fund brokerage, including allocations to brokers affiliated with the Investment Advisers, the use of brokerage commissions to pay fund expenses, and the use of "soft" commission dollars to pay for research services.
Annual Report
The Board noted that the growth of fund assets over time across the complex allows Fidelity to reinvest in the development of services designed to enhance the value or convenience of the Fidelity funds as investment vehicles. These services include 24-hour access to account information and market information through telephone representatives and over the Internet, investor education materials and asset allocation tools, and the expanded availability of Fidelity Investor Centers.
Investment in a Large Fund Family. The Board considered the benefits to shareholders of investing in a Fidelity fund, including the benefits of investing in a fund that is part of a large family of funds offering a variety of investment disciplines and providing a large variety of mutual fund investor services. The Board noted that Fidelity had taken, or had made recommendations that resulted in the Fidelity funds taking, a number of actions over the previous year that benefited particular funds, including (i) continuing to dedicate additional resources to investment research and to the support of the senior management team that oversees asset management; (ii) persisting in efforts to enhance Fidelity's global research capabilities; (iii) launching new funds and making other enhancements to meet client needs for global and income-oriented solutions; (iv) continuing to launch dedicated lower cost underlying funds to meet portfolio construction needs related to expanding underlying fund options for Fidelity funds of funds, specifically for the Freedom Fund product lines; (v) rationalizing product lines and gaining increased efficiencies through the mergers of several funds into other funds; (vi) strengthening Fidelity's index fund offerings by reducing investment minimums and adopting or lowering existing expense caps for certain funds and classes; (vii) enhancing Global Asset Allocation product offerings by launching new funds and strategies, including "open architecture" target date funds that utilize affiliated and unaffiliated sub-advisers; (viii) modifying the eligibility criteria for Institutional Class shares of Advisor funds to increase their marketability to a portion of the defined contribution plan market; (ix) creating a new low-cost retirement share class for certain Advisor funds to appeal to large retirement plans; (x) transitioning the management of certain Fidelity commodity funds to Geode Capital Management LLC, a registered commodity pool operator, while retaining administrative responsibilities for the funds; (xi) reorganizing a number of funds; and (xii) taking steps toward establishing a new Fidelity adviser to manage sector-based funds and products.
Investment Performance. The Board considered whether the fund has operated in accordance with its investment objective, as well as its record of compliance with its investment restrictions and its performance history.
The Board took into account discussions with the Investment Advisers about fund investment performance that occur at Board meetings throughout the year. In this regard the Board noted that as part of regularly scheduled fund reviews and other reports to the Board on fund performance, the Board periodically considers annualized return information for the fund, for different time periods, measured against a securities market index ("benchmark index") and a peer group of mutual funds with similar objectives ("peer group"). In its evaluation of fund investment performance, the Board gave particular attention to information indicating changes in performance of certain Fidelity funds for specific time periods and the Investment Advisers' explanations for any overperformance or, in the case of the fund, underperformance.
Annual Report
Board Approval of Investment Advisory Contracts and
Management Fees - continued
In addition to reviewing absolute and relative fund performance, the Independent Trustees periodically consider the appropriateness of fund performance metrics in evaluating the results achieved. In general, the Independent Trustees believe that fund performance should be evaluated based on net performance (after fees and expenses) of both the highest performing and lowest performing classes, where applicable, compared to appropriate benchmark indices, over appropriate time periods which may include full market cycles, and compared to peer groups, as applicable, over the same periods, taking into account relevant factors including the following: general market conditions; issuer-specific information; tactical opportunities for investment; and fund cash flows and other factors.
The Independent Trustees recognize that shareholders evaluate performance on a net basis over their own holding periods, for which one-, three-, and five-year periods are used as a proxy. For this reason, the performance information reviewed by the Board also included net cumulative calendar year total return information for the fund and an appropriate benchmark index and peer group for the most recent one-, three-, and five-year periods, as shown below. Returns are shown compared to the 25th percentile (top of box) and 75th percentile (bottom of box) of the peer universe.
Annual Report
Fidelity Advisor Dividend Growth Fund
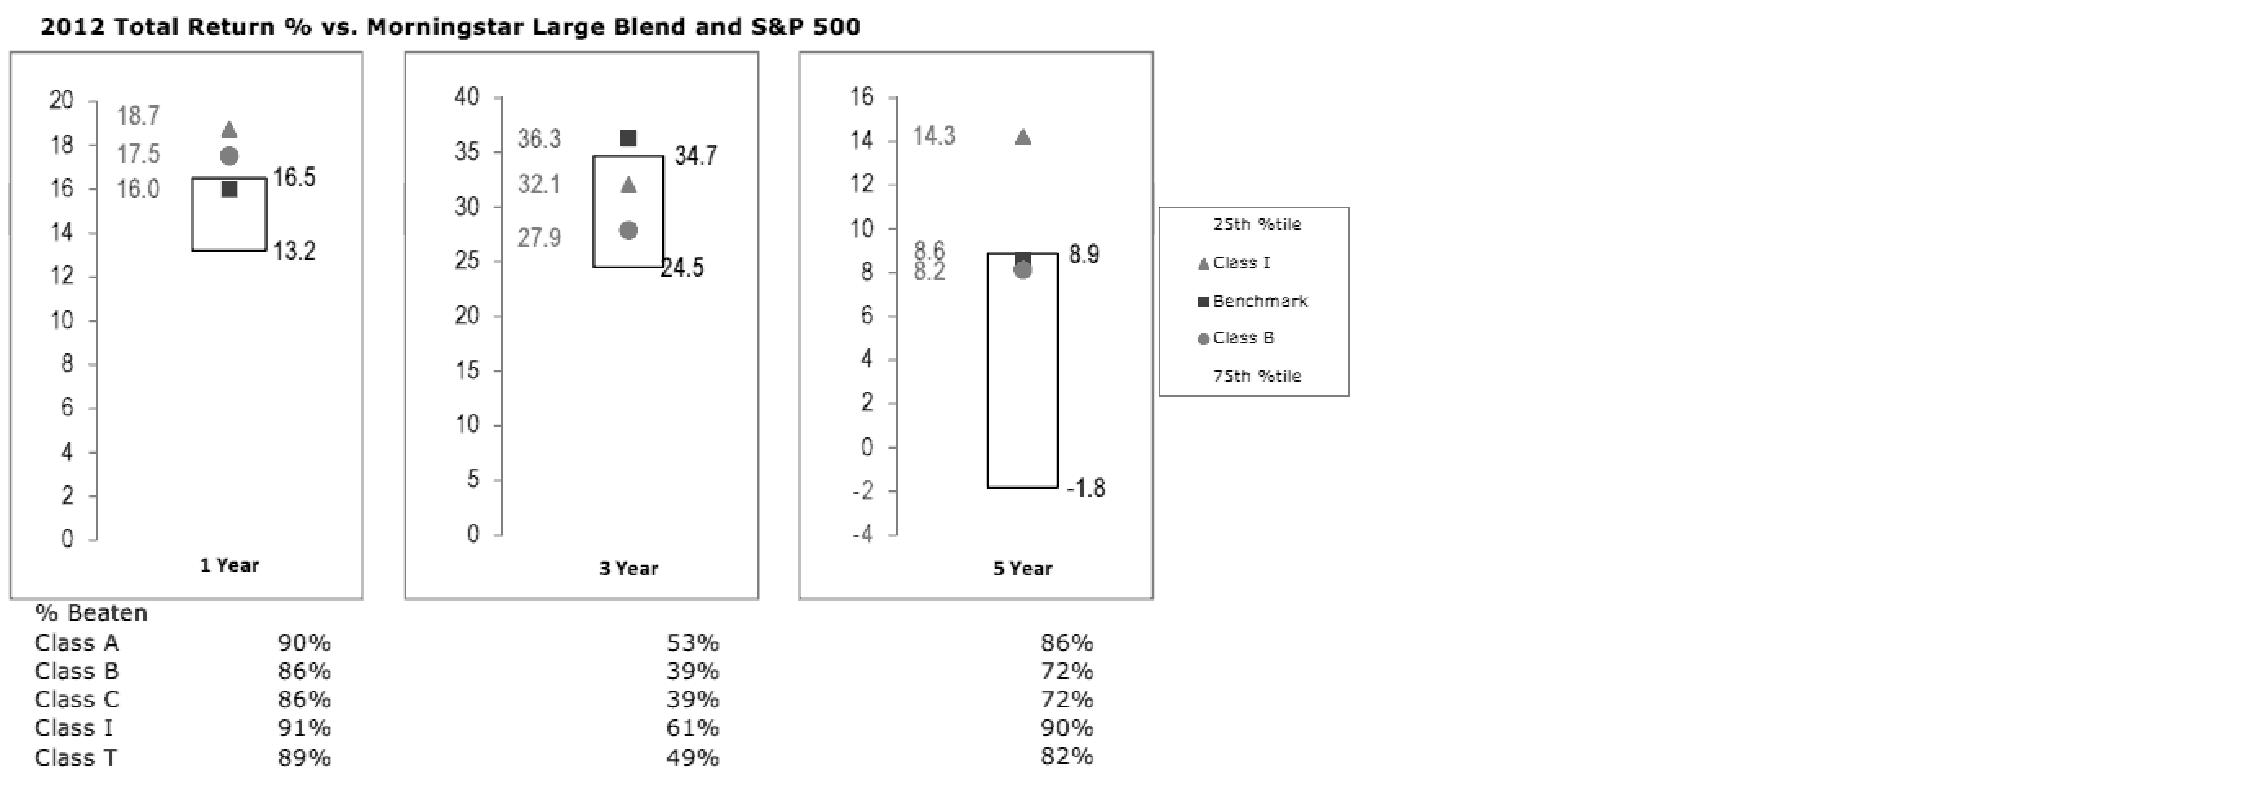
The Board has discussed the fund's performance with FMR, including the fund's underperformance based on more recent periods ended after 2012 (which periods are not shown in the chart above) but prior to the date of the Board's approval of the renewal of the Advisory Contracts, and has engaged with FMR to consider what steps might be taken to remediate the fund's more recent underperformance.
The Board also considered that the fund's management fee is subject to upward or downward adjustment depending upon whether, and to what extent, the fund's investment performance for the performance period exceeds, or is exceeded by, a securities index, thus leading to a performance adjustment for the same period. The Board noted that the performance adjustment provides FMR with a strong economic incentive to seek to achieve superior performance for the fund's shareholders and helps to more closely align the interests of FMR and the fund's shareholders.
Based on its review, the Board concluded that the nature, extent, and quality of services provided to the fund under the Advisory Contracts should benefit the fund's shareholders.
Competitiveness of Management Fee and Total Expense Ratio. The Board considered the fund's management fee and total expense ratio compared to "mapped groups" of competitive funds and classes. Fidelity creates "mapped groups" by combining similar Lipper investment objective categories that have comparable management fee characteristics. Combining Lipper investment objective categories aids the Board's management fee and total expense ratio comparisons by broadening the competitive group used for comparison and by reducing the number of universes to which various Fidelity funds are compared.
Annual Report
Board Approval of Investment Advisory Contracts and
Management Fees - continued
Management Fee. The Board considered two proprietary management fee comparisons for the 12-month periods shown in the chart below. The group of Lipper funds used by the Board for management fee comparisons is referred to below as the "Total Mapped Group." The Total Mapped Group comparison focuses on a fund's standing in terms of gross management fees before expense reimbursements or caps, and without giving effect to the fund's performance adjustment, relative to the total universe of funds with comparable investment mandates, regardless of whether their management fee structures also are comparable. Funds with comparable investment mandates offer exposure to similar types of securities. Funds with comparable management fee structures have similar management fee contractual arrangements (e.g., flat rate charged for advisory services, all-inclusive fee rate, etc.). "TMG %" represents the percentage of funds in the Total Mapped Group that had management fees that were lower than the fund's. For example, a TMG % of 11% means that 89% of the funds in the Total Mapped Group had higher management fees than the fund. The "Asset-Size Peer Group" (ASPG) comparison focuses on a fund's standing relative to a subset of non-Fidelity funds within the Total Mapped Group that are similar in size and management fee structure. The ASPG represents at least 15% of the funds in the Total Mapped Group with comparable asset size and management fee structures, subject to a minimum of 50 funds (or all funds in the Total Mapped Group if fewer than 50). Additional information, such as the ASPG quartile in which the fund's management fee ranked and the impact of the fund's performance adjustment, is also included in the chart and considered by the Board.
Fidelity Advisor Dividend Growth Fund
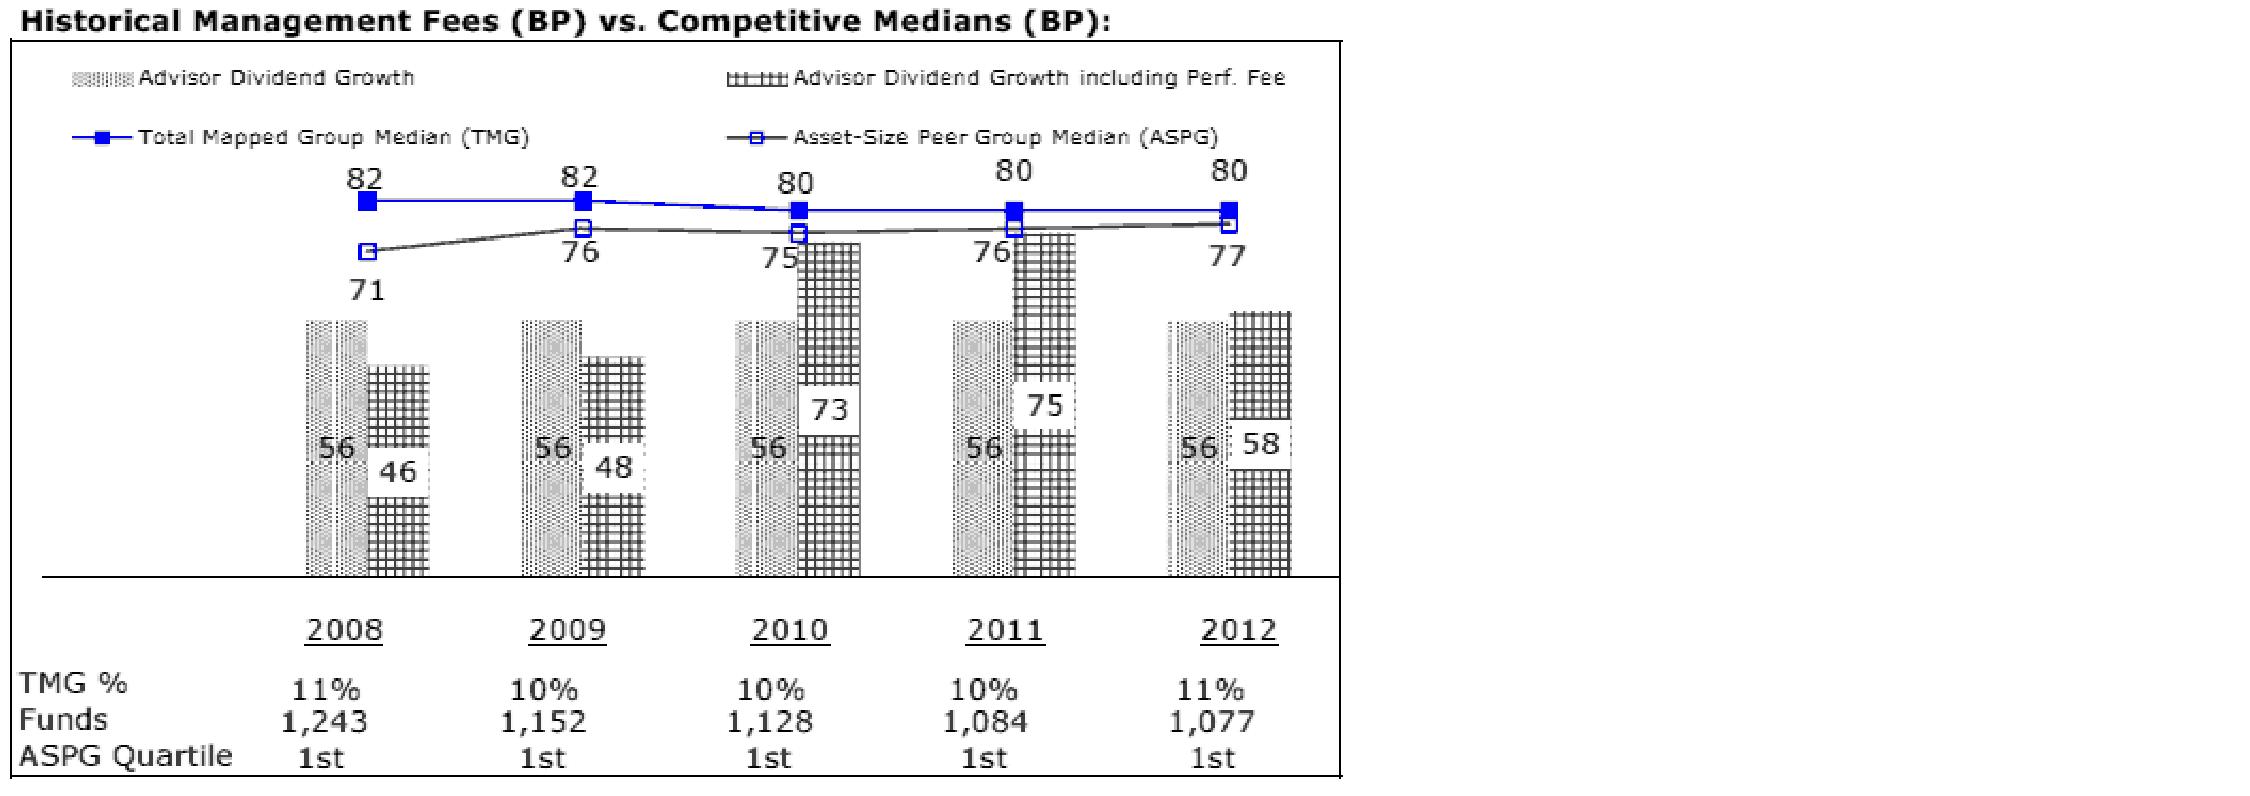
Annual Report
The Board noted that the fund's management fee ranked below the median of its Total Mapped Group and below the median of its ASPG for 2012. The Board also noted the effect of the fund's positive performance adjustment on the fund's management fee ranking.
Based on its review, the Board concluded that the fund's management fee is fair and reasonable in light of the services that the fund receives and the other factors considered.
Total Expense Ratio. In its review of each class's total expense ratio, the Board considered the fund's management fee as well as other fund or class expenses, as applicable, such as transfer agent fees, pricing and bookkeeping fees, fund-paid 12b-1 fees, and custodial, legal, and audit fees. The Board also noted the effects of any waivers and reimbursements on fees and expenses, as well as the impact of the fund's performance adjustment. As part of its review, the Board also considered the current and historical total expense ratios of each class of the fund compared to competitive fund median expenses. Each class of the fund is compared to those funds and classes in the Total Mapped Group (used by the Board for management fee comparisons) that have a similar sales load structure.
The Board noted that the total expense ratio of each of Class A, Class B, Class C, and Institutional Class ranked below its competitive median for 2012 and the total expense ratio of Class T ranked above its competitive median for 2012. The Board considered that, in general, various factors can affect total expense ratios. The Board noted that the total expense ratio of Class T was above the competitive median primarily because of higher 12b-1 fees on Class T. Class T has a higher 12b-1 fee, but a lower front-end sales charge, than traditionally priced front-end sales charge classes. The Board considered that Class T is primarily sold load-waived in the retirement plan market where its 0.50% 12b-1 fee is comparable to competing no-load, higher 12b-1 fee classes designed specifically for retirement plans. The Board noted that the fund offers multiple classes, each of which has a different sales load and 12b-1 fee structure, and that the multiple structures are intended to offer a range of pricing options for the intermediary market. The Board also noted that the total expense ratios of the classes vary primarily by the level of their 12b-1 fees, although differences in transfer agent fees may also cause expenses to vary from class to class.
Fees Charged to Other Fidelity Clients. The Board also considered Fidelity fee structures and other information with respect to clients of FMR and its affiliates, such as other mutual funds advised or subadvised by FMR or its affiliates, pension plan clients, and other institutional clients. The Board noted the findings of the 2013 ad hoc joint committee (created with the board of other Fidelity funds), which reviewed and compared Fidelity's institutional investment advisory business with its business of providing services to the Fidelity funds, including the differences in services provided, fees charged, and costs incurred, as well as competition in their respective marketplaces.
Annual Report
Board Approval of Investment Advisory Contracts and
Management Fees - continued
Based on its review of total expense ratios and fees charged to other Fidelity clients, the Board concluded that the total expense ratio of each class of the fund was reasonable, although Class T was above the median of the universe presented for comparison, in light of the services that the fund and its shareholders receive and the other factors considered.
Costs of the Services and Profitability. The Board considered the revenues earned and the expenses incurred by Fidelity in conducting the business of developing, marketing, distributing, managing, administering and servicing the fund and servicing the fund's shareholders. The Board also considered the level of Fidelity's profits in respect of all the Fidelity funds.
On an annual basis, FMR presents to the Board Fidelity's profitability for the fund. Fidelity calculates the profitability for each fund, as well as aggregate profitability for groups of Fidelity funds and all Fidelity funds, using a series of detailed revenue and cost allocation methodologies which originate with the books and records of Fidelity on which Fidelity's audited financial statements are based. The Audit Committee of the Board reviews any significant changes from the prior year's methodologies.
PricewaterhouseCoopers LLP (PwC), independent registered public accounting firm and auditor to Fidelity and certain Fidelity funds, has been engaged annually by the Board as part of the Board's assessment of Fidelity's profitability analysis. PwC's engagement includes the review and assessment of the methodologies used by Fidelity in determining the revenues and expenses attributable to Fidelity's mutual fund business, and completion of agreed-upon procedures surrounding the mathematical accuracy of fund profitability and its conformity to allocation methodologies. After considering PwC's reports issued under the engagement and information provided by Fidelity, the Board concluded that while other allocation methods may also be reasonable, Fidelity's profitability methodologies are reasonable in all material respects.
The Board also reviewed Fidelity's non-fund businesses and fall-out benefits related to the mutual fund business as well as cases where Fidelity's affiliates may benefit from or be related to the fund's business.
The Board considered the costs of the services provided by and the profits realized by Fidelity in connection with the operation of the fund and was satisfied that the profitability was not excessive in the circumstances.
Economies of Scale. The Board considered whether there have been economies of scale in respect of the management of the Fidelity funds, whether the Fidelity funds (including the fund) have appropriately benefited from any such economies of scale, and whether there is potential for realization of any further economies of scale. The Board considered the extent to which the fund will benefit from economies of scale through increased services to the fund, through waivers or reimbursements, or through fee or expense reductions. The Board also noted that in 2009, it and the board of other Fidelity funds created an ad hoc committee (the Economies of Scale Committee) to analyze whether FMR attains economies of scale in respect of the management and servicing of the Fidelity funds, whether the Fidelity funds have appropriately benefited from such economies of scale, and whether there is potential for realization of any further economies of scale.
Annual Report
The Board recognized that the fund's management contract incorporates a "group fee" structure, which provides for lower group fee rates as total fund assets under FMR's management increase, and for higher group fee rates as total fund assets under FMR's management decrease. FMR calculates the group fee rates based on a tiered asset "breakpoint" schedule that varies based on asset class. The Board considered that the group fee is designed to deliver the benefits of economies of scale to fund shareholders when total Fidelity fund assets increase, even if assets of any particular fund are unchanged or have declined, because some portion of Fidelity's costs are attributable to services provided to all Fidelity funds, and all funds benefit if those costs can be allocated among more assets. The Board concluded that, given the group fee structure, fund shareholders will benefit from lower management fees as assets under FMR's management increase at the fund complex level, regardless of whether Fidelity achieves any such economies of scale.
The Board concluded, taking into account the analysis of the Economies of Scale Committee, that economies of scale, if any, are being appropriately shared between fund shareholders and Fidelity.
Amendment to Description of Group Fee Rate. At its July 2013 meeting, the Board voted to approve an amendment to the fund's management contract to modify the description of the "group fee rate" effective August 1, 2013. The Board noted that under the prior description in the contract, the group fee rate was based on the average net assets of all registered investment companies with which FMR has management contracts. Under the contract's tiered asset breakpoint schedule, the group fee rate is lower as total fund assets under FMR's management increase, and higher as total fund assets under FMR's management decrease. The Board considered that the prior description would have excluded the assets of 64 Fidelity sector funds from the group fee rate calculation once Fidelity SelectCo, LLC, an affiliate of FMR, assumed management responsibilities for those funds. The Board noted that modifying the description of the group fee rate to continue to include the assets of those 64 funds for purposes of determining group fee rate breakpoints would avoid an immediate adverse impact on the group fee rate for any fund.
Annual Report
Board Approval of Investment Advisory Contracts and
Management Fees - continued
Additional Information Requested by the Board. In order to develop fully the factual basis for consideration of the Fidelity funds' Advisory Contracts, the Board requested and received additional information on certain topics, including: (i) fund performance trends and Fidelity's long-term strategies for certain funds; (ii) the potential to further rationalize the Fidelity fund lineup with the possibility of achieving savings for the funds and Fidelity; (iii) the methodology with respect to competitive fund data and peer group classifications; (iv) the arrangements with, and performance of, certain sub-advisers on behalf of the Fidelity funds, as well as certain proposed participating affiliate arrangements; (v) the realization of fall-out benefits in certain Fidelity business units; (vi) Fidelity's group fee structures, including the rationale for the individual fee rates of certain categories of funds and the definition of group assets; (vii) trends regarding industry use of performance fee structures and the performance adjustment methodologies applicable to the Fidelity funds; (viii) additional competitive analysis regarding the total expenses for certain classes; and (ix) fund profitability methodology, including Fidelity's cost allocation methodology, and the impact of certain factors on fund profitability results.
Based on its evaluation of all of the conclusions noted above, and after considering all factors it believed relevant, the Board ultimately concluded that the advisory fee structures are fair and reasonable, and that the fund's Advisory Contracts should be renewed.
Annual Report
Investment Adviser
Fidelity Management & Research Company
Boston, MA
Investment Sub-Advisers
FMR Co., Inc.
Fidelity Management & Research
(U.K.) Inc.
Fidelity Management & Research
(Hong Kong) Limited
Fidelity Management & Research
(Japan) Inc.
General Distributor
Fidelity Distributors Corporation
Smithfield, RI
Transfer and Service Agents
Fidelity Investments Institutional
Operations Company, Inc.
Boston, MA
Fidelity Service Company, Inc.
Boston, MA
Custodian
State Street Bank and Trust Company
Quincy, MA
(Fidelity Investment logo)(registered trademark)
ADGFZ-UANN-0114 1.9585502.100
(Fidelity Investment logo)(registered trademark)
Fidelity Advisor®
Equity Growth
Fund - Class A, Class T, Class B
and Class C
Annual Report
November 30, 2013
(Fidelity Cover Art)
Contents
|
Performance |
How the fund has done over time. |
|
|
Management's Discussion of Fund Performance |
The Portfolio Manager's review of fund performance and strategy. |
|
|
Shareholder Expense Example |
An example of shareholder expenses. |
|
|
Investment Changes |
A summary of major shifts in the fund's investments over the past six months. |
|
|
Investments |
A complete list of the fund's investments with their market values. |
|
|
Financial Statements |
Statements of assets and liabilities, operations, and changes in net assets, as well as financial highlights. |
|
|
Notes |
Notes to the financial statements. |
|
|
Report of Independent Registered Public Accounting Firm |
|
|
|
Trustees and Officers |
|
|
|
Board Approval of Investment Advisory Contracts and Management Fees |
|
To view a fund's proxy voting guidelines and proxy voting record for the 12-month period ended June 30, visit http://www.fidelity.com/proxyvotingresults or visit the Securities and Exchange Commission's (SEC) web site at http://www.sec.gov. You may also call 1-877-208-0098 to request a free copy of the proxy voting guidelines.
Standard & Poor's, S&P and S&P 500 are registered service marks of The McGraw-Hill Companies, Inc. and have been licensed for use by Fidelity Distributors Corporation.
Other third-party marks appearing herein are the property of their respective owners.
All other marks appearing herein are registered or unregistered trademarks or service marks of FMR LLC or an affiliated company. © 2014 FMR LLC. All rights reserved.
Annual Report
This report and the financial statements contained herein are submitted for the general information of the shareholders of the fund. This report is not authorized for distribution to prospective investors in the fund unless preceded or accompanied by an effective prospectus.
A fund files its complete schedule of portfolio holdings with the SEC for the first and third quarters of each fiscal year on Form N-Q. Forms N-Q are available on the SEC's web site at http://www.sec.gov. A fund's Forms N-Q may be reviewed and copied at the SEC's Public Reference Room in Washington, DC. Information regarding the operation of the SEC's Public Reference Room may be obtained by calling 1-800-SEC-0330. For a complete list of a fund's portfolio holdings, view the most recent holdings listing, semiannual report, or annual report on Fidelity's web site at http://www.fidelity.com, http://www.advisor.fidelity.com, or http://www.401k.com, as applicable.
NOT FDIC INSURED • MAY LOSE VALUE • NO BANK GUARANTEE
Neither the fund nor Fidelity Distributors Corporation is a bank.
Annual Report
Performance: The Bottom Line
Average annual total return reflects the change in the value of an investment, assuming reinvestment of the class' distributions from dividend income and capital gains (the profits earned upon the sale of securities that have grown in value, if any) and assuming a constant rate of performance each year. The $10,000 table and the fund's returns do not reflect the deduction of taxes that a shareholder would pay on fund distributions or the redemption of fund shares. During periods of reimbursement by Fidelity, a fund's total return will be greater than it would be had the reimbursement not occurred. How a fund did yesterday is no guarantee of how it will do tomorrow. Returns reflect the conversion of Class B shares to Class A shares after a maximum of seven years.
Average Annual Total Returns
|
Periods ended November 30, 2013 |
Past 1 |
Past 5 |
Past 10 |
|
Class A (incl. 5.75% sales charge) |
23.39% |
17.40% |
5.93% |
|
Class T (incl. 3.50% sales charge) |
26.12% |
17.74% |
5.99% |
|
Class B (incl. contingent deferred sales charge) A |
24.90% |
17.69% |
5.98% |
|
Class C (incl. contingent deferred sales charge) B |
28.96% |
17.93% |
5.76% |
A Class B shares' contingent deferred sales charges included in the past one year, past five years, and past ten years total return figures are 5%, 2% and 0%, respectively.
B Class C shares' contingent deferred sales charges included in the past one year, past five years, and past ten years total return figures are 1%, 0% and 0%, respectively.
Annual Report
$10,000 Over 10 Years
Let's say hypothetically that $10,000 was invested in Fidelity Advisor® Equity Growth Fund - Class A on November 30, 2003, and the current 5.75% sales charge was paid. The chart shows how the value of your investment would have changed, and also shows how the Russell 3000® Growth Index performed over the same period.
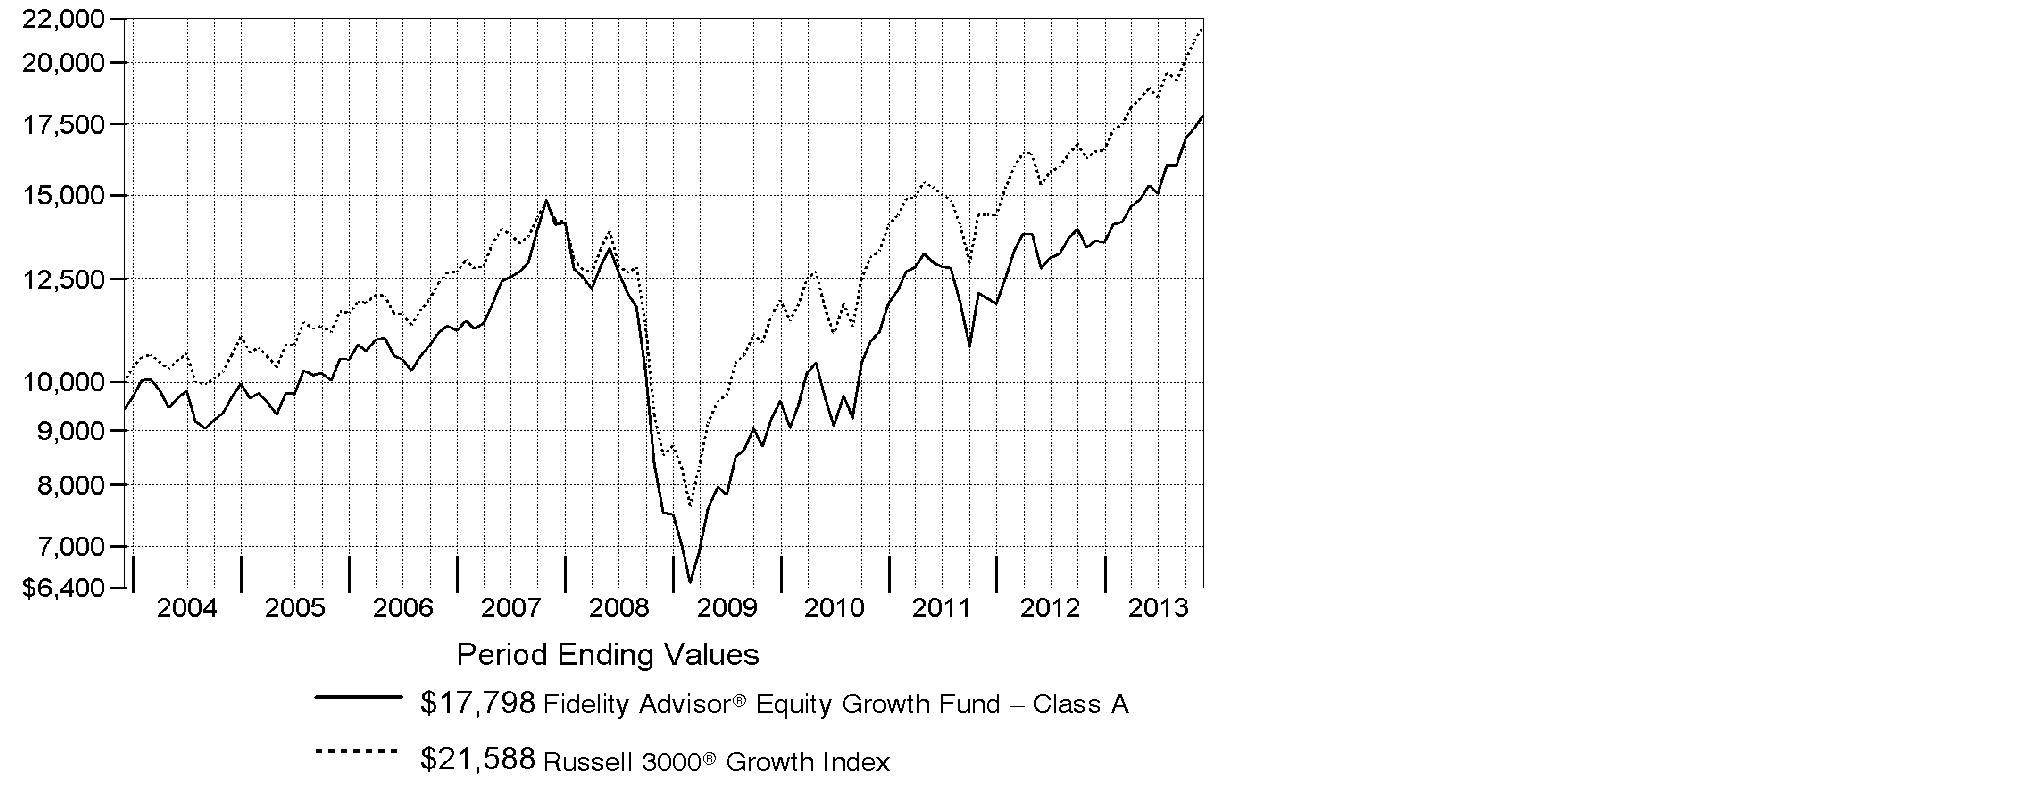
Annual Report
Management's Discussion of Fund Performance
Market Recap: With the current bull run nearing the five-year mark, equity benchmarks ripped up old records during the 12 months ending November 30, 2013. Gains were fueled by strengthening U.S. economic data, as well as generally improving economies and accommodative monetary policies worldwide. The broad S&P 500® Index reached new peaks in its 30.30% climb for the period, and the blue-chip Dow Jones Industrial AverageSM surpassed historic milestones en route to a 26.63% gain. The Nasdaq Composite Index®, up 36.73% amid a resurgence in growth-oriented stocks, closed above 4,000 for the first time since 2000. Shedding anxiety over the 2012 U.S. presidential election - and apparently confident that the federal debt-ceiling debate would be resolved - markets rose from period start through late May. News that the U.S. Federal Reserve was considering an end to its stimulative bond-buying kept stocks in flux over the summer but, by September, the Fed had set aside any imminent tapering. Despite jitters over a potential U.S. military strike in Syria and, later, an October budget impasse that briefly shuttered the federal government, volatility was subdued heading into the holidays, with investor optimism helping many markets home in on all-time highs at period end. Elsewhere, non-U.S. developed-market equities saw similar results, with the MSCI® EAFE® Index adding 24.97%.
Comments from Jason Weiner, Portfolio Manager of Fidelity Advisor® Equity Growth Fund: For the year, the fund's Class A, Class T, Class B and Class C shares gained 30.92%, 30.69%, 29.90% and 29.96%, respectively (excluding sales charges), roughly in line with the 30.83% return of the Russell 3000® Growth Index. Tesla Motors was by far the biggest relative contributor this period. In May, the automaker received rave reviews for its first electric luxury vehicle, the Model S, and shares catapulted higher. Subsequently, the firm ramped up production to meet growing demand, which helped it move into profitability. Another winner was social networking firm Facebook. The stock popped in July after the firm announced better-than-expected earnings and an explosion in mobile use and mobile revenue. Conversely, an overweighting, on average, in Apple was by far the biggest relative detractor. The tech giant struggled amid mounting competition in the smartphone industry - particularly from South Korea-based Samsung Electronics - and its lack of innovation during the period hurt the stock. Broadcom was another miss, as an overweighting here, on average, curbed results. The company produces baseband chips for smartphones and the stock lagged for most of the period, as the firm faced intensifying competition and setbacks in releasing new baseband chips. I sold Tesla and Broadcom prior to period end.
Annual Report
The views expressed above reflect those of the portfolio manager(s) only through the end of the period as stated on the cover of this report and do not necessarily represent the views of Fidelity or any other person in the Fidelity organization. Any such views are subject to change at any time based upon market or other conditions and Fidelity disclaims any responsibility to update such views. These views may not be relied on as investment advice and, because investment decisions for a Fidelity fund are based on numerous factors, may not be relied on as an indication of trading intent on behalf of any Fidelity fund.
Annual Report
Shareholder Expense Example
As a shareholder of the Fund, you incur two types of costs: (1) transaction costs, including sales charges (loads) on purchase payments or redemption proceeds, and (2) ongoing costs, including management fees, distribution and/or service (12b-1) fees and other Fund expenses. This Example is intended to help you understand your ongoing costs (in dollars) of investing in the Fund and to compare these costs with the ongoing costs of investing in other mutual funds.
The actual expense Example is based on an investment of $1,000 invested at the beginning of the period and held for the entire period (June 1, 2013 to November 30, 2013) for Class A, Class T, Class B, Class C and Institutional Class and for the period (August 13, 2013 to November 30, 2013) for Class Z. The hypothetical expense Example is based on an investment of $1,000 invested for the one-half year period (June 1, 2013 to November 30, 2013).
Actual Expenses
The first line of the accompanying table for each class of the Fund provides information about actual account values and actual expenses. You may use the information in this line, together with the amount you invested, to estimate the expenses that you paid over the period. Simply divide your account value by $1,000.00 (for example, an $8,600 account value divided by $1,000.00 = 8.6), then multiply the result by the number in the first line for a class of the Fund under the heading entitled "Expenses Paid During Period" to estimate the expenses you paid on your account during this period. In addition, the Fund, as a shareholder in the underlying Fidelity Central Funds, will indirectly bear its pro-rata share of the fees and expenses incurred by the underlying Fidelity Central Funds. These fees and expenses are not included in the Fund's annualized expense ratio used to calculate the expense estimate in the table below.
Hypothetical Example for Comparison Purposes
The second line of the accompanying table for each class of the Fund provides information about hypothetical account values and hypothetical expenses based on a Class' actual expense ratio and an assumed rate of return of 5% per year before expenses, which is not the Class' actual return. The hypothetical account values and expenses may not be used to estimate the actual ending account balance or expenses you paid for the period. You may use this information to compare the ongoing costs of investing in the Fund and other funds. To do so, compare this 5% hypothetical example with the 5% hypothetical examples that appear in the shareholder reports of the other funds. In addition, the Fund, as a shareholder in the underlying Fidelity Central Funds, will indirectly bear its pro-rata share of the fees and expenses incurred by the underlying Fidelity Central Funds. These fees and expenses are not included in the Fund's annualized expense ratio used to calculate the expense estimate in the table below.
Please note that the expenses shown in the table are meant to highlight your ongoing costs only and do not reflect any transaction costs. Therefore, the second line of the table is useful in comparing ongoing costs only, and will not help you determine the relative total costs of owning different funds. In addition, if these transactional costs were included, your costs would have been higher.
Annual Report
|
|
Annualized |
Beginning |
Ending |
Expenses Paid |
|
Class A |
1.10% |
|
|
|
|
Actual |
|
$ 1,000.00 |
$ 1,162.60 |
$ 5.96 C |
|
HypotheticalA |
|
$ 1,000.00 |
$ 1,019.55 |
$ 5.57 D |
|
Class T |
1.29% |
|
|
|
|
Actual |
|
$ 1,000.00 |
$ 1,161.40 |
$ 6.99 C |
|
HypotheticalA |
|
$ 1,000.00 |
$ 1,018.60 |
$ 6.53 D |
|
Class B |
1.89% |
|
|
|
|
Actual |
|
$ 1,000.00 |
$ 1,158.00 |
$ 10.22 C |
|
HypotheticalA |
|
$ 1,000.00 |
$ 1,015.59 |
$ 9.55 D |
|
Class C |
1.83% |
|
|
|
|
Actual |
|
$ 1,000.00 |
$ 1,158.20 |
$ 9.90 C |
|
HypotheticalA |
|
$ 1,000.00 |
$ 1,015.89 |
$ 9.25 D |
|
Institutional Class |
.78% |
|
|
|
|
Actual |
|
$ 1,000.00 |
$ 1,164.40 |
$ 4.23 C |
|
HypotheticalA |
|
$ 1,000.00 |
$ 1,021.16 |
$ 3.95 D |
|
Class Z |
.64% |
|
|
|
|
Actual |
|
$ 1,000.00 |
$ 1,100.30 |
$ 2.03 C |
|
HypotheticalA |
|
$ 1,000.00 |
$ 1,021.86 |
$ 3.24 D |
A 5% return per year before expenses
B Annualized expense ratio reflects expenses net of applicable fee waivers.
C Actual expenses are equal to each Class' annualized expense ratio; multiplied by the average account value over the period, multiplied by 183/365 (to reflect the one-half year period) for Class A, Class T, Class B, Class C and Institutional Class and multiplied by 110/365 (to reflect the period August 13, 2013 to November 30, 2013) for Class Z.
D Hypothetical expenses are equal to each Class' annualized expense ratio, multiplied by the average account value over the period, multiplied by 183/365 (to reflect the one-half year period).
Annual Report
Investment Changes (Unaudited)
|
Top Ten Stocks as of November 30, 2013 |
||
|
|
% of fund's |
% of fund's net assets |
|
Facebook, Inc. Class A |
5.9 |
2.2 |
|
Google, Inc. Class A |
3.8 |
2.7 |
|
Microsoft Corp. |
3.2 |
0.0 |
|
Harley-Davidson, Inc. |
3.0 |
2.5 |
|
Apple, Inc. |
2.6 |
4.9 |
|
Home Depot, Inc. |
2.5 |
3.2 |
|
QUALCOMM, Inc. |
2.3 |
1.4 |
|
Green Mountain Coffee Roasters, Inc. |
2.3 |
2.4 |
|
Procter & Gamble Co. |
1.9 |
0.0 |
|
Amazon.com, Inc. |
1.8 |
1.0 |
|
|
29.3 |
|
|
Top Five Market Sectors as of November 30, 2013 |
||
|
|
% of fund's |
% of fund's net assets |
|
Information Technology |
27.5 |
27.0 |
|
Consumer Discretionary |
20.4 |
20.8 |
|
Health Care |
16.9 |
17.0 |
|
Consumer Staples |
9.1 |
9.7 |
|
Industrials |
7.4 |
7.7 |
|
Asset Allocation (% of fund's net assets) |
|||||||
|
As of November 30, 2013* |
As of May 31, 2013** |
||||||
 |
Stocks 98.0% |
|
|
Stocks 98.3% |
|
||
 |
Convertible |
|
 |
Convertible |
|
||
 |
Short-Term |
|
|
Short-Term |
|
||
|
* Foreign investments |
12.3% |
|
** Foreign investments |
11.2% |
|
||

Annual Report
Investments November 30, 2013
Showing Percentage of Net Assets
|
Common Stocks - 98.0% |
|||
|
Shares |
Value (000s) |
||
|
CONSUMER DISCRETIONARY - 20.3% |
|||
|
Automobiles - 3.0% |
|||
|
Harley-Davidson, Inc. |
1,542,454 |
$ 103,375 |
|
|
Diversified Consumer Services - 1.4% |
|||
|
Anhanguera Educacional Participacoes SA |
2,140,700 |
14,251 |
|
|
H&R Block, Inc. |
316,752 |
8,834 |
|
|
Kroton Educacional SA |
1,507,000 |
25,340 |
|
|
|
48,425 |
||
|
Hotels, Restaurants & Leisure - 4.6% |
|||
|
Chipotle Mexican Grill, Inc. (a) |
66,068 |
34,610 |
|
|
Dunkin' Brands Group, Inc. |
452,136 |
22,146 |
|
|
Las Vegas Sands Corp. |
99,300 |
7,118 |
|
|
Starbucks Corp. |
767,501 |
62,521 |
|
|
Yum! Brands, Inc. |
424,779 |
32,997 |
|
|
|
159,392 |
||
|
Household Durables - 0.5% |
|||
|
Mohawk Industries, Inc. (a) |
133,816 |
18,737 |
|
|
Internet & Catalog Retail - 2.3% |
|||
|
Amazon.com, Inc. (a) |
164,844 |
64,886 |
|
|
TripAdvisor, Inc. (a) |
182,864 |
16,151 |
|
|
|
81,037 |
||
|
Leisure Equipment & Products - 0.0% |
|||
|
NJOY, Inc. (a)(e) |
202,642 |
1,637 |
|
|
Media - 0.8% |
|||
|
Comcast Corp. Class A (special) (non-vtg.) |
553,238 |
26,638 |
|
|
Multiline Retail - 0.4% |
|||
|
Dollarama, Inc. |
154,245 |
12,470 |
|
|
Specialty Retail - 5.4% |
|||
|
CarMax, Inc. (a) |
361,148 |
18,184 |
|
|
Five Below, Inc. (a) |
127,900 |
6,799 |
|
|
GNC Holdings, Inc. |
434,619 |
26,155 |
|
|
Home Depot, Inc. |
1,091,144 |
88,023 |
|
|
TJX Companies, Inc. |
262,455 |
16,503 |
|
|
Ulta Salon, Cosmetics & Fragrance, Inc. (a) |
81,420 |
10,335 |
|
|
Urban Outfitters, Inc. (a) |
610,143 |
23,808 |
|
|
|
189,807 |
||
|
Textiles, Apparel & Luxury Goods - 1.9% |
|||
|
ECLAT Textile Co. Ltd. |
1,099,560 |
14,003 |
|
|
Common Stocks - continued |
|||
|
Shares |
Value (000s) |
||
|
CONSUMER DISCRETIONARY - continued |
|||
|
Textiles, Apparel & Luxury Goods - continued |
|||
|
Michael Kors Holdings Ltd. (a) |
247,097 |
$ 20,151 |
|
|
NIKE, Inc. Class B |
422,757 |
33,457 |
|
|
|
67,611 |
||
|
TOTAL CONSUMER DISCRETIONARY |
709,129 |
||
|
CONSUMER STAPLES - 9.1% |
|||
|
Beverages - 1.2% |
|||
|
Monster Beverage Corp. (a) |
104,840 |
6,204 |
|
|
SABMiller PLC |
376,434 |
19,421 |
|
|
The Coca-Cola Co. |
426,326 |
17,134 |
|
|
|
42,759 |
||
|
Food & Staples Retailing - 1.1% |
|||
|
Costco Wholesale Corp. |
168,200 |
21,097 |
|
|
Whole Foods Market, Inc. |
327,683 |
18,547 |
|
|
|
39,644 |
||
|
Food Products - 3.6% |
|||
|
Annie's, Inc. (a) |
68,589 |
3,152 |
|
|
Green Mountain Coffee Roasters, Inc. (d) |
1,195,591 |
80,559 |
|
|
Mead Johnson Nutrition Co. Class A |
39,285 |
3,320 |
|
|
The Hershey Co. |
383,359 |
37,144 |
|
|
|
124,175 |
||
|
Household Products - 1.9% |
|||
|
Procter & Gamble Co. |
803,991 |
67,712 |
|
|
Personal Products - 1.3% |
|||
|
Herbalife Ltd. |
547,170 |
38,127 |
|
|
Inter Parfums, Inc. |
165,292 |
6,017 |
|
|
|
44,144 |
||
|
TOTAL CONSUMER STAPLES |
318,434 |
||
|
ENERGY - 4.3% |
|||
|
Energy Equipment & Services - 2.2% |
|||
|
Cameron International Corp. (a) |
229,392 |
12,706 |
|
|
Dril-Quip, Inc. (a) |
160,830 |
17,460 |
|
|
National Oilwell Varco, Inc. |
173,195 |
14,115 |
|
|
Oceaneering International, Inc. |
276,370 |
21,333 |
|
|
RigNet, Inc. (a) |
325,698 |
13,836 |
|
|
|
79,450 |
||
|
Common Stocks - continued |
|||
|
Shares |
Value (000s) |
||
|
ENERGY - continued |
|||
|
Oil, Gas & Consumable Fuels - 2.1% |
|||
|
Bonanza Creek Energy, Inc. (a) |
358,158 |
$ 16,429 |
|
|
Cobalt International Energy, Inc. (a) |
403,909 |
8,979 |
|
|
Continental Resources, Inc. (a) |
93,510 |
10,053 |
|
|
Markwest Energy Partners LP |
189,840 |
13,112 |
|
|
Noble Energy, Inc. |
133,000 |
9,342 |
|
|
Pioneer Natural Resources Co. |
83,502 |
14,842 |
|
|
|
72,757 |
||
|
TOTAL ENERGY |
152,207 |
||
|
FINANCIALS - 6.6% |
|||
|
Capital Markets - 3.7% |
|||
|
BlackRock, Inc. Class A |
73,200 |
22,161 |
|
|
E*TRADE Financial Corp. (a) |
1,049,455 |
18,806 |
|
|
Harvest Capital Credit Corp. (d) |
125,400 |
1,853 |
|
|
Invesco Ltd. |
1,303,271 |
45,419 |
|
|
Legg Mason, Inc. |
134,258 |
5,251 |
|
|
The Blackstone Group LP |
1,079,233 |
30,844 |
|
|
Virtus Investment Partners, Inc. (a) |
24,800 |
5,153 |
|
|
|
129,487 |
||
|
Commercial Banks - 1.0% |
|||
|
First Republic Bank |
133,800 |
6,837 |
|
|
HDFC Bank Ltd. sponsored ADR |
828,796 |
27,499 |
|
|
|
34,336 |
||
|
Consumer Finance - 0.6% |
|||
|
American Express Co. |
219,423 |
18,826 |
|
|
Mahindra & Mahindra Financial Services Ltd. |
495,252 |
2,347 |
|
|
|
21,173 |
||
|
Diversified Financial Services - 0.8% |
|||
|
Berkshire Hathaway, Inc. Class B (a) |
73,900 |
8,612 |
|
|
McGraw-Hill Companies, Inc. |
274,375 |
20,441 |
|
|
|
29,053 |
||
|
Real Estate Management & Development - 0.5% |
|||
|
Leopalace21 Corp. (a) |
248,300 |
1,411 |
|
|
Realogy Holdings Corp. (a) |
291,218 |
13,801 |
|
|
|
15,212 |
||
|
TOTAL FINANCIALS |
229,261 |
||
|
Common Stocks - continued |
|||
|
Shares |
Value (000s) |
||
|
HEALTH CARE - 16.9% |
|||
|
Biotechnology - 8.8% |
|||
|
Actelion Ltd. |
56,084 |
$ 4,672 |
|
|
Alexion Pharmaceuticals, Inc. (a) |
138,581 |
17,253 |
|
|
Amgen, Inc. |
189,429 |
21,610 |
|
|
Biogen Idec, Inc. (a) |
180,916 |
52,641 |
|
|
BioMarin Pharmaceutical, Inc. (a) |
440,879 |
31,029 |
|
|
Cytokinetics, Inc. warrants 6/25/17 (a) |
856,620 |
122 |
|
|
Enanta Pharmaceuticals, Inc. |
126,572 |
3,421 |
|
|
Gentium SpA sponsored ADR (a) |
190,208 |
10,313 |
|
|
Gilead Sciences, Inc. (a) |
653,239 |
48,869 |
|
|
Insmed, Inc. (a) |
954,020 |
15,455 |
|
|
Kamada (a) |
819,830 |
12,215 |
|
|
Ophthotech Corp. |
89,016 |
2,515 |
|
|
Regeneron Pharmaceuticals, Inc. (a) |
59,775 |
17,565 |
|
|
Swedish Orphan Biovitrum AB (a) |
1,227,713 |
12,774 |
|
|
Theravance, Inc. (a)(d) |
1,020,043 |
38,517 |
|
|
United Therapeutics Corp. (a) |
120,285 |
11,104 |
|
|
Vanda Pharmaceuticals, Inc. (a) |
671,242 |
7,880 |
|
|
|
307,955 |
||
|
Health Care Equipment & Supplies - 0.7% |
|||
|
AxoGen, Inc. (a) |
250,900 |
991 |
|
|
GI Dynamics, Inc. CDI (a) |
547,818 |
359 |
|
|
Intuitive Surgical, Inc. (a) |
9,300 |
3,505 |
|
|
The Cooper Companies, Inc. |
147,693 |
19,457 |
|
|
|
24,312 |
||
|
Health Care Providers & Services - 1.2% |
|||
|
Apollo Hospitals Enterprise Ltd. |
392,573 |
5,248 |
|
|
Express Scripts Holding Co. (a) |
461,092 |
31,055 |
|
|
Qualicorp SA (a) |
806,600 |
7,540 |
|
|
|
43,843 |
||
|
Health Care Technology - 0.6% |
|||
|
Cerner Corp. (a) |
363,740 |
20,904 |
|
|
Life Sciences Tools & Services - 0.8% |
|||
|
Illumina, Inc. (a) |
289,795 |
28,400 |
|
|
Pharmaceuticals - 4.8% |
|||
|
AbbVie, Inc. |
832,254 |
40,323 |
|
|
Actavis PLC (a) |
229,800 |
37,473 |
|
|
Cadence Pharmaceuticals, Inc. (a) |
710,600 |
6,410 |
|
|
Novo Nordisk A/S Series B |
105,397 |
18,841 |
|
|
Pacira Pharmaceuticals, Inc. (a) |
265,430 |
14,649 |
|
|
Common Stocks - continued |
|||
|
Shares |
Value (000s) |
||
|
HEALTH CARE - continued |
|||
|
Pharmaceuticals - continued |
|||
|
Perrigo Co. (d) |
126,291 |
$ 19,688 |
|
|
Valeant Pharmaceuticals International, Inc. (Canada) (a) |
275,652 |
30,223 |
|
|
|
167,607 |
||
|
TOTAL HEALTH CARE |
593,021 |
||
|
INDUSTRIALS - 7.4% |
|||
|
Aerospace & Defense - 2.2% |
|||
|
TransDigm Group, Inc. |
170,377 |
26,667 |
|
|
United Technologies Corp. |
470,719 |
52,184 |
|
|
|
78,851 |
||
|
Airlines - 0.2% |
|||
|
Ryanair Holdings PLC sponsored ADR |
113,180 |
5,435 |
|
|
Building Products - 0.3% |
|||
|
A.O. Smith Corp. |
212,338 |
11,498 |
|
|
Commercial Services & Supplies - 0.1% |
|||
|
KAR Auction Services, Inc. |
123,667 |
3,412 |
|
|
Construction & Engineering - 0.1% |
|||
|
Jacobs Engineering Group, Inc. (a) |
42,815 |
2,559 |
|
|
Electrical Equipment - 1.6% |
|||
|
AMETEK, Inc. |
343,355 |
16,900 |
|
|
Generac Holdings, Inc. |
326,516 |
17,390 |
|
|
Power Solutions International, Inc. (a) |
31,413 |
2,350 |
|
|
Roper Industries, Inc. |
136,569 |
17,713 |
|
|
|
54,353 |
||
|
Industrial Conglomerates - 1.3% |
|||
|
Danaher Corp. |
608,577 |
45,522 |
|
|
Machinery - 0.8% |
|||
|
Graco, Inc. |
39,222 |
3,029 |
|
|
Haitian International Holdings Ltd. |
205,000 |
469 |
|
|
Manitowoc Co., Inc. |
1,009,748 |
20,791 |
|
|
Weg SA |
301,500 |
4,094 |
|
|
|
28,383 |
||
|
Common Stocks - continued |
|||
|
Shares |
Value (000s) |
||
|
INDUSTRIALS - continued |
|||
|
Professional Services - 0.8% |
|||
|
Equifax, Inc. |
117,071 |
$ 7,882 |
|
|
Verisk Analytics, Inc. (a) |
325,329 |
21,182 |
|
|
|
29,064 |
||
|
TOTAL INDUSTRIALS |
259,077 |
||
|
INFORMATION TECHNOLOGY - 27.5% |
|||
|
Communications Equipment - 2.3% |
|||
|
QUALCOMM, Inc. |
1,104,051 |
81,236 |
|
|
Computers & Peripherals - 2.6% |
|||
|
Apple, Inc. |
161,801 |
89,973 |
|
|
Electronic Equipment & Components - 0.4% |
|||
|
National Instruments Corp. |
54,900 |
1,716 |
|
|
TE Connectivity Ltd. |
234,700 |
12,373 |
|
|
|
14,089 |
||
|
Internet Software & Services - 12.2% |
|||
|
Cornerstone OnDemand, Inc. (a) |
200,132 |
10,091 |
|
|
CoStar Group, Inc. (a) |
81,560 |
15,190 |
|
|
Facebook, Inc. Class A (a) |
4,372,200 |
205,541 |
|
|
Google, Inc. Class A (a) |
127,053 |
134,624 |
|
|
LinkedIn Corp. (a) |
38,931 |
8,722 |
|
|
MercadoLibre, Inc. (d) |
17,290 |
1,914 |
|
|
SPS Commerce, Inc. (a) |
195,299 |
12,845 |
|
|
Textura Corp. |
219,830 |
7,443 |
|
|
Twitter, Inc. |
26,800 |
1,114 |
|
|
Xoom Corp. |
57,100 |
1,578 |
|
|
Yahoo!, Inc. (a) |
769,153 |
28,443 |
|
|
|
427,505 |
||
|
IT Services - 2.2% |
|||
|
Gartner, Inc. Class A (a) |
118,660 |
7,671 |
|
|
QIWI PLC Class B sponsored ADR |
158,388 |
7,409 |
|
|
Visa, Inc. Class A |
302,908 |
61,630 |
|
|
|
76,710 |
||
|
Software - 7.8% |
|||
|
ANSYS, Inc. (a) |
4,168 |
357 |
|
|
Computer Modelling Group Ltd. |
432,800 |
11,018 |
|
|
Diligent Board Member Services, Inc. (a) |
489,277 |
1,548 |
|
|
Electronic Arts, Inc. (a) |
790,145 |
17,525 |
|
|
FireEye, Inc. |
502,139 |
19,267 |
|
|
Common Stocks - continued |
|||
|
Shares |
Value (000s) |
||
|
INFORMATION TECHNOLOGY - continued |
|||
|
Software - continued |
|||
|
FleetMatics Group PLC (a) |
124,200 |
$ 4,807 |
|
|
Microsoft Corp. |
2,956,500 |
112,731 |
|
|
salesforce.com, Inc. (a) |
1,139,492 |
59,356 |
|
|
ServiceNow, Inc. (a) |
85,100 |
4,520 |
|
|
SolarWinds, Inc. (a) |
107,112 |
3,582 |
|
|
Solera Holdings, Inc. |
61,100 |
4,078 |
|
|
SS&C Technologies Holdings, Inc. (a) |
617,646 |
26,627 |
|
|
Tableau Software, Inc. |
81,200 |
5,322 |
|
|
Workday, Inc. Class A (a) |
48,600 |
4,002 |
|
|
|
274,740 |
||
|
TOTAL INFORMATION TECHNOLOGY |
964,253 |
||
|
MATERIALS - 4.3% |
|||
|
Chemicals - 2.3% |
|||
|
FMC Corp. |
294,553 |
21,461 |
|
|
LyondellBasell Industries NV Class A |
142,845 |
11,025 |
|
|
Monsanto Co. |
218,363 |
24,747 |
|
|
Sherwin-Williams Co. |
125,145 |
22,905 |
|
|
|
80,138 |
||
|
Construction Materials - 2.0% |
|||
|
Eagle Materials, Inc. |
424,058 |
33,077 |
|
|
James Hardie Industries PLC sponsored ADR |
164,473 |
9,439 |
|
|
Vulcan Materials Co. |
474,730 |
26,761 |
|
|
|
69,277 |
||
|
TOTAL MATERIALS |
149,415 |
||
|
TELECOMMUNICATION SERVICES - 0.7% |
|||
|
Diversified Telecommunication Services - 0.3% |
|||
|
8x8, Inc. (a) |
1,073,298 |
11,184 |
|
|
Wireless Telecommunication Services - 0.4% |
|||
|
SBA Communications Corp. Class A (a) |
155,460 |
13,241 |
|
|
TOTAL TELECOMMUNICATION SERVICES |
24,425 |
||
|
Common Stocks - continued |
|||
|
Shares |
Value (000s) |
||
|
UTILITIES - 0.9% |
|||
|
Electric Utilities - 0.9% |
|||
|
ITC Holdings Corp. |
351,412 |
$ 31,796 |
|
|
TOTAL COMMON STOCKS (Cost $2,599,349) |
|
||
|
Convertible Preferred Stocks - 0.1% |
|||
|
|
|
|
|
|
CONSUMER DISCRETIONARY - 0.1% |
|||
|
Household Durables - 0.1% |
|||
|
Blu Homes, Inc. Series A, 5.00% (e) (Cost $4,044) |
875,350 |
|
|
|
Money Market Funds - 3.9% |
|||
|
|
|
|
|
|
Fidelity Cash Central Fund, 0.10% (b) |
68,826,521 |
68,827 |
|
|
Fidelity Securities Lending Cash Central Fund, 0.10% (b)(c) |
66,812,844 |
66,813 |
|
|
TOTAL MONEY MARKET FUNDS (Cost $135,640) |
|
||
|
TOTAL INVESTMENT PORTFOLIO - 102.0% (Cost $2,739,033) |
3,570,702 |
||
|
NET OTHER ASSETS (LIABILITIES) - (2.0)% |
(68,729) |
||
|
NET ASSETS - 100% |
$ 3,501,973 |
||
|
Legend |
|
(a) Non-income producing |
|
(b) Affiliated fund that is generally available only to investment companies and other accounts managed by Fidelity Investments. The rate quoted is the annualized seven-day yield of the fund at period end. A complete unaudited listing of the fund's holdings as of its most recent quarter end is available upon request. In addition, each Fidelity Central Fund's financial statements, which are not covered by the Fund's Report of Independent Registered Public Accounting Firm, are available on the SEC's website or upon request. |
|
(c) Investment made with cash collateral received from securities on loan. |
|
(d) Security or a portion of the security is on loan at period end. |
|
(e) Restricted securities - Investment in securities not registered under the Securities Act of 1933 (excluding 144A issues). At the end of the period, the value of restricted securities (excluding 144A issues) amounted to $5,681,000 or 0.1% of net assets. |
|
Additional information on each restricted holding is as follows: |
|
Security |
Acquisition Date |
Acquisition Cost (000s) |
|
Blu Homes, Inc. Series A, 5.00% |
6/21/13 |
$ 4,044 |
|
NJOY, Inc. |
9/11/13 |
$ 1,637 |
|
Affiliated Central Funds |
|
Information regarding fiscal year to date income earned by the Fund from investments in Fidelity Central Funds is as follows: |
|
Fund |
Income earned |
|
Fidelity Cash Central Fund |
$ 92 |
|
Fidelity Securities Lending Cash Central Fund |
479 |
|
Total |
$ 571 |
|
Other Information |
|
The following is a summary of the inputs used, as of November 30, 2013, involving the Fund's assets and liabilities carried at fair value. The inputs or methodology used for valuing securities may not be an indication of the risk associated with investing in those securities. For more information on valuation inputs, and their aggregation into the levels used in the table below, please refer to the Investment Valuation section in the accompanying Notes to Financial Statements. |
|
Valuation Inputs at Reporting Date: |
||||
|
Description |
Total |
Level 1 |
Level 2 |
Level 3 |
|
Investments in Securities: |
||||
|
Equities: |
||||
|
Consumer Discretionary |
$ 713,173 |
$ 707,492 |
$ - |
$ 5,681 |
|
Consumer Staples |
318,434 |
318,434 |
- |
- |
|
Energy |
152,207 |
152,207 |
- |
- |
|
Financials |
229,261 |
229,261 |
- |
- |
|
Health Care |
593,021 |
574,058 |
18,963 |
- |
|
Industrials |
259,077 |
259,077 |
- |
- |
|
Information Technology |
964,253 |
964,253 |
- |
- |
|
Materials |
149,415 |
149,415 |
- |
- |
|
Telecommunication Services |
24,425 |
24,425 |
- |
- |
|
Utilities |
31,796 |
31,796 |
- |
- |
|
Money Market Funds |
135,640 |
135,640 |
- |
- |
|
Total Investments in Securities: |
$ 3,570,702 |
$ 3,546,058 |
$ 18,963 |
$ 5,681 |
|
Distribution of investments by country or territory of incorporation, as a percentage of total net assets, is as follows (Unaudited): |
|
United States of America |
87.7% |
|
Ireland |
1.7% |
|
Canada |
1.6% |
|
Brazil |
1.4% |
|
Bermuda |
1.3% |
|
Cayman Islands |
1.1% |
|
India |
1.0% |
|
Others (Individually Less Than 1%) |
4.2% |
|
|
100.0% |
See accompanying notes which are an integral part of the financial statements.
Annual Report
Financial Statements
Statement of Assets and Liabilities
|
Amounts in thousands (except per-share amounts) |
November 30, 2013 |
|
|
|
|
|
|
Assets |
|
|
|
Investment in securities, at value (including securities loaned of $65,378) - See accompanying schedule: Unaffiliated issuers (cost $2,603,393) |
$ 3,435,062 |
|
|
Fidelity Central Funds (cost $135,640) |
135,640 |
|
|
Total Investments (cost $2,739,033) |
|
$ 3,570,702 |
|
Receivable for investments sold |
|
18,520 |
|
Receivable for fund shares sold |
|
846 |
|
Dividends receivable |
|
3,248 |
|
Distributions receivable from Fidelity Central Funds |
|
18 |
|
Prepaid expenses |
|
10 |
|
Other receivables |
|
180 |
|
Total assets |
|
3,593,524 |
|
|
|
|
|
Liabilities |
|
|
|
Payable for investments purchased |
$ 15,196 |
|
|
Payable for fund shares redeemed |
6,188 |
|
|
Accrued management fee |
1,621 |
|
|
Distribution and service plan fees payable |
834 |
|
|
Other affiliated payables |
660 |
|
|
Other payables and accrued expenses |
239 |
|
|
Collateral on securities loaned, at value |
66,813 |
|
|
Total liabilities |
|
91,551 |
|
|
|
|
|
Net Assets |
|
$ 3,501,973 |
|
Net Assets consist of: |
|
|
|
Paid in capital |
|
$ 3,186,218 |
|
Accumulated net investment loss |
|
(4,436) |
|
Accumulated undistributed net realized gain (loss) on investments and foreign currency transactions |
|
(511,477) |
|
Net unrealized appreciation (depreciation) on investments and assets and liabilities in foreign currencies |
|
831,668 |
|
Net Assets |
|
$ 3,501,973 |
See accompanying notes which are an integral part of the financial statements.
Annual Report
Financial Statements - continued
Statement of Assets and Liabilities - continued
|
Amounts in thousands (except per-share amounts) |
November 30, 2013 |
|
|
|
|
|
|
Calculation of Maximum Offering Price Class A: |
|
$ 80.87 |
|
|
|
|
|
Maximum offering price per share (100/94.25 of $80.87) |
|
$ 85.80 |
|
Class T: |
|
$ 80.31 |
|
|
|
|
|
Maximum offering price per share (100/96.50 of $80.31) |
|
$ 83.22 |
|
Class B: |
|
$ 71.91 |
|
|
|
|
|
Class C: |
|
$ 73.13 |
|
|
|
|
|
Institutional Class: |
|
$ 86.32 |
|
|
|
|
|
Class Z: |
|
$ 86.36 |
A Redemption price per share is equal to net asset value less any applicable contingent deferred sales charge.
See accompanying notes which are an integral part of the financial statements.
Annual Report
Statement of Operations
|
Amounts in thousands |
Year ended November 30, 2013 |
|
|
|
|
|
|
Investment Income |
|
|
|
Dividends |
|
$ 34,122 |
|
Income from Fidelity Central Funds |
|
571 |
|
Total income |
|
34,693 |
|
|
|
|
|
Expenses |
|
|
|
Management fee |
$ 18,537 |
|
|
Transfer agent fees |
7,096 |
|
|
Distribution and service plan fees |
9,196 |
|
|
Accounting and security lending fees |
989 |
|
|
Custodian fees and expenses |
122 |
|
|
Independent trustees' compensation |
19 |
|
|
Registration fees |
108 |
|
|
Audit |
66 |
|
|
Legal |
17 |
|
|
Miscellaneous |
30 |
|
|
Total expenses before reductions |
36,180 |
|
|
Expense reductions |
(404) |
35,776 |
|
Net investment income (loss) |
|
(1,083) |
|
Realized and Unrealized Gain (Loss) Net realized gain (loss) on: |
|
|
|
Investment securities: |
|
|
|
Unaffiliated issuers |
565,746 |
|
|
Redemption in-kind with affiliated entities |
80,385 |
|
|
Foreign currency transactions |
(152) |
|
|
Total net realized gain (loss) |
|
645,979 |
|
Change in net unrealized appreciation (depreciation) on: Investment securities |
266,588 |
|
|
Assets and liabilities in foreign currencies |
3 |
|
|
Total change in net unrealized appreciation (depreciation) |
|
266,591 |
|
Net gain (loss) |
|
912,570 |
|
Net increase (decrease) in net assets resulting from operations |
|
$ 911,487 |
See accompanying notes which are an integral part of the financial statements.
Annual Report
Financial Statements - continued
Statement of Changes in Net Assets
|
Amounts in thousands |
Year ended |
Year ended |
|
Increase (Decrease) in Net Assets |
|
|
|
Operations |
|
|
|
Net investment income (loss) |
$ (1,083) |
$ 1,561 |
|
Net realized gain (loss) |
645,979 |
91,215 |
|
Change in net unrealized appreciation (depreciation) |
266,591 |
277,882 |
|
Net increase (decrease) in net assets resulting |
911,487 |
370,658 |
|
Distributions to shareholders from net investment income |
(3,311) |
- |
|
Distributions to shareholders from net realized gain |
- |
(6,141) |
|
Total distributions |
(3,311) |
(6,141) |
|
Share transactions - net increase (decrease) |
(367,790) |
(218,428) |
|
Total increase (decrease) in net assets |
540,386 |
146,089 |
|
|
|
|
|
Net Assets |
|
|
|
Beginning of period |
2,961,587 |
2,815,498 |
|
End of period (including accumulated net investment loss of $4,436 and accumulated net investment loss of $410, respectively) |
$ 3,501,973 |
$ 2,961,587 |
See accompanying notes which are an integral part of the financial statements.
Annual Report
Financial Highlights - Class A
|
Years ended November 30, |
2013 |
2012 |
2011 |
2010 |
2009 |
|
Selected Per-Share Data |
|
|
|
|
|
|
Net asset value, beginning of period |
$ 61.77 |
$ 54.56 |
$ 50.75 |
$ 42.07 |
$ 34.36 |
|
Income from Investment Operations |
|
|
|
|
|
|
Net investment income (loss) C |
(.05) |
.02 |
(.04) |
(.14) |
(.01) |
|
Net realized and unrealized gain (loss) |
19.15 |
7.30 |
3.90 |
8.82 |
7.79 |
|
Total from investment operations |
19.10 |
7.32 |
3.86 |
8.68 |
7.78 |
|
Distributions from net investment income |
- |
- |
- |
- |
(.06) |
|
Distributions from net realized gain |
- |
(.11) |
(.05) |
- |
(.02) |
|
Total distributions |
- |
(.11) |
(.05) |
- |
(.07) G |
|
Net asset value, end of period |
$ 80.87 |
$ 61.77 |
$ 54.56 |
$ 50.75 |
$ 42.07 |
|
Total Return A, B |
30.92% |
13.45% |
7.61% |
20.63% |
22.71% |
|
Ratios to Average Net Assets D, F |
|
|
|
|
|
|
Expenses before reductions |
1.11% |
1.14% |
1.15% |
1.16% |
1.19% |
|
Expenses net of fee waivers, if any |
1.11% |
1.14% |
1.15% |
1.16% |
1.19% |
|
Expenses net of all reductions |
1.10% |
1.14% |
1.14% |
1.15% |
1.18% |
|
Net investment income (loss) |
(.07)% |
.04% |
(.08)% |
(.31)% |
(.04)% |
|
Supplemental Data |
|
|
|
|
|
|
Net assets, end of period (in millions) |
$ 772 |
$ 632 |
$ 609 |
$ 636 |
$ 640 |
|
Portfolio turnover rate E |
81% |
73% |
70% |
71% |
135% |
A Total returns would have been lower if certain expenses had not been reduced during the applicable periods shown.
B Total returns do not include the effect of the sales charges.
C Calculated based on average shares outstanding during the period.
D Fees and expenses of any underlying Fidelity Central Funds are not included in the Fund's expense ratio. The Fund indirectly bears its proportionate share of the expenses of any underlying Fidelity Central Funds.
E Amount does not include the portfolio activity of any underlying Fidelity Central Funds.
F Expense ratios reflect operating expenses of the class. Expenses before reductions do not reflect amounts reimbursed by the investment adviser or reductions from brokerage service arrangements or reductions from other expense offset arrangements and do not represent the amount paid by the class during periods when reimbursements or reductions occur. Expenses net of fee waivers reflect expenses after reimbursement by the investment adviser but prior to reductions from brokerage service arrangements or other expense offset arrangements. Expenses net of all reductions represent the net expenses paid by the class.
G Total distributions of $.07 per share is comprised of distributions from net investment income of $.059 and distributions from net realized gain of $.015 per share.
See accompanying notes which are an integral part of the financial statements.
Annual Report
Financial Highlights - Class T
|
Years ended November 30, |
2013 |
2012 |
2011 |
2010 |
2009 |
|
Selected Per-Share Data |
|
|
|
|
|
|
Net asset value, beginning of period |
$ 61.45 |
$ 54.26 |
$ 50.51 |
$ 41.94 |
$ 34.25 |
|
Income from Investment Operations |
|
|
|
|
|
|
Net investment income (loss) C |
(.17) |
(.08) |
(.14) |
(.22) |
(.09) |
|
Net realized and unrealized gain (loss) |
19.03 |
7.27 |
3.89 |
8.79 |
7.78 |
|
Total from investment operations |
18.86 |
7.19 |
3.75 |
8.57 |
7.69 |
|
Net asset value, end of period |
$ 80.31 |
$ 61.45 |
$ 54.26 |
$ 50.51 |
$ 41.94 |
|
Total Return A, B |
30.69% |
13.25% |
7.42% |
20.43% |
22.45% |
|
Ratios to Average Net Assets D, F |
|
|
|
|
|
|
Expenses before reductions |
1.29% |
1.31% |
1.32% |
1.34% |
1.39% |
|
Expenses net of fee waivers, if any |
1.29% |
1.31% |
1.32% |
1.34% |
1.39% |
|
Expenses net of all reductions |
1.28% |
1.31% |
1.31% |
1.33% |
1.39% |
|
Net investment income (loss) |
(.25)% |
(.13)% |
(.25)% |
(.48)% |
(.24)% |
|
Supplemental Data |
|
|
|
|
|
|
Net assets, end of period (in millions) |
$ 1,283 |
$ 1,108 |
$ 1,139 |
$ 1,246 |
$ 1,268 |
|
Portfolio turnover rate E |
81% |
73% |
70% |
71% |
135% |
A Total returns would have been lower if certain expenses had not been reduced during the applicable periods shown.
B Total returns do not include the effect of the sales charges.
C Calculated based on average shares outstanding during the period.
D Fees and expenses of any underlying Fidelity Central Funds are not included in the Fund's expense ratio. The Fund indirectly bears its proportionate share of the expenses of any underlying Fidelity Central Funds.
E Amount does not include the portfolio activity of any underlying Fidelity Central Funds.
F Expense ratios reflect operating expenses of the class. Expenses before reductions do not reflect amounts reimbursed by the investment adviser or reductions from brokerage service arrangements or reductions from other expense offset arrangements and do not represent the amount paid by the class during periods when reimbursements or reductions occur. Expenses net of fee waivers reflect expenses after reimbursement by the investment adviser but prior to reductions from brokerage service arrangements or other expense offset arrangements. Expenses net of all reductions represent the net expenses paid by the class.
See accompanying notes which are an integral part of the financial statements.
Annual Report
Financial Highlights - Class B
|
Years ended November 30, |
2013 |
2012 |
2011 |
2010 |
2009 |
|
Selected Per-Share Data |
|
|
|
|
|
|
Net asset value, beginning of period |
$ 55.36 |
$ 49.17 |
$ 46.04 |
$ 38.45 |
$ 31.57 |
|
Income from Investment Operations |
|
|
|
|
|
|
Net investment income (loss) C |
(.52) |
(.39) |
(.42) |
(.44) |
(.26) |
|
Net realized and unrealized gain (loss) |
17.07 |
6.58 |
3.55 |
8.03 |
7.14 |
|
Total from investment operations |
16.55 |
6.19 |
3.13 |
7.59 |
6.88 |
|
Net asset value, end of period |
$ 71.91 |
$ 55.36 |
$ 49.17 |
$ 46.04 |
$ 38.45 |
|
Total Return A, B |
29.90% |
12.59% |
6.80% |
19.74% |
21.79% |
|
Ratios to Average Net Assets D, F |
|
|
|
|
|
|
Expenses before reductions |
1.89% |
1.90% |
1.90% |
1.91% |
1.94% |
|
Expenses net of fee waivers, if any |
1.89% |
1.90% |
1.90% |
1.91% |
1.94% |
|
Expenses net of all reductions |
1.88% |
1.90% |
1.90% |
1.91% |
1.93% |
|
Net investment income (loss) |
(.85)% |
(.72)% |
(.83)% |
(1.06)% |
(.79)% |
|
Supplemental Data |
|
|
|
|
|
|
Net assets, end of period (in millions) |
$ 23 |
$ 26 |
$ 35 |
$ 54 |
$ 70 |
|
Portfolio turnover rate E |
81% |
73% |
70% |
71% |
135% |
A Total returns would have been lower if certain expenses had not been reduced during the applicable periods shown.
B Total returns do not include the effect of the contingent deferred sales charge.
C Calculated based on average shares outstanding during the period.
D Fees and expenses of any underlying Fidelity Central Funds are not included in the Fund's expense ratio. The Fund indirectly bears its proportionate share of the expenses of any underlying Fidelity Central Funds.
E Amount does not include the portfolio activity of any underlying Fidelity Central Funds.
F Expense ratios reflect operating expenses of the class. Expenses before reductions do not reflect amounts reimbursed by the investment adviser or reductions from brokerage service arrangements or reductions from other expense offset arrangements and do not represent the amount paid by the class during periods when reimbursements or reductions occur. Expenses net of fee waivers reflect expenses after reimbursement by the investment adviser but prior to reductions from brokerage service arrangements or other expense offset arrangements. Expenses net of all reductions represent the net expenses paid by the class.
See accompanying notes which are an integral part of the financial statements.
Annual Report
Financial Highlights - Class C
|
Years ended November 30, |
2013 |
2012 |
2011 |
2010 |
2009 |
|
Selected Per-Share Data |
|
|
|
|
|
|
Net asset value, beginning of period |
$ 56.27 |
$ 49.96 |
$ 46.77 |
$ 39.05 |
$ 32.06 |
|
Income from Investment Operations |
|
|
|
|
|
|
Net investment income (loss) C |
(.50) |
(.37) |
(.41) |
(.44) |
(.26) |
|
Net realized and unrealized gain (loss) |
17.36 |
6.68 |
3.60 |
8.16 |
7.25 |
|
Total from investment operations |
16.86 |
6.31 |
3.19 |
7.72 |
6.99 |
|
Net asset value, end of period |
$ 73.13 |
$ 56.27 |
$ 49.96 |
$ 46.77 |
$ 39.05 |
|
Total Return A, B |
29.96% |
12.63% |
6.82% |
19.77% |
21.80% |
|
Ratios to Average Net Assets D, F |
|
|
|
|
|
|
Expenses before reductions |
1.84% |
1.86% |
1.88% |
1.90% |
1.94% |
|
Expenses net of fee waivers, if any |
1.84% |
1.86% |
1.88% |
1.90% |
1.94% |
|
Expenses net of all reductions |
1.83% |
1.86% |
1.87% |
1.90% |
1.93% |
|
Net investment income (loss) |
(.79)% |
(.68)% |
(.81)% |
(1.05)% |
(.79)% |
|
Supplemental Data |
|
|
|
|
|
|
Net assets, end of period (in millions) |
$ 157 |
$ 133 |
$ 136 |
$ 143 |
$ 142 |
|
Portfolio turnover rate E |
81% |
73% |
70% |
71% |
135% |
A Total returns would have been lower if certain expenses had not been reduced during the applicable periods shown.
B Total returns do not include the effect of the contingent deferred sales charge.
C Calculated based on average shares outstanding during the period.
D Fees and expenses of any underlying Fidelity Central Funds are not included in the Fund's expense ratio. The Fund indirectly bears its proportionate share of the expenses of any underlying Fidelity Central Funds.
E Amount does not include the portfolio activity of any underlying Fidelity Central Funds.
F Expense ratios reflect operating expenses of the class. Expenses before reductions do not reflect amounts reimbursed by the investment adviser or reductions from brokerage service arrangements or reductions from other expense offset arrangements and do not represent the amount paid by the class during periods when reimbursements or reductions occur. Expenses net of fee waivers reflect expenses after reimbursement by the investment adviser but prior to reductions from brokerage service arrangements or other expense offset arrangements. Expenses net of all reductions represent the net expenses paid by the class.
See accompanying notes which are an integral part of the financial statements.
Annual Report
Financial Highlights - Institutional Class
|
Years ended November 30, |
2013 |
2012 |
2011 |
2010 |
2009 |
|
Selected Per-Share Data |
|
|
|
|
|
|
Net asset value, beginning of period |
$ 65.92 |
$ 58.24 |
$ 54.14 |
$ 44.71 |
$ 36.61 |
|
Income from Investment Operations |
|
|
|
|
|
|
Net investment income (loss) B |
.20 |
.25 |
.16 |
.02 |
.12 |
|
Net realized and unrealized gain (loss) |
20.40 |
7.75 |
4.16 |
9.41 |
8.27 |
|
Total from investment operations |
20.60 |
8.00 |
4.32 |
9.43 |
8.39 |
|
Distributions from net investment income |
(.20) |
- |
- |
- |
(.27) |
|
Distributions from net realized gain |
- |
(.32) |
(.22) |
- |
(.02) |
|
Total distributions |
(.20) |
(.32) |
(.22) |
- |
(.29) F |
|
Net asset value, end of period |
$ 86.32 |
$ 65.92 |
$ 58.24 |
$ 54.14 |
$ 44.71 |
|
Total Return A |
31.36% |
13.83% |
7.99% |
21.09% |
23.11% |
|
Ratios to Average Net Assets C, E |
|
|
|
|
|
|
Expenses before reductions |
.78% |
.80% |
.80% |
.80% |
.85% |
|
Expenses net of fee waivers, if any |
.78% |
.80% |
.80% |
.80% |
.85% |
|
Expenses net of all reductions |
.77% |
.79% |
.79% |
.80% |
.84% |
|
Net investment income (loss) |
.27% |
.39% |
.27% |
.05% |
.30% |
|
Supplemental Data |
|
|
|
|
|
|
Net assets, end of period (in millions) |
$ 1,266 |
$ 1,063 |
$ 897 |
$ 973 |
$ 983 |
|
Portfolio turnover rate D |
81% |
73% |
70% |
71% |
135% |
A Total returns would have been lower if certain expenses had not been reduced during the applicable periods shown.
B Calculated based on average shares outstanding during the period.
C Fees and expenses of any underlying Fidelity Central Funds are not included in the Fund's expense ratio. The Fund indirectly bears its proportionate share of the expenses of any underlying Fidelity Central Funds.
D Amount does not include the portfolio activity of any underlying Fidelity Central Funds.
E Expense ratios reflect operating expenses of the class. Expenses before reductions do not reflect amounts reimbursed by the investment adviser or reductions from brokerage service arrangements or reductions from other expense offset arrangements and do not represent the amount paid by the class during periods when reimbursements or reductions occur. Expenses net of fee waivers reflect expenses after reimbursement by the investment adviser but prior to reductions from brokerage service arrangements or other expense offset arrangements. Expenses net of all reductions represent the net expenses paid by the class.
F Total distributions of $.29 per share is comprised of distributions from net investment income of $.274 and distributions from net realized gain of $.015 per share.
See accompanying notes which are an integral part of the financial statements.
Annual Report
Financial Highlights - Class Z
|
Year ended November 30, |
2013 G |
|
Selected Per-Share Data |
|
|
Net asset value, beginning of period |
$ 78.49 |
|
Income from Investment Operations |
|
|
Net investment income (loss) D |
.09 |
|
Net realized and unrealized gain (loss) |
7.78 |
|
Total from investment operations |
7.87 |
|
Net asset value, end of period |
$ 86.36 |
|
Total Return B, C |
10.03% |
|
Ratios to Average Net Assets E, H |
|
|
Expenses before reductions |
.64% A |
|
Expenses net of fee waivers, if any |
.64% A |
|
Expenses net of all reductions |
.63% A |
|
Net investment income (loss) |
.38% A |
|
Supplemental Data |
|
|
Net assets, end of period (000 omitted) |
$ 110 |
|
Portfolio turnover rate F |
81% |
A Annualized
B Total returns for periods of less than one year are not annualized.
C Total returns would have been lower if certain expenses had not been reduced during the applicable periods shown.
D Calculated based on average shares outstanding during the period.
E Fees and expenses of any underlying Fidelity Central Funds are not included in the Fund's expense ratio. The Fund indirectly bears its proportionate share of the expenses of any underlying Fidelity Central Funds.
F Amount does not include the portfolio activity of any underlying Fidelity Central Funds.
G For the period August 13, 2013 (commencement of sale of shares) to November 30, 2013.
H Expense ratios reflect operating expenses of the class. Expenses before reductions do not reflect amounts reimbursed by the investment adviser or reductions from brokerage service arrangements or reductions from other expense offset arrangements and do not represent the amount paid by the class during periods when reimbursements or reductions occur. Expense ratios before reductions for start-up periods may not be representative of longer-term operating periods. Expenses net of fee waivers reflect expenses after reimbursement by the investment adviser but prior to reductions from brokerage service arrangements or other expense offset arrangements. Expenses net of all reductions represent the net expenses paid by the class.
See accompanying notes which are an integral part of the financial statements.
Annual Report
Notes to Financial Statements
For the period ended November 30, 2013
(Amounts in thousands except percentages)
1. Organization.
Fidelity Advisor Equity Growth Fund (the Fund) is a fund of Fidelity Advisor Series I (the Trust) and is authorized to issue an unlimited number of shares. The Trust is registered under the Investment Company Act of 1940, as amended (the 1940 Act), as an open-end management investment company organized as a Massachusetts business trust. The Fund commenced sale of Class Z shares on August 13, 2013. The Fund offers Class A, Class T, Class C, Institutional Class and Class Z shares, each of which, along with Class B shares, has equal rights as to assets and voting privileges. Class B shares are closed to new accounts and additional purchases, except for exchanges and reinvestments. Each class has exclusive voting rights with respect to matters that affect that class. Class B shares will automatically convert to Class A shares after a holding period of seven years from the initial date of purchase.
2. Investments in Fidelity Central Funds.
The Fund invests in Fidelity Central Funds, which are open-end investment companies generally available only to other investment companies and accounts managed by the investment adviser and its affiliates. The Fund's Schedule of Investments lists each of the Fidelity Central Funds held as of period end, if any, as an investment of the Fund, but does not include the underlying holdings of each Fidelity Central Fund. As an Investing Fund, the Fund indirectly bears its proportionate share of the expenses of the underlying Fidelity Central Funds.
The Money Market Central Funds seek preservation of capital and current income and are managed by Fidelity Investments Money Management, Inc. (FIMM), an affiliate of the investment adviser. Annualized expenses of the Money Market Central Funds as of their most recent shareholder report date are less than .01%.
A complete unaudited list of holdings for each Fidelity Central Fund is available upon request or at the Securities and Exchange Commission (the SEC) website at www.sec.gov. In addition, the financial statements of the Fidelity Central Funds, which are not covered by the Fund's Report of Independent Registered Public Accounting Firm, are available on the SEC website or upon request.
3. Significant Accounting Policies.
The financial statements have been prepared in conformity with accounting principles generally accepted in the United States of America (GAAP), which require management to make certain estimates and assumptions at the date of the financial statements. Actual results could differ from those estimates. Subsequent events, if any, through the date that the financial statements were issued have been evaluated in the preparation of
Annual Report
3. Significant Accounting Policies - continued
the financial statements. The following summarizes the significant accounting policies of the Fund:
Investment Valuation. Investments are valued as of 4:00 p.m. Eastern time on the last calendar day of the period. In accordance with valuation policies and procedures approved by the Board of Trustees (the Board), the Fund attempts to obtain prices from one or more third party pricing vendors or brokers to value its investments. When current market prices, quotations or currency exchange rates are not readily available or reliable, investments will be fair valued in good faith by the Fidelity Management & Research Company (FMR) Fair Value Committee (the Committee), in accordance with procedures adopted by the Board. Factors used in determining fair value vary by investment type and may include market or investment specific events. The frequency with which these procedures are used cannot be predicted and they may be utilized to a significant extent. The Committee oversees the Fund's valuation policies and procedures and is responsible for approving and reporting to the Board all fair value determinations.
The Fund categorizes the inputs to valuation techniques used to value its investments into a disclosure hierarchy consisting of three levels as shown below:
Level 1 - quoted prices in active markets for identical investments
Level 2 - other significant observable inputs (including quoted prices for similar investments, interest rates, prepayment speeds, etc.)
Level 3 - unobservable inputs (including the Fund's own assumptions based on the best information available)
Valuation techniques used to value the Fund's investments by major category are as follows:
Equity securities, including restricted securities, for which market quotations are readily available, are valued at the last reported sale price or official closing price as reported by a third party pricing vendor on the primary market or exchange on which they are traded and are categorized as Level 1 in the hierarchy. In the event there were no sales during the day or closing prices are not available, securities are valued at the last quoted bid price or may be valued using the last available price and are generally categorized as Level 2 in the hierarchy. For foreign equity securities, when market or security specific events arise, comparisons to the valuation of American Depositary Receipts (ADRs), futures contracts, Exchange-Traded Funds (ETFs) and certain indexes as well as quoted prices for similar securities may be used and would be categorized as Level 2 in the hierarchy. Utilizing these techniques may result in transfers between Level 1 and Level 2. For equity securities, including restricted securities, where observable inputs are limited, assumptions about market activity and risk are used and these securities may be categorized as Level 3 in the hierarchy.
Annual Report
Notes to Financial Statements - continued
(Amounts in thousands except percentages)
3. Significant Accounting Policies - continued
Investment Valuation - continued
Investments in open-end mutual funds, including the Fidelity Central Funds, are valued at their closing net asset value (NAV) each business day and are categorized as Level 1 in the hierarchy.
Changes in valuation techniques may result in transfers in or out of an assigned level within the disclosure hierarchy. The aggregate value of investments by input level, as of November 30, 2013, is included at the end of the Fund's Schedule of Investments.
Foreign Currency. The Fund may use foreign currency contracts to facilitate transactions in foreign-denominated securities. Gains and losses from these transactions may arise from changes in the value of the foreign currency or if the counterparties do not perform under the contracts' terms.
Foreign-denominated assets, including investment securities, and liabilities are translated into U.S. dollars at the exchange rates at period end. Purchases and sales of investment securities, income and dividends received and expenses denominated in foreign currencies are translated into U.S. dollars at the exchange rate in effect on the transaction date.
The effects of exchange rate fluctuations on investments are included with the net realized and unrealized gain (loss) on investment securities. Other foreign currency transactions resulting in realized and unrealized gain (loss) are disclosed separately.
Investment Transactions and Income. For financial reporting purposes, the Fund's investment holdings and NAV include trades executed through the end of the last business day of the period. The NAV per share for processing shareholder transactions is calculated as of the close of business of the New York Stock Exchange (NYSE), normally 4:00 p.m. Eastern time and includes trades executed through the end of the prior business day. Gains and losses on securities sold are determined on the basis of identified cost and may include proceeds received from litigation. Dividend income is recorded on the ex-dividend date, except for certain dividends from foreign securities where the ex-dividend date may have passed, which are recorded as soon as the Fund is informed of the ex-dividend date. Non-cash dividends included in dividend income, if any, are recorded at the fair market value of the securities received. Distributions received on securities that represent a return of capital or capital gain are recorded as a reduction of cost of investments and/or as a realized gain. Subsequent to ex-dividend date the Fund determines the components of these distributions, based upon receipt of tax filings or other correspondence relating to the underlying investment. Interest income and distributions from the Fidelity Central Funds are accrued as earned. Interest income includes coupon interest and amortization of premium and accretion of discount on debt
Annual Report
3. Significant Accounting Policies - continued
Investment Transactions and Income - continued
securities. Investment income is recorded net of foreign taxes withheld where recovery of such taxes is uncertain.
Class Allocations and Expenses. Investment income, realized and unrealized capital gains and losses, common expenses of the Fund, and certain fund-level expense reductions, if any, are allocated daily on a pro-rata basis to each class based on the relative net assets of each class to the total net assets of the Fund. Each class differs with respect to transfer agent and distribution and service plan fees incurred. Certain expense reductions may also differ by class. For the reporting period, the allocated portion of income and expenses to each class as a percent of its average net assets may vary due to the timing of recording these transactions in relation to fluctuating net assets of the classes. Expenses directly attributable to a fund are charged to that fund. Expenses attributable to more than one fund are allocated among the respective funds on the basis of relative net assets or other appropriate methods. Expense estimates are accrued in the period to which they relate and adjustments are made when actual amounts are known.
Deferred Trustee Compensation. Under a Deferred Compensation Plan (the Plan), independent Trustees may elect to defer receipt of a portion of their annual compensation. Deferred amounts are invested in a cross-section of Fidelity funds, are marked-to-market and remain in the Fund until distributed in accordance with the Plan. The investment of deferred amounts and the offsetting payable to the Trustees are included in the accompanying Statement of Assets and Liabilities.
Income Tax Information and Distributions to Shareholders. Each year, the Fund intends to qualify as a regulated investment company under Subchapter M of the Internal Revenue Code, including distributing substantially all of its taxable income and realized gains. As a result, no provision for U.S. Federal income taxes is required. As of November 30, 2013, the Fund did not have any unrecognized tax benefits in the financial statements; nor is the Fund aware of any tax positions for which it is reasonably possible that the total amounts of unrecognized tax benefits will significantly change in the next twelve months. The Fund files a U.S. federal tax return, in addition to state and local tax returns as required. The Fund's federal income tax returns are subject to examination by the Internal Revenue Service (IRS) for a period of three fiscal years after they are filed. State and local tax returns may be subject to examination for an additional fiscal year depending on the jurisdiction. Foreign taxes are provided for based on the Fund's understanding of the tax rules and rates that exist in the foreign markets in which it invests.
Annual Report
Notes to Financial Statements - continued
(Amounts in thousands except percentages)
3. Significant Accounting Policies - continued
Income Tax Information and Distributions to Shareholders - continued
Distributions are declared and recorded on the ex-dividend date. Income dividends and capital gain distributions are declared separately for each class. Income and capital gain distributions are determined in accordance with income tax regulations, which may differ from GAAP.
Capital accounts within the financial statements are adjusted for permanent book-tax differences. These adjustments have no impact on net assets or the results of operations. Temporary book-tax differences will reverse in a subsequent period.
Book-tax differences are primarily due to foreign currency transactions, passive foreign investment companies (PFIC), redemptions in kind, partnerships, deferred trustees compensation, capital loss carryforwards and losses deferred due to wash sales and excise tax regulations.
The federal tax cost of investment securities and unrealized appreciation (depreciation) as of period end were as follows:
|
Gross unrealized appreciation |
$ 848,765 |
|
Gross unrealized depreciation |
(24,574) |
|
Net unrealized appreciation (depreciation) on securities and other investments |
$ 824,191 |
|
|
|
|
Tax Cost |
$ 2,746,511 |
The tax-based components of distributable earnings as of period end were as follows:
|
Capital loss carryforward |
$ (503,999) |
|
Net unrealized appreciation (depreciation) |
$ 824,190 |
Capital loss carryforwards are only available to offset future capital gains of the Fund to the extent provided by regulations and may be limited. Under the Regulated Investment Company Modernization Act of 2010 (the Act), the Fund is permitted to carry forward capital losses incurred in taxable years beginning after December 22, 2010 for an unlimited period and such capital losses are required to be used prior to any losses that expire. The capital loss carryforward information presented below, including any applicable limitation, is estimated as of fiscal period end and is subject to adjustment.
|
Fiscal year of expiration |
|
|
2017 |
$ (503,999) |
Annual Report
3. Significant Accounting Policies - continued
Income Tax Information and Distributions to Shareholders - continued
The tax character of distributions paid was as follows:
|
|
November 30, 2013 |
November 30, 2012 |
|
Ordinary Income |
$ 3,311 |
$ 6,141 |
Restricted Securities. The Fund may invest in securities that are subject to legal or contractual restrictions on resale. These securities generally may be resold in transactions exempt from registration or to the public if the securities are registered. Disposal of these securities may involve time-consuming negotiations and expense, and prompt sale at an acceptable price may be difficult. Information regarding restricted securities is included at the end of the Fund's Schedule of Investments.
4. Purchases and Sales of Investments.
Purchases and sales of securities including in-kind transactions, other than short-term securities, aggregated $2,658,323 and $3,034,881, respectively.
5. Fees and Other Transactions with Affiliates.
Management Fee. Fidelity Management & Research Company (the investment adviser) and its affiliates provide the Fund with investment management related services for which the Fund pays a monthly management fee. The management fee is the sum of an individual fund fee rate that is based on an annual rate of .30% of the Fund's average net assets and an annualized group fee rate that averaged .25% during the period. The group fee rate is based upon the average net assets of all the mutual funds advised by the investment adviser, including any mutual funds previously advised by the investment adviser that are currently advised by Fidelity SelectCo, LLC, an affiliate of the investment adviser. The group fee rate decreases as assets under management increase and increases as assets under management decrease. For the reporting period, the total annual management fee rate was .55% of the Fund's average net assets.
Distribution and Service Plan Fees. In accordance with Rule 12b-1 of the 1940 Act, the Fund has adopted separate Distribution and Service Plans for each class of shares. Certain classes pay Fidelity Distributors Corporation (FDC), an affiliate of the investment adviser, separate Distribution and Service Fees, each of which is based on an annual percentage of each class' average net assets. In addition, FDC may pay financial intermediaries for selling shares of the Fund and providing shareholder support services.
Annual Report
Notes to Financial Statements - continued
(Amounts in thousands except percentages)
5. Fees and Other Transactions with Affiliates - continued
Distribution and Service Plan Fees - continued
For the period, the Distribution and Service Fee rates, total fees and amounts retained by FDC were as follows:
|
|
Distribution |
Service |
Total Fees |
Retained |
|
Class A |
-% |
.25% |
$ 1,721 |
$ 40 |
|
Class T |
.25% |
.25% |
5,834 |
53 |
|
Class B |
.75% |
.25% |
239 |
181 |
|
Class C |
.75% |
.25% |
1,402 |
59 |
|
|
|
|
$ 9,196 |
$ 333 |
Sales Load. FDC may receive a front-end sales charge of up to 5.75% for selling Class A shares and 3.50% for selling Class T shares, some of which is paid to financial intermediaries for selling shares of the Fund. Depending on the holding period, FDC may receive contingent deferred sales charges levied on Class A, Class T, Class B, and Class C redemptions. The deferred sales charges range from 5.00% to 1.00% for Class B shares, 1.00% for Class C shares, 1.00% for certain purchases of Class A shares and .25% for certain purchases of Class T shares.
For the period, sales charge amounts retained by FDC were as follows:
|
|
Retained |
|
Class A |
$ 58 |
|
Class T |
29 |
|
Class B* |
18 |
|
Class C* |
5 |
|
|
$ 110 |
* When Class B and Class C shares are initially sold, FDC pays commissions from its own resources to financial intermediaries through which the sales are made.
Transfer Agent Fees. Fidelity Investments Institutional Operations Company, Inc., (FIIOC), an affiliate of the investment adviser, is the transfer, dividend disbursing and shareholder servicing agent for each class of the Fund. FIIOC receives account fees and asset-based fees that vary according to the account size and type of account of the shareholders of the respective classes of the Fund, except for Class Z. FIIOC receives an asset-based fee of Class Z's average net assets. FIIOC pays for typesetting, printing and mailing of shareholder reports, except proxy statements.
Annual Report
5. Fees and Other Transactions with Affiliates - continued
Transfer Agent Fees - continued
For the period, transfer agent fees for each applicable class were as follows:
|
|
Amount |
% of |
|
Class A |
$ 1,867 |
.27 |
|
Class T |
2,329 |
.20 |
|
Class B |
71 |
.30 |
|
Class C |
345 |
.25 |
|
Institutional Class |
2,484 |
.19 |
|
Class Z |
-* |
.05** |
|
|
$ 7,096 |
|
* Amount represents fifteen dollars.
** Annualized
Accounting and Security Lending Fees. Fidelity Service Company, Inc. (FSC), an affiliate of the investment adviser, maintains the Fund's accounting records. The accounting fee is based on the level of average net assets for each month. Under a separate contract, FSC administers the security lending program. The security lending fee is based on the number and duration of lending transactions.
Brokerage Commissions. The Fund placed a portion of its portfolio transactions with brokerage firms which are affiliates of the investment adviser. Brokerage commissions are included in net realized gain (loss) and change in net unrealized appreciation (depreciation) in the Statement of Operations. The commissions paid to these affiliated firms were $41 for the period.
Redemptions In-Kind. During the period, 2,917 shares of the Fund held by affiliated entities were redeemed for investments with a value of $244,110. The net realized gain of $80,385 on investments delivered through in-kind redemptions is included in the accompanying Statement of Operations. The amount of in-kind redemptions is included in share transactions in the accompanying Statement of Changes in Net Assets as well as Note 10: Share Transactions. The Fund recognized no gain or loss for federal income tax purposes.
6. Committed Line of Credit.
The Fund participates with other funds managed by the investment adviser or an affiliate in a $4.25 billion credit facility (the "line of credit") to be utilized for temporary or emergency purposes to fund shareholder redemptions or for other short-term liquidity purposes. The Fund has agreed to pay commitment fees on its pro-rata portion of the line
Annual Report
Notes to Financial Statements - continued
(Amounts in thousands except percentages)
6. Committed Line of Credit - continued
of credit, which amounted to $7 and is reflected in Miscellaneous expenses on the Statement of Operations. During the period, there were no borrowings on this line of credit.
7. Security Lending.
The Fund lends portfolio securities through a lending agent from time to time in order to earn additional income. For equity securities, a lending agent is used and may loan securities to certain qualified borrowers, including Fidelity Capital Markets (FCM), a broker-dealer affiliated with the Fund. On the settlement date of the loan, the Fund receives collateral (in the form of U.S. Treasury obligations, letters of credit and/or cash) against the loaned securities and maintains collateral in an amount not less than 100% of the market value of the loaned securities during the period of the loan. The market value of the loaned securities is determined at the close of business of the Fund and any additional required collateral is delivered to the Fund on the next business day. If the borrower defaults on its obligation to return the securities loaned because of insolvency or other reasons, the Fund may apply collateral received from the borrower against the obligation. The Fund may experience delays and costs in recovering the securities loaned. Any cash collateral received is invested in the Fidelity Securities Lending Cash Central Fund. The value of loaned securities and cash collateral at period end are disclosed on the Fund's Statement of Assets and Liabilities. At period end, there were no security loans outstanding with FCM. Security lending income represents the income earned on investing cash collateral, less rebates paid to borrowers and any lending agent fees associated with the loan, plus any premium payments received for lending certain types of securities. Security lending income is presented in the Statement of Operations as a component of income from Fidelity Central Funds. Total security lending income during the period amounted to $479, including $15 from securities loaned to FCM.
8. Expense Reductions.
The investment adviser voluntarily agreed to reimburse a portion of the Fund's Class A, Class T, Class B, Class C and Institutional Class operating expenses. During the period, the reimbursement reduced expenses as follows:
The following classes were in reimbursement during the period:
|
|
Reimbursement |
|
Class A |
$ 3 |
|
Class T |
5 |
|
Class B |
-* |
|
Class C |
1 |
|
Institutional Class |
5 |
|
|
$ 14 |
* Amount represents ninety dollars.
Annual Report
8. Expense Reductions - continued
Commissions paid to certain brokers with whom the investment adviser, or its affiliates, places trades on behalf of the Fund include an amount in addition to trade execution, which may be rebated back to the Fund to offset certain expenses. This amount totaled $390 for the period. In addition, through arrangements with the Fund's custodian, credits realized as a result of uninvested cash balances were used to reduce the Fund's expenses. During the period, these credits reduced the Fund's custody expenses by two hundred and sixty-nine dollars.
9. Distributions to Shareholders.
Distributions to shareholders of each class were as follows:
|
Years ended November 30, |
2013 |
2012 |
|
From net investment income |
|
|
|
Institutional Class |
$ 3,311 |
$ - |
|
From net realized gain |
|
|
|
Class A |
$ - |
$ 1,215 |
|
Institutional Class |
- |
4,926 |
|
Total |
$ - |
$ 6,141 |
10. Share Transactions.
Transactions for each class of shares were as follows:
|
|
Shares |
Dollars |
||
|
Years ended November 30, |
2013 A |
2012 |
2013 A |
2012 |
|
Class A |
|
|
|
|
|
Shares sold |
1,339 |
1,382 |
$ 93,392 |
$ 82,422 |
|
Reinvestment of distributions |
- |
21 |
- |
1,098 |
|
Shares redeemed |
(2,021) |
(2,338) |
(140,383) |
(138,919) |
|
Net increase (decrease) |
(682) |
(935) |
$ (46,991) |
$ (55,399) |
|
Class T |
|
|
|
|
|
Shares sold |
1,688 |
2,021 |
$ 116,336 |
$ 120,048 |
|
Shares redeemed |
(3,732) |
(4,996) |
(255,751) |
(296,134) |
|
Net increase (decrease) |
(2,044) |
(2,975) |
$ (139,415) |
$ (176,086) |
|
Class B |
|
|
|
|
|
Shares sold |
5 |
5 |
$ 343 |
$ 239 |
|
Shares redeemed |
(159) |
(239) |
(9,702) |
(12,835) |
|
Net increase (decrease) |
(154) |
(234) |
$ (9,359) |
$ (12,596) |
Annual Report
Notes to Financial Statements - continued
(Amounts in thousands except percentages)
10. Share Transactions - continued
|
|
Shares |
Dollars |
||
|
Years ended November 30, |
2013 A |
2012 |
2013 A |
2012 |
|
Class C |
|
|
|
|
|
Shares sold |
155 |
154 |
$ 9,843 |
$ 8,368 |
|
Shares redeemed |
(367) |
(504) |
(22,580) |
(27,593) |
|
Net increase (decrease) |
(212) |
(350) |
$ (12,737) |
$ (19,225) |
|
Institutional Class |
|
|
|
|
|
Shares sold |
4,554 |
4,266 |
$ 315,218 |
$ 270,700 |
|
Reinvestment of distributions |
50 |
86 |
3,246 |
4,818 |
|
Shares redeemed |
(6,060) B |
(3,622) |
(477,852) B |
(230,640) |
|
Net increase (decrease) |
(1,456) |
730 |
$ (159,388) |
$ 44,878 |
|
Class Z |
|
|
|
|
|
Shares sold |
1 |
- |
$ 100 |
$ - |
|
Net increase (decrease) |
1 |
- |
$ 100 |
$ - |
A Share transactions for Class Z are for the period August 13, 2013 (commencement of sale of shares) to November 30, 2013.
B Amount includes in-kind redemptions (see Note 5: Redemptions In-Kind).
11. Other.
The Fund's organizational documents provide former and current trustees and officers with a limited indemnification against liabilities arising in connection with the performance of their duties to the Fund. In the normal course of business, the Fund may also enter into contracts that provide general indemnifications. The Fund's maximum exposure under these arrangements is unknown as this would be dependent on future claims that may be made against the Fund. The risk of material loss from such claims is considered remote.
At the end of the period, the Fidelity Advisor Freedom Funds were the owners of record, in the aggregate, of approximately 26% of the total outstanding shares of the Fund.
Annual Report
Report of Independent Registered Public Accounting Firm
To the Trustees of Fidelity Advisor Series I and Shareholders of Fidelity Advisor Equity Growth Fund:
We have audited the accompanying statement of assets and liabilities of Fidelity Advisor Equity Growth Fund (the Fund), a fund of Fidelity Advisor Series I, including the schedule of investments, as of November 30, 2013, and the related statement of operations for the year then ended, the statement of changes in net assets for each of the two years in the period then ended, and the financial highlights for each of the five years in the period then ended. These financial statements and financial highlights are the responsibility of the Fund's management. Our responsibility is to express an opinion on these financial statements and financial highlights based on our audits.
We conducted our audits in accordance with the standards of the Public Company Accounting Oversight Board (United States). Those standards require that we plan and perform the audit to obtain reasonable assurance about whether the financial statements and financial highlights are free of material misstatement. The Fund is not required to have, nor were we engaged to perform, an audit of its internal control over financial reporting. Our audits included consideration of internal control over financial reporting as a basis for designing audit procedures that are appropriate in the circumstances, but not for the purpose of expressing an opinion on the effectiveness of the Fund's internal control over financial reporting. Accordingly, we express no such opinion. An audit also includes examining, on a test basis, evidence supporting the amounts and disclosures in the financial statements, assessing the accounting principles used and significant estimates made by management, as well as evaluating the overall financial statement presentation. Our procedures included confirmation of securities owned as of November 30, 2013, by correspondence with the custodians and brokers; where replies were not received from brokers, we performed other auditing procedures. We believe that our audits provide a reasonable basis for our opinion.
In our opinion, the financial statements and financial highlights referred to above present fairly, in all material respects, the financial position of Fidelity Advisor Equity Growth Fund as of November 30, 2013, the results of its operations for the year then ended, the changes in its net assets for each of the two years in the period then ended, and the financial highlights for each of the five years in the period then ended, in conformity with accounting principles generally accepted in the United States of America.
DELOITTE & TOUCHE LLP
Boston, Massachusetts
January 15, 2014
Annual Report
Trustees and Officers
The Trustees, Member of the Advisory Board, and officers of the trust and fund, as applicable, are listed below. The Board of Trustees governs the fund and is responsible for protecting the interests of shareholders. The Trustees are experienced executives who meet periodically throughout the year to oversee the fund's activities, review contractual arrangements with companies that provide services to the fund, oversee management of the risks associated with such activities and contractual arrangements, and review the fund's performance. Except for James C. Curvey, Ned C. Lautenbach, Ronald P. O'Hanley, and William S. Stavropoulos, each of the Trustees oversees 173 funds. Mr. Curvey oversees 396 funds. Mr. Lautenbach, Mr. O'Hanley, and Mr. Stavropoulos each oversees 247 funds.
The Trustees hold office without limit in time except that (a) any Trustee may resign; (b) any Trustee may be removed by written instrument, signed by at least two-thirds of the number of Trustees prior to such removal; (c) any Trustee who requests to be retired or who has become incapacitated by illness or injury may be retired by written instrument signed by a majority of the other Trustees; and (d) any Trustee may be removed at any special meeting of shareholders by a two-thirds vote of the outstanding voting securities of the trust. Each Trustee who is not an interested person (as defined in the 1940 Act) of the trust and the fund (Independent Trustee), shall retire not later than the last day of the calendar year in which his or her 75th birthday occurs. The Independent Trustees may waive this mandatory retirement age policy with respect to individual Trustees. The officers and Advisory Board Member hold office without limit in time, except that any officer and Advisory Board Member may resign or may be removed by a vote of a majority of the Trustees at any regular meeting or any special meeting of the Trustees. Except as indicated, each individual has held the office shown or other offices in the same company for the past five years.
Experience, Skills, Attributes, and Qualifications of the Fund's Trustees. The Governance and Nominating Committee has adopted a statement of policy that describes the experience, qualifications, attributes, and skills that are necessary and desirable for potential Independent Trustee candidates (Statement of Policy). The Board believes that each Trustee satisfied at the time he or she was initially elected or appointed a Trustee, and continues to satisfy, the standards contemplated by the Statement of Policy. The Governance and Nominating Committee also engages professional search firms to help identify potential Independent Trustee candidates who have the experience, qualifications, attributes, and skills consistent with the Statement of Policy. From time to time, additional criteria based on the composition and skills of the current Independent Trustees, as well as experience or skills that may be appropriate in light of future changes to board composition, business conditions, and regulatory or other developments, have also been considered by the professional search firms and the Governance and Nominating Committee. In addition, the Board takes into account the Trustees' commitment and participation in Board and committee meetings, as well as their leadership of standing and ad hoc committees throughout their tenure.
Annual Report
Trustees and Officers - continued
In determining that a particular Trustee was and continues to be qualified to serve as a Trustee, the Board has considered a variety of criteria, none of which, in isolation, was controlling. The Board believes that, collectively, the Trustees have balanced and diverse experience, qualifications, attributes, and skills, which allow the Board to operate effectively in governing the fund and protecting the interests of shareholders. Information about the specific experience, skills, attributes, and qualifications of each Trustee, which in each case led to the Board's conclusion that the Trustee should serve (or continue to serve) as a trustee of the fund, is provided below.
Board Structure and Oversight Function. James C. Curvey is an interested person (as defined in the 1940 Act) and currently serves as Chairman. The Trustees have determined that an interested Chairman is appropriate and benefits shareholders because an interested Chairman has a personal and professional stake in the quality and continuity of services provided to the fund. Independent Trustees exercise their informed business judgment to appoint an individual of their choosing to serve as Chairman, regardless of whether the Trustee happens to be independent or a member of management. The Independent Trustees have determined that they can act independently and effectively without having an Independent Trustee serve as Chairman and that a key structural component for assuring that they are in a position to do so is for the Independent Trustees to constitute a substantial majority for the Board. The Independent Trustees also regularly meet in executive session. Ned C. Lautenbach serves as Chairman of the Independent Trustees and as such (i) acts as a liaison between the Independent Trustees and management with respect to matters important to the Independent Trustees and (ii) with management prepares agendas for Board meetings.
Fidelity funds are overseen by different Boards of Trustees. The fund's Board oversees Fidelity's equity and high income funds and another Board oversees Fidelity's investment-grade bond, money market, and asset allocation funds. The asset allocation funds may invest in Fidelity funds overseen by the fund's Board. The use of separate Boards, each with its own committee structure, allows the Trustees of each group of Fidelity funds to focus on the unique issues of the funds they oversee, including common research, investment, and operational issues. On occasion, the separate Boards establish joint committees to address issues of overlapping consequences for the Fidelity funds overseen by each Board.
The Trustees operate using a system of committees to facilitate the timely and efficient consideration of all matters of importance to the Trustees, the fund, and fund shareholders and to facilitate compliance with legal and regulatory requirements and oversight of the fund's activities and associated risks. The Board, acting through its committees, has charged FMR and its affiliates with (i) identifying events or circumstances the occurrence of which could have demonstrably adverse effects on the fund's business and/or reputation; (ii) implementing processes and controls to lessen the possibility that such events or circumstances occur or to mitigate the effects of such events or circumstances if they do occur; and (iii) creating and maintaining a system designed to evaluate continuously business and market conditions in order to facilitate the identification and implementation processes described in (i) and (ii) above. Because the day-to-day operations and activities of the fund are carried out by or through FMR, its affiliates and other service providers, the fund's exposure to risks is mitigated but not eliminated by the processes overseen by the Trustees. While each of the Board's committees has responsibility for overseeing different aspects of the fund's activities, oversight is exercised primarily through the Operations, Audit, and Compliance Committees. In addition, the Independent Trustees have worked with FMR to enhance the Board's oversight of investment and financial risks, legal and regulatory risks, technology risks, and operational risks, including the development of additional risk reporting to the Board. For example, a working group comprised of Independent Trustees and FMR has worked and continues to work to review the Fidelity funds' valuation-related activities, reporting and risk management. Appropriate personnel, including but not limited to the fund's Chief Compliance Officer (CCO), FMR's internal auditor, the independent accountants, the fund's Treasurer and portfolio management personnel, make periodic reports to the Board's committees, as appropriate, including an annual review of FMR's risk management program for the Fidelity funds. The responsibilities of each standing committee, including their oversight responsibilities, are described further under "Standing Committees of the Fund's Trustees."
Annual Report
The fund's Statement of Additional Information (SAI) includes more information about the Trustees. To request a free copy, call Fidelity at 1-877-208-0098.
Interested Trustees*:
Correspondence intended for each Trustee who is an interested person may be sent to Fidelity Investments, 245 Summer Street, Boston, Massachusetts 02210.
|
Name, Year of Birth; Principal Occupations and Other Relevant Experience+ |
|
|
James C. Curvey (1935) |
|
|
Year of Election or Appointment: 2007 Trustee Chairman of the Board of Trustees |
|
|
|
Mr. Curvey also serves as Trustee of other Fidelity funds. Mr. Curvey is a Director of Fidelity Investments Money Management, Inc. (2009-present), Director of Fidelity Research & Analysis Co. (2009-present) and Director of FMR and FMR Co., Inc. (2007-present). Mr. Curvey is also Vice Chairman (2007-present) and Director of FMR LLC. In addition, Mr. Curvey serves as an Overseer for the Boston Symphony Orchestra and a member of the Trustees of Villanova University. Previously, Mr. Curvey was the Vice Chairman (2006-2007) and Director (2000-2007) of FMR Corp. |
|
Ronald P. O'Hanley (1957) |
|
|
Year of Election or Appointment: 2011 Trustee |
|
|
|
Mr. O'Hanley also serves as Trustee of other Fidelity funds. He is Director of Fidelity SelectCo, LLC (2013-present), FMR Co., Inc. (2010-present), Director of Fidelity Investments Money Management, Inc. (2010-present), Director of Fidelity Research & Analysis Company (2010-present), President of Fidelity Asset Management and Corporate Services and a Member of Fidelity's Executive Committee (2010-present). Previously, Mr. O'Hanley served as President and Chief Executive Officer of BNY Mellon Asset Management (2007-2010). Mr. O'Hanley also served as Vice Chairman of Bank New York Mellon Corp. and a member of that firm's Executive Committee. Prior to the 2007 merger of The Bank of New York and Mellon Financial Corporation, he was Vice Chairman of Mellon Financial Corporation and President and Chief Executive Officer of Mellon Asset Management. He joined Mellon in February 1997. Mr. O'Hanley currently serves as Chairman of the Boston Public Library Foundation Board of Directors and sits on the Board of Directors of Beth Israel Deaconess Medical Center, the Board of Trustees of the Marine Biological Laboratory and the Advisory Board of the Maxwell School of Citizenship and Public Administration at Syracuse University. Mr. O'Hanley also chairs the Council on Asset Management for the Financial Services Roundtable and is a member of the Board of Directors of Institutional Investor's U.S. Institute. |
* Trustees have been determined to be "Interested Trustees" by virtue of, among other things, their affiliation with the trust or various entities under common control with FMR.
+ The information above includes each Trustee's principal occupation during the last five years and other information relating to the experience, attributes, and skills relevant to each Trustee's qualifications to serve as a Trustee, which led to the conclusion that each Trustee should serve as a Trustee for the fund.
Annual Report
Independent Trustees:
Correspondence intended for each Independent Trustee (that is, the Trustees other than the Interested Trustees) may be sent to Fidelity Investments, P.O. Box 55235, Boston, Massachusetts 02205-5235.
|
Name, Year of Birth; Principal Occupations and Other Relevant Experience+ |
|
|
Dennis J. Dirks (1948) |
|
|
Year of Election or Appointment: 2005 Trustee |
|
|
|
Mr. Dirks also serves as Trustee of other Fidelity funds. Prior to his retirement in May 2003, Mr. Dirks was Chief Operating Officer and a member of the Board of The Depository Trust & Clearing Corporation (DTCC). He also served as President, Chief Operating Officer, and Board member of The Depository Trust Company (DTC) and President and Board member of the National Securities Clearing Corporation (NSCC). In addition, Mr. Dirks served as Chief Executive Officer and Board member of the Government Securities Clearing Corporation, Chief Executive Officer and Board member of the Mortgage-Backed Securities Clearing Corporation, as a Trustee and a member of the Finance Committee of Manhattan College (2005-2008), and as a Trustee and a member of the Finance Committee of AHRC of Nassau County (2006-2008). Mr. Dirks is a member of the Independent Directors Council (IDC) Governing Council (2010-present) and Board of Directors for The Brookville Center for Children's Services, Inc. (2009-present). |
|
Alan J. Lacy (1953) |
|
|
Year of Election or Appointment: 2008 Trustee |
|
|
|
Mr. Lacy also serves as Trustee of other Fidelity funds. Mr. Lacy serves as Senior Adviser (2007-present) of Oak Hill Capital Partners, L.P. (private equity). Mr. Lacy also served as Chief Executive Officer (2000-2005) and Vice Chairman (2005-2006) of Sears Holdings Corporation and Sears, Roebuck and Co. (retail). In addition, Mr. Lacy serves as a member of the Board of Directors of Dave & Buster's Entertainment, Inc. (restaurant and entertainment complexes, 2010-present), Earth Fare, Inc. (retail grocery, 2012-present), The Hillman Companies, Inc. (hardware wholesalers, 2010-present), and Bristol-Myers Squibb Company (global pharmaceuticals, 2008-present). Mr. Lacy is a member of the Board of Trustees of The National Parks Conservation Association (2006-present). Previously, Mr. Lacy served as Chairman of the Board of Trustees of the National Parks Conservation Association (2008-2011) and as a member of the Board of Directors for the Western Union Company (global money transfer, 2006-2011). |
|
Ned C. Lautenbach (1944) |
|
|
Year of Election or Appointment: 2000 Trustee Chairman of the Independent Trustees |
|
|
|
Mr. Lautenbach also serves as Trustee of other Fidelity funds. Mr. Lautenbach currently serves as the Lead Director of the Eaton Corporation Board of Directors (diversified industrial, 1997-present). Mr. Lautenbach is Chairman of the Board of Directors of the Philharmonic Center for the Arts in Naples, Florida (2012-present) and a member of the Council on Foreign Relations (1994-present). Previously, Mr. Lautenbach was a Partner/Advisory Partner at Clayton, Dubilier & Rice, LLC (private equity investment, 1998-2010), as well as a Director of Sony Corporation (2006-2007). |
|
Joseph Mauriello (1944) |
|
|
Year of Election or Appointment: 2008 Trustee |
|
|
|
Mr. Mauriello also serves as Trustee of other Fidelity funds. Prior to his retirement in January 2006, Mr. Mauriello served in numerous senior management positions including Deputy Chairman and Chief Operating Officer (2004-2005), and Vice Chairman of Financial Services (2002-2004) of KPMG LLP US (professional services, 1965-2005). Mr. Mauriello currently serves as a member of the Board of Directors of XL Group plc. (global insurance and re-insurance, 2006-present). Previously, Mr. Mauriello served as a Director of the Hamilton Funds of the Bank of New York (2006-2007) and of Arcadia Resources Inc. (health care services and products, 2007-2012). |
|
Robert W. Selander (1950) |
|
|
Year of Election or Appointment: 2011 Trustee |
|
|
|
Mr. Selander also serves as Trustee of other Fidelity funds. Previously, Mr. Selander served as a Member of the Advisory Board of other Fidelity funds (2011), and Executive Vice Chairman (2010), Chief Executive Officer (2009-2010), and President and Chief Executive Officer (1997-2009) of Mastercard, Inc. |
|
Cornelia M. Small (1944) |
|
|
Year of Election or Appointment: 2005 Trustee |
|
|
|
Ms. Small also serves as Trustee of other Fidelity funds. Ms. Small is a member of the Board of Directors (2009-present) and Chair of the Investment Committee (2010-present) of the Teagle Foundation. Ms. Small also serves on the Investment Committee of the Berkshire Taconic Community Foundation (2008-present). Previously, Ms. Small served as Chairperson (2002-2008) and a member of the Investment Committee and Chairperson (2008-2012) and a member of the Board of Trustees of Smith College. In addition, Ms. Small served as Chief Investment Officer, Director of Global Equity Investments, and a member of the Board of Directors of Scudder, Stevens & Clark and Scudder Kemper Investments. |
|
William S. Stavropoulos (1939) |
|
|
Year of Election or Appointment: 2002 Trustee Vice Chairman of the Independent Trustees |
|
|
|
Mr. Stavropoulos also serves as Trustee of other Fidelity funds. Mr. Stavropoulos serves as President and Founder of the Michigan Baseball Foundation, the Great Lakes Loons (2007-present). Mr. Stavropoulos is Chairman Emeritus of the Board of Directors of The Dow Chemical Company, where he previously served in numerous senior management positions, including President, CEO (1995-2000; 2002-2004), Chairman of the Executive Committee (2000-2006), and as a member of the Board of Directors (1990-2006). Currently, Mr. Stavropoulos is Chairman of the Board of Directors of Univar Inc. (global distributor of commodity and specialty chemicals), a Director of Teradata Corporation (data warehousing and technology solutions), and Maersk Inc. (industrial conglomerate), and a member of the Advisory Board for Metalmark Capital LLC (private equity investment, 2005-present). Mr. Stavropoulos is an operating advisor to Clayton, Dubilier & Rice, LLC (private equity investment). In addition, Mr. Stavropoulos is a member of the University of Notre Dame Advisory Council for the College of Science, a Trustee of the Rollin L. Gerstacker Foundation, and a Director of the Naples Philharmonic Center for the Arts. Previously, Mr. Stavropoulos served as a Director of Chemical Financial Corporation (bank holding company, 1993-2012) and Tyco International, Ltd. (multinational manufacturing and services, 2007-2012). |
|
David M. Thomas (1949) |
|
|
Year of Election or Appointment: 2008 Trustee |
|
|
|
Mr. Thomas also serves as Trustee of other Fidelity funds. Mr. Thomas serves as Non-Executive Chairman of the Board of Directors of Fortune Brands Home and Security (home and security products, 2011-present), and as a member of the Board of Directors of Interpublic Group of Companies, Inc. (marketing communication, 2004-present). Previously, Mr. Thomas served as Executive Chairman (2005-2006) and Chairman and Chief Executive Officer (2000-2005) of IMS Health, Inc. (pharmaceutical and healthcare information solutions), and a Director of Fortune Brands, Inc. (consumer products, 2000-2011). |
+ The information above includes each Trustee's principal occupation during the last five years and other information relating to the experience, attributes, and skills relevant to each Trustee's qualifications to serve as a Trustee, which led to the conclusion that each Trustee should serve as a Trustee for the fund.
Advisory Board Member and Officers:
Correspondence intended for each officer and Peter S. Lynch may be sent to Fidelity Investments, 245 Summer Street, Boston, Massachusetts 02210. Officers appear below in alphabetical order.
|
Name, Year of Birth; Principal Occupation |
|
|
Peter S. Lynch (1944) |
|
|
Year of Election or Appointment: 2003 Member of the Advisory Board |
|
|
|
Mr. Lynch also serves as Member of the Advisory Board of other Fidelity funds. Mr. Lynch is Vice Chairman and a Director of FMR and FMR Co., Inc. In addition, Mr. Lynch serves as a Trustee of Boston College and as the Chairman of the Inner-City Scholarship Fund. Previously, Mr. Lynch served on the Special Olympics International Board of Directors (1997-2006). |
|
Elizabeth Paige Baumann (1968) |
|
|
Year of Election or Appointment: 2012 Anti-Money Laundering (AML) Officer |
|
|
|
Ms. Baumann also serves as AML Officer of other funds. She is Chief AML Officer of FMR LLC (2012-present) and is an employee of Fidelity Investments. Previously, Ms. Baumann served as Vice President and Deputy Anti-Money Laundering Officer (2007-2012). |
|
William C. Coffey (1969) |
|
|
Year of Election or Appointment: 2009 Assistant Secretary |
|
|
|
Mr. Coffey also serves as Assistant Secretary of other funds. He is Senior Vice President and Deputy General Counsel of FMR LLC (2010-present), and is an employee of Fidelity Investments. Previously, Mr. Coffey served as Vice President and Associate General Counsel of FMR LLC (2005-2009). |
|
Jonathan Davis (1968) |
|
|
Year of Election or Appointment: 2010 Assistant Treasurer |
|
|
|
Mr. Davis also serves as Assistant Treasurer of other funds. Mr. Davis is an employee of Fidelity Investments. Previously, Mr. Davis served as Vice President and Associate General Counsel of FMR LLC (2003-2010). |
|
Adrien E. Deberghes (1967) |
|
|
Year of Election or Appointment: 2008 Deputy Treasurer |
|
|
|
Mr. Deberghes also serves as an officer of other funds. He is an employee of Fidelity Investments (2008-present). Prior to joining Fidelity Investments, Mr. Deberghes was Senior Vice President of Mutual Fund Administration at State Street Corporation (2007-2008), Senior Director of Mutual Fund Administration at Investors Bank & Trust (2005-2007), and Director of Finance for Dunkin' Brands (2000-2005). |
|
Stephanie J. Dorsey (1969) |
|
|
Year of Election or Appointment: 2010 Assistant Treasurer |
|
|
|
Ms. Dorsey also serves as an officer of other funds. She is an employee of Fidelity Investments (2008-present) and has served in other fund officer roles. Prior to joining Fidelity Investments, Ms. Dorsey served as Treasurer (2004-2008) of the JPMorgan Mutual Funds and Vice President (2004-2008) of JPMorgan Chase Bank. |
|
Scott C. Goebel (1968) |
|
|
Year of Election or Appointment: 2008 Secretary and Chief Legal Officer (CLO) |
|
|
|
Mr. Goebel serves as Secretary and CLO of other funds. Mr. Goebel also serves as Secretary of Fidelity Investments Money Management, Inc. (FIMM) (2010-present) and Fidelity Research and Analysis Company (FRAC) (2010-present); General Counsel, Secretary, and Senior Vice President of FMR (2008-present) and FMR Co., Inc. (2008-present); Chief Legal Officer of Fidelity Management & Research (Hong Kong) Limited (2008-present) and Assistant Secretary of Fidelity Management & Research (Japan) Inc. (2008-present), and Fidelity Management & Research (U.K.) Inc. (2008-present). Previously, Mr. Goebel served as Secretary and CLO of other Fidelity funds (2008-2013), Assistant Secretary of FIMM (2008-2010), FRAC (2008-2010), and certain funds (2007-2008); and as Vice President and Secretary of Fidelity Distributors Corporation (FDC) (2005-2007). Mr. Goebel has been employed by FMR LLC or an affiliate since 2001. |
|
Joseph A. Hanlon (1968) |
|
|
Year of Election or Appointment: 2012 Chief Compliance Officer |
|
|
|
Mr. Hanlon also serves as Chief Compliance Officer of other funds. Mr. Hanlon serves as Compliance Officer of FMR, FMR Co., Inc., Fidelity Investments Money Management, Inc. (FIMM), Fidelity Research and Analysis Company (FRAC), and Fidelity Management & Research (Hong Kong) (2009-present), as Senior Vice President of the Fidelity Asset Management Division (2009-present), and is an employee of Fidelity Investments. Previously, Mr. Hanlon served as Compliance Officer of Fidelity Management & Research (Japan) Inc. (2009-2013), Strategic Advisers, Inc. (2009-2013), and Fidelity Management & Research (U.K.) Inc. (2009-2013). |
|
Bruce T. Herring (1965) |
|
|
Year of Election or Appointment: 2006 Vice President of certain Equity Funds |
|
|
|
Mr. Herring also serves as Vice President of other funds. He serves as Chief Investment Officer of Fidelity Global Asset Allocation (GAA) (2013-present), Group Chief Investment Officer of FMR, and President of Fidelity Research & Analysis Company (2010-present). Previously, Mr. Herring served as Chief Investment Officer and Director of Fidelity Management & Research (U.K.) Inc. (2010-2013), Vice President (2005-2006) and Senior Vice President (2006-2007) of Fidelity Management & Research Company, Vice President of FMR Co., Inc. (2001-2007), and as a portfolio manager for Fidelity U.S. Equity Funds. |
|
Brian B. Hogan (1964) |
|
|
Year of Election or Appointment: 2009 Vice President |
|
|
|
Mr. Hogan also serves as Vice President of other funds. Mr. Hogan serves as President of FMR's Equity Division (2009-present). Previously, Mr. Hogan served as Senior Vice President, Equity Research of FMR (2006-2009) and as a portfolio manager. |
|
Chris Maher (1972) |
|
|
Year of Election or Appointment: 2013 Assistant Treasurer |
|
|
|
Mr. Maher serves as Assistant Treasurer of other funds. Mr. Maher is Vice President of Valuation Oversight and is an employee of Fidelity Investments. Previously, Mr. Maher served as Vice President of Asset Management Compliance (2013), Vice President of FMR's Program Management Group (2010-2013), and Vice President of Valuation Oversight (2008-2010). |
|
Christine Reynolds (1958) |
|
|
Year of Election or Appointment: 2008 Chief Financial Officer |
|
|
|
Ms. Reynolds also serves as Chief Financial Officer of other funds. Ms. Reynolds became President of Fidelity Pricing and Cash Management Services (FPCMS) in August 2008. Ms. Reynolds served as Chief Operating Officer of FPCMS (2007-2008). Previously, Ms. Reynolds served as President, Treasurer, and Anti-Money Laundering officer of the Fidelity funds (2004-2007). |
|
Kenneth B. Robins (1969) |
|
|
Year of Election or Appointment: 2008 President and Treasurer |
|
|
|
Mr. Robins also serves as an officer of other funds. Mr. Robins serves as Executive Vice President of Fidelity Investments Money Management, Inc. (FIMM) (2013-present) and is an employee of Fidelity Investments (2004-present). Previously, Mr. Robins served in other fund officer roles. |
|
Gary W. Ryan (1958) |
|
|
Year of Election or Appointment: 2005 Assistant Treasurer |
|
|
|
Mr. Ryan also serves as Assistant Treasurer of other funds. Mr. Ryan is an employee of Fidelity Investments and has served in other fund officer roles. Previously, Mr. Ryan served as Vice President of Fund Reporting in Fidelity Pricing and Cash Management Services (FPCMS) (1999-2005). |
|
Stephen Sadoski (1971) |
|
|
Year of Election or Appointment: 2012 Deputy Treasurer |
|
|
|
Mr. Sadoski also serves as Deputy Treasurer of other funds. He is an employee of Fidelity Investments (2012-present) and has served in another fund officer role. Prior to joining Fidelity Investments, Mr. Sadoski served as an assistant chief accountant in the Division of Investment Management of the Securities and Exchange Commission (SEC) (2009-2012) and as a senior manager at Deloitte & Touche LLP (1997-2009). |
|
Stacie M. Smith (1974) |
|
|
Year of Election or Appointment: 2013 Deputy Treasurer |
|
|
|
Ms. Smith also serves as an officer of other funds. She is an employee of Fidelity Investments (2009-present) and has served in other fund officer roles. Prior to joining Fidelity Investments, Ms. Smith served as Senior Audit Manager of Ernst & Young LLP (1996-2009). |
|
Renee Stagnone (1975) |
|
|
Year of Election or Appointment: 2013 Deputy Treasurer |
|
|
|
Ms. Stagnone also serves as Deputy Treasurer of other funds. Ms. Stagnone is an employee of Fidelity Investments. |
|
Joseph F. Zambello (1957) |
|
|
Year of Election or Appointment: 2011 Deputy Treasurer |
|
|
|
Mr. Zambello also serves as Deputy Treasurer of other funds. Mr. Zambello is an employee of Fidelity Investments. Previously, Mr. Zambello served as Vice President of FMR's Program Management Group (2009-2011) and Vice President of the Transfer Agent Oversight Group (2005-2009). |
Annual Report
Board Approval of Investment Advisory Contracts and Management Fees
Fidelity Advisor Equity Growth Fund
Each year, the Board of Trustees, including the Independent Trustees (together, the Board), votes on the renewal of the management contract and sub-advisory agreements (together, the Advisory Contracts) for the fund. The Board, assisted by the advice of fund counsel and Independent Trustees' counsel, requests and considers a broad range of information relevant to the renewal of the Advisory Contracts throughout the year.
The Board meets regularly and, at each of its meetings, covers an extensive agenda of topics and materials and considers factors that are relevant to its annual consideration of the renewal of the fund's Advisory Contracts, including the services and support provided to the fund and its shareholders. The Board has established various standing committees, each composed of and chaired by Independent Trustees with varying backgrounds, to which the Board has assigned specific subject matter responsibilities in order to enhance effective decision-making by the Board. The Board, acting directly and through its Committees, requests and receives information concerning the annual consideration of the renewal of the fund's Advisory Contracts. The Board also meets as needed to consider matters specifically related to the Board's annual consideration of the renewal of Advisory Contracts. Members of the Board may also meet with trustees of other Fidelity funds through ad hoc joint committees to discuss certain matters relevant to the Fidelity funds.
At its July 2013 meeting, the Board, including the Independent Trustees, unanimously determined to renew the fund's Advisory Contracts. In reaching its determination, the Board considered all factors it believed relevant, including (i) the nature, extent, and quality of the services to be provided to the fund and its shareholders (including the investment performance of the fund); (ii) the competitiveness of the fund's management fee and total expense ratio relative to peer funds; (iii) the total costs of the services to be provided by and the profits to be realized by Fidelity from its relationship with the fund; (iv) the extent to which economies of scale exist and would be realized as the fund grows; and (v) whether fee levels reflect these economies of scale, if any, for the benefit of fund shareholders.
In considering whether to renew the Advisory Contracts for the fund, the Board reached a determination, with the assistance of fund counsel and Independent Trustees' counsel and through the exercise of its business judgment, that the renewal of the Advisory Contracts was in the best interests of the fund and its shareholders and that the compensation payable under the Advisory Contracts was fair and reasonable. The Board's decision to renew the Advisory Contracts was not based on any single factor, but rather was based on a comprehensive consideration of all the information provided to the Board at its meetings throughout the year. The Board, in reaching its determination to renew the Advisory Contracts, was aware that shareholders in the fund have a broad range of investment choices available to them, including a wide choice among mutual funds offered by Fidelity's competitors, and that the fund's shareholders, who have the opportunity to review and weigh the disclosure provided by the fund in its prospectus and other public disclosures, have chosen to invest in this fund, which is a part of the Fidelity family of funds.
Annual Report
Board Approval of Investment Advisory Contracts and
Management Fees - continued
Nature, Extent, and Quality of Services Provided. The Board considered the staffing within the investment adviser, Fidelity Management & Research Company (FMR), and the sub-advisers (together, the Investment Advisers) as it relates to the fund, including the backgrounds of the fund's investment personnel, and also considered the fund's investment objective, strategies, and related investment philosophy. The Independent Trustees also had discussions with senior management of Fidelity's investment operations and investment groups. The Board considered the structure of the portfolio manager compensation program and whether this structure provides appropriate incentives to act in the best interests of the fund.
Resources Dedicated to Investment Management and Support Services. The Board and the Fund Oversight and Research Committees reviewed the general qualifications and capabilities of the Investment Advisers' investment staff, including its size, education, experience, and resources, as well as the Investment Advisers' approach to recruiting, training, managing, and compensating investment personnel. The Board noted that FMR has continued to increase the resources devoted to non-U.S. offices, including expansion of Fidelity's global investment organization. The Board also noted that Fidelity's analysts have extensive resources, tools and capabilities that allow them to conduct sophisticated quantitative and fundamental analysis, as well as credit analysis of issuers, counterparties and guarantors. Further, the Board believes that Fidelity's investment professionals have sufficient access to global information and data so as to provide competitive investment results over time, and that those professionals also have access to sophisticated tools that permit them to assess portfolio construction and risk and performance attribution characteristics continuously, as well as to transmit new information and research conclusions rapidly around the world. Additionally, in its deliberations, the Board considered the Investment Advisers' trading and risk management capabilities and resources, which are an integral part of the investment management process.
Shareholder and Administrative Services. The Board considered (i) the nature, extent, quality, and cost of advisory, administrative, and shareholder services performed by the Investment Advisers and their affiliates under the Advisory Contracts and under separate agreements covering transfer agency, pricing and bookkeeping, and securities lending services for the fund; (ii) the nature and extent of the supervision of third party service providers, principally custodians and subcustodians; and (iii) the resources devoted to, and the record of compliance with, the fund's compliance policies and procedures. The Board also reviewed the allocation of fund brokerage, including allocations to brokers affiliated with the Investment Advisers, the use of brokerage commissions to pay fund expenses, and the use of "soft" commission dollars to pay for research services.
Annual Report
The Board noted that the growth of fund assets over time across the complex allows Fidelity to reinvest in the development of services designed to enhance the value or convenience of the Fidelity funds as investment vehicles. These services include 24-hour access to account information and market information through telephone representatives and over the Internet, investor education materials and asset allocation tools, and the expanded availability of Fidelity Investor Centers.
Investment in a Large Fund Family. The Board considered the benefits to shareholders of investing in a Fidelity fund, including the benefits of investing in a fund that is part of a large family of funds offering a variety of investment disciplines and providing a large variety of mutual fund investor services. The Board noted that Fidelity had taken, or had made recommendations that resulted in the Fidelity funds taking, a number of actions over the previous year that benefited particular funds, including (i) continuing to dedicate additional resources to investment research and to the support of the senior management team that oversees asset management; (ii) persisting in efforts to enhance Fidelity's global research capabilities; (iii) launching new funds and making other enhancements to meet client needs for global and income-oriented solutions; (iv) continuing to launch dedicated lower cost underlying funds to meet portfolio construction needs related to expanding underlying fund options for Fidelity funds of funds, specifically for the Freedom Fund product lines; (v) rationalizing product lines and gaining increased efficiencies through the mergers of several funds into other funds; (vi) strengthening Fidelity's index fund offerings by reducing investment minimums and adopting or lowering existing expense caps for certain funds and classes; (vii) enhancing Global Asset Allocation product offerings by launching new funds and strategies, including "open architecture" target date funds that utilize affiliated and unaffiliated sub-advisers; (viii) modifying the eligibility criteria for Institutional Class shares of Advisor funds to increase their marketability to a portion of the defined contribution plan market; (ix) creating a new low-cost retirement share class for certain Advisor funds to appeal to large retirement plans; (x) transitioning the management of certain Fidelity commodity funds to Geode Capital Management LLC, a registered commodity pool operator, while retaining administrative responsibilities for the funds; (xi) reorganizing a number of funds; and (xii) taking steps toward establishing a new Fidelity adviser to manage sector-based funds and products.
Investment Performance. The Board considered whether the fund has operated in accordance with its investment objective, as well as its record of compliance with its investment restrictions and its performance history.
The Board took into account discussions with the Investment Advisers about fund investment performance that occur at Board meetings throughout the year. In this regard the Board noted that as part of regularly scheduled fund reviews and other reports to the Board on fund performance, the Board periodically considers annualized return information for the fund, for different time periods, measured against a securities market index ("benchmark index") and a peer group of mutual funds with similar objectives ("peer group"). In its evaluation of fund investment performance, the Board gave particular attention to information indicating changes in performance of certain Fidelity funds for specific time periods and the Investment Advisers' explanations for any overperformance or underperformance.
Annual Report
Board Approval of Investment Advisory Contracts and
Management Fees - continued
In addition to reviewing absolute and relative fund performance, the Independent Trustees periodically consider the appropriateness of fund performance metrics in evaluating the results achieved. In general, the Independent Trustees believe that fund performance should be evaluated based on net performance (after fees and expenses) of both the highest performing and lowest performing classes, where applicable, compared to appropriate benchmark indices, over appropriate time periods which may include full market cycles, and compared to peer groups, as applicable, over the same periods, taking into account relevant factors including the following: general market conditions; issuer-specific information; tactical opportunities for investment; and fund cash flows and other factors.
The Independent Trustees recognize that shareholders evaluate performance on a net basis over their own holding periods, for which one-, three-, and five-year periods are used as a proxy. For this reason, the performance information reviewed by the Board also included net cumulative calendar year total return information for the fund and an appropriate benchmark index and peer group for the most recent one-, three-, and five-year periods, as shown below. Returns are shown compared to the 25th percentile (top of box) and 75th percentile (bottom of box) of the peer universe.
Annual Report
Fidelity Advisor Equity Growth Fund
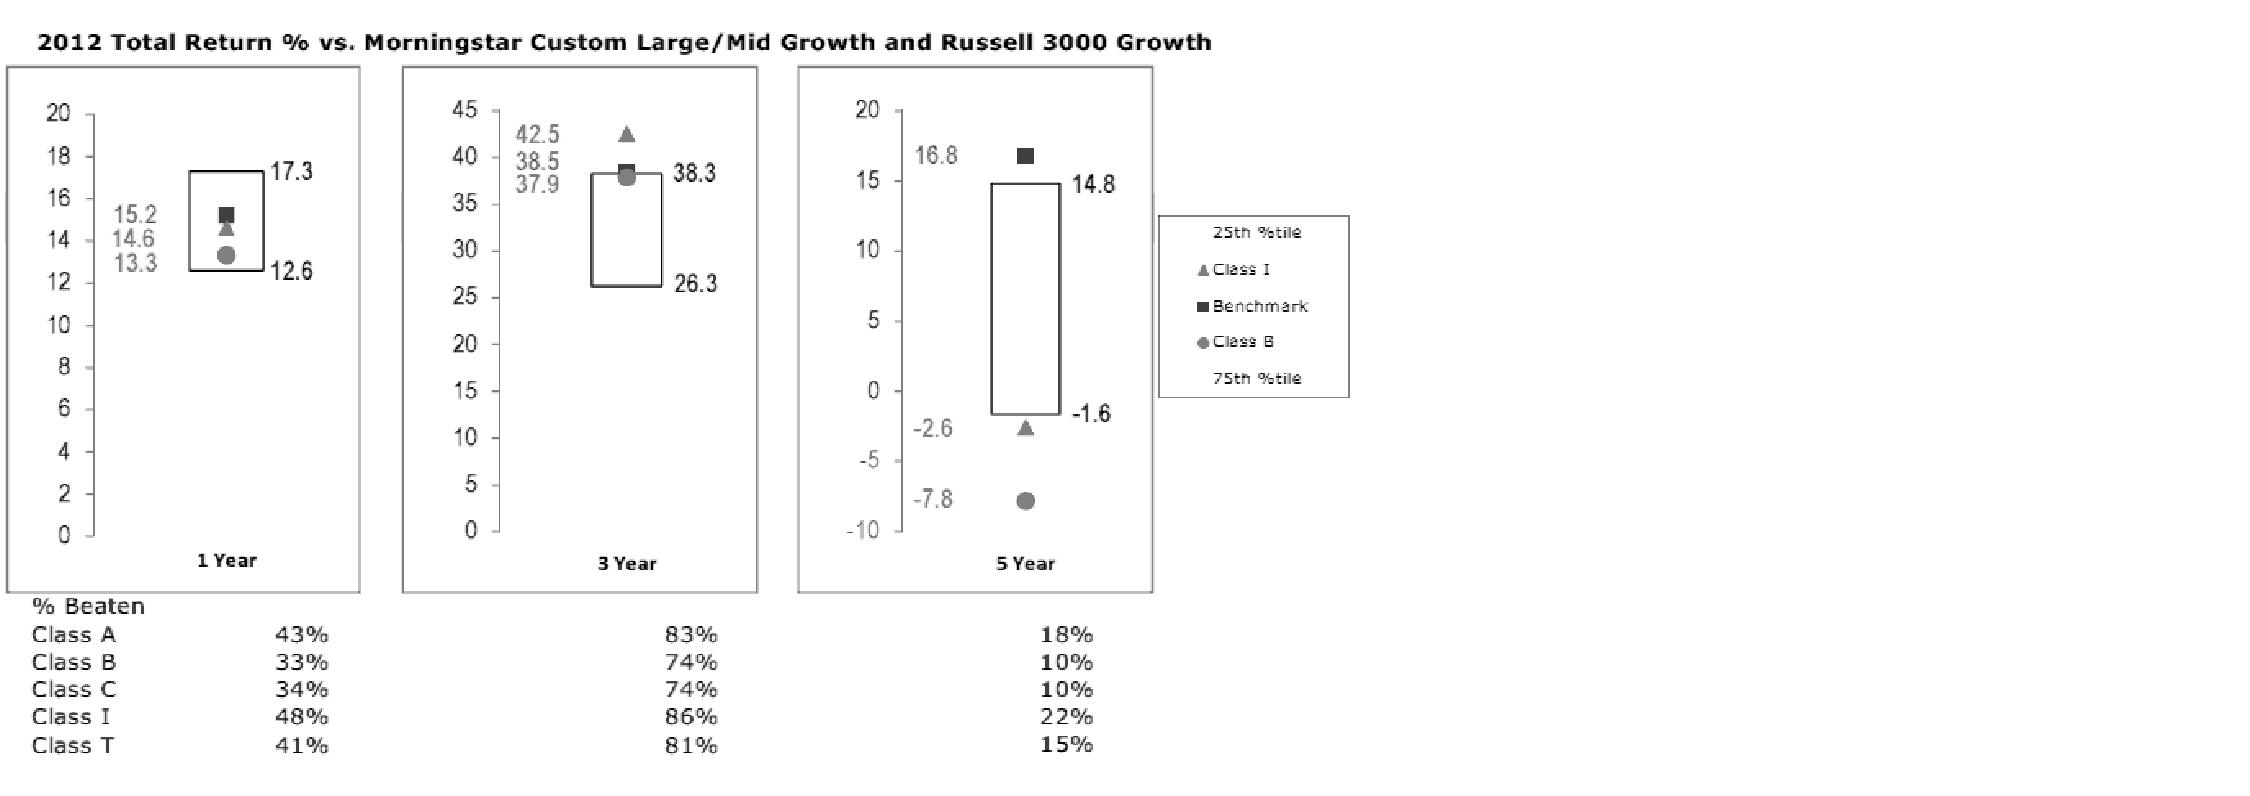
Based on its review, the Board concluded that the nature, extent, and quality of services provided to the fund under the Advisory Contracts should benefit the fund's shareholders.
Competitiveness of Management Fee and Total Expense Ratio. The Board considered the fund's management fee and total expense ratio compared to "mapped groups" of competitive funds and classes. Fidelity creates "mapped groups" by combining similar Lipper investment objective categories that have comparable management fee characteristics. Combining Lipper investment objective categories aids the Board's management fee and total expense ratio comparisons by broadening the competitive group used for comparison and by reducing the number of universes to which various Fidelity funds are compared.
Management Fee. The Board considered two proprietary management fee comparisons for the 12-month periods shown in the chart below. The group of Lipper funds used by the Board for management fee comparisons is referred to below as the "Total Mapped Group." The Total Mapped Group comparison focuses on a fund's standing in terms of gross management fees before expense reimbursements or caps relative to the total universe of funds with comparable investment mandates, regardless of whether their management fee structures also are comparable. Funds with comparable investment mandates offer exposure to similar types of securities. Funds with comparable management fee structures have similar management fee contractual arrangements (e.g., flat rate charged for advisory services, all-inclusive fee rate, etc.). "TMG %" represents the percentage of funds in the Total Mapped Group that had management fees that were lower than the fund's. For example, a TMG % of 11% means that 89% of the funds in the Total Mapped Group had higher management fees than the fund. The "Asset-Size Peer Group" (ASPG) comparison focuses on a fund's standing relative to a subset of non-Fidelity funds within the Total Mapped Group that are similar in size and management fee structure. The ASPG represents at least 15% of the funds in the Total Mapped Group with comparable asset size and management fee structures, subject to a minimum of 50 funds (or all funds in the Total Mapped Group if fewer than 50). Additional information, such as the ASPG quartile in which the fund's management fee ranked, is also included in the chart and considered by the Board.
Annual Report
Board Approval of Investment Advisory Contracts and
Management Fees - continued
Fidelity Advisor Equity Growth Fund
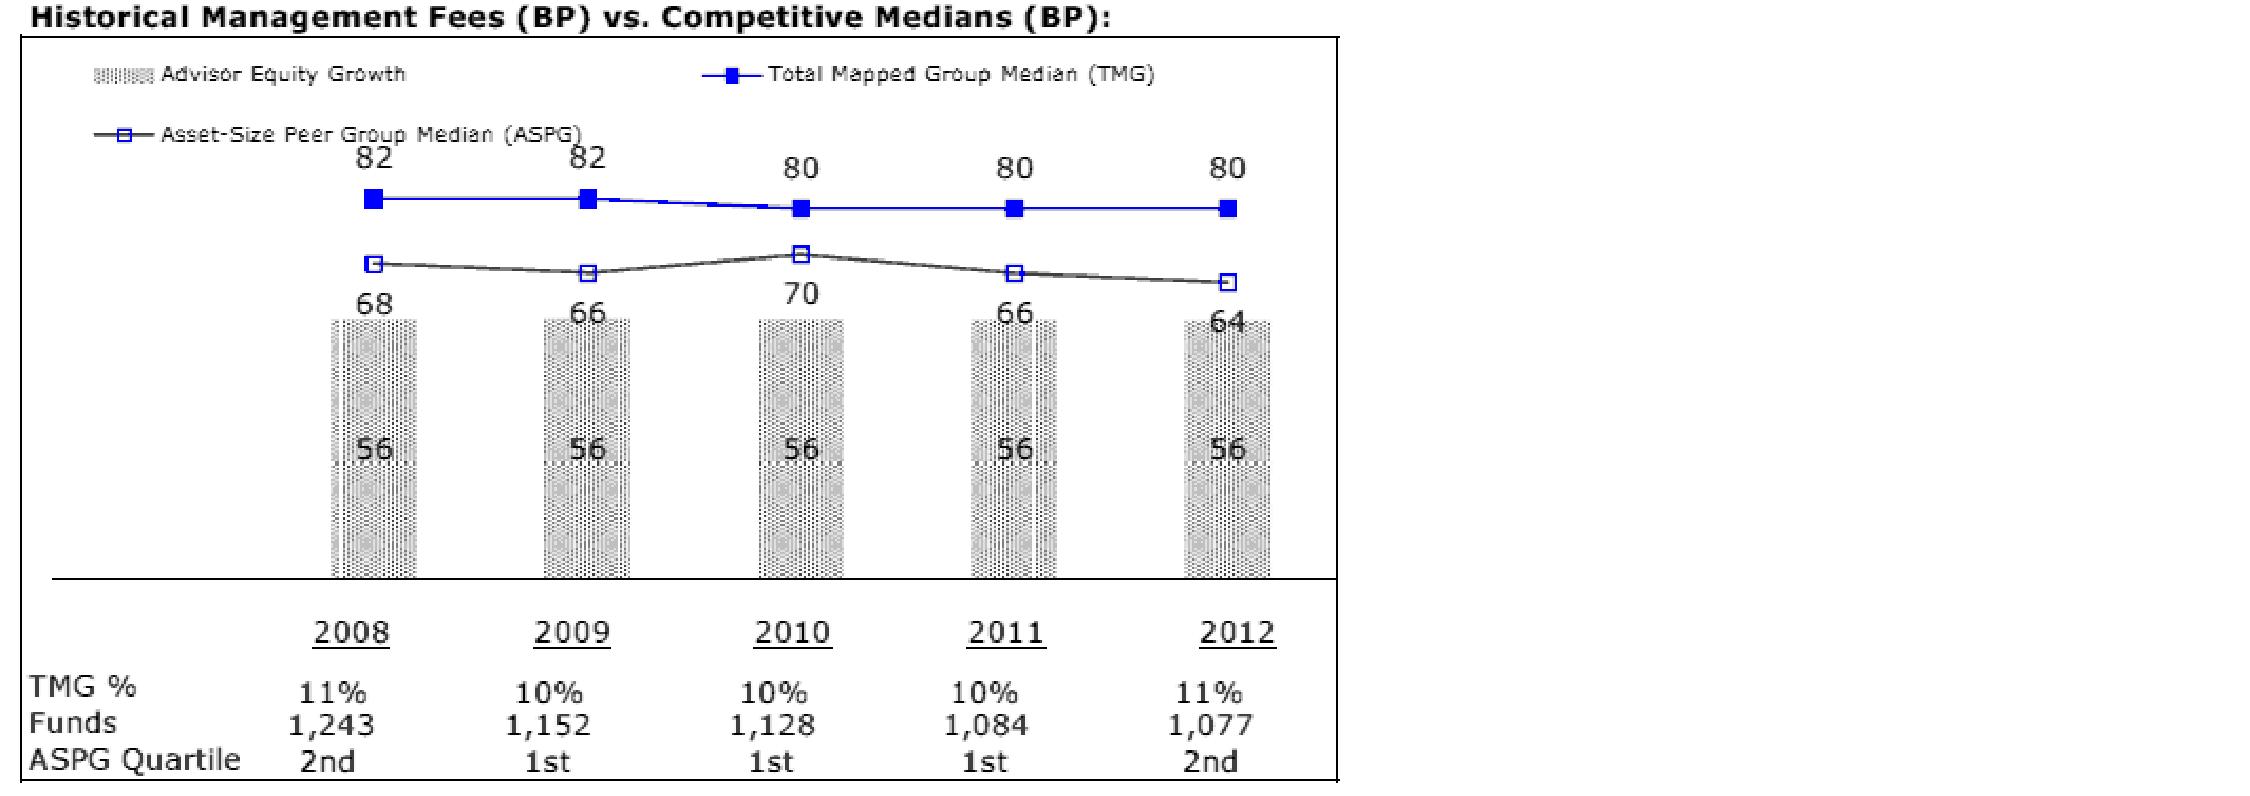
The Board noted that the fund's management fee ranked below the median of its Total Mapped Group and below the median of its ASPG for 2012.
Based on its review, the Board concluded that the fund's management fee is fair and reasonable in light of the services that the fund receives and the other factors considered.
Total Expense Ratio. In its review of each class's total expense ratio, the Board considered the fund's management fee as well as other fund or class expenses, as applicable, such as transfer agent fees, pricing and bookkeeping fees, fund-paid 12b-1 fees, and custodial, legal, and audit fees. The Board also noted the effects of any waivers and reimbursements on fees and expenses. As part of its review, the Board also considered the current and historical total expense ratios of each class of the fund compared to competitive fund median expenses. Each class of the fund is compared to those funds and classes in the Total Mapped Group (used by the Board for management fee comparisons) that have a similar sales load structure.
Annual Report
The Board noted that the total expense ratio of each of Class A, Class B, Class C, and Institutional Class ranked below its competitive median for 2012 and the total expense ratio of Class T ranked above its competitive median for 2012. The Board considered that, in general, various factors can affect total expense ratios. The Board noted that the total expense ratio of Class T was above the competitive median primarily because of higher 12b-1 fees on Class T. Class T has a higher 12b-1 fee, but a lower front-end sales charge, than traditionally priced front-end sales charge classes. The Board considered that Class T is primarily sold load-waived in the retirement plan market where its 0.50% 12b-1 fee is comparable to competing no-load, higher 12b-1 fee classes designed specifically for retirement plans. The Board noted that the fund offers multiple classes, each of which has a different sales load and 12b-1 fee structure, and that the multiple structures are intended to offer a range of pricing options for the intermediary market. The Board also noted that the total expense ratios of the classes vary primarily by the level of their 12b-1 fees, although differences in transfer agent fees may also cause expenses to vary from class to class.
Fees Charged to Other Fidelity Clients. The Board also considered Fidelity fee structures and other information with respect to clients of FMR and its affiliates, such as other mutual funds advised or subadvised by FMR or its affiliates, pension plan clients, and other institutional clients. The Board noted the findings of the 2013 ad hoc joint committee (created with the board of other Fidelity funds), which reviewed and compared Fidelity's institutional investment advisory business with its business of providing services to the Fidelity funds, including the differences in services provided, fees charged, and costs incurred, as well as competition in their respective marketplaces.
Based on its review of total expense ratios and fees charged to other Fidelity clients, the Board concluded that the total expense ratio of each class of the fund was reasonable, although Class T was above the median of the universe presented for comparison, in light of the services that the fund and its shareholders receive and the other factors considered.
Costs of the Services and Profitability. The Board considered the revenues earned and the expenses incurred by Fidelity in conducting the business of developing, marketing, distributing, managing, administering and servicing the fund and servicing the fund's shareholders. The Board also considered the level of Fidelity's profits in respect of all the Fidelity funds.
On an annual basis, FMR presents to the Board Fidelity's profitability for the fund. Fidelity calculates the profitability for each fund, as well as aggregate profitability for groups of Fidelity funds and all Fidelity funds, using a series of detailed revenue and cost allocation methodologies which originate with the books and records of Fidelity on which Fidelity's audited financial statements are based. The Audit Committee of the Board reviews any significant changes from the prior year's methodologies.
Annual Report
Board Approval of Investment Advisory Contracts and
Management Fees - continued
PricewaterhouseCoopers LLP (PwC), independent registered public accounting firm and auditor to Fidelity and certain Fidelity funds, has been engaged annually by the Board as part of the Board's assessment of Fidelity's profitability analysis. PwC's engagement includes the review and assessment of the methodologies used by Fidelity in determining the revenues and expenses attributable to Fidelity's mutual fund business, and completion of agreed-upon procedures surrounding the mathematical accuracy of fund profitability and its conformity to allocation methodologies. After considering PwC's reports issued under the engagement and information provided by Fidelity, the Board concluded that while other allocation methods may also be reasonable, Fidelity's profitability methodologies are reasonable in all material respects.
The Board also reviewed Fidelity's non-fund businesses and fall-out benefits related to the mutual fund business as well as cases where Fidelity's affiliates may benefit from or be related to the fund's business.
The Board considered the costs of the services provided by and the profits realized by Fidelity in connection with the operation of the fund and was satisfied that the profitability was not excessive in the circumstances.
Economies of Scale. The Board considered whether there have been economies of scale in respect of the management of the Fidelity funds, whether the Fidelity funds (including the fund) have appropriately benefited from any such economies of scale, and whether there is potential for realization of any further economies of scale. The Board considered the extent to which the fund will benefit from economies of scale through increased services to the fund, through waivers or reimbursements, or through fee or expense reductions. The Board also noted that in 2009, it and the board of other Fidelity funds created an ad hoc committee (the Economies of Scale Committee) to analyze whether FMR attains economies of scale in respect of the management and servicing of the Fidelity funds, whether the Fidelity funds have appropriately benefited from such economies of scale, and whether there is potential for realization of any further economies of scale.
The Board recognized that the fund's management contract incorporates a "group fee" structure, which provides for lower group fee rates as total fund assets under FMR's management increase, and for higher group fee rates as total fund assets under FMR's management decrease. FMR calculates the group fee rates based on a tiered asset "breakpoint" schedule that varies based on asset class. The Board considered that the group fee is designed to deliver the benefits of economies of scale to fund shareholders when total Fidelity fund assets increase, even if assets of any particular fund are unchanged or have declined, because some portion of Fidelity's costs are attributable to services provided to all Fidelity funds, and all funds benefit if those costs can be allocated among more assets. The Board concluded that, given the group fee structure, fund shareholders will benefit from lower management fees as assets under FMR's management increase at the fund complex level, regardless of whether Fidelity achieves any such economies of scale.
Annual Report
The Board concluded, taking into account the analysis of the Economies of Scale Committee, that economies of scale, if any, are being appropriately shared between fund shareholders and Fidelity.
Amendment to Description of Group Fee Rate. At its July 2013 meeting, the Board voted to approve an amendment to the fund's management contract to modify the description of the "group fee rate" effective August 1, 2013. The Board noted that under the prior description in the contract, the group fee rate was based on the average net assets of all registered investment companies with which FMR has management contracts. Under the contract's tiered asset breakpoint schedule, the group fee rate is lower as total fund assets under FMR's management increase, and higher as total fund assets under FMR's management decrease. The Board considered that the prior description would have excluded the assets of 64 Fidelity sector funds from the group fee rate calculation once Fidelity SelectCo, LLC, an affiliate of FMR, assumed management responsibilities for those funds. The Board noted that modifying the description of the group fee rate to continue to include the assets of those 64 funds for purposes of determining group fee rate breakpoints would avoid an immediate adverse impact on the group fee rate for any fund.
Additional Information Requested by the Board. In order to develop fully the factual basis for consideration of the Fidelity funds' Advisory Contracts, the Board requested and received additional information on certain topics, including: (i) fund performance trends and Fidelity's long-term strategies for certain funds; (ii) the potential to further rationalize the Fidelity fund lineup with the possibility of achieving savings for the funds and Fidelity; (iii) the methodology with respect to competitive fund data and peer group classifications; (iv) the arrangements with, and performance of, certain sub-advisers on behalf of the Fidelity funds, as well as certain proposed participating affiliate arrangements; (v) the realization of fall-out benefits in certain Fidelity business units; (vi) Fidelity's group fee structures, including the rationale for the individual fee rates of certain categories of funds and the definition of group assets; (vii) trends regarding industry use of performance fee structures and the performance adjustment methodologies applicable to the Fidelity funds; (viii) additional competitive analysis regarding the total expenses for certain classes; and (ix) fund profitability methodology, including Fidelity's cost allocation methodology, and the impact of certain factors on fund profitability results.
Annual Report
Board Approval of Investment Advisory Contracts and
Management Fees - continued
Based on its evaluation of all of the conclusions noted above, and after considering all factors it believed relevant, the Board ultimately concluded that the advisory fee structures are fair and reasonable, and that the fund's Advisory Contracts should be renewed.
Annual Report
Investment Adviser
Fidelity Management & Research Company
Boston, MA
Investment Sub-Advisers
FMR Co., Inc.
Fidelity Management & Research
(U.K.) Inc.
Fidelity Management & Research
(Hong Kong) Limited
Fidelity Management & Research
(Japan) Inc.
General Distributor
Fidelity Distributors Corporation
Smithfield, RI
Transfer and Service Agents
Fidelity Investments Institutional Operations Company, Inc.
Boston, MA
Fidelity Service Company, Inc.
Boston, MA
Custodian
JPMorgan Chase Bank
New York, NY
(Fidelity Investment logo)(registered trademark)
EPG-UANN-0114 1.786679.110
(Fidelity Investment logo)(registered trademark)
Fidelity Advisor®
Equity Growth
Fund - Institutional Class
Annual Report
November 30, 2013
(Fidelity Cover Art)
Contents
|
Performance |
How the fund has done over time. |
|
|
Management's Discussion of Fund Performance |
The Portfolio Manager's review of fund performance and strategy. |
|
|
Shareholder Expense Example |
An example of shareholder expenses. |
|
|
Investment Changes |
A summary of major shifts in the fund's investments over the past six months. |
|
|
Investments |
A complete list of the fund's investments with their market values. |
|
|
Financial Statements |
Statements of assets and liabilities, operations, and changes in net assets, as well as financial highlights. |
|
|
Notes |
Notes to the financial statements. |
|
|
Report of Independent Registered Public Accounting Firm |
|
|
|
Trustees and Officers |
|
|
|
Distributions |
|
|
|
Board Approval of Investment Advisory Contracts and Management Fees |
|
To view a fund's proxy voting guidelines and proxy voting record for the 12-month period ended June 30, visit http://www.fidelity.com/proxyvotingresults or visit the Securities and Exchange Commission's (SEC) web site at http://www.sec.gov. You may also call 1-877-208-0098 to request a free copy of the proxy voting guidelines.
Standard & Poor's, S&P and S&P 500 are registered service marks of The McGraw-Hill Companies, Inc. and have been licensed for use by Fidelity Distributors Corporation.
Other third-party marks appearing herein are the property of their respective owners.
All other marks appearing herein are registered or unregistered trademarks or service marks of FMR LLC or an affiliated company. © 2014 FMR LLC. All rights reserved.
Annual Report
This report and the financial statements contained herein are submitted for the general information of the shareholders of the fund. This report is not authorized for distribution to prospective investors in the fund unless preceded or accompanied by an effective prospectus.
A fund files its complete schedule of portfolio holdings with the SEC for the first and third quarters of each fiscal year on Form N-Q. Forms N-Q are available on the SEC's web site at http://www.sec.gov. A fund's Forms N-Q may be reviewed and copied at the SEC's Public Reference Room in Washington, DC. Information regarding the operation of the SEC's Public Reference Room may be obtained by calling 1-800-SEC-0330. For a complete list of a fund's portfolio holdings, view the most recent holdings listing, semiannual report, or annual report on Fidelity's web site at http://www.fidelity.com, http://www.advisor.fidelity.com, or http://www.401k.com, as applicable.
NOT FDIC INSURED • MAY LOSE VALUE • NO BANK GUARANTEE
Neither the fund nor Fidelity Distributors Corporation is a bank.
Annual Report
Performance: The Bottom Line
Average annual total return reflects the change in the value of an investment, assuming reinvestment of the class' distributions from dividend income and capital gains (the profits earned upon the sale of securities that have grown in value, if any) and assuming a constant rate of performance each year. The $10,000 table and the fund's returns do not reflect the deduction of taxes that a shareholder would pay on fund distributions or the redemption of fund shares. During periods of reimbursement by Fidelity, a fund's total return will be greater than it would be had the reimbursement not occurred. How a fund did yesterday is no guarantee of how it will do tomorrow.
Average Annual Total Returns
|
Periods ended November 30, 2013 |
Past 1 |
Past 5 |
Past 10 |
|
Institutional Class |
31.36% |
19.21% |
6.94% |
$10,000 Over 10 Years
Let's say hypothetically that $10,000 was invested in Fidelity Advisor® Equity Growth Fund - Institutional Class on November 30, 2003. The chart shows how the value of your investment would have changed, and also shows how the Russell 3000® Growth Index performed over the same period.
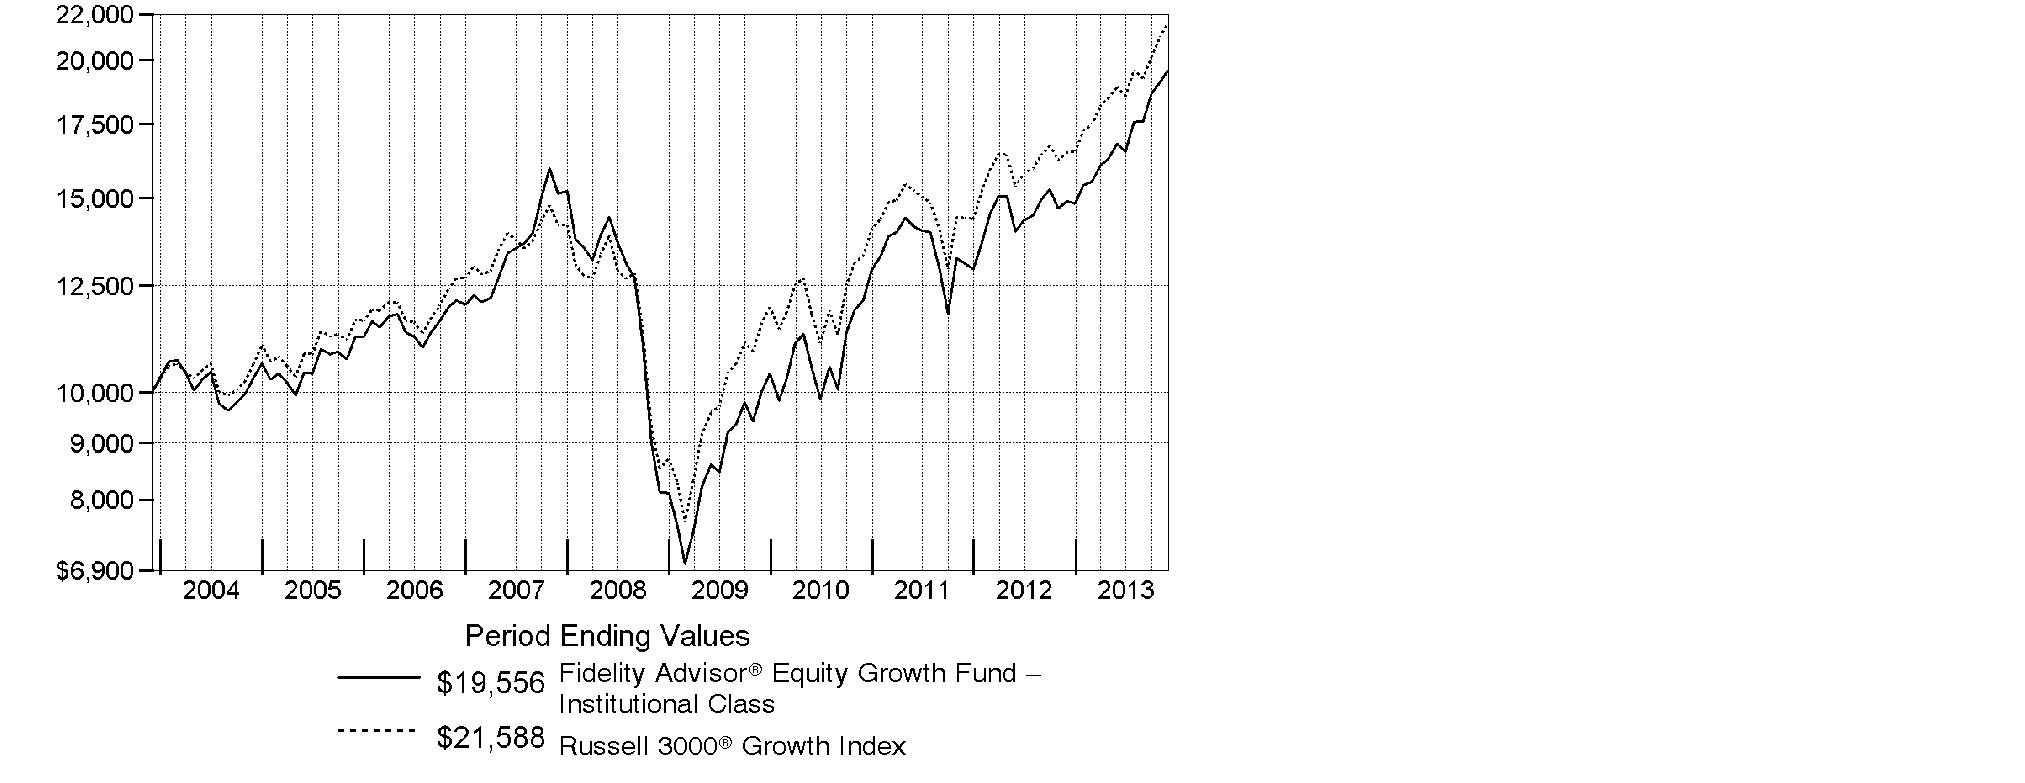
Annual Report
Management's Discussion of Fund Performance
Market Recap: With the current bull run nearing the five-year mark, equity benchmarks ripped up old records during the 12 months ending November 30, 2013. Gains were fueled by strengthening U.S. economic data, as well as generally improving economies and accommodative monetary policies worldwide. The broad S&P 500® Index reached new peaks in its 30.30% climb for the period, and the blue-chip Dow Jones Industrial AverageSM surpassed historic milestones en route to a 26.63% gain. The Nasdaq Composite Index®, up 36.73% amid a resurgence in growth-oriented stocks, closed above 4,000 for the first time since 2000. Shedding anxiety over the 2012 U.S. presidential election - and apparently confident that the federal debt-ceiling debate would be resolved - markets rose from period start through late May. News that the U.S. Federal Reserve was considering an end to its stimulative bond-buying kept stocks in flux over the summer but, by September, the Fed had set aside any imminent tapering. Despite jitters over a potential U.S. military strike in Syria and, later, an October budget impasse that briefly shuttered the federal government, volatility was subdued heading into the holidays, with investor optimism helping many markets home in on all-time highs at period end. Elsewhere, non-U.S. developed-market equities saw similar results, with the MSCI® EAFE® Index adding 24.97%.
Comments from Jason Weiner, Portfolio Manager of Fidelity Advisor® Equity Growth Fund: For the year, the fund's Institutional Class shares gained 31.36%, roughly in line with the 30.83% gain of the Russell 3000® Growth Index. Tesla Motors was by far the biggest relative contributor this period. In May, the automaker received rave reviews for its first electric luxury vehicle, the Model S, and shares catapulted higher. Subsequently, the firm ramped up production to meet growing demand, which helped it move into profitability. Another winner was social networking firm Facebook. The stock popped in July after the firm announced better-than-expected earnings and an explosion in mobile use and mobile revenue. Conversely, an overweighting, on average, in Apple was by far the biggest relative detractor. The tech giant struggled amid mounting competition in the smartphone industry - particularly from South Korea-based Samsung Electronics - and its lack of innovation during the period hurt the stock. Broadcom was another miss, as an overweighting here, on average, curbed results. The company produces baseband chips for smartphones and the stock lagged for most of the period, as the firm faced intensifying competition and setbacks in releasing new baseband chips. I sold Tesla and Broadcom prior to period end.
Annual Report
The views expressed above reflect those of the portfolio manager(s) only through the end of the period as stated on the cover of this report and do not necessarily represent the views of Fidelity or any other person in the Fidelity organization. Any such views are subject to change at any time based upon market or other conditions and Fidelity disclaims any responsibility to update such views. These views may not be relied on as investment advice and, because investment decisions for a Fidelity fund are based on numerous factors, may not be relied on as an indication of trading intent on behalf of any Fidelity fund.
Annual Report
Shareholder Expense Example
As a shareholder of the Fund, you incur two types of costs: (1) transaction costs, including sales charges (loads) on purchase payments or redemption proceeds, and (2) ongoing costs, including management fees, distribution and/or service (12b-1) fees and other Fund expenses. This Example is intended to help you understand your ongoing costs (in dollars) of investing in the Fund and to compare these costs with the ongoing costs of investing in other mutual funds.
The actual expense Example is based on an investment of $1,000 invested at the beginning of the period and held for the entire period (June 1, 2013 to November 30, 2013) for Class A, Class T, Class B, Class C and Institutional Class and for the period (August 13, 2013 to November 30, 2013) for Class Z. The hypothetical expense Example is based on an investment of $1,000 invested for the one-half year period (June 1, 2013 to November 30, 2013).
Actual Expenses
The first line of the accompanying table for each class of the Fund provides information about actual account values and actual expenses. You may use the information in this line, together with the amount you invested, to estimate the expenses that you paid over the period. Simply divide your account value by $1,000.00 (for example, an $8,600 account value divided by $1,000.00 = 8.6), then multiply the result by the number in the first line for a class of the Fund under the heading entitled "Expenses Paid During Period" to estimate the expenses you paid on your account during this period. In addition, the Fund, as a shareholder in the underlying Fidelity Central Funds, will indirectly bear its pro-rata share of the fees and expenses incurred by the underlying Fidelity Central Funds. These fees and expenses are not included in the Fund's annualized expense ratio used to calculate the expense estimate in the table below.
Hypothetical Example for Comparison Purposes
The second line of the accompanying table for each class of the Fund provides information about hypothetical account values and hypothetical expenses based on a Class' actual expense ratio and an assumed rate of return of 5% per year before expenses, which is not the Class' actual return. The hypothetical account values and expenses may not be used to estimate the actual ending account balance or expenses you paid for the period. You may use this information to compare the ongoing costs of investing in the Fund and other funds. To do so, compare this 5% hypothetical example with the 5% hypothetical examples that appear in the shareholder reports of the other funds. In addition, the Fund, as a shareholder in the underlying Fidelity Central Funds, will indirectly bear its pro-rata share of the fees and expenses incurred by the underlying Fidelity Central Funds. These fees and expenses are not included in the Fund's annualized expense ratio used to calculate the expense estimate in the table below.
Please note that the expenses shown in the table are meant to highlight your ongoing costs only and do not reflect any transaction costs. Therefore, the second line of the table is useful in comparing ongoing costs only, and will not help you determine the relative total costs of owning different funds. In addition, if these transactional costs were included, your costs would have been higher.
Annual Report
Shareholder Expense Example - continued
|
|
Annualized |
Beginning |
Ending |
Expenses Paid |
|
Class A |
1.10% |
|
|
|
|
Actual |
|
$ 1,000.00 |
$ 1,162.60 |
$ 5.96 C |
|
HypotheticalA |
|
$ 1,000.00 |
$ 1,019.55 |
$ 5.57 D |
|
Class T |
1.29% |
|
|
|
|
Actual |
|
$ 1,000.00 |
$ 1,161.40 |
$ 6.99 C |
|
HypotheticalA |
|
$ 1,000.00 |
$ 1,018.60 |
$ 6.53 D |
|
Class B |
1.89% |
|
|
|
|
Actual |
|
$ 1,000.00 |
$ 1,158.00 |
$ 10.22 C |
|
HypotheticalA |
|
$ 1,000.00 |
$ 1,015.59 |
$ 9.55 D |
|
Class C |
1.83% |
|
|
|
|
Actual |
|
$ 1,000.00 |
$ 1,158.20 |
$ 9.90 C |
|
HypotheticalA |
|
$ 1,000.00 |
$ 1,015.89 |
$ 9.25 D |
|
Institutional Class |
.78% |
|
|
|
|
Actual |
|
$ 1,000.00 |
$ 1,164.40 |
$ 4.23 C |
|
HypotheticalA |
|
$ 1,000.00 |
$ 1,021.16 |
$ 3.95 D |
|
Class Z |
.64% |
|
|
|
|
Actual |
|
$ 1,000.00 |
$ 1,100.30 |
$ 2.03 C |
|
HypotheticalA |
|
$ 1,000.00 |
$ 1,021.86 |
$ 3.24 D |
A 5% return per year before expenses
B Annualized expense ratio reflects expenses net of applicable fee waivers.
C Actual expenses are equal to each Class' annualized expense ratio; multiplied by the average account value over the period, multiplied by 183/365 (to reflect the one-half year period) for Class A, Class T, Class B, Class C and Institutional Class and multiplied by 110/365 (to reflect the period August 13, 2013 to November 30, 2013) for Class Z.
D Hypothetical expenses are equal to each Class' annualized expense ratio, multiplied by the average account value over the period, multiplied by 183/365 (to reflect the one-half year period).
Annual Report
Investment Changes (Unaudited)
|
Top Ten Stocks as of November 30, 2013 |
||
|
|
% of fund's |
% of fund's net assets |
|
Facebook, Inc. Class A |
5.9 |
2.2 |
|
Google, Inc. Class A |
3.8 |
2.7 |
|
Microsoft Corp. |
3.2 |
0.0 |
|
Harley-Davidson, Inc. |
3.0 |
2.5 |
|
Apple, Inc. |
2.6 |
4.9 |
|
Home Depot, Inc. |
2.5 |
3.2 |
|
QUALCOMM, Inc. |
2.3 |
1.4 |
|
Green Mountain Coffee Roasters, Inc. |
2.3 |
2.4 |
|
Procter & Gamble Co. |
1.9 |
0.0 |
|
Amazon.com, Inc. |
1.8 |
1.0 |
|
|
29.3 |
|
|
Top Five Market Sectors as of November 30, 2013 |
||
|
|
% of fund's |
% of fund's net assets |
|
Information Technology |
27.5 |
27.0 |
|
Consumer Discretionary |
20.4 |
20.8 |
|
Health Care |
16.9 |
17.0 |
|
Consumer Staples |
9.1 |
9.7 |
|
Industrials |
7.4 |
7.7 |
|
Asset Allocation (% of fund's net assets) |
|||||||
|
As of November 30, 2013* |
As of May 31, 2013** |
||||||
 |
Stocks 98.0% |
|
|
Stocks 98.3% |
|
||
 |
Convertible |
|
 |
Convertible |
|
||
 |
Short-Term |
|
|
Short-Term |
|
||
|
* Foreign investments |
12.3% |
|
** Foreign investments |
11.2% |
|
||

Annual Report
Investments November 30, 2013
Showing Percentage of Net Assets
|
Common Stocks - 98.0% |
|||
|
Shares |
Value (000s) |
||
|
CONSUMER DISCRETIONARY - 20.3% |
|||
|
Automobiles - 3.0% |
|||
|
Harley-Davidson, Inc. |
1,542,454 |
$ 103,375 |
|
|
Diversified Consumer Services - 1.4% |
|||
|
Anhanguera Educacional Participacoes SA |
2,140,700 |
14,251 |
|
|
H&R Block, Inc. |
316,752 |
8,834 |
|
|
Kroton Educacional SA |
1,507,000 |
25,340 |
|
|
|
48,425 |
||
|
Hotels, Restaurants & Leisure - 4.6% |
|||
|
Chipotle Mexican Grill, Inc. (a) |
66,068 |
34,610 |
|
|
Dunkin' Brands Group, Inc. |
452,136 |
22,146 |
|
|
Las Vegas Sands Corp. |
99,300 |
7,118 |
|
|
Starbucks Corp. |
767,501 |
62,521 |
|
|
Yum! Brands, Inc. |
424,779 |
32,997 |
|
|
|
159,392 |
||
|
Household Durables - 0.5% |
|||
|
Mohawk Industries, Inc. (a) |
133,816 |
18,737 |
|
|
Internet & Catalog Retail - 2.3% |
|||
|
Amazon.com, Inc. (a) |
164,844 |
64,886 |
|
|
TripAdvisor, Inc. (a) |
182,864 |
16,151 |
|
|
|
81,037 |
||
|
Leisure Equipment & Products - 0.0% |
|||
|
NJOY, Inc. (a)(e) |
202,642 |
1,637 |
|
|
Media - 0.8% |
|||
|
Comcast Corp. Class A (special) (non-vtg.) |
553,238 |
26,638 |
|
|
Multiline Retail - 0.4% |
|||
|
Dollarama, Inc. |
154,245 |
12,470 |
|
|
Specialty Retail - 5.4% |
|||
|
CarMax, Inc. (a) |
361,148 |
18,184 |
|
|
Five Below, Inc. (a) |
127,900 |
6,799 |
|
|
GNC Holdings, Inc. |
434,619 |
26,155 |
|
|
Home Depot, Inc. |
1,091,144 |
88,023 |
|
|
TJX Companies, Inc. |
262,455 |
16,503 |
|
|
Ulta Salon, Cosmetics & Fragrance, Inc. (a) |
81,420 |
10,335 |
|
|
Urban Outfitters, Inc. (a) |
610,143 |
23,808 |
|
|
|
189,807 |
||
|
Textiles, Apparel & Luxury Goods - 1.9% |
|||
|
ECLAT Textile Co. Ltd. |
1,099,560 |
14,003 |
|
|
Common Stocks - continued |
|||
|
Shares |
Value (000s) |
||
|
CONSUMER DISCRETIONARY - continued |
|||
|
Textiles, Apparel & Luxury Goods - continued |
|||
|
Michael Kors Holdings Ltd. (a) |
247,097 |
$ 20,151 |
|
|
NIKE, Inc. Class B |
422,757 |
33,457 |
|
|
|
67,611 |
||
|
TOTAL CONSUMER DISCRETIONARY |
709,129 |
||
|
CONSUMER STAPLES - 9.1% |
|||
|
Beverages - 1.2% |
|||
|
Monster Beverage Corp. (a) |
104,840 |
6,204 |
|
|
SABMiller PLC |
376,434 |
19,421 |
|
|
The Coca-Cola Co. |
426,326 |
17,134 |
|
|
|
42,759 |
||
|
Food & Staples Retailing - 1.1% |
|||
|
Costco Wholesale Corp. |
168,200 |
21,097 |
|
|
Whole Foods Market, Inc. |
327,683 |
18,547 |
|
|
|
39,644 |
||
|
Food Products - 3.6% |
|||
|
Annie's, Inc. (a) |
68,589 |
3,152 |
|
|
Green Mountain Coffee Roasters, Inc. (d) |
1,195,591 |
80,559 |
|
|
Mead Johnson Nutrition Co. Class A |
39,285 |
3,320 |
|
|
The Hershey Co. |
383,359 |
37,144 |
|
|
|
124,175 |
||
|
Household Products - 1.9% |
|||
|
Procter & Gamble Co. |
803,991 |
67,712 |
|
|
Personal Products - 1.3% |
|||
|
Herbalife Ltd. |
547,170 |
38,127 |
|
|
Inter Parfums, Inc. |
165,292 |
6,017 |
|
|
|
44,144 |
||
|
TOTAL CONSUMER STAPLES |
318,434 |
||
|
ENERGY - 4.3% |
|||
|
Energy Equipment & Services - 2.2% |
|||
|
Cameron International Corp. (a) |
229,392 |
12,706 |
|
|
Dril-Quip, Inc. (a) |
160,830 |
17,460 |
|
|
National Oilwell Varco, Inc. |
173,195 |
14,115 |
|
|
Oceaneering International, Inc. |
276,370 |
21,333 |
|
|
RigNet, Inc. (a) |
325,698 |
13,836 |
|
|
|
79,450 |
||
|
Common Stocks - continued |
|||
|
Shares |
Value (000s) |
||
|
ENERGY - continued |
|||
|
Oil, Gas & Consumable Fuels - 2.1% |
|||
|
Bonanza Creek Energy, Inc. (a) |
358,158 |
$ 16,429 |
|
|
Cobalt International Energy, Inc. (a) |
403,909 |
8,979 |
|
|
Continental Resources, Inc. (a) |
93,510 |
10,053 |
|
|
Markwest Energy Partners LP |
189,840 |
13,112 |
|
|
Noble Energy, Inc. |
133,000 |
9,342 |
|
|
Pioneer Natural Resources Co. |
83,502 |
14,842 |
|
|
|
72,757 |
||
|
TOTAL ENERGY |
152,207 |
||
|
FINANCIALS - 6.6% |
|||
|
Capital Markets - 3.7% |
|||
|
BlackRock, Inc. Class A |
73,200 |
22,161 |
|
|
E*TRADE Financial Corp. (a) |
1,049,455 |
18,806 |
|
|
Harvest Capital Credit Corp. (d) |
125,400 |
1,853 |
|
|
Invesco Ltd. |
1,303,271 |
45,419 |
|
|
Legg Mason, Inc. |
134,258 |
5,251 |
|
|
The Blackstone Group LP |
1,079,233 |
30,844 |
|
|
Virtus Investment Partners, Inc. (a) |
24,800 |
5,153 |
|
|
|
129,487 |
||
|
Commercial Banks - 1.0% |
|||
|
First Republic Bank |
133,800 |
6,837 |
|
|
HDFC Bank Ltd. sponsored ADR |
828,796 |
27,499 |
|
|
|
34,336 |
||
|
Consumer Finance - 0.6% |
|||
|
American Express Co. |
219,423 |
18,826 |
|
|
Mahindra & Mahindra Financial Services Ltd. |
495,252 |
2,347 |
|
|
|
21,173 |
||
|
Diversified Financial Services - 0.8% |
|||
|
Berkshire Hathaway, Inc. Class B (a) |
73,900 |
8,612 |
|
|
McGraw-Hill Companies, Inc. |
274,375 |
20,441 |
|
|
|
29,053 |
||
|
Real Estate Management & Development - 0.5% |
|||
|
Leopalace21 Corp. (a) |
248,300 |
1,411 |
|
|
Realogy Holdings Corp. (a) |
291,218 |
13,801 |
|
|
|
15,212 |
||
|
TOTAL FINANCIALS |
229,261 |
||
|
Common Stocks - continued |
|||
|
Shares |
Value (000s) |
||
|
HEALTH CARE - 16.9% |
|||
|
Biotechnology - 8.8% |
|||
|
Actelion Ltd. |
56,084 |
$ 4,672 |
|
|
Alexion Pharmaceuticals, Inc. (a) |
138,581 |
17,253 |
|
|
Amgen, Inc. |
189,429 |
21,610 |
|
|
Biogen Idec, Inc. (a) |
180,916 |
52,641 |
|
|
BioMarin Pharmaceutical, Inc. (a) |
440,879 |
31,029 |
|
|
Cytokinetics, Inc. warrants 6/25/17 (a) |
856,620 |
122 |
|
|
Enanta Pharmaceuticals, Inc. |
126,572 |
3,421 |
|
|
Gentium SpA sponsored ADR (a) |
190,208 |
10,313 |
|
|
Gilead Sciences, Inc. (a) |
653,239 |
48,869 |
|
|
Insmed, Inc. (a) |
954,020 |
15,455 |
|
|
Kamada (a) |
819,830 |
12,215 |
|
|
Ophthotech Corp. |
89,016 |
2,515 |
|
|
Regeneron Pharmaceuticals, Inc. (a) |
59,775 |
17,565 |
|
|
Swedish Orphan Biovitrum AB (a) |
1,227,713 |
12,774 |
|
|
Theravance, Inc. (a)(d) |
1,020,043 |
38,517 |
|
|
United Therapeutics Corp. (a) |
120,285 |
11,104 |
|
|
Vanda Pharmaceuticals, Inc. (a) |
671,242 |
7,880 |
|
|
|
307,955 |
||
|
Health Care Equipment & Supplies - 0.7% |
|||
|
AxoGen, Inc. (a) |
250,900 |
991 |
|
|
GI Dynamics, Inc. CDI (a) |
547,818 |
359 |
|
|
Intuitive Surgical, Inc. (a) |
9,300 |
3,505 |
|
|
The Cooper Companies, Inc. |
147,693 |
19,457 |
|
|
|
24,312 |
||
|
Health Care Providers & Services - 1.2% |
|||
|
Apollo Hospitals Enterprise Ltd. |
392,573 |
5,248 |
|
|
Express Scripts Holding Co. (a) |
461,092 |
31,055 |
|
|
Qualicorp SA (a) |
806,600 |
7,540 |
|
|
|
43,843 |
||
|
Health Care Technology - 0.6% |
|||
|
Cerner Corp. (a) |
363,740 |
20,904 |
|
|
Life Sciences Tools & Services - 0.8% |
|||
|
Illumina, Inc. (a) |
289,795 |
28,400 |
|
|
Pharmaceuticals - 4.8% |
|||
|
AbbVie, Inc. |
832,254 |
40,323 |
|
|
Actavis PLC (a) |
229,800 |
37,473 |
|
|
Cadence Pharmaceuticals, Inc. (a) |
710,600 |
6,410 |
|
|
Novo Nordisk A/S Series B |
105,397 |
18,841 |
|
|
Pacira Pharmaceuticals, Inc. (a) |
265,430 |
14,649 |
|
|
Common Stocks - continued |
|||
|
Shares |
Value (000s) |
||
|
HEALTH CARE - continued |
|||
|
Pharmaceuticals - continued |
|||
|
Perrigo Co. (d) |
126,291 |
$ 19,688 |
|
|
Valeant Pharmaceuticals International, Inc. (Canada) (a) |
275,652 |
30,223 |
|
|
|
167,607 |
||
|
TOTAL HEALTH CARE |
593,021 |
||
|
INDUSTRIALS - 7.4% |
|||
|
Aerospace & Defense - 2.2% |
|||
|
TransDigm Group, Inc. |
170,377 |
26,667 |
|
|
United Technologies Corp. |
470,719 |
52,184 |
|
|
|
78,851 |
||
|
Airlines - 0.2% |
|||
|
Ryanair Holdings PLC sponsored ADR |
113,180 |
5,435 |
|
|
Building Products - 0.3% |
|||
|
A.O. Smith Corp. |
212,338 |
11,498 |
|
|
Commercial Services & Supplies - 0.1% |
|||
|
KAR Auction Services, Inc. |
123,667 |
3,412 |
|
|
Construction & Engineering - 0.1% |
|||
|
Jacobs Engineering Group, Inc. (a) |
42,815 |
2,559 |
|
|
Electrical Equipment - 1.6% |
|||
|
AMETEK, Inc. |
343,355 |
16,900 |
|
|
Generac Holdings, Inc. |
326,516 |
17,390 |
|
|
Power Solutions International, Inc. (a) |
31,413 |
2,350 |
|
|
Roper Industries, Inc. |
136,569 |
17,713 |
|
|
|
54,353 |
||
|
Industrial Conglomerates - 1.3% |
|||
|
Danaher Corp. |
608,577 |
45,522 |
|
|
Machinery - 0.8% |
|||
|
Graco, Inc. |
39,222 |
3,029 |
|
|
Haitian International Holdings Ltd. |
205,000 |
469 |
|
|
Manitowoc Co., Inc. |
1,009,748 |
20,791 |
|
|
Weg SA |
301,500 |
4,094 |
|
|
|
28,383 |
||
|
Common Stocks - continued |
|||
|
Shares |
Value (000s) |
||
|
INDUSTRIALS - continued |
|||
|
Professional Services - 0.8% |
|||
|
Equifax, Inc. |
117,071 |
$ 7,882 |
|
|
Verisk Analytics, Inc. (a) |
325,329 |
21,182 |
|
|
|
29,064 |
||
|
TOTAL INDUSTRIALS |
259,077 |
||
|
INFORMATION TECHNOLOGY - 27.5% |
|||
|
Communications Equipment - 2.3% |
|||
|
QUALCOMM, Inc. |
1,104,051 |
81,236 |
|
|
Computers & Peripherals - 2.6% |
|||
|
Apple, Inc. |
161,801 |
89,973 |
|
|
Electronic Equipment & Components - 0.4% |
|||
|
National Instruments Corp. |
54,900 |
1,716 |
|
|
TE Connectivity Ltd. |
234,700 |
12,373 |
|
|
|
14,089 |
||
|
Internet Software & Services - 12.2% |
|||
|
Cornerstone OnDemand, Inc. (a) |
200,132 |
10,091 |
|
|
CoStar Group, Inc. (a) |
81,560 |
15,190 |
|
|
Facebook, Inc. Class A (a) |
4,372,200 |
205,541 |
|
|
Google, Inc. Class A (a) |
127,053 |
134,624 |
|
|
LinkedIn Corp. (a) |
38,931 |
8,722 |
|
|
MercadoLibre, Inc. (d) |
17,290 |
1,914 |
|
|
SPS Commerce, Inc. (a) |
195,299 |
12,845 |
|
|
Textura Corp. |
219,830 |
7,443 |
|
|
Twitter, Inc. |
26,800 |
1,114 |
|
|
Xoom Corp. |
57,100 |
1,578 |
|
|
Yahoo!, Inc. (a) |
769,153 |
28,443 |
|
|
|
427,505 |
||
|
IT Services - 2.2% |
|||
|
Gartner, Inc. Class A (a) |
118,660 |
7,671 |
|
|
QIWI PLC Class B sponsored ADR |
158,388 |
7,409 |
|
|
Visa, Inc. Class A |
302,908 |
61,630 |
|
|
|
76,710 |
||
|
Software - 7.8% |
|||
|
ANSYS, Inc. (a) |
4,168 |
357 |
|
|
Computer Modelling Group Ltd. |
432,800 |
11,018 |
|
|
Diligent Board Member Services, Inc. (a) |
489,277 |
1,548 |
|
|
Electronic Arts, Inc. (a) |
790,145 |
17,525 |
|
|
FireEye, Inc. |
502,139 |
19,267 |
|
|
Common Stocks - continued |
|||
|
Shares |
Value (000s) |
||
|
INFORMATION TECHNOLOGY - continued |
|||
|
Software - continued |
|||
|
FleetMatics Group PLC (a) |
124,200 |
$ 4,807 |
|
|
Microsoft Corp. |
2,956,500 |
112,731 |
|
|
salesforce.com, Inc. (a) |
1,139,492 |
59,356 |
|
|
ServiceNow, Inc. (a) |
85,100 |
4,520 |
|
|
SolarWinds, Inc. (a) |
107,112 |
3,582 |
|
|
Solera Holdings, Inc. |
61,100 |
4,078 |
|
|
SS&C Technologies Holdings, Inc. (a) |
617,646 |
26,627 |
|
|
Tableau Software, Inc. |
81,200 |
5,322 |
|
|
Workday, Inc. Class A (a) |
48,600 |
4,002 |
|
|
|
274,740 |
||
|
TOTAL INFORMATION TECHNOLOGY |
964,253 |
||
|
MATERIALS - 4.3% |
|||
|
Chemicals - 2.3% |
|||
|
FMC Corp. |
294,553 |
21,461 |
|
|
LyondellBasell Industries NV Class A |
142,845 |
11,025 |
|
|
Monsanto Co. |
218,363 |
24,747 |
|
|
Sherwin-Williams Co. |
125,145 |
22,905 |
|
|
|
80,138 |
||
|
Construction Materials - 2.0% |
|||
|
Eagle Materials, Inc. |
424,058 |
33,077 |
|
|
James Hardie Industries PLC sponsored ADR |
164,473 |
9,439 |
|
|
Vulcan Materials Co. |
474,730 |
26,761 |
|
|
|
69,277 |
||
|
TOTAL MATERIALS |
149,415 |
||
|
TELECOMMUNICATION SERVICES - 0.7% |
|||
|
Diversified Telecommunication Services - 0.3% |
|||
|
8x8, Inc. (a) |
1,073,298 |
11,184 |
|
|
Wireless Telecommunication Services - 0.4% |
|||
|
SBA Communications Corp. Class A (a) |
155,460 |
13,241 |
|
|
TOTAL TELECOMMUNICATION SERVICES |
24,425 |
||
|
Common Stocks - continued |
|||
|
Shares |
Value (000s) |
||
|
UTILITIES - 0.9% |
|||
|
Electric Utilities - 0.9% |
|||
|
ITC Holdings Corp. |
351,412 |
$ 31,796 |
|
|
TOTAL COMMON STOCKS (Cost $2,599,349) |
|
||
|
Convertible Preferred Stocks - 0.1% |
|||
|
|
|
|
|
|
CONSUMER DISCRETIONARY - 0.1% |
|||
|
Household Durables - 0.1% |
|||
|
Blu Homes, Inc. Series A, 5.00% (e) (Cost $4,044) |
875,350 |
|
|
|
Money Market Funds - 3.9% |
|||
|
|
|
|
|
|
Fidelity Cash Central Fund, 0.10% (b) |
68,826,521 |
68,827 |
|
|
Fidelity Securities Lending Cash Central Fund, 0.10% (b)(c) |
66,812,844 |
66,813 |
|
|
TOTAL MONEY MARKET FUNDS (Cost $135,640) |
|
||
|
TOTAL INVESTMENT PORTFOLIO - 102.0% (Cost $2,739,033) |
3,570,702 |
||
|
NET OTHER ASSETS (LIABILITIES) - (2.0)% |
(68,729) |
||
|
NET ASSETS - 100% |
$ 3,501,973 |
||
|
Legend |
|
(a) Non-income producing |
|
(b) Affiliated fund that is generally available only to investment companies and other accounts managed by Fidelity Investments. The rate quoted is the annualized seven-day yield of the fund at period end. A complete unaudited listing of the fund's holdings as of its most recent quarter end is available upon request. In addition, each Fidelity Central Fund's financial statements, which are not covered by the Fund's Report of Independent Registered Public Accounting Firm, are available on the SEC's website or upon request. |
|
(c) Investment made with cash collateral received from securities on loan. |
|
(d) Security or a portion of the security is on loan at period end. |
|
(e) Restricted securities - Investment in securities not registered under the Securities Act of 1933 (excluding 144A issues). At the end of the period, the value of restricted securities (excluding 144A issues) amounted to $5,681,000 or 0.1% of net assets. |
|
Additional information on each restricted holding is as follows: |
|
Security |
Acquisition Date |
Acquisition Cost (000s) |
|
Blu Homes, Inc. Series A, 5.00% |
6/21/13 |
$ 4,044 |
|
NJOY, Inc. |
9/11/13 |
$ 1,637 |
|
Affiliated Central Funds |
|
Information regarding fiscal year to date income earned by the Fund from investments in Fidelity Central Funds is as follows: |
|
Fund |
Income earned |
|
Fidelity Cash Central Fund |
$ 92 |
|
Fidelity Securities Lending Cash Central Fund |
479 |
|
Total |
$ 571 |
|
Other Information |
|
The following is a summary of the inputs used, as of November 30, 2013, involving the Fund's assets and liabilities carried at fair value. The inputs or methodology used for valuing securities may not be an indication of the risk associated with investing in those securities. For more information on valuation inputs, and their aggregation into the levels used in the table below, please refer to the Investment Valuation section in the accompanying Notes to Financial Statements. |
|
Valuation Inputs at Reporting Date: |
||||
|
Description |
Total |
Level 1 |
Level 2 |
Level 3 |
|
Investments in Securities: |
||||
|
Equities: |
||||
|
Consumer Discretionary |
$ 713,173 |
$ 707,492 |
$ - |
$ 5,681 |
|
Consumer Staples |
318,434 |
318,434 |
- |
- |
|
Energy |
152,207 |
152,207 |
- |
- |
|
Financials |
229,261 |
229,261 |
- |
- |
|
Health Care |
593,021 |
574,058 |
18,963 |
- |
|
Industrials |
259,077 |
259,077 |
- |
- |
|
Information Technology |
964,253 |
964,253 |
- |
- |
|
Materials |
149,415 |
149,415 |
- |
- |
|
Telecommunication Services |
24,425 |
24,425 |
- |
- |
|
Utilities |
31,796 |
31,796 |
- |
- |
|
Money Market Funds |
135,640 |
135,640 |
- |
- |
|
Total Investments in Securities: |
$ 3,570,702 |
$ 3,546,058 |
$ 18,963 |
$ 5,681 |
|
Distribution of investments by country or territory of incorporation, as a percentage of total net assets, is as follows (Unaudited): |
|
United States of America |
87.7% |
|
Ireland |
1.7% |
|
Canada |
1.6% |
|
Brazil |
1.4% |
|
Bermuda |
1.3% |
|
Cayman Islands |
1.1% |
|
India |
1.0% |
|
Others (Individually Less Than 1%) |
4.2% |
|
|
100.0% |
See accompanying notes which are an integral part of the financial statements.
Annual Report
Financial Statements
Statement of Assets and Liabilities
|
Amounts in thousands (except per-share amounts) |
November 30, 2013 |
|
|
|
|
|
|
Assets |
|
|
|
Investment in securities, at value (including securities loaned of $65,378) - See accompanying schedule: Unaffiliated issuers (cost $2,603,393) |
$ 3,435,062 |
|
|
Fidelity Central Funds (cost $135,640) |
135,640 |
|
|
Total Investments (cost $2,739,033) |
|
$ 3,570,702 |
|
Receivable for investments sold |
|
18,520 |
|
Receivable for fund shares sold |
|
846 |
|
Dividends receivable |
|
3,248 |
|
Distributions receivable from Fidelity Central Funds |
|
18 |
|
Prepaid expenses |
|
10 |
|
Other receivables |
|
180 |
|
Total assets |
|
3,593,524 |
|
|
|
|
|
Liabilities |
|
|
|
Payable for investments purchased |
$ 15,196 |
|
|
Payable for fund shares redeemed |
6,188 |
|
|
Accrued management fee |
1,621 |
|
|
Distribution and service plan fees payable |
834 |
|
|
Other affiliated payables |
660 |
|
|
Other payables and accrued expenses |
239 |
|
|
Collateral on securities loaned, at value |
66,813 |
|
|
Total liabilities |
|
91,551 |
|
|
|
|
|
Net Assets |
|
$ 3,501,973 |
|
Net Assets consist of: |
|
|
|
Paid in capital |
|
$ 3,186,218 |
|
Accumulated net investment loss |
|
(4,436) |
|
Accumulated undistributed net realized gain (loss) on investments and foreign currency transactions |
|
(511,477) |
|
Net unrealized appreciation (depreciation) on investments and assets and liabilities in foreign currencies |
|
831,668 |
|
Net Assets |
|
$ 3,501,973 |
See accompanying notes which are an integral part of the financial statements.
Annual Report
Statement of Assets and Liabilities - continued
|
Amounts in thousands (except per-share amounts) |
November 30, 2013 |
|
|
|
|
|
|
Calculation of Maximum Offering Price Class A: |
|
$ 80.87 |
|
|
|
|
|
Maximum offering price per share (100/94.25 of $80.87) |
|
$ 85.80 |
|
Class T: |
|
$ 80.31 |
|
|
|
|
|
Maximum offering price per share (100/96.50 of $80.31) |
|
$ 83.22 |
|
Class B: |
|
$ 71.91 |
|
|
|
|
|
Class C: |
|
$ 73.13 |
|
|
|
|
|
Institutional Class: |
|
$ 86.32 |
|
|
|
|
|
Class Z: |
|
$ 86.36 |
A Redemption price per share is equal to net asset value less any applicable contingent deferred sales charge.
See accompanying notes which are an integral part of the financial statements.
Annual Report
Financial Statements - continued
Statement of Operations
|
Amounts in thousands |
Year ended November 30, 2013 |
|
|
|
|
|
|
Investment Income |
|
|
|
Dividends |
|
$ 34,122 |
|
Income from Fidelity Central Funds |
|
571 |
|
Total income |
|
34,693 |
|
|
|
|
|
Expenses |
|
|
|
Management fee |
$ 18,537 |
|
|
Transfer agent fees |
7,096 |
|
|
Distribution and service plan fees |
9,196 |
|
|
Accounting and security lending fees |
989 |
|
|
Custodian fees and expenses |
122 |
|
|
Independent trustees' compensation |
19 |
|
|
Registration fees |
108 |
|
|
Audit |
66 |
|
|
Legal |
17 |
|
|
Miscellaneous |
30 |
|
|
Total expenses before reductions |
36,180 |
|
|
Expense reductions |
(404) |
35,776 |
|
Net investment income (loss) |
|
(1,083) |
|
Realized and Unrealized Gain (Loss) Net realized gain (loss) on: |
|
|
|
Investment securities: |
|
|
|
Unaffiliated issuers |
565,746 |
|
|
Redemption in-kind with affiliated entities |
80,385 |
|
|
Foreign currency transactions |
(152) |
|
|
Total net realized gain (loss) |
|
645,979 |
|
Change in net unrealized appreciation (depreciation) on: Investment securities |
266,588 |
|
|
Assets and liabilities in foreign currencies |
3 |
|
|
Total change in net unrealized appreciation (depreciation) |
|
266,591 |
|
Net gain (loss) |
|
912,570 |
|
Net increase (decrease) in net assets resulting from operations |
|
$ 911,487 |
See accompanying notes which are an integral part of the financial statements.
Annual Report
Statement of Changes in Net Assets
|
Amounts in thousands |
Year ended |
Year ended |
|
Increase (Decrease) in Net Assets |
|
|
|
Operations |
|
|
|
Net investment income (loss) |
$ (1,083) |
$ 1,561 |
|
Net realized gain (loss) |
645,979 |
91,215 |
|
Change in net unrealized appreciation (depreciation) |
266,591 |
277,882 |
|
Net increase (decrease) in net assets resulting |
911,487 |
370,658 |
|
Distributions to shareholders from net investment income |
(3,311) |
- |
|
Distributions to shareholders from net realized gain |
- |
(6,141) |
|
Total distributions |
(3,311) |
(6,141) |
|
Share transactions - net increase (decrease) |
(367,790) |
(218,428) |
|
Total increase (decrease) in net assets |
540,386 |
146,089 |
|
|
|
|
|
Net Assets |
|
|
|
Beginning of period |
2,961,587 |
2,815,498 |
|
End of period (including accumulated net investment loss of $4,436 and accumulated net investment loss of $410, respectively) |
$ 3,501,973 |
$ 2,961,587 |
See accompanying notes which are an integral part of the financial statements.
Annual Report
Financial Highlights - Class A
|
Years ended November 30, |
2013 |
2012 |
2011 |
2010 |
2009 |
|
Selected Per-Share Data |
|
|
|
|
|
|
Net asset value, beginning of period |
$ 61.77 |
$ 54.56 |
$ 50.75 |
$ 42.07 |
$ 34.36 |
|
Income from Investment Operations |
|
|
|
|
|
|
Net investment income (loss) C |
(.05) |
.02 |
(.04) |
(.14) |
(.01) |
|
Net realized and unrealized gain (loss) |
19.15 |
7.30 |
3.90 |
8.82 |
7.79 |
|
Total from investment operations |
19.10 |
7.32 |
3.86 |
8.68 |
7.78 |
|
Distributions from net investment income |
- |
- |
- |
- |
(.06) |
|
Distributions from net realized gain |
- |
(.11) |
(.05) |
- |
(.02) |
|
Total distributions |
- |
(.11) |
(.05) |
- |
(.07) G |
|
Net asset value, end of period |
$ 80.87 |
$ 61.77 |
$ 54.56 |
$ 50.75 |
$ 42.07 |
|
Total Return A, B |
30.92% |
13.45% |
7.61% |
20.63% |
22.71% |
|
Ratios to Average Net Assets D, F |
|
|
|
|
|
|
Expenses before reductions |
1.11% |
1.14% |
1.15% |
1.16% |
1.19% |
|
Expenses net of fee waivers, if any |
1.11% |
1.14% |
1.15% |
1.16% |
1.19% |
|
Expenses net of all reductions |
1.10% |
1.14% |
1.14% |
1.15% |
1.18% |
|
Net investment income (loss) |
(.07)% |
.04% |
(.08)% |
(.31)% |
(.04)% |
|
Supplemental Data |
|
|
|
|
|
|
Net assets, end of period (in millions) |
$ 772 |
$ 632 |
$ 609 |
$ 636 |
$ 640 |
|
Portfolio turnover rate E |
81% |
73% |
70% |
71% |
135% |
A Total returns would have been lower if certain expenses had not been reduced during the applicable periods shown.
B Total returns do not include the effect of the sales charges.
C Calculated based on average shares outstanding during the period.
D Fees and expenses of any underlying Fidelity Central Funds are not included in the Fund's expense ratio. The Fund indirectly bears its proportionate share of the expenses of any underlying Fidelity Central Funds.
E Amount does not include the portfolio activity of any underlying Fidelity Central Funds.
F Expense ratios reflect operating expenses of the class. Expenses before reductions do not reflect amounts reimbursed by the investment adviser or reductions from brokerage service arrangements or reductions from other expense offset arrangements and do not represent the amount paid by the class during periods when reimbursements or reductions occur. Expenses net of fee waivers reflect expenses after reimbursement by the investment adviser but prior to reductions from brokerage service arrangements or other expense offset arrangements. Expenses net of all reductions represent the net expenses paid by the class.
G Total distributions of $.07 per share is comprised of distributions from net investment income of $.059 and distributions from net realized gain of $.015 per share.
See accompanying notes which are an integral part of the financial statements.
Annual Report
Financial Highlights - Class T
|
Years ended November 30, |
2013 |
2012 |
2011 |
2010 |
2009 |
|
Selected Per-Share Data |
|
|
|
|
|
|
Net asset value, beginning of period |
$ 61.45 |
$ 54.26 |
$ 50.51 |
$ 41.94 |
$ 34.25 |
|
Income from Investment Operations |
|
|
|
|
|
|
Net investment income (loss) C |
(.17) |
(.08) |
(.14) |
(.22) |
(.09) |
|
Net realized and unrealized gain (loss) |
19.03 |
7.27 |
3.89 |
8.79 |
7.78 |
|
Total from investment operations |
18.86 |
7.19 |
3.75 |
8.57 |
7.69 |
|
Net asset value, end of period |
$ 80.31 |
$ 61.45 |
$ 54.26 |
$ 50.51 |
$ 41.94 |
|
Total Return A, B |
30.69% |
13.25% |
7.42% |
20.43% |
22.45% |
|
Ratios to Average Net Assets D, F |
|
|
|
|
|
|
Expenses before reductions |
1.29% |
1.31% |
1.32% |
1.34% |
1.39% |
|
Expenses net of fee waivers, if any |
1.29% |
1.31% |
1.32% |
1.34% |
1.39% |
|
Expenses net of all reductions |
1.28% |
1.31% |
1.31% |
1.33% |
1.39% |
|
Net investment income (loss) |
(.25)% |
(.13)% |
(.25)% |
(.48)% |
(.24)% |
|
Supplemental Data |
|
|
|
|
|
|
Net assets, end of period (in millions) |
$ 1,283 |
$ 1,108 |
$ 1,139 |
$ 1,246 |
$ 1,268 |
|
Portfolio turnover rate E |
81% |
73% |
70% |
71% |
135% |
A Total returns would have been lower if certain expenses had not been reduced during the applicable periods shown.
B Total returns do not include the effect of the sales charges.
C Calculated based on average shares outstanding during the period.
D Fees and expenses of any underlying Fidelity Central Funds are not included in the Fund's expense ratio. The Fund indirectly bears its proportionate share of the expenses of any underlying Fidelity Central Funds.
E Amount does not include the portfolio activity of any underlying Fidelity Central Funds.
F Expense ratios reflect operating expenses of the class. Expenses before reductions do not reflect amounts reimbursed by the investment adviser or reductions from brokerage service arrangements or reductions from other expense offset arrangements and do not represent the amount paid by the class during periods when reimbursements or reductions occur. Expenses net of fee waivers reflect expenses after reimbursement by the investment adviser but prior to reductions from brokerage service arrangements or other expense offset arrangements. Expenses net of all reductions represent the net expenses paid by the class.
See accompanying notes which are an integral part of the financial statements.
Annual Report
Financial Highlights - Class B
|
Years ended November 30, |
2013 |
2012 |
2011 |
2010 |
2009 |
|
Selected Per-Share Data |
|
|
|
|
|
|
Net asset value, beginning of period |
$ 55.36 |
$ 49.17 |
$ 46.04 |
$ 38.45 |
$ 31.57 |
|
Income from Investment Operations |
|
|
|
|
|
|
Net investment income (loss) C |
(.52) |
(.39) |
(.42) |
(.44) |
(.26) |
|
Net realized and unrealized gain (loss) |
17.07 |
6.58 |
3.55 |
8.03 |
7.14 |
|
Total from investment operations |
16.55 |
6.19 |
3.13 |
7.59 |
6.88 |
|
Net asset value, end of period |
$ 71.91 |
$ 55.36 |
$ 49.17 |
$ 46.04 |
$ 38.45 |
|
Total Return A, B |
29.90% |
12.59% |
6.80% |
19.74% |
21.79% |
|
Ratios to Average Net Assets D, F |
|
|
|
|
|
|
Expenses before reductions |
1.89% |
1.90% |
1.90% |
1.91% |
1.94% |
|
Expenses net of fee waivers, if any |
1.89% |
1.90% |
1.90% |
1.91% |
1.94% |
|
Expenses net of all reductions |
1.88% |
1.90% |
1.90% |
1.91% |
1.93% |
|
Net investment income (loss) |
(.85)% |
(.72)% |
(.83)% |
(1.06)% |
(.79)% |
|
Supplemental Data |
|
|
|
|
|
|
Net assets, end of period (in millions) |
$ 23 |
$ 26 |
$ 35 |
$ 54 |
$ 70 |
|
Portfolio turnover rate E |
81% |
73% |
70% |
71% |
135% |
A Total returns would have been lower if certain expenses had not been reduced during the applicable periods shown.
B Total returns do not include the effect of the contingent deferred sales charge.
C Calculated based on average shares outstanding during the period.
D Fees and expenses of any underlying Fidelity Central Funds are not included in the Fund's expense ratio. The Fund indirectly bears its proportionate share of the expenses of any underlying Fidelity Central Funds.
E Amount does not include the portfolio activity of any underlying Fidelity Central Funds.
F Expense ratios reflect operating expenses of the class. Expenses before reductions do not reflect amounts reimbursed by the investment adviser or reductions from brokerage service arrangements or reductions from other expense offset arrangements and do not represent the amount paid by the class during periods when reimbursements or reductions occur. Expenses net of fee waivers reflect expenses after reimbursement by the investment adviser but prior to reductions from brokerage service arrangements or other expense offset arrangements. Expenses net of all reductions represent the net expenses paid by the class.
See accompanying notes which are an integral part of the financial statements.
Annual Report
Financial Highlights - Class C
|
Years ended November 30, |
2013 |
2012 |
2011 |
2010 |
2009 |
|
Selected Per-Share Data |
|
|
|
|
|
|
Net asset value, beginning of period |
$ 56.27 |
$ 49.96 |
$ 46.77 |
$ 39.05 |
$ 32.06 |
|
Income from Investment Operations |
|
|
|
|
|
|
Net investment income (loss) C |
(.50) |
(.37) |
(.41) |
(.44) |
(.26) |
|
Net realized and unrealized gain (loss) |
17.36 |
6.68 |
3.60 |
8.16 |
7.25 |
|
Total from investment operations |
16.86 |
6.31 |
3.19 |
7.72 |
6.99 |
|
Net asset value, end of period |
$ 73.13 |
$ 56.27 |
$ 49.96 |
$ 46.77 |
$ 39.05 |
|
Total Return A, B |
29.96% |
12.63% |
6.82% |
19.77% |
21.80% |
|
Ratios to Average Net Assets D, F |
|
|
|
|
|
|
Expenses before reductions |
1.84% |
1.86% |
1.88% |
1.90% |
1.94% |
|
Expenses net of fee waivers, if any |
1.84% |
1.86% |
1.88% |
1.90% |
1.94% |
|
Expenses net of all reductions |
1.83% |
1.86% |
1.87% |
1.90% |
1.93% |
|
Net investment income (loss) |
(.79)% |
(.68)% |
(.81)% |
(1.05)% |
(.79)% |
|
Supplemental Data |
|
|
|
|
|
|
Net assets, end of period (in millions) |
$ 157 |
$ 133 |
$ 136 |
$ 143 |
$ 142 |
|
Portfolio turnover rate E |
81% |
73% |
70% |
71% |
135% |
A Total returns would have been lower if certain expenses had not been reduced during the applicable periods shown.
B Total returns do not include the effect of the contingent deferred sales charge.
C Calculated based on average shares outstanding during the period.
D Fees and expenses of any underlying Fidelity Central Funds are not included in the Fund's expense ratio. The Fund indirectly bears its proportionate share of the expenses of any underlying Fidelity Central Funds.
E Amount does not include the portfolio activity of any underlying Fidelity Central Funds.
F Expense ratios reflect operating expenses of the class. Expenses before reductions do not reflect amounts reimbursed by the investment adviser or reductions from brokerage service arrangements or reductions from other expense offset arrangements and do not represent the amount paid by the class during periods when reimbursements or reductions occur. Expenses net of fee waivers reflect expenses after reimbursement by the investment adviser but prior to reductions from brokerage service arrangements or other expense offset arrangements. Expenses net of all reductions represent the net expenses paid by the class.
See accompanying notes which are an integral part of the financial statements.
Annual Report
Financial Highlights - Institutional Class
|
Years ended November 30, |
2013 |
2012 |
2011 |
2010 |
2009 |
|
Selected Per-Share Data |
|
|
|
|
|
|
Net asset value, beginning of period |
$ 65.92 |
$ 58.24 |
$ 54.14 |
$ 44.71 |
$ 36.61 |
|
Income from Investment Operations |
|
|
|
|
|
|
Net investment income (loss) B |
.20 |
.25 |
.16 |
.02 |
.12 |
|
Net realized and unrealized gain (loss) |
20.40 |
7.75 |
4.16 |
9.41 |
8.27 |
|
Total from investment operations |
20.60 |
8.00 |
4.32 |
9.43 |
8.39 |
|
Distributions from net investment income |
(.20) |
- |
- |
- |
(.27) |
|
Distributions from net realized gain |
- |
(.32) |
(.22) |
- |
(.02) |
|
Total distributions |
(.20) |
(.32) |
(.22) |
- |
(.29) F |
|
Net asset value, end of period |
$ 86.32 |
$ 65.92 |
$ 58.24 |
$ 54.14 |
$ 44.71 |
|
Total Return A |
31.36% |
13.83% |
7.99% |
21.09% |
23.11% |
|
Ratios to Average Net Assets C, E |
|
|
|
|
|
|
Expenses before reductions |
.78% |
.80% |
.80% |
.80% |
.85% |
|
Expenses net of fee waivers, if any |
.78% |
.80% |
.80% |
.80% |
.85% |
|
Expenses net of all reductions |
.77% |
.79% |
.79% |
.80% |
.84% |
|
Net investment income (loss) |
.27% |
.39% |
.27% |
.05% |
.30% |
|
Supplemental Data |
|
|
|
|
|
|
Net assets, end of period (in millions) |
$ 1,266 |
$ 1,063 |
$ 897 |
$ 973 |
$ 983 |
|
Portfolio turnover rate D |
81% |
73% |
70% |
71% |
135% |
A Total returns would have been lower if certain expenses had not been reduced during the applicable periods shown.
B Calculated based on average shares outstanding during the period.
C Fees and expenses of any underlying Fidelity Central Funds are not included in the Fund's expense ratio. The Fund indirectly bears its proportionate share of the expenses of any underlying Fidelity Central Funds.
D Amount does not include the portfolio activity of any underlying Fidelity Central Funds.
E Expense ratios reflect operating expenses of the class. Expenses before reductions do not reflect amounts reimbursed by the investment adviser or reductions from brokerage service arrangements or reductions from other expense offset arrangements and do not represent the amount paid by the class during periods when reimbursements or reductions occur. Expenses net of fee waivers reflect expenses after reimbursement by the investment adviser but prior to reductions from brokerage service arrangements or other expense offset arrangements. Expenses net of all reductions represent the net expenses paid by the class.
F Total distributions of $.29 per share is comprised of distributions from net investment income of $.274 and distributions from net realized gain of $.015 per share.
See accompanying notes which are an integral part of the financial statements.
Annual Report
Financial Highlights - Class Z
|
Year ended November 30, |
2013 G |
|
Selected Per-Share Data |
|
|
Net asset value, beginning of period |
$ 78.49 |
|
Income from Investment Operations |
|
|
Net investment income (loss) D |
.09 |
|
Net realized and unrealized gain (loss) |
7.78 |
|
Total from investment operations |
7.87 |
|
Net asset value, end of period |
$ 86.36 |
|
Total Return B, C |
10.03% |
|
Ratios to Average Net Assets E, H |
|
|
Expenses before reductions |
.64% A |
|
Expenses net of fee waivers, if any |
.64% A |
|
Expenses net of all reductions |
.63% A |
|
Net investment income (loss) |
.38% A |
|
Supplemental Data |
|
|
Net assets, end of period (000 omitted) |
$ 110 |
|
Portfolio turnover rate F |
81% |
A Annualized
B Total returns for periods of less than one year are not annualized.
C Total returns would have been lower if certain expenses had not been reduced during the applicable periods shown.
D Calculated based on average shares outstanding during the period.
E Fees and expenses of any underlying Fidelity Central Funds are not included in the Fund's expense ratio. The Fund indirectly bears its proportionate share of the expenses of any underlying Fidelity Central Funds.
F Amount does not include the portfolio activity of any underlying Fidelity Central Funds.
G For the period August 13, 2013 (commencement of sale of shares) to November 30, 2013.
H Expense ratios reflect operating expenses of the class. Expenses before reductions do not reflect amounts reimbursed by the investment adviser or reductions from brokerage service arrangements or reductions from other expense offset arrangements and do not represent the amount paid by the class during periods when reimbursements or reductions occur. Expense ratios before reductions for start-up periods may not be representative of longer-term operating periods. Expenses net of fee waivers reflect expenses after reimbursement by the investment adviser but prior to reductions from brokerage service arrangements or other expense offset arrangements. Expenses net of all reductions represent the net expenses paid by the class.
See accompanying notes which are an integral part of the financial statements.
Annual Report
Notes to Financial Statements
For the period ended November 30, 2013
(Amounts in thousands except percentages)
1. Organization.
Fidelity Advisor Equity Growth Fund (the Fund) is a fund of Fidelity Advisor Series I (the Trust) and is authorized to issue an unlimited number of shares. The Trust is registered under the Investment Company Act of 1940, as amended (the 1940 Act), as an open-end management investment company organized as a Massachusetts business trust. The Fund commenced sale of Class Z shares on August 13, 2013. The Fund offers Class A, Class T, Class C, Institutional Class and Class Z shares, each of which, along with Class B shares, has equal rights as to assets and voting privileges. Class B shares are closed to new accounts and additional purchases, except for exchanges and reinvestments. Each class has exclusive voting rights with respect to matters that affect that class. Class B shares will automatically convert to Class A shares after a holding period of seven years from the initial date of purchase.
2. Investments in Fidelity Central Funds.
The Fund invests in Fidelity Central Funds, which are open-end investment companies generally available only to other investment companies and accounts managed by the investment adviser and its affiliates. The Fund's Schedule of Investments lists each of the Fidelity Central Funds held as of period end, if any, as an investment of the Fund, but does not include the underlying holdings of each Fidelity Central Fund. As an Investing Fund, the Fund indirectly bears its proportionate share of the expenses of the underlying Fidelity Central Funds.
The Money Market Central Funds seek preservation of capital and current income and are managed by Fidelity Investments Money Management, Inc. (FIMM), an affiliate of the investment adviser. Annualized expenses of the Money Market Central Funds as of their most recent shareholder report date are less than .01%.
A complete unaudited list of holdings for each Fidelity Central Fund is available upon request or at the Securities and Exchange Commission (the SEC) website at www.sec.gov. In addition, the financial statements of the Fidelity Central Funds, which are not covered by the Fund's Report of Independent Registered Public Accounting Firm, are available on the SEC website or upon request.
3. Significant Accounting Policies.
The financial statements have been prepared in conformity with accounting principles generally accepted in the United States of America (GAAP), which require management to make certain estimates and assumptions at the date of the financial statements. Actual results could differ from those estimates. Subsequent events, if any, through the date that the financial statements were issued have been evaluated in the preparation of
Annual Report
Notes to Financial Statements - continued
(Amounts in thousands except percentages)
3. Significant Accounting Policies - continued
the financial statements. The following summarizes the significant accounting policies of the Fund:
Investment Valuation. Investments are valued as of 4:00 p.m. Eastern time on the last calendar day of the period. In accordance with valuation policies and procedures approved by the Board of Trustees (the Board), the Fund attempts to obtain prices from one or more third party pricing vendors or brokers to value its investments. When current market prices, quotations or currency exchange rates are not readily available or reliable, investments will be fair valued in good faith by the Fidelity Management & Research Company (FMR) Fair Value Committee (the Committee), in accordance with procedures adopted by the Board. Factors used in determining fair value vary by investment type and may include market or investment specific events. The frequency with which these procedures are used cannot be predicted and they may be utilized to a significant extent. The Committee oversees the Fund's valuation policies and procedures and is responsible for approving and reporting to the Board all fair value determinations.
The Fund categorizes the inputs to valuation techniques used to value its investments into a disclosure hierarchy consisting of three levels as shown below:
Level 1 - quoted prices in active markets for identical investments
Level 2 - other significant observable inputs (including quoted prices for similar investments, interest rates, prepayment speeds, etc.)
Level 3 - unobservable inputs (including the Fund's own assumptions based on the best information available)
Valuation techniques used to value the Fund's investments by major category are as follows:
Equity securities, including restricted securities, for which market quotations are readily available, are valued at the last reported sale price or official closing price as reported by a third party pricing vendor on the primary market or exchange on which they are traded and are categorized as Level 1 in the hierarchy. In the event there were no sales during the day or closing prices are not available, securities are valued at the last quoted bid price or may be valued using the last available price and are generally categorized as Level 2 in the hierarchy. For foreign equity securities, when market or security specific events arise, comparisons to the valuation of American Depositary Receipts (ADRs), futures contracts, Exchange-Traded Funds (ETFs) and certain indexes as well as quoted prices for similar securities may be used and would be categorized as Level 2 in the hierarchy. Utilizing these techniques may result in transfers between Level 1 and Level 2. For equity securities, including restricted securities, where observable inputs are limited, assumptions about market activity and risk are used and these securities may be categorized as Level 3 in the hierarchy.
Annual Report
3. Significant Accounting Policies - continued
Investment Valuation - continued
Investments in open-end mutual funds, including the Fidelity Central Funds, are valued at their closing net asset value (NAV) each business day and are categorized as Level 1 in the hierarchy.
Changes in valuation techniques may result in transfers in or out of an assigned level within the disclosure hierarchy. The aggregate value of investments by input level, as of November 30, 2013, is included at the end of the Fund's Schedule of Investments.
Foreign Currency. The Fund may use foreign currency contracts to facilitate transactions in foreign-denominated securities. Gains and losses from these transactions may arise from changes in the value of the foreign currency or if the counterparties do not perform under the contracts' terms.
Foreign-denominated assets, including investment securities, and liabilities are translated into U.S. dollars at the exchange rates at period end. Purchases and sales of investment securities, income and dividends received and expenses denominated in foreign currencies are translated into U.S. dollars at the exchange rate in effect on the transaction date.
The effects of exchange rate fluctuations on investments are included with the net realized and unrealized gain (loss) on investment securities. Other foreign currency transactions resulting in realized and unrealized gain (loss) are disclosed separately.
Investment Transactions and Income. For financial reporting purposes, the Fund's investment holdings and NAV include trades executed through the end of the last business day of the period. The NAV per share for processing shareholder transactions is calculated as of the close of business of the New York Stock Exchange (NYSE), normally 4:00 p.m. Eastern time and includes trades executed through the end of the prior business day. Gains and losses on securities sold are determined on the basis of identified cost and may include proceeds received from litigation. Dividend income is recorded on the ex-dividend date, except for certain dividends from foreign securities where the ex-dividend date may have passed, which are recorded as soon as the Fund is informed of the ex-dividend date. Non-cash dividends included in dividend income, if any, are recorded at the fair market value of the securities received. Distributions received on securities that represent a return of capital or capital gain are recorded as a reduction of cost of investments and/or as a realized gain. Subsequent to ex-dividend date the Fund determines the components of these distributions, based upon receipt of tax filings or other correspondence relating to the underlying investment. Interest income and distributions from the Fidelity Central Funds are accrued as earned. Interest income includes coupon interest and amortization of premium and accretion of discount on debt
Annual Report
Notes to Financial Statements - continued
(Amounts in thousands except percentages)
3. Significant Accounting Policies - continued
Investment Transactions and Income - continued
securities. Investment income is recorded net of foreign taxes withheld where recovery of such taxes is uncertain.
Class Allocations and Expenses. Investment income, realized and unrealized capital gains and losses, common expenses of the Fund, and certain fund-level expense reductions, if any, are allocated daily on a pro-rata basis to each class based on the relative net assets of each class to the total net assets of the Fund. Each class differs with respect to transfer agent and distribution and service plan fees incurred. Certain expense reductions may also differ by class. For the reporting period, the allocated portion of income and expenses to each class as a percent of its average net assets may vary due to the timing of recording these transactions in relation to fluctuating net assets of the classes. Expenses directly attributable to a fund are charged to that fund. Expenses attributable to more than one fund are allocated among the respective funds on the basis of relative net assets or other appropriate methods. Expense estimates are accrued in the period to which they relate and adjustments are made when actual amounts are known.
Deferred Trustee Compensation. Under a Deferred Compensation Plan (the Plan), independent Trustees may elect to defer receipt of a portion of their annual compensation. Deferred amounts are invested in a cross-section of Fidelity funds, are marked-to-market and remain in the Fund until distributed in accordance with the Plan. The investment of deferred amounts and the offsetting payable to the Trustees are included in the accompanying Statement of Assets and Liabilities.
Income Tax Information and Distributions to Shareholders. Each year, the Fund intends to qualify as a regulated investment company under Subchapter M of the Internal Revenue Code, including distributing substantially all of its taxable income and realized gains. As a result, no provision for U.S. Federal income taxes is required. As of November 30, 2013, the Fund did not have any unrecognized tax benefits in the financial statements; nor is the Fund aware of any tax positions for which it is reasonably possible that the total amounts of unrecognized tax benefits will significantly change in the next twelve months. The Fund files a U.S. federal tax return, in addition to state and local tax returns as required. The Fund's federal income tax returns are subject to examination by the Internal Revenue Service (IRS) for a period of three fiscal years after they are filed. State and local tax returns may be subject to examination for an additional fiscal year depending on the jurisdiction. Foreign taxes are provided for based on the Fund's understanding of the tax rules and rates that exist in the foreign markets in which it invests.
Annual Report
3. Significant Accounting Policies - continued
Income Tax Information and Distributions to Shareholders - continued
Distributions are declared and recorded on the ex-dividend date. Income dividends and capital gain distributions are declared separately for each class. Income and capital gain distributions are determined in accordance with income tax regulations, which may differ from GAAP.
Capital accounts within the financial statements are adjusted for permanent book-tax differences. These adjustments have no impact on net assets or the results of operations. Temporary book-tax differences will reverse in a subsequent period.
Book-tax differences are primarily due to foreign currency transactions, passive foreign investment companies (PFIC), redemptions in kind, partnerships, deferred trustees compensation, capital loss carryforwards and losses deferred due to wash sales and excise tax regulations.
The federal tax cost of investment securities and unrealized appreciation (depreciation) as of period end were as follows:
|
Gross unrealized appreciation |
$ 848,765 |
|
Gross unrealized depreciation |
(24,574) |
|
Net unrealized appreciation (depreciation) on securities and other investments |
$ 824,191 |
|
|
|
|
Tax Cost |
$ 2,746,511 |
The tax-based components of distributable earnings as of period end were as follows:
|
Capital loss carryforward |
$ (503,999) |
|
Net unrealized appreciation (depreciation) |
$ 824,190 |
Capital loss carryforwards are only available to offset future capital gains of the Fund to the extent provided by regulations and may be limited. Under the Regulated Investment Company Modernization Act of 2010 (the Act), the Fund is permitted to carry forward capital losses incurred in taxable years beginning after December 22, 2010 for an unlimited period and such capital losses are required to be used prior to any losses that expire. The capital loss carryforward information presented below, including any applicable limitation, is estimated as of fiscal period end and is subject to adjustment.
|
Fiscal year of expiration |
|
|
2017 |
$ (503,999) |
Annual Report
Notes to Financial Statements - continued
(Amounts in thousands except percentages)
3. Significant Accounting Policies - continued
Income Tax Information and Distributions to Shareholders - continued
The tax character of distributions paid was as follows:
|
|
November 30, 2013 |
November 30, 2012 |
|
Ordinary Income |
$ 3,311 |
$ 6,141 |
Restricted Securities. The Fund may invest in securities that are subject to legal or contractual restrictions on resale. These securities generally may be resold in transactions exempt from registration or to the public if the securities are registered. Disposal of these securities may involve time-consuming negotiations and expense, and prompt sale at an acceptable price may be difficult. Information regarding restricted securities is included at the end of the Fund's Schedule of Investments.
4. Purchases and Sales of Investments.
Purchases and sales of securities including in-kind transactions, other than short-term securities, aggregated $2,658,323 and $3,034,881, respectively.
5. Fees and Other Transactions with Affiliates.
Management Fee. Fidelity Management & Research Company (the investment adviser) and its affiliates provide the Fund with investment management related services for which the Fund pays a monthly management fee. The management fee is the sum of an individual fund fee rate that is based on an annual rate of .30% of the Fund's average net assets and an annualized group fee rate that averaged .25% during the period. The group fee rate is based upon the average net assets of all the mutual funds advised by the investment adviser, including any mutual funds previously advised by the investment adviser that are currently advised by Fidelity SelectCo, LLC, an affiliate of the investment adviser. The group fee rate decreases as assets under management increase and increases as assets under management decrease. For the reporting period, the total annual management fee rate was .55% of the Fund's average net assets.
Distribution and Service Plan Fees. In accordance with Rule 12b-1 of the 1940 Act, the Fund has adopted separate Distribution and Service Plans for each class of shares. Certain classes pay Fidelity Distributors Corporation (FDC), an affiliate of the investment adviser, separate Distribution and Service Fees, each of which is based on an annual percentage of each class' average net assets. In addition, FDC may pay financial intermediaries for selling shares of the Fund and providing shareholder support services.
Annual Report
5. Fees and Other Transactions with Affiliates - continued
Distribution and Service Plan Fees - continued
For the period, the Distribution and Service Fee rates, total fees and amounts retained by FDC were as follows:
|
|
Distribution |
Service |
Total Fees |
Retained |
|
Class A |
-% |
.25% |
$ 1,721 |
$ 40 |
|
Class T |
.25% |
.25% |
5,834 |
53 |
|
Class B |
.75% |
.25% |
239 |
181 |
|
Class C |
.75% |
.25% |
1,402 |
59 |
|
|
|
|
$ 9,196 |
$ 333 |
Sales Load. FDC may receive a front-end sales charge of up to 5.75% for selling Class A shares and 3.50% for selling Class T shares, some of which is paid to financial intermediaries for selling shares of the Fund. Depending on the holding period, FDC may receive contingent deferred sales charges levied on Class A, Class T, Class B, and Class C redemptions. The deferred sales charges range from 5.00% to 1.00% for Class B shares, 1.00% for Class C shares, 1.00% for certain purchases of Class A shares and .25% for certain purchases of Class T shares.
For the period, sales charge amounts retained by FDC were as follows:
|
|
Retained |
|
Class A |
$ 58 |
|
Class T |
29 |
|
Class B* |
18 |
|
Class C* |
5 |
|
|
$ 110 |
* When Class B and Class C shares are initially sold, FDC pays commissions from its own resources to financial intermediaries through which the sales are made.
Transfer Agent Fees. Fidelity Investments Institutional Operations Company, Inc., (FIIOC), an affiliate of the investment adviser, is the transfer, dividend disbursing and shareholder servicing agent for each class of the Fund. FIIOC receives account fees and asset-based fees that vary according to the account size and type of account of the shareholders of the respective classes of the Fund, except for Class Z. FIIOC receives an asset-based fee of Class Z's average net assets. FIIOC pays for typesetting, printing and mailing of shareholder reports, except proxy statements.
Annual Report
Notes to Financial Statements - continued
(Amounts in thousands except percentages)
5. Fees and Other Transactions with Affiliates - continued
Transfer Agent Fees - continued
For the period, transfer agent fees for each applicable class were as follows:
|
|
Amount |
% of |
|
Class A |
$ 1,867 |
.27 |
|
Class T |
2,329 |
.20 |
|
Class B |
71 |
.30 |
|
Class C |
345 |
.25 |
|
Institutional Class |
2,484 |
.19 |
|
Class Z |
-* |
.05** |
|
|
$ 7,096 |
|
* Amount represents fifteen dollars.
** Annualized
Accounting and Security Lending Fees. Fidelity Service Company, Inc. (FSC), an affiliate of the investment adviser, maintains the Fund's accounting records. The accounting fee is based on the level of average net assets for each month. Under a separate contract, FSC administers the security lending program. The security lending fee is based on the number and duration of lending transactions.
Brokerage Commissions. The Fund placed a portion of its portfolio transactions with brokerage firms which are affiliates of the investment adviser. Brokerage commissions are included in net realized gain (loss) and change in net unrealized appreciation (depreciation) in the Statement of Operations. The commissions paid to these affiliated firms were $41 for the period.
Redemptions In-Kind. During the period, 2,917 shares of the Fund held by affiliated entities were redeemed for investments with a value of $244,110. The net realized gain of $80,385 on investments delivered through in-kind redemptions is included in the accompanying Statement of Operations. The amount of in-kind redemptions is included in share transactions in the accompanying Statement of Changes in Net Assets as well as Note 10: Share Transactions. The Fund recognized no gain or loss for federal income tax purposes.
6. Committed Line of Credit.
The Fund participates with other funds managed by the investment adviser or an affiliate in a $4.25 billion credit facility (the "line of credit") to be utilized for temporary or emergency purposes to fund shareholder redemptions or for other short-term liquidity purposes. The Fund has agreed to pay commitment fees on its pro-rata portion of the line
Annual Report
6. Committed Line of Credit - continued
of credit, which amounted to $7 and is reflected in Miscellaneous expenses on the Statement of Operations. During the period, there were no borrowings on this line of credit.
7. Security Lending.
The Fund lends portfolio securities through a lending agent from time to time in order to earn additional income. For equity securities, a lending agent is used and may loan securities to certain qualified borrowers, including Fidelity Capital Markets (FCM), a broker-dealer affiliated with the Fund. On the settlement date of the loan, the Fund receives collateral (in the form of U.S. Treasury obligations, letters of credit and/or cash) against the loaned securities and maintains collateral in an amount not less than 100% of the market value of the loaned securities during the period of the loan. The market value of the loaned securities is determined at the close of business of the Fund and any additional required collateral is delivered to the Fund on the next business day. If the borrower defaults on its obligation to return the securities loaned because of insolvency or other reasons, the Fund may apply collateral received from the borrower against the obligation. The Fund may experience delays and costs in recovering the securities loaned. Any cash collateral received is invested in the Fidelity Securities Lending Cash Central Fund. The value of loaned securities and cash collateral at period end are disclosed on the Fund's Statement of Assets and Liabilities. At period end, there were no security loans outstanding with FCM. Security lending income represents the income earned on investing cash collateral, less rebates paid to borrowers and any lending agent fees associated with the loan, plus any premium payments received for lending certain types of securities. Security lending income is presented in the Statement of Operations as a component of income from Fidelity Central Funds. Total security lending income during the period amounted to $479, including $15 from securities loaned to FCM.
8. Expense Reductions.
The investment adviser voluntarily agreed to reimburse a portion of the Fund's Class A, Class T, Class B, Class C and Institutional Class operating expenses. During the period, the reimbursement reduced expenses as follows:
The following classes were in reimbursement during the period:
|
|
Reimbursement |
|
Class A |
$ 3 |
|
Class T |
5 |
|
Class B |
-* |
|
Class C |
1 |
|
Institutional Class |
5 |
|
|
$ 14 |
* Amount represents ninety dollars.
Annual Report
Notes to Financial Statements - continued
(Amounts in thousands except percentages)
8. Expense Reductions - continued
Commissions paid to certain brokers with whom the investment adviser, or its affiliates, places trades on behalf of the Fund include an amount in addition to trade execution, which may be rebated back to the Fund to offset certain expenses. This amount totaled $390 for the period. In addition, through arrangements with the Fund's custodian, credits realized as a result of uninvested cash balances were used to reduce the Fund's expenses. During the period, these credits reduced the Fund's custody expenses by two hundred and sixty-nine dollars.
9. Distributions to Shareholders.
Distributions to shareholders of each class were as follows:
|
Years ended November 30, |
2013 |
2012 |
|
From net investment income |
|
|
|
Institutional Class |
$ 3,311 |
$ - |
|
From net realized gain |
|
|
|
Class A |
$ - |
$ 1,215 |
|
Institutional Class |
- |
4,926 |
|
Total |
$ - |
$ 6,141 |
10. Share Transactions.
Transactions for each class of shares were as follows:
|
|
Shares |
Dollars |
||
|
Years ended November 30, |
2013 A |
2012 |
2013 A |
2012 |
|
Class A |
|
|
|
|
|
Shares sold |
1,339 |
1,382 |
$ 93,392 |
$ 82,422 |
|
Reinvestment of distributions |
- |
21 |
- |
1,098 |
|
Shares redeemed |
(2,021) |
(2,338) |
(140,383) |
(138,919) |
|
Net increase (decrease) |
(682) |
(935) |
$ (46,991) |
$ (55,399) |
|
Class T |
|
|
|
|
|
Shares sold |
1,688 |
2,021 |
$ 116,336 |
$ 120,048 |
|
Shares redeemed |
(3,732) |
(4,996) |
(255,751) |
(296,134) |
|
Net increase (decrease) |
(2,044) |
(2,975) |
$ (139,415) |
$ (176,086) |
|
Class B |
|
|
|
|
|
Shares sold |
5 |
5 |
$ 343 |
$ 239 |
|
Shares redeemed |
(159) |
(239) |
(9,702) |
(12,835) |
|
Net increase (decrease) |
(154) |
(234) |
$ (9,359) |
$ (12,596) |
Annual Report
10. Share Transactions - continued
|
|
Shares |
Dollars |
||
|
Years ended November 30, |
2013 A |
2012 |
2013 A |
2012 |
|
Class C |
|
|
|
|
|
Shares sold |
155 |
154 |
$ 9,843 |
$ 8,368 |
|
Shares redeemed |
(367) |
(504) |
(22,580) |
(27,593) |
|
Net increase (decrease) |
(212) |
(350) |
$ (12,737) |
$ (19,225) |
|
Institutional Class |
|
|
|
|
|
Shares sold |
4,554 |
4,266 |
$ 315,218 |
$ 270,700 |
|
Reinvestment of distributions |
50 |
86 |
3,246 |
4,818 |
|
Shares redeemed |
(6,060) B |
(3,622) |
(477,852) B |
(230,640) |
|
Net increase (decrease) |
(1,456) |
730 |
$ (159,388) |
$ 44,878 |
|
Class Z |
|
|
|
|
|
Shares sold |
1 |
- |
$ 100 |
$ - |
|
Net increase (decrease) |
1 |
- |
$ 100 |
$ - |
A Share transactions for Class Z are for the period August 13, 2013 (commencement of sale of shares) to November 30, 2013.
B Amount includes in-kind redemptions (see Note 5: Redemptions In-Kind).
11. Other.
The Fund's organizational documents provide former and current trustees and officers with a limited indemnification against liabilities arising in connection with the performance of their duties to the Fund. In the normal course of business, the Fund may also enter into contracts that provide general indemnifications. The Fund's maximum exposure under these arrangements is unknown as this would be dependent on future claims that may be made against the Fund. The risk of material loss from such claims is considered remote.
At the end of the period, the Fidelity Advisor Freedom Funds were the owners of record, in the aggregate, of approximately 26% of the total outstanding shares of the Fund.
Annual Report
Report of Independent Registered Public Accounting Firm
To the Trustees of Fidelity Advisor Series I and Shareholders of Fidelity Advisor Equity Growth Fund:
We have audited the accompanying statement of assets and liabilities of Fidelity Advisor Equity Growth Fund (the Fund), a fund of Fidelity Advisor Series I, including the schedule of investments, as of November 30, 2013, and the related statement of operations for the year then ended, the statement of changes in net assets for each of the two years in the period then ended, and the financial highlights for each of the five years in the period then ended. These financial statements and financial highlights are the responsibility of the Fund's management. Our responsibility is to express an opinion on these financial statements and financial highlights based on our audits.
We conducted our audits in accordance with the standards of the Public Company Accounting Oversight Board (United States). Those standards require that we plan and perform the audit to obtain reasonable assurance about whether the financial statements and financial highlights are free of material misstatement. The Fund is not required to have, nor were we engaged to perform, an audit of its internal control over financial reporting. Our audits included consideration of internal control over financial reporting as a basis for designing audit procedures that are appropriate in the circumstances, but not for the purpose of expressing an opinion on the effectiveness of the Fund's internal control over financial reporting. Accordingly, we express no such opinion. An audit also includes examining, on a test basis, evidence supporting the amounts and disclosures in the financial statements, assessing the accounting principles used and significant estimates made by management, as well as evaluating the overall financial statement presentation. Our procedures included confirmation of securities owned as of November 30, 2013, by correspondence with the custodians and brokers; where replies were not received from brokers, we performed other auditing procedures. We believe that our audits provide a reasonable basis for our opinion.
In our opinion, the financial statements and financial highlights referred to above present fairly, in all material respects, the financial position of Fidelity Advisor Equity Growth Fund as of November 30, 2013, the results of its operations for the year then ended, the changes in its net assets for each of the two years in the period then ended, and the financial highlights for each of the five years in the period then ended, in conformity with accounting principles generally accepted in the United States of America.
DELOITTE & TOUCHE LLP
Boston, Massachusetts
January 15, 2014
Annual Report
Trustees and Officers
The Trustees, Member of the Advisory Board, and officers of the trust and fund, as applicable, are listed below. The Board of Trustees governs the fund and is responsible for protecting the interests of shareholders. The Trustees are experienced executives who meet periodically throughout the year to oversee the fund's activities, review contractual arrangements with companies that provide services to the fund, oversee management of the risks associated with such activities and contractual arrangements, and review the fund's performance. Except for James C. Curvey, Ned C. Lautenbach, Ronald P. O'Hanley, and William S. Stavropoulos, each of the Trustees oversees 173 funds. Mr. Curvey oversees 396 funds. Mr. Lautenbach, Mr. O'Hanley, and Mr. Stavropoulos each oversees 247 funds.
The Trustees hold office without limit in time except that (a) any Trustee may resign; (b) any Trustee may be removed by written instrument, signed by at least two-thirds of the number of Trustees prior to such removal; (c) any Trustee who requests to be retired or who has become incapacitated by illness or injury may be retired by written instrument signed by a majority of the other Trustees; and (d) any Trustee may be removed at any special meeting of shareholders by a two-thirds vote of the outstanding voting securities of the trust. Each Trustee who is not an interested person (as defined in the 1940 Act) of the trust and the fund (Independent Trustee), shall retire not later than the last day of the calendar year in which his or her 75th birthday occurs. The Independent Trustees may waive this mandatory retirement age policy with respect to individual Trustees. The officers and Advisory Board Member hold office without limit in time, except that any officer and Advisory Board Member may resign or may be removed by a vote of a majority of the Trustees at any regular meeting or any special meeting of the Trustees. Except as indicated, each individual has held the office shown or other offices in the same company for the past five years.
Experience, Skills, Attributes, and Qualifications of the Fund's Trustees. The Governance and Nominating Committee has adopted a statement of policy that describes the experience, qualifications, attributes, and skills that are necessary and desirable for potential Independent Trustee candidates (Statement of Policy). The Board believes that each Trustee satisfied at the time he or she was initially elected or appointed a Trustee, and continues to satisfy, the standards contemplated by the Statement of Policy. The Governance and Nominating Committee also engages professional search firms to help identify potential Independent Trustee candidates who have the experience, qualifications, attributes, and skills consistent with the Statement of Policy. From time to time, additional criteria based on the composition and skills of the current Independent Trustees, as well as experience or skills that may be appropriate in light of future changes to board composition, business conditions, and regulatory or other developments, have also been considered by the professional search firms and the Governance and Nominating Committee. In addition, the Board takes into account the Trustees' commitment and participation in Board and committee meetings, as well as their leadership of standing and ad hoc committees throughout their tenure.
Annual Report
Trustees and Officers - continued
In determining that a particular Trustee was and continues to be qualified to serve as a Trustee, the Board has considered a variety of criteria, none of which, in isolation, was controlling. The Board believes that, collectively, the Trustees have balanced and diverse experience, qualifications, attributes, and skills, which allow the Board to operate effectively in governing the fund and protecting the interests of shareholders. Information about the specific experience, skills, attributes, and qualifications of each Trustee, which in each case led to the Board's conclusion that the Trustee should serve (or continue to serve) as a trustee of the fund, is provided below.
Board Structure and Oversight Function. James C. Curvey is an interested person (as defined in the 1940 Act) and currently serves as Chairman. The Trustees have determined that an interested Chairman is appropriate and benefits shareholders because an interested Chairman has a personal and professional stake in the quality and continuity of services provided to the fund. Independent Trustees exercise their informed business judgment to appoint an individual of their choosing to serve as Chairman, regardless of whether the Trustee happens to be independent or a member of management. The Independent Trustees have determined that they can act independently and effectively without having an Independent Trustee serve as Chairman and that a key structural component for assuring that they are in a position to do so is for the Independent Trustees to constitute a substantial majority for the Board. The Independent Trustees also regularly meet in executive session. Ned C. Lautenbach serves as Chairman of the Independent Trustees and as such (i) acts as a liaison between the Independent Trustees and management with respect to matters important to the Independent Trustees and (ii) with management prepares agendas for Board meetings.
Fidelity funds are overseen by different Boards of Trustees. The fund's Board oversees Fidelity's equity and high income funds and another Board oversees Fidelity's investment-grade bond, money market, and asset allocation funds. The asset allocation funds may invest in Fidelity funds overseen by the fund's Board. The use of separate Boards, each with its own committee structure, allows the Trustees of each group of Fidelity funds to focus on the unique issues of the funds they oversee, including common research, investment, and operational issues. On occasion, the separate Boards establish joint committees to address issues of overlapping consequences for the Fidelity funds overseen by each Board.
The Trustees operate using a system of committees to facilitate the timely and efficient consideration of all matters of importance to the Trustees, the fund, and fund shareholders and to facilitate compliance with legal and regulatory requirements and oversight of the fund's activities and associated risks. The Board, acting through its committees, has charged FMR and its affiliates with (i) identifying events or circumstances the occurrence of which could have demonstrably adverse effects on the fund's business and/or reputation; (ii) implementing processes and controls to lessen the possibility that such events or circumstances occur or to mitigate the effects of such events or circumstances if they do occur; and (iii) creating and maintaining a system designed to evaluate continuously business and market conditions in order to facilitate the identification and implementation processes described in (i) and (ii) above. Because the day-to-day operations and activities of the fund are carried out by or through FMR, its affiliates and other service providers, the fund's exposure to risks is mitigated but not eliminated by the processes overseen by the Trustees. While each of the Board's committees has responsibility for overseeing different aspects of the fund's activities, oversight is exercised primarily through the Operations, Audit, and Compliance Committees. In addition, the Independent Trustees have worked with FMR to enhance the Board's oversight of investment and financial risks, legal and regulatory risks, technology risks, and operational risks, including the development of additional risk reporting to the Board. For example, a working group comprised of Independent Trustees and FMR has worked and continues to work to review the Fidelity funds' valuation-related activities, reporting and risk management. Appropriate personnel, including but not limited to the fund's Chief Compliance Officer (CCO), FMR's internal auditor, the independent accountants, the fund's Treasurer and portfolio management personnel, make periodic reports to the Board's committees, as appropriate, including an annual review of FMR's risk management program for the Fidelity funds. The responsibilities of each standing committee, including their oversight responsibilities, are described further under "Standing Committees of the Fund's Trustees."
Annual Report
The fund's Statement of Additional Information (SAI) includes more information about the Trustees. To request a free copy, call Fidelity at 1-877-208-0098.
Interested Trustees*:
Correspondence intended for each Trustee who is an interested person may be sent to Fidelity Investments, 245 Summer Street, Boston, Massachusetts 02210.
|
Name, Year of Birth; Principal Occupations and Other Relevant Experience+ |
|
|
James C. Curvey (1935) |
|
|
Year of Election or Appointment: 2007 Trustee Chairman of the Board of Trustees |
|
|
|
Mr. Curvey also serves as Trustee of other Fidelity funds. Mr. Curvey is a Director of Fidelity Investments Money Management, Inc. (2009-present), Director of Fidelity Research & Analysis Co. (2009-present) and Director of FMR and FMR Co., Inc. (2007-present). Mr. Curvey is also Vice Chairman (2007-present) and Director of FMR LLC. In addition, Mr. Curvey serves as an Overseer for the Boston Symphony Orchestra and a member of the Trustees of Villanova University. Previously, Mr. Curvey was the Vice Chairman (2006-2007) and Director (2000-2007) of FMR Corp. |
|
Ronald P. O'Hanley (1957) |
|
|
Year of Election or Appointment: 2011 Trustee |
|
|
|
Mr. O'Hanley also serves as Trustee of other Fidelity funds. He is Director of Fidelity SelectCo, LLC (2013-present), FMR Co., Inc. (2010-present), Director of Fidelity Investments Money Management, Inc. (2010-present), Director of Fidelity Research & Analysis Company (2010-present), President of Fidelity Asset Management and Corporate Services and a Member of Fidelity's Executive Committee (2010-present). Previously, Mr. O'Hanley served as President and Chief Executive Officer of BNY Mellon Asset Management (2007-2010). Mr. O'Hanley also served as Vice Chairman of Bank New York Mellon Corp. and a member of that firm's Executive Committee. Prior to the 2007 merger of The Bank of New York and Mellon Financial Corporation, he was Vice Chairman of Mellon Financial Corporation and President and Chief Executive Officer of Mellon Asset Management. He joined Mellon in February 1997. Mr. O'Hanley currently serves as Chairman of the Boston Public Library Foundation Board of Directors and sits on the Board of Directors of Beth Israel Deaconess Medical Center, the Board of Trustees of the Marine Biological Laboratory and the Advisory Board of the Maxwell School of Citizenship and Public Administration at Syracuse University. Mr. O'Hanley also chairs the Council on Asset Management for the Financial Services Roundtable and is a member of the Board of Directors of Institutional Investor's U.S. Institute. |
* Trustees have been determined to be "Interested Trustees" by virtue of, among other things, their affiliation with the trust or various entities under common control with FMR.
+ The information above includes each Trustee's principal occupation during the last five years and other information relating to the experience, attributes, and skills relevant to each Trustee's qualifications to serve as a Trustee, which led to the conclusion that each Trustee should serve as a Trustee for the fund.
Annual Report
Independent Trustees:
Correspondence intended for each Independent Trustee (that is, the Trustees other than the Interested Trustees) may be sent to Fidelity Investments, P.O. Box 55235, Boston, Massachusetts 02205-5235.
|
Name, Year of Birth; Principal Occupations and Other Relevant Experience+ |
|
|
Dennis J. Dirks (1948) |
|
|
Year of Election or Appointment: 2005 Trustee |
|
|
|
Mr. Dirks also serves as Trustee of other Fidelity funds. Prior to his retirement in May 2003, Mr. Dirks was Chief Operating Officer and a member of the Board of The Depository Trust & Clearing Corporation (DTCC). He also served as President, Chief Operating Officer, and Board member of The Depository Trust Company (DTC) and President and Board member of the National Securities Clearing Corporation (NSCC). In addition, Mr. Dirks served as Chief Executive Officer and Board member of the Government Securities Clearing Corporation, Chief Executive Officer and Board member of the Mortgage-Backed Securities Clearing Corporation, as a Trustee and a member of the Finance Committee of Manhattan College (2005-2008), and as a Trustee and a member of the Finance Committee of AHRC of Nassau County (2006-2008). Mr. Dirks is a member of the Independent Directors Council (IDC) Governing Council (2010-present) and Board of Directors for The Brookville Center for Children's Services, Inc. (2009-present). |
|
Alan J. Lacy (1953) |
|
|
Year of Election or Appointment: 2008 Trustee |
|
|
|
Mr. Lacy also serves as Trustee of other Fidelity funds. Mr. Lacy serves as Senior Adviser (2007-present) of Oak Hill Capital Partners, L.P. (private equity). Mr. Lacy also served as Chief Executive Officer (2000-2005) and Vice Chairman (2005-2006) of Sears Holdings Corporation and Sears, Roebuck and Co. (retail). In addition, Mr. Lacy serves as a member of the Board of Directors of Dave & Buster's Entertainment, Inc. (restaurant and entertainment complexes, 2010-present), Earth Fare, Inc. (retail grocery, 2012-present), The Hillman Companies, Inc. (hardware wholesalers, 2010-present), and Bristol-Myers Squibb Company (global pharmaceuticals, 2008-present). Mr. Lacy is a member of the Board of Trustees of The National Parks Conservation Association (2006-present). Previously, Mr. Lacy served as Chairman of the Board of Trustees of the National Parks Conservation Association (2008-2011) and as a member of the Board of Directors for the Western Union Company (global money transfer, 2006-2011). |
|
Ned C. Lautenbach (1944) |
|
|
Year of Election or Appointment: 2000 Trustee Chairman of the Independent Trustees |
|
|
|
Mr. Lautenbach also serves as Trustee of other Fidelity funds. Mr. Lautenbach currently serves as the Lead Director of the Eaton Corporation Board of Directors (diversified industrial, 1997-present). Mr. Lautenbach is Chairman of the Board of Directors of the Philharmonic Center for the Arts in Naples, Florida (2012-present) and a member of the Council on Foreign Relations (1994-present). Previously, Mr. Lautenbach was a Partner/Advisory Partner at Clayton, Dubilier & Rice, LLC (private equity investment, 1998-2010), as well as a Director of Sony Corporation (2006-2007). |
|
Joseph Mauriello (1944) |
|
|
Year of Election or Appointment: 2008 Trustee |
|
|
|
Mr. Mauriello also serves as Trustee of other Fidelity funds. Prior to his retirement in January 2006, Mr. Mauriello served in numerous senior management positions including Deputy Chairman and Chief Operating Officer (2004-2005), and Vice Chairman of Financial Services (2002-2004) of KPMG LLP US (professional services, 1965-2005). Mr. Mauriello currently serves as a member of the Board of Directors of XL Group plc. (global insurance and re-insurance, 2006-present). Previously, Mr. Mauriello served as a Director of the Hamilton Funds of the Bank of New York (2006-2007) and of Arcadia Resources Inc. (health care services and products, 2007-2012). |
|
Robert W. Selander (1950) |
|
|
Year of Election or Appointment: 2011 Trustee |
|
|
|
Mr. Selander also serves as Trustee of other Fidelity funds. Previously, Mr. Selander served as a Member of the Advisory Board of other Fidelity funds (2011), and Executive Vice Chairman (2010), Chief Executive Officer (2009-2010), and President and Chief Executive Officer (1997-2009) of Mastercard, Inc. |
|
Cornelia M. Small (1944) |
|
|
Year of Election or Appointment: 2005 Trustee |
|
|
|
Ms. Small also serves as Trustee of other Fidelity funds. Ms. Small is a member of the Board of Directors (2009-present) and Chair of the Investment Committee (2010-present) of the Teagle Foundation. Ms. Small also serves on the Investment Committee of the Berkshire Taconic Community Foundation (2008-present). Previously, Ms. Small served as Chairperson (2002-2008) and a member of the Investment Committee and Chairperson (2008-2012) and a member of the Board of Trustees of Smith College. In addition, Ms. Small served as Chief Investment Officer, Director of Global Equity Investments, and a member of the Board of Directors of Scudder, Stevens & Clark and Scudder Kemper Investments. |
|
William S. Stavropoulos (1939) |
|
|
Year of Election or Appointment: 2002 Trustee Vice Chairman of the Independent Trustees |
|
|
|
Mr. Stavropoulos also serves as Trustee of other Fidelity funds. Mr. Stavropoulos serves as President and Founder of the Michigan Baseball Foundation, the Great Lakes Loons (2007-present). Mr. Stavropoulos is Chairman Emeritus of the Board of Directors of The Dow Chemical Company, where he previously served in numerous senior management positions, including President, CEO (1995-2000; 2002-2004), Chairman of the Executive Committee (2000-2006), and as a member of the Board of Directors (1990-2006). Currently, Mr. Stavropoulos is Chairman of the Board of Directors of Univar Inc. (global distributor of commodity and specialty chemicals), a Director of Teradata Corporation (data warehousing and technology solutions), and Maersk Inc. (industrial conglomerate), and a member of the Advisory Board for Metalmark Capital LLC (private equity investment, 2005-present). Mr. Stavropoulos is an operating advisor to Clayton, Dubilier & Rice, LLC (private equity investment). In addition, Mr. Stavropoulos is a member of the University of Notre Dame Advisory Council for the College of Science, a Trustee of the Rollin L. Gerstacker Foundation, and a Director of the Naples Philharmonic Center for the Arts. Previously, Mr. Stavropoulos served as a Director of Chemical Financial Corporation (bank holding company, 1993-2012) and Tyco International, Ltd. (multinational manufacturing and services, 2007-2012). |
|
David M. Thomas (1949) |
|
|
Year of Election or Appointment: 2008 Trustee |
|
|
|
Mr. Thomas also serves as Trustee of other Fidelity funds. Mr. Thomas serves as Non-Executive Chairman of the Board of Directors of Fortune Brands Home and Security (home and security products, 2011-present), and as a member of the Board of Directors of Interpublic Group of Companies, Inc. (marketing communication, 2004-present). Previously, Mr. Thomas served as Executive Chairman (2005-2006) and Chairman and Chief Executive Officer (2000-2005) of IMS Health, Inc. (pharmaceutical and healthcare information solutions), and a Director of Fortune Brands, Inc. (consumer products, 2000-2011). |
+ The information above includes each Trustee's principal occupation during the last five years and other information relating to the experience, attributes, and skills relevant to each Trustee's qualifications to serve as a Trustee, which led to the conclusion that each Trustee should serve as a Trustee for the fund.
Advisory Board Member and Officers:
Correspondence intended for each officer and Peter S. Lynch may be sent to Fidelity Investments, 245 Summer Street, Boston, Massachusetts 02210. Officers appear below in alphabetical order.
|
Name, Year of Birth; Principal Occupation |
|
|
Peter S. Lynch (1944) |
|
|
Year of Election or Appointment: 2003 Member of the Advisory Board |
|
|
|
Mr. Lynch also serves as Member of the Advisory Board of other Fidelity funds. Mr. Lynch is Vice Chairman and a Director of FMR and FMR Co., Inc. In addition, Mr. Lynch serves as a Trustee of Boston College and as the Chairman of the Inner-City Scholarship Fund. Previously, Mr. Lynch served on the Special Olympics International Board of Directors (1997-2006). |
|
Elizabeth Paige Baumann (1968) |
|
|
Year of Election or Appointment: 2012 Anti-Money Laundering (AML) Officer |
|
|
|
Ms. Baumann also serves as AML Officer of other funds. She is Chief AML Officer of FMR LLC (2012-present) and is an employee of Fidelity Investments. Previously, Ms. Baumann served as Vice President and Deputy Anti-Money Laundering Officer (2007-2012). |
|
William C. Coffey (1969) |
|
|
Year of Election or Appointment: 2009 Assistant Secretary |
|
|
|
Mr. Coffey also serves as Assistant Secretary of other funds. He is Senior Vice President and Deputy General Counsel of FMR LLC (2010-present), and is an employee of Fidelity Investments. Previously, Mr. Coffey served as Vice President and Associate General Counsel of FMR LLC (2005-2009). |
|
Jonathan Davis (1968) |
|
|
Year of Election or Appointment: 2010 Assistant Treasurer |
|
|
|
Mr. Davis also serves as Assistant Treasurer of other funds. Mr. Davis is an employee of Fidelity Investments. Previously, Mr. Davis served as Vice President and Associate General Counsel of FMR LLC (2003-2010). |
|
Adrien E. Deberghes (1967) |
|
|
Year of Election or Appointment: 2008 Deputy Treasurer |
|
|
|
Mr. Deberghes also serves as an officer of other funds. He is an employee of Fidelity Investments (2008-present). Prior to joining Fidelity Investments, Mr. Deberghes was Senior Vice President of Mutual Fund Administration at State Street Corporation (2007-2008), Senior Director of Mutual Fund Administration at Investors Bank & Trust (2005-2007), and Director of Finance for Dunkin' Brands (2000-2005). |
|
Stephanie J. Dorsey (1969) |
|
|
Year of Election or Appointment: 2010 Assistant Treasurer |
|
|
|
Ms. Dorsey also serves as an officer of other funds. She is an employee of Fidelity Investments (2008-present) and has served in other fund officer roles. Prior to joining Fidelity Investments, Ms. Dorsey served as Treasurer (2004-2008) of the JPMorgan Mutual Funds and Vice President (2004-2008) of JPMorgan Chase Bank. |
|
Scott C. Goebel (1968) |
|
|
Year of Election or Appointment: 2008 Secretary and Chief Legal Officer (CLO) |
|
|
|
Mr. Goebel serves as Secretary and CLO of other funds. Mr. Goebel also serves as Secretary of Fidelity Investments Money Management, Inc. (FIMM) (2010-present) and Fidelity Research and Analysis Company (FRAC) (2010-present); General Counsel, Secretary, and Senior Vice President of FMR (2008-present) and FMR Co., Inc. (2008-present); Chief Legal Officer of Fidelity Management & Research (Hong Kong) Limited (2008-present) and Assistant Secretary of Fidelity Management & Research (Japan) Inc. (2008-present), and Fidelity Management & Research (U.K.) Inc. (2008-present). Previously, Mr. Goebel served as Secretary and CLO of other Fidelity funds (2008-2013), Assistant Secretary of FIMM (2008-2010), FRAC (2008-2010), and certain funds (2007-2008); and as Vice President and Secretary of Fidelity Distributors Corporation (FDC) (2005-2007). Mr. Goebel has been employed by FMR LLC or an affiliate since 2001. |
|
Joseph A. Hanlon (1968) |
|
|
Year of Election or Appointment: 2012 Chief Compliance Officer |
|
|
|
Mr. Hanlon also serves as Chief Compliance Officer of other funds. Mr. Hanlon serves as Compliance Officer of FMR, FMR Co., Inc., Fidelity Investments Money Management, Inc. (FIMM), Fidelity Research and Analysis Company (FRAC), and Fidelity Management & Research (Hong Kong) (2009-present), as Senior Vice President of the Fidelity Asset Management Division (2009-present), and is an employee of Fidelity Investments. Previously, Mr. Hanlon served as Compliance Officer of Fidelity Management & Research (Japan) Inc. (2009-2013), Strategic Advisers, Inc. (2009-2013), and Fidelity Management & Research (U.K.) Inc. (2009-2013). |
|
Bruce T. Herring (1965) |
|
|
Year of Election or Appointment: 2006 Vice President of certain Equity Funds |
|
|
|
Mr. Herring also serves as Vice President of other funds. He serves as Chief Investment Officer of Fidelity Global Asset Allocation (GAA) (2013-present), Group Chief Investment Officer of FMR, and President of Fidelity Research & Analysis Company (2010-present). Previously, Mr. Herring served as Chief Investment Officer and Director of Fidelity Management & Research (U.K.) Inc. (2010-2013), Vice President (2005-2006) and Senior Vice President (2006-2007) of Fidelity Management & Research Company, Vice President of FMR Co., Inc. (2001-2007), and as a portfolio manager for Fidelity U.S. Equity Funds. |
|
Brian B. Hogan (1964) |
|
|
Year of Election or Appointment: 2009 Vice President |
|
|
|
Mr. Hogan also serves as Vice President of other funds. Mr. Hogan serves as President of FMR's Equity Division (2009-present). Previously, Mr. Hogan served as Senior Vice President, Equity Research of FMR (2006-2009) and as a portfolio manager. |
|
Chris Maher (1972) |
|
|
Year of Election or Appointment: 2013 Assistant Treasurer |
|
|
|
Mr. Maher serves as Assistant Treasurer of other funds. Mr. Maher is Vice President of Valuation Oversight and is an employee of Fidelity Investments. Previously, Mr. Maher served as Vice President of Asset Management Compliance (2013), Vice President of FMR's Program Management Group (2010-2013), and Vice President of Valuation Oversight (2008-2010). |
|
Christine Reynolds (1958) |
|
|
Year of Election or Appointment: 2008 Chief Financial Officer |
|
|
|
Ms. Reynolds also serves as Chief Financial Officer of other funds. Ms. Reynolds became President of Fidelity Pricing and Cash Management Services (FPCMS) in August 2008. Ms. Reynolds served as Chief Operating Officer of FPCMS (2007-2008). Previously, Ms. Reynolds served as President, Treasurer, and Anti-Money Laundering officer of the Fidelity funds (2004-2007). |
|
Kenneth B. Robins (1969) |
|
|
Year of Election or Appointment: 2008 President and Treasurer |
|
|
|
Mr. Robins also serves as an officer of other funds. Mr. Robins serves as Executive Vice President of Fidelity Investments Money Management, Inc. (FIMM) (2013-present) and is an employee of Fidelity Investments (2004-present). Previously, Mr. Robins served in other fund officer roles. |
|
Gary W. Ryan (1958) |
|
|
Year of Election or Appointment: 2005 Assistant Treasurer |
|
|
|
Mr. Ryan also serves as Assistant Treasurer of other funds. Mr. Ryan is an employee of Fidelity Investments and has served in other fund officer roles. Previously, Mr. Ryan served as Vice President of Fund Reporting in Fidelity Pricing and Cash Management Services (FPCMS) (1999-2005). |
|
Stephen Sadoski (1971) |
|
|
Year of Election or Appointment: 2012 Deputy Treasurer |
|
|
|
Mr. Sadoski also serves as Deputy Treasurer of other funds. He is an employee of Fidelity Investments (2012-present) and has served in another fund officer role. Prior to joining Fidelity Investments, Mr. Sadoski served as an assistant chief accountant in the Division of Investment Management of the Securities and Exchange Commission (SEC) (2009-2012) and as a senior manager at Deloitte & Touche LLP (1997-2009). |
|
Stacie M. Smith (1974) |
|
|
Year of Election or Appointment: 2013 Deputy Treasurer |
|
|
|
Ms. Smith also serves as an officer of other funds. She is an employee of Fidelity Investments (2009-present) and has served in other fund officer roles. Prior to joining Fidelity Investments, Ms. Smith served as Senior Audit Manager of Ernst & Young LLP (1996-2009). |
|
Renee Stagnone (1975) |
|
|
Year of Election or Appointment: 2013 Deputy Treasurer |
|
|
|
Ms. Stagnone also serves as Deputy Treasurer of other funds. Ms. Stagnone is an employee of Fidelity Investments. |
|
Joseph F. Zambello (1957) |
|
|
Year of Election or Appointment: 2011 Deputy Treasurer |
|
|
|
Mr. Zambello also serves as Deputy Treasurer of other funds. Mr. Zambello is an employee of Fidelity Investments. Previously, Mr. Zambello served as Vice President of FMR's Program Management Group (2009-2011) and Vice President of the Transfer Agent Oversight Group (2005-2009). |
Annual Report
Distributions (Unaudited)
Institutional Class designates 100% of the dividends distributed during the fiscal year as qualifying for the dividends-received deduction for corporate shareholders.
Institutional Class designates 100% of the dividends distributed during the fiscal year as amounts which may be taken into account as a dividend for purposes of the maximum rate under section 1(h) (11) of the Internal Revenue Code.
The fund will notify shareholders in January 2014 of amounts for use in preparing 2013 income tax returns.
Annual Report
Board Approval of Investment Advisory Contracts and Management Fees
Fidelity Advisor Equity Growth Fund
Each year, the Board of Trustees, including the Independent Trustees (together, the Board), votes on the renewal of the management contract and sub-advisory agreements (together, the Advisory Contracts) for the fund. The Board, assisted by the advice of fund counsel and Independent Trustees' counsel, requests and considers a broad range of information relevant to the renewal of the Advisory Contracts throughout the year.
The Board meets regularly and, at each of its meetings, covers an extensive agenda of topics and materials and considers factors that are relevant to its annual consideration of the renewal of the fund's Advisory Contracts, including the services and support provided to the fund and its shareholders. The Board has established various standing committees, each composed of and chaired by Independent Trustees with varying backgrounds, to which the Board has assigned specific subject matter responsibilities in order to enhance effective decision-making by the Board. The Board, acting directly and through its Committees, requests and receives information concerning the annual consideration of the renewal of the fund's Advisory Contracts. The Board also meets as needed to consider matters specifically related to the Board's annual consideration of the renewal of Advisory Contracts. Members of the Board may also meet with trustees of other Fidelity funds through ad hoc joint committees to discuss certain matters relevant to the Fidelity funds.
At its July 2013 meeting, the Board, including the Independent Trustees, unanimously determined to renew the fund's Advisory Contracts. In reaching its determination, the Board considered all factors it believed relevant, including (i) the nature, extent, and quality of the services to be provided to the fund and its shareholders (including the investment performance of the fund); (ii) the competitiveness of the fund's management fee and total expense ratio relative to peer funds; (iii) the total costs of the services to be provided by and the profits to be realized by Fidelity from its relationship with the fund; (iv) the extent to which economies of scale exist and would be realized as the fund grows; and (v) whether fee levels reflect these economies of scale, if any, for the benefit of fund shareholders.
In considering whether to renew the Advisory Contracts for the fund, the Board reached a determination, with the assistance of fund counsel and Independent Trustees' counsel and through the exercise of its business judgment, that the renewal of the Advisory Contracts was in the best interests of the fund and its shareholders and that the compensation payable under the Advisory Contracts was fair and reasonable. The Board's decision to renew the Advisory Contracts was not based on any single factor, but rather was based on a comprehensive consideration of all the information provided to the Board at its meetings throughout the year. The Board, in reaching its determination to renew the Advisory Contracts, was aware that shareholders in the fund have a broad range of investment choices available to them, including a wide choice among mutual funds offered by Fidelity's competitors, and that the fund's shareholders, who have the opportunity to review and weigh the disclosure provided by the fund in its prospectus and other public disclosures, have chosen to invest in this fund, which is a part of the Fidelity family of funds.
Annual Report
Nature, Extent, and Quality of Services Provided. The Board considered the staffing within the investment adviser, Fidelity Management & Research Company (FMR), and the sub-advisers (together, the Investment Advisers) as it relates to the fund, including the backgrounds of the fund's investment personnel, and also considered the fund's investment objective, strategies, and related investment philosophy. The Independent Trustees also had discussions with senior management of Fidelity's investment operations and investment groups. The Board considered the structure of the portfolio manager compensation program and whether this structure provides appropriate incentives to act in the best interests of the fund.
Resources Dedicated to Investment Management and Support Services. The Board and the Fund Oversight and Research Committees reviewed the general qualifications and capabilities of the Investment Advisers' investment staff, including its size, education, experience, and resources, as well as the Investment Advisers' approach to recruiting, training, managing, and compensating investment personnel. The Board noted that FMR has continued to increase the resources devoted to non-U.S. offices, including expansion of Fidelity's global investment organization. The Board also noted that Fidelity's analysts have extensive resources, tools and capabilities that allow them to conduct sophisticated quantitative and fundamental analysis, as well as credit analysis of issuers, counterparties and guarantors. Further, the Board believes that Fidelity's investment professionals have sufficient access to global information and data so as to provide competitive investment results over time, and that those professionals also have access to sophisticated tools that permit them to assess portfolio construction and risk and performance attribution characteristics continuously, as well as to transmit new information and research conclusions rapidly around the world. Additionally, in its deliberations, the Board considered the Investment Advisers' trading and risk management capabilities and resources, which are an integral part of the investment management process.
Shareholder and Administrative Services. The Board considered (i) the nature, extent, quality, and cost of advisory, administrative, and shareholder services performed by the Investment Advisers and their affiliates under the Advisory Contracts and under separate agreements covering transfer agency, pricing and bookkeeping, and securities lending services for the fund; (ii) the nature and extent of the supervision of third party service providers, principally custodians and subcustodians; and (iii) the resources devoted to, and the record of compliance with, the fund's compliance policies and procedures. The Board also reviewed the allocation of fund brokerage, including allocations to brokers affiliated with the Investment Advisers, the use of brokerage commissions to pay fund expenses, and the use of "soft" commission dollars to pay for research services.
Annual Report
Board Approval of Investment Advisory Contracts and
Management Fees - continued
The Board noted that the growth of fund assets over time across the complex allows Fidelity to reinvest in the development of services designed to enhance the value or convenience of the Fidelity funds as investment vehicles. These services include 24-hour access to account information and market information through telephone representatives and over the Internet, investor education materials and asset allocation tools, and the expanded availability of Fidelity Investor Centers.
Investment in a Large Fund Family. The Board considered the benefits to shareholders of investing in a Fidelity fund, including the benefits of investing in a fund that is part of a large family of funds offering a variety of investment disciplines and providing a large variety of mutual fund investor services. The Board noted that Fidelity had taken, or had made recommendations that resulted in the Fidelity funds taking, a number of actions over the previous year that benefited particular funds, including (i) continuing to dedicate additional resources to investment research and to the support of the senior management team that oversees asset management; (ii) persisting in efforts to enhance Fidelity's global research capabilities; (iii) launching new funds and making other enhancements to meet client needs for global and income-oriented solutions; (iv) continuing to launch dedicated lower cost underlying funds to meet portfolio construction needs related to expanding underlying fund options for Fidelity funds of funds, specifically for the Freedom Fund product lines; (v) rationalizing product lines and gaining increased efficiencies through the mergers of several funds into other funds; (vi) strengthening Fidelity's index fund offerings by reducing investment minimums and adopting or lowering existing expense caps for certain funds and classes; (vii) enhancing Global Asset Allocation product offerings by launching new funds and strategies, including "open architecture" target date funds that utilize affiliated and unaffiliated sub-advisers; (viii) modifying the eligibility criteria for Institutional Class shares of Advisor funds to increase their marketability to a portion of the defined contribution plan market; (ix) creating a new low-cost retirement share class for certain Advisor funds to appeal to large retirement plans; (x) transitioning the management of certain Fidelity commodity funds to Geode Capital Management LLC, a registered commodity pool operator, while retaining administrative responsibilities for the funds; (xi) reorganizing a number of funds; and (xii) taking steps toward establishing a new Fidelity adviser to manage sector-based funds and products.
Investment Performance. The Board considered whether the fund has operated in accordance with its investment objective, as well as its record of compliance with its investment restrictions and its performance history.
The Board took into account discussions with the Investment Advisers about fund investment performance that occur at Board meetings throughout the year. In this regard the Board noted that as part of regularly scheduled fund reviews and other reports to the Board on fund performance, the Board periodically considers annualized return information for the fund, for different time periods, measured against a securities market index ("benchmark index") and a peer group of mutual funds with similar objectives ("peer group"). In its evaluation of fund investment performance, the Board gave particular attention to information indicating changes in performance of certain Fidelity funds for specific time periods and the Investment Advisers' explanations for any overperformance or underperformance.
Annual Report
In addition to reviewing absolute and relative fund performance, the Independent Trustees periodically consider the appropriateness of fund performance metrics in evaluating the results achieved. In general, the Independent Trustees believe that fund performance should be evaluated based on net performance (after fees and expenses) of both the highest performing and lowest performing classes, where applicable, compared to appropriate benchmark indices, over appropriate time periods which may include full market cycles, and compared to peer groups, as applicable, over the same periods, taking into account relevant factors including the following: general market conditions; issuer-specific information; tactical opportunities for investment; and fund cash flows and other factors.
The Independent Trustees recognize that shareholders evaluate performance on a net basis over their own holding periods, for which one-, three-, and five-year periods are used as a proxy. For this reason, the performance information reviewed by the Board also included net cumulative calendar year total return information for the fund and an appropriate benchmark index and peer group for the most recent one-, three-, and five-year periods, as shown below. Returns are shown compared to the 25th percentile (top of box) and 75th percentile (bottom of box) of the peer universe.
Annual Report
Board Approval of Investment Advisory Contracts and
Management Fees - continued
Fidelity Advisor Equity Growth Fund

Based on its review, the Board concluded that the nature, extent, and quality of services provided to the fund under the Advisory Contracts should benefit the fund's shareholders.
Competitiveness of Management Fee and Total Expense Ratio. The Board considered the fund's management fee and total expense ratio compared to "mapped groups" of competitive funds and classes. Fidelity creates "mapped groups" by combining similar Lipper investment objective categories that have comparable management fee characteristics. Combining Lipper investment objective categories aids the Board's management fee and total expense ratio comparisons by broadening the competitive group used for comparison and by reducing the number of universes to which various Fidelity funds are compared.
Management Fee. The Board considered two proprietary management fee comparisons for the 12-month periods shown in the chart below. The group of Lipper funds used by the Board for management fee comparisons is referred to below as the "Total Mapped Group." The Total Mapped Group comparison focuses on a fund's standing in terms of gross management fees before expense reimbursements or caps relative to the total universe of funds with comparable investment mandates, regardless of whether their management fee structures also are comparable. Funds with comparable investment mandates offer exposure to similar types of securities. Funds with comparable management fee structures have similar management fee contractual arrangements (e.g., flat rate charged for advisory services, all-inclusive fee rate, etc.). "TMG %" represents the percentage of funds in the Total Mapped Group that had management fees that were lower than the fund's. For example, a TMG % of 11% means that 89% of the funds in the Total Mapped Group had higher management fees than the fund. The "Asset-Size Peer Group" (ASPG) comparison focuses on a fund's standing relative to a subset of non-Fidelity funds within the Total Mapped Group that are similar in size and management fee structure. The ASPG represents at least 15% of the funds in the Total Mapped Group with comparable asset size and management fee structures, subject to a minimum of 50 funds (or all funds in the Total Mapped Group if fewer than 50). Additional information, such as the ASPG quartile in which the fund's management fee ranked, is also included in the chart and considered by the Board.
Annual Report
Fidelity Advisor Equity Growth Fund

The Board noted that the fund's management fee ranked below the median of its Total Mapped Group and below the median of its ASPG for 2012.
Based on its review, the Board concluded that the fund's management fee is fair and reasonable in light of the services that the fund receives and the other factors considered.
Total Expense Ratio. In its review of each class's total expense ratio, the Board considered the fund's management fee as well as other fund or class expenses, as applicable, such as transfer agent fees, pricing and bookkeeping fees, fund-paid 12b-1 fees, and custodial, legal, and audit fees. The Board also noted the effects of any waivers and reimbursements on fees and expenses. As part of its review, the Board also considered the current and historical total expense ratios of each class of the fund compared to competitive fund median expenses. Each class of the fund is compared to those funds and classes in the Total Mapped Group (used by the Board for management fee comparisons) that have a similar sales load structure.
Annual Report
Board Approval of Investment Advisory Contracts and
Management Fees - continued
The Board noted that the total expense ratio of each of Class A, Class B, Class C, and Institutional Class ranked below its competitive median for 2012 and the total expense ratio of Class T ranked above its competitive median for 2012. The Board considered that, in general, various factors can affect total expense ratios. The Board noted that the total expense ratio of Class T was above the competitive median primarily because of higher 12b-1 fees on Class T. Class T has a higher 12b-1 fee, but a lower front-end sales charge, than traditionally priced front-end sales charge classes. The Board considered that Class T is primarily sold load-waived in the retirement plan market where its 0.50% 12b-1 fee is comparable to competing no-load, higher 12b-1 fee classes designed specifically for retirement plans. The Board noted that the fund offers multiple classes, each of which has a different sales load and 12b-1 fee structure, and that the multiple structures are intended to offer a range of pricing options for the intermediary market. The Board also noted that the total expense ratios of the classes vary primarily by the level of their 12b-1 fees, although differences in transfer agent fees may also cause expenses to vary from class to class.
Fees Charged to Other Fidelity Clients. The Board also considered Fidelity fee structures and other information with respect to clients of FMR and its affiliates, such as other mutual funds advised or subadvised by FMR or its affiliates, pension plan clients, and other institutional clients. The Board noted the findings of the 2013 ad hoc joint committee (created with the board of other Fidelity funds), which reviewed and compared Fidelity's institutional investment advisory business with its business of providing services to the Fidelity funds, including the differences in services provided, fees charged, and costs incurred, as well as competition in their respective marketplaces.
Based on its review of total expense ratios and fees charged to other Fidelity clients, the Board concluded that the total expense ratio of each class of the fund was reasonable, although Class T was above the median of the universe presented for comparison, in light of the services that the fund and its shareholders receive and the other factors considered.
Costs of the Services and Profitability. The Board considered the revenues earned and the expenses incurred by Fidelity in conducting the business of developing, marketing, distributing, managing, administering and servicing the fund and servicing the fund's shareholders. The Board also considered the level of Fidelity's profits in respect of all the Fidelity funds.
On an annual basis, FMR presents to the Board Fidelity's profitability for the fund. Fidelity calculates the profitability for each fund, as well as aggregate profitability for groups of Fidelity funds and all Fidelity funds, using a series of detailed revenue and cost allocation methodologies which originate with the books and records of Fidelity on which Fidelity's audited financial statements are based. The Audit Committee of the Board reviews any significant changes from the prior year's methodologies.
Annual Report
PricewaterhouseCoopers LLP (PwC), independent registered public accounting firm and auditor to Fidelity and certain Fidelity funds, has been engaged annually by the Board as part of the Board's assessment of Fidelity's profitability analysis. PwC's engagement includes the review and assessment of the methodologies used by Fidelity in determining the revenues and expenses attributable to Fidelity's mutual fund business, and completion of agreed-upon procedures surrounding the mathematical accuracy of fund profitability and its conformity to allocation methodologies. After considering PwC's reports issued under the engagement and information provided by Fidelity, the Board concluded that while other allocation methods may also be reasonable, Fidelity's profitability methodologies are reasonable in all material respects.
The Board also reviewed Fidelity's non-fund businesses and fall-out benefits related to the mutual fund business as well as cases where Fidelity's affiliates may benefit from or be related to the fund's business.
The Board considered the costs of the services provided by and the profits realized by Fidelity in connection with the operation of the fund and was satisfied that the profitability was not excessive in the circumstances.
Economies of Scale. The Board considered whether there have been economies of scale in respect of the management of the Fidelity funds, whether the Fidelity funds (including the fund) have appropriately benefited from any such economies of scale, and whether there is potential for realization of any further economies of scale. The Board considered the extent to which the fund will benefit from economies of scale through increased services to the fund, through waivers or reimbursements, or through fee or expense reductions. The Board also noted that in 2009, it and the board of other Fidelity funds created an ad hoc committee (the Economies of Scale Committee) to analyze whether FMR attains economies of scale in respect of the management and servicing of the Fidelity funds, whether the Fidelity funds have appropriately benefited from such economies of scale, and whether there is potential for realization of any further economies of scale.
The Board recognized that the fund's management contract incorporates a "group fee" structure, which provides for lower group fee rates as total fund assets under FMR's management increase, and for higher group fee rates as total fund assets under FMR's management decrease. FMR calculates the group fee rates based on a tiered asset "breakpoint" schedule that varies based on asset class. The Board considered that the group fee is designed to deliver the benefits of economies of scale to fund shareholders when total Fidelity fund assets increase, even if assets of any particular fund are unchanged or have declined, because some portion of Fidelity's costs are attributable to services provided to all Fidelity funds, and all funds benefit if those costs can be allocated among more assets. The Board concluded that, given the group fee structure, fund shareholders will benefit from lower management fees as assets under FMR's management increase at the fund complex level, regardless of whether Fidelity achieves any such economies of scale.
Annual Report
Board Approval of Investment Advisory Contracts and
Management Fees - continued
The Board concluded, taking into account the analysis of the Economies of Scale Committee, that economies of scale, if any, are being appropriately shared between fund shareholders and Fidelity.
Amendment to Description of Group Fee Rate. At its July 2013 meeting, the Board voted to approve an amendment to the fund's management contract to modify the description of the "group fee rate" effective August 1, 2013. The Board noted that under the prior description in the contract, the group fee rate was based on the average net assets of all registered investment companies with which FMR has management contracts. Under the contract's tiered asset breakpoint schedule, the group fee rate is lower as total fund assets under FMR's management increase, and higher as total fund assets under FMR's management decrease. The Board considered that the prior description would have excluded the assets of 64 Fidelity sector funds from the group fee rate calculation once Fidelity SelectCo, LLC, an affiliate of FMR, assumed management responsibilities for those funds. The Board noted that modifying the description of the group fee rate to continue to include the assets of those 64 funds for purposes of determining group fee rate breakpoints would avoid an immediate adverse impact on the group fee rate for any fund.
Additional Information Requested by the Board. In order to develop fully the factual basis for consideration of the Fidelity funds' Advisory Contracts, the Board requested and received additional information on certain topics, including: (i) fund performance trends and Fidelity's long-term strategies for certain funds; (ii) the potential to further rationalize the Fidelity fund lineup with the possibility of achieving savings for the funds and Fidelity; (iii) the methodology with respect to competitive fund data and peer group classifications; (iv) the arrangements with, and performance of, certain sub-advisers on behalf of the Fidelity funds, as well as certain proposed participating affiliate arrangements; (v) the realization of fall-out benefits in certain Fidelity business units; (vi) Fidelity's group fee structures, including the rationale for the individual fee rates of certain categories of funds and the definition of group assets; (vii) trends regarding industry use of performance fee structures and the performance adjustment methodologies applicable to the Fidelity funds; (viii) additional competitive analysis regarding the total expenses for certain classes; and (ix) fund profitability methodology, including Fidelity's cost allocation methodology, and the impact of certain factors on fund profitability results.
Annual Report
Based on its evaluation of all of the conclusions noted above, and after considering all factors it believed relevant, the Board ultimately concluded that the advisory fee structures are fair and reasonable, and that the fund's Advisory Contracts should be renewed.
Annual Report
Investment Adviser
Fidelity Management & Research Company
Boston, MA
Investment Sub-Advisers
FMR Co., Inc.
Fidelity Management & Research
(U.K.) Inc.
Fidelity Management & Research
(Hong Kong) Limited
Fidelity Management & Research
(Japan) Inc.
General Distributor
Fidelity Distributors Corporation
Smithfield, RI
Transfer and Service Agents
Fidelity Investments Institutional Operations Company, Inc.
Boston, MA
Fidelity Service Company, Inc.
Boston, MA
Custodian
JPMorgan Chase Bank
New York, NY
(Fidelity Investment logo)(registered trademark)
EPGI-UANN-0114 1.786680.110
(Fidelity Investment logo)(registered trademark)
Fidelity Advisor®
Equity Growth
Fund - Class Z
Annual Report
November 30, 2013
(Fidelity Cover Art)
Contents
|
Performance |
How the fund has done over time. |
|
|
Management's Discussion of Fund Performance |
The Portfolio Manager's review of fund performance and strategy. |
|
|
Shareholder Expense Example |
An example of shareholder expenses. |
|
|
Investment Changes |
A summary of major shifts in the fund's investments over the past six months. |
|
|
Investments |
A complete list of the fund's investments with their market values. |
|
|
Financial Statements |
Statements of assets and liabilities, operations, and changes in net assets, as well as financial highlights. |
|
|
Notes |
Notes to the financial statements. |
|
|
Report of Independent Registered Public Accounting Firm |
|
|
|
Trustees and Officers |
|
|
|
Board Approval of Investment Advisory Contracts and Management Fees |
|
To view a fund's proxy voting guidelines and proxy voting record for the 12-month period ended June 30, visit http://www.fidelity.com/proxyvotingresults or visit the Securities and Exchange Commission's (SEC) web site at http://www.sec.gov. You may also call 1-877-208-0098 to request a free copy of the proxy voting guidelines.
Standard & Poor's, S&P and S&P 500 are registered service marks of The McGraw-Hill Companies, Inc. and have been licensed for use by Fidelity Distributors Corporation.
Other third-party marks appearing herein are the property of their respective owners.
All other marks appearing herein are registered or unregistered trademarks or service marks of FMR LLC or an affiliated company. © 2014 FMR LLC. All rights reserved.
Annual Report
This report and the financial statements contained herein are submitted for the general information of the shareholders of the fund. This report is not authorized for distribution to prospective investors in the fund unless preceded or accompanied by an effective prospectus.
A fund files its complete schedule of portfolio holdings with the SEC for the first and third quarters of each fiscal year on Form N-Q. Forms N-Q are available on the SEC's web site at http://www.sec.gov. A fund's Forms N-Q may be reviewed and copied at the SEC's Public Reference Room in Washington, DC. Information regarding the operation of the SEC's Public Reference Room may be obtained by calling 1-800-SEC-0330. For a complete list of a fund's portfolio holdings, view the most recent holdings listing, semiannual report, or annual report on Fidelity's web site at http://www.fidelity.com, http://www.advisor.fidelity.com, or http://www.401k.com, as applicable.
NOT FDIC INSURED • MAY LOSE VALUE • NO BANK GUARANTEE
Neither the fund nor Fidelity Distributors Corporation is a bank.
Annual Report
Performance: The Bottom Line
Average annual total return reflects the change in the value of an investment, assuming reinvestment of the class' distributions from dividend income and capital gains (the profits earned upon the sale of securities that have grown in value, if any) and assuming a constant rate of performance each year. The $10,000 table and the fund's returns do not reflect the deduction of taxes that a shareholder would pay on fund distributions or the redemption of fund shares. During periods of reimbursement by Fidelity, a fund's total return will be greater than it would be had the reimbursement not occurred. How a fund did yesterday is no guarantee of how it will do tomorrow.
Average Annual Total Returns
|
Periods ended November 30, 2013 |
Past 1 |
Past 5 |
Past 10 |
|
Class Z A |
31.42% |
19.22% |
6.94% |
A The initial offering of Class Z shares took place on August 13, 2013. Returns prior to August 13, 2013, are those of Institutional Class.
$10,000 Over 10 Years
Let's say hypothetically that $10,000 was invested in Fidelity Advisor® Equity Growth Fund - Class Z on November 30, 2003. The chart shows how the value of your investment would have changed, and also shows how the Russell 3000® Growth Index performed over the same period. See footnote A above for additional information regarding the performance of Class Z.
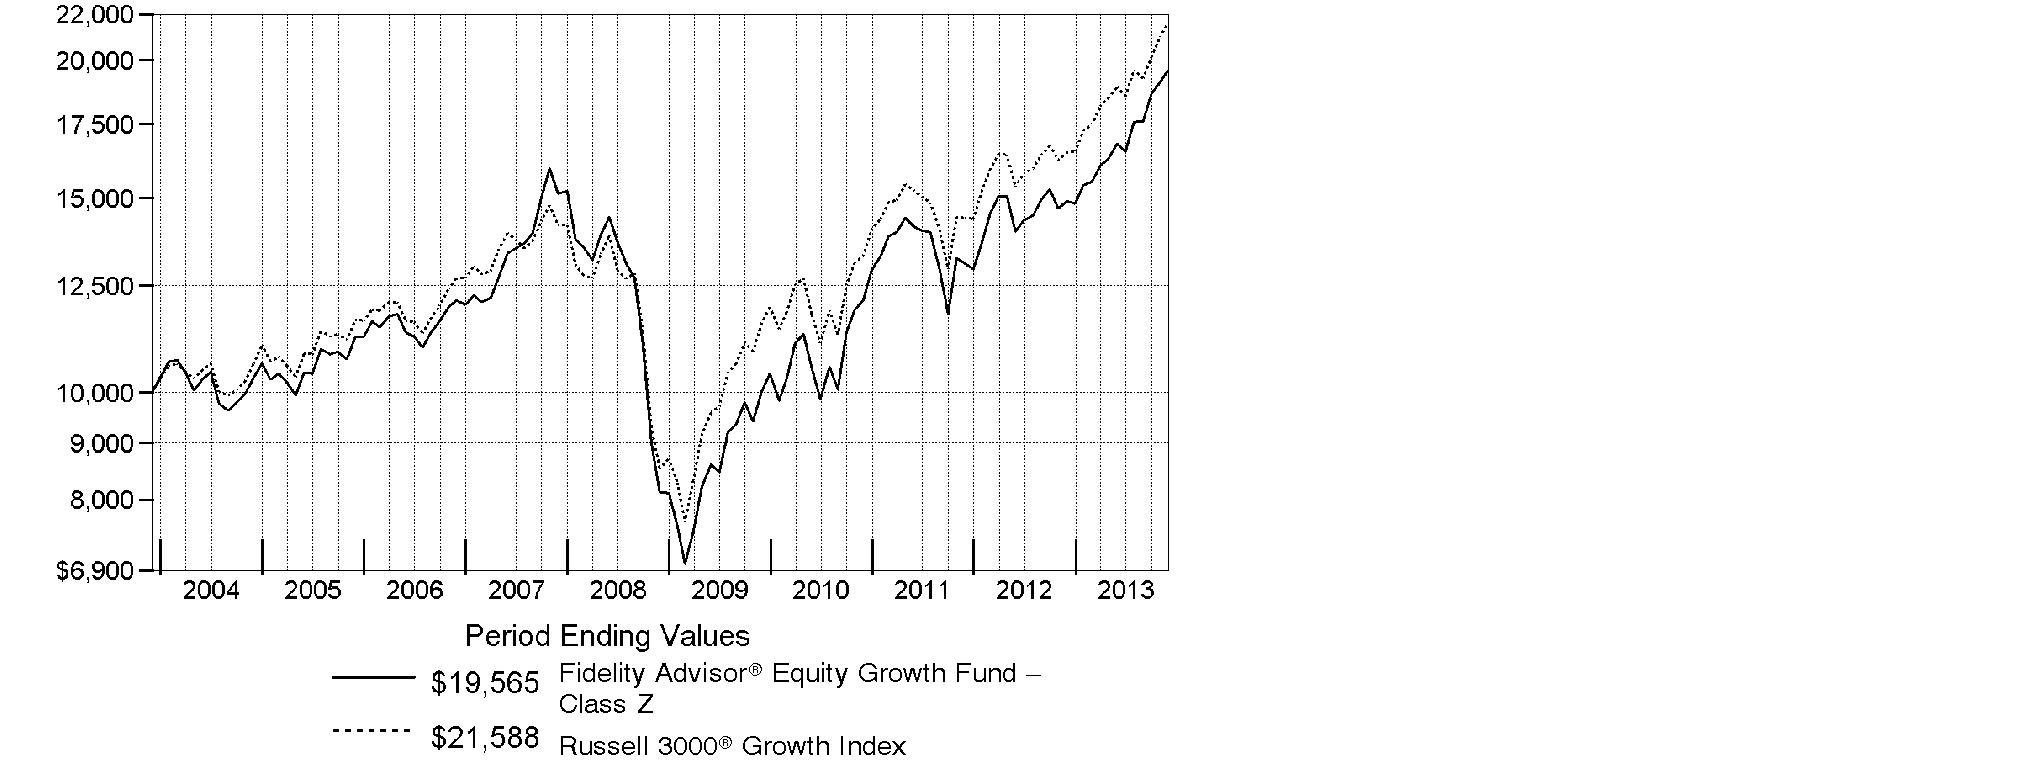
Annual Report
Management's Discussion of Fund Performance
Market Recap: With the current bull run nearing the five-year mark, equity benchmarks ripped up old records during the 12 months ending November 30, 2013. Gains were fueled by strengthening U.S. economic data, as well as generally improving economies and accommodative monetary policies worldwide. The broad S&P 500® Index reached new peaks in its 30.30% climb for the period, and the blue-chip Dow Jones Industrial AverageSM surpassed historic milestones en route to a 26.63% gain. The Nasdaq Composite Index®, up 36.73% amid a resurgence in growth-oriented stocks, closed above 4,000 for the first time since 2000. Shedding anxiety over the 2012 U.S. presidential election - and apparently confident that the federal debt-ceiling debate would be resolved - markets rose from period start through late May. News that the U.S. Federal Reserve was considering an end to its stimulative bond-buying kept stocks in flux over the summer but, by September, the Fed had set aside any imminent tapering. Despite jitters over a potential U.S. military strike in Syria and, later, an October budget impasse that briefly shuttered the federal government, volatility was subdued heading into the holidays, with investor optimism helping many markets home in on all-time highs at period end. Elsewhere, non-U.S. developed-market equities saw similar results, with the MSCI® EAFE® Index adding 24.97%.
Comments from Jason Weiner, Portfolio Manager of Fidelity Advisor® Equity Growth Fund: For the year, the fund's Class Z shares performed roughly in line with the 30.83% gain of the Russell 3000® Growth Index. (For specific results, please refer to the performance section of this report.) Tesla Motors was by far the biggest relative contributor this period. In May, the automaker received rave reviews for its first electric luxury vehicle, the Model S, and shares catapulted higher. Subsequently, the firm ramped up production to meet growing demand, which helped it move into profitability. Another winner was social networking firm Facebook. The stock popped in July after the firm announced better-than-expected earnings and an explosion in mobile use and mobile revenue. Conversely, an overweighting, on average, in Apple was by far the biggest relative detractor. The tech giant struggled amid mounting competition in the smartphone industry - particularly from South Korea-based Samsung Electronics - and its lack of innovation during the period hurt the stock. Broadcom was another miss, as an overweighting here, on average, curbed results. The company produces baseband chips for smartphones and the stock lagged for most of the period, as the firm faced intensifying competition and setbacks in releasing new baseband chips. I sold Tesla and Broadcom prior to period end.
The views expressed above reflect those of the portfolio manager(s) only through the end of the period as stated on the cover of this report and do not necessarily represent the views of Fidelity or any other person in the Fidelity organization. Any such views are subject to change at any time based upon market or other conditions and Fidelity disclaims any responsibility to update such views. These views may not be relied on as investment advice and, because investment decisions for a Fidelity fund are based on numerous factors, may not be relied on as an indication of trading intent on behalf of any Fidelity fund.
Annual Report
Shareholder Expense Example
As a shareholder of the Fund, you incur two types of costs: (1) transaction costs, including sales charges (loads) on purchase payments or redemption proceeds, and (2) ongoing costs, including management fees, distribution and/or service (12b-1) fees and other Fund expenses. This Example is intended to help you understand your ongoing costs (in dollars) of investing in the Fund and to compare these costs with the ongoing costs of investing in other mutual funds.
The actual expense Example is based on an investment of $1,000 invested at the beginning of the period and held for the entire period (June 1, 2013 to November 30, 2013) for Class A, Class T, Class B, Class C and Institutional Class and for the period (August 13, 2013 to November 30, 2013) for Class Z. The hypothetical expense Example is based on an investment of $1,000 invested for the one-half year period (June 1, 2013 to November 30, 2013).
Actual Expenses
The first line of the accompanying table for each class of the Fund provides information about actual account values and actual expenses. You may use the information in this line, together with the amount you invested, to estimate the expenses that you paid over the period. Simply divide your account value by $1,000.00 (for example, an $8,600 account value divided by $1,000.00 = 8.6), then multiply the result by the number in the first line for a class of the Fund under the heading entitled "Expenses Paid During Period" to estimate the expenses you paid on your account during this period. In addition, the Fund, as a shareholder in the underlying Fidelity Central Funds, will indirectly bear its pro-rata share of the fees and expenses incurred by the underlying Fidelity Central Funds. These fees and expenses are not included in the Fund's annualized expense ratio used to calculate the expense estimate in the table below.
Hypothetical Example for Comparison Purposes
The second line of the accompanying table for each class of the Fund provides information about hypothetical account values and hypothetical expenses based on a Class' actual expense ratio and an assumed rate of return of 5% per year before expenses, which is not the Class' actual return. The hypothetical account values and expenses may not be used to estimate the actual ending account balance or expenses you paid for the period. You may use this information to compare the ongoing costs of investing in the Fund and other funds. To do so, compare this 5% hypothetical example with the 5% hypothetical examples that appear in the shareholder reports of the other funds. In addition, the Fund, as a shareholder in the underlying Fidelity Central Funds, will indirectly bear its pro-rata share of the fees and expenses incurred by the underlying Fidelity Central Funds. These fees and expenses are not included in the Fund's annualized expense ratio used to calculate the expense estimate in the table below.
Please note that the expenses shown in the table are meant to highlight your ongoing costs only and do not reflect any transaction costs. Therefore, the second line of the table is useful in comparing ongoing costs only, and will not help you determine the relative total costs of owning different funds. In addition, if these transactional costs were included, your costs would have been higher.
Annual Report
|
|
Annualized |
Beginning |
Ending |
Expenses Paid |
|
Class A |
1.10% |
|
|
|
|
Actual |
|
$ 1,000.00 |
$ 1,162.60 |
$ 5.96 C |
|
HypotheticalA |
|
$ 1,000.00 |
$ 1,019.55 |
$ 5.57 D |
|
Class T |
1.29% |
|
|
|
|
Actual |
|
$ 1,000.00 |
$ 1,161.40 |
$ 6.99 C |
|
HypotheticalA |
|
$ 1,000.00 |
$ 1,018.60 |
$ 6.53 D |
|
Class B |
1.89% |
|
|
|
|
Actual |
|
$ 1,000.00 |
$ 1,158.00 |
$ 10.22 C |
|
HypotheticalA |
|
$ 1,000.00 |
$ 1,015.59 |
$ 9.55 D |
|
Class C |
1.83% |
|
|
|
|
Actual |
|
$ 1,000.00 |
$ 1,158.20 |
$ 9.90 C |
|
HypotheticalA |
|
$ 1,000.00 |
$ 1,015.89 |
$ 9.25 D |
|
Institutional Class |
.78% |
|
|
|
|
Actual |
|
$ 1,000.00 |
$ 1,164.40 |
$ 4.23 C |
|
HypotheticalA |
|
$ 1,000.00 |
$ 1,021.16 |
$ 3.95 D |
|
Class Z |
.64% |
|
|
|
|
Actual |
|
$ 1,000.00 |
$ 1,100.30 |
$ 2.03 C |
|
HypotheticalA |
|
$ 1,000.00 |
$ 1,021.86 |
$ 3.24 D |
A 5% return per year before expenses
B Annualized expense ratio reflects expenses net of applicable fee waivers.
C Actual expenses are equal to each Class' annualized expense ratio; multiplied by the average account value over the period, multiplied by 183/365 (to reflect the one-half year period) for Class A, Class T, Class B, Class C and Institutional Class and multiplied by 110/365 (to reflect the period August 13, 2013 to November 30, 2013) for Class Z.
D Hypothetical expenses are equal to each Class' annualized expense ratio, multiplied by the average account value over the period, multiplied by 183/365 (to reflect the one-half year period).
Annual Report
Investment Changes (Unaudited)
|
Top Ten Stocks as of November 30, 2013 |
||
|
|
% of fund's |
% of fund's net assets |
|
Facebook, Inc. Class A |
5.9 |
2.2 |
|
Google, Inc. Class A |
3.8 |
2.7 |
|
Microsoft Corp. |
3.2 |
0.0 |
|
Harley-Davidson, Inc. |
3.0 |
2.5 |
|
Apple, Inc. |
2.6 |
4.9 |
|
Home Depot, Inc. |
2.5 |
3.2 |
|
QUALCOMM, Inc. |
2.3 |
1.4 |
|
Green Mountain Coffee Roasters, Inc. |
2.3 |
2.4 |
|
Procter & Gamble Co. |
1.9 |
0.0 |
|
Amazon.com, Inc. |
1.8 |
1.0 |
|
|
29.3 |
|
|
Top Five Market Sectors as of November 30, 2013 |
||
|
|
% of fund's |
% of fund's net assets |
|
Information Technology |
27.5 |
27.0 |
|
Consumer Discretionary |
20.4 |
20.8 |
|
Health Care |
16.9 |
17.0 |
|
Consumer Staples |
9.1 |
9.7 |
|
Industrials |
7.4 |
7.7 |
|
Asset Allocation (% of fund's net assets) |
|||||||
|
As of November 30, 2013* |
As of May 31, 2013** |
||||||
 |
Stocks 98.0% |
|
|
Stocks 98.3% |
|
||
 |
Convertible |
|
 |
Convertible |
|
||
 |
Short-Term |
|
|
Short-Term |
|
||
|
* Foreign investments |
12.3% |
|
** Foreign investments |
11.2% |
|
||

Annual Report
Investments November 30, 2013
Showing Percentage of Net Assets
|
Common Stocks - 98.0% |
|||
|
Shares |
Value (000s) |
||
|
CONSUMER DISCRETIONARY - 20.3% |
|||
|
Automobiles - 3.0% |
|||
|
Harley-Davidson, Inc. |
1,542,454 |
$ 103,375 |
|
|
Diversified Consumer Services - 1.4% |
|||
|
Anhanguera Educacional Participacoes SA |
2,140,700 |
14,251 |
|
|
H&R Block, Inc. |
316,752 |
8,834 |
|
|
Kroton Educacional SA |
1,507,000 |
25,340 |
|
|
|
48,425 |
||
|
Hotels, Restaurants & Leisure - 4.6% |
|||
|
Chipotle Mexican Grill, Inc. (a) |
66,068 |
34,610 |
|
|
Dunkin' Brands Group, Inc. |
452,136 |
22,146 |
|
|
Las Vegas Sands Corp. |
99,300 |
7,118 |
|
|
Starbucks Corp. |
767,501 |
62,521 |
|
|
Yum! Brands, Inc. |
424,779 |
32,997 |
|
|
|
159,392 |
||
|
Household Durables - 0.5% |
|||
|
Mohawk Industries, Inc. (a) |
133,816 |
18,737 |
|
|
Internet & Catalog Retail - 2.3% |
|||
|
Amazon.com, Inc. (a) |
164,844 |
64,886 |
|
|
TripAdvisor, Inc. (a) |
182,864 |
16,151 |
|
|
|
81,037 |
||
|
Leisure Equipment & Products - 0.0% |
|||
|
NJOY, Inc. (a)(e) |
202,642 |
1,637 |
|
|
Media - 0.8% |
|||
|
Comcast Corp. Class A (special) (non-vtg.) |
553,238 |
26,638 |
|
|
Multiline Retail - 0.4% |
|||
|
Dollarama, Inc. |
154,245 |
12,470 |
|
|
Specialty Retail - 5.4% |
|||
|
CarMax, Inc. (a) |
361,148 |
18,184 |
|
|
Five Below, Inc. (a) |
127,900 |
6,799 |
|
|
GNC Holdings, Inc. |
434,619 |
26,155 |
|
|
Home Depot, Inc. |
1,091,144 |
88,023 |
|
|
TJX Companies, Inc. |
262,455 |
16,503 |
|
|
Ulta Salon, Cosmetics & Fragrance, Inc. (a) |
81,420 |
10,335 |
|
|
Urban Outfitters, Inc. (a) |
610,143 |
23,808 |
|
|
|
189,807 |
||
|
Textiles, Apparel & Luxury Goods - 1.9% |
|||
|
ECLAT Textile Co. Ltd. |
1,099,560 |
14,003 |
|
|
Common Stocks - continued |
|||
|
Shares |
Value (000s) |
||
|
CONSUMER DISCRETIONARY - continued |
|||
|
Textiles, Apparel & Luxury Goods - continued |
|||
|
Michael Kors Holdings Ltd. (a) |
247,097 |
$ 20,151 |
|
|
NIKE, Inc. Class B |
422,757 |
33,457 |
|
|
|
67,611 |
||
|
TOTAL CONSUMER DISCRETIONARY |
709,129 |
||
|
CONSUMER STAPLES - 9.1% |
|||
|
Beverages - 1.2% |
|||
|
Monster Beverage Corp. (a) |
104,840 |
6,204 |
|
|
SABMiller PLC |
376,434 |
19,421 |
|
|
The Coca-Cola Co. |
426,326 |
17,134 |
|
|
|
42,759 |
||
|
Food & Staples Retailing - 1.1% |
|||
|
Costco Wholesale Corp. |
168,200 |
21,097 |
|
|
Whole Foods Market, Inc. |
327,683 |
18,547 |
|
|
|
39,644 |
||
|
Food Products - 3.6% |
|||
|
Annie's, Inc. (a) |
68,589 |
3,152 |
|
|
Green Mountain Coffee Roasters, Inc. (d) |
1,195,591 |
80,559 |
|
|
Mead Johnson Nutrition Co. Class A |
39,285 |
3,320 |
|
|
The Hershey Co. |
383,359 |
37,144 |
|
|
|
124,175 |
||
|
Household Products - 1.9% |
|||
|
Procter & Gamble Co. |
803,991 |
67,712 |
|
|
Personal Products - 1.3% |
|||
|
Herbalife Ltd. |
547,170 |
38,127 |
|
|
Inter Parfums, Inc. |
165,292 |
6,017 |
|
|
|
44,144 |
||
|
TOTAL CONSUMER STAPLES |
318,434 |
||
|
ENERGY - 4.3% |
|||
|
Energy Equipment & Services - 2.2% |
|||
|
Cameron International Corp. (a) |
229,392 |
12,706 |
|
|
Dril-Quip, Inc. (a) |
160,830 |
17,460 |
|
|
National Oilwell Varco, Inc. |
173,195 |
14,115 |
|
|
Oceaneering International, Inc. |
276,370 |
21,333 |
|
|
RigNet, Inc. (a) |
325,698 |
13,836 |
|
|
|
79,450 |
||
|
Common Stocks - continued |
|||
|
Shares |
Value (000s) |
||
|
ENERGY - continued |
|||
|
Oil, Gas & Consumable Fuels - 2.1% |
|||
|
Bonanza Creek Energy, Inc. (a) |
358,158 |
$ 16,429 |
|
|
Cobalt International Energy, Inc. (a) |
403,909 |
8,979 |
|
|
Continental Resources, Inc. (a) |
93,510 |
10,053 |
|
|
Markwest Energy Partners LP |
189,840 |
13,112 |
|
|
Noble Energy, Inc. |
133,000 |
9,342 |
|
|
Pioneer Natural Resources Co. |
83,502 |
14,842 |
|
|
|
72,757 |
||
|
TOTAL ENERGY |
152,207 |
||
|
FINANCIALS - 6.6% |
|||
|
Capital Markets - 3.7% |
|||
|
BlackRock, Inc. Class A |
73,200 |
22,161 |
|
|
E*TRADE Financial Corp. (a) |
1,049,455 |
18,806 |
|
|
Harvest Capital Credit Corp. (d) |
125,400 |
1,853 |
|
|
Invesco Ltd. |
1,303,271 |
45,419 |
|
|
Legg Mason, Inc. |
134,258 |
5,251 |
|
|
The Blackstone Group LP |
1,079,233 |
30,844 |
|
|
Virtus Investment Partners, Inc. (a) |
24,800 |
5,153 |
|
|
|
129,487 |
||
|
Commercial Banks - 1.0% |
|||
|
First Republic Bank |
133,800 |
6,837 |
|
|
HDFC Bank Ltd. sponsored ADR |
828,796 |
27,499 |
|
|
|
34,336 |
||
|
Consumer Finance - 0.6% |
|||
|
American Express Co. |
219,423 |
18,826 |
|
|
Mahindra & Mahindra Financial Services Ltd. |
495,252 |
2,347 |
|
|
|
21,173 |
||
|
Diversified Financial Services - 0.8% |
|||
|
Berkshire Hathaway, Inc. Class B (a) |
73,900 |
8,612 |
|
|
McGraw-Hill Companies, Inc. |
274,375 |
20,441 |
|
|
|
29,053 |
||
|
Real Estate Management & Development - 0.5% |
|||
|
Leopalace21 Corp. (a) |
248,300 |
1,411 |
|
|
Realogy Holdings Corp. (a) |
291,218 |
13,801 |
|
|
|
15,212 |
||
|
TOTAL FINANCIALS |
229,261 |
||
|
Common Stocks - continued |
|||
|
Shares |
Value (000s) |
||
|
HEALTH CARE - 16.9% |
|||
|
Biotechnology - 8.8% |
|||
|
Actelion Ltd. |
56,084 |
$ 4,672 |
|
|
Alexion Pharmaceuticals, Inc. (a) |
138,581 |
17,253 |
|
|
Amgen, Inc. |
189,429 |
21,610 |
|
|
Biogen Idec, Inc. (a) |
180,916 |
52,641 |
|
|
BioMarin Pharmaceutical, Inc. (a) |
440,879 |
31,029 |
|
|
Cytokinetics, Inc. warrants 6/25/17 (a) |
856,620 |
122 |
|
|
Enanta Pharmaceuticals, Inc. |
126,572 |
3,421 |
|
|
Gentium SpA sponsored ADR (a) |
190,208 |
10,313 |
|
|
Gilead Sciences, Inc. (a) |
653,239 |
48,869 |
|
|
Insmed, Inc. (a) |
954,020 |
15,455 |
|
|
Kamada (a) |
819,830 |
12,215 |
|
|
Ophthotech Corp. |
89,016 |
2,515 |
|
|
Regeneron Pharmaceuticals, Inc. (a) |
59,775 |
17,565 |
|
|
Swedish Orphan Biovitrum AB (a) |
1,227,713 |
12,774 |
|
|
Theravance, Inc. (a)(d) |
1,020,043 |
38,517 |
|
|
United Therapeutics Corp. (a) |
120,285 |
11,104 |
|
|
Vanda Pharmaceuticals, Inc. (a) |
671,242 |
7,880 |
|
|
|
307,955 |
||
|
Health Care Equipment & Supplies - 0.7% |
|||
|
AxoGen, Inc. (a) |
250,900 |
991 |
|
|
GI Dynamics, Inc. CDI (a) |
547,818 |
359 |
|
|
Intuitive Surgical, Inc. (a) |
9,300 |
3,505 |
|
|
The Cooper Companies, Inc. |
147,693 |
19,457 |
|
|
|
24,312 |
||
|
Health Care Providers & Services - 1.2% |
|||
|
Apollo Hospitals Enterprise Ltd. |
392,573 |
5,248 |
|
|
Express Scripts Holding Co. (a) |
461,092 |
31,055 |
|
|
Qualicorp SA (a) |
806,600 |
7,540 |
|
|
|
43,843 |
||
|
Health Care Technology - 0.6% |
|||
|
Cerner Corp. (a) |
363,740 |
20,904 |
|
|
Life Sciences Tools & Services - 0.8% |
|||
|
Illumina, Inc. (a) |
289,795 |
28,400 |
|
|
Pharmaceuticals - 4.8% |
|||
|
AbbVie, Inc. |
832,254 |
40,323 |
|
|
Actavis PLC (a) |
229,800 |
37,473 |
|
|
Cadence Pharmaceuticals, Inc. (a) |
710,600 |
6,410 |
|
|
Novo Nordisk A/S Series B |
105,397 |
18,841 |
|
|
Pacira Pharmaceuticals, Inc. (a) |
265,430 |
14,649 |
|
|
Common Stocks - continued |
|||
|
Shares |
Value (000s) |
||
|
HEALTH CARE - continued |
|||
|
Pharmaceuticals - continued |
|||
|
Perrigo Co. (d) |
126,291 |
$ 19,688 |
|
|
Valeant Pharmaceuticals International, Inc. (Canada) (a) |
275,652 |
30,223 |
|
|
|
167,607 |
||
|
TOTAL HEALTH CARE |
593,021 |
||
|
INDUSTRIALS - 7.4% |
|||
|
Aerospace & Defense - 2.2% |
|||
|
TransDigm Group, Inc. |
170,377 |
26,667 |
|
|
United Technologies Corp. |
470,719 |
52,184 |
|
|
|
78,851 |
||
|
Airlines - 0.2% |
|||
|
Ryanair Holdings PLC sponsored ADR |
113,180 |
5,435 |
|
|
Building Products - 0.3% |
|||
|
A.O. Smith Corp. |
212,338 |
11,498 |
|
|
Commercial Services & Supplies - 0.1% |
|||
|
KAR Auction Services, Inc. |
123,667 |
3,412 |
|
|
Construction & Engineering - 0.1% |
|||
|
Jacobs Engineering Group, Inc. (a) |
42,815 |
2,559 |
|
|
Electrical Equipment - 1.6% |
|||
|
AMETEK, Inc. |
343,355 |
16,900 |
|
|
Generac Holdings, Inc. |
326,516 |
17,390 |
|
|
Power Solutions International, Inc. (a) |
31,413 |
2,350 |
|
|
Roper Industries, Inc. |
136,569 |
17,713 |
|
|
|
54,353 |
||
|
Industrial Conglomerates - 1.3% |
|||
|
Danaher Corp. |
608,577 |
45,522 |
|
|
Machinery - 0.8% |
|||
|
Graco, Inc. |
39,222 |
3,029 |
|
|
Haitian International Holdings Ltd. |
205,000 |
469 |
|
|
Manitowoc Co., Inc. |
1,009,748 |
20,791 |
|
|
Weg SA |
301,500 |
4,094 |
|
|
|
28,383 |
||
|
Common Stocks - continued |
|||
|
Shares |
Value (000s) |
||
|
INDUSTRIALS - continued |
|||
|
Professional Services - 0.8% |
|||
|
Equifax, Inc. |
117,071 |
$ 7,882 |
|
|
Verisk Analytics, Inc. (a) |
325,329 |
21,182 |
|
|
|
29,064 |
||
|
TOTAL INDUSTRIALS |
259,077 |
||
|
INFORMATION TECHNOLOGY - 27.5% |
|||
|
Communications Equipment - 2.3% |
|||
|
QUALCOMM, Inc. |
1,104,051 |
81,236 |
|
|
Computers & Peripherals - 2.6% |
|||
|
Apple, Inc. |
161,801 |
89,973 |
|
|
Electronic Equipment & Components - 0.4% |
|||
|
National Instruments Corp. |
54,900 |
1,716 |
|
|
TE Connectivity Ltd. |
234,700 |
12,373 |
|
|
|
14,089 |
||
|
Internet Software & Services - 12.2% |
|||
|
Cornerstone OnDemand, Inc. (a) |
200,132 |
10,091 |
|
|
CoStar Group, Inc. (a) |
81,560 |
15,190 |
|
|
Facebook, Inc. Class A (a) |
4,372,200 |
205,541 |
|
|
Google, Inc. Class A (a) |
127,053 |
134,624 |
|
|
LinkedIn Corp. (a) |
38,931 |
8,722 |
|
|
MercadoLibre, Inc. (d) |
17,290 |
1,914 |
|
|
SPS Commerce, Inc. (a) |
195,299 |
12,845 |
|
|
Textura Corp. |
219,830 |
7,443 |
|
|
Twitter, Inc. |
26,800 |
1,114 |
|
|
Xoom Corp. |
57,100 |
1,578 |
|
|
Yahoo!, Inc. (a) |
769,153 |
28,443 |
|
|
|
427,505 |
||
|
IT Services - 2.2% |
|||
|
Gartner, Inc. Class A (a) |
118,660 |
7,671 |
|
|
QIWI PLC Class B sponsored ADR |
158,388 |
7,409 |
|
|
Visa, Inc. Class A |
302,908 |
61,630 |
|
|
|
76,710 |
||
|
Software - 7.8% |
|||
|
ANSYS, Inc. (a) |
4,168 |
357 |
|
|
Computer Modelling Group Ltd. |
432,800 |
11,018 |
|
|
Diligent Board Member Services, Inc. (a) |
489,277 |
1,548 |
|
|
Electronic Arts, Inc. (a) |
790,145 |
17,525 |
|
|
FireEye, Inc. |
502,139 |
19,267 |
|
|
Common Stocks - continued |
|||
|
Shares |
Value (000s) |
||
|
INFORMATION TECHNOLOGY - continued |
|||
|
Software - continued |
|||
|
FleetMatics Group PLC (a) |
124,200 |
$ 4,807 |
|
|
Microsoft Corp. |
2,956,500 |
112,731 |
|
|
salesforce.com, Inc. (a) |
1,139,492 |
59,356 |
|
|
ServiceNow, Inc. (a) |
85,100 |
4,520 |
|
|
SolarWinds, Inc. (a) |
107,112 |
3,582 |
|
|
Solera Holdings, Inc. |
61,100 |
4,078 |
|
|
SS&C Technologies Holdings, Inc. (a) |
617,646 |
26,627 |
|
|
Tableau Software, Inc. |
81,200 |
5,322 |
|
|
Workday, Inc. Class A (a) |
48,600 |
4,002 |
|
|
|
274,740 |
||
|
TOTAL INFORMATION TECHNOLOGY |
964,253 |
||
|
MATERIALS - 4.3% |
|||
|
Chemicals - 2.3% |
|||
|
FMC Corp. |
294,553 |
21,461 |
|
|
LyondellBasell Industries NV Class A |
142,845 |
11,025 |
|
|
Monsanto Co. |
218,363 |
24,747 |
|
|
Sherwin-Williams Co. |
125,145 |
22,905 |
|
|
|
80,138 |
||
|
Construction Materials - 2.0% |
|||
|
Eagle Materials, Inc. |
424,058 |
33,077 |
|
|
James Hardie Industries PLC sponsored ADR |
164,473 |
9,439 |
|
|
Vulcan Materials Co. |
474,730 |
26,761 |
|
|
|
69,277 |
||
|
TOTAL MATERIALS |
149,415 |
||
|
TELECOMMUNICATION SERVICES - 0.7% |
|||
|
Diversified Telecommunication Services - 0.3% |
|||
|
8x8, Inc. (a) |
1,073,298 |
11,184 |
|
|
Wireless Telecommunication Services - 0.4% |
|||
|
SBA Communications Corp. Class A (a) |
155,460 |
13,241 |
|
|
TOTAL TELECOMMUNICATION SERVICES |
24,425 |
||
|
Common Stocks - continued |
|||
|
Shares |
Value (000s) |
||
|
UTILITIES - 0.9% |
|||
|
Electric Utilities - 0.9% |
|||
|
ITC Holdings Corp. |
351,412 |
$ 31,796 |
|
|
TOTAL COMMON STOCKS (Cost $2,599,349) |
|
||
|
Convertible Preferred Stocks - 0.1% |
|||
|
|
|
|
|
|
CONSUMER DISCRETIONARY - 0.1% |
|||
|
Household Durables - 0.1% |
|||
|
Blu Homes, Inc. Series A, 5.00% (e) (Cost $4,044) |
875,350 |
|
|
|
Money Market Funds - 3.9% |
|||
|
|
|
|
|
|
Fidelity Cash Central Fund, 0.10% (b) |
68,826,521 |
68,827 |
|
|
Fidelity Securities Lending Cash Central Fund, 0.10% (b)(c) |
66,812,844 |
66,813 |
|
|
TOTAL MONEY MARKET FUNDS (Cost $135,640) |
|
||
|
TOTAL INVESTMENT PORTFOLIO - 102.0% (Cost $2,739,033) |
3,570,702 |
||
|
NET OTHER ASSETS (LIABILITIES) - (2.0)% |
(68,729) |
||
|
NET ASSETS - 100% |
$ 3,501,973 |
||
|
Legend |
|
(a) Non-income producing |
|
(b) Affiliated fund that is generally available only to investment companies and other accounts managed by Fidelity Investments. The rate quoted is the annualized seven-day yield of the fund at period end. A complete unaudited listing of the fund's holdings as of its most recent quarter end is available upon request. In addition, each Fidelity Central Fund's financial statements, which are not covered by the Fund's Report of Independent Registered Public Accounting Firm, are available on the SEC's website or upon request. |
|
(c) Investment made with cash collateral received from securities on loan. |
|
(d) Security or a portion of the security is on loan at period end. |
|
(e) Restricted securities - Investment in securities not registered under the Securities Act of 1933 (excluding 144A issues). At the end of the period, the value of restricted securities (excluding 144A issues) amounted to $5,681,000 or 0.1% of net assets. |
|
Additional information on each restricted holding is as follows: |
|
Security |
Acquisition Date |
Acquisition Cost (000s) |
|
Blu Homes, Inc. Series A, 5.00% |
6/21/13 |
$ 4,044 |
|
NJOY, Inc. |
9/11/13 |
$ 1,637 |
|
Affiliated Central Funds |
|
Information regarding fiscal year to date income earned by the Fund from investments in Fidelity Central Funds is as follows: |
|
Fund |
Income earned |
|
Fidelity Cash Central Fund |
$ 92 |
|
Fidelity Securities Lending Cash Central Fund |
479 |
|
Total |
$ 571 |
|
Other Information |
|
The following is a summary of the inputs used, as of November 30, 2013, involving the Fund's assets and liabilities carried at fair value. The inputs or methodology used for valuing securities may not be an indication of the risk associated with investing in those securities. For more information on valuation inputs, and their aggregation into the levels used in the table below, please refer to the Investment Valuation section in the accompanying Notes to Financial Statements. |
|
Valuation Inputs at Reporting Date: |
||||
|
Description |
Total |
Level 1 |
Level 2 |
Level 3 |
|
Investments in Securities: |
||||
|
Equities: |
||||
|
Consumer Discretionary |
$ 713,173 |
$ 707,492 |
$ - |
$ 5,681 |
|
Consumer Staples |
318,434 |
318,434 |
- |
- |
|
Energy |
152,207 |
152,207 |
- |
- |
|
Financials |
229,261 |
229,261 |
- |
- |
|
Health Care |
593,021 |
574,058 |
18,963 |
- |
|
Industrials |
259,077 |
259,077 |
- |
- |
|
Information Technology |
964,253 |
964,253 |
- |
- |
|
Materials |
149,415 |
149,415 |
- |
- |
|
Telecommunication Services |
24,425 |
24,425 |
- |
- |
|
Utilities |
31,796 |
31,796 |
- |
- |
|
Money Market Funds |
135,640 |
135,640 |
- |
- |
|
Total Investments in Securities: |
$ 3,570,702 |
$ 3,546,058 |
$ 18,963 |
$ 5,681 |
|
Distribution of investments by country or territory of incorporation, as a percentage of total net assets, is as follows (Unaudited): |
|
United States of America |
87.7% |
|
Ireland |
1.7% |
|
Canada |
1.6% |
|
Brazil |
1.4% |
|
Bermuda |
1.3% |
|
Cayman Islands |
1.1% |
|
India |
1.0% |
|
Others (Individually Less Than 1%) |
4.2% |
|
|
100.0% |
See accompanying notes which are an integral part of the financial statements.
Annual Report
Financial Statements
Statement of Assets and Liabilities
|
Amounts in thousands (except per-share amounts) |
November 30, 2013 |
|
|
|
|
|
|
Assets |
|
|
|
Investment in securities, at value (including securities loaned of $65,378) - See accompanying schedule: Unaffiliated issuers (cost $2,603,393) |
$ 3,435,062 |
|
|
Fidelity Central Funds (cost $135,640) |
135,640 |
|
|
Total Investments (cost $2,739,033) |
|
$ 3,570,702 |
|
Receivable for investments sold |
|
18,520 |
|
Receivable for fund shares sold |
|
846 |
|
Dividends receivable |
|
3,248 |
|
Distributions receivable from Fidelity Central Funds |
|
18 |
|
Prepaid expenses |
|
10 |
|
Other receivables |
|
180 |
|
Total assets |
|
3,593,524 |
|
|
|
|
|
Liabilities |
|
|
|
Payable for investments purchased |
$ 15,196 |
|
|
Payable for fund shares redeemed |
6,188 |
|
|
Accrued management fee |
1,621 |
|
|
Distribution and service plan fees payable |
834 |
|
|
Other affiliated payables |
660 |
|
|
Other payables and accrued expenses |
239 |
|
|
Collateral on securities loaned, at value |
66,813 |
|
|
Total liabilities |
|
91,551 |
|
|
|
|
|
Net Assets |
|
$ 3,501,973 |
|
Net Assets consist of: |
|
|
|
Paid in capital |
|
$ 3,186,218 |
|
Accumulated net investment loss |
|
(4,436) |
|
Accumulated undistributed net realized gain (loss) on investments and foreign currency transactions |
|
(511,477) |
|
Net unrealized appreciation (depreciation) on investments and assets and liabilities in foreign currencies |
|
831,668 |
|
Net Assets |
|
$ 3,501,973 |
See accompanying notes which are an integral part of the financial statements.
Annual Report
Financial Statements - continued
Statement of Assets and Liabilities - continued
|
Amounts in thousands (except per-share amounts) |
November 30, 2013 |
|
|
|
|
|
|
Calculation of Maximum Offering Price Class A: |
|
$ 80.87 |
|
|
|
|
|
Maximum offering price per share (100/94.25 of $80.87) |
|
$ 85.80 |
|
Class T: |
|
$ 80.31 |
|
|
|
|
|
Maximum offering price per share (100/96.50 of $80.31) |
|
$ 83.22 |
|
Class B: |
|
$ 71.91 |
|
|
|
|
|
Class C: |
|
$ 73.13 |
|
|
|
|
|
Institutional Class: |
|
$ 86.32 |
|
|
|
|
|
Class Z: |
|
$ 86.36 |
A Redemption price per share is equal to net asset value less any applicable contingent deferred sales charge.
See accompanying notes which are an integral part of the financial statements.
Annual Report
Statement of Operations
|
Amounts in thousands |
Year ended November 30, 2013 |
|
|
|
|
|
|
Investment Income |
|
|
|
Dividends |
|
$ 34,122 |
|
Income from Fidelity Central Funds |
|
571 |
|
Total income |
|
34,693 |
|
|
|
|
|
Expenses |
|
|
|
Management fee |
$ 18,537 |
|
|
Transfer agent fees |
7,096 |
|
|
Distribution and service plan fees |
9,196 |
|
|
Accounting and security lending fees |
989 |
|
|
Custodian fees and expenses |
122 |
|
|
Independent trustees' compensation |
19 |
|
|
Registration fees |
108 |
|
|
Audit |
66 |
|
|
Legal |
17 |
|
|
Miscellaneous |
30 |
|
|
Total expenses before reductions |
36,180 |
|
|
Expense reductions |
(404) |
35,776 |
|
Net investment income (loss) |
|
(1,083) |
|
Realized and Unrealized Gain (Loss) Net realized gain (loss) on: |
|
|
|
Investment securities: |
|
|
|
Unaffiliated issuers |
565,746 |
|
|
Redemption in-kind with affiliated entities |
80,385 |
|
|
Foreign currency transactions |
(152) |
|
|
Total net realized gain (loss) |
|
645,979 |
|
Change in net unrealized appreciation (depreciation) on: Investment securities |
266,588 |
|
|
Assets and liabilities in foreign currencies |
3 |
|
|
Total change in net unrealized appreciation (depreciation) |
|
266,591 |
|
Net gain (loss) |
|
912,570 |
|
Net increase (decrease) in net assets resulting from operations |
|
$ 911,487 |
See accompanying notes which are an integral part of the financial statements.
Annual Report
Financial Statements - continued
Statement of Changes in Net Assets
|
Amounts in thousands |
Year ended |
Year ended |
|
Increase (Decrease) in Net Assets |
|
|
|
Operations |
|
|
|
Net investment income (loss) |
$ (1,083) |
$ 1,561 |
|
Net realized gain (loss) |
645,979 |
91,215 |
|
Change in net unrealized appreciation (depreciation) |
266,591 |
277,882 |
|
Net increase (decrease) in net assets resulting |
911,487 |
370,658 |
|
Distributions to shareholders from net investment income |
(3,311) |
- |
|
Distributions to shareholders from net realized gain |
- |
(6,141) |
|
Total distributions |
(3,311) |
(6,141) |
|
Share transactions - net increase (decrease) |
(367,790) |
(218,428) |
|
Total increase (decrease) in net assets |
540,386 |
146,089 |
|
|
|
|
|
Net Assets |
|
|
|
Beginning of period |
2,961,587 |
2,815,498 |
|
End of period (including accumulated net investment loss of $4,436 and accumulated net investment loss of $410, respectively) |
$ 3,501,973 |
$ 2,961,587 |
See accompanying notes which are an integral part of the financial statements.
Annual Report
Financial Highlights - Class A
|
Years ended November 30, |
2013 |
2012 |
2011 |
2010 |
2009 |
|
Selected Per-Share Data |
|
|
|
|
|
|
Net asset value, beginning of period |
$ 61.77 |
$ 54.56 |
$ 50.75 |
$ 42.07 |
$ 34.36 |
|
Income from Investment Operations |
|
|
|
|
|
|
Net investment income (loss) C |
(.05) |
.02 |
(.04) |
(.14) |
(.01) |
|
Net realized and unrealized gain (loss) |
19.15 |
7.30 |
3.90 |
8.82 |
7.79 |
|
Total from investment operations |
19.10 |
7.32 |
3.86 |
8.68 |
7.78 |
|
Distributions from net investment income |
- |
- |
- |
- |
(.06) |
|
Distributions from net realized gain |
- |
(.11) |
(.05) |
- |
(.02) |
|
Total distributions |
- |
(.11) |
(.05) |
- |
(.07) G |
|
Net asset value, end of period |
$ 80.87 |
$ 61.77 |
$ 54.56 |
$ 50.75 |
$ 42.07 |
|
Total Return A, B |
30.92% |
13.45% |
7.61% |
20.63% |
22.71% |
|
Ratios to Average Net Assets D, F |
|
|
|
|
|
|
Expenses before reductions |
1.11% |
1.14% |
1.15% |
1.16% |
1.19% |
|
Expenses net of fee waivers, if any |
1.11% |
1.14% |
1.15% |
1.16% |
1.19% |
|
Expenses net of all reductions |
1.10% |
1.14% |
1.14% |
1.15% |
1.18% |
|
Net investment income (loss) |
(.07)% |
.04% |
(.08)% |
(.31)% |
(.04)% |
|
Supplemental Data |
|
|
|
|
|
|
Net assets, end of period (in millions) |
$ 772 |
$ 632 |
$ 609 |
$ 636 |
$ 640 |
|
Portfolio turnover rate E |
81% |
73% |
70% |
71% |
135% |
A Total returns would have been lower if certain expenses had not been reduced during the applicable periods shown.
B Total returns do not include the effect of the sales charges.
C Calculated based on average shares outstanding during the period.
D Fees and expenses of any underlying Fidelity Central Funds are not included in the Fund's expense ratio. The Fund indirectly bears its proportionate share of the expenses of any underlying Fidelity Central Funds.
E Amount does not include the portfolio activity of any underlying Fidelity Central Funds.
F Expense ratios reflect operating expenses of the class. Expenses before reductions do not reflect amounts reimbursed by the investment adviser or reductions from brokerage service arrangements or reductions from other expense offset arrangements and do not represent the amount paid by the class during periods when reimbursements or reductions occur. Expenses net of fee waivers reflect expenses after reimbursement by the investment adviser but prior to reductions from brokerage service arrangements or other expense offset arrangements. Expenses net of all reductions represent the net expenses paid by the class.
G Total distributions of $.07 per share is comprised of distributions from net investment income of $.059 and distributions from net realized gain of $.015 per share.
See accompanying notes which are an integral part of the financial statements.
Annual Report
Financial Highlights - Class T
|
Years ended November 30, |
2013 |
2012 |
2011 |
2010 |
2009 |
|
Selected Per-Share Data |
|
|
|
|
|
|
Net asset value, beginning of period |
$ 61.45 |
$ 54.26 |
$ 50.51 |
$ 41.94 |
$ 34.25 |
|
Income from Investment Operations |
|
|
|
|
|
|
Net investment income (loss) C |
(.17) |
(.08) |
(.14) |
(.22) |
(.09) |
|
Net realized and unrealized gain (loss) |
19.03 |
7.27 |
3.89 |
8.79 |
7.78 |
|
Total from investment operations |
18.86 |
7.19 |
3.75 |
8.57 |
7.69 |
|
Net asset value, end of period |
$ 80.31 |
$ 61.45 |
$ 54.26 |
$ 50.51 |
$ 41.94 |
|
Total Return A, B |
30.69% |
13.25% |
7.42% |
20.43% |
22.45% |
|
Ratios to Average Net Assets D, F |
|
|
|
|
|
|
Expenses before reductions |
1.29% |
1.31% |
1.32% |
1.34% |
1.39% |
|
Expenses net of fee waivers, if any |
1.29% |
1.31% |
1.32% |
1.34% |
1.39% |
|
Expenses net of all reductions |
1.28% |
1.31% |
1.31% |
1.33% |
1.39% |
|
Net investment income (loss) |
(.25)% |
(.13)% |
(.25)% |
(.48)% |
(.24)% |
|
Supplemental Data |
|
|
|
|
|
|
Net assets, end of period (in millions) |
$ 1,283 |
$ 1,108 |
$ 1,139 |
$ 1,246 |
$ 1,268 |
|
Portfolio turnover rate E |
81% |
73% |
70% |
71% |
135% |
A Total returns would have been lower if certain expenses had not been reduced during the applicable periods shown.
B Total returns do not include the effect of the sales charges.
C Calculated based on average shares outstanding during the period.
D Fees and expenses of any underlying Fidelity Central Funds are not included in the Fund's expense ratio. The Fund indirectly bears its proportionate share of the expenses of any underlying Fidelity Central Funds.
E Amount does not include the portfolio activity of any underlying Fidelity Central Funds.
F Expense ratios reflect operating expenses of the class. Expenses before reductions do not reflect amounts reimbursed by the investment adviser or reductions from brokerage service arrangements or reductions from other expense offset arrangements and do not represent the amount paid by the class during periods when reimbursements or reductions occur. Expenses net of fee waivers reflect expenses after reimbursement by the investment adviser but prior to reductions from brokerage service arrangements or other expense offset arrangements. Expenses net of all reductions represent the net expenses paid by the class.
See accompanying notes which are an integral part of the financial statements.
Annual Report
Financial Highlights - Class B
|
Years ended November 30, |
2013 |
2012 |
2011 |
2010 |
2009 |
|
Selected Per-Share Data |
|
|
|
|
|
|
Net asset value, beginning of period |
$ 55.36 |
$ 49.17 |
$ 46.04 |
$ 38.45 |
$ 31.57 |
|
Income from Investment Operations |
|
|
|
|
|
|
Net investment income (loss) C |
(.52) |
(.39) |
(.42) |
(.44) |
(.26) |
|
Net realized and unrealized gain (loss) |
17.07 |
6.58 |
3.55 |
8.03 |
7.14 |
|
Total from investment operations |
16.55 |
6.19 |
3.13 |
7.59 |
6.88 |
|
Net asset value, end of period |
$ 71.91 |
$ 55.36 |
$ 49.17 |
$ 46.04 |
$ 38.45 |
|
Total Return A, B |
29.90% |
12.59% |
6.80% |
19.74% |
21.79% |
|
Ratios to Average Net Assets D, F |
|
|
|
|
|
|
Expenses before reductions |
1.89% |
1.90% |
1.90% |
1.91% |
1.94% |
|
Expenses net of fee waivers, if any |
1.89% |
1.90% |
1.90% |
1.91% |
1.94% |
|
Expenses net of all reductions |
1.88% |
1.90% |
1.90% |
1.91% |
1.93% |
|
Net investment income (loss) |
(.85)% |
(.72)% |
(.83)% |
(1.06)% |
(.79)% |
|
Supplemental Data |
|
|
|
|
|
|
Net assets, end of period (in millions) |
$ 23 |
$ 26 |
$ 35 |
$ 54 |
$ 70 |
|
Portfolio turnover rate E |
81% |
73% |
70% |
71% |
135% |
A Total returns would have been lower if certain expenses had not been reduced during the applicable periods shown.
B Total returns do not include the effect of the contingent deferred sales charge.
C Calculated based on average shares outstanding during the period.
D Fees and expenses of any underlying Fidelity Central Funds are not included in the Fund's expense ratio. The Fund indirectly bears its proportionate share of the expenses of any underlying Fidelity Central Funds.
E Amount does not include the portfolio activity of any underlying Fidelity Central Funds.
F Expense ratios reflect operating expenses of the class. Expenses before reductions do not reflect amounts reimbursed by the investment adviser or reductions from brokerage service arrangements or reductions from other expense offset arrangements and do not represent the amount paid by the class during periods when reimbursements or reductions occur. Expenses net of fee waivers reflect expenses after reimbursement by the investment adviser but prior to reductions from brokerage service arrangements or other expense offset arrangements. Expenses net of all reductions represent the net expenses paid by the class.
See accompanying notes which are an integral part of the financial statements.
Annual Report
Financial Highlights - Class C
|
Years ended November 30, |
2013 |
2012 |
2011 |
2010 |
2009 |
|
Selected Per-Share Data |
|
|
|
|
|
|
Net asset value, beginning of period |
$ 56.27 |
$ 49.96 |
$ 46.77 |
$ 39.05 |
$ 32.06 |
|
Income from Investment Operations |
|
|
|
|
|
|
Net investment income (loss) C |
(.50) |
(.37) |
(.41) |
(.44) |
(.26) |
|
Net realized and unrealized gain (loss) |
17.36 |
6.68 |
3.60 |
8.16 |
7.25 |
|
Total from investment operations |
16.86 |
6.31 |
3.19 |
7.72 |
6.99 |
|
Net asset value, end of period |
$ 73.13 |
$ 56.27 |
$ 49.96 |
$ 46.77 |
$ 39.05 |
|
Total Return A, B |
29.96% |
12.63% |
6.82% |
19.77% |
21.80% |
|
Ratios to Average Net Assets D, F |
|
|
|
|
|
|
Expenses before reductions |
1.84% |
1.86% |
1.88% |
1.90% |
1.94% |
|
Expenses net of fee waivers, if any |
1.84% |
1.86% |
1.88% |
1.90% |
1.94% |
|
Expenses net of all reductions |
1.83% |
1.86% |
1.87% |
1.90% |
1.93% |
|
Net investment income (loss) |
(.79)% |
(.68)% |
(.81)% |
(1.05)% |
(.79)% |
|
Supplemental Data |
|
|
|
|
|
|
Net assets, end of period (in millions) |
$ 157 |
$ 133 |
$ 136 |
$ 143 |
$ 142 |
|
Portfolio turnover rate E |
81% |
73% |
70% |
71% |
135% |
A Total returns would have been lower if certain expenses had not been reduced during the applicable periods shown.
B Total returns do not include the effect of the contingent deferred sales charge.
C Calculated based on average shares outstanding during the period.
D Fees and expenses of any underlying Fidelity Central Funds are not included in the Fund's expense ratio. The Fund indirectly bears its proportionate share of the expenses of any underlying Fidelity Central Funds.
E Amount does not include the portfolio activity of any underlying Fidelity Central Funds.
F Expense ratios reflect operating expenses of the class. Expenses before reductions do not reflect amounts reimbursed by the investment adviser or reductions from brokerage service arrangements or reductions from other expense offset arrangements and do not represent the amount paid by the class during periods when reimbursements or reductions occur. Expenses net of fee waivers reflect expenses after reimbursement by the investment adviser but prior to reductions from brokerage service arrangements or other expense offset arrangements. Expenses net of all reductions represent the net expenses paid by the class.
See accompanying notes which are an integral part of the financial statements.
Annual Report
Financial Highlights - Institutional Class
|
Years ended November 30, |
2013 |
2012 |
2011 |
2010 |
2009 |
|
Selected Per-Share Data |
|
|
|
|
|
|
Net asset value, beginning of period |
$ 65.92 |
$ 58.24 |
$ 54.14 |
$ 44.71 |
$ 36.61 |
|
Income from Investment Operations |
|
|
|
|
|
|
Net investment income (loss) B |
.20 |
.25 |
.16 |
.02 |
.12 |
|
Net realized and unrealized gain (loss) |
20.40 |
7.75 |
4.16 |
9.41 |
8.27 |
|
Total from investment operations |
20.60 |
8.00 |
4.32 |
9.43 |
8.39 |
|
Distributions from net investment income |
(.20) |
- |
- |
- |
(.27) |
|
Distributions from net realized gain |
- |
(.32) |
(.22) |
- |
(.02) |
|
Total distributions |
(.20) |
(.32) |
(.22) |
- |
(.29) F |
|
Net asset value, end of period |
$ 86.32 |
$ 65.92 |
$ 58.24 |
$ 54.14 |
$ 44.71 |
|
Total Return A |
31.36% |
13.83% |
7.99% |
21.09% |
23.11% |
|
Ratios to Average Net Assets C, E |
|
|
|
|
|
|
Expenses before reductions |
.78% |
.80% |
.80% |
.80% |
.85% |
|
Expenses net of fee waivers, if any |
.78% |
.80% |
.80% |
.80% |
.85% |
|
Expenses net of all reductions |
.77% |
.79% |
.79% |
.80% |
.84% |
|
Net investment income (loss) |
.27% |
.39% |
.27% |
.05% |
.30% |
|
Supplemental Data |
|
|
|
|
|
|
Net assets, end of period (in millions) |
$ 1,266 |
$ 1,063 |
$ 897 |
$ 973 |
$ 983 |
|
Portfolio turnover rate D |
81% |
73% |
70% |
71% |
135% |
A Total returns would have been lower if certain expenses had not been reduced during the applicable periods shown.
B Calculated based on average shares outstanding during the period.
C Fees and expenses of any underlying Fidelity Central Funds are not included in the Fund's expense ratio. The Fund indirectly bears its proportionate share of the expenses of any underlying Fidelity Central Funds.
D Amount does not include the portfolio activity of any underlying Fidelity Central Funds.
E Expense ratios reflect operating expenses of the class. Expenses before reductions do not reflect amounts reimbursed by the investment adviser or reductions from brokerage service arrangements or reductions from other expense offset arrangements and do not represent the amount paid by the class during periods when reimbursements or reductions occur. Expenses net of fee waivers reflect expenses after reimbursement by the investment adviser but prior to reductions from brokerage service arrangements or other expense offset arrangements. Expenses net of all reductions represent the net expenses paid by the class.
F Total distributions of $.29 per share is comprised of distributions from net investment income of $.274 and distributions from net realized gain of $.015 per share.
See accompanying notes which are an integral part of the financial statements.
Annual Report
Financial Highlights - Class Z
|
Year ended November 30, |
2013 G |
|
Selected Per-Share Data |
|
|
Net asset value, beginning of period |
$ 78.49 |
|
Income from Investment Operations |
|
|
Net investment income (loss) D |
.09 |
|
Net realized and unrealized gain (loss) |
7.78 |
|
Total from investment operations |
7.87 |
|
Net asset value, end of period |
$ 86.36 |
|
Total Return B, C |
10.03% |
|
Ratios to Average Net Assets E, H |
|
|
Expenses before reductions |
.64% A |
|
Expenses net of fee waivers, if any |
.64% A |
|
Expenses net of all reductions |
.63% A |
|
Net investment income (loss) |
.38% A |
|
Supplemental Data |
|
|
Net assets, end of period (000 omitted) |
$ 110 |
|
Portfolio turnover rate F |
81% |
A Annualized
B Total returns for periods of less than one year are not annualized.
C Total returns would have been lower if certain expenses had not been reduced during the applicable periods shown.
D Calculated based on average shares outstanding during the period.
E Fees and expenses of any underlying Fidelity Central Funds are not included in the Fund's expense ratio. The Fund indirectly bears its proportionate share of the expenses of any underlying Fidelity Central Funds.
F Amount does not include the portfolio activity of any underlying Fidelity Central Funds.
G For the period August 13, 2013 (commencement of sale of shares) to November 30, 2013.
H Expense ratios reflect operating expenses of the class. Expenses before reductions do not reflect amounts reimbursed by the investment adviser or reductions from brokerage service arrangements or reductions from other expense offset arrangements and do not represent the amount paid by the class during periods when reimbursements or reductions occur. Expense ratios before reductions for start-up periods may not be representative of longer-term operating periods. Expenses net of fee waivers reflect expenses after reimbursement by the investment adviser but prior to reductions from brokerage service arrangements or other expense offset arrangements. Expenses net of all reductions represent the net expenses paid by the class.
See accompanying notes which are an integral part of the financial statements.
Annual Report
Notes to Financial Statements
For the period ended November 30, 2013
(Amounts in thousands except percentages)
1. Organization.
Fidelity Advisor Equity Growth Fund (the Fund) is a fund of Fidelity Advisor Series I (the Trust) and is authorized to issue an unlimited number of shares. The Trust is registered under the Investment Company Act of 1940, as amended (the 1940 Act), as an open-end management investment company organized as a Massachusetts business trust. The Fund commenced sale of Class Z shares on August 13, 2013. The Fund offers Class A, Class T, Class C, Institutional Class and Class Z shares, each of which, along with Class B shares, has equal rights as to assets and voting privileges. Class B shares are closed to new accounts and additional purchases, except for exchanges and reinvestments. Each class has exclusive voting rights with respect to matters that affect that class. Class B shares will automatically convert to Class A shares after a holding period of seven years from the initial date of purchase.
2. Investments in Fidelity Central Funds.
The Fund invests in Fidelity Central Funds, which are open-end investment companies generally available only to other investment companies and accounts managed by the investment adviser and its affiliates. The Fund's Schedule of Investments lists each of the Fidelity Central Funds held as of period end, if any, as an investment of the Fund, but does not include the underlying holdings of each Fidelity Central Fund. As an Investing Fund, the Fund indirectly bears its proportionate share of the expenses of the underlying Fidelity Central Funds.
The Money Market Central Funds seek preservation of capital and current income and are managed by Fidelity Investments Money Management, Inc. (FIMM), an affiliate of the investment adviser. Annualized expenses of the Money Market Central Funds as of their most recent shareholder report date are less than .01%.
A complete unaudited list of holdings for each Fidelity Central Fund is available upon request or at the Securities and Exchange Commission (the SEC) website at www.sec.gov. In addition, the financial statements of the Fidelity Central Funds, which are not covered by the Fund's Report of Independent Registered Public Accounting Firm, are available on the SEC website or upon request.
3. Significant Accounting Policies.
The financial statements have been prepared in conformity with accounting principles generally accepted in the United States of America (GAAP), which require management to make certain estimates and assumptions at the date of the financial statements. Actual results could differ from those estimates. Subsequent events, if any, through the date that the financial statements were issued have been evaluated in the preparation of
Annual Report
3. Significant Accounting Policies - continued
the financial statements. The following summarizes the significant accounting policies of the Fund:
Investment Valuation. Investments are valued as of 4:00 p.m. Eastern time on the last calendar day of the period. In accordance with valuation policies and procedures approved by the Board of Trustees (the Board), the Fund attempts to obtain prices from one or more third party pricing vendors or brokers to value its investments. When current market prices, quotations or currency exchange rates are not readily available or reliable, investments will be fair valued in good faith by the Fidelity Management & Research Company (FMR) Fair Value Committee (the Committee), in accordance with procedures adopted by the Board. Factors used in determining fair value vary by investment type and may include market or investment specific events. The frequency with which these procedures are used cannot be predicted and they may be utilized to a significant extent. The Committee oversees the Fund's valuation policies and procedures and is responsible for approving and reporting to the Board all fair value determinations.
The Fund categorizes the inputs to valuation techniques used to value its investments into a disclosure hierarchy consisting of three levels as shown below:
Level 1 - quoted prices in active markets for identical investments
Level 2 - other significant observable inputs (including quoted prices for similar investments, interest rates, prepayment speeds, etc.)
Level 3 - unobservable inputs (including the Fund's own assumptions based on the best information available)
Valuation techniques used to value the Fund's investments by major category are as follows:
Equity securities, including restricted securities, for which market quotations are readily available, are valued at the last reported sale price or official closing price as reported by a third party pricing vendor on the primary market or exchange on which they are traded and are categorized as Level 1 in the hierarchy. In the event there were no sales during the day or closing prices are not available, securities are valued at the last quoted bid price or may be valued using the last available price and are generally categorized as Level 2 in the hierarchy. For foreign equity securities, when market or security specific events arise, comparisons to the valuation of American Depositary Receipts (ADRs), futures contracts, Exchange-Traded Funds (ETFs) and certain indexes as well as quoted prices for similar securities may be used and would be categorized as Level 2 in the hierarchy. Utilizing these techniques may result in transfers between Level 1 and Level 2. For equity securities, including restricted securities, where observable inputs are limited, assumptions about market activity and risk are used and these securities may be categorized as Level 3 in the hierarchy.
Annual Report
Notes to Financial Statements - continued
(Amounts in thousands except percentages)
3. Significant Accounting Policies - continued
Investment Valuation - continued
Investments in open-end mutual funds, including the Fidelity Central Funds, are valued at their closing net asset value (NAV) each business day and are categorized as Level 1 in the hierarchy.
Changes in valuation techniques may result in transfers in or out of an assigned level within the disclosure hierarchy. The aggregate value of investments by input level, as of November 30, 2013, is included at the end of the Fund's Schedule of Investments.
Foreign Currency. The Fund may use foreign currency contracts to facilitate transactions in foreign-denominated securities. Gains and losses from these transactions may arise from changes in the value of the foreign currency or if the counterparties do not perform under the contracts' terms.
Foreign-denominated assets, including investment securities, and liabilities are translated into U.S. dollars at the exchange rates at period end. Purchases and sales of investment securities, income and dividends received and expenses denominated in foreign currencies are translated into U.S. dollars at the exchange rate in effect on the transaction date.
The effects of exchange rate fluctuations on investments are included with the net realized and unrealized gain (loss) on investment securities. Other foreign currency transactions resulting in realized and unrealized gain (loss) are disclosed separately.
Investment Transactions and Income. For financial reporting purposes, the Fund's investment holdings and NAV include trades executed through the end of the last business day of the period. The NAV per share for processing shareholder transactions is calculated as of the close of business of the New York Stock Exchange (NYSE), normally 4:00 p.m. Eastern time and includes trades executed through the end of the prior business day. Gains and losses on securities sold are determined on the basis of identified cost and may include proceeds received from litigation. Dividend income is recorded on the ex-dividend date, except for certain dividends from foreign securities where the ex-dividend date may have passed, which are recorded as soon as the Fund is informed of the ex-dividend date. Non-cash dividends included in dividend income, if any, are recorded at the fair market value of the securities received. Distributions received on securities that represent a return of capital or capital gain are recorded as a reduction of cost of investments and/or as a realized gain. Subsequent to ex-dividend date the Fund determines the components of these distributions, based upon receipt of tax filings or other correspondence relating to the underlying investment. Interest income and distributions from the Fidelity Central Funds are accrued as earned. Interest income includes coupon interest and amortization of premium and accretion of discount on debt
Annual Report
3. Significant Accounting Policies - continued
Investment Transactions and Income - continued
securities. Investment income is recorded net of foreign taxes withheld where recovery of such taxes is uncertain.
Class Allocations and Expenses. Investment income, realized and unrealized capital gains and losses, common expenses of the Fund, and certain fund-level expense reductions, if any, are allocated daily on a pro-rata basis to each class based on the relative net assets of each class to the total net assets of the Fund. Each class differs with respect to transfer agent and distribution and service plan fees incurred. Certain expense reductions may also differ by class. For the reporting period, the allocated portion of income and expenses to each class as a percent of its average net assets may vary due to the timing of recording these transactions in relation to fluctuating net assets of the classes. Expenses directly attributable to a fund are charged to that fund. Expenses attributable to more than one fund are allocated among the respective funds on the basis of relative net assets or other appropriate methods. Expense estimates are accrued in the period to which they relate and adjustments are made when actual amounts are known.
Deferred Trustee Compensation. Under a Deferred Compensation Plan (the Plan), independent Trustees may elect to defer receipt of a portion of their annual compensation. Deferred amounts are invested in a cross-section of Fidelity funds, are marked-to-market and remain in the Fund until distributed in accordance with the Plan. The investment of deferred amounts and the offsetting payable to the Trustees are included in the accompanying Statement of Assets and Liabilities.
Income Tax Information and Distributions to Shareholders. Each year, the Fund intends to qualify as a regulated investment company under Subchapter M of the Internal Revenue Code, including distributing substantially all of its taxable income and realized gains. As a result, no provision for U.S. Federal income taxes is required. As of November 30, 2013, the Fund did not have any unrecognized tax benefits in the financial statements; nor is the Fund aware of any tax positions for which it is reasonably possible that the total amounts of unrecognized tax benefits will significantly change in the next twelve months. The Fund files a U.S. federal tax return, in addition to state and local tax returns as required. The Fund's federal income tax returns are subject to examination by the Internal Revenue Service (IRS) for a period of three fiscal years after they are filed. State and local tax returns may be subject to examination for an additional fiscal year depending on the jurisdiction. Foreign taxes are provided for based on the Fund's understanding of the tax rules and rates that exist in the foreign markets in which it invests.
Annual Report
Notes to Financial Statements - continued
(Amounts in thousands except percentages)
3. Significant Accounting Policies - continued
Income Tax Information and Distributions to Shareholders - continued
Distributions are declared and recorded on the ex-dividend date. Income dividends and capital gain distributions are declared separately for each class. Income and capital gain distributions are determined in accordance with income tax regulations, which may differ from GAAP.
Capital accounts within the financial statements are adjusted for permanent book-tax differences. These adjustments have no impact on net assets or the results of operations. Temporary book-tax differences will reverse in a subsequent period.
Book-tax differences are primarily due to foreign currency transactions, passive foreign investment companies (PFIC), redemptions in kind, partnerships, deferred trustees compensation, capital loss carryforwards and losses deferred due to wash sales and excise tax regulations.
The federal tax cost of investment securities and unrealized appreciation (depreciation) as of period end were as follows:
|
Gross unrealized appreciation |
$ 848,765 |
|
Gross unrealized depreciation |
(24,574) |
|
Net unrealized appreciation (depreciation) on securities and other investments |
$ 824,191 |
|
|
|
|
Tax Cost |
$ 2,746,511 |
The tax-based components of distributable earnings as of period end were as follows:
|
Capital loss carryforward |
$ (503,999) |
|
Net unrealized appreciation (depreciation) |
$ 824,190 |
Capital loss carryforwards are only available to offset future capital gains of the Fund to the extent provided by regulations and may be limited. Under the Regulated Investment Company Modernization Act of 2010 (the Act), the Fund is permitted to carry forward capital losses incurred in taxable years beginning after December 22, 2010 for an unlimited period and such capital losses are required to be used prior to any losses that expire. The capital loss carryforward information presented below, including any applicable limitation, is estimated as of fiscal period end and is subject to adjustment.
|
Fiscal year of expiration |
|
|
2017 |
$ (503,999) |
Annual Report
3. Significant Accounting Policies - continued
Income Tax Information and Distributions to Shareholders - continued
The tax character of distributions paid was as follows:
|
|
November 30, 2013 |
November 30, 2012 |
|
Ordinary Income |
$ 3,311 |
$ 6,141 |
Restricted Securities. The Fund may invest in securities that are subject to legal or contractual restrictions on resale. These securities generally may be resold in transactions exempt from registration or to the public if the securities are registered. Disposal of these securities may involve time-consuming negotiations and expense, and prompt sale at an acceptable price may be difficult. Information regarding restricted securities is included at the end of the Fund's Schedule of Investments.
4. Purchases and Sales of Investments.
Purchases and sales of securities including in-kind transactions, other than short-term securities, aggregated $2,658,323 and $3,034,881, respectively.
5. Fees and Other Transactions with Affiliates.
Management Fee. Fidelity Management & Research Company (the investment adviser) and its affiliates provide the Fund with investment management related services for which the Fund pays a monthly management fee. The management fee is the sum of an individual fund fee rate that is based on an annual rate of .30% of the Fund's average net assets and an annualized group fee rate that averaged .25% during the period. The group fee rate is based upon the average net assets of all the mutual funds advised by the investment adviser, including any mutual funds previously advised by the investment adviser that are currently advised by Fidelity SelectCo, LLC, an affiliate of the investment adviser. The group fee rate decreases as assets under management increase and increases as assets under management decrease. For the reporting period, the total annual management fee rate was .55% of the Fund's average net assets.
Distribution and Service Plan Fees. In accordance with Rule 12b-1 of the 1940 Act, the Fund has adopted separate Distribution and Service Plans for each class of shares. Certain classes pay Fidelity Distributors Corporation (FDC), an affiliate of the investment adviser, separate Distribution and Service Fees, each of which is based on an annual percentage of each class' average net assets. In addition, FDC may pay financial intermediaries for selling shares of the Fund and providing shareholder support services.
Annual Report
Notes to Financial Statements - continued
(Amounts in thousands except percentages)
5. Fees and Other Transactions with Affiliates - continued
Distribution and Service Plan Fees - continued
For the period, the Distribution and Service Fee rates, total fees and amounts retained by FDC were as follows:
|
|
Distribution |
Service |
Total Fees |
Retained |
|
Class A |
-% |
.25% |
$ 1,721 |
$ 40 |
|
Class T |
.25% |
.25% |
5,834 |
53 |
|
Class B |
.75% |
.25% |
239 |
181 |
|
Class C |
.75% |
.25% |
1,402 |
59 |
|
|
|
|
$ 9,196 |
$ 333 |
Sales Load. FDC may receive a front-end sales charge of up to 5.75% for selling Class A shares and 3.50% for selling Class T shares, some of which is paid to financial intermediaries for selling shares of the Fund. Depending on the holding period, FDC may receive contingent deferred sales charges levied on Class A, Class T, Class B, and Class C redemptions. The deferred sales charges range from 5.00% to 1.00% for Class B shares, 1.00% for Class C shares, 1.00% for certain purchases of Class A shares and .25% for certain purchases of Class T shares.
For the period, sales charge amounts retained by FDC were as follows:
|
|
Retained |
|
Class A |
$ 58 |
|
Class T |
29 |
|
Class B* |
18 |
|
Class C* |
5 |
|
|
$ 110 |
* When Class B and Class C shares are initially sold, FDC pays commissions from its own resources to financial intermediaries through which the sales are made.
Transfer Agent Fees. Fidelity Investments Institutional Operations Company, Inc., (FIIOC), an affiliate of the investment adviser, is the transfer, dividend disbursing and shareholder servicing agent for each class of the Fund. FIIOC receives account fees and asset-based fees that vary according to the account size and type of account of the shareholders of the respective classes of the Fund, except for Class Z. FIIOC receives an asset-based fee of Class Z's average net assets. FIIOC pays for typesetting, printing and mailing of shareholder reports, except proxy statements.
Annual Report
5. Fees and Other Transactions with Affiliates - continued
Transfer Agent Fees - continued
For the period, transfer agent fees for each applicable class were as follows:
|
|
Amount |
% of |
|
Class A |
$ 1,867 |
.27 |
|
Class T |
2,329 |
.20 |
|
Class B |
71 |
.30 |
|
Class C |
345 |
.25 |
|
Institutional Class |
2,484 |
.19 |
|
Class Z |
-* |
.05** |
|
|
$ 7,096 |
|
* Amount represents fifteen dollars.
** Annualized
Accounting and Security Lending Fees. Fidelity Service Company, Inc. (FSC), an affiliate of the investment adviser, maintains the Fund's accounting records. The accounting fee is based on the level of average net assets for each month. Under a separate contract, FSC administers the security lending program. The security lending fee is based on the number and duration of lending transactions.
Brokerage Commissions. The Fund placed a portion of its portfolio transactions with brokerage firms which are affiliates of the investment adviser. Brokerage commissions are included in net realized gain (loss) and change in net unrealized appreciation (depreciation) in the Statement of Operations. The commissions paid to these affiliated firms were $41 for the period.
Redemptions In-Kind. During the period, 2,917 shares of the Fund held by affiliated entities were redeemed for investments with a value of $244,110. The net realized gain of $80,385 on investments delivered through in-kind redemptions is included in the accompanying Statement of Operations. The amount of in-kind redemptions is included in share transactions in the accompanying Statement of Changes in Net Assets as well as Note 10: Share Transactions. The Fund recognized no gain or loss for federal income tax purposes.
6. Committed Line of Credit.
The Fund participates with other funds managed by the investment adviser or an affiliate in a $4.25 billion credit facility (the "line of credit") to be utilized for temporary or emergency purposes to fund shareholder redemptions or for other short-term liquidity purposes. The Fund has agreed to pay commitment fees on its pro-rata portion of the line
Annual Report
Notes to Financial Statements - continued
(Amounts in thousands except percentages)
6. Committed Line of Credit - continued
of credit, which amounted to $7 and is reflected in Miscellaneous expenses on the Statement of Operations. During the period, there were no borrowings on this line of credit.
7. Security Lending.
The Fund lends portfolio securities through a lending agent from time to time in order to earn additional income. For equity securities, a lending agent is used and may loan securities to certain qualified borrowers, including Fidelity Capital Markets (FCM), a broker-dealer affiliated with the Fund. On the settlement date of the loan, the Fund receives collateral (in the form of U.S. Treasury obligations, letters of credit and/or cash) against the loaned securities and maintains collateral in an amount not less than 100% of the market value of the loaned securities during the period of the loan. The market value of the loaned securities is determined at the close of business of the Fund and any additional required collateral is delivered to the Fund on the next business day. If the borrower defaults on its obligation to return the securities loaned because of insolvency or other reasons, the Fund may apply collateral received from the borrower against the obligation. The Fund may experience delays and costs in recovering the securities loaned. Any cash collateral received is invested in the Fidelity Securities Lending Cash Central Fund. The value of loaned securities and cash collateral at period end are disclosed on the Fund's Statement of Assets and Liabilities. At period end, there were no security loans outstanding with FCM. Security lending income represents the income earned on investing cash collateral, less rebates paid to borrowers and any lending agent fees associated with the loan, plus any premium payments received for lending certain types of securities. Security lending income is presented in the Statement of Operations as a component of income from Fidelity Central Funds. Total security lending income during the period amounted to $479, including $15 from securities loaned to FCM.
8. Expense Reductions.
The investment adviser voluntarily agreed to reimburse a portion of the Fund's Class A, Class T, Class B, Class C and Institutional Class operating expenses. During the period, the reimbursement reduced expenses as follows:
The following classes were in reimbursement during the period:
|
|
Reimbursement |
|
Class A |
$ 3 |
|
Class T |
5 |
|
Class B |
-* |
|
Class C |
1 |
|
Institutional Class |
5 |
|
|
$ 14 |
* Amount represents ninety dollars.
Annual Report
8. Expense Reductions - continued
Commissions paid to certain brokers with whom the investment adviser, or its affiliates, places trades on behalf of the Fund include an amount in addition to trade execution, which may be rebated back to the Fund to offset certain expenses. This amount totaled $390 for the period. In addition, through arrangements with the Fund's custodian, credits realized as a result of uninvested cash balances were used to reduce the Fund's expenses. During the period, these credits reduced the Fund's custody expenses by two hundred and sixty-nine dollars.
9. Distributions to Shareholders.
Distributions to shareholders of each class were as follows:
|
Years ended November 30, |
2013 |
2012 |
|
From net investment income |
|
|
|
Institutional Class |
$ 3,311 |
$ - |
|
From net realized gain |
|
|
|
Class A |
$ - |
$ 1,215 |
|
Institutional Class |
- |
4,926 |
|
Total |
$ - |
$ 6,141 |
10. Share Transactions.
Transactions for each class of shares were as follows:
|
|
Shares |
Dollars |
||
|
Years ended November 30, |
2013 A |
2012 |
2013 A |
2012 |
|
Class A |
|
|
|
|
|
Shares sold |
1,339 |
1,382 |
$ 93,392 |
$ 82,422 |
|
Reinvestment of distributions |
- |
21 |
- |
1,098 |
|
Shares redeemed |
(2,021) |
(2,338) |
(140,383) |
(138,919) |
|
Net increase (decrease) |
(682) |
(935) |
$ (46,991) |
$ (55,399) |
|
Class T |
|
|
|
|
|
Shares sold |
1,688 |
2,021 |
$ 116,336 |
$ 120,048 |
|
Shares redeemed |
(3,732) |
(4,996) |
(255,751) |
(296,134) |
|
Net increase (decrease) |
(2,044) |
(2,975) |
$ (139,415) |
$ (176,086) |
|
Class B |
|
|
|
|
|
Shares sold |
5 |
5 |
$ 343 |
$ 239 |
|
Shares redeemed |
(159) |
(239) |
(9,702) |
(12,835) |
|
Net increase (decrease) |
(154) |
(234) |
$ (9,359) |
$ (12,596) |
Annual Report
Notes to Financial Statements - continued
(Amounts in thousands except percentages)
10. Share Transactions - continued
|
|
Shares |
Dollars |
||
|
Years ended November 30, |
2013 A |
2012 |
2013 A |
2012 |
|
Class C |
|
|
|
|
|
Shares sold |
155 |
154 |
$ 9,843 |
$ 8,368 |
|
Shares redeemed |
(367) |
(504) |
(22,580) |
(27,593) |
|
Net increase (decrease) |
(212) |
(350) |
$ (12,737) |
$ (19,225) |
|
Institutional Class |
|
|
|
|
|
Shares sold |
4,554 |
4,266 |
$ 315,218 |
$ 270,700 |
|
Reinvestment of distributions |
50 |
86 |
3,246 |
4,818 |
|
Shares redeemed |
(6,060) B |
(3,622) |
(477,852) B |
(230,640) |
|
Net increase (decrease) |
(1,456) |
730 |
$ (159,388) |
$ 44,878 |
|
Class Z |
|
|
|
|
|
Shares sold |
1 |
- |
$ 100 |
$ - |
|
Net increase (decrease) |
1 |
- |
$ 100 |
$ - |
A Share transactions for Class Z are for the period August 13, 2013 (commencement of sale of shares) to November 30, 2013.
B Amount includes in-kind redemptions (see Note 5: Redemptions In-Kind).
11. Other.
The Fund's organizational documents provide former and current trustees and officers with a limited indemnification against liabilities arising in connection with the performance of their duties to the Fund. In the normal course of business, the Fund may also enter into contracts that provide general indemnifications. The Fund's maximum exposure under these arrangements is unknown as this would be dependent on future claims that may be made against the Fund. The risk of material loss from such claims is considered remote.
At the end of the period, the Fidelity Advisor Freedom Funds were the owners of record, in the aggregate, of approximately 26% of the total outstanding shares of the Fund.
Annual Report
Report of Independent Registered Public Accounting Firm
To the Trustees of Fidelity Advisor Series I and Shareholders of Fidelity Advisor Equity Growth Fund:
We have audited the accompanying statement of assets and liabilities of Fidelity Advisor Equity Growth Fund (the Fund), a fund of Fidelity Advisor Series I, including the schedule of investments, as of November 30, 2013, and the related statement of operations for the year then ended, the statement of changes in net assets for each of the two years in the period then ended, and the financial highlights for each of the five years in the period then ended. These financial statements and financial highlights are the responsibility of the Fund's management. Our responsibility is to express an opinion on these financial statements and financial highlights based on our audits.
We conducted our audits in accordance with the standards of the Public Company Accounting Oversight Board (United States). Those standards require that we plan and perform the audit to obtain reasonable assurance about whether the financial statements and financial highlights are free of material misstatement. The Fund is not required to have, nor were we engaged to perform, an audit of its internal control over financial reporting. Our audits included consideration of internal control over financial reporting as a basis for designing audit procedures that are appropriate in the circumstances, but not for the purpose of expressing an opinion on the effectiveness of the Fund's internal control over financial reporting. Accordingly, we express no such opinion. An audit also includes examining, on a test basis, evidence supporting the amounts and disclosures in the financial statements, assessing the accounting principles used and significant estimates made by management, as well as evaluating the overall financial statement presentation. Our procedures included confirmation of securities owned as of November 30, 2013, by correspondence with the custodians and brokers; where replies were not received from brokers, we performed other auditing procedures. We believe that our audits provide a reasonable basis for our opinion.
In our opinion, the financial statements and financial highlights referred to above present fairly, in all material respects, the financial position of Fidelity Advisor Equity Growth Fund as of November 30, 2013, the results of its operations for the year then ended, the changes in its net assets for each of the two years in the period then ended, and the financial highlights for each of the five years in the period then ended, in conformity with accounting principles generally accepted in the United States of America.
DELOITTE & TOUCHE LLP
Boston, Massachusetts
January 15, 2014
Annual Report
Trustees and Officers
The Trustees, Member of the Advisory Board, and officers of the trust and fund, as applicable, are listed below. The Board of Trustees governs the fund and is responsible for protecting the interests of shareholders. The Trustees are experienced executives who meet periodically throughout the year to oversee the fund's activities, review contractual arrangements with companies that provide services to the fund, oversee management of the risks associated with such activities and contractual arrangements, and review the fund's performance. Except for James C. Curvey, Ned C. Lautenbach, Ronald P. O'Hanley, and William S. Stavropoulos, each of the Trustees oversees 173 funds. Mr. Curvey oversees 396 funds. Mr. Lautenbach, Mr. O'Hanley, and Mr. Stavropoulos each oversees 247 funds.
The Trustees hold office without limit in time except that (a) any Trustee may resign; (b) any Trustee may be removed by written instrument, signed by at least two-thirds of the number of Trustees prior to such removal; (c) any Trustee who requests to be retired or who has become incapacitated by illness or injury may be retired by written instrument signed by a majority of the other Trustees; and (d) any Trustee may be removed at any special meeting of shareholders by a two-thirds vote of the outstanding voting securities of the trust. Each Trustee who is not an interested person (as defined in the 1940 Act) of the trust and the fund (Independent Trustee), shall retire not later than the last day of the calendar year in which his or her 75th birthday occurs. The Independent Trustees may waive this mandatory retirement age policy with respect to individual Trustees. The officers and Advisory Board Member hold office without limit in time, except that any officer and Advisory Board Member may resign or may be removed by a vote of a majority of the Trustees at any regular meeting or any special meeting of the Trustees. Except as indicated, each individual has held the office shown or other offices in the same company for the past five years.
Experience, Skills, Attributes, and Qualifications of the Fund's Trustees. The Governance and Nominating Committee has adopted a statement of policy that describes the experience, qualifications, attributes, and skills that are necessary and desirable for potential Independent Trustee candidates (Statement of Policy). The Board believes that each Trustee satisfied at the time he or she was initially elected or appointed a Trustee, and continues to satisfy, the standards contemplated by the Statement of Policy. The Governance and Nominating Committee also engages professional search firms to help identify potential Independent Trustee candidates who have the experience, qualifications, attributes, and skills consistent with the Statement of Policy. From time to time, additional criteria based on the composition and skills of the current Independent Trustees, as well as experience or skills that may be appropriate in light of future changes to board composition, business conditions, and regulatory or other developments, have also been considered by the professional search firms and the Governance and Nominating Committee. In addition, the Board takes into account the Trustees' commitment and participation in Board and committee meetings, as well as their leadership of standing and ad hoc committees throughout their tenure.
Annual Report
Trustees and Officers - continued
In determining that a particular Trustee was and continues to be qualified to serve as a Trustee, the Board has considered a variety of criteria, none of which, in isolation, was controlling. The Board believes that, collectively, the Trustees have balanced and diverse experience, qualifications, attributes, and skills, which allow the Board to operate effectively in governing the fund and protecting the interests of shareholders. Information about the specific experience, skills, attributes, and qualifications of each Trustee, which in each case led to the Board's conclusion that the Trustee should serve (or continue to serve) as a trustee of the fund, is provided below.
Board Structure and Oversight Function. James C. Curvey is an interested person (as defined in the 1940 Act) and currently serves as Chairman. The Trustees have determined that an interested Chairman is appropriate and benefits shareholders because an interested Chairman has a personal and professional stake in the quality and continuity of services provided to the fund. Independent Trustees exercise their informed business judgment to appoint an individual of their choosing to serve as Chairman, regardless of whether the Trustee happens to be independent or a member of management. The Independent Trustees have determined that they can act independently and effectively without having an Independent Trustee serve as Chairman and that a key structural component for assuring that they are in a position to do so is for the Independent Trustees to constitute a substantial majority for the Board. The Independent Trustees also regularly meet in executive session. Ned C. Lautenbach serves as Chairman of the Independent Trustees and as such (i) acts as a liaison between the Independent Trustees and management with respect to matters important to the Independent Trustees and (ii) with management prepares agendas for Board meetings.
Fidelity funds are overseen by different Boards of Trustees. The fund's Board oversees Fidelity's equity and high income funds and another Board oversees Fidelity's investment-grade bond, money market, and asset allocation funds. The asset allocation funds may invest in Fidelity funds overseen by the fund's Board. The use of separate Boards, each with its own committee structure, allows the Trustees of each group of Fidelity funds to focus on the unique issues of the funds they oversee, including common research, investment, and operational issues. On occasion, the separate Boards establish joint committees to address issues of overlapping consequences for the Fidelity funds overseen by each Board.
The Trustees operate using a system of committees to facilitate the timely and efficient consideration of all matters of importance to the Trustees, the fund, and fund shareholders and to facilitate compliance with legal and regulatory requirements and oversight of the fund's activities and associated risks. The Board, acting through its committees, has charged FMR and its affiliates with (i) identifying events or circumstances the occurrence of which could have demonstrably adverse effects on the fund's business and/or reputation; (ii) implementing processes and controls to lessen the possibility that such events or circumstances occur or to mitigate the effects of such events or circumstances if they do occur; and (iii) creating and maintaining a system designed to evaluate continuously business and market conditions in order to facilitate the identification and implementation processes described in (i) and (ii) above. Because the day-to-day operations and activities of the fund are carried out by or through FMR, its affiliates and other service providers, the fund's exposure to risks is mitigated but not eliminated by the processes overseen by the Trustees. While each of the Board's committees has responsibility for overseeing different aspects of the fund's activities, oversight is exercised primarily through the Operations, Audit, and Compliance Committees. In addition, the Independent Trustees have worked with FMR to enhance the Board's oversight of investment and financial risks, legal and regulatory risks, technology risks, and operational risks, including the development of additional risk reporting to the Board. For example, a working group comprised of Independent Trustees and FMR has worked and continues to work to review the Fidelity funds' valuation-related activities, reporting and risk management. Appropriate personnel, including but not limited to the fund's Chief Compliance Officer (CCO), FMR's internal auditor, the independent accountants, the fund's Treasurer and portfolio management personnel, make periodic reports to the Board's committees, as appropriate, including an annual review of FMR's risk management program for the Fidelity funds. The responsibilities of each standing committee, including their oversight responsibilities, are described further under "Standing Committees of the Fund's Trustees."
Annual Report
The fund's Statement of Additional Information (SAI) includes more information about the Trustees. To request a free copy, call Fidelity at 1-877-208-0098.
Interested Trustees*:
Correspondence intended for each Trustee who is an interested person may be sent to Fidelity Investments, 245 Summer Street, Boston, Massachusetts 02210.
|
Name, Year of Birth; Principal Occupations and Other Relevant Experience+ |
|
|
James C. Curvey (1935) |
|
|
Year of Election or Appointment: 2007 Trustee Chairman of the Board of Trustees |
|
|
|
Mr. Curvey also serves as Trustee of other Fidelity funds. Mr. Curvey is a Director of Fidelity Investments Money Management, Inc. (2009-present), Director of Fidelity Research & Analysis Co. (2009-present) and Director of FMR and FMR Co., Inc. (2007-present). Mr. Curvey is also Vice Chairman (2007-present) and Director of FMR LLC. In addition, Mr. Curvey serves as an Overseer for the Boston Symphony Orchestra and a member of the Trustees of Villanova University. Previously, Mr. Curvey was the Vice Chairman (2006-2007) and Director (2000-2007) of FMR Corp. |
|
Ronald P. O'Hanley (1957) |
|
|
Year of Election or Appointment: 2011 Trustee |
|
|
|
Mr. O'Hanley also serves as Trustee of other Fidelity funds. He is Director of Fidelity SelectCo, LLC (2013-present), FMR Co., Inc. (2010-present), Director of Fidelity Investments Money Management, Inc. (2010-present), Director of Fidelity Research & Analysis Company (2010-present), President of Fidelity Asset Management and Corporate Services and a Member of Fidelity's Executive Committee (2010-present). Previously, Mr. O'Hanley served as President and Chief Executive Officer of BNY Mellon Asset Management (2007-2010). Mr. O'Hanley also served as Vice Chairman of Bank New York Mellon Corp. and a member of that firm's Executive Committee. Prior to the 2007 merger of The Bank of New York and Mellon Financial Corporation, he was Vice Chairman of Mellon Financial Corporation and President and Chief Executive Officer of Mellon Asset Management. He joined Mellon in February 1997. Mr. O'Hanley currently serves as Chairman of the Boston Public Library Foundation Board of Directors and sits on the Board of Directors of Beth Israel Deaconess Medical Center, the Board of Trustees of the Marine Biological Laboratory and the Advisory Board of the Maxwell School of Citizenship and Public Administration at Syracuse University. Mr. O'Hanley also chairs the Council on Asset Management for the Financial Services Roundtable and is a member of the Board of Directors of Institutional Investor's U.S. Institute. |
* Trustees have been determined to be "Interested Trustees" by virtue of, among other things, their affiliation with the trust or various entities under common control with FMR.
+ The information above includes each Trustee's principal occupation during the last five years and other information relating to the experience, attributes, and skills relevant to each Trustee's qualifications to serve as a Trustee, which led to the conclusion that each Trustee should serve as a Trustee for the fund.
Annual Report
Independent Trustees:
Correspondence intended for each Independent Trustee (that is, the Trustees other than the Interested Trustees) may be sent to Fidelity Investments, P.O. Box 55235, Boston, Massachusetts 02205-5235.
|
Name, Year of Birth; Principal Occupations and Other Relevant Experience+ |
|
|
Dennis J. Dirks (1948) |
|
|
Year of Election or Appointment: 2005 Trustee |
|
|
|
Mr. Dirks also serves as Trustee of other Fidelity funds. Prior to his retirement in May 2003, Mr. Dirks was Chief Operating Officer and a member of the Board of The Depository Trust & Clearing Corporation (DTCC). He also served as President, Chief Operating Officer, and Board member of The Depository Trust Company (DTC) and President and Board member of the National Securities Clearing Corporation (NSCC). In addition, Mr. Dirks served as Chief Executive Officer and Board member of the Government Securities Clearing Corporation, Chief Executive Officer and Board member of the Mortgage-Backed Securities Clearing Corporation, as a Trustee and a member of the Finance Committee of Manhattan College (2005-2008), and as a Trustee and a member of the Finance Committee of AHRC of Nassau County (2006-2008). Mr. Dirks is a member of the Independent Directors Council (IDC) Governing Council (2010-present) and Board of Directors for The Brookville Center for Children's Services, Inc. (2009-present). |
|
Alan J. Lacy (1953) |
|
|
Year of Election or Appointment: 2008 Trustee |
|
|
|
Mr. Lacy also serves as Trustee of other Fidelity funds. Mr. Lacy serves as Senior Adviser (2007-present) of Oak Hill Capital Partners, L.P. (private equity). Mr. Lacy also served as Chief Executive Officer (2000-2005) and Vice Chairman (2005-2006) of Sears Holdings Corporation and Sears, Roebuck and Co. (retail). In addition, Mr. Lacy serves as a member of the Board of Directors of Dave & Buster's Entertainment, Inc. (restaurant and entertainment complexes, 2010-present), Earth Fare, Inc. (retail grocery, 2012-present), The Hillman Companies, Inc. (hardware wholesalers, 2010-present), and Bristol-Myers Squibb Company (global pharmaceuticals, 2008-present). Mr. Lacy is a member of the Board of Trustees of The National Parks Conservation Association (2006-present). Previously, Mr. Lacy served as Chairman of the Board of Trustees of the National Parks Conservation Association (2008-2011) and as a member of the Board of Directors for the Western Union Company (global money transfer, 2006-2011). |
|
Ned C. Lautenbach (1944) |
|
|
Year of Election or Appointment: 2000 Trustee Chairman of the Independent Trustees |
|
|
|
Mr. Lautenbach also serves as Trustee of other Fidelity funds. Mr. Lautenbach currently serves as the Lead Director of the Eaton Corporation Board of Directors (diversified industrial, 1997-present). Mr. Lautenbach is Chairman of the Board of Directors of the Philharmonic Center for the Arts in Naples, Florida (2012-present) and a member of the Council on Foreign Relations (1994-present). Previously, Mr. Lautenbach was a Partner/Advisory Partner at Clayton, Dubilier & Rice, LLC (private equity investment, 1998-2010), as well as a Director of Sony Corporation (2006-2007). |
|
Joseph Mauriello (1944) |
|
|
Year of Election or Appointment: 2008 Trustee |
|
|
|
Mr. Mauriello also serves as Trustee of other Fidelity funds. Prior to his retirement in January 2006, Mr. Mauriello served in numerous senior management positions including Deputy Chairman and Chief Operating Officer (2004-2005), and Vice Chairman of Financial Services (2002-2004) of KPMG LLP US (professional services, 1965-2005). Mr. Mauriello currently serves as a member of the Board of Directors of XL Group plc. (global insurance and re-insurance, 2006-present). Previously, Mr. Mauriello served as a Director of the Hamilton Funds of the Bank of New York (2006-2007) and of Arcadia Resources Inc. (health care services and products, 2007-2012). |
|
Robert W. Selander (1950) |
|
|
Year of Election or Appointment: 2011 Trustee |
|
|
|
Mr. Selander also serves as Trustee of other Fidelity funds. Previously, Mr. Selander served as a Member of the Advisory Board of other Fidelity funds (2011), and Executive Vice Chairman (2010), Chief Executive Officer (2009-2010), and President and Chief Executive Officer (1997-2009) of Mastercard, Inc. |
|
Cornelia M. Small (1944) |
|
|
Year of Election or Appointment: 2005 Trustee |
|
|
|
Ms. Small also serves as Trustee of other Fidelity funds. Ms. Small is a member of the Board of Directors (2009-present) and Chair of the Investment Committee (2010-present) of the Teagle Foundation. Ms. Small also serves on the Investment Committee of the Berkshire Taconic Community Foundation (2008-present). Previously, Ms. Small served as Chairperson (2002-2008) and a member of the Investment Committee and Chairperson (2008-2012) and a member of the Board of Trustees of Smith College. In addition, Ms. Small served as Chief Investment Officer, Director of Global Equity Investments, and a member of the Board of Directors of Scudder, Stevens & Clark and Scudder Kemper Investments. |
|
William S. Stavropoulos (1939) |
|
|
Year of Election or Appointment: 2002 Trustee Vice Chairman of the Independent Trustees |
|
|
|
Mr. Stavropoulos also serves as Trustee of other Fidelity funds. Mr. Stavropoulos serves as President and Founder of the Michigan Baseball Foundation, the Great Lakes Loons (2007-present). Mr. Stavropoulos is Chairman Emeritus of the Board of Directors of The Dow Chemical Company, where he previously served in numerous senior management positions, including President, CEO (1995-2000; 2002-2004), Chairman of the Executive Committee (2000-2006), and as a member of the Board of Directors (1990-2006). Currently, Mr. Stavropoulos is Chairman of the Board of Directors of Univar Inc. (global distributor of commodity and specialty chemicals), a Director of Teradata Corporation (data warehousing and technology solutions), and Maersk Inc. (industrial conglomerate), and a member of the Advisory Board for Metalmark Capital LLC (private equity investment, 2005-present). Mr. Stavropoulos is an operating advisor to Clayton, Dubilier & Rice, LLC (private equity investment). In addition, Mr. Stavropoulos is a member of the University of Notre Dame Advisory Council for the College of Science, a Trustee of the Rollin L. Gerstacker Foundation, and a Director of the Naples Philharmonic Center for the Arts. Previously, Mr. Stavropoulos served as a Director of Chemical Financial Corporation (bank holding company, 1993-2012) and Tyco International, Ltd. (multinational manufacturing and services, 2007-2012). |
|
David M. Thomas (1949) |
|
|
Year of Election or Appointment: 2008 Trustee |
|
|
|
Mr. Thomas also serves as Trustee of other Fidelity funds. Mr. Thomas serves as Non-Executive Chairman of the Board of Directors of Fortune Brands Home and Security (home and security products, 2011-present), and as a member of the Board of Directors of Interpublic Group of Companies, Inc. (marketing communication, 2004-present). Previously, Mr. Thomas served as Executive Chairman (2005-2006) and Chairman and Chief Executive Officer (2000-2005) of IMS Health, Inc. (pharmaceutical and healthcare information solutions), and a Director of Fortune Brands, Inc. (consumer products, 2000-2011). |
+ The information above includes each Trustee's principal occupation during the last five years and other information relating to the experience, attributes, and skills relevant to each Trustee's qualifications to serve as a Trustee, which led to the conclusion that each Trustee should serve as a Trustee for the fund.
Advisory Board Member and Officers:
Correspondence intended for each officer and Peter S. Lynch may be sent to Fidelity Investments, 245 Summer Street, Boston, Massachusetts 02210. Officers appear below in alphabetical order.
|
Name, Year of Birth; Principal Occupation |
|
|
Peter S. Lynch (1944) |
|
|
Year of Election or Appointment: 2003 Member of the Advisory Board |
|
|
|
Mr. Lynch also serves as Member of the Advisory Board of other Fidelity funds. Mr. Lynch is Vice Chairman and a Director of FMR and FMR Co., Inc. In addition, Mr. Lynch serves as a Trustee of Boston College and as the Chairman of the Inner-City Scholarship Fund. Previously, Mr. Lynch served on the Special Olympics International Board of Directors (1997-2006). |
|
Elizabeth Paige Baumann (1968) |
|
|
Year of Election or Appointment: 2012 Anti-Money Laundering (AML) Officer |
|
|
|
Ms. Baumann also serves as AML Officer of other funds. She is Chief AML Officer of FMR LLC (2012-present) and is an employee of Fidelity Investments. Previously, Ms. Baumann served as Vice President and Deputy Anti-Money Laundering Officer (2007-2012). |
|
William C. Coffey (1969) |
|
|
Year of Election or Appointment: 2009 Assistant Secretary |
|
|
|
Mr. Coffey also serves as Assistant Secretary of other funds. He is Senior Vice President and Deputy General Counsel of FMR LLC (2010-present), and is an employee of Fidelity Investments. Previously, Mr. Coffey served as Vice President and Associate General Counsel of FMR LLC (2005-2009). |
|
Jonathan Davis (1968) |
|
|
Year of Election or Appointment: 2010 Assistant Treasurer |
|
|
|
Mr. Davis also serves as Assistant Treasurer of other funds. Mr. Davis is an employee of Fidelity Investments. Previously, Mr. Davis served as Vice President and Associate General Counsel of FMR LLC (2003-2010). |
|
Adrien E. Deberghes (1967) |
|
|
Year of Election or Appointment: 2008 Deputy Treasurer |
|
|
|
Mr. Deberghes also serves as an officer of other funds. He is an employee of Fidelity Investments (2008-present). Prior to joining Fidelity Investments, Mr. Deberghes was Senior Vice President of Mutual Fund Administration at State Street Corporation (2007-2008), Senior Director of Mutual Fund Administration at Investors Bank & Trust (2005-2007), and Director of Finance for Dunkin' Brands (2000-2005). |
|
Stephanie J. Dorsey (1969) |
|
|
Year of Election or Appointment: 2010 Assistant Treasurer |
|
|
|
Ms. Dorsey also serves as an officer of other funds. She is an employee of Fidelity Investments (2008-present) and has served in other fund officer roles. Prior to joining Fidelity Investments, Ms. Dorsey served as Treasurer (2004-2008) of the JPMorgan Mutual Funds and Vice President (2004-2008) of JPMorgan Chase Bank. |
|
Scott C. Goebel (1968) |
|
|
Year of Election or Appointment: 2008 Secretary and Chief Legal Officer (CLO) |
|
|
|
Mr. Goebel serves as Secretary and CLO of other funds. Mr. Goebel also serves as Secretary of Fidelity Investments Money Management, Inc. (FIMM) (2010-present) and Fidelity Research and Analysis Company (FRAC) (2010-present); General Counsel, Secretary, and Senior Vice President of FMR (2008-present) and FMR Co., Inc. (2008-present); Chief Legal Officer of Fidelity Management & Research (Hong Kong) Limited (2008-present) and Assistant Secretary of Fidelity Management & Research (Japan) Inc. (2008-present), and Fidelity Management & Research (U.K.) Inc. (2008-present). Previously, Mr. Goebel served as Secretary and CLO of other Fidelity funds (2008-2013), Assistant Secretary of FIMM (2008-2010), FRAC (2008-2010), and certain funds (2007-2008); and as Vice President and Secretary of Fidelity Distributors Corporation (FDC) (2005-2007). Mr. Goebel has been employed by FMR LLC or an affiliate since 2001. |
|
Joseph A. Hanlon (1968) |
|
|
Year of Election or Appointment: 2012 Chief Compliance Officer |
|
|
|
Mr. Hanlon also serves as Chief Compliance Officer of other funds. Mr. Hanlon serves as Compliance Officer of FMR, FMR Co., Inc., Fidelity Investments Money Management, Inc. (FIMM), Fidelity Research and Analysis Company (FRAC), and Fidelity Management & Research (Hong Kong) (2009-present), as Senior Vice President of the Fidelity Asset Management Division (2009-present), and is an employee of Fidelity Investments. Previously, Mr. Hanlon served as Compliance Officer of Fidelity Management & Research (Japan) Inc. (2009-2013), Strategic Advisers, Inc. (2009-2013), and Fidelity Management & Research (U.K.) Inc. (2009-2013). |
|
Bruce T. Herring (1965) |
|
|
Year of Election or Appointment: 2006 Vice President of certain Equity Funds |
|
|
|
Mr. Herring also serves as Vice President of other funds. He serves as Chief Investment Officer of Fidelity Global Asset Allocation (GAA) (2013-present), Group Chief Investment Officer of FMR, and President of Fidelity Research & Analysis Company (2010-present). Previously, Mr. Herring served as Chief Investment Officer and Director of Fidelity Management & Research (U.K.) Inc. (2010-2013), Vice President (2005-2006) and Senior Vice President (2006-2007) of Fidelity Management & Research Company, Vice President of FMR Co., Inc. (2001-2007), and as a portfolio manager for Fidelity U.S. Equity Funds. |
|
Brian B. Hogan (1964) |
|
|
Year of Election or Appointment: 2009 Vice President |
|
|
|
Mr. Hogan also serves as Vice President of other funds. Mr. Hogan serves as President of FMR's Equity Division (2009-present). Previously, Mr. Hogan served as Senior Vice President, Equity Research of FMR (2006-2009) and as a portfolio manager. |
|
Chris Maher (1972) |
|
|
Year of Election or Appointment: 2013 Assistant Treasurer |
|
|
|
Mr. Maher serves as Assistant Treasurer of other funds. Mr. Maher is Vice President of Valuation Oversight and is an employee of Fidelity Investments. Previously, Mr. Maher served as Vice President of Asset Management Compliance (2013), Vice President of FMR's Program Management Group (2010-2013), and Vice President of Valuation Oversight (2008-2010). |
|
Christine Reynolds (1958) |
|
|
Year of Election or Appointment: 2008 Chief Financial Officer |
|
|
|
Ms. Reynolds also serves as Chief Financial Officer of other funds. Ms. Reynolds became President of Fidelity Pricing and Cash Management Services (FPCMS) in August 2008. Ms. Reynolds served as Chief Operating Officer of FPCMS (2007-2008). Previously, Ms. Reynolds served as President, Treasurer, and Anti-Money Laundering officer of the Fidelity funds (2004-2007). |
|
Kenneth B. Robins (1969) |
|
|
Year of Election or Appointment: 2008 President and Treasurer |
|
|
|
Mr. Robins also serves as an officer of other funds. Mr. Robins serves as Executive Vice President of Fidelity Investments Money Management, Inc. (FIMM) (2013-present) and is an employee of Fidelity Investments (2004-present). Previously, Mr. Robins served in other fund officer roles. |
|
Gary W. Ryan (1958) |
|
|
Year of Election or Appointment: 2005 Assistant Treasurer |
|
|
|
Mr. Ryan also serves as Assistant Treasurer of other funds. Mr. Ryan is an employee of Fidelity Investments and has served in other fund officer roles. Previously, Mr. Ryan served as Vice President of Fund Reporting in Fidelity Pricing and Cash Management Services (FPCMS) (1999-2005). |
|
Stephen Sadoski (1971) |
|
|
Year of Election or Appointment: 2012 Deputy Treasurer |
|
|
|
Mr. Sadoski also serves as Deputy Treasurer of other funds. He is an employee of Fidelity Investments (2012-present) and has served in another fund officer role. Prior to joining Fidelity Investments, Mr. Sadoski served as an assistant chief accountant in the Division of Investment Management of the Securities and Exchange Commission (SEC) (2009-2012) and as a senior manager at Deloitte & Touche LLP (1997-2009). |
|
Stacie M. Smith (1974) |
|
|
Year of Election or Appointment: 2013 Deputy Treasurer |
|
|
|
Ms. Smith also serves as an officer of other funds. She is an employee of Fidelity Investments (2009-present) and has served in other fund officer roles. Prior to joining Fidelity Investments, Ms. Smith served as Senior Audit Manager of Ernst & Young LLP (1996-2009). |
|
Renee Stagnone (1975) |
|
|
Year of Election or Appointment: 2013 Deputy Treasurer |
|
|
|
Ms. Stagnone also serves as Deputy Treasurer of other funds. Ms. Stagnone is an employee of Fidelity Investments. |
|
Joseph F. Zambello (1957) |
|
|
Year of Election or Appointment: 2011 Deputy Treasurer |
|
|
|
Mr. Zambello also serves as Deputy Treasurer of other funds. Mr. Zambello is an employee of Fidelity Investments. Previously, Mr. Zambello served as Vice President of FMR's Program Management Group (2009-2011) and Vice President of the Transfer Agent Oversight Group (2005-2009). |
Annual Report
Board Approval of Investment Advisory Contracts and Management Fees
Fidelity Advisor Equity Growth Fund
Each year, the Board of Trustees, including the Independent Trustees (together, the Board), votes on the renewal of the management contract and sub-advisory agreements (together, the Advisory Contracts) for the fund. The Board, assisted by the advice of fund counsel and Independent Trustees' counsel, requests and considers a broad range of information relevant to the renewal of the Advisory Contracts throughout the year.
The Board meets regularly and, at each of its meetings, covers an extensive agenda of topics and materials and considers factors that are relevant to its annual consideration of the renewal of the fund's Advisory Contracts, including the services and support provided to the fund and its shareholders. The Board has established various standing committees, each composed of and chaired by Independent Trustees with varying backgrounds, to which the Board has assigned specific subject matter responsibilities in order to enhance effective decision-making by the Board. The Board, acting directly and through its Committees, requests and receives information concerning the annual consideration of the renewal of the fund's Advisory Contracts. The Board also meets as needed to consider matters specifically related to the Board's annual consideration of the renewal of Advisory Contracts. Members of the Board may also meet with trustees of other Fidelity funds through ad hoc joint committees to discuss certain matters relevant to the Fidelity funds.
At its July 2013 meeting, the Board, including the Independent Trustees, unanimously determined to renew the fund's Advisory Contracts. In reaching its determination, the Board considered all factors it believed relevant, including (i) the nature, extent, and quality of the services to be provided to the fund and its shareholders (including the investment performance of the fund); (ii) the competitiveness of the fund's management fee and total expense ratio relative to peer funds; (iii) the total costs of the services to be provided by and the profits to be realized by Fidelity from its relationship with the fund; (iv) the extent to which economies of scale exist and would be realized as the fund grows; and (v) whether fee levels reflect these economies of scale, if any, for the benefit of fund shareholders.
In considering whether to renew the Advisory Contracts for the fund, the Board reached a determination, with the assistance of fund counsel and Independent Trustees' counsel and through the exercise of its business judgment, that the renewal of the Advisory Contracts was in the best interests of the fund and its shareholders and that the compensation payable under the Advisory Contracts was fair and reasonable. The Board's decision to renew the Advisory Contracts was not based on any single factor, but rather was based on a comprehensive consideration of all the information provided to the Board at its meetings throughout the year. The Board, in reaching its determination to renew the Advisory Contracts, was aware that shareholders in the fund have a broad range of investment choices available to them, including a wide choice among mutual funds offered by Fidelity's competitors, and that the fund's shareholders, who have the opportunity to review and weigh the disclosure provided by the fund in its prospectus and other public disclosures, have chosen to invest in this fund, which is a part of the Fidelity family of funds.
Annual Report
Board Approval of Investment Advisory Contracts and
Management Fees - continued
Nature, Extent, and Quality of Services Provided. The Board considered the staffing within the investment adviser, Fidelity Management & Research Company (FMR), and the sub-advisers (together, the Investment Advisers) as it relates to the fund, including the backgrounds of the fund's investment personnel, and also considered the fund's investment objective, strategies, and related investment philosophy. The Independent Trustees also had discussions with senior management of Fidelity's investment operations and investment groups. The Board considered the structure of the portfolio manager compensation program and whether this structure provides appropriate incentives to act in the best interests of the fund.
Resources Dedicated to Investment Management and Support Services. The Board and the Fund Oversight and Research Committees reviewed the general qualifications and capabilities of the Investment Advisers' investment staff, including its size, education, experience, and resources, as well as the Investment Advisers' approach to recruiting, training, managing, and compensating investment personnel. The Board noted that FMR has continued to increase the resources devoted to non-U.S. offices, including expansion of Fidelity's global investment organization. The Board also noted that Fidelity's analysts have extensive resources, tools and capabilities that allow them to conduct sophisticated quantitative and fundamental analysis, as well as credit analysis of issuers, counterparties and guarantors. Further, the Board believes that Fidelity's investment professionals have sufficient access to global information and data so as to provide competitive investment results over time, and that those professionals also have access to sophisticated tools that permit them to assess portfolio construction and risk and performance attribution characteristics continuously, as well as to transmit new information and research conclusions rapidly around the world. Additionally, in its deliberations, the Board considered the Investment Advisers' trading and risk management capabilities and resources, which are an integral part of the investment management process.
Shareholder and Administrative Services. The Board considered (i) the nature, extent, quality, and cost of advisory, administrative, and shareholder services performed by the Investment Advisers and their affiliates under the Advisory Contracts and under separate agreements covering transfer agency, pricing and bookkeeping, and securities lending services for the fund; (ii) the nature and extent of the supervision of third party service providers, principally custodians and subcustodians; and (iii) the resources devoted to, and the record of compliance with, the fund's compliance policies and procedures. The Board also reviewed the allocation of fund brokerage, including allocations to brokers affiliated with the Investment Advisers, the use of brokerage commissions to pay fund expenses, and the use of "soft" commission dollars to pay for research services.
Annual Report
The Board noted that the growth of fund assets over time across the complex allows Fidelity to reinvest in the development of services designed to enhance the value or convenience of the Fidelity funds as investment vehicles. These services include 24-hour access to account information and market information through telephone representatives and over the Internet, investor education materials and asset allocation tools, and the expanded availability of Fidelity Investor Centers.
Investment in a Large Fund Family. The Board considered the benefits to shareholders of investing in a Fidelity fund, including the benefits of investing in a fund that is part of a large family of funds offering a variety of investment disciplines and providing a large variety of mutual fund investor services. The Board noted that Fidelity had taken, or had made recommendations that resulted in the Fidelity funds taking, a number of actions over the previous year that benefited particular funds, including (i) continuing to dedicate additional resources to investment research and to the support of the senior management team that oversees asset management; (ii) persisting in efforts to enhance Fidelity's global research capabilities; (iii) launching new funds and making other enhancements to meet client needs for global and income-oriented solutions; (iv) continuing to launch dedicated lower cost underlying funds to meet portfolio construction needs related to expanding underlying fund options for Fidelity funds of funds, specifically for the Freedom Fund product lines; (v) rationalizing product lines and gaining increased efficiencies through the mergers of several funds into other funds; (vi) strengthening Fidelity's index fund offerings by reducing investment minimums and adopting or lowering existing expense caps for certain funds and classes; (vii) enhancing Global Asset Allocation product offerings by launching new funds and strategies, including "open architecture" target date funds that utilize affiliated and unaffiliated sub-advisers; (viii) modifying the eligibility criteria for Institutional Class shares of Advisor funds to increase their marketability to a portion of the defined contribution plan market; (ix) creating a new low-cost retirement share class for certain Advisor funds to appeal to large retirement plans; (x) transitioning the management of certain Fidelity commodity funds to Geode Capital Management LLC, a registered commodity pool operator, while retaining administrative responsibilities for the funds; (xi) reorganizing a number of funds; and (xii) taking steps toward establishing a new Fidelity adviser to manage sector-based funds and products.
Investment Performance. The Board considered whether the fund has operated in accordance with its investment objective, as well as its record of compliance with its investment restrictions and its performance history.
The Board took into account discussions with the Investment Advisers about fund investment performance that occur at Board meetings throughout the year. In this regard the Board noted that as part of regularly scheduled fund reviews and other reports to the Board on fund performance, the Board periodically considers annualized return information for the fund, for different time periods, measured against a securities market index ("benchmark index") and a peer group of mutual funds with similar objectives ("peer group"). In its evaluation of fund investment performance, the Board gave particular attention to information indicating changes in performance of certain Fidelity funds for specific time periods and the Investment Advisers' explanations for any overperformance or underperformance.
Annual Report
Board Approval of Investment Advisory Contracts and
Management Fees - continued
In addition to reviewing absolute and relative fund performance, the Independent Trustees periodically consider the appropriateness of fund performance metrics in evaluating the results achieved. In general, the Independent Trustees believe that fund performance should be evaluated based on net performance (after fees and expenses) of both the highest performing and lowest performing classes, where applicable, compared to appropriate benchmark indices, over appropriate time periods which may include full market cycles, and compared to peer groups, as applicable, over the same periods, taking into account relevant factors including the following: general market conditions; issuer-specific information; tactical opportunities for investment; and fund cash flows and other factors.
The Independent Trustees recognize that shareholders evaluate performance on a net basis over their own holding periods, for which one-, three-, and five-year periods are used as a proxy. For this reason, the performance information reviewed by the Board also included net cumulative calendar year total return information for the fund and an appropriate benchmark index and peer group for the most recent one-, three-, and five-year periods, as shown below. Returns are shown compared to the 25th percentile (top of box) and 75th percentile (bottom of box) of the peer universe.
Annual Report
Fidelity Advisor Equity Growth Fund

Based on its review, the Board concluded that the nature, extent, and quality of services provided to the fund under the Advisory Contracts should benefit the fund's shareholders.
Competitiveness of Management Fee and Total Expense Ratio. The Board considered the fund's management fee and total expense ratio compared to "mapped groups" of competitive funds and classes. Fidelity creates "mapped groups" by combining similar Lipper investment objective categories that have comparable management fee characteristics. Combining Lipper investment objective categories aids the Board's management fee and total expense ratio comparisons by broadening the competitive group used for comparison and by reducing the number of universes to which various Fidelity funds are compared.
Management Fee. The Board considered two proprietary management fee comparisons for the 12-month periods shown in the chart below. The group of Lipper funds used by the Board for management fee comparisons is referred to below as the "Total Mapped Group." The Total Mapped Group comparison focuses on a fund's standing in terms of gross management fees before expense reimbursements or caps relative to the total universe of funds with comparable investment mandates, regardless of whether their management fee structures also are comparable. Funds with comparable investment mandates offer exposure to similar types of securities. Funds with comparable management fee structures have similar management fee contractual arrangements (e.g., flat rate charged for advisory services, all-inclusive fee rate, etc.). "TMG %" represents the percentage of funds in the Total Mapped Group that had management fees that were lower than the fund's. For example, a TMG % of 11% means that 89% of the funds in the Total Mapped Group had higher management fees than the fund. The "Asset-Size Peer Group" (ASPG) comparison focuses on a fund's standing relative to a subset of non-Fidelity funds within the Total Mapped Group that are similar in size and management fee structure. The ASPG represents at least 15% of the funds in the Total Mapped Group with comparable asset size and management fee structures, subject to a minimum of 50 funds (or all funds in the Total Mapped Group if fewer than 50). Additional information, such as the ASPG quartile in which the fund's management fee ranked, is also included in the chart and considered by the Board.
Annual Report
Board Approval of Investment Advisory Contracts and
Management Fees - continued
Fidelity Advisor Equity Growth Fund

The Board noted that the fund's management fee ranked below the median of its Total Mapped Group and below the median of its ASPG for 2012.
Based on its review, the Board concluded that the fund's management fee is fair and reasonable in light of the services that the fund receives and the other factors considered.
Total Expense Ratio. In its review of each class's total expense ratio, the Board considered the fund's management fee as well as other fund or class expenses, as applicable, such as transfer agent fees, pricing and bookkeeping fees, fund-paid 12b-1 fees, and custodial, legal, and audit fees. The Board also noted the effects of any waivers and reimbursements on fees and expenses. As part of its review, the Board also considered the current and historical total expense ratios of each class of the fund compared to competitive fund median expenses. Each class of the fund is compared to those funds and classes in the Total Mapped Group (used by the Board for management fee comparisons) that have a similar sales load structure.
Annual Report
The Board noted that the total expense ratio of each of Class A, Class B, Class C, and Institutional Class ranked below its competitive median for 2012 and the total expense ratio of Class T ranked above its competitive median for 2012. The Board considered that, in general, various factors can affect total expense ratios. The Board noted that the total expense ratio of Class T was above the competitive median primarily because of higher 12b-1 fees on Class T. Class T has a higher 12b-1 fee, but a lower front-end sales charge, than traditionally priced front-end sales charge classes. The Board considered that Class T is primarily sold load-waived in the retirement plan market where its 0.50% 12b-1 fee is comparable to competing no-load, higher 12b-1 fee classes designed specifically for retirement plans. The Board noted that the fund offers multiple classes, each of which has a different sales load and 12b-1 fee structure, and that the multiple structures are intended to offer a range of pricing options for the intermediary market. The Board also noted that the total expense ratios of the classes vary primarily by the level of their 12b-1 fees, although differences in transfer agent fees may also cause expenses to vary from class to class.
Fees Charged to Other Fidelity Clients. The Board also considered Fidelity fee structures and other information with respect to clients of FMR and its affiliates, such as other mutual funds advised or subadvised by FMR or its affiliates, pension plan clients, and other institutional clients. The Board noted the findings of the 2013 ad hoc joint committee (created with the board of other Fidelity funds), which reviewed and compared Fidelity's institutional investment advisory business with its business of providing services to the Fidelity funds, including the differences in services provided, fees charged, and costs incurred, as well as competition in their respective marketplaces.
Based on its review of total expense ratios and fees charged to other Fidelity clients, the Board concluded that the total expense ratio of each class of the fund was reasonable, although Class T was above the median of the universe presented for comparison, in light of the services that the fund and its shareholders receive and the other factors considered.
Costs of the Services and Profitability. The Board considered the revenues earned and the expenses incurred by Fidelity in conducting the business of developing, marketing, distributing, managing, administering and servicing the fund and servicing the fund's shareholders. The Board also considered the level of Fidelity's profits in respect of all the Fidelity funds.
On an annual basis, FMR presents to the Board Fidelity's profitability for the fund. Fidelity calculates the profitability for each fund, as well as aggregate profitability for groups of Fidelity funds and all Fidelity funds, using a series of detailed revenue and cost allocation methodologies which originate with the books and records of Fidelity on which Fidelity's audited financial statements are based. The Audit Committee of the Board reviews any significant changes from the prior year's methodologies.
Annual Report
Board Approval of Investment Advisory Contracts and
Management Fees - continued
PricewaterhouseCoopers LLP (PwC), independent registered public accounting firm and auditor to Fidelity and certain Fidelity funds, has been engaged annually by the Board as part of the Board's assessment of Fidelity's profitability analysis. PwC's engagement includes the review and assessment of the methodologies used by Fidelity in determining the revenues and expenses attributable to Fidelity's mutual fund business, and completion of agreed-upon procedures surrounding the mathematical accuracy of fund profitability and its conformity to allocation methodologies. After considering PwC's reports issued under the engagement and information provided by Fidelity, the Board concluded that while other allocation methods may also be reasonable, Fidelity's profitability methodologies are reasonable in all material respects.
The Board also reviewed Fidelity's non-fund businesses and fall-out benefits related to the mutual fund business as well as cases where Fidelity's affiliates may benefit from or be related to the fund's business.
The Board considered the costs of the services provided by and the profits realized by Fidelity in connection with the operation of the fund and was satisfied that the profitability was not excessive in the circumstances.
Economies of Scale. The Board considered whether there have been economies of scale in respect of the management of the Fidelity funds, whether the Fidelity funds (including the fund) have appropriately benefited from any such economies of scale, and whether there is potential for realization of any further economies of scale. The Board considered the extent to which the fund will benefit from economies of scale through increased services to the fund, through waivers or reimbursements, or through fee or expense reductions. The Board also noted that in 2009, it and the board of other Fidelity funds created an ad hoc committee (the Economies of Scale Committee) to analyze whether FMR attains economies of scale in respect of the management and servicing of the Fidelity funds, whether the Fidelity funds have appropriately benefited from such economies of scale, and whether there is potential for realization of any further economies of scale.
The Board recognized that the fund's management contract incorporates a "group fee" structure, which provides for lower group fee rates as total fund assets under FMR's management increase, and for higher group fee rates as total fund assets under FMR's management decrease. FMR calculates the group fee rates based on a tiered asset "breakpoint" schedule that varies based on asset class. The Board considered that the group fee is designed to deliver the benefits of economies of scale to fund shareholders when total Fidelity fund assets increase, even if assets of any particular fund are unchanged or have declined, because some portion of Fidelity's costs are attributable to services provided to all Fidelity funds, and all funds benefit if those costs can be allocated among more assets. The Board concluded that, given the group fee structure, fund shareholders will benefit from lower management fees as assets under FMR's management increase at the fund complex level, regardless of whether Fidelity achieves any such economies of scale.
Annual Report
The Board concluded, taking into account the analysis of the Economies of Scale Committee, that economies of scale, if any, are being appropriately shared between fund shareholders and Fidelity.
Amendment to Description of Group Fee Rate. At its July 2013 meeting, the Board voted to approve an amendment to the fund's management contract to modify the description of the "group fee rate" effective August 1, 2013. The Board noted that under the prior description in the contract, the group fee rate was based on the average net assets of all registered investment companies with which FMR has management contracts. Under the contract's tiered asset breakpoint schedule, the group fee rate is lower as total fund assets under FMR's management increase, and higher as total fund assets under FMR's management decrease. The Board considered that the prior description would have excluded the assets of 64 Fidelity sector funds from the group fee rate calculation once Fidelity SelectCo, LLC, an affiliate of FMR, assumed management responsibilities for those funds. The Board noted that modifying the description of the group fee rate to continue to include the assets of those 64 funds for purposes of determining group fee rate breakpoints would avoid an immediate adverse impact on the group fee rate for any fund.
Additional Information Requested by the Board. In order to develop fully the factual basis for consideration of the Fidelity funds' Advisory Contracts, the Board requested and received additional information on certain topics, including: (i) fund performance trends and Fidelity's long-term strategies for certain funds; (ii) the potential to further rationalize the Fidelity fund lineup with the possibility of achieving savings for the funds and Fidelity; (iii) the methodology with respect to competitive fund data and peer group classifications; (iv) the arrangements with, and performance of, certain sub-advisers on behalf of the Fidelity funds, as well as certain proposed participating affiliate arrangements; (v) the realization of fall-out benefits in certain Fidelity business units; (vi) Fidelity's group fee structures, including the rationale for the individual fee rates of certain categories of funds and the definition of group assets; (vii) trends regarding industry use of performance fee structures and the performance adjustment methodologies applicable to the Fidelity funds; (viii) additional competitive analysis regarding the total expenses for certain classes; and (ix) fund profitability methodology, including Fidelity's cost allocation methodology, and the impact of certain factors on fund profitability results.
Annual Report
Board Approval of Investment Advisory Contracts and
Management Fees - continued
Based on its evaluation of all of the conclusions noted above, and after considering all factors it believed relevant, the Board ultimately concluded that the advisory fee structures are fair and reasonable, and that the fund's Advisory Contracts should be renewed.
Annual Report
Investment Adviser
Fidelity Management & Research Company
Boston, MA
Investment Sub-Advisers
FMR Co., Inc.
Fidelity Management & Research
(U.K.) Inc.
Fidelity Management & Research
(Hong Kong) Limited
Fidelity Management & Research
(Japan) Inc.
General Distributor
Fidelity Distributors Corporation
Smithfield, RI
Transfer and Service Agents
Fidelity Investments Institutional Operations Company, Inc.
Boston, MA
Fidelity Service Company, Inc.
Boston, MA
Custodian
JPMorgan Chase Bank
New York, NY
(Fidelity Investment logo)(registered trademark)
EPGZ-UANN-0114 1.9585492.100
(Fidelity Investment logo)(registered trademark)
Fidelity Advisor®
Equity Income
Fund - Class A, Class T, Class B and Class C
Annual Report
November 30, 2013
(Fidelity Cover Art)
Contents
|
Performance |
How the fund has done over time. |
|
|
Management's Discussion of Fund Performance |
The Portfolio Manager's review of fund performance and strategy. |
|
|
Shareholder Expense Example |
An example of shareholder expenses. |
|
|
Investment Changes |
A summary of major shifts in the fund's investments over the past six months. |
|
|
Investments |
A complete list of the fund's investments with their market values. |
|
|
Financial Statements |
Statements of assets and liabilities, operations, and changes in net assets, as well as financial highlights. |
|
|
Notes |
Notes to the financial statements. |
|
|
Report of Independent Registered Public Accounting Firm |
|
|
|
Trustees and Officers |
|
|
|
Distributions |
|
|
|
Board Approval of Investment Advisory Contracts and Management Fees |
|
To view a fund's proxy voting guidelines and proxy voting record for the 12-month period ended June 30, visit http://www.fidelity.com/proxyvotingresults or visit the Securities and Exchange Commission's (SEC) web site at http://www.sec.gov. You may also call 1-877-208-0098 to request a free copy of the proxy voting guidelines.
Standard & Poor's, S&P and S&P 500 are registered service marks of The McGraw-Hill Companies, Inc. and have been licensed for use by Fidelity Distributors Corporation.
Other third-party marks appearing herein are the property of their respective owners.
All other marks appearing herein are registered or unregistered trademarks or service marks of FMR LLC or an affiliated company. © 2014 FMR LLC. All rights reserved.
Annual Report
This report and the financial statements contained herein are submitted for the general information of the shareholders of the fund. This report is not authorized for distribution to prospective investors in the fund unless preceded or accompanied by an effective prospectus.
A fund files its complete schedule of portfolio holdings with the SEC for the first and third quarters of each fiscal year on Form N-Q. Forms N-Q are available on the SEC's web site at http://www.sec.gov. A fund's Forms N-Q may be reviewed and copied at the SEC's Public Reference Room in Washington, DC. Information regarding the operation of the SEC's Public Reference Room may be obtained by calling 1-800-SEC-0330. For a complete list of a fund's portfolio holdings, view the most recent holdings listing, semiannual report, or annual report on Fidelity's web site at http://www.fidelity.com, http://www.advisor.fidelity.com, or http://www.401k.com, as applicable.
NOT FDIC INSURED • MAY LOSE VALUE • NO BANK GUARANTEE
Neither the fund nor Fidelity Distributors Corporation is a bank.
Annual Report
Performance: The Bottom Line
Average annual total return reflects the change in the value of an investment, assuming reinvestment of the class' distributions from dividend income and capital gains (the profits earned upon the sale of securities that have grown in value, if any) and assuming a constant rate of performance each year. The $10,000 table and the fund's returns do not reflect the deduction of taxes that a shareholder would pay on fund distributions or the redemption of fund shares. During periods of reimbursement by Fidelity, a fund's total return will be greater than it would be had the reimbursement not occurred. How a fund did yesterday is no guarantee of how it will do tomorrow. Returns reflect the conversion of Class B shares to Class A shares after a maximum of seven years.
Average Annual Total Returns
|
Periods ended November 30, 2013 |
Past 1 |
Past 5 |
Past 10 |
|
Class A (incl. 5.75% sales charge) |
19.16% |
14.41% |
5.95% |
|
Class T (incl. 3.50% sales charge) |
21.73% |
14.73% |
5.99% |
|
Class B (incl. contingent deferred sales charge) A |
20.39% |
14.64% |
5.98% |
|
Class C (incl. contingent deferred sales charge) B |
24.46% |
14.89% |
5.77% |
A Class B shares' contingent deferred sales charges included in the past one year, past five years, and past ten years total return figures are 5%, 2%, and 0%, respectively.
B Class C shares' contingent deferred sales charges included in the past one year, past five years, and past ten years total return figures are 1%, 0%, and 0%, respectively.
Annual Report
$10,000 Over 10 Years
Let's say hypothetically that $10,000 was invested in Fidelity Advisor® Equity Income Fund - Class A on November 30, 2003, and the current 5.75% sales charge was paid. The chart shows how the value of your investment would have changed, and also shows how the Russell 3000® Value Index performed over the same period.
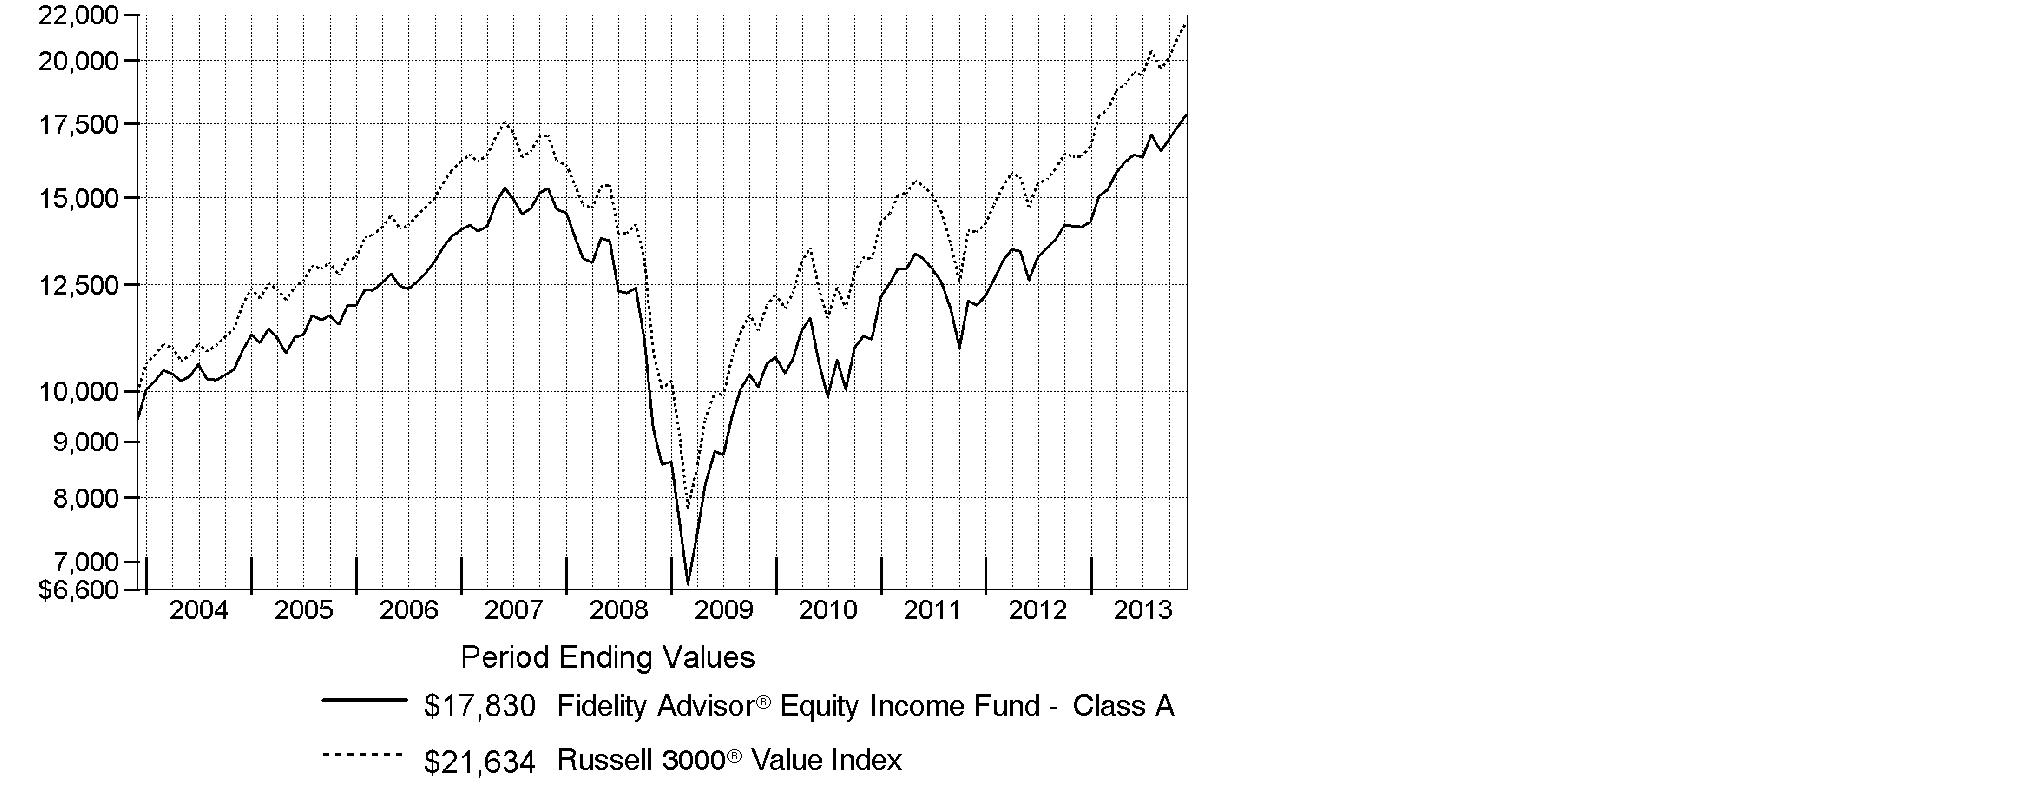
Annual Report
Management's Discussion of Fund Performance
Market Recap: With the current bull run nearing the five-year mark, equity benchmarks ripped up old records during the 12 months ending November 30, 2013. Gains were fueled by strengthening U.S. economic data, as well as generally improving economies and accommodative monetary policies worldwide. The broad S&P 500® Index reached new peaks in its 30.30% climb for the period, and the blue-chip Dow Jones Industrial AverageSM surpassed historic milestones en route to a 26.63% gain. The Nasdaq Composite Index®, up 36.73% amid a resurgence in growth-oriented stocks, closed above 4,000 for the first time since 2000. Shedding anxiety over the 2012 U.S. presidential election - and apparently confident that the federal debt-ceiling debate would be resolved - markets rose from period start through late May. News that the U.S. Federal Reserve was considering an end to its stimulative bond-buying kept stocks in flux over the summer but, by September, the Fed had set aside any imminent tapering. Despite jitters over a potential U.S. military strike in Syria and, later, an October budget impasse that briefly shuttered the federal government, volatility was subdued heading into the holidays, with investor optimism helping many markets home in on all-time highs at period end. Elsewhere, non-U.S. developed-market equities saw similar results, with the MSCI® EAFE® Index adding 24.97%.
Comments from James Morrow, Portfolio Manager of Fidelity Advisor® Equity Income Fund: For the year, the fund's Class A, Class T, Class B and Class C shares gained 26.43%, 26.14%, 25.39% and 25.46%, respectively (excluding sales charges), compared with 32.36% for the Russell 3000® Value Index. Versus the index, stock selection was particularly challenging, especially in information technology, industrials and energy. The fund's average cash stake of roughly 5% also detracted. However, underweighting the lagging real estate, utilities and materials groups contributed. The fund's biggest individual relative detractor was a sizable out-of-index stake in diversified technology company IBM, which failed to keep pace with the fast-growing, momentum-oriented stocks that led the market. On the positive side, we were helped by a substantial underweighting in energy giant Exxon Mobil, a relatively slow-growth business that could not keep pace with the fast-rising market. Tempering this positive impact, however, was the fund's out-of-benchmark allocation to Europe-based energy producer Royal Dutch Shell. Over time, it became clear that the company's dividend was not growing as fast as I had expected, and I significantly reduced the fund's position by period end.
Annual Report
The views expressed above reflect those of the portfolio manager(s) only through the end of the period as stated on the cover of this report and do not necessarily represent the views of Fidelity or any other person in the Fidelity organization. Any such views are subject to change at any time based upon market or other conditions and Fidelity disclaims any responsibility to update such views. These views may not be relied on as investment advice and, because investment decisions for a Fidelity fund are based on numerous factors, may not be relied on as an indication of trading intent on behalf of any Fidelity fund.
Annual Report
Shareholder Expense Example
As a shareholder of the Fund, you incur two types of costs: (1) transaction costs, including sales charges (loads) on purchase payments or redemption proceeds, and (2) ongoing costs, including management fees, distribution and/or service (12b-1) fees and other Fund expenses. This Example is intended to help you understand your ongoing costs (in dollars) of investing in the Fund and to compare these costs with the ongoing costs of investing in other mutual funds.
The actual expense Example is based on an investment of $1,000 invested at the beginning of the period and held for the entire period (June 1, 2013 to November 30, 2013) for Class A, Class T, Class B, Class C and Institutional Class and for the period (August 13, 2013 to November 30, 2013) for Class Z. The hypothetical expense Example is based on an investment of $1,000 invested for the one-half year period (June 1, 2013 to November 30, 2013).
Actual Expenses
The first line of the accompanying table for each class of the Fund provides information about actual account values and actual expenses. You may use the information in this line, together with the amount you invested, to estimate the expenses that you paid over the period. Simply divide your account value by $1,000.00 (for example, an $8,600 account value divided by $1,000.00 = 8.6), then multiply the result by the number in the first line for a class of the Fund under the heading entitled "Expenses Paid During Period" to estimate the expenses you paid on your account during this period. In addition, the Fund, as a shareholder in the underlying Fidelity Central Funds, will indirectly bear its pro-rata share of the fees and expenses incurred by the underlying Fidelity Central Funds. These fees and expenses are not included in the Fund's annualized expense ratio used to calculate the expense estimate in the table below.
Hypothetical Example for Comparison Purposes
The second line of the accompanying table for each class of the Fund provides information about hypothetical account values and hypothetical expenses based on a Class' actual expense ratio and an assumed rate of return of 5% per year before expenses, which is not the Class' actual return. The hypothetical account values and expenses may not be used to estimate the actual ending account balance or expenses you paid for the period. You may use this information to compare the ongoing costs of investing in the Fund and other funds. To do so, compare this 5% hypothetical example with the 5% hypothetical examples that appear in the shareholder reports of the other funds. In addition, the Fund, as a shareholder in the underlying Fidelity Central Funds, will indirectly bear its pro-rata share of the fees and expenses incurred by the underlying Fidelity Central Funds. These fees and expenses are not included in the Fund's annualized expense ratio used to calculate the expense estimate in the table below.
Please note that the expenses shown in the table are meant to highlight your ongoing costs only and do not reflect any transaction costs. Therefore, the second line of the table is useful in comparing ongoing costs only, and will not help you determine the relative total costs of owning different funds. In addition, if these transactional costs were included, your costs would have been higher.
Annual Report
|
|
Annualized |
Beginning |
Ending |
Expenses Paid |
|
Class A |
.97% |
|
|
|
|
Actual |
|
$ 1,000.00 |
$ 1,086.20 |
$ 5.07 C |
|
HypotheticalA |
|
$ 1,000.00 |
$ 1,020.21 |
$ 4.91 D |
|
Class T |
1.19% |
|
|
|
|
Actual |
|
$ 1,000.00 |
$ 1,085.10 |
$ 6.22 C |
|
HypotheticalA |
|
$ 1,000.00 |
$ 1,019.10 |
$ 6.02 D |
|
Class B |
1.79% |
|
|
|
|
Actual |
|
$ 1,000.00 |
$ 1,081.70 |
$ 9.34 C |
|
HypotheticalA |
|
$ 1,000.00 |
$ 1,016.09 |
$ 9.05 D |
|
Class C |
1.73% |
|
|
|
|
Actual |
|
$ 1,000.00 |
$ 1,081.90 |
$ 9.03 C |
|
HypotheticalA |
|
$ 1,000.00 |
$ 1,016.39 |
$ 8.74 D |
|
Institutional Class |
.71% |
|
|
|
|
Actual |
|
$ 1,000.00 |
$ 1,087.50 |
$ 3.72 C |
|
HypotheticalA |
|
$ 1,000.00 |
$ 1,021.51 |
$ 3.60 D |
|
Class Z |
.54% |
|
|
|
|
Actual |
|
$ 1,000.00 |
$ 1,043.00 |
$ 1.66 C |
|
HypotheticalA |
|
$ 1,000.00 |
$ 1,022.36 |
$ 2.74 D |
A 5% return per year before expenses
B Annualized expense ratio reflects expenses net of applicable fee waivers.
C Actual expenses are equal to each Class' annualized expense ratio; multiplied by the average account value over the period, multiplied by 183/365 (to reflect the one-half year period) for Class A, Class T, Class B, Class C and Institutional Class and multiplied by 110/365 (to reflect the period August 13, 2013 to November 30, 2013) for Class Z. The fees and expenses of the underlying Fidelity Central Funds in which the Fund invests are not included in each Class' annualized expense ratio.
D Hypothetical expenses are equal to each Class' annualized expense ratio, multiplied by the average account value over the period, multiplied by 183/365 (to reflect the one-half year period). The fees and expenses of the underlying Fidelity Central Funds in which the Fund invests are not included in each Class' annualized expense ratio.
Annual Report
Investment Changes (Unaudited)
|
Top Ten Stocks as of November 30, 2013 |
||
|
|
% of fund's |
% of fund's net assets |
|
JPMorgan Chase & Co. |
4.0 |
3.9 |
|
Wells Fargo & Co.* |
3.0 |
2.8 |
|
Chevron Corp. |
2.9 |
2.9 |
|
General Electric Co. |
2.5 |
2.1 |
|
Exxon Mobil Corp. |
2.4 |
2.2 |
|
MetLife, Inc. |
2.3 |
1.9 |
|
Cisco Systems, Inc. |
2.2 |
2.2 |
|
Procter & Gamble Co. |
2.1 |
2.4 |
|
Merck & Co., Inc. |
2.1 |
2.0 |
|
Paychex, Inc. |
1.9 |
2.2 |
|
|
25.4 |
|
* Security or a portion of the security is pledged as collateral for call options written.
|
Top Five Market Sectors as of November 30, 2013 |
||
|
|
% of fund's |
% of fund's net assets |
|
Financials |
21.4 |
21.5 |
|
Energy |
14.0 |
12.3 |
|
Health Care |
12.6 |
12.9 |
|
Information Technology |
11.5 |
11.3 |
|
Industrials |
10.4 |
10.3 |
|
Asset Allocation (% of fund's net assets) |
|||||||
|
As of November 30, 2013* |
As of May 31, 2013** |
||||||
 |
Stocks 90.8% |
|
|
Stocks 88.7% |
|
||
 |
Bonds 0.1% |
|
|
Bonds 0.1% |
|
||
 |
Convertible |
|
|
Convertible |
|
||
 |
Other Investments 0.3% |
|
|
Other Investments 0.4% |
|
||
 |
Short-Term |
|
|
Short-Term |
|
||
|
* Foreign investments |
11.5% |
|
** Foreign investments |
9.9% |
|
||
|
* Written options |
(0.1%) |
|
** Written options |
0.0% |
|
||

Annual Report
Investments November 30, 2013
Showing Percentage of Net Assets
|
Common Stocks - 90.2% |
|||
|
Shares |
Value (000s) |
||
|
CONSUMER DISCRETIONARY - 7.4% |
|||
|
Auto Components - 0.2% |
|||
|
Gentex Corp. |
189,860 |
$ 5,660 |
|
|
Diversified Consumer Services - 0.0% |
|||
|
Strayer Education, Inc. |
28,191 |
1,047 |
|
|
Hotels, Restaurants & Leisure - 1.6% |
|||
|
McDonald's Corp. |
209,217 |
20,371 |
|
|
Texas Roadhouse, Inc. Class A |
208,162 |
5,824 |
|
|
Wynn Resorts Ltd. |
11,650 |
1,932 |
|
|
Yum! Brands, Inc. |
149,721 |
11,630 |
|
|
|
39,757 |
||
|
Leisure Equipment & Products - 0.4% |
|||
|
New Academy Holding Co. LLC unit (i)(j) |
52,800 |
9,547 |
|
|
Media - 2.6% |
|||
|
Comcast Corp. Class A (h) |
687,374 |
34,279 |
|
|
Sinclair Broadcast Group, Inc. Class A |
107,035 |
3,513 |
|
|
Time Warner, Inc. |
412,351 |
27,096 |
|
|
|
64,888 |
||
|
Multiline Retail - 1.7% |
|||
|
Kohl's Corp. |
203,183 |
11,232 |
|
|
Target Corp. |
475,017 |
30,368 |
|
|
|
41,600 |
||
|
Specialty Retail - 0.7% |
|||
|
Adastria Holdings Co. Ltd. |
29,220 |
1,161 |
|
|
American Eagle Outfitters, Inc. |
276,375 |
4,497 |
|
|
Foot Locker, Inc. |
135,931 |
5,286 |
|
|
Staples, Inc. (h) |
334,933 |
5,202 |
|
|
|
16,146 |
||
|
Textiles, Apparel & Luxury Goods - 0.2% |
|||
|
Coach, Inc. |
68,100 |
3,943 |
|
|
TOTAL CONSUMER DISCRETIONARY |
182,588 |
||
|
CONSUMER STAPLES - 8.8% |
|||
|
Beverages - 1.4% |
|||
|
Molson Coors Brewing Co. Class B |
181,705 |
9,570 |
|
|
PepsiCo, Inc. |
110,922 |
9,368 |
|
|
The Coca-Cola Co. |
374,288 |
15,043 |
|
|
|
33,981 |
||
|
Food & Staples Retailing - 2.0% |
|||
|
CVS Caremark Corp. |
165,200 |
11,062 |
|
|
Common Stocks - continued |
|||
|
Shares |
Value (000s) |
||
|
CONSUMER STAPLES - continued |
|||
|
Food & Staples Retailing - continued |
|||
|
Wal-Mart Stores, Inc. |
152,750 |
$ 12,374 |
|
|
Walgreen Co. |
455,069 |
26,940 |
|
|
|
50,376 |
||
|
Food Products - 0.9% |
|||
|
Kellogg Co. |
353,552 |
21,439 |
|
|
Household Products - 2.1% |
|||
|
Procter & Gamble Co. |
632,117 |
53,237 |
|
|
Tobacco - 2.4% |
|||
|
Altria Group, Inc. |
456,865 |
16,895 |
|
|
British American Tobacco PLC sponsored ADR |
54,131 |
5,756 |
|
|
Lorillard, Inc. |
379,653 |
19,488 |
|
|
Philip Morris International, Inc. |
193,912 |
16,587 |
|
|
|
58,726 |
||
|
TOTAL CONSUMER STAPLES |
217,759 |
||
|
ENERGY - 13.1% |
|||
|
Energy Equipment & Services - 1.8% |
|||
|
Ensco PLC Class A |
140,477 |
8,299 |
|
|
Halliburton Co. |
13,871 |
731 |
|
|
National Oilwell Varco, Inc. |
123,449 |
10,061 |
|
|
Noble Corp. |
245,917 |
9,374 |
|
|
Schlumberger Ltd. |
125,757 |
11,119 |
|
|
Trinidad Drilling Ltd. |
455,100 |
4,236 |
|
|
|
43,820 |
||
|
Oil, Gas & Consumable Fuels - 11.3% |
|||
|
Access Midstream Partners LP |
69,647 |
3,912 |
|
|
Apache Corp. |
223,838 |
20,479 |
|
|
BG Group PLC |
60,800 |
1,242 |
|
|
Canadian Natural Resources Ltd. |
314,300 |
10,347 |
|
|
Chevron Corp. |
582,569 |
71,330 |
|
|
CONSOL Energy, Inc. |
184,732 |
6,573 |
|
|
EV Energy Partners LP |
159,189 |
5,205 |
|
|
Exxon Mobil Corp. |
624,675 |
58,395 |
|
|
Holly Energy Partners LP |
114,912 |
3,614 |
|
|
HollyFrontier Corp. |
106,227 |
5,097 |
|
|
Legacy Reserves LP |
115,099 |
3,107 |
|
|
Markwest Energy Partners LP |
187,588 |
12,957 |
|
|
Occidental Petroleum Corp. |
208,303 |
19,780 |
|
|
Royal Dutch Shell PLC Class A sponsored ADR |
173,458 |
11,570 |
|
|
Common Stocks - continued |
|||
|
Shares |
Value (000s) |
||
|
ENERGY - continued |
|||
|
Oil, Gas & Consumable Fuels - continued |
|||
|
Scorpio Tankers, Inc. |
126,500 |
$ 1,452 |
|
|
Southcross Energy Partners LP |
51,650 |
1,001 |
|
|
Suncor Energy, Inc. |
403,000 |
13,984 |
|
|
The Williams Companies, Inc. |
653,350 |
23,011 |
|
|
Tsakos Energy Navigation Ltd. |
287,877 |
1,442 |
|
|
Western Gas Equity Partners LP |
16,228 |
701 |
|
|
Williams Partners LP |
61,100 |
3,140 |
|
|
|
278,339 |
||
|
TOTAL ENERGY |
322,159 |
||
|
FINANCIALS - 20.5% |
|||
|
Capital Markets - 3.7% |
|||
|
Aberdeen Asset Management PLC |
94,500 |
761 |
|
|
Apollo Investment Corp. |
731,452 |
6,598 |
|
|
Ashmore Group PLC |
1,121,663 |
7,231 |
|
|
BlackRock, Inc. Class A |
20,477 |
6,199 |
|
|
Carlyle Group LP |
83,100 |
2,701 |
|
|
Charles Schwab Corp. |
431,134 |
10,554 |
|
|
Greenhill & Co., Inc. |
71,623 |
3,918 |
|
|
Invesco Ltd. |
69,900 |
2,436 |
|
|
KKR & Co. LP |
792,964 |
18,817 |
|
|
Morgan Stanley |
369,142 |
11,554 |
|
|
The Blackstone Group LP |
681,603 |
19,480 |
|
|
|
90,249 |
||
|
Commercial Banks - 5.4% |
|||
|
CIT Group, Inc. |
69,462 |
3,506 |
|
|
Comerica, Inc. |
130,080 |
5,899 |
|
|
M&T Bank Corp. (h) |
130,417 |
15,045 |
|
|
PNC Financial Services Group, Inc. |
69,200 |
5,325 |
|
|
Standard Chartered PLC (United Kingdom) |
348,991 |
8,272 |
|
|
U.S. Bancorp |
555,800 |
21,798 |
|
|
Wells Fargo & Co. (h) |
1,673,450 |
73,665 |
|
|
|
133,510 |
||
|
Diversified Financial Services - 4.6% |
|||
|
JPMorgan Chase & Co. |
1,730,257 |
99,011 |
|
|
KKR Financial Holdings LLC |
1,547,886 |
14,829 |
|
|
|
113,840 |
||
|
Common Stocks - continued |
|||
|
Shares |
Value (000s) |
||
|
FINANCIALS - continued |
|||
|
Insurance - 4.6% |
|||
|
ACE Ltd. |
201,111 |
$ 20,670 |
|
|
AFLAC, Inc. |
80,535 |
5,345 |
|
|
esure Group PLC |
702,700 |
2,921 |
|
|
Fidelity National Financial, Inc. Class A |
17,996 |
523 |
|
|
MetLife, Inc. |
1,090,458 |
56,911 |
|
|
MetLife, Inc. unit |
121,585 |
3,736 |
|
|
Prudential Financial, Inc. |
114,398 |
10,154 |
|
|
Validus Holdings Ltd. |
331,778 |
13,288 |
|
|
|
113,548 |
||
|
Real Estate Investment Trusts - 2.0% |
|||
|
American Capital Agency Corp. |
537,980 |
10,964 |
|
|
Annaly Capital Management, Inc. |
912,694 |
9,273 |
|
|
Coresite Realty Corp. |
57,820 |
1,871 |
|
|
First Potomac Realty Trust |
389,611 |
4,675 |
|
|
Home Properties, Inc. |
115,448 |
6,070 |
|
|
Rayonier, Inc. |
97,852 |
4,316 |
|
|
Retail Properties America, Inc. |
407,197 |
5,428 |
|
|
Two Harbors Investment Corp. |
565,041 |
5,227 |
|
|
Ventas, Inc. |
42,294 |
2,404 |
|
|
|
50,228 |
||
|
Real Estate Management & Development - 0.1% |
|||
|
Beazer Pre-Owned Rental Homes, Inc. (a)(j) |
96,000 |
2,016 |
|
|
Thrifts & Mortgage Finance - 0.1% |
|||
|
Radian Group, Inc. |
116,300 |
1,658 |
|
|
TOTAL FINANCIALS |
505,049 |
||
|
HEALTH CARE - 11.5% |
|||
|
Biotechnology - 0.6% |
|||
|
Amgen, Inc. |
118,249 |
13,490 |
|
|
Health Care Equipment & Supplies - 0.7% |
|||
|
Baxter International, Inc. |
64,000 |
4,381 |
|
|
Covidien PLC |
109,000 |
7,440 |
|
|
Hologic, Inc. (a) |
32,600 |
730 |
|
|
St. Jude Medical, Inc. |
90,162 |
5,267 |
|
|
|
17,818 |
||
|
Health Care Providers & Services - 1.6% |
|||
|
Aetna, Inc. |
138,467 |
9,545 |
|
|
Quest Diagnostics, Inc. |
95,936 |
5,846 |
|
|
Common Stocks - continued |
|||
|
Shares |
Value (000s) |
||
|
HEALTH CARE - continued |
|||
|
Health Care Providers & Services - continued |
|||
|
UnitedHealth Group, Inc. |
179,576 |
$ 13,375 |
|
|
WellPoint, Inc. |
118,445 |
11,001 |
|
|
|
39,767 |
||
|
Health Care Technology - 0.1% |
|||
|
Quality Systems, Inc. |
117,419 |
2,743 |
|
|
Pharmaceuticals - 8.5% |
|||
|
AbbVie, Inc. |
218,556 |
10,589 |
|
|
Actavis PLC (a) |
59,962 |
9,778 |
|
|
Astellas Pharma, Inc. |
79,900 |
4,734 |
|
|
AstraZeneca PLC sponsored ADR |
399,252 |
22,833 |
|
|
Eli Lilly & Co. (h) |
221,770 |
11,137 |
|
|
Johnson & Johnson |
500,018 |
47,332 |
|
|
Merck & Co., Inc. |
1,060,030 |
52,821 |
|
|
Pfizer, Inc. |
936,613 |
29,719 |
|
|
Sanofi SA |
72,826 |
7,695 |
|
|
Teva Pharmaceutical Industries Ltd. sponsored ADR |
324,298 |
13,218 |
|
|
|
209,856 |
||
|
TOTAL HEALTH CARE |
283,674 |
||
|
INDUSTRIALS - 9.9% |
|||
|
Aerospace & Defense - 1.1% |
|||
|
United Technologies Corp. |
245,307 |
27,195 |
|
|
Air Freight & Logistics - 2.1% |
|||
|
C.H. Robinson Worldwide, Inc. |
246,736 |
14,466 |
|
|
United Parcel Service, Inc. Class B |
362,690 |
37,132 |
|
|
|
51,598 |
||
|
Commercial Services & Supplies - 1.1% |
|||
|
Intrum Justitia AB |
253,384 |
6,451 |
|
|
Republic Services, Inc. |
630,889 |
22,024 |
|
|
|
28,475 |
||
|
Electrical Equipment - 0.6% |
|||
|
Eaton Corp. PLC |
53,300 |
3,873 |
|
|
Emerson Electric Co. |
76,270 |
5,109 |
|
|
Hubbell, Inc. Class B |
48,569 |
5,241 |
|
|
|
14,223 |
||
|
Industrial Conglomerates - 2.5% |
|||
|
General Electric Co. |
2,361,833 |
62,966 |
|
|
Common Stocks - continued |
|||
|
Shares |
Value (000s) |
||
|
INDUSTRIALS - continued |
|||
|
Machinery - 1.7% |
|||
|
Cummins, Inc. (h) |
73,837 |
$ 9,773 |
|
|
Douglas Dynamics, Inc. |
222,450 |
3,546 |
|
|
Harsco Corp. |
195,273 |
5,106 |
|
|
Illinois Tool Works, Inc. |
57,666 |
4,589 |
|
|
Stanley Black & Decker, Inc. (h) |
226,795 |
18,459 |
|
|
Stanley Black & Decker, Inc. unit (a) |
5,200 |
530 |
|
|
|
42,003 |
||
|
Professional Services - 0.5% |
|||
|
Acacia Research Corp. |
195,660 |
2,911 |
|
|
Michael Page International PLC |
1,080,418 |
8,397 |
|
|
|
11,308 |
||
|
Road & Rail - 0.3% |
|||
|
Union Pacific Corp. |
43,902 |
7,114 |
|
|
TOTAL INDUSTRIALS |
244,882 |
||
|
INFORMATION TECHNOLOGY - 10.7% |
|||
|
Communications Equipment - 2.2% |
|||
|
Cisco Systems, Inc. |
2,527,593 |
53,711 |
|
|
Computers & Peripherals - 0.8% |
|||
|
Apple, Inc. |
37,468 |
20,835 |
|
|
IT Services - 4.1% |
|||
|
Accenture PLC Class A |
205,996 |
15,959 |
|
|
IBM Corp. |
202,678 |
36,417 |
|
|
Paychex, Inc. |
1,085,667 |
47,476 |
|
|
|
99,852 |
||
|
Semiconductors & Semiconductor Equipment - 1.7% |
|||
|
Applied Materials, Inc. |
927,977 |
16,054 |
|
|
Broadcom Corp. Class A |
587,729 |
15,686 |
|
|
KLA-Tencor Corp. |
67,021 |
4,281 |
|
|
Siliconware Precision Industries Co. Ltd. sponsored ADR (e) |
989,533 |
5,799 |
|
|
|
41,820 |
||
|
Software - 1.9% |
|||
|
CA Technologies, Inc. |
183,281 |
6,048 |
|
|
Microsoft Corp. |
1,081,113 |
41,223 |
|
|
|
47,271 |
||
|
TOTAL INFORMATION TECHNOLOGY |
263,489 |
||
|
Common Stocks - continued |
|||
|
Shares |
Value (000s) |
||
|
MATERIALS - 0.9% |
|||
|
Chemicals - 0.4% |
|||
|
RPM International, Inc. |
184,099 |
$ 7,290 |
|
|
Sociedad Quimica y Minera de Chile SA (PN-B) sponsored ADR |
82,309 |
2,059 |
|
|
Tronox Ltd. Class A |
47,965 |
1,019 |
|
|
|
10,368 |
||
|
Metals & Mining - 0.5% |
|||
|
Commercial Metals Co. |
286,354 |
5,561 |
|
|
Freeport-McMoRan Copper & Gold, Inc. |
161,314 |
5,596 |
|
|
|
11,157 |
||
|
TOTAL MATERIALS |
21,525 |
||
|
TELECOMMUNICATION SERVICES - 3.8% |
|||
|
Diversified Telecommunication Services - 2.9% |
|||
|
AT&T, Inc. |
719,427 |
25,331 |
|
|
CenturyLink, Inc. |
428,970 |
13,169 |
|
|
Verizon Communications, Inc. |
651,777 |
32,341 |
|
|
|
70,841 |
||
|
Wireless Telecommunication Services - 0.9% |
|||
|
Vodafone Group PLC |
6,216,813 |
23,048 |
|
|
TOTAL TELECOMMUNICATION SERVICES |
93,889 |
||
|
UTILITIES - 3.6% |
|||
|
Electric Utilities - 3.1% |
|||
|
American Electric Power Co., Inc. |
133,815 |
6,297 |
|
|
FirstEnergy Corp. |
219,091 |
7,149 |
|
|
Hawaiian Electric Industries, Inc. (e) |
218,498 |
5,530 |
|
|
NextEra Energy, Inc. |
144,581 |
12,230 |
|
|
Northeast Utilities |
144,765 |
5,947 |
|
|
PPL Corp. |
495,891 |
15,229 |
|
|
Southern Co. |
480,457 |
19,521 |
|
|
Xcel Energy, Inc. |
209,276 |
5,864 |
|
|
|
77,767 |
||
|
Common Stocks - continued |
|||
|
Shares |
Value (000s) |
||
|
UTILITIES - continued |
|||
|
Multi-Utilities - 0.5% |
|||
|
CenterPoint Energy, Inc. |
33,314 |
$ 781 |
|
|
Sempra Energy |
126,314 |
11,171 |
|
|
|
11,952 |
||
|
TOTAL UTILITIES |
89,719 |
||
|
TOTAL COMMON STOCKS (Cost $1,819,559) |
2,224,733 |
||
|
Preferred Stocks - 1.9% |
|||
|
|
|
|
|
|
Convertible Preferred Stocks - 1.3% |
|||
|
CONSUMER DISCRETIONARY - 0.2% |
|||
|
Automobiles - 0.2% |
|||
|
General Motors Co. 4.75% |
85,400 |
4,543 |
|
|
FINANCIALS - 0.1% |
|||
|
Real Estate Investment Trusts - 0.1% |
|||
|
Weyerhaeuser Co. Series A, 6.375% |
43,200 |
2,361 |
|
|
HEALTH CARE - 0.1% |
|||
|
Health Care Equipment & Supplies - 0.1% |
|||
|
Alere, Inc. 3.00% |
11,539 |
3,185 |
|
|
INDUSTRIALS - 0.2% |
|||
|
Aerospace & Defense - 0.2% |
|||
|
United Technologies Corp. 7.50% |
69,700 |
4,556 |
|
|
TELECOMMUNICATION SERVICES - 0.1% |
|||
|
Wireless Telecommunication Services - 0.1% |
|||
|
Crown Castle International Corp. Series A, 4.50% (a) |
36,400 |
3,653 |
|
|
UTILITIES - 0.6% |
|||
|
Electric Utilities - 0.2% |
|||
|
NextEra Energy, Inc.: |
|
|
|
|
5.889% |
35,144 |
1,966 |
|
|
Series E, 5.599% |
61,200 |
3,493 |
|
|
|
5,459 |
||
|
Multi-Utilities - 0.4% |
|||
|
CenterPoint Energy, Inc. 2.00% ZENS |
73,300 |
3,794 |
|
|
Preferred Stocks - continued |
|||
|
Shares |
Value (000s) |
||
|
Convertible Preferred Stocks - continued |
|||
|
UTILITIES - continued |
|||
|
Multi-Utilities - continued |
|||
|
Dominion Resources, Inc.: |
|
|
|
|
Series A, 6.125% |
43,400 |
$ 2,380 |
|
|
Series B, 6.00% |
43,400 |
2,374 |
|
|
|
8,548 |
||
|
TOTAL UTILITIES |
14,007 |
||
|
TOTAL CONVERTIBLE PREFERRED STOCKS |
32,305 |
||
|
Nonconvertible Preferred Stocks - 0.6% |
|||
|
CONSUMER DISCRETIONARY - 0.2% |
|||
|
Automobiles - 0.2% |
|||
|
Volkswagen AG |
18,273 |
4,849 |
|
|
FINANCIALS - 0.4% |
|||
|
Consumer Finance - 0.4% |
|||
|
Ally Financial, Inc.: |
|
|
|
|
7.00% (g) |
8,531 |
8,190 |
|
|
Series A, 8.50% |
47,070 |
1,260 |
|
|
|
9,450 |
||
|
TOTAL NONCONVERTIBLE PREFERRED STOCKS |
14,299 |
||
|
TOTAL PREFERRED STOCKS (Cost $42,563) |
46,604 |
||
|
Corporate Bonds - 3.3% |
||||
|
|
Principal Amount (000s)(d) |
|
||
|
Convertible Bonds - 3.2% |
||||
|
CONSUMER DISCRETIONARY - 0.1% |
||||
|
Automobiles - 0.1% |
||||
|
Volkswagen International Finance NV 5.5% 11/9/15 (g) |
EUR |
2,400 |
3,897 |
|
|
ENERGY - 0.6% |
||||
|
Oil, Gas & Consumable Fuels - 0.6% |
||||
|
Alpha Natural Resources, Inc. 3.75% 12/15/17 |
|
4,810 |
4,750 |
|
|
Corporate Bonds - continued |
||||
|
|
Principal Amount (000s)(d) |
Value (000s) |
||
|
Convertible Bonds - continued |
||||
|
ENERGY - continued |
||||
|
Oil, Gas & Consumable Fuels - continued |
||||
|
Amyris, Inc. 3% 2/27/17 |
|
$ 516 |
$ 376 |
|
|
Chesapeake Energy Corp. 2.5% 5/15/37 |
|
3,360 |
3,455 |
|
|
Cobalt International Energy, Inc. 2.625% 12/1/19 |
|
2,530 |
2,514 |
|
|
Ship Finance International Ltd. 3.25% 2/1/18 |
|
3,590 |
3,753 |
|
|
|
14,848 |
|||
|
FINANCIALS - 0.4% |
||||
|
Insurance - 0.2% |
||||
|
Fidelity National Financial, Inc. 4.25% 8/15/18 |
|
3,730 |
5,646 |
|
|
Thrifts & Mortgage Finance - 0.2% |
||||
|
MGIC Investment Corp. 9% 4/1/63 (g) |
|
3,390 |
3,847 |
|
|
TOTAL FINANCIALS |
9,493 |
|||
|
HEALTH CARE - 1.0% |
||||
|
Biotechnology - 0.1% |
||||
|
Theravance, Inc. 2.125% 1/15/23 |
|
1,830 |
2,798 |
|
|
Health Care Equipment & Supplies - 0.2% |
||||
|
Teleflex, Inc. 3.875% 8/1/17 |
|
3,340 |
5,504 |
|
|
Health Care Providers & Services - 0.7% |
||||
|
HealthSouth Corp. 2% 12/1/43 |
|
5,366 |
5,950 |
|
|
WellPoint, Inc. 2.75% 10/15/42 |
|
7,510 |
10,317 |
|
|
|
16,267 |
|||
|
TOTAL HEALTH CARE |
24,569 |
|||
|
INDUSTRIALS - 0.3% |
||||
|
Commercial Services & Supplies - 0.2% |
||||
|
Covanta Holding Corp. 3.25% 6/1/14 |
|
3,050 |
3,584 |
|
|
Construction & Engineering - 0.1% |
||||
|
MasTec, Inc.: |
|
|
|
|
|
4% 6/15/14 |
|
1,580 |
3,188 |
|
|
4.25% 12/15/14 |
|
180 |
374 |
|
|
|
3,562 |
|||
|
TOTAL INDUSTRIALS |
7,146 |
|||
|
Corporate Bonds - continued |
||||
|
|
Principal Amount (000s)(d) |
Value (000s) |
||
|
Convertible Bonds - continued |
||||
|
INFORMATION TECHNOLOGY - 0.8% |
||||
|
Communications Equipment - 0.3% |
||||
|
InterDigital, Inc. 2.5% 3/15/16 |
|
$ 4,730 |
$ 4,907 |
|
|
Liberty Interactive LLC 0.75% 3/30/43 (g) |
|
800 |
1,000 |
|
|
|
5,907 |
|||
|
Computers & Peripherals - 0.2% |
||||
|
EMC Corp. 1.75% 1/1/14 |
|
3,530 |
5,263 |
|
|
Semiconductors & Semiconductor Equipment - 0.3% |
||||
|
GT Advanced Technologies, Inc. 3% 10/1/17 |
|
5,070 |
7,564 |
|
|
TOTAL INFORMATION TECHNOLOGY |
18,734 |
|||
|
TOTAL CONVERTIBLE BONDS |
78,687 |
|||
|
Nonconvertible Bonds - 0.1% |
||||
|
MATERIALS - 0.1% |
||||
|
Metals & Mining - 0.1% |
||||
|
Boart Longyear Management Pty Ltd. 7% 4/1/21 (g) |
|
1,120 |
840 |
|
|
Walter Energy, Inc. 8.5% 4/15/21 |
|
2,030 |
1,710 |
|
|
|
2,550 |
|||
|
TOTAL CORPORATE BONDS (Cost $72,017) |
81,237 |
|||
|
Other - 0.3% |
||||
|
ENERGY - 0.3% |
||||
|
Oil, Gas & Consumable Fuels - 0.3% |
||||
|
EQTY ER Holdings, LLC 12% 1/28/18 (f)(j)(k) |
|
5,667 |
5,667 |
|
|
Shares |
|
|
EQTY ER Holdings, LLC (f)(j)(k) |
|
2,833,333 |
2,833 |
|
|
TOTAL OTHER (Cost $8,500) . |
8,500 |
|||
|
Money Market Funds - 4.4% |
|||
|
Shares |
Value (000s) |
||
|
Fidelity Cash Central Fund, 0.10% (b) |
103,943,316 |
$ 103,943 |
|
|
Fidelity Securities Lending Cash Central Fund, 0.10% (b)(c) |
4,116,600 |
4,117 |
|
|
TOTAL MONEY MARKET FUNDS (Cost $108,060) |
108,060 |
||
|
TOTAL INVESTMENT PORTFOLIO - 100.1% (Cost $2,050,699) |
2,469,134 |
||
|
NET OTHER ASSETS (LIABILITIES) - (0.1)% |
(2,680) |
||
|
NET ASSETS - 100% |
$ 2,466,454 |
||
|
Written Options |
|||||||
|
Expiration Date/Exercise Price |
Number of Contracts |
Premium (000s) |
Value (000s) |
||||
|
Call Options |
|||||||
|
Comcast Corp. Class A |
1/18/14 - |
1,718 |
$ 187 |
$ (359) |
|||
|
Cummins, Inc. |
1/18/14 - |
185 |
28 |
(24) |
|||
|
Eli Lilly & Co. |
1/18/14 - |
1,109 |
43 |
(33) |
|||
|
M&T Bank Corp. |
1/18/14 - |
326 |
64 |
(95) |
|||
|
Stanley Black & Decker, Inc. |
12/21/13 - |
514 |
77 |
(41) |
|||
|
Staples, Inc. |
1/18/14 - |
837 |
27 |
(10) |
|||
|
Wells Fargo & Co. |
1/18/14 - |
8,367 |
405 |
(925) |
|||
|
TOTAL WRITTEN OPTIONS |
$ 831 |
$ (1,487) |
||||||
|
Currency Abbreviations |
||
|
EUR |
- |
European Monetary Unit |
|
Legend |
|
(a) Non-income producing |
|
(b) Affiliated fund that is generally available only to investment companies and other accounts managed by Fidelity Investments. The rate quoted is the annualized seven-day yield of the fund at period end. A complete unaudited listing of the fund's holdings as of its most recent quarter end is available upon request. In addition, each Fidelity Central Fund's financial statements, which are not covered by the Fund's Report of Independent Registered Public Accounting Firm, are available on the SEC's website or upon request. |
|
(c) Investment made with cash collateral received from securities on loan. |
|
(d) Amount is stated in United States dollars unless otherwise noted. |
|
(e) Security or a portion of the security is on loan at period end. |
|
(f) Affiliated company |
|
(g) Security exempt from registration under Rule 144A of the Securities Act of 1933. These securities may be resold in transactions exempt from registration, normally to qualified institutional buyers. At the end of the period, the value of these securities amounted to $17,774,000 or 0.7% of net assets. |
|
(h) Security or a portion of the security is pledged as collateral for call options written. At period end, the value of securities pledged amounted to $62,661,000. |
|
(i) Investment is owned by an entity that is treated as a corporation for U.S. tax purposes and is owned by the Fund. |
|
(j) Restricted securities - Investment in securities not registered under the Securities Act of 1933 (excluding 144A issues). At the end of the period, the value of restricted securities (excluding 144A issues) amounted to $20,063,000 or 0.8% of net assets. |
|
Additional information on each restricted holding is as follows: |
|
Security |
Acquisition Date |
Acquisition Cost (000s) |
|
Beazer Pre-Owned Rental Homes, Inc. |
5/3/12 - 10/23/12 |
$ 1,920 |
|
EQTY ER Holdings, LLC 12% 1/28/18 |
1/29/13 |
$ 5,667 |
|
EQTY ER Holdings, LLC |
1/29/13 |
$ 2,833 |
|
New Academy Holding Co. LLC unit |
8/1/11 |
$ 5,565 |
|
(k) Investments represent a non-operating interest in oil and gas wells through an entity owned by the fund that is treated as a corporation for U.S. tax purposes. |
|
Affiliated Central Funds |
|
Information regarding fiscal year to date income earned by the Fund from investments in Fidelity Central Funds is as follows: |
|
Fund |
Income earned |
|
Fidelity Cash Central Fund |
$ 104 |
|
Fidelity Securities Lending Cash Central Fund |
385 |
|
Total |
$ 489 |
|
Other Affiliated Issuers |
|
An affiliated company is a company in which the Fund has ownership of at least 5% of the voting securities. Fiscal year to date transactions with companies which are or were affiliates are as follows: |
|
Affiliate |
Value, beginning of period |
Purchases |
Sales Proceeds |
Dividend Income |
Value, |
|
EQTY ER Holdings, LLC 12% 1/28/18 |
$ - |
$ 5,667 |
$ - |
$ - |
$ 5,667 |
|
EQTY ER Holdings, LLC |
- |
2,833 |
- |
- |
2,833 |
|
Total |
$ - |
$ 8,500 |
$ - |
$ - |
$ 8,500 |
|
Other Information |
|
The following is a summary of the inputs used, as of November 30, 2013, involving the Fund's assets and liabilities carried at fair value. The inputs or methodology used for valuing securities may not be an indication of the risk associated with investing in those securities. For more information on valuation inputs, and their aggregation into the levels used in the tables below, please refer to the Investment Valuation section in the accompanying Notes to Financial Statements. |
|
Valuation Inputs at Reporting Date: |
||||
|
Description |
Total |
Level 1 |
Level 2 |
Level 3 |
|
Investments in Securities: |
||||
|
Equities: |
||||
|
Consumer Discretionary |
$ 191,980 |
$ 182,433 |
$ - |
$ 9,547 |
|
Consumer Staples |
217,759 |
217,759 |
- |
- |
|
Energy |
322,159 |
322,159 |
- |
- |
|
Financials |
516,860 |
500,557 |
14,287 |
2,016 |
|
Health Care |
286,859 |
279,164 |
7,695 |
- |
|
Industrials |
249,438 |
249,438 |
- |
- |
|
Information Technology |
263,489 |
263,489 |
- |
- |
|
Materials |
21,525 |
21,525 |
- |
- |
|
Telecommunication Services |
97,542 |
70,841 |
26,701 |
- |
|
Utilities |
103,726 |
94,473 |
9,253 |
- |
|
Corporate Bonds |
81,237 |
- |
81,237 |
- |
|
Other/Energy |
8,500 |
- |
- |
8,500 |
|
Money Market Funds |
108,060 |
108,060 |
- |
- |
|
Total Investments in Securities: |
$ 2,469,134 |
$ 2,309,898 |
$ 139,173 |
$ 20,063 |
|
Derivative Instruments: |
||||
|
Liabilities |
||||
|
Written Options |
$ (1,487) |
$ (1,487) |
$ - |
$ - |
|
Value of Derivative Instruments |
|
The following table is a summary of the Fund's value of derivative instruments by primary risk exposure as of November 30, 2013. For additional information on derivative instruments, please refer to the Derivative Instruments section in the accompanying Notes to Financial Statements. |
|
Primary Risk Exposure / |
Value |
|
|
|
Asset |
Liability |
|
Equity Risk |
||
|
Written Options (a) |
$ - |
$ (1,487) |
|
Total Value of Derivatives |
$ - |
$ (1,487) |
|
(a) Gross value is presented in the Statement of Assets and Liabilities in the written options, at value line-item. |
|
Distribution of investments by country or territory of incorporation, as a percentage of total net assets, is as follows (Unaudited): |
|
United States of America |
88.5% |
|
United Kingdom |
4.4% |
|
Ireland |
1.6% |
|
Canada |
1.2% |
|
Bermuda |
1.0% |
|
Others (Individually Less Than 1%) |
3.3% |
|
|
100.0% |
See accompanying notes which are an integral part of the financial statements.
Annual Report
Financial Statements
Statement of Assets and Liabilities
|
Amounts in thousands (except per-share amounts) |
November 30, 2013 |
|
|
|
|
|
|
Assets |
|
|
|
Investment in securities, at value (including securities loaned of $4,008) - See accompanying schedule: Unaffiliated issuers (cost $1,934,139) |
$ 2,352,574 |
|
|
Fidelity Central Funds (cost $108,060) |
108,060 |
|
|
Other affiliated issuers (cost $8,500) |
8,500 |
|
|
Total Investments (cost $2,050,699) |
|
$ 2,469,134 |
|
Receivable for fund shares sold |
|
946 |
|
Dividends receivable |
|
7,250 |
|
Interest receivable |
|
725 |
|
Distributions receivable from Fidelity Central Funds |
|
9 |
|
Prepaid expenses |
|
7 |
|
Other receivables |
|
114 |
|
Total assets |
|
2,478,185 |
|
|
|
|
|
Liabilities |
|
|
|
Payable for investments purchased |
$ 573 |
|
|
Payable for fund shares redeemed |
3,232 |
|
|
Accrued management fee |
925 |
|
|
Distribution and service plan fees payable |
754 |
|
|
Written options, at value (premium received $831) |
1,487 |
|
|
Other affiliated payables |
481 |
|
|
Other payables and accrued expenses |
162 |
|
|
Collateral on securities loaned, at value |
4,117 |
|
|
Total liabilities |
|
11,731 |
|
|
|
|
|
Net Assets |
|
$ 2,466,454 |
|
Net Assets consist of: |
|
|
|
Paid in capital |
|
$ 2,145,085 |
|
Undistributed net investment income |
|
11,107 |
|
Accumulated undistributed net realized gain (loss) on investments and foreign currency transactions |
|
(107,532) |
|
Net unrealized appreciation (depreciation) on investments and assets and liabilities in foreign currencies |
|
417,794 |
|
Net Assets |
|
$ 2,466,454 |
See accompanying notes which are an integral part of the financial statements.
Annual Report
Statement of Assets and Liabilities - continued
|
Amounts in thousands (except per-share amounts) |
November 30, 2013 |
|
|
|
|
|
|
Calculation of Maximum Offering Price Class A: |
|
$ 31.60 |
|
|
|
|
|
Maximum offering price per share (100/94.25 of $31.60) |
|
$ 33.53 |
|
Class T: |
|
$ 32.09 |
|
|
|
|
|
Maximum offering price per share (100/96.50 of $32.09) |
|
$ 33.25 |
|
Class B: |
|
$ 31.79 |
|
|
|
|
|
Class C: |
|
$ 31.73 |
|
|
|
|
|
Institutional Class: |
|
$ 32.62 |
|
|
|
|
|
Class Z: |
|
$ 32.63 |
A Redemption price per share is equal to net asset value less any applicable contingent deferred sales charge.
See accompanying notes which are an integral part of the financial statements.
Annual Report
Financial Statements - continued
Statement of Operations
|
Amounts in thousands |
Year ended November 30, 2013 |
|
|
|
|
|
|
Investment Income |
|
|
|
Dividends |
|
$ 67,324 |
|
Interest |
|
2,907 |
|
Income from Fidelity Central Funds |
|
489 |
|
Total income |
|
70,720 |
|
|
|
|
|
Expenses |
|
|
|
Management fee |
$ 10,530 |
|
|
Transfer agent fees |
5,071 |
|
|
Distribution and service plan fees |
8,429 |
|
|
Accounting and security lending fees |
699 |
|
|
Custodian fees and expenses |
53 |
|
|
Independent trustees' compensation |
13 |
|
|
Registration fees |
125 |
|
|
Audit |
68 |
|
|
Legal |
8 |
|
|
Miscellaneous |
20 |
|
|
Total expenses before reductions |
25,016 |
|
|
Expense reductions |
(221) |
24,795 |
|
Net investment income (loss) |
|
45,925 |
|
Realized and Unrealized Gain (Loss) Net realized gain (loss) on: |
|
|
|
Investment securities: |
|
|
|
Unaffiliated issuers |
209,890 |
|
|
Foreign currency transactions |
78 |
|
|
Written options |
983 |
|
|
Total net realized gain (loss) |
|
210,951 |
|
Change in net unrealized appreciation (depreciation) on: Investment securities |
277,176 |
|
|
Assets and liabilities in foreign currencies |
18 |
|
|
Written options |
(656) |
|
|
Total change in net unrealized appreciation (depreciation) |
|
276,538 |
|
Net gain (loss) |
|
487,489 |
|
Net increase (decrease) in net assets resulting from operations |
|
$ 533,414 |
See accompanying notes which are an integral part of the financial statements.
Annual Report
Statement of Changes in Net Assets
|
Amounts in thousands |
Year ended |
Year ended |
|
Increase (Decrease) in Net Assets |
|
|
|
Operations |
|
|
|
Net investment income (loss) |
$ 45,925 |
$ 50,901 |
|
Net realized gain (loss) |
210,951 |
109,033 |
|
Change in net unrealized appreciation (depreciation) |
276,538 |
183,817 |
|
Net increase (decrease) in net assets resulting |
533,414 |
343,751 |
|
Distributions to shareholders from net investment income |
(43,731) |
(45,384) |
|
Distributions to shareholders from net realized gain |
(2,444) |
- |
|
Total distributions |
(46,175) |
(45,384) |
|
Share transactions - net increase (decrease) |
(140,174) |
(210,314) |
|
Total increase (decrease) in net assets |
347,065 |
88,053 |
|
|
|
|
|
Net Assets |
|
|
|
Beginning of period |
2,119,389 |
2,031,336 |
|
End of period (including undistributed net investment income of $11,107 and undistributed net investment income of $9,853, respectively) |
$ 2,466,454 |
$ 2,119,389 |
See accompanying notes which are an integral part of the financial statements.
Annual Report
Financial Highlights - Class A
|
Years ended November 30, |
2013 |
2012 |
2011 |
2010 |
2009 |
|
Selected Per-Share Data |
|
|
|
|
|
|
Net asset value, beginning of period |
$ 25.55 |
$ 22.18 |
$ 21.07 |
$ 20.26 |
$ 16.72 |
|
Income from Investment Operations |
|
|
|
|
|
|
Net investment income (loss) C |
.60 |
.61 |
.42 |
.25 |
.28 |
|
Net realized and unrealized gain (loss) |
6.06 |
3.32 |
1.11 |
.81 |
3.58 |
|
Total from investment operations |
6.66 |
3.93 |
1.53 |
1.06 |
3.86 |
|
Distributions from net investment income |
(.58) |
(.56) |
(.42) |
(.25) |
(.32) |
|
Distributions from net realized gain |
(.03) |
- |
- |
- |
- |
|
Total distributions |
(.61) |
(.56) |
(.42) |
(.25) |
(.32) |
|
Net asset value, end of period |
$ 31.60 |
$ 25.55 |
$ 22.18 |
$ 21.07 |
$ 20.26 |
|
Total Return A, B |
26.43% |
17.90% |
7.25% |
5.26% |
23.58% |
|
Ratios to Average Net Assets D, F |
|
|
|
|
|
|
Expenses before reductions |
.98% |
1.02% |
1.03% |
1.04% |
1.07% |
|
Expenses net of fee waivers, if any |
.98% |
1.02% |
1.03% |
1.04% |
1.07% |
|
Expenses net of all reductions |
.97% |
1.01% |
1.02% |
1.04% |
1.07% |
|
Net investment income (loss) |
2.07% |
2.52% |
1.82% |
1.21% |
1.67% |
|
Supplemental Data |
|
|
|
|
|
|
Net assets, end of period (in millions) |
$ 777 |
$ 646 |
$ 634 |
$ 719 |
$ 831 |
|
Portfolio turnover rate E |
34% |
49% |
89% |
29% |
76% |
A Total returns would have been lower if certain expenses had not been reduced during the applicable periods shown.
B Total returns do not include the effect of the sales charges.
C Calculated based on average shares outstanding during the period.
D Fees and expenses of any underlying Fidelity Central Funds are not included in the Fund's expense ratio. The Fund indirectly bears its proportionate share of the expenses of any underlying Fidelity Central Funds.
E Amount does not include the portfolio activity of any underlying Fidelity Central Funds.
F Expense ratios reflect operating expenses of the class. Expenses before reductions do not reflect amounts reimbursed by the investment adviser or reductions from brokerage service arrangements or reductions from other expense offset arrangements and do not represent the amount paid by the class during periods when reimbursements or reductions occur. Expenses net of fee waivers reflect expenses after reimbursement by the investment adviser but prior to reductions from brokerage service arrangements or other expense offset arrangements. Expenses net of all reductions represent the net expenses paid by the class.
See accompanying notes which are an integral part of the financial statements.
Annual Report
Financial Highlights - Class T
|
Years ended November 30, |
2013 |
2012 |
2011 |
2010 |
2009 |
|
Selected Per-Share Data |
|
|
|
|
|
|
Net asset value, beginning of period |
$ 25.94 |
$ 22.50 |
$ 21.37 |
$ 20.54 |
$ 16.94 |
|
Income from Investment Operations |
|
|
|
|
|
|
Net investment income (loss) C |
.55 |
.57 |
.38 |
.22 |
.25 |
|
Net realized and unrealized gain (loss) |
6.15 |
3.37 |
1.13 |
.82 |
3.63 |
|
Total from investment operations |
6.70 |
3.94 |
1.51 |
1.04 |
3.88 |
|
Distributions from net investment income |
(.52) |
(.50) |
(.38) |
(.21) |
(.28) |
|
Distributions from net realized gain |
(.03) |
- |
- |
- |
- |
|
Total distributions |
(.55) |
(.50) |
(.38) |
(.21) |
(.28) |
|
Net asset value, end of period |
$ 32.09 |
$ 25.94 |
$ 22.50 |
$ 21.37 |
$ 20.54 |
|
Total Return A, B |
26.14% |
17.70% |
7.02% |
5.09% |
23.35% |
|
Ratios to Average Net Assets D, F |
|
|
|
|
|
|
Expenses before reductions |
1.19% |
1.21% |
1.22% |
1.23% |
1.28% |
|
Expenses net of fee waivers, if any |
1.19% |
1.21% |
1.22% |
1.23% |
1.28% |
|
Expenses net of all reductions |
1.18% |
1.21% |
1.21% |
1.22% |
1.27% |
|
Net investment income (loss) |
1.86% |
2.32% |
1.63% |
1.03% |
1.47% |
|
Supplemental Data |
|
|
|
|
|
|
Net assets, end of period (in millions) |
$ 984 |
$ 854 |
$ 862 |
$ 1,108 |
$ 1,264 |
|
Portfolio turnover rate E |
34% |
49% |
89% |
29% |
76% |
A Total returns would have been lower if certain expenses had not been reduced during the applicable periods shown.
B Total returns do not include the effect of the sales charges.
C Calculated based on average shares outstanding during the period.
D Fees and expenses of any underlying Fidelity Central Funds are not included in the Fund's expense ratio. The Fund indirectly bears its proportionate share of the expenses of any underlying Fidelity Central Funds.
E Amount does not include the portfolio activity of any underlying Fidelity Central Funds.
F Expense ratios reflect operating expenses of the class. Expenses before reductions do not reflect amounts reimbursed by the investment adviser or reductions from brokerage service arrangements or reductions from other expense offset arrangements and do not represent the amount paid by the class during periods when reimbursements or reductions occur. Expenses net of fee waivers reflect expenses after reimbursement by the investment adviser but prior to reductions from brokerage service arrangements or other expense offset arrangements. Expenses net of all reductions represent the net expenses paid by the class.
See accompanying notes which are an integral part of the financial statements.
Annual Report
Financial Highlights - Class B
|
Years ended November 30, |
2013 |
2012 |
2011 |
2010 |
2009 |
|
Selected Per-Share Data |
|
|
|
|
|
|
Net asset value, beginning of period |
$ 25.69 |
$ 22.29 |
$ 21.16 |
$ 20.33 |
$ 16.77 |
|
Income from Investment Operations |
|
|
|
|
|
|
Net investment income (loss) C |
.36 |
.42 |
.24 |
.09 |
.15 |
|
Net realized and unrealized gain (loss) |
6.10 |
3.34 |
1.12 |
.82 |
3.59 |
|
Total from investment operations |
6.46 |
3.76 |
1.36 |
.91 |
3.74 |
|
Distributions from net investment income |
(.33) |
(.36) |
(.23) |
(.08) |
(.18) |
|
Distributions from net realized gain |
(.03) |
- |
- |
- |
- |
|
Total distributions |
(.36) |
(.36) |
(.23) |
(.08) |
(.18) |
|
Net asset value, end of period |
$ 31.79 |
$ 25.69 |
$ 22.29 |
$ 21.16 |
$ 20.33 |
|
Total Return A, B |
25.39% |
16.97% |
6.43% |
4.49% |
22.59% |
|
Ratios to Average Net Assets D, F |
|
|
|
|
|
|
Expenses before reductions |
1.80% |
1.80% |
1.81% |
1.82% |
1.84% |
|
Expenses net of fee waivers, if any |
1.80% |
1.80% |
1.81% |
1.82% |
1.84% |
|
Expenses net of all reductions |
1.79% |
1.80% |
1.80% |
1.81% |
1.84% |
|
Net investment income (loss) |
1.26% |
1.73% |
1.04% |
.44% |
.90% |
|
Supplemental Data |
|
|
|
|
|
|
Net assets, end of period (in millions) |
$ 27 |
$ 31 |
$ 42 |
$ 63 |
$ 88 |
|
Portfolio turnover rate E |
34% |
49% |
89% |
29% |
76% |
A Total returns would have been lower if certain expenses had not been reduced during the applicable periods shown.
B Total returns do not include the effect of the contingent deferred sales charge.
C Calculated based on average shares outstanding during the period.
D Fees and expenses of any underlying Fidelity Central Funds are not included in the Fund's expense ratio. The Fund indirectly bears its proportionate share of the expenses of any underlying Fidelity Central Funds.
E Amount does not include the portfolio activity of any underlying Fidelity Central Funds.
F Expense ratios reflect operating expenses of the class. Expenses before reductions do not reflect amounts reimbursed by the investment adviser or reductions from brokerage service arrangements or reductions from other expense offset arrangements and do not represent the amount paid by the class during periods when reimbursements or reductions occur. Expenses net of fee waivers reflect expenses after reimbursement by the investment adviser but prior to reductions from brokerage service arrangements or other expense offset arrangements. Expenses net of all reductions represent the net expenses paid by the class.
See accompanying notes which are an integral part of the financial statements.
Annual Report
Financial Highlights - Class C
|
Years ended November 30, |
2013 |
2012 |
2011 |
2010 |
2009 |
|
Selected Per-Share Data |
|
|
|
|
|
|
Net asset value, beginning of period |
$ 25.66 |
$ 22.27 |
$ 21.16 |
$ 20.34 |
$ 16.78 |
|
Income from Investment Operations |
|
|
|
|
|
|
Net investment income (loss) C |
.38 |
.43 |
.25 |
.09 |
.16 |
|
Net realized and unrealized gain (loss) |
6.09 |
3.33 |
1.11 |
.82 |
3.59 |
|
Total from investment operations |
6.47 |
3.76 |
1.36 |
.91 |
3.75 |
|
Distributions from net investment income |
(.37) |
(.37) |
(.25) |
(.09) |
(.19) |
|
Distributions from net realized gain |
(.03) |
- |
- |
- |
- |
|
Total distributions |
(.40) |
(.37) |
(.25) |
(.09) |
(.19) |
|
Net asset value, end of period |
$ 31.73 |
$ 25.66 |
$ 22.27 |
$ 21.16 |
$ 20.34 |
|
Total Return A, B |
25.46% |
17.03% |
6.40% |
4.50% |
22.63% |
|
Ratios to Average Net Assets D, F |
|
|
|
|
|
|
Expenses before reductions |
1.74% |
1.77% |
1.78% |
1.80% |
1.83% |
|
Expenses net of fee waivers, if any |
1.74% |
1.77% |
1.78% |
1.80% |
1.83% |
|
Expenses net of all reductions |
1.73% |
1.77% |
1.77% |
1.79% |
1.83% |
|
Net investment income (loss) |
1.32% |
1.76% |
1.06% |
.46% |
.91% |
|
Supplemental Data |
|
|
|
|
|
|
Net assets, end of period (in millions) |
$ 195 |
$ 143 |
$ 134 |
$ 149 |
$ 165 |
|
Portfolio turnover rate E |
34% |
49% |
89% |
29% |
76% |
A Total returns would have been lower if certain expenses had not been reduced during the applicable periods shown.
B Total returns do not include the effect of the contingent deferred sales charge.
C Calculated based on average shares outstanding during the period.
D Fees and expenses of any underlying Fidelity Central Funds are not included in the Fund's expense ratio. The Fund indirectly bears its proportionate share of the expenses of any underlying Fidelity Central Funds.
E Amount does not include the portfolio activity of any underlying Fidelity Central Funds.
F Expense ratios reflect operating expenses of the class. Expenses before reductions do not reflect amounts reimbursed by the investment adviser or reductions from brokerage service arrangements or reductions from other expense offset arrangements and do not represent the amount paid by the class during periods when reimbursements or reductions occur. Expenses net of fee waivers reflect expenses after reimbursement by the investment adviser but prior to reductions from brokerage service arrangements or other expense offset arrangements. Expenses net of all reductions represent the net expenses paid by the class.
See accompanying notes which are an integral part of the financial statements.
Annual Report
Financial Highlights - Institutional Class
|
Years ended November 30, |
2013 |
2012 |
2011 |
2010 |
2009 |
|
Selected Per-Share Data |
|
|
|
|
|
|
Net asset value, beginning of period |
$ 26.36 |
$ 22.86 |
$ 21.70 |
$ 20.85 |
$ 17.20 |
|
Income from Investment Operations |
|
|
|
|
|
|
Net investment income (loss) B |
.70 |
.70 |
.50 |
.32 |
.34 |
|
Net realized and unrealized gain (loss) |
6.24 |
3.43 |
1.14 |
.83 |
3.68 |
|
Total from investment operations |
6.94 |
4.13 |
1.64 |
1.15 |
4.02 |
|
Distributions from net investment income |
(.65) |
(.63) |
(.48) |
(.30) |
(.37) |
|
Distributions from net realized gain |
(.03) |
- |
- |
- |
- |
|
Total distributions |
(.68) |
(.63) |
(.48) |
(.30) |
(.37) |
|
Net asset value, end of period |
$ 32.62 |
$ 26.36 |
$ 22.86 |
$ 21.70 |
$ 20.85 |
|
Total Return A |
26.72% |
18.27% |
7.55% |
5.56% |
23.90% |
|
Ratios to Average Net Assets C, E |
|
|
|
|
|
|
Expenses before reductions |
.72% |
.73% |
.74% |
.77% |
.79% |
|
Expenses net of fee waivers, if any |
.72% |
.73% |
.74% |
.77% |
.79% |
|
Expenses net of all reductions |
.71% |
.73% |
.73% |
.76% |
.78% |
|
Net investment income (loss) |
2.34% |
2.80% |
2.10% |
1.49% |
1.96% |
|
Supplemental Data |
|
|
|
|
|
|
Net assets, end of period (in millions) |
$ 483 |
$ 445 |
$ 360 |
$ 464 |
$ 1,127 |
|
Portfolio turnover rate D |
34% |
49% |
89% |
29% |
76% |
A Total returns would have been lower if certain expenses had not been reduced during the applicable periods shown.
B Calculated based on average shares outstanding during the period.
C Fees and expenses of any underlying Fidelity Central Funds are not included in the Fund's expense ratio. The Fund indirectly bears its proportionate share of the expenses of any underlying Fidelity Central Funds.
D Amount does not include the portfolio activity of any underlying Fidelity Central Funds.
E Expense ratios reflect operating expenses of the class. Expenses before reductions do not reflect amounts reimbursed by the investment adviser or reductions from brokerage service arrangements or reductions from other expense offset arrangements and do not represent the amount paid by the class during periods when reimbursements or reductions occur. Expenses net of fee waivers reflect expenses after reimbursement by the investment adviser but prior to reductions from brokerage service arrangements or other expense offset arrangements. Expenses net of all reductions represent the net expenses paid by the class.
See accompanying notes which are an integral part of the financial statements.
Annual Report
Financial Highlights - Class Z
|
Year ended November 30, |
2013 G |
|
Selected Per-Share Data |
|
|
Net asset value, beginning of period |
$ 31.44 |
|
Income from Investment Operations |
|
|
Net investment income (loss) D |
.23 |
|
Net realized and unrealized gain (loss) |
1.12 |
|
Total from investment operations |
1.35 |
|
Distributions from net investment income |
(.16) |
|
Net asset value, end of period |
$ 32.63 |
|
Total Return B, C |
4.30% |
|
Ratios to Average Net Assets E, H |
|
|
Expenses before reductions |
.54% A |
|
Expenses net of fee waivers, if any |
.54% A |
|
Expenses net of all reductions |
.54% A |
|
Net investment income (loss) |
2.37% A |
|
Supplemental Data |
|
|
Net assets, end of period (000 omitted) |
$ 104 |
|
Portfolio turnover rate F |
34% |
A Annualized
B Total returns for periods of less than one year are not annualized.
C Total returns would have been lower if certain expenses had not been reduced during the applicable periods shown.
D Calculated based on average shares outstanding during the period.
E Fees and expenses of any underlying Fidelity Central Funds are not included in the Fund's expense ratio. The Fund indirectly bears its proportionate share of the expenses of any underlying Fidelity Central Funds.
F Amount does not include the portfolio activity of any underlying Fidelity Central Funds.
G For the period August 13, 2013 (commencement of sale of shares) to November 30, 2013.
H Expense ratios reflect operating expenses of the class. Expenses before reductions do not reflect amounts reimbursed by the investment adviser or reductions from brokerage service arrangements or reductions from other expense offset arrangements and do not represent the amount paid by the class during periods when reimbursements or reductions occur. Expense ratios before reductions for start-up periods may not be representative of longer-term operating periods. Expenses net of fee waivers reflect expenses after reimbursement by the investment adviser but prior to reductions from brokerage service arrangements or other expense offset arrangements. Expenses net of all reductions represent the net expenses paid by the class.
See accompanying notes which are an integral part of the financial statements.
Annual Report
Notes to Financial Statements
For the period ended November 30, 2013
(Amounts in thousands except percentages)
1. Organization.
Fidelity Advisor Equity Income Fund (the Fund) is a fund of Fidelity Advisor Series I (the Trust) and is authorized to issue an unlimited number of shares. The Trust is registered under the Investment Company Act of 1940, as amended (the 1940 Act), as an open-end management investment company organized as a Massachusetts business trust. The Fund commenced sale of Class Z shares on August 13, 2013. The Fund offers Class A, Class T, Class C, Institutional Class and Class Z shares, each of which, along with Class B shares, has equal rights as to assets and voting privileges. Class B shares are closed to new accounts and additional purchases, except for exchanges and reinvestments. Each class has exclusive voting rights with respect to matters that affect that class. Class B shares will automatically convert to Class A shares after a holding period of seven years from the initial date of purchase.
2. Investments in Fidelity Central Funds.
The Fund invests in Fidelity Central Funds, which are open-end investment companies generally available only to other investment companies and accounts managed by the investment adviser and its affiliates. The Fund's Schedule of Investments lists each of the Fidelity Central Funds held as of period end, if any, as an investment of the Fund, but does not include the underlying holdings of each Fidelity Central Fund. As an Investing Fund, the Fund indirectly bears its proportionate share of the expenses of the underlying Fidelity Central Funds.
The Money Market Central Funds seek preservation of capital and current income and are managed by Fidelity Investments Money Management, Inc. (FIMM), an affiliate of the investment adviser. Annualized expenses of the Money Market Central Funds as of their most recent shareholder report date are less than .01%.
A complete unaudited list of holdings for each Fidelity Central Fund is available upon request or at the Securities and Exchange Commission (the SEC) website at www.sec.gov. In addition, the financial statements of the Fidelity Central Funds, which are not covered by the Fund's Report of Independent Registered Public Accounting Firm, are available on the SEC website or upon request.
3. Significant Accounting Policies.
The financial statements have been prepared in conformity with accounting principles generally accepted in the United States of America (GAAP), which require management to make certain estimates and assumptions at the date of the financial statements. Actual results could differ from those estimates. Subsequent events, if any, through the date that the financial statements were issued have been evaluated in the preparation of the financial statements. The following summarizes the significant accounting policies of the Fund:
Annual Report
Notes to Financial Statements - continued
(Amounts in thousands except percentages)
3. Significant Accounting Policies - continued
Investment Valuation. Investments are valued as of 4:00 p.m. Eastern time on the last calendar day of the period. In accordance with valuation policies and procedures approved by the Board of Trustees (the Board), the Fund attempts to obtain prices from one or more third party pricing vendors or brokers to value its investments. When current market prices, quotations or currency exchange rates are not readily available or reliable, investments will be fair valued in good faith by the Fidelity Management & Research Company (FMR) Fair Value Committee (the Committee), in accordance with procedures adopted by the Board. Factors used in determining fair value vary by investment type and may include market or investment specific events, changes in interest rates and credit quality. The frequency with which these procedures are used cannot be predicted and they may be utilized to a significant extent. The Committee oversees the Fund's valuation policies and procedures and is responsible for approving and reporting to the Board all fair value determinations.
The Fund categorizes the inputs to valuation techniques used to value its investments into a disclosure hierarchy consisting of three levels as shown below:
Level 1 - quoted prices in active markets for identical investments
Level 2 - other significant observable inputs (including quoted prices for similar investments, interest rates, prepayment speeds, etc.)
Level 3 - unobservable inputs (including the Fund's own assumptions based on the best information available)
Valuation techniques used to value the Fund's investments by major category are as follows:
Equity securities, including restricted securities, for which market quotations are readily available, are valued at the last reported sale price or official closing price as reported by a third party pricing vendor on the primary market or exchange on which they are traded and are categorized as Level 1 in the hierarchy. In the event there were no sales during the day or closing prices are not available, securities are valued at the last quoted bid price or may be valued using the last available price and are generally categorized as Level 2 in the hierarchy. For foreign equity securities, when market or security specific events arise, comparisons to the valuation of American Depositary Receipts (ADRs), futures contracts, Exchange-Traded Funds (ETFs) and certain indexes as well as quoted prices for similar securities may be used and would be categorized as Level 2 in the hierarchy. Utilizing these techniques may result in transfers between Level 1 and Level 2. For equity securities, including restricted securities, where observable inputs are limited, assumptions about market activity and risk are used and these securities may be categorized as Level 3 in the hierarchy.
Annual Report
3. Significant Accounting Policies - continued
Investment Valuation - continued
Debt securities, including restricted securities, are valued based on evaluated prices received from third party pricing vendors or from brokers who make markets in such securities. For corporate bonds, pricing vendors utilize matrix pricing which considers yield or price of bonds of comparable quality, coupon, maturity and type as well as broker-supplied prices. When independent prices are unavailable or unreliable, debt securities may be valued utilizing pricing methodologies which consider similar factors that would be used by third party pricing vendors. Debt securities are generally categorized as Level 2 in the hierarchy but may be Level 3 depending on the circumstances.
Exchange-traded options are valued using the last sale price or, in the absence of a sale, the last offering price and are categorized as Level 1 in the hierarchy. Investments in open-end mutual funds, including the Fidelity Central Funds, are valued at their closing net asset value (NAV) each business day and are categorized as Level 1 in the hierarchy.
Changes in valuation techniques may result in transfers in or out of an assigned level within the disclosure hierarchy. The aggregate value of investments by input level, as of November 30, 2013, is included at the end of the Fund's Schedule of Investments.
Foreign Currency. The Fund may use foreign currency contracts to facilitate transactions in foreign-denominated securities. Gains and losses from these transactions may arise from changes in the value of the foreign currency or if the counterparties do not perform under the contracts' terms.
Foreign-denominated assets, including investment securities, and liabilities are translated into U.S. dollars at the exchange rates at period end. Purchases and sales of investment securities, income and dividends received and expenses denominated in foreign currencies are translated into U.S. dollars at the exchange rate in effect on the transaction date.
The effects of exchange rate fluctuations on investments are included with the net realized and unrealized gain (loss) on investment securities. Other foreign currency transactions resulting in realized and unrealized gain (loss) are disclosed separately.
Investment Transactions and Income. For financial reporting purposes, the Fund's investment holdings and NAV include trades executed through the end of the last business day of the period. The NAV per share for processing shareholder transactions is calculated as of the close of business of the New York Stock Exchange (NYSE), normally 4:00 p.m. Eastern time and includes trades executed through the end of the prior business day. Gains and losses on securities sold are determined on the basis of identified cost and may include proceeds received from litigation. Dividend income is recorded on
Annual Report
Notes to Financial Statements - continued
(Amounts in thousands except percentages)
3. Significant Accounting Policies - continued
Investment Transactions and Income - continued
the ex-dividend date except for certain dividends from foreign securities where the ex-dividend date may have passed, which are recorded as soon as the Fund is informed of the ex-dividend date. Non-cash dividends included in dividend income, if any, are recorded at the fair market value of the securities received. Distributions received on securities that represent a return of capital or capital gain are recorded as a reduction of cost of investments and/or as a realized gain. Subsequent to ex-dividend date the Fund determines the components of these distributions, based upon receipt of tax filings or other correspondence relating to the underlying investment. Interest income and distributions from the Fidelity Central Funds are accrued as earned. Interest income includes coupon interest and amortization of premium and accretion of discount on debt securities. Investment income is recorded net of foreign taxes withheld where recovery of such taxes is uncertain.
Class Allocations and Expenses. Investment income, realized and unrealized capital gains and losses, common expenses of the Fund, and certain fund-level expense reductions, if any, are allocated daily on a pro-rata basis to each class based on the relative net assets of each class to the total net assets of the Fund. Each class differs with respect to transfer agent and distribution and service plan fees incurred. Certain expense reductions may also differ by class. For the reporting period, the allocated portion of income and expenses to each class as a percent of its average net assets may vary due to the timing of recording these transactions in relation to fluctuating net assets of the classes. Expenses directly attributable to a fund are charged to that fund. Expenses attributable to more than one fund are allocated among the respective funds on the basis of relative net assets or other appropriate methods. Expense estimates are accrued in the period to which they relate and adjustments are made when actual amounts are known.
Deferred Trustee Compensation. Under a Deferred Compensation Plan (the Plan), independent Trustees may elect to defer receipt of a portion of their annual compensation. Deferred amounts are invested in a cross-section of Fidelity funds, are marked-to-market and remain in the Fund until distributed in accordance with the Plan. The investment of deferred amounts and the offsetting payable to the Trustees are included in the accompanying Statement of Assets and Liabilities.
Income Tax Information and Distributions to Shareholders. Each year, the Fund intends to qualify as a regulated investment company under Subchapter M of the Internal Revenue Code, including distributing substantially all of its taxable income and realized gains. As a result, no provision for U.S. Federal income taxes is required. As of November 30, 2013, the Fund did not have any unrecognized tax benefits in the financial statements; nor is the Fund aware of any tax positions for which it is reasonably possible that
Annual Report
3. Significant Accounting Policies - continued
Income Tax Information and Distributions to Shareholders - continued
the total amounts of unrecognized tax benefits will significantly change in the next twelve months. The Fund files a U.S. federal tax return, in addition to state and local tax returns as required. The Fund's federal income tax returns are subject to examination by the Internal Revenue Service (IRS) for a period of three fiscal years after they are filed. State and local tax returns may be subject to examination for an additional fiscal year depending on the jurisdiction. Foreign taxes are provided for based on the Fund's understanding of the tax rules and rates that exist in the foreign markets in which it invests.
Distributions are declared and recorded on the ex-dividend date. Income dividends and capital gain distributions are declared separately for each class. Income and capital gain distributions are determined in accordance with income tax regulations, which may differ from GAAP. In addition, the fund will claim a portion of the payment made to redeeming shareholders as a distribution for income tax purposes.
Capital accounts within the financial statements are adjusted for permanent book-tax differences. These adjustments have no impact on net assets or the results of operations. Temporary book-tax differences will reverse in a subsequent period.
Book-tax differences are primarily due to foreign currency transactions, partnerships, market discount, equity-debt classifications, deferred trustee compensation, capital loss carryforwards and losses deferred due to wash sales and excise tax regulations.
The federal tax cost of investment securities and unrealized appreciation (depreciation) as of period end were as follows:
|
Gross unrealized appreciation |
$ 451,177 |
|
Gross unrealized depreciation |
(40,134) |
|
Net unrealized appreciation (depreciation) on securities and other investments |
$ 411,043 |
|
|
|
|
Tax Cost |
$ 2,058,091 |
The tax-based components of distributable earnings as of period end were as follows:
|
Undistributed ordinary income |
$ 11,847 |
|
Capital loss carryforward |
$ (100,096) |
|
Net unrealized appreciation (depreciation) |
$ 410,403 |
Capital loss carryforwards are only available to offset future capital gains of the Fund to the extent provided by regulations and may be limited. Under the Regulated Investment Company Modernization Act of 2010 (the Act), the Fund is permitted to carry forward
Annual Report
Notes to Financial Statements - continued
(Amounts in thousands except percentages)
3. Significant Accounting Policies - continued
Income Tax Information and Distributions to Shareholders - continued
capital losses incurred in taxable years beginning after December 22, 2010 for an unlimited period and such capital losses are required to be used prior to any losses that expire.
The capital loss carryforward information presented below, including any applicable limitation, is estimated as of fiscal period end and is subject to adjustment.
|
Fiscal year of expiration |
|
|
2017 |
$ 100,096 |
The tax character of distributions paid was as follows:
|
|
November 30, 2013 |
November 30, 2012 |
|
Ordinary Income |
$ 46,175 |
$ 45,384 |
Restricted Securities. The Fund may invest in securities that are subject to legal or contractual restrictions on resale. These securities generally may be resold in transactions exempt from registration or to the public if the securities are registered. Disposal of these securities may involve time-consuming negotiations and expense, and prompt sale at an acceptable price may be difficult. Information regarding restricted securities is included at the end of the Fund's Schedule of Investments.
New Accounting Pronouncement. The Financial Accounting Standards Board issued in December 2011, Accounting Standard Update No. 2011-11, Disclosures about Offsetting Assets and Liabilities, and in January 2013, Accounting Standards Update No. 2013-1 Clarifying the Scope of Disclosures about Offsetting Assets and Liabilities. These updates create new disclosure requirements requiring entities to disclose both gross and net information for derivatives and other financial instruments that are either offset in the Statement of Assets and Liabilities or subject to an enforceable master netting arrangement or similar agreement. The disclosure requirements are effective for annual reporting periods beginning on or after January 1, 2013, and interim periods within those annual periods. Management expects that the impact of the updates' adoption will be limited to additional financial statement disclosures as applicable.
4. Derivative Instruments.
Risk Exposures and the Use of Derivative Instruments. The Fund's investment objective allows the Fund to enter into various types of derivative contracts, including options. Derivatives are investments whose value is primarily derived from underlying assets, indices or reference rates and may be transacted on an exchange or over-the-counter (OTC). Derivatives may involve a future commitment to buy or sell a specified asset based on specified terms, to exchange future cash flows at periodic intervals based
Annual Report
4. Derivative Instruments - continued
Risk Exposures and the Use of Derivative Instruments - continued
on a notional principal amount, or for one party to make one or more payments upon the occurrence of specified events in exchange for periodic payments from the other party.
The Fund used derivatives to increase returns and to manage exposure to certain risks as defined below. The success of any strategy involving derivatives depends on analysis of numerous economic factors, and if the strategies for investment do not work as intended, the Fund may not achieve its objectives.
The Fund's use of derivatives increased or decreased its exposure to the following risk:
|
Equity Risk |
Equity risk relates to the fluctuations in the value of financial instruments as a result of changes in market prices (other than those arising from interest rate risk or foreign exchange risk), whether caused by factors specific to an individual investment, its issuer, or all factors affecting all instruments traded in a market or market segment. |
The Fund is also exposed to additional risks from investing in derivatives, such as liquidity risk and counterparty credit risk. Liquidity risk is the risk that the Fund will be unable to close out the derivative in the open market in a timely manner. Counterparty credit risk is the risk that the counterparty will not be able to fulfill its obligation to the Fund. Counterparty credit risk related to exchange-traded options may be mitigated by the protection provided by the exchange on which they trade.
Investing in derivatives may involve greater risks than investing in the underlying assets directly and, to varying degrees, may involve risk of loss in excess of any initial investment and collateral received and amounts recognized in the Statement of Assets and Liabilities. In addition, there may be the risk that the change in value of the derivative contract does not correspond to the change in value of the underlying instrument.
Options. Options give the purchaser the right, but not the obligation, to buy (call) or sell (put) an underlying security or financial instrument at an agreed exercise or strike price between or on certain dates. Options obligate the seller (writer) to buy (put) or sell (call) an underlying instrument at the exercise or strike price or cash settle an underlying derivative instrument if the holder exercises the option on or before the expiration date.
The Fund used exchange-traded written covered call options to manage its exposure to the market. When the Fund writes a covered call option, the Fund holds the underlying instrument which must be delivered to the holder upon the exercise of the option.
Upon entering into a written options contract, the Fund will receive a premium. Premiums received are reflected as a liability on the Statement of Assets and Liabilities. Options are valued daily and any unrealized appreciation (depreciation) is reflected on the Statement
Annual Report
Notes to Financial Statements - continued
(Amounts in thousands except percentages)
4. Derivative Instruments - continued
Options - continued
of Assets and Liabilities. When a written option is exercised, the premium is added to the proceeds from the sale of the underlying instrument in determining the gain or loss realized on that investment. When an option is closed the Fund will realize a gain or loss depending on whether the proceeds or amount paid for the closing sale transaction are greater or less than the premium received. When an option expires, gains and losses are realized to the extent of premiums received. The net realized gain (loss) on closed and expired written options and the change in net unrealized appreciation (depreciation) on written options are reflected separately on the Statement of Operations.
Writing call options tends to decrease exposure to the underlying instrument and risk of loss is the change in value in excess of the premium received.
Any open options at period end are presented in the Schedule of Investments under the caption "Written Options" and are representative of volume of activity during the period.
During the period, the Fund recognized net realized gain (loss) of $983 and a change in net unrealized appreciation (depreciation) of ($656) related to its investment in written options. This amount is included in the Statement of Operations.
The following is a summary of the Fund's written options activity:
|
Written Options |
Number of Contracts |
Amount of Premiums |
|
Outstanding at beginning of period |
- |
$ - |
|
Options Opened |
44 |
2,909 |
|
Options Exercised |
(14) |
(976) |
|
Options Closed |
(13) |
(664) |
|
Options Expired |
(4) |
(438) |
|
Outstanding at end of period |
13 |
$ 831 |
5. Purchases and Sales of Investments.
Purchases and sales of securities, other than short-term securities, aggregated $759,802 and $951,923, respectively.
6. Fees and Other Transactions with Affiliates.
Management Fee. Fidelity Management & Research Company (the investment adviser) and its affiliates provide the Fund with investment management related services for which the Fund pays a monthly management fee. The management fee is the sum of an individual fund fee rate that is based on an annual rate of .20% of the Fund's average net assets and an annualized group fee rate that averaged .25% during the period. The group fee rate is based upon the average net assets of all the mutual funds
Annual Report
6. Fees and Other Transactions with Affiliates - continued
Management Fee - continued
advised by the investment adviser, including any mutual funds previously advised by the investment adviser that are currently advised by Fidelity SelectCo, LLC, an affiliate of the investment adviser. The group fee rate decreases as assets under management increase and increases as assets under management decrease. For the reporting period, the total annual management fee rate was .45% of the Fund's average net assets.
Distribution and Service Plan Fees. In accordance with Rule 12b-1 of the 1940 Act, the Fund has adopted separate Distribution and Service Plans for each class of shares. Certain classes pay Fidelity Distributors Corporation (FDC), an affiliate of the investment adviser, separate Distribution and Service Fees, each of which is based on an annual percentage of each class' average net assets. In addition, FDC may pay financial intermediaries for selling shares of the Fund and providing shareholder support services.
For the period, the Distribution and Service Fee rates, total fees and amounts retained by FDC were as follows:
|
|
Distribution |
Service |
Total Fees |
Retained |
|
Class A |
-% |
.25% |
$ 1,790 |
$ 38 |
|
Class T |
.25% |
.25% |
4,656 |
29 |
|
Class B |
.75% |
.25% |
294 |
222 |
|
Class C |
.75% |
.25% |
1,689 |
174 |
|
|
|
|
$ 8,429 |
$ 463 |
Sales Load. FDC may receive a front-end sales charge of up to 5.75% for selling Class A shares and 3.50% for selling Class T shares, some of which is paid to financial intermediaries for selling shares of the Fund. Depending on the holding period, FDC may receive contingent deferred sales charges levied on Class A, Class T, Class B, and Class C redemptions. The deferred sales charges range from 5.00% to 1.00% for Class B shares, 1.00% for Class C shares, 1.00% for certain purchases of Class A shares and .25% for certain purchases of Class T shares.
For the period, sales charge amounts retained by FDC were as follows:
|
|
Retained |
|
Class A |
$ 162 |
|
Class T |
40 |
|
Class B* |
18 |
|
Class C* |
14 |
|
|
$ 234 |
* When Class B and Class C shares are initially sold, FDC pays commissions from its own resources to financial intermediaries through which the sales are made.
Annual Report
Notes to Financial Statements - continued
(Amounts in thousands except percentages)
6. Fees and Other Transactions with Affiliates - continued
Transfer Agent Fees. Fidelity Investments Institutional Operations Company, Inc., (FIIOC), an affiliate of the investment adviser, is the transfer, dividend disbursing and shareholder servicing agent for each class of the Fund. FIIOC receives account fees and asset-based fees that vary according to the account size and type of account of the shareholders of the respective classes of the Fund, except for Class Z. FIIOC receives an asset-based fee of Class Z's average net assets. FIIOC pays for typesetting, printing and mailing of shareholder reports, except proxy statements.
For the period, transfer agent fees for each class were as follows:
|
|
Amount |
% of |
|
Class A |
$ 1,691 |
.24 |
|
Class T |
1,826 |
.20 |
|
Class B |
88 |
.30 |
|
Class C |
409 |
.24 |
|
Institutional Class |
1,057 |
.22 |
|
Class Z |
-* |
.05** |
|
|
$ 5,071 |
|
* Amount represents fifteen dollars.
** Annualized
Accounting and Security Lending Fees. Fidelity Service Company, Inc. (FSC), an affiliate of the investment adviser, maintains the Fund's accounting records. The accounting fee is based on the level of average net assets for each month. Under a separate contract, FSC administers the security lending program. The security lending fee is based on the number and duration of lending transactions.
Brokerage Commissions. The Fund placed a portion of its portfolio transactions with brokerage firms which are affiliates of the investment adviser. Brokerage commissions are included in net realized gain (loss) and change in net unrealized appreciation (depreciation) in the Statement of Operations. The commissions paid to these affiliated firms were $17 for the period.
7. Committed Line of Credit.
The Fund participates with other funds managed by the investment adviser or an affiliate in a $4.25 billion credit facility (the "line of credit") to be utilized for temporary or emergency purposes to fund shareholder redemptions or for other short-term liquidity purposes. The Fund has agreed to pay commitment fees on its pro-rata portion of the line of credit, which amounted to $5 and is reflected in Miscellaneous expenses on the Statement of Operations. During the period, there were no borrowings on this line of credit.
Annual Report
8. Security Lending.
The Fund lends portfolio securities through a lending agent from time to time in order to earn additional income. For equity securities, a lending agent is used and may loan securities to certain qualified borrowers, including Fidelity Capital Markets (FCM), a broker-dealer affiliated with the Fund. On the settlement date of the loan, the Fund receives collateral (in the form of U.S. Treasury obligations, letters of credit and/or cash) against the loaned securities and maintains collateral in an amount not less than 100% of the market value of the loaned securities during the period of the loan. The market value of the loaned securities is determined at the close of business of the Fund and any additional required collateral is delivered to the Fund on the next business day. If the borrower defaults on its obligation to return the securities loaned because of insolvency or other reasons, the Fund may apply collateral received from the borrower against the obligation. The Fund may experience delays and costs in recovering the securities loaned. Any cash collateral received is invested in the Fidelity Securities Lending Cash Central Fund. The value of loaned securities and cash collateral at period end are disclosed on the Fund's Statement of Assets and Liabilities. At period end, there were no security loans outstanding with FCM. Security lending income represents the income earned on investing cash collateral, less rebates paid to borrowers and any lending agent fees associated with the loan, plus any premium payments received for lending certain types of securities. Security lending income is presented in the Statement of Operations as a component of income from Fidelity Central Funds. Total security lending income during the period amounted to $385, including $1 from securities loaned to FCM.
9. Expense Reductions.
The investment adviser voluntarily agreed to reimburse a portion of the Fund's Class A, Class T, Class B, Class C and Institutional Class operating expenses. During the period, this reimbursement reduced expenses as follows:
|
|
Reimbursement |
|
|
|
|
Class A |
$ 4 |
|
Class T |
6 |
|
Class B |
-* |
|
Class C |
1 |
|
Institutional Class |
3 |
|
|
$ 14 |
* Amount represents one hundred and sixty-three dollars.
Commissions paid to certain brokers with whom the investment adviser, or its affiliates, places trades on behalf of the Fund include an amount in addition to trade execution, which may be rebated back to the Fund to offset certain expenses. This amount totaled
Annual Report
Notes to Financial Statements - continued
(Amounts in thousands except percentages)
9. Expense Reductions - continued
$206 for the period. In addition, through arrangements with the Fund's custodian, credits realized as a result of uninvested cash balances were used to reduce the Fund's expenses. During the period, these credits reduced the Fund's custody expenses by $1.
10. Distributions to Shareholders.
Distributions to shareholders of each class were as follows:
|
Years ended November 30, |
2013 A |
2012 |
|
From net investment income |
|
|
|
Class A |
$ 14,351 |
$ 14,971 |
|
Class T |
16,481 |
17,872 |
|
Class B |
359 |
544 |
|
Class C |
2,111 |
2,166 |
|
Institutional Class |
10,429 |
9,831 |
|
Class Z |
-* |
- |
|
Total |
$ 43,731 |
$ 45,384 |
|
From net realized gain |
|
|
|
Class A |
$ 754 |
$ - |
|
Class T |
982 |
- |
|
Class B |
36 |
- |
|
Class C |
167 |
- |
|
Institutional Class |
505 |
- |
|
Total |
$ 2,444 |
$ - |
A Distributions for Class Z are for the period August 13, 2013 (commencement of sale of shares) to November 30, 2013.
* Amount represents four hundred and ninety-six dollars.
11. Share Transactions.
Transactions for each class of shares were as follows:
|
|
Shares |
Dollars |
||
|
Years ended November 30, |
2013 A |
2012 |
2013A |
2012 |
|
Class A |
|
|
|
|
|
Shares sold |
3,676 |
3,213 |
$ 106,691 |
$ 77,551 |
|
Reinvestment of distributions |
505 |
577 |
13,926 |
13,763 |
|
Shares redeemed |
(4,869) |
(7,076) |
(139,536) |
(170,494) |
|
Net increase (decrease) |
(688) |
(3,286) |
$ (18,919) |
$ (79,180) |
|
Class T |
|
|
|
|
|
Shares sold |
3,948 |
3,722 |
$ 115,563 |
$ 91,180 |
|
Reinvestment of distributions |
601 |
709 |
16,778 |
17,138 |
|
Shares redeemed |
(6,787) |
(9,817) |
(197,631) |
(240,587) |
|
Net increase (decrease) |
(2,238) |
(5,386) |
$ (65,290) |
$ (132,269) |
Annual Report
11. Share Transactions - continued
|
|
Shares |
Dollars |
||
|
Years ended November 30, |
2013 A |
2012 |
2013A |
2012 |
|
Class B |
|
|
|
|
|
Shares sold |
42 |
27 |
$ 1,216 |
$ 663 |
|
Reinvestment of distributions |
13 |
21 |
359 |
492 |
|
Shares redeemed |
(423) |
(695) |
(12,147) |
(16,864) |
|
Net increase (decrease) |
(368) |
(647) |
$ (10,572) |
$ (15,709) |
|
Class C |
|
|
|
|
|
Shares sold |
1,636 |
618 |
$ 48,035 |
$ 15,024 |
|
Reinvestment of distributions |
72 |
79 |
1,992 |
1,896 |
|
Shares redeemed |
(1,139) |
(1,166) |
(33,153) |
(28,340) |
|
Net increase (decrease) |
569 |
(469) |
$ 16,874 |
$ (11,420) |
|
Institutional Class |
|
|
|
|
|
Shares sold |
2,274 |
5,436 |
$ 67,514 |
$ 134,907 |
|
Reinvestment of distributions |
369 |
377 |
10,496 |
9,300 |
|
Shares redeemed |
(4,733) |
(4,659) |
(140,377) |
(115,943) |
|
Net increase (decrease) |
(2,090) |
1,154 |
$ (62,367) |
$ 28,264 |
|
Class Z |
|
|
|
|
|
Shares sold |
3 |
- |
$ 100 |
$ - |
|
Reinvestment of distributions |
-* |
- |
-** |
- |
|
Net increase (decrease) |
3 |
- |
$ 100 |
$ - |
A Share transactions for Class Z are for the period August 13, 2013 (commencement of sale of shares) to November 30, 2013.
* Amount represents seventy-two shares.
** Amount represents four hundred and ninety-six dollars.
12. Other.
The Fund's organizational documents provide former and current trustees and officers with a limited indemnification against liabilities arising in connection with the performance of their duties to the Fund. In the normal course of business, the Fund may also enter into contracts that provide general indemnifications. The Fund's maximum exposure under these arrangements is unknown as this would be dependent on future claims that may be made against the Fund. The risk of material loss from such claims is considered remote.
Annual Report
Report of Independent Registered Public Accounting Firm
To the Trustees of Fidelity Advisor Series I and Shareholders of Fidelity Advisor Equity Income Fund:
We have audited the accompanying statement of assets and liabilities of Fidelity Advisor Equity Income Fund (the Fund), a fund of Fidelity Advisor Series I, including the schedule of investments, as of November 30, 2013, and the related statement of operations for the year then ended, the statement of changes in net assets for each of the two years in the period then ended, and the financial highlights for each of the five years in the period then ended. These financial statements and financial highlights are the responsibility of the Fund's management. Our responsibility is to express an opinion on these financial statements and financial highlights based on our audits.
We conducted our audits in accordance with the standards of the Public Company Accounting Oversight Board (United States). Those standards require that we plan and perform the audit to obtain reasonable assurance about whether the financial statements and financial highlights are free of material misstatement. The Fund is not required to have, nor were we engaged to perform, an audit of its internal control over financial reporting. Our audits included consideration of internal control over financial reporting as a basis for designing audit procedures that are appropriate in the circumstances, but not for the purpose of expressing an opinion on the effectiveness of the Fund's internal control over financial reporting. Accordingly, we express no such opinion. An audit also includes examining, on a test basis, evidence supporting the amounts and disclosures in the financial statements, assessing the accounting principles used and significant estimates made by management, as well as evaluating the overall financial statement presentation. Our procedures included confirmation of securities owned as of November 30, 2013, by correspondence with the custodians and brokers; where replies were not received from brokers, we performed other auditing procedures. We believe that our audits provide a reasonable basis for our opinion.
In our opinion, the financial statements and financial highlights referred to above present fairly, in all material respects, the financial position of Fidelity Advisor Equity Income Fund as of November 30, 2013, the results of its operations for the year then ended, the changes in its net assets for each of the two years in the period then ended, and the financial highlights for each of the five years in the period then ended, in conformity with accounting principles generally accepted in the United States of America.
DELOITTE & TOUCHE LLP
Boston, Massachusetts
January 15, 2014
Annual Report
Trustees and Officers
The Trustees, Member of the Advisory Board, and officers of the trust and fund, as applicable, are listed below. The Board of Trustees governs the fund and is responsible for protecting the interests of shareholders. The Trustees are experienced executives who meet periodically throughout the year to oversee the fund's activities, review contractual arrangements with companies that provide services to the fund, oversee management of the risks associated with such activities and contractual arrangements, and review the fund's performance. Except for James C. Curvey, Ned C. Lautenbach, Ronald P. O'Hanley, and William S. Stavropoulos, each of the Trustees oversees 173 funds. Mr. Curvey oversees 396 funds. Mr. Lautenbach, Mr. O'Hanley, and Mr. Stavropoulos each oversees 247 funds.
The Trustees hold office without limit in time except that (a) any Trustee may resign; (b) any Trustee may be removed by written instrument, signed by at least two-thirds of the number of Trustees prior to such removal; (c) any Trustee who requests to be retired or who has become incapacitated by illness or injury may be retired by written instrument signed by a majority of the other Trustees; and (d) any Trustee may be removed at any special meeting of shareholders by a two-thirds vote of the outstanding voting securities of the trust. Each Trustee who is not an interested person (as defined in the 1940 Act) of the trust and the fund (Independent Trustee), shall retire not later than the last day of the calendar year in which his or her 75th birthday occurs. The Independent Trustees may waive this mandatory retirement age policy with respect to individual Trustees. The officers and Advisory Board Member hold office without limit in time, except that any officer and Advisory Board Member may resign or may be removed by a vote of a majority of the Trustees at any regular meeting or any special meeting of the Trustees. Except as indicated, each individual has held the office shown or other offices in the same company for the past five years.
Experience, Skills, Attributes, and Qualifications of the Fund's Trustees. The Governance and Nominating Committee has adopted a statement of policy that describes the experience, qualifications, attributes, and skills that are necessary and desirable for potential Independent Trustee candidates (Statement of Policy). The Board believes that each Trustee satisfied at the time he or she was initially elected or appointed a Trustee, and continues to satisfy, the standards contemplated by the Statement of Policy. The Governance and Nominating Committee also engages professional search firms to help identify potential Independent Trustee candidates who have the experience, qualifications, attributes, and skills consistent with the Statement of Policy. From time to time, additional criteria based on the composition and skills of the current Independent Trustees, as well as experience or skills that may be appropriate in light of future changes to board composition, business conditions, and regulatory or other developments, have also been considered by the professional search firms and the Governance and Nominating Committee. In addition, the Board takes into account the Trustees' commitment and participation in Board and committee meetings, as well as their leadership of standing and ad hoc committees throughout their tenure.
Annual Report
In determining that a particular Trustee was and continues to be qualified to serve as a Trustee, the Board has considered a variety of criteria, none of which, in isolation, was controlling. The Board believes that, collectively, the Trustees have balanced and diverse experience, qualifications, attributes, and skills, which allow the Board to operate effectively in governing the fund and protecting the interests of shareholders. Information about the specific experience, skills, attributes, and qualifications of each Trustee, which in each case led to the Board's conclusion that the Trustee should serve (or continue to serve) as a trustee of the fund, is provided below.
Board Structure and Oversight Function. James C. Curvey is an interested person (as defined in the 1940 Act) and currently serves as Chairman. The Trustees have determined that an interested Chairman is appropriate and benefits shareholders because an interested Chairman has a personal and professional stake in the quality and continuity of services provided to the fund. Independent Trustees exercise their informed business judgment to appoint an individual of their choosing to serve as Chairman, regardless of whether the Trustee happens to be independent or a member of management. The Independent Trustees have determined that they can act independently and effectively without having an Independent Trustee serve as Chairman and that a key structural component for assuring that they are in a position to do so is for the Independent Trustees to constitute a substantial majority for the Board. The Independent Trustees also regularly meet in executive session. Ned C. Lautenbach serves as Chairman of the Independent Trustees and as such (i) acts as a liaison between the Independent Trustees and management with respect to matters important to the Independent Trustees and (ii) with management prepares agendas for Board meetings.
Fidelity funds are overseen by different Boards of Trustees. The fund's Board oversees Fidelity's equity and high income funds and another Board oversees Fidelity's investment-grade bond, money market, and asset allocation funds. The asset allocation funds may invest in Fidelity funds overseen by the fund's Board. The use of separate Boards, each with its own committee structure, allows the Trustees of each group of Fidelity funds to focus on the unique issues of the funds they oversee, including common research, investment, and operational issues. On occasion, the separate Boards establish joint committees to address issues of overlapping consequences for the Fidelity funds overseen by each Board.
The Trustees operate using a system of committees to facilitate the timely and efficient consideration of all matters of importance to the Trustees, the fund, and fund shareholders and to facilitate compliance with legal and regulatory requirements and oversight of the fund's activities and associated risks. The Board, acting through its committees, has charged FMR and its affiliates with (i) identifying events or circumstances the occurrence of which could have demonstrably adverse effects on the fund's business and/or reputation; (ii) implementing processes and controls to lessen the possibility that such events or circumstances occur or to mitigate the effects of such events or circumstances if they do occur; and (iii) creating and maintaining a system designed to evaluate continuously business and market conditions in order to facilitate the identification and implementation processes described in (i) and (ii) above. Because the day-to-day operations and activities of the fund are carried out by or through FMR, its affiliates and other service providers, the fund's exposure to risks is mitigated but not eliminated by the processes overseen by the Trustees. While each of the Board's committees has responsibility for overseeing different aspects of the fund's activities, oversight is exercised primarily through the Operations, Audit, and Compliance Committees. In addition, the Independent Trustees have worked with FMR to enhance the Board's oversight of investment and financial risks, legal and regulatory risks, technology risks, and operational risks, including the development of additional risk reporting to the Board. For example, a working group comprised of Independent Trustees and FMR has worked and continues to work to review the Fidelity funds' valuation-related activities, reporting and risk management. Appropriate personnel, including but not limited to the fund's Chief Compliance Officer (CCO), FMR's internal auditor, the independent accountants, the fund's Treasurer and portfolio management personnel, make periodic reports to the Board's committees, as appropriate, including an annual review of FMR's risk management program for the Fidelity funds. The responsibilities of each standing committee, including their oversight responsibilities, are described further under "Standing Committees of the Fund's Trustees."
Annual Report
Trustees and Officers - continued
The fund's Statement of Additional Information (SAI) includes more information about the Trustees. To request a free copy, call Fidelity at 1-877-208-0098.
Interested Trustees*:
Correspondence intended for each Trustee who is an interested person may be sent to Fidelity Investments, 245 Summer Street, Boston, Massachusetts 02210.
|
Name, Year of Birth; Principal Occupations and Other Relevant Experience+ |
|
|
James C. Curvey (1935) |
|
|
Year of Election or Appointment: 2007 Trustee Chairman of the Board of Trustees |
|
|
|
Mr. Curvey also serves as Trustee of other Fidelity funds. Mr. Curvey is a Director of Fidelity Investments Money Management, Inc. (2009-present), Director of Fidelity Research & Analysis Co. (2009-present) and Director of FMR and FMR Co., Inc. (2007-present). Mr. Curvey is also Vice Chairman (2007-present) and Director of FMR LLC. In addition, Mr. Curvey serves as an Overseer for the Boston Symphony Orchestra and a member of the Trustees of Villanova University. Previously, Mr. Curvey was the Vice Chairman (2006-2007) and Director (2000-2007) of FMR Corp. |
|
Ronald P. O'Hanley (1957) |
|
|
Year of Election or Appointment: 2011 Trustee |
|
|
|
Mr. O'Hanley also serves as Trustee of other Fidelity funds. He is Director of Fidelity SelectCo, LLC (2013-present), FMR Co., Inc. (2010-present), Director of Fidelity Investments Money Management, Inc. (2010-present), Director of Fidelity Research & Analysis Company (2010-present), President of Fidelity Asset Management and Corporate Services and a Member of Fidelity's Executive Committee (2010-present). Previously, Mr. O'Hanley served as President and Chief Executive Officer of BNY Mellon Asset Management (2007-2010). Mr. O'Hanley also served as Vice Chairman of Bank New York Mellon Corp. and a member of that firm's Executive Committee. Prior to the 2007 merger of The Bank of New York and Mellon Financial Corporation, he was Vice Chairman of Mellon Financial Corporation and President and Chief Executive Officer of Mellon Asset Management. He joined Mellon in February 1997. Mr. O'Hanley currently serves as Chairman of the Boston Public Library Foundation Board of Directors and sits on the Board of Directors of Beth Israel Deaconess Medical Center, the Board of Trustees of the Marine Biological Laboratory and the Advisory Board of the Maxwell School of Citizenship and Public Administration at Syracuse University. Mr. O'Hanley also chairs the Council on Asset Management for the Financial Services Roundtable and is a member of the Board of Directors of Institutional Investor's U.S. Institute. |
* Trustees have been determined to be "Interested Trustees" by virtue of, among other things, their affiliation with the trust or various entities under common control with FMR.
+ The information above includes each Trustee's principal occupation during the last five years and other information relating to the experience, attributes, and skills relevant to each Trustee's qualifications to serve as a Trustee, which led to the conclusion that each Trustee should serve as a Trustee for the fund.
Annual Report
Trustees and Officers - continued
Independent Trustees:
Correspondence intended for each Independent Trustee (that is, the Trustees other than the Interested Trustees) may be sent to Fidelity Investments, P.O. Box 55235, Boston, Massachusetts 02205-5235.
|
Name, Year of Birth; Principal Occupations and Other Relevant Experience+ |
|
|
Dennis J. Dirks (1948) |
|
|
Year of Election or Appointment: 2005 Trustee |
|
|
|
Mr. Dirks also serves as Trustee of other Fidelity funds. Prior to his retirement in May 2003, Mr. Dirks was Chief Operating Officer and a member of the Board of The Depository Trust & Clearing Corporation (DTCC). He also served as President, Chief Operating Officer, and Board member of The Depository Trust Company (DTC) and President and Board member of the National Securities Clearing Corporation (NSCC). In addition, Mr. Dirks served as Chief Executive Officer and Board member of the Government Securities Clearing Corporation, Chief Executive Officer and Board member of the Mortgage-Backed Securities Clearing Corporation, as a Trustee and a member of the Finance Committee of Manhattan College (2005-2008), and as a Trustee and a member of the Finance Committee of AHRC of Nassau County (2006-2008). Mr. Dirks is a member of the Independent Directors Council (IDC) Governing Council (2010-present) and Board of Directors for The Brookville Center for Children's Services, Inc. (2009-present). |
|
Alan J. Lacy (1953) |
|
|
Year of Election or Appointment: 2008 Trustee |
|
|
|
Mr. Lacy also serves as Trustee of other Fidelity funds. Mr. Lacy serves as Senior Adviser (2007-present) of Oak Hill Capital Partners, L.P. (private equity). Mr. Lacy also served as Chief Executive Officer (2000-2005) and Vice Chairman (2005-2006) of Sears Holdings Corporation and Sears, Roebuck and Co. (retail). In addition, Mr. Lacy serves as a member of the Board of Directors of Dave & Buster's Entertainment, Inc. (restaurant and entertainment complexes, 2010-present), Earth Fare, Inc. (retail grocery, 2012-present), The Hillman Companies, Inc. (hardware wholesalers, 2010-present), and Bristol-Myers Squibb Company (global pharmaceuticals, 2008-present). Mr. Lacy is a member of the Board of Trustees of The National Parks Conservation Association (2006-present). Previously, Mr. Lacy served as Chairman of the Board of Trustees of the National Parks Conservation Association (2008-2011) and as a member of the Board of Directors for the Western Union Company (global money transfer, 2006-2011). |
|
Ned C. Lautenbach (1944) |
|
|
Year of Election or Appointment: 2000 Trustee Chairman of the Independent Trustees |
|
|
|
Mr. Lautenbach also serves as Trustee of other Fidelity funds. Mr. Lautenbach currently serves as the Lead Director of the Eaton Corporation Board of Directors (diversified industrial, 1997-present). Mr. Lautenbach is Chairman of the Board of Directors of the Philharmonic Center for the Arts in Naples, Florida (2012-present) and a member of the Council on Foreign Relations (1994-present). Previously, Mr. Lautenbach was a Partner/Advisory Partner at Clayton, Dubilier & Rice, LLC (private equity investment, 1998-2010), as well as a Director of Sony Corporation (2006-2007). |
|
Joseph Mauriello (1944) |
|
|
Year of Election or Appointment: 2008 Trustee |
|
|
|
Mr. Mauriello also serves as Trustee of other Fidelity funds. Prior to his retirement in January 2006, Mr. Mauriello served in numerous senior management positions including Deputy Chairman and Chief Operating Officer (2004-2005), and Vice Chairman of Financial Services (2002-2004) of KPMG LLP US (professional services, 1965-2005). Mr. Mauriello currently serves as a member of the Board of Directors of XL Group plc. (global insurance and re-insurance, 2006-present). Previously, Mr. Mauriello served as a Director of the Hamilton Funds of the Bank of New York (2006-2007) and of Arcadia Resources Inc. (health care services and products, 2007-2012). |
|
Robert W. Selander (1950) |
|
|
Year of Election or Appointment: 2011 Trustee |
|
|
|
Mr. Selander also serves as Trustee of other Fidelity funds. Previously, Mr. Selander served as a Member of the Advisory Board of other Fidelity funds (2011), and Executive Vice Chairman (2010), Chief Executive Officer (2009-2010), and President and Chief Executive Officer (1997-2009) of Mastercard, Inc. |
|
Cornelia M. Small (1944) |
|
|
Year of Election or Appointment: 2005 Trustee |
|
|
|
Ms. Small also serves as Trustee of other Fidelity funds. Ms. Small is a member of the Board of Directors (2009-present) and Chair of the Investment Committee (2010-present) of the Teagle Foundation. Ms. Small also serves on the Investment Committee of the Berkshire Taconic Community Foundation (2008-present). Previously, Ms. Small served as Chairperson (2002-2008) and a member of the Investment Committee and Chairperson (2008-2012) and a member of the Board of Trustees of Smith College. In addition, Ms. Small served as Chief Investment Officer, Director of Global Equity Investments, and a member of the Board of Directors of Scudder, Stevens & Clark and Scudder Kemper Investments. |
|
William S. Stavropoulos (1939) |
|
|
Year of Election or Appointment: 2002 Trustee Vice Chairman of the Independent Trustees |
|
|
|
Mr. Stavropoulos also serves as Trustee of other Fidelity funds. Mr. Stavropoulos serves as President and Founder of the Michigan Baseball Foundation, the Great Lakes Loons (2007-present). Mr. Stavropoulos is Chairman Emeritus of the Board of Directors of The Dow Chemical Company, where he previously served in numerous senior management positions, including President, CEO (1995-2000; 2002-2004), Chairman of the Executive Committee (2000-2006), and as a member of the Board of Directors (1990-2006). Currently, Mr. Stavropoulos is Chairman of the Board of Directors of Univar Inc. (global distributor of commodity and specialty chemicals), a Director of Teradata Corporation (data warehousing and technology solutions), and Maersk Inc. (industrial conglomerate), and a member of the Advisory Board for Metalmark Capital LLC (private equity investment, 2005-present). Mr. Stavropoulos is an operating advisor to Clayton, Dubilier & Rice, LLC (private equity investment). In addition, Mr. Stavropoulos is a member of the University of Notre Dame Advisory Council for the College of Science, a Trustee of the Rollin L. Gerstacker Foundation, and a Director of the Naples Philharmonic Center for the Arts. Previously, Mr. Stavropoulos served as a Director of Chemical Financial Corporation (bank holding company, 1993-2012) and Tyco International, Ltd. (multinational manufacturing and services, 2007-2012). |
|
David M. Thomas (1949) |
|
|
Year of Election or Appointment: 2008 Trustee |
|
|
|
Mr. Thomas also serves as Trustee of other Fidelity funds. Mr. Thomas serves as Non-Executive Chairman of the Board of Directors of Fortune Brands Home and Security (home and security products, 2011-present), and as a member of the Board of Directors of Interpublic Group of Companies, Inc. (marketing communication, 2004-present). Previously, Mr. Thomas served as Executive Chairman (2005-2006) and Chairman and Chief Executive Officer (2000-2005) of IMS Health, Inc. (pharmaceutical and healthcare information solutions), and a Director of Fortune Brands, Inc. (consumer products, 2000-2011). |
+ The information above includes each Trustee's principal occupation during the last five years and other information relating to the experience, attributes, and skills relevant to each Trustee's qualifications to serve as a Trustee, which led to the conclusion that each Trustee should serve as a Trustee for the fund.
Advisory Board Member and Officers:
Correspondence intended for each officer and Peter S. Lynch may be sent to Fidelity Investments, 245 Summer Street, Boston, Massachusetts 02210. Officers appear below in alphabetical order.
|
Name, Year of Birth; Principal Occupation |
|
|
Peter S. Lynch (1944) |
|
|
Year of Election or Appointment: 2003 Member of the Advisory Board |
|
|
|
Mr. Lynch also serves as Member of the Advisory Board of other Fidelity funds. Mr. Lynch is Vice Chairman and a Director of FMR and FMR Co., Inc. In addition, Mr. Lynch serves as a Trustee of Boston College and as the Chairman of the Inner-City Scholarship Fund. Previously, Mr. Lynch served on the Special Olympics International Board of Directors (1997-2006). |
|
Elizabeth Paige Baumann (1968) |
|
|
Year of Election or Appointment: 2012 Anti-Money Laundering (AML) Officer |
|
|
|
Ms. Baumann also serves as AML Officer of other funds. She is Chief AML Officer of FMR LLC (2012-present) and is an employee of Fidelity Investments. Previously, Ms. Baumann served as Vice President and Deputy Anti-Money Laundering Officer (2007-2012). |
|
William C. Coffey (1969) |
|
|
Year of Election or Appointment: 2009 Assistant Secretary |
|
|
|
Mr. Coffey also serves as Assistant Secretary of other funds. He is Senior Vice President and Deputy General Counsel of FMR LLC (2010-present), and is an employee of Fidelity Investments. Previously, Mr. Coffey served as Vice President and Associate General Counsel of FMR LLC (2005-2009). |
|
Jonathan Davis (1968) |
|
|
Year of Election or Appointment: 2010 Assistant Treasurer |
|
|
|
Mr. Davis also serves as Assistant Treasurer of other funds. Mr. Davis is an employee of Fidelity Investments. Previously, Mr. Davis served as Vice President and Associate General Counsel of FMR LLC (2003-2010). |
|
Adrien E. Deberghes (1967) |
|
|
Year of Election or Appointment: 2008 Deputy Treasurer |
|
|
|
Mr. Deberghes also serves as an officer of other funds. He is an employee of Fidelity Investments (2008-present). Prior to joining Fidelity Investments, Mr. Deberghes was Senior Vice President of Mutual Fund Administration at State Street Corporation (2007-2008), Senior Director of Mutual Fund Administration at Investors Bank & Trust (2005-2007), and Director of Finance for Dunkin' Brands (2000-2005). |
|
Stephanie J. Dorsey (1969) |
|
|
Year of Election or Appointment: 2010 Assistant Treasurer |
|
|
|
Ms. Dorsey also serves as an officer of other funds. She is an employee of Fidelity Investments (2008-present) and has served in other fund officer roles. Prior to joining Fidelity Investments, Ms. Dorsey served as Treasurer (2004-2008) of the JPMorgan Mutual Funds and Vice President (2004-2008) of JPMorgan Chase Bank. |
|
Scott C. Goebel (1968) |
|
|
Year of Election or Appointment: 2008 Secretary and Chief Legal Officer (CLO) |
|
|
|
Mr. Goebel serves as Secretary and CLO of other funds. Mr. Goebel also serves as Secretary of Fidelity Investments Money Management, Inc. (FIMM) (2010-present) and Fidelity Research and Analysis Company (FRAC) (2010-present); General Counsel, Secretary, and Senior Vice President of FMR (2008-present) and FMR Co., Inc. (2008-present); Chief Legal Officer of Fidelity Management & Research (Hong Kong) Limited (2008-present) and Assistant Secretary of Fidelity Management & Research (Japan) Inc. (2008-present), and Fidelity Management & Research (U.K.) Inc. (2008-present). Previously, Mr. Goebel served as Secretary and CLO of other Fidelity funds (2008-2013), Assistant Secretary of FIMM (2008-2010), FRAC (2008-2010), and certain funds (2007-2008); and as Vice President and Secretary of Fidelity Distributors Corporation (FDC) (2005-2007). Mr. Goebel has been employed by FMR LLC or an affiliate since 2001. |
|
Joseph A. Hanlon (1968) |
|
|
Year of Election or Appointment: 2012 Chief Compliance Officer |
|
|
|
Mr. Hanlon also serves as Chief Compliance Officer of other funds. Mr. Hanlon serves as Compliance Officer of FMR, FMR Co., Inc., Fidelity Investments Money Management, Inc. (FIMM), Fidelity Research and Analysis Company (FRAC), and Fidelity Management & Research (Hong Kong) (2009-present), as Senior Vice President of the Fidelity Asset Management Division (2009-present), and is an employee of Fidelity Investments. Previously, Mr. Hanlon served as Compliance Officer of Fidelity Management & Research (Japan) Inc. (2009-2013), Strategic Advisers, Inc. (2009-2013), and Fidelity Management & Research (U.K.) Inc. (2009-2013). |
|
Bruce T. Herring (1965) |
|
|
Year of Election or Appointment: 2006 Vice President of certain Equity Funds |
|
|
|
Mr. Herring also serves as Vice President of other funds. He serves as Chief Investment Officer of Fidelity Global Asset Allocation (GAA) (2013-present), Group Chief Investment Officer of FMR, and President of Fidelity Research & Analysis Company (2010-present). Previously, Mr. Herring served as Chief Investment Officer and Director of Fidelity Management & Research (U.K.) Inc. (2010-2013), Vice President (2005-2006) and Senior Vice President (2006-2007) of Fidelity Management & Research Company, Vice President of FMR Co., Inc. (2001-2007), and as a portfolio manager for Fidelity U.S. Equity Funds. |
|
Brian B. Hogan (1964) |
|
|
Year of Election or Appointment: 2009 Vice President |
|
|
|
Mr. Hogan also serves as Vice President of other funds. Mr. Hogan serves as President of FMR's Equity Division (2009-present). Previously, Mr. Hogan served as Senior Vice President, Equity Research of FMR (2006-2009) and as a portfolio manager. |
|
Chris Maher (1972) |
|
|
Year of Election or Appointment: 2013 Assistant Treasurer |
|
|
|
Mr. Maher serves as Assistant Treasurer of other funds. Mr. Maher is Vice President of Valuation Oversight and is an employee of Fidelity Investments. Previously, Mr. Maher served as Vice President of Asset Management Compliance (2013), Vice President of FMR's Program Management Group (2010-2013), and Vice President of Valuation Oversight (2008-2010). |
|
Christine Reynolds (1958) |
|
|
Year of Election or Appointment: 2008 Chief Financial Officer |
|
|
|
Ms. Reynolds also serves as Chief Financial Officer of other funds. Ms. Reynolds became President of Fidelity Pricing and Cash Management Services (FPCMS) in August 2008. Ms. Reynolds served as Chief Operating Officer of FPCMS (2007-2008). Previously, Ms. Reynolds served as President, Treasurer, and Anti-Money Laundering officer of the Fidelity funds (2004-2007). |
|
Kenneth B. Robins (1969) |
|
|
Year of Election or Appointment: 2008 President and Treasurer |
|
|
|
Mr. Robins also serves as an officer of other funds. Mr. Robins serves as Executive Vice President of Fidelity Investments Money Management, Inc. (FIMM) (2013-present) and is an employee of Fidelity Investments (2004-present). Previously, Mr. Robins served in other fund officer roles. |
|
Gary W. Ryan (1958) |
|
|
Year of Election or Appointment: 2005 Assistant Treasurer |
|
|
|
Mr. Ryan also serves as Assistant Treasurer of other funds. Mr. Ryan is an employee of Fidelity Investments and has served in other fund officer roles. Previously, Mr. Ryan served as Vice President of Fund Reporting in Fidelity Pricing and Cash Management Services (FPCMS) (1999-2005). |
|
Stephen Sadoski (1971) |
|
|
Year of Election or Appointment: 2012 Deputy Treasurer |
|
|
|
Mr. Sadoski also serves as Deputy Treasurer of other funds. He is an employee of Fidelity Investments (2012-present) and has served in another fund officer role. Prior to joining Fidelity Investments, Mr. Sadoski served as an assistant chief accountant in the Division of Investment Management of the Securities and Exchange Commission (SEC) (2009-2012) and as a senior manager at Deloitte & Touche LLP (1997-2009). |
|
Stacie M. Smith (1974) |
|
|
Year of Election or Appointment: 2013 Deputy Treasurer |
|
|
|
Ms. Smith also serves as an officer of other funds. She is an employee of Fidelity Investments (2009-present) and has served in other fund officer roles. Prior to joining Fidelity Investments, Ms. Smith served as Senior Audit Manager of Ernst & Young LLP (1996-2009). |
|
Renee Stagnone (1975) |
|
|
Year of Election or Appointment: 2013 Deputy Treasurer |
|
|
|
Ms. Stagnone also serves as Deputy Treasurer of other funds. Ms. Stagnone is an employee of Fidelity Investments. |
|
Joseph F. Zambello (1957) |
|
|
Year of Election or Appointment: 2011 Deputy Treasurer |
|
|
|
Mr. Zambello also serves as Deputy Treasurer of other funds. Mr. Zambello is an employee of Fidelity Investments. Previously, Mr. Zambello served as Vice President of FMR's Program Management Group (2009-2011) and Vice President of the Transfer Agent Oversight Group (2005-2009). |
Annual Report
Distributions (Unaudited)
A total of 0.05% of the dividends distributed during the fiscal year was derived from interest on U.S. Government securities which is generally exempt from state income tax.
A percentage of the dividends distributed during the fiscal year for the following funds qualifies for the dividends-received deduction for corporate shareholders:
|
|
December 14, |
December 27, |
April 5, |
July 5, |
October 4, |
|
Class A |
74% |
46% |
100% |
100% |
100% |
|
Class T |
78% |
46% |
100% |
100% |
100% |
|
Class B |
98% |
46% |
100% |
100% |
100% |
|
Class C |
95% |
46% |
100% |
100% |
100% |
Class A, Class T, Class B, and Class C designate 100% of the dividends distributed during the fiscal year as amounts which may be taken into account as a dividend for purposes of the maximum rate under section 1(h)(11) of the Internal Revenue Code.
The fund will notify shareholders in January 2014 of amounts for use in preparing 2013 income tax returns.
Annual Report
Board Approval of Investment Advisory Contracts and Management Fees
Fidelity Advisor Equity Income Fund
Each year, the Board of Trustees, including the Independent Trustees (together, the Board), votes on the renewal of the management contract and sub-advisory agreements (together, the Advisory Contracts) for the fund. The Board, assisted by the advice of fund counsel and Independent Trustees' counsel, requests and considers a broad range of information relevant to the renewal of the Advisory Contracts throughout the year.
The Board meets regularly and, at each of its meetings, covers an extensive agenda of topics and materials and considers factors that are relevant to its annual consideration of the renewal of the fund's Advisory Contracts, including the services and support provided to the fund and its shareholders. The Board has established various standing committees, each composed of and chaired by Independent Trustees with varying backgrounds, to which the Board has assigned specific subject matter responsibilities in order to enhance effective decision-making by the Board. The Board, acting directly and through its Committees, requests and receives information concerning the annual consideration of the renewal of the fund's Advisory Contracts. The Board also meets as needed to consider matters specifically related to the Board's annual consideration of the renewal of Advisory Contracts. Members of the Board may also meet with trustees of other Fidelity funds through ad hoc joint committees to discuss certain matters relevant to the Fidelity funds.
At its July 2013 meeting, the Board, including the Independent Trustees, unanimously determined to renew the fund's Advisory Contracts. In reaching its determination, the Board considered all factors it believed relevant, including (i) the nature, extent, and quality of the services to be provided to the fund and its shareholders (including the investment performance of the fund); (ii) the competitiveness of the fund's management fee and total expense ratio relative to peer funds; (iii) the total costs of the services to be provided by and the profits to be realized by Fidelity from its relationship with the fund; (iv) the extent to which economies of scale exist and would be realized as the fund grows; and (v) whether fee levels reflect these economies of scale, if any, for the benefit of fund shareholders.
In considering whether to renew the Advisory Contracts for the fund, the Board reached a determination, with the assistance of fund counsel and Independent Trustees' counsel and through the exercise of its business judgment, that the renewal of the Advisory Contracts was in the best interests of the fund and its shareholders and that the compensation payable under the Advisory Contracts was fair and reasonable. The Board's decision to renew the Advisory Contracts was not based on any single factor, but rather was based on a comprehensive consideration of all the information provided to the Board at its meetings throughout the year. The Board, in reaching its determination to renew the Advisory Contracts, was aware that shareholders in the fund have a broad range of investment choices available to them, including a wide choice among mutual funds offered by Fidelity's competitors, and that the fund's shareholders, who have the opportunity to review and weigh the disclosure provided by the fund in its prospectus and other public disclosures, have chosen to invest in this fund, which is a part of the Fidelity family of funds.
Annual Report
Board Approval of Investment Advisory Contracts and
Management Fees - continued
Nature, Extent, and Quality of Services Provided. The Board considered the staffing within the investment adviser, Fidelity Management & Research Company (FMR), and the sub-advisers (together, the Investment Advisers) as it relates to the fund, including the backgrounds of the fund's investment personnel, and also considered the fund's investment objective, strategies, and related investment philosophy. The Independent Trustees also had discussions with senior management of Fidelity's investment operations and investment groups. The Board considered the structure of the portfolio manager compensation program and whether this structure provides appropriate incentives to act in the best interests of the fund.
Resources Dedicated to Investment Management and Support Services. The Board and the Fund Oversight and Research Committees reviewed the general qualifications and capabilities of the Investment Advisers' investment staff, including its size, education, experience, and resources, as well as the Investment Advisers' approach to recruiting, training, managing, and compensating investment personnel. The Board noted that FMR has continued to increase the resources devoted to non-U.S. offices, including expansion of Fidelity's global investment organization. The Board also noted that Fidelity's analysts have extensive resources, tools and capabilities that allow them to conduct sophisticated quantitative and fundamental analysis, as well as credit analysis of issuers, counterparties and guarantors. Further, the Board believes that Fidelity's investment professionals have sufficient access to global information and data so as to provide competitive investment results over time, and that those professionals also have access to sophisticated tools that permit them to assess portfolio construction and risk and performance attribution characteristics continuously, as well as to transmit new information and research conclusions rapidly around the world. Additionally, in its deliberations, the Board considered the Investment Advisers' trading and risk management capabilities and resources, which are an integral part of the investment management process.
Shareholder and Administrative Services. The Board considered (i) the nature, extent, quality, and cost of advisory, administrative, and shareholder services performed by the Investment Advisers and their affiliates under the Advisory Contracts and under separate agreements covering transfer agency, pricing and bookkeeping, and securities lending services for the fund; (ii) the nature and extent of the supervision of third party service providers, principally custodians and subcustodians; and (iii) the resources devoted to, and the record of compliance with, the fund's compliance policies and procedures. The Board also reviewed the allocation of fund brokerage, including allocations to brokers affiliated with the Investment Advisers, the use of brokerage commissions to pay fund expenses, and the use of "soft" commission dollars to pay for research services.
Annual Report
The Board noted that the growth of fund assets over time across the complex allows Fidelity to reinvest in the development of services designed to enhance the value or convenience of the Fidelity funds as investment vehicles. These services include 24-hour access to account information and market information through telephone representatives and over the Internet, investor education materials and asset allocation tools, and the expanded availability of Fidelity Investor Centers.
Investment in a Large Fund Family. The Board considered the benefits to shareholders of investing in a Fidelity fund, including the benefits of investing in a fund that is part of a large family of funds offering a variety of investment disciplines and providing a large variety of mutual fund investor services. The Board noted that Fidelity had taken, or had made recommendations that resulted in the Fidelity funds taking, a number of actions over the previous year that benefited particular funds, including (i) continuing to dedicate additional resources to investment research and to the support of the senior management team that oversees asset management; (ii) persisting in efforts to enhance Fidelity's global research capabilities; (iii) launching new funds and making other enhancements to meet client needs for global and income-oriented solutions; (iv) continuing to launch dedicated lower cost underlying funds to meet portfolio construction needs related to expanding underlying fund options for Fidelity funds of funds, specifically for the Freedom Fund product lines; (v) rationalizing product lines and gaining increased efficiencies through the mergers of several funds into other funds; (vi) strengthening Fidelity's index fund offerings by reducing investment minimums and adopting or lowering existing expense caps for certain funds and classes; (vii) enhancing Global Asset Allocation product offerings by launching new funds and strategies, including "open architecture" target date funds that utilize affiliated and unaffiliated sub-advisers; (viii) modifying the eligibility criteria for Institutional Class shares of Advisor funds to increase their marketability to a portion of the defined contribution plan market; (ix) creating a new low-cost retirement share class for certain Advisor funds to appeal to large retirement plans; (x) transitioning the management of certain Fidelity commodity funds to Geode Capital Management LLC, a registered commodity pool operator, while retaining administrative responsibilities for the funds; (xi) reorganizing a number of funds; and (xii) taking steps toward establishing a new Fidelity adviser to manage sector-based funds and products.
Investment Performance. The Board considered whether the fund has operated in accordance with its investment objective, as well as its record of compliance with its investment restrictions and its performance history.
The Board took into account discussions with the Investment Advisers about fund investment performance that occur at Board meetings throughout the year. In this regard the Board noted that as part of regularly scheduled fund reviews and other reports to the Board on fund performance, the Board periodically considers annualized return information for the fund, for different time periods, measured against a securities market index ("benchmark index") and a peer group of mutual funds with similar objectives ("peer group"). In its evaluation of fund investment performance, the Board gave particular attention to information indicating changes in performance of certain Fidelity funds for specific time periods and the Investment Advisers' explanations for any overperformance or underperformance.
Annual Report
Board Approval of Investment Advisory Contracts and
Management Fees - continued
In addition to reviewing absolute and relative fund performance, the Independent Trustees periodically consider the appropriateness of fund performance metrics in evaluating the results achieved. In general, the Independent Trustees believe that fund performance should be evaluated based on net performance (after fees and expenses) of both the highest performing and lowest performing classes, where applicable, compared to appropriate benchmark indices, over appropriate time periods which may include full market cycles, and compared to peer groups, as applicable, over the same periods, taking into account relevant factors including the following: general market conditions; issuer-specific information; tactical opportunities for investment; and fund cash flows and other factors.
The Independent Trustees recognize that shareholders evaluate performance on a net basis over their own holding periods, for which one-, three-, and five-year periods are used as a proxy. For this reason, the performance information reviewed by the Board also included net cumulative calendar year total return information for the fund and an appropriate benchmark index and peer group for the most recent one-, three-, and five-year periods, as shown below. Returns are shown compared to the 25th percentile (top of box) and 75th percentile (bottom of box) of the peer universe.
Fidelity Advisor Equity Income Fund
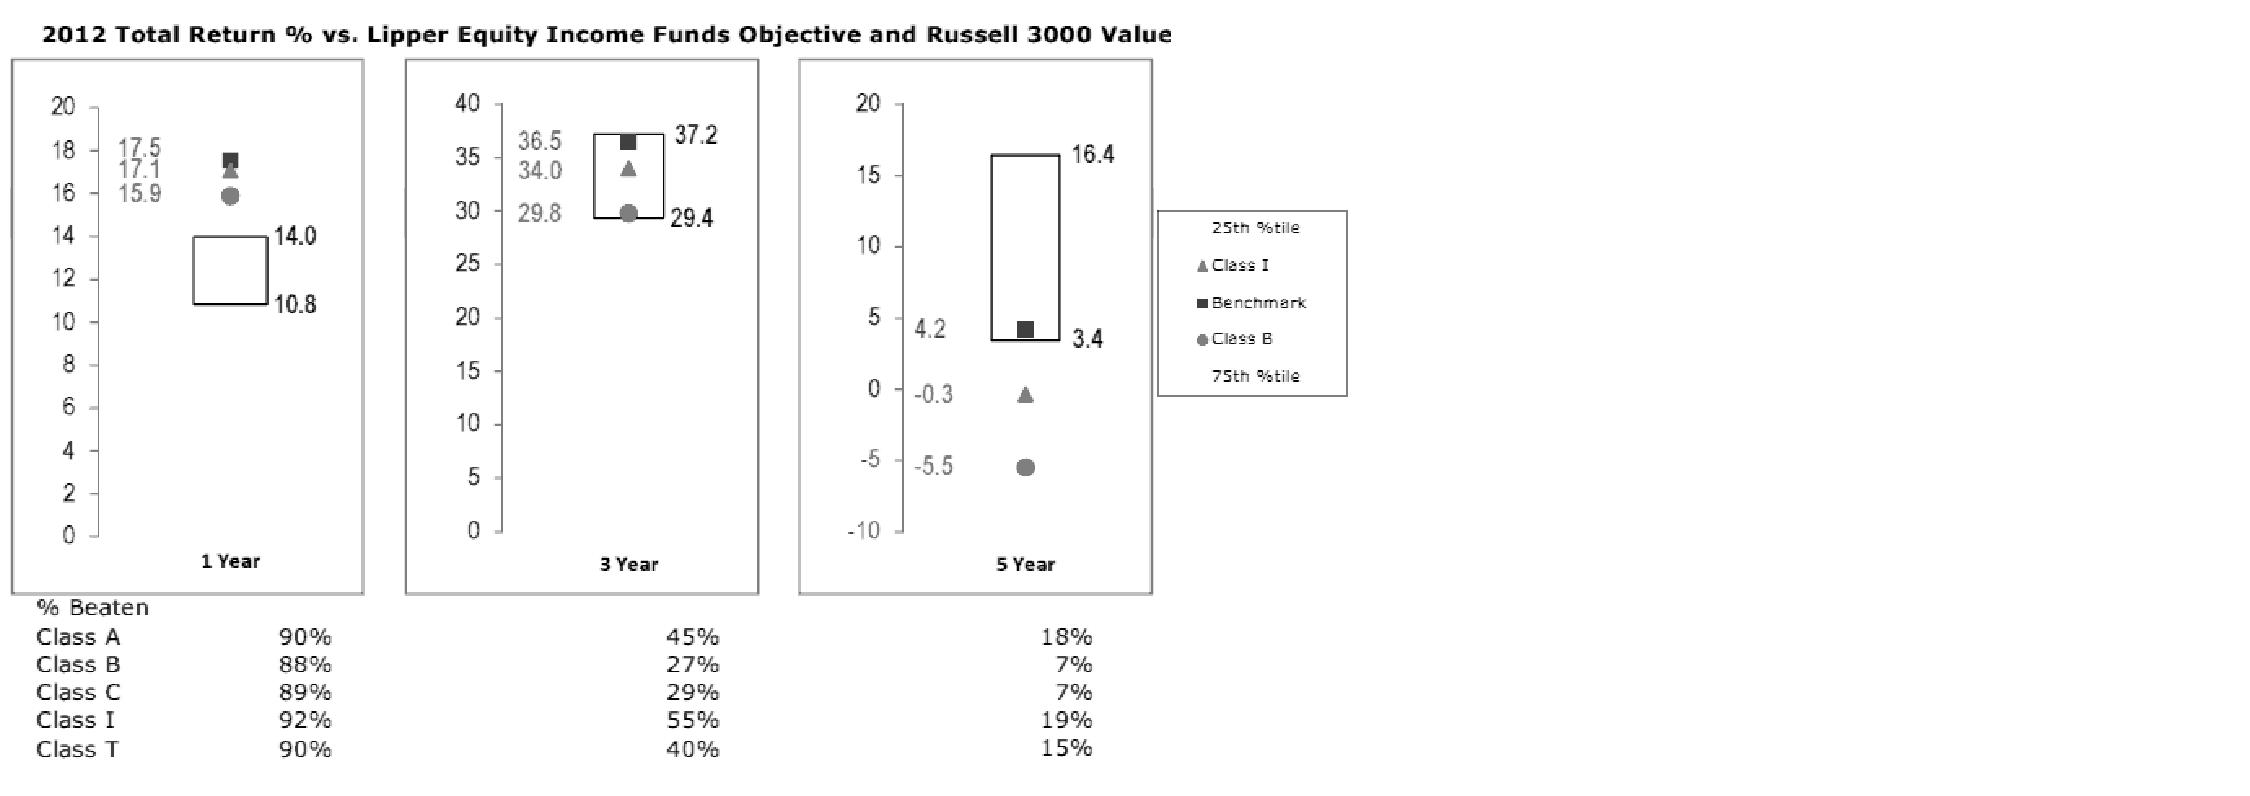
Annual Report
Based on its review, the Board concluded that the nature, extent, and quality of services provided to the fund under the Advisory Contracts should benefit the fund's shareholders.
Competitiveness of Management Fee and Total Expense Ratio. The Board considered the fund's management fee and total expense ratio compared to "mapped groups" of competitive funds and classes. Fidelity creates "mapped groups" by combining similar Lipper investment objective categories that have comparable management fee characteristics. Combining Lipper investment objective categories aids the Board's management fee and total expense ratio comparisons by broadening the competitive group used for comparison and by reducing the number of universes to which various Fidelity funds are compared.
Management Fee. The Board considered two proprietary management fee comparisons for the 12-month periods shown in the chart below. The group of Lipper funds used by the Board for management fee comparisons is referred to below as the "Total Mapped Group." The Total Mapped Group is broader than the Lipper peer group used by the Board for performance comparisons because the Total Mapped Group combines several Lipper investment objective categories while the Lipper peer group does not. The Total Mapped Group comparison focuses on a fund's standing in terms of gross management fees before expense reimbursements or caps relative to the total universe of funds with comparable investment mandates, regardless of whether their management fee structures also are comparable. Funds with comparable investment mandates offer exposure to similar types of securities. Funds with comparable management fee structures have similar management fee contractual arrangements (e.g., flat rate charged for advisory services, all-inclusive fee rate, etc.). "TMG %" represents the percentage of funds in the Total Mapped Group that had management fees that were lower than the fund's. For example, a TMG % of 15% means that 85% of the funds in the Total Mapped Group had higher management fees than the fund. The "Asset-Size Peer Group" (ASPG) comparison focuses on a fund's standing relative to a subset of non-Fidelity funds within the Total Mapped Group that are similar in size and management fee structure. The ASPG represents at least 15% of the funds in the Total Mapped Group with comparable asset size and management fee structures, subject to a minimum of 50 funds (or all funds in the Total Mapped Group if fewer than 50).Additional information, such as the ASPG quartile in which the fund's management fee ranked, is also included in the chart and considered by the Board.
Annual Report
Board Approval of Investment Advisory Contracts and
Management Fees - continued
Fidelity Advisor Equity Income Fund

The Board noted that the fund's management fee ranked below the median of its Total Mapped Group and below the median of its ASPG for 2012.
Based on its review, the Board concluded that the fund's management fee is fair and reasonable in light of the services that the fund receives and the other factors considered.
Total Expense Ratio. In its review of each class's total expense ratio, the Board considered the fund's management fee as well as other fund or class expenses, as applicable, such as transfer agent fees, pricing and bookkeeping fees, fund-paid 12b-1 fees, and custodial, legal, and audit fees. The Board also noted the effects of any waivers and reimbursements on fees and expenses. As part of its review, the Board also considered the current and historical total expense ratios of each class of the fund compared to competitive fund median expenses. Each class of the fund is compared to those funds and classes in the Total Mapped Group (used by the Board for management fee comparisons) that have a similar sales load structure.
The Board noted that the total expense ratio of each of Class A, Class B, Class C, and Institutional Class ranked below its competitive median for 2012 and the total expense ratio of Class T ranked above its competitive median for 2012. The Board considered that, in general, various factors can affect total expense ratios. The Board noted that the total expense ratio of Class T was above the competitive median primarily because of higher 12b-1 fees on Class T. Class T has a higher 12b-1 fee, but a lower front-end sales charge, than traditionally priced front-end sales charge classes. The Board considered that Class T is primarily sold load-waived in the retirement plan market where its 0.50% 12b-1 fee is comparable to competing no-load, higher 12b-1 fee classes designed specifically for retirement plans. The Board noted that the fund offers multiple classes, each of which has a different sales load and 12b-1 fee structure, and that the multiple structures are intended to offer a range of pricing options for the intermediary market. The Board also noted that the total expense ratios of the classes vary primarily by the level of their 12b-1 fees, although differences in transfer agent fees may also cause expenses to vary from class to class.
Annual Report
Fees Charged to Other Fidelity Clients. The Board also considered Fidelity fee structures and other information with respect to clients of FMR and its affiliates, such as other mutual funds advised or subadvised by FMR or its affiliates, pension plan clients, and other institutional clients. The Board noted the findings of the 2013 ad hoc joint committee (created with the board of other Fidelity funds), which reviewed and compared Fidelity's institutional investment advisory business with its business of providing services to the Fidelity funds, including the differences in services provided, fees charged, and costs incurred, as well as competition in their respective marketplaces.
Based on its review of total expense ratios and fees charged to other Fidelity clients, the Board concluded that the total expense ratio of each class of the fund was reasonable, although Class T was above the median of the universe presented for comparison, in light of the services that the fund and its shareholders receive and the other factors considered.
Costs of the Services and Profitability. The Board considered the revenues earned and the expenses incurred by Fidelity in conducting the business of developing, marketing, distributing, managing, administering and servicing the fund and servicing the fund's shareholders. The Board also considered the level of Fidelity's profits in respect of all the Fidelity funds.
On an annual basis, FMR presents to the Board Fidelity's profitability for the fund. Fidelity calculates the profitability for each fund, as well as aggregate profitability for groups of Fidelity funds and all Fidelity funds, using a series of detailed revenue and cost allocation methodologies which originate with the books and records of Fidelity on which Fidelity's audited financial statements are based. The Audit Committee of the Board reviews any significant changes from the prior year's methodologies.
PricewaterhouseCoopers LLP (PwC), independent registered public accounting firm and auditor to Fidelity and certain Fidelity funds, has been engaged annually by the Board as part of the Board's assessment of Fidelity's profitability analysis. PwC's engagement includes the review and assessment of the methodologies used by Fidelity in determining the revenues and expenses attributable to Fidelity's mutual fund business, and completion of agreed-upon procedures surrounding the mathematical accuracy of fund profitability and its conformity to allocation methodologies. After considering PwC's reports issued under the engagement and information provided by Fidelity, the Board concluded that while other allocation methods may also be reasonable, Fidelity's profitability methodologies are reasonable in all material respects.
Annual Report
Board Approval of Investment Advisory Contracts and
Management Fees - continued
The Board also reviewed Fidelity's non-fund businesses and fall-out benefits related to the mutual fund business as well as cases where Fidelity's affiliates may benefit from or be related to the fund's business.
The Board considered the costs of the services provided by and the profits realized by Fidelity in connection with the operation of the fund and was satisfied that the profitability was not excessive in the circumstances.
Economies of Scale. The Board considered whether there have been economies of scale in respect of the management of the Fidelity funds, whether the Fidelity funds (including the fund) have appropriately benefited from any such economies of scale, and whether there is potential for realization of any further economies of scale. The Board considered the extent to which the fund will benefit from economies of scale through increased services to the fund, through waivers or reimbursements, or through fee or expense reductions. The Board also noted that in 2009, it and the board of other Fidelity funds created an ad hoc committee (the Economies of Scale Committee) to analyze whether FMR attains economies of scale in respect of the management and servicing of the Fidelity funds, whether the Fidelity funds have appropriately benefited from such economies of scale, and whether there is potential for realization of any further economies of scale.
The Board recognized that the fund's management contract incorporates a "group fee" structure, which provides for lower group fee rates as total fund assets under FMR's management increase, and for higher group fee rates as total fund assets under FMR's management decrease. FMR calculates the group fee rates based on a tiered asset "breakpoint" schedule that varies based on asset class. The Board considered that the group fee is designed to deliver the benefits of economies of scale to fund shareholders when total Fidelity fund assets increase, even if assets of any particular fund are unchanged or have declined, because some portion of Fidelity's costs are attributable to services provided to all Fidelity funds, and all funds benefit if those costs can be allocated among more assets. The Board concluded that, given the group fee structure, fund shareholders will benefit from lower management fees as assets under FMR's management increase at the fund complex level, regardless of whether Fidelity achieves any such economies of scale.
The Board concluded, taking into account the analysis of the Economies of Scale Committee, that economies of scale, if any, are being appropriately shared between fund shareholders and Fidelity.
Amendment to Description of Group Fee Rate. At its July 2013 meeting, the Board voted to approve an amendment to the fund's management contract to modify the description of the "group fee rate" effective August 1, 2013. The Board noted that under the prior description in the contract, the group fee rate was based on the average net assets of all registered investment companies with which FMR has management contracts. Under the contract's tiered asset breakpoint schedule, the group fee rate is lower as total fund assets under FMR's management increase, and higher as total fund assets under FMR's management decrease. The Board considered that the prior description would have excluded the assets of 64 Fidelity sector funds from the group fee rate calculation once Fidelity SelectCo, LLC, an affiliate of FMR, assumed management responsibilities for those funds. The Board noted that modifying the description of the group fee rate to continue to include the assets of those 64 funds for purposes of determining group fee rate breakpoints would avoid an immediate adverse impact on the group fee rate for any fund.
Annual Report
Additional Information Requested by the Board. In order to develop fully the factual basis for consideration of the Fidelity funds' Advisory Contracts, the Board requested and received additional information on certain topics, including: (i) fund performance trends and Fidelity's long-term strategies for certain funds; (ii) the potential to further rationalize the Fidelity fund lineup with the possibility of achieving savings for the funds and Fidelity; (iii) the methodology with respect to competitive fund data and peer group classifications; (iv) the arrangements with, and performance of, certain sub-advisers on behalf of the Fidelity funds, as well as certain proposed participating affiliate arrangements; (v) the realization of fall-out benefits in certain Fidelity business units; (vi) Fidelity's group fee structures, including the rationale for the individual fee rates of certain categories of funds and the definition of group assets; (vii) trends regarding industry use of performance fee structures and the performance adjustment methodologies applicable to the Fidelity funds; (viii) additional competitive analysis regarding the total expenses for certain classes; and (ix) fund profitability methodology, including Fidelity's cost allocation methodology, and the impact of certain factors on fund profitability results.
Based on its evaluation of all of the conclusions noted above, and after considering all factors it believed relevant, the Board ultimately concluded that the advisory fee structures are fair and reasonable, and that the fund's Advisory Contracts should be renewed.
Annual Report
Investment Adviser
Fidelity Management & Research Company
Boston, MA
Investment Sub-Advisers
FMR Co., Inc.
Fidelity Management & Research
(U.K.) Inc.
Fidelity Management & Research
(Hong Kong) Limited
Fidelity Management & Research
(Japan) Inc.
General Distributor
Fidelity Distributors Corporation
Smithfield, RI
Transfer and Service Agents
Fidelity Investments Institutional
Operations Company, Inc.
Boston, MA
Fidelity Service Company, Inc.
Boston, MA
Custodian
JPMorgan Chase Bank
New York, NY
(Fidelity Investment logo)(registered trademark)
EPI-UANN-0114 1.786681.110
(Fidelity Investment logo)(registered trademark)
Fidelity Advisor®
Equity Income
Fund - Institutional Class
Annual Report
November 30, 2013
(Fidelity Cover Art)
Contents
|
Performance |
How the fund has done over time. |
|
|
Management's Discussion of Fund Performance |
The Portfolio Manager's review of fund performance and strategy. |
|
|
Shareholder Expense Example |
An example of shareholder expenses. |
|
|
Investment Changes |
A summary of major shifts in the fund's investments over the past six months. |
|
|
Investments |
A complete list of the fund's investments with their market values. |
|
|
Financial Statements |
Statements of assets and liabilities, operations, and changes in net assets, as well as financial highlights. |
|
|
Notes |
Notes to the financial statements. |
|
|
Report of Independent Registered Public Accounting Firm |
|
|
|
Trustees and Officers |
|
|
|
Distributions |
|
|
|
Board Approval of Investment Advisory Contracts and Management Fees |
|
To view a fund's proxy voting guidelines and proxy voting record for the 12-month period ended June 30, visit http://www.fidelity.com/proxyvotingresults or visit the Securities and Exchange Commission's (SEC) web site at http://www.sec.gov. You may also call 1-877-208-0098 to request a free copy of the proxy voting guidelines.
Standard & Poor's, S&P and S&P 500 are registered service marks of The McGraw-Hill Companies, Inc. and have been licensed for use by Fidelity Distributors Corporation.
Other third-party marks appearing herein are the property of their respective owners.
All other marks appearing herein are registered or unregistered trademarks or service marks of FMR LLC or an affiliated company. © 2014 FMR LLC. All rights reserved.
Annual Report
This report and the financial statements contained herein are submitted for the general information of the shareholders of the fund. This report is not authorized for distribution to prospective investors in the fund unless preceded or accompanied by an effective prospectus.
A fund files its complete schedule of portfolio holdings with the SEC for the first and third quarters of each fiscal year on Form N-Q. Forms N-Q are available on the SEC's web site at http://www.sec.gov. A fund's Forms N-Q may be reviewed and copied at the SEC's Public Reference Room in Washington, DC. Information regarding the operation of the SEC's Public Reference Room may be obtained by calling 1-800-SEC-0330. For a complete list of a fund's portfolio holdings, view the most recent holdings listing, semiannual report, or annual report on Fidelity's web site at http://www.fidelity.com, http://www.advisor.fidelity.com, or http://www.401k.com, as applicable.
NOT FDIC INSURED • MAY LOSE VALUE • NO BANK GUARANTEE
Neither the fund nor Fidelity Distributors Corporation is a bank.
Annual Report
Performance: The Bottom Line
Average annual total return reflects the change in the value of an investment, assuming reinvestment of the class' distributions from dividend income and capital gains (the profits earned upon the sale of securities that have grown in value, if any) and assuming a constant rate of performance each year. The $10,000 table and the fund's returns do not reflect the deduction of taxes that a shareholder would pay on fund distributions or the redemption of fund shares. During periods of reimbursement by Fidelity, a fund's total return will be greater than it would be had the reimbursement not occurred. How a fund did yesterday is no guarantee of how it will do tomorrow.
Average Annual Total Returns
|
Periods ended November 30, 2013 |
|
Past 1 |
Past 5 |
Past 10 |
|
Institutional Class |
|
26.72% |
16.08% |
6.89% |
$10,000 Over 10 Years
Let's say hypothetically that $10,000 was invested in Fidelity Advisor® Equity Income Fund - Institutional Class on November 30, 2003. The chart shows how the value of your investment would have changed, and also shows how the Russell 3000® Value Index performed over the same period.
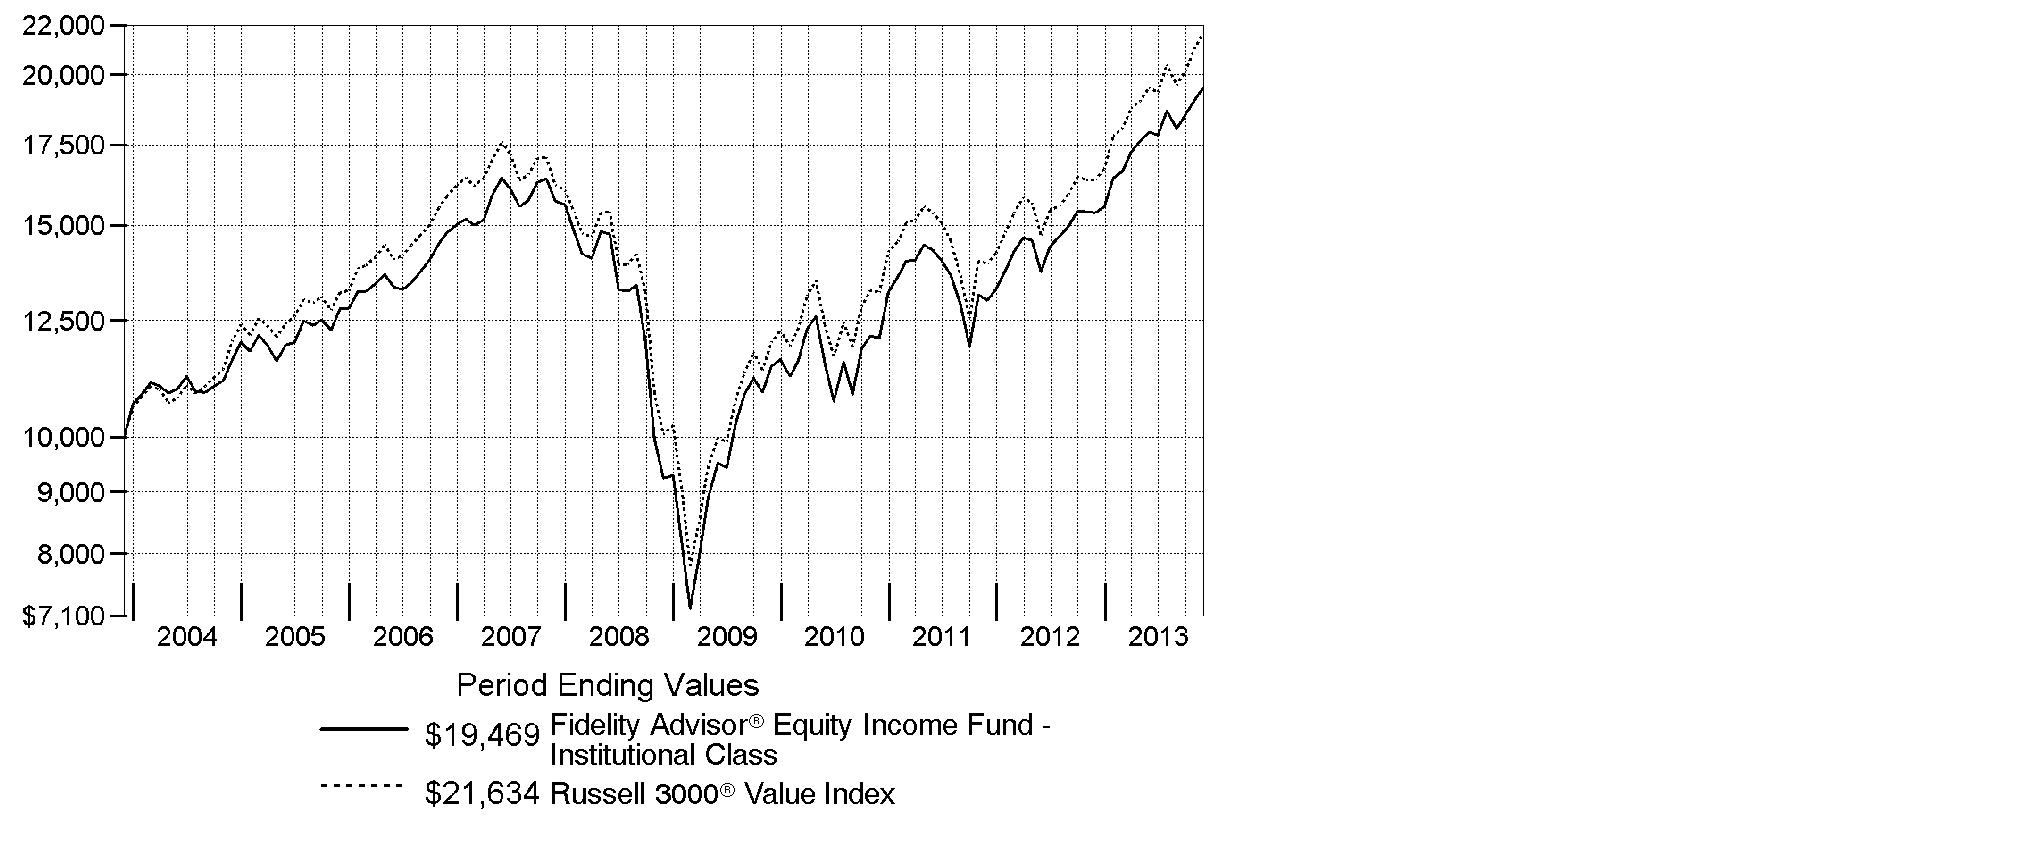
Annual Report
Management's Discussion of Fund Performance
Market Recap: With the current bull run nearing the five-year mark, equity benchmarks ripped up old records during the 12 months ending November 30, 2013. Gains were fueled by strengthening U.S. economic data, as well as generally improving economies and accommodative monetary policies worldwide. The broad S&P 500® Index reached new peaks in its 30.30% climb for the period, and the blue-chip Dow Jones Industrial AverageSM surpassed historic milestones en route to a 26.63% gain. The Nasdaq Composite Index®, up 36.73% amid a resurgence in growth-oriented stocks, closed above 4,000 for the first time since 2000. Shedding anxiety over the 2012 U.S. presidential election - and apparently confident that the federal debt-ceiling debate would be resolved - markets rose from period start through late May. News that the U.S. Federal Reserve was considering an end to its stimulative bond-buying kept stocks in flux over the summer but, by September, the Fed had set aside any imminent tapering. Despite jitters over a potential U.S. military strike in Syria and, later, an October budget impasse that briefly shuttered the federal government, volatility was subdued heading into the holidays, with investor optimism helping many markets home in on all-time highs at period end. Elsewhere, non-U.S. developed-market equities saw similar results, with the MSCI® EAFE® Index adding 24.97%.
Comments from James Morrow, Portfolio Manager of Fidelity Advisor® Equity Income Fund: For the year, the fund's Institutional Class shares gained 26.72%, compared with 32.36% for the Russell 3000® Value Index. Versus the index, stock selection was particularly challenging, especially in information technology, industrials and energy. The fund's roughly 5% cash stake also detracted. However, relative underweightings in the lagging real estate, utilities and materials groups contributed. The fund's average cash stake of roughly 5% also detracted. However, underweighting the lagging real estate, utilities and materials groups contributed. The fund's biggest individual relative detractor was a sizable out-of-index stake in diversified technology company IBM, which failed to keep pace with the fast-growing, momentum-oriented stocks that led the market. On the positive side, we were helped by a substantial underweighting in energy giant Exxon Mobil, a relatively slow-growth business that could not keep pace with the fast-rising market. Tempering this positive impact, however, was the fund's out-of-benchmark allocation to Europe-based energy producer Royal Dutch Shell. Over time, it became clear that the company's dividend was not growing as fast as I had expected, and I significantly reduced the fund's position by period end.
Annual Report
The views expressed above reflect those of the portfolio manager(s) only through the end of the period as stated on the cover of this report and do not necessarily represent the views of Fidelity or any other person in the Fidelity organization. Any such views are subject to change at any time based upon market or other conditions and Fidelity disclaims any responsibility to update such views. These views may not be relied on as investment advice and, because investment decisions for a Fidelity fund are based on numerous factors, may not be relied on as an indication of trading intent on behalf of any Fidelity fund.
Annual Report
Shareholder Expense Example
As a shareholder of the Fund, you incur two types of costs: (1) transaction costs, including sales charges (loads) on purchase payments or redemption proceeds, and (2) ongoing costs, including management fees, distribution and/or service (12b-1) fees and other Fund expenses. This Example is intended to help you understand your ongoing costs (in dollars) of investing in the Fund and to compare these costs with the ongoing costs of investing in other mutual funds.
The actual expense Example is based on an investment of $1,000 invested at the beginning of the period and held for the entire period (June 1, 2013 to November 30, 2013) for Class A, Class T, Class B, Class C and Institutional Class and for the period (August 13, 2013 to November 30, 2013) for Class Z. The hypothetical expense Example is based on an investment of $1,000 invested for the one-half year period (June 1, 2013 to November 30, 2013).
Actual Expenses
The first line of the accompanying table for each class of the Fund provides information about actual account values and actual expenses. You may use the information in this line, together with the amount you invested, to estimate the expenses that you paid over the period. Simply divide your account value by $1,000.00 (for example, an $8,600 account value divided by $1,000.00 = 8.6), then multiply the result by the number in the first line for a class of the Fund under the heading entitled "Expenses Paid During Period" to estimate the expenses you paid on your account during this period. In addition, the Fund, as a shareholder in the underlying Fidelity Central Funds, will indirectly bear its pro-rata share of the fees and expenses incurred by the underlying Fidelity Central Funds. These fees and expenses are not included in the Fund's annualized expense ratio used to calculate the expense estimate in the table below.
Hypothetical Example for Comparison Purposes
The second line of the accompanying table for each class of the Fund provides information about hypothetical account values and hypothetical expenses based on a Class' actual expense ratio and an assumed rate of return of 5% per year before expenses, which is not the Class' actual return. The hypothetical account values and expenses may not be used to estimate the actual ending account balance or expenses you paid for the period. You may use this information to compare the ongoing costs of investing in the Fund and other funds. To do so, compare this 5% hypothetical example with the 5% hypothetical examples that appear in the shareholder reports of the other funds. In addition, the Fund, as a shareholder in the underlying Fidelity Central Funds, will indirectly bear its pro-rata share of the fees and expenses incurred by the underlying Fidelity Central Funds. These fees and expenses are not included in the Fund's annualized expense ratio used to calculate the expense estimate in the table below.
Please note that the expenses shown in the table are meant to highlight your ongoing costs only and do not reflect any transaction costs. Therefore, the second line of the table is useful in comparing ongoing costs only, and will not help you determine the relative total costs of owning different funds. In addition, if these transactional costs were included, your costs would have been higher.
Annual Report
Shareholder Expense Example - continued
|
|
Annualized |
Beginning |
Ending |
Expenses Paid |
|
Class A |
.97% |
|
|
|
|
Actual |
|
$ 1,000.00 |
$ 1,086.20 |
$ 5.07 C |
|
HypotheticalA |
|
$ 1,000.00 |
$ 1,020.21 |
$ 4.91 D |
|
Class T |
1.19% |
|
|
|
|
Actual |
|
$ 1,000.00 |
$ 1,085.10 |
$ 6.22 C |
|
HypotheticalA |
|
$ 1,000.00 |
$ 1,019.10 |
$ 6.02 D |
|
Class B |
1.79% |
|
|
|
|
Actual |
|
$ 1,000.00 |
$ 1,081.70 |
$ 9.34 C |
|
HypotheticalA |
|
$ 1,000.00 |
$ 1,016.09 |
$ 9.05 D |
|
Class C |
1.73% |
|
|
|
|
Actual |
|
$ 1,000.00 |
$ 1,081.90 |
$ 9.03 C |
|
HypotheticalA |
|
$ 1,000.00 |
$ 1,016.39 |
$ 8.74 D |
|
Institutional Class |
.71% |
|
|
|
|
Actual |
|
$ 1,000.00 |
$ 1,087.50 |
$ 3.72 C |
|
HypotheticalA |
|
$ 1,000.00 |
$ 1,021.51 |
$ 3.60 D |
|
Class Z |
.54% |
|
|
|
|
Actual |
|
$ 1,000.00 |
$ 1,043.00 |
$ 1.66 C |
|
HypotheticalA |
|
$ 1,000.00 |
$ 1,022.36 |
$ 2.74 D |
A 5% return per year before expenses
B Annualized expense ratio reflects expenses net of applicable fee waivers.
C Actual expenses are equal to each Class' annualized expense ratio; multiplied by the average account value over the period, multiplied by 183/365 (to reflect the one-half year period) for Class A, Class T, Class B, Class C and Institutional Class and multiplied by 110/365 (to reflect the period August 13, 2013 to November 30, 2013) for Class Z. The fees and expenses of the underlying Fidelity Central Funds in which the Fund invests are not included in each Class' annualized expense ratio.
D Hypothetical expenses are equal to each Class' annualized expense ratio, multiplied by the average account value over the period, multiplied by 183/365 (to reflect the one-half year period). The fees and expenses of the underlying Fidelity Central Funds in which the Fund invests are not included in each Class' annualized expense ratio.
Annual Report
Investment Changes (Unaudited)
|
Top Ten Stocks as of November 30, 2013 |
||
|
|
% of fund's |
% of fund's net assets |
|
JPMorgan Chase & Co. |
4.0 |
3.9 |
|
Wells Fargo & Co.* |
3.0 |
2.8 |
|
Chevron Corp. |
2.9 |
2.9 |
|
General Electric Co. |
2.5 |
2.1 |
|
Exxon Mobil Corp. |
2.4 |
2.2 |
|
MetLife, Inc. |
2.3 |
1.9 |
|
Cisco Systems, Inc. |
2.2 |
2.2 |
|
Procter & Gamble Co. |
2.1 |
2.4 |
|
Merck & Co., Inc. |
2.1 |
2.0 |
|
Paychex, Inc. |
1.9 |
2.2 |
|
|
25.4 |
|
* Security or a portion of the security is pledged as collateral for call options written.
|
Top Five Market Sectors as of November 30, 2013 |
||
|
|
% of fund's |
% of fund's net assets |
|
Financials |
21.4 |
21.5 |
|
Energy |
14.0 |
12.3 |
|
Health Care |
12.6 |
12.9 |
|
Information Technology |
11.5 |
11.3 |
|
Industrials |
10.4 |
10.3 |
|
Asset Allocation (% of fund's net assets) |
|||||||
|
As of November 30, 2013* |
As of May 31, 2013** |
||||||
 |
Stocks 90.8% |
|
|
Stocks 88.7% |
|
||
 |
Bonds 0.1% |
|
|
Bonds 0.1% |
|
||
 |
Convertible |
|
|
Convertible |
|
||
 |
Other Investments 0.3% |
|
|
Other Investments 0.4% |
|
||
 |
Short-Term |
|
|
Short-Term |
|
||
|
* Foreign investments |
11.5% |
|
** Foreign investments |
9.9% |
|
||
|
* Written options |
(0.1%) |
|
** Written options |
0.0% |
|
||

Annual Report
Investments November 30, 2013
Showing Percentage of Net Assets
|
Common Stocks - 90.2% |
|||
|
Shares |
Value (000s) |
||
|
CONSUMER DISCRETIONARY - 7.4% |
|||
|
Auto Components - 0.2% |
|||
|
Gentex Corp. |
189,860 |
$ 5,660 |
|
|
Diversified Consumer Services - 0.0% |
|||
|
Strayer Education, Inc. |
28,191 |
1,047 |
|
|
Hotels, Restaurants & Leisure - 1.6% |
|||
|
McDonald's Corp. |
209,217 |
20,371 |
|
|
Texas Roadhouse, Inc. Class A |
208,162 |
5,824 |
|
|
Wynn Resorts Ltd. |
11,650 |
1,932 |
|
|
Yum! Brands, Inc. |
149,721 |
11,630 |
|
|
|
39,757 |
||
|
Leisure Equipment & Products - 0.4% |
|||
|
New Academy Holding Co. LLC unit (i)(j) |
52,800 |
9,547 |
|
|
Media - 2.6% |
|||
|
Comcast Corp. Class A (h) |
687,374 |
34,279 |
|
|
Sinclair Broadcast Group, Inc. Class A |
107,035 |
3,513 |
|
|
Time Warner, Inc. |
412,351 |
27,096 |
|
|
|
64,888 |
||
|
Multiline Retail - 1.7% |
|||
|
Kohl's Corp. |
203,183 |
11,232 |
|
|
Target Corp. |
475,017 |
30,368 |
|
|
|
41,600 |
||
|
Specialty Retail - 0.7% |
|||
|
Adastria Holdings Co. Ltd. |
29,220 |
1,161 |
|
|
American Eagle Outfitters, Inc. |
276,375 |
4,497 |
|
|
Foot Locker, Inc. |
135,931 |
5,286 |
|
|
Staples, Inc. (h) |
334,933 |
5,202 |
|
|
|
16,146 |
||
|
Textiles, Apparel & Luxury Goods - 0.2% |
|||
|
Coach, Inc. |
68,100 |
3,943 |
|
|
TOTAL CONSUMER DISCRETIONARY |
182,588 |
||
|
CONSUMER STAPLES - 8.8% |
|||
|
Beverages - 1.4% |
|||
|
Molson Coors Brewing Co. Class B |
181,705 |
9,570 |
|
|
PepsiCo, Inc. |
110,922 |
9,368 |
|
|
The Coca-Cola Co. |
374,288 |
15,043 |
|
|
|
33,981 |
||
|
Food & Staples Retailing - 2.0% |
|||
|
CVS Caremark Corp. |
165,200 |
11,062 |
|
|
Common Stocks - continued |
|||
|
Shares |
Value (000s) |
||
|
CONSUMER STAPLES - continued |
|||
|
Food & Staples Retailing - continued |
|||
|
Wal-Mart Stores, Inc. |
152,750 |
$ 12,374 |
|
|
Walgreen Co. |
455,069 |
26,940 |
|
|
|
50,376 |
||
|
Food Products - 0.9% |
|||
|
Kellogg Co. |
353,552 |
21,439 |
|
|
Household Products - 2.1% |
|||
|
Procter & Gamble Co. |
632,117 |
53,237 |
|
|
Tobacco - 2.4% |
|||
|
Altria Group, Inc. |
456,865 |
16,895 |
|
|
British American Tobacco PLC sponsored ADR |
54,131 |
5,756 |
|
|
Lorillard, Inc. |
379,653 |
19,488 |
|
|
Philip Morris International, Inc. |
193,912 |
16,587 |
|
|
|
58,726 |
||
|
TOTAL CONSUMER STAPLES |
217,759 |
||
|
ENERGY - 13.1% |
|||
|
Energy Equipment & Services - 1.8% |
|||
|
Ensco PLC Class A |
140,477 |
8,299 |
|
|
Halliburton Co. |
13,871 |
731 |
|
|
National Oilwell Varco, Inc. |
123,449 |
10,061 |
|
|
Noble Corp. |
245,917 |
9,374 |
|
|
Schlumberger Ltd. |
125,757 |
11,119 |
|
|
Trinidad Drilling Ltd. |
455,100 |
4,236 |
|
|
|
43,820 |
||
|
Oil, Gas & Consumable Fuels - 11.3% |
|||
|
Access Midstream Partners LP |
69,647 |
3,912 |
|
|
Apache Corp. |
223,838 |
20,479 |
|
|
BG Group PLC |
60,800 |
1,242 |
|
|
Canadian Natural Resources Ltd. |
314,300 |
10,347 |
|
|
Chevron Corp. |
582,569 |
71,330 |
|
|
CONSOL Energy, Inc. |
184,732 |
6,573 |
|
|
EV Energy Partners LP |
159,189 |
5,205 |
|
|
Exxon Mobil Corp. |
624,675 |
58,395 |
|
|
Holly Energy Partners LP |
114,912 |
3,614 |
|
|
HollyFrontier Corp. |
106,227 |
5,097 |
|
|
Legacy Reserves LP |
115,099 |
3,107 |
|
|
Markwest Energy Partners LP |
187,588 |
12,957 |
|
|
Occidental Petroleum Corp. |
208,303 |
19,780 |
|
|
Royal Dutch Shell PLC Class A sponsored ADR |
173,458 |
11,570 |
|
|
Common Stocks - continued |
|||
|
Shares |
Value (000s) |
||
|
ENERGY - continued |
|||
|
Oil, Gas & Consumable Fuels - continued |
|||
|
Scorpio Tankers, Inc. |
126,500 |
$ 1,452 |
|
|
Southcross Energy Partners LP |
51,650 |
1,001 |
|
|
Suncor Energy, Inc. |
403,000 |
13,984 |
|
|
The Williams Companies, Inc. |
653,350 |
23,011 |
|
|
Tsakos Energy Navigation Ltd. |
287,877 |
1,442 |
|
|
Western Gas Equity Partners LP |
16,228 |
701 |
|
|
Williams Partners LP |
61,100 |
3,140 |
|
|
|
278,339 |
||
|
TOTAL ENERGY |
322,159 |
||
|
FINANCIALS - 20.5% |
|||
|
Capital Markets - 3.7% |
|||
|
Aberdeen Asset Management PLC |
94,500 |
761 |
|
|
Apollo Investment Corp. |
731,452 |
6,598 |
|
|
Ashmore Group PLC |
1,121,663 |
7,231 |
|
|
BlackRock, Inc. Class A |
20,477 |
6,199 |
|
|
Carlyle Group LP |
83,100 |
2,701 |
|
|
Charles Schwab Corp. |
431,134 |
10,554 |
|
|
Greenhill & Co., Inc. |
71,623 |
3,918 |
|
|
Invesco Ltd. |
69,900 |
2,436 |
|
|
KKR & Co. LP |
792,964 |
18,817 |
|
|
Morgan Stanley |
369,142 |
11,554 |
|
|
The Blackstone Group LP |
681,603 |
19,480 |
|
|
|
90,249 |
||
|
Commercial Banks - 5.4% |
|||
|
CIT Group, Inc. |
69,462 |
3,506 |
|
|
Comerica, Inc. |
130,080 |
5,899 |
|
|
M&T Bank Corp. (h) |
130,417 |
15,045 |
|
|
PNC Financial Services Group, Inc. |
69,200 |
5,325 |
|
|
Standard Chartered PLC (United Kingdom) |
348,991 |
8,272 |
|
|
U.S. Bancorp |
555,800 |
21,798 |
|
|
Wells Fargo & Co. (h) |
1,673,450 |
73,665 |
|
|
|
133,510 |
||
|
Diversified Financial Services - 4.6% |
|||
|
JPMorgan Chase & Co. |
1,730,257 |
99,011 |
|
|
KKR Financial Holdings LLC |
1,547,886 |
14,829 |
|
|
|
113,840 |
||
|
Common Stocks - continued |
|||
|
Shares |
Value (000s) |
||
|
FINANCIALS - continued |
|||
|
Insurance - 4.6% |
|||
|
ACE Ltd. |
201,111 |
$ 20,670 |
|
|
AFLAC, Inc. |
80,535 |
5,345 |
|
|
esure Group PLC |
702,700 |
2,921 |
|
|
Fidelity National Financial, Inc. Class A |
17,996 |
523 |
|
|
MetLife, Inc. |
1,090,458 |
56,911 |
|
|
MetLife, Inc. unit |
121,585 |
3,736 |
|
|
Prudential Financial, Inc. |
114,398 |
10,154 |
|
|
Validus Holdings Ltd. |
331,778 |
13,288 |
|
|
|
113,548 |
||
|
Real Estate Investment Trusts - 2.0% |
|||
|
American Capital Agency Corp. |
537,980 |
10,964 |
|
|
Annaly Capital Management, Inc. |
912,694 |
9,273 |
|
|
Coresite Realty Corp. |
57,820 |
1,871 |
|
|
First Potomac Realty Trust |
389,611 |
4,675 |
|
|
Home Properties, Inc. |
115,448 |
6,070 |
|
|
Rayonier, Inc. |
97,852 |
4,316 |
|
|
Retail Properties America, Inc. |
407,197 |
5,428 |
|
|
Two Harbors Investment Corp. |
565,041 |
5,227 |
|
|
Ventas, Inc. |
42,294 |
2,404 |
|
|
|
50,228 |
||
|
Real Estate Management & Development - 0.1% |
|||
|
Beazer Pre-Owned Rental Homes, Inc. (a)(j) |
96,000 |
2,016 |
|
|
Thrifts & Mortgage Finance - 0.1% |
|||
|
Radian Group, Inc. |
116,300 |
1,658 |
|
|
TOTAL FINANCIALS |
505,049 |
||
|
HEALTH CARE - 11.5% |
|||
|
Biotechnology - 0.6% |
|||
|
Amgen, Inc. |
118,249 |
13,490 |
|
|
Health Care Equipment & Supplies - 0.7% |
|||
|
Baxter International, Inc. |
64,000 |
4,381 |
|
|
Covidien PLC |
109,000 |
7,440 |
|
|
Hologic, Inc. (a) |
32,600 |
730 |
|
|
St. Jude Medical, Inc. |
90,162 |
5,267 |
|
|
|
17,818 |
||
|
Health Care Providers & Services - 1.6% |
|||
|
Aetna, Inc. |
138,467 |
9,545 |
|
|
Quest Diagnostics, Inc. |
95,936 |
5,846 |
|
|
Common Stocks - continued |
|||
|
Shares |
Value (000s) |
||
|
HEALTH CARE - continued |
|||
|
Health Care Providers & Services - continued |
|||
|
UnitedHealth Group, Inc. |
179,576 |
$ 13,375 |
|
|
WellPoint, Inc. |
118,445 |
11,001 |
|
|
|
39,767 |
||
|
Health Care Technology - 0.1% |
|||
|
Quality Systems, Inc. |
117,419 |
2,743 |
|
|
Pharmaceuticals - 8.5% |
|||
|
AbbVie, Inc. |
218,556 |
10,589 |
|
|
Actavis PLC (a) |
59,962 |
9,778 |
|
|
Astellas Pharma, Inc. |
79,900 |
4,734 |
|
|
AstraZeneca PLC sponsored ADR |
399,252 |
22,833 |
|
|
Eli Lilly & Co. (h) |
221,770 |
11,137 |
|
|
Johnson & Johnson |
500,018 |
47,332 |
|
|
Merck & Co., Inc. |
1,060,030 |
52,821 |
|
|
Pfizer, Inc. |
936,613 |
29,719 |
|
|
Sanofi SA |
72,826 |
7,695 |
|
|
Teva Pharmaceutical Industries Ltd. sponsored ADR |
324,298 |
13,218 |
|
|
|
209,856 |
||
|
TOTAL HEALTH CARE |
283,674 |
||
|
INDUSTRIALS - 9.9% |
|||
|
Aerospace & Defense - 1.1% |
|||
|
United Technologies Corp. |
245,307 |
27,195 |
|
|
Air Freight & Logistics - 2.1% |
|||
|
C.H. Robinson Worldwide, Inc. |
246,736 |
14,466 |
|
|
United Parcel Service, Inc. Class B |
362,690 |
37,132 |
|
|
|
51,598 |
||
|
Commercial Services & Supplies - 1.1% |
|||
|
Intrum Justitia AB |
253,384 |
6,451 |
|
|
Republic Services, Inc. |
630,889 |
22,024 |
|
|
|
28,475 |
||
|
Electrical Equipment - 0.6% |
|||
|
Eaton Corp. PLC |
53,300 |
3,873 |
|
|
Emerson Electric Co. |
76,270 |
5,109 |
|
|
Hubbell, Inc. Class B |
48,569 |
5,241 |
|
|
|
14,223 |
||
|
Industrial Conglomerates - 2.5% |
|||
|
General Electric Co. |
2,361,833 |
62,966 |
|
|
Common Stocks - continued |
|||
|
Shares |
Value (000s) |
||
|
INDUSTRIALS - continued |
|||
|
Machinery - 1.7% |
|||
|
Cummins, Inc. (h) |
73,837 |
$ 9,773 |
|
|
Douglas Dynamics, Inc. |
222,450 |
3,546 |
|
|
Harsco Corp. |
195,273 |
5,106 |
|
|
Illinois Tool Works, Inc. |
57,666 |
4,589 |
|
|
Stanley Black & Decker, Inc. (h) |
226,795 |
18,459 |
|
|
Stanley Black & Decker, Inc. unit (a) |
5,200 |
530 |
|
|
|
42,003 |
||
|
Professional Services - 0.5% |
|||
|
Acacia Research Corp. |
195,660 |
2,911 |
|
|
Michael Page International PLC |
1,080,418 |
8,397 |
|
|
|
11,308 |
||
|
Road & Rail - 0.3% |
|||
|
Union Pacific Corp. |
43,902 |
7,114 |
|
|
TOTAL INDUSTRIALS |
244,882 |
||
|
INFORMATION TECHNOLOGY - 10.7% |
|||
|
Communications Equipment - 2.2% |
|||
|
Cisco Systems, Inc. |
2,527,593 |
53,711 |
|
|
Computers & Peripherals - 0.8% |
|||
|
Apple, Inc. |
37,468 |
20,835 |
|
|
IT Services - 4.1% |
|||
|
Accenture PLC Class A |
205,996 |
15,959 |
|
|
IBM Corp. |
202,678 |
36,417 |
|
|
Paychex, Inc. |
1,085,667 |
47,476 |
|
|
|
99,852 |
||
|
Semiconductors & Semiconductor Equipment - 1.7% |
|||
|
Applied Materials, Inc. |
927,977 |
16,054 |
|
|
Broadcom Corp. Class A |
587,729 |
15,686 |
|
|
KLA-Tencor Corp. |
67,021 |
4,281 |
|
|
Siliconware Precision Industries Co. Ltd. sponsored ADR (e) |
989,533 |
5,799 |
|
|
|
41,820 |
||
|
Software - 1.9% |
|||
|
CA Technologies, Inc. |
183,281 |
6,048 |
|
|
Microsoft Corp. |
1,081,113 |
41,223 |
|
|
|
47,271 |
||
|
TOTAL INFORMATION TECHNOLOGY |
263,489 |
||
|
Common Stocks - continued |
|||
|
Shares |
Value (000s) |
||
|
MATERIALS - 0.9% |
|||
|
Chemicals - 0.4% |
|||
|
RPM International, Inc. |
184,099 |
$ 7,290 |
|
|
Sociedad Quimica y Minera de Chile SA (PN-B) sponsored ADR |
82,309 |
2,059 |
|
|
Tronox Ltd. Class A |
47,965 |
1,019 |
|
|
|
10,368 |
||
|
Metals & Mining - 0.5% |
|||
|
Commercial Metals Co. |
286,354 |
5,561 |
|
|
Freeport-McMoRan Copper & Gold, Inc. |
161,314 |
5,596 |
|
|
|
11,157 |
||
|
TOTAL MATERIALS |
21,525 |
||
|
TELECOMMUNICATION SERVICES - 3.8% |
|||
|
Diversified Telecommunication Services - 2.9% |
|||
|
AT&T, Inc. |
719,427 |
25,331 |
|
|
CenturyLink, Inc. |
428,970 |
13,169 |
|
|
Verizon Communications, Inc. |
651,777 |
32,341 |
|
|
|
70,841 |
||
|
Wireless Telecommunication Services - 0.9% |
|||
|
Vodafone Group PLC |
6,216,813 |
23,048 |
|
|
TOTAL TELECOMMUNICATION SERVICES |
93,889 |
||
|
UTILITIES - 3.6% |
|||
|
Electric Utilities - 3.1% |
|||
|
American Electric Power Co., Inc. |
133,815 |
6,297 |
|
|
FirstEnergy Corp. |
219,091 |
7,149 |
|
|
Hawaiian Electric Industries, Inc. (e) |
218,498 |
5,530 |
|
|
NextEra Energy, Inc. |
144,581 |
12,230 |
|
|
Northeast Utilities |
144,765 |
5,947 |
|
|
PPL Corp. |
495,891 |
15,229 |
|
|
Southern Co. |
480,457 |
19,521 |
|
|
Xcel Energy, Inc. |
209,276 |
5,864 |
|
|
|
77,767 |
||
|
Common Stocks - continued |
|||
|
Shares |
Value (000s) |
||
|
UTILITIES - continued |
|||
|
Multi-Utilities - 0.5% |
|||
|
CenterPoint Energy, Inc. |
33,314 |
$ 781 |
|
|
Sempra Energy |
126,314 |
11,171 |
|
|
|
11,952 |
||
|
TOTAL UTILITIES |
89,719 |
||
|
TOTAL COMMON STOCKS (Cost $1,819,559) |
2,224,733 |
||
|
Preferred Stocks - 1.9% |
|||
|
|
|
|
|
|
Convertible Preferred Stocks - 1.3% |
|||
|
CONSUMER DISCRETIONARY - 0.2% |
|||
|
Automobiles - 0.2% |
|||
|
General Motors Co. 4.75% |
85,400 |
4,543 |
|
|
FINANCIALS - 0.1% |
|||
|
Real Estate Investment Trusts - 0.1% |
|||
|
Weyerhaeuser Co. Series A, 6.375% |
43,200 |
2,361 |
|
|
HEALTH CARE - 0.1% |
|||
|
Health Care Equipment & Supplies - 0.1% |
|||
|
Alere, Inc. 3.00% |
11,539 |
3,185 |
|
|
INDUSTRIALS - 0.2% |
|||
|
Aerospace & Defense - 0.2% |
|||
|
United Technologies Corp. 7.50% |
69,700 |
4,556 |
|
|
TELECOMMUNICATION SERVICES - 0.1% |
|||
|
Wireless Telecommunication Services - 0.1% |
|||
|
Crown Castle International Corp. Series A, 4.50% (a) |
36,400 |
3,653 |
|
|
UTILITIES - 0.6% |
|||
|
Electric Utilities - 0.2% |
|||
|
NextEra Energy, Inc.: |
|
|
|
|
5.889% |
35,144 |
1,966 |
|
|
Series E, 5.599% |
61,200 |
3,493 |
|
|
|
5,459 |
||
|
Multi-Utilities - 0.4% |
|||
|
CenterPoint Energy, Inc. 2.00% ZENS |
73,300 |
3,794 |
|
|
Preferred Stocks - continued |
|||
|
Shares |
Value (000s) |
||
|
Convertible Preferred Stocks - continued |
|||
|
UTILITIES - continued |
|||
|
Multi-Utilities - continued |
|||
|
Dominion Resources, Inc.: |
|
|
|
|
Series A, 6.125% |
43,400 |
$ 2,380 |
|
|
Series B, 6.00% |
43,400 |
2,374 |
|
|
|
8,548 |
||
|
TOTAL UTILITIES |
14,007 |
||
|
TOTAL CONVERTIBLE PREFERRED STOCKS |
32,305 |
||
|
Nonconvertible Preferred Stocks - 0.6% |
|||
|
CONSUMER DISCRETIONARY - 0.2% |
|||
|
Automobiles - 0.2% |
|||
|
Volkswagen AG |
18,273 |
4,849 |
|
|
FINANCIALS - 0.4% |
|||
|
Consumer Finance - 0.4% |
|||
|
Ally Financial, Inc.: |
|
|
|
|
7.00% (g) |
8,531 |
8,190 |
|
|
Series A, 8.50% |
47,070 |
1,260 |
|
|
|
9,450 |
||
|
TOTAL NONCONVERTIBLE PREFERRED STOCKS |
14,299 |
||
|
TOTAL PREFERRED STOCKS (Cost $42,563) |
46,604 |
||
|
Corporate Bonds - 3.3% |
||||
|
|
Principal Amount (000s)(d) |
|
||
|
Convertible Bonds - 3.2% |
||||
|
CONSUMER DISCRETIONARY - 0.1% |
||||
|
Automobiles - 0.1% |
||||
|
Volkswagen International Finance NV 5.5% 11/9/15 (g) |
EUR |
2,400 |
3,897 |
|
|
ENERGY - 0.6% |
||||
|
Oil, Gas & Consumable Fuels - 0.6% |
||||
|
Alpha Natural Resources, Inc. 3.75% 12/15/17 |
|
4,810 |
4,750 |
|
|
Corporate Bonds - continued |
||||
|
|
Principal Amount (000s)(d) |
Value (000s) |
||
|
Convertible Bonds - continued |
||||
|
ENERGY - continued |
||||
|
Oil, Gas & Consumable Fuels - continued |
||||
|
Amyris, Inc. 3% 2/27/17 |
|
$ 516 |
$ 376 |
|
|
Chesapeake Energy Corp. 2.5% 5/15/37 |
|
3,360 |
3,455 |
|
|
Cobalt International Energy, Inc. 2.625% 12/1/19 |
|
2,530 |
2,514 |
|
|
Ship Finance International Ltd. 3.25% 2/1/18 |
|
3,590 |
3,753 |
|
|
|
14,848 |
|||
|
FINANCIALS - 0.4% |
||||
|
Insurance - 0.2% |
||||
|
Fidelity National Financial, Inc. 4.25% 8/15/18 |
|
3,730 |
5,646 |
|
|
Thrifts & Mortgage Finance - 0.2% |
||||
|
MGIC Investment Corp. 9% 4/1/63 (g) |
|
3,390 |
3,847 |
|
|
TOTAL FINANCIALS |
9,493 |
|||
|
HEALTH CARE - 1.0% |
||||
|
Biotechnology - 0.1% |
||||
|
Theravance, Inc. 2.125% 1/15/23 |
|
1,830 |
2,798 |
|
|
Health Care Equipment & Supplies - 0.2% |
||||
|
Teleflex, Inc. 3.875% 8/1/17 |
|
3,340 |
5,504 |
|
|
Health Care Providers & Services - 0.7% |
||||
|
HealthSouth Corp. 2% 12/1/43 |
|
5,366 |
5,950 |
|
|
WellPoint, Inc. 2.75% 10/15/42 |
|
7,510 |
10,317 |
|
|
|
16,267 |
|||
|
TOTAL HEALTH CARE |
24,569 |
|||
|
INDUSTRIALS - 0.3% |
||||
|
Commercial Services & Supplies - 0.2% |
||||
|
Covanta Holding Corp. 3.25% 6/1/14 |
|
3,050 |
3,584 |
|
|
Construction & Engineering - 0.1% |
||||
|
MasTec, Inc.: |
|
|
|
|
|
4% 6/15/14 |
|
1,580 |
3,188 |
|
|
4.25% 12/15/14 |
|
180 |
374 |
|
|
|
3,562 |
|||
|
TOTAL INDUSTRIALS |
7,146 |
|||
|
Corporate Bonds - continued |
||||
|
|
Principal Amount (000s)(d) |
Value (000s) |
||
|
Convertible Bonds - continued |
||||
|
INFORMATION TECHNOLOGY - 0.8% |
||||
|
Communications Equipment - 0.3% |
||||
|
InterDigital, Inc. 2.5% 3/15/16 |
|
$ 4,730 |
$ 4,907 |
|
|
Liberty Interactive LLC 0.75% 3/30/43 (g) |
|
800 |
1,000 |
|
|
|
5,907 |
|||
|
Computers & Peripherals - 0.2% |
||||
|
EMC Corp. 1.75% 1/1/14 |
|
3,530 |
5,263 |
|
|
Semiconductors & Semiconductor Equipment - 0.3% |
||||
|
GT Advanced Technologies, Inc. 3% 10/1/17 |
|
5,070 |
7,564 |
|
|
TOTAL INFORMATION TECHNOLOGY |
18,734 |
|||
|
TOTAL CONVERTIBLE BONDS |
78,687 |
|||
|
Nonconvertible Bonds - 0.1% |
||||
|
MATERIALS - 0.1% |
||||
|
Metals & Mining - 0.1% |
||||
|
Boart Longyear Management Pty Ltd. 7% 4/1/21 (g) |
|
1,120 |
840 |
|
|
Walter Energy, Inc. 8.5% 4/15/21 |
|
2,030 |
1,710 |
|
|
|
2,550 |
|||
|
TOTAL CORPORATE BONDS (Cost $72,017) |
81,237 |
|||
|
Other - 0.3% |
||||
|
ENERGY - 0.3% |
||||
|
Oil, Gas & Consumable Fuels - 0.3% |
||||
|
EQTY ER Holdings, LLC 12% 1/28/18 (f)(j)(k) |
|
5,667 |
5,667 |
|
|
Shares |
|
|
EQTY ER Holdings, LLC (f)(j)(k) |
|
2,833,333 |
2,833 |
|
|
TOTAL OTHER (Cost $8,500) . |
8,500 |
|||
|
Money Market Funds - 4.4% |
|||
|
Shares |
Value (000s) |
||
|
Fidelity Cash Central Fund, 0.10% (b) |
103,943,316 |
$ 103,943 |
|
|
Fidelity Securities Lending Cash Central Fund, 0.10% (b)(c) |
4,116,600 |
4,117 |
|
|
TOTAL MONEY MARKET FUNDS (Cost $108,060) |
108,060 |
||
|
TOTAL INVESTMENT PORTFOLIO - 100.1% (Cost $2,050,699) |
2,469,134 |
||
|
NET OTHER ASSETS (LIABILITIES) - (0.1)% |
(2,680) |
||
|
NET ASSETS - 100% |
$ 2,466,454 |
||
|
Written Options |
|||||||
|
Expiration Date/Exercise Price |
Number of Contracts |
Premium (000s) |
Value (000s) |
||||
|
Call Options |
|||||||
|
Comcast Corp. Class A |
1/18/14 - |
1,718 |
$ 187 |
$ (359) |
|||
|
Cummins, Inc. |
1/18/14 - |
185 |
28 |
(24) |
|||
|
Eli Lilly & Co. |
1/18/14 - |
1,109 |
43 |
(33) |
|||
|
M&T Bank Corp. |
1/18/14 - |
326 |
64 |
(95) |
|||
|
Stanley Black & Decker, Inc. |
12/21/13 - |
514 |
77 |
(41) |
|||
|
Staples, Inc. |
1/18/14 - |
837 |
27 |
(10) |
|||
|
Wells Fargo & Co. |
1/18/14 - |
8,367 |
405 |
(925) |
|||
|
TOTAL WRITTEN OPTIONS |
$ 831 |
$ (1,487) |
||||||
|
Currency Abbreviations |
||
|
EUR |
- |
European Monetary Unit |
|
Legend |
|
(a) Non-income producing |
|
(b) Affiliated fund that is generally available only to investment companies and other accounts managed by Fidelity Investments. The rate quoted is the annualized seven-day yield of the fund at period end. A complete unaudited listing of the fund's holdings as of its most recent quarter end is available upon request. In addition, each Fidelity Central Fund's financial statements, which are not covered by the Fund's Report of Independent Registered Public Accounting Firm, are available on the SEC's website or upon request. |
|
(c) Investment made with cash collateral received from securities on loan. |
|
(d) Amount is stated in United States dollars unless otherwise noted. |
|
(e) Security or a portion of the security is on loan at period end. |
|
(f) Affiliated company |
|
(g) Security exempt from registration under Rule 144A of the Securities Act of 1933. These securities may be resold in transactions exempt from registration, normally to qualified institutional buyers. At the end of the period, the value of these securities amounted to $17,774,000 or 0.7% of net assets. |
|
(h) Security or a portion of the security is pledged as collateral for call options written. At period end, the value of securities pledged amounted to $62,661,000. |
|
(i) Investment is owned by an entity that is treated as a corporation for U.S. tax purposes and is owned by the Fund. |
|
(j) Restricted securities - Investment in securities not registered under the Securities Act of 1933 (excluding 144A issues). At the end of the period, the value of restricted securities (excluding 144A issues) amounted to $20,063,000 or 0.8% of net assets. |
|
Additional information on each restricted holding is as follows: |
|
Security |
Acquisition Date |
Acquisition Cost (000s) |
|
Beazer Pre-Owned Rental Homes, Inc. |
5/3/12 - 10/23/12 |
$ 1,920 |
|
EQTY ER Holdings, LLC 12% 1/28/18 |
1/29/13 |
$ 5,667 |
|
EQTY ER Holdings, LLC |
1/29/13 |
$ 2,833 |
|
New Academy Holding Co. LLC unit |
8/1/11 |
$ 5,565 |
|
(k) Investments represent a non-operating interest in oil and gas wells through an entity owned by the fund that is treated as a corporation for U.S. tax purposes. |
|
Affiliated Central Funds |
|
Information regarding fiscal year to date income earned by the Fund from investments in Fidelity Central Funds is as follows: |
|
Fund |
Income earned |
|
Fidelity Cash Central Fund |
$ 104 |
|
Fidelity Securities Lending Cash Central Fund |
385 |
|
Total |
$ 489 |
|
Other Affiliated Issuers |
|
An affiliated company is a company in which the Fund has ownership of at least 5% of the voting securities. Fiscal year to date transactions with companies which are or were affiliates are as follows: |
|
Affiliate |
Value, beginning of period |
Purchases |
Sales Proceeds |
Dividend Income |
Value, |
|
EQTY ER Holdings, LLC 12% 1/28/18 |
$ - |
$ 5,667 |
$ - |
$ - |
$ 5,667 |
|
EQTY ER Holdings, LLC |
- |
2,833 |
- |
- |
2,833 |
|
Total |
$ - |
$ 8,500 |
$ - |
$ - |
$ 8,500 |
|
Other Information |
|
The following is a summary of the inputs used, as of November 30, 2013, involving the Fund's assets and liabilities carried at fair value. The inputs or methodology used for valuing securities may not be an indication of the risk associated with investing in those securities. For more information on valuation inputs, and their aggregation into the levels used in the tables below, please refer to the Investment Valuation section in the accompanying Notes to Financial Statements. |
|
Valuation Inputs at Reporting Date: |
||||
|
Description |
Total |
Level 1 |
Level 2 |
Level 3 |
|
Investments in Securities: |
||||
|
Equities: |
||||
|
Consumer Discretionary |
$ 191,980 |
$ 182,433 |
$ - |
$ 9,547 |
|
Consumer Staples |
217,759 |
217,759 |
- |
- |
|
Energy |
322,159 |
322,159 |
- |
- |
|
Financials |
516,860 |
500,557 |
14,287 |
2,016 |
|
Health Care |
286,859 |
279,164 |
7,695 |
- |
|
Industrials |
249,438 |
249,438 |
- |
- |
|
Information Technology |
263,489 |
263,489 |
- |
- |
|
Materials |
21,525 |
21,525 |
- |
- |
|
Telecommunication Services |
97,542 |
70,841 |
26,701 |
- |
|
Utilities |
103,726 |
94,473 |
9,253 |
- |
|
Corporate Bonds |
81,237 |
- |
81,237 |
- |
|
Other/Energy |
8,500 |
- |
- |
8,500 |
|
Money Market Funds |
108,060 |
108,060 |
- |
- |
|
Total Investments in Securities: |
$ 2,469,134 |
$ 2,309,898 |
$ 139,173 |
$ 20,063 |
|
Derivative Instruments: |
||||
|
Liabilities |
||||
|
Written Options |
$ (1,487) |
$ (1,487) |
$ - |
$ - |
|
Value of Derivative Instruments |
|
The following table is a summary of the Fund's value of derivative instruments by primary risk exposure as of November 30, 2013. For additional information on derivative instruments, please refer to the Derivative Instruments section in the accompanying Notes to Financial Statements. |
|
Primary Risk Exposure / |
Value |
|
|
|
Asset |
Liability |
|
Equity Risk |
||
|
Written Options (a) |
$ - |
$ (1,487) |
|
Total Value of Derivatives |
$ - |
$ (1,487) |
|
(a) Gross value is presented in the Statement of Assets and Liabilities in the written options, at value line-item. |
|
Distribution of investments by country or territory of incorporation, as a percentage of total net assets, is as follows (Unaudited): |
|
United States of America |
88.5% |
|
United Kingdom |
4.4% |
|
Ireland |
1.6% |
|
Canada |
1.2% |
|
Bermuda |
1.0% |
|
Others (Individually Less Than 1%) |
3.3% |
|
|
100.0% |
See accompanying notes which are an integral part of the financial statements.
Annual Report
Financial Statements
Statement of Assets and Liabilities
|
Amounts in thousands (except per-share amounts) |
November 30, 2013 |
|
|
|
|
|
|
Assets |
|
|
|
Investment in securities, at value (including securities loaned of $4,008) - See accompanying schedule: Unaffiliated issuers (cost $1,934,139) |
$ 2,352,574 |
|
|
Fidelity Central Funds (cost $108,060) |
108,060 |
|
|
Other affiliated issuers (cost $8,500) |
8,500 |
|
|
Total Investments (cost $2,050,699) |
|
$ 2,469,134 |
|
Receivable for fund shares sold |
|
946 |
|
Dividends receivable |
|
7,250 |
|
Interest receivable |
|
725 |
|
Distributions receivable from Fidelity Central Funds |
|
9 |
|
Prepaid expenses |
|
7 |
|
Other receivables |
|
114 |
|
Total assets |
|
2,478,185 |
|
|
|
|
|
Liabilities |
|
|
|
Payable for investments purchased |
$ 573 |
|
|
Payable for fund shares redeemed |
3,232 |
|
|
Accrued management fee |
925 |
|
|
Distribution and service plan fees payable |
754 |
|
|
Written options, at value (premium received $831) |
1,487 |
|
|
Other affiliated payables |
481 |
|
|
Other payables and accrued expenses |
162 |
|
|
Collateral on securities loaned, at value |
4,117 |
|
|
Total liabilities |
|
11,731 |
|
|
|
|
|
Net Assets |
|
$ 2,466,454 |
|
Net Assets consist of: |
|
|
|
Paid in capital |
|
$ 2,145,085 |
|
Undistributed net investment income |
|
11,107 |
|
Accumulated undistributed net realized gain (loss) on investments and foreign currency transactions |
|
(107,532) |
|
Net unrealized appreciation (depreciation) on investments and assets and liabilities in foreign currencies |
|
417,794 |
|
Net Assets |
|
$ 2,466,454 |
See accompanying notes which are an integral part of the financial statements.
Annual Report
Financial Statements - continued
Statement of Assets and Liabilities - continued
|
Amounts in thousands (except per-share amounts) |
November 30, 2013 |
|
|
|
|
|
|
Calculation of Maximum Offering Price Class A: |
|
$ 31.60 |
|
|
|
|
|
Maximum offering price per share (100/94.25 of $31.60) |
|
$ 33.53 |
|
Class T: |
|
$ 32.09 |
|
|
|
|
|
Maximum offering price per share (100/96.50 of $32.09) |
|
$ 33.25 |
|
Class B: |
|
$ 31.79 |
|
|
|
|
|
Class C: |
|
$ 31.73 |
|
|
|
|
|
Institutional Class: |
|
$ 32.62 |
|
|
|
|
|
Class Z: |
|
$ 32.63 |
A Redemption price per share is equal to net asset value less any applicable contingent deferred sales charge.
See accompanying notes which are an integral part of the financial statements.
Annual Report
Statement of Operations
|
Amounts in thousands |
Year ended November 30, 2013 |
|
|
|
|
|
|
Investment Income |
|
|
|
Dividends |
|
$ 67,324 |
|
Interest |
|
2,907 |
|
Income from Fidelity Central Funds |
|
489 |
|
Total income |
|
70,720 |
|
|
|
|
|
Expenses |
|
|
|
Management fee |
$ 10,530 |
|
|
Transfer agent fees |
5,071 |
|
|
Distribution and service plan fees |
8,429 |
|
|
Accounting and security lending fees |
699 |
|
|
Custodian fees and expenses |
53 |
|
|
Independent trustees' compensation |
13 |
|
|
Registration fees |
125 |
|
|
Audit |
68 |
|
|
Legal |
8 |
|
|
Miscellaneous |
20 |
|
|
Total expenses before reductions |
25,016 |
|
|
Expense reductions |
(221) |
24,795 |
|
Net investment income (loss) |
|
45,925 |
|
Realized and Unrealized Gain (Loss) Net realized gain (loss) on: |
|
|
|
Investment securities: |
|
|
|
Unaffiliated issuers |
209,890 |
|
|
Foreign currency transactions |
78 |
|
|
Written options |
983 |
|
|
Total net realized gain (loss) |
|
210,951 |
|
Change in net unrealized appreciation (depreciation) on: Investment securities |
277,176 |
|
|
Assets and liabilities in foreign currencies |
18 |
|
|
Written options |
(656) |
|
|
Total change in net unrealized appreciation (depreciation) |
|
276,538 |
|
Net gain (loss) |
|
487,489 |
|
Net increase (decrease) in net assets resulting from operations |
|
$ 533,414 |
See accompanying notes which are an integral part of the financial statements.
Annual Report
Financial Statements - continued
Statement of Changes in Net Assets
|
Amounts in thousands |
Year ended |
Year ended |
|
Increase (Decrease) in Net Assets |
|
|
|
Operations |
|
|
|
Net investment income (loss) |
$ 45,925 |
$ 50,901 |
|
Net realized gain (loss) |
210,951 |
109,033 |
|
Change in net unrealized appreciation (depreciation) |
276,538 |
183,817 |
|
Net increase (decrease) in net assets resulting |
533,414 |
343,751 |
|
Distributions to shareholders from net investment income |
(43,731) |
(45,384) |
|
Distributions to shareholders from net realized gain |
(2,444) |
- |
|
Total distributions |
(46,175) |
(45,384) |
|
Share transactions - net increase (decrease) |
(140,174) |
(210,314) |
|
Total increase (decrease) in net assets |
347,065 |
88,053 |
|
|
|
|
|
Net Assets |
|
|
|
Beginning of period |
2,119,389 |
2,031,336 |
|
End of period (including undistributed net investment income of $11,107 and undistributed net investment income of $9,853, respectively) |
$ 2,466,454 |
$ 2,119,389 |
See accompanying notes which are an integral part of the financial statements.
Annual Report
Financial Highlights - Class A
|
Years ended November 30, |
2013 |
2012 |
2011 |
2010 |
2009 |
|
Selected Per-Share Data |
|
|
|
|
|
|
Net asset value, beginning of period |
$ 25.55 |
$ 22.18 |
$ 21.07 |
$ 20.26 |
$ 16.72 |
|
Income from Investment Operations |
|
|
|
|
|
|
Net investment income (loss) C |
.60 |
.61 |
.42 |
.25 |
.28 |
|
Net realized and unrealized gain (loss) |
6.06 |
3.32 |
1.11 |
.81 |
3.58 |
|
Total from investment operations |
6.66 |
3.93 |
1.53 |
1.06 |
3.86 |
|
Distributions from net investment income |
(.58) |
(.56) |
(.42) |
(.25) |
(.32) |
|
Distributions from net realized gain |
(.03) |
- |
- |
- |
- |
|
Total distributions |
(.61) |
(.56) |
(.42) |
(.25) |
(.32) |
|
Net asset value, end of period |
$ 31.60 |
$ 25.55 |
$ 22.18 |
$ 21.07 |
$ 20.26 |
|
Total Return A, B |
26.43% |
17.90% |
7.25% |
5.26% |
23.58% |
|
Ratios to Average Net Assets D, F |
|
|
|
|
|
|
Expenses before reductions |
.98% |
1.02% |
1.03% |
1.04% |
1.07% |
|
Expenses net of fee waivers, if any |
.98% |
1.02% |
1.03% |
1.04% |
1.07% |
|
Expenses net of all reductions |
.97% |
1.01% |
1.02% |
1.04% |
1.07% |
|
Net investment income (loss) |
2.07% |
2.52% |
1.82% |
1.21% |
1.67% |
|
Supplemental Data |
|
|
|
|
|
|
Net assets, end of period (in millions) |
$ 777 |
$ 646 |
$ 634 |
$ 719 |
$ 831 |
|
Portfolio turnover rate E |
34% |
49% |
89% |
29% |
76% |
A Total returns would have been lower if certain expenses had not been reduced during the applicable periods shown.
B Total returns do not include the effect of the sales charges.
C Calculated based on average shares outstanding during the period.
D Fees and expenses of any underlying Fidelity Central Funds are not included in the Fund's expense ratio. The Fund indirectly bears its proportionate share of the expenses of any underlying Fidelity Central Funds.
E Amount does not include the portfolio activity of any underlying Fidelity Central Funds.
F Expense ratios reflect operating expenses of the class. Expenses before reductions do not reflect amounts reimbursed by the investment adviser or reductions from brokerage service arrangements or reductions from other expense offset arrangements and do not represent the amount paid by the class during periods when reimbursements or reductions occur. Expenses net of fee waivers reflect expenses after reimbursement by the investment adviser but prior to reductions from brokerage service arrangements or other expense offset arrangements. Expenses net of all reductions represent the net expenses paid by the class.
See accompanying notes which are an integral part of the financial statements.
Annual Report
Financial Highlights - Class T
|
Years ended November 30, |
2013 |
2012 |
2011 |
2010 |
2009 |
|
Selected Per-Share Data |
|
|
|
|
|
|
Net asset value, beginning of period |
$ 25.94 |
$ 22.50 |
$ 21.37 |
$ 20.54 |
$ 16.94 |
|
Income from Investment Operations |
|
|
|
|
|
|
Net investment income (loss) C |
.55 |
.57 |
.38 |
.22 |
.25 |
|
Net realized and unrealized gain (loss) |
6.15 |
3.37 |
1.13 |
.82 |
3.63 |
|
Total from investment operations |
6.70 |
3.94 |
1.51 |
1.04 |
3.88 |
|
Distributions from net investment income |
(.52) |
(.50) |
(.38) |
(.21) |
(.28) |
|
Distributions from net realized gain |
(.03) |
- |
- |
- |
- |
|
Total distributions |
(.55) |
(.50) |
(.38) |
(.21) |
(.28) |
|
Net asset value, end of period |
$ 32.09 |
$ 25.94 |
$ 22.50 |
$ 21.37 |
$ 20.54 |
|
Total Return A, B |
26.14% |
17.70% |
7.02% |
5.09% |
23.35% |
|
Ratios to Average Net Assets D, F |
|
|
|
|
|
|
Expenses before reductions |
1.19% |
1.21% |
1.22% |
1.23% |
1.28% |
|
Expenses net of fee waivers, if any |
1.19% |
1.21% |
1.22% |
1.23% |
1.28% |
|
Expenses net of all reductions |
1.18% |
1.21% |
1.21% |
1.22% |
1.27% |
|
Net investment income (loss) |
1.86% |
2.32% |
1.63% |
1.03% |
1.47% |
|
Supplemental Data |
|
|
|
|
|
|
Net assets, end of period (in millions) |
$ 984 |
$ 854 |
$ 862 |
$ 1,108 |
$ 1,264 |
|
Portfolio turnover rate E |
34% |
49% |
89% |
29% |
76% |
A Total returns would have been lower if certain expenses had not been reduced during the applicable periods shown.
B Total returns do not include the effect of the sales charges.
C Calculated based on average shares outstanding during the period.
D Fees and expenses of any underlying Fidelity Central Funds are not included in the Fund's expense ratio. The Fund indirectly bears its proportionate share of the expenses of any underlying Fidelity Central Funds.
E Amount does not include the portfolio activity of any underlying Fidelity Central Funds.
F Expense ratios reflect operating expenses of the class. Expenses before reductions do not reflect amounts reimbursed by the investment adviser or reductions from brokerage service arrangements or reductions from other expense offset arrangements and do not represent the amount paid by the class during periods when reimbursements or reductions occur. Expenses net of fee waivers reflect expenses after reimbursement by the investment adviser but prior to reductions from brokerage service arrangements or other expense offset arrangements. Expenses net of all reductions represent the net expenses paid by the class.
See accompanying notes which are an integral part of the financial statements.
Annual Report
Financial Highlights - Class B
|
Years ended November 30, |
2013 |
2012 |
2011 |
2010 |
2009 |
|
Selected Per-Share Data |
|
|
|
|
|
|
Net asset value, beginning of period |
$ 25.69 |
$ 22.29 |
$ 21.16 |
$ 20.33 |
$ 16.77 |
|
Income from Investment Operations |
|
|
|
|
|
|
Net investment income (loss) C |
.36 |
.42 |
.24 |
.09 |
.15 |
|
Net realized and unrealized gain (loss) |
6.10 |
3.34 |
1.12 |
.82 |
3.59 |
|
Total from investment operations |
6.46 |
3.76 |
1.36 |
.91 |
3.74 |
|
Distributions from net investment income |
(.33) |
(.36) |
(.23) |
(.08) |
(.18) |
|
Distributions from net realized gain |
(.03) |
- |
- |
- |
- |
|
Total distributions |
(.36) |
(.36) |
(.23) |
(.08) |
(.18) |
|
Net asset value, end of period |
$ 31.79 |
$ 25.69 |
$ 22.29 |
$ 21.16 |
$ 20.33 |
|
Total Return A, B |
25.39% |
16.97% |
6.43% |
4.49% |
22.59% |
|
Ratios to Average Net Assets D, F |
|
|
|
|
|
|
Expenses before reductions |
1.80% |
1.80% |
1.81% |
1.82% |
1.84% |
|
Expenses net of fee waivers, if any |
1.80% |
1.80% |
1.81% |
1.82% |
1.84% |
|
Expenses net of all reductions |
1.79% |
1.80% |
1.80% |
1.81% |
1.84% |
|
Net investment income (loss) |
1.26% |
1.73% |
1.04% |
.44% |
.90% |
|
Supplemental Data |
|
|
|
|
|
|
Net assets, end of period (in millions) |
$ 27 |
$ 31 |
$ 42 |
$ 63 |
$ 88 |
|
Portfolio turnover rate E |
34% |
49% |
89% |
29% |
76% |
A Total returns would have been lower if certain expenses had not been reduced during the applicable periods shown.
B Total returns do not include the effect of the contingent deferred sales charge.
C Calculated based on average shares outstanding during the period.
D Fees and expenses of any underlying Fidelity Central Funds are not included in the Fund's expense ratio. The Fund indirectly bears its proportionate share of the expenses of any underlying Fidelity Central Funds.
E Amount does not include the portfolio activity of any underlying Fidelity Central Funds.
F Expense ratios reflect operating expenses of the class. Expenses before reductions do not reflect amounts reimbursed by the investment adviser or reductions from brokerage service arrangements or reductions from other expense offset arrangements and do not represent the amount paid by the class during periods when reimbursements or reductions occur. Expenses net of fee waivers reflect expenses after reimbursement by the investment adviser but prior to reductions from brokerage service arrangements or other expense offset arrangements. Expenses net of all reductions represent the net expenses paid by the class.
See accompanying notes which are an integral part of the financial statements.
Annual Report
Financial Highlights - Class C
|
Years ended November 30, |
2013 |
2012 |
2011 |
2010 |
2009 |
|
Selected Per-Share Data |
|
|
|
|
|
|
Net asset value, beginning of period |
$ 25.66 |
$ 22.27 |
$ 21.16 |
$ 20.34 |
$ 16.78 |
|
Income from Investment Operations |
|
|
|
|
|
|
Net investment income (loss) C |
.38 |
.43 |
.25 |
.09 |
.16 |
|
Net realized and unrealized gain (loss) |
6.09 |
3.33 |
1.11 |
.82 |
3.59 |
|
Total from investment operations |
6.47 |
3.76 |
1.36 |
.91 |
3.75 |
|
Distributions from net investment income |
(.37) |
(.37) |
(.25) |
(.09) |
(.19) |
|
Distributions from net realized gain |
(.03) |
- |
- |
- |
- |
|
Total distributions |
(.40) |
(.37) |
(.25) |
(.09) |
(.19) |
|
Net asset value, end of period |
$ 31.73 |
$ 25.66 |
$ 22.27 |
$ 21.16 |
$ 20.34 |
|
Total Return A, B |
25.46% |
17.03% |
6.40% |
4.50% |
22.63% |
|
Ratios to Average Net Assets D, F |
|
|
|
|
|
|
Expenses before reductions |
1.74% |
1.77% |
1.78% |
1.80% |
1.83% |
|
Expenses net of fee waivers, if any |
1.74% |
1.77% |
1.78% |
1.80% |
1.83% |
|
Expenses net of all reductions |
1.73% |
1.77% |
1.77% |
1.79% |
1.83% |
|
Net investment income (loss) |
1.32% |
1.76% |
1.06% |
.46% |
.91% |
|
Supplemental Data |
|
|
|
|
|
|
Net assets, end of period (in millions) |
$ 195 |
$ 143 |
$ 134 |
$ 149 |
$ 165 |
|
Portfolio turnover rate E |
34% |
49% |
89% |
29% |
76% |
A Total returns would have been lower if certain expenses had not been reduced during the applicable periods shown.
B Total returns do not include the effect of the contingent deferred sales charge.
C Calculated based on average shares outstanding during the period.
D Fees and expenses of any underlying Fidelity Central Funds are not included in the Fund's expense ratio. The Fund indirectly bears its proportionate share of the expenses of any underlying Fidelity Central Funds.
E Amount does not include the portfolio activity of any underlying Fidelity Central Funds.
F Expense ratios reflect operating expenses of the class. Expenses before reductions do not reflect amounts reimbursed by the investment adviser or reductions from brokerage service arrangements or reductions from other expense offset arrangements and do not represent the amount paid by the class during periods when reimbursements or reductions occur. Expenses net of fee waivers reflect expenses after reimbursement by the investment adviser but prior to reductions from brokerage service arrangements or other expense offset arrangements. Expenses net of all reductions represent the net expenses paid by the class.
See accompanying notes which are an integral part of the financial statements.
Annual Report
Financial Highlights - Institutional Class
|
Years ended November 30, |
2013 |
2012 |
2011 |
2010 |
2009 |
|
Selected Per-Share Data |
|
|
|
|
|
|
Net asset value, beginning of period |
$ 26.36 |
$ 22.86 |
$ 21.70 |
$ 20.85 |
$ 17.20 |
|
Income from Investment Operations |
|
|
|
|
|
|
Net investment income (loss) B |
.70 |
.70 |
.50 |
.32 |
.34 |
|
Net realized and unrealized gain (loss) |
6.24 |
3.43 |
1.14 |
.83 |
3.68 |
|
Total from investment operations |
6.94 |
4.13 |
1.64 |
1.15 |
4.02 |
|
Distributions from net investment income |
(.65) |
(.63) |
(.48) |
(.30) |
(.37) |
|
Distributions from net realized gain |
(.03) |
- |
- |
- |
- |
|
Total distributions |
(.68) |
(.63) |
(.48) |
(.30) |
(.37) |
|
Net asset value, end of period |
$ 32.62 |
$ 26.36 |
$ 22.86 |
$ 21.70 |
$ 20.85 |
|
Total Return A |
26.72% |
18.27% |
7.55% |
5.56% |
23.90% |
|
Ratios to Average Net Assets C, E |
|
|
|
|
|
|
Expenses before reductions |
.72% |
.73% |
.74% |
.77% |
.79% |
|
Expenses net of fee waivers, if any |
.72% |
.73% |
.74% |
.77% |
.79% |
|
Expenses net of all reductions |
.71% |
.73% |
.73% |
.76% |
.78% |
|
Net investment income (loss) |
2.34% |
2.80% |
2.10% |
1.49% |
1.96% |
|
Supplemental Data |
|
|
|
|
|
|
Net assets, end of period (in millions) |
$ 483 |
$ 445 |
$ 360 |
$ 464 |
$ 1,127 |
|
Portfolio turnover rate D |
34% |
49% |
89% |
29% |
76% |
A Total returns would have been lower if certain expenses had not been reduced during the applicable periods shown.
B Calculated based on average shares outstanding during the period.
C Fees and expenses of any underlying Fidelity Central Funds are not included in the Fund's expense ratio. The Fund indirectly bears its proportionate share of the expenses of any underlying Fidelity Central Funds.
D Amount does not include the portfolio activity of any underlying Fidelity Central Funds.
E Expense ratios reflect operating expenses of the class. Expenses before reductions do not reflect amounts reimbursed by the investment adviser or reductions from brokerage service arrangements or reductions from other expense offset arrangements and do not represent the amount paid by the class during periods when reimbursements or reductions occur. Expenses net of fee waivers reflect expenses after reimbursement by the investment adviser but prior to reductions from brokerage service arrangements or other expense offset arrangements. Expenses net of all reductions represent the net expenses paid by the class.
See accompanying notes which are an integral part of the financial statements.
Annual Report
Financial Highlights - Class Z
|
Year ended November 30, |
2013 G |
|
Selected Per-Share Data |
|
|
Net asset value, beginning of period |
$ 31.44 |
|
Income from Investment Operations |
|
|
Net investment income (loss) D |
.23 |
|
Net realized and unrealized gain (loss) |
1.12 |
|
Total from investment operations |
1.35 |
|
Distributions from net investment income |
(.16) |
|
Net asset value, end of period |
$ 32.63 |
|
Total Return B, C |
4.30% |
|
Ratios to Average Net Assets E, H |
|
|
Expenses before reductions |
.54% A |
|
Expenses net of fee waivers, if any |
.54% A |
|
Expenses net of all reductions |
.54% A |
|
Net investment income (loss) |
2.37% A |
|
Supplemental Data |
|
|
Net assets, end of period (000 omitted) |
$ 104 |
|
Portfolio turnover rate F |
34% |
A Annualized
B Total returns for periods of less than one year are not annualized.
C Total returns would have been lower if certain expenses had not been reduced during the applicable periods shown.
D Calculated based on average shares outstanding during the period.
E Fees and expenses of any underlying Fidelity Central Funds are not included in the Fund's expense ratio. The Fund indirectly bears its proportionate share of the expenses of any underlying Fidelity Central Funds.
F Amount does not include the portfolio activity of any underlying Fidelity Central Funds.
G For the period August 13, 2013 (commencement of sale of shares) to November 30, 2013.
H Expense ratios reflect operating expenses of the class. Expenses before reductions do not reflect amounts reimbursed by the investment adviser or reductions from brokerage service arrangements or reductions from other expense offset arrangements and do not represent the amount paid by the class during periods when reimbursements or reductions occur. Expense ratios before reductions for start-up periods may not be representative of longer-term operating periods. Expenses net of fee waivers reflect expenses after reimbursement by the investment adviser but prior to reductions from brokerage service arrangements or other expense offset arrangements. Expenses net of all reductions represent the net expenses paid by the class.
See accompanying notes which are an integral part of the financial statements.
Annual Report
Notes to Financial Statements
For the period ended November 30, 2013
(Amounts in thousands except percentages)
1. Organization.
Fidelity Advisor Equity Income Fund (the Fund) is a fund of Fidelity Advisor Series I (the Trust) and is authorized to issue an unlimited number of shares. The Trust is registered under the Investment Company Act of 1940, as amended (the 1940 Act), as an open-end management investment company organized as a Massachusetts business trust. The Fund commenced sale of Class Z shares on August 13, 2013. The Fund offers Class A, Class T, Class C, Institutional Class and Class Z shares, each of which, along with Class B shares, has equal rights as to assets and voting privileges. Class B shares are closed to new accounts and additional purchases, except for exchanges and reinvestments. Each class has exclusive voting rights with respect to matters that affect that class. Class B shares will automatically convert to Class A shares after a holding period of seven years from the initial date of purchase.
2. Investments in Fidelity Central Funds.
The Fund invests in Fidelity Central Funds, which are open-end investment companies generally available only to other investment companies and accounts managed by the investment adviser and its affiliates. The Fund's Schedule of Investments lists each of the Fidelity Central Funds held as of period end, if any, as an investment of the Fund, but does not include the underlying holdings of each Fidelity Central Fund. As an Investing Fund, the Fund indirectly bears its proportionate share of the expenses of the underlying Fidelity Central Funds.
The Money Market Central Funds seek preservation of capital and current income and are managed by Fidelity Investments Money Management, Inc. (FIMM), an affiliate of the investment adviser. Annualized expenses of the Money Market Central Funds as of their most recent shareholder report date are less than .01%.
A complete unaudited list of holdings for each Fidelity Central Fund is available upon request or at the Securities and Exchange Commission (the SEC) website at www.sec.gov. In addition, the financial statements of the Fidelity Central Funds, which are not covered by the Fund's Report of Independent Registered Public Accounting Firm, are available on the SEC website or upon request.
3. Significant Accounting Policies.
The financial statements have been prepared in conformity with accounting principles generally accepted in the United States of America (GAAP), which require management to make certain estimates and assumptions at the date of the financial statements. Actual results could differ from those estimates. Subsequent events, if any, through the date that the financial statements were issued have been evaluated in the preparation of the financial statements. The following summarizes the significant accounting policies of the Fund:
Annual Report
3. Significant Accounting Policies - continued
Investment Valuation. Investments are valued as of 4:00 p.m. Eastern time on the last calendar day of the period. In accordance with valuation policies and procedures approved by the Board of Trustees (the Board), the Fund attempts to obtain prices from one or more third party pricing vendors or brokers to value its investments. When current market prices, quotations or currency exchange rates are not readily available or reliable, investments will be fair valued in good faith by the Fidelity Management & Research Company (FMR) Fair Value Committee (the Committee), in accordance with procedures adopted by the Board. Factors used in determining fair value vary by investment type and may include market or investment specific events, changes in interest rates and credit quality. The frequency with which these procedures are used cannot be predicted and they may be utilized to a significant extent. The Committee oversees the Fund's valuation policies and procedures and is responsible for approving and reporting to the Board all fair value determinations.
The Fund categorizes the inputs to valuation techniques used to value its investments into a disclosure hierarchy consisting of three levels as shown below:
Level 1 - quoted prices in active markets for identical investments
Level 2 - other significant observable inputs (including quoted prices for similar investments, interest rates, prepayment speeds, etc.)
Level 3 - unobservable inputs (including the Fund's own assumptions based on the best information available)
Valuation techniques used to value the Fund's investments by major category are as follows:
Equity securities, including restricted securities, for which market quotations are readily available, are valued at the last reported sale price or official closing price as reported by a third party pricing vendor on the primary market or exchange on which they are traded and are categorized as Level 1 in the hierarchy. In the event there were no sales during the day or closing prices are not available, securities are valued at the last quoted bid price or may be valued using the last available price and are generally categorized as Level 2 in the hierarchy. For foreign equity securities, when market or security specific events arise, comparisons to the valuation of American Depositary Receipts (ADRs), futures contracts, Exchange-Traded Funds (ETFs) and certain indexes as well as quoted prices for similar securities may be used and would be categorized as Level 2 in the hierarchy. Utilizing these techniques may result in transfers between Level 1 and Level 2. For equity securities, including restricted securities, where observable inputs are limited, assumptions about market activity and risk are used and these securities may be categorized as Level 3 in the hierarchy.
Annual Report
Notes to Financial Statements - continued
(Amounts in thousands except percentages)
3. Significant Accounting Policies - continued
Investment Valuation - continued
Debt securities, including restricted securities, are valued based on evaluated prices received from third party pricing vendors or from brokers who make markets in such securities. For corporate bonds, pricing vendors utilize matrix pricing which considers yield or price of bonds of comparable quality, coupon, maturity and type as well as broker-supplied prices. When independent prices are unavailable or unreliable, debt securities may be valued utilizing pricing methodologies which consider similar factors that would be used by third party pricing vendors. Debt securities are generally categorized as Level 2 in the hierarchy but may be Level 3 depending on the circumstances.
Exchange-traded options are valued using the last sale price or, in the absence of a sale, the last offering price and are categorized as Level 1 in the hierarchy. Investments in open-end mutual funds, including the Fidelity Central Funds, are valued at their closing net asset value (NAV) each business day and are categorized as Level 1 in the hierarchy.
Changes in valuation techniques may result in transfers in or out of an assigned level within the disclosure hierarchy. The aggregate value of investments by input level, as of November 30, 2013, is included at the end of the Fund's Schedule of Investments.
Foreign Currency. The Fund may use foreign currency contracts to facilitate transactions in foreign-denominated securities. Gains and losses from these transactions may arise from changes in the value of the foreign currency or if the counterparties do not perform under the contracts' terms.
Foreign-denominated assets, including investment securities, and liabilities are translated into U.S. dollars at the exchange rates at period end. Purchases and sales of investment securities, income and dividends received and expenses denominated in foreign currencies are translated into U.S. dollars at the exchange rate in effect on the transaction date.
The effects of exchange rate fluctuations on investments are included with the net realized and unrealized gain (loss) on investment securities. Other foreign currency transactions resulting in realized and unrealized gain (loss) are disclosed separately.
Investment Transactions and Income. For financial reporting purposes, the Fund's investment holdings and NAV include trades executed through the end of the last business day of the period. The NAV per share for processing shareholder transactions is calculated as of the close of business of the New York Stock Exchange (NYSE), normally 4:00 p.m. Eastern time and includes trades executed through the end of the prior business day. Gains and losses on securities sold are determined on the basis of identified cost and may include proceeds received from litigation. Dividend income is recorded on
Annual Report
3. Significant Accounting Policies - continued
Investment Transactions and Income - continued
the ex-dividend date except for certain dividends from foreign securities where the ex-dividend date may have passed, which are recorded as soon as the Fund is informed of the ex-dividend date. Non-cash dividends included in dividend income, if any, are recorded at the fair market value of the securities received. Distributions received on securities that represent a return of capital or capital gain are recorded as a reduction of cost of investments and/or as a realized gain. Subsequent to ex-dividend date the Fund determines the components of these distributions, based upon receipt of tax filings or other correspondence relating to the underlying investment. Interest income and distributions from the Fidelity Central Funds are accrued as earned. Interest income includes coupon interest and amortization of premium and accretion of discount on debt securities. Investment income is recorded net of foreign taxes withheld where recovery of such taxes is uncertain.
Class Allocations and Expenses. Investment income, realized and unrealized capital gains and losses, common expenses of the Fund, and certain fund-level expense reductions, if any, are allocated daily on a pro-rata basis to each class based on the relative net assets of each class to the total net assets of the Fund. Each class differs with respect to transfer agent and distribution and service plan fees incurred. Certain expense reductions may also differ by class. For the reporting period, the allocated portion of income and expenses to each class as a percent of its average net assets may vary due to the timing of recording these transactions in relation to fluctuating net assets of the classes. Expenses directly attributable to a fund are charged to that fund. Expenses attributable to more than one fund are allocated among the respective funds on the basis of relative net assets or other appropriate methods. Expense estimates are accrued in the period to which they relate and adjustments are made when actual amounts are known.
Deferred Trustee Compensation. Under a Deferred Compensation Plan (the Plan), independent Trustees may elect to defer receipt of a portion of their annual compensation. Deferred amounts are invested in a cross-section of Fidelity funds, are marked-to-market and remain in the Fund until distributed in accordance with the Plan. The investment of deferred amounts and the offsetting payable to the Trustees are included in the accompanying Statement of Assets and Liabilities.
Income Tax Information and Distributions to Shareholders. Each year, the Fund intends to qualify as a regulated investment company under Subchapter M of the Internal Revenue Code, including distributing substantially all of its taxable income and realized gains. As a result, no provision for U.S. Federal income taxes is required. As of November 30, 2013, the Fund did not have any unrecognized tax benefits in the financial statements; nor is the Fund aware of any tax positions for which it is reasonably possible that
Annual Report
Notes to Financial Statements - continued
(Amounts in thousands except percentages)
3. Significant Accounting Policies - continued
Income Tax Information and Distributions to Shareholders - continued
the total amounts of unrecognized tax benefits will significantly change in the next twelve months. The Fund files a U.S. federal tax return, in addition to state and local tax returns as required. The Fund's federal income tax returns are subject to examination by the Internal Revenue Service (IRS) for a period of three fiscal years after they are filed. State and local tax returns may be subject to examination for an additional fiscal year depending on the jurisdiction. Foreign taxes are provided for based on the Fund's understanding of the tax rules and rates that exist in the foreign markets in which it invests.
Distributions are declared and recorded on the ex-dividend date. Income dividends and capital gain distributions are declared separately for each class. Income and capital gain distributions are determined in accordance with income tax regulations, which may differ from GAAP. In addition, the fund will claim a portion of the payment made to redeeming shareholders as a distribution for income tax purposes.
Capital accounts within the financial statements are adjusted for permanent book-tax differences. These adjustments have no impact on net assets or the results of operations. Temporary book-tax differences will reverse in a subsequent period.
Book-tax differences are primarily due to foreign currency transactions, partnerships, market discount, equity-debt classifications, deferred trustee compensation, capital loss carryforwards and losses deferred due to wash sales and excise tax regulations.
The federal tax cost of investment securities and unrealized appreciation (depreciation) as of period end were as follows:
|
Gross unrealized appreciation |
$ 451,177 |
|
Gross unrealized depreciation |
(40,134) |
|
Net unrealized appreciation (depreciation) on securities and other investments |
$ 411,043 |
|
|
|
|
Tax Cost |
$ 2,058,091 |
The tax-based components of distributable earnings as of period end were as follows:
|
Undistributed ordinary income |
$ 11,847 |
|
Capital loss carryforward |
$ (100,096) |
|
Net unrealized appreciation (depreciation) |
$ 410,403 |
Capital loss carryforwards are only available to offset future capital gains of the Fund to the extent provided by regulations and may be limited. Under the Regulated Investment Company Modernization Act of 2010 (the Act), the Fund is permitted to carry forward
Annual Report
3. Significant Accounting Policies - continued
Income Tax Information and Distributions to Shareholders - continued
capital losses incurred in taxable years beginning after December 22, 2010 for an unlimited period and such capital losses are required to be used prior to any losses that expire.
The capital loss carryforward information presented below, including any applicable limitation, is estimated as of fiscal period end and is subject to adjustment.
|
Fiscal year of expiration |
|
|
2017 |
$ 100,096 |
The tax character of distributions paid was as follows:
|
|
November 30, 2013 |
November 30, 2012 |
|
Ordinary Income |
$ 46,175 |
$ 45,384 |
Restricted Securities. The Fund may invest in securities that are subject to legal or contractual restrictions on resale. These securities generally may be resold in transactions exempt from registration or to the public if the securities are registered. Disposal of these securities may involve time-consuming negotiations and expense, and prompt sale at an acceptable price may be difficult. Information regarding restricted securities is included at the end of the Fund's Schedule of Investments.
New Accounting Pronouncement. The Financial Accounting Standards Board issued in December 2011, Accounting Standard Update No. 2011-11, Disclosures about Offsetting Assets and Liabilities, and in January 2013, Accounting Standards Update No. 2013-1 Clarifying the Scope of Disclosures about Offsetting Assets and Liabilities. These updates create new disclosure requirements requiring entities to disclose both gross and net information for derivatives and other financial instruments that are either offset in the Statement of Assets and Liabilities or subject to an enforceable master netting arrangement or similar agreement. The disclosure requirements are effective for annual reporting periods beginning on or after January 1, 2013, and interim periods within those annual periods. Management expects that the impact of the updates' adoption will be limited to additional financial statement disclosures as applicable.
4. Derivative Instruments.
Risk Exposures and the Use of Derivative Instruments. The Fund's investment objective allows the Fund to enter into various types of derivative contracts, including options. Derivatives are investments whose value is primarily derived from underlying assets, indices or reference rates and may be transacted on an exchange or over-the-counter (OTC). Derivatives may involve a future commitment to buy or sell a specified asset based on specified terms, to exchange future cash flows at periodic intervals based
Annual Report
Notes to Financial Statements - continued
(Amounts in thousands except percentages)
4. Derivative Instruments - continued
Risk Exposures and the Use of Derivative Instruments - continued
on a notional principal amount, or for one party to make one or more payments upon the occurrence of specified events in exchange for periodic payments from the other party.
The Fund used derivatives to increase returns and to manage exposure to certain risks as defined below. The success of any strategy involving derivatives depends on analysis of numerous economic factors, and if the strategies for investment do not work as intended, the Fund may not achieve its objectives.
The Fund's use of derivatives increased or decreased its exposure to the following risk:
|
Equity Risk |
Equity risk relates to the fluctuations in the value of financial instruments as a result of changes in market prices (other than those arising from interest rate risk or foreign exchange risk), whether caused by factors specific to an individual investment, its issuer, or all factors affecting all instruments traded in a market or market segment. |
The Fund is also exposed to additional risks from investing in derivatives, such as liquidity risk and counterparty credit risk. Liquidity risk is the risk that the Fund will be unable to close out the derivative in the open market in a timely manner. Counterparty credit risk is the risk that the counterparty will not be able to fulfill its obligation to the Fund. Counterparty credit risk related to exchange-traded options may be mitigated by the protection provided by the exchange on which they trade.
Investing in derivatives may involve greater risks than investing in the underlying assets directly and, to varying degrees, may involve risk of loss in excess of any initial investment and collateral received and amounts recognized in the Statement of Assets and Liabilities. In addition, there may be the risk that the change in value of the derivative contract does not correspond to the change in value of the underlying instrument.
Options. Options give the purchaser the right, but not the obligation, to buy (call) or sell (put) an underlying security or financial instrument at an agreed exercise or strike price between or on certain dates. Options obligate the seller (writer) to buy (put) or sell (call) an underlying instrument at the exercise or strike price or cash settle an underlying derivative instrument if the holder exercises the option on or before the expiration date.
The Fund used exchange-traded written covered call options to manage its exposure to the market. When the Fund writes a covered call option, the Fund holds the underlying instrument which must be delivered to the holder upon the exercise of the option.
Upon entering into a written options contract, the Fund will receive a premium. Premiums received are reflected as a liability on the Statement of Assets and Liabilities. Options are valued daily and any unrealized appreciation (depreciation) is reflected on the Statement
Annual Report
4. Derivative Instruments - continued
Options - continued
of Assets and Liabilities. When a written option is exercised, the premium is added to the proceeds from the sale of the underlying instrument in determining the gain or loss realized on that investment. When an option is closed the Fund will realize a gain or loss depending on whether the proceeds or amount paid for the closing sale transaction are greater or less than the premium received. When an option expires, gains and losses are realized to the extent of premiums received. The net realized gain (loss) on closed and expired written options and the change in net unrealized appreciation (depreciation) on written options are reflected separately on the Statement of Operations.
Writing call options tends to decrease exposure to the underlying instrument and risk of loss is the change in value in excess of the premium received.
Any open options at period end are presented in the Schedule of Investments under the caption "Written Options" and are representative of volume of activity during the period.
During the period, the Fund recognized net realized gain (loss) of $983 and a change in net unrealized appreciation (depreciation) of ($656) related to its investment in written options. This amount is included in the Statement of Operations.
The following is a summary of the Fund's written options activity:
|
Written Options |
Number of Contracts |
Amount of Premiums |
|
Outstanding at beginning of period |
- |
$ - |
|
Options Opened |
44 |
2,909 |
|
Options Exercised |
(14) |
(976) |
|
Options Closed |
(13) |
(664) |
|
Options Expired |
(4) |
(438) |
|
Outstanding at end of period |
13 |
$ 831 |
5. Purchases and Sales of Investments.
Purchases and sales of securities, other than short-term securities, aggregated $759,802 and $951,923, respectively.
6. Fees and Other Transactions with Affiliates.
Management Fee. Fidelity Management & Research Company (the investment adviser) and its affiliates provide the Fund with investment management related services for which the Fund pays a monthly management fee. The management fee is the sum of an individual fund fee rate that is based on an annual rate of .20% of the Fund's average net assets and an annualized group fee rate that averaged .25% during the period. The group fee rate is based upon the average net assets of all the mutual funds
Annual Report
Notes to Financial Statements - continued
(Amounts in thousands except percentages)
6. Fees and Other Transactions with Affiliates - continued
Management Fee - continued
advised by the investment adviser, including any mutual funds previously advised by the investment adviser that are currently advised by Fidelity SelectCo, LLC, an affiliate of the investment adviser. The group fee rate decreases as assets under management increase and increases as assets under management decrease. For the reporting period, the total annual management fee rate was .45% of the Fund's average net assets.
Distribution and Service Plan Fees. In accordance with Rule 12b-1 of the 1940 Act, the Fund has adopted separate Distribution and Service Plans for each class of shares. Certain classes pay Fidelity Distributors Corporation (FDC), an affiliate of the investment adviser, separate Distribution and Service Fees, each of which is based on an annual percentage of each class' average net assets. In addition, FDC may pay financial intermediaries for selling shares of the Fund and providing shareholder support services.
For the period, the Distribution and Service Fee rates, total fees and amounts retained by FDC were as follows:
|
|
Distribution |
Service |
Total Fees |
Retained |
|
Class A |
-% |
.25% |
$ 1,790 |
$ 38 |
|
Class T |
.25% |
.25% |
4,656 |
29 |
|
Class B |
.75% |
.25% |
294 |
222 |
|
Class C |
.75% |
.25% |
1,689 |
174 |
|
|
|
|
$ 8,429 |
$ 463 |
Sales Load. FDC may receive a front-end sales charge of up to 5.75% for selling Class A shares and 3.50% for selling Class T shares, some of which is paid to financial intermediaries for selling shares of the Fund. Depending on the holding period, FDC may receive contingent deferred sales charges levied on Class A, Class T, Class B, and Class C redemptions. The deferred sales charges range from 5.00% to 1.00% for Class B shares, 1.00% for Class C shares, 1.00% for certain purchases of Class A shares and .25% for certain purchases of Class T shares.
For the period, sales charge amounts retained by FDC were as follows:
|
|
Retained |
|
Class A |
$ 162 |
|
Class T |
40 |
|
Class B* |
18 |
|
Class C* |
14 |
|
|
$ 234 |
* When Class B and Class C shares are initially sold, FDC pays commissions from its own resources to financial intermediaries through which the sales are made.
Annual Report
6. Fees and Other Transactions with Affiliates - continued
Transfer Agent Fees. Fidelity Investments Institutional Operations Company, Inc., (FIIOC), an affiliate of the investment adviser, is the transfer, dividend disbursing and shareholder servicing agent for each class of the Fund. FIIOC receives account fees and asset-based fees that vary according to the account size and type of account of the shareholders of the respective classes of the Fund, except for Class Z. FIIOC receives an asset-based fee of Class Z's average net assets. FIIOC pays for typesetting, printing and mailing of shareholder reports, except proxy statements.
For the period, transfer agent fees for each class were as follows:
|
|
Amount |
% of |
|
Class A |
$ 1,691 |
.24 |
|
Class T |
1,826 |
.20 |
|
Class B |
88 |
.30 |
|
Class C |
409 |
.24 |
|
Institutional Class |
1,057 |
.22 |
|
Class Z |
-* |
.05** |
|
|
$ 5,071 |
|
* Amount represents fifteen dollars.
** Annualized
Accounting and Security Lending Fees. Fidelity Service Company, Inc. (FSC), an affiliate of the investment adviser, maintains the Fund's accounting records. The accounting fee is based on the level of average net assets for each month. Under a separate contract, FSC administers the security lending program. The security lending fee is based on the number and duration of lending transactions.
Brokerage Commissions. The Fund placed a portion of its portfolio transactions with brokerage firms which are affiliates of the investment adviser. Brokerage commissions are included in net realized gain (loss) and change in net unrealized appreciation (depreciation) in the Statement of Operations. The commissions paid to these affiliated firms were $17 for the period.
7. Committed Line of Credit.
The Fund participates with other funds managed by the investment adviser or an affiliate in a $4.25 billion credit facility (the "line of credit") to be utilized for temporary or emergency purposes to fund shareholder redemptions or for other short-term liquidity purposes. The Fund has agreed to pay commitment fees on its pro-rata portion of the line of credit, which amounted to $5 and is reflected in Miscellaneous expenses on the Statement of Operations. During the period, there were no borrowings on this line of credit.
Annual Report
Notes to Financial Statements - continued
(Amounts in thousands except percentages)
8. Security Lending.
The Fund lends portfolio securities through a lending agent from time to time in order to earn additional income. For equity securities, a lending agent is used and may loan securities to certain qualified borrowers, including Fidelity Capital Markets (FCM), a broker-dealer affiliated with the Fund. On the settlement date of the loan, the Fund receives collateral (in the form of U.S. Treasury obligations, letters of credit and/or cash) against the loaned securities and maintains collateral in an amount not less than 100% of the market value of the loaned securities during the period of the loan. The market value of the loaned securities is determined at the close of business of the Fund and any additional required collateral is delivered to the Fund on the next business day. If the borrower defaults on its obligation to return the securities loaned because of insolvency or other reasons, the Fund may apply collateral received from the borrower against the obligation. The Fund may experience delays and costs in recovering the securities loaned. Any cash collateral received is invested in the Fidelity Securities Lending Cash Central Fund. The value of loaned securities and cash collateral at period end are disclosed on the Fund's Statement of Assets and Liabilities. At period end, there were no security loans outstanding with FCM. Security lending income represents the income earned on investing cash collateral, less rebates paid to borrowers and any lending agent fees associated with the loan, plus any premium payments received for lending certain types of securities. Security lending income is presented in the Statement of Operations as a component of income from Fidelity Central Funds. Total security lending income during the period amounted to $385, including $1 from securities loaned to FCM.
9. Expense Reductions.
The investment adviser voluntarily agreed to reimburse a portion of the Fund's Class A, Class T, Class B, Class C and Institutional Class operating expenses. During the period, this reimbursement reduced expenses as follows:
|
|
Reimbursement |
|
|
|
|
Class A |
$ 4 |
|
Class T |
6 |
|
Class B |
-* |
|
Class C |
1 |
|
Institutional Class |
3 |
|
|
$ 14 |
* Amount represents one hundred and sixty-three dollars.
Commissions paid to certain brokers with whom the investment adviser, or its affiliates, places trades on behalf of the Fund include an amount in addition to trade execution, which may be rebated back to the Fund to offset certain expenses. This amount totaled
Annual Report
9. Expense Reductions - continued
$206 for the period. In addition, through arrangements with the Fund's custodian, credits realized as a result of uninvested cash balances were used to reduce the Fund's expenses. During the period, these credits reduced the Fund's custody expenses by $1.
10. Distributions to Shareholders.
Distributions to shareholders of each class were as follows:
|
Years ended November 30, |
2013 A |
2012 |
|
From net investment income |
|
|
|
Class A |
$ 14,351 |
$ 14,971 |
|
Class T |
16,481 |
17,872 |
|
Class B |
359 |
544 |
|
Class C |
2,111 |
2,166 |
|
Institutional Class |
10,429 |
9,831 |
|
Class Z |
-* |
- |
|
Total |
$ 43,731 |
$ 45,384 |
|
From net realized gain |
|
|
|
Class A |
$ 754 |
$ - |
|
Class T |
982 |
- |
|
Class B |
36 |
- |
|
Class C |
167 |
- |
|
Institutional Class |
505 |
- |
|
Total |
$ 2,444 |
$ - |
A Distributions for Class Z are for the period August 13, 2013 (commencement of sale of shares) to November 30, 2013.
* Amount represents four hundred and ninety-six dollars.
11. Share Transactions.
Transactions for each class of shares were as follows:
|
|
Shares |
Dollars |
||
|
Years ended November 30, |
2013 A |
2012 |
2013A |
2012 |
|
Class A |
|
|
|
|
|
Shares sold |
3,676 |
3,213 |
$ 106,691 |
$ 77,551 |
|
Reinvestment of distributions |
505 |
577 |
13,926 |
13,763 |
|
Shares redeemed |
(4,869) |
(7,076) |
(139,536) |
(170,494) |
|
Net increase (decrease) |
(688) |
(3,286) |
$ (18,919) |
$ (79,180) |
|
Class T |
|
|
|
|
|
Shares sold |
3,948 |
3,722 |
$ 115,563 |
$ 91,180 |
|
Reinvestment of distributions |
601 |
709 |
16,778 |
17,138 |
|
Shares redeemed |
(6,787) |
(9,817) |
(197,631) |
(240,587) |
|
Net increase (decrease) |
(2,238) |
(5,386) |
$ (65,290) |
$ (132,269) |
Annual Report
Notes to Financial Statements - continued
(Amounts in thousands except percentages)
11. Share Transactions - continued
|
|
Shares |
Dollars |
||
|
Years ended November 30, |
2013 A |
2012 |
2013A |
2012 |
|
Class B |
|
|
|
|
|
Shares sold |
42 |
27 |
$ 1,216 |
$ 663 |
|
Reinvestment of distributions |
13 |
21 |
359 |
492 |
|
Shares redeemed |
(423) |
(695) |
(12,147) |
(16,864) |
|
Net increase (decrease) |
(368) |
(647) |
$ (10,572) |
$ (15,709) |
|
Class C |
|
|
|
|
|
Shares sold |
1,636 |
618 |
$ 48,035 |
$ 15,024 |
|
Reinvestment of distributions |
72 |
79 |
1,992 |
1,896 |
|
Shares redeemed |
(1,139) |
(1,166) |
(33,153) |
(28,340) |
|
Net increase (decrease) |
569 |
(469) |
$ 16,874 |
$ (11,420) |
|
Institutional Class |
|
|
|
|
|
Shares sold |
2,274 |
5,436 |
$ 67,514 |
$ 134,907 |
|
Reinvestment of distributions |
369 |
377 |
10,496 |
9,300 |
|
Shares redeemed |
(4,733) |
(4,659) |
(140,377) |
(115,943) |
|
Net increase (decrease) |
(2,090) |
1,154 |
$ (62,367) |
$ 28,264 |
|
Class Z |
|
|
|
|
|
Shares sold |
3 |
- |
$ 100 |
$ - |
|
Reinvestment of distributions |
-* |
- |
-** |
- |
|
Net increase (decrease) |
3 |
- |
$ 100 |
$ - |
A Share transactions for Class Z are for the period August 13, 2013 (commencement of sale of shares) to November 30, 2013.
* Amount represents seventy-two shares.
** Amount represents four hundred and ninety-six dollars.
12. Other.
The Fund's organizational documents provide former and current trustees and officers with a limited indemnification against liabilities arising in connection with the performance of their duties to the Fund. In the normal course of business, the Fund may also enter into contracts that provide general indemnifications. The Fund's maximum exposure under these arrangements is unknown as this would be dependent on future claims that may be made against the Fund. The risk of material loss from such claims is considered remote.
Annual Report
Report of Independent Registered Public Accounting Firm
To the Trustees of Fidelity Advisor Series I and Shareholders of Fidelity Advisor Equity Income Fund:
We have audited the accompanying statement of assets and liabilities of Fidelity Advisor Equity Income Fund (the Fund), a fund of Fidelity Advisor Series I, including the schedule of investments, as of November 30, 2013, and the related statement of operations for the year then ended, the statement of changes in net assets for each of the two years in the period then ended, and the financial highlights for each of the five years in the period then ended. These financial statements and financial highlights are the responsibility of the Fund's management. Our responsibility is to express an opinion on these financial statements and financial highlights based on our audits.
We conducted our audits in accordance with the standards of the Public Company Accounting Oversight Board (United States). Those standards require that we plan and perform the audit to obtain reasonable assurance about whether the financial statements and financial highlights are free of material misstatement. The Fund is not required to have, nor were we engaged to perform, an audit of its internal control over financial reporting. Our audits included consideration of internal control over financial reporting as a basis for designing audit procedures that are appropriate in the circumstances, but not for the purpose of expressing an opinion on the effectiveness of the Fund's internal control over financial reporting. Accordingly, we express no such opinion. An audit also includes examining, on a test basis, evidence supporting the amounts and disclosures in the financial statements, assessing the accounting principles used and significant estimates made by management, as well as evaluating the overall financial statement presentation. Our procedures included confirmation of securities owned as of November 30, 2013, by correspondence with the custodians and brokers; where replies were not received from brokers, we performed other auditing procedures. We believe that our audits provide a reasonable basis for our opinion.
In our opinion, the financial statements and financial highlights referred to above present fairly, in all material respects, the financial position of Fidelity Advisor Equity Income Fund as of November 30, 2013, the results of its operations for the year then ended, the changes in its net assets for each of the two years in the period then ended, and the financial highlights for each of the five years in the period then ended, in conformity with accounting principles generally accepted in the United States of America.
DELOITTE & TOUCHE LLP
Boston, Massachusetts
January 15, 2014
Annual Report
Trustees and Officers
The Trustees, Member of the Advisory Board, and officers of the trust and fund, as applicable, are listed below. The Board of Trustees governs the fund and is responsible for protecting the interests of shareholders. The Trustees are experienced executives who meet periodically throughout the year to oversee the fund's activities, review contractual arrangements with companies that provide services to the fund, oversee management of the risks associated with such activities and contractual arrangements, and review the fund's performance. Except for James C. Curvey, Ned C. Lautenbach, Ronald P. O'Hanley, and William S. Stavropoulos, each of the Trustees oversees 173 funds. Mr. Curvey oversees 396 funds. Mr. Lautenbach, Mr. O'Hanley, and Mr. Stavropoulos each oversees 247 funds.
The Trustees hold office without limit in time except that (a) any Trustee may resign; (b) any Trustee may be removed by written instrument, signed by at least two-thirds of the number of Trustees prior to such removal; (c) any Trustee who requests to be retired or who has become incapacitated by illness or injury may be retired by written instrument signed by a majority of the other Trustees; and (d) any Trustee may be removed at any special meeting of shareholders by a two-thirds vote of the outstanding voting securities of the trust. Each Trustee who is not an interested person (as defined in the 1940 Act) of the trust and the fund (Independent Trustee), shall retire not later than the last day of the calendar year in which his or her 75th birthday occurs. The Independent Trustees may waive this mandatory retirement age policy with respect to individual Trustees. The officers and Advisory Board Member hold office without limit in time, except that any officer and Advisory Board Member may resign or may be removed by a vote of a majority of the Trustees at any regular meeting or any special meeting of the Trustees. Except as indicated, each individual has held the office shown or other offices in the same company for the past five years.
Experience, Skills, Attributes, and Qualifications of the Fund's Trustees. The Governance and Nominating Committee has adopted a statement of policy that describes the experience, qualifications, attributes, and skills that are necessary and desirable for potential Independent Trustee candidates (Statement of Policy). The Board believes that each Trustee satisfied at the time he or she was initially elected or appointed a Trustee, and continues to satisfy, the standards contemplated by the Statement of Policy. The Governance and Nominating Committee also engages professional search firms to help identify potential Independent Trustee candidates who have the experience, qualifications, attributes, and skills consistent with the Statement of Policy. From time to time, additional criteria based on the composition and skills of the current Independent Trustees, as well as experience or skills that may be appropriate in light of future changes to board composition, business conditions, and regulatory or other developments, have also been considered by the professional search firms and the Governance and Nominating Committee. In addition, the Board takes into account the Trustees' commitment and participation in Board and committee meetings, as well as their leadership of standing and ad hoc committees throughout their tenure.
Annual Report
Trustees and Officers - continued
In determining that a particular Trustee was and continues to be qualified to serve as a Trustee, the Board has considered a variety of criteria, none of which, in isolation, was controlling. The Board believes that, collectively, the Trustees have balanced and diverse experience, qualifications, attributes, and skills, which allow the Board to operate effectively in governing the fund and protecting the interests of shareholders. Information about the specific experience, skills, attributes, and qualifications of each Trustee, which in each case led to the Board's conclusion that the Trustee should serve (or continue to serve) as a trustee of the fund, is provided below.
Board Structure and Oversight Function. James C. Curvey is an interested person (as defined in the 1940 Act) and currently serves as Chairman. The Trustees have determined that an interested Chairman is appropriate and benefits shareholders because an interested Chairman has a personal and professional stake in the quality and continuity of services provided to the fund. Independent Trustees exercise their informed business judgment to appoint an individual of their choosing to serve as Chairman, regardless of whether the Trustee happens to be independent or a member of management. The Independent Trustees have determined that they can act independently and effectively without having an Independent Trustee serve as Chairman and that a key structural component for assuring that they are in a position to do so is for the Independent Trustees to constitute a substantial majority for the Board. The Independent Trustees also regularly meet in executive session. Ned C. Lautenbach serves as Chairman of the Independent Trustees and as such (i) acts as a liaison between the Independent Trustees and management with respect to matters important to the Independent Trustees and (ii) with management prepares agendas for Board meetings.
Fidelity funds are overseen by different Boards of Trustees. The fund's Board oversees Fidelity's equity and high income funds and another Board oversees Fidelity's investment-grade bond, money market, and asset allocation funds. The asset allocation funds may invest in Fidelity funds overseen by the fund's Board. The use of separate Boards, each with its own committee structure, allows the Trustees of each group of Fidelity funds to focus on the unique issues of the funds they oversee, including common research, investment, and operational issues. On occasion, the separate Boards establish joint committees to address issues of overlapping consequences for the Fidelity funds overseen by each Board.
The Trustees operate using a system of committees to facilitate the timely and efficient consideration of all matters of importance to the Trustees, the fund, and fund shareholders and to facilitate compliance with legal and regulatory requirements and oversight of the fund's activities and associated risks. The Board, acting through its committees, has charged FMR and its affiliates with (i) identifying events or circumstances the occurrence of which could have demonstrably adverse effects on the fund's business and/or reputation; (ii) implementing processes and controls to lessen the possibility that such events or circumstances occur or to mitigate the effects of such events or circumstances if they do occur; and (iii) creating and maintaining a system designed to evaluate continuously business and market conditions in order to facilitate the identification and implementation processes described in (i) and (ii) above. Because the day-to-day operations and activities of the fund are carried out by or through FMR, its affiliates and other service providers, the fund's exposure to risks is mitigated but not eliminated by the processes overseen by the Trustees. While each of the Board's committees has responsibility for overseeing different aspects of the fund's activities, oversight is exercised primarily through the Operations, Audit, and Compliance Committees. In addition, the Independent Trustees have worked with FMR to enhance the Board's oversight of investment and financial risks, legal and regulatory risks, technology risks, and operational risks, including the development of additional risk reporting to the Board. For example, a working group comprised of Independent Trustees and FMR has worked and continues to work to review the Fidelity funds' valuation-related activities, reporting and risk management. Appropriate personnel, including but not limited to the fund's Chief Compliance Officer (CCO), FMR's internal auditor, the independent accountants, the fund's Treasurer and portfolio management personnel, make periodic reports to the Board's committees, as appropriate, including an annual review of FMR's risk management program for the Fidelity funds. The responsibilities of each standing committee, including their oversight responsibilities, are described further under "Standing Committees of the Fund's Trustees."
Annual Report
The fund's Statement of Additional Information (SAI) includes more information about the Trustees. To request a free copy, call Fidelity at 1-877-208-0098.
Interested Trustees*:
Correspondence intended for each Trustee who is an interested person may be sent to Fidelity Investments, 245 Summer Street, Boston, Massachusetts 02210.
|
Name, Year of Birth; Principal Occupations and Other Relevant Experience+ |
|
|
James C. Curvey (1935) |
|
|
Year of Election or Appointment: 2007 Trustee Chairman of the Board of Trustees |
|
|
|
Mr. Curvey also serves as Trustee of other Fidelity funds. Mr. Curvey is a Director of Fidelity Investments Money Management, Inc. (2009-present), Director of Fidelity Research & Analysis Co. (2009-present) and Director of FMR and FMR Co., Inc. (2007-present). Mr. Curvey is also Vice Chairman (2007-present) and Director of FMR LLC. In addition, Mr. Curvey serves as an Overseer for the Boston Symphony Orchestra and a member of the Trustees of Villanova University. Previously, Mr. Curvey was the Vice Chairman (2006-2007) and Director (2000-2007) of FMR Corp. |
|
Ronald P. O'Hanley (1957) |
|
|
Year of Election or Appointment: 2011 Trustee |
|
|
|
Mr. O'Hanley also serves as Trustee of other Fidelity funds. He is Director of Fidelity SelectCo, LLC (2013-present), FMR Co., Inc. (2010-present), Director of Fidelity Investments Money Management, Inc. (2010-present), Director of Fidelity Research & Analysis Company (2010-present), President of Fidelity Asset Management and Corporate Services and a Member of Fidelity's Executive Committee (2010-present). Previously, Mr. O'Hanley served as President and Chief Executive Officer of BNY Mellon Asset Management (2007-2010). Mr. O'Hanley also served as Vice Chairman of Bank New York Mellon Corp. and a member of that firm's Executive Committee. Prior to the 2007 merger of The Bank of New York and Mellon Financial Corporation, he was Vice Chairman of Mellon Financial Corporation and President and Chief Executive Officer of Mellon Asset Management. He joined Mellon in February 1997. Mr. O'Hanley currently serves as Chairman of the Boston Public Library Foundation Board of Directors and sits on the Board of Directors of Beth Israel Deaconess Medical Center, the Board of Trustees of the Marine Biological Laboratory and the Advisory Board of the Maxwell School of Citizenship and Public Administration at Syracuse University. Mr. O'Hanley also chairs the Council on Asset Management for the Financial Services Roundtable and is a member of the Board of Directors of Institutional Investor's U.S. Institute. |
* Trustees have been determined to be "Interested Trustees" by virtue of, among other things, their affiliation with the trust or various entities under common control with FMR.
+ The information above includes each Trustee's principal occupation during the last five years and other information relating to the experience, attributes, and skills relevant to each Trustee's qualifications to serve as a Trustee, which led to the conclusion that each Trustee should serve as a Trustee for the fund.
Annual Report
Independent Trustees:
Correspondence intended for each Independent Trustee (that is, the Trustees other than the Interested Trustees) may be sent to Fidelity Investments, P.O. Box 55235, Boston, Massachusetts 02205-5235.
|
Name, Year of Birth; Principal Occupations and Other Relevant Experience+ |
|
|
Dennis J. Dirks (1948) |
|
|
Year of Election or Appointment: 2005 Trustee |
|
|
|
Mr. Dirks also serves as Trustee of other Fidelity funds. Prior to his retirement in May 2003, Mr. Dirks was Chief Operating Officer and a member of the Board of The Depository Trust & Clearing Corporation (DTCC). He also served as President, Chief Operating Officer, and Board member of The Depository Trust Company (DTC) and President and Board member of the National Securities Clearing Corporation (NSCC). In addition, Mr. Dirks served as Chief Executive Officer and Board member of the Government Securities Clearing Corporation, Chief Executive Officer and Board member of the Mortgage-Backed Securities Clearing Corporation, as a Trustee and a member of the Finance Committee of Manhattan College (2005-2008), and as a Trustee and a member of the Finance Committee of AHRC of Nassau County (2006-2008). Mr. Dirks is a member of the Independent Directors Council (IDC) Governing Council (2010-present) and Board of Directors for The Brookville Center for Children's Services, Inc. (2009-present). |
|
Alan J. Lacy (1953) |
|
|
Year of Election or Appointment: 2008 Trustee |
|
|
|
Mr. Lacy also serves as Trustee of other Fidelity funds. Mr. Lacy serves as Senior Adviser (2007-present) of Oak Hill Capital Partners, L.P. (private equity). Mr. Lacy also served as Chief Executive Officer (2000-2005) and Vice Chairman (2005-2006) of Sears Holdings Corporation and Sears, Roebuck and Co. (retail). In addition, Mr. Lacy serves as a member of the Board of Directors of Dave & Buster's Entertainment, Inc. (restaurant and entertainment complexes, 2010-present), Earth Fare, Inc. (retail grocery, 2012-present), The Hillman Companies, Inc. (hardware wholesalers, 2010-present), and Bristol-Myers Squibb Company (global pharmaceuticals, 2008-present). Mr. Lacy is a member of the Board of Trustees of The National Parks Conservation Association (2006-present). Previously, Mr. Lacy served as Chairman of the Board of Trustees of the National Parks Conservation Association (2008-2011) and as a member of the Board of Directors for the Western Union Company (global money transfer, 2006-2011). |
|
Ned C. Lautenbach (1944) |
|
|
Year of Election or Appointment: 2000 Trustee Chairman of the Independent Trustees |
|
|
|
Mr. Lautenbach also serves as Trustee of other Fidelity funds. Mr. Lautenbach currently serves as the Lead Director of the Eaton Corporation Board of Directors (diversified industrial, 1997-present). Mr. Lautenbach is Chairman of the Board of Directors of the Philharmonic Center for the Arts in Naples, Florida (2012-present) and a member of the Council on Foreign Relations (1994-present). Previously, Mr. Lautenbach was a Partner/Advisory Partner at Clayton, Dubilier & Rice, LLC (private equity investment, 1998-2010), as well as a Director of Sony Corporation (2006-2007). |
|
Joseph Mauriello (1944) |
|
|
Year of Election or Appointment: 2008 Trustee |
|
|
|
Mr. Mauriello also serves as Trustee of other Fidelity funds. Prior to his retirement in January 2006, Mr. Mauriello served in numerous senior management positions including Deputy Chairman and Chief Operating Officer (2004-2005), and Vice Chairman of Financial Services (2002-2004) of KPMG LLP US (professional services, 1965-2005). Mr. Mauriello currently serves as a member of the Board of Directors of XL Group plc. (global insurance and re-insurance, 2006-present). Previously, Mr. Mauriello served as a Director of the Hamilton Funds of the Bank of New York (2006-2007) and of Arcadia Resources Inc. (health care services and products, 2007-2012). |
|
Robert W. Selander (1950) |
|
|
Year of Election or Appointment: 2011 Trustee |
|
|
|
Mr. Selander also serves as Trustee of other Fidelity funds. Previously, Mr. Selander served as a Member of the Advisory Board of other Fidelity funds (2011), and Executive Vice Chairman (2010), Chief Executive Officer (2009-2010), and President and Chief Executive Officer (1997-2009) of Mastercard, Inc. |
|
Cornelia M. Small (1944) |
|
|
Year of Election or Appointment: 2005 Trustee |
|
|
|
Ms. Small also serves as Trustee of other Fidelity funds. Ms. Small is a member of the Board of Directors (2009-present) and Chair of the Investment Committee (2010-present) of the Teagle Foundation. Ms. Small also serves on the Investment Committee of the Berkshire Taconic Community Foundation (2008-present). Previously, Ms. Small served as Chairperson (2002-2008) and a member of the Investment Committee and Chairperson (2008-2012) and a member of the Board of Trustees of Smith College. In addition, Ms. Small served as Chief Investment Officer, Director of Global Equity Investments, and a member of the Board of Directors of Scudder, Stevens & Clark and Scudder Kemper Investments. |
|
William S. Stavropoulos (1939) |
|
|
Year of Election or Appointment: 2002 Trustee Vice Chairman of the Independent Trustees |
|
|
|
Mr. Stavropoulos also serves as Trustee of other Fidelity funds. Mr. Stavropoulos serves as President and Founder of the Michigan Baseball Foundation, the Great Lakes Loons (2007-present). Mr. Stavropoulos is Chairman Emeritus of the Board of Directors of The Dow Chemical Company, where he previously served in numerous senior management positions, including President, CEO (1995-2000; 2002-2004), Chairman of the Executive Committee (2000-2006), and as a member of the Board of Directors (1990-2006). Currently, Mr. Stavropoulos is Chairman of the Board of Directors of Univar Inc. (global distributor of commodity and specialty chemicals), a Director of Teradata Corporation (data warehousing and technology solutions), and Maersk Inc. (industrial conglomerate), and a member of the Advisory Board for Metalmark Capital LLC (private equity investment, 2005-present). Mr. Stavropoulos is an operating advisor to Clayton, Dubilier & Rice, LLC (private equity investment). In addition, Mr. Stavropoulos is a member of the University of Notre Dame Advisory Council for the College of Science, a Trustee of the Rollin L. Gerstacker Foundation, and a Director of the Naples Philharmonic Center for the Arts. Previously, Mr. Stavropoulos served as a Director of Chemical Financial Corporation (bank holding company, 1993-2012) and Tyco International, Ltd. (multinational manufacturing and services, 2007-2012). |
|
David M. Thomas (1949) |
|
|
Year of Election or Appointment: 2008 Trustee |
|
|
|
Mr. Thomas also serves as Trustee of other Fidelity funds. Mr. Thomas serves as Non-Executive Chairman of the Board of Directors of Fortune Brands Home and Security (home and security products, 2011-present), and as a member of the Board of Directors of Interpublic Group of Companies, Inc. (marketing communication, 2004-present). Previously, Mr. Thomas served as Executive Chairman (2005-2006) and Chairman and Chief Executive Officer (2000-2005) of IMS Health, Inc. (pharmaceutical and healthcare information solutions), and a Director of Fortune Brands, Inc. (consumer products, 2000-2011). |
+ The information above includes each Trustee's principal occupation during the last five years and other information relating to the experience, attributes, and skills relevant to each Trustee's qualifications to serve as a Trustee, which led to the conclusion that each Trustee should serve as a Trustee for the fund.
Advisory Board Member and Officers:
Correspondence intended for each officer and Peter S. Lynch may be sent to Fidelity Investments, 245 Summer Street, Boston, Massachusetts 02210. Officers appear below in alphabetical order.
|
Name, Year of Birth; Principal Occupation |
|
|
Peter S. Lynch (1944) |
|
|
Year of Election or Appointment: 2003 Member of the Advisory Board |
|
|
|
Mr. Lynch also serves as Member of the Advisory Board of other Fidelity funds. Mr. Lynch is Vice Chairman and a Director of FMR and FMR Co., Inc. In addition, Mr. Lynch serves as a Trustee of Boston College and as the Chairman of the Inner-City Scholarship Fund. Previously, Mr. Lynch served on the Special Olympics International Board of Directors (1997-2006). |
|
Elizabeth Paige Baumann (1968) |
|
|
Year of Election or Appointment: 2012 Anti-Money Laundering (AML) Officer |
|
|
|
Ms. Baumann also serves as AML Officer of other funds. She is Chief AML Officer of FMR LLC (2012-present) and is an employee of Fidelity Investments. Previously, Ms. Baumann served as Vice President and Deputy Anti-Money Laundering Officer (2007-2012). |
|
William C. Coffey (1969) |
|
|
Year of Election or Appointment: 2009 Assistant Secretary |
|
|
|
Mr. Coffey also serves as Assistant Secretary of other funds. He is Senior Vice President and Deputy General Counsel of FMR LLC (2010-present), and is an employee of Fidelity Investments. Previously, Mr. Coffey served as Vice President and Associate General Counsel of FMR LLC (2005-2009). |
|
Jonathan Davis (1968) |
|
|
Year of Election or Appointment: 2010 Assistant Treasurer |
|
|
|
Mr. Davis also serves as Assistant Treasurer of other funds. Mr. Davis is an employee of Fidelity Investments. Previously, Mr. Davis served as Vice President and Associate General Counsel of FMR LLC (2003-2010). |
|
Adrien E. Deberghes (1967) |
|
|
Year of Election or Appointment: 2008 Deputy Treasurer |
|
|
|
Mr. Deberghes also serves as an officer of other funds. He is an employee of Fidelity Investments (2008-present). Prior to joining Fidelity Investments, Mr. Deberghes was Senior Vice President of Mutual Fund Administration at State Street Corporation (2007-2008), Senior Director of Mutual Fund Administration at Investors Bank & Trust (2005-2007), and Director of Finance for Dunkin' Brands (2000-2005). |
|
Stephanie J. Dorsey (1969) |
|
|
Year of Election or Appointment: 2010 Assistant Treasurer |
|
|
|
Ms. Dorsey also serves as an officer of other funds. She is an employee of Fidelity Investments (2008-present) and has served in other fund officer roles. Prior to joining Fidelity Investments, Ms. Dorsey served as Treasurer (2004-2008) of the JPMorgan Mutual Funds and Vice President (2004-2008) of JPMorgan Chase Bank. |
|
Scott C. Goebel (1968) |
|
|
Year of Election or Appointment: 2008 Secretary and Chief Legal Officer (CLO) |
|
|
|
Mr. Goebel serves as Secretary and CLO of other funds. Mr. Goebel also serves as Secretary of Fidelity Investments Money Management, Inc. (FIMM) (2010-present) and Fidelity Research and Analysis Company (FRAC) (2010-present); General Counsel, Secretary, and Senior Vice President of FMR (2008-present) and FMR Co., Inc. (2008-present); Chief Legal Officer of Fidelity Management & Research (Hong Kong) Limited (2008-present) and Assistant Secretary of Fidelity Management & Research (Japan) Inc. (2008-present), and Fidelity Management & Research (U.K.) Inc. (2008-present). Previously, Mr. Goebel served as Secretary and CLO of other Fidelity funds (2008-2013), Assistant Secretary of FIMM (2008-2010), FRAC (2008-2010), and certain funds (2007-2008); and as Vice President and Secretary of Fidelity Distributors Corporation (FDC) (2005-2007). Mr. Goebel has been employed by FMR LLC or an affiliate since 2001. |
|
Joseph A. Hanlon (1968) |
|
|
Year of Election or Appointment: 2012 Chief Compliance Officer |
|
|
|
Mr. Hanlon also serves as Chief Compliance Officer of other funds. Mr. Hanlon serves as Compliance Officer of FMR, FMR Co., Inc., Fidelity Investments Money Management, Inc. (FIMM), Fidelity Research and Analysis Company (FRAC), and Fidelity Management & Research (Hong Kong) (2009-present), as Senior Vice President of the Fidelity Asset Management Division (2009-present), and is an employee of Fidelity Investments. Previously, Mr. Hanlon served as Compliance Officer of Fidelity Management & Research (Japan) Inc. (2009-2013), Strategic Advisers, Inc. (2009-2013), and Fidelity Management & Research (U.K.) Inc. (2009-2013). |
|
Bruce T. Herring (1965) |
|
|
Year of Election or Appointment: 2006 Vice President of certain Equity Funds |
|
|
|
Mr. Herring also serves as Vice President of other funds. He serves as Chief Investment Officer of Fidelity Global Asset Allocation (GAA) (2013-present), Group Chief Investment Officer of FMR, and President of Fidelity Research & Analysis Company (2010-present). Previously, Mr. Herring served as Chief Investment Officer and Director of Fidelity Management & Research (U.K.) Inc. (2010-2013), Vice President (2005-2006) and Senior Vice President (2006-2007) of Fidelity Management & Research Company, Vice President of FMR Co., Inc. (2001-2007), and as a portfolio manager for Fidelity U.S. Equity Funds. |
|
Brian B. Hogan (1964) |
|
|
Year of Election or Appointment: 2009 Vice President |
|
|
|
Mr. Hogan also serves as Vice President of other funds. Mr. Hogan serves as President of FMR's Equity Division (2009-present). Previously, Mr. Hogan served as Senior Vice President, Equity Research of FMR (2006-2009) and as a portfolio manager. |
|
Chris Maher (1972) |
|
|
Year of Election or Appointment: 2013 Assistant Treasurer |
|
|
|
Mr. Maher serves as Assistant Treasurer of other funds. Mr. Maher is Vice President of Valuation Oversight and is an employee of Fidelity Investments. Previously, Mr. Maher served as Vice President of Asset Management Compliance (2013), Vice President of FMR's Program Management Group (2010-2013), and Vice President of Valuation Oversight (2008-2010). |
|
Christine Reynolds (1958) |
|
|
Year of Election or Appointment: 2008 Chief Financial Officer |
|
|
|
Ms. Reynolds also serves as Chief Financial Officer of other funds. Ms. Reynolds became President of Fidelity Pricing and Cash Management Services (FPCMS) in August 2008. Ms. Reynolds served as Chief Operating Officer of FPCMS (2007-2008). Previously, Ms. Reynolds served as President, Treasurer, and Anti-Money Laundering officer of the Fidelity funds (2004-2007). |
|
Kenneth B. Robins (1969) |
|
|
Year of Election or Appointment: 2008 President and Treasurer |
|
|
|
Mr. Robins also serves as an officer of other funds. Mr. Robins serves as Executive Vice President of Fidelity Investments Money Management, Inc. (FIMM) (2013-present) and is an employee of Fidelity Investments (2004-present). Previously, Mr. Robins served in other fund officer roles. |
|
Gary W. Ryan (1958) |
|
|
Year of Election or Appointment: 2005 Assistant Treasurer |
|
|
|
Mr. Ryan also serves as Assistant Treasurer of other funds. Mr. Ryan is an employee of Fidelity Investments and has served in other fund officer roles. Previously, Mr. Ryan served as Vice President of Fund Reporting in Fidelity Pricing and Cash Management Services (FPCMS) (1999-2005). |
|
Stephen Sadoski (1971) |
|
|
Year of Election or Appointment: 2012 Deputy Treasurer |
|
|
|
Mr. Sadoski also serves as Deputy Treasurer of other funds. He is an employee of Fidelity Investments (2012-present) and has served in another fund officer role. Prior to joining Fidelity Investments, Mr. Sadoski served as an assistant chief accountant in the Division of Investment Management of the Securities and Exchange Commission (SEC) (2009-2012) and as a senior manager at Deloitte & Touche LLP (1997-2009). |
|
Stacie M. Smith (1974) |
|
|
Year of Election or Appointment: 2013 Deputy Treasurer |
|
|
|
Ms. Smith also serves as an officer of other funds. She is an employee of Fidelity Investments (2009-present) and has served in other fund officer roles. Prior to joining Fidelity Investments, Ms. Smith served as Senior Audit Manager of Ernst & Young LLP (1996-2009). |
|
Renee Stagnone (1975) |
|
|
Year of Election or Appointment: 2013 Deputy Treasurer |
|
|
|
Ms. Stagnone also serves as Deputy Treasurer of other funds. Ms. Stagnone is an employee of Fidelity Investments. |
|
Joseph F. Zambello (1957) |
|
|
Year of Election or Appointment: 2011 Deputy Treasurer |
|
|
|
Mr. Zambello also serves as Deputy Treasurer of other funds. Mr. Zambello is an employee of Fidelity Investments. Previously, Mr. Zambello served as Vice President of FMR's Program Management Group (2009-2011) and Vice President of the Transfer Agent Oversight Group (2005-2009). |
Annual Report
Distributions (Unaudited)
A total of 0.05% of the dividends distributed during the fiscal year was derived from interest on U.S. Government securities which is generally exempt from state income tax.
Institutional Class designates 100% of the dividends distributed during the fiscal year as qualifying for the dividends-received deduction for corporate shareholders.
Institutional Class designates 100% of the dividends distributed during the fiscal year as amounts which may be taken into account as a dividend for purposes of the maximum rate under section 1(h) (11) of the Internal Revenue Code.
The fund will notify shareholders in January 2014 of amounts for use in preparing 2013 income tax returns.
Annual Report
Board Approval of Investment Advisory Contracts and Management Fees
Fidelity Advisor Equity Income Fund
Each year, the Board of Trustees, including the Independent Trustees (together, the Board), votes on the renewal of the management contract and sub-advisory agreements (together, the Advisory Contracts) for the fund. The Board, assisted by the advice of fund counsel and Independent Trustees' counsel, requests and considers a broad range of information relevant to the renewal of the Advisory Contracts throughout the year.
The Board meets regularly and, at each of its meetings, covers an extensive agenda of topics and materials and considers factors that are relevant to its annual consideration of the renewal of the fund's Advisory Contracts, including the services and support provided to the fund and its shareholders. The Board has established various standing committees, each composed of and chaired by Independent Trustees with varying backgrounds, to which the Board has assigned specific subject matter responsibilities in order to enhance effective decision-making by the Board. The Board, acting directly and through its Committees, requests and receives information concerning the annual consideration of the renewal of the fund's Advisory Contracts. The Board also meets as needed to consider matters specifically related to the Board's annual consideration of the renewal of Advisory Contracts. Members of the Board may also meet with trustees of other Fidelity funds through ad hoc joint committees to discuss certain matters relevant to the Fidelity funds.
At its July 2013 meeting, the Board, including the Independent Trustees, unanimously determined to renew the fund's Advisory Contracts. In reaching its determination, the Board considered all factors it believed relevant, including (i) the nature, extent, and quality of the services to be provided to the fund and its shareholders (including the investment performance of the fund); (ii) the competitiveness of the fund's management fee and total expense ratio relative to peer funds; (iii) the total costs of the services to be provided by and the profits to be realized by Fidelity from its relationship with the fund; (iv) the extent to which economies of scale exist and would be realized as the fund grows; and (v) whether fee levels reflect these economies of scale, if any, for the benefit of fund shareholders.
In considering whether to renew the Advisory Contracts for the fund, the Board reached a determination, with the assistance of fund counsel and Independent Trustees' counsel and through the exercise of its business judgment, that the renewal of the Advisory Contracts was in the best interests of the fund and its shareholders and that the compensation payable under the Advisory Contracts was fair and reasonable. The Board's decision to renew the Advisory Contracts was not based on any single factor, but rather was based on a comprehensive consideration of all the information provided to the Board at its meetings throughout the year. The Board, in reaching its determination to renew the Advisory Contracts, was aware that shareholders in the fund have a broad range of investment choices available to them, including a wide choice among mutual funds offered by Fidelity's competitors, and that the fund's shareholders, who have the opportunity to review and weigh the disclosure provided by the fund in its prospectus and other public disclosures, have chosen to invest in this fund, which is a part of the Fidelity family of funds.
Annual Report
Nature, Extent, and Quality of Services Provided. The Board considered the staffing within the investment adviser, Fidelity Management & Research Company (FMR), and the sub-advisers (together, the Investment Advisers) as it relates to the fund, including the backgrounds of the fund's investment personnel, and also considered the fund's investment objective, strategies, and related investment philosophy. The Independent Trustees also had discussions with senior management of Fidelity's investment operations and investment groups. The Board considered the structure of the portfolio manager compensation program and whether this structure provides appropriate incentives to act in the best interests of the fund.
Resources Dedicated to Investment Management and Support Services. The Board and the Fund Oversight and Research Committees reviewed the general qualifications and capabilities of the Investment Advisers' investment staff, including its size, education, experience, and resources, as well as the Investment Advisers' approach to recruiting, training, managing, and compensating investment personnel. The Board noted that FMR has continued to increase the resources devoted to non-U.S. offices, including expansion of Fidelity's global investment organization. The Board also noted that Fidelity's analysts have extensive resources, tools and capabilities that allow them to conduct sophisticated quantitative and fundamental analysis, as well as credit analysis of issuers, counterparties and guarantors. Further, the Board believes that Fidelity's investment professionals have sufficient access to global information and data so as to provide competitive investment results over time, and that those professionals also have access to sophisticated tools that permit them to assess portfolio construction and risk and performance attribution characteristics continuously, as well as to transmit new information and research conclusions rapidly around the world. Additionally, in its deliberations, the Board considered the Investment Advisers' trading and risk management capabilities and resources, which are an integral part of the investment management process.
Shareholder and Administrative Services. The Board considered (i) the nature, extent, quality, and cost of advisory, administrative, and shareholder services performed by the Investment Advisers and their affiliates under the Advisory Contracts and under separate agreements covering transfer agency, pricing and bookkeeping, and securities lending services for the fund; (ii) the nature and extent of the supervision of third party service providers, principally custodians and subcustodians; and (iii) the resources devoted to, and the record of compliance with, the fund's compliance policies and procedures. The Board also reviewed the allocation of fund brokerage, including allocations to brokers affiliated with the Investment Advisers, the use of brokerage commissions to pay fund expenses, and the use of "soft" commission dollars to pay for research services.
Annual Report
Board Approval of Investment Advisory Contracts and
Management Fees - continued
The Board noted that the growth of fund assets over time across the complex allows Fidelity to reinvest in the development of services designed to enhance the value or convenience of the Fidelity funds as investment vehicles. These services include 24-hour access to account information and market information through telephone representatives and over the Internet, investor education materials and asset allocation tools, and the expanded availability of Fidelity Investor Centers.
Investment in a Large Fund Family. The Board considered the benefits to shareholders of investing in a Fidelity fund, including the benefits of investing in a fund that is part of a large family of funds offering a variety of investment disciplines and providing a large variety of mutual fund investor services. The Board noted that Fidelity had taken, or had made recommendations that resulted in the Fidelity funds taking, a number of actions over the previous year that benefited particular funds, including (i) continuing to dedicate additional resources to investment research and to the support of the senior management team that oversees asset management; (ii) persisting in efforts to enhance Fidelity's global research capabilities; (iii) launching new funds and making other enhancements to meet client needs for global and income-oriented solutions; (iv) continuing to launch dedicated lower cost underlying funds to meet portfolio construction needs related to expanding underlying fund options for Fidelity funds of funds, specifically for the Freedom Fund product lines; (v) rationalizing product lines and gaining increased efficiencies through the mergers of several funds into other funds; (vi) strengthening Fidelity's index fund offerings by reducing investment minimums and adopting or lowering existing expense caps for certain funds and classes; (vii) enhancing Global Asset Allocation product offerings by launching new funds and strategies, including "open architecture" target date funds that utilize affiliated and unaffiliated sub-advisers; (viii) modifying the eligibility criteria for Institutional Class shares of Advisor funds to increase their marketability to a portion of the defined contribution plan market; (ix) creating a new low-cost retirement share class for certain Advisor funds to appeal to large retirement plans; (x) transitioning the management of certain Fidelity commodity funds to Geode Capital Management LLC, a registered commodity pool operator, while retaining administrative responsibilities for the funds; (xi) reorganizing a number of funds; and (xii) taking steps toward establishing a new Fidelity adviser to manage sector-based funds and products.
Investment Performance. The Board considered whether the fund has operated in accordance with its investment objective, as well as its record of compliance with its investment restrictions and its performance history.
The Board took into account discussions with the Investment Advisers about fund investment performance that occur at Board meetings throughout the year. In this regard the Board noted that as part of regularly scheduled fund reviews and other reports to the Board on fund performance, the Board periodically considers annualized return information for the fund, for different time periods, measured against a securities market index ("benchmark index") and a peer group of mutual funds with similar objectives ("peer group"). In its evaluation of fund investment performance, the Board gave particular attention to information indicating changes in performance of certain Fidelity funds for specific time periods and the Investment Advisers' explanations for any overperformance or underperformance.
Annual Report
In addition to reviewing absolute and relative fund performance, the Independent Trustees periodically consider the appropriateness of fund performance metrics in evaluating the results achieved. In general, the Independent Trustees believe that fund performance should be evaluated based on net performance (after fees and expenses) of both the highest performing and lowest performing classes, where applicable, compared to appropriate benchmark indices, over appropriate time periods which may include full market cycles, and compared to peer groups, as applicable, over the same periods, taking into account relevant factors including the following: general market conditions; issuer-specific information; tactical opportunities for investment; and fund cash flows and other factors.
The Independent Trustees recognize that shareholders evaluate performance on a net basis over their own holding periods, for which one-, three-, and five-year periods are used as a proxy. For this reason, the performance information reviewed by the Board also included net cumulative calendar year total return information for the fund and an appropriate benchmark index and peer group for the most recent one-, three-, and five-year periods, as shown below. Returns are shown compared to the 25th percentile (top of box) and 75th percentile (bottom of box) of the peer universe.
Fidelity Advisor Equity Income Fund

Annual Report
Board Approval of Investment Advisory Contracts and
Management Fees - continued
Based on its review, the Board concluded that the nature, extent, and quality of services provided to the fund under the Advisory Contracts should benefit the fund's shareholders.
Competitiveness of Management Fee and Total Expense Ratio. The Board considered the fund's management fee and total expense ratio compared to "mapped groups" of competitive funds and classes. Fidelity creates "mapped groups" by combining similar Lipper investment objective categories that have comparable management fee characteristics. Combining Lipper investment objective categories aids the Board's management fee and total expense ratio comparisons by broadening the competitive group used for comparison and by reducing the number of universes to which various Fidelity funds are compared.
Management Fee. The Board considered two proprietary management fee comparisons for the 12-month periods shown in the chart below. The group of Lipper funds used by the Board for management fee comparisons is referred to below as the "Total Mapped Group." The Total Mapped Group is broader than the Lipper peer group used by the Board for performance comparisons because the Total Mapped Group combines several Lipper investment objective categories while the Lipper peer group does not. The Total Mapped Group comparison focuses on a fund's standing in terms of gross management fees before expense reimbursements or caps relative to the total universe of funds with comparable investment mandates, regardless of whether their management fee structures also are comparable. Funds with comparable investment mandates offer exposure to similar types of securities. Funds with comparable management fee structures have similar management fee contractual arrangements (e.g., flat rate charged for advisory services, all-inclusive fee rate, etc.). "TMG %" represents the percentage of funds in the Total Mapped Group that had management fees that were lower than the fund's. For example, a TMG % of 15% means that 85% of the funds in the Total Mapped Group had higher management fees than the fund. The "Asset-Size Peer Group" (ASPG) comparison focuses on a fund's standing relative to a subset of non-Fidelity funds within the Total Mapped Group that are similar in size and management fee structure. The ASPG represents at least 15% of the funds in the Total Mapped Group with comparable asset size and management fee structures, subject to a minimum of 50 funds (or all funds in the Total Mapped Group if fewer than 50).Additional information, such as the ASPG quartile in which the fund's management fee ranked, is also included in the chart and considered by the Board.
Annual Report
Fidelity Advisor Equity Income Fund
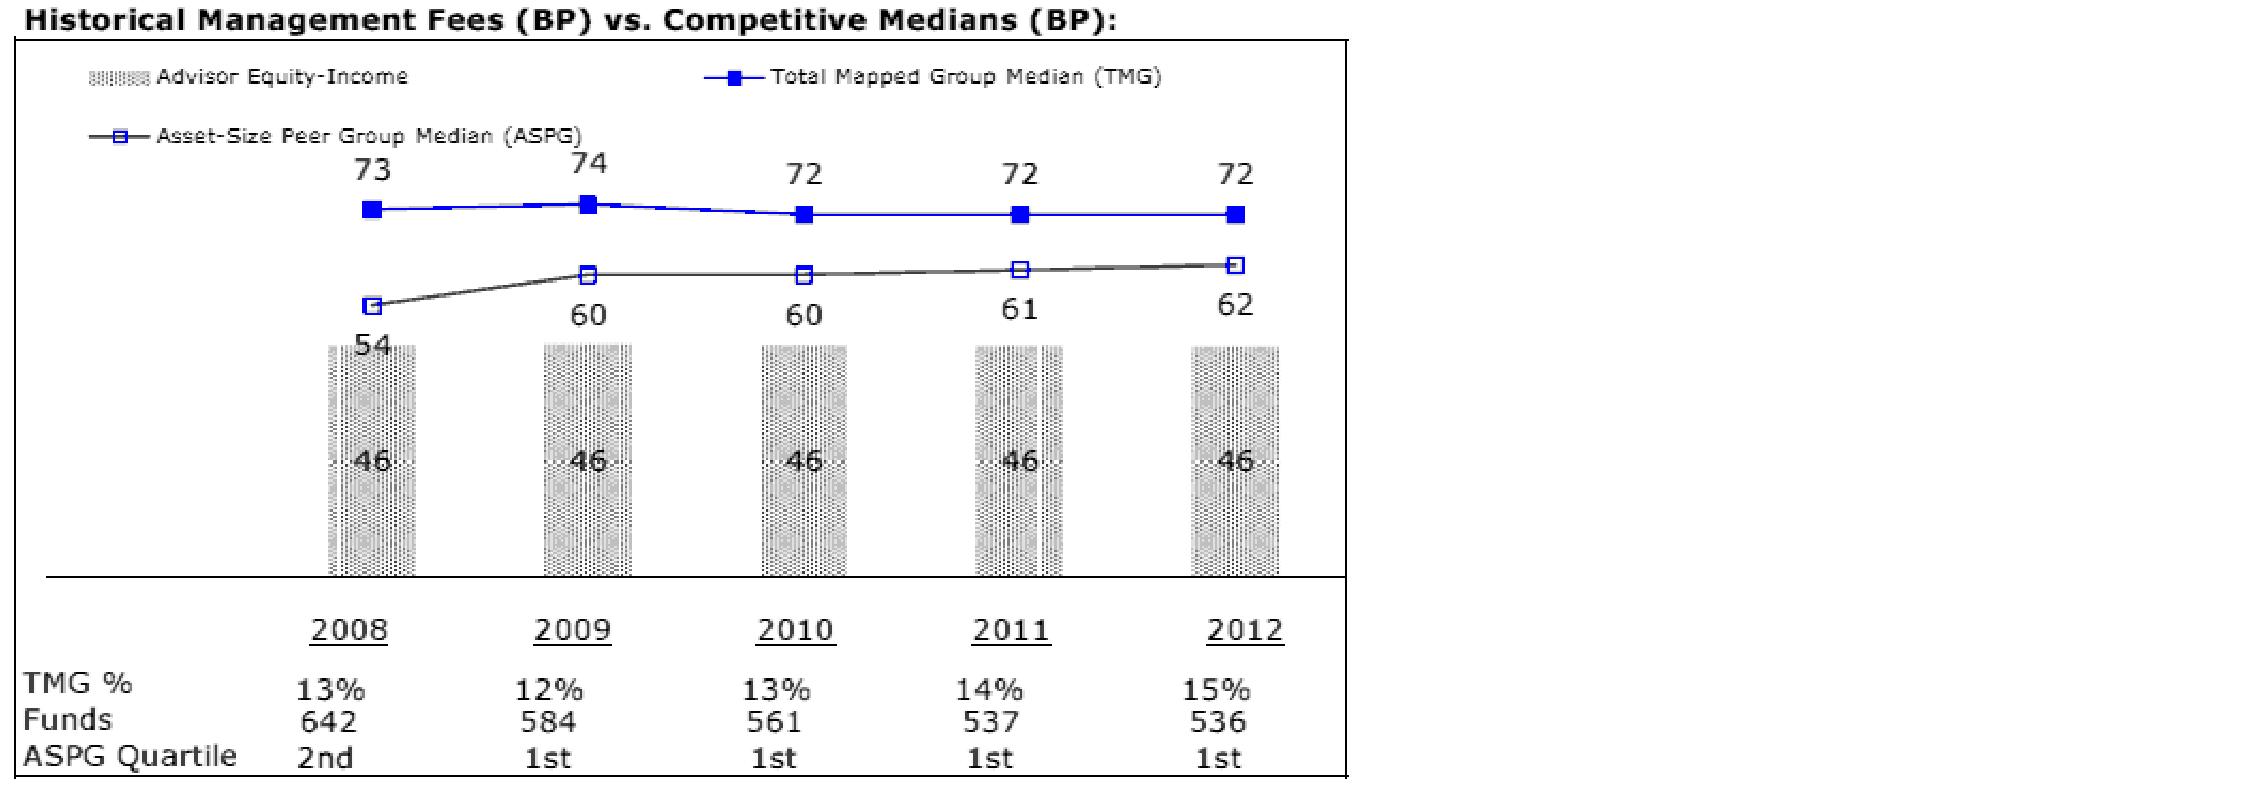
The Board noted that the fund's management fee ranked below the median of its Total Mapped Group and below the median of its ASPG for 2012.
Based on its review, the Board concluded that the fund's management fee is fair and reasonable in light of the services that the fund receives and the other factors considered.
Total Expense Ratio. In its review of each class's total expense ratio, the Board considered the fund's management fee as well as other fund or class expenses, as applicable, such as transfer agent fees, pricing and bookkeeping fees, fund-paid 12b-1 fees, and custodial, legal, and audit fees. The Board also noted the effects of any waivers and reimbursements on fees and expenses. As part of its review, the Board also considered the current and historical total expense ratios of each class of the fund compared to competitive fund median expenses. Each class of the fund is compared to those funds and classes in the Total Mapped Group (used by the Board for management fee comparisons) that have a similar sales load structure.
The Board noted that the total expense ratio of each of Class A, Class B, Class C, and Institutional Class ranked below its competitive median for 2012 and the total expense ratio of Class T ranked above its competitive median for 2012. The Board considered that, in general, various factors can affect total expense ratios. The Board noted that the total expense ratio of Class T was above the competitive median primarily because of higher 12b-1 fees on Class T. Class T has a higher 12b-1 fee, but a lower front-end sales charge, than traditionally priced front-end sales charge classes. The Board considered that Class T is primarily sold load-waived in the retirement plan market where its 0.50% 12b-1 fee is comparable to competing no-load, higher 12b-1 fee classes designed specifically for retirement plans. The Board noted that the fund offers multiple classes, each of which has a different sales load and 12b-1 fee structure, and that the multiple structures are intended to offer a range of pricing options for the intermediary market. The Board also noted that the total expense ratios of the classes vary primarily by the level of their 12b-1 fees, although differences in transfer agent fees may also cause expenses to vary from class to class.
Annual Report
Board Approval of Investment Advisory Contracts and
Management Fees - continued
Fees Charged to Other Fidelity Clients. The Board also considered Fidelity fee structures and other information with respect to clients of FMR and its affiliates, such as other mutual funds advised or subadvised by FMR or its affiliates, pension plan clients, and other institutional clients. The Board noted the findings of the 2013 ad hoc joint committee (created with the board of other Fidelity funds), which reviewed and compared Fidelity's institutional investment advisory business with its business of providing services to the Fidelity funds, including the differences in services provided, fees charged, and costs incurred, as well as competition in their respective marketplaces.
Based on its review of total expense ratios and fees charged to other Fidelity clients, the Board concluded that the total expense ratio of each class of the fund was reasonable, although Class T was above the median of the universe presented for comparison, in light of the services that the fund and its shareholders receive and the other factors considered.
Costs of the Services and Profitability. The Board considered the revenues earned and the expenses incurred by Fidelity in conducting the business of developing, marketing, distributing, managing, administering and servicing the fund and servicing the fund's shareholders. The Board also considered the level of Fidelity's profits in respect of all the Fidelity funds.
On an annual basis, FMR presents to the Board Fidelity's profitability for the fund. Fidelity calculates the profitability for each fund, as well as aggregate profitability for groups of Fidelity funds and all Fidelity funds, using a series of detailed revenue and cost allocation methodologies which originate with the books and records of Fidelity on which Fidelity's audited financial statements are based. The Audit Committee of the Board reviews any significant changes from the prior year's methodologies.
PricewaterhouseCoopers LLP (PwC), independent registered public accounting firm and auditor to Fidelity and certain Fidelity funds, has been engaged annually by the Board as part of the Board's assessment of Fidelity's profitability analysis. PwC's engagement includes the review and assessment of the methodologies used by Fidelity in determining the revenues and expenses attributable to Fidelity's mutual fund business, and completion of agreed-upon procedures surrounding the mathematical accuracy of fund profitability and its conformity to allocation methodologies. After considering PwC's reports issued under the engagement and information provided by Fidelity, the Board concluded that while other allocation methods may also be reasonable, Fidelity's profitability methodologies are reasonable in all material respects.
Annual Report
The Board also reviewed Fidelity's non-fund businesses and fall-out benefits related to the mutual fund business as well as cases where Fidelity's affiliates may benefit from or be related to the fund's business.
The Board considered the costs of the services provided by and the profits realized by Fidelity in connection with the operation of the fund and was satisfied that the profitability was not excessive in the circumstances.
Economies of Scale. The Board considered whether there have been economies of scale in respect of the management of the Fidelity funds, whether the Fidelity funds (including the fund) have appropriately benefited from any such economies of scale, and whether there is potential for realization of any further economies of scale. The Board considered the extent to which the fund will benefit from economies of scale through increased services to the fund, through waivers or reimbursements, or through fee or expense reductions. The Board also noted that in 2009, it and the board of other Fidelity funds created an ad hoc committee (the Economies of Scale Committee) to analyze whether FMR attains economies of scale in respect of the management and servicing of the Fidelity funds, whether the Fidelity funds have appropriately benefited from such economies of scale, and whether there is potential for realization of any further economies of scale.
The Board recognized that the fund's management contract incorporates a "group fee" structure, which provides for lower group fee rates as total fund assets under FMR's management increase, and for higher group fee rates as total fund assets under FMR's management decrease. FMR calculates the group fee rates based on a tiered asset "breakpoint" schedule that varies based on asset class. The Board considered that the group fee is designed to deliver the benefits of economies of scale to fund shareholders when total Fidelity fund assets increase, even if assets of any particular fund are unchanged or have declined, because some portion of Fidelity's costs are attributable to services provided to all Fidelity funds, and all funds benefit if those costs can be allocated among more assets. The Board concluded that, given the group fee structure, fund shareholders will benefit from lower management fees as assets under FMR's management increase at the fund complex level, regardless of whether Fidelity achieves any such economies of scale.
The Board concluded, taking into account the analysis of the Economies of Scale Committee, that economies of scale, if any, are being appropriately shared between fund shareholders and Fidelity.
Amendment to Description of Group Fee Rate. At its July 2013 meeting, the Board voted to approve an amendment to the fund's management contract to modify the description of the "group fee rate" effective August 1, 2013. The Board noted that under the prior description in the contract, the group fee rate was based on the average net assets of all registered investment companies with which FMR has management contracts. Under the contract's tiered asset breakpoint schedule, the group fee rate is lower as total fund assets under FMR's management increase, and higher as total fund assets under FMR's management decrease. The Board considered that the prior description would have excluded the assets of 64 Fidelity sector funds from the group fee rate calculation once Fidelity SelectCo, LLC, an affiliate of FMR, assumed management responsibilities for those funds. The Board noted that modifying the description of the group fee rate to continue to include the assets of those 64 funds for purposes of determining group fee rate breakpoints would avoid an immediate adverse impact on the group fee rate for any fund.
Annual Report
Board Approval of Investment Advisory Contracts and
Management Fees - continued
Additional Information Requested by the Board. In order to develop fully the factual basis for consideration of the Fidelity funds' Advisory Contracts, the Board requested and received additional information on certain topics, including: (i) fund performance trends and Fidelity's long-term strategies for certain funds; (ii) the potential to further rationalize the Fidelity fund lineup with the possibility of achieving savings for the funds and Fidelity; (iii) the methodology with respect to competitive fund data and peer group classifications; (iv) the arrangements with, and performance of, certain sub-advisers on behalf of the Fidelity funds, as well as certain proposed participating affiliate arrangements; (v) the realization of fall-out benefits in certain Fidelity business units; (vi) Fidelity's group fee structures, including the rationale for the individual fee rates of certain categories of funds and the definition of group assets; (vii) trends regarding industry use of performance fee structures and the performance adjustment methodologies applicable to the Fidelity funds; (viii) additional competitive analysis regarding the total expenses for certain classes; and (ix) fund profitability methodology, including Fidelity's cost allocation methodology, and the impact of certain factors on fund profitability results.
Based on its evaluation of all of the conclusions noted above, and after considering all factors it believed relevant, the Board ultimately concluded that the advisory fee structures are fair and reasonable, and that the fund's Advisory Contracts should be renewed.
Annual Report
Investment Adviser
Fidelity Management & Research Company
Boston, MA
Investment Sub-Advisers
FMR Co., Inc.
Fidelity Management & Research
(U.K.) Inc.
Fidelity Management & Research
(Hong Kong) Limited
Fidelity Management & Research
(Japan) Inc.
General Distributor
Fidelity Distributors Corporation
Smithfield, RI
Transfer and Service Agents
Fidelity Investments Institutional
Operations Company, Inc.
Boston, MA
Fidelity Service Company, Inc.
Boston, MA
Custodian
JPMorgan Chase Bank
New York, NY
(Fidelity Investment logo)(registered trademark)
EPII-UANN-0114 1.786682.110
(Fidelity Investment logo)(registered trademark)
Fidelity Advisor®
Equity Income
Fund - Class Z
Annual Report
November 30, 2013
(Fidelity Cover Art)
Contents
|
Performance |
How the fund has done over time. |
|
|
Management's Discussion of Fund Performance |
The Portfolio Manager's review of fund performance and strategy. |
|
|
Shareholder Expense Example |
An example of shareholder expenses. |
|
|
Investment Changes |
A summary of major shifts in the fund's investments over the past six months. |
|
|
Investments |
A complete list of the fund's investments with their market values. |
|
|
Financial Statements |
Statements of assets and liabilities, operations, and changes in net assets, as well as financial highlights. |
|
|
Notes |
Notes to the financial statements. |
|
|
Report of Independent Registered Public Accounting Firm |
|
|
|
Trustees and Officers |
|
|
|
Distributions |
|
|
|
Board Approval of Investment Advisory Contracts and Management Fees |
|
To view a fund's proxy voting guidelines and proxy voting record for the 12-month period ended June 30, visit http://www.fidelity.com/proxyvotingresults or visit the Securities and Exchange Commission's (SEC) web site at http://www.sec.gov. You may also call 1-877-208-0098 to request a free copy of the proxy voting guidelines.
Standard & Poor's, S&P and S&P 500 are registered service marks of The McGraw-Hill Companies, Inc. and have been licensed for use by Fidelity Distributors Corporation.
Other third-party marks appearing herein are the property of their respective owners.
All other marks appearing herein are registered or unregistered trademarks or service marks of FMR LLC or an affiliated company. © 2014 FMR LLC. All rights reserved.
Annual Report
This report and the financial statements contained herein are submitted for the general information of the shareholders of the fund. This report is not authorized for distribution to prospective investors in the fund unless preceded or accompanied by an effective prospectus.
A fund files its complete schedule of portfolio holdings with the SEC for the first and third quarters of each fiscal year on Form N-Q. Forms N-Q are available on the SEC's web site at http://www.sec.gov. A fund's Forms N-Q may be reviewed and copied at the SEC's Public Reference Room in Washington, DC. Information regarding the operation of the SEC's Public Reference Room may be obtained by calling 1-800-SEC-0330. For a complete list of a fund's portfolio holdings, view the most recent holdings listing, semiannual report, or annual report on Fidelity's web site at http://www.fidelity.com, http://www.advisor.fidelity.com, or http://www.401k.com, as applicable.
NOT FDIC INSURED • MAY LOSE VALUE • NO BANK GUARANTEE
Neither the fund nor Fidelity Distributors Corporation is a bank.
Annual Report
Performance: The Bottom Line
Average annual total return reflects the change in the value of an investment, assuming reinvestment of the class' distributions from dividend income and capital gains (the profits earned upon the sale of securities that have grown in value, if any) and assuming a constant rate of performance each year. The $10,000 table and the fund's returns do not reflect the deduction of taxes that a shareholder would pay on fund distributions or the redemption of fund shares. During periods of reimbursement by Fidelity, a fund's total return will be greater than it would be had the reimbursement not occurred. How a fund did yesterday is no guarantee of how it will do tomorrow.
Average Annual Total Returns
|
Periods ended November 30, 2013 |
|
Past 1 |
Past 5 |
Past 10 |
|
Class Z A |
|
26.82% |
16.10% |
6.90% |
A The initial offering of Class Z shares took place on August 13, 2013. Returns prior to August 13, 2013 are those of Institutional Class.
$10,000 Over 10 Years
Let's say hypothetically that $10,000 was invested in Fidelity Advisor® Equity Income Fund - Class Z on November 30, 2003. The chart shows how the value of your investment would have changed, and also shows how the Russell 3000® Value Index performed over the same period. See footnote A above for additional information regarding the performance of Class Z.
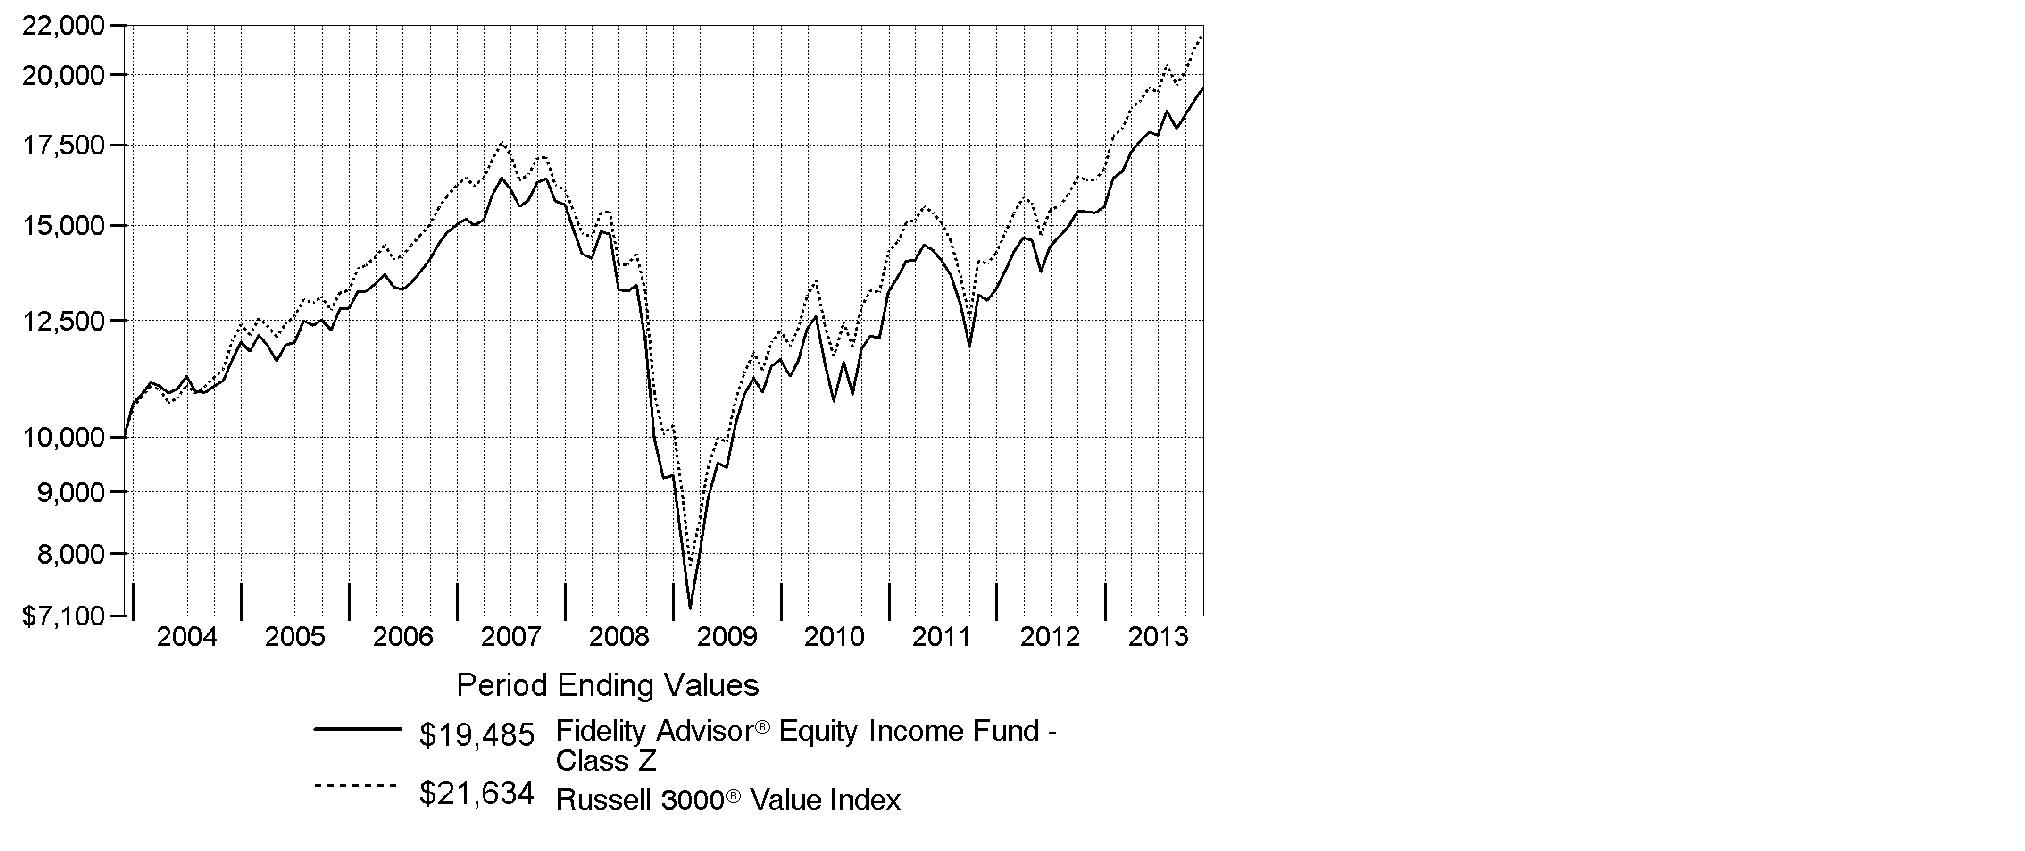
Annual Report
Management's Discussion of Fund Performance
Market Recap: With the current bull run nearing the five-year mark, equity benchmarks ripped up old records during the 12 months ending November 30, 2013. Gains were fueled by strengthening U.S. economic data, as well as generally improving economies and accommodative monetary policies worldwide. The broad S&P 500® Index reached new peaks in its 30.30% climb for the period, and the blue-chip Dow Jones Industrial AverageSM surpassed historic milestones en route to a 26.63% gain. The Nasdaq Composite Index®, up 36.73% amid a resurgence in growth-oriented stocks, closed above 4,000 for the first time since 2000. Shedding anxiety over the 2012 U.S. presidential election - and apparently confident that the federal debt-ceiling debate would be resolved - markets rose from period start through late May. News that the U.S. Federal Reserve was considering an end to its stimulative bond-buying kept stocks in flux over the summer but, by September, the Fed had set aside any imminent tapering. Despite jitters over a potential U.S. military strike in Syria and, later, an October budget impasse that briefly shuttered the federal government, volatility was subdued heading into the holidays, with investor optimism helping many markets home in on all-time highs at period end. Elsewhere, non-U.S. developed-market equities saw similar results, with the MSCI® EAFE® Index adding 24.97%.
Comments from James Morrow, Portfolio Manager of Fidelity Advisor® Equity Income Fund: For the year, the fund's Class Z shares trailed the 32.36% gain of the Russell 3000® Value Index. (For specific class-level results, please refer to the performance section of this report). Versus the index, stock selection was particularly challenging, especially in information technology, industrials and energy. The fund's average cash stake of roughly 5% also detracted. However, underweighting the lagging real estate, utilities and materials groups contributed. The fund's biggest individual relative detractor was a sizable out-of-index stake in diversified technology company IBM, which failed to keep pace with the fast-growing, momentum-oriented stocks that led the market. On the positive side, we were helped by a substantial underweighting in energy giant Exxon Mobil, a relatively slow-growth business that could not keep pace with the fast-rising market. Tempering this positive impact, however, was the fund's out-of-benchmark allocation to Europe-based energy producer Royal Dutch Shell. Over time, it became clear that the company's dividend was not growing as fast as I had expected, and I significantly reduced the fund's position by period end.
The views expressed above reflect those of the portfolio manager(s) only through the end of the period as stated on the cover of this report and do not necessarily represent the views of Fidelity or any other person in the Fidelity organization. Any such views are subject to change at any time based upon market or other conditions and Fidelity disclaims any responsibility to update such views. These views may not be relied on as investment advice and, because investment decisions for a Fidelity fund are based on numerous factors, may not be relied on as an indication of trading intent on behalf of any Fidelity fund.
Annual Report
Shareholder Expense Example
As a shareholder of the Fund, you incur two types of costs: (1) transaction costs, including sales charges (loads) on purchase payments or redemption proceeds, and (2) ongoing costs, including management fees, distribution and/or service (12b-1) fees and other Fund expenses. This Example is intended to help you understand your ongoing costs (in dollars) of investing in the Fund and to compare these costs with the ongoing costs of investing in other mutual funds.
The actual expense Example is based on an investment of $1,000 invested at the beginning of the period and held for the entire period (June 1, 2013 to November 30, 2013) for Class A, Class T, Class B, Class C and Institutional Class and for the period (August 13, 2013 to November 30, 2013) for Class Z. The hypothetical expense Example is based on an investment of $1,000 invested for the one-half year period (June 1, 2013 to November 30, 2013).
Actual Expenses
The first line of the accompanying table for each class of the Fund provides information about actual account values and actual expenses. You may use the information in this line, together with the amount you invested, to estimate the expenses that you paid over the period. Simply divide your account value by $1,000.00 (for example, an $8,600 account value divided by $1,000.00 = 8.6), then multiply the result by the number in the first line for a class of the Fund under the heading entitled "Expenses Paid During Period" to estimate the expenses you paid on your account during this period. In addition, the Fund, as a shareholder in the underlying Fidelity Central Funds, will indirectly bear its pro-rata share of the fees and expenses incurred by the underlying Fidelity Central Funds. These fees and expenses are not included in the Fund's annualized expense ratio used to calculate the expense estimate in the table below.
Hypothetical Example for Comparison Purposes
The second line of the accompanying table for each class of the Fund provides information about hypothetical account values and hypothetical expenses based on a Class' actual expense ratio and an assumed rate of return of 5% per year before expenses, which is not the Class' actual return. The hypothetical account values and expenses may not be used to estimate the actual ending account balance or expenses you paid for the period. You may use this information to compare the ongoing costs of investing in the Fund and other funds. To do so, compare this 5% hypothetical example with the 5% hypothetical examples that appear in the shareholder reports of the other funds. In addition, the Fund, as a shareholder in the underlying Fidelity Central Funds, will indirectly bear its pro-rata share of the fees and expenses incurred by the underlying Fidelity Central Funds. These fees and expenses are not included in the Fund's annualized expense ratio used to calculate the expense estimate in the table below.
Please note that the expenses shown in the table are meant to highlight your ongoing costs only and do not reflect any transaction costs. Therefore, the second line of the table is useful in comparing ongoing costs only, and will not help you determine the relative total costs of owning different funds. In addition, if these transactional costs were included, your costs would have been higher.
Annual Report
|
|
Annualized |
Beginning |
Ending |
Expenses Paid |
|
Class A |
.97% |
|
|
|
|
Actual |
|
$ 1,000.00 |
$ 1,086.20 |
$ 5.07 C |
|
HypotheticalA |
|
$ 1,000.00 |
$ 1,020.21 |
$ 4.91 D |
|
Class T |
1.19% |
|
|
|
|
Actual |
|
$ 1,000.00 |
$ 1,085.10 |
$ 6.22 C |
|
HypotheticalA |
|
$ 1,000.00 |
$ 1,019.10 |
$ 6.02 D |
|
Class B |
1.79% |
|
|
|
|
Actual |
|
$ 1,000.00 |
$ 1,081.70 |
$ 9.34 C |
|
HypotheticalA |
|
$ 1,000.00 |
$ 1,016.09 |
$ 9.05 D |
|
Class C |
1.73% |
|
|
|
|
Actual |
|
$ 1,000.00 |
$ 1,081.90 |
$ 9.03 C |
|
HypotheticalA |
|
$ 1,000.00 |
$ 1,016.39 |
$ 8.74 D |
|
Institutional Class |
.71% |
|
|
|
|
Actual |
|
$ 1,000.00 |
$ 1,087.50 |
$ 3.72 C |
|
HypotheticalA |
|
$ 1,000.00 |
$ 1,021.51 |
$ 3.60 D |
|
Class Z |
.54% |
|
|
|
|
Actual |
|
$ 1,000.00 |
$ 1,043.00 |
$ 1.66 C |
|
HypotheticalA |
|
$ 1,000.00 |
$ 1,022.36 |
$ 2.74 D |
A 5% return per year before expenses
B Annualized expense ratio reflects expenses net of applicable fee waivers.
C Actual expenses are equal to each Class' annualized expense ratio; multiplied by the average account value over the period, multiplied by 183/365 (to reflect the one-half year period) for Class A, Class T, Class B, Class C and Institutional Class and multiplied by 110/365 (to reflect the period August 13, 2013 to November 30, 2013) for Class Z. The fees and expenses of the underlying Fidelity Central Funds in which the Fund invests are not included in each Class' annualized expense ratio.
D Hypothetical expenses are equal to each Class' annualized expense ratio, multiplied by the average account value over the period, multiplied by 183/365 (to reflect the one-half year period). The fees and expenses of the underlying Fidelity Central Funds in which the Fund invests are not included in each Class' annualized expense ratio.
Annual Report
Investment Changes (Unaudited)
|
Top Ten Stocks as of November 30, 2013 |
||
|
|
% of fund's |
% of fund's net assets |
|
JPMorgan Chase & Co. |
4.0 |
3.9 |
|
Wells Fargo & Co.* |
3.0 |
2.8 |
|
Chevron Corp. |
2.9 |
2.9 |
|
General Electric Co. |
2.5 |
2.1 |
|
Exxon Mobil Corp. |
2.4 |
2.2 |
|
MetLife, Inc. |
2.3 |
1.9 |
|
Cisco Systems, Inc. |
2.2 |
2.2 |
|
Procter & Gamble Co. |
2.1 |
2.4 |
|
Merck & Co., Inc. |
2.1 |
2.0 |
|
Paychex, Inc. |
1.9 |
2.2 |
|
|
25.4 |
|
* Security or a portion of the security is pledged as collateral for call options written.
|
Top Five Market Sectors as of November 30, 2013 |
||
|
|
% of fund's |
% of fund's net assets |
|
Financials |
21.4 |
21.5 |
|
Energy |
14.0 |
12.3 |
|
Health Care |
12.6 |
12.9 |
|
Information Technology |
11.5 |
11.3 |
|
Industrials |
10.4 |
10.3 |
|
Asset Allocation (% of fund's net assets) |
|||||||
|
As of November 30, 2013* |
As of May 31, 2013** |
||||||
 |
Stocks 90.8% |
|
|
Stocks 88.7% |
|
||
 |
Bonds 0.1% |
|
|
Bonds 0.1% |
|
||
 |
Convertible |
|
|
Convertible |
|
||
 |
Other Investments 0.3% |
|
|
Other Investments 0.4% |
|
||
 |
Short-Term |
|
|
Short-Term |
|
||
|
* Foreign investments |
11.5% |
|
** Foreign investments |
9.9% |
|
||
|
* Written options |
(0.1%) |
|
** Written options |
0.0% |
|
||

Annual Report
Investments November 30, 2013
Showing Percentage of Net Assets
|
Common Stocks - 90.2% |
|||
|
Shares |
Value (000s) |
||
|
CONSUMER DISCRETIONARY - 7.4% |
|||
|
Auto Components - 0.2% |
|||
|
Gentex Corp. |
189,860 |
$ 5,660 |
|
|
Diversified Consumer Services - 0.0% |
|||
|
Strayer Education, Inc. |
28,191 |
1,047 |
|
|
Hotels, Restaurants & Leisure - 1.6% |
|||
|
McDonald's Corp. |
209,217 |
20,371 |
|
|
Texas Roadhouse, Inc. Class A |
208,162 |
5,824 |
|
|
Wynn Resorts Ltd. |
11,650 |
1,932 |
|
|
Yum! Brands, Inc. |
149,721 |
11,630 |
|
|
|
39,757 |
||
|
Leisure Equipment & Products - 0.4% |
|||
|
New Academy Holding Co. LLC unit (i)(j) |
52,800 |
9,547 |
|
|
Media - 2.6% |
|||
|
Comcast Corp. Class A (h) |
687,374 |
34,279 |
|
|
Sinclair Broadcast Group, Inc. Class A |
107,035 |
3,513 |
|
|
Time Warner, Inc. |
412,351 |
27,096 |
|
|
|
64,888 |
||
|
Multiline Retail - 1.7% |
|||
|
Kohl's Corp. |
203,183 |
11,232 |
|
|
Target Corp. |
475,017 |
30,368 |
|
|
|
41,600 |
||
|
Specialty Retail - 0.7% |
|||
|
Adastria Holdings Co. Ltd. |
29,220 |
1,161 |
|
|
American Eagle Outfitters, Inc. |
276,375 |
4,497 |
|
|
Foot Locker, Inc. |
135,931 |
5,286 |
|
|
Staples, Inc. (h) |
334,933 |
5,202 |
|
|
|
16,146 |
||
|
Textiles, Apparel & Luxury Goods - 0.2% |
|||
|
Coach, Inc. |
68,100 |
3,943 |
|
|
TOTAL CONSUMER DISCRETIONARY |
182,588 |
||
|
CONSUMER STAPLES - 8.8% |
|||
|
Beverages - 1.4% |
|||
|
Molson Coors Brewing Co. Class B |
181,705 |
9,570 |
|
|
PepsiCo, Inc. |
110,922 |
9,368 |
|
|
The Coca-Cola Co. |
374,288 |
15,043 |
|
|
|
33,981 |
||
|
Food & Staples Retailing - 2.0% |
|||
|
CVS Caremark Corp. |
165,200 |
11,062 |
|
|
Common Stocks - continued |
|||
|
Shares |
Value (000s) |
||
|
CONSUMER STAPLES - continued |
|||
|
Food & Staples Retailing - continued |
|||
|
Wal-Mart Stores, Inc. |
152,750 |
$ 12,374 |
|
|
Walgreen Co. |
455,069 |
26,940 |
|
|
|
50,376 |
||
|
Food Products - 0.9% |
|||
|
Kellogg Co. |
353,552 |
21,439 |
|
|
Household Products - 2.1% |
|||
|
Procter & Gamble Co. |
632,117 |
53,237 |
|
|
Tobacco - 2.4% |
|||
|
Altria Group, Inc. |
456,865 |
16,895 |
|
|
British American Tobacco PLC sponsored ADR |
54,131 |
5,756 |
|
|
Lorillard, Inc. |
379,653 |
19,488 |
|
|
Philip Morris International, Inc. |
193,912 |
16,587 |
|
|
|
58,726 |
||
|
TOTAL CONSUMER STAPLES |
217,759 |
||
|
ENERGY - 13.1% |
|||
|
Energy Equipment & Services - 1.8% |
|||
|
Ensco PLC Class A |
140,477 |
8,299 |
|
|
Halliburton Co. |
13,871 |
731 |
|
|
National Oilwell Varco, Inc. |
123,449 |
10,061 |
|
|
Noble Corp. |
245,917 |
9,374 |
|
|
Schlumberger Ltd. |
125,757 |
11,119 |
|
|
Trinidad Drilling Ltd. |
455,100 |
4,236 |
|
|
|
43,820 |
||
|
Oil, Gas & Consumable Fuels - 11.3% |
|||
|
Access Midstream Partners LP |
69,647 |
3,912 |
|
|
Apache Corp. |
223,838 |
20,479 |
|
|
BG Group PLC |
60,800 |
1,242 |
|
|
Canadian Natural Resources Ltd. |
314,300 |
10,347 |
|
|
Chevron Corp. |
582,569 |
71,330 |
|
|
CONSOL Energy, Inc. |
184,732 |
6,573 |
|
|
EV Energy Partners LP |
159,189 |
5,205 |
|
|
Exxon Mobil Corp. |
624,675 |
58,395 |
|
|
Holly Energy Partners LP |
114,912 |
3,614 |
|
|
HollyFrontier Corp. |
106,227 |
5,097 |
|
|
Legacy Reserves LP |
115,099 |
3,107 |
|
|
Markwest Energy Partners LP |
187,588 |
12,957 |
|
|
Occidental Petroleum Corp. |
208,303 |
19,780 |
|
|
Royal Dutch Shell PLC Class A sponsored ADR |
173,458 |
11,570 |
|
|
Common Stocks - continued |
|||
|
Shares |
Value (000s) |
||
|
ENERGY - continued |
|||
|
Oil, Gas & Consumable Fuels - continued |
|||
|
Scorpio Tankers, Inc. |
126,500 |
$ 1,452 |
|
|
Southcross Energy Partners LP |
51,650 |
1,001 |
|
|
Suncor Energy, Inc. |
403,000 |
13,984 |
|
|
The Williams Companies, Inc. |
653,350 |
23,011 |
|
|
Tsakos Energy Navigation Ltd. |
287,877 |
1,442 |
|
|
Western Gas Equity Partners LP |
16,228 |
701 |
|
|
Williams Partners LP |
61,100 |
3,140 |
|
|
|
278,339 |
||
|
TOTAL ENERGY |
322,159 |
||
|
FINANCIALS - 20.5% |
|||
|
Capital Markets - 3.7% |
|||
|
Aberdeen Asset Management PLC |
94,500 |
761 |
|
|
Apollo Investment Corp. |
731,452 |
6,598 |
|
|
Ashmore Group PLC |
1,121,663 |
7,231 |
|
|
BlackRock, Inc. Class A |
20,477 |
6,199 |
|
|
Carlyle Group LP |
83,100 |
2,701 |
|
|
Charles Schwab Corp. |
431,134 |
10,554 |
|
|
Greenhill & Co., Inc. |
71,623 |
3,918 |
|
|
Invesco Ltd. |
69,900 |
2,436 |
|
|
KKR & Co. LP |
792,964 |
18,817 |
|
|
Morgan Stanley |
369,142 |
11,554 |
|
|
The Blackstone Group LP |
681,603 |
19,480 |
|
|
|
90,249 |
||
|
Commercial Banks - 5.4% |
|||
|
CIT Group, Inc. |
69,462 |
3,506 |
|
|
Comerica, Inc. |
130,080 |
5,899 |
|
|
M&T Bank Corp. (h) |
130,417 |
15,045 |
|
|
PNC Financial Services Group, Inc. |
69,200 |
5,325 |
|
|
Standard Chartered PLC (United Kingdom) |
348,991 |
8,272 |
|
|
U.S. Bancorp |
555,800 |
21,798 |
|
|
Wells Fargo & Co. (h) |
1,673,450 |
73,665 |
|
|
|
133,510 |
||
|
Diversified Financial Services - 4.6% |
|||
|
JPMorgan Chase & Co. |
1,730,257 |
99,011 |
|
|
KKR Financial Holdings LLC |
1,547,886 |
14,829 |
|
|
|
113,840 |
||
|
Common Stocks - continued |
|||
|
Shares |
Value (000s) |
||
|
FINANCIALS - continued |
|||
|
Insurance - 4.6% |
|||
|
ACE Ltd. |
201,111 |
$ 20,670 |
|
|
AFLAC, Inc. |
80,535 |
5,345 |
|
|
esure Group PLC |
702,700 |
2,921 |
|
|
Fidelity National Financial, Inc. Class A |
17,996 |
523 |
|
|
MetLife, Inc. |
1,090,458 |
56,911 |
|
|
MetLife, Inc. unit |
121,585 |
3,736 |
|
|
Prudential Financial, Inc. |
114,398 |
10,154 |
|
|
Validus Holdings Ltd. |
331,778 |
13,288 |
|
|
|
113,548 |
||
|
Real Estate Investment Trusts - 2.0% |
|||
|
American Capital Agency Corp. |
537,980 |
10,964 |
|
|
Annaly Capital Management, Inc. |
912,694 |
9,273 |
|
|
Coresite Realty Corp. |
57,820 |
1,871 |
|
|
First Potomac Realty Trust |
389,611 |
4,675 |
|
|
Home Properties, Inc. |
115,448 |
6,070 |
|
|
Rayonier, Inc. |
97,852 |
4,316 |
|
|
Retail Properties America, Inc. |
407,197 |
5,428 |
|
|
Two Harbors Investment Corp. |
565,041 |
5,227 |
|
|
Ventas, Inc. |
42,294 |
2,404 |
|
|
|
50,228 |
||
|
Real Estate Management & Development - 0.1% |
|||
|
Beazer Pre-Owned Rental Homes, Inc. (a)(j) |
96,000 |
2,016 |
|
|
Thrifts & Mortgage Finance - 0.1% |
|||
|
Radian Group, Inc. |
116,300 |
1,658 |
|
|
TOTAL FINANCIALS |
505,049 |
||
|
HEALTH CARE - 11.5% |
|||
|
Biotechnology - 0.6% |
|||
|
Amgen, Inc. |
118,249 |
13,490 |
|
|
Health Care Equipment & Supplies - 0.7% |
|||
|
Baxter International, Inc. |
64,000 |
4,381 |
|
|
Covidien PLC |
109,000 |
7,440 |
|
|
Hologic, Inc. (a) |
32,600 |
730 |
|
|
St. Jude Medical, Inc. |
90,162 |
5,267 |
|
|
|
17,818 |
||
|
Health Care Providers & Services - 1.6% |
|||
|
Aetna, Inc. |
138,467 |
9,545 |
|
|
Quest Diagnostics, Inc. |
95,936 |
5,846 |
|
|
Common Stocks - continued |
|||
|
Shares |
Value (000s) |
||
|
HEALTH CARE - continued |
|||
|
Health Care Providers & Services - continued |
|||
|
UnitedHealth Group, Inc. |
179,576 |
$ 13,375 |
|
|
WellPoint, Inc. |
118,445 |
11,001 |
|
|
|
39,767 |
||
|
Health Care Technology - 0.1% |
|||
|
Quality Systems, Inc. |
117,419 |
2,743 |
|
|
Pharmaceuticals - 8.5% |
|||
|
AbbVie, Inc. |
218,556 |
10,589 |
|
|
Actavis PLC (a) |
59,962 |
9,778 |
|
|
Astellas Pharma, Inc. |
79,900 |
4,734 |
|
|
AstraZeneca PLC sponsored ADR |
399,252 |
22,833 |
|
|
Eli Lilly & Co. (h) |
221,770 |
11,137 |
|
|
Johnson & Johnson |
500,018 |
47,332 |
|
|
Merck & Co., Inc. |
1,060,030 |
52,821 |
|
|
Pfizer, Inc. |
936,613 |
29,719 |
|
|
Sanofi SA |
72,826 |
7,695 |
|
|
Teva Pharmaceutical Industries Ltd. sponsored ADR |
324,298 |
13,218 |
|
|
|
209,856 |
||
|
TOTAL HEALTH CARE |
283,674 |
||
|
INDUSTRIALS - 9.9% |
|||
|
Aerospace & Defense - 1.1% |
|||
|
United Technologies Corp. |
245,307 |
27,195 |
|
|
Air Freight & Logistics - 2.1% |
|||
|
C.H. Robinson Worldwide, Inc. |
246,736 |
14,466 |
|
|
United Parcel Service, Inc. Class B |
362,690 |
37,132 |
|
|
|
51,598 |
||
|
Commercial Services & Supplies - 1.1% |
|||
|
Intrum Justitia AB |
253,384 |
6,451 |
|
|
Republic Services, Inc. |
630,889 |
22,024 |
|
|
|
28,475 |
||
|
Electrical Equipment - 0.6% |
|||
|
Eaton Corp. PLC |
53,300 |
3,873 |
|
|
Emerson Electric Co. |
76,270 |
5,109 |
|
|
Hubbell, Inc. Class B |
48,569 |
5,241 |
|
|
|
14,223 |
||
|
Industrial Conglomerates - 2.5% |
|||
|
General Electric Co. |
2,361,833 |
62,966 |
|
|
Common Stocks - continued |
|||
|
Shares |
Value (000s) |
||
|
INDUSTRIALS - continued |
|||
|
Machinery - 1.7% |
|||
|
Cummins, Inc. (h) |
73,837 |
$ 9,773 |
|
|
Douglas Dynamics, Inc. |
222,450 |
3,546 |
|
|
Harsco Corp. |
195,273 |
5,106 |
|
|
Illinois Tool Works, Inc. |
57,666 |
4,589 |
|
|
Stanley Black & Decker, Inc. (h) |
226,795 |
18,459 |
|
|
Stanley Black & Decker, Inc. unit (a) |
5,200 |
530 |
|
|
|
42,003 |
||
|
Professional Services - 0.5% |
|||
|
Acacia Research Corp. |
195,660 |
2,911 |
|
|
Michael Page International PLC |
1,080,418 |
8,397 |
|
|
|
11,308 |
||
|
Road & Rail - 0.3% |
|||
|
Union Pacific Corp. |
43,902 |
7,114 |
|
|
TOTAL INDUSTRIALS |
244,882 |
||
|
INFORMATION TECHNOLOGY - 10.7% |
|||
|
Communications Equipment - 2.2% |
|||
|
Cisco Systems, Inc. |
2,527,593 |
53,711 |
|
|
Computers & Peripherals - 0.8% |
|||
|
Apple, Inc. |
37,468 |
20,835 |
|
|
IT Services - 4.1% |
|||
|
Accenture PLC Class A |
205,996 |
15,959 |
|
|
IBM Corp. |
202,678 |
36,417 |
|
|
Paychex, Inc. |
1,085,667 |
47,476 |
|
|
|
99,852 |
||
|
Semiconductors & Semiconductor Equipment - 1.7% |
|||
|
Applied Materials, Inc. |
927,977 |
16,054 |
|
|
Broadcom Corp. Class A |
587,729 |
15,686 |
|
|
KLA-Tencor Corp. |
67,021 |
4,281 |
|
|
Siliconware Precision Industries Co. Ltd. sponsored ADR (e) |
989,533 |
5,799 |
|
|
|
41,820 |
||
|
Software - 1.9% |
|||
|
CA Technologies, Inc. |
183,281 |
6,048 |
|
|
Microsoft Corp. |
1,081,113 |
41,223 |
|
|
|
47,271 |
||
|
TOTAL INFORMATION TECHNOLOGY |
263,489 |
||
|
Common Stocks - continued |
|||
|
Shares |
Value (000s) |
||
|
MATERIALS - 0.9% |
|||
|
Chemicals - 0.4% |
|||
|
RPM International, Inc. |
184,099 |
$ 7,290 |
|
|
Sociedad Quimica y Minera de Chile SA (PN-B) sponsored ADR |
82,309 |
2,059 |
|
|
Tronox Ltd. Class A |
47,965 |
1,019 |
|
|
|
10,368 |
||
|
Metals & Mining - 0.5% |
|||
|
Commercial Metals Co. |
286,354 |
5,561 |
|
|
Freeport-McMoRan Copper & Gold, Inc. |
161,314 |
5,596 |
|
|
|
11,157 |
||
|
TOTAL MATERIALS |
21,525 |
||
|
TELECOMMUNICATION SERVICES - 3.8% |
|||
|
Diversified Telecommunication Services - 2.9% |
|||
|
AT&T, Inc. |
719,427 |
25,331 |
|
|
CenturyLink, Inc. |
428,970 |
13,169 |
|
|
Verizon Communications, Inc. |
651,777 |
32,341 |
|
|
|
70,841 |
||
|
Wireless Telecommunication Services - 0.9% |
|||
|
Vodafone Group PLC |
6,216,813 |
23,048 |
|
|
TOTAL TELECOMMUNICATION SERVICES |
93,889 |
||
|
UTILITIES - 3.6% |
|||
|
Electric Utilities - 3.1% |
|||
|
American Electric Power Co., Inc. |
133,815 |
6,297 |
|
|
FirstEnergy Corp. |
219,091 |
7,149 |
|
|
Hawaiian Electric Industries, Inc. (e) |
218,498 |
5,530 |
|
|
NextEra Energy, Inc. |
144,581 |
12,230 |
|
|
Northeast Utilities |
144,765 |
5,947 |
|
|
PPL Corp. |
495,891 |
15,229 |
|
|
Southern Co. |
480,457 |
19,521 |
|
|
Xcel Energy, Inc. |
209,276 |
5,864 |
|
|
|
77,767 |
||
|
Common Stocks - continued |
|||
|
Shares |
Value (000s) |
||
|
UTILITIES - continued |
|||
|
Multi-Utilities - 0.5% |
|||
|
CenterPoint Energy, Inc. |
33,314 |
$ 781 |
|
|
Sempra Energy |
126,314 |
11,171 |
|
|
|
11,952 |
||
|
TOTAL UTILITIES |
89,719 |
||
|
TOTAL COMMON STOCKS (Cost $1,819,559) |
2,224,733 |
||
|
Preferred Stocks - 1.9% |
|||
|
|
|
|
|
|
Convertible Preferred Stocks - 1.3% |
|||
|
CONSUMER DISCRETIONARY - 0.2% |
|||
|
Automobiles - 0.2% |
|||
|
General Motors Co. 4.75% |
85,400 |
4,543 |
|
|
FINANCIALS - 0.1% |
|||
|
Real Estate Investment Trusts - 0.1% |
|||
|
Weyerhaeuser Co. Series A, 6.375% |
43,200 |
2,361 |
|
|
HEALTH CARE - 0.1% |
|||
|
Health Care Equipment & Supplies - 0.1% |
|||
|
Alere, Inc. 3.00% |
11,539 |
3,185 |
|
|
INDUSTRIALS - 0.2% |
|||
|
Aerospace & Defense - 0.2% |
|||
|
United Technologies Corp. 7.50% |
69,700 |
4,556 |
|
|
TELECOMMUNICATION SERVICES - 0.1% |
|||
|
Wireless Telecommunication Services - 0.1% |
|||
|
Crown Castle International Corp. Series A, 4.50% (a) |
36,400 |
3,653 |
|
|
UTILITIES - 0.6% |
|||
|
Electric Utilities - 0.2% |
|||
|
NextEra Energy, Inc.: |
|
|
|
|
5.889% |
35,144 |
1,966 |
|
|
Series E, 5.599% |
61,200 |
3,493 |
|
|
|
5,459 |
||
|
Multi-Utilities - 0.4% |
|||
|
CenterPoint Energy, Inc. 2.00% ZENS |
73,300 |
3,794 |
|
|
Preferred Stocks - continued |
|||
|
Shares |
Value (000s) |
||
|
Convertible Preferred Stocks - continued |
|||
|
UTILITIES - continued |
|||
|
Multi-Utilities - continued |
|||
|
Dominion Resources, Inc.: |
|
|
|
|
Series A, 6.125% |
43,400 |
$ 2,380 |
|
|
Series B, 6.00% |
43,400 |
2,374 |
|
|
|
8,548 |
||
|
TOTAL UTILITIES |
14,007 |
||
|
TOTAL CONVERTIBLE PREFERRED STOCKS |
32,305 |
||
|
Nonconvertible Preferred Stocks - 0.6% |
|||
|
CONSUMER DISCRETIONARY - 0.2% |
|||
|
Automobiles - 0.2% |
|||
|
Volkswagen AG |
18,273 |
4,849 |
|
|
FINANCIALS - 0.4% |
|||
|
Consumer Finance - 0.4% |
|||
|
Ally Financial, Inc.: |
|
|
|
|
7.00% (g) |
8,531 |
8,190 |
|
|
Series A, 8.50% |
47,070 |
1,260 |
|
|
|
9,450 |
||
|
TOTAL NONCONVERTIBLE PREFERRED STOCKS |
14,299 |
||
|
TOTAL PREFERRED STOCKS (Cost $42,563) |
46,604 |
||
|
Corporate Bonds - 3.3% |
||||
|
|
Principal Amount (000s)(d) |
|
||
|
Convertible Bonds - 3.2% |
||||
|
CONSUMER DISCRETIONARY - 0.1% |
||||
|
Automobiles - 0.1% |
||||
|
Volkswagen International Finance NV 5.5% 11/9/15 (g) |
EUR |
2,400 |
3,897 |
|
|
ENERGY - 0.6% |
||||
|
Oil, Gas & Consumable Fuels - 0.6% |
||||
|
Alpha Natural Resources, Inc. 3.75% 12/15/17 |
|
4,810 |
4,750 |
|
|
Corporate Bonds - continued |
||||
|
|
Principal Amount (000s)(d) |
Value (000s) |
||
|
Convertible Bonds - continued |
||||
|
ENERGY - continued |
||||
|
Oil, Gas & Consumable Fuels - continued |
||||
|
Amyris, Inc. 3% 2/27/17 |
|
$ 516 |
$ 376 |
|
|
Chesapeake Energy Corp. 2.5% 5/15/37 |
|
3,360 |
3,455 |
|
|
Cobalt International Energy, Inc. 2.625% 12/1/19 |
|
2,530 |
2,514 |
|
|
Ship Finance International Ltd. 3.25% 2/1/18 |
|
3,590 |
3,753 |
|
|
|
14,848 |
|||
|
FINANCIALS - 0.4% |
||||
|
Insurance - 0.2% |
||||
|
Fidelity National Financial, Inc. 4.25% 8/15/18 |
|
3,730 |
5,646 |
|
|
Thrifts & Mortgage Finance - 0.2% |
||||
|
MGIC Investment Corp. 9% 4/1/63 (g) |
|
3,390 |
3,847 |
|
|
TOTAL FINANCIALS |
9,493 |
|||
|
HEALTH CARE - 1.0% |
||||
|
Biotechnology - 0.1% |
||||
|
Theravance, Inc. 2.125% 1/15/23 |
|
1,830 |
2,798 |
|
|
Health Care Equipment & Supplies - 0.2% |
||||
|
Teleflex, Inc. 3.875% 8/1/17 |
|
3,340 |
5,504 |
|
|
Health Care Providers & Services - 0.7% |
||||
|
HealthSouth Corp. 2% 12/1/43 |
|
5,366 |
5,950 |
|
|
WellPoint, Inc. 2.75% 10/15/42 |
|
7,510 |
10,317 |
|
|
|
16,267 |
|||
|
TOTAL HEALTH CARE |
24,569 |
|||
|
INDUSTRIALS - 0.3% |
||||
|
Commercial Services & Supplies - 0.2% |
||||
|
Covanta Holding Corp. 3.25% 6/1/14 |
|
3,050 |
3,584 |
|
|
Construction & Engineering - 0.1% |
||||
|
MasTec, Inc.: |
|
|
|
|
|
4% 6/15/14 |
|
1,580 |
3,188 |
|
|
4.25% 12/15/14 |
|
180 |
374 |
|
|
|
3,562 |
|||
|
TOTAL INDUSTRIALS |
7,146 |
|||
|
Corporate Bonds - continued |
||||
|
|
Principal Amount (000s)(d) |
Value (000s) |
||
|
Convertible Bonds - continued |
||||
|
INFORMATION TECHNOLOGY - 0.8% |
||||
|
Communications Equipment - 0.3% |
||||
|
InterDigital, Inc. 2.5% 3/15/16 |
|
$ 4,730 |
$ 4,907 |
|
|
Liberty Interactive LLC 0.75% 3/30/43 (g) |
|
800 |
1,000 |
|
|
|
5,907 |
|||
|
Computers & Peripherals - 0.2% |
||||
|
EMC Corp. 1.75% 1/1/14 |
|
3,530 |
5,263 |
|
|
Semiconductors & Semiconductor Equipment - 0.3% |
||||
|
GT Advanced Technologies, Inc. 3% 10/1/17 |
|
5,070 |
7,564 |
|
|
TOTAL INFORMATION TECHNOLOGY |
18,734 |
|||
|
TOTAL CONVERTIBLE BONDS |
78,687 |
|||
|
Nonconvertible Bonds - 0.1% |
||||
|
MATERIALS - 0.1% |
||||
|
Metals & Mining - 0.1% |
||||
|
Boart Longyear Management Pty Ltd. 7% 4/1/21 (g) |
|
1,120 |
840 |
|
|
Walter Energy, Inc. 8.5% 4/15/21 |
|
2,030 |
1,710 |
|
|
|
2,550 |
|||
|
TOTAL CORPORATE BONDS (Cost $72,017) |
81,237 |
|||
|
Other - 0.3% |
||||
|
ENERGY - 0.3% |
||||
|
Oil, Gas & Consumable Fuels - 0.3% |
||||
|
EQTY ER Holdings, LLC 12% 1/28/18 (f)(j)(k) |
|
5,667 |
5,667 |
|
|
Shares |
|
|
EQTY ER Holdings, LLC (f)(j)(k) |
|
2,833,333 |
2,833 |
|
|
TOTAL OTHER (Cost $8,500) . |
8,500 |
|||
|
Money Market Funds - 4.4% |
|||
|
Shares |
Value (000s) |
||
|
Fidelity Cash Central Fund, 0.10% (b) |
103,943,316 |
$ 103,943 |
|
|
Fidelity Securities Lending Cash Central Fund, 0.10% (b)(c) |
4,116,600 |
4,117 |
|
|
TOTAL MONEY MARKET FUNDS (Cost $108,060) |
108,060 |
||
|
TOTAL INVESTMENT PORTFOLIO - 100.1% (Cost $2,050,699) |
2,469,134 |
||
|
NET OTHER ASSETS (LIABILITIES) - (0.1)% |
(2,680) |
||
|
NET ASSETS - 100% |
$ 2,466,454 |
||
|
Written Options |
|||||||
|
Expiration Date/Exercise Price |
Number of Contracts |
Premium (000s) |
Value (000s) |
||||
|
Call Options |
|||||||
|
Comcast Corp. Class A |
1/18/14 - |
1,718 |
$ 187 |
$ (359) |
|||
|
Cummins, Inc. |
1/18/14 - |
185 |
28 |
(24) |
|||
|
Eli Lilly & Co. |
1/18/14 - |
1,109 |
43 |
(33) |
|||
|
M&T Bank Corp. |
1/18/14 - |
326 |
64 |
(95) |
|||
|
Stanley Black & Decker, Inc. |
12/21/13 - |
514 |
77 |
(41) |
|||
|
Staples, Inc. |
1/18/14 - |
837 |
27 |
(10) |
|||
|
Wells Fargo & Co. |
1/18/14 - |
8,367 |
405 |
(925) |
|||
|
TOTAL WRITTEN OPTIONS |
$ 831 |
$ (1,487) |
||||||
|
Currency Abbreviations |
||
|
EUR |
- |
European Monetary Unit |
|
Legend |
|
(a) Non-income producing |
|
(b) Affiliated fund that is generally available only to investment companies and other accounts managed by Fidelity Investments. The rate quoted is the annualized seven-day yield of the fund at period end. A complete unaudited listing of the fund's holdings as of its most recent quarter end is available upon request. In addition, each Fidelity Central Fund's financial statements, which are not covered by the Fund's Report of Independent Registered Public Accounting Firm, are available on the SEC's website or upon request. |
|
(c) Investment made with cash collateral received from securities on loan. |
|
(d) Amount is stated in United States dollars unless otherwise noted. |
|
(e) Security or a portion of the security is on loan at period end. |
|
(f) Affiliated company |
|
(g) Security exempt from registration under Rule 144A of the Securities Act of 1933. These securities may be resold in transactions exempt from registration, normally to qualified institutional buyers. At the end of the period, the value of these securities amounted to $17,774,000 or 0.7% of net assets. |
|
(h) Security or a portion of the security is pledged as collateral for call options written. At period end, the value of securities pledged amounted to $62,661,000. |
|
(i) Investment is owned by an entity that is treated as a corporation for U.S. tax purposes and is owned by the Fund. |
|
(j) Restricted securities - Investment in securities not registered under the Securities Act of 1933 (excluding 144A issues). At the end of the period, the value of restricted securities (excluding 144A issues) amounted to $20,063,000 or 0.8% of net assets. |
|
Additional information on each restricted holding is as follows: |
|
Security |
Acquisition Date |
Acquisition Cost (000s) |
|
Beazer Pre-Owned Rental Homes, Inc. |
5/3/12 - 10/23/12 |
$ 1,920 |
|
EQTY ER Holdings, LLC 12% 1/28/18 |
1/29/13 |
$ 5,667 |
|
EQTY ER Holdings, LLC |
1/29/13 |
$ 2,833 |
|
New Academy Holding Co. LLC unit |
8/1/11 |
$ 5,565 |
|
(k) Investments represent a non-operating interest in oil and gas wells through an entity owned by the fund that is treated as a corporation for U.S. tax purposes. |
|
Affiliated Central Funds |
|
Information regarding fiscal year to date income earned by the Fund from investments in Fidelity Central Funds is as follows: |
|
Fund |
Income earned |
|
Fidelity Cash Central Fund |
$ 104 |
|
Fidelity Securities Lending Cash Central Fund |
385 |
|
Total |
$ 489 |
|
Other Affiliated Issuers |
|
An affiliated company is a company in which the Fund has ownership of at least 5% of the voting securities. Fiscal year to date transactions with companies which are or were affiliates are as follows: |
|
Affiliate |
Value, beginning of period |
Purchases |
Sales Proceeds |
Dividend Income |
Value, |
|
EQTY ER Holdings, LLC 12% 1/28/18 |
$ - |
$ 5,667 |
$ - |
$ - |
$ 5,667 |
|
EQTY ER Holdings, LLC |
- |
2,833 |
- |
- |
2,833 |
|
Total |
$ - |
$ 8,500 |
$ - |
$ - |
$ 8,500 |
|
Other Information |
|
The following is a summary of the inputs used, as of November 30, 2013, involving the Fund's assets and liabilities carried at fair value. The inputs or methodology used for valuing securities may not be an indication of the risk associated with investing in those securities. For more information on valuation inputs, and their aggregation into the levels used in the tables below, please refer to the Investment Valuation section in the accompanying Notes to Financial Statements. |
|
Valuation Inputs at Reporting Date: |
||||
|
Description |
Total |
Level 1 |
Level 2 |
Level 3 |
|
Investments in Securities: |
||||
|
Equities: |
||||
|
Consumer Discretionary |
$ 191,980 |
$ 182,433 |
$ - |
$ 9,547 |
|
Consumer Staples |
217,759 |
217,759 |
- |
- |
|
Energy |
322,159 |
322,159 |
- |
- |
|
Financials |
516,860 |
500,557 |
14,287 |
2,016 |
|
Health Care |
286,859 |
279,164 |
7,695 |
- |
|
Industrials |
249,438 |
249,438 |
- |
- |
|
Information Technology |
263,489 |
263,489 |
- |
- |
|
Materials |
21,525 |
21,525 |
- |
- |
|
Telecommunication Services |
97,542 |
70,841 |
26,701 |
- |
|
Utilities |
103,726 |
94,473 |
9,253 |
- |
|
Corporate Bonds |
81,237 |
- |
81,237 |
- |
|
Other/Energy |
8,500 |
- |
- |
8,500 |
|
Money Market Funds |
108,060 |
108,060 |
- |
- |
|
Total Investments in Securities: |
$ 2,469,134 |
$ 2,309,898 |
$ 139,173 |
$ 20,063 |
|
Derivative Instruments: |
||||
|
Liabilities |
||||
|
Written Options |
$ (1,487) |
$ (1,487) |
$ - |
$ - |
|
Value of Derivative Instruments |
|
The following table is a summary of the Fund's value of derivative instruments by primary risk exposure as of November 30, 2013. For additional information on derivative instruments, please refer to the Derivative Instruments section in the accompanying Notes to Financial Statements. |
|
Primary Risk Exposure / |
Value |
|
|
|
Asset |
Liability |
|
Equity Risk |
||
|
Written Options (a) |
$ - |
$ (1,487) |
|
Total Value of Derivatives |
$ - |
$ (1,487) |
|
(a) Gross value is presented in the Statement of Assets and Liabilities in the written options, at value line-item. |
|
Distribution of investments by country or territory of incorporation, as a percentage of total net assets, is as follows (Unaudited): |
|
United States of America |
88.5% |
|
United Kingdom |
4.4% |
|
Ireland |
1.6% |
|
Canada |
1.2% |
|
Bermuda |
1.0% |
|
Others (Individually Less Than 1%) |
3.3% |
|
|
100.0% |
See accompanying notes which are an integral part of the financial statements.
Annual Report
Financial Statements
Statement of Assets and Liabilities
|
Amounts in thousands (except per-share amounts) |
November 30, 2013 |
|
|
|
|
|
|
Assets |
|
|
|
Investment in securities, at value (including securities loaned of $4,008) - See accompanying schedule: Unaffiliated issuers (cost $1,934,139) |
$ 2,352,574 |
|
|
Fidelity Central Funds (cost $108,060) |
108,060 |
|
|
Other affiliated issuers (cost $8,500) |
8,500 |
|
|
Total Investments (cost $2,050,699) |
|
$ 2,469,134 |
|
Receivable for fund shares sold |
|
946 |
|
Dividends receivable |
|
7,250 |
|
Interest receivable |
|
725 |
|
Distributions receivable from Fidelity Central Funds |
|
9 |
|
Prepaid expenses |
|
7 |
|
Other receivables |
|
114 |
|
Total assets |
|
2,478,185 |
|
|
|
|
|
Liabilities |
|
|
|
Payable for investments purchased |
$ 573 |
|
|
Payable for fund shares redeemed |
3,232 |
|
|
Accrued management fee |
925 |
|
|
Distribution and service plan fees payable |
754 |
|
|
Written options, at value (premium received $831) |
1,487 |
|
|
Other affiliated payables |
481 |
|
|
Other payables and accrued expenses |
162 |
|
|
Collateral on securities loaned, at value |
4,117 |
|
|
Total liabilities |
|
11,731 |
|
|
|
|
|
Net Assets |
|
$ 2,466,454 |
|
Net Assets consist of: |
|
|
|
Paid in capital |
|
$ 2,145,085 |
|
Undistributed net investment income |
|
11,107 |
|
Accumulated undistributed net realized gain (loss) on investments and foreign currency transactions |
|
(107,532) |
|
Net unrealized appreciation (depreciation) on investments and assets and liabilities in foreign currencies |
|
417,794 |
|
Net Assets |
|
$ 2,466,454 |
See accompanying notes which are an integral part of the financial statements.
Annual Report
Statement of Assets and Liabilities - continued
|
Amounts in thousands (except per-share amounts) |
November 30, 2013 |
|
|
|
|
|
|
Calculation of Maximum Offering Price Class A: |
|
$ 31.60 |
|
|
|
|
|
Maximum offering price per share (100/94.25 of $31.60) |
|
$ 33.53 |
|
Class T: |
|
$ 32.09 |
|
|
|
|
|
Maximum offering price per share (100/96.50 of $32.09) |
|
$ 33.25 |
|
Class B: |
|
$ 31.79 |
|
|
|
|
|
Class C: |
|
$ 31.73 |
|
|
|
|
|
Institutional Class: |
|
$ 32.62 |
|
|
|
|
|
Class Z: |
|
$ 32.63 |
A Redemption price per share is equal to net asset value less any applicable contingent deferred sales charge.
See accompanying notes which are an integral part of the financial statements.
Annual Report
Financial Statements - continued
Statement of Operations
|
Amounts in thousands |
Year ended November 30, 2013 |
|
|
|
|
|
|
Investment Income |
|
|
|
Dividends |
|
$ 67,324 |
|
Interest |
|
2,907 |
|
Income from Fidelity Central Funds |
|
489 |
|
Total income |
|
70,720 |
|
|
|
|
|
Expenses |
|
|
|
Management fee |
$ 10,530 |
|
|
Transfer agent fees |
5,071 |
|
|
Distribution and service plan fees |
8,429 |
|
|
Accounting and security lending fees |
699 |
|
|
Custodian fees and expenses |
53 |
|
|
Independent trustees' compensation |
13 |
|
|
Registration fees |
125 |
|
|
Audit |
68 |
|
|
Legal |
8 |
|
|
Miscellaneous |
20 |
|
|
Total expenses before reductions |
25,016 |
|
|
Expense reductions |
(221) |
24,795 |
|
Net investment income (loss) |
|
45,925 |
|
Realized and Unrealized Gain (Loss) Net realized gain (loss) on: |
|
|
|
Investment securities: |
|
|
|
Unaffiliated issuers |
209,890 |
|
|
Foreign currency transactions |
78 |
|
|
Written options |
983 |
|
|
Total net realized gain (loss) |
|
210,951 |
|
Change in net unrealized appreciation (depreciation) on: Investment securities |
277,176 |
|
|
Assets and liabilities in foreign currencies |
18 |
|
|
Written options |
(656) |
|
|
Total change in net unrealized appreciation (depreciation) |
|
276,538 |
|
Net gain (loss) |
|
487,489 |
|
Net increase (decrease) in net assets resulting from operations |
|
$ 533,414 |
See accompanying notes which are an integral part of the financial statements.
Annual Report
Statement of Changes in Net Assets
|
Amounts in thousands |
Year ended |
Year ended |
|
Increase (Decrease) in Net Assets |
|
|
|
Operations |
|
|
|
Net investment income (loss) |
$ 45,925 |
$ 50,901 |
|
Net realized gain (loss) |
210,951 |
109,033 |
|
Change in net unrealized appreciation (depreciation) |
276,538 |
183,817 |
|
Net increase (decrease) in net assets resulting |
533,414 |
343,751 |
|
Distributions to shareholders from net investment income |
(43,731) |
(45,384) |
|
Distributions to shareholders from net realized gain |
(2,444) |
- |
|
Total distributions |
(46,175) |
(45,384) |
|
Share transactions - net increase (decrease) |
(140,174) |
(210,314) |
|
Total increase (decrease) in net assets |
347,065 |
88,053 |
|
|
|
|
|
Net Assets |
|
|
|
Beginning of period |
2,119,389 |
2,031,336 |
|
End of period (including undistributed net investment income of $11,107 and undistributed net investment income of $9,853, respectively) |
$ 2,466,454 |
$ 2,119,389 |
See accompanying notes which are an integral part of the financial statements.
Annual Report
Financial Highlights - Class A
|
Years ended November 30, |
2013 |
2012 |
2011 |
2010 |
2009 |
|
Selected Per-Share Data |
|
|
|
|
|
|
Net asset value, beginning of period |
$ 25.55 |
$ 22.18 |
$ 21.07 |
$ 20.26 |
$ 16.72 |
|
Income from Investment Operations |
|
|
|
|
|
|
Net investment income (loss) C |
.60 |
.61 |
.42 |
.25 |
.28 |
|
Net realized and unrealized gain (loss) |
6.06 |
3.32 |
1.11 |
.81 |
3.58 |
|
Total from investment operations |
6.66 |
3.93 |
1.53 |
1.06 |
3.86 |
|
Distributions from net investment income |
(.58) |
(.56) |
(.42) |
(.25) |
(.32) |
|
Distributions from net realized gain |
(.03) |
- |
- |
- |
- |
|
Total distributions |
(.61) |
(.56) |
(.42) |
(.25) |
(.32) |
|
Net asset value, end of period |
$ 31.60 |
$ 25.55 |
$ 22.18 |
$ 21.07 |
$ 20.26 |
|
Total Return A, B |
26.43% |
17.90% |
7.25% |
5.26% |
23.58% |
|
Ratios to Average Net Assets D, F |
|
|
|
|
|
|
Expenses before reductions |
.98% |
1.02% |
1.03% |
1.04% |
1.07% |
|
Expenses net of fee waivers, if any |
.98% |
1.02% |
1.03% |
1.04% |
1.07% |
|
Expenses net of all reductions |
.97% |
1.01% |
1.02% |
1.04% |
1.07% |
|
Net investment income (loss) |
2.07% |
2.52% |
1.82% |
1.21% |
1.67% |
|
Supplemental Data |
|
|
|
|
|
|
Net assets, end of period (in millions) |
$ 777 |
$ 646 |
$ 634 |
$ 719 |
$ 831 |
|
Portfolio turnover rate E |
34% |
49% |
89% |
29% |
76% |
A Total returns would have been lower if certain expenses had not been reduced during the applicable periods shown.
B Total returns do not include the effect of the sales charges.
C Calculated based on average shares outstanding during the period.
D Fees and expenses of any underlying Fidelity Central Funds are not included in the Fund's expense ratio. The Fund indirectly bears its proportionate share of the expenses of any underlying Fidelity Central Funds.
E Amount does not include the portfolio activity of any underlying Fidelity Central Funds.
F Expense ratios reflect operating expenses of the class. Expenses before reductions do not reflect amounts reimbursed by the investment adviser or reductions from brokerage service arrangements or reductions from other expense offset arrangements and do not represent the amount paid by the class during periods when reimbursements or reductions occur. Expenses net of fee waivers reflect expenses after reimbursement by the investment adviser but prior to reductions from brokerage service arrangements or other expense offset arrangements. Expenses net of all reductions represent the net expenses paid by the class.
See accompanying notes which are an integral part of the financial statements.
Annual Report
Financial Highlights - Class T
|
Years ended November 30, |
2013 |
2012 |
2011 |
2010 |
2009 |
|
Selected Per-Share Data |
|
|
|
|
|
|
Net asset value, beginning of period |
$ 25.94 |
$ 22.50 |
$ 21.37 |
$ 20.54 |
$ 16.94 |
|
Income from Investment Operations |
|
|
|
|
|
|
Net investment income (loss) C |
.55 |
.57 |
.38 |
.22 |
.25 |
|
Net realized and unrealized gain (loss) |
6.15 |
3.37 |
1.13 |
.82 |
3.63 |
|
Total from investment operations |
6.70 |
3.94 |
1.51 |
1.04 |
3.88 |
|
Distributions from net investment income |
(.52) |
(.50) |
(.38) |
(.21) |
(.28) |
|
Distributions from net realized gain |
(.03) |
- |
- |
- |
- |
|
Total distributions |
(.55) |
(.50) |
(.38) |
(.21) |
(.28) |
|
Net asset value, end of period |
$ 32.09 |
$ 25.94 |
$ 22.50 |
$ 21.37 |
$ 20.54 |
|
Total Return A, B |
26.14% |
17.70% |
7.02% |
5.09% |
23.35% |
|
Ratios to Average Net Assets D, F |
|
|
|
|
|
|
Expenses before reductions |
1.19% |
1.21% |
1.22% |
1.23% |
1.28% |
|
Expenses net of fee waivers, if any |
1.19% |
1.21% |
1.22% |
1.23% |
1.28% |
|
Expenses net of all reductions |
1.18% |
1.21% |
1.21% |
1.22% |
1.27% |
|
Net investment income (loss) |
1.86% |
2.32% |
1.63% |
1.03% |
1.47% |
|
Supplemental Data |
|
|
|
|
|
|
Net assets, end of period (in millions) |
$ 984 |
$ 854 |
$ 862 |
$ 1,108 |
$ 1,264 |
|
Portfolio turnover rate E |
34% |
49% |
89% |
29% |
76% |
A Total returns would have been lower if certain expenses had not been reduced during the applicable periods shown.
B Total returns do not include the effect of the sales charges.
C Calculated based on average shares outstanding during the period.
D Fees and expenses of any underlying Fidelity Central Funds are not included in the Fund's expense ratio. The Fund indirectly bears its proportionate share of the expenses of any underlying Fidelity Central Funds.
E Amount does not include the portfolio activity of any underlying Fidelity Central Funds.
F Expense ratios reflect operating expenses of the class. Expenses before reductions do not reflect amounts reimbursed by the investment adviser or reductions from brokerage service arrangements or reductions from other expense offset arrangements and do not represent the amount paid by the class during periods when reimbursements or reductions occur. Expenses net of fee waivers reflect expenses after reimbursement by the investment adviser but prior to reductions from brokerage service arrangements or other expense offset arrangements. Expenses net of all reductions represent the net expenses paid by the class.
See accompanying notes which are an integral part of the financial statements.
Annual Report
Financial Highlights - Class B
|
Years ended November 30, |
2013 |
2012 |
2011 |
2010 |
2009 |
|
Selected Per-Share Data |
|
|
|
|
|
|
Net asset value, beginning of period |
$ 25.69 |
$ 22.29 |
$ 21.16 |
$ 20.33 |
$ 16.77 |
|
Income from Investment Operations |
|
|
|
|
|
|
Net investment income (loss) C |
.36 |
.42 |
.24 |
.09 |
.15 |
|
Net realized and unrealized gain (loss) |
6.10 |
3.34 |
1.12 |
.82 |
3.59 |
|
Total from investment operations |
6.46 |
3.76 |
1.36 |
.91 |
3.74 |
|
Distributions from net investment income |
(.33) |
(.36) |
(.23) |
(.08) |
(.18) |
|
Distributions from net realized gain |
(.03) |
- |
- |
- |
- |
|
Total distributions |
(.36) |
(.36) |
(.23) |
(.08) |
(.18) |
|
Net asset value, end of period |
$ 31.79 |
$ 25.69 |
$ 22.29 |
$ 21.16 |
$ 20.33 |
|
Total Return A, B |
25.39% |
16.97% |
6.43% |
4.49% |
22.59% |
|
Ratios to Average Net Assets D, F |
|
|
|
|
|
|
Expenses before reductions |
1.80% |
1.80% |
1.81% |
1.82% |
1.84% |
|
Expenses net of fee waivers, if any |
1.80% |
1.80% |
1.81% |
1.82% |
1.84% |
|
Expenses net of all reductions |
1.79% |
1.80% |
1.80% |
1.81% |
1.84% |
|
Net investment income (loss) |
1.26% |
1.73% |
1.04% |
.44% |
.90% |
|
Supplemental Data |
|
|
|
|
|
|
Net assets, end of period (in millions) |
$ 27 |
$ 31 |
$ 42 |
$ 63 |
$ 88 |
|
Portfolio turnover rate E |
34% |
49% |
89% |
29% |
76% |
A Total returns would have been lower if certain expenses had not been reduced during the applicable periods shown.
B Total returns do not include the effect of the contingent deferred sales charge.
C Calculated based on average shares outstanding during the period.
D Fees and expenses of any underlying Fidelity Central Funds are not included in the Fund's expense ratio. The Fund indirectly bears its proportionate share of the expenses of any underlying Fidelity Central Funds.
E Amount does not include the portfolio activity of any underlying Fidelity Central Funds.
F Expense ratios reflect operating expenses of the class. Expenses before reductions do not reflect amounts reimbursed by the investment adviser or reductions from brokerage service arrangements or reductions from other expense offset arrangements and do not represent the amount paid by the class during periods when reimbursements or reductions occur. Expenses net of fee waivers reflect expenses after reimbursement by the investment adviser but prior to reductions from brokerage service arrangements or other expense offset arrangements. Expenses net of all reductions represent the net expenses paid by the class.
See accompanying notes which are an integral part of the financial statements.
Annual Report
Financial Highlights - Class C
|
Years ended November 30, |
2013 |
2012 |
2011 |
2010 |
2009 |
|
Selected Per-Share Data |
|
|
|
|
|
|
Net asset value, beginning of period |
$ 25.66 |
$ 22.27 |
$ 21.16 |
$ 20.34 |
$ 16.78 |
|
Income from Investment Operations |
|
|
|
|
|
|
Net investment income (loss) C |
.38 |
.43 |
.25 |
.09 |
.16 |
|
Net realized and unrealized gain (loss) |
6.09 |
3.33 |
1.11 |
.82 |
3.59 |
|
Total from investment operations |
6.47 |
3.76 |
1.36 |
.91 |
3.75 |
|
Distributions from net investment income |
(.37) |
(.37) |
(.25) |
(.09) |
(.19) |
|
Distributions from net realized gain |
(.03) |
- |
- |
- |
- |
|
Total distributions |
(.40) |
(.37) |
(.25) |
(.09) |
(.19) |
|
Net asset value, end of period |
$ 31.73 |
$ 25.66 |
$ 22.27 |
$ 21.16 |
$ 20.34 |
|
Total Return A, B |
25.46% |
17.03% |
6.40% |
4.50% |
22.63% |
|
Ratios to Average Net Assets D, F |
|
|
|
|
|
|
Expenses before reductions |
1.74% |
1.77% |
1.78% |
1.80% |
1.83% |
|
Expenses net of fee waivers, if any |
1.74% |
1.77% |
1.78% |
1.80% |
1.83% |
|
Expenses net of all reductions |
1.73% |
1.77% |
1.77% |
1.79% |
1.83% |
|
Net investment income (loss) |
1.32% |
1.76% |
1.06% |
.46% |
.91% |
|
Supplemental Data |
|
|
|
|
|
|
Net assets, end of period (in millions) |
$ 195 |
$ 143 |
$ 134 |
$ 149 |
$ 165 |
|
Portfolio turnover rate E |
34% |
49% |
89% |
29% |
76% |
A Total returns would have been lower if certain expenses had not been reduced during the applicable periods shown.
B Total returns do not include the effect of the contingent deferred sales charge.
C Calculated based on average shares outstanding during the period.
D Fees and expenses of any underlying Fidelity Central Funds are not included in the Fund's expense ratio. The Fund indirectly bears its proportionate share of the expenses of any underlying Fidelity Central Funds.
E Amount does not include the portfolio activity of any underlying Fidelity Central Funds.
F Expense ratios reflect operating expenses of the class. Expenses before reductions do not reflect amounts reimbursed by the investment adviser or reductions from brokerage service arrangements or reductions from other expense offset arrangements and do not represent the amount paid by the class during periods when reimbursements or reductions occur. Expenses net of fee waivers reflect expenses after reimbursement by the investment adviser but prior to reductions from brokerage service arrangements or other expense offset arrangements. Expenses net of all reductions represent the net expenses paid by the class.
See accompanying notes which are an integral part of the financial statements.
Annual Report
Financial Highlights - Institutional Class
|
Years ended November 30, |
2013 |
2012 |
2011 |
2010 |
2009 |
|
Selected Per-Share Data |
|
|
|
|
|
|
Net asset value, beginning of period |
$ 26.36 |
$ 22.86 |
$ 21.70 |
$ 20.85 |
$ 17.20 |
|
Income from Investment Operations |
|
|
|
|
|
|
Net investment income (loss) B |
.70 |
.70 |
.50 |
.32 |
.34 |
|
Net realized and unrealized gain (loss) |
6.24 |
3.43 |
1.14 |
.83 |
3.68 |
|
Total from investment operations |
6.94 |
4.13 |
1.64 |
1.15 |
4.02 |
|
Distributions from net investment income |
(.65) |
(.63) |
(.48) |
(.30) |
(.37) |
|
Distributions from net realized gain |
(.03) |
- |
- |
- |
- |
|
Total distributions |
(.68) |
(.63) |
(.48) |
(.30) |
(.37) |
|
Net asset value, end of period |
$ 32.62 |
$ 26.36 |
$ 22.86 |
$ 21.70 |
$ 20.85 |
|
Total Return A |
26.72% |
18.27% |
7.55% |
5.56% |
23.90% |
|
Ratios to Average Net Assets C, E |
|
|
|
|
|
|
Expenses before reductions |
.72% |
.73% |
.74% |
.77% |
.79% |
|
Expenses net of fee waivers, if any |
.72% |
.73% |
.74% |
.77% |
.79% |
|
Expenses net of all reductions |
.71% |
.73% |
.73% |
.76% |
.78% |
|
Net investment income (loss) |
2.34% |
2.80% |
2.10% |
1.49% |
1.96% |
|
Supplemental Data |
|
|
|
|
|
|
Net assets, end of period (in millions) |
$ 483 |
$ 445 |
$ 360 |
$ 464 |
$ 1,127 |
|
Portfolio turnover rate D |
34% |
49% |
89% |
29% |
76% |
A Total returns would have been lower if certain expenses had not been reduced during the applicable periods shown.
B Calculated based on average shares outstanding during the period.
C Fees and expenses of any underlying Fidelity Central Funds are not included in the Fund's expense ratio. The Fund indirectly bears its proportionate share of the expenses of any underlying Fidelity Central Funds.
D Amount does not include the portfolio activity of any underlying Fidelity Central Funds.
E Expense ratios reflect operating expenses of the class. Expenses before reductions do not reflect amounts reimbursed by the investment adviser or reductions from brokerage service arrangements or reductions from other expense offset arrangements and do not represent the amount paid by the class during periods when reimbursements or reductions occur. Expenses net of fee waivers reflect expenses after reimbursement by the investment adviser but prior to reductions from brokerage service arrangements or other expense offset arrangements. Expenses net of all reductions represent the net expenses paid by the class.
See accompanying notes which are an integral part of the financial statements.
Annual Report
Financial Highlights - Class Z
|
Year ended November 30, |
2013 G |
|
Selected Per-Share Data |
|
|
Net asset value, beginning of period |
$ 31.44 |
|
Income from Investment Operations |
|
|
Net investment income (loss) D |
.23 |
|
Net realized and unrealized gain (loss) |
1.12 |
|
Total from investment operations |
1.35 |
|
Distributions from net investment income |
(.16) |
|
Net asset value, end of period |
$ 32.63 |
|
Total Return B, C |
4.30% |
|
Ratios to Average Net Assets E, H |
|
|
Expenses before reductions |
.54% A |
|
Expenses net of fee waivers, if any |
.54% A |
|
Expenses net of all reductions |
.54% A |
|
Net investment income (loss) |
2.37% A |
|
Supplemental Data |
|
|
Net assets, end of period (000 omitted) |
$ 104 |
|
Portfolio turnover rate F |
34% |
A Annualized
B Total returns for periods of less than one year are not annualized.
C Total returns would have been lower if certain expenses had not been reduced during the applicable periods shown.
D Calculated based on average shares outstanding during the period.
E Fees and expenses of any underlying Fidelity Central Funds are not included in the Fund's expense ratio. The Fund indirectly bears its proportionate share of the expenses of any underlying Fidelity Central Funds.
F Amount does not include the portfolio activity of any underlying Fidelity Central Funds.
G For the period August 13, 2013 (commencement of sale of shares) to November 30, 2013.
H Expense ratios reflect operating expenses of the class. Expenses before reductions do not reflect amounts reimbursed by the investment adviser or reductions from brokerage service arrangements or reductions from other expense offset arrangements and do not represent the amount paid by the class during periods when reimbursements or reductions occur. Expense ratios before reductions for start-up periods may not be representative of longer-term operating periods. Expenses net of fee waivers reflect expenses after reimbursement by the investment adviser but prior to reductions from brokerage service arrangements or other expense offset arrangements. Expenses net of all reductions represent the net expenses paid by the class.
See accompanying notes which are an integral part of the financial statements.
Annual Report
Notes to Financial Statements
For the period ended November 30, 2013
(Amounts in thousands except percentages)
1. Organization.
Fidelity Advisor Equity Income Fund (the Fund) is a fund of Fidelity Advisor Series I (the Trust) and is authorized to issue an unlimited number of shares. The Trust is registered under the Investment Company Act of 1940, as amended (the 1940 Act), as an open-end management investment company organized as a Massachusetts business trust. The Fund commenced sale of Class Z shares on August 13, 2013. The Fund offers Class A, Class T, Class C, Institutional Class and Class Z shares, each of which, along with Class B shares, has equal rights as to assets and voting privileges. Class B shares are closed to new accounts and additional purchases, except for exchanges and reinvestments. Each class has exclusive voting rights with respect to matters that affect that class. Class B shares will automatically convert to Class A shares after a holding period of seven years from the initial date of purchase.
2. Investments in Fidelity Central Funds.
The Fund invests in Fidelity Central Funds, which are open-end investment companies generally available only to other investment companies and accounts managed by the investment adviser and its affiliates. The Fund's Schedule of Investments lists each of the Fidelity Central Funds held as of period end, if any, as an investment of the Fund, but does not include the underlying holdings of each Fidelity Central Fund. As an Investing Fund, the Fund indirectly bears its proportionate share of the expenses of the underlying Fidelity Central Funds.
The Money Market Central Funds seek preservation of capital and current income and are managed by Fidelity Investments Money Management, Inc. (FIMM), an affiliate of the investment adviser. Annualized expenses of the Money Market Central Funds as of their most recent shareholder report date are less than .01%.
A complete unaudited list of holdings for each Fidelity Central Fund is available upon request or at the Securities and Exchange Commission (the SEC) website at www.sec.gov. In addition, the financial statements of the Fidelity Central Funds, which are not covered by the Fund's Report of Independent Registered Public Accounting Firm, are available on the SEC website or upon request.
3. Significant Accounting Policies.
The financial statements have been prepared in conformity with accounting principles generally accepted in the United States of America (GAAP), which require management to make certain estimates and assumptions at the date of the financial statements. Actual results could differ from those estimates. Subsequent events, if any, through the date that the financial statements were issued have been evaluated in the preparation of the financial statements. The following summarizes the significant accounting policies of the Fund:
Annual Report
Notes to Financial Statements - continued
(Amounts in thousands except percentages)
3. Significant Accounting Policies - continued
Investment Valuation. Investments are valued as of 4:00 p.m. Eastern time on the last calendar day of the period. In accordance with valuation policies and procedures approved by the Board of Trustees (the Board), the Fund attempts to obtain prices from one or more third party pricing vendors or brokers to value its investments. When current market prices, quotations or currency exchange rates are not readily available or reliable, investments will be fair valued in good faith by the Fidelity Management & Research Company (FMR) Fair Value Committee (the Committee), in accordance with procedures adopted by the Board. Factors used in determining fair value vary by investment type and may include market or investment specific events, changes in interest rates and credit quality. The frequency with which these procedures are used cannot be predicted and they may be utilized to a significant extent. The Committee oversees the Fund's valuation policies and procedures and is responsible for approving and reporting to the Board all fair value determinations.
The Fund categorizes the inputs to valuation techniques used to value its investments into a disclosure hierarchy consisting of three levels as shown below:
Level 1 - quoted prices in active markets for identical investments
Level 2 - other significant observable inputs (including quoted prices for similar investments, interest rates, prepayment speeds, etc.)
Level 3 - unobservable inputs (including the Fund's own assumptions based on the best information available)
Valuation techniques used to value the Fund's investments by major category are as follows:
Equity securities, including restricted securities, for which market quotations are readily available, are valued at the last reported sale price or official closing price as reported by a third party pricing vendor on the primary market or exchange on which they are traded and are categorized as Level 1 in the hierarchy. In the event there were no sales during the day or closing prices are not available, securities are valued at the last quoted bid price or may be valued using the last available price and are generally categorized as Level 2 in the hierarchy. For foreign equity securities, when market or security specific events arise, comparisons to the valuation of American Depositary Receipts (ADRs), futures contracts, Exchange-Traded Funds (ETFs) and certain indexes as well as quoted prices for similar securities may be used and would be categorized as Level 2 in the hierarchy. Utilizing these techniques may result in transfers between Level 1 and Level 2. For equity securities, including restricted securities, where observable inputs are limited, assumptions about market activity and risk are used and these securities may be categorized as Level 3 in the hierarchy.
Annual Report
3. Significant Accounting Policies - continued
Investment Valuation - continued
Debt securities, including restricted securities, are valued based on evaluated prices received from third party pricing vendors or from brokers who make markets in such securities. For corporate bonds, pricing vendors utilize matrix pricing which considers yield or price of bonds of comparable quality, coupon, maturity and type as well as broker-supplied prices. When independent prices are unavailable or unreliable, debt securities may be valued utilizing pricing methodologies which consider similar factors that would be used by third party pricing vendors. Debt securities are generally categorized as Level 2 in the hierarchy but may be Level 3 depending on the circumstances.
Exchange-traded options are valued using the last sale price or, in the absence of a sale, the last offering price and are categorized as Level 1 in the hierarchy. Investments in open-end mutual funds, including the Fidelity Central Funds, are valued at their closing net asset value (NAV) each business day and are categorized as Level 1 in the hierarchy.
Changes in valuation techniques may result in transfers in or out of an assigned level within the disclosure hierarchy. The aggregate value of investments by input level, as of November 30, 2013, is included at the end of the Fund's Schedule of Investments.
Foreign Currency. The Fund may use foreign currency contracts to facilitate transactions in foreign-denominated securities. Gains and losses from these transactions may arise from changes in the value of the foreign currency or if the counterparties do not perform under the contracts' terms.
Foreign-denominated assets, including investment securities, and liabilities are translated into U.S. dollars at the exchange rates at period end. Purchases and sales of investment securities, income and dividends received and expenses denominated in foreign currencies are translated into U.S. dollars at the exchange rate in effect on the transaction date.
The effects of exchange rate fluctuations on investments are included with the net realized and unrealized gain (loss) on investment securities. Other foreign currency transactions resulting in realized and unrealized gain (loss) are disclosed separately.
Investment Transactions and Income. For financial reporting purposes, the Fund's investment holdings and NAV include trades executed through the end of the last business day of the period. The NAV per share for processing shareholder transactions is calculated as of the close of business of the New York Stock Exchange (NYSE), normally 4:00 p.m. Eastern time and includes trades executed through the end of the prior business day. Gains and losses on securities sold are determined on the basis of identified cost and may include proceeds received from litigation. Dividend income is recorded on
Annual Report
Notes to Financial Statements - continued
(Amounts in thousands except percentages)
3. Significant Accounting Policies - continued
Investment Transactions and Income - continued
the ex-dividend date except for certain dividends from foreign securities where the ex-dividend date may have passed, which are recorded as soon as the Fund is informed of the ex-dividend date. Non-cash dividends included in dividend income, if any, are recorded at the fair market value of the securities received. Distributions received on securities that represent a return of capital or capital gain are recorded as a reduction of cost of investments and/or as a realized gain. Subsequent to ex-dividend date the Fund determines the components of these distributions, based upon receipt of tax filings or other correspondence relating to the underlying investment. Interest income and distributions from the Fidelity Central Funds are accrued as earned. Interest income includes coupon interest and amortization of premium and accretion of discount on debt securities. Investment income is recorded net of foreign taxes withheld where recovery of such taxes is uncertain.
Class Allocations and Expenses. Investment income, realized and unrealized capital gains and losses, common expenses of the Fund, and certain fund-level expense reductions, if any, are allocated daily on a pro-rata basis to each class based on the relative net assets of each class to the total net assets of the Fund. Each class differs with respect to transfer agent and distribution and service plan fees incurred. Certain expense reductions may also differ by class. For the reporting period, the allocated portion of income and expenses to each class as a percent of its average net assets may vary due to the timing of recording these transactions in relation to fluctuating net assets of the classes. Expenses directly attributable to a fund are charged to that fund. Expenses attributable to more than one fund are allocated among the respective funds on the basis of relative net assets or other appropriate methods. Expense estimates are accrued in the period to which they relate and adjustments are made when actual amounts are known.
Deferred Trustee Compensation. Under a Deferred Compensation Plan (the Plan), independent Trustees may elect to defer receipt of a portion of their annual compensation. Deferred amounts are invested in a cross-section of Fidelity funds, are marked-to-market and remain in the Fund until distributed in accordance with the Plan. The investment of deferred amounts and the offsetting payable to the Trustees are included in the accompanying Statement of Assets and Liabilities.
Income Tax Information and Distributions to Shareholders. Each year, the Fund intends to qualify as a regulated investment company under Subchapter M of the Internal Revenue Code, including distributing substantially all of its taxable income and realized gains. As a result, no provision for U.S. Federal income taxes is required. As of November 30, 2013, the Fund did not have any unrecognized tax benefits in the financial statements; nor is the Fund aware of any tax positions for which it is reasonably possible that
Annual Report
3. Significant Accounting Policies - continued
Income Tax Information and Distributions to Shareholders - continued
the total amounts of unrecognized tax benefits will significantly change in the next twelve months. The Fund files a U.S. federal tax return, in addition to state and local tax returns as required. The Fund's federal income tax returns are subject to examination by the Internal Revenue Service (IRS) for a period of three fiscal years after they are filed. State and local tax returns may be subject to examination for an additional fiscal year depending on the jurisdiction. Foreign taxes are provided for based on the Fund's understanding of the tax rules and rates that exist in the foreign markets in which it invests.
Distributions are declared and recorded on the ex-dividend date. Income dividends and capital gain distributions are declared separately for each class. Income and capital gain distributions are determined in accordance with income tax regulations, which may differ from GAAP. In addition, the fund will claim a portion of the payment made to redeeming shareholders as a distribution for income tax purposes.
Capital accounts within the financial statements are adjusted for permanent book-tax differences. These adjustments have no impact on net assets or the results of operations. Temporary book-tax differences will reverse in a subsequent period.
Book-tax differences are primarily due to foreign currency transactions, partnerships, market discount, equity-debt classifications, deferred trustee compensation, capital loss carryforwards and losses deferred due to wash sales and excise tax regulations.
The federal tax cost of investment securities and unrealized appreciation (depreciation) as of period end were as follows:
|
Gross unrealized appreciation |
$ 451,177 |
|
Gross unrealized depreciation |
(40,134) |
|
Net unrealized appreciation (depreciation) on securities and other investments |
$ 411,043 |
|
|
|
|
Tax Cost |
$ 2,058,091 |
The tax-based components of distributable earnings as of period end were as follows:
|
Undistributed ordinary income |
$ 11,847 |
|
Capital loss carryforward |
$ (100,096) |
|
Net unrealized appreciation (depreciation) |
$ 410,403 |
Capital loss carryforwards are only available to offset future capital gains of the Fund to the extent provided by regulations and may be limited. Under the Regulated Investment Company Modernization Act of 2010 (the Act), the Fund is permitted to carry forward
Annual Report
Notes to Financial Statements - continued
(Amounts in thousands except percentages)
3. Significant Accounting Policies - continued
Income Tax Information and Distributions to Shareholders - continued
capital losses incurred in taxable years beginning after December 22, 2010 for an unlimited period and such capital losses are required to be used prior to any losses that expire.
The capital loss carryforward information presented below, including any applicable limitation, is estimated as of fiscal period end and is subject to adjustment.
|
Fiscal year of expiration |
|
|
2017 |
$ 100,096 |
The tax character of distributions paid was as follows:
|
|
November 30, 2013 |
November 30, 2012 |
|
Ordinary Income |
$ 46,175 |
$ 45,384 |
Restricted Securities. The Fund may invest in securities that are subject to legal or contractual restrictions on resale. These securities generally may be resold in transactions exempt from registration or to the public if the securities are registered. Disposal of these securities may involve time-consuming negotiations and expense, and prompt sale at an acceptable price may be difficult. Information regarding restricted securities is included at the end of the Fund's Schedule of Investments.
New Accounting Pronouncement. The Financial Accounting Standards Board issued in December 2011, Accounting Standard Update No. 2011-11, Disclosures about Offsetting Assets and Liabilities, and in January 2013, Accounting Standards Update No. 2013-1 Clarifying the Scope of Disclosures about Offsetting Assets and Liabilities. These updates create new disclosure requirements requiring entities to disclose both gross and net information for derivatives and other financial instruments that are either offset in the Statement of Assets and Liabilities or subject to an enforceable master netting arrangement or similar agreement. The disclosure requirements are effective for annual reporting periods beginning on or after January 1, 2013, and interim periods within those annual periods. Management expects that the impact of the updates' adoption will be limited to additional financial statement disclosures as applicable.
4. Derivative Instruments.
Risk Exposures and the Use of Derivative Instruments. The Fund's investment objective allows the Fund to enter into various types of derivative contracts, including options. Derivatives are investments whose value is primarily derived from underlying assets, indices or reference rates and may be transacted on an exchange or over-the-counter (OTC). Derivatives may involve a future commitment to buy or sell a specified asset based on specified terms, to exchange future cash flows at periodic intervals based
Annual Report
4. Derivative Instruments - continued
Risk Exposures and the Use of Derivative Instruments - continued
on a notional principal amount, or for one party to make one or more payments upon the occurrence of specified events in exchange for periodic payments from the other party.
The Fund used derivatives to increase returns and to manage exposure to certain risks as defined below. The success of any strategy involving derivatives depends on analysis of numerous economic factors, and if the strategies for investment do not work as intended, the Fund may not achieve its objectives.
The Fund's use of derivatives increased or decreased its exposure to the following risk:
|
Equity Risk |
Equity risk relates to the fluctuations in the value of financial instruments as a result of changes in market prices (other than those arising from interest rate risk or foreign exchange risk), whether caused by factors specific to an individual investment, its issuer, or all factors affecting all instruments traded in a market or market segment. |
The Fund is also exposed to additional risks from investing in derivatives, such as liquidity risk and counterparty credit risk. Liquidity risk is the risk that the Fund will be unable to close out the derivative in the open market in a timely manner. Counterparty credit risk is the risk that the counterparty will not be able to fulfill its obligation to the Fund. Counterparty credit risk related to exchange-traded options may be mitigated by the protection provided by the exchange on which they trade.
Investing in derivatives may involve greater risks than investing in the underlying assets directly and, to varying degrees, may involve risk of loss in excess of any initial investment and collateral received and amounts recognized in the Statement of Assets and Liabilities. In addition, there may be the risk that the change in value of the derivative contract does not correspond to the change in value of the underlying instrument.
Options. Options give the purchaser the right, but not the obligation, to buy (call) or sell (put) an underlying security or financial instrument at an agreed exercise or strike price between or on certain dates. Options obligate the seller (writer) to buy (put) or sell (call) an underlying instrument at the exercise or strike price or cash settle an underlying derivative instrument if the holder exercises the option on or before the expiration date.
The Fund used exchange-traded written covered call options to manage its exposure to the market. When the Fund writes a covered call option, the Fund holds the underlying instrument which must be delivered to the holder upon the exercise of the option.
Upon entering into a written options contract, the Fund will receive a premium. Premiums received are reflected as a liability on the Statement of Assets and Liabilities. Options are valued daily and any unrealized appreciation (depreciation) is reflected on the Statement
Annual Report
Notes to Financial Statements - continued
(Amounts in thousands except percentages)
4. Derivative Instruments - continued
Options - continued
of Assets and Liabilities. When a written option is exercised, the premium is added to the proceeds from the sale of the underlying instrument in determining the gain or loss realized on that investment. When an option is closed the Fund will realize a gain or loss depending on whether the proceeds or amount paid for the closing sale transaction are greater or less than the premium received. When an option expires, gains and losses are realized to the extent of premiums received. The net realized gain (loss) on closed and expired written options and the change in net unrealized appreciation (depreciation) on written options are reflected separately on the Statement of Operations.
Writing call options tends to decrease exposure to the underlying instrument and risk of loss is the change in value in excess of the premium received.
Any open options at period end are presented in the Schedule of Investments under the caption "Written Options" and are representative of volume of activity during the period.
During the period, the Fund recognized net realized gain (loss) of $983 and a change in net unrealized appreciation (depreciation) of ($656) related to its investment in written options. This amount is included in the Statement of Operations.
The following is a summary of the Fund's written options activity:
|
Written Options |
Number of Contracts |
Amount of Premiums |
|
Outstanding at beginning of period |
- |
$ - |
|
Options Opened |
44 |
2,909 |
|
Options Exercised |
(14) |
(976) |
|
Options Closed |
(13) |
(664) |
|
Options Expired |
(4) |
(438) |
|
Outstanding at end of period |
13 |
$ 831 |
5. Purchases and Sales of Investments.
Purchases and sales of securities, other than short-term securities, aggregated $759,802 and $951,923, respectively.
6. Fees and Other Transactions with Affiliates.
Management Fee. Fidelity Management & Research Company (the investment adviser) and its affiliates provide the Fund with investment management related services for which the Fund pays a monthly management fee. The management fee is the sum of an individual fund fee rate that is based on an annual rate of .20% of the Fund's average net assets and an annualized group fee rate that averaged .25% during the period. The group fee rate is based upon the average net assets of all the mutual funds
Annual Report
6. Fees and Other Transactions with Affiliates - continued
Management Fee - continued
advised by the investment adviser, including any mutual funds previously advised by the investment adviser that are currently advised by Fidelity SelectCo, LLC, an affiliate of the investment adviser. The group fee rate decreases as assets under management increase and increases as assets under management decrease. For the reporting period, the total annual management fee rate was .45% of the Fund's average net assets.
Distribution and Service Plan Fees. In accordance with Rule 12b-1 of the 1940 Act, the Fund has adopted separate Distribution and Service Plans for each class of shares. Certain classes pay Fidelity Distributors Corporation (FDC), an affiliate of the investment adviser, separate Distribution and Service Fees, each of which is based on an annual percentage of each class' average net assets. In addition, FDC may pay financial intermediaries for selling shares of the Fund and providing shareholder support services.
For the period, the Distribution and Service Fee rates, total fees and amounts retained by FDC were as follows:
|
|
Distribution |
Service |
Total Fees |
Retained |
|
Class A |
-% |
.25% |
$ 1,790 |
$ 38 |
|
Class T |
.25% |
.25% |
4,656 |
29 |
|
Class B |
.75% |
.25% |
294 |
222 |
|
Class C |
.75% |
.25% |
1,689 |
174 |
|
|
|
|
$ 8,429 |
$ 463 |
Sales Load. FDC may receive a front-end sales charge of up to 5.75% for selling Class A shares and 3.50% for selling Class T shares, some of which is paid to financial intermediaries for selling shares of the Fund. Depending on the holding period, FDC may receive contingent deferred sales charges levied on Class A, Class T, Class B, and Class C redemptions. The deferred sales charges range from 5.00% to 1.00% for Class B shares, 1.00% for Class C shares, 1.00% for certain purchases of Class A shares and .25% for certain purchases of Class T shares.
For the period, sales charge amounts retained by FDC were as follows:
|
|
Retained |
|
Class A |
$ 162 |
|
Class T |
40 |
|
Class B* |
18 |
|
Class C* |
14 |
|
|
$ 234 |
* When Class B and Class C shares are initially sold, FDC pays commissions from its own resources to financial intermediaries through which the sales are made.
Annual Report
Notes to Financial Statements - continued
(Amounts in thousands except percentages)
6. Fees and Other Transactions with Affiliates - continued
Transfer Agent Fees. Fidelity Investments Institutional Operations Company, Inc., (FIIOC), an affiliate of the investment adviser, is the transfer, dividend disbursing and shareholder servicing agent for each class of the Fund. FIIOC receives account fees and asset-based fees that vary according to the account size and type of account of the shareholders of the respective classes of the Fund, except for Class Z. FIIOC receives an asset-based fee of Class Z's average net assets. FIIOC pays for typesetting, printing and mailing of shareholder reports, except proxy statements.
For the period, transfer agent fees for each class were as follows:
|
|
Amount |
% of |
|
Class A |
$ 1,691 |
.24 |
|
Class T |
1,826 |
.20 |
|
Class B |
88 |
.30 |
|
Class C |
409 |
.24 |
|
Institutional Class |
1,057 |
.22 |
|
Class Z |
-* |
.05** |
|
|
$ 5,071 |
|
* Amount represents fifteen dollars.
** Annualized
Accounting and Security Lending Fees. Fidelity Service Company, Inc. (FSC), an affiliate of the investment adviser, maintains the Fund's accounting records. The accounting fee is based on the level of average net assets for each month. Under a separate contract, FSC administers the security lending program. The security lending fee is based on the number and duration of lending transactions.
Brokerage Commissions. The Fund placed a portion of its portfolio transactions with brokerage firms which are affiliates of the investment adviser. Brokerage commissions are included in net realized gain (loss) and change in net unrealized appreciation (depreciation) in the Statement of Operations. The commissions paid to these affiliated firms were $17 for the period.
7. Committed Line of Credit.
The Fund participates with other funds managed by the investment adviser or an affiliate in a $4.25 billion credit facility (the "line of credit") to be utilized for temporary or emergency purposes to fund shareholder redemptions or for other short-term liquidity purposes. The Fund has agreed to pay commitment fees on its pro-rata portion of the line of credit, which amounted to $5 and is reflected in Miscellaneous expenses on the Statement of Operations. During the period, there were no borrowings on this line of credit.
Annual Report
8. Security Lending.
The Fund lends portfolio securities through a lending agent from time to time in order to earn additional income. For equity securities, a lending agent is used and may loan securities to certain qualified borrowers, including Fidelity Capital Markets (FCM), a broker-dealer affiliated with the Fund. On the settlement date of the loan, the Fund receives collateral (in the form of U.S. Treasury obligations, letters of credit and/or cash) against the loaned securities and maintains collateral in an amount not less than 100% of the market value of the loaned securities during the period of the loan. The market value of the loaned securities is determined at the close of business of the Fund and any additional required collateral is delivered to the Fund on the next business day. If the borrower defaults on its obligation to return the securities loaned because of insolvency or other reasons, the Fund may apply collateral received from the borrower against the obligation. The Fund may experience delays and costs in recovering the securities loaned. Any cash collateral received is invested in the Fidelity Securities Lending Cash Central Fund. The value of loaned securities and cash collateral at period end are disclosed on the Fund's Statement of Assets and Liabilities. At period end, there were no security loans outstanding with FCM. Security lending income represents the income earned on investing cash collateral, less rebates paid to borrowers and any lending agent fees associated with the loan, plus any premium payments received for lending certain types of securities. Security lending income is presented in the Statement of Operations as a component of income from Fidelity Central Funds. Total security lending income during the period amounted to $385, including $1 from securities loaned to FCM.
9. Expense Reductions.
The investment adviser voluntarily agreed to reimburse a portion of the Fund's Class A, Class T, Class B, Class C and Institutional Class operating expenses. During the period, this reimbursement reduced expenses as follows:
|
|
Reimbursement |
|
|
|
|
Class A |
$ 4 |
|
Class T |
6 |
|
Class B |
-* |
|
Class C |
1 |
|
Institutional Class |
3 |
|
|
$ 14 |
* Amount represents one hundred and sixty-three dollars.
Commissions paid to certain brokers with whom the investment adviser, or its affiliates, places trades on behalf of the Fund include an amount in addition to trade execution, which may be rebated back to the Fund to offset certain expenses. This amount totaled
Annual Report
Notes to Financial Statements - continued
(Amounts in thousands except percentages)
9. Expense Reductions - continued
$206 for the period. In addition, through arrangements with the Fund's custodian, credits realized as a result of uninvested cash balances were used to reduce the Fund's expenses. During the period, these credits reduced the Fund's custody expenses by $1.
10. Distributions to Shareholders.
Distributions to shareholders of each class were as follows:
|
Years ended November 30, |
2013 A |
2012 |
|
From net investment income |
|
|
|
Class A |
$ 14,351 |
$ 14,971 |
|
Class T |
16,481 |
17,872 |
|
Class B |
359 |
544 |
|
Class C |
2,111 |
2,166 |
|
Institutional Class |
10,429 |
9,831 |
|
Class Z |
-* |
- |
|
Total |
$ 43,731 |
$ 45,384 |
|
From net realized gain |
|
|
|
Class A |
$ 754 |
$ - |
|
Class T |
982 |
- |
|
Class B |
36 |
- |
|
Class C |
167 |
- |
|
Institutional Class |
505 |
- |
|
Total |
$ 2,444 |
$ - |
A Distributions for Class Z are for the period August 13, 2013 (commencement of sale of shares) to November 30, 2013.
* Amount represents four hundred and ninety-six dollars.
11. Share Transactions.
Transactions for each class of shares were as follows:
|
|
Shares |
Dollars |
||
|
Years ended November 30, |
2013 A |
2012 |
2013A |
2012 |
|
Class A |
|
|
|
|
|
Shares sold |
3,676 |
3,213 |
$ 106,691 |
$ 77,551 |
|
Reinvestment of distributions |
505 |
577 |
13,926 |
13,763 |
|
Shares redeemed |
(4,869) |
(7,076) |
(139,536) |
(170,494) |
|
Net increase (decrease) |
(688) |
(3,286) |
$ (18,919) |
$ (79,180) |
|
Class T |
|
|
|
|
|
Shares sold |
3,948 |
3,722 |
$ 115,563 |
$ 91,180 |
|
Reinvestment of distributions |
601 |
709 |
16,778 |
17,138 |
|
Shares redeemed |
(6,787) |
(9,817) |
(197,631) |
(240,587) |
|
Net increase (decrease) |
(2,238) |
(5,386) |
$ (65,290) |
$ (132,269) |
Annual Report
11. Share Transactions - continued
|
|
Shares |
Dollars |
||
|
Years ended November 30, |
2013 A |
2012 |
2013A |
2012 |
|
Class B |
|
|
|
|
|
Shares sold |
42 |
27 |
$ 1,216 |
$ 663 |
|
Reinvestment of distributions |
13 |
21 |
359 |
492 |
|
Shares redeemed |
(423) |
(695) |
(12,147) |
(16,864) |
|
Net increase (decrease) |
(368) |
(647) |
$ (10,572) |
$ (15,709) |
|
Class C |
|
|
|
|
|
Shares sold |
1,636 |
618 |
$ 48,035 |
$ 15,024 |
|
Reinvestment of distributions |
72 |
79 |
1,992 |
1,896 |
|
Shares redeemed |
(1,139) |
(1,166) |
(33,153) |
(28,340) |
|
Net increase (decrease) |
569 |
(469) |
$ 16,874 |
$ (11,420) |
|
Institutional Class |
|
|
|
|
|
Shares sold |
2,274 |
5,436 |
$ 67,514 |
$ 134,907 |
|
Reinvestment of distributions |
369 |
377 |
10,496 |
9,300 |
|
Shares redeemed |
(4,733) |
(4,659) |
(140,377) |
(115,943) |
|
Net increase (decrease) |
(2,090) |
1,154 |
$ (62,367) |
$ 28,264 |
|
Class Z |
|
|
|
|
|
Shares sold |
3 |
- |
$ 100 |
$ - |
|
Reinvestment of distributions |
-* |
- |
-** |
- |
|
Net increase (decrease) |
3 |
- |
$ 100 |
$ - |
A Share transactions for Class Z are for the period August 13, 2013 (commencement of sale of shares) to November 30, 2013.
* Amount represents seventy-two shares.
** Amount represents four hundred and ninety-six dollars.
12. Other.
The Fund's organizational documents provide former and current trustees and officers with a limited indemnification against liabilities arising in connection with the performance of their duties to the Fund. In the normal course of business, the Fund may also enter into contracts that provide general indemnifications. The Fund's maximum exposure under these arrangements is unknown as this would be dependent on future claims that may be made against the Fund. The risk of material loss from such claims is considered remote.
Annual Report
Report of Independent Registered Public Accounting Firm
To the Trustees of Fidelity Advisor Series I and Shareholders of Fidelity Advisor Equity Income Fund:
We have audited the accompanying statement of assets and liabilities of Fidelity Advisor Equity Income Fund (the Fund), a fund of Fidelity Advisor Series I, including the schedule of investments, as of November 30, 2013, and the related statement of operations for the year then ended, the statement of changes in net assets for each of the two years in the period then ended, and the financial highlights for each of the five years in the period then ended. These financial statements and financial highlights are the responsibility of the Fund's management. Our responsibility is to express an opinion on these financial statements and financial highlights based on our audits.
We conducted our audits in accordance with the standards of the Public Company Accounting Oversight Board (United States). Those standards require that we plan and perform the audit to obtain reasonable assurance about whether the financial statements and financial highlights are free of material misstatement. The Fund is not required to have, nor were we engaged to perform, an audit of its internal control over financial reporting. Our audits included consideration of internal control over financial reporting as a basis for designing audit procedures that are appropriate in the circumstances, but not for the purpose of expressing an opinion on the effectiveness of the Fund's internal control over financial reporting. Accordingly, we express no such opinion. An audit also includes examining, on a test basis, evidence supporting the amounts and disclosures in the financial statements, assessing the accounting principles used and significant estimates made by management, as well as evaluating the overall financial statement presentation. Our procedures included confirmation of securities owned as of November 30, 2013, by correspondence with the custodians and brokers; where replies were not received from brokers, we performed other auditing procedures. We believe that our audits provide a reasonable basis for our opinion.
In our opinion, the financial statements and financial highlights referred to above present fairly, in all material respects, the financial position of Fidelity Advisor Equity Income Fund as of November 30, 2013, the results of its operations for the year then ended, the changes in its net assets for each of the two years in the period then ended, and the financial highlights for each of the five years in the period then ended, in conformity with accounting principles generally accepted in the United States of America.
DELOITTE & TOUCHE LLP
Boston, Massachusetts
January 15, 2014
Annual Report
Trustees and Officers
The Trustees, Member of the Advisory Board, and officers of the trust and fund, as applicable, are listed below. The Board of Trustees governs the fund and is responsible for protecting the interests of shareholders. The Trustees are experienced executives who meet periodically throughout the year to oversee the fund's activities, review contractual arrangements with companies that provide services to the fund, oversee management of the risks associated with such activities and contractual arrangements, and review the fund's performance. Except for James C. Curvey, Ned C. Lautenbach, Ronald P. O'Hanley, and William S. Stavropoulos, each of the Trustees oversees 173 funds. Mr. Curvey oversees 396 funds. Mr. Lautenbach, Mr. O'Hanley, and Mr. Stavropoulos each oversees 247 funds.
The Trustees hold office without limit in time except that (a) any Trustee may resign; (b) any Trustee may be removed by written instrument, signed by at least two-thirds of the number of Trustees prior to such removal; (c) any Trustee who requests to be retired or who has become incapacitated by illness or injury may be retired by written instrument signed by a majority of the other Trustees; and (d) any Trustee may be removed at any special meeting of shareholders by a two-thirds vote of the outstanding voting securities of the trust. Each Trustee who is not an interested person (as defined in the 1940 Act) of the trust and the fund (Independent Trustee), shall retire not later than the last day of the calendar year in which his or her 75th birthday occurs. The Independent Trustees may waive this mandatory retirement age policy with respect to individual Trustees. The officers and Advisory Board Member hold office without limit in time, except that any officer and Advisory Board Member may resign or may be removed by a vote of a majority of the Trustees at any regular meeting or any special meeting of the Trustees. Except as indicated, each individual has held the office shown or other offices in the same company for the past five years.
Experience, Skills, Attributes, and Qualifications of the Fund's Trustees. The Governance and Nominating Committee has adopted a statement of policy that describes the experience, qualifications, attributes, and skills that are necessary and desirable for potential Independent Trustee candidates (Statement of Policy). The Board believes that each Trustee satisfied at the time he or she was initially elected or appointed a Trustee, and continues to satisfy, the standards contemplated by the Statement of Policy. The Governance and Nominating Committee also engages professional search firms to help identify potential Independent Trustee candidates who have the experience, qualifications, attributes, and skills consistent with the Statement of Policy. From time to time, additional criteria based on the composition and skills of the current Independent Trustees, as well as experience or skills that may be appropriate in light of future changes to board composition, business conditions, and regulatory or other developments, have also been considered by the professional search firms and the Governance and Nominating Committee. In addition, the Board takes into account the Trustees' commitment and participation in Board and committee meetings, as well as their leadership of standing and ad hoc committees throughout their tenure.
Annual Report
In determining that a particular Trustee was and continues to be qualified to serve as a Trustee, the Board has considered a variety of criteria, none of which, in isolation, was controlling. The Board believes that, collectively, the Trustees have balanced and diverse experience, qualifications, attributes, and skills, which allow the Board to operate effectively in governing the fund and protecting the interests of shareholders. Information about the specific experience, skills, attributes, and qualifications of each Trustee, which in each case led to the Board's conclusion that the Trustee should serve (or continue to serve) as a trustee of the fund, is provided below.
Board Structure and Oversight Function. James C. Curvey is an interested person (as defined in the 1940 Act) and currently serves as Chairman. The Trustees have determined that an interested Chairman is appropriate and benefits shareholders because an interested Chairman has a personal and professional stake in the quality and continuity of services provided to the fund. Independent Trustees exercise their informed business judgment to appoint an individual of their choosing to serve as Chairman, regardless of whether the Trustee happens to be independent or a member of management. The Independent Trustees have determined that they can act independently and effectively without having an Independent Trustee serve as Chairman and that a key structural component for assuring that they are in a position to do so is for the Independent Trustees to constitute a substantial majority for the Board. The Independent Trustees also regularly meet in executive session. Ned C. Lautenbach serves as Chairman of the Independent Trustees and as such (i) acts as a liaison between the Independent Trustees and management with respect to matters important to the Independent Trustees and (ii) with management prepares agendas for Board meetings.
Fidelity funds are overseen by different Boards of Trustees. The fund's Board oversees Fidelity's equity and high income funds and another Board oversees Fidelity's investment-grade bond, money market, and asset allocation funds. The asset allocation funds may invest in Fidelity funds overseen by the fund's Board. The use of separate Boards, each with its own committee structure, allows the Trustees of each group of Fidelity funds to focus on the unique issues of the funds they oversee, including common research, investment, and operational issues. On occasion, the separate Boards establish joint committees to address issues of overlapping consequences for the Fidelity funds overseen by each Board.
The Trustees operate using a system of committees to facilitate the timely and efficient consideration of all matters of importance to the Trustees, the fund, and fund shareholders and to facilitate compliance with legal and regulatory requirements and oversight of the fund's activities and associated risks. The Board, acting through its committees, has charged FMR and its affiliates with (i) identifying events or circumstances the occurrence of which could have demonstrably adverse effects on the fund's business and/or reputation; (ii) implementing processes and controls to lessen the possibility that such events or circumstances occur or to mitigate the effects of such events or circumstances if they do occur; and (iii) creating and maintaining a system designed to evaluate continuously business and market conditions in order to facilitate the identification and implementation processes described in (i) and (ii) above. Because the day-to-day operations and activities of the fund are carried out by or through FMR, its affiliates and other service providers, the fund's exposure to risks is mitigated but not eliminated by the processes overseen by the Trustees. While each of the Board's committees has responsibility for overseeing different aspects of the fund's activities, oversight is exercised primarily through the Operations, Audit, and Compliance Committees. In addition, the Independent Trustees have worked with FMR to enhance the Board's oversight of investment and financial risks, legal and regulatory risks, technology risks, and operational risks, including the development of additional risk reporting to the Board. For example, a working group comprised of Independent Trustees and FMR has worked and continues to work to review the Fidelity funds' valuation-related activities, reporting and risk management. Appropriate personnel, including but not limited to the fund's Chief Compliance Officer (CCO), FMR's internal auditor, the independent accountants, the fund's Treasurer and portfolio management personnel, make periodic reports to the Board's committees, as appropriate, including an annual review of FMR's risk management program for the Fidelity funds. The responsibilities of each standing committee, including their oversight responsibilities, are described further under "Standing Committees of the Fund's Trustees."
Annual Report
Trustees and Officers - continued
The fund's Statement of Additional Information (SAI) includes more information about the Trustees. To request a free copy, call Fidelity at 1-877-208-0098.
Interested Trustees*:
Correspondence intended for each Trustee who is an interested person may be sent to Fidelity Investments, 245 Summer Street, Boston, Massachusetts 02210.
|
Name, Year of Birth; Principal Occupations and Other Relevant Experience+ |
|
|
James C. Curvey (1935) |
|
|
Year of Election or Appointment: 2007 Trustee Chairman of the Board of Trustees |
|
|
|
Mr. Curvey also serves as Trustee of other Fidelity funds. Mr. Curvey is a Director of Fidelity Investments Money Management, Inc. (2009-present), Director of Fidelity Research & Analysis Co. (2009-present) and Director of FMR and FMR Co., Inc. (2007-present). Mr. Curvey is also Vice Chairman (2007-present) and Director of FMR LLC. In addition, Mr. Curvey serves as an Overseer for the Boston Symphony Orchestra and a member of the Trustees of Villanova University. Previously, Mr. Curvey was the Vice Chairman (2006-2007) and Director (2000-2007) of FMR Corp. |
|
Ronald P. O'Hanley (1957) |
|
|
Year of Election or Appointment: 2011 Trustee |
|
|
|
Mr. O'Hanley also serves as Trustee of other Fidelity funds. He is Director of Fidelity SelectCo, LLC (2013-present), FMR Co., Inc. (2010-present), Director of Fidelity Investments Money Management, Inc. (2010-present), Director of Fidelity Research & Analysis Company (2010-present), President of Fidelity Asset Management and Corporate Services and a Member of Fidelity's Executive Committee (2010-present). Previously, Mr. O'Hanley served as President and Chief Executive Officer of BNY Mellon Asset Management (2007-2010). Mr. O'Hanley also served as Vice Chairman of Bank New York Mellon Corp. and a member of that firm's Executive Committee. Prior to the 2007 merger of The Bank of New York and Mellon Financial Corporation, he was Vice Chairman of Mellon Financial Corporation and President and Chief Executive Officer of Mellon Asset Management. He joined Mellon in February 1997. Mr. O'Hanley currently serves as Chairman of the Boston Public Library Foundation Board of Directors and sits on the Board of Directors of Beth Israel Deaconess Medical Center, the Board of Trustees of the Marine Biological Laboratory and the Advisory Board of the Maxwell School of Citizenship and Public Administration at Syracuse University. Mr. O'Hanley also chairs the Council on Asset Management for the Financial Services Roundtable and is a member of the Board of Directors of Institutional Investor's U.S. Institute. |
* Trustees have been determined to be "Interested Trustees" by virtue of, among other things, their affiliation with the trust or various entities under common control with FMR.
+ The information above includes each Trustee's principal occupation during the last five years and other information relating to the experience, attributes, and skills relevant to each Trustee's qualifications to serve as a Trustee, which led to the conclusion that each Trustee should serve as a Trustee for the fund.
Annual Report
Trustees and Officers - continued
Independent Trustees:
Correspondence intended for each Independent Trustee (that is, the Trustees other than the Interested Trustees) may be sent to Fidelity Investments, P.O. Box 55235, Boston, Massachusetts 02205-5235.
|
Name, Year of Birth; Principal Occupations and Other Relevant Experience+ |
|
|
Dennis J. Dirks (1948) |
|
|
Year of Election or Appointment: 2005 Trustee |
|
|
|
Mr. Dirks also serves as Trustee of other Fidelity funds. Prior to his retirement in May 2003, Mr. Dirks was Chief Operating Officer and a member of the Board of The Depository Trust & Clearing Corporation (DTCC). He also served as President, Chief Operating Officer, and Board member of The Depository Trust Company (DTC) and President and Board member of the National Securities Clearing Corporation (NSCC). In addition, Mr. Dirks served as Chief Executive Officer and Board member of the Government Securities Clearing Corporation, Chief Executive Officer and Board member of the Mortgage-Backed Securities Clearing Corporation, as a Trustee and a member of the Finance Committee of Manhattan College (2005-2008), and as a Trustee and a member of the Finance Committee of AHRC of Nassau County (2006-2008). Mr. Dirks is a member of the Independent Directors Council (IDC) Governing Council (2010-present) and Board of Directors for The Brookville Center for Children's Services, Inc. (2009-present). |
|
Alan J. Lacy (1953) |
|
|
Year of Election or Appointment: 2008 Trustee |
|
|
|
Mr. Lacy also serves as Trustee of other Fidelity funds. Mr. Lacy serves as Senior Adviser (2007-present) of Oak Hill Capital Partners, L.P. (private equity). Mr. Lacy also served as Chief Executive Officer (2000-2005) and Vice Chairman (2005-2006) of Sears Holdings Corporation and Sears, Roebuck and Co. (retail). In addition, Mr. Lacy serves as a member of the Board of Directors of Dave & Buster's Entertainment, Inc. (restaurant and entertainment complexes, 2010-present), Earth Fare, Inc. (retail grocery, 2012-present), The Hillman Companies, Inc. (hardware wholesalers, 2010-present), and Bristol-Myers Squibb Company (global pharmaceuticals, 2008-present). Mr. Lacy is a member of the Board of Trustees of The National Parks Conservation Association (2006-present). Previously, Mr. Lacy served as Chairman of the Board of Trustees of the National Parks Conservation Association (2008-2011) and as a member of the Board of Directors for the Western Union Company (global money transfer, 2006-2011). |
|
Ned C. Lautenbach (1944) |
|
|
Year of Election or Appointment: 2000 Trustee Chairman of the Independent Trustees |
|
|
|
Mr. Lautenbach also serves as Trustee of other Fidelity funds. Mr. Lautenbach currently serves as the Lead Director of the Eaton Corporation Board of Directors (diversified industrial, 1997-present). Mr. Lautenbach is Chairman of the Board of Directors of the Philharmonic Center for the Arts in Naples, Florida (2012-present) and a member of the Council on Foreign Relations (1994-present). Previously, Mr. Lautenbach was a Partner/Advisory Partner at Clayton, Dubilier & Rice, LLC (private equity investment, 1998-2010), as well as a Director of Sony Corporation (2006-2007). |
|
Joseph Mauriello (1944) |
|
|
Year of Election or Appointment: 2008 Trustee |
|
|
|
Mr. Mauriello also serves as Trustee of other Fidelity funds. Prior to his retirement in January 2006, Mr. Mauriello served in numerous senior management positions including Deputy Chairman and Chief Operating Officer (2004-2005), and Vice Chairman of Financial Services (2002-2004) of KPMG LLP US (professional services, 1965-2005). Mr. Mauriello currently serves as a member of the Board of Directors of XL Group plc. (global insurance and re-insurance, 2006-present). Previously, Mr. Mauriello served as a Director of the Hamilton Funds of the Bank of New York (2006-2007) and of Arcadia Resources Inc. (health care services and products, 2007-2012). |
|
Robert W. Selander (1950) |
|
|
Year of Election or Appointment: 2011 Trustee |
|
|
|
Mr. Selander also serves as Trustee of other Fidelity funds. Previously, Mr. Selander served as a Member of the Advisory Board of other Fidelity funds (2011), and Executive Vice Chairman (2010), Chief Executive Officer (2009-2010), and President and Chief Executive Officer (1997-2009) of Mastercard, Inc. |
|
Cornelia M. Small (1944) |
|
|
Year of Election or Appointment: 2005 Trustee |
|
|
|
Ms. Small also serves as Trustee of other Fidelity funds. Ms. Small is a member of the Board of Directors (2009-present) and Chair of the Investment Committee (2010-present) of the Teagle Foundation. Ms. Small also serves on the Investment Committee of the Berkshire Taconic Community Foundation (2008-present). Previously, Ms. Small served as Chairperson (2002-2008) and a member of the Investment Committee and Chairperson (2008-2012) and a member of the Board of Trustees of Smith College. In addition, Ms. Small served as Chief Investment Officer, Director of Global Equity Investments, and a member of the Board of Directors of Scudder, Stevens & Clark and Scudder Kemper Investments. |
|
William S. Stavropoulos (1939) |
|
|
Year of Election or Appointment: 2002 Trustee Vice Chairman of the Independent Trustees |
|
|
|
Mr. Stavropoulos also serves as Trustee of other Fidelity funds. Mr. Stavropoulos serves as President and Founder of the Michigan Baseball Foundation, the Great Lakes Loons (2007-present). Mr. Stavropoulos is Chairman Emeritus of the Board of Directors of The Dow Chemical Company, where he previously served in numerous senior management positions, including President, CEO (1995-2000; 2002-2004), Chairman of the Executive Committee (2000-2006), and as a member of the Board of Directors (1990-2006). Currently, Mr. Stavropoulos is Chairman of the Board of Directors of Univar Inc. (global distributor of commodity and specialty chemicals), a Director of Teradata Corporation (data warehousing and technology solutions), and Maersk Inc. (industrial conglomerate), and a member of the Advisory Board for Metalmark Capital LLC (private equity investment, 2005-present). Mr. Stavropoulos is an operating advisor to Clayton, Dubilier & Rice, LLC (private equity investment). In addition, Mr. Stavropoulos is a member of the University of Notre Dame Advisory Council for the College of Science, a Trustee of the Rollin L. Gerstacker Foundation, and a Director of the Naples Philharmonic Center for the Arts. Previously, Mr. Stavropoulos served as a Director of Chemical Financial Corporation (bank holding company, 1993-2012) and Tyco International, Ltd. (multinational manufacturing and services, 2007-2012). |
|
David M. Thomas (1949) |
|
|
Year of Election or Appointment: 2008 Trustee |
|
|
|
Mr. Thomas also serves as Trustee of other Fidelity funds. Mr. Thomas serves as Non-Executive Chairman of the Board of Directors of Fortune Brands Home and Security (home and security products, 2011-present), and as a member of the Board of Directors of Interpublic Group of Companies, Inc. (marketing communication, 2004-present). Previously, Mr. Thomas served as Executive Chairman (2005-2006) and Chairman and Chief Executive Officer (2000-2005) of IMS Health, Inc. (pharmaceutical and healthcare information solutions), and a Director of Fortune Brands, Inc. (consumer products, 2000-2011). |
+ The information above includes each Trustee's principal occupation during the last five years and other information relating to the experience, attributes, and skills relevant to each Trustee's qualifications to serve as a Trustee, which led to the conclusion that each Trustee should serve as a Trustee for the fund.
Advisory Board Member and Officers:
Correspondence intended for each officer and Peter S. Lynch may be sent to Fidelity Investments, 245 Summer Street, Boston, Massachusetts 02210. Officers appear below in alphabetical order.
|
Name, Year of Birth; Principal Occupation |
|
|
Peter S. Lynch (1944) |
|
|
Year of Election or Appointment: 2003 Member of the Advisory Board |
|
|
|
Mr. Lynch also serves as Member of the Advisory Board of other Fidelity funds. Mr. Lynch is Vice Chairman and a Director of FMR and FMR Co., Inc. In addition, Mr. Lynch serves as a Trustee of Boston College and as the Chairman of the Inner-City Scholarship Fund. Previously, Mr. Lynch served on the Special Olympics International Board of Directors (1997-2006). |
|
Elizabeth Paige Baumann (1968) |
|
|
Year of Election or Appointment: 2012 Anti-Money Laundering (AML) Officer |
|
|
|
Ms. Baumann also serves as AML Officer of other funds. She is Chief AML Officer of FMR LLC (2012-present) and is an employee of Fidelity Investments. Previously, Ms. Baumann served as Vice President and Deputy Anti-Money Laundering Officer (2007-2012). |
|
William C. Coffey (1969) |
|
|
Year of Election or Appointment: 2009 Assistant Secretary |
|
|
|
Mr. Coffey also serves as Assistant Secretary of other funds. He is Senior Vice President and Deputy General Counsel of FMR LLC (2010-present), and is an employee of Fidelity Investments. Previously, Mr. Coffey served as Vice President and Associate General Counsel of FMR LLC (2005-2009). |
|
Jonathan Davis (1968) |
|
|
Year of Election or Appointment: 2010 Assistant Treasurer |
|
|
|
Mr. Davis also serves as Assistant Treasurer of other funds. Mr. Davis is an employee of Fidelity Investments. Previously, Mr. Davis served as Vice President and Associate General Counsel of FMR LLC (2003-2010). |
|
Adrien E. Deberghes (1967) |
|
|
Year of Election or Appointment: 2008 Deputy Treasurer |
|
|
|
Mr. Deberghes also serves as an officer of other funds. He is an employee of Fidelity Investments (2008-present). Prior to joining Fidelity Investments, Mr. Deberghes was Senior Vice President of Mutual Fund Administration at State Street Corporation (2007-2008), Senior Director of Mutual Fund Administration at Investors Bank & Trust (2005-2007), and Director of Finance for Dunkin' Brands (2000-2005). |
|
Stephanie J. Dorsey (1969) |
|
|
Year of Election or Appointment: 2010 Assistant Treasurer |
|
|
|
Ms. Dorsey also serves as an officer of other funds. She is an employee of Fidelity Investments (2008-present) and has served in other fund officer roles. Prior to joining Fidelity Investments, Ms. Dorsey served as Treasurer (2004-2008) of the JPMorgan Mutual Funds and Vice President (2004-2008) of JPMorgan Chase Bank. |
|
Scott C. Goebel (1968) |
|
|
Year of Election or Appointment: 2008 Secretary and Chief Legal Officer (CLO) |
|
|
|
Mr. Goebel serves as Secretary and CLO of other funds. Mr. Goebel also serves as Secretary of Fidelity Investments Money Management, Inc. (FIMM) (2010-present) and Fidelity Research and Analysis Company (FRAC) (2010-present); General Counsel, Secretary, and Senior Vice President of FMR (2008-present) and FMR Co., Inc. (2008-present); Chief Legal Officer of Fidelity Management & Research (Hong Kong) Limited (2008-present) and Assistant Secretary of Fidelity Management & Research (Japan) Inc. (2008-present), and Fidelity Management & Research (U.K.) Inc. (2008-present). Previously, Mr. Goebel served as Secretary and CLO of other Fidelity funds (2008-2013), Assistant Secretary of FIMM (2008-2010), FRAC (2008-2010), and certain funds (2007-2008); and as Vice President and Secretary of Fidelity Distributors Corporation (FDC) (2005-2007). Mr. Goebel has been employed by FMR LLC or an affiliate since 2001. |
|
Joseph A. Hanlon (1968) |
|
|
Year of Election or Appointment: 2012 Chief Compliance Officer |
|
|
|
Mr. Hanlon also serves as Chief Compliance Officer of other funds. Mr. Hanlon serves as Compliance Officer of FMR, FMR Co., Inc., Fidelity Investments Money Management, Inc. (FIMM), Fidelity Research and Analysis Company (FRAC), and Fidelity Management & Research (Hong Kong) (2009-present), as Senior Vice President of the Fidelity Asset Management Division (2009-present), and is an employee of Fidelity Investments. Previously, Mr. Hanlon served as Compliance Officer of Fidelity Management & Research (Japan) Inc. (2009-2013), Strategic Advisers, Inc. (2009-2013), and Fidelity Management & Research (U.K.) Inc. (2009-2013). |
|
Bruce T. Herring (1965) |
|
|
Year of Election or Appointment: 2006 Vice President of certain Equity Funds |
|
|
|
Mr. Herring also serves as Vice President of other funds. He serves as Chief Investment Officer of Fidelity Global Asset Allocation (GAA) (2013-present), Group Chief Investment Officer of FMR, and President of Fidelity Research & Analysis Company (2010-present). Previously, Mr. Herring served as Chief Investment Officer and Director of Fidelity Management & Research (U.K.) Inc. (2010-2013), Vice President (2005-2006) and Senior Vice President (2006-2007) of Fidelity Management & Research Company, Vice President of FMR Co., Inc. (2001-2007), and as a portfolio manager for Fidelity U.S. Equity Funds. |
|
Brian B. Hogan (1964) |
|
|
Year of Election or Appointment: 2009 Vice President |
|
|
|
Mr. Hogan also serves as Vice President of other funds. Mr. Hogan serves as President of FMR's Equity Division (2009-present). Previously, Mr. Hogan served as Senior Vice President, Equity Research of FMR (2006-2009) and as a portfolio manager. |
|
Chris Maher (1972) |
|
|
Year of Election or Appointment: 2013 Assistant Treasurer |
|
|
|
Mr. Maher serves as Assistant Treasurer of other funds. Mr. Maher is Vice President of Valuation Oversight and is an employee of Fidelity Investments. Previously, Mr. Maher served as Vice President of Asset Management Compliance (2013), Vice President of FMR's Program Management Group (2010-2013), and Vice President of Valuation Oversight (2008-2010). |
|
Christine Reynolds (1958) |
|
|
Year of Election or Appointment: 2008 Chief Financial Officer |
|
|
|
Ms. Reynolds also serves as Chief Financial Officer of other funds. Ms. Reynolds became President of Fidelity Pricing and Cash Management Services (FPCMS) in August 2008. Ms. Reynolds served as Chief Operating Officer of FPCMS (2007-2008). Previously, Ms. Reynolds served as President, Treasurer, and Anti-Money Laundering officer of the Fidelity funds (2004-2007). |
|
Kenneth B. Robins (1969) |
|
|
Year of Election or Appointment: 2008 President and Treasurer |
|
|
|
Mr. Robins also serves as an officer of other funds. Mr. Robins serves as Executive Vice President of Fidelity Investments Money Management, Inc. (FIMM) (2013-present) and is an employee of Fidelity Investments (2004-present). Previously, Mr. Robins served in other fund officer roles. |
|
Gary W. Ryan (1958) |
|
|
Year of Election or Appointment: 2005 Assistant Treasurer |
|
|
|
Mr. Ryan also serves as Assistant Treasurer of other funds. Mr. Ryan is an employee of Fidelity Investments and has served in other fund officer roles. Previously, Mr. Ryan served as Vice President of Fund Reporting in Fidelity Pricing and Cash Management Services (FPCMS) (1999-2005). |
|
Stephen Sadoski (1971) |
|
|
Year of Election or Appointment: 2012 Deputy Treasurer |
|
|
|
Mr. Sadoski also serves as Deputy Treasurer of other funds. He is an employee of Fidelity Investments (2012-present) and has served in another fund officer role. Prior to joining Fidelity Investments, Mr. Sadoski served as an assistant chief accountant in the Division of Investment Management of the Securities and Exchange Commission (SEC) (2009-2012) and as a senior manager at Deloitte & Touche LLP (1997-2009). |
|
Stacie M. Smith (1974) |
|
|
Year of Election or Appointment: 2013 Deputy Treasurer |
|
|
|
Ms. Smith also serves as an officer of other funds. She is an employee of Fidelity Investments (2009-present) and has served in other fund officer roles. Prior to joining Fidelity Investments, Ms. Smith served as Senior Audit Manager of Ernst & Young LLP (1996-2009). |
|
Renee Stagnone (1975) |
|
|
Year of Election or Appointment: 2013 Deputy Treasurer |
|
|
|
Ms. Stagnone also serves as Deputy Treasurer of other funds. Ms. Stagnone is an employee of Fidelity Investments. |
|
Joseph F. Zambello (1957) |
|
|
Year of Election or Appointment: 2011 Deputy Treasurer |
|
|
|
Mr. Zambello also serves as Deputy Treasurer of other funds. Mr. Zambello is an employee of Fidelity Investments. Previously, Mr. Zambello served as Vice President of FMR's Program Management Group (2009-2011) and Vice President of the Transfer Agent Oversight Group (2005-2009). |
Annual Report
Distributions (Unaudited)
A total of 0.05% of the dividends distributed during the fiscal year was derived from interest on U.S. Government securities which is generally exempt from state income tax.
Class Z designates 100% of the dividends distributed during the fiscal year as qualifying for the dividends-received deduction for corporate shareholders.
Class Z designates 100% of the dividends distributed during the fiscal year as amounts which may be taken into account as a dividend for purposes of the maximum rate under section 1(h) (11) of the Internal Revenue Code.
The fund will notify shareholders in January 2014 of amounts for use in preparing 2013 income tax returns.
Annual Report
Board Approval of Investment Advisory Contracts and Management Fees
Fidelity Advisor Equity Income Fund
Each year, the Board of Trustees, including the Independent Trustees (together, the Board), votes on the renewal of the management contract and sub-advisory agreements (together, the Advisory Contracts) for the fund. The Board, assisted by the advice of fund counsel and Independent Trustees' counsel, requests and considers a broad range of information relevant to the renewal of the Advisory Contracts throughout the year.
The Board meets regularly and, at each of its meetings, covers an extensive agenda of topics and materials and considers factors that are relevant to its annual consideration of the renewal of the fund's Advisory Contracts, including the services and support provided to the fund and its shareholders. The Board has established various standing committees, each composed of and chaired by Independent Trustees with varying backgrounds, to which the Board has assigned specific subject matter responsibilities in order to enhance effective decision-making by the Board. The Board, acting directly and through its Committees, requests and receives information concerning the annual consideration of the renewal of the fund's Advisory Contracts. The Board also meets as needed to consider matters specifically related to the Board's annual consideration of the renewal of Advisory Contracts. Members of the Board may also meet with trustees of other Fidelity funds through ad hoc joint committees to discuss certain matters relevant to the Fidelity funds.
At its July 2013 meeting, the Board, including the Independent Trustees, unanimously determined to renew the fund's Advisory Contracts. In reaching its determination, the Board considered all factors it believed relevant, including (i) the nature, extent, and quality of the services to be provided to the fund and its shareholders (including the investment performance of the fund); (ii) the competitiveness of the fund's management fee and total expense ratio relative to peer funds; (iii) the total costs of the services to be provided by and the profits to be realized by Fidelity from its relationship with the fund; (iv) the extent to which economies of scale exist and would be realized as the fund grows; and (v) whether fee levels reflect these economies of scale, if any, for the benefit of fund shareholders.
In considering whether to renew the Advisory Contracts for the fund, the Board reached a determination, with the assistance of fund counsel and Independent Trustees' counsel and through the exercise of its business judgment, that the renewal of the Advisory Contracts was in the best interests of the fund and its shareholders and that the compensation payable under the Advisory Contracts was fair and reasonable. The Board's decision to renew the Advisory Contracts was not based on any single factor, but rather was based on a comprehensive consideration of all the information provided to the Board at its meetings throughout the year. The Board, in reaching its determination to renew the Advisory Contracts, was aware that shareholders in the fund have a broad range of investment choices available to them, including a wide choice among mutual funds offered by Fidelity's competitors, and that the fund's shareholders, who have the opportunity to review and weigh the disclosure provided by the fund in its prospectus and other public disclosures, have chosen to invest in this fund, which is a part of the Fidelity family of funds.
Annual Report
Board Approval of Investment Advisory Contracts and
Management Fees - continued
Nature, Extent, and Quality of Services Provided. The Board considered the staffing within the investment adviser, Fidelity Management & Research Company (FMR), and the sub-advisers (together, the Investment Advisers) as it relates to the fund, including the backgrounds of the fund's investment personnel, and also considered the fund's investment objective, strategies, and related investment philosophy. The Independent Trustees also had discussions with senior management of Fidelity's investment operations and investment groups. The Board considered the structure of the portfolio manager compensation program and whether this structure provides appropriate incentives to act in the best interests of the fund.
Resources Dedicated to Investment Management and Support Services. The Board and the Fund Oversight and Research Committees reviewed the general qualifications and capabilities of the Investment Advisers' investment staff, including its size, education, experience, and resources, as well as the Investment Advisers' approach to recruiting, training, managing, and compensating investment personnel. The Board noted that FMR has continued to increase the resources devoted to non-U.S. offices, including expansion of Fidelity's global investment organization. The Board also noted that Fidelity's analysts have extensive resources, tools and capabilities that allow them to conduct sophisticated quantitative and fundamental analysis, as well as credit analysis of issuers, counterparties and guarantors. Further, the Board believes that Fidelity's investment professionals have sufficient access to global information and data so as to provide competitive investment results over time, and that those professionals also have access to sophisticated tools that permit them to assess portfolio construction and risk and performance attribution characteristics continuously, as well as to transmit new information and research conclusions rapidly around the world. Additionally, in its deliberations, the Board considered the Investment Advisers' trading and risk management capabilities and resources, which are an integral part of the investment management process.
Shareholder and Administrative Services. The Board considered (i) the nature, extent, quality, and cost of advisory, administrative, and shareholder services performed by the Investment Advisers and their affiliates under the Advisory Contracts and under separate agreements covering transfer agency, pricing and bookkeeping, and securities lending services for the fund; (ii) the nature and extent of the supervision of third party service providers, principally custodians and subcustodians; and (iii) the resources devoted to, and the record of compliance with, the fund's compliance policies and procedures. The Board also reviewed the allocation of fund brokerage, including allocations to brokers affiliated with the Investment Advisers, the use of brokerage commissions to pay fund expenses, and the use of "soft" commission dollars to pay for research services.
Annual Report
The Board noted that the growth of fund assets over time across the complex allows Fidelity to reinvest in the development of services designed to enhance the value or convenience of the Fidelity funds as investment vehicles. These services include 24-hour access to account information and market information through telephone representatives and over the Internet, investor education materials and asset allocation tools, and the expanded availability of Fidelity Investor Centers.
Investment in a Large Fund Family. The Board considered the benefits to shareholders of investing in a Fidelity fund, including the benefits of investing in a fund that is part of a large family of funds offering a variety of investment disciplines and providing a large variety of mutual fund investor services. The Board noted that Fidelity had taken, or had made recommendations that resulted in the Fidelity funds taking, a number of actions over the previous year that benefited particular funds, including (i) continuing to dedicate additional resources to investment research and to the support of the senior management team that oversees asset management; (ii) persisting in efforts to enhance Fidelity's global research capabilities; (iii) launching new funds and making other enhancements to meet client needs for global and income-oriented solutions; (iv) continuing to launch dedicated lower cost underlying funds to meet portfolio construction needs related to expanding underlying fund options for Fidelity funds of funds, specifically for the Freedom Fund product lines; (v) rationalizing product lines and gaining increased efficiencies through the mergers of several funds into other funds; (vi) strengthening Fidelity's index fund offerings by reducing investment minimums and adopting or lowering existing expense caps for certain funds and classes; (vii) enhancing Global Asset Allocation product offerings by launching new funds and strategies, including "open architecture" target date funds that utilize affiliated and unaffiliated sub-advisers; (viii) modifying the eligibility criteria for Institutional Class shares of Advisor funds to increase their marketability to a portion of the defined contribution plan market; (ix) creating a new low-cost retirement share class for certain Advisor funds to appeal to large retirement plans; (x) transitioning the management of certain Fidelity commodity funds to Geode Capital Management LLC, a registered commodity pool operator, while retaining administrative responsibilities for the funds; (xi) reorganizing a number of funds; and (xii) taking steps toward establishing a new Fidelity adviser to manage sector-based funds and products.
Investment Performance. The Board considered whether the fund has operated in accordance with its investment objective, as well as its record of compliance with its investment restrictions and its performance history.
The Board took into account discussions with the Investment Advisers about fund investment performance that occur at Board meetings throughout the year. In this regard the Board noted that as part of regularly scheduled fund reviews and other reports to the Board on fund performance, the Board periodically considers annualized return information for the fund, for different time periods, measured against a securities market index ("benchmark index") and a peer group of mutual funds with similar objectives ("peer group"). In its evaluation of fund investment performance, the Board gave particular attention to information indicating changes in performance of certain Fidelity funds for specific time periods and the Investment Advisers' explanations for any overperformance or underperformance.
Annual Report
Board Approval of Investment Advisory Contracts and
Management Fees - continued
In addition to reviewing absolute and relative fund performance, the Independent Trustees periodically consider the appropriateness of fund performance metrics in evaluating the results achieved. In general, the Independent Trustees believe that fund performance should be evaluated based on net performance (after fees and expenses) of both the highest performing and lowest performing classes, where applicable, compared to appropriate benchmark indices, over appropriate time periods which may include full market cycles, and compared to peer groups, as applicable, over the same periods, taking into account relevant factors including the following: general market conditions; issuer-specific information; tactical opportunities for investment; and fund cash flows and other factors.
The Independent Trustees recognize that shareholders evaluate performance on a net basis over their own holding periods, for which one-, three-, and five-year periods are used as a proxy. For this reason, the performance information reviewed by the Board also included net cumulative calendar year total return information for the fund and an appropriate benchmark index and peer group for the most recent one-, three-, and five-year periods, as shown below. Returns are shown compared to the 25th percentile (top of box) and 75th percentile (bottom of box) of the peer universe.
Fidelity Advisor Equity Income Fund

Annual Report
Based on its review, the Board concluded that the nature, extent, and quality of services provided to the fund under the Advisory Contracts should benefit the fund's shareholders.
Competitiveness of Management Fee and Total Expense Ratio. The Board considered the fund's management fee and total expense ratio compared to "mapped groups" of competitive funds and classes. Fidelity creates "mapped groups" by combining similar Lipper investment objective categories that have comparable management fee characteristics. Combining Lipper investment objective categories aids the Board's management fee and total expense ratio comparisons by broadening the competitive group used for comparison and by reducing the number of universes to which various Fidelity funds are compared.
Management Fee. The Board considered two proprietary management fee comparisons for the 12-month periods shown in the chart below. The group of Lipper funds used by the Board for management fee comparisons is referred to below as the "Total Mapped Group." The Total Mapped Group is broader than the Lipper peer group used by the Board for performance comparisons because the Total Mapped Group combines several Lipper investment objective categories while the Lipper peer group does not. The Total Mapped Group comparison focuses on a fund's standing in terms of gross management fees before expense reimbursements or caps relative to the total universe of funds with comparable investment mandates, regardless of whether their management fee structures also are comparable. Funds with comparable investment mandates offer exposure to similar types of securities. Funds with comparable management fee structures have similar management fee contractual arrangements (e.g., flat rate charged for advisory services, all-inclusive fee rate, etc.). "TMG %" represents the percentage of funds in the Total Mapped Group that had management fees that were lower than the fund's. For example, a TMG % of 15% means that 85% of the funds in the Total Mapped Group had higher management fees than the fund. The "Asset-Size Peer Group" (ASPG) comparison focuses on a fund's standing relative to a subset of non-Fidelity funds within the Total Mapped Group that are similar in size and management fee structure. The ASPG represents at least 15% of the funds in the Total Mapped Group with comparable asset size and management fee structures, subject to a minimum of 50 funds (or all funds in the Total Mapped Group if fewer than 50).Additional information, such as the ASPG quartile in which the fund's management fee ranked, is also included in the chart and considered by the Board.
Annual Report
Board Approval of Investment Advisory Contracts and
Management Fees - continued
Fidelity Advisor Equity Income Fund

The Board noted that the fund's management fee ranked below the median of its Total Mapped Group and below the median of its ASPG for 2012.
Based on its review, the Board concluded that the fund's management fee is fair and reasonable in light of the services that the fund receives and the other factors considered.
Total Expense Ratio. In its review of each class's total expense ratio, the Board considered the fund's management fee as well as other fund or class expenses, as applicable, such as transfer agent fees, pricing and bookkeeping fees, fund-paid 12b-1 fees, and custodial, legal, and audit fees. The Board also noted the effects of any waivers and reimbursements on fees and expenses. As part of its review, the Board also considered the current and historical total expense ratios of each class of the fund compared to competitive fund median expenses. Each class of the fund is compared to those funds and classes in the Total Mapped Group (used by the Board for management fee comparisons) that have a similar sales load structure.
The Board noted that the total expense ratio of each of Class A, Class B, Class C, and Institutional Class ranked below its competitive median for 2012 and the total expense ratio of Class T ranked above its competitive median for 2012. The Board considered that, in general, various factors can affect total expense ratios. The Board noted that the total expense ratio of Class T was above the competitive median primarily because of higher 12b-1 fees on Class T. Class T has a higher 12b-1 fee, but a lower front-end sales charge, than traditionally priced front-end sales charge classes. The Board considered that Class T is primarily sold load-waived in the retirement plan market where its 0.50% 12b-1 fee is comparable to competing no-load, higher 12b-1 fee classes designed specifically for retirement plans. The Board noted that the fund offers multiple classes, each of which has a different sales load and 12b-1 fee structure, and that the multiple structures are intended to offer a range of pricing options for the intermediary market. The Board also noted that the total expense ratios of the classes vary primarily by the level of their 12b-1 fees, although differences in transfer agent fees may also cause expenses to vary from class to class.
Annual Report
Fees Charged to Other Fidelity Clients. The Board also considered Fidelity fee structures and other information with respect to clients of FMR and its affiliates, such as other mutual funds advised or subadvised by FMR or its affiliates, pension plan clients, and other institutional clients. The Board noted the findings of the 2013 ad hoc joint committee (created with the board of other Fidelity funds), which reviewed and compared Fidelity's institutional investment advisory business with its business of providing services to the Fidelity funds, including the differences in services provided, fees charged, and costs incurred, as well as competition in their respective marketplaces.
Based on its review of total expense ratios and fees charged to other Fidelity clients, the Board concluded that the total expense ratio of each class of the fund was reasonable, although Class T was above the median of the universe presented for comparison, in light of the services that the fund and its shareholders receive and the other factors considered.
Costs of the Services and Profitability. The Board considered the revenues earned and the expenses incurred by Fidelity in conducting the business of developing, marketing, distributing, managing, administering and servicing the fund and servicing the fund's shareholders. The Board also considered the level of Fidelity's profits in respect of all the Fidelity funds.
On an annual basis, FMR presents to the Board Fidelity's profitability for the fund. Fidelity calculates the profitability for each fund, as well as aggregate profitability for groups of Fidelity funds and all Fidelity funds, using a series of detailed revenue and cost allocation methodologies which originate with the books and records of Fidelity on which Fidelity's audited financial statements are based. The Audit Committee of the Board reviews any significant changes from the prior year's methodologies.
PricewaterhouseCoopers LLP (PwC), independent registered public accounting firm and auditor to Fidelity and certain Fidelity funds, has been engaged annually by the Board as part of the Board's assessment of Fidelity's profitability analysis. PwC's engagement includes the review and assessment of the methodologies used by Fidelity in determining the revenues and expenses attributable to Fidelity's mutual fund business, and completion of agreed-upon procedures surrounding the mathematical accuracy of fund profitability and its conformity to allocation methodologies. After considering PwC's reports issued under the engagement and information provided by Fidelity, the Board concluded that while other allocation methods may also be reasonable, Fidelity's profitability methodologies are reasonable in all material respects.
Annual Report
Board Approval of Investment Advisory Contracts and
Management Fees - continued
The Board also reviewed Fidelity's non-fund businesses and fall-out benefits related to the mutual fund business as well as cases where Fidelity's affiliates may benefit from or be related to the fund's business.
The Board considered the costs of the services provided by and the profits realized by Fidelity in connection with the operation of the fund and was satisfied that the profitability was not excessive in the circumstances.
Economies of Scale. The Board considered whether there have been economies of scale in respect of the management of the Fidelity funds, whether the Fidelity funds (including the fund) have appropriately benefited from any such economies of scale, and whether there is potential for realization of any further economies of scale. The Board considered the extent to which the fund will benefit from economies of scale through increased services to the fund, through waivers or reimbursements, or through fee or expense reductions. The Board also noted that in 2009, it and the board of other Fidelity funds created an ad hoc committee (the Economies of Scale Committee) to analyze whether FMR attains economies of scale in respect of the management and servicing of the Fidelity funds, whether the Fidelity funds have appropriately benefited from such economies of scale, and whether there is potential for realization of any further economies of scale.
The Board recognized that the fund's management contract incorporates a "group fee" structure, which provides for lower group fee rates as total fund assets under FMR's management increase, and for higher group fee rates as total fund assets under FMR's management decrease. FMR calculates the group fee rates based on a tiered asset "breakpoint" schedule that varies based on asset class. The Board considered that the group fee is designed to deliver the benefits of economies of scale to fund shareholders when total Fidelity fund assets increase, even if assets of any particular fund are unchanged or have declined, because some portion of Fidelity's costs are attributable to services provided to all Fidelity funds, and all funds benefit if those costs can be allocated among more assets. The Board concluded that, given the group fee structure, fund shareholders will benefit from lower management fees as assets under FMR's management increase at the fund complex level, regardless of whether Fidelity achieves any such economies of scale.
The Board concluded, taking into account the analysis of the Economies of Scale Committee, that economies of scale, if any, are being appropriately shared between fund shareholders and Fidelity.
Amendment to Description of Group Fee Rate. At its July 2013 meeting, the Board voted to approve an amendment to the fund's management contract to modify the description of the "group fee rate" effective August 1, 2013. The Board noted that under the prior description in the contract, the group fee rate was based on the average net assets of all registered investment companies with which FMR has management contracts. Under the contract's tiered asset breakpoint schedule, the group fee rate is lower as total fund assets under FMR's management increase, and higher as total fund assets under FMR's management decrease. The Board considered that the prior description would have excluded the assets of 64 Fidelity sector funds from the group fee rate calculation once Fidelity SelectCo, LLC, an affiliate of FMR, assumed management responsibilities for those funds. The Board noted that modifying the description of the group fee rate to continue to include the assets of those 64 funds for purposes of determining group fee rate breakpoints would avoid an immediate adverse impact on the group fee rate for any fund.
Annual Report
Additional Information Requested by the Board. In order to develop fully the factual basis for consideration of the Fidelity funds' Advisory Contracts, the Board requested and received additional information on certain topics, including: (i) fund performance trends and Fidelity's long-term strategies for certain funds; (ii) the potential to further rationalize the Fidelity fund lineup with the possibility of achieving savings for the funds and Fidelity; (iii) the methodology with respect to competitive fund data and peer group classifications; (iv) the arrangements with, and performance of, certain sub-advisers on behalf of the Fidelity funds, as well as certain proposed participating affiliate arrangements; (v) the realization of fall-out benefits in certain Fidelity business units; (vi) Fidelity's group fee structures, including the rationale for the individual fee rates of certain categories of funds and the definition of group assets; (vii) trends regarding industry use of performance fee structures and the performance adjustment methodologies applicable to the Fidelity funds; (viii) additional competitive analysis regarding the total expenses for certain classes; and (ix) fund profitability methodology, including Fidelity's cost allocation methodology, and the impact of certain factors on fund profitability results.
Based on its evaluation of all of the conclusions noted above, and after considering all factors it believed relevant, the Board ultimately concluded that the advisory fee structures are fair and reasonable, and that the fund's Advisory Contracts should be renewed.
Annual Report
Investment Adviser
Fidelity Management & Research Company
Boston, MA
Investment Sub-Advisers
FMR Co., Inc.
Fidelity Management & Research
(U.K.) Inc.
Fidelity Management & Research
(Hong Kong) Limited
Fidelity Management & Research
(Japan) Inc.
General Distributor
Fidelity Distributors Corporation
Smithfield, RI
Transfer and Service Agents
Fidelity Investments Institutional
Operations Company, Inc.
Boston, MA
Fidelity Service Company, Inc.
Boston, MA
Custodian
JPMorgan Chase Bank
New York, NY
(Fidelity Investment logo)(registered trademark)
EPIZ-UANN-0114 1.9585507.100
(Fidelity Investment logo)(registered trademark)
Fidelity Advisor®
Equity Value
Fund - Class A, Class T, Class B
and Class C
Annual Report
November 30, 2013
(Fidelity Cover Art)
Contents
|
Performance |
How the fund has done over time. |
|
|
Management's Discussion of Fund Performance |
The Portfolio Manager's review of fund performance and strategy. |
|
|
Shareholder Expense Example |
An example of shareholder expenses. |
|
|
Investment Changes |
A summary of major shifts in the fund's investments over the past six months. |
|
|
Investments |
A complete list of the fund's investments with their market values. |
|
|
Financial Statements |
Statements of assets and liabilities, operations, and changes in net assets, as well as financial highlights. |
|
|
Notes |
Notes to the financial statements. |
|
|
Report of Independent Registered Public Accounting Firm |
|
|
|
Trustees and Officers |
|
|
|
Distributions |
|
|
|
Board Approval of Investment Advisory Contracts and Management Fees |
|
To view a fund's proxy voting guidelines and proxy voting record for the 12-month period ended June 30, visit http://www.fidelity.com/proxyvotingresults or visit the Securities and Exchange Commission's (SEC) web site at http://www.sec.gov. You may also call 1-877-208-0098 to request a free copy of the proxy voting guidelines.
Standard & Poor's, S&P and S&P 500 are registered service marks of The McGraw-Hill Companies, Inc. and have been licensed for use by Fidelity Distributors Corporation.
Other third-party marks appearing herein are the property of their respective owners.
All other marks appearing herein are registered or unregistered trademarks or service marks of FMR LLC or an affiliated company. © 2014 FMR LLC. All rights reserved.
Annual Report
This report and the financial statements contained herein are submitted for the general information
of the shareholders of the fund. This report is not authorized for distribution to prospective investors
in the fund unless preceded or accompanied by an effective prospectus.
A fund files its complete schedule of portfolio holdings with the SEC for the first and third quarters
of each fiscal year on Form N-Q. Forms N-Q are available on the SEC's web site at
http://www.sec.gov. A fund's Forms N-Q may be reviewed and copied at the SEC's Public Reference
Room in Washington, DC. Information regarding the operation of the SEC's Public Reference Room
may be obtained by calling 1-800-SEC-0330. For a complete list of a fund's portfolio holdings, view
the most recent holdings listing, semiannual report, or annual report on Fidelity's web site at
http://www.fidelity.com, http://www.advisor.fidelity.com, or http://www.401k.com, as applicable.
NOT FDIC INSURED • MAY LOSE VALUE • NO BANK GUARANTEE
Neither the fund nor Fidelity Distributors Corporation is a bank.
Annual Report
Performance: The Bottom Line
Average annual total return reflects the change in the value of an investment, assuming reinvestment of the class' distributions from dividend income and capital gains (the profits earned upon the sale of securities that have grown in value, if any) and assuming a constant rate of performance each year. The $10,000 table and the fund's returns do not reflect the deduction of taxes that a shareholder would pay on fund distributions or the redemption of fund shares. During periods of reimbursement by Fidelity, a fund's total return will be greater than it would be had the reimbursement not occurred. How a fund did yesterday is no guarantee of how it will do tomorrow. Returns reflect the conversion of Class B shares to Class A shares after a maximum of seven years.
Average Annual Total Returns
|
Periods ended November 30, 2013 |
Past 1 |
Past 5 |
Past 10 |
|
Class A (incl. 5.75% sales charge) |
25.43% |
15.59% |
6.20% |
|
Class T (incl. 3.50% sales charge) |
28.17% |
15.84% |
6.18% |
|
Class B (incl. contingent deferred sales charge)A |
27.13% |
15.87% |
6.26% |
|
Class C (incl. contingent deferred sales charge)B |
31.16% |
16.09% |
6.03% |
A Class B shares' contingent deferred sales charges included in the past one year, past five years, and past ten years total return figures are 5%, 2%, and 0%, respectively.
B Class C shares' contingent deferred sales charges included in the past one year, past five years, and past ten years total return figures are 1%, 0%, and 0%, respectively.
$10,000 Over 10 Years
Let's say hypothetically that $10,000 was invested in Fidelity Advisor® Equity Value Fund - Class A on November 30, 2003, and the current 5.75% sales charge was paid. The chart shows how the value of your investment would have changed, and also shows how the Russell 3000® Value Index performed over the same period.
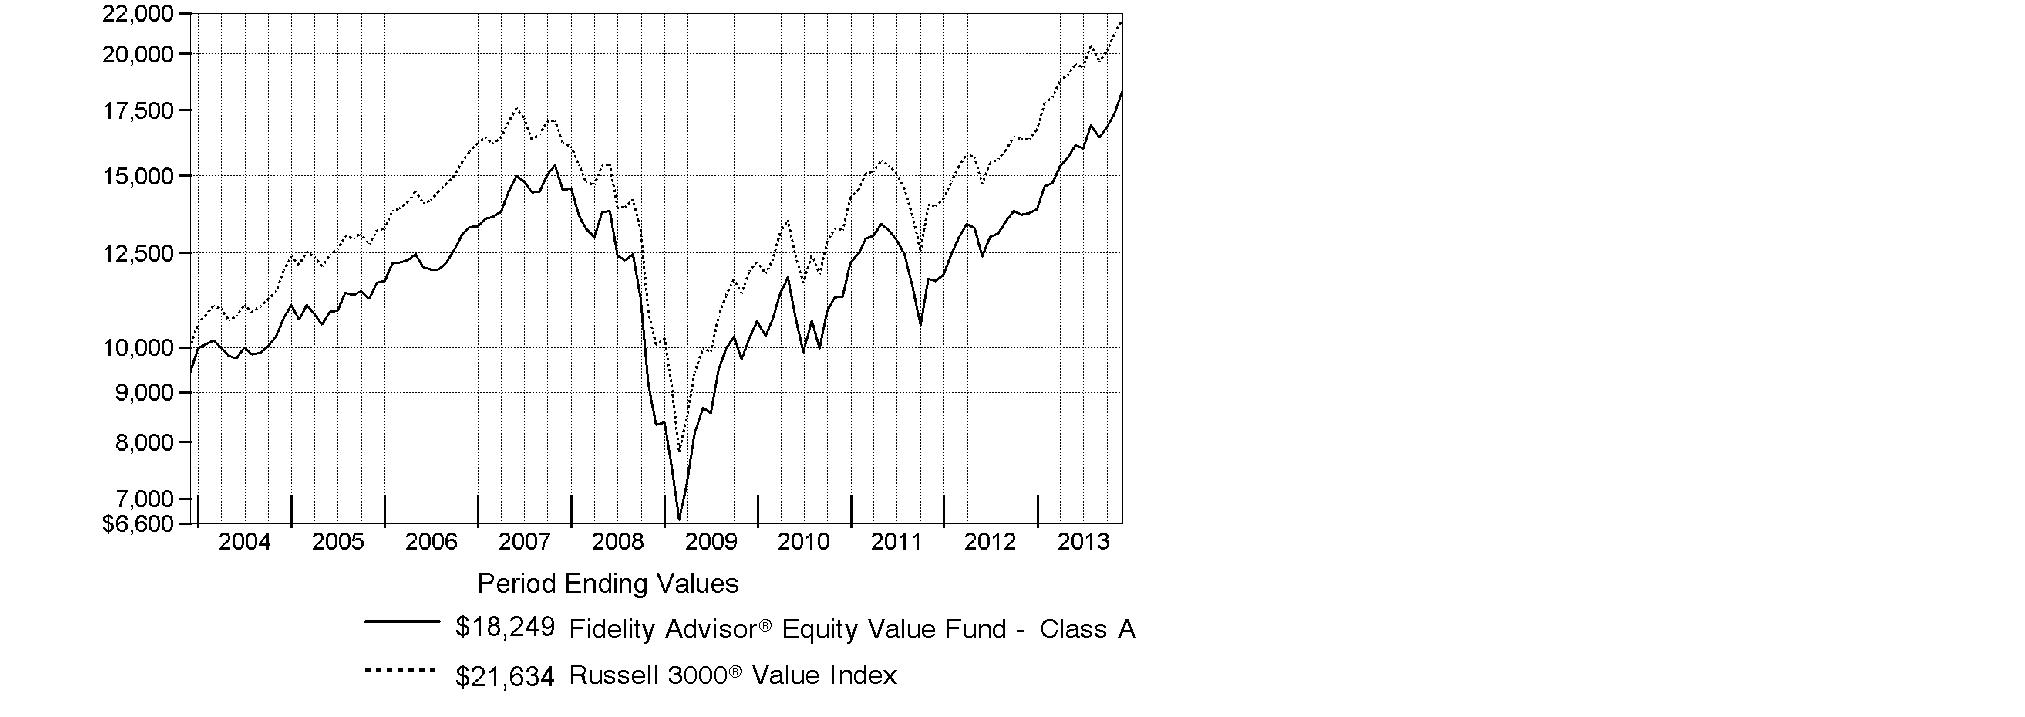
Annual Report
Management's Discussion of Fund Performance
Market Recap: With the current bull run nearing the five-year mark, equity benchmarks ripped up old records during the 12 months ending November 30, 2013. Gains were fueled by strengthening U.S. economic data, as well as generally improving economies and accommodative monetary policies worldwide. The broad S&P 500® Index reached new peaks in its 30.30% climb for the period, and the blue-chip Dow Jones Industrial AverageSM surpassed historic milestones en route to a 26.63% gain. The Nasdaq Composite Index®, up 36.73% amid a resurgence in growth-oriented stocks, closed above 4,000 for the first time since 2000. Shedding anxiety over the 2012 U.S. presidential election - and apparently confident that the federal debt-ceiling debate would be resolved - markets rose from period start through late May. News that the U.S. Federal Reserve was considering an end to its stimulative bond-buying kept stocks in flux over the summer but, by September, the Fed had set aside any imminent tapering. Despite jitters over a potential U.S. military strike in Syria and, later, an October budget impasse that briefly shuttered the federal government, volatility was subdued heading into the holidays, with investor optimism helping many markets home in on all-time highs at period end. Elsewhere, non-U.S. developed-market equities saw similar results, with the MSCI® EAFE® Index adding 24.97%.
Comments from Sean Gavin, Portfolio Manager of Fidelity Advisor® Equity Value Fund: For the year, the fund's Class A, Class T, Class B and Class C shares returned 33.09%, 32.82%, 32.13% and 32.16%, respectively (excluding sales charges), straddling the 32.36% advance of the Russell 3000® Value Index. Versus the index, the fund benefited from its overweighting in information technology and its underweightings in real estate investment trusts (REITs) and utilities. At the issuer level, the top contribution came from not owning telecommunication services provider and index component AT&T, followed by investments in Jazz Pharmaceuticals and pharmaceutical distribution firm McKesson - neither of which was in the benchmark - and personal computer manufacturer Dell. Dell was sold from the fund before the end of the period. On the down side, relative performance was curtailed by security selection in financials and energy, including not owning outperforming benchmark constituent Bank of America and an out-of-benchmark investment in underperforming energy exploration & production company Suncor Energy. Owning California electric utility Edison International also detracted. The fund's modest cash position - held for liquidity purposes - also was a drag on performance in an up market.
Annual Report
The views expressed above reflect those of the portfolio manager(s) only through the end of the period as stated on the cover of this report and do not necessarily represent the views of Fidelity or any other person in the Fidelity organization. Any such views are subject to change at any time based upon market or other conditions and Fidelity disclaims any responsibility to update such views. These views may not be relied on as investment advice and, because investment decisions for a Fidelity fund are based on numerous factors, may not be relied on as an indication of trading intent on behalf of any Fidelity fund.
Annual Report
Shareholder Expense Example
As a shareholder of the Fund, you incur two types of costs: (1) transaction costs, including sales charges (loads) on purchase payments or redemption proceeds, and (2) ongoing costs, including management fees, distribution and/or service (12b-1) fees and other Fund expenses. This Example is intended to help you understand your ongoing costs (in dollars) of investing in the Fund and to compare these costs with the ongoing costs of investing in other mutual funds.
The Example is based on an investment of $1,000 invested at the beginning of the period and held for the entire period (June 1, 2013 to November 30, 2013).
Actual Expenses
The first line of the accompanying table for each class of the Fund provides information about actual account values and actual expenses. You may use the information in this line, together with the amount you invested, to estimate the expenses that you paid over the period. Simply divide your account value by $1,000.00 (for example, an $8,600 account value divided by $1,000.00 = 8.6), then multiply the result by the number in the first line for a class of the Fund under the heading entitled "Expenses Paid During Period" to estimate the expenses you paid on your account during this period. In addition, the Fund, as a shareholder in the underlying Fidelity Central Funds, will indirectly bear its pro-rata share of the fees and expenses incurred by the underlying Fidelity Central Funds. These fees and expenses are not included in the Fund's annualized expense ratio used to calculate the expense estimate in the table below.
Hypothetical Example for Comparison Purposes
The second line of the accompanying table for each class of the Fund provides information about hypothetical account values and hypothetical expenses based on a Class' actual expense ratio and an assumed rate of return of 5% per year before expenses, which is not the Class' actual return. The hypothetical account values and expenses may not be used to estimate the actual ending account balance or expenses you paid for the period. You may use this information to compare the ongoing costs of investing in the Fund and other funds. To do so, compare this 5% hypothetical example with the 5% hypothetical examples that appear in the shareholder reports of the other funds. In addition, the Fund, as a shareholder in the underlying Fidelity Central Funds, will indirectly bear its pro-rata share of the fees and expenses incurred by the underlying Fidelity Central Funds. These fees and expenses are not included in the Fund's annualized expense ratio used to calculate the expense estimate in the table below.
Please note that the expenses shown in the table are meant to highlight your ongoing costs only and do not reflect any transaction costs. Therefore, the second line of the table is useful in comparing ongoing costs only, and will not help you determine the relative total costs of owning different funds. In addition, if these transactional costs were included, your costs would have been higher.
Annual Report
Shareholder Expense Example - continued
|
|
Annualized |
Beginning |
Ending |
Expenses Paid |
|
Class A |
1.20% |
|
|
|
|
Actual |
|
$ 1,000.00 |
$ 1,133.40 |
$ 6.42 |
|
HypotheticalA |
|
$ 1,000.00 |
$ 1,019.05 |
$ 6.07 |
|
Class T |
1.46% |
|
|
|
|
Actual |
|
$ 1,000.00 |
$ 1,131.90 |
$ 7.80 |
|
HypotheticalA |
|
$ 1,000.00 |
$ 1,017.75 |
$ 7.39 |
|
Class B |
1.97% |
|
|
|
|
Actual |
|
$ 1,000.00 |
$ 1,128.80 |
$ 10.51 |
|
HypotheticalA |
|
$ 1,000.00 |
$ 1,015.19 |
$ 9.95 |
|
Class C |
1.95% |
|
|
|
|
Actual |
|
$ 1,000.00 |
$ 1,129.20 |
$ 10.41 |
|
HypotheticalA |
|
$ 1,000.00 |
$ 1,015.29 |
$ 9.85 |
|
Institutional Class |
.85% |
|
|
|
|
Actual |
|
$ 1,000.00 |
$ 1,135.50 |
$ 4.55 |
|
HypotheticalA |
|
$ 1,000.00 |
$ 1,020.81 |
$ 4.31 |
A 5% return per year before expenses
B Annualized expense ratio reflects expenses net of applicable fee waivers.
* Expenses are equal to each Class' annualized expense ratio, multiplied by the average account value over the period, multiplied by 183/365 (to reflect the one-half year period).
Annual Report
Investment Changes (Unaudited)
|
Top Ten Stocks as of November 30, 2013 |
||
|
|
% of fund's |
% of fund's net assets |
|
JPMorgan Chase & Co. |
4.3 |
3.1 |
|
Chevron Corp. |
3.9 |
4.8 |
|
Wells Fargo & Co. |
3.4 |
3.4 |
|
Berkshire Hathaway, Inc. Class B |
2.8 |
3.9 |
|
Exxon Mobil Corp. |
2.8 |
3.6 |
|
U.S. Bancorp |
2.6 |
2.0 |
|
Apple, Inc. |
2.3 |
0.5 |
|
Amgen, Inc. |
2.1 |
1.0 |
|
Cisco Systems, Inc. |
2.1 |
2.5 |
|
UnitedHealth Group, Inc. |
2.0 |
1.9 |
|
|
28.3 |
|
|
Top Five Market Sectors as of November 30, 2013 |
||
|
|
% of fund's |
% of fund's net assets |
|
Financials |
27.1 |
25.7 |
|
Health Care |
17.2 |
16.2 |
|
Information Technology |
14.0 |
12.2 |
|
Energy |
12.8 |
14.4 |
|
Consumer Discretionary |
9.7 |
11.5 |
|
Asset Allocation (% of fund's net assets) |
|||||||
|
As of November 30, 2013* |
As of May 31, 2013** |
||||||
 |
Stocks 98.0% |
|
|
Stocks 98.0% |
|
||
 |
Convertible |
|
|
Convertible |
|
||
 |
Short-Term |
|
|
Short-Term |
|
||
|
* Foreign investments |
17.7% |
|
** Foreign investments |
14.6% |
|
||

Annual Report
Investments November 30, 2013
Showing Percentage of Net Assets
|
Common Stocks - 98.0% |
|||
|
Shares |
Value |
||
|
CONSUMER DISCRETIONARY - 9.7% |
|||
|
Diversified Consumer Services - 0.5% |
|||
|
Steiner Leisure Ltd. (a) |
6,932 |
$ 410,097 |
|
|
Media - 3.9% |
|||
|
Comcast Corp. Class A |
19,947 |
994,757 |
|
|
John Wiley & Sons, Inc. Class A |
14,615 |
744,780 |
|
|
Time Warner Cable, Inc. |
4,357 |
602,225 |
|
|
Viacom, Inc. Class B (non-vtg.) |
12,200 |
978,074 |
|
|
|
3,319,836 |
||
|
Multiline Retail - 1.9% |
|||
|
Kohl's Corp. |
10,300 |
569,384 |
|
|
Macy's, Inc. |
19,647 |
1,046,399 |
|
|
|
1,615,783 |
||
|
Specialty Retail - 2.6% |
|||
|
Advance Auto Parts, Inc. |
7,900 |
797,979 |
|
|
American Eagle Outfitters, Inc. |
34,488 |
561,120 |
|
|
AutoZone, Inc. (a) |
1,315 |
607,004 |
|
|
Murphy U.S.A., Inc. |
5,100 |
230,775 |
|
|
|
2,196,878 |
||
|
Textiles, Apparel & Luxury Goods - 0.8% |
|||
|
Coach, Inc. |
12,065 |
698,564 |
|
|
TOTAL CONSUMER DISCRETIONARY |
8,241,158 |
||
|
CONSUMER STAPLES - 8.4% |
|||
|
Beverages - 0.5% |
|||
|
C&C Group PLC |
68,355 |
412,855 |
|
|
Food & Staples Retailing - 4.3% |
|||
|
CVS Caremark Corp. |
25,100 |
1,680,696 |
|
|
Tesco PLC |
73,700 |
419,611 |
|
|
Wal-Mart Stores, Inc. |
10,500 |
850,605 |
|
|
Walgreen Co. |
11,900 |
704,480 |
|
|
|
3,655,392 |
||
|
Food Products - 0.8% |
|||
|
Amira Nature Foods Ltd. (a) |
13,580 |
215,243 |
|
|
The J.M. Smucker Co. |
4,069 |
424,153 |
|
|
|
639,396 |
||
|
Household Products - 1.6% |
|||
|
Central Garden & Pet Co. Class A (non-vtg.) (a) |
60,100 |
469,982 |
|
|
Energizer Holdings, Inc. |
8,300 |
915,905 |
|
|
|
1,385,887 |
||
|
Common Stocks - continued |
|||
|
Shares |
Value |
||
|
CONSUMER STAPLES - continued |
|||
|
Tobacco - 1.2% |
|||
|
British American Tobacco PLC sponsored ADR |
3,755 |
$ 399,269 |
|
|
Lorillard, Inc. |
12,700 |
651,891 |
|
|
|
1,051,160 |
||
|
TOTAL CONSUMER STAPLES |
7,144,690 |
||
|
ENERGY - 12.8% |
|||
|
Energy Equipment & Services - 1.9% |
|||
|
Ensco PLC Class A |
6,997 |
413,383 |
|
|
National Oilwell Varco, Inc. |
15,200 |
1,238,800 |
|
|
|
1,652,183 |
||
|
Oil, Gas & Consumable Fuels - 10.9% |
|||
|
Ardmore Shipping Corp. |
11,600 |
148,364 |
|
|
Chevron Corp. |
27,397 |
3,354,489 |
|
|
Exxon Mobil Corp. |
25,272 |
2,362,427 |
|
|
Marathon Petroleum Corp. |
11,000 |
910,140 |
|
|
Peabody Energy Corp. |
24,098 |
438,584 |
|
|
Phillips 66 Co. |
14,200 |
988,462 |
|
|
Suncor Energy, Inc. |
30,300 |
1,051,396 |
|
|
|
9,253,862 |
||
|
TOTAL ENERGY |
10,906,045 |
||
|
FINANCIALS - 27.1% |
|||
|
Capital Markets - 2.3% |
|||
|
Bank of New York Mellon Corp. |
30,700 |
1,034,590 |
|
|
East Capital Explorer AB (a) |
13,008 |
126,424 |
|
|
GP Investments Ltd. Class A (depositary receipt) (a) |
179,200 |
310,918 |
|
|
MLP AG |
66,088 |
441,818 |
|
|
|
1,913,750 |
||
|
Commercial Banks - 6.6% |
|||
|
East West Bancorp, Inc. |
15,500 |
531,340 |
|
|
U.S. Bancorp |
55,266 |
2,167,533 |
|
|
Wells Fargo & Co. |
66,132 |
2,911,131 |
|
|
|
5,610,004 |
||
|
Consumer Finance - 2.5% |
|||
|
American Express Co. |
8,800 |
755,040 |
|
|
Capital One Financial Corp. |
19,118 |
1,369,422 |
|
|
|
2,124,462 |
||
|
Common Stocks - continued |
|||
|
Shares |
Value |
||
|
FINANCIALS - continued |
|||
|
Diversified Financial Services - 8.5% |
|||
|
Berkshire Hathaway, Inc. Class B (a) |
20,589 |
$ 2,399,236 |
|
|
JPMorgan Chase & Co. |
63,752 |
3,647,884 |
|
|
The NASDAQ Stock Market, Inc. |
30,534 |
1,199,681 |
|
|
|
7,246,801 |
||
|
Insurance - 7.2% |
|||
|
ACE Ltd. |
10,300 |
1,058,634 |
|
|
Allied World Assurance Co. Holdings Ltd. |
3,800 |
428,070 |
|
|
Everest Re Group Ltd. |
4,296 |
673,742 |
|
|
Fidelity National Financial, Inc. Class A |
27,680 |
804,658 |
|
|
Greenlight Capital Re, Ltd. (a) |
15,225 |
517,802 |
|
|
MetLife, Inc. |
17,179 |
896,572 |
|
|
ProAssurance Corp. |
9,900 |
475,992 |
|
|
Prudential PLC |
21,199 |
452,112 |
|
|
The Travelers Companies, Inc. |
9,087 |
824,554 |
|
|
|
6,132,136 |
||
|
TOTAL FINANCIALS |
23,027,153 |
||
|
HEALTH CARE - 17.2% |
|||
|
Biotechnology - 2.1% |
|||
|
Amgen, Inc. |
16,000 |
1,825,280 |
|
|
Health Care Equipment & Supplies - 1.4% |
|||
|
Baxter International, Inc. |
6,200 |
424,390 |
|
|
Stryker Corp. |
10,000 |
744,200 |
|
|
|
1,168,590 |
||
|
Health Care Providers & Services - 7.6% |
|||
|
CIGNA Corp. |
14,762 |
1,290,937 |
|
|
Express Scripts Holding Co. (a) |
16,699 |
1,124,678 |
|
|
Humana, Inc. |
7,250 |
753,928 |
|
|
McKesson Corp. |
6,929 |
1,149,452 |
|
|
Select Medical Holdings Corp. |
49,621 |
429,718 |
|
|
UnitedHealth Group, Inc. |
23,000 |
1,713,040 |
|
|
|
6,461,753 |
||
|
Pharmaceuticals - 6.1% |
|||
|
AstraZeneca PLC sponsored ADR |
8,600 |
491,834 |
|
|
GlaxoSmithKline PLC sponsored ADR |
19,461 |
1,029,876 |
|
|
Jazz Pharmaceuticals PLC (a) |
6,638 |
776,115 |
|
|
Merck & Co., Inc. |
18,375 |
915,626 |
|
|
Common Stocks - continued |
|||
|
Shares |
Value |
||
|
HEALTH CARE - continued |
|||
|
Pharmaceuticals - continued |
|||
|
Mylan, Inc. (a) |
10,105 |
$ 445,934 |
|
|
Teva Pharmaceutical Industries Ltd. sponsored ADR |
37,200 |
1,516,272 |
|
|
|
5,175,657 |
||
|
TOTAL HEALTH CARE |
14,631,280 |
||
|
INDUSTRIALS - 4.2% |
|||
|
Aerospace & Defense - 0.9% |
|||
|
United Technologies Corp. |
6,947 |
770,144 |
|
|
Electrical Equipment - 0.6% |
|||
|
Emerson Electric Co. |
7,360 |
493,046 |
|
|
Industrial Conglomerates - 1.2% |
|||
|
3M Co. |
7,600 |
1,014,676 |
|
|
Machinery - 0.4% |
|||
|
Global Brass & Copper Holdings, Inc. |
22,951 |
378,692 |
|
|
Professional Services - 1.1% |
|||
|
Dun & Bradstreet Corp. (d) |
7,835 |
915,520 |
|
|
TOTAL INDUSTRIALS |
3,572,078 |
||
|
INFORMATION TECHNOLOGY - 14.0% |
|||
|
Communications Equipment - 2.1% |
|||
|
Cisco Systems, Inc. |
83,282 |
1,769,743 |
|
|
Computers & Peripherals - 4.6% |
|||
|
Apple, Inc. |
3,500 |
1,946,245 |
|
|
EMC Corp. |
42,900 |
1,023,165 |
|
|
Hewlett-Packard Co. |
36,439 |
996,607 |
|
|
|
3,966,017 |
||
|
Electronic Equipment & Components - 0.5% |
|||
|
TE Connectivity Ltd. |
7,998 |
421,655 |
|
|
IT Services - 3.0% |
|||
|
Amdocs Ltd. |
13,021 |
526,830 |
|
|
Fiserv, Inc. (a) |
7,600 |
835,164 |
|
|
IBM Corp. |
3,240 |
582,163 |
|
|
The Western Union Co. |
36,500 |
608,455 |
|
|
|
2,552,612 |
||
|
Common Stocks - continued |
|||
|
Shares |
Value |
||
|
INFORMATION TECHNOLOGY - continued |
|||
|
Semiconductors & Semiconductor Equipment - 1.6% |
|||
|
Samsung Electronics Co. Ltd. |
620 |
$ 875,327 |
|
|
Skyworks Solutions, Inc. (a) |
17,750 |
471,973 |
|
|
|
1,347,300 |
||
|
Software - 2.2% |
|||
|
CA Technologies, Inc. |
17,645 |
582,285 |
|
|
Microsoft Corp. |
33,900 |
1,292,607 |
|
|
|
1,874,892 |
||
|
TOTAL INFORMATION TECHNOLOGY |
11,932,219 |
||
|
MATERIALS - 2.2% |
|||
|
Chemicals - 1.5% |
|||
|
Agrium, Inc. |
4,700 |
423,754 |
|
|
CF Industries Holdings, Inc. |
1,955 |
424,978 |
|
|
Potash Corp. of Saskatchewan, Inc. |
13,600 |
430,572 |
|
|
|
1,279,304 |
||
|
Containers & Packaging - 0.7% |
|||
|
Ball Corp. |
11,800 |
589,764 |
|
|
TOTAL MATERIALS |
1,869,068 |
||
|
TELECOMMUNICATION SERVICES - 0.5% |
|||
|
Wireless Telecommunication Services - 0.5% |
|||
|
Vodafone Group PLC |
122,500 |
454,152 |
|
|
UTILITIES - 1.9% |
|||
|
Electric Utilities - 1.9% |
|||
|
American Electric Power Co., Inc. |
16,500 |
776,490 |
|
|
Edison International |
17,993 |
831,457 |
|
|
|
1,607,947 |
||
|
TOTAL COMMON STOCKS (Cost $66,686,756) |
|
||
|
Convertible Bonds - 0.7% |
||||
|
|
Principal Amount |
Value |
||
|
INDUSTRIALS - 0.7% |
||||
|
Marine - 0.7% |
||||
|
DryShips, Inc. 5% 12/1/14 (Cost $541,927) |
|
$ 620,000 |
$ 602,175 |
|
|
Money Market Funds - 1.8% |
|||
|
Shares |
|
||
|
Fidelity Cash Central Fund, 0.10% (b) |
950,440 |
950,440 |
|
|
Fidelity Securities Lending Cash Central Fund, 0.10% (b)(c) |
634,675 |
634,675 |
|
|
TOTAL MONEY MARKET FUNDS (Cost $1,585,115) |
|
||
|
TOTAL INVESTMENT PORTFOLIO - 100.5% (Cost $68,813,798) |
85,573,080 |
||
|
NET OTHER ASSETS (LIABILITIES) - (0.5)% |
(453,655) |
||
|
NET ASSETS - 100% |
$ 85,119,425 |
||
|
Legend |
|
(a) Non-income producing |
|
(b) Affiliated fund that is generally available only to investment companies and other accounts managed by Fidelity Investments. The rate quoted is the annualized seven-day yield of the fund at period end. A complete unaudited listing of the fund's holdings as of its most recent quarter end is available upon request. In addition, each Fidelity Central Fund's financial statements, which are not covered by the Fund's Report of Independent Registered Public Accounting Firm, are available on the SEC's website or upon request. |
|
(c) Investment made with cash collateral received from securities on loan. |
|
(d) Security or a portion of the security is on loan at period end. |
|
Affiliated Central Funds |
|
Information regarding fiscal year to date income earned by the Fund from investments in Fidelity Central Funds is as follows: |
|
Fund |
Income earned |
|
Fidelity Cash Central Fund |
$ 1,940 |
|
Fidelity Securities Lending Cash Central Fund |
5,353 |
|
Total |
$ 7,293 |
|
Other Information |
|
The following is a summary of the inputs used, as of November 30, 2013, involving the Fund's assets and liabilities carried at fair value. The inputs or methodology used for valuing securities may not be an indication of the risk associated with investing in those securities. For more information on valuation inputs, and their aggregation into the levels used in the table below, please refer to the Investment Valuation section in the accompanying Notes to Financial Statements. |
|
Valuation Inputs at Reporting Date: |
||||
|
Description |
Total |
Level 1 |
Level 2 |
Level 3 |
|
Investments in Securities: |
||||
|
Equities: |
||||
|
Consumer Discretionary |
$ 8,241,158 |
$ 8,241,158 |
$ - |
$ - |
|
Consumer Staples |
7,144,690 |
7,144,690 |
- |
- |
|
Energy |
10,906,045 |
10,906,045 |
- |
- |
|
Financials |
23,027,153 |
22,575,041 |
452,112 |
- |
|
Health Care |
14,631,280 |
14,631,280 |
- |
- |
|
Industrials |
3,572,078 |
3,572,078 |
- |
- |
|
Information Technology |
11,932,219 |
11,932,219 |
- |
- |
|
Materials |
1,869,068 |
1,869,068 |
- |
- |
|
Telecommunication Services |
454,152 |
- |
454,152 |
- |
|
Utilities |
1,607,947 |
1,607,947 |
- |
- |
|
Corporate Bonds |
602,175 |
- |
602,175 |
- |
|
Money Market Funds |
1,585,115 |
1,585,115 |
- |
- |
|
Total Investments in Securities: |
$ 85,573,080 |
$ 84,064,641 |
$ 1,508,439 |
$ - |
|
Distribution of investments by country or territory of incorporation, as a percentage of total net assets, is as follows (Unaudited): |
|
United States of America |
82.3% |
|
United Kingdom |
4.3% |
|
Switzerland |
2.2% |
|
Canada |
2.2% |
|
Israel |
1.8% |
|
Ireland |
1.4% |
|
Bermuda |
1.2% |
|
Korea (South) |
1.0% |
|
Others (Individually Less Than 1%) |
3.6% |
|
|
100.0% |
See accompanying notes which are an integral part of the financial statements.
Annual Report
Financial Statements
Statement of Assets and Liabilities
|
|
November 30, 2013 |
|
|
|
|
|
|
Assets |
|
|
|
Investment in securities, at value (including securities loaned of $619,305) - See accompanying schedule: Unaffiliated issuers (cost $67,228,683) |
$ 83,987,965 |
|
|
Fidelity Central Funds (cost $1,585,115) |
1,585,115 |
|
|
Total Investments (cost $68,813,798) |
|
$ 85,573,080 |
|
Receivable for investments sold |
|
160,950 |
|
Receivable for fund shares sold |
|
100,250 |
|
Dividends receivable |
|
184,104 |
|
Interest receivable |
|
15,500 |
|
Distributions receivable from Fidelity Central Funds |
|
159 |
|
Prepaid expenses |
|
228 |
|
Other receivables |
|
334 |
|
Total assets |
|
86,034,605 |
|
|
|
|
|
Liabilities |
|
|
|
Payable for investments purchased |
$ 121,469 |
|
|
Payable for fund shares redeemed |
26,323 |
|
|
Accrued management fee |
36,520 |
|
|
Distribution and service plan fees payable |
31,285 |
|
|
Other affiliated payables |
20,118 |
|
|
Other payables and accrued expenses |
44,790 |
|
|
Collateral on securities loaned, at value |
634,675 |
|
|
Total liabilities |
|
915,180 |
|
|
|
|
|
Net Assets |
|
$ 85,119,425 |
|
Net Assets consist of: |
|
|
|
Paid in capital |
|
$ 86,554,151 |
|
Undistributed net investment income |
|
548,272 |
|
Accumulated undistributed net realized gain (loss) on investments and foreign currency transactions |
|
(18,742,368) |
|
Net unrealized appreciation (depreciation) on investments and assets and liabilities in foreign currencies |
|
16,759,370 |
|
Net Assets |
|
$ 85,119,425 |
See accompanying notes which are an integral part of the financial statements.
Annual Report
Statement of Assets and Liabilities - continued
|
|
November 30, 2013 |
|
|
|
|
|
|
Calculation of Maximum Offering Price Class A: |
|
$ 13.93 |
|
|
|
|
|
Maximum offering price per share (100/94.25 of $13.93) |
|
$ 14.78 |
|
Class T: |
|
$ 13.90 |
|
|
|
|
|
Maximum offering price per share (100/96.50 of $13.90) |
|
$ 14.40 |
|
Class B: |
|
$ 13.76 |
|
|
|
|
|
Class C: |
|
$ 13.63 |
|
|
|
|
|
Institutional Class: |
|
$ 14.16 |
A Redemption price per share is equal to net asset value less any applicable contingent deferred sales charge.
See accompanying notes which are an integral part of the financial statements.
Annual Report
Financial Statements - continued
Statement of Operations
|
|
Year ended November 30, 2013 |
|
|
|
|
|
|
Investment Income |
|
|
|
Dividends |
|
$ 1,573,824 |
|
Interest |
|
95,748 |
|
Income from Fidelity Central Funds |
|
7,293 |
|
Total income |
|
1,676,865 |
|
|
|
|
|
Expenses |
|
|
|
Management fee |
$ 407,833 |
|
|
Performance adjustment |
(63,832) |
|
|
Transfer agent fees |
208,685 |
|
|
Distribution and service plan fees |
335,878 |
|
|
Accounting and security lending fees |
28,758 |
|
|
Custodian fees and expenses |
11,950 |
|
|
Independent trustees' compensation |
396 |
|
|
Registration fees |
62,089 |
|
|
Audit |
59,486 |
|
|
Legal |
318 |
|
|
Miscellaneous |
761 |
|
|
Total expenses before reductions |
1,052,322 |
|
|
Expense reductions |
(11,078) |
1,041,244 |
|
Net investment income (loss) |
|
635,621 |
|
Realized and Unrealized Gain (Loss) Net realized gain (loss) on: |
|
|
|
Investment securities: |
|
|
|
Unaffiliated issuers |
10,295,955 |
|
|
Foreign currency transactions |
485 |
|
|
Total net realized gain (loss) |
|
10,296,440 |
|
Change in net unrealized appreciation (depreciation) on: Investment securities |
9,888,368 |
|
|
Assets and liabilities in foreign currencies |
125 |
|
|
Total change in net unrealized appreciation (depreciation) |
|
9,888,493 |
|
Net gain (loss) |
|
20,184,933 |
|
Net increase (decrease) in net assets resulting from operations |
|
$ 20,820,554 |
See accompanying notes which are an integral part of the financial statements.
Annual Report
Statement of Changes in Net Assets
|
|
Year ended |
Year ended |
|
Increase (Decrease) in Net Assets |
|
|
|
Operations |
|
|
|
Net investment income (loss) |
$ 635,621 |
$ 664,905 |
|
Net realized gain (loss) |
10,296,440 |
6,112,162 |
|
Change in net unrealized appreciation (depreciation) |
9,888,493 |
3,630,671 |
|
Net increase (decrease) in net assets resulting |
20,820,554 |
10,407,738 |
|
Distributions to shareholders from net investment income |
(666,191) |
(227,180) |
|
Share transactions - net increase (decrease) |
581,153 |
(11,212,076) |
|
Total increase (decrease) in net assets |
20,735,516 |
(1,031,518) |
|
|
|
|
|
Net Assets |
|
|
|
Beginning of period |
64,383,909 |
65,415,427 |
|
End of period (including undistributed net investment income of $548,272 and undistributed net investment income of $576,510, respectively) |
$ 85,119,425 |
$ 64,383,909 |
See accompanying notes which are an integral part of the financial statements.
Annual Report
Financial Highlights - Class A
|
Years ended November 30, |
2013 |
2012 |
2011 |
2010 |
2009 |
|
Selected Per-Share Data |
|
|
|
|
|
|
Net asset value, beginning of period |
$ 10.60 |
$ 9.09 |
$ 8.85 |
$ 8.07 |
$ 6.70 |
|
Income from Investment Operations |
|
|
|
|
|
|
Net investment income (loss) C |
.13 |
.12 |
.06 |
.07 F |
.06 |
|
Net realized and unrealized gain (loss) |
3.33 |
1.44 |
.27 |
.77 |
1.42 |
|
Total from investment operations |
3.46 |
1.56 |
.33 |
.84 |
1.48 |
|
Distributions from net investment income |
(.13) |
(.05) |
(.09) |
(.06) |
(.11) |
|
Net asset value, end of period |
$ 13.93 |
$ 10.60 |
$ 9.09 |
$ 8.85 |
$ 8.07 |
|
Total Return A,B |
33.09% |
17.27% |
3.72% |
10.42% |
22.49% |
|
Ratios to Average Net Assets D,G |
|
|
|
|
|
|
Expenses before reductions |
1.22% |
1.30% |
1.27% |
1.28% |
1.33% |
|
Expenses net of fee waivers, if any |
1.22% |
1.25% |
1.25% |
1.25% |
1.25% |
|
Expenses net of all reductions |
1.20% |
1.25% |
1.25% |
1.25% |
1.24% |
|
Net investment income (loss) |
1.07% |
1.20% |
.59% |
.83% F |
.89% |
|
Supplemental Data |
|
|
|
|
|
|
Net assets, end of period (000 omitted) |
$ 39,538 |
$ 29,282 |
$ 27,910 |
$ 34,244 |
$ 36,306 |
|
Portfolio turnover rate E |
68% |
77% |
65% |
103% |
135% |
A Total returns would have been lower if certain expenses had not been reduced during the applicable periods shown.
B Total returns do not include the effect of the sales charges.
C Calculated based on average shares outstanding during the period.
D Fees and expenses of any underlying Fidelity Central Funds are not included in the Fund's expense ratio. The Fund indirectly bears its proportionate share of the expenses of any underlying Fidelity Central Funds.
E Amount does not include the portfolio activity of any underlying Fidelity Central Funds.
F Investment income per share reflects a large, non-recurring dividend which amounted to $.05 per share. Excluding this non-recurring dividend, the ratio of net investment income (loss) to average net assets would have been .20%.
G Expense ratios reflect operating expenses of the class. Expenses before reductions do not reflect amounts reimbursed by the investment adviser or reductions from brokerage service arrangements or reductions from other expense offset arrangements and do not represent the amount paid by the class during periods when reimbursements or reductions occur. Expenses net of fee waivers reflect expenses after reimbursement by the investment adviser but prior to reductions from brokerage service arrangements or other expense offset arrangements. Expenses net of all reductions represent the net expenses paid by the class.
See accompanying notes which are an integral part of the financial statements.
Annual Report
Financial Highlights - Class T
|
Years ended November 30, |
2013 |
2012 |
2011 |
2010 |
2009 |
|
Selected Per-Share Data |
|
|
|
|
|
|
Net asset value, beginning of period |
$ 10.57 |
$ 9.06 |
$ 8.81 |
$ 8.04 |
$ 6.67 |
|
Income from Investment Operations |
|
|
|
|
|
|
Net investment income (loss) C |
.10 |
.09 |
.03 |
.05 F |
.04 |
|
Net realized and unrealized gain (loss) |
3.34 |
1.44 |
.28 |
.76 |
1.42 |
|
Total from investment operations |
3.44 |
1.53 |
.31 |
.81 |
1.46 |
|
Distributions from net investment income |
(.11) |
(.02) |
(.06) |
(.04) |
(.09) |
|
Net asset value, end of period |
$ 13.90 |
$ 10.57 |
$ 9.06 |
$ 8.81 |
$ 8.04 |
|
Total Return A,B |
32.82% |
16.94% |
3.53% |
10.06% |
22.12% |
|
Ratios to Average Net Assets D,G |
|
|
|
|
|
|
Expenses before reductions |
1.48% |
1.55% |
1.53% |
1.54% |
1.59% |
|
Expenses net of fee waivers, if any |
1.48% |
1.50% |
1.50% |
1.50% |
1.50% |
|
Expenses net of all reductions |
1.46% |
1.50% |
1.50% |
1.49% |
1.49% |
|
Net investment income (loss) |
.81% |
.95% |
.34% |
.58% F |
.64% |
|
Supplemental Data |
|
|
|
|
|
|
Net assets, end of period (000 omitted) |
$ 27,241 |
$ 21,212 |
$ 21,319 |
$ 25,208 |
$ 29,288 |
|
Portfolio turnover rate E |
68% |
77% |
65% |
103% |
135% |
A Total returns would have been lower if certain expenses had not been reduced during the applicable periods shown.
B Total returns do not include the effect of the sales charges.
C Calculated based on average shares outstanding during the period.
D Fees and expenses of any underlying Fidelity Central Funds are not included in the Fund's expense ratio. The Fund indirectly bears its proportionate share of the expenses of any underlying Fidelity Central Funds.
E Amount does not include the portfolio activity of any underlying Fidelity Central Funds.
F Investment income per share reflects a large, non-recurring dividends which amounted to $.05 per share. Excluding this non-recurring dividend, the ratio of net investment income (loss) to average net assets would have been (.05)%.
G Expense ratios reflect operating expenses of the class. Expenses before reductions do not reflect amounts reimbursed by the investment adviser or reductions from brokerage service arrangements or reductions from other expense offset arrangements and do not represent the amount paid by the class during periods when reimbursements or reductions occur. Expenses net of fee waivers reflect expenses after reimbursement by the investment adviser but prior to reductions from brokerage service arrangements or other expense offset arrangements. Expenses net of all reductions represent the net expenses paid by the class.
See accompanying notes which are an integral part of the financial statements.
Annual Report
Financial Highlights - Class B
|
Years ended November 30, |
2013 |
2012 |
2011 |
2010 |
2009 |
|
Selected Per-Share Data |
|
|
|
|
|
|
Net asset value, beginning of period |
$ 10.45 |
$ 8.98 |
$ 8.73 |
$ 7.96 |
$ 6.57 |
|
Income from Investment Operations |
|
|
|
|
|
|
Net investment income (loss) C |
.04 |
.04 |
(.01) |
.01 F |
.01 |
|
Net realized and unrealized gain (loss) |
3.31 |
1.43 |
.27 |
.76 |
1.40 |
|
Total from investment operations |
3.35 |
1.47 |
.26 |
.77 |
1.41 |
|
Distributions from net investment income |
(.04) |
- |
(.01) |
- |
(.02) |
|
Net asset value, end of period |
$ 13.76 |
$ 10.45 |
$ 8.98 |
$ 8.73 |
$ 7.96 |
|
Total Return A,B |
32.13% |
16.37% |
2.96% |
9.67% |
21.46% |
|
Ratios to Average Net Assets D,G |
|
|
|
|
|
|
Expenses before reductions |
1.99% |
2.06% |
2.02% |
2.03% |
2.08% |
|
Expenses net of fee waivers, if any |
1.99% |
2.00% |
2.00% |
2.00% |
2.00% |
|
Expenses net of all reductions |
1.97% |
2.00% |
2.00% |
1.99% |
1.99% |
|
Net investment income (loss) |
.30% |
.45% |
(.16)% |
.08% F |
.14% |
|
Supplemental Data |
|
|
|
|
|
|
Net assets, end of period (000 omitted) |
$ 2,886 |
$ 2,981 |
$ 3,884 |
$ 5,478 |
$ 7,007 |
|
Portfolio turnover rate E |
68% |
77% |
65% |
103% |
135% |
A Total returns would have been lower if certain expenses had not been reduced during the applicable periods shown.
B Total returns do not include the effect of the contingent deferred sales charge.
C Calculated based on average shares outstanding during the period.
D Fees and expenses of any underlying Fidelity Central Funds are not included in the Fund's expense ratio. The Fund indirectly bears its proportionate share of the expenses of any underlying Fidelity Central Funds.
E Amount does not include the portfolio activity of any underlying Fidelity Central Funds.
F Investment income per share reflects a large, non-recurring dividend which amounted to $.05 per share. Excluding this non-recurring dividend, the ratio of net investment income (loss) to average net assets would have been (.55)%.
G Expense ratios reflect operating expenses of the class. Expenses before reductions do not reflect amounts reimbursed by the investment adviser or reductions from brokerage service arrangements or reductions from other expense offset arrangements and do not represent the amount paid by the class during periods when reimbursements or reductions occur. Expenses net of fee waivers reflect expenses after reimbursement by the investment adviser but prior to reductions from brokerage service arrangements or other expense offset arrangements. Expenses net of all reductions represent the net expenses paid by the class.
See accompanying notes which are an integral part of the financial statements.
Annual Report
Financial Highlights - Class C
|
Years ended November 30, |
2013 |
2012 |
2011 |
2010 |
2009 |
|
Selected Per-Share Data |
|
|
|
|
|
|
Net asset value, beginning of period |
$ 10.37 |
$ 8.91 |
$ 8.67 |
$ 7.91 |
$ 6.55 |
|
Income from Investment Operations |
|
|
|
|
|
|
Net investment income (loss) C |
.04 |
.04 |
(.01) |
.01 F |
.01 |
|
Net realized and unrealized gain (loss) |
3.28 |
1.42 |
.27 |
.75 |
1.39 |
|
Total from investment operations |
3.32 |
1.46 |
.26 |
.76 |
1.40 |
|
Distributions from net investment income |
(.06) |
- |
(.02) |
- H |
(.04) |
|
Net asset value, end of period |
$ 13.63 |
$ 10.37 |
$ 8.91 |
$ 8.67 |
$ 7.91 |
|
Total Return A,B |
32.16% |
16.39% |
2.95% |
9.64% |
21.46% |
|
Ratios to Average Net Assets D,G |
|
|
|
|
|
|
Expenses before reductions |
1.97% |
2.05% |
2.02% |
2.03% |
2.08% |
|
Expenses net of fee waivers, if any |
1.97% |
2.00% |
2.00% |
2.00% |
2.00% |
|
Expenses net of all reductions |
1.96% |
2.00% |
2.00% |
1.99% |
1.99% |
|
Net investment income (loss) |
.32% |
.45% |
(.16)% |
.08% F |
.14% |
|
Supplemental Data |
|
|
|
|
|
|
Net assets, end of period (000 omitted) |
$ 12,329 |
$ 8,785 |
$ 8,922 |
$ 10,265 |
$ 11,556 |
|
Portfolio turnover rate E |
68% |
77% |
65% |
103% |
135% |
A Total returns would have been lower if certain expenses had not been reduced during the applicable periods shown.
B Total returns do not include the effect of the contingent deferred sales charge.
C Calculated based on average shares outstanding during the period.
D Fees and expenses of any underlying Fidelity Central Funds are not included in the Fund's expense ratio. The Fund indirectly bears its proportionate share of the expenses of any underlying Fidelity Central Funds.
E Amount does not include the portfolio activity of any underlying Fidelity Central Funds.
F Investment income per share reflects a large, non-recurring dividend which amounted to $.05 per share. Excluding this non-recurring dividend, the ratio of net investment income (loss) to average net assets would have been (.55)%.
G Expense ratios reflect operating expenses of the class. Expenses before reductions do not reflect amounts reimbursed by the investment adviser or reductions from brokerage service arrangements or reductions from other expense offset arrangements and do not represent the amount paid by the class during periods when reimbursements or reductions occur. Expenses net of fee waivers reflect expenses after reimbursement by the investment adviser but prior to reductions from brokerage service arrangements or other expense offset arrangements. Expenses net of all reductions represent the net expenses paid by the class.
H Amount represents less than $.01 per share.
See accompanying notes which are an integral part of the financial statements.
Annual Report
Financial Highlights - Institutional Class
|
Years ended November 30, |
2013 |
2012 |
2011 |
2010 |
2009 |
|
Selected Per-Share Data |
|
|
|
|
|
|
Net asset value, beginning of period |
$ 10.75 |
$ 9.22 |
$ 8.97 |
$ 8.18 |
$ 6.80 |
|
Income from Investment Operations |
|
|
|
|
|
|
Net investment income (loss) B |
.17 |
.15 |
.08 |
.09 E |
.08 |
|
Net realized and unrealized gain (loss) |
3.39 |
1.45 |
.29 |
.78 |
1.43 |
|
Total from investment operations |
3.56 |
1.60 |
.37 |
.87 |
1.51 |
|
Distributions from net investment income |
(.15) |
(.07) |
(.12) |
(.08) |
(.13) |
|
Net asset value, end of period |
$ 14.16 |
$ 10.75 |
$ 9.22 |
$ 8.97 |
$ 8.18 |
|
Total Return A |
33.61% |
17.49% |
4.05% |
10.65% |
22.71% |
|
Ratios to Average Net Assets C,F |
|
|
|
|
|
|
Expenses before reductions |
.89% |
.96% |
1.01% |
1.03% |
1.08% |
|
Expenses net of fee waivers, if any |
.89% |
.96% |
1.00% |
1.00% |
1.00% |
|
Expenses net of all reductions |
.87% |
.96% |
1.00% |
1.00% |
1.00% |
|
Net investment income (loss) |
1.40% |
1.49% |
.84% |
1.08% E |
1.14% |
|
Supplemental Data |
|
|
|
|
|
|
Net assets, end of period (000 omitted) |
$ 3,126 |
$ 2,123 |
$ 3,381 |
$ 6,617 |
$ 6,168 |
|
Portfolio turnover rate D |
68% |
77% |
65% |
103% |
135% |
A Total returns would have been lower if certain expenses had not been reduced during the applicable periods shown.
B Calculated based on average shares outstanding during the period.
C Fees and expenses of any underlying Fidelity Central Funds are not included in the Fund's expense ratio. The Fund indirectly bears its proportionate share of the expenses of any underlying Fidelity Central Funds.
D Amount does not include the portfolio activity of any underlying Fidelity Central Funds.
E Investment income per share reflects a large, non-recurring dividend which amounted to $.05 per share. Excluding this non-recurring dividend, the ratio of net investment income (loss) to average net assets would have been .45%.
F Expense ratios reflect operating expenses of the class. Expenses before reductions do not reflect amounts reimbursed by the investment adviser or reductions from brokerage service arrangements or reductions from other expense offset arrangements and do not represent the amount paid by the class during periods when reimbursements or reductions occur. Expenses net of fee waivers reflect expenses after reimbursement by the investment adviser but prior to reductions from brokerage service arrangements or other expense offset arrangements. Expenses net of all reductions represent the net expenses paid by the class.
See accompanying notes which are an integral part of the financial statements.
Annual Report
Notes to Financial Statements
For the period ended November 30, 2013
1. Organization.
Fidelity Advisor Equity Value Fund (the Fund) is a fund of Fidelity Advisor Series I (the Trust) and is authorized to issue an unlimited number of shares. The Trust is registered under the Investment Company Act of 1940, as amended (the 1940 Act), as an open-end management investment company organized as a Massachusetts business trust. The Fund offers Class A, Class T, Class C and Institutional Class shares, each of which, along with Class B shares, has equal rights as to assets and voting privileges. Class B shares are closed to new accounts and additional purchases, except for exchanges and reinvestments. Each class has exclusive voting rights with respect to matters that affect that class. Class B shares will automatically convert to Class A shares after a holding period of seven years from the initial date of purchase.
2. Investments in Fidelity Central Funds.
The Fund invests in Fidelity Central Funds, which are open-end investment companies generally available only to other investment companies and accounts managed by the investment adviser and its affiliates. The Fund's Schedule of Investments lists each of the Fidelity Central Funds held as of period end, if any, as an investment of the Fund, but does not include the underlying holdings of each Fidelity Central Fund. As an Investing Fund, the Fund indirectly bears its proportionate share of the expenses of the underlying Fidelity Central Funds.
The Money Market Central Funds seek preservation of capital and current income and are managed by Fidelity Investments Money Management, Inc. (FIMM), an affiliate of the investment adviser. Annualized expenses of the Money Market Central Funds as of their most recent shareholder report date are less than .01%.
A complete unaudited list of holdings for each Fidelity Central Fund is available upon request or at the Securities and Exchange Commission (the SEC) website at www.sec.gov. In addition, the financial statements of the Fidelity Central Funds, which are not covered by the Fund's Report of Independent Registered Public Accounting Firm, are available on the SEC website or upon request.
3. Significant Accounting Policies.
The financial statements have been prepared in conformity with accounting principles generally accepted in the United States of America (GAAP), which require management to make certain estimates and assumptions at the date of the financial statements. Actual results could differ from those estimates. Subsequent events, if any, through the date that the financial statements were issued have been evaluated in the preparation of
Annual Report
Notes to Financial Statements - continued
3. Significant Accounting Policies - continued
the financial statements. The following summarizes the significant accounting policies of the Fund:
Investment Valuation. Investments are valued as of 4:00 p.m. Eastern time on the last calendar day of the period. In accordance with valuation policies and procedures approved by the Board of Trustees (the Board), the Fund attempts to obtain prices from one or more third party pricing vendors or brokers to value its investments. When current market prices, quotations or currency exchange rates are not readily available or reliable, investments will be fair valued in good faith by the Fidelity Management & Research Company (FMR) Fair Value Committee (the Committee), in accordance with procedures adopted by the Board. Factors used in determining fair value vary by investment type and may include market or investment specific events, changes in interest rates and credit quality. The frequency with which these procedures are used cannot be predicted and they may be utilized to a significant extent. The Committee oversees the Fund's valuation policies and procedures and is responsible for approving and reporting to the Board all fair value determinations.
The Fund categorizes the inputs to valuation techniques used to value its investments into a disclosure hierarchy consisting of three levels as shown below:
Level 1 - quoted prices in active markets for identical investments
Level 2 - other significant observable inputs (including quoted prices for similar investments, interest rates, prepayment speeds, etc.)
Level 3 - unobservable inputs (including the Fund's own assumptions based on the best information available)
Valuation techniques used to value the Fund's investments by major category are as follows:
Equity securities, including restricted securities, for which market quotations are readily available, are valued at the last reported sale price or official closing price as reported by a third party pricing vendor on the primary market or exchange on which they are traded and are categorized as Level 1 in the hierarchy. In the event there were no sales during the day or closing prices are not available, securities are valued at the last quoted bid price or may be valued using the last available price and are generally categorized as Level 2 in the hierarchy. For foreign equity securities, when market or security specific events arise, comparisons to the valuation of American Depositary Receipts (ADRs), futures contracts, Exchange-Traded Funds (ETFs) and certain indexes as well as quoted prices for similar securities may be used and would be categorized as Level 2 in the hierarchy. Utilizing these techniques may result in transfers between Level 1 and Level 2. For equity securities, including restricted securities, where observable inputs are
Annual Report
3. Significant Accounting Policies - continued
Investment Valuation - continued
limited, assumptions about market activity and risk are used and these securities may be categorized as Level 3 in the hierarchy.
Debt securities, including restricted securities, are valued based on evaluated prices received from third party pricing vendors or from brokers who make markets in such securities. For corporate bonds, pricing vendors utilize matrix pricing which considers yield or price of bonds of comparable quality, coupon, maturity and type as well as broker-supplied prices. When independent prices are unavailable or unreliable, debt securities may be valued utilizing pricing methodologies which consider similar factors that would be used by third party pricing vendors. Debt securities are generally categorized as Level 2 in the hierarchy but may be Level 3 depending on the circumstances.
Investments in open-end mutual funds, including the Fidelity Central Funds, are valued at their closing net asset value (NAV) each business day and are categorized as Level 1 in the hierarchy.
Foreign Currency. The Fund may use foreign currency contracts to facilitate transactions in foreign-denominated securities. Gains and losses from these transactions may arise from changes in the value of the foreign currency or if the counterparties do not perform under the contracts' terms.
Foreign-denominated assets, including investment securities, and liabilities are translated into U.S. dollars at the exchange rates at period end. Purchases and sales of investment securities, income and dividends received and expenses denominated in foreign currencies are translated into U.S. dollars at the exchange rate in effect on the transaction date.
The effects of exchange rate fluctuations on investments are included with the net realized and unrealized gain (loss) on investment securities. Other foreign currency transactions resulting in realized and unrealized gain (loss) are disclosed separately.
Investment Transactions and Income. For financial reporting purposes, the Fund's investment holdings and NAV include trades executed through the end of the last business day of the period. The NAV per share for processing shareholder transactions is calculated as of the close of business of the New York Stock Exchange (NYSE), normally 4:00 p.m. Eastern time and includes trades executed through the end of the prior business day. Gains and losses on securities sold are determined on the basis of identified cost and may include proceeds received from litigation. Dividend income is recorded on the ex-dividend date, except for certain dividends from foreign securities where the ex-dividend date may have passed, which are recorded as soon as the Fund is informed of the ex-dividend date. Non-cash dividends included in dividend income, if any, are
Annual Report
Notes to Financial Statements - continued
3. Significant Accounting Policies - continued
Investment Transactions and Income - continued
recorded at the fair market value of the securities received. Distributions received on securities that represent a return of capital or capital gain are recorded as a reduction of cost of investments and/or as a realized gain. Subsequent to ex-dividend date the Fund determines the components of these distributions, based upon receipt of tax filings or other correspondence relating to the underlying investment. Interest income and distributions from the Fidelity Central Funds are accrued as earned. Interest income includes coupon interest and amortization of premium and accretion of discount on debt securities. Investment income is recorded net of foreign taxes withheld where recovery of such taxes is uncertain.
Class Allocations and Expenses. Investment income, realized and unrealized capital gains and losses, common expenses of the Fund, and certain fund-level expense reductions, if any, are allocated daily on a pro-rata basis to each class based on the relative net assets of each class to the total net assets of the Fund. Each class differs with respect to transfer agent and distribution and service plan fees incurred. Certain expense reductions may also differ by class. For the reporting period, the allocated portion of income and expenses to each class as a percent of its average net assets may vary due to the timing of recording these transactions in relation to fluctuating net assets of the classes. Expenses directly attributable to a fund are charged to that fund. Expenses attributable to more than one fund are allocated among the respective funds on the basis of relative net assets or other appropriate methods. Expense estimates are accrued in the period to which they relate and adjustments are made when actual amounts are known.
Income Tax Information and Distributions to Shareholders. Each year, the Fund intends to qualify as a regulated investment company under Subchapter M of the Internal Revenue Code, including distributing substantially all of its taxable income and realized gains. As a result, no provision for U.S. Federal income taxes is required. As of November 30, 2013, the Fund did not have any unrecognized tax benefits in the financial statements; nor is the Fund aware of any tax positions for which it is reasonably possible that the total amounts of unrecognized tax benefits will significantly change in the next twelve months. The Fund files a U.S. federal tax return, in addition to state and local tax returns as required. The Fund's federal income tax returns are subject to examination by the Internal Revenue Service (IRS) for a period of three fiscal years after they are filed. State and local tax returns may be subject to examination for an additional fiscal year depending on the jurisdiction. Foreign taxes are provided for based on the Fund's understanding of the tax rules and rates that exist in the foreign markets in which it invests.
Distributions are declared and recorded on the ex-dividend date. Income dividends and capital gain distributions are declared separately for each class. Income and capital gain
Annual Report
3. Significant Accounting Policies - continued
Income Tax Information and Distributions to Shareholders - continued
distributions are determined in accordance with income tax regulations, which may differ from GAAP.
Capital accounts within the financial statements are adjusted for permanent book-tax differences. These adjustments have no impact on net assets or the results of operations. Temporary book-tax differences will reverse in a subsequent period.
Book-tax differences are primarily due to foreign currency transactions, passive foreign investment companies (PFIC), market discount, capital loss carryforwards, loss deferred due to wash sales and excise tax regulations.
The federal tax cost of investment securities and unrealized appreciation (depreciation) as of period end were as follows:
|
Gross unrealized appreciation |
$ 16,889,059 |
|
Gross unrealized depreciation |
(473,235) |
|
Net unrealized appreciation (depreciation) on securities and other investments |
$ 16,415,824 |
|
|
|
|
Tax Cost |
$ 69,157,256 |
The tax-based components of distributable earnings as of period end were as follows:
|
Undistributed ordinary income |
$ 483,156 |
|
Capital loss carryforward |
$ (18,333,795) |
|
Net unrealized appreciation (depreciation) |
$ 16,415,912 |
Capital loss carryforwards are only available to offset future capital gains of the Fund to the extent provided by regulations and may be limited. Under the Regulated Investment Company Modernization Act of 2010 (the Act), the Fund is permitted to carry forward capital losses incurred in taxable years beginning after December 22, 2010 for an unlimited period and such capital losses are required to be used prior to any losses that expire. The capital loss carryforward information presented below, including any applicable limitation, is estimated as of fiscal period end and is subject to adjustment.
|
2017 |
$ (18,333,795) |
The tax character of distributions paid was as follows:
|
|
November 30, 2013 |
November 30, 2012 |
|
Ordinary Income |
$ 666,191 |
$ 227,180 |
Annual Report
Notes to Financial Statements - continued
4. Purchases and Sales of Investments.
Purchases and sales of securities, other than short-term securities, aggregated $49,650,869 and $49,325,749, respectively.
5. Fees and Other Transactions with Affiliates.
Management Fee. Fidelity Management & Research Company (the investment adviser) and its affiliates provide the Fund with investment management related services for which the Fund pays a monthly management fee. The management fee is the sum of an individual fund fee rate that is based on an annual rate of .30% of the Fund's average net assets and an annualized group fee rate that averaged .25% during the period. The group fee rate is based upon the average net assets of all the mutual funds advised by the investment adviser, including any mutual funds previously advised by the investment adviser that are currently advised by Fidelity SelectCo, LLC, an affiliate of the investment adviser. The group fee rate decreases as assets under management increase and increases as assets under management decrease. In addition, the management fee is subject to a performance adjustment (up to a maximum of ± .20% of the Fund's average net assets over a 36 month performance period). The upward or downward adjustment to the management fee is based on the relative investment performance of the Institutional Class of the Fund as compared to an appropriate benchmark index over the same 36 month performance period. For the reporting period, the total annual management fee rate, including the performance adjustment, was .47% of the Fund's average net assets. The performance adjustment included in the management fee rate may be higher or lower than the maximum performance adjustment rate due to the difference between the average net assets for the reporting and performance periods.
Distribution and Service Plan Fees. In accordance with Rule 12b-1 of the 1940 Act, the Fund has adopted separate Distribution and Service Plans for each class of shares. Certain classes pay Fidelity Distributors Corporation (FDC), an affiliate of the investment adviser, separate Distribution and Service Fees, each of which is based on an annual percentage of each class' average net assets. In addition, FDC may pay financial intermediaries for selling shares of the Fund and providing shareholder support services. For the period, the Distribution and Service Fee rates, total fees and amounts retained by FDC were as follows:
|
|
Distribution |
Service |
Total Fees |
Retained |
|
Class A |
-% |
.25% |
$ 84,770 |
$ 2,106 |
|
Class T |
.25% |
.25% |
120,416 |
567 |
|
Class B |
.75% |
.25% |
28,759 |
21,848 |
|
Class C |
.75% |
.25% |
101,933 |
11,289 |
|
|
|
|
$ 335,878 |
$ 35,810 |
Annual Report
5. Fees and Other Transactions with Affiliates - continued
Sales Load. FDC may receive a front-end sales charge of up to 5.75% for selling Class A shares and 3.50% for selling Class T shares, some of which is paid to financial intermediaries for selling shares of the Fund. Depending on the holding period, FDC may receive contingent deferred sales charges levied on Class A, Class T, Class B, and Class C redemptions. The deferred sales charges range from 5.00% to 1.00% for Class B shares, 1.00% for Class C shares, 1.00% for certain purchases of Class A shares and .25% for certain purchases of Class T shares.
For the period, sales charge amounts retained by FDC were as follows:
|
|
Retained |
|
Class A |
$ 17,335 |
|
Class T |
3,769 |
|
Class B* |
3,217 |
|
Class C* |
2,445 |
|
|
$ 26,766 |
* When Class B and Class C shares are initially sold, FDC pays commissions from its own resources to financial intermediaries through which the sales are made.
Transfer Agent Fees. Fidelity Investments Institutional Operations Company, Inc., (FIIOC), an affiliate of the investment adviser, is the transfer, dividend disbursing and shareholder servicing agent for each class of the Fund. FIIOC receives account fees and asset-based fees that vary according to the account size and type of account of the shareholders of the respective classes of the Fund. FIIOC pays for typesetting, printing and mailing of shareholder reports, except proxy statements.
For the period, transfer agent fees for each applicable class were as follows:
|
|
Amount |
% of |
|
Class A |
$ 95,802 |
.28 |
|
Class T |
69,873 |
.29 |
|
Class B |
8,625 |
.30 |
|
Class C |
29,190 |
.29 |
|
Institutional Class |
5,195 |
.20 |
|
|
$ 208,685 |
|
Accounting and Security Lending Fees. Fidelity Service Company, Inc. (FSC), an affiliate of the investment adviser, maintains the Fund's accounting records. The accounting fee is based on the level of average net assets for each month. Under a separate
Annual Report
Notes to Financial Statements - continued
5. Fees and Other Transactions with Affiliates - continued
Accounting and Security Lending Fees - continued
contract, FSC administers the security lending program. The security lending fee is based on the number and duration of lending transactions.
Brokerage Commissions. The Fund placed a portion of its portfolio transactions with brokerage firms which are affiliates of the investment adviser. Brokerage commissions are included in net realized gain (loss) and change in net unrealized appreciation (depreciation) in the Statement of Operations. The commissions paid to these affiliated firms were $1,758 for the period.
6. Committed Line of Credit.
The Fund participates with other funds managed by the investment adviser or an affiliate in a $4.25 billion credit facility (the "line of credit") to be utilized for temporary or emergency purposes to fund shareholder redemptions or for other short-term liquidity purposes. The Fund has agreed to pay commitment fees on its pro-rata portion of the line of credit, which amounted to $153 and is reflected in Miscellaneous expenses on the Statement of Operations. During the period, there were no borrowings on this line of credit.
7. Security Lending.
The Fund lends portfolio securities through a lending agent from time to time in order to earn additional income. For equity securities, a lending agent is used and may loan securities to certain qualified borrowers, including Fidelity Capital Markets (FCM), a broker-dealer affiliated with the Fund. On the settlement date of the loan, the Fund receives collateral (in the form of U.S. Treasury obligations, letters of credit and/or cash) against the loaned securities and maintains collateral in an amount not less than 100% of the market value of the loaned securities during the period of the loan. The market value of the loaned securities is determined at the close of business of the Fund and any additional required collateral is delivered to the Fund on the next business day. If the borrower defaults on its obligation to return the securities loaned because of insolvency or other reasons, the Fund may apply collateral received from the borrower against the obligation. The Fund may experience delays and costs in recovering the securities loaned. Any cash collateral received is invested in the Fidelity Securities Lending Cash Central Fund. The value of loaned securities and cash collateral at period end are disclosed on the Fund's Statement of Assets and Liabilities. At period end, there were no security loans outstanding with FCM. Security lending income represents the income earned on investing cash collateral, less rebates paid to borrowers and any lending agent fees associated with the loan, plus any premium payments received for lending certain types of securities. Security lending income is presented in the Statement of Operations
Annual Report
7. Security Lending - continued
as a component of income from Fidelity Central Funds. Total security lending income during the period amounted to $5,353, including $13 from securities loaned to FCM.
8. Expense Reductions.
Commissions paid to certain brokers with whom the investment adviser, or its affiliates, places trades on behalf of the Fund include an amount in addition to trade execution, which may be rebated back to the Fund to offset certain expenses. This amount totaled $11,070 for the period. In addition, through arrangements with the Fund's custodian, credits realized as a result of uninvested cash balances were used to reduce the Fund's expenses. During the period, these credits reduced the Fund's custody expenses by $8.
9. Distributions to Shareholders.
Distributions to shareholders of each class were as follows:
|
Years ended November 30, |
2013 |
2012 |
|
From net investment income |
|
|
|
Class A |
$ 368,863 |
$ 153,829 |
|
Class T |
207,812 |
48,135 |
|
Class B |
10,127 |
- |
|
Class C |
48,842 |
- |
|
Institutional Class |
30,547 |
25,216 |
|
Total |
$ 666,191 |
$ 227,180 |
10. Share Transactions.
Transactions for each class of shares were as follows:
|
|
Shares |
Dollars |
||
|
Years ended November 30, |
2013 |
2012 |
2013 |
2012 |
|
Class A |
|
|
|
|
|
Shares sold |
583,952 |
512,068 |
$ 7,135,653 |
$ 5,071,992 |
|
Reinvestment of distributions |
32,284 |
15,952 |
339,948 |
141,492 |
|
Shares redeemed |
(541,866) |
(833,957) |
(6,484,059) |
(8,294,641) |
|
Net increase (decrease) |
74,370 |
(305,937) |
$ 991,542 |
$ (3,081,157) |
|
Class T |
|
|
|
|
|
Shares sold |
369,830 |
358,551 |
$ 4,472,830 |
$ 3,605,553 |
|
Reinvestment of distributions |
19,297 |
5,241 |
203,195 |
46,483 |
|
Shares redeemed |
(436,241) |
(709,166) |
(5,247,116) |
(7,062,030) |
|
Net increase (decrease) |
(47,114) |
(345,374) |
$ (571,091) |
$ (3,409,994) |
Annual Report
Notes to Financial Statements - continued
10. Share Transactions - continued
|
|
Shares |
Dollars |
||
|
Years ended November 30, |
2013 |
2012 |
2013 |
2012 |
|
Class B |
|
|
|
|
|
Shares sold |
6,153 |
1,897 |
$ 75,269 |
$ 19,084 |
|
Reinvestment of distributions |
894 |
- |
9,368 |
- |
|
Shares redeemed |
(82,657) |
(148,957) |
(973,124) |
(1,471,427) |
|
Net increase (decrease) |
(75,610) |
(147,060) |
$ (888,487) |
$ (1,452,343) |
|
Class C |
|
|
|
|
|
Shares sold |
203,559 |
132,946 |
$ 2,446,409 |
$ 1,314,514 |
|
Reinvestment of distributions |
4,183 |
- |
43,420 |
- |
|
Shares redeemed |
(150,316) |
(286,550) |
(1,733,957) |
(2,827,158) |
|
Net increase (decrease) |
57,426 |
(153,604) |
$ 755,872 |
$ (1,512,644) |
|
Institutional Class |
|
|
|
|
|
Shares sold |
65,871 |
19,258 |
$ 815,361 |
$ 195,293 |
|
Reinvestment of distributions |
2,690 |
2,110 |
28,699 |
18,952 |
|
Shares redeemed |
(45,258) |
(190,665) |
(550,743) |
(1,970,183) |
|
Net increase (decrease) |
23,303 |
(169,297) |
$ 293,317 |
$ (1,755,938) |
11. Other.
The Fund's organizational documents provide former and current trustees and officers with a limited indemnification against liabilities arising in connection with the performance of their duties to the Fund. In the normal course of business, the Fund may also enter into contracts that provide general indemnifications. The Fund's maximum exposure under these arrangements is unknown as this would be dependent on future claims that may be made against the Fund. The risk of material loss from such claims is considered remote.
Annual Report
Report of Independent Registered Public Accounting Firm
To the Trustees of Fidelity Advisor Series I and Shareholders of Fidelity Advisor Equity Value Fund:
We have audited the accompanying statement of assets and liabilities of Fidelity Advisor Equity Value Fund (the Fund), a fund of Fidelity Advisor Series I, including the schedule of investments, as of November 30, 2013, and the related statement of operations for the year then ended, the statement of changes in net assets for each of the two years in the period then ended, and the financial highlights for each of the five years in the period then ended. These financial statements and financial highlights are the responsibility of the Fund's management. Our responsibility is to express an opinion on these financial statements and financial highlights based on our audits.
We conducted our audits in accordance with the standards of the Public Company Accounting Oversight Board (United States). Those standards require that we plan and perform the audit to obtain reasonable assurance about whether the financial statements and financial highlights are free of material misstatement. The Fund is not required to have, nor were we engaged to perform, an audit of its internal control over financial reporting. Our audits included consideration of internal control over financial reporting as a basis for designing audit procedures that are appropriate in the circumstances, but not for the purpose of expressing an opinion on the effectiveness of the Fund's internal control over financial reporting. Accordingly, we express no such opinion. An audit also includes examining, on a test basis, evidence supporting the amounts and disclosures in the financial statements, assessing the accounting principles used and significant estimates made by management, as well as evaluating the overall financial statement presentation. Our procedures included confirmation of securities owned as of November 30, 2013, by correspondence with the custodians and brokers; where replies were not received from brokers, we performed other auditing procedures. We believe that our audits provide a reasonable basis for our opinion.
In our opinion, the financial statements and financial highlights referred to above present fairly, in all material respects, the financial position of Fidelity Advisor Equity Value Fund as of November 30, 2013, the results of its operations for the year then ended, the changes in its net assets for each of the two years in the period then ended, and the financial highlights for each of the five years in the period then ended, in conformity with accounting principles generally accepted in the United States of America.
DELOITTE & TOUCHE LLP
Boston, Massachusetts
January 14, 2014
Annual Report
Trustees and Officers
The Trustees, Member of the Advisory Board, and officers of the trust and fund, as applicable, are listed below. The Board of Trustees governs the fund and is responsible for protecting the interests of shareholders. The Trustees are experienced executives who meet periodically throughout the year to oversee the fund's activities, review contractual arrangements with companies that provide services to the fund, oversee management of the risks associated with such activities and contractual arrangements, and review the fund's performance. Except for James C. Curvey, Ned C. Lautenbach, Ronald P. O'Hanley, and William S. Stavropoulos, each of the Trustees oversees 173 funds. Mr. Curvey oversees 396 funds. Mr. Lautenbach, Mr. O'Hanley, and Mr. Stavropoulos each oversees 247 funds.
The Trustees hold office without limit in time except that (a) any Trustee may resign; (b) any Trustee may be removed by written instrument, signed by at least two-thirds of the number of Trustees prior to such removal; (c) any Trustee who requests to be retired or who has become incapacitated by illness or injury may be retired by written instrument signed by a majority of the other Trustees; and (d) any Trustee may be removed at any special meeting of shareholders by a two-thirds vote of the outstanding voting securities of the trust. Each Trustee who is not an interested person (as defined in the 1940 Act) of the trust and the fund (Independent Trustee), shall retire not later than the last day of the calendar year in which his or her 75th birthday occurs. The Independent Trustees may waive this mandatory retirement age policy with respect to individual Trustees. The officers and Advisory Board Member hold office without limit in time, except that any officer and Advisory Board Member may resign or may be removed by a vote of a majority of the Trustees at any regular meeting or any special meeting of the Trustees. Except as indicated, each individual has held the office shown or other offices in the same company for the past five years.
Experience, Skills, Attributes, and Qualifications of the Fund's Trustees. The Governance and Nominating Committee has adopted a statement of policy that describes the experience, qualifications, attributes, and skills that are necessary and desirable for potential Independent Trustee candidates (Statement of Policy). The Board believes that each Trustee satisfied at the time he or she was initially elected or appointed a Trustee, and continues to satisfy, the standards contemplated by the Statement of Policy. The Governance and Nominating Committee also engages professional search firms to help identify potential Independent Trustee candidates who have the experience, qualifications, attributes, and skills consistent with the Statement of Policy. From time to time, additional criteria based on the composition and skills of the current Independent Trustees, as well as experience or skills that may be appropriate in light of future changes to board composition, business conditions, and regulatory or other developments, have also been considered by the professional search firms and the Governance and Nominating Committee. In addition, the Board takes into account the Trustees' commitment and participation in Board and committee meetings, as well as their leadership of standing and ad hoc committees throughout their tenure.
Annual Report
In determining that a particular Trustee was and continues to be qualified to serve as a Trustee, the Board has considered a variety of criteria, none of which, in isolation, was controlling. The Board believes that, collectively, the Trustees have balanced and diverse experience, qualifications, attributes, and skills, which allow the Board to operate effectively in governing the fund and protecting the interests of shareholders. Information about the specific experience, skills, attributes, and qualifications of each Trustee, which in each case led to the Board's conclusion that the Trustee should serve (or continue to serve) as a trustee of the fund, is provided below.
Board Structure and Oversight Function. James C. Curvey is an interested person (as defined in the 1940 Act) and currently serves as Chairman. The Trustees have determined that an interested Chairman is appropriate and benefits shareholders because an interested Chairman has a personal and professional stake in the quality and continuity of services provided to the fund. Independent Trustees exercise their informed business judgment to appoint an individual of their choosing to serve as Chairman, regardless of whether the Trustee happens to be independent or a member of management. The Independent Trustees have determined that they can act independently and effectively without having an Independent Trustee serve as Chairman and that a key structural component for assuring that they are in a position to do so is for the Independent Trustees to constitute a substantial majority for the Board. The Independent Trustees also regularly meet in executive session. Ned C. Lautenbach serves as Chairman of the Independent Trustees and as such (i) acts as a liaison between the Independent Trustees and management with respect to matters important to the Independent Trustees and (ii) with management prepares agendas for Board meetings.
Fidelity funds are overseen by different Boards of Trustees. The fund's Board oversees Fidelity's equity and high income funds and another Board oversees Fidelity's investment-grade bond, money market, and asset allocation funds. The asset allocation funds may invest in Fidelity funds overseen by the fund's Board. The use of separate Boards, each with its own committee structure, allows the Trustees of each group of Fidelity funds to focus on the unique issues of the funds they oversee, including common research, investment, and operational issues. On occasion, the separate Boards establish joint committees to address issues of overlapping consequences for the Fidelity funds overseen by each Board.
The Trustees operate using a system of committees to facilitate the timely and efficient consideration of all matters of importance to the Trustees, the fund, and fund shareholders and to facilitate compliance with legal and regulatory requirements and oversight of the fund's activities and associated risks. The Board, acting through its committees, has charged FMR and its affiliates with (i) identifying events or circumstances the occurrence of which could have demonstrably adverse effects on the fund's business and/or reputation; (ii) implementing processes and controls to lessen the possibility that such events or circumstances occur or to mitigate the effects of such events or circumstances if they do occur; and (iii) creating and maintaining a system designed to evaluate continuously business and market conditions in order to facilitate the identification and implementation processes described in (i) and (ii) above. Because the day-to-day operations and activities of the fund are carried out by or through FMR, its affiliates and other service providers, the fund's exposure to risks is mitigated but not eliminated by the processes overseen by the Trustees. While each of the Board's committees has responsibility for overseeing different aspects of the fund's activities, oversight is exercised primarily through the Operations, Audit, and Compliance Committees. In addition, the Independent Trustees have worked with FMR to enhance the Board's oversight of investment and financial risks, legal and regulatory risks, technology risks, and operational risks, including the development of additional risk reporting to the Board. For example, a working group comprised of Independent Trustees and FMR has worked and continues to work to review the Fidelity funds' valuation-related activities, reporting and risk management. Appropriate personnel, including but not limited to the fund's Chief Compliance Officer (CCO), FMR's internal auditor, the independent accountants, the fund's Treasurer and portfolio management personnel, make periodic reports to the Board's committees, as appropriate, including an annual review of FMR's risk management program for the Fidelity funds. The responsibilities of each standing committee, including their oversight responsibilities, are described further under "Standing Committees of the Fund's Trustees."
Annual Report
Trustees and Officers - continued
The fund's Statement of Additional Information (SAI) includes more information about the Trustees. To request a free copy, call Fidelity at 1-877-208-0098.
Interested Trustees*:
Correspondence intended for each Trustee who is an interested person may be sent to Fidelity Investments, 245 Summer Street, Boston, Massachusetts 02210.
|
Name, Year of Birth; Principal Occupations and Other Relevant Experience+ |
|
|
James C. Curvey (1935) |
|
|
Year of Election or Appointment: 2007 Trustee Chairman of the Board of Trustees |
|
|
|
Mr. Curvey also serves as Trustee of other Fidelity funds. Mr. Curvey is a Director of Fidelity Investments Money Management, Inc. (2009-present), Director of Fidelity Research & Analysis Co. (2009-present) and Director of FMR and FMR Co., Inc. (2007-present). Mr. Curvey is also Vice Chairman (2007-present) and Director of FMR LLC. In addition, Mr. Curvey serves as an Overseer for the Boston Symphony Orchestra and a member of the Trustees of Villanova University. Previously, Mr. Curvey was the Vice Chairman (2006-2007) and Director (2000-2007) of FMR Corp. |
|
Ronald P. O'Hanley (1957) |
|
|
Year of Election or Appointment: 2011 Trustee |
|
|
|
Mr. O'Hanley also serves as Trustee of other Fidelity funds. He is Director of Fidelity SelectCo, LLC (2013-present), FMR Co., Inc. (2010-present), Director of Fidelity Investments Money Management, Inc. (2010-present), Director of Fidelity Research & Analysis Company (2010-present), President of Fidelity Asset Management and Corporate Services and a Member of Fidelity's Executive Committee (2010-present). Previously, Mr. O'Hanley served as President and Chief Executive Officer of BNY Mellon Asset Management (2007-2010). Mr. O'Hanley also served as Vice Chairman of Bank New York Mellon Corp. and a member of that firm's Executive Committee. Prior to the 2007 merger of The Bank of New York and Mellon Financial Corporation, he was Vice Chairman of Mellon Financial Corporation and President and Chief Executive Officer of Mellon Asset Management. He joined Mellon in February 1997. Mr. O'Hanley currently serves as Chairman of the Boston Public Library Foundation Board of Directors and sits on the Board of Directors of Beth Israel Deaconess Medical Center, the Board of Trustees of the Marine Biological Laboratory and the Advisory Board of the Maxwell School of Citizenship and Public Administration at Syracuse University. Mr. O'Hanley also chairs the Council on Asset Management for the Financial Services Roundtable and is a member of the Board of Directors of Institutional Investor's U.S. Institute. |
* Trustees have been determined to be "Interested Trustees" by virtue of, among other things, their affiliation with the trust or various entities under common control with FMR.
+ The information above includes each Trustee's principal occupation during the last five years and other information relating to the experience, attributes, and skills relevant to each Trustee's qualifications to serve as a Trustee, which led to the conclusion that each Trustee should serve as a Trustee for the fund.
Annual Report
Trustees and Officers - continued
Independent Trustees:
Correspondence intended for each Independent Trustee (that is, the Trustees other than the Interested Trustees) may be sent to Fidelity Investments, P.O. Box 55235, Boston, Massachusetts 02205-5235.
|
Name, Year of Birth; Principal Occupations and Other Relevant Experience+ |
|
|
Dennis J. Dirks (1948) |
|
|
Year of Election or Appointment: 2005 Trustee |
|
|
|
Mr. Dirks also serves as Trustee of other Fidelity funds. Prior to his retirement in May 2003, Mr. Dirks was Chief Operating Officer and a member of the Board of The Depository Trust & Clearing Corporation (DTCC). He also served as President, Chief Operating Officer, and Board member of The Depository Trust Company (DTC) and President and Board member of the National Securities Clearing Corporation (NSCC). In addition, Mr. Dirks served as Chief Executive Officer and Board member of the Government Securities Clearing Corporation, Chief Executive Officer and Board member of the Mortgage-Backed Securities Clearing Corporation, as a Trustee and a member of the Finance Committee of Manhattan College (2005-2008), and as a Trustee and a member of the Finance Committee of AHRC of Nassau County (2006-2008). Mr. Dirks is a member of the Independent Directors Council (IDC) Governing Council (2010-present) and Board of Directors for The Brookville Center for Children's Services, Inc. (2009-present). |
|
Alan J. Lacy (1953) |
|
|
Year of Election or Appointment: 2008 Trustee |
|
|
|
Mr. Lacy also serves as Trustee of other Fidelity funds. Mr. Lacy serves as Senior Adviser (2007-present) of Oak Hill Capital Partners, L.P. (private equity). Mr. Lacy also served as Chief Executive Officer (2000-2005) and Vice Chairman (2005-2006) of Sears Holdings Corporation and Sears, Roebuck and Co. (retail). In addition, Mr. Lacy serves as a member of the Board of Directors of Dave & Buster's Entertainment, Inc. (restaurant and entertainment complexes, 2010-present), Earth Fare, Inc. (retail grocery, 2012-present), The Hillman Companies, Inc. (hardware wholesalers, 2010-present), and Bristol-Myers Squibb Company (global pharmaceuticals, 2008-present). Mr. Lacy is a member of the Board of Trustees of The National Parks Conservation Association (2006-present). Previously, Mr. Lacy served as Chairman of the Board of Trustees of the National Parks Conservation Association (2008-2011) and as a member of the Board of Directors for the Western Union Company (global money transfer, 2006-2011). |
|
Ned C. Lautenbach (1944) |
|
|
Year of Election or Appointment: 2000 Trustee Chairman of the Independent Trustees |
|
|
|
Mr. Lautenbach also serves as Trustee of other Fidelity funds. Mr. Lautenbach currently serves as the Lead Director of the Eaton Corporation Board of Directors (diversified industrial, 1997-present). Mr. Lautenbach is Chairman of the Board of Directors of the Philharmonic Center for the Arts in Naples, Florida (2012-present) and a member of the Council on Foreign Relations (1994-present). Previously, Mr. Lautenbach was a Partner/Advisory Partner at Clayton, Dubilier & Rice, LLC (private equity investment, 1998-2010), as well as a Director of Sony Corporation (2006-2007). |
|
Joseph Mauriello (1944) |
|
|
Year of Election or Appointment: 2008 Trustee |
|
|
|
Mr. Mauriello also serves as Trustee of other Fidelity funds. Prior to his retirement in January 2006, Mr. Mauriello served in numerous senior management positions including Deputy Chairman and Chief Operating Officer (2004-2005), and Vice Chairman of Financial Services (2002-2004) of KPMG LLP US (professional services, 1965-2005). Mr. Mauriello currently serves as a member of the Board of Directors of XL Group plc. (global insurance and re-insurance, 2006-present). Previously, Mr. Mauriello served as a Director of the Hamilton Funds of the Bank of New York (2006-2007) and of Arcadia Resources Inc. (health care services and products, 2007-2012). |
|
Robert W. Selander (1950) |
|
|
Year of Election or Appointment: 2011 Trustee |
|
|
|
Mr. Selander also serves as Trustee of other Fidelity funds. Previously, Mr. Selander served as a Member of the Advisory Board of other Fidelity funds (2011), and Executive Vice Chairman (2010), Chief Executive Officer (2009-2010), and President and Chief Executive Officer (1997-2009) of Mastercard, Inc. |
|
Cornelia M. Small (1944) |
|
|
Year of Election or Appointment: 2005 Trustee |
|
|
|
Ms. Small also serves as Trustee of other Fidelity funds. Ms. Small is a member of the Board of Directors (2009-present) and Chair of the Investment Committee (2010-present) of the Teagle Foundation. Ms. Small also serves on the Investment Committee of the Berkshire Taconic Community Foundation (2008-present). Previously, Ms. Small served as Chairperson (2002-2008) and a member of the Investment Committee and Chairperson (2008-2012) and a member of the Board of Trustees of Smith College. In addition, Ms. Small served as Chief Investment Officer, Director of Global Equity Investments, and a member of the Board of Directors of Scudder, Stevens & Clark and Scudder Kemper Investments. |
|
William S. Stavropoulos (1939) |
|
|
Year of Election or Appointment: 2002 Trustee Vice Chairman of the Independent Trustees |
|
|
|
Mr. Stavropoulos also serves as Trustee of other Fidelity funds. Mr. Stavropoulos serves as President and Founder of the Michigan Baseball Foundation, the Great Lakes Loons (2007-present). Mr. Stavropoulos is Chairman Emeritus of the Board of Directors of The Dow Chemical Company, where he previously served in numerous senior management positions, including President, CEO (1995-2000; 2002-2004), Chairman of the Executive Committee (2000-2006), and as a member of the Board of Directors (1990-2006). Currently, Mr. Stavropoulos is Chairman of the Board of Directors of Univar Inc. (global distributor of commodity and specialty chemicals), a Director of Teradata Corporation (data warehousing and technology solutions), and Maersk Inc. (industrial conglomerate), and a member of the Advisory Board for Metalmark Capital LLC (private equity investment, 2005-present). Mr. Stavropoulos is an operating advisor to Clayton, Dubilier & Rice, LLC (private equity investment). In addition, Mr. Stavropoulos is a member of the University of Notre Dame Advisory Council for the College of Science, a Trustee of the Rollin L. Gerstacker Foundation, and a Director of the Naples Philharmonic Center for the Arts. Previously, Mr. Stavropoulos served as a Director of Chemical Financial Corporation (bank holding company, 1993-2012) and Tyco International, Ltd. (multinational manufacturing and services, 2007-2012). |
|
David M. Thomas (1949) |
|
|
Year of Election or Appointment: 2008 Trustee |
|
|
|
Mr. Thomas also serves as Trustee of other Fidelity funds. Mr. Thomas serves as Non-Executive Chairman of the Board of Directors of Fortune Brands Home and Security (home and security products, 2011-present), and as a member of the Board of Directors of Interpublic Group of Companies, Inc. (marketing communication, 2004-present). Previously, Mr. Thomas served as Executive Chairman (2005-2006) and Chairman and Chief Executive Officer (2000-2005) of IMS Health, Inc. (pharmaceutical and healthcare information solutions), and a Director of Fortune Brands, Inc. (consumer products, 2000-2011). |
+ The information above includes each Trustee's principal occupation during the last five years and other information relating to the experience, attributes, and skills relevant to each Trustee's qualifications to serve as a Trustee, which led to the conclusion that each Trustee should serve as a Trustee for the fund.
Advisory Board Member and Officers:
Correspondence intended for each officer and Peter S. Lynch may be sent to Fidelity Investments, 245 Summer Street, Boston, Massachusetts 02210. Officers appear below in alphabetical order.
|
Name, Year of Birth; Principal Occupation |
|
|
Peter S. Lynch (1944) |
|
|
Year of Election or Appointment: 2003 Member of the Advisory Board |
|
|
|
Mr. Lynch also serves as Member of the Advisory Board of other Fidelity funds. Mr. Lynch is Vice Chairman and a Director of FMR and FMR Co., Inc. In addition, Mr. Lynch serves as a Trustee of Boston College and as the Chairman of the Inner-City Scholarship Fund. Previously, Mr. Lynch served on the Special Olympics International Board of Directors (1997-2006). |
|
Elizabeth Paige Baumann (1968) |
|
|
Year of Election or Appointment: 2012 Anti-Money Laundering (AML) Officer |
|
|
|
Ms. Baumann also serves as AML Officer of other funds. She is Chief AML Officer of FMR LLC (2012-present) and is an employee of Fidelity Investments. Previously, Ms. Baumann served as Vice President and Deputy Anti-Money Laundering Officer (2007-2012). |
|
William C. Coffey (1969) |
|
|
Year of Election or Appointment: 2009 Assistant Secretary |
|
|
|
Mr. Coffey also serves as Assistant Secretary of other funds. He is Senior Vice President and Deputy General Counsel of FMR LLC (2010-present), and is an employee of Fidelity Investments. Previously, Mr. Coffey served as Vice President and Associate General Counsel of FMR LLC (2005-2009). |
|
Jonathan Davis (1968) |
|
|
Year of Election or Appointment: 2010 Assistant Treasurer |
|
|
|
Mr. Davis also serves as Assistant Treasurer of other funds. Mr. Davis is an employee of Fidelity Investments. Previously, Mr. Davis served as Vice President and Associate General Counsel of FMR LLC (2003-2010). |
|
Adrien E. Deberghes (1967) |
|
|
Year of Election or Appointment: 2008 Deputy Treasurer |
|
|
|
Mr. Deberghes also serves as an officer of other funds. He is an employee of Fidelity Investments (2008-present). Prior to joining Fidelity Investments, Mr. Deberghes was Senior Vice President of Mutual Fund Administration at State Street Corporation (2007-2008), Senior Director of Mutual Fund Administration at Investors Bank & Trust (2005-2007), and Director of Finance for Dunkin' Brands (2000-2005). |
|
Stephanie J. Dorsey (1969) |
|
|
Year of Election or Appointment: 2010 Assistant Treasurer |
|
|
|
Ms. Dorsey also serves as an officer of other funds. She is an employee of Fidelity Investments (2008-present) and has served in other fund officer roles. Prior to joining Fidelity Investments, Ms. Dorsey served as Treasurer (2004-2008) of the JPMorgan Mutual Funds and Vice President (2004-2008) of JPMorgan Chase Bank. |
|
Scott C. Goebel (1968) |
|
|
Year of Election or Appointment: 2008 Secretary and Chief Legal Officer (CLO) |
|
|
|
Mr. Goebel serves as Secretary and CLO of other funds. Mr. Goebel also serves as Secretary of Fidelity Investments Money Management, Inc. (FIMM) (2010-present) and Fidelity Research and Analysis Company (FRAC) (2010-present); General Counsel, Secretary, and Senior Vice President of FMR (2008-present) and FMR Co., Inc. (2008-present); Chief Legal Officer of Fidelity Management & Research (Hong Kong) Limited (2008-present) and Assistant Secretary of Fidelity Management & Research (Japan) Inc. (2008-present), and Fidelity Management & Research (U.K.) Inc. (2008-present). Previously, Mr. Goebel served as Secretary and CLO of other Fidelity funds (2008-2013), Assistant Secretary of FIMM (2008-2010), FRAC (2008-2010), and certain funds (2007-2008); and as Vice President and Secretary of Fidelity Distributors Corporation (FDC) (2005-2007). Mr. Goebel has been employed by FMR LLC or an affiliate since 2001. |
|
Joseph A. Hanlon (1968) |
|
|
Year of Election or Appointment: 2012 Chief Compliance Officer |
|
|
|
Mr. Hanlon also serves as Chief Compliance Officer of other funds. Mr. Hanlon serves as Compliance Officer of FMR, FMR Co., Inc., Fidelity Investments Money Management, Inc. (FIMM), Fidelity Research and Analysis Company (FRAC), and Fidelity Management & Research (Hong Kong) (2009-present), as Senior Vice President of the Fidelity Asset Management Division (2009-present), and is an employee of Fidelity Investments. Previously, Mr. Hanlon served as Compliance Officer of Fidelity Management & Research (Japan) Inc. (2009-2013), Strategic Advisers, Inc. (2009-2013), and Fidelity Management & Research (U.K.) Inc. (2009-2013). |
|
Thomas C. Hense (1964) |
|
|
Year of Election or Appointment: 2008/2010 Vice President |
|
|
|
Mr. Hense also serves as Vice President of other funds (High Income (2008), Small Cap (2008), and Value (2010) funds). Previously, Mr. Hense served as a portfolio manager for Fidelity's Institutional Money Management Group (Pyramis) (2003-2008). |
|
Brian B. Hogan (1964) |
|
|
Year of Election or Appointment: 2009 Vice President |
|
|
|
Mr. Hogan also serves as Vice President of other funds. Mr. Hogan serves as President of FMR's Equity Division (2009-present). Previously, Mr. Hogan served as Senior Vice President, Equity Research of FMR (2006-2009) and as a portfolio manager. |
|
Chris Maher (1972) |
|
|
Year of Election or Appointment: 2013 Assistant Treasurer |
|
|
|
Mr. Maher serves as Assistant Treasurer of other funds. Mr. Maher is Vice President of Valuation Oversight and is an employee of Fidelity Investments. Previously, Mr. Maher served as Vice President of Asset Management Compliance (2013), Vice President of FMR's Program Management Group (2010-2013), and Vice President of Valuation Oversight (2008-2010). |
|
Christine Reynolds (1958) |
|
|
Year of Election or Appointment: 2008 Chief Financial Officer |
|
|
|
Ms. Reynolds also serves as Chief Financial Officer of other funds. Ms. Reynolds became President of Fidelity Pricing and Cash Management Services (FPCMS) in August 2008. Ms. Reynolds served as Chief Operating Officer of FPCMS (2007-2008). Previously, Ms. Reynolds served as President, Treasurer, and Anti-Money Laundering officer of the Fidelity funds (2004-2007). |
|
Kenneth B. Robins (1969) |
|
|
Year of Election or Appointment: 2008 President and Treasurer |
|
|
|
Mr. Robins also serves as an officer of other funds. Mr. Robins serves as Executive Vice President of Fidelity Investments Money Management, Inc. (FIMM) (2013-present) and is an employee of Fidelity Investments (2004-present). Previously, Mr. Robins served in other fund officer roles. |
|
Gary W. Ryan (1958) |
|
|
Year of Election or Appointment: 2005 Assistant Treasurer |
|
|
|
Mr. Ryan also serves as Assistant Treasurer of other funds. Mr. Ryan is an employee of Fidelity Investments and has served in other fund officer roles. Previously, Mr. Ryan served as Vice President of Fund Reporting in Fidelity Pricing and Cash Management Services (FPCMS) (1999-2005). |
|
Stephen Sadoski (1971) |
|
|
Year of Election or Appointment: 2012 Deputy Treasurer |
|
|
|
Mr. Sadoski also serves as Deputy Treasurer of other funds. He is an employee of Fidelity Investments (2012-present) and has served in another fund officer role. Prior to joining Fidelity Investments, Mr. Sadoski served as an assistant chief accountant in the Division of Investment Management of the Securities and Exchange Commission (SEC) (2009-2012) and as a senior manager at Deloitte & Touche LLP (1997-2009). |
|
Stacie M. Smith (1974) |
|
|
Year of Election or Appointment: 2013 Deputy Treasurer |
|
|
|
Ms. Smith also serves as an officer of other funds. She is an employee of Fidelity Investments (2009-present) and has served in other fund officer roles. Prior to joining Fidelity Investments, Ms. Smith served as Senior Audit Manager of Ernst & Young LLP (1996-2009). |
|
Renee Stagnone (1975) |
|
|
Year of Election or Appointment: 2013 Deputy Treasurer |
|
|
|
Ms. Stagnone also serves as Deputy Treasurer of other funds. Ms. Stagnone is an employee of Fidelity Investments. |
|
Joseph F. Zambello (1957) |
|
|
Year of Election or Appointment: 2011 Deputy Treasurer |
|
|
|
Mr. Zambello also serves as Deputy Treasurer of other funds. Mr. Zambello is an employee of Fidelity Investments. Previously, Mr. Zambello served as Vice President of FMR's Program Management Group (2009-2011) and Vice President of the Transfer Agent Oversight Group (2005-2009). |
Annual Report
Distributions (Unaudited)
Class A, Class T, Class B, and Class C designate 100% of the dividends distributed in December 2012, as qualifying for the dividends-received deduction for corporate shareholders.
Class A, Class T, Class B, and Class C designate 100% of the dividends distributed during the fiscal year as amounts which may be taken into account as a dividend for purposes of the maximum rate under section 1(h)(11) of the Internal Revenue Code.
The fund will notify shareholders in January 2014 of amounts for use in preparing 2013 income tax returns.
Annual Report
Board Approval of Investment Advisory Contracts and Management Fees
Fidelity Advisor Equity Value Fund
Each year, the Board of Trustees, including the Independent Trustees (together, the Board), votes on the renewal of the management contract and sub-advisory agreements (together, the Advisory Contracts) for the fund. The Board, assisted by the advice of fund counsel and Independent Trustees' counsel, requests and considers a broad range of information relevant to the renewal of the Advisory Contracts throughout the year.
The Board meets regularly and, at each of its meetings, covers an extensive agenda of topics and materials and considers factors that are relevant to its annual consideration of the renewal of the fund's Advisory Contracts, including the services and support provided to the fund and its shareholders. The Board has established various standing committees, each composed of and chaired by Independent Trustees with varying backgrounds, to which the Board has assigned specific subject matter responsibilities in order to enhance effective decision-making by the Board. The Board, acting directly and through its Committees, requests and receives information concerning the annual consideration of the renewal of the fund's Advisory Contracts. The Board also meets as needed to consider matters specifically related to the Board's annual consideration of the renewal of Advisory Contracts. Members of the Board may also meet with trustees of other Fidelity funds through ad hoc joint committees to discuss certain matters relevant to the Fidelity funds.
At its July 2013 meeting, the Board, including the Independent Trustees, unanimously determined to renew the fund's Advisory Contracts. In reaching its determination, the Board considered all factors it believed relevant, including (i) the nature, extent, and quality of the services to be provided to the fund and its shareholders (including the investment performance of the fund); (ii) the competitiveness of the fund's management fee and total expense ratio relative to peer funds; (iii) the total costs of the services to be provided by and the profits to be realized by Fidelity from its relationship with the fund; (iv) the extent to which economies of scale exist and would be realized as the fund grows; and (v) whether fee levels reflect these economies of scale, if any, for the benefit of fund shareholders.
In considering whether to renew the Advisory Contracts for the fund, the Board reached a determination, with the assistance of fund counsel and Independent Trustees' counsel and through the exercise of its business judgment, that the renewal of the Advisory Contracts was in the best interests of the fund and its shareholders and that the compensation payable under the Advisory Contracts was fair and reasonable. The Board's decision to renew the Advisory Contracts was not based on any single factor, but rather was based on a comprehensive consideration of all the information provided to the Board at its meetings throughout the year. The Board, in reaching its determination to renew the Advisory Contracts, was aware that shareholders in the fund have a broad range of investment choices available to them, including a wide choice among mutual funds offered by Fidelity's competitors, and that the fund's shareholders, who have the opportunity to review and weigh the disclosure provided by the fund in its prospectus and other public disclosures, have chosen to invest in this fund, which is a part of the Fidelity family of funds.
Annual Report
Board Approval of Investment Advisory Contracts and
Management Fees - continued
Nature, Extent, and Quality of Services Provided. The Board considered the staffing within the investment adviser, Fidelity Management & Research Company (FMR), and the sub-advisers (together, the Investment Advisers) as it relates to the fund, including the backgrounds of the fund's investment personnel, and also considered the fund's investment objective, strategies, and related investment philosophy. The Independent Trustees also had discussions with senior management of Fidelity's investment operations and investment groups. The Board considered the structure of the portfolio manager compensation program and whether this structure provides appropriate incentives to act in the best interests of the fund.
Resources Dedicated to Investment Management and Support Services. The Board and the Fund Oversight and Research Committees reviewed the general qualifications and capabilities of the Investment Advisers' investment staff, including its size, education, experience, and resources, as well as the Investment Advisers' approach to recruiting, training, managing, and compensating investment personnel. The Board noted that FMR has continued to increase the resources devoted to non-U.S. offices, including expansion of Fidelity's global investment organization. The Board also noted that Fidelity's analysts have extensive resources, tools and capabilities that allow them to conduct sophisticated quantitative and fundamental analysis, as well as credit analysis of issuers, counterparties and guarantors. Further, the Board believes that Fidelity's investment professionals have sufficient access to global information and data so as to provide competitive investment results over time, and that those professionals also have access to sophisticated tools that permit them to assess portfolio construction and risk and performance attribution characteristics continuously, as well as to transmit new information and research conclusions rapidly around the world. Additionally, in its deliberations, the Board considered the Investment Advisers' trading and risk management capabilities and resources, which are an integral part of the investment management process.
Shareholder and Administrative Services. The Board considered (i) the nature, extent, quality, and cost of advisory, administrative, and shareholder services performed by the Investment Advisers and their affiliates under the Advisory Contracts and under separate agreements covering transfer agency, pricing and bookkeeping, and securities lending services for the fund; (ii) the nature and extent of the supervision of third party service providers, principally custodians and subcustodians; and (iii) the resources devoted to, and the record of compliance with, the fund's compliance policies and procedures. The Board also reviewed the allocation of fund brokerage, including allocations to brokers affiliated with the Investment Advisers, the use of brokerage commissions to pay fund expenses, and the use of "soft" commission dollars to pay for research services.
Annual Report
The Board noted that the growth of fund assets over time across the complex allows Fidelity to reinvest in the development of services designed to enhance the value or convenience of the Fidelity funds as investment vehicles. These services include 24-hour access to account information and market information through telephone representatives and over the Internet, investor education materials and asset allocation tools, and the expanded availability of Fidelity Investor Centers.
Investment in a Large Fund Family. The Board considered the benefits to shareholders of investing in a Fidelity fund, including the benefits of investing in a fund that is part of a large family of funds offering a variety of investment disciplines and providing a large variety of mutual fund investor services. The Board noted that Fidelity had taken, or had made recommendations that resulted in the Fidelity funds taking, a number of actions over the previous year that benefited particular funds, including (i) continuing to dedicate additional resources to investment research and to the support of the senior management team that oversees asset management; (ii) persisting in efforts to enhance Fidelity's global research capabilities; (iii) launching new funds and making other enhancements to meet client needs for global and income-oriented solutions; (iv) continuing to launch dedicated lower cost underlying funds to meet portfolio construction needs related to expanding underlying fund options for Fidelity funds of funds, specifically for the Freedom Fund product lines; (v) rationalizing product lines and gaining increased efficiencies through the mergers of several funds into other funds; (vi) strengthening Fidelity's index fund offerings by reducing investment minimums and adopting or lowering existing expense caps for certain funds and classes; (vii) enhancing Global Asset Allocation product offerings by launching new funds and strategies, including "open architecture" target date funds that utilize affiliated and unaffiliated sub-advisers; (viii) modifying the eligibility criteria for Institutional Class shares of Advisor funds to increase their marketability to a portion of the defined contribution plan market; (ix) creating a new low-cost retirement share class for certain Advisor funds to appeal to large retirement plans; (x) transitioning the management of certain Fidelity commodity funds to Geode Capital Management LLC, a registered commodity pool operator, while retaining administrative responsibilities for the funds; (xi) reorganizing a number of funds; and (xii) taking steps toward establishing a new Fidelity adviser to manage sector-based funds and products.
Investment Performance. The Board considered whether the fund has operated in accordance with its investment objective, as well as its record of compliance with its investment restrictions and its performance history.
The Board took into account discussions with the Investment Advisers about fund investment performance that occur at Board meetings throughout the year. In this regard the Board noted that as part of regularly scheduled fund reviews and other reports to the Board on fund performance, the Board periodically considers annualized return information for the fund, for different time periods, measured against a securities market index ("benchmark index") and a peer group of mutual funds with similar objectives ("peer group"). In its evaluation of fund investment performance, the Board gave particular attention to information indicating changes in performance of certain Fidelity funds for specific time periods and the Investment Advisers' explanations for any overperformance or, in the case of the fund, underperformance.
Annual Report
Board Approval of Investment Advisory Contracts and
Management Fees - continued
In addition to reviewing absolute and relative fund performance, the Independent Trustees periodically consider the appropriateness of fund performance metrics in evaluating the results achieved. In general, the Independent Trustees believe that fund performance should be evaluated based on net performance (after fees and expenses) of both the highest performing and lowest performing classes, where applicable, compared to appropriate benchmark indices, over appropriate time periods which may include full market cycles, and compared to peer groups, as applicable, over the same periods, taking into account relevant factors including the following: general market conditions; issuer-specific information; tactical opportunities for investment; and fund cash flows and other factors.
The Independent Trustees recognize that shareholders evaluate performance on a net basis over their own holding periods, for which one-, three-, and five-year periods are used as a proxy. For this reason, the performance information reviewed by the Board also included net cumulative calendar year total return information for the fund and an appropriate benchmark index and peer group for the most recent one-, three-, and five-year periods, as shown below. Returns are shown compared to the 25th percentile (top of box) and 75th percentile (bottom of box) of the peer universe.
Annual Report
Fidelity Advisor Equity Value Fund
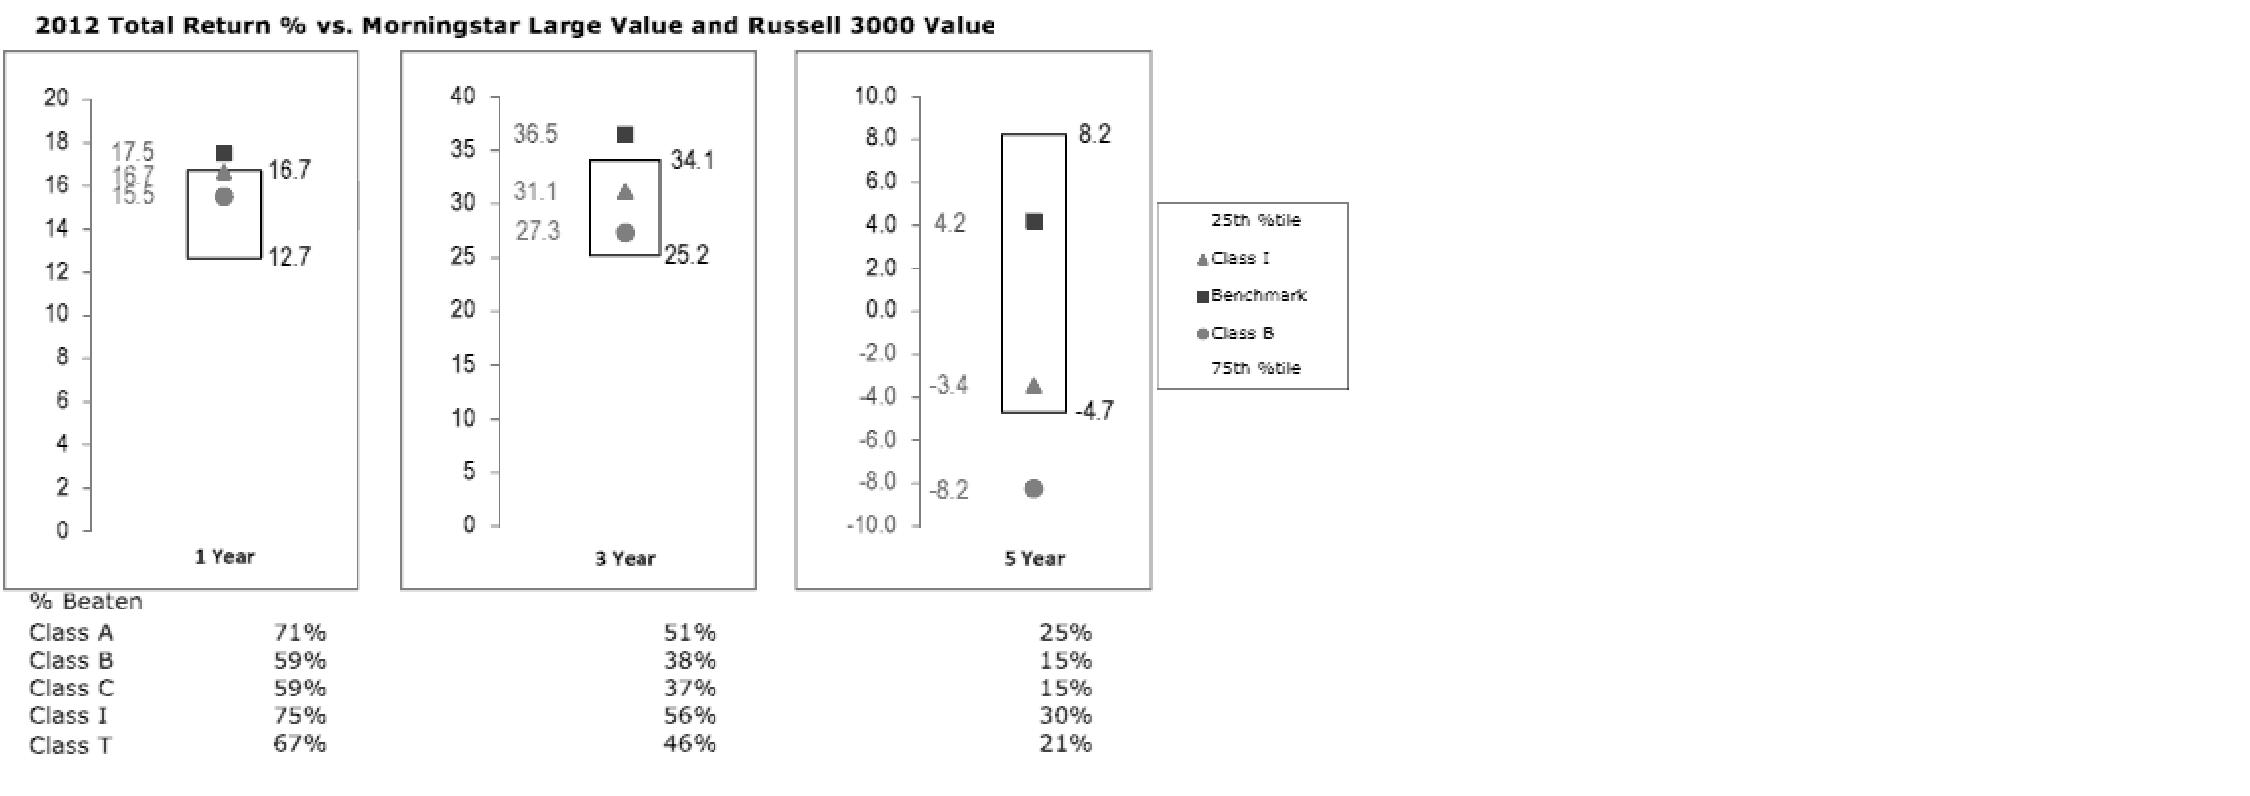
The Board has discussed the fund's performance with FMR, including the fund's underperformance based on more recent periods ended after 2012 (which periods are not shown in the chart above) but prior to the date of the Board's approval of the renewal of the Advisory Contracts, and has engaged with FMR to consider what steps might be taken to remediate the fund's more recent underperformance.
The Board also considered that the fund's management fee is subject to upward or downward adjustment depending upon whether, and to what extent, the fund's investment performance for the performance period exceeds, or is exceeded by, a securities index, thus leading to a performance adjustment for the same period. The Board noted that the performance adjustment provides FMR with a strong economic incentive to seek to achieve superior performance for the fund's shareholders and helps to more closely align the interests of FMR and the fund's shareholders.
Based on its review, the Board concluded that the nature, extent, and quality of services provided to the fund under the Advisory Contracts should benefit the fund's shareholders.
Competitiveness of Management Fee and Total Expense Ratio. The Board considered the fund's management fee and total expense ratio compared to "mapped groups" of competitive funds and classes. Fidelity creates "mapped groups" by combining similar Lipper investment objective categories that have comparable management fee characteristics. Combining Lipper investment objective categories aids the Board's management fee and total expense ratio comparisons by broadening the competitive group used for comparison and by reducing the number of universes to which various Fidelity funds are compared.
Annual Report
Board Approval of Investment Advisory Contracts and
Management Fees - continued
Management Fee. The Board considered two proprietary management fee comparisons for the 12-month periods shown in the chart below. The group of Lipper funds used by the Board for management fee comparisons is referred to below as the "Total Mapped Group." The Total Mapped Group comparison focuses on a fund's standing in terms of gross management fees before expense reimbursements or caps, and without giving effect to the fund's performance adjustment, relative to the total universe of funds with comparable investment mandates, regardless of whether their management fee structures also are comparable. Funds with comparable investment mandates offer exposure to similar types of securities. Funds with comparable management fee structures have similar management fee contractual arrangements (e.g., flat rate charged for advisory services, all-inclusive fee rate, etc.). "TMG %" represents the percentage of funds in the Total Mapped Group that had management fees that were lower than the fund's. For example, a TMG % of 11% means that 89% of the funds in the Total Mapped Group had higher management fees than the fund. The "Asset-Size Peer Group" (ASPG) comparison focuses on a fund's standing relative to non-Fidelity funds similar in size to the fund within the Total Mapped Group. The "Asset-Size Peer Group" (ASPG) comparison focuses on a fund's standing relative to a subset of non-Fidelity funds within the Total Mapped Group that are similar in size and management fee structure. The ASPG represents at least 15% of the funds in the Total Mapped Group with comparable asset size and management fee structures, subject to a minimum of 50 funds (or all funds in the Total Mapped Group if fewer than 50). Additional information, such as the ASPG quartile in which the fund's management fee ranked and the impact of the fund's performance adjustment, is also included in the chart and considered by the Board.
Annual Report
Fidelity Advisor Equity Value Fund

The Board noted that the fund's management fee ranked below the median of its Total Mapped Group and below the median of its ASPG for 2012. The Board also noted the effect of the fund's negative performance adjustment on the fund's management fee ranking.
Based on its review, the Board concluded that the fund's management fee is fair and reasonable in light of the services that the fund receives and the other factors considered.
Total Expense Ratio. In its review of each class's total expense ratio, the Board considered the fund's management fee as well as other fund or class expenses, as applicable, such as transfer agent fees, pricing and bookkeeping fees, fund-paid 12b-1 fees, and custodial, legal, and audit fees. The Board also noted the effects of any waivers and reimbursements on fees and expenses, as well as the impact of the fund's performance adjustment. As part of its review, the Board also considered the current and historical total expense ratios of each class of the fund compared to competitive fund median expenses. Each class of the fund is compared to those funds and classes in the Total Mapped Group (used by the Board for management fee comparisons) that have a similar sales load structure.
The Board noted that the total expense ratio of each of Class A and Institutional Class ranked below its competitive median for 2012, the total expense ratio of Class B ranked equal to its competitive median for 2012, and the total expense ratio of each of Class T and Class C ranked above its competitive median for 2012. The Board considered that, in general, various factors can affect total expense ratios. The Board noted that the total expense ratio of Class T was above the competitive median primarily because of higher 12b-1 fees on Class T. Class T has a higher 12b-1 fee, but a lower front-end sales charge, than traditionally priced front-end sales charge classes. The Board considered that Class T is primarily sold load-waived in the retirement plan market where its 0.50% 12b-1 fee is comparable to competing no-load, higher 12b-1 fee classes designed specifically for retirement plans. The Board noted that the fund offers multiple classes, each of which has a different sales load and 12b-1 fee structure, and that the multiple structures are intended to offer a range of pricing options for the intermediary market. The Board also noted that the total expense ratios of the classes vary primarily by the level of their 12b-1 fees, although differences in transfer agent fees may also cause expenses to vary from class to class.
Annual Report
Board Approval of Investment Advisory Contracts and
Management Fees - continued
Fees Charged to Other Fidelity Clients. The Board also considered Fidelity fee structures and other information with respect to clients of FMR and its affiliates, such as other mutual funds advised or subadvised by FMR or its affiliates, pension plan clients, and other institutional clients. The Board noted the findings of the 2013 ad hoc joint committee (created with the board of other Fidelity funds), which reviewed and compared Fidelity's institutional investment advisory business with its business of providing services to the Fidelity funds, including the differences in services provided, fees charged, and costs incurred, as well as competition in their respective marketplaces.
Based on its review of total expense ratios and fees charged to other Fidelity clients, the Board concluded that the total expense ratio of each class of the fund was reasonable, although in some cases above the median of the universe presented for comparison, in light of the services that the fund and its shareholders receive and the other factors considered.
Costs of the Services and Profitability. The Board considered the revenues earned and the expenses incurred by Fidelity in conducting the business of developing, marketing, distributing, managing, administering and servicing the fund and servicing the fund's shareholders. The Board also considered the level of Fidelity's profits in respect of all the Fidelity funds.
On an annual basis, FMR presents to the Board Fidelity's profitability for the fund. Fidelity calculates the profitability for each fund, as well as aggregate profitability for groups of Fidelity funds and all Fidelity funds, using a series of detailed revenue and cost allocation methodologies which originate with the books and records of Fidelity on which Fidelity's audited financial statements are based. The Audit Committee of the Board reviews any significant changes from the prior year's methodologies.
PricewaterhouseCoopers LLP (PwC), independent registered public accounting firm and auditor to Fidelity and certain Fidelity funds, has been engaged annually by the Board as part of the Board's assessment of Fidelity's profitability analysis. PwC's engagement includes the review and assessment of the methodologies used by Fidelity in determining the revenues and expenses attributable to Fidelity's mutual fund business, and completion of agreed-upon procedures surrounding the mathematical accuracy of fund profitability and its conformity to allocation methodologies. After considering PwC's reports issued under the engagement and information provided by Fidelity, the Board concluded that while other allocation methods may also be reasonable, Fidelity's profitability methodologies are reasonable in all material respects.
Annual Report
The Board also reviewed Fidelity's non-fund businesses and fall-out benefits related to the mutual fund business as well as cases where Fidelity's affiliates may benefit from or be related to the fund's business.
The Board considered the costs of the services provided by and the profits realized by Fidelity in connection with the operation of the fund and was satisfied that the profitability was not excessive in the circumstances.
Economies of Scale. The Board considered whether there have been economies of scale in respect of the management of the Fidelity funds, whether the Fidelity funds (including the fund) have appropriately benefited from any such economies of scale, and whether there is potential for realization of any further economies of scale. The Board considered the extent to which the fund will benefit from economies of scale through increased services to the fund, through waivers or reimbursements, or through fee or expense reductions. The Board also noted that in 2009, it and the board of other Fidelity funds created an ad hoc committee (the Economies of Scale Committee) to analyze whether FMR attains economies of scale in respect of the management and servicing of the Fidelity funds, whether the Fidelity funds have appropriately benefited from such economies of scale, and whether there is potential for realization of any further economies of scale.
The Board recognized that the fund's management contract incorporates a "group fee" structure, which provides for lower group fee rates as total fund assets under FMR's management increase, and for higher group fee rates as total fund assets under FMR's management decrease. FMR calculates the group fee rates based on a tiered asset "breakpoint" schedule that varies based on asset class. The Board considered that the group fee is designed to deliver the benefits of economies of scale to fund shareholders when total Fidelity fund assets increase, even if assets of any particular fund are unchanged or have declined, because some portion of Fidelity's costs are attributable to services provided to all Fidelity funds, and all funds benefit if those costs can be allocated among more assets. The Board concluded that, given the group fee structure, fund shareholders will benefit from lower management fees as assets under FMR's management increase at the fund complex level, regardless of whether Fidelity achieves any such economies of scale.
Annual Report
Board Approval of Investment Advisory Contracts and
Management Fees - continued
The Board concluded, taking into account the analysis of the Economies of Scale Committee, that economies of scale, if any, are being appropriately shared between fund shareholders and Fidelity.
Amendment to Description of Group Fee Rate. At its July 2013 meeting, the Board voted to approve an amendment to the fund's management contract to modify the description of the "group fee rate" effective August 1, 2013. The Board noted that under the prior description in the contract, the group fee rate was based on the average net assets of all registered investment companies with which FMR has management contracts. Under the contract's tiered asset breakpoint schedule, the group fee rate is lower as total fund assets under FMR's management increase, and higher as total fund assets under FMR's management decrease. The Board considered that the prior description would have excluded the assets of 64 Fidelity sector funds from the group fee rate calculation once Fidelity SelectCo, LLC, an affiliate of FMR, assumed management responsibilities for those funds. The Board noted that modifying the description of the group fee rate to continue to include the assets of those 64 funds for purposes of determining group fee rate breakpoints would avoid an immediate adverse impact on the group fee rate for any fund.
Additional Information Requested by the Board. In order to develop fully the factual basis for consideration of the Fidelity funds' Advisory Contracts, the Board requested and received additional information on certain topics, including: (i) fund performance trends and Fidelity's long-term strategies for certain funds; (ii) the potential to further rationalize the Fidelity fund lineup with the possibility of achieving savings for the funds and Fidelity; (iii) the methodology with respect to competitive fund data and peer group classifications; (iv) the arrangements with, and performance of, certain sub-advisers on behalf of the Fidelity funds, as well as certain proposed participating affiliate arrangements; (v) the realization of fall-out benefits in certain Fidelity business units; (vi) Fidelity's group fee structures, including the rationale for the individual fee rates of certain categories of funds and the definition of group assets; (vii) trends regarding industry use of performance fee structures and the performance adjustment methodologies applicable to the Fidelity funds; (viii) additional competitive analysis regarding the total expenses for certain classes; and (ix) fund profitability methodology, including Fidelity's cost allocation methodology, and the impact of certain factors on fund profitability results.
Based on its evaluation of all of the conclusions noted above, and after considering all factors it believed relevant, the Board ultimately concluded that the advisory fee structures are fair and reasonable, and that the fund's Advisory Contracts should be renewed.
Annual Report
Investment Adviser
Fidelity Management & Research Company
Boston, MA
Investment Sub-Advisers
FMR Co., Inc.
Fidelity Management & Research
(U.K.) Inc.
Fidelity Management & Research (Hong Kong) Limited
Fidelity Management & Research (Japan) Inc.
General Distributor
Fidelity Distributors Corporation
Smithfield, RI
Transfer and Service Agents
Fidelity Investments Institutional
Operations Company, Inc.
Boston, MA
Fidelity Service Company, Inc.
Boston, MA
Custodian
State Street Bank and Trust Company
Quincy, MA
(Fidelity Investment logo)(registered trademark)
AEV-UANN-0114 1.786683.110
(Fidelity Investment logo)(registered trademark)
Fidelity Advisor®
Equity Value
Fund - Institutional Class
Annual Report
November 30, 2013
(Fidelity Cover Art)
Contents
|
Performance |
How the fund has done over time. |
|
|
Management's Discussion of Fund Performance |
The Portfolio Manager's review of fund performance and strategy. |
|
|
Shareholder Expense Example |
An example of shareholder expenses. |
|
|
Investment Changes |
A summary of major shifts in the fund's investments over the past six months. |
|
|
Investments |
A complete list of the fund's investments with their market values. |
|
|
Financial Statements |
Statements of assets and liabilities, operations, and changes in net assets, as well as financial highlights. |
|
|
Notes |
Notes to the financial statements. |
|
|
Report of Independent Registered Public Accounting Firm |
|
|
|
Trustees and Officers |
|
|
|
Distributions |
|
|
|
Board Approval of Investment Advisory Contracts and Management Fees |
|
To view a fund's proxy voting guidelines and proxy voting record for the 12-month period ended June 30, visit http://www.fidelity.com/proxyvotingresults or visit the Securities and Exchange Commission's (SEC) website at http://www.sec.gov. You may also call 1-877-208-0098 to request a free copy of the proxy voting guidelines.
Standard & Poor's, S&P and S&P 500 are registered service marks of The McGraw-Hill Companies, Inc. and have been licensed for use by Fidelity Distributors Corporation.
Other third-party marks appearing herein are the property of their respective owners.
All other marks appearing herein are registered or unregistered trademarks or service marks of FMR LLC or an affiliated company. © 2014 FMR LLC. All rights reserved.
Annual Report
This report and the financial statements contained herein are submitted for the general information
of the shareholders of the fund. This report is not authorized for distribution to prospective investors
in the fund unless preceded or accompanied by an effective prospectus.
A fund files its complete schedule of portfolio holdings with the SEC for the first and third quarters
of each fiscal year on Form N-Q. Forms N-Q are available on the SEC's web site at
http://www.sec.gov. A fund's Forms N-Q may be reviewed and copied at the SEC's Public Reference
Room in Washington, DC. Information regarding the operation of the SEC's Public Reference Room
may be obtained by calling 1-800-SEC-0330. For a complete list of a fund's portfolio holdings, view
the most recent holdings listing, semiannual report, or annual report on Fidelity's web site at
http://www.fidelity.com, http://www.advisor.fidelity.com, or http://www.401k.com, as applicable.
NOT FDIC INSURED • MAY LOSE VALUE • NO BANK GUARANTEE
Neither the fund nor Fidelity Distributors Corporation is a bank.
Annual Report
Performance: The Bottom Line
Average annual total return reflects the change in the value of an investment, assuming reinvestment of the class' distributions from dividend income and capital gains (the profits earned upon the sale of securities that have grown in value, if any) and assuming a constant rate of performance each year. The $10,000 table and the fund's returns do not reflect the deduction of taxes that a shareholder would pay on fund distributions or the redemption of fund shares. During periods of reimbursement by Fidelity, a fund's total return will be greater than it would be had the reimbursement not occurred. How a fund did yesterday is no guarantee of how it will do tomorrow.
Average Annual Total Returns
|
Periods ended November 30, 2013 |
Past 1 |
Past 5 |
Past 10 |
|
Institutional Class |
33.61% |
17.27% |
7.15% |
$10,000 Over 10 Years
Let's say hypothetically that $10,000 was invested in Fidelity Advisor® Equity Value Fund - Institutional Class on November 30, 2003. The chart shows how the value of your investment would have changed, and also shows how the Russell 3000® Value Index performed over the same period.
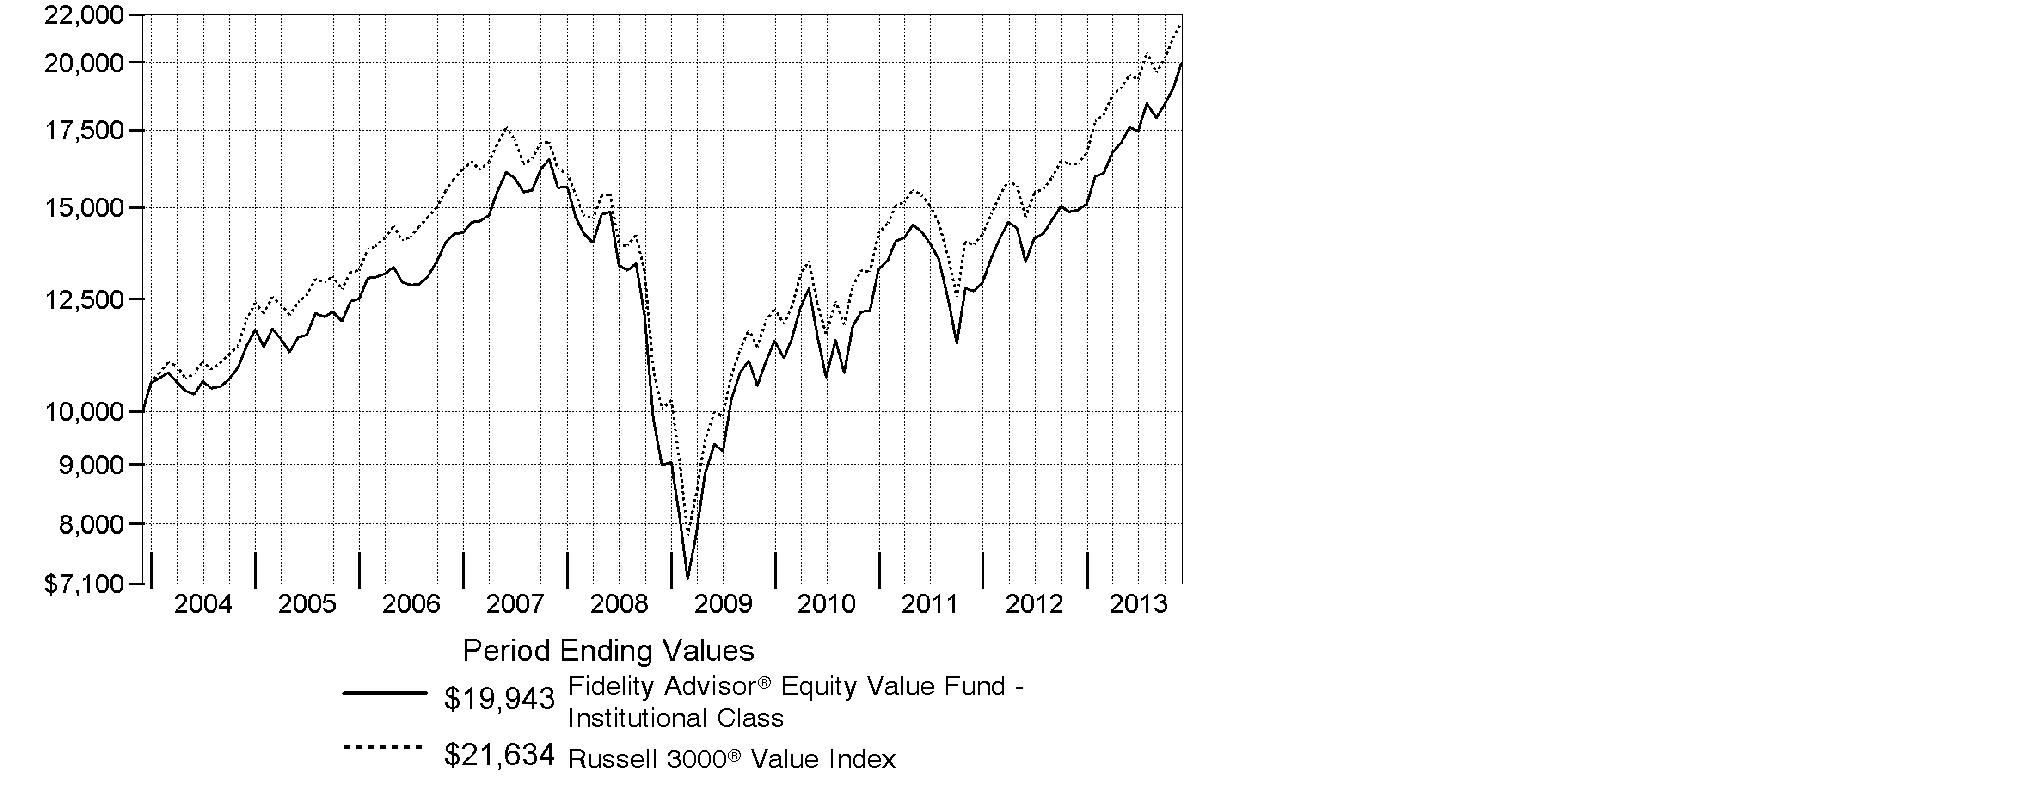
Annual Report
Management's Discussion of Fund Performance
Market Recap: With the current bull run nearing the five-year mark, equity benchmarks ripped up old records during the 12 months ending November 30, 2013. Gains were fueled by strengthening U.S. economic data, as well as generally improving economies and accommodative monetary policies worldwide. The broad S&P 500® Index reached new peaks in its 30.30% climb for the period, and the blue-chip Dow Jones Industrial AverageSM surpassed historic milestones en route to a 26.63% gain. The Nasdaq Composite Index®, up 36.73% amid a resurgence in growth-oriented stocks, closed above 4,000 for the first time since 2000. Shedding anxiety over the 2012 U.S. presidential election - and apparently confident that the federal debt-ceiling debate would be resolved - markets rose from period start through late May. News that the U.S. Federal Reserve was considering an end to its stimulative bond-buying kept stocks in flux over the summer but, by September, the Fed had set aside any imminent tapering. Despite jitters over a potential U.S. military strike in Syria and, later, an October budget impasse that briefly shuttered the federal government, volatility was subdued heading into the holidays, with investor optimism helping many markets home in on all-time highs at period end. Elsewhere, non-U.S. developed-market equities saw similar results, with the MSCI® EAFE® Index adding 24.97%.
Comments from Sean Gavin, Portfolio Manager of Fidelity Advisor® Equity Value Fund: For the year, the fund's Institutional Class shares returned 33.61%, outperforming the 32.36% advance of its benchmark, the Russell 3000® Value Index. Versus the index, the fund benefited from its overweighting in information technology and its underweightings in real estate investment trusts (REITs) and utilities. At the issuer level, the top contribution came from not owning telecommunication services provider and index component AT&T, followed by investments in Jazz Pharmaceuticals and pharmaceutical distribution firm McKesson - neither of which was in the benchmark - and personal computer manufacturer Dell. Dell was sold from the fund before the end of the period. On the down side, relative performance was curtailed by security selection in financials and energy, including not owning outperforming benchmark constituent Bank of America and an out-of-benchmark investment in underperforming energy exploration & production company Suncor Energy. Owning California electric utility Edison International also detracted. The fund's modest cash position - held for liquidity purposes - also was a drag on performance in an up market.
Annual Report
The views expressed above reflect those of the portfolio manager(s) only through the end of the period as stated on the cover of this report and do not necessarily represent the views of Fidelity or any other person in the Fidelity organization. Any such views are subject to change at any time based upon market or other conditions and Fidelity disclaims any responsibility to update such views. These views may not be relied on as investment advice and, because investment decisions for a Fidelity fund are based on numerous factors, may not be relied on as an indication of trading intent on behalf of any Fidelity fund.
Annual Report
Shareholder Expense Example
As a shareholder of the Fund, you incur two types of costs: (1) transaction costs, including sales charges (loads) on purchase payments or redemption proceeds, and (2) ongoing costs, including management fees, distribution and/or service (12b-1) fees and other Fund expenses. This Example is intended to help you understand your ongoing costs (in dollars) of investing in the Fund and to compare these costs with the ongoing costs of investing in other mutual funds.
The Example is based on an investment of $1,000 invested at the beginning of the period and held for the entire period (June 1, 2013 to November 30, 2013).
Actual Expenses
The first line of the accompanying table for each class of the Fund provides information about actual account values and actual expenses. You may use the information in this line, together with the amount you invested, to estimate the expenses that you paid over the period. Simply divide your account value by $1,000.00 (for example, an $8,600 account value divided by $1,000.00 = 8.6), then multiply the result by the number in the first line for a class of the Fund under the heading entitled "Expenses Paid During Period" to estimate the expenses you paid on your account during this period. In addition, the Fund, as a shareholder in the underlying Fidelity Central Funds, will indirectly bear its pro-rata share of the fees and expenses incurred by the underlying Fidelity Central Funds. These fees and expenses are not included in the Fund's annualized expense ratio used to calculate the expense estimate in the table below.
Hypothetical Example for Comparison Purposes
The second line of the accompanying table for each class of the Fund provides information about hypothetical account values and hypothetical expenses based on a Class' actual expense ratio and an assumed rate of return of 5% per year before expenses, which is not the Class' actual return. The hypothetical account values and expenses may not be used to estimate the actual ending account balance or expenses you paid for the period. You may use this information to compare the ongoing costs of investing in the Fund and other funds. To do so, compare this 5% hypothetical example with the 5% hypothetical examples that appear in the shareholder reports of the other funds. In addition, the Fund, as a shareholder in the underlying Fidelity Central Funds, will indirectly bear its pro-rata share of the fees and expenses incurred by the underlying Fidelity Central Funds. These fees and expenses are not included in the Fund's annualized expense ratio used to calculate the expense estimate in the table below.
Please note that the expenses shown in the table are meant to highlight your ongoing costs only and do not reflect any transaction costs. Therefore, the second line of the table is useful in comparing ongoing costs only, and will not help you determine the relative total costs of owning different funds. In addition, if these transactional costs were included, your costs would have been higher.
Annual Report
Shareholder Expense Example - continued
|
|
Annualized |
Beginning |
Ending |
Expenses Paid |
|
Class A |
1.20% |
|
|
|
|
Actual |
|
$ 1,000.00 |
$ 1,133.40 |
$ 6.42 |
|
HypotheticalA |
|
$ 1,000.00 |
$ 1,019.05 |
$ 6.07 |
|
Class T |
1.46% |
|
|
|
|
Actual |
|
$ 1,000.00 |
$ 1,131.90 |
$ 7.80 |
|
HypotheticalA |
|
$ 1,000.00 |
$ 1,017.75 |
$ 7.39 |
|
Class B |
1.97% |
|
|
|
|
Actual |
|
$ 1,000.00 |
$ 1,128.80 |
$ 10.51 |
|
HypotheticalA |
|
$ 1,000.00 |
$ 1,015.19 |
$ 9.95 |
|
Class C |
1.95% |
|
|
|
|
Actual |
|
$ 1,000.00 |
$ 1,129.20 |
$ 10.41 |
|
HypotheticalA |
|
$ 1,000.00 |
$ 1,015.29 |
$ 9.85 |
|
Institutional Class |
.85% |
|
|
|
|
Actual |
|
$ 1,000.00 |
$ 1,135.50 |
$ 4.55 |
|
HypotheticalA |
|
$ 1,000.00 |
$ 1,020.81 |
$ 4.31 |
A 5% return per year before expenses
B Annualized expense ratio reflects expenses net of applicable fee waivers.
* Expenses are equal to each Class' annualized expense ratio, multiplied by the average account value over the period, multiplied by 183/365 (to reflect the one-half year period).
Annual Report
Investment Changes (Unaudited)
|
Top Ten Stocks as of November 30, 2013 |
||
|
|
% of fund's |
% of fund's net assets |
|
JPMorgan Chase & Co. |
4.3 |
3.1 |
|
Chevron Corp. |
3.9 |
4.8 |
|
Wells Fargo & Co. |
3.4 |
3.4 |
|
Berkshire Hathaway, Inc. Class B |
2.8 |
3.9 |
|
Exxon Mobil Corp. |
2.8 |
3.6 |
|
U.S. Bancorp |
2.6 |
2.0 |
|
Apple, Inc. |
2.3 |
0.5 |
|
Amgen, Inc. |
2.1 |
1.0 |
|
Cisco Systems, Inc. |
2.1 |
2.5 |
|
UnitedHealth Group, Inc. |
2.0 |
1.9 |
|
|
28.3 |
|
|
Top Five Market Sectors as of November 30, 2013 |
||
|
|
% of fund's |
% of fund's net assets |
|
Financials |
27.1 |
25.7 |
|
Health Care |
17.2 |
16.2 |
|
Information Technology |
14.0 |
12.2 |
|
Energy |
12.8 |
14.4 |
|
Consumer Discretionary |
9.7 |
11.5 |
|
Asset Allocation (% of fund's net assets) |
|||||||
|
As of November 30, 2013* |
As of May 31, 2013** |
||||||
 |
Stocks 98.0% |
|
|
Stocks 98.0% |
|
||
 |
Convertible |
|
|
Convertible |
|
||
 |
Short-Term |
|
|
Short-Term |
|
||
|
* Foreign investments |
17.7% |
|
** Foreign investments |
14.6% |
|
||

Annual Report
Investments November 30, 2013
Showing Percentage of Net Assets
|
Common Stocks - 98.0% |
|||
|
Shares |
Value |
||
|
CONSUMER DISCRETIONARY - 9.7% |
|||
|
Diversified Consumer Services - 0.5% |
|||
|
Steiner Leisure Ltd. (a) |
6,932 |
$ 410,097 |
|
|
Media - 3.9% |
|||
|
Comcast Corp. Class A |
19,947 |
994,757 |
|
|
John Wiley & Sons, Inc. Class A |
14,615 |
744,780 |
|
|
Time Warner Cable, Inc. |
4,357 |
602,225 |
|
|
Viacom, Inc. Class B (non-vtg.) |
12,200 |
978,074 |
|
|
|
3,319,836 |
||
|
Multiline Retail - 1.9% |
|||
|
Kohl's Corp. |
10,300 |
569,384 |
|
|
Macy's, Inc. |
19,647 |
1,046,399 |
|
|
|
1,615,783 |
||
|
Specialty Retail - 2.6% |
|||
|
Advance Auto Parts, Inc. |
7,900 |
797,979 |
|
|
American Eagle Outfitters, Inc. |
34,488 |
561,120 |
|
|
AutoZone, Inc. (a) |
1,315 |
607,004 |
|
|
Murphy U.S.A., Inc. |
5,100 |
230,775 |
|
|
|
2,196,878 |
||
|
Textiles, Apparel & Luxury Goods - 0.8% |
|||
|
Coach, Inc. |
12,065 |
698,564 |
|
|
TOTAL CONSUMER DISCRETIONARY |
8,241,158 |
||
|
CONSUMER STAPLES - 8.4% |
|||
|
Beverages - 0.5% |
|||
|
C&C Group PLC |
68,355 |
412,855 |
|
|
Food & Staples Retailing - 4.3% |
|||
|
CVS Caremark Corp. |
25,100 |
1,680,696 |
|
|
Tesco PLC |
73,700 |
419,611 |
|
|
Wal-Mart Stores, Inc. |
10,500 |
850,605 |
|
|
Walgreen Co. |
11,900 |
704,480 |
|
|
|
3,655,392 |
||
|
Food Products - 0.8% |
|||
|
Amira Nature Foods Ltd. (a) |
13,580 |
215,243 |
|
|
The J.M. Smucker Co. |
4,069 |
424,153 |
|
|
|
639,396 |
||
|
Household Products - 1.6% |
|||
|
Central Garden & Pet Co. Class A (non-vtg.) (a) |
60,100 |
469,982 |
|
|
Energizer Holdings, Inc. |
8,300 |
915,905 |
|
|
|
1,385,887 |
||
|
Common Stocks - continued |
|||
|
Shares |
Value |
||
|
CONSUMER STAPLES - continued |
|||
|
Tobacco - 1.2% |
|||
|
British American Tobacco PLC sponsored ADR |
3,755 |
$ 399,269 |
|
|
Lorillard, Inc. |
12,700 |
651,891 |
|
|
|
1,051,160 |
||
|
TOTAL CONSUMER STAPLES |
7,144,690 |
||
|
ENERGY - 12.8% |
|||
|
Energy Equipment & Services - 1.9% |
|||
|
Ensco PLC Class A |
6,997 |
413,383 |
|
|
National Oilwell Varco, Inc. |
15,200 |
1,238,800 |
|
|
|
1,652,183 |
||
|
Oil, Gas & Consumable Fuels - 10.9% |
|||
|
Ardmore Shipping Corp. |
11,600 |
148,364 |
|
|
Chevron Corp. |
27,397 |
3,354,489 |
|
|
Exxon Mobil Corp. |
25,272 |
2,362,427 |
|
|
Marathon Petroleum Corp. |
11,000 |
910,140 |
|
|
Peabody Energy Corp. |
24,098 |
438,584 |
|
|
Phillips 66 Co. |
14,200 |
988,462 |
|
|
Suncor Energy, Inc. |
30,300 |
1,051,396 |
|
|
|
9,253,862 |
||
|
TOTAL ENERGY |
10,906,045 |
||
|
FINANCIALS - 27.1% |
|||
|
Capital Markets - 2.3% |
|||
|
Bank of New York Mellon Corp. |
30,700 |
1,034,590 |
|
|
East Capital Explorer AB (a) |
13,008 |
126,424 |
|
|
GP Investments Ltd. Class A (depositary receipt) (a) |
179,200 |
310,918 |
|
|
MLP AG |
66,088 |
441,818 |
|
|
|
1,913,750 |
||
|
Commercial Banks - 6.6% |
|||
|
East West Bancorp, Inc. |
15,500 |
531,340 |
|
|
U.S. Bancorp |
55,266 |
2,167,533 |
|
|
Wells Fargo & Co. |
66,132 |
2,911,131 |
|
|
|
5,610,004 |
||
|
Consumer Finance - 2.5% |
|||
|
American Express Co. |
8,800 |
755,040 |
|
|
Capital One Financial Corp. |
19,118 |
1,369,422 |
|
|
|
2,124,462 |
||
|
Common Stocks - continued |
|||
|
Shares |
Value |
||
|
FINANCIALS - continued |
|||
|
Diversified Financial Services - 8.5% |
|||
|
Berkshire Hathaway, Inc. Class B (a) |
20,589 |
$ 2,399,236 |
|
|
JPMorgan Chase & Co. |
63,752 |
3,647,884 |
|
|
The NASDAQ Stock Market, Inc. |
30,534 |
1,199,681 |
|
|
|
7,246,801 |
||
|
Insurance - 7.2% |
|||
|
ACE Ltd. |
10,300 |
1,058,634 |
|
|
Allied World Assurance Co. Holdings Ltd. |
3,800 |
428,070 |
|
|
Everest Re Group Ltd. |
4,296 |
673,742 |
|
|
Fidelity National Financial, Inc. Class A |
27,680 |
804,658 |
|
|
Greenlight Capital Re, Ltd. (a) |
15,225 |
517,802 |
|
|
MetLife, Inc. |
17,179 |
896,572 |
|
|
ProAssurance Corp. |
9,900 |
475,992 |
|
|
Prudential PLC |
21,199 |
452,112 |
|
|
The Travelers Companies, Inc. |
9,087 |
824,554 |
|
|
|
6,132,136 |
||
|
TOTAL FINANCIALS |
23,027,153 |
||
|
HEALTH CARE - 17.2% |
|||
|
Biotechnology - 2.1% |
|||
|
Amgen, Inc. |
16,000 |
1,825,280 |
|
|
Health Care Equipment & Supplies - 1.4% |
|||
|
Baxter International, Inc. |
6,200 |
424,390 |
|
|
Stryker Corp. |
10,000 |
744,200 |
|
|
|
1,168,590 |
||
|
Health Care Providers & Services - 7.6% |
|||
|
CIGNA Corp. |
14,762 |
1,290,937 |
|
|
Express Scripts Holding Co. (a) |
16,699 |
1,124,678 |
|
|
Humana, Inc. |
7,250 |
753,928 |
|
|
McKesson Corp. |
6,929 |
1,149,452 |
|
|
Select Medical Holdings Corp. |
49,621 |
429,718 |
|
|
UnitedHealth Group, Inc. |
23,000 |
1,713,040 |
|
|
|
6,461,753 |
||
|
Pharmaceuticals - 6.1% |
|||
|
AstraZeneca PLC sponsored ADR |
8,600 |
491,834 |
|
|
GlaxoSmithKline PLC sponsored ADR |
19,461 |
1,029,876 |
|
|
Jazz Pharmaceuticals PLC (a) |
6,638 |
776,115 |
|
|
Merck & Co., Inc. |
18,375 |
915,626 |
|
|
Common Stocks - continued |
|||
|
Shares |
Value |
||
|
HEALTH CARE - continued |
|||
|
Pharmaceuticals - continued |
|||
|
Mylan, Inc. (a) |
10,105 |
$ 445,934 |
|
|
Teva Pharmaceutical Industries Ltd. sponsored ADR |
37,200 |
1,516,272 |
|
|
|
5,175,657 |
||
|
TOTAL HEALTH CARE |
14,631,280 |
||
|
INDUSTRIALS - 4.2% |
|||
|
Aerospace & Defense - 0.9% |
|||
|
United Technologies Corp. |
6,947 |
770,144 |
|
|
Electrical Equipment - 0.6% |
|||
|
Emerson Electric Co. |
7,360 |
493,046 |
|
|
Industrial Conglomerates - 1.2% |
|||
|
3M Co. |
7,600 |
1,014,676 |
|
|
Machinery - 0.4% |
|||
|
Global Brass & Copper Holdings, Inc. |
22,951 |
378,692 |
|
|
Professional Services - 1.1% |
|||
|
Dun & Bradstreet Corp. (d) |
7,835 |
915,520 |
|
|
TOTAL INDUSTRIALS |
3,572,078 |
||
|
INFORMATION TECHNOLOGY - 14.0% |
|||
|
Communications Equipment - 2.1% |
|||
|
Cisco Systems, Inc. |
83,282 |
1,769,743 |
|
|
Computers & Peripherals - 4.6% |
|||
|
Apple, Inc. |
3,500 |
1,946,245 |
|
|
EMC Corp. |
42,900 |
1,023,165 |
|
|
Hewlett-Packard Co. |
36,439 |
996,607 |
|
|
|
3,966,017 |
||
|
Electronic Equipment & Components - 0.5% |
|||
|
TE Connectivity Ltd. |
7,998 |
421,655 |
|
|
IT Services - 3.0% |
|||
|
Amdocs Ltd. |
13,021 |
526,830 |
|
|
Fiserv, Inc. (a) |
7,600 |
835,164 |
|
|
IBM Corp. |
3,240 |
582,163 |
|
|
The Western Union Co. |
36,500 |
608,455 |
|
|
|
2,552,612 |
||
|
Common Stocks - continued |
|||
|
Shares |
Value |
||
|
INFORMATION TECHNOLOGY - continued |
|||
|
Semiconductors & Semiconductor Equipment - 1.6% |
|||
|
Samsung Electronics Co. Ltd. |
620 |
$ 875,327 |
|
|
Skyworks Solutions, Inc. (a) |
17,750 |
471,973 |
|
|
|
1,347,300 |
||
|
Software - 2.2% |
|||
|
CA Technologies, Inc. |
17,645 |
582,285 |
|
|
Microsoft Corp. |
33,900 |
1,292,607 |
|
|
|
1,874,892 |
||
|
TOTAL INFORMATION TECHNOLOGY |
11,932,219 |
||
|
MATERIALS - 2.2% |
|||
|
Chemicals - 1.5% |
|||
|
Agrium, Inc. |
4,700 |
423,754 |
|
|
CF Industries Holdings, Inc. |
1,955 |
424,978 |
|
|
Potash Corp. of Saskatchewan, Inc. |
13,600 |
430,572 |
|
|
|
1,279,304 |
||
|
Containers & Packaging - 0.7% |
|||
|
Ball Corp. |
11,800 |
589,764 |
|
|
TOTAL MATERIALS |
1,869,068 |
||
|
TELECOMMUNICATION SERVICES - 0.5% |
|||
|
Wireless Telecommunication Services - 0.5% |
|||
|
Vodafone Group PLC |
122,500 |
454,152 |
|
|
UTILITIES - 1.9% |
|||
|
Electric Utilities - 1.9% |
|||
|
American Electric Power Co., Inc. |
16,500 |
776,490 |
|
|
Edison International |
17,993 |
831,457 |
|
|
|
1,607,947 |
||
|
TOTAL COMMON STOCKS (Cost $66,686,756) |
|
||
|
Convertible Bonds - 0.7% |
||||
|
|
Principal Amount |
Value |
||
|
INDUSTRIALS - 0.7% |
||||
|
Marine - 0.7% |
||||
|
DryShips, Inc. 5% 12/1/14 (Cost $541,927) |
|
$ 620,000 |
$ 602,175 |
|
|
Money Market Funds - 1.8% |
|||
|
Shares |
|
||
|
Fidelity Cash Central Fund, 0.10% (b) |
950,440 |
950,440 |
|
|
Fidelity Securities Lending Cash Central Fund, 0.10% (b)(c) |
634,675 |
634,675 |
|
|
TOTAL MONEY MARKET FUNDS (Cost $1,585,115) |
|
||
|
TOTAL INVESTMENT PORTFOLIO - 100.5% (Cost $68,813,798) |
85,573,080 |
||
|
NET OTHER ASSETS (LIABILITIES) - (0.5)% |
(453,655) |
||
|
NET ASSETS - 100% |
$ 85,119,425 |
||
|
Legend |
|
(a) Non-income producing |
|
(b) Affiliated fund that is generally available only to investment companies and other accounts managed by Fidelity Investments. The rate quoted is the annualized seven-day yield of the fund at period end. A complete unaudited listing of the fund's holdings as of its most recent quarter end is available upon request. In addition, each Fidelity Central Fund's financial statements, which are not covered by the Fund's Report of Independent Registered Public Accounting Firm, are available on the SEC's website or upon request. |
|
(c) Investment made with cash collateral received from securities on loan. |
|
(d) Security or a portion of the security is on loan at period end. |
|
Affiliated Central Funds |
|
Information regarding fiscal year to date income earned by the Fund from investments in Fidelity Central Funds is as follows: |
|
Fund |
Income earned |
|
Fidelity Cash Central Fund |
$ 1,940 |
|
Fidelity Securities Lending Cash Central Fund |
5,353 |
|
Total |
$ 7,293 |
|
Other Information |
|
The following is a summary of the inputs used, as of November 30, 2013, involving the Fund's assets and liabilities carried at fair value. The inputs or methodology used for valuing securities may not be an indication of the risk associated with investing in those securities. For more information on valuation inputs, and their aggregation into the levels used in the table below, please refer to the Investment Valuation section in the accompanying Notes to Financial Statements. |
|
Valuation Inputs at Reporting Date: |
||||
|
Description |
Total |
Level 1 |
Level 2 |
Level 3 |
|
Investments in Securities: |
||||
|
Equities: |
||||
|
Consumer Discretionary |
$ 8,241,158 |
$ 8,241,158 |
$ - |
$ - |
|
Consumer Staples |
7,144,690 |
7,144,690 |
- |
- |
|
Energy |
10,906,045 |
10,906,045 |
- |
- |
|
Financials |
23,027,153 |
22,575,041 |
452,112 |
- |
|
Health Care |
14,631,280 |
14,631,280 |
- |
- |
|
Industrials |
3,572,078 |
3,572,078 |
- |
- |
|
Information Technology |
11,932,219 |
11,932,219 |
- |
- |
|
Materials |
1,869,068 |
1,869,068 |
- |
- |
|
Telecommunication Services |
454,152 |
- |
454,152 |
- |
|
Utilities |
1,607,947 |
1,607,947 |
- |
- |
|
Corporate Bonds |
602,175 |
- |
602,175 |
- |
|
Money Market Funds |
1,585,115 |
1,585,115 |
- |
- |
|
Total Investments in Securities: |
$ 85,573,080 |
$ 84,064,641 |
$ 1,508,439 |
$ - |
|
Distribution of investments by country or territory of incorporation, as a percentage of total net assets, is as follows (Unaudited): |
|
United States of America |
82.3% |
|
United Kingdom |
4.3% |
|
Switzerland |
2.2% |
|
Canada |
2.2% |
|
Israel |
1.8% |
|
Ireland |
1.4% |
|
Bermuda |
1.2% |
|
Korea (South) |
1.0% |
|
Others (Individually Less Than 1%) |
3.6% |
|
|
100.0% |
See accompanying notes which are an integral part of the financial statements.
Annual Report
Financial Statements
Statement of Assets and Liabilities
|
|
November 30, 2013 |
|
|
|
|
|
|
Assets |
|
|
|
Investment in securities, at value (including securities loaned of $619,305) - See accompanying schedule: Unaffiliated issuers (cost $67,228,683) |
$ 83,987,965 |
|
|
Fidelity Central Funds (cost $1,585,115) |
1,585,115 |
|
|
Total Investments (cost $68,813,798) |
|
$ 85,573,080 |
|
Receivable for investments sold |
|
160,950 |
|
Receivable for fund shares sold |
|
100,250 |
|
Dividends receivable |
|
184,104 |
|
Interest receivable |
|
15,500 |
|
Distributions receivable from Fidelity Central Funds |
|
159 |
|
Prepaid expenses |
|
228 |
|
Other receivables |
|
334 |
|
Total assets |
|
86,034,605 |
|
|
|
|
|
Liabilities |
|
|
|
Payable for investments purchased |
$ 121,469 |
|
|
Payable for fund shares redeemed |
26,323 |
|
|
Accrued management fee |
36,520 |
|
|
Distribution and service plan fees payable |
31,285 |
|
|
Other affiliated payables |
20,118 |
|
|
Other payables and accrued expenses |
44,790 |
|
|
Collateral on securities loaned, at value |
634,675 |
|
|
Total liabilities |
|
915,180 |
|
|
|
|
|
Net Assets |
|
$ 85,119,425 |
|
Net Assets consist of: |
|
|
|
Paid in capital |
|
$ 86,554,151 |
|
Undistributed net investment income |
|
548,272 |
|
Accumulated undistributed net realized gain (loss) on investments and foreign currency transactions |
|
(18,742,368) |
|
Net unrealized appreciation (depreciation) on investments and assets and liabilities in foreign currencies |
|
16,759,370 |
|
Net Assets |
|
$ 85,119,425 |
See accompanying notes which are an integral part of the financial statements.
Annual Report
Statement of Assets and Liabilities - continued
|
|
November 30, 2013 |
|
|
|
|
|
|
Calculation of Maximum Offering Price Class A: |
|
$ 13.93 |
|
|
|
|
|
Maximum offering price per share (100/94.25 of $13.93) |
|
$ 14.78 |
|
Class T: |
|
$ 13.90 |
|
|
|
|
|
Maximum offering price per share (100/96.50 of $13.90) |
|
$ 14.40 |
|
Class B: |
|
$ 13.76 |
|
|
|
|
|
Class C: |
|
$ 13.63 |
|
|
|
|
|
Institutional Class: |
|
$ 14.16 |
A Redemption price per share is equal to net asset value less any applicable contingent deferred sales charge.
See accompanying notes which are an integral part of the financial statements.
Annual Report
Financial Statements - continued
Statement of Operations
|
|
Year ended November 30, 2013 |
|
|
|
|
|
|
Investment Income |
|
|
|
Dividends |
|
$ 1,573,824 |
|
Interest |
|
95,748 |
|
Income from Fidelity Central Funds |
|
7,293 |
|
Total income |
|
1,676,865 |
|
|
|
|
|
Expenses |
|
|
|
Management fee |
$ 407,833 |
|
|
Performance adjustment |
(63,832) |
|
|
Transfer agent fees |
208,685 |
|
|
Distribution and service plan fees |
335,878 |
|
|
Accounting and security lending fees |
28,758 |
|
|
Custodian fees and expenses |
11,950 |
|
|
Independent trustees' compensation |
396 |
|
|
Registration fees |
62,089 |
|
|
Audit |
59,486 |
|
|
Legal |
318 |
|
|
Miscellaneous |
761 |
|
|
Total expenses before reductions |
1,052,322 |
|
|
Expense reductions |
(11,078) |
1,041,244 |
|
Net investment income (loss) |
|
635,621 |
|
Realized and Unrealized Gain (Loss) Net realized gain (loss) on: |
|
|
|
Investment securities: |
|
|
|
Unaffiliated issuers |
10,295,955 |
|
|
Foreign currency transactions |
485 |
|
|
Total net realized gain (loss) |
|
10,296,440 |
|
Change in net unrealized appreciation (depreciation) on: Investment securities |
9,888,368 |
|
|
Assets and liabilities in foreign currencies |
125 |
|
|
Total change in net unrealized appreciation (depreciation) |
|
9,888,493 |
|
Net gain (loss) |
|
20,184,933 |
|
Net increase (decrease) in net assets resulting from operations |
|
$ 20,820,554 |
See accompanying notes which are an integral part of the financial statements.
Annual Report
Statement of Changes in Net Assets
|
|
Year ended |
Year ended |
|
Increase (Decrease) in Net Assets |
|
|
|
Operations |
|
|
|
Net investment income (loss) |
$ 635,621 |
$ 664,905 |
|
Net realized gain (loss) |
10,296,440 |
6,112,162 |
|
Change in net unrealized appreciation (depreciation) |
9,888,493 |
3,630,671 |
|
Net increase (decrease) in net assets resulting |
20,820,554 |
10,407,738 |
|
Distributions to shareholders from net investment income |
(666,191) |
(227,180) |
|
Share transactions - net increase (decrease) |
581,153 |
(11,212,076) |
|
Total increase (decrease) in net assets |
20,735,516 |
(1,031,518) |
|
|
|
|
|
Net Assets |
|
|
|
Beginning of period |
64,383,909 |
65,415,427 |
|
End of period (including undistributed net investment income of $548,272 and undistributed net investment income of $576,510, respectively) |
$ 85,119,425 |
$ 64,383,909 |
See accompanying notes which are an integral part of the financial statements.
Annual Report
Financial Highlights - Class A
|
Years ended November 30, |
2013 |
2012 |
2011 |
2010 |
2009 |
|
Selected Per-Share Data |
|
|
|
|
|
|
Net asset value, beginning of period |
$ 10.60 |
$ 9.09 |
$ 8.85 |
$ 8.07 |
$ 6.70 |
|
Income from Investment Operations |
|
|
|
|
|
|
Net investment income (loss) C |
.13 |
.12 |
.06 |
.07 F |
.06 |
|
Net realized and unrealized gain (loss) |
3.33 |
1.44 |
.27 |
.77 |
1.42 |
|
Total from investment operations |
3.46 |
1.56 |
.33 |
.84 |
1.48 |
|
Distributions from net investment income |
(.13) |
(.05) |
(.09) |
(.06) |
(.11) |
|
Net asset value, end of period |
$ 13.93 |
$ 10.60 |
$ 9.09 |
$ 8.85 |
$ 8.07 |
|
Total Return A,B |
33.09% |
17.27% |
3.72% |
10.42% |
22.49% |
|
Ratios to Average Net Assets D,G |
|
|
|
|
|
|
Expenses before reductions |
1.22% |
1.30% |
1.27% |
1.28% |
1.33% |
|
Expenses net of fee waivers, if any |
1.22% |
1.25% |
1.25% |
1.25% |
1.25% |
|
Expenses net of all reductions |
1.20% |
1.25% |
1.25% |
1.25% |
1.24% |
|
Net investment income (loss) |
1.07% |
1.20% |
.59% |
.83% F |
.89% |
|
Supplemental Data |
|
|
|
|
|
|
Net assets, end of period (000 omitted) |
$ 39,538 |
$ 29,282 |
$ 27,910 |
$ 34,244 |
$ 36,306 |
|
Portfolio turnover rate E |
68% |
77% |
65% |
103% |
135% |
A Total returns would have been lower if certain expenses had not been reduced during the applicable periods shown.
B Total returns do not include the effect of the sales charges.
C Calculated based on average shares outstanding during the period.
D Fees and expenses of any underlying Fidelity Central Funds are not included in the Fund's expense ratio. The Fund indirectly bears its proportionate share of the expenses of any underlying Fidelity Central Funds.
E Amount does not include the portfolio activity of any underlying Fidelity Central Funds.
F Investment income per share reflects a large, non-recurring dividend which amounted to $.05 per share. Excluding this non-recurring dividend, the ratio of net investment income (loss) to average net assets would have been .20%.
G Expense ratios reflect operating expenses of the class. Expenses before reductions do not reflect amounts reimbursed by the investment adviser or reductions from brokerage service arrangements or reductions from other expense offset arrangements and do not represent the amount paid by the class during periods when reimbursements or reductions occur. Expenses net of fee waivers reflect expenses after reimbursement by the investment adviser but prior to reductions from brokerage service arrangements or other expense offset arrangements. Expenses net of all reductions represent the net expenses paid by the class.
See accompanying notes which are an integral part of the financial statements.
Annual Report
Financial Highlights - Class T
|
Years ended November 30, |
2013 |
2012 |
2011 |
2010 |
2009 |
|
Selected Per-Share Data |
|
|
|
|
|
|
Net asset value, beginning of period |
$ 10.57 |
$ 9.06 |
$ 8.81 |
$ 8.04 |
$ 6.67 |
|
Income from Investment Operations |
|
|
|
|
|
|
Net investment income (loss) C |
.10 |
.09 |
.03 |
.05 F |
.04 |
|
Net realized and unrealized gain (loss) |
3.34 |
1.44 |
.28 |
.76 |
1.42 |
|
Total from investment operations |
3.44 |
1.53 |
.31 |
.81 |
1.46 |
|
Distributions from net investment income |
(.11) |
(.02) |
(.06) |
(.04) |
(.09) |
|
Net asset value, end of period |
$ 13.90 |
$ 10.57 |
$ 9.06 |
$ 8.81 |
$ 8.04 |
|
Total Return A,B |
32.82% |
16.94% |
3.53% |
10.06% |
22.12% |
|
Ratios to Average Net Assets D,G |
|
|
|
|
|
|
Expenses before reductions |
1.48% |
1.55% |
1.53% |
1.54% |
1.59% |
|
Expenses net of fee waivers, if any |
1.48% |
1.50% |
1.50% |
1.50% |
1.50% |
|
Expenses net of all reductions |
1.46% |
1.50% |
1.50% |
1.49% |
1.49% |
|
Net investment income (loss) |
.81% |
.95% |
.34% |
.58% F |
.64% |
|
Supplemental Data |
|
|
|
|
|
|
Net assets, end of period (000 omitted) |
$ 27,241 |
$ 21,212 |
$ 21,319 |
$ 25,208 |
$ 29,288 |
|
Portfolio turnover rate E |
68% |
77% |
65% |
103% |
135% |
A Total returns would have been lower if certain expenses had not been reduced during the applicable periods shown.
B Total returns do not include the effect of the sales charges.
C Calculated based on average shares outstanding during the period.
D Fees and expenses of any underlying Fidelity Central Funds are not included in the Fund's expense ratio. The Fund indirectly bears its proportionate share of the expenses of any underlying Fidelity Central Funds.
E Amount does not include the portfolio activity of any underlying Fidelity Central Funds.
F Investment income per share reflects a large, non-recurring dividends which amounted to $.05 per share. Excluding this non-recurring dividend, the ratio of net investment income (loss) to average net assets would have been (.05)%.
G Expense ratios reflect operating expenses of the class. Expenses before reductions do not reflect amounts reimbursed by the investment adviser or reductions from brokerage service arrangements or reductions from other expense offset arrangements and do not represent the amount paid by the class during periods when reimbursements or reductions occur. Expenses net of fee waivers reflect expenses after reimbursement by the investment adviser but prior to reductions from brokerage service arrangements or other expense offset arrangements. Expenses net of all reductions represent the net expenses paid by the class.
See accompanying notes which are an integral part of the financial statements.
Annual Report
Financial Highlights - Class B
|
Years ended November 30, |
2013 |
2012 |
2011 |
2010 |
2009 |
|
Selected Per-Share Data |
|
|
|
|
|
|
Net asset value, beginning of period |
$ 10.45 |
$ 8.98 |
$ 8.73 |
$ 7.96 |
$ 6.57 |
|
Income from Investment Operations |
|
|
|
|
|
|
Net investment income (loss) C |
.04 |
.04 |
(.01) |
.01 F |
.01 |
|
Net realized and unrealized gain (loss) |
3.31 |
1.43 |
.27 |
.76 |
1.40 |
|
Total from investment operations |
3.35 |
1.47 |
.26 |
.77 |
1.41 |
|
Distributions from net investment income |
(.04) |
- |
(.01) |
- |
(.02) |
|
Net asset value, end of period |
$ 13.76 |
$ 10.45 |
$ 8.98 |
$ 8.73 |
$ 7.96 |
|
Total Return A,B |
32.13% |
16.37% |
2.96% |
9.67% |
21.46% |
|
Ratios to Average Net Assets D,G |
|
|
|
|
|
|
Expenses before reductions |
1.99% |
2.06% |
2.02% |
2.03% |
2.08% |
|
Expenses net of fee waivers, if any |
1.99% |
2.00% |
2.00% |
2.00% |
2.00% |
|
Expenses net of all reductions |
1.97% |
2.00% |
2.00% |
1.99% |
1.99% |
|
Net investment income (loss) |
.30% |
.45% |
(.16)% |
.08% F |
.14% |
|
Supplemental Data |
|
|
|
|
|
|
Net assets, end of period (000 omitted) |
$ 2,886 |
$ 2,981 |
$ 3,884 |
$ 5,478 |
$ 7,007 |
|
Portfolio turnover rate E |
68% |
77% |
65% |
103% |
135% |
A Total returns would have been lower if certain expenses had not been reduced during the applicable periods shown.
B Total returns do not include the effect of the contingent deferred sales charge.
C Calculated based on average shares outstanding during the period.
D Fees and expenses of any underlying Fidelity Central Funds are not included in the Fund's expense ratio. The Fund indirectly bears its proportionate share of the expenses of any underlying Fidelity Central Funds.
E Amount does not include the portfolio activity of any underlying Fidelity Central Funds.
F Investment income per share reflects a large, non-recurring dividend which amounted to $.05 per share. Excluding this non-recurring dividend, the ratio of net investment income (loss) to average net assets would have been (.55)%.
G Expense ratios reflect operating expenses of the class. Expenses before reductions do not reflect amounts reimbursed by the investment adviser or reductions from brokerage service arrangements or reductions from other expense offset arrangements and do not represent the amount paid by the class during periods when reimbursements or reductions occur. Expenses net of fee waivers reflect expenses after reimbursement by the investment adviser but prior to reductions from brokerage service arrangements or other expense offset arrangements. Expenses net of all reductions represent the net expenses paid by the class.
See accompanying notes which are an integral part of the financial statements.
Annual Report
Financial Highlights - Class C
|
Years ended November 30, |
2013 |
2012 |
2011 |
2010 |
2009 |
|
Selected Per-Share Data |
|
|
|
|
|
|
Net asset value, beginning of period |
$ 10.37 |
$ 8.91 |
$ 8.67 |
$ 7.91 |
$ 6.55 |
|
Income from Investment Operations |
|
|
|
|
|
|
Net investment income (loss) C |
.04 |
.04 |
(.01) |
.01 F |
.01 |
|
Net realized and unrealized gain (loss) |
3.28 |
1.42 |
.27 |
.75 |
1.39 |
|
Total from investment operations |
3.32 |
1.46 |
.26 |
.76 |
1.40 |
|
Distributions from net investment income |
(.06) |
- |
(.02) |
- H |
(.04) |
|
Net asset value, end of period |
$ 13.63 |
$ 10.37 |
$ 8.91 |
$ 8.67 |
$ 7.91 |
|
Total Return A,B |
32.16% |
16.39% |
2.95% |
9.64% |
21.46% |
|
Ratios to Average Net Assets D,G |
|
|
|
|
|
|
Expenses before reductions |
1.97% |
2.05% |
2.02% |
2.03% |
2.08% |
|
Expenses net of fee waivers, if any |
1.97% |
2.00% |
2.00% |
2.00% |
2.00% |
|
Expenses net of all reductions |
1.96% |
2.00% |
2.00% |
1.99% |
1.99% |
|
Net investment income (loss) |
.32% |
.45% |
(.16)% |
.08% F |
.14% |
|
Supplemental Data |
|
|
|
|
|
|
Net assets, end of period (000 omitted) |
$ 12,329 |
$ 8,785 |
$ 8,922 |
$ 10,265 |
$ 11,556 |
|
Portfolio turnover rate E |
68% |
77% |
65% |
103% |
135% |
A Total returns would have been lower if certain expenses had not been reduced during the applicable periods shown.
B Total returns do not include the effect of the contingent deferred sales charge.
C Calculated based on average shares outstanding during the period.
D Fees and expenses of any underlying Fidelity Central Funds are not included in the Fund's expense ratio. The Fund indirectly bears its proportionate share of the expenses of any underlying Fidelity Central Funds.
E Amount does not include the portfolio activity of any underlying Fidelity Central Funds.
F Investment income per share reflects a large, non-recurring dividend which amounted to $.05 per share. Excluding this non-recurring dividend, the ratio of net investment income (loss) to average net assets would have been (.55)%.
G Expense ratios reflect operating expenses of the class. Expenses before reductions do not reflect amounts reimbursed by the investment adviser or reductions from brokerage service arrangements or reductions from other expense offset arrangements and do not represent the amount paid by the class during periods when reimbursements or reductions occur. Expenses net of fee waivers reflect expenses after reimbursement by the investment adviser but prior to reductions from brokerage service arrangements or other expense offset arrangements. Expenses net of all reductions represent the net expenses paid by the class.
H Amount represents less than $.01 per share.
See accompanying notes which are an integral part of the financial statements.
Annual Report
Financial Highlights - Institutional Class
|
Years ended November 30, |
2013 |
2012 |
2011 |
2010 |
2009 |
|
Selected Per-Share Data |
|
|
|
|
|
|
Net asset value, beginning of period |
$ 10.75 |
$ 9.22 |
$ 8.97 |
$ 8.18 |
$ 6.80 |
|
Income from Investment Operations |
|
|
|
|
|
|
Net investment income (loss) B |
.17 |
.15 |
.08 |
.09 E |
.08 |
|
Net realized and unrealized gain (loss) |
3.39 |
1.45 |
.29 |
.78 |
1.43 |
|
Total from investment operations |
3.56 |
1.60 |
.37 |
.87 |
1.51 |
|
Distributions from net investment income |
(.15) |
(.07) |
(.12) |
(.08) |
(.13) |
|
Net asset value, end of period |
$ 14.16 |
$ 10.75 |
$ 9.22 |
$ 8.97 |
$ 8.18 |
|
Total Return A |
33.61% |
17.49% |
4.05% |
10.65% |
22.71% |
|
Ratios to Average Net Assets C,F |
|
|
|
|
|
|
Expenses before reductions |
.89% |
.96% |
1.01% |
1.03% |
1.08% |
|
Expenses net of fee waivers, if any |
.89% |
.96% |
1.00% |
1.00% |
1.00% |
|
Expenses net of all reductions |
.87% |
.96% |
1.00% |
1.00% |
1.00% |
|
Net investment income (loss) |
1.40% |
1.49% |
.84% |
1.08% E |
1.14% |
|
Supplemental Data |
|
|
|
|
|
|
Net assets, end of period (000 omitted) |
$ 3,126 |
$ 2,123 |
$ 3,381 |
$ 6,617 |
$ 6,168 |
|
Portfolio turnover rate D |
68% |
77% |
65% |
103% |
135% |
A Total returns would have been lower if certain expenses had not been reduced during the applicable periods shown.
B Calculated based on average shares outstanding during the period.
C Fees and expenses of any underlying Fidelity Central Funds are not included in the Fund's expense ratio. The Fund indirectly bears its proportionate share of the expenses of any underlying Fidelity Central Funds.
D Amount does not include the portfolio activity of any underlying Fidelity Central Funds.
E Investment income per share reflects a large, non-recurring dividend which amounted to $.05 per share. Excluding this non-recurring dividend, the ratio of net investment income (loss) to average net assets would have been .45%.
F Expense ratios reflect operating expenses of the class. Expenses before reductions do not reflect amounts reimbursed by the investment adviser or reductions from brokerage service arrangements or reductions from other expense offset arrangements and do not represent the amount paid by the class during periods when reimbursements or reductions occur. Expenses net of fee waivers reflect expenses after reimbursement by the investment adviser but prior to reductions from brokerage service arrangements or other expense offset arrangements. Expenses net of all reductions represent the net expenses paid by the class.
See accompanying notes which are an integral part of the financial statements.
Annual Report
Notes to Financial Statements
For the period ended November 30, 2013
1. Organization.
Fidelity Advisor Equity Value Fund (the Fund) is a fund of Fidelity Advisor Series I (the Trust) and is authorized to issue an unlimited number of shares. The Trust is registered under the Investment Company Act of 1940, as amended (the 1940 Act), as an open-end management investment company organized as a Massachusetts business trust. The Fund offers Class A, Class T, Class C and Institutional Class shares, each of which, along with Class B shares, has equal rights as to assets and voting privileges. Class B shares are closed to new accounts and additional purchases, except for exchanges and reinvestments. Each class has exclusive voting rights with respect to matters that affect that class. Class B shares will automatically convert to Class A shares after a holding period of seven years from the initial date of purchase.
2. Investments in Fidelity Central Funds.
The Fund invests in Fidelity Central Funds, which are open-end investment companies generally available only to other investment companies and accounts managed by the investment adviser and its affiliates. The Fund's Schedule of Investments lists each of the Fidelity Central Funds held as of period end, if any, as an investment of the Fund, but does not include the underlying holdings of each Fidelity Central Fund. As an Investing Fund, the Fund indirectly bears its proportionate share of the expenses of the underlying Fidelity Central Funds.
The Money Market Central Funds seek preservation of capital and current income and are managed by Fidelity Investments Money Management, Inc. (FIMM), an affiliate of the investment adviser. Annualized expenses of the Money Market Central Funds as of their most recent shareholder report date are less than .01%.
A complete unaudited list of holdings for each Fidelity Central Fund is available upon request or at the Securities and Exchange Commission (the SEC) website at www.sec.gov. In addition, the financial statements of the Fidelity Central Funds, which are not covered by the Fund's Report of Independent Registered Public Accounting Firm, are available on the SEC website or upon request.
3. Significant Accounting Policies.
The financial statements have been prepared in conformity with accounting principles generally accepted in the United States of America (GAAP), which require management to make certain estimates and assumptions at the date of the financial statements. Actual results could differ from those estimates. Subsequent events, if any, through the date that the financial statements were issued have been evaluated in the preparation of
Annual Report
Notes to Financial Statements - continued
3. Significant Accounting Policies - continued
the financial statements. The following summarizes the significant accounting policies of the Fund:
Investment Valuation. Investments are valued as of 4:00 p.m. Eastern time on the last calendar day of the period. In accordance with valuation policies and procedures approved by the Board of Trustees (the Board), the Fund attempts to obtain prices from one or more third party pricing vendors or brokers to value its investments. When current market prices, quotations or currency exchange rates are not readily available or reliable, investments will be fair valued in good faith by the Fidelity Management & Research Company (FMR) Fair Value Committee (the Committee), in accordance with procedures adopted by the Board. Factors used in determining fair value vary by investment type and may include market or investment specific events, changes in interest rates and credit quality. The frequency with which these procedures are used cannot be predicted and they may be utilized to a significant extent. The Committee oversees the Fund's valuation policies and procedures and is responsible for approving and reporting to the Board all fair value determinations.
The Fund categorizes the inputs to valuation techniques used to value its investments into a disclosure hierarchy consisting of three levels as shown below:
Level 1 - quoted prices in active markets for identical investments
Level 2 - other significant observable inputs (including quoted prices for similar investments, interest rates, prepayment speeds, etc.)
Level 3 - unobservable inputs (including the Fund's own assumptions based on the best information available)
Valuation techniques used to value the Fund's investments by major category are as follows:
Equity securities, including restricted securities, for which market quotations are readily available, are valued at the last reported sale price or official closing price as reported by a third party pricing vendor on the primary market or exchange on which they are traded and are categorized as Level 1 in the hierarchy. In the event there were no sales during the day or closing prices are not available, securities are valued at the last quoted bid price or may be valued using the last available price and are generally categorized as Level 2 in the hierarchy. For foreign equity securities, when market or security specific events arise, comparisons to the valuation of American Depositary Receipts (ADRs), futures contracts, Exchange-Traded Funds (ETFs) and certain indexes as well as quoted prices for similar securities may be used and would be categorized as Level 2 in the hierarchy. Utilizing these techniques may result in transfers between Level 1 and Level 2. For equity securities, including restricted securities, where observable inputs are
Annual Report
3. Significant Accounting Policies - continued
Investment Valuation - continued
limited, assumptions about market activity and risk are used and these securities may be categorized as Level 3 in the hierarchy.
Debt securities, including restricted securities, are valued based on evaluated prices received from third party pricing vendors or from brokers who make markets in such securities. For corporate bonds, pricing vendors utilize matrix pricing which considers yield or price of bonds of comparable quality, coupon, maturity and type as well as broker-supplied prices. When independent prices are unavailable or unreliable, debt securities may be valued utilizing pricing methodologies which consider similar factors that would be used by third party pricing vendors. Debt securities are generally categorized as Level 2 in the hierarchy but may be Level 3 depending on the circumstances.
Investments in open-end mutual funds, including the Fidelity Central Funds, are valued at their closing net asset value (NAV) each business day and are categorized as Level 1 in the hierarchy.
Foreign Currency. The Fund may use foreign currency contracts to facilitate transactions in foreign-denominated securities. Gains and losses from these transactions may arise from changes in the value of the foreign currency or if the counterparties do not perform under the contracts' terms.
Foreign-denominated assets, including investment securities, and liabilities are translated into U.S. dollars at the exchange rates at period end. Purchases and sales of investment securities, income and dividends received and expenses denominated in foreign currencies are translated into U.S. dollars at the exchange rate in effect on the transaction date.
The effects of exchange rate fluctuations on investments are included with the net realized and unrealized gain (loss) on investment securities. Other foreign currency transactions resulting in realized and unrealized gain (loss) are disclosed separately.
Investment Transactions and Income. For financial reporting purposes, the Fund's investment holdings and NAV include trades executed through the end of the last business day of the period. The NAV per share for processing shareholder transactions is calculated as of the close of business of the New York Stock Exchange (NYSE), normally 4:00 p.m. Eastern time and includes trades executed through the end of the prior business day. Gains and losses on securities sold are determined on the basis of identified cost and may include proceeds received from litigation. Dividend income is recorded on the ex-dividend date, except for certain dividends from foreign securities where the ex-dividend date may have passed, which are recorded as soon as the Fund is informed of the ex-dividend date. Non-cash dividends included in dividend income, if any, are
Annual Report
Notes to Financial Statements - continued
3. Significant Accounting Policies - continued
Investment Transactions and Income - continued
recorded at the fair market value of the securities received. Distributions received on securities that represent a return of capital or capital gain are recorded as a reduction of cost of investments and/or as a realized gain. Subsequent to ex-dividend date the Fund determines the components of these distributions, based upon receipt of tax filings or other correspondence relating to the underlying investment. Interest income and distributions from the Fidelity Central Funds are accrued as earned. Interest income includes coupon interest and amortization of premium and accretion of discount on debt securities. Investment income is recorded net of foreign taxes withheld where recovery of such taxes is uncertain.
Class Allocations and Expenses. Investment income, realized and unrealized capital gains and losses, common expenses of the Fund, and certain fund-level expense reductions, if any, are allocated daily on a pro-rata basis to each class based on the relative net assets of each class to the total net assets of the Fund. Each class differs with respect to transfer agent and distribution and service plan fees incurred. Certain expense reductions may also differ by class. For the reporting period, the allocated portion of income and expenses to each class as a percent of its average net assets may vary due to the timing of recording these transactions in relation to fluctuating net assets of the classes. Expenses directly attributable to a fund are charged to that fund. Expenses attributable to more than one fund are allocated among the respective funds on the basis of relative net assets or other appropriate methods. Expense estimates are accrued in the period to which they relate and adjustments are made when actual amounts are known.
Income Tax Information and Distributions to Shareholders. Each year, the Fund intends to qualify as a regulated investment company under Subchapter M of the Internal Revenue Code, including distributing substantially all of its taxable income and realized gains. As a result, no provision for U.S. Federal income taxes is required. As of November 30, 2013, the Fund did not have any unrecognized tax benefits in the financial statements; nor is the Fund aware of any tax positions for which it is reasonably possible that the total amounts of unrecognized tax benefits will significantly change in the next twelve months. The Fund files a U.S. federal tax return, in addition to state and local tax returns as required. The Fund's federal income tax returns are subject to examination by the Internal Revenue Service (IRS) for a period of three fiscal years after they are filed. State and local tax returns may be subject to examination for an additional fiscal year depending on the jurisdiction. Foreign taxes are provided for based on the Fund's understanding of the tax rules and rates that exist in the foreign markets in which it invests.
Distributions are declared and recorded on the ex-dividend date. Income dividends and capital gain distributions are declared separately for each class. Income and capital gain
Annual Report
3. Significant Accounting Policies - continued
Income Tax Information and Distributions to Shareholders - continued
distributions are determined in accordance with income tax regulations, which may differ from GAAP.
Capital accounts within the financial statements are adjusted for permanent book-tax differences. These adjustments have no impact on net assets or the results of operations. Temporary book-tax differences will reverse in a subsequent period.
Book-tax differences are primarily due to foreign currency transactions, passive foreign investment companies (PFIC), market discount, capital loss carryforwards, loss deferred due to wash sales and excise tax regulations.
The federal tax cost of investment securities and unrealized appreciation (depreciation) as of period end were as follows:
|
Gross unrealized appreciation |
$ 16,889,059 |
|
Gross unrealized depreciation |
(473,235) |
|
Net unrealized appreciation (depreciation) on securities and other investments |
$ 16,415,824 |
|
|
|
|
Tax Cost |
$ 69,157,256 |
The tax-based components of distributable earnings as of period end were as follows:
|
Undistributed ordinary income |
$ 483,156 |
|
Capital loss carryforward |
$ (18,333,795) |
|
Net unrealized appreciation (depreciation) |
$ 16,415,912 |
Capital loss carryforwards are only available to offset future capital gains of the Fund to the extent provided by regulations and may be limited. Under the Regulated Investment Company Modernization Act of 2010 (the Act), the Fund is permitted to carry forward capital losses incurred in taxable years beginning after December 22, 2010 for an unlimited period and such capital losses are required to be used prior to any losses that expire. The capital loss carryforward information presented below, including any applicable limitation, is estimated as of fiscal period end and is subject to adjustment.
|
2017 |
$ (18,333,795) |
The tax character of distributions paid was as follows:
|
|
November 30, 2013 |
November 30, 2012 |
|
Ordinary Income |
$ 666,191 |
$ 227,180 |
Annual Report
Notes to Financial Statements - continued
4. Purchases and Sales of Investments.
Purchases and sales of securities, other than short-term securities, aggregated $49,650,869 and $49,325,749, respectively.
5. Fees and Other Transactions with Affiliates.
Management Fee. Fidelity Management & Research Company (the investment adviser) and its affiliates provide the Fund with investment management related services for which the Fund pays a monthly management fee. The management fee is the sum of an individual fund fee rate that is based on an annual rate of .30% of the Fund's average net assets and an annualized group fee rate that averaged .25% during the period. The group fee rate is based upon the average net assets of all the mutual funds advised by the investment adviser, including any mutual funds previously advised by the investment adviser that are currently advised by Fidelity SelectCo, LLC, an affiliate of the investment adviser. The group fee rate decreases as assets under management increase and increases as assets under management decrease. In addition, the management fee is subject to a performance adjustment (up to a maximum of ± .20% of the Fund's average net assets over a 36 month performance period). The upward or downward adjustment to the management fee is based on the relative investment performance of the Institutional Class of the Fund as compared to an appropriate benchmark index over the same 36 month performance period. For the reporting period, the total annual management fee rate, including the performance adjustment, was .47% of the Fund's average net assets. The performance adjustment included in the management fee rate may be higher or lower than the maximum performance adjustment rate due to the difference between the average net assets for the reporting and performance periods.
Distribution and Service Plan Fees. In accordance with Rule 12b-1 of the 1940 Act, the Fund has adopted separate Distribution and Service Plans for each class of shares. Certain classes pay Fidelity Distributors Corporation (FDC), an affiliate of the investment adviser, separate Distribution and Service Fees, each of which is based on an annual percentage of each class' average net assets. In addition, FDC may pay financial intermediaries for selling shares of the Fund and providing shareholder support services. For the period, the Distribution and Service Fee rates, total fees and amounts retained by FDC were as follows:
|
|
Distribution |
Service |
Total Fees |
Retained |
|
Class A |
-% |
.25% |
$ 84,770 |
$ 2,106 |
|
Class T |
.25% |
.25% |
120,416 |
567 |
|
Class B |
.75% |
.25% |
28,759 |
21,848 |
|
Class C |
.75% |
.25% |
101,933 |
11,289 |
|
|
|
|
$ 335,878 |
$ 35,810 |
Annual Report
5. Fees and Other Transactions with Affiliates - continued
Sales Load. FDC may receive a front-end sales charge of up to 5.75% for selling Class A shares and 3.50% for selling Class T shares, some of which is paid to financial intermediaries for selling shares of the Fund. Depending on the holding period, FDC may receive contingent deferred sales charges levied on Class A, Class T, Class B, and Class C redemptions. The deferred sales charges range from 5.00% to 1.00% for Class B shares, 1.00% for Class C shares, 1.00% for certain purchases of Class A shares and .25% for certain purchases of Class T shares.
For the period, sales charge amounts retained by FDC were as follows:
|
|
Retained |
|
Class A |
$ 17,335 |
|
Class T |
3,769 |
|
Class B* |
3,217 |
|
Class C* |
2,445 |
|
|
$ 26,766 |
* When Class B and Class C shares are initially sold, FDC pays commissions from its own resources to financial intermediaries through which the sales are made.
Transfer Agent Fees. Fidelity Investments Institutional Operations Company, Inc., (FIIOC), an affiliate of the investment adviser, is the transfer, dividend disbursing and shareholder servicing agent for each class of the Fund. FIIOC receives account fees and asset-based fees that vary according to the account size and type of account of the shareholders of the respective classes of the Fund. FIIOC pays for typesetting, printing and mailing of shareholder reports, except proxy statements.
For the period, transfer agent fees for each applicable class were as follows:
|
|
Amount |
% of |
|
Class A |
$ 95,802 |
.28 |
|
Class T |
69,873 |
.29 |
|
Class B |
8,625 |
.30 |
|
Class C |
29,190 |
.29 |
|
Institutional Class |
5,195 |
.20 |
|
|
$ 208,685 |
|
Accounting and Security Lending Fees. Fidelity Service Company, Inc. (FSC), an affiliate of the investment adviser, maintains the Fund's accounting records. The accounting fee is based on the level of average net assets for each month. Under a separate
Annual Report
Notes to Financial Statements - continued
5. Fees and Other Transactions with Affiliates - continued
Accounting and Security Lending Fees - continued
contract, FSC administers the security lending program. The security lending fee is based on the number and duration of lending transactions.
Brokerage Commissions. The Fund placed a portion of its portfolio transactions with brokerage firms which are affiliates of the investment adviser. Brokerage commissions are included in net realized gain (loss) and change in net unrealized appreciation (depreciation) in the Statement of Operations. The commissions paid to these affiliated firms were $1,758 for the period.
6. Committed Line of Credit.
The Fund participates with other funds managed by the investment adviser or an affiliate in a $4.25 billion credit facility (the "line of credit") to be utilized for temporary or emergency purposes to fund shareholder redemptions or for other short-term liquidity purposes. The Fund has agreed to pay commitment fees on its pro-rata portion of the line of credit, which amounted to $153 and is reflected in Miscellaneous expenses on the Statement of Operations. During the period, there were no borrowings on this line of credit.
7. Security Lending.
The Fund lends portfolio securities through a lending agent from time to time in order to earn additional income. For equity securities, a lending agent is used and may loan securities to certain qualified borrowers, including Fidelity Capital Markets (FCM), a broker-dealer affiliated with the Fund. On the settlement date of the loan, the Fund receives collateral (in the form of U.S. Treasury obligations, letters of credit and/or cash) against the loaned securities and maintains collateral in an amount not less than 100% of the market value of the loaned securities during the period of the loan. The market value of the loaned securities is determined at the close of business of the Fund and any additional required collateral is delivered to the Fund on the next business day. If the borrower defaults on its obligation to return the securities loaned because of insolvency or other reasons, the Fund may apply collateral received from the borrower against the obligation. The Fund may experience delays and costs in recovering the securities loaned. Any cash collateral received is invested in the Fidelity Securities Lending Cash Central Fund. The value of loaned securities and cash collateral at period end are disclosed on the Fund's Statement of Assets and Liabilities. At period end, there were no security loans outstanding with FCM. Security lending income represents the income earned on investing cash collateral, less rebates paid to borrowers and any lending agent fees associated with the loan, plus any premium payments received for lending certain types of securities. Security lending income is presented in the Statement of Operations
Annual Report
7. Security Lending - continued
as a component of income from Fidelity Central Funds. Total security lending income during the period amounted to $5,353, including $13 from securities loaned to FCM.
8. Expense Reductions.
Commissions paid to certain brokers with whom the investment adviser, or its affiliates, places trades on behalf of the Fund include an amount in addition to trade execution, which may be rebated back to the Fund to offset certain expenses. This amount totaled $11,070 for the period. In addition, through arrangements with the Fund's custodian, credits realized as a result of uninvested cash balances were used to reduce the Fund's expenses. During the period, these credits reduced the Fund's custody expenses by $8.
9. Distributions to Shareholders.
Distributions to shareholders of each class were as follows:
|
Years ended November 30, |
2013 |
2012 |
|
From net investment income |
|
|
|
Class A |
$ 368,863 |
$ 153,829 |
|
Class T |
207,812 |
48,135 |
|
Class B |
10,127 |
- |
|
Class C |
48,842 |
- |
|
Institutional Class |
30,547 |
25,216 |
|
Total |
$ 666,191 |
$ 227,180 |
10. Share Transactions.
Transactions for each class of shares were as follows:
|
|
Shares |
Dollars |
||
|
Years ended November 30, |
2013 |
2012 |
2013 |
2012 |
|
Class A |
|
|
|
|
|
Shares sold |
583,952 |
512,068 |
$ 7,135,653 |
$ 5,071,992 |
|
Reinvestment of distributions |
32,284 |
15,952 |
339,948 |
141,492 |
|
Shares redeemed |
(541,866) |
(833,957) |
(6,484,059) |
(8,294,641) |
|
Net increase (decrease) |
74,370 |
(305,937) |
$ 991,542 |
$ (3,081,157) |
|
Class T |
|
|
|
|
|
Shares sold |
369,830 |
358,551 |
$ 4,472,830 |
$ 3,605,553 |
|
Reinvestment of distributions |
19,297 |
5,241 |
203,195 |
46,483 |
|
Shares redeemed |
(436,241) |
(709,166) |
(5,247,116) |
(7,062,030) |
|
Net increase (decrease) |
(47,114) |
(345,374) |
$ (571,091) |
$ (3,409,994) |
Annual Report
Notes to Financial Statements - continued
10. Share Transactions - continued
|
|
Shares |
Dollars |
||
|
Years ended November 30, |
2013 |
2012 |
2013 |
2012 |
|
Class B |
|
|
|
|
|
Shares sold |
6,153 |
1,897 |
$ 75,269 |
$ 19,084 |
|
Reinvestment of distributions |
894 |
- |
9,368 |
- |
|
Shares redeemed |
(82,657) |
(148,957) |
(973,124) |
(1,471,427) |
|
Net increase (decrease) |
(75,610) |
(147,060) |
$ (888,487) |
$ (1,452,343) |
|
Class C |
|
|
|
|
|
Shares sold |
203,559 |
132,946 |
$ 2,446,409 |
$ 1,314,514 |
|
Reinvestment of distributions |
4,183 |
- |
43,420 |
- |
|
Shares redeemed |
(150,316) |
(286,550) |
(1,733,957) |
(2,827,158) |
|
Net increase (decrease) |
57,426 |
(153,604) |
$ 755,872 |
$ (1,512,644) |
|
Institutional Class |
|
|
|
|
|
Shares sold |
65,871 |
19,258 |
$ 815,361 |
$ 195,293 |
|
Reinvestment of distributions |
2,690 |
2,110 |
28,699 |
18,952 |
|
Shares redeemed |
(45,258) |
(190,665) |
(550,743) |
(1,970,183) |
|
Net increase (decrease) |
23,303 |
(169,297) |
$ 293,317 |
$ (1,755,938) |
11. Other.
The Fund's organizational documents provide former and current trustees and officers with a limited indemnification against liabilities arising in connection with the performance of their duties to the Fund. In the normal course of business, the Fund may also enter into contracts that provide general indemnifications. The Fund's maximum exposure under these arrangements is unknown as this would be dependent on future claims that may be made against the Fund. The risk of material loss from such claims is considered remote.
Annual Report
Report of Independent Registered Public Accounting Firm
To the Trustees of Fidelity Advisor Series I and Shareholders of Fidelity Advisor Equity Value Fund:
We have audited the accompanying statement of assets and liabilities of Fidelity Advisor Equity Value Fund (the Fund), a fund of Fidelity Advisor Series I, including the schedule of investments, as of November 30, 2013, and the related statement of operations for the year then ended, the statement of changes in net assets for each of the two years in the period then ended, and the financial highlights for each of the five years in the period then ended. These financial statements and financial highlights are the responsibility of the Fund's management. Our responsibility is to express an opinion on these financial statements and financial highlights based on our audits.
We conducted our audits in accordance with the standards of the Public Company Accounting Oversight Board (United States). Those standards require that we plan and perform the audit to obtain reasonable assurance about whether the financial statements and financial highlights are free of material misstatement. The Fund is not required to have, nor were we engaged to perform, an audit of its internal control over financial reporting. Our audits included consideration of internal control over financial reporting as a basis for designing audit procedures that are appropriate in the circumstances, but not for the purpose of expressing an opinion on the effectiveness of the Fund's internal control over financial reporting. Accordingly, we express no such opinion. An audit also includes examining, on a test basis, evidence supporting the amounts and disclosures in the financial statements, assessing the accounting principles used and significant estimates made by management, as well as evaluating the overall financial statement presentation. Our procedures included confirmation of securities owned as of November 30, 2013, by correspondence with the custodians and brokers; where replies were not received from brokers, we performed other auditing procedures. We believe that our audits provide a reasonable basis for our opinion.
In our opinion, the financial statements and financial highlights referred to above present fairly, in all material respects, the financial position of Fidelity Advisor Equity Value Fund as of November 30, 2013, the results of its operations for the year then ended, the changes in its net assets for each of the two years in the period then ended, and the financial highlights for each of the five years in the period then ended, in conformity with accounting principles generally accepted in the United States of America.
DELOITTE & TOUCHE LLP
Boston, Massachusetts
January 14, 2014
Annual Report
Trustees and Officers
The Trustees, Member of the Advisory Board, and officers of the trust and fund, as applicable, are listed below. The Board of Trustees governs the fund and is responsible for protecting the interests of shareholders. The Trustees are experienced executives who meet periodically throughout the year to oversee the fund's activities, review contractual arrangements with companies that provide services to the fund, oversee management of the risks associated with such activities and contractual arrangements, and review the fund's performance. Except for James C. Curvey, Ned C. Lautenbach, Ronald P. O'Hanley, and William S. Stavropoulos, each of the Trustees oversees 173 funds. Mr. Curvey oversees 396 funds. Mr. Lautenbach, Mr. O'Hanley, and Mr. Stavropoulos each oversees 247 funds.
The Trustees hold office without limit in time except that (a) any Trustee may resign; (b) any Trustee may be removed by written instrument, signed by at least two-thirds of the number of Trustees prior to such removal; (c) any Trustee who requests to be retired or who has become incapacitated by illness or injury may be retired by written instrument signed by a majority of the other Trustees; and (d) any Trustee may be removed at any special meeting of shareholders by a two-thirds vote of the outstanding voting securities of the trust. Each Trustee who is not an interested person (as defined in the 1940 Act) of the trust and the fund (Independent Trustee), shall retire not later than the last day of the calendar year in which his or her 75th birthday occurs. The Independent Trustees may waive this mandatory retirement age policy with respect to individual Trustees. The officers and Advisory Board Member hold office without limit in time, except that any officer and Advisory Board Member may resign or may be removed by a vote of a majority of the Trustees at any regular meeting or any special meeting of the Trustees. Except as indicated, each individual has held the office shown or other offices in the same company for the past five years.
Experience, Skills, Attributes, and Qualifications of the Fund's Trustees. The Governance and Nominating Committee has adopted a statement of policy that describes the experience, qualifications, attributes, and skills that are necessary and desirable for potential Independent Trustee candidates (Statement of Policy). The Board believes that each Trustee satisfied at the time he or she was initially elected or appointed a Trustee, and continues to satisfy, the standards contemplated by the Statement of Policy. The Governance and Nominating Committee also engages professional search firms to help identify potential Independent Trustee candidates who have the experience, qualifications, attributes, and skills consistent with the Statement of Policy. From time to time, additional criteria based on the composition and skills of the current Independent Trustees, as well as experience or skills that may be appropriate in light of future changes to board composition, business conditions, and regulatory or other developments, have also been considered by the professional search firms and the Governance and Nominating Committee. In addition, the Board takes into account the Trustees' commitment and participation in Board and committee meetings, as well as their leadership of standing and ad hoc committees throughout their tenure.
Annual Report
In determining that a particular Trustee was and continues to be qualified to serve as a Trustee, the Board has considered a variety of criteria, none of which, in isolation, was controlling. The Board believes that, collectively, the Trustees have balanced and diverse experience, qualifications, attributes, and skills, which allow the Board to operate effectively in governing the fund and protecting the interests of shareholders. Information about the specific experience, skills, attributes, and qualifications of each Trustee, which in each case led to the Board's conclusion that the Trustee should serve (or continue to serve) as a trustee of the fund, is provided below.
Board Structure and Oversight Function. James C. Curvey is an interested person (as defined in the 1940 Act) and currently serves as Chairman. The Trustees have determined that an interested Chairman is appropriate and benefits shareholders because an interested Chairman has a personal and professional stake in the quality and continuity of services provided to the fund. Independent Trustees exercise their informed business judgment to appoint an individual of their choosing to serve as Chairman, regardless of whether the Trustee happens to be independent or a member of management. The Independent Trustees have determined that they can act independently and effectively without having an Independent Trustee serve as Chairman and that a key structural component for assuring that they are in a position to do so is for the Independent Trustees to constitute a substantial majority for the Board. The Independent Trustees also regularly meet in executive session. Ned C. Lautenbach serves as Chairman of the Independent Trustees and as such (i) acts as a liaison between the Independent Trustees and management with respect to matters important to the Independent Trustees and (ii) with management prepares agendas for Board meetings.
Fidelity funds are overseen by different Boards of Trustees. The fund's Board oversees Fidelity's equity and high income funds and another Board oversees Fidelity's investment-grade bond, money market, and asset allocation funds. The asset allocation funds may invest in Fidelity funds overseen by the fund's Board. The use of separate Boards, each with its own committee structure, allows the Trustees of each group of Fidelity funds to focus on the unique issues of the funds they oversee, including common research, investment, and operational issues. On occasion, the separate Boards establish joint committees to address issues of overlapping consequences for the Fidelity funds overseen by each Board.
The Trustees operate using a system of committees to facilitate the timely and efficient consideration of all matters of importance to the Trustees, the fund, and fund shareholders and to facilitate compliance with legal and regulatory requirements and oversight of the fund's activities and associated risks. The Board, acting through its committees, has charged FMR and its affiliates with (i) identifying events or circumstances the occurrence of which could have demonstrably adverse effects on the fund's business and/or reputation; (ii) implementing processes and controls to lessen the possibility that such events or circumstances occur or to mitigate the effects of such events or circumstances if they do occur; and (iii) creating and maintaining a system designed to evaluate continuously business and market conditions in order to facilitate the identification and implementation processes described in (i) and (ii) above. Because the day-to-day operations and activities of the fund are carried out by or through FMR, its affiliates and other service providers, the fund's exposure to risks is mitigated but not eliminated by the processes overseen by the Trustees. While each of the Board's committees has responsibility for overseeing different aspects of the fund's activities, oversight is exercised primarily through the Operations, Audit, and Compliance Committees. In addition, the Independent Trustees have worked with FMR to enhance the Board's oversight of investment and financial risks, legal and regulatory risks, technology risks, and operational risks, including the development of additional risk reporting to the Board. For example, a working group comprised of Independent Trustees and FMR has worked and continues to work to review the Fidelity funds' valuation-related activities, reporting and risk management. Appropriate personnel, including but not limited to the fund's Chief Compliance Officer (CCO), FMR's internal auditor, the independent accountants, the fund's Treasurer and portfolio management personnel, make periodic reports to the Board's committees, as appropriate, including an annual review of FMR's risk management program for the Fidelity funds. The responsibilities of each standing committee, including their oversight responsibilities, are described further under "Standing Committees of the Fund's Trustees."
Annual Report
Trustees and Officers - continued
The fund's Statement of Additional Information (SAI) includes more information about the Trustees. To request a free copy, call Fidelity at 1-877-208-0098.
Interested Trustees*:
Correspondence intended for each Trustee who is an interested person may be sent to Fidelity Investments, 245 Summer Street, Boston, Massachusetts 02210.
|
Name, Year of Birth; Principal Occupations and Other Relevant Experience+ |
|
|
James C. Curvey (1935) |
|
|
Year of Election or Appointment: 2007 Trustee Chairman of the Board of Trustees |
|
|
|
Mr. Curvey also serves as Trustee of other Fidelity funds. Mr. Curvey is a Director of Fidelity Investments Money Management, Inc. (2009-present), Director of Fidelity Research & Analysis Co. (2009-present) and Director of FMR and FMR Co., Inc. (2007-present). Mr. Curvey is also Vice Chairman (2007-present) and Director of FMR LLC. In addition, Mr. Curvey serves as an Overseer for the Boston Symphony Orchestra and a member of the Trustees of Villanova University. Previously, Mr. Curvey was the Vice Chairman (2006-2007) and Director (2000-2007) of FMR Corp. |
|
Ronald P. O'Hanley (1957) |
|
|
Year of Election or Appointment: 2011 Trustee |
|
|
|
Mr. O'Hanley also serves as Trustee of other Fidelity funds. He is Director of Fidelity SelectCo, LLC (2013-present), FMR Co., Inc. (2010-present), Director of Fidelity Investments Money Management, Inc. (2010-present), Director of Fidelity Research & Analysis Company (2010-present), President of Fidelity Asset Management and Corporate Services and a Member of Fidelity's Executive Committee (2010-present). Previously, Mr. O'Hanley served as President and Chief Executive Officer of BNY Mellon Asset Management (2007-2010). Mr. O'Hanley also served as Vice Chairman of Bank New York Mellon Corp. and a member of that firm's Executive Committee. Prior to the 2007 merger of The Bank of New York and Mellon Financial Corporation, he was Vice Chairman of Mellon Financial Corporation and President and Chief Executive Officer of Mellon Asset Management. He joined Mellon in February 1997. Mr. O'Hanley currently serves as Chairman of the Boston Public Library Foundation Board of Directors and sits on the Board of Directors of Beth Israel Deaconess Medical Center, the Board of Trustees of the Marine Biological Laboratory and the Advisory Board of the Maxwell School of Citizenship and Public Administration at Syracuse University. Mr. O'Hanley also chairs the Council on Asset Management for the Financial Services Roundtable and is a member of the Board of Directors of Institutional Investor's U.S. Institute. |
* Trustees have been determined to be "Interested Trustees" by virtue of, among other things, their affiliation with the trust or various entities under common control with FMR.
+ The information above includes each Trustee's principal occupation during the last five years and other information relating to the experience, attributes, and skills relevant to each Trustee's qualifications to serve as a Trustee, which led to the conclusion that each Trustee should serve as a Trustee for the fund.
Annual Report
Trustees and Officers - continued
Independent Trustees:
Correspondence intended for each Independent Trustee (that is, the Trustees other than the Interested Trustees) may be sent to Fidelity Investments, P.O. Box 55235, Boston, Massachusetts 02205-5235.
|
Name, Year of Birth; Principal Occupations and Other Relevant Experience+ |
|
|
Dennis J. Dirks (1948) |
|
|
Year of Election or Appointment: 2005 Trustee |
|
|
|
Mr. Dirks also serves as Trustee of other Fidelity funds. Prior to his retirement in May 2003, Mr. Dirks was Chief Operating Officer and a member of the Board of The Depository Trust & Clearing Corporation (DTCC). He also served as President, Chief Operating Officer, and Board member of The Depository Trust Company (DTC) and President and Board member of the National Securities Clearing Corporation (NSCC). In addition, Mr. Dirks served as Chief Executive Officer and Board member of the Government Securities Clearing Corporation, Chief Executive Officer and Board member of the Mortgage-Backed Securities Clearing Corporation, as a Trustee and a member of the Finance Committee of Manhattan College (2005-2008), and as a Trustee and a member of the Finance Committee of AHRC of Nassau County (2006-2008). Mr. Dirks is a member of the Independent Directors Council (IDC) Governing Council (2010-present) and Board of Directors for The Brookville Center for Children's Services, Inc. (2009-present). |
|
Alan J. Lacy (1953) |
|
|
Year of Election or Appointment: 2008 Trustee |
|
|
|
Mr. Lacy also serves as Trustee of other Fidelity funds. Mr. Lacy serves as Senior Adviser (2007-present) of Oak Hill Capital Partners, L.P. (private equity). Mr. Lacy also served as Chief Executive Officer (2000-2005) and Vice Chairman (2005-2006) of Sears Holdings Corporation and Sears, Roebuck and Co. (retail). In addition, Mr. Lacy serves as a member of the Board of Directors of Dave & Buster's Entertainment, Inc. (restaurant and entertainment complexes, 2010-present), Earth Fare, Inc. (retail grocery, 2012-present), The Hillman Companies, Inc. (hardware wholesalers, 2010-present), and Bristol-Myers Squibb Company (global pharmaceuticals, 2008-present). Mr. Lacy is a member of the Board of Trustees of The National Parks Conservation Association (2006-present). Previously, Mr. Lacy served as Chairman of the Board of Trustees of the National Parks Conservation Association (2008-2011) and as a member of the Board of Directors for the Western Union Company (global money transfer, 2006-2011). |
|
Ned C. Lautenbach (1944) |
|
|
Year of Election or Appointment: 2000 Trustee Chairman of the Independent Trustees |
|
|
|
Mr. Lautenbach also serves as Trustee of other Fidelity funds. Mr. Lautenbach currently serves as the Lead Director of the Eaton Corporation Board of Directors (diversified industrial, 1997-present). Mr. Lautenbach is Chairman of the Board of Directors of the Philharmonic Center for the Arts in Naples, Florida (2012-present) and a member of the Council on Foreign Relations (1994-present). Previously, Mr. Lautenbach was a Partner/Advisory Partner at Clayton, Dubilier & Rice, LLC (private equity investment, 1998-2010), as well as a Director of Sony Corporation (2006-2007). |
|
Joseph Mauriello (1944) |
|
|
Year of Election or Appointment: 2008 Trustee |
|
|
|
Mr. Mauriello also serves as Trustee of other Fidelity funds. Prior to his retirement in January 2006, Mr. Mauriello served in numerous senior management positions including Deputy Chairman and Chief Operating Officer (2004-2005), and Vice Chairman of Financial Services (2002-2004) of KPMG LLP US (professional services, 1965-2005). Mr. Mauriello currently serves as a member of the Board of Directors of XL Group plc. (global insurance and re-insurance, 2006-present). Previously, Mr. Mauriello served as a Director of the Hamilton Funds of the Bank of New York (2006-2007) and of Arcadia Resources Inc. (health care services and products, 2007-2012). |
|
Robert W. Selander (1950) |
|
|
Year of Election or Appointment: 2011 Trustee |
|
|
|
Mr. Selander also serves as Trustee of other Fidelity funds. Previously, Mr. Selander served as a Member of the Advisory Board of other Fidelity funds (2011), and Executive Vice Chairman (2010), Chief Executive Officer (2009-2010), and President and Chief Executive Officer (1997-2009) of Mastercard, Inc. |
|
Cornelia M. Small (1944) |
|
|
Year of Election or Appointment: 2005 Trustee |
|
|
|
Ms. Small also serves as Trustee of other Fidelity funds. Ms. Small is a member of the Board of Directors (2009-present) and Chair of the Investment Committee (2010-present) of the Teagle Foundation. Ms. Small also serves on the Investment Committee of the Berkshire Taconic Community Foundation (2008-present). Previously, Ms. Small served as Chairperson (2002-2008) and a member of the Investment Committee and Chairperson (2008-2012) and a member of the Board of Trustees of Smith College. In addition, Ms. Small served as Chief Investment Officer, Director of Global Equity Investments, and a member of the Board of Directors of Scudder, Stevens & Clark and Scudder Kemper Investments. |
|
William S. Stavropoulos (1939) |
|
|
Year of Election or Appointment: 2002 Trustee Vice Chairman of the Independent Trustees |
|
|
|
Mr. Stavropoulos also serves as Trustee of other Fidelity funds. Mr. Stavropoulos serves as President and Founder of the Michigan Baseball Foundation, the Great Lakes Loons (2007-present). Mr. Stavropoulos is Chairman Emeritus of the Board of Directors of The Dow Chemical Company, where he previously served in numerous senior management positions, including President, CEO (1995-2000; 2002-2004), Chairman of the Executive Committee (2000-2006), and as a member of the Board of Directors (1990-2006). Currently, Mr. Stavropoulos is Chairman of the Board of Directors of Univar Inc. (global distributor of commodity and specialty chemicals), a Director of Teradata Corporation (data warehousing and technology solutions), and Maersk Inc. (industrial conglomerate), and a member of the Advisory Board for Metalmark Capital LLC (private equity investment, 2005-present). Mr. Stavropoulos is an operating advisor to Clayton, Dubilier & Rice, LLC (private equity investment). In addition, Mr. Stavropoulos is a member of the University of Notre Dame Advisory Council for the College of Science, a Trustee of the Rollin L. Gerstacker Foundation, and a Director of the Naples Philharmonic Center for the Arts. Previously, Mr. Stavropoulos served as a Director of Chemical Financial Corporation (bank holding company, 1993-2012) and Tyco International, Ltd. (multinational manufacturing and services, 2007-2012). |
|
David M. Thomas (1949) |
|
|
Year of Election or Appointment: 2008 Trustee |
|
|
|
Mr. Thomas also serves as Trustee of other Fidelity funds. Mr. Thomas serves as Non-Executive Chairman of the Board of Directors of Fortune Brands Home and Security (home and security products, 2011-present), and as a member of the Board of Directors of Interpublic Group of Companies, Inc. (marketing communication, 2004-present). Previously, Mr. Thomas served as Executive Chairman (2005-2006) and Chairman and Chief Executive Officer (2000-2005) of IMS Health, Inc. (pharmaceutical and healthcare information solutions), and a Director of Fortune Brands, Inc. (consumer products, 2000-2011). |
+ The information above includes each Trustee's principal occupation during the last five years and other information relating to the experience, attributes, and skills relevant to each Trustee's qualifications to serve as a Trustee, which led to the conclusion that each Trustee should serve as a Trustee for the fund.
Advisory Board Member and Officers:
Correspondence intended for each officer and Peter S. Lynch may be sent to Fidelity Investments, 245 Summer Street, Boston, Massachusetts 02210. Officers appear below in alphabetical order.
|
Name, Year of Birth; Principal Occupation |
|
|
Peter S. Lynch (1944) |
|
|
Year of Election or Appointment: 2003 Member of the Advisory Board |
|
|
|
Mr. Lynch also serves as Member of the Advisory Board of other Fidelity funds. Mr. Lynch is Vice Chairman and a Director of FMR and FMR Co., Inc. In addition, Mr. Lynch serves as a Trustee of Boston College and as the Chairman of the Inner-City Scholarship Fund. Previously, Mr. Lynch served on the Special Olympics International Board of Directors (1997-2006). |
|
Elizabeth Paige Baumann (1968) |
|
|
Year of Election or Appointment: 2012 Anti-Money Laundering (AML) Officer |
|
|
|
Ms. Baumann also serves as AML Officer of other funds. She is Chief AML Officer of FMR LLC (2012-present) and is an employee of Fidelity Investments. Previously, Ms. Baumann served as Vice President and Deputy Anti-Money Laundering Officer (2007-2012). |
|
William C. Coffey (1969) |
|
|
Year of Election or Appointment: 2009 Assistant Secretary |
|
|
|
Mr. Coffey also serves as Assistant Secretary of other funds. He is Senior Vice President and Deputy General Counsel of FMR LLC (2010-present), and is an employee of Fidelity Investments. Previously, Mr. Coffey served as Vice President and Associate General Counsel of FMR LLC (2005-2009). |
|
Jonathan Davis (1968) |
|
|
Year of Election or Appointment: 2010 Assistant Treasurer |
|
|
|
Mr. Davis also serves as Assistant Treasurer of other funds. Mr. Davis is an employee of Fidelity Investments. Previously, Mr. Davis served as Vice President and Associate General Counsel of FMR LLC (2003-2010). |
|
Adrien E. Deberghes (1967) |
|
|
Year of Election or Appointment: 2008 Deputy Treasurer |
|
|
|
Mr. Deberghes also serves as an officer of other funds. He is an employee of Fidelity Investments (2008-present). Prior to joining Fidelity Investments, Mr. Deberghes was Senior Vice President of Mutual Fund Administration at State Street Corporation (2007-2008), Senior Director of Mutual Fund Administration at Investors Bank & Trust (2005-2007), and Director of Finance for Dunkin' Brands (2000-2005). |
|
Stephanie J. Dorsey (1969) |
|
|
Year of Election or Appointment: 2010 Assistant Treasurer |
|
|
|
Ms. Dorsey also serves as an officer of other funds. She is an employee of Fidelity Investments (2008-present) and has served in other fund officer roles. Prior to joining Fidelity Investments, Ms. Dorsey served as Treasurer (2004-2008) of the JPMorgan Mutual Funds and Vice President (2004-2008) of JPMorgan Chase Bank. |
|
Scott C. Goebel (1968) |
|
|
Year of Election or Appointment: 2008 Secretary and Chief Legal Officer (CLO) |
|
|
|
Mr. Goebel serves as Secretary and CLO of other funds. Mr. Goebel also serves as Secretary of Fidelity Investments Money Management, Inc. (FIMM) (2010-present) and Fidelity Research and Analysis Company (FRAC) (2010-present); General Counsel, Secretary, and Senior Vice President of FMR (2008-present) and FMR Co., Inc. (2008-present); Chief Legal Officer of Fidelity Management & Research (Hong Kong) Limited (2008-present) and Assistant Secretary of Fidelity Management & Research (Japan) Inc. (2008-present), and Fidelity Management & Research (U.K.) Inc. (2008-present). Previously, Mr. Goebel served as Secretary and CLO of other Fidelity funds (2008-2013), Assistant Secretary of FIMM (2008-2010), FRAC (2008-2010), and certain funds (2007-2008); and as Vice President and Secretary of Fidelity Distributors Corporation (FDC) (2005-2007). Mr. Goebel has been employed by FMR LLC or an affiliate since 2001. |
|
Joseph A. Hanlon (1968) |
|
|
Year of Election or Appointment: 2012 Chief Compliance Officer |
|
|
|
Mr. Hanlon also serves as Chief Compliance Officer of other funds. Mr. Hanlon serves as Compliance Officer of FMR, FMR Co., Inc., Fidelity Investments Money Management, Inc. (FIMM), Fidelity Research and Analysis Company (FRAC), and Fidelity Management & Research (Hong Kong) (2009-present), as Senior Vice President of the Fidelity Asset Management Division (2009-present), and is an employee of Fidelity Investments. Previously, Mr. Hanlon served as Compliance Officer of Fidelity Management & Research (Japan) Inc. (2009-2013), Strategic Advisers, Inc. (2009-2013), and Fidelity Management & Research (U.K.) Inc. (2009-2013). |
|
Thomas C. Hense (1964) |
|
|
Year of Election or Appointment: 2008/2010 Vice President |
|
|
|
Mr. Hense also serves as Vice President of other funds (High Income (2008), Small Cap (2008), and Value (2010) funds). Previously, Mr. Hense served as a portfolio manager for Fidelity's Institutional Money Management Group (Pyramis) (2003-2008). |
|
Brian B. Hogan (1964) |
|
|
Year of Election or Appointment: 2009 Vice President |
|
|
|
Mr. Hogan also serves as Vice President of other funds. Mr. Hogan serves as President of FMR's Equity Division (2009-present). Previously, Mr. Hogan served as Senior Vice President, Equity Research of FMR (2006-2009) and as a portfolio manager. |
|
Chris Maher (1972) |
|
|
Year of Election or Appointment: 2013 Assistant Treasurer |
|
|
|
Mr. Maher serves as Assistant Treasurer of other funds. Mr. Maher is Vice President of Valuation Oversight and is an employee of Fidelity Investments. Previously, Mr. Maher served as Vice President of Asset Management Compliance (2013), Vice President of FMR's Program Management Group (2010-2013), and Vice President of Valuation Oversight (2008-2010). |
|
Christine Reynolds (1958) |
|
|
Year of Election or Appointment: 2008 Chief Financial Officer |
|
|
|
Ms. Reynolds also serves as Chief Financial Officer of other funds. Ms. Reynolds became President of Fidelity Pricing and Cash Management Services (FPCMS) in August 2008. Ms. Reynolds served as Chief Operating Officer of FPCMS (2007-2008). Previously, Ms. Reynolds served as President, Treasurer, and Anti-Money Laundering officer of the Fidelity funds (2004-2007). |
|
Kenneth B. Robins (1969) |
|
|
Year of Election or Appointment: 2008 President and Treasurer |
|
|
|
Mr. Robins also serves as an officer of other funds. Mr. Robins serves as Executive Vice President of Fidelity Investments Money Management, Inc. (FIMM) (2013-present) and is an employee of Fidelity Investments (2004-present). Previously, Mr. Robins served in other fund officer roles. |
|
Gary W. Ryan (1958) |
|
|
Year of Election or Appointment: 2005 Assistant Treasurer |
|
|
|
Mr. Ryan also serves as Assistant Treasurer of other funds. Mr. Ryan is an employee of Fidelity Investments and has served in other fund officer roles. Previously, Mr. Ryan served as Vice President of Fund Reporting in Fidelity Pricing and Cash Management Services (FPCMS) (1999-2005). |
|
Stephen Sadoski (1971) |
|
|
Year of Election or Appointment: 2012 Deputy Treasurer |
|
|
|
Mr. Sadoski also serves as Deputy Treasurer of other funds. He is an employee of Fidelity Investments (2012-present) and has served in another fund officer role. Prior to joining Fidelity Investments, Mr. Sadoski served as an assistant chief accountant in the Division of Investment Management of the Securities and Exchange Commission (SEC) (2009-2012) and as a senior manager at Deloitte & Touche LLP (1997-2009). |
|
Stacie M. Smith (1974) |
|
|
Year of Election or Appointment: 2013 Deputy Treasurer |
|
|
|
Ms. Smith also serves as an officer of other funds. She is an employee of Fidelity Investments (2009-present) and has served in other fund officer roles. Prior to joining Fidelity Investments, Ms. Smith served as Senior Audit Manager of Ernst & Young LLP (1996-2009). |
|
Renee Stagnone (1975) |
|
|
Year of Election or Appointment: 2013 Deputy Treasurer |
|
|
|
Ms. Stagnone also serves as Deputy Treasurer of other funds. Ms. Stagnone is an employee of Fidelity Investments. |
|
Joseph F. Zambello (1957) |
|
|
Year of Election or Appointment: 2011 Deputy Treasurer |
|
|
|
Mr. Zambello also serves as Deputy Treasurer of other funds. Mr. Zambello is an employee of Fidelity Investments. Previously, Mr. Zambello served as Vice President of FMR's Program Management Group (2009-2011) and Vice President of the Transfer Agent Oversight Group (2005-2009). |
Annual Report
Distributions (Unaudited)
Institutional Class designates 100% of the dividend distributed in December 2012, as qualifying for the dividends-received deduction for corporate shareholders.
Institutional Class designates 100% of the dividend distributed during the fiscal year as amounts which may be taken into account as a dividend for purposes of the maximum rate under section 1(h)(11) of the Internal Revenue Code.
The fund will notify shareholders in January 2014 of amounts for use in preparing 2013 income tax returns.
Annual Report
Board Approval of Investment Advisory Contracts and Management Fees
Fidelity Advisor Equity Value Fund
Each year, the Board of Trustees, including the Independent Trustees (together, the Board), votes on the renewal of the management contract and sub-advisory agreements (together, the Advisory Contracts) for the fund. The Board, assisted by the advice of fund counsel and Independent Trustees' counsel, requests and considers a broad range of information relevant to the renewal of the Advisory Contracts throughout the year.
The Board meets regularly and, at each of its meetings, covers an extensive agenda of topics and materials and considers factors that are relevant to its annual consideration of the renewal of the fund's Advisory Contracts, including the services and support provided to the fund and its shareholders. The Board has established various standing committees, each composed of and chaired by Independent Trustees with varying backgrounds, to which the Board has assigned specific subject matter responsibilities in order to enhance effective decision-making by the Board. The Board, acting directly and through its Committees, requests and receives information concerning the annual consideration of the renewal of the fund's Advisory Contracts. The Board also meets as needed to consider matters specifically related to the Board's annual consideration of the renewal of Advisory Contracts. Members of the Board may also meet with trustees of other Fidelity funds through ad hoc joint committees to discuss certain matters relevant to the Fidelity funds.
At its July 2013 meeting, the Board, including the Independent Trustees, unanimously determined to renew the fund's Advisory Contracts. In reaching its determination, the Board considered all factors it believed relevant, including (i) the nature, extent, and quality of the services to be provided to the fund and its shareholders (including the investment performance of the fund); (ii) the competitiveness of the fund's management fee and total expense ratio relative to peer funds; (iii) the total costs of the services to be provided by and the profits to be realized by Fidelity from its relationship with the fund; (iv) the extent to which economies of scale exist and would be realized as the fund grows; and (v) whether fee levels reflect these economies of scale, if any, for the benefit of fund shareholders.
In considering whether to renew the Advisory Contracts for the fund, the Board reached a determination, with the assistance of fund counsel and Independent Trustees' counsel and through the exercise of its business judgment, that the renewal of the Advisory Contracts was in the best interests of the fund and its shareholders and that the compensation payable under the Advisory Contracts was fair and reasonable. The Board's decision to renew the Advisory Contracts was not based on any single factor, but rather was based on a comprehensive consideration of all the information provided to the Board at its meetings throughout the year. The Board, in reaching its determination to renew the Advisory Contracts, was aware that shareholders in the fund have a broad range of investment choices available to them, including a wide choice among mutual funds offered by Fidelity's competitors, and that the fund's shareholders, who have the opportunity to review and weigh the disclosure provided by the fund in its prospectus and other public disclosures, have chosen to invest in this fund, which is a part of the Fidelity family of funds.
Annual Report
Board Approval of Investment Advisory Contracts and
Management Fees - continued
Nature, Extent, and Quality of Services Provided. The Board considered the staffing within the investment adviser, Fidelity Management & Research Company (FMR), and the sub-advisers (together, the Investment Advisers) as it relates to the fund, including the backgrounds of the fund's investment personnel, and also considered the fund's investment objective, strategies, and related investment philosophy. The Independent Trustees also had discussions with senior management of Fidelity's investment operations and investment groups. The Board considered the structure of the portfolio manager compensation program and whether this structure provides appropriate incentives to act in the best interests of the fund.
Resources Dedicated to Investment Management and Support Services. The Board and the Fund Oversight and Research Committees reviewed the general qualifications and capabilities of the Investment Advisers' investment staff, including its size, education, experience, and resources, as well as the Investment Advisers' approach to recruiting, training, managing, and compensating investment personnel. The Board noted that FMR has continued to increase the resources devoted to non-U.S. offices, including expansion of Fidelity's global investment organization. The Board also noted that Fidelity's analysts have extensive resources, tools and capabilities that allow them to conduct sophisticated quantitative and fundamental analysis, as well as credit analysis of issuers, counterparties and guarantors. Further, the Board believes that Fidelity's investment professionals have sufficient access to global information and data so as to provide competitive investment results over time, and that those professionals also have access to sophisticated tools that permit them to assess portfolio construction and risk and performance attribution characteristics continuously, as well as to transmit new information and research conclusions rapidly around the world. Additionally, in its deliberations, the Board considered the Investment Advisers' trading and risk management capabilities and resources, which are an integral part of the investment management process.
Shareholder and Administrative Services. The Board considered (i) the nature, extent, quality, and cost of advisory, administrative, and shareholder services performed by the Investment Advisers and their affiliates under the Advisory Contracts and under separate agreements covering transfer agency, pricing and bookkeeping, and securities lending services for the fund; (ii) the nature and extent of the supervision of third party service providers, principally custodians and subcustodians; and (iii) the resources devoted to, and the record of compliance with, the fund's compliance policies and procedures. The Board also reviewed the allocation of fund brokerage, including allocations to brokers affiliated with the Investment Advisers, the use of brokerage commissions to pay fund expenses, and the use of "soft" commission dollars to pay for research services.
Annual Report
The Board noted that the growth of fund assets over time across the complex allows Fidelity to reinvest in the development of services designed to enhance the value or convenience of the Fidelity funds as investment vehicles. These services include 24-hour access to account information and market information through telephone representatives and over the Internet, investor education materials and asset allocation tools, and the expanded availability of Fidelity Investor Centers.
Investment in a Large Fund Family. The Board considered the benefits to shareholders of investing in a Fidelity fund, including the benefits of investing in a fund that is part of a large family of funds offering a variety of investment disciplines and providing a large variety of mutual fund investor services. The Board noted that Fidelity had taken, or had made recommendations that resulted in the Fidelity funds taking, a number of actions over the previous year that benefited particular funds, including (i) continuing to dedicate additional resources to investment research and to the support of the senior management team that oversees asset management; (ii) persisting in efforts to enhance Fidelity's global research capabilities; (iii) launching new funds and making other enhancements to meet client needs for global and income-oriented solutions; (iv) continuing to launch dedicated lower cost underlying funds to meet portfolio construction needs related to expanding underlying fund options for Fidelity funds of funds, specifically for the Freedom Fund product lines; (v) rationalizing product lines and gaining increased efficiencies through the mergers of several funds into other funds; (vi) strengthening Fidelity's index fund offerings by reducing investment minimums and adopting or lowering existing expense caps for certain funds and classes; (vii) enhancing Global Asset Allocation product offerings by launching new funds and strategies, including "open architecture" target date funds that utilize affiliated and unaffiliated sub-advisers; (viii) modifying the eligibility criteria for Institutional Class shares of Advisor funds to increase their marketability to a portion of the defined contribution plan market; (ix) creating a new low-cost retirement share class for certain Advisor funds to appeal to large retirement plans; (x) transitioning the management of certain Fidelity commodity funds to Geode Capital Management LLC, a registered commodity pool operator, while retaining administrative responsibilities for the funds; (xi) reorganizing a number of funds; and (xii) taking steps toward establishing a new Fidelity adviser to manage sector-based funds and products.
Investment Performance. The Board considered whether the fund has operated in accordance with its investment objective, as well as its record of compliance with its investment restrictions and its performance history.
The Board took into account discussions with the Investment Advisers about fund investment performance that occur at Board meetings throughout the year. In this regard the Board noted that as part of regularly scheduled fund reviews and other reports to the Board on fund performance, the Board periodically considers annualized return information for the fund, for different time periods, measured against a securities market index ("benchmark index") and a peer group of mutual funds with similar objectives ("peer group"). In its evaluation of fund investment performance, the Board gave particular attention to information indicating changes in performance of certain Fidelity funds for specific time periods and the Investment Advisers' explanations for any overperformance or, in the case of the fund, underperformance.
Annual Report
Board Approval of Investment Advisory Contracts and
Management Fees - continued
In addition to reviewing absolute and relative fund performance, the Independent Trustees periodically consider the appropriateness of fund performance metrics in evaluating the results achieved. In general, the Independent Trustees believe that fund performance should be evaluated based on net performance (after fees and expenses) of both the highest performing and lowest performing classes, where applicable, compared to appropriate benchmark indices, over appropriate time periods which may include full market cycles, and compared to peer groups, as applicable, over the same periods, taking into account relevant factors including the following: general market conditions; issuer-specific information; tactical opportunities for investment; and fund cash flows and other factors.
The Independent Trustees recognize that shareholders evaluate performance on a net basis over their own holding periods, for which one-, three-, and five-year periods are used as a proxy. For this reason, the performance information reviewed by the Board also included net cumulative calendar year total return information for the fund and an appropriate benchmark index and peer group for the most recent one-, three-, and five-year periods, as shown below. Returns are shown compared to the 25th percentile (top of box) and 75th percentile (bottom of box) of the peer universe.
Annual Report
Fidelity Advisor Equity Value Fund

The Board has discussed the fund's performance with FMR, including the fund's underperformance based on more recent periods ended after 2012 (which periods are not shown in the chart above) but prior to the date of the Board's approval of the renewal of the Advisory Contracts, and has engaged with FMR to consider what steps might be taken to remediate the fund's more recent underperformance.
The Board also considered that the fund's management fee is subject to upward or downward adjustment depending upon whether, and to what extent, the fund's investment performance for the performance period exceeds, or is exceeded by, a securities index, thus leading to a performance adjustment for the same period. The Board noted that the performance adjustment provides FMR with a strong economic incentive to seek to achieve superior performance for the fund's shareholders and helps to more closely align the interests of FMR and the fund's shareholders.
Based on its review, the Board concluded that the nature, extent, and quality of services provided to the fund under the Advisory Contracts should benefit the fund's shareholders.
Competitiveness of Management Fee and Total Expense Ratio. The Board considered the fund's management fee and total expense ratio compared to "mapped groups" of competitive funds and classes. Fidelity creates "mapped groups" by combining similar Lipper investment objective categories that have comparable management fee characteristics. Combining Lipper investment objective categories aids the Board's management fee and total expense ratio comparisons by broadening the competitive group used for comparison and by reducing the number of universes to which various Fidelity funds are compared.
Annual Report
Board Approval of Investment Advisory Contracts and
Management Fees - continued
Management Fee. The Board considered two proprietary management fee comparisons for the 12-month periods shown in the chart below. The group of Lipper funds used by the Board for management fee comparisons is referred to below as the "Total Mapped Group." The Total Mapped Group comparison focuses on a fund's standing in terms of gross management fees before expense reimbursements or caps, and without giving effect to the fund's performance adjustment, relative to the total universe of funds with comparable investment mandates, regardless of whether their management fee structures also are comparable. Funds with comparable investment mandates offer exposure to similar types of securities. Funds with comparable management fee structures have similar management fee contractual arrangements (e.g., flat rate charged for advisory services, all-inclusive fee rate, etc.). "TMG %" represents the percentage of funds in the Total Mapped Group that had management fees that were lower than the fund's. For example, a TMG % of 11% means that 89% of the funds in the Total Mapped Group had higher management fees than the fund. The "Asset-Size Peer Group" (ASPG) comparison focuses on a fund's standing relative to non-Fidelity funds similar in size to the fund within the Total Mapped Group. The "Asset-Size Peer Group" (ASPG) comparison focuses on a fund's standing relative to a subset of non-Fidelity funds within the Total Mapped Group that are similar in size and management fee structure. The ASPG represents at least 15% of the funds in the Total Mapped Group with comparable asset size and management fee structures, subject to a minimum of 50 funds (or all funds in the Total Mapped Group if fewer than 50). Additional information, such as the ASPG quartile in which the fund's management fee ranked and the impact of the fund's performance adjustment, is also included in the chart and considered by the Board.
Annual Report
Fidelity Advisor Equity Value Fund
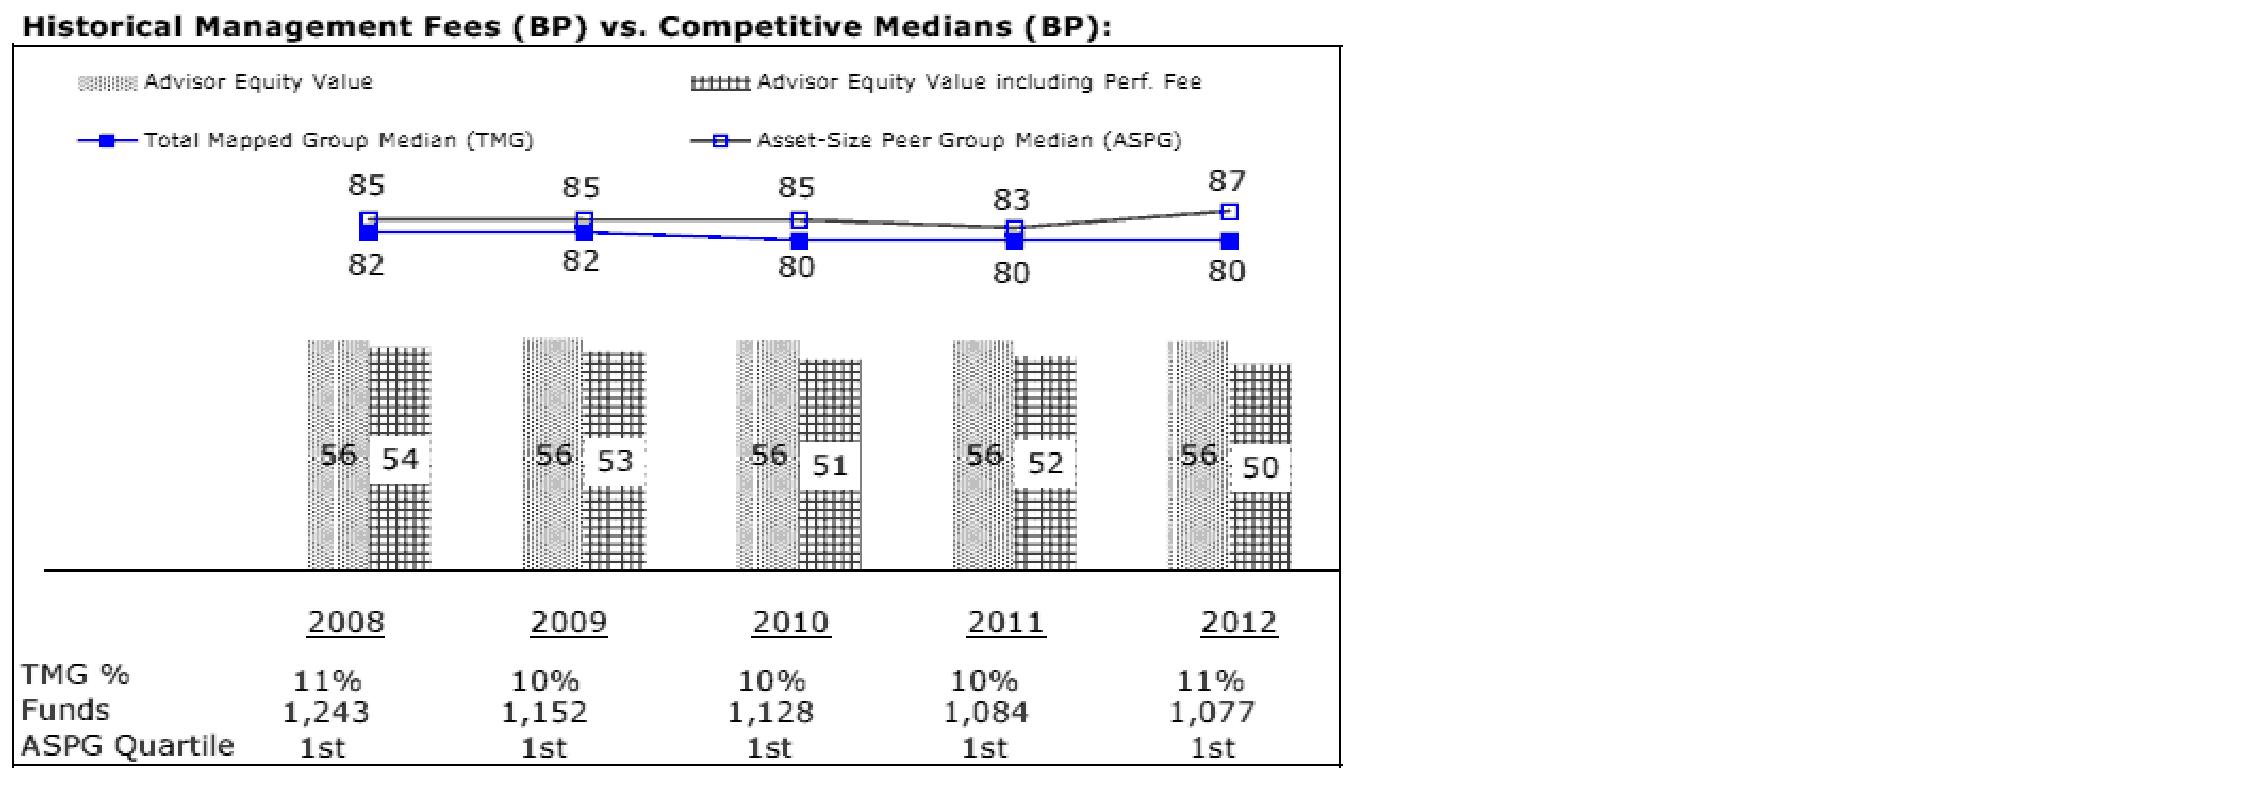
The Board noted that the fund's management fee ranked below the median of its Total Mapped Group and below the median of its ASPG for 2012. The Board also noted the effect of the fund's negative performance adjustment on the fund's management fee ranking.
Based on its review, the Board concluded that the fund's management fee is fair and reasonable in light of the services that the fund receives and the other factors considered.
Total Expense Ratio. In its review of each class's total expense ratio, the Board considered the fund's management fee as well as other fund or class expenses, as applicable, such as transfer agent fees, pricing and bookkeeping fees, fund-paid 12b-1 fees, and custodial, legal, and audit fees. The Board also noted the effects of any waivers and reimbursements on fees and expenses, as well as the impact of the fund's performance adjustment. As part of its review, the Board also considered the current and historical total expense ratios of each class of the fund compared to competitive fund median expenses. Each class of the fund is compared to those funds and classes in the Total Mapped Group (used by the Board for management fee comparisons) that have a similar sales load structure.
The Board noted that the total expense ratio of each of Class A and Institutional Class ranked below its competitive median for 2012, the total expense ratio of Class B ranked equal to its competitive median for 2012, and the total expense ratio of each of Class T and Class C ranked above its competitive median for 2012. The Board considered that, in general, various factors can affect total expense ratios. The Board noted that the total expense ratio of Class T was above the competitive median primarily because of higher 12b-1 fees on Class T. Class T has a higher 12b-1 fee, but a lower front-end sales charge, than traditionally priced front-end sales charge classes. The Board considered that Class T is primarily sold load-waived in the retirement plan market where its 0.50% 12b-1 fee is comparable to competing no-load, higher 12b-1 fee classes designed specifically for retirement plans. The Board noted that the fund offers multiple classes, each of which has a different sales load and 12b-1 fee structure, and that the multiple structures are intended to offer a range of pricing options for the intermediary market. The Board also noted that the total expense ratios of the classes vary primarily by the level of their 12b-1 fees, although differences in transfer agent fees may also cause expenses to vary from class to class.
Annual Report
Board Approval of Investment Advisory Contracts and
Management Fees - continued
Fees Charged to Other Fidelity Clients. The Board also considered Fidelity fee structures and other information with respect to clients of FMR and its affiliates, such as other mutual funds advised or subadvised by FMR or its affiliates, pension plan clients, and other institutional clients. The Board noted the findings of the 2013 ad hoc joint committee (created with the board of other Fidelity funds), which reviewed and compared Fidelity's institutional investment advisory business with its business of providing services to the Fidelity funds, including the differences in services provided, fees charged, and costs incurred, as well as competition in their respective marketplaces.
Based on its review of total expense ratios and fees charged to other Fidelity clients, the Board concluded that the total expense ratio of each class of the fund was reasonable, although in some cases above the median of the universe presented for comparison, in light of the services that the fund and its shareholders receive and the other factors considered.
Costs of the Services and Profitability. The Board considered the revenues earned and the expenses incurred by Fidelity in conducting the business of developing, marketing, distributing, managing, administering and servicing the fund and servicing the fund's shareholders. The Board also considered the level of Fidelity's profits in respect of all the Fidelity funds.
On an annual basis, FMR presents to the Board Fidelity's profitability for the fund. Fidelity calculates the profitability for each fund, as well as aggregate profitability for groups of Fidelity funds and all Fidelity funds, using a series of detailed revenue and cost allocation methodologies which originate with the books and records of Fidelity on which Fidelity's audited financial statements are based. The Audit Committee of the Board reviews any significant changes from the prior year's methodologies.
PricewaterhouseCoopers LLP (PwC), independent registered public accounting firm and auditor to Fidelity and certain Fidelity funds, has been engaged annually by the Board as part of the Board's assessment of Fidelity's profitability analysis. PwC's engagement includes the review and assessment of the methodologies used by Fidelity in determining the revenues and expenses attributable to Fidelity's mutual fund business, and completion of agreed-upon procedures surrounding the mathematical accuracy of fund profitability and its conformity to allocation methodologies. After considering PwC's reports issued under the engagement and information provided by Fidelity, the Board concluded that while other allocation methods may also be reasonable, Fidelity's profitability methodologies are reasonable in all material respects.
Annual Report
The Board also reviewed Fidelity's non-fund businesses and fall-out benefits related to the mutual fund business as well as cases where Fidelity's affiliates may benefit from or be related to the fund's business.
The Board considered the costs of the services provided by and the profits realized by Fidelity in connection with the operation of the fund and was satisfied that the profitability was not excessive in the circumstances.
Economies of Scale. The Board considered whether there have been economies of scale in respect of the management of the Fidelity funds, whether the Fidelity funds (including the fund) have appropriately benefited from any such economies of scale, and whether there is potential for realization of any further economies of scale. The Board considered the extent to which the fund will benefit from economies of scale through increased services to the fund, through waivers or reimbursements, or through fee or expense reductions. The Board also noted that in 2009, it and the board of other Fidelity funds created an ad hoc committee (the Economies of Scale Committee) to analyze whether FMR attains economies of scale in respect of the management and servicing of the Fidelity funds, whether the Fidelity funds have appropriately benefited from such economies of scale, and whether there is potential for realization of any further economies of scale.
The Board recognized that the fund's management contract incorporates a "group fee" structure, which provides for lower group fee rates as total fund assets under FMR's management increase, and for higher group fee rates as total fund assets under FMR's management decrease. FMR calculates the group fee rates based on a tiered asset "breakpoint" schedule that varies based on asset class. The Board considered that the group fee is designed to deliver the benefits of economies of scale to fund shareholders when total Fidelity fund assets increase, even if assets of any particular fund are unchanged or have declined, because some portion of Fidelity's costs are attributable to services provided to all Fidelity funds, and all funds benefit if those costs can be allocated among more assets. The Board concluded that, given the group fee structure, fund shareholders will benefit from lower management fees as assets under FMR's management increase at the fund complex level, regardless of whether Fidelity achieves any such economies of scale.
Annual Report
Board Approval of Investment Advisory Contracts and
Management Fees - continued
The Board concluded, taking into account the analysis of the Economies of Scale Committee, that economies of scale, if any, are being appropriately shared between fund shareholders and Fidelity.
Amendment to Description of Group Fee Rate. At its July 2013 meeting, the Board voted to approve an amendment to the fund's management contract to modify the description of the "group fee rate" effective August 1, 2013. The Board noted that under the prior description in the contract, the group fee rate was based on the average net assets of all registered investment companies with which FMR has management contracts. Under the contract's tiered asset breakpoint schedule, the group fee rate is lower as total fund assets under FMR's management increase, and higher as total fund assets under FMR's management decrease. The Board considered that the prior description would have excluded the assets of 64 Fidelity sector funds from the group fee rate calculation once Fidelity SelectCo, LLC, an affiliate of FMR, assumed management responsibilities for those funds. The Board noted that modifying the description of the group fee rate to continue to include the assets of those 64 funds for purposes of determining group fee rate breakpoints would avoid an immediate adverse impact on the group fee rate for any fund.
Additional Information Requested by the Board. In order to develop fully the factual basis for consideration of the Fidelity funds' Advisory Contracts, the Board requested and received additional information on certain topics, including: (i) fund performance trends and Fidelity's long-term strategies for certain funds; (ii) the potential to further rationalize the Fidelity fund lineup with the possibility of achieving savings for the funds and Fidelity; (iii) the methodology with respect to competitive fund data and peer group classifications; (iv) the arrangements with, and performance of, certain sub-advisers on behalf of the Fidelity funds, as well as certain proposed participating affiliate arrangements; (v) the realization of fall-out benefits in certain Fidelity business units; (vi) Fidelity's group fee structures, including the rationale for the individual fee rates of certain categories of funds and the definition of group assets; (vii) trends regarding industry use of performance fee structures and the performance adjustment methodologies applicable to the Fidelity funds; (viii) additional competitive analysis regarding the total expenses for certain classes; and (ix) fund profitability methodology, including Fidelity's cost allocation methodology, and the impact of certain factors on fund profitability results.
Based on its evaluation of all of the conclusions noted above, and after considering all factors it believed relevant, the Board ultimately concluded that the advisory fee structures are fair and reasonable, and that the fund's Advisory Contracts should be renewed.
Annual Report
Investment Adviser
Fidelity Management & Research Company
Boston, MA
Investment Sub-Advisers
FMR Co., Inc.
Fidelity Management & Research
(U.K.) Inc.
Fidelity Management & Research (Hong Kong) Limited
Fidelity Management & Research (Japan) Inc.
General Distributor
Fidelity Distributors Corporation
Smithfield, RI
Transfer and Service Agents
Fidelity Investments Institutional
Operations Company, Inc.
Boston, MA
Fidelity Service Company, Inc.
Boston, MA
Custodian
State Street Bank and Trust Company
Quincy, MA
(Fidelity Investment logo)(registered trademark)
AEVI-UANN-0114 1.786684.110
(Fidelity Investment logo)(registered trademark)
Fidelity Advisor®
Growth & Income
Fund - Class A, Class T, Class B
and Class C
Annual Report
November 30, 2013
(Fidelity Cover Art)
Contents
|
Performance |
How the fund has done over time. |
|
|
Management's Discussion of Fund Performance |
The Portfolio Manager's review of fund performance and strategy. |
|
|
Shareholder Expense Example |
An example of shareholder expenses. |
|
|
Investment Changes |
A summary of major shifts in the fund's investments over the past six months. |
|
|
Investments |
A complete list of the fund's investments with their market values. |
|
|
Financial Statements |
Statements of assets and liabilities, operations, and changes in net assets, as well as financial highlights. |
|
|
Notes |
Notes to the financial statements. |
|
|
Report of Independent Registered Public Accounting Firm |
|
|
|
Trustees and Officers |
|
|
|
Distributions |
|
|
|
Board Approval of Investment Advisory Contracts and Management Fees |
|
To view a fund's proxy voting guidelines and proxy voting record for the 12-month period ended June 30, visit http://www.fidelity.com/proxyvotingresults or visit the Securities and Exchange Commission's (SEC) web site at http://www.sec.gov. You may also call 1-877-208-0098 to request a free copy of the proxy voting guidelines.
Standard & Poor's, S&P and S&P 500 are registered service marks of The McGraw-Hill Companies, Inc. and have been licensed for use by Fidelity Distributors Corporation.
Other third-party marks appearing herein are the property of their respective owners.
All other marks appearing herein are registered or unregistered trademarks or service marks of FMR LLC or an affiliated company. © 2014 FMR LLC. All rights reserved.
Annual Report
This report and the financial statements contained herein are submitted for the general information of the shareholders of the fund. This report is not authorized for distribution to prospective investors in the fund unless preceded or accompanied by an effective prospectus.
A fund files its complete schedule of portfolio holdings with the SEC for the first and third quarters of each fiscal year on Form N-Q. Forms N-Q are available on the SEC's web site at http://www.sec.gov. A fund's Forms N-Q may be reviewed and copied at the SEC's Public Reference Room in Washington, DC. Information regarding the operation of the SEC's Public Reference Room may be obtained by calling 1-800-SEC-0330. For a complete list of a fund's portfolio holdings, view the most recent holdings listing, semiannual report, or annual report on Fidelity's web site at http://www.fidelity.com, http://www.advisor.fidelity.com, or http://www.401k.com, as applicable.
NOT FDIC INSURED • MAY LOSE VALUE • NO BANK GUARANTEE
Neither the fund nor Fidelity Distributors Corporation is a bank.
Annual Report
Performance: The Bottom Line
Average annual total return reflects the change in the value of an investment, assuming reinvestment of the class' distributions from dividend income and capital gains (the profits earned upon the sale of securities that have grown in value, if any) and assuming a constant rate of performance each year. The $10,000 table and the fund's returns do not reflect the deduction of taxes that a shareholder would pay on fund distributions or the redemption of fund shares. During periods of reimbursement by Fidelity, a fund's total return will be greater than it would be had the reimbursement not occurred. How a fund did yesterday is no guarantee of how it will do tomorrow. Returns reflect the conversion of Class B shares to Class A shares after a maximum of seven years.
Average Annual Total Returns
|
Periods ended November 30, 2013 |
Past 1 |
Past 5 |
Past 10 |
|
Class A (incl. 5.75% sales charge) |
24.28% |
16.47% |
6.28% |
|
Class T (incl. 3.50% sales charge) |
27.01% |
16.73% |
6.29% |
|
Class B (incl. contingent deferred sales charge) A |
25.81% |
16.73% |
6.34% |
|
Class C (incl. contingent deferred sales charge) B |
29.95% |
17.00% |
6.14% |
A Class B shares' contingent deferred sales charges included in the past one year, past five years, and past ten years total return figures are 5%, 2%, and 0%, respectively.
B Class C shares' contingent deferred sales charges included in the past one year, past five years, and past ten years total return figures are 1%, 0%, and 0%, respectively.
Annual Report
$10,000 Over 10 Years
Let's say hypothetically that $10,000 was invested in Fidelity Advisor® Growth & Income Fund - Class A on November 30, 2003, and the current 5.75% sales charge was paid. The chart shows how the value of your investment would have changed, and also shows how the S&P 500® Index performed over the same period.
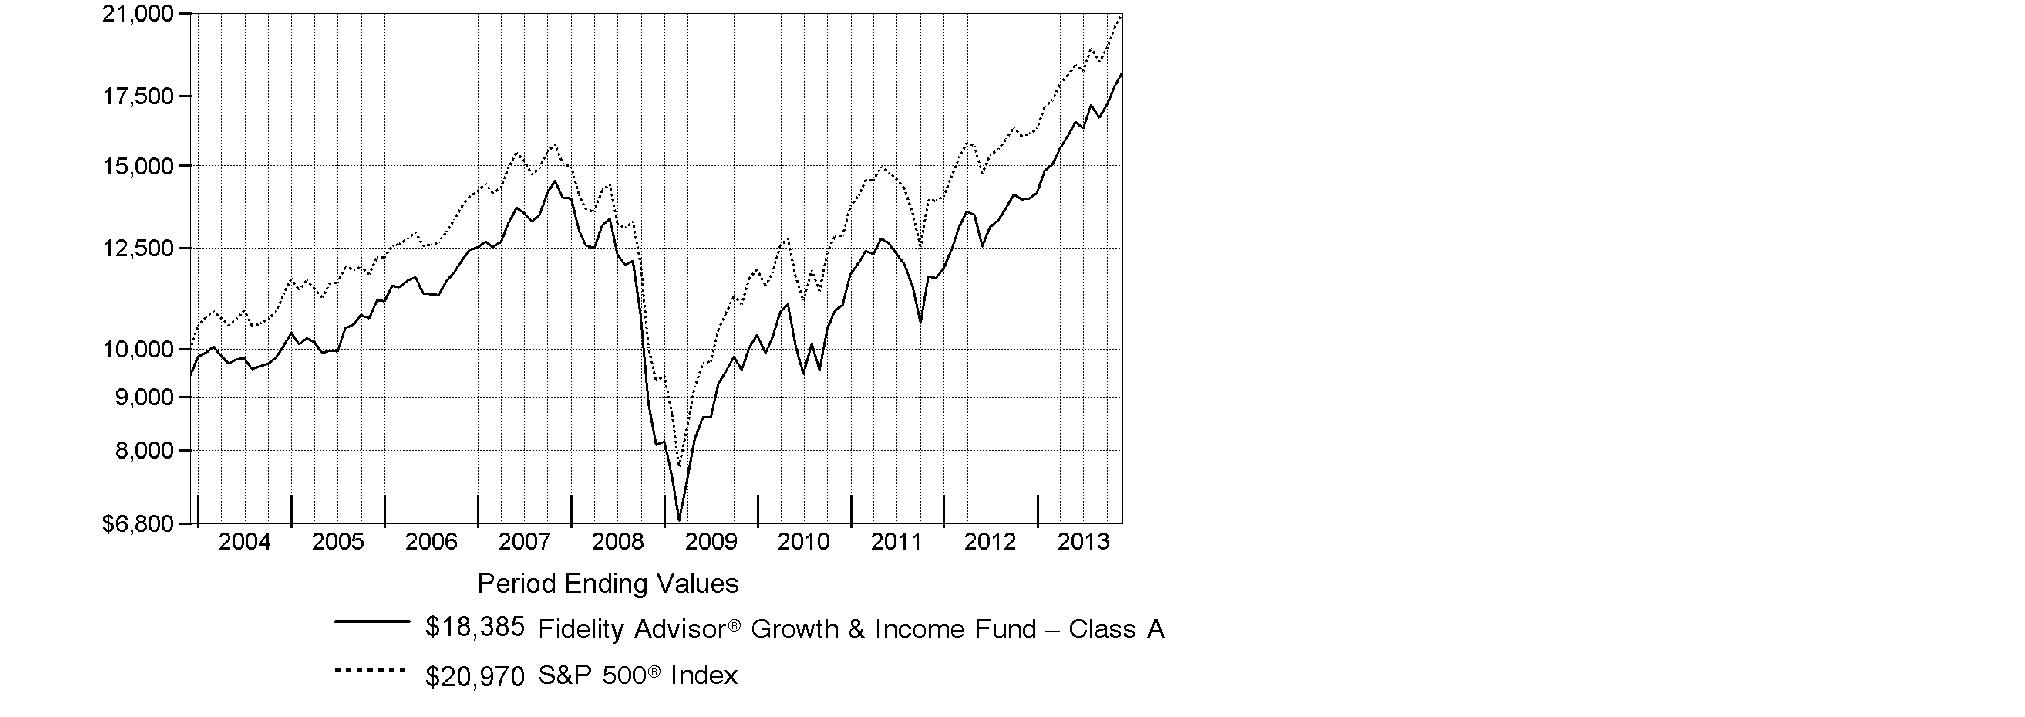
Annual Report
Management's Discussion of Fund Performance
Market Recap: With the current bull run nearing the five-year mark, equity benchmarks ripped up old records during the 12 months ending November 30, 2013. Gains were fueled by strengthening U.S. economic data, as well as generally improving economies and accommodative monetary policies worldwide. The broad S&P 500® Index reached new peaks in its 30.30% climb for the period, and the blue-chip Dow Jones Industrial AverageSM surpassed historic milestones en route to a 26.63% gain. The Nasdaq Composite Index®, up 36.73% amid a resurgence in growth-oriented stocks, closed above 4,000 for the first time since 2000. Shedding anxiety over the 2012 U.S. presidential election - and apparently confident that the federal debt-ceiling debate would be resolved - markets rose from period start through late May. News that the U.S. Federal Reserve was considering an end to its stimulative bond-buying kept stocks in flux over the summer but, by September, the Fed had set aside any imminent tapering. Despite jitters over a potential U.S. military strike in Syria and, later, an October budget impasse that briefly shuttered the federal government, volatility was subdued heading into the holidays, with investor optimism helping many markets home in on all-time highs at period end. Elsewhere, non-U.S. developed-market equities saw similar results, with the MSCI® EAFE® Index adding 24.97%.
Comments from Matt Fruhan, Portfolio Manager of Fidelity Advisor® Growth & Income Fund: For the year, the fund's Class A, Class T, Class B and Class C shares gained 31.86%, 31.62%, 30.81% and 30.95%, respectively (excluding sales charges), topping the S&P 500®. Relative to the index, top individual contributors included discount brokerage Charles Schwab and retail drugstore chain Walgreen. When interest rates spiked based on speculation about when the U.S. Federal Reserve would begin to taper its stimulative bond purchases, Schwab's earning estimates exploded to the upside, and the stock went up dramatically. Walgreen gained on news it had ended a long contract dispute with pharmacy benefit manager Express Scripts Holding. I reduced the fund's exposure to both Schwab and Walgreen as the stocks gained, but both positions remained comfortably overweight at period end. Conversely, performance was hampered the most by an overweight in big-box retailer Target. The company's share price plunged in August after management revised its earnings forecast, mostly due to its larger-than-expected loss related to its recent expansion into. I maintained an overweight due to my conviction that the issues related to the company's entry into this new market can be corrected and the business remains on track for long-term growth that exceeds investors' expectations.
Annual Report
The views expressed above reflect those of the portfolio manager(s) only through the end of the period as stated on the cover of this report and do not necessarily represent the views of Fidelity or any other person in the Fidelity organization. Any such views are subject to change at any time based upon market or other conditions and Fidelity disclaims any responsibility to update such views. These views may not be relied on as investment advice and, because investment decisions for a Fidelity fund are based on numerous factors, may not be relied on as an indication of trading intent on behalf of any Fidelity fund.
Annual Report
Shareholder Expense Example
As a shareholder of the Fund, you incur two types of costs: (1) transaction costs, including sales charges (loads) on purchase payments or redemption proceeds, and (2) ongoing costs, including management fees, distribution and/or service (12b-1) fees and other Fund expenses. This Example is intended to help you understand your ongoing costs (in dollars) of investing in the Fund and to compare these costs with the ongoing costs of investing in other mutual funds.
The Example is based on an investment of $1,000 invested at the beginning of the period and held for the entire period (June 1, 2013 to November 30, 2013).
Actual Expenses
The first line of the accompanying table for each class of the Fund provides information about actual account values and actual expenses. You may use the information in this line, together with the amount you invested, to estimate the expenses that you paid over the period. Simply divide your account value by $1,000.00 (for example, an $8,600 account value divided by $1,000.00 = 8.6), then multiply the result by the number in the first line for a class of the Fund under the heading entitled "Expenses Paid During Period" to estimate the expenses you paid on your account during this period. In addition, the Fund, as a shareholder in the underlying Fidelity Central Funds, will indirectly bear its pro-rata share of the fees and expenses incurred by the underlying Fidelity Central Funds. These fees and expenses are not included in the Fund's annualized expense ratio used to calculate the expense estimate in the table below.
Hypothetical Example for Comparison Purposes
The second line of the accompanying table for each class of the Fund provides information about hypothetical account values and hypothetical expenses based on a Class' actual expense ratio and an assumed rate of return of 5% per year before expenses, which is not the Class' actual return. The hypothetical account values and expenses may not be used to estimate the actual ending account balance or expenses you paid for the period. You may use this information to compare the ongoing costs of investing in the Fund and other funds. To do so, compare this 5% hypothetical example with the 5% hypothetical examples that appear in the shareholder reports of the other funds. In addition, the Fund, as a shareholder in the underlying Fidelity Central Funds, will indirectly bear its pro-rata share of the fees and expenses incurred by the underlying Fidelity Central Funds. These fees and expenses are not included in the Fund's annualized expense ratio used to calculate the expense estimate in the table below.
Please note that the expenses shown in the table are meant to highlight your ongoing costs only and do not reflect any transaction costs. Therefore, the second line of the table is useful in comparing ongoing costs only, and will not help you determine the relative total costs of owning different funds. In addition, if these transactional costs were included, your costs would have been higher.
Annual Report
|
|
Annualized |
Beginning |
Ending |
Expenses Paid |
|
Class A |
1.02% |
|
|
|
|
Actual |
|
$ 1,000.00 |
$ 1,114.60 |
$ 5.41 |
|
HypotheticalA |
|
$ 1,000.00 |
$ 1,019.95 |
$ 5.17 |
|
Class T |
1.24% |
|
|
|
|
Actual |
|
$ 1,000.00 |
$ 1,113.80 |
$ 6.57 |
|
HypotheticalA |
|
$ 1,000.00 |
$ 1,018.85 |
$ 6.28 |
|
Class B |
1.81% |
|
|
|
|
Actual |
|
$ 1,000.00 |
$ 1,109.90 |
$ 9.57 |
|
HypotheticalA |
|
$ 1,000.00 |
$ 1,015.99 |
$ 9.15 |
|
Class C |
1.74% |
|
|
|
|
Actual |
|
$ 1,000.00 |
$ 1,110.80 |
$ 9.21 |
|
HypotheticalA |
|
$ 1,000.00 |
$ 1,016.34 |
$ 8.80 |
|
Institutional Class |
.68% |
|
|
|
|
Actual |
|
$ 1,000.00 |
$ 1,117.10 |
$ 3.61 |
|
HypotheticalA |
|
$ 1,000.00 |
$ 1,021.66 |
$ 3.45 |
A 5% return per year before expenses
B Annualized expense ratio reflects expenses net of applicable fee waivers.
* Expenses are equal to each Class' annualized expense ratio, multiplied by the average account value over the period, multiplied by 183/365 (to reflect the one-half year period).
Annual Report
Investment Changes (Unaudited)
|
Top Ten Stocks as of November 30, 2013 |
||
|
|
% of fund's |
% of fund's net assets |
|
Apple, Inc. |
3.9 |
3.4 |
|
JPMorgan Chase & Co. |
3.8 |
3.9 |
|
General Electric Co. |
3.0 |
2.9 |
|
Microsoft Corp. |
2.9 |
2.5 |
|
Chevron Corp. |
2.4 |
2.8 |
|
Citigroup, Inc. |
2.1 |
2.1 |
|
Procter & Gamble Co. |
2.0 |
2.1 |
|
Google, Inc. Class A |
2.0 |
1.8 |
|
Wells Fargo & Co. |
1.9 |
2.8 |
|
Occidental Petroleum Corp. |
1.9 |
2.1 |
|
|
25.9 |
|
|
Top Five Market Sectors as of November 30, 2013 |
||
|
|
% of fund's |
% of fund's net assets |
|
Financials |
19.2 |
20.6 |
|
Information Technology |
18.5 |
16.8 |
|
Health Care |
12.8 |
13.9 |
|
Consumer Staples |
12.0 |
10.5 |
|
Energy |
11.8 |
12.3 |
|
Asset Allocation (% of fund's net assets) |
|||||||
|
As of November 30, 2013* |
As of May 31, 2013** |
||||||
 |
Stocks 98.9% |
|
|
Stocks 98.7% |
|
||
 |
Convertible |
|
|
Convertible |
|
||
 |
Short-Term |
|
|
Short-Term |
|
||
|
* Foreign investments |
13.3% |
|
** Foreign investments |
10.9% |
|
||

Annual Report
Investments November 30, 2013
Showing Percentage of Net Assets
|
Common Stocks - 98.9% |
|||
|
Shares |
Value (000s) |
||
|
CONSUMER DISCRETIONARY - 9.4% |
|||
|
Automobiles - 0.3% |
|||
|
Ford Motor Co. |
86,820 |
$ 1,483 |
|
|
Distributors - 0.1% |
|||
|
LKQ Corp. (a) |
15,790 |
523 |
|
|
Diversified Consumer Services - 0.3% |
|||
|
H&R Block, Inc. |
58,626 |
1,635 |
|
|
Hotels, Restaurants & Leisure - 1.4% |
|||
|
McDonald's Corp. |
45,545 |
4,435 |
|
|
Yum! Brands, Inc. |
44,664 |
3,469 |
|
|
|
7,904 |
||
|
Internet & Catalog Retail - 0.0% |
|||
|
Expedia, Inc. |
3,400 |
217 |
|
|
Leisure Equipment & Products - 0.3% |
|||
|
Mattel, Inc. |
43,679 |
2,021 |
|
|
Media - 3.0% |
|||
|
Comcast Corp. Class A (special) (non-vtg.) |
202,829 |
9,766 |
|
|
Scripps Networks Interactive, Inc. Class A |
6,920 |
516 |
|
|
Time Warner, Inc. |
106,576 |
7,003 |
|
|
|
17,285 |
||
|
Multiline Retail - 1.9% |
|||
|
Kohl's Corp. |
19,721 |
1,090 |
|
|
Target Corp. |
159,894 |
10,222 |
|
|
|
11,312 |
||
|
Specialty Retail - 1.7% |
|||
|
American Eagle Outfitters, Inc. |
23,611 |
384 |
|
|
H&M Hennes & Mauritz AB (B Shares) |
16,400 |
695 |
|
|
Lowe's Companies, Inc. |
170,940 |
8,116 |
|
|
Staples, Inc. |
48,629 |
755 |
|
|
|
9,950 |
||
|
Textiles, Apparel & Luxury Goods - 0.4% |
|||
|
adidas AG |
7,100 |
864 |
|
|
Coach, Inc. |
9,895 |
573 |
|
|
Li & Fung Ltd. |
672,000 |
915 |
|
|
|
2,352 |
||
|
TOTAL CONSUMER DISCRETIONARY |
54,682 |
||
|
CONSUMER STAPLES - 12.0% |
|||
|
Beverages - 2.9% |
|||
|
C&C Group PLC |
30,500 |
184 |
|
|
Common Stocks - continued |
|||
|
Shares |
Value (000s) |
||
|
CONSUMER STAPLES - continued |
|||
|
Beverages - continued |
|||
|
Coca-Cola Enterprises, Inc. |
1,800 |
$ 75 |
|
|
Diageo PLC |
9,636 |
307 |
|
|
Molson Coors Brewing Co. Class B |
24,797 |
1,306 |
|
|
PepsiCo, Inc. |
50,563 |
4,271 |
|
|
Pernod Ricard SA |
3,500 |
397 |
|
|
Remy Cointreau SA |
9,500 |
810 |
|
|
SABMiller PLC |
21,300 |
1,099 |
|
|
The Coca-Cola Co. |
204,664 |
8,225 |
|
|
|
16,674 |
||
|
Food & Staples Retailing - 2.1% |
|||
|
CVS Caremark Corp. |
46,751 |
3,130 |
|
|
Jeronimo Martins SGPS SA |
24,300 |
502 |
|
|
Sysco Corp. |
21,309 |
717 |
|
|
Walgreen Co. |
132,182 |
7,825 |
|
|
|
12,174 |
||
|
Food Products - 1.3% |
|||
|
Danone SA |
24,867 |
1,807 |
|
|
Kellogg Co. |
68,402 |
4,148 |
|
|
Mead Johnson Nutrition Co. Class A |
7,100 |
600 |
|
|
Unilever NV (Certificaten Van Aandelen) (Bearer) |
23,800 |
935 |
|
|
|
7,490 |
||
|
Household Products - 2.7% |
|||
|
Kimberly-Clark Corp. |
36,293 |
3,962 |
|
|
Procter & Gamble Co. |
138,835 |
11,693 |
|
|
Svenska Cellulosa AB (SCA) (B Shares) |
14,600 |
426 |
|
|
|
16,081 |
||
|
Personal Products - 0.0% |
|||
|
Oriflame Cosmetics SA SDR |
3,300 |
103 |
|
|
Tobacco - 3.0% |
|||
|
British American Tobacco PLC sponsored ADR |
77,076 |
8,195 |
|
|
Lorillard, Inc. |
108,467 |
5,568 |
|
|
Philip Morris International, Inc. |
40,721 |
3,483 |
|
|
|
17,246 |
||
|
TOTAL CONSUMER STAPLES |
69,768 |
||
|
ENERGY - 11.6% |
|||
|
Energy Equipment & Services - 1.2% |
|||
|
Ensco PLC Class A |
30,658 |
1,811 |
|
|
Common Stocks - continued |
|||
|
Shares |
Value (000s) |
||
|
ENERGY - continued |
|||
|
Energy Equipment & Services - continued |
|||
|
Halliburton Co. |
39,630 |
$ 2,088 |
|
|
Schlumberger Ltd. |
34,434 |
3,045 |
|
|
|
6,944 |
||
|
Oil, Gas & Consumable Fuels - 10.4% |
|||
|
Access Midstream Partners LP |
18,129 |
1,018 |
|
|
Apache Corp. |
37,814 |
3,460 |
|
|
Atlas Pipeline Partners LP |
50,620 |
1,770 |
|
|
BG Group PLC |
97,764 |
1,997 |
|
|
Canadian Natural Resources Ltd. |
117,450 |
3,867 |
|
|
Chevron Corp. |
113,461 |
13,892 |
|
|
ENI SpA |
24,300 |
582 |
|
|
Exxon Mobil Corp. |
42,125 |
3,938 |
|
|
Imperial Oil Ltd. |
14,300 |
617 |
|
|
Magellan Midstream Partners LP |
2,354 |
146 |
|
|
Markwest Energy Partners LP |
46,705 |
3,226 |
|
|
MPLX LP |
7,303 |
278 |
|
|
Occidental Petroleum Corp. |
116,007 |
11,016 |
|
|
Peabody Energy Corp. |
10,000 |
182 |
|
|
Royal Dutch Shell PLC Class A (United Kingdom) |
130,655 |
4,369 |
|
|
Suncor Energy, Inc. |
147,390 |
5,114 |
|
|
The Williams Companies, Inc. |
125,570 |
4,423 |
|
|
Western Gas Partners LP |
5,200 |
331 |
|
|
|
60,226 |
||
|
TOTAL ENERGY |
67,170 |
||
|
FINANCIALS - 19.2% |
|||
|
Capital Markets - 3.6% |
|||
|
Ashmore Group PLC |
91,687 |
591 |
|
|
Charles Schwab Corp. |
237,900 |
5,824 |
|
|
Greenhill & Co., Inc. |
9,726 |
532 |
|
|
KKR & Co. LP |
107,101 |
2,542 |
|
|
Morgan Stanley |
156,330 |
4,893 |
|
|
Northern Trust Corp. |
43,780 |
2,583 |
|
|
State Street Corp. |
49,379 |
3,585 |
|
|
UBS AG |
26,166 |
498 |
|
|
|
21,048 |
||
|
Commercial Banks - 5.1% |
|||
|
BNP Paribas SA |
6,900 |
518 |
|
|
Comerica, Inc. |
51,657 |
2,343 |
|
|
Common Stocks - continued |
|||
|
Shares |
Value (000s) |
||
|
FINANCIALS - continued |
|||
|
Commercial Banks - continued |
|||
|
Erste Group Bank AG |
18,300 |
$ 644 |
|
|
Nordea Bank AB |
44,400 |
574 |
|
|
PNC Financial Services Group, Inc. |
58,616 |
4,511 |
|
|
Standard Chartered PLC (United Kingdom) |
108,621 |
2,575 |
|
|
SunTrust Banks, Inc. |
29,735 |
1,077 |
|
|
U.S. Bancorp |
151,130 |
5,927 |
|
|
Wells Fargo & Co. |
255,894 |
11,264 |
|
|
|
29,433 |
||
|
Consumer Finance - 0.2% |
|||
|
SLM Corp. |
41,544 |
1,107 |
|
|
Diversified Financial Services - 7.5% |
|||
|
Bank of America Corp. |
468,161 |
7,406 |
|
|
Citigroup, Inc. |
232,322 |
12,294 |
|
|
JPMorgan Chase & Co. |
389,596 |
22,293 |
|
|
KKR Financial Holdings LLC |
157,566 |
1,509 |
|
|
|
43,502 |
||
|
Insurance - 1.8% |
|||
|
AFLAC, Inc. |
5,609 |
372 |
|
|
Arthur J. Gallagher & Co. |
14,219 |
662 |
|
|
Marsh & McLennan Companies, Inc. |
17,279 |
820 |
|
|
MetLife, Inc. |
134,887 |
7,040 |
|
|
MetLife, Inc. unit |
28,500 |
876 |
|
|
Ping An Insurance (Group) Co. of China Ltd. (H Shares) |
6,500 |
61 |
|
|
Prudential Financial, Inc. |
9,546 |
847 |
|
|
|
10,678 |
||
|
Real Estate Investment Trusts - 0.4% |
|||
|
BioMed Realty Trust, Inc. |
19,500 |
362 |
|
|
Sun Communities, Inc. |
43,746 |
1,785 |
|
|
|
2,147 |
||
|
Real Estate Management & Development - 0.3% |
|||
|
Beazer Pre-Owned Rental Homes, Inc. (a)(e) |
67,500 |
1,418 |
|
|
Thrifts & Mortgage Finance - 0.3% |
|||
|
Radian Group, Inc. |
119,190 |
1,700 |
|
|
TOTAL FINANCIALS |
111,033 |
||
|
HEALTH CARE - 12.1% |
|||
|
Biotechnology - 0.9% |
|||
|
Amgen, Inc. |
48,156 |
5,494 |
|
|
Common Stocks - continued |
|||
|
Shares |
Value (000s) |
||
|
HEALTH CARE - continued |
|||
|
Health Care Equipment & Supplies - 1.3% |
|||
|
Abbott Laboratories |
23,626 |
$ 902 |
|
|
Ansell Ltd. |
21,166 |
391 |
|
|
Baxter International, Inc. |
4,282 |
293 |
|
|
Coloplast A/S Series B |
3,100 |
204 |
|
|
ResMed, Inc. (d) |
6,468 |
316 |
|
|
St. Jude Medical, Inc. |
35,293 |
2,062 |
|
|
Stryker Corp. |
25,759 |
1,917 |
|
|
Zimmer Holdings, Inc. |
15,690 |
1,434 |
|
|
|
7,519 |
||
|
Health Care Providers & Services - 3.2% |
|||
|
Aetna, Inc. |
34,588 |
2,384 |
|
|
AmerisourceBergen Corp. |
5,000 |
353 |
|
|
Fresenius Medical Care AG & Co. KGaA |
9,600 |
673 |
|
|
McKesson Corp. |
23,233 |
3,854 |
|
|
Patterson Companies, Inc. |
12,600 |
523 |
|
|
Quest Diagnostics, Inc. |
75,152 |
4,580 |
|
|
UnitedHealth Group, Inc. |
53,336 |
3,972 |
|
|
WellPoint, Inc. |
20,575 |
1,911 |
|
|
|
18,250 |
||
|
Health Care Technology - 0.2% |
|||
|
Quality Systems, Inc. |
49,251 |
1,151 |
|
|
Life Sciences Tools & Services - 0.3% |
|||
|
Lonza Group AG |
17,031 |
1,587 |
|
|
Pharmaceuticals - 6.2% |
|||
|
AbbVie, Inc. |
60,826 |
2,947 |
|
|
AstraZeneca PLC sponsored ADR |
28,626 |
1,637 |
|
|
GlaxoSmithKline PLC sponsored ADR |
97,359 |
5,152 |
|
|
Johnson & Johnson |
94,001 |
8,898 |
|
|
Merck & Co., Inc. |
198,685 |
9,900 |
|
|
Novartis AG sponsored ADR |
38,993 |
3,085 |
|
|
Sanofi SA |
21,480 |
2,270 |
|
|
Teva Pharmaceutical Industries Ltd. sponsored ADR |
48,868 |
1,992 |
|
|
|
35,881 |
||
|
TOTAL HEALTH CARE |
69,882 |
||
|
INDUSTRIALS - 11.1% |
|||
|
Aerospace & Defense - 2.0% |
|||
|
Honeywell International, Inc. |
9,619 |
851 |
|
|
Rolls-Royce Group PLC |
13,700 |
277 |
|
|
Common Stocks - continued |
|||
|
Shares |
Value (000s) |
||
|
INDUSTRIALS - continued |
|||
|
Aerospace & Defense - continued |
|||
|
The Boeing Co. |
49,094 |
$ 6,591 |
|
|
United Technologies Corp. |
33,631 |
3,728 |
|
|
|
11,447 |
||
|
Air Freight & Logistics - 1.6% |
|||
|
C.H. Robinson Worldwide, Inc. |
44,426 |
2,605 |
|
|
United Parcel Service, Inc. Class B |
68,479 |
7,011 |
|
|
|
9,616 |
||
|
Building Products - 0.0% |
|||
|
Fagerhult AB |
1,924 |
60 |
|
|
Commercial Services & Supplies - 0.3% |
|||
|
KAR Auction Services, Inc. |
29,300 |
808 |
|
|
Ritchie Brothers Auctioneers, Inc. (d) |
35,400 |
731 |
|
|
|
1,539 |
||
|
Electrical Equipment - 0.3% |
|||
|
Hubbell, Inc. Class B |
15,082 |
1,627 |
|
|
Zumtobel AG |
6,734 |
106 |
|
|
|
1,733 |
||
|
Industrial Conglomerates - 3.0% |
|||
|
General Electric Co. |
648,793 |
17,297 |
|
|
Machinery - 1.1% |
|||
|
Andritz AG |
5,087 |
323 |
|
|
Caterpillar, Inc. |
7,752 |
656 |
|
|
Cummins, Inc. |
2,800 |
371 |
|
|
Douglas Dynamics, Inc. |
72,895 |
1,162 |
|
|
Ingersoll-Rand PLC |
30,447 |
2,175 |
|
|
ITT Corp. |
25,641 |
1,047 |
|
|
Pfeiffer Vacuum Technology AG |
2,546 |
317 |
|
|
Xylem, Inc. |
8,600 |
297 |
|
|
|
6,348 |
||
|
Professional Services - 0.4% |
|||
|
Acacia Research Corp. |
32,864 |
489 |
|
|
Amadeus Fire AG |
3,843 |
258 |
|
|
Bureau Veritas SA |
34,204 |
1,016 |
|
|
Michael Page International PLC |
86,694 |
674 |
|
|
|
2,437 |
||
|
Road & Rail - 1.6% |
|||
|
CSX Corp. |
188,633 |
5,144 |
|
|
Common Stocks - continued |
|||
|
Shares |
Value (000s) |
||
|
INDUSTRIALS - continued |
|||
|
Road & Rail - continued |
|||
|
J.B. Hunt Transport Services, Inc. |
20,925 |
$ 1,573 |
|
|
Norfolk Southern Corp. |
26,708 |
2,342 |
|
|
|
9,059 |
||
|
Trading Companies & Distributors - 0.8% |
|||
|
Beacon Roofing Supply, Inc. (a) |
17,130 |
637 |
|
|
Beijer (G&L) AG Series B |
8,289 |
179 |
|
|
Brenntag AG |
1,400 |
249 |
|
|
MSC Industrial Direct Co., Inc. Class A |
22,576 |
1,735 |
|
|
W.W. Grainger, Inc. |
6,773 |
1,747 |
|
|
Watsco, Inc. |
2,551 |
245 |
|
|
|
4,792 |
||
|
TOTAL INDUSTRIALS |
64,328 |
||
|
INFORMATION TECHNOLOGY - 18.5% |
|||
|
Communications Equipment - 2.2% |
|||
|
Cisco Systems, Inc. |
373,154 |
7,930 |
|
|
QUALCOMM, Inc. |
67,613 |
4,975 |
|
|
|
12,905 |
||
|
Computers & Peripherals - 4.1% |
|||
|
Apple, Inc. |
40,794 |
22,679 |
|
|
EMC Corp. |
44,630 |
1,064 |
|
|
|
23,743 |
||
|
Internet Software & Services - 2.0% |
|||
|
Google, Inc. Class A (a) |
10,761 |
11,402 |
|
|
IT Services - 5.5% |
|||
|
Accenture PLC Class A |
16,442 |
1,274 |
|
|
Cognizant Technology Solutions Corp. Class A (a) |
31,410 |
2,949 |
|
|
Fidelity National Information Services, Inc. |
39,338 |
1,994 |
|
|
IBM Corp. |
11,700 |
2,102 |
|
|
MasterCard, Inc. Class A |
7,939 |
6,040 |
|
|
Paychex, Inc. |
216,852 |
9,483 |
|
|
The Western Union Co. |
158,161 |
2,637 |
|
|
Visa, Inc. Class A |
26,835 |
5,460 |
|
|
|
31,939 |
||
|
Semiconductors & Semiconductor Equipment - 1.5% |
|||
|
Altera Corp. |
49,605 |
1,600 |
|
|
Analog Devices, Inc. |
27,573 |
1,330 |
|
|
Applied Materials, Inc. |
177,949 |
3,079 |
|
|
Common Stocks - continued |
|||
|
Shares |
Value (000s) |
||
|
INFORMATION TECHNOLOGY - continued |
|||
|
Semiconductors & Semiconductor Equipment - continued |
|||
|
Broadcom Corp. Class A |
74,864 |
$ 1,998 |
|
|
Maxim Integrated Products, Inc. |
19,900 |
567 |
|
|
|
8,574 |
||
|
Software - 3.2% |
|||
|
Microsoft Corp. |
441,901 |
16,850 |
|
|
Oracle Corp. |
58,236 |
2,055 |
|
|
|
18,905 |
||
|
TOTAL INFORMATION TECHNOLOGY |
107,468 |
||
|
MATERIALS - 2.3% |
|||
|
Chemicals - 2.0% |
|||
|
Airgas, Inc. |
14,252 |
1,548 |
|
|
E.I. du Pont de Nemours & Co. |
26,352 |
1,617 |
|
|
FMC Corp. |
14,899 |
1,086 |
|
|
Johnson Matthey PLC |
5,100 |
265 |
|
|
Monsanto Co. |
33,039 |
3,744 |
|
|
Potash Corp. of Saskatchewan, Inc. |
14,900 |
472 |
|
|
Royal DSM NV |
6,700 |
526 |
|
|
Syngenta AG (Switzerland) |
6,172 |
2,420 |
|
|
Tronox Ltd. Class A |
4,600 |
98 |
|
|
|
11,776 |
||
|
Metals & Mining - 0.3% |
|||
|
Freeport-McMoRan Copper & Gold, Inc. |
12,200 |
423 |
|
|
Grupo Mexico SA de CV Series B |
122,300 |
359 |
|
|
Southern Copper Corp. |
23,690 |
595 |
|
|
|
1,377 |
||
|
TOTAL MATERIALS |
13,153 |
||
|
TELECOMMUNICATION SERVICES - 1.9% |
|||
|
Diversified Telecommunication Services - 1.4% |
|||
|
CenturyLink, Inc. |
18,886 |
580 |
|
|
Verizon Communications, Inc. |
145,988 |
7,244 |
|
|
|
7,824 |
||
|
Wireless Telecommunication Services - 0.5% |
|||
|
Vodafone Group PLC sponsored ADR |
82,985 |
3,078 |
|
|
TOTAL TELECOMMUNICATION SERVICES |
10,902 |
||
|
Common Stocks - continued |
|||
|
Shares |
Value (000s) |
||
|
UTILITIES - 0.8% |
|||
|
Electric Utilities - 0.5% |
|||
|
Ceske Energeticke Zavody A/S |
5,900 |
$ 164 |
|
|
Duke Energy Corp. |
9,581 |
670 |
|
|
EDF SA |
15,400 |
573 |
|
|
Hawaiian Electric Industries, Inc. |
22,909 |
580 |
|
|
ITC Holdings Corp. |
5,641 |
510 |
|
|
Northeast Utilities |
8,165 |
335 |
|
|
|
2,832 |
||
|
Multi-Utilities - 0.3% |
|||
|
E.ON AG |
34,074 |
656 |
|
|
National Grid PLC |
8,665 |
110 |
|
|
Sempra Energy |
11,400 |
1,008 |
|
|
|
1,774 |
||
|
TOTAL UTILITIES |
4,606 |
||
|
TOTAL COMMON STOCKS (Cost $451,001) |
|
||
|
Convertible Preferred Stocks - 0.8% |
|||
|
|
|
|
|
|
HEALTH CARE - 0.7% |
|||
|
Health Care Equipment & Supplies - 0.7% |
|||
|
Alere, Inc. 3.00% |
14,654 |
4,045 |
|
|
INDUSTRIALS - 0.1% |
|||
|
Aerospace & Defense - 0.1% |
|||
|
United Technologies Corp. 7.50% |
9,200 |
601 |
|
|
TOTAL CONVERTIBLE PREFERRED STOCKS (Cost $4,525) |
|
||
|
Convertible Bonds - 0.2% |
||||
|
|
Principal |
|
||
|
ENERGY - 0.2% |
||||
|
Oil, Gas & Consumable Fuels - 0.2% |
||||
|
Amyris, Inc. 3% 2/27/17 |
|
$ 772 |
562 |
|
|
Peabody Energy Corp. 4.75% 12/15/41 |
|
600 |
482 |
|
|
|
1,044 |
|||
|
Convertible Bonds - continued |
||||
|
|
Principal |
Value (000s) |
||
|
HEALTH CARE - 0.0% |
||||
|
Health Care Equipment & Supplies - 0.0% |
||||
|
Volcano Corp. 1.75% 12/1/17 |
|
$ 280 |
$ 280 |
|
|
TOTAL CONVERTIBLE BONDS (Cost $1,503) |
|
|||
|
Money Market Funds - 0.2% |
|||
|
Shares |
|
||
|
Fidelity Securities Lending Cash Central Fund, 0.10% (b)(c) |
961,900 |
|
|
|
TOTAL INVESTMENT PORTFOLIO - 100.1% (Cost $457,991) |
579,924 |
||
|
NET OTHER ASSETS (LIABILITIES) - (0.1)% |
(486) |
||
|
NET ASSETS - 100% |
$ 579,438 |
||
|
Legend |
|
(a) Non-income producing |
|
(b) Affiliated fund that is generally available only to investment companies and other accounts managed by Fidelity Investments. The rate quoted is the annualized seven-day yield of the fund at period end. A complete unaudited listing of the fund's holdings as of its most recent quarter end is available upon request. In addition, each Fidelity Central Fund's financial statements, which are not covered by the Fund's Report of Independent Registered Public Accounting Firm, are available on the SEC's website or upon request. |
|
(c) Investment made with cash collateral received from securities on loan. |
|
(d) Security or a portion of the security is on loan at period end. |
|
(e) Restricted securities - Investment in securities not registered under the Securities Act of 1933 (excluding 144A issues). At the end of the period, the value of restricted securities (excluding 144A issues) amounted to $1,418,000 or 0.2% of net assets. |
|
Additional information on each restricted holding is as follows: |
|
Security |
Acquisition |
Acquisition |
|
Beazer Pre-Owned Rental Homes, Inc. |
5/3/12 - 10/23/12 |
$ 1,350 |
|
Affiliated Central Funds |
|
Information regarding fiscal year to date income earned by the Fund from investments in Fidelity Central Funds is as follows: |
|
Fund |
Income earned |
|
Fidelity Cash Central Fund |
$ 2 |
|
Fidelity Securities Lending Cash Central Fund |
35 |
|
Total |
$ 37 |
|
Other Information |
|
The following is a summary of the inputs used, as of November 30, 2013, involving the Fund's assets and liabilities carried at fair value. The inputs or methodology used for valuing securities may not be an indication of the risk associated with investing in those securities. For more information on valuation inputs, and their aggregation into the levels used in the table below, please refer to the Investment Valuation section in the accompanying Notes to Financial Statements. |
|
Valuation Inputs at Reporting Date: |
||||
|
Description |
Total |
Level 1 |
Level 2 |
Level 3 |
|
Investments in Securities: |
||||
|
Equities: |
||||
|
Consumer Discretionary |
$ 54,682 |
$ 54,682 |
$ - |
$ - |
|
Consumer Staples |
69,768 |
68,526 |
1,242 |
- |
|
Energy |
67,170 |
62,219 |
4,951 |
- |
|
Financials |
111,033 |
108,241 |
1,374 |
1,418 |
|
Health Care |
73,927 |
70,984 |
2,943 |
- |
|
Industrials |
64,929 |
64,929 |
- |
- |
|
Information Technology |
107,468 |
107,468 |
- |
- |
|
Materials |
13,153 |
10,733 |
2,420 |
- |
|
Telecommunication Services |
10,902 |
10,902 |
- |
- |
|
Utilities |
4,606 |
4,496 |
110 |
- |
|
Corporate Bonds |
1,324 |
- |
1,324 |
- |
|
Money Market Funds |
962 |
962 |
- |
- |
|
Total Investments in Securities: |
$ 579,924 |
$ 564,142 |
$ 14,364 |
$ 1,418 |
|
Distribution of investments by country or territory of incorporation, as a percentage of total net assets, is as follows (Unaudited): |
|
United States of America |
86.7% |
|
United Kingdom |
5.5% |
|
Canada |
1.9% |
|
France |
1.4% |
|
Switzerland |
1.3% |
|
Others (Individually Less Than 1%) |
3.2% |
|
|
100.0% |
See accompanying notes which are an integral part of the financial statements.
Annual Report
Financial Statements
Statement of Assets and Liabilities
|
Amounts in thousands (except per-share amounts) |
November 30, 2013 |
|
|
|
|
|
|
Assets |
|
|
|
Investment in securities, at value (including securities loaned of $929) - See accompanying schedule: Unaffiliated issuers (cost $457,029) |
$ 578,962 |
|
|
Fidelity Central Funds (cost $962) |
962 |
|
|
Total Investments (cost $457,991) |
|
$ 579,924 |
|
Receivable for investments sold |
|
1,490 |
|
Receivable for fund shares sold |
|
565 |
|
Dividends receivable |
|
1,457 |
|
Interest receivable |
|
22 |
|
Distributions receivable from Fidelity Central Funds |
|
1 |
|
Prepaid expenses |
|
3 |
|
Other receivables |
|
2 |
|
Total assets |
|
583,464 |
|
|
|
|
|
Liabilities |
|
|
|
Payable to custodian bank |
$ 522 |
|
|
Payable for investments purchased |
1,046 |
|
|
Payable for fund shares redeemed |
884 |
|
|
Accrued management fee |
216 |
|
|
Distribution and service plan fees payable |
212 |
|
|
Other affiliated payables |
125 |
|
|
Other payables and accrued expenses |
59 |
|
|
Collateral on securities loaned, at value |
962 |
|
|
Total liabilities |
|
4,026 |
|
|
|
|
|
Net Assets |
|
$ 579,438 |
|
Net Assets consist of: |
|
|
|
Paid in capital |
|
$ 455,910 |
|
Undistributed net investment income |
|
1,552 |
|
Accumulated undistributed net realized gain (loss) on investments and foreign currency transactions |
|
42 |
|
Net unrealized appreciation (depreciation) on investments and assets and liabilities in foreign currencies |
|
121,934 |
|
Net Assets |
|
$ 579,438 |
See accompanying notes which are an integral part of the financial statements.
Annual Report
Statement of Assets and Liabilities - continued
|
Amounts in thousands (except per-share amounts) |
November 30, 2013 |
|
|
|
|
|
|
Calculation of Maximum Offering Price Class A: |
|
$ 25.87 |
|
|
|
|
|
Maximum offering price per share (100/94.25 of $25.87) |
|
$ 27.45 |
|
Class T: |
|
$ 25.84 |
|
|
|
|
|
Maximum offering price per share (100/96.50 of $25.84) |
|
$ 26.78 |
|
Class B: |
|
$ 24.74 |
|
|
|
|
|
Class C: |
|
$ 24.66 |
|
|
|
|
|
Institutional Class: |
|
$ 26.13 |
A Redemption price per share is equal to net asset value less any applicable contingent deferred sales charge.
See accompanying notes which are an integral part of the financial statements.
Annual Report
Financial Statements - continued
Statement of Operations
|
Amounts in thousands |
Year ended November 30, 2013 |
|
|
|
|
|
|
Investment Income |
|
|
|
Dividends |
|
$ 23,598 |
|
Interest |
|
70 |
|
Income from Fidelity Central Funds |
|
37 |
|
Total income |
|
23,705 |
|
|
|
|
|
Expenses |
|
|
|
Management fee |
$ 4,121 |
|
|
Transfer agent fees |
1,955 |
|
|
Distribution and service plan fees |
2,251 |
|
|
Accounting and security lending fees |
307 |
|
|
Custodian fees and expenses |
74 |
|
|
Independent trustees' compensation |
6 |
|
|
Registration fees |
75 |
|
|
Audit |
64 |
|
|
Legal |
4 |
|
|
Interest |
1 |
|
|
Miscellaneous |
12 |
|
|
Total expenses before reductions |
8,870 |
|
|
Expense reductions |
(138) |
8,732 |
|
Net investment income (loss) |
|
14,973 |
|
Realized and Unrealized Gain (Loss) Net realized gain (loss) on: |
|
|
|
Investment securities: |
|
|
|
Unaffiliated issuers (net of foreign taxes of $1) |
66,416 |
|
|
Redemption in-kind with affiliated entities |
230,003 |
|
|
Foreign currency transactions |
2 |
|
|
Total net realized gain (loss) |
|
296,421 |
|
Change in net unrealized appreciation (depreciation) on: Investment securities |
(64,392) |
|
|
Assets and liabilities in foreign currencies |
(2) |
|
|
Total change in net unrealized appreciation (depreciation) |
|
(64,394) |
|
Net gain (loss) |
|
232,027 |
|
Net increase (decrease) in net assets resulting from operations |
|
$ 247,000 |
See accompanying notes which are an integral part of the financial statements.
Annual Report
Statement of Changes in Net Assets
|
Amounts in thousands |
Year ended |
Year ended |
|
Increase (Decrease) in Net Assets |
|
|
|
Operations |
|
|
|
Net investment income (loss) |
$ 14,973 |
$ 28,263 |
|
Net realized gain (loss) |
296,421 |
38,247 |
|
Change in net unrealized appreciation (depreciation) |
(64,394) |
189,073 |
|
Net increase (decrease) in net assets resulting |
247,000 |
255,583 |
|
Distributions to shareholders from net investment income |
(2,542) |
(45,234) |
|
Distributions to shareholders from net realized gain |
- |
(2,237) |
|
Total distributions |
(2,542) |
(47,471) |
|
Share transactions - net increase (decrease) |
(1,114,198) |
(170,346) |
|
Total increase (decrease) in net assets |
(869,740) |
37,766 |
|
|
|
|
|
Net Assets |
|
|
|
Beginning of period |
1,449,178 |
1,411,412 |
|
End of period (including undistributed net investment income of $1,552 and distributions in excess of net investment income of $28, respectively) |
$ 579,438 |
$ 1,449,178 |
See accompanying notes which are an integral part of the financial statements.
Annual Report
Financial Highlights - Class A
|
Years ended November 30, |
2013 |
2012 |
2011 |
2010 |
2009 |
|
Selected Per-Share Data |
|
|
|
|
|
|
Net asset value, beginning of period |
$ 19.67 |
$ 17.00 |
$ 16.05 |
$ 14.67 |
$ 11.96 |
|
Income from Investment Operations |
|
|
|
|
|
|
Net investment income (loss) C |
.37 |
.33 |
.21 |
.04 |
.08 |
|
Net realized and unrealized gain (loss) |
5.88 |
2.90 |
.78 |
1.41 |
2.75 |
|
Total from investment operations |
6.25 |
3.23 |
.99 |
1.45 |
2.83 |
|
Distributions from net investment income |
(.05) |
(.53) |
(.04) |
(.07) |
(.12) |
|
Distributions from net realized gain |
- |
(.03) |
- |
- |
- |
|
Total distributions |
(.05) |
(.56) |
(.04) |
(.07) |
(.12) |
|
Net asset value, end of period |
$ 25.87 |
$ 19.67 |
$ 17.00 |
$ 16.05 |
$ 14.67 |
|
Total Return A, B |
31.86% |
19.20% |
6.17% |
9.90% |
23.96% |
|
Ratios to Average Net Assets D, F |
|
|
|
|
|
|
Expenses before reductions |
1.02% |
1.05% |
1.06% |
1.05% |
1.09% |
|
Expenses net of fee waivers, if any |
1.02% |
1.05% |
1.06% |
1.05% |
1.09% |
|
Expenses net of all reductions |
1.00% |
1.04% |
1.05% |
1.05% |
1.08% |
|
Net investment income (loss) |
1.61% |
1.75% |
1.22% |
.26% |
.60% |
|
Supplemental Data |
|
|
|
|
|
|
Net assets, end of period (in millions) |
$ 255 |
$ 183 |
$ 170 |
$ 232 |
$ 252 |
|
Portfolio turnover rate E |
48% |
57% |
123% |
102% |
117% |
A Total returns would have been lower if certain expenses had not been reduced during the applicable periods shown.
B Total returns do not include the effect of the sales charges.
C Calculated based on average shares outstanding during the period.
D Fees and expenses of any underlying Fidelity Central Funds are not included in the Fund's expense ratio. The Fund indirectly bears its proportionate share of the expenses of any underlying Fidelity Central Funds.
E Amount does not include the portfolio activity of any underlying Fidelity Central Funds.
F Expense ratios reflect operating expenses of the class. Expenses before reductions do not reflect amounts reimbursed by the investment adviser or reductions from brokerage service arrangements or reductions from other expense offset arrangements and do not represent the amount paid by the class during periods when reimbursements or reductions occur. Expenses net of fee waivers reflect expenses after reimbursement by the investment adviser but prior to reductions from brokerage service arrangements or other expense offset arrangements. Expenses net of all reductions represent the net expenses paid by the class.
See accompanying notes which are an integral part of the financial statements.
Annual Report
Financial Highlights - Class T
|
Years ended November 30, |
2013 |
2012 |
2011 |
2010 |
2009 |
|
Selected Per-Share Data |
|
|
|
|
|
|
Net asset value, beginning of period |
$ 19.68 |
$ 16.97 |
$ 16.02 |
$ 14.64 |
$ 11.90 |
|
Income from Investment Operations |
|
|
|
|
|
|
Net investment income (loss) C |
.32 |
.29 |
.17 |
- G |
.04 |
|
Net realized and unrealized gain (loss) |
5.89 |
2.89 |
.78 |
1.41 |
2.75 |
|
Total from investment operations |
6.21 |
3.18 |
.95 |
1.41 |
2.79 |
|
Distributions from net investment income |
(.05) |
(.44) |
- |
(.03) |
(.05) |
|
Distributions from net realized gain |
- |
(.03) |
- |
- |
- |
|
Total distributions |
(.05) |
(.47) |
- |
(.03) |
(.05) |
|
Net asset value, end of period |
$ 25.84 |
$ 19.68 |
$ 16.97 |
$ 16.02 |
$ 14.64 |
|
Total Return A, B |
31.62% |
18.93% |
5.93% |
9.63% |
23.57% |
|
Ratios to Average Net Assets D, F |
|
|
|
|
|
|
Expenses before reductions |
1.25% |
1.27% |
1.29% |
1.31% |
1.34% |
|
Expenses net of fee waivers, if any |
1.25% |
1.27% |
1.29% |
1.31% |
1.34% |
|
Expenses net of all reductions |
1.23% |
1.26% |
1.28% |
1.30% |
1.34% |
|
Net investment income (loss) |
1.38% |
1.53% |
.99% |
.01% |
.35% |
|
Supplemental Data |
|
|
|
|
|
|
Net assets, end of period (in millions) |
$ 214 |
$ 166 |
$ 158 |
$ 178 |
$ 201 |
|
Portfolio turnover rate E |
48% |
57% |
123% |
102% |
117% |
A Total returns would have been lower if certain expenses had not been reduced during the applicable periods shown.
B Total returns do not include the effect of the sales charges.
C Calculated based on average shares outstanding during the period.
D Fees and expenses of any underlying Fidelity Central Funds are not included in the Fund's expense ratio. The Fund indirectly bears its proportionate share of the expenses of any underlying Fidelity Central Funds.
E Amount does not include the portfolio activity of any underlying Fidelity Central Funds.
F Expense ratios reflect operating expenses of the class. Expenses before reductions do not reflect amounts reimbursed by the investment adviser or reductions from brokerage service arrangements or reductions from other expense offset arrangements and do not represent the amount paid by the class during periods when reimbursements or reductions occur. Expenses net of fee waivers reflect expenses after reimbursement by the investment adviser but prior to reductions from brokerage service arrangements or other expense offset arrangements. Expenses net of all reductions represent the net expenses paid by the class.
G Amount represents less than $.01 per share.
See accompanying notes which are an integral part of the financial statements.
Annual Report
Financial Highlights - Class B
|
Years ended November 30, |
2013 |
2012 |
2011 |
2010 |
2009 |
|
Selected Per-Share Data |
|
|
|
|
|
|
Net asset value, beginning of period |
$ 18.95 |
$ 16.24 |
$ 15.41 |
$ 14.13 |
$ 11.49 |
|
Income from Investment Operations |
|
|
|
|
|
|
Net investment income (loss) C |
.18 |
.18 |
.08 |
(.07) |
(.02) |
|
Net realized and unrealized gain (loss) |
5.65 |
2.78 |
.75 |
1.35 |
2.66 |
|
Total from investment operations |
5.83 |
2.96 |
.83 |
1.28 |
2.64 |
|
Distributions from net investment income |
(.04) |
(.22) |
- |
- |
- |
|
Distributions from net realized gain |
- |
(.03) |
- |
- |
- |
|
Total distributions |
(.04) |
(.25) |
- |
- |
- |
|
Net asset value, end of period |
$ 24.74 |
$ 18.95 |
$ 16.24 |
$ 15.41 |
$ 14.13 |
|
Total Return A, B |
30.81% |
18.31% |
5.39% |
9.06% |
22.98% |
|
Ratios to Average Net Assets D, F |
|
|
|
|
|
|
Expenses before reductions |
1.81% |
1.81% |
1.81% |
1.82% |
1.85% |
|
Expenses net of fee waivers, if any |
1.81% |
1.81% |
1.81% |
1.82% |
1.85% |
|
Expenses net of all reductions |
1.80% |
1.81% |
1.80% |
1.81% |
1.84% |
|
Net investment income (loss) |
.82% |
.99% |
.47% |
(.51)% |
(.16)% |
|
Supplemental Data |
|
|
|
|
|
|
Net assets, end of period (in millions) |
$ 12 |
$ 11 |
$ 13 |
$ 19 |
$ 27 |
|
Portfolio turnover rate E |
48% |
57% |
123% |
102% |
117% |
A Total returns would have been lower if certain expenses had not been reduced during the applicable periods shown.
B Total returns do not include the effect of the contingent deferred sales charge.
C Calculated based on average shares outstanding during the period.
D Fees and expenses of any underlying Fidelity Central Funds are not included in the Fund's expense ratio. The Fund indirectly bears its proportionate share of the expenses of any underlying Fidelity Central Funds.
E Amount does not include the portfolio activity of any underlying Fidelity Central Funds.
F Expense ratios reflect operating expenses of the class. Expenses before reductions do not reflect amounts reimbursed by the investment adviser or reductions from brokerage service arrangements or reductions from other expense offset arrangements and do not represent the amount paid by the class during periods when reimbursements or reductions occur. Expenses net of fee waivers reflect expenses after reimbursement by the investment adviser but prior to reductions from brokerage service arrangements or other expense offset arrangements. Expenses net of all reductions represent the net expenses paid by the class.
See accompanying notes which are an integral part of the financial statements.
Annual Report
Financial Highlights - Class C
|
Years ended November 30, |
2013 |
2012 |
2011 |
2010 |
2009 |
|
Selected Per-Share Data |
|
|
|
|
|
|
Net asset value, beginning of period |
$ 18.87 |
$ 16.23 |
$ 15.39 |
$ 14.12 |
$ 11.47 |
|
Income from Investment Operations |
|
|
|
|
|
|
Net investment income (loss) C |
.19 |
.19 |
.08 |
(.07) |
(.02) |
|
Net realized and unrealized gain (loss) |
5.64 |
2.77 |
.76 |
1.34 |
2.67 |
|
Total from investment operations |
5.83 |
2.96 |
.84 |
1.27 |
2.65 |
|
Distributions from net investment income |
(.04) |
(.29) |
- |
- |
- |
|
Distributions from net realized gain |
- |
(.03) |
- |
- |
- |
|
Total distributions |
(.04) |
(.32) |
- |
- |
- |
|
Net asset value, end of period |
$ 24.66 |
$ 18.87 |
$ 16.23 |
$ 15.39 |
$ 14.12 |
|
Total Return A, B |
30.95% |
18.33% |
5.46% |
8.99% |
23.10% |
|
Ratios to Average Net Assets D, F |
|
|
|
|
|
|
Expenses before reductions |
1.74% |
1.76% |
1.78% |
1.80% |
1.84% |
|
Expenses net of fee waivers, if any |
1.74% |
1.76% |
1.78% |
1.80% |
1.84% |
|
Expenses net of all reductions |
1.73% |
1.76% |
1.77% |
1.80% |
1.83% |
|
Net investment income (loss) |
.89% |
1.04% |
.50% |
(.49)% |
(.15)% |
|
Supplemental Data |
|
|
|
|
|
|
Net assets, end of period (in millions) |
$ 74 |
$ 58 |
$ 53 |
$ 58 |
$ 63 |
|
Portfolio turnover rate E |
48% |
57% |
123% |
102% |
117% |
A Total returns would have been lower if certain expenses had not been reduced during the applicable periods shown.
B Total returns do not include the effect of the contingent deferred sales charge.
C Calculated based on average shares outstanding during the period.
D Fees and expenses of any underlying Fidelity Central Funds are not included in the Fund's expense ratio. The Fund indirectly bears its proportionate share of the expenses of any underlying Fidelity Central Funds.
E Amount does not include the portfolio activity of any underlying Fidelity Central Funds.
F Expense ratios reflect operating expenses of the class. Expenses before reductions do not reflect amounts reimbursed by the investment adviser or reductions from brokerage service arrangements or reductions from other expense offset arrangements and do not represent the amount paid by the class during periods when reimbursements or reductions occur. Expenses net of fee waivers reflect expenses after reimbursement by the investment adviser but prior to reductions from brokerage service arrangements or other expense offset arrangements. Expenses net of all reductions represent the net expenses paid by the class.
See accompanying notes which are an integral part of the financial statements.
Annual Report
Financial Highlights - Institutional Class
|
Years ended November 30, |
2013 |
2012 |
2011 |
2010 |
2009 |
|
Selected Per-Share Data |
|
|
|
|
|
|
Net asset value, beginning of period |
$ 19.79 |
$ 17.16 |
$ 16.19 |
$ 14.80 |
$ 12.07 |
|
Income from Investment Operations |
|
|
|
|
|
|
Net investment income (loss) B |
.43 |
.40 |
.27 |
.09 |
.12 |
|
Net realized and unrealized gain (loss) |
5.97 |
2.91 |
.79 |
1.41 |
2.78 |
|
Total from investment operations |
6.40 |
3.31 |
1.06 |
1.50 |
2.90 |
|
Distributions from net investment income |
(.06) |
(.65) |
(.09) |
(.11) |
(.17) |
|
Distributions from net realized gain |
- |
(.03) |
- |
- |
- |
|
Total distributions |
(.06) |
(.68) |
(.09) |
(.11) |
(.17) |
|
Net asset value, end of period |
$ 26.13 |
$ 19.79 |
$ 17.16 |
$ 16.19 |
$ 14.80 |
|
Total Return A |
32.41% |
19.59% |
6.56% |
10.23% |
24.36% |
|
Ratios to Average Net Assets C, E |
|
|
|
|
|
|
Expenses before reductions |
.70% |
.71% |
.72% |
.73% |
.77% |
|
Expenses net of fee waivers, if any |
.70% |
.71% |
.72% |
.73% |
.77% |
|
Expenses net of all reductions |
.68% |
.70% |
.71% |
.72% |
.77% |
|
Net investment income (loss) |
1.93% |
2.09% |
1.56% |
.59% |
.92% |
|
Supplemental Data |
|
|
|
|
|
|
Net assets, end of period (in millions) |
$ 24 |
$ 1,031 |
$ 1,017 |
$ 870 |
$ 1,017 |
|
Portfolio turnover rate D |
48% |
57% |
123% |
102% |
117% |
A Total returns would have been lower if certain expenses had not been reduced during the applicable periods shown.
B Calculated based on average shares outstanding during the period.
C Fees and expenses of any underlying Fidelity Central Funds are not included in the Fund's expense ratio. The Fund indirectly bears its proportionate share of the expenses of any underlying Fidelity Central Funds.
D Amount does not include the portfolio activity of any underlying Fidelity Central Funds.
E Expense ratios reflect operating expenses of the class. Expenses before reductions do not reflect amounts reimbursed by the investment adviser or reductions from brokerage service arrangements or reductions from other expense offset arrangements and do not represent the amount paid by the class during periods when reimbursements or reductions occur. Expenses net of fee waivers reflect expenses after reimbursement by the investment adviser but prior to reductions from brokerage service arrangements or other expense offset arrangements. Expenses net of all reductions represent the net expenses paid by the class.
See accompanying notes which are an integral part of the financial statements.
Annual Report
Notes to Financial Statements
For the period ended November 30, 2013
(Amounts in thousands except percentages)
1. Organization.
Fidelity Advisor Growth & Income Fund (the Fund) is a fund of Fidelity Advisor Series I (the Trust) and is authorized to issue an unlimited number of shares. The Trust is registered under the Investment Company Act of 1940, as amended (the 1940 Act), as an open-end management investment company organized as a Massachusetts business trust. The Fund offers Class A, Class T, Class C and Institutional Class shares, each of which, along with Class B shares, has equal rights as to assets and voting privileges. Class B shares are closed to new accounts and additional purchases, except for exchanges and reinvestments. Each class has exclusive voting rights with respect to matters that affect that class. Class B shares will automatically convert to Class A shares after a holding period of seven years from the initial date of purchase.
2. Investments in Fidelity Central Funds.
The Fund invests in Fidelity Central Funds, which are open-end investment companies generally available only to other investment companies and accounts managed by the investment adviser and its affiliates. The Fund's Schedule of Investments lists each of the Fidelity Central Funds held as of period end, if any, as an investment of the Fund, but does not include the underlying holdings of each Fidelity Central Fund. As an Investing Fund, the Fund indirectly bears its proportionate share of the expenses of the underlying Fidelity Central Funds.
The Money Market Central Funds seek preservation of capital and current income and are managed by Fidelity Investments Money Management, Inc. (FIMM), an affiliate of the investment adviser. Annualized expenses of the Money Market Central Funds as of their most recent shareholder report date are less than .01%.
A complete unaudited list of holdings for each Fidelity Central Fund is available upon request or at the Securities and Exchange Commission (the SEC) website at www.sec.gov. In addition, the financial statements of the Fidelity Central Funds, which are not covered by the Fund's Report of Independent Registered Public Accounting Firm, are available on the SEC website or upon request.
3. Significant Accounting Policies.
The financial statements have been prepared in conformity with accounting principles generally accepted in the United States of America (GAAP), which require management to make certain estimates and assumptions at the date of the financial statements. Actual results could differ from those estimates. Subsequent events, if any, through the date that the financial statements were issued have been evaluated in the preparation of
Annual Report
Notes to Financial Statements - continued
(Amounts in thousands except percentages)
3. Significant Accounting Policies - continued
the financial statements. The following summarizes the significant accounting policies of the Fund:
Investment Valuation. Investments are valued as of 4:00 p.m. Eastern time on the last calendar day of the period. In accordance with valuation policies and procedures approved by the Board of Trustees (the Board), the Fund attempts to obtain prices from one or more third party pricing vendors or brokers to value its investments. When current market prices, quotations or currency exchange rates are not readily available or reliable, investments will be fair valued in good faith by the Fidelity Management & Research Company (FMR) Fair Value Committee (the Committee), in accordance with procedures adopted by the Board. Factors used in determining fair value vary by investment type and may include market or investment specific events, changes in interest rates and credit quality. The frequency with which these procedures are used cannot be predicted and they may be utilized to a significant extent. The Committee oversees the Fund's valuation policies and procedures and is responsible for approving and reporting to the Board all fair value determinations.
The Fund categorizes the inputs to valuation techniques used to value its investments into a disclosure hierarchy consisting of three levels as shown below:
Level 1 - quoted prices in active markets for identical investments
Level 2 - other significant observable inputs (including quoted prices for similar investments, interest rates, prepayment speeds, etc.)
Level 3 - unobservable inputs (including the Fund's own assumptions based on the best information available)
Valuation techniques used to value the Fund's investments by major category are as follows:
Equity securities, including restricted securities, for which market quotations are readily available, are valued at the last reported sale price or official closing price as reported by a third party pricing vendor on the primary market or exchange on which they are traded and are categorized as Level 1 in the hierarchy. In the event there were no sales during the day or closing prices are not available, securities are valued at the last quoted bid price or may be valued using the last available price and are generally categorized as Level 2 in the hierarchy. For foreign equity securities, when market or security specific events arise, comparisons to the valuation of American Depositary Receipts (ADRs), futures contracts, Exchange-Traded Funds (ETFs) and certain indexes as well as quoted prices for similar securities may be used and would be categorized as Level 2 in the hierarchy. Utilizing these techniques may result in transfers between Level 1 and Level 2. For equity securities, including restricted securities, where observable inputs are limited, assumptions about market activity and risk are used and these securities may be categorized as Level 3 in the hierarchy.
Annual Report
3. Significant Accounting Policies - continued
Investment Valuation - continued
Debt securities, including restricted securities, are valued based on evaluated prices received from third party pricing vendors or from brokers who make markets in such securities. For corporate bonds, pricing vendors utilize matrix pricing which considers yield or price of bonds of comparable quality, coupon, maturity and type as well as broker-supplied prices. When independent prices are unavailable or unreliable, debt securities may be valued utilizing pricing methodologies which consider similar factors that would be used by third party pricing vendors. Debt securities are generally categorized as Level 2 in the hierarchy but may be Level 3 depending on the circumstances.
Investments in open-end mutual funds, including the Fidelity Central Funds, are valued at their closing net asset value (NAV) each business day and are categorized as Level 1 in the hierarchy.
Changes in valuation techniques may result in transfers in or out of an assigned level within the disclosure hierarchy. The aggregate value of investments by input level, as of November 30, 2013, is included at the end of the Fund's Schedule of Investments.
Foreign Currency. The Fund may use foreign currency contracts to facilitate transactions in foreign-denominated securities. Gains and losses from these transactions may arise from changes in the value of the foreign currency or if the counterparties do not perform under the contracts' terms.
Foreign-denominated assets, including investment securities, and liabilities are translated into U.S. dollars at the exchange rates at period end. Purchases and sales of investment securities, income and dividends received and expenses denominated in foreign currencies are translated into U.S. dollars at the exchange rate in effect on the transaction date.
The effects of exchange rate fluctuations on investments are included with the net realized and unrealized gain (loss) on investment securities. Other foreign currency transactions resulting in realized and unrealized gain (loss) are disclosed separately.
Investment Transactions and Income. For financial reporting purposes, the Fund's investment holdings and NAV include trades executed through the end of the last business day of the period. The NAV per share for processing shareholder transactions is calculated as of the close of business of the New York Stock Exchange (NYSE), normally 4:00 p.m. Eastern time and includes trades executed through the end of the prior business day. Gains and losses on securities sold are determined on the basis of identified cost and may include proceeds received from litigation. Dividend income is recorded on the ex-dividend date, except for certain dividends from foreign securities where the
Annual Report
Notes to Financial Statements - continued
(Amounts in thousands except percentages)
3. Significant Accounting Policies - continued
Investment Transactions and Income - continued
ex-dividend date may have passed, which are recorded as soon as the Fund is informed of the ex-dividend date. Non-cash dividends included in dividend income, if any, are recorded at the fair market value of the securities received. Distributions received on securities that represent a return of capital or capital gain are recorded as a reduction of cost of investments and/or as a realized gain. Subsequent to ex-dividend date the Fund determines the components of these distributions, based upon receipt of tax filings or other correspondence relating to the underlying investment. Interest income and distributions from the Fidelity Central Funds are accrued as earned. Interest income includes coupon interest and amortization of premium and accretion of discount on debt securities. Investment income is recorded net of foreign taxes withheld where recovery of such taxes is uncertain.
Class Allocations and Expenses. Investment income, realized and unrealized capital gains and losses, common expenses of the Fund, and certain fund-level expense reductions, if any, are allocated daily on a pro-rata basis to each class based on the relative net assets of each class to the total net assets of the Fund. Each class differs with respect to transfer agent and distribution and service plan fees incurred. Certain expense reductions may also differ by class. For the reporting period, the allocated portion of income and expenses to each class as a percent of its average net assets may vary due to the timing of recording these transactions in relation to fluctuating net assets of the classes. Expenses directly attributable to a fund are charged to that fund. Expenses attributable to more than one fund are allocated among the respective funds on the basis of relative net assets or other appropriate methods. Expense estimates are accrued in the period to which they relate and adjustments are made when actual amounts are known.
Income Tax Information and Distributions to Shareholders. Each year, the Fund intends to qualify as a regulated investment company under Subchapter M of the Internal Revenue Code, including distributing substantially all of its taxable income and realized gains. As a result, no provision for U.S. Federal income taxes is required. As of November 30, 2013, the Fund did not have any unrecognized tax benefits in the financial statements; nor is the Fund aware of any tax positions for which it is reasonably possible that the total amounts of unrecognized tax benefits will significantly change in the next twelve months. The Fund files a U.S. federal tax return, in addition to state and local tax returns as required. The Fund's federal income tax returns are subject to examination by the Internal Revenue Service (IRS) for a period of three fiscal years after they are filed. State and local tax returns may be subject to examination for an additional fiscal year depending on the jurisdiction. Foreign taxes are provided for based on the Fund's understanding of the tax rules and rates that exist in the foreign markets in which it invests.
Annual Report
3. Significant Accounting Policies - continued
Income Tax Information and Distributions to Shareholders - continued
Distributions are declared and recorded on the ex-dividend date. Income dividends and capital gain distributions are declared separately for each class. Income and capital gain distributions are determined in accordance with income tax regulations, which may differ from GAAP. In addition, the fund will claim a portion of the payment made to redeeming shareholders as a distribution for income tax purposes.
Capital accounts within the financial statements are adjusted for permanent book-tax differences. These adjustments have no impact on net assets or the results of operations. Temporary book-tax differences will reverse in a subsequent period.
Book-tax differences are primarily due to foreign currency transactions, certain foreign taxes, market discount, redemptions in kind, partnerships, equity-debt classifications, capital loss carryforwards, and losses deferred due to wash sales.
The federal tax cost of investment securities and unrealized appreciation (depreciation) as of period end were as follows:
|
Gross unrealized appreciation |
$ 125,060 |
|
Gross unrealized depreciation |
(5,870) |
|
Net unrealized appreciation (depreciation) on securities and other investments |
$ 119,190 |
|
|
|
|
Tax Cost |
$ 460,734 |
The tax-based components of distributable earnings as of period end were as follows:
|
Undistributed ordinary income |
$ 1,555 |
|
Undistributed long-term capital gain |
$ 3,994 |
|
Net unrealized appreciation (depreciation) |
$ 119,191 |
Capital loss carryforwards are only available to offset future capital gains of the Fund to the extent provided by regulations and may be limited. Under the Regulated Investment Company Modernization Act of 2010 (the Act), the Fund is permitted to carry forward capital losses incurred in taxable years beginning after December 22, 2010 for an unlimited period and such capital losses are required to be used prior to any losses that expire. The capital loss carryforward information presented below, including any applicable limitation, is estimated as of fiscal period end and is subject to adjustment.
|
Fiscal year of expiration |
|
|
2016 |
$ (1,206) |
Annual Report
Notes to Financial Statements - continued
(Amounts in thousands except percentages)
3. Significant Accounting Policies - continued
Income Tax Information and Distributions to Shareholders - continued
The capital loss carryforward expiring fiscal 2016 was acquired from Capital One Appreciation Fund.
The tax character of distributions paid was as follows:
|
|
November 30, 2013 |
November 30, 2012 |
|
Ordinary Income |
$ 2,542 |
$ 47,471 |
Restricted Securities. The Fund may invest in securities that are subject to legal or contractual restrictions on resale. These securities generally may be resold in transactions exempt from registration or to the public if the securities are registered. Disposal of these securities may involve time-consuming negotiations and expense, and prompt sale at an acceptable price may be difficult. Information regarding restricted securities is included at the end of the Fund's Schedule of Investments.
4. Purchases and Sales of Investments.
Purchases and sales of securities, including in-kind transactions, other than short-term securities, aggregated $437,811 and $1,529,122, respectively.
5. Fees and Other Transactions with Affiliates.
Management Fee. Fidelity Management & Research Company (the investment adviser) and its affiliates provide the Fund with investment management related services for which the Fund pays a monthly management fee. The management fee is the sum of an individual fund fee rate that is based on an annual rate of .20% of the Fund's average net assets and an annualized group fee rate that averaged 0.25% during the period. The group fee rate is based upon the average net assets of all the mutual funds advised by the investment adviser, including any mutual funds previously advised by the investment adviser that are currently advised by Fidelity SelectCo, LLC, an affiliate of the investment adviser. The group fee rate decreases as assets under management increase and increases as assets under management decrease. For the reporting period, the total annual management fee rate was .45% of the Fund's average net assets.
Distribution and Service Plan Fees. In accordance with Rule 12b-1 of the 1940 Act, the Fund has adopted separate Distribution and Service Plans for each class of shares. Certain classes pay Fidelity Distributors Corporation (FDC), an affiliate of the investment adviser, separate Distribution and Service Fees, each of which is based on an annual percentage of each class' average net assets. In addition, FDC may pay financial intermediaries for selling shares of the Fund and providing shareholder support services.
Annual Report
5. Fees and Other Transactions with Affiliates - continued
Distribution and Service Plan Fees - continued
For the period, the Distribution and Service Fee rates, total fees and amounts retained by FDC were as follows:
|
|
Distribution |
Service |
Total Fees |
Retained |
|
Class A |
-% |
.25% |
$ 539 |
$ 10 |
|
Class T |
.25% |
.25% |
945 |
6 |
|
Class B |
.75% |
.25% |
111 |
84 |
|
Class C |
.75% |
.25% |
656 |
53 |
|
|
|
|
$ 2,251 |
$ 153 |
Sales Load. FDC may receive a front-end sales charge of up to 5.75% for selling Class A shares and 3.50% for selling Class T shares, some of which is paid to financial intermediaries for selling shares of the Fund. Depending on the holding period, FDC may receive contingent deferred sales charges levied on Class A, Class T, Class B, and Class C redemptions. The deferred sales charges range from 5.00% to 1.00% for Class B shares, 1.00% for Class C shares, 1.00% for certain purchases of Class A shares and .25% for certain purchases of Class T shares.
For the period, sales charge amounts retained by FDC were as follows:
|
|
Retained |
|
Class A |
$ 58 |
|
Class T |
22 |
|
Class B* |
13 |
|
Class C* |
4 |
|
|
$ 97 |
* When Class B and Class C shares are initially sold, FDC pays commissions from its own resources to financial intermediaries through which the sales
are made
Transfer Agent Fees. Fidelity Investments Institutional Operations Company, Inc., (FIIOC), an affiliate of the investment adviser, is the transfer, dividend disbursing and shareholder servicing agent for each class of the Fund. FIIOC receives account fees and asset-based fees that vary according to the account size and type of account of the shareholders of the respective classes of the Fund. FIIOC pays for typesetting, printing and mailing of shareholder reports, except proxy statements.
Annual Report
Notes to Financial Statements - continued
(Amounts in thousands except percentages)
5. Fees and Other Transactions with Affiliates - continued
Transfer Agent Fees - continued
For the period, transfer agent fees for each class were as follows:
|
|
Amount |
% of |
|
Class A |
$ 553 |
.26 |
|
Class T |
445 |
.23 |
|
Class B |
33 |
.30 |
|
Class C |
$ 150 |
.23 |
|
Institutional Class |
774 |
.18 |
|
|
$ 1,955 |
|
Accounting and Security Lending Fees. Fidelity Service Company, Inc. (FSC), an affiliate of the investment adviser, maintains the Fund's accounting records. The accounting fee is based on the level of average net assets for each month. Under a separate contract, FSC administers the security lending program. The security lending fee is based on the number and duration of lending transactions.
Brokerage Commissions. The Fund placed a portion of its portfolio transactions with brokerage firms which are affiliates of the investment adviser. Brokerage commissions are included in net realized gain (loss) and change in net unrealized appreciation (depreciation) in the Statement of Operations. The commissions paid to these affiliated firms were $22 for the period.
Interfund Lending Program. Pursuant to an Exemptive Order issued by the SEC, the Fund, along with other registered investment companies having management contracts with FMR or other affiliated entities of FMR, may participate in an interfund lending program. This program provides an alternative credit facility allowing the funds to borrow from, or lend money to, other participating affiliated funds. At period end, there were no interfund loans outstanding. The Fund's activity in this program during the period for which loans were outstanding was as follows:
|
Borrower or Lender |
Average Loan |
Weighted Average |
Interest |
|
Borrower |
$ 5,619 |
.37% |
$ 1 |
Redemptions In-Kind. During the period, 48,895 shares of the Fund held by affiliated entities were redeemed for investments, including accrued interest, with a value of $1,068,902. The net realized gain of $230,003 on investments delivered through in-kind redemptions is included in the accompanying Statement of Operations. The amount of in-kind redemptions is included in share transactions in the accompanying Statement of Changes in Net Assets as well as Note 10: Share Transactions. The Fund recognized no gain or loss for federal income tax purposes.
Annual Report
6. Committed Line of Credit.
The Fund participates with other funds managed by the investment adviser or an affiliate in a $4.25 billion credit facility (the "line of credit") to be utilized for temporary or emergency purposes to fund shareholder redemptions or for other short-term liquidity purposes. The Fund has agreed to pay commitment fees on its pro-rata portion of the line of credit, which amounted to $2 and is reflected in Miscellaneous expenses on the Statement of Operations. During the period, there were no borrowings on this line of credit.
7. Security Lending.
The Fund lends portfolio securities through a lending agent from time to time in order to earn additional income. For equity securities, a lending agent is used and may loan securities to certain qualified borrowers, including Fidelity Capital Markets (FCM), a broker-dealer affiliated with the Fund. On the settlement date of the loan, the Fund receives collateral (in the form of U.S. Treasury obligations, letters of credit and/or cash) against the loaned securities and maintains collateral in an amount not less than 100% of the market value of the loaned securities during the period of the loan. The market value of the loaned securities is determined at the close of business of the Fund and any additional required collateral is delivered to the Fund on the next business day. If the borrower defaults on its obligation to return the securities loaned because of insolvency or other reasons, the Fund may apply collateral received from the borrower against the obligation. The Fund may experience delays and costs in recovering the securities loaned. Any cash collateral received is invested in the Fidelity Securities Lending Cash Central Fund. The value of loaned securities and cash collateral at period end are disclosed on the Fund's Statement of Assets and Liabilities. The value of securities loaned to FCM at period end was $244. Security lending income represents the income earned on investing cash collateral, less rebates paid to borrowers and any lending agent fees associated with the loan, plus any premium payments received for lending certain types of securities. Security lending income is presented in the Statement of Operations as a component of income from Fidelity Central Funds. Total security lending income during the period amounted to $35, including $2 from securities loaned to FCM.
8. Expense Reductions.
Commissions paid to certain brokers with whom the investment adviser, or its affiliates, places trades on behalf of the Fund include an amount in addition to trade execution, which may be rebated back to the Fund to offset certain expenses. This amount totaled $138 for the period.
Annual Report
Notes to Financial Statements - continued
(Amounts in thousands except percentages)
9. Distributions to Shareholders.
Distributions to shareholders of each class were as follows:
|
Years ended November 30, |
2013 |
2012 |
|
From net investment income |
|
|
|
Class A |
$ 483 |
$ 4,963 |
|
Class T |
402 |
3,843 |
|
Class B |
21 |
142 |
|
Class C |
120 |
894 |
|
Institutional Class |
1,516 |
35,392 |
|
Total |
$ 2,542 |
$ 45,234 |
|
From net realized gain |
|
|
|
Class A |
$ - |
$ 283 |
|
Class T |
- |
258 |
|
Class B |
- |
18 |
|
Class C |
- |
94 |
|
Institutional Class |
- |
1,584 |
|
Total |
$ - |
$ 2,237 |
10. Share Transactions.
Transactions for each class of shares were as follows:
|
|
Shares |
Dollars |
||
|
Years ended November 30, |
2013 |
2012 |
2013 |
2012 |
|
Class A |
|
|
|
|
|
Shares sold |
2,156 |
1,303 |
$ 49,371 |
$ 24,427 |
|
Reinvestment of distributions |
22 |
252 |
431 |
4,662 |
|
Shares redeemed |
(1,607) |
(2,279) |
(36,195) |
(42,887) |
|
Net increase (decrease) |
571 |
(724) |
$ 13,607 |
$ (13,798) |
|
Class T |
|
|
|
|
|
Shares sold |
1,319 |
780 |
$ 30,032 |
$ 14,651 |
|
Reinvestment of distributions |
19 |
212 |
386 |
3,940 |
|
Shares redeemed |
(1,489) |
(1,871) |
(33,603) |
(34,844) |
|
Net increase (decrease) |
(151) |
(879) |
$ (3,185) |
$ (16,253) |
|
Class B |
|
|
|
|
|
Shares sold |
84 |
14 |
$ 1,875 |
$ 233 |
|
Reinvestment of distributions |
1 |
8 |
19 |
147 |
|
Shares redeemed |
(200) |
(242) |
(4,324) |
(4,364) |
|
Net increase (decrease) |
(115) |
(220) |
$ (2,430) |
$ (3,984) |
|
Class C |
|
|
|
|
|
Shares sold |
483 |
306 |
$ 10,663 |
$ 5,607 |
|
Reinvestment of distributions |
5 |
47 |
103 |
851 |
|
Shares redeemed |
(547) |
(558) |
(11,826) |
(10,063) |
|
Net increase (decrease) |
(59) |
(205) |
$ (1,060) |
$ (3,605) |
Annual Report
10. Share Transactions - continued
|
|
Shares |
Dollars |
||
|
Years ended November 30, |
2013 |
2012 |
2013 |
2012 |
|
Institutional Class |
|
|
|
|
|
Shares sold |
3,091 |
9,408 |
$ 67,555 |
$ 179,442 |
|
Reinvestment of distributions |
75 |
1,996 |
1,511 |
36,899 |
|
Shares redeemed |
(54,343) A |
(18,539) |
(1,190,196) A |
(349,047) |
|
Net increase (decrease) |
(51,177) |
(7,135) |
$ (1,121,130) |
$ (132,706) |
A Amount includes in-kind redemptions (see Note 5: Redemptions In-Kind).
11. Other.
The Fund's organizational documents provide former and current trustees and officers with a limited indemnification against liabilities arising in connection with the performance of their duties to the Fund. In the normal course of business, the Fund may also enter into contracts that provide general indemnifications. The Fund's maximum exposure under these arrangements is unknown as this would be dependent on future claims that may be made against the Fund. The risk of material loss from such claims is considered remote.
Annual Report
Report of Independent Registered Public Accounting Firm
To the Trustees of Fidelity Advisor Series I and Shareholders of Fidelity Advisor Growth & Income Fund:
We have audited the accompanying statement of assets and liabilities of Fidelity Advisor Growth & Income Fund (the Fund), a fund of Fidelity Advisor Series I, including the schedule of investments, as of November 30, 2013, and the related statement of operations for the year then ended, the statement of changes in net assets for each of the two years in the period then ended, and the financial highlights for each of the five years in the period then ended. These financial statements and financial highlights are the responsibility of the Fund's management. Our responsibility is to express an opinion on these financial statements and financial highlights based on our audits.
We conducted our audits in accordance with the standards of the Public Company Accounting Oversight Board (United States). Those standards require that we plan and perform the audit to obtain reasonable assurance about whether the financial statements and financial highlights are free of material misstatement. The Fund is not required to have, nor were we engaged to perform, an audit of its internal control over financial reporting. Our audits included consideration of internal control over financial reporting as a basis for designing audit procedures that are appropriate in the circumstances, but not for the purpose of expressing an opinion on the effectiveness of the Fund's internal control over financial reporting. Accordingly, we express no such opinion. An audit also includes examining, on a test basis, evidence supporting the amounts and disclosures in the financial statements, assessing the accounting principles used and significant estimates made by management, as well as evaluating the overall financial statement presentation. Our procedures included confirmation of securities owned as of November 30, 2013, by correspondence with the custodians and brokers; where replies were not received from brokers, we performed other auditing procedures. We believe that our audits provide a reasonable basis for our opinion.
In our opinion, the financial statements and financial highlights referred to above present fairly, in all material respects, the financial position of Fidelity Advisor Growth & Income Fund as of November 30, 2013, the results of its operations for the year then ended, the changes in its net assets for each of the two years in the period then ended, and the financial highlights for each of the five years in the period then ended, in conformity with accounting principles generally accepted in the United States of America.
DELOITTE & TOUCHE LLP
Boston, Massachusetts
January 14, 2014
Annual Report
Trustees and Officers
The Trustees, Member of the Advisory Board, and officers of the trust and fund, as applicable, are listed below. The Board of Trustees governs the fund and is responsible for protecting the interests of shareholders. The Trustees are experienced executives who meet periodically throughout the year to oversee the fund's activities, review contractual arrangements with companies that provide services to the fund, oversee management of the risks associated with such activities and contractual arrangements, and review the fund's performance. Except for James C. Curvey, Ned C. Lautenbach, Ronald P. O'Hanley, and William S. Stavropoulos, each of the Trustees oversees 173 funds. Mr. Curvey oversees 396 funds. Mr. Lautenbach, Mr. O'Hanley, and Mr. Stavropoulos each oversees 247 funds.
The Trustees hold office without limit in time except that (a) any Trustee may resign; (b) any Trustee may be removed by written instrument, signed by at least two-thirds of the number of Trustees prior to such removal; (c) any Trustee who requests to be retired or who has become incapacitated by illness or injury may be retired by written instrument signed by a majority of the other Trustees; and (d) any Trustee may be removed at any special meeting of shareholders by a two-thirds vote of the outstanding voting securities of the trust. Each Trustee who is not an interested person (as defined in the 1940 Act) of the trust and the fund (Independent Trustee), shall retire not later than the last day of the calendar year in which his or her 75th birthday occurs. The Independent Trustees may waive this mandatory retirement age policy with respect to individual Trustees. The officers and Advisory Board Member hold office without limit in time, except that any officer and Advisory Board Member may resign or may be removed by a vote of a majority of the Trustees at any regular meeting or any special meeting of the Trustees. Except as indicated, each individual has held the office shown or other offices in the same company for the past five years.
Experience, Skills, Attributes, and Qualifications of the Fund's Trustees. The Governance and Nominating Committee has adopted a statement of policy that describes the experience, qualifications, attributes, and skills that are necessary and desirable for potential Independent Trustee candidates (Statement of Policy). The Board believes that each Trustee satisfied at the time he or she was initially elected or appointed a Trustee, and continues to satisfy, the standards contemplated by the Statement of Policy. The Governance and Nominating Committee also engages professional search firms to help identify potential Independent Trustee candidates who have the experience, qualifications, attributes, and skills consistent with the Statement of Policy. From time to time, additional criteria based on the composition and skills of the current Independent Trustees, as well as experience or skills that may be appropriate in light of future changes to board composition, business conditions, and regulatory or other developments, have also been considered by the professional search firms and the Governance and Nominating Committee. In addition, the Board takes into account the Trustees' commitment and participation in Board and committee meetings, as well as their leadership of standing and ad hoc committees throughout their tenure.
Annual Report
In determining that a particular Trustee was and continues to be qualified to serve as a Trustee, the Board has considered a variety of criteria, none of which, in isolation, was controlling. The Board believes that, collectively, the Trustees have balanced and diverse experience, qualifications, attributes, and skills, which allow the Board to operate effectively in governing the fund and protecting the interests of shareholders. Information about the specific experience, skills, attributes, and qualifications of each Trustee, which in each case led to the Board's conclusion that the Trustee should serve (or continue to serve) as a trustee of the fund, is provided below.
Board Structure and Oversight Function. James C. Curvey is an interested person (as defined in the 1940 Act) and currently serves as Chairman. The Trustees have determined that an interested Chairman is appropriate and benefits shareholders because an interested Chairman has a personal and professional stake in the quality and continuity of services provided to the fund. Independent Trustees exercise their informed business judgment to appoint an individual of their choosing to serve as Chairman, regardless of whether the Trustee happens to be independent or a member of management. The Independent Trustees have determined that they can act independently and effectively without having an Independent Trustee serve as Chairman and that a key structural component for assuring that they are in a position to do so is for the Independent Trustees to constitute a substantial majority for the Board. The Independent Trustees also regularly meet in executive session. Ned C. Lautenbach serves as Chairman of the Independent Trustees and as such (i) acts as a liaison between the Independent Trustees and management with respect to matters important to the Independent Trustees and (ii) with management prepares agendas for Board meetings.
Fidelity funds are overseen by different Boards of Trustees. The fund's Board oversees Fidelity's equity and high income funds and another Board oversees Fidelity's investment-grade bond, money market, and asset allocation funds. The asset allocation funds may invest in Fidelity funds overseen by the fund's Board. The use of separate Boards, each with its own committee structure, allows the Trustees of each group of Fidelity funds to focus on the unique issues of the funds they oversee, including common research, investment, and operational issues. On occasion, the separate Boards establish joint committees to address issues of overlapping consequences for the Fidelity funds overseen by each Board.
The Trustees operate using a system of committees to facilitate the timely and efficient consideration of all matters of importance to the Trustees, the fund, and fund shareholders and to facilitate compliance with legal and regulatory requirements and oversight of the fund's activities and associated risks. The Board, acting through its committees, has charged FMR and its affiliates with (i) identifying events or circumstances the occurrence of which could have demonstrably adverse effects on the fund's business and/or reputation; (ii) implementing processes and controls to lessen the possibility that such events or circumstances occur or to mitigate the effects of such events or circumstances if they do occur; and (iii) creating and maintaining a system designed to evaluate continuously business and market conditions in order to facilitate the identification and implementation processes described in (i) and (ii) above. Because the day-to-day operations and activities of the fund are carried out by or through FMR, its affiliates and other service providers, the fund's exposure to risks is mitigated but not eliminated by the processes overseen by the Trustees. While each of the Board's committees has responsibility for overseeing different aspects of the fund's activities, oversight is exercised primarily through the Operations, Audit, and Compliance Committees. In addition, the Independent Trustees have worked with FMR to enhance the Board's oversight of investment and financial risks, legal and regulatory risks, technology risks, and operational risks, including the development of additional risk reporting to the Board. For example, a working group comprised of Independent Trustees and FMR has worked and continues to work to review the Fidelity fund's valuation-related activities, reporting and risk management. Appropriate personnel, including but not limited to the fund's Chief Compliance Officer (CCO), FMR's internal auditor, the independent accountants, the fund's Treasurer and portfolio management personnel, make periodic reports to the Board's committees, as appropriate, including an annual review of FMR's risk management program for the Fidelity funds. The responsibilities of each standing committee, including their oversight responsibilities, are described further under "Standing Committees of the Fund's Trustees."
Annual Report
Trustees and Officers - continued
The fund's Statement of Additional Information (SAI) includes more information about the Trustees. To request a free copy, call Fidelity at 1-877-208-0098.
Interested Trustees*:
Correspondence intended for each Trustee who is an interested person may be sent to Fidelity Investments, 245 Summer Street, Boston, Massachusetts 02210.
|
Name, Year of Birth; Principal Occupations and Other Relevant Experience+ |
|
|
James C. Curvey (1935) |
|
|
Year of Election or Appointment: 2007 Trustee Chairman of the Board of Trustees |
|
|
|
Mr. Curvey also serves as Trustee of other Fidelity funds. Mr. Curvey is a Director of Fidelity Investments Money Management, Inc. (2009-present), Director of Fidelity Research & Analysis Co. (2009-present) and Director of FMR and FMR Co., Inc. (2007-present). Mr. Curvey is also Vice Chairman (2007-present) and Director of FMR LLC. In addition, Mr. Curvey serves as an Overseer for the Boston Symphony Orchestra and a member of the Trustees of Villanova University. Previously, Mr. Curvey was the Vice Chairman (2006-2007) and Director (2000-2007) of FMR Corp. |
|
Ronald P. O'Hanley (1957) |
|
|
Year of Election or Appointment: 2011 Trustee |
|
|
|
Mr. O'Hanley also serves as Trustee of other Fidelity funds. He is Director of Fidelity SelectCo, LLC (2013-present), FMR Co., Inc. (2010-present), Director of Fidelity Investments Money Management, Inc. (2010-present), Director of Fidelity Research & Analysis Company (2010-present), President of Fidelity Asset Management and Corporate Services and a Member of Fidelity's Executive Committee (2010-present). Previously, Mr. O'Hanley served as President and Chief Executive Officer of BNY Mellon Asset Management (2007-2010). Mr. O'Hanley also served as Vice Chairman of Bank New York Mellon Corp. and a member of that firm's Executive Committee. Prior to the 2007 merger of The Bank of New York and Mellon Financial Corporation, he was Vice Chairman of Mellon Financial Corporation and President and Chief Executive Officer of Mellon Asset Management. He joined Mellon in February 1997. Mr. O'Hanley currently serves as Chairman of the Boston Public Library Foundation Board of Directors and sits on the Board of Directors of Beth Israel Deaconess Medical Center, the Board of Trustees of the Marine Biological Laboratory and the Advisory Board of the Maxwell School of Citizenship and Public Administration at Syracuse University. Mr. O'Hanley also chairs the Council on Asset Management for the Financial Services Roundtable and is a member of the Board of Directors of Institutional Investor's U.S. Institute. |
* Trustees have been determined to be "Interested Trustees" by virtue of, among other things, their affiliation with the trust or various entities under common control with FMR.
+ The information above includes each Trustee's principal occupation during the last five years and other information relating to the experience, attributes, and skills relevant to each Trustee's qualifications to serve as a Trustee, which led to the conclusion that each Trustee should serve as a Trustee for the fund.
Annual Report
Trustees and Officers - continued
Independent Trustees:
Correspondence intended for each Independent Trustee (that is, the Trustees other than the Interested Trustees) may be sent to Fidelity Investments, P.O. Box 55235, Boston, Massachusetts 02205-5235.
|
Name, Year of Birth; Principal Occupations and Other Relevant Experience+ |
|
|
Dennis J. Dirks (1948) |
|
|
Year of Election or Appointment: 2005 Trustee |
|
|
|
Mr. Dirks also serves as Trustee of other Fidelity funds. Prior to his retirement in May 2003, Mr. Dirks was Chief Operating Officer and a member of the Board of The Depository Trust & Clearing Corporation (DTCC). He also served as President, Chief Operating Officer, and Board member of The Depository Trust Company (DTC) and President and Board member of the National Securities Clearing Corporation (NSCC). In addition, Mr. Dirks served as Chief Executive Officer and Board member of the Government Securities Clearing Corporation, Chief Executive Officer and Board member of the Mortgage-Backed Securities Clearing Corporation, as a Trustee and a member of the Finance Committee of Manhattan College (2005-2008), and as a Trustee and a member of the Finance Committee of AHRC of Nassau County (2006-2008). Mr. Dirks is a member of the Independent Directors Council (IDC) Governing Council (2010-present) and Board of Directors for The Brookville Center for Children's Services, Inc. (2009-present). |
|
Alan J. Lacy (1953) |
|
|
Year of Election or Appointment: 2008 Trustee |
|
|
|
Mr. Lacy also serves as Trustee of other Fidelity funds. Mr. Lacy serves as Senior Adviser (2007-present) of Oak Hill Capital Partners, L.P. (private equity). Mr. Lacy also served as Chief Executive Officer (2000-2005) and Vice Chairman (2005-2006) of Sears Holdings Corporation and Sears, Roebuck and Co. (retail). In addition, Mr. Lacy serves as a member of the Board of Directors of Dave & Buster's Entertainment, Inc. (restaurant and entertainment complexes, 2010-present), Earth Fare, Inc. (retail grocery, 2012-present), The Hillman Companies, Inc. (hardware wholesalers, 2010-present), and Bristol-Myers Squibb Company (global pharmaceuticals, 2008-present). Mr. Lacy is a member of the Board of Trustees of The National Parks Conservation Association (2006-present). Previously, Mr. Lacy served as Chairman of the Board of Trustees of the National Parks Conservation Association (2008-2011) and as a member of the Board of Directors for the Western Union Company (global money transfer, 2006-2011). |
|
Ned C. Lautenbach (1944) |
|
|
Year of Election or Appointment: 2000 Trustee Chairman of the Independent Trustees |
|
|
|
Mr. Lautenbach also serves as Trustee of other Fidelity funds. Mr. Lautenbach currently serves as the Lead Director of the Eaton Corporation Board of Directors (diversified industrial, 1997-present). Mr. Lautenbach is Chairman of the Board of Directors of the Philharmonic Center for the Arts in Naples, Florida (2012-present) and a member of the Council on Foreign Relations (1994-present). Previously, Mr. Lautenbach was a Partner/Advisory Partner at Clayton, Dubilier & Rice, LLC (private equity investment, 1998-2010), as well as a Director of Sony Corporation (2006-2007). |
|
Joseph Mauriello (1944) |
|
|
Year of Election or Appointment: 2008 Trustee |
|
|
|
Mr. Mauriello also serves as Trustee of other Fidelity funds. Prior to his retirement in January 2006, Mr. Mauriello served in numerous senior management positions including Deputy Chairman and Chief Operating Officer (2004-2005), and Vice Chairman of Financial Services (2002-2004) of KPMG LLP US (professional services, 1965-2005). Mr. Mauriello currently serves as a member of the Board of Directors of XL Group plc. (global insurance and re-insurance, 2006-present). Previously, Mr. Mauriello served as a Director of the Hamilton Funds of the Bank of New York (2006-2007) and of Arcadia Resources Inc. (health care services and products, 2007-2012). |
|
Robert W. Selander (1950) |
|
|
Year of Election or Appointment: 2011 Trustee |
|
|
|
Mr. Selander also serves as Trustee of other Fidelity funds. Previously, Mr. Selander served as a Member of the Advisory Board of other Fidelity funds (2011), and Executive Vice Chairman (2010), Chief Executive Officer (2009-2010), and President and Chief Executive Officer (1997-2009) of Mastercard, Inc. |
|
Cornelia M. Small (1944) |
|
|
Year of Election or Appointment: 2005 Trustee |
|
|
|
Ms. Small also serves as Trustee of other Fidelity funds. Ms. Small is a member of the Board of Directors (2009-present) and Chair of the Investment Committee (2010-present) of the Teagle Foundation. Ms. Small also serves on the Investment Committee of the Berkshire Taconic Community Foundation (2008-present). Previously, Ms. Small served as Chairperson (2002-2008) and a member of the Investment Committee and Chairperson (2008-2012) and a member of the Board of Trustees of Smith College. In addition, Ms. Small served as Chief Investment Officer, Director of Global Equity Investments, and a member of the Board of Directors of Scudder, Stevens & Clark and Scudder Kemper Investments. |
|
William S. Stavropoulos (1939) |
|
|
Year of Election or Appointment: 2002 Trustee Vice Chairman of the Independent Trustees |
|
|
|
Mr. Stavropoulos also serves as Trustee of other Fidelity funds. Mr. Stavropoulos serves as President and Founder of the Michigan Baseball Foundation, the Great Lakes Loons (2007-present). Mr. Stavropoulos is Chairman Emeritus of the Board of Directors of The Dow Chemical Company, where he previously served in numerous senior management positions, including President, CEO (1995-2000; 2002-2004), Chairman of the Executive Committee (2000-2006), and as a member of the Board of Directors (1990-2006). Currently, Mr. Stavropoulos is Chairman of the Board of Directors of Univar Inc. (global distributor of commodity and specialty chemicals), a Director of Teradata Corporation (data warehousing and technology solutions), and Maersk Inc. (industrial conglomerate), and a member of the Advisory Board for Metalmark Capital LLC (private equity investment, 2005-present). Mr. Stavropoulos is an operating advisor to Clayton, Dubilier & Rice, LLC (private equity investment). In addition, Mr. Stavropoulos is a member of the University of Notre Dame Advisory Council for the College of Science, a Trustee of the Rollin L. Gerstacker Foundation, and a Director of the Naples Philharmonic Center for the Arts. Previously, Mr. Stavropoulos served as a Director of Chemical Financial Corporation (bank holding company, 1993-2012) and Tyco International, Ltd. (multinational manufacturing and services, 2007-2012). |
|
David M. Thomas (1949) |
|
|
Year of Election or Appointment: 2008 Trustee |
|
|
|
Mr. Thomas also serves as Trustee of other Fidelity funds. Mr. Thomas serves as Non-Executive Chairman of the Board of Directors of Fortune Brands Home and Security (home and security products, 2011-present), and as a member of the Board of Directors of Interpublic Group of Companies, Inc. (marketing communication, 2004-present). Previously, Mr. Thomas served as Executive Chairman (2005-2006) and Chairman and Chief Executive Officer (2000-2005) of IMS Health, Inc. (pharmaceutical and healthcare information solutions), and a Director of Fortune Brands, Inc. (consumer products, 2000-2011). |
+ The information above includes each Trustee's principal occupation during the last five years and other information relating to the experience, attributes, and skills relevant to each Trustee's qualifications to serve as a Trustee, which led to the conclusion that each Trustee should serve as a Trustee for the fund.
Advisory Board Member and Officers:
Correspondence intended for each officer and Peter S. Lynch may be sent to Fidelity Investments, 245 Summer Street, Boston, Massachusetts 02210. Officers appear below in alphabetical order.
|
Name, Year of Birth; Principal Occupation |
|
|
Peter S. Lynch (1944) |
|
|
Year of Election or Appointment: 2003 Member of the Advisory Board |
|
|
|
Mr. Lynch also serves as Member of the Advisory Board of other Fidelity funds. Mr. Lynch is Vice Chairman and a Director of FMR and FMR Co., Inc. In addition, Mr. Lynch serves as a Trustee of Boston College and as the Chairman of the Inner-City Scholarship Fund. Previously, Mr. Lynch served on the Special Olympics International Board of Directors (1997-2006). |
|
Elizabeth Paige Baumann (1968) |
|
|
Year of Election or Appointment: 2012 Anti-Money Laundering (AML) Officer |
|
|
|
Ms. Baumann also serves as AML Officer of other funds. She is Chief AML Officer of FMR LLC (2012-present) and is an employee of Fidelity Investments. Previously, Ms. Baumann served as Vice President and Deputy Anti-Money Laundering Officer (2007-2012). |
|
William C. Coffey (1969) |
|
|
Year of Election or Appointment: 2009 Assistant Secretary |
|
|
|
Mr. Coffey also serves as Assistant Secretary of other funds. He is Senior Vice President and Deputy General Counsel of FMR LLC (2010-present), and is an employee of Fidelity Investments. Previously, Mr. Coffey served as Vice President and Associate General Counsel of FMR LLC (2005-2009). |
|
Jonathan Davis (1968) |
|
|
Year of Election or Appointment: 2010 Assistant Treasurer |
|
|
|
Mr. Davis also serves as Assistant Treasurer of other funds. Mr. Davis is an employee of Fidelity Investments. Previously, Mr. Davis served as Vice President and Associate General Counsel of FMR LLC (2003-2010). |
|
Adrien E. Deberghes (1967) |
|
|
Year of Election or Appointment: 2008 Deputy Treasurer |
|
|
|
Mr. Deberghes also serves as an officer of other funds. He is an employee of Fidelity Investments (2008-present). Prior to joining Fidelity Investments, Mr. Deberghes was Senior Vice President of Mutual Fund Administration at State Street Corporation (2007-2008), Senior Director of Mutual Fund Administration at Investors Bank & Trust (2005-2007), and Director of Finance for Dunkin' Brands (2000-2005). |
|
Stephanie J. Dorsey (1969) |
|
|
Year of Election or Appointment: 2010 Assistant Treasurer |
|
|
|
Ms. Dorsey also serves as an officer of other funds. She is an employee of Fidelity Investments (2008-present) and has served in other fund officer roles. Prior to joining Fidelity Investments, Ms. Dorsey served as Treasurer (2004-2008) of the JPMorgan Mutual Funds and Vice President (2004-2008) of JPMorgan Chase Bank. |
|
Scott C. Goebel (1968) |
|
|
Year of Election or Appointment: 2008 Secretary and Chief Legal Officer (CLO) |
|
|
|
Mr. Goebel serves as Secretary and CLO of other funds. Mr. Goebel also serves as Secretary of Fidelity Investments Money Management, Inc. (FIMM) (2010-present) and Fidelity Research and Analysis Company (FRAC) (2010-present); General Counsel, Secretary, and Senior Vice President of FMR (2008-present) and FMR Co., Inc. (2008-present); Chief Legal Officer of Fidelity Management & Research (Hong Kong) Limited (2008-present) and Assistant Secretary of Fidelity Management & Research (Japan) Inc. (2008-present), and Fidelity Management & Research (U.K.) Inc. (2008-present). Previously, Mr. Goebel served as Secretary and CLO of other Fidelity funds (2008-2013), Assistant Secretary of FIMM (2008-2010), FRAC (2008-2010), and certain funds (2007-2008); and as Vice President and Secretary of Fidelity Distributors Corporation (FDC) (2005-2007). Mr. Goebel has been employed by FMR LLC or an affiliate since 2001. |
|
Joseph A. Hanlon (1968) |
|
|
Year of Election or Appointment: 2012 Chief Compliance Officer |
|
|
|
Mr. Hanlon also serves as Chief Compliance Officer of other funds. Mr. Hanlon serves as Compliance Officer of FMR, FMR Co., Inc., Fidelity Investments Money Management, Inc. (FIMM), Fidelity Research and Analysis Company (FRAC), and Fidelity Management & Research (Hong Kong) (2009-present), as Senior Vice President of the Fidelity Asset Management Division (2009-present), and is an employee of Fidelity Investments. Previously, Mr. Hanlon served as Compliance Officer of Fidelity Management & Research (Japan) Inc. (2009-2013), Strategic Advisers, Inc. (2009-2013), and Fidelity Management & Research (U.K.) Inc. (2009-2013). |
|
Bruce T. Herring (1965) |
|
|
Year of Election or Appointment: 2006 Vice President of certain Equity Funds |
|
|
|
Mr. Herring also serves as Vice President of other funds. He serves as Chief Investment Officer of Fidelity Global Asset Allocation (GAA) (2013-present), Chief Investment Officer and Director of Fidelity Management & Research (U.K.) Inc. (2010-present), Group Chief Investment Officer of FMR, and President of Fidelity Research & Analysis Company (2010-present). Previously, Mr. Herring served as Vice President (2005-2006) and Senior Vice President (2006-2007) of Fidelity Management & Research Company, Vice President of FMR Co., Inc. (2001-2007), and as a portfolio manager for Fidelity U.S. Equity Funds. |
|
Brian B. Hogan (1964) |
|
|
Year of Election or Appointment: 2009 Vice President |
|
|
|
Mr. Hogan also serves as Vice President of other funds. Mr. Hogan serves as President of FMR's Equity Division (2009-present). Previously, Mr. Hogan served as Senior Vice President, Equity Research of FMR (2006-2009) and as a portfolio manager. |
|
Chris Maher (1972) |
|
|
Year of Election or Appointment: 2013 Assistant Treasurer |
|
|
|
Mr. Maher serves as Assistant Treasurer of other funds. Mr. Maher is Vice President of Valuation Oversight and is an employee of Fidelity Investments. Previously, Mr. Maher served as Vice President of Asset Management Compliance (2013), Vice President of FMR's Program Management Group (2010-2013), and Vice President of Valuation Oversight (2008-2010). |
|
Christine Reynolds (1958) |
|
|
Year of Election or Appointment: 2008 Chief Financial Officer |
|
|
|
Ms. Reynolds also serves as Chief Financial Officer of other funds. Ms. Reynolds became President of Fidelity Pricing and Cash Management Services (FPCMS) in August 2008. Ms. Reynolds served as Chief Operating Officer of FPCMS (2007-2008). Previously, Ms. Reynolds served as President, Treasurer, and Anti-Money Laundering officer of the Fidelity funds (2004-2007). |
|
Kenneth B. Robins (1969) |
|
|
Year of Election or Appointment: 2008 President and Treasurer |
|
|
|
Mr. Robins also serves as an officer of other funds. Mr. Robins serves as Executive Vice President of Fidelity Investments Money Management, Inc. (FIMM) (2013-present) and is an employee of Fidelity Investments (2004-present). Previously, Mr. Robins served in other fund officer roles. |
|
Gary W. Ryan (1958) |
|
|
Year of Election or Appointment: 2005 Assistant Treasurer |
|
|
|
Mr. Ryan also serves as Assistant Treasurer of other funds. Mr. Ryan is an employee of Fidelity Investments and has served in other fund officer roles. Previously, Mr. Ryan served as Vice President of Fund Reporting in Fidelity Pricing and Cash Management Services (FPCMS) (1999-2005). |
|
Stephen Sadoski (1971) |
|
|
Year of Election or Appointment: 2012 Deputy Treasurer |
|
|
|
Mr. Sadoski also serves as Deputy Treasurer of other funds. He is an employee of Fidelity Investments (2012-present) and has served in another fund officer role. Prior to joining Fidelity Investments, Mr. Sadoski served as an assistant chief accountant in the Division of Investment Management of the Securities and Exchange Commission (SEC) (2009-2012) and as a senior manager at Deloitte & Touche LLP (1997-2009). |
|
Stacie M. Smith (1974) |
|
|
Year of Election or Appointment: 2013 Deputy Treasurer |
|
|
|
Ms. Smith also serves as an officer of other funds. She is an employee of Fidelity Investments (2009-present) and has served in other fund officer roles. Prior to joining Fidelity Investments, Ms. Smith served as Senior Audit Manager of Ernst & Young LLP (1996-2009). |
|
Renee Stagnone (1975) |
|
|
Year of Election or Appointment: 2013 Deputy Treasurer |
|
|
|
Ms. Stagnone also serves as Deputy Treasurer of other funds. Ms. Stagnone is an employee of Fidelity Investments. |
|
Joseph F. Zambello (1957) |
|
|
Year of Election or Appointment: 2011 Deputy Treasurer |
|
|
|
Mr. Zambello also serves as Deputy Treasurer of other funds. Mr. Zambello is an employee of Fidelity Investments. Previously, Mr. Zambello served as Vice President of FMR's Program Management Group (2009-2011) and Vice President of the Transfer Agent Oversight Group (2005-2009). |
Annual Report
Distributions (Unaudited)
The Board of Trustees of Fidelity Advisor Growth & Income Fund voted to pay to shareholders of record at the opening of business on record date, the following distributions per share derived from capital gains realized from sales of portfolio securities, and dividends derived from net investment income:
|
|
Pay Date |
Record Date |
Dividend |
Capital Gain |
|
Class A |
12/16/13 |
12/13/13 |
$0.113 |
$0.110 |
|
Class A |
01/13/14 |
01/10/14 |
$0.000 |
$0.069 |
|
Class T |
12/16/13 |
12/13/13 |
$0.054 |
$0.110 |
|
Class T |
01/13/14 |
01/10/14 |
$0.000 |
$0.069 |
|
Class B |
12/16/13 |
12/13/13 |
$0.000 |
$0.110 |
|
Class B |
01/13/14 |
01/10/14 |
$0.000 |
$0.069 |
|
Class C |
12/16/13 |
12/13/13 |
$0.000 |
$0.110 |
|
Class C |
01/13/14 |
01/10/14 |
$0.000 |
$0.069 |
The fund hereby designates as a capital gain dividend with respect to the taxable year ended November 30, 2013 $25,748,475, or, if subsequently determined to be different, the net capital gain of such year.
Class A designates 98%, Class T designates 100%, Class B designates 100%, and Class C designates 100% of the dividends distributed during the fiscal year as qualifying for the dividends-received deduction for corporate shareholders.
Class A, Class T, Class B, and Class C designates 100% of dividends distributed during the fiscal year as amounts which may be taken into account as a dividend for purposes of the maximum rate under section 1(h)(11) of the Internal Revenue code.
The fund will notify shareholders in January 2014 of amounts for use in preparing 2013 income tax returns.
Annual Report
Board Approval of Investment Advisory Contracts and Management Fees
Fidelity Advisor Growth & Income Fund
Each year, the Board of Trustees, including the Independent Trustees (together, the Board), votes on the renewal of the management contract and sub-advisory agreements (together, the Advisory Contracts) for the fund. The Board, assisted by the advice of fund counsel and Independent Trustees' counsel, requests and considers a broad range of information relevant to the renewal of the Advisory Contracts throughout the year.
The Board meets regularly and, at each of its meetings, covers an extensive agenda of topics and materials and considers factors that are relevant to its annual consideration of the renewal of the fund's Advisory Contracts, including the services and support provided to the fund and its shareholders. The Board has established various standing committees, each composed of and chaired by Independent Trustees with varying backgrounds, to which the Board has assigned specific subject matter responsibilities in order to enhance effective decision-making by the Board. The Board, acting directly and through its Committees, requests and receives information concerning the annual consideration of the renewal of the fund's Advisory Contracts. The Board also meets as needed to consider matters specifically related to the Board's annual consideration of the renewal of Advisory Contracts. Members of the Board may also meet with trustees of other Fidelity funds through ad hoc joint committees to discuss certain matters relevant to the Fidelity funds.
At its July 2013 meeting, the Board, including the Independent Trustees, unanimously determined to renew the fund's Advisory Contracts. In reaching its determination, the Board considered all factors it believed relevant, including (i) the nature, extent, and quality of the services to be provided to the fund and its shareholders (including the investment performance of the fund); (ii) the competitiveness of the fund's management fee and total expense ratio relative to peer funds; (iii) the total costs of the services to be provided by and the profits to be realized by Fidelity from its relationship with the fund; (iv) the extent to which economies of scale exist and would be realized as the fund grows; and (v) whether fee levels reflect these economies of scale, if any, for the benefit of fund shareholders.
In considering whether to renew the Advisory Contracts for the fund, the Board reached a determination, with the assistance of fund counsel and Independent Trustees' counsel and through the exercise of its business judgment, that the renewal of the Advisory Contracts was in the best interests of the fund and its shareholders and that the compensation payable under the Advisory Contracts was fair and reasonable. The Board's decision to renew the Advisory Contracts was not based on any single factor, but rather was based on a comprehensive consideration of all the information provided to the Board at its meetings throughout the year. The Board, in reaching its determination to renew the Advisory Contracts, was aware that shareholders in the fund have a broad range of investment choices available to them, including a wide choice among mutual funds offered by Fidelity's competitors, and that the fund's shareholders, who have the opportunity to review and weigh the disclosure provided by the fund in its prospectus and other public disclosures, have chosen to invest in this fund, which is a part of the Fidelity family of funds.
Annual Report
Nature, Extent, and Quality of Services Provided. The Board considered the staffing within the investment adviser, Fidelity Management & Research Company (FMR), and the sub-advisers (together, the Investment Advisers) as it relates to the fund, including the backgrounds of the fund's investment personnel, and also considered the fund's investment objective, strategies, and related investment philosophy. The Independent Trustees also had discussions with senior management of Fidelity's investment operations and investment groups. The Board considered the structure of the portfolio manager compensation program and whether this structure provides appropriate incentives to act in the best interests of the fund.
Resources Dedicated to Investment Management and Support Services. The Board and the Fund Oversight and Research Committees reviewed the general qualifications and capabilities of the Investment Advisers' investment staff, including its size, education, experience, and resources, as well as the Investment Advisers' approach to recruiting, training, managing, and compensating investment personnel. The Board noted that FMR has continued to increase the resources devoted to non-U.S. offices, including expansion of Fidelity's global investment organization. The Board also noted that Fidelity's analysts have extensive resources, tools and capabilities that allow them to conduct sophisticated quantitative and fundamental analysis, as well as credit analysis of issuers, counterparties and guarantors. Further, the Board believes that Fidelity's investment professionals have sufficient access to global information and data so as to provide competitive investment results over time, and that those professionals also have access to sophisticated tools that permit them to assess portfolio construction and risk and performance attribution characteristics continuously, as well as to transmit new information and research conclusions rapidly around the world. Additionally, in its deliberations, the Board considered the Investment Advisers' trading and risk management capabilities and resources, which are an integral part of the investment management process.
Shareholder and Administrative Services. The Board considered (i) the nature, extent, quality, and cost of advisory, administrative, and shareholder services performed by the Investment Advisers and their affiliates under the Advisory Contracts and under separate agreements covering transfer agency, pricing and bookkeeping, and securities lending services for the fund; (ii) the nature and extent of the supervision of third party service providers, principally custodians and subcustodians; and (iii) the resources devoted to, and the record of compliance with, the fund's compliance policies and procedures. The Board also reviewed the allocation of fund brokerage, including allocations to brokers affiliated with the Investment Advisers, the use of brokerage commissions to pay fund expenses, and the use of "soft" commission dollars to pay for research services.
Annual Report
Board Approval of Investment Advisory Contracts and
Management Fees - continued
The Board noted that the growth of fund assets over time across the complex allows Fidelity to reinvest in the development of services designed to enhance the value or convenience of the Fidelity funds as investment vehicles. These services include 24-hour access to account information and market information through telephone representatives and over the Internet, investor education materials and asset allocation tools, and the expanded availability of Fidelity Investor Centers.
Investment in a Large Fund Family. The Board considered the benefits to shareholders of investing in a Fidelity fund, including the benefits of investing in a fund that is part of a large family of funds offering a variety of investment disciplines and providing a large variety of mutual fund investor services. The Board noted that Fidelity had taken, or had made recommendations that resulted in the Fidelity funds taking, a number of actions over the previous year that benefited particular funds, including (i) continuing to dedicate additional resources to investment research and to the support of the senior management team that oversees asset management; (ii) persisting in efforts to enhance Fidelity's global research capabilities; (iii) launching new funds and making other enhancements to meet client needs for global and income-oriented solutions; (iv) continuing to launch dedicated lower cost underlying funds to meet portfolio construction needs related to expanding underlying fund options for Fidelity funds of funds, specifically for the Freedom Fund product lines; (v) rationalizing product lines and gaining increased efficiencies through the mergers of several funds into other funds; (vi) strengthening Fidelity's index fund offerings by reducing investment minimums and adopting or lowering existing expense caps for certain funds and classes; (vii) enhancing Global Asset Allocation product offerings by launching new funds and strategies, including "open architecture" target date funds that utilize affiliated and unaffiliated sub-advisers; (viii) modifying the eligibility criteria for Institutional Class shares of Advisor funds to increase their marketability to a portion of the defined contribution plan market; (ix) creating a new low-cost retirement share class for certain Advisor funds to appeal to large retirement plans; (x) transitioning the management of certain Fidelity commodity funds to Geode Capital Management LLC, a registered commodity pool operator, while retaining administrative responsibilities for the funds; (xi) reorganizing a number of funds; and (xii) taking steps toward establishing a new Fidelity adviser to manage sector-based funds and products.
Investment Performance. The Board considered whether the fund has operated in accordance with its investment objective, as well as its record of compliance with its investment restrictions and its performance history.
The Board took into account discussions with the Investment Advisers about fund investment performance that occur at Board meetings throughout the year. In this regard the Board noted that as part of regularly scheduled fund reviews and other reports to the Board on fund performance, the Board periodically considers annualized return information for the fund, for different time periods, measured against a securities market index ("benchmark index") and a peer group of mutual funds with similar objectives ("peer group"). In its evaluation of fund investment performance, the Board gave particular attention to information indicating changes in performance of certain Fidelity funds for specific time periods and the Investment Advisers' explanations for any overperformance or underperformance.
Annual Report
In addition to reviewing absolute and relative fund performance, the Independent Trustees periodically consider the appropriateness of fund performance metrics in evaluating the results achieved. In general, the Independent Trustees believe that fund performance should be evaluated based on net performance (after fees and expenses) of both the highest performing and lowest performing classes, where applicable, compared to appropriate benchmark indices, over appropriate time periods which may include full market cycles, and compared to peer groups, as applicable, over the same periods, taking into account relevant factors including the following: general market conditions; issuer-specific information; tactical opportunities for investment; and fund cash flows and other factors.
The Independent Trustees recognize that shareholders evaluate performance on a net basis over their own holding periods, for which one-, three-, and five-year periods are used as a proxy. For this reason, the performance information reviewed by the Board also included net cumulative calendar year total return information for the fund and an appropriate benchmark index and peer group for the most recent one-, three-, and five-year periods, as shown below. Returns are shown compared to the 25th percentile (top of box) and 75th percentile (bottom of box) of the peer universe.
Annual Report
Board Approval of Investment Advisory Contracts and
Management Fees - continued
Fidelity Advisor Growth & Income Fund
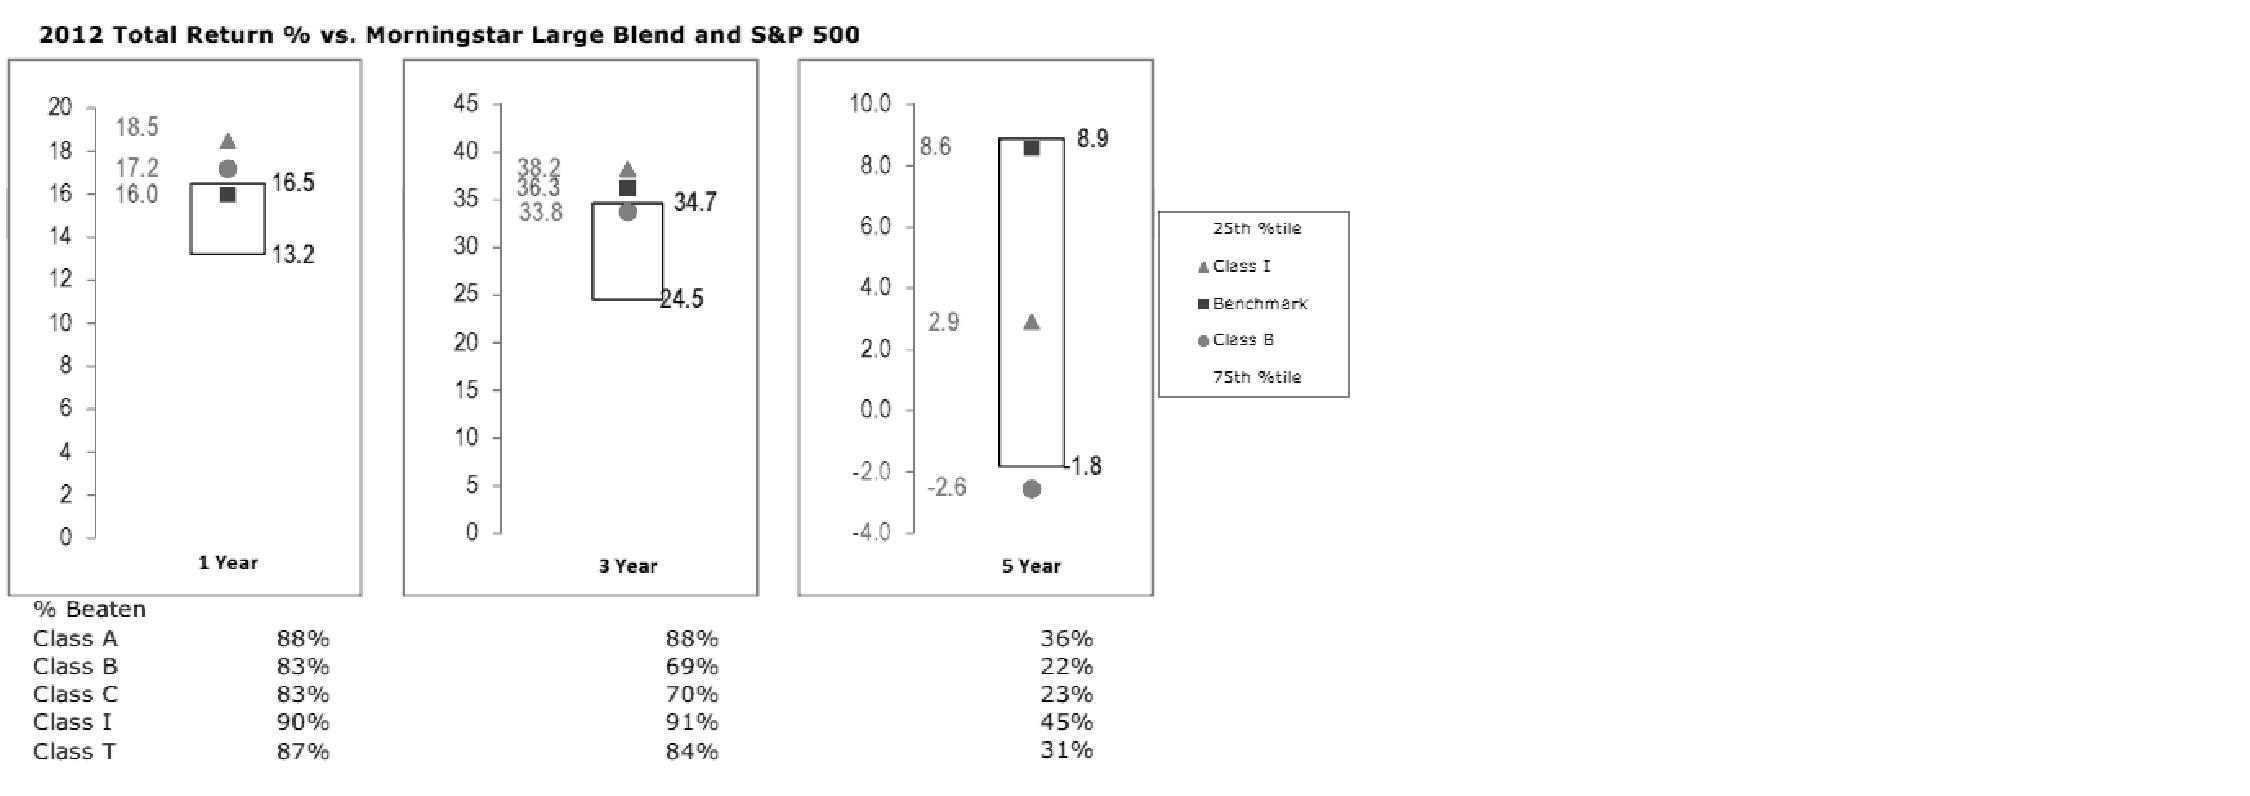
Based on its review, the Board concluded that the nature, extent, and quality of services provided to the fund under the Advisory Contracts should benefit the fund's shareholders.
Competitiveness of Management Fee and Total Expense Ratio. The Board considered the fund's management fee and total expense ratio compared to "mapped groups" of competitive funds and classes. Fidelity creates "mapped groups" by combining similar Lipper investment objective categories that have comparable management fee characteristics. Combining Lipper investment objective categories aids the Board's management fee and total expense ratio comparisons by broadening the competitive group used for comparison and by reducing the number of universes to which various Fidelity funds are compared.
Management Fee. The Board considered two proprietary management fee comparisons for the 12-month periods shown in the chart below. The group of Lipper funds used by the Board for management fee comparisons is referred to below as the "Total Mapped Group." The Total Mapped Group comparison focuses on a fund's standing in terms of gross management fees before expense reimbursements or caps relative to the total universe of funds with comparable investment mandates, regardless of whether their management fee structures also are comparable. Funds with comparable investment mandates offer exposure to similar types of securities. Funds with comparable management fee structures have similar management fee contractual arrangements (e.g., flat rate charged for advisory services, all-inclusive fee rate, etc.). "TMG %" represents the percentage of funds in the Total Mapped Group that had management fees that were lower than the fund's. For example, a TMG % of 15% means that 85% of the funds in the Total Mapped Group had higher management fees than the fund. The "Asset-Size Peer Group" (ASPG) comparison focuses on a fund's standing relative to a subset of non-Fidelity funds within the Total Mapped Group that are similar in size and management fee structure. The ASPG represents at least 15% of the funds in the Total Mapped Group with comparable asset size and management fee structures, subject to a minimum of 50 funds (or all funds in the Total Mapped Group if fewer than 50). Additional information, such as the ASPG quartile in which the fund's management fee ranked, is also included in the chart and considered by the Board.
Annual Report
Fidelity Advisor Growth & Income Fund

The Board noted that the fund's management fee ranked below the median of its Total Mapped Group and below the median of its ASPG for 2012.
Based on its review, the Board concluded that the fund's management fee is fair and reasonable in light of the services that the fund receives and the other factors considered.
Total Expense Ratio. In its review of each class's total expense ratio, the Board considered the fund's management fee as well as other fund or class expenses, as applicable, such as transfer agent fees, pricing and bookkeeping fees, fund-paid 12b-1 fees, and custodial, legal, and audit fees. The Board also noted the effects of any waivers and reimbursements on fees and expenses. As part of its review, the Board also considered the current and historical total expense ratios of each class of the fund compared to competitive fund median expenses. Each class of the fund is compared to those funds and classes in the Total Mapped Group (used by the Board for management fee comparisons) that have a similar sales load structure.
Annual Report
Board Approval of Investment Advisory Contracts and
Management Fees - continued
The Board noted that the total expense ratio of each of Class A, Class B, Class C, and Institutional Class ranked below its competitive median for 2012 and the total expense ratio of Class T ranked above its competitive median for 2012. The Board considered that, in general, various factors can affect total expense ratios. The Board noted that the total expense ratio of Class T was above the competitive median primarily because of higher 12b-1 fees on Class T. Class T has a higher 12b-1 fee, but a lower front-end sales charge, than traditionally priced front-end sales charge classes. The Board considered that Class T is primarily sold load-waived in the retirement plan market where its 0.50% 12b-1 fee is comparable to competing no-load, higher 12b-1 fee classes designed specifically for retirement plans. The Board noted that the fund offers multiple classes, each of which has a different sales load and 12b-1 fee structure, and that the multiple structures are intended to offer a range of pricing options for the intermediary market. The Board also noted that the total expense ratios of the classes vary primarily by the level of their 12b-1 fees, although differences in transfer agent fees may also cause expenses to vary from class to class.
Fees Charged to Other Fidelity Clients. The Board also considered Fidelity fee structures and other information with respect to clients of FMR and its affiliates, such as other mutual funds advised or subadvised by FMR or its affiliates, pension plan clients, and other institutional clients. The Board noted the findings of the 2013 ad hoc joint committee (created with the board of other Fidelity funds), which reviewed and compared Fidelity's institutional investment advisory business with its business of providing services to the Fidelity funds, including the differences in services provided, fees charged, and costs incurred, as well as competition in their respective marketplaces.
Based on its review of total expense ratios and fees charged to other Fidelity clients, the Board concluded that the total expense ratio of each class of the fund was reasonable, although Class T was above the median of the universe presented for comparison, in light of the services that the fund and its shareholders receive and the other factors considered.
Costs of the Services and Profitability. The Board considered the revenues earned and the expenses incurred by Fidelity in conducting the business of developing, marketing, distributing, managing, administering and servicing the fund and servicing the fund's shareholders. The Board also considered the level of Fidelity's profits in respect of all the Fidelity funds.
On an annual basis, FMR presents to the Board Fidelity's profitability for the fund. Fidelity calculates the profitability for each fund, as well as aggregate profitability for groups of Fidelity funds and all Fidelity funds, using a series of detailed revenue and cost allocation methodologies which originate with the books and records of Fidelity on which Fidelity's audited financial statements are based. The Audit Committee of the Board reviews any significant changes from the prior year's methodologies.
Annual Report
PricewaterhouseCoopers LLP (PwC), independent registered public accounting firm and auditor to Fidelity and certain Fidelity funds, has been engaged annually by the Board as part of the Board's assessment of Fidelity's profitability analysis. PwC's engagement includes the review and assessment of the methodologies used by Fidelity in determining the revenues and expenses attributable to Fidelity's mutual fund business, and completion of agreed-upon procedures surrounding the mathematical accuracy of fund profitability and its conformity to allocation methodologies. After considering PwC's reports issued under the engagement and information provided by Fidelity, the Board concluded that while other allocation methods may also be reasonable, Fidelity's profitability methodologies are reasonable in all material respects.
The Board also reviewed Fidelity's non-fund businesses and fall-out benefits related to the mutual fund business as well as cases where Fidelity's affiliates may benefit from or be related to the fund's business.
The Board considered the costs of the services provided by and the profits realized by Fidelity in connection with the operation of the fund and was satisfied that the profitability was not excessive in the circumstances.
Economies of Scale. The Board considered whether there have been economies of scale in respect of the management of the Fidelity funds, whether the Fidelity funds (including the fund) have appropriately benefited from any such economies of scale, and whether there is potential for realization of any further economies of scale. The Board considered the extent to which the fund will benefit from economies of scale through increased services to the fund, through waivers or reimbursements, or through fee or expense reductions. The Board also noted that in 2009, it and the board of other Fidelity funds created an ad hoc committee (the Economies of Scale Committee) to analyze whether FMR attains economies of scale in respect of the management and servicing of the Fidelity funds, whether the Fidelity funds have appropriately benefited from such economies of scale, and whether there is potential for realization of any further economies of scale.
The Board recognized that the fund's management contract incorporates a "group fee" structure, which provides for lower group fee rates as total fund assets under FMR's management increase, and for higher group fee rates as total fund assets under FMR's management decrease. FMR calculates the group fee rates based on a tiered asset "breakpoint" schedule that varies based on asset class. The Board considered that the group fee is designed to deliver the benefits of economies of scale to fund shareholders when total Fidelity fund assets increase, even if assets of any particular fund are unchanged or have declined, because some portion of Fidelity's costs are attributable to services provided to all Fidelity funds, and all funds benefit if those costs can be allocated among more assets. The Board concluded that, given the group fee structure, fund shareholders will benefit from lower management fees as assets under FMR's management increase at the fund complex level, regardless of whether Fidelity achieves any such economies of scale.
Annual Report
Board Approval of Investment Advisory Contracts and
Management Fees - continued
The Board concluded, taking into account the analysis of the Economies of Scale Committee, that economies of scale, if any, are being appropriately shared between fund shareholders and Fidelity.
Amendment to Description of Group Fee Rate. At its July 2013 meeting, the Board voted to approve an amendment to the fund's management contract to modify the description of the "group fee rate" effective August 1, 2013. The Board noted that under the prior description in the contract, the group fee rate was based on the average net assets of all registered investment companies with which FMR has management contracts. Under the contract's tiered asset breakpoint schedule, the group fee rate is lower as total fund assets under FMR's management increase, and higher as total fund assets under FMR's management decrease. The Board considered that the prior description would have excluded the assets of 64 Fidelity sector funds from the group fee rate calculation once Fidelity SelectCo, LLC, an affiliate of FMR, assumed management responsibilities for those funds. The Board noted that modifying the description of the group fee rate to continue to include the assets of those 64 funds for purposes of determining group fee rate breakpoints would avoid an immediate adverse impact on the group fee rate for any fund.
Additional Information Requested by the Board. In order to develop fully the factual basis for consideration of the Fidelity funds' Advisory Contracts, the Board requested and received additional information on certain topics, including: (i) fund performance trends and Fidelity's long-term strategies for certain funds; (ii) the potential to further rationalize the Fidelity fund lineup with the possibility of achieving savings for the funds and Fidelity; (iii) the methodology with respect to competitive fund data and peer group classifications; (iv) the arrangements with, and performance of, certain sub-advisers on behalf of the Fidelity funds, as well as certain proposed participating affiliate arrangements; (v) the realization of fall-out benefits in certain Fidelity business units; (vi) Fidelity's group fee structures, including the rationale for the individual fee rates of certain categories of funds and the definition of group assets; (vii) trends regarding industry use of performance fee structures and the performance adjustment methodologies applicable to the Fidelity funds; (viii) additional competitive analysis regarding the total expenses for certain classes; and (ix) fund profitability methodology, including Fidelity's cost allocation methodology, and the impact of certain factors on fund profitability results.
Based on its evaluation of all of the conclusions noted above, and after considering all factors it believed relevant, the Board ultimately concluded that the advisory fee structures are fair and reasonable, and that the fund's Advisory Contracts should be renewed.
Annual Report
Investment Adviser
Fidelity Management & Research Company
Boston, MA
Investment Sub-Advisers
FMR Co., Inc.
Fidelity Management & Research
(U.K.) Inc.
Fidelity Management & Research (Japan) Inc.
Fidelity Management & Research (Hong Kong) Limited
General Distributor
Fidelity Distributors Corporation
Smithfield, RI
Transfer and Service Agents
Fidelity Investments Institutional
Operations Company, Inc.
Boston, MA
Fidelity Service Company, Inc.
Boston, MA
Custodian
JPMorgan Chase Bank
New York, NY
(Fidelity Investment logo)(registered trademark)
AGAI-UANN-0114 1.786687.110
(Fidelity Investment logo)(registered trademark)
Fidelity Advisor®
Growth & Income
Fund - Institutional Class
Annual Report
November 30, 2013
(Fidelity Cover Art)
Contents
|
Performance |
How the fund has done over time. |
|
|
Management's Discussion of Fund Performance |
The Portfolio Manager's review of fund performance and strategy. |
|
|
Shareholder Expense Example |
An example of shareholder expenses. |
|
|
Investment Changes |
A summary of major shifts in the fund's investments over the past six months. |
|
|
Investments |
A complete list of the fund's investments with their market values. |
|
|
Financial Statements |
Statements of assets and liabilities, operations, and changes in net assets, as well as financial highlights. |
|
|
Notes |
Notes to the financial statements. |
|
|
Report of Independent Registered Public Accounting Firm |
|
|
|
Trustees and Officers |
|
|
|
Distributions |
|
|
|
Board Approval of Investment Advisory Contracts and Management Fees |
|
To view a fund's proxy voting guidelines and proxy voting record for the 12-month period ended June 30, visit http://www.fidelity.com/proxyvotingresults or visit the Securities and Exchange Commission's (SEC) web site at http://www.sec.gov. You may also call 1-877-208-0098 to request a free copy of the proxy voting guidelines.
Standard & Poor's, S&P and S&P 500 are registered service marks of The McGraw-Hill Companies, Inc. and have been licensed for use by Fidelity Distributors Corporation.
Other third-party marks appearing herein are the property of their respective owners.
All other marks appearing herein are registered or unregistered trademarks or service marks of FMR LLC or an affiliated company. © 2014 FMR LLC. All rights reserved.
Annual Report
This report and the financial statements contained herein are submitted for the general information of the shareholders of the fund. This report is not authorized for distribution to prospective investors in the fund unless preceded or accompanied by an effective prospectus.
A fund files its complete schedule of portfolio holdings with the SEC for the first and third quarters of each fiscal year on Form N-Q. Forms N-Q are available on the SEC's web site at http://www.sec.gov. A fund's Forms N-Q may be reviewed and copied at the SEC's Public Reference Room in Washington, DC. Information regarding the operation of the SEC's Public Reference Room may be obtained by calling 1-800-SEC-0330. For a complete list of a fund's portfolio holdings, view the most recent holdings listing, semiannual report, or annual report on Fidelity's web site at http://www.fidelity.com, http://www.advisor.fidelity.com, or http://www.401k.com, as applicable.
NOT FDIC INSURED • MAY LOSE VALUE • NO BANK GUARANTEE
Neither the fund nor Fidelity Distributors Corporation is a bank.
Annual Report
Performance: The Bottom Line
Average annual total return reflects the change in the value of an investment, assuming reinvestment of the class' distributions from dividend income and capital gains (the profits earned upon the sale of securities that have grown in value, if any) and assuming a constant rate of performance each year. The $10,000 table and the fund's returns do not reflect the deduction of taxes that a shareholder would pay on fund distributions or the redemption of fund shares. During periods of reimbursement by Fidelity, a fund's total return will be greater than it would be had the reimbursement not occurred. How a fund did yesterday is no guarantee of how it will do tomorrow.
Average Annual Total Returns
|
Periods ended November 30, 2013 |
Past 1 |
Past 5 |
Past 10 |
|
Institutional Class |
32.41% |
18.26% |
7.27% |
$10,000 Over 10 years
Let's say hypothetically that $10,000 was invested in Fidelity Advisor® Growth & Income Fund - Institutional Class on November 30, 2003. The chart shows how the value of your investment would have changed, and also shows how the S&P 500® Index performed over the same period.
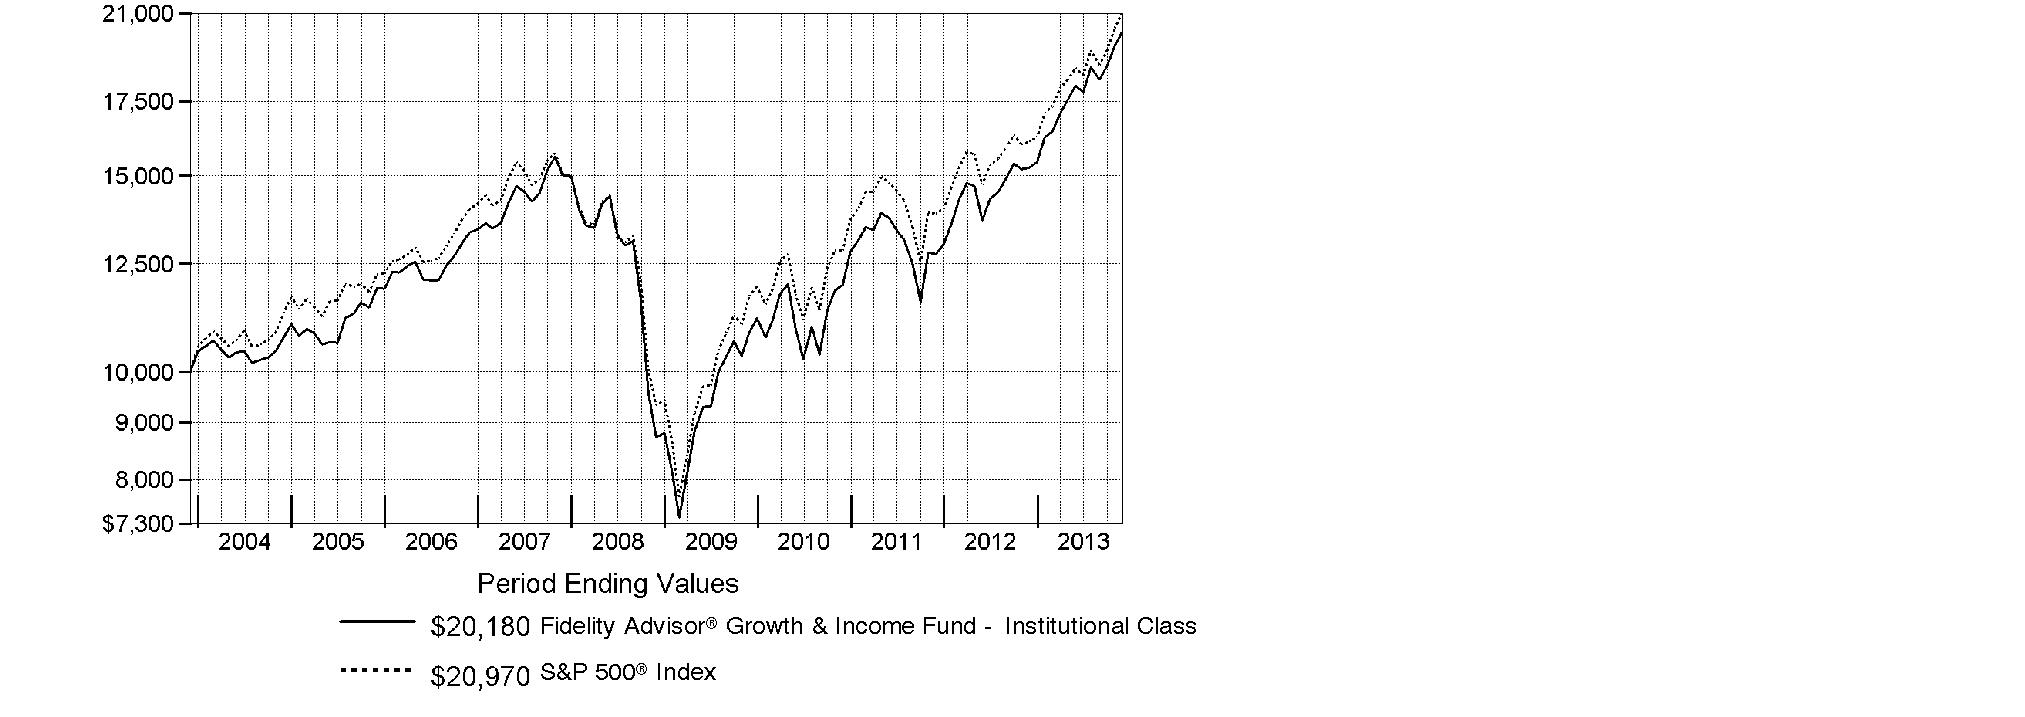
Annual Report
Management's Discussion of Fund Performance
Market Recap: With the current bull run nearing the five-year mark, equity benchmarks ripped up old records during the 12 months ending November 30, 2013. Gains were fueled by strengthening U.S. economic data, as well as generally improving economies and accommodative monetary policies worldwide. The broad S&P 500® Index reached new peaks in its 30.30% climb for the period, and the blue-chip Dow Jones Industrial AverageSM surpassed historic milestones en route to a 26.63% gain. The Nasdaq Composite Index®, up 36.73% amid a resurgence in growth-oriented stocks, closed above 4,000 for the first time since 2000. Shedding anxiety over the 2012 U.S. presidential election - and apparently confident that the federal debt-ceiling debate would be resolved - markets rose from period start through late May. News that the U.S. Federal Reserve was considering an end to its stimulative bond-buying kept stocks in flux over the summer but, by September, the Fed had set aside any imminent tapering. Despite jitters over a potential U.S. military strike in Syria and, later, an October budget impasse that briefly shuttered the federal government, volatility was subdued heading into the holidays, with investor optimism helping many markets home in on all-time highs at period end. Elsewhere, non-U.S. developed-market equities saw similar results, with the MSCI® EAFE® Index adding 24.97%.
Comments from Matt Fruhan, Portfolio Manager of Fidelity Advisor® Growth & Income Fund: For the year, the fund's Institutional Class shares gained 32.41%, topping the S&P 500®. Relative to the index, top individual contributors included discount brokerage Charles Schwab and retail drugstore chain Walgreen. When interest rates spiked based on speculation about when the U.S. Federal Reserve would begin to taper its stimulative bond purchases, Schwab's earning estimates exploded to the upside, and the stock went up dramatically. Walgreen gained on news it had ended a long contract dispute with pharmacy benefit manager Express Scripts Holding. I reduced the fund's exposure to both Schwab and Walgreen as the stocks gained, but both positions remained comfortably overweight at period end. Conversely, performance was hampered the most by an overweight in big-box retailer Target. The company's share price plunged in August after management revised its earnings forecast, mostly due to its larger-than-expected loss related to its recent expansion into. I maintained an overweight due to my conviction that the issues related to the company's entry into this new market can be corrected and the business remains on track for long-term growth that exceeds investors' expectations.
Annual Report
The views expressed above reflect those of the portfolio manager(s) only through the end of the period as stated on the cover of this report and do not necessarily represent the views of Fidelity or any other person in the Fidelity organization. Any such views are subject to change at any time based upon market or other conditions and Fidelity disclaims any responsibility to update such views. These views may not be relied on as investment advice and, because investment decisions for a Fidelity fund are based on numerous factors, may not be relied on as an indication of trading intent on behalf of any Fidelity fund.
Annual Report
Shareholder Expense Example
As a shareholder of the Fund, you incur two types of costs: (1) transaction costs, including sales charges (loads) on purchase payments or redemption proceeds, and (2) ongoing costs, including management fees, distribution and/or service (12b-1) fees and other Fund expenses. This Example is intended to help you understand your ongoing costs (in dollars) of investing in the Fund and to compare these costs with the ongoing costs of investing in other mutual funds.
The Example is based on an investment of $1,000 invested at the beginning of the period and held for the entire period (June 1, 2013 to November 30, 2013).
Actual Expenses
The first line of the accompanying table for each class of the Fund provides information about actual account values and actual expenses. You may use the information in this line, together with the amount you invested, to estimate the expenses that you paid over the period. Simply divide your account value by $1,000.00 (for example, an $8,600 account value divided by $1,000.00 = 8.6), then multiply the result by the number in the first line for a class of the Fund under the heading entitled "Expenses Paid During Period" to estimate the expenses you paid on your account during this period. In addition, the Fund, as a shareholder in the underlying Fidelity Central Funds, will indirectly bear its pro-rata share of the fees and expenses incurred by the underlying Fidelity Central Funds. These fees and expenses are not included in the Fund's annualized expense ratio used to calculate the expense estimate in the table below.
Hypothetical Example for Comparison Purposes
The second line of the accompanying table for each class of the Fund provides information about hypothetical account values and hypothetical expenses based on a Class' actual expense ratio and an assumed rate of return of 5% per year before expenses, which is not the Class' actual return. The hypothetical account values and expenses may not be used to estimate the actual ending account balance or expenses you paid for the period. You may use this information to compare the ongoing costs of investing in the Fund and other funds. To do so, compare this 5% hypothetical example with the 5% hypothetical examples that appear in the shareholder reports of the other funds. In addition, the Fund, as a shareholder in the underlying Fidelity Central Funds, will indirectly bear its pro-rata share of the fees and expenses incurred by the underlying Fidelity Central Funds. These fees and expenses are not included in the Fund's annualized expense ratio used to calculate the expense estimate in the table below.
Please note that the expenses shown in the table are meant to highlight your ongoing costs only and do not reflect any transaction costs. Therefore, the second line of the table is useful in comparing ongoing costs only, and will not help you determine the relative total costs of owning different funds. In addition, if these transactional costs were included, your costs would have been higher.
Annual Report
Shareholder Expense Example - continued
|
|
Annualized |
Beginning |
Ending |
Expenses Paid |
|
Class A |
1.02% |
|
|
|
|
Actual |
|
$ 1,000.00 |
$ 1,114.60 |
$ 5.41 |
|
HypotheticalA |
|
$ 1,000.00 |
$ 1,019.95 |
$ 5.17 |
|
Class T |
1.24% |
|
|
|
|
Actual |
|
$ 1,000.00 |
$ 1,113.80 |
$ 6.57 |
|
HypotheticalA |
|
$ 1,000.00 |
$ 1,018.85 |
$ 6.28 |
|
Class B |
1.81% |
|
|
|
|
Actual |
|
$ 1,000.00 |
$ 1,109.90 |
$ 9.57 |
|
HypotheticalA |
|
$ 1,000.00 |
$ 1,015.99 |
$ 9.15 |
|
Class C |
1.74% |
|
|
|
|
Actual |
|
$ 1,000.00 |
$ 1,110.80 |
$ 9.21 |
|
HypotheticalA |
|
$ 1,000.00 |
$ 1,016.34 |
$ 8.80 |
|
Institutional Class |
.68% |
|
|
|
|
Actual |
|
$ 1,000.00 |
$ 1,117.10 |
$ 3.61 |
|
HypotheticalA |
|
$ 1,000.00 |
$ 1,021.66 |
$ 3.45 |
A 5% return per year before expenses
B Annualized expense ratio reflects expenses net of applicable fee waivers.
* Expenses are equal to each Class' annualized expense ratio, multiplied by the average account value over the period, multiplied by 183/365 (to reflect the one-half year period).
Annual Report
Investment Changes (Unaudited)
|
Top Ten Stocks as of November 30, 2013 |
||
|
|
% of fund's |
% of fund's net assets |
|
Apple, Inc. |
3.9 |
3.4 |
|
JPMorgan Chase & Co. |
3.8 |
3.9 |
|
General Electric Co. |
3.0 |
2.9 |
|
Microsoft Corp. |
2.9 |
2.5 |
|
Chevron Corp. |
2.4 |
2.8 |
|
Citigroup, Inc. |
2.1 |
2.1 |
|
Procter & Gamble Co. |
2.0 |
2.1 |
|
Google, Inc. Class A |
2.0 |
1.8 |
|
Wells Fargo & Co. |
1.9 |
2.8 |
|
Occidental Petroleum Corp. |
1.9 |
2.1 |
|
|
25.9 |
|
|
Top Five Market Sectors as of November 30, 2013 |
||
|
|
% of fund's |
% of fund's net assets |
|
Financials |
19.2 |
20.6 |
|
Information Technology |
18.5 |
16.8 |
|
Health Care |
12.8 |
13.9 |
|
Consumer Staples |
12.0 |
10.5 |
|
Energy |
11.8 |
12.3 |
|
Asset Allocation (% of fund's net assets) |
|||||||
|
As of November 30, 2013* |
As of May 31, 2013** |
||||||
 |
Stocks 98.9% |
|
|
Stocks 98.7% |
|
||
 |
Convertible |
|
|
Convertible |
|
||
 |
Short-Term |
|
|
Short-Term |
|
||
|
* Foreign investments |
13.3% |
|
** Foreign investments |
10.9% |
|
||

Annual Report
Investments November 30, 2013
Showing Percentage of Net Assets
|
Common Stocks - 98.9% |
|||
|
Shares |
Value (000s) |
||
|
CONSUMER DISCRETIONARY - 9.4% |
|||
|
Automobiles - 0.3% |
|||
|
Ford Motor Co. |
86,820 |
$ 1,483 |
|
|
Distributors - 0.1% |
|||
|
LKQ Corp. (a) |
15,790 |
523 |
|
|
Diversified Consumer Services - 0.3% |
|||
|
H&R Block, Inc. |
58,626 |
1,635 |
|
|
Hotels, Restaurants & Leisure - 1.4% |
|||
|
McDonald's Corp. |
45,545 |
4,435 |
|
|
Yum! Brands, Inc. |
44,664 |
3,469 |
|
|
|
7,904 |
||
|
Internet & Catalog Retail - 0.0% |
|||
|
Expedia, Inc. |
3,400 |
217 |
|
|
Leisure Equipment & Products - 0.3% |
|||
|
Mattel, Inc. |
43,679 |
2,021 |
|
|
Media - 3.0% |
|||
|
Comcast Corp. Class A (special) (non-vtg.) |
202,829 |
9,766 |
|
|
Scripps Networks Interactive, Inc. Class A |
6,920 |
516 |
|
|
Time Warner, Inc. |
106,576 |
7,003 |
|
|
|
17,285 |
||
|
Multiline Retail - 1.9% |
|||
|
Kohl's Corp. |
19,721 |
1,090 |
|
|
Target Corp. |
159,894 |
10,222 |
|
|
|
11,312 |
||
|
Specialty Retail - 1.7% |
|||
|
American Eagle Outfitters, Inc. |
23,611 |
384 |
|
|
H&M Hennes & Mauritz AB (B Shares) |
16,400 |
695 |
|
|
Lowe's Companies, Inc. |
170,940 |
8,116 |
|
|
Staples, Inc. |
48,629 |
755 |
|
|
|
9,950 |
||
|
Textiles, Apparel & Luxury Goods - 0.4% |
|||
|
adidas AG |
7,100 |
864 |
|
|
Coach, Inc. |
9,895 |
573 |
|
|
Li & Fung Ltd. |
672,000 |
915 |
|
|
|
2,352 |
||
|
TOTAL CONSUMER DISCRETIONARY |
54,682 |
||
|
CONSUMER STAPLES - 12.0% |
|||
|
Beverages - 2.9% |
|||
|
C&C Group PLC |
30,500 |
184 |
|
|
Common Stocks - continued |
|||
|
Shares |
Value (000s) |
||
|
CONSUMER STAPLES - continued |
|||
|
Beverages - continued |
|||
|
Coca-Cola Enterprises, Inc. |
1,800 |
$ 75 |
|
|
Diageo PLC |
9,636 |
307 |
|
|
Molson Coors Brewing Co. Class B |
24,797 |
1,306 |
|
|
PepsiCo, Inc. |
50,563 |
4,271 |
|
|
Pernod Ricard SA |
3,500 |
397 |
|
|
Remy Cointreau SA |
9,500 |
810 |
|
|
SABMiller PLC |
21,300 |
1,099 |
|
|
The Coca-Cola Co. |
204,664 |
8,225 |
|
|
|
16,674 |
||
|
Food & Staples Retailing - 2.1% |
|||
|
CVS Caremark Corp. |
46,751 |
3,130 |
|
|
Jeronimo Martins SGPS SA |
24,300 |
502 |
|
|
Sysco Corp. |
21,309 |
717 |
|
|
Walgreen Co. |
132,182 |
7,825 |
|
|
|
12,174 |
||
|
Food Products - 1.3% |
|||
|
Danone SA |
24,867 |
1,807 |
|
|
Kellogg Co. |
68,402 |
4,148 |
|
|
Mead Johnson Nutrition Co. Class A |
7,100 |
600 |
|
|
Unilever NV (Certificaten Van Aandelen) (Bearer) |
23,800 |
935 |
|
|
|
7,490 |
||
|
Household Products - 2.7% |
|||
|
Kimberly-Clark Corp. |
36,293 |
3,962 |
|
|
Procter & Gamble Co. |
138,835 |
11,693 |
|
|
Svenska Cellulosa AB (SCA) (B Shares) |
14,600 |
426 |
|
|
|
16,081 |
||
|
Personal Products - 0.0% |
|||
|
Oriflame Cosmetics SA SDR |
3,300 |
103 |
|
|
Tobacco - 3.0% |
|||
|
British American Tobacco PLC sponsored ADR |
77,076 |
8,195 |
|
|
Lorillard, Inc. |
108,467 |
5,568 |
|
|
Philip Morris International, Inc. |
40,721 |
3,483 |
|
|
|
17,246 |
||
|
TOTAL CONSUMER STAPLES |
69,768 |
||
|
ENERGY - 11.6% |
|||
|
Energy Equipment & Services - 1.2% |
|||
|
Ensco PLC Class A |
30,658 |
1,811 |
|
|
Common Stocks - continued |
|||
|
Shares |
Value (000s) |
||
|
ENERGY - continued |
|||
|
Energy Equipment & Services - continued |
|||
|
Halliburton Co. |
39,630 |
$ 2,088 |
|
|
Schlumberger Ltd. |
34,434 |
3,045 |
|
|
|
6,944 |
||
|
Oil, Gas & Consumable Fuels - 10.4% |
|||
|
Access Midstream Partners LP |
18,129 |
1,018 |
|
|
Apache Corp. |
37,814 |
3,460 |
|
|
Atlas Pipeline Partners LP |
50,620 |
1,770 |
|
|
BG Group PLC |
97,764 |
1,997 |
|
|
Canadian Natural Resources Ltd. |
117,450 |
3,867 |
|
|
Chevron Corp. |
113,461 |
13,892 |
|
|
ENI SpA |
24,300 |
582 |
|
|
Exxon Mobil Corp. |
42,125 |
3,938 |
|
|
Imperial Oil Ltd. |
14,300 |
617 |
|
|
Magellan Midstream Partners LP |
2,354 |
146 |
|
|
Markwest Energy Partners LP |
46,705 |
3,226 |
|
|
MPLX LP |
7,303 |
278 |
|
|
Occidental Petroleum Corp. |
116,007 |
11,016 |
|
|
Peabody Energy Corp. |
10,000 |
182 |
|
|
Royal Dutch Shell PLC Class A (United Kingdom) |
130,655 |
4,369 |
|
|
Suncor Energy, Inc. |
147,390 |
5,114 |
|
|
The Williams Companies, Inc. |
125,570 |
4,423 |
|
|
Western Gas Partners LP |
5,200 |
331 |
|
|
|
60,226 |
||
|
TOTAL ENERGY |
67,170 |
||
|
FINANCIALS - 19.2% |
|||
|
Capital Markets - 3.6% |
|||
|
Ashmore Group PLC |
91,687 |
591 |
|
|
Charles Schwab Corp. |
237,900 |
5,824 |
|
|
Greenhill & Co., Inc. |
9,726 |
532 |
|
|
KKR & Co. LP |
107,101 |
2,542 |
|
|
Morgan Stanley |
156,330 |
4,893 |
|
|
Northern Trust Corp. |
43,780 |
2,583 |
|
|
State Street Corp. |
49,379 |
3,585 |
|
|
UBS AG |
26,166 |
498 |
|
|
|
21,048 |
||
|
Commercial Banks - 5.1% |
|||
|
BNP Paribas SA |
6,900 |
518 |
|
|
Comerica, Inc. |
51,657 |
2,343 |
|
|
Common Stocks - continued |
|||
|
Shares |
Value (000s) |
||
|
FINANCIALS - continued |
|||
|
Commercial Banks - continued |
|||
|
Erste Group Bank AG |
18,300 |
$ 644 |
|
|
Nordea Bank AB |
44,400 |
574 |
|
|
PNC Financial Services Group, Inc. |
58,616 |
4,511 |
|
|
Standard Chartered PLC (United Kingdom) |
108,621 |
2,575 |
|
|
SunTrust Banks, Inc. |
29,735 |
1,077 |
|
|
U.S. Bancorp |
151,130 |
5,927 |
|
|
Wells Fargo & Co. |
255,894 |
11,264 |
|
|
|
29,433 |
||
|
Consumer Finance - 0.2% |
|||
|
SLM Corp. |
41,544 |
1,107 |
|
|
Diversified Financial Services - 7.5% |
|||
|
Bank of America Corp. |
468,161 |
7,406 |
|
|
Citigroup, Inc. |
232,322 |
12,294 |
|
|
JPMorgan Chase & Co. |
389,596 |
22,293 |
|
|
KKR Financial Holdings LLC |
157,566 |
1,509 |
|
|
|
43,502 |
||
|
Insurance - 1.8% |
|||
|
AFLAC, Inc. |
5,609 |
372 |
|
|
Arthur J. Gallagher & Co. |
14,219 |
662 |
|
|
Marsh & McLennan Companies, Inc. |
17,279 |
820 |
|
|
MetLife, Inc. |
134,887 |
7,040 |
|
|
MetLife, Inc. unit |
28,500 |
876 |
|
|
Ping An Insurance (Group) Co. of China Ltd. (H Shares) |
6,500 |
61 |
|
|
Prudential Financial, Inc. |
9,546 |
847 |
|
|
|
10,678 |
||
|
Real Estate Investment Trusts - 0.4% |
|||
|
BioMed Realty Trust, Inc. |
19,500 |
362 |
|
|
Sun Communities, Inc. |
43,746 |
1,785 |
|
|
|
2,147 |
||
|
Real Estate Management & Development - 0.3% |
|||
|
Beazer Pre-Owned Rental Homes, Inc. (a)(e) |
67,500 |
1,418 |
|
|
Thrifts & Mortgage Finance - 0.3% |
|||
|
Radian Group, Inc. |
119,190 |
1,700 |
|
|
TOTAL FINANCIALS |
111,033 |
||
|
HEALTH CARE - 12.1% |
|||
|
Biotechnology - 0.9% |
|||
|
Amgen, Inc. |
48,156 |
5,494 |
|
|
Common Stocks - continued |
|||
|
Shares |
Value (000s) |
||
|
HEALTH CARE - continued |
|||
|
Health Care Equipment & Supplies - 1.3% |
|||
|
Abbott Laboratories |
23,626 |
$ 902 |
|
|
Ansell Ltd. |
21,166 |
391 |
|
|
Baxter International, Inc. |
4,282 |
293 |
|
|
Coloplast A/S Series B |
3,100 |
204 |
|
|
ResMed, Inc. (d) |
6,468 |
316 |
|
|
St. Jude Medical, Inc. |
35,293 |
2,062 |
|
|
Stryker Corp. |
25,759 |
1,917 |
|
|
Zimmer Holdings, Inc. |
15,690 |
1,434 |
|
|
|
7,519 |
||
|
Health Care Providers & Services - 3.2% |
|||
|
Aetna, Inc. |
34,588 |
2,384 |
|
|
AmerisourceBergen Corp. |
5,000 |
353 |
|
|
Fresenius Medical Care AG & Co. KGaA |
9,600 |
673 |
|
|
McKesson Corp. |
23,233 |
3,854 |
|
|
Patterson Companies, Inc. |
12,600 |
523 |
|
|
Quest Diagnostics, Inc. |
75,152 |
4,580 |
|
|
UnitedHealth Group, Inc. |
53,336 |
3,972 |
|
|
WellPoint, Inc. |
20,575 |
1,911 |
|
|
|
18,250 |
||
|
Health Care Technology - 0.2% |
|||
|
Quality Systems, Inc. |
49,251 |
1,151 |
|
|
Life Sciences Tools & Services - 0.3% |
|||
|
Lonza Group AG |
17,031 |
1,587 |
|
|
Pharmaceuticals - 6.2% |
|||
|
AbbVie, Inc. |
60,826 |
2,947 |
|
|
AstraZeneca PLC sponsored ADR |
28,626 |
1,637 |
|
|
GlaxoSmithKline PLC sponsored ADR |
97,359 |
5,152 |
|
|
Johnson & Johnson |
94,001 |
8,898 |
|
|
Merck & Co., Inc. |
198,685 |
9,900 |
|
|
Novartis AG sponsored ADR |
38,993 |
3,085 |
|
|
Sanofi SA |
21,480 |
2,270 |
|
|
Teva Pharmaceutical Industries Ltd. sponsored ADR |
48,868 |
1,992 |
|
|
|
35,881 |
||
|
TOTAL HEALTH CARE |
69,882 |
||
|
INDUSTRIALS - 11.1% |
|||
|
Aerospace & Defense - 2.0% |
|||
|
Honeywell International, Inc. |
9,619 |
851 |
|
|
Rolls-Royce Group PLC |
13,700 |
277 |
|
|
Common Stocks - continued |
|||
|
Shares |
Value (000s) |
||
|
INDUSTRIALS - continued |
|||
|
Aerospace & Defense - continued |
|||
|
The Boeing Co. |
49,094 |
$ 6,591 |
|
|
United Technologies Corp. |
33,631 |
3,728 |
|
|
|
11,447 |
||
|
Air Freight & Logistics - 1.6% |
|||
|
C.H. Robinson Worldwide, Inc. |
44,426 |
2,605 |
|
|
United Parcel Service, Inc. Class B |
68,479 |
7,011 |
|
|
|
9,616 |
||
|
Building Products - 0.0% |
|||
|
Fagerhult AB |
1,924 |
60 |
|
|
Commercial Services & Supplies - 0.3% |
|||
|
KAR Auction Services, Inc. |
29,300 |
808 |
|
|
Ritchie Brothers Auctioneers, Inc. (d) |
35,400 |
731 |
|
|
|
1,539 |
||
|
Electrical Equipment - 0.3% |
|||
|
Hubbell, Inc. Class B |
15,082 |
1,627 |
|
|
Zumtobel AG |
6,734 |
106 |
|
|
|
1,733 |
||
|
Industrial Conglomerates - 3.0% |
|||
|
General Electric Co. |
648,793 |
17,297 |
|
|
Machinery - 1.1% |
|||
|
Andritz AG |
5,087 |
323 |
|
|
Caterpillar, Inc. |
7,752 |
656 |
|
|
Cummins, Inc. |
2,800 |
371 |
|
|
Douglas Dynamics, Inc. |
72,895 |
1,162 |
|
|
Ingersoll-Rand PLC |
30,447 |
2,175 |
|
|
ITT Corp. |
25,641 |
1,047 |
|
|
Pfeiffer Vacuum Technology AG |
2,546 |
317 |
|
|
Xylem, Inc. |
8,600 |
297 |
|
|
|
6,348 |
||
|
Professional Services - 0.4% |
|||
|
Acacia Research Corp. |
32,864 |
489 |
|
|
Amadeus Fire AG |
3,843 |
258 |
|
|
Bureau Veritas SA |
34,204 |
1,016 |
|
|
Michael Page International PLC |
86,694 |
674 |
|
|
|
2,437 |
||
|
Road & Rail - 1.6% |
|||
|
CSX Corp. |
188,633 |
5,144 |
|
|
Common Stocks - continued |
|||
|
Shares |
Value (000s) |
||
|
INDUSTRIALS - continued |
|||
|
Road & Rail - continued |
|||
|
J.B. Hunt Transport Services, Inc. |
20,925 |
$ 1,573 |
|
|
Norfolk Southern Corp. |
26,708 |
2,342 |
|
|
|
9,059 |
||
|
Trading Companies & Distributors - 0.8% |
|||
|
Beacon Roofing Supply, Inc. (a) |
17,130 |
637 |
|
|
Beijer (G&L) AG Series B |
8,289 |
179 |
|
|
Brenntag AG |
1,400 |
249 |
|
|
MSC Industrial Direct Co., Inc. Class A |
22,576 |
1,735 |
|
|
W.W. Grainger, Inc. |
6,773 |
1,747 |
|
|
Watsco, Inc. |
2,551 |
245 |
|
|
|
4,792 |
||
|
TOTAL INDUSTRIALS |
64,328 |
||
|
INFORMATION TECHNOLOGY - 18.5% |
|||
|
Communications Equipment - 2.2% |
|||
|
Cisco Systems, Inc. |
373,154 |
7,930 |
|
|
QUALCOMM, Inc. |
67,613 |
4,975 |
|
|
|
12,905 |
||
|
Computers & Peripherals - 4.1% |
|||
|
Apple, Inc. |
40,794 |
22,679 |
|
|
EMC Corp. |
44,630 |
1,064 |
|
|
|
23,743 |
||
|
Internet Software & Services - 2.0% |
|||
|
Google, Inc. Class A (a) |
10,761 |
11,402 |
|
|
IT Services - 5.5% |
|||
|
Accenture PLC Class A |
16,442 |
1,274 |
|
|
Cognizant Technology Solutions Corp. Class A (a) |
31,410 |
2,949 |
|
|
Fidelity National Information Services, Inc. |
39,338 |
1,994 |
|
|
IBM Corp. |
11,700 |
2,102 |
|
|
MasterCard, Inc. Class A |
7,939 |
6,040 |
|
|
Paychex, Inc. |
216,852 |
9,483 |
|
|
The Western Union Co. |
158,161 |
2,637 |
|
|
Visa, Inc. Class A |
26,835 |
5,460 |
|
|
|
31,939 |
||
|
Semiconductors & Semiconductor Equipment - 1.5% |
|||
|
Altera Corp. |
49,605 |
1,600 |
|
|
Analog Devices, Inc. |
27,573 |
1,330 |
|
|
Applied Materials, Inc. |
177,949 |
3,079 |
|
|
Common Stocks - continued |
|||
|
Shares |
Value (000s) |
||
|
INFORMATION TECHNOLOGY - continued |
|||
|
Semiconductors & Semiconductor Equipment - continued |
|||
|
Broadcom Corp. Class A |
74,864 |
$ 1,998 |
|
|
Maxim Integrated Products, Inc. |
19,900 |
567 |
|
|
|
8,574 |
||
|
Software - 3.2% |
|||
|
Microsoft Corp. |
441,901 |
16,850 |
|
|
Oracle Corp. |
58,236 |
2,055 |
|
|
|
18,905 |
||
|
TOTAL INFORMATION TECHNOLOGY |
107,468 |
||
|
MATERIALS - 2.3% |
|||
|
Chemicals - 2.0% |
|||
|
Airgas, Inc. |
14,252 |
1,548 |
|
|
E.I. du Pont de Nemours & Co. |
26,352 |
1,617 |
|
|
FMC Corp. |
14,899 |
1,086 |
|
|
Johnson Matthey PLC |
5,100 |
265 |
|
|
Monsanto Co. |
33,039 |
3,744 |
|
|
Potash Corp. of Saskatchewan, Inc. |
14,900 |
472 |
|
|
Royal DSM NV |
6,700 |
526 |
|
|
Syngenta AG (Switzerland) |
6,172 |
2,420 |
|
|
Tronox Ltd. Class A |
4,600 |
98 |
|
|
|
11,776 |
||
|
Metals & Mining - 0.3% |
|||
|
Freeport-McMoRan Copper & Gold, Inc. |
12,200 |
423 |
|
|
Grupo Mexico SA de CV Series B |
122,300 |
359 |
|
|
Southern Copper Corp. |
23,690 |
595 |
|
|
|
1,377 |
||
|
TOTAL MATERIALS |
13,153 |
||
|
TELECOMMUNICATION SERVICES - 1.9% |
|||
|
Diversified Telecommunication Services - 1.4% |
|||
|
CenturyLink, Inc. |
18,886 |
580 |
|
|
Verizon Communications, Inc. |
145,988 |
7,244 |
|
|
|
7,824 |
||
|
Wireless Telecommunication Services - 0.5% |
|||
|
Vodafone Group PLC sponsored ADR |
82,985 |
3,078 |
|
|
TOTAL TELECOMMUNICATION SERVICES |
10,902 |
||
|
Common Stocks - continued |
|||
|
Shares |
Value (000s) |
||
|
UTILITIES - 0.8% |
|||
|
Electric Utilities - 0.5% |
|||
|
Ceske Energeticke Zavody A/S |
5,900 |
$ 164 |
|
|
Duke Energy Corp. |
9,581 |
670 |
|
|
EDF SA |
15,400 |
573 |
|
|
Hawaiian Electric Industries, Inc. |
22,909 |
580 |
|
|
ITC Holdings Corp. |
5,641 |
510 |
|
|
Northeast Utilities |
8,165 |
335 |
|
|
|
2,832 |
||
|
Multi-Utilities - 0.3% |
|||
|
E.ON AG |
34,074 |
656 |
|
|
National Grid PLC |
8,665 |
110 |
|
|
Sempra Energy |
11,400 |
1,008 |
|
|
|
1,774 |
||
|
TOTAL UTILITIES |
4,606 |
||
|
TOTAL COMMON STOCKS (Cost $451,001) |
|
||
|
Convertible Preferred Stocks - 0.8% |
|||
|
|
|
|
|
|
HEALTH CARE - 0.7% |
|||
|
Health Care Equipment & Supplies - 0.7% |
|||
|
Alere, Inc. 3.00% |
14,654 |
4,045 |
|
|
INDUSTRIALS - 0.1% |
|||
|
Aerospace & Defense - 0.1% |
|||
|
United Technologies Corp. 7.50% |
9,200 |
601 |
|
|
TOTAL CONVERTIBLE PREFERRED STOCKS (Cost $4,525) |
|
||
|
Convertible Bonds - 0.2% |
||||
|
|
Principal |
|
||
|
ENERGY - 0.2% |
||||
|
Oil, Gas & Consumable Fuels - 0.2% |
||||
|
Amyris, Inc. 3% 2/27/17 |
|
$ 772 |
562 |
|
|
Peabody Energy Corp. 4.75% 12/15/41 |
|
600 |
482 |
|
|
|
1,044 |
|||
|
Convertible Bonds - continued |
||||
|
|
Principal |
Value (000s) |
||
|
HEALTH CARE - 0.0% |
||||
|
Health Care Equipment & Supplies - 0.0% |
||||
|
Volcano Corp. 1.75% 12/1/17 |
|
$ 280 |
$ 280 |
|
|
TOTAL CONVERTIBLE BONDS (Cost $1,503) |
|
|||
|
Money Market Funds - 0.2% |
|||
|
Shares |
|
||
|
Fidelity Securities Lending Cash Central Fund, 0.10% (b)(c) |
961,900 |
|
|
|
TOTAL INVESTMENT PORTFOLIO - 100.1% (Cost $457,991) |
579,924 |
||
|
NET OTHER ASSETS (LIABILITIES) - (0.1)% |
(486) |
||
|
NET ASSETS - 100% |
$ 579,438 |
||
|
Legend |
|
(a) Non-income producing |
|
(b) Affiliated fund that is generally available only to investment companies and other accounts managed by Fidelity Investments. The rate quoted is the annualized seven-day yield of the fund at period end. A complete unaudited listing of the fund's holdings as of its most recent quarter end is available upon request. In addition, each Fidelity Central Fund's financial statements, which are not covered by the Fund's Report of Independent Registered Public Accounting Firm, are available on the SEC's website or upon request. |
|
(c) Investment made with cash collateral received from securities on loan. |
|
(d) Security or a portion of the security is on loan at period end. |
|
(e) Restricted securities - Investment in securities not registered under the Securities Act of 1933 (excluding 144A issues). At the end of the period, the value of restricted securities (excluding 144A issues) amounted to $1,418,000 or 0.2% of net assets. |
|
Additional information on each restricted holding is as follows: |
|
Security |
Acquisition |
Acquisition |
|
Beazer Pre-Owned Rental Homes, Inc. |
5/3/12 - 10/23/12 |
$ 1,350 |
|
Affiliated Central Funds |
|
Information regarding fiscal year to date income earned by the Fund from investments in Fidelity Central Funds is as follows: |
|
Fund |
Income earned |
|
Fidelity Cash Central Fund |
$ 2 |
|
Fidelity Securities Lending Cash Central Fund |
35 |
|
Total |
$ 37 |
|
Other Information |
|
The following is a summary of the inputs used, as of November 30, 2013, involving the Fund's assets and liabilities carried at fair value. The inputs or methodology used for valuing securities may not be an indication of the risk associated with investing in those securities. For more information on valuation inputs, and their aggregation into the levels used in the table below, please refer to the Investment Valuation section in the accompanying Notes to Financial Statements. |
|
Valuation Inputs at Reporting Date: |
||||
|
Description |
Total |
Level 1 |
Level 2 |
Level 3 |
|
Investments in Securities: |
||||
|
Equities: |
||||
|
Consumer Discretionary |
$ 54,682 |
$ 54,682 |
$ - |
$ - |
|
Consumer Staples |
69,768 |
68,526 |
1,242 |
- |
|
Energy |
67,170 |
62,219 |
4,951 |
- |
|
Financials |
111,033 |
108,241 |
1,374 |
1,418 |
|
Health Care |
73,927 |
70,984 |
2,943 |
- |
|
Industrials |
64,929 |
64,929 |
- |
- |
|
Information Technology |
107,468 |
107,468 |
- |
- |
|
Materials |
13,153 |
10,733 |
2,420 |
- |
|
Telecommunication Services |
10,902 |
10,902 |
- |
- |
|
Utilities |
4,606 |
4,496 |
110 |
- |
|
Corporate Bonds |
1,324 |
- |
1,324 |
- |
|
Money Market Funds |
962 |
962 |
- |
- |
|
Total Investments in Securities: |
$ 579,924 |
$ 564,142 |
$ 14,364 |
$ 1,418 |
|
Distribution of investments by country or territory of incorporation, as a percentage of total net assets, is as follows (Unaudited): |
|
United States of America |
86.7% |
|
United Kingdom |
5.5% |
|
Canada |
1.9% |
|
France |
1.4% |
|
Switzerland |
1.3% |
|
Others (Individually Less Than 1%) |
3.2% |
|
|
100.0% |
See accompanying notes which are an integral part of the financial statements.
Annual Report
Financial Statements
Statement of Assets and Liabilities
|
Amounts in thousands (except per-share amounts) |
November 30, 2013 |
|
|
|
|
|
|
Assets |
|
|
|
Investment in securities, at value (including securities loaned of $929) - See accompanying schedule: Unaffiliated issuers (cost $457,029) |
$ 578,962 |
|
|
Fidelity Central Funds (cost $962) |
962 |
|
|
Total Investments (cost $457,991) |
|
$ 579,924 |
|
Receivable for investments sold |
|
1,490 |
|
Receivable for fund shares sold |
|
565 |
|
Dividends receivable |
|
1,457 |
|
Interest receivable |
|
22 |
|
Distributions receivable from Fidelity Central Funds |
|
1 |
|
Prepaid expenses |
|
3 |
|
Other receivables |
|
2 |
|
Total assets |
|
583,464 |
|
|
|
|
|
Liabilities |
|
|
|
Payable to custodian bank |
$ 522 |
|
|
Payable for investments purchased |
1,046 |
|
|
Payable for fund shares redeemed |
884 |
|
|
Accrued management fee |
216 |
|
|
Distribution and service plan fees payable |
212 |
|
|
Other affiliated payables |
125 |
|
|
Other payables and accrued expenses |
59 |
|
|
Collateral on securities loaned, at value |
962 |
|
|
Total liabilities |
|
4,026 |
|
|
|
|
|
Net Assets |
|
$ 579,438 |
|
Net Assets consist of: |
|
|
|
Paid in capital |
|
$ 455,910 |
|
Undistributed net investment income |
|
1,552 |
|
Accumulated undistributed net realized gain (loss) on investments and foreign currency transactions |
|
42 |
|
Net unrealized appreciation (depreciation) on investments and assets and liabilities in foreign currencies |
|
121,934 |
|
Net Assets |
|
$ 579,438 |
See accompanying notes which are an integral part of the financial statements.
Annual Report
Financial Statements - continued
Statement of Assets and Liabilities - continued
|
Amounts in thousands (except per-share amounts) |
November 30, 2013 |
|
|
|
|
|
|
Calculation of Maximum Offering Price Class A: |
|
$ 25.87 |
|
|
|
|
|
Maximum offering price per share (100/94.25 of $25.87) |
|
$ 27.45 |
|
Class T: |
|
$ 25.84 |
|
|
|
|
|
Maximum offering price per share (100/96.50 of $25.84) |
|
$ 26.78 |
|
Class B: |
|
$ 24.74 |
|
|
|
|
|
Class C: |
|
$ 24.66 |
|
|
|
|
|
Institutional Class: |
|
$ 26.13 |
A Redemption price per share is equal to net asset value less any applicable contingent deferred sales charge.
See accompanying notes which are an integral part of the financial statements.
Annual Report
Statement of Operations
|
Amounts in thousands |
Year ended November 30, 2013 |
|
|
|
|
|
|
Investment Income |
|
|
|
Dividends |
|
$ 23,598 |
|
Interest |
|
70 |
|
Income from Fidelity Central Funds |
|
37 |
|
Total income |
|
23,705 |
|
|
|
|
|
Expenses |
|
|
|
Management fee |
$ 4,121 |
|
|
Transfer agent fees |
1,955 |
|
|
Distribution and service plan fees |
2,251 |
|
|
Accounting and security lending fees |
307 |
|
|
Custodian fees and expenses |
74 |
|
|
Independent trustees' compensation |
6 |
|
|
Registration fees |
75 |
|
|
Audit |
64 |
|
|
Legal |
4 |
|
|
Interest |
1 |
|
|
Miscellaneous |
12 |
|
|
Total expenses before reductions |
8,870 |
|
|
Expense reductions |
(138) |
8,732 |
|
Net investment income (loss) |
|
14,973 |
|
Realized and Unrealized Gain (Loss) Net realized gain (loss) on: |
|
|
|
Investment securities: |
|
|
|
Unaffiliated issuers (net of foreign taxes of $1) |
66,416 |
|
|
Redemption in-kind with affiliated entities |
230,003 |
|
|
Foreign currency transactions |
2 |
|
|
Total net realized gain (loss) |
|
296,421 |
|
Change in net unrealized appreciation (depreciation) on: Investment securities |
(64,392) |
|
|
Assets and liabilities in foreign currencies |
(2) |
|
|
Total change in net unrealized appreciation (depreciation) |
|
(64,394) |
|
Net gain (loss) |
|
232,027 |
|
Net increase (decrease) in net assets resulting from operations |
|
$ 247,000 |
See accompanying notes which are an integral part of the financial statements.
Annual Report
Financial Statements - continued
Statement of Changes in Net Assets
|
Amounts in thousands |
Year ended |
Year ended |
|
Increase (Decrease) in Net Assets |
|
|
|
Operations |
|
|
|
Net investment income (loss) |
$ 14,973 |
$ 28,263 |
|
Net realized gain (loss) |
296,421 |
38,247 |
|
Change in net unrealized appreciation (depreciation) |
(64,394) |
189,073 |
|
Net increase (decrease) in net assets resulting |
247,000 |
255,583 |
|
Distributions to shareholders from net investment income |
(2,542) |
(45,234) |
|
Distributions to shareholders from net realized gain |
- |
(2,237) |
|
Total distributions |
(2,542) |
(47,471) |
|
Share transactions - net increase (decrease) |
(1,114,198) |
(170,346) |
|
Total increase (decrease) in net assets |
(869,740) |
37,766 |
|
|
|
|
|
Net Assets |
|
|
|
Beginning of period |
1,449,178 |
1,411,412 |
|
End of period (including undistributed net investment income of $1,552 and distributions in excess of net investment income of $28, respectively) |
$ 579,438 |
$ 1,449,178 |
See accompanying notes which are an integral part of the financial statements.
Annual Report
Financial Highlights - Class A
|
Years ended November 30, |
2013 |
2012 |
2011 |
2010 |
2009 |
|
Selected Per-Share Data |
|
|
|
|
|
|
Net asset value, beginning of period |
$ 19.67 |
$ 17.00 |
$ 16.05 |
$ 14.67 |
$ 11.96 |
|
Income from Investment Operations |
|
|
|
|
|
|
Net investment income (loss) C |
.37 |
.33 |
.21 |
.04 |
.08 |
|
Net realized and unrealized gain (loss) |
5.88 |
2.90 |
.78 |
1.41 |
2.75 |
|
Total from investment operations |
6.25 |
3.23 |
.99 |
1.45 |
2.83 |
|
Distributions from net investment income |
(.05) |
(.53) |
(.04) |
(.07) |
(.12) |
|
Distributions from net realized gain |
- |
(.03) |
- |
- |
- |
|
Total distributions |
(.05) |
(.56) |
(.04) |
(.07) |
(.12) |
|
Net asset value, end of period |
$ 25.87 |
$ 19.67 |
$ 17.00 |
$ 16.05 |
$ 14.67 |
|
Total Return A, B |
31.86% |
19.20% |
6.17% |
9.90% |
23.96% |
|
Ratios to Average Net Assets D, F |
|
|
|
|
|
|
Expenses before reductions |
1.02% |
1.05% |
1.06% |
1.05% |
1.09% |
|
Expenses net of fee waivers, if any |
1.02% |
1.05% |
1.06% |
1.05% |
1.09% |
|
Expenses net of all reductions |
1.00% |
1.04% |
1.05% |
1.05% |
1.08% |
|
Net investment income (loss) |
1.61% |
1.75% |
1.22% |
.26% |
.60% |
|
Supplemental Data |
|
|
|
|
|
|
Net assets, end of period (in millions) |
$ 255 |
$ 183 |
$ 170 |
$ 232 |
$ 252 |
|
Portfolio turnover rate E |
48% |
57% |
123% |
102% |
117% |
A Total returns would have been lower if certain expenses had not been reduced during the applicable periods shown.
B Total returns do not include the effect of the sales charges.
C Calculated based on average shares outstanding during the period.
D Fees and expenses of any underlying Fidelity Central Funds are not included in the Fund's expense ratio. The Fund indirectly bears its proportionate share of the expenses of any underlying Fidelity Central Funds.
E Amount does not include the portfolio activity of any underlying Fidelity Central Funds.
F Expense ratios reflect operating expenses of the class. Expenses before reductions do not reflect amounts reimbursed by the investment adviser or reductions from brokerage service arrangements or reductions from other expense offset arrangements and do not represent the amount paid by the class during periods when reimbursements or reductions occur. Expenses net of fee waivers reflect expenses after reimbursement by the investment adviser but prior to reductions from brokerage service arrangements or other expense offset arrangements. Expenses net of all reductions represent the net expenses paid by the class.
See accompanying notes which are an integral part of the financial statements.
Annual Report
Financial Highlights - Class T
|
Years ended November 30, |
2013 |
2012 |
2011 |
2010 |
2009 |
|
Selected Per-Share Data |
|
|
|
|
|
|
Net asset value, beginning of period |
$ 19.68 |
$ 16.97 |
$ 16.02 |
$ 14.64 |
$ 11.90 |
|
Income from Investment Operations |
|
|
|
|
|
|
Net investment income (loss) C |
.32 |
.29 |
.17 |
- G |
.04 |
|
Net realized and unrealized gain (loss) |
5.89 |
2.89 |
.78 |
1.41 |
2.75 |
|
Total from investment operations |
6.21 |
3.18 |
.95 |
1.41 |
2.79 |
|
Distributions from net investment income |
(.05) |
(.44) |
- |
(.03) |
(.05) |
|
Distributions from net realized gain |
- |
(.03) |
- |
- |
- |
|
Total distributions |
(.05) |
(.47) |
- |
(.03) |
(.05) |
|
Net asset value, end of period |
$ 25.84 |
$ 19.68 |
$ 16.97 |
$ 16.02 |
$ 14.64 |
|
Total Return A, B |
31.62% |
18.93% |
5.93% |
9.63% |
23.57% |
|
Ratios to Average Net Assets D, F |
|
|
|
|
|
|
Expenses before reductions |
1.25% |
1.27% |
1.29% |
1.31% |
1.34% |
|
Expenses net of fee waivers, if any |
1.25% |
1.27% |
1.29% |
1.31% |
1.34% |
|
Expenses net of all reductions |
1.23% |
1.26% |
1.28% |
1.30% |
1.34% |
|
Net investment income (loss) |
1.38% |
1.53% |
.99% |
.01% |
.35% |
|
Supplemental Data |
|
|
|
|
|
|
Net assets, end of period (in millions) |
$ 214 |
$ 166 |
$ 158 |
$ 178 |
$ 201 |
|
Portfolio turnover rate E |
48% |
57% |
123% |
102% |
117% |
A Total returns would have been lower if certain expenses had not been reduced during the applicable periods shown.
B Total returns do not include the effect of the sales charges.
C Calculated based on average shares outstanding during the period.
D Fees and expenses of any underlying Fidelity Central Funds are not included in the Fund's expense ratio. The Fund indirectly bears its proportionate share of the expenses of any underlying Fidelity Central Funds.
E Amount does not include the portfolio activity of any underlying Fidelity Central Funds.
F Expense ratios reflect operating expenses of the class. Expenses before reductions do not reflect amounts reimbursed by the investment adviser or reductions from brokerage service arrangements or reductions from other expense offset arrangements and do not represent the amount paid by the class during periods when reimbursements or reductions occur. Expenses net of fee waivers reflect expenses after reimbursement by the investment adviser but prior to reductions from brokerage service arrangements or other expense offset arrangements. Expenses net of all reductions represent the net expenses paid by the class.
G Amount represents less than $.01 per share.
See accompanying notes which are an integral part of the financial statements.
Annual Report
Financial Highlights - Class B
|
Years ended November 30, |
2013 |
2012 |
2011 |
2010 |
2009 |
|
Selected Per-Share Data |
|
|
|
|
|
|
Net asset value, beginning of period |
$ 18.95 |
$ 16.24 |
$ 15.41 |
$ 14.13 |
$ 11.49 |
|
Income from Investment Operations |
|
|
|
|
|
|
Net investment income (loss) C |
.18 |
.18 |
.08 |
(.07) |
(.02) |
|
Net realized and unrealized gain (loss) |
5.65 |
2.78 |
.75 |
1.35 |
2.66 |
|
Total from investment operations |
5.83 |
2.96 |
.83 |
1.28 |
2.64 |
|
Distributions from net investment income |
(.04) |
(.22) |
- |
- |
- |
|
Distributions from net realized gain |
- |
(.03) |
- |
- |
- |
|
Total distributions |
(.04) |
(.25) |
- |
- |
- |
|
Net asset value, end of period |
$ 24.74 |
$ 18.95 |
$ 16.24 |
$ 15.41 |
$ 14.13 |
|
Total Return A, B |
30.81% |
18.31% |
5.39% |
9.06% |
22.98% |
|
Ratios to Average Net Assets D, F |
|
|
|
|
|
|
Expenses before reductions |
1.81% |
1.81% |
1.81% |
1.82% |
1.85% |
|
Expenses net of fee waivers, if any |
1.81% |
1.81% |
1.81% |
1.82% |
1.85% |
|
Expenses net of all reductions |
1.80% |
1.81% |
1.80% |
1.81% |
1.84% |
|
Net investment income (loss) |
.82% |
.99% |
.47% |
(.51)% |
(.16)% |
|
Supplemental Data |
|
|
|
|
|
|
Net assets, end of period (in millions) |
$ 12 |
$ 11 |
$ 13 |
$ 19 |
$ 27 |
|
Portfolio turnover rate E |
48% |
57% |
123% |
102% |
117% |
A Total returns would have been lower if certain expenses had not been reduced during the applicable periods shown.
B Total returns do not include the effect of the contingent deferred sales charge.
C Calculated based on average shares outstanding during the period.
D Fees and expenses of any underlying Fidelity Central Funds are not included in the Fund's expense ratio. The Fund indirectly bears its proportionate share of the expenses of any underlying Fidelity Central Funds.
E Amount does not include the portfolio activity of any underlying Fidelity Central Funds.
F Expense ratios reflect operating expenses of the class. Expenses before reductions do not reflect amounts reimbursed by the investment adviser or reductions from brokerage service arrangements or reductions from other expense offset arrangements and do not represent the amount paid by the class during periods when reimbursements or reductions occur. Expenses net of fee waivers reflect expenses after reimbursement by the investment adviser but prior to reductions from brokerage service arrangements or other expense offset arrangements. Expenses net of all reductions represent the net expenses paid by the class.
See accompanying notes which are an integral part of the financial statements.
Annual Report
Financial Highlights - Class C
|
Years ended November 30, |
2013 |
2012 |
2011 |
2010 |
2009 |
|
Selected Per-Share Data |
|
|
|
|
|
|
Net asset value, beginning of period |
$ 18.87 |
$ 16.23 |
$ 15.39 |
$ 14.12 |
$ 11.47 |
|
Income from Investment Operations |
|
|
|
|
|
|
Net investment income (loss) C |
.19 |
.19 |
.08 |
(.07) |
(.02) |
|
Net realized and unrealized gain (loss) |
5.64 |
2.77 |
.76 |
1.34 |
2.67 |
|
Total from investment operations |
5.83 |
2.96 |
.84 |
1.27 |
2.65 |
|
Distributions from net investment income |
(.04) |
(.29) |
- |
- |
- |
|
Distributions from net realized gain |
- |
(.03) |
- |
- |
- |
|
Total distributions |
(.04) |
(.32) |
- |
- |
- |
|
Net asset value, end of period |
$ 24.66 |
$ 18.87 |
$ 16.23 |
$ 15.39 |
$ 14.12 |
|
Total Return A, B |
30.95% |
18.33% |
5.46% |
8.99% |
23.10% |
|
Ratios to Average Net Assets D, F |
|
|
|
|
|
|
Expenses before reductions |
1.74% |
1.76% |
1.78% |
1.80% |
1.84% |
|
Expenses net of fee waivers, if any |
1.74% |
1.76% |
1.78% |
1.80% |
1.84% |
|
Expenses net of all reductions |
1.73% |
1.76% |
1.77% |
1.80% |
1.83% |
|
Net investment income (loss) |
.89% |
1.04% |
.50% |
(.49)% |
(.15)% |
|
Supplemental Data |
|
|
|
|
|
|
Net assets, end of period (in millions) |
$ 74 |
$ 58 |
$ 53 |
$ 58 |
$ 63 |
|
Portfolio turnover rate E |
48% |
57% |
123% |
102% |
117% |
A Total returns would have been lower if certain expenses had not been reduced during the applicable periods shown.
B Total returns do not include the effect of the contingent deferred sales charge.
C Calculated based on average shares outstanding during the period.
D Fees and expenses of any underlying Fidelity Central Funds are not included in the Fund's expense ratio. The Fund indirectly bears its proportionate share of the expenses of any underlying Fidelity Central Funds.
E Amount does not include the portfolio activity of any underlying Fidelity Central Funds.
F Expense ratios reflect operating expenses of the class. Expenses before reductions do not reflect amounts reimbursed by the investment adviser or reductions from brokerage service arrangements or reductions from other expense offset arrangements and do not represent the amount paid by the class during periods when reimbursements or reductions occur. Expenses net of fee waivers reflect expenses after reimbursement by the investment adviser but prior to reductions from brokerage service arrangements or other expense offset arrangements. Expenses net of all reductions represent the net expenses paid by the class.
See accompanying notes which are an integral part of the financial statements.
Annual Report
Financial Highlights - Institutional Class
|
Years ended November 30, |
2013 |
2012 |
2011 |
2010 |
2009 |
|
Selected Per-Share Data |
|
|
|
|
|
|
Net asset value, beginning of period |
$ 19.79 |
$ 17.16 |
$ 16.19 |
$ 14.80 |
$ 12.07 |
|
Income from Investment Operations |
|
|
|
|
|
|
Net investment income (loss) B |
.43 |
.40 |
.27 |
.09 |
.12 |
|
Net realized and unrealized gain (loss) |
5.97 |
2.91 |
.79 |
1.41 |
2.78 |
|
Total from investment operations |
6.40 |
3.31 |
1.06 |
1.50 |
2.90 |
|
Distributions from net investment income |
(.06) |
(.65) |
(.09) |
(.11) |
(.17) |
|
Distributions from net realized gain |
- |
(.03) |
- |
- |
- |
|
Total distributions |
(.06) |
(.68) |
(.09) |
(.11) |
(.17) |
|
Net asset value, end of period |
$ 26.13 |
$ 19.79 |
$ 17.16 |
$ 16.19 |
$ 14.80 |
|
Total Return A |
32.41% |
19.59% |
6.56% |
10.23% |
24.36% |
|
Ratios to Average Net Assets C, E |
|
|
|
|
|
|
Expenses before reductions |
.70% |
.71% |
.72% |
.73% |
.77% |
|
Expenses net of fee waivers, if any |
.70% |
.71% |
.72% |
.73% |
.77% |
|
Expenses net of all reductions |
.68% |
.70% |
.71% |
.72% |
.77% |
|
Net investment income (loss) |
1.93% |
2.09% |
1.56% |
.59% |
.92% |
|
Supplemental Data |
|
|
|
|
|
|
Net assets, end of period (in millions) |
$ 24 |
$ 1,031 |
$ 1,017 |
$ 870 |
$ 1,017 |
|
Portfolio turnover rate D |
48% |
57% |
123% |
102% |
117% |
A Total returns would have been lower if certain expenses had not been reduced during the applicable periods shown.
B Calculated based on average shares outstanding during the period.
C Fees and expenses of any underlying Fidelity Central Funds are not included in the Fund's expense ratio. The Fund indirectly bears its proportionate share of the expenses of any underlying Fidelity Central Funds.
D Amount does not include the portfolio activity of any underlying Fidelity Central Funds.
E Expense ratios reflect operating expenses of the class. Expenses before reductions do not reflect amounts reimbursed by the investment adviser or reductions from brokerage service arrangements or reductions from other expense offset arrangements and do not represent the amount paid by the class during periods when reimbursements or reductions occur. Expenses net of fee waivers reflect expenses after reimbursement by the investment adviser but prior to reductions from brokerage service arrangements or other expense offset arrangements. Expenses net of all reductions represent the net expenses paid by the class.
See accompanying notes which are an integral part of the financial statements.
Annual Report
Notes to Financial Statements
For the period ended November 30, 2013
(Amounts in thousands except percentages)
1. Organization.
Fidelity Advisor Growth & Income Fund (the Fund) is a fund of Fidelity Advisor Series I (the Trust) and is authorized to issue an unlimited number of shares. The Trust is registered under the Investment Company Act of 1940, as amended (the 1940 Act), as an open-end management investment company organized as a Massachusetts business trust. The Fund offers Class A, Class T, Class C and Institutional Class shares, each of which, along with Class B shares, has equal rights as to assets and voting privileges. Class B shares are closed to new accounts and additional purchases, except for exchanges and reinvestments. Each class has exclusive voting rights with respect to matters that affect that class. Class B shares will automatically convert to Class A shares after a holding period of seven years from the initial date of purchase.
2. Investments in Fidelity Central Funds.
The Fund invests in Fidelity Central Funds, which are open-end investment companies generally available only to other investment companies and accounts managed by the investment adviser and its affiliates. The Fund's Schedule of Investments lists each of the Fidelity Central Funds held as of period end, if any, as an investment of the Fund, but does not include the underlying holdings of each Fidelity Central Fund. As an Investing Fund, the Fund indirectly bears its proportionate share of the expenses of the underlying Fidelity Central Funds.
The Money Market Central Funds seek preservation of capital and current income and are managed by Fidelity Investments Money Management, Inc. (FIMM), an affiliate of the investment adviser. Annualized expenses of the Money Market Central Funds as of their most recent shareholder report date are less than .01%.
A complete unaudited list of holdings for each Fidelity Central Fund is available upon request or at the Securities and Exchange Commission (the SEC) website at www.sec.gov. In addition, the financial statements of the Fidelity Central Funds, which are not covered by the Fund's Report of Independent Registered Public Accounting Firm, are available on the SEC website or upon request.
3. Significant Accounting Policies.
The financial statements have been prepared in conformity with accounting principles generally accepted in the United States of America (GAAP), which require management to make certain estimates and assumptions at the date of the financial statements. Actual results could differ from those estimates. Subsequent events, if any, through the date that the financial statements were issued have been evaluated in the preparation of
Annual Report
Notes to Financial Statements - continued
(Amounts in thousands except percentages)
3. Significant Accounting Policies - continued
the financial statements. The following summarizes the significant accounting policies of the Fund:
Investment Valuation. Investments are valued as of 4:00 p.m. Eastern time on the last calendar day of the period. In accordance with valuation policies and procedures approved by the Board of Trustees (the Board), the Fund attempts to obtain prices from one or more third party pricing vendors or brokers to value its investments. When current market prices, quotations or currency exchange rates are not readily available or reliable, investments will be fair valued in good faith by the Fidelity Management & Research Company (FMR) Fair Value Committee (the Committee), in accordance with procedures adopted by the Board. Factors used in determining fair value vary by investment type and may include market or investment specific events, changes in interest rates and credit quality. The frequency with which these procedures are used cannot be predicted and they may be utilized to a significant extent. The Committee oversees the Fund's valuation policies and procedures and is responsible for approving and reporting to the Board all fair value determinations.
The Fund categorizes the inputs to valuation techniques used to value its investments into a disclosure hierarchy consisting of three levels as shown below:
Level 1 - quoted prices in active markets for identical investments
Level 2 - other significant observable inputs (including quoted prices for similar investments, interest rates, prepayment speeds, etc.)
Level 3 - unobservable inputs (including the Fund's own assumptions based on the best information available)
Valuation techniques used to value the Fund's investments by major category are as follows:
Equity securities, including restricted securities, for which market quotations are readily available, are valued at the last reported sale price or official closing price as reported by a third party pricing vendor on the primary market or exchange on which they are traded and are categorized as Level 1 in the hierarchy. In the event there were no sales during the day or closing prices are not available, securities are valued at the last quoted bid price or may be valued using the last available price and are generally categorized as Level 2 in the hierarchy. For foreign equity securities, when market or security specific events arise, comparisons to the valuation of American Depositary Receipts (ADRs), futures contracts, Exchange-Traded Funds (ETFs) and certain indexes as well as quoted prices for similar securities may be used and would be categorized as Level 2 in the hierarchy. Utilizing these techniques may result in transfers between Level 1 and Level 2. For equity securities, including restricted securities, where observable inputs are limited, assumptions about market activity and risk are used and these securities may be categorized as Level 3 in the hierarchy.
Annual Report
3. Significant Accounting Policies - continued
Investment Valuation - continued
Debt securities, including restricted securities, are valued based on evaluated prices received from third party pricing vendors or from brokers who make markets in such securities. For corporate bonds, pricing vendors utilize matrix pricing which considers yield or price of bonds of comparable quality, coupon, maturity and type as well as broker-supplied prices. When independent prices are unavailable or unreliable, debt securities may be valued utilizing pricing methodologies which consider similar factors that would be used by third party pricing vendors. Debt securities are generally categorized as Level 2 in the hierarchy but may be Level 3 depending on the circumstances.
Investments in open-end mutual funds, including the Fidelity Central Funds, are valued at their closing net asset value (NAV) each business day and are categorized as Level 1 in the hierarchy.
Changes in valuation techniques may result in transfers in or out of an assigned level within the disclosure hierarchy. The aggregate value of investments by input level, as of November 30, 2013, is included at the end of the Fund's Schedule of Investments.
Foreign Currency. The Fund may use foreign currency contracts to facilitate transactions in foreign-denominated securities. Gains and losses from these transactions may arise from changes in the value of the foreign currency or if the counterparties do not perform under the contracts' terms.
Foreign-denominated assets, including investment securities, and liabilities are translated into U.S. dollars at the exchange rates at period end. Purchases and sales of investment securities, income and dividends received and expenses denominated in foreign currencies are translated into U.S. dollars at the exchange rate in effect on the transaction date.
The effects of exchange rate fluctuations on investments are included with the net realized and unrealized gain (loss) on investment securities. Other foreign currency transactions resulting in realized and unrealized gain (loss) are disclosed separately.
Investment Transactions and Income. For financial reporting purposes, the Fund's investment holdings and NAV include trades executed through the end of the last business day of the period. The NAV per share for processing shareholder transactions is calculated as of the close of business of the New York Stock Exchange (NYSE), normally 4:00 p.m. Eastern time and includes trades executed through the end of the prior business day. Gains and losses on securities sold are determined on the basis of identified cost and may include proceeds received from litigation. Dividend income is recorded on the ex-dividend date, except for certain dividends from foreign securities where the
Annual Report
Notes to Financial Statements - continued
(Amounts in thousands except percentages)
3. Significant Accounting Policies - continued
Investment Transactions and Income - continued
ex-dividend date may have passed, which are recorded as soon as the Fund is informed of the ex-dividend date. Non-cash dividends included in dividend income, if any, are recorded at the fair market value of the securities received. Distributions received on securities that represent a return of capital or capital gain are recorded as a reduction of cost of investments and/or as a realized gain. Subsequent to ex-dividend date the Fund determines the components of these distributions, based upon receipt of tax filings or other correspondence relating to the underlying investment. Interest income and distributions from the Fidelity Central Funds are accrued as earned. Interest income includes coupon interest and amortization of premium and accretion of discount on debt securities. Investment income is recorded net of foreign taxes withheld where recovery of such taxes is uncertain.
Class Allocations and Expenses. Investment income, realized and unrealized capital gains and losses, common expenses of the Fund, and certain fund-level expense reductions, if any, are allocated daily on a pro-rata basis to each class based on the relative net assets of each class to the total net assets of the Fund. Each class differs with respect to transfer agent and distribution and service plan fees incurred. Certain expense reductions may also differ by class. For the reporting period, the allocated portion of income and expenses to each class as a percent of its average net assets may vary due to the timing of recording these transactions in relation to fluctuating net assets of the classes. Expenses directly attributable to a fund are charged to that fund. Expenses attributable to more than one fund are allocated among the respective funds on the basis of relative net assets or other appropriate methods. Expense estimates are accrued in the period to which they relate and adjustments are made when actual amounts are known.
Income Tax Information and Distributions to Shareholders. Each year, the Fund intends to qualify as a regulated investment company under Subchapter M of the Internal Revenue Code, including distributing substantially all of its taxable income and realized gains. As a result, no provision for U.S. Federal income taxes is required. As of November 30, 2013, the Fund did not have any unrecognized tax benefits in the financial statements; nor is the Fund aware of any tax positions for which it is reasonably possible that the total amounts of unrecognized tax benefits will significantly change in the next twelve months. The Fund files a U.S. federal tax return, in addition to state and local tax returns as required. The Fund's federal income tax returns are subject to examination by the Internal Revenue Service (IRS) for a period of three fiscal years after they are filed. State and local tax returns may be subject to examination for an additional fiscal year depending on the jurisdiction. Foreign taxes are provided for based on the Fund's understanding of the tax rules and rates that exist in the foreign markets in which it invests.
Annual Report
3. Significant Accounting Policies - continued
Income Tax Information and Distributions to Shareholders - continued
Distributions are declared and recorded on the ex-dividend date. Income dividends and capital gain distributions are declared separately for each class. Income and capital gain distributions are determined in accordance with income tax regulations, which may differ from GAAP. In addition, the fund will claim a portion of the payment made to redeeming shareholders as a distribution for income tax purposes.
Capital accounts within the financial statements are adjusted for permanent book-tax differences. These adjustments have no impact on net assets or the results of operations. Temporary book-tax differences will reverse in a subsequent period.
Book-tax differences are primarily due to foreign currency transactions, certain foreign taxes, market discount, redemptions in kind, partnerships, equity-debt classifications, capital loss carryforwards, and losses deferred due to wash sales.
The federal tax cost of investment securities and unrealized appreciation (depreciation) as of period end were as follows:
|
Gross unrealized appreciation |
$ 125,060 |
|
Gross unrealized depreciation |
(5,870) |
|
Net unrealized appreciation (depreciation) on securities and other investments |
$ 119,190 |
|
|
|
|
Tax Cost |
$ 460,734 |
The tax-based components of distributable earnings as of period end were as follows:
|
Undistributed ordinary income |
$ 1,555 |
|
Undistributed long-term capital gain |
$ 3,994 |
|
Net unrealized appreciation (depreciation) |
$ 119,191 |
Capital loss carryforwards are only available to offset future capital gains of the Fund to the extent provided by regulations and may be limited. Under the Regulated Investment Company Modernization Act of 2010 (the Act), the Fund is permitted to carry forward capital losses incurred in taxable years beginning after December 22, 2010 for an unlimited period and such capital losses are required to be used prior to any losses that expire. The capital loss carryforward information presented below, including any applicable limitation, is estimated as of fiscal period end and is subject to adjustment.
|
Fiscal year of expiration |
|
|
2016 |
$ (1,206) |
Annual Report
Notes to Financial Statements - continued
(Amounts in thousands except percentages)
3. Significant Accounting Policies - continued
Income Tax Information and Distributions to Shareholders - continued
The capital loss carryforward expiring fiscal 2016 was acquired from Capital One Appreciation Fund.
The tax character of distributions paid was as follows:
|
|
November 30, 2013 |
November 30, 2012 |
|
Ordinary Income |
$ 2,542 |
$ 47,471 |
Restricted Securities. The Fund may invest in securities that are subject to legal or contractual restrictions on resale. These securities generally may be resold in transactions exempt from registration or to the public if the securities are registered. Disposal of these securities may involve time-consuming negotiations and expense, and prompt sale at an acceptable price may be difficult. Information regarding restricted securities is included at the end of the Fund's Schedule of Investments.
4. Purchases and Sales of Investments.
Purchases and sales of securities, including in-kind transactions, other than short-term securities, aggregated $437,811 and $1,529,122, respectively.
5. Fees and Other Transactions with Affiliates.
Management Fee. Fidelity Management & Research Company (the investment adviser) and its affiliates provide the Fund with investment management related services for which the Fund pays a monthly management fee. The management fee is the sum of an individual fund fee rate that is based on an annual rate of .20% of the Fund's average net assets and an annualized group fee rate that averaged 0.25% during the period. The group fee rate is based upon the average net assets of all the mutual funds advised by the investment adviser, including any mutual funds previously advised by the investment adviser that are currently advised by Fidelity SelectCo, LLC, an affiliate of the investment adviser. The group fee rate decreases as assets under management increase and increases as assets under management decrease. For the reporting period, the total annual management fee rate was .45% of the Fund's average net assets.
Distribution and Service Plan Fees. In accordance with Rule 12b-1 of the 1940 Act, the Fund has adopted separate Distribution and Service Plans for each class of shares. Certain classes pay Fidelity Distributors Corporation (FDC), an affiliate of the investment adviser, separate Distribution and Service Fees, each of which is based on an annual percentage of each class' average net assets. In addition, FDC may pay financial intermediaries for selling shares of the Fund and providing shareholder support services.
Annual Report
5. Fees and Other Transactions with Affiliates - continued
Distribution and Service Plan Fees - continued
For the period, the Distribution and Service Fee rates, total fees and amounts retained by FDC were as follows:
|
|
Distribution |
Service |
Total Fees |
Retained |
|
Class A |
-% |
.25% |
$ 539 |
$ 10 |
|
Class T |
.25% |
.25% |
945 |
6 |
|
Class B |
.75% |
.25% |
111 |
84 |
|
Class C |
.75% |
.25% |
656 |
53 |
|
|
|
|
$ 2,251 |
$ 153 |
Sales Load. FDC may receive a front-end sales charge of up to 5.75% for selling Class A shares and 3.50% for selling Class T shares, some of which is paid to financial intermediaries for selling shares of the Fund. Depending on the holding period, FDC may receive contingent deferred sales charges levied on Class A, Class T, Class B, and Class C redemptions. The deferred sales charges range from 5.00% to 1.00% for Class B shares, 1.00% for Class C shares, 1.00% for certain purchases of Class A shares and .25% for certain purchases of Class T shares.
For the period, sales charge amounts retained by FDC were as follows:
|
|
Retained |
|
Class A |
$ 58 |
|
Class T |
22 |
|
Class B* |
13 |
|
Class C* |
4 |
|
|
$ 97 |
* When Class B and Class C shares are initially sold, FDC pays commissions from its own resources to financial intermediaries through which the sales
are made
Transfer Agent Fees. Fidelity Investments Institutional Operations Company, Inc., (FIIOC), an affiliate of the investment adviser, is the transfer, dividend disbursing and shareholder servicing agent for each class of the Fund. FIIOC receives account fees and asset-based fees that vary according to the account size and type of account of the shareholders of the respective classes of the Fund. FIIOC pays for typesetting, printing and mailing of shareholder reports, except proxy statements.
Annual Report
Notes to Financial Statements - continued
(Amounts in thousands except percentages)
5. Fees and Other Transactions with Affiliates - continued
Transfer Agent Fees - continued
For the period, transfer agent fees for each class were as follows:
|
|
Amount |
% of |
|
Class A |
$ 553 |
.26 |
|
Class T |
445 |
.23 |
|
Class B |
33 |
.30 |
|
Class C |
$ 150 |
.23 |
|
Institutional Class |
774 |
.18 |
|
|
$ 1,955 |
|
Accounting and Security Lending Fees. Fidelity Service Company, Inc. (FSC), an affiliate of the investment adviser, maintains the Fund's accounting records. The accounting fee is based on the level of average net assets for each month. Under a separate contract, FSC administers the security lending program. The security lending fee is based on the number and duration of lending transactions.
Brokerage Commissions. The Fund placed a portion of its portfolio transactions with brokerage firms which are affiliates of the investment adviser. Brokerage commissions are included in net realized gain (loss) and change in net unrealized appreciation (depreciation) in the Statement of Operations. The commissions paid to these affiliated firms were $22 for the period.
Interfund Lending Program. Pursuant to an Exemptive Order issued by the SEC, the Fund, along with other registered investment companies having management contracts with FMR or other affiliated entities of FMR, may participate in an interfund lending program. This program provides an alternative credit facility allowing the funds to borrow from, or lend money to, other participating affiliated funds. At period end, there were no interfund loans outstanding. The Fund's activity in this program during the period for which loans were outstanding was as follows:
|
Borrower or Lender |
Average Loan |
Weighted Average |
Interest |
|
Borrower |
$ 5,619 |
.37% |
$ 1 |
Redemptions In-Kind. During the period, 48,895 shares of the Fund held by affiliated entities were redeemed for investments, including accrued interest, with a value of $1,068,902. The net realized gain of $230,003 on investments delivered through in-kind redemptions is included in the accompanying Statement of Operations. The amount of in-kind redemptions is included in share transactions in the accompanying Statement of Changes in Net Assets as well as Note 10: Share Transactions. The Fund recognized no gain or loss for federal income tax purposes.
Annual Report
6. Committed Line of Credit.
The Fund participates with other funds managed by the investment adviser or an affiliate in a $4.25 billion credit facility (the "line of credit") to be utilized for temporary or emergency purposes to fund shareholder redemptions or for other short-term liquidity purposes. The Fund has agreed to pay commitment fees on its pro-rata portion of the line of credit, which amounted to $2 and is reflected in Miscellaneous expenses on the Statement of Operations. During the period, there were no borrowings on this line of credit.
7. Security Lending.
The Fund lends portfolio securities through a lending agent from time to time in order to earn additional income. For equity securities, a lending agent is used and may loan securities to certain qualified borrowers, including Fidelity Capital Markets (FCM), a broker-dealer affiliated with the Fund. On the settlement date of the loan, the Fund receives collateral (in the form of U.S. Treasury obligations, letters of credit and/or cash) against the loaned securities and maintains collateral in an amount not less than 100% of the market value of the loaned securities during the period of the loan. The market value of the loaned securities is determined at the close of business of the Fund and any additional required collateral is delivered to the Fund on the next business day. If the borrower defaults on its obligation to return the securities loaned because of insolvency or other reasons, the Fund may apply collateral received from the borrower against the obligation. The Fund may experience delays and costs in recovering the securities loaned. Any cash collateral received is invested in the Fidelity Securities Lending Cash Central Fund. The value of loaned securities and cash collateral at period end are disclosed on the Fund's Statement of Assets and Liabilities. The value of securities loaned to FCM at period end was $244. Security lending income represents the income earned on investing cash collateral, less rebates paid to borrowers and any lending agent fees associated with the loan, plus any premium payments received for lending certain types of securities. Security lending income is presented in the Statement of Operations as a component of income from Fidelity Central Funds. Total security lending income during the period amounted to $35, including $2 from securities loaned to FCM.
8. Expense Reductions.
Commissions paid to certain brokers with whom the investment adviser, or its affiliates, places trades on behalf of the Fund include an amount in addition to trade execution, which may be rebated back to the Fund to offset certain expenses. This amount totaled $138 for the period.
Annual Report
Notes to Financial Statements - continued
(Amounts in thousands except percentages)
9. Distributions to Shareholders.
Distributions to shareholders of each class were as follows:
|
Years ended November 30, |
2013 |
2012 |
|
From net investment income |
|
|
|
Class A |
$ 483 |
$ 4,963 |
|
Class T |
402 |
3,843 |
|
Class B |
21 |
142 |
|
Class C |
120 |
894 |
|
Institutional Class |
1,516 |
35,392 |
|
Total |
$ 2,542 |
$ 45,234 |
|
From net realized gain |
|
|
|
Class A |
$ - |
$ 283 |
|
Class T |
- |
258 |
|
Class B |
- |
18 |
|
Class C |
- |
94 |
|
Institutional Class |
- |
1,584 |
|
Total |
$ - |
$ 2,237 |
10. Share Transactions.
Transactions for each class of shares were as follows:
|
|
Shares |
Dollars |
||
|
Years ended November 30, |
2013 |
2012 |
2013 |
2012 |
|
Class A |
|
|
|
|
|
Shares sold |
2,156 |
1,303 |
$ 49,371 |
$ 24,427 |
|
Reinvestment of distributions |
22 |
252 |
431 |
4,662 |
|
Shares redeemed |
(1,607) |
(2,279) |
(36,195) |
(42,887) |
|
Net increase (decrease) |
571 |
(724) |
$ 13,607 |
$ (13,798) |
|
Class T |
|
|
|
|
|
Shares sold |
1,319 |
780 |
$ 30,032 |
$ 14,651 |
|
Reinvestment of distributions |
19 |
212 |
386 |
3,940 |
|
Shares redeemed |
(1,489) |
(1,871) |
(33,603) |
(34,844) |
|
Net increase (decrease) |
(151) |
(879) |
$ (3,185) |
$ (16,253) |
|
Class B |
|
|
|
|
|
Shares sold |
84 |
14 |
$ 1,875 |
$ 233 |
|
Reinvestment of distributions |
1 |
8 |
19 |
147 |
|
Shares redeemed |
(200) |
(242) |
(4,324) |
(4,364) |
|
Net increase (decrease) |
(115) |
(220) |
$ (2,430) |
$ (3,984) |
|
Class C |
|
|
|
|
|
Shares sold |
483 |
306 |
$ 10,663 |
$ 5,607 |
|
Reinvestment of distributions |
5 |
47 |
103 |
851 |
|
Shares redeemed |
(547) |
(558) |
(11,826) |
(10,063) |
|
Net increase (decrease) |
(59) |
(205) |
$ (1,060) |
$ (3,605) |
Annual Report
10. Share Transactions - continued
|
|
Shares |
Dollars |
||
|
Years ended November 30, |
2013 |
2012 |
2013 |
2012 |
|
Institutional Class |
|
|
|
|
|
Shares sold |
3,091 |
9,408 |
$ 67,555 |
$ 179,442 |
|
Reinvestment of distributions |
75 |
1,996 |
1,511 |
36,899 |
|
Shares redeemed |
(54,343) A |
(18,539) |
(1,190,196) A |
(349,047) |
|
Net increase (decrease) |
(51,177) |
(7,135) |
$ (1,121,130) |
$ (132,706) |
A Amount includes in-kind redemptions (see Note 5: Redemptions In-Kind).
11. Other.
The Fund's organizational documents provide former and current trustees and officers with a limited indemnification against liabilities arising in connection with the performance of their duties to the Fund. In the normal course of business, the Fund may also enter into contracts that provide general indemnifications. The Fund's maximum exposure under these arrangements is unknown as this would be dependent on future claims that may be made against the Fund. The risk of material loss from such claims is considered remote.
Annual Report
Report of Independent Registered Public Accounting Firm
To the Trustees of Fidelity Advisor Series I and Shareholders of Fidelity Advisor Growth & Income Fund:
We have audited the accompanying statement of assets and liabilities of Fidelity Advisor Growth & Income Fund (the Fund), a fund of Fidelity Advisor Series I, including the schedule of investments, as of November 30, 2013, and the related statement of operations for the year then ended, the statement of changes in net assets for each of the two years in the period then ended, and the financial highlights for each of the five years in the period then ended. These financial statements and financial highlights are the responsibility of the Fund's management. Our responsibility is to express an opinion on these financial statements and financial highlights based on our audits.
We conducted our audits in accordance with the standards of the Public Company Accounting Oversight Board (United States). Those standards require that we plan and perform the audit to obtain reasonable assurance about whether the financial statements and financial highlights are free of material misstatement. The Fund is not required to have, nor were we engaged to perform, an audit of its internal control over financial reporting. Our audits included consideration of internal control over financial reporting as a basis for designing audit procedures that are appropriate in the circumstances, but not for the purpose of expressing an opinion on the effectiveness of the Fund's internal control over financial reporting. Accordingly, we express no such opinion. An audit also includes examining, on a test basis, evidence supporting the amounts and disclosures in the financial statements, assessing the accounting principles used and significant estimates made by management, as well as evaluating the overall financial statement presentation. Our procedures included confirmation of securities owned as of November 30, 2013, by correspondence with the custodians and brokers; where replies were not received from brokers, we performed other auditing procedures. We believe that our audits provide a reasonable basis for our opinion.
In our opinion, the financial statements and financial highlights referred to above present fairly, in all material respects, the financial position of Fidelity Advisor Growth & Income Fund as of November 30, 2013, the results of its operations for the year then ended, the changes in its net assets for each of the two years in the period then ended, and the financial highlights for each of the five years in the period then ended, in conformity with accounting principles generally accepted in the United States of America.
DELOITTE & TOUCHE LLP
Boston, Massachusetts
January 14, 2014
Annual Report
Trustees and Officers
The Trustees, Member of the Advisory Board, and officers of the trust and fund, as applicable, are listed below. The Board of Trustees governs the fund and is responsible for protecting the interests of shareholders. The Trustees are experienced executives who meet periodically throughout the year to oversee the fund's activities, review contractual arrangements with companies that provide services to the fund, oversee management of the risks associated with such activities and contractual arrangements, and review the fund's performance. Except for James C. Curvey, Ned C. Lautenbach, Ronald P. O'Hanley, and William S. Stavropoulos, each of the Trustees oversees 173 funds. Mr. Curvey oversees 396 funds. Mr. Lautenbach, Mr. O'Hanley, and Mr. Stavropoulos each oversees 247 funds.
The Trustees hold office without limit in time except that (a) any Trustee may resign; (b) any Trustee may be removed by written instrument, signed by at least two-thirds of the number of Trustees prior to such removal; (c) any Trustee who requests to be retired or who has become incapacitated by illness or injury may be retired by written instrument signed by a majority of the other Trustees; and (d) any Trustee may be removed at any special meeting of shareholders by a two-thirds vote of the outstanding voting securities of the trust. Each Trustee who is not an interested person (as defined in the 1940 Act) of the trust and the fund (Independent Trustee), shall retire not later than the last day of the calendar year in which his or her 75th birthday occurs. The Independent Trustees may waive this mandatory retirement age policy with respect to individual Trustees. The officers and Advisory Board Member hold office without limit in time, except that any officer and Advisory Board Member may resign or may be removed by a vote of a majority of the Trustees at any regular meeting or any special meeting of the Trustees. Except as indicated, each individual has held the office shown or other offices in the same company for the past five years.
Experience, Skills, Attributes, and Qualifications of the Fund's Trustees. The Governance and Nominating Committee has adopted a statement of policy that describes the experience, qualifications, attributes, and skills that are necessary and desirable for potential Independent Trustee candidates (Statement of Policy). The Board believes that each Trustee satisfied at the time he or she was initially elected or appointed a Trustee, and continues to satisfy, the standards contemplated by the Statement of Policy. The Governance and Nominating Committee also engages professional search firms to help identify potential Independent Trustee candidates who have the experience, qualifications, attributes, and skills consistent with the Statement of Policy. From time to time, additional criteria based on the composition and skills of the current Independent Trustees, as well as experience or skills that may be appropriate in light of future changes to board composition, business conditions, and regulatory or other developments, have also been considered by the professional search firms and the Governance and Nominating Committee. In addition, the Board takes into account the Trustees' commitment and participation in Board and committee meetings, as well as their leadership of standing and ad hoc committees throughout their tenure.
Annual Report
In determining that a particular Trustee was and continues to be qualified to serve as a Trustee, the Board has considered a variety of criteria, none of which, in isolation, was controlling. The Board believes that, collectively, the Trustees have balanced and diverse experience, qualifications, attributes, and skills, which allow the Board to operate effectively in governing the fund and protecting the interests of shareholders. Information about the specific experience, skills, attributes, and qualifications of each Trustee, which in each case led to the Board's conclusion that the Trustee should serve (or continue to serve) as a trustee of the fund, is provided below.
Board Structure and Oversight Function. James C. Curvey is an interested person (as defined in the 1940 Act) and currently serves as Chairman. The Trustees have determined that an interested Chairman is appropriate and benefits shareholders because an interested Chairman has a personal and professional stake in the quality and continuity of services provided to the fund. Independent Trustees exercise their informed business judgment to appoint an individual of their choosing to serve as Chairman, regardless of whether the Trustee happens to be independent or a member of management. The Independent Trustees have determined that they can act independently and effectively without having an Independent Trustee serve as Chairman and that a key structural component for assuring that they are in a position to do so is for the Independent Trustees to constitute a substantial majority for the Board. The Independent Trustees also regularly meet in executive session. Ned C. Lautenbach serves as Chairman of the Independent Trustees and as such (i) acts as a liaison between the Independent Trustees and management with respect to matters important to the Independent Trustees and (ii) with management prepares agendas for Board meetings.
Fidelity funds are overseen by different Boards of Trustees. The fund's Board oversees Fidelity's equity and high income funds and another Board oversees Fidelity's investment-grade bond, money market, and asset allocation funds. The asset allocation funds may invest in Fidelity funds overseen by the fund's Board. The use of separate Boards, each with its own committee structure, allows the Trustees of each group of Fidelity funds to focus on the unique issues of the funds they oversee, including common research, investment, and operational issues. On occasion, the separate Boards establish joint committees to address issues of overlapping consequences for the Fidelity funds overseen by each Board.
The Trustees operate using a system of committees to facilitate the timely and efficient consideration of all matters of importance to the Trustees, the fund, and fund shareholders and to facilitate compliance with legal and regulatory requirements and oversight of the fund's activities and associated risks. The Board, acting through its committees, has charged FMR and its affiliates with (i) identifying events or circumstances the occurrence of which could have demonstrably adverse effects on the fund's business and/or reputation; (ii) implementing processes and controls to lessen the possibility that such events or circumstances occur or to mitigate the effects of such events or circumstances if they do occur; and (iii) creating and maintaining a system designed to evaluate continuously business and market conditions in order to facilitate the identification and implementation processes described in (i) and (ii) above. Because the day-to-day operations and activities of the fund are carried out by or through FMR, its affiliates and other service providers, the fund's exposure to risks is mitigated but not eliminated by the processes overseen by the Trustees. While each of the Board's committees has responsibility for overseeing different aspects of the fund's activities, oversight is exercised primarily through the Operations, Audit, and Compliance Committees. In addition, the Independent Trustees have worked with FMR to enhance the Board's oversight of investment and financial risks, legal and regulatory risks, technology risks, and operational risks, including the development of additional risk reporting to the Board. For example, a working group comprised of Independent Trustees and FMR has worked and continues to work to review the Fidelity fund's valuation-related activities, reporting and risk management. Appropriate personnel, including but not limited to the fund's Chief Compliance Officer (CCO), FMR's internal auditor, the independent accountants, the fund's Treasurer and portfolio management personnel, make periodic reports to the Board's committees, as appropriate, including an annual review of FMR's risk management program for the Fidelity funds. The responsibilities of each standing committee, including their oversight responsibilities, are described further under "Standing Committees of the Fund's Trustees."
Annual Report
Trustees and Officers - continued
The fund's Statement of Additional Information (SAI) includes more information about the Trustees. To request a free copy, call Fidelity at 1-877-208-0098.
Interested Trustees*:
Correspondence intended for each Trustee who is an interested person may be sent to Fidelity Investments, 245 Summer Street, Boston, Massachusetts 02210.
|
Name, Year of Birth; Principal Occupations and Other Relevant Experience+ |
|
|
James C. Curvey (1935) |
|
|
Year of Election or Appointment: 2007 Trustee Chairman of the Board of Trustees |
|
|
|
Mr. Curvey also serves as Trustee of other Fidelity funds. Mr. Curvey is a Director of Fidelity Investments Money Management, Inc. (2009-present), Director of Fidelity Research & Analysis Co. (2009-present) and Director of FMR and FMR Co., Inc. (2007-present). Mr. Curvey is also Vice Chairman (2007-present) and Director of FMR LLC. In addition, Mr. Curvey serves as an Overseer for the Boston Symphony Orchestra and a member of the Trustees of Villanova University. Previously, Mr. Curvey was the Vice Chairman (2006-2007) and Director (2000-2007) of FMR Corp. |
|
Ronald P. O'Hanley (1957) |
|
|
Year of Election or Appointment: 2011 Trustee |
|
|
|
Mr. O'Hanley also serves as Trustee of other Fidelity funds. He is Director of Fidelity SelectCo, LLC (2013-present), FMR Co., Inc. (2010-present), Director of Fidelity Investments Money Management, Inc. (2010-present), Director of Fidelity Research & Analysis Company (2010-present), President of Fidelity Asset Management and Corporate Services and a Member of Fidelity's Executive Committee (2010-present). Previously, Mr. O'Hanley served as President and Chief Executive Officer of BNY Mellon Asset Management (2007-2010). Mr. O'Hanley also served as Vice Chairman of Bank New York Mellon Corp. and a member of that firm's Executive Committee. Prior to the 2007 merger of The Bank of New York and Mellon Financial Corporation, he was Vice Chairman of Mellon Financial Corporation and President and Chief Executive Officer of Mellon Asset Management. He joined Mellon in February 1997. Mr. O'Hanley currently serves as Chairman of the Boston Public Library Foundation Board of Directors and sits on the Board of Directors of Beth Israel Deaconess Medical Center, the Board of Trustees of the Marine Biological Laboratory and the Advisory Board of the Maxwell School of Citizenship and Public Administration at Syracuse University. Mr. O'Hanley also chairs the Council on Asset Management for the Financial Services Roundtable and is a member of the Board of Directors of Institutional Investor's U.S. Institute. |
* Trustees have been determined to be "Interested Trustees" by virtue of, among other things, their affiliation with the trust or various entities under common control with FMR.
+ The information above includes each Trustee's principal occupation during the last five years and other information relating to the experience, attributes, and skills relevant to each Trustee's qualifications to serve as a Trustee, which led to the conclusion that each Trustee should serve as a Trustee for the fund.
Annual Report
Trustees and Officers - continued
Independent Trustees:
Correspondence intended for each Independent Trustee (that is, the Trustees other than the Interested Trustees) may be sent to Fidelity Investments, P.O. Box 55235, Boston, Massachusetts 02205-5235.
|
Name, Year of Birth; Principal Occupations and Other Relevant Experience+ |
|
|
Dennis J. Dirks (1948) |
|
|
Year of Election or Appointment: 2005 Trustee |
|
|
|
Mr. Dirks also serves as Trustee of other Fidelity funds. Prior to his retirement in May 2003, Mr. Dirks was Chief Operating Officer and a member of the Board of The Depository Trust & Clearing Corporation (DTCC). He also served as President, Chief Operating Officer, and Board member of The Depository Trust Company (DTC) and President and Board member of the National Securities Clearing Corporation (NSCC). In addition, Mr. Dirks served as Chief Executive Officer and Board member of the Government Securities Clearing Corporation, Chief Executive Officer and Board member of the Mortgage-Backed Securities Clearing Corporation, as a Trustee and a member of the Finance Committee of Manhattan College (2005-2008), and as a Trustee and a member of the Finance Committee of AHRC of Nassau County (2006-2008). Mr. Dirks is a member of the Independent Directors Council (IDC) Governing Council (2010-present) and Board of Directors for The Brookville Center for Children's Services, Inc. (2009-present). |
|
Alan J. Lacy (1953) |
|
|
Year of Election or Appointment: 2008 Trustee |
|
|
|
Mr. Lacy also serves as Trustee of other Fidelity funds. Mr. Lacy serves as Senior Adviser (2007-present) of Oak Hill Capital Partners, L.P. (private equity). Mr. Lacy also served as Chief Executive Officer (2000-2005) and Vice Chairman (2005-2006) of Sears Holdings Corporation and Sears, Roebuck and Co. (retail). In addition, Mr. Lacy serves as a member of the Board of Directors of Dave & Buster's Entertainment, Inc. (restaurant and entertainment complexes, 2010-present), Earth Fare, Inc. (retail grocery, 2012-present), The Hillman Companies, Inc. (hardware wholesalers, 2010-present), and Bristol-Myers Squibb Company (global pharmaceuticals, 2008-present). Mr. Lacy is a member of the Board of Trustees of The National Parks Conservation Association (2006-present). Previously, Mr. Lacy served as Chairman of the Board of Trustees of the National Parks Conservation Association (2008-2011) and as a member of the Board of Directors for the Western Union Company (global money transfer, 2006-2011). |
|
Ned C. Lautenbach (1944) |
|
|
Year of Election or Appointment: 2000 Trustee Chairman of the Independent Trustees |
|
|
|
Mr. Lautenbach also serves as Trustee of other Fidelity funds. Mr. Lautenbach currently serves as the Lead Director of the Eaton Corporation Board of Directors (diversified industrial, 1997-present). Mr. Lautenbach is Chairman of the Board of Directors of the Philharmonic Center for the Arts in Naples, Florida (2012-present) and a member of the Council on Foreign Relations (1994-present). Previously, Mr. Lautenbach was a Partner/Advisory Partner at Clayton, Dubilier & Rice, LLC (private equity investment, 1998-2010), as well as a Director of Sony Corporation (2006-2007). |
|
Joseph Mauriello (1944) |
|
|
Year of Election or Appointment: 2008 Trustee |
|
|
|
Mr. Mauriello also serves as Trustee of other Fidelity funds. Prior to his retirement in January 2006, Mr. Mauriello served in numerous senior management positions including Deputy Chairman and Chief Operating Officer (2004-2005), and Vice Chairman of Financial Services (2002-2004) of KPMG LLP US (professional services, 1965-2005). Mr. Mauriello currently serves as a member of the Board of Directors of XL Group plc. (global insurance and re-insurance, 2006-present). Previously, Mr. Mauriello served as a Director of the Hamilton Funds of the Bank of New York (2006-2007) and of Arcadia Resources Inc. (health care services and products, 2007-2012). |
|
Robert W. Selander (1950) |
|
|
Year of Election or Appointment: 2011 Trustee |
|
|
|
Mr. Selander also serves as Trustee of other Fidelity funds. Previously, Mr. Selander served as a Member of the Advisory Board of other Fidelity funds (2011), and Executive Vice Chairman (2010), Chief Executive Officer (2009-2010), and President and Chief Executive Officer (1997-2009) of Mastercard, Inc. |
|
Cornelia M. Small (1944) |
|
|
Year of Election or Appointment: 2005 Trustee |
|
|
|
Ms. Small also serves as Trustee of other Fidelity funds. Ms. Small is a member of the Board of Directors (2009-present) and Chair of the Investment Committee (2010-present) of the Teagle Foundation. Ms. Small also serves on the Investment Committee of the Berkshire Taconic Community Foundation (2008-present). Previously, Ms. Small served as Chairperson (2002-2008) and a member of the Investment Committee and Chairperson (2008-2012) and a member of the Board of Trustees of Smith College. In addition, Ms. Small served as Chief Investment Officer, Director of Global Equity Investments, and a member of the Board of Directors of Scudder, Stevens & Clark and Scudder Kemper Investments. |
|
William S. Stavropoulos (1939) |
|
|
Year of Election or Appointment: 2002 Trustee Vice Chairman of the Independent Trustees |
|
|
|
Mr. Stavropoulos also serves as Trustee of other Fidelity funds. Mr. Stavropoulos serves as President and Founder of the Michigan Baseball Foundation, the Great Lakes Loons (2007-present). Mr. Stavropoulos is Chairman Emeritus of the Board of Directors of The Dow Chemical Company, where he previously served in numerous senior management positions, including President, CEO (1995-2000; 2002-2004), Chairman of the Executive Committee (2000-2006), and as a member of the Board of Directors (1990-2006). Currently, Mr. Stavropoulos is Chairman of the Board of Directors of Univar Inc. (global distributor of commodity and specialty chemicals), a Director of Teradata Corporation (data warehousing and technology solutions), and Maersk Inc. (industrial conglomerate), and a member of the Advisory Board for Metalmark Capital LLC (private equity investment, 2005-present). Mr. Stavropoulos is an operating advisor to Clayton, Dubilier & Rice, LLC (private equity investment). In addition, Mr. Stavropoulos is a member of the University of Notre Dame Advisory Council for the College of Science, a Trustee of the Rollin L. Gerstacker Foundation, and a Director of the Naples Philharmonic Center for the Arts. Previously, Mr. Stavropoulos served as a Director of Chemical Financial Corporation (bank holding company, 1993-2012) and Tyco International, Ltd. (multinational manufacturing and services, 2007-2012). |
|
David M. Thomas (1949) |
|
|
Year of Election or Appointment: 2008 Trustee |
|
|
|
Mr. Thomas also serves as Trustee of other Fidelity funds. Mr. Thomas serves as Non-Executive Chairman of the Board of Directors of Fortune Brands Home and Security (home and security products, 2011-present), and as a member of the Board of Directors of Interpublic Group of Companies, Inc. (marketing communication, 2004-present). Previously, Mr. Thomas served as Executive Chairman (2005-2006) and Chairman and Chief Executive Officer (2000-2005) of IMS Health, Inc. (pharmaceutical and healthcare information solutions), and a Director of Fortune Brands, Inc. (consumer products, 2000-2011). |
+ The information above includes each Trustee's principal occupation during the last five years and other information relating to the experience, attributes, and skills relevant to each Trustee's qualifications to serve as a Trustee, which led to the conclusion that each Trustee should serve as a Trustee for the fund.
Advisory Board Member and Officers:
Correspondence intended for each officer and Peter S. Lynch may be sent to Fidelity Investments, 245 Summer Street, Boston, Massachusetts 02210. Officers appear below in alphabetical order.
|
Name, Year of Birth; Principal Occupation |
|
|
Peter S. Lynch (1944) |
|
|
Year of Election or Appointment: 2003 Member of the Advisory Board |
|
|
|
Mr. Lynch also serves as Member of the Advisory Board of other Fidelity funds. Mr. Lynch is Vice Chairman and a Director of FMR and FMR Co., Inc. In addition, Mr. Lynch serves as a Trustee of Boston College and as the Chairman of the Inner-City Scholarship Fund. Previously, Mr. Lynch served on the Special Olympics International Board of Directors (1997-2006). |
|
Elizabeth Paige Baumann (1968) |
|
|
Year of Election or Appointment: 2012 Anti-Money Laundering (AML) Officer |
|
|
|
Ms. Baumann also serves as AML Officer of other funds. She is Chief AML Officer of FMR LLC (2012-present) and is an employee of Fidelity Investments. Previously, Ms. Baumann served as Vice President and Deputy Anti-Money Laundering Officer (2007-2012). |
|
William C. Coffey (1969) |
|
|
Year of Election or Appointment: 2009 Assistant Secretary |
|
|
|
Mr. Coffey also serves as Assistant Secretary of other funds. He is Senior Vice President and Deputy General Counsel of FMR LLC (2010-present), and is an employee of Fidelity Investments. Previously, Mr. Coffey served as Vice President and Associate General Counsel of FMR LLC (2005-2009). |
|
Jonathan Davis (1968) |
|
|
Year of Election or Appointment: 2010 Assistant Treasurer |
|
|
|
Mr. Davis also serves as Assistant Treasurer of other funds. Mr. Davis is an employee of Fidelity Investments. Previously, Mr. Davis served as Vice President and Associate General Counsel of FMR LLC (2003-2010). |
|
Adrien E. Deberghes (1967) |
|
|
Year of Election or Appointment: 2008 Deputy Treasurer |
|
|
|
Mr. Deberghes also serves as an officer of other funds. He is an employee of Fidelity Investments (2008-present). Prior to joining Fidelity Investments, Mr. Deberghes was Senior Vice President of Mutual Fund Administration at State Street Corporation (2007-2008), Senior Director of Mutual Fund Administration at Investors Bank & Trust (2005-2007), and Director of Finance for Dunkin' Brands (2000-2005). |
|
Stephanie J. Dorsey (1969) |
|
|
Year of Election or Appointment: 2010 Assistant Treasurer |
|
|
|
Ms. Dorsey also serves as an officer of other funds. She is an employee of Fidelity Investments (2008-present) and has served in other fund officer roles. Prior to joining Fidelity Investments, Ms. Dorsey served as Treasurer (2004-2008) of the JPMorgan Mutual Funds and Vice President (2004-2008) of JPMorgan Chase Bank. |
|
Scott C. Goebel (1968) |
|
|
Year of Election or Appointment: 2008 Secretary and Chief Legal Officer (CLO) |
|
|
|
Mr. Goebel serves as Secretary and CLO of other funds. Mr. Goebel also serves as Secretary of Fidelity Investments Money Management, Inc. (FIMM) (2010-present) and Fidelity Research and Analysis Company (FRAC) (2010-present); General Counsel, Secretary, and Senior Vice President of FMR (2008-present) and FMR Co., Inc. (2008-present); Chief Legal Officer of Fidelity Management & Research (Hong Kong) Limited (2008-present) and Assistant Secretary of Fidelity Management & Research (Japan) Inc. (2008-present), and Fidelity Management & Research (U.K.) Inc. (2008-present). Previously, Mr. Goebel served as Secretary and CLO of other Fidelity funds (2008-2013), Assistant Secretary of FIMM (2008-2010), FRAC (2008-2010), and certain funds (2007-2008); and as Vice President and Secretary of Fidelity Distributors Corporation (FDC) (2005-2007). Mr. Goebel has been employed by FMR LLC or an affiliate since 2001. |
|
Joseph A. Hanlon (1968) |
|
|
Year of Election or Appointment: 2012 Chief Compliance Officer |
|
|
|
Mr. Hanlon also serves as Chief Compliance Officer of other funds. Mr. Hanlon serves as Compliance Officer of FMR, FMR Co., Inc., Fidelity Investments Money Management, Inc. (FIMM), Fidelity Research and Analysis Company (FRAC), and Fidelity Management & Research (Hong Kong) (2009-present), as Senior Vice President of the Fidelity Asset Management Division (2009-present), and is an employee of Fidelity Investments. Previously, Mr. Hanlon served as Compliance Officer of Fidelity Management & Research (Japan) Inc. (2009-2013), Strategic Advisers, Inc. (2009-2013), and Fidelity Management & Research (U.K.) Inc. (2009-2013). |
|
Bruce T. Herring (1965) |
|
|
Year of Election or Appointment: 2006 Vice President of certain Equity Funds |
|
|
|
Mr. Herring also serves as Vice President of other funds. He serves as Chief Investment Officer of Fidelity Global Asset Allocation (GAA) (2013-present), Chief Investment Officer and Director of Fidelity Management & Research (U.K.) Inc. (2010-present), Group Chief Investment Officer of FMR, and President of Fidelity Research & Analysis Company (2010-present). Previously, Mr. Herring served as Vice President (2005-2006) and Senior Vice President (2006-2007) of Fidelity Management & Research Company, Vice President of FMR Co., Inc. (2001-2007), and as a portfolio manager for Fidelity U.S. Equity Funds. |
|
Brian B. Hogan (1964) |
|
|
Year of Election or Appointment: 2009 Vice President |
|
|
|
Mr. Hogan also serves as Vice President of other funds. Mr. Hogan serves as President of FMR's Equity Division (2009-present). Previously, Mr. Hogan served as Senior Vice President, Equity Research of FMR (2006-2009) and as a portfolio manager. |
|
Chris Maher (1972) |
|
|
Year of Election or Appointment: 2013 Assistant Treasurer |
|
|
|
Mr. Maher serves as Assistant Treasurer of other funds. Mr. Maher is Vice President of Valuation Oversight and is an employee of Fidelity Investments. Previously, Mr. Maher served as Vice President of Asset Management Compliance (2013), Vice President of FMR's Program Management Group (2010-2013), and Vice President of Valuation Oversight (2008-2010). |
|
Christine Reynolds (1958) |
|
|
Year of Election or Appointment: 2008 Chief Financial Officer |
|
|
|
Ms. Reynolds also serves as Chief Financial Officer of other funds. Ms. Reynolds became President of Fidelity Pricing and Cash Management Services (FPCMS) in August 2008. Ms. Reynolds served as Chief Operating Officer of FPCMS (2007-2008). Previously, Ms. Reynolds served as President, Treasurer, and Anti-Money Laundering officer of the Fidelity funds (2004-2007). |
|
Kenneth B. Robins (1969) |
|
|
Year of Election or Appointment: 2008 President and Treasurer |
|
|
|
Mr. Robins also serves as an officer of other funds. Mr. Robins serves as Executive Vice President of Fidelity Investments Money Management, Inc. (FIMM) (2013-present) and is an employee of Fidelity Investments (2004-present). Previously, Mr. Robins served in other fund officer roles. |
|
Gary W. Ryan (1958) |
|
|
Year of Election or Appointment: 2005 Assistant Treasurer |
|
|
|
Mr. Ryan also serves as Assistant Treasurer of other funds. Mr. Ryan is an employee of Fidelity Investments and has served in other fund officer roles. Previously, Mr. Ryan served as Vice President of Fund Reporting in Fidelity Pricing and Cash Management Services (FPCMS) (1999-2005). |
|
Stephen Sadoski (1971) |
|
|
Year of Election or Appointment: 2012 Deputy Treasurer |
|
|
|
Mr. Sadoski also serves as Deputy Treasurer of other funds. He is an employee of Fidelity Investments (2012-present) and has served in another fund officer role. Prior to joining Fidelity Investments, Mr. Sadoski served as an assistant chief accountant in the Division of Investment Management of the Securities and Exchange Commission (SEC) (2009-2012) and as a senior manager at Deloitte & Touche LLP (1997-2009). |
|
Stacie M. Smith (1974) |
|
|
Year of Election or Appointment: 2013 Deputy Treasurer |
|
|
|
Ms. Smith also serves as an officer of other funds. She is an employee of Fidelity Investments (2009-present) and has served in other fund officer roles. Prior to joining Fidelity Investments, Ms. Smith served as Senior Audit Manager of Ernst & Young LLP (1996-2009). |
|
Renee Stagnone (1975) |
|
|
Year of Election or Appointment: 2013 Deputy Treasurer |
|
|
|
Ms. Stagnone also serves as Deputy Treasurer of other funds. Ms. Stagnone is an employee of Fidelity Investments. |
|
Joseph F. Zambello (1957) |
|
|
Year of Election or Appointment: 2011 Deputy Treasurer |
|
|
|
Mr. Zambello also serves as Deputy Treasurer of other funds. Mr. Zambello is an employee of Fidelity Investments. Previously, Mr. Zambello served as Vice President of FMR's Program Management Group (2009-2011) and Vice President of the Transfer Agent Oversight Group (2005-2009). |
Annual Report
Distributions (Unaudited)
The Board of Trustees of Fidelity Advisor Growth & Income Fund voted to pay to shareholders of record at the opening of business on record date, the following distributions per share derived from capital gains realized from sales of portfolio securities:
|
|
Pay Date |
Record Date |
Dividend |
Capital Gain |
|
Institutional Class |
12/16/13 |
12/13/13 |
$0.000 |
$0.110 |
|
Institutional Class |
01/13/14 |
01/10/14 |
$0.000 |
$0.069 |
The fund hereby designates as a capital gain dividend with respect to the taxable year ended November 30, 2013, $25,748,475, or, if subsequently determined to be different, the net capital gain of such year.
Institutional Class designates 91% of the dividends distributed during the fiscal year as qualifying for the dividends-received deduction for corporate shareholders.
Institutional Class designates 100% of dividends distributed during the fiscal year as amounts which may be taken into account as a dividend for purposes of the maximum rate under section 1(h)(11) of the Internal Revenue Code.
The fund will notify shareholders in January 2014 of amounts for use in preparing 2013 income tax returns.
Annual Report
Board Approval of Investment Advisory Contracts and Management Fees
Fidelity Advisor Growth & Income Fund
Each year, the Board of Trustees, including the Independent Trustees (together, the Board), votes on the renewal of the management contract and sub-advisory agreements (together, the Advisory Contracts) for the fund. The Board, assisted by the advice of fund counsel and Independent Trustees' counsel, requests and considers a broad range of information relevant to the renewal of the Advisory Contracts throughout the year.
The Board meets regularly and, at each of its meetings, covers an extensive agenda of topics and materials and considers factors that are relevant to its annual consideration of the renewal of the fund's Advisory Contracts, including the services and support provided to the fund and its shareholders. The Board has established various standing committees, each composed of and chaired by Independent Trustees with varying backgrounds, to which the Board has assigned specific subject matter responsibilities in order to enhance effective decision-making by the Board. The Board, acting directly and through its Committees, requests and receives information concerning the annual consideration of the renewal of the fund's Advisory Contracts. The Board also meets as needed to consider matters specifically related to the Board's annual consideration of the renewal of Advisory Contracts. Members of the Board may also meet with trustees of other Fidelity funds through ad hoc joint committees to discuss certain matters relevant to the Fidelity funds.
At its July 2013 meeting, the Board, including the Independent Trustees, unanimously determined to renew the fund's Advisory Contracts. In reaching its determination, the Board considered all factors it believed relevant, including (i) the nature, extent, and quality of the services to be provided to the fund and its shareholders (including the investment performance of the fund); (ii) the competitiveness of the fund's management fee and total expense ratio relative to peer funds; (iii) the total costs of the services to be provided by and the profits to be realized by Fidelity from its relationship with the fund; (iv) the extent to which economies of scale exist and would be realized as the fund grows; and (v) whether fee levels reflect these economies of scale, if any, for the benefit of fund shareholders.
In considering whether to renew the Advisory Contracts for the fund, the Board reached a determination, with the assistance of fund counsel and Independent Trustees' counsel and through the exercise of its business judgment, that the renewal of the Advisory Contracts was in the best interests of the fund and its shareholders and that the compensation payable under the Advisory Contracts was fair and reasonable. The Board's decision to renew the Advisory Contracts was not based on any single factor, but rather was based on a comprehensive consideration of all the information provided to the Board at its meetings throughout the year. The Board, in reaching its determination to renew the Advisory Contracts, was aware that shareholders in the fund have a broad range of investment choices available to them, including a wide choice among mutual funds offered by Fidelity's competitors, and that the fund's shareholders, who have the opportunity to review and weigh the disclosure provided by the fund in its prospectus and other public disclosures, have chosen to invest in this fund, which is a part of the Fidelity family of funds.
Annual Report
Nature, Extent, and Quality of Services Provided. The Board considered the staffing within the investment adviser, Fidelity Management & Research Company (FMR), and the sub-advisers (together, the Investment Advisers) as it relates to the fund, including the backgrounds of the fund's investment personnel, and also considered the fund's investment objective, strategies, and related investment philosophy. The Independent Trustees also had discussions with senior management of Fidelity's investment operations and investment groups. The Board considered the structure of the portfolio manager compensation program and whether this structure provides appropriate incentives to act in the best interests of the fund.
Resources Dedicated to Investment Management and Support Services. The Board and the Fund Oversight and Research Committees reviewed the general qualifications and capabilities of the Investment Advisers' investment staff, including its size, education, experience, and resources, as well as the Investment Advisers' approach to recruiting, training, managing, and compensating investment personnel. The Board noted that FMR has continued to increase the resources devoted to non-U.S. offices, including expansion of Fidelity's global investment organization. The Board also noted that Fidelity's analysts have extensive resources, tools and capabilities that allow them to conduct sophisticated quantitative and fundamental analysis, as well as credit analysis of issuers, counterparties and guarantors. Further, the Board believes that Fidelity's investment professionals have sufficient access to global information and data so as to provide competitive investment results over time, and that those professionals also have access to sophisticated tools that permit them to assess portfolio construction and risk and performance attribution characteristics continuously, as well as to transmit new information and research conclusions rapidly around the world. Additionally, in its deliberations, the Board considered the Investment Advisers' trading and risk management capabilities and resources, which are an integral part of the investment management process.
Shareholder and Administrative Services. The Board considered (i) the nature, extent, quality, and cost of advisory, administrative, and shareholder services performed by the Investment Advisers and their affiliates under the Advisory Contracts and under separate agreements covering transfer agency, pricing and bookkeeping, and securities lending services for the fund; (ii) the nature and extent of the supervision of third party service providers, principally custodians and subcustodians; and (iii) the resources devoted to, and the record of compliance with, the fund's compliance policies and procedures. The Board also reviewed the allocation of fund brokerage, including allocations to brokers affiliated with the Investment Advisers, the use of brokerage commissions to pay fund expenses, and the use of "soft" commission dollars to pay for research services.
Annual Report
Board Approval of Investment Advisory Contracts and
Management Fees - continued
The Board noted that the growth of fund assets over time across the complex allows Fidelity to reinvest in the development of services designed to enhance the value or convenience of the Fidelity funds as investment vehicles. These services include 24-hour access to account information and market information through telephone representatives and over the Internet, investor education materials and asset allocation tools, and the expanded availability of Fidelity Investor Centers.
Investment in a Large Fund Family. The Board considered the benefits to shareholders of investing in a Fidelity fund, including the benefits of investing in a fund that is part of a large family of funds offering a variety of investment disciplines and providing a large variety of mutual fund investor services. The Board noted that Fidelity had taken, or had made recommendations that resulted in the Fidelity funds taking, a number of actions over the previous year that benefited particular funds, including (i) continuing to dedicate additional resources to investment research and to the support of the senior management team that oversees asset management; (ii) persisting in efforts to enhance Fidelity's global research capabilities; (iii) launching new funds and making other enhancements to meet client needs for global and income-oriented solutions; (iv) continuing to launch dedicated lower cost underlying funds to meet portfolio construction needs related to expanding underlying fund options for Fidelity funds of funds, specifically for the Freedom Fund product lines; (v) rationalizing product lines and gaining increased efficiencies through the mergers of several funds into other funds; (vi) strengthening Fidelity's index fund offerings by reducing investment minimums and adopting or lowering existing expense caps for certain funds and classes; (vii) enhancing Global Asset Allocation product offerings by launching new funds and strategies, including "open architecture" target date funds that utilize affiliated and unaffiliated sub-advisers; (viii) modifying the eligibility criteria for Institutional Class shares of Advisor funds to increase their marketability to a portion of the defined contribution plan market; (ix) creating a new low-cost retirement share class for certain Advisor funds to appeal to large retirement plans; (x) transitioning the management of certain Fidelity commodity funds to Geode Capital Management LLC, a registered commodity pool operator, while retaining administrative responsibilities for the funds; (xi) reorganizing a number of funds; and (xii) taking steps toward establishing a new Fidelity adviser to manage sector-based funds and products.
Investment Performance. The Board considered whether the fund has operated in accordance with its investment objective, as well as its record of compliance with its investment restrictions and its performance history.
The Board took into account discussions with the Investment Advisers about fund investment performance that occur at Board meetings throughout the year. In this regard the Board noted that as part of regularly scheduled fund reviews and other reports to the Board on fund performance, the Board periodically considers annualized return information for the fund, for different time periods, measured against a securities market index ("benchmark index") and a peer group of mutual funds with similar objectives ("peer group"). In its evaluation of fund investment performance, the Board gave particular attention to information indicating changes in performance of certain Fidelity funds for specific time periods and the Investment Advisers' explanations for any overperformance or underperformance.
Annual Report
In addition to reviewing absolute and relative fund performance, the Independent Trustees periodically consider the appropriateness of fund performance metrics in evaluating the results achieved. In general, the Independent Trustees believe that fund performance should be evaluated based on net performance (after fees and expenses) of both the highest performing and lowest performing classes, where applicable, compared to appropriate benchmark indices, over appropriate time periods which may include full market cycles, and compared to peer groups, as applicable, over the same periods, taking into account relevant factors including the following: general market conditions; issuer-specific information; tactical opportunities for investment; and fund cash flows and other factors.
The Independent Trustees recognize that shareholders evaluate performance on a net basis over their own holding periods, for which one-, three-, and five-year periods are used as a proxy. For this reason, the performance information reviewed by the Board also included net cumulative calendar year total return information for the fund and an appropriate benchmark index and peer group for the most recent one-, three-, and five-year periods, as shown below. Returns are shown compared to the 25th percentile (top of box) and 75th percentile (bottom of box) of the peer universe.
Annual Report
Board Approval of Investment Advisory Contracts and
Management Fees - continued
Fidelity Advisor Growth & Income Fund

Based on its review, the Board concluded that the nature, extent, and quality of services provided to the fund under the Advisory Contracts should benefit the fund's shareholders.
Competitiveness of Management Fee and Total Expense Ratio. The Board considered the fund's management fee and total expense ratio compared to "mapped groups" of competitive funds and classes. Fidelity creates "mapped groups" by combining similar Lipper investment objective categories that have comparable management fee characteristics. Combining Lipper investment objective categories aids the Board's management fee and total expense ratio comparisons by broadening the competitive group used for comparison and by reducing the number of universes to which various Fidelity funds are compared.
Management Fee. The Board considered two proprietary management fee comparisons for the 12-month periods shown in the chart below. The group of Lipper funds used by the Board for management fee comparisons is referred to below as the "Total Mapped Group." The Total Mapped Group comparison focuses on a fund's standing in terms of gross management fees before expense reimbursements or caps relative to the total universe of funds with comparable investment mandates, regardless of whether their management fee structures also are comparable. Funds with comparable investment mandates offer exposure to similar types of securities. Funds with comparable management fee structures have similar management fee contractual arrangements (e.g., flat rate charged for advisory services, all-inclusive fee rate, etc.). "TMG %" represents the percentage of funds in the Total Mapped Group that had management fees that were lower than the fund's. For example, a TMG % of 15% means that 85% of the funds in the Total Mapped Group had higher management fees than the fund. The "Asset-Size Peer Group" (ASPG) comparison focuses on a fund's standing relative to a subset of non-Fidelity funds within the Total Mapped Group that are similar in size and management fee structure. The ASPG represents at least 15% of the funds in the Total Mapped Group with comparable asset size and management fee structures, subject to a minimum of 50 funds (or all funds in the Total Mapped Group if fewer than 50). Additional information, such as the ASPG quartile in which the fund's management fee ranked, is also included in the chart and considered by the Board.
Annual Report
Fidelity Advisor Growth & Income Fund
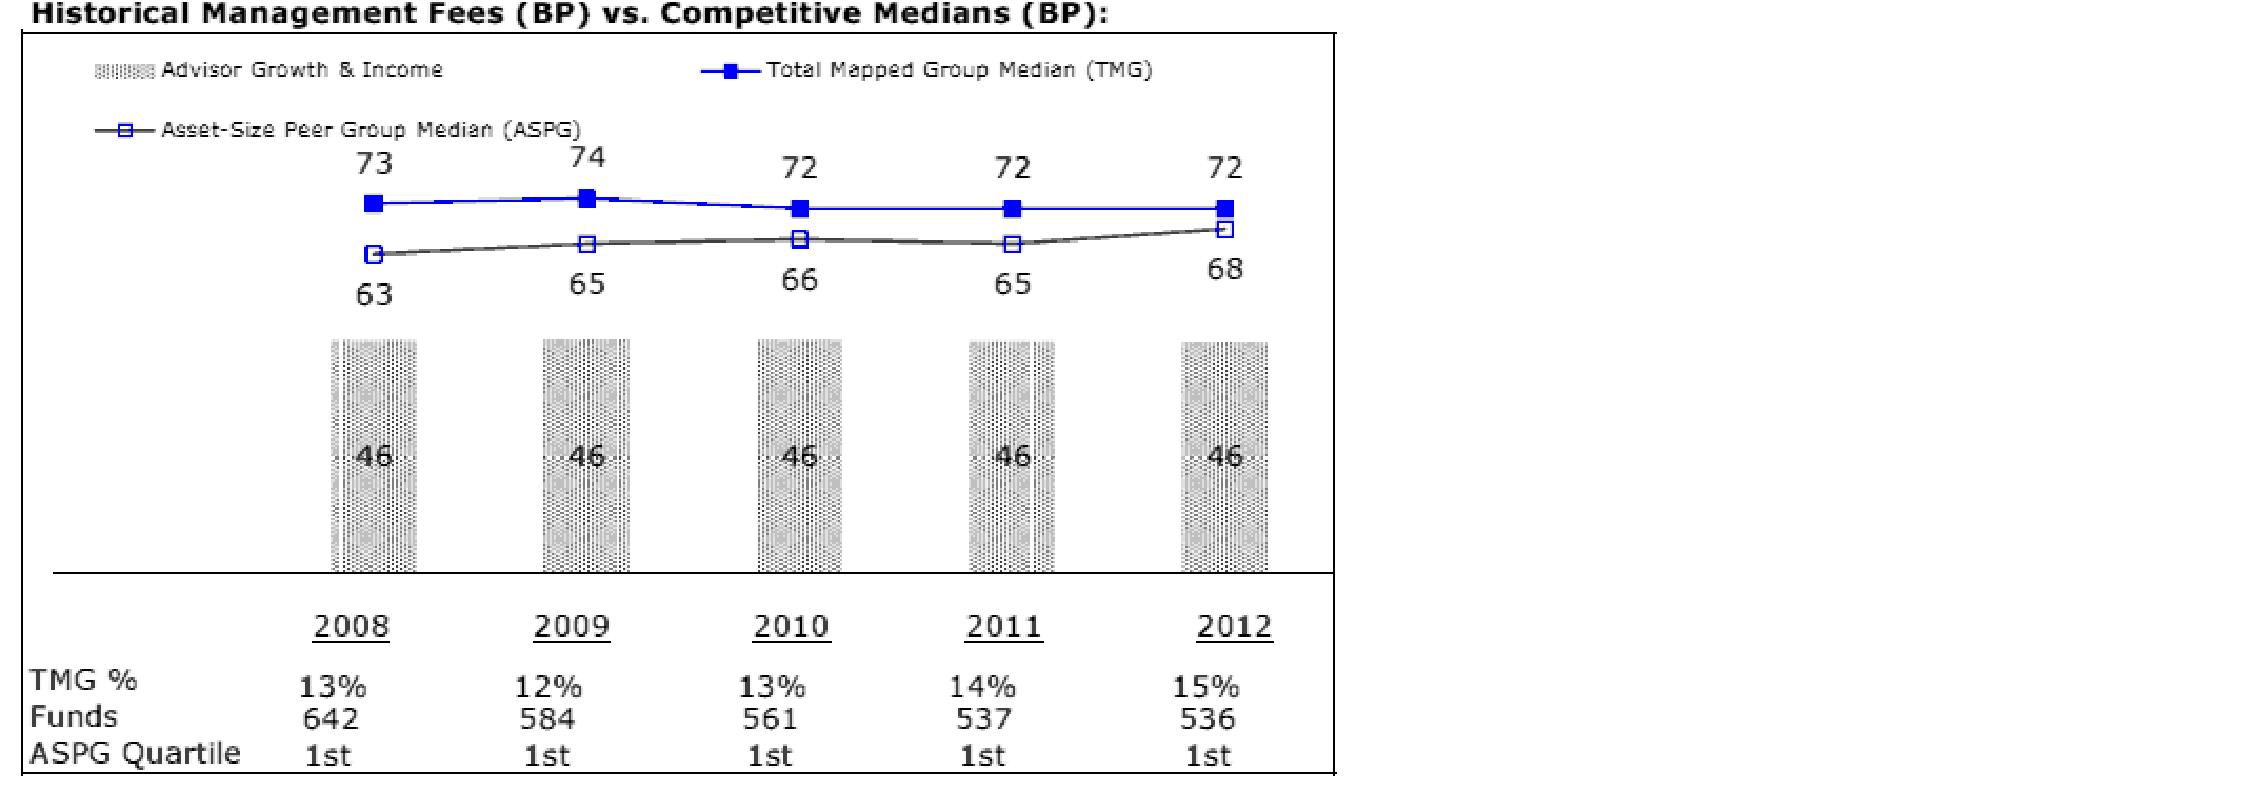
The Board noted that the fund's management fee ranked below the median of its Total Mapped Group and below the median of its ASPG for 2012.
Based on its review, the Board concluded that the fund's management fee is fair and reasonable in light of the services that the fund receives and the other factors considered.
Total Expense Ratio. In its review of each class's total expense ratio, the Board considered the fund's management fee as well as other fund or class expenses, as applicable, such as transfer agent fees, pricing and bookkeeping fees, fund-paid 12b-1 fees, and custodial, legal, and audit fees. The Board also noted the effects of any waivers and reimbursements on fees and expenses. As part of its review, the Board also considered the current and historical total expense ratios of each class of the fund compared to competitive fund median expenses. Each class of the fund is compared to those funds and classes in the Total Mapped Group (used by the Board for management fee comparisons) that have a similar sales load structure.
Annual Report
Board Approval of Investment Advisory Contracts and
Management Fees - continued
The Board noted that the total expense ratio of each of Class A, Class B, Class C, and Institutional Class ranked below its competitive median for 2012 and the total expense ratio of Class T ranked above its competitive median for 2012. The Board considered that, in general, various factors can affect total expense ratios. The Board noted that the total expense ratio of Class T was above the competitive median primarily because of higher 12b-1 fees on Class T. Class T has a higher 12b-1 fee, but a lower front-end sales charge, than traditionally priced front-end sales charge classes. The Board considered that Class T is primarily sold load-waived in the retirement plan market where its 0.50% 12b-1 fee is comparable to competing no-load, higher 12b-1 fee classes designed specifically for retirement plans. The Board noted that the fund offers multiple classes, each of which has a different sales load and 12b-1 fee structure, and that the multiple structures are intended to offer a range of pricing options for the intermediary market. The Board also noted that the total expense ratios of the classes vary primarily by the level of their 12b-1 fees, although differences in transfer agent fees may also cause expenses to vary from class to class.
Fees Charged to Other Fidelity Clients. The Board also considered Fidelity fee structures and other information with respect to clients of FMR and its affiliates, such as other mutual funds advised or subadvised by FMR or its affiliates, pension plan clients, and other institutional clients. The Board noted the findings of the 2013 ad hoc joint committee (created with the board of other Fidelity funds), which reviewed and compared Fidelity's institutional investment advisory business with its business of providing services to the Fidelity funds, including the differences in services provided, fees charged, and costs incurred, as well as competition in their respective marketplaces.
Based on its review of total expense ratios and fees charged to other Fidelity clients, the Board concluded that the total expense ratio of each class of the fund was reasonable, although Class T was above the median of the universe presented for comparison, in light of the services that the fund and its shareholders receive and the other factors considered.
Costs of the Services and Profitability. The Board considered the revenues earned and the expenses incurred by Fidelity in conducting the business of developing, marketing, distributing, managing, administering and servicing the fund and servicing the fund's shareholders. The Board also considered the level of Fidelity's profits in respect of all the Fidelity funds.
On an annual basis, FMR presents to the Board Fidelity's profitability for the fund. Fidelity calculates the profitability for each fund, as well as aggregate profitability for groups of Fidelity funds and all Fidelity funds, using a series of detailed revenue and cost allocation methodologies which originate with the books and records of Fidelity on which Fidelity's audited financial statements are based. The Audit Committee of the Board reviews any significant changes from the prior year's methodologies.
Annual Report
PricewaterhouseCoopers LLP (PwC), independent registered public accounting firm and auditor to Fidelity and certain Fidelity funds, has been engaged annually by the Board as part of the Board's assessment of Fidelity's profitability analysis. PwC's engagement includes the review and assessment of the methodologies used by Fidelity in determining the revenues and expenses attributable to Fidelity's mutual fund business, and completion of agreed-upon procedures surrounding the mathematical accuracy of fund profitability and its conformity to allocation methodologies. After considering PwC's reports issued under the engagement and information provided by Fidelity, the Board concluded that while other allocation methods may also be reasonable, Fidelity's profitability methodologies are reasonable in all material respects.
The Board also reviewed Fidelity's non-fund businesses and fall-out benefits related to the mutual fund business as well as cases where Fidelity's affiliates may benefit from or be related to the fund's business.
The Board considered the costs of the services provided by and the profits realized by Fidelity in connection with the operation of the fund and was satisfied that the profitability was not excessive in the circumstances.
Economies of Scale. The Board considered whether there have been economies of scale in respect of the management of the Fidelity funds, whether the Fidelity funds (including the fund) have appropriately benefited from any such economies of scale, and whether there is potential for realization of any further economies of scale. The Board considered the extent to which the fund will benefit from economies of scale through increased services to the fund, through waivers or reimbursements, or through fee or expense reductions. The Board also noted that in 2009, it and the board of other Fidelity funds created an ad hoc committee (the Economies of Scale Committee) to analyze whether FMR attains economies of scale in respect of the management and servicing of the Fidelity funds, whether the Fidelity funds have appropriately benefited from such economies of scale, and whether there is potential for realization of any further economies of scale.
The Board recognized that the fund's management contract incorporates a "group fee" structure, which provides for lower group fee rates as total fund assets under FMR's management increase, and for higher group fee rates as total fund assets under FMR's management decrease. FMR calculates the group fee rates based on a tiered asset "breakpoint" schedule that varies based on asset class. The Board considered that the group fee is designed to deliver the benefits of economies of scale to fund shareholders when total Fidelity fund assets increase, even if assets of any particular fund are unchanged or have declined, because some portion of Fidelity's costs are attributable to services provided to all Fidelity funds, and all funds benefit if those costs can be allocated among more assets. The Board concluded that, given the group fee structure, fund shareholders will benefit from lower management fees as assets under FMR's management increase at the fund complex level, regardless of whether Fidelity achieves any such economies of scale.
Annual Report
Board Approval of Investment Advisory Contracts and
Management Fees - continued
The Board concluded, taking into account the analysis of the Economies of Scale Committee, that economies of scale, if any, are being appropriately shared between fund shareholders and Fidelity.
Amendment to Description of Group Fee Rate. At its July 2013 meeting, the Board voted to approve an amendment to the fund's management contract to modify the description of the "group fee rate" effective August 1, 2013. The Board noted that under the prior description in the contract, the group fee rate was based on the average net assets of all registered investment companies with which FMR has management contracts. Under the contract's tiered asset breakpoint schedule, the group fee rate is lower as total fund assets under FMR's management increase, and higher as total fund assets under FMR's management decrease. The Board considered that the prior description would have excluded the assets of 64 Fidelity sector funds from the group fee rate calculation once Fidelity SelectCo, LLC, an affiliate of FMR, assumed management responsibilities for those funds. The Board noted that modifying the description of the group fee rate to continue to include the assets of those 64 funds for purposes of determining group fee rate breakpoints would avoid an immediate adverse impact on the group fee rate for any fund.
Additional Information Requested by the Board. In order to develop fully the factual basis for consideration of the Fidelity funds' Advisory Contracts, the Board requested and received additional information on certain topics, including: (i) fund performance trends and Fidelity's long-term strategies for certain funds; (ii) the potential to further rationalize the Fidelity fund lineup with the possibility of achieving savings for the funds and Fidelity; (iii) the methodology with respect to competitive fund data and peer group classifications; (iv) the arrangements with, and performance of, certain sub-advisers on behalf of the Fidelity funds, as well as certain proposed participating affiliate arrangements; (v) the realization of fall-out benefits in certain Fidelity business units; (vi) Fidelity's group fee structures, including the rationale for the individual fee rates of certain categories of funds and the definition of group assets; (vii) trends regarding industry use of performance fee structures and the performance adjustment methodologies applicable to the Fidelity funds; (viii) additional competitive analysis regarding the total expenses for certain classes; and (ix) fund profitability methodology, including Fidelity's cost allocation methodology, and the impact of certain factors on fund profitability results.
Based on its evaluation of all of the conclusions noted above, and after considering all factors it believed relevant, the Board ultimately concluded that the advisory fee structures are fair and reasonable, and that the fund's Advisory Contracts should be renewed.
Annual Report
Investment Adviser
Fidelity Management & Research Company
Boston, MA
Investment Sub-Advisers
FMR Co., Inc.
Fidelity Management & Research
(U.K.) Inc.
Fidelity Management & Research (Japan) Inc.
Fidelity Management & Research (Hong Kong) Limited
General Distributor
Fidelity Distributors Corporation
Smithfield, RI
Transfer and Service Agents
Fidelity Investments Institutional
Operations Company, Inc.
Boston, MA
Fidelity Service Company, Inc.
Boston, MA
Custodian
JPMorgan Chase Bank
New York, NY
(Fidelity Investment logo)(registered trademark)
AGAII-UANN-0114 1.786688.110
(Fidelity Investment logo)(registered trademark)
Fidelity Advisor®
Growth Opportunities
Fund - Class A, Class T, Class B
and Class C
Annual Report
November 30, 2013
(Fidelity Cover Art)
Contents
|
Performance |
How the fund has done over time. |
|
|
Management's Discussion of Fund Performance |
The Portfolio Manager's review of fund performance and strategy. |
|
|
Shareholder Expense Example |
An example of shareholder expenses. |
|
|
Investment Changes |
A summary of major shifts in the fund's investments over the past six months. |
|
|
Investments |
A complete list of the fund's investments with their market values. |
|
|
Financial Statements |
Statements of assets and liabilities, operations, and changes in net assets, as well as financial highlights. |
|
|
Notes |
Notes to the financial statements. |
|
|
Report of Independent Registered Public Accounting Firm |
|
|
|
Trustees and Officers |
|
|
|
Board Approval of Investment Advisory Contracts and Management Fees |
|
To view a fund's proxy voting guidelines and proxy voting record for the 12-month period ended June 30, visit http://www.fidelity.com/proxyvotingresults or visit the Securities and Exchange Commission's (SEC) web site at http://www.sec.gov. You may also call 1-877-208-0098 to request a free copy of the proxy voting guidelines.
Standard & Poor's, S&P and S&P 500 are registered service marks of The McGraw-Hill Companies, Inc. and have been licensed for use by Fidelity Distributors Corporation.
Other third-party marks appearing herein are the property of their respective owners.
All other marks appearing herein are registered or unregistered trademarks or service marks of FMR LLC or an affiliated company. © 2014 FMR LLC. All rights reserved.
Annual Report
This report and the financial statements contained herein are submitted for the general information of the shareholders of the fund. This report is not authorized for distribution to prospective investors in the fund unless preceded or accompanied by an effective prospectus.
A fund files its complete schedule of portfolio holdings with the SEC for the first and third quarters of each fiscal year on Form N-Q. Forms N-Q are available on the SEC's web site at http://www.sec.gov. A fund's Forms N-Q may be reviewed and copied at the SEC's Public Reference Room in Washington, DC. Information regarding the operation of the SEC's Public Reference Room may be obtained by calling 1-800-SEC-0330. For a complete list of a fund's portfolio holdings, view the most recent holdings listing, semiannual report, or annual report on Fidelity's web site at http://www.fidelity.com, http://www.advisor.fidelity.com, or http://www.401k.com, as applicable.
NOT FDIC INSURED • MAY LOSE VALUE • NO BANK GUARANTEE
Neither the fund nor Fidelity Distributors Corporation is a bank.
Annual Report
Performance: The Bottom Line
Average annual total return reflects the change in the value of an investment, assuming reinvestment of the class' distributions from dividend income and capital gains (the profits earned upon the sale of securities that have grown in value, if any) and assuming a constant rate of performance each year. The $10,000 table and the fund's returns do not reflect the deduction of taxes that a shareholder would pay on fund distributions or the redemption of fund shares. During periods of reimbursement by Fidelity, a fund's total return will be greater than it would be had the reimbursement not occurred. How a fund did yesterday is no guarantee of how it will do tomorrow. Returns reflect the conversion of Class B shares to Class A shares after a maximum of seven years.
Average Annual Total Returns
|
Periods ended November 30, 2013 |
|
Past 1 |
Past 5 |
Past 10 |
|
Class A (incl. 5.75% sales charge) C |
|
25.14% |
22.40% |
6.86% |
|
Class T (incl. 3.50% sales charge) C |
|
27.86% |
22.74% |
6.92% |
|
Class B (incl. contingent deferred |
|
26.72% |
22.74% |
6.93% |
|
Class C (incl. contingent deferred |
|
30.78% |
22.94% |
6.70% |
A Class B shares' contingent deferred sales charges included in the past one year, past five years, and past ten years total return figures are 5%, 2%, and 0%, respectively.
B Class C shares' contingent deferred sales charges included in the past one year, past five years, and past ten years total return figures are 1%, 0%, and 0%, respectively.
C Prior to February 1, 2007, Fidelity Advisor® Growth Opportunities Fund operated under certain different investment policies and compared its performance to a different index. The fund's historical performance may not represent its current investment policies.
Annual Report
$10,000 Over 10 Years
Let's say hypothetically that $10,000 was invested in Fidelity Advisor® Growth Opportunities Fund - Class A on November 30, 2003, and the current 5.75% sales charge was paid. The chart shows how the value of your investment would have changed, and also shows how the Russell 1000® Growth Index performed over the same period.
Annual Report
Management's Discussion of Fund Performance
Market Recap: With the current bull run nearing the five-year mark, equity benchmarks ripped up old records during the 12 months ending November 30, 2013. Gains were fueled by strengthening U.S. economic data, as well as generally improving economies and accommodative monetary policies worldwide. The broad S&P 500® Index reached new peaks in its 30.30% climb for the period, and the blue-chip Dow Jones Industrial AverageSM surpassed historic milestones en route to a 26.63% gain. The Nasdaq Composite Index®, up 36.73% amid a resurgence in growth-oriented stocks, closed above 4,000 for the first time since 2000. Shedding anxiety over the 2012 U.S. presidential election - and apparently confident that the federal debt-ceiling debate would be resolved - markets rose from period start through late May. News that the U.S. Federal Reserve was considering an end to its stimulative bond-buying kept stocks in flux over the summer but, by September, the Fed had set aside any imminent tapering. Despite jitters over a potential U.S. military strike in Syria and, later, an October budget impasse that briefly shuttered the federal government, volatility was subdued heading into the holidays, with investor optimism helping many markets home in on all-time highs at period end. Elsewhere, non-U.S. developed-market equities saw similar results, with the MSCI® EAFE® Index adding 24.97%.
Comments from Steve Wymer, Lead Portfolio Manager of Fidelity Advisor® Growth Opportunities Fund: For the year, the fund's Class A, Class T, Class B and Class C shares returned 32.78%, 32.50%, 31.72% and 31.78%, respectively (excluding sales charges), outperforming the 29.74% gain of the Russell 1000® Growth Index. Our focus on well-positioned firms with strong product cycles and growth catalysts drew us to the pharmaceuticals, biotechnology & life science space, where a large overweighting and successful picks significantly boosted the fund's relative result. Shares of Isis Pharmaceuticals, our biggest relative contributor, jumped in late June after the drug developer released positive mid-stage data for its promising drug for patients with high triglycerides and type 2 diabetes. Regeneron Pharmaceuticals - one of the fund's largest holdings - received a boost because a key competitor of its age-related macular degeneration program, EYLEA®, had a major setback and delayed its product launch. On the flip side, a sizable position in long-time fund holding lululemon athletica hurt the most. Shares lagged due to consecutive quarters of weaker-than-expected financial results, and were further hampered by two big events - the company's recall of a line of women's yoga pants in March, after they were found to be too sheer, and the June departure of its CEO.
Annual Report
The views expressed above reflect those of the portfolio manager(s) only through the end of the period as stated on the cover of this report and do not necessarily represent the views of Fidelity or any other person in the Fidelity organization. Any such views are subject to change at any time based upon market or other conditions and Fidelity disclaims any responsibility to update such views. These views may not be relied on as investment advice and, because investment decisions for a Fidelity fund are based on numerous factors, may not be relied on as an indication of trading intent on behalf of any Fidelity fund.
Annual Report
Shareholder Expense Example
As a shareholder of the Fund, you incur two types of costs: (1) transaction costs, including sales charges (loads) on purchase payments or redemption proceeds, and (2) ongoing costs, including management fees, distribution and/or service (12b-1) fees and other Fund expenses. This Example is intended to help you understand your ongoing costs (in dollars) of investing in the Fund and to compare these costs with the ongoing costs of investing in other mutual funds.
The actual expense Example is based on an investment of $1,000 invested at the beginning of the period and held for the entire period (June 1, 2013 to November 30, 2013) for Class A, Class T, Class B, Class C and Institutional Class and for the period (August 13, 2013 to November 30, 2013) for Class Z. The hypothetical expense Example is based on an investment of $1,000 invested for the one-half year period (June 1, 2013 to November 30, 2013).
Actual Expenses
The first line of the accompanying table for each class of the Fund provides information about actual account values and actual expenses. You may use the information in this line, together with the amount you invested, to estimate the expenses that you paid over the period. Simply divide your account value by $1,000.00 (for example, an $8,600 account value divided by $1,000.00 = 8.6), then multiply the result by the number in the first line for a class of the Fund under the heading entitled "Expenses Paid During Period" to estimate the expenses you paid on your account during this period. In addition, the Fund, as a shareholder in the underlying Fidelity Central Funds, will indirectly bear its pro-rata share of the fees and expenses incurred by the underlying Fidelity Central Funds. These fees and expenses are not included in the Fund's annualized expense ratio used to calculate the expense estimate in the table below.
Hypothetical Example for Comparison Purposes
The second line of the accompanying table for each class of the Fund provides information about hypothetical account values and hypothetical expenses based on a Class' actual expense ratio and an assumed rate of return of 5% per year before expenses, which is not the Class' actual return. The hypothetical account values and expenses may not be used to estimate the actual ending account balance or expenses you paid for the period. You may use this information to compare the ongoing costs of investing in the Fund and other funds. To do so, compare this 5% hypothetical example with the 5% hypothetical examples that appear in the shareholder reports of the other funds. In addition, the Fund, as a shareholder in the underlying Fidelity Central Funds, will indirectly bear its pro-rata share of the fees and expenses incurred by the underlying Fidelity Central Funds. These fees and expenses are not included in the Fund's annualized expense ratio used to calculate the expense estimate in the table below.
Please note that the expenses shown in the table are meant to highlight your ongoing costs only and do not reflect any transaction costs. Therefore, the second line of the table is useful in comparing ongoing costs only, and will not help you determine the relative total costs of owning different funds. In addition, if these transactional costs were included, your costs would have been higher.
Annual Report
|
|
Annualized |
Beginning |
Ending |
Expenses Paid |
|
Class A |
1.22% |
|
|
|
|
Actual |
|
$ 1,000.00 |
$ 1,136.70 |
$ 6.53 C |
|
HypotheticalA |
|
$ 1,000.00 |
$ 1,018.95 |
$ 6.17 D |
|
Class T |
1.43% |
|
|
|
|
Actual |
|
$ 1,000.00 |
$ 1,135.50 |
$ 7.66 C |
|
HypotheticalA |
|
$ 1,000.00 |
$ 1,017.90 |
$ 7.23 D |
|
Class B |
2.03% |
|
|
|
|
Actual |
|
$ 1,000.00 |
$ 1,132.00 |
$ 10.85 C |
|
HypotheticalA |
|
$ 1,000.00 |
$ 1,014.89 |
$ 10.25 D |
|
Class C |
1.96% |
|
|
|
|
Actual |
|
$ 1,000.00 |
$ 1,132.60 |
$ 10.48 C |
|
HypotheticalA |
|
$ 1,000.00 |
$ 1,015.24 |
$ 9.90 D |
|
Institutional Class |
.94% |
|
|
|
|
Actual |
|
$ 1,000.00 |
$ 1,138.40 |
$ 5.04 C |
|
HypotheticalA |
|
$ 1,000.00 |
$ 1,020.36 |
$ 4.76 D |
|
Class Z |
.78% |
|
|
|
|
Actual |
|
$ 1,000.00 |
$ 1,073.20 |
$ 2.44 C |
|
HypotheticalA |
|
$ 1,000.00 |
$ 1,021.16 |
$ 3.95 D |
A 5% return per year before expenses
B Annualized expense ratio reflects expenses net of applicable fee waivers.
C Actual expenses are equal to each Class' annualized expense ratio, multiplied by the average account value over the period, multiplied by 183/365 (to reflect the one-half year period) for Class A, Class T, Class B, Class C and Institutional Class and multiplied by 110/365 (to reflect the period August 13, 2013 to November 30, 2013) for Class Z. The fees and expenses of the underlying Fidelity Central Funds in which the Fund invests are not included in each Class' annualized expense ratio.
D Hypothetical expenses are equal to each Class' annualized expense ratio, multiplied by the average account value over the period, multiplied by 183/365 (to reflect the one-half year period). The fees and expenses of the underlying Fidelity Central Funds in which the Fund invests are not included in each Class' annualized expense ratio.
Annual Report
Investment Changes (Unaudited)
|
Top Ten Stocks as of November 30, 2013 |
||
|
|
% of fund's |
% of fund's net assets |
|
Google, Inc. Class A |
4.8 |
4.6 |
|
Apple, Inc. |
4.1 |
4.8 |
|
salesforce.com, Inc. |
3.6 |
3.6 |
|
Regeneron Pharmaceuticals, Inc. |
3.0 |
3.5 |
|
Facebook, Inc. Class A |
2.1 |
0.5 |
|
Seattle Genetics, Inc. |
2.1 |
2.3 |
|
lululemon athletica, Inc. |
1.9 |
2.7 |
|
Comcast Corp. Class A |
1.7 |
0.2 |
|
Alkermes PLC |
1.5 |
1.5 |
|
Visa, Inc. Class A |
1.5 |
1.3 |
|
|
26.3 |
|
|
Top Five Market Sectors as of November 30, 2013 |
||
|
|
% of fund's |
% of fund's net assets |
|
Information Technology |
33.1 |
34.7 |
|
Health Care |
19.0 |
19.4 |
|
Consumer Discretionary |
18.2 |
18.5 |
|
Consumer Staples |
9.9 |
9.2 |
|
Industrials |
7.0 |
7.1 |
|
Asset Allocation (% of fund's net assets) |
|||||||
|
As of November 30, 2013* |
As of May 31, 2013** |
||||||
 |
Stocks 97.5% |
|
|
Stocks 99.2% |
|
||
 |
Convertible |
|
|
Convertible |
|
||
 |
Short-Term |
|
|
Short-Term |
|
||
|
* Foreign investments |
6.5% |
|
** Foreign investments |
6.2% |
|
||

Annual Report
Investments November 30, 2013
Showing Percentage of Net Assets
|
Common Stocks - 97.5% |
|||
|
Shares |
Value (000s) |
||
|
CONSUMER DISCRETIONARY - 18.2% |
|||
|
Auto Components - 0.2% |
|||
|
Tenneco, Inc. (a) |
115,600 |
$ 6,635 |
|
|
Automobiles - 0.6% |
|||
|
Tesla Motors, Inc. (a)(d) |
146,400 |
18,634 |
|
|
Hotels, Restaurants & Leisure - 3.1% |
|||
|
Arcos Dorados Holdings, Inc. Class A (d) |
222,600 |
2,716 |
|
|
BJ's Restaurants, Inc. (a) |
54,500 |
1,615 |
|
|
Buffalo Wild Wings, Inc. (a) |
64,200 |
9,645 |
|
|
Chipotle Mexican Grill, Inc. (a) |
22,800 |
11,944 |
|
|
Chuys Holdings, Inc. (a) |
114,500 |
3,989 |
|
|
Dunkin' Brands Group, Inc. |
163,600 |
8,013 |
|
|
Las Vegas Sands Corp. |
133,992 |
9,605 |
|
|
McDonald's Corp. |
135,600 |
13,203 |
|
|
Potbelly Corp. |
3,000 |
84 |
|
|
Starbucks Corp. |
315,500 |
25,701 |
|
|
Starwood Hotels & Resorts Worldwide, Inc. |
61,200 |
4,558 |
|
|
The Cheesecake Factory, Inc. |
64,300 |
3,135 |
|
|
Wendy's Co. |
779,700 |
6,713 |
|
|
|
100,921 |
||
|
Household Durables - 1.0% |
|||
|
Lennar Corp. Class A (d) |
359,500 |
12,856 |
|
|
SodaStream International Ltd. (a) |
105,300 |
6,053 |
|
|
Toll Brothers, Inc. (a) |
240,300 |
8,194 |
|
|
Tupperware Brands Corp. |
54,600 |
4,987 |
|
|
|
32,090 |
||
|
Internet & Catalog Retail - 1.9% |
|||
|
Amazon.com, Inc. (a) |
109,000 |
42,905 |
|
|
priceline.com, Inc. (a) |
13,500 |
16,096 |
|
|
Shutterfly, Inc. (a) |
79,400 |
3,750 |
|
|
zulily, Inc. |
6,800 |
238 |
|
|
|
62,989 |
||
|
Media - 3.6% |
|||
|
AMC Networks, Inc. Class A (a) |
161,500 |
10,367 |
|
|
Comcast Corp. Class A |
1,095,900 |
54,653 |
|
|
DIRECTV (a) |
112,300 |
7,424 |
|
|
IMAX Corp. (a) |
434,100 |
13,383 |
|
|
Lions Gate Entertainment Corp. (a) |
241,100 |
7,628 |
|
|
News Corp. Class A (a) |
39,325 |
706 |
|
|
Common Stocks - continued |
|||
|
Shares |
Value (000s) |
||
|
CONSUMER DISCRETIONARY - continued |
|||
|
Media - continued |
|||
|
The Walt Disney Co. |
123,300 |
$ 8,698 |
|
|
Twenty-First Century Fox, Inc. Class A |
476,800 |
15,968 |
|
|
|
118,827 |
||
|
Multiline Retail - 0.2% |
|||
|
Target Corp. |
91,300 |
5,837 |
|
|
Specialty Retail - 3.4% |
|||
|
Abercrombie & Fitch Co. Class A |
117,300 |
4,021 |
|
|
Bed Bath & Beyond, Inc. (a) |
64,700 |
5,049 |
|
|
Cabela's, Inc. Class A (a) |
105,000 |
6,431 |
|
|
CarMax, Inc. (a) |
209,700 |
10,558 |
|
|
DSW, Inc. Class A |
82,400 |
3,694 |
|
|
Five Below, Inc. (a) |
105,600 |
5,614 |
|
|
GNC Holdings, Inc. |
137,500 |
8,275 |
|
|
Home Depot, Inc. |
236,100 |
19,046 |
|
|
Lumber Liquidators Holdings, Inc. (a)(d) |
361,200 |
36,369 |
|
|
The Container Store Group, Inc. |
6,800 |
277 |
|
|
TJX Companies, Inc. |
156,600 |
9,847 |
|
|
|
109,181 |
||
|
Textiles, Apparel & Luxury Goods - 4.2% |
|||
|
Fifth & Pacific Companies, Inc. (a) |
146,100 |
4,772 |
|
|
Fossil Group, Inc. (a) |
147,100 |
18,721 |
|
|
lululemon athletica, Inc. (a)(d) |
902,216 |
62,902 |
|
|
Michael Kors Holdings Ltd. (a) |
197,700 |
16,122 |
|
|
NIKE, Inc. Class B |
150,400 |
11,903 |
|
|
Prada SpA |
454,000 |
4,383 |
|
|
Skechers U.S.A., Inc. Class A (sub. vtg.) (a) |
130,100 |
4,374 |
|
|
Steven Madden Ltd. (a) |
264,600 |
10,309 |
|
|
Under Armour, Inc. Class A (sub. vtg.) (a) |
48,600 |
3,922 |
|
|
Vince Holding Corp. |
5,100 |
149 |
|
|
|
137,557 |
||
|
TOTAL CONSUMER DISCRETIONARY |
592,671 |
||
|
CONSUMER STAPLES - 9.9% |
|||
|
Beverages - 1.6% |
|||
|
Monster Beverage Corp. (a) |
83,300 |
4,930 |
|
|
PepsiCo, Inc. |
178,300 |
15,059 |
|
|
Common Stocks - continued |
|||
|
Shares |
Value (000s) |
||
|
CONSUMER STAPLES - continued |
|||
|
Beverages - continued |
|||
|
SABMiller PLC |
92,200 |
$ 4,757 |
|
|
The Coca-Cola Co. |
640,800 |
25,754 |
|
|
|
50,500 |
||
|
Food & Staples Retailing - 3.2% |
|||
|
Costco Wholesale Corp. |
249,300 |
31,270 |
|
|
CVS Caremark Corp. |
360,000 |
24,106 |
|
|
Fresh Market, Inc. (a) |
56,433 |
2,297 |
|
|
Wal-Mart Stores, Inc. |
233,480 |
18,914 |
|
|
Walgreen Co. |
298,500 |
17,671 |
|
|
Whole Foods Market, Inc. |
204,100 |
11,552 |
|
|
|
105,810 |
||
|
Food Products - 1.8% |
|||
|
Bunge Ltd. |
63,200 |
5,064 |
|
|
Green Mountain Coffee Roasters, Inc. (d) |
628,900 |
42,375 |
|
|
Mead Johnson Nutrition Co. Class A |
99,100 |
8,375 |
|
|
Mondelez International, Inc. |
125,000 |
4,191 |
|
|
|
60,005 |
||
|
Household Products - 0.8% |
|||
|
Procter & Gamble Co. |
198,200 |
16,692 |
|
|
Svenska Cellulosa AB (SCA) (B Shares) |
309,500 |
9,036 |
|
|
|
25,728 |
||
|
Personal Products - 0.4% |
|||
|
Avon Products, Inc. |
100,242 |
1,787 |
|
|
Herbalife Ltd. |
177,900 |
12,396 |
|
|
|
14,183 |
||
|
Tobacco - 2.1% |
|||
|
Altria Group, Inc. |
808,500 |
29,898 |
|
|
Japan Tobacco, Inc. |
34,800 |
1,175 |
|
|
Lorillard, Inc. |
179,800 |
9,229 |
|
|
Philip Morris International, Inc. |
319,250 |
27,309 |
|
|
|
67,611 |
||
|
TOTAL CONSUMER STAPLES |
323,837 |
||
|
ENERGY - 4.2% |
|||
|
Energy Equipment & Services - 1.5% |
|||
|
FMC Technologies, Inc. (a) |
95,840 |
4,610 |
|
|
Halliburton Co. |
118,300 |
6,232 |
|
|
Common Stocks - continued |
|||
|
Shares |
Value (000s) |
||
|
ENERGY - continued |
|||
|
Energy Equipment & Services - continued |
|||
|
National Oilwell Varco, Inc. |
83,988 |
$ 6,845 |
|
|
Schlumberger Ltd. |
351,900 |
31,115 |
|
|
|
48,802 |
||
|
Oil, Gas & Consumable Fuels - 2.7% |
|||
|
Anadarko Petroleum Corp. |
74,200 |
6,590 |
|
|
Cabot Oil & Gas Corp. |
158,400 |
5,457 |
|
|
Chesapeake Energy Corp. |
165,264 |
4,441 |
|
|
Concho Resources, Inc. (a) |
69,800 |
7,254 |
|
|
Continental Resources, Inc. (a) |
87,800 |
9,439 |
|
|
EOG Resources, Inc. |
20,600 |
3,399 |
|
|
Hess Corp. |
135,100 |
10,961 |
|
|
Noble Energy, Inc. |
95,300 |
6,694 |
|
|
Occidental Petroleum Corp. |
166,300 |
15,792 |
|
|
PDC Energy, Inc. (a) |
48,700 |
2,869 |
|
|
Peabody Energy Corp. |
118,100 |
2,149 |
|
|
Phillips 66 Co. |
36,700 |
2,555 |
|
|
Pioneer Natural Resources Co. |
27,400 |
4,870 |
|
|
Range Resources Corp. |
16,300 |
1,266 |
|
|
Valero Energy Corp. |
117,000 |
5,349 |
|
|
|
89,085 |
||
|
TOTAL ENERGY |
137,887 |
||
|
FINANCIALS - 4.0% |
|||
|
Capital Markets - 0.6% |
|||
|
BlackRock, Inc. Class A |
10,400 |
3,149 |
|
|
Charles Schwab Corp. |
389,100 |
9,525 |
|
|
Goldman Sachs Group, Inc. |
24,591 |
4,154 |
|
|
T. Rowe Price Group, Inc. |
30,300 |
2,438 |
|
|
|
19,266 |
||
|
Commercial Banks - 0.3% |
|||
|
Signature Bank (a) |
31,800 |
3,379 |
|
|
Wells Fargo & Co. |
125,000 |
5,503 |
|
|
|
8,882 |
||
|
Consumer Finance - 2.1% |
|||
|
American Express Co. |
432,100 |
37,074 |
|
|
Discover Financial Services |
607,633 |
32,387 |
|
|
|
69,461 |
||
|
Common Stocks - continued |
|||
|
Shares |
Value (000s) |
||
|
FINANCIALS - continued |
|||
|
Diversified Financial Services - 0.8% |
|||
|
Bank of America Corp. |
297,800 |
$ 4,711 |
|
|
BM&F Bovespa SA |
765,958 |
3,800 |
|
|
Citigroup, Inc. |
105,700 |
5,594 |
|
|
CME Group, Inc. |
22,000 |
1,803 |
|
|
JPMorgan Chase & Co. |
200,900 |
11,495 |
|
|
|
27,403 |
||
|
Real Estate Investment Trusts - 0.1% |
|||
|
Simon Property Group, Inc. |
25,978 |
3,893 |
|
|
Real Estate Management & Development - 0.1% |
|||
|
The St. Joe Co. (a)(d) |
100,400 |
1,781 |
|
|
TOTAL FINANCIALS |
130,686 |
||
|
HEALTH CARE - 19.0% |
|||
|
Biotechnology - 15.3% |
|||
|
ACADIA Pharmaceuticals, Inc. (a) |
108,300 |
2,522 |
|
|
Agios Pharmaceuticals, Inc. |
38,217 |
671 |
|
|
Alexion Pharmaceuticals, Inc. (a) |
39,500 |
4,918 |
|
|
Alkermes PLC (a) |
1,241,000 |
50,112 |
|
|
Alnylam Pharmaceuticals, Inc. (a) |
128,800 |
7,883 |
|
|
Amarin Corp. PLC ADR (a)(d) |
265,000 |
482 |
|
|
Amgen, Inc. |
232,000 |
26,467 |
|
|
Biogen Idec, Inc. (a) |
45,600 |
13,268 |
|
|
Bluebird Bio, Inc. (d) |
70,947 |
1,449 |
|
|
Celgene Corp. (a) |
55,235 |
8,935 |
|
|
Celldex Therapeutics, Inc. (a) |
215,700 |
5,988 |
|
|
Cepheid, Inc. (a) |
136,353 |
6,193 |
|
|
Clovis Oncology, Inc. (a) |
16,500 |
995 |
|
|
Elan Corp. PLC sponsored ADR (a) |
286,800 |
5,185 |
|
|
Exelixis, Inc. (a)(d) |
2,397,011 |
13,975 |
|
|
Gilead Sciences, Inc. (a) |
516,100 |
38,609 |
|
|
ImmunoGen, Inc. (a)(d) |
1,369,351 |
19,897 |
|
|
Immunomedics, Inc. (a)(d) |
1,348,687 |
5,826 |
|
|
Insmed, Inc. (a) |
330,600 |
5,356 |
|
|
InterMune, Inc. (a) |
110,400 |
1,527 |
|
|
Intrexon Corp. |
10,100 |
231 |
|
|
Ironwood Pharmaceuticals, Inc. Class A (a) |
227,500 |
2,598 |
|
|
Isis Pharmaceuticals, Inc. (a)(d) |
1,259,953 |
48,836 |
|
|
Lexicon Pharmaceuticals, Inc. (a) |
8,418,904 |
20,205 |
|
|
Merrimack Pharmaceuticals, Inc. (a)(d) |
591,500 |
2,331 |
|
|
Common Stocks - continued |
|||
|
Shares |
Value (000s) |
||
|
HEALTH CARE - continued |
|||
|
Biotechnology - continued |
|||
|
Metabolix, Inc. (a) |
246,795 |
$ 276 |
|
|
NPS Pharmaceuticals, Inc. (a) |
484,500 |
12,796 |
|
|
Prothena Corp. PLC (a) |
117,602 |
3,320 |
|
|
Receptos, Inc. |
87,600 |
2,027 |
|
|
Regeneron Pharmaceuticals, Inc. (a) |
332,600 |
97,738 |
|
|
Regulus Therapeutics, Inc. (a) |
295,138 |
1,856 |
|
|
Rigel Pharmaceuticals, Inc. (a) |
690,248 |
1,836 |
|
|
Seattle Genetics, Inc. (a)(d) |
1,665,767 |
68,446 |
|
|
Transition Therapeutics, Inc. (a) |
1,007,397 |
5,823 |
|
|
Vertex Pharmaceuticals, Inc. (a) |
68,690 |
4,768 |
|
|
XOMA Corp. (a) |
1,110,100 |
5,306 |
|
|
|
498,651 |
||
|
Health Care Equipment & Supplies - 0.7% |
|||
|
Abbott Laboratories |
89,300 |
3,410 |
|
|
Align Technology, Inc. (a) |
29,700 |
1,623 |
|
|
Baxter International, Inc. |
38,900 |
2,663 |
|
|
Cyberonics, Inc. (a) |
67,300 |
4,625 |
|
|
Steris Corp. |
201,100 |
9,279 |
|
|
|
21,600 |
||
|
Health Care Providers & Services - 0.8% |
|||
|
Accretive Health, Inc. (a) |
596,000 |
5,054 |
|
|
BioScrip, Inc. (a) |
792,300 |
5,396 |
|
|
Catamaran Corp. (a) |
30,500 |
1,392 |
|
|
Express Scripts Holding Co. (a) |
125,167 |
8,430 |
|
|
McKesson Corp. |
30,800 |
5,109 |
|
|
|
25,381 |
||
|
Health Care Technology - 0.3% |
|||
|
athenahealth, Inc. (a) |
80,800 |
10,599 |
|
|
Veeva Systems, Inc. Class A |
2,900 |
117 |
|
|
|
10,716 |
||
|
Life Sciences Tools & Services - 0.2% |
|||
|
Illumina, Inc. (a)(d) |
86,000 |
8,428 |
|
|
Pharmaceuticals - 1.7% |
|||
|
AbbVie, Inc. |
156,200 |
7,568 |
|
|
Actavis PLC (a) |
44,500 |
7,257 |
|
|
Allergan, Inc. |
84,600 |
8,210 |
|
|
Auxilium Pharmaceuticals, Inc. (a) |
226,700 |
4,627 |
|
|
Bristol-Myers Squibb Co. |
239,700 |
12,316 |
|
|
Common Stocks - continued |
|||
|
Shares |
Value (000s) |
||
|
HEALTH CARE - continued |
|||
|
Pharmaceuticals - continued |
|||
|
Hospira, Inc. (a) |
57,200 |
$ 2,249 |
|
|
Johnson & Johnson |
37,800 |
3,578 |
|
|
Questcor Pharmaceuticals, Inc. (d) |
169,300 |
9,821 |
|
|
|
55,626 |
||
|
TOTAL HEALTH CARE |
620,402 |
||
|
INDUSTRIALS - 7.0% |
|||
|
Aerospace & Defense - 0.9% |
|||
|
Honeywell International, Inc. |
125,800 |
11,135 |
|
|
The Boeing Co. |
132,500 |
17,788 |
|
|
|
28,923 |
||
|
Air Freight & Logistics - 0.9% |
|||
|
FedEx Corp. |
64,100 |
8,891 |
|
|
United Parcel Service, Inc. Class B |
210,400 |
21,541 |
|
|
|
30,432 |
||
|
Airlines - 1.5% |
|||
|
Delta Air Lines, Inc. |
157,500 |
4,564 |
|
|
Southwest Airlines Co. |
528,000 |
9,816 |
|
|
Spirit Airlines, Inc. (a) |
330,700 |
15,169 |
|
|
United Continental Holdings, Inc. (a) |
475,800 |
18,675 |
|
|
|
48,224 |
||
|
Construction & Engineering - 0.1% |
|||
|
Quanta Services, Inc. (a) |
97,859 |
2,898 |
|
|
Electrical Equipment - 0.2% |
|||
|
Roper Industries, Inc. |
38,800 |
5,032 |
|
|
Industrial Conglomerates - 1.1% |
|||
|
3M Co. |
69,100 |
9,226 |
|
|
Danaher Corp. |
282,200 |
21,109 |
|
|
General Electric Co. |
263,800 |
7,033 |
|
|
|
37,368 |
||
|
Machinery - 0.4% |
|||
|
Caterpillar, Inc. |
81,800 |
6,920 |
|
|
Cummins, Inc. |
29,400 |
3,891 |
|
|
ITT Corp. |
24,100 |
984 |
|
|
Xylem, Inc. |
63,000 |
2,177 |
|
|
|
13,972 |
||
|
Road & Rail - 1.9% |
|||
|
CSX Corp. |
324,100 |
8,838 |
|
|
Common Stocks - continued |
|||
|
Shares |
Value (000s) |
||
|
INDUSTRIALS - continued |
|||
|
Road & Rail - continued |
|||
|
Hertz Global Holdings, Inc. (a) |
643,500 |
$ 15,611 |
|
|
J.B. Hunt Transport Services, Inc. |
35,000 |
2,632 |
|
|
Kansas City Southern |
10,800 |
1,307 |
|
|
Union Pacific Corp. |
199,400 |
32,311 |
|
|
|
60,699 |
||
|
TOTAL INDUSTRIALS |
227,548 |
||
|
INFORMATION TECHNOLOGY - 32.8% |
|||
|
Communications Equipment - 1.9% |
|||
|
Infinera Corp. (a)(d) |
1,483,881 |
13,800 |
|
|
QUALCOMM, Inc. |
582,565 |
42,865 |
|
|
Riverbed Technology, Inc. (a) |
115,800 |
2,003 |
|
|
ViaSat, Inc. (a) |
49,600 |
2,984 |
|
|
|
61,652 |
||
|
Computers & Peripherals - 4.5% |
|||
|
3D Systems Corp. (a)(d) |
35,700 |
2,683 |
|
|
Apple, Inc. |
243,658 |
135,491 |
|
|
Fusion-io, Inc. (a)(d) |
618,532 |
6,210 |
|
|
SanDisk Corp. |
49,200 |
3,353 |
|
|
|
147,737 |
||
|
Electronic Equipment & Components - 0.1% |
|||
|
IPG Photonics Corp. (d) |
44,600 |
3,234 |
|
|
Internet Software & Services - 9.5% |
|||
|
Akamai Technologies, Inc. (a) |
31,400 |
1,404 |
|
|
Angie's List, Inc. (a) |
238,600 |
3,107 |
|
|
Benefitfocus, Inc. |
4,200 |
203 |
|
|
Cornerstone OnDemand, Inc. (a) |
140,000 |
7,059 |
|
|
eBay, Inc. (a) |
577,300 |
29,165 |
|
|
Facebook, Inc. Class A (a) |
1,460,641 |
68,665 |
|
|
Google, Inc. Class A (a) |
146,565 |
155,304 |
|
|
LinkedIn Corp. (a) |
18,800 |
4,212 |
|
|
Qihoo 360 Technology Co. Ltd. ADR (a)(d) |
108,700 |
8,861 |
|
|
Rackspace Hosting, Inc. (a) |
133,802 |
5,113 |
|
|
Rocket Fuel, Inc. (d) |
1,200 |
57 |
|
|
Tencent Holdings Ltd. |
150,200 |
8,687 |
|
|
Trulia, Inc. (a) |
89,500 |
3,073 |
|
|
Twitter, Inc. |
24,600 |
1,023 |
|
|
Common Stocks - continued |
|||
|
Shares |
Value (000s) |
||
|
INFORMATION TECHNOLOGY - continued |
|||
|
Internet Software & Services - continued |
|||
|
Web.com Group, Inc. (a) |
469,200 |
$ 13,396 |
|
|
Wix.com Ltd. (a) |
34,700 |
711 |
|
|
|
310,040 |
||
|
IT Services - 3.7% |
|||
|
Cognizant Technology Solutions Corp. Class A (a) |
127,216 |
11,944 |
|
|
IBM Corp. |
117,900 |
21,184 |
|
|
MasterCard, Inc. Class A |
52,200 |
39,714 |
|
|
Visa, Inc. Class A |
240,400 |
48,912 |
|
|
|
121,754 |
||
|
Semiconductors & Semiconductor Equipment - 5.2% |
|||
|
Applied Materials, Inc. |
211,300 |
3,655 |
|
|
Applied Micro Circuits Corp. (a) |
1,394,600 |
17,502 |
|
|
Broadcom Corp. Class A |
152,300 |
4,065 |
|
|
Cavium, Inc. (a) |
74,300 |
2,690 |
|
|
Cree, Inc. (a) |
737,800 |
41,169 |
|
|
Cypress Semiconductor Corp. |
1,344,866 |
13,032 |
|
|
Intel Corp. |
101,900 |
2,429 |
|
|
Mellanox Technologies Ltd. (a)(d) |
198,600 |
7,733 |
|
|
Nanoco Group PLC (a)(d) |
483,200 |
1,168 |
|
|
NVIDIA Corp. |
2,409,030 |
37,581 |
|
|
Rambus, Inc. (a) |
1,255,300 |
10,783 |
|
|
Silicon Laboratories, Inc. (a) |
671,400 |
26,218 |
|
|
Xilinx, Inc. |
60,800 |
2,701 |
|
|
|
170,726 |
||
|
Software - 7.9% |
|||
|
Adobe Systems, Inc. (a) |
81,800 |
4,645 |
|
|
Citrix Systems, Inc. (a) |
35,500 |
2,106 |
|
|
Concur Technologies, Inc. (a) |
66,400 |
6,447 |
|
|
FireEye, Inc. |
4,885 |
187 |
|
|
Interactive Intelligence Group, Inc. (a) |
78,700 |
5,119 |
|
|
Intuit, Inc. |
72,200 |
5,359 |
|
|
Microsoft Corp. |
902,900 |
34,428 |
|
|
NetSuite, Inc. (a) |
133,800 |
12,856 |
|
|
Oracle Corp. |
338,200 |
11,935 |
|
|
QLIK Technologies, Inc. (a) |
237,774 |
5,963 |
|
|
Red Hat, Inc. (a) |
534,930 |
25,061 |
|
|
salesforce.com, Inc. (a) |
2,256,400 |
117,536 |
|
|
ServiceNow, Inc. (a) |
125,400 |
6,660 |
|
|
SolarWinds, Inc. (a) |
94,700 |
3,167 |
|
|
Solera Holdings, Inc. |
13,500 |
901 |
|
|
Common Stocks - continued |
|||
|
Shares |
Value (000s) |
||
|
INFORMATION TECHNOLOGY - continued |
|||
|
Software - continued |
|||
|
Splunk, Inc. (a) |
41,100 |
$ 2,966 |
|
|
TiVo, Inc. (a) |
262,000 |
3,361 |
|
|
VMware, Inc. Class A (a) |
28,700 |
2,314 |
|
|
Workday, Inc. Class A (a) |
62,300 |
5,130 |
|
|
|
256,141 |
||
|
TOTAL INFORMATION TECHNOLOGY |
1,071,284 |
||
|
MATERIALS - 1.9% |
|||
|
Chemicals - 1.6% |
|||
|
E.I. du Pont de Nemours & Co. |
101,600 |
6,236 |
|
|
Eastman Chemical Co. |
31,200 |
2,403 |
|
|
Monsanto Co. |
325,500 |
36,889 |
|
|
The Mosaic Co. |
99,500 |
4,766 |
|
|
|
50,294 |
||
|
Metals & Mining - 0.3% |
|||
|
Nucor Corp. |
76,800 |
3,921 |
|
|
U.S. Silica Holdings, Inc. |
190,500 |
6,574 |
|
|
|
10,495 |
||
|
TOTAL MATERIALS |
60,789 |
||
|
TELECOMMUNICATION SERVICES - 0.5% |
|||
|
Diversified Telecommunication Services - 0.3% |
|||
|
Verizon Communications, Inc. |
178,400 |
8,852 |
|
|
Wireless Telecommunication Services - 0.2% |
|||
|
RingCentral, Inc. |
5,000 |
79 |
|
|
Sprint Corp. (a) |
240,987 |
2,022 |
|
|
T-Mobile U.S., Inc. (a) |
183,700 |
4,778 |
|
|
|
6,879 |
||
|
TOTAL TELECOMMUNICATION SERVICES |
15,731 |
||
|
TOTAL COMMON STOCKS (Cost $2,127,984) |
|
||
|
Preferred Stocks - 0.3% |
|||
|
Shares |
Value (000s) |
||
|
Convertible Preferred Stocks - 0.3% |
|||
|
HEALTH CARE - 0.0% |
|||
|
Pharmaceuticals - 0.0% |
|||
|
aTyr Pharma, Inc. 8.00% (e) |
638,618 |
$ 1,615 |
|
|
INFORMATION TECHNOLOGY - 0.3% |
|||
|
Software - 0.3% |
|||
|
MongoDB, Inc. Series F, 8.00% (e) |
515,124 |
8,615 |
|
|
TOTAL CONVERTIBLE PREFERRED STOCKS |
10,230 |
||
|
Nonconvertible Preferred Stocks - 0.0% |
|||
|
HEALTH CARE - 0.0% |
|||
|
Pharmaceuticals - 0.0% |
|||
|
Equilibrate Asia Therapeutics Series D (e) |
676,657 |
11 |
|
|
Equilibrate Worldwide Therapeutics Series D (e) |
676,657 |
27 |
|
|
Neuropathic Worldwide Therapeutics Series D (e) |
676,657 |
5 |
|
|
Oculus Worldwide Therapeutics Series D (e) |
676,657 |
8 |
|
|
Orchestrate U.S. Therapeutics, Inc. Series D (e) |
676,657 |
12 |
|
|
Orchestrate Worldwide Therapeutics Series D (e) |
676,657 |
21 |
|
|
|
84 |
||
|
TOTAL PREFERRED STOCKS (Cost $10,314) |
|
||
|
Money Market Funds - 6.7% |
|||
|
|
|
|
|
|
Fidelity Cash Central Fund, 0.10% (b) |
72,069,932 |
72,070 |
|
|
Fidelity Securities Lending Cash Central Fund, 0.10% (b)(c) |
148,019,702 |
148,020 |
|
|
TOTAL MONEY MARKET FUNDS (Cost $220,090) |
|
||
|
TOTAL INVESTMENT PORTFOLIO - 104.5% (Cost $2,358,388) |
3,411,239 |
||
|
NET OTHER ASSETS (LIABILITIES) - (4.5)% |
(147,143) |
||
|
NET ASSETS - 100% |
$ 3,264,096 |
||
|
Legend |
|
(a) Non-income producing |
|
(b) Affiliated fund that is generally available only to investment companies and other accounts managed by Fidelity Investments. The rate quoted is the annualized seven-day yield of the fund at period end. A complete unaudited listing of the fund's holdings as of its most recent quarter end is available upon request. In addition, each Fidelity Central Fund's financial statements, which are not covered by the Fund's Report of Independent Registered Public Accounting Firm, are available on the SEC's website or upon request. |
|
(c) Investment made with cash collateral received from securities on loan. |
|
(d) Security or a portion of the security is on loan at period end. |
|
(e) Restricted securities - Investment in securities not registered under the Securities Act of 1933 (excluding 144A issues). At the end of the period, the value of restricted securities (excluding 144A issues) amounted to $10,314,000 or 0.3% of net assets. |
|
Additional information on each restricted holding is as follows: |
|
Security |
Acquisition Date |
Acquisition Cost (000s) |
|
aTyr Pharma, Inc. 8.00% |
4/8/13 |
$ 1,615 |
|
Equilibrate Asia Therapeutics Series D |
5/17/13 |
$ 11 |
|
Equilibrate Worldwide Therapeutics Series D |
5/17/13 |
$ 27 |
|
MongoDB, Inc. Series F, 8.00% |
10/2/13 |
$ 8,615 |
|
Neuropathic Worldwide Therapeutics Series D |
5/17/13 |
$ 5 |
|
Oculus Worldwide Therapeutics Series D |
5/17/13 |
$ 8 |
|
Orchestrate U.S. Therapeutics, Inc. Series D |
5/17/13 |
$ 12 |
|
Orchestrate Worldwide Therapeutics Series D |
5/17/13 |
$ 21 |
|
Affiliated Central Funds |
|
Information regarding fiscal year to date income earned by the Fund from investments in Fidelity Central Funds is as follows: |
|
Fund |
Income earned |
|
Fidelity Cash Central Fund |
$ 40 |
|
Fidelity Securities Lending Cash Central Fund |
1,023 |
|
Total |
$ 1,063 |
|
Other Information |
|
The following is a summary of the inputs used, as of November 30, 2013, involving the Fund's assets and liabilities carried at fair value. The inputs or methodology used for valuing securities may not be an indication of the risk associated with investing in those securities. For more information on valuation inputs, and their aggregation into the levels used in the table below, please refer to the Investment Valuation section in the accompanying Notes to Financial Statements. |
|
Valuation Inputs at Reporting Date: |
||||
|
Description |
Total |
Level 1 |
Level 2 |
Level 3 |
|
Investments in Securities: |
||||
|
Equities: |
||||
|
Consumer Discretionary |
$ 592,671 |
$ 592,671 |
$ - |
$ - |
|
Consumer Staples |
323,837 |
323,837 |
- |
- |
|
Energy |
137,887 |
137,887 |
- |
- |
|
Financials |
130,686 |
130,686 |
- |
- |
|
Health Care |
622,101 |
620,402 |
- |
1,699 |
|
Industrials |
227,548 |
227,548 |
- |
- |
|
Information Technology |
1,079,899 |
1,071,284 |
- |
8,615 |
|
Materials |
60,789 |
60,789 |
- |
- |
|
Telecommunication Services |
15,731 |
15,731 |
- |
- |
|
Money Market Funds |
220,090 |
220,090 |
- |
- |
|
Total Investments in Securities: |
$ 3,411,239 |
$ 3,400,925 |
$ - |
$ 10,314 |
See accompanying notes which are an integral part of the financial statements.
Annual Report
Financial Statements
Statement of Assets and Liabilities
|
Amounts in thousands (except per-share amounts) |
November 30, 2013 |
|
|
|
|
|
|
Assets |
|
|
|
Investment in securities, at value (including securities loaned of $144,819) - See accompanying schedule: Unaffiliated issuers (cost $2,138,298) |
$ 3,191,149 |
|
|
Fidelity Central Funds (cost $220,090) |
220,090 |
|
|
Total Investments (cost $2,358,388) |
|
$ 3,411,239 |
|
Cash |
|
2,733 |
|
Foreign currency held at value (cost $53) |
|
53 |
|
Receivable for fund shares sold |
|
3,876 |
|
Dividends receivable |
|
2,437 |
|
Distributions receivable from Fidelity Central Funds |
|
99 |
|
Prepaid expenses |
|
9 |
|
Other receivables |
|
155 |
|
Total assets |
|
3,420,601 |
|
|
|
|
|
Liabilities |
|
|
|
Payable for investments purchased |
$ 3,360 |
|
|
Payable for fund shares redeemed |
1,663 |
|
|
Accrued management fee |
1,809 |
|
|
Distribution and service plan fees payable |
833 |
|
|
Other affiliated payables |
607 |
|
|
Other payables and accrued expenses |
213 |
|
|
Collateral on securities loaned, at value |
148,020 |
|
|
Total liabilities |
|
156,505 |
|
|
|
|
|
Net Assets |
|
$ 3,264,096 |
|
Net Assets consist of: |
|
|
|
Paid in capital |
|
$ 2,467,371 |
|
Accumulated net investment loss |
|
(5,796) |
|
Accumulated undistributed net realized gain (loss) on investments and foreign currency transactions |
|
(250,330) |
|
Net unrealized appreciation (depreciation) on investments and assets and liabilities in foreign currencies |
|
1,052,851 |
|
Net Assets |
|
$ 3,264,096 |
See accompanying notes which are an integral part of the financial statements.
Annual Report
Financial Statements - continued
Statement of Assets and Liabilities - continued
|
Amounts in thousands (except per-share amounts) |
November 30, 2013 |
|
|
|
|
|
|
Calculation of Maximum Offering Price Class A: |
|
$ 54.89 |
|
|
|
|
|
Maximum offering price per share (100/94.25 of $54.89) |
|
$ 58.24 |
|
Class T: |
|
$ 55.04 |
|
|
|
|
|
Maximum offering price per share (100/96.50 of $55.04) |
|
$ 57.04 |
|
Class B: |
|
$ 50.87 |
|
|
|
|
|
Class C: |
|
$ 51.17 |
|
|
|
|
|
Institutional Class: |
|
$ 57.18 |
|
|
|
|
|
Class Z: |
|
$ 57.20 |
A Redemption price per share is equal to net asset value less any applicable contingent deferred sales charge.
See accompanying notes which are an integral part of the financial statements.
Annual Report
Statement of Operations
|
Amounts in thousands |
Year ended November 30, 2013 |
|
|
|
|
|
|
Investment Income |
|
|
|
Dividends |
|
$ 25,690 |
|
Income from Fidelity Central Funds |
|
1,063 |
|
Total income |
|
26,753 |
|
|
|
|
|
Expenses |
|
|
|
Management fee |
$ 14,417 |
|
|
Performance adjustment |
3,537 |
|
|
Transfer agent fees |
5,525 |
|
|
Distribution and service plan fees |
8,757 |
|
|
Accounting and security lending fees |
793 |
|
|
Custodian fees and expenses |
49 |
|
|
Independent trustees' compensation |
14 |
|
|
Appreciation in deferred trustee compensation account |
1 |
|
|
Registration fees |
193 |
|
|
Audit |
63 |
|
|
Legal |
10 |
|
|
Miscellaneous |
21 |
|
|
Total expenses before reductions |
33,380 |
|
|
Expense reductions |
(95) |
33,285 |
|
Net investment income (loss) |
|
(6,532) |
|
Realized and Unrealized Gain (Loss) Net realized gain (loss) on: |
|
|
|
Investment securities: |
|
|
|
Unaffiliated issuers |
167,078 |
|
|
Foreign currency transactions |
5 |
|
|
Total net realized gain (loss) |
|
167,083 |
|
Change in net unrealized appreciation (depreciation) on: Investment securities |
587,054 |
|
|
Assets and liabilities in foreign currencies |
1 |
|
|
Total change in net unrealized appreciation (depreciation) |
|
587,055 |
|
Net gain (loss) |
|
754,138 |
|
Net increase (decrease) in net assets resulting from operations |
|
$ 747,606 |
See accompanying notes which are an integral part of the financial statements.
Annual Report
Financial Statements - continued
Statement of Changes in Net Assets
|
Amounts in thousands |
Year ended |
Year ended |
|
Increase (Decrease) in Net Assets |
|
|
|
Operations |
|
|
|
Net investment income (loss) |
$ (6,532) |
$ (7,218) |
|
Net realized gain (loss) |
167,083 |
165,968 |
|
Change in net unrealized appreciation (depreciation) |
587,055 |
117,910 |
|
Net increase (decrease) in net assets resulting |
747,606 |
276,660 |
|
Share transactions - net increase (decrease) |
411,715 |
182,997 |
|
Total increase (decrease) in net assets |
1,159,321 |
459,657 |
|
|
|
|
|
Net Assets |
|
|
|
Beginning of period |
2,104,775 |
1,645,118 |
|
End of period (including accumulated net investment loss of $5,796 and accumulated net investment loss of $6,762, respectively) |
$ 3,264,096 |
$ 2,104,775 |
See accompanying notes which are an integral part of the financial statements.
Annual Report
Financial Highlights - Class A
|
Years ended November 30, |
2013 |
2012 |
2011 |
2010 |
2009 |
|
Selected Per-Share Data |
|
|
|
|
|
|
Net asset value, beginning of period |
$ 41.34 |
$ 35.39 |
$ 32.30 |
$ 26.30 |
$ 18.92 |
|
Income from Investment Operations |
|
|
|
|
|
|
Net investment income (loss) C |
(.10) |
(.11) |
(.08) |
- H |
.10 |
|
Net realized and unrealized gain (loss) |
13.65 |
6.06 |
3.17 |
6.13 |
7.28 |
|
Total from investment operations |
13.55 |
5.95 |
3.09 |
6.13 |
7.38 |
|
Distributions from net investment income |
- |
- |
- |
(.11) |
- |
|
Distributions from net realized gain |
- |
- |
- |
(.02) |
- |
|
Total distributions |
- |
- |
- |
(.13) |
- |
|
Net asset value, end of period |
$ 54.89 |
$ 41.34 |
$ 35.39 |
$ 32.30 |
$ 26.30 |
|
Total Return A, B |
32.78% |
16.81% |
9.57% |
23.42% |
39.01% |
|
Ratios to Average Net Assets D, G |
|
|
|
|
|
|
Expenses before reductions |
1.23% |
1.30% |
1.08% |
.90% |
.80% |
|
Expenses net of fee waivers, if any |
1.23% |
1.29% |
1.08% |
.90% |
.80% |
|
Expenses net of all reductions |
1.23% |
1.29% |
1.07% |
.90% |
.80% |
|
Net investment income (loss) |
(.20)% |
(.29)% |
(.23)% |
-% F |
.45% |
|
Supplemental Data |
|
|
|
|
|
|
Net assets, end of period (in millions) |
$ 555 |
$ 359 |
$ 267 |
$ 255 |
$ 236 |
|
Portfolio turnover rate E |
17% |
34% |
31% |
35% |
114% |
A Total returns would have been lower if certain expenses had not been reduced during the applicable periods shown.
B Total returns do not include the effect of the sales charges.
C Calculated based on average shares outstanding during the period.
D Fees and expenses of any underlying Fidelity Central Funds are not included in the Fund's expense ratio. The Fund indirectly bears its proportionate share of the expenses of any underlying Fidelity Central Funds.
E Amount does not include the portfolio activity of any underlying Fidelity Central Funds.
F Amount represents less than .01%.
G Expense ratios reflect operating expenses of the class. Expenses before reductions do not reflect amounts reimbursed by the investment adviser or reductions from brokerage service arrangements or reductions from other expense offset arrangements and do not represent the amount paid by the class during periods when reimbursements or reductions occur. Expenses net of fee waivers reflect expenses after reimbursement by the investment adviser but prior to reductions from brokerage service arrangements or other expense offset arrangements. Expenses net of all reductions represent the net expenses paid by the class.
H Amount represents less than $.01 per share.
See accompanying notes which are an integral part of the financial statements.
Annual Report
Financial Highlights - Class T
|
Years ended November 30, |
2013 |
2012 |
2011 |
2010 |
2009 |
|
Selected Per-Share Data |
|
|
|
|
|
|
Net asset value, beginning of period |
$ 41.54 |
$ 35.62 |
$ 32.58 |
$ 26.52 |
$ 19.12 |
|
Income from Investment Operations |
|
|
|
|
|
|
Net investment income (loss) C |
(.19) |
(.19) |
(.15) |
(.06) |
.05 |
|
Net realized and unrealized gain (loss) |
13.69 |
6.11 |
3.19 |
6.19 |
7.35 |
|
Total from investment operations |
13.50 |
5.92 |
3.04 |
6.13 |
7.40 |
|
Distributions from net investment income |
- |
- |
- |
(.05) |
- |
|
Distributions from net realized gain |
- |
- |
- |
(.02) |
- |
|
Total distributions |
- |
- |
- |
(.07) |
- |
|
Net asset value, end of period |
$ 55.04 |
$ 41.54 |
$ 35.62 |
$ 32.58 |
$ 26.52 |
|
Total Return A, B |
32.50% |
16.62% |
9.33% |
23.18% |
38.70% |
|
Ratios to Average Net Assets D, F |
|
|
|
|
|
|
Expenses before reductions |
1.43% |
1.48% |
1.25% |
1.10% |
1.03% |
|
Expenses net of fee waivers, if any |
1.43% |
1.48% |
1.25% |
1.10% |
1.03% |
|
Expenses net of all reductions |
1.43% |
1.48% |
1.25% |
1.09% |
1.02% |
|
Net investment income (loss) |
(.40)% |
(.48)% |
(.40)% |
(.20)% |
.23% |
|
Supplemental Data |
|
|
|
|
|
|
Net assets, end of period (in millions) |
$ 1,426 |
$ 1,187 |
$ 1,102 |
$ 1,126 |
$ 1,051 |
|
Portfolio turnover rate E |
17% |
34% |
31% |
35% |
114% |
A Total returns would have been lower if certain expenses had not been reduced during the applicable periods shown.
B Total returns do not include the effect of the sales charges.
C Calculated based on average shares outstanding during the period.
D Fees and expenses of any underlying Fidelity Central Funds are not included in the Fund's expense ratio. The Fund indirectly bears its proportionate share of the expenses of any underlying Fidelity Central Funds.
E Amount does not include the portfolio activity of any underlying Fidelity Central Funds.
F Expense ratios reflect operating expenses of the class. Expenses before reductions do not reflect amounts reimbursed by the investment adviser or reductions from brokerage service arrangements or reductions from other expense offset arrangements and do not represent the amount paid by the class during periods when reimbursements or reductions occur. Expenses net of fee waivers reflect expenses after reimbursement by the investment adviser but prior to reductions from brokerage service arrangements or other expense offset arrangements. Expenses net of all reductions represent the net expenses paid by the class.
See accompanying notes which are an integral part of the financial statements.
Annual Report
Financial Highlights - Class B
|
Years ended November 30, |
2013 |
2012 |
2011 |
2010 |
2009 |
|
Selected Per-Share Data |
|
|
|
|
|
|
Net asset value, beginning of period |
$ 38.62 |
$ 33.31 |
$ 30.64 |
$ 25.01 |
$ 18.13 |
|
Income from Investment Operations |
|
|
|
|
|
|
Net investment income (loss) C |
(.44) |
(.39) |
(.33) |
(.21) |
(.06) |
|
Net realized and unrealized gain (loss) |
12.69 |
5.70 |
3.00 |
5.84 |
6.94 |
|
Total from investment operations |
12.25 |
5.31 |
2.67 |
5.63 |
6.88 |
|
Net asset value, end of period |
$ 50.87 |
$ 38.62 |
$ 33.31 |
$ 30.64 |
$ 25.01 |
|
Total Return A, B |
31.72% |
15.94% |
8.71% |
22.51% |
37.95% |
|
Ratios to Average Net Assets D, F |
|
|
|
|
|
|
Expenses before reductions |
2.03% |
2.07% |
1.83% |
1.66% |
1.56% |
|
Expenses net of fee waivers, if any |
2.03% |
2.05% |
1.83% |
1.66% |
1.56% |
|
Expenses net of all reductions |
2.03% |
2.05% |
1.83% |
1.65% |
1.55% |
|
Net investment income (loss) |
(1.00)% |
(1.05)% |
(.98)% |
(.76)% |
(.30)% |
|
Supplemental Data |
|
|
|
|
|
|
Net assets, end of period (in millions) |
$ 12 |
$ 13 |
$ 14 |
$ 18 |
$ 21 |
|
Portfolio turnover rate E |
17% |
34% |
31% |
35% |
114% |
A Total returns would have been lower if certain expenses had not been reduced during the applicable periods shown.
B Total returns do not include the effect of the contingent deferred sales charge.
C Calculated based on average shares outstanding during the period.
D Fees and expenses of any underlying Fidelity Central Funds are not included in the Fund's expense ratio. The Fund indirectly bears its proportionate share of the expenses of any underlying Fidelity Central Funds.
E Amount does not include the portfolio activity of any underlying Fidelity Central Funds.
F Expense ratios reflect operating expenses of the class. Expenses before reductions do not reflect amounts reimbursed by the investment adviser or reductions from brokerage service arrangements or reductions from other expense offset arrangements and do not represent the amount paid by the class during periods when reimbursements or reductions occur. Expenses net of fee waivers reflect expenses after reimbursement by the investment adviser but prior to reductions from brokerage service arrangements or other expense offset arrangements. Expenses net of all reductions represent the net expenses paid by the class.
See accompanying notes which are an integral part of the financial statements.
Annual Report
Financial Highlights - Class C
|
Years ended November 30, |
2013 |
2012 |
2011 |
2010 |
2009 |
|
Selected Per-Share Data |
|
|
|
|
|
|
Net asset value, beginning of period |
$ 38.83 |
$ 33.48 |
$ 30.79 |
$ 25.14 |
$ 18.22 |
|
Income from Investment Operations |
|
|
|
|
|
|
Net investment income (loss) C |
(.42) |
(.38) |
(.33) |
(.21) |
(.06) |
|
Net realized and unrealized gain (loss) |
12.76 |
5.73 |
3.02 |
5.86 |
6.98 |
|
Total from investment operations |
12.34 |
5.35 |
2.69 |
5.65 |
6.92 |
|
Net asset value, end of period |
$ 51.17 |
$ 38.83 |
$ 33.48 |
$ 30.79 |
$ 25.14 |
|
Total Return A, B |
31.78% |
15.98% |
8.74% |
22.47% |
37.98% |
|
Ratios to Average Net Assets D, F |
|
|
|
|
|
|
Expenses before reductions |
1.96% |
2.04% |
1.82% |
1.65% |
1.56% |
|
Expenses net of fee waivers, if any |
1.96% |
2.03% |
1.82% |
1.65% |
1.56% |
|
Expenses net of all reductions |
1.96% |
2.02% |
1.82% |
1.65% |
1.55% |
|
Net investment income (loss) |
(.93)% |
(1.02)% |
(.97)% |
(.75)% |
(.30)% |
|
Supplemental Data |
|
|
|
|
|
|
Net assets, end of period (in millions) |
$ 159 |
$ 71 |
$ 47 |
$ 41 |
$ 37 |
|
Portfolio turnover rate E |
17% |
34% |
31% |
35% |
114% |
A Total returns would have been lower if certain expenses had not been reduced during the applicable periods shown.
B Total returns do not include the effect of the contingent deferred sales charge.
C Calculated based on average shares outstanding during the period.
D Fees and expenses of any underlying Fidelity Central Funds are not included in the Fund's expense ratio. The Fund indirectly bears its proportionate share of the expenses of any underlying Fidelity Central Funds.
E Amount does not include the portfolio activity of any underlying Fidelity Central Funds.
F Expense ratios reflect operating expenses of the class. Expenses before reductions do not reflect amounts reimbursed by the investment adviser or reductions from brokerage service arrangements or reductions from other expense offset arrangements and do not represent the amount paid by the class during periods when reimbursements or reductions occur. Expenses net of fee waivers reflect expenses after reimbursement by the investment adviser but prior to reductions from brokerage service arrangements or other expense offset arrangements. Expenses net of all reductions represent the net expenses paid by the class.
See accompanying notes which are an integral part of the financial statements.
Annual Report
Financial Highlights - Institutional Class
|
Years ended November 30, |
2013 |
2012 |
2011 |
2010 |
2009 |
|
Selected Per-Share Data |
|
|
|
|
|
|
Net asset value, beginning of period |
$ 42.94 |
$ 36.63 |
$ 33.33 |
$ 27.11 |
$ 19.43 |
|
Income from Investment Operations |
|
|
|
|
|
|
Net investment income (loss) B |
.05 |
.01 |
.05 |
.10 |
.17 |
|
Net realized and unrealized gain (loss) |
14.19 |
6.30 |
3.25 |
6.33 |
7.51 |
|
Total from investment operations |
14.24 |
6.31 |
3.30 |
6.43 |
7.68 |
|
Distributions from net investment income |
- |
- |
- |
(.19) |
- |
|
Distributions from net realized gain |
- |
- |
- |
(.02) |
- |
|
Total distributions |
- |
- |
- |
(.21) |
- |
|
Net asset value, end of period |
$ 57.18 |
$ 42.94 |
$ 36.63 |
$ 33.33 |
$ 27.11 |
|
Total Return A |
33.16% |
17.23% |
9.90% |
23.86% |
39.53% |
|
Ratios to Average Net Assets C, E |
|
|
|
|
|
|
Expenses before reductions |
.93% |
.97% |
.72% |
.57% |
.46% |
|
Expenses net of fee waivers, if any |
.93% |
.97% |
.72% |
.57% |
.46% |
|
Expenses net of all reductions |
.93% |
.97% |
.72% |
.56% |
.46% |
|
Net investment income (loss) |
.09% |
.04% |
.13% |
.33% |
.79% |
|
Supplemental Data |
|
|
|
|
|
|
Net assets, end of period (in millions) |
$ 1,112 |
$ 475 |
$ 215 |
$ 118 |
$ 26 |
|
Portfolio turnover rate D |
17% |
34% |
31% |
35% |
114% |
A Total returns would have been lower if certain expenses had not been reduced during the applicable periods shown.
B Calculated based on average shares outstanding during the period.
C Fees and expenses of any underlying Fidelity Central Funds are not included in the Fund's expense ratio. The Fund indirectly bears its proportionate share of the expenses of any underlying Fidelity Central Funds.
D Amount does not include the portfolio activity of any underlying Fidelity Central Funds.
E Expense ratios reflect operating expenses of the class. Expenses before reductions do not reflect amounts reimbursed by the investment adviser or reductions from brokerage service arrangements or reductions from other expense offset arrangements and do not represent the amount paid by the class during periods when reimbursements or reductions occur. Expenses net of fee waivers reflect expenses after reimbursement by the investment adviser but prior to reductions from brokerage service arrangements or other expense offset arrangements. Expenses net of all reductions represent the net expenses paid by the class.
See accompanying notes which are an integral part of the financial statements.
Annual Report
Financial Highlights - Class Z
|
Year ended November 30, |
2013 G |
|
Selected Per-Share Data |
|
|
Net asset value, beginning of period |
$ 53.30 |
|
Income from Investment Operations |
|
|
Net investment income (loss) D |
.02 |
|
Net realized and unrealized gain (loss) |
3.88 |
|
Total from investment operations |
3.90 |
|
Net asset value, end of period |
$ 57.20 |
|
Total Return B, C |
7.32% |
|
Ratios to Average Net Assets E, H |
|
|
Expenses before reductions |
.78% A |
|
Expenses net of fee waivers, if any |
.78% A |
|
Expenses net of all reductions |
.78% A |
|
Net investment income (loss) |
.14% A |
|
Supplemental Data |
|
|
Net assets, end of period (000 omitted) |
$ 107 |
|
Portfolio turnover rate F |
17% |
A Annualized
B Total returns for periods of less than one year are not annualized.
C Total returns would have been lower if certain expenses had not been reduced during the applicable periods shown.
D Calculated based on average shares outstanding during the period.
E Fees and expenses of any underlying Fidelity Central Funds are not included in the Fund's expense ratio. The Fund indirectly bears its proportionate share of the expenses of any underlying Fidelity Central Funds.
F Amount does not include the portfolio activity of any underlying Fidelity Central Funds.
G For the period August 13, 2013 (commencement of sale of shares) to November 30, 2013.
H Expense ratios reflect operating expenses of the class. Expenses before reductions do not reflect amounts reimbursed by the investment adviser or reductions from brokerage service arrangements or reductions from other expense offset arrangements and do not represent the amount paid by the class during periods when reimbursements or reductions occur. Expense ratios before reductions for start-up periods may not be representative of longer-term operating periods. Expenses net of fee waivers reflect expenses after reimbursement by the investment adviser but prior to reductions from brokerage service arrangements or other expense offset arrangements. Expenses net of all reductions represent the net expenses paid by the class.
See accompanying notes which are an integral part of the financial statements.
Annual Report
Notes to Financial Statements
For the period ended November 30, 2013
(Amounts in thousands except percentages)
1. Organization.
Fidelity Advisor Growth Opportunities Fund (the Fund) is a fund of Fidelity Advisor Series I (the Trust) and is authorized to issue an unlimited number of shares. The Trust is registered under the Investment Company Act of 1940, as amended (the 1940 Act), as an open-end management investment company organized as a Massachusetts business trust. The Fund commenced sale of Class Z shares on August 13, 2013. The Fund offers Class A, Class T, Class C, Institutional Class and Class Z shares, each of which, along with Class B shares, has equal rights as to assets and voting privileges. Class B shares are closed to new accounts and additional purchases, except for exchanges and reinvestments. Each class has exclusive voting rights with respect to matters that affect that class. Class B shares will automatically convert to Class A shares after a holding period of seven years from the initial date of purchase.
2. Investments in Fidelity Central Funds.
The Fund invests in Fidelity Central Funds, which are open-end investment companies generally available only to other investment companies and accounts managed by the investment adviser and its affiliates. The Fund's Schedule of Investments lists each of the Fidelity Central Funds held as of period end, if any, as an investment of the Fund, but does not include the underlying holdings of each Fidelity Central Fund. As an Investing Fund, the Fund indirectly bears its proportionate share of the expenses of the underlying Fidelity Central Funds.
The Money Market Central Funds seek preservation of capital and current income and are managed by Fidelity Investments Money Management, Inc. (FIMM), an affiliate of the investment adviser. Annualized expenses of the Money Market Central Funds as of their most recent shareholder report date are less than .01%.
A complete unaudited list of holdings for each Fidelity Central Fund is available upon request or at the Securities and Exchange Commission (the SEC) website at www.sec.gov. In addition, the financial statements of the Fidelity Central Funds, which are not covered by the Fund's Report of Independent Registered Public Accounting Firm, are available on the SEC website or upon request.
3. Significant Accounting Policies.
The financial statements have been prepared in conformity with accounting principles generally accepted in the United States of America (GAAP), which require management to make certain estimates and assumptions at the date of the financial statements. Actual results could differ from those estimates. Subsequent events, if any, through the date that the financial statements were issued have been evaluated in the preparation of
Annual Report
3. Significant Accounting Policies - continued
the financial statements. The following summarizes the significant accounting policies of the Fund:
Investment Valuation. Investments are valued as of 4:00 p.m. Eastern time on the last calendar day of the period. In accordance with valuation policies and procedures approved by the Board of Trustees (the Board), the Fund attempts to obtain prices from one or more third party pricing vendors or brokers to value its investments. When current market prices, quotations or currency exchange rates are not readily available or reliable, investments will be fair valued in good faith by the Fidelity Management & Research Company (FMR) Fair Value Committee (the Committee), in accordance with procedures adopted by the Board. Factors used in determining fair value vary by investment type and may include market or investment specific events. The frequency with which these procedures are used cannot be predicted and they may be utilized to a significant extent. The Committee oversees the Fund's valuation policies and procedures and is responsible for approving and reporting to the Board all fair value determinations.
The Fund categorizes the inputs to valuation techniques used to value its investments into a disclosure hierarchy consisting of three levels as shown below:
Level 1 - quoted prices in active markets for identical investments
Level 2 - other significant observable inputs (including quoted prices for similar investments, interest rates, prepayment speeds, etc.)
Level 3 - unobservable inputs (including the Fund's own assumptions based on the best information available)
Valuation techniques used to value the Fund's investments by major category are as follows:
Equity securities, including restricted securities, for which market quotations are readily available, are valued at the last reported sale price or official closing price as reported by a third party pricing vendor on the primary market or exchange on which they are traded and are categorized as Level 1 in the hierarchy. In the event there were no sales during the day or closing prices are not available, securities are valued at the last quoted bid price or may be valued using the last available price and are generally categorized as Level 2 in the hierarchy. For foreign equity securities, when market or security specific events arise, comparisons to the valuation of American Depositary Receipts (ADRs), futures contracts, Exchange-Traded Funds (ETFs) and certain indexes as well as quoted prices for similar securities may be used and would be categorized as Level 2 in the hierarchy. Utilizing these techniques may result in transfers between Level 1 and Level 2. For equity securities, including restricted securities, where observable inputs are
Annual Report
Notes to Financial Statements - continued
(Amounts in thousands except percentages)
3. Significant Accounting Policies - continued
Investment Valuation - continued
limited, assumptions about market activity and risk are used and these securities may be categorized as Level 3 in the hierarchy.
Investments in open-end mutual funds, including the Fidelity Central Funds, are valued at their closing net asset value (NAV) each business day and are categorized as Level 1 in the hierarchy.
Changes in valuation techniques may result in transfers in or out of an assigned level within the disclosure hierarchy. The aggregate value of investments by input level, as of November 30, 2013, is included at the end of the Fund's Schedule of Investments.
Foreign Currency. The Fund may use foreign currency contracts to facilitate transactions in foreign-denominated securities. Gains and losses from these transactions may arise from changes in the value of the foreign currency or if the counterparties do not perform under the contracts' terms.
Foreign-denominated assets, including investment securities, and liabilities are translated into U.S. dollars at the exchange rates at period end. Purchases and sales of investment securities, income and dividends received and expenses denominated in foreign currencies are translated into U.S. dollars at the exchange rate in effect on the transaction date.
The effects of exchange rate fluctuations on investments are included with the net realized and unrealized gain (loss) on investment securities. Other foreign currency transactions resulting in realized and unrealized gain (loss) are disclosed separately.
Investment Transactions and Income. For financial reporting purposes, the Fund's investment holdings and NAV include trades executed through the end of the last business day of the period. The NAV per share for processing shareholder transactions is calculated as of the close of business of the New York Stock Exchange (NYSE), normally 4:00 p.m. Eastern time and includes trades executed through the end of the prior business day. Gains and losses on securities sold are determined on the basis of identified cost and may include proceeds received from litigation. Dividend income is recorded on the ex-dividend date, except for certain dividends from foreign securities where the ex-dividend date may have passed, which are recorded as soon as the Fund is informed of the ex-dividend date. Non-cash dividends included in dividend income, if any, are recorded at the fair market value of the securities received. Distributions received on securities that represent a return of capital or capital gain are recorded as a reduction of cost of investments and/or as a realized gain. Subsequent to ex-dividend date the Fund determines the components of these distributions, based upon receipt of tax filings or other correspondence relating to the underlying investment. Interest income and
Annual Report
3. Significant Accounting Policies - continued
Investment Transactions and Income - continued
distributions from the Fidelity Central Funds are accrued as earned. Interest income includes coupon interest and amortization of premium and accretion of discount on debt securities. Investment income is recorded net of foreign taxes withheld where recovery of such taxes is uncertain.
Class Allocations and Expenses. Investment income, realized and unrealized capital gains and losses, common expenses of the Fund, and certain fund-level expense reductions, if any, are allocated daily on a pro-rata basis to each class based on the relative net assets of each class to the total net assets of the Fund. Each class differs with respect to transfer agent and distribution and service plan fees incurred. Certain expense reductions may also differ by class. For the reporting period, the allocated portion of income and expenses to each class as a percent of its average net assets may vary due to the timing of recording these transactions in relation to fluctuating net assets of the classes. Expenses directly attributable to a fund are charged to that fund. Expenses attributable to more than one fund are allocated among the respective funds on the basis of relative net assets or other appropriate methods. Expense estimates are accrued in the period to which they relate and adjustments are made when actual amounts are known.
Deferred Trustee Compensation. Under a Deferred Compensation Plan (the Plan), independent Trustees may elect to defer receipt of a portion of their annual compensation. Deferred amounts are invested in a cross-section of Fidelity funds, are marked-to-market and remain in the Fund until distributed in accordance with the Plan. The investment of deferred amounts and the offsetting payable to the Trustees are included in the accompanying Statement of Assets and Liabilities.
Income Tax Information and Distributions to Shareholders. Each year, the Fund intends to qualify as a regulated investment company under Subchapter M of the Internal Revenue Code, including distributing substantially all of its taxable income and realized gains. As a result, no provision for U.S. Federal income taxes is required. As of November 30, 2013, the Fund did not have any unrecognized tax benefits in the financial statements; nor is the Fund aware of any tax positions for which it is reasonably possible that the total amounts of unrecognized tax benefits will significantly change in the next twelve months. The Fund files a U.S. federal tax return, in addition to state and local tax returns as required. The Fund's federal income tax returns are subject to examination by the Internal Revenue Service (IRS) for a period of three fiscal years after they are filed. State and local tax returns may be subject to examination for an additional fiscal year depending on the jurisdiction. Foreign taxes are provided for based on the Fund's understanding of the tax rules and rates that exist in the foreign markets in which it invests.
Annual Report
Notes to Financial Statements - continued
(Amounts in thousands except percentages)
3. Significant Accounting Policies - continued
Income Tax Information and Distributions to Shareholders - continued
Distributions are declared and recorded on the ex-dividend date. Income dividends and capital gain distributions are declared separately for each class. Income and capital gain distributions are determined in accordance with income tax regulations, which may differ from GAAP.
Capital accounts within the financial statements are adjusted for permanent book-tax differences. These adjustments have no impact on net assets or the results of operations. Temporary book-tax differences will reverse in a subsequent period.
Book-tax differences are primarily due to foreign currency transactions, passive foreign investment companies (PFIC), deferred trustees compensation, net operating losses, capital loss carryforwards and losses deferred due to wash sales and excise tax regulations.
The federal tax cost of investment securities and unrealized appreciation (depreciation) as of period end were as follows:
|
Gross unrealized appreciation |
$ 1,167,699 |
|
Gross unrealized depreciation |
(118,341) |
|
Net unrealized appreciation (depreciation) on securities and other investments |
$ 1,049,358 |
|
|
|
|
Tax Cost |
$ 2,361,881 |
The tax-based components of distributable earnings as of period end were as follows:
|
Capital loss carryforward |
$ (246,838) |
|
Net unrealized appreciation (depreciation) |
$ 1,049,358 |
Capital loss carryforwards are only available to offset future capital gains of the Fund to the extent provided by regulations and may be limited. Under the Regulated Investment Company Modernization Act of 2010 (the Act), the Fund is permitted to carry forward capital losses incurred in taxable years beginning after December 22, 2010 for an unlimited period and such capital losses are required to be used prior to any losses that expire. The capital loss carryforward information presented below, including any applicable limitation, is estimated as of fiscal period end and is subject to adjustment.
|
Fiscal year of expiration |
|
|
2017 |
$ (246,838) |
Restricted Securities. The Fund may invest in securities that are subject to legal or contractual restrictions on resale. These securities generally may be resold in
Annual Report
3. Significant Accounting Policies - continued
Restricted Securities - continued
transactions exempt from registration or to the public if the securities are registered. Disposal of these securities may involve time-consuming negotiations and expense, and prompt sale at an acceptable price may be difficult. Information regarding restricted securities is included at the end of the Fund's Schedule of Investments.
4. Purchases and Sales of Investments.
Purchases and sales of securities, other than short-term securities, aggregated $794,298 and $433,223, respectively.
5. Fees and Other Transactions with Affiliates.
Management Fee. Fidelity Management & Research Company (the investment adviser) and its affiliates provide the Fund with investment management related services for which the Fund pays a monthly management fee. The management fee is the sum of an individual fund fee rate that is based on an annual rate of .30% of the Fund's average net assets and an annualized group fee rate that averaged .25% during the period. The group fee rate is based upon the average net assets of all the mutual funds advised by the investment adviser, including any mutual funds previously advised by the investment adviser that are currently advised by Fidelity SelectCo, LLC, an affiliate of the investment adviser. The group fee rate decreases as assets under management increase and increases as assets under management decrease. In addition, the management fee is subject to a performance adjustment (up to a maximum of ± .20% of the Fund's average net assets over a 36 month performance period). The upward or downward adjustment to the management fee is based on the investment performance of the asset-weighted return of all classes as compared to an appropriate benchmark index over the same 36 month performance period. For the reporting period, the total annual management fee rate, including the performance adjustment, was .69% of the Fund's average net assets. The performance adjustment included in the management fee rate may be higher or lower than the maximum performance adjustment rate due to the difference between the average net assets for the reporting and performance periods.
Distribution and Service Plan Fees. In accordance with Rule 12b-1 of the 1940 Act, the Fund has adopted separate Distribution and Service Plans for each class of shares. Certain classes pay Fidelity Distributors Corporation (FDC), an affiliate of the investment adviser, separate Distribution and Service Fees, each of which is based on an annual percentage of each class' average net assets. In addition, FDC may pay financial intermediaries for selling shares of the Fund and providing shareholder support services.
Annual Report
Notes to Financial Statements - continued
(Amounts in thousands except percentages)
5. Fees and Other Transactions with Affiliates - continued
Distribution and Service Plan Fees - continued
For the period, the Distribution and Service Fee rates, total fees and amounts retained by FDC were as follows:
|
|
Distribution |
Service |
Total Fees |
Retained |
|
Class A |
-% |
.25% |
$ 1,106 |
$ 32 |
|
Class T |
.25% |
.25% |
6,480 |
92 |
|
Class B |
.75% |
.25% |
124 |
95 |
|
Class C |
.75% |
.25% |
1,047 |
361 |
|
|
|
|
$ 8,757 |
$ 580 |
Sales Load. FDC may receive a front-end sales charge of up to 5.75% for selling Class A shares and 3.50% for selling Class T shares, some of which is paid to financial intermediaries for selling shares of the Fund. Depending on the holding period, FDC may receive contingent deferred sales charges levied on Class A, Class T, Class B, and Class C redemptions. The deferred sales charges range from 5.00% to 1.00% for Class B shares, 1.00% for Class C shares, 1.00% for certain purchases of Class A shares and .25% for certain purchases of Class T shares.
For the period, sales charge amounts retained by FDC were as follows:
|
|
Retained |
|
Class A |
$ 195 |
|
Class T |
55 |
|
Class B* |
7 |
|
Class C* |
13 |
|
|
$ 270 |
* When Class B and Class C shares are initially sold, FDC pays commissions from its own resources to financial intermediaries through which the sales are made.
Transfer Agent Fees. Fidelity Investments Institutional Operations Company, Inc., (FIIOC), an affiliate of the investment adviser, is the transfer, dividend disbursing and shareholder servicing agent for each class of the Fund. FIIOC receives account fees and asset-based fees that vary according to the account size and type of account of the shareholders of the respective classes of the Fund, except for Class Z. FIIOC receives an asset-based fee for Class Z's average net assets. FIIOC pays for typesetting, printing and mailing of shareholder reports, except proxy statements.
Annual Report
5. Fees and Other Transactions with Affiliates - continued
Transfer Agent Fees - continued
For the period, transfer agent fees for each class were as follows:
|
|
Amount |
% of |
|
Class A |
$ 1,107 |
.25 |
|
Class T |
2,612 |
.20 |
|
Class B |
37 |
.30 |
|
Class C |
245 |
.23 |
|
Institutional Class |
1,524 |
.20 |
|
Class Z |
-** |
.05* |
|
|
$ 5,525 |
|
* Annualized
** Amount represents fifteen dollars.
Accounting and Security Lending Fees. Fidelity Service Company, Inc. (FSC), an affiliate of the investment adviser, maintains the Fund's accounting records. The accounting fee is based on the level of average net assets for each month. Under a separate contract, FSC administers the security lending program. The security lending fee is based on the number and duration of lending transactions.
Brokerage Commissions. The Fund placed a portion of its portfolio transactions with brokerage firms which are affiliates of the investment adviser. Brokerage commissions are included in net realized gain (loss) and change in net unrealized appreciation (depreciation) in the Statement of Operations. The commissions paid to these affiliated firms were $14 for the period.
6. Committed Line of Credit.
The Fund participates with other funds managed by the investment adviser or an affiliate in a $4.25 billion credit facility (the "line of credit") to be utilized for temporary or emergency purposes to fund shareholder redemptions or for other short-term liquidity purposes. The Fund has agreed to pay commitment fees on its pro-rata portion of the line of credit, which amounted to $5 and is reflected in Miscellaneous expenses on the Statement of Operations. During the period, there were no borrowings on this line of credit.
7. Security Lending.
The Fund lends portfolio securities through a lending agent from time to time in order to earn additional income. For equity securities, a lending agent is used and may loan securities to certain qualified borrowers, including Fidelity Capital Markets (FCM), a
Annual Report
Notes to Financial Statements - continued
(Amounts in thousands except percentages)
7. Security Lending - continued
broker-dealer affiliated with the Fund. On the settlement date of the loan, the Fund receives collateral (in the form of U.S. Treasury obligations, letters of credit and/or cash) against the loaned securities and maintains collateral in an amount not less than 100% of the market value of the loaned securities during the period of the loan. The market value of the loaned securities is determined at the close of business of the Fund and any additional required collateral is delivered to the Fund on the next business day. If the borrower defaults on its obligation to return the securities loaned because of insolvency or other reasons, the Fund may apply collateral received from the borrower against the obligation. The Fund may experience delays and costs in recovering the securities loaned. Any cash collateral received is invested in the Fidelity Securities Lending Cash Central Fund. The value of loaned securities and cash collateral at period end are disclosed on the Fund's Statement of Assets and Liabilities. The value of securities loaned to FCM at period end was $53. Security lending income represents the income earned on investing cash collateral, less rebates paid to borrowers and any lending agent fees associated with the loan, plus any premium payments received for lending certain types of securities. Security lending income is presented in the Statement of Operations as a component of income from Fidelity Central Funds. Total security lending income during the period amounted to $1,023, including $76 from securities loaned to FCM.
8. Expense Reductions.
The investment adviser voluntarily agreed to reimburse a portion of the Fund's Class A, Class T, Class B, Class C and Institutional Class operating expenses.
During the period, this reimbursement reduced expenses as follows:
|
|
Reimbursement |
|
Class A |
$ 2 |
|
Class T |
6 |
|
Class B |
-* |
|
Class C |
1 |
|
Institutional Class |
5 |
|
|
$ 14 |
* Amount represents fifty-seven dollars.
Commissions paid to certain brokers with whom the investment adviser, or its affiliates, places trades on behalf of the Fund include an amount in addition to trade execution, which may be rebated back to the Fund to offset certain expenses. This amount totaled $81 for the period.
Annual Report
9. Share Transactions.
Transactions for each class of shares were as follows:
|
|
Shares |
Dollars |
||
|
Years ended November 30, |
2013 A |
2012 |
2013 A |
2012 |
|
Class A |
|
|
|
|
|
Shares sold |
3,550 |
3,450 |
$ 172,665 |
$ 139,006 |
|
Shares redeemed |
(2,123) |
(2,315) |
(101,685) |
(91,797) |
|
Net increase (decrease) |
1,427 |
1,135 |
$ 70,980 |
$ 47,209 |
|
Class T |
|
|
|
|
|
Shares sold |
2,633 |
3,463 |
$ 126,086 |
$ 139,248 |
|
Shares redeemed |
(5,298) |
(5,834) |
(251,560) |
(232,825) |
|
Net increase (decrease) |
(2,665) |
(2,371) |
$ (125,474) |
$ (93,577) |
|
Class B |
|
|
|
|
|
Shares sold |
20 |
58 |
$ 916 |
$ 2,241 |
|
Shares redeemed |
(122) |
(126) |
(5,334) |
(4,712) |
|
Net increase (decrease) |
(102) |
(68) |
$ (4,418) |
$ (2,471) |
|
Class C |
|
|
|
|
|
Shares sold |
1,606 |
834 |
$ 73,545 |
$ 31,589 |
|
Shares redeemed |
(315) |
(408) |
(13,899) |
(15,301) |
|
Net increase (decrease) |
1,291 |
426 |
$ 59,646 |
$ 16,288 |
|
Institutional Class |
|
|
|
|
|
Shares sold |
11,525 |
8,961 |
$ 569,791 |
$ 367,678 |
|
Shares redeemed |
(3,146) |
(3,778) |
(158,910) |
(152,130) |
|
Net increase (decrease) |
8,379 |
5,183 |
$ 410,881 |
$ 215,548 |
|
Class Z |
|
|
|
|
|
Shares sold |
2 |
- |
$ 100 |
$ - |
A Share transactions for Class Z are for the period August 13, 2013 (commencement of sale of shares) to November 30, 2013.
10. Other.
The Fund's organizational documents provide former and current trustees and officers with a limited indemnification against liabilities arising in connection with the performance of their duties to the Fund. In the normal course of business, the Fund may also enter into contracts that provide general indemnifications. The Fund's maximum exposure under these arrangements is unknown as this would be dependent on future claims that may be made against the Fund. The risk of material loss from such claims is considered remote.
Annual Report
Report of Independent Registered Public Accounting Firm
To the Trustees of Fidelity Advisor Series I and Shareholders of Fidelity Advisor Growth Opportunities Fund:
We have audited the accompanying statement of assets and liabilities of Fidelity Advisor Growth Opportunities Fund (the Fund), a fund of Fidelity Advisor Series I, including the schedule of investments, as of November 30, 2013, and the related statement of operations for the year then ended, the statement of changes in net assets for each of the two years in the period then ended, and the financial highlights for each of the five years in the period then ended. These financial statements and financial highlights are the responsibility of the Fund's management. Our responsibility is to express an opinion on these financial statements and financial highlights based on our audits.
We conducted our audits in accordance with the standards of the Public Company Accounting Oversight Board (United States). Those standards require that we plan and perform the audit to obtain reasonable assurance about whether the financial statements and financial highlights are free of material misstatement. The Fund is not required to have, nor were we engaged to perform, an audit of its internal control over financial reporting. Our audits included consideration of internal control over financial reporting as a basis for designing audit procedures that are appropriate in the circumstances, but not for the purpose of expressing an opinion on the effectiveness of the Fund's internal control over financial reporting. Accordingly, we express no such opinion. An audit also includes examining, on a test basis, evidence supporting the amounts and disclosures in the financial statements, assessing the accounting principles used and significant estimates made by management, as well as evaluating the overall financial statement presentation. Our procedures included confirmation of securities owned as of November 30, 2013, by correspondence with the custodians and brokers; where replies were not received from brokers, we performed other auditing procedures. We believe that our audits provide a reasonable basis for our opinion.
In our opinion, the financial statements and financial highlights referred to above present fairly, in all material respects, the financial position of Fidelity Advisor Growth Opportunities Fund as of November 30, 2013, the results of its operations for the year then ended, the changes in its net assets for each of the two years in the period then ended, and the financial highlights for each of the five years in the period then ended, in conformity with accounting principles generally accepted in the United States of America.
DELOITTE & TOUCHE LLP
Boston, Massachusetts
January 14, 2014
Annual Report
Trustees and Officers
The Trustees, Member of the Advisory Board, and officers of the trust and fund, as applicable, are listed below. The Board of Trustees governs the fund and is responsible for protecting the interests of shareholders. The Trustees are experienced executives who meet periodically throughout the year to oversee the fund's activities, review contractual arrangements with companies that provide services to the fund, oversee management of the risks associated with such activities and contractual arrangements, and review the fund's performance. Except for James C. Curvey, Ned C. Lautenbach, Ronald P. O'Hanley, and William S. Stavropoulos, each of the Trustees oversees 173 funds. Mr. Curvey oversees 396 funds. Mr. Lautenbach, Mr. O'Hanley, and Mr. Stavropoulos each oversees 247 funds.
The Trustees hold office without limit in time except that (a) any Trustee may resign; (b) any Trustee may be removed by written instrument, signed by at least two-thirds of the number of Trustees prior to such removal; (c) any Trustee who requests to be retired or who has become incapacitated by illness or injury may be retired by written instrument signed by a majority of the other Trustees; and (d) any Trustee may be removed at any special meeting of shareholders by a two-thirds vote of the outstanding voting securities of the trust. Each Trustee who is not an interested person (as defined in the 1940 Act) of the trust and the fund (Independent Trustee), shall retire not later than the last day of the calendar year in which his or her 75th birthday occurs. The Independent Trustees may waive this mandatory retirement age policy with respect to individual Trustees. The officers and Advisory Board Member hold office without limit in time, except that any officer and Advisory Board Member may resign or may be removed by a vote of a majority of the Trustees at any regular meeting or any special meeting of the Trustees. Except as indicated, each individual has held the office shown or other offices in the same company for the past five years.
Experience, Skills, Attributes, and Qualifications of the Fund's Trustees. The Governance and Nominating Committee has adopted a statement of policy that describes the experience, qualifications, attributes, and skills that are necessary and desirable for potential Independent Trustee candidates (Statement of Policy). The Board believes that each Trustee satisfied at the time he or she was initially elected or appointed a Trustee, and continues to satisfy, the standards contemplated by the Statement of Policy. The Governance and Nominating Committee also engages professional search firms to help identify potential Independent Trustee candidates who have the experience, qualifications, attributes, and skills consistent with the Statement of Policy. From time to time, additional criteria based on the composition and skills of the current Independent Trustees, as well as experience or skills that may be appropriate in light of future changes to board composition, business conditions, and regulatory or other developments, have also been considered by the professional search firms and the Governance and Nominating Committee. In addition, the Board takes into account the Trustees' commitment and participation in Board and committee meetings, as well as their leadership of standing and ad hoc committees throughout their tenure.
Annual Report
Trustees and Officers - continued
In determining that a particular Trustee was and continues to be qualified to serve as a Trustee, the Board has considered a variety of criteria, none of which, in isolation, was controlling. The Board believes that, collectively, the Trustees have balanced and diverse experience, qualifications, attributes, and skills, which allow the Board to operate effectively in governing the fund and protecting the interests of shareholders. Information about the specific experience, skills, attributes, and qualifications of each Trustee, which in each case led to the Board's conclusion that the Trustee should serve (or continue to serve) as a trustee of the fund, is provided below.
Board Structure and Oversight Function. James C. Curvey is an interested person (as defined in the 1940 Act) and currently serves as Chairman. The Trustees have determined that an interested Chairman is appropriate and benefits shareholders because an interested Chairman has a personal and professional stake in the quality and continuity of services provided to the fund. Independent Trustees exercise their informed business judgment to appoint an individual of their choosing to serve as Chairman, regardless of whether the Trustee happens to be independent or a member of management. The Independent Trustees have determined that they can act independently and effectively without having an Independent Trustee serve as Chairman and that a key structural component for assuring that they are in a position to do so is for the Independent Trustees to constitute a substantial majority for the Board. The Independent Trustees also regularly meet in executive session. Ned C. Lautenbach serves as Chairman of the Independent Trustees and as such (i) acts as a liaison between the Independent Trustees and management with respect to matters important to the Independent Trustees and (ii) with management prepares agendas for Board meetings.
Fidelity funds are overseen by different Boards of Trustees. The fund's Board oversees Fidelity's equity and high income funds and another Board oversees Fidelity's investment-grade bond, money market, and asset allocation funds. The asset allocation funds may invest in Fidelity funds overseen by the fund's Board. The use of separate Boards, each with its own committee structure, allows the Trustees of each group of Fidelity funds to focus on the unique issues of the funds they oversee, including common research, investment, and operational issues. On occasion, the separate Boards establish joint committees to address issues of overlapping consequences for the Fidelity funds overseen by each Board.
The Trustees operate using a system of committees to facilitate the timely and efficient consideration of all matters of importance to the Trustees, the fund, and fund shareholders and to facilitate compliance with legal and regulatory requirements and oversight of the fund's activities and associated risks. The Board, acting through its committees, has charged FMR and its affiliates with (i) identifying events or circumstances the occurrence of which could have demonstrably adverse effects on the fund's business and/or reputation; (ii) implementing processes and controls to lessen the possibility that such events or circumstances occur or to mitigate the effects of such events or circumstances if they do occur; and (iii) creating and maintaining a system designed to evaluate continuously business and market conditions in order to facilitate the identification and implementation processes described in (i) and (ii) above. Because the day-to-day operations and activities of the fund are carried out by or through FMR, its affiliates and other service providers, the fund's exposure to risks is mitigated but not eliminated by the processes overseen by the Trustees. While each of the Board's committees has responsibility for overseeing different aspects of the fund's activities, oversight is exercised primarily through the Operations, Audit, and Compliance Committees. In addition, the Independent Trustees have worked with FMR to enhance the Board's oversight of investment and financial risks, legal and regulatory risks, technology risks, and operational risks, including the development of additional risk reporting to the Board. For example, a working group comprised of Independent Trustees and FMR has worked and continues to work to review the Fidelity funds' valuation-related activities, reporting and risk management. Appropriate personnel, including but not limited to the fund's Chief Compliance Officer (CCO), FMR's internal auditor, the independent accountants, the fund's Treasurer and portfolio management personnel, make periodic reports to the Board's committees, as appropriate, including an annual review of FMR's risk management program for the Fidelity funds. The responsibilities of each standing committee, including their oversight responsibilities, are described further under "Standing Committees of the Fund's Trustees."
Annual Report
The fund's Statement of Additional Information (SAI) includes more information about the Trustees. To request a free copy, call Fidelity at 1-877-208-0098.
Interested Trustees*:
Correspondence intended for each Trustee who is an interested person may be sent to Fidelity Investments, 245 Summer Street, Boston, Massachusetts 02210.
|
Name, Year of Birth; Principal Occupations and Other Relevant Experience+ |
|
|
James C. Curvey (1935) |
|
|
Year of Election or Appointment: 2007 Trustee Chairman of the Board of Trustees |
|
|
|
Mr. Curvey also serves as Trustee of other Fidelity funds. Mr. Curvey is a Director of Fidelity Investments Money Management, Inc. (2009-present), Director of Fidelity Research & Analysis Co. (2009-present) and Director of FMR and FMR Co., Inc. (2007-present). Mr. Curvey is also Vice Chairman (2007-present) and Director of FMR LLC. In addition, Mr. Curvey serves as an Overseer for the Boston Symphony Orchestra and a member of the Trustees of Villanova University. Previously, Mr. Curvey was the Vice Chairman (2006-2007) and Director (2000-2007) of FMR Corp. |
|
Ronald P. O'Hanley (1957) |
|
|
Year of Election or Appointment: 2011 Trustee |
|
|
|
Mr. O'Hanley also serves as Trustee of other Fidelity funds. He is Director of Fidelity SelectCo, LLC (2013-present), FMR Co., Inc. (2010-present), Director of Fidelity Investments Money Management, Inc. (2010-present), Director of Fidelity Research & Analysis Company (2010-present), President of Fidelity Asset Management and Corporate Services and a Member of Fidelity's Executive Committee (2010-present). Previously, Mr. O'Hanley served as President and Chief Executive Officer of BNY Mellon Asset Management (2007-2010). Mr. O'Hanley also served as Vice Chairman of Bank New York Mellon Corp. and a member of that firm's Executive Committee. Prior to the 2007 merger of The Bank of New York and Mellon Financial Corporation, he was Vice Chairman of Mellon Financial Corporation and President and Chief Executive Officer of Mellon Asset Management. He joined Mellon in February 1997. Mr. O'Hanley currently serves as Chairman of the Boston Public Library Foundation Board of Directors and sits on the Board of Directors of Beth Israel Deaconess Medical Center, the Board of Trustees of the Marine Biological Laboratory and the Advisory Board of the Maxwell School of Citizenship and Public Administration at Syracuse University. Mr. O'Hanley also chairs the Council on Asset Management for the Financial Services Roundtable and is a member of the Board of Directors of Institutional Investor's U.S. Institute. |
* Trustees have been determined to be "Interested Trustees" by virtue of, among other things, their affiliation with the trust or various entities under common control with FMR.
+ The information above includes each Trustee's principal occupation during the last five years and other information relating to the experience, attributes, and skills relevant to each Trustee's qualifications to serve as a Trustee, which led to the conclusion that each Trustee should serve as a Trustee for the fund.
Annual Report
Independent Trustees:
Correspondence intended for each Independent Trustee (that is, the Trustees other than the Interested Trustees) may be sent to Fidelity Investments, P.O. Box 55235, Boston, Massachusetts 02205-5235.
|
Name, Year of Birth; Principal Occupations and Other Relevant Experience+ |
|
|
Dennis J. Dirks (1948) |
|
|
Year of Election or Appointment: 2005 Trustee |
|
|
|
Mr. Dirks also serves as Trustee of other Fidelity funds. Prior to his retirement in May 2003, Mr. Dirks was Chief Operating Officer and a member of the Board of The Depository Trust & Clearing Corporation (DTCC). He also served as President, Chief Operating Officer, and Board member of The Depository Trust Company (DTC) and President and Board member of the National Securities Clearing Corporation (NSCC). In addition, Mr. Dirks served as Chief Executive Officer and Board member of the Government Securities Clearing Corporation, Chief Executive Officer and Board member of the Mortgage-Backed Securities Clearing Corporation, as a Trustee and a member of the Finance Committee of Manhattan College (2005-2008), and as a Trustee and a member of the Finance Committee of AHRC of Nassau County (2006-2008). Mr. Dirks is a member of the Independent Directors Council (IDC) Governing Council (2010-present) and Board of Directors for The Brookville Center for Children's Services, Inc. (2009-present). |
|
Alan J. Lacy (1953) |
|
|
Year of Election or Appointment: 2008 Trustee |
|
|
|
Mr. Lacy also serves as Trustee of other Fidelity funds. Mr. Lacy serves as Senior Adviser (2007-present) of Oak Hill Capital Partners, L.P. (private equity). Mr. Lacy also served as Chief Executive Officer (2000-2005) and Vice Chairman (2005-2006) of Sears Holdings Corporation and Sears, Roebuck and Co. (retail). In addition, Mr. Lacy serves as a member of the Board of Directors of Dave & Buster's Entertainment, Inc. (restaurant and entertainment complexes, 2010-present), Earth Fare, Inc. (retail grocery, 2012-present), The Hillman Companies, Inc. (hardware wholesalers, 2010-present), and Bristol-Myers Squibb Company (global pharmaceuticals, 2008-present). Mr. Lacy is a member of the Board of Trustees of The National Parks Conservation Association (2006-present). Previously, Mr. Lacy served as Chairman of the Board of Trustees of the National Parks Conservation Association (2008-2011) and as a member of the Board of Directors for the Western Union Company (global money transfer, 2006-2011). |
|
Ned C. Lautenbach (1944) |
|
|
Year of Election or Appointment: 2000 Trustee Chairman of the Independent Trustees |
|
|
|
Mr. Lautenbach also serves as Trustee of other Fidelity funds. Mr. Lautenbach currently serves as the Lead Director of the Eaton Corporation Board of Directors (diversified industrial, 1997-present). Mr. Lautenbach is Chairman of the Board of Directors of the Philharmonic Center for the Arts in Naples, Florida (2012-present) and a member of the Council on Foreign Relations (1994-present). Previously, Mr. Lautenbach was a Partner/Advisory Partner at Clayton, Dubilier & Rice, LLC (private equity investment, 1998-2010), as well as a Director of Sony Corporation (2006-2007). |
|
Joseph Mauriello (1944) |
|
|
Year of Election or Appointment: 2008 Trustee |
|
|
|
Mr. Mauriello also serves as Trustee of other Fidelity funds. Prior to his retirement in January 2006, Mr. Mauriello served in numerous senior management positions including Deputy Chairman and Chief Operating Officer (2004-2005), and Vice Chairman of Financial Services (2002-2004) of KPMG LLP US (professional services, 1965-2005). Mr. Mauriello currently serves as a member of the Board of Directors of XL Group plc. (global insurance and re-insurance, 2006-present). Previously, Mr. Mauriello served as a Director of the Hamilton Funds of the Bank of New York (2006-2007) and of Arcadia Resources Inc. (health care services and products, 2007-2012). |
|
Robert W. Selander (1950) |
|
|
Year of Election or Appointment: 2011 Trustee |
|
|
|
Mr. Selander also serves as Trustee of other Fidelity funds. Previously, Mr. Selander served as a Member of the Advisory Board of other Fidelity funds (2011), and Executive Vice Chairman (2010), Chief Executive Officer (2009-2010), and President and Chief Executive Officer (1997-2009) of Mastercard, Inc. |
|
Cornelia M. Small (1944) |
|
|
Year of Election or Appointment: 2005 Trustee |
|
|
|
Ms. Small also serves as Trustee of other Fidelity funds. Ms. Small is a member of the Board of Directors (2009-present) and Chair of the Investment Committee (2010-present) of the Teagle Foundation. Ms. Small also serves on the Investment Committee of the Berkshire Taconic Community Foundation (2008-present). Previously, Ms. Small served as Chairperson (2002-2008) and a member of the Investment Committee and Chairperson (2008-2012) and a member of the Board of Trustees of Smith College. In addition, Ms. Small served as Chief Investment Officer, Director of Global Equity Investments, and a member of the Board of Directors of Scudder, Stevens & Clark and Scudder Kemper Investments. |
|
William S. Stavropoulos (1939) |
|
|
Year of Election or Appointment: 2002 Trustee Vice Chairman of the Independent Trustees |
|
|
|
Mr. Stavropoulos also serves as Trustee of other Fidelity funds. Mr. Stavropoulos serves as President and Founder of the Michigan Baseball Foundation, the Great Lakes Loons (2007-present). Mr. Stavropoulos is Chairman Emeritus of the Board of Directors of The Dow Chemical Company, where he previously served in numerous senior management positions, including President, CEO (1995-2000; 2002-2004), Chairman of the Executive Committee (2000-2006), and as a member of the Board of Directors (1990-2006). Currently, Mr. Stavropoulos is Chairman of the Board of Directors of Univar Inc. (global distributor of commodity and specialty chemicals), a Director of Teradata Corporation (data warehousing and technology solutions), and Maersk Inc. (industrial conglomerate), and a member of the Advisory Board for Metalmark Capital LLC (private equity investment, 2005-present). Mr. Stavropoulos is an operating advisor to Clayton, Dubilier & Rice, LLC (private equity investment). In addition, Mr. Stavropoulos is a member of the University of Notre Dame Advisory Council for the College of Science, a Trustee of the Rollin L. Gerstacker Foundation, and a Director of the Naples Philharmonic Center for the Arts. Previously, Mr. Stavropoulos served as a Director of Chemical Financial Corporation (bank holding company, 1993-2012) and Tyco International, Ltd. (multinational manufacturing and services, 2007-2012). |
|
David M. Thomas (1949) |
|
|
Year of Election or Appointment: 2008 Trustee |
|
|
|
Mr. Thomas also serves as Trustee of other Fidelity funds. Mr. Thomas serves as Non-Executive Chairman of the Board of Directors of Fortune Brands Home and Security (home and security products, 2011-present), and as a member of the Board of Directors of Interpublic Group of Companies, Inc. (marketing communication, 2004-present). Previously, Mr. Thomas served as Executive Chairman (2005-2006) and Chairman and Chief Executive Officer (2000-2005) of IMS Health, Inc. (pharmaceutical and healthcare information solutions), and a Director of Fortune Brands, Inc. (consumer products, 2000-2011). |
+ The information above includes each Trustee's principal occupation during the last five years and other information relating to the experience, attributes, and skills relevant to each Trustee's qualifications to serve as a Trustee, which led to the conclusion that each Trustee should serve as a Trustee for the fund.
Advisory Board Member and Officers:
Correspondence intended for each officer and Peter S. Lynch may be sent to Fidelity Investments, 245 Summer Street, Boston, Massachusetts 02210. Officers appear below in alphabetical order.
|
Name, Year of Birth; Principal Occupation |
|
|
Peter S. Lynch (1944) |
|
|
Year of Election or Appointment: 2003 Member of the Advisory Board |
|
|
|
Mr. Lynch also serves as Member of the Advisory Board of other Fidelity funds. Mr. Lynch is Vice Chairman and a Director of FMR and FMR Co., Inc. In addition, Mr. Lynch serves as a Trustee of Boston College and as the Chairman of the Inner-City Scholarship Fund. Previously, Mr. Lynch served on the Special Olympics International Board of Directors (1997-2006). |
|
Elizabeth Paige Baumann (1968) |
|
|
Year of Election or Appointment: 2012 Anti-Money Laundering (AML) Officer |
|
|
|
Ms. Baumann also serves as AML Officer of other funds. She is Chief AML Officer of FMR LLC (2012-present) and is an employee of Fidelity Investments. Previously, Ms. Baumann served as Vice President and Deputy Anti-Money Laundering Officer (2007-2012). |
|
William C. Coffey (1969) |
|
|
Year of Election or Appointment: 2009 Assistant Secretary |
|
|
|
Mr. Coffey also serves as Assistant Secretary of other funds. He is Senior Vice President and Deputy General Counsel of FMR LLC (2010-present), and is an employee of Fidelity Investments. Previously, Mr. Coffey served as Vice President and Associate General Counsel of FMR LLC (2005-2009). |
|
Jonathan Davis (1968) |
|
|
Year of Election or Appointment: 2010 Assistant Treasurer |
|
|
|
Mr. Davis also serves as Assistant Treasurer of other funds. Mr. Davis is an employee of Fidelity Investments. Previously, Mr. Davis served as Vice President and Associate General Counsel of FMR LLC (2003-2010). |
|
Adrien E. Deberghes (1967) |
|
|
Year of Election or Appointment: 2008 Deputy Treasurer |
|
|
|
Mr. Deberghes also serves as an officer of other funds. He is an employee of Fidelity Investments (2008-present). Prior to joining Fidelity Investments, Mr. Deberghes was Senior Vice President of Mutual Fund Administration at State Street Corporation (2007-2008), Senior Director of Mutual Fund Administration at Investors Bank & Trust (2005-2007), and Director of Finance for Dunkin' Brands (2000-2005). |
|
Stephanie J. Dorsey (1969) |
|
|
Year of Election or Appointment: 2010 Assistant Treasurer |
|
|
|
Ms. Dorsey also serves as an officer of other funds. She is an employee of Fidelity Investments (2008-present) and has served in other fund officer roles. Prior to joining Fidelity Investments, Ms. Dorsey served as Treasurer (2004-2008) of the JPMorgan Mutual Funds and Vice President (2004-2008) of JPMorgan Chase Bank. |
|
Scott C. Goebel (1968) |
|
|
Year of Election or Appointment: 2008 Secretary and Chief Legal Officer (CLO) |
|
|
|
Mr. Goebel serves as Secretary and CLO of other funds. Mr. Goebel also serves as Secretary of Fidelity Investments Money Management, Inc. (FIMM) (2010-present) and Fidelity Research and Analysis Company (FRAC) (2010-present); General Counsel, Secretary, and Senior Vice President of FMR (2008-present) and FMR Co., Inc. (2008-present); Chief Legal Officer of Fidelity Management & Research (Hong Kong) Limited (2008-present) and Assistant Secretary of Fidelity Management & Research (Japan) Inc. (2008-present), and Fidelity Management & Research (U.K.) Inc. (2008-present). Previously, Mr. Goebel served as Secretary and CLO of other Fidelity funds (2008-2013), Assistant Secretary of FIMM (2008-2010), FRAC (2008-2010), and certain funds (2007-2008); and as Vice President and Secretary of Fidelity Distributors Corporation (FDC) (2005-2007). Mr. Goebel has been employed by FMR LLC or an affiliate since 2001. |
|
Joseph A. Hanlon (1968) |
|
|
Year of Election or Appointment: 2012 Chief Compliance Officer |
|
|
|
Mr. Hanlon also serves as Chief Compliance Officer of other funds. Mr. Hanlon serves as Compliance Officer of FMR, FMR Co., Inc., Fidelity Investments Money Management, Inc. (FIMM), Fidelity Research and Analysis Company (FRAC), and Fidelity Management & Research (Hong Kong) (2009-present), as Senior Vice President of the Fidelity Asset Management Division (2009-present), and is an employee of Fidelity Investments. Previously, Mr. Hanlon served as Compliance Officer of Fidelity Management & Research (Japan) Inc. (2009-2013), Strategic Advisers, Inc. (2009-2013), and Fidelity Management & Research (U.K.) Inc. (2009-2013). |
|
Bruce T. Herring (1965) |
|
|
Year of Election or Appointment: 2006 Vice President of certain Equity Funds |
|
|
|
Mr. Herring also serves as Vice President of other funds. He serves as Chief Investment Officer of Fidelity Global Asset Allocation (GAA) (2013-present), Group Chief Investment Officer of FMR, and President of Fidelity Research & Analysis Company (2010-present). Previously, Mr. Herring served as Chief Investment Officer and Director of Fidelity Management & Research (U.K.) Inc. (2010-2013), Vice President (2005-2006) and Senior Vice President (2006-2007) of Fidelity Management & Research Company, Vice President of FMR Co., Inc. (2001-2007), and as a portfolio manager for Fidelity U.S. Equity Funds. |
|
Brian B. Hogan (1964) |
|
|
Year of Election or Appointment: 2009 Vice President |
|
|
|
Mr. Hogan also serves as Vice President of other funds. Mr. Hogan serves as President of FMR's Equity Division (2009-present). Previously, Mr. Hogan served as Senior Vice President, Equity Research of FMR (2006-2009) and as a portfolio manager. |
|
Chris Maher (1972) |
|
|
Year of Election or Appointment: 2013 Assistant Treasurer |
|
|
|
Mr. Maher serves as Assistant Treasurer of other funds. Mr. Maher is Vice President of Valuation Oversight and is an employee of Fidelity Investments. Previously, Mr. Maher served as Vice President of Asset Management Compliance (2013), Vice President of FMR's Program Management Group (2010-2013), and Vice President of Valuation Oversight (2008-2010). |
|
Christine Reynolds (1958) |
|
|
Year of Election or Appointment: 2008 Chief Financial Officer |
|
|
|
Ms. Reynolds also serves as Chief Financial Officer of other funds. Ms. Reynolds became President of Fidelity Pricing and Cash Management Services (FPCMS) in August 2008. Ms. Reynolds served as Chief Operating Officer of FPCMS (2007-2008). Previously, Ms. Reynolds served as President, Treasurer, and Anti-Money Laundering officer of the Fidelity funds (2004-2007). |
|
Kenneth B. Robins (1969) |
|
|
Year of Election or Appointment: 2008 President and Treasurer |
|
|
|
Mr. Robins also serves as an officer of other funds. Mr. Robins serves as Executive Vice President of Fidelity Investments Money Management, Inc. (FIMM) (2013-present) and is an employee of Fidelity Investments (2004-present). Previously, Mr. Robins served in other fund officer roles. |
|
Gary W. Ryan (1958) |
|
|
Year of Election or Appointment: 2005 Assistant Treasurer |
|
|
|
Mr. Ryan also serves as Assistant Treasurer of other funds. Mr. Ryan is an employee of Fidelity Investments and has served in other fund officer roles. Previously, Mr. Ryan served as Vice President of Fund Reporting in Fidelity Pricing and Cash Management Services (FPCMS) (1999-2005). |
|
Stephen Sadoski (1971) |
|
|
Year of Election or Appointment: 2012 Deputy Treasurer |
|
|
|
Mr. Sadoski also serves as Deputy Treasurer of other funds. He is an employee of Fidelity Investments (2012-present) and has served in another fund officer role. Prior to joining Fidelity Investments, Mr. Sadoski served as an assistant chief accountant in the Division of Investment Management of the Securities and Exchange Commission (SEC) (2009-2012) and as a senior manager at Deloitte & Touche LLP (1997-2009). |
|
Stacie M. Smith (1974) |
|
|
Year of Election or Appointment: 2013 Deputy Treasurer |
|
|
|
Ms. Smith also serves as an officer of other funds. She is an employee of Fidelity Investments (2009-present) and has served in other fund officer roles. Prior to joining Fidelity Investments, Ms. Smith served as Senior Audit Manager of Ernst & Young LLP (1996-2009). |
|
Renee Stagnone (1975) |
|
|
Year of Election or Appointment: 2013 Deputy Treasurer |
|
|
|
Ms. Stagnone also serves as Deputy Treasurer of other funds. Ms. Stagnone is an employee of Fidelity Investments. |
|
Joseph F. Zambello (1957) |
|
|
Year of Election or Appointment: 2011 Deputy Treasurer |
|
|
|
Mr. Zambello also serves as Deputy Treasurer of other funds. Mr. Zambello is an employee of Fidelity Investments. Previously, Mr. Zambello served as Vice President of FMR's Program Management Group (2009-2011) and Vice President of the Transfer Agent Oversight Group (2005-2009). |
Annual Report
Board Approval of Investment Advisory Contracts and Management Fees
Fidelity Advisor Growth Opportunities Fund
Each year, the Board of Trustees, including the Independent Trustees (together, the Board), votes on the renewal of the management contract and sub-advisory agreements (together, the Advisory Contracts) for the fund. The Board, assisted by the advice of fund counsel and Independent Trustees' counsel, requests and considers a broad range of information relevant to the renewal of the Advisory Contracts throughout the year.
The Board meets regularly and, at each of its meetings, covers an extensive agenda of topics and materials and considers factors that are relevant to its annual consideration of the renewal of the fund's Advisory Contracts, including the services and support provided to the fund and its shareholders. The Board has established various standing committees, each composed of and chaired by Independent Trustees with varying backgrounds, to which the Board has assigned specific subject matter responsibilities in order to enhance effective decision-making by the Board. The Board, acting directly and through its Committees, requests and receives information concerning the annual consideration of the renewal of the fund's Advisory Contracts. The Board also meets as needed to consider matters specifically related to the Board's annual consideration of the renewal of Advisory Contracts. Members of the Board may also meet with trustees of other Fidelity funds through ad hoc joint committees to discuss certain matters relevant to the Fidelity funds.
At its July 2013 meeting, the Board, including the Independent Trustees, unanimously determined to renew the fund's Advisory Contracts. In reaching its determination, the Board considered all factors it believed relevant, including (i) the nature, extent, and quality of the services to be provided to the fund and its shareholders (including the investment performance of the fund); (ii) the competitiveness of the fund's management fee and total expense ratio relative to peer funds; (iii) the total costs of the services to be provided by and the profits to be realized by Fidelity from its relationship with the fund; (iv) the extent to which economies of scale exist and would be realized as the fund grows; and (v) whether fee levels reflect these economies of scale, if any, for the benefit of fund shareholders.
In considering whether to renew the Advisory Contracts for the fund, the Board reached a determination, with the assistance of fund counsel and Independent Trustees' counsel and through the exercise of its business judgment, that the renewal of the Advisory Contracts was in the best interests of the fund and its shareholders and that the compensation payable under the Advisory Contracts was fair and reasonable. The Board's decision to renew the Advisory Contracts was not based on any single factor, but rather was based on a comprehensive consideration of all the information provided to the Board at its meetings throughout the year. The Board, in reaching its determination to renew the Advisory Contracts, was aware that shareholders in the fund have a broad range of investment choices available to them, including a wide choice among mutual funds offered by Fidelity's competitors, and that the fund's shareholders, who have the opportunity to review and weigh the disclosure provided by the fund in its prospectus and other public disclosures, have chosen to invest in this fund, which is a part of the Fidelity family of funds.
Annual Report
Board Approval of Investment Advisory Contracts and
Management Fees - continued
Nature, Extent, and Quality of Services Provided. The Board considered the staffing within the investment adviser, Fidelity Management & Research Company (FMR), and the sub-advisers (together, the Investment Advisers) as it relates to the fund, including the backgrounds of the fund's investment personnel, and also considered the fund's investment objective, strategies, and related investment philosophy. The Independent Trustees also had discussions with senior management of Fidelity's investment operations and investment groups. The Board considered the structure of the portfolio manager compensation program and whether this structure provides appropriate incentives to act in the best interests of the fund.
Resources Dedicated to Investment Management and Support Services. The Board and the Fund Oversight and Research Committees reviewed the general qualifications and capabilities of the Investment Advisers' investment staff, including its size, education, experience, and resources, as well as the Investment Advisers' approach to recruiting, training, managing, and compensating investment personnel. The Board noted that FMR has continued to increase the resources devoted to non-U.S. offices, including expansion of Fidelity's global investment organization. The Board also noted that Fidelity's analysts have extensive resources, tools and capabilities that allow them to conduct sophisticated quantitative and fundamental analysis, as well as credit analysis of issuers, counterparties and guarantors. Further, the Board believes that Fidelity's investment professionals have sufficient access to global information and data so as to provide competitive investment results over time, and that those professionals also have access to sophisticated tools that permit them to assess portfolio construction and risk and performance attribution characteristics continuously, as well as to transmit new information and research conclusions rapidly around the world. Additionally, in its deliberations, the Board considered the Investment Advisers' trading and risk management capabilities and resources, which are an integral part of the investment management process.
Shareholder and Administrative Services. The Board considered (i) the nature, extent, quality, and cost of advisory, administrative, and shareholder services performed by the Investment Advisers and their affiliates under the Advisory Contracts and under separate agreements covering transfer agency, pricing and bookkeeping, and securities lending services for the fund; (ii) the nature and extent of the supervision of third party service providers, principally custodians and subcustodians; and (iii) the resources devoted to, and the record of compliance with, the fund's compliance policies and procedures. The Board also reviewed the allocation of fund brokerage, including allocations to brokers affiliated with the Investment Advisers, the use of brokerage commissions to pay fund expenses, and the use of "soft" commission dollars to pay for research services.
Annual Report
The Board noted that the growth of fund assets over time across the complex allows Fidelity to reinvest in the development of services designed to enhance the value or convenience of the Fidelity funds as investment vehicles. These services include 24-hour access to account information and market information through telephone representatives and over the Internet, investor education materials and asset allocation tools, and the expanded availability of Fidelity Investor Centers.
Investment in a Large Fund Family. The Board considered the benefits to shareholders of investing in a Fidelity fund, including the benefits of investing in a fund that is part of a large family of funds offering a variety of investment disciplines and providing a large variety of mutual fund investor services. The Board noted that Fidelity had taken, or had made recommendations that resulted in the Fidelity funds taking, a number of actions over the previous year that benefited particular funds, including (i) continuing to dedicate additional resources to investment research and to the support of the senior management team that oversees asset management; (ii) persisting in efforts to enhance Fidelity's global research capabilities; (iii) launching new funds and making other enhancements to meet client needs for global and income-oriented solutions; (iv) continuing to launch dedicated lower cost underlying funds to meet portfolio construction needs related to expanding underlying fund options for Fidelity funds of funds, specifically for the Freedom Fund product lines; (v) rationalizing product lines and gaining increased efficiencies through the mergers of several funds into other funds; (vi) strengthening Fidelity's index fund offerings by reducing investment minimums and adopting or lowering existing expense caps for certain funds and classes; (vii) enhancing Global Asset Allocation product offerings by launching new funds and strategies, including "open architecture" target date funds that utilize affiliated and unaffiliated sub-advisers; (viii) modifying the eligibility criteria for Institutional Class shares of Advisor funds to increase their marketability to a portion of the defined contribution plan market; (ix) creating a new low-cost retirement share class for certain Advisor funds to appeal to large retirement plans; (x) transitioning the management of certain Fidelity commodity funds to Geode Capital Management LLC, a registered commodity pool operator, while retaining administrative responsibilities for the funds; (xi) reorganizing a number of funds; and (xii) taking steps toward establishing a new Fidelity adviser to manage sector-based funds and products.
Investment Performance. The Board considered whether the fund has operated in accordance with its investment objective, as well as its record of compliance with its investment restrictions and its performance history. The Board noted that there was a portfolio management change for the fund in October 2012.
Annual Report
Board Approval of Investment Advisory Contracts and
Management Fees - continued
The Board took into account discussions with the Investment Advisers about fund investment performance that occur at Board meetings throughout the year. In this regard the Board noted that as part of regularly scheduled fund reviews and other reports to the Board on fund performance, the Board periodically considers annualized return information for the fund, for different time periods, measured against a securities market index ("benchmark index") and a peer group of mutual funds with similar objectives ("peer group"). In its evaluation of fund investment performance, the Board gave particular attention to information indicating changes in performance of certain Fidelity funds for specific time periods and the Investment Advisers' explanations for any overperformance or underperformance.
In addition to reviewing absolute and relative fund performance, the Independent Trustees periodically consider the appropriateness of fund performance metrics in evaluating the results achieved. In general, the Independent Trustees believe that fund performance should be evaluated based on net performance (after fees and expenses) of both the highest performing and lowest performing classes, where applicable, compared to appropriate benchmark indices, over appropriate time periods which may include full market cycles, and compared to peer groups, as applicable, over the same periods, taking into account relevant factors including the following: general market conditions; issuer-specific information; tactical opportunities for investment; and fund cash flows and other factors.
The Independent Trustees recognize that shareholders evaluate performance on a net basis over their own holding periods, for which one-, three-, and five-year periods are used as a proxy. For this reason, the performance information reviewed by the Board also included net cumulative calendar year total return information for the fund and an appropriate benchmark index and peer group for the most recent one-, three-, and five-year periods, as shown below. Returns are shown compared to the 25th percentile (top of box) and 75th percentile (bottom of box) of the peer universe.
Annual Report
Fidelity Advisor Growth Opportunities Fund
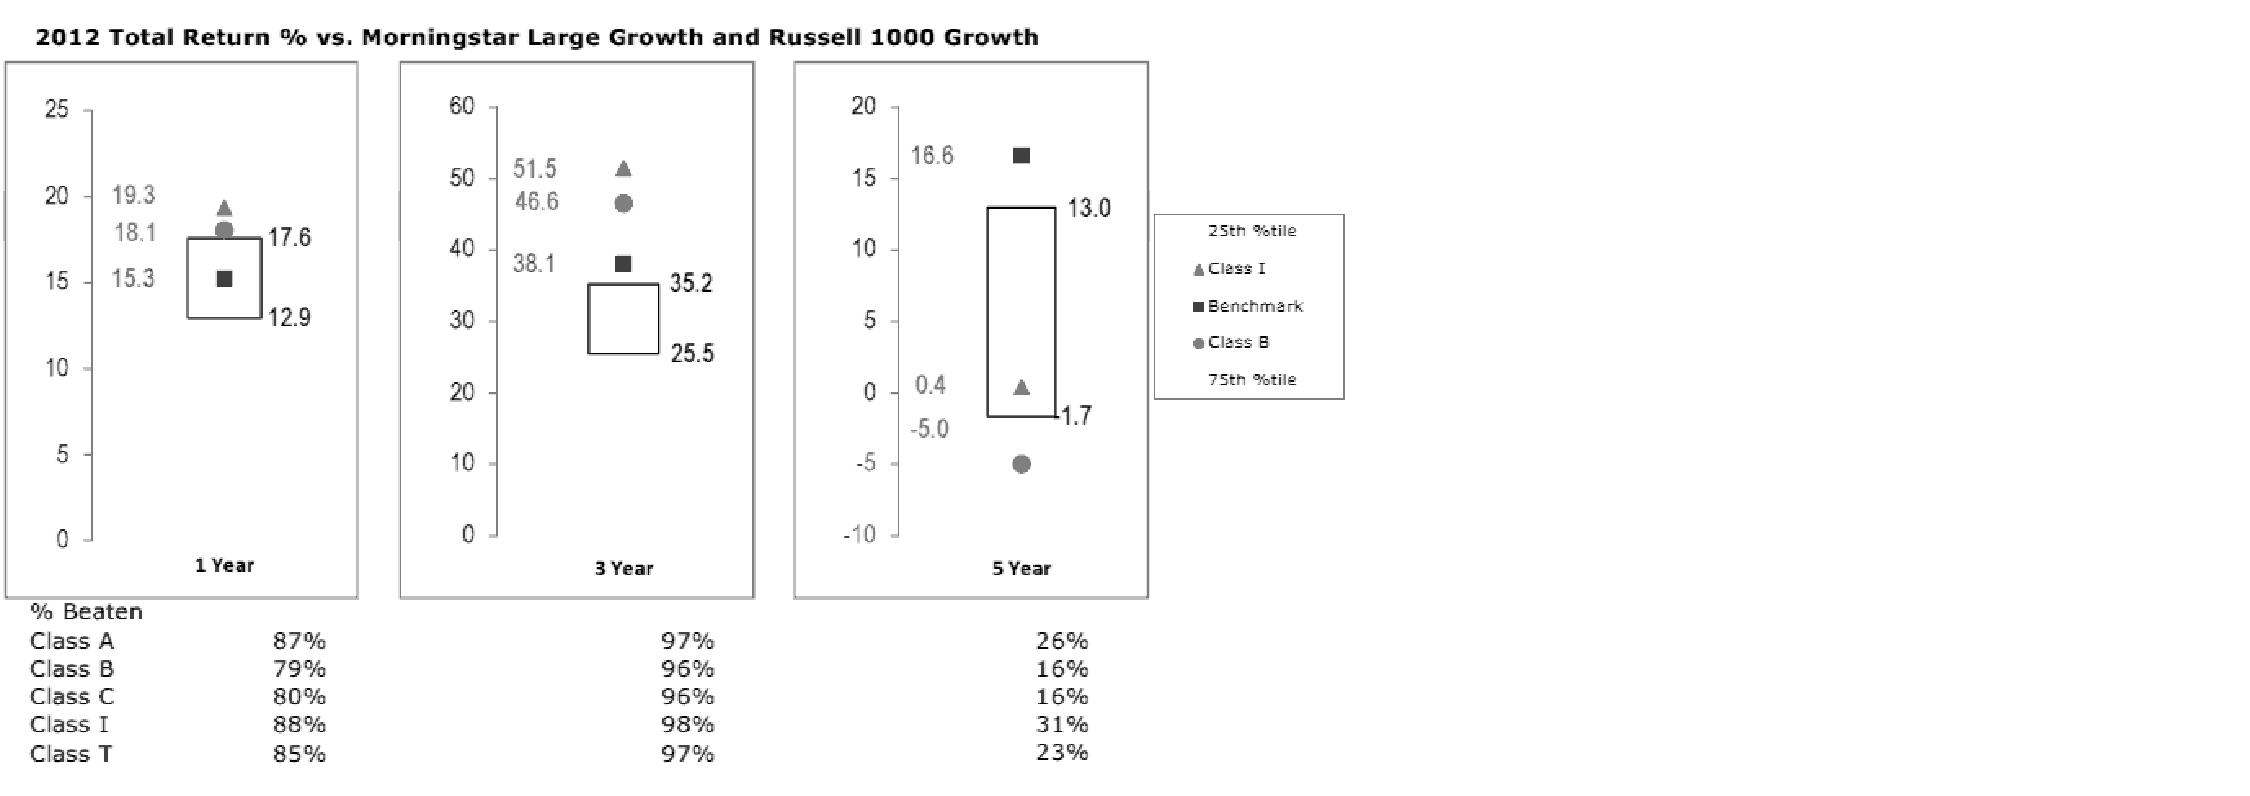
The Board also considered that the fund's management fee is subject to upward or downward adjustment depending upon whether, and to what extent, the fund's investment performance for the performance period exceeds, or is exceeded by, a securities index, thus leading to a performance adjustment for the same period. The Board noted that the performance adjustment provides FMR with a strong economic incentive to seek to achieve superior performance for the fund's shareholders and helps to more closely align the interests of FMR and the fund's shareholders.
Based on its review, the Board concluded that the nature, extent, and quality of services provided to the fund under the Advisory Contracts should benefit the fund's shareholders.
Competitiveness of Management Fee and Total Expense Ratio. The Board considered the fund's management fee and total expense ratio compared to "mapped groups" of competitive funds and classes. Fidelity creates "mapped groups" by combining similar Lipper investment objective categories that have comparable management fee characteristics. Combining Lipper investment objective categories aids the Board's management fee and total expense ratio comparisons by broadening the competitive group used for comparison and by reducing the number of universes to which various Fidelity funds are compared.
Management Fee. The Board considered two proprietary management fee comparisons for the 12-month periods shown in the chart below. The group of Lipper funds used by the Board for management fee comparisons is referred to below as the "Total Mapped Group." The Total Mapped Group comparison focuses on a fund's standing in terms of gross management fees before expense reimbursements or caps, and without giving effect to the fund's performance adjustment, relative to the total universe of funds with comparable investment mandates, regardless of whether their management fee structures also are comparable. Funds with comparable investment mandates offer exposure to similar types of securities. Funds with comparable management fee structures have similar management fee contractual arrangements (e.g., flat rate charged for advisory services, all-inclusive fee rate, etc.). "TMG %" represents the percentage of funds in the Total Mapped Group that had management fees that were lower than the fund's. For example, a TMG % of 11% means that 89% of the funds in the Total Mapped Group had higher management fees than the fund. The "Asset-Size Peer Group" (ASPG) comparison focuses on a fund's standing relative to a subset of non-Fidelity funds within the Total Mapped Group that are similar in size and management fee structure. The ASPG represents at least 15% of the funds in the Total Mapped Group with comparable asset size and management fee structures, subject to a minimum of 50 funds (or all funds in the Total Mapped Group if fewer than 50).Additional information, such as the ASPG quartile in which the fund's management fee ranked and the impact of the fund's performance adjustment, is also included in the chart and considered by the Board.
Annual Report
Board Approval of Investment Advisory Contracts and
Management Fees - continued
Fidelity Advisor Growth Opportunities Fund
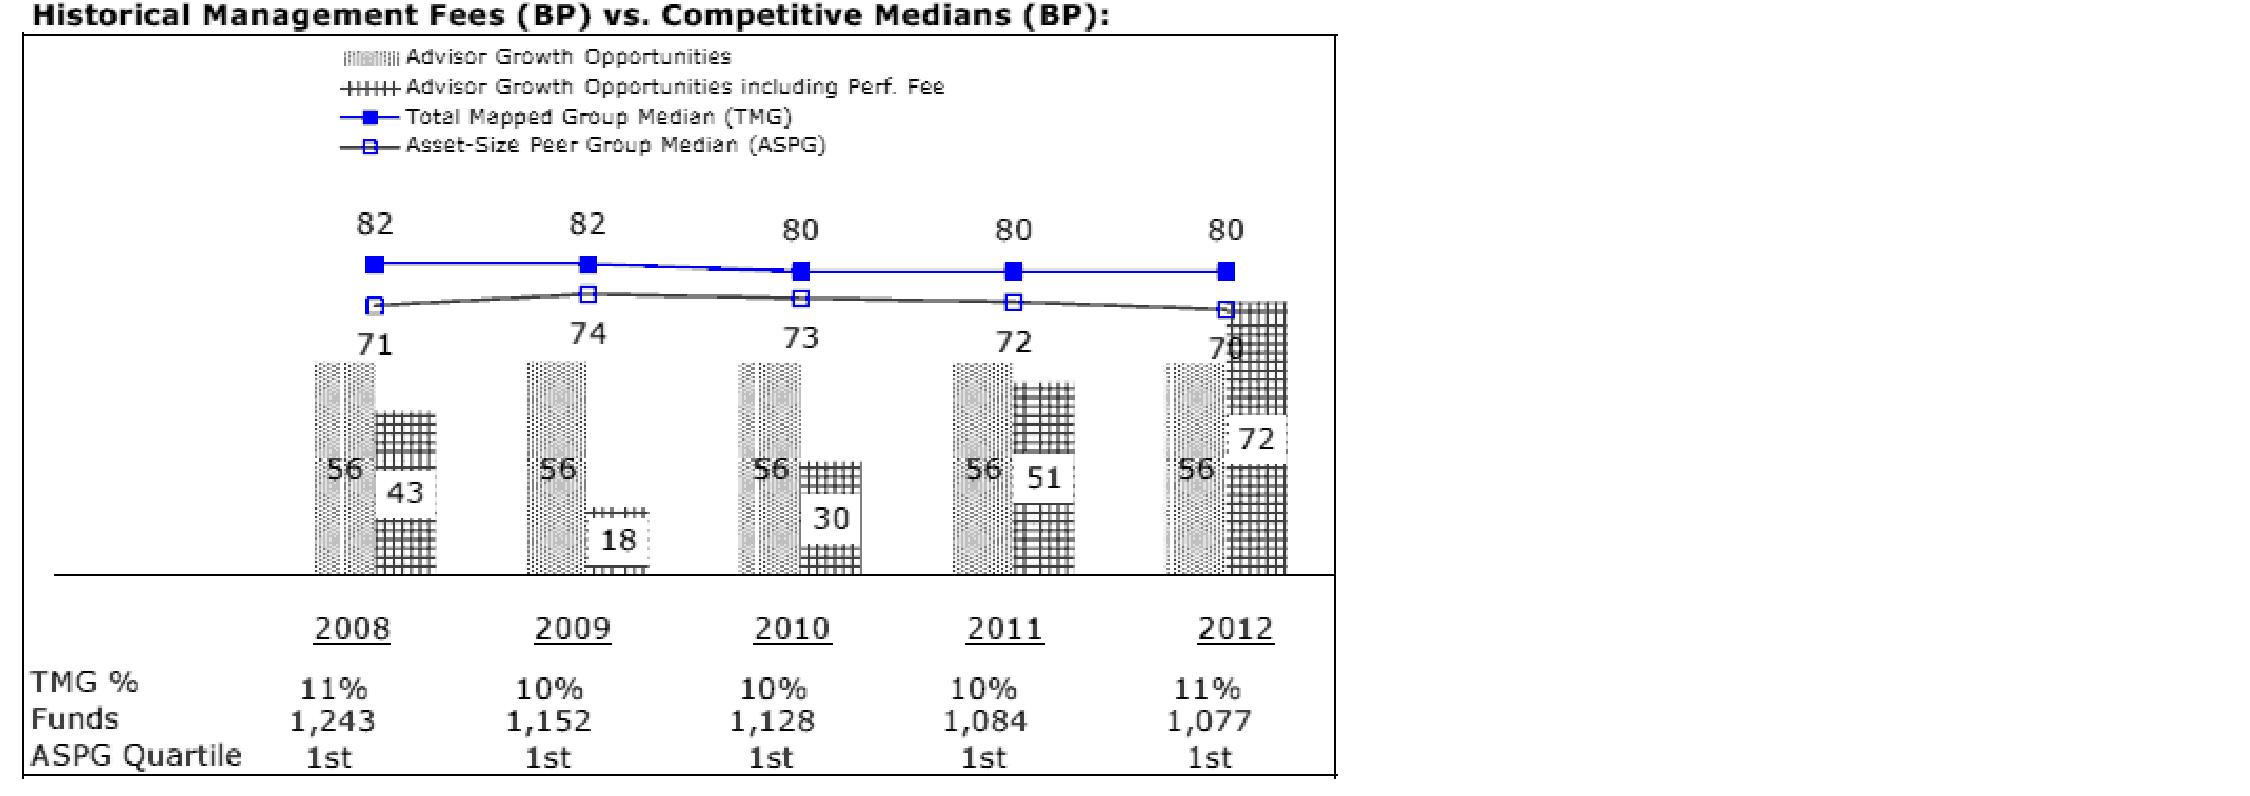
The Board noted that the fund's management fee ranked below the median of its Total Mapped Group and below the median of its ASPG for 2012. The Board also noted the effect of the fund's positive performance adjustment on the fund's management fee ranking.
Annual Report
Furthermore, the Board considered that shareholders approved a prospective change in the index used to calculate the fund's performance adjustment, beginning February 1, 2007. The Board also considered that, because the performance adjustment is based on a rolling 36-month measurement period, during a transition period the fund's performance is compared to a blended index return that reflects the performance of the former index for the portion of the measurement period prior to February 1, 2007 and the performance of the current index for the remainder of the measurement period. The Board noted that the fund's performance adjustments for 2008 through 2010 shown in the chart above reflect the effect of using the blended index return to calculate the fund's performance adjustment.
Based on its review, the Board concluded that the fund's management fee is fair and reasonable in light of the services that the fund receives and the other factors considered.
Total Expense Ratio. In its review of each class's total expense ratio, the Board considered the fund's management fee as well as other fund or class expenses, as applicable, such as transfer agent fees, pricing and bookkeeping fees, fund-paid 12b-1 fees, and custodial, legal, and audit fees. The Board also noted the effects of any waivers and reimbursements on fees and expenses, as well as the impact of the fund's performance adjustment. As part of its review, the Board also considered the current and historical total expense ratios of each class of the fund compared to competitive fund median expenses. Each class of the fund is compared to those funds and classes in the Total Mapped Group (used by the Board for management fee comparisons) that have a similar sales load structure.
The Board noted that the total expense ratio of Institutional Class ranked below its competitive median for 2012 and the total expense ratio of each of Class A, Class T, Class B, and Class C ranked above its competitive median for 2012. The Board considered that, in general, various factors can affect total expense ratios. The Board noted that the total expense ratio of Class T was above the competitive median primarily because of higher 12b-1 fees on Class T. Class T has a higher 12b-1 fee, but a lower front-end sales charge, than traditionally priced front-end sales charge classes. The Board considered that Class T is primarily sold load-waived in the retirement plan market where its 0.50% 12b-1 fee is comparable to competing no-load, higher 12b-1 fee classes designed specifically for retirement plans. The Board noted that the fund offers multiple classes, each of which has a different sales load and 12b-1 fee structure, and that the multiple structures are intended to offer a range of pricing options for the intermediary market. The Board also noted that the total expense ratios of the classes vary primarily by the level of their 12b-1 fees, although differences in transfer agent fees may also cause expenses to vary from class to class.
Annual Report
Board Approval of Investment Advisory Contracts and
Management Fees - continued
Fees Charged to Other Fidelity Clients. The Board also considered Fidelity fee structures and other information with respect to clients of FMR and its affiliates, such as other mutual funds advised or subadvised by FMR or its affiliates, pension plan clients, and other institutional clients. The Board noted the findings of the 2013 ad hoc joint committee (created with the board of other Fidelity funds), which reviewed and compared Fidelity's institutional investment advisory business with its business of providing services to the Fidelity funds, including the differences in services provided, fees charged, and costs incurred, as well as competition in their respective marketplaces.
Based on its review of total expense ratios and fees charged to other Fidelity clients, the Board concluded that the total expense ratio of each class of the fund was reasonable, although in some cases above the median of the universe presented for comparison, in light of the services that the fund and its shareholders receive and the other factors considered.
Costs of the Services and Profitability. The Board considered the revenues earned and the expenses incurred by Fidelity in conducting the business of developing, marketing, distributing, managing, administering and servicing the fund and servicing the fund's shareholders. The Board also considered the level of Fidelity's profits in respect of all the Fidelity funds.
On an annual basis, FMR presents to the Board Fidelity's profitability for the fund. Fidelity calculates the profitability for each fund, as well as aggregate profitability for groups of Fidelity funds and all Fidelity funds, using a series of detailed revenue and cost allocation methodologies which originate with the books and records of Fidelity on which Fidelity's audited financial statements are based. The Audit Committee of the Board reviews any significant changes from the prior year's methodologies.
PricewaterhouseCoopers LLP (PwC), independent registered public accounting firm and auditor to Fidelity and certain Fidelity funds, has been engaged annually by the Board as part of the Board's assessment of Fidelity's profitability analysis. PwC's engagement includes the review and assessment of the methodologies used by Fidelity in determining the revenues and expenses attributable to Fidelity's mutual fund business, and completion of agreed-upon procedures surrounding the mathematical accuracy of fund profitability and its conformity to allocation methodologies. After considering PwC's reports issued under the engagement and information provided by Fidelity, the Board concluded that while other allocation methods may also be reasonable, Fidelity's profitability methodologies are reasonable in all material respects.
The Board also reviewed Fidelity's non-fund businesses and fall-out benefits related to the mutual fund business as well as cases where Fidelity's affiliates may benefit from or be related to the fund's business.
Annual Report
The Board considered the costs of the services provided by and the profits realized by Fidelity in connection with the operation of the fund and was satisfied that the profitability was not excessive in the circumstances.
Economies of Scale. The Board considered whether there have been economies of scale in respect of the management of the Fidelity funds, whether the Fidelity funds (including the fund) have appropriately benefited from any such economies of scale, and whether there is potential for realization of any further economies of scale. The Board considered the extent to which the fund will benefit from economies of scale through increased services to the fund, through waivers or reimbursements, or through fee or expense reductions. The Board also noted that in 2009, it and the board of other Fidelity funds created an ad hoc committee (the Economies of Scale Committee) to analyze whether FMR attains economies of scale in respect of the management and servicing of the Fidelity funds, whether the Fidelity funds have appropriately benefited from such economies of scale, and whether there is potential for realization of any further economies of scale.
The Board recognized that the fund's management contract incorporates a "group fee" structure, which provides for lower group fee rates as total fund assets under FMR's management increase, and for higher group fee rates as total fund assets under FMR's management decrease. FMR calculates the group fee rates based on a tiered asset "breakpoint" schedule that varies based on asset class. The Board considered that the group fee is designed to deliver the benefits of economies of scale to fund shareholders when total Fidelity fund assets increase, even if assets of any particular fund are unchanged or have declined, because some portion of Fidelity's costs are attributable to services provided to all Fidelity funds, and all funds benefit if those costs can be allocated among more assets. The Board concluded that, given the group fee structure, fund shareholders will benefit from lower management fees as assets under FMR's management increase at the fund complex level, regardless of whether Fidelity achieves any such economies of scale.
The Board concluded, taking into account the analysis of the Economies of Scale Committee, that economies of scale, if any, are being appropriately shared between fund shareholders and Fidelity.
Amendment to Description of Group Fee Rate. At its July 2013 meeting, the Board voted to approve an amendment to the fund's management contract to modify the description of the "group fee rate" effective August 1, 2013. The Board noted that under the prior description in the contract, the group fee rate was based on the average net assets of all registered investment companies with which FMR has management contracts. Under the contract's tiered asset breakpoint schedule, the group fee rate is lower as total fund assets under FMR's management increase, and higher as total fund assets under FMR's management decrease. The Board considered that the prior description would have excluded the assets of 64 Fidelity sector funds from the group fee rate calculation once Fidelity SelectCo, LLC, an affiliate of FMR, assumed management responsibilities for those funds. The Board noted that modifying the description of the group fee rate to continue to include the assets of those 64 funds for purposes of determining group fee rate breakpoints would avoid an immediate adverse impact on the group fee rate for any fund.
Annual Report
Board Approval of Investment Advisory Contracts and
Management Fees - continued
Additional Information Requested by the Board. In order to develop fully the factual basis for consideration of the Fidelity funds' Advisory Contracts, the Board requested and received additional information on certain topics, including: (i) fund performance trends and Fidelity's long-term strategies for certain funds; (ii) the potential to further rationalize the Fidelity fund lineup with the possibility of achieving savings for the funds and Fidelity; (iii) the methodology with respect to competitive fund data and peer group classifications; (iv) the arrangements with, and performance of, certain sub-advisers on behalf of the Fidelity funds, as well as certain proposed participating affiliate arrangements; (v) the realization of fall-out benefits in certain Fidelity business units; (vi) Fidelity's group fee structures, including the rationale for the individual fee rates of certain categories of funds and the definition of group assets; (vii) trends regarding industry use of performance fee structures and the performance adjustment methodologies applicable to the Fidelity funds; (viii) additional competitive analysis regarding the total expenses for certain classes; and (ix) fund profitability methodology, including Fidelity's cost allocation methodology, and the impact of certain factors on fund profitability results.
Based on its evaluation of all of the conclusions noted above, and after considering all factors it believed relevant, the Board ultimately concluded that the advisory fee structures are fair and reasonable, and that the fund's Advisory Contracts should be renewed.
Annual Report
Investment Adviser
Fidelity Management & Research Company
Boston, MA
Investment Sub-Advisers
FMR Co., Inc.
Fidelity Management & Research
(U.K.) Inc.
Fidelity Management & Research (Japan) Inc.
Fidelity Management & Research (Hong Kong) Limited
General Distributor
Fidelity Distributors Corporation
Smithfield, RI
Transfer and Service Agents
Fidelity Investments Institutional
Operations Company, Inc.
Boston, MA
Fidelity Service Company, Inc.
Boston, MA
Custodian
The Bank of New York Mellon
New York, NY
(Fidelity Investment logo)(registered trademark)
GO-UANN-0114 1.786689.110
(Fidelity Investment logo)(registered trademark)
Fidelity Advisor®
Growth Opportunities
Fund - Institutional Class
Annual Report
November 30, 2013
(Fidelity Cover Art)
Contents
|
Performance |
How the fund has done over time. |
|
|
Management's Discussion of Fund Performance |
The Portfolio Manager's review of fund performance and strategy. |
|
|
Shareholder Expense Example |
An example of shareholder expenses. |
|
|
Investment Changes |
A summary of major shifts in the fund's investments over the past six months. |
|
|
Investments |
A complete list of the fund's investments with their market values. |
|
|
Financial Statements |
Statements of assets and liabilities, operations, and changes in net assets, as well as financial highlights. |
|
|
Notes |
Notes to the financial statements. |
|
|
Report of Independent Registered Public Accounting Firm |
|
|
|
Trustees and Officers |
|
|
|
Board Approval of Investment Advisory Contracts and Management Fees |
|
To view a fund's proxy voting guidelines and proxy voting record for the 12-month period ended June 30, visit http://www.fidelity.com/proxyvotingresults or visit the Securities and Exchange Commission's (SEC) web site at http://www.sec.gov. You may also call 1-877-208-0098 to request a free copy of the proxy voting guidelines.
Standard & Poor's, S&P and S&P 500 are registered service marks of The McGraw-Hill Companies, Inc. and have been licensed for use by Fidelity Distributors Corporation.
Other third-party marks appearing herein are the property of their respective owners.
All other marks appearing herein are registered or unregistered trademarks or service marks of FMR LLC or an affiliated company. © 2014 FMR LLC. All rights reserved.
Annual Report
This report and the financial statements contained herein are submitted for the general information of the shareholders of the fund. This report is not authorized for distribution to prospective investors in the fund unless preceded or accompanied by an effective prospectus.
A fund files its complete schedule of portfolio holdings with the SEC for the first and third quarters of each fiscal year on Form N-Q. Forms N-Q are available on the SEC's web site at http://www.sec.gov. A fund's Forms N-Q may be reviewed and copied at the SEC's Public Reference Room in Washington, DC. Information regarding the operation of the SEC's Public Reference Room may be obtained by calling 1-800-SEC-0330. For a complete list of a fund's portfolio holdings, view the most recent holdings listing, semiannual report, or annual report on Fidelity's web site at http://www.fidelity.com, http://www.advisor.fidelity.com, or http://www.401k.com, as applicable.
NOT FDIC INSURED • MAY LOSE VALUE • NO BANK GUARANTEE
Neither the fund nor Fidelity Distributors Corporation is a bank.
Annual Report
Performance: The Bottom Line
Average annual total return reflects the change in the value of an investment, assuming reinvestment of the class's distributions from dividend income and capital gains (the profits earned upon the sale of securities that have grown in value, if any) and assuming a constant rate of performance each year. The $10,000 table and the fund's returns do not reflect the deduction of taxes that a shareholder would pay on fund distributions or the redemption of fund shares. During periods of reimbursement by Fidelity, a fund's total return will be greater than it would be had the reimbursement not occurred. How a fund did yesterday is no guarantee of how it will do tomorrow.
Average Annual Total Returns
|
Periods ended November 30, 2013 |
|
Past 1 |
Past 5 |
Past 10 |
|
Institutional Class A |
|
33.16% |
24.28% |
7.88% |
A Prior to February 1, 2007, Fidelity Advisor® Growth Opportunities Fund operated under certain different investment policies and compared its performance to a different index. The fund's historical performance may not represent its current investment policies.
$10,000 Over 10 Years
Let's say hypothetically that $10,000 was invested in Fidelity Advisor® Growth Opportunities Fund - Institutional Class on November 30, 2003. The chart shows how the value of your investment would have changed, and also shows how the Russell 1000® Growth Index performed over the same period.
Annual Report
Management's Discussion of Fund Performance
Market Recap: With the current bull run nearing the five-year mark, equity benchmarks ripped up old records during the 12 months ending November 30, 2013. Gains were fueled by strengthening U.S. economic data, as well as generally improving economies and accommodative monetary policies worldwide. The broad S&P 500® Index reached new peaks in its 30.30% climb for the period, and the blue-chip Dow Jones Industrial AverageSM surpassed historic milestones en route to a 26.63% gain. The Nasdaq Composite Index®, up 36.73% amid a resurgence in growth-oriented stocks, closed above 4,000 for the first time since 2000. Shedding anxiety over the 2012 U.S. presidential election - and apparently confident that the federal debt-ceiling debate would be resolved - markets rose from period start through late May. News that the U.S. Federal Reserve was considering an end to its stimulative bond-buying kept stocks in flux over the summer but, by September, the Fed had set aside any imminent tapering. Despite jitters over a potential U.S. military strike in Syria and, later, an October budget impasse that briefly shuttered the federal government, volatility was subdued heading into the holidays, with investor optimism helping many markets home in on all-time highs at period end. Elsewhere, non-U.S. developed-market equities saw similar results, with the MSCI® EAFE® Index adding 24.97%.
Comments from Steve Wymer, Lead Portfolio Manager of Fidelity Advisor® Growth Opportunities Fund: For the year, the fund's Institutional Class shares returned 33.16%, outperforming the 29.74% gain of the Russell 1000® Growth Index. Our focus on well-positioned firms with strong product cycles and growth catalysts drew us to the pharmaceuticals, biotechnology & life science space, where a large overweighting and successful picks significantly boosted the fund's relative result. Shares of Isis Pharmaceuticals, our biggest relative contributor, jumped in late June after the drug developer released positive mid-stage data for its promising drug for patients with high triglycerides and type 2 diabetes. Regeneron Pharmaceuticals - one of the fund's largest holdings - received a boost because a key competitor of its age-related macular degeneration program, EYLEA®, had a major setback and delayed its product launch. On the flip side, a sizable position in long-time fund holding lululemon athletica hurt the most. Shares lagged due to consecutive quarters of weaker-than-expected financial results, and were further hampered by two big events - the company's recall of a line of women's yoga pants in March, after they were found to be too sheer, and the June departure of its CEO.
Annual Report
The views expressed above reflect those of the portfolio manager(s) only through the end of the period as stated on the cover of this report and do not necessarily represent the views of Fidelity or any other person in the Fidelity organization. Any such views are subject to change at any time based upon market or other conditions and Fidelity disclaims any responsibility to update such views. These views may not be relied on as investment advice and, because investment decisions for a Fidelity fund are based on numerous factors, may not be relied on as an indication of trading intent on behalf of any Fidelity fund.
Annual Report
Shareholder Expense Example
As a shareholder of the Fund, you incur two types of costs: (1) transaction costs, including sales charges (loads) on purchase payments or redemption proceeds, and (2) ongoing costs, including management fees, distribution and/or service (12b-1) fees and other Fund expenses. This Example is intended to help you understand your ongoing costs (in dollars) of investing in the Fund and to compare these costs with the ongoing costs of investing in other mutual funds.
The actual expense Example is based on an investment of $1,000 invested at the beginning of the period and held for the entire period (June 1, 2013 to November 30, 2013) for Class A, Class T, Class B, Class C and Institutional Class and for the period (August 13, 2013 to November 30, 2013) for Class Z. The hypothetical expense Example is based on an investment of $1,000 invested for the one-half year period (June 1, 2013 to November 30, 2013).
Actual Expenses
The first line of the accompanying table for each class of the Fund provides information about actual account values and actual expenses. You may use the information in this line, together with the amount you invested, to estimate the expenses that you paid over the period. Simply divide your account value by $1,000.00 (for example, an $8,600 account value divided by $1,000.00 = 8.6), then multiply the result by the number in the first line for a class of the Fund under the heading entitled "Expenses Paid During Period" to estimate the expenses you paid on your account during this period. In addition, the Fund, as a shareholder in the underlying Fidelity Central Funds, will indirectly bear its pro-rata share of the fees and expenses incurred by the underlying Fidelity Central Funds. These fees and expenses are not included in the Fund's annualized expense ratio used to calculate the expense estimate in the table below.
Hypothetical Example for Comparison Purposes
The second line of the accompanying table for each class of the Fund provides information about hypothetical account values and hypothetical expenses based on a Class' actual expense ratio and an assumed rate of return of 5% per year before expenses, which is not the Class' actual return. The hypothetical account values and expenses may not be used to estimate the actual ending account balance or expenses you paid for the period. You may use this information to compare the ongoing costs of investing in the Fund and other funds. To do so, compare this 5% hypothetical example with the 5% hypothetical examples that appear in the shareholder reports of the other funds. In addition, the Fund, as a shareholder in the underlying Fidelity Central Funds, will indirectly bear its pro-rata share of the fees and expenses incurred by the underlying Fidelity Central Funds. These fees and expenses are not included in the Fund's annualized expense ratio used to calculate the expense estimate in the table below.
Please note that the expenses shown in the table are meant to highlight your ongoing costs only and do not reflect any transaction costs. Therefore, the second line of the table is useful in comparing ongoing costs only, and will not help you determine the relative total costs of owning different funds. In addition, if these transactional costs were included, your costs would have been higher.
Annual Report
Shareholder Expense Example - continued
|
|
Annualized |
Beginning |
Ending |
Expenses Paid |
|
Class A |
1.22% |
|
|
|
|
Actual |
|
$ 1,000.00 |
$ 1,136.70 |
$ 6.53 C |
|
HypotheticalA |
|
$ 1,000.00 |
$ 1,018.95 |
$ 6.17 D |
|
Class T |
1.43% |
|
|
|
|
Actual |
|
$ 1,000.00 |
$ 1,135.50 |
$ 7.66 C |
|
HypotheticalA |
|
$ 1,000.00 |
$ 1,017.90 |
$ 7.23 D |
|
Class B |
2.03% |
|
|
|
|
Actual |
|
$ 1,000.00 |
$ 1,132.00 |
$ 10.85 C |
|
HypotheticalA |
|
$ 1,000.00 |
$ 1,014.89 |
$ 10.25 D |
|
Class C |
1.96% |
|
|
|
|
Actual |
|
$ 1,000.00 |
$ 1,132.60 |
$ 10.48 C |
|
HypotheticalA |
|
$ 1,000.00 |
$ 1,015.24 |
$ 9.90 D |
|
Institutional Class |
.94% |
|
|
|
|
Actual |
|
$ 1,000.00 |
$ 1,138.40 |
$ 5.04 C |
|
HypotheticalA |
|
$ 1,000.00 |
$ 1,020.36 |
$ 4.76 D |
|
Class Z |
.78% |
|
|
|
|
Actual |
|
$ 1,000.00 |
$ 1,073.20 |
$ 2.44 C |
|
HypotheticalA |
|
$ 1,000.00 |
$ 1,021.16 |
$ 3.95 D |
A 5% return per year before expenses
B Annualized expense ratio reflects expenses net of applicable fee waivers.
C Actual expenses are equal to each Class' annualized expense ratio, multiplied by the average account value over the period, multiplied by 183/365 (to reflect the one-half year period) for Class A, Class T, Class B, Class C and Institutional Class and multiplied by 110/365 (to reflect the period August 13, 2013 to November 30, 2013) for Class Z. The fees and expenses of the underlying Fidelity Central Funds in which the Fund invests are not included in each Class' annualized expense ratio.
D Hypothetical expenses are equal to each Class' annualized expense ratio, multiplied by the average account value over the period, multiplied by 183/365 (to reflect the one-half year period). The fees and expenses of the underlying Fidelity Central Funds in which the Fund invests are not included in each Class' annualized expense ratio.
Annual Report
Investment Changes (Unaudited)
|
Top Ten Stocks as of November 30, 2013 |
||
|
|
% of fund's |
% of fund's net assets |
|
Google, Inc. Class A |
4.8 |
4.6 |
|
Apple, Inc. |
4.1 |
4.8 |
|
salesforce.com, Inc. |
3.6 |
3.6 |
|
Regeneron Pharmaceuticals, Inc. |
3.0 |
3.5 |
|
Facebook, Inc. Class A |
2.1 |
0.5 |
|
Seattle Genetics, Inc. |
2.1 |
2.3 |
|
lululemon athletica, Inc. |
1.9 |
2.7 |
|
Comcast Corp. Class A |
1.7 |
0.2 |
|
Alkermes PLC |
1.5 |
1.5 |
|
Visa, Inc. Class A |
1.5 |
1.3 |
|
|
26.3 |
|
|
Top Five Market Sectors as of November 30, 2013 |
||
|
|
% of fund's |
% of fund's net assets |
|
Information Technology |
33.1 |
34.7 |
|
Health Care |
19.0 |
19.4 |
|
Consumer Discretionary |
18.2 |
18.5 |
|
Consumer Staples |
9.9 |
9.2 |
|
Industrials |
7.0 |
7.1 |
|
Asset Allocation (% of fund's net assets) |
|||||||
|
As of November 30, 2013* |
As of May 31, 2013** |
||||||
 |
Stocks 97.5% |
|
|
Stocks 99.2% |
|
||
 |
Convertible |
|
|
Convertible |
|
||
 |
Short-Term |
|
|
Short-Term |
|
||
|
* Foreign investments |
6.5% |
|
** Foreign investments |
6.2% |
|
||

Annual Report
Investments November 30, 2013
Showing Percentage of Net Assets
|
Common Stocks - 97.5% |
|||
|
Shares |
Value (000s) |
||
|
CONSUMER DISCRETIONARY - 18.2% |
|||
|
Auto Components - 0.2% |
|||
|
Tenneco, Inc. (a) |
115,600 |
$ 6,635 |
|
|
Automobiles - 0.6% |
|||
|
Tesla Motors, Inc. (a)(d) |
146,400 |
18,634 |
|
|
Hotels, Restaurants & Leisure - 3.1% |
|||
|
Arcos Dorados Holdings, Inc. Class A (d) |
222,600 |
2,716 |
|
|
BJ's Restaurants, Inc. (a) |
54,500 |
1,615 |
|
|
Buffalo Wild Wings, Inc. (a) |
64,200 |
9,645 |
|
|
Chipotle Mexican Grill, Inc. (a) |
22,800 |
11,944 |
|
|
Chuys Holdings, Inc. (a) |
114,500 |
3,989 |
|
|
Dunkin' Brands Group, Inc. |
163,600 |
8,013 |
|
|
Las Vegas Sands Corp. |
133,992 |
9,605 |
|
|
McDonald's Corp. |
135,600 |
13,203 |
|
|
Potbelly Corp. |
3,000 |
84 |
|
|
Starbucks Corp. |
315,500 |
25,701 |
|
|
Starwood Hotels & Resorts Worldwide, Inc. |
61,200 |
4,558 |
|
|
The Cheesecake Factory, Inc. |
64,300 |
3,135 |
|
|
Wendy's Co. |
779,700 |
6,713 |
|
|
|
100,921 |
||
|
Household Durables - 1.0% |
|||
|
Lennar Corp. Class A (d) |
359,500 |
12,856 |
|
|
SodaStream International Ltd. (a) |
105,300 |
6,053 |
|
|
Toll Brothers, Inc. (a) |
240,300 |
8,194 |
|
|
Tupperware Brands Corp. |
54,600 |
4,987 |
|
|
|
32,090 |
||
|
Internet & Catalog Retail - 1.9% |
|||
|
Amazon.com, Inc. (a) |
109,000 |
42,905 |
|
|
priceline.com, Inc. (a) |
13,500 |
16,096 |
|
|
Shutterfly, Inc. (a) |
79,400 |
3,750 |
|
|
zulily, Inc. |
6,800 |
238 |
|
|
|
62,989 |
||
|
Media - 3.6% |
|||
|
AMC Networks, Inc. Class A (a) |
161,500 |
10,367 |
|
|
Comcast Corp. Class A |
1,095,900 |
54,653 |
|
|
DIRECTV (a) |
112,300 |
7,424 |
|
|
IMAX Corp. (a) |
434,100 |
13,383 |
|
|
Lions Gate Entertainment Corp. (a) |
241,100 |
7,628 |
|
|
News Corp. Class A (a) |
39,325 |
706 |
|
|
Common Stocks - continued |
|||
|
Shares |
Value (000s) |
||
|
CONSUMER DISCRETIONARY - continued |
|||
|
Media - continued |
|||
|
The Walt Disney Co. |
123,300 |
$ 8,698 |
|
|
Twenty-First Century Fox, Inc. Class A |
476,800 |
15,968 |
|
|
|
118,827 |
||
|
Multiline Retail - 0.2% |
|||
|
Target Corp. |
91,300 |
5,837 |
|
|
Specialty Retail - 3.4% |
|||
|
Abercrombie & Fitch Co. Class A |
117,300 |
4,021 |
|
|
Bed Bath & Beyond, Inc. (a) |
64,700 |
5,049 |
|
|
Cabela's, Inc. Class A (a) |
105,000 |
6,431 |
|
|
CarMax, Inc. (a) |
209,700 |
10,558 |
|
|
DSW, Inc. Class A |
82,400 |
3,694 |
|
|
Five Below, Inc. (a) |
105,600 |
5,614 |
|
|
GNC Holdings, Inc. |
137,500 |
8,275 |
|
|
Home Depot, Inc. |
236,100 |
19,046 |
|
|
Lumber Liquidators Holdings, Inc. (a)(d) |
361,200 |
36,369 |
|
|
The Container Store Group, Inc. |
6,800 |
277 |
|
|
TJX Companies, Inc. |
156,600 |
9,847 |
|
|
|
109,181 |
||
|
Textiles, Apparel & Luxury Goods - 4.2% |
|||
|
Fifth & Pacific Companies, Inc. (a) |
146,100 |
4,772 |
|
|
Fossil Group, Inc. (a) |
147,100 |
18,721 |
|
|
lululemon athletica, Inc. (a)(d) |
902,216 |
62,902 |
|
|
Michael Kors Holdings Ltd. (a) |
197,700 |
16,122 |
|
|
NIKE, Inc. Class B |
150,400 |
11,903 |
|
|
Prada SpA |
454,000 |
4,383 |
|
|
Skechers U.S.A., Inc. Class A (sub. vtg.) (a) |
130,100 |
4,374 |
|
|
Steven Madden Ltd. (a) |
264,600 |
10,309 |
|
|
Under Armour, Inc. Class A (sub. vtg.) (a) |
48,600 |
3,922 |
|
|
Vince Holding Corp. |
5,100 |
149 |
|
|
|
137,557 |
||
|
TOTAL CONSUMER DISCRETIONARY |
592,671 |
||
|
CONSUMER STAPLES - 9.9% |
|||
|
Beverages - 1.6% |
|||
|
Monster Beverage Corp. (a) |
83,300 |
4,930 |
|
|
PepsiCo, Inc. |
178,300 |
15,059 |
|
|
Common Stocks - continued |
|||
|
Shares |
Value (000s) |
||
|
CONSUMER STAPLES - continued |
|||
|
Beverages - continued |
|||
|
SABMiller PLC |
92,200 |
$ 4,757 |
|
|
The Coca-Cola Co. |
640,800 |
25,754 |
|
|
|
50,500 |
||
|
Food & Staples Retailing - 3.2% |
|||
|
Costco Wholesale Corp. |
249,300 |
31,270 |
|
|
CVS Caremark Corp. |
360,000 |
24,106 |
|
|
Fresh Market, Inc. (a) |
56,433 |
2,297 |
|
|
Wal-Mart Stores, Inc. |
233,480 |
18,914 |
|
|
Walgreen Co. |
298,500 |
17,671 |
|
|
Whole Foods Market, Inc. |
204,100 |
11,552 |
|
|
|
105,810 |
||
|
Food Products - 1.8% |
|||
|
Bunge Ltd. |
63,200 |
5,064 |
|
|
Green Mountain Coffee Roasters, Inc. (d) |
628,900 |
42,375 |
|
|
Mead Johnson Nutrition Co. Class A |
99,100 |
8,375 |
|
|
Mondelez International, Inc. |
125,000 |
4,191 |
|
|
|
60,005 |
||
|
Household Products - 0.8% |
|||
|
Procter & Gamble Co. |
198,200 |
16,692 |
|
|
Svenska Cellulosa AB (SCA) (B Shares) |
309,500 |
9,036 |
|
|
|
25,728 |
||
|
Personal Products - 0.4% |
|||
|
Avon Products, Inc. |
100,242 |
1,787 |
|
|
Herbalife Ltd. |
177,900 |
12,396 |
|
|
|
14,183 |
||
|
Tobacco - 2.1% |
|||
|
Altria Group, Inc. |
808,500 |
29,898 |
|
|
Japan Tobacco, Inc. |
34,800 |
1,175 |
|
|
Lorillard, Inc. |
179,800 |
9,229 |
|
|
Philip Morris International, Inc. |
319,250 |
27,309 |
|
|
|
67,611 |
||
|
TOTAL CONSUMER STAPLES |
323,837 |
||
|
ENERGY - 4.2% |
|||
|
Energy Equipment & Services - 1.5% |
|||
|
FMC Technologies, Inc. (a) |
95,840 |
4,610 |
|
|
Halliburton Co. |
118,300 |
6,232 |
|
|
Common Stocks - continued |
|||
|
Shares |
Value (000s) |
||
|
ENERGY - continued |
|||
|
Energy Equipment & Services - continued |
|||
|
National Oilwell Varco, Inc. |
83,988 |
$ 6,845 |
|
|
Schlumberger Ltd. |
351,900 |
31,115 |
|
|
|
48,802 |
||
|
Oil, Gas & Consumable Fuels - 2.7% |
|||
|
Anadarko Petroleum Corp. |
74,200 |
6,590 |
|
|
Cabot Oil & Gas Corp. |
158,400 |
5,457 |
|
|
Chesapeake Energy Corp. |
165,264 |
4,441 |
|
|
Concho Resources, Inc. (a) |
69,800 |
7,254 |
|
|
Continental Resources, Inc. (a) |
87,800 |
9,439 |
|
|
EOG Resources, Inc. |
20,600 |
3,399 |
|
|
Hess Corp. |
135,100 |
10,961 |
|
|
Noble Energy, Inc. |
95,300 |
6,694 |
|
|
Occidental Petroleum Corp. |
166,300 |
15,792 |
|
|
PDC Energy, Inc. (a) |
48,700 |
2,869 |
|
|
Peabody Energy Corp. |
118,100 |
2,149 |
|
|
Phillips 66 Co. |
36,700 |
2,555 |
|
|
Pioneer Natural Resources Co. |
27,400 |
4,870 |
|
|
Range Resources Corp. |
16,300 |
1,266 |
|
|
Valero Energy Corp. |
117,000 |
5,349 |
|
|
|
89,085 |
||
|
TOTAL ENERGY |
137,887 |
||
|
FINANCIALS - 4.0% |
|||
|
Capital Markets - 0.6% |
|||
|
BlackRock, Inc. Class A |
10,400 |
3,149 |
|
|
Charles Schwab Corp. |
389,100 |
9,525 |
|
|
Goldman Sachs Group, Inc. |
24,591 |
4,154 |
|
|
T. Rowe Price Group, Inc. |
30,300 |
2,438 |
|
|
|
19,266 |
||
|
Commercial Banks - 0.3% |
|||
|
Signature Bank (a) |
31,800 |
3,379 |
|
|
Wells Fargo & Co. |
125,000 |
5,503 |
|
|
|
8,882 |
||
|
Consumer Finance - 2.1% |
|||
|
American Express Co. |
432,100 |
37,074 |
|
|
Discover Financial Services |
607,633 |
32,387 |
|
|
|
69,461 |
||
|
Common Stocks - continued |
|||
|
Shares |
Value (000s) |
||
|
FINANCIALS - continued |
|||
|
Diversified Financial Services - 0.8% |
|||
|
Bank of America Corp. |
297,800 |
$ 4,711 |
|
|
BM&F Bovespa SA |
765,958 |
3,800 |
|
|
Citigroup, Inc. |
105,700 |
5,594 |
|
|
CME Group, Inc. |
22,000 |
1,803 |
|
|
JPMorgan Chase & Co. |
200,900 |
11,495 |
|
|
|
27,403 |
||
|
Real Estate Investment Trusts - 0.1% |
|||
|
Simon Property Group, Inc. |
25,978 |
3,893 |
|
|
Real Estate Management & Development - 0.1% |
|||
|
The St. Joe Co. (a)(d) |
100,400 |
1,781 |
|
|
TOTAL FINANCIALS |
130,686 |
||
|
HEALTH CARE - 19.0% |
|||
|
Biotechnology - 15.3% |
|||
|
ACADIA Pharmaceuticals, Inc. (a) |
108,300 |
2,522 |
|
|
Agios Pharmaceuticals, Inc. |
38,217 |
671 |
|
|
Alexion Pharmaceuticals, Inc. (a) |
39,500 |
4,918 |
|
|
Alkermes PLC (a) |
1,241,000 |
50,112 |
|
|
Alnylam Pharmaceuticals, Inc. (a) |
128,800 |
7,883 |
|
|
Amarin Corp. PLC ADR (a)(d) |
265,000 |
482 |
|
|
Amgen, Inc. |
232,000 |
26,467 |
|
|
Biogen Idec, Inc. (a) |
45,600 |
13,268 |
|
|
Bluebird Bio, Inc. (d) |
70,947 |
1,449 |
|
|
Celgene Corp. (a) |
55,235 |
8,935 |
|
|
Celldex Therapeutics, Inc. (a) |
215,700 |
5,988 |
|
|
Cepheid, Inc. (a) |
136,353 |
6,193 |
|
|
Clovis Oncology, Inc. (a) |
16,500 |
995 |
|
|
Elan Corp. PLC sponsored ADR (a) |
286,800 |
5,185 |
|
|
Exelixis, Inc. (a)(d) |
2,397,011 |
13,975 |
|
|
Gilead Sciences, Inc. (a) |
516,100 |
38,609 |
|
|
ImmunoGen, Inc. (a)(d) |
1,369,351 |
19,897 |
|
|
Immunomedics, Inc. (a)(d) |
1,348,687 |
5,826 |
|
|
Insmed, Inc. (a) |
330,600 |
5,356 |
|
|
InterMune, Inc. (a) |
110,400 |
1,527 |
|
|
Intrexon Corp. |
10,100 |
231 |
|
|
Ironwood Pharmaceuticals, Inc. Class A (a) |
227,500 |
2,598 |
|
|
Isis Pharmaceuticals, Inc. (a)(d) |
1,259,953 |
48,836 |
|
|
Lexicon Pharmaceuticals, Inc. (a) |
8,418,904 |
20,205 |
|
|
Merrimack Pharmaceuticals, Inc. (a)(d) |
591,500 |
2,331 |
|
|
Common Stocks - continued |
|||
|
Shares |
Value (000s) |
||
|
HEALTH CARE - continued |
|||
|
Biotechnology - continued |
|||
|
Metabolix, Inc. (a) |
246,795 |
$ 276 |
|
|
NPS Pharmaceuticals, Inc. (a) |
484,500 |
12,796 |
|
|
Prothena Corp. PLC (a) |
117,602 |
3,320 |
|
|
Receptos, Inc. |
87,600 |
2,027 |
|
|
Regeneron Pharmaceuticals, Inc. (a) |
332,600 |
97,738 |
|
|
Regulus Therapeutics, Inc. (a) |
295,138 |
1,856 |
|
|
Rigel Pharmaceuticals, Inc. (a) |
690,248 |
1,836 |
|
|
Seattle Genetics, Inc. (a)(d) |
1,665,767 |
68,446 |
|
|
Transition Therapeutics, Inc. (a) |
1,007,397 |
5,823 |
|
|
Vertex Pharmaceuticals, Inc. (a) |
68,690 |
4,768 |
|
|
XOMA Corp. (a) |
1,110,100 |
5,306 |
|
|
|
498,651 |
||
|
Health Care Equipment & Supplies - 0.7% |
|||
|
Abbott Laboratories |
89,300 |
3,410 |
|
|
Align Technology, Inc. (a) |
29,700 |
1,623 |
|
|
Baxter International, Inc. |
38,900 |
2,663 |
|
|
Cyberonics, Inc. (a) |
67,300 |
4,625 |
|
|
Steris Corp. |
201,100 |
9,279 |
|
|
|
21,600 |
||
|
Health Care Providers & Services - 0.8% |
|||
|
Accretive Health, Inc. (a) |
596,000 |
5,054 |
|
|
BioScrip, Inc. (a) |
792,300 |
5,396 |
|
|
Catamaran Corp. (a) |
30,500 |
1,392 |
|
|
Express Scripts Holding Co. (a) |
125,167 |
8,430 |
|
|
McKesson Corp. |
30,800 |
5,109 |
|
|
|
25,381 |
||
|
Health Care Technology - 0.3% |
|||
|
athenahealth, Inc. (a) |
80,800 |
10,599 |
|
|
Veeva Systems, Inc. Class A |
2,900 |
117 |
|
|
|
10,716 |
||
|
Life Sciences Tools & Services - 0.2% |
|||
|
Illumina, Inc. (a)(d) |
86,000 |
8,428 |
|
|
Pharmaceuticals - 1.7% |
|||
|
AbbVie, Inc. |
156,200 |
7,568 |
|
|
Actavis PLC (a) |
44,500 |
7,257 |
|
|
Allergan, Inc. |
84,600 |
8,210 |
|
|
Auxilium Pharmaceuticals, Inc. (a) |
226,700 |
4,627 |
|
|
Bristol-Myers Squibb Co. |
239,700 |
12,316 |
|
|
Common Stocks - continued |
|||
|
Shares |
Value (000s) |
||
|
HEALTH CARE - continued |
|||
|
Pharmaceuticals - continued |
|||
|
Hospira, Inc. (a) |
57,200 |
$ 2,249 |
|
|
Johnson & Johnson |
37,800 |
3,578 |
|
|
Questcor Pharmaceuticals, Inc. (d) |
169,300 |
9,821 |
|
|
|
55,626 |
||
|
TOTAL HEALTH CARE |
620,402 |
||
|
INDUSTRIALS - 7.0% |
|||
|
Aerospace & Defense - 0.9% |
|||
|
Honeywell International, Inc. |
125,800 |
11,135 |
|
|
The Boeing Co. |
132,500 |
17,788 |
|
|
|
28,923 |
||
|
Air Freight & Logistics - 0.9% |
|||
|
FedEx Corp. |
64,100 |
8,891 |
|
|
United Parcel Service, Inc. Class B |
210,400 |
21,541 |
|
|
|
30,432 |
||
|
Airlines - 1.5% |
|||
|
Delta Air Lines, Inc. |
157,500 |
4,564 |
|
|
Southwest Airlines Co. |
528,000 |
9,816 |
|
|
Spirit Airlines, Inc. (a) |
330,700 |
15,169 |
|
|
United Continental Holdings, Inc. (a) |
475,800 |
18,675 |
|
|
|
48,224 |
||
|
Construction & Engineering - 0.1% |
|||
|
Quanta Services, Inc. (a) |
97,859 |
2,898 |
|
|
Electrical Equipment - 0.2% |
|||
|
Roper Industries, Inc. |
38,800 |
5,032 |
|
|
Industrial Conglomerates - 1.1% |
|||
|
3M Co. |
69,100 |
9,226 |
|
|
Danaher Corp. |
282,200 |
21,109 |
|
|
General Electric Co. |
263,800 |
7,033 |
|
|
|
37,368 |
||
|
Machinery - 0.4% |
|||
|
Caterpillar, Inc. |
81,800 |
6,920 |
|
|
Cummins, Inc. |
29,400 |
3,891 |
|
|
ITT Corp. |
24,100 |
984 |
|
|
Xylem, Inc. |
63,000 |
2,177 |
|
|
|
13,972 |
||
|
Road & Rail - 1.9% |
|||
|
CSX Corp. |
324,100 |
8,838 |
|
|
Common Stocks - continued |
|||
|
Shares |
Value (000s) |
||
|
INDUSTRIALS - continued |
|||
|
Road & Rail - continued |
|||
|
Hertz Global Holdings, Inc. (a) |
643,500 |
$ 15,611 |
|
|
J.B. Hunt Transport Services, Inc. |
35,000 |
2,632 |
|
|
Kansas City Southern |
10,800 |
1,307 |
|
|
Union Pacific Corp. |
199,400 |
32,311 |
|
|
|
60,699 |
||
|
TOTAL INDUSTRIALS |
227,548 |
||
|
INFORMATION TECHNOLOGY - 32.8% |
|||
|
Communications Equipment - 1.9% |
|||
|
Infinera Corp. (a)(d) |
1,483,881 |
13,800 |
|
|
QUALCOMM, Inc. |
582,565 |
42,865 |
|
|
Riverbed Technology, Inc. (a) |
115,800 |
2,003 |
|
|
ViaSat, Inc. (a) |
49,600 |
2,984 |
|
|
|
61,652 |
||
|
Computers & Peripherals - 4.5% |
|||
|
3D Systems Corp. (a)(d) |
35,700 |
2,683 |
|
|
Apple, Inc. |
243,658 |
135,491 |
|
|
Fusion-io, Inc. (a)(d) |
618,532 |
6,210 |
|
|
SanDisk Corp. |
49,200 |
3,353 |
|
|
|
147,737 |
||
|
Electronic Equipment & Components - 0.1% |
|||
|
IPG Photonics Corp. (d) |
44,600 |
3,234 |
|
|
Internet Software & Services - 9.5% |
|||
|
Akamai Technologies, Inc. (a) |
31,400 |
1,404 |
|
|
Angie's List, Inc. (a) |
238,600 |
3,107 |
|
|
Benefitfocus, Inc. |
4,200 |
203 |
|
|
Cornerstone OnDemand, Inc. (a) |
140,000 |
7,059 |
|
|
eBay, Inc. (a) |
577,300 |
29,165 |
|
|
Facebook, Inc. Class A (a) |
1,460,641 |
68,665 |
|
|
Google, Inc. Class A (a) |
146,565 |
155,304 |
|
|
LinkedIn Corp. (a) |
18,800 |
4,212 |
|
|
Qihoo 360 Technology Co. Ltd. ADR (a)(d) |
108,700 |
8,861 |
|
|
Rackspace Hosting, Inc. (a) |
133,802 |
5,113 |
|
|
Rocket Fuel, Inc. (d) |
1,200 |
57 |
|
|
Tencent Holdings Ltd. |
150,200 |
8,687 |
|
|
Trulia, Inc. (a) |
89,500 |
3,073 |
|
|
Twitter, Inc. |
24,600 |
1,023 |
|
|
Common Stocks - continued |
|||
|
Shares |
Value (000s) |
||
|
INFORMATION TECHNOLOGY - continued |
|||
|
Internet Software & Services - continued |
|||
|
Web.com Group, Inc. (a) |
469,200 |
$ 13,396 |
|
|
Wix.com Ltd. (a) |
34,700 |
711 |
|
|
|
310,040 |
||
|
IT Services - 3.7% |
|||
|
Cognizant Technology Solutions Corp. Class A (a) |
127,216 |
11,944 |
|
|
IBM Corp. |
117,900 |
21,184 |
|
|
MasterCard, Inc. Class A |
52,200 |
39,714 |
|
|
Visa, Inc. Class A |
240,400 |
48,912 |
|
|
|
121,754 |
||
|
Semiconductors & Semiconductor Equipment - 5.2% |
|||
|
Applied Materials, Inc. |
211,300 |
3,655 |
|
|
Applied Micro Circuits Corp. (a) |
1,394,600 |
17,502 |
|
|
Broadcom Corp. Class A |
152,300 |
4,065 |
|
|
Cavium, Inc. (a) |
74,300 |
2,690 |
|
|
Cree, Inc. (a) |
737,800 |
41,169 |
|
|
Cypress Semiconductor Corp. |
1,344,866 |
13,032 |
|
|
Intel Corp. |
101,900 |
2,429 |
|
|
Mellanox Technologies Ltd. (a)(d) |
198,600 |
7,733 |
|
|
Nanoco Group PLC (a)(d) |
483,200 |
1,168 |
|
|
NVIDIA Corp. |
2,409,030 |
37,581 |
|
|
Rambus, Inc. (a) |
1,255,300 |
10,783 |
|
|
Silicon Laboratories, Inc. (a) |
671,400 |
26,218 |
|
|
Xilinx, Inc. |
60,800 |
2,701 |
|
|
|
170,726 |
||
|
Software - 7.9% |
|||
|
Adobe Systems, Inc. (a) |
81,800 |
4,645 |
|
|
Citrix Systems, Inc. (a) |
35,500 |
2,106 |
|
|
Concur Technologies, Inc. (a) |
66,400 |
6,447 |
|
|
FireEye, Inc. |
4,885 |
187 |
|
|
Interactive Intelligence Group, Inc. (a) |
78,700 |
5,119 |
|
|
Intuit, Inc. |
72,200 |
5,359 |
|
|
Microsoft Corp. |
902,900 |
34,428 |
|
|
NetSuite, Inc. (a) |
133,800 |
12,856 |
|
|
Oracle Corp. |
338,200 |
11,935 |
|
|
QLIK Technologies, Inc. (a) |
237,774 |
5,963 |
|
|
Red Hat, Inc. (a) |
534,930 |
25,061 |
|
|
salesforce.com, Inc. (a) |
2,256,400 |
117,536 |
|
|
ServiceNow, Inc. (a) |
125,400 |
6,660 |
|
|
SolarWinds, Inc. (a) |
94,700 |
3,167 |
|
|
Solera Holdings, Inc. |
13,500 |
901 |
|
|
Common Stocks - continued |
|||
|
Shares |
Value (000s) |
||
|
INFORMATION TECHNOLOGY - continued |
|||
|
Software - continued |
|||
|
Splunk, Inc. (a) |
41,100 |
$ 2,966 |
|
|
TiVo, Inc. (a) |
262,000 |
3,361 |
|
|
VMware, Inc. Class A (a) |
28,700 |
2,314 |
|
|
Workday, Inc. Class A (a) |
62,300 |
5,130 |
|
|
|
256,141 |
||
|
TOTAL INFORMATION TECHNOLOGY |
1,071,284 |
||
|
MATERIALS - 1.9% |
|||
|
Chemicals - 1.6% |
|||
|
E.I. du Pont de Nemours & Co. |
101,600 |
6,236 |
|
|
Eastman Chemical Co. |
31,200 |
2,403 |
|
|
Monsanto Co. |
325,500 |
36,889 |
|
|
The Mosaic Co. |
99,500 |
4,766 |
|
|
|
50,294 |
||
|
Metals & Mining - 0.3% |
|||
|
Nucor Corp. |
76,800 |
3,921 |
|
|
U.S. Silica Holdings, Inc. |
190,500 |
6,574 |
|
|
|
10,495 |
||
|
TOTAL MATERIALS |
60,789 |
||
|
TELECOMMUNICATION SERVICES - 0.5% |
|||
|
Diversified Telecommunication Services - 0.3% |
|||
|
Verizon Communications, Inc. |
178,400 |
8,852 |
|
|
Wireless Telecommunication Services - 0.2% |
|||
|
RingCentral, Inc. |
5,000 |
79 |
|
|
Sprint Corp. (a) |
240,987 |
2,022 |
|
|
T-Mobile U.S., Inc. (a) |
183,700 |
4,778 |
|
|
|
6,879 |
||
|
TOTAL TELECOMMUNICATION SERVICES |
15,731 |
||
|
TOTAL COMMON STOCKS (Cost $2,127,984) |
|
||
|
Preferred Stocks - 0.3% |
|||
|
Shares |
Value (000s) |
||
|
Convertible Preferred Stocks - 0.3% |
|||
|
HEALTH CARE - 0.0% |
|||
|
Pharmaceuticals - 0.0% |
|||
|
aTyr Pharma, Inc. 8.00% (e) |
638,618 |
$ 1,615 |
|
|
INFORMATION TECHNOLOGY - 0.3% |
|||
|
Software - 0.3% |
|||
|
MongoDB, Inc. Series F, 8.00% (e) |
515,124 |
8,615 |
|
|
TOTAL CONVERTIBLE PREFERRED STOCKS |
10,230 |
||
|
Nonconvertible Preferred Stocks - 0.0% |
|||
|
HEALTH CARE - 0.0% |
|||
|
Pharmaceuticals - 0.0% |
|||
|
Equilibrate Asia Therapeutics Series D (e) |
676,657 |
11 |
|
|
Equilibrate Worldwide Therapeutics Series D (e) |
676,657 |
27 |
|
|
Neuropathic Worldwide Therapeutics Series D (e) |
676,657 |
5 |
|
|
Oculus Worldwide Therapeutics Series D (e) |
676,657 |
8 |
|
|
Orchestrate U.S. Therapeutics, Inc. Series D (e) |
676,657 |
12 |
|
|
Orchestrate Worldwide Therapeutics Series D (e) |
676,657 |
21 |
|
|
|
84 |
||
|
TOTAL PREFERRED STOCKS (Cost $10,314) |
|
||
|
Money Market Funds - 6.7% |
|||
|
|
|
|
|
|
Fidelity Cash Central Fund, 0.10% (b) |
72,069,932 |
72,070 |
|
|
Fidelity Securities Lending Cash Central Fund, 0.10% (b)(c) |
148,019,702 |
148,020 |
|
|
TOTAL MONEY MARKET FUNDS (Cost $220,090) |
|
||
|
TOTAL INVESTMENT PORTFOLIO - 104.5% (Cost $2,358,388) |
3,411,239 |
||
|
NET OTHER ASSETS (LIABILITIES) - (4.5)% |
(147,143) |
||
|
NET ASSETS - 100% |
$ 3,264,096 |
||
|
Legend |
|
(a) Non-income producing |
|
(b) Affiliated fund that is generally available only to investment companies and other accounts managed by Fidelity Investments. The rate quoted is the annualized seven-day yield of the fund at period end. A complete unaudited listing of the fund's holdings as of its most recent quarter end is available upon request. In addition, each Fidelity Central Fund's financial statements, which are not covered by the Fund's Report of Independent Registered Public Accounting Firm, are available on the SEC's website or upon request. |
|
(c) Investment made with cash collateral received from securities on loan. |
|
(d) Security or a portion of the security is on loan at period end. |
|
(e) Restricted securities - Investment in securities not registered under the Securities Act of 1933 (excluding 144A issues). At the end of the period, the value of restricted securities (excluding 144A issues) amounted to $10,314,000 or 0.3% of net assets. |
|
Additional information on each restricted holding is as follows: |
|
Security |
Acquisition Date |
Acquisition Cost (000s) |
|
aTyr Pharma, Inc. 8.00% |
4/8/13 |
$ 1,615 |
|
Equilibrate Asia Therapeutics Series D |
5/17/13 |
$ 11 |
|
Equilibrate Worldwide Therapeutics Series D |
5/17/13 |
$ 27 |
|
MongoDB, Inc. Series F, 8.00% |
10/2/13 |
$ 8,615 |
|
Neuropathic Worldwide Therapeutics Series D |
5/17/13 |
$ 5 |
|
Oculus Worldwide Therapeutics Series D |
5/17/13 |
$ 8 |
|
Orchestrate U.S. Therapeutics, Inc. Series D |
5/17/13 |
$ 12 |
|
Orchestrate Worldwide Therapeutics Series D |
5/17/13 |
$ 21 |
|
Affiliated Central Funds |
|
Information regarding fiscal year to date income earned by the Fund from investments in Fidelity Central Funds is as follows: |
|
Fund |
Income earned |
|
Fidelity Cash Central Fund |
$ 40 |
|
Fidelity Securities Lending Cash Central Fund |
1,023 |
|
Total |
$ 1,063 |
|
Other Information |
|
The following is a summary of the inputs used, as of November 30, 2013, involving the Fund's assets and liabilities carried at fair value. The inputs or methodology used for valuing securities may not be an indication of the risk associated with investing in those securities. For more information on valuation inputs, and their aggregation into the levels used in the table below, please refer to the Investment Valuation section in the accompanying Notes to Financial Statements. |
|
Valuation Inputs at Reporting Date: |
||||
|
Description |
Total |
Level 1 |
Level 2 |
Level 3 |
|
Investments in Securities: |
||||
|
Equities: |
||||
|
Consumer Discretionary |
$ 592,671 |
$ 592,671 |
$ - |
$ - |
|
Consumer Staples |
323,837 |
323,837 |
- |
- |
|
Energy |
137,887 |
137,887 |
- |
- |
|
Financials |
130,686 |
130,686 |
- |
- |
|
Health Care |
622,101 |
620,402 |
- |
1,699 |
|
Industrials |
227,548 |
227,548 |
- |
- |
|
Information Technology |
1,079,899 |
1,071,284 |
- |
8,615 |
|
Materials |
60,789 |
60,789 |
- |
- |
|
Telecommunication Services |
15,731 |
15,731 |
- |
- |
|
Money Market Funds |
220,090 |
220,090 |
- |
- |
|
Total Investments in Securities: |
$ 3,411,239 |
$ 3,400,925 |
$ - |
$ 10,314 |
See accompanying notes which are an integral part of the financial statements.
Annual Report
Financial Statements
Statement of Assets and Liabilities
|
Amounts in thousands (except per-share amounts) |
November 30, 2013 |
|
|
|
|
|
|
Assets |
|
|
|
Investment in securities, at value (including securities loaned of $144,819) - See accompanying schedule: Unaffiliated issuers (cost $2,138,298) |
$ 3,191,149 |
|
|
Fidelity Central Funds (cost $220,090) |
220,090 |
|
|
Total Investments (cost $2,358,388) |
|
$ 3,411,239 |
|
Cash |
|
2,733 |
|
Foreign currency held at value (cost $53) |
|
53 |
|
Receivable for fund shares sold |
|
3,876 |
|
Dividends receivable |
|
2,437 |
|
Distributions receivable from Fidelity Central Funds |
|
99 |
|
Prepaid expenses |
|
9 |
|
Other receivables |
|
155 |
|
Total assets |
|
3,420,601 |
|
|
|
|
|
Liabilities |
|
|
|
Payable for investments purchased |
$ 3,360 |
|
|
Payable for fund shares redeemed |
1,663 |
|
|
Accrued management fee |
1,809 |
|
|
Distribution and service plan fees payable |
833 |
|
|
Other affiliated payables |
607 |
|
|
Other payables and accrued expenses |
213 |
|
|
Collateral on securities loaned, at value |
148,020 |
|
|
Total liabilities |
|
156,505 |
|
|
|
|
|
Net Assets |
|
$ 3,264,096 |
|
Net Assets consist of: |
|
|
|
Paid in capital |
|
$ 2,467,371 |
|
Accumulated net investment loss |
|
(5,796) |
|
Accumulated undistributed net realized gain (loss) on investments and foreign currency transactions |
|
(250,330) |
|
Net unrealized appreciation (depreciation) on investments and assets and liabilities in foreign currencies |
|
1,052,851 |
|
Net Assets |
|
$ 3,264,096 |
See accompanying notes which are an integral part of the financial statements.
Annual Report
Statement of Assets and Liabilities - continued
|
Amounts in thousands (except per-share amounts) |
November 30, 2013 |
|
|
|
|
|
|
Calculation of Maximum Offering Price Class A: |
|
$ 54.89 |
|
|
|
|
|
Maximum offering price per share (100/94.25 of $54.89) |
|
$ 58.24 |
|
Class T: |
|
$ 55.04 |
|
|
|
|
|
Maximum offering price per share (100/96.50 of $55.04) |
|
$ 57.04 |
|
Class B: |
|
$ 50.87 |
|
|
|
|
|
Class C: |
|
$ 51.17 |
|
|
|
|
|
Institutional Class: |
|
$ 57.18 |
|
|
|
|
|
Class Z: |
|
$ 57.20 |
A Redemption price per share is equal to net asset value less any applicable contingent deferred sales charge.
See accompanying notes which are an integral part of the financial statements.
Annual Report
Financial Statements - continued
Statement of Operations
|
Amounts in thousands |
Year ended November 30, 2013 |
|
|
|
|
|
|
Investment Income |
|
|
|
Dividends |
|
$ 25,690 |
|
Income from Fidelity Central Funds |
|
1,063 |
|
Total income |
|
26,753 |
|
|
|
|
|
Expenses |
|
|
|
Management fee |
$ 14,417 |
|
|
Performance adjustment |
3,537 |
|
|
Transfer agent fees |
5,525 |
|
|
Distribution and service plan fees |
8,757 |
|
|
Accounting and security lending fees |
793 |
|
|
Custodian fees and expenses |
49 |
|
|
Independent trustees' compensation |
14 |
|
|
Appreciation in deferred trustee compensation account |
1 |
|
|
Registration fees |
193 |
|
|
Audit |
63 |
|
|
Legal |
10 |
|
|
Miscellaneous |
21 |
|
|
Total expenses before reductions |
33,380 |
|
|
Expense reductions |
(95) |
33,285 |
|
Net investment income (loss) |
|
(6,532) |
|
Realized and Unrealized Gain (Loss) Net realized gain (loss) on: |
|
|
|
Investment securities: |
|
|
|
Unaffiliated issuers |
167,078 |
|
|
Foreign currency transactions |
5 |
|
|
Total net realized gain (loss) |
|
167,083 |
|
Change in net unrealized appreciation (depreciation) on: Investment securities |
587,054 |
|
|
Assets and liabilities in foreign currencies |
1 |
|
|
Total change in net unrealized appreciation (depreciation) |
|
587,055 |
|
Net gain (loss) |
|
754,138 |
|
Net increase (decrease) in net assets resulting from operations |
|
$ 747,606 |
See accompanying notes which are an integral part of the financial statements.
Annual Report
Statement of Changes in Net Assets
|
Amounts in thousands |
Year ended |
Year ended |
|
Increase (Decrease) in Net Assets |
|
|
|
Operations |
|
|
|
Net investment income (loss) |
$ (6,532) |
$ (7,218) |
|
Net realized gain (loss) |
167,083 |
165,968 |
|
Change in net unrealized appreciation (depreciation) |
587,055 |
117,910 |
|
Net increase (decrease) in net assets resulting |
747,606 |
276,660 |
|
Share transactions - net increase (decrease) |
411,715 |
182,997 |
|
Total increase (decrease) in net assets |
1,159,321 |
459,657 |
|
|
|
|
|
Net Assets |
|
|
|
Beginning of period |
2,104,775 |
1,645,118 |
|
End of period (including accumulated net investment loss of $5,796 and accumulated net investment loss of $6,762, respectively) |
$ 3,264,096 |
$ 2,104,775 |
See accompanying notes which are an integral part of the financial statements.
Annual Report
Financial Highlights - Class A
|
Years ended November 30, |
2013 |
2012 |
2011 |
2010 |
2009 |
|
Selected Per-Share Data |
|
|
|
|
|
|
Net asset value, beginning of period |
$ 41.34 |
$ 35.39 |
$ 32.30 |
$ 26.30 |
$ 18.92 |
|
Income from Investment Operations |
|
|
|
|
|
|
Net investment income (loss) C |
(.10) |
(.11) |
(.08) |
- H |
.10 |
|
Net realized and unrealized gain (loss) |
13.65 |
6.06 |
3.17 |
6.13 |
7.28 |
|
Total from investment operations |
13.55 |
5.95 |
3.09 |
6.13 |
7.38 |
|
Distributions from net investment income |
- |
- |
- |
(.11) |
- |
|
Distributions from net realized gain |
- |
- |
- |
(.02) |
- |
|
Total distributions |
- |
- |
- |
(.13) |
- |
|
Net asset value, end of period |
$ 54.89 |
$ 41.34 |
$ 35.39 |
$ 32.30 |
$ 26.30 |
|
Total Return A, B |
32.78% |
16.81% |
9.57% |
23.42% |
39.01% |
|
Ratios to Average Net Assets D, G |
|
|
|
|
|
|
Expenses before reductions |
1.23% |
1.30% |
1.08% |
.90% |
.80% |
|
Expenses net of fee waivers, if any |
1.23% |
1.29% |
1.08% |
.90% |
.80% |
|
Expenses net of all reductions |
1.23% |
1.29% |
1.07% |
.90% |
.80% |
|
Net investment income (loss) |
(.20)% |
(.29)% |
(.23)% |
-% F |
.45% |
|
Supplemental Data |
|
|
|
|
|
|
Net assets, end of period (in millions) |
$ 555 |
$ 359 |
$ 267 |
$ 255 |
$ 236 |
|
Portfolio turnover rate E |
17% |
34% |
31% |
35% |
114% |
A Total returns would have been lower if certain expenses had not been reduced during the applicable periods shown.
B Total returns do not include the effect of the sales charges.
C Calculated based on average shares outstanding during the period.
D Fees and expenses of any underlying Fidelity Central Funds are not included in the Fund's expense ratio. The Fund indirectly bears its proportionate share of the expenses of any underlying Fidelity Central Funds.
E Amount does not include the portfolio activity of any underlying Fidelity Central Funds.
F Amount represents less than .01%.
G Expense ratios reflect operating expenses of the class. Expenses before reductions do not reflect amounts reimbursed by the investment adviser or reductions from brokerage service arrangements or reductions from other expense offset arrangements and do not represent the amount paid by the class during periods when reimbursements or reductions occur. Expenses net of fee waivers reflect expenses after reimbursement by the investment adviser but prior to reductions from brokerage service arrangements or other expense offset arrangements. Expenses net of all reductions represent the net expenses paid by the class.
H Amount represents less than $.01 per share.
See accompanying notes which are an integral part of the financial statements.
Annual Report
Financial Highlights - Class T
|
Years ended November 30, |
2013 |
2012 |
2011 |
2010 |
2009 |
|
Selected Per-Share Data |
|
|
|
|
|
|
Net asset value, beginning of period |
$ 41.54 |
$ 35.62 |
$ 32.58 |
$ 26.52 |
$ 19.12 |
|
Income from Investment Operations |
|
|
|
|
|
|
Net investment income (loss) C |
(.19) |
(.19) |
(.15) |
(.06) |
.05 |
|
Net realized and unrealized gain (loss) |
13.69 |
6.11 |
3.19 |
6.19 |
7.35 |
|
Total from investment operations |
13.50 |
5.92 |
3.04 |
6.13 |
7.40 |
|
Distributions from net investment income |
- |
- |
- |
(.05) |
- |
|
Distributions from net realized gain |
- |
- |
- |
(.02) |
- |
|
Total distributions |
- |
- |
- |
(.07) |
- |
|
Net asset value, end of period |
$ 55.04 |
$ 41.54 |
$ 35.62 |
$ 32.58 |
$ 26.52 |
|
Total Return A, B |
32.50% |
16.62% |
9.33% |
23.18% |
38.70% |
|
Ratios to Average Net Assets D, F |
|
|
|
|
|
|
Expenses before reductions |
1.43% |
1.48% |
1.25% |
1.10% |
1.03% |
|
Expenses net of fee waivers, if any |
1.43% |
1.48% |
1.25% |
1.10% |
1.03% |
|
Expenses net of all reductions |
1.43% |
1.48% |
1.25% |
1.09% |
1.02% |
|
Net investment income (loss) |
(.40)% |
(.48)% |
(.40)% |
(.20)% |
.23% |
|
Supplemental Data |
|
|
|
|
|
|
Net assets, end of period (in millions) |
$ 1,426 |
$ 1,187 |
$ 1,102 |
$ 1,126 |
$ 1,051 |
|
Portfolio turnover rate E |
17% |
34% |
31% |
35% |
114% |
A Total returns would have been lower if certain expenses had not been reduced during the applicable periods shown.
B Total returns do not include the effect of the sales charges.
C Calculated based on average shares outstanding during the period.
D Fees and expenses of any underlying Fidelity Central Funds are not included in the Fund's expense ratio. The Fund indirectly bears its proportionate share of the expenses of any underlying Fidelity Central Funds.
E Amount does not include the portfolio activity of any underlying Fidelity Central Funds.
F Expense ratios reflect operating expenses of the class. Expenses before reductions do not reflect amounts reimbursed by the investment adviser or reductions from brokerage service arrangements or reductions from other expense offset arrangements and do not represent the amount paid by the class during periods when reimbursements or reductions occur. Expenses net of fee waivers reflect expenses after reimbursement by the investment adviser but prior to reductions from brokerage service arrangements or other expense offset arrangements. Expenses net of all reductions represent the net expenses paid by the class.
See accompanying notes which are an integral part of the financial statements.
Annual Report
Financial Highlights - Class B
|
Years ended November 30, |
2013 |
2012 |
2011 |
2010 |
2009 |
|
Selected Per-Share Data |
|
|
|
|
|
|
Net asset value, beginning of period |
$ 38.62 |
$ 33.31 |
$ 30.64 |
$ 25.01 |
$ 18.13 |
|
Income from Investment Operations |
|
|
|
|
|
|
Net investment income (loss) C |
(.44) |
(.39) |
(.33) |
(.21) |
(.06) |
|
Net realized and unrealized gain (loss) |
12.69 |
5.70 |
3.00 |
5.84 |
6.94 |
|
Total from investment operations |
12.25 |
5.31 |
2.67 |
5.63 |
6.88 |
|
Net asset value, end of period |
$ 50.87 |
$ 38.62 |
$ 33.31 |
$ 30.64 |
$ 25.01 |
|
Total Return A, B |
31.72% |
15.94% |
8.71% |
22.51% |
37.95% |
|
Ratios to Average Net Assets D, F |
|
|
|
|
|
|
Expenses before reductions |
2.03% |
2.07% |
1.83% |
1.66% |
1.56% |
|
Expenses net of fee waivers, if any |
2.03% |
2.05% |
1.83% |
1.66% |
1.56% |
|
Expenses net of all reductions |
2.03% |
2.05% |
1.83% |
1.65% |
1.55% |
|
Net investment income (loss) |
(1.00)% |
(1.05)% |
(.98)% |
(.76)% |
(.30)% |
|
Supplemental Data |
|
|
|
|
|
|
Net assets, end of period (in millions) |
$ 12 |
$ 13 |
$ 14 |
$ 18 |
$ 21 |
|
Portfolio turnover rate E |
17% |
34% |
31% |
35% |
114% |
A Total returns would have been lower if certain expenses had not been reduced during the applicable periods shown.
B Total returns do not include the effect of the contingent deferred sales charge.
C Calculated based on average shares outstanding during the period.
D Fees and expenses of any underlying Fidelity Central Funds are not included in the Fund's expense ratio. The Fund indirectly bears its proportionate share of the expenses of any underlying Fidelity Central Funds.
E Amount does not include the portfolio activity of any underlying Fidelity Central Funds.
F Expense ratios reflect operating expenses of the class. Expenses before reductions do not reflect amounts reimbursed by the investment adviser or reductions from brokerage service arrangements or reductions from other expense offset arrangements and do not represent the amount paid by the class during periods when reimbursements or reductions occur. Expenses net of fee waivers reflect expenses after reimbursement by the investment adviser but prior to reductions from brokerage service arrangements or other expense offset arrangements. Expenses net of all reductions represent the net expenses paid by the class.
See accompanying notes which are an integral part of the financial statements.
Annual Report
Financial Highlights - Class C
|
Years ended November 30, |
2013 |
2012 |
2011 |
2010 |
2009 |
|
Selected Per-Share Data |
|
|
|
|
|
|
Net asset value, beginning of period |
$ 38.83 |
$ 33.48 |
$ 30.79 |
$ 25.14 |
$ 18.22 |
|
Income from Investment Operations |
|
|
|
|
|
|
Net investment income (loss) C |
(.42) |
(.38) |
(.33) |
(.21) |
(.06) |
|
Net realized and unrealized gain (loss) |
12.76 |
5.73 |
3.02 |
5.86 |
6.98 |
|
Total from investment operations |
12.34 |
5.35 |
2.69 |
5.65 |
6.92 |
|
Net asset value, end of period |
$ 51.17 |
$ 38.83 |
$ 33.48 |
$ 30.79 |
$ 25.14 |
|
Total Return A, B |
31.78% |
15.98% |
8.74% |
22.47% |
37.98% |
|
Ratios to Average Net Assets D, F |
|
|
|
|
|
|
Expenses before reductions |
1.96% |
2.04% |
1.82% |
1.65% |
1.56% |
|
Expenses net of fee waivers, if any |
1.96% |
2.03% |
1.82% |
1.65% |
1.56% |
|
Expenses net of all reductions |
1.96% |
2.02% |
1.82% |
1.65% |
1.55% |
|
Net investment income (loss) |
(.93)% |
(1.02)% |
(.97)% |
(.75)% |
(.30)% |
|
Supplemental Data |
|
|
|
|
|
|
Net assets, end of period (in millions) |
$ 159 |
$ 71 |
$ 47 |
$ 41 |
$ 37 |
|
Portfolio turnover rate E |
17% |
34% |
31% |
35% |
114% |
A Total returns would have been lower if certain expenses had not been reduced during the applicable periods shown.
B Total returns do not include the effect of the contingent deferred sales charge.
C Calculated based on average shares outstanding during the period.
D Fees and expenses of any underlying Fidelity Central Funds are not included in the Fund's expense ratio. The Fund indirectly bears its proportionate share of the expenses of any underlying Fidelity Central Funds.
E Amount does not include the portfolio activity of any underlying Fidelity Central Funds.
F Expense ratios reflect operating expenses of the class. Expenses before reductions do not reflect amounts reimbursed by the investment adviser or reductions from brokerage service arrangements or reductions from other expense offset arrangements and do not represent the amount paid by the class during periods when reimbursements or reductions occur. Expenses net of fee waivers reflect expenses after reimbursement by the investment adviser but prior to reductions from brokerage service arrangements or other expense offset arrangements. Expenses net of all reductions represent the net expenses paid by the class.
See accompanying notes which are an integral part of the financial statements.
Annual Report
Financial Highlights - Institutional Class
|
Years ended November 30, |
2013 |
2012 |
2011 |
2010 |
2009 |
|
Selected Per-Share Data |
|
|
|
|
|
|
Net asset value, beginning of period |
$ 42.94 |
$ 36.63 |
$ 33.33 |
$ 27.11 |
$ 19.43 |
|
Income from Investment Operations |
|
|
|
|
|
|
Net investment income (loss) B |
.05 |
.01 |
.05 |
.10 |
.17 |
|
Net realized and unrealized gain (loss) |
14.19 |
6.30 |
3.25 |
6.33 |
7.51 |
|
Total from investment operations |
14.24 |
6.31 |
3.30 |
6.43 |
7.68 |
|
Distributions from net investment income |
- |
- |
- |
(.19) |
- |
|
Distributions from net realized gain |
- |
- |
- |
(.02) |
- |
|
Total distributions |
- |
- |
- |
(.21) |
- |
|
Net asset value, end of period |
$ 57.18 |
$ 42.94 |
$ 36.63 |
$ 33.33 |
$ 27.11 |
|
Total Return A |
33.16% |
17.23% |
9.90% |
23.86% |
39.53% |
|
Ratios to Average Net Assets C, E |
|
|
|
|
|
|
Expenses before reductions |
.93% |
.97% |
.72% |
.57% |
.46% |
|
Expenses net of fee waivers, if any |
.93% |
.97% |
.72% |
.57% |
.46% |
|
Expenses net of all reductions |
.93% |
.97% |
.72% |
.56% |
.46% |
|
Net investment income (loss) |
.09% |
.04% |
.13% |
.33% |
.79% |
|
Supplemental Data |
|
|
|
|
|
|
Net assets, end of period (in millions) |
$ 1,112 |
$ 475 |
$ 215 |
$ 118 |
$ 26 |
|
Portfolio turnover rate D |
17% |
34% |
31% |
35% |
114% |
A Total returns would have been lower if certain expenses had not been reduced during the applicable periods shown.
B Calculated based on average shares outstanding during the period.
C Fees and expenses of any underlying Fidelity Central Funds are not included in the Fund's expense ratio. The Fund indirectly bears its proportionate share of the expenses of any underlying Fidelity Central Funds.
D Amount does not include the portfolio activity of any underlying Fidelity Central Funds.
E Expense ratios reflect operating expenses of the class. Expenses before reductions do not reflect amounts reimbursed by the investment adviser or reductions from brokerage service arrangements or reductions from other expense offset arrangements and do not represent the amount paid by the class during periods when reimbursements or reductions occur. Expenses net of fee waivers reflect expenses after reimbursement by the investment adviser but prior to reductions from brokerage service arrangements or other expense offset arrangements. Expenses net of all reductions represent the net expenses paid by the class.
See accompanying notes which are an integral part of the financial statements.
Annual Report
Financial Highlights - Class Z
|
Year ended November 30, |
2013 G |
|
Selected Per-Share Data |
|
|
Net asset value, beginning of period |
$ 53.30 |
|
Income from Investment Operations |
|
|
Net investment income (loss) D |
.02 |
|
Net realized and unrealized gain (loss) |
3.88 |
|
Total from investment operations |
3.90 |
|
Net asset value, end of period |
$ 57.20 |
|
Total Return B, C |
7.32% |
|
Ratios to Average Net Assets E, H |
|
|
Expenses before reductions |
.78% A |
|
Expenses net of fee waivers, if any |
.78% A |
|
Expenses net of all reductions |
.78% A |
|
Net investment income (loss) |
.14% A |
|
Supplemental Data |
|
|
Net assets, end of period (000 omitted) |
$ 107 |
|
Portfolio turnover rate F |
17% |
A Annualized
B Total returns for periods of less than one year are not annualized.
C Total returns would have been lower if certain expenses had not been reduced during the applicable periods shown.
D Calculated based on average shares outstanding during the period.
E Fees and expenses of any underlying Fidelity Central Funds are not included in the Fund's expense ratio. The Fund indirectly bears its proportionate share of the expenses of any underlying Fidelity Central Funds.
F Amount does not include the portfolio activity of any underlying Fidelity Central Funds.
G For the period August 13, 2013 (commencement of sale of shares) to November 30, 2013.
H Expense ratios reflect operating expenses of the class. Expenses before reductions do not reflect amounts reimbursed by the investment adviser or reductions from brokerage service arrangements or reductions from other expense offset arrangements and do not represent the amount paid by the class during periods when reimbursements or reductions occur. Expense ratios before reductions for start-up periods may not be representative of longer-term operating periods. Expenses net of fee waivers reflect expenses after reimbursement by the investment adviser but prior to reductions from brokerage service arrangements or other expense offset arrangements. Expenses net of all reductions represent the net expenses paid by the class.
See accompanying notes which are an integral part of the financial statements.
Annual Report
Notes to Financial Statements
For the period ended November 30, 2013
(Amounts in thousands except percentages)
1. Organization.
Fidelity Advisor Growth Opportunities Fund (the Fund) is a fund of Fidelity Advisor Series I (the Trust) and is authorized to issue an unlimited number of shares. The Trust is registered under the Investment Company Act of 1940, as amended (the 1940 Act), as an open-end management investment company organized as a Massachusetts business trust. The Fund commenced sale of Class Z shares on August 13, 2013. The Fund offers Class A, Class T, Class C, Institutional Class and Class Z shares, each of which, along with Class B shares, has equal rights as to assets and voting privileges. Class B shares are closed to new accounts and additional purchases, except for exchanges and reinvestments. Each class has exclusive voting rights with respect to matters that affect that class. Class B shares will automatically convert to Class A shares after a holding period of seven years from the initial date of purchase.
2. Investments in Fidelity Central Funds.
The Fund invests in Fidelity Central Funds, which are open-end investment companies generally available only to other investment companies and accounts managed by the investment adviser and its affiliates. The Fund's Schedule of Investments lists each of the Fidelity Central Funds held as of period end, if any, as an investment of the Fund, but does not include the underlying holdings of each Fidelity Central Fund. As an Investing Fund, the Fund indirectly bears its proportionate share of the expenses of the underlying Fidelity Central Funds.
The Money Market Central Funds seek preservation of capital and current income and are managed by Fidelity Investments Money Management, Inc. (FIMM), an affiliate of the investment adviser. Annualized expenses of the Money Market Central Funds as of their most recent shareholder report date are less than .01%.
A complete unaudited list of holdings for each Fidelity Central Fund is available upon request or at the Securities and Exchange Commission (the SEC) website at www.sec.gov. In addition, the financial statements of the Fidelity Central Funds, which are not covered by the Fund's Report of Independent Registered Public Accounting Firm, are available on the SEC website or upon request.
3. Significant Accounting Policies.
The financial statements have been prepared in conformity with accounting principles generally accepted in the United States of America (GAAP), which require management to make certain estimates and assumptions at the date of the financial statements. Actual results could differ from those estimates. Subsequent events, if any, through the date that the financial statements were issued have been evaluated in the preparation of
Annual Report
Notes to Financial Statements - continued
(Amounts in thousands except percentages)
3. Significant Accounting Policies - continued
the financial statements. The following summarizes the significant accounting policies of the Fund:
Investment Valuation. Investments are valued as of 4:00 p.m. Eastern time on the last calendar day of the period. In accordance with valuation policies and procedures approved by the Board of Trustees (the Board), the Fund attempts to obtain prices from one or more third party pricing vendors or brokers to value its investments. When current market prices, quotations or currency exchange rates are not readily available or reliable, investments will be fair valued in good faith by the Fidelity Management & Research Company (FMR) Fair Value Committee (the Committee), in accordance with procedures adopted by the Board. Factors used in determining fair value vary by investment type and may include market or investment specific events. The frequency with which these procedures are used cannot be predicted and they may be utilized to a significant extent. The Committee oversees the Fund's valuation policies and procedures and is responsible for approving and reporting to the Board all fair value determinations.
The Fund categorizes the inputs to valuation techniques used to value its investments into a disclosure hierarchy consisting of three levels as shown below:
Level 1 - quoted prices in active markets for identical investments
Level 2 - other significant observable inputs (including quoted prices for similar investments, interest rates, prepayment speeds, etc.)
Level 3 - unobservable inputs (including the Fund's own assumptions based on the best information available)
Valuation techniques used to value the Fund's investments by major category are as follows:
Equity securities, including restricted securities, for which market quotations are readily available, are valued at the last reported sale price or official closing price as reported by a third party pricing vendor on the primary market or exchange on which they are traded and are categorized as Level 1 in the hierarchy. In the event there were no sales during the day or closing prices are not available, securities are valued at the last quoted bid price or may be valued using the last available price and are generally categorized as Level 2 in the hierarchy. For foreign equity securities, when market or security specific events arise, comparisons to the valuation of American Depositary Receipts (ADRs), futures contracts, Exchange-Traded Funds (ETFs) and certain indexes as well as quoted prices for similar securities may be used and would be categorized as Level 2 in the hierarchy. Utilizing these techniques may result in transfers between Level 1 and Level 2. For equity securities, including restricted securities, where observable inputs are
Annual Report
3. Significant Accounting Policies - continued
Investment Valuation - continued
limited, assumptions about market activity and risk are used and these securities may be categorized as Level 3 in the hierarchy.
Investments in open-end mutual funds, including the Fidelity Central Funds, are valued at their closing net asset value (NAV) each business day and are categorized as Level 1 in the hierarchy.
Changes in valuation techniques may result in transfers in or out of an assigned level within the disclosure hierarchy. The aggregate value of investments by input level, as of November 30, 2013, is included at the end of the Fund's Schedule of Investments.
Foreign Currency. The Fund may use foreign currency contracts to facilitate transactions in foreign-denominated securities. Gains and losses from these transactions may arise from changes in the value of the foreign currency or if the counterparties do not perform under the contracts' terms.
Foreign-denominated assets, including investment securities, and liabilities are translated into U.S. dollars at the exchange rates at period end. Purchases and sales of investment securities, income and dividends received and expenses denominated in foreign currencies are translated into U.S. dollars at the exchange rate in effect on the transaction date.
The effects of exchange rate fluctuations on investments are included with the net realized and unrealized gain (loss) on investment securities. Other foreign currency transactions resulting in realized and unrealized gain (loss) are disclosed separately.
Investment Transactions and Income. For financial reporting purposes, the Fund's investment holdings and NAV include trades executed through the end of the last business day of the period. The NAV per share for processing shareholder transactions is calculated as of the close of business of the New York Stock Exchange (NYSE), normally 4:00 p.m. Eastern time and includes trades executed through the end of the prior business day. Gains and losses on securities sold are determined on the basis of identified cost and may include proceeds received from litigation. Dividend income is recorded on the ex-dividend date, except for certain dividends from foreign securities where the ex-dividend date may have passed, which are recorded as soon as the Fund is informed of the ex-dividend date. Non-cash dividends included in dividend income, if any, are recorded at the fair market value of the securities received. Distributions received on securities that represent a return of capital or capital gain are recorded as a reduction of cost of investments and/or as a realized gain. Subsequent to ex-dividend date the Fund determines the components of these distributions, based upon receipt of tax filings or other correspondence relating to the underlying investment. Interest income and
Annual Report
Notes to Financial Statements - continued
(Amounts in thousands except percentages)
3. Significant Accounting Policies - continued
Investment Transactions and Income - continued
distributions from the Fidelity Central Funds are accrued as earned. Interest income includes coupon interest and amortization of premium and accretion of discount on debt securities. Investment income is recorded net of foreign taxes withheld where recovery of such taxes is uncertain.
Class Allocations and Expenses. Investment income, realized and unrealized capital gains and losses, common expenses of the Fund, and certain fund-level expense reductions, if any, are allocated daily on a pro-rata basis to each class based on the relative net assets of each class to the total net assets of the Fund. Each class differs with respect to transfer agent and distribution and service plan fees incurred. Certain expense reductions may also differ by class. For the reporting period, the allocated portion of income and expenses to each class as a percent of its average net assets may vary due to the timing of recording these transactions in relation to fluctuating net assets of the classes. Expenses directly attributable to a fund are charged to that fund. Expenses attributable to more than one fund are allocated among the respective funds on the basis of relative net assets or other appropriate methods. Expense estimates are accrued in the period to which they relate and adjustments are made when actual amounts are known.
Deferred Trustee Compensation. Under a Deferred Compensation Plan (the Plan), independent Trustees may elect to defer receipt of a portion of their annual compensation. Deferred amounts are invested in a cross-section of Fidelity funds, are marked-to-market and remain in the Fund until distributed in accordance with the Plan. The investment of deferred amounts and the offsetting payable to the Trustees are included in the accompanying Statement of Assets and Liabilities.
Income Tax Information and Distributions to Shareholders. Each year, the Fund intends to qualify as a regulated investment company under Subchapter M of the Internal Revenue Code, including distributing substantially all of its taxable income and realized gains. As a result, no provision for U.S. Federal income taxes is required. As of November 30, 2013, the Fund did not have any unrecognized tax benefits in the financial statements; nor is the Fund aware of any tax positions for which it is reasonably possible that the total amounts of unrecognized tax benefits will significantly change in the next twelve months. The Fund files a U.S. federal tax return, in addition to state and local tax returns as required. The Fund's federal income tax returns are subject to examination by the Internal Revenue Service (IRS) for a period of three fiscal years after they are filed. State and local tax returns may be subject to examination for an additional fiscal year depending on the jurisdiction. Foreign taxes are provided for based on the Fund's understanding of the tax rules and rates that exist in the foreign markets in which it invests.
Annual Report
3. Significant Accounting Policies - continued
Income Tax Information and Distributions to Shareholders - continued
Distributions are declared and recorded on the ex-dividend date. Income dividends and capital gain distributions are declared separately for each class. Income and capital gain distributions are determined in accordance with income tax regulations, which may differ from GAAP.
Capital accounts within the financial statements are adjusted for permanent book-tax differences. These adjustments have no impact on net assets or the results of operations. Temporary book-tax differences will reverse in a subsequent period.
Book-tax differences are primarily due to foreign currency transactions, passive foreign investment companies (PFIC), deferred trustees compensation, net operating losses, capital loss carryforwards and losses deferred due to wash sales and excise tax regulations.
The federal tax cost of investment securities and unrealized appreciation (depreciation) as of period end were as follows:
|
Gross unrealized appreciation |
$ 1,167,699 |
|
Gross unrealized depreciation |
(118,341) |
|
Net unrealized appreciation (depreciation) on securities and other investments |
$ 1,049,358 |
|
|
|
|
Tax Cost |
$ 2,361,881 |
The tax-based components of distributable earnings as of period end were as follows:
|
Capital loss carryforward |
$ (246,838) |
|
Net unrealized appreciation (depreciation) |
$ 1,049,358 |
Capital loss carryforwards are only available to offset future capital gains of the Fund to the extent provided by regulations and may be limited. Under the Regulated Investment Company Modernization Act of 2010 (the Act), the Fund is permitted to carry forward capital losses incurred in taxable years beginning after December 22, 2010 for an unlimited period and such capital losses are required to be used prior to any losses that expire. The capital loss carryforward information presented below, including any applicable limitation, is estimated as of fiscal period end and is subject to adjustment.
|
Fiscal year of expiration |
|
|
2017 |
$ (246,838) |
Restricted Securities. The Fund may invest in securities that are subject to legal or contractual restrictions on resale. These securities generally may be resold in
Annual Report
Notes to Financial Statements - continued
(Amounts in thousands except percentages)
3. Significant Accounting Policies - continued
Restricted Securities - continued
transactions exempt from registration or to the public if the securities are registered. Disposal of these securities may involve time-consuming negotiations and expense, and prompt sale at an acceptable price may be difficult. Information regarding restricted securities is included at the end of the Fund's Schedule of Investments.
4. Purchases and Sales of Investments.
Purchases and sales of securities, other than short-term securities, aggregated $794,298 and $433,223, respectively.
5. Fees and Other Transactions with Affiliates.
Management Fee. Fidelity Management & Research Company (the investment adviser) and its affiliates provide the Fund with investment management related services for which the Fund pays a monthly management fee. The management fee is the sum of an individual fund fee rate that is based on an annual rate of .30% of the Fund's average net assets and an annualized group fee rate that averaged .25% during the period. The group fee rate is based upon the average net assets of all the mutual funds advised by the investment adviser, including any mutual funds previously advised by the investment adviser that are currently advised by Fidelity SelectCo, LLC, an affiliate of the investment adviser. The group fee rate decreases as assets under management increase and increases as assets under management decrease. In addition, the management fee is subject to a performance adjustment (up to a maximum of ± .20% of the Fund's average net assets over a 36 month performance period). The upward or downward adjustment to the management fee is based on the investment performance of the asset-weighted return of all classes as compared to an appropriate benchmark index over the same 36 month performance period. For the reporting period, the total annual management fee rate, including the performance adjustment, was .69% of the Fund's average net assets. The performance adjustment included in the management fee rate may be higher or lower than the maximum performance adjustment rate due to the difference between the average net assets for the reporting and performance periods.
Distribution and Service Plan Fees. In accordance with Rule 12b-1 of the 1940 Act, the Fund has adopted separate Distribution and Service Plans for each class of shares. Certain classes pay Fidelity Distributors Corporation (FDC), an affiliate of the investment adviser, separate Distribution and Service Fees, each of which is based on an annual percentage of each class' average net assets. In addition, FDC may pay financial intermediaries for selling shares of the Fund and providing shareholder support services.
Annual Report
5. Fees and Other Transactions with Affiliates - continued
Distribution and Service Plan Fees - continued
For the period, the Distribution and Service Fee rates, total fees and amounts retained by FDC were as follows:
|
|
Distribution |
Service |
Total Fees |
Retained |
|
Class A |
-% |
.25% |
$ 1,106 |
$ 32 |
|
Class T |
.25% |
.25% |
6,480 |
92 |
|
Class B |
.75% |
.25% |
124 |
95 |
|
Class C |
.75% |
.25% |
1,047 |
361 |
|
|
|
|
$ 8,757 |
$ 580 |
Sales Load. FDC may receive a front-end sales charge of up to 5.75% for selling Class A shares and 3.50% for selling Class T shares, some of which is paid to financial intermediaries for selling shares of the Fund. Depending on the holding period, FDC may receive contingent deferred sales charges levied on Class A, Class T, Class B, and Class C redemptions. The deferred sales charges range from 5.00% to 1.00% for Class B shares, 1.00% for Class C shares, 1.00% for certain purchases of Class A shares and .25% for certain purchases of Class T shares.
For the period, sales charge amounts retained by FDC were as follows:
|
|
Retained |
|
Class A |
$ 195 |
|
Class T |
55 |
|
Class B* |
7 |
|
Class C* |
13 |
|
|
$ 270 |
* When Class B and Class C shares are initially sold, FDC pays commissions from its own resources to financial intermediaries through which the sales are made.
Transfer Agent Fees. Fidelity Investments Institutional Operations Company, Inc., (FIIOC), an affiliate of the investment adviser, is the transfer, dividend disbursing and shareholder servicing agent for each class of the Fund. FIIOC receives account fees and asset-based fees that vary according to the account size and type of account of the shareholders of the respective classes of the Fund, except for Class Z. FIIOC receives an asset-based fee for Class Z's average net assets. FIIOC pays for typesetting, printing and mailing of shareholder reports, except proxy statements.
Annual Report
Notes to Financial Statements - continued
(Amounts in thousands except percentages)
5. Fees and Other Transactions with Affiliates - continued
Transfer Agent Fees - continued
For the period, transfer agent fees for each class were as follows:
|
|
Amount |
% of |
|
Class A |
$ 1,107 |
.25 |
|
Class T |
2,612 |
.20 |
|
Class B |
37 |
.30 |
|
Class C |
245 |
.23 |
|
Institutional Class |
1,524 |
.20 |
|
Class Z |
-** |
.05* |
|
|
$ 5,525 |
|
* Annualized
** Amount represents fifteen dollars.
Accounting and Security Lending Fees. Fidelity Service Company, Inc. (FSC), an affiliate of the investment adviser, maintains the Fund's accounting records. The accounting fee is based on the level of average net assets for each month. Under a separate contract, FSC administers the security lending program. The security lending fee is based on the number and duration of lending transactions.
Brokerage Commissions. The Fund placed a portion of its portfolio transactions with brokerage firms which are affiliates of the investment adviser. Brokerage commissions are included in net realized gain (loss) and change in net unrealized appreciation (depreciation) in the Statement of Operations. The commissions paid to these affiliated firms were $14 for the period.
6. Committed Line of Credit.
The Fund participates with other funds managed by the investment adviser or an affiliate in a $4.25 billion credit facility (the "line of credit") to be utilized for temporary or emergency purposes to fund shareholder redemptions or for other short-term liquidity purposes. The Fund has agreed to pay commitment fees on its pro-rata portion of the line of credit, which amounted to $5 and is reflected in Miscellaneous expenses on the Statement of Operations. During the period, there were no borrowings on this line of credit.
7. Security Lending.
The Fund lends portfolio securities through a lending agent from time to time in order to earn additional income. For equity securities, a lending agent is used and may loan securities to certain qualified borrowers, including Fidelity Capital Markets (FCM), a
Annual Report
7. Security Lending - continued
broker-dealer affiliated with the Fund. On the settlement date of the loan, the Fund receives collateral (in the form of U.S. Treasury obligations, letters of credit and/or cash) against the loaned securities and maintains collateral in an amount not less than 100% of the market value of the loaned securities during the period of the loan. The market value of the loaned securities is determined at the close of business of the Fund and any additional required collateral is delivered to the Fund on the next business day. If the borrower defaults on its obligation to return the securities loaned because of insolvency or other reasons, the Fund may apply collateral received from the borrower against the obligation. The Fund may experience delays and costs in recovering the securities loaned. Any cash collateral received is invested in the Fidelity Securities Lending Cash Central Fund. The value of loaned securities and cash collateral at period end are disclosed on the Fund's Statement of Assets and Liabilities. The value of securities loaned to FCM at period end was $53. Security lending income represents the income earned on investing cash collateral, less rebates paid to borrowers and any lending agent fees associated with the loan, plus any premium payments received for lending certain types of securities. Security lending income is presented in the Statement of Operations as a component of income from Fidelity Central Funds. Total security lending income during the period amounted to $1,023, including $76 from securities loaned to FCM.
8. Expense Reductions.
The investment adviser voluntarily agreed to reimburse a portion of the Fund's Class A, Class T, Class B, Class C and Institutional Class operating expenses.
During the period, this reimbursement reduced expenses as follows:
|
|
Reimbursement |
|
Class A |
$ 2 |
|
Class T |
6 |
|
Class B |
-* |
|
Class C |
1 |
|
Institutional Class |
5 |
|
|
$ 14 |
* Amount represents fifty-seven dollars.
Commissions paid to certain brokers with whom the investment adviser, or its affiliates, places trades on behalf of the Fund include an amount in addition to trade execution, which may be rebated back to the Fund to offset certain expenses. This amount totaled $81 for the period.
Annual Report
Notes to Financial Statements - continued
(Amounts in thousands except percentages)
9. Share Transactions.
Transactions for each class of shares were as follows:
|
|
Shares |
Dollars |
||
|
Years ended November 30, |
2013 A |
2012 |
2013 A |
2012 |
|
Class A |
|
|
|
|
|
Shares sold |
3,550 |
3,450 |
$ 172,665 |
$ 139,006 |
|
Shares redeemed |
(2,123) |
(2,315) |
(101,685) |
(91,797) |
|
Net increase (decrease) |
1,427 |
1,135 |
$ 70,980 |
$ 47,209 |
|
Class T |
|
|
|
|
|
Shares sold |
2,633 |
3,463 |
$ 126,086 |
$ 139,248 |
|
Shares redeemed |
(5,298) |
(5,834) |
(251,560) |
(232,825) |
|
Net increase (decrease) |
(2,665) |
(2,371) |
$ (125,474) |
$ (93,577) |
|
Class B |
|
|
|
|
|
Shares sold |
20 |
58 |
$ 916 |
$ 2,241 |
|
Shares redeemed |
(122) |
(126) |
(5,334) |
(4,712) |
|
Net increase (decrease) |
(102) |
(68) |
$ (4,418) |
$ (2,471) |
|
Class C |
|
|
|
|
|
Shares sold |
1,606 |
834 |
$ 73,545 |
$ 31,589 |
|
Shares redeemed |
(315) |
(408) |
(13,899) |
(15,301) |
|
Net increase (decrease) |
1,291 |
426 |
$ 59,646 |
$ 16,288 |
|
Institutional Class |
|
|
|
|
|
Shares sold |
11,525 |
8,961 |
$ 569,791 |
$ 367,678 |
|
Shares redeemed |
(3,146) |
(3,778) |
(158,910) |
(152,130) |
|
Net increase (decrease) |
8,379 |
5,183 |
$ 410,881 |
$ 215,548 |
|
Class Z |
|
|
|
|
|
Shares sold |
2 |
- |
$ 100 |
$ - |
A Share transactions for Class Z are for the period August 13, 2013 (commencement of sale of shares) to November 30, 2013.
10. Other.
The Fund's organizational documents provide former and current trustees and officers with a limited indemnification against liabilities arising in connection with the performance of their duties to the Fund. In the normal course of business, the Fund may also enter into contracts that provide general indemnifications. The Fund's maximum exposure under these arrangements is unknown as this would be dependent on future claims that may be made against the Fund. The risk of material loss from such claims is considered remote.
Annual Report
Report of Independent Registered Public Accounting Firm
To the Trustees of Fidelity Advisor Series I and Shareholders of Fidelity Advisor Growth Opportunities Fund:
We have audited the accompanying statement of assets and liabilities of Fidelity Advisor Growth Opportunities Fund (the Fund), a fund of Fidelity Advisor Series I, including the schedule of investments, as of November 30, 2013, and the related statement of operations for the year then ended, the statement of changes in net assets for each of the two years in the period then ended, and the financial highlights for each of the five years in the period then ended. These financial statements and financial highlights are the responsibility of the Fund's management. Our responsibility is to express an opinion on these financial statements and financial highlights based on our audits.
We conducted our audits in accordance with the standards of the Public Company Accounting Oversight Board (United States). Those standards require that we plan and perform the audit to obtain reasonable assurance about whether the financial statements and financial highlights are free of material misstatement. The Fund is not required to have, nor were we engaged to perform, an audit of its internal control over financial reporting. Our audits included consideration of internal control over financial reporting as a basis for designing audit procedures that are appropriate in the circumstances, but not for the purpose of expressing an opinion on the effectiveness of the Fund's internal control over financial reporting. Accordingly, we express no such opinion. An audit also includes examining, on a test basis, evidence supporting the amounts and disclosures in the financial statements, assessing the accounting principles used and significant estimates made by management, as well as evaluating the overall financial statement presentation. Our procedures included confirmation of securities owned as of November 30, 2013, by correspondence with the custodians and brokers; where replies were not received from brokers, we performed other auditing procedures. We believe that our audits provide a reasonable basis for our opinion.
In our opinion, the financial statements and financial highlights referred to above present fairly, in all material respects, the financial position of Fidelity Advisor Growth Opportunities Fund as of November 30, 2013, the results of its operations for the year then ended, the changes in its net assets for each of the two years in the period then ended, and the financial highlights for each of the five years in the period then ended, in conformity with accounting principles generally accepted in the United States of America.
DELOITTE & TOUCHE LLP
Boston, Massachusetts
January 14, 2014
Annual Report
Trustees and Officers
The Trustees, Member of the Advisory Board, and officers of the trust and fund, as applicable, are listed below. The Board of Trustees governs the fund and is responsible for protecting the interests of shareholders. The Trustees are experienced executives who meet periodically throughout the year to oversee the fund's activities, review contractual arrangements with companies that provide services to the fund, oversee management of the risks associated with such activities and contractual arrangements, and review the fund's performance. Except for James C. Curvey, Ned C. Lautenbach, Ronald P. O'Hanley, and William S. Stavropoulos, each of the Trustees oversees 173 funds. Mr. Curvey oversees 396 funds. Mr. Lautenbach, Mr. O'Hanley, and Mr. Stavropoulos each oversees 247 funds.
The Trustees hold office without limit in time except that (a) any Trustee may resign; (b) any Trustee may be removed by written instrument, signed by at least two-thirds of the number of Trustees prior to such removal; (c) any Trustee who requests to be retired or who has become incapacitated by illness or injury may be retired by written instrument signed by a majority of the other Trustees; and (d) any Trustee may be removed at any special meeting of shareholders by a two-thirds vote of the outstanding voting securities of the trust. Each Trustee who is not an interested person (as defined in the 1940 Act) of the trust and the fund (Independent Trustee), shall retire not later than the last day of the calendar year in which his or her 75th birthday occurs. The Independent Trustees may waive this mandatory retirement age policy with respect to individual Trustees. The officers and Advisory Board Member hold office without limit in time, except that any officer and Advisory Board Member may resign or may be removed by a vote of a majority of the Trustees at any regular meeting or any special meeting of the Trustees. Except as indicated, each individual has held the office shown or other offices in the same company for the past five years.
Experience, Skills, Attributes, and Qualifications of the Fund's Trustees. The Governance and Nominating Committee has adopted a statement of policy that describes the experience, qualifications, attributes, and skills that are necessary and desirable for potential Independent Trustee candidates (Statement of Policy). The Board believes that each Trustee satisfied at the time he or she was initially elected or appointed a Trustee, and continues to satisfy, the standards contemplated by the Statement of Policy. The Governance and Nominating Committee also engages professional search firms to help identify potential Independent Trustee candidates who have the experience, qualifications, attributes, and skills consistent with the Statement of Policy. From time to time, additional criteria based on the composition and skills of the current Independent Trustees, as well as experience or skills that may be appropriate in light of future changes to board composition, business conditions, and regulatory or other developments, have also been considered by the professional search firms and the Governance and Nominating Committee. In addition, the Board takes into account the Trustees' commitment and participation in Board and committee meetings, as well as their leadership of standing and ad hoc committees throughout their tenure.
Annual Report
Trustees and Officers - continued
In determining that a particular Trustee was and continues to be qualified to serve as a Trustee, the Board has considered a variety of criteria, none of which, in isolation, was controlling. The Board believes that, collectively, the Trustees have balanced and diverse experience, qualifications, attributes, and skills, which allow the Board to operate effectively in governing the fund and protecting the interests of shareholders. Information about the specific experience, skills, attributes, and qualifications of each Trustee, which in each case led to the Board's conclusion that the Trustee should serve (or continue to serve) as a trustee of the fund, is provided below.
Board Structure and Oversight Function. James C. Curvey is an interested person (as defined in the 1940 Act) and currently serves as Chairman. The Trustees have determined that an interested Chairman is appropriate and benefits shareholders because an interested Chairman has a personal and professional stake in the quality and continuity of services provided to the fund. Independent Trustees exercise their informed business judgment to appoint an individual of their choosing to serve as Chairman, regardless of whether the Trustee happens to be independent or a member of management. The Independent Trustees have determined that they can act independently and effectively without having an Independent Trustee serve as Chairman and that a key structural component for assuring that they are in a position to do so is for the Independent Trustees to constitute a substantial majority for the Board. The Independent Trustees also regularly meet in executive session. Ned C. Lautenbach serves as Chairman of the Independent Trustees and as such (i) acts as a liaison between the Independent Trustees and management with respect to matters important to the Independent Trustees and (ii) with management prepares agendas for Board meetings.
Fidelity funds are overseen by different Boards of Trustees. The fund's Board oversees Fidelity's equity and high income funds and another Board oversees Fidelity's investment-grade bond, money market, and asset allocation funds. The asset allocation funds may invest in Fidelity funds overseen by the fund's Board. The use of separate Boards, each with its own committee structure, allows the Trustees of each group of Fidelity funds to focus on the unique issues of the funds they oversee, including common research, investment, and operational issues. On occasion, the separate Boards establish joint committees to address issues of overlapping consequences for the Fidelity funds overseen by each Board.
The Trustees operate using a system of committees to facilitate the timely and efficient consideration of all matters of importance to the Trustees, the fund, and fund shareholders and to facilitate compliance with legal and regulatory requirements and oversight of the fund's activities and associated risks. The Board, acting through its committees, has charged FMR and its affiliates with (i) identifying events or circumstances the occurrence of which could have demonstrably adverse effects on the fund's business and/or reputation; (ii) implementing processes and controls to lessen the possibility that such events or circumstances occur or to mitigate the effects of such events or circumstances if they do occur; and (iii) creating and maintaining a system designed to evaluate continuously business and market conditions in order to facilitate the identification and implementation processes described in (i) and (ii) above. Because the day-to-day operations and activities of the fund are carried out by or through FMR, its affiliates and other service providers, the fund's exposure to risks is mitigated but not eliminated by the processes overseen by the Trustees. While each of the Board's committees has responsibility for overseeing different aspects of the fund's activities, oversight is exercised primarily through the Operations, Audit, and Compliance Committees. In addition, the Independent Trustees have worked with FMR to enhance the Board's oversight of investment and financial risks, legal and regulatory risks, technology risks, and operational risks, including the development of additional risk reporting to the Board. For example, a working group comprised of Independent Trustees and FMR has worked and continues to work to review the Fidelity funds' valuation-related activities, reporting and risk management. Appropriate personnel, including but not limited to the fund's Chief Compliance Officer (CCO), FMR's internal auditor, the independent accountants, the fund's Treasurer and portfolio management personnel, make periodic reports to the Board's committees, as appropriate, including an annual review of FMR's risk management program for the Fidelity funds. The responsibilities of each standing committee, including their oversight responsibilities, are described further under "Standing Committees of the Fund's Trustees."
Annual Report
The fund's Statement of Additional Information (SAI) includes more information about the Trustees. To request a free copy, call Fidelity at 1-877-208-0098.
Interested Trustees*:
Correspondence intended for each Trustee who is an interested person may be sent to Fidelity Investments, 245 Summer Street, Boston, Massachusetts 02210.
|
Name, Year of Birth; Principal Occupations and Other Relevant Experience+ |
|
|
James C. Curvey (1935) |
|
|
Year of Election or Appointment: 2007 Trustee Chairman of the Board of Trustees |
|
|
|
Mr. Curvey also serves as Trustee of other Fidelity funds. Mr. Curvey is a Director of Fidelity Investments Money Management, Inc. (2009-present), Director of Fidelity Research & Analysis Co. (2009-present) and Director of FMR and FMR Co., Inc. (2007-present). Mr. Curvey is also Vice Chairman (2007-present) and Director of FMR LLC. In addition, Mr. Curvey serves as an Overseer for the Boston Symphony Orchestra and a member of the Trustees of Villanova University. Previously, Mr. Curvey was the Vice Chairman (2006-2007) and Director (2000-2007) of FMR Corp. |
|
Ronald P. O'Hanley (1957) |
|
|
Year of Election or Appointment: 2011 Trustee |
|
|
|
Mr. O'Hanley also serves as Trustee of other Fidelity funds. He is Director of Fidelity SelectCo, LLC (2013-present), FMR Co., Inc. (2010-present), Director of Fidelity Investments Money Management, Inc. (2010-present), Director of Fidelity Research & Analysis Company (2010-present), President of Fidelity Asset Management and Corporate Services and a Member of Fidelity's Executive Committee (2010-present). Previously, Mr. O'Hanley served as President and Chief Executive Officer of BNY Mellon Asset Management (2007-2010). Mr. O'Hanley also served as Vice Chairman of Bank New York Mellon Corp. and a member of that firm's Executive Committee. Prior to the 2007 merger of The Bank of New York and Mellon Financial Corporation, he was Vice Chairman of Mellon Financial Corporation and President and Chief Executive Officer of Mellon Asset Management. He joined Mellon in February 1997. Mr. O'Hanley currently serves as Chairman of the Boston Public Library Foundation Board of Directors and sits on the Board of Directors of Beth Israel Deaconess Medical Center, the Board of Trustees of the Marine Biological Laboratory and the Advisory Board of the Maxwell School of Citizenship and Public Administration at Syracuse University. Mr. O'Hanley also chairs the Council on Asset Management for the Financial Services Roundtable and is a member of the Board of Directors of Institutional Investor's U.S. Institute. |
* Trustees have been determined to be "Interested Trustees" by virtue of, among other things, their affiliation with the trust or various entities under common control with FMR.
+ The information above includes each Trustee's principal occupation during the last five years and other information relating to the experience, attributes, and skills relevant to each Trustee's qualifications to serve as a Trustee, which led to the conclusion that each Trustee should serve as a Trustee for the fund.
Annual Report
Independent Trustees:
Correspondence intended for each Independent Trustee (that is, the Trustees other than the Interested Trustees) may be sent to Fidelity Investments, P.O. Box 55235, Boston, Massachusetts 02205-5235.
|
Name, Year of Birth; Principal Occupations and Other Relevant Experience+ |
|
|
Dennis J. Dirks (1948) |
|
|
Year of Election or Appointment: 2005 Trustee |
|
|
|
Mr. Dirks also serves as Trustee of other Fidelity funds. Prior to his retirement in May 2003, Mr. Dirks was Chief Operating Officer and a member of the Board of The Depository Trust & Clearing Corporation (DTCC). He also served as President, Chief Operating Officer, and Board member of The Depository Trust Company (DTC) and President and Board member of the National Securities Clearing Corporation (NSCC). In addition, Mr. Dirks served as Chief Executive Officer and Board member of the Government Securities Clearing Corporation, Chief Executive Officer and Board member of the Mortgage-Backed Securities Clearing Corporation, as a Trustee and a member of the Finance Committee of Manhattan College (2005-2008), and as a Trustee and a member of the Finance Committee of AHRC of Nassau County (2006-2008). Mr. Dirks is a member of the Independent Directors Council (IDC) Governing Council (2010-present) and Board of Directors for The Brookville Center for Children's Services, Inc. (2009-present). |
|
Alan J. Lacy (1953) |
|
|
Year of Election or Appointment: 2008 Trustee |
|
|
|
Mr. Lacy also serves as Trustee of other Fidelity funds. Mr. Lacy serves as Senior Adviser (2007-present) of Oak Hill Capital Partners, L.P. (private equity). Mr. Lacy also served as Chief Executive Officer (2000-2005) and Vice Chairman (2005-2006) of Sears Holdings Corporation and Sears, Roebuck and Co. (retail). In addition, Mr. Lacy serves as a member of the Board of Directors of Dave & Buster's Entertainment, Inc. (restaurant and entertainment complexes, 2010-present), Earth Fare, Inc. (retail grocery, 2012-present), The Hillman Companies, Inc. (hardware wholesalers, 2010-present), and Bristol-Myers Squibb Company (global pharmaceuticals, 2008-present). Mr. Lacy is a member of the Board of Trustees of The National Parks Conservation Association (2006-present). Previously, Mr. Lacy served as Chairman of the Board of Trustees of the National Parks Conservation Association (2008-2011) and as a member of the Board of Directors for the Western Union Company (global money transfer, 2006-2011). |
|
Ned C. Lautenbach (1944) |
|
|
Year of Election or Appointment: 2000 Trustee Chairman of the Independent Trustees |
|
|
|
Mr. Lautenbach also serves as Trustee of other Fidelity funds. Mr. Lautenbach currently serves as the Lead Director of the Eaton Corporation Board of Directors (diversified industrial, 1997-present). Mr. Lautenbach is Chairman of the Board of Directors of the Philharmonic Center for the Arts in Naples, Florida (2012-present) and a member of the Council on Foreign Relations (1994-present). Previously, Mr. Lautenbach was a Partner/Advisory Partner at Clayton, Dubilier & Rice, LLC (private equity investment, 1998-2010), as well as a Director of Sony Corporation (2006-2007). |
|
Joseph Mauriello (1944) |
|
|
Year of Election or Appointment: 2008 Trustee |
|
|
|
Mr. Mauriello also serves as Trustee of other Fidelity funds. Prior to his retirement in January 2006, Mr. Mauriello served in numerous senior management positions including Deputy Chairman and Chief Operating Officer (2004-2005), and Vice Chairman of Financial Services (2002-2004) of KPMG LLP US (professional services, 1965-2005). Mr. Mauriello currently serves as a member of the Board of Directors of XL Group plc. (global insurance and re-insurance, 2006-present). Previously, Mr. Mauriello served as a Director of the Hamilton Funds of the Bank of New York (2006-2007) and of Arcadia Resources Inc. (health care services and products, 2007-2012). |
|
Robert W. Selander (1950) |
|
|
Year of Election or Appointment: 2011 Trustee |
|
|
|
Mr. Selander also serves as Trustee of other Fidelity funds. Previously, Mr. Selander served as a Member of the Advisory Board of other Fidelity funds (2011), and Executive Vice Chairman (2010), Chief Executive Officer (2009-2010), and President and Chief Executive Officer (1997-2009) of Mastercard, Inc. |
|
Cornelia M. Small (1944) |
|
|
Year of Election or Appointment: 2005 Trustee |
|
|
|
Ms. Small also serves as Trustee of other Fidelity funds. Ms. Small is a member of the Board of Directors (2009-present) and Chair of the Investment Committee (2010-present) of the Teagle Foundation. Ms. Small also serves on the Investment Committee of the Berkshire Taconic Community Foundation (2008-present). Previously, Ms. Small served as Chairperson (2002-2008) and a member of the Investment Committee and Chairperson (2008-2012) and a member of the Board of Trustees of Smith College. In addition, Ms. Small served as Chief Investment Officer, Director of Global Equity Investments, and a member of the Board of Directors of Scudder, Stevens & Clark and Scudder Kemper Investments. |
|
William S. Stavropoulos (1939) |
|
|
Year of Election or Appointment: 2002 Trustee Vice Chairman of the Independent Trustees |
|
|
|
Mr. Stavropoulos also serves as Trustee of other Fidelity funds. Mr. Stavropoulos serves as President and Founder of the Michigan Baseball Foundation, the Great Lakes Loons (2007-present). Mr. Stavropoulos is Chairman Emeritus of the Board of Directors of The Dow Chemical Company, where he previously served in numerous senior management positions, including President, CEO (1995-2000; 2002-2004), Chairman of the Executive Committee (2000-2006), and as a member of the Board of Directors (1990-2006). Currently, Mr. Stavropoulos is Chairman of the Board of Directors of Univar Inc. (global distributor of commodity and specialty chemicals), a Director of Teradata Corporation (data warehousing and technology solutions), and Maersk Inc. (industrial conglomerate), and a member of the Advisory Board for Metalmark Capital LLC (private equity investment, 2005-present). Mr. Stavropoulos is an operating advisor to Clayton, Dubilier & Rice, LLC (private equity investment). In addition, Mr. Stavropoulos is a member of the University of Notre Dame Advisory Council for the College of Science, a Trustee of the Rollin L. Gerstacker Foundation, and a Director of the Naples Philharmonic Center for the Arts. Previously, Mr. Stavropoulos served as a Director of Chemical Financial Corporation (bank holding company, 1993-2012) and Tyco International, Ltd. (multinational manufacturing and services, 2007-2012). |
|
David M. Thomas (1949) |
|
|
Year of Election or Appointment: 2008 Trustee |
|
|
|
Mr. Thomas also serves as Trustee of other Fidelity funds. Mr. Thomas serves as Non-Executive Chairman of the Board of Directors of Fortune Brands Home and Security (home and security products, 2011-present), and as a member of the Board of Directors of Interpublic Group of Companies, Inc. (marketing communication, 2004-present). Previously, Mr. Thomas served as Executive Chairman (2005-2006) and Chairman and Chief Executive Officer (2000-2005) of IMS Health, Inc. (pharmaceutical and healthcare information solutions), and a Director of Fortune Brands, Inc. (consumer products, 2000-2011). |
+ The information above includes each Trustee's principal occupation during the last five years and other information relating to the experience, attributes, and skills relevant to each Trustee's qualifications to serve as a Trustee, which led to the conclusion that each Trustee should serve as a Trustee for the fund.
Advisory Board Member and Officers:
Correspondence intended for each officer and Peter S. Lynch may be sent to Fidelity Investments, 245 Summer Street, Boston, Massachusetts 02210. Officers appear below in alphabetical order.
|
Name, Year of Birth; Principal Occupation |
|
|
Peter S. Lynch (1944) |
|
|
Year of Election or Appointment: 2003 Member of the Advisory Board |
|
|
|
Mr. Lynch also serves as Member of the Advisory Board of other Fidelity funds. Mr. Lynch is Vice Chairman and a Director of FMR and FMR Co., Inc. In addition, Mr. Lynch serves as a Trustee of Boston College and as the Chairman of the Inner-City Scholarship Fund. Previously, Mr. Lynch served on the Special Olympics International Board of Directors (1997-2006). |
|
Elizabeth Paige Baumann (1968) |
|
|
Year of Election or Appointment: 2012 Anti-Money Laundering (AML) Officer |
|
|
|
Ms. Baumann also serves as AML Officer of other funds. She is Chief AML Officer of FMR LLC (2012-present) and is an employee of Fidelity Investments. Previously, Ms. Baumann served as Vice President and Deputy Anti-Money Laundering Officer (2007-2012). |
|
William C. Coffey (1969) |
|
|
Year of Election or Appointment: 2009 Assistant Secretary |
|
|
|
Mr. Coffey also serves as Assistant Secretary of other funds. He is Senior Vice President and Deputy General Counsel of FMR LLC (2010-present), and is an employee of Fidelity Investments. Previously, Mr. Coffey served as Vice President and Associate General Counsel of FMR LLC (2005-2009). |
|
Jonathan Davis (1968) |
|
|
Year of Election or Appointment: 2010 Assistant Treasurer |
|
|
|
Mr. Davis also serves as Assistant Treasurer of other funds. Mr. Davis is an employee of Fidelity Investments. Previously, Mr. Davis served as Vice President and Associate General Counsel of FMR LLC (2003-2010). |
|
Adrien E. Deberghes (1967) |
|
|
Year of Election or Appointment: 2008 Deputy Treasurer |
|
|
|
Mr. Deberghes also serves as an officer of other funds. He is an employee of Fidelity Investments (2008-present). Prior to joining Fidelity Investments, Mr. Deberghes was Senior Vice President of Mutual Fund Administration at State Street Corporation (2007-2008), Senior Director of Mutual Fund Administration at Investors Bank & Trust (2005-2007), and Director of Finance for Dunkin' Brands (2000-2005). |
|
Stephanie J. Dorsey (1969) |
|
|
Year of Election or Appointment: 2010 Assistant Treasurer |
|
|
|
Ms. Dorsey also serves as an officer of other funds. She is an employee of Fidelity Investments (2008-present) and has served in other fund officer roles. Prior to joining Fidelity Investments, Ms. Dorsey served as Treasurer (2004-2008) of the JPMorgan Mutual Funds and Vice President (2004-2008) of JPMorgan Chase Bank. |
|
Scott C. Goebel (1968) |
|
|
Year of Election or Appointment: 2008 Secretary and Chief Legal Officer (CLO) |
|
|
|
Mr. Goebel serves as Secretary and CLO of other funds. Mr. Goebel also serves as Secretary of Fidelity Investments Money Management, Inc. (FIMM) (2010-present) and Fidelity Research and Analysis Company (FRAC) (2010-present); General Counsel, Secretary, and Senior Vice President of FMR (2008-present) and FMR Co., Inc. (2008-present); Chief Legal Officer of Fidelity Management & Research (Hong Kong) Limited (2008-present) and Assistant Secretary of Fidelity Management & Research (Japan) Inc. (2008-present), and Fidelity Management & Research (U.K.) Inc. (2008-present). Previously, Mr. Goebel served as Secretary and CLO of other Fidelity funds (2008-2013), Assistant Secretary of FIMM (2008-2010), FRAC (2008-2010), and certain funds (2007-2008); and as Vice President and Secretary of Fidelity Distributors Corporation (FDC) (2005-2007). Mr. Goebel has been employed by FMR LLC or an affiliate since 2001. |
|
Joseph A. Hanlon (1968) |
|
|
Year of Election or Appointment: 2012 Chief Compliance Officer |
|
|
|
Mr. Hanlon also serves as Chief Compliance Officer of other funds. Mr. Hanlon serves as Compliance Officer of FMR, FMR Co., Inc., Fidelity Investments Money Management, Inc. (FIMM), Fidelity Research and Analysis Company (FRAC), and Fidelity Management & Research (Hong Kong) (2009-present), as Senior Vice President of the Fidelity Asset Management Division (2009-present), and is an employee of Fidelity Investments. Previously, Mr. Hanlon served as Compliance Officer of Fidelity Management & Research (Japan) Inc. (2009-2013), Strategic Advisers, Inc. (2009-2013), and Fidelity Management & Research (U.K.) Inc. (2009-2013). |
|
Bruce T. Herring (1965) |
|
|
Year of Election or Appointment: 2006 Vice President of certain Equity Funds |
|
|
|
Mr. Herring also serves as Vice President of other funds. He serves as Chief Investment Officer of Fidelity Global Asset Allocation (GAA) (2013-present), Group Chief Investment Officer of FMR, and President of Fidelity Research & Analysis Company (2010-present). Previously, Mr. Herring served as Chief Investment Officer and Director of Fidelity Management & Research (U.K.) Inc. (2010-2013), Vice President (2005-2006) and Senior Vice President (2006-2007) of Fidelity Management & Research Company, Vice President of FMR Co., Inc. (2001-2007), and as a portfolio manager for Fidelity U.S. Equity Funds. |
|
Brian B. Hogan (1964) |
|
|
Year of Election or Appointment: 2009 Vice President |
|
|
|
Mr. Hogan also serves as Vice President of other funds. Mr. Hogan serves as President of FMR's Equity Division (2009-present). Previously, Mr. Hogan served as Senior Vice President, Equity Research of FMR (2006-2009) and as a portfolio manager. |
|
Chris Maher (1972) |
|
|
Year of Election or Appointment: 2013 Assistant Treasurer |
|
|
|
Mr. Maher serves as Assistant Treasurer of other funds. Mr. Maher is Vice President of Valuation Oversight and is an employee of Fidelity Investments. Previously, Mr. Maher served as Vice President of Asset Management Compliance (2013), Vice President of FMR's Program Management Group (2010-2013), and Vice President of Valuation Oversight (2008-2010). |
|
Christine Reynolds (1958) |
|
|
Year of Election or Appointment: 2008 Chief Financial Officer |
|
|
|
Ms. Reynolds also serves as Chief Financial Officer of other funds. Ms. Reynolds became President of Fidelity Pricing and Cash Management Services (FPCMS) in August 2008. Ms. Reynolds served as Chief Operating Officer of FPCMS (2007-2008). Previously, Ms. Reynolds served as President, Treasurer, and Anti-Money Laundering officer of the Fidelity funds (2004-2007). |
|
Kenneth B. Robins (1969) |
|
|
Year of Election or Appointment: 2008 President and Treasurer |
|
|
|
Mr. Robins also serves as an officer of other funds. Mr. Robins serves as Executive Vice President of Fidelity Investments Money Management, Inc. (FIMM) (2013-present) and is an employee of Fidelity Investments (2004-present). Previously, Mr. Robins served in other fund officer roles. |
|
Gary W. Ryan (1958) |
|
|
Year of Election or Appointment: 2005 Assistant Treasurer |
|
|
|
Mr. Ryan also serves as Assistant Treasurer of other funds. Mr. Ryan is an employee of Fidelity Investments and has served in other fund officer roles. Previously, Mr. Ryan served as Vice President of Fund Reporting in Fidelity Pricing and Cash Management Services (FPCMS) (1999-2005). |
|
Stephen Sadoski (1971) |
|
|
Year of Election or Appointment: 2012 Deputy Treasurer |
|
|
|
Mr. Sadoski also serves as Deputy Treasurer of other funds. He is an employee of Fidelity Investments (2012-present) and has served in another fund officer role. Prior to joining Fidelity Investments, Mr. Sadoski served as an assistant chief accountant in the Division of Investment Management of the Securities and Exchange Commission (SEC) (2009-2012) and as a senior manager at Deloitte & Touche LLP (1997-2009). |
|
Stacie M. Smith (1974) |
|
|
Year of Election or Appointment: 2013 Deputy Treasurer |
|
|
|
Ms. Smith also serves as an officer of other funds. She is an employee of Fidelity Investments (2009-present) and has served in other fund officer roles. Prior to joining Fidelity Investments, Ms. Smith served as Senior Audit Manager of Ernst & Young LLP (1996-2009). |
|
Renee Stagnone (1975) |
|
|
Year of Election or Appointment: 2013 Deputy Treasurer |
|
|
|
Ms. Stagnone also serves as Deputy Treasurer of other funds. Ms. Stagnone is an employee of Fidelity Investments. |
|
Joseph F. Zambello (1957) |
|
|
Year of Election or Appointment: 2011 Deputy Treasurer |
|
|
|
Mr. Zambello also serves as Deputy Treasurer of other funds. Mr. Zambello is an employee of Fidelity Investments. Previously, Mr. Zambello served as Vice President of FMR's Program Management Group (2009-2011) and Vice President of the Transfer Agent Oversight Group (2005-2009). |
Annual Report
Board Approval of Investment Advisory Contracts and Management Fees
Fidelity Advisor Growth Opportunities Fund
Each year, the Board of Trustees, including the Independent Trustees (together, the Board), votes on the renewal of the management contract and sub-advisory agreements (together, the Advisory Contracts) for the fund. The Board, assisted by the advice of fund counsel and Independent Trustees' counsel, requests and considers a broad range of information relevant to the renewal of the Advisory Contracts throughout the year.
The Board meets regularly and, at each of its meetings, covers an extensive agenda of topics and materials and considers factors that are relevant to its annual consideration of the renewal of the fund's Advisory Contracts, including the services and support provided to the fund and its shareholders. The Board has established various standing committees, each composed of and chaired by Independent Trustees with varying backgrounds, to which the Board has assigned specific subject matter responsibilities in order to enhance effective decision-making by the Board. The Board, acting directly and through its Committees, requests and receives information concerning the annual consideration of the renewal of the fund's Advisory Contracts. The Board also meets as needed to consider matters specifically related to the Board's annual consideration of the renewal of Advisory Contracts. Members of the Board may also meet with trustees of other Fidelity funds through ad hoc joint committees to discuss certain matters relevant to the Fidelity funds.
At its July 2013 meeting, the Board, including the Independent Trustees, unanimously determined to renew the fund's Advisory Contracts. In reaching its determination, the Board considered all factors it believed relevant, including (i) the nature, extent, and quality of the services to be provided to the fund and its shareholders (including the investment performance of the fund); (ii) the competitiveness of the fund's management fee and total expense ratio relative to peer funds; (iii) the total costs of the services to be provided by and the profits to be realized by Fidelity from its relationship with the fund; (iv) the extent to which economies of scale exist and would be realized as the fund grows; and (v) whether fee levels reflect these economies of scale, if any, for the benefit of fund shareholders.
In considering whether to renew the Advisory Contracts for the fund, the Board reached a determination, with the assistance of fund counsel and Independent Trustees' counsel and through the exercise of its business judgment, that the renewal of the Advisory Contracts was in the best interests of the fund and its shareholders and that the compensation payable under the Advisory Contracts was fair and reasonable. The Board's decision to renew the Advisory Contracts was not based on any single factor, but rather was based on a comprehensive consideration of all the information provided to the Board at its meetings throughout the year. The Board, in reaching its determination to renew the Advisory Contracts, was aware that shareholders in the fund have a broad range of investment choices available to them, including a wide choice among mutual funds offered by Fidelity's competitors, and that the fund's shareholders, who have the opportunity to review and weigh the disclosure provided by the fund in its prospectus and other public disclosures, have chosen to invest in this fund, which is a part of the Fidelity family of funds.
Annual Report
Board Approval of Investment Advisory Contracts and
Management Fees - continued
Nature, Extent, and Quality of Services Provided. The Board considered the staffing within the investment adviser, Fidelity Management & Research Company (FMR), and the sub-advisers (together, the Investment Advisers) as it relates to the fund, including the backgrounds of the fund's investment personnel, and also considered the fund's investment objective, strategies, and related investment philosophy. The Independent Trustees also had discussions with senior management of Fidelity's investment operations and investment groups. The Board considered the structure of the portfolio manager compensation program and whether this structure provides appropriate incentives to act in the best interests of the fund.
Resources Dedicated to Investment Management and Support Services. The Board and the Fund Oversight and Research Committees reviewed the general qualifications and capabilities of the Investment Advisers' investment staff, including its size, education, experience, and resources, as well as the Investment Advisers' approach to recruiting, training, managing, and compensating investment personnel. The Board noted that FMR has continued to increase the resources devoted to non-U.S. offices, including expansion of Fidelity's global investment organization. The Board also noted that Fidelity's analysts have extensive resources, tools and capabilities that allow them to conduct sophisticated quantitative and fundamental analysis, as well as credit analysis of issuers, counterparties and guarantors. Further, the Board believes that Fidelity's investment professionals have sufficient access to global information and data so as to provide competitive investment results over time, and that those professionals also have access to sophisticated tools that permit them to assess portfolio construction and risk and performance attribution characteristics continuously, as well as to transmit new information and research conclusions rapidly around the world. Additionally, in its deliberations, the Board considered the Investment Advisers' trading and risk management capabilities and resources, which are an integral part of the investment management process.
Shareholder and Administrative Services. The Board considered (i) the nature, extent, quality, and cost of advisory, administrative, and shareholder services performed by the Investment Advisers and their affiliates under the Advisory Contracts and under separate agreements covering transfer agency, pricing and bookkeeping, and securities lending services for the fund; (ii) the nature and extent of the supervision of third party service providers, principally custodians and subcustodians; and (iii) the resources devoted to, and the record of compliance with, the fund's compliance policies and procedures. The Board also reviewed the allocation of fund brokerage, including allocations to brokers affiliated with the Investment Advisers, the use of brokerage commissions to pay fund expenses, and the use of "soft" commission dollars to pay for research services.
Annual Report
The Board noted that the growth of fund assets over time across the complex allows Fidelity to reinvest in the development of services designed to enhance the value or convenience of the Fidelity funds as investment vehicles. These services include 24-hour access to account information and market information through telephone representatives and over the Internet, investor education materials and asset allocation tools, and the expanded availability of Fidelity Investor Centers.
Investment in a Large Fund Family. The Board considered the benefits to shareholders of investing in a Fidelity fund, including the benefits of investing in a fund that is part of a large family of funds offering a variety of investment disciplines and providing a large variety of mutual fund investor services. The Board noted that Fidelity had taken, or had made recommendations that resulted in the Fidelity funds taking, a number of actions over the previous year that benefited particular funds, including (i) continuing to dedicate additional resources to investment research and to the support of the senior management team that oversees asset management; (ii) persisting in efforts to enhance Fidelity's global research capabilities; (iii) launching new funds and making other enhancements to meet client needs for global and income-oriented solutions; (iv) continuing to launch dedicated lower cost underlying funds to meet portfolio construction needs related to expanding underlying fund options for Fidelity funds of funds, specifically for the Freedom Fund product lines; (v) rationalizing product lines and gaining increased efficiencies through the mergers of several funds into other funds; (vi) strengthening Fidelity's index fund offerings by reducing investment minimums and adopting or lowering existing expense caps for certain funds and classes; (vii) enhancing Global Asset Allocation product offerings by launching new funds and strategies, including "open architecture" target date funds that utilize affiliated and unaffiliated sub-advisers; (viii) modifying the eligibility criteria for Institutional Class shares of Advisor funds to increase their marketability to a portion of the defined contribution plan market; (ix) creating a new low-cost retirement share class for certain Advisor funds to appeal to large retirement plans; (x) transitioning the management of certain Fidelity commodity funds to Geode Capital Management LLC, a registered commodity pool operator, while retaining administrative responsibilities for the funds; (xi) reorganizing a number of funds; and (xii) taking steps toward establishing a new Fidelity adviser to manage sector-based funds and products.
Investment Performance. The Board considered whether the fund has operated in accordance with its investment objective, as well as its record of compliance with its investment restrictions and its performance history. The Board noted that there was a portfolio management change for the fund in October 2012.
Annual Report
Board Approval of Investment Advisory Contracts and
Management Fees - continued
The Board took into account discussions with the Investment Advisers about fund investment performance that occur at Board meetings throughout the year. In this regard the Board noted that as part of regularly scheduled fund reviews and other reports to the Board on fund performance, the Board periodically considers annualized return information for the fund, for different time periods, measured against a securities market index ("benchmark index") and a peer group of mutual funds with similar objectives ("peer group"). In its evaluation of fund investment performance, the Board gave particular attention to information indicating changes in performance of certain Fidelity funds for specific time periods and the Investment Advisers' explanations for any overperformance or underperformance.
In addition to reviewing absolute and relative fund performance, the Independent Trustees periodically consider the appropriateness of fund performance metrics in evaluating the results achieved. In general, the Independent Trustees believe that fund performance should be evaluated based on net performance (after fees and expenses) of both the highest performing and lowest performing classes, where applicable, compared to appropriate benchmark indices, over appropriate time periods which may include full market cycles, and compared to peer groups, as applicable, over the same periods, taking into account relevant factors including the following: general market conditions; issuer-specific information; tactical opportunities for investment; and fund cash flows and other factors.
The Independent Trustees recognize that shareholders evaluate performance on a net basis over their own holding periods, for which one-, three-, and five-year periods are used as a proxy. For this reason, the performance information reviewed by the Board also included net cumulative calendar year total return information for the fund and an appropriate benchmark index and peer group for the most recent one-, three-, and five-year periods, as shown below. Returns are shown compared to the 25th percentile (top of box) and 75th percentile (bottom of box) of the peer universe.
Annual Report
Fidelity Advisor Growth Opportunities Fund

The Board also considered that the fund's management fee is subject to upward or downward adjustment depending upon whether, and to what extent, the fund's investment performance for the performance period exceeds, or is exceeded by, a securities index, thus leading to a performance adjustment for the same period. The Board noted that the performance adjustment provides FMR with a strong economic incentive to seek to achieve superior performance for the fund's shareholders and helps to more closely align the interests of FMR and the fund's shareholders.
Based on its review, the Board concluded that the nature, extent, and quality of services provided to the fund under the Advisory Contracts should benefit the fund's shareholders.
Competitiveness of Management Fee and Total Expense Ratio. The Board considered the fund's management fee and total expense ratio compared to "mapped groups" of competitive funds and classes. Fidelity creates "mapped groups" by combining similar Lipper investment objective categories that have comparable management fee characteristics. Combining Lipper investment objective categories aids the Board's management fee and total expense ratio comparisons by broadening the competitive group used for comparison and by reducing the number of universes to which various Fidelity funds are compared.
Management Fee. The Board considered two proprietary management fee comparisons for the 12-month periods shown in the chart below. The group of Lipper funds used by the Board for management fee comparisons is referred to below as the "Total Mapped Group." The Total Mapped Group comparison focuses on a fund's standing in terms of gross management fees before expense reimbursements or caps, and without giving effect to the fund's performance adjustment, relative to the total universe of funds with comparable investment mandates, regardless of whether their management fee structures also are comparable. Funds with comparable investment mandates offer exposure to similar types of securities. Funds with comparable management fee structures have similar management fee contractual arrangements (e.g., flat rate charged for advisory services, all-inclusive fee rate, etc.). "TMG %" represents the percentage of funds in the Total Mapped Group that had management fees that were lower than the fund's. For example, a TMG % of 11% means that 89% of the funds in the Total Mapped Group had higher management fees than the fund. The "Asset-Size Peer Group" (ASPG) comparison focuses on a fund's standing relative to a subset of non-Fidelity funds within the Total Mapped Group that are similar in size and management fee structure. The ASPG represents at least 15% of the funds in the Total Mapped Group with comparable asset size and management fee structures, subject to a minimum of 50 funds (or all funds in the Total Mapped Group if fewer than 50).Additional information, such as the ASPG quartile in which the fund's management fee ranked and the impact of the fund's performance adjustment, is also included in the chart and considered by the Board.
Annual Report
Board Approval of Investment Advisory Contracts and
Management Fees - continued
Fidelity Advisor Growth Opportunities Fund

The Board noted that the fund's management fee ranked below the median of its Total Mapped Group and below the median of its ASPG for 2012. The Board also noted the effect of the fund's positive performance adjustment on the fund's management fee ranking.
Annual Report
Furthermore, the Board considered that shareholders approved a prospective change in the index used to calculate the fund's performance adjustment, beginning February 1, 2007. The Board also considered that, because the performance adjustment is based on a rolling 36-month measurement period, during a transition period the fund's performance is compared to a blended index return that reflects the performance of the former index for the portion of the measurement period prior to February 1, 2007 and the performance of the current index for the remainder of the measurement period. The Board noted that the fund's performance adjustments for 2008 through 2010 shown in the chart above reflect the effect of using the blended index return to calculate the fund's performance adjustment.
Based on its review, the Board concluded that the fund's management fee is fair and reasonable in light of the services that the fund receives and the other factors considered.
Total Expense Ratio. In its review of each class's total expense ratio, the Board considered the fund's management fee as well as other fund or class expenses, as applicable, such as transfer agent fees, pricing and bookkeeping fees, fund-paid 12b-1 fees, and custodial, legal, and audit fees. The Board also noted the effects of any waivers and reimbursements on fees and expenses, as well as the impact of the fund's performance adjustment. As part of its review, the Board also considered the current and historical total expense ratios of each class of the fund compared to competitive fund median expenses. Each class of the fund is compared to those funds and classes in the Total Mapped Group (used by the Board for management fee comparisons) that have a similar sales load structure.
The Board noted that the total expense ratio of Institutional Class ranked below its competitive median for 2012 and the total expense ratio of each of Class A, Class T, Class B, and Class C ranked above its competitive median for 2012. The Board considered that, in general, various factors can affect total expense ratios. The Board noted that the total expense ratio of Class T was above the competitive median primarily because of higher 12b-1 fees on Class T. Class T has a higher 12b-1 fee, but a lower front-end sales charge, than traditionally priced front-end sales charge classes. The Board considered that Class T is primarily sold load-waived in the retirement plan market where its 0.50% 12b-1 fee is comparable to competing no-load, higher 12b-1 fee classes designed specifically for retirement plans. The Board noted that the fund offers multiple classes, each of which has a different sales load and 12b-1 fee structure, and that the multiple structures are intended to offer a range of pricing options for the intermediary market. The Board also noted that the total expense ratios of the classes vary primarily by the level of their 12b-1 fees, although differences in transfer agent fees may also cause expenses to vary from class to class.
Annual Report
Board Approval of Investment Advisory Contracts and
Management Fees - continued
Fees Charged to Other Fidelity Clients. The Board also considered Fidelity fee structures and other information with respect to clients of FMR and its affiliates, such as other mutual funds advised or subadvised by FMR or its affiliates, pension plan clients, and other institutional clients. The Board noted the findings of the 2013 ad hoc joint committee (created with the board of other Fidelity funds), which reviewed and compared Fidelity's institutional investment advisory business with its business of providing services to the Fidelity funds, including the differences in services provided, fees charged, and costs incurred, as well as competition in their respective marketplaces.
Based on its review of total expense ratios and fees charged to other Fidelity clients, the Board concluded that the total expense ratio of each class of the fund was reasonable, although in some cases above the median of the universe presented for comparison, in light of the services that the fund and its shareholders receive and the other factors considered.
Costs of the Services and Profitability. The Board considered the revenues earned and the expenses incurred by Fidelity in conducting the business of developing, marketing, distributing, managing, administering and servicing the fund and servicing the fund's shareholders. The Board also considered the level of Fidelity's profits in respect of all the Fidelity funds.
On an annual basis, FMR presents to the Board Fidelity's profitability for the fund. Fidelity calculates the profitability for each fund, as well as aggregate profitability for groups of Fidelity funds and all Fidelity funds, using a series of detailed revenue and cost allocation methodologies which originate with the books and records of Fidelity on which Fidelity's audited financial statements are based. The Audit Committee of the Board reviews any significant changes from the prior year's methodologies.
PricewaterhouseCoopers LLP (PwC), independent registered public accounting firm and auditor to Fidelity and certain Fidelity funds, has been engaged annually by the Board as part of the Board's assessment of Fidelity's profitability analysis. PwC's engagement includes the review and assessment of the methodologies used by Fidelity in determining the revenues and expenses attributable to Fidelity's mutual fund business, and completion of agreed-upon procedures surrounding the mathematical accuracy of fund profitability and its conformity to allocation methodologies. After considering PwC's reports issued under the engagement and information provided by Fidelity, the Board concluded that while other allocation methods may also be reasonable, Fidelity's profitability methodologies are reasonable in all material respects.
The Board also reviewed Fidelity's non-fund businesses and fall-out benefits related to the mutual fund business as well as cases where Fidelity's affiliates may benefit from or be related to the fund's business.
Annual Report
The Board considered the costs of the services provided by and the profits realized by Fidelity in connection with the operation of the fund and was satisfied that the profitability was not excessive in the circumstances.
Economies of Scale. The Board considered whether there have been economies of scale in respect of the management of the Fidelity funds, whether the Fidelity funds (including the fund) have appropriately benefited from any such economies of scale, and whether there is potential for realization of any further economies of scale. The Board considered the extent to which the fund will benefit from economies of scale through increased services to the fund, through waivers or reimbursements, or through fee or expense reductions. The Board also noted that in 2009, it and the board of other Fidelity funds created an ad hoc committee (the Economies of Scale Committee) to analyze whether FMR attains economies of scale in respect of the management and servicing of the Fidelity funds, whether the Fidelity funds have appropriately benefited from such economies of scale, and whether there is potential for realization of any further economies of scale.
The Board recognized that the fund's management contract incorporates a "group fee" structure, which provides for lower group fee rates as total fund assets under FMR's management increase, and for higher group fee rates as total fund assets under FMR's management decrease. FMR calculates the group fee rates based on a tiered asset "breakpoint" schedule that varies based on asset class. The Board considered that the group fee is designed to deliver the benefits of economies of scale to fund shareholders when total Fidelity fund assets increase, even if assets of any particular fund are unchanged or have declined, because some portion of Fidelity's costs are attributable to services provided to all Fidelity funds, and all funds benefit if those costs can be allocated among more assets. The Board concluded that, given the group fee structure, fund shareholders will benefit from lower management fees as assets under FMR's management increase at the fund complex level, regardless of whether Fidelity achieves any such economies of scale.
The Board concluded, taking into account the analysis of the Economies of Scale Committee, that economies of scale, if any, are being appropriately shared between fund shareholders and Fidelity.
Amendment to Description of Group Fee Rate. At its July 2013 meeting, the Board voted to approve an amendment to the fund's management contract to modify the description of the "group fee rate" effective August 1, 2013. The Board noted that under the prior description in the contract, the group fee rate was based on the average net assets of all registered investment companies with which FMR has management contracts. Under the contract's tiered asset breakpoint schedule, the group fee rate is lower as total fund assets under FMR's management increase, and higher as total fund assets under FMR's management decrease. The Board considered that the prior description would have excluded the assets of 64 Fidelity sector funds from the group fee rate calculation once Fidelity SelectCo, LLC, an affiliate of FMR, assumed management responsibilities for those funds. The Board noted that modifying the description of the group fee rate to continue to include the assets of those 64 funds for purposes of determining group fee rate breakpoints would avoid an immediate adverse impact on the group fee rate for any fund.
Annual Report
Board Approval of Investment Advisory Contracts and
Management Fees - continued
Additional Information Requested by the Board. In order to develop fully the factual basis for consideration of the Fidelity funds' Advisory Contracts, the Board requested and received additional information on certain topics, including: (i) fund performance trends and Fidelity's long-term strategies for certain funds; (ii) the potential to further rationalize the Fidelity fund lineup with the possibility of achieving savings for the funds and Fidelity; (iii) the methodology with respect to competitive fund data and peer group classifications; (iv) the arrangements with, and performance of, certain sub-advisers on behalf of the Fidelity funds, as well as certain proposed participating affiliate arrangements; (v) the realization of fall-out benefits in certain Fidelity business units; (vi) Fidelity's group fee structures, including the rationale for the individual fee rates of certain categories of funds and the definition of group assets; (vii) trends regarding industry use of performance fee structures and the performance adjustment methodologies applicable to the Fidelity funds; (viii) additional competitive analysis regarding the total expenses for certain classes; and (ix) fund profitability methodology, including Fidelity's cost allocation methodology, and the impact of certain factors on fund profitability results.
Based on its evaluation of all of the conclusions noted above, and after considering all factors it believed relevant, the Board ultimately concluded that the advisory fee structures are fair and reasonable, and that the fund's Advisory Contracts should be renewed.
Annual Report
Investment Adviser
Fidelity Management & Research Company
Boston, MA
Investment Sub-Advisers
FMR Co., Inc.
Fidelity Management & Research
(U.K.) Inc.
Fidelity Management & Research (Japan) Inc.
Fidelity Management & Research (Hong Kong) Limited
General Distributor
Fidelity Distributors Corporation
Smithfield, RI
Transfer and Service Agents
Fidelity Investments Institutional
Operations Company, Inc.
Boston, MA
Fidelity Service Company, Inc.
Boston, MA
Custodian
The Bank of New York Mellon
New York, NY
(Fidelity Investment logo)(registered trademark)
GOI-UANN-0114 1.786690.110
(Fidelity Investment logo)(registered trademark)
Fidelity Advisor®
Growth Opportunities
Fund - Class Z
Annual Report
November 30, 2013
(Fidelity Cover Art)
Contents
|
Performance |
How the fund has done over time. |
|
|
Management's Discussion of Fund Performance |
The Portfolio Manager's review of fund performance and strategy. |
|
|
Shareholder Expense Example |
An example of shareholder expenses. |
|
|
Investment Changes |
A summary of major shifts in the fund's investments over the past six months. |
|
|
Investments |
A complete list of the fund's investments with their market values. |
|
|
Financial Statements |
Statements of assets and liabilities, operations, and changes in net assets, as well as financial highlights. |
|
|
Notes |
Notes to the financial statements. |
|
|
Report of Independent Registered Public Accounting Firm |
|
|
|
Trustees and Officers |
|
|
|
Board Approval of Investment Advisory Contracts and Management Fees |
|
To view a fund's proxy voting guidelines and proxy voting record for the 12-month period ended June 30, visit http://www.fidelity.com/proxyvotingresults or visit the Securities and Exchange Commission's (SEC) web site at http://www.sec.gov. You may also call 1-877-208-0098 to request a free copy of the proxy voting guidelines.
Standard & Poor's, S&P and S&P 500 are registered service marks of The McGraw-Hill Companies, Inc. and have been licensed for use by Fidelity Distributors Corporation.
Other third-party marks appearing herein are the property of their respective owners.
All other marks appearing herein are registered or unregistered trademarks or service marks of FMR LLC or an affiliated company. © 2014 FMR LLC. All rights reserved.
Annual Report
This report and the financial statements contained herein are submitted for the general information of the shareholders of the fund. This report is not authorized for distribution to prospective investors in the fund unless preceded or accompanied by an effective prospectus.
A fund files its complete schedule of portfolio holdings with the SEC for the first and third quarters of each fiscal year on Form N-Q. Forms N-Q are available on the SEC's web site at http://www.sec.gov. A fund's Forms N-Q may be reviewed and copied at the SEC's Public Reference Room in Washington, DC. Information regarding the operation of the SEC's Public Reference Room may be obtained by calling 1-800-SEC-0330. For a complete list of a fund's portfolio holdings, view the most recent holdings listing, semiannual report, or annual report on Fidelity's web site at http://www.fidelity.com, http://www.advisor.fidelity.com, or http://www.401k.com, as applicable.
NOT FDIC INSURED • MAY LOSE VALUE • NO BANK GUARANTEE
Neither the fund nor Fidelity Distributors Corporation is a bank.
Annual Report
Performance: The Bottom Line
Average annual total return reflects the change in the value of an investment, assuming reinvestment of the class's distributions from dividend income and capital gains (the profits earned upon the sale of securities that have grown in value, if any) and assuming a constant rate of performance each year. The $10,000 table and the fund's returns do not reflect the deduction of taxes that a shareholder would pay on fund distributions or the redemption of fund shares. During periods of reimbursement by Fidelity, a fund's total return will be greater than it would be had the reimbursement not occurred. How a fund did yesterday is no guarantee of how it will do tomorrow.
Average Annual Total Returns
|
Periods ended November 30, 2013 |
Past 1 |
Past 5 |
Past 10 |
|
Class Z A, B |
33.21% |
24.29% |
7.89% |
A The initial offering of Class Z shares took place on August 13, 2013. Returns prior to August 13, 2013 are those of Institutional Class.
B Prior to February 1, 2007, Fidelity Advisor® Growth Opportunities Fund operated under certain different investment policies and compared its performance to a different index. The fund's historical performance may not represent its current investment policies.
$10,000 Over 10 Years
Let's say hypothetically that $10,000 was invested in Fidelity Advisor® Growth Opportunities Fund - Class Z on November 30, 2003. The chart shows how the value of your investment would have changed, and also shows how the Russell 1000® Growth Index performed over the same period. See footnote A above for additional information regarding the performance of Class Z.

Annual Report
Management's Discussion of Fund Performance
Market Recap: With the current bull run nearing the five-year mark, equity benchmarks ripped up old records during the 12 months ending November 30, 2013. Gains were fueled by strengthening U.S. economic data, as well as generally improving economies and accommodative monetary policies worldwide. The broad S&P 500® Index reached new peaks in its 30.30% climb for the period, and the blue-chip Dow Jones Industrial AverageSM surpassed historic milestones en route to a 26.63% gain. The Nasdaq Composite Index®, up 36.73% amid a resurgence in growth-oriented stocks, closed above 4,000 for the first time since 2000. Shedding anxiety over the 2012 U.S. presidential election - and apparently confident that the federal debt-ceiling debate would be resolved - markets rose from period start through late May. News that the U.S. Federal Reserve was considering an end to its stimulative bond-buying kept stocks in flux over the summer but, by September, the Fed had set aside any imminent tapering. Despite jitters over a potential U.S. military strike in Syria and, later, an October budget impasse that briefly shuttered the federal government, volatility was subdued heading into the holidays, with investor optimism helping many markets home in on all-time highs at period end. Elsewhere, non-U.S. developed-market equities saw similar results, with the MSCI® EAFE® Index adding 24.97%.
Comments from Steve Wymer, Lead Portfolio Manager of Fidelity Advisor® Growth Opportunities Fund: For the year, the fund's Class Z shares outperformed the 29.74% gain of the Russell 1000® Growth Index. (For specific results, please refer to the performance section of this report.) Our focus on well-positioned firms with strong product cycles and growth catalysts drew us to the pharmaceuticals, biotechnology & life science space, where a large overweighting and successful picks significantly boosted the fund's relative result. Shares of Isis Pharmaceuticals, our biggest relative contributor, jumped in late June after the drug developer released positive mid-stage data for its promising drug for patients with high triglycerides and type 2 diabetes. Regeneron Pharmaceuticals - one of the fund's largest holdings - received a boost because a key competitor of its age-related macular degeneration program, EYLEA®, had a major setback and delayed its product launch. On the flip side, a sizable position in long-time fund holding lululemon athletica hurt the most. Shares lagged due to consecutive quarters of weaker-than-expected financial results, and were further hampered by two big events - the company's recall of a line of women's yoga pants in March, after they were found to be too sheer, and the June departure of its CEO.
The views expressed above reflect those of the portfolio manager(s) only through the end of the period as stated on the cover of this report and do not necessarily represent the views of Fidelity or any other person in the Fidelity organization. Any such views are subject to change at any time based upon market or other conditions and Fidelity disclaims any responsibility to update such views. These views may not be relied on as investment advice and, because investment decisions for a Fidelity fund are based on numerous factors, may not be relied on as an indication of trading intent on behalf of any Fidelity fund.
Annual Report
Shareholder Expense Example
As a shareholder of the Fund, you incur two types of costs: (1) transaction costs, including sales charges (loads) on purchase payments or redemption proceeds, and (2) ongoing costs, including management fees, distribution and/or service (12b-1) fees and other Fund expenses. This Example is intended to help you understand your ongoing costs (in dollars) of investing in the Fund and to compare these costs with the ongoing costs of investing in other mutual funds.
The actual expense Example is based on an investment of $1,000 invested at the beginning of the period and held for the entire period (June 1, 2013 to November 30, 2013) for Class A, Class T, Class B, Class C and Institutional Class and for the period (August 13, 2013 to November 30, 2013) for Class Z. The hypothetical expense Example is based on an investment of $1,000 invested for the one-half year period (June 1, 2013 to November 30, 2013).
Actual Expenses
The first line of the accompanying table for each class of the Fund provides information about actual account values and actual expenses. You may use the information in this line, together with the amount you invested, to estimate the expenses that you paid over the period. Simply divide your account value by $1,000.00 (for example, an $8,600 account value divided by $1,000.00 = 8.6), then multiply the result by the number in the first line for a class of the Fund under the heading entitled "Expenses Paid During Period" to estimate the expenses you paid on your account during this period. In addition, the Fund, as a shareholder in the underlying Fidelity Central Funds, will indirectly bear its pro-rata share of the fees and expenses incurred by the underlying Fidelity Central Funds. These fees and expenses are not included in the Fund's annualized expense ratio used to calculate the expense estimate in the table below.
Hypothetical Example for Comparison Purposes
The second line of the accompanying table for each class of the Fund provides information about hypothetical account values and hypothetical expenses based on a Class' actual expense ratio and an assumed rate of return of 5% per year before expenses, which is not the Class' actual return. The hypothetical account values and expenses may not be used to estimate the actual ending account balance or expenses you paid for the period. You may use this information to compare the ongoing costs of investing in the Fund and other funds. To do so, compare this 5% hypothetical example with the 5% hypothetical examples that appear in the shareholder reports of the other funds. In addition, the Fund, as a shareholder in the underlying Fidelity Central Funds, will indirectly bear its pro-rata share of the fees and expenses incurred by the underlying Fidelity Central Funds. These fees and expenses are not included in the Fund's annualized expense ratio used to calculate the expense estimate in the table below.
Please note that the expenses shown in the table are meant to highlight your ongoing costs only and do not reflect any transaction costs. Therefore, the second line of the table is useful in comparing ongoing costs only, and will not help you determine the relative total costs of owning different funds. In addition, if these transactional costs were included, your costs would have been higher.
Annual Report
|
|
Annualized |
Beginning |
Ending |
Expenses Paid |
|
Class A |
1.22% |
|
|
|
|
Actual |
|
$ 1,000.00 |
$ 1,136.70 |
$ 6.53 C |
|
HypotheticalA |
|
$ 1,000.00 |
$ 1,018.95 |
$ 6.17 D |
|
Class T |
1.43% |
|
|
|
|
Actual |
|
$ 1,000.00 |
$ 1,135.50 |
$ 7.66 C |
|
HypotheticalA |
|
$ 1,000.00 |
$ 1,017.90 |
$ 7.23 D |
|
Class B |
2.03% |
|
|
|
|
Actual |
|
$ 1,000.00 |
$ 1,132.00 |
$ 10.85 C |
|
HypotheticalA |
|
$ 1,000.00 |
$ 1,014.89 |
$ 10.25 D |
|
Class C |
1.96% |
|
|
|
|
Actual |
|
$ 1,000.00 |
$ 1,132.60 |
$ 10.48 C |
|
HypotheticalA |
|
$ 1,000.00 |
$ 1,015.24 |
$ 9.90 D |
|
Institutional Class |
.94% |
|
|
|
|
Actual |
|
$ 1,000.00 |
$ 1,138.40 |
$ 5.04 C |
|
HypotheticalA |
|
$ 1,000.00 |
$ 1,020.36 |
$ 4.76 D |
|
Class Z |
.78% |
|
|
|
|
Actual |
|
$ 1,000.00 |
$ 1,073.20 |
$ 2.44 C |
|
HypotheticalA |
|
$ 1,000.00 |
$ 1,021.16 |
$ 3.95 D |
A 5% return per year before expenses
B Annualized expense ratio reflects expenses net of applicable fee waivers.
C Actual expenses are equal to each Class' annualized expense ratio, multiplied by the average account value over the period, multiplied by 183/365 (to reflect the one-half year period) for Class A, Class T, Class B, Class C and Institutional Class and multiplied by 110/365 (to reflect the period August 13, 2013 to November 30, 2013) for Class Z. The fees and expenses of the underlying Fidelity Central Funds in which the Fund invests are not included in each Class' annualized expense ratio.
D Hypothetical expenses are equal to each Class' annualized expense ratio, multiplied by the average account value over the period, multiplied by 183/365 (to reflect the one-half year period). The fees and expenses of the underlying Fidelity Central Funds in which the Fund invests are not included in each Class' annualized expense ratio.
Annual Report
Investment Changes (Unaudited)
|
Top Ten Stocks as of November 30, 2013 |
||
|
|
% of fund's |
% of fund's net assets |
|
Google, Inc. Class A |
4.8 |
4.6 |
|
Apple, Inc. |
4.1 |
4.8 |
|
salesforce.com, Inc. |
3.6 |
3.6 |
|
Regeneron Pharmaceuticals, Inc. |
3.0 |
3.5 |
|
Facebook, Inc. Class A |
2.1 |
0.5 |
|
Seattle Genetics, Inc. |
2.1 |
2.3 |
|
lululemon athletica, Inc. |
1.9 |
2.7 |
|
Comcast Corp. Class A |
1.7 |
0.2 |
|
Alkermes PLC |
1.5 |
1.5 |
|
Visa, Inc. Class A |
1.5 |
1.3 |
|
|
26.3 |
|
|
Top Five Market Sectors as of November 30, 2013 |
||
|
|
% of fund's |
% of fund's net assets |
|
Information Technology |
33.1 |
34.7 |
|
Health Care |
19.0 |
19.4 |
|
Consumer Discretionary |
18.2 |
18.5 |
|
Consumer Staples |
9.9 |
9.2 |
|
Industrials |
7.0 |
7.1 |
|
Asset Allocation (% of fund's net assets) |
|||||||
|
As of November 30, 2013* |
As of May 31, 2013** |
||||||
 |
Stocks 97.5% |
|
|
Stocks 99.2% |
|
||
 |
Convertible |
|
|
Convertible |
|
||
 |
Short-Term |
|
|
Short-Term |
|
||
|
* Foreign investments |
6.5% |
|
** Foreign investments |
6.2% |
|
||

Annual Report
Investments November 30, 2013
Showing Percentage of Net Assets
|
Common Stocks - 97.5% |
|||
|
Shares |
Value (000s) |
||
|
CONSUMER DISCRETIONARY - 18.2% |
|||
|
Auto Components - 0.2% |
|||
|
Tenneco, Inc. (a) |
115,600 |
$ 6,635 |
|
|
Automobiles - 0.6% |
|||
|
Tesla Motors, Inc. (a)(d) |
146,400 |
18,634 |
|
|
Hotels, Restaurants & Leisure - 3.1% |
|||
|
Arcos Dorados Holdings, Inc. Class A (d) |
222,600 |
2,716 |
|
|
BJ's Restaurants, Inc. (a) |
54,500 |
1,615 |
|
|
Buffalo Wild Wings, Inc. (a) |
64,200 |
9,645 |
|
|
Chipotle Mexican Grill, Inc. (a) |
22,800 |
11,944 |
|
|
Chuys Holdings, Inc. (a) |
114,500 |
3,989 |
|
|
Dunkin' Brands Group, Inc. |
163,600 |
8,013 |
|
|
Las Vegas Sands Corp. |
133,992 |
9,605 |
|
|
McDonald's Corp. |
135,600 |
13,203 |
|
|
Potbelly Corp. |
3,000 |
84 |
|
|
Starbucks Corp. |
315,500 |
25,701 |
|
|
Starwood Hotels & Resorts Worldwide, Inc. |
61,200 |
4,558 |
|
|
The Cheesecake Factory, Inc. |
64,300 |
3,135 |
|
|
Wendy's Co. |
779,700 |
6,713 |
|
|
|
100,921 |
||
|
Household Durables - 1.0% |
|||
|
Lennar Corp. Class A (d) |
359,500 |
12,856 |
|
|
SodaStream International Ltd. (a) |
105,300 |
6,053 |
|
|
Toll Brothers, Inc. (a) |
240,300 |
8,194 |
|
|
Tupperware Brands Corp. |
54,600 |
4,987 |
|
|
|
32,090 |
||
|
Internet & Catalog Retail - 1.9% |
|||
|
Amazon.com, Inc. (a) |
109,000 |
42,905 |
|
|
priceline.com, Inc. (a) |
13,500 |
16,096 |
|
|
Shutterfly, Inc. (a) |
79,400 |
3,750 |
|
|
zulily, Inc. |
6,800 |
238 |
|
|
|
62,989 |
||
|
Media - 3.6% |
|||
|
AMC Networks, Inc. Class A (a) |
161,500 |
10,367 |
|
|
Comcast Corp. Class A |
1,095,900 |
54,653 |
|
|
DIRECTV (a) |
112,300 |
7,424 |
|
|
IMAX Corp. (a) |
434,100 |
13,383 |
|
|
Lions Gate Entertainment Corp. (a) |
241,100 |
7,628 |
|
|
News Corp. Class A (a) |
39,325 |
706 |
|
|
Common Stocks - continued |
|||
|
Shares |
Value (000s) |
||
|
CONSUMER DISCRETIONARY - continued |
|||
|
Media - continued |
|||
|
The Walt Disney Co. |
123,300 |
$ 8,698 |
|
|
Twenty-First Century Fox, Inc. Class A |
476,800 |
15,968 |
|
|
|
118,827 |
||
|
Multiline Retail - 0.2% |
|||
|
Target Corp. |
91,300 |
5,837 |
|
|
Specialty Retail - 3.4% |
|||
|
Abercrombie & Fitch Co. Class A |
117,300 |
4,021 |
|
|
Bed Bath & Beyond, Inc. (a) |
64,700 |
5,049 |
|
|
Cabela's, Inc. Class A (a) |
105,000 |
6,431 |
|
|
CarMax, Inc. (a) |
209,700 |
10,558 |
|
|
DSW, Inc. Class A |
82,400 |
3,694 |
|
|
Five Below, Inc. (a) |
105,600 |
5,614 |
|
|
GNC Holdings, Inc. |
137,500 |
8,275 |
|
|
Home Depot, Inc. |
236,100 |
19,046 |
|
|
Lumber Liquidators Holdings, Inc. (a)(d) |
361,200 |
36,369 |
|
|
The Container Store Group, Inc. |
6,800 |
277 |
|
|
TJX Companies, Inc. |
156,600 |
9,847 |
|
|
|
109,181 |
||
|
Textiles, Apparel & Luxury Goods - 4.2% |
|||
|
Fifth & Pacific Companies, Inc. (a) |
146,100 |
4,772 |
|
|
Fossil Group, Inc. (a) |
147,100 |
18,721 |
|
|
lululemon athletica, Inc. (a)(d) |
902,216 |
62,902 |
|
|
Michael Kors Holdings Ltd. (a) |
197,700 |
16,122 |
|
|
NIKE, Inc. Class B |
150,400 |
11,903 |
|
|
Prada SpA |
454,000 |
4,383 |
|
|
Skechers U.S.A., Inc. Class A (sub. vtg.) (a) |
130,100 |
4,374 |
|
|
Steven Madden Ltd. (a) |
264,600 |
10,309 |
|
|
Under Armour, Inc. Class A (sub. vtg.) (a) |
48,600 |
3,922 |
|
|
Vince Holding Corp. |
5,100 |
149 |
|
|
|
137,557 |
||
|
TOTAL CONSUMER DISCRETIONARY |
592,671 |
||
|
CONSUMER STAPLES - 9.9% |
|||
|
Beverages - 1.6% |
|||
|
Monster Beverage Corp. (a) |
83,300 |
4,930 |
|
|
PepsiCo, Inc. |
178,300 |
15,059 |
|
|
Common Stocks - continued |
|||
|
Shares |
Value (000s) |
||
|
CONSUMER STAPLES - continued |
|||
|
Beverages - continued |
|||
|
SABMiller PLC |
92,200 |
$ 4,757 |
|
|
The Coca-Cola Co. |
640,800 |
25,754 |
|
|
|
50,500 |
||
|
Food & Staples Retailing - 3.2% |
|||
|
Costco Wholesale Corp. |
249,300 |
31,270 |
|
|
CVS Caremark Corp. |
360,000 |
24,106 |
|
|
Fresh Market, Inc. (a) |
56,433 |
2,297 |
|
|
Wal-Mart Stores, Inc. |
233,480 |
18,914 |
|
|
Walgreen Co. |
298,500 |
17,671 |
|
|
Whole Foods Market, Inc. |
204,100 |
11,552 |
|
|
|
105,810 |
||
|
Food Products - 1.8% |
|||
|
Bunge Ltd. |
63,200 |
5,064 |
|
|
Green Mountain Coffee Roasters, Inc. (d) |
628,900 |
42,375 |
|
|
Mead Johnson Nutrition Co. Class A |
99,100 |
8,375 |
|
|
Mondelez International, Inc. |
125,000 |
4,191 |
|
|
|
60,005 |
||
|
Household Products - 0.8% |
|||
|
Procter & Gamble Co. |
198,200 |
16,692 |
|
|
Svenska Cellulosa AB (SCA) (B Shares) |
309,500 |
9,036 |
|
|
|
25,728 |
||
|
Personal Products - 0.4% |
|||
|
Avon Products, Inc. |
100,242 |
1,787 |
|
|
Herbalife Ltd. |
177,900 |
12,396 |
|
|
|
14,183 |
||
|
Tobacco - 2.1% |
|||
|
Altria Group, Inc. |
808,500 |
29,898 |
|
|
Japan Tobacco, Inc. |
34,800 |
1,175 |
|
|
Lorillard, Inc. |
179,800 |
9,229 |
|
|
Philip Morris International, Inc. |
319,250 |
27,309 |
|
|
|
67,611 |
||
|
TOTAL CONSUMER STAPLES |
323,837 |
||
|
ENERGY - 4.2% |
|||
|
Energy Equipment & Services - 1.5% |
|||
|
FMC Technologies, Inc. (a) |
95,840 |
4,610 |
|
|
Halliburton Co. |
118,300 |
6,232 |
|
|
Common Stocks - continued |
|||
|
Shares |
Value (000s) |
||
|
ENERGY - continued |
|||
|
Energy Equipment & Services - continued |
|||
|
National Oilwell Varco, Inc. |
83,988 |
$ 6,845 |
|
|
Schlumberger Ltd. |
351,900 |
31,115 |
|
|
|
48,802 |
||
|
Oil, Gas & Consumable Fuels - 2.7% |
|||
|
Anadarko Petroleum Corp. |
74,200 |
6,590 |
|
|
Cabot Oil & Gas Corp. |
158,400 |
5,457 |
|
|
Chesapeake Energy Corp. |
165,264 |
4,441 |
|
|
Concho Resources, Inc. (a) |
69,800 |
7,254 |
|
|
Continental Resources, Inc. (a) |
87,800 |
9,439 |
|
|
EOG Resources, Inc. |
20,600 |
3,399 |
|
|
Hess Corp. |
135,100 |
10,961 |
|
|
Noble Energy, Inc. |
95,300 |
6,694 |
|
|
Occidental Petroleum Corp. |
166,300 |
15,792 |
|
|
PDC Energy, Inc. (a) |
48,700 |
2,869 |
|
|
Peabody Energy Corp. |
118,100 |
2,149 |
|
|
Phillips 66 Co. |
36,700 |
2,555 |
|
|
Pioneer Natural Resources Co. |
27,400 |
4,870 |
|
|
Range Resources Corp. |
16,300 |
1,266 |
|
|
Valero Energy Corp. |
117,000 |
5,349 |
|
|
|
89,085 |
||
|
TOTAL ENERGY |
137,887 |
||
|
FINANCIALS - 4.0% |
|||
|
Capital Markets - 0.6% |
|||
|
BlackRock, Inc. Class A |
10,400 |
3,149 |
|
|
Charles Schwab Corp. |
389,100 |
9,525 |
|
|
Goldman Sachs Group, Inc. |
24,591 |
4,154 |
|
|
T. Rowe Price Group, Inc. |
30,300 |
2,438 |
|
|
|
19,266 |
||
|
Commercial Banks - 0.3% |
|||
|
Signature Bank (a) |
31,800 |
3,379 |
|
|
Wells Fargo & Co. |
125,000 |
5,503 |
|
|
|
8,882 |
||
|
Consumer Finance - 2.1% |
|||
|
American Express Co. |
432,100 |
37,074 |
|
|
Discover Financial Services |
607,633 |
32,387 |
|
|
|
69,461 |
||
|
Common Stocks - continued |
|||
|
Shares |
Value (000s) |
||
|
FINANCIALS - continued |
|||
|
Diversified Financial Services - 0.8% |
|||
|
Bank of America Corp. |
297,800 |
$ 4,711 |
|
|
BM&F Bovespa SA |
765,958 |
3,800 |
|
|
Citigroup, Inc. |
105,700 |
5,594 |
|
|
CME Group, Inc. |
22,000 |
1,803 |
|
|
JPMorgan Chase & Co. |
200,900 |
11,495 |
|
|
|
27,403 |
||
|
Real Estate Investment Trusts - 0.1% |
|||
|
Simon Property Group, Inc. |
25,978 |
3,893 |
|
|
Real Estate Management & Development - 0.1% |
|||
|
The St. Joe Co. (a)(d) |
100,400 |
1,781 |
|
|
TOTAL FINANCIALS |
130,686 |
||
|
HEALTH CARE - 19.0% |
|||
|
Biotechnology - 15.3% |
|||
|
ACADIA Pharmaceuticals, Inc. (a) |
108,300 |
2,522 |
|
|
Agios Pharmaceuticals, Inc. |
38,217 |
671 |
|
|
Alexion Pharmaceuticals, Inc. (a) |
39,500 |
4,918 |
|
|
Alkermes PLC (a) |
1,241,000 |
50,112 |
|
|
Alnylam Pharmaceuticals, Inc. (a) |
128,800 |
7,883 |
|
|
Amarin Corp. PLC ADR (a)(d) |
265,000 |
482 |
|
|
Amgen, Inc. |
232,000 |
26,467 |
|
|
Biogen Idec, Inc. (a) |
45,600 |
13,268 |
|
|
Bluebird Bio, Inc. (d) |
70,947 |
1,449 |
|
|
Celgene Corp. (a) |
55,235 |
8,935 |
|
|
Celldex Therapeutics, Inc. (a) |
215,700 |
5,988 |
|
|
Cepheid, Inc. (a) |
136,353 |
6,193 |
|
|
Clovis Oncology, Inc. (a) |
16,500 |
995 |
|
|
Elan Corp. PLC sponsored ADR (a) |
286,800 |
5,185 |
|
|
Exelixis, Inc. (a)(d) |
2,397,011 |
13,975 |
|
|
Gilead Sciences, Inc. (a) |
516,100 |
38,609 |
|
|
ImmunoGen, Inc. (a)(d) |
1,369,351 |
19,897 |
|
|
Immunomedics, Inc. (a)(d) |
1,348,687 |
5,826 |
|
|
Insmed, Inc. (a) |
330,600 |
5,356 |
|
|
InterMune, Inc. (a) |
110,400 |
1,527 |
|
|
Intrexon Corp. |
10,100 |
231 |
|
|
Ironwood Pharmaceuticals, Inc. Class A (a) |
227,500 |
2,598 |
|
|
Isis Pharmaceuticals, Inc. (a)(d) |
1,259,953 |
48,836 |
|
|
Lexicon Pharmaceuticals, Inc. (a) |
8,418,904 |
20,205 |
|
|
Merrimack Pharmaceuticals, Inc. (a)(d) |
591,500 |
2,331 |
|
|
Common Stocks - continued |
|||
|
Shares |
Value (000s) |
||
|
HEALTH CARE - continued |
|||
|
Biotechnology - continued |
|||
|
Metabolix, Inc. (a) |
246,795 |
$ 276 |
|
|
NPS Pharmaceuticals, Inc. (a) |
484,500 |
12,796 |
|
|
Prothena Corp. PLC (a) |
117,602 |
3,320 |
|
|
Receptos, Inc. |
87,600 |
2,027 |
|
|
Regeneron Pharmaceuticals, Inc. (a) |
332,600 |
97,738 |
|
|
Regulus Therapeutics, Inc. (a) |
295,138 |
1,856 |
|
|
Rigel Pharmaceuticals, Inc. (a) |
690,248 |
1,836 |
|
|
Seattle Genetics, Inc. (a)(d) |
1,665,767 |
68,446 |
|
|
Transition Therapeutics, Inc. (a) |
1,007,397 |
5,823 |
|
|
Vertex Pharmaceuticals, Inc. (a) |
68,690 |
4,768 |
|
|
XOMA Corp. (a) |
1,110,100 |
5,306 |
|
|
|
498,651 |
||
|
Health Care Equipment & Supplies - 0.7% |
|||
|
Abbott Laboratories |
89,300 |
3,410 |
|
|
Align Technology, Inc. (a) |
29,700 |
1,623 |
|
|
Baxter International, Inc. |
38,900 |
2,663 |
|
|
Cyberonics, Inc. (a) |
67,300 |
4,625 |
|
|
Steris Corp. |
201,100 |
9,279 |
|
|
|
21,600 |
||
|
Health Care Providers & Services - 0.8% |
|||
|
Accretive Health, Inc. (a) |
596,000 |
5,054 |
|
|
BioScrip, Inc. (a) |
792,300 |
5,396 |
|
|
Catamaran Corp. (a) |
30,500 |
1,392 |
|
|
Express Scripts Holding Co. (a) |
125,167 |
8,430 |
|
|
McKesson Corp. |
30,800 |
5,109 |
|
|
|
25,381 |
||
|
Health Care Technology - 0.3% |
|||
|
athenahealth, Inc. (a) |
80,800 |
10,599 |
|
|
Veeva Systems, Inc. Class A |
2,900 |
117 |
|
|
|
10,716 |
||
|
Life Sciences Tools & Services - 0.2% |
|||
|
Illumina, Inc. (a)(d) |
86,000 |
8,428 |
|
|
Pharmaceuticals - 1.7% |
|||
|
AbbVie, Inc. |
156,200 |
7,568 |
|
|
Actavis PLC (a) |
44,500 |
7,257 |
|
|
Allergan, Inc. |
84,600 |
8,210 |
|
|
Auxilium Pharmaceuticals, Inc. (a) |
226,700 |
4,627 |
|
|
Bristol-Myers Squibb Co. |
239,700 |
12,316 |
|
|
Common Stocks - continued |
|||
|
Shares |
Value (000s) |
||
|
HEALTH CARE - continued |
|||
|
Pharmaceuticals - continued |
|||
|
Hospira, Inc. (a) |
57,200 |
$ 2,249 |
|
|
Johnson & Johnson |
37,800 |
3,578 |
|
|
Questcor Pharmaceuticals, Inc. (d) |
169,300 |
9,821 |
|
|
|
55,626 |
||
|
TOTAL HEALTH CARE |
620,402 |
||
|
INDUSTRIALS - 7.0% |
|||
|
Aerospace & Defense - 0.9% |
|||
|
Honeywell International, Inc. |
125,800 |
11,135 |
|
|
The Boeing Co. |
132,500 |
17,788 |
|
|
|
28,923 |
||
|
Air Freight & Logistics - 0.9% |
|||
|
FedEx Corp. |
64,100 |
8,891 |
|
|
United Parcel Service, Inc. Class B |
210,400 |
21,541 |
|
|
|
30,432 |
||
|
Airlines - 1.5% |
|||
|
Delta Air Lines, Inc. |
157,500 |
4,564 |
|
|
Southwest Airlines Co. |
528,000 |
9,816 |
|
|
Spirit Airlines, Inc. (a) |
330,700 |
15,169 |
|
|
United Continental Holdings, Inc. (a) |
475,800 |
18,675 |
|
|
|
48,224 |
||
|
Construction & Engineering - 0.1% |
|||
|
Quanta Services, Inc. (a) |
97,859 |
2,898 |
|
|
Electrical Equipment - 0.2% |
|||
|
Roper Industries, Inc. |
38,800 |
5,032 |
|
|
Industrial Conglomerates - 1.1% |
|||
|
3M Co. |
69,100 |
9,226 |
|
|
Danaher Corp. |
282,200 |
21,109 |
|
|
General Electric Co. |
263,800 |
7,033 |
|
|
|
37,368 |
||
|
Machinery - 0.4% |
|||
|
Caterpillar, Inc. |
81,800 |
6,920 |
|
|
Cummins, Inc. |
29,400 |
3,891 |
|
|
ITT Corp. |
24,100 |
984 |
|
|
Xylem, Inc. |
63,000 |
2,177 |
|
|
|
13,972 |
||
|
Road & Rail - 1.9% |
|||
|
CSX Corp. |
324,100 |
8,838 |
|
|
Common Stocks - continued |
|||
|
Shares |
Value (000s) |
||
|
INDUSTRIALS - continued |
|||
|
Road & Rail - continued |
|||
|
Hertz Global Holdings, Inc. (a) |
643,500 |
$ 15,611 |
|
|
J.B. Hunt Transport Services, Inc. |
35,000 |
2,632 |
|
|
Kansas City Southern |
10,800 |
1,307 |
|
|
Union Pacific Corp. |
199,400 |
32,311 |
|
|
|
60,699 |
||
|
TOTAL INDUSTRIALS |
227,548 |
||
|
INFORMATION TECHNOLOGY - 32.8% |
|||
|
Communications Equipment - 1.9% |
|||
|
Infinera Corp. (a)(d) |
1,483,881 |
13,800 |
|
|
QUALCOMM, Inc. |
582,565 |
42,865 |
|
|
Riverbed Technology, Inc. (a) |
115,800 |
2,003 |
|
|
ViaSat, Inc. (a) |
49,600 |
2,984 |
|
|
|
61,652 |
||
|
Computers & Peripherals - 4.5% |
|||
|
3D Systems Corp. (a)(d) |
35,700 |
2,683 |
|
|
Apple, Inc. |
243,658 |
135,491 |
|
|
Fusion-io, Inc. (a)(d) |
618,532 |
6,210 |
|
|
SanDisk Corp. |
49,200 |
3,353 |
|
|
|
147,737 |
||
|
Electronic Equipment & Components - 0.1% |
|||
|
IPG Photonics Corp. (d) |
44,600 |
3,234 |
|
|
Internet Software & Services - 9.5% |
|||
|
Akamai Technologies, Inc. (a) |
31,400 |
1,404 |
|
|
Angie's List, Inc. (a) |
238,600 |
3,107 |
|
|
Benefitfocus, Inc. |
4,200 |
203 |
|
|
Cornerstone OnDemand, Inc. (a) |
140,000 |
7,059 |
|
|
eBay, Inc. (a) |
577,300 |
29,165 |
|
|
Facebook, Inc. Class A (a) |
1,460,641 |
68,665 |
|
|
Google, Inc. Class A (a) |
146,565 |
155,304 |
|
|
LinkedIn Corp. (a) |
18,800 |
4,212 |
|
|
Qihoo 360 Technology Co. Ltd. ADR (a)(d) |
108,700 |
8,861 |
|
|
Rackspace Hosting, Inc. (a) |
133,802 |
5,113 |
|
|
Rocket Fuel, Inc. (d) |
1,200 |
57 |
|
|
Tencent Holdings Ltd. |
150,200 |
8,687 |
|
|
Trulia, Inc. (a) |
89,500 |
3,073 |
|
|
Twitter, Inc. |
24,600 |
1,023 |
|
|
Common Stocks - continued |
|||
|
Shares |
Value (000s) |
||
|
INFORMATION TECHNOLOGY - continued |
|||
|
Internet Software & Services - continued |
|||
|
Web.com Group, Inc. (a) |
469,200 |
$ 13,396 |
|
|
Wix.com Ltd. (a) |
34,700 |
711 |
|
|
|
310,040 |
||
|
IT Services - 3.7% |
|||
|
Cognizant Technology Solutions Corp. Class A (a) |
127,216 |
11,944 |
|
|
IBM Corp. |
117,900 |
21,184 |
|
|
MasterCard, Inc. Class A |
52,200 |
39,714 |
|
|
Visa, Inc. Class A |
240,400 |
48,912 |
|
|
|
121,754 |
||
|
Semiconductors & Semiconductor Equipment - 5.2% |
|||
|
Applied Materials, Inc. |
211,300 |
3,655 |
|
|
Applied Micro Circuits Corp. (a) |
1,394,600 |
17,502 |
|
|
Broadcom Corp. Class A |
152,300 |
4,065 |
|
|
Cavium, Inc. (a) |
74,300 |
2,690 |
|
|
Cree, Inc. (a) |
737,800 |
41,169 |
|
|
Cypress Semiconductor Corp. |
1,344,866 |
13,032 |
|
|
Intel Corp. |
101,900 |
2,429 |
|
|
Mellanox Technologies Ltd. (a)(d) |
198,600 |
7,733 |
|
|
Nanoco Group PLC (a)(d) |
483,200 |
1,168 |
|
|
NVIDIA Corp. |
2,409,030 |
37,581 |
|
|
Rambus, Inc. (a) |
1,255,300 |
10,783 |
|
|
Silicon Laboratories, Inc. (a) |
671,400 |
26,218 |
|
|
Xilinx, Inc. |
60,800 |
2,701 |
|
|
|
170,726 |
||
|
Software - 7.9% |
|||
|
Adobe Systems, Inc. (a) |
81,800 |
4,645 |
|
|
Citrix Systems, Inc. (a) |
35,500 |
2,106 |
|
|
Concur Technologies, Inc. (a) |
66,400 |
6,447 |
|
|
FireEye, Inc. |
4,885 |
187 |
|
|
Interactive Intelligence Group, Inc. (a) |
78,700 |
5,119 |
|
|
Intuit, Inc. |
72,200 |
5,359 |
|
|
Microsoft Corp. |
902,900 |
34,428 |
|
|
NetSuite, Inc. (a) |
133,800 |
12,856 |
|
|
Oracle Corp. |
338,200 |
11,935 |
|
|
QLIK Technologies, Inc. (a) |
237,774 |
5,963 |
|
|
Red Hat, Inc. (a) |
534,930 |
25,061 |
|
|
salesforce.com, Inc. (a) |
2,256,400 |
117,536 |
|
|
ServiceNow, Inc. (a) |
125,400 |
6,660 |
|
|
SolarWinds, Inc. (a) |
94,700 |
3,167 |
|
|
Solera Holdings, Inc. |
13,500 |
901 |
|
|
Common Stocks - continued |
|||
|
Shares |
Value (000s) |
||
|
INFORMATION TECHNOLOGY - continued |
|||
|
Software - continued |
|||
|
Splunk, Inc. (a) |
41,100 |
$ 2,966 |
|
|
TiVo, Inc. (a) |
262,000 |
3,361 |
|
|
VMware, Inc. Class A (a) |
28,700 |
2,314 |
|
|
Workday, Inc. Class A (a) |
62,300 |
5,130 |
|
|
|
256,141 |
||
|
TOTAL INFORMATION TECHNOLOGY |
1,071,284 |
||
|
MATERIALS - 1.9% |
|||
|
Chemicals - 1.6% |
|||
|
E.I. du Pont de Nemours & Co. |
101,600 |
6,236 |
|
|
Eastman Chemical Co. |
31,200 |
2,403 |
|
|
Monsanto Co. |
325,500 |
36,889 |
|
|
The Mosaic Co. |
99,500 |
4,766 |
|
|
|
50,294 |
||
|
Metals & Mining - 0.3% |
|||
|
Nucor Corp. |
76,800 |
3,921 |
|
|
U.S. Silica Holdings, Inc. |
190,500 |
6,574 |
|
|
|
10,495 |
||
|
TOTAL MATERIALS |
60,789 |
||
|
TELECOMMUNICATION SERVICES - 0.5% |
|||
|
Diversified Telecommunication Services - 0.3% |
|||
|
Verizon Communications, Inc. |
178,400 |
8,852 |
|
|
Wireless Telecommunication Services - 0.2% |
|||
|
RingCentral, Inc. |
5,000 |
79 |
|
|
Sprint Corp. (a) |
240,987 |
2,022 |
|
|
T-Mobile U.S., Inc. (a) |
183,700 |
4,778 |
|
|
|
6,879 |
||
|
TOTAL TELECOMMUNICATION SERVICES |
15,731 |
||
|
TOTAL COMMON STOCKS (Cost $2,127,984) |
|
||
|
Preferred Stocks - 0.3% |
|||
|
Shares |
Value (000s) |
||
|
Convertible Preferred Stocks - 0.3% |
|||
|
HEALTH CARE - 0.0% |
|||
|
Pharmaceuticals - 0.0% |
|||
|
aTyr Pharma, Inc. 8.00% (e) |
638,618 |
$ 1,615 |
|
|
INFORMATION TECHNOLOGY - 0.3% |
|||
|
Software - 0.3% |
|||
|
MongoDB, Inc. Series F, 8.00% (e) |
515,124 |
8,615 |
|
|
TOTAL CONVERTIBLE PREFERRED STOCKS |
10,230 |
||
|
Nonconvertible Preferred Stocks - 0.0% |
|||
|
HEALTH CARE - 0.0% |
|||
|
Pharmaceuticals - 0.0% |
|||
|
Equilibrate Asia Therapeutics Series D (e) |
676,657 |
11 |
|
|
Equilibrate Worldwide Therapeutics Series D (e) |
676,657 |
27 |
|
|
Neuropathic Worldwide Therapeutics Series D (e) |
676,657 |
5 |
|
|
Oculus Worldwide Therapeutics Series D (e) |
676,657 |
8 |
|
|
Orchestrate U.S. Therapeutics, Inc. Series D (e) |
676,657 |
12 |
|
|
Orchestrate Worldwide Therapeutics Series D (e) |
676,657 |
21 |
|
|
|
84 |
||
|
TOTAL PREFERRED STOCKS (Cost $10,314) |
|
||
|
Money Market Funds - 6.7% |
|||
|
|
|
|
|
|
Fidelity Cash Central Fund, 0.10% (b) |
72,069,932 |
72,070 |
|
|
Fidelity Securities Lending Cash Central Fund, 0.10% (b)(c) |
148,019,702 |
148,020 |
|
|
TOTAL MONEY MARKET FUNDS (Cost $220,090) |
|
||
|
TOTAL INVESTMENT PORTFOLIO - 104.5% (Cost $2,358,388) |
3,411,239 |
||
|
NET OTHER ASSETS (LIABILITIES) - (4.5)% |
(147,143) |
||
|
NET ASSETS - 100% |
$ 3,264,096 |
||
|
Legend |
|
(a) Non-income producing |
|
(b) Affiliated fund that is generally available only to investment companies and other accounts managed by Fidelity Investments. The rate quoted is the annualized seven-day yield of the fund at period end. A complete unaudited listing of the fund's holdings as of its most recent quarter end is available upon request. In addition, each Fidelity Central Fund's financial statements, which are not covered by the Fund's Report of Independent Registered Public Accounting Firm, are available on the SEC's website or upon request. |
|
(c) Investment made with cash collateral received from securities on loan. |
|
(d) Security or a portion of the security is on loan at period end. |
|
(e) Restricted securities - Investment in securities not registered under the Securities Act of 1933 (excluding 144A issues). At the end of the period, the value of restricted securities (excluding 144A issues) amounted to $10,314,000 or 0.3% of net assets. |
|
Additional information on each restricted holding is as follows: |
|
Security |
Acquisition Date |
Acquisition Cost (000s) |
|
aTyr Pharma, Inc. 8.00% |
4/8/13 |
$ 1,615 |
|
Equilibrate Asia Therapeutics Series D |
5/17/13 |
$ 11 |
|
Equilibrate Worldwide Therapeutics Series D |
5/17/13 |
$ 27 |
|
MongoDB, Inc. Series F, 8.00% |
10/2/13 |
$ 8,615 |
|
Neuropathic Worldwide Therapeutics Series D |
5/17/13 |
$ 5 |
|
Oculus Worldwide Therapeutics Series D |
5/17/13 |
$ 8 |
|
Orchestrate U.S. Therapeutics, Inc. Series D |
5/17/13 |
$ 12 |
|
Orchestrate Worldwide Therapeutics Series D |
5/17/13 |
$ 21 |
|
Affiliated Central Funds |
|
Information regarding fiscal year to date income earned by the Fund from investments in Fidelity Central Funds is as follows: |
|
Fund |
Income earned |
|
Fidelity Cash Central Fund |
$ 40 |
|
Fidelity Securities Lending Cash Central Fund |
1,023 |
|
Total |
$ 1,063 |
|
Other Information |
|
The following is a summary of the inputs used, as of November 30, 2013, involving the Fund's assets and liabilities carried at fair value. The inputs or methodology used for valuing securities may not be an indication of the risk associated with investing in those securities. For more information on valuation inputs, and their aggregation into the levels used in the table below, please refer to the Investment Valuation section in the accompanying Notes to Financial Statements. |
|
Valuation Inputs at Reporting Date: |
||||
|
Description |
Total |
Level 1 |
Level 2 |
Level 3 |
|
Investments in Securities: |
||||
|
Equities: |
||||
|
Consumer Discretionary |
$ 592,671 |
$ 592,671 |
$ - |
$ - |
|
Consumer Staples |
323,837 |
323,837 |
- |
- |
|
Energy |
137,887 |
137,887 |
- |
- |
|
Financials |
130,686 |
130,686 |
- |
- |
|
Health Care |
622,101 |
620,402 |
- |
1,699 |
|
Industrials |
227,548 |
227,548 |
- |
- |
|
Information Technology |
1,079,899 |
1,071,284 |
- |
8,615 |
|
Materials |
60,789 |
60,789 |
- |
- |
|
Telecommunication Services |
15,731 |
15,731 |
- |
- |
|
Money Market Funds |
220,090 |
220,090 |
- |
- |
|
Total Investments in Securities: |
$ 3,411,239 |
$ 3,400,925 |
$ - |
$ 10,314 |
See accompanying notes which are an integral part of the financial statements.
Annual Report
Financial Statements
Statement of Assets and Liabilities
|
Amounts in thousands (except per-share amounts) |
November 30, 2013 |
|
|
|
|
|
|
Assets |
|
|
|
Investment in securities, at value (including securities loaned of $144,819) - See accompanying schedule: Unaffiliated issuers (cost $2,138,298) |
$ 3,191,149 |
|
|
Fidelity Central Funds (cost $220,090) |
220,090 |
|
|
Total Investments (cost $2,358,388) |
|
$ 3,411,239 |
|
Cash |
|
2,733 |
|
Foreign currency held at value (cost $53) |
|
53 |
|
Receivable for fund shares sold |
|
3,876 |
|
Dividends receivable |
|
2,437 |
|
Distributions receivable from Fidelity Central Funds |
|
99 |
|
Prepaid expenses |
|
9 |
|
Other receivables |
|
155 |
|
Total assets |
|
3,420,601 |
|
|
|
|
|
Liabilities |
|
|
|
Payable for investments purchased |
$ 3,360 |
|
|
Payable for fund shares redeemed |
1,663 |
|
|
Accrued management fee |
1,809 |
|
|
Distribution and service plan fees payable |
833 |
|
|
Other affiliated payables |
607 |
|
|
Other payables and accrued expenses |
213 |
|
|
Collateral on securities loaned, at value |
148,020 |
|
|
Total liabilities |
|
156,505 |
|
|
|
|
|
Net Assets |
|
$ 3,264,096 |
|
Net Assets consist of: |
|
|
|
Paid in capital |
|
$ 2,467,371 |
|
Accumulated net investment loss |
|
(5,796) |
|
Accumulated undistributed net realized gain (loss) on investments and foreign currency transactions |
|
(250,330) |
|
Net unrealized appreciation (depreciation) on investments and assets and liabilities in foreign currencies |
|
1,052,851 |
|
Net Assets |
|
$ 3,264,096 |
See accompanying notes which are an integral part of the financial statements.
Annual Report
Financial Statements - continued
Statement of Assets and Liabilities - continued
|
Amounts in thousands (except per-share amounts) |
November 30, 2013 |
|
|
|
|
|
|
Calculation of Maximum Offering Price Class A: |
|
$ 54.89 |
|
|
|
|
|
Maximum offering price per share (100/94.25 of $54.89) |
|
$ 58.24 |
|
Class T: |
|
$ 55.04 |
|
|
|
|
|
Maximum offering price per share (100/96.50 of $55.04) |
|
$ 57.04 |
|
Class B: |
|
$ 50.87 |
|
|
|
|
|
Class C: |
|
$ 51.17 |
|
|
|
|
|
Institutional Class: |
|
$ 57.18 |
|
|
|
|
|
Class Z: |
|
$ 57.20 |
A Redemption price per share is equal to net asset value less any applicable contingent deferred sales charge.
See accompanying notes which are an integral part of the financial statements.
Annual Report
Statement of Operations
|
Amounts in thousands |
Year ended November 30, 2013 |
|
|
|
|
|
|
Investment Income |
|
|
|
Dividends |
|
$ 25,690 |
|
Income from Fidelity Central Funds |
|
1,063 |
|
Total income |
|
26,753 |
|
|
|
|
|
Expenses |
|
|
|
Management fee |
$ 14,417 |
|
|
Performance adjustment |
3,537 |
|
|
Transfer agent fees |
5,525 |
|
|
Distribution and service plan fees |
8,757 |
|
|
Accounting and security lending fees |
793 |
|
|
Custodian fees and expenses |
49 |
|
|
Independent trustees' compensation |
14 |
|
|
Appreciation in deferred trustee compensation account |
1 |
|
|
Registration fees |
193 |
|
|
Audit |
63 |
|
|
Legal |
10 |
|
|
Miscellaneous |
21 |
|
|
Total expenses before reductions |
33,380 |
|
|
Expense reductions |
(95) |
33,285 |
|
Net investment income (loss) |
|
(6,532) |
|
Realized and Unrealized Gain (Loss) Net realized gain (loss) on: |
|
|
|
Investment securities: |
|
|
|
Unaffiliated issuers |
167,078 |
|
|
Foreign currency transactions |
5 |
|
|
Total net realized gain (loss) |
|
167,083 |
|
Change in net unrealized appreciation (depreciation) on: Investment securities |
587,054 |
|
|
Assets and liabilities in foreign currencies |
1 |
|
|
Total change in net unrealized appreciation (depreciation) |
|
587,055 |
|
Net gain (loss) |
|
754,138 |
|
Net increase (decrease) in net assets resulting from operations |
|
$ 747,606 |
See accompanying notes which are an integral part of the financial statements.
Annual Report
Financial Statements - continued
Statement of Changes in Net Assets
|
Amounts in thousands |
Year ended |
Year ended |
|
Increase (Decrease) in Net Assets |
|
|
|
Operations |
|
|
|
Net investment income (loss) |
$ (6,532) |
$ (7,218) |
|
Net realized gain (loss) |
167,083 |
165,968 |
|
Change in net unrealized appreciation (depreciation) |
587,055 |
117,910 |
|
Net increase (decrease) in net assets resulting |
747,606 |
276,660 |
|
Share transactions - net increase (decrease) |
411,715 |
182,997 |
|
Total increase (decrease) in net assets |
1,159,321 |
459,657 |
|
|
|
|
|
Net Assets |
|
|
|
Beginning of period |
2,104,775 |
1,645,118 |
|
End of period (including accumulated net investment loss of $5,796 and accumulated net investment loss of $6,762, respectively) |
$ 3,264,096 |
$ 2,104,775 |
See accompanying notes which are an integral part of the financial statements.
Annual Report
Financial Highlights - Class A
|
Years ended November 30, |
2013 |
2012 |
2011 |
2010 |
2009 |
|
Selected Per-Share Data |
|
|
|
|
|
|
Net asset value, beginning of period |
$ 41.34 |
$ 35.39 |
$ 32.30 |
$ 26.30 |
$ 18.92 |
|
Income from Investment Operations |
|
|
|
|
|
|
Net investment income (loss) C |
(.10) |
(.11) |
(.08) |
- H |
.10 |
|
Net realized and unrealized gain (loss) |
13.65 |
6.06 |
3.17 |
6.13 |
7.28 |
|
Total from investment operations |
13.55 |
5.95 |
3.09 |
6.13 |
7.38 |
|
Distributions from net investment income |
- |
- |
- |
(.11) |
- |
|
Distributions from net realized gain |
- |
- |
- |
(.02) |
- |
|
Total distributions |
- |
- |
- |
(.13) |
- |
|
Net asset value, end of period |
$ 54.89 |
$ 41.34 |
$ 35.39 |
$ 32.30 |
$ 26.30 |
|
Total Return A, B |
32.78% |
16.81% |
9.57% |
23.42% |
39.01% |
|
Ratios to Average Net Assets D, G |
|
|
|
|
|
|
Expenses before reductions |
1.23% |
1.30% |
1.08% |
.90% |
.80% |
|
Expenses net of fee waivers, if any |
1.23% |
1.29% |
1.08% |
.90% |
.80% |
|
Expenses net of all reductions |
1.23% |
1.29% |
1.07% |
.90% |
.80% |
|
Net investment income (loss) |
(.20)% |
(.29)% |
(.23)% |
-% F |
.45% |
|
Supplemental Data |
|
|
|
|
|
|
Net assets, end of period (in millions) |
$ 555 |
$ 359 |
$ 267 |
$ 255 |
$ 236 |
|
Portfolio turnover rate E |
17% |
34% |
31% |
35% |
114% |
A Total returns would have been lower if certain expenses had not been reduced during the applicable periods shown.
B Total returns do not include the effect of the sales charges.
C Calculated based on average shares outstanding during the period.
D Fees and expenses of any underlying Fidelity Central Funds are not included in the Fund's expense ratio. The Fund indirectly bears its proportionate share of the expenses of any underlying Fidelity Central Funds.
E Amount does not include the portfolio activity of any underlying Fidelity Central Funds.
F Amount represents less than .01%.
G Expense ratios reflect operating expenses of the class. Expenses before reductions do not reflect amounts reimbursed by the investment adviser or reductions from brokerage service arrangements or reductions from other expense offset arrangements and do not represent the amount paid by the class during periods when reimbursements or reductions occur. Expenses net of fee waivers reflect expenses after reimbursement by the investment adviser but prior to reductions from brokerage service arrangements or other expense offset arrangements. Expenses net of all reductions represent the net expenses paid by the class.
H Amount represents less than $.01 per share.
See accompanying notes which are an integral part of the financial statements.
Annual Report
Financial Highlights - Class T
|
Years ended November 30, |
2013 |
2012 |
2011 |
2010 |
2009 |
|
Selected Per-Share Data |
|
|
|
|
|
|
Net asset value, beginning of period |
$ 41.54 |
$ 35.62 |
$ 32.58 |
$ 26.52 |
$ 19.12 |
|
Income from Investment Operations |
|
|
|
|
|
|
Net investment income (loss) C |
(.19) |
(.19) |
(.15) |
(.06) |
.05 |
|
Net realized and unrealized gain (loss) |
13.69 |
6.11 |
3.19 |
6.19 |
7.35 |
|
Total from investment operations |
13.50 |
5.92 |
3.04 |
6.13 |
7.40 |
|
Distributions from net investment income |
- |
- |
- |
(.05) |
- |
|
Distributions from net realized gain |
- |
- |
- |
(.02) |
- |
|
Total distributions |
- |
- |
- |
(.07) |
- |
|
Net asset value, end of period |
$ 55.04 |
$ 41.54 |
$ 35.62 |
$ 32.58 |
$ 26.52 |
|
Total Return A, B |
32.50% |
16.62% |
9.33% |
23.18% |
38.70% |
|
Ratios to Average Net Assets D, F |
|
|
|
|
|
|
Expenses before reductions |
1.43% |
1.48% |
1.25% |
1.10% |
1.03% |
|
Expenses net of fee waivers, if any |
1.43% |
1.48% |
1.25% |
1.10% |
1.03% |
|
Expenses net of all reductions |
1.43% |
1.48% |
1.25% |
1.09% |
1.02% |
|
Net investment income (loss) |
(.40)% |
(.48)% |
(.40)% |
(.20)% |
.23% |
|
Supplemental Data |
|
|
|
|
|
|
Net assets, end of period (in millions) |
$ 1,426 |
$ 1,187 |
$ 1,102 |
$ 1,126 |
$ 1,051 |
|
Portfolio turnover rate E |
17% |
34% |
31% |
35% |
114% |
A Total returns would have been lower if certain expenses had not been reduced during the applicable periods shown.
B Total returns do not include the effect of the sales charges.
C Calculated based on average shares outstanding during the period.
D Fees and expenses of any underlying Fidelity Central Funds are not included in the Fund's expense ratio. The Fund indirectly bears its proportionate share of the expenses of any underlying Fidelity Central Funds.
E Amount does not include the portfolio activity of any underlying Fidelity Central Funds.
F Expense ratios reflect operating expenses of the class. Expenses before reductions do not reflect amounts reimbursed by the investment adviser or reductions from brokerage service arrangements or reductions from other expense offset arrangements and do not represent the amount paid by the class during periods when reimbursements or reductions occur. Expenses net of fee waivers reflect expenses after reimbursement by the investment adviser but prior to reductions from brokerage service arrangements or other expense offset arrangements. Expenses net of all reductions represent the net expenses paid by the class.
See accompanying notes which are an integral part of the financial statements.
Annual Report
Financial Highlights - Class B
|
Years ended November 30, |
2013 |
2012 |
2011 |
2010 |
2009 |
|
Selected Per-Share Data |
|
|
|
|
|
|
Net asset value, beginning of period |
$ 38.62 |
$ 33.31 |
$ 30.64 |
$ 25.01 |
$ 18.13 |
|
Income from Investment Operations |
|
|
|
|
|
|
Net investment income (loss) C |
(.44) |
(.39) |
(.33) |
(.21) |
(.06) |
|
Net realized and unrealized gain (loss) |
12.69 |
5.70 |
3.00 |
5.84 |
6.94 |
|
Total from investment operations |
12.25 |
5.31 |
2.67 |
5.63 |
6.88 |
|
Net asset value, end of period |
$ 50.87 |
$ 38.62 |
$ 33.31 |
$ 30.64 |
$ 25.01 |
|
Total Return A, B |
31.72% |
15.94% |
8.71% |
22.51% |
37.95% |
|
Ratios to Average Net Assets D, F |
|
|
|
|
|
|
Expenses before reductions |
2.03% |
2.07% |
1.83% |
1.66% |
1.56% |
|
Expenses net of fee waivers, if any |
2.03% |
2.05% |
1.83% |
1.66% |
1.56% |
|
Expenses net of all reductions |
2.03% |
2.05% |
1.83% |
1.65% |
1.55% |
|
Net investment income (loss) |
(1.00)% |
(1.05)% |
(.98)% |
(.76)% |
(.30)% |
|
Supplemental Data |
|
|
|
|
|
|
Net assets, end of period (in millions) |
$ 12 |
$ 13 |
$ 14 |
$ 18 |
$ 21 |
|
Portfolio turnover rate E |
17% |
34% |
31% |
35% |
114% |
A Total returns would have been lower if certain expenses had not been reduced during the applicable periods shown.
B Total returns do not include the effect of the contingent deferred sales charge.
C Calculated based on average shares outstanding during the period.
D Fees and expenses of any underlying Fidelity Central Funds are not included in the Fund's expense ratio. The Fund indirectly bears its proportionate share of the expenses of any underlying Fidelity Central Funds.
E Amount does not include the portfolio activity of any underlying Fidelity Central Funds.
F Expense ratios reflect operating expenses of the class. Expenses before reductions do not reflect amounts reimbursed by the investment adviser or reductions from brokerage service arrangements or reductions from other expense offset arrangements and do not represent the amount paid by the class during periods when reimbursements or reductions occur. Expenses net of fee waivers reflect expenses after reimbursement by the investment adviser but prior to reductions from brokerage service arrangements or other expense offset arrangements. Expenses net of all reductions represent the net expenses paid by the class.
See accompanying notes which are an integral part of the financial statements.
Annual Report
Financial Highlights - Class C
|
Years ended November 30, |
2013 |
2012 |
2011 |
2010 |
2009 |
|
Selected Per-Share Data |
|
|
|
|
|
|
Net asset value, beginning of period |
$ 38.83 |
$ 33.48 |
$ 30.79 |
$ 25.14 |
$ 18.22 |
|
Income from Investment Operations |
|
|
|
|
|
|
Net investment income (loss) C |
(.42) |
(.38) |
(.33) |
(.21) |
(.06) |
|
Net realized and unrealized gain (loss) |
12.76 |
5.73 |
3.02 |
5.86 |
6.98 |
|
Total from investment operations |
12.34 |
5.35 |
2.69 |
5.65 |
6.92 |
|
Net asset value, end of period |
$ 51.17 |
$ 38.83 |
$ 33.48 |
$ 30.79 |
$ 25.14 |
|
Total Return A, B |
31.78% |
15.98% |
8.74% |
22.47% |
37.98% |
|
Ratios to Average Net Assets D, F |
|
|
|
|
|
|
Expenses before reductions |
1.96% |
2.04% |
1.82% |
1.65% |
1.56% |
|
Expenses net of fee waivers, if any |
1.96% |
2.03% |
1.82% |
1.65% |
1.56% |
|
Expenses net of all reductions |
1.96% |
2.02% |
1.82% |
1.65% |
1.55% |
|
Net investment income (loss) |
(.93)% |
(1.02)% |
(.97)% |
(.75)% |
(.30)% |
|
Supplemental Data |
|
|
|
|
|
|
Net assets, end of period (in millions) |
$ 159 |
$ 71 |
$ 47 |
$ 41 |
$ 37 |
|
Portfolio turnover rate E |
17% |
34% |
31% |
35% |
114% |
A Total returns would have been lower if certain expenses had not been reduced during the applicable periods shown.
B Total returns do not include the effect of the contingent deferred sales charge.
C Calculated based on average shares outstanding during the period.
D Fees and expenses of any underlying Fidelity Central Funds are not included in the Fund's expense ratio. The Fund indirectly bears its proportionate share of the expenses of any underlying Fidelity Central Funds.
E Amount does not include the portfolio activity of any underlying Fidelity Central Funds.
F Expense ratios reflect operating expenses of the class. Expenses before reductions do not reflect amounts reimbursed by the investment adviser or reductions from brokerage service arrangements or reductions from other expense offset arrangements and do not represent the amount paid by the class during periods when reimbursements or reductions occur. Expenses net of fee waivers reflect expenses after reimbursement by the investment adviser but prior to reductions from brokerage service arrangements or other expense offset arrangements. Expenses net of all reductions represent the net expenses paid by the class.
See accompanying notes which are an integral part of the financial statements.
Annual Report
Financial Highlights - Institutional Class
|
Years ended November 30, |
2013 |
2012 |
2011 |
2010 |
2009 |
|
Selected Per-Share Data |
|
|
|
|
|
|
Net asset value, beginning of period |
$ 42.94 |
$ 36.63 |
$ 33.33 |
$ 27.11 |
$ 19.43 |
|
Income from Investment Operations |
|
|
|
|
|
|
Net investment income (loss) B |
.05 |
.01 |
.05 |
.10 |
.17 |
|
Net realized and unrealized gain (loss) |
14.19 |
6.30 |
3.25 |
6.33 |
7.51 |
|
Total from investment operations |
14.24 |
6.31 |
3.30 |
6.43 |
7.68 |
|
Distributions from net investment income |
- |
- |
- |
(.19) |
- |
|
Distributions from net realized gain |
- |
- |
- |
(.02) |
- |
|
Total distributions |
- |
- |
- |
(.21) |
- |
|
Net asset value, end of period |
$ 57.18 |
$ 42.94 |
$ 36.63 |
$ 33.33 |
$ 27.11 |
|
Total Return A |
33.16% |
17.23% |
9.90% |
23.86% |
39.53% |
|
Ratios to Average Net Assets C, E |
|
|
|
|
|
|
Expenses before reductions |
.93% |
.97% |
.72% |
.57% |
.46% |
|
Expenses net of fee waivers, if any |
.93% |
.97% |
.72% |
.57% |
.46% |
|
Expenses net of all reductions |
.93% |
.97% |
.72% |
.56% |
.46% |
|
Net investment income (loss) |
.09% |
.04% |
.13% |
.33% |
.79% |
|
Supplemental Data |
|
|
|
|
|
|
Net assets, end of period (in millions) |
$ 1,112 |
$ 475 |
$ 215 |
$ 118 |
$ 26 |
|
Portfolio turnover rate D |
17% |
34% |
31% |
35% |
114% |
A Total returns would have been lower if certain expenses had not been reduced during the applicable periods shown.
B Calculated based on average shares outstanding during the period.
C Fees and expenses of any underlying Fidelity Central Funds are not included in the Fund's expense ratio. The Fund indirectly bears its proportionate share of the expenses of any underlying Fidelity Central Funds.
D Amount does not include the portfolio activity of any underlying Fidelity Central Funds.
E Expense ratios reflect operating expenses of the class. Expenses before reductions do not reflect amounts reimbursed by the investment adviser or reductions from brokerage service arrangements or reductions from other expense offset arrangements and do not represent the amount paid by the class during periods when reimbursements or reductions occur. Expenses net of fee waivers reflect expenses after reimbursement by the investment adviser but prior to reductions from brokerage service arrangements or other expense offset arrangements. Expenses net of all reductions represent the net expenses paid by the class.
See accompanying notes which are an integral part of the financial statements.
Annual Report
Financial Highlights - Class Z
|
Year ended November 30, |
2013 G |
|
Selected Per-Share Data |
|
|
Net asset value, beginning of period |
$ 53.30 |
|
Income from Investment Operations |
|
|
Net investment income (loss) D |
.02 |
|
Net realized and unrealized gain (loss) |
3.88 |
|
Total from investment operations |
3.90 |
|
Net asset value, end of period |
$ 57.20 |
|
Total Return B, C |
7.32% |
|
Ratios to Average Net Assets E, H |
|
|
Expenses before reductions |
.78% A |
|
Expenses net of fee waivers, if any |
.78% A |
|
Expenses net of all reductions |
.78% A |
|
Net investment income (loss) |
.14% A |
|
Supplemental Data |
|
|
Net assets, end of period (000 omitted) |
$ 107 |
|
Portfolio turnover rate F |
17% |
A Annualized
B Total returns for periods of less than one year are not annualized.
C Total returns would have been lower if certain expenses had not been reduced during the applicable periods shown.
D Calculated based on average shares outstanding during the period.
E Fees and expenses of any underlying Fidelity Central Funds are not included in the Fund's expense ratio. The Fund indirectly bears its proportionate share of the expenses of any underlying Fidelity Central Funds.
F Amount does not include the portfolio activity of any underlying Fidelity Central Funds.
G For the period August 13, 2013 (commencement of sale of shares) to November 30, 2013.
H Expense ratios reflect operating expenses of the class. Expenses before reductions do not reflect amounts reimbursed by the investment adviser or reductions from brokerage service arrangements or reductions from other expense offset arrangements and do not represent the amount paid by the class during periods when reimbursements or reductions occur. Expense ratios before reductions for start-up periods may not be representative of longer-term operating periods. Expenses net of fee waivers reflect expenses after reimbursement by the investment adviser but prior to reductions from brokerage service arrangements or other expense offset arrangements. Expenses net of all reductions represent the net expenses paid by the class.
See accompanying notes which are an integral part of the financial statements.
Annual Report
Notes to Financial Statements
For the period ended November 30, 2013
(Amounts in thousands except percentages)
1. Organization.
Fidelity Advisor Growth Opportunities Fund (the Fund) is a fund of Fidelity Advisor Series I (the Trust) and is authorized to issue an unlimited number of shares. The Trust is registered under the Investment Company Act of 1940, as amended (the 1940 Act), as an open-end management investment company organized as a Massachusetts business trust. The Fund commenced sale of Class Z shares on August 13, 2013. The Fund offers Class A, Class T, Class C, Institutional Class and Class Z shares, each of which, along with Class B shares, has equal rights as to assets and voting privileges. Class B shares are closed to new accounts and additional purchases, except for exchanges and reinvestments. Each class has exclusive voting rights with respect to matters that affect that class. Class B shares will automatically convert to Class A shares after a holding period of seven years from the initial date of purchase.
2. Investments in Fidelity Central Funds.
The Fund invests in Fidelity Central Funds, which are open-end investment companies generally available only to other investment companies and accounts managed by the investment adviser and its affiliates. The Fund's Schedule of Investments lists each of the Fidelity Central Funds held as of period end, if any, as an investment of the Fund, but does not include the underlying holdings of each Fidelity Central Fund. As an Investing Fund, the Fund indirectly bears its proportionate share of the expenses of the underlying Fidelity Central Funds.
The Money Market Central Funds seek preservation of capital and current income and are managed by Fidelity Investments Money Management, Inc. (FIMM), an affiliate of the investment adviser. Annualized expenses of the Money Market Central Funds as of their most recent shareholder report date are less than .01%.
A complete unaudited list of holdings for each Fidelity Central Fund is available upon request or at the Securities and Exchange Commission (the SEC) website at www.sec.gov. In addition, the financial statements of the Fidelity Central Funds, which are not covered by the Fund's Report of Independent Registered Public Accounting Firm, are available on the SEC website or upon request.
3. Significant Accounting Policies.
The financial statements have been prepared in conformity with accounting principles generally accepted in the United States of America (GAAP), which require management to make certain estimates and assumptions at the date of the financial statements. Actual results could differ from those estimates. Subsequent events, if any, through the date that the financial statements were issued have been evaluated in the preparation of
Annual Report
3. Significant Accounting Policies - continued
the financial statements. The following summarizes the significant accounting policies of the Fund:
Investment Valuation. Investments are valued as of 4:00 p.m. Eastern time on the last calendar day of the period. In accordance with valuation policies and procedures approved by the Board of Trustees (the Board), the Fund attempts to obtain prices from one or more third party pricing vendors or brokers to value its investments. When current market prices, quotations or currency exchange rates are not readily available or reliable, investments will be fair valued in good faith by the Fidelity Management & Research Company (FMR) Fair Value Committee (the Committee), in accordance with procedures adopted by the Board. Factors used in determining fair value vary by investment type and may include market or investment specific events. The frequency with which these procedures are used cannot be predicted and they may be utilized to a significant extent. The Committee oversees the Fund's valuation policies and procedures and is responsible for approving and reporting to the Board all fair value determinations.
The Fund categorizes the inputs to valuation techniques used to value its investments into a disclosure hierarchy consisting of three levels as shown below:
Level 1 - quoted prices in active markets for identical investments
Level 2 - other significant observable inputs (including quoted prices for similar investments, interest rates, prepayment speeds, etc.)
Level 3 - unobservable inputs (including the Fund's own assumptions based on the best information available)
Valuation techniques used to value the Fund's investments by major category are as follows:
Equity securities, including restricted securities, for which market quotations are readily available, are valued at the last reported sale price or official closing price as reported by a third party pricing vendor on the primary market or exchange on which they are traded and are categorized as Level 1 in the hierarchy. In the event there were no sales during the day or closing prices are not available, securities are valued at the last quoted bid price or may be valued using the last available price and are generally categorized as Level 2 in the hierarchy. For foreign equity securities, when market or security specific events arise, comparisons to the valuation of American Depositary Receipts (ADRs), futures contracts, Exchange-Traded Funds (ETFs) and certain indexes as well as quoted prices for similar securities may be used and would be categorized as Level 2 in the hierarchy. Utilizing these techniques may result in transfers between Level 1 and Level 2. For equity securities, including restricted securities, where observable inputs are
Annual Report
Notes to Financial Statements - continued
(Amounts in thousands except percentages)
3. Significant Accounting Policies - continued
Investment Valuation - continued
limited, assumptions about market activity and risk are used and these securities may be categorized as Level 3 in the hierarchy.
Investments in open-end mutual funds, including the Fidelity Central Funds, are valued at their closing net asset value (NAV) each business day and are categorized as Level 1 in the hierarchy.
Changes in valuation techniques may result in transfers in or out of an assigned level within the disclosure hierarchy. The aggregate value of investments by input level, as of November 30, 2013, is included at the end of the Fund's Schedule of Investments.
Foreign Currency. The Fund may use foreign currency contracts to facilitate transactions in foreign-denominated securities. Gains and losses from these transactions may arise from changes in the value of the foreign currency or if the counterparties do not perform under the contracts' terms.
Foreign-denominated assets, including investment securities, and liabilities are translated into U.S. dollars at the exchange rates at period end. Purchases and sales of investment securities, income and dividends received and expenses denominated in foreign currencies are translated into U.S. dollars at the exchange rate in effect on the transaction date.
The effects of exchange rate fluctuations on investments are included with the net realized and unrealized gain (loss) on investment securities. Other foreign currency transactions resulting in realized and unrealized gain (loss) are disclosed separately.
Investment Transactions and Income. For financial reporting purposes, the Fund's investment holdings and NAV include trades executed through the end of the last business day of the period. The NAV per share for processing shareholder transactions is calculated as of the close of business of the New York Stock Exchange (NYSE), normally 4:00 p.m. Eastern time and includes trades executed through the end of the prior business day. Gains and losses on securities sold are determined on the basis of identified cost and may include proceeds received from litigation. Dividend income is recorded on the ex-dividend date, except for certain dividends from foreign securities where the ex-dividend date may have passed, which are recorded as soon as the Fund is informed of the ex-dividend date. Non-cash dividends included in dividend income, if any, are recorded at the fair market value of the securities received. Distributions received on securities that represent a return of capital or capital gain are recorded as a reduction of cost of investments and/or as a realized gain. Subsequent to ex-dividend date the Fund determines the components of these distributions, based upon receipt of tax filings or other correspondence relating to the underlying investment. Interest income and
Annual Report
3. Significant Accounting Policies - continued
Investment Transactions and Income - continued
distributions from the Fidelity Central Funds are accrued as earned. Interest income includes coupon interest and amortization of premium and accretion of discount on debt securities. Investment income is recorded net of foreign taxes withheld where recovery of such taxes is uncertain.
Class Allocations and Expenses. Investment income, realized and unrealized capital gains and losses, common expenses of the Fund, and certain fund-level expense reductions, if any, are allocated daily on a pro-rata basis to each class based on the relative net assets of each class to the total net assets of the Fund. Each class differs with respect to transfer agent and distribution and service plan fees incurred. Certain expense reductions may also differ by class. For the reporting period, the allocated portion of income and expenses to each class as a percent of its average net assets may vary due to the timing of recording these transactions in relation to fluctuating net assets of the classes. Expenses directly attributable to a fund are charged to that fund. Expenses attributable to more than one fund are allocated among the respective funds on the basis of relative net assets or other appropriate methods. Expense estimates are accrued in the period to which they relate and adjustments are made when actual amounts are known.
Deferred Trustee Compensation. Under a Deferred Compensation Plan (the Plan), independent Trustees may elect to defer receipt of a portion of their annual compensation. Deferred amounts are invested in a cross-section of Fidelity funds, are marked-to-market and remain in the Fund until distributed in accordance with the Plan. The investment of deferred amounts and the offsetting payable to the Trustees are included in the accompanying Statement of Assets and Liabilities.
Income Tax Information and Distributions to Shareholders. Each year, the Fund intends to qualify as a regulated investment company under Subchapter M of the Internal Revenue Code, including distributing substantially all of its taxable income and realized gains. As a result, no provision for U.S. Federal income taxes is required. As of November 30, 2013, the Fund did not have any unrecognized tax benefits in the financial statements; nor is the Fund aware of any tax positions for which it is reasonably possible that the total amounts of unrecognized tax benefits will significantly change in the next twelve months. The Fund files a U.S. federal tax return, in addition to state and local tax returns as required. The Fund's federal income tax returns are subject to examination by the Internal Revenue Service (IRS) for a period of three fiscal years after they are filed. State and local tax returns may be subject to examination for an additional fiscal year depending on the jurisdiction. Foreign taxes are provided for based on the Fund's understanding of the tax rules and rates that exist in the foreign markets in which it invests.
Annual Report
Notes to Financial Statements - continued
(Amounts in thousands except percentages)
3. Significant Accounting Policies - continued
Income Tax Information and Distributions to Shareholders - continued
Distributions are declared and recorded on the ex-dividend date. Income dividends and capital gain distributions are declared separately for each class. Income and capital gain distributions are determined in accordance with income tax regulations, which may differ from GAAP.
Capital accounts within the financial statements are adjusted for permanent book-tax differences. These adjustments have no impact on net assets or the results of operations. Temporary book-tax differences will reverse in a subsequent period.
Book-tax differences are primarily due to foreign currency transactions, passive foreign investment companies (PFIC), deferred trustees compensation, net operating losses, capital loss carryforwards and losses deferred due to wash sales and excise tax regulations.
The federal tax cost of investment securities and unrealized appreciation (depreciation) as of period end were as follows:
|
Gross unrealized appreciation |
$ 1,167,699 |
|
Gross unrealized depreciation |
(118,341) |
|
Net unrealized appreciation (depreciation) on securities and other investments |
$ 1,049,358 |
|
|
|
|
Tax Cost |
$ 2,361,881 |
The tax-based components of distributable earnings as of period end were as follows:
|
Capital loss carryforward |
$ (246,838) |
|
Net unrealized appreciation (depreciation) |
$ 1,049,358 |
Capital loss carryforwards are only available to offset future capital gains of the Fund to the extent provided by regulations and may be limited. Under the Regulated Investment Company Modernization Act of 2010 (the Act), the Fund is permitted to carry forward capital losses incurred in taxable years beginning after December 22, 2010 for an unlimited period and such capital losses are required to be used prior to any losses that expire. The capital loss carryforward information presented below, including any applicable limitation, is estimated as of fiscal period end and is subject to adjustment.
|
Fiscal year of expiration |
|
|
2017 |
$ (246,838) |
Restricted Securities. The Fund may invest in securities that are subject to legal or contractual restrictions on resale. These securities generally may be resold in
Annual Report
3. Significant Accounting Policies - continued
Restricted Securities - continued
transactions exempt from registration or to the public if the securities are registered. Disposal of these securities may involve time-consuming negotiations and expense, and prompt sale at an acceptable price may be difficult. Information regarding restricted securities is included at the end of the Fund's Schedule of Investments.
4. Purchases and Sales of Investments.
Purchases and sales of securities, other than short-term securities, aggregated $794,298 and $433,223, respectively.
5. Fees and Other Transactions with Affiliates.
Management Fee. Fidelity Management & Research Company (the investment adviser) and its affiliates provide the Fund with investment management related services for which the Fund pays a monthly management fee. The management fee is the sum of an individual fund fee rate that is based on an annual rate of .30% of the Fund's average net assets and an annualized group fee rate that averaged .25% during the period. The group fee rate is based upon the average net assets of all the mutual funds advised by the investment adviser, including any mutual funds previously advised by the investment adviser that are currently advised by Fidelity SelectCo, LLC, an affiliate of the investment adviser. The group fee rate decreases as assets under management increase and increases as assets under management decrease. In addition, the management fee is subject to a performance adjustment (up to a maximum of ± .20% of the Fund's average net assets over a 36 month performance period). The upward or downward adjustment to the management fee is based on the investment performance of the asset-weighted return of all classes as compared to an appropriate benchmark index over the same 36 month performance period. For the reporting period, the total annual management fee rate, including the performance adjustment, was .69% of the Fund's average net assets. The performance adjustment included in the management fee rate may be higher or lower than the maximum performance adjustment rate due to the difference between the average net assets for the reporting and performance periods.
Distribution and Service Plan Fees. In accordance with Rule 12b-1 of the 1940 Act, the Fund has adopted separate Distribution and Service Plans for each class of shares. Certain classes pay Fidelity Distributors Corporation (FDC), an affiliate of the investment adviser, separate Distribution and Service Fees, each of which is based on an annual percentage of each class' average net assets. In addition, FDC may pay financial intermediaries for selling shares of the Fund and providing shareholder support services.
Annual Report
Notes to Financial Statements - continued
(Amounts in thousands except percentages)
5. Fees and Other Transactions with Affiliates - continued
Distribution and Service Plan Fees - continued
For the period, the Distribution and Service Fee rates, total fees and amounts retained by FDC were as follows:
|
|
Distribution |
Service |
Total Fees |
Retained |
|
Class A |
-% |
.25% |
$ 1,106 |
$ 32 |
|
Class T |
.25% |
.25% |
6,480 |
92 |
|
Class B |
.75% |
.25% |
124 |
95 |
|
Class C |
.75% |
.25% |
1,047 |
361 |
|
|
|
|
$ 8,757 |
$ 580 |
Sales Load. FDC may receive a front-end sales charge of up to 5.75% for selling Class A shares and 3.50% for selling Class T shares, some of which is paid to financial intermediaries for selling shares of the Fund. Depending on the holding period, FDC may receive contingent deferred sales charges levied on Class A, Class T, Class B, and Class C redemptions. The deferred sales charges range from 5.00% to 1.00% for Class B shares, 1.00% for Class C shares, 1.00% for certain purchases of Class A shares and .25% for certain purchases of Class T shares.
For the period, sales charge amounts retained by FDC were as follows:
|
|
Retained |
|
Class A |
$ 195 |
|
Class T |
55 |
|
Class B* |
7 |
|
Class C* |
13 |
|
|
$ 270 |
* When Class B and Class C shares are initially sold, FDC pays commissions from its own resources to financial intermediaries through which the sales are made.
Transfer Agent Fees. Fidelity Investments Institutional Operations Company, Inc., (FIIOC), an affiliate of the investment adviser, is the transfer, dividend disbursing and shareholder servicing agent for each class of the Fund. FIIOC receives account fees and asset-based fees that vary according to the account size and type of account of the shareholders of the respective classes of the Fund, except for Class Z. FIIOC receives an asset-based fee for Class Z's average net assets. FIIOC pays for typesetting, printing and mailing of shareholder reports, except proxy statements.
Annual Report
5. Fees and Other Transactions with Affiliates - continued
Transfer Agent Fees - continued
For the period, transfer agent fees for each class were as follows:
|
|
Amount |
% of |
|
Class A |
$ 1,107 |
.25 |
|
Class T |
2,612 |
.20 |
|
Class B |
37 |
.30 |
|
Class C |
245 |
.23 |
|
Institutional Class |
1,524 |
.20 |
|
Class Z |
-** |
.05* |
|
|
$ 5,525 |
|
* Annualized
** Amount represents fifteen dollars.
Accounting and Security Lending Fees. Fidelity Service Company, Inc. (FSC), an affiliate of the investment adviser, maintains the Fund's accounting records. The accounting fee is based on the level of average net assets for each month. Under a separate contract, FSC administers the security lending program. The security lending fee is based on the number and duration of lending transactions.
Brokerage Commissions. The Fund placed a portion of its portfolio transactions with brokerage firms which are affiliates of the investment adviser. Brokerage commissions are included in net realized gain (loss) and change in net unrealized appreciation (depreciation) in the Statement of Operations. The commissions paid to these affiliated firms were $14 for the period.
6. Committed Line of Credit.
The Fund participates with other funds managed by the investment adviser or an affiliate in a $4.25 billion credit facility (the "line of credit") to be utilized for temporary or emergency purposes to fund shareholder redemptions or for other short-term liquidity purposes. The Fund has agreed to pay commitment fees on its pro-rata portion of the line of credit, which amounted to $5 and is reflected in Miscellaneous expenses on the Statement of Operations. During the period, there were no borrowings on this line of credit.
7. Security Lending.
The Fund lends portfolio securities through a lending agent from time to time in order to earn additional income. For equity securities, a lending agent is used and may loan securities to certain qualified borrowers, including Fidelity Capital Markets (FCM), a
Annual Report
Notes to Financial Statements - continued
(Amounts in thousands except percentages)
7. Security Lending - continued
broker-dealer affiliated with the Fund. On the settlement date of the loan, the Fund receives collateral (in the form of U.S. Treasury obligations, letters of credit and/or cash) against the loaned securities and maintains collateral in an amount not less than 100% of the market value of the loaned securities during the period of the loan. The market value of the loaned securities is determined at the close of business of the Fund and any additional required collateral is delivered to the Fund on the next business day. If the borrower defaults on its obligation to return the securities loaned because of insolvency or other reasons, the Fund may apply collateral received from the borrower against the obligation. The Fund may experience delays and costs in recovering the securities loaned. Any cash collateral received is invested in the Fidelity Securities Lending Cash Central Fund. The value of loaned securities and cash collateral at period end are disclosed on the Fund's Statement of Assets and Liabilities. The value of securities loaned to FCM at period end was $53. Security lending income represents the income earned on investing cash collateral, less rebates paid to borrowers and any lending agent fees associated with the loan, plus any premium payments received for lending certain types of securities. Security lending income is presented in the Statement of Operations as a component of income from Fidelity Central Funds. Total security lending income during the period amounted to $1,023, including $76 from securities loaned to FCM.
8. Expense Reductions.
The investment adviser voluntarily agreed to reimburse a portion of the Fund's Class A, Class T, Class B, Class C and Institutional Class operating expenses.
During the period, this reimbursement reduced expenses as follows:
|
|
Reimbursement |
|
Class A |
$ 2 |
|
Class T |
6 |
|
Class B |
-* |
|
Class C |
1 |
|
Institutional Class |
5 |
|
|
$ 14 |
* Amount represents fifty-seven dollars.
Commissions paid to certain brokers with whom the investment adviser, or its affiliates, places trades on behalf of the Fund include an amount in addition to trade execution, which may be rebated back to the Fund to offset certain expenses. This amount totaled $81 for the period.
Annual Report
9. Share Transactions.
Transactions for each class of shares were as follows:
|
|
Shares |
Dollars |
||
|
Years ended November 30, |
2013 A |
2012 |
2013 A |
2012 |
|
Class A |
|
|
|
|
|
Shares sold |
3,550 |
3,450 |
$ 172,665 |
$ 139,006 |
|
Shares redeemed |
(2,123) |
(2,315) |
(101,685) |
(91,797) |
|
Net increase (decrease) |
1,427 |
1,135 |
$ 70,980 |
$ 47,209 |
|
Class T |
|
|
|
|
|
Shares sold |
2,633 |
3,463 |
$ 126,086 |
$ 139,248 |
|
Shares redeemed |
(5,298) |
(5,834) |
(251,560) |
(232,825) |
|
Net increase (decrease) |
(2,665) |
(2,371) |
$ (125,474) |
$ (93,577) |
|
Class B |
|
|
|
|
|
Shares sold |
20 |
58 |
$ 916 |
$ 2,241 |
|
Shares redeemed |
(122) |
(126) |
(5,334) |
(4,712) |
|
Net increase (decrease) |
(102) |
(68) |
$ (4,418) |
$ (2,471) |
|
Class C |
|
|
|
|
|
Shares sold |
1,606 |
834 |
$ 73,545 |
$ 31,589 |
|
Shares redeemed |
(315) |
(408) |
(13,899) |
(15,301) |
|
Net increase (decrease) |
1,291 |
426 |
$ 59,646 |
$ 16,288 |
|
Institutional Class |
|
|
|
|
|
Shares sold |
11,525 |
8,961 |
$ 569,791 |
$ 367,678 |
|
Shares redeemed |
(3,146) |
(3,778) |
(158,910) |
(152,130) |
|
Net increase (decrease) |
8,379 |
5,183 |
$ 410,881 |
$ 215,548 |
|
Class Z |
|
|
|
|
|
Shares sold |
2 |
- |
$ 100 |
$ - |
A Share transactions for Class Z are for the period August 13, 2013 (commencement of sale of shares) to November 30, 2013.
10. Other.
The Fund's organizational documents provide former and current trustees and officers with a limited indemnification against liabilities arising in connection with the performance of their duties to the Fund. In the normal course of business, the Fund may also enter into contracts that provide general indemnifications. The Fund's maximum exposure under these arrangements is unknown as this would be dependent on future claims that may be made against the Fund. The risk of material loss from such claims is considered remote.
Annual Report
Report of Independent Registered Public Accounting Firm
To the Trustees of Fidelity Advisor Series I and Shareholders of Fidelity Advisor Growth Opportunities Fund:
We have audited the accompanying statement of assets and liabilities of Fidelity Advisor Growth Opportunities Fund (the Fund), a fund of Fidelity Advisor Series I, including the schedule of investments, as of November 30, 2013, and the related statement of operations for the year then ended, the statement of changes in net assets for each of the two years in the period then ended, and the financial highlights for each of the five years in the period then ended. These financial statements and financial highlights are the responsibility of the Fund's management. Our responsibility is to express an opinion on these financial statements and financial highlights based on our audits.
We conducted our audits in accordance with the standards of the Public Company Accounting Oversight Board (United States). Those standards require that we plan and perform the audit to obtain reasonable assurance about whether the financial statements and financial highlights are free of material misstatement. The Fund is not required to have, nor were we engaged to perform, an audit of its internal control over financial reporting. Our audits included consideration of internal control over financial reporting as a basis for designing audit procedures that are appropriate in the circumstances, but not for the purpose of expressing an opinion on the effectiveness of the Fund's internal control over financial reporting. Accordingly, we express no such opinion. An audit also includes examining, on a test basis, evidence supporting the amounts and disclosures in the financial statements, assessing the accounting principles used and significant estimates made by management, as well as evaluating the overall financial statement presentation. Our procedures included confirmation of securities owned as of November 30, 2013, by correspondence with the custodians and brokers; where replies were not received from brokers, we performed other auditing procedures. We believe that our audits provide a reasonable basis for our opinion.
In our opinion, the financial statements and financial highlights referred to above present fairly, in all material respects, the financial position of Fidelity Advisor Growth Opportunities Fund as of November 30, 2013, the results of its operations for the year then ended, the changes in its net assets for each of the two years in the period then ended, and the financial highlights for each of the five years in the period then ended, in conformity with accounting principles generally accepted in the United States of America.
DELOITTE & TOUCHE LLP
Boston, Massachusetts
January 14, 2014
Annual Report
Trustees and Officers
The Trustees, Member of the Advisory Board, and officers of the trust and fund, as applicable, are listed below. The Board of Trustees governs the fund and is responsible for protecting the interests of shareholders. The Trustees are experienced executives who meet periodically throughout the year to oversee the fund's activities, review contractual arrangements with companies that provide services to the fund, oversee management of the risks associated with such activities and contractual arrangements, and review the fund's performance. Except for James C. Curvey, Ned C. Lautenbach, Ronald P. O'Hanley, and William S. Stavropoulos, each of the Trustees oversees 173 funds. Mr. Curvey oversees 396 funds. Mr. Lautenbach, Mr. O'Hanley, and Mr. Stavropoulos each oversees 247 funds.
The Trustees hold office without limit in time except that (a) any Trustee may resign; (b) any Trustee may be removed by written instrument, signed by at least two-thirds of the number of Trustees prior to such removal; (c) any Trustee who requests to be retired or who has become incapacitated by illness or injury may be retired by written instrument signed by a majority of the other Trustees; and (d) any Trustee may be removed at any special meeting of shareholders by a two-thirds vote of the outstanding voting securities of the trust. Each Trustee who is not an interested person (as defined in the 1940 Act) of the trust and the fund (Independent Trustee), shall retire not later than the last day of the calendar year in which his or her 75th birthday occurs. The Independent Trustees may waive this mandatory retirement age policy with respect to individual Trustees. The officers and Advisory Board Member hold office without limit in time, except that any officer and Advisory Board Member may resign or may be removed by a vote of a majority of the Trustees at any regular meeting or any special meeting of the Trustees. Except as indicated, each individual has held the office shown or other offices in the same company for the past five years.
Experience, Skills, Attributes, and Qualifications of the Fund's Trustees. The Governance and Nominating Committee has adopted a statement of policy that describes the experience, qualifications, attributes, and skills that are necessary and desirable for potential Independent Trustee candidates (Statement of Policy). The Board believes that each Trustee satisfied at the time he or she was initially elected or appointed a Trustee, and continues to satisfy, the standards contemplated by the Statement of Policy. The Governance and Nominating Committee also engages professional search firms to help identify potential Independent Trustee candidates who have the experience, qualifications, attributes, and skills consistent with the Statement of Policy. From time to time, additional criteria based on the composition and skills of the current Independent Trustees, as well as experience or skills that may be appropriate in light of future changes to board composition, business conditions, and regulatory or other developments, have also been considered by the professional search firms and the Governance and Nominating Committee. In addition, the Board takes into account the Trustees' commitment and participation in Board and committee meetings, as well as their leadership of standing and ad hoc committees throughout their tenure.
Annual Report
Trustees and Officers - continued
In determining that a particular Trustee was and continues to be qualified to serve as a Trustee, the Board has considered a variety of criteria, none of which, in isolation, was controlling. The Board believes that, collectively, the Trustees have balanced and diverse experience, qualifications, attributes, and skills, which allow the Board to operate effectively in governing the fund and protecting the interests of shareholders. Information about the specific experience, skills, attributes, and qualifications of each Trustee, which in each case led to the Board's conclusion that the Trustee should serve (or continue to serve) as a trustee of the fund, is provided below.
Board Structure and Oversight Function. James C. Curvey is an interested person (as defined in the 1940 Act) and currently serves as Chairman. The Trustees have determined that an interested Chairman is appropriate and benefits shareholders because an interested Chairman has a personal and professional stake in the quality and continuity of services provided to the fund. Independent Trustees exercise their informed business judgment to appoint an individual of their choosing to serve as Chairman, regardless of whether the Trustee happens to be independent or a member of management. The Independent Trustees have determined that they can act independently and effectively without having an Independent Trustee serve as Chairman and that a key structural component for assuring that they are in a position to do so is for the Independent Trustees to constitute a substantial majority for the Board. The Independent Trustees also regularly meet in executive session. Ned C. Lautenbach serves as Chairman of the Independent Trustees and as such (i) acts as a liaison between the Independent Trustees and management with respect to matters important to the Independent Trustees and (ii) with management prepares agendas for Board meetings.
Fidelity funds are overseen by different Boards of Trustees. The fund's Board oversees Fidelity's equity and high income funds and another Board oversees Fidelity's investment-grade bond, money market, and asset allocation funds. The asset allocation funds may invest in Fidelity funds overseen by the fund's Board. The use of separate Boards, each with its own committee structure, allows the Trustees of each group of Fidelity funds to focus on the unique issues of the funds they oversee, including common research, investment, and operational issues. On occasion, the separate Boards establish joint committees to address issues of overlapping consequences for the Fidelity funds overseen by each Board.
The Trustees operate using a system of committees to facilitate the timely and efficient consideration of all matters of importance to the Trustees, the fund, and fund shareholders and to facilitate compliance with legal and regulatory requirements and oversight of the fund's activities and associated risks. The Board, acting through its committees, has charged FMR and its affiliates with (i) identifying events or circumstances the occurrence of which could have demonstrably adverse effects on the fund's business and/or reputation; (ii) implementing processes and controls to lessen the possibility that such events or circumstances occur or to mitigate the effects of such events or circumstances if they do occur; and (iii) creating and maintaining a system designed to evaluate continuously business and market conditions in order to facilitate the identification and implementation processes described in (i) and (ii) above. Because the day-to-day operations and activities of the fund are carried out by or through FMR, its affiliates and other service providers, the fund's exposure to risks is mitigated but not eliminated by the processes overseen by the Trustees. While each of the Board's committees has responsibility for overseeing different aspects of the fund's activities, oversight is exercised primarily through the Operations, Audit, and Compliance Committees. In addition, the Independent Trustees have worked with FMR to enhance the Board's oversight of investment and financial risks, legal and regulatory risks, technology risks, and operational risks, including the development of additional risk reporting to the Board. For example, a working group comprised of Independent Trustees and FMR has worked and continues to work to review the Fidelity funds' valuation-related activities, reporting and risk management. Appropriate personnel, including but not limited to the fund's Chief Compliance Officer (CCO), FMR's internal auditor, the independent accountants, the fund's Treasurer and portfolio management personnel, make periodic reports to the Board's committees, as appropriate, including an annual review of FMR's risk management program for the Fidelity funds. The responsibilities of each standing committee, including their oversight responsibilities, are described further under "Standing Committees of the Fund's Trustees."
Annual Report
The fund's Statement of Additional Information (SAI) includes more information about the Trustees. To request a free copy, call Fidelity at 1-877-208-0098.
Interested Trustees*:
Correspondence intended for each Trustee who is an interested person may be sent to Fidelity Investments, 245 Summer Street, Boston, Massachusetts 02210.
|
Name, Year of Birth; Principal Occupations and Other Relevant Experience+ |
|
|
James C. Curvey (1935) |
|
|
Year of Election or Appointment: 2007 Trustee Chairman of the Board of Trustees |
|
|
|
Mr. Curvey also serves as Trustee of other Fidelity funds. Mr. Curvey is a Director of Fidelity Investments Money Management, Inc. (2009-present), Director of Fidelity Research & Analysis Co. (2009-present) and Director of FMR and FMR Co., Inc. (2007-present). Mr. Curvey is also Vice Chairman (2007-present) and Director of FMR LLC. In addition, Mr. Curvey serves as an Overseer for the Boston Symphony Orchestra and a member of the Trustees of Villanova University. Previously, Mr. Curvey was the Vice Chairman (2006-2007) and Director (2000-2007) of FMR Corp. |
|
Ronald P. O'Hanley (1957) |
|
|
Year of Election or Appointment: 2011 Trustee |
|
|
|
Mr. O'Hanley also serves as Trustee of other Fidelity funds. He is Director of Fidelity SelectCo, LLC (2013-present), FMR Co., Inc. (2010-present), Director of Fidelity Investments Money Management, Inc. (2010-present), Director of Fidelity Research & Analysis Company (2010-present), President of Fidelity Asset Management and Corporate Services and a Member of Fidelity's Executive Committee (2010-present). Previously, Mr. O'Hanley served as President and Chief Executive Officer of BNY Mellon Asset Management (2007-2010). Mr. O'Hanley also served as Vice Chairman of Bank New York Mellon Corp. and a member of that firm's Executive Committee. Prior to the 2007 merger of The Bank of New York and Mellon Financial Corporation, he was Vice Chairman of Mellon Financial Corporation and President and Chief Executive Officer of Mellon Asset Management. He joined Mellon in February 1997. Mr. O'Hanley currently serves as Chairman of the Boston Public Library Foundation Board of Directors and sits on the Board of Directors of Beth Israel Deaconess Medical Center, the Board of Trustees of the Marine Biological Laboratory and the Advisory Board of the Maxwell School of Citizenship and Public Administration at Syracuse University. Mr. O'Hanley also chairs the Council on Asset Management for the Financial Services Roundtable and is a member of the Board of Directors of Institutional Investor's U.S. Institute. |
* Trustees have been determined to be "Interested Trustees" by virtue of, among other things, their affiliation with the trust or various entities under common control with FMR.
+ The information above includes each Trustee's principal occupation during the last five years and other information relating to the experience, attributes, and skills relevant to each Trustee's qualifications to serve as a Trustee, which led to the conclusion that each Trustee should serve as a Trustee for the fund.
Annual Report
Independent Trustees:
Correspondence intended for each Independent Trustee (that is, the Trustees other than the Interested Trustees) may be sent to Fidelity Investments, P.O. Box 55235, Boston, Massachusetts 02205-5235.
|
Name, Year of Birth; Principal Occupations and Other Relevant Experience+ |
|
|
Dennis J. Dirks (1948) |
|
|
Year of Election or Appointment: 2005 Trustee |
|
|
|
Mr. Dirks also serves as Trustee of other Fidelity funds. Prior to his retirement in May 2003, Mr. Dirks was Chief Operating Officer and a member of the Board of The Depository Trust & Clearing Corporation (DTCC). He also served as President, Chief Operating Officer, and Board member of The Depository Trust Company (DTC) and President and Board member of the National Securities Clearing Corporation (NSCC). In addition, Mr. Dirks served as Chief Executive Officer and Board member of the Government Securities Clearing Corporation, Chief Executive Officer and Board member of the Mortgage-Backed Securities Clearing Corporation, as a Trustee and a member of the Finance Committee of Manhattan College (2005-2008), and as a Trustee and a member of the Finance Committee of AHRC of Nassau County (2006-2008). Mr. Dirks is a member of the Independent Directors Council (IDC) Governing Council (2010-present) and Board of Directors for The Brookville Center for Children's Services, Inc. (2009-present). |
|
Alan J. Lacy (1953) |
|
|
Year of Election or Appointment: 2008 Trustee |
|
|
|
Mr. Lacy also serves as Trustee of other Fidelity funds. Mr. Lacy serves as Senior Adviser (2007-present) of Oak Hill Capital Partners, L.P. (private equity). Mr. Lacy also served as Chief Executive Officer (2000-2005) and Vice Chairman (2005-2006) of Sears Holdings Corporation and Sears, Roebuck and Co. (retail). In addition, Mr. Lacy serves as a member of the Board of Directors of Dave & Buster's Entertainment, Inc. (restaurant and entertainment complexes, 2010-present), Earth Fare, Inc. (retail grocery, 2012-present), The Hillman Companies, Inc. (hardware wholesalers, 2010-present), and Bristol-Myers Squibb Company (global pharmaceuticals, 2008-present). Mr. Lacy is a member of the Board of Trustees of The National Parks Conservation Association (2006-present). Previously, Mr. Lacy served as Chairman of the Board of Trustees of the National Parks Conservation Association (2008-2011) and as a member of the Board of Directors for the Western Union Company (global money transfer, 2006-2011). |
|
Ned C. Lautenbach (1944) |
|
|
Year of Election or Appointment: 2000 Trustee Chairman of the Independent Trustees |
|
|
|
Mr. Lautenbach also serves as Trustee of other Fidelity funds. Mr. Lautenbach currently serves as the Lead Director of the Eaton Corporation Board of Directors (diversified industrial, 1997-present). Mr. Lautenbach is Chairman of the Board of Directors of the Philharmonic Center for the Arts in Naples, Florida (2012-present) and a member of the Council on Foreign Relations (1994-present). Previously, Mr. Lautenbach was a Partner/Advisory Partner at Clayton, Dubilier & Rice, LLC (private equity investment, 1998-2010), as well as a Director of Sony Corporation (2006-2007). |
|
Joseph Mauriello (1944) |
|
|
Year of Election or Appointment: 2008 Trustee |
|
|
|
Mr. Mauriello also serves as Trustee of other Fidelity funds. Prior to his retirement in January 2006, Mr. Mauriello served in numerous senior management positions including Deputy Chairman and Chief Operating Officer (2004-2005), and Vice Chairman of Financial Services (2002-2004) of KPMG LLP US (professional services, 1965-2005). Mr. Mauriello currently serves as a member of the Board of Directors of XL Group plc. (global insurance and re-insurance, 2006-present). Previously, Mr. Mauriello served as a Director of the Hamilton Funds of the Bank of New York (2006-2007) and of Arcadia Resources Inc. (health care services and products, 2007-2012). |
|
Robert W. Selander (1950) |
|
|
Year of Election or Appointment: 2011 Trustee |
|
|
|
Mr. Selander also serves as Trustee of other Fidelity funds. Previously, Mr. Selander served as a Member of the Advisory Board of other Fidelity funds (2011), and Executive Vice Chairman (2010), Chief Executive Officer (2009-2010), and President and Chief Executive Officer (1997-2009) of Mastercard, Inc. |
|
Cornelia M. Small (1944) |
|
|
Year of Election or Appointment: 2005 Trustee |
|
|
|
Ms. Small also serves as Trustee of other Fidelity funds. Ms. Small is a member of the Board of Directors (2009-present) and Chair of the Investment Committee (2010-present) of the Teagle Foundation. Ms. Small also serves on the Investment Committee of the Berkshire Taconic Community Foundation (2008-present). Previously, Ms. Small served as Chairperson (2002-2008) and a member of the Investment Committee and Chairperson (2008-2012) and a member of the Board of Trustees of Smith College. In addition, Ms. Small served as Chief Investment Officer, Director of Global Equity Investments, and a member of the Board of Directors of Scudder, Stevens & Clark and Scudder Kemper Investments. |
|
William S. Stavropoulos (1939) |
|
|
Year of Election or Appointment: 2002 Trustee Vice Chairman of the Independent Trustees |
|
|
|
Mr. Stavropoulos also serves as Trustee of other Fidelity funds. Mr. Stavropoulos serves as President and Founder of the Michigan Baseball Foundation, the Great Lakes Loons (2007-present). Mr. Stavropoulos is Chairman Emeritus of the Board of Directors of The Dow Chemical Company, where he previously served in numerous senior management positions, including President, CEO (1995-2000; 2002-2004), Chairman of the Executive Committee (2000-2006), and as a member of the Board of Directors (1990-2006). Currently, Mr. Stavropoulos is Chairman of the Board of Directors of Univar Inc. (global distributor of commodity and specialty chemicals), a Director of Teradata Corporation (data warehousing and technology solutions), and Maersk Inc. (industrial conglomerate), and a member of the Advisory Board for Metalmark Capital LLC (private equity investment, 2005-present). Mr. Stavropoulos is an operating advisor to Clayton, Dubilier & Rice, LLC (private equity investment). In addition, Mr. Stavropoulos is a member of the University of Notre Dame Advisory Council for the College of Science, a Trustee of the Rollin L. Gerstacker Foundation, and a Director of the Naples Philharmonic Center for the Arts. Previously, Mr. Stavropoulos served as a Director of Chemical Financial Corporation (bank holding company, 1993-2012) and Tyco International, Ltd. (multinational manufacturing and services, 2007-2012). |
|
David M. Thomas (1949) |
|
|
Year of Election or Appointment: 2008 Trustee |
|
|
|
Mr. Thomas also serves as Trustee of other Fidelity funds. Mr. Thomas serves as Non-Executive Chairman of the Board of Directors of Fortune Brands Home and Security (home and security products, 2011-present), and as a member of the Board of Directors of Interpublic Group of Companies, Inc. (marketing communication, 2004-present). Previously, Mr. Thomas served as Executive Chairman (2005-2006) and Chairman and Chief Executive Officer (2000-2005) of IMS Health, Inc. (pharmaceutical and healthcare information solutions), and a Director of Fortune Brands, Inc. (consumer products, 2000-2011). |
+ The information above includes each Trustee's principal occupation during the last five years and other information relating to the experience, attributes, and skills relevant to each Trustee's qualifications to serve as a Trustee, which led to the conclusion that each Trustee should serve as a Trustee for the fund.
Advisory Board Member and Officers:
Correspondence intended for each officer and Peter S. Lynch may be sent to Fidelity Investments, 245 Summer Street, Boston, Massachusetts 02210. Officers appear below in alphabetical order.
|
Name, Year of Birth; Principal Occupation |
|
|
Peter S. Lynch (1944) |
|
|
Year of Election or Appointment: 2003 Member of the Advisory Board |
|
|
|
Mr. Lynch also serves as Member of the Advisory Board of other Fidelity funds. Mr. Lynch is Vice Chairman and a Director of FMR and FMR Co., Inc. In addition, Mr. Lynch serves as a Trustee of Boston College and as the Chairman of the Inner-City Scholarship Fund. Previously, Mr. Lynch served on the Special Olympics International Board of Directors (1997-2006). |
|
Elizabeth Paige Baumann (1968) |
|
|
Year of Election or Appointment: 2012 Anti-Money Laundering (AML) Officer |
|
|
|
Ms. Baumann also serves as AML Officer of other funds. She is Chief AML Officer of FMR LLC (2012-present) and is an employee of Fidelity Investments. Previously, Ms. Baumann served as Vice President and Deputy Anti-Money Laundering Officer (2007-2012). |
|
William C. Coffey (1969) |
|
|
Year of Election or Appointment: 2009 Assistant Secretary |
|
|
|
Mr. Coffey also serves as Assistant Secretary of other funds. He is Senior Vice President and Deputy General Counsel of FMR LLC (2010-present), and is an employee of Fidelity Investments. Previously, Mr. Coffey served as Vice President and Associate General Counsel of FMR LLC (2005-2009). |
|
Jonathan Davis (1968) |
|
|
Year of Election or Appointment: 2010 Assistant Treasurer |
|
|
|
Mr. Davis also serves as Assistant Treasurer of other funds. Mr. Davis is an employee of Fidelity Investments. Previously, Mr. Davis served as Vice President and Associate General Counsel of FMR LLC (2003-2010). |
|
Adrien E. Deberghes (1967) |
|
|
Year of Election or Appointment: 2008 Deputy Treasurer |
|
|
|
Mr. Deberghes also serves as an officer of other funds. He is an employee of Fidelity Investments (2008-present). Prior to joining Fidelity Investments, Mr. Deberghes was Senior Vice President of Mutual Fund Administration at State Street Corporation (2007-2008), Senior Director of Mutual Fund Administration at Investors Bank & Trust (2005-2007), and Director of Finance for Dunkin' Brands (2000-2005). |
|
Stephanie J. Dorsey (1969) |
|
|
Year of Election or Appointment: 2010 Assistant Treasurer |
|
|
|
Ms. Dorsey also serves as an officer of other funds. She is an employee of Fidelity Investments (2008-present) and has served in other fund officer roles. Prior to joining Fidelity Investments, Ms. Dorsey served as Treasurer (2004-2008) of the JPMorgan Mutual Funds and Vice President (2004-2008) of JPMorgan Chase Bank. |
|
Scott C. Goebel (1968) |
|
|
Year of Election or Appointment: 2008 Secretary and Chief Legal Officer (CLO) |
|
|
|
Mr. Goebel serves as Secretary and CLO of other funds. Mr. Goebel also serves as Secretary of Fidelity Investments Money Management, Inc. (FIMM) (2010-present) and Fidelity Research and Analysis Company (FRAC) (2010-present); General Counsel, Secretary, and Senior Vice President of FMR (2008-present) and FMR Co., Inc. (2008-present); Chief Legal Officer of Fidelity Management & Research (Hong Kong) Limited (2008-present) and Assistant Secretary of Fidelity Management & Research (Japan) Inc. (2008-present), and Fidelity Management & Research (U.K.) Inc. (2008-present). Previously, Mr. Goebel served as Secretary and CLO of other Fidelity funds (2008-2013), Assistant Secretary of FIMM (2008-2010), FRAC (2008-2010), and certain funds (2007-2008); and as Vice President and Secretary of Fidelity Distributors Corporation (FDC) (2005-2007). Mr. Goebel has been employed by FMR LLC or an affiliate since 2001. |
|
Joseph A. Hanlon (1968) |
|
|
Year of Election or Appointment: 2012 Chief Compliance Officer |
|
|
|
Mr. Hanlon also serves as Chief Compliance Officer of other funds. Mr. Hanlon serves as Compliance Officer of FMR, FMR Co., Inc., Fidelity Investments Money Management, Inc. (FIMM), Fidelity Research and Analysis Company (FRAC), and Fidelity Management & Research (Hong Kong) (2009-present), as Senior Vice President of the Fidelity Asset Management Division (2009-present), and is an employee of Fidelity Investments. Previously, Mr. Hanlon served as Compliance Officer of Fidelity Management & Research (Japan) Inc. (2009-2013), Strategic Advisers, Inc. (2009-2013), and Fidelity Management & Research (U.K.) Inc. (2009-2013). |
|
Bruce T. Herring (1965) |
|
|
Year of Election or Appointment: 2006 Vice President of certain Equity Funds |
|
|
|
Mr. Herring also serves as Vice President of other funds. He serves as Chief Investment Officer of Fidelity Global Asset Allocation (GAA) (2013-present), Group Chief Investment Officer of FMR, and President of Fidelity Research & Analysis Company (2010-present). Previously, Mr. Herring served as Chief Investment Officer and Director of Fidelity Management & Research (U.K.) Inc. (2010-2013), Vice President (2005-2006) and Senior Vice President (2006-2007) of Fidelity Management & Research Company, Vice President of FMR Co., Inc. (2001-2007), and as a portfolio manager for Fidelity U.S. Equity Funds. |
|
Brian B. Hogan (1964) |
|
|
Year of Election or Appointment: 2009 Vice President |
|
|
|
Mr. Hogan also serves as Vice President of other funds. Mr. Hogan serves as President of FMR's Equity Division (2009-present). Previously, Mr. Hogan served as Senior Vice President, Equity Research of FMR (2006-2009) and as a portfolio manager. |
|
Chris Maher (1972) |
|
|
Year of Election or Appointment: 2013 Assistant Treasurer |
|
|
|
Mr. Maher serves as Assistant Treasurer of other funds. Mr. Maher is Vice President of Valuation Oversight and is an employee of Fidelity Investments. Previously, Mr. Maher served as Vice President of Asset Management Compliance (2013), Vice President of FMR's Program Management Group (2010-2013), and Vice President of Valuation Oversight (2008-2010). |
|
Christine Reynolds (1958) |
|
|
Year of Election or Appointment: 2008 Chief Financial Officer |
|
|
|
Ms. Reynolds also serves as Chief Financial Officer of other funds. Ms. Reynolds became President of Fidelity Pricing and Cash Management Services (FPCMS) in August 2008. Ms. Reynolds served as Chief Operating Officer of FPCMS (2007-2008). Previously, Ms. Reynolds served as President, Treasurer, and Anti-Money Laundering officer of the Fidelity funds (2004-2007). |
|
Kenneth B. Robins (1969) |
|
|
Year of Election or Appointment: 2008 President and Treasurer |
|
|
|
Mr. Robins also serves as an officer of other funds. Mr. Robins serves as Executive Vice President of Fidelity Investments Money Management, Inc. (FIMM) (2013-present) and is an employee of Fidelity Investments (2004-present). Previously, Mr. Robins served in other fund officer roles. |
|
Gary W. Ryan (1958) |
|
|
Year of Election or Appointment: 2005 Assistant Treasurer |
|
|
|
Mr. Ryan also serves as Assistant Treasurer of other funds. Mr. Ryan is an employee of Fidelity Investments and has served in other fund officer roles. Previously, Mr. Ryan served as Vice President of Fund Reporting in Fidelity Pricing and Cash Management Services (FPCMS) (1999-2005). |
|
Stephen Sadoski (1971) |
|
|
Year of Election or Appointment: 2012 Deputy Treasurer |
|
|
|
Mr. Sadoski also serves as Deputy Treasurer of other funds. He is an employee of Fidelity Investments (2012-present) and has served in another fund officer role. Prior to joining Fidelity Investments, Mr. Sadoski served as an assistant chief accountant in the Division of Investment Management of the Securities and Exchange Commission (SEC) (2009-2012) and as a senior manager at Deloitte & Touche LLP (1997-2009). |
|
Stacie M. Smith (1974) |
|
|
Year of Election or Appointment: 2013 Deputy Treasurer |
|
|
|
Ms. Smith also serves as an officer of other funds. She is an employee of Fidelity Investments (2009-present) and has served in other fund officer roles. Prior to joining Fidelity Investments, Ms. Smith served as Senior Audit Manager of Ernst & Young LLP (1996-2009). |
|
Renee Stagnone (1975) |
|
|
Year of Election or Appointment: 2013 Deputy Treasurer |
|
|
|
Ms. Stagnone also serves as Deputy Treasurer of other funds. Ms. Stagnone is an employee of Fidelity Investments. |
|
Joseph F. Zambello (1957) |
|
|
Year of Election or Appointment: 2011 Deputy Treasurer |
|
|
|
Mr. Zambello also serves as Deputy Treasurer of other funds. Mr. Zambello is an employee of Fidelity Investments. Previously, Mr. Zambello served as Vice President of FMR's Program Management Group (2009-2011) and Vice President of the Transfer Agent Oversight Group (2005-2009). |
Annual Report
Board Approval of Investment Advisory Contracts and Management Fees
Fidelity Advisor Growth Opportunities Fund
Each year, the Board of Trustees, including the Independent Trustees (together, the Board), votes on the renewal of the management contract and sub-advisory agreements (together, the Advisory Contracts) for the fund. The Board, assisted by the advice of fund counsel and Independent Trustees' counsel, requests and considers a broad range of information relevant to the renewal of the Advisory Contracts throughout the year.
The Board meets regularly and, at each of its meetings, covers an extensive agenda of topics and materials and considers factors that are relevant to its annual consideration of the renewal of the fund's Advisory Contracts, including the services and support provided to the fund and its shareholders. The Board has established various standing committees, each composed of and chaired by Independent Trustees with varying backgrounds, to which the Board has assigned specific subject matter responsibilities in order to enhance effective decision-making by the Board. The Board, acting directly and through its Committees, requests and receives information concerning the annual consideration of the renewal of the fund's Advisory Contracts. The Board also meets as needed to consider matters specifically related to the Board's annual consideration of the renewal of Advisory Contracts. Members of the Board may also meet with trustees of other Fidelity funds through ad hoc joint committees to discuss certain matters relevant to the Fidelity funds.
At its July 2013 meeting, the Board, including the Independent Trustees, unanimously determined to renew the fund's Advisory Contracts. In reaching its determination, the Board considered all factors it believed relevant, including (i) the nature, extent, and quality of the services to be provided to the fund and its shareholders (including the investment performance of the fund); (ii) the competitiveness of the fund's management fee and total expense ratio relative to peer funds; (iii) the total costs of the services to be provided by and the profits to be realized by Fidelity from its relationship with the fund; (iv) the extent to which economies of scale exist and would be realized as the fund grows; and (v) whether fee levels reflect these economies of scale, if any, for the benefit of fund shareholders.
In considering whether to renew the Advisory Contracts for the fund, the Board reached a determination, with the assistance of fund counsel and Independent Trustees' counsel and through the exercise of its business judgment, that the renewal of the Advisory Contracts was in the best interests of the fund and its shareholders and that the compensation payable under the Advisory Contracts was fair and reasonable. The Board's decision to renew the Advisory Contracts was not based on any single factor, but rather was based on a comprehensive consideration of all the information provided to the Board at its meetings throughout the year. The Board, in reaching its determination to renew the Advisory Contracts, was aware that shareholders in the fund have a broad range of investment choices available to them, including a wide choice among mutual funds offered by Fidelity's competitors, and that the fund's shareholders, who have the opportunity to review and weigh the disclosure provided by the fund in its prospectus and other public disclosures, have chosen to invest in this fund, which is a part of the Fidelity family of funds.
Annual Report
Board Approval of Investment Advisory Contracts and
Management Fees - continued
Nature, Extent, and Quality of Services Provided. The Board considered the staffing within the investment adviser, Fidelity Management & Research Company (FMR), and the sub-advisers (together, the Investment Advisers) as it relates to the fund, including the backgrounds of the fund's investment personnel, and also considered the fund's investment objective, strategies, and related investment philosophy. The Independent Trustees also had discussions with senior management of Fidelity's investment operations and investment groups. The Board considered the structure of the portfolio manager compensation program and whether this structure provides appropriate incentives to act in the best interests of the fund.
Resources Dedicated to Investment Management and Support Services. The Board and the Fund Oversight and Research Committees reviewed the general qualifications and capabilities of the Investment Advisers' investment staff, including its size, education, experience, and resources, as well as the Investment Advisers' approach to recruiting, training, managing, and compensating investment personnel. The Board noted that FMR has continued to increase the resources devoted to non-U.S. offices, including expansion of Fidelity's global investment organization. The Board also noted that Fidelity's analysts have extensive resources, tools and capabilities that allow them to conduct sophisticated quantitative and fundamental analysis, as well as credit analysis of issuers, counterparties and guarantors. Further, the Board believes that Fidelity's investment professionals have sufficient access to global information and data so as to provide competitive investment results over time, and that those professionals also have access to sophisticated tools that permit them to assess portfolio construction and risk and performance attribution characteristics continuously, as well as to transmit new information and research conclusions rapidly around the world. Additionally, in its deliberations, the Board considered the Investment Advisers' trading and risk management capabilities and resources, which are an integral part of the investment management process.
Shareholder and Administrative Services. The Board considered (i) the nature, extent, quality, and cost of advisory, administrative, and shareholder services performed by the Investment Advisers and their affiliates under the Advisory Contracts and under separate agreements covering transfer agency, pricing and bookkeeping, and securities lending services for the fund; (ii) the nature and extent of the supervision of third party service providers, principally custodians and subcustodians; and (iii) the resources devoted to, and the record of compliance with, the fund's compliance policies and procedures. The Board also reviewed the allocation of fund brokerage, including allocations to brokers affiliated with the Investment Advisers, the use of brokerage commissions to pay fund expenses, and the use of "soft" commission dollars to pay for research services.
Annual Report
The Board noted that the growth of fund assets over time across the complex allows Fidelity to reinvest in the development of services designed to enhance the value or convenience of the Fidelity funds as investment vehicles. These services include 24-hour access to account information and market information through telephone representatives and over the Internet, investor education materials and asset allocation tools, and the expanded availability of Fidelity Investor Centers.
Investment in a Large Fund Family. The Board considered the benefits to shareholders of investing in a Fidelity fund, including the benefits of investing in a fund that is part of a large family of funds offering a variety of investment disciplines and providing a large variety of mutual fund investor services. The Board noted that Fidelity had taken, or had made recommendations that resulted in the Fidelity funds taking, a number of actions over the previous year that benefited particular funds, including (i) continuing to dedicate additional resources to investment research and to the support of the senior management team that oversees asset management; (ii) persisting in efforts to enhance Fidelity's global research capabilities; (iii) launching new funds and making other enhancements to meet client needs for global and income-oriented solutions; (iv) continuing to launch dedicated lower cost underlying funds to meet portfolio construction needs related to expanding underlying fund options for Fidelity funds of funds, specifically for the Freedom Fund product lines; (v) rationalizing product lines and gaining increased efficiencies through the mergers of several funds into other funds; (vi) strengthening Fidelity's index fund offerings by reducing investment minimums and adopting or lowering existing expense caps for certain funds and classes; (vii) enhancing Global Asset Allocation product offerings by launching new funds and strategies, including "open architecture" target date funds that utilize affiliated and unaffiliated sub-advisers; (viii) modifying the eligibility criteria for Institutional Class shares of Advisor funds to increase their marketability to a portion of the defined contribution plan market; (ix) creating a new low-cost retirement share class for certain Advisor funds to appeal to large retirement plans; (x) transitioning the management of certain Fidelity commodity funds to Geode Capital Management LLC, a registered commodity pool operator, while retaining administrative responsibilities for the funds; (xi) reorganizing a number of funds; and (xii) taking steps toward establishing a new Fidelity adviser to manage sector-based funds and products.
Investment Performance. The Board considered whether the fund has operated in accordance with its investment objective, as well as its record of compliance with its investment restrictions and its performance history. The Board noted that there was a portfolio management change for the fund in October 2012.
Annual Report
Board Approval of Investment Advisory Contracts and
Management Fees - continued
The Board took into account discussions with the Investment Advisers about fund investment performance that occur at Board meetings throughout the year. In this regard the Board noted that as part of regularly scheduled fund reviews and other reports to the Board on fund performance, the Board periodically considers annualized return information for the fund, for different time periods, measured against a securities market index ("benchmark index") and a peer group of mutual funds with similar objectives ("peer group"). In its evaluation of fund investment performance, the Board gave particular attention to information indicating changes in performance of certain Fidelity funds for specific time periods and the Investment Advisers' explanations for any overperformance or underperformance.
In addition to reviewing absolute and relative fund performance, the Independent Trustees periodically consider the appropriateness of fund performance metrics in evaluating the results achieved. In general, the Independent Trustees believe that fund performance should be evaluated based on net performance (after fees and expenses) of both the highest performing and lowest performing classes, where applicable, compared to appropriate benchmark indices, over appropriate time periods which may include full market cycles, and compared to peer groups, as applicable, over the same periods, taking into account relevant factors including the following: general market conditions; issuer-specific information; tactical opportunities for investment; and fund cash flows and other factors.
The Independent Trustees recognize that shareholders evaluate performance on a net basis over their own holding periods, for which one-, three-, and five-year periods are used as a proxy. For this reason, the performance information reviewed by the Board also included net cumulative calendar year total return information for the fund and an appropriate benchmark index and peer group for the most recent one-, three-, and five-year periods, as shown below. Returns are shown compared to the 25th percentile (top of box) and 75th percentile (bottom of box) of the peer universe.
Annual Report
Fidelity Advisor Growth Opportunities Fund

The Board also considered that the fund's management fee is subject to upward or downward adjustment depending upon whether, and to what extent, the fund's investment performance for the performance period exceeds, or is exceeded by, a securities index, thus leading to a performance adjustment for the same period. The Board noted that the performance adjustment provides FMR with a strong economic incentive to seek to achieve superior performance for the fund's shareholders and helps to more closely align the interests of FMR and the fund's shareholders.
Based on its review, the Board concluded that the nature, extent, and quality of services provided to the fund under the Advisory Contracts should benefit the fund's shareholders.
Competitiveness of Management Fee and Total Expense Ratio. The Board considered the fund's management fee and total expense ratio compared to "mapped groups" of competitive funds and classes. Fidelity creates "mapped groups" by combining similar Lipper investment objective categories that have comparable management fee characteristics. Combining Lipper investment objective categories aids the Board's management fee and total expense ratio comparisons by broadening the competitive group used for comparison and by reducing the number of universes to which various Fidelity funds are compared.
Management Fee. The Board considered two proprietary management fee comparisons for the 12-month periods shown in the chart below. The group of Lipper funds used by the Board for management fee comparisons is referred to below as the "Total Mapped Group." The Total Mapped Group comparison focuses on a fund's standing in terms of gross management fees before expense reimbursements or caps, and without giving effect to the fund's performance adjustment, relative to the total universe of funds with comparable investment mandates, regardless of whether their management fee structures also are comparable. Funds with comparable investment mandates offer exposure to similar types of securities. Funds with comparable management fee structures have similar management fee contractual arrangements (e.g., flat rate charged for advisory services, all-inclusive fee rate, etc.). "TMG %" represents the percentage of funds in the Total Mapped Group that had management fees that were lower than the fund's. For example, a TMG % of 11% means that 89% of the funds in the Total Mapped Group had higher management fees than the fund. The "Asset-Size Peer Group" (ASPG) comparison focuses on a fund's standing relative to a subset of non-Fidelity funds within the Total Mapped Group that are similar in size and management fee structure. The ASPG represents at least 15% of the funds in the Total Mapped Group with comparable asset size and management fee structures, subject to a minimum of 50 funds (or all funds in the Total Mapped Group if fewer than 50).Additional information, such as the ASPG quartile in which the fund's management fee ranked and the impact of the fund's performance adjustment, is also included in the chart and considered by the Board.
Annual Report
Board Approval of Investment Advisory Contracts and
Management Fees - continued
Fidelity Advisor Growth Opportunities Fund

The Board noted that the fund's management fee ranked below the median of its Total Mapped Group and below the median of its ASPG for 2012. The Board also noted the effect of the fund's positive performance adjustment on the fund's management fee ranking.
Annual Report
Furthermore, the Board considered that shareholders approved a prospective change in the index used to calculate the fund's performance adjustment, beginning February 1, 2007. The Board also considered that, because the performance adjustment is based on a rolling 36-month measurement period, during a transition period the fund's performance is compared to a blended index return that reflects the performance of the former index for the portion of the measurement period prior to February 1, 2007 and the performance of the current index for the remainder of the measurement period. The Board noted that the fund's performance adjustments for 2008 through 2010 shown in the chart above reflect the effect of using the blended index return to calculate the fund's performance adjustment.
Based on its review, the Board concluded that the fund's management fee is fair and reasonable in light of the services that the fund receives and the other factors considered.
Total Expense Ratio. In its review of each class's total expense ratio, the Board considered the fund's management fee as well as other fund or class expenses, as applicable, such as transfer agent fees, pricing and bookkeeping fees, fund-paid 12b-1 fees, and custodial, legal, and audit fees. The Board also noted the effects of any waivers and reimbursements on fees and expenses, as well as the impact of the fund's performance adjustment. As part of its review, the Board also considered the current and historical total expense ratios of each class of the fund compared to competitive fund median expenses. Each class of the fund is compared to those funds and classes in the Total Mapped Group (used by the Board for management fee comparisons) that have a similar sales load structure.
The Board noted that the total expense ratio of Institutional Class ranked below its competitive median for 2012 and the total expense ratio of each of Class A, Class T, Class B, and Class C ranked above its competitive median for 2012. The Board considered that, in general, various factors can affect total expense ratios. The Board noted that the total expense ratio of Class T was above the competitive median primarily because of higher 12b-1 fees on Class T. Class T has a higher 12b-1 fee, but a lower front-end sales charge, than traditionally priced front-end sales charge classes. The Board considered that Class T is primarily sold load-waived in the retirement plan market where its 0.50% 12b-1 fee is comparable to competing no-load, higher 12b-1 fee classes designed specifically for retirement plans. The Board noted that the fund offers multiple classes, each of which has a different sales load and 12b-1 fee structure, and that the multiple structures are intended to offer a range of pricing options for the intermediary market. The Board also noted that the total expense ratios of the classes vary primarily by the level of their 12b-1 fees, although differences in transfer agent fees may also cause expenses to vary from class to class.
Annual Report
Board Approval of Investment Advisory Contracts and
Management Fees - continued
Fees Charged to Other Fidelity Clients. The Board also considered Fidelity fee structures and other information with respect to clients of FMR and its affiliates, such as other mutual funds advised or subadvised by FMR or its affiliates, pension plan clients, and other institutional clients. The Board noted the findings of the 2013 ad hoc joint committee (created with the board of other Fidelity funds), which reviewed and compared Fidelity's institutional investment advisory business with its business of providing services to the Fidelity funds, including the differences in services provided, fees charged, and costs incurred, as well as competition in their respective marketplaces.
Based on its review of total expense ratios and fees charged to other Fidelity clients, the Board concluded that the total expense ratio of each class of the fund was reasonable, although in some cases above the median of the universe presented for comparison, in light of the services that the fund and its shareholders receive and the other factors considered.
Costs of the Services and Profitability. The Board considered the revenues earned and the expenses incurred by Fidelity in conducting the business of developing, marketing, distributing, managing, administering and servicing the fund and servicing the fund's shareholders. The Board also considered the level of Fidelity's profits in respect of all the Fidelity funds.
On an annual basis, FMR presents to the Board Fidelity's profitability for the fund. Fidelity calculates the profitability for each fund, as well as aggregate profitability for groups of Fidelity funds and all Fidelity funds, using a series of detailed revenue and cost allocation methodologies which originate with the books and records of Fidelity on which Fidelity's audited financial statements are based. The Audit Committee of the Board reviews any significant changes from the prior year's methodologies.
PricewaterhouseCoopers LLP (PwC), independent registered public accounting firm and auditor to Fidelity and certain Fidelity funds, has been engaged annually by the Board as part of the Board's assessment of Fidelity's profitability analysis. PwC's engagement includes the review and assessment of the methodologies used by Fidelity in determining the revenues and expenses attributable to Fidelity's mutual fund business, and completion of agreed-upon procedures surrounding the mathematical accuracy of fund profitability and its conformity to allocation methodologies. After considering PwC's reports issued under the engagement and information provided by Fidelity, the Board concluded that while other allocation methods may also be reasonable, Fidelity's profitability methodologies are reasonable in all material respects.
The Board also reviewed Fidelity's non-fund businesses and fall-out benefits related to the mutual fund business as well as cases where Fidelity's affiliates may benefit from or be related to the fund's business.
Annual Report
The Board considered the costs of the services provided by and the profits realized by Fidelity in connection with the operation of the fund and was satisfied that the profitability was not excessive in the circumstances.
Economies of Scale. The Board considered whether there have been economies of scale in respect of the management of the Fidelity funds, whether the Fidelity funds (including the fund) have appropriately benefited from any such economies of scale, and whether there is potential for realization of any further economies of scale. The Board considered the extent to which the fund will benefit from economies of scale through increased services to the fund, through waivers or reimbursements, or through fee or expense reductions. The Board also noted that in 2009, it and the board of other Fidelity funds created an ad hoc committee (the Economies of Scale Committee) to analyze whether FMR attains economies of scale in respect of the management and servicing of the Fidelity funds, whether the Fidelity funds have appropriately benefited from such economies of scale, and whether there is potential for realization of any further economies of scale.
The Board recognized that the fund's management contract incorporates a "group fee" structure, which provides for lower group fee rates as total fund assets under FMR's management increase, and for higher group fee rates as total fund assets under FMR's management decrease. FMR calculates the group fee rates based on a tiered asset "breakpoint" schedule that varies based on asset class. The Board considered that the group fee is designed to deliver the benefits of economies of scale to fund shareholders when total Fidelity fund assets increase, even if assets of any particular fund are unchanged or have declined, because some portion of Fidelity's costs are attributable to services provided to all Fidelity funds, and all funds benefit if those costs can be allocated among more assets. The Board concluded that, given the group fee structure, fund shareholders will benefit from lower management fees as assets under FMR's management increase at the fund complex level, regardless of whether Fidelity achieves any such economies of scale.
The Board concluded, taking into account the analysis of the Economies of Scale Committee, that economies of scale, if any, are being appropriately shared between fund shareholders and Fidelity.
Amendment to Description of Group Fee Rate. At its July 2013 meeting, the Board voted to approve an amendment to the fund's management contract to modify the description of the "group fee rate" effective August 1, 2013. The Board noted that under the prior description in the contract, the group fee rate was based on the average net assets of all registered investment companies with which FMR has management contracts. Under the contract's tiered asset breakpoint schedule, the group fee rate is lower as total fund assets under FMR's management increase, and higher as total fund assets under FMR's management decrease. The Board considered that the prior description would have excluded the assets of 64 Fidelity sector funds from the group fee rate calculation once Fidelity SelectCo, LLC, an affiliate of FMR, assumed management responsibilities for those funds. The Board noted that modifying the description of the group fee rate to continue to include the assets of those 64 funds for purposes of determining group fee rate breakpoints would avoid an immediate adverse impact on the group fee rate for any fund.
Annual Report
Board Approval of Investment Advisory Contracts and
Management Fees - continued
Additional Information Requested by the Board. In order to develop fully the factual basis for consideration of the Fidelity funds' Advisory Contracts, the Board requested and received additional information on certain topics, including: (i) fund performance trends and Fidelity's long-term strategies for certain funds; (ii) the potential to further rationalize the Fidelity fund lineup with the possibility of achieving savings for the funds and Fidelity; (iii) the methodology with respect to competitive fund data and peer group classifications; (iv) the arrangements with, and performance of, certain sub-advisers on behalf of the Fidelity funds, as well as certain proposed participating affiliate arrangements; (v) the realization of fall-out benefits in certain Fidelity business units; (vi) Fidelity's group fee structures, including the rationale for the individual fee rates of certain categories of funds and the definition of group assets; (vii) trends regarding industry use of performance fee structures and the performance adjustment methodologies applicable to the Fidelity funds; (viii) additional competitive analysis regarding the total expenses for certain classes; and (ix) fund profitability methodology, including Fidelity's cost allocation methodology, and the impact of certain factors on fund profitability results.
Based on its evaluation of all of the conclusions noted above, and after considering all factors it believed relevant, the Board ultimately concluded that the advisory fee structures are fair and reasonable, and that the fund's Advisory Contracts should be renewed.
Annual Report
Investment Adviser
Fidelity Management & Research Company
Boston, MA
Investment Sub-Advisers
FMR Co., Inc.
Fidelity Management & Research
(U.K.) Inc.
Fidelity Management & Research (Japan) Inc.
Fidelity Management & Research (Hong Kong) Limited
General Distributor
Fidelity Distributors Corporation
Smithfield, RI
Transfer and Service Agents
Fidelity Investments Institutional
Operations Company, Inc.
Boston, MA
Fidelity Service Company, Inc.
Boston, MA
Custodian
The Bank of New York Mellon
New York, NY
(Fidelity Investment logo)(registered trademark)
GOZ-UANN-0114 1.9585497.100
(Fidelity Investment logo)(registered trademark)
Fidelity Advisor®
Large Cap
Fund - Class A, Class T, Class B
and Class C
Annual Report
November 30, 2013
(Fidelity Cover Art)
Contents
|
Performance |
How the fund has done over time. |
|
|
Management's Discussion of Fund Performance |
The Portfolio Manager's review of fund performance and strategy. |
|
|
Shareholder Expense Example |
An example of shareholder expenses. |
|
|
Investment Changes |
A summary of major shifts in the fund's investments over the past six months. |
|
|
Investments |
A complete list of the fund's investments with their market values. |
|
|
Financial Statements |
Statements of assets and liabilities, operations, and changes in net assets, as well as financial highlights. |
|
|
Notes |
Notes to the financial statements. |
|
|
Report of Independent Registered Public Accounting Firm |
|
|
|
Trustees and Officers |
|
|
|
Distributions |
|
|
|
Board Approval of Investment Advisory Contracts and Management Fees |
|
To view a fund's proxy voting guidelines and proxy voting record for the 12-month period ended June 30, visit http://www.fidelity.com/proxyvotingresults or visit the Securities and Exchange Commission's (SEC) web site at http://www.sec.gov. You may also call 1-877-208-0098 to request a free copy of the proxy voting guidelines.
Standard & Poor's, S&P and S&P 500 are registered service marks of The McGraw-Hill Companies, Inc. and have been licensed for use by Fidelity Distributors Corporation.
Other third-party marks appearing herein are the property of their respective owners.
All other marks appearing herein are registered or unregistered trademarks or service marks of FMR LLC or an affiliated company. © 2014 FMR LLC. All rights reserved.
Annual Report
This report and the financial statements contained herein are submitted for the general information of the shareholders of the fund. This report is not authorized for distribution to prospective investors in the fund unless preceded or accompanied by an effective prospectus.
A fund files its complete schedule of portfolio holdings with the SEC for the first and third quarters of each fiscal year on Form N-Q. Forms N-Q are available on the SEC's web site at http://www.sec.gov. A fund's Forms N-Q may be reviewed and copied at the SEC's Public Reference Room in Washington, DC. Information regarding the operation of the SEC's Public Reference Room may be obtained by calling 1-800-SEC-0330. For a complete list of a fund's portfolio holdings, view the most recent holdings listing, semiannual report, or annual report on Fidelity's web site at http://www.fidelity.com, http://www.advisor.fidelity.com, or http://www.401k.com, as applicable.
NOT FDIC INSURED • MAY LOSE VALUE • NO BANK GUARANTEE
Neither the fund nor Fidelity Distributors Corporation is a bank.
Annual Report
Performance: The Bottom Line
Average annual total return reflects the change in the value of an investment, assuming reinvestment of the class' distributions from dividend income and capital gains (the profits earned upon the sale of securities that have grown in value, if any) and assuming a constant rate of performance each year. The $10,000 table and the fund's returns do not reflect the deduction of taxes that a shareholder would pay on fund distributions or the redemption of fund shares. During periods of reimbursement by Fidelity, a fund's total return will be greater than it would be had the reimbursement not occurred. How a fund did yesterday is no guarantee of how it will do tomorrow. Returns reflect the conversion of Class B shares to Class A shares after a maximum of seven years.
Average Annual Total Returns
|
Periods ended November 30, 2013 |
|
Past 1 |
Past 5 |
Past 10 |
|
Class A (incl. 5.75% sales charge) |
|
30.22% |
22.40% |
8.08% |
|
Class T (incl. 3.50% sales charge) |
|
33.00% |
22.67% |
8.09% |
|
Class B (incl. contingent deferred sales charge) A |
|
32.08% |
22.74% |
8.16% |
|
Class C (incl. contingent deferred sales charge) B |
|
36.14% |
22.92% |
7.91% |
A Class B shares' contingent deferred sales charges included in the past one year, past five years, and past ten years total return figures are 5%, 2%, and 0%, respectively.
B Class C shares' contingent deferred sales charges included in the past one year, past five years, and past ten years total return figures are 1%, 0%, and 0%, respectively.
Annual Report
$10,000 Over 10 Years
Let's say hypothetically that $10,000 was invested in Fidelity Advisor® Large Cap Fund - Class A on November 30, 2003, and the current 5.75% sales charge was paid. The chart shows how the value of your investment would have changed, and also shows how the S&P 500® Index performed over the same period.
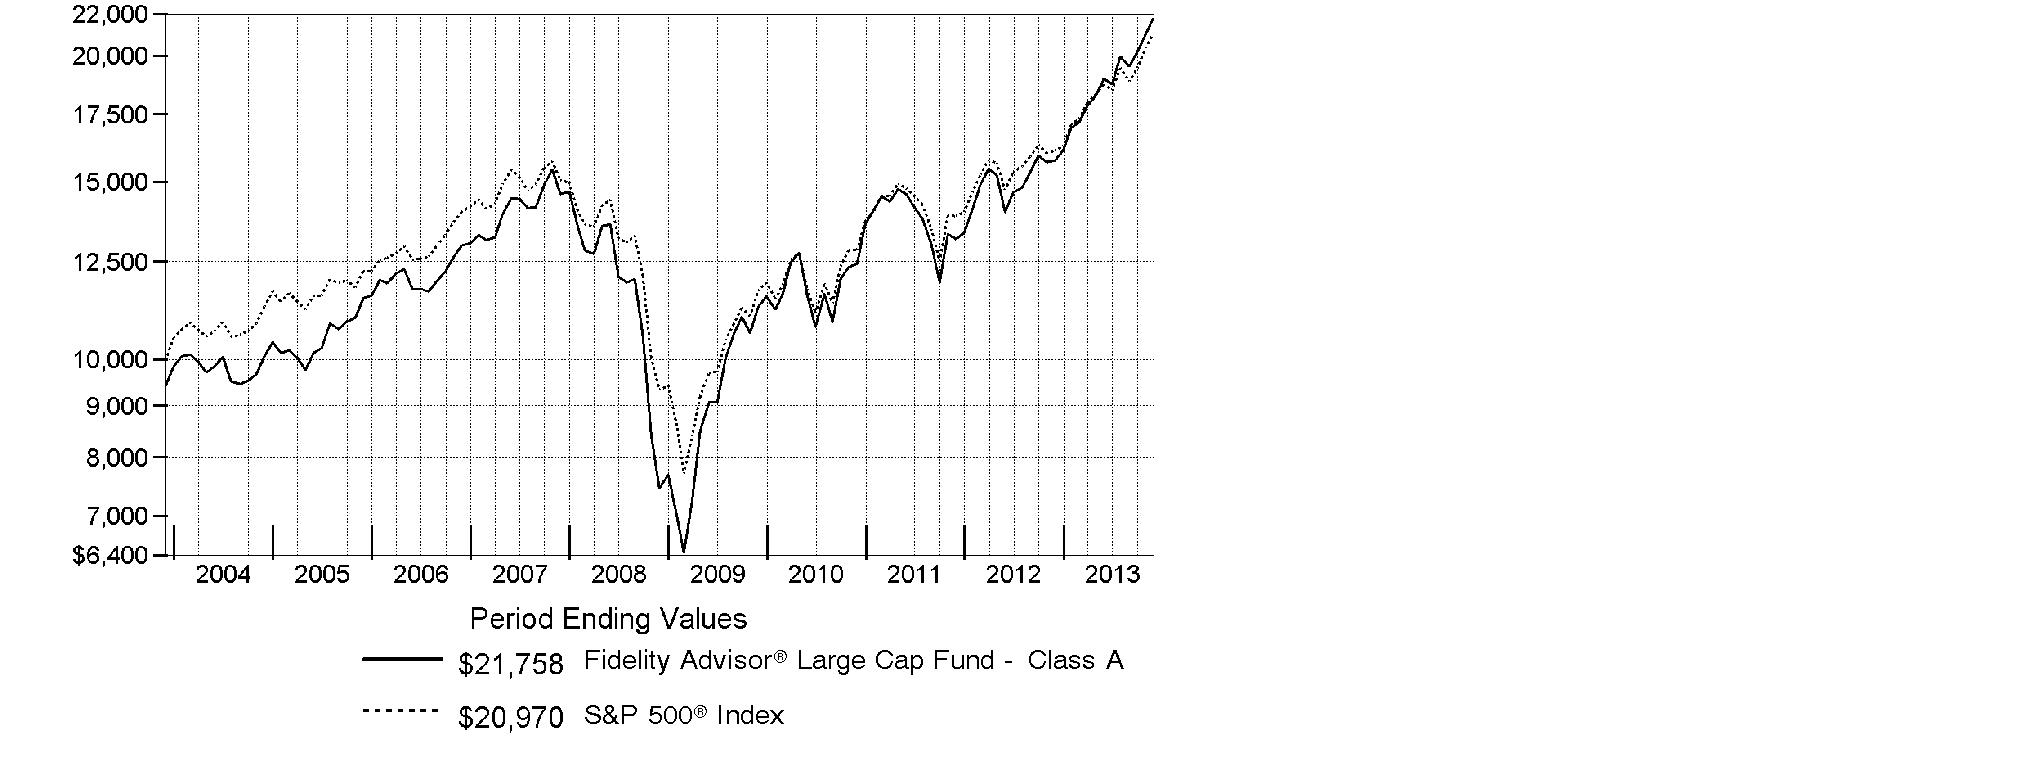
Annual Report
Management's Discussion of Fund Performance
Market Recap: With the current bull run nearing the five-year mark, equity benchmarks ripped up old records during the 12 months ending November 30, 2013. Gains were fueled by strengthening U.S. economic data, as well as generally improving economies and accommodative monetary policies worldwide. The broad S&P 500® Index reached new peaks in its 30.30% climb for the period, and the blue-chip Dow Jones Industrial AverageSM surpassed historic milestones en route to a 26.63% gain. The Nasdaq Composite Index®, up 36.73% amid a resurgence in growth-oriented stocks, closed above 4,000 for the first time since 2000. Shedding anxiety over the 2012 U.S. presidential election - and apparently confident that the federal debt-ceiling debate would be resolved - markets rose from period start through late May. News that the U.S. Federal Reserve was considering an end to its stimulative bond-buying kept stocks in flux over the summer but, by September, the Fed had set aside any imminent tapering. Despite jitters over a potential U.S. military strike in Syria and, later, an October budget impasse that briefly shuttered the federal government, volatility was subdued heading into the holidays, with investor optimism helping many markets home in on all-time highs at period end. Elsewhere, non-U.S. developed-market equities saw similar results, with the MSCI® EAFE® Index adding 24.97%.
Comments from Matt Fruhan, Portfolio Manager of Fidelity Advisor® Large Cap Fund: For the year, the fund's Class A, Class T, Class B and Class C shares gained 38.16%, 37.82%, 37.08% and 37.14%, respectively (excluding sales charges), handily topping the S&P 500®. Relative to the index, top contributors included Gentium, an Italian biotechnology firm that sells a drug to treat veno-occlusive disease (VOD). In July, Gentium received a positive opinion from the European Medicines Agency, and in October was granted approval to market and sell the drug in the European Union. The fund also benefited from Alere, a point-of-care diagnostics company that saw its stock appreciate because pressure from activist shareholders forced management to detail plans to optimize its cost structure to drive earnings growth. The top relative contributor was an out-of-index stake in Radian Group, a mortgage insurer that saw its stock soar because investors started to appreciate the relative strength of the company's capital position versus its peers. I reduced the fund's exposure to each of these names as their stock prices gained. Performance was hampered by an out-of-index stake in Acacia Research, a firm that helps patent owners realize value from their intellectual property. The stock declined on concern about inconsistency in earnings and cash flow.
Annual Report
The views expressed above reflect those of the portfolio manager(s) only through the end of the period as stated on the cover of this report and do not necessarily represent the views of Fidelity or any other person in the Fidelity organization. Any such views are subject to change at any time based upon market or other conditions and Fidelity disclaims any responsibility to update such views. These views may not be relied on as investment advice and, because investment decisions for a Fidelity fund are based on numerous factors, may not be relied on as an indication of trading intent on behalf of any Fidelity fund.
Annual Report
Shareholder Expense Example
As a shareholder of the Fund, you incur two types of costs: (1) transaction costs, including sales charges (loads) on purchase payments or redemption proceeds, and (2) ongoing costs, including management fees, distribution and/or service (12b-1) fees and other Fund expenses. This Example is intended to help you understand your ongoing costs (in dollars) of investing in the Fund and to compare these costs with the ongoing costs of investing in other mutual funds.
The Example is based on an investment of $1,000 invested at the beginning of the period and held for the entire period (June 1, 2013 to November 30, 2013).
Actual Expenses
The first line of the accompanying table for each class of the Fund provides information about actual account values and actual expenses. You may use the information in this line, together with the amount you invested, to estimate the expenses that you paid over the period. Simply divide your account value by $1,000.00 (for example, an $8,600 account value divided by $1,000.00 = 8.6), then multiply the result by the number in the first line for a class of the Fund under the heading entitled "Expenses Paid During Period" to estimate the expenses you paid on your account during this period. In addition, the Fund, as a shareholder in the underlying Fidelity Central Funds, will indirectly bear its pro-rata share of the fees and expenses incurred by the underlying Fidelity Central Funds. These fees and expenses are not included in the Fund's annualized expense ratio used to calculate the expense estimate in the table below.
Hypothetical Example for Comparison Purposes
The second line of the accompanying table for each class of the Fund provides information about hypothetical account values and hypothetical expenses based on a Class' actual expense ratio and an assumed rate of return of 5% per year before expenses, which is not the Class' actual return. The hypothetical account values and expenses may not be used to estimate the actual ending account balance or expenses you paid for the period. You may use this information to compare the ongoing costs of investing in the Fund and other funds. To do so, compare this 5% hypothetical example with the 5% hypothetical examples that appear in the shareholder reports of the other funds. In addition, the Fund, as a shareholder in the underlying Fidelity Central Funds, will indirectly bear its pro-rata share of the fees and expenses incurred by the underlying Fidelity Central Funds. These fees and expenses are not included in the Fund's annualized expense ratio used to calculate the expense estimate in the table below.
Please note that the expenses shown in the table are meant to highlight your ongoing costs only and do not reflect any transaction costs. Therefore, the second line of the table is useful in comparing ongoing costs only, and will not help you determine the relative total costs of owning different funds. In addition, if these transactional costs were included, your costs would have been higher.
Annual Report
|
|
Annualized |
Beginning |
Ending |
Expenses Paid |
|
Class A |
1.30% |
|
|
|
|
Actual |
|
$ 1,000.00 |
$ 1,145.90 |
$ 6.99 |
|
HypotheticalA |
|
$ 1,000.00 |
$ 1,018.55 |
$ 6.58 |
|
Class T |
1.56% |
|
|
|
|
Actual |
|
$ 1,000.00 |
$ 1,144.60 |
$ 8.39 |
|
HypotheticalA |
|
$ 1,000.00 |
$ 1,017.25 |
$ 7.89 |
|
Class B |
2.13% |
|
|
|
|
Actual |
|
$ 1,000.00 |
$ 1,141.40 |
$ 11.43 |
|
HypotheticalA |
|
$ 1,000.00 |
$ 1,014.39 |
$ 10.76 |
|
Class C |
2.04% |
|
|
|
|
Actual |
|
$ 1,000.00 |
$ 1,141.90 |
$ 10.95 |
|
HypotheticalA |
|
$ 1,000.00 |
$ 1,014.84 |
$ 10.30 |
|
Institutional Class |
1.01% |
|
|
|
|
Actual |
|
$ 1,000.00 |
$ 1,147.90 |
$ 5.44 |
|
HypotheticalA |
|
$ 1,000.00 |
$ 1,020.00 |
$ 5.11 |
A 5% return per year before expenses
B Annualized expense ratio reflects expenses net of applicable fee waivers.
* Expenses are equal to each Class' annualized expense ratio, multiplied by the average account value over the period, multiplied by 183/365 (to reflect the one-half year period).
Annual Report
Investment Changes (Unaudited)
|
Top Ten Stocks as of November 30, 2013 |
||
|
|
% of fund's |
% of fund's net assets |
|
Apple, Inc. |
3.8 |
3.4 |
|
JPMorgan Chase & Co. |
3.7 |
3.8 |
|
Microsoft Corp. |
2.5 |
2.2 |
|
General Electric Co. |
2.4 |
2.6 |
|
Google, Inc. Class A |
2.1 |
2.3 |
|
Citigroup, Inc. |
2.1 |
2.1 |
|
Chevron Corp. |
1.8 |
2.4 |
|
Bank of America Corp. |
1.7 |
1.8 |
|
Wells Fargo & Co. |
1.7 |
2.7 |
|
Occidental Petroleum Corp. |
1.6 |
1.9 |
|
|
23.4 |
|
|
Top Five Market Sectors as of November 30, 2013 |
||
|
|
% of fund's |
% of fund's net assets |
|
Financials |
20.9 |
22.0 |
|
Information Technology |
20.5 |
19.6 |
|
Health Care |
15.2 |
15.8 |
|
Energy |
11.7 |
12.8 |
|
Industrials |
10.0 |
10.2 |
|
Asset Allocation (% of fund's net assets) |
|||||||
|
As of November 30, 2013* |
As of May 31, 2013** |
||||||
 |
Stocks 98.3% |
|
|
Stocks 99.7% |
|
||
 |
Convertible |
|
|
Convertible |
|
||
 |
Short-Term |
|
|
Short-Term |
|
||
|
* Foreign investments |
12.0% |
|
** Foreign investments |
8.8% |
|
||

Annual Report
Investments November 30, 2013
Showing Percentage of Net Assets
|
Common Stocks - 98.3% |
|||
|
Shares |
Value |
||
|
CONSUMER DISCRETIONARY - 7.7% |
|||
|
Auto Components - 0.1% |
|||
|
The Goodyear Tire & Rubber Co. |
34,669 |
$ 771,732 |
|
|
Automobiles - 0.4% |
|||
|
Ford Motor Co. |
136,290 |
2,327,833 |
|
|
Distributors - 0.1% |
|||
|
LKQ Corp. (a) |
26,300 |
871,845 |
|
|
Diversified Consumer Services - 0.4% |
|||
|
H&R Block, Inc. |
86,217 |
2,404,592 |
|
|
Hotels, Restaurants & Leisure - 0.6% |
|||
|
Wyndham Worldwide Corp. |
13,300 |
953,743 |
|
|
Yum! Brands, Inc. |
38,112 |
2,960,540 |
|
|
|
3,914,283 |
||
|
Internet & Catalog Retail - 0.1% |
|||
|
Expedia, Inc. |
6,700 |
426,723 |
|
|
Leisure Equipment & Products - 0.4% |
|||
|
Mattel, Inc. |
35,400 |
1,637,958 |
|
|
NJOY, Inc. (a)(e) |
115,947 |
936,852 |
|
|
|
2,574,810 |
||
|
Media - 2.4% |
|||
|
Comcast Corp. Class A (special) (non-vtg.) |
183,287 |
8,825,269 |
|
|
Discovery Communications, Inc. Class A (a) |
2,877 |
251,076 |
|
|
Time Warner, Inc. |
101,959 |
6,699,726 |
|
|
|
15,776,071 |
||
|
Multiline Retail - 1.6% |
|||
|
Kohl's Corp. |
10,500 |
580,440 |
|
|
Target Corp. |
155,638 |
9,949,937 |
|
|
|
10,530,377 |
||
|
Specialty Retail - 1.4% |
|||
|
Bed Bath & Beyond, Inc. (a) |
3,600 |
280,908 |
|
|
Lowe's Companies, Inc. |
165,779 |
7,871,187 |
|
|
Staples, Inc. |
73,409 |
1,140,042 |
|
|
|
9,292,137 |
||
|
Textiles, Apparel & Luxury Goods - 0.2% |
|||
|
Coach, Inc. |
7,800 |
451,620 |
|
|
Li & Fung Ltd. |
306,000 |
416,813 |
|
|
lululemon athletica, Inc. (a) |
9,100 |
634,452 |
|
|
|
1,502,885 |
||
|
TOTAL CONSUMER DISCRETIONARY |
50,393,288 |
||
|
Common Stocks - continued |
|||
|
Shares |
Value |
||
|
CONSUMER STAPLES - 9.0% |
|||
|
Beverages - 2.0% |
|||
|
Molson Coors Brewing Co. Class B |
7,700 |
$ 405,559 |
|
|
Monster Beverage Corp. (a) |
14,280 |
845,090 |
|
|
PepsiCo, Inc. |
42,640 |
3,601,374 |
|
|
Pernod Ricard SA |
3,900 |
442,122 |
|
|
Remy Cointreau SA |
8,500 |
724,750 |
|
|
SABMiller PLC |
33,400 |
1,723,191 |
|
|
The Coca-Cola Co. |
127,825 |
5,137,287 |
|
|
|
12,879,373 |
||
|
Food & Staples Retailing - 1.7% |
|||
|
CVS Caremark Corp. |
41,411 |
2,772,881 |
|
|
Sysco Corp. |
15,700 |
527,991 |
|
|
Walgreen Co. |
130,405 |
7,719,976 |
|
|
|
11,020,848 |
||
|
Food Products - 1.1% |
|||
|
Danone SA |
21,003 |
1,526,259 |
|
|
Kellogg Co. |
66,767 |
4,048,751 |
|
|
Mead Johnson Nutrition Co. Class A |
7,100 |
600,021 |
|
|
Unilever NV (Certificaten Van Aandelen) (Bearer) |
30,900 |
1,213,889 |
|
|
|
7,388,920 |
||
|
Household Products - 1.8% |
|||
|
Kimberly-Clark Corp. |
20,935 |
2,285,265 |
|
|
Procter & Gamble Co. |
114,352 |
9,630,725 |
|
|
|
11,915,990 |
||
|
Tobacco - 2.4% |
|||
|
British American Tobacco PLC sponsored ADR |
64,701 |
6,879,657 |
|
|
Lorillard, Inc. |
96,926 |
4,975,212 |
|
|
Philip Morris International, Inc. |
40,775 |
3,487,894 |
|
|
|
15,342,763 |
||
|
TOTAL CONSUMER STAPLES |
58,547,894 |
||
|
ENERGY - 11.6% |
|||
|
Energy Equipment & Services - 2.4% |
|||
|
Cameron International Corp. (a) |
52,445 |
2,904,929 |
|
|
Dresser-Rand Group, Inc. (a) |
23,702 |
1,337,741 |
|
|
Ensco PLC Class A |
25,450 |
1,503,586 |
|
|
Halliburton Co. |
72,336 |
3,810,660 |
|
|
Helmerich & Payne, Inc. |
15,730 |
1,211,210 |
|
|
Common Stocks - continued |
|||
|
Shares |
Value |
||
|
ENERGY - continued |
|||
|
Energy Equipment & Services - continued |
|||
|
National Oilwell Varco, Inc. |
17,482 |
$ 1,424,783 |
|
|
Schlumberger Ltd. |
33,855 |
2,993,459 |
|
|
|
15,186,368 |
||
|
Oil, Gas & Consumable Fuels - 9.2% |
|||
|
Amyris, Inc. (a)(d) |
497,494 |
1,383,033 |
|
|
Apache Corp. |
71,360 |
6,528,726 |
|
|
BG Group PLC |
133,200 |
2,721,170 |
|
|
BP PLC sponsored ADR |
25,990 |
1,221,790 |
|
|
Canadian Natural Resources Ltd. |
180,300 |
5,935,621 |
|
|
Chevron Corp. |
97,557 |
11,944,879 |
|
|
ENI SpA |
24,100 |
576,866 |
|
|
Exxon Mobil Corp. |
44,048 |
4,117,607 |
|
|
Imperial Oil Ltd. |
23,600 |
1,017,917 |
|
|
Occidental Petroleum Corp. |
110,675 |
10,509,698 |
|
|
Peabody Energy Corp. |
58,632 |
1,067,102 |
|
|
Royal Dutch Shell PLC Class A (United Kingdom) |
99,376 |
3,322,890 |
|
|
Suncor Energy, Inc. |
174,000 |
6,037,721 |
|
|
The Williams Companies, Inc. |
104,975 |
3,697,220 |
|
|
|
60,082,240 |
||
|
TOTAL ENERGY |
75,268,608 |
||
|
FINANCIALS - 20.9% |
|||
|
Capital Markets - 3.0% |
|||
|
Charles Schwab Corp. |
212,203 |
5,194,729 |
|
|
KKR & Co. LP |
41,042 |
973,927 |
|
|
Morgan Stanley |
229,403 |
7,180,314 |
|
|
Northern Trust Corp. |
33,788 |
1,993,154 |
|
|
State Street Corp. |
53,958 |
3,917,890 |
|
|
UBS AG |
20,920 |
397,865 |
|
|
|
19,657,879 |
||
|
Commercial Banks - 4.4% |
|||
|
BNP Paribas SA |
7,800 |
585,575 |
|
|
CIT Group, Inc. |
42,005 |
2,120,412 |
|
|
Comerica, Inc. |
36,274 |
1,645,026 |
|
|
Erste Group Bank AG |
22,238 |
782,922 |
|
|
PNC Financial Services Group, Inc. |
36,180 |
2,784,051 |
|
|
Standard Chartered PLC (United Kingdom) |
109,816 |
2,602,837 |
|
|
SunTrust Banks, Inc. |
49,508 |
1,793,675 |
|
|
U.S. Bancorp |
118,715 |
4,656,002 |
|
|
Common Stocks - continued |
|||
|
Shares |
Value |
||
|
FINANCIALS - continued |
|||
|
Commercial Banks - continued |
|||
|
UniCredit SpA |
120,800 |
$ 876,524 |
|
|
Wells Fargo & Co. |
245,144 |
10,791,239 |
|
|
|
28,638,263 |
||
|
Consumer Finance - 0.2% |
|||
|
SLM Corp. |
15,255 |
406,546 |
|
|
Springleaf Holdings, Inc. |
35,200 |
742,016 |
|
|
|
1,148,562 |
||
|
Diversified Financial Services - 8.2% |
|||
|
Bank of America Corp. |
682,750 |
10,801,105 |
|
|
Citigroup, Inc. |
262,779 |
13,906,265 |
|
|
JPMorgan Chase & Co. |
419,543 |
24,006,250 |
|
|
KKR Financial Holdings LLC |
168,984 |
1,618,867 |
|
|
KKR Renaissance Co-Invest LP unit (e) |
29,500 |
2,979,795 |
|
|
|
53,312,282 |
||
|
Insurance - 3.4% |
|||
|
AIA Group Ltd. |
12,400 |
62,859 |
|
|
American International Group, Inc. |
76,857 |
3,823,636 |
|
|
Genworth Financial, Inc. Class A (a) |
223,451 |
3,376,345 |
|
|
Lincoln National Corp. |
73,536 |
3,774,603 |
|
|
MetLife, Inc. |
178,590 |
9,320,612 |
|
|
Prudential Financial, Inc. |
16,866 |
1,497,026 |
|
|
|
21,855,081 |
||
|
Thrifts & Mortgage Finance - 1.7% |
|||
|
MGIC Investment Corp. (a) |
275,692 |
2,235,862 |
|
|
Radian Group, Inc. (d) |
629,868 |
8,981,918 |
|
|
|
11,217,780 |
||
|
TOTAL FINANCIALS |
135,829,847 |
||
|
HEALTH CARE - 15.2% |
|||
|
Biotechnology - 3.3% |
|||
|
Amgen, Inc. |
51,997 |
5,931,818 |
|
|
ARIAD Pharmaceuticals, Inc. (a) |
29,095 |
141,111 |
|
|
Clovis Oncology, Inc. (a) |
32,800 |
1,977,184 |
|
|
Discovery Laboratories, Inc. (a) |
319,900 |
767,760 |
|
|
Gentium SpA sponsored ADR (a)(d) |
160,674 |
8,711,744 |
|
|
Infinity Pharmaceuticals, Inc. (a) |
41,523 |
606,651 |
|
|
Insmed, Inc. (a) |
26,364 |
427,097 |
|
|
Intercept Pharmaceuticals, Inc. (a) |
27,731 |
1,452,272 |
|
|
Common Stocks - continued |
|||
|
Shares |
Value |
||
|
HEALTH CARE - continued |
|||
|
Biotechnology - continued |
|||
|
MEI Pharma, Inc. (a) |
116,203 |
$ 920,328 |
|
|
Merrimack Pharmaceuticals, Inc. (a) |
41,101 |
161,938 |
|
|
Synageva BioPharma Corp. (a) |
8,194 |
495,000 |
|
|
|
21,592,903 |
||
|
Health Care Equipment & Supplies - 3.7% |
|||
|
Abbott Laboratories |
30,525 |
1,165,750 |
|
|
Accuray, Inc. (a) |
123,401 |
984,740 |
|
|
Alere, Inc. (a) |
226,822 |
7,421,616 |
|
|
Align Technology, Inc. (a) |
52,805 |
2,885,265 |
|
|
Baxter International, Inc. |
4,522 |
309,531 |
|
|
Boston Scientific Corp. (a) |
346,884 |
4,016,917 |
|
|
Hologic, Inc. (a) |
31,843 |
712,965 |
|
|
IDEXX Laboratories, Inc. (a) |
6,800 |
708,288 |
|
|
Intuitive Surgical, Inc. (a) |
3,250 |
1,224,925 |
|
|
NxStage Medical, Inc. (a) |
39,298 |
401,233 |
|
|
St. Jude Medical, Inc. |
40,000 |
2,336,800 |
|
|
Stryker Corp. |
5,000 |
372,100 |
|
|
Volcano Corp. (a) |
39,544 |
900,417 |
|
|
Zimmer Holdings, Inc. |
9,800 |
895,818 |
|
|
|
24,336,365 |
||
|
Health Care Providers & Services - 3.6% |
|||
|
Aetna, Inc. |
45,034 |
3,104,194 |
|
|
Catamaran Corp. (a) |
26,600 |
1,214,155 |
|
|
Express Scripts Holding Co. (a) |
50,210 |
3,381,644 |
|
|
McKesson Corp. |
29,896 |
4,959,447 |
|
|
MWI Veterinary Supply, Inc. (a) |
1,000 |
182,170 |
|
|
Quest Diagnostics, Inc. |
42,355 |
2,581,114 |
|
|
UnitedHealth Group, Inc. |
79,778 |
5,941,865 |
|
|
WellPoint, Inc. |
23,091 |
2,144,692 |
|
|
|
23,509,281 |
||
|
Health Care Technology - 0.0% |
|||
|
HMS Holdings Corp. (a) |
10,200 |
233,682 |
|
|
Life Sciences Tools & Services - 0.6% |
|||
|
Illumina, Inc. (a) |
19,473 |
1,908,354 |
|
|
QIAGEN NV (a) |
55,295 |
1,287,821 |
|
|
Thermo Fisher Scientific, Inc. |
5,000 |
504,250 |
|
|
|
3,700,425 |
||
|
Pharmaceuticals - 4.0% |
|||
|
AbbVie, Inc. |
12,184 |
590,315 |
|
|
Common Stocks - continued |
|||
|
Shares |
Value |
||
|
HEALTH CARE - continued |
|||
|
Pharmaceuticals - continued |
|||
|
Actavis PLC (a) |
13,179 |
$ 2,149,100 |
|
|
Cardiome Pharma Corp. (a) |
30,267 |
187,148 |
|
|
Endo Health Solutions, Inc. (a)(d) |
23,540 |
1,581,653 |
|
|
GlaxoSmithKline PLC sponsored ADR |
72,989 |
3,862,578 |
|
|
Jazz Pharmaceuticals PLC (a) |
7,007 |
819,258 |
|
|
Johnson & Johnson |
33,913 |
3,210,205 |
|
|
Merck & Co., Inc. |
167,311 |
8,337,107 |
|
|
Novartis AG sponsored ADR |
17,711 |
1,401,294 |
|
|
Orexo AB (a) |
18,000 |
466,510 |
|
|
Sanofi SA |
3,174 |
335,361 |
|
|
Teva Pharmaceutical Industries Ltd. sponsored ADR |
62,539 |
2,549,090 |
|
|
XenoPort, Inc. (a) |
52,187 |
278,679 |
|
|
|
25,768,298 |
||
|
TOTAL HEALTH CARE |
99,140,954 |
||
|
INDUSTRIALS - 10.0% |
|||
|
Aerospace & Defense - 1.7% |
|||
|
Esterline Technologies Corp. (a) |
13,296 |
1,170,314 |
|
|
Honeywell International, Inc. |
19,280 |
1,706,473 |
|
|
KEYW Holding Corp. (a) |
135,382 |
1,677,383 |
|
|
The Boeing Co. |
39,863 |
5,351,608 |
|
|
United Technologies Corp. |
7,022 |
778,459 |
|
|
|
10,684,237 |
||
|
Air Freight & Logistics - 1.1% |
|||
|
C.H. Robinson Worldwide, Inc. |
31,258 |
1,832,657 |
|
|
United Parcel Service, Inc. Class B |
54,225 |
5,551,556 |
|
|
|
7,384,213 |
||
|
Electrical Equipment - 0.5% |
|||
|
AMETEK, Inc. |
30,230 |
1,487,921 |
|
|
Hubbell, Inc. Class B |
5,300 |
571,923 |
|
|
Roper Industries, Inc. |
9,835 |
1,275,600 |
|
|
|
3,335,444 |
||
|
Industrial Conglomerates - 2.9% |
|||
|
Danaher Corp. |
40,408 |
3,022,518 |
|
|
General Electric Co. |
585,144 |
15,599,939 |
|
|
|
18,622,457 |
||
|
Machinery - 1.2% |
|||
|
Caterpillar, Inc. |
20,233 |
1,711,712 |
|
|
Common Stocks - continued |
|||
|
Shares |
Value |
||
|
INDUSTRIALS - continued |
|||
|
Machinery - continued |
|||
|
Cummins, Inc. |
6,323 |
$ 836,912 |
|
|
Ingersoll-Rand PLC |
66,783 |
4,769,642 |
|
|
Xylem, Inc. |
12,600 |
435,456 |
|
|
|
7,753,722 |
||
|
Professional Services - 0.8% |
|||
|
Acacia Research Corp. (d) |
178,687 |
2,658,863 |
|
|
Bureau Veritas SA |
6,600 |
196,042 |
|
|
Michael Page International PLC |
140,378 |
1,091,077 |
|
|
Towers Watson & Co. |
3,900 |
439,140 |
|
|
Verisk Analytics, Inc. (a) |
15,100 |
983,161 |
|
|
|
5,368,283 |
||
|
Road & Rail - 1.5% |
|||
|
CSX Corp. |
227,641 |
6,207,770 |
|
|
Hertz Global Holdings, Inc. (a) |
62,700 |
1,521,102 |
|
|
Norfolk Southern Corp. |
25,158 |
2,206,105 |
|
|
|
9,934,977 |
||
|
Trading Companies & Distributors - 0.3% |
|||
|
Beacon Roofing Supply, Inc. (a) |
25,184 |
936,341 |
|
|
WESCO International, Inc. (a) |
13,812 |
1,187,556 |
|
|
|
2,123,897 |
||
|
TOTAL INDUSTRIALS |
65,207,230 |
||
|
INFORMATION TECHNOLOGY - 20.5% |
|||
|
Communications Equipment - 2.3% |
|||
|
Cisco Systems, Inc. |
475,104 |
10,095,960 |
|
|
QUALCOMM, Inc. |
62,150 |
4,572,997 |
|
|
|
14,668,957 |
||
|
Computers & Peripherals - 4.3% |
|||
|
Apple, Inc. |
44,403 |
24,691,167 |
|
|
EMC Corp. |
114,808 |
2,738,171 |
|
|
NCR Corp. (a) |
11,650 |
407,168 |
|
|
|
27,836,506 |
||
|
Internet Software & Services - 2.1% |
|||
|
Google, Inc. Class A (a) |
13,176 |
13,961,158 |
|
|
IT Services - 5.1% |
|||
|
Accenture PLC Class A |
6,400 |
495,808 |
|
|
Cognizant Technology Solutions Corp. Class A (a) |
48,592 |
4,562,303 |
|
|
Common Stocks - continued |
|||
|
Shares |
Value |
||
|
INFORMATION TECHNOLOGY - continued |
|||
|
IT Services - continued |
|||
|
Fidelity National Information Services, Inc. |
35,624 |
$ 1,805,424 |
|
|
Gartner, Inc. Class A (a) |
13,133 |
849,048 |
|
|
IBM Corp. |
12,731 |
2,287,506 |
|
|
MasterCard, Inc. Class A |
9,600 |
7,303,776 |
|
|
Paychex, Inc. |
132,664 |
5,801,397 |
|
|
The Western Union Co. |
110,262 |
1,838,068 |
|
|
Unisys Corp. (a) |
73,662 |
2,023,495 |
|
|
Visa, Inc. Class A |
30,830 |
6,272,672 |
|
|
|
33,239,497 |
||
|
Semiconductors & Semiconductor Equipment - 1.6% |
|||
|
Applied Materials, Inc. |
196,961 |
3,407,425 |
|
|
Broadcom Corp. Class A |
161,260 |
4,304,029 |
|
|
Lam Research Corp. (a) |
37,834 |
1,971,530 |
|
|
NXP Semiconductors NV (a) |
20,827 |
885,148 |
|
|
|
10,568,132 |
||
|
Software - 5.1% |
|||
|
Adobe Systems, Inc. (a) |
37,710 |
2,141,174 |
|
|
Autodesk, Inc. (a) |
87,631 |
3,965,303 |
|
|
Citrix Systems, Inc. (a) |
16,196 |
960,747 |
|
|
Concur Technologies, Inc. (a) |
23,224 |
2,254,818 |
|
|
Electronic Arts, Inc. (a) |
39,132 |
867,948 |
|
|
Interactive Intelligence Group, Inc. (a) |
3,800 |
247,152 |
|
|
Microsoft Corp. |
430,104 |
16,399,866 |
|
|
Oracle Corp. |
87,300 |
3,080,817 |
|
|
Parametric Technology Corp. (a) |
24,882 |
809,660 |
|
|
salesforce.com, Inc. (a) |
18,100 |
942,829 |
|
|
VMware, Inc. Class A (a) |
12,835 |
1,034,886 |
|
|
Workday, Inc. Class A (a) |
2,000 |
164,700 |
|
|
|
32,869,900 |
||
|
TOTAL INFORMATION TECHNOLOGY |
133,144,150 |
||
|
MATERIALS - 2.2% |
|||
|
Chemicals - 1.5% |
|||
|
Airgas, Inc. |
14,048 |
1,526,034 |
|
|
E.I. du Pont de Nemours & Co. |
22,788 |
1,398,727 |
|
|
Intrepid Potash, Inc. (d) |
42,400 |
655,080 |
|
|
Monsanto Co. |
38,317 |
4,342,466 |
|
|
Common Stocks - continued |
|||
|
Shares |
Value |
||
|
MATERIALS - continued |
|||
|
Chemicals - continued |
|||
|
Potash Corp. of Saskatchewan, Inc. |
30,600 |
$ 968,786 |
|
|
Syngenta AG (Switzerland) |
3,300 |
1,293,684 |
|
|
|
10,184,777 |
||
|
Construction Materials - 0.0% |
|||
|
Imerys SA |
1,600 |
129,358 |
|
|
Metals & Mining - 0.7% |
|||
|
Freeport-McMoRan Copper & Gold, Inc. |
29,500 |
1,023,355 |
|
|
Grupo Mexico SA de CV Series B |
238,900 |
701,689 |
|
|
Southern Copper Corp. |
37,050 |
929,955 |
|
|
Walter Energy, Inc. (d) |
118,390 |
1,684,690 |
|
|
|
4,339,689 |
||
|
TOTAL MATERIALS |
14,653,824 |
||
|
TELECOMMUNICATION SERVICES - 1.1% |
|||
|
Diversified Telecommunication Services - 0.9% |
|||
|
Verizon Communications, Inc. |
117,797 |
5,845,087 |
|
|
Wireless Telecommunication Services - 0.2% |
|||
|
Vodafone Group PLC sponsored ADR |
37,171 |
1,378,672 |
|
|
TOTAL TELECOMMUNICATION SERVICES |
7,223,759 |
||
|
UTILITIES - 0.1% |
|||
|
Independent Power Producers & Energy Traders - 0.1% |
|||
|
APR Energy PLC (d) |
22,186 |
375,736 |
|
|
TOTAL COMMON STOCKS (Cost $495,854,059) |
|
||
|
Convertible Preferred Stocks - 0.0% |
|||
|
|
|
|
|
|
CONSUMER DISCRETIONARY - 0.0% |
|||
|
Leisure Equipment & Products - 0.0% |
|||
|
NJOY, Inc. Series C (e) (Cost $271,645) |
33,607 |
271,545 |
|
|
Convertible Bonds - 0.1% |
||||
|
|
Principal Amount |
Value |
||
|
ENERGY - 0.1% |
||||
|
Oil, Gas & Consumable Fuels - 0.1% |
||||
|
Amyris, Inc. 3% 2/27/17 (Cost $605,000) |
|
$ 605,000 |
$ 440,537 |
|
|
Money Market Funds - 4.0% |
|||
|
Shares |
|
||
|
Fidelity Cash Central Fund, 0.10% (b) |
9,868,438 |
9,868,438 |
|
|
Fidelity Securities Lending Cash Central Fund, 0.10% (b)(c) |
15,922,592 |
15,922,592 |
|
|
TOTAL MONEY MARKET FUNDS (Cost $25,791,030) |
|
||
|
TOTAL INVESTMENT PORTFOLIO - 102.4% (Cost $522,521,734) |
666,288,402 |
||
|
NET OTHER ASSETS (LIABILITIES) - (2.4)% |
(15,562,337) |
||
|
NET ASSETS - 100% |
$ 650,726,065 |
||
|
Legend |
|
(a) Non-income producing |
|
(b) Affiliated fund that is generally available only to investment companies and other accounts managed by Fidelity Investments. The rate quoted is the annualized seven-day yield of the fund at period end. A complete unaudited listing of the fund's holdings as of its most recent quarter end is available upon request. In addition, each Fidelity Central Fund's financial statements, which are not covered by the Fund's Report of Independent Registered Public Accounting Firm, are available on the SEC's website or upon request. |
|
(c) Investment made with cash collateral received from securities on loan. |
|
(d) Security or a portion of the security is on loan at period end. |
|
(e) Restricted securities - Investment in securities not registered under the Securities Act of 1933 (excluding 144A issues). At the end of the period, the value of restricted securities (excluding 144A issues) amounted to $4,188,192 or 0.6% of net assets. |
|
Additional information on each restricted holding is as follows: |
|
Security |
Acquisition Date |
Acquisition Cost |
|
KKR Renaissance Co-Invest LP unit |
7/25/13 |
$ 3,112,250 |
|
NJOY, Inc. |
9/11/13 - 10/24/13 |
$ 936,852 |
|
NJOY, Inc. |
6/7/13 |
$ 271,645 |
|
Affiliated Central Funds |
|
Information regarding fiscal year to date income earned by the Fund from investments in Fidelity Central Funds is as follows: |
|
Fund |
Income earned |
|
Fidelity Cash Central Fund |
$ 5,982 |
|
Fidelity Securities Lending Cash Central Fund |
234,319 |
|
Total |
$ 240,301 |
|
Other Information |
|
The following is a summary of the inputs used, as of November 30, 2013, involving the Fund's assets and liabilities carried at fair value. The inputs or methodology used for valuing securities may not be an indication of the risk associated with investing in those securities. For more information on valuation inputs, and their aggregation into the levels used in the table below, please refer to the Investment Valuation section in the accompanying Notes to Financial Statements. |
|
Valuation Inputs at Reporting Date: |
||||
|
Description |
Total |
Level 1 |
Level 2 |
Level 3 |
|
Investments in Securities: |
||||
|
Equities: |
||||
|
Consumer Discretionary |
$ 50,664,833 |
$ 49,456,436 |
$ - |
$ 1,208,397 |
|
Consumer Staples |
58,547,894 |
57,334,005 |
1,213,889 |
- |
|
Energy |
75,268,608 |
71,368,852 |
3,899,756 |
- |
|
Financials |
135,829,847 |
132,452,187 |
397,865 |
2,979,795 |
|
Health Care |
99,140,954 |
98,805,593 |
335,361 |
- |
|
Industrials |
65,207,230 |
65,207,230 |
- |
- |
|
Information Technology |
133,144,150 |
133,144,150 |
- |
- |
|
Materials |
14,653,824 |
13,360,140 |
1,293,684 |
- |
|
Telecommunication Services |
7,223,759 |
7,223,759 |
- |
- |
|
Utilities |
375,736 |
375,736 |
- |
- |
|
Corporate Bonds |
440,537 |
- |
440,537 |
- |
|
Money Market Funds |
25,791,030 |
25,791,030 |
- |
- |
|
Total Investments in Securities: |
$ 666,288,402 |
$ 654,519,118 |
$ 7,581,092 |
$ 4,188,192 |
|
Distribution of investments by country or territory of incorporation, as a percentage of total net assets, is as follows (Unaudited): |
|
United States of America |
88.0% |
|
United Kingdom |
4.2% |
|
Canada |
2.3% |
|
Italy |
1.5% |
|
Ireland |
1.2% |
|
Others (Individually Less Than 1%) |
2.8% |
|
|
100.0% |
See accompanying notes which are an integral part of the financial statements.
Annual Report
Financial Statements
Statement of Assets and Liabilities
|
|
November 30, 2013 |
|
|
|
|
|
|
Assets |
|
|
|
Investment in securities, at value (including securities loaned of $15,669,649) - See accompanying schedule: Unaffiliated issuers (cost $496,730,704) |
$ 640,497,372 |
|
|
Fidelity Central Funds (cost $25,791,030) |
25,791,030 |
|
|
Total Investments (cost $522,521,734) |
|
$ 666,288,402 |
|
Cash |
|
772 |
|
Foreign currency held at value (cost $172,241) |
|
172,279 |
|
Receivable for investments sold |
|
611,667 |
|
Receivable for fund shares sold |
|
2,103,236 |
|
Dividends receivable |
|
1,368,770 |
|
Interest receivable |
|
4,739 |
|
Distributions receivable from Fidelity Central Funds |
|
14,248 |
|
Prepaid expenses |
|
2,964 |
|
Other receivables |
|
2,271 |
|
Total assets |
|
670,569,348 |
|
|
|
|
|
Liabilities |
|
|
|
Payable for investments purchased |
$ 2,466,782 |
|
|
Payable for fund shares redeemed |
549,030 |
|
|
Accrued management fee |
570,982 |
|
|
Distribution and service plan fees payable |
150,656 |
|
|
Other affiliated payables |
130,907 |
|
|
Other payables and accrued expenses |
52,334 |
|
|
Collateral on securities loaned, at value |
15,922,592 |
|
|
Total liabilities |
|
19,843,283 |
|
|
|
|
|
Net Assets |
|
$ 650,726,065 |
|
Net Assets consist of: |
|
|
|
Paid in capital |
|
$ 460,204,374 |
|
Undistributed net investment income |
|
4,161,853 |
|
Accumulated undistributed net realized gain (loss) on investments and foreign currency transactions |
|
42,592,363 |
|
Net unrealized appreciation (depreciation) on investments and assets and liabilities in foreign currencies |
|
143,767,475 |
|
Net Assets |
|
$ 650,726,065 |
See accompanying notes which are an integral part of the financial statements.
Annual Report
Statement of Assets and Liabilities - continued
|
|
November 30, 2013 |
|
|
|
|
|
|
Calculation of Maximum Offering Price Class A: |
|
$ 28.11 |
|
|
|
|
|
Maximum offering price per share (100/94.25 of $28.11) |
|
$ 29.82 |
|
Class T: |
|
$ 28.02 |
|
|
|
|
|
Maximum offering price per share (100/96.50 of $28.02) |
|
$ 29.04 |
|
Class B: |
|
$ 26.24 |
|
|
|
|
|
Class C: |
|
$ 26.07 |
|
|
|
|
|
Institutional Class: |
|
$ 29.03 |
A Redemption price per share is equal to net asset value less any applicable contingent deferred sales charge.
See accompanying notes which are an integral part of the financial statements.
Annual Report
Financial Statements - continued
Statement of Operations
|
|
Year ended November 30, 2013 |
|
|
|
|
|
|
Investment Income |
|
|
|
Dividends |
|
$ 19,531,718 |
|
Interest |
|
18,150 |
|
Income from Fidelity Central Funds |
|
240,301 |
|
Total income |
|
19,790,169 |
|
|
|
|
|
Expenses |
|
|
|
Management fee |
$ 5,705,881 |
|
|
Performance adjustment |
1,580,167 |
|
|
Transfer agent fees |
2,121,112 |
|
|
Distribution and service plan fees |
1,390,530 |
|
|
Accounting and security lending fees |
343,530 |
|
|
Custodian fees and expenses |
70,348 |
|
|
Independent trustees' compensation |
5,967 |
|
|
Registration fees |
80,062 |
|
|
Audit |
59,612 |
|
|
Legal |
3,873 |
|
|
Interest |
1,258 |
|
|
Miscellaneous |
11,423 |
|
|
Total expenses before reductions |
11,373,763 |
|
|
Expense reductions |
(139,371) |
11,234,392 |
|
Net investment income (loss) |
|
8,555,777 |
|
Realized and Unrealized Gain (Loss) Net realized gain (loss) on: |
|
|
|
Investment securities: |
|
|
|
Unaffiliated issuers |
86,169,091 |
|
|
Redemption in-kind with affiliated entities |
267,456,609 |
|
|
Foreign currency transactions |
(20,296) |
|
|
Total net realized gain (loss) |
|
353,605,404 |
|
Change in net unrealized appreciation (depreciation) on: Investment securities |
(32,407,352) |
|
|
Assets and liabilities in foreign currencies |
(1,538) |
|
|
Total change in net unrealized appreciation (depreciation) |
|
(32,408,890) |
|
Net gain (loss) |
|
321,196,514 |
|
Net increase (decrease) in net assets resulting from operations |
|
$ 329,752,291 |
See accompanying notes which are an integral part of the financial statements.
Annual Report
Statement of Changes in Net Assets
|
|
Year ended |
Year ended |
|
Increase (Decrease) in Net Assets |
|
|
|
Operations |
|
|
|
Net investment income (loss) |
$ 8,555,777 |
$ 12,844,939 |
|
Net realized gain (loss) |
353,605,404 |
43,445,666 |
|
Change in net unrealized appreciation (depreciation) |
(32,408,890) |
175,969,722 |
|
Net increase (decrease) in net assets resulting |
329,752,291 |
232,260,327 |
|
Distributions to shareholders from net investment income |
(767,567) |
(17,554,132) |
|
Distributions to shareholders from net realized gain |
(3,062,648) |
(24,770,255) |
|
Total distributions |
(3,830,215) |
(42,324,387) |
|
Share transactions - net increase (decrease) |
(985,531,295) |
(103,985,044) |
|
Total increase (decrease) in net assets |
(659,609,219) |
85,950,896 |
|
|
|
|
|
Net Assets |
|
|
|
Beginning of period |
1,310,335,284 |
1,224,384,388 |
|
End of period (including undistributed net investment income of $4,161,853 and distributions in excess of net investment income of $12, respectively) |
$ 650,726,065 |
$ 1,310,335,284 |
See accompanying notes which are an integral part of the financial statements.
Annual Report
Financial Highlights - Class A
|
Years ended November 30, |
2013 |
2012 |
2011 |
2010 |
2009 |
|
Selected Per-Share Data |
|
|
|
|
|
|
Net asset value, beginning of period |
$ 20.43 |
$ 17.57 |
$ 16.69 |
$ 15.19 |
$ 10.13 |
|
Income from Investment Operations |
|
|
|
|
|
|
Net investment income (loss) C |
.16 |
.15 |
.09 |
.05 |
.06 |
|
Net realized and unrealized gain (loss) |
7.61 |
3.30 |
.87 |
1.52 |
5.08 |
|
Total from investment operations |
7.77 |
3.45 |
.96 |
1.57 |
5.14 |
|
Distributions from net investment income |
(.02) |
(.18) |
(.06) |
(.07) |
(.08) |
|
Distributions from net realized gain |
(.07) |
(.41) |
(.02) |
- |
- |
|
Total distributions |
(.09) |
(.59) |
(.08) |
(.07) |
(.08) |
|
Net asset value, end of period |
$ 28.11 |
$ 20.43 |
$ 17.57 |
$ 16.69 |
$ 15.19 |
|
Total Return A,B |
38.16% |
19.69% |
5.73% |
10.36% |
51.10% |
|
Ratios to Average Net Assets D,F |
|
|
|
|
|
|
Expenses before reductions |
1.26% |
1.25% |
1.29% |
1.22% |
1.16% |
|
Expenses net of fee waivers, if any |
1.26% |
1.25% |
1.29% |
1.22% |
1.16% |
|
Expenses net of all reductions |
1.24% |
1.24% |
1.28% |
1.21% |
1.15% |
|
Net investment income (loss) |
.68% |
.76% |
.49% |
.31% |
.49% |
|
Supplemental Data |
|
|
|
|
|
|
Net assets, end of period (000 omitted) |
$ 214,686 |
$ 123,303 |
$ 103,670 |
$ 116,837 |
$ 112,450 |
|
Portfolio turnover rate E |
54% |
59% |
83% |
146% |
185% |
A Total returns would have been lower if certain expenses had not been reduced during the applicable periods shown.
B Total returns do not include the effect of the sales charges.
C Calculated based on average shares outstanding during the period.
D Fees and expenses of any underlying Fidelity Central Funds are not included in the Fund's expense ratio. The Fund indirectly bears its proportionate share of the expenses of any underlying Fidelity Central Funds.
E Amount does not include the portfolio activity of any underlying Fidelity Central Funds.
F Expense ratios reflect operating expenses of the class. Expenses before reductions do not reflect amounts reimbursed by the investment adviser or reductions from brokerage service arrangements or reductions from other expense offset arrangements and do not represent the amount paid by the class during periods when reimbursements or reductions occur. Expenses net of fee waivers reflect expenses after reimbursement by the investment adviser but prior to reductions from brokerage service arrangements or other expense offset arrangements. Expenses net of all reductions represent the net expenses paid by the class.
See accompanying notes which are an integral part of the financial statements.
Annual Report
Financial Highlights - Class T
|
Years ended November 30, |
2013 |
2012 |
2011 |
2010 |
2009 |
|
Selected Per-Share Data |
|
|
|
|
|
|
Net asset value, beginning of period |
$ 20.41 |
$ 17.51 |
$ 16.63 |
$ 15.14 |
$ 10.07 |
|
Income from Investment Operations |
|
|
|
|
|
|
Net investment income (loss) C |
.10 |
.10 |
.04 |
.01 |
.03 |
|
Net realized and unrealized gain (loss) |
7.59 |
3.29 |
.87 |
1.52 |
5.06 |
|
Total from investment operations |
7.69 |
3.39 |
.91 |
1.53 |
5.09 |
|
Distributions from net investment income |
(.01) |
(.10) |
- G |
(.04) |
(.02) |
|
Distributions from net realized gain |
(.07) |
(.39) |
(.02) |
- |
- |
|
Total distributions |
(.08) |
(.49) |
(.03) H |
(.04) |
(.02) |
|
Net asset value, end of period |
$ 28.02 |
$ 20.41 |
$ 17.51 |
$ 16.63 |
$ 15.14 |
|
Total Return A,B |
37.82% |
19.39% |
5.44% |
10.09% |
50.71% |
|
Ratios to Average Net Assets D,F |
|
|
|
|
|
|
Expenses before reductions |
1.51% |
1.49% |
1.54% |
1.47% |
1.42% |
|
Expenses net of fee waivers, if any |
1.51% |
1.49% |
1.54% |
1.47% |
1.42% |
|
Expenses net of all reductions |
1.49% |
1.49% |
1.53% |
1.47% |
1.41% |
|
Net investment income (loss) |
.42% |
.52% |
.24% |
.06% |
.23% |
|
Supplemental Data |
|
|
|
|
|
|
Net assets, end of period (000 omitted) |
$ 114,864 |
$ 76,151 |
$ 69,678 |
$ 76,373 |
$ 87,009 |
|
Portfolio turnover rate E |
54% |
59% |
83% |
146% |
185% |
A Total returns would have been lower if certain expenses had not been reduced during the applicable periods shown.
B Total returns do not include the effect of the sales charges.
C Calculated based on average shares outstanding during the period.
D Fees and expenses of any underlying Fidelity Central Funds are not included in the Fund's expense ratio. The Fund indirectly bears its proportionate share of the expenses of any underlying Fidelity Central Funds.
E Amount does not include the portfolio activity of any underlying Fidelity Central Funds.
F Expense ratios reflect operating expenses of the class. Expenses before reductions do not reflect amounts reimbursed by the investment adviser or reductions from brokerage service arrangements or reductions from other expense offset arrangements and do not represent the amount paid by the class during periods when reimbursements or reductions occur. Expenses net of fee waivers reflect expenses after reimbursement by the investment adviser but prior to reductions from brokerage service arrangements or other expense offset arrangements. Expenses net of all reductions represent the net expenses paid by the class.
G Amount represents less than $.01 per share.
H Total distributions of $.03 per share is comprised of distributions from net investment income of $.004 and distributions from net realized gain of $.021 per share.
See accompanying notes which are an integral part of the financial statements.
Annual Report
Financial Highlights - Class B
|
Years ended November 30, |
2013 |
2012 |
2011 |
2010 |
2009 |
|
Selected Per-Share Data |
|
|
|
|
|
|
Net asset value, beginning of period |
$ 19.21 |
$ 16.49 |
$ 15.72 |
$ 14.35 |
$ 9.57 |
|
Income from Investment Operations |
|
|
|
|
|
|
Net investment income (loss) C |
(.03) |
- G |
(.05) |
(.07) |
(.03) |
|
Net realized and unrealized gain (loss) |
7.13 |
3.10 |
.82 |
1.44 |
4.81 |
|
Total from investment operations |
7.10 |
3.10 |
.77 |
1.37 |
4.78 |
|
Distributions from net realized gain |
(.07) |
(.38) |
- |
- |
- |
|
Net asset value, end of period |
$ 26.24 |
$ 19.21 |
$ 16.49 |
$ 15.72 |
$ 14.35 |
|
Total Return A,B |
37.08% |
18.77% |
4.90% |
9.55% |
49.95% |
|
Ratios to Average Net Assets D,F |
|
|
|
|
|
|
Expenses before reductions |
2.06% |
2.02% |
2.04% |
1.98% |
1.91% |
|
Expenses net of fee waivers, if any |
2.06% |
2.02% |
2.04% |
1.98% |
1.91% |
|
Expenses net of all reductions |
2.05% |
2.01% |
2.04% |
1.97% |
1.90% |
|
Net investment income (loss) |
(.13)% |
(.01)% |
(.26)% |
(.45)% |
(.26)% |
|
Supplemental Data |
|
|
|
|
|
|
Net assets, end of period (000 omitted) |
$ 10,499 |
$ 10,535 |
$ 12,839 |
$ 17,535 |
$ 21,907 |
|
Portfolio turnover rate E |
54% |
59% |
83% |
146% |
185% |
A Total returns would have been lower if certain expenses had not been reduced during the applicable periods shown.
B Total returns do not include the effect of the contingent deferred sales charge.
C Calculated based on average shares outstanding during the period.
D Fees and expenses of any underlying Fidelity Central Funds are not included in the Fund's expense ratio. The Fund indirectly bears its proportionate share of the expenses of any underlying Fidelity Central Funds.
E Amount does not include the portfolio activity of any underlying Fidelity Central Funds.
F Expense ratios reflect operating expenses of the class. Expenses before reductions do not reflect amounts reimbursed by the investment adviser or reductions from brokerage service arrangements or reductions from other expense offset arrangements and do not represent the amount paid by the class during periods when reimbursements or reductions occur. Expenses net of fee waivers reflect expenses after reimbursement by the investment adviser but prior to reductions from brokerage service arrangements or other expense offset arrangements. Expenses net of all reductions represent the net expenses paid by the class.
G Amount represents less than $.01 per share.
See accompanying notes which are an integral part of the financial statements.
Annual Report
Financial Highlights - Class C
|
Years ended November 30, |
2013 |
2012 |
2011 |
2010 |
2009 |
|
Selected Per-Share Data |
|
|
|
|
|
|
Net asset value, beginning of period |
$ 19.08 |
$ 16.41 |
$ 15.65 |
$ 14.28 |
$ 9.53 |
|
Income from Investment Operations |
|
|
|
|
|
|
Net investment income (loss) C |
(.02) |
- G |
(.04) |
(.07) |
(.03) |
|
Net realized and unrealized gain (loss) |
7.08 |
3.09 |
.80 |
1.44 |
4.78 |
|
Total from investment operations |
7.06 |
3.09 |
.76 |
1.37 |
4.75 |
|
Distributions from net investment income |
- G |
(.03) |
- |
- |
- |
|
Distributions from net realized gain |
(.07) |
(.39) |
- |
- |
- |
|
Total distributions |
(.07) |
(.42) |
- |
- |
- |
|
Net asset value, end of period |
$ 26.07 |
$ 19.08 |
$ 16.41 |
$ 15.65 |
$ 14.28 |
|
Total Return A,B |
37.14% |
18.83% |
4.86% |
9.59% |
49.84% |
|
Ratios to Average Net Assets D,F |
|
|
|
|
|
|
Expenses before reductions |
2.00% |
2.00% |
2.03% |
1.97% |
1.91% |
|
Expenses net of fee waivers, if any |
2.00% |
2.00% |
2.03% |
1.97% |
1.91% |
|
Expenses net of all reductions |
1.99% |
1.99% |
2.03% |
1.96% |
1.90% |
|
Net investment income (loss) |
(.07)% |
.01% |
(.25)% |
(.44)% |
(.26)% |
|
Supplemental Data |
|
|
|
|
|
|
Net assets, end of period (000 omitted) |
$ 67,780 |
$ 28,856 |
$ 24,197 |
$ 25,162 |
$ 24,650 |
|
Portfolio turnover rate E |
54% |
59% |
83% |
146% |
185% |
A Total returns would have been lower if certain expenses had not been reduced during the applicable periods shown.
B Total returns do not include the effect of the contingent deferred sales charge.
C Calculated based on average shares outstanding during the period.
D Fees and expenses of any underlying Fidelity Central Funds are not included in the Fund's expense ratio. The Fund indirectly bears its proportionate share of the expenses of any underlying Fidelity Central Funds.
E Amount does not include the portfolio activity of any underlying Fidelity Central Funds.
F Expense ratios reflect operating expenses of the class. Expenses before reductions do not reflect amounts reimbursed by the investment adviser or reductions from brokerage service arrangements or reductions from other expense offset arrangements and do not represent the amount paid by the class during periods when reimbursements or reductions occur. Expenses net of fee waivers reflect expenses after reimbursement by the investment adviser but prior to reductions from brokerage service arrangements or other expense offset arrangements. Expenses net of all reductions represent the net expenses paid by the class.
G Amount represents less than $.01 per share.
See accompanying notes which are an integral part of the financial statements.
Annual Report
Financial Highlights - Institutional Class
|
Years ended November 30, |
2013 |
2012 |
2011 |
2010 |
2009 |
|
Selected Per-Share Data |
|
|
|
|
|
|
Net asset value, beginning of period |
$ 21.03 |
$ 18.13 |
$ 17.22 |
$ 15.65 |
$ 10.48 |
|
Income from Investment Operations |
|
|
|
|
|
|
Net investment income (loss) B |
.24 |
.22 |
.15 |
.11 |
.10 |
|
Net realized and unrealized gain (loss) |
7.85 |
3.40 |
.89 |
1.57 |
5.22 |
|
Total from investment operations |
8.09 |
3.62 |
1.04 |
1.68 |
5.32 |
|
Distributions from net investment income |
(.02) |
(.31) |
(.11) |
(.11) |
(.15) |
|
Distributions from net realized gain |
(.07) |
(.41) |
(.02) |
- |
- |
|
Total distributions |
(.09) |
(.72) |
(.13) |
(.11) |
(.15) |
|
Net asset value, end of period |
$ 29.03 |
$ 21.03 |
$ 18.13 |
$ 17.22 |
$ 15.65 |
|
Total Return A |
38.62% |
20.10% |
6.03% |
10.78% |
51.54% |
|
Ratios to Average Net Assets C,E |
|
|
|
|
|
|
Expenses before reductions |
.95% |
.91% |
.95% |
.88% |
.84% |
|
Expenses net of fee waivers, if any |
.95% |
.91% |
.95% |
.88% |
.84% |
|
Expenses net of all reductions |
.94% |
.91% |
.94% |
.87% |
.83% |
|
Net investment income (loss) |
.98% |
1.10% |
.83% |
.65% |
.82% |
|
Supplemental Data |
|
|
|
|
|
|
Net assets, end of period (000 omitted) |
$ 242,897 |
$ 1,071,491 |
$ 1,013,999 |
$ 876,299 |
$ 924,675 |
|
Portfolio turnover rate D |
54% |
59% |
83% |
146% |
185% |
A Total returns would have been lower if certain expenses had not been reduced during the applicable periods shown.
B Calculated based on average shares outstanding during the period.
C Fees and expenses of any underlying Fidelity Central Funds are not included in the Fund's expense ratio. The Fund indirectly bears its proportionate share of the expenses of any underlying Fidelity Central Funds.
D Amount does not include the portfolio activity of any underlying Fidelity Central Funds.
E Expense ratios reflect operating expenses of the class. Expenses before reductions do not reflect amounts reimbursed by the investment adviser or reductions from brokerage service arrangements or reductions from other expense offset arrangements and do not represent the amount paid by the class during periods when reimbursements or reductions occur. Expenses net of fee waivers reflect expenses after reimbursement by the investment adviser but prior to reductions from brokerage service arrangements or other expense offset arrangements. Expenses net of all reductions represent the net expenses paid by the class.
See accompanying notes which are an integral part of the financial statements.
Annual Report
Notes to Financial Statements
For the period ended November 30, 2013
1. Organization.
Fidelity Advisor Large Cap Fund (the Fund) is a fund of Fidelity Advisor Series I (the Trust) and is authorized to issue an unlimited number of shares. The Trust is registered under the Investment Company Act of 1940, as amended (the 1940 Act), as an open-end management investment company organized as a Massachusetts business trust. The Fund offers Class A, Class T, Class C and Institutional Class shares, each of which, along with Class B shares, has equal rights as to assets and voting privileges. Class B shares are closed to new accounts and additional purchases, except for exchanges and reinvestments. Each class has exclusive voting rights with respect to matters that affect that class. Class B shares will automatically convert to Class A shares after a holding period of seven years from the initial date of purchase.
2. Investments in Fidelity Central Funds.
The Fund invests in Fidelity Central Funds, which are open-end investment companies generally available only to other investment companies and accounts managed by the investment adviser and its affiliates. The Fund's Schedule of Investments lists each of the Fidelity Central Funds held as of period end, if any, as an investment of the Fund, but does not include the underlying holdings of each Fidelity Central Fund. As an Investing Fund, the Fund indirectly bears its proportionate share of the expenses of the underlying Fidelity Central Funds.
The Money Market Central Funds seek preservation of capital and current income and are managed by Fidelity Investments Money Management, Inc. (FIMM), an affiliate of the investment adviser. Annualized expenses of the Money Market Central Funds as of their most recent shareholder report date are less than .01%.
A complete unaudited list of holdings for each Fidelity Central Fund is available upon request or at the Securities and Exchange Commission (the SEC) website at www.sec.gov. In addition, the financial statements of the Fidelity Central Funds, which are not covered by the Fund's Report of Independent Registered Public Accounting Firm, are available on the SEC website or upon request.
3. Significant Accounting Policies.
The financial statements have been prepared in conformity with accounting principles generally accepted in the United States of America (GAAP), which require management to make certain estimates and assumptions at the date of the financial statements. Actual results could differ from those estimates. Subsequent events, if any, through the date that the financial statements were issued have been evaluated in the preparation of
Annual Report
Notes to Financial Statements - continued
3. Significant Accounting Policies - continued
the financial statements. The following summarizes the significant accounting policies of the Fund:
Investment Valuation. Investments are valued as of 4:00 p.m. Eastern time on the last calendar day of the period. In accordance with valuation policies and procedures approved by the Board of Trustees (the Board), the Fund attempts to obtain prices from one or more third party pricing vendors or brokers to value its investments. When current market prices, quotations or currency exchange rates are not readily available or reliable, investments will be fair valued in good faith by the Fidelity Management & Research Company (FMR) Fair Value Committee (the Committee), in accordance with procedures adopted by the Board. Factors used in determining fair value vary by investment type and may include market or investment specific events, changes in interest rates and credit quality. The frequency with which these procedures are used cannot be predicted and they may be utilized to a significant extent. The Committee oversees the Fund's valuation policies and procedures and is responsible for approving and reporting to the Board all fair value determinations.
The Fund categorizes the inputs to valuation techniques used to value its investments into a disclosure hierarchy consisting of three levels as shown below:
Level 1 - quoted prices in active markets for identical investments
Level 2 - other significant observable inputs (including quoted prices for similar investments, interest rates, prepayment speeds, etc.)
Level 3 - unobservable inputs (including the Fund's own assumptions based on the best information available)
Valuation techniques used to value the Fund's investments by major category are as follows:
Equity securities, including restricted securities, for which market quotations are readily available, are valued at the last reported sale price or official closing price as reported by a third party pricing vendor on the primary market or exchange on which they are traded and are categorized as Level 1 in the hierarchy. In the event there were no sales during the day or closing prices are not available, securities are valued at the last quoted bid price or may be valued using the last available price and are generally categorized as Level 2 in the hierarchy. For foreign equity securities, when market or security specific events arise, comparisons to the valuation of American Depositary Receipts (ADRs), futures contracts, Exchange-Traded Funds (ETFs) and certain indexes as well as quoted prices for similar securities may be used and would be categorized as Level 2 in the hierarchy. Utilizing these techniques may result in transfers between Level 1 and Level 2. For equity securities, including restricted securities, where observable inputs are
Annual Report
3. Significant Accounting Policies - continued
Investment Valuation - continued
limited, assumptions about market activity and risk are used and these securities may be categorized as Level 3 in the hierarchy.
Debt securities, including restricted securities, are valued based on evaluated prices received from third party pricing vendors or from brokers who make markets in such securities. For corporate bonds, pricing vendors utilize matrix pricing which considers yield or price of bonds of comparable quality, coupon, maturity and type as well as broker-supplied prices. When independent prices are unavailable or unreliable, debt securities may be valued utilizing pricing methodologies which consider similar factors that would be used by third party pricing vendors. Debt securities are generally categorized as Level 2 in the hierarchy but may be Level 3 depending on the circumstances.
Investments in open-end mutual funds, including the Fidelity Central Funds, are valued at their closing net asset value (NAV) each business day and are categorized as Level 1 in the hierarchy.
Changes in valuation techniques may result in transfers in or out of an assigned level within the disclosure hierarchy. The aggregate value of investments by input level, as of November 30, 2013 is included at the end of the Fund's Schedule of Investments.
Foreign Currency. The Fund may use foreign currency contracts to facilitate transactions in foreign-denominated securities. Gains and losses from these transactions may arise from changes in the value of the foreign currency or if the counterparties do not perform under the contracts' terms.
Foreign-denominated assets, including investment securities, and liabilities are translated into U.S. dollars at the exchange rates at period end. Purchases and sales of investment securities, income and dividends received and expenses denominated in foreign currencies are translated into U.S. dollars at the exchange rate in effect on the transaction date.
The effects of exchange rate fluctuations on investments are included with the net realized and unrealized gain (loss) on investment securities. Other foreign currency transactions resulting in realized and unrealized gain (loss) are disclosed separately.
Investment Transactions and Income. For financial reporting purposes, the Fund's investment holdings and NAV include trades executed through the end of the last business day of the period. The NAV per share for processing shareholder transactions is calculated as of the close of business of the New York Stock Exchange (NYSE), normally 4:00 p.m. Eastern time and includes trades executed through the end of the prior business day. Gains and losses on securities sold are determined on the basis of identified cost and may include proceeds received from litigation. Dividend income is recorded on
Annual Report
Notes to Financial Statements - continued
3. Significant Accounting Policies - continued
Investment Transactions and Income - continued
the ex-dividend date, except for certain dividends from foreign securities where the ex-dividend date may have passed, which are recorded as soon as the Fund is informed of the ex-dividend date. Non-cash dividends included in dividend income, if any, are recorded at the fair market value of the securities received. Distributions received on securities that represent a return of capital or capital gain are recorded as a reduction of cost of investments and/or as a realized gain. Subsequent to ex-dividend date the Fund determines the components of these distributions, based upon receipt of tax filings or other correspondence relating to the underlying investment. Interest income and distributions from the Fidelity Central Funds are accrued as earned. Interest income includes coupon interest and amortization of premium and accretion of discount on debt securities. Investment income is recorded net of foreign taxes withheld where recovery of such taxes is uncertain.
Class Allocations and Expenses. Investment income, realized and unrealized capital gains and losses, common expenses of the Fund, and certain fund-level expense reductions, if any, are allocated daily on a pro-rata basis to each class based on the relative net assets of each class to the total net assets of the Fund. Each class differs with respect to transfer agent and distribution and service plan fees incurred. Certain expense reductions may also differ by class. For the reporting period, the allocated portion of income and expenses to each class as a percent of its average net assets may vary due to the timing of recording these transactions in relation to fluctuating net assets of the classes. Expenses directly attributable to a fund are charged to that fund. Expenses attributable to more than one fund are allocated among the respective funds on the basis of relative net assets or other appropriate methods. Expense estimates are accrued in the period to which they relate and adjustments are made when actual amounts are known.
Income Tax Information and Distributions to Shareholders. Each year, the Fund intends to qualify as a regulated investment company under Subchapter M of the Internal Revenue Code, including distributing substantially all of its taxable income and realized gains. As a result, no provision for U.S. Federal income taxes is required. As of November 30, 2013, the Fund did not have any unrecognized tax benefits in the financial statements; nor is the Fund aware of any tax positions for which it is reasonably possible that the total amounts of unrecognized tax benefits will significantly change in the next twelve months. The Fund files a U.S. federal tax return, in addition to state and local tax returns as required. The Fund's federal income tax returns are subject to examination by the Internal Revenue Service (IRS) for a period of three fiscal years after they are filed. State and local tax returns may be subject to examination for an additional fiscal year depending on the jurisdiction. Foreign taxes are provided for based on the Fund's
Annual Report
3. Significant Accounting Policies - continued
Income Tax Information and Distributions to Shareholders - continued
understanding of the tax rules and rates that exist in the foreign markets in which it invests.
Distributions are declared and recorded on the ex-dividend date. Income dividends and capital gain distributions are declared separately for each class. Income and capital gain distributions are determined in accordance with income tax regulations, which may differ from GAAP. In addition, the Fund claimed a portion of the payment made to redeeming shareholders as a distribution for income tax purposes.
Capital accounts within the financial statements are adjusted for permanent book-tax differences. These adjustments have no impact on net assets or the results of operations. Temporary book-tax differences will reverse in a subsequent period.
Book-tax differences are primarily due to futures contracts, foreign currency transactions, partnerships, deferred trustees compensation, passive foreign investment companies (PFIC), redemptions in kind and losses deferred due to wash sales.
The federal tax cost of investment securities and unrealized appreciation (depreciation) as of period were as follows:
|
Gross unrealized appreciation |
$ 154,037,343 |
|
Gross unrealized depreciation |
(13,968,895) |
|
Net unrealized appreciation (depreciation) on securities and other investments |
$ 140,068,448 |
|
|
|
|
Tax Cost |
$ 526,219,954 |
The tax-based components of distributable earnings as of period end were as follows:
|
Undistributed ordinary income |
$ 4,161,865 |
|
Undistributed long-term capital gain |
$ 46,290,583 |
|
Net unrealized appreciation (depreciation) |
$ 140,069,255 |
The tax character of distributions paid was as follows:
|
|
November 30, 2013 |
November 30, 2012 |
|
Ordinary Income |
$ 767,567 |
$ 18,679,689 |
|
Long-term Capital Gains |
3,062,648 |
23,644,698 |
|
Total |
$ 3,830,215 |
$ 42,324,387 |
Restricted Securities. The Fund may invest in securities that are subject to legal or contractual restrictions on resale. These securities generally may be resold in transactions exempt from registration or to the public if the securities are registered.
Annual Report
Notes to Financial Statements - continued
3. Significant Accounting Policies - continued
Restricted Securities - continued
Disposal of these securities may involve time-consuming negotiations and expense, and prompt sale at an acceptable price may be difficult. Information regarding restricted securities is included at the end of the Fund's Schedule of Investments.
4. Purchases and Sales of Investments.
Purchases and sales of securities including in-kind transactions, other than short-term securities, aggregated $560,357,092 and $1,538,601,792, respectively.
5. Fees and Other Transactions with Affiliates.
Management Fee. Fidelity Management & Research Company (the investment adviser) and its affiliates provide the Fund with investment management related services for which the Fund pays a monthly management fee. The management fee is the sum of an individual fund fee rate that is based on an annual rate of .30% of the Fund's average net assets and an annualized group fee rate that averaged .25% during the period. The group fee rate is based upon the average net assets of all the mutual funds advised by the investment adviser, including any mutual funds previously advised by the investment adviser that are currently advised by Fidelity SelectCo, LLC, an affiliate of the investment adviser. The group fee rate decreases as assets under management increase and increases as assets under management decrease. In addition, the management fee is subject to a performance adjustment (up to a maximum of ± .20% of the Fund's average net assets over a 36 month performance period). The upward or downward adjustment to the management fee is based on the relative investment performance of the Institutional Class of the Fund as compared to an appropriate benchmark index over the same 36 month performance period. For the reporting period, the total annual management fee rate, including the performance adjustment, was .71% of the Fund's average net assets. The performance adjustment included in the management fee rate may be higher or lower than the maximum performance adjustment rate due to the difference between the average net assets for the reporting and performance periods.
Distribution and Service Plan Fees. In accordance with Rule 12b-1 of the 1940 Act, the Fund has adopted separate Distribution and Service Plans for each class of shares. Certain classes pay Fidelity Distributors Corporation (FDC), an affiliate of the investment adviser, separate Distribution and Service Fees, each of which is based on an annual percentage of each class' average net assets. In addition, FDC may pay financial intermediaries for selling shares of the Fund and providing shareholder support services.
Annual Report
5. Fees and Other Transactions with Affiliates - continued
Distribution and Service Plan Fees - continued
For the period, the Distribution and Service Fee rates, total fees and amounts retained by FDC were as follows:
|
|
Distribution |
Service |
Total Fees |
Retained |
|
Class A |
-% |
.25% |
$ 383,053 |
$ 8,846 |
|
Class T |
.25% |
.25% |
461,542 |
2,157 |
|
Class B |
.75% |
.25% |
104,147 |
79,777 |
|
Class C |
.75% |
.25% |
441,788 |
86,563 |
|
|
|
|
$ 1,390,530 |
$ 177,343 |
Sales Load. FDC may receive a front-end sales charge of up to 5.75% for selling Class A shares and 3.50% for selling Class T shares, some of which is paid to financial intermediaries for selling shares of the Fund. Depending on the holding period, FDC may receive contingent deferred sales charges levied on Class A, Class T, Class B, and Class C redemptions. The deferred sales charges range from 5.00% to 1.00% for Class B shares, 1.00% for Class C shares, 1.00% for certain purchases of Class A shares and .25% for certain purchases of Class T shares.
For the period, sales charge amounts retained by FDC were as follows:
|
|
Retained |
|
Class A |
$ 94,248 |
|
Class T |
15,639 |
|
Class B* |
8,361 |
|
Class C* |
4,809 |
|
|
$ 123,057 |
* When Class B and Class C shares are initially sold, FDC pays commissions from its own resources to financial intermediaries through which the sales are made.
Transfer Agent Fees. Fidelity Investments Institutional Operations Company, Inc., (FIIOC), an affiliate of the investment adviser, is the transfer, dividend disbursing and shareholder servicing agent for each class of the Fund. FIIOC receives account fees and asset-based fees that vary according to the account size and type of account of the shareholders of the respective classes of the Fund. FIIOC pays for typesetting, printing
Annual Report
Notes to Financial Statements - continued
5. Fees and Other Transactions with Affiliates - continued
Transfer Agent Fees - continued
and mailing of shareholder reports, except proxy statements. For the period, transfer agent fees for each class were as follows:
|
|
Amount |
% of |
|
Class A |
$ 374,904 |
.24 |
|
Class T |
228,130 |
.25 |
|
Class B |
31,140 |
.30 |
|
Class C |
107,719 |
.24 |
|
Institutional Class |
1,379,219 |
.19 |
|
|
$ 2,121,112 |
|
Accounting and Security Lending Fees. Fidelity Service Company, Inc. (FSC), an affiliate of the investment adviser, maintains the Fund's accounting records. The accounting fee is based on the level of average net assets for each month. Under a separate contract, FSC administers the security lending program. The security lending fee is based on the number and duration of lending transactions.
Brokerage Commissions. The Fund placed a portion of its portfolio transactions with brokerage firms which are affiliates of the investment adviser. Brokerage commissions are included in net realized gain (loss) and change in net unrealized appreciation (depreciation) in the Consolidated Statement of Operations. The commissions paid to these affiliated firms were $28,551 for the period.
Interfund Lending Program. Pursuant to an Exemptive Order issued by the SEC, the Fund, along with other registered investment companies having management contracts with FMR or other affiliated entities of FMR, may participate in an interfund lending program. This program provides an alternative credit facility allowing the funds to borrow from, or lend money to, other participating affiliated funds. At period end, there were no interfund loans outstanding. The Fund's activity in this program during the period for which loans were outstanding was as follows:
|
Borrower or Lender |
Average Loan |
Weighted Average |
Interest Expense |
|
Borrower |
$ 6,989,550 |
.32% |
$ 1,258 |
Redemptions In-Kind. During the period, 40,816,644 shares of the Fund held by affiliated entities were redeemed for investments with a value of $1,012,290,613. The net realized gain of $267,456,609 on investments delivered through in-kind
Annual Report
5. Fees and Other Transactions with Affiliates - continued
Redemptions In-Kind - continued
redemptions is included in the accompanying Statement of Operations. The amount of in-kind redemptions is included in share transactions in the accompanying Statement of Changes in Net Assets as well as Note 10: Share transactions. The Fund recognized no gain or loss for federal income tax purposes.
6. Committed Line of Credit.
The Fund participates with other funds managed by the investment adviser or an affiliate in a $4.25 billion credit facility (the "line of credit") to be utilized for temporary or emergency purposes to fund shareholder redemptions or for other short-term liquidity purposes. The Fund has agreed to pay commitment fees on its pro-rata portion of the line of credit, which amounted to $2,372 and is reflected in Miscellaneous expenses on the Statement of Operations. During the period, there were no borrowings on this line of credit.
7. Security Lending.
The Fund lends portfolio securities through a lending agent from time to time in order to earn additional income. For equity securities, a lending agent is used and may loan securities to certain qualified borrowers, including Fidelity Capital Markets (FCM), a broker-dealer affiliated with the Fund. On the settlement date of the loan, the Fund receives collateral (in the form of U.S. Treasury obligations, letters of credit and/or cash) against the loaned securities and maintains collateral in an amount not less than 100% of the market value of the loaned securities during the period of the loan. The market value of the loaned securities is determined at the close of business of the Fund and any additional required collateral is delivered to the Fund on the next business day. If the borrower defaults on its obligation to return the securities loaned because of insolvency or other reasons, the Fund may apply collateral received from the borrower against the obligation. The Fund may experience delays and costs in recovering the securities loaned. Any cash collateral received is invested in the Fidelity Securities Lending Cash Central Fund. The value of loaned securities and cash collateral at period end are disclosed on the Fund's Statement of Assets and Liabilities. At period end, there were no security loans outstanding with FCM. Security lending income represents the income earned on investing cash collateral, less rebates paid to borrowers and any lending agent fees associated with the loan, plus any premium payments received for lending certain types of securities. Security lending income is presented in the Statement of Operations as a component of income from Fidelity Central Funds. Total security lending income during the period amounted to $234,319, including $2,632 from securities loaned to FCM.
Annual Report
Notes to Financial Statements - continued
8. Expense Reductions.
Commissions paid to certain brokers with whom the investment adviser, or its affiliates, places trades on behalf of the Fund include an amount in addition to trade execution, which may be rebated back to the Fund to offset certain expenses. This amount totaled $139,371 for the period.
9. Distributions to Shareholders.
Distributions to shareholders of each class were as follows:
|
Years ended November 30, |
2013 |
2012 |
|
From net investment income |
|
|
|
Class A |
$ 97,380 |
$ 1,078,226 |
|
Class T |
40,120 |
375,579 |
|
Class C |
2,988 |
48,918 |
|
Institutional Class |
627,079 |
16,051,409 |
|
Total |
$ 767,567 |
$ 17,554,132 |
|
From net realized gain |
|
|
|
Class A |
$ 432,999 |
$ 2,386,881 |
|
Class T |
258,270 |
1,426,914 |
|
Class B |
37,356 |
202,398 |
|
Class C |
107,120 |
573,674 |
|
Institutional Class |
2,226,903 |
20,180,388 |
|
Total |
$ 3,062,648 |
$ 24,770,255 |
10. Share Transactions.
Transactions for each class of shares were as follows:
|
|
Shares |
Dollars |
||
|
Years ended November 30, |
2013 |
2012 |
2013 |
2012 |
|
Class A |
|
|
|
|
|
Shares sold |
3,029,803 |
1,413,103 |
$ 76,581,820 |
$ 27,688,034 |
|
Reinvestment of distributions |
23,308 |
159,026 |
490,518 |
3,196,230 |
|
Shares redeemed |
(1,452,421) |
(1,437,321) |
(34,520,330) |
(28,289,639) |
|
Net increase (decrease) |
1,600,690 |
134,808 |
$ 42,552,008 |
$ 2,594,625 |
|
Class T |
|
|
|
|
|
Shares sold |
1,144,172 |
701,433 |
$ 27,872,295 |
$ 13,951,718 |
|
Reinvestment of distributions |
13,925 |
86,842 |
292,962 |
1,767,817 |
|
Shares redeemed |
(790,235) |
(1,036,832) |
(18,493,343) |
(20,267,280) |
|
Net increase (decrease) |
367,862 |
(248,557) |
$ 9,671,914 |
$ (4,547,745) |
Annual Report
10. Share Transactions - continued
|
|
Shares |
Dollars |
||
|
Years ended November 30, |
2013 |
2012 |
2013 |
2012 |
|
Class B |
|
|
|
|
|
Shares sold |
44,781 |
12,858 |
$ 1,050,694 |
$ 235,820 |
|
Reinvestment of distributions |
1,700 |
9,445 |
33,725 |
181,350 |
|
Shares redeemed |
(194,809) |
(252,591) |
(4,361,870) |
(4,660,207) |
|
Net increase (decrease) |
(148,328) |
(230,288) |
$ (3,277,451) |
$ (4,243,037) |
|
Class C |
|
|
|
|
|
Shares sold |
1,380,277 |
342,265 |
$ 31,649,256 |
$ 6,287,339 |
|
Reinvestment of distributions |
5,033 |
29,148 |
99,148 |
555,861 |
|
Shares redeemed |
(297,963) |
(333,164) |
(6,636,716) |
(6,136,206) |
|
Net increase (decrease) |
1,087,347 |
38,249 |
$ 25,111,688 |
$ 706,994 |
|
Institutional Class |
|
|
|
|
|
Shares sold |
5,489,820 |
8,141,510 |
$ 135,166,774 |
$ 164,428,797 |
|
Reinvestment of distributions |
130,311 |
1,775,271 |
2,822,578 |
36,037,728 |
|
Shares redeemed |
(48,206,491)A |
(14,893,473) |
(1,197,578,806)A |
(298,962,406) |
|
Net increase (decrease) |
(42,586,360) |
(4,976,692) |
$ (1,059,589,454) |
$ (98,495,881) |
A Amount includes in-kind redemptions (see Note 5: Redemptions In-Kind).
11. Other.
The Fund's organizational documents provide former and current trustees and officers with a limited indemnification against liabilities arising in connection with the performance of their duties to the Fund. In the normal course of business, the Fund may also enter into contracts that provide general indemnifications. The Fund's maximum exposure under these arrangements is unknown as this would be dependent on future claims that may be made against the Fund. The risk of material loss from such claims is considered remote.
Annual Report
Report of Independent Registered Public Accounting Firm
To the Trustees of Fidelity Advisor Series I and Shareholders of Fidelity Advisor Large Cap Fund:
We have audited the accompanying statement of assets and liabilities of Fidelity Advisor Large Cap Fund (the Fund), a fund of Fidelity Advisor Series I, including the schedule of investments, as of November 30, 2013, and the related statement of operations for the year then ended, the statement of changes in net assets for each of the two years in the period then ended, and the financial highlights for each of the five years in the period then ended. These financial statements and financial highlights are the responsibility of the Fund's management. Our responsibility is to express an opinion on these financial statements and financial highlights based on our audits.
We conducted our audits in accordance with the standards of the Public Company Accounting Oversight Board (United States). Those standards require that we plan and perform the audit to obtain reasonable assurance about whether the financial statements and financial highlights are free of material misstatement. The Fund is not required to have, nor were we engaged to perform, an audit of its internal control over financial reporting. Our audits included consideration of internal control over financial reporting as a basis for designing audit procedures that are appropriate in the circumstances, but not for the purpose of expressing an opinion on the effectiveness of the Fund's internal control over financial reporting. Accordingly, we express no such opinion. An audit also includes examining, on a test basis, evidence supporting the amounts and disclosures in the financial statements, assessing the accounting principles used and significant estimates made by management, as well as evaluating the overall financial statement presentation. Our procedures included confirmation of securities owned as of November 30, 2013, by correspondence with the custodians and brokers; where replies were not received from brokers, we performed other auditing procedures. We believe that our audits provide a reasonable basis for our opinion.
In our opinion, the financial statements and financial highlights referred to above present fairly, in all material respects, the financial position of Fidelity Advisor Large Cap Fund as of November 30, 2013, the results of its operations for the year then ended, the changes in its net assets for each of the two years in the period then ended, and the financial highlights for each of the five years in the period then ended, in conformity with accounting principles generally accepted in the United States of America.
DELOITTE & TOUCHE LLP
Boston, Massachusetts
January 14, 2014
Annual Report
Trustees and Officers
The Trustees, Member of the Advisory Board, and officers of the trust and fund, as applicable, are listed below. The Board of Trustees governs the fund and is responsible for protecting the interests of shareholders. The Trustees are experienced executives who meet periodically throughout the year to oversee the fund's activities, review contractual arrangements with companies that provide services to the fund, oversee management of the risks associated with such activities and contractual arrangements, and review the fund's performance. Except for James C. Curvey, Ned C. Lautenbach, Ronald P. O'Hanley, and William S. Stavropoulos, each of the Trustees oversees 173 funds. Mr. Curvey oversees 396 funds. Mr. Lautenbach, Mr. O'Hanley, and Mr. Stavropoulos each oversees 247 funds.
The Trustees hold office without limit in time except that (a) any Trustee may resign; (b) any Trustee may be removed by written instrument, signed by at least two-thirds of the number of Trustees prior to such removal; (c) any Trustee who requests to be retired or who has become incapacitated by illness or injury may be retired by written instrument signed by a majority of the other Trustees; and (d) any Trustee may be removed at any special meeting of shareholders by a two-thirds vote of the outstanding voting securities of the trust. Each Trustee who is not an interested person (as defined in the 1940 Act) of the trust and the fund (Independent Trustee), shall retire not later than the last day of the calendar year in which his or her 75th birthday occurs. The Independent Trustees may waive this mandatory retirement age policy with respect to individual Trustees. The officers and Advisory Board Member hold office without limit in time, except that any officer and Advisory Board Member may resign or may be removed by a vote of a majority of the Trustees at any regular meeting or any special meeting of the Trustees. Except as indicated, each individual has held the office shown or other offices in the same company for the past five years.
Experience, Skills, Attributes, and Qualifications of the Fund's Trustees. The Governance and Nominating Committee has adopted a statement of policy that describes the experience, qualifications, attributes, and skills that are necessary and desirable for potential Independent Trustee candidates (Statement of Policy). The Board believes that each Trustee satisfied at the time he or she was initially elected or appointed a Trustee, and continues to satisfy, the standards contemplated by the Statement of Policy. The Governance and Nominating Committee also engages professional search firms to help identify potential Independent Trustee candidates who have the experience, qualifications, attributes, and skills consistent with the Statement of Policy. From time to time, additional criteria based on the composition and skills of the current Independent Trustees, as well as experience or skills that may be appropriate in light of future changes to board composition, business conditions, and regulatory or other developments, have also been considered by the professional search firms and the Governance and Nominating Committee. In addition, the Board takes into account the Trustees' commitment and participation in Board and committee meetings, as well as their leadership of standing and ad hoc committees throughout their tenure.
Annual Report
Trustees and Officers - continued
In determining that a particular Trustee was and continues to be qualified to serve as a Trustee, the Board has considered a variety of criteria, none of which, in isolation, was controlling. The Board believes that, collectively, the Trustees have balanced and diverse experience, qualifications, attributes, and skills, which allow the Board to operate effectively in governing the fund and protecting the interests of shareholders. Information about the specific experience, skills, attributes, and qualifications of each Trustee, which in each case led to the Board's conclusion that the Trustee should serve (or continue to serve) as a trustee of the fund, is provided below.
Board Structure and Oversight Function. James C. Curvey is an interested person (as defined in the 1940 Act) and currently serves as Chairman. The Trustees have determined that an interested Chairman is appropriate and benefits shareholders because an interested Chairman has a personal and professional stake in the quality and continuity of services provided to the fund. Independent Trustees exercise their informed business judgment to appoint an individual of their choosing to serve as Chairman, regardless of whether the Trustee happens to be independent or a member of management. The Independent Trustees have determined that they can act independently and effectively without having an Independent Trustee serve as Chairman and that a key structural component for assuring that they are in a position to do so is for the Independent Trustees to constitute a substantial majority for the Board. The Independent Trustees also regularly meet in executive session. Ned C. Lautenbach serves as Chairman of the Independent Trustees and as such (i) acts as a liaison between the Independent Trustees and management with respect to matters important to the Independent Trustees and (ii) with management prepares agendas for Board meetings.
Fidelity funds are overseen by different Boards of Trustees. The fund's Board oversees Fidelity's equity and high income funds and another Board oversees Fidelity's investment-grade bond, money market, and asset allocation funds. The asset allocation funds may invest in Fidelity funds overseen by the fund's Board. The use of separate Boards, each with its own committee structure, allows the Trustees of each group of Fidelity funds to focus on the unique issues of the funds they oversee, including common research, investment, and operational issues. On occasion, the separate Boards establish joint committees to address issues of overlapping consequences for the Fidelity funds overseen by each Board.
The Trustees operate using a system of committees to facilitate the timely and efficient consideration of all matters of importance to the Trustees, the fund, and fund shareholders and to facilitate compliance with legal and regulatory requirements and oversight of the fund's activities and associated risks. The Board, acting through its committees, has charged FMR and its affiliates with (i) identifying events or circumstances the occurrence of which could have demonstrably adverse effects on the fund's business and/or reputation; (ii) implementing processes and controls to lessen the possibility that such events or circumstances occur or to mitigate the effects of such events or circumstances if they do occur; and (iii) creating and maintaining a system designed to evaluate continuously business and market conditions in order to facilitate the identification and implementation processes described in (i) and (ii) above. Because the day-to-day operations and activities of the fund are carried out by or through FMR, its affiliates and other service providers, the fund's exposure to risks is mitigated but not eliminated by the processes overseen by the Trustees. While each of the Board's committees has responsibility for overseeing different aspects of the fund's activities, oversight is exercised primarily through the Operations, Audit, and Compliance Committees. In addition, the Independent Trustees have worked with FMR to enhance the Board's oversight of investment and financial risks, legal and regulatory risks, technology risks, and operational risks, including the development of additional risk reporting to the Board. For example, a working group comprised of Independent Trustees and FMR has worked and continues to work to review the Fidelity funds' valuation-related activities, reporting and risk management. Appropriate personnel, including but not limited to the fund's Chief Compliance Officer (CCO), FMR's internal auditor, the independent accountants, the fund's Treasurer and portfolio management personnel, make periodic reports to the Board's committees, as appropriate, including an annual review of FMR's risk management program for the Fidelity funds. The responsibilities of each standing committee, including their oversight responsibilities, are described further under "Standing Committees of the Fund's Trustees."
Annual Report
The fund's Statement of Additional Information (SAI) includes more information about the Trustees. To request a free copy, call Fidelity at 1-877-208-0098.
Interested Trustees*:
Correspondence intended for each Trustee who is an interested person may be sent to Fidelity Investments, 245 Summer Street, Boston, Massachusetts 02210.
|
Name, Year of Birth; Principal Occupations and Other Relevant Experience+ |
|
|
James C. Curvey (1935) |
|
|
Year of Election or Appointment: 2007 Trustee Chairman of the Board of Trustees |
|
|
|
Mr. Curvey also serves as Trustee of other Fidelity funds. Mr. Curvey is a Director of Fidelity Investments Money Management, Inc. (2009-present), Director of Fidelity Research & Analysis Co. (2009-present) and Director of FMR and FMR Co., Inc. (2007-present). Mr. Curvey is also Vice Chairman (2007-present) and Director of FMR LLC. In addition, Mr. Curvey serves as an Overseer for the Boston Symphony Orchestra and a member of the Trustees of Villanova University. Previously, Mr. Curvey was the Vice Chairman (2006-2007) and Director (2000-2007) of FMR Corp. |
|
Ronald P. O'Hanley (1957) |
|
|
Year of Election or Appointment: 2011 Trustee |
|
|
|
Mr. O'Hanley also serves as Trustee of other Fidelity funds. He is Director of Fidelity SelectCo, LLC (2013-present), FMR Co., Inc. (2010-present), Director of Fidelity Investments Money Management, Inc. (2010-present), Director of Fidelity Research & Analysis Company (2010-present), President of Fidelity Asset Management and Corporate Services and a Member of Fidelity's Executive Committee (2010-present). Previously, Mr. O'Hanley served as President and Chief Executive Officer of BNY Mellon Asset Management (2007-2010). Mr. O'Hanley also served as Vice Chairman of Bank New York Mellon Corp. and a member of that firm's Executive Committee. Prior to the 2007 merger of The Bank of New York and Mellon Financial Corporation, he was Vice Chairman of Mellon Financial Corporation and President and Chief Executive Officer of Mellon Asset Management. He joined Mellon in February 1997. Mr. O'Hanley currently serves as Chairman of the Boston Public Library Foundation Board of Directors and sits on the Board of Directors of Beth Israel Deaconess Medical Center, the Board of Trustees of the Marine Biological Laboratory and the Advisory Board of the Maxwell School of Citizenship and Public Administration at Syracuse University. Mr. O'Hanley also chairs the Council on Asset Management for the Financial Services Roundtable and is a member of the Board of Directors of Institutional Investor's U.S. Institute. |
* Trustees have been determined to be "Interested Trustees" by virtue of, among other things, their affiliation with the trust or various entities under common control with FMR.
+ The information above includes each Trustee's principal occupation during the last five years and other information relating to the experience, attributes, and skills relevant to each Trustee's qualifications to serve as a Trustee, which led to the conclusion that each Trustee should serve as a Trustee for the fund.
Annual Report
Independent Trustees:
Correspondence intended for each Independent Trustee (that is, the Trustees other than the Interested Trustees) may be sent to Fidelity Investments, P.O. Box 55235, Boston, Massachusetts 02205-5235.
|
Name, Year of Birth; Principal Occupations and Other Relevant Experience+ |
|
|
Dennis J. Dirks (1948) |
|
|
Year of Election or Appointment: 2005 Trustee |
|
|
|
Mr. Dirks also serves as Trustee of other Fidelity funds. Prior to his retirement in May 2003, Mr. Dirks was Chief Operating Officer and a member of the Board of The Depository Trust & Clearing Corporation (DTCC). He also served as President, Chief Operating Officer, and Board member of The Depository Trust Company (DTC) and President and Board member of the National Securities Clearing Corporation (NSCC). In addition, Mr. Dirks served as Chief Executive Officer and Board member of the Government Securities Clearing Corporation, Chief Executive Officer and Board member of the Mortgage-Backed Securities Clearing Corporation, as a Trustee and a member of the Finance Committee of Manhattan College (2005-2008), and as a Trustee and a member of the Finance Committee of AHRC of Nassau County (2006-2008). Mr. Dirks is a member of the Independent Directors Council (IDC) Governing Council (2010-present) and Board of Directors for The Brookville Center for Children's Services, Inc. (2009-present). |
|
Alan J. Lacy (1953) |
|
|
Year of Election or Appointment: 2008 Trustee |
|
|
|
Mr. Lacy also serves as Trustee of other Fidelity funds. Mr. Lacy serves as Senior Adviser (2007-present) of Oak Hill Capital Partners, L.P. (private equity). Mr. Lacy also served as Chief Executive Officer (2000-2005) and Vice Chairman (2005-2006) of Sears Holdings Corporation and Sears, Roebuck and Co. (retail). In addition, Mr. Lacy serves as a member of the Board of Directors of Dave & Buster's Entertainment, Inc. (restaurant and entertainment complexes, 2010-present), Earth Fare, Inc. (retail grocery, 2012-present), The Hillman Companies, Inc. (hardware wholesalers, 2010-present), and Bristol-Myers Squibb Company (global pharmaceuticals, 2008-present). Mr. Lacy is a member of the Board of Trustees of The National Parks Conservation Association (2006-present). Previously, Mr. Lacy served as Chairman of the Board of Trustees of the National Parks Conservation Association (2008-2011) and as a member of the Board of Directors for the Western Union Company (global money transfer, 2006-2011). |
|
Ned C. Lautenbach (1944) |
|
|
Year of Election or Appointment: 2000 Trustee Chairman of the Independent Trustees |
|
|
|
Mr. Lautenbach also serves as Trustee of other Fidelity funds. Mr. Lautenbach currently serves as the Lead Director of the Eaton Corporation Board of Directors (diversified industrial, 1997-present). Mr. Lautenbach is Chairman of the Board of Directors of the Philharmonic Center for the Arts in Naples, Florida (2012-present) and a member of the Council on Foreign Relations (1994-present). Previously, Mr. Lautenbach was a Partner/Advisory Partner at Clayton, Dubilier & Rice, LLC (private equity investment, 1998-2010), as well as a Director of Sony Corporation (2006-2007). |
|
Joseph Mauriello (1944) |
|
|
Year of Election or Appointment: 2008 Trustee |
|
|
|
Mr. Mauriello also serves as Trustee of other Fidelity funds. Prior to his retirement in January 2006, Mr. Mauriello served in numerous senior management positions including Deputy Chairman and Chief Operating Officer (2004-2005), and Vice Chairman of Financial Services (2002-2004) of KPMG LLP US (professional services, 1965-2005). Mr. Mauriello currently serves as a member of the Board of Directors of XL Group plc. (global insurance and re-insurance, 2006-present). Previously, Mr. Mauriello served as a Director of the Hamilton Funds of the Bank of New York (2006-2007) and of Arcadia Resources Inc. (health care services and products, 2007-2012). |
|
Robert W. Selander (1950) |
|
|
Year of Election or Appointment: 2011 Trustee |
|
|
|
Mr. Selander also serves as Trustee of other Fidelity funds. Previously, Mr. Selander served as a Member of the Advisory Board of other Fidelity funds (2011), and Executive Vice Chairman (2010), Chief Executive Officer (2009-2010), and President and Chief Executive Officer (1997-2009) of Mastercard, Inc. |
|
Cornelia M. Small (1944) |
|
|
Year of Election or Appointment: 2005 Trustee |
|
|
|
Ms. Small also serves as Trustee of other Fidelity funds. Ms. Small is a member of the Board of Directors (2009-present) and Chair of the Investment Committee (2010-present) of the Teagle Foundation. Ms. Small also serves on the Investment Committee of the Berkshire Taconic Community Foundation (2008-present). Previously, Ms. Small served as Chairperson (2002-2008) and a member of the Investment Committee and Chairperson (2008-2012) and a member of the Board of Trustees of Smith College. In addition, Ms. Small served as Chief Investment Officer, Director of Global Equity Investments, and a member of the Board of Directors of Scudder, Stevens & Clark and Scudder Kemper Investments. |
|
William S. Stavropoulos (1939) |
|
|
Year of Election or Appointment: 2002 Trustee Vice Chairman of the Independent Trustees |
|
|
|
Mr. Stavropoulos also serves as Trustee of other Fidelity funds. Mr. Stavropoulos serves as President and Founder of the Michigan Baseball Foundation, the Great Lakes Loons (2007-present). Mr. Stavropoulos is Chairman Emeritus of the Board of Directors of The Dow Chemical Company, where he previously served in numerous senior management positions, including President, CEO (1995-2000; 2002-2004), Chairman of the Executive Committee (2000-2006), and as a member of the Board of Directors (1990-2006). Currently, Mr. Stavropoulos is Chairman of the Board of Directors of Univar Inc. (global distributor of commodity and specialty chemicals), a Director of Teradata Corporation (data warehousing and technology solutions), and Maersk Inc. (industrial conglomerate), and a member of the Advisory Board for Metalmark Capital LLC (private equity investment, 2005-present). Mr. Stavropoulos is an operating advisor to Clayton, Dubilier & Rice, LLC (private equity investment). In addition, Mr. Stavropoulos is a member of the University of Notre Dame Advisory Council for the College of Science, a Trustee of the Rollin L. Gerstacker Foundation, and a Director of the Naples Philharmonic Center for the Arts. Previously, Mr. Stavropoulos served as a Director of Chemical Financial Corporation (bank holding company, 1993-2012) and Tyco International, Ltd. (multinational manufacturing and services, 2007-2012). |
|
David M. Thomas (1949) |
|
|
Year of Election or Appointment: 2008 Trustee |
|
|
|
Mr. Thomas also serves as Trustee of other Fidelity funds. Mr. Thomas serves as Non-Executive Chairman of the Board of Directors of Fortune Brands Home and Security (home and security products, 2011-present), and as a member of the Board of Directors of Interpublic Group of Companies, Inc. (marketing communication, 2004-present). Previously, Mr. Thomas served as Executive Chairman (2005-2006) and Chairman and Chief Executive Officer (2000-2005) of IMS Health, Inc. (pharmaceutical and healthcare information solutions), and a Director of Fortune Brands, Inc. (consumer products, 2000-2011). |
+ The information above includes each Trustee's principal occupation during the last five years and other information relating to the experience, attributes, and skills relevant to each Trustee's qualifications to serve as a Trustee, which led to the conclusion that each Trustee should serve as a Trustee for the fund.
Advisory Board Member and Officers:
Correspondence intended for each officer and Peter S. Lynch may be sent to Fidelity Investments, 245 Summer Street, Boston, Massachusetts 02210.
Officers appear below in alphabetical order.
|
Name, Year of Birth; Principal Occupation |
|
|
Peter S. Lynch (1944) |
|
|
Year of Election or Appointment: 2003 Member of the Advisory Board |
|
|
|
Mr. Lynch also serves as Member of the Advisory Board of other Fidelity funds. Mr. Lynch is Vice Chairman and a Director of FMR and FMR Co., Inc. In addition, Mr. Lynch serves as a Trustee of Boston College and as the Chairman of the Inner-City Scholarship Fund. Previously, Mr. Lynch served on the Special Olympics International Board of Directors (1997-2006). |
|
Elizabeth Paige Baumann (1968) |
|
|
Year of Election or Appointment: 2012 Anti-Money Laundering (AML) Officer |
|
|
|
Ms. Baumann also serves as AML Officer of other funds. She is Chief AML Officer of FMR LLC (2012-present) and is an employee of Fidelity Investments. Previously, Ms. Baumann served as Vice President and Deputy Anti-Money Laundering Officer (2007-2012). |
|
William C. Coffey (1969) |
|
|
Year of Election or Appointment: 2009 Assistant Secretary |
|
|
|
Mr. Coffey also serves as Assistant Secretary of other funds. He is Senior Vice President and Deputy General Counsel of FMR LLC (2010-present), and is an employee of Fidelity Investments. Previously, Mr. Coffey served as Vice President and Associate General Counsel of FMR LLC (2005-2009). |
|
Jonathan Davis (1968) |
|
|
Year of Election or Appointment: 2010 Assistant Treasurer |
|
|
|
Mr. Davis also serves as Assistant Treasurer of other funds. Mr. Davis is an employee of Fidelity Investments. Previously, Mr. Davis served as Vice President and Associate General Counsel of FMR LLC (2003-2010). |
|
Adrien E. Deberghes (1967) |
|
|
Year of Election or Appointment: 2008 Deputy Treasurer |
|
|
|
Mr. Deberghes also serves as an officer of other funds. He is an employee of Fidelity Investments (2008-present). Prior to joining Fidelity Investments, Mr. Deberghes was Senior Vice President of Mutual Fund Administration at State Street Corporation (2007-2008), Senior Director of Mutual Fund Administration at Investors Bank & Trust (2005-2007), and Director of Finance for Dunkin' Brands (2000-2005). |
|
Stephanie J. Dorsey (1969) |
|
|
Year of Election or Appointment: 2010 Assistant Treasurer |
|
|
|
Ms. Dorsey also serves as an officer of other funds. She is an employee of Fidelity Investments (2008-present) and has served in other fund officer roles. Prior to joining Fidelity Investments, Ms. Dorsey served as Treasurer (2004-2008) of the JPMorgan Mutual Funds and Vice President (2004-2008) of JPMorgan Chase Bank. |
|
Scott C. Goebel (1968) |
|
|
Year of Election or Appointment: 2008 Secretary and Chief Legal Officer (CLO) |
|
|
|
Mr. Goebel serves as Secretary and CLO of other funds. Mr. Goebel also serves as Secretary of Fidelity Investments Money Management, Inc. (FIMM) (2010-present) and Fidelity Research and Analysis Company (FRAC) (2010-present); General Counsel, Secretary, and Senior Vice President of FMR (2008-present) and FMR Co., Inc. (2008-present); Chief Legal Officer of Fidelity Management & Research (Hong Kong) Limited (2008-present) and Assistant Secretary of Fidelity Management & Research (Japan) Inc. (2008-present), and Fidelity Management & Research (U.K.) Inc. (2008-present). Previously, Mr. Goebel served as Secretary and CLO of other Fidelity funds (2008-2013), Assistant Secretary of FIMM (2008-2010), FRAC (2008-2010), and certain funds (2007-2008); and as Vice President and Secretary of Fidelity Distributors Corporation (FDC) (2005-2007). Mr. Goebel has been employed by FMR LLC or an affiliate since 2001. |
|
Joseph A. Hanlon (1968) |
|
|
Year of Election or Appointment: 2012 Chief Compliance Officer |
|
|
|
Mr. Hanlon also serves as Chief Compliance Officer of other funds. Mr. Hanlon serves as Compliance Officer of FMR, FMR Co., Inc., Fidelity Investments Money Management, Inc. (FIMM), Fidelity Research and Analysis Company (FRAC), and Fidelity Management & Research (Hong Kong) (2009-present), as Senior Vice President of the Fidelity Asset Management Division (2009-present), and is an employee of Fidelity Investments. Previously, Mr. Hanlon served as Compliance Officer of Fidelity Management & Research (Japan) Inc. (2009-2013), Strategic Advisers, Inc. (2009-2013), and Fidelity Management & Research (U.K.) Inc. (2009-2013). |
|
Bruce T. Herring (1965) |
|
|
Year of Election or Appointment: 2006 Vice President of certain Equity Funds |
|
|
|
Mr. Herring also serves as Vice President of other funds. He serves as Chief Investment Officer of Fidelity Global Asset Allocation (GAA) (2013-present), Group Chief Investment Officer of FMR, and President of Fidelity Research & Analysis Company (2010-present). Previously, Mr. Herring served as Chief Investment Officer and Director of Fidelity Management & Research (U.K.) Inc. (2010-2013), Vice President (2005-2006) and Senior Vice President (2006-2007) of Fidelity Management & Research Company, Vice President of FMR Co., Inc. (2001-2007), and as a portfolio manager for Fidelity U.S. Equity Funds. |
|
Brian B. Hogan (1964) |
|
|
Year of Election or Appointment: 2009 Vice President |
|
|
|
Mr. Hogan also serves as Vice President of other funds. Mr. Hogan serves as President of FMR's Equity Division (2009-present). Previously, Mr. Hogan served as Senior Vice President, Equity Research of FMR (2006-2009) and as a portfolio manager. |
|
Chris Maher (1972) |
|
|
Year of Election or Appointment: 2013 Assistant Treasurer |
|
|
|
Mr. Maher serves as Assistant Treasurer of other funds. Mr. Maher is Vice President of Valuation Oversight and is an employee of Fidelity Investments. Previously, Mr. Maher served as Vice President of Asset Management Compliance (2013), Vice President of FMR's Program Management Group (2010-2013), and Vice President of Valuation Oversight (2008-2010). |
|
Christine Reynolds (1958) |
|
|
Year of Election or Appointment: 2008 Chief Financial Officer |
|
|
|
Ms. Reynolds also serves as Chief Financial Officer of other funds. Ms. Reynolds became President of Fidelity Pricing and Cash Management Services (FPCMS) in August 2008. Ms. Reynolds served as Chief Operating Officer of FPCMS (2007-2008). Previously, Ms. Reynolds served as President, Treasurer, and Anti-Money Laundering officer of the Fidelity funds (2004-2007). |
|
Kenneth B. Robins (1969) |
|
|
Year of Election or Appointment: 2008 President and Treasurer |
|
|
|
Mr. Robins also serves as an officer of other funds. Mr. Robins serves as Executive Vice President of Fidelity Investments Money Management, Inc. (FIMM) (2013-present) and is an employee of Fidelity Investments (2004-present). Previously, Mr. Robins served in other fund officer roles. |
|
Gary W. Ryan (1958) |
|
|
Year of Election or Appointment: 2005 Assistant Treasurer |
|
|
|
Mr. Ryan also serves as Assistant Treasurer of other funds. Mr. Ryan is an employee of Fidelity Investments and has served in other fund officer roles. Previously, Mr. Ryan served as Vice President of Fund Reporting in Fidelity Pricing and Cash Management Services (FPCMS) (1999-2005). |
|
Stephen Sadoski (1971) |
|
|
Year of Election or Appointment: 2012 Deputy Treasurer |
|
|
|
Mr. Sadoski also serves as Deputy Treasurer of other funds. He is an employee of Fidelity Investments (2012-present) and has served in another fund officer role. Prior to joining Fidelity Investments, Mr. Sadoski served as an assistant chief accountant in the Division of Investment Management of the Securities and Exchange Commission (SEC) (2009-2012) and as a senior manager at Deloitte & Touche LLP (1997-2009). |
|
Stacie M. Smith (1974) |
|
|
Year of Election or Appointment: 2013 Deputy Treasurer |
|
|
|
Ms. Smith also serves as an officer of other funds. She is an employee of Fidelity Investments (2009-present) and has served in other fund officer roles. Prior to joining Fidelity Investments, Ms. Smith served as Senior Audit Manager of Ernst & Young LLP (1996-2009). |
|
Renee Stagnone (1975) |
|
|
Year of Election or Appointment: 2013 Deputy Treasurer |
|
|
|
Ms. Stagnone also serves as Deputy Treasurer of other funds. Ms. Stagnone is an employee of Fidelity Investments. |
|
Joseph F. Zambello (1957) |
|
|
Year of Election or Appointment: 2011 Deputy Treasurer |
|
|
|
Mr. Zambello also serves as Deputy Treasurer of other funds. Mr. Zambello is an employee of Fidelity Investments. Previously, Mr. Zambello served as Vice President of FMR's Program Management Group (2009-2011) and Vice President of the Transfer Agent Oversight Group (2005-2009). |
Annual Report
Distributions (Unaudited)
The Board of Trustees of Advisor Large Cap Fund voted to pay to shareholders of record at the opening of business on record date, the following distributions per share derived from capital gains realized from sales of portfolio securities, and dividends derived from net investment income:
|
|
Pay Date |
Record Date |
Dividends |
Capital Gains |
|
Class A |
12/16/13 |
12/13/13 |
$0.223 |
$1.627 |
|
Class A |
01/13/14 |
01/10/14 |
$0.000 |
$0.312 |
|
Class T |
12/16/13 |
12/13/13 |
$0.153 |
$1.627 |
|
Class T |
01/13/14 |
01/10/14 |
$0.000 |
$0.312 |
|
Class B |
12/16/13 |
12/13/13 |
$0.000 |
$1.627 |
|
Class B |
01/13/14 |
01/10/14 |
$0.000 |
$0.312 |
|
Class C |
12/16/13 |
12/13/13 |
$0.104 |
$1.627 |
|
Class C |
01/13/14 |
01/10/14 |
$0.000 |
$0.312 |
The fund hereby designates as a capital gain dividend with respect to the taxable year ended November 30, 2013, $61,880,978, or, if subsequently determined to be different, the net capital gain of such year.
Class A, Class T and Class C designates 100% of each; of the dividends distributed during the fiscal year as qualifying for the dividends-received deduction for corporate shareholders.
Class A, Class T and Class C designates 100% of the dividends distributed during the fiscal year as amounts which may be taken into account as a dividend for purposes of the maximum rate under section 1(h)(11) of the Internal Revenue Code.
The fund will notify shareholders in January 2014 of amounts for use in preparing 2013 income tax returns.
Annual Report
Board Approval of Investment Advisory Contracts and Management Fees
Fidelity Advisor Large Cap Fund
Each year, the Board of Trustees, including the Independent Trustees (together, the Board), votes on the renewal of the management contract and sub-advisory agreements (together, the Advisory Contracts) for the fund. The Board, assisted by the advice of fund counsel and Independent Trustees' counsel, requests and considers a broad range of information relevant to the renewal of the Advisory Contracts throughout the year.
The Board meets regularly and, at each of its meetings, covers an extensive agenda of topics and materials and considers factors that are relevant to its annual consideration of the renewal of the fund's Advisory Contracts, including the services and support provided to the fund and its shareholders. The Board has established various standing committees, each composed of and chaired by Independent Trustees with varying backgrounds, to which the Board has assigned specific subject matter responsibilities in order to enhance effective decision-making by the Board. The Board, acting directly and through its Committees, requests and receives information concerning the annual consideration of the renewal of the fund's Advisory Contracts. The Board also meets as needed to consider matters specifically related to the Board's annual consideration of the renewal of Advisory Contracts. Members of the Board may also meet with trustees of other Fidelity funds through ad hoc joint committees to discuss certain matters relevant to the Fidelity funds.
At its July 2013 meeting, the Board, including the Independent Trustees, unanimously determined to renew the fund's Advisory Contracts. In reaching its determination, the Board considered all factors it believed relevant, including (i) the nature, extent, and quality of the services to be provided to the fund and its shareholders (including the investment performance of the fund); (ii) the competitiveness of the fund's management fee and total expense ratio relative to peer funds; (iii) the total costs of the services to be provided by and the profits to be realized by Fidelity from its relationship with the fund; (iv) the extent to which economies of scale exist and would be realized as the fund grows; and (v) whether fee levels reflect these economies of scale, if any, for the benefit of fund shareholders.
In considering whether to renew the Advisory Contracts for the fund, the Board reached a determination, with the assistance of fund counsel and Independent Trustees' counsel and through the exercise of its business judgment, that the renewal of the Advisory Contracts was in the best interests of the fund and its shareholders and that the compensation payable under the Advisory Contracts was fair and reasonable. The Board's decision to renew the Advisory Contracts was not based on any single factor, but rather was based on a comprehensive consideration of all the information provided to the Board at its meetings throughout the year. The Board, in reaching its determination to renew the Advisory Contracts, was aware that shareholders in the fund have a broad range of investment choices available to them, including a wide choice among mutual funds offered by Fidelity's competitors, and that the fund's shareholders, who have the opportunity to review and weigh the disclosure provided by the fund in its prospectus and other public disclosures, have chosen to invest in this fund, which is a part of the Fidelity family of funds.
Annual Report
Nature, Extent, and Quality of Services Provided. The Board considered the staffing within the investment adviser, Fidelity Management & Research Company (FMR), and the sub-advisers (together, the Investment Advisers) as it relates to the fund, including the backgrounds of the fund's investment personnel, and also considered the fund's investment objective, strategies, and related investment philosophy. The Independent Trustees also had discussions with senior management of Fidelity's investment operations and investment groups. The Board considered the structure of the portfolio manager compensation program and whether this structure provides appropriate incentives to act in the best interests of the fund.
Resources Dedicated to Investment Management and Support Services. The Board and the Fund Oversight and Research Committees reviewed the general qualifications and capabilities of the Investment Advisers' investment staff, including its size, education, experience, and resources, as well as the Investment Advisers' approach to recruiting, training, managing, and compensating investment personnel. The Board noted that FMR has continued to increase the resources devoted to non-U.S. offices, including expansion of Fidelity's global investment organization. The Board also noted that Fidelity's analysts have extensive resources, tools and capabilities that allow them to conduct sophisticated quantitative and fundamental analysis, as well as credit analysis of issuers, counterparties and guarantors. Further, the Board believes that Fidelity's investment professionals have sufficient access to global information and data so as to provide competitive investment results over time, and that those professionals also have access to sophisticated tools that permit them to assess portfolio construction and risk and performance attribution characteristics continuously, as well as to transmit new information and research conclusions rapidly around the world. Additionally, in its deliberations, the Board considered the Investment Advisers' trading and risk management capabilities and resources, which are an integral part of the investment management process.
Shareholder and Administrative Services. The Board considered (i) the nature, extent, quality, and cost of advisory, administrative, and shareholder services performed by the Investment Advisers and their affiliates under the Advisory Contracts and under separate agreements covering transfer agency, pricing and bookkeeping, and securities lending services for the fund; (ii) the nature and extent of the supervision of third party service providers, principally custodians and subcustodians; and (iii) the resources devoted to, and the record of compliance with, the fund's compliance policies and procedures. The Board also reviewed the allocation of fund brokerage, including allocations to brokers affiliated with the Investment Advisers, the use of brokerage commissions to pay fund expenses, and the use of "soft" commission dollars to pay for research services.
Annual Report
Board Approval of Investment Advisory Contracts and
Management Fees - continued
The Board noted that the growth of fund assets over time across the complex allows Fidelity to reinvest in the development of services designed to enhance the value or convenience of the Fidelity funds as investment vehicles. These services include 24-hour access to account information and market information through telephone representatives and over the Internet, investor education materials and asset allocation tools, and the expanded availability of Fidelity Investor Centers.
Investment in a Large Fund Family. The Board considered the benefits to shareholders of investing in a Fidelity fund, including the benefits of investing in a fund that is part of a large family of funds offering a variety of investment disciplines and providing a large variety of mutual fund investor services. The Board noted that Fidelity had taken, or had made recommendations that resulted in the Fidelity funds taking, a number of actions over the previous year that benefited particular funds, including (i) continuing to dedicate additional resources to investment research and to the support of the senior management team that oversees asset management; (ii) persisting in efforts to enhance Fidelity's global research capabilities; (iii) launching new funds and making other enhancements to meet client needs for global and income-oriented solutions; (iv) continuing to launch dedicated lower cost underlying funds to meet portfolio construction needs related to expanding underlying fund options for Fidelity funds of funds, specifically for the Freedom Fund product lines; (v) rationalizing product lines and gaining increased efficiencies through the mergers of several funds into other funds; (vi) strengthening Fidelity's index fund offerings by reducing investment minimums and adopting or lowering existing expense caps for certain funds and classes; (vii) enhancing Global Asset Allocation product offerings by launching new funds and strategies, including "open architecture" target date funds that utilize affiliated and unaffiliated sub-advisers; (viii) modifying the eligibility criteria for Institutional Class shares of Advisor funds to increase their marketability to a portion of the defined contribution plan market; (ix) creating a new low-cost retirement share class for certain Advisor funds to appeal to large retirement plans; (x) transitioning the management of certain Fidelity commodity funds to Geode Capital Management LLC, a registered commodity pool operator, while retaining administrative responsibilities for the funds; (xi) reorganizing a number of funds; and (xii) taking steps toward establishing a new Fidelity adviser to manage sector-based funds and products.
Investment Performance. The Board considered whether the fund has operated in accordance with its investment objective, as well as its record of compliance with its investment restrictions and its performance history.
The Board took into account discussions with the Investment Advisers about fund investment performance that occur at Board meetings throughout the year. In this regard the Board noted that as part of regularly scheduled fund reviews and other reports to the Board on fund performance, the Board periodically considers annualized return information for the fund, for different time periods, measured against a securities market index ("benchmark index") and a peer group of mutual funds with similar objectives ("peer group"). In its evaluation of fund investment performance, the Board gave particular attention to information indicating changes in performance of certain Fidelity funds for specific time periods and the Investment Advisers' explanations for any overperformance or underperformance.
Annual Report
In addition to reviewing absolute and relative fund performance, the Independent Trustees periodically consider the appropriateness of fund performance metrics in evaluating the results achieved. In general, the Independent Trustees believe that fund performance should be evaluated based on net performance (after fees and expenses) of both the highest performing and lowest performing classes, where applicable, compared to appropriate benchmark indices, over appropriate time periods which may include full market cycles, and compared to peer groups, as applicable, over the same periods, taking into account relevant factors including the following: general market conditions; issuer-specific information; tactical opportunities for investment; and fund cash flows and other factors.
The Independent Trustees recognize that shareholders evaluate performance on a net basis over their own holding periods, for which one-, three-, and five-year periods are used as a proxy. For this reason, the performance information reviewed by the Board also included net cumulative calendar year total return information for the fund and an appropriate benchmark index and peer group for the most recent one-, three-, and five-year periods, as shown below. Returns are shown compared to the 25th percentile (top of box) and 75th percentile (bottom of box) of the peer universe.
Annual Report
Board Approval of Investment Advisory Contracts and
Management Fees - continued
Fidelity Advisor Large Cap Fund

The Board also considered that the fund's management fee is subject to upward or downward adjustment depending upon whether, and to what extent, the fund's investment performance for the performance period exceeds, or is exceeded by, a securities index, thus leading to a performance adjustment for the same period. The Board noted that the performance adjustment provides FMR with a strong economic incentive to seek to achieve superior performance for the fund's shareholders and helps to more closely align the interests of FMR and the fund's shareholders.
Based on its review, the Board concluded that the nature, extent, and quality of services provided to the fund under the Advisory Contracts should benefit the fund's shareholders.
Competitiveness of Management Fee and Total Expense Ratio. The Board considered the fund's management fee and total expense ratio compared to "mapped groups" of competitive funds and classes. Fidelity creates "mapped groups" by combining similar Lipper investment objective categories that have comparable management fee characteristics. Combining Lipper investment objective categories aids the Board's management fee and total expense ratio comparisons by broadening the competitive group used for comparison and by reducing the number of universes to which various Fidelity funds are compared.
Management Fee. The Board considered two proprietary management fee comparisons for the 12-month periods shown in the chart below. The group of Lipper funds used by the Board for management fee comparisons is referred to below as the "Total Mapped Group." The Total Mapped Group comparison focuses on a fund's standing in terms of gross management fees before expense reimbursements or caps, and without giving effect to the fund's performance adjustment, relative to the total universe of funds with comparable investment mandates, regardless of whether their management fee structures also are comparable. Funds with comparable investment mandates offer exposure to similar types of securities. Funds with comparable management fee structures have similar management fee contractual arrangements (e.g., flat rate charged for advisory services, all-inclusive fee rate, etc.). "TMG %" represents the percentage of funds in the Total Mapped Group that had management fees that were lower than the fund's. For example, a TMG % of 11% means that 89% of the funds in the Total Mapped Group had higher management fees than the fund. The "Asset-Size Peer Group" (ASPG) comparison focuses on a fund's standing relative to a subset of non-Fidelity funds within the Total Mapped Group that are similar in size and management fee structure. The ASPG represents at least 15% of the funds in the Total Mapped Group with comparable asset size and management fee structures, subject to a minimum of 50 funds (or all funds in the Total Mapped Group if fewer than 50).Additional information, such as the ASPG quartile in which the fund's management fee ranked and the impact of the fund's performance adjustment, is also included in the chart and considered by the Board.
Annual Report
Fidelity Advisor Large Cap Fund
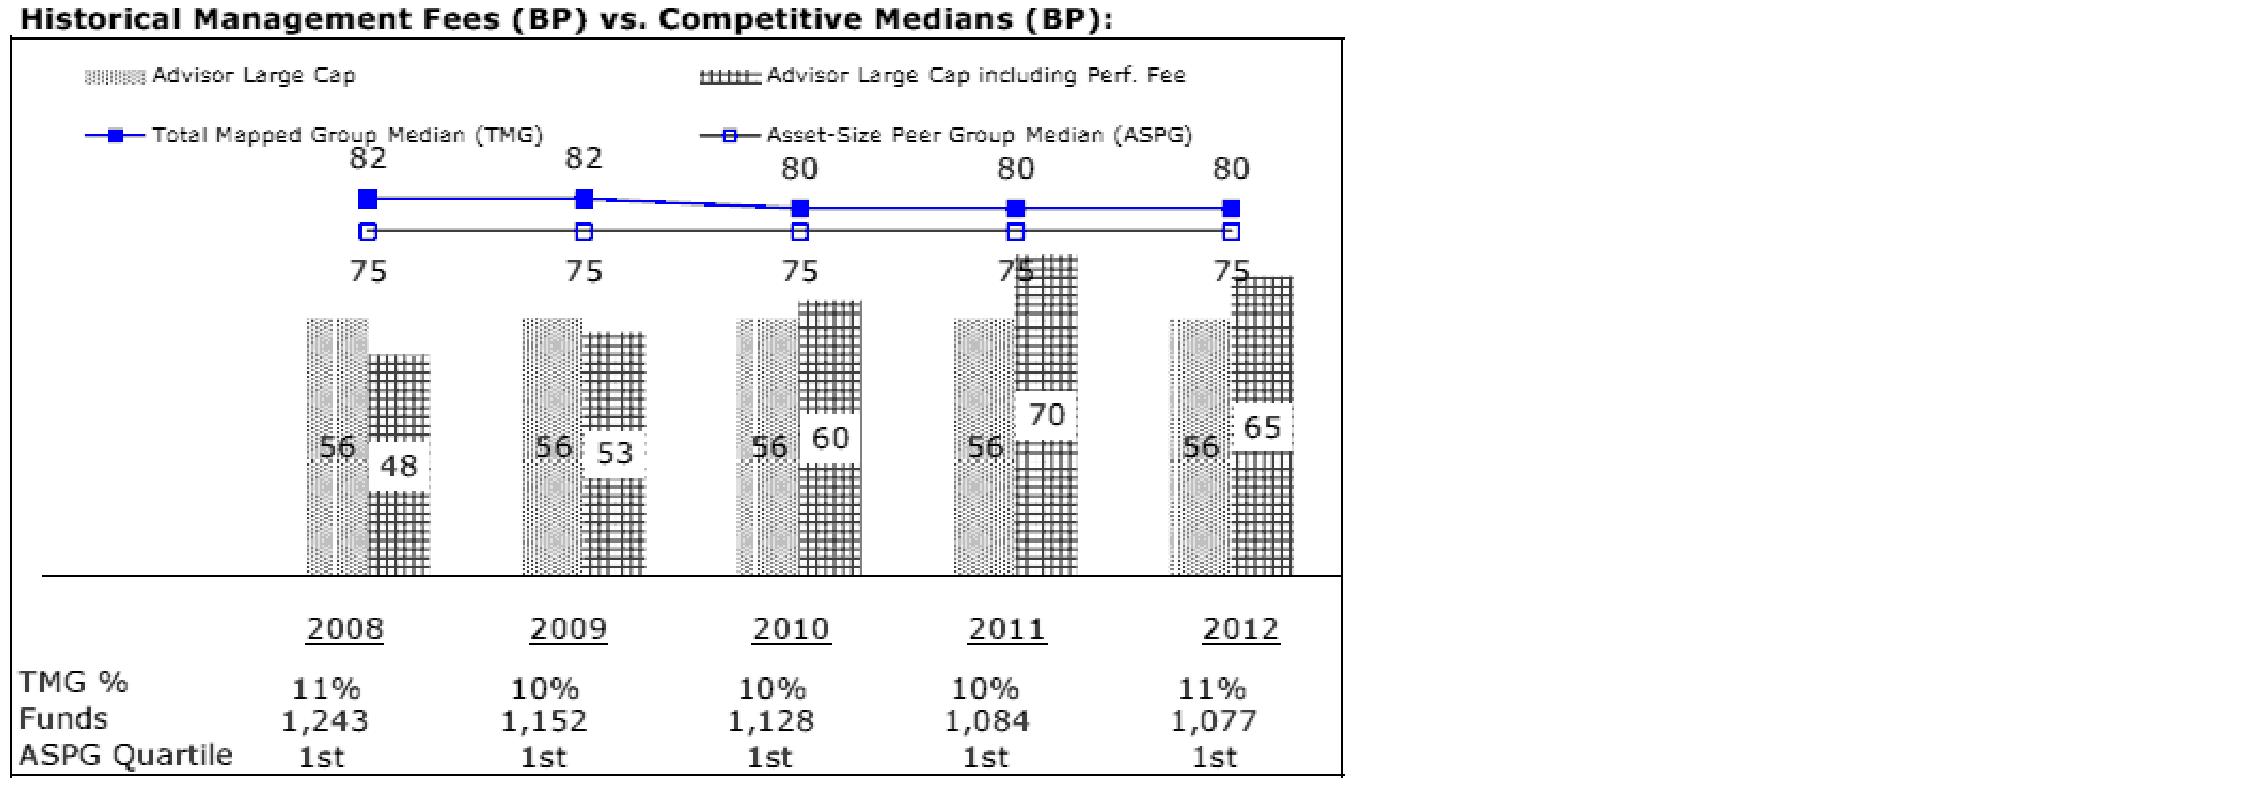
The Board noted that the fund's management fee ranked below the median of its Total Mapped Group and below the median of its ASPG for 2012. The Board also noted the effect of the fund's positive performance adjustment on the fund's management fee ranking.
Annual Report
Board Approval of Investment Advisory Contracts and
Management Fees - continued
Based on its review, the Board concluded that the fund's management fee is fair and reasonable in light of the services that the fund receives and the other factors considered.
Total Expense Ratio. In its review of each class's total expense ratio, the Board considered the fund's management fee as well as other fund or class expenses, as applicable, such as transfer agent fees, pricing and bookkeeping fees, fund-paid 12b-1 fees, and custodial, legal, and audit fees. The Board also noted the effects of any waivers and reimbursements on fees and expenses, as well as the impact of the fund's performance adjustment. As part of its review, the Board also considered the current and historical total expense ratios of each class of the fund compared to competitive fund median expenses. Each class of the fund is compared to those funds and classes in the Total Mapped Group (used by the Board for management fee comparisons) that have a similar sales load structure.
The Board noted that the total expense ratio of each of Class A and Institutional Class ranked below its competitive median for 2012 and the total expense ratio of each of Class T, Class B, and Class C ranked above its competitive median for 2012. The Board considered that, in general, various factors can affect total expense ratios. The Board noted that the total expense ratio of Class T was above the competitive median primarily because of higher 12b-1 fees on Class T. Class T has a higher 12b-1 fee, but a lower front-end sales charge, than traditionally priced front-end sales charge classes. The Board considered that Class T is primarily sold load-waived in the retirement plan market where its 0.50% 12b-1 fee is comparable to competing no-load, higher 12b-1 fee classes designed specifically for retirement plans. The Board noted that the fund offers multiple classes, each of which has a different sales load and 12b-1 fee structure, and that the multiple structures are intended to offer a range of pricing options for the intermediary market. The Board also noted that the total expense ratios of the classes vary primarily by the level of their 12b-1 fees, although differences in transfer agent fees may also cause expenses to vary from class to class.
Fees Charged to Other Fidelity Clients. The Board also considered Fidelity fee structures and other information with respect to clients of FMR and its affiliates, such as other mutual funds advised or subadvised by FMR or its affiliates, pension plan clients, and other institutional clients. The Board noted the findings of the 2013 ad hoc joint committee (created with the board of other Fidelity funds), which reviewed and compared Fidelity's institutional investment advisory business with its business of providing services to the Fidelity funds, including the differences in services provided, fees charged, and costs incurred, as well as competition in their respective marketplaces.
Based on its review of total expense ratios and fees charged to other Fidelity clients, the Board concluded that the total expense ratio of each class of the fund was reasonable, although in some cases above the median of the universe presented for comparison, in light of the services that the fund and its shareholders receive and the other factors considered.
Annual Report
Costs of the Services and Profitability. The Board considered the revenues earned and the expenses incurred by Fidelity in conducting the business of developing, marketing, distributing, managing, administering and servicing the fund and servicing the fund's shareholders. The Board also considered the level of Fidelity's profits in respect of all the Fidelity funds.
On an annual basis, FMR presents to the Board Fidelity's profitability for the fund. Fidelity calculates the profitability for each fund, as well as aggregate profitability for groups of Fidelity funds and all Fidelity funds, using a series of detailed revenue and cost allocation methodologies which originate with the books and records of Fidelity on which Fidelity's audited financial statements are based. The Audit Committee of the Board reviews any significant changes from the prior year's methodologies.
PricewaterhouseCoopers LLP (PwC), independent registered public accounting firm and auditor to Fidelity and certain Fidelity funds, has been engaged annually by the Board as part of the Board's assessment of Fidelity's profitability analysis. PwC's engagement includes the review and assessment of the methodologies used by Fidelity in determining the revenues and expenses attributable to Fidelity's mutual fund business, and completion of agreed-upon procedures surrounding the mathematical accuracy of fund profitability and its conformity to allocation methodologies. After considering PwC's reports issued under the engagement and information provided by Fidelity, the Board concluded that while other allocation methods may also be reasonable, Fidelity's profitability methodologies are reasonable in all material respects.
The Board also reviewed Fidelity's non-fund businesses and fall-out benefits related to the mutual fund business as well as cases where Fidelity's affiliates may benefit from or be related to the fund's business.
The Board considered the costs of the services provided by and the profits realized by Fidelity in connection with the operation of the fund and was satisfied that the profitability was not excessive in the circumstances.
Economies of Scale. The Board considered whether there have been economies of scale in respect of the management of the Fidelity funds, whether the Fidelity funds (including the fund) have appropriately benefited from any such economies of scale, and whether there is potential for realization of any further economies of scale. The Board considered the extent to which the fund will benefit from economies of scale through increased services to the fund, through waivers or reimbursements, or through fee or expense reductions. The Board also noted that in 2009, it and the board of other Fidelity funds created an ad hoc committee (the Economies of Scale Committee) to analyze whether FMR attains economies of scale in respect of the management and servicing of the Fidelity funds, whether the Fidelity funds have appropriately benefited from such economies of scale, and whether there is potential for realization of any further economies of scale.
Annual Report
Board Approval of Investment Advisory Contracts and
Management Fees - continued
The Board recognized that the fund's management contract incorporates a "group fee" structure, which provides for lower group fee rates as total fund assets under FMR's management increase, and for higher group fee rates as total fund assets under FMR's management decrease. FMR calculates the group fee rates based on a tiered asset "breakpoint" schedule that varies based on asset class. The Board considered that the group fee is designed to deliver the benefits of economies of scale to fund shareholders when total Fidelity fund assets increase, even if assets of any particular fund are unchanged or have declined, because some portion of Fidelity's costs are attributable to services provided to all Fidelity funds, and all funds benefit if those costs can be allocated among more assets. The Board concluded that, given the group fee structure, fund shareholders will benefit from lower management fees as assets under FMR's management increase at the fund complex level, regardless of whether Fidelity achieves any such economies of scale.
The Board concluded, taking into account the analysis of the Economies of Scale Committee, that economies of scale, if any, are being appropriately shared between fund shareholders and Fidelity.
Amendment to Description of Group Fee Rate. At its July 2013 meeting, the Board voted to approve an amendment to the fund's management contract to modify the description of the "group fee rate" effective August 1, 2013. The Board noted that under the prior description in the contract, the group fee rate was based on the average net assets of all registered investment companies with which FMR has management contracts. Under the contract's tiered asset breakpoint schedule, the group fee rate is lower as total fund assets under FMR's management increase, and higher as total fund assets under FMR's management decrease. The Board considered that the prior description would have excluded the assets of 64 Fidelity sector funds from the group fee rate calculation once Fidelity SelectCo, LLC, an affiliate of FMR, assumed management responsibilities for those funds. The Board noted that modifying the description of the group fee rate to continue to include the assets of those 64 funds for purposes of determining group fee rate breakpoints would avoid an immediate adverse impact on the group fee rate for any fund.
Additional Information Requested by the Board. In order to develop fully the factual basis for consideration of the Fidelity funds' Advisory Contracts, the Board requested and received additional information on certain topics, including: (i) fund performance trends and Fidelity's long-term strategies for certain funds; (ii) the potential to further rationalize the Fidelity fund lineup with the possibility of achieving savings for the funds and Fidelity; (iii) the methodology with respect to competitive fund data and peer group classifications; (iv) the arrangements with, and performance of, certain sub-advisers on behalf of the Fidelity funds, as well as certain proposed participating affiliate arrangements; (v) the realization of fall-out benefits in certain Fidelity business units; (vi) Fidelity's group fee structures, including the rationale for the individual fee rates of certain categories of funds and the definition of group assets; (vii) trends regarding industry use of performance fee structures and the performance adjustment methodologies applicable to the Fidelity funds; (viii) additional competitive analysis regarding the total expenses for certain classes; and (ix) fund profitability methodology, including Fidelity's cost allocation methodology, and the impact of certain factors on fund profitability results.
Annual Report
Based on its evaluation of all of the conclusions noted above, and after considering all factors it believed relevant, the Board ultimately concluded that the advisory fee structures are fair and reasonable, and that the fund's Advisory Contracts should be renewed.
Annual Report
Investment Adviser
Fidelity Management & Research Company
Boston, MA
Investment Sub-Advisers
FMR Co., Inc.
Fidelity Management & Research
(U.K.) Inc.
Fidelity Management & Research (Japan) Inc.
Fidelity Management & Research (Hong Kong) Limited
General Distributor
Fidelity Distributors Corporation
Smithfield, RI
Transfer and Service Agents
Fidelity Investments Institutional
Operations Company, Inc.
Boston, MA
Fidelity Service Company, Inc.
Boston, MA
Custodian
Brown Brothers Harriman & Co.
Boston, MA
(Fidelity Investment logo)(registered trademark)
LC-UANN-0114 1.786691.110
(Fidelity Investment logo)(registered trademark)
Fidelity Advisor®
Large Cap
Fund - Institutional Class
Annual Report
November 30, 2013
(Fidelity Cover Art)
Contents
|
Performance |
How the fund has done over time. |
|
|
Management's Discussion of Fund Performance |
The Portfolio Manager's review of fund performance and strategy. |
|
|
Shareholder Expense Example |
An example of shareholder expenses. |
|
|
Investment Changes |
A summary of major shifts in the fund's investments over the past six months. |
|
|
Investments |
A complete list of the fund's investments with their market values. |
|
|
Financial Statements |
Statements of assets and liabilities, operations, and changes in net assets, as well as financial highlights. |
|
|
Notes |
Notes to the financial statements. |
|
|
Report of Independent Registered Public Accounting Firm |
|
|
|
Trustees and Officers |
|
|
|
Distributions |
|
|
|
Board Approval of Investment Advisory Contracts and Management Fees |
|
To view a fund's proxy voting guidelines and proxy voting record for the 12-month period ended June 30, visit http://www.fidelity.com/proxyvotingresults or visit the Securities and Exchange Commission's (SEC) web site at http://www.sec.gov. You may also call 1-877-208-0098 to request a free copy of the proxy voting guidelines.
Standard & Poor's, S&P and S&P 500 are registered service marks of The McGraw-Hill Companies, Inc. and have been licensed for use by Fidelity Distributors Corporation.
Other third-party marks appearing herein are the property of their respective owners.
All other marks appearing herein are registered or unregistered trademarks or service marks of FMR LLC or an affiliated company. © 2014 FMR LLC. All rights reserved.
Annual Report
This report and the financial statements contained herein are submitted for the general information of the shareholders of the fund. This report is not authorized for distribution to prospective investors in the fund unless preceded or accompanied by an effective prospectus.
A fund files its complete schedule of portfolio holdings with the SEC for the first and third quarters of each fiscal year on Form N-Q. Forms N-Q are available on the SEC's web site at http://www.sec.gov. A fund's Forms N-Q may be reviewed and copied at the SEC's Public Reference Room in Washington, DC. Information regarding the operation of the SEC's Public Reference Room may be obtained by calling 1-800-SEC-0330. For a complete list of a fund's portfolio holdings, view the most recent holdings listing, semiannual report, or annual report on Fidelity's web site at http://www.fidelity.com, http://www.advisor.fidelity.com, or http://www.401k.com, as applicable.
NOT FDIC INSURED • MAY LOSE VALUE • NO BANK GUARANTEE
Neither the fund nor Fidelity Distributors Corporation is a bank.
Annual Report
Performance: The Bottom Line
Average annual total return reflects the change in the value of an investment, assuming reinvestment of the class's distributions from dividend income and capital gains (the profits earned upon the sale of securities that have grown in value, if any) and assuming a constant rate of performance each year. The $10,000 table and the fund's returns do not reflect the deduction of taxes that a shareholder would pay on fund distributions or the redemption of fund shares. During periods of reimbursement by Fidelity, a fund's total return will be greater than it would be had the reimbursement not occurred. How a fund did yesterday is no guarantee of how it will do tomorrow.
Average Annual Total Returns
|
Periods ended November 30, 2013 |
|
Past 1 |
Past 5 |
Past 10 |
|
Institutional Class |
|
38.62% |
24.27% |
9.09% |
$10,000 Over 10 Years
Let's say hypothetically that $10,000 was invested in Fidelity Advisor® Large Cap Fund - Institutional Class on November 30, 2003. The chart shows how the value of your investment would have changed, and also shows how the S&P 500® Index performed over the same period.
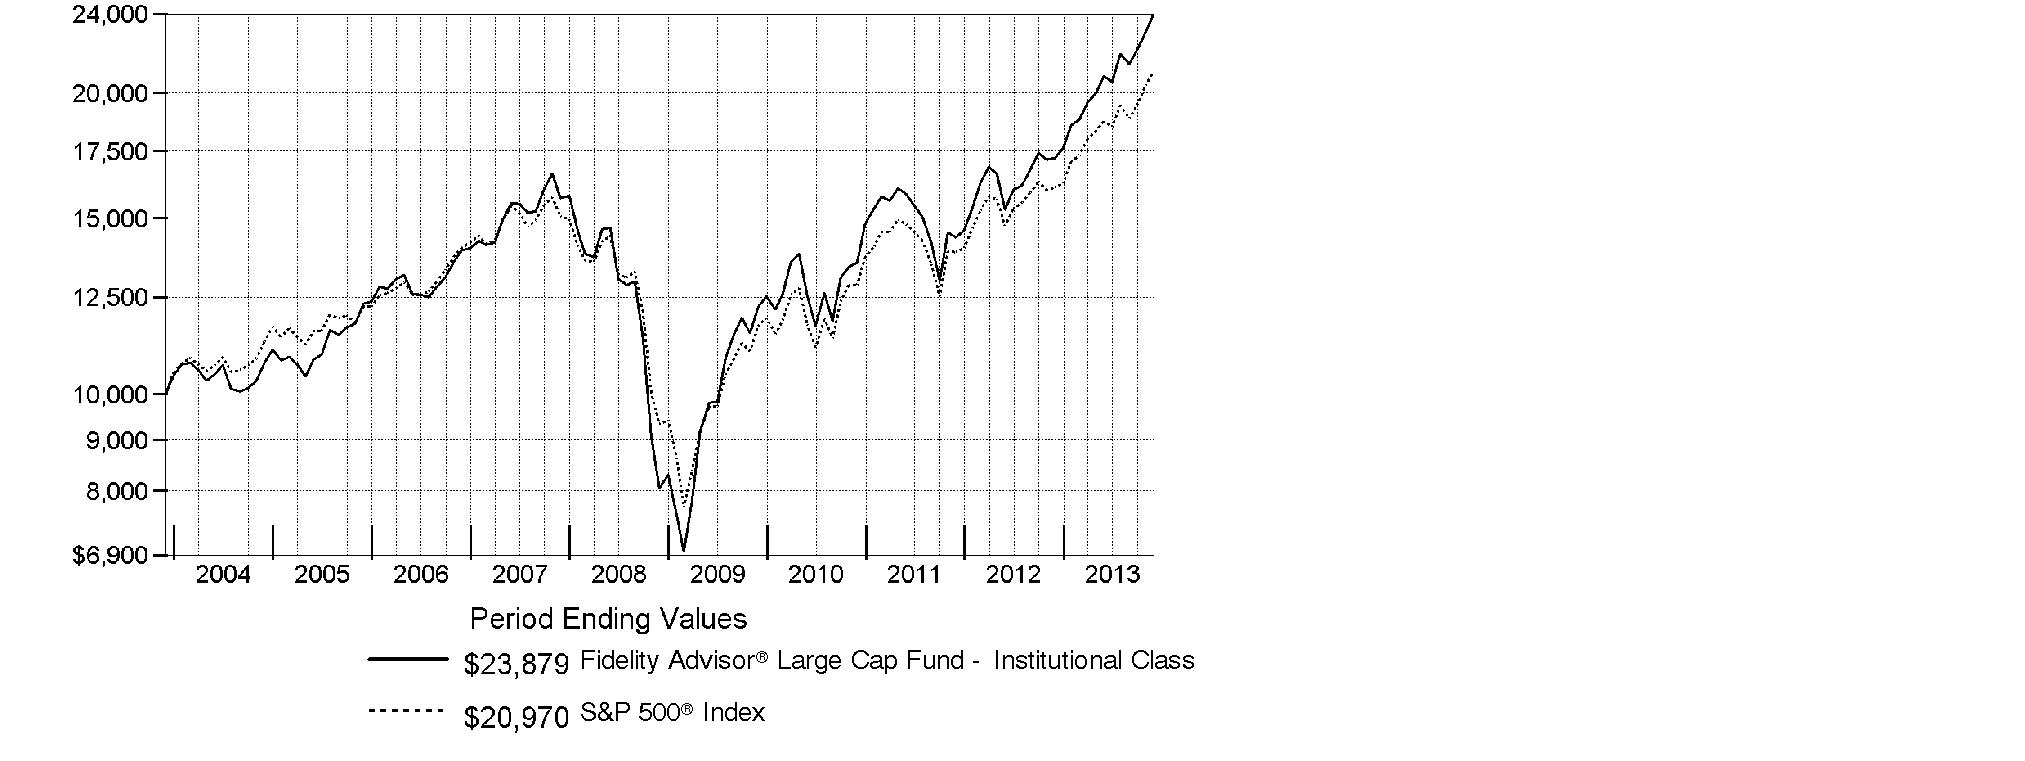
Annual Report
Management's Discussion of Fund Performance
Market Recap: With the current bull run nearing the five-year mark, equity benchmarks ripped up old records during the 12 months ending November 30, 2013. Gains were fueled by strengthening U.S. economic data, as well as generally improving economies and accommodative monetary policies worldwide. The broad S&P 500® Index reached new peaks in its 30.30% climb for the period, and the blue-chip Dow Jones Industrial AverageSM surpassed historic milestones en route to a 26.63% gain. The Nasdaq Composite Index®, up 36.73% amid a resurgence in growth-oriented stocks, closed above 4,000 for the first time since 2000. Shedding anxiety over the 2012 U.S. presidential election - and apparently confident that the federal debt-ceiling debate would be resolved - markets rose from period start through late May. News that the U.S. Federal Reserve was considering an end to its stimulative bond-buying kept stocks in flux over the summer but, by September, the Fed had set aside any imminent tapering. Despite jitters over a potential U.S. military strike in Syria and, later, an October budget impasse that briefly shuttered the federal government, volatility was subdued heading into the holidays, with investor optimism helping many markets home in on all-time highs at period end. Elsewhere, non-U.S. developed-market equities saw similar results, with the MSCI® EAFE® Index adding 24.97%.
Comments from Matt Fruhan, Portfolio Manager of Fidelity Advisor® Large Cap Fund: For the year, the fund's Institutional Class shares gained 38.62%, handily topping the S&P 500®. Relative to the index, top contributors included Gentium, an Italian biotechnology firm that sells a drug to treat veno-occlusive disease (VOD). In July, Gentium received a positive opinion from the European Medicines Agency, and in October was granted approval to market and sell the drug in the European Union. The fund also benefited from Alere, a point-of-care diagnostics company that saw its stock appreciate because pressure from activist shareholders forced management to detail plans to optimize its cost structure to drive earnings growth. The top relative contributor was an out-of-index stake in Radian Group, a mortgage insurer that saw its stock soar because investors started to appreciate the relative strength of the company's capital position versus its peers. I reduced the fund's exposure to each of these names as their stock prices gained. Performance was hampered by an out-of-index stake in Acacia Research, a firm that helps patent owners realize value from their intellectual property. The stock declined on concern about inconsistency in earnings and cash flow.
Annual Report
The views expressed above reflect those of the portfolio manager(s) only through the end of the period as stated on the cover of this report and do not necessarily represent the views of Fidelity or any other person in the Fidelity organization. Any such views are subject to change at any time based upon market or other conditions and Fidelity disclaims any responsibility to update such views. These views may not be relied on as investment advice and, because investment decisions for a Fidelity fund are based on numerous factors, may not be relied on as an indication of trading intent on behalf of any Fidelity fund.
Annual Report
Shareholder Expense Example
As a shareholder of the Fund, you incur two types of costs: (1) transaction costs, including sales charges (loads) on purchase payments or redemption proceeds, and (2) ongoing costs, including management fees, distribution and/or service (12b-1) fees and other Fund expenses. This Example is intended to help you understand your ongoing costs (in dollars) of investing in the Fund and to compare these costs with the ongoing costs of investing in other mutual funds.
The Example is based on an investment of $1,000 invested at the beginning of the period and held for the entire period (June 1, 2013 to November 30, 2013).
Actual Expenses
The first line of the accompanying table for each class of the Fund provides information about actual account values and actual expenses. You may use the information in this line, together with the amount you invested, to estimate the expenses that you paid over the period. Simply divide your account value by $1,000.00 (for example, an $8,600 account value divided by $1,000.00 = 8.6), then multiply the result by the number in the first line for a class of the Fund under the heading entitled "Expenses Paid During Period" to estimate the expenses you paid on your account during this period. In addition, the Fund, as a shareholder in the underlying Fidelity Central Funds, will indirectly bear its pro-rata share of the fees and expenses incurred by the underlying Fidelity Central Funds. These fees and expenses are not included in the Fund's annualized expense ratio used to calculate the expense estimate in the table below.
Hypothetical Example for Comparison Purposes
The second line of the accompanying table for each class of the Fund provides information about hypothetical account values and hypothetical expenses based on a Class' actual expense ratio and an assumed rate of return of 5% per year before expenses, which is not the Class' actual return. The hypothetical account values and expenses may not be used to estimate the actual ending account balance or expenses you paid for the period. You may use this information to compare the ongoing costs of investing in the Fund and other funds. To do so, compare this 5% hypothetical example with the 5% hypothetical examples that appear in the shareholder reports of the other funds. In addition, the Fund, as a shareholder in the underlying Fidelity Central Funds, will indirectly bear its pro-rata share of the fees and expenses incurred by the underlying Fidelity Central Funds. These fees and expenses are not included in the Fund's annualized expense ratio used to calculate the expense estimate in the table below.
Please note that the expenses shown in the table are meant to highlight your ongoing costs only and do not reflect any transaction costs. Therefore, the second line of the table is useful in comparing ongoing costs only, and will not help you determine the relative total costs of owning different funds. In addition, if these transactional costs were included, your costs would have been higher.
Annual Report
Shareholder Expense Example - continued
|
|
Annualized |
Beginning |
Ending |
Expenses Paid |
|
Class A |
1.30% |
|
|
|
|
Actual |
|
$ 1,000.00 |
$ 1,145.90 |
$ 6.99 |
|
HypotheticalA |
|
$ 1,000.00 |
$ 1,018.55 |
$ 6.58 |
|
Class T |
1.56% |
|
|
|
|
Actual |
|
$ 1,000.00 |
$ 1,144.60 |
$ 8.39 |
|
HypotheticalA |
|
$ 1,000.00 |
$ 1,017.25 |
$ 7.89 |
|
Class B |
2.13% |
|
|
|
|
Actual |
|
$ 1,000.00 |
$ 1,141.40 |
$ 11.43 |
|
HypotheticalA |
|
$ 1,000.00 |
$ 1,014.39 |
$ 10.76 |
|
Class C |
2.04% |
|
|
|
|
Actual |
|
$ 1,000.00 |
$ 1,141.90 |
$ 10.95 |
|
HypotheticalA |
|
$ 1,000.00 |
$ 1,014.84 |
$ 10.30 |
|
Institutional Class |
1.01% |
|
|
|
|
Actual |
|
$ 1,000.00 |
$ 1,147.90 |
$ 5.44 |
|
HypotheticalA |
|
$ 1,000.00 |
$ 1,020.00 |
$ 5.11 |
A 5% return per year before expenses
B Annualized expense ratio reflects expenses net of applicable fee waivers.
* Expenses are equal to each Class' annualized expense ratio, multiplied by the average account value over the period, multiplied by 183/365 (to reflect the one-half year period).
Annual Report
Investment Changes (Unaudited)
|
Top Ten Stocks as of November 30, 2013 |
||
|
|
% of fund's |
% of fund's net assets |
|
Apple, Inc. |
3.8 |
3.4 |
|
JPMorgan Chase & Co. |
3.7 |
3.8 |
|
Microsoft Corp. |
2.5 |
2.2 |
|
General Electric Co. |
2.4 |
2.6 |
|
Google, Inc. Class A |
2.1 |
2.3 |
|
Citigroup, Inc. |
2.1 |
2.1 |
|
Chevron Corp. |
1.8 |
2.4 |
|
Bank of America Corp. |
1.7 |
1.8 |
|
Wells Fargo & Co. |
1.7 |
2.7 |
|
Occidental Petroleum Corp. |
1.6 |
1.9 |
|
|
23.4 |
|
|
Top Five Market Sectors as of November 30, 2013 |
||
|
|
% of fund's |
% of fund's net assets |
|
Financials |
20.9 |
22.0 |
|
Information Technology |
20.5 |
19.6 |
|
Health Care |
15.2 |
15.8 |
|
Energy |
11.7 |
12.8 |
|
Industrials |
10.0 |
10.2 |
|
Asset Allocation (% of fund's net assets) |
|||||||
|
As of November 30, 2013* |
As of May 31, 2013** |
||||||
 |
Stocks 98.3% |
|
|
Stocks 99.7% |
|
||
 |
Convertible |
|
|
Convertible |
|
||
 |
Short-Term |
|
|
Short-Term |
|
||
|
* Foreign investments |
12.0% |
|
** Foreign investments |
8.8% |
|
||

Annual Report
Investments November 30, 2013
Showing Percentage of Net Assets
|
Common Stocks - 98.3% |
|||
|
Shares |
Value |
||
|
CONSUMER DISCRETIONARY - 7.7% |
|||
|
Auto Components - 0.1% |
|||
|
The Goodyear Tire & Rubber Co. |
34,669 |
$ 771,732 |
|
|
Automobiles - 0.4% |
|||
|
Ford Motor Co. |
136,290 |
2,327,833 |
|
|
Distributors - 0.1% |
|||
|
LKQ Corp. (a) |
26,300 |
871,845 |
|
|
Diversified Consumer Services - 0.4% |
|||
|
H&R Block, Inc. |
86,217 |
2,404,592 |
|
|
Hotels, Restaurants & Leisure - 0.6% |
|||
|
Wyndham Worldwide Corp. |
13,300 |
953,743 |
|
|
Yum! Brands, Inc. |
38,112 |
2,960,540 |
|
|
|
3,914,283 |
||
|
Internet & Catalog Retail - 0.1% |
|||
|
Expedia, Inc. |
6,700 |
426,723 |
|
|
Leisure Equipment & Products - 0.4% |
|||
|
Mattel, Inc. |
35,400 |
1,637,958 |
|
|
NJOY, Inc. (a)(e) |
115,947 |
936,852 |
|
|
|
2,574,810 |
||
|
Media - 2.4% |
|||
|
Comcast Corp. Class A (special) (non-vtg.) |
183,287 |
8,825,269 |
|
|
Discovery Communications, Inc. Class A (a) |
2,877 |
251,076 |
|
|
Time Warner, Inc. |
101,959 |
6,699,726 |
|
|
|
15,776,071 |
||
|
Multiline Retail - 1.6% |
|||
|
Kohl's Corp. |
10,500 |
580,440 |
|
|
Target Corp. |
155,638 |
9,949,937 |
|
|
|
10,530,377 |
||
|
Specialty Retail - 1.4% |
|||
|
Bed Bath & Beyond, Inc. (a) |
3,600 |
280,908 |
|
|
Lowe's Companies, Inc. |
165,779 |
7,871,187 |
|
|
Staples, Inc. |
73,409 |
1,140,042 |
|
|
|
9,292,137 |
||
|
Textiles, Apparel & Luxury Goods - 0.2% |
|||
|
Coach, Inc. |
7,800 |
451,620 |
|
|
Li & Fung Ltd. |
306,000 |
416,813 |
|
|
lululemon athletica, Inc. (a) |
9,100 |
634,452 |
|
|
|
1,502,885 |
||
|
TOTAL CONSUMER DISCRETIONARY |
50,393,288 |
||
|
Common Stocks - continued |
|||
|
Shares |
Value |
||
|
CONSUMER STAPLES - 9.0% |
|||
|
Beverages - 2.0% |
|||
|
Molson Coors Brewing Co. Class B |
7,700 |
$ 405,559 |
|
|
Monster Beverage Corp. (a) |
14,280 |
845,090 |
|
|
PepsiCo, Inc. |
42,640 |
3,601,374 |
|
|
Pernod Ricard SA |
3,900 |
442,122 |
|
|
Remy Cointreau SA |
8,500 |
724,750 |
|
|
SABMiller PLC |
33,400 |
1,723,191 |
|
|
The Coca-Cola Co. |
127,825 |
5,137,287 |
|
|
|
12,879,373 |
||
|
Food & Staples Retailing - 1.7% |
|||
|
CVS Caremark Corp. |
41,411 |
2,772,881 |
|
|
Sysco Corp. |
15,700 |
527,991 |
|
|
Walgreen Co. |
130,405 |
7,719,976 |
|
|
|
11,020,848 |
||
|
Food Products - 1.1% |
|||
|
Danone SA |
21,003 |
1,526,259 |
|
|
Kellogg Co. |
66,767 |
4,048,751 |
|
|
Mead Johnson Nutrition Co. Class A |
7,100 |
600,021 |
|
|
Unilever NV (Certificaten Van Aandelen) (Bearer) |
30,900 |
1,213,889 |
|
|
|
7,388,920 |
||
|
Household Products - 1.8% |
|||
|
Kimberly-Clark Corp. |
20,935 |
2,285,265 |
|
|
Procter & Gamble Co. |
114,352 |
9,630,725 |
|
|
|
11,915,990 |
||
|
Tobacco - 2.4% |
|||
|
British American Tobacco PLC sponsored ADR |
64,701 |
6,879,657 |
|
|
Lorillard, Inc. |
96,926 |
4,975,212 |
|
|
Philip Morris International, Inc. |
40,775 |
3,487,894 |
|
|
|
15,342,763 |
||
|
TOTAL CONSUMER STAPLES |
58,547,894 |
||
|
ENERGY - 11.6% |
|||
|
Energy Equipment & Services - 2.4% |
|||
|
Cameron International Corp. (a) |
52,445 |
2,904,929 |
|
|
Dresser-Rand Group, Inc. (a) |
23,702 |
1,337,741 |
|
|
Ensco PLC Class A |
25,450 |
1,503,586 |
|
|
Halliburton Co. |
72,336 |
3,810,660 |
|
|
Helmerich & Payne, Inc. |
15,730 |
1,211,210 |
|
|
Common Stocks - continued |
|||
|
Shares |
Value |
||
|
ENERGY - continued |
|||
|
Energy Equipment & Services - continued |
|||
|
National Oilwell Varco, Inc. |
17,482 |
$ 1,424,783 |
|
|
Schlumberger Ltd. |
33,855 |
2,993,459 |
|
|
|
15,186,368 |
||
|
Oil, Gas & Consumable Fuels - 9.2% |
|||
|
Amyris, Inc. (a)(d) |
497,494 |
1,383,033 |
|
|
Apache Corp. |
71,360 |
6,528,726 |
|
|
BG Group PLC |
133,200 |
2,721,170 |
|
|
BP PLC sponsored ADR |
25,990 |
1,221,790 |
|
|
Canadian Natural Resources Ltd. |
180,300 |
5,935,621 |
|
|
Chevron Corp. |
97,557 |
11,944,879 |
|
|
ENI SpA |
24,100 |
576,866 |
|
|
Exxon Mobil Corp. |
44,048 |
4,117,607 |
|
|
Imperial Oil Ltd. |
23,600 |
1,017,917 |
|
|
Occidental Petroleum Corp. |
110,675 |
10,509,698 |
|
|
Peabody Energy Corp. |
58,632 |
1,067,102 |
|
|
Royal Dutch Shell PLC Class A (United Kingdom) |
99,376 |
3,322,890 |
|
|
Suncor Energy, Inc. |
174,000 |
6,037,721 |
|
|
The Williams Companies, Inc. |
104,975 |
3,697,220 |
|
|
|
60,082,240 |
||
|
TOTAL ENERGY |
75,268,608 |
||
|
FINANCIALS - 20.9% |
|||
|
Capital Markets - 3.0% |
|||
|
Charles Schwab Corp. |
212,203 |
5,194,729 |
|
|
KKR & Co. LP |
41,042 |
973,927 |
|
|
Morgan Stanley |
229,403 |
7,180,314 |
|
|
Northern Trust Corp. |
33,788 |
1,993,154 |
|
|
State Street Corp. |
53,958 |
3,917,890 |
|
|
UBS AG |
20,920 |
397,865 |
|
|
|
19,657,879 |
||
|
Commercial Banks - 4.4% |
|||
|
BNP Paribas SA |
7,800 |
585,575 |
|
|
CIT Group, Inc. |
42,005 |
2,120,412 |
|
|
Comerica, Inc. |
36,274 |
1,645,026 |
|
|
Erste Group Bank AG |
22,238 |
782,922 |
|
|
PNC Financial Services Group, Inc. |
36,180 |
2,784,051 |
|
|
Standard Chartered PLC (United Kingdom) |
109,816 |
2,602,837 |
|
|
SunTrust Banks, Inc. |
49,508 |
1,793,675 |
|
|
U.S. Bancorp |
118,715 |
4,656,002 |
|
|
Common Stocks - continued |
|||
|
Shares |
Value |
||
|
FINANCIALS - continued |
|||
|
Commercial Banks - continued |
|||
|
UniCredit SpA |
120,800 |
$ 876,524 |
|
|
Wells Fargo & Co. |
245,144 |
10,791,239 |
|
|
|
28,638,263 |
||
|
Consumer Finance - 0.2% |
|||
|
SLM Corp. |
15,255 |
406,546 |
|
|
Springleaf Holdings, Inc. |
35,200 |
742,016 |
|
|
|
1,148,562 |
||
|
Diversified Financial Services - 8.2% |
|||
|
Bank of America Corp. |
682,750 |
10,801,105 |
|
|
Citigroup, Inc. |
262,779 |
13,906,265 |
|
|
JPMorgan Chase & Co. |
419,543 |
24,006,250 |
|
|
KKR Financial Holdings LLC |
168,984 |
1,618,867 |
|
|
KKR Renaissance Co-Invest LP unit (e) |
29,500 |
2,979,795 |
|
|
|
53,312,282 |
||
|
Insurance - 3.4% |
|||
|
AIA Group Ltd. |
12,400 |
62,859 |
|
|
American International Group, Inc. |
76,857 |
3,823,636 |
|
|
Genworth Financial, Inc. Class A (a) |
223,451 |
3,376,345 |
|
|
Lincoln National Corp. |
73,536 |
3,774,603 |
|
|
MetLife, Inc. |
178,590 |
9,320,612 |
|
|
Prudential Financial, Inc. |
16,866 |
1,497,026 |
|
|
|
21,855,081 |
||
|
Thrifts & Mortgage Finance - 1.7% |
|||
|
MGIC Investment Corp. (a) |
275,692 |
2,235,862 |
|
|
Radian Group, Inc. (d) |
629,868 |
8,981,918 |
|
|
|
11,217,780 |
||
|
TOTAL FINANCIALS |
135,829,847 |
||
|
HEALTH CARE - 15.2% |
|||
|
Biotechnology - 3.3% |
|||
|
Amgen, Inc. |
51,997 |
5,931,818 |
|
|
ARIAD Pharmaceuticals, Inc. (a) |
29,095 |
141,111 |
|
|
Clovis Oncology, Inc. (a) |
32,800 |
1,977,184 |
|
|
Discovery Laboratories, Inc. (a) |
319,900 |
767,760 |
|
|
Gentium SpA sponsored ADR (a)(d) |
160,674 |
8,711,744 |
|
|
Infinity Pharmaceuticals, Inc. (a) |
41,523 |
606,651 |
|
|
Insmed, Inc. (a) |
26,364 |
427,097 |
|
|
Intercept Pharmaceuticals, Inc. (a) |
27,731 |
1,452,272 |
|
|
Common Stocks - continued |
|||
|
Shares |
Value |
||
|
HEALTH CARE - continued |
|||
|
Biotechnology - continued |
|||
|
MEI Pharma, Inc. (a) |
116,203 |
$ 920,328 |
|
|
Merrimack Pharmaceuticals, Inc. (a) |
41,101 |
161,938 |
|
|
Synageva BioPharma Corp. (a) |
8,194 |
495,000 |
|
|
|
21,592,903 |
||
|
Health Care Equipment & Supplies - 3.7% |
|||
|
Abbott Laboratories |
30,525 |
1,165,750 |
|
|
Accuray, Inc. (a) |
123,401 |
984,740 |
|
|
Alere, Inc. (a) |
226,822 |
7,421,616 |
|
|
Align Technology, Inc. (a) |
52,805 |
2,885,265 |
|
|
Baxter International, Inc. |
4,522 |
309,531 |
|
|
Boston Scientific Corp. (a) |
346,884 |
4,016,917 |
|
|
Hologic, Inc. (a) |
31,843 |
712,965 |
|
|
IDEXX Laboratories, Inc. (a) |
6,800 |
708,288 |
|
|
Intuitive Surgical, Inc. (a) |
3,250 |
1,224,925 |
|
|
NxStage Medical, Inc. (a) |
39,298 |
401,233 |
|
|
St. Jude Medical, Inc. |
40,000 |
2,336,800 |
|
|
Stryker Corp. |
5,000 |
372,100 |
|
|
Volcano Corp. (a) |
39,544 |
900,417 |
|
|
Zimmer Holdings, Inc. |
9,800 |
895,818 |
|
|
|
24,336,365 |
||
|
Health Care Providers & Services - 3.6% |
|||
|
Aetna, Inc. |
45,034 |
3,104,194 |
|
|
Catamaran Corp. (a) |
26,600 |
1,214,155 |
|
|
Express Scripts Holding Co. (a) |
50,210 |
3,381,644 |
|
|
McKesson Corp. |
29,896 |
4,959,447 |
|
|
MWI Veterinary Supply, Inc. (a) |
1,000 |
182,170 |
|
|
Quest Diagnostics, Inc. |
42,355 |
2,581,114 |
|
|
UnitedHealth Group, Inc. |
79,778 |
5,941,865 |
|
|
WellPoint, Inc. |
23,091 |
2,144,692 |
|
|
|
23,509,281 |
||
|
Health Care Technology - 0.0% |
|||
|
HMS Holdings Corp. (a) |
10,200 |
233,682 |
|
|
Life Sciences Tools & Services - 0.6% |
|||
|
Illumina, Inc. (a) |
19,473 |
1,908,354 |
|
|
QIAGEN NV (a) |
55,295 |
1,287,821 |
|
|
Thermo Fisher Scientific, Inc. |
5,000 |
504,250 |
|
|
|
3,700,425 |
||
|
Pharmaceuticals - 4.0% |
|||
|
AbbVie, Inc. |
12,184 |
590,315 |
|
|
Common Stocks - continued |
|||
|
Shares |
Value |
||
|
HEALTH CARE - continued |
|||
|
Pharmaceuticals - continued |
|||
|
Actavis PLC (a) |
13,179 |
$ 2,149,100 |
|
|
Cardiome Pharma Corp. (a) |
30,267 |
187,148 |
|
|
Endo Health Solutions, Inc. (a)(d) |
23,540 |
1,581,653 |
|
|
GlaxoSmithKline PLC sponsored ADR |
72,989 |
3,862,578 |
|
|
Jazz Pharmaceuticals PLC (a) |
7,007 |
819,258 |
|
|
Johnson & Johnson |
33,913 |
3,210,205 |
|
|
Merck & Co., Inc. |
167,311 |
8,337,107 |
|
|
Novartis AG sponsored ADR |
17,711 |
1,401,294 |
|
|
Orexo AB (a) |
18,000 |
466,510 |
|
|
Sanofi SA |
3,174 |
335,361 |
|
|
Teva Pharmaceutical Industries Ltd. sponsored ADR |
62,539 |
2,549,090 |
|
|
XenoPort, Inc. (a) |
52,187 |
278,679 |
|
|
|
25,768,298 |
||
|
TOTAL HEALTH CARE |
99,140,954 |
||
|
INDUSTRIALS - 10.0% |
|||
|
Aerospace & Defense - 1.7% |
|||
|
Esterline Technologies Corp. (a) |
13,296 |
1,170,314 |
|
|
Honeywell International, Inc. |
19,280 |
1,706,473 |
|
|
KEYW Holding Corp. (a) |
135,382 |
1,677,383 |
|
|
The Boeing Co. |
39,863 |
5,351,608 |
|
|
United Technologies Corp. |
7,022 |
778,459 |
|
|
|
10,684,237 |
||
|
Air Freight & Logistics - 1.1% |
|||
|
C.H. Robinson Worldwide, Inc. |
31,258 |
1,832,657 |
|
|
United Parcel Service, Inc. Class B |
54,225 |
5,551,556 |
|
|
|
7,384,213 |
||
|
Electrical Equipment - 0.5% |
|||
|
AMETEK, Inc. |
30,230 |
1,487,921 |
|
|
Hubbell, Inc. Class B |
5,300 |
571,923 |
|
|
Roper Industries, Inc. |
9,835 |
1,275,600 |
|
|
|
3,335,444 |
||
|
Industrial Conglomerates - 2.9% |
|||
|
Danaher Corp. |
40,408 |
3,022,518 |
|
|
General Electric Co. |
585,144 |
15,599,939 |
|
|
|
18,622,457 |
||
|
Machinery - 1.2% |
|||
|
Caterpillar, Inc. |
20,233 |
1,711,712 |
|
|
Common Stocks - continued |
|||
|
Shares |
Value |
||
|
INDUSTRIALS - continued |
|||
|
Machinery - continued |
|||
|
Cummins, Inc. |
6,323 |
$ 836,912 |
|
|
Ingersoll-Rand PLC |
66,783 |
4,769,642 |
|
|
Xylem, Inc. |
12,600 |
435,456 |
|
|
|
7,753,722 |
||
|
Professional Services - 0.8% |
|||
|
Acacia Research Corp. (d) |
178,687 |
2,658,863 |
|
|
Bureau Veritas SA |
6,600 |
196,042 |
|
|
Michael Page International PLC |
140,378 |
1,091,077 |
|
|
Towers Watson & Co. |
3,900 |
439,140 |
|
|
Verisk Analytics, Inc. (a) |
15,100 |
983,161 |
|
|
|
5,368,283 |
||
|
Road & Rail - 1.5% |
|||
|
CSX Corp. |
227,641 |
6,207,770 |
|
|
Hertz Global Holdings, Inc. (a) |
62,700 |
1,521,102 |
|
|
Norfolk Southern Corp. |
25,158 |
2,206,105 |
|
|
|
9,934,977 |
||
|
Trading Companies & Distributors - 0.3% |
|||
|
Beacon Roofing Supply, Inc. (a) |
25,184 |
936,341 |
|
|
WESCO International, Inc. (a) |
13,812 |
1,187,556 |
|
|
|
2,123,897 |
||
|
TOTAL INDUSTRIALS |
65,207,230 |
||
|
INFORMATION TECHNOLOGY - 20.5% |
|||
|
Communications Equipment - 2.3% |
|||
|
Cisco Systems, Inc. |
475,104 |
10,095,960 |
|
|
QUALCOMM, Inc. |
62,150 |
4,572,997 |
|
|
|
14,668,957 |
||
|
Computers & Peripherals - 4.3% |
|||
|
Apple, Inc. |
44,403 |
24,691,167 |
|
|
EMC Corp. |
114,808 |
2,738,171 |
|
|
NCR Corp. (a) |
11,650 |
407,168 |
|
|
|
27,836,506 |
||
|
Internet Software & Services - 2.1% |
|||
|
Google, Inc. Class A (a) |
13,176 |
13,961,158 |
|
|
IT Services - 5.1% |
|||
|
Accenture PLC Class A |
6,400 |
495,808 |
|
|
Cognizant Technology Solutions Corp. Class A (a) |
48,592 |
4,562,303 |
|
|
Common Stocks - continued |
|||
|
Shares |
Value |
||
|
INFORMATION TECHNOLOGY - continued |
|||
|
IT Services - continued |
|||
|
Fidelity National Information Services, Inc. |
35,624 |
$ 1,805,424 |
|
|
Gartner, Inc. Class A (a) |
13,133 |
849,048 |
|
|
IBM Corp. |
12,731 |
2,287,506 |
|
|
MasterCard, Inc. Class A |
9,600 |
7,303,776 |
|
|
Paychex, Inc. |
132,664 |
5,801,397 |
|
|
The Western Union Co. |
110,262 |
1,838,068 |
|
|
Unisys Corp. (a) |
73,662 |
2,023,495 |
|
|
Visa, Inc. Class A |
30,830 |
6,272,672 |
|
|
|
33,239,497 |
||
|
Semiconductors & Semiconductor Equipment - 1.6% |
|||
|
Applied Materials, Inc. |
196,961 |
3,407,425 |
|
|
Broadcom Corp. Class A |
161,260 |
4,304,029 |
|
|
Lam Research Corp. (a) |
37,834 |
1,971,530 |
|
|
NXP Semiconductors NV (a) |
20,827 |
885,148 |
|
|
|
10,568,132 |
||
|
Software - 5.1% |
|||
|
Adobe Systems, Inc. (a) |
37,710 |
2,141,174 |
|
|
Autodesk, Inc. (a) |
87,631 |
3,965,303 |
|
|
Citrix Systems, Inc. (a) |
16,196 |
960,747 |
|
|
Concur Technologies, Inc. (a) |
23,224 |
2,254,818 |
|
|
Electronic Arts, Inc. (a) |
39,132 |
867,948 |
|
|
Interactive Intelligence Group, Inc. (a) |
3,800 |
247,152 |
|
|
Microsoft Corp. |
430,104 |
16,399,866 |
|
|
Oracle Corp. |
87,300 |
3,080,817 |
|
|
Parametric Technology Corp. (a) |
24,882 |
809,660 |
|
|
salesforce.com, Inc. (a) |
18,100 |
942,829 |
|
|
VMware, Inc. Class A (a) |
12,835 |
1,034,886 |
|
|
Workday, Inc. Class A (a) |
2,000 |
164,700 |
|
|
|
32,869,900 |
||
|
TOTAL INFORMATION TECHNOLOGY |
133,144,150 |
||
|
MATERIALS - 2.2% |
|||
|
Chemicals - 1.5% |
|||
|
Airgas, Inc. |
14,048 |
1,526,034 |
|
|
E.I. du Pont de Nemours & Co. |
22,788 |
1,398,727 |
|
|
Intrepid Potash, Inc. (d) |
42,400 |
655,080 |
|
|
Monsanto Co. |
38,317 |
4,342,466 |
|
|
Common Stocks - continued |
|||
|
Shares |
Value |
||
|
MATERIALS - continued |
|||
|
Chemicals - continued |
|||
|
Potash Corp. of Saskatchewan, Inc. |
30,600 |
$ 968,786 |
|
|
Syngenta AG (Switzerland) |
3,300 |
1,293,684 |
|
|
|
10,184,777 |
||
|
Construction Materials - 0.0% |
|||
|
Imerys SA |
1,600 |
129,358 |
|
|
Metals & Mining - 0.7% |
|||
|
Freeport-McMoRan Copper & Gold, Inc. |
29,500 |
1,023,355 |
|
|
Grupo Mexico SA de CV Series B |
238,900 |
701,689 |
|
|
Southern Copper Corp. |
37,050 |
929,955 |
|
|
Walter Energy, Inc. (d) |
118,390 |
1,684,690 |
|
|
|
4,339,689 |
||
|
TOTAL MATERIALS |
14,653,824 |
||
|
TELECOMMUNICATION SERVICES - 1.1% |
|||
|
Diversified Telecommunication Services - 0.9% |
|||
|
Verizon Communications, Inc. |
117,797 |
5,845,087 |
|
|
Wireless Telecommunication Services - 0.2% |
|||
|
Vodafone Group PLC sponsored ADR |
37,171 |
1,378,672 |
|
|
TOTAL TELECOMMUNICATION SERVICES |
7,223,759 |
||
|
UTILITIES - 0.1% |
|||
|
Independent Power Producers & Energy Traders - 0.1% |
|||
|
APR Energy PLC (d) |
22,186 |
375,736 |
|
|
TOTAL COMMON STOCKS (Cost $495,854,059) |
|
||
|
Convertible Preferred Stocks - 0.0% |
|||
|
|
|
|
|
|
CONSUMER DISCRETIONARY - 0.0% |
|||
|
Leisure Equipment & Products - 0.0% |
|||
|
NJOY, Inc. Series C (e) (Cost $271,645) |
33,607 |
271,545 |
|
|
Convertible Bonds - 0.1% |
||||
|
|
Principal Amount |
Value |
||
|
ENERGY - 0.1% |
||||
|
Oil, Gas & Consumable Fuels - 0.1% |
||||
|
Amyris, Inc. 3% 2/27/17 (Cost $605,000) |
|
$ 605,000 |
$ 440,537 |
|
|
Money Market Funds - 4.0% |
|||
|
Shares |
|
||
|
Fidelity Cash Central Fund, 0.10% (b) |
9,868,438 |
9,868,438 |
|
|
Fidelity Securities Lending Cash Central Fund, 0.10% (b)(c) |
15,922,592 |
15,922,592 |
|
|
TOTAL MONEY MARKET FUNDS (Cost $25,791,030) |
|
||
|
TOTAL INVESTMENT PORTFOLIO - 102.4% (Cost $522,521,734) |
666,288,402 |
||
|
NET OTHER ASSETS (LIABILITIES) - (2.4)% |
(15,562,337) |
||
|
NET ASSETS - 100% |
$ 650,726,065 |
||
|
Legend |
|
(a) Non-income producing |
|
(b) Affiliated fund that is generally available only to investment companies and other accounts managed by Fidelity Investments. The rate quoted is the annualized seven-day yield of the fund at period end. A complete unaudited listing of the fund's holdings as of its most recent quarter end is available upon request. In addition, each Fidelity Central Fund's financial statements, which are not covered by the Fund's Report of Independent Registered Public Accounting Firm, are available on the SEC's website or upon request. |
|
(c) Investment made with cash collateral received from securities on loan. |
|
(d) Security or a portion of the security is on loan at period end. |
|
(e) Restricted securities - Investment in securities not registered under the Securities Act of 1933 (excluding 144A issues). At the end of the period, the value of restricted securities (excluding 144A issues) amounted to $4,188,192 or 0.6% of net assets. |
|
Additional information on each restricted holding is as follows: |
|
Security |
Acquisition Date |
Acquisition Cost |
|
KKR Renaissance Co-Invest LP unit |
7/25/13 |
$ 3,112,250 |
|
NJOY, Inc. |
9/11/13 - 10/24/13 |
$ 936,852 |
|
NJOY, Inc. |
6/7/13 |
$ 271,645 |
|
Affiliated Central Funds |
|
Information regarding fiscal year to date income earned by the Fund from investments in Fidelity Central Funds is as follows: |
|
Fund |
Income earned |
|
Fidelity Cash Central Fund |
$ 5,982 |
|
Fidelity Securities Lending Cash Central Fund |
234,319 |
|
Total |
$ 240,301 |
|
Other Information |
|
The following is a summary of the inputs used, as of November 30, 2013, involving the Fund's assets and liabilities carried at fair value. The inputs or methodology used for valuing securities may not be an indication of the risk associated with investing in those securities. For more information on valuation inputs, and their aggregation into the levels used in the table below, please refer to the Investment Valuation section in the accompanying Notes to Financial Statements. |
|
Valuation Inputs at Reporting Date: |
||||
|
Description |
Total |
Level 1 |
Level 2 |
Level 3 |
|
Investments in Securities: |
||||
|
Equities: |
||||
|
Consumer Discretionary |
$ 50,664,833 |
$ 49,456,436 |
$ - |
$ 1,208,397 |
|
Consumer Staples |
58,547,894 |
57,334,005 |
1,213,889 |
- |
|
Energy |
75,268,608 |
71,368,852 |
3,899,756 |
- |
|
Financials |
135,829,847 |
132,452,187 |
397,865 |
2,979,795 |
|
Health Care |
99,140,954 |
98,805,593 |
335,361 |
- |
|
Industrials |
65,207,230 |
65,207,230 |
- |
- |
|
Information Technology |
133,144,150 |
133,144,150 |
- |
- |
|
Materials |
14,653,824 |
13,360,140 |
1,293,684 |
- |
|
Telecommunication Services |
7,223,759 |
7,223,759 |
- |
- |
|
Utilities |
375,736 |
375,736 |
- |
- |
|
Corporate Bonds |
440,537 |
- |
440,537 |
- |
|
Money Market Funds |
25,791,030 |
25,791,030 |
- |
- |
|
Total Investments in Securities: |
$ 666,288,402 |
$ 654,519,118 |
$ 7,581,092 |
$ 4,188,192 |
|
Distribution of investments by country or territory of incorporation, as a percentage of total net assets, is as follows (Unaudited): |
|
United States of America |
88.0% |
|
United Kingdom |
4.2% |
|
Canada |
2.3% |
|
Italy |
1.5% |
|
Ireland |
1.2% |
|
Others (Individually Less Than 1%) |
2.8% |
|
|
100.0% |
See accompanying notes which are an integral part of the financial statements.
Annual Report
Financial Statements
Statement of Assets and Liabilities
|
|
November 30, 2013 |
|
|
|
|
|
|
Assets |
|
|
|
Investment in securities, at value (including securities loaned of $15,669,649) - See accompanying schedule: Unaffiliated issuers (cost $496,730,704) |
$ 640,497,372 |
|
|
Fidelity Central Funds (cost $25,791,030) |
25,791,030 |
|
|
Total Investments (cost $522,521,734) |
|
$ 666,288,402 |
|
Cash |
|
772 |
|
Foreign currency held at value (cost $172,241) |
|
172,279 |
|
Receivable for investments sold |
|
611,667 |
|
Receivable for fund shares sold |
|
2,103,236 |
|
Dividends receivable |
|
1,368,770 |
|
Interest receivable |
|
4,739 |
|
Distributions receivable from Fidelity Central Funds |
|
14,248 |
|
Prepaid expenses |
|
2,964 |
|
Other receivables |
|
2,271 |
|
Total assets |
|
670,569,348 |
|
|
|
|
|
Liabilities |
|
|
|
Payable for investments purchased |
$ 2,466,782 |
|
|
Payable for fund shares redeemed |
549,030 |
|
|
Accrued management fee |
570,982 |
|
|
Distribution and service plan fees payable |
150,656 |
|
|
Other affiliated payables |
130,907 |
|
|
Other payables and accrued expenses |
52,334 |
|
|
Collateral on securities loaned, at value |
15,922,592 |
|
|
Total liabilities |
|
19,843,283 |
|
|
|
|
|
Net Assets |
|
$ 650,726,065 |
|
Net Assets consist of: |
|
|
|
Paid in capital |
|
$ 460,204,374 |
|
Undistributed net investment income |
|
4,161,853 |
|
Accumulated undistributed net realized gain (loss) on investments and foreign currency transactions |
|
42,592,363 |
|
Net unrealized appreciation (depreciation) on investments and assets and liabilities in foreign currencies |
|
143,767,475 |
|
Net Assets |
|
$ 650,726,065 |
See accompanying notes which are an integral part of the financial statements.
Annual Report
Statement of Assets and Liabilities - continued
|
|
November 30, 2013 |
|
|
|
|
|
|
Calculation of Maximum Offering Price Class A: |
|
$ 28.11 |
|
|
|
|
|
Maximum offering price per share (100/94.25 of $28.11) |
|
$ 29.82 |
|
Class T: |
|
$ 28.02 |
|
|
|
|
|
Maximum offering price per share (100/96.50 of $28.02) |
|
$ 29.04 |
|
Class B: |
|
$ 26.24 |
|
|
|
|
|
Class C: |
|
$ 26.07 |
|
|
|
|
|
Institutional Class: |
|
$ 29.03 |
A Redemption price per share is equal to net asset value less any applicable contingent deferred sales charge.
See accompanying notes which are an integral part of the financial statements.
Annual Report
Financial Statements - continued
Statement of Operations
|
|
Year ended November 30, 2013 |
|
|
|
|
|
|
Investment Income |
|
|
|
Dividends |
|
$ 19,531,718 |
|
Interest |
|
18,150 |
|
Income from Fidelity Central Funds |
|
240,301 |
|
Total income |
|
19,790,169 |
|
|
|
|
|
Expenses |
|
|
|
Management fee |
$ 5,705,881 |
|
|
Performance adjustment |
1,580,167 |
|
|
Transfer agent fees |
2,121,112 |
|
|
Distribution and service plan fees |
1,390,530 |
|
|
Accounting and security lending fees |
343,530 |
|
|
Custodian fees and expenses |
70,348 |
|
|
Independent trustees' compensation |
5,967 |
|
|
Registration fees |
80,062 |
|
|
Audit |
59,612 |
|
|
Legal |
3,873 |
|
|
Interest |
1,258 |
|
|
Miscellaneous |
11,423 |
|
|
Total expenses before reductions |
11,373,763 |
|
|
Expense reductions |
(139,371) |
11,234,392 |
|
Net investment income (loss) |
|
8,555,777 |
|
Realized and Unrealized Gain (Loss) Net realized gain (loss) on: |
|
|
|
Investment securities: |
|
|
|
Unaffiliated issuers |
86,169,091 |
|
|
Redemption in-kind with affiliated entities |
267,456,609 |
|
|
Foreign currency transactions |
(20,296) |
|
|
Total net realized gain (loss) |
|
353,605,404 |
|
Change in net unrealized appreciation (depreciation) on: Investment securities |
(32,407,352) |
|
|
Assets and liabilities in foreign currencies |
(1,538) |
|
|
Total change in net unrealized appreciation (depreciation) |
|
(32,408,890) |
|
Net gain (loss) |
|
321,196,514 |
|
Net increase (decrease) in net assets resulting from operations |
|
$ 329,752,291 |
See accompanying notes which are an integral part of the financial statements.
Annual Report
Statement of Changes in Net Assets
|
|
Year ended |
Year ended |
|
Increase (Decrease) in Net Assets |
|
|
|
Operations |
|
|
|
Net investment income (loss) |
$ 8,555,777 |
$ 12,844,939 |
|
Net realized gain (loss) |
353,605,404 |
43,445,666 |
|
Change in net unrealized appreciation (depreciation) |
(32,408,890) |
175,969,722 |
|
Net increase (decrease) in net assets resulting |
329,752,291 |
232,260,327 |
|
Distributions to shareholders from net investment income |
(767,567) |
(17,554,132) |
|
Distributions to shareholders from net realized gain |
(3,062,648) |
(24,770,255) |
|
Total distributions |
(3,830,215) |
(42,324,387) |
|
Share transactions - net increase (decrease) |
(985,531,295) |
(103,985,044) |
|
Total increase (decrease) in net assets |
(659,609,219) |
85,950,896 |
|
|
|
|
|
Net Assets |
|
|
|
Beginning of period |
1,310,335,284 |
1,224,384,388 |
|
End of period (including undistributed net investment income of $4,161,853 and distributions in excess of net investment income of $12, respectively) |
$ 650,726,065 |
$ 1,310,335,284 |
See accompanying notes which are an integral part of the financial statements.
Annual Report
Financial Highlights - Class A
|
Years ended November 30, |
2013 |
2012 |
2011 |
2010 |
2009 |
|
Selected Per-Share Data |
|
|
|
|
|
|
Net asset value, beginning of period |
$ 20.43 |
$ 17.57 |
$ 16.69 |
$ 15.19 |
$ 10.13 |
|
Income from Investment Operations |
|
|
|
|
|
|
Net investment income (loss) C |
.16 |
.15 |
.09 |
.05 |
.06 |
|
Net realized and unrealized gain (loss) |
7.61 |
3.30 |
.87 |
1.52 |
5.08 |
|
Total from investment operations |
7.77 |
3.45 |
.96 |
1.57 |
5.14 |
|
Distributions from net investment income |
(.02) |
(.18) |
(.06) |
(.07) |
(.08) |
|
Distributions from net realized gain |
(.07) |
(.41) |
(.02) |
- |
- |
|
Total distributions |
(.09) |
(.59) |
(.08) |
(.07) |
(.08) |
|
Net asset value, end of period |
$ 28.11 |
$ 20.43 |
$ 17.57 |
$ 16.69 |
$ 15.19 |
|
Total Return A,B |
38.16% |
19.69% |
5.73% |
10.36% |
51.10% |
|
Ratios to Average Net Assets D,F |
|
|
|
|
|
|
Expenses before reductions |
1.26% |
1.25% |
1.29% |
1.22% |
1.16% |
|
Expenses net of fee waivers, if any |
1.26% |
1.25% |
1.29% |
1.22% |
1.16% |
|
Expenses net of all reductions |
1.24% |
1.24% |
1.28% |
1.21% |
1.15% |
|
Net investment income (loss) |
.68% |
.76% |
.49% |
.31% |
.49% |
|
Supplemental Data |
|
|
|
|
|
|
Net assets, end of period (000 omitted) |
$ 214,686 |
$ 123,303 |
$ 103,670 |
$ 116,837 |
$ 112,450 |
|
Portfolio turnover rate E |
54% |
59% |
83% |
146% |
185% |
A Total returns would have been lower if certain expenses had not been reduced during the applicable periods shown.
B Total returns do not include the effect of the sales charges.
C Calculated based on average shares outstanding during the period.
D Fees and expenses of any underlying Fidelity Central Funds are not included in the Fund's expense ratio. The Fund indirectly bears its proportionate share of the expenses of any underlying Fidelity Central Funds.
E Amount does not include the portfolio activity of any underlying Fidelity Central Funds.
F Expense ratios reflect operating expenses of the class. Expenses before reductions do not reflect amounts reimbursed by the investment adviser or reductions from brokerage service arrangements or reductions from other expense offset arrangements and do not represent the amount paid by the class during periods when reimbursements or reductions occur. Expenses net of fee waivers reflect expenses after reimbursement by the investment adviser but prior to reductions from brokerage service arrangements or other expense offset arrangements. Expenses net of all reductions represent the net expenses paid by the class.
See accompanying notes which are an integral part of the financial statements.
Annual Report
Financial Highlights - Class T
|
Years ended November 30, |
2013 |
2012 |
2011 |
2010 |
2009 |
|
Selected Per-Share Data |
|
|
|
|
|
|
Net asset value, beginning of period |
$ 20.41 |
$ 17.51 |
$ 16.63 |
$ 15.14 |
$ 10.07 |
|
Income from Investment Operations |
|
|
|
|
|
|
Net investment income (loss) C |
.10 |
.10 |
.04 |
.01 |
.03 |
|
Net realized and unrealized gain (loss) |
7.59 |
3.29 |
.87 |
1.52 |
5.06 |
|
Total from investment operations |
7.69 |
3.39 |
.91 |
1.53 |
5.09 |
|
Distributions from net investment income |
(.01) |
(.10) |
- G |
(.04) |
(.02) |
|
Distributions from net realized gain |
(.07) |
(.39) |
(.02) |
- |
- |
|
Total distributions |
(.08) |
(.49) |
(.03) H |
(.04) |
(.02) |
|
Net asset value, end of period |
$ 28.02 |
$ 20.41 |
$ 17.51 |
$ 16.63 |
$ 15.14 |
|
Total Return A,B |
37.82% |
19.39% |
5.44% |
10.09% |
50.71% |
|
Ratios to Average Net Assets D,F |
|
|
|
|
|
|
Expenses before reductions |
1.51% |
1.49% |
1.54% |
1.47% |
1.42% |
|
Expenses net of fee waivers, if any |
1.51% |
1.49% |
1.54% |
1.47% |
1.42% |
|
Expenses net of all reductions |
1.49% |
1.49% |
1.53% |
1.47% |
1.41% |
|
Net investment income (loss) |
.42% |
.52% |
.24% |
.06% |
.23% |
|
Supplemental Data |
|
|
|
|
|
|
Net assets, end of period (000 omitted) |
$ 114,864 |
$ 76,151 |
$ 69,678 |
$ 76,373 |
$ 87,009 |
|
Portfolio turnover rate E |
54% |
59% |
83% |
146% |
185% |
A Total returns would have been lower if certain expenses had not been reduced during the applicable periods shown.
B Total returns do not include the effect of the sales charges.
C Calculated based on average shares outstanding during the period.
D Fees and expenses of any underlying Fidelity Central Funds are not included in the Fund's expense ratio. The Fund indirectly bears its proportionate share of the expenses of any underlying Fidelity Central Funds.
E Amount does not include the portfolio activity of any underlying Fidelity Central Funds.
F Expense ratios reflect operating expenses of the class. Expenses before reductions do not reflect amounts reimbursed by the investment adviser or reductions from brokerage service arrangements or reductions from other expense offset arrangements and do not represent the amount paid by the class during periods when reimbursements or reductions occur. Expenses net of fee waivers reflect expenses after reimbursement by the investment adviser but prior to reductions from brokerage service arrangements or other expense offset arrangements. Expenses net of all reductions represent the net expenses paid by the class.
G Amount represents less than $.01 per share.
H Total distributions of $.03 per share is comprised of distributions from net investment income of $.004 and distributions from net realized gain of $.021 per share.
See accompanying notes which are an integral part of the financial statements.
Annual Report
Financial Highlights - Class B
|
Years ended November 30, |
2013 |
2012 |
2011 |
2010 |
2009 |
|
Selected Per-Share Data |
|
|
|
|
|
|
Net asset value, beginning of period |
$ 19.21 |
$ 16.49 |
$ 15.72 |
$ 14.35 |
$ 9.57 |
|
Income from Investment Operations |
|
|
|
|
|
|
Net investment income (loss) C |
(.03) |
- G |
(.05) |
(.07) |
(.03) |
|
Net realized and unrealized gain (loss) |
7.13 |
3.10 |
.82 |
1.44 |
4.81 |
|
Total from investment operations |
7.10 |
3.10 |
.77 |
1.37 |
4.78 |
|
Distributions from net realized gain |
(.07) |
(.38) |
- |
- |
- |
|
Net asset value, end of period |
$ 26.24 |
$ 19.21 |
$ 16.49 |
$ 15.72 |
$ 14.35 |
|
Total Return A,B |
37.08% |
18.77% |
4.90% |
9.55% |
49.95% |
|
Ratios to Average Net Assets D,F |
|
|
|
|
|
|
Expenses before reductions |
2.06% |
2.02% |
2.04% |
1.98% |
1.91% |
|
Expenses net of fee waivers, if any |
2.06% |
2.02% |
2.04% |
1.98% |
1.91% |
|
Expenses net of all reductions |
2.05% |
2.01% |
2.04% |
1.97% |
1.90% |
|
Net investment income (loss) |
(.13)% |
(.01)% |
(.26)% |
(.45)% |
(.26)% |
|
Supplemental Data |
|
|
|
|
|
|
Net assets, end of period (000 omitted) |
$ 10,499 |
$ 10,535 |
$ 12,839 |
$ 17,535 |
$ 21,907 |
|
Portfolio turnover rate E |
54% |
59% |
83% |
146% |
185% |
A Total returns would have been lower if certain expenses had not been reduced during the applicable periods shown.
B Total returns do not include the effect of the contingent deferred sales charge.
C Calculated based on average shares outstanding during the period.
D Fees and expenses of any underlying Fidelity Central Funds are not included in the Fund's expense ratio. The Fund indirectly bears its proportionate share of the expenses of any underlying Fidelity Central Funds.
E Amount does not include the portfolio activity of any underlying Fidelity Central Funds.
F Expense ratios reflect operating expenses of the class. Expenses before reductions do not reflect amounts reimbursed by the investment adviser or reductions from brokerage service arrangements or reductions from other expense offset arrangements and do not represent the amount paid by the class during periods when reimbursements or reductions occur. Expenses net of fee waivers reflect expenses after reimbursement by the investment adviser but prior to reductions from brokerage service arrangements or other expense offset arrangements. Expenses net of all reductions represent the net expenses paid by the class.
G Amount represents less than $.01 per share.
See accompanying notes which are an integral part of the financial statements.
Annual Report
Financial Highlights - Class C
|
Years ended November 30, |
2013 |
2012 |
2011 |
2010 |
2009 |
|
Selected Per-Share Data |
|
|
|
|
|
|
Net asset value, beginning of period |
$ 19.08 |
$ 16.41 |
$ 15.65 |
$ 14.28 |
$ 9.53 |
|
Income from Investment Operations |
|
|
|
|
|
|
Net investment income (loss) C |
(.02) |
- G |
(.04) |
(.07) |
(.03) |
|
Net realized and unrealized gain (loss) |
7.08 |
3.09 |
.80 |
1.44 |
4.78 |
|
Total from investment operations |
7.06 |
3.09 |
.76 |
1.37 |
4.75 |
|
Distributions from net investment income |
- G |
(.03) |
- |
- |
- |
|
Distributions from net realized gain |
(.07) |
(.39) |
- |
- |
- |
|
Total distributions |
(.07) |
(.42) |
- |
- |
- |
|
Net asset value, end of period |
$ 26.07 |
$ 19.08 |
$ 16.41 |
$ 15.65 |
$ 14.28 |
|
Total Return A,B |
37.14% |
18.83% |
4.86% |
9.59% |
49.84% |
|
Ratios to Average Net Assets D,F |
|
|
|
|
|
|
Expenses before reductions |
2.00% |
2.00% |
2.03% |
1.97% |
1.91% |
|
Expenses net of fee waivers, if any |
2.00% |
2.00% |
2.03% |
1.97% |
1.91% |
|
Expenses net of all reductions |
1.99% |
1.99% |
2.03% |
1.96% |
1.90% |
|
Net investment income (loss) |
(.07)% |
.01% |
(.25)% |
(.44)% |
(.26)% |
|
Supplemental Data |
|
|
|
|
|
|
Net assets, end of period (000 omitted) |
$ 67,780 |
$ 28,856 |
$ 24,197 |
$ 25,162 |
$ 24,650 |
|
Portfolio turnover rate E |
54% |
59% |
83% |
146% |
185% |
A Total returns would have been lower if certain expenses had not been reduced during the applicable periods shown.
B Total returns do not include the effect of the contingent deferred sales charge.
C Calculated based on average shares outstanding during the period.
D Fees and expenses of any underlying Fidelity Central Funds are not included in the Fund's expense ratio. The Fund indirectly bears its proportionate share of the expenses of any underlying Fidelity Central Funds.
E Amount does not include the portfolio activity of any underlying Fidelity Central Funds.
F Expense ratios reflect operating expenses of the class. Expenses before reductions do not reflect amounts reimbursed by the investment adviser or reductions from brokerage service arrangements or reductions from other expense offset arrangements and do not represent the amount paid by the class during periods when reimbursements or reductions occur. Expenses net of fee waivers reflect expenses after reimbursement by the investment adviser but prior to reductions from brokerage service arrangements or other expense offset arrangements. Expenses net of all reductions represent the net expenses paid by the class.
G Amount represents less than $.01 per share.
See accompanying notes which are an integral part of the financial statements.
Annual Report
Financial Highlights - Institutional Class
|
Years ended November 30, |
2013 |
2012 |
2011 |
2010 |
2009 |
|
Selected Per-Share Data |
|
|
|
|
|
|
Net asset value, beginning of period |
$ 21.03 |
$ 18.13 |
$ 17.22 |
$ 15.65 |
$ 10.48 |
|
Income from Investment Operations |
|
|
|
|
|
|
Net investment income (loss) B |
.24 |
.22 |
.15 |
.11 |
.10 |
|
Net realized and unrealized gain (loss) |
7.85 |
3.40 |
.89 |
1.57 |
5.22 |
|
Total from investment operations |
8.09 |
3.62 |
1.04 |
1.68 |
5.32 |
|
Distributions from net investment income |
(.02) |
(.31) |
(.11) |
(.11) |
(.15) |
|
Distributions from net realized gain |
(.07) |
(.41) |
(.02) |
- |
- |
|
Total distributions |
(.09) |
(.72) |
(.13) |
(.11) |
(.15) |
|
Net asset value, end of period |
$ 29.03 |
$ 21.03 |
$ 18.13 |
$ 17.22 |
$ 15.65 |
|
Total Return A |
38.62% |
20.10% |
6.03% |
10.78% |
51.54% |
|
Ratios to Average Net Assets C,E |
|
|
|
|
|
|
Expenses before reductions |
.95% |
.91% |
.95% |
.88% |
.84% |
|
Expenses net of fee waivers, if any |
.95% |
.91% |
.95% |
.88% |
.84% |
|
Expenses net of all reductions |
.94% |
.91% |
.94% |
.87% |
.83% |
|
Net investment income (loss) |
.98% |
1.10% |
.83% |
.65% |
.82% |
|
Supplemental Data |
|
|
|
|
|
|
Net assets, end of period (000 omitted) |
$ 242,897 |
$ 1,071,491 |
$ 1,013,999 |
$ 876,299 |
$ 924,675 |
|
Portfolio turnover rate D |
54% |
59% |
83% |
146% |
185% |
A Total returns would have been lower if certain expenses had not been reduced during the applicable periods shown.
B Calculated based on average shares outstanding during the period.
C Fees and expenses of any underlying Fidelity Central Funds are not included in the Fund's expense ratio. The Fund indirectly bears its proportionate share of the expenses of any underlying Fidelity Central Funds.
D Amount does not include the portfolio activity of any underlying Fidelity Central Funds.
E Expense ratios reflect operating expenses of the class. Expenses before reductions do not reflect amounts reimbursed by the investment adviser or reductions from brokerage service arrangements or reductions from other expense offset arrangements and do not represent the amount paid by the class during periods when reimbursements or reductions occur. Expenses net of fee waivers reflect expenses after reimbursement by the investment adviser but prior to reductions from brokerage service arrangements or other expense offset arrangements. Expenses net of all reductions represent the net expenses paid by the class.
See accompanying notes which are an integral part of the financial statements.
Annual Report
Notes to Financial Statements
For the period ended November 30, 2013
1. Organization.
Fidelity Advisor Large Cap Fund (the Fund) is a fund of Fidelity Advisor Series I (the Trust) and is authorized to issue an unlimited number of shares. The Trust is registered under the Investment Company Act of 1940, as amended (the 1940 Act), as an open-end management investment company organized as a Massachusetts business trust. The Fund offers Class A, Class T, Class C and Institutional Class shares, each of which, along with Class B shares, has equal rights as to assets and voting privileges. Class B shares are closed to new accounts and additional purchases, except for exchanges and reinvestments. Each class has exclusive voting rights with respect to matters that affect that class. Class B shares will automatically convert to Class A shares after a holding period of seven years from the initial date of purchase.
2. Investments in Fidelity Central Funds.
The Fund invests in Fidelity Central Funds, which are open-end investment companies generally available only to other investment companies and accounts managed by the investment adviser and its affiliates. The Fund's Schedule of Investments lists each of the Fidelity Central Funds held as of period end, if any, as an investment of the Fund, but does not include the underlying holdings of each Fidelity Central Fund. As an Investing Fund, the Fund indirectly bears its proportionate share of the expenses of the underlying Fidelity Central Funds.
The Money Market Central Funds seek preservation of capital and current income and are managed by Fidelity Investments Money Management, Inc. (FIMM), an affiliate of the investment adviser. Annualized expenses of the Money Market Central Funds as of their most recent shareholder report date are less than .01%.
A complete unaudited list of holdings for each Fidelity Central Fund is available upon request or at the Securities and Exchange Commission (the SEC) website at www.sec.gov. In addition, the financial statements of the Fidelity Central Funds, which are not covered by the Fund's Report of Independent Registered Public Accounting Firm, are available on the SEC website or upon request.
3. Significant Accounting Policies.
The financial statements have been prepared in conformity with accounting principles generally accepted in the United States of America (GAAP), which require management to make certain estimates and assumptions at the date of the financial statements. Actual results could differ from those estimates. Subsequent events, if any, through the date that the financial statements were issued have been evaluated in the preparation of
Annual Report
Notes to Financial Statements - continued
3. Significant Accounting Policies - continued
the financial statements. The following summarizes the significant accounting policies of the Fund:
Investment Valuation. Investments are valued as of 4:00 p.m. Eastern time on the last calendar day of the period. In accordance with valuation policies and procedures approved by the Board of Trustees (the Board), the Fund attempts to obtain prices from one or more third party pricing vendors or brokers to value its investments. When current market prices, quotations or currency exchange rates are not readily available or reliable, investments will be fair valued in good faith by the Fidelity Management & Research Company (FMR) Fair Value Committee (the Committee), in accordance with procedures adopted by the Board. Factors used in determining fair value vary by investment type and may include market or investment specific events, changes in interest rates and credit quality. The frequency with which these procedures are used cannot be predicted and they may be utilized to a significant extent. The Committee oversees the Fund's valuation policies and procedures and is responsible for approving and reporting to the Board all fair value determinations.
The Fund categorizes the inputs to valuation techniques used to value its investments into a disclosure hierarchy consisting of three levels as shown below:
Level 1 - quoted prices in active markets for identical investments
Level 2 - other significant observable inputs (including quoted prices for similar investments, interest rates, prepayment speeds, etc.)
Level 3 - unobservable inputs (including the Fund's own assumptions based on the best information available)
Valuation techniques used to value the Fund's investments by major category are as follows:
Equity securities, including restricted securities, for which market quotations are readily available, are valued at the last reported sale price or official closing price as reported by a third party pricing vendor on the primary market or exchange on which they are traded and are categorized as Level 1 in the hierarchy. In the event there were no sales during the day or closing prices are not available, securities are valued at the last quoted bid price or may be valued using the last available price and are generally categorized as Level 2 in the hierarchy. For foreign equity securities, when market or security specific events arise, comparisons to the valuation of American Depositary Receipts (ADRs), futures contracts, Exchange-Traded Funds (ETFs) and certain indexes as well as quoted prices for similar securities may be used and would be categorized as Level 2 in the hierarchy. Utilizing these techniques may result in transfers between Level 1 and Level 2. For equity securities, including restricted securities, where observable inputs are
Annual Report
3. Significant Accounting Policies - continued
Investment Valuation - continued
limited, assumptions about market activity and risk are used and these securities may be categorized as Level 3 in the hierarchy.
Debt securities, including restricted securities, are valued based on evaluated prices received from third party pricing vendors or from brokers who make markets in such securities. For corporate bonds, pricing vendors utilize matrix pricing which considers yield or price of bonds of comparable quality, coupon, maturity and type as well as broker-supplied prices. When independent prices are unavailable or unreliable, debt securities may be valued utilizing pricing methodologies which consider similar factors that would be used by third party pricing vendors. Debt securities are generally categorized as Level 2 in the hierarchy but may be Level 3 depending on the circumstances.
Investments in open-end mutual funds, including the Fidelity Central Funds, are valued at their closing net asset value (NAV) each business day and are categorized as Level 1 in the hierarchy.
Changes in valuation techniques may result in transfers in or out of an assigned level within the disclosure hierarchy. The aggregate value of investments by input level, as of November 30, 2013 is included at the end of the Fund's Schedule of Investments.
Foreign Currency. The Fund may use foreign currency contracts to facilitate transactions in foreign-denominated securities. Gains and losses from these transactions may arise from changes in the value of the foreign currency or if the counterparties do not perform under the contracts' terms.
Foreign-denominated assets, including investment securities, and liabilities are translated into U.S. dollars at the exchange rates at period end. Purchases and sales of investment securities, income and dividends received and expenses denominated in foreign currencies are translated into U.S. dollars at the exchange rate in effect on the transaction date.
The effects of exchange rate fluctuations on investments are included with the net realized and unrealized gain (loss) on investment securities. Other foreign currency transactions resulting in realized and unrealized gain (loss) are disclosed separately.
Investment Transactions and Income. For financial reporting purposes, the Fund's investment holdings and NAV include trades executed through the end of the last business day of the period. The NAV per share for processing shareholder transactions is calculated as of the close of business of the New York Stock Exchange (NYSE), normally 4:00 p.m. Eastern time and includes trades executed through the end of the prior business day. Gains and losses on securities sold are determined on the basis of identified cost and may include proceeds received from litigation. Dividend income is recorded on
Annual Report
Notes to Financial Statements - continued
3. Significant Accounting Policies - continued
Investment Transactions and Income - continued
the ex-dividend date, except for certain dividends from foreign securities where the ex-dividend date may have passed, which are recorded as soon as the Fund is informed of the ex-dividend date. Non-cash dividends included in dividend income, if any, are recorded at the fair market value of the securities received. Distributions received on securities that represent a return of capital or capital gain are recorded as a reduction of cost of investments and/or as a realized gain. Subsequent to ex-dividend date the Fund determines the components of these distributions, based upon receipt of tax filings or other correspondence relating to the underlying investment. Interest income and distributions from the Fidelity Central Funds are accrued as earned. Interest income includes coupon interest and amortization of premium and accretion of discount on debt securities. Investment income is recorded net of foreign taxes withheld where recovery of such taxes is uncertain.
Class Allocations and Expenses. Investment income, realized and unrealized capital gains and losses, common expenses of the Fund, and certain fund-level expense reductions, if any, are allocated daily on a pro-rata basis to each class based on the relative net assets of each class to the total net assets of the Fund. Each class differs with respect to transfer agent and distribution and service plan fees incurred. Certain expense reductions may also differ by class. For the reporting period, the allocated portion of income and expenses to each class as a percent of its average net assets may vary due to the timing of recording these transactions in relation to fluctuating net assets of the classes. Expenses directly attributable to a fund are charged to that fund. Expenses attributable to more than one fund are allocated among the respective funds on the basis of relative net assets or other appropriate methods. Expense estimates are accrued in the period to which they relate and adjustments are made when actual amounts are known.
Income Tax Information and Distributions to Shareholders. Each year, the Fund intends to qualify as a regulated investment company under Subchapter M of the Internal Revenue Code, including distributing substantially all of its taxable income and realized gains. As a result, no provision for U.S. Federal income taxes is required. As of November 30, 2013, the Fund did not have any unrecognized tax benefits in the financial statements; nor is the Fund aware of any tax positions for which it is reasonably possible that the total amounts of unrecognized tax benefits will significantly change in the next twelve months. The Fund files a U.S. federal tax return, in addition to state and local tax returns as required. The Fund's federal income tax returns are subject to examination by the Internal Revenue Service (IRS) for a period of three fiscal years after they are filed. State and local tax returns may be subject to examination for an additional fiscal year depending on the jurisdiction. Foreign taxes are provided for based on the Fund's
Annual Report
3. Significant Accounting Policies - continued
Income Tax Information and Distributions to Shareholders - continued
understanding of the tax rules and rates that exist in the foreign markets in which it invests.
Distributions are declared and recorded on the ex-dividend date. Income dividends and capital gain distributions are declared separately for each class. Income and capital gain distributions are determined in accordance with income tax regulations, which may differ from GAAP. In addition, the Fund claimed a portion of the payment made to redeeming shareholders as a distribution for income tax purposes.
Capital accounts within the financial statements are adjusted for permanent book-tax differences. These adjustments have no impact on net assets or the results of operations. Temporary book-tax differences will reverse in a subsequent period.
Book-tax differences are primarily due to futures contracts, foreign currency transactions, partnerships, deferred trustees compensation, passive foreign investment companies (PFIC), redemptions in kind and losses deferred due to wash sales.
The federal tax cost of investment securities and unrealized appreciation (depreciation) as of period were as follows:
|
Gross unrealized appreciation |
$ 154,037,343 |
|
Gross unrealized depreciation |
(13,968,895) |
|
Net unrealized appreciation (depreciation) on securities and other investments |
$ 140,068,448 |
|
|
|
|
Tax Cost |
$ 526,219,954 |
The tax-based components of distributable earnings as of period end were as follows:
|
Undistributed ordinary income |
$ 4,161,865 |
|
Undistributed long-term capital gain |
$ 46,290,583 |
|
Net unrealized appreciation (depreciation) |
$ 140,069,255 |
The tax character of distributions paid was as follows:
|
|
November 30, 2013 |
November 30, 2012 |
|
Ordinary Income |
$ 767,567 |
$ 18,679,689 |
|
Long-term Capital Gains |
3,062,648 |
23,644,698 |
|
Total |
$ 3,830,215 |
$ 42,324,387 |
Restricted Securities. The Fund may invest in securities that are subject to legal or contractual restrictions on resale. These securities generally may be resold in transactions exempt from registration or to the public if the securities are registered.
Annual Report
Notes to Financial Statements - continued
3. Significant Accounting Policies - continued
Restricted Securities - continued
Disposal of these securities may involve time-consuming negotiations and expense, and prompt sale at an acceptable price may be difficult. Information regarding restricted securities is included at the end of the Fund's Schedule of Investments.
4. Purchases and Sales of Investments.
Purchases and sales of securities including in-kind transactions, other than short-term securities, aggregated $560,357,092 and $1,538,601,792, respectively.
5. Fees and Other Transactions with Affiliates.
Management Fee. Fidelity Management & Research Company (the investment adviser) and its affiliates provide the Fund with investment management related services for which the Fund pays a monthly management fee. The management fee is the sum of an individual fund fee rate that is based on an annual rate of .30% of the Fund's average net assets and an annualized group fee rate that averaged .25% during the period. The group fee rate is based upon the average net assets of all the mutual funds advised by the investment adviser, including any mutual funds previously advised by the investment adviser that are currently advised by Fidelity SelectCo, LLC, an affiliate of the investment adviser. The group fee rate decreases as assets under management increase and increases as assets under management decrease. In addition, the management fee is subject to a performance adjustment (up to a maximum of ± .20% of the Fund's average net assets over a 36 month performance period). The upward or downward adjustment to the management fee is based on the relative investment performance of the Institutional Class of the Fund as compared to an appropriate benchmark index over the same 36 month performance period. For the reporting period, the total annual management fee rate, including the performance adjustment, was .71% of the Fund's average net assets. The performance adjustment included in the management fee rate may be higher or lower than the maximum performance adjustment rate due to the difference between the average net assets for the reporting and performance periods.
Distribution and Service Plan Fees. In accordance with Rule 12b-1 of the 1940 Act, the Fund has adopted separate Distribution and Service Plans for each class of shares. Certain classes pay Fidelity Distributors Corporation (FDC), an affiliate of the investment adviser, separate Distribution and Service Fees, each of which is based on an annual percentage of each class' average net assets. In addition, FDC may pay financial intermediaries for selling shares of the Fund and providing shareholder support services.
Annual Report
5. Fees and Other Transactions with Affiliates - continued
Distribution and Service Plan Fees - continued
For the period, the Distribution and Service Fee rates, total fees and amounts retained by FDC were as follows:
|
|
Distribution |
Service |
Total Fees |
Retained |
|
Class A |
-% |
.25% |
$ 383,053 |
$ 8,846 |
|
Class T |
.25% |
.25% |
461,542 |
2,157 |
|
Class B |
.75% |
.25% |
104,147 |
79,777 |
|
Class C |
.75% |
.25% |
441,788 |
86,563 |
|
|
|
|
$ 1,390,530 |
$ 177,343 |
Sales Load. FDC may receive a front-end sales charge of up to 5.75% for selling Class A shares and 3.50% for selling Class T shares, some of which is paid to financial intermediaries for selling shares of the Fund. Depending on the holding period, FDC may receive contingent deferred sales charges levied on Class A, Class T, Class B, and Class C redemptions. The deferred sales charges range from 5.00% to 1.00% for Class B shares, 1.00% for Class C shares, 1.00% for certain purchases of Class A shares and .25% for certain purchases of Class T shares.
For the period, sales charge amounts retained by FDC were as follows:
|
|
Retained |
|
Class A |
$ 94,248 |
|
Class T |
15,639 |
|
Class B* |
8,361 |
|
Class C* |
4,809 |
|
|
$ 123,057 |
* When Class B and Class C shares are initially sold, FDC pays commissions from its own resources to financial intermediaries through which the sales are made.
Transfer Agent Fees. Fidelity Investments Institutional Operations Company, Inc., (FIIOC), an affiliate of the investment adviser, is the transfer, dividend disbursing and shareholder servicing agent for each class of the Fund. FIIOC receives account fees and asset-based fees that vary according to the account size and type of account of the shareholders of the respective classes of the Fund. FIIOC pays for typesetting, printing
Annual Report
Notes to Financial Statements - continued
5. Fees and Other Transactions with Affiliates - continued
Transfer Agent Fees - continued
and mailing of shareholder reports, except proxy statements. For the period, transfer agent fees for each class were as follows:
|
|
Amount |
% of |
|
Class A |
$ 374,904 |
.24 |
|
Class T |
228,130 |
.25 |
|
Class B |
31,140 |
.30 |
|
Class C |
107,719 |
.24 |
|
Institutional Class |
1,379,219 |
.19 |
|
|
$ 2,121,112 |
|
Accounting and Security Lending Fees. Fidelity Service Company, Inc. (FSC), an affiliate of the investment adviser, maintains the Fund's accounting records. The accounting fee is based on the level of average net assets for each month. Under a separate contract, FSC administers the security lending program. The security lending fee is based on the number and duration of lending transactions.
Brokerage Commissions. The Fund placed a portion of its portfolio transactions with brokerage firms which are affiliates of the investment adviser. Brokerage commissions are included in net realized gain (loss) and change in net unrealized appreciation (depreciation) in the Consolidated Statement of Operations. The commissions paid to these affiliated firms were $28,551 for the period.
Interfund Lending Program. Pursuant to an Exemptive Order issued by the SEC, the Fund, along with other registered investment companies having management contracts with FMR or other affiliated entities of FMR, may participate in an interfund lending program. This program provides an alternative credit facility allowing the funds to borrow from, or lend money to, other participating affiliated funds. At period end, there were no interfund loans outstanding. The Fund's activity in this program during the period for which loans were outstanding was as follows:
|
Borrower or Lender |
Average Loan |
Weighted Average |
Interest Expense |
|
Borrower |
$ 6,989,550 |
.32% |
$ 1,258 |
Redemptions In-Kind. During the period, 40,816,644 shares of the Fund held by affiliated entities were redeemed for investments with a value of $1,012,290,613. The net realized gain of $267,456,609 on investments delivered through in-kind
Annual Report
5. Fees and Other Transactions with Affiliates - continued
Redemptions In-Kind - continued
redemptions is included in the accompanying Statement of Operations. The amount of in-kind redemptions is included in share transactions in the accompanying Statement of Changes in Net Assets as well as Note 10: Share transactions. The Fund recognized no gain or loss for federal income tax purposes.
6. Committed Line of Credit.
The Fund participates with other funds managed by the investment adviser or an affiliate in a $4.25 billion credit facility (the "line of credit") to be utilized for temporary or emergency purposes to fund shareholder redemptions or for other short-term liquidity purposes. The Fund has agreed to pay commitment fees on its pro-rata portion of the line of credit, which amounted to $2,372 and is reflected in Miscellaneous expenses on the Statement of Operations. During the period, there were no borrowings on this line of credit.
7. Security Lending.
The Fund lends portfolio securities through a lending agent from time to time in order to earn additional income. For equity securities, a lending agent is used and may loan securities to certain qualified borrowers, including Fidelity Capital Markets (FCM), a broker-dealer affiliated with the Fund. On the settlement date of the loan, the Fund receives collateral (in the form of U.S. Treasury obligations, letters of credit and/or cash) against the loaned securities and maintains collateral in an amount not less than 100% of the market value of the loaned securities during the period of the loan. The market value of the loaned securities is determined at the close of business of the Fund and any additional required collateral is delivered to the Fund on the next business day. If the borrower defaults on its obligation to return the securities loaned because of insolvency or other reasons, the Fund may apply collateral received from the borrower against the obligation. The Fund may experience delays and costs in recovering the securities loaned. Any cash collateral received is invested in the Fidelity Securities Lending Cash Central Fund. The value of loaned securities and cash collateral at period end are disclosed on the Fund's Statement of Assets and Liabilities. At period end, there were no security loans outstanding with FCM. Security lending income represents the income earned on investing cash collateral, less rebates paid to borrowers and any lending agent fees associated with the loan, plus any premium payments received for lending certain types of securities. Security lending income is presented in the Statement of Operations as a component of income from Fidelity Central Funds. Total security lending income during the period amounted to $234,319, including $2,632 from securities loaned to FCM.
Annual Report
Notes to Financial Statements - continued
8. Expense Reductions.
Commissions paid to certain brokers with whom the investment adviser, or its affiliates, places trades on behalf of the Fund include an amount in addition to trade execution, which may be rebated back to the Fund to offset certain expenses. This amount totaled $139,371 for the period.
9. Distributions to Shareholders.
Distributions to shareholders of each class were as follows:
|
Years ended November 30, |
2013 |
2012 |
|
From net investment income |
|
|
|
Class A |
$ 97,380 |
$ 1,078,226 |
|
Class T |
40,120 |
375,579 |
|
Class C |
2,988 |
48,918 |
|
Institutional Class |
627,079 |
16,051,409 |
|
Total |
$ 767,567 |
$ 17,554,132 |
|
From net realized gain |
|
|
|
Class A |
$ 432,999 |
$ 2,386,881 |
|
Class T |
258,270 |
1,426,914 |
|
Class B |
37,356 |
202,398 |
|
Class C |
107,120 |
573,674 |
|
Institutional Class |
2,226,903 |
20,180,388 |
|
Total |
$ 3,062,648 |
$ 24,770,255 |
10. Share Transactions.
Transactions for each class of shares were as follows:
|
|
Shares |
Dollars |
||
|
Years ended November 30, |
2013 |
2012 |
2013 |
2012 |
|
Class A |
|
|
|
|
|
Shares sold |
3,029,803 |
1,413,103 |
$ 76,581,820 |
$ 27,688,034 |
|
Reinvestment of distributions |
23,308 |
159,026 |
490,518 |
3,196,230 |
|
Shares redeemed |
(1,452,421) |
(1,437,321) |
(34,520,330) |
(28,289,639) |
|
Net increase (decrease) |
1,600,690 |
134,808 |
$ 42,552,008 |
$ 2,594,625 |
|
Class T |
|
|
|
|
|
Shares sold |
1,144,172 |
701,433 |
$ 27,872,295 |
$ 13,951,718 |
|
Reinvestment of distributions |
13,925 |
86,842 |
292,962 |
1,767,817 |
|
Shares redeemed |
(790,235) |
(1,036,832) |
(18,493,343) |
(20,267,280) |
|
Net increase (decrease) |
367,862 |
(248,557) |
$ 9,671,914 |
$ (4,547,745) |
Annual Report
10. Share Transactions - continued
|
|
Shares |
Dollars |
||
|
Years ended November 30, |
2013 |
2012 |
2013 |
2012 |
|
Class B |
|
|
|
|
|
Shares sold |
44,781 |
12,858 |
$ 1,050,694 |
$ 235,820 |
|
Reinvestment of distributions |
1,700 |
9,445 |
33,725 |
181,350 |
|
Shares redeemed |
(194,809) |
(252,591) |
(4,361,870) |
(4,660,207) |
|
Net increase (decrease) |
(148,328) |
(230,288) |
$ (3,277,451) |
$ (4,243,037) |
|
Class C |
|
|
|
|
|
Shares sold |
1,380,277 |
342,265 |
$ 31,649,256 |
$ 6,287,339 |
|
Reinvestment of distributions |
5,033 |
29,148 |
99,148 |
555,861 |
|
Shares redeemed |
(297,963) |
(333,164) |
(6,636,716) |
(6,136,206) |
|
Net increase (decrease) |
1,087,347 |
38,249 |
$ 25,111,688 |
$ 706,994 |
|
Institutional Class |
|
|
|
|
|
Shares sold |
5,489,820 |
8,141,510 |
$ 135,166,774 |
$ 164,428,797 |
|
Reinvestment of distributions |
130,311 |
1,775,271 |
2,822,578 |
36,037,728 |
|
Shares redeemed |
(48,206,491)A |
(14,893,473) |
(1,197,578,806)A |
(298,962,406) |
|
Net increase (decrease) |
(42,586,360) |
(4,976,692) |
$ (1,059,589,454) |
$ (98,495,881) |
A Amount includes in-kind redemptions (see Note 5: Redemptions In-Kind).
11. Other.
The Fund's organizational documents provide former and current trustees and officers with a limited indemnification against liabilities arising in connection with the performance of their duties to the Fund. In the normal course of business, the Fund may also enter into contracts that provide general indemnifications. The Fund's maximum exposure under these arrangements is unknown as this would be dependent on future claims that may be made against the Fund. The risk of material loss from such claims is considered remote.
Annual Report
Report of Independent Registered Public Accounting Firm
To the Trustees of Fidelity Advisor Series I and Shareholders of Fidelity Advisor Large Cap Fund:
We have audited the accompanying statement of assets and liabilities of Fidelity Advisor Large Cap Fund (the Fund), a fund of Fidelity Advisor Series I, including the schedule of investments, as of November 30, 2013, and the related statement of operations for the year then ended, the statement of changes in net assets for each of the two years in the period then ended, and the financial highlights for each of the five years in the period then ended. These financial statements and financial highlights are the responsibility of the Fund's management. Our responsibility is to express an opinion on these financial statements and financial highlights based on our audits.
We conducted our audits in accordance with the standards of the Public Company Accounting Oversight Board (United States). Those standards require that we plan and perform the audit to obtain reasonable assurance about whether the financial statements and financial highlights are free of material misstatement. The Fund is not required to have, nor were we engaged to perform, an audit of its internal control over financial reporting. Our audits included consideration of internal control over financial reporting as a basis for designing audit procedures that are appropriate in the circumstances, but not for the purpose of expressing an opinion on the effectiveness of the Fund's internal control over financial reporting. Accordingly, we express no such opinion. An audit also includes examining, on a test basis, evidence supporting the amounts and disclosures in the financial statements, assessing the accounting principles used and significant estimates made by management, as well as evaluating the overall financial statement presentation. Our procedures included confirmation of securities owned as of November 30, 2013, by correspondence with the custodians and brokers; where replies were not received from brokers, we performed other auditing procedures. We believe that our audits provide a reasonable basis for our opinion.
In our opinion, the financial statements and financial highlights referred to above present fairly, in all material respects, the financial position of Fidelity Advisor Large Cap Fund as of November 30, 2013, the results of its operations for the year then ended, the changes in its net assets for each of the two years in the period then ended, and the financial highlights for each of the five years in the period then ended, in conformity with accounting principles generally accepted in the United States of America.
DELOITTE & TOUCHE LLP
Boston, Massachusetts
January 14, 2014
Annual Report
Trustees and Officers
The Trustees, Member of the Advisory Board, and officers of the trust and fund, as applicable, are listed below. The Board of Trustees governs the fund and is responsible for protecting the interests of shareholders. The Trustees are experienced executives who meet periodically throughout the year to oversee the fund's activities, review contractual arrangements with companies that provide services to the fund, oversee management of the risks associated with such activities and contractual arrangements, and review the fund's performance. Except for James C. Curvey, Ned C. Lautenbach, Ronald P. O'Hanley, and William S. Stavropoulos, each of the Trustees oversees 173 funds. Mr. Curvey oversees 396 funds. Mr. Lautenbach, Mr. O'Hanley, and Mr. Stavropoulos each oversees 247 funds.
The Trustees hold office without limit in time except that (a) any Trustee may resign; (b) any Trustee may be removed by written instrument, signed by at least two-thirds of the number of Trustees prior to such removal; (c) any Trustee who requests to be retired or who has become incapacitated by illness or injury may be retired by written instrument signed by a majority of the other Trustees; and (d) any Trustee may be removed at any special meeting of shareholders by a two-thirds vote of the outstanding voting securities of the trust. Each Trustee who is not an interested person (as defined in the 1940 Act) of the trust and the fund (Independent Trustee), shall retire not later than the last day of the calendar year in which his or her 75th birthday occurs. The Independent Trustees may waive this mandatory retirement age policy with respect to individual Trustees. The officers and Advisory Board Member hold office without limit in time, except that any officer and Advisory Board Member may resign or may be removed by a vote of a majority of the Trustees at any regular meeting or any special meeting of the Trustees. Except as indicated, each individual has held the office shown or other offices in the same company for the past five years.
Experience, Skills, Attributes, and Qualifications of the Fund's Trustees. The Governance and Nominating Committee has adopted a statement of policy that describes the experience, qualifications, attributes, and skills that are necessary and desirable for potential Independent Trustee candidates (Statement of Policy). The Board believes that each Trustee satisfied at the time he or she was initially elected or appointed a Trustee, and continues to satisfy, the standards contemplated by the Statement of Policy. The Governance and Nominating Committee also engages professional search firms to help identify potential Independent Trustee candidates who have the experience, qualifications, attributes, and skills consistent with the Statement of Policy. From time to time, additional criteria based on the composition and skills of the current Independent Trustees, as well as experience or skills that may be appropriate in light of future changes to board composition, business conditions, and regulatory or other developments, have also been considered by the professional search firms and the Governance and Nominating Committee. In addition, the Board takes into account the Trustees' commitment and participation in Board and committee meetings, as well as their leadership of standing and ad hoc committees throughout their tenure.
Annual Report
Trustees and Officers - continued
In determining that a particular Trustee was and continues to be qualified to serve as a Trustee, the Board has considered a variety of criteria, none of which, in isolation, was controlling. The Board believes that, collectively, the Trustees have balanced and diverse experience, qualifications, attributes, and skills, which allow the Board to operate effectively in governing the fund and protecting the interests of shareholders. Information about the specific experience, skills, attributes, and qualifications of each Trustee, which in each case led to the Board's conclusion that the Trustee should serve (or continue to serve) as a trustee of the fund, is provided below.
Board Structure and Oversight Function. James C. Curvey is an interested person (as defined in the 1940 Act) and currently serves as Chairman. The Trustees have determined that an interested Chairman is appropriate and benefits shareholders because an interested Chairman has a personal and professional stake in the quality and continuity of services provided to the fund. Independent Trustees exercise their informed business judgment to appoint an individual of their choosing to serve as Chairman, regardless of whether the Trustee happens to be independent or a member of management. The Independent Trustees have determined that they can act independently and effectively without having an Independent Trustee serve as Chairman and that a key structural component for assuring that they are in a position to do so is for the Independent Trustees to constitute a substantial majority for the Board. The Independent Trustees also regularly meet in executive session. Ned C. Lautenbach serves as Chairman of the Independent Trustees and as such (i) acts as a liaison between the Independent Trustees and management with respect to matters important to the Independent Trustees and (ii) with management prepares agendas for Board meetings.
Fidelity funds are overseen by different Boards of Trustees. The fund's Board oversees Fidelity's equity and high income funds and another Board oversees Fidelity's investment-grade bond, money market, and asset allocation funds. The asset allocation funds may invest in Fidelity funds overseen by the fund's Board. The use of separate Boards, each with its own committee structure, allows the Trustees of each group of Fidelity funds to focus on the unique issues of the funds they oversee, including common research, investment, and operational issues. On occasion, the separate Boards establish joint committees to address issues of overlapping consequences for the Fidelity funds overseen by each Board.
The Trustees operate using a system of committees to facilitate the timely and efficient consideration of all matters of importance to the Trustees, the fund, and fund shareholders and to facilitate compliance with legal and regulatory requirements and oversight of the fund's activities and associated risks. The Board, acting through its committees, has charged FMR and its affiliates with (i) identifying events or circumstances the occurrence of which could have demonstrably adverse effects on the fund's business and/or reputation; (ii) implementing processes and controls to lessen the possibility that such events or circumstances occur or to mitigate the effects of such events or circumstances if they do occur; and (iii) creating and maintaining a system designed to evaluate continuously business and market conditions in order to facilitate the identification and implementation processes described in (i) and (ii) above. Because the day-to-day operations and activities of the fund are carried out by or through FMR, its affiliates and other service providers, the fund's exposure to risks is mitigated but not eliminated by the processes overseen by the Trustees. While each of the Board's committees has responsibility for overseeing different aspects of the fund's activities, oversight is exercised primarily through the Operations, Audit, and Compliance Committees. In addition, the Independent Trustees have worked with FMR to enhance the Board's oversight of investment and financial risks, legal and regulatory risks, technology risks, and operational risks, including the development of additional risk reporting to the Board. For example, a working group comprised of Independent Trustees and FMR has worked and continues to work to review the Fidelity funds' valuation-related activities, reporting and risk management. Appropriate personnel, including but not limited to the fund's Chief Compliance Officer (CCO), FMR's internal auditor, the independent accountants, the fund's Treasurer and portfolio management personnel, make periodic reports to the Board's committees, as appropriate, including an annual review of FMR's risk management program for the Fidelity funds. The responsibilities of each standing committee, including their oversight responsibilities, are described further under "Standing Committees of the Fund's Trustees."
Annual Report
The fund's Statement of Additional Information (SAI) includes more information about the Trustees. To request a free copy, call Fidelity at 1-877-208-0098.
Interested Trustees*:
Correspondence intended for each Trustee who is an interested person may be sent to Fidelity Investments, 245 Summer Street, Boston, Massachusetts 02210.
|
Name, Year of Birth; Principal Occupations and Other Relevant Experience+ |
|
|
James C. Curvey (1935) |
|
|
Year of Election or Appointment: 2007 Trustee Chairman of the Board of Trustees |
|
|
|
Mr. Curvey also serves as Trustee of other Fidelity funds. Mr. Curvey is a Director of Fidelity Investments Money Management, Inc. (2009-present), Director of Fidelity Research & Analysis Co. (2009-present) and Director of FMR and FMR Co., Inc. (2007-present). Mr. Curvey is also Vice Chairman (2007-present) and Director of FMR LLC. In addition, Mr. Curvey serves as an Overseer for the Boston Symphony Orchestra and a member of the Trustees of Villanova University. Previously, Mr. Curvey was the Vice Chairman (2006-2007) and Director (2000-2007) of FMR Corp. |
|
Ronald P. O'Hanley (1957) |
|
|
Year of Election or Appointment: 2011 Trustee |
|
|
|
Mr. O'Hanley also serves as Trustee of other Fidelity funds. He is Director of Fidelity SelectCo, LLC (2013-present), FMR Co., Inc. (2010-present), Director of Fidelity Investments Money Management, Inc. (2010-present), Director of Fidelity Research & Analysis Company (2010-present), President of Fidelity Asset Management and Corporate Services and a Member of Fidelity's Executive Committee (2010-present). Previously, Mr. O'Hanley served as President and Chief Executive Officer of BNY Mellon Asset Management (2007-2010). Mr. O'Hanley also served as Vice Chairman of Bank New York Mellon Corp. and a member of that firm's Executive Committee. Prior to the 2007 merger of The Bank of New York and Mellon Financial Corporation, he was Vice Chairman of Mellon Financial Corporation and President and Chief Executive Officer of Mellon Asset Management. He joined Mellon in February 1997. Mr. O'Hanley currently serves as Chairman of the Boston Public Library Foundation Board of Directors and sits on the Board of Directors of Beth Israel Deaconess Medical Center, the Board of Trustees of the Marine Biological Laboratory and the Advisory Board of the Maxwell School of Citizenship and Public Administration at Syracuse University. Mr. O'Hanley also chairs the Council on Asset Management for the Financial Services Roundtable and is a member of the Board of Directors of Institutional Investor's U.S. Institute. |
* Trustees have been determined to be "Interested Trustees" by virtue of, among other things, their affiliation with the trust or various entities under common control with FMR.
+ The information above includes each Trustee's principal occupation during the last five years and other information relating to the experience, attributes, and skills relevant to each Trustee's qualifications to serve as a Trustee, which led to the conclusion that each Trustee should serve as a Trustee for the fund.
Annual Report
Independent Trustees:
Correspondence intended for each Independent Trustee (that is, the Trustees other than the Interested Trustees) may be sent to Fidelity Investments, P.O. Box 55235, Boston, Massachusetts 02205-5235.
|
Name, Year of Birth; Principal Occupations and Other Relevant Experience+ |
|
|
Dennis J. Dirks (1948) |
|
|
Year of Election or Appointment: 2005 Trustee |
|
|
|
Mr. Dirks also serves as Trustee of other Fidelity funds. Prior to his retirement in May 2003, Mr. Dirks was Chief Operating Officer and a member of the Board of The Depository Trust & Clearing Corporation (DTCC). He also served as President, Chief Operating Officer, and Board member of The Depository Trust Company (DTC) and President and Board member of the National Securities Clearing Corporation (NSCC). In addition, Mr. Dirks served as Chief Executive Officer and Board member of the Government Securities Clearing Corporation, Chief Executive Officer and Board member of the Mortgage-Backed Securities Clearing Corporation, as a Trustee and a member of the Finance Committee of Manhattan College (2005-2008), and as a Trustee and a member of the Finance Committee of AHRC of Nassau County (2006-2008). Mr. Dirks is a member of the Independent Directors Council (IDC) Governing Council (2010-present) and Board of Directors for The Brookville Center for Children's Services, Inc. (2009-present). |
|
Alan J. Lacy (1953) |
|
|
Year of Election or Appointment: 2008 Trustee |
|
|
|
Mr. Lacy also serves as Trustee of other Fidelity funds. Mr. Lacy serves as Senior Adviser (2007-present) of Oak Hill Capital Partners, L.P. (private equity). Mr. Lacy also served as Chief Executive Officer (2000-2005) and Vice Chairman (2005-2006) of Sears Holdings Corporation and Sears, Roebuck and Co. (retail). In addition, Mr. Lacy serves as a member of the Board of Directors of Dave & Buster's Entertainment, Inc. (restaurant and entertainment complexes, 2010-present), Earth Fare, Inc. (retail grocery, 2012-present), The Hillman Companies, Inc. (hardware wholesalers, 2010-present), and Bristol-Myers Squibb Company (global pharmaceuticals, 2008-present). Mr. Lacy is a member of the Board of Trustees of The National Parks Conservation Association (2006-present). Previously, Mr. Lacy served as Chairman of the Board of Trustees of the National Parks Conservation Association (2008-2011) and as a member of the Board of Directors for the Western Union Company (global money transfer, 2006-2011). |
|
Ned C. Lautenbach (1944) |
|
|
Year of Election or Appointment: 2000 Trustee Chairman of the Independent Trustees |
|
|
|
Mr. Lautenbach also serves as Trustee of other Fidelity funds. Mr. Lautenbach currently serves as the Lead Director of the Eaton Corporation Board of Directors (diversified industrial, 1997-present). Mr. Lautenbach is Chairman of the Board of Directors of the Philharmonic Center for the Arts in Naples, Florida (2012-present) and a member of the Council on Foreign Relations (1994-present). Previously, Mr. Lautenbach was a Partner/Advisory Partner at Clayton, Dubilier & Rice, LLC (private equity investment, 1998-2010), as well as a Director of Sony Corporation (2006-2007). |
|
Joseph Mauriello (1944) |
|
|
Year of Election or Appointment: 2008 Trustee |
|
|
|
Mr. Mauriello also serves as Trustee of other Fidelity funds. Prior to his retirement in January 2006, Mr. Mauriello served in numerous senior management positions including Deputy Chairman and Chief Operating Officer (2004-2005), and Vice Chairman of Financial Services (2002-2004) of KPMG LLP US (professional services, 1965-2005). Mr. Mauriello currently serves as a member of the Board of Directors of XL Group plc. (global insurance and re-insurance, 2006-present). Previously, Mr. Mauriello served as a Director of the Hamilton Funds of the Bank of New York (2006-2007) and of Arcadia Resources Inc. (health care services and products, 2007-2012). |
|
Robert W. Selander (1950) |
|
|
Year of Election or Appointment: 2011 Trustee |
|
|
|
Mr. Selander also serves as Trustee of other Fidelity funds. Previously, Mr. Selander served as a Member of the Advisory Board of other Fidelity funds (2011), and Executive Vice Chairman (2010), Chief Executive Officer (2009-2010), and President and Chief Executive Officer (1997-2009) of Mastercard, Inc. |
|
Cornelia M. Small (1944) |
|
|
Year of Election or Appointment: 2005 Trustee |
|
|
|
Ms. Small also serves as Trustee of other Fidelity funds. Ms. Small is a member of the Board of Directors (2009-present) and Chair of the Investment Committee (2010-present) of the Teagle Foundation. Ms. Small also serves on the Investment Committee of the Berkshire Taconic Community Foundation (2008-present). Previously, Ms. Small served as Chairperson (2002-2008) and a member of the Investment Committee and Chairperson (2008-2012) and a member of the Board of Trustees of Smith College. In addition, Ms. Small served as Chief Investment Officer, Director of Global Equity Investments, and a member of the Board of Directors of Scudder, Stevens & Clark and Scudder Kemper Investments. |
|
William S. Stavropoulos (1939) |
|
|
Year of Election or Appointment: 2002 Trustee Vice Chairman of the Independent Trustees |
|
|
|
Mr. Stavropoulos also serves as Trustee of other Fidelity funds. Mr. Stavropoulos serves as President and Founder of the Michigan Baseball Foundation, the Great Lakes Loons (2007-present). Mr. Stavropoulos is Chairman Emeritus of the Board of Directors of The Dow Chemical Company, where he previously served in numerous senior management positions, including President, CEO (1995-2000; 2002-2004), Chairman of the Executive Committee (2000-2006), and as a member of the Board of Directors (1990-2006). Currently, Mr. Stavropoulos is Chairman of the Board of Directors of Univar Inc. (global distributor of commodity and specialty chemicals), a Director of Teradata Corporation (data warehousing and technology solutions), and Maersk Inc. (industrial conglomerate), and a member of the Advisory Board for Metalmark Capital LLC (private equity investment, 2005-present). Mr. Stavropoulos is an operating advisor to Clayton, Dubilier & Rice, LLC (private equity investment). In addition, Mr. Stavropoulos is a member of the University of Notre Dame Advisory Council for the College of Science, a Trustee of the Rollin L. Gerstacker Foundation, and a Director of the Naples Philharmonic Center for the Arts. Previously, Mr. Stavropoulos served as a Director of Chemical Financial Corporation (bank holding company, 1993-2012) and Tyco International, Ltd. (multinational manufacturing and services, 2007-2012). |
|
David M. Thomas (1949) |
|
|
Year of Election or Appointment: 2008 Trustee |
|
|
|
Mr. Thomas also serves as Trustee of other Fidelity funds. Mr. Thomas serves as Non-Executive Chairman of the Board of Directors of Fortune Brands Home and Security (home and security products, 2011-present), and as a member of the Board of Directors of Interpublic Group of Companies, Inc. (marketing communication, 2004-present). Previously, Mr. Thomas served as Executive Chairman (2005-2006) and Chairman and Chief Executive Officer (2000-2005) of IMS Health, Inc. (pharmaceutical and healthcare information solutions), and a Director of Fortune Brands, Inc. (consumer products, 2000-2011). |
+ The information above includes each Trustee's principal occupation during the last five years and other information relating to the experience, attributes, and skills relevant to each Trustee's qualifications to serve as a Trustee, which led to the conclusion that each Trustee should serve as a Trustee for the fund.
Advisory Board Member and Officers:
Correspondence intended for each officer and Peter S. Lynch may be sent to Fidelity Investments, 245 Summer Street, Boston, Massachusetts 02210.
Officers appear below in alphabetical order.
|
Name, Year of Birth; Principal Occupation |
|
|
Peter S. Lynch (1944) |
|
|
Year of Election or Appointment: 2003 Member of the Advisory Board |
|
|
|
Mr. Lynch also serves as Member of the Advisory Board of other Fidelity funds. Mr. Lynch is Vice Chairman and a Director of FMR and FMR Co., Inc. In addition, Mr. Lynch serves as a Trustee of Boston College and as the Chairman of the Inner-City Scholarship Fund. Previously, Mr. Lynch served on the Special Olympics International Board of Directors (1997-2006). |
|
Elizabeth Paige Baumann (1968) |
|
|
Year of Election or Appointment: 2012 Anti-Money Laundering (AML) Officer |
|
|
|
Ms. Baumann also serves as AML Officer of other funds. She is Chief AML Officer of FMR LLC (2012-present) and is an employee of Fidelity Investments. Previously, Ms. Baumann served as Vice President and Deputy Anti-Money Laundering Officer (2007-2012). |
|
William C. Coffey (1969) |
|
|
Year of Election or Appointment: 2009 Assistant Secretary |
|
|
|
Mr. Coffey also serves as Assistant Secretary of other funds. He is Senior Vice President and Deputy General Counsel of FMR LLC (2010-present), and is an employee of Fidelity Investments. Previously, Mr. Coffey served as Vice President and Associate General Counsel of FMR LLC (2005-2009). |
|
Jonathan Davis (1968) |
|
|
Year of Election or Appointment: 2010 Assistant Treasurer |
|
|
|
Mr. Davis also serves as Assistant Treasurer of other funds. Mr. Davis is an employee of Fidelity Investments. Previously, Mr. Davis served as Vice President and Associate General Counsel of FMR LLC (2003-2010). |
|
Adrien E. Deberghes (1967) |
|
|
Year of Election or Appointment: 2008 Deputy Treasurer |
|
|
|
Mr. Deberghes also serves as an officer of other funds. He is an employee of Fidelity Investments (2008-present). Prior to joining Fidelity Investments, Mr. Deberghes was Senior Vice President of Mutual Fund Administration at State Street Corporation (2007-2008), Senior Director of Mutual Fund Administration at Investors Bank & Trust (2005-2007), and Director of Finance for Dunkin' Brands (2000-2005). |
|
Stephanie J. Dorsey (1969) |
|
|
Year of Election or Appointment: 2010 Assistant Treasurer |
|
|
|
Ms. Dorsey also serves as an officer of other funds. She is an employee of Fidelity Investments (2008-present) and has served in other fund officer roles. Prior to joining Fidelity Investments, Ms. Dorsey served as Treasurer (2004-2008) of the JPMorgan Mutual Funds and Vice President (2004-2008) of JPMorgan Chase Bank. |
|
Scott C. Goebel (1968) |
|
|
Year of Election or Appointment: 2008 Secretary and Chief Legal Officer (CLO) |
|
|
|
Mr. Goebel serves as Secretary and CLO of other funds. Mr. Goebel also serves as Secretary of Fidelity Investments Money Management, Inc. (FIMM) (2010-present) and Fidelity Research and Analysis Company (FRAC) (2010-present); General Counsel, Secretary, and Senior Vice President of FMR (2008-present) and FMR Co., Inc. (2008-present); Chief Legal Officer of Fidelity Management & Research (Hong Kong) Limited (2008-present) and Assistant Secretary of Fidelity Management & Research (Japan) Inc. (2008-present), and Fidelity Management & Research (U.K.) Inc. (2008-present). Previously, Mr. Goebel served as Secretary and CLO of other Fidelity funds (2008-2013), Assistant Secretary of FIMM (2008-2010), FRAC (2008-2010), and certain funds (2007-2008); and as Vice President and Secretary of Fidelity Distributors Corporation (FDC) (2005-2007). Mr. Goebel has been employed by FMR LLC or an affiliate since 2001. |
|
Joseph A. Hanlon (1968) |
|
|
Year of Election or Appointment: 2012 Chief Compliance Officer |
|
|
|
Mr. Hanlon also serves as Chief Compliance Officer of other funds. Mr. Hanlon serves as Compliance Officer of FMR, FMR Co., Inc., Fidelity Investments Money Management, Inc. (FIMM), Fidelity Research and Analysis Company (FRAC), and Fidelity Management & Research (Hong Kong) (2009-present), as Senior Vice President of the Fidelity Asset Management Division (2009-present), and is an employee of Fidelity Investments. Previously, Mr. Hanlon served as Compliance Officer of Fidelity Management & Research (Japan) Inc. (2009-2013), Strategic Advisers, Inc. (2009-2013), and Fidelity Management & Research (U.K.) Inc. (2009-2013). |
|
Bruce T. Herring (1965) |
|
|
Year of Election or Appointment: 2006 Vice President of certain Equity Funds |
|
|
|
Mr. Herring also serves as Vice President of other funds. He serves as Chief Investment Officer of Fidelity Global Asset Allocation (GAA) (2013-present), Group Chief Investment Officer of FMR, and President of Fidelity Research & Analysis Company (2010-present). Previously, Mr. Herring served as Chief Investment Officer and Director of Fidelity Management & Research (U.K.) Inc. (2010-2013), Vice President (2005-2006) and Senior Vice President (2006-2007) of Fidelity Management & Research Company, Vice President of FMR Co., Inc. (2001-2007), and as a portfolio manager for Fidelity U.S. Equity Funds. |
|
Brian B. Hogan (1964) |
|
|
Year of Election or Appointment: 2009 Vice President |
|
|
|
Mr. Hogan also serves as Vice President of other funds. Mr. Hogan serves as President of FMR's Equity Division (2009-present). Previously, Mr. Hogan served as Senior Vice President, Equity Research of FMR (2006-2009) and as a portfolio manager. |
|
Chris Maher (1972) |
|
|
Year of Election or Appointment: 2013 Assistant Treasurer |
|
|
|
Mr. Maher serves as Assistant Treasurer of other funds. Mr. Maher is Vice President of Valuation Oversight and is an employee of Fidelity Investments. Previously, Mr. Maher served as Vice President of Asset Management Compliance (2013), Vice President of FMR's Program Management Group (2010-2013), and Vice President of Valuation Oversight (2008-2010). |
|
Christine Reynolds (1958) |
|
|
Year of Election or Appointment: 2008 Chief Financial Officer |
|
|
|
Ms. Reynolds also serves as Chief Financial Officer of other funds. Ms. Reynolds became President of Fidelity Pricing and Cash Management Services (FPCMS) in August 2008. Ms. Reynolds served as Chief Operating Officer of FPCMS (2007-2008). Previously, Ms. Reynolds served as President, Treasurer, and Anti-Money Laundering officer of the Fidelity funds (2004-2007). |
|
Kenneth B. Robins (1969) |
|
|
Year of Election or Appointment: 2008 President and Treasurer |
|
|
|
Mr. Robins also serves as an officer of other funds. Mr. Robins serves as Executive Vice President of Fidelity Investments Money Management, Inc. (FIMM) (2013-present) and is an employee of Fidelity Investments (2004-present). Previously, Mr. Robins served in other fund officer roles. |
|
Gary W. Ryan (1958) |
|
|
Year of Election or Appointment: 2005 Assistant Treasurer |
|
|
|
Mr. Ryan also serves as Assistant Treasurer of other funds. Mr. Ryan is an employee of Fidelity Investments and has served in other fund officer roles. Previously, Mr. Ryan served as Vice President of Fund Reporting in Fidelity Pricing and Cash Management Services (FPCMS) (1999-2005). |
|
Stephen Sadoski (1971) |
|
|
Year of Election or Appointment: 2012 Deputy Treasurer |
|
|
|
Mr. Sadoski also serves as Deputy Treasurer of other funds. He is an employee of Fidelity Investments (2012-present) and has served in another fund officer role. Prior to joining Fidelity Investments, Mr. Sadoski served as an assistant chief accountant in the Division of Investment Management of the Securities and Exchange Commission (SEC) (2009-2012) and as a senior manager at Deloitte & Touche LLP (1997-2009). |
|
Stacie M. Smith (1974) |
|
|
Year of Election or Appointment: 2013 Deputy Treasurer |
|
|
|
Ms. Smith also serves as an officer of other funds. She is an employee of Fidelity Investments (2009-present) and has served in other fund officer roles. Prior to joining Fidelity Investments, Ms. Smith served as Senior Audit Manager of Ernst & Young LLP (1996-2009). |
|
Renee Stagnone (1975) |
|
|
Year of Election or Appointment: 2013 Deputy Treasurer |
|
|
|
Ms. Stagnone also serves as Deputy Treasurer of other funds. Ms. Stagnone is an employee of Fidelity Investments. |
|
Joseph F. Zambello (1957) |
|
|
Year of Election or Appointment: 2011 Deputy Treasurer |
|
|
|
Mr. Zambello also serves as Deputy Treasurer of other funds. Mr. Zambello is an employee of Fidelity Investments. Previously, Mr. Zambello served as Vice President of FMR's Program Management Group (2009-2011) and Vice President of the Transfer Agent Oversight Group (2005-2009). |
Annual Report
Distributions (Unaudited)
The Board of Trustees of Advisor Large Cap Fund voted to pay to shareholders of record at the opening of business on record date, the following distributions per share derived from capital gains realized from sales of portfolio securities, and dividends derived from net investment income:
|
|
Pay Date |
Record Date |
Dividends |
Capital Gains |
|
Institutional Class |
12/16/13 |
12/13/13 |
$0.179 |
$1.627 |
|
|
01/13/14 |
01/10/14 |
$0.000 |
$0.312 |
The fund hereby designates as a capital gain dividend with respect to the taxable year ended November 31, 2013, $61,880,978, or, if subsequently determined to be different, the net capital gain of such year.
Institutional Class designates 100% of the dividends distributed during the fiscal year as qualifying for the dividends-received deduction for corporate shareholders.
Institutional Class designates 100% of the dividends distributed during the fiscal year as amounts which may be taken into account as a dividend for purposes of the maximum rate under section 1(h) (11) of the Internal Revenue Code.
The fund will notify shareholders in January 2014 of amounts for use in preparing 2013 income tax returns.
Annual Report
Board Approval of Investment Advisory Contracts and Management Fees
Fidelity Advisor Large Cap Fund
Each year, the Board of Trustees, including the Independent Trustees (together, the Board), votes on the renewal of the management contract and sub-advisory agreements (together, the Advisory Contracts) for the fund. The Board, assisted by the advice of fund counsel and Independent Trustees' counsel, requests and considers a broad range of information relevant to the renewal of the Advisory Contracts throughout the year.
The Board meets regularly and, at each of its meetings, covers an extensive agenda of topics and materials and considers factors that are relevant to its annual consideration of the renewal of the fund's Advisory Contracts, including the services and support provided to the fund and its shareholders. The Board has established various standing committees, each composed of and chaired by Independent Trustees with varying backgrounds, to which the Board has assigned specific subject matter responsibilities in order to enhance effective decision-making by the Board. The Board, acting directly and through its Committees, requests and receives information concerning the annual consideration of the renewal of the fund's Advisory Contracts. The Board also meets as needed to consider matters specifically related to the Board's annual consideration of the renewal of Advisory Contracts. Members of the Board may also meet with trustees of other Fidelity funds through ad hoc joint committees to discuss certain matters relevant to the Fidelity funds.
At its July 2013 meeting, the Board, including the Independent Trustees, unanimously determined to renew the fund's Advisory Contracts. In reaching its determination, the Board considered all factors it believed relevant, including (i) the nature, extent, and quality of the services to be provided to the fund and its shareholders (including the investment performance of the fund); (ii) the competitiveness of the fund's management fee and total expense ratio relative to peer funds; (iii) the total costs of the services to be provided by and the profits to be realized by Fidelity from its relationship with the fund; (iv) the extent to which economies of scale exist and would be realized as the fund grows; and (v) whether fee levels reflect these economies of scale, if any, for the benefit of fund shareholders.
In considering whether to renew the Advisory Contracts for the fund, the Board reached a determination, with the assistance of fund counsel and Independent Trustees' counsel and through the exercise of its business judgment, that the renewal of the Advisory Contracts was in the best interests of the fund and its shareholders and that the compensation payable under the Advisory Contracts was fair and reasonable. The Board's decision to renew the Advisory Contracts was not based on any single factor, but rather was based on a comprehensive consideration of all the information provided to the Board at its meetings throughout the year. The Board, in reaching its determination to renew the Advisory Contracts, was aware that shareholders in the fund have a broad range of investment choices available to them, including a wide choice among mutual funds offered by Fidelity's competitors, and that the fund's shareholders, who have the opportunity to review and weigh the disclosure provided by the fund in its prospectus and other public disclosures, have chosen to invest in this fund, which is a part of the Fidelity family of funds.
Annual Report
Nature, Extent, and Quality of Services Provided. The Board considered the staffing within the investment adviser, Fidelity Management & Research Company (FMR), and the sub-advisers (together, the Investment Advisers) as it relates to the fund, including the backgrounds of the fund's investment personnel, and also considered the fund's investment objective, strategies, and related investment philosophy. The Independent Trustees also had discussions with senior management of Fidelity's investment operations and investment groups. The Board considered the structure of the portfolio manager compensation program and whether this structure provides appropriate incentives to act in the best interests of the fund.
Resources Dedicated to Investment Management and Support Services. The Board and the Fund Oversight and Research Committees reviewed the general qualifications and capabilities of the Investment Advisers' investment staff, including its size, education, experience, and resources, as well as the Investment Advisers' approach to recruiting, training, managing, and compensating investment personnel. The Board noted that FMR has continued to increase the resources devoted to non-U.S. offices, including expansion of Fidelity's global investment organization. The Board also noted that Fidelity's analysts have extensive resources, tools and capabilities that allow them to conduct sophisticated quantitative and fundamental analysis, as well as credit analysis of issuers, counterparties and guarantors. Further, the Board believes that Fidelity's investment professionals have sufficient access to global information and data so as to provide competitive investment results over time, and that those professionals also have access to sophisticated tools that permit them to assess portfolio construction and risk and performance attribution characteristics continuously, as well as to transmit new information and research conclusions rapidly around the world. Additionally, in its deliberations, the Board considered the Investment Advisers' trading and risk management capabilities and resources, which are an integral part of the investment management process.
Shareholder and Administrative Services. The Board considered (i) the nature, extent, quality, and cost of advisory, administrative, and shareholder services performed by the Investment Advisers and their affiliates under the Advisory Contracts and under separate agreements covering transfer agency, pricing and bookkeeping, and securities lending services for the fund; (ii) the nature and extent of the supervision of third party service providers, principally custodians and subcustodians; and (iii) the resources devoted to, and the record of compliance with, the fund's compliance policies and procedures. The Board also reviewed the allocation of fund brokerage, including allocations to brokers affiliated with the Investment Advisers, the use of brokerage commissions to pay fund expenses, and the use of "soft" commission dollars to pay for research services.
Annual Report
Board Approval of Investment Advisory Contracts and
Management Fees - continued
The Board noted that the growth of fund assets over time across the complex allows Fidelity to reinvest in the development of services designed to enhance the value or convenience of the Fidelity funds as investment vehicles. These services include 24-hour access to account information and market information through telephone representatives and over the Internet, investor education materials and asset allocation tools, and the expanded availability of Fidelity Investor Centers.
Investment in a Large Fund Family. The Board considered the benefits to shareholders of investing in a Fidelity fund, including the benefits of investing in a fund that is part of a large family of funds offering a variety of investment disciplines and providing a large variety of mutual fund investor services. The Board noted that Fidelity had taken, or had made recommendations that resulted in the Fidelity funds taking, a number of actions over the previous year that benefited particular funds, including (i) continuing to dedicate additional resources to investment research and to the support of the senior management team that oversees asset management; (ii) persisting in efforts to enhance Fidelity's global research capabilities; (iii) launching new funds and making other enhancements to meet client needs for global and income-oriented solutions; (iv) continuing to launch dedicated lower cost underlying funds to meet portfolio construction needs related to expanding underlying fund options for Fidelity funds of funds, specifically for the Freedom Fund product lines; (v) rationalizing product lines and gaining increased efficiencies through the mergers of several funds into other funds; (vi) strengthening Fidelity's index fund offerings by reducing investment minimums and adopting or lowering existing expense caps for certain funds and classes; (vii) enhancing Global Asset Allocation product offerings by launching new funds and strategies, including "open architecture" target date funds that utilize affiliated and unaffiliated sub-advisers; (viii) modifying the eligibility criteria for Institutional Class shares of Advisor funds to increase their marketability to a portion of the defined contribution plan market; (ix) creating a new low-cost retirement share class for certain Advisor funds to appeal to large retirement plans; (x) transitioning the management of certain Fidelity commodity funds to Geode Capital Management LLC, a registered commodity pool operator, while retaining administrative responsibilities for the funds; (xi) reorganizing a number of funds; and (xii) taking steps toward establishing a new Fidelity adviser to manage sector-based funds and products.
Investment Performance. The Board considered whether the fund has operated in accordance with its investment objective, as well as its record of compliance with its investment restrictions and its performance history.
The Board took into account discussions with the Investment Advisers about fund investment performance that occur at Board meetings throughout the year. In this regard the Board noted that as part of regularly scheduled fund reviews and other reports to the Board on fund performance, the Board periodically considers annualized return information for the fund, for different time periods, measured against a securities market index ("benchmark index") and a peer group of mutual funds with similar objectives ("peer group"). In its evaluation of fund investment performance, the Board gave particular attention to information indicating changes in performance of certain Fidelity funds for specific time periods and the Investment Advisers' explanations for any overperformance or underperformance.
Annual Report
In addition to reviewing absolute and relative fund performance, the Independent Trustees periodically consider the appropriateness of fund performance metrics in evaluating the results achieved. In general, the Independent Trustees believe that fund performance should be evaluated based on net performance (after fees and expenses) of both the highest performing and lowest performing classes, where applicable, compared to appropriate benchmark indices, over appropriate time periods which may include full market cycles, and compared to peer groups, as applicable, over the same periods, taking into account relevant factors including the following: general market conditions; issuer-specific information; tactical opportunities for investment; and fund cash flows and other factors.
The Independent Trustees recognize that shareholders evaluate performance on a net basis over their own holding periods, for which one-, three-, and five-year periods are used as a proxy. For this reason, the performance information reviewed by the Board also included net cumulative calendar year total return information for the fund and an appropriate benchmark index and peer group for the most recent one-, three-, and five-year periods, as shown below. Returns are shown compared to the 25th percentile (top of box) and 75th percentile (bottom of box) of the peer universe.
Annual Report
Board Approval of Investment Advisory Contracts and
Management Fees - continued
Fidelity Advisor Large Cap Fund
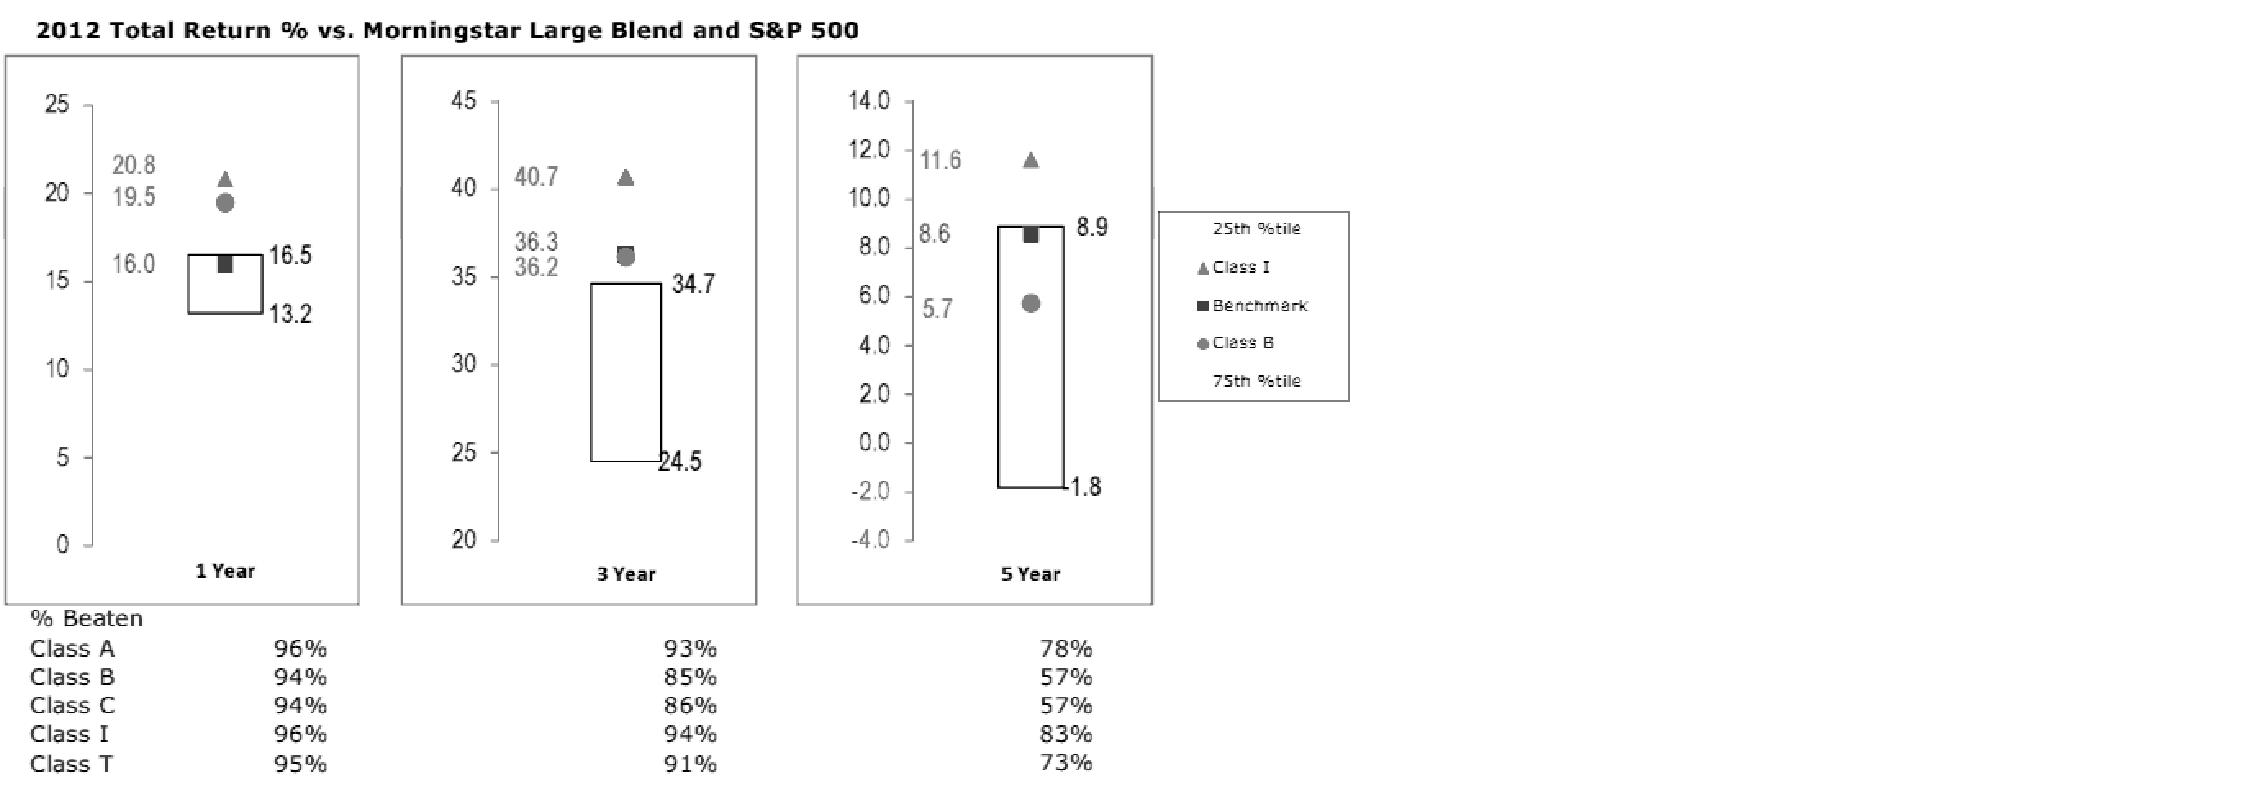
The Board also considered that the fund's management fee is subject to upward or downward adjustment depending upon whether, and to what extent, the fund's investment performance for the performance period exceeds, or is exceeded by, a securities index, thus leading to a performance adjustment for the same period. The Board noted that the performance adjustment provides FMR with a strong economic incentive to seek to achieve superior performance for the fund's shareholders and helps to more closely align the interests of FMR and the fund's shareholders.
Based on its review, the Board concluded that the nature, extent, and quality of services provided to the fund under the Advisory Contracts should benefit the fund's shareholders.
Competitiveness of Management Fee and Total Expense Ratio. The Board considered the fund's management fee and total expense ratio compared to "mapped groups" of competitive funds and classes. Fidelity creates "mapped groups" by combining similar Lipper investment objective categories that have comparable management fee characteristics. Combining Lipper investment objective categories aids the Board's management fee and total expense ratio comparisons by broadening the competitive group used for comparison and by reducing the number of universes to which various Fidelity funds are compared.
Management Fee. The Board considered two proprietary management fee comparisons for the 12-month periods shown in the chart below. The group of Lipper funds used by the Board for management fee comparisons is referred to below as the "Total Mapped Group." The Total Mapped Group comparison focuses on a fund's standing in terms of gross management fees before expense reimbursements or caps, and without giving effect to the fund's performance adjustment, relative to the total universe of funds with comparable investment mandates, regardless of whether their management fee structures also are comparable. Funds with comparable investment mandates offer exposure to similar types of securities. Funds with comparable management fee structures have similar management fee contractual arrangements (e.g., flat rate charged for advisory services, all-inclusive fee rate, etc.). "TMG %" represents the percentage of funds in the Total Mapped Group that had management fees that were lower than the fund's. For example, a TMG % of 11% means that 89% of the funds in the Total Mapped Group had higher management fees than the fund. The "Asset-Size Peer Group" (ASPG) comparison focuses on a fund's standing relative to a subset of non-Fidelity funds within the Total Mapped Group that are similar in size and management fee structure. The ASPG represents at least 15% of the funds in the Total Mapped Group with comparable asset size and management fee structures, subject to a minimum of 50 funds (or all funds in the Total Mapped Group if fewer than 50).Additional information, such as the ASPG quartile in which the fund's management fee ranked and the impact of the fund's performance adjustment, is also included in the chart and considered by the Board.
Annual Report
Fidelity Advisor Large Cap Fund

The Board noted that the fund's management fee ranked below the median of its Total Mapped Group and below the median of its ASPG for 2012. The Board also noted the effect of the fund's positive performance adjustment on the fund's management fee ranking.
Annual Report
Board Approval of Investment Advisory Contracts and
Management Fees - continued
Based on its review, the Board concluded that the fund's management fee is fair and reasonable in light of the services that the fund receives and the other factors considered.
Total Expense Ratio. In its review of each class's total expense ratio, the Board considered the fund's management fee as well as other fund or class expenses, as applicable, such as transfer agent fees, pricing and bookkeeping fees, fund-paid 12b-1 fees, and custodial, legal, and audit fees. The Board also noted the effects of any waivers and reimbursements on fees and expenses, as well as the impact of the fund's performance adjustment. As part of its review, the Board also considered the current and historical total expense ratios of each class of the fund compared to competitive fund median expenses. Each class of the fund is compared to those funds and classes in the Total Mapped Group (used by the Board for management fee comparisons) that have a similar sales load structure.
The Board noted that the total expense ratio of each of Class A and Institutional Class ranked below its competitive median for 2012 and the total expense ratio of each of Class T, Class B, and Class C ranked above its competitive median for 2012. The Board considered that, in general, various factors can affect total expense ratios. The Board noted that the total expense ratio of Class T was above the competitive median primarily because of higher 12b-1 fees on Class T. Class T has a higher 12b-1 fee, but a lower front-end sales charge, than traditionally priced front-end sales charge classes. The Board considered that Class T is primarily sold load-waived in the retirement plan market where its 0.50% 12b-1 fee is comparable to competing no-load, higher 12b-1 fee classes designed specifically for retirement plans. The Board noted that the fund offers multiple classes, each of which has a different sales load and 12b-1 fee structure, and that the multiple structures are intended to offer a range of pricing options for the intermediary market. The Board also noted that the total expense ratios of the classes vary primarily by the level of their 12b-1 fees, although differences in transfer agent fees may also cause expenses to vary from class to class.
Fees Charged to Other Fidelity Clients. The Board also considered Fidelity fee structures and other information with respect to clients of FMR and its affiliates, such as other mutual funds advised or subadvised by FMR or its affiliates, pension plan clients, and other institutional clients. The Board noted the findings of the 2013 ad hoc joint committee (created with the board of other Fidelity funds), which reviewed and compared Fidelity's institutional investment advisory business with its business of providing services to the Fidelity funds, including the differences in services provided, fees charged, and costs incurred, as well as competition in their respective marketplaces.
Based on its review of total expense ratios and fees charged to other Fidelity clients, the Board concluded that the total expense ratio of each class of the fund was reasonable, although in some cases above the median of the universe presented for comparison, in light of the services that the fund and its shareholders receive and the other factors considered.
Annual Report
Costs of the Services and Profitability. The Board considered the revenues earned and the expenses incurred by Fidelity in conducting the business of developing, marketing, distributing, managing, administering and servicing the fund and servicing the fund's shareholders. The Board also considered the level of Fidelity's profits in respect of all the Fidelity funds.
On an annual basis, FMR presents to the Board Fidelity's profitability for the fund. Fidelity calculates the profitability for each fund, as well as aggregate profitability for groups of Fidelity funds and all Fidelity funds, using a series of detailed revenue and cost allocation methodologies which originate with the books and records of Fidelity on which Fidelity's audited financial statements are based. The Audit Committee of the Board reviews any significant changes from the prior year's methodologies.
PricewaterhouseCoopers LLP (PwC), independent registered public accounting firm and auditor to Fidelity and certain Fidelity funds, has been engaged annually by the Board as part of the Board's assessment of Fidelity's profitability analysis. PwC's engagement includes the review and assessment of the methodologies used by Fidelity in determining the revenues and expenses attributable to Fidelity's mutual fund business, and completion of agreed-upon procedures surrounding the mathematical accuracy of fund profitability and its conformity to allocation methodologies. After considering PwC's reports issued under the engagement and information provided by Fidelity, the Board concluded that while other allocation methods may also be reasonable, Fidelity's profitability methodologies are reasonable in all material respects.
The Board also reviewed Fidelity's non-fund businesses and fall-out benefits related to the mutual fund business as well as cases where Fidelity's affiliates may benefit from or be related to the fund's business.
The Board considered the costs of the services provided by and the profits realized by Fidelity in connection with the operation of the fund and was satisfied that the profitability was not excessive in the circumstances.
Economies of Scale. The Board considered whether there have been economies of scale in respect of the management of the Fidelity funds, whether the Fidelity funds (including the fund) have appropriately benefited from any such economies of scale, and whether there is potential for realization of any further economies of scale. The Board considered the extent to which the fund will benefit from economies of scale through increased services to the fund, through waivers or reimbursements, or through fee or expense reductions. The Board also noted that in 2009, it and the board of other Fidelity funds created an ad hoc committee (the Economies of Scale Committee) to analyze whether FMR attains economies of scale in respect of the management and servicing of the Fidelity funds, whether the Fidelity funds have appropriately benefited from such economies of scale, and whether there is potential for realization of any further economies of scale.
Annual Report
Board Approval of Investment Advisory Contracts and
Management Fees - continued
The Board recognized that the fund's management contract incorporates a "group fee" structure, which provides for lower group fee rates as total fund assets under FMR's management increase, and for higher group fee rates as total fund assets under FMR's management decrease. FMR calculates the group fee rates based on a tiered asset "breakpoint" schedule that varies based on asset class. The Board considered that the group fee is designed to deliver the benefits of economies of scale to fund shareholders when total Fidelity fund assets increase, even if assets of any particular fund are unchanged or have declined, because some portion of Fidelity's costs are attributable to services provided to all Fidelity funds, and all funds benefit if those costs can be allocated among more assets. The Board concluded that, given the group fee structure, fund shareholders will benefit from lower management fees as assets under FMR's management increase at the fund complex level, regardless of whether Fidelity achieves any such economies of scale.
The Board concluded, taking into account the analysis of the Economies of Scale Committee, that economies of scale, if any, are being appropriately shared between fund shareholders and Fidelity.
Amendment to Description of Group Fee Rate. At its July 2013 meeting, the Board voted to approve an amendment to the fund's management contract to modify the description of the "group fee rate" effective August 1, 2013. The Board noted that under the prior description in the contract, the group fee rate was based on the average net assets of all registered investment companies with which FMR has management contracts. Under the contract's tiered asset breakpoint schedule, the group fee rate is lower as total fund assets under FMR's management increase, and higher as total fund assets under FMR's management decrease. The Board considered that the prior description would have excluded the assets of 64 Fidelity sector funds from the group fee rate calculation once Fidelity SelectCo, LLC, an affiliate of FMR, assumed management responsibilities for those funds. The Board noted that modifying the description of the group fee rate to continue to include the assets of those 64 funds for purposes of determining group fee rate breakpoints would avoid an immediate adverse impact on the group fee rate for any fund.
Additional Information Requested by the Board. In order to develop fully the factual basis for consideration of the Fidelity funds' Advisory Contracts, the Board requested and received additional information on certain topics, including: (i) fund performance trends and Fidelity's long-term strategies for certain funds; (ii) the potential to further rationalize the Fidelity fund lineup with the possibility of achieving savings for the funds and Fidelity; (iii) the methodology with respect to competitive fund data and peer group classifications; (iv) the arrangements with, and performance of, certain sub-advisers on behalf of the Fidelity funds, as well as certain proposed participating affiliate arrangements; (v) the realization of fall-out benefits in certain Fidelity business units; (vi) Fidelity's group fee structures, including the rationale for the individual fee rates of certain categories of funds and the definition of group assets; (vii) trends regarding industry use of performance fee structures and the performance adjustment methodologies applicable to the Fidelity funds; (viii) additional competitive analysis regarding the total expenses for certain classes; and (ix) fund profitability methodology, including Fidelity's cost allocation methodology, and the impact of certain factors on fund profitability results.
Annual Report
Based on its evaluation of all of the conclusions noted above, and after considering all factors it believed relevant, the Board ultimately concluded that the advisory fee structures are fair and reasonable, and that the fund's Advisory Contracts should be renewed.
Annual Report
Investment Adviser
Fidelity Management & Research Company
Boston, MA
Investment Sub-Advisers
FMR Co., Inc.
Fidelity Management & Research
(U.K.) Inc.
Fidelity Management & Research (Japan) Inc.
Fidelity Management & Research (Hong Kong) Limited
General Distributor
Fidelity Distributors Corporation
Smithfield, RI
Transfer and Service Agents
Fidelity Investments Institutional
Operations Company, Inc.
Boston, MA
Fidelity Service Company, Inc.
Boston, MA
Custodian
Brown Brothers Harriman & Co.
Boston, MA
(Fidelity Investment logo)(registered trademark)
LCI-UANN-0114 1.786692.110
Fidelity Advisor®
Series Growth Opportunities Fund
Annual Report
November 30, 2013
(Fidelity Cover Art)
Contents
|
Shareholder Expense Example |
An example of shareholder expenses. |
|
|
Investment Summary |
A summary of the Fund's holdings. |
|
|
Investments |
A complete list of the fund's investments with their market values. |
|
|
Financial Statements |
Statements of assets and liabilities, operations, and changes in net assets, as well as financial highlights. |
|
|
Notes |
Notes to the Financial Statements. |
|
|
Report of Independent Registered Public Accounting Firm |
|
|
|
Trustees and Officers |
|
|
|
Distributions |
|
|
|
Board Approval of Investment Advisory Contracts and Management Fees |
|
To view a fund's proxy voting guidelines and proxy voting record for the 12-month period ended June 30, visit http://www.fidelity.com/proxyvotingresults or visit the Securities and Exchange Commission's (SEC) web site at http://www.sec.gov. You may also call 1-877-208-0098 to request a free copy of the proxy voting guidelines.
Standard & Poor's, S&P and S&P 500 are registered service marks of The McGraw-Hill Companies, Inc. and have been licensed for use by Fidelity Distributors Corporation.
Other third-party marks appearing herein are the property of their respective owners.
All other marks appearing herein are registered or unregistered trademarks or service marks of FMR LLC or an affiliated company. © 2014 FMR LLC. All rights reserved.
This report and the financial statements contained herein are submitted for the general information of the shareholders of the fund. This report is not authorized for distribution to prospective investors in the fund unless preceded or accompanied by an effective prospectus.
A fund files its complete schedule of portfolio holdings with the SEC for the first and third quarters of each fiscal year on Form N-Q. Forms N-Q are available on the SEC's web site at http://www.sec.gov. A fund's Forms N-Q may be reviewed and copied at the SEC's Public Reference Room in Washington, DC. Information regarding the operation of the SEC's Public Reference Room may be obtained by calling 1-800-SEC-0330. For a complete list of a fund's portfolio holdings, view the most recent holdings listing, semiannual report, or annual report on Fidelity's web site at http://www.fidelity.com, http://www.advisor.fidelity.com, or http://www.401k.com, as applicable.
NOT FDIC INSURED • MAY LOSE VALUE • NO BANK GUARANTEE
Neither the fund nor Fidelity Distributors Corporation is a bank.
Annual Report
Shareholder Expense Example
As a shareholder of the Fund, you incur two types of costs: (1) transaction costs and (2) ongoing costs, including management fees and other Fund expenses. This Example is intended to help you understand your ongoing costs (in dollars) of investing in the Fund and to compare these costs with the ongoing costs of investing in other mutual funds.
The actual expense Example is based on an investment of $1,000 invested at the beginning of the period and held for the entire period (November 7, 2013 to November 30, 2013). The hypothetical expense Example is based on an investment of $1,000 invested for the one-half year period (June 1, 2013 to November 30, 2013).
Actual Expenses
The first line of the accompanying table provides information about actual account values and actual expenses. You may use the information in this line, together with the amount you invested, to estimate the expenses that you paid over the period. Simply divide your account value by $1,000.00 (for example, an $8,600 account value divided by $1,000.00 = 8.6), then multiply the result by the number in the first line under the heading entitled "Expenses Paid During Period" to estimate the expenses you paid on your account during this period. In addition, the Fund, as a shareholder in the underlying Fidelity Central Funds, will indirectly bear its pro-rata share of the fees and expenses incurred by the underlying Fidelity Central Funds. These fees and expenses are not included in the Fund's annualized expense ratio used to calculate the expense estimate in the table below.
Hypothetical Example for Comparison Purposes
The second line of the accompanying table provides information about hypothetical account values and hypothetical expenses based on the Fund's actual expense ratio and an assumed rate of return of 5% per year before expenses, which is not the Fund's actual return. The hypothetical account values and expenses may not be used to estimate the actual ending account balance or expenses you paid for the period. You may use this information to compare the ongoing costs of investing in the Fund and other funds. To do so, compare this 5% hypothetical example with the 5% hypothetical examples that appear in the shareholder reports of the other funds. In addition, the Fund, as a shareholder in the underlying Fidelity Central Funds, will indirectly bear its pro-rata share of the fees and expenses incurred by the underlying Fidelity Central Funds. These fees and expenses are not included in the Fund's annualized expense ratio used to calculate the expense estimate in the table below.
Please note that the expenses shown in the table are meant to highlight your ongoing costs only and do not reflect any transaction costs. Therefore, the second line of the table is useful in comparing ongoing costs only, and will not help you determine the relative total costs of owning different funds.
Annual Report
Shareholder Expense Example - continued
|
|
Annualized |
Beginning |
Ending |
Expenses Paid |
|
Actual |
.85% |
$ 1,000.00 |
$ 1,023.00 |
$ .57 C |
|
HypotheticalA |
|
$ 1,000.00 |
$ 1,020.81 |
$ 4.31 D |
A 5% return per year before expenses
B Annualized expense ratio reflects expenses net of applicable fee waivers.
C Actual expenses are equal to the Fund's annualized expense ratio, multiplied by the average account value over the period, multiplied by 24/365 (to reflect the period November 7, 2013 to November 30, 2013).
D Hypothetical expenses are equal to the Fund's annualized expense ratio, multiplied by the average account value over the period, multiplied by 183/365 (to reflect the one-half year period).
Annual Report
Investment Summary (Unaudited)
|
Top Ten Stocks as of November 30, 2013 |
|
|
|
% of fund's |
|
Google, Inc. Class A |
4.9 |
|
Apple, Inc. |
4.3 |
|
salesforce.com, Inc. |
3.7 |
|
Regeneron Pharmaceuticals, Inc. |
3.0 |
|
Facebook, Inc. Class A |
2.2 |
|
lululemon athletica, Inc. |
1.9 |
|
Seattle Genetics, Inc. |
1.9 |
|
Comcast Corp. Class A |
1.8 |
|
Visa, Inc. Class A |
1.5 |
|
QUALCOMM, Inc. |
1.4 |
|
|
26.6 |
|
Top Five Market Sectors as of November 30, 2013 |
|
|
|
% of fund's |
|
Information Technology |
31.5 |
|
Consumer Discretionary |
18.1 |
|
Health Care |
15.6 |
|
Consumer Staples |
9.9 |
|
Industrials |
7.3 |
|
Asset Allocation (% of fund's net assets) |
|||
|
As of November 30, 2013 * |
|||
 |
Stocks and |
|
|
 |
Short-Term |
|
|
|
* Foreign investments |
5.1% |
|
|

Annual Report
Investments November 30, 2013
Showing Percentage of Net Assets
|
Common Stocks - 94.5% |
|||
|
Shares |
Value |
||
|
CONSUMER DISCRETIONARY - 18.1% |
|||
|
Auto Components - 0.2% |
|||
|
Tenneco, Inc. (a) |
30,300 |
$ 1,739,220 |
|
|
Automobiles - 0.6% |
|||
|
Tesla Motors, Inc. (a) |
38,700 |
4,925,736 |
|
|
Hotels, Restaurants & Leisure - 2.9% |
|||
|
Arcos Dorados Holdings, Inc. Class A (d) |
59,800 |
729,560 |
|
|
BJ's Restaurants, Inc. (a) |
14,600 |
432,744 |
|
|
Buffalo Wild Wings, Inc. (a) |
14,400 |
2,163,456 |
|
|
Chipotle Mexican Grill, Inc. (a) |
6,000 |
3,143,160 |
|
|
Chuys Holdings, Inc. (a) |
30,900 |
1,076,556 |
|
|
Dunkin' Brands Group, Inc. |
33,200 |
1,626,136 |
|
|
Las Vegas Sands Corp. |
35,200 |
2,523,136 |
|
|
McDonald's Corp. |
36,600 |
3,563,742 |
|
|
Starbucks Corp. |
83,100 |
6,769,326 |
|
|
Starwood Hotels & Resorts Worldwide, Inc. |
16,300 |
1,214,024 |
|
|
Wendy's Co. (d) |
201,700 |
1,736,637 |
|
|
|
24,978,477 |
||
|
Household Durables - 1.0% |
|||
|
Lennar Corp. Class A (d) |
102,100 |
3,651,096 |
|
|
SodaStream International Ltd. (a) |
29,500 |
1,695,660 |
|
|
Toll Brothers, Inc. (a) |
65,100 |
2,219,910 |
|
|
Tupperware Brands Corp. |
14,700 |
1,342,698 |
|
|
|
8,909,364 |
||
|
Internet & Catalog Retail - 2.0% |
|||
|
Amazon.com, Inc. (a) |
28,800 |
11,336,256 |
|
|
priceline.com, Inc. (a) |
3,600 |
4,292,388 |
|
|
Shutterfly, Inc. (a) |
20,800 |
982,384 |
|
|
zulily, Inc. |
1,800 |
62,982 |
|
|
|
16,674,010 |
||
|
Media - 3.8% |
|||
|
AMC Networks, Inc. Class A (a) |
44,300 |
2,843,617 |
|
|
Comcast Corp. Class A |
297,800 |
14,851,286 |
|
|
DIRECTV (a) |
30,000 |
1,983,300 |
|
|
IMAX Corp. (a) |
118,700 |
3,659,521 |
|
|
Lions Gate Entertainment Corp. (a) |
65,600 |
2,075,584 |
|
|
News Corp. Class A (a) |
10,500 |
188,580 |
|
|
The Walt Disney Co. |
32,700 |
2,306,658 |
|
|
Twenty-First Century Fox, Inc. Class A |
126,800 |
4,246,532 |
|
|
|
32,155,078 |
||
|
Common Stocks - continued |
|||
|
Shares |
Value |
||
|
CONSUMER DISCRETIONARY - continued |
|||
|
Multiline Retail - 0.2% |
|||
|
Target Corp. |
24,900 |
$ 1,591,857 |
|
|
Specialty Retail - 3.2% |
|||
|
Bed Bath & Beyond, Inc. (a) |
17,300 |
1,349,919 |
|
|
Cabela's, Inc. Class A (a) |
27,500 |
1,684,375 |
|
|
CarMax, Inc. (a) |
56,200 |
2,829,670 |
|
|
DSW, Inc. Class A |
21,700 |
972,811 |
|
|
Five Below, Inc. (a) |
9,400 |
499,704 |
|
|
GNC Holdings, Inc. |
36,100 |
2,172,498 |
|
|
Home Depot, Inc. |
71,600 |
5,775,972 |
|
|
Lumber Liquidators Holdings, Inc. (a) |
92,400 |
9,303,756 |
|
|
The Container Store Group, Inc. |
1,900 |
77,311 |
|
|
TJX Companies, Inc. |
41,000 |
2,578,080 |
|
|
|
27,244,096 |
||
|
Textiles, Apparel & Luxury Goods - 4.2% |
|||
|
Fifth & Pacific Companies, Inc. (a) |
38,100 |
1,244,346 |
|
|
Fossil Group, Inc. (a) |
38,800 |
4,938,076 |
|
|
lululemon athletica, Inc. (a)(d) |
236,200 |
16,467,864 |
|
|
Michael Kors Holdings Ltd. (a) |
51,500 |
4,199,825 |
|
|
NIKE, Inc. Class B |
39,900 |
3,157,686 |
|
|
Prada SpA |
126,300 |
1,219,412 |
|
|
Skechers U.S.A., Inc. Class A (sub. vtg.) (a) |
35,400 |
1,190,148 |
|
|
Steven Madden Ltd. (a) |
68,800 |
2,680,448 |
|
|
Under Armour, Inc. Class A (sub. vtg.) (a) |
12,400 |
1,000,680 |
|
|
Vince Holding Corp. |
1,300 |
38,051 |
|
|
|
36,136,536 |
||
|
TOTAL CONSUMER DISCRETIONARY |
154,354,374 |
||
|
CONSUMER STAPLES - 9.9% |
|||
|
Beverages - 1.6% |
|||
|
Monster Beverage Corp. (a) |
23,200 |
1,372,976 |
|
|
PepsiCo, Inc. |
47,900 |
4,045,634 |
|
|
SABMiller PLC |
26,200 |
1,351,725 |
|
|
The Coca-Cola Co. |
172,700 |
6,940,813 |
|
|
|
13,711,148 |
||
|
Food & Staples Retailing - 3.3% |
|||
|
Costco Wholesale Corp. |
67,000 |
8,403,810 |
|
|
CVS Caremark Corp. |
96,800 |
6,481,728 |
|
|
Fresh Market, Inc. (a) |
14,900 |
606,579 |
|
|
Wal-Mart Stores, Inc. |
62,100 |
5,030,721 |
|
|
Common Stocks - continued |
|||
|
Shares |
Value |
||
|
CONSUMER STAPLES - continued |
|||
|
Food & Staples Retailing - continued |
|||
|
Walgreen Co. |
78,500 |
$ 4,647,200 |
|
|
Whole Foods Market, Inc. |
54,200 |
3,067,720 |
|
|
|
28,237,758 |
||
|
Food Products - 1.3% |
|||
|
Bunge Ltd. |
17,400 |
1,394,088 |
|
|
Green Mountain Coffee Roasters, Inc. |
98,900 |
6,663,882 |
|
|
Mead Johnson Nutrition Co. Class A |
26,800 |
2,264,868 |
|
|
Mondelez International, Inc. |
33,200 |
1,113,196 |
|
|
|
11,436,034 |
||
|
Household Products - 1.1% |
|||
|
Procter & Gamble Co. |
79,200 |
6,670,224 |
|
|
Svenska Cellulosa AB (SCA) (B Shares) |
84,300 |
2,461,136 |
|
|
|
9,131,360 |
||
|
Personal Products - 0.5% |
|||
|
Avon Products, Inc. |
27,400 |
488,542 |
|
|
Herbalife Ltd. |
47,500 |
3,309,800 |
|
|
|
3,798,342 |
||
|
Tobacco - 2.1% |
|||
|
Altria Group, Inc. |
218,300 |
8,072,734 |
|
|
Japan Tobacco, Inc. |
9,400 |
317,478 |
|
|
Lorillard, Inc. |
48,100 |
2,468,973 |
|
|
Philip Morris International, Inc. |
86,000 |
7,356,440 |
|
|
|
18,215,625 |
||
|
TOTAL CONSUMER STAPLES |
84,530,267 |
||
|
ENERGY - 4.4% |
|||
|
Energy Equipment & Services - 1.5% |
|||
|
FMC Technologies, Inc. (a) |
25,500 |
1,226,550 |
|
|
Halliburton Co. |
30,800 |
1,622,544 |
|
|
National Oilwell Varco, Inc. |
21,900 |
1,784,850 |
|
|
Schlumberger Ltd. |
92,600 |
8,187,692 |
|
|
|
12,821,636 |
||
|
Oil, Gas & Consumable Fuels - 2.9% |
|||
|
Anadarko Petroleum Corp. |
19,800 |
1,758,636 |
|
|
Cabot Oil & Gas Corp. |
41,800 |
1,440,010 |
|
|
Chesapeake Energy Corp. |
44,100 |
1,184,967 |
|
|
Concho Resources, Inc. (a) |
18,600 |
1,933,098 |
|
|
Continental Resources, Inc. (a) |
23,100 |
2,483,481 |
|
|
Common Stocks - continued |
|||
|
Shares |
Value |
||
|
ENERGY - continued |
|||
|
Oil, Gas & Consumable Fuels - continued |
|||
|
EOG Resources, Inc. |
5,600 |
$ 924,000 |
|
|
Exxon Mobil Corp. |
200 |
18,696 |
|
|
Hess Corp. |
35,600 |
2,888,228 |
|
|
Noble Energy, Inc. |
9,800 |
688,352 |
|
|
Occidental Petroleum Corp. |
61,600 |
5,849,536 |
|
|
PDC Energy, Inc. (a) |
12,700 |
748,157 |
|
|
Peabody Energy Corp. |
55,200 |
1,004,640 |
|
|
Phillips 66 Co. |
9,700 |
675,217 |
|
|
Pioneer Natural Resources Co. |
7,300 |
1,297,575 |
|
|
Range Resources Corp. |
4,300 |
333,895 |
|
|
Valero Energy Corp. |
30,900 |
1,412,748 |
|
|
|
24,641,236 |
||
|
TOTAL ENERGY |
37,462,872 |
||
|
FINANCIALS - 5.3% |
|||
|
Capital Markets - 0.8% |
|||
|
BlackRock, Inc. Class A |
6,100 |
1,846,775 |
|
|
Charles Schwab Corp. |
124,800 |
3,055,104 |
|
|
Goldman Sachs Group, Inc. |
6,400 |
1,081,216 |
|
|
T. Rowe Price Group, Inc. |
7,900 |
635,634 |
|
|
|
6,618,729 |
||
|
Commercial Banks - 0.3% |
|||
|
Signature Bank (a) |
8,300 |
881,875 |
|
|
Wells Fargo & Co. |
33,100 |
1,457,062 |
|
|
|
2,338,937 |
||
|
Consumer Finance - 2.1% |
|||
|
American Express Co. |
115,300 |
9,892,740 |
|
|
Discover Financial Services |
159,800 |
8,517,340 |
|
|
|
18,410,080 |
||
|
Diversified Financial Services - 1.9% |
|||
|
Bank of America Corp. |
74,600 |
1,180,172 |
|
|
BM&F Bovespa SA |
210,800 |
1,045,759 |
|
|
Citigroup, Inc. |
197,100 |
10,430,532 |
|
|
CME Group, Inc. |
5,700 |
467,115 |
|
|
JPMorgan Chase & Co. |
51,900 |
2,969,718 |
|
|
|
16,093,296 |
||
|
Real Estate Investment Trusts - 0.1% |
|||
|
Simon Property Group, Inc. |
7,100 |
1,063,935 |
|
|
Common Stocks - continued |
|||
|
Shares |
Value |
||
|
FINANCIALS - continued |
|||
|
Real Estate Management & Development - 0.1% |
|||
|
The St. Joe Co. (a) |
29,700 |
$ 526,878 |
|
|
TOTAL FINANCIALS |
45,051,855 |
||
|
HEALTH CARE - 15.6% |
|||
|
Biotechnology - 10.9% |
|||
|
ACADIA Pharmaceuticals, Inc. (a) |
27,700 |
645,133 |
|
|
Alexion Pharmaceuticals, Inc. (a) |
36,100 |
4,494,450 |
|
|
Alkermes PLC (a) |
3,600 |
145,368 |
|
|
Amarin Corp. PLC ADR (a)(d) |
64,500 |
117,390 |
|
|
Amgen, Inc. |
61,100 |
6,970,288 |
|
|
Biogen Idec, Inc. (a) |
12,300 |
3,578,931 |
|
|
BioMarin Pharmaceutical, Inc. (a) |
35,600 |
2,505,528 |
|
|
Bluebird Bio, Inc. |
100 |
2,042 |
|
|
Celgene Corp. (a) |
14,600 |
2,361,842 |
|
|
Cepheid, Inc. (a) |
36,300 |
1,648,746 |
|
|
Clovis Oncology, Inc. (a) |
4,300 |
259,204 |
|
|
Exelixis, Inc. (a) |
51,379 |
299,540 |
|
|
Gilead Sciences, Inc. (a) |
140,000 |
10,473,400 |
|
|
ImmunoGen, Inc. (a)(d) |
363,900 |
5,287,467 |
|
|
Insmed, Inc. (a) |
92,800 |
1,503,360 |
|
|
InterMune, Inc. (a) |
27,800 |
384,474 |
|
|
Intrexon Corp. |
2,500 |
57,225 |
|
|
Isis Pharmaceuticals, Inc. (a) |
2,900 |
112,404 |
|
|
Lexicon Pharmaceuticals, Inc. (a) |
145,000 |
348,000 |
|
|
Merrimack Pharmaceuticals, Inc. (a)(d) |
163,000 |
642,220 |
|
|
Metabolix, Inc. (a) |
70,600 |
79,072 |
|
|
NPS Pharmaceuticals, Inc. (a) |
1,400 |
36,974 |
|
|
Receptos, Inc. |
23,800 |
550,732 |
|
|
Regeneron Pharmaceuticals, Inc. (a) |
86,800 |
25,507,048 |
|
|
Rigel Pharmaceuticals, Inc. (a) |
181,900 |
483,854 |
|
|
Seattle Genetics, Inc. (a) |
386,543 |
15,883,052 |
|
|
Swedish Orphan Biovitrium AB (a) |
106,000 |
1,102,929 |
|
|
Theravance, Inc. (a) |
86,000 |
3,247,360 |
|
|
Transition Therapeutics, Inc. (a) |
178,600 |
1,032,308 |
|
|
Vertex Pharmaceuticals, Inc. (a) |
18,700 |
1,298,154 |
|
|
XOMA Corp. (a) |
325,000 |
1,553,500 |
|
|
|
92,611,995 |
||
|
Health Care Equipment & Supplies - 0.6% |
|||
|
Abbott Laboratories |
23,700 |
905,103 |
|
|
Align Technology, Inc. (a) |
7,800 |
426,192 |
|
|
Common Stocks - continued |
|||
|
Shares |
Value |
||
|
HEALTH CARE - continued |
|||
|
Health Care Equipment & Supplies - continued |
|||
|
Baxter International, Inc. |
10,500 |
$ 718,725 |
|
|
Cyberonics, Inc. (a) |
18,000 |
1,236,960 |
|
|
Steris Corp. |
46,100 |
2,127,054 |
|
|
|
5,414,034 |
||
|
Health Care Providers & Services - 1.2% |
|||
|
Accretive Health, Inc. (a) |
158,100 |
1,340,688 |
|
|
BioScrip, Inc. (a) |
202,700 |
1,380,387 |
|
|
Catamaran Corp. (a) |
20,600 |
940,285 |
|
|
Express Scripts Holding Co. (a) |
34,100 |
2,296,635 |
|
|
McKesson Corp. |
23,600 |
3,915,004 |
|
|
|
9,872,999 |
||
|
Health Care Technology - 0.3% |
|||
|
athenahealth, Inc. (a) |
21,300 |
2,793,921 |
|
|
Life Sciences Tools & Services - 0.5% |
|||
|
Illumina, Inc. (a) |
43,100 |
4,223,800 |
|
|
Pharmaceuticals - 2.1% |
|||
|
AbbVie, Inc. |
40,800 |
1,976,760 |
|
|
Actavis PLC (a) |
12,000 |
1,956,840 |
|
|
Allergan, Inc. |
22,300 |
2,164,215 |
|
|
Auxilium Pharmaceuticals, Inc. (a) |
59,800 |
1,220,518 |
|
|
Bristol-Myers Squibb Co. |
63,100 |
3,242,078 |
|
|
Hospira, Inc. (a) |
15,800 |
621,098 |
|
|
Jazz Pharmaceuticals PLC (a) |
6,800 |
795,056 |
|
|
Johnson & Johnson |
10,000 |
946,600 |
|
|
Questcor Pharmaceuticals, Inc. |
45,000 |
2,610,450 |
|
|
Valeant Pharmaceuticals International, Inc. (Canada) (a) |
23,100 |
2,532,728 |
|
|
XenoPort, Inc. (a) |
47,400 |
253,116 |
|
|
|
18,319,459 |
||
|
TOTAL HEALTH CARE |
133,236,208 |
||
|
INDUSTRIALS - 7.3% |
|||
|
Aerospace & Defense - 0.9% |
|||
|
Honeywell International, Inc. |
33,200 |
2,938,532 |
|
|
The Boeing Co. |
35,500 |
4,765,875 |
|
|
|
7,704,407 |
||
|
Common Stocks - continued |
|||
|
Shares |
Value |
||
|
INDUSTRIALS - continued |
|||
|
Air Freight & Logistics - 1.0% |
|||
|
FedEx Corp. |
17,000 |
$ 2,357,900 |
|
|
United Parcel Service, Inc. Class B |
56,300 |
5,763,994 |
|
|
|
8,121,894 |
||
|
Airlines - 1.6% |
|||
|
Delta Air Lines, Inc. |
41,600 |
1,205,568 |
|
|
Southwest Airlines Co. |
140,100 |
2,604,459 |
|
|
Spirit Airlines, Inc. (a) |
80,000 |
3,669,600 |
|
|
United Continental Holdings, Inc. (a) |
153,100 |
6,009,175 |
|
|
|
13,488,802 |
||
|
Construction & Engineering - 0.1% |
|||
|
Quanta Services, Inc. (a) |
26,500 |
784,665 |
|
|
Electrical Equipment - 0.2% |
|||
|
Roper Industries, Inc. |
10,300 |
1,335,910 |
|
|
Industrial Conglomerates - 1.2% |
|||
|
3M Co. |
18,400 |
2,456,584 |
|
|
Danaher Corp. |
83,500 |
6,245,800 |
|
|
General Electric Co. |
69,200 |
1,844,872 |
|
|
|
10,547,256 |
||
|
Machinery - 0.4% |
|||
|
Caterpillar, Inc. |
22,000 |
1,861,200 |
|
|
Cummins, Inc. |
7,800 |
1,032,408 |
|
|
ITT Corp. |
6,300 |
257,166 |
|
|
Xylem, Inc. |
16,600 |
573,696 |
|
|
|
3,724,470 |
||
|
Road & Rail - 1.9% |
|||
|
CSX Corp. |
84,500 |
2,304,315 |
|
|
Hertz Global Holdings, Inc. (a) |
169,100 |
4,102,366 |
|
|
J.B. Hunt Transport Services, Inc. |
10,400 |
781,976 |
|
|
Kansas City Southern |
2,800 |
338,856 |
|
|
Union Pacific Corp. |
53,100 |
8,604,324 |
|
|
|
16,131,837 |
||
|
TOTAL INDUSTRIALS |
61,839,241 |
||
|
INFORMATION TECHNOLOGY - 31.5% |
|||
|
Communications Equipment - 1.9% |
|||
|
Infinera Corp. (a) |
399,900 |
3,719,070 |
|
|
Common Stocks - continued |
|||
|
Shares |
Value |
||
|
INFORMATION TECHNOLOGY - continued |
|||
|
Communications Equipment - continued |
|||
|
QUALCOMM, Inc. |
156,900 |
$ 11,544,702 |
|
|
ViaSat, Inc. (a) |
13,600 |
818,312 |
|
|
|
16,082,084 |
||
|
Computers & Peripherals - 4.6% |
|||
|
3D Systems Corp. (a) |
8,800 |
661,408 |
|
|
Apple, Inc. |
65,800 |
36,589,406 |
|
|
Fusion-io, Inc. (a) |
133,300 |
1,338,332 |
|
|
SanDisk Corp. |
13,000 |
885,950 |
|
|
|
39,475,096 |
||
|
Electronic Equipment & Components - 0.1% |
|||
|
IPG Photonics Corp. (d) |
11,700 |
848,484 |
|
|
Internet Software & Services - 9.4% |
|||
|
Akamai Technologies, Inc. (a) |
8,400 |
375,648 |
|
|
Angie's List, Inc. (a) |
62,900 |
818,958 |
|
|
Benefitfocus, Inc. |
1,100 |
53,141 |
|
|
Cornerstone OnDemand, Inc. (a) |
38,700 |
1,951,254 |
|
|
eBay, Inc. (a) |
155,600 |
7,860,912 |
|
|
Facebook, Inc. Class A (a) |
404,200 |
19,001,442 |
|
|
Google, Inc. Class A (a) |
39,300 |
41,641,888 |
|
|
LinkedIn Corp. (a) |
4,900 |
1,097,747 |
|
|
Qihoo 360 Technology Co. Ltd. ADR (a)(d) |
28,700 |
2,339,624 |
|
|
Rackspace Hosting, Inc. (a) |
35,600 |
1,360,276 |
|
|
Tencent Holdings Ltd. |
40,200 |
2,325,129 |
|
|
Trulia, Inc. (a) |
22,900 |
786,386 |
|
|
Twitter, Inc. |
2,600 |
108,082 |
|
|
Web.com Group, Inc. (a) |
2,000 |
57,100 |
|
|
Wix.com Ltd. (a) |
8,400 |
172,200 |
|
|
|
79,949,787 |
||
|
IT Services - 3.8% |
|||
|
Cognizant Technology Solutions Corp. Class A (a) |
34,000 |
3,192,260 |
|
|
IBM Corp. |
31,600 |
5,677,888 |
|
|
MasterCard, Inc. Class A |
13,800 |
10,499,178 |
|
|
Visa, Inc. Class A |
64,000 |
13,021,440 |
|
|
|
32,390,766 |
||
|
Semiconductors & Semiconductor Equipment - 3.6% |
|||
|
Applied Materials, Inc. |
75,900 |
1,313,070 |
|
|
Applied Micro Circuits Corp. (a) |
373,200 |
4,683,660 |
|
|
Broadcom Corp. Class A |
40,800 |
1,088,952 |
|
|
Cavium, Inc. (a) |
19,900 |
720,380 |
|
|
Common Stocks - continued |
|||
|
Shares |
Value |
||
|
INFORMATION TECHNOLOGY - continued |
|||
|
Semiconductors & Semiconductor Equipment - continued |
|||
|
Cree, Inc. (a)(d) |
200,600 |
$ 11,193,480 |
|
|
Cypress Semiconductor Corp. |
347,000 |
3,362,430 |
|
|
Intel Corp. |
27,400 |
653,216 |
|
|
Mellanox Technologies Ltd. (a) |
8,700 |
338,778 |
|
|
Nanoco Group PLC (a) |
132,600 |
320,578 |
|
|
NVIDIA Corp. |
25,600 |
399,360 |
|
|
Rambus, Inc. (a) |
247,600 |
2,126,884 |
|
|
Silicon Laboratories, Inc. (a) |
105,700 |
4,127,585 |
|
|
Xilinx, Inc. |
16,500 |
733,095 |
|
|
|
31,061,468 |
||
|
Software - 8.1% |
|||
|
Adobe Systems, Inc. (a) |
21,300 |
1,209,414 |
|
|
Citrix Systems, Inc. (a) |
9,600 |
569,472 |
|
|
Concur Technologies, Inc. (a) |
17,600 |
1,708,784 |
|
|
FireEye, Inc. |
1,300 |
49,881 |
|
|
Interactive Intelligence Group, Inc. (a) |
21,900 |
1,424,376 |
|
|
Intuit, Inc. |
19,400 |
1,440,062 |
|
|
Microsoft Corp. |
244,200 |
9,311,346 |
|
|
NetSuite, Inc. (a) |
35,700 |
3,430,056 |
|
|
Oracle Corp. |
90,100 |
3,179,629 |
|
|
QLIK Technologies, Inc. (a) |
63,200 |
1,585,056 |
|
|
Red Hat, Inc. (a) |
143,200 |
6,708,920 |
|
|
salesforce.com, Inc. (a) |
605,000 |
31,514,450 |
|
|
ServiceNow, Inc. (a) |
32,000 |
1,699,520 |
|
|
SolarWinds, Inc. (a) |
25,400 |
849,376 |
|
|
Solera Holdings, Inc. |
3,800 |
253,650 |
|
|
Splunk, Inc. (a) |
11,300 |
815,408 |
|
|
TiVo, Inc. (a) |
70,100 |
899,383 |
|
|
VMware, Inc. Class A (a) |
7,800 |
628,914 |
|
|
Workday, Inc. Class A (a) |
17,100 |
1,408,185 |
|
|
|
68,685,882 |
||
|
TOTAL INFORMATION TECHNOLOGY |
268,493,567 |
||
|
MATERIALS - 1.9% |
|||
|
Chemicals - 1.6% |
|||
|
E.I. du Pont de Nemours & Co. |
27,000 |
1,657,260 |
|
|
Eastman Chemical Co. |
8,300 |
639,349 |
|
|
Common Stocks - continued |
|||
|
Shares |
Value |
||
|
MATERIALS - continued |
|||
|
Chemicals - continued |
|||
|
Monsanto Co. |
87,100 |
$ 9,871,043 |
|
|
The Mosaic Co. |
26,300 |
1,259,770 |
|
|
|
13,427,422 |
||
|
Metals & Mining - 0.3% |
|||
|
Nucor Corp. |
20,400 |
1,041,624 |
|
|
U.S. Silica Holdings, Inc. |
50,600 |
1,746,206 |
|
|
|
2,787,830 |
||
|
TOTAL MATERIALS |
16,215,252 |
||
|
TELECOMMUNICATION SERVICES - 0.5% |
|||
|
Diversified Telecommunication Services - 0.3% |
|||
|
Verizon Communications, Inc. |
48,300 |
2,396,646 |
|
|
Wireless Telecommunication Services - 0.2% |
|||
|
Sprint Corp. (a) |
59,700 |
500,883 |
|
|
T-Mobile U.S., Inc. (a) |
48,500 |
1,261,485 |
|
|
|
1,762,368 |
||
|
TOTAL TELECOMMUNICATION SERVICES |
4,159,014 |
||
|
TOTAL COMMON STOCKS (Cost $788,244,293) |
|
||
|
U.S. Treasury Obligations - 0.2% |
||||
|
|
Principal Amount |
|
||
|
U.S. Treasury Bills, yield at date of purchase 0.06% 2/6/14 (e) |
|
$ 1,550,000 |
|
|
|
Money Market Funds - 6.0% |
|||
|
Shares |
Value |
||
|
Fidelity Cash Central Fund, 0.10% (b) |
44,057,789 |
$ 44,057,789 |
|
|
Fidelity Securities Lending Cash Central Fund, 0.10% (b)(c) |
7,122,228 |
7,122,228 |
|
|
TOTAL MONEY MARKET FUNDS (Cost $51,180,017) |
|
||
|
TOTAL INVESTMENT PORTFOLIO - 100.7% (Cost $840,974,131) |
858,072,560 |
||
|
NET OTHER ASSETS (LIABILITIES) - (0.7)% |
(5,791,292) |
||
|
NET ASSETS - 100% |
$ 852,281,268 |
||
|
Futures Contracts |
|||||
|
|
Expiration Date |
Underlying Face Amount at Value |
Unrealized Appreciation/ |
||
|
Purchased |
|||||
|
Equity Index Contracts |
|||||
|
280 ICE Russell 1000 Growth Index Contracts (United States) |
Dec. 2013 |
$ 23,548,000 |
$ 562,371 |
||
|
18 ICE Russell 2000 Mini Index Contracts (United States) |
Dec. 2013 |
2,055,060 |
77,017 |
||
|
TOTAL EQUITY INDEX CONTRACTS |
$ 25,603,060 |
$ 639,388 |
|||
|
|
|
The face value of futures purchased as a percentage of net assets is 3% |
|
Legend |
|
(a) Non-income producing |
|
(b) Affiliated fund that is generally available only to investment companies and other accounts managed by Fidelity Investments. The rate quoted is the annualized seven-day yield of the fund at period end. A complete unaudited listing of the fund's holdings as of its most recent quarter end is available upon request. In addition, each Fidelity Central Fund's financial statements, which are not covered by the Fund's Report of Independent Registered Public Accounting Firm, are available on the SEC's website or upon request. |
|
(c) Investment made with cash collateral received from securities on loan. |
|
(d) Security or a portion of the security is on loan at period end. |
|
(e) Security or a portion of the security was pledged to cover margin requirements for futures contracts. At period end, the value of securities pledged amounted to $594,959. |
|
Affiliated Central Funds |
|
Information regarding fiscal year to date income earned by the Fund from investments in Fidelity Central Funds is as follows: |
|
Fund |
Income earned |
|
Fidelity Cash Central Fund |
$ 2,830 |
|
Fidelity Securities Lending Cash Central Fund |
1,290 |
|
Total |
$ 4,120 |
|
Other Information |
|
The following is a summary of the inputs used, as of November 30, 2013, involving the Fund's assets and liabilities carried at fair value. The inputs or methodology used for valuing securities may not be an indication of the risk associated with investing in those securities. For more information on valuation inputs, and their aggregation into the levels used in the table below, please refer to the Investment Valuation section in the accompanying Notes to Financial Statements. |
|
Valuation Inputs at Reporting Date: |
||||
|
Description |
Total |
Level 1 |
Level 2 |
Level 3 |
|
Investments in Securities: |
||||
|
Equities: |
||||
|
Consumer Discretionary |
$ 154,354,374 |
$ 154,354,374 |
$ - |
$ - |
|
Consumer Staples |
84,530,267 |
84,530,267 |
- |
- |
|
Energy |
37,462,872 |
37,462,872 |
- |
- |
|
Financials |
45,051,855 |
45,051,855 |
- |
- |
|
Health Care |
133,236,208 |
133,236,208 |
- |
- |
|
Industrials |
61,839,241 |
61,839,241 |
- |
- |
|
Information Technology |
268,493,567 |
268,493,567 |
- |
- |
|
Materials |
16,215,252 |
16,215,252 |
- |
- |
|
Telecommunication Services |
4,159,014 |
4,159,014 |
- |
- |
|
U.S. Government and Government Agency Obligations |
1,549,893 |
- |
1,549,893 |
- |
|
Money Market Funds |
51,180,017 |
51,180,017 |
- |
- |
|
Total Investments in Securities: |
$ 858,072,560 |
$ 856,522,667 |
$ 1,549,893 |
$ - |
|
Derivative Instruments: |
||||
|
Assets |
||||
|
Futures Contracts |
$ 639,388 |
$ 639,388 |
$ - |
$ - |
|
Value of Derivative Instruments |
|
The following table is a summary of the Fund's value of derivative instruments by primary risk exposure as of November 30, 2013. For additional information on derivative instruments, please refer to the Derivative Instruments section in the accompanying Notes to Financial Statements. |
|
Primary Risk Exposure / |
Value |
|
|
|
Asset |
Liability |
|
Equity Risk |
||
|
Futures Contracts (a) |
$ 639,388 |
$ - |
|
Total Value of Derivatives |
$ 639,388 |
$ - |
|
(a) Reflects gross cumulative appreciation (depreciation) on futures contracts as presented in the Schedule of Investments. Only the period end receivable or payable for daily variation margin and net unrealized appreciation (depreciation) are presented in the Statement of Assets and Liabilities. |
See accompanying notes which are an integral part of the financial statements.
Annual Report
Financial Statements
Statement of Assets and Liabilities
|
|
November 30, 2013 |
|
|
|
|
|
|
Assets |
|
|
|
Investment in securities, at value (including securities loaned of $6,934,842) - See accompanying schedule: Unaffiliated issuers (cost $789,794,114) |
$ 806,892,543 |
|
|
Fidelity Central Funds (cost $51,180,017) |
51,180,017 |
|
|
Total Investments (cost $840,974,131) |
|
$ 858,072,560 |
|
Foreign currency held at value (cost $13,973) |
|
13,977 |
|
Receivable for investments sold |
|
1,415,485 |
|
Dividends receivable |
|
522,118 |
|
Distributions receivable from Fidelity Central Funds |
|
4,120 |
|
Receivable for daily variation margin for derivative instruments |
|
27,360 |
|
Total assets |
|
860,055,620 |
|
|
|
|
|
Liabilities |
|
|
|
Payable for investments purchased |
$ 231,919 |
|
|
Accrued management fee |
268,554 |
|
|
Other affiliated payables |
109,597 |
|
|
Other payables and accrued expenses |
42,054 |
|
|
Collateral on securities loaned, at value |
7,122,228 |
|
|
Total liabilities |
|
7,774,352 |
|
|
|
|
|
Net Assets |
|
$ 852,281,268 |
|
Net Assets consist of: |
|
|
|
Paid in capital |
|
$ 833,473,945 |
|
Undistributed net investment income |
|
188,976 |
|
Accumulated undistributed net realized gain (loss) on investments and foreign currency transactions |
|
880,518 |
|
Net unrealized appreciation (depreciation) on investments and assets and liabilities in foreign currencies |
|
17,737,829 |
|
Net Assets, for 83,347,395 shares outstanding |
|
$ 852,281,268 |
|
Net Asset Value, offering price and redemption price per share ($852,281,268 ÷ 83,347,395 shares) |
|
$ 10.23 |
See accompanying notes which are an integral part of the financial statements.
Annual Report
Statement of Operations
|
|
For the period November 7, 2013 |
|
|
|
|
|
|
Investment Income |
|
|
|
Dividends |
|
$ 605,004 |
|
Interest |
|
54 |
|
Income from Fidelity Central Funds |
|
4,120 |
|
Total income |
|
609,178 |
|
|
|
|
|
Expenses |
|
|
|
Management fee |
$ 268,554 |
|
|
Transfer agent fees |
92,420 |
|
|
Accounting and security lending fees |
17,177 |
|
|
Custodian fees and expenses |
6,761 |
|
|
Audit |
35,290 |
|
|
Total expenses |
|
420,202 |
|
Net investment income (loss) |
|
188,976 |
|
Realized and Unrealized Gain (Loss) Net realized gain (loss) on: |
|
|
|
Investment securities: |
|
|
|
Unaffiliated issuers |
327,941 |
|
|
Foreign currency transactions |
192 |
|
|
Futures contracts |
552,385 |
|
|
Total net realized gain (loss) |
|
880,518 |
|
Change in net unrealized appreciation (depreciation) on: Investment securities |
17,098,429 |
|
|
Assets and liabilities in foreign currencies |
12 |
|
|
Futures contracts |
639,388 |
|
|
Total change in net unrealized appreciation (depreciation) |
|
17,737,829 |
|
Net gain (loss) |
|
18,618,347 |
|
Net increase (decrease) in net assets resulting from operations |
|
$ 18,807,323 |
See accompanying notes which are an integral part of the financial statements.
Annual Report
Financial Statements - continued
Statement of Changes in Net Assets
|
For the period November 7, 2013 |
|
|
Increase (Decrease) in Net Assets |
|
|
Operations |
|
|
Net investment income (loss) |
$ 188,976 |
|
Net realized gain (loss) |
880,518 |
|
Change in net unrealized appreciation (depreciation) |
17,737,829 |
|
Net increase (decrease) in net assets resulting |
18,807,323 |
|
Share transactions |
833,473,945 |
|
Total increase (decrease) in net assets |
852,281,268 |
|
|
|
|
Net Assets |
|
|
Beginning of period |
- |
|
End of period (including undistributed net investment income of $188,976) |
$ 852,281,268 |
|
Other Information Shares |
|
|
Sold |
83,347,395 |
See accompanying notes which are an integral part of the financial statements.
Annual Report
Financial Highlights
|
|
Period ended |
|
Selected Per-Share Data |
|
|
Net asset value, beginning of period |
$ 10.00 |
|
Income from Investment Operations |
|
|
Net investment income (loss) C |
- I |
|
Net realized and unrealized gain (loss) |
.23 |
|
Total from investment operations |
.23 |
|
Net asset value, end of period |
$ 10.23 |
|
Total Return B |
2.30% |
|
Ratios to Average Net Assets D,G |
|
|
Expenses before reductions |
.85% A |
|
Expenses net of fee waivers, if any |
.85% A |
|
Expenses net of all reductions |
.85% A |
|
Net investment income (loss) |
.38% A |
|
Supplemental Data |
|
|
Net assets, end of period (000 omitted) |
$ 852,281 |
|
Portfolio turnover rate E |
65% H |
A Annualized
B Total returns for periods of less than one year are not annualized.
C Calculated based on average shares outstanding during the period.
D Fees and expenses of any underlying Fidelity Central Funds are not included in the Fund's expense ratio. The Fund indirectly bears its proportionate share of the expenses of any underlying Fidelity Central Funds.
E Amount does not include the portfolio activity of any underlying Fidelity Central Funds.
F For the period November 7, 2013 (commencement of operations) to November 30, 2013.
G Expense ratios reflect operating expenses of the Fund. Expenses before reductions do not reflect amounts reimbursed by the investment adviser or reductions from expense offset arrangements and do not represent the amount paid by the Fund during periods when reimbursements or reductions occur. Expense ratios before reductions for start-up periods may not be representative of longer term operating periods. Expenses net of fee waivers reflect expenses after reimbursement by the investment adviser but prior to reductions from expense offset arrangements. Expenses net of all reductions represent the net expenses paid by the Fund.
H Amount not annualized.
I Amount represents less than $.01 per share.
See accompanying notes which are an integral part of the financial statements.
Annual Report
Notes to Financial Statements
For the period ended November 30, 2013
1. Organization.
Fidelity Advisor® Series Growth Opportunities Fund (the Fund) is a fund of Fidelity Advisor Series I (the Trust) and is authorized to issue an unlimited number of shares. Shares of the Fund are only available for purchase by mutual funds for which Fidelity Management & Research Company (FMR) or an affiliate serves as an investment manager. The Trust is registered under the Investment Company Act of 1940, as amended (the 1940 Act), as an open-end management investment company organized as a Massachusetts business trust.
2. Investments in Fidelity Central Funds.
The Fund invests in Fidelity Central Funds, which are open-end investment companies generally available only to other investment companies and accounts managed by the investment adviser and its affiliates. The Fund's Schedule of Investments lists each of the Fidelity Central Funds held as of period end, if any, as an investment of the Fund, but does not include the underlying holdings of each Fidelity Central Fund. As an Investing Fund, the Fund indirectly bears its proportionate share of the expenses of the underlying Fidelity Central Funds.
The Money Market Central Funds seek preservation of capital and current income and are managed by Fidelity Investments Money Management, Inc. (FIMM), an affiliate of the investment adviser. Annualized expenses of the Money Market Central Funds as of their most recent shareholder report date are less than .01%.
A complete unaudited list of holdings for each Fidelity Central Fund is available upon request or at the Securities and Exchange Commission (the SEC) website at www.sec.gov. In addition, the financial statements of the Fidelity Central Funds, which are not covered by the Fund's Report of Independent Registered Public Accounting Firm, are available on the SEC website or upon request.
3. Significant Accounting Policies.
The financial statements have been prepared in conformity with accounting principles generally accepted in the United States of America (GAAP), which require management to make certain estimates and assumptions at the date of the financial statements. Actual results could differ from those estimates. Subsequent events, if any, through the date that the financial statements were issued have been evaluated in the preparation of the financial statements. The following summarizes the significant accounting policies of the Fund:
Investment Valuation. Investments are valued as of 4:00 p.m. Eastern time on the last calendar day of the period. In accordance with valuation policies and procedures approved by the Board of Trustees (the Board), the Fund attempts to obtain prices from
Annual Report
Notes to Financial Statements - continued
3. Significant Accounting Policies - continued
Investment Valuation - continued
one or more third party pricing vendors or brokers to value its investments. When current market prices, quotations or currency exchange rates are not readily available or reliable, investments will be fair valued in good faith by the FMR Fair Value Committee (the Committee), in accordance with procedures adopted by the Board. Factors used in determining fair value vary by investment type and may include market or investment specific events, changes in interest rates and credit quality. The frequency with which these procedures are used cannot be predicted and they may be utilized to a significant extent. The Committee oversees the Fund's valuation policies and procedures and is responsible for approving and reporting to the Board all fair value determinations.
The Fund categorizes the inputs to valuation techniques used to value its investments into a disclosure hierarchy consisting of three levels as shown below:
Level 1 - quoted prices in active markets for identical investments
Level 2 - other significant observable inputs (including quoted prices for similar investments, interest rates, prepayment speeds, etc.)
Level 3 - unobservable inputs (including the Fund's own assumptions based on the best information available)
Valuation techniques used to value the Fund's investments by major category are as follows:
Equity securities, including restricted securities, for which market quotations are readily available, are valued at the last reported sale price or official closing price as reported by a third party pricing vendor on the primary market or exchange on which they are traded and are categorized as Level 1 in the hierarchy. In the event there were no sales during the day or closing prices are not available, securities are valued at the last quoted bid price or may be valued using the last available price and are generally categorized as Level 2 in the hierarchy. For foreign equity securities, when market or security specific events arise, comparisons to the valuation of American Depositary Receipts (ADRs), futures contracts, Exchange-Traded Funds (ETFs) and certain indexes as well as quoted prices for similar securities may be used and would be categorized as Level 2 in the hierarchy. Utilizing these techniques may result in transfers between Level 1 and Level 2. For equity securities, including restricted securities, where observable inputs are limited, assumptions about market activity and risk are used and these securities may be categorized as Level 3 in the hierarchy.
Annual Report
3. Significant Accounting Policies - continued
Investment Valuation - continued
Debt securities, including restricted securities, are valued based on evaluated prices received from third party pricing vendors or from brokers who make markets in such securities. For U.S. government and government agency obligations, pricing vendors utilize matrix pricing which considers yield or price of bonds of comparable quality, coupon, maturity and type as well as broker-supplied prices. When independent prices are unavailable or unreliable, debt securities may be valued utilizing pricing methodologies which consider similar factors that would be used by third party pricing vendors. Debt securities are generally categorized as Level 2 in the hierarchy but may be Level 3 depending on the circumstances.
Futures contracts are valued at the settlement price established each day by the board of trade or exchange on which they are traded and are categorized as Level 1 in the hierarchy. Investments in open-end mutual funds, including the Fidelity Central Funds, are valued at their closing net asset value (NAV) each business day and are categorized as Level 1 in the hierarchy.
Changes in valuation techniques may result in transfers in or out of an assigned level within the disclosure hierarchy. The aggregate value of investments by input level, as of November 30, 2013 is included at the end of the Fund's Schedule of Investments.
Foreign Currency. The Fund may use foreign currency contracts to facilitate transactions in foreign-denominated securities. Gains and losses from these transactions may arise from changes in the value of the foreign currency or if the counterparties do not perform under the contracts' terms.
Foreign-denominated assets, including investment securities, and liabilities are translated into U.S. dollars at the exchange rates at period end. Purchases and sales of investment securities, income and dividends received and expenses denominated in foreign currencies are translated into U.S. dollars at the exchange rate in effect on the transaction date.
The effects of exchange rate fluctuations on investments are included with the net realized and unrealized gain (loss) on investment securities. Other foreign currency transactions resulting in realized and unrealized gain (loss) are disclosed separately.
Investment Transactions and Income. For financial reporting purposes, the Fund's investment holdings and NAV include trades executed through the end of the last business day of the period. The NAV per share for processing shareholder transactions is calculated as of the close of business of the New York Stock Exchange (NYSE), normally 4:00 p.m. Eastern time and includes trades executed through the end of the prior business day. Gains and losses on securities sold are determined on the basis of identified
Annual Report
Notes to Financial Statements - continued
3. Significant Accounting Policies - continued
Investment Transactions and Income - continued
cost. Dividend income is recorded on the ex-dividend date, except for certain dividends from foreign securities where the ex-dividend date may have passed, which are recorded as soon as the Fund is informed of the ex-dividend date. Non-cash dividends included in dividend income, if any, are recorded at the fair market value of the securities received. Interest income and distributions from the Fidelity Central Funds are accrued as earned. Distributions received on securities that represent a return of capital or capital gain are recorded as a reduction of cost of investments and/or as a realized gain. Subsequent to ex-dividend date the Fund determines the components of these distributions, based upon receipt of tax filings or other correspondence relating to the underlying investment. Interest income includes coupon interest and amortization of premium and accretion of discount on debt securities. Investment income is recorded net of foreign taxes withheld where recovery of such taxes is uncertain.
Expenses. Expenses directly attributable to a fund are charged to that fund. Expenses attributable to more than one fund are allocated among the respective funds on the basis of relative net assets or other appropriate methods. Expense estimates are accrued in the period to which they relate and adjustments are made when actual amounts are known.
Income Tax Information and Distributions to Shareholders. Each year, the Fund intends to qualify as a regulated investment company under Subchapter M of the Internal Revenue Code, including distributing substantially all of its taxable income and realized gains. As a result, no provision for U.S. Federal income taxes is required. As of November 30, 2013, the Fund did not have any unrecognized tax benefits in the financial statements; nor is the Fund aware of any tax positions for which it is reasonably possible that the total amounts of unrecognized tax benefits will significantly change in the next twelve months. The Fund files a U.S. federal tax return, in addition to state and local tax returns as required. The Fund's federal income tax returns are subject to examination by the Internal Revenue Service (IRS) for a period of three fiscal years after they are filed. State and local tax returns may be subject to examination for an additional fiscal year depending on the jurisdiction. Foreign taxes are provided for based on the Fund's understanding of the tax rules and rates that exist in the foreign markets in which it invests.
Distributions are declared and recorded on the ex-dividend date. Income and capital gain distributions are determined in accordance with income tax regulations, which may differ from GAAP.
Capital accounts within the financial statements are adjusted for permanent book-tax differences. These adjustments have no impact on net assets or the results of operations. Temporary book-tax differences will reverse in a subsequent period.
Annual Report
3. Significant Accounting Policies - continued
Income Tax Information and Distributions to Shareholders - continued
Book-tax differences are primarily due to foreign currency transactions, futures contracts, passive foreign investment companies (PFIC), and losses deferred due to wash sales.
The federal tax cost of investment securities and unrealized appreciation (depreciation) as of period end were as follows:
|
Gross unrealized appreciation |
$ 26,815,043 |
|
Gross unrealized depreciation |
(9,739,962) |
|
Net unrealized appreciation (depreciation) on securities and other investments |
$ 17,075,081 |
|
|
|
|
Tax Cost |
$ 840,997,479 |
The tax-based components of distributable earnings as of period end were as follows:
|
Undistributed ordinary income |
$ 1,017,121 |
|
Undistributed long-term capital gain |
$ 715,110 |
|
Net unrealized appreciation (depreciation) |
$ 17,075,093 |
4. Derivative Instruments.
Risk Exposures and the Use of Derivative Instruments. The Fund's investment objective allows the Fund to enter into various types of derivative contracts, including futures contracts. Derivatives are investments whose value is primarily derived from underlying assets, indices or reference rates and may be transacted on an exchange or over-the-counter (OTC). Derivatives may involve a future commitment to buy or sell a specified asset based on specified terms, to exchange future cash flows at periodic intervals based on a notional principal amount, or for one party to make one or more payments upon the occurrence of specified events in exchange for periodic payments from the other party.
The Fund used derivatives to increase returns and to manage exposure to certain risks as defined below. The success of any strategy involving derivatives depends on analysis of numerous economic factors, and if the strategies for investment do not work as intended, the Fund may not achieve its objectives.
Annual Report
Notes to Financial Statements - continued
4. Derivative Instruments - continued
Risk Exposures and the Use of Derivative Instruments - continued
The Fund's use of derivatives increased or decreased its exposure to the following risk:
|
Equity Risk |
Equity risk relates to the fluctuations in the value of financial instruments as a result of changes in market prices (other than those arising from interest rate risk or foreign exchange risk), whether caused by factors specific to an individual investment, its issuer, or all factors affecting all instruments traded in a market or market segment. |
The Fund is also exposed to additional risks from investing in derivatives, such as liquidity risk and counterparty credit risk. Liquidity risk is the risk that the Fund will be unable to close out the derivative in the open market in a timely manner. Counterparty credit risk is the risk that the counterparty will not be able to fulfill its obligation to the Fund. Counterparty credit risk related to exchange-traded futures contracts may be mitigated by the protection provided by the exchange on which they trade.
Investing in derivatives may involve greater risks than investing in the underlying assets directly and, to varying degrees, may involve risk of loss in excess of any initial investment and collateral received and amounts recognized in the Statement of Assets and Liabilities. In addition, there may be the risk that the change in value of the derivative contract does not correspond to the change in value of the underlying instrument.
Futures Contracts. A futures contract is an agreement between two parties to buy or sell a specified underlying instrument for a fixed price at a specified future date. The Fund used futures contracts to manage its exposure to the stock market.
Upon entering into a futures contract, a fund is required to deposit either cash or securities (initial margin) with a clearing broker in an amount equal to a certain percentage of the face value of the contract. Futures contracts are marked-to-market daily and subsequent daily payments (variation margin) are made or received by a fund depending on the daily fluctuations in the value of the futures contracts and are recorded as unrealized appreciation or (depreciation). This receivable and/or payable, if any, is included in daily variation margin for derivative instruments in the Statement of Assets and Liabilities. Realized gain or (loss) is recorded upon the expiration or closing of a futures contract.
Any open futures contracts at period end are presented in the Schedule of Investments under the caption "Futures Contracts." The underlying face amount at value reflects each contract's exposure to the underlying instrument or index at period end and is representative of volume of activity during the period. Securities deposited to meet initial margin requirements are identified in the Schedule of Investments.
During the period the Fund recognized net realized gain (loss) of $552,385 and a change in net unrealized appreciation (depreciation) of $639,388 related to its investment in futures contracts. These amounts are included in the Statement of Operations.
Annual Report
5. Purchases and Sales of Investments.
Purchases and sales of securities including in-kind transactions, other than short-term securities, aggregated $1,293,270,005 and $505,353,606, respectively.
6. Fees and Other Transactions with Affiliates.
Management Fee. Fidelity Management & Research Company (the investment adviser) and its affiliates provide the Fund with investment management related services for which the Fund pays a monthly management fee. The management fee is the sum of an individual fund fee rate that is based on an annual rate of .30% of the Fund's average net assets and an annualized group fee rate that averaged .25% during the period. The group fee rate is based upon the average net assets of all the mutual funds advised by the investment adviser, including any mutual funds previously advised by the investment adviser that are currently advised by Fidelity SelectCo, LLC, an affiliate of the investment adviser. The group fee rate decreases as assets under management increase and increases as assets under management decrease. In addition, the management fee is subject to a performance adjustment (up to a maximum of ± .20% of the Fund's average net assets over a 36 month performance period). The upward or downward adjustment to the management fee is based on the Fund's relative investment performance as compared to an appropriate benchmark index over the same 36 month performance period. The Fund's performance adjustment will not take effect until November 1, 2014. Subsequent months will be added until the performance period includes 36 months. For the reporting period, the total annualized management fee rate was ..55% of the Fund's average net assets.
Transfer Agent Fees. Fidelity Investments Institutional Operations Company, Inc. (FIIOC), an affiliate of the investment adviser, is the Fund's transfer, dividend disbursing and shareholder servicing agent. FIIOC receives account fees and asset-based fees that vary according to account size and type of account. FIIOC pays for typesetting, printing and mailing of shareholder reports, except proxy statements. For the period, the transfer agent fees were equivalent to an annualized rate of .19% of average net assets.
Accounting and Security Lending Fees. Fidelity Service Company, Inc. (FSC), an affiliate of the investment adviser, maintains the Fund's accounting records. The accounting fee is based on the level of average net assets for each month. Under a separate contract, FSC administers the security lending program. The security lending fee is based on the number and duration of lending transactions.
Brokerage Commissions. The Fund placed a portion of its portfolio transactions with brokerage firms which are affiliates of the investment adviser. Brokerage commissions are included in net realized gain (loss) and change in net unrealized appreciation (depreciation) in the Statement of Operations. The commissions paid to these affiliated firms were $1,096 for the period.
Annual Report
Notes to Financial Statements - continued
6. Fees and Other Transactions with Affiliates - continued
Exchanges In-Kind. During the period, certain investment companies managed by the investment adviser or its affiliates (Investing Funds) completed exchanges in-kind with the Fund. The Investing Funds delivered investments valued at $833,473,925 in exchange for 83,347,393 shares of the Fund. The amount of in-kind exchanges is included in share transactions in the accompanying Statement of Changes in Net Assets. The Fund recognized no gain or loss for federal income tax purposes.
7. Security Lending.
The Fund lends portfolio securities through a lending agent from time to time in order to earn additional income. For equity securities, a lending agent is used and may loan securities to certain qualified borrowers, including Fidelity Capital Markets (FCM), a broker-dealer affiliated with the Fund. On the settlement date of the loan, the Fund receives collateral (in the form of U.S. Treasury obligations, letters of credit and/or cash) against the loaned securities and maintains collateral in an amount not less than 100% of the market value of the loaned securities during the period of the loan. The market value of the loaned securities is determined at the close of business of the Fund and any additional required collateral is delivered to the Fund on the next business day. If the borrower defaults on its obligation to return the securities loaned because of insolvency or other reasons, the Fund may apply collateral received from the borrower against the obligation. The Fund may experience delays and costs in recovering the securities loaned. Any cash collateral received is invested in the Fidelity Securities Lending Cash Central Fund. The value of loaned securities and cash collateral at period end are disclosed on the Fund's Statement of Assets and Liabilities. Security lending income represents the income earned on investing cash collateral, less rebates paid to borrowers and any lending agent fees associated with the loan, plus any premium payments received for lending certain types of securities. Security lending income is presented in the Statement of Operations as a component of income from Fidelity Central Funds. Total security lending income during the period amounted to $1,290. During the period, there were no securities loaned to FCM.
8. Other.
The Fund's organizational documents provide former and current trustees and officers with a limited indemnification against liabilities arising in connection with the performance of their duties to the Fund. In the normal course of business, the Fund may also enter into contracts that provide general indemnifications. The Fund's maximum exposure under these arrangements is unknown as this would be dependent on future claims that may be made against the Fund. The risk of material loss from such claims is considered remote.
At the end of the period, mutual funds managed by the investment adviser or its affiliates were the owners of record of all of the outstanding shares of the Fund.
Annual Report
Report of Independent Registered Public Accounting Firm
To the Trustees of Fidelity Advisor Series I and Shareholders of Fidelity Advisor Series Growth Opportunities Fund:
We have audited the accompanying statement of assets and liabilities of Fidelity Advisor Series Growth Opportunities Fund (the Fund), a fund of Fidelity Advisor Series I, including the schedule of investments, as of November 30, 2013, and the related statement of operations, the statement of changes in net assets and the financial highlights for the period from November 7, 2013 (commencement of operations) to November 30, 2013. These financial statements and financial highlights are the responsibility of the Fund's management. Our responsibility is to express an opinion on these financial statements and financial highlights based on our audit.
We conducted our audit in accordance with the standards of the Public Company Accounting Oversight Board (United States). Those standards require that we plan and perform the audit to obtain reasonable assurance about whether the financial statements and financial highlights are free of material misstatement. The Fund is not required to have, nor were we engaged to perform, an audit of its internal control over financial reporting. Our audit included consideration of internal control over financial reporting as a basis for designing audit procedures that are appropriate in the circumstances, but not for the purpose of expressing an opinion on the effectiveness of the Fund's internal control over financial reporting. Accordingly, we express no such opinion. An audit also includes examining, on a test basis, evidence supporting the amounts and disclosures in the financial statements, assessing the accounting principles used and significant estimates made by management, as well as evaluating the overall financial statement presentation. Our procedures included confirmation of securities owned as of November 30, 2013, by correspondence with the custodians and brokers; where replies were not received from brokers, we performed other auditing procedures. We believe that our audit provides a reasonable basis for our opinion.
In our opinion, the financial statements and financial highlights referred to above present fairly, in all material respects, the financial position of Fidelity Advisor Series Growth Opportunities Fund as of November 30, 2013, and the results of its operations, the changes in its net assets and the financial highlights for the period from November 7, 2013 (commencement of operations) to November 30, 2013, in conformity with accounting principles generally accepted in the United States of America.
DELOITTE & TOUCHE LLP
Boston, Massachusetts
January 16, 2014
Annual Report
Trustees and Officers
The Trustees, Member of the Advisory Board, and officers of the trust and fund, as applicable, are listed below. The Board of Trustees governs the fund and is responsible for protecting the interests of shareholders. The Trustees are experienced executives who meet periodically throughout the year to oversee the fund's activities, review contractual arrangements with companies that provide services to the fund, oversee management of the risks associated with such activities and contractual arrangements, and review the fund's performance. Except for James C. Curvey, Ned C. Lautenbach, Ronald P. O'Hanley, and William S. Stavropoulos, each of the Trustees oversees 173 funds. Mr. Curvey oversees 396 funds. Mr. Lautenbach, Mr. O'Hanley, and Mr. Stavropoulos each oversees 247 funds.
The Trustees hold office without limit in time except that (a) any Trustee may resign; (b) any Trustee may be removed by written instrument, signed by at least two-thirds of the number of Trustees prior to such removal; (c) any Trustee who requests to be retired or who has become incapacitated by illness or injury may be retired by written instrument signed by a majority of the other Trustees; and (d) any Trustee may be removed at any special meeting of shareholders by a two-thirds vote of the outstanding voting securities of the trust. Each Trustee who is not an interested person (as defined in the 1940 Act) of the trust and the fund (Independent Trustee), shall retire not later than the last day of the calendar year in which his or her 75th birthday occurs. The Independent Trustees may waive this mandatory retirement age policy with respect to individual Trustees. The officers and Advisory Board Member hold office without limit in time, except that any officer and Advisory Board Member may resign or may be removed by a vote of a majority of the Trustees at any regular meeting or any special meeting of the Trustees. Except as indicated, each individual has held the office shown or other offices in the same company for the past five years.
Experience, Skills, Attributes, and Qualifications of the Fund's Trustees. The Governance and Nominating Committee has adopted a statement of policy that describes the experience, qualifications, attributes, and skills that are necessary and desirable for potential Independent Trustee candidates (Statement of Policy). The Board believes that each Trustee satisfied at the time he or she was initially elected or appointed a Trustee, and continues to satisfy, the standards contemplated by the Statement of Policy. The Governance and Nominating Committee also engages professional search firms to help identify potential Independent Trustee candidates who have the experience, qualifications, attributes, and skills consistent with the Statement of Policy. From time to time, additional criteria based on the composition and skills of the current Independent Trustees, as well as experience or skills that may be appropriate in light of future changes to board composition, business conditions, and regulatory or other developments, have also been considered by the professional search firms and the Governance and Nominating Committee. In addition, the Board takes into account the Trustees' commitment and participation in Board and committee meetings, as well as their leadership of standing and ad hoc committees throughout their tenure.
Annual Report
In determining that a particular Trustee was and continues to be qualified to serve as a Trustee, the Board has considered a variety of criteria, none of which, in isolation, was controlling. The Board believes that, collectively, the Trustees have balanced and diverse experience, qualifications, attributes, and skills, which allow the Board to operate effectively in governing the fund and protecting the interests of shareholders. Information about the specific experience, skills, attributes, and qualifications of each Trustee, which in each case led to the Board's conclusion that the Trustee should serve (or continue to serve) as a trustee of the fund, is provided below.
Board Structure and Oversight Function. James C. Curvey is an interested person (as defined in the 1940 Act) and currently serves as Chairman. The Trustees have determined that an interested Chairman is appropriate and benefits shareholders because an interested Chairman has a personal and professional stake in the quality and continuity of services provided to the fund. Independent Trustees exercise their informed business judgment to appoint an individual of their choosing to serve as Chairman, regardless of whether the Trustee happens to be independent or a member of management. The Independent Trustees have determined that they can act independently and effectively without having an Independent Trustee serve as Chairman and that a key structural component for assuring that they are in a position to do so is for the Independent Trustees to constitute a substantial majority for the Board. The Independent Trustees also regularly meet in executive session. Ned C. Lautenbach serves as Chairman of the Independent Trustees and as such (i) acts as a liaison between the Independent Trustees and management with respect to matters important to the Independent Trustees and (ii) with management prepares agendas for Board meetings.
Fidelity funds are overseen by different Boards of Trustees. The fund's Board oversees Fidelity's equity and high income funds and another Board oversees Fidelity's investment-grade bond, money market, and asset allocation funds. The asset allocation funds may invest in Fidelity funds overseen by the fund's Board. The use of separate Boards, each with its own committee structure, allows the Trustees of each group of Fidelity funds to focus on the unique issues of the funds they oversee, including common research, investment, and operational issues. On occasion, the separate Boards establish joint committees to address issues of overlapping consequences for the Fidelity funds overseen by each Board.
The Trustees operate using a system of committees to facilitate the timely and efficient consideration of all matters of importance to the Trustees, the fund, and fund shareholders and to facilitate compliance with legal and regulatory requirements and oversight of the fund's activities and associated risks. The Board, acting through its committees, has charged FMR and its affiliates with (i) identifying events or circumstances the occurrence of which could have demonstrably adverse effects on the fund's business and/or reputation; (ii) implementing processes and controls to lessen the possibility that such events or circumstances occur or to mitigate the effects of such events or circumstances if they do occur; and (iii) creating and maintaining a system designed to evaluate continuously business and market conditions in order to facilitate the identification and implementation processes described in (i) and (ii) above. Because the day-to-day operations and activities of the fund are carried out by or through FMR, its affiliates and other service providers, the fund's exposure to risks is mitigated but not eliminated by the processes overseen by the Trustees. While each of the Board's committees has responsibility for overseeing different aspects of the fund's activities, oversight is exercised primarily through the Operations, Audit, and Compliance Committees. In addition, the Independent Trustees have worked with FMR to enhance the Board's oversight of investment and financial risks, legal and regulatory risks, technology risks, and operational risks, including the development of additional risk reporting to the Board. For example, a working group comprised of Independent Trustees and FMR has worked and continues to work to review the Fidelity funds' valuation-related activities, reporting and risk management. Appropriate personnel, including but not limited to the fund's Chief Compliance Officer (CCO), FMR's internal auditor, the independent accountants, the fund's Treasurer and portfolio management personnel, make periodic reports to the Board's committees, as appropriate, including an annual review of FMR's risk management program for the Fidelity funds. The responsibilities of each standing committee, including their oversight responsibilities, are described further under "Standing Committees of the Fund's Trustees."
Annual Report
Trustees and Officers - continued
The fund's Statement of Additional Information (SAI) includes more information about the Trustees. To request a free copy, call Fidelity at 1-877-208-0098.
Interested Trustees*:
Correspondence intended for each Trustee who is an interested person may be sent to Fidelity Investments, 245 Summer Street, Boston, Massachusetts 02210.
|
Name, Year of Birth; Principal Occupations and Other Relevant Experience+ |
|
|
James C. Curvey (1935) |
|
|
Year of Election or Appointment: 2007 Trustee Chairman of the Board of Trustees |
|
|
|
Mr. Curvey also serves as Trustee of other Fidelity funds. Mr. Curvey is a Director of Fidelity Investments Money Management, Inc. (2009-present), Director of Fidelity Research & Analysis Co. (2009-present) and Director of FMR and FMR Co., Inc. (2007-present). Mr. Curvey is also Vice Chairman (2007-present) and Director of FMR LLC. In addition, Mr. Curvey serves as an Overseer for the Boston Symphony Orchestra and a member of the Trustees of Villanova University. Previously, Mr. Curvey was the Vice Chairman (2006-2007) and Director (2000-2007) of FMR Corp. |
|
Ronald P. O'Hanley (1957) |
|
|
Year of Election or Appointment: 2011 Trustee |
|
|
|
Mr. O'Hanley also serves as Trustee of other Fidelity funds. He is Director of Fidelity SelectCo, LLC (2013-present), FMR Co., Inc. (2010-present), Director of Fidelity Investments Money Management, Inc. (2010-present), Director of Fidelity Research & Analysis Company (2010-present), President of Fidelity Asset Management and Corporate Services and a Member of Fidelity's Executive Committee (2010-present). Previously, Mr. O'Hanley served as President and Chief Executive Officer of BNY Mellon Asset Management (2007-2010). Mr. O'Hanley also served as Vice Chairman of Bank New York Mellon Corp. and a member of that firm's Executive Committee. Prior to the 2007 merger of The Bank of New York and Mellon Financial Corporation, he was Vice Chairman of Mellon Financial Corporation and President and Chief Executive Officer of Mellon Asset Management. He joined Mellon in February 1997. Mr. O'Hanley currently serves as Chairman of the Boston Public Library Foundation Board of Directors and sits on the Board of Directors of Beth Israel Deaconess Medical Center, the Board of Trustees of the Marine Biological Laboratory and the Advisory Board of the Maxwell School of Citizenship and Public Administration at Syracuse University. Mr. O'Hanley also chairs the Council on Asset Management for the Financial Services Roundtable and is a member of the Board of Directors of Institutional Investor's U.S. Institute. |
* Trustees have been determined to be "Interested Trustees" by virtue of, among other things, their affiliation with the trust or various entities under common control with FMR.
+ The information above includes each Trustee's principal occupation during the last five years and other information relating to the experience, attributes, and skills relevant to each Trustee's qualifications to serve as a Trustee, which led to the conclusion that each Trustee should serve as a Trustee for the fund.
Annual Report
Trustees and Officers - continued
Independent Trustees:
Correspondence intended for each Independent Trustee (that is, the Trustees other than the Interested Trustees) may be sent to Fidelity Investments, P.O. Box 55235, Boston, Massachusetts 02205-5235.
|
Name, Year of Birth; Principal Occupations and Other Relevant Experience+ |
|
|
Dennis J. Dirks (1948) |
|
|
Year of Election or Appointment: 2005 Trustee |
|
|
|
Mr. Dirks also serves as Trustee of other Fidelity funds. Prior to his retirement in May 2003, Mr. Dirks was Chief Operating Officer and a member of the Board of The Depository Trust & Clearing Corporation (DTCC). He also served as President, Chief Operating Officer, and Board member of The Depository Trust Company (DTC) and President and Board member of the National Securities Clearing Corporation (NSCC). In addition, Mr. Dirks served as Chief Executive Officer and Board member of the Government Securities Clearing Corporation, Chief Executive Officer and Board member of the Mortgage-Backed Securities Clearing Corporation, as a Trustee and a member of the Finance Committee of Manhattan College (2005-2008), and as a Trustee and a member of the Finance Committee of AHRC of Nassau County (2006-2008). Mr. Dirks is a member of the Independent Directors Council (IDC) Governing Council (2010-present) and Board of Directors for The Brookville Center for Children's Services, Inc. (2009-present). |
|
Alan J. Lacy (1953) |
|
|
Year of Election or Appointment: 2008 Trustee |
|
|
|
Mr. Lacy also serves as Trustee of other Fidelity funds. Mr. Lacy serves as Senior Adviser (2007-present) of Oak Hill Capital Partners, L.P. (private equity). Mr. Lacy also served as Chief Executive Officer (2000-2005) and Vice Chairman (2005-2006) of Sears Holdings Corporation and Sears, Roebuck and Co. (retail). In addition, Mr. Lacy serves as a member of the Board of Directors of Dave & Buster's Entertainment, Inc. (restaurant and entertainment complexes, 2010-present), Earth Fare, Inc. (retail grocery, 2012-present), The Hillman Companies, Inc. (hardware wholesalers, 2010-present), and Bristol-Myers Squibb Company (global pharmaceuticals, 2008-present). Mr. Lacy is a member of the Board of Trustees of The National Parks Conservation Association (2006-present). Previously, Mr. Lacy served as Chairman of the Board of Trustees of the National Parks Conservation Association (2008-2011) and as a member of the Board of Directors for the Western Union Company (global money transfer, 2006-2011). |
|
Ned C. Lautenbach (1944) |
|
|
Year of Election or Appointment: 2000 Trustee Chairman of the Independent Trustees |
|
|
|
Mr. Lautenbach also serves as Trustee of other Fidelity funds. Mr. Lautenbach currently serves as the Lead Director of the Eaton Corporation Board of Directors (diversified industrial, 1997-present). Mr. Lautenbach is Chairman of the Board of Directors of the Philharmonic Center for the Arts in Naples, Florida (2012-present) and a member of the Council on Foreign Relations (1994-present). Previously, Mr. Lautenbach was a Partner/Advisory Partner at Clayton, Dubilier & Rice, LLC (private equity investment, 1998-2010), as well as a Director of Sony Corporation (2006-2007). |
|
Joseph Mauriello (1944) |
|
|
Year of Election or Appointment: 2008 Trustee |
|
|
|
Mr. Mauriello also serves as Trustee of other Fidelity funds. Prior to his retirement in January 2006, Mr. Mauriello served in numerous senior management positions including Deputy Chairman and Chief Operating Officer (2004-2005), and Vice Chairman of Financial Services (2002-2004) of KPMG LLP US (professional services, 1965-2005). Mr. Mauriello currently serves as a member of the Board of Directors of XL Group plc. (global insurance and re-insurance, 2006-present). Previously, Mr. Mauriello served as a Director of the Hamilton Funds of the Bank of New York (2006-2007) and of Arcadia Resources Inc. (health care services and products, 2007-2012). |
|
Robert W. Selander (1950) |
|
|
Year of Election or Appointment: 2011 Trustee |
|
|
|
Mr. Selander also serves as Trustee of other Fidelity funds. Previously, Mr. Selander served as a Member of the Advisory Board of other Fidelity funds (2011), and Executive Vice Chairman (2010), Chief Executive Officer (2009-2010), and President and Chief Executive Officer (1997-2009) of Mastercard, Inc. |
|
Cornelia M. Small (1944) |
|
|
Year of Election or Appointment: 2005 Trustee |
|
|
|
Ms. Small also serves as Trustee of other Fidelity funds. Ms. Small is a member of the Board of Directors (2009-present) and Chair of the Investment Committee (2010-present) of the Teagle Foundation. Ms. Small also serves on the Investment Committee of the Berkshire Taconic Community Foundation (2008-present). Previously, Ms. Small served as Chairperson (2002-2008) and a member of the Investment Committee and Chairperson (2008-2012) and a member of the Board of Trustees of Smith College. In addition, Ms. Small served as Chief Investment Officer, Director of Global Equity Investments, and a member of the Board of Directors of Scudder, Stevens & Clark and Scudder Kemper Investments. |
|
William S. Stavropoulos (1939) |
|
|
Year of Election or Appointment: 2002 Trustee Vice Chairman of the Independent Trustees |
|
|
|
Mr. Stavropoulos also serves as Trustee of other Fidelity funds. Mr. Stavropoulos serves as President and Founder of the Michigan Baseball Foundation, the Great Lakes Loons (2007-present). Mr. Stavropoulos is Chairman Emeritus of the Board of Directors of The Dow Chemical Company, where he previously served in numerous senior management positions, including President, CEO (1995-2000; 2002-2004), Chairman of the Executive Committee (2000-2006), and as a member of the Board of Directors (1990-2006). Currently, Mr. Stavropoulos is Chairman of the Board of Directors of Univar Inc. (global distributor of commodity and specialty chemicals), a Director of Teradata Corporation (data warehousing and technology solutions), and Maersk Inc. (industrial conglomerate), and a member of the Advisory Board for Metalmark Capital LLC (private equity investment, 2005-present). Mr. Stavropoulos is an operating advisor to Clayton, Dubilier & Rice, LLC (private equity investment). In addition, Mr. Stavropoulos is a member of the University of Notre Dame Advisory Council for the College of Science, a Trustee of the Rollin L. Gerstacker Foundation, and a Director of the Naples Philharmonic Center for the Arts. Previously, Mr. Stavropoulos served as a Director of Chemical Financial Corporation (bank holding company, 1993-2012) and Tyco International, Ltd. (multinational manufacturing and services, 2007-2012). |
|
David M. Thomas (1949) |
|
|
Year of Election or Appointment: 2008 Trustee |
|
|
|
Mr. Thomas also serves as Trustee of other Fidelity funds. Mr. Thomas serves as Non-Executive Chairman of the Board of Directors of Fortune Brands Home and Security (home and security products, 2011-present), and as a member of the Board of Directors of Interpublic Group of Companies, Inc. (marketing communication, 2004-present). Previously, Mr. Thomas served as Executive Chairman (2005-2006) and Chairman and Chief Executive Officer (2000-2005) of IMS Health, Inc. (pharmaceutical and healthcare information solutions), and a Director of Fortune Brands, Inc. (consumer products, 2000-2011). |
+ The information above includes each Trustee's principal occupation during the last five years and other information relating to the experience, attributes, and skills relevant to each Trustee's qualifications to serve as a Trustee, which led to the conclusion that each Trustee should serve as a Trustee for the fund.
Advisory Board Member and Officers:
Correspondence intended for each officer and Peter S. Lynch may be sent to Fidelity Investments, 245 Summer Street, Boston, Massachusetts 02210. Officers appear below in alphabetical order.
|
Name, Year of Birth; Principal Occupation |
|
|
Peter S. Lynch (1944) |
|
|
Year of Election or Appointment: 2003 Member of the Advisory Board |
|
|
|
Mr. Lynch also serves as Member of the Advisory Board of other Fidelity funds. Mr. Lynch is Vice Chairman and a Director of FMR and FMR Co., Inc. In addition, Mr. Lynch serves as a Trustee of Boston College and as the Chairman of the Inner-City Scholarship Fund. Previously, Mr. Lynch served on the Special Olympics International Board of Directors (1997-2006). |
|
Elizabeth Paige Baumann (1968) |
|
|
Year of Election or Appointment: 2012 Anti-Money Laundering (AML) Officer |
|
|
|
Ms. Baumann also serves as AML Officer of other funds. She is Chief AML Officer of FMR LLC (2012-present) and is an employee of Fidelity Investments. Previously, Ms. Baumann served as Vice President and Deputy Anti-Money Laundering Officer (2007-2012). |
|
William C. Coffey (1969) |
|
|
Year of Election or Appointment: 2009 Assistant Secretary |
|
|
|
Mr. Coffey also serves as Assistant Secretary of other funds. He is Senior Vice President and Deputy General Counsel of FMR LLC (2010-present), and is an employee of Fidelity Investments. Previously, Mr. Coffey served as Vice President and Associate General Counsel of FMR LLC (2005-2009). |
|
Jonathan Davis (1968) |
|
|
Year of Election or Appointment: 2010 Assistant Treasurer |
|
|
|
Mr. Davis also serves as Assistant Treasurer of other funds. Mr. Davis is an employee of Fidelity Investments. Previously, Mr. Davis served as Vice President and Associate General Counsel of FMR LLC (2003-2010). |
|
Adrien E. Deberghes (1967) |
|
|
Year of Election or Appointment: 2008 Deputy Treasurer |
|
|
|
Mr. Deberghes also serves as an officer of other funds. He is an employee of Fidelity Investments (2008-present). Prior to joining Fidelity Investments, Mr. Deberghes was Senior Vice President of Mutual Fund Administration at State Street Corporation (2007-2008), Senior Director of Mutual Fund Administration at Investors Bank & Trust (2005-2007), and Director of Finance for Dunkin' Brands (2000-2005). |
|
Stephanie J. Dorsey (1969) |
|
|
Year of Election or Appointment: 2010 Assistant Treasurer |
|
|
|
Ms. Dorsey also serves as an officer of other funds. She is an employee of Fidelity Investments (2008-present) and has served in other fund officer roles. Prior to joining Fidelity Investments, Ms. Dorsey served as Treasurer (2004-2008) of the JPMorgan Mutual Funds and Vice President (2004-2008) of JPMorgan Chase Bank. |
|
Scott C. Goebel (1968) |
|
|
Year of Election or Appointment: 2008 Secretary and Chief Legal Officer (CLO) |
|
|
|
Mr. Goebel serves as Secretary and CLO of other funds. Mr. Goebel also serves as Secretary of Fidelity Investments Money Management, Inc. (FIMM) (2010-present) and Fidelity Research and Analysis Company (FRAC) (2010-present); General Counsel, Secretary, and Senior Vice President of FMR (2008-present) and FMR Co., Inc. (2008-present); Chief Legal Officer of Fidelity Management & Research (Hong Kong) Limited (2008-present) and Assistant Secretary of Fidelity Management & Research (Japan) Inc. (2008-present), and Fidelity Management & Research (U.K.) Inc. (2008-present). Previously, Mr. Goebel served as Secretary and CLO of other Fidelity funds (2008-2013), Assistant Secretary of FIMM (2008-2010), FRAC (2008-2010), and certain funds (2007-2008); and as Vice President and Secretary of Fidelity Distributors Corporation (FDC) (2005-2007). Mr. Goebel has been employed by FMR LLC or an affiliate since 2001. |
|
Joseph A. Hanlon (1968) |
|
|
Year of Election or Appointment: 2012 Chief Compliance Officer |
|
|
|
Mr. Hanlon also serves as Chief Compliance Officer of other funds. Mr. Hanlon serves as Compliance Officer of FMR, FMR Co., Inc., Fidelity Investments Money Management, Inc. (FIMM), Fidelity Research and Analysis Company (FRAC), and Fidelity Management & Research (Hong Kong) (2009-present), as Senior Vice President of the Fidelity Asset Management Division (2009-present), and is an employee of Fidelity Investments. Previously, Mr. Hanlon served as Compliance Officer of Fidelity Management & Research (Japan) Inc. (2009-2013), Strategic Advisers, Inc. (2009-2013), and Fidelity Management & Research (U.K.) Inc. (2009-2013). |
|
Bruce T. Herring (1965) |
|
|
Year of Election or Appointment: 2006 Vice President of certain Equity Funds |
|
|
|
Mr. Herring also serves as Vice President of other funds. He serves as Chief Investment Officer of Fidelity Global Asset Allocation (GAA) (2013-present), Group Chief Investment Officer of FMR, and President of Fidelity Research & Analysis Company (2010-present). Previously, Mr. Herring served as Chief Investment Officer and Director of Fidelity Management & Research (U.K.) Inc. (2010-2013), Vice President (2005-2006) and Senior Vice President (2006-2007) of Fidelity Management & Research Company, Vice President of FMR Co., Inc. (2001-2007), and as a portfolio manager for Fidelity U.S. Equity Funds. |
|
Brian B. Hogan (1964) |
|
|
Year of Election or Appointment: 2009 Vice President |
|
|
|
Mr. Hogan also serves as Vice President of other funds. Mr. Hogan serves as President of FMR's Equity Division (2009-present). Previously, Mr. Hogan served as Senior Vice President, Equity Research of FMR (2006-2009) and as a portfolio manager. |
|
Chris Maher (1972) |
|
|
Year of Election or Appointment: 2013 Assistant Treasurer |
|
|
|
Mr. Maher serves as Assistant Treasurer of other funds. Mr. Maher is Vice President of Valuation Oversight and is an employee of Fidelity Investments. Previously, Mr. Maher served as Vice President of Asset Management Compliance (2013), Vice President of FMR's Program Management Group (2010-2013), and Vice President of Valuation Oversight (2008-2010). |
|
Christine Reynolds (1958) |
|
|
Year of Election or Appointment: 2008 Chief Financial Officer |
|
|
|
Ms. Reynolds also serves as Chief Financial Officer of other funds. Ms. Reynolds became President of Fidelity Pricing and Cash Management Services (FPCMS) in August 2008. Ms. Reynolds served as Chief Operating Officer of FPCMS (2007-2008). Previously, Ms. Reynolds served as President, Treasurer, and Anti-Money Laundering officer of the Fidelity funds (2004-2007). |
|
Kenneth B. Robins (1969) |
|
|
Year of Election or Appointment: 2008 President and Treasurer |
|
|
|
Mr. Robins also serves as an officer of other funds. Mr. Robins serves as Executive Vice President of Fidelity Investments Money Management, Inc. (FIMM) (2013-present) and is an employee of Fidelity Investments (2004-present). Previously, Mr. Robins served in other fund officer roles. |
|
Gary W. Ryan (1958) |
|
|
Year of Election or Appointment: 2005 Assistant Treasurer |
|
|
|
Mr. Ryan also serves as Assistant Treasurer of other funds. Mr. Ryan is an employee of Fidelity Investments and has served in other fund officer roles. Previously, Mr. Ryan served as Vice President of Fund Reporting in Fidelity Pricing and Cash Management Services (FPCMS) (1999-2005). |
|
Stephen Sadoski (1971) |
|
|
Year of Election or Appointment: 2012 Deputy Treasurer |
|
|
|
Mr. Sadoski also serves as Deputy Treasurer of other funds. He is an employee of Fidelity Investments (2012-present) and has served in another fund officer role. Prior to joining Fidelity Investments, Mr. Sadoski served as an assistant chief accountant in the Division of Investment Management of the Securities and Exchange Commission (SEC) (2009-2012) and as a senior manager at Deloitte & Touche LLP (1997-2009). |
|
Stacie M. Smith (1974) |
|
|
Year of Election or Appointment: 2013 Deputy Treasurer |
|
|
|
Ms. Smith also serves as an officer of other funds. She is an employee of Fidelity Investments (2009-present) and has served in other fund officer roles. Prior to joining Fidelity Investments, Ms. Smith served as Senior Audit Manager of Ernst & Young LLP (1996-2009). |
|
Renee Stagnone (1975) |
|
|
Year of Election or Appointment: 2013 Deputy Treasurer |
|
|
|
Ms. Stagnone also serves as Deputy Treasurer of other funds. Ms. Stagnone is an employee of Fidelity Investments. |
|
Joseph F. Zambello (1957) |
|
|
Year of Election or Appointment: 2011 Deputy Treasurer |
|
|
|
Mr. Zambello also serves as Deputy Treasurer of other funds. Mr. Zambello is an employee of Fidelity Investments. Previously, Mr. Zambello served as Vice President of FMR's Program Management Group (2009-2011) and Vice President of the Transfer Agent Oversight Group (2005-2009). |
Annual Report
Distributions (Unaudited)
The Board of Trustees of Fidelity Advisor Series Growth Opportunities voted to pay to shareholders of record at the opening of business on record date, the following distributions per share derived from capital gains realized from sales of portfolio securities:
|
|
Pay Date |
Record Date |
Capital Gains |
|
Fidelity Advisor Series Growth Opportunities |
01/13/2014 |
01/10/2014 |
$0.020 |
The fund hereby designates as a capital gain dividend with respect to the taxable year ended November 30, 2013 $715,110 or, if subsequently determined to be different, the net capital gain of such year.
The fund will notify shareholders in January 20l4 of amounts for use in preparing 20l3 income tax returns.
Annual Report
Board Approval of Investment Advisory Contracts and Management Fees
Fidelity Advisor Series Growth Opportunities Fund
On September 18, 2013, the Board of Trustees, including the Independent Trustees (together, the Board), voted to approve the management contract and sub-advisory agreements (together, the Advisory Contracts) for the fund. The Board, assisted by the advice of fund counsel and Independent Trustees' counsel, considered a broad range of information.
Nature, Extent, and Quality of Services Provided. The Board considered the staffing within the investment adviser, FMR, and the sub-advisers (together, the Investment Advisers), including the backgrounds of the fund's investment personnel, and also considered the fund's investment objective, strategies, and related investment philosophy. The Board considered the structure of the portfolio manager compensation program and whether this structure provides appropriate incentives to act in the best interests of the fund.
Resources Dedicated to Investment Management and Support Services. The Board and the Fund Oversight and Research Committees reviewed the general qualifications and capabilities of the Investment Advisers' investment staff, including its size, education, experience, and resources, as well as the Investment Advisers' approach to recruiting, training, managing, and compensating investment personnel. The Board also noted that FMR has continued to increase the resources devoted to non-U.S. offices, including expansion of Fidelity's global investment organization. The Board noted that Fidelity's analysts have extensive resources, tools and capabilities that allow them to conduct sophisticated quantitative and fundamental analysis, as well as credit analysis of issuers, counterparties and guarantors. The Board also believes that Fidelity's investment professionals have sufficient access to global information and data so as to provide competitive investment results over time, and that those professionals also have access to sophisticated tools that permit them to assess portfolio construction and risk and performance attribution characteristics continuously, as well as to transmit new information and research conclusions rapidly around the world. Additionally, in its deliberations, the Board considered the Investment Advisers' trading and risk management capabilities and resources, which are an integral part of the investment management process.
Shareholder and Administrative Services. The Board considered the nature, extent, quality, and cost of advisory, administrative, and shareholder services to be performed by the Investment Advisers and their affiliates under the Advisory Contracts and under separate agreements covering transfer agency, and pricing and bookkeeping, and securities lending services for the fund. The Board also considered the nature and extent of the supervision of third party service providers, principally custodians and subcustodians.
The Board noted that the growth of fund assets over time across the complex allows Fidelity to reinvest in the development of services designed to enhance the value or convenience of the Fidelity funds as investment vehicles. These services include 24-hour access to account information and market information through telephone representatives and over the Internet, investor education materials and asset allocation tools, and the expanded availability of Fidelity Investor Centers.
Annual Report
Board Approval of Investment Advisory Contracts and
Management Fees - continued
Investment Performance. The fund is a new fund and therefore had no historical performance for the Board to review at the time it approved the fund's Advisory Contracts. The Board considered the Investment Advisers' strength in fundamental, research-driven security selection, which the Board is familiar with through its supervision of other Fidelity funds.
Based on its review, the Board concluded that the nature, extent, and quality of services to be provided to the fund under the Advisory Contracts should benefit the fund's shareholders.
Competitiveness of Management Fee and Total Expense Ratio. The Board considered the fund's proposed management fee and the projected total expense ratio of the fund in reviewing the Advisory Contracts. The Board noted that the fund's proposed management fee rate is lower than the median fee rate of funds with similar Lipper investment objective categories and comparable investment mandates. The Board also considered that the projected total expense ratios are comparable to those of similar classes and funds that Fidelity offers to shareholders.
Based on its review, the Board concluded that the fund's management fee and projected total expense ratio were reasonable in light of the services that the fund and its shareholders will receive and the other factors considered.
Costs of the Services and Profitability. The fund is a new fund and therefore no revenue, cost, or profitability data was available for the Board to review in respect of the fund at the time it approved the Advisory Contracts. In connection with its future renewal of the fund's Advisory Contracts, the Board will consider the revenues earned and the expenses incurred by Fidelity in conducting the business of developing, marketing, distributing, managing, administering and servicing the fund and its shareholders.
Economies of Scale. The Board will consider economies of scale when there is operating experience to permit assessment thereof. It noted that, notwithstanding the entrepreneurial risk associated with a new fund, the management fee was at a level normally associated, by comparison with competitors, with very high fund net assets, and Fidelity asserted to the Board that the level of the fee anticipated economies of scale at lower asset levels even before, if ever, economies of scale are achieved. The Board also noted that the fund and its shareholders would have access to the very considerable number and variety of services available through Fidelity and its affiliates.
Based on its evaluation of all of the conclusions noted above, and after considering all factors it believed relevant, the Board ultimately concluded that the advisory fee structures are fair and reasonable, and that the fund's Advisory Contracts should be approved.
Annual Report
Investment Adviser
Fidelity Management & Research Company
Boston, MA
Investment Sub-Advisers
FMR Co., Inc.
Fidelity Management & Research (Hong Kong) Limited
Fidelity Management & Research (Japan) Inc.
General Distributor
Fidelity Distributors Corporation
Smithfield, RI
Transfer and Service Agents
Fidelity Investments Institutional Operations Company, Inc.
Boston, MA
Fidelity Service Company, Inc.
Boston, MA
Custodian
State Street Bank & Trust Company
Quincy, MA
(Fidelity Investment logo)(registered trademark)
Corporate Headquarters
245 Summer St., Boston, MA 02210
www.fidelity.com
AXS3-ANN-0114 1.967930.100
Fidelity Advisor®
Series Small Cap Fund
Annual Report
November 30, 2013
(Fidelity Cover Art)
Contents
|
Shareholder Expense Example |
An example of shareholder expenses. |
|
|
Investment Summary |
A summary of the fund's holdings. |
|
|
Investments |
A complete list of the fund's investments with their market values. |
|
|
Financial Statements |
Statements of assets and liabilities, operations, and changes in net assets, as well as financial highlights. |
|
|
Notes |
Notes to the Financial Statements. |
|
|
Report of Independent Registered Public Accounting Firm |
|
|
|
Trustees and Officers |
|
|
|
Distributions |
|
|
|
Board Approval of Investment Advisory Contracts and Management Fees |
|
To view a fund's proxy voting guidelines and proxy voting record for the 12-month period ended June 30, visit http://www.fidelity.com/proxyvotingresults or visit the Securities and Exchange Commission's (SEC) web site at http://www.sec.gov. You may also call 1-877-208-0098 to request a free copy of the proxy voting guidelines.
Standard & Poor's, S&P and S&P 500 are registered service marks of The McGraw-Hill Companies, Inc. and have been licensed for use by Fidelity Distributors Corporation.
Other third-party marks appearing herein are the property of their respective owners.
All other marks appearing herein are registered or unregistered trademarks or service marks of FMR LLC or an affiliated company. © 2014 FMR LLC. All rights reserved.
This report and the financial statements contained herein are submitted for the general information of the shareholders of the fund. This report is not authorized for distribution to prospective investors in the fund unless preceded or accompanied by an effective prospectus.
A fund files its complete schedule of portfolio holdings with the SEC for the first and third quarters of each fiscal year on Form N-Q. Forms N-Q are available on the SEC's web site at http://www.sec.gov. A fund's Forms N-Q may be reviewed and copied at the SEC's Public Reference Room in Washington, DC. Information regarding the operation of the SEC's Public Reference Room may be obtained by calling 1-800-SEC-0330. For a complete list of a fund's portfolio holdings, view the most recent holdings listing, semiannual report, or annual report on Fidelity's web site at http://www.fidelity.com, http://www.advisor.fidelity.com, or http://www.401k.com, as applicable.
NOT FDIC INSURED • MAY LOSE VALUE • NO BANK GUARANTEE
Neither the fund nor Fidelity Distributors Corporation is a bank.
Annual Report
Shareholder Expense Example
As a shareholder of the Fund, you incur two types of costs: (1) transaction costs, and (2) ongoing costs, including management fees and other Fund expenses. This Example is intended to help you understand your ongoing costs (in dollars) of investing in the Fund and to compare these costs with the ongoing costs of investing in other mutual funds.
The actual expense Example is based on an investment of $1,000 invested at the beginning of the period and held for the entire period (November 7, 2013 to November 30, 2013). The hypothetical expense Example is based on an investment of $1,000 invested for the one-half year period (June 1, 2013 to November 30, 2013).
Actual Expenses
The first line of the accompanying table provides information about actual account values and actual expenses. You may use the information in this line, together with the amount you invested, to estimate the expenses that you paid over the period. Simply divide your account value by $1,000.00 (for example, an $8,600 account value divided by $1,000.00 = 8.6), then multiply the result by the number in the first line under the heading entitled "Expenses Paid During Period" to estimate the expenses you paid on your account during this period. In addition, the Fund, as a shareholder in the underlying Fidelity Central Funds, will indirectly bear its pro-rata share of the fees and expenses incurred by the underlying Fidelity Central Funds. These fees and expenses are not included in the Fund's annualized expense ratio used to calculate the expense estimate in the table below.
Hypothetical Example for Comparison Purposes
The second line of the accompanying table provides information about hypothetical account values and hypothetical expenses based on the Fund's actual expense ratio and an assumed rate of return of 5% per year before expenses, which is not the Fund's actual return. The hypothetical account values and expenses may not be used to estimate the actual ending account balance or expenses you paid for the period. You may use this information to compare the ongoing costs of investing in the Fund and other funds. To do so, compare this 5% hypothetical example with the 5% hypothetical examples that appear in the shareholder reports of the other funds. In addition, the Fund, as a shareholder in the underlying Fidelity Central Funds, will indirectly bear its pro-rata share of the fees and expenses incurred by the underlying Fidelity Central Funds. These fees and expenses are not included in the Fund's annualized expense ratio used to calculate the expense estimate in the table below.
Please note that the expenses shown in the table are meant to highlight your ongoing costs only and do not reflect any transaction costs. Therefore, the second line of the table is useful in comparing ongoing costs only, and will not help you determine the relative total costs of owning different funds.
Annual Report
Shareholder Expense Example - continued
|
|
Annualized |
Beginning |
Ending |
Expenses Paid |
|
Actual |
.95% |
$ 1,000.00 |
$ 1,039.00 |
$ .64 C |
|
HypotheticalA |
|
$ 1,000.00 |
$ 1,020.31 |
$ 4.81 D |
A 5% return per year before expenses
B Annualized expense ratio reflects expenses net of applicable fee waivers.
C Actual expenses are equal to the Fund's annualized expense ratio, multiplied by the average account value over the period, multiplied by 24/365 (to reflect the period November 7, 2013 to November 30, 2013).
D Hypothetical expenses are equal to the Fund's annualized expense ratio, multiplied by the average account value over the period, multiplied by 183/365 (to reflect the one-half year period).
Annual Report
Investment Summary (Unaudited)
|
Top Ten Stocks as of November 30, 2013 |
|
|
|
% of fund's |
|
Global Payments, Inc. |
1.8 |
|
Badger Daylighting Ltd. |
1.7 |
|
Primerica, Inc. |
1.7 |
|
Moog, Inc. Class A |
1.7 |
|
Skechers U.S.A., Inc. Class A (sub. vtg.) |
1.7 |
|
Office Depot, Inc. |
1.7 |
|
The Ensign Group, Inc. |
1.6 |
|
PolyOne Corp. |
1.6 |
|
WESCO International, Inc. |
1.5 |
|
Jazz Pharmaceuticals PLC |
1.4 |
|
|
16.4 |
|
Top Five Market Sectors as of November 30, 2013 |
|
|
|
% of fund's |
|
Financials |
18.5 |
|
Information Technology |
15.6 |
|
Consumer Discretionary |
15.3 |
|
Industrials |
14.8 |
|
Health Care |
11.2 |
|
Asset Allocation (% of fund's net assets) |
||||||
|
As of November 30, 2013* |
|
|||||
 |
Stocks and |
|
|
|
||
 |
Short-Term Investments and Net Other Assets (Liabilities) 0.6% |
|
|
|
||
|
* Foreign investments |
18.0% |
|
|
|
||

Annual Report
Investments November 30, 2013
Showing Percentage of Net Assets
|
Common Stocks - 90.7% |
|||
|
Shares |
Value |
||
|
CONSUMER DISCRETIONARY - 15.3% |
|||
|
Auto Components - 0.6% |
|||
|
Dorman Products, Inc. |
61,700 |
$ 3,071,426 |
|
|
Diversified Consumer Services - 1.8% |
|||
|
Best Bridal, Inc. |
392,500 |
2,612,963 |
|
|
Grand Canyon Education, Inc. (a) |
80,200 |
3,652,308 |
|
|
Meiko Network Japan Co. Ltd. |
222,100 |
2,291,568 |
|
|
|
8,556,839 |
||
|
Hotels, Restaurants & Leisure - 1.5% |
|||
|
AFC Enterprises, Inc. (a) |
30,800 |
1,342,572 |
|
|
Life Time Fitness, Inc. (a) |
55,500 |
2,692,305 |
|
|
Texas Roadhouse, Inc. Class A |
111,000 |
3,105,780 |
|
|
|
7,140,657 |
||
|
Household Durables - 1.8% |
|||
|
Iida Group Holdings Co. Ltd. (a) |
155,000 |
3,118,307 |
|
|
Tupperware Brands Corp. |
60,500 |
5,526,070 |
|
|
|
8,644,377 |
||
|
Multiline Retail - 0.7% |
|||
|
Big Lots, Inc. (a) |
84,140 |
3,225,086 |
|
|
Specialty Retail - 5.5% |
|||
|
Aarons, Inc. Class A |
148,100 |
4,241,584 |
|
|
Aeropostale, Inc. (a)(d) |
424,200 |
4,377,744 |
|
|
Ascena Retail Group, Inc. (a) |
141,900 |
3,022,470 |
|
|
Jumbo SA (a) |
191,200 |
2,977,337 |
|
|
Murphy U.S.A., Inc. |
86,400 |
3,909,600 |
|
|
Office Depot, Inc. (a) |
1,499,000 |
8,154,560 |
|
|
|
26,683,295 |
||
|
Textiles, Apparel & Luxury Goods - 3.4% |
|||
|
Skechers U.S.A., Inc. Class A (sub. vtg.) (a) |
246,800 |
8,297,416 |
|
|
Steven Madden Ltd. (a) |
145,300 |
5,660,888 |
|
|
Wolverine World Wide, Inc. |
86,400 |
2,843,424 |
|
|
|
16,801,728 |
||
|
TOTAL CONSUMER DISCRETIONARY |
74,123,408 |
||
|
CONSUMER STAPLES - 4.8% |
|||
|
Food & Staples Retailing - 1.7% |
|||
|
Ain Pharmaciez, Inc. |
16,000 |
741,081 |
|
|
Sundrug Co. Ltd. |
85,100 |
3,833,633 |
|
|
Tsuruha Holdings, Inc. |
37,000 |
3,405,827 |
|
|
|
7,980,541 |
||
|
Common Stocks - continued |
|||
|
Shares |
Value |
||
|
CONSUMER STAPLES - continued |
|||
|
Food Products - 1.0% |
|||
|
Darling International, Inc. (a) |
230,100 |
$ 4,769,973 |
|
|
Personal Products - 2.1% |
|||
|
Atrium Innovations, Inc. (a) |
283,800 |
6,495,709 |
|
|
Prestige Brands Holdings, Inc. (a) |
111,000 |
3,911,640 |
|
|
|
10,407,349 |
||
|
TOTAL CONSUMER STAPLES |
23,157,863 |
||
|
ENERGY - 5.5% |
|||
|
Energy Equipment & Services - 3.9% |
|||
|
Cathedral Energy Services Ltd. |
442,100 |
2,101,176 |
|
|
Key Energy Services, Inc. (a) |
605,400 |
4,746,336 |
|
|
Oil States International, Inc. (a) |
30,800 |
3,152,380 |
|
|
Pason Systems, Inc. |
254,300 |
5,432,789 |
|
|
Western Energy Services Corp. |
464,100 |
3,271,478 |
|
|
|
18,704,159 |
||
|
Oil, Gas & Consumable Fuels - 1.6% |
|||
|
BP Prudhoe Bay Royalty Trust |
2,186 |
166,223 |
|
|
Sunoco Logistics Partners LP |
30,800 |
2,180,024 |
|
|
World Fuel Services Corp. |
145,300 |
5,579,520 |
|
|
|
7,925,767 |
||
|
TOTAL ENERGY |
26,629,926 |
||
|
FINANCIALS - 18.5% |
|||
|
Capital Markets - 0.4% |
|||
|
Virtus Investment Partners, Inc. (a) |
9,300 |
1,932,540 |
|
|
Commercial Banks - 4.7% |
|||
|
Bank of the Ozarks, Inc. |
49,300 |
2,768,195 |
|
|
East West Bancorp, Inc. |
145,300 |
4,980,884 |
|
|
First Financial Bankshares, Inc. (d) |
24,700 |
1,639,586 |
|
|
Popular, Inc. (a) |
92,500 |
2,643,650 |
|
|
Prosperity Bancshares, Inc. |
49,400 |
3,168,022 |
|
|
Sterling Financial Corp. |
148,100 |
4,835,465 |
|
|
SVB Financial Group (a) |
24,700 |
2,500,628 |
|
|
|
22,536,430 |
||
|
Consumer Finance - 0.6% |
|||
|
EZCORP, Inc. (non-vtg.) Class A (a) |
248,500 |
2,902,480 |
|
|
Common Stocks - continued |
|||
|
Shares |
Value |
||
|
FINANCIALS - continued |
|||
|
Insurance - 6.5% |
|||
|
CNO Financial Group, Inc. |
314,800 |
$ 5,326,416 |
|
|
Enstar Group Ltd. (a) |
24,700 |
3,440,957 |
|
|
HCC Insurance Holdings, Inc. |
111,000 |
5,103,780 |
|
|
Primerica, Inc. |
193,700 |
8,334,911 |
|
|
ProAssurance Corp. |
86,400 |
4,154,112 |
|
|
Reinsurance Group of America, Inc. |
66,600 |
4,993,668 |
|
|
|
31,353,844 |
||
|
Real Estate Investment Trusts - 5.2% |
|||
|
Aviv REIT, Inc. |
92,500 |
2,377,250 |
|
|
Corrections Corp. of America |
98,700 |
3,291,645 |
|
|
EPR Properties |
49,400 |
2,484,326 |
|
|
Equity Lifestyle Properties, Inc. |
55,500 |
1,970,250 |
|
|
First Industrial Realty Trust, Inc. |
135,700 |
2,369,322 |
|
|
MFA Financial, Inc. |
531,500 |
3,874,635 |
|
|
National Health Investors, Inc. |
37,000 |
2,178,190 |
|
|
Rouse Properties, Inc. (d) |
197,400 |
4,814,586 |
|
|
Sovran Self Storage, Inc. |
30,800 |
2,055,592 |
|
|
|
25,415,796 |
||
|
Real Estate Management & Development - 0.3% |
|||
|
Relo Holdings Corp. |
30,800 |
1,503,246 |
|
|
Thrifts & Mortgage Finance - 0.8% |
|||
|
EverBank Financial Corp. |
234,400 |
4,001,208 |
|
|
TOTAL FINANCIALS |
89,645,544 |
||
|
HEALTH CARE - 11.2% |
|||
|
Biotechnology - 1.1% |
|||
|
United Therapeutics Corp. (a) |
60,500 |
5,584,755 |
|
|
Health Care Equipment & Supplies - 1.7% |
|||
|
DENTSPLY International, Inc. |
67,900 |
3,229,324 |
|
|
The Cooper Companies, Inc. |
37,000 |
4,874,380 |
|
|
|
8,103,704 |
||
|
Health Care Providers & Services - 6.2% |
|||
|
AmSurg Corp. (a) |
145,300 |
7,020,896 |
|
|
Centene Corp. (a) |
24,700 |
1,475,331 |
|
|
Community Health Systems, Inc. |
111,000 |
4,578,750 |
|
|
Health Net, Inc. (a) |
98,700 |
3,015,285 |
|
|
Henry Schein, Inc. (a) |
24,700 |
2,815,800 |
|
|
Common Stocks - continued |
|||
|
Shares |
Value |
||
|
HEALTH CARE - continued |
|||
|
Health Care Providers & Services - continued |
|||
|
MEDNAX, Inc. (a) |
30,800 |
$ 3,412,640 |
|
|
The Ensign Group, Inc. |
172,700 |
7,800,859 |
|
|
|
30,119,561 |
||
|
Health Care Technology - 0.8% |
|||
|
Quality Systems, Inc. |
160,400 |
3,746,944 |
|
|
Pharmaceuticals - 1.4% |
|||
|
Jazz Pharmaceuticals PLC (a) |
60,500 |
7,073,660 |
|
|
TOTAL HEALTH CARE |
54,628,624 |
||
|
INDUSTRIALS - 14.8% |
|||
|
Aerospace & Defense - 2.9% |
|||
|
Moog, Inc. Class A (a) |
121,100 |
8,315,937 |
|
|
Teledyne Technologies, Inc. (a) |
60,500 |
5,610,165 |
|
|
|
13,926,102 |
||
|
Commercial Services & Supplies - 2.4% |
|||
|
Mitie Group PLC |
801,900 |
4,087,344 |
|
|
UniFirst Corp. |
37,800 |
3,864,672 |
|
|
West Corp. |
154,200 |
3,551,226 |
|
|
|
11,503,242 |
||
|
Construction & Engineering - 1.7% |
|||
|
Badger Daylighting Ltd. |
106,100 |
8,557,998 |
|
|
Machinery - 3.3% |
|||
|
Actuant Corp. Class A |
98,700 |
3,857,196 |
|
|
Hy-Lok Corp. |
55,249 |
1,461,876 |
|
|
Standex International Corp. |
61,700 |
3,635,364 |
|
|
TriMas Corp. (a) |
123,400 |
4,513,972 |
|
|
Valmont Industries, Inc. |
17,400 |
2,517,954 |
|
|
|
15,986,362 |
||
|
Marine - 0.2% |
|||
|
SITC International Holdings Co. Ltd. |
2,591,000 |
1,139,665 |
|
|
Professional Services - 1.2% |
|||
|
Benefit One, Inc. (d) |
259,100 |
2,476,050 |
|
|
Stantec, Inc. |
49,300 |
3,198,665 |
|
|
|
5,674,715 |
||
|
Trading Companies & Distributors - 3.1% |
|||
|
DXP Enterprises, Inc. (a) |
37,000 |
3,625,260 |
|
|
Common Stocks - continued |
|||
|
Shares |
Value |
||
|
INDUSTRIALS - continued |
|||
|
Trading Companies & Distributors - continued |
|||
|
Textainer Group Holdings Ltd. (d) |
98,700 |
$ 3,832,521 |
|
|
WESCO International, Inc. (a) |
86,400 |
7,428,672 |
|
|
|
14,886,453 |
||
|
TOTAL INDUSTRIALS |
71,674,537 |
||
|
INFORMATION TECHNOLOGY - 15.6% |
|||
|
Electronic Equipment & Components - 4.3% |
|||
|
Belden, Inc. |
55,500 |
3,886,110 |
|
|
CDW Corp. |
242,200 |
5,401,060 |
|
|
Insight Enterprises, Inc. (a) |
160,400 |
3,860,828 |
|
|
Jabil Circuit, Inc. |
168,100 |
3,407,387 |
|
|
ScanSource, Inc. (a) |
106,200 |
4,459,338 |
|
|
|
21,014,723 |
||
|
Internet Software & Services - 2.9% |
|||
|
Perficient, Inc. (a) |
212,300 |
4,602,664 |
|
|
Stamps.com, Inc. (a) |
121,100 |
5,579,077 |
|
|
ValueClick, Inc. (a) |
172,700 |
3,695,780 |
|
|
|
13,877,521 |
||
|
IT Services - 6.7% |
|||
|
EPAM Systems, Inc. (a)(d) |
117,500 |
4,167,725 |
|
|
Genpact Ltd. (a) |
185,100 |
3,313,290 |
|
|
Global Payments, Inc. |
136,700 |
8,618,936 |
|
|
iGATE Corp. (a) |
149,800 |
5,015,304 |
|
|
Syntel, Inc. |
43,200 |
3,817,584 |
|
|
VeriFone Systems, Inc. (a) |
148,000 |
3,790,280 |
|
|
WEX, Inc. (a) |
37,000 |
3,672,620 |
|
|
|
32,395,739 |
||
|
Semiconductors & Semiconductor Equipment - 0.7% |
|||
|
Omnivision Technologies, Inc. (a) |
222,100 |
3,560,263 |
|
|
Software - 1.0% |
|||
|
SWORD Group |
82,661 |
1,783,638 |
|
|
Verint Systems, Inc. (a) |
86,400 |
3,276,288 |
|
|
|
5,059,926 |
||
|
TOTAL INFORMATION TECHNOLOGY |
75,908,172 |
||
|
Common Stocks - continued |
|||
|
Shares |
Value |
||
|
MATERIALS - 4.7% |
|||
|
Chemicals - 2.9% |
|||
|
Axiall Corp. |
61,700 |
$ 2,795,010 |
|
|
FUCHS PETROLUB AG |
43,200 |
3,574,840 |
|
|
PolyOne Corp. |
230,100 |
7,469,046 |
|
|
|
13,838,896 |
||
|
Containers & Packaging - 0.8% |
|||
|
Sealed Air Corp. |
123,400 |
3,962,374 |
|
|
Metals & Mining - 1.0% |
|||
|
Aurubis AG |
55,500 |
3,274,073 |
|
|
Reliance Steel & Aluminum Co. |
24,700 |
1,816,191 |
|
|
|
5,090,264 |
||
|
TOTAL MATERIALS |
22,891,534 |
||
|
UTILITIES - 0.3% |
|||
|
Gas Utilities - 0.3% |
|||
|
New Jersey Resources Corp. |
37,000 |
1,690,530 |
|
|
TOTAL COMMON STOCKS (Cost $423,753,217) |
|
||
|
U.S. Treasury Obligations - 0.4% |
||||
|
|
Principal Amount |
|
||
|
U.S. Treasury Bills, yield at date of purchase 0.06% to 0.07% 2/6/14 (e) |
|
$ 1,820,000 |
|
|
|
Money Market Funds - 10.8% |
|||
|
Shares |
Value |
||
|
Fidelity Cash Central Fund, 0.10% (b) |
46,988,046 |
$ 46,988,046 |
|
|
Fidelity Securities Lending Cash Central Fund, 0.10% (b)(c) |
5,486,405 |
5,486,405 |
|
|
TOTAL MONEY MARKET FUNDS (Cost $52,474,451) |
|
||
|
TOTAL INVESTMENT PORTFOLIO - 101.9% (Cost $478,047,449) |
494,644,463 |
||
|
NET OTHER ASSETS (LIABILITIES) - (1.9)% |
(9,105,854) |
||
|
NET ASSETS - 100% |
$ 485,538,609 |
||
|
Futures Contracts |
|||||
|
|
Expiration Date |
Underlying Face Amount at Value |
Unrealized Appreciation/ |
||
|
Purchased |
|||||
|
Equity Index Contracts |
|||||
|
372 ICE Russell 2000 Mini Index Contracts (United States) |
Dec. 2013 |
$ 42,471,240 |
$ 1,389,318 |
||
|
The face value of futures purchased as a percentage of net assets is 8.7% |
|
Legend |
|
(a) Non-income producing |
|
(b) Affiliated fund that is generally available only to investment companies and other accounts managed by Fidelity Investments. The rate quoted is the annualized seven-day yield of the fund at period end. A complete unaudited listing of the fund's holdings as of its most recent quarter end is available upon request. In addition, each Fidelity Central Fund's financial statements, which are not covered by the Fund's Report of Independent Registered Public Accounting Firm, are available on the SEC's website or upon request. |
|
(c) Investment made with cash collateral received from securities on loan. |
|
(d) Security or a portion of the security is on loan at period end. |
|
(e) Security or a portion of the security was pledged to cover margin requirements for futures contracts. At period end, the value of securities pledged amounted to $1,819,874. |
|
Affiliated Central Funds |
|
Information regarding fiscal year to date income earned by the Fund from investments in Fidelity Central Funds is as follows: |
|
Fund |
Income earned |
|
Fidelity Cash Central Fund |
$ 2,245 |
|
Fidelity Securities Lending Cash Central Fund |
1,295 |
|
Total |
$ 3,540 |
|
Other Information |
|
The following is a summary of the inputs used, as of November 30, 2013, involving the Fund's assets and liabilities carried at fair value. The inputs or methodology used for valuing securities may not be an indication of the risk associated with investing in those securities. For more information on valuation inputs, and their aggregation into the levels used in the table below, please refer to the Investment Valuation section in the accompanying Notes to Financial Statements. |
|
Valuation Inputs at Reporting Date: |
||||
|
Description |
Total |
Level 1 |
Level 2 |
Level 3 |
|
Investments in Securities: |
||||
|
Equities: |
||||
|
Consumer Discretionary |
$ 74,123,408 |
$ 74,123,408 |
$ - |
$ - |
|
Consumer Staples |
23,157,863 |
23,157,863 |
- |
- |
|
Energy |
26,629,926 |
26,629,926 |
- |
- |
|
Financials |
89,645,544 |
89,645,544 |
- |
- |
|
Health Care |
54,628,624 |
54,628,624 |
- |
- |
|
Industrials |
71,674,537 |
71,674,537 |
- |
- |
|
Information Technology |
75,908,172 |
75,908,172 |
- |
- |
|
Materials |
22,891,534 |
22,891,534 |
- |
- |
|
Utilities |
1,690,530 |
1,690,530 |
- |
- |
|
U.S. Government and Government Agency Obligations |
1,819,874 |
- |
1,819,874 |
- |
|
Money Market Funds |
52,474,451 |
52,474,451 |
- |
- |
|
Total Investments in Securities: |
$ 494,644,463 |
$ 492,824,589 |
$ 1,819,874 |
$ - |
|
Derivative Instruments: |
||||
|
Assets |
||||
|
Futures Contracts |
$ 1,389,318 |
$ 1,389,318 |
$ - |
$ - |
|
Value of Derivative Instruments |
|
The following table is a summary of the Fund's value of derivative instruments by primary risk exposure as of November 30, 2013. For additional information on derivative instruments, please refer to the Derivative Instruments section in the accompanying Notes to Financial Statements. |
|
Primary Risk Exposure / |
Value |
|
|
|
Asset |
Liability |
|
Equity Risk |
||
|
Futures Contracts (a) |
$ 1,389,318 |
$ - |
|
Total Value of Derivatives |
$ 1,389,318 |
$ - |
|
(a) Reflects gross cumulative appreciation (depreciation) on futures contracts as presented in the Schedule of Investments. Only the period end receivable or payable for daily variation margin and net unrealized appreciation (depreciation) are presented in the Statement of Assets and Liabilities. |
|
Distribution of investments by country or territory of incorporation, as a percentage of total net assets, is as follows (Unaudited): |
|
United States of America |
82.0% |
|
Canada |
5.9% |
|
Japan |
4.2% |
|
Bermuda |
2.2% |
|
Ireland |
1.4% |
|
Germany |
1.4% |
|
Others (Individually Less Than 1%) |
2.9% |
|
|
100.0% |
See accompanying notes which are an integral part of the financial statements.
Annual Report
Financial Statements
Statement of Assets and Liabilities
|
|
November 30, 2013 |
|
|
|
|
|
|
Assets |
|
|
|
Investment in securities, at value (including securities loaned of $5,382,475) - See accompanying schedule: Unaffiliated issuers (cost $425,572,998) |
$ 442,170,012 |
|
|
Fidelity Central Funds (cost $52,474,451) |
52,474,451 |
|
|
Total Investments (cost $478,047,449) |
|
$ 494,644,463 |
|
Foreign currency held at value (cost $33,421) |
|
33,421 |
|
Receivable for investments sold |
|
734,221 |
|
Dividends receivable |
|
78,465 |
|
Distributions receivable from Fidelity Central Funds |
|
3,540 |
|
Receivable for daily variation margin for derivative instruments |
|
47,546 |
|
Receivable from investment adviser for expense reductions |
|
34,621 |
|
Total assets |
|
495,576,277 |
|
|
|
|
|
Liabilities |
|
|
|
Payable for investments purchased |
$ 4,268,650 |
|
|
Accrued management fee |
191,680 |
|
|
Other affiliated payables |
62,492 |
|
|
Other payables and accrued expenses |
28,441 |
|
|
Collateral on securities loaned, at value |
5,486,405 |
|
|
Total liabilities |
|
10,037,668 |
|
|
|
|
|
Net Assets |
|
$ 485,538,609 |
|
Net Assets consist of: |
|
|
|
Paid in capital |
|
$ 467,540,177 |
|
Accumulated undistributed net realized gain (loss) on investments and foreign currency transactions |
|
12,652 |
|
Net unrealized appreciation (depreciation) on investments and assets and liabilities in foreign currencies |
|
17,985,780 |
|
Net Assets, for 46,745,828 shares outstanding |
|
$ 485,538,609 |
|
Net Asset Value, offering price and redemption price per share ($485,538,609 ÷ 46,745,828 shares) |
|
$ 10.39 |
See accompanying notes which are an integral part of the financial statements.
Annual Report
Statement of Operations
|
|
For the period November 7, 2013 |
|
|
|
|
|
|
Investment Income |
|
|
|
Dividends |
|
$ 145,386 |
|
Special dividends |
|
33,418 |
|
Interest |
|
50 |
|
Income from Fidelity Central Funds |
|
3,540 |
|
Total income |
|
182,394 |
|
|
|
|
|
Expenses |
|
|
|
Management fee |
$ 191,680 |
|
|
Transfer agent fees |
51,872 |
|
|
Accounting and security lending fees |
10,620 |
|
|
Custodian fees and expenses |
2,483 |
|
|
Audit |
25,959 |
|
|
Total expenses before reductions |
282,614 |
|
|
Expense reductions |
(34,621) |
247,993 |
|
Net investment income (loss) |
|
(65,599) |
|
Realized and Unrealized Gain (Loss) Net realized gain (loss) on: |
|
|
|
Investment securities: |
|
|
|
Unaffiliated issuers |
16,707 |
|
|
Foreign currency transactions |
(4,116) |
|
|
Futures contracts |
65,659 |
|
|
Total net realized gain (loss) |
|
78,250 |
|
Change in net unrealized appreciation (depreciation) on: Investment securities |
16,597,014 |
|
|
Assets and liabilities in foreign currencies |
(552) |
|
|
Futures contracts |
1,389,318 |
|
|
Total change in net unrealized appreciation (depreciation) |
|
17,985,780 |
|
Net gain (loss) |
|
18,064,030 |
|
Net increase (decrease) in net assets resulting from operations |
|
$ 17,998,431 |
See accompanying notes which are an integral part of the financial statements.
Annual Report
Financial Statements - continued
Statement of Changes in Net Assets
|
|
For the period November 7, 2013 |
|
Increase (Decrease) in Net Assets |
|
|
Operations |
|
|
Net investment income (loss) |
$ (65,599) |
|
Net realized gain (loss) |
78,250 |
|
Change in net unrealized appreciation (depreciation) |
17,985,780 |
|
Net increase (decrease) in net assets resulting |
17,998,431 |
|
Share transactions |
468,584,982 |
|
Cost of shares redeemed |
(1,044,804) |
|
Net increase (decrease) in net assets resulting from share transactions |
467,540,178 |
|
Total increase (decrease) in net assets |
485,538,609 |
|
|
|
|
Net Assets |
|
|
Beginning of period |
- |
|
End of period |
$ 485,538,609 |
|
Other Information Shares |
|
|
Sold |
46,848,562 |
|
Redeemed |
(102,734) |
|
Net increase (decrease) |
46,745,828 |
See accompanying notes which are an integral part of the financial statements.
Annual Report
Financial Highlights
|
|
Period ended November 30, 2013 H |
|
Selected Per-Share Data |
|
|
Net asset value, beginning of period |
$ 10.00 |
|
Income from Investment Operations |
|
|
Net investment income (loss) D |
- G,J |
|
Net realized and unrealized gain (loss) |
.39 |
|
Total from investment operations |
.39 |
|
Net asset value, end of period |
$ 10.39 |
|
Total Return B, C |
3.90% |
|
Ratios to Average Net Assets E,I |
|
|
Expenses before reductions |
1.07% A |
|
Expenses net of fee waivers, if any |
.95% A |
|
Expenses net of all reductions |
.95% A |
|
Net investment income (loss) |
(.25)% A, G |
|
Supplemental Data |
|
|
Net assets, end of period (000 omitted) |
$ 485,539 |
|
Portfolio turnover rate F |
4% K |
A Annualized
B Total returns for periods of less than one year are not annualized.
C Total returns would have been lower if certain expenses had not been reduced during the applicable periods shown.
D Calculated based on average shares outstanding during the period.
E Fees and expenses of any underlying Fidelity Central Funds are not included in the Fund's expense ratio. The Fund indirectly bears its proportionate share of the expenses of any underlying Fidelity Central Funds.
F Amount does not include the portfolio activity of any underlying Fidelity Central Funds.
G Investment income per share reflects a large, non-recurring dividend which amounted to less than $.01 per share. Excluding this non-recurring dividend, the ratio of net investment income (loss) to average net assets would have been (.36)%.
H For the period November 7, 2013 (commencement of operations) to November 30, 2013.
I Expense ratios reflect operating expenses of the Fund. Expenses before reductions do not reflect amounts reimbursed by the investment adviser or reductions from expense offset arrangements and do not represent the amount paid by the Fund during periods when reimbursements or reductions occur. Expense ratios before reductions for start-up periods may not be representative of longer term operating periods. Expenses net of fee waivers reflect expenses after reimbursement by the investment adviser but prior to reductions from expense offset arrangements. Expenses net of all reductions represent the net expenses paid by the Fund.
J Amount represents less than $.01 per share.
K Amount not annualized.
See accompanying notes which are an integral part of the financial statements.
Annual Report
Notes to Financial Statements
For the period ended November 30, 2013
1. Organization.
Fidelity Advisor® Series Small Cap Fund (the Fund) is a fund of Fidelity Advisor Series I (the Trust) and is authorized to issue an unlimited number of shares. Shares of the Fund are only available for purchase by mutual funds for which Fidelity Management & Research Company (FMR) or an affiliate serves as an investment manager. The Trust is registered under the Investment Company Act of 1940, as amended (the 1940 Act), as an open-end management investment company organized as a Massachusetts business trust.
2. Investments in Fidelity Central Funds.
The Fund invests in Fidelity Central Funds, which are open-end investment companies generally available only to other investment companies and accounts managed by the investment adviser and its affiliates. The Fund's Schedule of Investments lists each of the Fidelity Central Funds held as of period end, if any, as an investment of the Fund, but does not include the underlying holdings of each Fidelity Central Fund. As an Investing Fund, the Fund indirectly bears its proportionate share of the expenses of the underlying Fidelity Central Funds.
The Money Market Central Funds seek preservation of capital and current income and are managed by Fidelity Investments Money Management, Inc. (FIMM), an affiliate of the investment adviser. Annualized expenses of the Money Market Central Funds as of their most recent shareholder report date are less than .01%.
A complete unaudited list of holdings for each Fidelity Central Fund is available upon request or at the Securities and Exchange Commission (the SEC) website at www.sec.gov. In addition, the financial statements of the Fidelity Central Funds, which are not covered by the Fund's Report of Independent Registered Public Accounting Firm, are available on the SEC website or upon request.
3. Significant Accounting Policies.
The financial statements have been prepared in conformity with accounting principles generally accepted in the United States of America (GAAP), which require management to make certain estimates and assumptions at the date of the financial statements. Actual results could differ from those estimates. Subsequent events, if any, through the date that the financial statements were issued have been evaluated in the preparation of the financial statements. The following summarizes the significant accounting policies of the Fund:
Investment Valuation. Investments are valued as of 4:00 p.m. Eastern time on the last calendar day of the period. In accordance with valuation policies and procedures
Annual Report
Notes to Financial Statements - continued
3. Significant Accounting Policies - continued
Investment Valuation - continued
approved by the Board of Trustees (the Board), the Fund attempts to obtain prices from one or more third party pricing vendors or brokers to value its investments. When current market prices, quotations or currency exchange rates are not readily available or reliable, investments will be fair valued in good faith by the FMR Fair Value Committee (the Committee), in accordance with procedures adopted by the Board. Factors used in determining fair value vary by investment type and may include market or investment specific events, changes in interest rates and credit quality. The frequency with which these procedures are used cannot be predicted and they may be utilized to a significant extent. The Committee oversees the Fund's valuation policies and procedures and is responsible for approving and reporting to the Board all fair value determinations.
The Fund categorizes the inputs to valuation techniques used to value its investments into a disclosure hierarchy consisting of three levels as shown below:
Level 1 - quoted prices in active markets for identical investments
Level 2 - other significant observable inputs (including quoted prices for similar investments, interest rates, prepayment speeds, etc.)
Level 3 - unobservable inputs (including the Fund's own assumptions based on the best information available)
Valuation techniques used to value the Fund's investments by major category are as follows:
Equity securities, including restricted securities, for which market quotations are readily available, are valued at the last reported sale price or official closing price as reported by a third party pricing vendor on the primary market or exchange on which they are traded and are categorized as Level 1 in the hierarchy. In the event there were no sales during the day or closing prices are not available, securities are valued at the last quoted bid price or may be valued using the last available price and are generally categorized as Level 2 in the hierarchy. For foreign equity securities, when market or security specific events arise, comparisons to the valuation of American Depositary Receipts (ADRs), futures contracts, Exchange-Traded Funds (ETFs) and certain indexes as well as quoted prices for similar securities may be used and would be categorized as Level 2 in the hierarchy. Utilizing these techniques may result in transfers between Level 1 and Level 2. For equity securities, including restricted securities, where observable inputs are limited, assumptions about market activity and risk are used and these securities may be categorized as Level 3 in the hierarchy.
Annual Report
3. Significant Accounting Policies - continued
Investment Valuation - continued
Debt securities, including restricted securities, are valued based on evaluated prices received from third party pricing vendors or from brokers who make markets in such securities. For U.S. government and government agency obligations, pricing vendors utilize matrix pricing which considers yield or price of bonds of comparable quality, coupon, maturity and type as well as broker-supplied prices. When independent prices are unavailable or unreliable, debt securities may be valued utilizing pricing methodologies which consider similar factors that would be used by third party pricing vendors. Debt securities are generally categorized as Level 2 in the hierarchy but may be Level 3 depending on the circumstances.
Futures contracts are valued at the settlement price established each day by the board of trade or exchange on which they are traded and are categorized as Level 1 in the hierarchy. Investments in open-end mutual funds, including the Fidelity Central Funds, are valued at their closing net asset value (NAV) each business day and are categorized as Level 1 in the hierarchy.
Changes in valuation techniques may result in transfers in or out of an assigned level within the disclosure hierarchy. The aggregate value of investments by input level, as of November 30, 2013, is included at the end of the Fund's Schedule of Investments.
Foreign Currency. The Fund may use foreign currency contracts to facilitate transactions in foreign-denominated securities. Gains and losses from these transactions may arise from changes in the value of the foreign currency or if the counterparties do not perform under the contracts' terms.
Foreign-denominated assets, including investment securities, and liabilities are translated into U.S. dollars at the exchange rates at period end. Purchases and sales of investment securities, income and dividends received and expenses denominated in foreign currencies are translated into U.S. dollars at the exchange rate in effect on the transaction date.
The effects of exchange rate fluctuations on investments are included with the net realized and unrealized gain (loss) on investment securities. Other foreign currency transactions resulting in realized and unrealized gain (loss) are disclosed separately.
Investment Transactions and Income. For financial reporting purposes, the Fund's investment holdings and NAV include trades executed through the end of the last business day of the period. The NAV per share for processing shareholder transactions is calculated as of the close of business of the New York Stock Exchange (NYSE), normally
Annual Report
Notes to Financial Statements - continued
3. Significant Accounting Policies - continued
Investment Transactions and Income - continued
4:00 p.m. Eastern time and includes trades executed through the end of the prior business day. Gains and losses on securities sold are determined on the basis of identified cost. Dividend income is recorded on the ex-dividend date, except for certain dividends from foreign securities where the ex-dividend date may have passed, which are recorded as soon as the Fund is informed of the ex-dividend date. Non-cash dividends included in dividend income, if any, are recorded at the fair market value of the securities received. Distributions received on securities that represent a return of capital or capital gain are recorded as a reduction of cost of investments and/or as a realized gain. Subsequent to ex-dividend date the Fund determines the components of these distributions, based upon receipt of tax filings or other correspondence relating to the underlying investment. Large, non-recurring dividends recognized by the Fund are presented separately on the Statement of Operations as "Special Dividends" and the impact of these dividends is presented in the Financial Highlights. Interest income and distributions from the Fidelity Central Funds are accrued as earned. Interest income includes coupon interest and amortization of premium and accretion of discount on debt securities. Investment income is recorded net of foreign taxes withheld where recovery of such taxes is uncertain.
Expenses. Expenses directly attributable to a fund are charged to that fund. Expenses attributable to more than one fund are allocated among the respective funds on the basis of relative net assets or other appropriate methods. Expense estimates are accrued in the period to which they relate and adjustments are made when actual amounts are known.
Income Tax Information and Distributions to Shareholders. Each year, the Fund intends to qualify as a regulated investment company under Subchapter M of the Internal Revenue Code, including distributing substantially all of its taxable income and realized gains. As a result, no provision for U.S. Federal income taxes is required. As of November 30, 2013, the Fund did not have any unrecognized tax benefits in the financial statements; nor is the Fund aware of any tax positions for which it is reasonably possible that the total amounts of unrecognized tax benefits will significantly change in the next twelve months. The Fund files a U.S. federal tax return, in addition to state and local tax returns as required. The Fund's federal income tax returns are subject to examination by the Internal Revenue Service (IRS) for a period of three fiscal years after they are filed. State and local tax returns may be subject to examination for an additional fiscal year depending on the jurisdiction. Foreign taxes are provided for based on the Fund's understanding of the tax rules and rates that exist in the foreign markets in which it invests.
Distributions are declared and recorded on the ex-dividend date. Income and capital gain distributions are determined in accordance with income tax regulations, which may differ from GAAP.
Annual Report
3. Significant Accounting Policies - continued
Income Tax Information and Distributions to Shareholders - continued
Capital accounts within the financial statements are adjusted for permanent book-tax differences. These adjustments have no impact on net assets or the results of operations. Temporary book-tax differences will reverse in a subsequent period.
Book-tax differences are primarily due to futures contracts, foreign currency transactions, net operating losses and losses deferred due to wash sales.
The federal tax cost of investment securities and unrealized appreciation (depreciation) as of period end were as follows:
|
Gross unrealized appreciation |
$ 19,869,684 |
|
Gross unrealized depreciation |
(3,297,100) |
|
Net unrealized appreciation (depreciation) on securities and other investments |
$ 16,572,584 |
|
|
|
|
Tax Cost |
$ 478,071,879 |
The tax-based components of distributable earnings as of period end were as follows:
|
Undistributed ordinary income |
$ 553,414 |
|
Undistributed long-term capital gain |
$ 872,986 |
|
Net unrealized appreciation (depreciation) |
$ 16,572,032 |
4. Derivative Instruments.
Risk Exposures and the Use of Derivative Instruments. The Fund's investment objective allows the Fund to enter into various types of derivative contracts, including futures contracts. Derivatives are investments whose value is primarily derived from underlying assets, indices or reference rates and may be transacted on an exchange or over-the-counter (OTC). Derivatives may involve a future commitment to buy or sell a specified asset based on specified terms, to exchange future cash flows at periodic intervals based on a notional principal amount, or for one party to make one or more payments upon the occurrence of specified events in exchange for periodic payments from the other party.
The Fund used derivatives to increase returns and to manage exposure to certain risks as defined below. The success of any strategy involving derivatives depends on analysis of numerous economic factors, and if the strategies for investment do not work as intended, the Fund may not achieve its objectives.
Annual Report
Notes to Financial Statements - continued
4. Derivative Instruments - continued
Risk Exposures and the Use of Derivative Instruments - continued
The Fund's use of derivatives increased or decreased its exposure to the following risk:
|
Equity Risk |
Equity risk relates to the fluctuations in the value of financial instruments as a result of changes in market prices (other than those arising from interest rate risk or foreign exchange risk), whether caused by factors specific to an individual investment, its issuer, or all factors affecting all instruments traded in a market or market segment. |
The Fund is also exposed to additional risks from investing in derivatives, such as liquidity risk and counterparty credit risk. Liquidity risk is the risk that the Fund will be unable to close out the derivative in the open market in a timely manner. Counterparty credit risk is the risk that the counterparty will not be able to fulfill its obligation to the Fund. Counterparty credit risk related to exchange-traded futures contracts may be mitigated by the protection provided by the exchange on which they trade.
Investing in derivatives may involve greater risks than investing in the underlying assets directly and, to varying degrees, may involve risk of loss in excess of any initial investment and collateral received and amounts recognized in the Statement of Assets and Liabilities. In addition, there may be the risk that the change in value of the derivative contract does not correspond to the change in value of the underlying instrument.
Futures Contracts. A futures contract is an agreement between two parties to buy or sell a specified underlying instrument for a fixed price at a specified future date. The Fund used futures contracts to manage its exposure to the stock market.
Upon entering into a futures contract, a fund is required to deposit either cash or securities (initial margin) with a clearing broker in an amount equal to a certain percentage of the face value of the contract. Futures contracts are marked-to-market daily and subsequent daily payments (variation margin) are made or received by a fund depending on the daily fluctuations in the value of the futures contracts and are recorded as unrealized appreciation or (depreciation). This receivable and/or payable, if any, is included in daily variation margin for derivative instruments in the Statement of Assets and Liabilities. Realized gain or (loss) is recorded upon the expiration or closing of a futures contract.
Any open futures contracts at period end are presented in the Schedule of Investments under the caption "Futures Contracts." The underlying face amount at value reflects each contract's exposure to the underlying instrument or index at period end and is representative of volume of activity during the period. Securities deposited to meet initial margin requirements are identified in the Schedule of Investments.
During the period the Fund recognized net realized gain (loss) of $65,659 and a change in net unrealized appreciation (depreciation) of $1,389,318 related to its investment in futures contracts. These amounts are included in the Statement of Operations.
Annual Report
5. Purchases and Sales of Investments.
Purchases and sales of securities including in-kind transactions, other than short-term securities, aggregated $440,121,402 and $16,379,943, respectively.
6. Fees and Other Transactions with Affiliates.
Management Fee. Fidelity Management & Research Company (the investment adviser) and its affiliates provide the Fund with investment management related services for which the Fund pays a monthly management fee. The management fee is the sum of an individual fund fee rate that is based on an annual rate of .45% of the Fund's average net assets and an annualized group fee rate that averaged .25% during the period. The group fee rate is based upon the average net assets of all the mutual funds advised by the investment adviser, including any mutual funds previously advised by the investment adviser that are currently advised by Fidelity SelectCo. LLC, an affiliate of the investment adviser. The group fee rate decreases as assets under management increase and increases as assets under management decrease. In addition, the management fee is subject to a performance adjustment (up to a maximum of ± .20% of the Fund's average net assets over a 36 month performance period). The upward or downward adjustment to the management fee is based on the Fund's relative investment performance as compared to an appropriate benchmark index over the same 36 month performance period. The Fund's performance adjustment will not take effect until November 1, 2014. Subsequent months will be added until the performance period includes 36 months. For the reporting period, the total annualized management fee rate was ..70% of the Fund's average net assets.
Transfer Agent Fees. Fidelity Investments Institutional Operations Company, Inc. (FIIOC), an affiliate of the investment adviser, is the Fund's transfer, dividend disbursing and shareholder servicing agent. FIIOC receives account fees and asset-based fees that vary according to account size and type of account. FIIOC pays for typesetting, printing and mailing of shareholder reports, except proxy statements. For the period, the transfer agent fees were equivalent to an annualized rate of .19% of average net assets.
Accounting and Security Lending Fees. Fidelity Service Company, Inc. (FSC), an affiliate of the investment adviser, maintains the Fund's accounting records. The accounting fee is based on the level of average net assets for each month. Under a separate contract, FSC administers the security lending program. The security lending fee is based on the number and duration of lending transactions.
Brokerage Commissions. The Fund placed a portion of its portfolio transactions with brokerage firms which are affiliates of the investment adviser. Brokerage commissions are included in net realized gain (loss) and change in net unrealized appreciation (depreciation) in the Statement of Operations. The commissions paid to these affiliated firms were $428 for the period.
Annual Report
Notes to Financial Statements - continued
6. Fees and Other Transactions with Affiliates - continued
Exchanges In-Kind. During the period, certain investment companies managed by the investment adviser or its affiliates (Investing Funds) completed exchanges in-kind with the Fund. The Investing Funds delivered investments valued at $456,921,991 in exchange for 45,692,199 shares of the Fund. The amount of in-kind exchanges is included in share transactions in the accompanying Statement of Changes in Net Assets. The Fund recognized no gain or loss for federal income tax purposes.
7. Security Lending.
The Fund lends portfolio securities through a lending agent from time to time in order to earn additional income. For equity securities, a lending agent is used and may loan securities to certain qualified borrowers, including Fidelity Capital Markets (FCM), a broker-dealer affiliated with the Fund. On the settlement date of the loan, the Fund receives collateral (in the form of U.S. Treasury obligations, letters of credit and/or cash) against the loaned securities and maintains collateral in an amount not less than 100% of the market value of the loaned securities during the period of the loan. The market value of the loaned securities is determined at the close of business of the Fund and any additional required collateral is delivered to the Fund on the next business day. If the borrower defaults on its obligation to return the securities loaned because of insolvency or other reasons, the Fund may apply collateral received from the borrower against the obligation. The Fund may experience delays and costs in recovering the securities loaned. Any cash collateral received is invested in Fidelity Securities Lending Cash Central Fund. The value of loaned securities and cash collateral at period end are disclosed on the Fund's Statement of Assets and Liabilities. Security lending income represents the income earned on investing cash collateral, less rebates paid to borrowers and any lending agent fees associated with the loan, plus any premium payments received for lending certain types of securities. Security lending income is presented in the Statement of Operations as a component of income from Fidelity Central Funds. Total security lending income during the period amounted to $1,295. During the period, there were no securities loaned to FCM.
8. Expense Reductions.
The investment adviser contractually agreed to reimburse the Fund to the extent annual operating expenses exceeded .95% of average net assets. This reimbursement will remain in place through January 31, 2015. Some expenses, for example interest expense, are excluded from this waiver. During the period this waiver reduced the Fund's expenses by $34,621.
Annual Report
9. Other.
The Fund's organizational documents provide former and current trustees and officers with a limited indemnification against liabilities arising in connection with the performance of their duties to the Fund. In the normal course of business, the Fund may also enter into contracts that provide general indemnifications. The Fund's maximum exposure under these arrangements is unknown as this would be dependent on future claims that may be made against the Fund. The risk of material loss from such claims is considered remote.
At the end of the period, mutual funds managed by the investment adviser or its affiliates were the owners of records of all of the outstanding shares of the Funds.
Annual Report
Report of Independent Registered Public Accounting Firm
To the Trustees of Fidelity Advisor Series I and the Shareholders of Fidelity Advisor Series Small Cap Fund:
In our opinion, the accompanying statement of assets and liabilities, including the schedule of investments, and the related statements of operations, of changes in net assets and the financial highlights present fairly, in all material respects, the financial position of Fidelity Advisor Series Small Cap Fund (a fund of Fidelity Advisor Series I) at November 30, 2013, and the results of its operations, the changes in its net assets and the financial highlights for the period from November 7, 2013 (commencement of operations) to November 30, 2013, in conformity with accounting principles generally accepted in the United States of America. These financial statements and financial highlights (hereafter referred to as "financial statements") are the responsibility of the Fidelity Advisor Series Small Cap Fund's management. Our responsibility is to express an opinion on these financial statements based on our audit. We conducted our audit of these financial statements in accordance with the standards of the Public Company Accounting Oversight Board (United States). Those standards require that we plan and perform the audit to obtain reasonable assurance about whether the financial statements are free of material misstatement. An audit includes examining, on a test basis, evidence supporting the amounts and disclosures in the financial statements, assessing the accounting principles used and significant estimates made by management, and evaluating the overall financial statement presentation. We believe that our audit, which included confirmation of securities at November 30, 2013 by correspondence with the custodian and brokers, provides a reasonable basis for our opinion.
PricewaterhouseCoopers LLP
Boston, Massachusetts
January 16, 2014
Annual Report
Trustees and Officers
The Trustees, Member of the Advisory Board, and officers of the trust and fund, as applicable, are listed below. The Board of Trustees governs the fund and is responsible for protecting the interests of shareholders. The Trustees are experienced executives who meet periodically throughout the year to oversee the fund's activities, review contractual arrangements with companies that provide services to the fund, oversee management of the risks associated with such activities and contractual arrangements, and review the fund's performance. Except for James C. Curvey, Ned C. Lautenbach, Ronald P. O'Hanley, and William S. Stavropoulos, each of the Trustees oversees 173 funds. Mr. Curvey oversees 396 funds. Mr. Lautenbach, Mr. O'Hanley, and Mr. Stavropoulos each oversees 247 funds.
The Trustees hold office without limit in time except that (a) any Trustee may resign; (b) any Trustee may be removed by written instrument, signed by at least two-thirds of the number of Trustees prior to such removal; (c) any Trustee who requests to be retired or who has become incapacitated by illness or injury may be retired by written instrument signed by a majority of the other Trustees; and (d) any Trustee may be removed at any special meeting of shareholders by a two-thirds vote of the outstanding voting securities of the trust. Each Trustee who is not an interested person (as defined in the 1940 Act) of the trust and the fund (Independent Trustee), shall retire not later than the last day of the calendar year in which his or her 75th birthday occurs. The Independent Trustees may waive this mandatory retirement age policy with respect to individual Trustees. The officers and Advisory Board Member hold office without limit in time, except that any officer and Advisory Board Member may resign or may be removed by a vote of a majority of the Trustees at any regular meeting or any special meeting of the Trustees. Except as indicated, each individual has held the office shown or other offices in the same company for the past five years.
Experience, Skills, Attributes, and Qualifications of the Fund's Trustees. The Governance and Nominating Committee has adopted a statement of policy that describes the experience, qualifications, attributes, and skills that are necessary and desirable for potential Independent Trustee candidates (Statement of Policy). The Board believes that each Trustee satisfied at the time he or she was initially elected or appointed a Trustee, and continues to satisfy, the standards contemplated by the Statement of Policy. The Governance and Nominating Committee also engages professional search firms to help identify potential Independent Trustee candidates who have the experience, qualifications, attributes, and skills consistent with the Statement of Policy. From time to time, additional criteria based on the composition and skills of the current Independent Trustees, as well as experience or skills that may be appropriate in light of future changes to board composition, business conditions, and regulatory or other developments, have also been considered by the professional search firms and the Governance and Nominating Committee. In addition, the Board takes into account the Trustees' commitment and participation in Board and committee meetings, as well as their leadership of standing and ad hoc committees throughout their tenure.
In determining that a particular Trustee was and continues to be qualified to serve as a Trustee, the Board has considered a variety of criteria, none of which, in isolation, was controlling. The Board believes that, collectively, the Trustees have balanced and diverse experience, qualifications, attributes, and skills, which allow the Board to operate effectively in governing the fund and protecting the interests of shareholders. Information about the specific experience, skills, attributes, and qualifications of each Trustee, which in each case led to the Board's conclusion that the Trustee should serve (or continue to serve) as a trustee of the fund, is provided below.
Annual Report
Board Structure and Oversight Function. James C. Curvey is an interested person (as defined in the 1940 Act) and currently serves as Chairman. The Trustees have determined that an interested Chairman is appropriate and benefits shareholders because an interested Chairman has a personal and professional stake in the quality and continuity of services provided to the fund. Independent Trustees exercise their informed business judgment to appoint an individual of their choosing to serve as Chairman, regardless of whether the Trustee happens to be independent or a member of management. The Independent Trustees have determined that they can act independently and effectively without having an Independent Trustee serve as Chairman and that a key structural component for assuring that they are in a position to do so is for the Independent Trustees to constitute a substantial majority for the Board. The Independent Trustees also regularly meet in executive session. Ned C. Lautenbach serves as Chairman of the Independent Trustees and as such (i) acts as a liaison between the Independent Trustees and management with respect to matters important to the Independent Trustees and (ii) with management prepares agendas for Board meetings.
Fidelity funds are overseen by different Boards of Trustees. The fund's Board oversees Fidelity's equity and high income funds and another Board oversees Fidelity's investment-grade bond, money market, and asset allocation funds. The asset allocation funds may invest in Fidelity funds overseen by the fund's Board. The use of separate Boards, each with its own committee structure, allows the Trustees of each group of Fidelity funds to focus on the unique issues of the funds they oversee, including common research, investment, and operational issues. On occasion, the separate Boards establish joint committees to address issues of overlapping consequences for the Fidelity funds overseen by each Board.
The Trustees operate using a system of committees to facilitate the timely and efficient consideration of all matters of importance to the Trustees, the fund, and fund shareholders and to facilitate compliance with legal and regulatory requirements and oversight of the fund's activities and associated risks. The Board, acting through its committees, has charged FMR and its affiliates with (i) identifying events or circumstances the occurrence of which could have demonstrably adverse effects on the fund's business and/or reputation; (ii) implementing processes and controls to lessen the possibility that such events or circumstances occur or to mitigate the effects of such events or circumstances if they do occur; and (iii) creating and maintaining a system designed to evaluate continuously business and market conditions in order to facilitate the identification and implementation processes described in (i) and (ii) above. Because the day-to-day operations and activities of the fund are carried out by or through FMR, its affiliates and other service providers, the fund's exposure to risks is mitigated but not eliminated by the processes overseen by the Trustees. While each of the Board's committees has responsibility for overseeing different aspects of the fund's activities, oversight is exercised primarily through the Operations, Audit, and Compliance Committees. In addition, the Independent Trustees have worked with FMR to enhance the Board's oversight of investment and financial risks, legal and regulatory risks, technology risks, and operational risks, including the development of additional risk reporting to the Board. For example, a working group comprised of Independent Trustees and FMR has worked and continues to work to review the Fidelity funds' valuation-related activities, reporting and risk management. Appropriate personnel, including but not limited to the fund's Chief Compliance Officer (CCO), FMR's internal auditor, the independent accountants, the fund's Treasurer and portfolio management personnel, make periodic reports to the Board's committees, as appropriate, including an annual review of FMR's risk management program for the Fidelity funds. The responsibilities of each standing committee, including their oversight responsibilities, are described further under "Standing Committees of the Fund's Trustees."
Annual Report
Trustees and Officers - continued
The fund's Statement of Additional Information (SAI) includes more information about the Trustees. To request a free copy, call Fidelity at 1-877-208-0098.
Interested Trustees*:
Correspondence intended for each Trustee who is an interested person may be sent to Fidelity Investments, 245 Summer Street, Boston, Massachusetts 02210.
|
Name, Year of Birth; Principal Occupations and Other Relevant Experience+ |
|
|
James C. Curvey (1935) |
|
|
Year of Election or Appointment: 2007 Trustee Chairman of the Board of Trustees |
|
|
|
Mr. Curvey also serves as Trustee of other Fidelity funds. Mr. Curvey is a Director of Fidelity Investments Money Management, Inc. (2009-present), Director of Fidelity Research & Analysis Co. (2009-present) and Director of FMR and FMR Co., Inc. (2007-present). Mr. Curvey is also Vice Chairman (2007-present) and Director of FMR LLC. In addition, Mr. Curvey serves as an Overseer for the Boston Symphony Orchestra and a member of the Trustees of Villanova University. Previously, Mr. Curvey was the Vice Chairman (2006-2007) and Director (2000-2007) of FMR Corp. |
|
Ronald P. O'Hanley (1957) |
|
|
Year of Election or Appointment: 2011 Trustee |
|
|
|
Mr. O'Hanley also serves as Trustee of other Fidelity funds. He is Director of Fidelity SelectCo, LLC (2013-present), FMR Co., Inc. (2010-present), Director of Fidelity Investments Money Management, Inc. (2010-present), Director of Fidelity Research & Analysis Company (2010-present), President of Fidelity Asset Management and Corporate Services and a Member of Fidelity's Executive Committee (2010-present). Previously, Mr. O'Hanley served as President and Chief Executive Officer of BNY Mellon Asset Management (2007-2010). Mr. O'Hanley also served as Vice Chairman of Bank New York Mellon Corp. and a member of that firm's Executive Committee. Prior to the 2007 merger of The Bank of New York and Mellon Financial Corporation, he was Vice Chairman of Mellon Financial Corporation and President and Chief Executive Officer of Mellon Asset Management. He joined Mellon in February 1997. Mr. O'Hanley currently serves as Chairman of the Boston Public Library Foundation Board of Directors and sits on the Board of Directors of Beth Israel Deaconess Medical Center, the Board of Trustees of the Marine Biological Laboratory and the Advisory Board of the Maxwell School of Citizenship and Public Administration at Syracuse University. Mr. O'Hanley also chairs the Council on Asset Management for the Financial Services Roundtable and is a member of the Board of Directors of Institutional Investor's U.S. Institute. |
* Trustees have been determined to be "Interested Trustees" by virtue of, among other things, their affiliation with the trust or various entities under common control with FMR.
+ The information above includes each Trustee's principal occupation during the last five years and other information relating to the experience, attributes, and skills relevant to each Trustee's qualifications to serve as a Trustee, which led to the conclusion that each Trustee should serve as a Trustee for the fund.
Annual Report
Trustees and Officers - continued
Independent Trustees:
Correspondence intended for each Independent Trustee (that is, the Trustees other than the Interested Trustees) may be sent to Fidelity Investments, P.O. Box 55235, Boston, Massachusetts 02205-5235.
|
Name, Year of Birth; Principal Occupations and Other Relevant Experience+ |
|
|
Dennis J. Dirks (1948) |
|
|
Year of Election or Appointment: 2005 Trustee |
|
|
|
Mr. Dirks also serves as Trustee of other Fidelity funds. Prior to his retirement in May 2003, Mr. Dirks was Chief Operating Officer and a member of the Board of The Depository Trust & Clearing Corporation (DTCC). He also served as President, Chief Operating Officer, and Board member of The Depository Trust Company (DTC) and President and Board member of the National Securities Clearing Corporation (NSCC). In addition, Mr. Dirks served as Chief Executive Officer and Board member of the Government Securities Clearing Corporation, Chief Executive Officer and Board member of the Mortgage-Backed Securities Clearing Corporation, as a Trustee and a member of the Finance Committee of Manhattan College (2005-2008), and as a Trustee and a member of the Finance Committee of AHRC of Nassau County (2006-2008). Mr. Dirks is a member of the Independent Directors Council (IDC) Governing Council (2010-present) and Board of Directors for The Brookville Center for Children's Services, Inc. (2009-present). |
|
Alan J. Lacy (1953) |
|
|
Year of Election or Appointment: 2008 Trustee |
|
|
|
Mr. Lacy also serves as Trustee of other Fidelity funds. Mr. Lacy serves as Senior Adviser (2007-present) of Oak Hill Capital Partners, L.P. (private equity). Mr. Lacy also served as Chief Executive Officer (2000-2005) and Vice Chairman (2005-2006) of Sears Holdings Corporation and Sears, Roebuck and Co. (retail). In addition, Mr. Lacy serves as a member of the Board of Directors of Dave & Buster's Entertainment, Inc. (restaurant and entertainment complexes, 2010-present), Earth Fare, Inc. (retail grocery, 2012-present), The Hillman Companies, Inc. (hardware wholesalers, 2010-present), and Bristol-Myers Squibb Company (global pharmaceuticals, 2008-present). Mr. Lacy is a member of the Board of Trustees of The National Parks Conservation Association (2006-present). Previously, Mr. Lacy served as Chairman of the Board of Trustees of the National Parks Conservation Association (2008-2011) and as a member of the Board of Directors for the Western Union Company (global money transfer, 2006-2011). |
|
Ned C. Lautenbach (1944) |
|
|
Year of Election or Appointment: 2000 Trustee Chairman of the Independent Trustees |
|
|
|
Mr. Lautenbach also serves as Trustee of other Fidelity funds. Mr. Lautenbach currently serves as the Lead Director of the Eaton Corporation Board of Directors (diversified industrial, 1997-present). Mr. Lautenbach is Chairman of the Board of Directors of the Philharmonic Center for the Arts in Naples, Florida (2012-present) and a member of the Council on Foreign Relations (1994-present). Previously, Mr. Lautenbach was a Partner/Advisory Partner at Clayton, Dubilier & Rice, LLC (private equity investment, 1998-2010), as well as a Director of Sony Corporation (2006-2007). |
|
Joseph Mauriello (1944) |
|
|
Year of Election or Appointment: 2008 Trustee |
|
|
|
Mr. Mauriello also serves as Trustee of other Fidelity funds. Prior to his retirement in January 2006, Mr. Mauriello served in numerous senior management positions including Deputy Chairman and Chief Operating Officer (2004-2005), and Vice Chairman of Financial Services (2002-2004) of KPMG LLP US (professional services, 1965-2005). Mr. Mauriello currently serves as a member of the Board of Directors of XL Group plc. (global insurance and re-insurance, 2006-present). Previously, Mr. Mauriello served as a Director of the Hamilton Funds of the Bank of New York (2006-2007) and of Arcadia Resources Inc. (health care services and products, 2007-2012). |
|
Robert W. Selander (1950) |
|
|
Year of Election or Appointment: 2011 Trustee |
|
|
|
Mr. Selander also serves as Trustee of other Fidelity funds. Previously, Mr. Selander served as a Member of the Advisory Board of other Fidelity funds (2011), and Executive Vice Chairman (2010), Chief Executive Officer (2009-2010), and President and Chief Executive Officer (1997-2009) of Mastercard, Inc. |
|
Cornelia M. Small (1944) |
|
|
Year of Election or Appointment: 2005 Trustee |
|
|
|
Ms. Small also serves as Trustee of other Fidelity funds. Ms. Small is a member of the Board of Directors (2009-present) and Chair of the Investment Committee (2010-present) of the Teagle Foundation. Ms. Small also serves on the Investment Committee of the Berkshire Taconic Community Foundation (2008-present). Previously, Ms. Small served as Chairperson (2002-2008) and a member of the Investment Committee and Chairperson (2008-2012) and a member of the Board of Trustees of Smith College. In addition, Ms. Small served as Chief Investment Officer, Director of Global Equity Investments, and a member of the Board of Directors of Scudder, Stevens & Clark and Scudder Kemper Investments. |
|
William S. Stavropoulos (1939) |
|
|
Year of Election or Appointment: 2002 Trustee Vice Chairman of the Independent Trustees |
|
|
|
Mr. Stavropoulos also serves as Trustee of other Fidelity funds. Mr. Stavropoulos serves as President and Founder of the Michigan Baseball Foundation, the Great Lakes Loons (2007-present). Mr. Stavropoulos is Chairman Emeritus of the Board of Directors of The Dow Chemical Company, where he previously served in numerous senior management positions, including President, CEO (1995-2000; 2002-2004), Chairman of the Executive Committee (2000-2006), and as a member of the Board of Directors (1990-2006). Currently, Mr. Stavropoulos is Chairman of the Board of Directors of Univar Inc. (global distributor of commodity and specialty chemicals), a Director of Teradata Corporation (data warehousing and technology solutions), and Maersk Inc. (industrial conglomerate), and a member of the Advisory Board for Metalmark Capital LLC (private equity investment, 2005-present). Mr. Stavropoulos is an operating advisor to Clayton, Dubilier & Rice, LLC (private equity investment). In addition, Mr. Stavropoulos is a member of the University of Notre Dame Advisory Council for the College of Science, a Trustee of the Rollin L. Gerstacker Foundation, and a Director of the Naples Philharmonic Center for the Arts. Previously, Mr. Stavropoulos served as a Director of Chemical Financial Corporation (bank holding company, 1993-2012) and Tyco International, Ltd. (multinational manufacturing and services, 2007-2012). |
|
David M. Thomas (1949) |
|
|
Year of Election or Appointment: 2008 Trustee |
|
|
|
Mr. Thomas also serves as Trustee of other Fidelity funds. Mr. Thomas serves as Non-Executive Chairman of the Board of Directors of Fortune Brands Home and Security (home and security products, 2011-present), and as a member of the Board of Directors of Interpublic Group of Companies, Inc. (marketing communication, 2004-present). Previously, Mr. Thomas served as Executive Chairman (2005-2006) and Chairman and Chief Executive Officer (2000-2005) of IMS Health, Inc. (pharmaceutical and healthcare information solutions), and a Director of Fortune Brands, Inc. (consumer products, 2000-2011). |
+ The information above includes each Trustee's principal occupation during the last five years and other information relating to the experience, attributes, and skills relevant to each Trustee's qualifications to serve as a Trustee, which led to the conclusion that each Trustee should serve as a Trustee for the fund.
Advisory Board Member and Officers:
Correspondence intended for each officer and Peter S. Lynch may be sent to Fidelity Investments, 245 Summer Street, Boston, Massachusetts 02210. Officers appear below in alphabetical order.
|
Name, Year of Birth; Principal Occupation |
|
|
Peter S. Lynch (1944) |
|
|
Year of Election or Appointment: 2003 Member of the Advisory Board |
|
|
|
Mr. Lynch also serves as Member of the Advisory Board of other Fidelity funds. Mr. Lynch is Vice Chairman and a Director of FMR and FMR Co., Inc. In addition, Mr. Lynch serves as a Trustee of Boston College and as the Chairman of the Inner-City Scholarship Fund. Previously, Mr. Lynch served on the Special Olympics International Board of Directors (1997-2006). |
|
Elizabeth Paige Baumann (1968) |
|
|
Year of Election or Appointment: 2012 Anti-Money Laundering (AML) Officer |
|
|
|
Ms. Baumann also serves as AML Officer of other funds. She is Chief AML Officer of FMR LLC (2012-present) and is an employee of Fidelity Investments. Previously, Ms. Baumann served as Vice President and Deputy Anti-Money Laundering Officer (2007-2012). |
|
William C. Coffey (1969) |
|
|
Year of Election or Appointment: 2009 Assistant Secretary |
|
|
|
Mr. Coffey also serves as Assistant Secretary of other funds. He is Senior Vice President and Deputy General Counsel of FMR LLC (2010-present), and is an employee of Fidelity Investments. Previously, Mr. Coffey served as Vice President and Associate General Counsel of FMR LLC (2005-2009). |
|
Jonathan Davis (1968) |
|
|
Year of Election or Appointment: 2010 Assistant Treasurer |
|
|
|
Mr. Davis also serves as Assistant Treasurer of other funds. Mr. Davis is an employee of Fidelity Investments. Previously, Mr. Davis served as Vice President and Associate General Counsel of FMR LLC (2003-2010). |
|
Adrien E. Deberghes (1967) |
|
|
Year of Election or Appointment: 2008 Deputy Treasurer |
|
|
|
Mr. Deberghes also serves as an officer of other funds. He is an employee of Fidelity Investments (2008-present). Prior to joining Fidelity Investments, Mr. Deberghes was Senior Vice President of Mutual Fund Administration at State Street Corporation (2007-2008), Senior Director of Mutual Fund Administration at Investors Bank & Trust (2005-2007), and Director of Finance for Dunkin' Brands (2000-2005). |
|
Stephanie J. Dorsey (1969) |
|
|
Year of Election or Appointment: 2010 Assistant Treasurer |
|
|
|
Ms. Dorsey also serves as an officer of other funds. She is an employee of Fidelity Investments (2008-present) and has served in other fund officer roles. Prior to joining Fidelity Investments, Ms. Dorsey served as Treasurer (2004-2008) of the JPMorgan Mutual Funds and Vice President (2004-2008) of JPMorgan Chase Bank. |
|
Scott C. Goebel (1968) |
|
|
Year of Election or Appointment: 2008 Secretary and Chief Legal Officer (CLO) |
|
|
|
Mr. Goebel serves as Secretary and CLO of other funds. Mr. Goebel also serves as Secretary of Fidelity Investments Money Management, Inc. (FIMM) (2010-present) and Fidelity Research and Analysis Company (FRAC) (2010-present); General Counsel, Secretary, and Senior Vice President of FMR (2008-present) and FMR Co., Inc. (2008-present); Chief Legal Officer of Fidelity Management & Research (Hong Kong) Limited (2008-present) and Assistant Secretary of Fidelity Management & Research (Japan) Inc. (2008-present), and Fidelity Management & Research (U.K.) Inc. (2008-present). Previously, Mr. Goebel served as Secretary and CLO of other Fidelity funds (2008-2013), Assistant Secretary of FIMM (2008-2010), FRAC (2008-2010), and certain funds (2007-2008); and as Vice President and Secretary of Fidelity Distributors Corporation (FDC) (2005-2007). Mr. Goebel has been employed by FMR LLC or an affiliate since 2001. |
|
Joseph A. Hanlon (1968) |
|
|
Year of Election or Appointment: 2012 Chief Compliance Officer |
|
|
|
Mr. Hanlon also serves as Chief Compliance Officer of other funds. Mr. Hanlon serves as Compliance Officer of FMR, FMR Co., Inc., Fidelity Investments Money Management, Inc. (FIMM), Fidelity Research and Analysis Company (FRAC), and Fidelity Management & Research (Hong Kong) (2009-present), as Senior Vice President of the Fidelity Asset Management Division (2009-present), and is an employee of Fidelity Investments. Previously, Mr. Hanlon served as Compliance Officer of Fidelity Management & Research (Japan) Inc. (2009-2013), Strategic Advisers, Inc. (2009-2013), and Fidelity Management & Research (U.K.) Inc. (2009-2013). |
|
Thomas C. Hense (1964) |
|
|
Year of Election or Appointment: 2008/2010 Vice President |
|
|
|
Mr. Hense also serves as Vice President of other funds (High Income (2008), Small Cap (2008), and Value (2010) funds). Previously, Mr. Hense served as a portfolio manager for Fidelity's Institutional Money Management Group (Pyramis) (2003-2008). |
|
Brian B. Hogan (1964) |
|
|
Year of Election or Appointment: 2009 Vice President |
|
|
|
Mr. Hogan also serves as Vice President of other funds. Mr. Hogan serves as President of FMR's Equity Division (2009-present). Previously, Mr. Hogan served as Senior Vice President, Equity Research of FMR (2006-2009) and as a portfolio manager. |
|
Chris Maher (1972) |
|
|
Year of Election or Appointment: 2013 Assistant Treasurer |
|
|
|
Mr. Maher serves as Assistant Treasurer of other funds. Mr. Maher is Vice President of Valuation Oversight and is an employee of Fidelity Investments. Previously, Mr. Maher served as Vice President of Asset Management Compliance (2013), Vice President of FMR's Program Management Group (2010-2013), and Vice President of Valuation Oversight (2008-2010). |
|
Christine Reynolds (1958) |
|
|
Year of Election or Appointment: 2008 Chief Financial Officer |
|
|
|
Ms. Reynolds also serves as Chief Financial Officer of other funds. Ms. Reynolds became President of Fidelity Pricing and Cash Management Services (FPCMS) in August 2008. Ms. Reynolds served as Chief Operating Officer of FPCMS (2007-2008). Previously, Ms. Reynolds served as President, Treasurer, and Anti-Money Laundering officer of the Fidelity funds (2004-2007). |
|
Kenneth B. Robins (1969) |
|
|
Year of Election or Appointment: 2008 President and Treasurer |
|
|
|
Mr. Robins also serves as an officer of other funds. Mr. Robins serves as Executive Vice President of Fidelity Investments Money Management, Inc. (FIMM) (2013-present) and is an employee of Fidelity Investments (2004-present). Previously, Mr. Robins served in other fund officer roles. |
|
Gary W. Ryan (1958) |
|
|
Year of Election or Appointment: 2005 Assistant Treasurer |
|
|
|
Mr. Ryan also serves as Assistant Treasurer of other funds. Mr. Ryan is an employee of Fidelity Investments and has served in other fund officer roles. Previously, Mr. Ryan served as Vice President of Fund Reporting in Fidelity Pricing and Cash Management Services (FPCMS) (1999-2005). |
|
Stephen Sadoski (1971) |
|
|
Year of Election or Appointment: 2012 Deputy Treasurer |
|
|
|
Mr. Sadoski also serves as Deputy Treasurer of other funds. He is an employee of Fidelity Investments (2012-present) and has served in another fund officer role. Prior to joining Fidelity Investments, Mr. Sadoski served as an assistant chief accountant in the Division of Investment Management of the Securities and Exchange Commission (SEC) (2009-2012) and as a senior manager at Deloitte & Touche LLP (1997-2009). |
|
Stacie M. Smith (1974) |
|
|
Year of Election or Appointment: 2013 Deputy Treasurer |
|
|
|
Ms. Smith also serves as an officer of other funds. She is an employee of Fidelity Investments (2009-present) and has served in other fund officer roles. Prior to joining Fidelity Investments, Ms. Smith served as Senior Audit Manager of Ernst & Young LLP (1996-2009). |
|
Renee Stagnone (1975) |
|
|
Year of Election or Appointment: 2013 Deputy Treasurer |
|
|
|
Ms. Stagnone also serves as Deputy Treasurer of other funds. Ms. Stagnone is an employee of Fidelity Investments. |
|
Joseph F. Zambello (1957) |
|
|
Year of Election or Appointment: 2011 Deputy Treasurer |
|
|
|
Mr. Zambello also serves as Deputy Treasurer of other funds. Mr. Zambello is an employee of Fidelity Investments. Previously, Mr. Zambello served as Vice President of FMR's Program Management Group (2009-2011) and Vice President of the Transfer Agent Oversight Group (2005-2009). |
Annual Report
Distributions (Unaudited)
The Board of Trustees of Fidelity Advisor Series Small Cap Fund voted to pay to shareholders of record at the opening of business on record date, the following distributions per share derived from capital gains realized from sales of portfolio securities:
|
|
Pay Date |
Record Date |
Capital Gains |
|
Fidelity Advisor Series Small Cap Fund |
01/13/2014 |
01/10/2014 |
$0.033 |
The fund hereby designates as a capital gain with respect to the taxable year ended November 30, 2013, $872,986, or, if subsequently determined to be different, the net capital gain of such year.
The fund will notify shareholders in January 20l4 of amounts for use in preparing 20l3 income tax returns.
Annual Report
Board Approval of Investment Advisory Contracts and Management Fees
Fidelity Advisor Series Small Cap Fund
On September 18, 2013, the Board of Trustees, including the Independent Trustees (together, the Board), voted to approve the management contract and sub-advisory agreements (together, the Advisory Contracts) for the fund. The Board, assisted by the advice of fund counsel and Independent Trustees' counsel, considered a broad range of information.
Nature, Extent, and Quality of Services Provided. The Board considered the staffing within the investment adviser, FMR, and the sub-advisers (together, the Investment Advisers), including the backgrounds of the fund's investment personnel, and also considered the fund's investment objective, strategies, and related investment philosophy. The Board considered the structure of the portfolio manager compensation program and whether this structure provides appropriate incentives to act in the best interests of the fund.
Resources Dedicated to Investment Management and Support Services. The Board and the Fund Oversight and Research Committees reviewed the general qualifications and capabilities of the Investment Advisers' investment staff, including its size, education, experience, and resources, as well as the Investment Advisers' approach to recruiting, training, managing, and compensating investment personnel. The Board also noted that FMR has continued to increase the resources devoted to non-U.S. offices, including expansion of Fidelity's global investment organization. The Board noted that Fidelity's analysts have extensive resources, tools and capabilities that allow them to conduct sophisticated quantitative and fundamental analysis, as well as credit analysis of issuers, counterparties and guarantors. The Board also believes that Fidelity's investment professionals have sufficient access to global information and data so as to provide competitive investment results over time, and that those professionals also have access to sophisticated tools that permit them to assess portfolio construction and risk and performance attribution characteristics continuously, as well as to transmit new information and research conclusions rapidly around the world. Additionally, in its deliberations, the Board considered the Investment Advisers' trading and risk management capabilities and resources, which are an integral part of the investment management process.
Shareholder and Administrative Services. The Board considered the nature, extent, quality, and cost of advisory, administrative, and shareholder services to be performed by the Investment Advisers and their affiliates under the Advisory Contracts and under separate agreements covering transfer agency, and pricing and bookkeeping, and securities lending services for the fund. The Board also considered the nature and extent of the supervision of third party service providers, principally custodians and subcustodians.
The Board noted that the growth of fund assets over time across the complex allows Fidelity to reinvest in the development of services designed to enhance the value or convenience of the Fidelity funds as investment vehicles. These services include 24-hour access to account information and market information through telephone representatives and over the Internet, investor education materials and asset allocation tools, and the expanded availability of Fidelity Investor Centers.
Annual Report
Board Approval of Investment Advisory Contracts and
Management Fees - continued
Investment Performance. The fund is a new fund and therefore had no historical performance for the Board to review at the time it approved the fund's Advisory Contracts. The Board considered the Investment Advisers' strength in fundamental, research-driven security selection, which the Board is familiar with through its supervision of other Fidelity funds.
Based on its review, the Board concluded that the nature, extent, and quality of services to be provided to the fund under the Advisory Contracts should benefit the fund's shareholders.
Competitiveness of Management Fee and Total Expense Ratio. The Board considered the fund's proposed management fee and the projected total expense ratio of the fund in reviewing the Advisory Contracts. The Board noted that the fund's proposed management fee rate is lower than the median fee rate of funds with similar Lipper investment objective categories and comparable investment mandates. The Board also considered that the projected total expense ratios are comparable to those of similar classes and funds that Fidelity offers to shareholders.
The Board also noted that FMR has contractually agreed to reimburse Fidelity Advisor Series Small Cap Fund until January 31, 2015, to the extent total operating expenses (excluding interest, taxes, certain securities lending costs, brokerage commissions, extraordinary expenses, and acquired fund fees and expenses, if any), as a percentage of its average net assets exceed a certain limit.
Based on its review, the Board concluded that the fund's management fee and projected total expense ratio were reasonable in light of the services that the fund and its shareholders will receive and the other factors considered.
Costs of the Services and Profitability. The fund is a new fund and therefore no revenue, cost, or profitability data was available for the Board to review in respect of the fund at the time it approved the Advisory Contracts. In connection with its future renewal of the fund's Advisory Contracts, the Board will consider the revenues earned and the expenses incurred by Fidelity in conducting the business of developing, marketing, distributing, managing, administering and servicing the fund and its shareholders.
Economies of Scale. The Board will consider economies of scale when there is operating experience to permit assessment thereof. It noted that, notwithstanding the entrepreneurial risk associated with a new fund, the management fee was at a level normally associated, by comparison with competitors, with very high fund net assets, and Fidelity asserted to the Board that the level of the fee anticipated economies of scale at lower asset levels even before, if ever, economies of scale are achieved. The Board also noted that the fund and its shareholders would have access to the very considerable number and variety of services available through Fidelity and its affiliates.
Annual Report
Based on its evaluation of all of the conclusions noted above, and after considering all factors it believed relevant, the Board ultimately concluded that the advisory fee structures are fair and reasonable, and that the fund's Advisory Contracts should be approved.
Annual Report
Investment Adviser
Fidelity Management & Research Company
Boston, MA
Investment Sub-Advisers
FMR Co., Inc.
Fidelity Management & Research (Hong Kong) Limited
Fidelity Management & Research (Japan) Inc.
General Distributor
Fidelity Distributors Corporation
Smithfield, RI
Transfer and Service Agents
Fidelity Investments Institutional Operations Company, Inc.
Boston, MA
Fidelity Service Company, Inc.
Boston, MA
Custodian
State Street Bank & Trust Company
Quincy, MA
(Fidelity Investment logo)(registered trademark)
Corporate Headquarters
245 Summer St., Boston, MA 02210
www.fidelity.com
AXS5-ANN-0114 1.967941.100
(Fidelity Investment logo)(registered trademark)
Fidelity Advisor®
Small Cap
Fund - Class A, Class T, Class B
and Class C
Annual Report
November 30, 2013
(Fidelity Cover Art)
Contents
|
Performance |
How the fund has done over time. |
|
|
Management's Discussion of Fund Performance |
The Portfolio Manager's review of fund performance and strategy. |
|
|
Shareholder Expense Example |
An example of shareholder expenses. |
|
|
Investment Changes |
A summary of major shifts in the fund's investments over the past six months. |
|
|
Investments |
A complete list of the fund's investments with their market values. |
|
|
Financial Statements |
Statements of assets and liabilities, operations, and changes in net assets, as well as financial highlights. |
|
|
Notes |
Notes to the financial statements. |
|
|
Report of Independent Registered Public Accounting Firm |
|
|
|
Trustees and Officers |
|
|
|
Distributions |
|
|
|
Board Approval of Investment Advisory Contracts and Management Fees |
|
To view a fund's proxy voting guidelines and proxy voting record for the 12-month period ended June 30, visit http://www.fidelity.com/proxyvotingresults or visit the Securities and Exchange Commission's (SEC) web site at http://www.sec.gov. You may also call 1-877-208-0098 to request a free copy of the proxy voting guidelines.
Standard & Poor's, S&P and S&P 500 are registered service marks of The McGraw-Hill Companies, Inc. and have been licensed for use by Fidelity Distributors Corporation.
Other third-party marks appearing herein are the property of their respective owners.
All other marks appearing herein are registered or unregistered trademarks or service marks of FMR LLC or an affiliated company. © 2014 FMR LLC. All rights reserved.
Annual Report
This report and the financial statements contained herein are submitted for the general information of the shareholders of the fund. This report is not authorized for distribution to prospective investors in the fund unless preceded or accompanied by an effective prospectus.
A fund files its complete schedule of portfolio holdings with the SEC for the first and third quarters of each fiscal year on Form N-Q. Forms N-Q are available on the SEC's web site at http://www.sec.gov. A fund's Forms N-Q may be reviewed and copied at the SEC's Public Reference Room in Washington, DC. Information regarding the operation of the SEC's Public Reference Room may be obtained by calling 1-800-SEC-0330. For a complete list of a fund's portfolio holdings, view the most recent holdings listing, semiannual report, or annual report on Fidelity's web site at http://www.fidelity.com, http://www.advisor.fidelity.com, or http://www.401k.com, as applicable.
NOT FDIC INSURED • MAY LOSE VALUE • NO BANK GUARANTEE
Neither the fund nor Fidelity Distributors Corporation is a bank.
Annual Report
Performance: The Bottom Line
Average annual total return reflects the change in the value of an investment, assuming reinvestment of the class' distributions from dividend income and capital gains (the profits earned upon the sale of securities that have grown in value, if any) and assuming a constant rate of performance each year. The $10,000 table and the fund's returns do not reflect the deduction of taxes that a shareholder would pay on fund distributions or the redemption of fund shares. During periods of reimbursement by Fidelity, a fund's total return will be greater than it would be had the reimbursement not occurred. How a fund did yesterday is no guarantee of how it will do tomorrow. Returns reflect the conversion of Class B shares to Class A shares after a maximum of seven years.
Average Annual Total Returns
|
Periods ended November 30, 2013 |
Past 1 |
Past 5 |
Past 10 |
|
Class A (incl. 5.75% sales charge) |
30.34% |
14.75% |
9.26% |
|
Class T (incl. 3.50% sales charge) |
33.27% |
15.04% |
9.30% |
|
Class B (incl. contingent deferred sales charge) A |
32.26% |
15.00% |
9.32% |
|
Class C (incl. contingent deferred sales charge) B |
36.28% |
15.26% |
9.10% |
A Class B shares' contingent deferred sales charges included in the past one year, past five years, and past ten years total return figures are 5%, 2%, and 0%, respectively.
B Class C shares' contingent deferred sales charges included in the past one year, past five years, and past ten years total return figures are 1%, 0%, and 0%, respectively.
Annual Report
$10,000 Over 10 Years
Let's say hypothetically that $10,000 was invested in Fidelity Advisor® Small Cap Fund - Class A on November 30, 2003, and the current 5.75% sales charge was paid. The chart shows how the value of your investment would have changed, and also shows how the Russell 2000® Index performed over the same period.
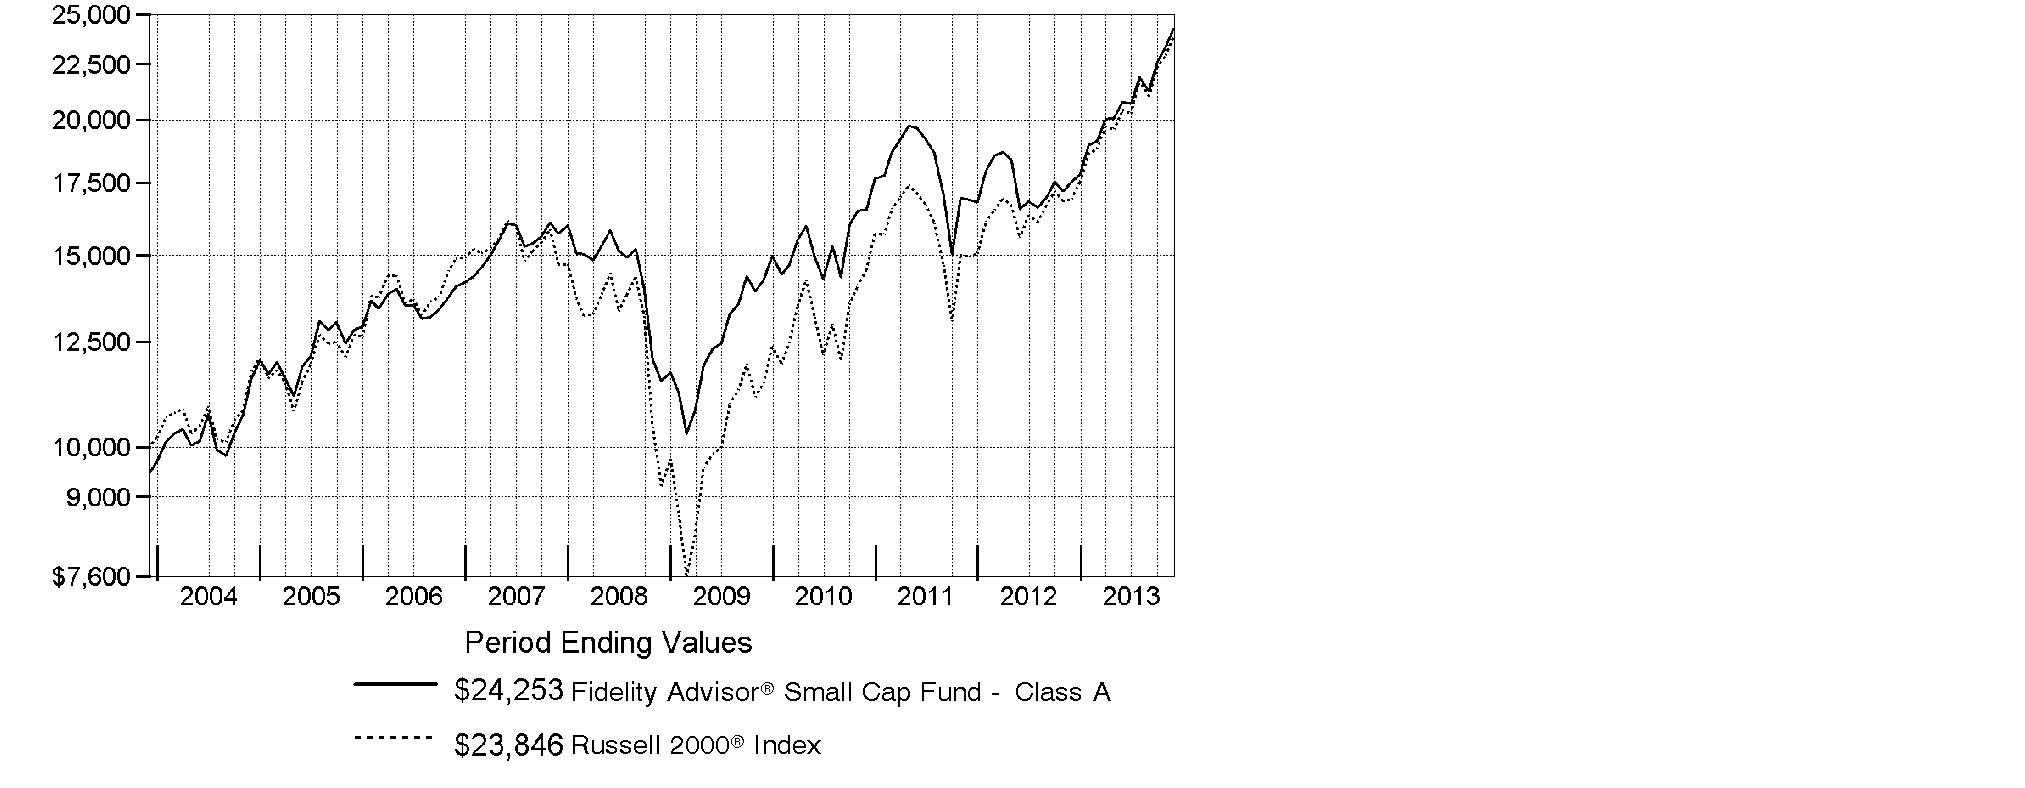
Annual Report
Management's Discussion of Fund Performance
Market Recap: With the current bull run nearing the five-year mark, equity benchmarks ripped up old records during the 12 months ending November 30, 2013. Gains were fueled by strengthening U.S. economic data, as well as generally improving economies and accommodative monetary policies worldwide. The broad S&P 500® Index reached new peaks in its 30.30% climb for the period, and the blue-chip Dow Jones Industrial AverageSM surpassed historic milestones en route to a 26.63% gain. The Nasdaq Composite Index®, up 36.73% amid a resurgence in growth-oriented stocks, closed above 4,000 for the first time since 2000. Shedding anxiety over the 2012 U.S. presidential election - and apparently confident that the federal debt-ceiling debate would be resolved - markets rose from period start through late May. News that the U.S. Federal Reserve was considering an end to its stimulative bond-buying kept stocks in flux over the summer but, by September, the Fed had set aside any imminent tapering. Despite jitters over a potential U.S. military strike in Syria and, later, an October budget impasse that briefly shuttered the federal government, volatility was subdued heading into the holidays, with investor optimism helping many markets home in on all-time highs at period end. Elsewhere, non-U.S. developed-market equities saw similar results, with the MSCI® EAFE® Index adding 24.97%.
Comments from James Harmon, Portfolio Manager of Fidelity Advisor® Small Cap Fund: For the year, the fund's Class A, Class T, Class B and Class C shares returned 38.30%, 38.11%, 37.26% and 37.28%, respectively (excluding sales charges), lagging the Russell 2000® Index. On a relative basis, the fund was hampered the most by weak stock picking among energy and retailing stocks, while positioning in the real estate industry contributed. Given my management focus on high-quality, "steady Eddie" businesses, it was extremely difficult to keep pace with many of the speculative small-cap names that led the market's rally. On an individual security basis, the fund's biggest relative detractor was EZCORP, which is primarily a pawnbroker in the U.S. and Mexico. The stock was hurt by low gold prices and business-execution challenges, among other factors. Another detractor was a non-index investment in fuel logistics company World Fuel Services, which was hurt by worries about potential legal liability surrounding a July train crash in Canada. In contrast, iGATE, a provider of India-based offshore information technology consulting services, was the fund's leading contributor. Coming into the period, iGATE's shares were very inexpensively valued, and renewed optimism about the prospects for the company's 2011 acquisition of Patni Computer Systems helped iGATE's stock to bounce back.
Annual Report
The views expressed above reflect those of the portfolio manager(s) only through the end of the period as stated on the cover of this report and do not necessarily represent the views of Fidelity or any other person in the Fidelity organization. Any such views are subject to change at any time based upon market or other conditions and Fidelity disclaims any responsibility to update such views. These views may not be relied on as investment advice and, because investment decisions for a Fidelity fund are based on numerous factors, may not be relied on as an indication of trading intent on behalf of any Fidelity fund.
Annual Report
Shareholder Expense Example
As a shareholder of the Fund, you incur two types of costs: (1) transaction costs, including sales charges (loads) on purchase payments or redemption proceeds, and (2) ongoing costs, including management fees, distribution and/or service (12b-1) fees and other Fund expenses. This Example is intended to help you understand your ongoing costs (in dollars) of investing in the Fund and to compare these costs with the ongoing costs of investing in other mutual funds.
The actual expense Example is based on an investment of $1,000 invested at the beginning of the period and held for the entire period (June 1, 2013 to November 31, 2013) for Class A, Class T, Class B, Class C and Institutional Class and for the period (August 13, 2013 to November 30, 2013) for Class Z. The hypothetical expense Example is based on investment of $1,000 for the one-half year period (June 1, 2013 to November 30, 2013).
Actual Expenses
The first line of the accompanying table for each class of the Fund provides information about actual account values and actual expenses. You may use the information in this line, together with the amount you invested, to estimate the expenses that you paid over the period. Simply divide your account value by $1,000.00 (for example, an $8,600 account value divided by $1,000.00 = 8.6), then multiply the result by the number in the first line for a class of the Fund under the heading entitled "Expenses Paid During Period" to estimate the expenses you paid on your account during this period. In addition, the Fund, as a shareholder in the underlying Fidelity Central Funds, will indirectly bear its pro-rata share of the fees and expenses incurred by the underlying Fidelity Central Funds. These fees and expenses are not included in the Fund's annualized expense ratio used to calculate the expense estimate in the table below.
Hypothetical Example for Comparison Purposes
The second line of the accompanying table for each class of the Fund provides information about hypothetical account values and hypothetical expenses based on a Class' actual expense ratio and an assumed rate of return of 5% per year before expenses, which is not the Class' actual return. The hypothetical account values and expenses may not be used to estimate the actual ending account balance or expenses you paid for the period. You may use this information to compare the ongoing costs of investing in the Fund and other funds. To do so, compare this 5% hypothetical example with the 5% hypothetical examples that appear in the shareholder reports of the other funds. In addition, the Fund, as a shareholder in the underlying Fidelity Central Funds, will indirectly bear its pro-rata share of the fees and expenses incurred by the underlying Fidelity Central Funds. These fees and expenses are not included in the Fund's annualized expense ratio used to calculate the expense estimate in the table below.
Please note that the expenses shown in the table are meant to highlight your ongoing costs only and do not reflect any transaction costs. Therefore, the second line of the table is useful in comparing ongoing costs only, and will not help you determine the relative total costs of owning different funds. In addition, if these transactional costs were included, your costs would have been higher.
Annual Report
|
|
Annualized |
Beginning |
Ending |
Expenses Paid |
|
Class A |
1.00% |
|
|
|
|
Actual |
|
$ 1,000.00 |
$ 1,167.90 |
$ 5.43 C |
|
HypotheticalA |
|
$ 1,000.00 |
$ 1,020.05 |
$ 5.06 D |
|
Class T |
1.21% |
|
|
|
|
Actual |
|
$ 1,000.00 |
$ 1,167.10 |
$ 6.57 C |
|
HypotheticalA |
|
$ 1,000.00 |
$ 1,019.00 |
$ 6.12 D |
|
Class B |
1.81% |
|
|
|
|
Actual |
|
$ 1,000.00 |
$ 1,163.70 |
$ 9.82 C |
|
HypotheticalA |
|
$ 1,000.00 |
$ 1,015.99 |
$ 9.15 D |
|
Class C |
1.75% |
|
|
|
|
Actual |
|
$ 1,000.00 |
$ 1,163.40 |
$ 9.49 C |
|
HypotheticalA |
|
$ 1,000.00 |
$ 1,016.29 |
$ 8.85 D |
|
Institutional Class |
.70% |
|
|
|
|
Actual |
|
$ 1,000.00 |
$ 1,169.80 |
$ 3.81 C |
|
HypotheticalA |
|
$ 1,000.00 |
$ 1,021.56 |
$ 3.55 D |
|
Class Z |
.56% |
|
|
|
|
Actual |
|
$ 1,000.00 |
$ 1,099.00 |
$ 1.77 C |
|
HypotheticalA |
|
$ 1,000.00 |
$ 1,022.26 |
$ 2.84 D |
A 5% return per year before expenses
B Annualized expense ratio reflects expenses net of applicable fee waivers.
C Actual expenses are equal to each Class' annualized expense ratio, multiplied by the average account value over the period, multiplied by 183/365 (to reflect the one-half year period) for Class A, Class T, Class B, Class C and Institutional Class and multiplied by 110/365 (to reflect the period August 13, 2013 to November 30, 2013) for Class Z. The fees and expenses of the underlying Fidelity Central Funds in which the Fund invests are not included in each Class' annualized expense ratio.
D Hypothetical expenses are equal to each Class' annualized expense ratio, multiplied by the average account value over the period, multiplied by 183/365 (to reflect the one-half year period). The fees and expenses of the underlying Fidelity Central Funds in which the Fund invests are not included in each Class' annualized expense ratio.
Annual Report
Investment Changes (Unaudited)
|
Top Ten Stocks as of November 30, 2013 |
||
|
|
% of fund's |
% of fund's net assets |
|
Global Payments, Inc. |
1.8 |
0.9 |
|
Badger Daylighting Ltd. |
1.8 |
1.1 |
|
Primerica, Inc. |
1.7 |
1.6 |
|
Moog, Inc. Class A |
1.7 |
1.3 |
|
Office Depot, Inc. |
1.7 |
0.8 |
|
Skechers U.S.A., Inc. Class A (sub. vtg.) |
1.7 |
1.3 |
|
The Ensign Group, Inc. |
1.6 |
1.3 |
|
PolyOne Corp. |
1.6 |
1.7 |
|
WESCO International, Inc. |
1.5 |
1.4 |
|
Jazz Pharmaceuticals PLC |
1.5 |
0.9 |
|
|
16.6 |
|
|
Top Five Market Sectors as of November 30, 2013 |
||
|
|
% of fund's |
% of fund's net assets |
|
Financials |
19.2 |
22.2 |
|
Information Technology |
16.7 |
14.7 |
|
Consumer Discretionary |
16.3 |
18.6 |
|
Industrials |
14.7 |
13.7 |
|
Health Care |
11.3 |
9.7 |
|
Asset Allocation (% of fund's net assets) |
|||||||
|
As of November 30, 2013* |
As of May 31, 2013** |
||||||
 |
Stocks and Equity |
|
|
Stocks and Equity |
|
||
 |
Short-Term |
|
|
Short-Term |
|
||
|
* Foreign investments |
19.7% |
|
** Foreign investments |
17.9% |
|
||

Annual Report
Investments November 30, 2013
Showing Percentage of Net Assets
|
Common Stocks - 93.6% |
|||
|
Shares |
Value (000s) |
||
|
CONSUMER DISCRETIONARY - 16.3% |
|||
|
Auto Components - 0.6% |
|||
|
Dorman Products, Inc. |
438,300 |
$ 21,819 |
|
|
Diversified Consumer Services - 1.7% |
|||
|
Best Bridal, Inc. (d)(e) |
2,789,100 |
18,568 |
|
|
Grand Canyon Education, Inc. (a) |
569,800 |
25,949 |
|
|
Meiko Network Japan Co. Ltd. (e) |
1,577,900 |
16,280 |
|
|
|
60,797 |
||
|
Hotels, Restaurants & Leisure - 1.5% |
|||
|
AFC Enterprises, Inc. (a) |
219,200 |
9,555 |
|
|
Life Time Fitness, Inc. (a) |
394,500 |
19,137 |
|
|
Texas Roadhouse, Inc. Class A |
789,000 |
22,076 |
|
|
|
50,768 |
||
|
Household Durables - 1.8% |
|||
|
Iida Group Holdings Co. Ltd. (a)(d) |
1,100,999 |
22,150 |
|
|
Tupperware Brands Corp. |
438,300 |
40,034 |
|
|
|
62,184 |
||
|
Multiline Retail - 0.7% |
|||
|
Big Lots, Inc. (a) |
600,205 |
23,006 |
|
|
Specialty Retail - 6.6% |
|||
|
Aarons, Inc. Class A |
1,051,900 |
30,126 |
|
|
Aeropostale, Inc. (a)(d) |
3,014,100 |
31,106 |
|
|
Ascena Retail Group, Inc. (a) |
1,008,100 |
21,473 |
|
|
Genesco, Inc. (a) |
500,000 |
37,455 |
|
|
Jumbo SA (a) |
1,358,800 |
21,159 |
|
|
Murphy U.S.A., Inc. |
613,600 |
27,765 |
|
|
Office Depot, Inc. (a)(d) |
10,852,600 |
59,038 |
|
|
|
228,122 |
||
|
Textiles, Apparel & Luxury Goods - 3.4% |
|||
|
Skechers U.S.A., Inc. Class A (sub. vtg.) (a) |
1,753,200 |
58,943 |
|
|
Steven Madden Ltd. (a) |
1,052,000 |
40,986 |
|
|
Wolverine World Wide, Inc. |
613,600 |
20,194 |
|
|
|
120,123 |
||
|
TOTAL CONSUMER DISCRETIONARY |
566,819 |
||
|
CONSUMER STAPLES - 4.8% |
|||
|
Food & Staples Retailing - 1.7% |
|||
|
Ain Pharmaciez, Inc. |
114,000 |
5,280 |
|
|
Common Stocks - continued |
|||
|
Shares |
Value (000s) |
||
|
CONSUMER STAPLES - continued |
|||
|
Food & Staples Retailing - continued |
|||
|
Sundrug Co. Ltd. |
604,900 |
$ 27,250 |
|
|
Tsuruha Holdings, Inc. |
263,000 |
24,209 |
|
|
|
56,739 |
||
|
Food Products - 1.0% |
|||
|
Darling International, Inc. (a) |
1,665,600 |
34,528 |
|
|
Personal Products - 2.1% |
|||
|
Atrium Innovations, Inc. (a)(e) |
2,016,200 |
46,147 |
|
|
Prestige Brands Holdings, Inc. (a) |
789,000 |
27,804 |
|
|
|
73,951 |
||
|
TOTAL CONSUMER STAPLES |
165,218 |
||
|
ENERGY - 5.5% |
|||
|
Energy Equipment & Services - 3.9% |
|||
|
Cathedral Energy Services Ltd. (e) |
3,141,600 |
14,931 |
|
|
Key Energy Services, Inc. (a) |
4,383,100 |
34,364 |
|
|
Oil States International, Inc. (a) |
219,200 |
22,435 |
|
|
Pason Systems, Inc. |
1,840,900 |
39,328 |
|
|
Western Energy Services Corp. (a)(f) |
1,080,720 |
7,618 |
|
|
Western Energy Services Corp. |
2,279,200 |
16,066 |
|
|
|
134,742 |
||
|
Oil, Gas & Consumable Fuels - 1.6% |
|||
|
BP Prudhoe Bay Royalty Trust (d) |
15,506 |
1,179 |
|
|
Sunoco Logistics Partners LP |
219,200 |
15,515 |
|
|
World Fuel Services Corp. |
1,052,000 |
40,397 |
|
|
|
57,091 |
||
|
TOTAL ENERGY |
191,833 |
||
|
FINANCIALS - 19.2% |
|||
|
Capital Markets - 0.4% |
|||
|
Virtus Investment Partners, Inc. (a) |
65,700 |
13,652 |
|
|
Commercial Banks - 4.6% |
|||
|
Bank of the Ozarks, Inc. |
350,700 |
19,692 |
|
|
East West Bancorp, Inc. |
1,051,900 |
36,059 |
|
|
First Financial Bankshares, Inc. (d) |
175,300 |
11,636 |
|
|
Popular, Inc. (a) |
657,500 |
18,791 |
|
|
Prosperity Bancshares, Inc. |
350,600 |
22,484 |
|
|
Common Stocks - continued |
|||
|
Shares |
Value (000s) |
||
|
FINANCIALS - continued |
|||
|
Commercial Banks - continued |
|||
|
Sterling Financial Corp. |
1,051,900 |
$ 34,345 |
|
|
SVB Financial Group (a) |
175,300 |
17,747 |
|
|
|
160,754 |
||
|
Consumer Finance - 0.6% |
|||
|
EZCORP, Inc. (non-vtg.) Class A (a) |
1,765,700 |
20,623 |
|
|
Insurance - 7.3% |
|||
|
CNO Financial Group, Inc. |
2,279,200 |
38,564 |
|
|
Enstar Group Ltd. (a) |
175,300 |
24,421 |
|
|
HCC Insurance Holdings, Inc. |
789,000 |
36,278 |
|
|
Primerica, Inc. |
1,402,600 |
60,354 |
|
|
ProAssurance Corp. |
613,600 |
29,502 |
|
|
Reinsurance Group of America, Inc. |
473,400 |
35,496 |
|
|
RenaissanceRe Holdings Ltd. |
300,000 |
28,410 |
|
|
|
253,025 |
||
|
Real Estate Investment Trusts - 5.2% |
|||
|
Aviv REIT, Inc. |
657,500 |
16,898 |
|
|
Corrections Corp. of America |
701,300 |
23,388 |
|
|
EPR Properties |
350,600 |
17,632 |
|
|
Equity Lifestyle Properties, Inc. |
394,500 |
14,005 |
|
|
First Industrial Realty Trust, Inc. |
964,300 |
16,837 |
|
|
MFA Financial, Inc. |
3,814,900 |
27,811 |
|
|
National Health Investors, Inc. |
263,000 |
15,483 |
|
|
Rouse Properties, Inc. (d) |
1,402,600 |
34,209 |
|
|
Sovran Self Storage, Inc. |
219,200 |
14,629 |
|
|
|
180,892 |
||
|
Real Estate Management & Development - 0.3% |
|||
|
Relo Holdings Corp. |
219,200 |
10,698 |
|
|
Thrifts & Mortgage Finance - 0.8% |
|||
|
EverBank Financial Corp. (d) |
1,665,600 |
28,432 |
|
|
TOTAL FINANCIALS |
668,076 |
||
|
HEALTH CARE - 11.3% |
|||
|
Biotechnology - 1.2% |
|||
|
United Therapeutics Corp. (a) |
438,300 |
40,459 |
|
|
Health Care Equipment & Supplies - 1.6% |
|||
|
DENTSPLY International, Inc. |
482,100 |
22,929 |
|
|
The Cooper Companies, Inc. |
263,000 |
34,648 |
|
|
|
57,577 |
||
|
Common Stocks - continued |
|||
|
Shares |
Value (000s) |
||
|
HEALTH CARE - continued |
|||
|
Health Care Providers & Services - 6.2% |
|||
|
AmSurg Corp. (a) |
1,051,900 |
$ 50,828 |
|
|
Centene Corp. (a) |
175,300 |
10,471 |
|
|
Community Health Systems, Inc. |
789,000 |
32,546 |
|
|
Health Net, Inc. (a) |
701,300 |
21,425 |
|
|
Henry Schein, Inc. (a) |
175,300 |
19,984 |
|
|
MEDNAX, Inc. (a) |
219,200 |
24,287 |
|
|
The Ensign Group, Inc. (e) |
1,227,300 |
55,437 |
|
|
|
214,978 |
||
|
Health Care Technology - 0.8% |
|||
|
Quality Systems, Inc. |
1,139,600 |
26,621 |
|
|
Pharmaceuticals - 1.5% |
|||
|
Jazz Pharmaceuticals PLC (a) |
438,300 |
51,246 |
|
|
TOTAL HEALTH CARE |
390,881 |
||
|
INDUSTRIALS - 14.7% |
|||
|
Aerospace & Defense - 2.9% |
|||
|
Moog, Inc. Class A (a) |
876,600 |
60,196 |
|
|
Teledyne Technologies, Inc. (a) |
438,300 |
40,644 |
|
|
|
100,840 |
||
|
Commercial Services & Supplies - 2.3% |
|||
|
Mitie Group PLC |
5,698,100 |
29,044 |
|
|
UniFirst Corp. |
263,799 |
26,971 |
|
|
West Corp. |
1,095,800 |
25,236 |
|
|
|
81,251 |
||
|
Construction & Engineering - 1.8% |
|||
|
Badger Daylighting Ltd. (e) |
753,900 |
60,809 |
|
|
Machinery - 3.3% |
|||
|
Actuant Corp. Class A |
701,300 |
27,407 |
|
|
Hy-Lok Corp. |
400,000 |
10,584 |
|
|
Standex International Corp. |
438,300 |
25,825 |
|
|
TriMas Corp. (a) |
876,544 |
32,064 |
|
|
Valmont Industries, Inc. |
119,840 |
17,342 |
|
|
|
113,222 |
||
|
Marine - 0.2% |
|||
|
SITC International Holdings Co. Ltd. |
18,409,000 |
8,097 |
|
|
Common Stocks - continued |
|||
|
Shares |
Value (000s) |
||
|
INDUSTRIALS - continued |
|||
|
Professional Services - 1.2% |
|||
|
Benefit One, Inc. |
1,840,900 |
$ 17,592 |
|
|
Stantec, Inc. |
350,700 |
22,754 |
|
|
|
40,346 |
||
|
Trading Companies & Distributors - 3.0% |
|||
|
DXP Enterprises, Inc. (a) |
263,000 |
25,769 |
|
|
Textainer Group Holdings Ltd. |
701,300 |
27,231 |
|
|
WESCO International, Inc. (a) |
613,600 |
52,757 |
|
|
|
105,757 |
||
|
TOTAL INDUSTRIALS |
510,322 |
||
|
INFORMATION TECHNOLOGY - 16.7% |
|||
|
Electronic Equipment & Components - 4.3% |
|||
|
Belden, Inc. |
394,500 |
27,623 |
|
|
CDW Corp. (d) |
1,753,300 |
39,099 |
|
|
Insight Enterprises, Inc. (a) |
1,139,600 |
27,430 |
|
|
Jabil Circuit, Inc. |
1,202,130 |
24,367 |
|
|
ScanSource, Inc. (a) |
754,881 |
31,697 |
|
|
|
150,216 |
||
|
Internet Software & Services - 2.9% |
|||
|
Perficient, Inc. (a) |
1,528,600 |
33,140 |
|
|
Stamps.com, Inc. (a)(e) |
876,600 |
40,385 |
|
|
ValueClick, Inc. (a) |
1,227,300 |
26,264 |
|
|
|
99,789 |
||
|
IT Services - 6.7% |
|||
|
EPAM Systems, Inc. (a) |
843,700 |
29,926 |
|
|
Genpact Ltd. (a) |
1,314,900 |
23,537 |
|
|
Global Payments, Inc. |
989,700 |
62,403 |
|
|
iGATE Corp. (a) |
1,080,600 |
36,178 |
|
|
Syntel, Inc. |
306,800 |
27,112 |
|
|
VeriFone Systems, Inc. (a) |
1,052,000 |
26,942 |
|
|
WEX, Inc. (a) |
263,000 |
26,105 |
|
|
|
232,203 |
||
|
Semiconductors & Semiconductor Equipment - 0.7% |
|||
|
Omnivision Technologies, Inc. (a) |
1,577,900 |
25,294 |
|
|
Software - 2.1% |
|||
|
NIIT Technologies Ltd. (e) |
3,800,000 |
19,396 |
|
|
SWORD Group (e) |
587,339 |
12,673 |
|
|
Common Stocks - continued |
|||
|
Shares |
Value (000s) |
||
|
INFORMATION TECHNOLOGY - continued |
|||
|
Software - continued |
|||
|
Verint Systems, Inc. (a) |
613,600 |
$ 23,268 |
|
|
Zensar Technologies Ltd. (a)(e) |
3,499,999 |
18,120 |
|
|
|
73,457 |
||
|
TOTAL INFORMATION TECHNOLOGY |
580,959 |
||
|
MATERIALS - 4.7% |
|||
|
Chemicals - 2.9% |
|||
|
Axiall Corp. |
438,300 |
19,855 |
|
|
FUCHS PETROLUB AG |
306,800 |
25,388 |
|
|
PolyOne Corp. |
1,665,600 |
54,065 |
|
|
|
99,308 |
||
|
Containers & Packaging - 0.8% |
|||
|
Sealed Air Corp. |
876,600 |
28,148 |
|
|
Metals & Mining - 1.0% |
|||
|
Aurubis AG |
394,500 |
23,272 |
|
|
Maharashtra Seamless Ltd. (a) |
190,000 |
510 |
|
|
Reliance Steel & Aluminum Co. |
175,300 |
12,890 |
|
|
|
36,672 |
||
|
TOTAL MATERIALS |
164,128 |
||
|
UTILITIES - 0.4% |
|||
|
Gas Utilities - 0.4% |
|||
|
New Jersey Resources Corp. |
263,000 |
12,016 |
|
|
TOTAL COMMON STOCKS (Cost $2,362,139) |
|
||
|
U.S. Treasury Obligations - 0.3% |
||||
|
|
Principal Amount (000s) |
|
||
|
U.S. Treasury Bills, yield at date of purchase 0.01% to 0.07% 12/12/13 to 2/27/14 (g) |
|
$ 10,260 |
|
|
|
Money Market Funds - 9.2% |
|||
|
Shares |
Value (000s) |
||
|
Fidelity Cash Central Fund, 0.10% (b) |
262,782,714 |
$ 262,783 |
|
|
Fidelity Securities Lending Cash Central Fund, 0.10% (b)(c) |
57,688,350 |
57,688 |
|
|
TOTAL MONEY MARKET FUNDS (Cost $320,471) |
|
||
|
TOTAL INVESTMENT PORTFOLIO - 103.1% (Cost $2,692,870) |
3,580,983 |
||
|
NET OTHER ASSETS (LIABILITIES) - (3.1)% |
(107,717) |
||
|
NET ASSETS - 100% |
$ 3,473,266 |
||
|
Futures Contracts |
|||||
|
|
Expiration Date |
Underlying Face Amount at Value (000s) |
Unrealized Appreciation/ |
||
|
Purchased |
|||||
|
Equity Index Contracts |
|||||
|
1,852 ICE Russell 2000 Mini Index Contracts (United States) |
Dec. 2013 |
$ 211,443 |
$ 7,338 |
||
|
|
|
The face value of futures purchased as a percentage of net assets is 6.1% |
|
Legend |
|
(a) Non-income producing |
|
(b) Affiliated fund that is generally available only to investment companies and other accounts managed by Fidelity Investments. The rate quoted is the annualized seven-day yield of the fund at period end. A complete unaudited listing of the fund's holdings as of its most recent quarter end is available upon request. In addition, each Fidelity Central Fund's financial statements, which are not covered by the Fund's Report of Independent Registered Public Accounting Firm, are available on the SEC's website or upon request. |
|
(c) Investment made with cash collateral received from securities on loan. |
|
(d) Security or a portion of the security is on loan at period end. |
|
(e) Affiliated company |
|
(f) Security exempt from registration under Rule 144A of the Securities Act of 1933. These securities may be resold in transactions exempt from registration, normally to qualified institutional buyers. At the end of the period, the value of these securities amounted to $7,618,000 or 0.2% of net assets. |
|
(g) Security or a portion of the security was pledged to cover margin requirements for futures contracts. At period end, the value of securities pledged amounted to $8,565,000. |
|
Affiliated Central Funds |
|
Information regarding fiscal year to date income earned by the Fund from investments in Fidelity Central Funds is as follows: |
|
Fund |
Income earned |
|
Fidelity Cash Central Fund |
$ 107 |
|
Fidelity Securities Lending Cash Central Fund |
1,296 |
|
Total |
$ 1,403 |
|
Other Affiliated Issuers |
|
An affiliated company is a company in which the Fund has ownership of at least 5% of the voting securities. Fiscal year to date transactions with companies which are or were affiliates are as follows: |
|
Affiliate |
Value, |
Purchases |
Sales |
Dividend |
Value, |
|
Aeropostale, Inc. |
$ 56,018 |
$ 3,852 |
$ 17,732* |
$ - |
$ - |
|
AFC Enterprises, Inc. |
32,238 |
- |
32,813* |
- |
- |
|
Atrium Innovations, Inc. |
26,627 |
- |
5,014* |
- |
46,147 |
|
Badger Daylighting Ltd. |
26,674 |
- |
7,093* |
759 |
60,809 |
|
Benefit One, Inc. |
13,959 |
- |
5,786* |
430 |
- |
|
Best Bridal, Inc. |
16,354 |
- |
2,706* |
325 |
18,568 |
|
Cathedral Energy Services Ltd. |
15,502 |
3,121 |
2,215* |
806 |
14,931 |
|
CBIZ, Inc. |
29,631 |
- |
31,193 |
- |
- |
|
Healthways, Inc. |
24,886 |
- |
31,115 |
- |
- |
|
iGATE Corp. |
64,457 |
- |
78,315* |
- |
- |
|
Insight Enterprises, Inc. |
59,290 |
- |
46,403* |
- |
- |
|
Meiko Network Japan Co. Ltd. |
25,756 |
- |
11,282* |
532 |
16,280 |
|
NIIT Technologies Ltd. |
19,569 |
- |
- |
550 |
19,396 |
|
Affiliate |
Value, |
Purchases |
Sales |
Dividend |
Value, |
|
Perficient, Inc. |
$ 30,492 |
$ - |
$ 24,689* |
$ - |
$ - |
|
Prestige Brands Holdings, Inc. |
58,320 |
- |
59,982* |
- |
- |
|
Simplex Holdings, Inc. |
10,454 |
- |
17,258 |
194 |
- |
|
Stamps.com, Inc. |
35,518 |
- |
22,764* |
- |
40,385 |
|
SWORD Group |
13,117 |
- |
4,035* |
561 |
12,673 |
|
The Ensign Group, Inc. |
36,106 |
- |
7,533* |
364 |
55,437 |
|
Zensar Technologies Ltd. |
15,637 |
1,208 |
- |
492 |
18,120 |
|
Total |
$ 610,605 |
$ 8,181 |
$ 407,928 |
$ 5,013 |
$ 302,746 |
|
* Includes the value of securities delivered through in-kind transactions. |
|
Other Information |
|
The following is a summary of the inputs used, as of November 30, 2013, involving the Fund's assets and liabilities carried at fair value. The inputs or methodology used for valuing securities may not be an indication of the risk associated with investing in those securities. For more information on valuation inputs, and their aggregation into the levels used in the tables below, please refer to the Investment Valuation section in the accompanying Notes to Financial Statements. |
|
Valuation Inputs at Reporting Date: |
||||
|
Description |
Total |
Level 1 |
Level 2 |
Level 3 |
|
Investments in Securities: |
||||
|
Equities: |
||||
|
Consumer Discretionary |
$ 566,819 |
$ 566,819 |
$ - |
$ - |
|
Consumer Staples |
165,218 |
165,218 |
- |
- |
|
Energy |
191,833 |
191,833 |
- |
- |
|
Financials |
668,076 |
668,076 |
- |
- |
|
Health Care |
390,881 |
390,881 |
- |
- |
|
Industrials |
510,322 |
510,322 |
- |
- |
|
Information Technology |
580,959 |
580,959 |
- |
- |
|
Materials |
164,128 |
164,128 |
- |
- |
|
Utilities |
12,016 |
12,016 |
- |
- |
|
U.S. Government and Government Agency Obligations |
10,260 |
- |
10,260 |
- |
|
Money Market Funds |
320,471 |
320,471 |
- |
- |
|
Total Investments in Securities: |
$ 3,580,983 |
$ 3,570,723 |
$ 10,260 |
$ - |
|
Derivative Instruments: |
||||
|
Assets |
||||
|
Futures Contracts |
$ 7,338 |
$ 7,338 |
$ - |
$ - |
|
The following is a summary of transfers between Level 1 and Level 2 for the period ended November 30, 2013. Transfers are assumed to have occurred at the beginning of the period, and are primarily attributable to the valuation techniques used for foreign equity securities, as discussed in the accompanying Notes to Financial Statements: |
|
Transfers |
Total (000s) |
|
Level 1 to Level 2 |
$ 0 |
|
Level 2 to Level 1 |
$ 162,651 |
|
Value of Derivative Instruments |
|
The following table is a summary of the Fund's value of derivative instruments by primary risk exposure as of November 30, 2013. For additional information on derivative instruments, please refer to the Derivative Instruments section in the accompanying Notes to Financial Statements. |
|
Primary Risk Exposure / |
Value |
|
|
|
Asset |
Liability |
|
Equity Risk |
||
|
Futures Contracts (a) |
$ 7,338 |
$ - |
|
Total Value of Derivatives |
$ 7,338 |
$ - |
|
(a) Reflects gross cumulative appreciation (depreciation) on futures contracts as presented in the Schedule of Investments. Only the period end receivable or payable for daily variation margin and net unrealized appreciation (depreciation) are presented in the Statement of Assets and Liabilities. |
|
Distribution of investments by country or territory of incorporation, as a percentage of total net assets, is as follows (Unaudited): |
|
United States of America |
80.3% |
|
Canada |
6.0% |
|
Japan |
4.1% |
|
Bermuda |
3.0% |
|
Ireland |
1.5% |
|
Germany |
1.3% |
|
India |
1.0% |
|
Others (Individually Less Than 1%) |
2.8% |
|
|
100.0% |
See accompanying notes which are an integral part of the financial statements.
Annual Report
Financial Statements
Statement of Assets and Liabilities
|
Amounts in thousands (except per-share amounts) |
November 30, 2013 |
|
|
|
|
|
|
Assets |
|
|
|
Investment in securities, at value (including securities loaned of $57,034) - See accompanying schedule: Unaffiliated issuers (cost $2,167,513) |
$ 2,957,766 |
|
|
Fidelity Central Funds (cost $320,471) |
320,471 |
|
|
Other affiliated issuers (cost $204,886) |
302,746 |
|
|
Total Investments (cost $2,692,870) |
|
$ 3,580,983 |
|
Foreign currency held at value (cost $240) |
|
240 |
|
Receivable for investments sold |
|
5,035 |
|
Receivable for fund shares sold |
|
2,098 |
|
Dividends receivable |
|
962 |
|
Distributions receivable from Fidelity Central Funds |
|
70 |
|
Receivable for daily variation margin for derivative instruments |
|
236 |
|
Prepaid expenses |
|
11 |
|
Other receivables |
|
4 |
|
Total assets |
|
3,589,639 |
|
|
|
|
|
Liabilities |
|
|
|
Payable for investments purchased |
$ 48,030 |
|
|
Payable for fund shares redeemed |
7,512 |
|
|
Accrued management fee |
1,367 |
|
|
Distribution and service plan fees payable |
1,016 |
|
|
Other affiliated payables |
690 |
|
|
Other payables and accrued expenses |
70 |
|
|
Collateral on securities loaned, at value |
57,688 |
|
|
Total liabilities |
|
116,373 |
|
|
|
|
|
Net Assets |
|
$ 3,473,266 |
|
Net Assets consist of: |
|
|
|
Paid in capital |
|
$ 2,191,218 |
|
Undistributed net investment income |
|
453 |
|
Accumulated undistributed net realized gain (loss) on investments and foreign currency transactions |
|
386,157 |
|
Net unrealized appreciation (depreciation) on investments and assets and liabilities in foreign currencies |
|
895,438 |
|
Net Assets |
|
$ 3,473,266 |
See accompanying notes which are an integral part of the financial statements.
Annual Report
Statement of Assets and Liabilities - continued
|
Amounts in thousands (except per-share amounts) |
November 30, 2013 |
|
|
|
|
|
|
Calculation of Maximum Offering Price Class A: |
|
$ 30.96 |
|
|
|
|
|
Maximum offering price per share (100/94.25 of $30.96) |
|
$ 32.85 |
|
Class T: |
|
$ 29.69 |
|
|
|
|
|
Maximum offering price per share (100/96.50 of $29.69) |
|
$ 30.77 |
|
Class B: |
|
$ 26.45 |
|
|
|
|
|
Class C: |
|
$ 26.77 |
|
|
|
|
|
Institutional Class: |
|
$ 32.73 |
|
|
|
|
|
Class Z: |
|
$ 32.74 |
A Redemption price per share is equal to net asset value less any applicable contingent deferred sales charge.
See accompanying notes which are an integral part of the financial statements.
Annual Report
Financial Statements - continued
Statement of Operations
|
Amounts in thousands |
Year ended November 30, 2013 |
|
|
|
|
|
|
Investment Income |
|
|
|
Dividends (including $5,013 earned from other affiliated issuers) |
|
$ 46,998 |
|
Special dividends |
|
6,248 |
|
Interest |
|
3 |
|
Income from Fidelity Central Funds |
|
1,403 |
|
Total income |
|
54,652 |
|
|
|
|
|
Expenses |
|
|
|
Management fee |
$ 26,309 |
|
|
Performance adjustment |
(8,636) |
|
|
Transfer agent fees |
8,302 |
|
|
Distribution and service plan fees |
11,819 |
|
|
Accounting and security lending fees |
1,048 |
|
|
Custodian fees and expenses |
155 |
|
|
Independent trustees' compensation |
21 |
|
|
Registration fees |
146 |
|
|
Audit |
77 |
|
|
Legal |
11 |
|
|
Miscellaneous |
25 |
|
|
Total expenses before reductions |
39,277 |
|
|
Expense reductions |
(351) |
38,926 |
|
Net investment income (loss) |
|
15,726 |
|
Realized and Unrealized Gain (Loss) Net realized gain (loss) on: |
|
|
|
Investment securities: |
|
|
|
Unaffiliated issuers |
407,084 |
|
|
Redemption in-kind with affiliated entities (including gain from Other affiliated issuers of $29,049) |
131,946 |
|
|
Other affiliated issuers |
128,365 |
|
|
Foreign currency transactions |
234 |
|
|
Futures contracts |
18,846 |
|
|
Total net realized gain (loss) |
|
686,475 |
|
Change in net unrealized appreciation (depreciation) on: Investment securities |
494,401 |
|
|
Assets and liabilities in foreign currencies |
12 |
|
|
Futures contracts |
7,338 |
|
|
Total change in net unrealized appreciation (depreciation) |
|
501,751 |
|
Net gain (loss) |
|
1,188,226 |
|
Net increase (decrease) in net assets resulting from operations |
|
$ 1,203,952 |
See accompanying notes which are an integral part of the financial statements.
Annual Report
Statement of Changes in Net Assets
|
Amounts in thousands |
Year ended |
Year ended |
|
Increase (Decrease) in Net Assets |
|
|
|
Operations |
|
|
|
Net investment income (loss) |
$ 15,726 |
$ (6,474) |
|
Net realized gain (loss) |
686,475 |
(41,068) |
|
Change in net unrealized appreciation (depreciation) |
501,751 |
195,754 |
|
Net increase (decrease) in net assets resulting |
1,203,952 |
148,212 |
|
Distributions to shareholders from net investment income |
(9,250) |
- |
|
Distributions to shareholders from net realized gain |
(2,080) |
(357,601) |
|
Total distributions |
(11,330) |
(357,601) |
|
Share transactions - net increase (decrease) |
(1,450,861) |
(461,339) |
|
Total increase (decrease) in net assets |
(258,239) |
(670,728) |
|
|
|
|
|
Net Assets |
|
|
|
Beginning of period |
3,731,505 |
4,402,233 |
|
End of period (including undistributed net investment income of $453 and accumulated net investment loss of $4,395, respectively) |
$ 3,473,266 |
$ 3,731,505 |
See accompanying notes which are an integral part of the financial statements.
Annual Report
Financial Highlights - Class A
|
Years ended November 30, |
2013 |
2012 |
2011 |
2010 |
2009 |
|
Selected Per-Share Data |
|
|
|
|
|
|
Net asset value, beginning of period |
$ 22.45 |
$ 23.60 |
$ 24.35 |
$ 21.00 |
$ 17.69 |
|
Income from Investment Operations |
|
|
|
|
|
|
Net investment income (loss) C |
.12 F |
(.03) |
(.09) G |
(.13) |
(.03) |
|
Net realized and unrealized gain (loss) |
8.45 |
.79 |
.67 |
3.48 |
4.09 |
|
Total from investment operations |
8.57 |
.76 |
.58 |
3.35 |
4.06 |
|
Distributions from net investment income |
(.05) |
- |
- |
- |
(.03) |
|
Distributions from net realized gain |
(.01) |
(1.91) |
(1.33) |
- |
(.72) |
|
Total distributions |
(.06) |
(1.91) |
(1.33) |
- |
(.75) |
|
Net asset value, end of period |
$ 30.96 |
$ 22.45 |
$ 23.60 |
$ 24.35 |
$ 21.00 |
|
Total Return A, B |
38.30% |
3.87% |
2.17% |
15.95% |
24.04% |
|
Ratios to Average Net Assets D, H |
|
|
|
|
|
|
Expenses before reductions |
1.01% |
1.06% |
1.31% |
1.44% |
1.53% |
|
Expenses net of fee waivers, if any |
1.01% |
1.06% |
1.31% |
1.40% |
1.40% |
|
Expenses net of all reductions |
1.00% |
1.06% |
1.31% |
1.40% |
1.40% |
|
Net investment income (loss) |
.46% F |
(.13)% |
(.35)% G |
(.58)% |
(.16)% |
|
Supplemental Data |
|
|
|
|
|
|
Net assets, end of period (in millions) |
$ 1,263 |
$ 1,212 |
$ 1,461 |
$ 1,501 |
$ 1,223 |
|
Portfolio turnover rate E |
34% |
69% |
38% |
43% |
46% |
A Total returns would have been lower if certain expenses had not been reduced during the applicable periods shown.
B Total returns do not include the effect of the sales charges.
C Calculated based on average shares outstanding during the period.
D Fees and expenses of any underlying Fidelity Central Funds are not included in the Fund's expense ratio. The Fund indirectly bears its proportionate share of the expenses of any underlying Fidelity Central Funds.
E Amount does not include the portfolio activity of any underlying Fidelity Central Funds.
F Investment income per share reflects a large, non-recurring dividend which amounted to $.04 per share. Excluding this non-recurring dividend, the ratio of net investment income (loss) to average net assets would have been .29%.
G Investment income per share reflects a large, non-recurring dividend which amounted to $.04 per share. Excluding this non-recurring dividend, the ratio of net investment income (loss) to average net assets would have been (.50)%.
H Expense ratios reflect operating expenses of the class. Expenses before reductions do not reflect amounts reimbursed by the investment adviser or reductions from brokerage service arrangements or reductions from other expense offset arrangements and do not represent the amount paid by the class during periods when reimbursements or reductions occur. Expenses net of fee waivers reflect expenses after reimbursement by the investment adviser but prior to reductions from brokerage service arrangements or other expense offset arrangements. Expenses net of all reductions represent the net expenses paid by the class.
See accompanying notes which are an integral part of the financial statements.
Annual Report
Financial Highlights - Class T
|
Years ended November 30, |
2013 |
2012 |
2011 |
2010 |
2009 |
|
Selected Per-Share Data |
|
|
|
|
|
|
Net asset value, beginning of period |
$ 21.52 |
$ 22.75 |
$ 23.57 |
$ 20.37 |
$ 17.20 |
|
Income from Investment Operations |
|
|
|
|
|
|
Net investment income (loss) C |
.06 F |
(.07) |
(.13) G |
(.18) |
(.07) |
|
Net realized and unrealized gain (loss) |
8.13 |
.75 |
.64 |
3.38 |
3.96 |
|
Total from investment operations |
8.19 |
.68 |
.51 |
3.20 |
3.89 |
|
Distributions from net investment income |
(.01) |
- |
- |
- |
- |
|
Distributions from net realized gain |
(.01) |
(1.91) |
(1.33) |
- |
(.72) |
|
Total distributions |
(.02) |
(1.91) |
(1.33) |
- |
(.72) |
|
Net asset value, end of period |
$ 29.69 |
$ 21.52 |
$ 22.75 |
$ 23.57 |
$ 20.37 |
|
Total Return A, B |
38.11% |
3.64% |
1.94% |
15.71% |
23.69% |
|
Ratios to Average Net Assets D, H |
|
|
|
|
|
|
Expenses before reductions |
1.22% |
1.26% |
1.51% |
1.63% |
1.74% |
|
Expenses net of fee waivers, if any |
1.22% |
1.26% |
1.51% |
1.63% |
1.65% |
|
Expenses net of all reductions |
1.21% |
1.25% |
1.51% |
1.63% |
1.65% |
|
Net investment income (loss) |
.25% F |
(.33)% |
(.55)% G |
(.81)% |
(.41)% |
|
Supplemental Data |
|
|
|
|
|
|
Net assets, end of period (in millions) |
$ 1,113 |
$ 1,054 |
$ 1,244 |
$ 1,356 |
$ 1,277 |
|
Portfolio turnover rate E |
34% |
69% |
38% |
43% |
46% |
A Total returns would have been lower if certain expenses had not been reduced during the applicable periods shown.
B Total returns do not include the effect of the sales charges.
C Calculated based on average shares outstanding during the period.
D Fees and expenses of any underlying Fidelity Central Funds are not included in the Fund's expense ratio. The Fund indirectly bears its proportionate share of the expenses of any underlying Fidelity Central Funds.
E Amount does not include the portfolio activity of any underlying Fidelity Central Funds.
F Investment income per share reflects a large, non-recurring dividend which amounted to $.04 per share. Excluding this non-recurring dividend, the ratio of net investment income (loss) to average net assets would have been .09%.
G Investment income per share reflects a large, non-recurring dividend which amounted to $.04 per share. Excluding this non-recurring dividend, the ratio of net investment income (loss) to average net assets would have been (.70)%.
H Expense ratios reflect operating expenses of the class. Expenses before reductions do not reflect amounts reimbursed by the investment adviser or reductions from brokerage service arrangements or reductions from other expense offset arrangements and do not represent the amount paid by the class during periods when reimbursements or reductions occur. Expenses net of fee waivers reflect expenses after reimbursement by the investment adviser but prior to reductions from brokerage service arrangements or other expense offset arrangements. Expenses net of all reductions represent the net expenses paid by the class.
See accompanying notes which are an integral part of the financial statements.
Annual Report
Financial Highlights - Class B
|
Years ended November 30, |
2013 |
2012 |
2011 |
2010 |
2009 |
|
Selected Per-Share Data |
|
|
|
|
|
|
Net asset value, beginning of period |
$ 19.27 |
$ 20.69 |
$ 21.66 |
$ 18.82 |
$ 16.02 |
|
Income from Investment Operations |
|
|
|
|
|
|
Net investment income (loss) C |
(.08) F |
(.18) |
(.25) G |
(.27) |
(.15) |
|
Net realized and unrealized gain (loss) |
7.26 |
.67 |
.61 |
3.11 |
3.67 |
|
Total from investment operations |
7.18 |
.49 |
.36 |
2.84 |
3.52 |
|
Distributions from net realized gain |
- |
(1.91) |
(1.33) |
- |
(.72) |
|
Net asset value, end of period |
$ 26.45 |
$ 19.27 |
$ 20.69 |
$ 21.66 |
$ 18.82 |
|
Total Return A, B |
37.26% |
3.03% |
1.39% |
15.09% |
23.10% |
|
Ratios to Average Net Assets D, H |
|
|
|
|
|
|
Expenses before reductions |
1.81% |
1.85% |
2.10% |
2.22% |
2.31% |
|
Expenses net of fee waivers, if any |
1.81% |
1.85% |
2.10% |
2.15% |
2.15% |
|
Expenses net of all reductions |
1.80% |
1.84% |
2.10% |
2.14% |
2.15% |
|
Net investment income (loss) |
(.34)% F |
(.92)% |
(1.14)% G |
(1.33)% |
(.91)% |
|
Supplemental Data |
|
|
|
|
|
|
Net assets, end of period (in millions) |
$ 40 |
$ 40 |
$ 55 |
$ 76 |
$ 89 |
|
Portfolio turnover rate E |
34% |
69% |
38% |
43% |
46% |
A Total returns would have been lower if certain expenses had not been reduced during the applicable periods shown.
B Total returns do not include the effect of the contingent deferred sales charge.
C Calculated based on average shares outstanding during the period.
D Fees and expenses of any underlying Fidelity Central Funds are not included in the Fund's expense ratio. The Fund indirectly bears its proportionate share of the expenses of any underlying Fidelity Central Funds.
E Amount does not include the portfolio activity of any underlying Fidelity Central Funds.
F Investment income per share reflects a large, non-recurring dividend which amounted to $.04 per share. Excluding this non-recurring dividend, the ratio of net investment income (loss) to average net assets would have been (.51)%.
G Investment income per share reflects a large, non-recurring dividend which amounted to $.03 per share. Excluding this non-recurring dividend, the ratio of net investment income (loss) to average net assets would have been (1.29)%.
H Expense ratios reflect operating expenses of the class. Expenses before reductions do not reflect amounts reimbursed by the investment adviser or reductions from brokerage service arrangements or reductions from other expense offset arrangements and do not represent the amount paid by the class during periods when reimbursements or reductions occur. Expenses net of fee waivers reflect expenses after reimbursement by the investment adviser but prior to reductions from brokerage service arrangements or other expense offset arrangements. Expenses net of all reductions represent the net expenses paid by the class.
See accompanying notes which are an integral part of the financial statements.
Annual Report
Financial Highlights - Class C
|
Years ended November 30, |
2013 |
2012 |
2011 |
2010 |
2009 |
|
Selected Per-Share Data |
|
|
|
|
|
|
Net asset value, beginning of period |
$ 19.50 |
$ 20.90 |
$ 21.87 |
$ 19.00 |
$ 16.16 |
|
Income from Investment Operations |
|
|
|
|
|
|
Net investment income (loss) C |
(.07) F |
(.17) |
(.24) G |
(.27) |
(.15) |
|
Net realized and unrealized gain (loss) |
7.34 |
.68 |
.60 |
3.14 |
3.71 |
|
Total from investment operations |
7.27 |
.51 |
.36 |
2.87 |
3.56 |
|
Distributions from net realized gain |
- |
(1.91) |
(1.33) |
- |
(.72) |
|
Net asset value, end of period |
$ 26.77 |
$ 19.50 |
$ 20.90 |
$ 21.87 |
$ 19.00 |
|
Total Return A, B |
37.28% |
3.10% |
1.37% |
15.11% |
23.15% |
|
Ratios to Average Net Assets D, H |
|
|
|
|
|
|
Expenses before reductions |
1.76% |
1.81% |
2.06% |
2.18% |
2.28% |
|
Expenses net of fee waivers, if any |
1.76% |
1.81% |
2.06% |
2.15% |
2.15% |
|
Expenses net of all reductions |
1.75% |
1.80% |
2.05% |
2.14% |
2.15% |
|
Net investment income (loss) |
(.29)% F |
(.88)% |
(1.10)% G |
(1.33)% |
(.91)% |
|
Supplemental Data |
|
|
|
|
|
|
Net assets, end of period (in millions) |
$ 334 |
$ 284 |
$ 328 |
$ 336 |
$ 299 |
|
Portfolio turnover rate E |
34% |
69% |
38% |
43% |
46% |
A Total returns would have been lower if certain expenses had not been reduced during the applicable periods shown.
B Total returns do not include the effect of the contingent deferred sales charge.
C Calculated based on average shares outstanding during the period.
D Fees and expenses of any underlying Fidelity Central Funds are not included in the Fund's expense ratio. The Fund indirectly bears its proportionate share of the expenses of any underlying Fidelity Central Funds.
E Amount does not include the portfolio activity of any underlying Fidelity Central Funds.
F Investment income per share reflects a large, non-recurring dividend which amounted to $.04 per share. Excluding this non-recurring dividend, the ratio of net investment income (loss) to average net assets would have been (.45)%.
G Investment income per share reflects a large, non-recurring dividend which amounted to $.03 per share. Excluding this non-recurring dividend, the ratio of net investment income (loss) to average net assets would have been (1.25)%.
H Expense ratios reflect operating expenses of the class. Expenses before reductions do not reflect amounts reimbursed by the investment adviser or reductions from brokerage service arrangements or reductions from other expense offset arrangements and do not represent the amount paid by the class during periods when reimbursements or reductions occur. Expenses net of fee waivers reflect expenses after reimbursement by the investment adviser but prior to reductions from brokerage service arrangements or other expense offset arrangements. Expenses net of all reductions represent the net expenses paid by the class.
See accompanying notes which are an integral part of the financial statements.
Annual Report
Financial Highlights - Institutional Class
|
Years ended November 30, |
2013 |
2012 |
2011 |
2010 |
2009 |
|
Selected Per-Share Data |
|
|
|
|
|
|
Net asset value, beginning of period |
$ 23.73 |
$ 24.77 |
$ 25.42 |
$ 21.86 |
$ 18.42 |
|
Income from Investment Operations |
|
|
|
|
|
|
Net investment income (loss) B |
.21 E |
.04 |
(.01) F |
(.07) |
.02 |
|
Net realized and unrealized gain (loss) |
8.94 |
.83 |
.69 |
3.63 |
4.24 |
|
Total from investment operations |
9.15 |
.87 |
.68 |
3.56 |
4.26 |
|
Distributions from net investment income |
(.13) |
- |
- |
- |
(.10) |
|
Distributions from net realized gain |
(.01) |
(1.91) |
(1.33) |
- |
(.72) |
|
Total distributions |
(.15) H |
(1.91) |
(1.33) |
- |
(.82) |
|
Net asset value, end of period |
$ 32.73 |
$ 23.73 |
$ 24.77 |
$ 25.42 |
$ 21.86 |
|
Total Return A |
38.79% |
4.15% |
2.49% |
16.29% |
24.31% |
|
Ratios to Average Net Assets C, G |
|
|
|
|
|
|
Expenses before reductions |
.71% |
.75% |
1.01% |
1.12% |
1.21% |
|
Expenses net of fee waivers, if any |
.71% |
.75% |
1.01% |
1.12% |
1.15% |
|
Expenses net of all reductions |
.70% |
.74% |
1.00% |
1.12% |
1.15% |
|
Net investment income (loss) |
.76% E |
.18% |
(.05)% F |
(.30)% |
.09% |
|
Supplemental Data |
|
|
|
|
|
|
Net assets, end of period (in millions) |
$ 718 |
$ 1,141 |
$ 1,314 |
$ 1,165 |
$ 977 |
|
Portfolio turnover rate D |
34% |
69% |
38% |
43% |
46% |
A Total returns would have been lower if certain expenses had not been reduced during the applicable periods shown.
B Calculated based on average shares outstanding during the period.
C Fees and expenses of any underlying Fidelity Central Funds are not included in the Fund's expense ratio. The Fund indirectly bears its proportionate share of the expenses of any underlying Fidelity Central Funds.
D Amount does not include the portfolio activity of any underlying Fidelity Central Funds.
E Investment income per share reflects a large, non-recurring dividend which amounted to $.05 per share. Excluding this non-recurring dividend, the ratio of net investment income (loss) to average net assets would have been .59%.
F Investment income per share reflects a large, non-recurring dividend which amounted to $.04 per share. Excluding this non-recurring dividend, the ratio of net investment income (loss) to average net assets would have been (.19)%.
G Expense ratios reflect operating expenses of the class. Expenses before reductions do not reflect amounts reimbursed by the investment adviser or reductions from brokerage service arrangements or reductions from other expense offset arrangements and do not represent the amount paid by the class during periods when reimbursements or reductions occur. Expenses net of fee waivers reflect expenses after reimbursement by the investment adviser but prior to reductions from brokerage service arrangements or other expense offset arrangements. Expenses net of all reductions represent the net expenses paid by the class.
H Total distributions of $.15 per share is comprised of distributions from net investment income of $.133 and distributions from net realized gain of $.014 per share.
See accompanying notes which are an integral part of the financial statements.
Annual Report
Financial Highlights - Class Z
|
Year ended November 30, |
2013 H |
|
Selected Per-Share Data |
|
|
Net asset value, beginning of period |
$ 29.79 |
|
Income from Investment Operations |
|
|
Net investment income (loss) D |
.02 G |
|
Net realized and unrealized gain (loss) |
2.93 |
|
Total from investment operations |
2.95 |
|
Net asset value, end of period |
$ 32.74 |
|
Total Return B, C |
9.90% |
|
Ratios to Average Net Assets E, I |
|
|
Expenses before reductions |
.56% A |
|
Expenses net of fee waivers, if any |
.56% A |
|
Expenses net of all reductions |
.55% A |
|
Net investment income (loss) |
.26% A, G |
|
Supplemental Data |
|
|
Net assets, end of period (in millions) |
$ 5 |
|
Portfolio turnover rate F |
34% |
A Annualized
B Total returns for periods of less than one year are not annualized.
C Total returns would have been lower if certain expenses had not been reduced during the applicable periods shown.
D Calculated based on average shares outstanding during the period.
E Fees and expenses of any underlying Fidelity Central Funds are not included in the Fund's expense ratio. The Fund indirectly bears its proportionate share of the expenses of any underlying Fidelity Central Funds.
F Amount does not include the portfolio activity of any underlying Fidelity Central Funds.
G Investment income per share reflects a large, non-recurring dividend which amounted to $.01 per share. Excluding this non-recurring dividend, the ratio of net investment income (loss) to average net assets would have been .09%.
H For the period August 13, 2013 (commencement of sale of shares) to November 30, 2013.
I Expense ratios reflect operating expenses of the class. Expenses before reductions do not reflect amounts reimbursed by the investment adviser or reductions from brokerage service arrangements or reductions from other expense offset arrangements and do not represent the amount paid by the class during periods when reimbursements or reductions occur. Expense ratios before reductions for start-up periods may not be representative of longer-term operating periods. Expenses net of fee waivers reflect expenses after reimbursement by the investment adviser but prior to reductions from brokerage service arrangements or other expense offset arrangements. Expenses net of all reductions represent the net expenses paid by the class.
See accompanying notes which are an integral part of the financial statements.
Annual Report
Notes to Financial Statements
For the period ended November 30, 2013
(Amounts in thousands except percentages)
1. Organization.
Fidelity Advisor Small Cap Fund (the Fund) is a fund of Fidelity Advisor Series I (the Trust) and is authorized to issue an unlimited number of shares. The Trust is registered under the Investment Company Act of 1940, as amended (the 1940 Act), as an open-end management investment company organized as a Massachusetts business trust. The Fund commenced sale of Class Z on August 13, 2013. The Fund offers Class A, Class T, Class C, Institutional Class and Class Z shares, each of which, along with Class B shares, has equal rights as to assets and voting privileges. Class B shares are closed to new accounts and additional purchases, except for exchanges and reinvestments. Each class has exclusive voting rights with respect to matters that affect that class. Class B shares will automatically convert to Class A shares after a holding period of seven years from the initial date of purchase.
2. Investments in Fidelity Central Funds.
The Fund invests in Fidelity Central Funds, which are open-end investment companies generally available only to other investment companies and accounts managed by the investment adviser and its affiliates. The Fund's Schedule of Investments lists each of the Fidelity Central Funds held as of period end, if any, as an investment of the Fund, but does not include the underlying holdings of each Fidelity Central Fund. As an Investing Fund, the Fund indirectly bears its proportionate share of the expenses of the underlying Fidelity Central Funds.
The Money Market Central Funds seek preservation of capital and current income and are managed by Fidelity Investments Money Management, Inc. (FIMM), an affiliate of the investment adviser. Annualized expenses of the Money Market Central Funds as of their most recent shareholder report date are less than .01%.
A complete unaudited list of holdings for each Fidelity Central Fund is available upon request or at the Securities and Exchange Commission (the SEC) website at www.sec.gov. In addition, the financial statements of the Fidelity Central Funds, which are not covered by the Fund's Report of Independent Registered Public Accounting Firm, are available on the SEC website or upon request.
3. Significant Accounting Policies.
The financial statements have been prepared in conformity with accounting principles generally accepted in the United States of America (GAAP), which require management to make certain estimates and assumptions at the date of the financial statements. Actual results could differ from those estimates. Subsequent events, if any, through the date that the financial statements were issued have been evaluated in the preparation of
Annual Report
3. Significant Accounting Policies - continued
the financial statements. The following summarizes the significant accounting policies of the Fund:
Investment Valuation. Investments are valued as of 4:00 p.m. Eastern time on the last calendar day of the period. In accordance with valuation policies and procedures approved by the Board of Trustees (the Board), the Fund attempts to obtain prices from one or more third party pricing vendors or brokers to value its investments. When current market prices, quotations or currency exchange rates are not readily available or reliable, investments will be fair valued in good faith by the Fidelity Management & Research Company (FMR) Fair Value Committee (the Committee), in accordance with procedures adopted by the Board. Factors used in determining fair value vary by investment type and may include market or investment specific events, changes in interest rates and credit quality. The frequency with which these procedures are used cannot be predicted and they may be utilized to a significant extent. The Committee oversees the Fund's valuation policies and procedures and is responsible for approving and reporting to the Board all fair value determinations.
The Fund categorizes the inputs to valuation techniques used to value its investments into a disclosure hierarchy consisting of three levels as shown below:
Level 1 - quoted prices in active markets for identical investments
Level 2 - other significant observable inputs (including quoted prices for similar investments, interest rates, prepayment speeds, etc.)
Level 3 - unobservable inputs (including the Fund's own assumptions based on the best information available)
Valuation techniques used to value the Fund's investments by major category are as follows:
Equity securities, including restricted securities, for which market quotations are readily available, are valued at the last reported sale price or official closing price as reported by a third party pricing vendor on the primary market or exchange on which they are traded and are categorized as Level 1 in the hierarchy. In the event there were no sales during the day or closing prices are not available, securities are valued at the last quoted bid price or may be valued using the last available price and are generally categorized as Level 2 in the hierarchy. For foreign equity securities, when market or security specific events arise, comparisons to the valuation of American Depositary Receipts (ADRs), futures contracts, Exchange-Traded Funds (ETFs) and certain indexes as well as quoted prices for similar securities may be used and would be categorized as Level 2 in the hierarchy. Utilizing these techniques may result in transfers between Level 1 and Level 2. For equity securities, including restricted securities, where observable inputs are
Annual Report
Notes to Financial Statements - continued
(Amounts in thousands except percentages)
3. Significant Accounting Policies - continued
Investment Valuation - continued
limited, assumptions about market activity and risk are used and these securities may be categorized as Level 3 in the hierarchy.
Debt securities, including restricted securities, are valued based on evaluated prices received from third party pricing vendors or from brokers who make markets in such securities. For U.S. government and government agency obligations, pricing vendors utilize matrix pricing which considers yield or price of bonds of comparable quality, coupon, maturity and type as well as broker-supplied prices. When independent prices are unavailable or unreliable, debt securities may be valued utilizing pricing methodologies which consider similar factors that would be used by third party pricing vendors. Debt securities are generally categorized as Level 2 in the hierarchy but may be Level 3 depending on the circumstances.
Futures contracts are valued at the settlement price established each day by the board of trade or exchange on which they are traded and are categorized as Level 1 in the hierarchy. Investments in open-end mutual funds, including the Fidelity Central Funds, are valued at their closing net asset value (NAV) each business day and are categorized as Level 1 in the hierarchy.
Changes in valuation techniques may result in transfers in or out of an assigned level within the disclosure hierarchy. The aggregate value of investments by input level, as of November 30, 2013, including information on transfers between Levels 1 and 2, is included at the end of the Fund's Schedule of Investments.
Foreign Currency. The Fund may use foreign currency contracts to facilitate transactions in foreign-denominated securities. Gains and losses from these transactions may arise from changes in the value of the foreign currency or if the counterparties do not perform under the contracts' terms.
Foreign-denominated assets, including investment securities, and liabilities are translated into U.S. dollars at the exchange rates at period end. Purchases and sales of investment securities, income and dividends received and expenses denominated in foreign currencies are translated into U.S. dollars at the exchange rate in effect on the transaction date.
The effects of exchange rate fluctuations on investments are included with the net realized and unrealized gain (loss) on investment securities. Other foreign currency transactions resulting in realized and unrealized gain (loss) are disclosed separately.
Investment Transactions and Income. For financial reporting purposes, the Fund's investment holdings and NAV include trades executed through the end of the last business day of the period. The NAV per share for processing shareholder transactions is
Annual Report
3. Significant Accounting Policies - continued
Investment Transactions and Income - continued
calculated as of the close of business of the New York Stock Exchange (NYSE), normally 4:00 p.m. Eastern time and includes trades executed through the end of the prior business day. Gains and losses on securities sold are determined on the basis of identified cost and may include proceeds received from litigation. Dividend income is recorded on the ex-dividend date, except for certain dividends from foreign securities where the ex-dividend date may have passed, which are recorded as soon as the Fund is informed of the ex-dividend date. Non-cash dividends included in dividend income, if any, are recorded at the fair market value of the securities received. Distributions received on securities that represent a return of capital or capital gain are recorded as a reduction of cost of investments and/or as a realized gain. Subsequent to ex-dividend date the Fund determines the components of these distributions, based upon receipt of tax filings or other correspondence relating to the underlying investment. Large, non-recurring dividends recognized by the Fund are presented separately on the Statement of Operations as "Special Dividends" and the impact of these dividends is presented in the Financial Highlights. Interest income and distributions from the Fidelity Central Funds are accrued as earned. Interest income includes coupon interest and amortization of premium and accretion of discount on debt securities. Investment income is recorded net of foreign taxes withheld where recovery of such taxes is uncertain.
Class Allocations and Expenses. Investment income, realized and unrealized capital gains and losses, common expenses of the Fund, and certain fund-level expense reductions, if any, are allocated daily on a pro-rata basis to each class based on the relative net assets of each class to the total net assets of the Fund. Each class differs with respect to transfer agent and distribution and service plan fees incurred. Certain expense reductions may also differ by class. For the reporting period, the allocated portion of income and expenses to each class as a percent of its average net assets may vary due to the timing of recording these transactions in relation to fluctuating net assets of the classes. Expenses directly attributable to a fund are charged to that fund. Expenses attributable to more than one fund are allocated among the respective funds on the basis of relative net assets or other appropriate methods. Expense estimates are accrued in the period to which they relate and adjustments are made when actual amounts are known.
Income Tax Information and Distributions to Shareholders. Each year, the Fund intends to qualify as a regulated investment company under Subchapter M of the Internal Revenue Code, including distributing substantially all of its taxable income and realized gains. As a result, no provision for U.S. Federal income taxes is required. As of November 30, 2013, the Fund did not have any unrecognized tax benefits in the financial statements; nor is the Fund aware of any tax positions for which it is reasonably possible that the total amounts of unrecognized tax benefits will significantly change in the next
Annual Report
Notes to Financial Statements - continued
(Amounts in thousands except percentages)
3. Significant Accounting Policies - continued
Income Tax Information and Distributions to Shareholders - continued
twelve months. The Fund files a U.S. federal tax return, in addition to state and local tax returns as required. The Fund's federal income tax returns are subject to examination by the Internal Revenue Service (IRS) for a period of three fiscal years after they are filed. State and local tax returns may be subject to examination for an additional fiscal year depending on the jurisdiction. Foreign taxes are provided for based on the Fund's understanding of the tax rules and rates that exist in the foreign markets in which it invests.
Distributions are declared and recorded on the ex-dividend date. Income dividends and capital gain distributions are declared separately for each class. Income and capital gain distributions are determined in accordance with income tax regulations, which may differ from GAAP. In addition, the Fund claimed a portion of the payment made to redeeming shareholders as a distribution for income tax purposes.
Capital accounts within the financial statements are adjusted for permanent book-tax differences. These adjustments have no impact on net assets or the results of operations. Temporary book-tax differences will reverse in a subsequent period.
Book-tax differences are primarily due to futures transactions, foreign currency transactions, passive foreign investment companies (PFIC), redemptions in kind, partnerships, capital loss carryforwards and losses deferred due to wash sales and excise tax regulations.
The federal tax cost of investment securities and unrealized appreciation (depreciation) as of period end were as follows:
|
Gross unrealized appreciation |
$ 976,658 |
|
Gross unrealized depreciation |
(87,632) |
|
Net unrealized appreciation (depreciation) on securities and other investments |
$ 889,026 |
|
|
|
|
Tax Cost |
$ 2,691,957 |
The tax-based components of distributable earnings as of period end were as follows:
|
Undistributed ordinary income |
$ 453 |
|
Undistributed long-term capital gain |
$ 399,951 |
|
Net unrealized appreciation (depreciation) |
$ 889,013 |
Annual Report
3. Significant Accounting Policies - continued
Income Tax Information and Distributions to Shareholders - continued
The tax character of distributions paid was as follows:
|
|
November 30, 2013 |
November 30, 2012 |
|
Ordinary Income |
$ 11,330 |
$ - |
|
Long-term Capital Gains |
- |
357,601 |
|
Total |
$ 11,330 |
$ 357,601 |
Restricted Securities. The Fund may invest in securities that are subject to legal or contractual restrictions on resale. These securities generally may be resold in transactions exempt from registration or to the public if the securities are registered. Disposal of these securities may involve time-consuming negotiations and expense, and prompt sale at an acceptable price may be difficult. Information regarding restricted securities is included at the end of the Fund's Schedule of Investments.
New Accounting Pronouncement. The Financial Accounting Standards Board issued in December 2011, Accounting Standard Update No. 2011-11, Disclosures about Offsetting Assets and Liabilities, and in January 2013, Accounting Standards Update No. 2013-1 Clarifying the Scope of Disclosures about Offsetting Assets and Liabilities. These updates create new disclosure requirements requiring entities to disclose both gross and net information for derivatives and other financial instruments that are either offset in the Statement of Assets and Liabilities or subject to an enforceable master netting arrangement or similar agreement. The disclosure requirements are effective for annual reporting periods beginning on or after January 1, 2013, and interim periods within those annual periods. Management expects that the impact of the updates' adoption will be limited to additional financial statement disclosures as applicable.
4. Derivative Instruments.
Risk Exposures and the Use of Derivative Instruments. The Fund's investment objective allows the Fund to enter into various types of derivative contracts, including futures contracts. Derivatives are investments whose value is primarily derived from underlying assets, indices or reference rates and may be transacted on an exchange or over-the-counter (OTC). Derivatives may involve a future commitment to buy or sell a specified asset based on specified terms, to exchange future cash flows at periodic intervals based on a notional principal amount, or for one party to make one or more payments upon the occurrence of specified events in exchange for periodic payments from the other party.
The Fund used derivatives to increase returns and to manage exposure to certain risks as defined below. The success of any strategy involving derivatives depends on analysis of
Annual Report
Notes to Financial Statements - continued
(Amounts in thousands except percentages)
4. Derivative Instruments - continued
Risk Exposures and the Use of Derivative Instruments - continued
numerous economic factors, and if the strategies for investment do not work as intended, the Fund may not achieve its objectives.
The Fund's use of derivatives increased or decreased its exposure to the following risk:
|
Equity Risk |
Equity risk relates to the fluctuations in the value of financial instruments as a result of changes in market prices (other than those arising from interest rate risk or foreign exchange risk), whether caused by factors specific to an individual investment, its issuer, or all factors affecting all instruments traded in a market or market segment. |
The Fund is also exposed to additional risks from investing in derivatives, such as liquidity risk and counterparty credit risk. Liquidity risk is the risk that the Fund will be unable to close out the derivative in the open market in a timely manner. Counterparty credit risk is the risk that the counterparty will not be able to fulfill its obligation to the Fund. Counterparty credit risk related to exchange-traded futures contracts may be mitigated by the protection provided by the exchange on which they trade.
Investing in derivatives may involve greater risks than investing in the underlying assets directly and, to varying degrees, may involve risk of loss in excess of any initial investment and collateral received and amounts recognized in the Statement of Assets and Liabilities. In addition, there may be the risk that the change in value of the derivative contract does not correspond to the change in value of the underlying instrument.
Futures Contracts. A futures contract is an agreement between two parties to buy or sell a specified underlying instrument for a fixed price at a specified future date. The Fund used futures contracts to manage its exposure to the stock market.
Upon entering into a futures contract, a fund is required to deposit either cash or securities (initial margin) with a clearing broker in an amount equal to a certain percentage of the face value of the contract. Futures contracts are marked-to-market daily and subsequent daily payments (variation margin) are made or received by a fund depending on the daily fluctuations in the value of the futures contracts and are recorded as unrealized appreciation or (depreciation). This receivable and/or payable, if any, is included in daily variation margin for derivative instruments in the Statement of Assets and Liabilities. Realized gain or (loss) is recorded upon the expiration or closing of a futures contract.
Any open futures contracts at period end are presented in the Schedule of Investments under the caption "Futures Contracts." The underlying face amount at value reflects each contract's exposure to the underlying instrument or index at period end and is representative of volume of activity during the period. Securities deposited to meet initial margin requirements are identified in the Schedule of Investments.
Annual Report
4. Derivative Instruments - continued
Futures Contracts - continued
During the period the Fund recognized net realized gain (loss) of $18,846 and a change in net unrealized appreciation (depreciation) of $7,338 related to its investment in futures contracts. These amounts are included in the Statement of Operations.
5. Purchases and Sales of Investments.
Purchases and sales of securities including in-kind transactions, other than short-term securities, aggregated $1,234,566 and $2,840,735, respectively.
6. Fees and Other Transactions with Affiliates.
Management Fee. FMR (the investment adviser) and its affiliates provide the Fund with investment management related services for which the Fund pays a monthly management fee. The management fee is the sum of an individual fund fee rate that is based on an annual rate of .45% of the Fund's average net assets and an annualized group fee rate that averaged .25% during the period. The group fee rate is based upon the average net assets of all the mutual funds advised by the investment adviser, including any mutual funds previously advised by the investment adviser that are currently advised by Fidelity SelectCo, LLC, an affiliate of the investment adviser. The group fee rate decreases as assets under management increase and increases as assets under management decrease. In addition, the management fee is subject to a performance adjustment (up to a maximum of ± .20% of the Fund's average net assets over a 36 month performance period). The upward or downward adjustment to the management fee is based on the relative investment performance of the Institutional Class of the Fund as compared to an appropriate benchmark index over the same 36 month performance period. For the reporting period, the total annual management fee rate, including the performance adjustment, was .47% of the Fund's average net assets. The performance adjustment included in the management fee rate may be higher or lower than the maximum performance adjustment rate due to the difference between the average net assets for the reporting and performance periods.
Distribution and Service Plan Fees. In accordance with Rule 12b-1 of the 1940 Act, the Fund has adopted separate Distribution and Service Plans for each class of shares. Certain classes pay Fidelity Distributors Corporation (FDC), an affiliate of the investment adviser, separate Distribution and Service Fees, each of which is based on an annual percentage of each class' average net assets. In addition, FDC may pay financial intermediaries for selling shares of the Fund and providing shareholder support services.
Annual Report
Notes to Financial Statements - continued
(Amounts in thousands except percentages)
6. Fees and Other Transactions with Affiliates - continued
Distribution and Service Plan Fees - continued
For the period, the Distribution and Service Fee rates, total fees and amounts retained by FDC were as follows:
|
|
Distribution |
Service |
Total Fees |
Retained |
|
Class A |
-% |
.25% |
$ 3,042 |
$ 35 |
|
Class T |
.25% |
.25% |
5,316 |
23 |
|
Class B |
.75% |
.25% |
391 |
297 |
|
Class C |
.75% |
.25% |
3,070 |
223 |
|
|
|
|
$ 11,819 |
$ 578 |
Sales Load. FDC may receive a front-end sales charge of up to 5.75% for selling Class A shares and 3.50% for selling Class T shares, some of which is paid to financial intermediaries for selling shares of the Fund. Depending on the holding period, FDC may receive contingent deferred sales charges levied on Class A, Class T, Class B, and Class C redemptions. The deferred sales charges range from 5.00% to 1.00% for Class B shares, 1.00% for Class C shares, 1.00% for certain purchases of Class A shares and .25% for certain purchases of Class T shares.
For the period, sales charge amounts retained by FDC were as follows:
|
|
Retained |
|
Class A |
$ 159 |
|
Class T |
30 |
|
Class B* |
47 |
|
Class C* |
12 |
|
|
$ 248 |
* When Class B and Class C shares are initially sold, FDC pays commissions from its own resources to financial intermediaries through which the sales are made.
Transfer Agent Fees. Fidelity Investments Institutional Operations Company, Inc., (FIIOC), an affiliate of the investment adviser, is the transfer, dividend disbursing and shareholder servicing agent for each class of the Fund. FIIOC receives account fees and asset-based fees that vary according to the account size and type of account of the shareholders of the respective classes of the Fund, except for Class Z. FIIOC receives an asset-based fee of Class Z's average net assets. FIIOC pays for typesetting, printing and mailing of shareholder reports, except proxy statements.
Annual Report
6. Fees and Other Transactions with Affiliates - continued
Transfer Agent Fees - continued
For the period, transfer agent fees for each class were as follows:
|
|
Amount |
% of |
|
Class A |
$ 3,051 |
.25 |
|
Class T |
2,179 |
.20 |
|
Class B |
117 |
.30 |
|
Class C |
758 |
.25 |
|
Institutional Class |
2,197 |
.20 |
|
Class Z |
-† |
.05* |
|
|
$ 8,302 |
|
* Annualized.
† Amount represents ninety six dollars.
Accounting and Security Lending Fees. Fidelity Service Company, Inc. (FSC), an affiliate of the investment adviser, maintains the Fund's accounting records. The accounting fee is based on the level of average net assets for each month. Under a separate contract, FSC administers the security lending program. The security lending fee is based on the number and duration of lending transactions.
Brokerage Commissions. The Fund placed a portion of its portfolio transactions with brokerage firms which are affiliates of the investment adviser. Brokerage commissions are included in net realized gain (loss) and change in net unrealized appreciation (depreciation) in the Statement of Operations. The commissions paid to these affiliated firms were $35 for the period.
Redemptions In-Kind. During the period, 14,529 shares of the Fund held by affiliated entities were redeemed for investments with a value of $456,922. The net realized gain of $131,946 on investments delivered through in-kind redemptions is included in the accompanying Statement of Operations. The amount of in-kind redemptions is included in share transactions in the accompanying Statement of Changes in Net Assets as well as Note 11: Share Transactions. The Fund recognized no gain or loss for federal income tax purposes.
7. Committed Line of Credit.
The Fund participates with other funds managed by the investment adviser or an affiliate in a $4.25 billion credit facility (the "line of credit") to be utilized for temporary or emergency purposes to fund shareholder redemptions or for other short-term liquidity
Annual Report
Notes to Financial Statements - continued
(Amounts in thousands except percentages)
7. Committed Line of Credit - continued
purposes. The Fund has agreed to pay commitment fees on its pro-rata portion of the line of credit, which amounted to $8 and is reflected in Miscellaneous expenses on the Statement of Operations. During the period, there were no borrowings on this line of credit.
8. Security Lending.
The Fund lends portfolio securities through a lending agent from time to time in order to earn additional income. For equity securities, a lending agent is used and may loan securities to certain qualified borrowers, including Fidelity Capital Markets (FCM), a broker-dealer affiliated with the Fund. On the settlement date of the loan, the Fund receives collateral (in the form of U.S. Treasury obligations, letters of credit and/or cash) against the loaned securities and maintains collateral in an amount not less than 100% of the market value of the loaned securities during the period of the loan. The market value of the loaned securities is determined at the close of business of the Fund and any additional required collateral is delivered to the Fund on the next business day. If the borrower defaults on its obligation to return the securities loaned because of insolvency or other reasons, the Fund may apply collateral received from the borrower against the obligation. The Fund may experience delays and costs in recovering the securities loaned. Any cash collateral received is invested in the Fidelity Securities Lending Cash Central Fund. The value of loaned securities and cash collateral at period end are disclosed on the Fund's Statement of Assets and Liabilities. At period end, there were no security loans outstanding with FCM. Security lending income represents the income earned on investing cash collateral, less rebates paid to borrowers and any lending agent fees associated with the loan, plus any premium payments received for lending certain types of securities. Security lending income is presented in the Statement of Operations as a component of income from Fidelity Central Funds Total security lending income during the period amounted to $1,296 and includes $7 from securities loaned to FCM.
9. Expense Reductions.
The investment adviser voluntarily agreed to reimburse a portion of the Fund's Class A, Class T, Class B, Class C and Institutional Class operating expenses. During the period, this reimbursement reduced expenses as follows:
|
|
Reimbursement |
|
Class A |
$ 4 |
|
Class T |
5 |
|
Class B |
-* |
|
Class C |
1 |
|
Institutional Class |
4 |
|
|
$ 14 |
* Amount represents one hundred and forty-three dollars.
Annual Report
9. Expense Reductions - continued
In addition, commissions paid to certain brokers with whom the investment adviser, or its affiliates, places trades on behalf of the Fund include an amount in addition to trade execution, which may be rebated back to the Fund to offset certain expenses. This amount totaled $337 for the period.
10. Distributions to Shareholders.
Distributions to shareholders of each class were as follows:
|
Years ended November 30, |
2013 |
2012 |
|
From net investment income |
|
|
|
Class A |
$ 2,598 |
$ - |
|
Class T |
386 |
- |
|
Institutional Class |
6,266 |
- |
|
Total |
$ 9,250 |
$ - |
|
From net realized gain |
|
|
|
Class A |
$ 743 |
$ 117,808 |
|
Class T |
678 |
103,545 |
|
Class B |
- |
5,032 |
|
Class C |
- |
29,813 |
|
Institutional Class |
659 |
101,403 |
|
Total |
$ 2,080 |
$ 357,601 |
11. Share Transactions.
Transactions for each class of shares were as follows:
|
|
Shares |
Dollars |
||
|
Years ended November 30, |
2013A |
2012 |
2013A |
2012 |
|
Class A |
|
|
|
|
|
Shares sold |
8,347 |
12,312 |
$ 219,693 |
$ 276,482 |
|
Reinvestment of distributions |
140 |
5,215 |
3,122 |
108,709 |
|
Shares redeemed |
(21,663) |
(25,473) |
(562,269) |
(571,082) |
|
Net increase (decrease) |
(13,176) |
(7,946) |
$ (339,454) |
$ (185,891) |
|
Class T |
|
|
|
|
|
Shares sold |
7,343 |
9,256 |
$ 185,578 |
$ 199,877 |
|
Reinvestment of distributions |
47 |
4,916 |
1,017 |
98,476 |
|
Shares redeemed |
(18,873) |
(19,846) |
(469,350) |
(425,632) |
|
Net increase (decrease) |
(11,483) |
(5,674) |
$ (282,755) |
$ (127,279) |
Annual Report
Notes to Financial Statements - continued
(Amounts in thousands except percentages)
11. Share Transactions - continued
|
|
Shares |
Dollars |
||
|
Years ended November 30, |
2013A |
2012 |
2013A |
2012 |
|
Class B |
|
|
|
|
|
Shares sold |
15 |
50 |
$ 339 |
$ 930 |
|
Reinvestment of distributions |
- |
259 |
- |
4,675 |
|
Shares redeemed |
(591) |
(898) |
(13,025) |
(17,325) |
|
Net increase (decrease) |
(576) |
(589) |
$ (12,686) |
$ (11,720) |
|
Class C |
|
|
|
|
|
Shares sold |
1,802 |
1,952 |
$ 41,461 |
$ 38,194 |
|
Reinvestment of distributions |
- |
1,471 |
- |
26,825 |
|
Shares redeemed |
(3,914) |
(4,534) |
(89,461) |
(88,156) |
|
Net increase (decrease) |
(2,112) |
(1,111) |
$ (48,000) |
$ (23,137) |
|
Institutional Class |
|
|
|
|
|
Shares sold |
9,471 |
15,032 |
$ 253,670 |
$ 356,876 |
|
Reinvestment of distributions |
264 |
3,988 |
6,205 |
87,654 |
|
Shares redeemed |
(35,873)B |
(23,976) |
(1,032,519)B |
(557,842) |
|
Net increase (decrease) |
(26,138) |
(4,956) |
$ (772,644) |
$ (113,312) |
|
Class Z |
|
|
|
|
|
Shares sold |
146 |
- |
$ 4,691 |
$ - |
|
Shares redeemed |
-* |
- |
(13) |
- |
|
Net increase (decrease) |
146 |
- |
$ 4,678 |
$ - |
A Share transactions for Class Z are for the period August 13, 2013 (commencement of sale of shares) to November 30, 2013.
B Amount includes in-kind redemptions (see Note 6: Redemptions In-Kind).
* Amount represents three hundred eighty eight shares.
12. Other.
The Fund's organizational documents provide former and current trustees and officers with a limited indemnification against liabilities arising in connection with the performance of their duties to the Fund. In the normal course of business, the Fund may also enter into contracts that provide general indemnifications. The Fund's maximum exposure under these arrangements is unknown as this would be dependent on future claims that may be made against the Fund. The risk of material loss from such claims is considered remote.
Annual Report
Report of Independent Registered Public Accounting Firm
To the Trustees of Fidelity Advisor Series I and the Shareholders of Fidelity Advisor Small Cap Fund:
In our opinion, the accompanying statement of assets and liabilities, including the schedule of investments, and the related statements of operations and of changes in net assets and the financial highlights present fairly, in all material respects, the financial position of Fidelity Advisor Small Cap Fund (a fund of Fidelity Advisor Series I) at November 30, 2013, the results of its operations for the year then ended, the changes in its net assets for each of the two years in the period then ended and the financial highlights for each of the five years in the period then ended, in conformity with accounting principles generally accepted in the United States of America. These financial statements and financial highlights (hereafter referred to as "financial statements") are the responsibility of the Fidelity Advisor Small Cap Fund's management. Our responsibility is to express an opinion on these financial statements based on our audits. We conducted our audits of these financial statements in accordance with the standards of the Public Company Accounting Oversight Board (United States). Those standards require that we plan and perform the audit to obtain reasonable assurance about whether the financial statements are free of material misstatement. An audit includes examining, on a test basis, evidence supporting the amounts and disclosures in the financial statements, assessing the accounting principles used and significant estimates made by management, and evaluating the overall financial statement presentation. We believe that our audits, which included confirmation of securities at November 30, 2013 by correspondence with the custodian and brokers, provide a reasonable basis for our opinion.
PricewaterhouseCoopers LLP
Boston, Massachusetts
January 13, 2014
Annual Report
Trustees and Officers
The Trustees, Member of the Advisory Board, and officers of the trust and fund, as applicable, are listed below. The Board of Trustees governs the fund and is responsible for protecting the interests of shareholders. The Trustees are experienced executives who meet periodically throughout the year to oversee the fund's activities, review contractual arrangements with companies that provide services to the fund, oversee management of the risks associated with such activities and contractual arrangements, and review the fund's performance. Except for James C. Curvey, Ned C. Lautenbach, Ronald P. O'Hanley, and William S. Stavropoulos, each of the Trustees oversees 173 funds. Mr. Curvey oversees 396 funds. Mr. Lautenbach, Mr. O'Hanley, and Mr. Stavropoulos each oversees 247 funds.
The Trustees hold office without limit in time except that (a) any Trustee may resign; (b) any Trustee may be removed by written instrument, signed by at least two-thirds of the number of Trustees prior to such removal; (c) any Trustee who requests to be retired or who has become incapacitated by illness or injury may be retired by written instrument signed by a majority of the other Trustees; and (d) any Trustee may be removed at any special meeting of shareholders by a two-thirds vote of the outstanding voting securities of the trust. Each Trustee who is not an interested person (as defined in the 1940 Act) of the trust and the fund (Independent Trustee), shall retire not later than the last day of the calendar year in which his or her 75th birthday occurs. The Independent Trustees may waive this mandatory retirement age policy with respect to individual Trustees. The officers and Advisory Board Member hold office without limit in time, except that any officer and Advisory Board Member may resign or may be removed by a vote of a majority of the Trustees at any regular meeting or any special meeting of the Trustees. Except as indicated, each individual has held the office shown or other offices in the same company for the past five years.
Experience, Skills, Attributes, and Qualifications of the Fund's Trustees. The Governance and Nominating Committee has adopted a statement of policy that describes the experience, qualifications, attributes, and skills that are necessary and desirable for potential Independent Trustee candidates (Statement of Policy). The Board believes that each Trustee satisfied at the time he or she was initially elected or appointed a Trustee, and continues to satisfy, the standards contemplated by the Statement of Policy. The Governance and Nominating Committee also engages professional search firms to help identify potential Independent Trustee candidates who have the experience, qualifications, attributes, and skills consistent with the Statement of Policy. From time to time, additional criteria based on the composition and skills of the current Independent Trustees, as well as experience or skills that may be appropriate in light of future changes to board composition, business conditions, and regulatory or other developments, have also been considered by the professional search firms and the Governance and Nominating Committee. In addition, the Board takes into account the Trustees' commitment and participation in Board and committee meetings, as well as their leadership of standing and ad hoc committees throughout their tenure.
Annual Report
Trustees and Officers - continued
In determining that a particular Trustee was and continues to be qualified to serve as a Trustee, the Board has considered a variety of criteria, none of which, in isolation, was controlling. The Board believes that, collectively, the Trustees have balanced and diverse experience, qualifications, attributes, and skills, which allow the Board to operate effectively in governing the fund and protecting the interests of shareholders. Information about the specific experience, skills, attributes, and qualifications of each Trustee, which in each case led to the Board's conclusion that the Trustee should serve (or continue to serve) as a trustee of the fund, is provided below.
Board Structure and Oversight Function. James C. Curvey is an interested person (as defined in the 1940 Act) and currently serves as Chairman. The Trustees have determined that an interested Chairman is appropriate and benefits shareholders because an interested Chairman has a personal and professional stake in the quality and continuity of services provided to the fund. Independent Trustees exercise their informed business judgment to appoint an individual of their choosing to serve as Chairman, regardless of whether the Trustee happens to be independent or a member of management. The Independent Trustees have determined that they can act independently and effectively without having an Independent Trustee serve as Chairman and that a key structural component for assuring that they are in a position to do so is for the Independent Trustees to constitute a substantial majority for the Board. The Independent Trustees also regularly meet in executive session. Ned C. Lautenbach serves as Chairman of the Independent Trustees and as such (i) acts as a liaison between the Independent Trustees and management with respect to matters important to the Independent Trustees and (ii) with management prepares agendas for Board meetings.
Fidelity funds are overseen by different Boards of Trustees. The fund's Board oversees Fidelity's equity and high income funds and another Board oversees Fidelity's investment-grade bond, money market, and asset allocation funds. The asset allocation funds may invest in Fidelity funds overseen by the fund's Board. The use of separate Boards, each with its own committee structure, allows the Trustees of each group of Fidelity funds to focus on the unique issues of the funds they oversee, including common research, investment, and operational issues. On occasion, the separate Boards establish joint committees to address issues of overlapping consequences for the Fidelity funds overseen by each Board.
The Trustees operate using a system of committees to facilitate the timely and efficient consideration of all matters of importance to the Trustees, the fund, and fund shareholders and to facilitate compliance with legal and regulatory requirements and oversight of the fund's activities and associated risks. The Board, acting through its committees, has charged FMR and its affiliates with (i) identifying events or circumstances the occurrence of which could have demonstrably adverse effects on the fund's business and/or reputation; (ii) implementing processes and controls to lessen the possibility that such events or circumstances occur or to mitigate the effects of such events or circumstances if they do occur; and (iii) creating and maintaining a system designed to evaluate continuously business and market conditions in order to facilitate the identification and implementation processes described in (i) and (ii) above. Because the day-to-day operations and activities of the fund are carried out by or through FMR, its affiliates and other service providers, the fund's exposure to risks is mitigated but not eliminated by the processes overseen by the Trustees. While each of the Board's committees has responsibility for overseeing different aspects of the fund's activities, oversight is exercised primarily through the Operations, Audit, and Compliance Committees. In addition, the Independent Trustees have worked with FMR to enhance the Board's oversight of investment and financial risks, legal and regulatory risks, technology risks, and operational risks, including the development of additional risk reporting to the Board. For example, a working group comprised of Independent Trustees and FMR has worked and continues to work to review the Fidelity funds' valuation-related activities, reporting and risk management. Appropriate personnel, including but not limited to the fund's Chief Compliance Officer (CCO), FMR's internal auditor, the independent accountants, the fund's Treasurer and portfolio management personnel, make periodic reports to the Board's committees, as appropriate, including an annual review of FMR's risk management program for the Fidelity funds. The responsibilities of each standing committee, including their oversight responsibilities, are described further under "Standing Committees of the Fund's Trustees."
Annual Report
The fund's Statement of Additional Information (SAI) includes more information about the Trustees. To request a free copy, call Fidelity at 1-877-208-0098.
Interested Trustees*:
Correspondence intended for each Trustee who is an interested person may be sent to Fidelity Investments, 245 Summer Street, Boston, Massachusetts 02210.
|
Name, Year of Birth; Principal Occupations and Other Relevant Experience+ |
|
|
James C. Curvey (1935) |
|
|
Year of Election or Appointment: 2007 Trustee Chairman of the Board of Trustees |
|
|
|
Mr. Curvey also serves as Trustee of other Fidelity funds. Mr. Curvey is a Director of Fidelity Investments Money Management, Inc. (2009-present), Director of Fidelity Research & Analysis Co. (2009-present) and Director of FMR and FMR Co., Inc. (2007-present). Mr. Curvey is also Vice Chairman (2007-present) and Director of FMR LLC. In addition, Mr. Curvey serves as an Overseer for the Boston Symphony Orchestra and a member of the Trustees of Villanova University. Previously, Mr. Curvey was the Vice Chairman (2006-2007) and Director (2000-2007) of FMR Corp. |
|
Ronald P. O'Hanley (1957) |
|
|
Year of Election or Appointment: 2011 Trustee |
|
|
|
Mr. O'Hanley also serves as Trustee of other Fidelity funds. He is Director of Fidelity SelectCo, LLC (2013-present), FMR Co., Inc. (2010-present), Director of Fidelity Investments Money Management, Inc. (2010-present), Director of Fidelity Research & Analysis Company (2010-present), President of Fidelity Asset Management and Corporate Services and a Member of Fidelity's Executive Committee (2010-present). Previously, Mr. O'Hanley served as President and Chief Executive Officer of BNY Mellon Asset Management (2007-2010). Mr. O'Hanley also served as Vice Chairman of Bank New York Mellon Corp. and a member of that firm's Executive Committee. Prior to the 2007 merger of The Bank of New York and Mellon Financial Corporation, he was Vice Chairman of Mellon Financial Corporation and President and Chief Executive Officer of Mellon Asset Management. He joined Mellon in February 1997. Mr. O'Hanley currently serves as Chairman of the Boston Public Library Foundation Board of Directors and sits on the Board of Directors of Beth Israel Deaconess Medical Center, the Board of Trustees of the Marine Biological Laboratory and the Advisory Board of the Maxwell School of Citizenship and Public Administration at Syracuse University. Mr. O'Hanley also chairs the Council on Asset Management for the Financial Services Roundtable and is a member of the Board of Directors of Institutional Investor's U.S. Institute. |
* Trustees have been determined to be "Interested Trustees" by virtue of, among other things, their affiliation with the trust or various entities under common control with FMR.
+ The information above includes each Trustee's principal occupation during the last five years and other information relating to the experience, attributes, and skills relevant to each Trustee's qualifications to serve as a Trustee, which led to the conclusion that each Trustee should serve as a Trustee for each fund.
Annual Report
Independent Trustees:
Correspondence intended for each Independent Trustee (that is, the Trustees other than the Interested Trustees) may be sent to Fidelity Investments, P.O. Box 55235, Boston, Massachusetts 02205-5235.
|
Name, Year of Birth; Principal Occupations and Other Relevant Experience+ |
|
|
Dennis J. Dirks (1948) |
|
|
Year of Election or Appointment: 2005 Trustee |
|
|
|
Mr. Dirks also serves as Trustee of other Fidelity funds. Prior to his retirement in May 2003, Mr. Dirks was Chief Operating Officer and a member of the Board of The Depository Trust & Clearing Corporation (DTCC). He also served as President, Chief Operating Officer, and Board member of The Depository Trust Company (DTC) and President and Board member of the National Securities Clearing Corporation (NSCC). In addition, Mr. Dirks served as Chief Executive Officer and Board member of the Government Securities Clearing Corporation, Chief Executive Officer and Board member of the Mortgage-Backed Securities Clearing Corporation, as a Trustee and a member of the Finance Committee of Manhattan College (2005-2008), and as a Trustee and a member of the Finance Committee of AHRC of Nassau County (2006-2008). Mr. Dirks is a member of the Independent Directors Council (IDC) Governing Council (2010-present) and Board of Directors for The Brookville Center for Children's Services, Inc. (2009-present). |
|
Alan J. Lacy (1953) |
|
|
Year of Election or Appointment: 2008 Trustee |
|
|
|
Mr. Lacy also serves as Trustee of other Fidelity funds. Mr. Lacy serves as Senior Adviser (2007-present) of Oak Hill Capital Partners, L.P. (private equity). Mr. Lacy also served as Chief Executive Officer (2000-2005) and Vice Chairman (2005-2006) of Sears Holdings Corporation and Sears, Roebuck and Co. (retail). In addition, Mr. Lacy serves as a member of the Board of Directors of Dave & Buster's Entertainment, Inc. (restaurant and entertainment complexes, 2010-present), Earth Fare, Inc. (retail grocery, 2012-present), The Hillman Companies, Inc. (hardware wholesalers, 2010-present), and Bristol-Myers Squibb Company (global pharmaceuticals, 2008-present). Mr. Lacy is a member of the Board of Trustees of The National Parks Conservation Association (2006-present). Previously, Mr. Lacy served as Chairman of the Board of Trustees of the National Parks Conservation Association (2008-2011) and as a member of the Board of Directors for the Western Union Company (global money transfer, 2006-2011). |
|
Ned C. Lautenbach (1944) |
|
|
Year of Election or Appointment: 2000 Trustee Chairman of the Independent Trustees |
|
|
|
Mr. Lautenbach also serves as Trustee of other Fidelity funds. Mr. Lautenbach currently serves as the Lead Director of the Eaton Corporation Board of Directors (diversified industrial, 1997-present). Mr. Lautenbach is Chairman of the Board of Directors of the Philharmonic Center for the Arts in Naples, Florida (2012-present) and a member of the Council on Foreign Relations (1994-present). Previously, Mr. Lautenbach was a Partner/Advisory Partner at Clayton, Dubilier & Rice, LLC (private equity investment, 1998-2010), as well as a Director of Sony Corporation (2006-2007). |
|
Joseph Mauriello (1944) |
|
|
Year of Election or Appointment: 2008 Trustee |
|
|
|
Mr. Mauriello also serves as Trustee of other Fidelity funds. Prior to his retirement in January 2006, Mr. Mauriello served in numerous senior management positions including Deputy Chairman and Chief Operating Officer (2004-2005), and Vice Chairman of Financial Services (2002-2004) of KPMG LLP US (professional services, 1965-2005). Mr. Mauriello currently serves as a member of the Board of Directors of XL Group plc. (global insurance and re-insurance, 2006-present). Previously, Mr. Mauriello served as a Director of the Hamilton Funds of the Bank of New York (2006-2007) and of Arcadia Resources Inc. (health care services and products, 2007-2012). |
|
Robert W. Selander (1950) |
|
|
Year of Election or Appointment: 2011 Trustee |
|
|
|
Mr. Selander also serves as Trustee of other Fidelity funds. Previously, Mr. Selander served as a Member of the Advisory Board of other Fidelity funds (2011), and Executive Vice Chairman (2010), Chief Executive Officer (2009-2010), and President and Chief Executive Officer (1997-2009) of Mastercard, Inc. |
|
Cornelia M. Small (1944) |
|
|
Year of Election or Appointment: 2005 Trustee |
|
|
|
Ms. Small also serves as Trustee of other Fidelity funds. Ms. Small is a member of the Board of Directors (2009-present) and Chair of the Investment Committee (2010-present) of the Teagle Foundation. Ms. Small also serves on the Investment Committee of the Berkshire Taconic Community Foundation (2008-present). Previously, Ms. Small served as Chairperson (2002-2008) and a member of the Investment Committee and Chairperson (2008-2012) and a member of the Board of Trustees of Smith College. In addition, Ms. Small served as Chief Investment Officer, Director of Global Equity Investments, and a member of the Board of Directors of Scudder, Stevens & Clark and Scudder Kemper Investments. |
|
William S. Stavropoulos (1939) |
|
|
Year of Election or Appointment: 2002 Trustee Vice Chairman of the Independent Trustees |
|
|
|
Mr. Stavropoulos also serves as Trustee of other Fidelity funds. Mr. Stavropoulos serves as President and Founder of the Michigan Baseball Foundation, the Great Lakes Loons (2007-present). Mr. Stavropoulos is Chairman Emeritus of the Board of Directors of The Dow Chemical Company, where he previously served in numerous senior management positions, including President, CEO (1995-2000; 2002-2004), Chairman of the Executive Committee (2000-2006), and as a member of the Board of Directors (1990-2006). Currently, Mr. Stavropoulos is Chairman of the Board of Directors of Univar Inc. (global distributor of commodity and specialty chemicals), a Director of Teradata Corporation (data warehousing and technology solutions), and Maersk Inc. (industrial conglomerate), and a member of the Advisory Board for Metalmark Capital LLC (private equity investment, 2005-present). Mr. Stavropoulos is an operating advisor to Clayton, Dubilier & Rice, LLC (private equity investment). In addition, Mr. Stavropoulos is a member of the University of Notre Dame Advisory Council for the College of Science, a Trustee of the Rollin L. Gerstacker Foundation, and a Director of the Naples Philharmonic Center for the Arts. Previously, Mr. Stavropoulos served as a Director of Chemical Financial Corporation (bank holding company, 1993-2012) and Tyco International, Ltd. (multinational manufacturing and services, 2007-2012). |
|
David M. Thomas (1949) |
|
|
Year of Election or Appointment: 2008 Trustee |
|
|
|
Mr. Thomas also serves as Trustee of other Fidelity funds. Mr. Thomas serves as Non-Executive Chairman of the Board of Directors of Fortune Brands Home and Security (home and security products, 2011-present), and as a member of the Board of Directors of Interpublic Group of Companies, Inc. (marketing communication, 2004-present). Previously, Mr. Thomas served as Executive Chairman (2005-2006) and Chairman and Chief Executive Officer (2000-2005) of IMS Health, Inc. (pharmaceutical and healthcare information solutions), and a Director of Fortune Brands, Inc. (consumer products, 2000-2011). |
+ The information above includes each Trustee's principal occupation during the last five years and other information relating to the experience, attributes, and skills relevant to each Trustee's qualifications to serve as a Trustee, which led to the conclusion that each Trustee should serve as a Trustee for the fund.
Advisory Board Member and Officers:
Correspondence intended for each officer and Peter S. Lynch may be sent to Fidelity Investments, 245 Summer Street, Boston, Massachusetts 02210. Officers appear below in alphabetical order.
|
Name, Year of Birth; Principal Occupation |
|
|
Peter S. Lynch (1944) |
|
|
Year of Election or Appointment: 2003 Member of the Advisory Board |
|
|
|
Mr. Lynch also serves as Member of the Advisory Board of other Fidelity funds. Mr. Lynch is Vice Chairman and a Director of FMR and FMR Co., Inc. In addition, Mr. Lynch serves as a Trustee of Boston College and as the Chairman of the Inner-City Scholarship Fund. Previously, Mr. Lynch served on the Special Olympics International Board of Directors (1997-2006). |
|
Elizabeth Paige Baumann (1968) |
|
|
Year of Election or Appointment: 2012 Anti-Money Laundering (AML) Officer |
|
|
|
Ms. Baumann also serves as AML Officer of other funds. She is Chief AML Officer of FMR LLC (2012-present) and is an employee of Fidelity Investments. Previously, Ms. Baumann served as Vice President and Deputy Anti-Money Laundering Officer (2007-2012). |
|
William C. Coffey (1969) |
|
|
Year of Election or Appointment: 2009 Assistant Secretary |
|
|
|
Mr. Coffey also serves as Assistant Secretary of other funds. He is Senior Vice President and Deputy General Counsel of FMR LLC (2010-present), and is an employee of Fidelity Investments. Previously, Mr. Coffey served as Vice President and Associate General Counsel of FMR LLC (2005-2009). |
|
Jonathan Davis (1968) |
|
|
Year of Election or Appointment: 2010 Assistant Treasurer |
|
|
|
Mr. Davis also serves as Assistant Treasurer of other funds. Mr. Davis is an employee of Fidelity Investments. Previously, Mr. Davis served as Vice President and Associate General Counsel of FMR LLC (2003-2010). |
|
Adrien E. Deberghes (1967) |
|
|
Year of Election or Appointment: 2008 Deputy Treasurer |
|
|
|
Mr. Deberghes also serves as an officer of other funds. He is an employee of Fidelity Investments (2008-present). Prior to joining Fidelity Investments, Mr. Deberghes was Senior Vice President of Mutual Fund Administration at State Street Corporation (2007-2008), Senior Director of Mutual Fund Administration at Investors Bank & Trust (2005-2007), and Director of Finance for Dunkin' Brands (2000-2005). |
|
Stephanie J. Dorsey (1969) |
|
|
Year of Election or Appointment: 2010 Assistant Treasurer |
|
|
|
Ms. Dorsey also serves as an officer of other funds. She is an employee of Fidelity Investments (2008-present) and has served in other fund officer roles. Prior to joining Fidelity Investments, Ms. Dorsey served as Treasurer (2004-2008) of the JPMorgan Mutual Funds and Vice President (2004-2008) of JPMorgan Chase Bank. |
|
Scott C. Goebel (1968) |
|
|
Year of Election or Appointment: 2008 Secretary and Chief Legal Officer (CLO) |
|
|
|
Mr. Goebel serves as Secretary and CLO of other funds. Mr. Goebel also serves as Secretary of Fidelity Investments Money Management, Inc. (FIMM) (2010-present) and Fidelity Research and Analysis Company (FRAC) (2010-present); General Counsel, Secretary, and Senior Vice President of FMR (2008-present) and FMR Co., Inc. (2008-present); Chief Legal Officer of Fidelity Management & Research (Hong Kong) Limited (2008-present) and Assistant Secretary of Fidelity Management & Research (Japan) Inc. (2008-present), and Fidelity Management & Research (U.K.) Inc. (2008-present). Previously, Mr. Goebel served as Secretary and CLO of other Fidelity funds (2008-2013), Assistant Secretary of FIMM (2008-2010), FRAC (2008-2010), and certain funds (2007-2008); and as Vice President and Secretary of Fidelity Distributors Corporation (FDC) (2005-2007). Mr. Goebel has been employed by FMR LLC or an affiliate since 2001. |
|
Joseph A. Hanlon (1968) |
|
|
Year of Election or Appointment: 2012 Chief Compliance Officer |
|
|
|
Mr. Hanlon also serves as Chief Compliance Officer of other funds. Mr. Hanlon serves as Compliance Officer of FMR, FMR Co., Inc., Fidelity Investments Money Management, Inc. (FIMM), Fidelity Research and Analysis Company (FRAC), and Fidelity Management & Research (Hong Kong) (2009-present), as Senior Vice President of the Fidelity Asset Management Division (2009-present), and is an employee of Fidelity Investments. Previously, Mr. Hanlon served as Compliance Officer of Fidelity Management & Research (Japan) Inc. (2009-2013), Strategic Advisers, Inc. (2009-2013), and Fidelity Management & Research (U.K.) Inc. (2009-2013). |
|
Thomas C. Hense (1964) |
|
|
Year of Election or Appointment: 2008/2010 Vice President |
|
|
|
Mr. Hense also serves as Vice President of other funds (High Income (2008), Small Cap (2008), and Value (2010) funds). Previously, Mr. Hense served as a portfolio manager for Fidelity's Institutional Money Management Group (Pyramis) (2003-2008). |
|
Brian B. Hogan (1964) |
|
|
Year of Election or Appointment: 2009 Vice President |
|
|
|
Mr. Hogan also serves as Vice President of other funds. Mr. Hogan serves as President of FMR's Equity Division (2009-present). Previously, Mr. Hogan served as Senior Vice President, Equity Research of FMR (2006-2009) and as a portfolio manager. |
|
Chris Maher (1972) |
|
|
Year of Election or Appointment: 2013 Assistant Treasurer |
|
|
|
Mr. Maher serves as Assistant Treasurer of other funds. Mr. Maher is Vice President of Valuation Oversight and is an employee of Fidelity Investments. Previously, Mr. Maher served as Vice President of Asset Management Compliance (2013), Vice President of FMR's Program Management Group (2010-2013), and Vice President of Valuation Oversight (2008-2010). |
|
Christine Reynolds (1958) |
|
|
Year of Election or Appointment: 2008 Chief Financial Officer |
|
|
|
Ms. Reynolds also serves as Chief Financial Officer of other funds. Ms. Reynolds became President of Fidelity Pricing and Cash Management Services (FPCMS) in August 2008. Ms. Reynolds served as Chief Operating Officer of FPCMS (2007-2008). Previously, Ms. Reynolds served as President, Treasurer, and Anti-Money Laundering officer of the Fidelity funds (2004-2007). |
|
Kenneth B. Robins (1969) |
|
|
Year of Election or Appointment: 2008 President and Treasurer |
|
|
|
Mr. Robins also serves as an officer of other funds. Mr. Robins serves as Executive Vice President of Fidelity Investments Money Management, Inc. (FIMM) (2013-present) and is an employee of Fidelity Investments (2004-present). Previously, Mr. Robins served in other fund officer roles. |
|
Gary W. Ryan (1958) |
|
|
Year of Election or Appointment: 2005 Assistant Treasurer |
|
|
|
Mr. Ryan also serves as Assistant Treasurer of other funds. Mr. Ryan is an employee of Fidelity Investments and has served in other fund officer roles. Previously, Mr. Ryan served as Vice President of Fund Reporting in Fidelity Pricing and Cash Management Services (FPCMS) (1999-2005). |
|
Stephen Sadoski (1971) |
|
|
Year of Election or Appointment: 2012 Deputy Treasurer |
|
|
|
Mr. Sadoski also serves as Deputy Treasurer of other funds. He is an employee of Fidelity Investments (2012-present) and has served in another fund officer role. Prior to joining Fidelity Investments, Mr. Sadoski served as an assistant chief accountant in the Division of Investment Management of the Securities and Exchange Commission (SEC) (2009-2012) and as a senior manager at Deloitte & Touche LLP (1997-2009). |
|
Stacie M. Smith (1974) |
|
|
Year of Election or Appointment: 2013 Deputy Treasurer |
|
|
|
Ms. Smith also serves as an officer of other funds. She is an employee of Fidelity Investments (2009-present) and has served in other fund officer roles. Prior to joining Fidelity Investments, Ms. Smith served as Senior Audit Manager of Ernst & Young LLP (1996-2009). |
|
Renee Stagnone (1975) |
|
|
Year of Election or Appointment: 2013 Deputy Treasurer |
|
|
|
Ms. Stagnone also serves as Deputy Treasurer of other funds. Ms. Stagnone is an employee of Fidelity Investments. |
|
Joseph F. Zambello (1957) |
|
|
Year of Election or Appointment: 2011 Deputy Treasurer |
|
|
|
Mr. Zambello also serves as Deputy Treasurer of other funds. Mr. Zambello is an employee of Fidelity Investments. Previously, Mr. Zambello served as Vice President of FMR's Program Management Group (2009-2011) and Vice President of the Transfer Agent Oversight Group (2005-2009). |
Annual Report
Distributions (Unaudited)
The Board of Trustees of Advisor Small Cap Fund voted to pay to shareholders of record at the opening of business on record date, the following distributions per share derived from capital gains realized from sales of portfolio securities and dividends from net investment income:
|
|
Pay Date |
Record Date |
Dividends |
Capital Gains |
|
Class A |
12/16/2013 |
12/13/2013 |
$0.007 |
$3.320 |
|
|
01/13/2014 |
01/10/2014 |
- |
$0.182 |
|
Class T |
12/16/2013 |
12/13/2013 |
- |
$3.320 |
|
|
01/13/2014 |
01/10/2014 |
- |
$0.182 |
|
Class B |
12/16/2013 |
12/13/2013 |
- |
$3.320 |
|
|
01/13/2014 |
01/10/2014 |
- |
$0.182 |
|
Class C |
12/16/2013 |
12/13/2013 |
- |
$3.320 |
|
|
01/13/2014 |
01/10/2014 |
- |
$0.182 |
The fund hereby designates as a capital gain dividend with respect to the taxable year ended November 30, 2013 ($448,830,974), or, if subsequently determined to be different, the net capital gain of such year.
Class A and Class T designate 100% of the dividends distributed during the fiscal year as qualifying for the dividends-received deduction for corporate shareholders.
Class A and Class T designate 100% of dividends distributed during the fiscal year as amounts which may be taken into account as a dividend for purposes of the maximum rate under section 1(h)(11) of the Internal Revenue Code.
The fund will notify shareholders in January 2014 of amounts for use in preparing 2013 income tax returns.
Annual Report
Board Approval of Investment Advisory Contracts and Management Fees
Fidelity Advisor Small Cap Fund
Each year, the Board of Trustees, including the Independent Trustees (together, the Board), votes on the renewal of the management contract and sub-advisory agreements (together, the Advisory Contracts) for the fund. The Board, assisted by the advice of fund counsel and Independent Trustees' counsel, requests and considers a broad range of information relevant to the renewal of the Advisory Contracts throughout the year.
The Board meets regularly and, at each of its meetings, covers an extensive agenda of topics and materials and considers factors that are relevant to its annual consideration of the renewal of the fund's Advisory Contracts, including the services and support provided to the fund and its shareholders. The Board has established various standing committees, each composed of and chaired by Independent Trustees with varying backgrounds, to which the Board has assigned specific subject matter responsibilities in order to enhance effective decision-making by the Board. The Board, acting directly and through its Committees, requests and receives information concerning the annual consideration of the renewal of the fund's Advisory Contracts. The Board also meets as needed to consider matters specifically related to the Board's annual consideration of the renewal of Advisory Contracts. Members of the Board may also meet with trustees of other Fidelity funds through ad hoc joint committees to discuss certain matters relevant to the Fidelity funds.
At its July 2013 meeting, the Board, including the Independent Trustees, unanimously determined to renew the fund's Advisory Contracts. In reaching its determination, the Board considered all factors it believed relevant, including (i) the nature, extent, and quality of the services to be provided to the fund and its shareholders (including the investment performance of the fund); (ii) the competitiveness of the fund's management fee and total expense ratio relative to peer funds; (iii) the total costs of the services to be provided by and the profits to be realized by Fidelity from its relationship with the fund; (iv) the extent to which economies of scale exist and would be realized as the fund grows; and (v) whether fee levels reflect these economies of scale, if any, for the benefit of fund shareholders.
In considering whether to renew the Advisory Contracts for the fund, the Board reached a determination, with the assistance of fund counsel and Independent Trustees' counsel and through the exercise of its business judgment, that the renewal of the Advisory Contracts was in the best interests of the fund and its shareholders and that the compensation payable under the Advisory Contracts was fair and reasonable. The Board's decision to renew the Advisory Contracts was not based on any single factor, but rather was based on a comprehensive consideration of all the information provided to the Board at its meetings throughout the year. The Board, in reaching its determination to renew the Advisory Contracts, was aware that shareholders in the fund have a broad range of investment choices available to them, including a wide choice among mutual funds offered by Fidelity's competitors, and that the fund's shareholders, who have the opportunity to review and weigh the disclosure provided by the fund in its prospectus and other public disclosures, have chosen to invest in this fund, which is a part of the Fidelity family of funds.
Annual Report
Nature, Extent, and Quality of Services Provided. The Board considered the staffing within the investment adviser, Fidelity Management & Research Company (FMR), and the sub-advisers (together, the Investment Advisers) as it relates to the fund, including the backgrounds of the fund's investment personnel, and also considered the fund's investment objective, strategies, and related investment philosophy. The Independent Trustees also had discussions with senior management of Fidelity's investment operations and investment groups. The Board considered the structure of the portfolio manager compensation program and whether this structure provides appropriate incentives to act in the best interests of the fund.
Resources Dedicated to Investment Management and Support Services. The Board and the Fund Oversight and Research Committees reviewed the general qualifications and capabilities of the Investment Advisers' investment staff, including its size, education, experience, and resources, as well as the Investment Advisers' approach to recruiting, training, managing, and compensating investment personnel. The Board noted that FMR has continued to increase the resources devoted to non-U.S. offices, including expansion of Fidelity's global investment organization. The Board also noted that Fidelity's analysts have extensive resources, tools and capabilities that allow them to conduct sophisticated quantitative and fundamental analysis, as well as credit analysis of issuers, counterparties and guarantors. Further, the Board believes that Fidelity's investment professionals have sufficient access to global information and data so as to provide competitive investment results over time, and that those professionals also have access to sophisticated tools that permit them to assess portfolio construction and risk and performance attribution characteristics continuously, as well as to transmit new information and research conclusions rapidly around the world. Additionally, in its deliberations, the Board considered the Investment Advisers' trading and risk management capabilities and resources, which are an integral part of the investment management process.
Shareholder and Administrative Services. The Board considered (i) the nature, extent, quality, and cost of advisory, administrative, and shareholder services performed by the Investment Advisers and their affiliates under the Advisory Contracts and under separate agreements covering transfer agency, pricing and bookkeeping, and securities lending services for the fund; (ii) the nature and extent of the supervision of third party service providers, principally custodians and subcustodians; and (iii) the resources devoted to, and the record of compliance with, the fund's compliance policies and procedures. The Board also reviewed the allocation of fund brokerage, including allocations to brokers affiliated with the Investment Advisers, the use of brokerage commissions to pay fund expenses, and the use of "soft" commission dollars to pay for research services.
Annual Report
Board Approval of Investment Advisory Contracts and
Management Fees - continued
The Board noted that the growth of fund assets over time across the complex allows Fidelity to reinvest in the development of services designed to enhance the value or convenience of the Fidelity funds as investment vehicles. These services include 24-hour access to account information and market information through telephone representatives and over the Internet, investor education materials and asset allocation tools, and the expanded availability of Fidelity Investor Centers.
Investment in a Large Fund Family. The Board considered the benefits to shareholders of investing in a Fidelity fund, including the benefits of investing in a fund that is part of a large family of funds offering a variety of investment disciplines and providing a large variety of mutual fund investor services. The Board noted that Fidelity had taken, or had made recommendations that resulted in the Fidelity funds taking, a number of actions over the previous year that benefited particular funds, including (i) continuing to dedicate additional resources to investment research and to the support of the senior management team that oversees asset management; (ii) persisting in efforts to enhance Fidelity's global research capabilities; (iii) launching new funds and making other enhancements to meet client needs for global and income-oriented solutions; (iv) continuing to launch dedicated lower cost underlying funds to meet portfolio construction needs related to expanding underlying fund options for Fidelity funds of funds, specifically for the Freedom Fund product lines; (v) rationalizing product lines and gaining increased efficiencies through the mergers of several funds into other funds; (vi) strengthening Fidelity's index fund offerings by reducing investment minimums and adopting or lowering existing expense caps for certain funds and classes; (vii) enhancing Global Asset Allocation product offerings by launching new funds and strategies, including "open architecture" target date funds that utilize affiliated and unaffiliated sub-advisers; (viii) modifying the eligibility criteria for Institutional Class shares of Advisor funds to increase their marketability to a portion of the defined contribution plan market; (ix) creating a new low-cost retirement share class for certain Advisor funds to appeal to large retirement plans; (x) transitioning the management of certain Fidelity commodity funds to Geode Capital Management LLC, a registered commodity pool operator, while retaining administrative responsibilities for the funds; (xi) reorganizing a number of funds; and (xii) taking steps toward establishing a new Fidelity adviser to manage sector-based funds and products.
Investment Performance. The Board considered whether the fund has operated in accordance with its investment objective, as well as its record of compliance with its investment restrictions and its performance history.
The Board took into account discussions with the Investment Advisers about fund investment performance that occur at Board meetings throughout the year. In this regard the Board noted that as part of regularly scheduled fund reviews and other reports to the Board on fund performance, the Board periodically considers annualized return information for the fund, for different time periods, measured against a securities market index ("benchmark index") and a peer group of mutual funds with similar objectives ("peer group"). In its evaluation of fund investment performance, the Board gave particular attention to information indicating changes in performance of certain Fidelity funds for specific time periods and the Investment Advisers' explanations for any overperformance or, in the case of the fund, underperformance.
Annual Report
In addition to reviewing absolute and relative fund performance, the Independent Trustees periodically consider the appropriateness of fund performance metrics in evaluating the results achieved. In general, the Independent Trustees believe that fund performance should be evaluated based on net performance (after fees and expenses) of both the highest performing and lowest performing classes, where applicable, compared to appropriate benchmark indices, over appropriate time periods which may include full market cycles, and compared to peer groups, as applicable, over the same periods, taking into account relevant factors including the following: general market conditions; issuer-specific information; tactical opportunities for investment; and fund cash flows and other factors.
The Independent Trustees recognize that shareholders evaluate performance on a net basis over their own holding periods, for which one-, three-, and five-year periods are used as a proxy. For this reason, the performance information reviewed by the Board also included net cumulative calendar year total return information for the fund and an appropriate benchmark index and peer group for the most recent one-, three-, and five-year periods, as shown below. Returns are shown compared to the 25th percentile (top of box) and 75th percentile (bottom of box) of the peer universe.
Annual Report
Board Approval of Investment Advisory Contracts and
Management Fees - continued
Fidelity Advisor Small Cap Fund

The Board has discussed the fund's underperformance with FMR and has engaged with FMR to consider what steps might be taken to remediate the fund's underperformance.
The Board also considered that the fund's management fee is subject to upward or downward adjustment depending upon whether, and to what extent, the fund's investment performance for the performance period exceeds, or is exceeded by, a securities index, thus leading to a performance adjustment for the same period. The Board noted that the performance adjustment provides FMR with a strong economic incentive to seek to achieve superior performance for the fund's shareholders and helps to more closely align the interests of FMR and the fund's shareholders.
Based on its review, the Board concluded that the nature, extent, and quality of services provided to the fund under the Advisory Contracts should benefit the fund's shareholders.
Competitiveness of Management Fee and Total Expense Ratio. The Board considered the fund's management fee and total expense ratio compared to "mapped groups" of competitive funds and classes. Fidelity creates "mapped groups" by combining similar Lipper investment objective categories that have comparable management fee characteristics. Combining Lipper investment objective categories aids the Board's management fee and total expense ratio comparisons by broadening the competitive group used for comparison and by reducing the number of universes to which various Fidelity funds are compared.
Annual Report
Management Fee. The Board considered two proprietary management fee comparisons for the 12-month periods shown in the chart below. The group of Lipper funds used by the Board for management fee comparisons is referred to below as the "Total Mapped Group." The Total Mapped Group comparison focuses on a fund's standing in terms of gross management fees before expense reimbursements or caps, and without giving effect to the fund's performance adjustment, relative to the total universe of funds with comparable investment mandates, regardless of whether their management fee structures also are comparable. Funds with comparable investment mandates offer exposure to similar types of securities. Funds with comparable management fee structures have similar management fee contractual arrangements (e.g., flat rate charged for advisory services, all-inclusive fee rate, etc.). "TMG %" represents the percentage of funds in the Total Mapped Group that had management fees that were lower than the fund's. For example, a TMG % of 14% means that 86% of the funds in the Total Mapped Group had higher management fees than the fund. The "Asset-Size Peer Group" (ASPG) comparison focuses on a fund's standing relative to a subset of non-Fidelity funds within the Total Mapped Group that are similar in size and management fee structure. The ASPG represents at least 15% of the funds in the Total Mapped Group with comparable asset size and management fee structures, subject to a minimum of 50 funds (or all funds in the Total Mapped Group if fewer than 50). Additional information, such as the ASPG quartile in which the fund's management fee ranked and the impact of the fund's performance adjustment, is also included in the chart and considered by the Board.
Fidelity Advisor Small Cap Fund

The Board noted that the fund's management fee ranked below the median of its Total Mapped Group and below the median of its ASPG for 2012. The Board also noted the effect of the fund's negative performance adjustment on the fund's management fee ranking.
Annual Report
Board Approval of Investment Advisory Contracts and
Management Fees - continued
Based on its review, the Board concluded that the fund's management fee is fair and reasonable in light of the services that the fund receives and the other factors considered.
Total Expense Ratio. In its review of each class's total expense ratio, the Board considered the fund's management fee as well as other fund or class expenses, as applicable, such as transfer agent fees, pricing and bookkeeping fees, fund-paid 12b-1 fees, and custodial, legal, and audit fees. The Board also noted the effects of any waivers and reimbursements on fees and expenses, as well as the impact of the fund's performance adjustment. As part of its review, the Board also considered the current and historical total expense ratios of each class of the fund compared to competitive fund median expenses. Each class of the fund is compared to those funds and classes in the Total Mapped Group (used by the Board for management fee comparisons) that have a similar sales load structure.
The Board noted that the total expense ratio of each class ranked below its competitive median for 2012.
Fees Charged to Other Fidelity Clients. The Board also considered Fidelity fee structures and other information with respect to clients of FMR and its affiliates, such as other mutual funds advised or subadvised by FMR or its affiliates, pension plan clients, and other institutional clients. The Board noted the findings of the 2013 ad hoc joint committee (created with the board of other Fidelity funds), which reviewed and compared Fidelity's institutional investment advisory business with its business of providing services to the Fidelity funds, including the differences in services provided, fees charged, and costs incurred, as well as competition in their respective marketplaces.
Based on its review of total expense ratios and fees charged to other Fidelity clients, the Board concluded that the total expense ratio of each class of the fund was reasonable in light of the services that the fund and its shareholders receive and the other factors considered.
Costs of the Services and Profitability. The Board considered the revenues earned and the expenses incurred by Fidelity in conducting the business of developing, marketing, distributing, managing, administering and servicing the fund and servicing the fund's shareholders. The Board also considered the level of Fidelity's profits in respect of all the Fidelity funds.
On an annual basis, FMR presents to the Board Fidelity's profitability for the fund. Fidelity calculates the profitability for each fund, as well as aggregate profitability for groups of Fidelity funds and all Fidelity funds, using a series of detailed revenue and cost allocation methodologies which originate with the books and records of Fidelity on which Fidelity's audited financial statements are based. The Audit Committee of the Board reviews any significant changes from the prior year's methodologies.
Annual Report
PricewaterhouseCoopers LLP (PwC), independent registered public accounting firm and auditor to Fidelity and certain Fidelity funds, has been engaged annually by the Board as part of the Board's assessment of Fidelity's profitability analysis. PwC's engagement includes the review and assessment of the methodologies used by Fidelity in determining the revenues and expenses attributable to Fidelity's mutual fund business, and completion of agreed-upon procedures surrounding the mathematical accuracy of fund profitability and its conformity to allocation methodologies. After considering PwC's reports issued under the engagement and information provided by Fidelity, the Board concluded that while other allocation methods may also be reasonable, Fidelity's profitability methodologies are reasonable in all material respects.
The Board also reviewed Fidelity's non-fund businesses and fall-out benefits related to the mutual fund business as well as cases where Fidelity's affiliates may benefit from or be related to the fund's business.
The Board considered the costs of the services provided by and the profits realized by Fidelity in connection with the operation of the fund and was satisfied that the profitability was not excessive in the circumstances.
Economies of Scale. The Board considered whether there have been economies of scale in respect of the management of the Fidelity funds, whether the Fidelity funds (including the fund) have appropriately benefited from any such economies of scale, and whether there is potential for realization of any further economies of scale. The Board considered the extent to which the fund will benefit from economies of scale through increased services to the fund, through waivers or reimbursements, or through fee or expense reductions. The Board also noted that in 2009, it and the board of other Fidelity funds created an ad hoc committee (the Economies of Scale Committee) to analyze whether FMR attains economies of scale in respect of the management and servicing of the Fidelity funds, whether the Fidelity funds have appropriately benefited from such economies of scale, and whether there is potential for realization of any further economies of scale.
The Board recognized that the fund's management contract incorporates a "group fee" structure, which provides for lower group fee rates as total fund assets under FMR's management increase, and for higher group fee rates as total fund assets under FMR's management decrease. FMR calculates the group fee rates based on a tiered asset "breakpoint" schedule that varies based on asset class. The Board considered that the group fee is designed to deliver the benefits of economies of scale to fund shareholders when total Fidelity fund assets increase, even if assets of any particular fund are unchanged or have declined, because some portion of Fidelity's costs are attributable to services provided to all Fidelity funds, and all funds benefit if those costs can be allocated among more assets. The Board concluded that, given the group fee structure, fund shareholders will benefit from lower management fees as assets under FMR's management increase at the fund complex level, regardless of whether Fidelity achieves any such economies of scale.
Annual Report
Board Approval of Investment Advisory Contracts and
Management Fees - continued
The Board concluded, taking into account the analysis of the Economies of Scale Committee, that economies of scale, if any, are being appropriately shared between fund shareholders and Fidelity.
Amendment to Description of Group Fee Rate. At its July 2013 meeting, the Board voted to approve an amendment to the fund's management contract to modify the description of the "group fee rate" effective August 1, 2013. The Board noted that under the prior description in the contract, the group fee rate was based on the average net assets of all registered investment companies with which FMR has management contracts. Under the contract's tiered asset breakpoint schedule, the group fee rate is lower as total fund assets under FMR's management increase, and higher as total fund assets under FMR's management decrease. The Board considered that the prior description would have excluded the assets of 64 Fidelity sector funds from the group fee rate calculation once Fidelity SelectCo, LLC, an affiliate of FMR, assumed management responsibilities for those funds. The Board noted that modifying the description of the group fee rate to continue to include the assets of those 64 funds for purposes of determining group fee rate breakpoints would avoid an immediate adverse impact on the group fee rate for any fund.
Additional Information Requested by the Board. In order to develop fully the factual basis for consideration of the Fidelity funds' Advisory Contracts, the Board requested and received additional information on certain topics, including: (i) fund performance trends and Fidelity's long-term strategies for certain funds; (ii) the potential to further rationalize the Fidelity fund lineup with the possibility of achieving savings for the funds and Fidelity; (iii) the methodology with respect to competitive fund data and peer group classifications; (iv) the arrangements with, and performance of, certain sub-advisers on behalf of the Fidelity funds, as well as certain proposed participating affiliate arrangements; (v) the realization of fall-out benefits in certain Fidelity business units; (vi) Fidelity's group fee structures, including the rationale for the individual fee rates of certain categories of funds and the definition of group assets; (vii) trends regarding industry use of performance fee structures and the performance adjustment methodologies applicable to the Fidelity funds; (viii) additional competitive analysis regarding the total expenses for certain classes; and (ix) fund profitability methodology, including Fidelity's cost allocation methodology, and the impact of certain factors on fund profitability results.
Annual Report
Based on its evaluation of all of the conclusions noted above, and after considering all factors it believed relevant, the Board ultimately concluded that the advisory fee structures are fair and reasonable, and that the fund's Advisory Contracts should be renewed.
Annual Report
Investment Adviser
Fidelity Management & Research Company
Boston, MA
Investment Sub-Advisers
FMR Co., Inc.
Fidelity Management & Research
(U.K.) Inc.
Fidelity Management & Research
(Hong Kong) Limited
Fidelity Management & Research
(Japan) Inc.
General Distributor
Fidelity Distributors Corporation
Smithfield, RI
Transfer and Service Agents
Fidelity Investments Institutional
Operations Company, Inc.
Boston, MA
Fidelity Service Company, Inc.
Boston, MA
Custodian
State Street Bank and Trust Company
Quincy, MA
(Fidelity Investment logo)(registered trademark)
ASCF-UANN-0114 1.786697.110
(Fidelity Investment logo)(registered trademark)
Fidelity Advisor®
Small Cap
Fund - Institutional Class
Annual Report
November 30, 2013
(Fidelity Cover Art)
Contents
|
Performance |
How the fund has done over time. |
|
|
Management's Discussion of Fund Performance |
The Portfolio Manager's review of fund performance and strategy. |
|
|
Shareholder Expense Example |
An example of shareholder expenses. |
|
|
Investment Changes |
A summary of major shifts in the fund's investments over the past six months. |
|
|
Investments |
A complete list of the fund's investments with their market values. |
|
|
Financial Statements |
Statements of assets and liabilities, operations, and changes in net assets, as well as financial highlights. |
|
|
Notes |
Notes to the financial statements. |
|
|
Report of Independent Registered Public Accounting Firm |
|
|
|
Trustees and Officers |
|
|
|
Distributions |
|
|
|
Board Approval of Investment Advisory Contracts and Management Fees |
|
To view a fund's proxy voting guidelines and proxy voting record for the 12-month period ended June 30, visit http://www.fidelity.com/proxyvotingresults or visit the Securities and Exchange Commission's (SEC) web site at http://www.sec.gov. You may also call 1-877-208-0098 to request a free copy of the proxy voting guidelines.
Standard & Poor's, S&P and S&P 500 are registered service marks of The McGraw-Hill Companies, Inc. and have been licensed for use by Fidelity Distributors Corporation.
Other third-party marks appearing herein are the property of their respective owners.
All other marks appearing herein are registered or unregistered trademarks or service marks of FMR LLC or an affiliated company. © 2014 FMR LLC. All rights reserved.
Annual Report
This report and the financial statements contained herein are submitted for the general information of the shareholders of the fund. This report is not authorized for distribution to prospective investors in the fund unless preceded or accompanied by an effective prospectus.
A fund files its complete schedule of portfolio holdings with the SEC for the first and third quarters of each fiscal year on Form N-Q. Forms N-Q are available on the SEC's web site at http://www.sec.gov. A fund's Forms N-Q may be reviewed and copied at the SEC's Public Reference Room in Washington, DC. Information regarding the operation of the SEC's Public Reference Room may be obtained by calling 1-800-SEC-0330. For a complete list of a fund's portfolio holdings, view the most recent holdings listing, semiannual report, or annual report on Fidelity's web site at http://www.fidelity.com, http://www.advisor.fidelity.com, or http://www.401k.com, as applicable.
NOT FDIC INSURED • MAY LOSE VALUE • NO BANK GUARANTEE
Neither the fund nor Fidelity Distributors Corporation is a bank.
Annual Report
Performance: The Bottom Line
Average annual total return reflects the change in the value of an investment, assuming reinvestment of the class' distributions from dividend income and capital gains (the profits earned upon the sale of securities that have grown in value, if any) and assuming a constant rate of performance each year. The $10,000 table and the fund's returns do not reflect the deduction of taxes that a shareholder would pay on fund distributions or the redemption of fund shares. During periods of reimbursement by Fidelity, a fund's total return will be greater than it would be had the reimbursement not occurred. How a fund did yesterday is no guarantee of how it will do tomorrow.
Average Annual Total Returns
|
Periods ended November 30, 2013 |
Past 1 |
Past 5 |
Past 10 |
|
Institutional Class |
38.79% |
16.45% |
10.27% |
$10,000 Over 10 Years
Let's say hypothetically that $10,000 was invested in Fidelity Advisor® Small Cap Fund - Institutional Class on November 30, 2003. The chart shows how the value of your investment would have changed, and also shows how the Russell 2000® Index performed over the same period.
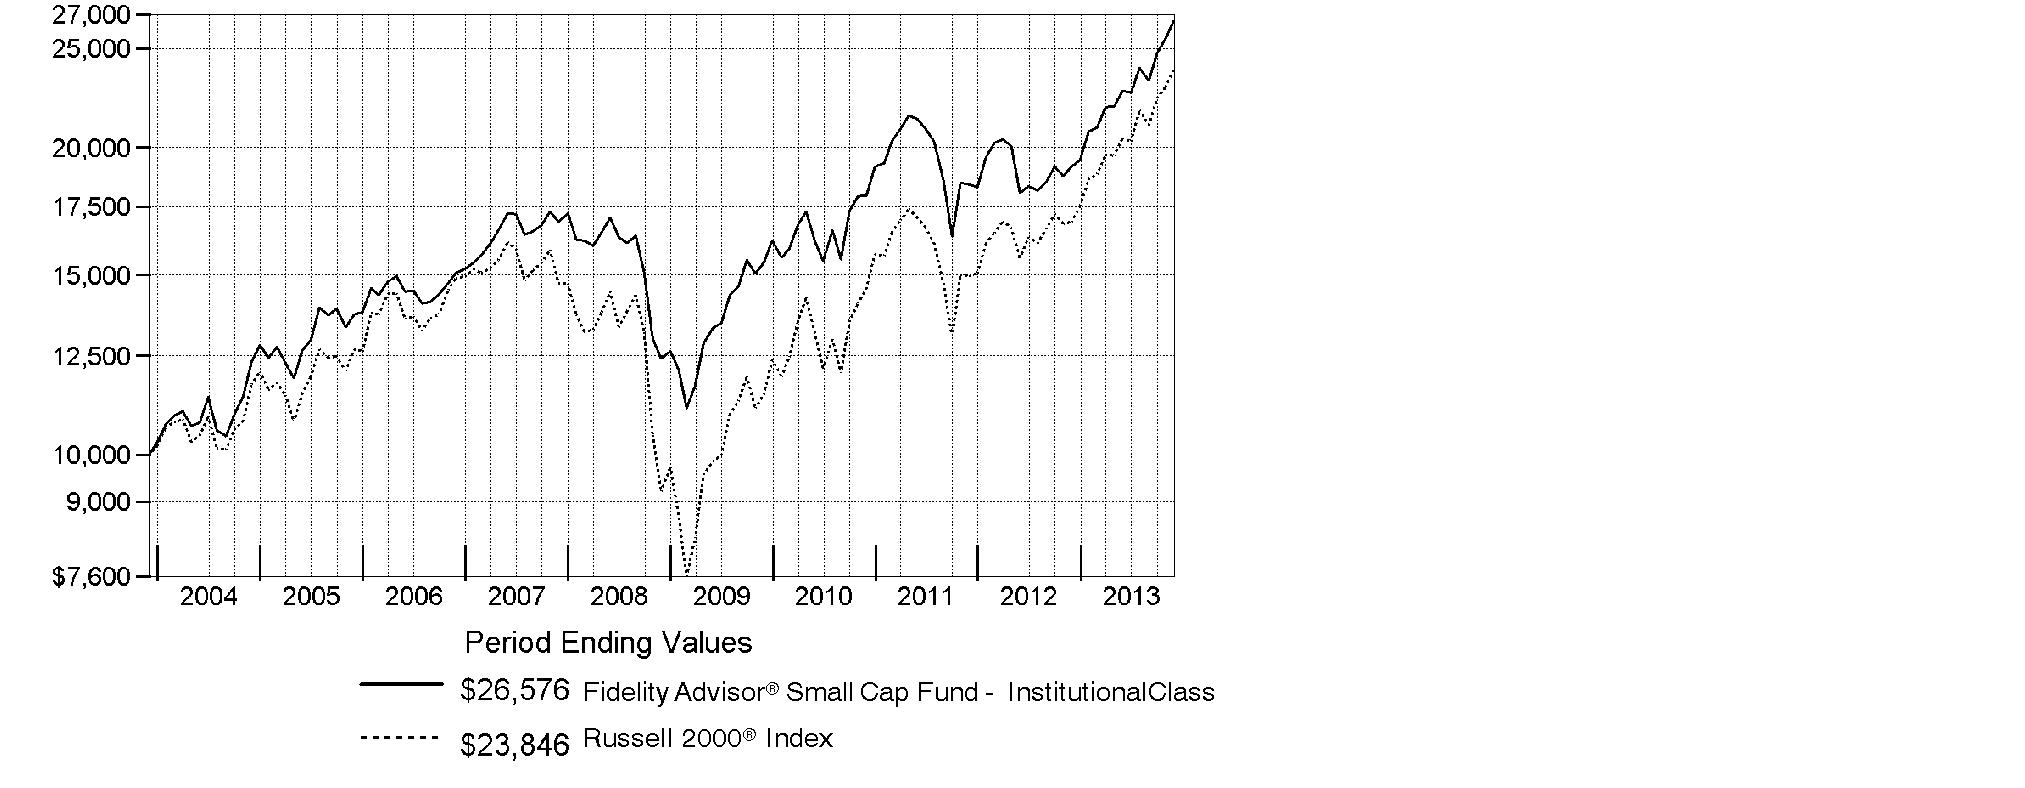
Annual Report
Management's Discussion of Fund Performance
Market Recap: With the current bull run nearing the five-year mark, equity benchmarks ripped up old records during the 12 months ending November 30, 2013. Gains were fueled by strengthening U.S. economic data, as well as generally improving economies and accommodative monetary policies worldwide. The broad S&P 500® Index reached new peaks in its 30.30% climb for the period, and the blue-chip Dow Jones Industrial AverageSM surpassed historic milestones en route to a 26.63% gain. The Nasdaq Composite Index®, up 36.73% amid a resurgence in growth-oriented stocks, closed above 4,000 for the first time since 2000. Shedding anxiety over the 2012 U.S. presidential election - and apparently confident that the federal debt-ceiling debate would be resolved - markets rose from period start through late May. News that the U.S. Federal Reserve was considering an end to its stimulative bond-buying kept stocks in flux over the summer but, by September, the Fed had set aside any imminent tapering. Despite jitters over a potential U.S. military strike in Syria and, later, an October budget impasse that briefly shuttered the federal government, volatility was subdued heading into the holidays, with investor optimism helping many markets home in on all-time highs at period end. Elsewhere, non-U.S. developed-market equities saw similar results, with the MSCI® EAFE® Index adding 24.97%.
Comments from James Harmon, Portfolio Manager of Fidelity Advisor® Small Cap Fund: During the year, the fund's Institutional Class shares returned 38.79%, lagging the Russell 2000® Index. On a relative basis, the fund was hampered the most by weak stock picking among energy and retail stocks, while my positioning in the real estate industry contributed. Given my management focus on high-quality, "steady Eddie" businesses, it was extremely difficult to keep pace with many of the speculative small-cap names that led the market's rally. On an individual security basis, the fund's biggest relative detractor was EZCORP, which is primarily a pawnbroker in the U.S. and Mexico. The stock was hurt by low gold prices and business-execution challenges, among other factors. Another detractor was a non-index investment in fuel logistics company World Fuel Services, which was hurt by worries about potential legal liability surrounding a July train crash in Canada. In contrast, iGATE, a provider of India-based offshore information technology consulting services, was the fund's leading contributor. Coming into the period, iGATE's shares were very inexpensively valued, and renewed optimism about the prospects for the company's 2011 acquisition of Patni Computer Systems helped iGATE's stock to bounce back.
Annual Report
The views expressed above reflect those of the portfolio manager(s) only through the end of the period as stated on the cover of this report and do not necessarily represent the views of Fidelity or any other person in the Fidelity organization. Any such views are subject to change at any time based upon market or other conditions and Fidelity disclaims any responsibility to update such views. These views may not be relied on as investment advice and, because investment decisions for a Fidelity fund are based on numerous factors, may not be relied on as an indication of trading intent on behalf of any Fidelity fund.
Annual Report
Shareholder Expense Example
As a shareholder of the Fund, you incur two types of costs: (1) transaction costs, including sales charges (loads) on purchase payments or redemption proceeds, and (2) ongoing costs, including management fees, distribution and/or service (12b-1) fees and other Fund expenses. This Example is intended to help you understand your ongoing costs (in dollars) of investing in the Fund and to compare these costs with the ongoing costs of investing in other mutual funds.
The actual expense Example is based on an investment of $1,000 invested at the beginning of the period and held for the entire period (June 1, 2013 to November 31, 2013) for Class A, Class T, Class B, Class C and Institutional Class and for the period (August 13, 2013 to November 30, 2013) for Class Z. The hypothetical expense Example is based on investment of $1,000 for the one-half year period (June 1, 2013 to November 30, 2013).
Actual Expenses
The first line of the accompanying table for each class of the Fund provides information about actual account values and actual expenses. You may use the information in this line, together with the amount you invested, to estimate the expenses that you paid over the period. Simply divide your account value by $1,000.00 (for example, an $8,600 account value divided by $1,000.00 = 8.6), then multiply the result by the number in the first line for a class of the Fund under the heading entitled "Expenses Paid During Period" to estimate the expenses you paid on your account during this period. In addition, the Fund, as a shareholder in the underlying Fidelity Central Funds, will indirectly bear its pro-rata share of the fees and expenses incurred by the underlying Fidelity Central Funds. These fees and expenses are not included in the Fund's annualized expense ratio used to calculate the expense estimate in the table below.
Hypothetical Example for Comparison Purposes
The second line of the accompanying table for each class of the Fund provides information about hypothetical account values and hypothetical expenses based on a Class' actual expense ratio and an assumed rate of return of 5% per year before expenses, which is not the Class' actual return. The hypothetical account values and expenses may not be used to estimate the actual ending account balance or expenses you paid for the period. You may use this information to compare the ongoing costs of investing in the Fund and other funds. To do so, compare this 5% hypothetical example with the 5% hypothetical examples that appear in the shareholder reports of the other funds. In addition, the Fund, as a shareholder in the underlying Fidelity Central Funds, will indirectly bear its pro-rata share of the fees and expenses incurred by the underlying Fidelity Central Funds. These fees and expenses are not included in the Fund's annualized expense ratio used to calculate the expense estimate in the table below.
Please note that the expenses shown in the table are meant to highlight your ongoing costs only and do not reflect any transaction costs. Therefore, the second line of the table is useful in comparing ongoing costs only, and will not help you determine the relative total costs of owning different funds. In addition, if these transactional costs were included, your costs would have been higher.
Annual Report
|
|
Annualized |
Beginning |
Ending |
Expenses Paid |
|
Class A |
1.00% |
|
|
|
|
Actual |
|
$ 1,000.00 |
$ 1,167.90 |
$ 5.43 C |
|
HypotheticalA |
|
$ 1,000.00 |
$ 1,020.05 |
$ 5.06 D |
|
Class T |
1.21% |
|
|
|
|
Actual |
|
$ 1,000.00 |
$ 1,167.10 |
$ 6.57 C |
|
HypotheticalA |
|
$ 1,000.00 |
$ 1,019.00 |
$ 6.12 D |
|
Class B |
1.81% |
|
|
|
|
Actual |
|
$ 1,000.00 |
$ 1,163.70 |
$ 9.82 C |
|
HypotheticalA |
|
$ 1,000.00 |
$ 1,015.99 |
$ 9.15 D |
|
Class C |
1.75% |
|
|
|
|
Actual |
|
$ 1,000.00 |
$ 1,163.40 |
$ 9.49 C |
|
HypotheticalA |
|
$ 1,000.00 |
$ 1,016.29 |
$ 8.85 D |
|
Institutional Class |
.70% |
|
|
|
|
Actual |
|
$ 1,000.00 |
$ 1,169.80 |
$ 3.81 C |
|
HypotheticalA |
|
$ 1,000.00 |
$ 1,021.56 |
$ 3.55 D |
|
Class Z |
.56% |
|
|
|
|
Actual |
|
$ 1,000.00 |
$ 1,099.00 |
$ 1.77 C |
|
HypotheticalA |
|
$ 1,000.00 |
$ 1,022.26 |
$ 2.84 D |
A 5% return per year before expenses
B Annualized expense ratio reflects expenses net of applicable fee waivers.
C Actual expenses are equal to each Class' annualized expense ratio, multiplied by the average account value over the period, multiplied by 183/365 (to reflect the one-half year period) for Class A, Class T, Class B, Class C and Institutional Class and multiplied by 110/365 (to reflect the period August 13, 2013 to November 30, 2013) for Class Z. The fees and expenses of the underlying Fidelity Central Funds in which the Fund invests are not included in each Class' annualized expense ratio.
D Hypothetical expenses are equal to each Class' annualized expense ratio, multiplied by the average account value over the period, multiplied by 183/365 (to reflect the one-half year period). The fees and expenses of the underlying Fidelity Central Funds in which the Fund invests are not included in each Class' annualized expense ratio.
Annual Report
Investment Changes (Unaudited)
|
Top Ten Stocks as of November 30, 2013 |
||
|
|
% of fund's |
% of fund's net assets |
|
Global Payments, Inc. |
1.8 |
0.9 |
|
Badger Daylighting Ltd. |
1.8 |
1.1 |
|
Primerica, Inc. |
1.7 |
1.6 |
|
Moog, Inc. Class A |
1.7 |
1.3 |
|
Office Depot, Inc. |
1.7 |
0.8 |
|
Skechers U.S.A., Inc. Class A (sub. vtg.) |
1.7 |
1.3 |
|
The Ensign Group, Inc. |
1.6 |
1.3 |
|
PolyOne Corp. |
1.6 |
1.7 |
|
WESCO International, Inc. |
1.5 |
1.4 |
|
Jazz Pharmaceuticals PLC |
1.5 |
0.9 |
|
|
16.6 |
|
|
Top Five Market Sectors as of November 30, 2013 |
||
|
|
% of fund's |
% of fund's net assets |
|
Financials |
19.2 |
22.2 |
|
Information Technology |
16.7 |
14.7 |
|
Consumer Discretionary |
16.3 |
18.6 |
|
Industrials |
14.7 |
13.7 |
|
Health Care |
11.3 |
9.7 |
|
Asset Allocation (% of fund's net assets) |
|||||||
|
As of November 30, 2013* |
As of May 31, 2013** |
||||||
 |
Stocks and Equity |
|
|
Stocks and Equity |
|
||
 |
Short-Term |
|
|
Short-Term |
|
||
|
* Foreign investments |
19.7% |
|
** Foreign investments |
17.9% |
|
||

Annual Report
Investments November 30, 2013
Showing Percentage of Net Assets
|
Common Stocks - 93.6% |
|||
|
Shares |
Value (000s) |
||
|
CONSUMER DISCRETIONARY - 16.3% |
|||
|
Auto Components - 0.6% |
|||
|
Dorman Products, Inc. |
438,300 |
$ 21,819 |
|
|
Diversified Consumer Services - 1.7% |
|||
|
Best Bridal, Inc. (d)(e) |
2,789,100 |
18,568 |
|
|
Grand Canyon Education, Inc. (a) |
569,800 |
25,949 |
|
|
Meiko Network Japan Co. Ltd. (e) |
1,577,900 |
16,280 |
|
|
|
60,797 |
||
|
Hotels, Restaurants & Leisure - 1.5% |
|||
|
AFC Enterprises, Inc. (a) |
219,200 |
9,555 |
|
|
Life Time Fitness, Inc. (a) |
394,500 |
19,137 |
|
|
Texas Roadhouse, Inc. Class A |
789,000 |
22,076 |
|
|
|
50,768 |
||
|
Household Durables - 1.8% |
|||
|
Iida Group Holdings Co. Ltd. (a)(d) |
1,100,999 |
22,150 |
|
|
Tupperware Brands Corp. |
438,300 |
40,034 |
|
|
|
62,184 |
||
|
Multiline Retail - 0.7% |
|||
|
Big Lots, Inc. (a) |
600,205 |
23,006 |
|
|
Specialty Retail - 6.6% |
|||
|
Aarons, Inc. Class A |
1,051,900 |
30,126 |
|
|
Aeropostale, Inc. (a)(d) |
3,014,100 |
31,106 |
|
|
Ascena Retail Group, Inc. (a) |
1,008,100 |
21,473 |
|
|
Genesco, Inc. (a) |
500,000 |
37,455 |
|
|
Jumbo SA (a) |
1,358,800 |
21,159 |
|
|
Murphy U.S.A., Inc. |
613,600 |
27,765 |
|
|
Office Depot, Inc. (a)(d) |
10,852,600 |
59,038 |
|
|
|
228,122 |
||
|
Textiles, Apparel & Luxury Goods - 3.4% |
|||
|
Skechers U.S.A., Inc. Class A (sub. vtg.) (a) |
1,753,200 |
58,943 |
|
|
Steven Madden Ltd. (a) |
1,052,000 |
40,986 |
|
|
Wolverine World Wide, Inc. |
613,600 |
20,194 |
|
|
|
120,123 |
||
|
TOTAL CONSUMER DISCRETIONARY |
566,819 |
||
|
CONSUMER STAPLES - 4.8% |
|||
|
Food & Staples Retailing - 1.7% |
|||
|
Ain Pharmaciez, Inc. |
114,000 |
5,280 |
|
|
Common Stocks - continued |
|||
|
Shares |
Value (000s) |
||
|
CONSUMER STAPLES - continued |
|||
|
Food & Staples Retailing - continued |
|||
|
Sundrug Co. Ltd. |
604,900 |
$ 27,250 |
|
|
Tsuruha Holdings, Inc. |
263,000 |
24,209 |
|
|
|
56,739 |
||
|
Food Products - 1.0% |
|||
|
Darling International, Inc. (a) |
1,665,600 |
34,528 |
|
|
Personal Products - 2.1% |
|||
|
Atrium Innovations, Inc. (a)(e) |
2,016,200 |
46,147 |
|
|
Prestige Brands Holdings, Inc. (a) |
789,000 |
27,804 |
|
|
|
73,951 |
||
|
TOTAL CONSUMER STAPLES |
165,218 |
||
|
ENERGY - 5.5% |
|||
|
Energy Equipment & Services - 3.9% |
|||
|
Cathedral Energy Services Ltd. (e) |
3,141,600 |
14,931 |
|
|
Key Energy Services, Inc. (a) |
4,383,100 |
34,364 |
|
|
Oil States International, Inc. (a) |
219,200 |
22,435 |
|
|
Pason Systems, Inc. |
1,840,900 |
39,328 |
|
|
Western Energy Services Corp. (a)(f) |
1,080,720 |
7,618 |
|
|
Western Energy Services Corp. |
2,279,200 |
16,066 |
|
|
|
134,742 |
||
|
Oil, Gas & Consumable Fuels - 1.6% |
|||
|
BP Prudhoe Bay Royalty Trust (d) |
15,506 |
1,179 |
|
|
Sunoco Logistics Partners LP |
219,200 |
15,515 |
|
|
World Fuel Services Corp. |
1,052,000 |
40,397 |
|
|
|
57,091 |
||
|
TOTAL ENERGY |
191,833 |
||
|
FINANCIALS - 19.2% |
|||
|
Capital Markets - 0.4% |
|||
|
Virtus Investment Partners, Inc. (a) |
65,700 |
13,652 |
|
|
Commercial Banks - 4.6% |
|||
|
Bank of the Ozarks, Inc. |
350,700 |
19,692 |
|
|
East West Bancorp, Inc. |
1,051,900 |
36,059 |
|
|
First Financial Bankshares, Inc. (d) |
175,300 |
11,636 |
|
|
Popular, Inc. (a) |
657,500 |
18,791 |
|
|
Prosperity Bancshares, Inc. |
350,600 |
22,484 |
|
|
Common Stocks - continued |
|||
|
Shares |
Value (000s) |
||
|
FINANCIALS - continued |
|||
|
Commercial Banks - continued |
|||
|
Sterling Financial Corp. |
1,051,900 |
$ 34,345 |
|
|
SVB Financial Group (a) |
175,300 |
17,747 |
|
|
|
160,754 |
||
|
Consumer Finance - 0.6% |
|||
|
EZCORP, Inc. (non-vtg.) Class A (a) |
1,765,700 |
20,623 |
|
|
Insurance - 7.3% |
|||
|
CNO Financial Group, Inc. |
2,279,200 |
38,564 |
|
|
Enstar Group Ltd. (a) |
175,300 |
24,421 |
|
|
HCC Insurance Holdings, Inc. |
789,000 |
36,278 |
|
|
Primerica, Inc. |
1,402,600 |
60,354 |
|
|
ProAssurance Corp. |
613,600 |
29,502 |
|
|
Reinsurance Group of America, Inc. |
473,400 |
35,496 |
|
|
RenaissanceRe Holdings Ltd. |
300,000 |
28,410 |
|
|
|
253,025 |
||
|
Real Estate Investment Trusts - 5.2% |
|||
|
Aviv REIT, Inc. |
657,500 |
16,898 |
|
|
Corrections Corp. of America |
701,300 |
23,388 |
|
|
EPR Properties |
350,600 |
17,632 |
|
|
Equity Lifestyle Properties, Inc. |
394,500 |
14,005 |
|
|
First Industrial Realty Trust, Inc. |
964,300 |
16,837 |
|
|
MFA Financial, Inc. |
3,814,900 |
27,811 |
|
|
National Health Investors, Inc. |
263,000 |
15,483 |
|
|
Rouse Properties, Inc. (d) |
1,402,600 |
34,209 |
|
|
Sovran Self Storage, Inc. |
219,200 |
14,629 |
|
|
|
180,892 |
||
|
Real Estate Management & Development - 0.3% |
|||
|
Relo Holdings Corp. |
219,200 |
10,698 |
|
|
Thrifts & Mortgage Finance - 0.8% |
|||
|
EverBank Financial Corp. (d) |
1,665,600 |
28,432 |
|
|
TOTAL FINANCIALS |
668,076 |
||
|
HEALTH CARE - 11.3% |
|||
|
Biotechnology - 1.2% |
|||
|
United Therapeutics Corp. (a) |
438,300 |
40,459 |
|
|
Health Care Equipment & Supplies - 1.6% |
|||
|
DENTSPLY International, Inc. |
482,100 |
22,929 |
|
|
The Cooper Companies, Inc. |
263,000 |
34,648 |
|
|
|
57,577 |
||
|
Common Stocks - continued |
|||
|
Shares |
Value (000s) |
||
|
HEALTH CARE - continued |
|||
|
Health Care Providers & Services - 6.2% |
|||
|
AmSurg Corp. (a) |
1,051,900 |
$ 50,828 |
|
|
Centene Corp. (a) |
175,300 |
10,471 |
|
|
Community Health Systems, Inc. |
789,000 |
32,546 |
|
|
Health Net, Inc. (a) |
701,300 |
21,425 |
|
|
Henry Schein, Inc. (a) |
175,300 |
19,984 |
|
|
MEDNAX, Inc. (a) |
219,200 |
24,287 |
|
|
The Ensign Group, Inc. (e) |
1,227,300 |
55,437 |
|
|
|
214,978 |
||
|
Health Care Technology - 0.8% |
|||
|
Quality Systems, Inc. |
1,139,600 |
26,621 |
|
|
Pharmaceuticals - 1.5% |
|||
|
Jazz Pharmaceuticals PLC (a) |
438,300 |
51,246 |
|
|
TOTAL HEALTH CARE |
390,881 |
||
|
INDUSTRIALS - 14.7% |
|||
|
Aerospace & Defense - 2.9% |
|||
|
Moog, Inc. Class A (a) |
876,600 |
60,196 |
|
|
Teledyne Technologies, Inc. (a) |
438,300 |
40,644 |
|
|
|
100,840 |
||
|
Commercial Services & Supplies - 2.3% |
|||
|
Mitie Group PLC |
5,698,100 |
29,044 |
|
|
UniFirst Corp. |
263,799 |
26,971 |
|
|
West Corp. |
1,095,800 |
25,236 |
|
|
|
81,251 |
||
|
Construction & Engineering - 1.8% |
|||
|
Badger Daylighting Ltd. (e) |
753,900 |
60,809 |
|
|
Machinery - 3.3% |
|||
|
Actuant Corp. Class A |
701,300 |
27,407 |
|
|
Hy-Lok Corp. |
400,000 |
10,584 |
|
|
Standex International Corp. |
438,300 |
25,825 |
|
|
TriMas Corp. (a) |
876,544 |
32,064 |
|
|
Valmont Industries, Inc. |
119,840 |
17,342 |
|
|
|
113,222 |
||
|
Marine - 0.2% |
|||
|
SITC International Holdings Co. Ltd. |
18,409,000 |
8,097 |
|
|
Common Stocks - continued |
|||
|
Shares |
Value (000s) |
||
|
INDUSTRIALS - continued |
|||
|
Professional Services - 1.2% |
|||
|
Benefit One, Inc. |
1,840,900 |
$ 17,592 |
|
|
Stantec, Inc. |
350,700 |
22,754 |
|
|
|
40,346 |
||
|
Trading Companies & Distributors - 3.0% |
|||
|
DXP Enterprises, Inc. (a) |
263,000 |
25,769 |
|
|
Textainer Group Holdings Ltd. |
701,300 |
27,231 |
|
|
WESCO International, Inc. (a) |
613,600 |
52,757 |
|
|
|
105,757 |
||
|
TOTAL INDUSTRIALS |
510,322 |
||
|
INFORMATION TECHNOLOGY - 16.7% |
|||
|
Electronic Equipment & Components - 4.3% |
|||
|
Belden, Inc. |
394,500 |
27,623 |
|
|
CDW Corp. (d) |
1,753,300 |
39,099 |
|
|
Insight Enterprises, Inc. (a) |
1,139,600 |
27,430 |
|
|
Jabil Circuit, Inc. |
1,202,130 |
24,367 |
|
|
ScanSource, Inc. (a) |
754,881 |
31,697 |
|
|
|
150,216 |
||
|
Internet Software & Services - 2.9% |
|||
|
Perficient, Inc. (a) |
1,528,600 |
33,140 |
|
|
Stamps.com, Inc. (a)(e) |
876,600 |
40,385 |
|
|
ValueClick, Inc. (a) |
1,227,300 |
26,264 |
|
|
|
99,789 |
||
|
IT Services - 6.7% |
|||
|
EPAM Systems, Inc. (a) |
843,700 |
29,926 |
|
|
Genpact Ltd. (a) |
1,314,900 |
23,537 |
|
|
Global Payments, Inc. |
989,700 |
62,403 |
|
|
iGATE Corp. (a) |
1,080,600 |
36,178 |
|
|
Syntel, Inc. |
306,800 |
27,112 |
|
|
VeriFone Systems, Inc. (a) |
1,052,000 |
26,942 |
|
|
WEX, Inc. (a) |
263,000 |
26,105 |
|
|
|
232,203 |
||
|
Semiconductors & Semiconductor Equipment - 0.7% |
|||
|
Omnivision Technologies, Inc. (a) |
1,577,900 |
25,294 |
|
|
Software - 2.1% |
|||
|
NIIT Technologies Ltd. (e) |
3,800,000 |
19,396 |
|
|
SWORD Group (e) |
587,339 |
12,673 |
|
|
Common Stocks - continued |
|||
|
Shares |
Value (000s) |
||
|
INFORMATION TECHNOLOGY - continued |
|||
|
Software - continued |
|||
|
Verint Systems, Inc. (a) |
613,600 |
$ 23,268 |
|
|
Zensar Technologies Ltd. (a)(e) |
3,499,999 |
18,120 |
|
|
|
73,457 |
||
|
TOTAL INFORMATION TECHNOLOGY |
580,959 |
||
|
MATERIALS - 4.7% |
|||
|
Chemicals - 2.9% |
|||
|
Axiall Corp. |
438,300 |
19,855 |
|
|
FUCHS PETROLUB AG |
306,800 |
25,388 |
|
|
PolyOne Corp. |
1,665,600 |
54,065 |
|
|
|
99,308 |
||
|
Containers & Packaging - 0.8% |
|||
|
Sealed Air Corp. |
876,600 |
28,148 |
|
|
Metals & Mining - 1.0% |
|||
|
Aurubis AG |
394,500 |
23,272 |
|
|
Maharashtra Seamless Ltd. (a) |
190,000 |
510 |
|
|
Reliance Steel & Aluminum Co. |
175,300 |
12,890 |
|
|
|
36,672 |
||
|
TOTAL MATERIALS |
164,128 |
||
|
UTILITIES - 0.4% |
|||
|
Gas Utilities - 0.4% |
|||
|
New Jersey Resources Corp. |
263,000 |
12,016 |
|
|
TOTAL COMMON STOCKS (Cost $2,362,139) |
|
||
|
U.S. Treasury Obligations - 0.3% |
||||
|
|
Principal Amount (000s) |
|
||
|
U.S. Treasury Bills, yield at date of purchase 0.01% to 0.07% 12/12/13 to 2/27/14 (g) |
|
$ 10,260 |
|
|
|
Money Market Funds - 9.2% |
|||
|
Shares |
Value (000s) |
||
|
Fidelity Cash Central Fund, 0.10% (b) |
262,782,714 |
$ 262,783 |
|
|
Fidelity Securities Lending Cash Central Fund, 0.10% (b)(c) |
57,688,350 |
57,688 |
|
|
TOTAL MONEY MARKET FUNDS (Cost $320,471) |
|
||
|
TOTAL INVESTMENT PORTFOLIO - 103.1% (Cost $2,692,870) |
3,580,983 |
||
|
NET OTHER ASSETS (LIABILITIES) - (3.1)% |
(107,717) |
||
|
NET ASSETS - 100% |
$ 3,473,266 |
||
|
Futures Contracts |
|||||
|
|
Expiration Date |
Underlying Face Amount at Value (000s) |
Unrealized Appreciation/ |
||
|
Purchased |
|||||
|
Equity Index Contracts |
|||||
|
1,852 ICE Russell 2000 Mini Index Contracts (United States) |
Dec. 2013 |
$ 211,443 |
$ 7,338 |
||
|
|
|
The face value of futures purchased as a percentage of net assets is 6.1% |
|
Legend |
|
(a) Non-income producing |
|
(b) Affiliated fund that is generally available only to investment companies and other accounts managed by Fidelity Investments. The rate quoted is the annualized seven-day yield of the fund at period end. A complete unaudited listing of the fund's holdings as of its most recent quarter end is available upon request. In addition, each Fidelity Central Fund's financial statements, which are not covered by the Fund's Report of Independent Registered Public Accounting Firm, are available on the SEC's website or upon request. |
|
(c) Investment made with cash collateral received from securities on loan. |
|
(d) Security or a portion of the security is on loan at period end. |
|
(e) Affiliated company |
|
(f) Security exempt from registration under Rule 144A of the Securities Act of 1933. These securities may be resold in transactions exempt from registration, normally to qualified institutional buyers. At the end of the period, the value of these securities amounted to $7,618,000 or 0.2% of net assets. |
|
(g) Security or a portion of the security was pledged to cover margin requirements for futures contracts. At period end, the value of securities pledged amounted to $8,565,000. |
|
Affiliated Central Funds |
|
Information regarding fiscal year to date income earned by the Fund from investments in Fidelity Central Funds is as follows: |
|
Fund |
Income earned |
|
Fidelity Cash Central Fund |
$ 107 |
|
Fidelity Securities Lending Cash Central Fund |
1,296 |
|
Total |
$ 1,403 |
|
Other Affiliated Issuers |
|
An affiliated company is a company in which the Fund has ownership of at least 5% of the voting securities. Fiscal year to date transactions with companies which are or were affiliates are as follows: |
|
Affiliate |
Value, |
Purchases |
Sales |
Dividend |
Value, |
|
Aeropostale, Inc. |
$ 56,018 |
$ 3,852 |
$ 17,732* |
$ - |
$ - |
|
AFC Enterprises, Inc. |
32,238 |
- |
32,813* |
- |
- |
|
Atrium Innovations, Inc. |
26,627 |
- |
5,014* |
- |
46,147 |
|
Badger Daylighting Ltd. |
26,674 |
- |
7,093* |
759 |
60,809 |
|
Benefit One, Inc. |
13,959 |
- |
5,786* |
430 |
- |
|
Best Bridal, Inc. |
16,354 |
- |
2,706* |
325 |
18,568 |
|
Cathedral Energy Services Ltd. |
15,502 |
3,121 |
2,215* |
806 |
14,931 |
|
CBIZ, Inc. |
29,631 |
- |
31,193 |
- |
- |
|
Healthways, Inc. |
24,886 |
- |
31,115 |
- |
- |
|
iGATE Corp. |
64,457 |
- |
78,315* |
- |
- |
|
Insight Enterprises, Inc. |
59,290 |
- |
46,403* |
- |
- |
|
Meiko Network Japan Co. Ltd. |
25,756 |
- |
11,282* |
532 |
16,280 |
|
NIIT Technologies Ltd. |
19,569 |
- |
- |
550 |
19,396 |
|
Affiliate |
Value, |
Purchases |
Sales |
Dividend |
Value, |
|
Perficient, Inc. |
$ 30,492 |
$ - |
$ 24,689* |
$ - |
$ - |
|
Prestige Brands Holdings, Inc. |
58,320 |
- |
59,982* |
- |
- |
|
Simplex Holdings, Inc. |
10,454 |
- |
17,258 |
194 |
- |
|
Stamps.com, Inc. |
35,518 |
- |
22,764* |
- |
40,385 |
|
SWORD Group |
13,117 |
- |
4,035* |
561 |
12,673 |
|
The Ensign Group, Inc. |
36,106 |
- |
7,533* |
364 |
55,437 |
|
Zensar Technologies Ltd. |
15,637 |
1,208 |
- |
492 |
18,120 |
|
Total |
$ 610,605 |
$ 8,181 |
$ 407,928 |
$ 5,013 |
$ 302,746 |
|
* Includes the value of securities delivered through in-kind transactions. |
|
Other Information |
|
The following is a summary of the inputs used, as of November 30, 2013, involving the Fund's assets and liabilities carried at fair value. The inputs or methodology used for valuing securities may not be an indication of the risk associated with investing in those securities. For more information on valuation inputs, and their aggregation into the levels used in the tables below, please refer to the Investment Valuation section in the accompanying Notes to Financial Statements. |
|
Valuation Inputs at Reporting Date: |
||||
|
Description |
Total |
Level 1 |
Level 2 |
Level 3 |
|
Investments in Securities: |
||||
|
Equities: |
||||
|
Consumer Discretionary |
$ 566,819 |
$ 566,819 |
$ - |
$ - |
|
Consumer Staples |
165,218 |
165,218 |
- |
- |
|
Energy |
191,833 |
191,833 |
- |
- |
|
Financials |
668,076 |
668,076 |
- |
- |
|
Health Care |
390,881 |
390,881 |
- |
- |
|
Industrials |
510,322 |
510,322 |
- |
- |
|
Information Technology |
580,959 |
580,959 |
- |
- |
|
Materials |
164,128 |
164,128 |
- |
- |
|
Utilities |
12,016 |
12,016 |
- |
- |
|
U.S. Government and Government Agency Obligations |
10,260 |
- |
10,260 |
- |
|
Money Market Funds |
320,471 |
320,471 |
- |
- |
|
Total Investments in Securities: |
$ 3,580,983 |
$ 3,570,723 |
$ 10,260 |
$ - |
|
Derivative Instruments: |
||||
|
Assets |
||||
|
Futures Contracts |
$ 7,338 |
$ 7,338 |
$ - |
$ - |
|
The following is a summary of transfers between Level 1 and Level 2 for the period ended November 30, 2013. Transfers are assumed to have occurred at the beginning of the period, and are primarily attributable to the valuation techniques used for foreign equity securities, as discussed in the accompanying Notes to Financial Statements: |
|
Transfers |
Total (000s) |
|
Level 1 to Level 2 |
$ 0 |
|
Level 2 to Level 1 |
$ 162,651 |
|
Value of Derivative Instruments |
|
The following table is a summary of the Fund's value of derivative instruments by primary risk exposure as of November 30, 2013. For additional information on derivative instruments, please refer to the Derivative Instruments section in the accompanying Notes to Financial Statements. |
|
Primary Risk Exposure / |
Value |
|
|
|
Asset |
Liability |
|
Equity Risk |
||
|
Futures Contracts (a) |
$ 7,338 |
$ - |
|
Total Value of Derivatives |
$ 7,338 |
$ - |
|
(a) Reflects gross cumulative appreciation (depreciation) on futures contracts as presented in the Schedule of Investments. Only the period end receivable or payable for daily variation margin and net unrealized appreciation (depreciation) are presented in the Statement of Assets and Liabilities. |
|
Distribution of investments by country or territory of incorporation, as a percentage of total net assets, is as follows (Unaudited): |
|
United States of America |
80.3% |
|
Canada |
6.0% |
|
Japan |
4.1% |
|
Bermuda |
3.0% |
|
Ireland |
1.5% |
|
Germany |
1.3% |
|
India |
1.0% |
|
Others (Individually Less Than 1%) |
2.8% |
|
|
100.0% |
See accompanying notes which are an integral part of the financial statements.
Annual Report
Financial Statements
Statement of Assets and Liabilities
|
Amounts in thousands (except per-share amounts) |
November 30, 2013 |
|
|
|
|
|
|
Assets |
|
|
|
Investment in securities, at value (including securities loaned of $57,034) - See accompanying schedule: Unaffiliated issuers (cost $2,167,513) |
$ 2,957,766 |
|
|
Fidelity Central Funds (cost $320,471) |
320,471 |
|
|
Other affiliated issuers (cost $204,886) |
302,746 |
|
|
Total Investments (cost $2,692,870) |
|
$ 3,580,983 |
|
Foreign currency held at value (cost $240) |
|
240 |
|
Receivable for investments sold |
|
5,035 |
|
Receivable for fund shares sold |
|
2,098 |
|
Dividends receivable |
|
962 |
|
Distributions receivable from Fidelity Central Funds |
|
70 |
|
Receivable for daily variation margin for derivative instruments |
|
236 |
|
Prepaid expenses |
|
11 |
|
Other receivables |
|
4 |
|
Total assets |
|
3,589,639 |
|
|
|
|
|
Liabilities |
|
|
|
Payable for investments purchased |
$ 48,030 |
|
|
Payable for fund shares redeemed |
7,512 |
|
|
Accrued management fee |
1,367 |
|
|
Distribution and service plan fees payable |
1,016 |
|
|
Other affiliated payables |
690 |
|
|
Other payables and accrued expenses |
70 |
|
|
Collateral on securities loaned, at value |
57,688 |
|
|
Total liabilities |
|
116,373 |
|
|
|
|
|
Net Assets |
|
$ 3,473,266 |
|
Net Assets consist of: |
|
|
|
Paid in capital |
|
$ 2,191,218 |
|
Undistributed net investment income |
|
453 |
|
Accumulated undistributed net realized gain (loss) on investments and foreign currency transactions |
|
386,157 |
|
Net unrealized appreciation (depreciation) on investments and assets and liabilities in foreign currencies |
|
895,438 |
|
Net Assets |
|
$ 3,473,266 |
See accompanying notes which are an integral part of the financial statements.
Annual Report
Statement of Assets and Liabilities - continued
|
Amounts in thousands (except per-share amounts) |
November 30, 2013 |
|
|
|
|
|
|
Calculation of Maximum Offering Price Class A: |
|
$ 30.96 |
|
|
|
|
|
Maximum offering price per share (100/94.25 of $30.96) |
|
$ 32.85 |
|
Class T: |
|
$ 29.69 |
|
|
|
|
|
Maximum offering price per share (100/96.50 of $29.69) |
|
$ 30.77 |
|
Class B: |
|
$ 26.45 |
|
|
|
|
|
Class C: |
|
$ 26.77 |
|
|
|
|
|
Institutional Class: |
|
$ 32.73 |
|
|
|
|
|
Class Z: |
|
$ 32.74 |
A Redemption price per share is equal to net asset value less any applicable contingent deferred sales charge.
See accompanying notes which are an integral part of the financial statements.
Annual Report
Financial Statements - continued
Statement of Operations
|
Amounts in thousands |
Year ended November 30, 2013 |
|
|
|
|
|
|
Investment Income |
|
|
|
Dividends (including $5,013 earned from other affiliated issuers) |
|
$ 46,998 |
|
Special dividends |
|
6,248 |
|
Interest |
|
3 |
|
Income from Fidelity Central Funds |
|
1,403 |
|
Total income |
|
54,652 |
|
|
|
|
|
Expenses |
|
|
|
Management fee |
$ 26,309 |
|
|
Performance adjustment |
(8,636) |
|
|
Transfer agent fees |
8,302 |
|
|
Distribution and service plan fees |
11,819 |
|
|
Accounting and security lending fees |
1,048 |
|
|
Custodian fees and expenses |
155 |
|
|
Independent trustees' compensation |
21 |
|
|
Registration fees |
146 |
|
|
Audit |
77 |
|
|
Legal |
11 |
|
|
Miscellaneous |
25 |
|
|
Total expenses before reductions |
39,277 |
|
|
Expense reductions |
(351) |
38,926 |
|
Net investment income (loss) |
|
15,726 |
|
Realized and Unrealized Gain (Loss) Net realized gain (loss) on: |
|
|
|
Investment securities: |
|
|
|
Unaffiliated issuers |
407,084 |
|
|
Redemption in-kind with affiliated entities (including gain from Other affiliated issuers of $29,049) |
131,946 |
|
|
Other affiliated issuers |
128,365 |
|
|
Foreign currency transactions |
234 |
|
|
Futures contracts |
18,846 |
|
|
Total net realized gain (loss) |
|
686,475 |
|
Change in net unrealized appreciation (depreciation) on: Investment securities |
494,401 |
|
|
Assets and liabilities in foreign currencies |
12 |
|
|
Futures contracts |
7,338 |
|
|
Total change in net unrealized appreciation (depreciation) |
|
501,751 |
|
Net gain (loss) |
|
1,188,226 |
|
Net increase (decrease) in net assets resulting from operations |
|
$ 1,203,952 |
See accompanying notes which are an integral part of the financial statements.
Annual Report
Statement of Changes in Net Assets
|
Amounts in thousands |
Year ended |
Year ended |
|
Increase (Decrease) in Net Assets |
|
|
|
Operations |
|
|
|
Net investment income (loss) |
$ 15,726 |
$ (6,474) |
|
Net realized gain (loss) |
686,475 |
(41,068) |
|
Change in net unrealized appreciation (depreciation) |
501,751 |
195,754 |
|
Net increase (decrease) in net assets resulting |
1,203,952 |
148,212 |
|
Distributions to shareholders from net investment income |
(9,250) |
- |
|
Distributions to shareholders from net realized gain |
(2,080) |
(357,601) |
|
Total distributions |
(11,330) |
(357,601) |
|
Share transactions - net increase (decrease) |
(1,450,861) |
(461,339) |
|
Total increase (decrease) in net assets |
(258,239) |
(670,728) |
|
|
|
|
|
Net Assets |
|
|
|
Beginning of period |
3,731,505 |
4,402,233 |
|
End of period (including undistributed net investment income of $453 and accumulated net investment loss of $4,395, respectively) |
$ 3,473,266 |
$ 3,731,505 |
See accompanying notes which are an integral part of the financial statements.
Annual Report
Financial Highlights - Class A
|
Years ended November 30, |
2013 |
2012 |
2011 |
2010 |
2009 |
|
Selected Per-Share Data |
|
|
|
|
|
|
Net asset value, beginning of period |
$ 22.45 |
$ 23.60 |
$ 24.35 |
$ 21.00 |
$ 17.69 |
|
Income from Investment Operations |
|
|
|
|
|
|
Net investment income (loss) C |
.12 F |
(.03) |
(.09) G |
(.13) |
(.03) |
|
Net realized and unrealized gain (loss) |
8.45 |
.79 |
.67 |
3.48 |
4.09 |
|
Total from investment operations |
8.57 |
.76 |
.58 |
3.35 |
4.06 |
|
Distributions from net investment income |
(.05) |
- |
- |
- |
(.03) |
|
Distributions from net realized gain |
(.01) |
(1.91) |
(1.33) |
- |
(.72) |
|
Total distributions |
(.06) |
(1.91) |
(1.33) |
- |
(.75) |
|
Net asset value, end of period |
$ 30.96 |
$ 22.45 |
$ 23.60 |
$ 24.35 |
$ 21.00 |
|
Total Return A, B |
38.30% |
3.87% |
2.17% |
15.95% |
24.04% |
|
Ratios to Average Net Assets D, H |
|
|
|
|
|
|
Expenses before reductions |
1.01% |
1.06% |
1.31% |
1.44% |
1.53% |
|
Expenses net of fee waivers, if any |
1.01% |
1.06% |
1.31% |
1.40% |
1.40% |
|
Expenses net of all reductions |
1.00% |
1.06% |
1.31% |
1.40% |
1.40% |
|
Net investment income (loss) |
.46% F |
(.13)% |
(.35)% G |
(.58)% |
(.16)% |
|
Supplemental Data |
|
|
|
|
|
|
Net assets, end of period (in millions) |
$ 1,263 |
$ 1,212 |
$ 1,461 |
$ 1,501 |
$ 1,223 |
|
Portfolio turnover rate E |
34% |
69% |
38% |
43% |
46% |
A Total returns would have been lower if certain expenses had not been reduced during the applicable periods shown.
B Total returns do not include the effect of the sales charges.
C Calculated based on average shares outstanding during the period.
D Fees and expenses of any underlying Fidelity Central Funds are not included in the Fund's expense ratio. The Fund indirectly bears its proportionate share of the expenses of any underlying Fidelity Central Funds.
E Amount does not include the portfolio activity of any underlying Fidelity Central Funds.
F Investment income per share reflects a large, non-recurring dividend which amounted to $.04 per share. Excluding this non-recurring dividend, the ratio of net investment income (loss) to average net assets would have been .29%.
G Investment income per share reflects a large, non-recurring dividend which amounted to $.04 per share. Excluding this non-recurring dividend, the ratio of net investment income (loss) to average net assets would have been (.50)%.
H Expense ratios reflect operating expenses of the class. Expenses before reductions do not reflect amounts reimbursed by the investment adviser or reductions from brokerage service arrangements or reductions from other expense offset arrangements and do not represent the amount paid by the class during periods when reimbursements or reductions occur. Expenses net of fee waivers reflect expenses after reimbursement by the investment adviser but prior to reductions from brokerage service arrangements or other expense offset arrangements. Expenses net of all reductions represent the net expenses paid by the class.
See accompanying notes which are an integral part of the financial statements.
Annual Report
Financial Highlights - Class T
|
Years ended November 30, |
2013 |
2012 |
2011 |
2010 |
2009 |
|
Selected Per-Share Data |
|
|
|
|
|
|
Net asset value, beginning of period |
$ 21.52 |
$ 22.75 |
$ 23.57 |
$ 20.37 |
$ 17.20 |
|
Income from Investment Operations |
|
|
|
|
|
|
Net investment income (loss) C |
.06 F |
(.07) |
(.13) G |
(.18) |
(.07) |
|
Net realized and unrealized gain (loss) |
8.13 |
.75 |
.64 |
3.38 |
3.96 |
|
Total from investment operations |
8.19 |
.68 |
.51 |
3.20 |
3.89 |
|
Distributions from net investment income |
(.01) |
- |
- |
- |
- |
|
Distributions from net realized gain |
(.01) |
(1.91) |
(1.33) |
- |
(.72) |
|
Total distributions |
(.02) |
(1.91) |
(1.33) |
- |
(.72) |
|
Net asset value, end of period |
$ 29.69 |
$ 21.52 |
$ 22.75 |
$ 23.57 |
$ 20.37 |
|
Total Return A, B |
38.11% |
3.64% |
1.94% |
15.71% |
23.69% |
|
Ratios to Average Net Assets D, H |
|
|
|
|
|
|
Expenses before reductions |
1.22% |
1.26% |
1.51% |
1.63% |
1.74% |
|
Expenses net of fee waivers, if any |
1.22% |
1.26% |
1.51% |
1.63% |
1.65% |
|
Expenses net of all reductions |
1.21% |
1.25% |
1.51% |
1.63% |
1.65% |
|
Net investment income (loss) |
.25% F |
(.33)% |
(.55)% G |
(.81)% |
(.41)% |
|
Supplemental Data |
|
|
|
|
|
|
Net assets, end of period (in millions) |
$ 1,113 |
$ 1,054 |
$ 1,244 |
$ 1,356 |
$ 1,277 |
|
Portfolio turnover rate E |
34% |
69% |
38% |
43% |
46% |
A Total returns would have been lower if certain expenses had not been reduced during the applicable periods shown.
B Total returns do not include the effect of the sales charges.
C Calculated based on average shares outstanding during the period.
D Fees and expenses of any underlying Fidelity Central Funds are not included in the Fund's expense ratio. The Fund indirectly bears its proportionate share of the expenses of any underlying Fidelity Central Funds.
E Amount does not include the portfolio activity of any underlying Fidelity Central Funds.
F Investment income per share reflects a large, non-recurring dividend which amounted to $.04 per share. Excluding this non-recurring dividend, the ratio of net investment income (loss) to average net assets would have been .09%.
G Investment income per share reflects a large, non-recurring dividend which amounted to $.04 per share. Excluding this non-recurring dividend, the ratio of net investment income (loss) to average net assets would have been (.70)%.
H Expense ratios reflect operating expenses of the class. Expenses before reductions do not reflect amounts reimbursed by the investment adviser or reductions from brokerage service arrangements or reductions from other expense offset arrangements and do not represent the amount paid by the class during periods when reimbursements or reductions occur. Expenses net of fee waivers reflect expenses after reimbursement by the investment adviser but prior to reductions from brokerage service arrangements or other expense offset arrangements. Expenses net of all reductions represent the net expenses paid by the class.
See accompanying notes which are an integral part of the financial statements.
Annual Report
Financial Highlights - Class B
|
Years ended November 30, |
2013 |
2012 |
2011 |
2010 |
2009 |
|
Selected Per-Share Data |
|
|
|
|
|
|
Net asset value, beginning of period |
$ 19.27 |
$ 20.69 |
$ 21.66 |
$ 18.82 |
$ 16.02 |
|
Income from Investment Operations |
|
|
|
|
|
|
Net investment income (loss) C |
(.08) F |
(.18) |
(.25) G |
(.27) |
(.15) |
|
Net realized and unrealized gain (loss) |
7.26 |
.67 |
.61 |
3.11 |
3.67 |
|
Total from investment operations |
7.18 |
.49 |
.36 |
2.84 |
3.52 |
|
Distributions from net realized gain |
- |
(1.91) |
(1.33) |
- |
(.72) |
|
Net asset value, end of period |
$ 26.45 |
$ 19.27 |
$ 20.69 |
$ 21.66 |
$ 18.82 |
|
Total Return A, B |
37.26% |
3.03% |
1.39% |
15.09% |
23.10% |
|
Ratios to Average Net Assets D, H |
|
|
|
|
|
|
Expenses before reductions |
1.81% |
1.85% |
2.10% |
2.22% |
2.31% |
|
Expenses net of fee waivers, if any |
1.81% |
1.85% |
2.10% |
2.15% |
2.15% |
|
Expenses net of all reductions |
1.80% |
1.84% |
2.10% |
2.14% |
2.15% |
|
Net investment income (loss) |
(.34)% F |
(.92)% |
(1.14)% G |
(1.33)% |
(.91)% |
|
Supplemental Data |
|
|
|
|
|
|
Net assets, end of period (in millions) |
$ 40 |
$ 40 |
$ 55 |
$ 76 |
$ 89 |
|
Portfolio turnover rate E |
34% |
69% |
38% |
43% |
46% |
A Total returns would have been lower if certain expenses had not been reduced during the applicable periods shown.
B Total returns do not include the effect of the contingent deferred sales charge.
C Calculated based on average shares outstanding during the period.
D Fees and expenses of any underlying Fidelity Central Funds are not included in the Fund's expense ratio. The Fund indirectly bears its proportionate share of the expenses of any underlying Fidelity Central Funds.
E Amount does not include the portfolio activity of any underlying Fidelity Central Funds.
F Investment income per share reflects a large, non-recurring dividend which amounted to $.04 per share. Excluding this non-recurring dividend, the ratio of net investment income (loss) to average net assets would have been (.51)%.
G Investment income per share reflects a large, non-recurring dividend which amounted to $.03 per share. Excluding this non-recurring dividend, the ratio of net investment income (loss) to average net assets would have been (1.29)%.
H Expense ratios reflect operating expenses of the class. Expenses before reductions do not reflect amounts reimbursed by the investment adviser or reductions from brokerage service arrangements or reductions from other expense offset arrangements and do not represent the amount paid by the class during periods when reimbursements or reductions occur. Expenses net of fee waivers reflect expenses after reimbursement by the investment adviser but prior to reductions from brokerage service arrangements or other expense offset arrangements. Expenses net of all reductions represent the net expenses paid by the class.
See accompanying notes which are an integral part of the financial statements.
Annual Report
Financial Highlights - Class C
|
Years ended November 30, |
2013 |
2012 |
2011 |
2010 |
2009 |
|
Selected Per-Share Data |
|
|
|
|
|
|
Net asset value, beginning of period |
$ 19.50 |
$ 20.90 |
$ 21.87 |
$ 19.00 |
$ 16.16 |
|
Income from Investment Operations |
|
|
|
|
|
|
Net investment income (loss) C |
(.07) F |
(.17) |
(.24) G |
(.27) |
(.15) |
|
Net realized and unrealized gain (loss) |
7.34 |
.68 |
.60 |
3.14 |
3.71 |
|
Total from investment operations |
7.27 |
.51 |
.36 |
2.87 |
3.56 |
|
Distributions from net realized gain |
- |
(1.91) |
(1.33) |
- |
(.72) |
|
Net asset value, end of period |
$ 26.77 |
$ 19.50 |
$ 20.90 |
$ 21.87 |
$ 19.00 |
|
Total Return A, B |
37.28% |
3.10% |
1.37% |
15.11% |
23.15% |
|
Ratios to Average Net Assets D, H |
|
|
|
|
|
|
Expenses before reductions |
1.76% |
1.81% |
2.06% |
2.18% |
2.28% |
|
Expenses net of fee waivers, if any |
1.76% |
1.81% |
2.06% |
2.15% |
2.15% |
|
Expenses net of all reductions |
1.75% |
1.80% |
2.05% |
2.14% |
2.15% |
|
Net investment income (loss) |
(.29)% F |
(.88)% |
(1.10)% G |
(1.33)% |
(.91)% |
|
Supplemental Data |
|
|
|
|
|
|
Net assets, end of period (in millions) |
$ 334 |
$ 284 |
$ 328 |
$ 336 |
$ 299 |
|
Portfolio turnover rate E |
34% |
69% |
38% |
43% |
46% |
A Total returns would have been lower if certain expenses had not been reduced during the applicable periods shown.
B Total returns do not include the effect of the contingent deferred sales charge.
C Calculated based on average shares outstanding during the period.
D Fees and expenses of any underlying Fidelity Central Funds are not included in the Fund's expense ratio. The Fund indirectly bears its proportionate share of the expenses of any underlying Fidelity Central Funds.
E Amount does not include the portfolio activity of any underlying Fidelity Central Funds.
F Investment income per share reflects a large, non-recurring dividend which amounted to $.04 per share. Excluding this non-recurring dividend, the ratio of net investment income (loss) to average net assets would have been (.45)%.
G Investment income per share reflects a large, non-recurring dividend which amounted to $.03 per share. Excluding this non-recurring dividend, the ratio of net investment income (loss) to average net assets would have been (1.25)%.
H Expense ratios reflect operating expenses of the class. Expenses before reductions do not reflect amounts reimbursed by the investment adviser or reductions from brokerage service arrangements or reductions from other expense offset arrangements and do not represent the amount paid by the class during periods when reimbursements or reductions occur. Expenses net of fee waivers reflect expenses after reimbursement by the investment adviser but prior to reductions from brokerage service arrangements or other expense offset arrangements. Expenses net of all reductions represent the net expenses paid by the class.
See accompanying notes which are an integral part of the financial statements.
Annual Report
Financial Highlights - Institutional Class
|
Years ended November 30, |
2013 |
2012 |
2011 |
2010 |
2009 |
|
Selected Per-Share Data |
|
|
|
|
|
|
Net asset value, beginning of period |
$ 23.73 |
$ 24.77 |
$ 25.42 |
$ 21.86 |
$ 18.42 |
|
Income from Investment Operations |
|
|
|
|
|
|
Net investment income (loss) B |
.21 E |
.04 |
(.01) F |
(.07) |
.02 |
|
Net realized and unrealized gain (loss) |
8.94 |
.83 |
.69 |
3.63 |
4.24 |
|
Total from investment operations |
9.15 |
.87 |
.68 |
3.56 |
4.26 |
|
Distributions from net investment income |
(.13) |
- |
- |
- |
(.10) |
|
Distributions from net realized gain |
(.01) |
(1.91) |
(1.33) |
- |
(.72) |
|
Total distributions |
(.15) H |
(1.91) |
(1.33) |
- |
(.82) |
|
Net asset value, end of period |
$ 32.73 |
$ 23.73 |
$ 24.77 |
$ 25.42 |
$ 21.86 |
|
Total Return A |
38.79% |
4.15% |
2.49% |
16.29% |
24.31% |
|
Ratios to Average Net Assets C, G |
|
|
|
|
|
|
Expenses before reductions |
.71% |
.75% |
1.01% |
1.12% |
1.21% |
|
Expenses net of fee waivers, if any |
.71% |
.75% |
1.01% |
1.12% |
1.15% |
|
Expenses net of all reductions |
.70% |
.74% |
1.00% |
1.12% |
1.15% |
|
Net investment income (loss) |
.76% E |
.18% |
(.05)% F |
(.30)% |
.09% |
|
Supplemental Data |
|
|
|
|
|
|
Net assets, end of period (in millions) |
$ 718 |
$ 1,141 |
$ 1,314 |
$ 1,165 |
$ 977 |
|
Portfolio turnover rate D |
34% |
69% |
38% |
43% |
46% |
A Total returns would have been lower if certain expenses had not been reduced during the applicable periods shown.
B Calculated based on average shares outstanding during the period.
C Fees and expenses of any underlying Fidelity Central Funds are not included in the Fund's expense ratio. The Fund indirectly bears its proportionate share of the expenses of any underlying Fidelity Central Funds.
D Amount does not include the portfolio activity of any underlying Fidelity Central Funds.
E Investment income per share reflects a large, non-recurring dividend which amounted to $.05 per share. Excluding this non-recurring dividend, the ratio of net investment income (loss) to average net assets would have been .59%.
F Investment income per share reflects a large, non-recurring dividend which amounted to $.04 per share. Excluding this non-recurring dividend, the ratio of net investment income (loss) to average net assets would have been (.19)%.
G Expense ratios reflect operating expenses of the class. Expenses before reductions do not reflect amounts reimbursed by the investment adviser or reductions from brokerage service arrangements or reductions from other expense offset arrangements and do not represent the amount paid by the class during periods when reimbursements or reductions occur. Expenses net of fee waivers reflect expenses after reimbursement by the investment adviser but prior to reductions from brokerage service arrangements or other expense offset arrangements. Expenses net of all reductions represent the net expenses paid by the class.
H Total distributions of $.15 per share is comprised of distributions from net investment income of $.133 and distributions from net realized gain of $.014 per share.
See accompanying notes which are an integral part of the financial statements.
Annual Report
Financial Highlights - Class Z
|
Year ended November 30, |
2013 H |
|
Selected Per-Share Data |
|
|
Net asset value, beginning of period |
$ 29.79 |
|
Income from Investment Operations |
|
|
Net investment income (loss) D |
.02 G |
|
Net realized and unrealized gain (loss) |
2.93 |
|
Total from investment operations |
2.95 |
|
Net asset value, end of period |
$ 32.74 |
|
Total Return B, C |
9.90% |
|
Ratios to Average Net Assets E, I |
|
|
Expenses before reductions |
.56% A |
|
Expenses net of fee waivers, if any |
.56% A |
|
Expenses net of all reductions |
.55% A |
|
Net investment income (loss) |
.26% A, G |
|
Supplemental Data |
|
|
Net assets, end of period (in millions) |
$ 5 |
|
Portfolio turnover rate F |
34% |
A Annualized
B Total returns for periods of less than one year are not annualized.
C Total returns would have been lower if certain expenses had not been reduced during the applicable periods shown.
D Calculated based on average shares outstanding during the period.
E Fees and expenses of any underlying Fidelity Central Funds are not included in the Fund's expense ratio. The Fund indirectly bears its proportionate share of the expenses of any underlying Fidelity Central Funds.
F Amount does not include the portfolio activity of any underlying Fidelity Central Funds.
G Investment income per share reflects a large, non-recurring dividend which amounted to $.01 per share. Excluding this non-recurring dividend, the ratio of net investment income (loss) to average net assets would have been .09%.
H For the period August 13, 2013 (commencement of sale of shares) to November 30, 2013.
I Expense ratios reflect operating expenses of the class. Expenses before reductions do not reflect amounts reimbursed by the investment adviser or reductions from brokerage service arrangements or reductions from other expense offset arrangements and do not represent the amount paid by the class during periods when reimbursements or reductions occur. Expense ratios before reductions for start-up periods may not be representative of longer-term operating periods. Expenses net of fee waivers reflect expenses after reimbursement by the investment adviser but prior to reductions from brokerage service arrangements or other expense offset arrangements. Expenses net of all reductions represent the net expenses paid by the class.
See accompanying notes which are an integral part of the financial statements.
Annual Report
Notes to Financial Statements
For the period ended November 30, 2013
(Amounts in thousands except percentages)
1. Organization.
Fidelity Advisor Small Cap Fund (the Fund) is a fund of Fidelity Advisor Series I (the Trust) and is authorized to issue an unlimited number of shares. The Trust is registered under the Investment Company Act of 1940, as amended (the 1940 Act), as an open-end management investment company organized as a Massachusetts business trust. The Fund commenced sale of Class Z on August 13, 2013. The Fund offers Class A, Class T, Class C, Institutional Class and Class Z shares, each of which, along with Class B shares, has equal rights as to assets and voting privileges. Class B shares are closed to new accounts and additional purchases, except for exchanges and reinvestments. Each class has exclusive voting rights with respect to matters that affect that class. Class B shares will automatically convert to Class A shares after a holding period of seven years from the initial date of purchase.
2. Investments in Fidelity Central Funds.
The Fund invests in Fidelity Central Funds, which are open-end investment companies generally available only to other investment companies and accounts managed by the investment adviser and its affiliates. The Fund's Schedule of Investments lists each of the Fidelity Central Funds held as of period end, if any, as an investment of the Fund, but does not include the underlying holdings of each Fidelity Central Fund. As an Investing Fund, the Fund indirectly bears its proportionate share of the expenses of the underlying Fidelity Central Funds.
The Money Market Central Funds seek preservation of capital and current income and are managed by Fidelity Investments Money Management, Inc. (FIMM), an affiliate of the investment adviser. Annualized expenses of the Money Market Central Funds as of their most recent shareholder report date are less than .01%.
A complete unaudited list of holdings for each Fidelity Central Fund is available upon request or at the Securities and Exchange Commission (the SEC) website at www.sec.gov. In addition, the financial statements of the Fidelity Central Funds, which are not covered by the Fund's Report of Independent Registered Public Accounting Firm, are available on the SEC website or upon request.
3. Significant Accounting Policies.
The financial statements have been prepared in conformity with accounting principles generally accepted in the United States of America (GAAP), which require management to make certain estimates and assumptions at the date of the financial statements. Actual results could differ from those estimates. Subsequent events, if any, through the date that the financial statements were issued have been evaluated in the preparation of
Annual Report
3. Significant Accounting Policies - continued
the financial statements. The following summarizes the significant accounting policies of the Fund:
Investment Valuation. Investments are valued as of 4:00 p.m. Eastern time on the last calendar day of the period. In accordance with valuation policies and procedures approved by the Board of Trustees (the Board), the Fund attempts to obtain prices from one or more third party pricing vendors or brokers to value its investments. When current market prices, quotations or currency exchange rates are not readily available or reliable, investments will be fair valued in good faith by the Fidelity Management & Research Company (FMR) Fair Value Committee (the Committee), in accordance with procedures adopted by the Board. Factors used in determining fair value vary by investment type and may include market or investment specific events, changes in interest rates and credit quality. The frequency with which these procedures are used cannot be predicted and they may be utilized to a significant extent. The Committee oversees the Fund's valuation policies and procedures and is responsible for approving and reporting to the Board all fair value determinations.
The Fund categorizes the inputs to valuation techniques used to value its investments into a disclosure hierarchy consisting of three levels as shown below:
Level 1 - quoted prices in active markets for identical investments
Level 2 - other significant observable inputs (including quoted prices for similar investments, interest rates, prepayment speeds, etc.)
Level 3 - unobservable inputs (including the Fund's own assumptions based on the best information available)
Valuation techniques used to value the Fund's investments by major category are as follows:
Equity securities, including restricted securities, for which market quotations are readily available, are valued at the last reported sale price or official closing price as reported by a third party pricing vendor on the primary market or exchange on which they are traded and are categorized as Level 1 in the hierarchy. In the event there were no sales during the day or closing prices are not available, securities are valued at the last quoted bid price or may be valued using the last available price and are generally categorized as Level 2 in the hierarchy. For foreign equity securities, when market or security specific events arise, comparisons to the valuation of American Depositary Receipts (ADRs), futures contracts, Exchange-Traded Funds (ETFs) and certain indexes as well as quoted prices for similar securities may be used and would be categorized as Level 2 in the hierarchy. Utilizing these techniques may result in transfers between Level 1 and Level 2. For equity securities, including restricted securities, where observable inputs are
Annual Report
Notes to Financial Statements - continued
(Amounts in thousands except percentages)
3. Significant Accounting Policies - continued
Investment Valuation - continued
limited, assumptions about market activity and risk are used and these securities may be categorized as Level 3 in the hierarchy.
Debt securities, including restricted securities, are valued based on evaluated prices received from third party pricing vendors or from brokers who make markets in such securities. For U.S. government and government agency obligations, pricing vendors utilize matrix pricing which considers yield or price of bonds of comparable quality, coupon, maturity and type as well as broker-supplied prices. When independent prices are unavailable or unreliable, debt securities may be valued utilizing pricing methodologies which consider similar factors that would be used by third party pricing vendors. Debt securities are generally categorized as Level 2 in the hierarchy but may be Level 3 depending on the circumstances.
Futures contracts are valued at the settlement price established each day by the board of trade or exchange on which they are traded and are categorized as Level 1 in the hierarchy. Investments in open-end mutual funds, including the Fidelity Central Funds, are valued at their closing net asset value (NAV) each business day and are categorized as Level 1 in the hierarchy.
Changes in valuation techniques may result in transfers in or out of an assigned level within the disclosure hierarchy. The aggregate value of investments by input level, as of November 30, 2013, including information on transfers between Levels 1 and 2, is included at the end of the Fund's Schedule of Investments.
Foreign Currency. The Fund may use foreign currency contracts to facilitate transactions in foreign-denominated securities. Gains and losses from these transactions may arise from changes in the value of the foreign currency or if the counterparties do not perform under the contracts' terms.
Foreign-denominated assets, including investment securities, and liabilities are translated into U.S. dollars at the exchange rates at period end. Purchases and sales of investment securities, income and dividends received and expenses denominated in foreign currencies are translated into U.S. dollars at the exchange rate in effect on the transaction date.
The effects of exchange rate fluctuations on investments are included with the net realized and unrealized gain (loss) on investment securities. Other foreign currency transactions resulting in realized and unrealized gain (loss) are disclosed separately.
Investment Transactions and Income. For financial reporting purposes, the Fund's investment holdings and NAV include trades executed through the end of the last business day of the period. The NAV per share for processing shareholder transactions is
Annual Report
3. Significant Accounting Policies - continued
Investment Transactions and Income - continued
calculated as of the close of business of the New York Stock Exchange (NYSE), normally 4:00 p.m. Eastern time and includes trades executed through the end of the prior business day. Gains and losses on securities sold are determined on the basis of identified cost and may include proceeds received from litigation. Dividend income is recorded on the ex-dividend date, except for certain dividends from foreign securities where the ex-dividend date may have passed, which are recorded as soon as the Fund is informed of the ex-dividend date. Non-cash dividends included in dividend income, if any, are recorded at the fair market value of the securities received. Distributions received on securities that represent a return of capital or capital gain are recorded as a reduction of cost of investments and/or as a realized gain. Subsequent to ex-dividend date the Fund determines the components of these distributions, based upon receipt of tax filings or other correspondence relating to the underlying investment. Large, non-recurring dividends recognized by the Fund are presented separately on the Statement of Operations as "Special Dividends" and the impact of these dividends is presented in the Financial Highlights. Interest income and distributions from the Fidelity Central Funds are accrued as earned. Interest income includes coupon interest and amortization of premium and accretion of discount on debt securities. Investment income is recorded net of foreign taxes withheld where recovery of such taxes is uncertain.
Class Allocations and Expenses. Investment income, realized and unrealized capital gains and losses, common expenses of the Fund, and certain fund-level expense reductions, if any, are allocated daily on a pro-rata basis to each class based on the relative net assets of each class to the total net assets of the Fund. Each class differs with respect to transfer agent and distribution and service plan fees incurred. Certain expense reductions may also differ by class. For the reporting period, the allocated portion of income and expenses to each class as a percent of its average net assets may vary due to the timing of recording these transactions in relation to fluctuating net assets of the classes. Expenses directly attributable to a fund are charged to that fund. Expenses attributable to more than one fund are allocated among the respective funds on the basis of relative net assets or other appropriate methods. Expense estimates are accrued in the period to which they relate and adjustments are made when actual amounts are known.
Income Tax Information and Distributions to Shareholders. Each year, the Fund intends to qualify as a regulated investment company under Subchapter M of the Internal Revenue Code, including distributing substantially all of its taxable income and realized gains. As a result, no provision for U.S. Federal income taxes is required. As of November 30, 2013, the Fund did not have any unrecognized tax benefits in the financial statements; nor is the Fund aware of any tax positions for which it is reasonably possible that the total amounts of unrecognized tax benefits will significantly change in the next
Annual Report
Notes to Financial Statements - continued
(Amounts in thousands except percentages)
3. Significant Accounting Policies - continued
Income Tax Information and Distributions to Shareholders - continued
twelve months. The Fund files a U.S. federal tax return, in addition to state and local tax returns as required. The Fund's federal income tax returns are subject to examination by the Internal Revenue Service (IRS) for a period of three fiscal years after they are filed. State and local tax returns may be subject to examination for an additional fiscal year depending on the jurisdiction. Foreign taxes are provided for based on the Fund's understanding of the tax rules and rates that exist in the foreign markets in which it invests.
Distributions are declared and recorded on the ex-dividend date. Income dividends and capital gain distributions are declared separately for each class. Income and capital gain distributions are determined in accordance with income tax regulations, which may differ from GAAP. In addition, the Fund claimed a portion of the payment made to redeeming shareholders as a distribution for income tax purposes.
Capital accounts within the financial statements are adjusted for permanent book-tax differences. These adjustments have no impact on net assets or the results of operations. Temporary book-tax differences will reverse in a subsequent period.
Book-tax differences are primarily due to futures transactions, foreign currency transactions, passive foreign investment companies (PFIC), redemptions in kind, partnerships, capital loss carryforwards and losses deferred due to wash sales and excise tax regulations.
The federal tax cost of investment securities and unrealized appreciation (depreciation) as of period end were as follows:
|
Gross unrealized appreciation |
$ 976,658 |
|
Gross unrealized depreciation |
(87,632) |
|
Net unrealized appreciation (depreciation) on securities and other investments |
$ 889,026 |
|
|
|
|
Tax Cost |
$ 2,691,957 |
The tax-based components of distributable earnings as of period end were as follows:
|
Undistributed ordinary income |
$ 453 |
|
Undistributed long-term capital gain |
$ 399,951 |
|
Net unrealized appreciation (depreciation) |
$ 889,013 |
Annual Report
3. Significant Accounting Policies - continued
Income Tax Information and Distributions to Shareholders - continued
The tax character of distributions paid was as follows:
|
|
November 30, 2013 |
November 30, 2012 |
|
Ordinary Income |
$ 11,330 |
$ - |
|
Long-term Capital Gains |
- |
357,601 |
|
Total |
$ 11,330 |
$ 357,601 |
Restricted Securities. The Fund may invest in securities that are subject to legal or contractual restrictions on resale. These securities generally may be resold in transactions exempt from registration or to the public if the securities are registered. Disposal of these securities may involve time-consuming negotiations and expense, and prompt sale at an acceptable price may be difficult. Information regarding restricted securities is included at the end of the Fund's Schedule of Investments.
New Accounting Pronouncement. The Financial Accounting Standards Board issued in December 2011, Accounting Standard Update No. 2011-11, Disclosures about Offsetting Assets and Liabilities, and in January 2013, Accounting Standards Update No. 2013-1 Clarifying the Scope of Disclosures about Offsetting Assets and Liabilities. These updates create new disclosure requirements requiring entities to disclose both gross and net information for derivatives and other financial instruments that are either offset in the Statement of Assets and Liabilities or subject to an enforceable master netting arrangement or similar agreement. The disclosure requirements are effective for annual reporting periods beginning on or after January 1, 2013, and interim periods within those annual periods. Management expects that the impact of the updates' adoption will be limited to additional financial statement disclosures as applicable.
4. Derivative Instruments.
Risk Exposures and the Use of Derivative Instruments. The Fund's investment objective allows the Fund to enter into various types of derivative contracts, including futures contracts. Derivatives are investments whose value is primarily derived from underlying assets, indices or reference rates and may be transacted on an exchange or over-the-counter (OTC). Derivatives may involve a future commitment to buy or sell a specified asset based on specified terms, to exchange future cash flows at periodic intervals based on a notional principal amount, or for one party to make one or more payments upon the occurrence of specified events in exchange for periodic payments from the other party.
The Fund used derivatives to increase returns and to manage exposure to certain risks as defined below. The success of any strategy involving derivatives depends on analysis of
Annual Report
Notes to Financial Statements - continued
(Amounts in thousands except percentages)
4. Derivative Instruments - continued
Risk Exposures and the Use of Derivative Instruments - continued
numerous economic factors, and if the strategies for investment do not work as intended, the Fund may not achieve its objectives.
The Fund's use of derivatives increased or decreased its exposure to the following risk:
|
Equity Risk |
Equity risk relates to the fluctuations in the value of financial instruments as a result of changes in market prices (other than those arising from interest rate risk or foreign exchange risk), whether caused by factors specific to an individual investment, its issuer, or all factors affecting all instruments traded in a market or market segment. |
The Fund is also exposed to additional risks from investing in derivatives, such as liquidity risk and counterparty credit risk. Liquidity risk is the risk that the Fund will be unable to close out the derivative in the open market in a timely manner. Counterparty credit risk is the risk that the counterparty will not be able to fulfill its obligation to the Fund. Counterparty credit risk related to exchange-traded futures contracts may be mitigated by the protection provided by the exchange on which they trade.
Investing in derivatives may involve greater risks than investing in the underlying assets directly and, to varying degrees, may involve risk of loss in excess of any initial investment and collateral received and amounts recognized in the Statement of Assets and Liabilities. In addition, there may be the risk that the change in value of the derivative contract does not correspond to the change in value of the underlying instrument.
Futures Contracts. A futures contract is an agreement between two parties to buy or sell a specified underlying instrument for a fixed price at a specified future date. The Fund used futures contracts to manage its exposure to the stock market.
Upon entering into a futures contract, a fund is required to deposit either cash or securities (initial margin) with a clearing broker in an amount equal to a certain percentage of the face value of the contract. Futures contracts are marked-to-market daily and subsequent daily payments (variation margin) are made or received by a fund depending on the daily fluctuations in the value of the futures contracts and are recorded as unrealized appreciation or (depreciation). This receivable and/or payable, if any, is included in daily variation margin for derivative instruments in the Statement of Assets and Liabilities. Realized gain or (loss) is recorded upon the expiration or closing of a futures contract.
Any open futures contracts at period end are presented in the Schedule of Investments under the caption "Futures Contracts." The underlying face amount at value reflects each contract's exposure to the underlying instrument or index at period end and is representative of volume of activity during the period. Securities deposited to meet initial margin requirements are identified in the Schedule of Investments.
Annual Report
4. Derivative Instruments - continued
Futures Contracts - continued
During the period the Fund recognized net realized gain (loss) of $18,846 and a change in net unrealized appreciation (depreciation) of $7,338 related to its investment in futures contracts. These amounts are included in the Statement of Operations.
5. Purchases and Sales of Investments.
Purchases and sales of securities including in-kind transactions, other than short-term securities, aggregated $1,234,566 and $2,840,735, respectively.
6. Fees and Other Transactions with Affiliates.
Management Fee. FMR (the investment adviser) and its affiliates provide the Fund with investment management related services for which the Fund pays a monthly management fee. The management fee is the sum of an individual fund fee rate that is based on an annual rate of .45% of the Fund's average net assets and an annualized group fee rate that averaged .25% during the period. The group fee rate is based upon the average net assets of all the mutual funds advised by the investment adviser, including any mutual funds previously advised by the investment adviser that are currently advised by Fidelity SelectCo, LLC, an affiliate of the investment adviser. The group fee rate decreases as assets under management increase and increases as assets under management decrease. In addition, the management fee is subject to a performance adjustment (up to a maximum of ± .20% of the Fund's average net assets over a 36 month performance period). The upward or downward adjustment to the management fee is based on the relative investment performance of the Institutional Class of the Fund as compared to an appropriate benchmark index over the same 36 month performance period. For the reporting period, the total annual management fee rate, including the performance adjustment, was .47% of the Fund's average net assets. The performance adjustment included in the management fee rate may be higher or lower than the maximum performance adjustment rate due to the difference between the average net assets for the reporting and performance periods.
Distribution and Service Plan Fees. In accordance with Rule 12b-1 of the 1940 Act, the Fund has adopted separate Distribution and Service Plans for each class of shares. Certain classes pay Fidelity Distributors Corporation (FDC), an affiliate of the investment adviser, separate Distribution and Service Fees, each of which is based on an annual percentage of each class' average net assets. In addition, FDC may pay financial intermediaries for selling shares of the Fund and providing shareholder support services.
Annual Report
Notes to Financial Statements - continued
(Amounts in thousands except percentages)
6. Fees and Other Transactions with Affiliates - continued
Distribution and Service Plan Fees - continued
For the period, the Distribution and Service Fee rates, total fees and amounts retained by FDC were as follows:
|
|
Distribution |
Service |
Total Fees |
Retained |
|
Class A |
-% |
.25% |
$ 3,042 |
$ 35 |
|
Class T |
.25% |
.25% |
5,316 |
23 |
|
Class B |
.75% |
.25% |
391 |
297 |
|
Class C |
.75% |
.25% |
3,070 |
223 |
|
|
|
|
$ 11,819 |
$ 578 |
Sales Load. FDC may receive a front-end sales charge of up to 5.75% for selling Class A shares and 3.50% for selling Class T shares, some of which is paid to financial intermediaries for selling shares of the Fund. Depending on the holding period, FDC may receive contingent deferred sales charges levied on Class A, Class T, Class B, and Class C redemptions. The deferred sales charges range from 5.00% to 1.00% for Class B shares, 1.00% for Class C shares, 1.00% for certain purchases of Class A shares and .25% for certain purchases of Class T shares.
For the period, sales charge amounts retained by FDC were as follows:
|
|
Retained |
|
Class A |
$ 159 |
|
Class T |
30 |
|
Class B* |
47 |
|
Class C* |
12 |
|
|
$ 248 |
* When Class B and Class C shares are initially sold, FDC pays commissions from its own resources to financial intermediaries through which the sales are made.
Transfer Agent Fees. Fidelity Investments Institutional Operations Company, Inc., (FIIOC), an affiliate of the investment adviser, is the transfer, dividend disbursing and shareholder servicing agent for each class of the Fund. FIIOC receives account fees and asset-based fees that vary according to the account size and type of account of the shareholders of the respective classes of the Fund, except for Class Z. FIIOC receives an asset-based fee of Class Z's average net assets. FIIOC pays for typesetting, printing and mailing of shareholder reports, except proxy statements.
Annual Report
6. Fees and Other Transactions with Affiliates - continued
Transfer Agent Fees - continued
For the period, transfer agent fees for each class were as follows:
|
|
Amount |
% of |
|
Class A |
$ 3,051 |
.25 |
|
Class T |
2,179 |
.20 |
|
Class B |
117 |
.30 |
|
Class C |
758 |
.25 |
|
Institutional Class |
2,197 |
.20 |
|
Class Z |
-† |
.05* |
|
|
$ 8,302 |
|
* Annualized.
† Amount represents ninety six dollars.
Accounting and Security Lending Fees. Fidelity Service Company, Inc. (FSC), an affiliate of the investment adviser, maintains the Fund's accounting records. The accounting fee is based on the level of average net assets for each month. Under a separate contract, FSC administers the security lending program. The security lending fee is based on the number and duration of lending transactions.
Brokerage Commissions. The Fund placed a portion of its portfolio transactions with brokerage firms which are affiliates of the investment adviser. Brokerage commissions are included in net realized gain (loss) and change in net unrealized appreciation (depreciation) in the Statement of Operations. The commissions paid to these affiliated firms were $35 for the period.
Redemptions In-Kind. During the period, 14,529 shares of the Fund held by affiliated entities were redeemed for investments with a value of $456,922. The net realized gain of $131,946 on investments delivered through in-kind redemptions is included in the accompanying Statement of Operations. The amount of in-kind redemptions is included in share transactions in the accompanying Statement of Changes in Net Assets as well as Note 11: Share Transactions. The Fund recognized no gain or loss for federal income tax purposes.
7. Committed Line of Credit.
The Fund participates with other funds managed by the investment adviser or an affiliate in a $4.25 billion credit facility (the "line of credit") to be utilized for temporary or emergency purposes to fund shareholder redemptions or for other short-term liquidity
Annual Report
Notes to Financial Statements - continued
(Amounts in thousands except percentages)
7. Committed Line of Credit - continued
purposes. The Fund has agreed to pay commitment fees on its pro-rata portion of the line of credit, which amounted to $8 and is reflected in Miscellaneous expenses on the Statement of Operations. During the period, there were no borrowings on this line of credit.
8. Security Lending.
The Fund lends portfolio securities through a lending agent from time to time in order to earn additional income. For equity securities, a lending agent is used and may loan securities to certain qualified borrowers, including Fidelity Capital Markets (FCM), a broker-dealer affiliated with the Fund. On the settlement date of the loan, the Fund receives collateral (in the form of U.S. Treasury obligations, letters of credit and/or cash) against the loaned securities and maintains collateral in an amount not less than 100% of the market value of the loaned securities during the period of the loan. The market value of the loaned securities is determined at the close of business of the Fund and any additional required collateral is delivered to the Fund on the next business day. If the borrower defaults on its obligation to return the securities loaned because of insolvency or other reasons, the Fund may apply collateral received from the borrower against the obligation. The Fund may experience delays and costs in recovering the securities loaned. Any cash collateral received is invested in the Fidelity Securities Lending Cash Central Fund. The value of loaned securities and cash collateral at period end are disclosed on the Fund's Statement of Assets and Liabilities. At period end, there were no security loans outstanding with FCM. Security lending income represents the income earned on investing cash collateral, less rebates paid to borrowers and any lending agent fees associated with the loan, plus any premium payments received for lending certain types of securities. Security lending income is presented in the Statement of Operations as a component of income from Fidelity Central Funds Total security lending income during the period amounted to $1,296 and includes $7 from securities loaned to FCM.
9. Expense Reductions.
The investment adviser voluntarily agreed to reimburse a portion of the Fund's Class A, Class T, Class B, Class C and Institutional Class operating expenses. During the period, this reimbursement reduced expenses as follows:
|
|
Reimbursement |
|
Class A |
$ 4 |
|
Class T |
5 |
|
Class B |
-* |
|
Class C |
1 |
|
Institutional Class |
4 |
|
|
$ 14 |
* Amount represents one hundred and forty-three dollars.
Annual Report
9. Expense Reductions - continued
In addition, commissions paid to certain brokers with whom the investment adviser, or its affiliates, places trades on behalf of the Fund include an amount in addition to trade execution, which may be rebated back to the Fund to offset certain expenses. This amount totaled $337 for the period.
10. Distributions to Shareholders.
Distributions to shareholders of each class were as follows:
|
Years ended November 30, |
2013 |
2012 |
|
From net investment income |
|
|
|
Class A |
$ 2,598 |
$ - |
|
Class T |
386 |
- |
|
Institutional Class |
6,266 |
- |
|
Total |
$ 9,250 |
$ - |
|
From net realized gain |
|
|
|
Class A |
$ 743 |
$ 117,808 |
|
Class T |
678 |
103,545 |
|
Class B |
- |
5,032 |
|
Class C |
- |
29,813 |
|
Institutional Class |
659 |
101,403 |
|
Total |
$ 2,080 |
$ 357,601 |
11. Share Transactions.
Transactions for each class of shares were as follows:
|
|
Shares |
Dollars |
||
|
Years ended November 30, |
2013A |
2012 |
2013A |
2012 |
|
Class A |
|
|
|
|
|
Shares sold |
8,347 |
12,312 |
$ 219,693 |
$ 276,482 |
|
Reinvestment of distributions |
140 |
5,215 |
3,122 |
108,709 |
|
Shares redeemed |
(21,663) |
(25,473) |
(562,269) |
(571,082) |
|
Net increase (decrease) |
(13,176) |
(7,946) |
$ (339,454) |
$ (185,891) |
|
Class T |
|
|
|
|
|
Shares sold |
7,343 |
9,256 |
$ 185,578 |
$ 199,877 |
|
Reinvestment of distributions |
47 |
4,916 |
1,017 |
98,476 |
|
Shares redeemed |
(18,873) |
(19,846) |
(469,350) |
(425,632) |
|
Net increase (decrease) |
(11,483) |
(5,674) |
$ (282,755) |
$ (127,279) |
Annual Report
Notes to Financial Statements - continued
(Amounts in thousands except percentages)
11. Share Transactions - continued
|
|
Shares |
Dollars |
||
|
Years ended November 30, |
2013A |
2012 |
2013A |
2012 |
|
Class B |
|
|
|
|
|
Shares sold |
15 |
50 |
$ 339 |
$ 930 |
|
Reinvestment of distributions |
- |
259 |
- |
4,675 |
|
Shares redeemed |
(591) |
(898) |
(13,025) |
(17,325) |
|
Net increase (decrease) |
(576) |
(589) |
$ (12,686) |
$ (11,720) |
|
Class C |
|
|
|
|
|
Shares sold |
1,802 |
1,952 |
$ 41,461 |
$ 38,194 |
|
Reinvestment of distributions |
- |
1,471 |
- |
26,825 |
|
Shares redeemed |
(3,914) |
(4,534) |
(89,461) |
(88,156) |
|
Net increase (decrease) |
(2,112) |
(1,111) |
$ (48,000) |
$ (23,137) |
|
Institutional Class |
|
|
|
|
|
Shares sold |
9,471 |
15,032 |
$ 253,670 |
$ 356,876 |
|
Reinvestment of distributions |
264 |
3,988 |
6,205 |
87,654 |
|
Shares redeemed |
(35,873)B |
(23,976) |
(1,032,519)B |
(557,842) |
|
Net increase (decrease) |
(26,138) |
(4,956) |
$ (772,644) |
$ (113,312) |
|
Class Z |
|
|
|
|
|
Shares sold |
146 |
- |
$ 4,691 |
$ - |
|
Shares redeemed |
-* |
- |
(13) |
- |
|
Net increase (decrease) |
146 |
- |
$ 4,678 |
$ - |
A Share transactions for Class Z are for the period August 13, 2013 (commencement of sale of shares) to November 30, 2013.
B Amount includes in-kind redemptions (see Note 6: Redemptions In-Kind).
* Amount represents three hundred eighty eight shares.
12. Other.
The Fund's organizational documents provide former and current trustees and officers with a limited indemnification against liabilities arising in connection with the performance of their duties to the Fund. In the normal course of business, the Fund may also enter into contracts that provide general indemnifications. The Fund's maximum exposure under these arrangements is unknown as this would be dependent on future claims that may be made against the Fund. The risk of material loss from such claims is considered remote.
Annual Report
Report of Independent Registered Public Accounting Firm
To the Trustees of Fidelity Advisor Series I and the Shareholders of Fidelity Advisor Small Cap Fund:
In our opinion, the accompanying statement of assets and liabilities, including the schedule of investments, and the related statements of operations and of changes in net assets and the financial highlights present fairly, in all material respects, the financial position of Fidelity Advisor Small Cap Fund (a fund of Fidelity Advisor Series I) at November 30, 2013, the results of its operations for the year then ended, the changes in its net assets for each of the two years in the period then ended and the financial highlights for each of the five years in the period then ended, in conformity with accounting principles generally accepted in the United States of America. These financial statements and financial highlights (hereafter referred to as "financial statements") are the responsibility of the Fidelity Advisor Small Cap Fund's management. Our responsibility is to express an opinion on these financial statements based on our audits. We conducted our audits of these financial statements in accordance with the standards of the Public Company Accounting Oversight Board (United States). Those standards require that we plan and perform the audit to obtain reasonable assurance about whether the financial statements are free of material misstatement. An audit includes examining, on a test basis, evidence supporting the amounts and disclosures in the financial statements, assessing the accounting principles used and significant estimates made by management, and evaluating the overall financial statement presentation. We believe that our audits, which included confirmation of securities at November 30, 2013 by correspondence with the custodian and brokers, provide a reasonable basis for our opinion.
PricewaterhouseCoopers LLP
Boston, Massachusetts
January 13, 2014
Annual Report
Trustees and Officers
The Trustees, Member of the Advisory Board, and officers of the trust and fund, as applicable, are listed below. The Board of Trustees governs the fund and is responsible for protecting the interests of shareholders. The Trustees are experienced executives who meet periodically throughout the year to oversee the fund's activities, review contractual arrangements with companies that provide services to the fund, oversee management of the risks associated with such activities and contractual arrangements, and review the fund's performance. Except for James C. Curvey, Ned C. Lautenbach, Ronald P. O'Hanley, and William S. Stavropoulos, each of the Trustees oversees 173 funds. Mr. Curvey oversees 396 funds. Mr. Lautenbach, Mr. O'Hanley, and Mr. Stavropoulos each oversees 247 funds.
The Trustees hold office without limit in time except that (a) any Trustee may resign; (b) any Trustee may be removed by written instrument, signed by at least two-thirds of the number of Trustees prior to such removal; (c) any Trustee who requests to be retired or who has become incapacitated by illness or injury may be retired by written instrument signed by a majority of the other Trustees; and (d) any Trustee may be removed at any special meeting of shareholders by a two-thirds vote of the outstanding voting securities of the trust. Each Trustee who is not an interested person (as defined in the 1940 Act) of the trust and the fund (Independent Trustee), shall retire not later than the last day of the calendar year in which his or her 75th birthday occurs. The Independent Trustees may waive this mandatory retirement age policy with respect to individual Trustees. The officers and Advisory Board Member hold office without limit in time, except that any officer and Advisory Board Member may resign or may be removed by a vote of a majority of the Trustees at any regular meeting or any special meeting of the Trustees. Except as indicated, each individual has held the office shown or other offices in the same company for the past five years.
Experience, Skills, Attributes, and Qualifications of the Fund's Trustees. The Governance and Nominating Committee has adopted a statement of policy that describes the experience, qualifications, attributes, and skills that are necessary and desirable for potential Independent Trustee candidates (Statement of Policy). The Board believes that each Trustee satisfied at the time he or she was initially elected or appointed a Trustee, and continues to satisfy, the standards contemplated by the Statement of Policy. The Governance and Nominating Committee also engages professional search firms to help identify potential Independent Trustee candidates who have the experience, qualifications, attributes, and skills consistent with the Statement of Policy. From time to time, additional criteria based on the composition and skills of the current Independent Trustees, as well as experience or skills that may be appropriate in light of future changes to board composition, business conditions, and regulatory or other developments, have also been considered by the professional search firms and the Governance and Nominating Committee. In addition, the Board takes into account the Trustees' commitment and participation in Board and committee meetings, as well as their leadership of standing and ad hoc committees throughout their tenure.
Annual Report
Trustees and Officers - continued
In determining that a particular Trustee was and continues to be qualified to serve as a Trustee, the Board has considered a variety of criteria, none of which, in isolation, was controlling. The Board believes that, collectively, the Trustees have balanced and diverse experience, qualifications, attributes, and skills, which allow the Board to operate effectively in governing the fund and protecting the interests of shareholders. Information about the specific experience, skills, attributes, and qualifications of each Trustee, which in each case led to the Board's conclusion that the Trustee should serve (or continue to serve) as a trustee of the fund, is provided below.
Board Structure and Oversight Function. James C. Curvey is an interested person (as defined in the 1940 Act) and currently serves as Chairman. The Trustees have determined that an interested Chairman is appropriate and benefits shareholders because an interested Chairman has a personal and professional stake in the quality and continuity of services provided to the fund. Independent Trustees exercise their informed business judgment to appoint an individual of their choosing to serve as Chairman, regardless of whether the Trustee happens to be independent or a member of management. The Independent Trustees have determined that they can act independently and effectively without having an Independent Trustee serve as Chairman and that a key structural component for assuring that they are in a position to do so is for the Independent Trustees to constitute a substantial majority for the Board. The Independent Trustees also regularly meet in executive session. Ned C. Lautenbach serves as Chairman of the Independent Trustees and as such (i) acts as a liaison between the Independent Trustees and management with respect to matters important to the Independent Trustees and (ii) with management prepares agendas for Board meetings.
Fidelity funds are overseen by different Boards of Trustees. The fund's Board oversees Fidelity's equity and high income funds and another Board oversees Fidelity's investment-grade bond, money market, and asset allocation funds. The asset allocation funds may invest in Fidelity funds overseen by the fund's Board. The use of separate Boards, each with its own committee structure, allows the Trustees of each group of Fidelity funds to focus on the unique issues of the funds they oversee, including common research, investment, and operational issues. On occasion, the separate Boards establish joint committees to address issues of overlapping consequences for the Fidelity funds overseen by each Board.
The Trustees operate using a system of committees to facilitate the timely and efficient consideration of all matters of importance to the Trustees, the fund, and fund shareholders and to facilitate compliance with legal and regulatory requirements and oversight of the fund's activities and associated risks. The Board, acting through its committees, has charged FMR and its affiliates with (i) identifying events or circumstances the occurrence of which could have demonstrably adverse effects on the fund's business and/or reputation; (ii) implementing processes and controls to lessen the possibility that such events or circumstances occur or to mitigate the effects of such events or circumstances if they do occur; and (iii) creating and maintaining a system designed to evaluate continuously business and market conditions in order to facilitate the identification and implementation processes described in (i) and (ii) above. Because the day-to-day operations and activities of the fund are carried out by or through FMR, its affiliates and other service providers, the fund's exposure to risks is mitigated but not eliminated by the processes overseen by the Trustees. While each of the Board's committees has responsibility for overseeing different aspects of the fund's activities, oversight is exercised primarily through the Operations, Audit, and Compliance Committees. In addition, the Independent Trustees have worked with FMR to enhance the Board's oversight of investment and financial risks, legal and regulatory risks, technology risks, and operational risks, including the development of additional risk reporting to the Board. For example, a working group comprised of Independent Trustees and FMR has worked and continues to work to review the Fidelity funds' valuation-related activities, reporting and risk management. Appropriate personnel, including but not limited to the fund's Chief Compliance Officer (CCO), FMR's internal auditor, the independent accountants, the fund's Treasurer and portfolio management personnel, make periodic reports to the Board's committees, as appropriate, including an annual review of FMR's risk management program for the Fidelity funds. The responsibilities of each standing committee, including their oversight responsibilities, are described further under "Standing Committees of the Fund's Trustees."
Annual Report
The fund's Statement of Additional Information (SAI) includes more information about the Trustees. To request a free copy, call Fidelity at 1-877-208-0098.
Interested Trustees*:
Correspondence intended for each Trustee who is an interested person may be sent to Fidelity Investments, 245 Summer Street, Boston, Massachusetts 02210.
|
Name, Year of Birth; Principal Occupations and Other Relevant Experience+ |
|
|
James C. Curvey (1935) |
|
|
Year of Election or Appointment: 2007 Trustee Chairman of the Board of Trustees |
|
|
|
Mr. Curvey also serves as Trustee of other Fidelity funds. Mr. Curvey is a Director of Fidelity Investments Money Management, Inc. (2009-present), Director of Fidelity Research & Analysis Co. (2009-present) and Director of FMR and FMR Co., Inc. (2007-present). Mr. Curvey is also Vice Chairman (2007-present) and Director of FMR LLC. In addition, Mr. Curvey serves as an Overseer for the Boston Symphony Orchestra and a member of the Trustees of Villanova University. Previously, Mr. Curvey was the Vice Chairman (2006-2007) and Director (2000-2007) of FMR Corp. |
|
Ronald P. O'Hanley (1957) |
|
|
Year of Election or Appointment: 2011 Trustee |
|
|
|
Mr. O'Hanley also serves as Trustee of other Fidelity funds. He is Director of Fidelity SelectCo, LLC (2013-present), FMR Co., Inc. (2010-present), Director of Fidelity Investments Money Management, Inc. (2010-present), Director of Fidelity Research & Analysis Company (2010-present), President of Fidelity Asset Management and Corporate Services and a Member of Fidelity's Executive Committee (2010-present). Previously, Mr. O'Hanley served as President and Chief Executive Officer of BNY Mellon Asset Management (2007-2010). Mr. O'Hanley also served as Vice Chairman of Bank New York Mellon Corp. and a member of that firm's Executive Committee. Prior to the 2007 merger of The Bank of New York and Mellon Financial Corporation, he was Vice Chairman of Mellon Financial Corporation and President and Chief Executive Officer of Mellon Asset Management. He joined Mellon in February 1997. Mr. O'Hanley currently serves as Chairman of the Boston Public Library Foundation Board of Directors and sits on the Board of Directors of Beth Israel Deaconess Medical Center, the Board of Trustees of the Marine Biological Laboratory and the Advisory Board of the Maxwell School of Citizenship and Public Administration at Syracuse University. Mr. O'Hanley also chairs the Council on Asset Management for the Financial Services Roundtable and is a member of the Board of Directors of Institutional Investor's U.S. Institute. |
* Trustees have been determined to be "Interested Trustees" by virtue of, among other things, their affiliation with the trust or various entities under common control with FMR.
+ The information above includes each Trustee's principal occupation during the last five years and other information relating to the experience, attributes, and skills relevant to each Trustee's qualifications to serve as a Trustee, which led to the conclusion that each Trustee should serve as a Trustee for each fund.
Annual Report
Independent Trustees:
Correspondence intended for each Independent Trustee (that is, the Trustees other than the Interested Trustees) may be sent to Fidelity Investments, P.O. Box 55235, Boston, Massachusetts 02205-5235.
|
Name, Year of Birth; Principal Occupations and Other Relevant Experience+ |
|
|
Dennis J. Dirks (1948) |
|
|
Year of Election or Appointment: 2005 Trustee |
|
|
|
Mr. Dirks also serves as Trustee of other Fidelity funds. Prior to his retirement in May 2003, Mr. Dirks was Chief Operating Officer and a member of the Board of The Depository Trust & Clearing Corporation (DTCC). He also served as President, Chief Operating Officer, and Board member of The Depository Trust Company (DTC) and President and Board member of the National Securities Clearing Corporation (NSCC). In addition, Mr. Dirks served as Chief Executive Officer and Board member of the Government Securities Clearing Corporation, Chief Executive Officer and Board member of the Mortgage-Backed Securities Clearing Corporation, as a Trustee and a member of the Finance Committee of Manhattan College (2005-2008), and as a Trustee and a member of the Finance Committee of AHRC of Nassau County (2006-2008). Mr. Dirks is a member of the Independent Directors Council (IDC) Governing Council (2010-present) and Board of Directors for The Brookville Center for Children's Services, Inc. (2009-present). |
|
Alan J. Lacy (1953) |
|
|
Year of Election or Appointment: 2008 Trustee |
|
|
|
Mr. Lacy also serves as Trustee of other Fidelity funds. Mr. Lacy serves as Senior Adviser (2007-present) of Oak Hill Capital Partners, L.P. (private equity). Mr. Lacy also served as Chief Executive Officer (2000-2005) and Vice Chairman (2005-2006) of Sears Holdings Corporation and Sears, Roebuck and Co. (retail). In addition, Mr. Lacy serves as a member of the Board of Directors of Dave & Buster's Entertainment, Inc. (restaurant and entertainment complexes, 2010-present), Earth Fare, Inc. (retail grocery, 2012-present), The Hillman Companies, Inc. (hardware wholesalers, 2010-present), and Bristol-Myers Squibb Company (global pharmaceuticals, 2008-present). Mr. Lacy is a member of the Board of Trustees of The National Parks Conservation Association (2006-present). Previously, Mr. Lacy served as Chairman of the Board of Trustees of the National Parks Conservation Association (2008-2011) and as a member of the Board of Directors for the Western Union Company (global money transfer, 2006-2011). |
|
Ned C. Lautenbach (1944) |
|
|
Year of Election or Appointment: 2000 Trustee Chairman of the Independent Trustees |
|
|
|
Mr. Lautenbach also serves as Trustee of other Fidelity funds. Mr. Lautenbach currently serves as the Lead Director of the Eaton Corporation Board of Directors (diversified industrial, 1997-present). Mr. Lautenbach is Chairman of the Board of Directors of the Philharmonic Center for the Arts in Naples, Florida (2012-present) and a member of the Council on Foreign Relations (1994-present). Previously, Mr. Lautenbach was a Partner/Advisory Partner at Clayton, Dubilier & Rice, LLC (private equity investment, 1998-2010), as well as a Director of Sony Corporation (2006-2007). |
|
Joseph Mauriello (1944) |
|
|
Year of Election or Appointment: 2008 Trustee |
|
|
|
Mr. Mauriello also serves as Trustee of other Fidelity funds. Prior to his retirement in January 2006, Mr. Mauriello served in numerous senior management positions including Deputy Chairman and Chief Operating Officer (2004-2005), and Vice Chairman of Financial Services (2002-2004) of KPMG LLP US (professional services, 1965-2005). Mr. Mauriello currently serves as a member of the Board of Directors of XL Group plc. (global insurance and re-insurance, 2006-present). Previously, Mr. Mauriello served as a Director of the Hamilton Funds of the Bank of New York (2006-2007) and of Arcadia Resources Inc. (health care services and products, 2007-2012). |
|
Robert W. Selander (1950) |
|
|
Year of Election or Appointment: 2011 Trustee |
|
|
|
Mr. Selander also serves as Trustee of other Fidelity funds. Previously, Mr. Selander served as a Member of the Advisory Board of other Fidelity funds (2011), and Executive Vice Chairman (2010), Chief Executive Officer (2009-2010), and President and Chief Executive Officer (1997-2009) of Mastercard, Inc. |
|
Cornelia M. Small (1944) |
|
|
Year of Election or Appointment: 2005 Trustee |
|
|
|
Ms. Small also serves as Trustee of other Fidelity funds. Ms. Small is a member of the Board of Directors (2009-present) and Chair of the Investment Committee (2010-present) of the Teagle Foundation. Ms. Small also serves on the Investment Committee of the Berkshire Taconic Community Foundation (2008-present). Previously, Ms. Small served as Chairperson (2002-2008) and a member of the Investment Committee and Chairperson (2008-2012) and a member of the Board of Trustees of Smith College. In addition, Ms. Small served as Chief Investment Officer, Director of Global Equity Investments, and a member of the Board of Directors of Scudder, Stevens & Clark and Scudder Kemper Investments. |
|
William S. Stavropoulos (1939) |
|
|
Year of Election or Appointment: 2002 Trustee Vice Chairman of the Independent Trustees |
|
|
|
Mr. Stavropoulos also serves as Trustee of other Fidelity funds. Mr. Stavropoulos serves as President and Founder of the Michigan Baseball Foundation, the Great Lakes Loons (2007-present). Mr. Stavropoulos is Chairman Emeritus of the Board of Directors of The Dow Chemical Company, where he previously served in numerous senior management positions, including President, CEO (1995-2000; 2002-2004), Chairman of the Executive Committee (2000-2006), and as a member of the Board of Directors (1990-2006). Currently, Mr. Stavropoulos is Chairman of the Board of Directors of Univar Inc. (global distributor of commodity and specialty chemicals), a Director of Teradata Corporation (data warehousing and technology solutions), and Maersk Inc. (industrial conglomerate), and a member of the Advisory Board for Metalmark Capital LLC (private equity investment, 2005-present). Mr. Stavropoulos is an operating advisor to Clayton, Dubilier & Rice, LLC (private equity investment). In addition, Mr. Stavropoulos is a member of the University of Notre Dame Advisory Council for the College of Science, a Trustee of the Rollin L. Gerstacker Foundation, and a Director of the Naples Philharmonic Center for the Arts. Previously, Mr. Stavropoulos served as a Director of Chemical Financial Corporation (bank holding company, 1993-2012) and Tyco International, Ltd. (multinational manufacturing and services, 2007-2012). |
|
David M. Thomas (1949) |
|
|
Year of Election or Appointment: 2008 Trustee |
|
|
|
Mr. Thomas also serves as Trustee of other Fidelity funds. Mr. Thomas serves as Non-Executive Chairman of the Board of Directors of Fortune Brands Home and Security (home and security products, 2011-present), and as a member of the Board of Directors of Interpublic Group of Companies, Inc. (marketing communication, 2004-present). Previously, Mr. Thomas served as Executive Chairman (2005-2006) and Chairman and Chief Executive Officer (2000-2005) of IMS Health, Inc. (pharmaceutical and healthcare information solutions), and a Director of Fortune Brands, Inc. (consumer products, 2000-2011). |
+ The information above includes each Trustee's principal occupation during the last five years and other information relating to the experience, attributes, and skills relevant to each Trustee's qualifications to serve as a Trustee, which led to the conclusion that each Trustee should serve as a Trustee for the fund.
Advisory Board Member and Officers:
Correspondence intended for each officer and Peter S. Lynch may be sent to Fidelity Investments, 245 Summer Street, Boston, Massachusetts 02210. Officers appear below in alphabetical order.
|
Name, Year of Birth; Principal Occupation |
|
|
Peter S. Lynch (1944) |
|
|
Year of Election or Appointment: 2003 Member of the Advisory Board |
|
|
|
Mr. Lynch also serves as Member of the Advisory Board of other Fidelity funds. Mr. Lynch is Vice Chairman and a Director of FMR and FMR Co., Inc. In addition, Mr. Lynch serves as a Trustee of Boston College and as the Chairman of the Inner-City Scholarship Fund. Previously, Mr. Lynch served on the Special Olympics International Board of Directors (1997-2006). |
|
Elizabeth Paige Baumann (1968) |
|
|
Year of Election or Appointment: 2012 Anti-Money Laundering (AML) Officer |
|
|
|
Ms. Baumann also serves as AML Officer of other funds. She is Chief AML Officer of FMR LLC (2012-present) and is an employee of Fidelity Investments. Previously, Ms. Baumann served as Vice President and Deputy Anti-Money Laundering Officer (2007-2012). |
|
William C. Coffey (1969) |
|
|
Year of Election or Appointment: 2009 Assistant Secretary |
|
|
|
Mr. Coffey also serves as Assistant Secretary of other funds. He is Senior Vice President and Deputy General Counsel of FMR LLC (2010-present), and is an employee of Fidelity Investments. Previously, Mr. Coffey served as Vice President and Associate General Counsel of FMR LLC (2005-2009). |
|
Jonathan Davis (1968) |
|
|
Year of Election or Appointment: 2010 Assistant Treasurer |
|
|
|
Mr. Davis also serves as Assistant Treasurer of other funds. Mr. Davis is an employee of Fidelity Investments. Previously, Mr. Davis served as Vice President and Associate General Counsel of FMR LLC (2003-2010). |
|
Adrien E. Deberghes (1967) |
|
|
Year of Election or Appointment: 2008 Deputy Treasurer |
|
|
|
Mr. Deberghes also serves as an officer of other funds. He is an employee of Fidelity Investments (2008-present). Prior to joining Fidelity Investments, Mr. Deberghes was Senior Vice President of Mutual Fund Administration at State Street Corporation (2007-2008), Senior Director of Mutual Fund Administration at Investors Bank & Trust (2005-2007), and Director of Finance for Dunkin' Brands (2000-2005). |
|
Stephanie J. Dorsey (1969) |
|
|
Year of Election or Appointment: 2010 Assistant Treasurer |
|
|
|
Ms. Dorsey also serves as an officer of other funds. She is an employee of Fidelity Investments (2008-present) and has served in other fund officer roles. Prior to joining Fidelity Investments, Ms. Dorsey served as Treasurer (2004-2008) of the JPMorgan Mutual Funds and Vice President (2004-2008) of JPMorgan Chase Bank. |
|
Scott C. Goebel (1968) |
|
|
Year of Election or Appointment: 2008 Secretary and Chief Legal Officer (CLO) |
|
|
|
Mr. Goebel serves as Secretary and CLO of other funds. Mr. Goebel also serves as Secretary of Fidelity Investments Money Management, Inc. (FIMM) (2010-present) and Fidelity Research and Analysis Company (FRAC) (2010-present); General Counsel, Secretary, and Senior Vice President of FMR (2008-present) and FMR Co., Inc. (2008-present); Chief Legal Officer of Fidelity Management & Research (Hong Kong) Limited (2008-present) and Assistant Secretary of Fidelity Management & Research (Japan) Inc. (2008-present), and Fidelity Management & Research (U.K.) Inc. (2008-present). Previously, Mr. Goebel served as Secretary and CLO of other Fidelity funds (2008-2013), Assistant Secretary of FIMM (2008-2010), FRAC (2008-2010), and certain funds (2007-2008); and as Vice President and Secretary of Fidelity Distributors Corporation (FDC) (2005-2007). Mr. Goebel has been employed by FMR LLC or an affiliate since 2001. |
|
Joseph A. Hanlon (1968) |
|
|
Year of Election or Appointment: 2012 Chief Compliance Officer |
|
|
|
Mr. Hanlon also serves as Chief Compliance Officer of other funds. Mr. Hanlon serves as Compliance Officer of FMR, FMR Co., Inc., Fidelity Investments Money Management, Inc. (FIMM), Fidelity Research and Analysis Company (FRAC), and Fidelity Management & Research (Hong Kong) (2009-present), as Senior Vice President of the Fidelity Asset Management Division (2009-present), and is an employee of Fidelity Investments. Previously, Mr. Hanlon served as Compliance Officer of Fidelity Management & Research (Japan) Inc. (2009-2013), Strategic Advisers, Inc. (2009-2013), and Fidelity Management & Research (U.K.) Inc. (2009-2013). |
|
Thomas C. Hense (1964) |
|
|
Year of Election or Appointment: 2008/2010 Vice President |
|
|
|
Mr. Hense also serves as Vice President of other funds (High Income (2008), Small Cap (2008), and Value (2010) funds). Previously, Mr. Hense served as a portfolio manager for Fidelity's Institutional Money Management Group (Pyramis) (2003-2008). |
|
Brian B. Hogan (1964) |
|
|
Year of Election or Appointment: 2009 Vice President |
|
|
|
Mr. Hogan also serves as Vice President of other funds. Mr. Hogan serves as President of FMR's Equity Division (2009-present). Previously, Mr. Hogan served as Senior Vice President, Equity Research of FMR (2006-2009) and as a portfolio manager. |
|
Chris Maher (1972) |
|
|
Year of Election or Appointment: 2013 Assistant Treasurer |
|
|
|
Mr. Maher serves as Assistant Treasurer of other funds. Mr. Maher is Vice President of Valuation Oversight and is an employee of Fidelity Investments. Previously, Mr. Maher served as Vice President of Asset Management Compliance (2013), Vice President of FMR's Program Management Group (2010-2013), and Vice President of Valuation Oversight (2008-2010). |
|
Christine Reynolds (1958) |
|
|
Year of Election or Appointment: 2008 Chief Financial Officer |
|
|
|
Ms. Reynolds also serves as Chief Financial Officer of other funds. Ms. Reynolds became President of Fidelity Pricing and Cash Management Services (FPCMS) in August 2008. Ms. Reynolds served as Chief Operating Officer of FPCMS (2007-2008). Previously, Ms. Reynolds served as President, Treasurer, and Anti-Money Laundering officer of the Fidelity funds (2004-2007). |
|
Kenneth B. Robins (1969) |
|
|
Year of Election or Appointment: 2008 President and Treasurer |
|
|
|
Mr. Robins also serves as an officer of other funds. Mr. Robins serves as Executive Vice President of Fidelity Investments Money Management, Inc. (FIMM) (2013-present) and is an employee of Fidelity Investments (2004-present). Previously, Mr. Robins served in other fund officer roles. |
|
Gary W. Ryan (1958) |
|
|
Year of Election or Appointment: 2005 Assistant Treasurer |
|
|
|
Mr. Ryan also serves as Assistant Treasurer of other funds. Mr. Ryan is an employee of Fidelity Investments and has served in other fund officer roles. Previously, Mr. Ryan served as Vice President of Fund Reporting in Fidelity Pricing and Cash Management Services (FPCMS) (1999-2005). |
|
Stephen Sadoski (1971) |
|
|
Year of Election or Appointment: 2012 Deputy Treasurer |
|
|
|
Mr. Sadoski also serves as Deputy Treasurer of other funds. He is an employee of Fidelity Investments (2012-present) and has served in another fund officer role. Prior to joining Fidelity Investments, Mr. Sadoski served as an assistant chief accountant in the Division of Investment Management of the Securities and Exchange Commission (SEC) (2009-2012) and as a senior manager at Deloitte & Touche LLP (1997-2009). |
|
Stacie M. Smith (1974) |
|
|
Year of Election or Appointment: 2013 Deputy Treasurer |
|
|
|
Ms. Smith also serves as an officer of other funds. She is an employee of Fidelity Investments (2009-present) and has served in other fund officer roles. Prior to joining Fidelity Investments, Ms. Smith served as Senior Audit Manager of Ernst & Young LLP (1996-2009). |
|
Renee Stagnone (1975) |
|
|
Year of Election or Appointment: 2013 Deputy Treasurer |
|
|
|
Ms. Stagnone also serves as Deputy Treasurer of other funds. Ms. Stagnone is an employee of Fidelity Investments. |
|
Joseph F. Zambello (1957) |
|
|
Year of Election or Appointment: 2011 Deputy Treasurer |
|
|
|
Mr. Zambello also serves as Deputy Treasurer of other funds. Mr. Zambello is an employee of Fidelity Investments. Previously, Mr. Zambello served as Vice President of FMR's Program Management Group (2009-2011) and Vice President of the Transfer Agent Oversight Group (2005-2009). |
Annual Report
Distributions (Unaudited)
The Board of Trustees of Advisor Small Cap Fund voted to pay to shareholders of record at the opening of business on record date, the following distributions per share derived from capital gains realized from sales of portfolio securities and dividends from net investment income:
|
|
Pay Date |
Record Date |
Dividends |
Capital Gains |
|
Institutional Class |
12/16/2013 |
12/13/2013 |
$0.06 |
$3.320 |
|
|
01/13/2014 |
01/10/2014 |
- |
$0.182 |
The fund hereby designates as a capital gain dividend with respect to the taxable year ended November 30, 2013 $448,830,974 or, if subsequently determined to be different, the net capital gain of such year.
Institutional Class designates 100% of the dividends distributed during the fiscal year as qualifying for the dividends-received deduction for corporate shareholders.
Institutional Class designates 100% of dividends distributed during the fiscal year as amounts which may be taken into account as a dividend for purposes of the maximum rate under section 1(h)(11) of the Internal Revenue Code.
The fund will notify shareholders in January 2014 of amounts for use in preparing 2013 income tax returns.
Annual Report
Board Approval of Investment Advisory Contracts and Management Fees
Fidelity Advisor Small Cap Fund
Each year, the Board of Trustees, including the Independent Trustees (together, the Board), votes on the renewal of the management contract and sub-advisory agreements (together, the Advisory Contracts) for the fund. The Board, assisted by the advice of fund counsel and Independent Trustees' counsel, requests and considers a broad range of information relevant to the renewal of the Advisory Contracts throughout the year.
The Board meets regularly and, at each of its meetings, covers an extensive agenda of topics and materials and considers factors that are relevant to its annual consideration of the renewal of the fund's Advisory Contracts, including the services and support provided to the fund and its shareholders. The Board has established various standing committees, each composed of and chaired by Independent Trustees with varying backgrounds, to which the Board has assigned specific subject matter responsibilities in order to enhance effective decision-making by the Board. The Board, acting directly and through its Committees, requests and receives information concerning the annual consideration of the renewal of the fund's Advisory Contracts. The Board also meets as needed to consider matters specifically related to the Board's annual consideration of the renewal of Advisory Contracts. Members of the Board may also meet with trustees of other Fidelity funds through ad hoc joint committees to discuss certain matters relevant to the Fidelity funds.
At its July 2013 meeting, the Board, including the Independent Trustees, unanimously determined to renew the fund's Advisory Contracts. In reaching its determination, the Board considered all factors it believed relevant, including (i) the nature, extent, and quality of the services to be provided to the fund and its shareholders (including the investment performance of the fund); (ii) the competitiveness of the fund's management fee and total expense ratio relative to peer funds; (iii) the total costs of the services to be provided by and the profits to be realized by Fidelity from its relationship with the fund; (iv) the extent to which economies of scale exist and would be realized as the fund grows; and (v) whether fee levels reflect these economies of scale, if any, for the benefit of fund shareholders.
In considering whether to renew the Advisory Contracts for the fund, the Board reached a determination, with the assistance of fund counsel and Independent Trustees' counsel and through the exercise of its business judgment, that the renewal of the Advisory Contracts was in the best interests of the fund and its shareholders and that the compensation payable under the Advisory Contracts was fair and reasonable. The Board's decision to renew the Advisory Contracts was not based on any single factor, but rather was based on a comprehensive consideration of all the information provided to the Board at its meetings throughout the year. The Board, in reaching its determination to renew the Advisory Contracts, was aware that shareholders in the fund have a broad range of investment choices available to them, including a wide choice among mutual funds offered by Fidelity's competitors, and that the fund's shareholders, who have the opportunity to review and weigh the disclosure provided by the fund in its prospectus and other public disclosures, have chosen to invest in this fund, which is a part of the Fidelity family of funds.
Annual Report
Nature, Extent, and Quality of Services Provided. The Board considered the staffing within the investment adviser, Fidelity Management & Research Company (FMR), and the sub-advisers (together, the Investment Advisers) as it relates to the fund, including the backgrounds of the fund's investment personnel, and also considered the fund's investment objective, strategies, and related investment philosophy. The Independent Trustees also had discussions with senior management of Fidelity's investment operations and investment groups. The Board considered the structure of the portfolio manager compensation program and whether this structure provides appropriate incentives to act in the best interests of the fund.
Resources Dedicated to Investment Management and Support Services. The Board and the Fund Oversight and Research Committees reviewed the general qualifications and capabilities of the Investment Advisers' investment staff, including its size, education, experience, and resources, as well as the Investment Advisers' approach to recruiting, training, managing, and compensating investment personnel. The Board noted that FMR has continued to increase the resources devoted to non-U.S. offices, including expansion of Fidelity's global investment organization. The Board also noted that Fidelity's analysts have extensive resources, tools and capabilities that allow them to conduct sophisticated quantitative and fundamental analysis, as well as credit analysis of issuers, counterparties and guarantors. Further, the Board believes that Fidelity's investment professionals have sufficient access to global information and data so as to provide competitive investment results over time, and that those professionals also have access to sophisticated tools that permit them to assess portfolio construction and risk and performance attribution characteristics continuously, as well as to transmit new information and research conclusions rapidly around the world. Additionally, in its deliberations, the Board considered the Investment Advisers' trading and risk management capabilities and resources, which are an integral part of the investment management process.
Shareholder and Administrative Services. The Board considered (i) the nature, extent, quality, and cost of advisory, administrative, and shareholder services performed by the Investment Advisers and their affiliates under the Advisory Contracts and under separate agreements covering transfer agency, pricing and bookkeeping, and securities lending services for the fund; (ii) the nature and extent of the supervision of third party service providers, principally custodians and subcustodians; and (iii) the resources devoted to, and the record of compliance with, the fund's compliance policies and procedures. The Board also reviewed the allocation of fund brokerage, including allocations to brokers affiliated with the Investment Advisers, the use of brokerage commissions to pay fund expenses, and the use of "soft" commission dollars to pay for research services.
Annual Report
Board Approval of Investment Advisory Contracts and
Management Fees - continued
The Board noted that the growth of fund assets over time across the complex allows Fidelity to reinvest in the development of services designed to enhance the value or convenience of the Fidelity funds as investment vehicles. These services include 24-hour access to account information and market information through telephone representatives and over the Internet, investor education materials and asset allocation tools, and the expanded availability of Fidelity Investor Centers.
Investment in a Large Fund Family. The Board considered the benefits to shareholders of investing in a Fidelity fund, including the benefits of investing in a fund that is part of a large family of funds offering a variety of investment disciplines and providing a large variety of mutual fund investor services. The Board noted that Fidelity had taken, or had made recommendations that resulted in the Fidelity funds taking, a number of actions over the previous year that benefited particular funds, including (i) continuing to dedicate additional resources to investment research and to the support of the senior management team that oversees asset management; (ii) persisting in efforts to enhance Fidelity's global research capabilities; (iii) launching new funds and making other enhancements to meet client needs for global and income-oriented solutions; (iv) continuing to launch dedicated lower cost underlying funds to meet portfolio construction needs related to expanding underlying fund options for Fidelity funds of funds, specifically for the Freedom Fund product lines; (v) rationalizing product lines and gaining increased efficiencies through the mergers of several funds into other funds; (vi) strengthening Fidelity's index fund offerings by reducing investment minimums and adopting or lowering existing expense caps for certain funds and classes; (vii) enhancing Global Asset Allocation product offerings by launching new funds and strategies, including "open architecture" target date funds that utilize affiliated and unaffiliated sub-advisers; (viii) modifying the eligibility criteria for Institutional Class shares of Advisor funds to increase their marketability to a portion of the defined contribution plan market; (ix) creating a new low-cost retirement share class for certain Advisor funds to appeal to large retirement plans; (x) transitioning the management of certain Fidelity commodity funds to Geode Capital Management LLC, a registered commodity pool operator, while retaining administrative responsibilities for the funds; (xi) reorganizing a number of funds; and (xii) taking steps toward establishing a new Fidelity adviser to manage sector-based funds and products.
Investment Performance. The Board considered whether the fund has operated in accordance with its investment objective, as well as its record of compliance with its investment restrictions and its performance history.
The Board took into account discussions with the Investment Advisers about fund investment performance that occur at Board meetings throughout the year. In this regard the Board noted that as part of regularly scheduled fund reviews and other reports to the Board on fund performance, the Board periodically considers annualized return information for the fund, for different time periods, measured against a securities market index ("benchmark index") and a peer group of mutual funds with similar objectives ("peer group"). In its evaluation of fund investment performance, the Board gave particular attention to information indicating changes in performance of certain Fidelity funds for specific time periods and the Investment Advisers' explanations for any overperformance or, in the case of the fund, underperformance.
Annual Report
In addition to reviewing absolute and relative fund performance, the Independent Trustees periodically consider the appropriateness of fund performance metrics in evaluating the results achieved. In general, the Independent Trustees believe that fund performance should be evaluated based on net performance (after fees and expenses) of both the highest performing and lowest performing classes, where applicable, compared to appropriate benchmark indices, over appropriate time periods which may include full market cycles, and compared to peer groups, as applicable, over the same periods, taking into account relevant factors including the following: general market conditions; issuer-specific information; tactical opportunities for investment; and fund cash flows and other factors.
The Independent Trustees recognize that shareholders evaluate performance on a net basis over their own holding periods, for which one-, three-, and five-year periods are used as a proxy. For this reason, the performance information reviewed by the Board also included net cumulative calendar year total return information for the fund and an appropriate benchmark index and peer group for the most recent one-, three-, and five-year periods, as shown below. Returns are shown compared to the 25th percentile (top of box) and 75th percentile (bottom of box) of the peer universe.
Annual Report
Board Approval of Investment Advisory Contracts and
Management Fees - continued
Fidelity Advisor Small Cap Fund
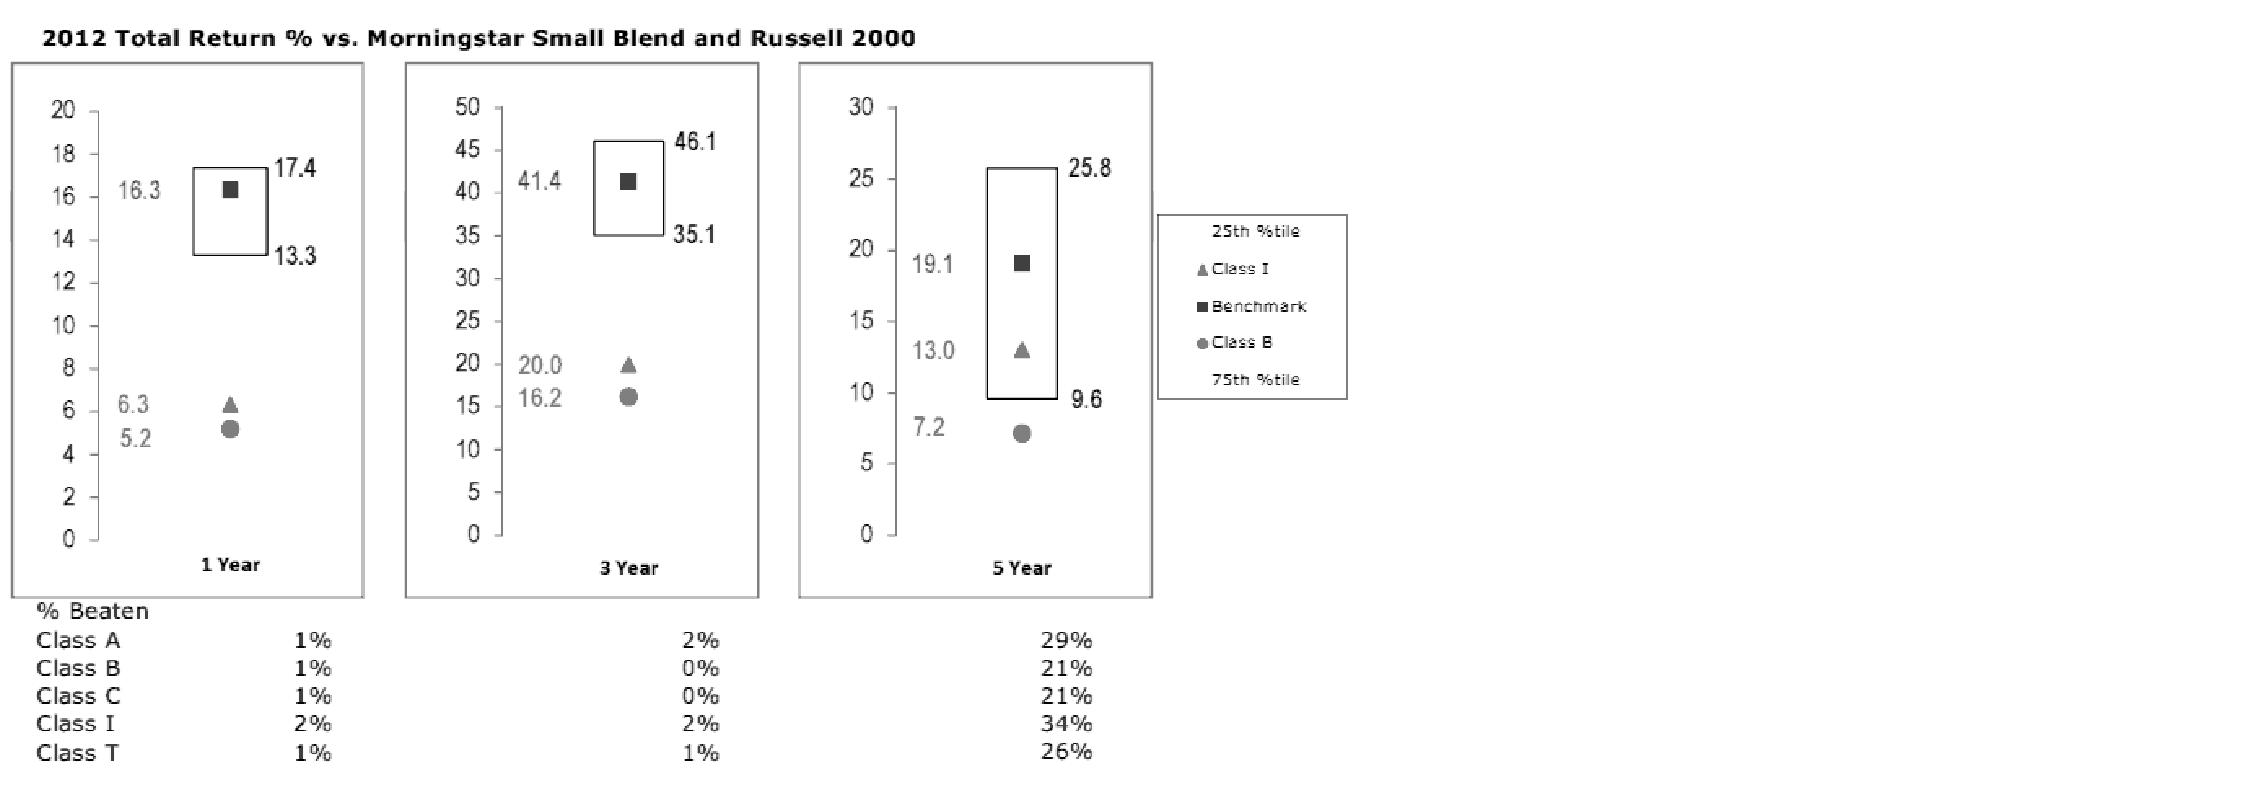
The Board has discussed the fund's underperformance with FMR and has engaged with FMR to consider what steps might be taken to remediate the fund's underperformance.
The Board also considered that the fund's management fee is subject to upward or downward adjustment depending upon whether, and to what extent, the fund's investment performance for the performance period exceeds, or is exceeded by, a securities index, thus leading to a performance adjustment for the same period. The Board noted that the performance adjustment provides FMR with a strong economic incentive to seek to achieve superior performance for the fund's shareholders and helps to more closely align the interests of FMR and the fund's shareholders.
Based on its review, the Board concluded that the nature, extent, and quality of services provided to the fund under the Advisory Contracts should benefit the fund's shareholders.
Competitiveness of Management Fee and Total Expense Ratio. The Board considered the fund's management fee and total expense ratio compared to "mapped groups" of competitive funds and classes. Fidelity creates "mapped groups" by combining similar Lipper investment objective categories that have comparable management fee characteristics. Combining Lipper investment objective categories aids the Board's management fee and total expense ratio comparisons by broadening the competitive group used for comparison and by reducing the number of universes to which various Fidelity funds are compared.
Annual Report
Management Fee. The Board considered two proprietary management fee comparisons for the 12-month periods shown in the chart below. The group of Lipper funds used by the Board for management fee comparisons is referred to below as the "Total Mapped Group." The Total Mapped Group comparison focuses on a fund's standing in terms of gross management fees before expense reimbursements or caps, and without giving effect to the fund's performance adjustment, relative to the total universe of funds with comparable investment mandates, regardless of whether their management fee structures also are comparable. Funds with comparable investment mandates offer exposure to similar types of securities. Funds with comparable management fee structures have similar management fee contractual arrangements (e.g., flat rate charged for advisory services, all-inclusive fee rate, etc.). "TMG %" represents the percentage of funds in the Total Mapped Group that had management fees that were lower than the fund's. For example, a TMG % of 14% means that 86% of the funds in the Total Mapped Group had higher management fees than the fund. The "Asset-Size Peer Group" (ASPG) comparison focuses on a fund's standing relative to a subset of non-Fidelity funds within the Total Mapped Group that are similar in size and management fee structure. The ASPG represents at least 15% of the funds in the Total Mapped Group with comparable asset size and management fee structures, subject to a minimum of 50 funds (or all funds in the Total Mapped Group if fewer than 50). Additional information, such as the ASPG quartile in which the fund's management fee ranked and the impact of the fund's performance adjustment, is also included in the chart and considered by the Board.
Fidelity Advisor Small Cap Fund

The Board noted that the fund's management fee ranked below the median of its Total Mapped Group and below the median of its ASPG for 2012. The Board also noted the effect of the fund's negative performance adjustment on the fund's management fee ranking.
Annual Report
Board Approval of Investment Advisory Contracts and
Management Fees - continued
Based on its review, the Board concluded that the fund's management fee is fair and reasonable in light of the services that the fund receives and the other factors considered.
Total Expense Ratio. In its review of each class's total expense ratio, the Board considered the fund's management fee as well as other fund or class expenses, as applicable, such as transfer agent fees, pricing and bookkeeping fees, fund-paid 12b-1 fees, and custodial, legal, and audit fees. The Board also noted the effects of any waivers and reimbursements on fees and expenses, as well as the impact of the fund's performance adjustment. As part of its review, the Board also considered the current and historical total expense ratios of each class of the fund compared to competitive fund median expenses. Each class of the fund is compared to those funds and classes in the Total Mapped Group (used by the Board for management fee comparisons) that have a similar sales load structure.
The Board noted that the total expense ratio of each class ranked below its competitive median for 2012.
Fees Charged to Other Fidelity Clients. The Board also considered Fidelity fee structures and other information with respect to clients of FMR and its affiliates, such as other mutual funds advised or subadvised by FMR or its affiliates, pension plan clients, and other institutional clients. The Board noted the findings of the 2013 ad hoc joint committee (created with the board of other Fidelity funds), which reviewed and compared Fidelity's institutional investment advisory business with its business of providing services to the Fidelity funds, including the differences in services provided, fees charged, and costs incurred, as well as competition in their respective marketplaces.
Based on its review of total expense ratios and fees charged to other Fidelity clients, the Board concluded that the total expense ratio of each class of the fund was reasonable in light of the services that the fund and its shareholders receive and the other factors considered.
Costs of the Services and Profitability. The Board considered the revenues earned and the expenses incurred by Fidelity in conducting the business of developing, marketing, distributing, managing, administering and servicing the fund and servicing the fund's shareholders. The Board also considered the level of Fidelity's profits in respect of all the Fidelity funds.
On an annual basis, FMR presents to the Board Fidelity's profitability for the fund. Fidelity calculates the profitability for each fund, as well as aggregate profitability for groups of Fidelity funds and all Fidelity funds, using a series of detailed revenue and cost allocation methodologies which originate with the books and records of Fidelity on which Fidelity's audited financial statements are based. The Audit Committee of the Board reviews any significant changes from the prior year's methodologies.
Annual Report
PricewaterhouseCoopers LLP (PwC), independent registered public accounting firm and auditor to Fidelity and certain Fidelity funds, has been engaged annually by the Board as part of the Board's assessment of Fidelity's profitability analysis. PwC's engagement includes the review and assessment of the methodologies used by Fidelity in determining the revenues and expenses attributable to Fidelity's mutual fund business, and completion of agreed-upon procedures surrounding the mathematical accuracy of fund profitability and its conformity to allocation methodologies. After considering PwC's reports issued under the engagement and information provided by Fidelity, the Board concluded that while other allocation methods may also be reasonable, Fidelity's profitability methodologies are reasonable in all material respects.
The Board also reviewed Fidelity's non-fund businesses and fall-out benefits related to the mutual fund business as well as cases where Fidelity's affiliates may benefit from or be related to the fund's business.
The Board considered the costs of the services provided by and the profits realized by Fidelity in connection with the operation of the fund and was satisfied that the profitability was not excessive in the circumstances.
Economies of Scale. The Board considered whether there have been economies of scale in respect of the management of the Fidelity funds, whether the Fidelity funds (including the fund) have appropriately benefited from any such economies of scale, and whether there is potential for realization of any further economies of scale. The Board considered the extent to which the fund will benefit from economies of scale through increased services to the fund, through waivers or reimbursements, or through fee or expense reductions. The Board also noted that in 2009, it and the board of other Fidelity funds created an ad hoc committee (the Economies of Scale Committee) to analyze whether FMR attains economies of scale in respect of the management and servicing of the Fidelity funds, whether the Fidelity funds have appropriately benefited from such economies of scale, and whether there is potential for realization of any further economies of scale.
The Board recognized that the fund's management contract incorporates a "group fee" structure, which provides for lower group fee rates as total fund assets under FMR's management increase, and for higher group fee rates as total fund assets under FMR's management decrease. FMR calculates the group fee rates based on a tiered asset "breakpoint" schedule that varies based on asset class. The Board considered that the group fee is designed to deliver the benefits of economies of scale to fund shareholders when total Fidelity fund assets increase, even if assets of any particular fund are unchanged or have declined, because some portion of Fidelity's costs are attributable to services provided to all Fidelity funds, and all funds benefit if those costs can be allocated among more assets. The Board concluded that, given the group fee structure, fund shareholders will benefit from lower management fees as assets under FMR's management increase at the fund complex level, regardless of whether Fidelity achieves any such economies of scale.
Annual Report
Board Approval of Investment Advisory Contracts and
Management Fees - continued
The Board concluded, taking into account the analysis of the Economies of Scale Committee, that economies of scale, if any, are being appropriately shared between fund shareholders and Fidelity.
Amendment to Description of Group Fee Rate. At its July 2013 meeting, the Board voted to approve an amendment to the fund's management contract to modify the description of the "group fee rate" effective August 1, 2013. The Board noted that under the prior description in the contract, the group fee rate was based on the average net assets of all registered investment companies with which FMR has management contracts. Under the contract's tiered asset breakpoint schedule, the group fee rate is lower as total fund assets under FMR's management increase, and higher as total fund assets under FMR's management decrease. The Board considered that the prior description would have excluded the assets of 64 Fidelity sector funds from the group fee rate calculation once Fidelity SelectCo, LLC, an affiliate of FMR, assumed management responsibilities for those funds. The Board noted that modifying the description of the group fee rate to continue to include the assets of those 64 funds for purposes of determining group fee rate breakpoints would avoid an immediate adverse impact on the group fee rate for any fund.
Additional Information Requested by the Board. In order to develop fully the factual basis for consideration of the Fidelity funds' Advisory Contracts, the Board requested and received additional information on certain topics, including: (i) fund performance trends and Fidelity's long-term strategies for certain funds; (ii) the potential to further rationalize the Fidelity fund lineup with the possibility of achieving savings for the funds and Fidelity; (iii) the methodology with respect to competitive fund data and peer group classifications; (iv) the arrangements with, and performance of, certain sub-advisers on behalf of the Fidelity funds, as well as certain proposed participating affiliate arrangements; (v) the realization of fall-out benefits in certain Fidelity business units; (vi) Fidelity's group fee structures, including the rationale for the individual fee rates of certain categories of funds and the definition of group assets; (vii) trends regarding industry use of performance fee structures and the performance adjustment methodologies applicable to the Fidelity funds; (viii) additional competitive analysis regarding the total expenses for certain classes; and (ix) fund profitability methodology, including Fidelity's cost allocation methodology, and the impact of certain factors on fund profitability results.
Annual Report
Based on its evaluation of all of the conclusions noted above, and after considering all factors it believed relevant, the Board ultimately concluded that the advisory fee structures are fair and reasonable, and that the fund's Advisory Contracts should be renewed.
Annual Report
Investment Adviser
Fidelity Management & Research Company
Boston, MA
Investment Sub-Advisers
FMR Co., Inc.
Fidelity Management & Research
(U.K.) Inc.
Fidelity Management & Research
(Hong Kong) Limited
Fidelity Management & Research
(Japan) Inc.
General Distributor
Fidelity Distributors Corporation
Smithfield, RI
Transfer and Service Agents
Fidelity Investments Institutional
Operations Company, Inc.
Boston, MA
Fidelity Service Company, Inc.
Boston, MA
Custodian
State Street Bank and Trust Company
Quincy, MA
(Fidelity Investment logo)(registered trademark)
ASCFI-UANN-0114 1.786698.110
(Fidelity Investment logo)(registered trademark)
Fidelity Advisor®
Small Cap
Fund - Class Z
Annual Report
November 30, 2013
(Fidelity Cover Art)
Contents
|
Performance |
How the fund has done over time. |
|
|
Management's Discussion of Fund Performance |
The Portfolio Manager's review of fund performance and strategy. |
|
|
Shareholder Expense Example |
An example of shareholder expenses. |
|
|
Investment Changes |
A summary of major shifts in the fund's investments over the past six months. |
|
|
Investments |
A complete list of the fund's investments with their market values. |
|
|
Financial Statements |
Statements of assets and liabilities, operations, and changes in net assets, as well as financial highlights. |
|
|
Notes |
Notes to the financial statements. |
|
|
Report of Independent Registered Public Accounting Firm |
|
|
|
Trustees and Officers |
|
|
|
Distributions |
|
|
|
Board Approval of Investment Advisory Contracts and Management Fees |
|
To view a fund's proxy voting guidelines and proxy voting record for the 12-month period ended June 30, visit http://www.fidelity.com/proxyvotingresults or visit the Securities and Exchange Commission's (SEC) web site at http://www.sec.gov. You may also call 1-877-208-0098 to request a free copy of the proxy voting guidelines.
Standard & Poor's, S&P and S&P 500 are registered service marks of The McGraw-Hill Companies, Inc. and have been licensed for use by Fidelity Distributors Corporation.
Other third-party marks appearing herein are the property of their respective owners.
All other marks appearing herein are registered or unregistered trademarks or service marks of FMR LLC or an affiliated company. © 2014 FMR LLC. All rights reserved.
Annual Report
This report and the financial statements contained herein are submitted for the general information of the shareholders of the fund. This report is not authorized for distribution to prospective investors in the fund unless preceded or accompanied by an effective prospectus.
A fund files its complete schedule of portfolio holdings with the SEC for the first and third quarters of each fiscal year on Form N-Q. Forms N-Q are available on the SEC's web site at http://www.sec.gov. A fund's Forms N-Q may be reviewed and copied at the SEC's Public Reference Room in Washington, DC. Information regarding the operation of the SEC's Public Reference Room may be obtained by calling 1-800-SEC-0330. For a complete list of a fund's portfolio holdings, view the most recent holdings listing, semiannual report, or annual report on Fidelity's web site at http://www.fidelity.com, http://www.advisor.fidelity.com, or http://www.401k.com, as applicable.
NOT FDIC INSURED • MAY LOSE VALUE • NO BANK GUARANTEE
Neither the fund nor Fidelity Distributors Corporation is a bank.
Annual Report
Performance: The Bottom Line
Average annual total return reflects the change in the value of an investment, assuming reinvestment of the class' distributions from dividend income and capital gains (the profits earned upon the sale of securities that have grown in value, if any) and assuming a constant rate of performance each year. The $10,000 table and the fund's returns do not reflect the deduction of taxes that a shareholder would pay on fund distributions or the redemption of fund shares. During periods of reimbursement by Fidelity, a fund's total return will be greater than it would be had the reimbursement not occurred. How a fund did yesterday is no guarantee of how it will do tomorrow.
Average Annual Total Returns
|
Periods ended November 30, 2013 |
Past 1 |
Past 5 |
Past 10 |
|
Class Z A |
38.83% |
16.46% |
10.27% |
A The initial offering of Class Z shares took place on August 13, 2013. Returns prior to August 13, 2013 are those of Institutional Class.
$10,000 Over 10 Years
Let's say hypothetically that $10,000 was invested in Fidelity Advisor® Small Cap Fund - Class Z on November 30, 2003. The chart shows how the value of your investment would have changed, and also shows how the Russell 2000® Index performed over the same period. See footnote A above for additional information regarding the performance of Class Z.
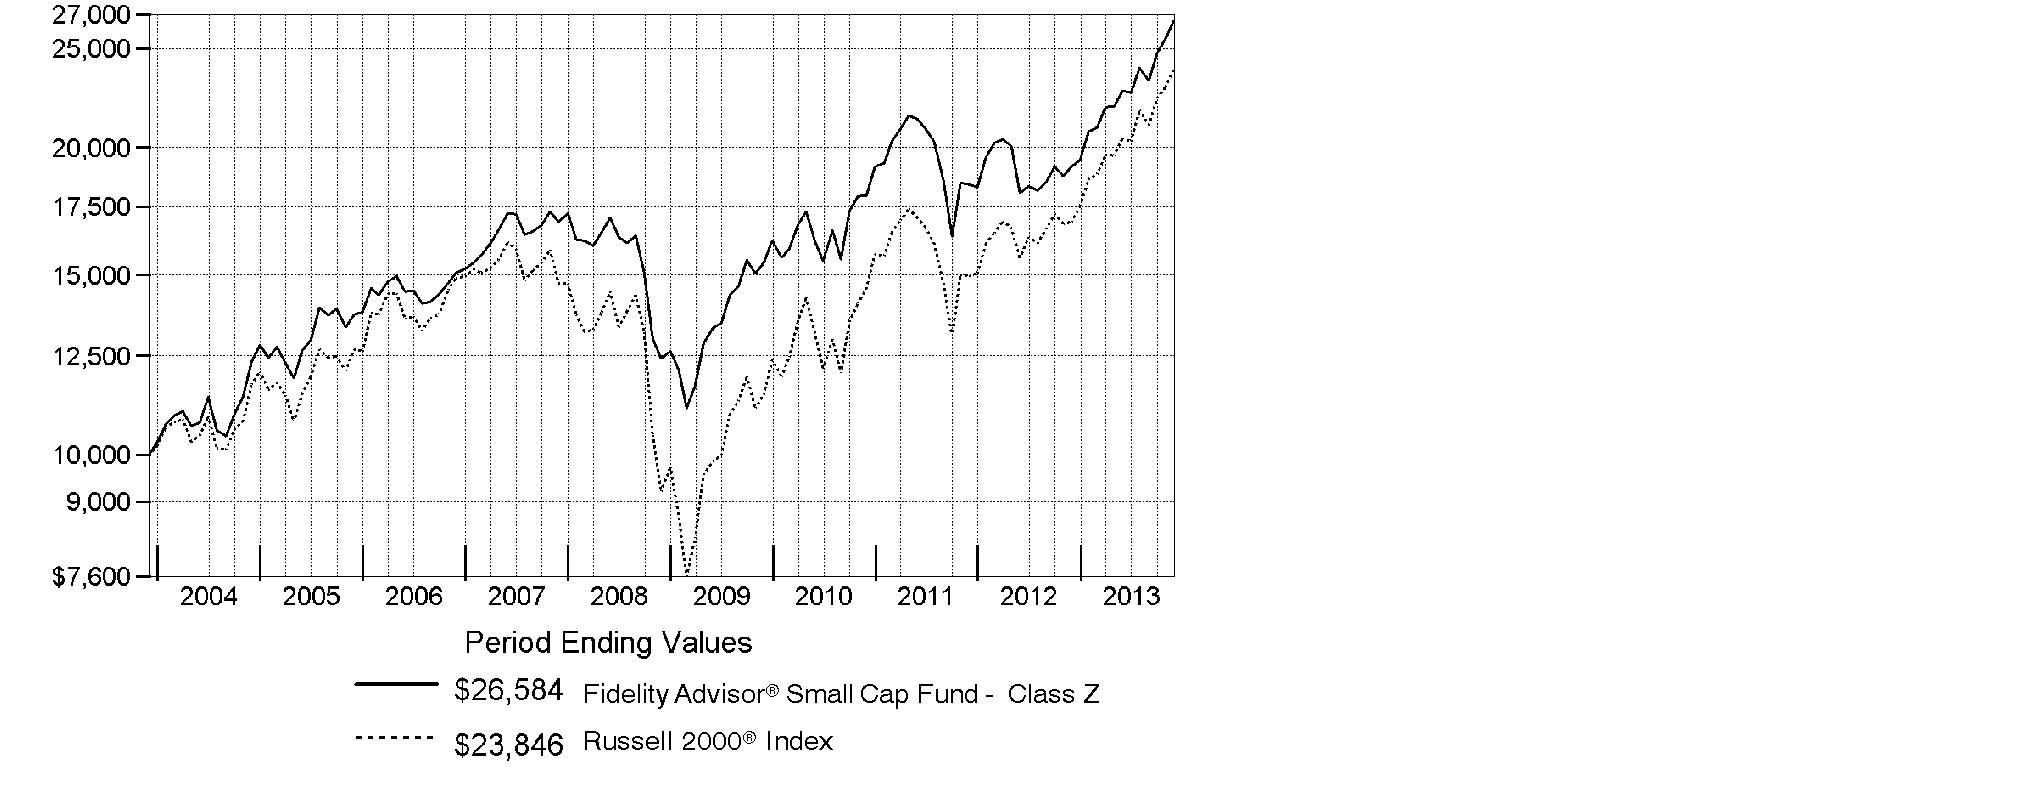
Annual Report
Management's Discussion of Fund Performance
Market Recap: With the current bull run nearing the five-year mark, equity benchmarks ripped up old records during the 12 months ending November 30, 2013. Gains were fueled by strengthening U.S. economic data, as well as generally improving economies and accommodative monetary policies worldwide. The broad S&P 500® Index reached new peaks in its 30.30% climb for the period, and the blue-chip Dow Jones Industrial AverageSM surpassed historic milestones en route to a 26.63% gain. The Nasdaq Composite Index®, up 36.73% amid a resurgence in growth-oriented stocks, closed above 4,000 for the first time since 2000. Shedding anxiety over the 2012 U.S. presidential election - and apparently confident that the federal debt-ceiling debate would be resolved - markets rose from period start through late May. News that the U.S. Federal Reserve was considering an end to its stimulative bond-buying kept stocks in flux over the summer but, by September, the Fed had set aside any imminent tapering. Despite jitters over a potential U.S. military strike in Syria and, later, an October budget impasse that briefly shuttered the federal government, volatility was subdued heading into the holidays, with investor optimism helping many markets home in on all-time highs at period end. Elsewhere, non-U.S. developed-market equities saw similar results, with the MSCI® EAFE® Index adding 24.97%.
Comments from James Harmon, Portfolio Manager of Fidelity Advisor® Small Cap Fund: For the year, the fund's Class Z shares trailed the 40.99% gain of the Russell 2000® Index. (For specific class-level results, please refer to the performance section of this report). On a relative basis, the fund was hampered the most by weak stock picking among energy and retailing stocks, while positioning in the real estate industry contributed. Given my management focus on high-quality, "steady Eddie" businesses, it was extremely difficult to keep pace with many of the speculative small-cap names that led the market's rally. On an individual security basis, the fund's biggest relative detractor was EZCORP, which is primarily a pawnbroker in the U.S. and Mexico. The stock was hurt by low gold prices and business-execution challenges, among other factors. Another detractor was a non-index investment in fuel logistics company World Fuel Services, which was hurt by worries about potential legal liability surrounding a July train crash in Canada. In contrast, iGATE, a provider of India-based offshore information technology consulting services, was the fund's leading contributor. Coming into the period, iGATE's shares were very inexpensively valued, and renewed optimism about the prospects for the company's 2011 acquisition of Patni Computer Systems helped iGATE's stock to bounce back.
The views expressed above reflect those of the portfolio manager(s) only through the end of the period as stated on the cover of this report and do not necessarily represent the views of Fidelity or any other person in the Fidelity organization. Any such views are subject to change at any time based upon market or other conditions and Fidelity disclaims any responsibility to update such views. These views may not be relied on as investment advice and, because investment decisions for a Fidelity fund are based on numerous factors, may not be relied on as an indication of trading intent on behalf of any Fidelity fund.
Annual Report
Shareholder Expense Example
As a shareholder of the Fund, you incur two types of costs: (1) transaction costs, including sales charges (loads) on purchase payments or redemption proceeds, and (2) ongoing costs, including management fees, distribution and/or service (12b-1) fees and other Fund expenses. This Example is intended to help you understand your ongoing costs (in dollars) of investing in the Fund and to compare these costs with the ongoing costs of investing in other mutual funds.
The actual expense Example is based on an investment of $1,000 invested at the beginning of the period and held for the entire period (June 1, 2013 to November 31, 2013) for Class A, Class T, Class B, Class C and Institutional Class and for the period (August 13, 2013 to November 30, 2013) for Class Z. The hypothetical expense Example is based on investment of $1,000 for the one-half year period (June 1, 2013 to November 30, 2013).
Actual Expenses
The first line of the accompanying table for each class of the Fund provides information about actual account values and actual expenses. You may use the information in this line, together with the amount you invested, to estimate the expenses that you paid over the period. Simply divide your account value by $1,000.00 (for example, an $8,600 account value divided by $1,000.00 = 8.6), then multiply the result by the number in the first line for a class of the Fund under the heading entitled "Expenses Paid During Period" to estimate the expenses you paid on your account during this period. In addition, the Fund, as a shareholder in the underlying Fidelity Central Funds, will indirectly bear its pro-rata share of the fees and expenses incurred by the underlying Fidelity Central Funds. These fees and expenses are not included in the Fund's annualized expense ratio used to calculate the expense estimate in the table below.
Hypothetical Example for Comparison Purposes
The second line of the accompanying table for each class of the Fund provides information about hypothetical account values and hypothetical expenses based on a Class' actual expense ratio and an assumed rate of return of 5% per year before expenses, which is not the Class' actual return. The hypothetical account values and expenses may not be used to estimate the actual ending account balance or expenses you paid for the period. You may use this information to compare the ongoing costs of investing in the Fund and other funds. To do so, compare this 5% hypothetical example with the 5% hypothetical examples that appear in the shareholder reports of the other funds. In addition, the Fund, as a shareholder in the underlying Fidelity Central Funds, will indirectly bear its pro-rata share of the fees and expenses incurred by the underlying Fidelity Central Funds. These fees and expenses are not included in the Fund's annualized expense ratio used to calculate the expense estimate in the table below.
Please note that the expenses shown in the table are meant to highlight your ongoing costs only and do not reflect any transaction costs. Therefore, the second line of the table is useful in comparing ongoing costs only, and will not help you determine the relative total costs of owning different funds. In addition, if these transactional costs were included, your costs would have been higher.
Annual Report
|
|
Annualized |
Beginning |
Ending |
Expenses Paid |
|
Class A |
1.00% |
|
|
|
|
Actual |
|
$ 1,000.00 |
$ 1,167.90 |
$ 5.43 C |
|
HypotheticalA |
|
$ 1,000.00 |
$ 1,020.05 |
$ 5.06 D |
|
Class T |
1.21% |
|
|
|
|
Actual |
|
$ 1,000.00 |
$ 1,167.10 |
$ 6.57 C |
|
HypotheticalA |
|
$ 1,000.00 |
$ 1,019.00 |
$ 6.12 D |
|
Class B |
1.81% |
|
|
|
|
Actual |
|
$ 1,000.00 |
$ 1,163.70 |
$ 9.82 C |
|
HypotheticalA |
|
$ 1,000.00 |
$ 1,015.99 |
$ 9.15 D |
|
Class C |
1.75% |
|
|
|
|
Actual |
|
$ 1,000.00 |
$ 1,163.40 |
$ 9.49 C |
|
HypotheticalA |
|
$ 1,000.00 |
$ 1,016.29 |
$ 8.85 D |
|
Institutional Class |
.70% |
|
|
|
|
Actual |
|
$ 1,000.00 |
$ 1,169.80 |
$ 3.81 C |
|
HypotheticalA |
|
$ 1,000.00 |
$ 1,021.56 |
$ 3.55 D |
|
Class Z |
.56% |
|
|
|
|
Actual |
|
$ 1,000.00 |
$ 1,099.00 |
$ 1.77 C |
|
HypotheticalA |
|
$ 1,000.00 |
$ 1,022.26 |
$ 2.84 D |
A 5% return per year before expenses
B Annualized expense ratio reflects expenses net of applicable fee waivers.
C Actual expenses are equal to each Class' annualized expense ratio, multiplied by the average account value over the period, multiplied by 183/365 (to reflect the one-half year period) for Class A, Class T, Class B, Class C and Institutional Class and multiplied by 110/365 (to reflect the period August 13, 2013 to November 30, 2013) for Class Z. The fees and expenses of the underlying Fidelity Central Funds in which the Fund invests are not included in each Class' annualized expense ratio.
D Hypothetical expenses are equal to each Class' annualized expense ratio, multiplied by the average account value over the period, multiplied by 183/365 (to reflect the one-half year period). The fees and expenses of the underlying Fidelity Central Funds in which the Fund invests are not included in each Class' annualized expense ratio.
Annual Report
Investment Changes (Unaudited)
|
Top Ten Stocks as of November 30, 2013 |
||
|
|
% of fund's |
% of fund's net assets |
|
Global Payments, Inc. |
1.8 |
0.9 |
|
Badger Daylighting Ltd. |
1.8 |
1.1 |
|
Primerica, Inc. |
1.7 |
1.6 |
|
Moog, Inc. Class A |
1.7 |
1.3 |
|
Office Depot, Inc. |
1.7 |
0.8 |
|
Skechers U.S.A., Inc. Class A (sub. vtg.) |
1.7 |
1.3 |
|
The Ensign Group, Inc. |
1.6 |
1.3 |
|
PolyOne Corp. |
1.6 |
1.7 |
|
WESCO International, Inc. |
1.5 |
1.4 |
|
Jazz Pharmaceuticals PLC |
1.5 |
0.9 |
|
|
16.6 |
|
|
Top Five Market Sectors as of November 30, 2013 |
||
|
|
% of fund's |
% of fund's net assets |
|
Financials |
19.2 |
22.2 |
|
Information Technology |
16.7 |
14.7 |
|
Consumer Discretionary |
16.3 |
18.6 |
|
Industrials |
14.7 |
13.7 |
|
Health Care |
11.3 |
9.7 |
|
Asset Allocation (% of fund's net assets) |
|||||||
|
As of November 30, 2013* |
As of May 31, 2013** |
||||||
 |
Stocks and Equity |
|
|
Stocks and Equity |
|
||
 |
Short-Term |
|
|
Short-Term |
|
||
|
* Foreign investments |
19.7% |
|
** Foreign investments |
17.9% |
|
||

Annual Report
Investments November 30, 2013
Showing Percentage of Net Assets
|
Common Stocks - 93.6% |
|||
|
Shares |
Value (000s) |
||
|
CONSUMER DISCRETIONARY - 16.3% |
|||
|
Auto Components - 0.6% |
|||
|
Dorman Products, Inc. |
438,300 |
$ 21,819 |
|
|
Diversified Consumer Services - 1.7% |
|||
|
Best Bridal, Inc. (d)(e) |
2,789,100 |
18,568 |
|
|
Grand Canyon Education, Inc. (a) |
569,800 |
25,949 |
|
|
Meiko Network Japan Co. Ltd. (e) |
1,577,900 |
16,280 |
|
|
|
60,797 |
||
|
Hotels, Restaurants & Leisure - 1.5% |
|||
|
AFC Enterprises, Inc. (a) |
219,200 |
9,555 |
|
|
Life Time Fitness, Inc. (a) |
394,500 |
19,137 |
|
|
Texas Roadhouse, Inc. Class A |
789,000 |
22,076 |
|
|
|
50,768 |
||
|
Household Durables - 1.8% |
|||
|
Iida Group Holdings Co. Ltd. (a)(d) |
1,100,999 |
22,150 |
|
|
Tupperware Brands Corp. |
438,300 |
40,034 |
|
|
|
62,184 |
||
|
Multiline Retail - 0.7% |
|||
|
Big Lots, Inc. (a) |
600,205 |
23,006 |
|
|
Specialty Retail - 6.6% |
|||
|
Aarons, Inc. Class A |
1,051,900 |
30,126 |
|
|
Aeropostale, Inc. (a)(d) |
3,014,100 |
31,106 |
|
|
Ascena Retail Group, Inc. (a) |
1,008,100 |
21,473 |
|
|
Genesco, Inc. (a) |
500,000 |
37,455 |
|
|
Jumbo SA (a) |
1,358,800 |
21,159 |
|
|
Murphy U.S.A., Inc. |
613,600 |
27,765 |
|
|
Office Depot, Inc. (a)(d) |
10,852,600 |
59,038 |
|
|
|
228,122 |
||
|
Textiles, Apparel & Luxury Goods - 3.4% |
|||
|
Skechers U.S.A., Inc. Class A (sub. vtg.) (a) |
1,753,200 |
58,943 |
|
|
Steven Madden Ltd. (a) |
1,052,000 |
40,986 |
|
|
Wolverine World Wide, Inc. |
613,600 |
20,194 |
|
|
|
120,123 |
||
|
TOTAL CONSUMER DISCRETIONARY |
566,819 |
||
|
CONSUMER STAPLES - 4.8% |
|||
|
Food & Staples Retailing - 1.7% |
|||
|
Ain Pharmaciez, Inc. |
114,000 |
5,280 |
|
|
Common Stocks - continued |
|||
|
Shares |
Value (000s) |
||
|
CONSUMER STAPLES - continued |
|||
|
Food & Staples Retailing - continued |
|||
|
Sundrug Co. Ltd. |
604,900 |
$ 27,250 |
|
|
Tsuruha Holdings, Inc. |
263,000 |
24,209 |
|
|
|
56,739 |
||
|
Food Products - 1.0% |
|||
|
Darling International, Inc. (a) |
1,665,600 |
34,528 |
|
|
Personal Products - 2.1% |
|||
|
Atrium Innovations, Inc. (a)(e) |
2,016,200 |
46,147 |
|
|
Prestige Brands Holdings, Inc. (a) |
789,000 |
27,804 |
|
|
|
73,951 |
||
|
TOTAL CONSUMER STAPLES |
165,218 |
||
|
ENERGY - 5.5% |
|||
|
Energy Equipment & Services - 3.9% |
|||
|
Cathedral Energy Services Ltd. (e) |
3,141,600 |
14,931 |
|
|
Key Energy Services, Inc. (a) |
4,383,100 |
34,364 |
|
|
Oil States International, Inc. (a) |
219,200 |
22,435 |
|
|
Pason Systems, Inc. |
1,840,900 |
39,328 |
|
|
Western Energy Services Corp. (a)(f) |
1,080,720 |
7,618 |
|
|
Western Energy Services Corp. |
2,279,200 |
16,066 |
|
|
|
134,742 |
||
|
Oil, Gas & Consumable Fuels - 1.6% |
|||
|
BP Prudhoe Bay Royalty Trust (d) |
15,506 |
1,179 |
|
|
Sunoco Logistics Partners LP |
219,200 |
15,515 |
|
|
World Fuel Services Corp. |
1,052,000 |
40,397 |
|
|
|
57,091 |
||
|
TOTAL ENERGY |
191,833 |
||
|
FINANCIALS - 19.2% |
|||
|
Capital Markets - 0.4% |
|||
|
Virtus Investment Partners, Inc. (a) |
65,700 |
13,652 |
|
|
Commercial Banks - 4.6% |
|||
|
Bank of the Ozarks, Inc. |
350,700 |
19,692 |
|
|
East West Bancorp, Inc. |
1,051,900 |
36,059 |
|
|
First Financial Bankshares, Inc. (d) |
175,300 |
11,636 |
|
|
Popular, Inc. (a) |
657,500 |
18,791 |
|
|
Prosperity Bancshares, Inc. |
350,600 |
22,484 |
|
|
Common Stocks - continued |
|||
|
Shares |
Value (000s) |
||
|
FINANCIALS - continued |
|||
|
Commercial Banks - continued |
|||
|
Sterling Financial Corp. |
1,051,900 |
$ 34,345 |
|
|
SVB Financial Group (a) |
175,300 |
17,747 |
|
|
|
160,754 |
||
|
Consumer Finance - 0.6% |
|||
|
EZCORP, Inc. (non-vtg.) Class A (a) |
1,765,700 |
20,623 |
|
|
Insurance - 7.3% |
|||
|
CNO Financial Group, Inc. |
2,279,200 |
38,564 |
|
|
Enstar Group Ltd. (a) |
175,300 |
24,421 |
|
|
HCC Insurance Holdings, Inc. |
789,000 |
36,278 |
|
|
Primerica, Inc. |
1,402,600 |
60,354 |
|
|
ProAssurance Corp. |
613,600 |
29,502 |
|
|
Reinsurance Group of America, Inc. |
473,400 |
35,496 |
|
|
RenaissanceRe Holdings Ltd. |
300,000 |
28,410 |
|
|
|
253,025 |
||
|
Real Estate Investment Trusts - 5.2% |
|||
|
Aviv REIT, Inc. |
657,500 |
16,898 |
|
|
Corrections Corp. of America |
701,300 |
23,388 |
|
|
EPR Properties |
350,600 |
17,632 |
|
|
Equity Lifestyle Properties, Inc. |
394,500 |
14,005 |
|
|
First Industrial Realty Trust, Inc. |
964,300 |
16,837 |
|
|
MFA Financial, Inc. |
3,814,900 |
27,811 |
|
|
National Health Investors, Inc. |
263,000 |
15,483 |
|
|
Rouse Properties, Inc. (d) |
1,402,600 |
34,209 |
|
|
Sovran Self Storage, Inc. |
219,200 |
14,629 |
|
|
|
180,892 |
||
|
Real Estate Management & Development - 0.3% |
|||
|
Relo Holdings Corp. |
219,200 |
10,698 |
|
|
Thrifts & Mortgage Finance - 0.8% |
|||
|
EverBank Financial Corp. (d) |
1,665,600 |
28,432 |
|
|
TOTAL FINANCIALS |
668,076 |
||
|
HEALTH CARE - 11.3% |
|||
|
Biotechnology - 1.2% |
|||
|
United Therapeutics Corp. (a) |
438,300 |
40,459 |
|
|
Health Care Equipment & Supplies - 1.6% |
|||
|
DENTSPLY International, Inc. |
482,100 |
22,929 |
|
|
The Cooper Companies, Inc. |
263,000 |
34,648 |
|
|
|
57,577 |
||
|
Common Stocks - continued |
|||
|
Shares |
Value (000s) |
||
|
HEALTH CARE - continued |
|||
|
Health Care Providers & Services - 6.2% |
|||
|
AmSurg Corp. (a) |
1,051,900 |
$ 50,828 |
|
|
Centene Corp. (a) |
175,300 |
10,471 |
|
|
Community Health Systems, Inc. |
789,000 |
32,546 |
|
|
Health Net, Inc. (a) |
701,300 |
21,425 |
|
|
Henry Schein, Inc. (a) |
175,300 |
19,984 |
|
|
MEDNAX, Inc. (a) |
219,200 |
24,287 |
|
|
The Ensign Group, Inc. (e) |
1,227,300 |
55,437 |
|
|
|
214,978 |
||
|
Health Care Technology - 0.8% |
|||
|
Quality Systems, Inc. |
1,139,600 |
26,621 |
|
|
Pharmaceuticals - 1.5% |
|||
|
Jazz Pharmaceuticals PLC (a) |
438,300 |
51,246 |
|
|
TOTAL HEALTH CARE |
390,881 |
||
|
INDUSTRIALS - 14.7% |
|||
|
Aerospace & Defense - 2.9% |
|||
|
Moog, Inc. Class A (a) |
876,600 |
60,196 |
|
|
Teledyne Technologies, Inc. (a) |
438,300 |
40,644 |
|
|
|
100,840 |
||
|
Commercial Services & Supplies - 2.3% |
|||
|
Mitie Group PLC |
5,698,100 |
29,044 |
|
|
UniFirst Corp. |
263,799 |
26,971 |
|
|
West Corp. |
1,095,800 |
25,236 |
|
|
|
81,251 |
||
|
Construction & Engineering - 1.8% |
|||
|
Badger Daylighting Ltd. (e) |
753,900 |
60,809 |
|
|
Machinery - 3.3% |
|||
|
Actuant Corp. Class A |
701,300 |
27,407 |
|
|
Hy-Lok Corp. |
400,000 |
10,584 |
|
|
Standex International Corp. |
438,300 |
25,825 |
|
|
TriMas Corp. (a) |
876,544 |
32,064 |
|
|
Valmont Industries, Inc. |
119,840 |
17,342 |
|
|
|
113,222 |
||
|
Marine - 0.2% |
|||
|
SITC International Holdings Co. Ltd. |
18,409,000 |
8,097 |
|
|
Common Stocks - continued |
|||
|
Shares |
Value (000s) |
||
|
INDUSTRIALS - continued |
|||
|
Professional Services - 1.2% |
|||
|
Benefit One, Inc. |
1,840,900 |
$ 17,592 |
|
|
Stantec, Inc. |
350,700 |
22,754 |
|
|
|
40,346 |
||
|
Trading Companies & Distributors - 3.0% |
|||
|
DXP Enterprises, Inc. (a) |
263,000 |
25,769 |
|
|
Textainer Group Holdings Ltd. |
701,300 |
27,231 |
|
|
WESCO International, Inc. (a) |
613,600 |
52,757 |
|
|
|
105,757 |
||
|
TOTAL INDUSTRIALS |
510,322 |
||
|
INFORMATION TECHNOLOGY - 16.7% |
|||
|
Electronic Equipment & Components - 4.3% |
|||
|
Belden, Inc. |
394,500 |
27,623 |
|
|
CDW Corp. (d) |
1,753,300 |
39,099 |
|
|
Insight Enterprises, Inc. (a) |
1,139,600 |
27,430 |
|
|
Jabil Circuit, Inc. |
1,202,130 |
24,367 |
|
|
ScanSource, Inc. (a) |
754,881 |
31,697 |
|
|
|
150,216 |
||
|
Internet Software & Services - 2.9% |
|||
|
Perficient, Inc. (a) |
1,528,600 |
33,140 |
|
|
Stamps.com, Inc. (a)(e) |
876,600 |
40,385 |
|
|
ValueClick, Inc. (a) |
1,227,300 |
26,264 |
|
|
|
99,789 |
||
|
IT Services - 6.7% |
|||
|
EPAM Systems, Inc. (a) |
843,700 |
29,926 |
|
|
Genpact Ltd. (a) |
1,314,900 |
23,537 |
|
|
Global Payments, Inc. |
989,700 |
62,403 |
|
|
iGATE Corp. (a) |
1,080,600 |
36,178 |
|
|
Syntel, Inc. |
306,800 |
27,112 |
|
|
VeriFone Systems, Inc. (a) |
1,052,000 |
26,942 |
|
|
WEX, Inc. (a) |
263,000 |
26,105 |
|
|
|
232,203 |
||
|
Semiconductors & Semiconductor Equipment - 0.7% |
|||
|
Omnivision Technologies, Inc. (a) |
1,577,900 |
25,294 |
|
|
Software - 2.1% |
|||
|
NIIT Technologies Ltd. (e) |
3,800,000 |
19,396 |
|
|
SWORD Group (e) |
587,339 |
12,673 |
|
|
Common Stocks - continued |
|||
|
Shares |
Value (000s) |
||
|
INFORMATION TECHNOLOGY - continued |
|||
|
Software - continued |
|||
|
Verint Systems, Inc. (a) |
613,600 |
$ 23,268 |
|
|
Zensar Technologies Ltd. (a)(e) |
3,499,999 |
18,120 |
|
|
|
73,457 |
||
|
TOTAL INFORMATION TECHNOLOGY |
580,959 |
||
|
MATERIALS - 4.7% |
|||
|
Chemicals - 2.9% |
|||
|
Axiall Corp. |
438,300 |
19,855 |
|
|
FUCHS PETROLUB AG |
306,800 |
25,388 |
|
|
PolyOne Corp. |
1,665,600 |
54,065 |
|
|
|
99,308 |
||
|
Containers & Packaging - 0.8% |
|||
|
Sealed Air Corp. |
876,600 |
28,148 |
|
|
Metals & Mining - 1.0% |
|||
|
Aurubis AG |
394,500 |
23,272 |
|
|
Maharashtra Seamless Ltd. (a) |
190,000 |
510 |
|
|
Reliance Steel & Aluminum Co. |
175,300 |
12,890 |
|
|
|
36,672 |
||
|
TOTAL MATERIALS |
164,128 |
||
|
UTILITIES - 0.4% |
|||
|
Gas Utilities - 0.4% |
|||
|
New Jersey Resources Corp. |
263,000 |
12,016 |
|
|
TOTAL COMMON STOCKS (Cost $2,362,139) |
|
||
|
U.S. Treasury Obligations - 0.3% |
||||
|
|
Principal Amount (000s) |
|
||
|
U.S. Treasury Bills, yield at date of purchase 0.01% to 0.07% 12/12/13 to 2/27/14 (g) |
|
$ 10,260 |
|
|
|
Money Market Funds - 9.2% |
|||
|
Shares |
Value (000s) |
||
|
Fidelity Cash Central Fund, 0.10% (b) |
262,782,714 |
$ 262,783 |
|
|
Fidelity Securities Lending Cash Central Fund, 0.10% (b)(c) |
57,688,350 |
57,688 |
|
|
TOTAL MONEY MARKET FUNDS (Cost $320,471) |
|
||
|
TOTAL INVESTMENT PORTFOLIO - 103.1% (Cost $2,692,870) |
3,580,983 |
||
|
NET OTHER ASSETS (LIABILITIES) - (3.1)% |
(107,717) |
||
|
NET ASSETS - 100% |
$ 3,473,266 |
||
|
Futures Contracts |
|||||
|
|
Expiration Date |
Underlying Face Amount at Value (000s) |
Unrealized Appreciation/ |
||
|
Purchased |
|||||
|
Equity Index Contracts |
|||||
|
1,852 ICE Russell 2000 Mini Index Contracts (United States) |
Dec. 2013 |
$ 211,443 |
$ 7,338 |
||
|
|
|
The face value of futures purchased as a percentage of net assets is 6.1% |
|
Legend |
|
(a) Non-income producing |
|
(b) Affiliated fund that is generally available only to investment companies and other accounts managed by Fidelity Investments. The rate quoted is the annualized seven-day yield of the fund at period end. A complete unaudited listing of the fund's holdings as of its most recent quarter end is available upon request. In addition, each Fidelity Central Fund's financial statements, which are not covered by the Fund's Report of Independent Registered Public Accounting Firm, are available on the SEC's website or upon request. |
|
(c) Investment made with cash collateral received from securities on loan. |
|
(d) Security or a portion of the security is on loan at period end. |
|
(e) Affiliated company |
|
(f) Security exempt from registration under Rule 144A of the Securities Act of 1933. These securities may be resold in transactions exempt from registration, normally to qualified institutional buyers. At the end of the period, the value of these securities amounted to $7,618,000 or 0.2% of net assets. |
|
(g) Security or a portion of the security was pledged to cover margin requirements for futures contracts. At period end, the value of securities pledged amounted to $8,565,000. |
|
Affiliated Central Funds |
|
Information regarding fiscal year to date income earned by the Fund from investments in Fidelity Central Funds is as follows: |
|
Fund |
Income earned |
|
Fidelity Cash Central Fund |
$ 107 |
|
Fidelity Securities Lending Cash Central Fund |
1,296 |
|
Total |
$ 1,403 |
|
Other Affiliated Issuers |
|
An affiliated company is a company in which the Fund has ownership of at least 5% of the voting securities. Fiscal year to date transactions with companies which are or were affiliates are as follows: |
|
Affiliate |
Value, |
Purchases |
Sales |
Dividend |
Value, |
|
Aeropostale, Inc. |
$ 56,018 |
$ 3,852 |
$ 17,732* |
$ - |
$ - |
|
AFC Enterprises, Inc. |
32,238 |
- |
32,813* |
- |
- |
|
Atrium Innovations, Inc. |
26,627 |
- |
5,014* |
- |
46,147 |
|
Badger Daylighting Ltd. |
26,674 |
- |
7,093* |
759 |
60,809 |
|
Benefit One, Inc. |
13,959 |
- |
5,786* |
430 |
- |
|
Best Bridal, Inc. |
16,354 |
- |
2,706* |
325 |
18,568 |
|
Cathedral Energy Services Ltd. |
15,502 |
3,121 |
2,215* |
806 |
14,931 |
|
CBIZ, Inc. |
29,631 |
- |
31,193 |
- |
- |
|
Healthways, Inc. |
24,886 |
- |
31,115 |
- |
- |
|
iGATE Corp. |
64,457 |
- |
78,315* |
- |
- |
|
Insight Enterprises, Inc. |
59,290 |
- |
46,403* |
- |
- |
|
Meiko Network Japan Co. Ltd. |
25,756 |
- |
11,282* |
532 |
16,280 |
|
NIIT Technologies Ltd. |
19,569 |
- |
- |
550 |
19,396 |
|
Affiliate |
Value, |
Purchases |
Sales |
Dividend |
Value, |
|
Perficient, Inc. |
$ 30,492 |
$ - |
$ 24,689* |
$ - |
$ - |
|
Prestige Brands Holdings, Inc. |
58,320 |
- |
59,982* |
- |
- |
|
Simplex Holdings, Inc. |
10,454 |
- |
17,258 |
194 |
- |
|
Stamps.com, Inc. |
35,518 |
- |
22,764* |
- |
40,385 |
|
SWORD Group |
13,117 |
- |
4,035* |
561 |
12,673 |
|
The Ensign Group, Inc. |
36,106 |
- |
7,533* |
364 |
55,437 |
|
Zensar Technologies Ltd. |
15,637 |
1,208 |
- |
492 |
18,120 |
|
Total |
$ 610,605 |
$ 8,181 |
$ 407,928 |
$ 5,013 |
$ 302,746 |
|
* Includes the value of securities delivered through in-kind transactions. |
|
Other Information |
|
The following is a summary of the inputs used, as of November 30, 2013, involving the Fund's assets and liabilities carried at fair value. The inputs or methodology used for valuing securities may not be an indication of the risk associated with investing in those securities. For more information on valuation inputs, and their aggregation into the levels used in the tables below, please refer to the Investment Valuation section in the accompanying Notes to Financial Statements. |
|
Valuation Inputs at Reporting Date: |
||||
|
Description |
Total |
Level 1 |
Level 2 |
Level 3 |
|
Investments in Securities: |
||||
|
Equities: |
||||
|
Consumer Discretionary |
$ 566,819 |
$ 566,819 |
$ - |
$ - |
|
Consumer Staples |
165,218 |
165,218 |
- |
- |
|
Energy |
191,833 |
191,833 |
- |
- |
|
Financials |
668,076 |
668,076 |
- |
- |
|
Health Care |
390,881 |
390,881 |
- |
- |
|
Industrials |
510,322 |
510,322 |
- |
- |
|
Information Technology |
580,959 |
580,959 |
- |
- |
|
Materials |
164,128 |
164,128 |
- |
- |
|
Utilities |
12,016 |
12,016 |
- |
- |
|
U.S. Government and Government Agency Obligations |
10,260 |
- |
10,260 |
- |
|
Money Market Funds |
320,471 |
320,471 |
- |
- |
|
Total Investments in Securities: |
$ 3,580,983 |
$ 3,570,723 |
$ 10,260 |
$ - |
|
Derivative Instruments: |
||||
|
Assets |
||||
|
Futures Contracts |
$ 7,338 |
$ 7,338 |
$ - |
$ - |
|
The following is a summary of transfers between Level 1 and Level 2 for the period ended November 30, 2013. Transfers are assumed to have occurred at the beginning of the period, and are primarily attributable to the valuation techniques used for foreign equity securities, as discussed in the accompanying Notes to Financial Statements: |
|
Transfers |
Total (000s) |
|
Level 1 to Level 2 |
$ 0 |
|
Level 2 to Level 1 |
$ 162,651 |
|
Value of Derivative Instruments |
|
The following table is a summary of the Fund's value of derivative instruments by primary risk exposure as of November 30, 2013. For additional information on derivative instruments, please refer to the Derivative Instruments section in the accompanying Notes to Financial Statements. |
|
Primary Risk Exposure / |
Value |
|
|
|
Asset |
Liability |
|
Equity Risk |
||
|
Futures Contracts (a) |
$ 7,338 |
$ - |
|
Total Value of Derivatives |
$ 7,338 |
$ - |
|
(a) Reflects gross cumulative appreciation (depreciation) on futures contracts as presented in the Schedule of Investments. Only the period end receivable or payable for daily variation margin and net unrealized appreciation (depreciation) are presented in the Statement of Assets and Liabilities. |
|
Distribution of investments by country or territory of incorporation, as a percentage of total net assets, is as follows (Unaudited): |
|
United States of America |
80.3% |
|
Canada |
6.0% |
|
Japan |
4.1% |
|
Bermuda |
3.0% |
|
Ireland |
1.5% |
|
Germany |
1.3% |
|
India |
1.0% |
|
Others (Individually Less Than 1%) |
2.8% |
|
|
100.0% |
See accompanying notes which are an integral part of the financial statements.
Annual Report
Financial Statements
Statement of Assets and Liabilities
|
Amounts in thousands (except per-share amounts) |
November 30, 2013 |
|
|
|
|
|
|
Assets |
|
|
|
Investment in securities, at value (including securities loaned of $57,034) - See accompanying schedule: Unaffiliated issuers (cost $2,167,513) |
$ 2,957,766 |
|
|
Fidelity Central Funds (cost $320,471) |
320,471 |
|
|
Other affiliated issuers (cost $204,886) |
302,746 |
|
|
Total Investments (cost $2,692,870) |
|
$ 3,580,983 |
|
Foreign currency held at value (cost $240) |
|
240 |
|
Receivable for investments sold |
|
5,035 |
|
Receivable for fund shares sold |
|
2,098 |
|
Dividends receivable |
|
962 |
|
Distributions receivable from Fidelity Central Funds |
|
70 |
|
Receivable for daily variation margin for derivative instruments |
|
236 |
|
Prepaid expenses |
|
11 |
|
Other receivables |
|
4 |
|
Total assets |
|
3,589,639 |
|
|
|
|
|
Liabilities |
|
|
|
Payable for investments purchased |
$ 48,030 |
|
|
Payable for fund shares redeemed |
7,512 |
|
|
Accrued management fee |
1,367 |
|
|
Distribution and service plan fees payable |
1,016 |
|
|
Other affiliated payables |
690 |
|
|
Other payables and accrued expenses |
70 |
|
|
Collateral on securities loaned, at value |
57,688 |
|
|
Total liabilities |
|
116,373 |
|
|
|
|
|
Net Assets |
|
$ 3,473,266 |
|
Net Assets consist of: |
|
|
|
Paid in capital |
|
$ 2,191,218 |
|
Undistributed net investment income |
|
453 |
|
Accumulated undistributed net realized gain (loss) on investments and foreign currency transactions |
|
386,157 |
|
Net unrealized appreciation (depreciation) on investments and assets and liabilities in foreign currencies |
|
895,438 |
|
Net Assets |
|
$ 3,473,266 |
See accompanying notes which are an integral part of the financial statements.
Annual Report
Statement of Assets and Liabilities - continued
|
Amounts in thousands (except per-share amounts) |
November 30, 2013 |
|
|
|
|
|
|
Calculation of Maximum Offering Price Class A: |
|
$ 30.96 |
|
|
|
|
|
Maximum offering price per share (100/94.25 of $30.96) |
|
$ 32.85 |
|
Class T: |
|
$ 29.69 |
|
|
|
|
|
Maximum offering price per share (100/96.50 of $29.69) |
|
$ 30.77 |
|
Class B: |
|
$ 26.45 |
|
|
|
|
|
Class C: |
|
$ 26.77 |
|
|
|
|
|
Institutional Class: |
|
$ 32.73 |
|
|
|
|
|
Class Z: |
|
$ 32.74 |
A Redemption price per share is equal to net asset value less any applicable contingent deferred sales charge.
See accompanying notes which are an integral part of the financial statements.
Annual Report
Financial Statements - continued
Statement of Operations
|
Amounts in thousands |
Year ended November 30, 2013 |
|
|
|
|
|
|
Investment Income |
|
|
|
Dividends (including $5,013 earned from other affiliated issuers) |
|
$ 46,998 |
|
Special dividends |
|
6,248 |
|
Interest |
|
3 |
|
Income from Fidelity Central Funds |
|
1,403 |
|
Total income |
|
54,652 |
|
|
|
|
|
Expenses |
|
|
|
Management fee |
$ 26,309 |
|
|
Performance adjustment |
(8,636) |
|
|
Transfer agent fees |
8,302 |
|
|
Distribution and service plan fees |
11,819 |
|
|
Accounting and security lending fees |
1,048 |
|
|
Custodian fees and expenses |
155 |
|
|
Independent trustees' compensation |
21 |
|
|
Registration fees |
146 |
|
|
Audit |
77 |
|
|
Legal |
11 |
|
|
Miscellaneous |
25 |
|
|
Total expenses before reductions |
39,277 |
|
|
Expense reductions |
(351) |
38,926 |
|
Net investment income (loss) |
|
15,726 |
|
Realized and Unrealized Gain (Loss) Net realized gain (loss) on: |
|
|
|
Investment securities: |
|
|
|
Unaffiliated issuers |
407,084 |
|
|
Redemption in-kind with affiliated entities (including gain from Other affiliated issuers of $29,049) |
131,946 |
|
|
Other affiliated issuers |
128,365 |
|
|
Foreign currency transactions |
234 |
|
|
Futures contracts |
18,846 |
|
|
Total net realized gain (loss) |
|
686,475 |
|
Change in net unrealized appreciation (depreciation) on: Investment securities |
494,401 |
|
|
Assets and liabilities in foreign currencies |
12 |
|
|
Futures contracts |
7,338 |
|
|
Total change in net unrealized appreciation (depreciation) |
|
501,751 |
|
Net gain (loss) |
|
1,188,226 |
|
Net increase (decrease) in net assets resulting from operations |
|
$ 1,203,952 |
See accompanying notes which are an integral part of the financial statements.
Annual Report
Statement of Changes in Net Assets
|
Amounts in thousands |
Year ended |
Year ended |
|
Increase (Decrease) in Net Assets |
|
|
|
Operations |
|
|
|
Net investment income (loss) |
$ 15,726 |
$ (6,474) |
|
Net realized gain (loss) |
686,475 |
(41,068) |
|
Change in net unrealized appreciation (depreciation) |
501,751 |
195,754 |
|
Net increase (decrease) in net assets resulting |
1,203,952 |
148,212 |
|
Distributions to shareholders from net investment income |
(9,250) |
- |
|
Distributions to shareholders from net realized gain |
(2,080) |
(357,601) |
|
Total distributions |
(11,330) |
(357,601) |
|
Share transactions - net increase (decrease) |
(1,450,861) |
(461,339) |
|
Total increase (decrease) in net assets |
(258,239) |
(670,728) |
|
|
|
|
|
Net Assets |
|
|
|
Beginning of period |
3,731,505 |
4,402,233 |
|
End of period (including undistributed net investment income of $453 and accumulated net investment loss of $4,395, respectively) |
$ 3,473,266 |
$ 3,731,505 |
See accompanying notes which are an integral part of the financial statements.
Annual Report
Financial Highlights - Class A
|
Years ended November 30, |
2013 |
2012 |
2011 |
2010 |
2009 |
|
Selected Per-Share Data |
|
|
|
|
|
|
Net asset value, beginning of period |
$ 22.45 |
$ 23.60 |
$ 24.35 |
$ 21.00 |
$ 17.69 |
|
Income from Investment Operations |
|
|
|
|
|
|
Net investment income (loss) C |
.12 F |
(.03) |
(.09) G |
(.13) |
(.03) |
|
Net realized and unrealized gain (loss) |
8.45 |
.79 |
.67 |
3.48 |
4.09 |
|
Total from investment operations |
8.57 |
.76 |
.58 |
3.35 |
4.06 |
|
Distributions from net investment income |
(.05) |
- |
- |
- |
(.03) |
|
Distributions from net realized gain |
(.01) |
(1.91) |
(1.33) |
- |
(.72) |
|
Total distributions |
(.06) |
(1.91) |
(1.33) |
- |
(.75) |
|
Net asset value, end of period |
$ 30.96 |
$ 22.45 |
$ 23.60 |
$ 24.35 |
$ 21.00 |
|
Total Return A, B |
38.30% |
3.87% |
2.17% |
15.95% |
24.04% |
|
Ratios to Average Net Assets D, H |
|
|
|
|
|
|
Expenses before reductions |
1.01% |
1.06% |
1.31% |
1.44% |
1.53% |
|
Expenses net of fee waivers, if any |
1.01% |
1.06% |
1.31% |
1.40% |
1.40% |
|
Expenses net of all reductions |
1.00% |
1.06% |
1.31% |
1.40% |
1.40% |
|
Net investment income (loss) |
.46% F |
(.13)% |
(.35)% G |
(.58)% |
(.16)% |
|
Supplemental Data |
|
|
|
|
|
|
Net assets, end of period (in millions) |
$ 1,263 |
$ 1,212 |
$ 1,461 |
$ 1,501 |
$ 1,223 |
|
Portfolio turnover rate E |
34% |
69% |
38% |
43% |
46% |
A Total returns would have been lower if certain expenses had not been reduced during the applicable periods shown.
B Total returns do not include the effect of the sales charges.
C Calculated based on average shares outstanding during the period.
D Fees and expenses of any underlying Fidelity Central Funds are not included in the Fund's expense ratio. The Fund indirectly bears its proportionate share of the expenses of any underlying Fidelity Central Funds.
E Amount does not include the portfolio activity of any underlying Fidelity Central Funds.
F Investment income per share reflects a large, non-recurring dividend which amounted to $.04 per share. Excluding this non-recurring dividend, the ratio of net investment income (loss) to average net assets would have been .29%.
G Investment income per share reflects a large, non-recurring dividend which amounted to $.04 per share. Excluding this non-recurring dividend, the ratio of net investment income (loss) to average net assets would have been (.50)%.
H Expense ratios reflect operating expenses of the class. Expenses before reductions do not reflect amounts reimbursed by the investment adviser or reductions from brokerage service arrangements or reductions from other expense offset arrangements and do not represent the amount paid by the class during periods when reimbursements or reductions occur. Expenses net of fee waivers reflect expenses after reimbursement by the investment adviser but prior to reductions from brokerage service arrangements or other expense offset arrangements. Expenses net of all reductions represent the net expenses paid by the class.
See accompanying notes which are an integral part of the financial statements.
Annual Report
Financial Highlights - Class T
|
Years ended November 30, |
2013 |
2012 |
2011 |
2010 |
2009 |
|
Selected Per-Share Data |
|
|
|
|
|
|
Net asset value, beginning of period |
$ 21.52 |
$ 22.75 |
$ 23.57 |
$ 20.37 |
$ 17.20 |
|
Income from Investment Operations |
|
|
|
|
|
|
Net investment income (loss) C |
.06 F |
(.07) |
(.13) G |
(.18) |
(.07) |
|
Net realized and unrealized gain (loss) |
8.13 |
.75 |
.64 |
3.38 |
3.96 |
|
Total from investment operations |
8.19 |
.68 |
.51 |
3.20 |
3.89 |
|
Distributions from net investment income |
(.01) |
- |
- |
- |
- |
|
Distributions from net realized gain |
(.01) |
(1.91) |
(1.33) |
- |
(.72) |
|
Total distributions |
(.02) |
(1.91) |
(1.33) |
- |
(.72) |
|
Net asset value, end of period |
$ 29.69 |
$ 21.52 |
$ 22.75 |
$ 23.57 |
$ 20.37 |
|
Total Return A, B |
38.11% |
3.64% |
1.94% |
15.71% |
23.69% |
|
Ratios to Average Net Assets D, H |
|
|
|
|
|
|
Expenses before reductions |
1.22% |
1.26% |
1.51% |
1.63% |
1.74% |
|
Expenses net of fee waivers, if any |
1.22% |
1.26% |
1.51% |
1.63% |
1.65% |
|
Expenses net of all reductions |
1.21% |
1.25% |
1.51% |
1.63% |
1.65% |
|
Net investment income (loss) |
.25% F |
(.33)% |
(.55)% G |
(.81)% |
(.41)% |
|
Supplemental Data |
|
|
|
|
|
|
Net assets, end of period (in millions) |
$ 1,113 |
$ 1,054 |
$ 1,244 |
$ 1,356 |
$ 1,277 |
|
Portfolio turnover rate E |
34% |
69% |
38% |
43% |
46% |
A Total returns would have been lower if certain expenses had not been reduced during the applicable periods shown.
B Total returns do not include the effect of the sales charges.
C Calculated based on average shares outstanding during the period.
D Fees and expenses of any underlying Fidelity Central Funds are not included in the Fund's expense ratio. The Fund indirectly bears its proportionate share of the expenses of any underlying Fidelity Central Funds.
E Amount does not include the portfolio activity of any underlying Fidelity Central Funds.
F Investment income per share reflects a large, non-recurring dividend which amounted to $.04 per share. Excluding this non-recurring dividend, the ratio of net investment income (loss) to average net assets would have been .09%.
G Investment income per share reflects a large, non-recurring dividend which amounted to $.04 per share. Excluding this non-recurring dividend, the ratio of net investment income (loss) to average net assets would have been (.70)%.
H Expense ratios reflect operating expenses of the class. Expenses before reductions do not reflect amounts reimbursed by the investment adviser or reductions from brokerage service arrangements or reductions from other expense offset arrangements and do not represent the amount paid by the class during periods when reimbursements or reductions occur. Expenses net of fee waivers reflect expenses after reimbursement by the investment adviser but prior to reductions from brokerage service arrangements or other expense offset arrangements. Expenses net of all reductions represent the net expenses paid by the class.
See accompanying notes which are an integral part of the financial statements.
Annual Report
Financial Highlights - Class B
|
Years ended November 30, |
2013 |
2012 |
2011 |
2010 |
2009 |
|
Selected Per-Share Data |
|
|
|
|
|
|
Net asset value, beginning of period |
$ 19.27 |
$ 20.69 |
$ 21.66 |
$ 18.82 |
$ 16.02 |
|
Income from Investment Operations |
|
|
|
|
|
|
Net investment income (loss) C |
(.08) F |
(.18) |
(.25) G |
(.27) |
(.15) |
|
Net realized and unrealized gain (loss) |
7.26 |
.67 |
.61 |
3.11 |
3.67 |
|
Total from investment operations |
7.18 |
.49 |
.36 |
2.84 |
3.52 |
|
Distributions from net realized gain |
- |
(1.91) |
(1.33) |
- |
(.72) |
|
Net asset value, end of period |
$ 26.45 |
$ 19.27 |
$ 20.69 |
$ 21.66 |
$ 18.82 |
|
Total Return A, B |
37.26% |
3.03% |
1.39% |
15.09% |
23.10% |
|
Ratios to Average Net Assets D, H |
|
|
|
|
|
|
Expenses before reductions |
1.81% |
1.85% |
2.10% |
2.22% |
2.31% |
|
Expenses net of fee waivers, if any |
1.81% |
1.85% |
2.10% |
2.15% |
2.15% |
|
Expenses net of all reductions |
1.80% |
1.84% |
2.10% |
2.14% |
2.15% |
|
Net investment income (loss) |
(.34)% F |
(.92)% |
(1.14)% G |
(1.33)% |
(.91)% |
|
Supplemental Data |
|
|
|
|
|
|
Net assets, end of period (in millions) |
$ 40 |
$ 40 |
$ 55 |
$ 76 |
$ 89 |
|
Portfolio turnover rate E |
34% |
69% |
38% |
43% |
46% |
A Total returns would have been lower if certain expenses had not been reduced during the applicable periods shown.
B Total returns do not include the effect of the contingent deferred sales charge.
C Calculated based on average shares outstanding during the period.
D Fees and expenses of any underlying Fidelity Central Funds are not included in the Fund's expense ratio. The Fund indirectly bears its proportionate share of the expenses of any underlying Fidelity Central Funds.
E Amount does not include the portfolio activity of any underlying Fidelity Central Funds.
F Investment income per share reflects a large, non-recurring dividend which amounted to $.04 per share. Excluding this non-recurring dividend, the ratio of net investment income (loss) to average net assets would have been (.51)%.
G Investment income per share reflects a large, non-recurring dividend which amounted to $.03 per share. Excluding this non-recurring dividend, the ratio of net investment income (loss) to average net assets would have been (1.29)%.
H Expense ratios reflect operating expenses of the class. Expenses before reductions do not reflect amounts reimbursed by the investment adviser or reductions from brokerage service arrangements or reductions from other expense offset arrangements and do not represent the amount paid by the class during periods when reimbursements or reductions occur. Expenses net of fee waivers reflect expenses after reimbursement by the investment adviser but prior to reductions from brokerage service arrangements or other expense offset arrangements. Expenses net of all reductions represent the net expenses paid by the class.
See accompanying notes which are an integral part of the financial statements.
Annual Report
Financial Highlights - Class C
|
Years ended November 30, |
2013 |
2012 |
2011 |
2010 |
2009 |
|
Selected Per-Share Data |
|
|
|
|
|
|
Net asset value, beginning of period |
$ 19.50 |
$ 20.90 |
$ 21.87 |
$ 19.00 |
$ 16.16 |
|
Income from Investment Operations |
|
|
|
|
|
|
Net investment income (loss) C |
(.07) F |
(.17) |
(.24) G |
(.27) |
(.15) |
|
Net realized and unrealized gain (loss) |
7.34 |
.68 |
.60 |
3.14 |
3.71 |
|
Total from investment operations |
7.27 |
.51 |
.36 |
2.87 |
3.56 |
|
Distributions from net realized gain |
- |
(1.91) |
(1.33) |
- |
(.72) |
|
Net asset value, end of period |
$ 26.77 |
$ 19.50 |
$ 20.90 |
$ 21.87 |
$ 19.00 |
|
Total Return A, B |
37.28% |
3.10% |
1.37% |
15.11% |
23.15% |
|
Ratios to Average Net Assets D, H |
|
|
|
|
|
|
Expenses before reductions |
1.76% |
1.81% |
2.06% |
2.18% |
2.28% |
|
Expenses net of fee waivers, if any |
1.76% |
1.81% |
2.06% |
2.15% |
2.15% |
|
Expenses net of all reductions |
1.75% |
1.80% |
2.05% |
2.14% |
2.15% |
|
Net investment income (loss) |
(.29)% F |
(.88)% |
(1.10)% G |
(1.33)% |
(.91)% |
|
Supplemental Data |
|
|
|
|
|
|
Net assets, end of period (in millions) |
$ 334 |
$ 284 |
$ 328 |
$ 336 |
$ 299 |
|
Portfolio turnover rate E |
34% |
69% |
38% |
43% |
46% |
A Total returns would have been lower if certain expenses had not been reduced during the applicable periods shown.
B Total returns do not include the effect of the contingent deferred sales charge.
C Calculated based on average shares outstanding during the period.
D Fees and expenses of any underlying Fidelity Central Funds are not included in the Fund's expense ratio. The Fund indirectly bears its proportionate share of the expenses of any underlying Fidelity Central Funds.
E Amount does not include the portfolio activity of any underlying Fidelity Central Funds.
F Investment income per share reflects a large, non-recurring dividend which amounted to $.04 per share. Excluding this non-recurring dividend, the ratio of net investment income (loss) to average net assets would have been (.45)%.
G Investment income per share reflects a large, non-recurring dividend which amounted to $.03 per share. Excluding this non-recurring dividend, the ratio of net investment income (loss) to average net assets would have been (1.25)%.
H Expense ratios reflect operating expenses of the class. Expenses before reductions do not reflect amounts reimbursed by the investment adviser or reductions from brokerage service arrangements or reductions from other expense offset arrangements and do not represent the amount paid by the class during periods when reimbursements or reductions occur. Expenses net of fee waivers reflect expenses after reimbursement by the investment adviser but prior to reductions from brokerage service arrangements or other expense offset arrangements. Expenses net of all reductions represent the net expenses paid by the class.
See accompanying notes which are an integral part of the financial statements.
Annual Report
Financial Highlights - Institutional Class
|
Years ended November 30, |
2013 |
2012 |
2011 |
2010 |
2009 |
|
Selected Per-Share Data |
|
|
|
|
|
|
Net asset value, beginning of period |
$ 23.73 |
$ 24.77 |
$ 25.42 |
$ 21.86 |
$ 18.42 |
|
Income from Investment Operations |
|
|
|
|
|
|
Net investment income (loss) B |
.21 E |
.04 |
(.01) F |
(.07) |
.02 |
|
Net realized and unrealized gain (loss) |
8.94 |
.83 |
.69 |
3.63 |
4.24 |
|
Total from investment operations |
9.15 |
.87 |
.68 |
3.56 |
4.26 |
|
Distributions from net investment income |
(.13) |
- |
- |
- |
(.10) |
|
Distributions from net realized gain |
(.01) |
(1.91) |
(1.33) |
- |
(.72) |
|
Total distributions |
(.15) H |
(1.91) |
(1.33) |
- |
(.82) |
|
Net asset value, end of period |
$ 32.73 |
$ 23.73 |
$ 24.77 |
$ 25.42 |
$ 21.86 |
|
Total Return A |
38.79% |
4.15% |
2.49% |
16.29% |
24.31% |
|
Ratios to Average Net Assets C, G |
|
|
|
|
|
|
Expenses before reductions |
.71% |
.75% |
1.01% |
1.12% |
1.21% |
|
Expenses net of fee waivers, if any |
.71% |
.75% |
1.01% |
1.12% |
1.15% |
|
Expenses net of all reductions |
.70% |
.74% |
1.00% |
1.12% |
1.15% |
|
Net investment income (loss) |
.76% E |
.18% |
(.05)% F |
(.30)% |
.09% |
|
Supplemental Data |
|
|
|
|
|
|
Net assets, end of period (in millions) |
$ 718 |
$ 1,141 |
$ 1,314 |
$ 1,165 |
$ 977 |
|
Portfolio turnover rate D |
34% |
69% |
38% |
43% |
46% |
A Total returns would have been lower if certain expenses had not been reduced during the applicable periods shown.
B Calculated based on average shares outstanding during the period.
C Fees and expenses of any underlying Fidelity Central Funds are not included in the Fund's expense ratio. The Fund indirectly bears its proportionate share of the expenses of any underlying Fidelity Central Funds.
D Amount does not include the portfolio activity of any underlying Fidelity Central Funds.
E Investment income per share reflects a large, non-recurring dividend which amounted to $.05 per share. Excluding this non-recurring dividend, the ratio of net investment income (loss) to average net assets would have been .59%.
F Investment income per share reflects a large, non-recurring dividend which amounted to $.04 per share. Excluding this non-recurring dividend, the ratio of net investment income (loss) to average net assets would have been (.19)%.
G Expense ratios reflect operating expenses of the class. Expenses before reductions do not reflect amounts reimbursed by the investment adviser or reductions from brokerage service arrangements or reductions from other expense offset arrangements and do not represent the amount paid by the class during periods when reimbursements or reductions occur. Expenses net of fee waivers reflect expenses after reimbursement by the investment adviser but prior to reductions from brokerage service arrangements or other expense offset arrangements. Expenses net of all reductions represent the net expenses paid by the class.
H Total distributions of $.15 per share is comprised of distributions from net investment income of $.133 and distributions from net realized gain of $.014 per share.
See accompanying notes which are an integral part of the financial statements.
Annual Report
Financial Highlights - Class Z
|
Year ended November 30, |
2013 H |
|
Selected Per-Share Data |
|
|
Net asset value, beginning of period |
$ 29.79 |
|
Income from Investment Operations |
|
|
Net investment income (loss) D |
.02 G |
|
Net realized and unrealized gain (loss) |
2.93 |
|
Total from investment operations |
2.95 |
|
Net asset value, end of period |
$ 32.74 |
|
Total Return B, C |
9.90% |
|
Ratios to Average Net Assets E, I |
|
|
Expenses before reductions |
.56% A |
|
Expenses net of fee waivers, if any |
.56% A |
|
Expenses net of all reductions |
.55% A |
|
Net investment income (loss) |
.26% A, G |
|
Supplemental Data |
|
|
Net assets, end of period (in millions) |
$ 5 |
|
Portfolio turnover rate F |
34% |
A Annualized
B Total returns for periods of less than one year are not annualized.
C Total returns would have been lower if certain expenses had not been reduced during the applicable periods shown.
D Calculated based on average shares outstanding during the period.
E Fees and expenses of any underlying Fidelity Central Funds are not included in the Fund's expense ratio. The Fund indirectly bears its proportionate share of the expenses of any underlying Fidelity Central Funds.
F Amount does not include the portfolio activity of any underlying Fidelity Central Funds.
G Investment income per share reflects a large, non-recurring dividend which amounted to $.01 per share. Excluding this non-recurring dividend, the ratio of net investment income (loss) to average net assets would have been .09%.
H For the period August 13, 2013 (commencement of sale of shares) to November 30, 2013.
I Expense ratios reflect operating expenses of the class. Expenses before reductions do not reflect amounts reimbursed by the investment adviser or reductions from brokerage service arrangements or reductions from other expense offset arrangements and do not represent the amount paid by the class during periods when reimbursements or reductions occur. Expense ratios before reductions for start-up periods may not be representative of longer-term operating periods. Expenses net of fee waivers reflect expenses after reimbursement by the investment adviser but prior to reductions from brokerage service arrangements or other expense offset arrangements. Expenses net of all reductions represent the net expenses paid by the class.
See accompanying notes which are an integral part of the financial statements.
Annual Report
Notes to Financial Statements
For the period ended November 30, 2013
(Amounts in thousands except percentages)
1. Organization.
Fidelity Advisor Small Cap Fund (the Fund) is a fund of Fidelity Advisor Series I (the Trust) and is authorized to issue an unlimited number of shares. The Trust is registered under the Investment Company Act of 1940, as amended (the 1940 Act), as an open-end management investment company organized as a Massachusetts business trust. The Fund commenced sale of Class Z on August 13, 2013. The Fund offers Class A, Class T, Class C, Institutional Class and Class Z shares, each of which, along with Class B shares, has equal rights as to assets and voting privileges. Class B shares are closed to new accounts and additional purchases, except for exchanges and reinvestments. Each class has exclusive voting rights with respect to matters that affect that class. Class B shares will automatically convert to Class A shares after a holding period of seven years from the initial date of purchase.
2. Investments in Fidelity Central Funds.
The Fund invests in Fidelity Central Funds, which are open-end investment companies generally available only to other investment companies and accounts managed by the investment adviser and its affiliates. The Fund's Schedule of Investments lists each of the Fidelity Central Funds held as of period end, if any, as an investment of the Fund, but does not include the underlying holdings of each Fidelity Central Fund. As an Investing Fund, the Fund indirectly bears its proportionate share of the expenses of the underlying Fidelity Central Funds.
The Money Market Central Funds seek preservation of capital and current income and are managed by Fidelity Investments Money Management, Inc. (FIMM), an affiliate of the investment adviser. Annualized expenses of the Money Market Central Funds as of their most recent shareholder report date are less than .01%.
A complete unaudited list of holdings for each Fidelity Central Fund is available upon request or at the Securities and Exchange Commission (the SEC) website at www.sec.gov. In addition, the financial statements of the Fidelity Central Funds, which are not covered by the Fund's Report of Independent Registered Public Accounting Firm, are available on the SEC website or upon request.
3. Significant Accounting Policies.
The financial statements have been prepared in conformity with accounting principles generally accepted in the United States of America (GAAP), which require management to make certain estimates and assumptions at the date of the financial statements. Actual results could differ from those estimates. Subsequent events, if any, through the date that the financial statements were issued have been evaluated in the preparation of
Annual Report
3. Significant Accounting Policies - continued
the financial statements. The following summarizes the significant accounting policies of the Fund:
Investment Valuation. Investments are valued as of 4:00 p.m. Eastern time on the last calendar day of the period. In accordance with valuation policies and procedures approved by the Board of Trustees (the Board), the Fund attempts to obtain prices from one or more third party pricing vendors or brokers to value its investments. When current market prices, quotations or currency exchange rates are not readily available or reliable, investments will be fair valued in good faith by the Fidelity Management & Research Company (FMR) Fair Value Committee (the Committee), in accordance with procedures adopted by the Board. Factors used in determining fair value vary by investment type and may include market or investment specific events, changes in interest rates and credit quality. The frequency with which these procedures are used cannot be predicted and they may be utilized to a significant extent. The Committee oversees the Fund's valuation policies and procedures and is responsible for approving and reporting to the Board all fair value determinations.
The Fund categorizes the inputs to valuation techniques used to value its investments into a disclosure hierarchy consisting of three levels as shown below:
Level 1 - quoted prices in active markets for identical investments
Level 2 - other significant observable inputs (including quoted prices for similar investments, interest rates, prepayment speeds, etc.)
Level 3 - unobservable inputs (including the Fund's own assumptions based on the best information available)
Valuation techniques used to value the Fund's investments by major category are as follows:
Equity securities, including restricted securities, for which market quotations are readily available, are valued at the last reported sale price or official closing price as reported by a third party pricing vendor on the primary market or exchange on which they are traded and are categorized as Level 1 in the hierarchy. In the event there were no sales during the day or closing prices are not available, securities are valued at the last quoted bid price or may be valued using the last available price and are generally categorized as Level 2 in the hierarchy. For foreign equity securities, when market or security specific events arise, comparisons to the valuation of American Depositary Receipts (ADRs), futures contracts, Exchange-Traded Funds (ETFs) and certain indexes as well as quoted prices for similar securities may be used and would be categorized as Level 2 in the hierarchy. Utilizing these techniques may result in transfers between Level 1 and Level 2. For equity securities, including restricted securities, where observable inputs are
Annual Report
Notes to Financial Statements - continued
(Amounts in thousands except percentages)
3. Significant Accounting Policies - continued
Investment Valuation - continued
limited, assumptions about market activity and risk are used and these securities may be categorized as Level 3 in the hierarchy.
Debt securities, including restricted securities, are valued based on evaluated prices received from third party pricing vendors or from brokers who make markets in such securities. For U.S. government and government agency obligations, pricing vendors utilize matrix pricing which considers yield or price of bonds of comparable quality, coupon, maturity and type as well as broker-supplied prices. When independent prices are unavailable or unreliable, debt securities may be valued utilizing pricing methodologies which consider similar factors that would be used by third party pricing vendors. Debt securities are generally categorized as Level 2 in the hierarchy but may be Level 3 depending on the circumstances.
Futures contracts are valued at the settlement price established each day by the board of trade or exchange on which they are traded and are categorized as Level 1 in the hierarchy. Investments in open-end mutual funds, including the Fidelity Central Funds, are valued at their closing net asset value (NAV) each business day and are categorized as Level 1 in the hierarchy.
Changes in valuation techniques may result in transfers in or out of an assigned level within the disclosure hierarchy. The aggregate value of investments by input level, as of November 30, 2013, including information on transfers between Levels 1 and 2, is included at the end of the Fund's Schedule of Investments.
Foreign Currency. The Fund may use foreign currency contracts to facilitate transactions in foreign-denominated securities. Gains and losses from these transactions may arise from changes in the value of the foreign currency or if the counterparties do not perform under the contracts' terms.
Foreign-denominated assets, including investment securities, and liabilities are translated into U.S. dollars at the exchange rates at period end. Purchases and sales of investment securities, income and dividends received and expenses denominated in foreign currencies are translated into U.S. dollars at the exchange rate in effect on the transaction date.
The effects of exchange rate fluctuations on investments are included with the net realized and unrealized gain (loss) on investment securities. Other foreign currency transactions resulting in realized and unrealized gain (loss) are disclosed separately.
Investment Transactions and Income. For financial reporting purposes, the Fund's investment holdings and NAV include trades executed through the end of the last business day of the period. The NAV per share for processing shareholder transactions is
Annual Report
3. Significant Accounting Policies - continued
Investment Transactions and Income - continued
calculated as of the close of business of the New York Stock Exchange (NYSE), normally 4:00 p.m. Eastern time and includes trades executed through the end of the prior business day. Gains and losses on securities sold are determined on the basis of identified cost and may include proceeds received from litigation. Dividend income is recorded on the ex-dividend date, except for certain dividends from foreign securities where the ex-dividend date may have passed, which are recorded as soon as the Fund is informed of the ex-dividend date. Non-cash dividends included in dividend income, if any, are recorded at the fair market value of the securities received. Distributions received on securities that represent a return of capital or capital gain are recorded as a reduction of cost of investments and/or as a realized gain. Subsequent to ex-dividend date the Fund determines the components of these distributions, based upon receipt of tax filings or other correspondence relating to the underlying investment. Large, non-recurring dividends recognized by the Fund are presented separately on the Statement of Operations as "Special Dividends" and the impact of these dividends is presented in the Financial Highlights. Interest income and distributions from the Fidelity Central Funds are accrued as earned. Interest income includes coupon interest and amortization of premium and accretion of discount on debt securities. Investment income is recorded net of foreign taxes withheld where recovery of such taxes is uncertain.
Class Allocations and Expenses. Investment income, realized and unrealized capital gains and losses, common expenses of the Fund, and certain fund-level expense reductions, if any, are allocated daily on a pro-rata basis to each class based on the relative net assets of each class to the total net assets of the Fund. Each class differs with respect to transfer agent and distribution and service plan fees incurred. Certain expense reductions may also differ by class. For the reporting period, the allocated portion of income and expenses to each class as a percent of its average net assets may vary due to the timing of recording these transactions in relation to fluctuating net assets of the classes. Expenses directly attributable to a fund are charged to that fund. Expenses attributable to more than one fund are allocated among the respective funds on the basis of relative net assets or other appropriate methods. Expense estimates are accrued in the period to which they relate and adjustments are made when actual amounts are known.
Income Tax Information and Distributions to Shareholders. Each year, the Fund intends to qualify as a regulated investment company under Subchapter M of the Internal Revenue Code, including distributing substantially all of its taxable income and realized gains. As a result, no provision for U.S. Federal income taxes is required. As of November 30, 2013, the Fund did not have any unrecognized tax benefits in the financial statements; nor is the Fund aware of any tax positions for which it is reasonably possible that the total amounts of unrecognized tax benefits will significantly change in the next
Annual Report
Notes to Financial Statements - continued
(Amounts in thousands except percentages)
3. Significant Accounting Policies - continued
Income Tax Information and Distributions to Shareholders - continued
twelve months. The Fund files a U.S. federal tax return, in addition to state and local tax returns as required. The Fund's federal income tax returns are subject to examination by the Internal Revenue Service (IRS) for a period of three fiscal years after they are filed. State and local tax returns may be subject to examination for an additional fiscal year depending on the jurisdiction. Foreign taxes are provided for based on the Fund's understanding of the tax rules and rates that exist in the foreign markets in which it invests.
Distributions are declared and recorded on the ex-dividend date. Income dividends and capital gain distributions are declared separately for each class. Income and capital gain distributions are determined in accordance with income tax regulations, which may differ from GAAP. In addition, the Fund claimed a portion of the payment made to redeeming shareholders as a distribution for income tax purposes.
Capital accounts within the financial statements are adjusted for permanent book-tax differences. These adjustments have no impact on net assets or the results of operations. Temporary book-tax differences will reverse in a subsequent period.
Book-tax differences are primarily due to futures transactions, foreign currency transactions, passive foreign investment companies (PFIC), redemptions in kind, partnerships, capital loss carryforwards and losses deferred due to wash sales and excise tax regulations.
The federal tax cost of investment securities and unrealized appreciation (depreciation) as of period end were as follows:
|
Gross unrealized appreciation |
$ 976,658 |
|
Gross unrealized depreciation |
(87,632) |
|
Net unrealized appreciation (depreciation) on securities and other investments |
$ 889,026 |
|
|
|
|
Tax Cost |
$ 2,691,957 |
The tax-based components of distributable earnings as of period end were as follows:
|
Undistributed ordinary income |
$ 453 |
|
Undistributed long-term capital gain |
$ 399,951 |
|
Net unrealized appreciation (depreciation) |
$ 889,013 |
Annual Report
3. Significant Accounting Policies - continued
Income Tax Information and Distributions to Shareholders - continued
The tax character of distributions paid was as follows:
|
|
November 30, 2013 |
November 30, 2012 |
|
Ordinary Income |
$ 11,330 |
$ - |
|
Long-term Capital Gains |
- |
357,601 |
|
Total |
$ 11,330 |
$ 357,601 |
Restricted Securities. The Fund may invest in securities that are subject to legal or contractual restrictions on resale. These securities generally may be resold in transactions exempt from registration or to the public if the securities are registered. Disposal of these securities may involve time-consuming negotiations and expense, and prompt sale at an acceptable price may be difficult. Information regarding restricted securities is included at the end of the Fund's Schedule of Investments.
New Accounting Pronouncement. The Financial Accounting Standards Board issued in December 2011, Accounting Standard Update No. 2011-11, Disclosures about Offsetting Assets and Liabilities, and in January 2013, Accounting Standards Update No. 2013-1 Clarifying the Scope of Disclosures about Offsetting Assets and Liabilities. These updates create new disclosure requirements requiring entities to disclose both gross and net information for derivatives and other financial instruments that are either offset in the Statement of Assets and Liabilities or subject to an enforceable master netting arrangement or similar agreement. The disclosure requirements are effective for annual reporting periods beginning on or after January 1, 2013, and interim periods within those annual periods. Management expects that the impact of the updates' adoption will be limited to additional financial statement disclosures as applicable.
4. Derivative Instruments.
Risk Exposures and the Use of Derivative Instruments. The Fund's investment objective allows the Fund to enter into various types of derivative contracts, including futures contracts. Derivatives are investments whose value is primarily derived from underlying assets, indices or reference rates and may be transacted on an exchange or over-the-counter (OTC). Derivatives may involve a future commitment to buy or sell a specified asset based on specified terms, to exchange future cash flows at periodic intervals based on a notional principal amount, or for one party to make one or more payments upon the occurrence of specified events in exchange for periodic payments from the other party.
The Fund used derivatives to increase returns and to manage exposure to certain risks as defined below. The success of any strategy involving derivatives depends on analysis of
Annual Report
Notes to Financial Statements - continued
(Amounts in thousands except percentages)
4. Derivative Instruments - continued
Risk Exposures and the Use of Derivative Instruments - continued
numerous economic factors, and if the strategies for investment do not work as intended, the Fund may not achieve its objectives.
The Fund's use of derivatives increased or decreased its exposure to the following risk:
|
Equity Risk |
Equity risk relates to the fluctuations in the value of financial instruments as a result of changes in market prices (other than those arising from interest rate risk or foreign exchange risk), whether caused by factors specific to an individual investment, its issuer, or all factors affecting all instruments traded in a market or market segment. |
The Fund is also exposed to additional risks from investing in derivatives, such as liquidity risk and counterparty credit risk. Liquidity risk is the risk that the Fund will be unable to close out the derivative in the open market in a timely manner. Counterparty credit risk is the risk that the counterparty will not be able to fulfill its obligation to the Fund. Counterparty credit risk related to exchange-traded futures contracts may be mitigated by the protection provided by the exchange on which they trade.
Investing in derivatives may involve greater risks than investing in the underlying assets directly and, to varying degrees, may involve risk of loss in excess of any initial investment and collateral received and amounts recognized in the Statement of Assets and Liabilities. In addition, there may be the risk that the change in value of the derivative contract does not correspond to the change in value of the underlying instrument.
Futures Contracts. A futures contract is an agreement between two parties to buy or sell a specified underlying instrument for a fixed price at a specified future date. The Fund used futures contracts to manage its exposure to the stock market.
Upon entering into a futures contract, a fund is required to deposit either cash or securities (initial margin) with a clearing broker in an amount equal to a certain percentage of the face value of the contract. Futures contracts are marked-to-market daily and subsequent daily payments (variation margin) are made or received by a fund depending on the daily fluctuations in the value of the futures contracts and are recorded as unrealized appreciation or (depreciation). This receivable and/or payable, if any, is included in daily variation margin for derivative instruments in the Statement of Assets and Liabilities. Realized gain or (loss) is recorded upon the expiration or closing of a futures contract.
Any open futures contracts at period end are presented in the Schedule of Investments under the caption "Futures Contracts." The underlying face amount at value reflects each contract's exposure to the underlying instrument or index at period end and is representative of volume of activity during the period. Securities deposited to meet initial margin requirements are identified in the Schedule of Investments.
Annual Report
4. Derivative Instruments - continued
Futures Contracts - continued
During the period the Fund recognized net realized gain (loss) of $18,846 and a change in net unrealized appreciation (depreciation) of $7,338 related to its investment in futures contracts. These amounts are included in the Statement of Operations.
5. Purchases and Sales of Investments.
Purchases and sales of securities including in-kind transactions, other than short-term securities, aggregated $1,234,566 and $2,840,735, respectively.
6. Fees and Other Transactions with Affiliates.
Management Fee. FMR (the investment adviser) and its affiliates provide the Fund with investment management related services for which the Fund pays a monthly management fee. The management fee is the sum of an individual fund fee rate that is based on an annual rate of .45% of the Fund's average net assets and an annualized group fee rate that averaged .25% during the period. The group fee rate is based upon the average net assets of all the mutual funds advised by the investment adviser, including any mutual funds previously advised by the investment adviser that are currently advised by Fidelity SelectCo, LLC, an affiliate of the investment adviser. The group fee rate decreases as assets under management increase and increases as assets under management decrease. In addition, the management fee is subject to a performance adjustment (up to a maximum of ± .20% of the Fund's average net assets over a 36 month performance period). The upward or downward adjustment to the management fee is based on the relative investment performance of the Institutional Class of the Fund as compared to an appropriate benchmark index over the same 36 month performance period. For the reporting period, the total annual management fee rate, including the performance adjustment, was .47% of the Fund's average net assets. The performance adjustment included in the management fee rate may be higher or lower than the maximum performance adjustment rate due to the difference between the average net assets for the reporting and performance periods.
Distribution and Service Plan Fees. In accordance with Rule 12b-1 of the 1940 Act, the Fund has adopted separate Distribution and Service Plans for each class of shares. Certain classes pay Fidelity Distributors Corporation (FDC), an affiliate of the investment adviser, separate Distribution and Service Fees, each of which is based on an annual percentage of each class' average net assets. In addition, FDC may pay financial intermediaries for selling shares of the Fund and providing shareholder support services.
Annual Report
Notes to Financial Statements - continued
(Amounts in thousands except percentages)
6. Fees and Other Transactions with Affiliates - continued
Distribution and Service Plan Fees - continued
For the period, the Distribution and Service Fee rates, total fees and amounts retained by FDC were as follows:
|
|
Distribution |
Service |
Total Fees |
Retained |
|
Class A |
-% |
.25% |
$ 3,042 |
$ 35 |
|
Class T |
.25% |
.25% |
5,316 |
23 |
|
Class B |
.75% |
.25% |
391 |
297 |
|
Class C |
.75% |
.25% |
3,070 |
223 |
|
|
|
|
$ 11,819 |
$ 578 |
Sales Load. FDC may receive a front-end sales charge of up to 5.75% for selling Class A shares and 3.50% for selling Class T shares, some of which is paid to financial intermediaries for selling shares of the Fund. Depending on the holding period, FDC may receive contingent deferred sales charges levied on Class A, Class T, Class B, and Class C redemptions. The deferred sales charges range from 5.00% to 1.00% for Class B shares, 1.00% for Class C shares, 1.00% for certain purchases of Class A shares and .25% for certain purchases of Class T shares.
For the period, sales charge amounts retained by FDC were as follows:
|
|
Retained |
|
Class A |
$ 159 |
|
Class T |
30 |
|
Class B* |
47 |
|
Class C* |
12 |
|
|
$ 248 |
* When Class B and Class C shares are initially sold, FDC pays commissions from its own resources to financial intermediaries through which the sales are made.
Transfer Agent Fees. Fidelity Investments Institutional Operations Company, Inc., (FIIOC), an affiliate of the investment adviser, is the transfer, dividend disbursing and shareholder servicing agent for each class of the Fund. FIIOC receives account fees and asset-based fees that vary according to the account size and type of account of the shareholders of the respective classes of the Fund, except for Class Z. FIIOC receives an asset-based fee of Class Z's average net assets. FIIOC pays for typesetting, printing and mailing of shareholder reports, except proxy statements.
Annual Report
6. Fees and Other Transactions with Affiliates - continued
Transfer Agent Fees - continued
For the period, transfer agent fees for each class were as follows:
|
|
Amount |
% of |
|
Class A |
$ 3,051 |
.25 |
|
Class T |
2,179 |
.20 |
|
Class B |
117 |
.30 |
|
Class C |
758 |
.25 |
|
Institutional Class |
2,197 |
.20 |
|
Class Z |
-† |
.05* |
|
|
$ 8,302 |
|
* Annualized.
† Amount represents ninety six dollars.
Accounting and Security Lending Fees. Fidelity Service Company, Inc. (FSC), an affiliate of the investment adviser, maintains the Fund's accounting records. The accounting fee is based on the level of average net assets for each month. Under a separate contract, FSC administers the security lending program. The security lending fee is based on the number and duration of lending transactions.
Brokerage Commissions. The Fund placed a portion of its portfolio transactions with brokerage firms which are affiliates of the investment adviser. Brokerage commissions are included in net realized gain (loss) and change in net unrealized appreciation (depreciation) in the Statement of Operations. The commissions paid to these affiliated firms were $35 for the period.
Redemptions In-Kind. During the period, 14,529 shares of the Fund held by affiliated entities were redeemed for investments with a value of $456,922. The net realized gain of $131,946 on investments delivered through in-kind redemptions is included in the accompanying Statement of Operations. The amount of in-kind redemptions is included in share transactions in the accompanying Statement of Changes in Net Assets as well as Note 11: Share Transactions. The Fund recognized no gain or loss for federal income tax purposes.
7. Committed Line of Credit.
The Fund participates with other funds managed by the investment adviser or an affiliate in a $4.25 billion credit facility (the "line of credit") to be utilized for temporary or emergency purposes to fund shareholder redemptions or for other short-term liquidity
Annual Report
Notes to Financial Statements - continued
(Amounts in thousands except percentages)
7. Committed Line of Credit - continued
purposes. The Fund has agreed to pay commitment fees on its pro-rata portion of the line of credit, which amounted to $8 and is reflected in Miscellaneous expenses on the Statement of Operations. During the period, there were no borrowings on this line of credit.
8. Security Lending.
The Fund lends portfolio securities through a lending agent from time to time in order to earn additional income. For equity securities, a lending agent is used and may loan securities to certain qualified borrowers, including Fidelity Capital Markets (FCM), a broker-dealer affiliated with the Fund. On the settlement date of the loan, the Fund receives collateral (in the form of U.S. Treasury obligations, letters of credit and/or cash) against the loaned securities and maintains collateral in an amount not less than 100% of the market value of the loaned securities during the period of the loan. The market value of the loaned securities is determined at the close of business of the Fund and any additional required collateral is delivered to the Fund on the next business day. If the borrower defaults on its obligation to return the securities loaned because of insolvency or other reasons, the Fund may apply collateral received from the borrower against the obligation. The Fund may experience delays and costs in recovering the securities loaned. Any cash collateral received is invested in the Fidelity Securities Lending Cash Central Fund. The value of loaned securities and cash collateral at period end are disclosed on the Fund's Statement of Assets and Liabilities. At period end, there were no security loans outstanding with FCM. Security lending income represents the income earned on investing cash collateral, less rebates paid to borrowers and any lending agent fees associated with the loan, plus any premium payments received for lending certain types of securities. Security lending income is presented in the Statement of Operations as a component of income from Fidelity Central Funds Total security lending income during the period amounted to $1,296 and includes $7 from securities loaned to FCM.
9. Expense Reductions.
The investment adviser voluntarily agreed to reimburse a portion of the Fund's Class A, Class T, Class B, Class C and Institutional Class operating expenses. During the period, this reimbursement reduced expenses as follows:
|
|
Reimbursement |
|
Class A |
$ 4 |
|
Class T |
5 |
|
Class B |
-* |
|
Class C |
1 |
|
Institutional Class |
4 |
|
|
$ 14 |
* Amount represents one hundred and forty-three dollars.
Annual Report
9. Expense Reductions - continued
In addition, commissions paid to certain brokers with whom the investment adviser, or its affiliates, places trades on behalf of the Fund include an amount in addition to trade execution, which may be rebated back to the Fund to offset certain expenses. This amount totaled $337 for the period.
10. Distributions to Shareholders.
Distributions to shareholders of each class were as follows:
|
Years ended November 30, |
2013 |
2012 |
|
From net investment income |
|
|
|
Class A |
$ 2,598 |
$ - |
|
Class T |
386 |
- |
|
Institutional Class |
6,266 |
- |
|
Total |
$ 9,250 |
$ - |
|
From net realized gain |
|
|
|
Class A |
$ 743 |
$ 117,808 |
|
Class T |
678 |
103,545 |
|
Class B |
- |
5,032 |
|
Class C |
- |
29,813 |
|
Institutional Class |
659 |
101,403 |
|
Total |
$ 2,080 |
$ 357,601 |
11. Share Transactions.
Transactions for each class of shares were as follows:
|
|
Shares |
Dollars |
||
|
Years ended November 30, |
2013A |
2012 |
2013A |
2012 |
|
Class A |
|
|
|
|
|
Shares sold |
8,347 |
12,312 |
$ 219,693 |
$ 276,482 |
|
Reinvestment of distributions |
140 |
5,215 |
3,122 |
108,709 |
|
Shares redeemed |
(21,663) |
(25,473) |
(562,269) |
(571,082) |
|
Net increase (decrease) |
(13,176) |
(7,946) |
$ (339,454) |
$ (185,891) |
|
Class T |
|
|
|
|
|
Shares sold |
7,343 |
9,256 |
$ 185,578 |
$ 199,877 |
|
Reinvestment of distributions |
47 |
4,916 |
1,017 |
98,476 |
|
Shares redeemed |
(18,873) |
(19,846) |
(469,350) |
(425,632) |
|
Net increase (decrease) |
(11,483) |
(5,674) |
$ (282,755) |
$ (127,279) |
Annual Report
Notes to Financial Statements - continued
(Amounts in thousands except percentages)
11. Share Transactions - continued
|
|
Shares |
Dollars |
||
|
Years ended November 30, |
2013A |
2012 |
2013A |
2012 |
|
Class B |
|
|
|
|
|
Shares sold |
15 |
50 |
$ 339 |
$ 930 |
|
Reinvestment of distributions |
- |
259 |
- |
4,675 |
|
Shares redeemed |
(591) |
(898) |
(13,025) |
(17,325) |
|
Net increase (decrease) |
(576) |
(589) |
$ (12,686) |
$ (11,720) |
|
Class C |
|
|
|
|
|
Shares sold |
1,802 |
1,952 |
$ 41,461 |
$ 38,194 |
|
Reinvestment of distributions |
- |
1,471 |
- |
26,825 |
|
Shares redeemed |
(3,914) |
(4,534) |
(89,461) |
(88,156) |
|
Net increase (decrease) |
(2,112) |
(1,111) |
$ (48,000) |
$ (23,137) |
|
Institutional Class |
|
|
|
|
|
Shares sold |
9,471 |
15,032 |
$ 253,670 |
$ 356,876 |
|
Reinvestment of distributions |
264 |
3,988 |
6,205 |
87,654 |
|
Shares redeemed |
(35,873)B |
(23,976) |
(1,032,519)B |
(557,842) |
|
Net increase (decrease) |
(26,138) |
(4,956) |
$ (772,644) |
$ (113,312) |
|
Class Z |
|
|
|
|
|
Shares sold |
146 |
- |
$ 4,691 |
$ - |
|
Shares redeemed |
-* |
- |
(13) |
- |
|
Net increase (decrease) |
146 |
- |
$ 4,678 |
$ - |
A Share transactions for Class Z are for the period August 13, 2013 (commencement of sale of shares) to November 30, 2013.
B Amount includes in-kind redemptions (see Note 6: Redemptions In-Kind).
* Amount represents three hundred eighty eight shares.
12. Other.
The Fund's organizational documents provide former and current trustees and officers with a limited indemnification against liabilities arising in connection with the performance of their duties to the Fund. In the normal course of business, the Fund may also enter into contracts that provide general indemnifications. The Fund's maximum exposure under these arrangements is unknown as this would be dependent on future claims that may be made against the Fund. The risk of material loss from such claims is considered remote.
Annual Report
Report of Independent Registered Public Accounting Firm
To the Trustees of Fidelity Advisor Series I and the Shareholders of Fidelity Advisor Small Cap Fund:
In our opinion, the accompanying statement of assets and liabilities, including the schedule of investments, and the related statements of operations and of changes in net assets and the financial highlights present fairly, in all material respects, the financial position of Fidelity Advisor Small Cap Fund (a fund of Fidelity Advisor Series I) at November 30, 2013, the results of its operations for the year then ended, the changes in its net assets for each of the two years in the period then ended and the financial highlights for each of the five years in the period then ended, in conformity with accounting principles generally accepted in the United States of America. These financial statements and financial highlights (hereafter referred to as "financial statements") are the responsibility of the Fidelity Advisor Small Cap Fund's management. Our responsibility is to express an opinion on these financial statements based on our audits. We conducted our audits of these financial statements in accordance with the standards of the Public Company Accounting Oversight Board (United States). Those standards require that we plan and perform the audit to obtain reasonable assurance about whether the financial statements are free of material misstatement. An audit includes examining, on a test basis, evidence supporting the amounts and disclosures in the financial statements, assessing the accounting principles used and significant estimates made by management, and evaluating the overall financial statement presentation. We believe that our audits, which included confirmation of securities at November 30, 2013 by correspondence with the custodian and brokers, provide a reasonable basis for our opinion.
PricewaterhouseCoopers LLP
Boston, Massachusetts
January 13, 2014
Annual Report
Trustees and Officers
The Trustees, Member of the Advisory Board, and officers of the trust and fund, as applicable, are listed below. The Board of Trustees governs the fund and is responsible for protecting the interests of shareholders. The Trustees are experienced executives who meet periodically throughout the year to oversee the fund's activities, review contractual arrangements with companies that provide services to the fund, oversee management of the risks associated with such activities and contractual arrangements, and review the fund's performance. Except for James C. Curvey, Ned C. Lautenbach, Ronald P. O'Hanley, and William S. Stavropoulos, each of the Trustees oversees 173 funds. Mr. Curvey oversees 396 funds. Mr. Lautenbach, Mr. O'Hanley, and Mr. Stavropoulos each oversees 247 funds.
The Trustees hold office without limit in time except that (a) any Trustee may resign; (b) any Trustee may be removed by written instrument, signed by at least two-thirds of the number of Trustees prior to such removal; (c) any Trustee who requests to be retired or who has become incapacitated by illness or injury may be retired by written instrument signed by a majority of the other Trustees; and (d) any Trustee may be removed at any special meeting of shareholders by a two-thirds vote of the outstanding voting securities of the trust. Each Trustee who is not an interested person (as defined in the 1940 Act) of the trust and the fund (Independent Trustee), shall retire not later than the last day of the calendar year in which his or her 75th birthday occurs. The Independent Trustees may waive this mandatory retirement age policy with respect to individual Trustees. The officers and Advisory Board Member hold office without limit in time, except that any officer and Advisory Board Member may resign or may be removed by a vote of a majority of the Trustees at any regular meeting or any special meeting of the Trustees. Except as indicated, each individual has held the office shown or other offices in the same company for the past five years.
Experience, Skills, Attributes, and Qualifications of the Fund's Trustees. The Governance and Nominating Committee has adopted a statement of policy that describes the experience, qualifications, attributes, and skills that are necessary and desirable for potential Independent Trustee candidates (Statement of Policy). The Board believes that each Trustee satisfied at the time he or she was initially elected or appointed a Trustee, and continues to satisfy, the standards contemplated by the Statement of Policy. The Governance and Nominating Committee also engages professional search firms to help identify potential Independent Trustee candidates who have the experience, qualifications, attributes, and skills consistent with the Statement of Policy. From time to time, additional criteria based on the composition and skills of the current Independent Trustees, as well as experience or skills that may be appropriate in light of future changes to board composition, business conditions, and regulatory or other developments, have also been considered by the professional search firms and the Governance and Nominating Committee. In addition, the Board takes into account the Trustees' commitment and participation in Board and committee meetings, as well as their leadership of standing and ad hoc committees throughout their tenure.
Annual Report
Trustees and Officers - continued
In determining that a particular Trustee was and continues to be qualified to serve as a Trustee, the Board has considered a variety of criteria, none of which, in isolation, was controlling. The Board believes that, collectively, the Trustees have balanced and diverse experience, qualifications, attributes, and skills, which allow the Board to operate effectively in governing the fund and protecting the interests of shareholders. Information about the specific experience, skills, attributes, and qualifications of each Trustee, which in each case led to the Board's conclusion that the Trustee should serve (or continue to serve) as a trustee of the fund, is provided below.
Board Structure and Oversight Function. James C. Curvey is an interested person (as defined in the 1940 Act) and currently serves as Chairman. The Trustees have determined that an interested Chairman is appropriate and benefits shareholders because an interested Chairman has a personal and professional stake in the quality and continuity of services provided to the fund. Independent Trustees exercise their informed business judgment to appoint an individual of their choosing to serve as Chairman, regardless of whether the Trustee happens to be independent or a member of management. The Independent Trustees have determined that they can act independently and effectively without having an Independent Trustee serve as Chairman and that a key structural component for assuring that they are in a position to do so is for the Independent Trustees to constitute a substantial majority for the Board. The Independent Trustees also regularly meet in executive session. Ned C. Lautenbach serves as Chairman of the Independent Trustees and as such (i) acts as a liaison between the Independent Trustees and management with respect to matters important to the Independent Trustees and (ii) with management prepares agendas for Board meetings.
Fidelity funds are overseen by different Boards of Trustees. The fund's Board oversees Fidelity's equity and high income funds and another Board oversees Fidelity's investment-grade bond, money market, and asset allocation funds. The asset allocation funds may invest in Fidelity funds overseen by the fund's Board. The use of separate Boards, each with its own committee structure, allows the Trustees of each group of Fidelity funds to focus on the unique issues of the funds they oversee, including common research, investment, and operational issues. On occasion, the separate Boards establish joint committees to address issues of overlapping consequences for the Fidelity funds overseen by each Board.
The Trustees operate using a system of committees to facilitate the timely and efficient consideration of all matters of importance to the Trustees, the fund, and fund shareholders and to facilitate compliance with legal and regulatory requirements and oversight of the fund's activities and associated risks. The Board, acting through its committees, has charged FMR and its affiliates with (i) identifying events or circumstances the occurrence of which could have demonstrably adverse effects on the fund's business and/or reputation; (ii) implementing processes and controls to lessen the possibility that such events or circumstances occur or to mitigate the effects of such events or circumstances if they do occur; and (iii) creating and maintaining a system designed to evaluate continuously business and market conditions in order to facilitate the identification and implementation processes described in (i) and (ii) above. Because the day-to-day operations and activities of the fund are carried out by or through FMR, its affiliates and other service providers, the fund's exposure to risks is mitigated but not eliminated by the processes overseen by the Trustees. While each of the Board's committees has responsibility for overseeing different aspects of the fund's activities, oversight is exercised primarily through the Operations, Audit, and Compliance Committees. In addition, the Independent Trustees have worked with FMR to enhance the Board's oversight of investment and financial risks, legal and regulatory risks, technology risks, and operational risks, including the development of additional risk reporting to the Board. For example, a working group comprised of Independent Trustees and FMR has worked and continues to work to review the Fidelity funds' valuation-related activities, reporting and risk management. Appropriate personnel, including but not limited to the fund's Chief Compliance Officer (CCO), FMR's internal auditor, the independent accountants, the fund's Treasurer and portfolio management personnel, make periodic reports to the Board's committees, as appropriate, including an annual review of FMR's risk management program for the Fidelity funds. The responsibilities of each standing committee, including their oversight responsibilities, are described further under "Standing Committees of the Fund's Trustees."
Annual Report
The fund's Statement of Additional Information (SAI) includes more information about the Trustees. To request a free copy, call Fidelity at 1-877-208-0098.
Interested Trustees*:
Correspondence intended for each Trustee who is an interested person may be sent to Fidelity Investments, 245 Summer Street, Boston, Massachusetts 02210.
|
Name, Year of Birth; Principal Occupations and Other Relevant Experience+ |
|
|
James C. Curvey (1935) |
|
|
Year of Election or Appointment: 2007 Trustee Chairman of the Board of Trustees |
|
|
|
Mr. Curvey also serves as Trustee of other Fidelity funds. Mr. Curvey is a Director of Fidelity Investments Money Management, Inc. (2009-present), Director of Fidelity Research & Analysis Co. (2009-present) and Director of FMR and FMR Co., Inc. (2007-present). Mr. Curvey is also Vice Chairman (2007-present) and Director of FMR LLC. In addition, Mr. Curvey serves as an Overseer for the Boston Symphony Orchestra and a member of the Trustees of Villanova University. Previously, Mr. Curvey was the Vice Chairman (2006-2007) and Director (2000-2007) of FMR Corp. |
|
Ronald P. O'Hanley (1957) |
|
|
Year of Election or Appointment: 2011 Trustee |
|
|
|
Mr. O'Hanley also serves as Trustee of other Fidelity funds. He is Director of Fidelity SelectCo, LLC (2013-present), FMR Co., Inc. (2010-present), Director of Fidelity Investments Money Management, Inc. (2010-present), Director of Fidelity Research & Analysis Company (2010-present), President of Fidelity Asset Management and Corporate Services and a Member of Fidelity's Executive Committee (2010-present). Previously, Mr. O'Hanley served as President and Chief Executive Officer of BNY Mellon Asset Management (2007-2010). Mr. O'Hanley also served as Vice Chairman of Bank New York Mellon Corp. and a member of that firm's Executive Committee. Prior to the 2007 merger of The Bank of New York and Mellon Financial Corporation, he was Vice Chairman of Mellon Financial Corporation and President and Chief Executive Officer of Mellon Asset Management. He joined Mellon in February 1997. Mr. O'Hanley currently serves as Chairman of the Boston Public Library Foundation Board of Directors and sits on the Board of Directors of Beth Israel Deaconess Medical Center, the Board of Trustees of the Marine Biological Laboratory and the Advisory Board of the Maxwell School of Citizenship and Public Administration at Syracuse University. Mr. O'Hanley also chairs the Council on Asset Management for the Financial Services Roundtable and is a member of the Board of Directors of Institutional Investor's U.S. Institute. |
* Trustees have been determined to be "Interested Trustees" by virtue of, among other things, their affiliation with the trust or various entities under common control with FMR.
+ The information above includes each Trustee's principal occupation during the last five years and other information relating to the experience, attributes, and skills relevant to each Trustee's qualifications to serve as a Trustee, which led to the conclusion that each Trustee should serve as a Trustee for each fund.
Annual Report
Independent Trustees:
Correspondence intended for each Independent Trustee (that is, the Trustees other than the Interested Trustees) may be sent to Fidelity Investments, P.O. Box 55235, Boston, Massachusetts 02205-5235.
|
Name, Year of Birth; Principal Occupations and Other Relevant Experience+ |
|
|
Dennis J. Dirks (1948) |
|
|
Year of Election or Appointment: 2005 Trustee |
|
|
|
Mr. Dirks also serves as Trustee of other Fidelity funds. Prior to his retirement in May 2003, Mr. Dirks was Chief Operating Officer and a member of the Board of The Depository Trust & Clearing Corporation (DTCC). He also served as President, Chief Operating Officer, and Board member of The Depository Trust Company (DTC) and President and Board member of the National Securities Clearing Corporation (NSCC). In addition, Mr. Dirks served as Chief Executive Officer and Board member of the Government Securities Clearing Corporation, Chief Executive Officer and Board member of the Mortgage-Backed Securities Clearing Corporation, as a Trustee and a member of the Finance Committee of Manhattan College (2005-2008), and as a Trustee and a member of the Finance Committee of AHRC of Nassau County (2006-2008). Mr. Dirks is a member of the Independent Directors Council (IDC) Governing Council (2010-present) and Board of Directors for The Brookville Center for Children's Services, Inc. (2009-present). |
|
Alan J. Lacy (1953) |
|
|
Year of Election or Appointment: 2008 Trustee |
|
|
|
Mr. Lacy also serves as Trustee of other Fidelity funds. Mr. Lacy serves as Senior Adviser (2007-present) of Oak Hill Capital Partners, L.P. (private equity). Mr. Lacy also served as Chief Executive Officer (2000-2005) and Vice Chairman (2005-2006) of Sears Holdings Corporation and Sears, Roebuck and Co. (retail). In addition, Mr. Lacy serves as a member of the Board of Directors of Dave & Buster's Entertainment, Inc. (restaurant and entertainment complexes, 2010-present), Earth Fare, Inc. (retail grocery, 2012-present), The Hillman Companies, Inc. (hardware wholesalers, 2010-present), and Bristol-Myers Squibb Company (global pharmaceuticals, 2008-present). Mr. Lacy is a member of the Board of Trustees of The National Parks Conservation Association (2006-present). Previously, Mr. Lacy served as Chairman of the Board of Trustees of the National Parks Conservation Association (2008-2011) and as a member of the Board of Directors for the Western Union Company (global money transfer, 2006-2011). |
|
Ned C. Lautenbach (1944) |
|
|
Year of Election or Appointment: 2000 Trustee Chairman of the Independent Trustees |
|
|
|
Mr. Lautenbach also serves as Trustee of other Fidelity funds. Mr. Lautenbach currently serves as the Lead Director of the Eaton Corporation Board of Directors (diversified industrial, 1997-present). Mr. Lautenbach is Chairman of the Board of Directors of the Philharmonic Center for the Arts in Naples, Florida (2012-present) and a member of the Council on Foreign Relations (1994-present). Previously, Mr. Lautenbach was a Partner/Advisory Partner at Clayton, Dubilier & Rice, LLC (private equity investment, 1998-2010), as well as a Director of Sony Corporation (2006-2007). |
|
Joseph Mauriello (1944) |
|
|
Year of Election or Appointment: 2008 Trustee |
|
|
|
Mr. Mauriello also serves as Trustee of other Fidelity funds. Prior to his retirement in January 2006, Mr. Mauriello served in numerous senior management positions including Deputy Chairman and Chief Operating Officer (2004-2005), and Vice Chairman of Financial Services (2002-2004) of KPMG LLP US (professional services, 1965-2005). Mr. Mauriello currently serves as a member of the Board of Directors of XL Group plc. (global insurance and re-insurance, 2006-present). Previously, Mr. Mauriello served as a Director of the Hamilton Funds of the Bank of New York (2006-2007) and of Arcadia Resources Inc. (health care services and products, 2007-2012). |
|
Robert W. Selander (1950) |
|
|
Year of Election or Appointment: 2011 Trustee |
|
|
|
Mr. Selander also serves as Trustee of other Fidelity funds. Previously, Mr. Selander served as a Member of the Advisory Board of other Fidelity funds (2011), and Executive Vice Chairman (2010), Chief Executive Officer (2009-2010), and President and Chief Executive Officer (1997-2009) of Mastercard, Inc. |
|
Cornelia M. Small (1944) |
|
|
Year of Election or Appointment: 2005 Trustee |
|
|
|
Ms. Small also serves as Trustee of other Fidelity funds. Ms. Small is a member of the Board of Directors (2009-present) and Chair of the Investment Committee (2010-present) of the Teagle Foundation. Ms. Small also serves on the Investment Committee of the Berkshire Taconic Community Foundation (2008-present). Previously, Ms. Small served as Chairperson (2002-2008) and a member of the Investment Committee and Chairperson (2008-2012) and a member of the Board of Trustees of Smith College. In addition, Ms. Small served as Chief Investment Officer, Director of Global Equity Investments, and a member of the Board of Directors of Scudder, Stevens & Clark and Scudder Kemper Investments. |
|
William S. Stavropoulos (1939) |
|
|
Year of Election or Appointment: 2002 Trustee Vice Chairman of the Independent Trustees |
|
|
|
Mr. Stavropoulos also serves as Trustee of other Fidelity funds. Mr. Stavropoulos serves as President and Founder of the Michigan Baseball Foundation, the Great Lakes Loons (2007-present). Mr. Stavropoulos is Chairman Emeritus of the Board of Directors of The Dow Chemical Company, where he previously served in numerous senior management positions, including President, CEO (1995-2000; 2002-2004), Chairman of the Executive Committee (2000-2006), and as a member of the Board of Directors (1990-2006). Currently, Mr. Stavropoulos is Chairman of the Board of Directors of Univar Inc. (global distributor of commodity and specialty chemicals), a Director of Teradata Corporation (data warehousing and technology solutions), and Maersk Inc. (industrial conglomerate), and a member of the Advisory Board for Metalmark Capital LLC (private equity investment, 2005-present). Mr. Stavropoulos is an operating advisor to Clayton, Dubilier & Rice, LLC (private equity investment). In addition, Mr. Stavropoulos is a member of the University of Notre Dame Advisory Council for the College of Science, a Trustee of the Rollin L. Gerstacker Foundation, and a Director of the Naples Philharmonic Center for the Arts. Previously, Mr. Stavropoulos served as a Director of Chemical Financial Corporation (bank holding company, 1993-2012) and Tyco International, Ltd. (multinational manufacturing and services, 2007-2012). |
|
David M. Thomas (1949) |
|
|
Year of Election or Appointment: 2008 Trustee |
|
|
|
Mr. Thomas also serves as Trustee of other Fidelity funds. Mr. Thomas serves as Non-Executive Chairman of the Board of Directors of Fortune Brands Home and Security (home and security products, 2011-present), and as a member of the Board of Directors of Interpublic Group of Companies, Inc. (marketing communication, 2004-present). Previously, Mr. Thomas served as Executive Chairman (2005-2006) and Chairman and Chief Executive Officer (2000-2005) of IMS Health, Inc. (pharmaceutical and healthcare information solutions), and a Director of Fortune Brands, Inc. (consumer products, 2000-2011). |
+ The information above includes each Trustee's principal occupation during the last five years and other information relating to the experience, attributes, and skills relevant to each Trustee's qualifications to serve as a Trustee, which led to the conclusion that each Trustee should serve as a Trustee for the fund.
Advisory Board Member and Officers:
Correspondence intended for each officer and Peter S. Lynch may be sent to Fidelity Investments, 245 Summer Street, Boston, Massachusetts 02210. Officers appear below in alphabetical order.
|
Name, Year of Birth; Principal Occupation |
|
|
Peter S. Lynch (1944) |
|
|
Year of Election or Appointment: 2003 Member of the Advisory Board |
|
|
|
Mr. Lynch also serves as Member of the Advisory Board of other Fidelity funds. Mr. Lynch is Vice Chairman and a Director of FMR and FMR Co., Inc. In addition, Mr. Lynch serves as a Trustee of Boston College and as the Chairman of the Inner-City Scholarship Fund. Previously, Mr. Lynch served on the Special Olympics International Board of Directors (1997-2006). |
|
Elizabeth Paige Baumann (1968) |
|
|
Year of Election or Appointment: 2012 Anti-Money Laundering (AML) Officer |
|
|
|
Ms. Baumann also serves as AML Officer of other funds. She is Chief AML Officer of FMR LLC (2012-present) and is an employee of Fidelity Investments. Previously, Ms. Baumann served as Vice President and Deputy Anti-Money Laundering Officer (2007-2012). |
|
William C. Coffey (1969) |
|
|
Year of Election or Appointment: 2009 Assistant Secretary |
|
|
|
Mr. Coffey also serves as Assistant Secretary of other funds. He is Senior Vice President and Deputy General Counsel of FMR LLC (2010-present), and is an employee of Fidelity Investments. Previously, Mr. Coffey served as Vice President and Associate General Counsel of FMR LLC (2005-2009). |
|
Jonathan Davis (1968) |
|
|
Year of Election or Appointment: 2010 Assistant Treasurer |
|
|
|
Mr. Davis also serves as Assistant Treasurer of other funds. Mr. Davis is an employee of Fidelity Investments. Previously, Mr. Davis served as Vice President and Associate General Counsel of FMR LLC (2003-2010). |
|
Adrien E. Deberghes (1967) |
|
|
Year of Election or Appointment: 2008 Deputy Treasurer |
|
|
|
Mr. Deberghes also serves as an officer of other funds. He is an employee of Fidelity Investments (2008-present). Prior to joining Fidelity Investments, Mr. Deberghes was Senior Vice President of Mutual Fund Administration at State Street Corporation (2007-2008), Senior Director of Mutual Fund Administration at Investors Bank & Trust (2005-2007), and Director of Finance for Dunkin' Brands (2000-2005). |
|
Stephanie J. Dorsey (1969) |
|
|
Year of Election or Appointment: 2010 Assistant Treasurer |
|
|
|
Ms. Dorsey also serves as an officer of other funds. She is an employee of Fidelity Investments (2008-present) and has served in other fund officer roles. Prior to joining Fidelity Investments, Ms. Dorsey served as Treasurer (2004-2008) of the JPMorgan Mutual Funds and Vice President (2004-2008) of JPMorgan Chase Bank. |
|
Scott C. Goebel (1968) |
|
|
Year of Election or Appointment: 2008 Secretary and Chief Legal Officer (CLO) |
|
|
|
Mr. Goebel serves as Secretary and CLO of other funds. Mr. Goebel also serves as Secretary of Fidelity Investments Money Management, Inc. (FIMM) (2010-present) and Fidelity Research and Analysis Company (FRAC) (2010-present); General Counsel, Secretary, and Senior Vice President of FMR (2008-present) and FMR Co., Inc. (2008-present); Chief Legal Officer of Fidelity Management & Research (Hong Kong) Limited (2008-present) and Assistant Secretary of Fidelity Management & Research (Japan) Inc. (2008-present), and Fidelity Management & Research (U.K.) Inc. (2008-present). Previously, Mr. Goebel served as Secretary and CLO of other Fidelity funds (2008-2013), Assistant Secretary of FIMM (2008-2010), FRAC (2008-2010), and certain funds (2007-2008); and as Vice President and Secretary of Fidelity Distributors Corporation (FDC) (2005-2007). Mr. Goebel has been employed by FMR LLC or an affiliate since 2001. |
|
Joseph A. Hanlon (1968) |
|
|
Year of Election or Appointment: 2012 Chief Compliance Officer |
|
|
|
Mr. Hanlon also serves as Chief Compliance Officer of other funds. Mr. Hanlon serves as Compliance Officer of FMR, FMR Co., Inc., Fidelity Investments Money Management, Inc. (FIMM), Fidelity Research and Analysis Company (FRAC), and Fidelity Management & Research (Hong Kong) (2009-present), as Senior Vice President of the Fidelity Asset Management Division (2009-present), and is an employee of Fidelity Investments. Previously, Mr. Hanlon served as Compliance Officer of Fidelity Management & Research (Japan) Inc. (2009-2013), Strategic Advisers, Inc. (2009-2013), and Fidelity Management & Research (U.K.) Inc. (2009-2013). |
|
Thomas C. Hense (1964) |
|
|
Year of Election or Appointment: 2008/2010 Vice President |
|
|
|
Mr. Hense also serves as Vice President of other funds (High Income (2008), Small Cap (2008), and Value (2010) funds). Previously, Mr. Hense served as a portfolio manager for Fidelity's Institutional Money Management Group (Pyramis) (2003-2008). |
|
Brian B. Hogan (1964) |
|
|
Year of Election or Appointment: 2009 Vice President |
|
|
|
Mr. Hogan also serves as Vice President of other funds. Mr. Hogan serves as President of FMR's Equity Division (2009-present). Previously, Mr. Hogan served as Senior Vice President, Equity Research of FMR (2006-2009) and as a portfolio manager. |
|
Chris Maher (1972) |
|
|
Year of Election or Appointment: 2013 Assistant Treasurer |
|
|
|
Mr. Maher serves as Assistant Treasurer of other funds. Mr. Maher is Vice President of Valuation Oversight and is an employee of Fidelity Investments. Previously, Mr. Maher served as Vice President of Asset Management Compliance (2013), Vice President of FMR's Program Management Group (2010-2013), and Vice President of Valuation Oversight (2008-2010). |
|
Christine Reynolds (1958) |
|
|
Year of Election or Appointment: 2008 Chief Financial Officer |
|
|
|
Ms. Reynolds also serves as Chief Financial Officer of other funds. Ms. Reynolds became President of Fidelity Pricing and Cash Management Services (FPCMS) in August 2008. Ms. Reynolds served as Chief Operating Officer of FPCMS (2007-2008). Previously, Ms. Reynolds served as President, Treasurer, and Anti-Money Laundering officer of the Fidelity funds (2004-2007). |
|
Kenneth B. Robins (1969) |
|
|
Year of Election or Appointment: 2008 President and Treasurer |
|
|
|
Mr. Robins also serves as an officer of other funds. Mr. Robins serves as Executive Vice President of Fidelity Investments Money Management, Inc. (FIMM) (2013-present) and is an employee of Fidelity Investments (2004-present). Previously, Mr. Robins served in other fund officer roles. |
|
Gary W. Ryan (1958) |
|
|
Year of Election or Appointment: 2005 Assistant Treasurer |
|
|
|
Mr. Ryan also serves as Assistant Treasurer of other funds. Mr. Ryan is an employee of Fidelity Investments and has served in other fund officer roles. Previously, Mr. Ryan served as Vice President of Fund Reporting in Fidelity Pricing and Cash Management Services (FPCMS) (1999-2005). |
|
Stephen Sadoski (1971) |
|
|
Year of Election or Appointment: 2012 Deputy Treasurer |
|
|
|
Mr. Sadoski also serves as Deputy Treasurer of other funds. He is an employee of Fidelity Investments (2012-present) and has served in another fund officer role. Prior to joining Fidelity Investments, Mr. Sadoski served as an assistant chief accountant in the Division of Investment Management of the Securities and Exchange Commission (SEC) (2009-2012) and as a senior manager at Deloitte & Touche LLP (1997-2009). |
|
Stacie M. Smith (1974) |
|
|
Year of Election or Appointment: 2013 Deputy Treasurer |
|
|
|
Ms. Smith also serves as an officer of other funds. She is an employee of Fidelity Investments (2009-present) and has served in other fund officer roles. Prior to joining Fidelity Investments, Ms. Smith served as Senior Audit Manager of Ernst & Young LLP (1996-2009). |
|
Renee Stagnone (1975) |
|
|
Year of Election or Appointment: 2013 Deputy Treasurer |
|
|
|
Ms. Stagnone also serves as Deputy Treasurer of other funds. Ms. Stagnone is an employee of Fidelity Investments. |
|
Joseph F. Zambello (1957) |
|
|
Year of Election or Appointment: 2011 Deputy Treasurer |
|
|
|
Mr. Zambello also serves as Deputy Treasurer of other funds. Mr. Zambello is an employee of Fidelity Investments. Previously, Mr. Zambello served as Vice President of FMR's Program Management Group (2009-2011) and Vice President of the Transfer Agent Oversight Group (2005-2009). |
Annual Report
Distributions (Unaudited)
The Board of Trustees of Advisor Small Cap Fund voted to pay to shareholders of record at the opening of business on record date, the following distributions per share derived from capital gains realized from sales of portfolio securities, and dividends derived from net investment income:
|
|
Pay Date |
Record Date |
Dividends |
Capital Gains |
|
Class Z |
12/16/2013 |
12/13/2014 |
$0.155 |
$3.320 |
|
|
01/13/14 |
01/10/14 |
- |
$0.182 |
The fund hereby designates as a capital gain dividend with respect to the taxable year ended November 30, 2013 $448,830,974 or, if subsequently determined to be different, the net capital gain of such year.
The fund will notify shareholders in January 2014 of amounts for use in preparing 2013 income tax returns.
Annual Report
Board Approval of Investment Advisory Contracts and Management Fees
Fidelity Advisor Small Cap Fund
Each year, the Board of Trustees, including the Independent Trustees (together, the Board), votes on the renewal of the management contract and sub-advisory agreements (together, the Advisory Contracts) for the fund. The Board, assisted by the advice of fund counsel and Independent Trustees' counsel, requests and considers a broad range of information relevant to the renewal of the Advisory Contracts throughout the year.
The Board meets regularly and, at each of its meetings, covers an extensive agenda of topics and materials and considers factors that are relevant to its annual consideration of the renewal of the fund's Advisory Contracts, including the services and support provided to the fund and its shareholders. The Board has established various standing committees, each composed of and chaired by Independent Trustees with varying backgrounds, to which the Board has assigned specific subject matter responsibilities in order to enhance effective decision-making by the Board. The Board, acting directly and through its Committees, requests and receives information concerning the annual consideration of the renewal of the fund's Advisory Contracts. The Board also meets as needed to consider matters specifically related to the Board's annual consideration of the renewal of Advisory Contracts. Members of the Board may also meet with trustees of other Fidelity funds through ad hoc joint committees to discuss certain matters relevant to the Fidelity funds.
At its July 2013 meeting, the Board, including the Independent Trustees, unanimously determined to renew the fund's Advisory Contracts. In reaching its determination, the Board considered all factors it believed relevant, including (i) the nature, extent, and quality of the services to be provided to the fund and its shareholders (including the investment performance of the fund); (ii) the competitiveness of the fund's management fee and total expense ratio relative to peer funds; (iii) the total costs of the services to be provided by and the profits to be realized by Fidelity from its relationship with the fund; (iv) the extent to which economies of scale exist and would be realized as the fund grows; and (v) whether fee levels reflect these economies of scale, if any, for the benefit of fund shareholders.
In considering whether to renew the Advisory Contracts for the fund, the Board reached a determination, with the assistance of fund counsel and Independent Trustees' counsel and through the exercise of its business judgment, that the renewal of the Advisory Contracts was in the best interests of the fund and its shareholders and that the compensation payable under the Advisory Contracts was fair and reasonable. The Board's decision to renew the Advisory Contracts was not based on any single factor, but rather was based on a comprehensive consideration of all the information provided to the Board at its meetings throughout the year. The Board, in reaching its determination to renew the Advisory Contracts, was aware that shareholders in the fund have a broad range of investment choices available to them, including a wide choice among mutual funds offered by Fidelity's competitors, and that the fund's shareholders, who have the opportunity to review and weigh the disclosure provided by the fund in its prospectus and other public disclosures, have chosen to invest in this fund, which is a part of the Fidelity family of funds.
Annual Report
Nature, Extent, and Quality of Services Provided. The Board considered the staffing within the investment adviser, Fidelity Management & Research Company (FMR), and the sub-advisers (together, the Investment Advisers) as it relates to the fund, including the backgrounds of the fund's investment personnel, and also considered the fund's investment objective, strategies, and related investment philosophy. The Independent Trustees also had discussions with senior management of Fidelity's investment operations and investment groups. The Board considered the structure of the portfolio manager compensation program and whether this structure provides appropriate incentives to act in the best interests of the fund.
Resources Dedicated to Investment Management and Support Services. The Board and the Fund Oversight and Research Committees reviewed the general qualifications and capabilities of the Investment Advisers' investment staff, including its size, education, experience, and resources, as well as the Investment Advisers' approach to recruiting, training, managing, and compensating investment personnel. The Board noted that FMR has continued to increase the resources devoted to non-U.S. offices, including expansion of Fidelity's global investment organization. The Board also noted that Fidelity's analysts have extensive resources, tools and capabilities that allow them to conduct sophisticated quantitative and fundamental analysis, as well as credit analysis of issuers, counterparties and guarantors. Further, the Board believes that Fidelity's investment professionals have sufficient access to global information and data so as to provide competitive investment results over time, and that those professionals also have access to sophisticated tools that permit them to assess portfolio construction and risk and performance attribution characteristics continuously, as well as to transmit new information and research conclusions rapidly around the world. Additionally, in its deliberations, the Board considered the Investment Advisers' trading and risk management capabilities and resources, which are an integral part of the investment management process.
Shareholder and Administrative Services. The Board considered (i) the nature, extent, quality, and cost of advisory, administrative, and shareholder services performed by the Investment Advisers and their affiliates under the Advisory Contracts and under separate agreements covering transfer agency, pricing and bookkeeping, and securities lending services for the fund; (ii) the nature and extent of the supervision of third party service providers, principally custodians and subcustodians; and (iii) the resources devoted to, and the record of compliance with, the fund's compliance policies and procedures. The Board also reviewed the allocation of fund brokerage, including allocations to brokers affiliated with the Investment Advisers, the use of brokerage commissions to pay fund expenses, and the use of "soft" commission dollars to pay for research services.
Annual Report
Board Approval of Investment Advisory Contracts and
Management Fees - continued
The Board noted that the growth of fund assets over time across the complex allows Fidelity to reinvest in the development of services designed to enhance the value or convenience of the Fidelity funds as investment vehicles. These services include 24-hour access to account information and market information through telephone representatives and over the Internet, investor education materials and asset allocation tools, and the expanded availability of Fidelity Investor Centers.
Investment in a Large Fund Family. The Board considered the benefits to shareholders of investing in a Fidelity fund, including the benefits of investing in a fund that is part of a large family of funds offering a variety of investment disciplines and providing a large variety of mutual fund investor services. The Board noted that Fidelity had taken, or had made recommendations that resulted in the Fidelity funds taking, a number of actions over the previous year that benefited particular funds, including (i) continuing to dedicate additional resources to investment research and to the support of the senior management team that oversees asset management; (ii) persisting in efforts to enhance Fidelity's global research capabilities; (iii) launching new funds and making other enhancements to meet client needs for global and income-oriented solutions; (iv) continuing to launch dedicated lower cost underlying funds to meet portfolio construction needs related to expanding underlying fund options for Fidelity funds of funds, specifically for the Freedom Fund product lines; (v) rationalizing product lines and gaining increased efficiencies through the mergers of several funds into other funds; (vi) strengthening Fidelity's index fund offerings by reducing investment minimums and adopting or lowering existing expense caps for certain funds and classes; (vii) enhancing Global Asset Allocation product offerings by launching new funds and strategies, including "open architecture" target date funds that utilize affiliated and unaffiliated sub-advisers; (viii) modifying the eligibility criteria for Institutional Class shares of Advisor funds to increase their marketability to a portion of the defined contribution plan market; (ix) creating a new low-cost retirement share class for certain Advisor funds to appeal to large retirement plans; (x) transitioning the management of certain Fidelity commodity funds to Geode Capital Management LLC, a registered commodity pool operator, while retaining administrative responsibilities for the funds; (xi) reorganizing a number of funds; and (xii) taking steps toward establishing a new Fidelity adviser to manage sector-based funds and products.
Investment Performance. The Board considered whether the fund has operated in accordance with its investment objective, as well as its record of compliance with its investment restrictions and its performance history.
The Board took into account discussions with the Investment Advisers about fund investment performance that occur at Board meetings throughout the year. In this regard the Board noted that as part of regularly scheduled fund reviews and other reports to the Board on fund performance, the Board periodically considers annualized return information for the fund, for different time periods, measured against a securities market index ("benchmark index") and a peer group of mutual funds with similar objectives ("peer group"). In its evaluation of fund investment performance, the Board gave particular attention to information indicating changes in performance of certain Fidelity funds for specific time periods and the Investment Advisers' explanations for any overperformance or, in the case of the fund, underperformance.
Annual Report
In addition to reviewing absolute and relative fund performance, the Independent Trustees periodically consider the appropriateness of fund performance metrics in evaluating the results achieved. In general, the Independent Trustees believe that fund performance should be evaluated based on net performance (after fees and expenses) of both the highest performing and lowest performing classes, where applicable, compared to appropriate benchmark indices, over appropriate time periods which may include full market cycles, and compared to peer groups, as applicable, over the same periods, taking into account relevant factors including the following: general market conditions; issuer-specific information; tactical opportunities for investment; and fund cash flows and other factors.
The Independent Trustees recognize that shareholders evaluate performance on a net basis over their own holding periods, for which one-, three-, and five-year periods are used as a proxy. For this reason, the performance information reviewed by the Board also included net cumulative calendar year total return information for the fund and an appropriate benchmark index and peer group for the most recent one-, three-, and five-year periods, as shown below. Returns are shown compared to the 25th percentile (top of box) and 75th percentile (bottom of box) of the peer universe.
Annual Report
Board Approval of Investment Advisory Contracts and
Management Fees - continued
Fidelity Advisor Small Cap Fund

The Board has discussed the fund's underperformance with FMR and has engaged with FMR to consider what steps might be taken to remediate the fund's underperformance.
The Board also considered that the fund's management fee is subject to upward or downward adjustment depending upon whether, and to what extent, the fund's investment performance for the performance period exceeds, or is exceeded by, a securities index, thus leading to a performance adjustment for the same period. The Board noted that the performance adjustment provides FMR with a strong economic incentive to seek to achieve superior performance for the fund's shareholders and helps to more closely align the interests of FMR and the fund's shareholders.
Based on its review, the Board concluded that the nature, extent, and quality of services provided to the fund under the Advisory Contracts should benefit the fund's shareholders.
Competitiveness of Management Fee and Total Expense Ratio. The Board considered the fund's management fee and total expense ratio compared to "mapped groups" of competitive funds and classes. Fidelity creates "mapped groups" by combining similar Lipper investment objective categories that have comparable management fee characteristics. Combining Lipper investment objective categories aids the Board's management fee and total expense ratio comparisons by broadening the competitive group used for comparison and by reducing the number of universes to which various Fidelity funds are compared.
Annual Report
Management Fee. The Board considered two proprietary management fee comparisons for the 12-month periods shown in the chart below. The group of Lipper funds used by the Board for management fee comparisons is referred to below as the "Total Mapped Group." The Total Mapped Group comparison focuses on a fund's standing in terms of gross management fees before expense reimbursements or caps, and without giving effect to the fund's performance adjustment, relative to the total universe of funds with comparable investment mandates, regardless of whether their management fee structures also are comparable. Funds with comparable investment mandates offer exposure to similar types of securities. Funds with comparable management fee structures have similar management fee contractual arrangements (e.g., flat rate charged for advisory services, all-inclusive fee rate, etc.). "TMG %" represents the percentage of funds in the Total Mapped Group that had management fees that were lower than the fund's. For example, a TMG % of 14% means that 86% of the funds in the Total Mapped Group had higher management fees than the fund. The "Asset-Size Peer Group" (ASPG) comparison focuses on a fund's standing relative to a subset of non-Fidelity funds within the Total Mapped Group that are similar in size and management fee structure. The ASPG represents at least 15% of the funds in the Total Mapped Group with comparable asset size and management fee structures, subject to a minimum of 50 funds (or all funds in the Total Mapped Group if fewer than 50). Additional information, such as the ASPG quartile in which the fund's management fee ranked and the impact of the fund's performance adjustment, is also included in the chart and considered by the Board.
Fidelity Advisor Small Cap Fund
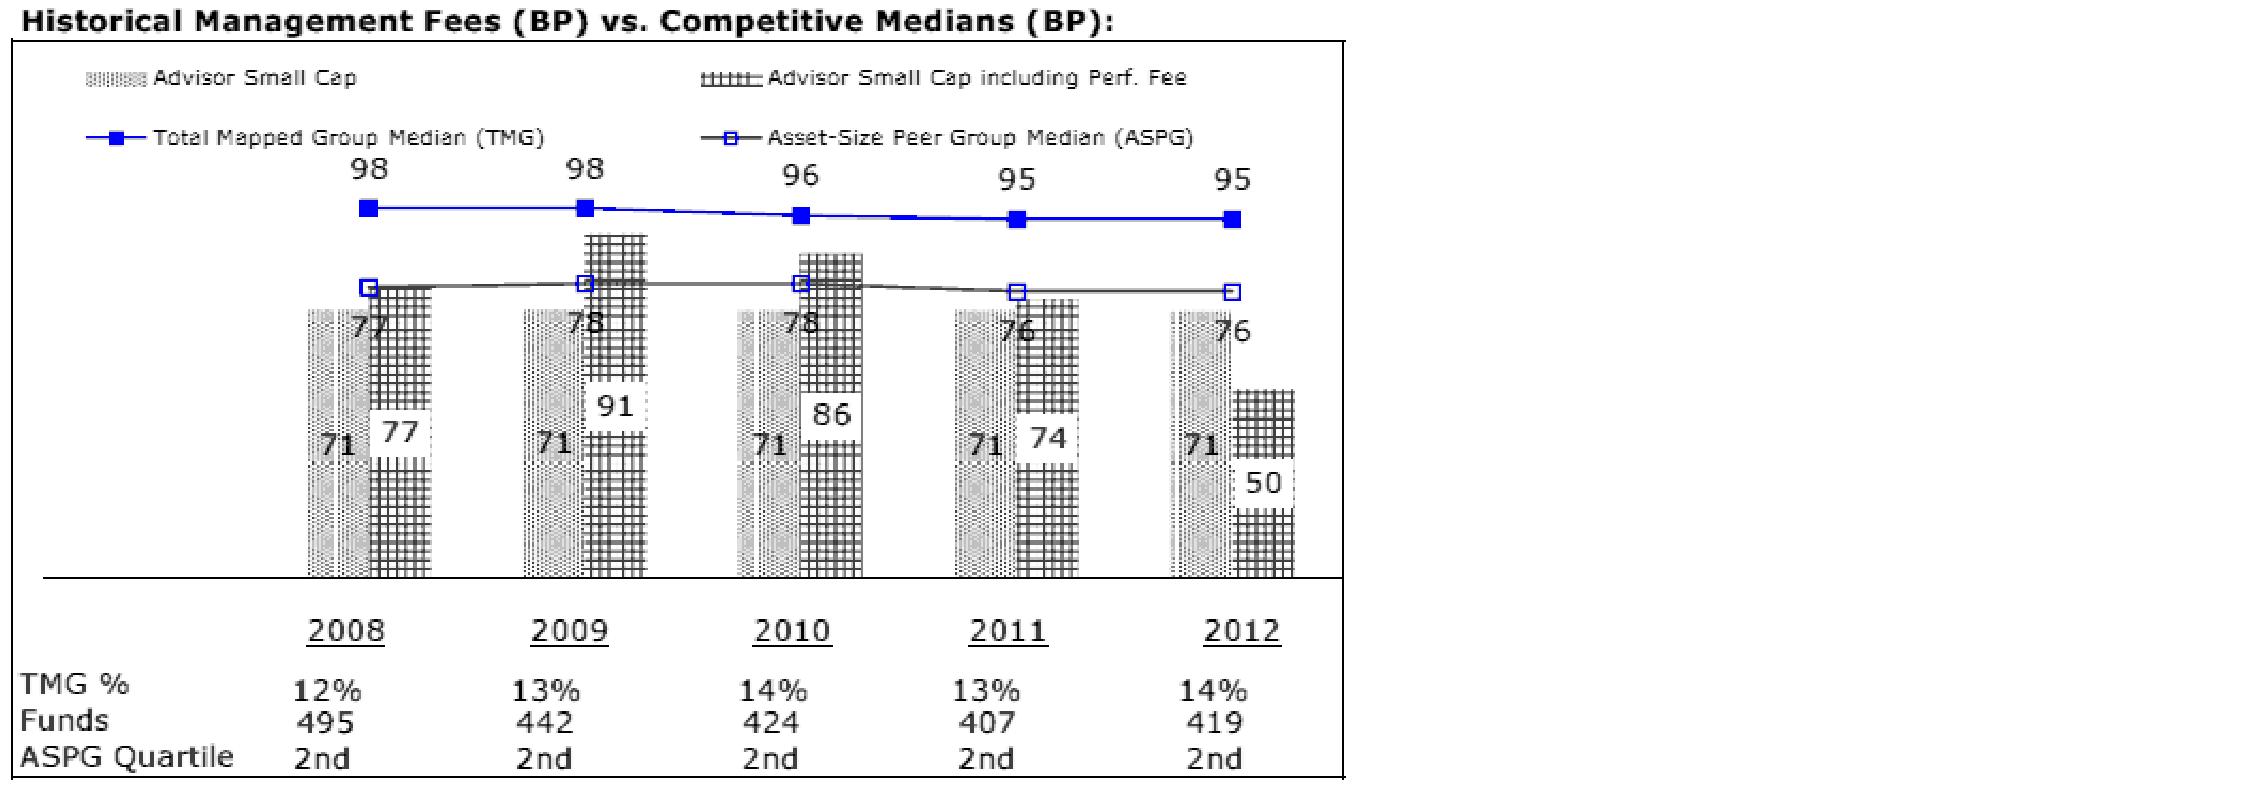
The Board noted that the fund's management fee ranked below the median of its Total Mapped Group and below the median of its ASPG for 2012. The Board also noted the effect of the fund's negative performance adjustment on the fund's management fee ranking.
Annual Report
Board Approval of Investment Advisory Contracts and
Management Fees - continued
Based on its review, the Board concluded that the fund's management fee is fair and reasonable in light of the services that the fund receives and the other factors considered.
Total Expense Ratio. In its review of each class's total expense ratio, the Board considered the fund's management fee as well as other fund or class expenses, as applicable, such as transfer agent fees, pricing and bookkeeping fees, fund-paid 12b-1 fees, and custodial, legal, and audit fees. The Board also noted the effects of any waivers and reimbursements on fees and expenses, as well as the impact of the fund's performance adjustment. As part of its review, the Board also considered the current and historical total expense ratios of each class of the fund compared to competitive fund median expenses. Each class of the fund is compared to those funds and classes in the Total Mapped Group (used by the Board for management fee comparisons) that have a similar sales load structure.
The Board noted that the total expense ratio of each class ranked below its competitive median for 2012.
Fees Charged to Other Fidelity Clients. The Board also considered Fidelity fee structures and other information with respect to clients of FMR and its affiliates, such as other mutual funds advised or subadvised by FMR or its affiliates, pension plan clients, and other institutional clients. The Board noted the findings of the 2013 ad hoc joint committee (created with the board of other Fidelity funds), which reviewed and compared Fidelity's institutional investment advisory business with its business of providing services to the Fidelity funds, including the differences in services provided, fees charged, and costs incurred, as well as competition in their respective marketplaces.
Based on its review of total expense ratios and fees charged to other Fidelity clients, the Board concluded that the total expense ratio of each class of the fund was reasonable in light of the services that the fund and its shareholders receive and the other factors considered.
Costs of the Services and Profitability. The Board considered the revenues earned and the expenses incurred by Fidelity in conducting the business of developing, marketing, distributing, managing, administering and servicing the fund and servicing the fund's shareholders. The Board also considered the level of Fidelity's profits in respect of all the Fidelity funds.
On an annual basis, FMR presents to the Board Fidelity's profitability for the fund. Fidelity calculates the profitability for each fund, as well as aggregate profitability for groups of Fidelity funds and all Fidelity funds, using a series of detailed revenue and cost allocation methodologies which originate with the books and records of Fidelity on which Fidelity's audited financial statements are based. The Audit Committee of the Board reviews any significant changes from the prior year's methodologies.
Annual Report
PricewaterhouseCoopers LLP (PwC), independent registered public accounting firm and auditor to Fidelity and certain Fidelity funds, has been engaged annually by the Board as part of the Board's assessment of Fidelity's profitability analysis. PwC's engagement includes the review and assessment of the methodologies used by Fidelity in determining the revenues and expenses attributable to Fidelity's mutual fund business, and completion of agreed-upon procedures surrounding the mathematical accuracy of fund profitability and its conformity to allocation methodologies. After considering PwC's reports issued under the engagement and information provided by Fidelity, the Board concluded that while other allocation methods may also be reasonable, Fidelity's profitability methodologies are reasonable in all material respects.
The Board also reviewed Fidelity's non-fund businesses and fall-out benefits related to the mutual fund business as well as cases where Fidelity's affiliates may benefit from or be related to the fund's business.
The Board considered the costs of the services provided by and the profits realized by Fidelity in connection with the operation of the fund and was satisfied that the profitability was not excessive in the circumstances.
Economies of Scale. The Board considered whether there have been economies of scale in respect of the management of the Fidelity funds, whether the Fidelity funds (including the fund) have appropriately benefited from any such economies of scale, and whether there is potential for realization of any further economies of scale. The Board considered the extent to which the fund will benefit from economies of scale through increased services to the fund, through waivers or reimbursements, or through fee or expense reductions. The Board also noted that in 2009, it and the board of other Fidelity funds created an ad hoc committee (the Economies of Scale Committee) to analyze whether FMR attains economies of scale in respect of the management and servicing of the Fidelity funds, whether the Fidelity funds have appropriately benefited from such economies of scale, and whether there is potential for realization of any further economies of scale.
The Board recognized that the fund's management contract incorporates a "group fee" structure, which provides for lower group fee rates as total fund assets under FMR's management increase, and for higher group fee rates as total fund assets under FMR's management decrease. FMR calculates the group fee rates based on a tiered asset "breakpoint" schedule that varies based on asset class. The Board considered that the group fee is designed to deliver the benefits of economies of scale to fund shareholders when total Fidelity fund assets increase, even if assets of any particular fund are unchanged or have declined, because some portion of Fidelity's costs are attributable to services provided to all Fidelity funds, and all funds benefit if those costs can be allocated among more assets. The Board concluded that, given the group fee structure, fund shareholders will benefit from lower management fees as assets under FMR's management increase at the fund complex level, regardless of whether Fidelity achieves any such economies of scale.
Annual Report
Board Approval of Investment Advisory Contracts and
Management Fees - continued
The Board concluded, taking into account the analysis of the Economies of Scale Committee, that economies of scale, if any, are being appropriately shared between fund shareholders and Fidelity.
Amendment to Description of Group Fee Rate. At its July 2013 meeting, the Board voted to approve an amendment to the fund's management contract to modify the description of the "group fee rate" effective August 1, 2013. The Board noted that under the prior description in the contract, the group fee rate was based on the average net assets of all registered investment companies with which FMR has management contracts. Under the contract's tiered asset breakpoint schedule, the group fee rate is lower as total fund assets under FMR's management increase, and higher as total fund assets under FMR's management decrease. The Board considered that the prior description would have excluded the assets of 64 Fidelity sector funds from the group fee rate calculation once Fidelity SelectCo, LLC, an affiliate of FMR, assumed management responsibilities for those funds. The Board noted that modifying the description of the group fee rate to continue to include the assets of those 64 funds for purposes of determining group fee rate breakpoints would avoid an immediate adverse impact on the group fee rate for any fund.
Additional Information Requested by the Board. In order to develop fully the factual basis for consideration of the Fidelity funds' Advisory Contracts, the Board requested and received additional information on certain topics, including: (i) fund performance trends and Fidelity's long-term strategies for certain funds; (ii) the potential to further rationalize the Fidelity fund lineup with the possibility of achieving savings for the funds and Fidelity; (iii) the methodology with respect to competitive fund data and peer group classifications; (iv) the arrangements with, and performance of, certain sub-advisers on behalf of the Fidelity funds, as well as certain proposed participating affiliate arrangements; (v) the realization of fall-out benefits in certain Fidelity business units; (vi) Fidelity's group fee structures, including the rationale for the individual fee rates of certain categories of funds and the definition of group assets; (vii) trends regarding industry use of performance fee structures and the performance adjustment methodologies applicable to the Fidelity funds; (viii) additional competitive analysis regarding the total expenses for certain classes; and (ix) fund profitability methodology, including Fidelity's cost allocation methodology, and the impact of certain factors on fund profitability results.
Annual Report
Based on its evaluation of all of the conclusions noted above, and after considering all factors it believed relevant, the Board ultimately concluded that the advisory fee structures are fair and reasonable, and that the fund's Advisory Contracts should be renewed.
Annual Report
Investment Adviser
Fidelity Management & Research Company
Boston, MA
Investment Sub-Advisers
FMR Co., Inc.
Fidelity Management & Research
(U.K.) Inc.
Fidelity Management & Research
(Hong Kong) Limited
Fidelity Management & Research
(Japan) Inc.
General Distributor
Fidelity Distributors Corporation
Smithfield, RI
Transfer and Service Agents
Fidelity Investments Institutional
Operations Company, Inc.
Boston, MA
Fidelity Service Company, Inc.
Boston, MA
Custodian
State Street Bank and Trust Company
Quincy, MA
(Fidelity Investment logo)(registered trademark)
ASCFZ-UANN-0114 1.9585487.100
(Fidelity Investment logo)(registered trademark)
Fidelity Advisor® Stock Selector
Mid Cap
Fund - Class A, Class T, Class B
and Class C
Annual Report
November 30, 2013
(Fidelity Cover Art)
Contents
|
Performance |
How the fund has done over time. |
|
|
Management's Discussion of Fund Performance |
The Portfolio Managers' review of fund performance and strategy. |
|
|
Shareholder Expense Example |
An example of shareholder expenses. |
|
|
Investment Changes |
A summary of major shifts in the fund's investments over the past six months. |
|
|
Investments |
A complete list of the fund's investments with their market values. |
|
|
Financial Statements |
Statements of assets and liabilities, operations, and changes in net assets, as well as financial highlights. |
|
|
Notes |
Notes to the financial statements. |
|
|
Report of Independent Registered Public Accounting Firm |
|
|
|
Trustees and Officers |
|
|
|
Distributions |
|
|
|
Board Approval of Investment Advisory Contracts and Management Fees |
|
To view a fund's proxy voting guidelines and proxy voting record for the 12-month period ended June 30, visit http://www.fidelity.com/proxyvotingresults or visit the Securities and Exchange Commission's (SEC) web site at http://www.sec.gov. You may also call 1-877-208-0098 to request a free copy of the proxy voting guidelines.
Standard & Poor's, S&P and S&P 500 are registered service marks of The McGraw-Hill Companies, Inc. and have been licensed for use by Fidelity Distributors Corporation.
Other third-party marks appearing herein are the property of their respective owners.
All other marks appearing herein are registered or unregistered trademarks or service marks of FMR LLC or an affiliated company. © 2014 FMR LLC. All rights reserved.
Annual Report
This report and the financial statements contained herein are submitted for the general information of the shareholders of the fund. This report is not authorized for distribution to prospective investors in the fund unless preceded or accompanied by an effective prospectus.
A fund files its complete schedule of portfolio holdings with the SEC for the first and third quarters of each fiscal year on Form N-Q. Forms N-Q are available on the SEC's web site at http://www.sec.gov. A fund's Forms N-Q may be reviewed and copied at the SEC's Public Reference Room in Washington, DC. Information regarding the operation of the SEC's Public Reference Room may be obtained by calling 1-800-SEC-0330. For a complete list of a fund's portfolio holdings, view the most recent holdings listing, semiannual report, or annual report on Fidelity's web site at http://www.fidelity.com, http://www.advisor.fidelity.com, or http://www.401k.com, as applicable.
NOT FDIC INSURED • MAY LOSE VALUE • NO BANK GUARANTEE
Neither the fund nor Fidelity Distributors Corporation is a bank.
Annual Report
Performance: The Bottom Line
Average annual total return reflects the change in the value of an investment, assuming reinvestment of the class' distributions from dividend income and capital gains (the profits earned upon the sale of securities that have grown in value, if any) and assuming a constant rate of performance each year. The $10,000 table and the fund's returns do not reflect the deduction of taxes that a shareholder would pay on fund distributions or the redemption of fund shares. During periods of reimbursement by Fidelity, a fund's total return will be greater than it would be had the reimbursement not occurred. How a fund did yesterday is no guarantee of how it will do tomorrow. Returns reflect the conversion of Class B shares to Class A shares after a maximum of seven years.
Average Annual Total Returns
|
Periods ended November 30, 2013 |
Past 1 |
Past 5 |
Past 10 |
|
Class A (incl. 5.75% sales charge) |
21.65% |
20.92% |
6.82% |
|
Class T (incl. 3.50% sales charge) |
24.29% |
21.26% |
6.88% |
|
Class B (incl. contingent deferred sales charge) A |
23.01% |
21.22% |
6.86% |
|
Class C (incl. contingent deferred sales charge) B |
27.09% |
21.45% |
6.66% |
A Class B shares' contingent deferred sales charges included in the past one year, past five years, and past 10 years total return figures are 5%, 2%, and 0%, respectively.
B Class C shares' contingent deferred sales charges included in the past one year, past five years, and past 10 years total return figures are 1%, 0%, and 0%, respectively.
Annual Report
$10,000 Over 10 Years
Let's say hypothetically that $10,000 was invested in Fidelity Advisor® Stock Selector Mid Cap Fund - Class A on November 30, 2003, and the current 5.75% sales charge was paid. The chart shows how the value of your investment would have changed, and also shows how the S&P MidCap 400® Index performed over the same period.
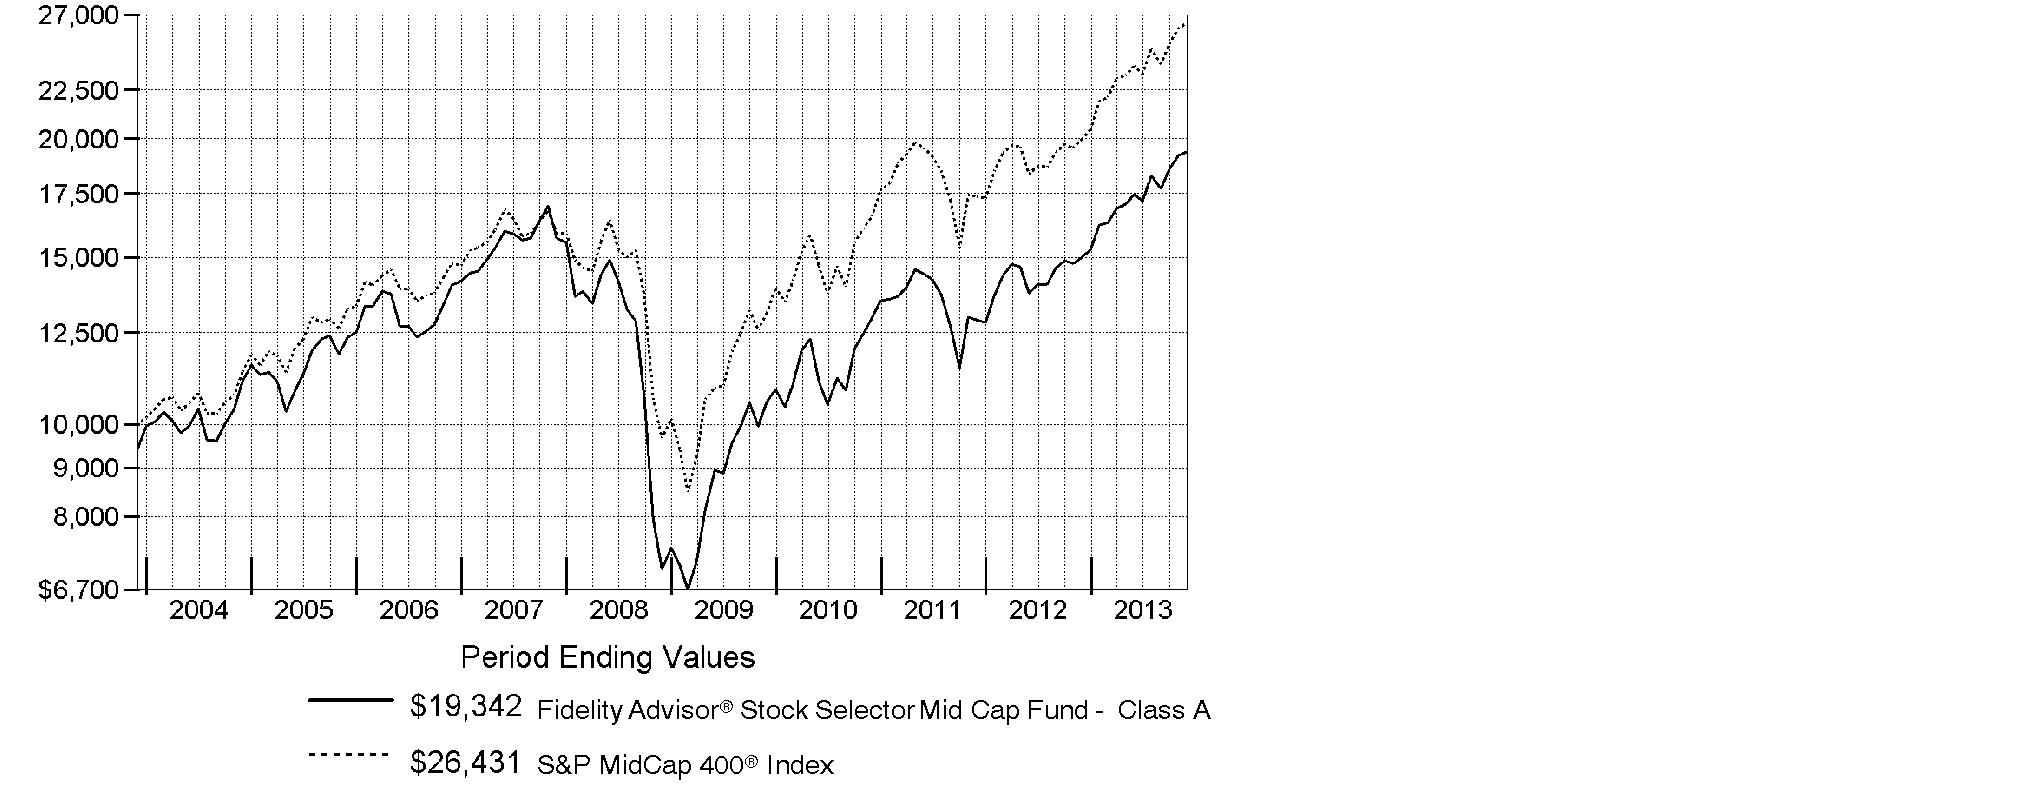
Annual Report
Management's Discussion of Fund Performance
Market Recap: With the current bull run nearing the five-year mark, equity benchmarks ripped up old records during the 12 months ending November 30, 2013. Gains were fueled by strengthening U.S. economic data, as well as generally improving economies and accommodative monetary policies worldwide. The broad S&P 500® Index reached new peaks in its 30.30% climb for the period, and the blue-chip Dow Jones Industrial AverageSM surpassed historic milestones en route to a 26.63% gain. The Nasdaq Composite Index®, up 36.73% amid a resurgence in growth-oriented stocks, closed above 4,000 for the first time since 2000. Shedding anxiety over the 2012 U.S. presidential election - and apparently confident that the federal debt-ceiling debate would be resolved - markets rose from period start through late May. News that the U.S. Federal Reserve was considering an end to its stimulative bond-buying kept stocks in flux over the summer but, by September, the Fed had set aside any imminent tapering. Despite jitters over a potential U.S. military strike in Syria and, later, an October budget impasse that briefly shuttered the federal government, volatility was subdued heading into the holidays, with investor optimism helping many markets home in on all-time highs at period end. Elsewhere, non-U.S. developed-market equities saw similar results, with the MSCI® EAFE® Index adding 24.97%.
Comments from Shadman Riaz and Eddie Yoon, two Co-Portfolio Managers of Fidelity Advisor® Stock Selector Mid Cap Fund, who are responsible for the fund's energy and health care sleeves, respectively, as part of Fidelity's Stock Selector Mid Cap Group: For the year, the fund's Class A, Class T, Class B and Class C shares returned 29.07%, 28.80%, 28.01% and 28.09%, respectively (excluding sales charges), trailing the 32.33% gain of the S&P MidCap 400® Index. Versus the index, weak choices in industrials and information technology hurt the most, and offset strong picks in financials and health care. Nuance Communications was the fund's biggest relative detractor. The voice-recognition technology company struggled in its transition to a more subscription-heavy business model, while slowing growth and weak communication among management made matters worse, and the stock fell. Untimely positioning in specialty pharmaceuticals company Endo Health Solutions hurt, as did a stake in underperforming commercial building products maker Armstrong World Industries, which we sold from the fund. On the plus side, picks in financial helped the most by far. Japan-based diversified financials firm Monex Group was our top individual contributor, while Regeneron Pharmaceuticals - which was removed from the benchmark in May - also helped. We eliminated both positions by period end. Nuance, Armstrong and Monex were not in the index.
The views expressed above reflect those of the portfolio manager(s) only through the end of the period as stated on the cover of this report and do not necessarily represent the views of Fidelity or any other person in the Fidelity organization. Any such views are subject to change at any time based upon market or other conditions and Fidelity disclaims any responsibility to update such views. These views may not be relied on as investment advice and, because investment decisions for a Fidelity fund are based on numerous factors, may not be relied on as an indication of trading intent on behalf of any Fidelity fund.
Annual Report
Shareholder Expense Example
As a shareholder of the Fund, you incur two types of costs: (1) transaction costs, including sales charges (loads) on purchase payments or redemption proceeds, and (2) ongoing costs, including management fees, distribution and/or service (12b-1) fees and other Fund expenses. This Example is intended to help you understand your ongoing costs (in dollars) of investing in the Fund and to compare these costs with the ongoing costs of investing in other mutual funds.
The Example is based on an investment of $1,000 invested at the beginning of the period and held for the entire period (June 1, 2013 to November 30, 2013).
Actual Expenses
The first line of the accompanying table for each class of the Fund provides information about actual account values and actual expenses. You may use the information in this line, together with the amount you invested, to estimate the expenses that you paid over the period. Simply divide your account value by $1,000.00 (for example, an $8,600 account value divided by $1,000.00 = 8.6), then multiply the result by the number in the first line for a class of the Fund under the heading entitled "Expenses Paid During Period" to estimate the expenses you paid on your account during this period. A small balance maintenance fee of $12.00 that is charged once a year may apply for certain accounts with a value of less than $2,000. This fee is not included in the table below. If it was, the estimate of expenses you paid during the period would be higher, and your ending account value lower, by this amount. In addition, the Fund, as a shareholder in the underlying Fidelity Central Funds, will indirectly bear its pro-rata share of the fees and expenses incurred by the underlying Fidelity Central Funds. These fees and expenses are not included in the Fund's annualized expense ratio used to calculate the expense estimate in the table below.
Hypothetical Example for Comparison Purposes
The second line of the accompanying table for each class of the Fund provides information about hypothetical account values and hypothetical expenses based on a Class' actual expense ratio and an assumed rate of return of 5% per year before expenses, which is not the Class' actual return. The hypothetical account values and expenses may not be used to estimate the actual ending account balance or expenses you paid for the period. You may use this information to compare the ongoing costs of investing in the Fund and other funds. To do so, compare this 5% hypothetical example with the 5% hypothetical examples that appear in the shareholder reports of the other funds. A small balance maintenance fee of $12.00 that is charged once a year may apply for certain accounts with a value of less than $2,000. This fee is not included in the table below. If it was, the estimate of expenses you paid during the period would be higher, and your ending account value lower, by this amount. In addition, the Fund, as a shareholder in the underlying Fidelity Central Funds, will indirectly bear its pro-rata share of the fees and expenses incurred by the underlying Fidelity Central Funds. These fees and expenses are not included in the Fund's annualized expense ratio used to calculate the expense estimate in the table below.
Please note that the expenses shown in the table are meant to highlight your ongoing costs only and do not reflect any transaction costs. Therefore, the second line of the table is useful in comparing ongoing costs only, and will not help you determine the relative total costs of owning different funds. In addition, if these transactional costs were included, your costs would have been higher.
Annual Report
|
|
Annualized |
Beginning |
Ending |
Expenses Paid |
|
Class A |
.94% |
|
|
|
|
Actual |
|
$ 1,000.00 |
$ 1,108.60 |
$ 4.97 |
|
HypotheticalA |
|
$ 1,000.00 |
$ 1,020.36 |
$ 4.76 |
|
Class T |
1.15% |
|
|
|
|
Actual |
|
$ 1,000.00 |
$ 1,107.50 |
$ 6.08 |
|
HypotheticalA |
|
$ 1,000.00 |
$ 1,019.30 |
$ 5.82 |
|
Class B |
1.75% |
|
|
|
|
Actual |
|
$ 1,000.00 |
$ 1,104.10 |
$ 9.23 |
|
HypotheticalA |
|
$ 1,000.00 |
$ 1,016.29 |
$ 8.85 |
|
Class C |
1.68% |
|
|
|
|
Actual |
|
$ 1,000.00 |
$ 1,104.50 |
$ 8.86 |
|
HypotheticalA |
|
$ 1,000.00 |
$ 1,016.65 |
$ 8.49 |
|
Fidelity Stock Selector Mid Cap Fund |
.71% |
|
|
|
|
Actual |
|
$ 1,000.00 |
$ 1,110.00 |
$ 3.76 |
|
HypotheticalA |
|
$ 1,000.00 |
$ 1,021.51 |
$ 3.60 |
|
Institutional Class |
.67% |
|
|
|
|
Actual |
|
$ 1,000.00 |
$ 1,110.10 |
$ 3.54 |
|
HypotheticalA |
|
$ 1,000.00 |
$ 1,021.71 |
$ 3.40 |
A 5% return per year before expenses
B Annualized expense ratio reflects expenses net of applicable fee waivers.
* Expenses are equal to each Class' annualized expense ratio, multiplied by the average account value over the period, multiplied by 183/365 (to reflect the one-half year period).
Annual Report
Investment Changes (Unaudited)
|
Top Ten Stocks as of November 30, 2013 |
||
|
|
% of fund's |
% of fund's net assets |
|
J.B. Hunt Transport Services, Inc. |
1.9 |
1.2 |
|
Capital One Financial Corp. |
1.8 |
1.6 |
|
Hubbell, Inc. Class B |
1.7 |
1.4 |
|
AMETEK, Inc. |
1.7 |
2.0 |
|
Roper Industries, Inc. |
1.5 |
1.2 |
|
Verisk Analytics, Inc. |
1.5 |
0.9 |
|
Interactive Brokers Group, Inc. |
1.2 |
0.8 |
|
Foot Locker, Inc. |
1.2 |
0.0 |
|
SLM Corp. |
1.1 |
1.0 |
|
Raymond James Financial, Inc. |
1.1 |
0.5 |
|
|
14.7 |
|
|
Top Five Market Sectors as of November 30, 2013 |
||
|
|
% of fund's |
% of fund's net assets |
|
Financials |
22.3 |
22.3 |
|
Industrials |
16.8 |
17.7 |
|
Information Technology |
15.6 |
15.1 |
|
Consumer Discretionary |
13.9 |
12.6 |
|
Health Care |
8.9 |
9.0 |
|
Asset Allocation (% of fund's net assets) |
|||||||
|
As of November 30, 2013* |
As of May 31, 2013** |
||||||
 |
Stocks and |
|
|
Stocks and |
|
||
 |
Short-Term |
|
|
Short-Term |
|
||
|
* Foreign investments |
8.5% |
|
** Foreign investments |
8.5% |
|
||

Annual Report
Investments November 30, 2013
Showing Percentage of Net Assets
|
Common Stocks - 98.0% |
|||
|
Shares |
Value (000s) |
||
|
CONSUMER DISCRETIONARY - 13.9% |
|||
|
Distributors - 0.8% |
|||
|
LKQ Corp. (a) |
487,380 |
$ 16,157 |
|
|
Hotels, Restaurants & Leisure - 0.7% |
|||
|
Panera Bread Co. Class A (a) |
82,900 |
14,664 |
|
|
Household Durables - 2.4% |
|||
|
Jarden Corp. (a) |
411,415 |
23,138 |
|
|
NVR, Inc. (a) |
14,400 |
13,968 |
|
|
Tupperware Brands Corp. |
153,580 |
14,028 |
|
|
|
51,134 |
||
|
Internet & Catalog Retail - 0.5% |
|||
|
Liberty Media Corp. Interactive Series A (a) |
348,310 |
9,781 |
|
|
Leisure Equipment & Products - 0.5% |
|||
|
Brunswick Corp. |
237,700 |
10,863 |
|
|
Media - 0.3% |
|||
|
AMC Networks, Inc. Class A (a) |
117,900 |
7,568 |
|
|
Multiline Retail - 1.0% |
|||
|
Dollar General Corp. (a) |
173,940 |
9,904 |
|
|
Dollar Tree, Inc. (a) |
206,878 |
11,513 |
|
|
|
21,417 |
||
|
Specialty Retail - 7.4% |
|||
|
Abercrombie & Fitch Co. Class A |
123,582 |
4,236 |
|
|
American Eagle Outfitters, Inc. |
439,800 |
7,156 |
|
|
Cabela's, Inc. Class A (a) |
188,400 |
11,540 |
|
|
Dick's Sporting Goods, Inc. |
336,280 |
19,007 |
|
|
DSW, Inc. Class A |
128,400 |
5,756 |
|
|
Foot Locker, Inc. |
633,700 |
24,645 |
|
|
L Brands, Inc. |
130,315 |
8,469 |
|
|
O'Reilly Automotive, Inc. (a) |
49,810 |
6,224 |
|
|
PetSmart, Inc. |
150,260 |
11,136 |
|
|
Ross Stores, Inc. |
181,910 |
13,909 |
|
|
Sally Beauty Holdings, Inc. (a) |
550,320 |
15,486 |
|
|
Tractor Supply Co. |
253,536 |
18,561 |
|
|
Williams-Sonoma, Inc. |
213,960 |
12,649 |
|
|
|
158,774 |
||
|
Textiles, Apparel & Luxury Goods - 0.3% |
|||
|
Ralph Lauren Corp. |
42,600 |
7,465 |
|
|
TOTAL CONSUMER DISCRETIONARY |
297,823 |
||
|
Common Stocks - continued |
|||
|
Shares |
Value (000s) |
||
|
CONSUMER STAPLES - 3.6% |
|||
|
Beverages - 0.5% |
|||
|
Beam, Inc. |
101,800 |
$ 6,875 |
|
|
Monster Beverage Corp. (a) |
58,984 |
3,491 |
|
|
|
10,366 |
||
|
Food & Staples Retailing - 0.9% |
|||
|
United Natural Foods, Inc. (a) |
164,345 |
11,315 |
|
|
Whole Foods Market, Inc. |
131,842 |
7,462 |
|
|
|
18,777 |
||
|
Food Products - 2.2% |
|||
|
Hain Celestial Group, Inc. (a) |
108,400 |
8,964 |
|
|
Mead Johnson Nutrition Co. Class A |
102,300 |
8,645 |
|
|
The Hershey Co. |
83,900 |
8,129 |
|
|
TreeHouse Foods, Inc. (a) |
85,280 |
5,982 |
|
|
WhiteWave Foods Co. (a) |
741,900 |
15,780 |
|
|
|
47,500 |
||
|
TOTAL CONSUMER STAPLES |
76,643 |
||
|
ENERGY - 6.1% |
|||
|
Energy Equipment & Services - 1.8% |
|||
|
Dril-Quip, Inc. (a) |
131,100 |
14,232 |
|
|
Helmerich & Payne, Inc. |
125,980 |
9,700 |
|
|
Oil States International, Inc. (a) |
57,000 |
5,834 |
|
|
Rowan Companies PLC (a) |
254,710 |
8,818 |
|
|
|
38,584 |
||
|
Oil, Gas & Consumable Fuels - 4.3% |
|||
|
Atlas Pipeline Partners LP |
227,660 |
7,959 |
|
|
Cheniere Energy, Inc. (a) |
170,200 |
6,738 |
|
|
Cimarex Energy Co. |
200,600 |
18,973 |
|
|
Energen Corp. |
176,400 |
12,731 |
|
|
HollyFrontier Corp. |
96,570 |
4,633 |
|
|
SM Energy Co. |
197,946 |
17,447 |
|
|
Targa Resources Corp. |
82,900 |
6,722 |
|
|
Whiting Petroleum Corp. (a) |
138,900 |
8,390 |
|
|
WPX Energy, Inc. (a) |
442,880 |
8,233 |
|
|
|
91,826 |
||
|
TOTAL ENERGY |
130,410 |
||
|
Common Stocks - continued |
|||
|
Shares |
Value (000s) |
||
|
FINANCIALS - 22.3% |
|||
|
Capital Markets - 4.0% |
|||
|
ABG Sundal Collier ASA (a) |
3,100,000 |
$ 2,474 |
|
|
Ashmore Global Opportunities Ltd. (United Kingdom) |
443,737 |
3,656 |
|
|
KKR & Co. LP |
852,564 |
20,231 |
|
|
MLP AG |
1,650,000 |
11,031 |
|
|
Oaktree Capital Group LLC Class A |
112,900 |
6,291 |
|
|
Och-Ziff Capital Management Group LLC Class A |
380,000 |
5,278 |
|
|
Raymond James Financial, Inc. |
492,800 |
23,743 |
|
|
Virtus Investment Partners, Inc. (a) |
66,400 |
13,798 |
|
|
|
86,502 |
||
|
Commercial Banks - 3.4% |
|||
|
CIT Group, Inc. |
140,498 |
7,092 |
|
|
City National Corp. |
187,910 |
14,349 |
|
|
Erste Group Bank AG |
544,274 |
19,162 |
|
|
Huntington Bancshares, Inc. |
2,489,478 |
22,853 |
|
|
Synovus Financial Corp. |
2,464,089 |
8,600 |
|
|
|
72,056 |
||
|
Consumer Finance - 3.8% |
|||
|
ACOM Co. Ltd. (a) |
2,622,800 |
9,729 |
|
|
Capital One Financial Corp. |
540,800 |
38,738 |
|
|
Cash America International, Inc. |
239,527 |
9,009 |
|
|
SLM Corp. |
896,616 |
23,895 |
|
|
|
81,371 |
||
|
Diversified Financial Services - 1.2% |
|||
|
Interactive Brokers Group, Inc. |
1,065,767 |
25,845 |
|
|
Insurance - 2.0% |
|||
|
Direct Line Insurance Group PLC |
4,072,691 |
15,674 |
|
|
Fairfax Financial Holdings Ltd. (sub. vtg.) |
24,800 |
9,551 |
|
|
Fidelity National Financial, Inc. Class A |
220,000 |
6,395 |
|
|
Validus Holdings Ltd. |
269,489 |
10,793 |
|
|
|
42,413 |
||
|
Real Estate Investment Trusts - 6.7% |
|||
|
Acadia Realty Trust (SBI) |
300,580 |
7,806 |
|
|
Alexandria Real Estate Equities, Inc. |
143,875 |
9,102 |
|
|
Camden Property Trust (SBI) |
137,022 |
7,936 |
|
|
Corrections Corp. of America |
132,800 |
4,429 |
|
|
Cousins Properties, Inc. |
542,500 |
5,810 |
|
|
Equity One, Inc. |
403,833 |
9,046 |
|
|
Essex Property Trust, Inc. |
85,664 |
13,005 |
|
|
Glimcher Realty Trust |
469,064 |
4,555 |
|
|
Common Stocks - continued |
|||
|
Shares |
Value (000s) |
||
|
FINANCIALS - continued |
|||
|
Real Estate Investment Trusts - continued |
|||
|
LaSalle Hotel Properties (SBI) |
139,500 |
$ 4,369 |
|
|
Mid-America Apartment Communities, Inc. |
176,600 |
10,638 |
|
|
National Retail Properties, Inc. (d) |
344,169 |
10,927 |
|
|
Piedmont Office Realty Trust, Inc. Class A |
423,278 |
6,933 |
|
|
Rayonier, Inc. |
30,900 |
1,363 |
|
|
Redwood Trust, Inc. (d) |
449,400 |
8,350 |
|
|
Senior Housing Properties Trust (SBI) |
362,900 |
8,220 |
|
|
SL Green Realty Corp. |
145,665 |
13,178 |
|
|
Sovran Self Storage, Inc. |
64,339 |
4,294 |
|
|
Terreno Realty Corp. |
282,610 |
5,005 |
|
|
UDR, Inc. |
91,400 |
2,127 |
|
|
Weyerhaeuser Co. |
231,114 |
6,963 |
|
|
|
144,056 |
||
|
Real Estate Management & Development - 0.6% |
|||
|
Altisource Portfolio Solutions SA |
43,010 |
6,924 |
|
|
CBRE Group, Inc. (a) |
205,932 |
4,992 |
|
|
|
11,916 |
||
|
Thrifts & Mortgage Finance - 0.6% |
|||
|
Ocwen Financial Corp. (a) |
233,463 |
13,228 |
|
|
TOTAL FINANCIALS |
477,387 |
||
|
HEALTH CARE - 8.9% |
|||
|
Biotechnology - 1.1% |
|||
|
Alexion Pharmaceuticals, Inc. (a) |
74,000 |
9,213 |
|
|
Grifols SA ADR |
260,000 |
8,927 |
|
|
Medivation, Inc. (a) |
100,000 |
6,301 |
|
|
|
24,441 |
||
|
Health Care Equipment & Supplies - 1.7% |
|||
|
Boston Scientific Corp. (a) |
1,550,000 |
17,949 |
|
|
The Cooper Companies, Inc. |
140,000 |
18,444 |
|
|
|
36,393 |
||
|
Health Care Providers & Services - 2.7% |
|||
|
Catamaran Corp. (a) |
245,000 |
11,183 |
|
|
Community Health Systems, Inc. |
200,000 |
8,250 |
|
|
HCA Holdings, Inc. |
128,000 |
5,942 |
|
|
Humana, Inc. |
77,000 |
8,007 |
|
|
Common Stocks - continued |
|||
|
Shares |
Value (000s) |
||
|
HEALTH CARE - continued |
|||
|
Health Care Providers & Services - continued |
|||
|
MEDNAX, Inc. (a) |
150,000 |
$ 16,620 |
|
|
Quest Diagnostics, Inc. |
120,000 |
7,313 |
|
|
|
57,315 |
||
|
Health Care Technology - 0.5% |
|||
|
Cerner Corp. (a) |
190,000 |
10,919 |
|
|
Life Sciences Tools & Services - 0.6% |
|||
|
Illumina, Inc. (a) |
124,000 |
12,152 |
|
|
Pharmaceuticals - 2.3% |
|||
|
Actavis PLC (a) |
120,000 |
19,568 |
|
|
Perrigo Co. (d) |
90,000 |
14,030 |
|
|
Salix Pharmaceuticals Ltd. (a) |
191,000 |
16,199 |
|
|
|
49,797 |
||
|
TOTAL HEALTH CARE |
191,017 |
||
|
INDUSTRIALS - 16.8% |
|||
|
Aerospace & Defense - 1.0% |
|||
|
TransDigm Group, Inc. |
142,510 |
22,306 |
|
|
Commercial Services & Supplies - 0.4% |
|||
|
Covanta Holding Corp. |
412,561 |
7,385 |
|
|
West Corp. |
86,500 |
1,992 |
|
|
|
9,377 |
||
|
Electrical Equipment - 5.7% |
|||
|
AMETEK, Inc. |
730,090 |
35,935 |
|
|
Eaton Corp. PLC |
233,500 |
16,966 |
|
|
Hubbell, Inc. Class B |
341,540 |
36,856 |
|
|
Roper Industries, Inc. |
241,520 |
31,325 |
|
|
|
121,082 |
||
|
Machinery - 2.8% |
|||
|
Cummins, Inc. |
136,400 |
18,054 |
|
|
Ingersoll-Rand PLC |
258,907 |
18,491 |
|
|
Manitowoc Co., Inc. |
768,300 |
15,819 |
|
|
WABCO Holdings, Inc. (a) |
92,218 |
8,171 |
|
|
|
60,535 |
||
|
Professional Services - 1.5% |
|||
|
Verisk Analytics, Inc. (a) |
474,800 |
30,914 |
|
|
Road & Rail - 1.9% |
|||
|
J.B. Hunt Transport Services, Inc. |
542,940 |
40,821 |
|
|
Common Stocks - continued |
|||
|
Shares |
Value (000s) |
||
|
INDUSTRIALS - continued |
|||
|
Trading Companies & Distributors - 3.5% |
|||
|
Beacon Roofing Supply, Inc. (a) |
436,593 |
$ 16,233 |
|
|
MSC Industrial Direct Co., Inc. Class A |
300,908 |
23,125 |
|
|
W.W. Grainger, Inc. |
56,000 |
14,444 |
|
|
Watsco, Inc. |
207,300 |
19,893 |
|
|
|
73,695 |
||
|
TOTAL INDUSTRIALS |
358,730 |
||
|
INFORMATION TECHNOLOGY - 15.6% |
|||
|
Communications Equipment - 2.9% |
|||
|
Aruba Networks, Inc. (a) |
583,600 |
10,411 |
|
|
F5 Networks, Inc. (a) |
165,300 |
13,598 |
|
|
Juniper Networks, Inc. (a) |
488,900 |
9,910 |
|
|
Polycom, Inc. (a) |
824,877 |
8,867 |
|
|
Radware Ltd. (a) |
478,200 |
8,129 |
|
|
Riverbed Technology, Inc. (a) |
584,050 |
10,104 |
|
|
|
61,019 |
||
|
Computers & Peripherals - 0.9% |
|||
|
NCR Corp. (a) |
567,300 |
19,827 |
|
|
Electronic Equipment & Components - 1.3% |
|||
|
Arrow Electronics, Inc. (a) |
203,310 |
10,438 |
|
|
Ingram Micro, Inc. Class A (a) |
425,500 |
9,974 |
|
|
Jabil Circuit, Inc. |
309,300 |
6,270 |
|
|
|
26,682 |
||
|
Internet Software & Services - 2.1% |
|||
|
Bankrate, Inc. (a) |
345,342 |
6,472 |
|
|
Equinix, Inc. (a) |
79,300 |
12,744 |
|
|
Rackspace Hosting, Inc. (a)(d) |
398,400 |
15,223 |
|
|
Velti PLC (e) |
215,084 |
18 |
|
|
Yahoo!, Inc. (a) |
307,000 |
11,353 |
|
|
|
45,810 |
||
|
IT Services - 1.8% |
|||
|
Alliance Data Systems Corp. (a)(d) |
88,720 |
21,493 |
|
|
EPAM Systems, Inc. (a) |
188,100 |
6,672 |
|
|
Total System Services, Inc. |
344,600 |
10,700 |
|
|
|
38,865 |
||
|
Semiconductors & Semiconductor Equipment - 2.7% |
|||
|
Altera Corp. |
91,500 |
2,951 |
|
|
Applied Micro Circuits Corp. (a) |
312,900 |
3,927 |
|
|
Common Stocks - continued |
|||
|
Shares |
Value (000s) |
||
|
INFORMATION TECHNOLOGY - continued |
|||
|
Semiconductors & Semiconductor Equipment - continued |
|||
|
Atmel Corp. (a) |
1,064,800 |
$ 8,146 |
|
|
Broadcom Corp. Class A |
246,100 |
6,568 |
|
|
Cree, Inc. (a) |
198,500 |
11,076 |
|
|
RF Micro Devices, Inc. (a) |
1,290,200 |
6,812 |
|
|
Skyworks Solutions, Inc. (a) |
710,750 |
18,899 |
|
|
|
58,379 |
||
|
Software - 3.9% |
|||
|
Autodesk, Inc. (a) |
177,900 |
8,050 |
|
|
Citrix Systems, Inc. (a) |
203,795 |
12,089 |
|
|
Compuware Corp. |
890,800 |
9,790 |
|
|
Electronic Arts, Inc. (a) |
128,200 |
2,843 |
|
|
MICROS Systems, Inc. (a)(d) |
168,800 |
9,068 |
|
|
Nuance Communications, Inc. (a)(d) |
492,634 |
6,660 |
|
|
Parametric Technology Corp. (a) |
324,000 |
10,543 |
|
|
Rovi Corp. (a) |
502,600 |
9,248 |
|
|
SolarWinds, Inc. (a) |
92,380 |
3,089 |
|
|
Synopsys, Inc. (a) |
307,300 |
11,256 |
|
|
|
82,636 |
||
|
TOTAL INFORMATION TECHNOLOGY |
333,218 |
||
|
MATERIALS - 6.9% |
|||
|
Chemicals - 4.6% |
|||
|
Airgas, Inc. |
212,104 |
23,041 |
|
|
Albemarle Corp. |
153,782 |
10,566 |
|
|
Ashland, Inc. |
102,000 |
9,290 |
|
|
Eastman Chemical Co. |
88,970 |
6,853 |
|
|
FMC Corp. |
190,240 |
13,861 |
|
|
Sherwin-Williams Co. |
37,431 |
6,851 |
|
|
Valspar Corp. |
172,130 |
12,154 |
|
|
W.R. Grace & Co. (a) |
149,297 |
14,337 |
|
|
|
96,953 |
||
|
Containers & Packaging - 1.1% |
|||
|
Aptargroup, Inc. |
201,956 |
13,111 |
|
|
Rock-Tenn Co. Class A |
114,200 |
10,783 |
|
|
|
23,894 |
||
|
Common Stocks - continued |
|||
|
Shares |
Value (000s) |
||
|
MATERIALS - continued |
|||
|
Metals & Mining - 1.2% |
|||
|
Carpenter Technology Corp. |
171,600 |
$ 10,346 |
|
|
Reliance Steel & Aluminum Co. |
217,185 |
15,970 |
|
|
|
26,316 |
||
|
TOTAL MATERIALS |
147,163 |
||
|
TELECOMMUNICATION SERVICES - 0.3% |
|||
|
Diversified Telecommunication Services - 0.2% |
|||
|
TW Telecom, Inc. (a) |
163,511 |
4,631 |
|
|
Wireless Telecommunication Services - 0.1% |
|||
|
SBA Communications Corp. Class A (a) |
29,210 |
2,488 |
|
|
TOTAL TELECOMMUNICATION SERVICES |
7,119 |
||
|
UTILITIES - 3.6% |
|||
|
Electric Utilities - 2.1% |
|||
|
Great Plains Energy, Inc. |
405,400 |
9,624 |
|
|
OGE Energy Corp. |
595,800 |
20,507 |
|
|
PNM Resources, Inc. |
341,538 |
7,948 |
|
|
Portland General Electric Co. |
197,500 |
5,887 |
|
|
|
43,966 |
||
|
Gas Utilities - 0.8% |
|||
|
National Fuel Gas Co. |
163,851 |
11,057 |
|
|
Questar Corp. |
288,164 |
6,489 |
|
|
|
17,546 |
||
|
Independent Power Producers & Energy Traders - 0.4% |
|||
|
Black Hills Corp. |
185,300 |
9,315 |
|
|
Water Utilities - 0.3% |
|||
|
American Water Works Co., Inc. |
127,420 |
5,396 |
|
|
TOTAL UTILITIES |
76,223 |
||
|
TOTAL COMMON STOCKS (Cost $1,790,620) |
|
||
|
U.S. Treasury Obligations - 0.0% |
||||
|
|
Principal |
Value (000s) |
||
|
U.S. Treasury Bills, yield at date of purchase 0.03% to 0.04% 1/2/14 to 1/23/14 |
|
$ 295 |
$ 295 |
|
|
Money Market Funds - 4.6% |
|||
|
Shares |
|
||
|
Fidelity Cash Central Fund, 0.10% (b) |
34,823,346 |
34,823 |
|
|
Fidelity Securities Lending Cash Central Fund, 0.10% (b)(c) |
63,510,655 |
63,511 |
|
|
TOTAL MONEY MARKET FUNDS (Cost $98,334) |
|
||
|
TOTAL INVESTMENT PORTFOLIO - 102.6% (Cost $1,889,249) |
2,194,362 |
||
|
NET OTHER ASSETS (LIABILITIES) - (2.6)% |
(54,659) |
||
|
NET ASSETS - 100% |
$ 2,139,703 |
||
|
Futures Contracts |
|||||
|
|
Expiration |
Underlying |
Unrealized |
||
|
Purchased |
|||||
|
Equity Index Contracts |
|||||
|
99 CME E-mini S&P MidCap 400 Index Contracts (United States) |
Dec. 2013 |
$ 12,901 |
$ (46) |
||
|
The face value of futures purchased as a percentage of net assets is 0.6% |
|
Legend |
|
(a) Non-income producing |
|
(b) Affiliated fund that is generally available only to investment companies and other accounts managed by Fidelity Investments. The rate quoted is the annualized seven-day yield of the fund at period end. A complete unaudited listing of the fund's holdings as of its most recent quarter end is available upon request. In addition, each Fidelity Central Fund's financial statements, which are not covered by the Fund's Report of Independent Registered Public Accounting Firm, are available on the SEC's website or upon request. |
|
(c) Investment made with cash collateral received from securities on loan. |
|
(d) Security or a portion of the security is on loan at period end. |
|
(e) Restricted securities - Investment in securities not registered under the Securities Act of 1933 (excluding 144A issues). At the end of the period, the value of restricted securities (excluding 144A issues) amounted to $18,000 or 0.0% of net assets. |
|
Additional information on each restricted holding is as follows: |
|
Security |
Acquisition |
Acquisition |
|
Velti PLC |
4/19/13 |
$ 323 |
|
Affiliated Central Funds |
|
Information regarding fiscal year to date income earned by the Fund from investments in Fidelity Central Funds is as follows: |
|
Fund |
Income earned |
|
Fidelity Cash Central Fund |
$ 60 |
|
Fidelity Securities Lending Cash Central Fund |
284 |
|
Total |
$ 344 |
|
Other Information |
|
The following is a summary of the inputs used, as of November 30, 2013, involving the Fund's assets and liabilities carried at fair value. The inputs or methodology used for valuing securities may not be an indication of the risk associated with investing in those securities. For more information on valuation inputs, and their aggregation into the levels used in the table below, please refer to the Investment Valuation section in the accompanying Notes to Financial Statements. |
|
Valuation Inputs at Reporting Date: |
||||
|
Description |
Total |
Level 1 |
Level 2 |
Level 3 |
|
Investments in Securities: |
||||
|
Equities: |
||||
|
Consumer Discretionary |
$ 297,823 |
$ 297,823 |
$ - |
$ - |
|
Consumer Staples |
76,643 |
76,643 |
- |
- |
|
Energy |
130,410 |
130,410 |
- |
- |
|
Financials |
477,387 |
477,387 |
- |
- |
|
Health Care |
191,017 |
191,017 |
- |
- |
|
Industrials |
358,730 |
358,730 |
- |
- |
|
Information Technology |
333,218 |
333,200 |
18 |
- |
|
Materials |
147,163 |
147,163 |
- |
- |
|
Telecommunication Services |
7,119 |
7,119 |
- |
- |
|
Utilities |
76,223 |
76,223 |
- |
- |
|
U.S. Government and Government Agency Obligations |
295 |
- |
295 |
- |
|
Money Market Funds |
98,334 |
98,334 |
- |
- |
|
Total Investments in Securities: |
$ 2,194,362 |
$ 2,194,049 |
$ 313 |
$ - |
|
Derivative Instruments: |
||||
|
Liabilities |
||||
|
Futures Contracts |
$ (46) |
$ (46) |
$ - |
$ - |
|
Value of Derivative Instruments |
|
The following table is a summary of the Fund's value of derivative instruments by primary risk exposure as of November 30, 2013. For additional information on derivative instruments, please refer to the Derivative Instruments section in the accompanying Notes to Financial Statements. |
|
Primary Risk Exposure / |
Value |
|
|
|
Asset |
Liability |
|
Equity Risk |
||
|
Futures Contracts (a) |
$ - |
$ (46) |
|
Total Value of Derivatives |
$ - |
$ (46) |
|
(a) Reflects gross cumulative appreciation (depreciation) on futures contracts as presented in the Schedule of Investments. Only the period end receivable or payable for daily variation margin and net unrealized appreciation (depreciation) are presented in the Statement of Assets and Liabilities. |
See accompanying notes which are an integral part of the financial statements.
Annual Report
Financial Statements
Statement of Assets and Liabilities
|
Amounts in thousands (except per-share amounts) |
November 30, 2013 |
|
|
|
|
|
|
Assets |
|
|
|
Investment in securities, at value (including securities loaned of $62,228) - See accompanying schedule: Unaffiliated issuers (cost $1,790,915) |
$ 2,096,028 |
|
|
Fidelity Central Funds (cost $98,334) |
98,334 |
|
|
Total Investments (cost $1,889,249) |
|
$ 2,194,362 |
|
Receivable for investments sold |
|
22,603 |
|
Receivable for fund shares sold |
|
717 |
|
Dividends receivable |
|
1,522 |
|
Distributions receivable from Fidelity Central Funds |
|
11 |
|
Prepaid expenses |
|
6 |
|
Other receivables |
|
10 |
|
Total assets |
|
2,219,231 |
|
|
|
|
|
Liabilities |
|
|
|
Payable to custodian bank |
$ 3,640 |
|
|
Payable for investments purchased |
6,951 |
|
|
Payable for fund shares redeemed |
3,617 |
|
|
Accrued management fee |
657 |
|
|
Distribution and service plan fees payable |
644 |
|
|
Payable for daily variation margin for derivative instruments |
46 |
|
|
Other affiliated payables |
428 |
|
|
Other payables and accrued expenses |
34 |
|
|
Collateral on securities loaned, at value |
63,511 |
|
|
Total liabilities |
|
79,528 |
|
|
|
|
|
Net Assets |
|
$ 2,139,703 |
|
Net Assets consist of: |
|
|
|
Paid in capital |
|
$ 2,376,183 |
|
Distributions in excess of net investment income |
|
(2,603) |
|
Accumulated undistributed net realized gain (loss) on investments and foreign currency transactions |
|
(538,954) |
|
Net unrealized appreciation (depreciation) on investments and assets and liabilities in foreign currencies |
|
305,077 |
|
Net Assets |
|
$ 2,139,703 |
See accompanying notes which are an integral part of the financial statements.
Annual Report
Statement of Assets and Liabilities - continued
|
Amounts in thousands (except per-share amounts) |
November 30, 2013 |
|
|
|
|
|
|
Calculation of Maximum Offering Price Class A: |
|
$ 28.37 |
|
|
|
|
|
Maximum offering price per share (100/94.25 of $28.37) |
|
$ 30.10 |
|
Class T: |
|
$ 28.63 |
|
|
|
|
|
Maximum offering price per share (100/96.50 of $28.63) |
|
$ 29.67 |
|
Class B: |
|
$ 26.51 |
|
|
|
|
|
Class C: |
|
$ 26.52 |
|
|
|
|
|
Fidelity Stock Selector Mid Cap Fund: |
|
$ 29.56 |
|
|
|
|
|
Institutional Class: |
|
$ 29.64 |
A Redemption price per share is equal to net asset value less any applicable contingent deferred sales charge.
See accompanying notes which are an integral part of the financial statements.
Annual Report
Financial Statements - continued
Statement of Operations
|
Amounts in thousands |
Year ended November 30, 2013 |
|
|
|
|
|
|
Investment Income |
|
|
|
Dividends |
|
$ 26,043 |
|
Interest |
|
1 |
|
Income from Fidelity Central Funds |
|
344 |
|
Total income |
|
26,388 |
|
|
|
|
|
Expenses |
|
|
|
Management fee |
$ 11,156 |
|
|
Performance adjustment |
(2,847) |
|
|
Transfer agent fees |
4,476 |
|
|
Distribution and service plan fees |
7,433 |
|
|
Accounting and security lending fees |
618 |
|
|
Custodian fees and expenses |
62 |
|
|
Independent trustees' compensation |
11 |
|
|
Registration fees |
125 |
|
|
Audit |
67 |
|
|
Legal |
25 |
|
|
Miscellaneous |
100 |
|
|
Total expenses before reductions |
21,226 |
|
|
Expense reductions |
(552) |
20,674 |
|
Net investment income (loss) |
|
5,714 |
|
Realized and Unrealized Gain (Loss) Net realized gain (loss) on: |
|
|
|
Investment securities: |
|
|
|
Unaffiliated issuers |
286,098 |
|
|
Foreign currency transactions |
(360) |
|
|
Futures contracts |
1,479 |
|
|
Total net realized gain (loss) |
|
287,217 |
|
Change in net unrealized appreciation (depreciation) on: Investment securities |
209,055 |
|
|
Assets and liabilities in foreign currencies |
77 |
|
|
Futures contracts |
(43) |
|
|
Total change in net unrealized appreciation (depreciation) |
|
209,089 |
|
Net gain (loss) |
|
496,306 |
|
Net increase (decrease) in net assets resulting from operations |
|
$ 502,020 |
See accompanying notes which are an integral part of the financial statements.
Annual Report
Statement of Changes in Net Assets
|
Amounts in thousands |
Year ended |
Year ended |
|
Increase (Decrease) in Net Assets |
|
|
|
Operations |
|
|
|
Net investment income (loss) |
$ 5,714 |
$ 5,143 |
|
Net realized gain (loss) |
287,217 |
131,666 |
|
Change in net unrealized appreciation (depreciation) |
209,089 |
136,150 |
|
Net increase (decrease) in net assets resulting |
502,020 |
272,959 |
|
Distributions to shareholders from net investment income |
(8,172) |
(7,037) |
|
Distributions to shareholders from net realized gain |
(2,873) |
- |
|
Total distributions |
(11,045) |
(7,037) |
|
Share transactions - net increase (decrease) |
(34,691) |
(510,527) |
|
Total increase (decrease) in net assets |
456,284 |
(244,605) |
|
|
|
|
|
Net Assets |
|
|
|
Beginning of period |
1,683,419 |
1,928,024 |
|
End of period (including distributions in excess of net investment income of $2,603 and undistributed net investment income of $3,217, respectively) |
$ 2,139,703 |
$ 1,683,419 |
See accompanying notes which are an integral part of the financial statements.
Annual Report
Financial Highlights - Class A
|
Years ended November 30, |
2013 |
2012 |
2011 |
2010 |
2009 |
|
Selected Per-Share Data |
|
|
|
|
|
|
Net asset value, beginning of period |
$ 22.16 |
$ 19.15 |
$ 19.22 |
$ 15.75 |
$ 10.52 |
|
Income from Investment Operations |
|
|
|
|
|
|
Net investment income (loss) C |
.10 |
.09 |
.08 F |
(.02) |
.03 |
|
Net realized and unrealized gain (loss) |
6.29 |
3.02 |
(.15) |
3.55 |
5.20 |
|
Total from investment operations |
6.39 |
3.11 |
(.07) |
3.53 |
5.23 |
|
Distributions from net investment income |
(.14) |
(.10) |
- |
(.03) G |
- |
|
Distributions from net realized gain |
(.04) |
- |
- |
(.03) G |
- |
|
Total distributions |
(.18) |
(.10) |
- |
(.06) |
- |
|
Net asset value, end of period |
$ 28.37 |
$ 22.16 |
$ 19.15 |
$ 19.22 |
$ 15.75 |
|
Total Return A, B |
29.07% |
16.32% |
(.36)% |
22.48% |
49.71% |
|
Ratios to Average Net Assets D, H |
|
|
|
|
|
|
Expenses before reductions |
.95% |
.94% |
.92% |
.86% |
.83% |
|
Expenses net of fee waivers, if any |
.95% |
.94% |
.92% |
.86% |
.83% |
|
Expenses net of all reductions |
.92% |
.94% |
.91% |
.84% |
.81% |
|
Net investment income (loss) |
.39% |
.41% |
.39% F |
(.12)% |
.25% |
|
Supplemental Data |
|
|
|
|
|
|
Net assets, end of period (in millions) |
$ 692 |
$ 593 |
$ 644 |
$ 945 |
$ 906 |
|
Portfolio turnover rate E |
79% I |
72% |
198% |
141% |
244% |
A Total returns would have been lower if certain expenses had not been reduced during the applicable periods shown.
B Total returns do not include the effect of the sales charges.
C Calculated based on average shares outstanding during the period.
D Fees and expenses of any underlying Fidelity Central Funds are not included in the Fund's expense ratio. The Fund indirectly bears its proportionate share of the expenses of any underlying Fidelity Central Funds.
E Amount does not include the portfolio activity of any underlying Fidelity Central Funds.
F Investment income per share reflects a large, non-recurring dividend which amounted to $.05 per share. Excluding this non-recurring dividend, the ratio of net investment income (loss) to average net assets would have been .12%.
G The amounts shown reflect certain reclassifications related to book to tax differences that were made in the year shown.
H Expense ratios reflect operating expenses of the class. Expenses before reductions do not reflect amounts reimbursed by the investment adviser or reductions from brokerage service arrangements or reductions from other expense offset arrangements and do not represent the amount paid by the class during periods when reimbursements or reductions occur. Expenses net of fee waivers reflect expenses after reimbursement by the investment adviser but prior to reductions from brokerage service arrangements or other expense offset arrangements. Expenses net of all reductions represent the net expenses paid by the class.
I The portfolio turnover rate does not include the assets acquired in the merger.
See accompanying notes which are an integral part of the financial statements.
Annual Report
Financial Highlights - Class T
|
Years ended November 30, |
2013 |
2012 |
2011 |
2010 |
2009 |
|
Selected Per-Share Data |
|
|
|
|
|
|
Net asset value, beginning of period |
$ 22.36 |
$ 19.30 |
$ 19.41 |
$ 15.89 |
$ 10.64 |
|
Income from Investment Operations |
|
|
|
|
|
|
Net investment income (loss) C |
.04 |
.05 |
.04 F |
(.05) |
.01 |
|
Net realized and unrealized gain (loss) |
6.36 |
3.05 |
(.15) |
3.59 |
5.24 |
|
Total from investment operations |
6.40 |
3.10 |
(.11) |
3.54 |
5.25 |
|
Distributions from net investment income |
(.09) |
(.04) |
- |
- |
- |
|
Distributions from net realized gain |
(.04) |
- |
- |
(.02) G |
- |
|
Total distributions |
(.13) |
(.04) |
- |
(.02) |
- |
|
Net asset value, end of period |
$ 28.63 |
$ 22.36 |
$ 19.30 |
$ 19.41 |
$ 15.89 |
|
Total Return A, B |
28.80% |
16.12% |
(.57)% |
22.31% |
49.34% |
|
Ratios to Average Net Assets D, H |
|
|
|
|
|
|
Expenses before reductions |
1.16% |
1.14% |
1.11% |
1.03% |
1.02% |
|
Expenses net of fee waivers, if any |
1.16% |
1.14% |
1.11% |
1.03% |
1.02% |
|
Expenses net of all reductions |
1.13% |
1.13% |
1.10% |
1.01% |
.99% |
|
Net investment income (loss) |
.17% |
.22% |
.20% F |
(.30)% |
.07% |
|
Supplemental Data |
|
|
|
|
|
|
Net assets, end of period (in millions) |
$ 817 |
$ 755 |
$ 871 |
$ 1,282 |
$ 1,520 |
|
Portfolio turnover rate E |
79% I |
72% |
198% |
141% |
244% |
A Total returns would have been lower if certain expenses had not been reduced during the applicable periods shown.
B Total returns do not include the effect of the sales charges.
C Calculated based on average shares outstanding during the period.
D Fees and expenses of any underlying Fidelity Central Funds are not included in the Fund's expense ratio. The Fund indirectly bears its proportionate share of the expenses of any underlying Fidelity Central Funds.
E Amount does not include the portfolio activity of any underlying Fidelity Central Funds.
F Investment income per share reflects a large, non-recurring dividend which amounted to $.05 per share. Excluding this non-recurring dividend, the ratio of net investment income (loss) to average net assets would have been (.07)%.
G The amounts shown reflect certain reclassifications related to book to tax differences that were made in the year shown.
H Expense ratios reflect operating expenses of the class. Expenses before reductions do not reflect amounts reimbursed by the investment adviser or reductions from brokerage service arrangements or reductions from other expense offset arrangements and do not represent the amount paid by the class during periods when reimbursements or reductions occur. Expenses net of fee waivers reflect expenses after reimbursement by the investment adviser but prior to reductions from brokerage service arrangements or other expense offset arrangements. Expenses net of all reductions represent the net expenses paid by the class.
I The portfolio turnover rate does not include the assets acquired in the merger.
See accompanying notes which are an integral part of the financial statements.
Annual Report
Financial Highlights - Class B
|
Years ended November 30, |
2013 |
2012 |
2011 |
2010 |
2009 |
|
Selected Per-Share Data |
|
|
|
|
|
|
Net asset value, beginning of period |
$ 20.71 |
$ 17.94 |
$ 18.15 |
$ 14.93 |
$ 10.05 |
|
Income from Investment Operations |
|
|
|
|
|
|
Net investment income (loss) C |
(.10) |
(.07) |
(.07) F |
(.15) |
(.06) |
|
Net realized and unrealized gain (loss) |
5.90 |
2.84 |
(.14) |
3.37 |
4.94 |
|
Total from investment operations |
5.80 |
2.77 |
(.21) |
3.22 |
4.88 |
|
Distributions from net investment income |
- |
- |
- |
- |
- |
|
Distributions from net realized gain |
- |
- |
- |
- |
- |
|
Total distributions |
- |
- |
- |
- |
- |
|
Net asset value, end of period |
$ 26.51 |
$ 20.71 |
$ 17.94 |
$ 18.15 |
$ 14.93 |
|
Total Return A, B |
28.01% |
15.44% |
(1.16)% |
21.57% |
48.56% |
|
Ratios to Average Net Assets D, G |
|
|
|
|
|
|
Expenses before reductions |
1.76% |
1.73% |
1.71% |
1.63% |
1.59% |
|
Expenses net of fee waivers, if any |
1.76% |
1.73% |
1.71% |
1.63% |
1.59% |
|
Expenses net of all reductions |
1.74% |
1.73% |
1.70% |
1.61% |
1.57% |
|
Net investment income (loss) |
(.43)% |
(.38)% |
(.40)% F |
(.90)% |
(.51)% |
|
Supplemental Data |
|
|
|
|
|
|
Net assets, end of period (in millions) |
$ 21 |
$ 22 |
$ 28 |
$ 75 |
$ 131 |
|
Portfolio turnover rate E |
79% H |
72% |
198% |
141% |
244% |
A Total returns would have been lower if certain expenses had not been reduced during the applicable periods shown.
B Total returns do not include the effect of the contingent deferred sales charge.
C Calculated based on average shares outstanding during the period.
D Fees and expenses of any underlying Fidelity Central Funds are not included in the Fund's expense ratio. The Fund indirectly bears its proportionate share of the expenses of any underlying Fidelity Central Funds.
E Amount does not include the portfolio activity of any underlying Fidelity Central Funds.
F Investment income per share reflects a large, non-recurring dividend which amounted to $.05 per share. Excluding this non-recurring dividend, the ratio of net investment income (loss) to average net assets would have been (.67)%.
G Expense ratios reflect operating expenses of the class. Expenses before reductions do not reflect amounts reimbursed by the investment adviser or reductions from brokerage service arrangements or reductions from other expense offset arrangements and do not represent the amount paid by the class during periods when reimbursements or reductions occur. Expenses net of fee waivers reflect expenses after reimbursement by the investment adviser but prior to reductions from brokerage service arrangements or other expense offset arrangements. Expenses net of all reductions represent the net expenses paid by the class.
H The portfolio turnover rate does not include the assets acquired in the merger.
See accompanying notes which are an integral part of the financial statements.
Annual Report
Financial Highlights - Class C
|
Years ended November 30, |
2013 |
2012 |
2011 |
2010 |
2009 |
|
Selected Per-Share Data |
|
|
|
|
|
|
Net asset value, beginning of period |
$ 20.73 |
$ 17.95 |
$ 18.15 |
$ 14.93 |
$ 10.05 |
|
Income from Investment Operations |
|
|
|
|
|
|
Net investment income (loss) C |
(.09) |
(.06) |
(.07) F |
(.14) |
(.06) |
|
Net realized and unrealized gain (loss) |
5.91 |
2.84 |
(.13) |
3.36 |
4.94 |
|
Total from investment operations |
5.82 |
2.78 |
(.20) |
3.22 |
4.88 |
|
Distributions from net investment income |
(.02) |
- |
- |
- |
- |
|
Distributions from net realized gain |
(.01) |
- |
- |
- |
- |
|
Total distributions |
(.03) |
- |
- |
- |
- |
|
Net asset value, end of period |
$ 26.52 |
$ 20.73 |
$ 17.95 |
$ 18.15 |
$ 14.93 |
|
Total Return A, B |
28.09% |
15.49% |
(1.10)% |
21.57% |
48.56% |
|
Ratios to Average Net Assets D, G |
|
|
|
|
|
|
Expenses before reductions |
1.69% |
1.68% |
1.66% |
1.60% |
1.58% |
|
Expenses net of fee waivers, if any |
1.69% |
1.68% |
1.66% |
1.60% |
1.58% |
|
Expenses net of all reductions |
1.67% |
1.68% |
1.65% |
1.58% |
1.55% |
|
Net investment income (loss) |
(.36)% |
(.33)% |
(.35)% F |
(.86)% |
(.50)% |
|
Supplemental Data |
|
|
|
|
|
|
Net assets, end of period (in millions) |
$ 172 |
$ 141 |
$ 150 |
$ 189 |
$ 186 |
|
Portfolio turnover rate E |
79% H |
72% |
198% |
141% |
244% |
A Total returns would have been lower if certain expenses had not been reduced during the applicable periods shown.
B Total returns do not include the effect of the contingent deferred sales charge.
C Calculated based on average shares outstanding during the period.
D Fees and expenses of any underlying Fidelity Central Funds are not included in the Fund's expense ratio. The Fund indirectly bears its proportionate share of the expenses of any underlying Fidelity Central Funds.
E Amount does not include the portfolio activity of any underlying Fidelity Central Funds.
F Investment income per share reflects a large, non-recurring dividend which amounted to $.05 per share. Excluding this non-recurring dividend, the ratio of net investment income (loss) to average net assets would have been (.62)%.
G Expense ratios reflect operating expenses of the class. Expenses before reductions do not reflect amounts reimbursed by the investment adviser or reductions from brokerage service arrangements or reductions from other expense offset arrangements and do not represent the amount paid by the class during periods when reimbursements or reductions occur. Expenses net of fee waivers reflect expenses after reimbursement by the investment adviser but prior to reductions from brokerage service arrangements or other expense offset arrangements. Expenses net of all reductions represent the net expenses paid by the class.
H The portfolio turnover rate does not include the assets acquired in the merger.
See accompanying notes which are an integral part of the financial statements.
Annual Report
Financial Highlights - Fidelity Stock Selector Mid Cap Fund
|
Years ended November 30, |
2013 |
2012 G |
|
Selected Per-Share Data |
|
|
|
Net asset value, beginning of period |
$ 23.14 |
$ 21.20 |
|
Income from Investment Operations |
|
|
|
Net investment income (loss) D |
.17 |
.09 |
|
Net realized and unrealized gain (loss) |
6.54 |
1.85 |
|
Total from investment operations |
6.71 |
1.94 |
|
Distributions from net investment income |
(.25) |
- |
|
Distributions from net realized gain |
(.04) |
- |
|
Total distributions |
(.29) |
- |
|
Net asset value, end of period |
$ 29.56 |
$ 23.14 |
|
Total Return B, C |
29.36% |
9.15% |
|
Ratios to Average Net Assets E, H |
|
|
|
Expenses before reductions |
.71% |
.59% A |
|
Expenses net of fee waivers, if any |
.71% |
.59% A |
|
Expenses net of all reductions |
.69% |
.58% A |
|
Net investment income (loss) |
.62% |
.86% A |
|
Supplemental Data |
|
|
|
Net assets, end of period (in millions) |
$ 225 |
$ 1 |
|
Portfolio turnover rate F |
79% I |
72% |
A Annualized
B Total returns for periods of less than one year are not annualized.
C Total returns would have been lower if certain expenses had not been reduced during the applicable periods shown.
D Calculated based on average shares outstanding during the period.
E Fees and expenses of any underlying Fidelity Central Funds are not included in the Fund's expense ratio. The Fund indirectly bears its proportionate share of the expenses of any underlying Fidelity Central Funds.
F Amount does not include the portfolio activity of any underlying Fidelity Central Funds.
G For the period June 6, 2012 (commencement of sale of shares) to November 30, 2012.
H Expense ratios reflect operating expenses of the class. Expenses before reductions do not reflect amounts reimbursed by the investment adviser or reductions from brokerage service arrangements or reductions from other expense offset arrangements and do not represent the amount paid by the class during periods when reimbursements or reductions occur. Expense ratios before reductions for start-up periods may not be representative of longer-term operating periods. Expenses net of fee waivers reflect expenses after reimbursement by the investment adviser but prior to reductions from brokerage service arrangements or other expense offset arrangements. Expenses net of all reductions represent the net expenses paid by the class.
I The portfolio turnover rate does not include the assets acquired in the merger.
See accompanying notes which are an integral part of the financial statements.
Annual Report
Financial Highlights - Institutional Class
|
Years ended November 30, |
2013 |
2012 |
2011 |
2010 |
2009 |
|
Selected Per-Share Data |
|
|
|
|
|
|
Net asset value, beginning of period |
$ 23.14 |
$ 20.01 |
$ 20.02 |
$ 16.40 |
$ 10.92 |
|
Income from Investment Operations |
|
|
|
|
|
|
Net investment income (loss) B |
.18 |
.15 |
.14 E |
.04 |
.08 |
|
Net realized and unrealized gain (loss) |
6.56 |
3.15 |
(.15) |
3.69 |
5.40 |
|
Total from investment operations |
6.74 |
3.30 |
(.01) |
3.73 |
5.48 |
|
Distributions from net investment income |
(.20) |
(.17) |
- |
(.08) F |
- |
|
Distributions from net realized gain |
(.04) |
- |
- |
(.03) F |
- |
|
Total distributions |
(.24) |
(.17) |
- |
(.11) |
- |
|
Net asset value, end of period |
$ 29.64 |
$ 23.14 |
$ 20.01 |
$ 20.02 |
$ 16.40 |
|
Total Return A |
29.44% |
16.66% |
(.05)% |
22.86% |
50.18% |
|
Ratios to Average Net Assets C, G |
|
|
|
|
|
|
Expenses before reductions |
.67% |
.65% |
.62% |
.54% |
.50% |
|
Expenses net of fee waivers, if any |
.67% |
.65% |
.62% |
.54% |
.50% |
|
Expenses net of all reductions |
.65% |
.64% |
.61% |
.52% |
.47% |
|
Net investment income (loss) |
.66% |
.71% |
.69% E |
.20% |
.59% |
|
Supplemental Data |
|
|
|
|
|
|
Net assets, end of period (in millions) |
$ 214 |
$ 172 |
$ 234 |
$ 354 |
$ 319 |
|
Portfolio turnover rate D |
79% H |
72% |
198% |
141% |
244% |
A Total returns would have been lower if certain expenses had not been reduced during the applicable periods shown.
B Calculated based on average shares outstanding during the period.
C Fees and expenses of any underlying Fidelity Central Funds are not included in the Fund's expense ratio. The Fund indirectly bears its proportionate share of the expenses of any underlying Fidelity Central Funds.
D Amount does not include the portfolio activity of any underlying Fidelity Central Funds.
E Investment income per share reflects a large, non-recurring dividend which amounted to $.06 per share. Excluding this non-recurring dividend, the ratio of net investment income (loss) to average net assets would have been .42%.
F The amounts shown reflect certain reclassifications related to book to tax differences that were made in the year shown.
G Expense ratios reflect operating expenses of the class. Expenses before reductions do not reflect amounts reimbursed by the investment adviser or reductions from brokerage service arrangements or reductions from other expense offset arrangements and do not represent the amount paid by the class during periods when reimbursements or reductions occur. Expenses net of fee waivers reflect expenses after reimbursement by the investment adviser but prior to reductions from brokerage service arrangements or other expense offset arrangements. Expenses net of all reductions represent the net expenses paid by the class.
H The portfolio turnover rate does not include the assets acquired in the merger.
See accompanying notes which are an integral part of the financial statements.
Annual Report
Notes to Financial Statements
For the period ended November 30, 2013
(Amounts in thousands except percentages)
1. Organization.
Fidelity Advisor Stock Selector Mid Cap Fund (the Fund) is a fund of Fidelity Advisor Series I (the Trust) and is authorized to issue an unlimited number of shares. The Trust is registered under the Investment Company Act of 1940, as amended (the 1940 Act), as an open-end management investment company organized as a Massachusetts business trust. The Fund offers Class A, Class T, Class C, Fidelity Stock Selector Mid Cap Fund and Institutional Class shares, each of which, along with Class B shares, has equal rights as to assets and voting privileges. Class B shares are closed to new accounts and additional purchases, except for exchanges and reinvestments. Each class has exclusive voting rights with respect to matters that affect that class. Class B shares will automatically convert to Class A shares after a holding period of seven years from the initial date of purchase.
2. Investments in Fidelity Central Funds.
The Fund invests in Fidelity Central Funds, which are open-end investment companies generally available only to other investment companies and accounts managed by the investment adviser and its affiliates. The Fund's Schedule of Investments lists each of the Fidelity Central Funds held as of period end, if any, as an investment of the Fund, but does not include the underlying holdings of each Fidelity Central Fund. As an Investing Fund, the Fund indirectly bears its proportionate share of the expenses of the underlying Fidelity Central Funds.
The Money Market Central Funds seek preservation of capital and current income and are managed by Fidelity Investments Money Management, Inc. (FIMM), an affiliate of the investment adviser. Annualized expenses of the Money Market Central Funds as of their most recent shareholder report date are less than .01%.
A complete unaudited list of holdings for each Fidelity Central Fund is available upon request or at the Securities and Exchange Commission (the SEC) website at www.sec.gov. In addition, the financial statements of the Fidelity Central Funds, which are not covered by the Fund's Report of Independent Registered Public Accounting Firm, are available on the SEC website or upon request.
3. Significant Accounting Policies.
The financial statements have been prepared in conformity with accounting principles generally accepted in the United States of America (GAAP), which require management to make certain estimates and assumptions at the date of the financial statements. Actual results could differ from those estimates. Subsequent events, if any, through the date that the financial statements were issued have been evaluated in the preparation of
Annual Report
3. Significant Accounting Policies - continued
the financial statements. The following summarizes the significant accounting policies of the Fund:
Investment Valuation. Investments are valued as of 4:00 p.m. Eastern time on the last calendar day of the period. In accordance with valuation policies and procedures approved by the Board of Trustees (the Board), the Fund attempts to obtain prices from one or more third party pricing vendors or brokers to value its investments. When current market prices, quotations or currency exchange rates are not readily available or reliable, investments will be fair valued in good faith by the Fidelity Management & Research Company (FMR) Fair Value Committee (the Committee), in accordance with procedures adopted by the Board. Factors used in determining fair value vary by investment type and may include market or investment specific events, changes in interest rates and credit quality. The frequency with which these procedures are used cannot be predicted and they may be utilized to a significant extent. The Committee oversees the Fund's valuation policies and procedures and is responsible for approving and reporting to the Board all fair value determinations.
The Fund categorizes the inputs to valuation techniques used to value its investments into a disclosure hierarchy consisting of three levels as shown below:
Level 1 - quoted prices in active markets for identical investments
Level 2 - other significant observable inputs (including quoted prices for similar investments, interest rates, prepayment speeds, etc.)
Level 3 - unobservable inputs (including the Fund's own assumptions based on the best information available)
Valuation techniques used to value the Fund's investments by major category are as follows:
Equity securities, including restricted securities, for which market quotations are readily available, are valued at the last reported sale price or official closing price as reported by a third party pricing vendor on the primary market or exchange on which they are traded and are categorized as Level 1 in the hierarchy. In the event there were no sales during the day or closing prices are not available, securities are valued at the last quoted bid price or may be valued using the last available price and are generally categorized as Level 2 in the hierarchy. For foreign equity securities, when market or security specific events arise, comparisons to the valuation of American Depositary Receipts (ADRs), futures contracts, Exchange-Traded Funds (ETFs) and certain indexes as well as quoted prices for similar securities may be used and would be categorized as Level 2 in the hierarchy. Utilizing these techniques may result in transfers between Level 1 and Level 2. For equity securities, including restricted securities, where observable inputs are
Annual Report
Notes to Financial Statements - continued
(Amounts in thousands except percentages)
3. Significant Accounting Policies - continued
Investment Valuation - continued
limited, assumptions about market activity and risk are used and these securities may be categorized as Level 3 in the hierarchy.
Debt securities, including restricted securities, are valued based on evaluated prices received from third party pricing vendors or from brokers who make markets in such securities. For U.S. government and government agency obligations, pricing vendors utilize matrix pricing which considers yield or price of bonds of comparable quality, coupon, maturity and type as well as broker-supplied prices. When independent prices are unavailable or unreliable, debt securities may be valued utilizing pricing methodologies which consider similar factors that would be used by third party pricing vendors. Debt securities are generally categorized as Level 2 in the hierarchy but may be Level 3 depending on the circumstances.
Futures contracts are valued at the settlement price established each day by the board of trade or exchange on which they are traded and are categorized as Level 1 in the hierarchy. Investments in open-end mutual funds, including the Fidelity Central Funds, are valued at their closing net asset value (NAV) each business day and are categorized as Level 1 in the hierarchy.
Changes in valuation techniques may result in transfers in or out of an assigned level within the disclosure hierarchy. The aggregate value of investments by input level, as of November 30, 2013 is included at the end of the Fund's Schedule of Investments.
Foreign Currency. The Fund may use foreign currency contracts to facilitate transactions in foreign-denominated securities. Gains and losses from these transactions may arise from changes in the value of the foreign currency or if the counterparties do not perform under the contracts' terms.
Foreign-denominated assets, including investment securities, and liabilities are translated into U.S. dollars at the exchange rates at period end. Purchases and sales of investment securities, income and dividends received and expenses denominated in foreign currencies are translated into U.S. dollars at the exchange rate in effect on the transaction date.
The effects of exchange rate fluctuations on investments are included with the net realized and unrealized gain (loss) on investment securities. Other foreign currency transactions resulting in realized and unrealized gain (loss) are disclosed separately.
Investment Transactions and Income. For financial reporting purposes, the Fund's investment holdings and NAV include trades executed through the end of the last business day of the period. The NAV per share for processing shareholder transactions is calculated as of the close of business of the New York Stock Exchange (NYSE), normally
Annual Report
3. Significant Accounting Policies - continued
Investment Transactions and Income - continued
4:00 p.m. Eastern time and includes trades executed through the end of the prior business day. Gains and losses on securities sold are determined on the basis of identified cost and may include proceeds received from litigation. Dividend income is recorded on the ex-dividend date, except for certain dividends from foreign securities where the ex-dividend date may have passed, which are recorded as soon as the Fund is informed of the ex-dividend date. Non-cash dividends included in dividend income, if any, are recorded at the fair market value of the securities received. Distributions received on securities that represent a return of capital or capital gain are recorded as a reduction of cost of investments and/or as a realized gain. Subsequent to ex-dividend date the Fund determines the components of these distributions, based upon receipt of tax filings or other correspondence relating to the underlying investment. Interest income and distributions from the Fidelity Central Funds are accrued as earned. Interest income includes coupon interest and amortization of premium and accretion of discount on debt securities. Investment income is recorded net of foreign taxes withheld where recovery of such taxes is uncertain.
Class Allocations and Expenses. Investment income, realized and unrealized capital gains and losses, common expenses of the Fund, and certain fund-level expense reductions, if any, are allocated daily on a pro-rata basis to each class based on the relative net assets of each class to the total net assets of the Fund. Each class differs with respect to transfer agent and distribution and service plan fees incurred. Certain expense reductions may also differ by class. For the reporting period, the allocated portion of income and expenses to each class as a percent of its average net assets may vary due to the timing of recording these transactions in relation to fluctuating net assets of the classes. Expenses directly attributable to a fund are charged to that fund. Expenses attributable to more than one fund are allocated among the respective funds on the basis of relative net assets or other appropriate methods. Expense estimates are accrued in the period to which they relate and adjustments are made when actual amounts are known.
Income Tax Information and Distributions to Shareholders. Each year, the Fund intends to qualify as a regulated investment company under Subchapter M of the Internal Revenue Code, including distributing substantially all of its taxable income and realized gains. As a result, no provision for U.S. Federal income taxes is required. As of November 30, 2013, the Fund did not have any unrecognized tax benefits in the financial statements; nor is the Fund aware of any tax positions for which it is reasonably possible that the total amounts of unrecognized tax benefits will significantly change in the next twelve months. The Fund files a U.S. federal tax return, in addition to state and local tax returns as required. The Fund's federal income tax returns are subject to examination by the Internal Revenue Service (IRS) for a period of three fiscal years after they are filed.
Annual Report
Notes to Financial Statements - continued
(Amounts in thousands except percentages)
3. Significant Accounting Policies - continued
Income Tax Information and Distributions to Shareholders - continued
State and local tax returns may be subject to examination for an additional fiscal year depending on the jurisdiction. Foreign taxes are provided for based on the Fund's understanding of the tax rules and rates that exist in the foreign markets in which it invests.
Distributions are declared and recorded on the ex-dividend date. Income dividends and capital gain distributions are declared separately for each class. Income and capital gain distributions are determined in accordance with income tax regulations, which may differ from GAAP.
Capital accounts within the financial statements are adjusted for permanent book-tax differences. These adjustments have no impact on net assets or the results of operations. Temporary book-tax differences will reverse in a subsequent period.
Book-tax differences are primarily due to futures contracts, foreign currency transactions, passive foreign investment companies (PFIC), market discount, partnerships, deferred trustees compensation, capital loss carryforwards and losses deferred due to wash sales and excise tax regulations.
The federal tax cost of investment securities and unrealized appreciation (depreciation) as of period end were as follows:
|
Gross unrealized appreciation |
$ 369,401 |
|
Gross unrealized depreciation |
(63,598) |
|
Net unrealized appreciation (depreciation) on securities and other investments |
$ 305,803 |
|
|
|
|
Tax Cost |
$ 1,888,559 |
The tax-based components of distributable earnings as of period end were as follows:
|
Capital loss carryforward |
$ (539,689) |
|
Net unrealized appreciation (depreciation) |
$ 305,812 |
Capital loss carryforwards are only available to offset future capital gains of the Fund to the extent provided by regulations and may be limited. Under the Regulated Investment Company Modernization Act of 2010 (the Act), the Fund is permitted to carry forward capital losses incurred in taxable years beginning after December 22, 2010 for an unlimited period and such capital losses are required to be used prior to any losses that expire.
Annual Report
3. Significant Accounting Policies - continued
Income Tax Information and Distributions to Shareholders - continued
The capital loss carryforward information presented below, including any applicable limitation, is estimated as of fiscal period end and is subject to adjustment.
|
Fiscal year of expiration |
|
|
2015 |
$ (1,870) |
|
2016 |
(389,648) |
|
2017 |
(148,171) |
|
Total capital loss carryforward |
$ (539,689) |
The Fund acquired $12,695 of capital loss carryforwards from Fidelity Mid Cap Growth Fund and $3,970 of capital loss carryforwards from Fidelity Advisor Growth Strategies Fund when they merged into the Fund in January 2013. The losses acquired from Fidelity Advisor Growth Strategies Fund that will be available to offset future capital gains of the Fund will be limited to approximately $935 per year. As a result, at least $1,022 of the losses acquired from Fidelity Advisor Growth Strategies Fund will expire unused and is not included in the table above.
The tax character of distributions paid was as follows:
|
|
November 30, 2013 |
November 30, 2012 |
|
Ordinary Income |
$ 11,045 |
$ 7,037 |
Restricted Securities. The Fund may invest in securities that are subject to legal or contractual restrictions on resale. These securities generally may be resold in transactions exempt from registration or to the public if the securities are registered. Disposal of these securities may involve time-consuming negotiations and expense, and prompt sale at an acceptable price may be difficult. Information regarding restricted securities is included at the end of the Fund's Schedule of Investments.
New Accounting Pronouncement. The Financial Accounting Standards Board issued in December 2011, Accounting Standard Update No. 2011-11, Disclosures about Offsetting Assets and Liabilities, and in January 2013, Accounting Standards Update No. 2013-1 Clarifying the Scope of Disclosures about Offsetting Assets and Liabilities. These updates create new disclosure requirements requiring entities to disclose both gross and net information for derivatives and other financial instruments that are either offset in the Statement of Assets and Liabilities or subject to an enforceable master netting arrangement or similar agreement. The disclosure requirements are effective for annual reporting periods beginning on or after January 1, 2013, and interim periods within those annual periods. Management expects that the impact of the updates' adoption will be limited to additional financial statement disclosures as applicable.
Annual Report
Notes to Financial Statements - continued
(Amounts in thousands except percentages)
4. Derivative Instruments.
Risk Exposures and the Use of Derivative Instruments. The Fund's investment objective allows the Fund to enter into various types of derivative contracts, including futures contracts. Derivatives are investments whose value is primarily derived from underlying assets, indices or reference rates and may be transacted on an exchange or over-the-counter (OTC). Derivatives may involve a future commitment to buy or sell a specified asset based on specified terms, to exchange future cash flows at periodic intervals based on a notional principal amount, or for one party to make one or more payments upon the occurrence of specified events in exchange for periodic payments from the other party.
The Fund used derivatives to increase returns and to manage exposure to certain risks as defined below. The success of any strategy involving derivatives depends on analysis of numerous economic factors, and if the strategies for investment do not work as intended, the Fund may not achieve its objectives.
The Fund's use of derivatives increased or decreased its exposure to the following risk:
|
Equity Risk |
Equity risk relates to the fluctuations in the value of financial instruments as a result of changes in market prices (other than those arising from interest rate risk or foreign exchange risk), whether caused by factors specific to an individual investment, its issuer, or all factors affecting all instruments traded in a market or market segment. |
The Fund is also exposed to additional risks from investing in derivatives, such as liquidity risk and counterparty credit risk. Liquidity risk is the risk that the Fund will be unable to close out the derivative in the open market in a timely manner. Counterparty credit risk is the risk that the counterparty will not be able to fulfill its obligation to the Fund. Counterparty credit risk related to exchange-traded futures contracts may be mitigated by the protection provided by the exchange on which they trade.
Investing in derivatives may involve greater risks than investing in the underlying assets directly and, to varying degrees, may involve risk of loss in excess of any initial investment and collateral received and amounts recognized in the Statement of Assets and Liabilities. In addition, there may be the risk that the change in value of the derivative contract does not correspond to the change in value of the underlying instrument.
Futures Contracts. A futures contract is an agreement between two parties to buy or sell a specified underlying instrument for a fixed price at a specified future date. The Fund used futures contracts to manage its exposure to the stock markets.
Upon entering into a futures contract, a fund is required to deposit either cash or securities (initial margin) with a clearing broker in an amount equal to a certain percentage of the face value of the contract. Futures contracts are marked-to-market daily and subsequent daily payments (variation margin) are made or received by a fund depending on
Annual Report
4. Derivative Instruments - continued
Futures Contracts - continued
the daily fluctuations in the value of the futures contracts and are recorded as unrealized appreciation or (depreciation). This receivable and/or payable, if any, is included in daily variation margin for derivative instruments in the Statement of Assets and Liabilities. Realized gain or (loss) is recorded upon the expiration or closing of a futures contract.
Any open futures contracts at period end are presented in the Schedule of Investments under the caption "Futures Contracts." The underlying face amount at value reflects each contract's exposure to the underlying instrument or index at period end and is representative of volume of activity during the period.
During the period the Fund recognized net realized gain (loss) of $1,479 and a change in net unrealized appreciation (depreciation) of $(43) related to its investment in futures contracts. These amounts are included in the Statement of Operations.
5. Purchases and Sales of Investments.
Purchases and sales of securities, other than short-term securities, aggregated $1,522,901 and $1,815,166, respectively.
6. Fees and Other Transactions with Affiliates.
Management Fee. Fidelity Management & Research Company (the investment adviser) and its affiliates provide the Fund with investment management related services for which the Fund pays a monthly management fee. The management fee is the sum of an individual fund fee rate that is based on an annual rate of .30% of the Fund's average net assets and an annualized group fee rate that averaged .25% during the period. The group fee rate is based upon the average net assets of all the mutual funds advised by the investment adviser, including any mutual funds previously advised by the investment adviser that are currently advised by Fidelity SelectCo, LLC, an affiliate of the investment adviser. The group fee rate decreases as assets under management increase and increases as assets under management decrease. In addition, the management fee is subject to a performance adjustment (up to a maximum of ± .20% of the Fund's average net assets over a 36 month performance period). The upward or downward adjustment to the management fee is based on the relative investment performance of the Institutional Class of the Fund as compared to an appropriate benchmark index over the same 36 month performance period. For the reporting period, the total annual management fee rate, including the performance adjustment, was .41% of the Fund's average net assets. The performance adjustment included in the management fee rate may be higher or lower than the maximum performance adjustment rate due to the difference between the average net assets for the reporting and performance periods.
Annual Report
Notes to Financial Statements - continued
(Amounts in thousands except percentages)
6. Fees and Other Transactions with Affiliates - continued
Distribution and Service Plan Fees. In accordance with Rule 12b-1 of the 1940 Act, the Fund has adopted separate Distribution and Service Plans for each class of shares. Certain classes pay Fidelity Distributors Corporation (FDC), an affiliate of the investment adviser, separate Distribution and Service Fees, each of which is based on an annual percentage of each class' average net assets. In addition, FDC may pay financial intermediaries for selling shares of the Fund and providing shareholder support services. For the period, the Distribution and Service Fee rates, total fees and amounts retained by FDC were as follows:
|
|
Distribution |
Service |
Total Fees |
Retained |
|
Class A |
-% |
.25% |
$ 1,631 |
$ 131 |
|
Class T |
.25% |
.25% |
3,977 |
24 |
|
Class B |
.75% |
.25% |
218 |
167 |
|
Class C |
.75% |
.25% |
1,607 |
49 |
|
|
|
|
$ 7,433 |
$ 371 |
Sales Load. FDC may receive a front-end sales charge of up to 5.75% for selling Class A shares and 3.50% for selling Class T shares, some of which is paid to financial intermediaries for selling shares of the Fund. Depending on the holding period, FDC may receive contingent deferred sales charges levied on Class A, Class T, Class B, and Class C redemptions. The deferred sales charges range from 5.00% to 1.00% for Class B shares, 1.00% for Class C shares, 1.00% for certain purchases of Class A shares and .25% for certain purchases of Class T shares.
For the period, sales charge amounts retained by FDC were as follows:
|
|
Retained |
|
Class A |
$ 43 |
|
Class T |
20 |
|
Class B* |
12 |
|
Class C* |
3 |
|
|
$ 78 |
* When Class B and Class C shares are initially sold, FDC pays commissions from its own resources to financial intermediaries through which the sales
are made.
Transfer Agent Fees. Fidelity Investments Institutional Operations Company, Inc., (FIIOC), an affiliate of the investment adviser, is the transfer, dividend disbursing and shareholder servicing agent for each class of the Fund. FIIOC receives account fees and asset-based fees that vary according to the account size and type of account of the shareholders of the respective classes of the Fund. FIIOC pays for typesetting, printing and mailing of shareholder reports, except proxy statements.
Annual Report
6. Fees and Other Transactions with Affiliates - continued
Transfer Agent Fees - continued
For the period, transfer agent fees for each class were as follows:
|
|
Amount |
% of |
|
Class A |
$ 1,555 |
.24 |
|
Class T |
1,592 |
.20 |
|
Class B |
65 |
.30 |
|
Class C |
372 |
.23 |
|
Fidelity Stock Selector Mid Cap Fund |
472 |
.25 |
|
Institutional Class |
420 |
.21 |
|
|
$ 4,476 |
|
Accounting and Security Lending Fees. Fidelity Service Company, Inc. (FSC), an affiliate of the investment adviser, maintains the Fund's accounting records. The accounting fee is based on the level of average net assets for each month. Under a separate contract, FSC administers the security lending program. The security lending fee is based on the number and duration of lending transactions.
Brokerage Commissions. The Fund placed a portion of its portfolio transactions with brokerage firms which are affiliates of the investment adviser. Brokerage commissions are included in net realized gain (loss) and change in net unrealized appreciation (depreciation) in the Statement of Operations. The commissions paid to these affiliated firms were $39 for the period.
7. Committed Line of Credit.
The Fund participates with other funds managed by the investment adviser or an affiliate in a $4.25 billion credit facility (the "line of credit") to be utilized for temporary or emergency purposes to fund shareholder redemptions or for other short-term liquidity purposes. The Fund has agreed to pay commitment fees on its pro-rata portion of the line of credit, which amounted to $4 and is reflected in Miscellaneous expenses on the Statement of Operations. During the period, there were no borrowings on this line of credit.
8. Security Lending.
The Fund lends portfolio securities through a lending agent from time to time in order to earn additional income. For equity securities, a lending agent is used and may loan securities to certain qualified borrowers, including Fidelity Capital Markets (FCM), a broker-dealer affiliated with the Fund. On the settlement date of the loan, the Fund
Annual Report
Notes to Financial Statements - continued
(Amounts in thousands except percentages)
8. Security Lending - continued
receives collateral (in the form of U.S. Treasury obligations, letters of credit and/or cash) against the loaned securities and maintains collateral in an amount not less than 100% of the market value of the loaned securities during the period of the loan. The market value of the loaned securities is determined at the close of business of the Fund and any additional required collateral is delivered to the Fund on the next business day. If the borrower defaults on its obligation to return the securities loaned because of insolvency or other reasons, the Fund may apply collateral received from the borrower against the obligation. The Fund may experience delays and costs in recovering the securities loaned. Any cash collateral received is invested in the Fidelity Securities Lending Cash Central Fund. The value of loaned securities and cash collateral at period end are disclosed on the Fund's Statement of Assets and Liabilities. At period end, there were no security loans outstanding with FCM. Security lending income represents the income earned on investing cash collateral, less rebates paid to borrowers, and any lending agent fees associated with the loan, plus any premium payments received for lending certain types of securities. Security lending income is presented in the Statement of Operations as a component of income from Fidelity Central Funds. Total security lending income during the period amounted to $284, including $5 from securities loaned to FCM.
9. Expense Reductions.
The investment adviser voluntarily agreed to reimburse a portion of the Fund's Class A, Class T, Class B, Class C and Institutional Class operating expenses. During the period, this reimbursement reduced expenses as follows:
|
|
Reimbursement |
|
Class A |
$ 6 |
|
Class T |
7 |
|
Class B |
-* |
|
Class C |
2 |
|
Institutional Class |
2 |
|
|
$ 17 |
* Amount represents two hundred dollars.
Commissions paid to certain brokers with whom the investment adviser, or its affiliates, places trades on behalf of the Fund include an amount in addition to trade execution, which may be rebated back to the Fund to offset certain expenses. This amount totaled $532 for the period.
In addition, the investment adviser reimbursed a portion of the Fund's operating expenses during the period in the amount of $3.
Annual Report
10. Distributions to Shareholders.
Distributions to shareholders of each class were as follows:
|
Years ended November 30, |
2013 |
2012 A |
|
From net investment income |
|
|
|
Class A |
$ 3,606 |
$ 3,191 |
|
Class T |
2,972 |
1,890 |
|
Class C |
121 |
- |
|
Fidelity Stock Selector Mid Cap Fund |
16 |
- |
|
Institutional Class |
1,457 |
1,956 |
|
Total |
$ 8,172 |
$ 7,037 |
|
From net realized gain |
|
|
|
Class A |
$ 1,106 |
$ - |
|
Class T |
1,403 |
- |
|
Class C |
54 |
- |
|
Fidelity Stock Selector Mid Cap Fund |
3 |
- |
|
Institutional Class |
307 |
- |
|
Total |
$ 2,873 |
$ - |
A Distributions for Fidelity Stock Selector Mid Cap Fund are for the period June 6, 2012 (commencement of sale of shares) to November 30, 2012.
11. Share Transactions.
Transactions for each class of shares were as follows:
|
|
Shares |
Dollars |
||
|
Years ended November 30, |
2013 |
2012 A |
2013 |
2012 A |
|
Class A |
|
|
|
|
|
Shares sold |
1,576 |
2,534 |
$ 39,740 |
$ 52,691 |
|
Issued in exchange for shares of Fidelity Advisor Growth Strategies Fund |
483 |
- |
11,196 |
- |
|
Issued in exchange for shares of Fidelity Mid Cap Growth Fund |
410 |
- |
9,497 |
- |
|
Reinvestment of distributions |
196 |
158 |
4,309 |
2,914 |
|
Shares redeemed |
(5,036) |
(9,598) |
(125,748) |
(199,005) |
|
Net increase (decrease) |
(2,371) |
(6,906) |
$ (61,006) |
$ (143,400) |
|
Class T |
|
|
|
|
|
Shares sold |
2,840 |
3,511 |
$ 71,906 |
$ 74,253 |
|
Issued in exchange for shares of Fidelity Advisor Growth Strategies Fund |
643 |
- |
15,054 |
- |
|
Issued in exchange for shares of Fidelity Mid Cap Growth Fund |
182 |
- |
4,267 |
- |
|
Reinvestment of distributions |
188 |
96 |
4,170 |
1,803 |
|
Shares redeemed |
(9,076) |
(14,999) |
(228,859) |
(312,249) |
|
Net increase (decrease) |
(5,223) |
(11,392) |
$ (133,462) |
$ (236,193) |
Annual Report
Notes to Financial Statements - continued
(Amounts in thousands except percentages)
11. Share Transactions - continued
|
|
Shares |
Dollars |
||
|
Years ended November 30, |
2013 |
2012 A |
2013 |
2012 A |
|
Class B |
|
|
|
|
|
Shares sold |
4 |
3 |
$ 95 |
$ 54 |
|
Issued in exchange for shares of Fidelity Advisor Growth Strategies Fund |
75 |
- |
1,640 |
- |
|
Issued in exchange for shares of Fidelity Mid Cap Growth Fund |
28 |
- |
614 |
- |
|
Shares redeemed |
(363) |
(540) |
(8,472) |
(10,540) |
|
Net increase (decrease) |
(256) |
(537) |
$ (6,123) |
$ (10,486) |
|
Class C |
|
|
|
|
|
Shares sold |
236 |
225 |
$ 5,603 |
$ 4,440 |
|
Issued in exchange for shares of Fidelity Advisor Growth Strategies Fund |
209 |
- |
4,553 |
- |
|
Issued in exchange for shares of Fidelity Mid Cap Growth Fund |
219 |
- |
4,769 |
- |
|
Reinvestment of distributions |
7 |
- |
152 |
- |
|
Shares redeemed |
(993) |
(1,754) |
(23,227) |
(34,462) |
|
Net increase (decrease) |
(322) |
(1,529) |
$ (8,150) |
$ (30,022) |
|
Fidelity Stock Selector Mid Cap Fund |
|
|
|
|
|
Shares sold |
1,327 |
69 |
$ 35,648 |
$ 1,562 |
|
Issued in exchange for shares of Fidelity Mid Cap Growth Fund |
8,810 |
- |
212,139 |
- |
|
Reinvestment of distributions |
1 |
- |
16 |
- |
|
Shares redeemed |
(2,600) |
(4) |
(67,266) |
(89) |
|
Net increase (decrease) |
7,538 |
65 |
$ 180,537 |
$ 1,473 |
|
Institutional Class |
|
|
|
|
|
Shares sold |
1,231 |
1,655 |
$ 32,432 |
$ 35,850 |
|
Issued in exchange for shares of Fidelity Advisor Growth Strategies Fund |
20 |
- |
479 |
- |
|
Issued in exchange for shares of Fidelity Mid Cap Growth Fund |
37 |
- |
888 |
- |
|
Reinvestment of distributions |
68 |
93 |
1,564 |
1,794 |
|
Shares redeemed |
(1,567) |
(6,043) |
(41,850) |
(129,543) |
|
Net increase (decrease) |
(211) |
(4,295) |
$ (6,487) |
$ (91,899) |
A Share transactions for Fidelity Stock Selector Mid Cap Fund are for the period June 6, 2012 (commencement of sale of shares) to November 30, 2012.
Annual Report
12. Merger Information.
On January 11, 2013, the Fund acquired all of the assets and assumed all of the liabilities of Fidelity Advisor Growth Strategies Fund and Fidelity Mid Cap Growth Fund ("Target Funds") pursuant to agreements and plans of reorganization approved by the Board of Trustees ("The Board") on June 12, 2012. The acquisition was accomplished by an exchange of shares of each class of the Fund for corresponding shares then outstanding of the Target Funds at their net asset value on the acquisition date. The reorganization provides shareholders of the Target Funds access to a larger portfolio with a similar investment objective. The reorganization qualified as a tax-free reorganization for federal income tax purposes with no gain or loss recognized to the funds or their shareholders. The Target Funds' net assets of $32,922, including securities of $32,974 and unrealized appreciation of $2,113 for Fidelity Advisor Growth Strategies Fund; and net assets of $232,174, including securities of $233,755 and unrealized appreciation of $14,520 for Fidelity Mid Cap Growth Fund were combined with the Fund's net assets of $1,716,041 for total net assets after the acquisition of $1,981,137.
Pro forma results of operations of the combined entity for the entire period ended November 30, 2013, as though the acquisition had occurred as of the beginning of the year (rather than on the actual acquisition dates), are as follows:
|
Net investment income (loss) |
$ 6,032 |
|
Total net realized gain (loss) |
288,183 |
|
Total change in net unrealized appreciation (depreciation) |
219,225 |
|
Net increase (decrease) in net assets resulting from operations |
$ 513,440 |
Because the combined investment portfolios have been managed as a single portfolio since the acquisition was completed, it is not practicable to separate the amounts of revenue and earnings of the acquired fund that have been included in the Fund's accompanying Statement of Operations since January 11, 2013.
13. Other.
The Fund's organizational documents provide former and current trustees and officers with a limited indemnification against liabilities arising in connection with the performance of their duties to the Fund. In the normal course of business, the Fund may also enter into contracts that provide general indemnifications. The Fund's maximum exposure under these arrangements is unknown as this would be dependent on future claims that may be made against the Fund. The risk of material loss from such claims is considered remote.
Annual Report
Report of Independent Registered Public Accounting Firm
To the Trustees of Fidelity Advisor Series I and Shareholders of Fidelity Advisor Stock Selector Mid Cap Fund:
We have audited the accompanying statement of assets and liabilities of Fidelity Advisor Stock Selector Mid Cap Fund (the Fund), a fund of Fidelity Advisor Series I, including the schedule of investments, as of November 30, 2013, and the related statement of operations for the year then ended, the statement of changes in net assets for each of the two years in the period then ended, and the financial highlights for each of the five years in the period then ended. These financial statements and financial highlights are the responsibility of the Fund's management. Our responsibility is to express an opinion on these financial statements and financial highlights based on our audits.
We conducted our audits in accordance with the standards of the Public Company Accounting Oversight Board (United States). Those standards require that we plan and perform the audit to obtain reasonable assurance about whether the financial statements and financial highlights are free of material misstatement. The Fund is not required to have, nor were we engaged to perform, an audit of its internal control over financial reporting. Our audits included consideration of internal control over financial reporting as a basis for designing audit procedures that are appropriate in the circumstances, but not for the purpose of expressing an opinion on the effectiveness of the Fund's internal control over financial reporting. Accordingly, we express no such opinion. An audit also includes examining, on a test basis, evidence supporting the amounts and disclosures in the financial statements, assessing the accounting principles used and significant estimates made by management, as well as evaluating the overall financial statement presentation. Our procedures included confirmation of securities owned as of November 30, 2013, by correspondence with the custodians and brokers; where replies were not received from brokers, we performed other auditing procedures. We believe that our audits provide a reasonable basis for our opinion.
In our opinion, the financial statements and financial highlights referred to above present fairly, in all material respects, the financial position of Fidelity Advisor Stock Selector Mid Cap Fund as of November 30, 2013, the results of its operations for the year then ended, the changes in its net assets for each of the two years in the period then ended, and the financial highlights for each of the five years in the period then ended, in conformity with accounting principles generally accepted in the United States of America.
DELOITTE & TOUCHE LLP
Boston, Massachusetts
January 16, 2014
Annual Report
Trustees and Officers
The Trustees, Member of the Advisory Board, and officers of the trust and fund, as applicable, are listed below. The Board of Trustees governs the fund and is responsible for protecting the interests of shareholders. The Trustees are experienced executives who meet periodically throughout the year to oversee the fund's activities, review contractual arrangements with companies that provide services to the fund, oversee management of the risks associated with such activities and contractual arrangements, and review the fund's performance. Except for James C. Curvey, Ned C. Lautenbach, Ronald P. O'Hanley, and William S. Stavropoulos, each of the Trustees oversees 173 funds. Mr. Curvey oversees 396 funds. Mr. Lautenbach, Mr. O'Hanley, and Mr. Stavropoulos each oversees 247 funds.
The Trustees hold office without limit in time except that (a) any Trustee may resign; (b) any Trustee may be removed by written instrument, signed by at least two-thirds of the number of Trustees prior to such removal; (c) any Trustee who requests to be retired or who has become incapacitated by illness or injury may be retired by written instrument signed by a majority of the other Trustees; and (d) any Trustee may be removed at any special meeting of shareholders by a two-thirds vote of the outstanding voting securities of the trust. Each Trustee who is not an interested person (as defined in the 1940 Act) of the trust and the fund (Independent Trustee), shall retire not later than the last day of the calendar year in which his or her 75th birthday occurs. The Independent Trustees may waive this mandatory retirement age policy with respect to individual Trustees. The officers and Advisory Board Member hold office without limit in time, except that any officer and Advisory Board Member may resign or may be removed by a vote of a majority of the Trustees at any regular meeting or any special meeting of the Trustees. Except as indicated, each individual has held the office shown or other offices in the same company for the past five years.
Experience, Skills, Attributes, and Qualifications of the Fund's Trustees. The Governance and Nominating Committee has adopted a statement of policy that describes the experience, qualifications, attributes, and skills that are necessary and desirable for potential Independent Trustee candidates (Statement of Policy). The Board believes that each Trustee satisfied at the time he or she was initially elected or appointed a Trustee, and continues to satisfy, the standards contemplated by the Statement of Policy. The Governance and Nominating Committee also engages professional search firms to help identify potential Independent Trustee candidates who have the experience, qualifications, attributes, and skills consistent with the Statement of Policy. From time to time, additional criteria based on the composition and skills of the current Independent Trustees, as well as experience or skills that may be appropriate in light of future changes to board composition, business conditions, and regulatory or other developments, have also been considered by the professional search firms and the Governance and Nominating Committee. In addition, the Board takes into account the Trustees' commitment and participation in Board and committee meetings, as well as their leadership of standing and ad hoc committees throughout their tenure.
Annual Report
In determining that a particular Trustee was and continues to be qualified to serve as a Trustee, the Board has considered a variety of criteria, none of which, in isolation, was controlling. The Board believes that, collectively, the Trustees have balanced and diverse experience, qualifications, attributes, and skills, which allow the Board to operate effectively in governing the fund and protecting the interests of shareholders. Information about the specific experience, skills, attributes, and qualifications of each Trustee, which in each case led to the Board's conclusion that the Trustee should serve (or continue to serve) as a trustee of the fund, is provided below.
Board Structure and Oversight Function. James C. Curvey is an interested person (as defined in the 1940 Act) and currently serves as Chairman. The Trustees have determined that an interested Chairman is appropriate and benefits shareholders because an interested Chairman has a personal and professional stake in the quality and continuity of services provided to the fund. Independent Trustees exercise their informed business judgment to appoint an individual of their choosing to serve as Chairman, regardless of whether the Trustee happens to be independent or a member of management. The Independent Trustees have determined that they can act independently and effectively without having an Independent Trustee serve as Chairman and that a key structural component for assuring that they are in a position to do so is for the Independent Trustees to constitute a substantial majority for the Board. The Independent Trustees also regularly meet in executive session. Ned C. Lautenbach serves as Chairman of the Independent Trustees and as such (i) acts as a liaison between the Independent Trustees and management with respect to matters important to the Independent Trustees and (ii) with management prepares agendas for Board meetings.
Fidelity funds are overseen by different Boards of Trustees. The fund's Board oversees Fidelity's equity and high income funds and another Board oversees Fidelity's investment-grade bond, money market, and asset allocation funds. The asset allocation funds may invest in Fidelity funds overseen by the fund's Board. The use of separate Boards, each with its own committee structure, allows the Trustees of each group of Fidelity funds to focus on the unique issues of the funds they oversee, including common research, investment, and operational issues. On occasion, the separate Boards establish joint committees to address issues of overlapping consequences for the Fidelity funds overseen by each Board.
The Trustees operate using a system of committees to facilitate the timely and efficient consideration of all matters of importance to the Trustees, the fund, and fund shareholders and to facilitate compliance with legal and regulatory requirements and oversight of the fund's activities and associated risks. The Board, acting through its committees, has charged FMR and its affiliates with (i) identifying events or circumstances the occurrence of which could have demonstrably adverse effects on the fund's business and/or reputation; (ii) implementing processes and controls to lessen the possibility that such events or circumstances occur or to mitigate the effects of such events or circumstances if they do occur; and (iii) creating and maintaining a system designed to evaluate continuously business and market conditions in order to facilitate the identification and implementation processes described in (i) and (ii) above. Because the day-to-day operations and activities of the fund are carried out by or through FMR, its affiliates and other service providers, the fund's exposure to risks is mitigated but not eliminated by the processes overseen by the Trustees. While each of the Board's committees has responsibility for overseeing different aspects of the fund's activities, oversight is exercised primarily through the Operations, Audit, and Compliance Committees. In addition, the Independent Trustees have worked with FMR to enhance the Board's oversight of investment and financial risks, legal and regulatory risks, technology risks, and operational risks, including the development of additional risk reporting to the Board. For example, a working group comprised of Independent Trustees and FMR has worked and continues to work to review the Fidelity funds' valuation-related activities, reporting and risk management. Appropriate personnel, including but not limited to the fund's Chief Compliance Officer (CCO), FMR's internal auditor, the independent accountants, the fund's Treasurer and portfolio management personnel, make periodic reports to the Board's committees, as appropriate, including an annual review of FMR's risk management program for the Fidelity funds. The responsibilities of each standing committee, including their oversight responsibilities, are described further under "Standing Committees of the Fund's Trustees."
Annual Report
Trustees and Officers - continued
The fund's Statement of Additional Information (SAI) includes more information about the Trustees. To request a free copy, call Fidelity at 1-877-208-0098.
Interested Trustees*:
Correspondence intended for each Trustee who is an interested person may be sent to Fidelity Investments, 245 Summer Street, Boston, Massachusetts 02210.
|
Name, Year of Birth; Principal Occupations and Other Relevant Experience+ |
|
|
James C. Curvey (1935) |
|
|
Year of Election or Appointment: 2007 Trustee Chairman of the Board of Trustees |
|
|
|
Mr. Curvey also serves as Trustee of other Fidelity funds. Mr. Curvey is a Director of Fidelity Investments Money Management, Inc. (2009-present), Director of Fidelity Research & Analysis Co. (2009-present) and Director of FMR and FMR Co., Inc. (2007-present). Mr. Curvey is also Vice Chairman (2007-present) and Director of FMR LLC. In addition, Mr. Curvey serves as an Overseer for the Boston Symphony Orchestra and a member of the Trustees of Villanova University. Previously, Mr. Curvey was the Vice Chairman (2006-2007) and Director (2000-2007) of FMR Corp. |
|
Ronald P. O'Hanley (1957) |
|
|
Year of Election or Appointment: 2011 Trustee |
|
|
|
Mr. O'Hanley also serves as Trustee of other Fidelity funds. He is Director of Fidelity SelectCo, LLC (2013-present), FMR Co., Inc. (2010-present), Director of Fidelity Investments Money Management, Inc. (2010-present), Director of Fidelity Research & Analysis Company (2010-present), President of Fidelity Asset Management and Corporate Services and a Member of Fidelity's Executive Committee (2010-present). Previously, Mr. O'Hanley served as President and Chief Executive Officer of BNY Mellon Asset Management (2007-2010). Mr. O'Hanley also served as Vice Chairman of Bank New York Mellon Corp. and a member of that firm's Executive Committee. Prior to the 2007 merger of The Bank of New York and Mellon Financial Corporation, he was Vice Chairman of Mellon Financial Corporation and President and Chief Executive Officer of Mellon Asset Management. He joined Mellon in February 1997. Mr. O'Hanley currently serves as Chairman of the Boston Public Library Foundation Board of Directors and sits on the Board of Directors of Beth Israel Deaconess Medical Center, the Board of Trustees of the Marine Biological Laboratory and the Advisory Board of the Maxwell School of Citizenship and Public Administration at Syracuse University. Mr. O'Hanley also chairs the Council on Asset Management for the Financial Services Roundtable and is a member of the Board of Directors of Institutional Investor's U.S. Institute. |
* Trustees have been determined to be "Interested Trustees" by virtue of, among other things, their affiliation with the trust or various entities under common control with FMR.
+ The information above includes each Trustee's principal occupation during the last five years and other information relating to the experience, attributes, and skills relevant to each Trustee's qualifications to serve as a Trustee, which led to the conclusion that each Trustee should serve as a Trustee for the fund.
Annual Report
Trustees and Officers - continued
Independent Trustees:
Correspondence intended for each Independent Trustee (that is, the Trustees other than the Interested Trustees) may be sent to Fidelity Investments, P.O. Box 55235, Boston, Massachusetts 02205-5235.
|
Name, Year of Birth; Principal Occupations and Other Relevant Experience+ |
|
|
Dennis J. Dirks (1948) |
|
|
Year of Election or Appointment: 2005 Trustee |
|
|
|
Mr. Dirks also serves as Trustee of other Fidelity funds. Prior to his retirement in May 2003, Mr. Dirks was Chief Operating Officer and a member of the Board of The Depository Trust & Clearing Corporation (DTCC). He also served as President, Chief Operating Officer, and Board member of The Depository Trust Company (DTC) and President and Board member of the National Securities Clearing Corporation (NSCC). In addition, Mr. Dirks served as Chief Executive Officer and Board member of the Government Securities Clearing Corporation, Chief Executive Officer and Board member of the Mortgage-Backed Securities Clearing Corporation, as a Trustee and a member of the Finance Committee of Manhattan College (2005-2008), and as a Trustee and a member of the Finance Committee of AHRC of Nassau County (2006-2008). Mr. Dirks is a member of the Independent Directors Council (IDC) Governing Council (2010-present) and Board of Directors for The Brookville Center for Children's Services, Inc. (2009-present). |
|
Alan J. Lacy (1953) |
|
|
Year of Election or Appointment: 2008 Trustee |
|
|
|
Mr. Lacy also serves as Trustee of other Fidelity funds. Mr. Lacy serves as Senior Adviser (2007-present) of Oak Hill Capital Partners, L.P. (private equity). Mr. Lacy also served as Chief Executive Officer (2000-2005) and Vice Chairman (2005-2006) of Sears Holdings Corporation and Sears, Roebuck and Co. (retail). In addition, Mr. Lacy serves as a member of the Board of Directors of Dave & Buster's Entertainment, Inc. (restaurant and entertainment complexes, 2010-present), Earth Fare, Inc. (retail grocery, 2012-present), The Hillman Companies, Inc. (hardware wholesalers, 2010-present), and Bristol-Myers Squibb Company (global pharmaceuticals, 2008-present). Mr. Lacy is a member of the Board of Trustees of The National Parks Conservation Association (2006-present). Previously, Mr. Lacy served as Chairman of the Board of Trustees of the National Parks Conservation Association (2008-2011) and as a member of the Board of Directors for the Western Union Company (global money transfer, 2006-2011). |
|
Ned C. Lautenbach (1944) |
|
|
Year of Election or Appointment: 2000 Trustee Chairman of the Independent Trustees |
|
|
|
Mr. Lautenbach also serves as Trustee of other Fidelity funds. Mr. Lautenbach currently serves as the Lead Director of the Eaton Corporation Board of Directors (diversified industrial, 1997-present). Mr. Lautenbach is Chairman of the Board of Directors of the Philharmonic Center for the Arts in Naples, Florida (2012-present) and a member of the Council on Foreign Relations (1994-present). Previously, Mr. Lautenbach was a Partner/Advisory Partner at Clayton, Dubilier & Rice, LLC (private equity investment, 1998-2010), as well as a Director of Sony Corporation (2006-2007). |
|
Joseph Mauriello (1944) |
|
|
Year of Election or Appointment: 2008 Trustee |
|
|
|
Mr. Mauriello also serves as Trustee of other Fidelity funds. Prior to his retirement in January 2006, Mr. Mauriello served in numerous senior management positions including Deputy Chairman and Chief Operating Officer (2004-2005), and Vice Chairman of Financial Services (2002-2004) of KPMG LLP US (professional services, 1965-2005). Mr. Mauriello currently serves as a member of the Board of Directors of XL Group plc. (global insurance and re-insurance, 2006-present). Previously, Mr. Mauriello served as a Director of the Hamilton Funds of the Bank of New York (2006-2007) and of Arcadia Resources Inc. (health care services and products, 2007-2012). |
|
Robert W. Selander (1950) |
|
|
Year of Election or Appointment: 2011 Trustee |
|
|
|
Mr. Selander also serves as Trustee of other Fidelity funds. Previously, Mr. Selander served as a Member of the Advisory Board of other Fidelity funds (2011), and Executive Vice Chairman (2010), Chief Executive Officer (2009-2010), and President and Chief Executive Officer (1997-2009) of Mastercard, Inc. |
|
Cornelia M. Small (1944) |
|
|
Year of Election or Appointment: 2005 Trustee |
|
|
|
Ms. Small also serves as Trustee of other Fidelity funds. Ms. Small is a member of the Board of Directors (2009-present) and Chair of the Investment Committee (2010-present) of the Teagle Foundation. Ms. Small also serves on the Investment Committee of the Berkshire Taconic Community Foundation (2008-present). Previously, Ms. Small served as Chairperson (2002-2008) and a member of the Investment Committee and Chairperson (2008-2012) and a member of the Board of Trustees of Smith College. In addition, Ms. Small served as Chief Investment Officer, Director of Global Equity Investments, and a member of the Board of Directors of Scudder, Stevens & Clark and Scudder Kemper Investments. |
|
William S. Stavropoulos (1939) |
|
|
Year of Election or Appointment: 2002 Trustee Vice Chairman of the Independent Trustees |
|
|
|
Mr. Stavropoulos also serves as Trustee of other Fidelity funds. Mr. Stavropoulos serves as President and Founder of the Michigan Baseball Foundation, the Great Lakes Loons (2007-present). Mr. Stavropoulos is Chairman Emeritus of the Board of Directors of The Dow Chemical Company, where he previously served in numerous senior management positions, including President, CEO (1995-2000; 2002-2004), Chairman of the Executive Committee (2000-2006), and as a member of the Board of Directors (1990-2006). Currently, Mr. Stavropoulos is Chairman of the Board of Directors of Univar Inc. (global distributor of commodity and specialty chemicals), a Director of Teradata Corporation (data warehousing and technology solutions), and Maersk Inc. (industrial conglomerate), and a member of the Advisory Board for Metalmark Capital LLC (private equity investment, 2005-present). Mr. Stavropoulos is an operating advisor to Clayton, Dubilier & Rice, LLC (private equity investment). In addition, Mr. Stavropoulos is a member of the University of Notre Dame Advisory Council for the College of Science, a Trustee of the Rollin L. Gerstacker Foundation, and a Director of the Naples Philharmonic Center for the Arts. Previously, Mr. Stavropoulos served as a Director of Chemical Financial Corporation (bank holding company, 1993-2012) and Tyco International, Ltd. (multinational manufacturing and services, 2007-2012). |
|
David M. Thomas (1949) |
|
|
Year of Election or Appointment: 2008 Trustee |
|
|
|
Mr. Thomas also serves as Trustee of other Fidelity funds. Mr. Thomas serves as Non-Executive Chairman of the Board of Directors of Fortune Brands Home and Security (home and security products, 2011-present), and as a member of the Board of Directors of Interpublic Group of Companies, Inc. (marketing communication, 2004-present). Previously, Mr. Thomas served as Executive Chairman (2005-2006) and Chairman and Chief Executive Officer (2000-2005) of IMS Health, Inc. (pharmaceutical and healthcare information solutions), and a Director of Fortune Brands, Inc. (consumer products, 2000-2011). |
+ The information above includes each Trustee's principal occupation during the last five years and other information relating to the experience, attributes, and skills relevant to each Trustee's qualifications to serve as a Trustee, which led to the conclusion that each Trustee should serve as a Trustee for the fund.
Advisory Board Member and Officers:
Correspondence intended for each officer and Peter S. Lynch may be sent to Fidelity Investments, 245 Summer Street, Boston, Massachusetts 02210. Officers appear below in alphabetical order.
|
Name, Year of Birth; Principal Occupation |
|
|
Peter S. Lynch (1944) |
|
|
Year of Election or Appointment: 2003 Member of the Advisory Board |
|
|
|
Mr. Lynch also serves as Member of the Advisory Board of other Fidelity funds. Mr. Lynch is Vice Chairman and a Director of FMR and FMR Co., Inc. In addition, Mr. Lynch serves as a Trustee of Boston College and as the Chairman of the Inner-City Scholarship Fund. Previously, Mr. Lynch served on the Special Olympics International Board of Directors (1997-2006). |
|
Elizabeth Paige Baumann (1968) |
|
|
Year of Election or Appointment: 2012 Anti-Money Laundering (AML) Officer |
|
|
|
Ms. Baumann also serves as AML Officer of other funds. She is Chief AML Officer of FMR LLC (2012-present) and is an employee of Fidelity Investments. Previously, Ms. Baumann served as Vice President and Deputy Anti-Money Laundering Officer (2007-2012). |
|
William C. Coffey (1969) |
|
|
Year of Election or Appointment: 2009 Assistant Secretary |
|
|
|
Mr. Coffey also serves as Assistant Secretary of other funds. He is Senior Vice President and Deputy General Counsel of FMR LLC (2010-present), and is an employee of Fidelity Investments. Previously, Mr. Coffey served as Vice President and Associate General Counsel of FMR LLC (2005-2009). |
|
Jonathan Davis (1968) |
|
|
Year of Election or Appointment: 2010 Assistant Treasurer |
|
|
|
Mr. Davis also serves as Assistant Treasurer of other funds. Mr. Davis is an employee of Fidelity Investments. Previously, Mr. Davis served as Vice President and Associate General Counsel of FMR LLC (2003-2010). |
|
Adrien E. Deberghes (1967) |
|
|
Year of Election or Appointment: 2008 Deputy Treasurer |
|
|
|
Mr. Deberghes also serves as an officer of other funds. He is an employee of Fidelity Investments (2008-present). Prior to joining Fidelity Investments, Mr. Deberghes was Senior Vice President of Mutual Fund Administration at State Street Corporation (2007-2008), Senior Director of Mutual Fund Administration at Investors Bank & Trust (2005-2007), and Director of Finance for Dunkin' Brands (2000-2005). |
|
Stephanie J. Dorsey (1969) |
|
|
Year of Election or Appointment: 2010 Assistant Treasurer |
|
|
|
Ms. Dorsey also serves as an officer of other funds. She is an employee of Fidelity Investments (2008-present) and has served in other fund officer roles. Prior to joining Fidelity Investments, Ms. Dorsey served as Treasurer (2004-2008) of the JPMorgan Mutual Funds and Vice President (2004-2008) of JPMorgan Chase Bank. |
|
Scott C. Goebel (1968) |
|
|
Year of Election or Appointment: 2008 Secretary and Chief Legal Officer (CLO) |
|
|
|
Mr. Goebel serves as Secretary and CLO of other funds. Mr. Goebel also serves as Secretary of Fidelity Investments Money Management, Inc. (FIMM) (2010-present) and Fidelity Research and Analysis Company (FRAC) (2010-present); General Counsel, Secretary, and Senior Vice President of FMR (2008-present) and FMR Co., Inc. (2008-present); Chief Legal Officer of Fidelity Management & Research (Hong Kong) Limited (2008-present) and Assistant Secretary of Fidelity Management & Research (Japan) Inc. (2008-present), and Fidelity Management & Research (U.K.) Inc. (2008-present). Previously, Mr. Goebel served as Secretary and CLO of other Fidelity funds (2008-2013), Assistant Secretary of FIMM (2008-2010), FRAC (2008-2010), and certain funds (2007-2008); and as Vice President and Secretary of Fidelity Distributors Corporation (FDC) (2005-2007). Mr. Goebel has been employed by FMR LLC or an affiliate since 2001. |
|
Joseph A. Hanlon (1968) |
|
|
Year of Election or Appointment: 2012 Chief Compliance Officer |
|
|
|
Mr. Hanlon also serves as Chief Compliance Officer of other funds. Mr. Hanlon serves as Compliance Officer of FMR, FMR Co., Inc., Fidelity Investments Money Management, Inc. (FIMM), Fidelity Research and Analysis Company (FRAC), and Fidelity Management & Research (Hong Kong) (2009-present), as Senior Vice President of the Fidelity Asset Management Division (2009-present), and is an employee of Fidelity Investments. Previously, Mr. Hanlon served as Compliance Officer of Fidelity Management & Research (Japan) Inc. (2009-2013), Strategic Advisers, Inc. (2009-2013), and Fidelity Management & Research (U.K.) Inc. (2009-2013). |
|
Bruce T. Herring (1965) |
|
|
Year of Election or Appointment: 2006 Vice President of certain Equity Funds |
|
|
|
Mr. Herring also serves as Vice President of other funds. He serves as Chief Investment Officer of Fidelity Global Asset Allocation (GAA) (2013-present), Group Chief Investment Officer of FMR, and President of Fidelity Research & Analysis Company (2010-present). Previously, Mr. Herring served as Chief Investment Officer and Director of Fidelity Management & Research (U.K.) Inc. (2010-2013), Vice President (2005-2006) and Senior Vice President (2006-2007) of Fidelity Management & Research Company, Vice President of FMR Co., Inc. (2001-2007), and as a portfolio manager for Fidelity U.S. Equity Funds. |
|
Brian B. Hogan (1964) |
|
|
Year of Election or Appointment: 2009 Vice President |
|
|
|
Mr. Hogan also serves as Vice President of other funds. Mr. Hogan serves as President of FMR's Equity Division (2009-present). Previously, Mr. Hogan served as Senior Vice President, Equity Research of FMR (2006-2009) and as a portfolio manager. |
|
Chris Maher (1972) |
|
|
Year of Election or Appointment: 2013 Assistant Treasurer |
|
|
|
Mr. Maher serves as Assistant Treasurer of other funds. Mr. Maher is Vice President of Valuation Oversight and is an employee of Fidelity Investments. Previously, Mr. Maher served as Vice President of Asset Management Compliance (2013), Vice President of FMR's Program Management Group (2010-2013), and Vice President of Valuation Oversight (2008-2010). |
|
Christine Reynolds (1958) |
|
|
Year of Election or Appointment: 2008 Chief Financial Officer |
|
|
|
Ms. Reynolds also serves as Chief Financial Officer of other funds. Ms. Reynolds became President of Fidelity Pricing and Cash Management Services (FPCMS) in August 2008. Ms. Reynolds served as Chief Operating Officer of FPCMS (2007-2008). Previously, Ms. Reynolds served as President, Treasurer, and Anti-Money Laundering officer of the Fidelity funds (2004-2007). |
|
Kenneth B. Robins (1969) |
|
|
Year of Election or Appointment: 2008 President and Treasurer |
|
|
|
Mr. Robins also serves as an officer of other funds. Mr. Robins serves as Executive Vice President of Fidelity Investments Money Management, Inc. (FIMM) (2013-present) and is an employee of Fidelity Investments (2004-present). Previously, Mr. Robins served in other fund officer roles. |
|
Gary W. Ryan (1958) |
|
|
Year of Election or Appointment: 2005 Assistant Treasurer |
|
|
|
Mr. Ryan also serves as Assistant Treasurer of other funds. Mr. Ryan is an employee of Fidelity Investments and has served in other fund officer roles. Previously, Mr. Ryan served as Vice President of Fund Reporting in Fidelity Pricing and Cash Management Services (FPCMS) (1999-2005). |
|
Stephen Sadoski (1971) |
|
|
Year of Election or Appointment: 2012 Deputy Treasurer |
|
|
|
Mr. Sadoski also serves as Deputy Treasurer of other funds. He is an employee of Fidelity Investments (2012-present) and has served in another fund officer role. Prior to joining Fidelity Investments, Mr. Sadoski served as an assistant chief accountant in the Division of Investment Management of the Securities and Exchange Commission (SEC) (2009-2012) and as a senior manager at Deloitte & Touche LLP (1997-2009). |
|
Stacie M. Smith (1974) |
|
|
Year of Election or Appointment: 2013 Deputy Treasurer |
|
|
|
Ms. Smith also serves as an officer of other funds. She is an employee of Fidelity Investments (2009-present) and has served in other fund officer roles. Prior to joining Fidelity Investments, Ms. Smith served as Senior Audit Manager of Ernst & Young LLP (1996-2009). |
|
Renee Stagnone (1975) |
|
|
Year of Election or Appointment: 2013 Deputy Treasurer |
|
|
|
Ms. Stagnone also serves as Deputy Treasurer of other funds. Ms. Stagnone is an employee of Fidelity Investments. |
|
Joseph F. Zambello (1957) |
|
|
Year of Election or Appointment: 2011 Deputy Treasurer |
|
|
|
Mr. Zambello also serves as Deputy Treasurer of other funds. Mr. Zambello is an employee of Fidelity Investments. Previously, Mr. Zambello served as Vice President of FMR's Program Management Group (2009-2011) and Vice President of the Transfer Agent Oversight Group (2005-2009). |
Annual Report
Distributions (Unaudited)
Class A designates 84%, and 64%; Class T designates 100%, and 64%; Class C designates 100%, and 64% of the dividends distributed on December 14, 2012 and December 27, 2012, respectively during the fiscal year as qualifying for the dividends-received deduction for corporate shareholders.
Class A designates 95%, and 79%; Class T designates 100%, and 79%; and Class C designates 100%, and 79%; of the dividends distributed on December 14, 2012 and December 27, 2012, respectively during the fiscal year as amounts which may be taken into account as a dividend for purposes of the maximum rate under section 1(h)(11) of the Internal Revenue Code.
The fund will notify shareholders in January 2014 of amounts for use in preparing 2013 income tax returns.
Annual Report
Board Approval of Investment Advisory Contracts and Management Fees
Fidelity Advisor Stock Selector Mid Cap Fund
Each year, the Board of Trustees, including the Independent Trustees (together, the Board), votes on the renewal of the management contract and sub-advisory agreements (together, the Advisory Contracts) for the fund. The Board, assisted by the advice of fund counsel and Independent Trustees' counsel, requests and considers a broad range of information relevant to the renewal of the Advisory Contracts throughout the year.
The Board meets regularly and, at each of its meetings, covers an extensive agenda of topics and materials and considers factors that are relevant to its annual consideration of the renewal of the fund's Advisory Contracts, including the services and support provided to the fund and its shareholders. The Board has established various standing committees, each composed of and chaired by Independent Trustees with varying backgrounds, to which the Board has assigned specific subject matter responsibilities in order to enhance effective decision-making by the Board. The Board, acting directly and through its Committees, requests and receives information concerning the annual consideration of the renewal of the fund's Advisory Contracts. The Board also meets as needed to consider matters specifically related to the Board's annual consideration of the renewal of Advisory Contracts. Members of the Board may also meet with trustees of other Fidelity funds through ad hoc joint committees to discuss certain matters relevant to the Fidelity funds.
At its July 2013 meeting, the Board, including the Independent Trustees, unanimously determined to renew the fund's Advisory Contracts. In reaching its determination, the Board considered all factors it believed relevant, including (i) the nature, extent, and quality of the services to be provided to the fund and its shareholders (including the investment performance of the fund); (ii) the competitiveness of the fund's management fee and total expense ratio relative to peer funds; (iii) the total costs of the services to be provided by and the profits to be realized by Fidelity from its relationship with the fund; (iv) the extent to which economies of scale exist and would be realized as the fund grows; and (v) whether fee levels reflect these economies of scale, if any, for the benefit of fund shareholders.
In considering whether to renew the Advisory Contracts for the fund, the Board reached a determination, with the assistance of fund counsel and Independent Trustees' counsel and through the exercise of its business judgment, that the renewal of the Advisory Contracts was in the best interests of the fund and its shareholders and that the compensation payable under the Advisory Contracts was fair and reasonable. The Board's decision to renew the Advisory Contracts was not based on any single factor, but rather was based on a comprehensive consideration of all the information provided to the Board at its meetings throughout the year. The Board, in reaching its determination to renew the Advisory Contracts, was aware that shareholders in the fund have a broad range of investment choices available to them, including a wide choice among mutual funds offered by Fidelity's competitors, and that the fund's shareholders, who have the opportunity to review and weigh the disclosure provided by the fund in its prospectus and other public disclosures, have chosen to invest in this fund, which is a part of the Fidelity family of funds.
Annual Report
Board Approval of Investment Advisory Contracts and
Management Fees - continued
Nature, Extent, and Quality of Services Provided. The Board considered the staffing within the investment adviser, Fidelity Management & Research Company (FMR), and the sub-advisers (together, the Investment Advisers) as it relates to the fund, including the backgrounds of the fund's investment personnel, and also considered the fund's investment objective, strategies, and related investment philosophy. The Independent Trustees also had discussions with senior management of Fidelity's investment operations and investment groups. The Board considered the structure of the portfolio manager compensation program and whether this structure provides appropriate incentives to act in the best interests of the fund.
Resources Dedicated to Investment Management and Support Services. The Board and the Fund Oversight and Research Committees reviewed the general qualifications and capabilities of the Investment Advisers' investment staff, including its size, education, experience, and resources, as well as the Investment Advisers' approach to recruiting, training, managing, and compensating investment personnel. The Board noted that FMR has continued to increase the resources devoted to non-U.S. offices, including expansion of Fidelity's global investment organization. The Board also noted that Fidelity's analysts have extensive resources, tools and capabilities that allow them to conduct sophisticated quantitative and fundamental analysis, as well as credit analysis of issuers, counterparties and guarantors. Further, the Board believes that Fidelity's investment professionals have sufficient access to global information and data so as to provide competitive investment results over time, and that those professionals also have access to sophisticated tools that permit them to assess portfolio construction and risk and performance attribution characteristics continuously, as well as to transmit new information and research conclusions rapidly around the world. Additionally, in its deliberations, the Board considered the Investment Advisers' trading and risk management capabilities and resources, which are an integral part of the investment management process.
Shareholder and Administrative Services. The Board considered (i) the nature, extent, quality, and cost of advisory, administrative, and shareholder services performed by the Investment Advisers and their affiliates under the Advisory Contracts and under separate agreements covering transfer agency, pricing and bookkeeping, and securities lending services for the fund; (ii) the nature and extent of the supervision of third party service providers, principally custodians and subcustodians; and (iii) the resources devoted to, and the record of compliance with, the fund's compliance policies and procedures. The Board also reviewed the allocation of fund brokerage, including allocations to brokers affiliated with the Investment Advisers, the use of brokerage commissions to pay fund expenses, and the use of "soft" commission dollars to pay for research services.
Annual Report
The Board noted that the growth of fund assets over time across the complex allows Fidelity to reinvest in the development of services designed to enhance the value or convenience of the Fidelity funds as investment vehicles. These services include 24-hour access to account information and market information through telephone representatives and over the Internet, investor education materials and asset allocation tools, and the expanded availability of Fidelity Investor Centers.
Investment in a Large Fund Family. The Board considered the benefits to shareholders of investing in a Fidelity fund, including the benefits of investing in a fund that is part of a large family of funds offering a variety of investment disciplines and providing a large variety of mutual fund investor services. The Board noted that Fidelity had taken, or had made recommendations that resulted in the Fidelity funds taking, a number of actions over the previous year that benefited particular funds, including (i) continuing to dedicate additional resources to investment research and to the support of the senior management team that oversees asset management; (ii) persisting in efforts to enhance Fidelity's global research capabilities; (iii) launching new funds and making other enhancements to meet client needs for global and income-oriented solutions; (iv) continuing to launch dedicated lower cost underlying funds to meet portfolio construction needs related to expanding underlying fund options for Fidelity funds of funds, specifically for the Freedom Fund product lines; (v) rationalizing product lines and gaining increased efficiencies through the mergers of several funds into other funds; (vi) strengthening Fidelity's index fund offerings by reducing investment minimums and adopting or lowering existing expense caps for certain funds and classes; (vii) enhancing Global Asset Allocation product offerings by launching new funds and strategies, including "open architecture" target date funds that utilize affiliated and unaffiliated sub-advisers; (viii) modifying the eligibility criteria for Institutional Class shares of Advisor funds to increase their marketability to a portion of the defined contribution plan market; (ix) creating a new low-cost retirement share class for certain Advisor funds to appeal to large retirement plans; (x) transitioning the management of certain Fidelity commodity funds to Geode Capital Management LLC, a registered commodity pool operator, while retaining administrative responsibilities for the funds; (xi) reorganizing a number of funds; and (xii) taking steps toward establishing a new Fidelity adviser to manage sector-based funds and products.
Investment Performance. The Board considered whether the fund has operated in accordance with its investment objective, as well as its record of compliance with its investment restrictions and its performance history. The Board noted that there was a portfolio management change for a sleeve of the fund in October 2012.
Annual Report
Board Approval of Investment Advisory Contracts and
Management Fees - continued
The Board took into account discussions with the Investment Advisers about fund investment performance that occur at Board meetings throughout the year. In this regard the Board noted that as part of regularly scheduled fund reviews and other reports to the Board on fund performance, the Board periodically considers annualized return information for the fund, for different time periods, measured against a securities market index ("benchmark index") and a peer group of mutual funds with similar objectives ("peer group"). In its evaluation of fund investment performance, the Board gave particular attention to information indicating changes in performance of certain Fidelity funds for specific time periods and the Investment Advisers' explanations for any overperformance or, in the case of the fund, underperformance.
In addition to reviewing absolute and relative fund performance, the Independent Trustees periodically consider the appropriateness of fund performance metrics in evaluating the results achieved. In general, the Independent Trustees believe that fund performance should be evaluated based on net performance (after fees and expenses) of both the highest performing and lowest performing classes, where applicable, compared to appropriate benchmark indices, over appropriate time periods which may include full market cycles, and compared to peer groups, as applicable, over the same periods, taking into account relevant factors including the following: general market conditions; issuer-specific information; tactical opportunities for investment; and fund cash flows and other factors.
The Independent Trustees recognize that shareholders evaluate performance on a net basis over their own holding periods, for which one-, three-, and five-year periods are used as a proxy. For this reason, the performance information reviewed by the Board also included net cumulative calendar year total return information for the fund and an appropriate benchmark index and peer group for the most recent one-, three-, and five-year periods, as shown below. Returns are shown compared to the 25th percentile (top of box) and 75th percentile (bottom of box) of the peer universe.
Annual Report
Fidelity Advisor Stock Selector Mid Cap Fund
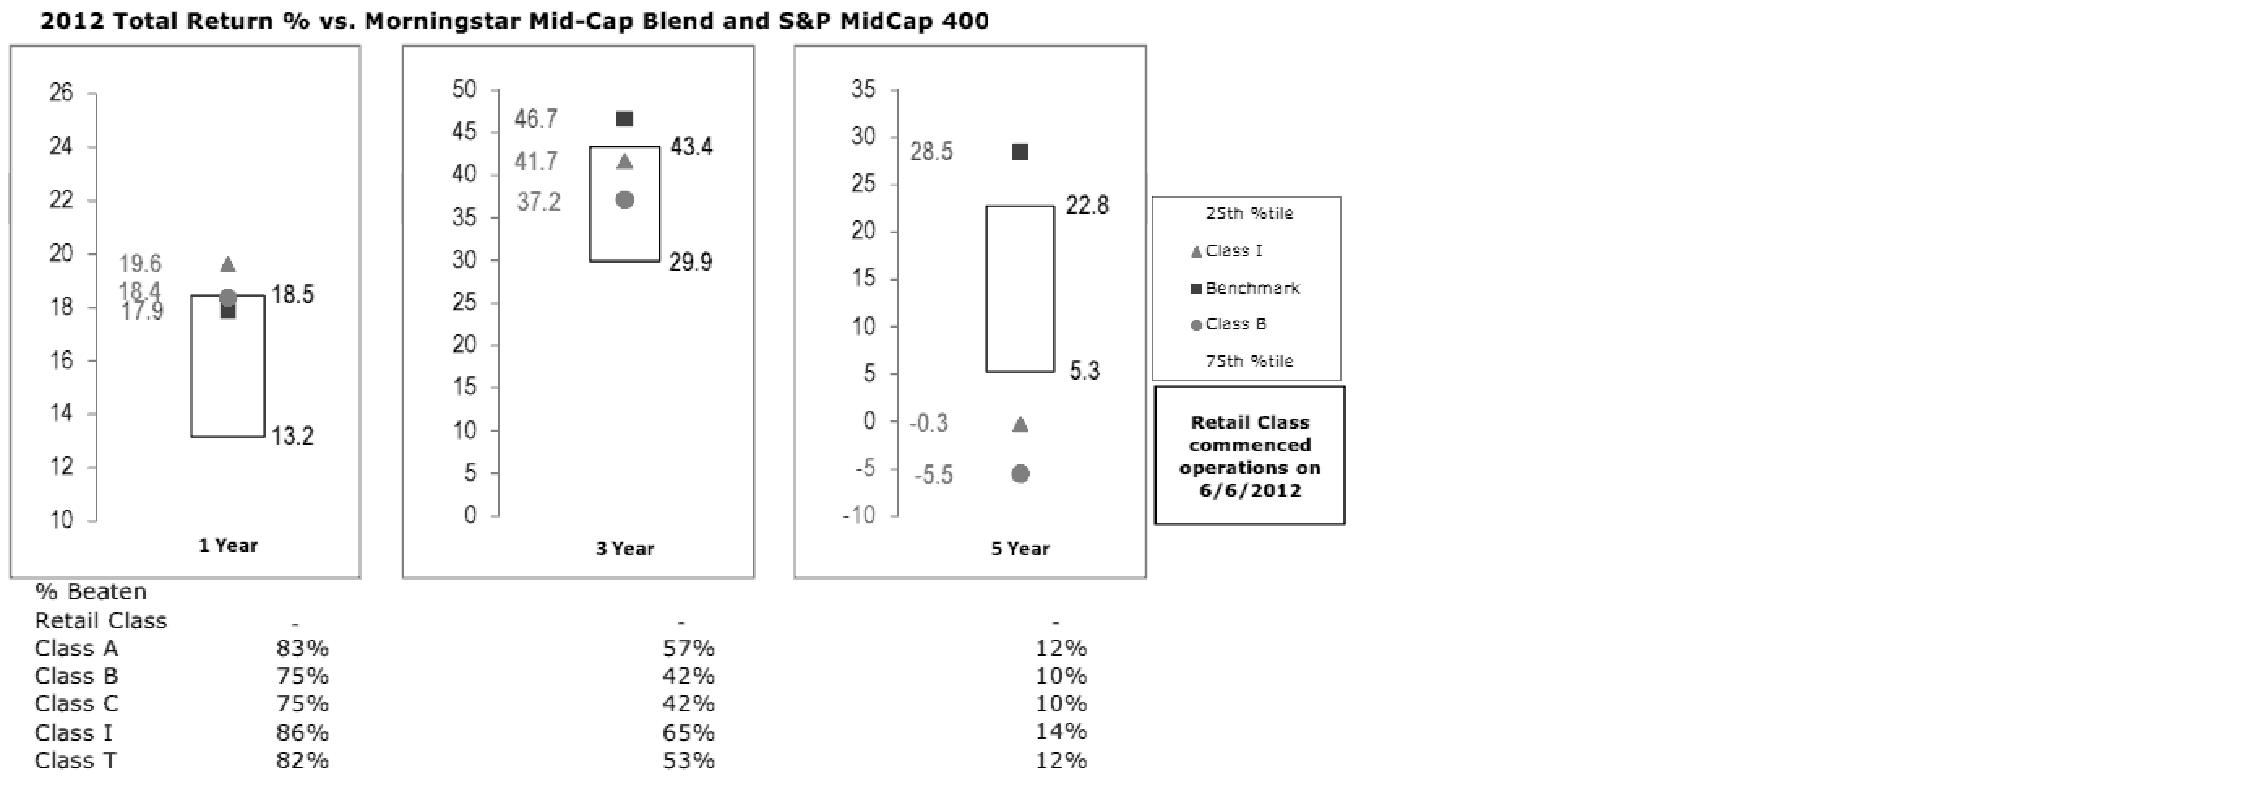
The Board has discussed the fund's performance with FMR, including the fund's underperformance based on more recent periods ended after 2012 (which periods are not shown in the chart above) but prior to the date of the Board's approval of the renewal of the Advisory Contracts, and has engaged with FMR to consider what steps might be taken to remediate the fund's more recent underperformance.
The Board also considered that the fund's management fee is subject to upward or downward adjustment depending upon whether, and to what extent, the fund's investment performance for the performance period exceeds, or is exceeded by, a securities index, thus leading to a performance adjustment for the same period. The Board noted that the performance adjustment provides FMR with a strong economic incentive to seek to achieve superior performance for the fund's shareholders and helps to more closely align the interests of FMR and the fund's shareholders.
Based on its review, the Board concluded that the nature, extent, and quality of services provided to the fund under the Advisory Contracts should benefit the fund's shareholders.
Competitiveness of Management Fee and Total Expense Ratio. The Board considered the fund's management fee and total expense ratio compared to "mapped groups" of competitive funds and classes. Fidelity creates "mapped groups" by combining similar Lipper investment objective categories that have comparable management fee characteristics. Combining Lipper investment objective categories aids the Board's management fee and total expense ratio comparisons by broadening the competitive group used for comparison and by reducing the number of universes to which various Fidelity funds are compared.
Annual Report
Board Approval of Investment Advisory Contracts and
Management Fees - continued
Management Fee. The Board considered two proprietary management fee comparisons for the 12-month periods shown in the chart below. The group of Lipper funds used by the Board for management fee comparisons is referred to below as the "Total Mapped Group." The Total Mapped Group comparison focuses on a fund's standing in terms of gross management fees before expense reimbursements or caps, and without giving effect to the fund's performance adjustment, relative to the total universe of funds with comparable investment mandates, regardless of whether their management fee structures also are comparable. Funds with comparable investment mandates offer exposure to similar types of securities. Funds with comparable management fee structures have similar management fee contractual arrangements (e.g., flat rate charged for advisory services, all-inclusive fee rate, etc.). "TMG %" represents the percentage of funds in the Total Mapped Group that had management fees that were lower than the fund's. For example, a TMG % of 11% means that 89% of the funds in the Total Mapped Group had higher management fees than the fund. The "Asset-Size Peer Group" (ASPG) comparison focuses on a fund's standing relative to a subset of non-Fidelity funds within the Total Mapped Group that are similar in size and management fee structure. The ASPG represents at least 15% of the funds in the Total Mapped Group with comparable asset size and management fee structures, subject to a minimum of 50 funds (or all funds in the Total Mapped Group if fewer than 50). Additional information, such as the ASPG quartile in which the fund's management fee ranked and the impact of the fund's performance adjustment, is also included in the chart and considered by the Board.
Fidelity Advisor Stock Selector Mid Cap Fund

Annual Report
The Board noted that the fund's management fee ranked below the median of its Total Mapped Group and below the median of its ASPG for 2012. The Board also noted the effect of the fund's negative performance adjustment on the fund's management fee ranking.
Based on its review, the Board concluded that the fund's management fee is fair and reasonable in light of the services that the fund receives and the other factors considered.
Total Expense Ratio. In its review of each class's total expense ratio, the Board considered the fund's management fee as well as other fund or class expenses, as applicable, such as transfer agent fees, pricing and bookkeeping fees, fund-paid 12b-1 fees, and custodial, legal, and audit fees. The Board also noted the effects of any waivers and reimbursements on fees and expenses, as well as the impact of the fund's performance adjustment. As part of its review, the Board also considered the current and historical total expense ratios of each class of the fund compared to competitive fund median expenses. Each class of the fund is compared to those funds and classes in the Total Mapped Group (used by the Board for management fee comparisons) that have a similar sales load structure.
The Board noted that the total expense ratio of each class ranked below its competitive median for 2012.
Fees Charged to Other Fidelity Clients. The Board also considered Fidelity fee structures and other information with respect to clients of FMR and its affiliates, such as other mutual funds advised or subadvised by FMR or its affiliates, pension plan clients, and other institutional clients. The Board noted the findings of the 2013 ad hoc joint committee (created with the board of other Fidelity funds), which reviewed and compared Fidelity's institutional investment advisory business with its business of providing services to the Fidelity funds, including the differences in services provided, fees charged, and costs incurred, as well as competition in their respective marketplaces.
Based on its review of total expense ratios and fees charged to other Fidelity clients, the Board concluded that the total expense ratio of each class of the fund was reasonable in light of the services that the fund and its shareholders receive and the other factors considered.
Costs of the Services and Profitability. The Board considered the revenues earned and the expenses incurred by Fidelity in conducting the business of developing, marketing, distributing, managing, administering and servicing the fund and servicing the fund's shareholders. The Board also considered the level of Fidelity's profits in respect of all the Fidelity funds.
On an annual basis, FMR presents to the Board Fidelity's profitability for the fund. Fidelity calculates the profitability for each fund, as well as aggregate profitability for groups of Fidelity funds and all Fidelity funds, using a series of detailed revenue and cost allocation methodologies which originate with the books and records of Fidelity on which Fidelity's audited financial statements are based. The Audit Committee of the Board reviews any significant changes from the prior year's methodologies.
Annual Report
Board Approval of Investment Advisory Contracts and
Management Fees - continued
PricewaterhouseCoopers LLP (PwC), independent registered public accounting firm and auditor to Fidelity and certain Fidelity funds, has been engaged annually by the Board as part of the Board's assessment of Fidelity's profitability analysis. PwC's engagement includes the review and assessment of the methodologies used by Fidelity in determining the revenues and expenses attributable to Fidelity's mutual fund business, and completion of agreed-upon procedures surrounding the mathematical accuracy of fund profitability and its conformity to allocation methodologies. After considering PwC's reports issued under the engagement and information provided by Fidelity, the Board concluded that while other allocation methods may also be reasonable, Fidelity's profitability methodologies are reasonable in all material respects.
The Board also reviewed Fidelity's non-fund businesses and fall-out benefits related to the mutual fund business as well as cases where Fidelity's affiliates may benefit from or be related to the fund's business.
The Board considered the costs of the services provided by and the profits realized by Fidelity in connection with the operation of the fund and was satisfied that the profitability was not excessive in the circumstances.
Economies of Scale. The Board considered whether there have been economies of scale in respect of the management of the Fidelity funds, whether the Fidelity funds (including the fund) have appropriately benefited from any such economies of scale, and whether there is potential for realization of any further economies of scale. The Board considered the extent to which the fund will benefit from economies of scale through increased services to the fund, through waivers or reimbursements, or through fee or expense reductions. The Board also noted that in 2009, it and the board of other Fidelity funds created an ad hoc committee (the Economies of Scale Committee) to analyze whether FMR attains economies of scale in respect of the management and servicing of the Fidelity funds, whether the Fidelity funds have appropriately benefited from such economies of scale, and whether there is potential for realization of any further economies of scale.
The Board recognized that the fund's management contract incorporates a "group fee" structure, which provides for lower group fee rates as total fund assets under FMR's management increase, and for higher group fee rates as total fund assets under FMR's management decrease. FMR calculates the group fee rates based on a tiered asset "breakpoint" schedule that varies based on asset class. The Board considered that the group fee is designed to deliver the benefits of economies of scale to fund shareholders when total Fidelity fund assets increase, even if assets of any particular fund are unchanged or have declined, because some portion of Fidelity's costs are attributable to services provided to all Fidelity funds, and all funds benefit if those costs can be allocated among more assets. The Board concluded that, given the group fee structure, fund shareholders will benefit from lower management fees as assets under FMR's management increase at the fund complex level, regardless of whether Fidelity achieves any such economies of scale.
Annual Report
The Board concluded, taking into account the analysis of the Economies of Scale Committee, that economies of scale, if any, are being appropriately shared between fund shareholders and Fidelity.
Amendment to Description of Group Fee Rate. At its July 2013 meeting, the Board voted to approve an amendment to the fund's management contract to modify the description of the "group fee rate" effective August 1, 2013. The Board noted that under the prior description in the contract, the group fee rate was based on the average net assets of all registered investment companies with which FMR has management contracts. Under the contract's tiered asset breakpoint schedule, the group fee rate is lower as total fund assets under FMR's management increase, and higher as total fund assets under FMR's management decrease. The Board considered that the prior description would have excluded the assets of 64 Fidelity sector funds from the group fee rate calculation once Fidelity SelectCo, LLC, an affiliate of FMR, assumed management responsibilities for those funds. The Board noted that modifying the description of the group fee rate to continue to include the assets of those 64 funds for purposes of determining group fee rate breakpoints would avoid an immediate adverse impact on the group fee rate for any fund.
Additional Information Requested by the Board. In order to develop fully the factual basis for consideration of the Fidelity funds' Advisory Contracts, the Board requested and received additional information on certain topics, including: (i) fund performance trends and Fidelity's long-term strategies for certain funds; (ii) the potential to further rationalize the Fidelity fund lineup with the possibility of achieving savings for the funds and Fidelity; (iii) the methodology with respect to competitive fund data and peer group classifications; (iv) the arrangements with, and performance of, certain sub-advisers on behalf of the Fidelity funds, as well as certain proposed participating affiliate arrangements; (v) the realization of fall-out benefits in certain Fidelity business units; (vi) Fidelity's group fee structures, including the rationale for the individual fee rates of certain categories of funds and the definition of group assets; (vii) trends regarding industry use of performance fee structures and the performance adjustment methodologies applicable to the Fidelity funds; (viii) additional competitive analysis regarding the total expenses for certain classes; and (ix) fund profitability methodology, including Fidelity's cost allocation methodology, and the impact of certain factors on fund profitability results.
Annual Report
Board Approval of Investment Advisory Contracts and
Management Fees - continued
Based on its evaluation of all of the conclusions noted above, and after considering all factors it believed relevant, the Board ultimately concluded that the advisory fee structures are fair and reasonable, and that the fund's Advisory Contracts should be renewed.
Annual Report
Investment Adviser
Fidelity Management & Research Company
Boston, MA
Investment Sub-Advisers
FMR Co., Inc.
Fidelity Management & Research
(U.K.) Inc.
Fidelity Management & Research
(Hong Kong) Limited
Fidelity Management & Research
(Japan) Inc.
General Distributor
Fidelity Distributors Corporation
Smithfield, RI
Transfer and Service Agents
Fidelity Investments Institutional
Operations Company, Inc.
Boston, MA
Fidelity Service Company, Inc.
Boston, MA
Custodian
Brown Brothers Harriman & Co.
Boston, MA
(Fidelity Investment logo)(registered trademark)
MC-UANN-0114 1.786695.110
Semiannual Report
(Fidelity Investment logo)(registered trademark)
Fidelity Advisor ® Stock Selector
Mid Cap
Fund - Institutional Class
Annual Report
November 30, 2013
(Fidelity Cover Art)
Contents
|
Performance |
How the fund has done over time. |
|
|
Management's Discussion of Fund Performance |
The Portfolio Managers' review of fund performance and strategy. |
|
|
Shareholder Expense Example |
An example of shareholder expenses. |
|
|
Investment Changes |
A summary of major shifts in the fund's investments over the past six months. |
|
|
Investments |
A complete list of the fund's investments with their market values. |
|
|
Financial Statements |
Statements of assets and liabilities, operations, and changes in net assets, as well as financial highlights. |
|
|
Notes |
Notes to the financial statements. |
|
|
Report of Independent Registered Public Accounting Firm |
|
|
|
Trustees and Officers |
|
|
|
Distributions |
|
|
|
Board Approval of Investment Advisory Contracts and Management Fees |
|
To view a fund's proxy voting guidelines and proxy voting record for the 12-month period ended June 30, visit http://www.fidelity.com/proxyvotingresults or visit the Securities and Exchange Commission's (SEC) web site at http://www.sec.gov. You may also call 1-877-208-0098 to request a free copy of the proxy voting guidelines.
Standard & Poor's, S&P and S&P 500 are registered service marks of The McGraw-Hill Companies, Inc. and have been licensed for use by Fidelity Distributors Corporation.
Other third-party marks appearing herein are the property of their respective owners.
All other marks appearing herein are registered or unregistered trademarks or service marks of FMR LLC or an affiliated company. © 2014 FMR LLC. All rights reserved.
Annual Report
This report and the financial statements contained herein are submitted for the general information of the shareholders of the fund. This report is not authorized for distribution to prospective investors in the fund unless preceded or accompanied by an effective prospectus.
A fund files its complete schedule of portfolio holdings with the SEC for the first and third quarters of each fiscal year on Form N-Q. Forms N-Q are available on the SEC's web site at http://www.sec.gov. A fund's Forms N-Q may be reviewed and copied at the SEC's Public Reference Room in Washington, DC. Information regarding the operation of the SEC's Public Reference Room may be obtained by calling 1-800-SEC-0330. For a complete list of a fund's portfolio holdings, view the most recent holdings listing, semiannual report, or annual report on Fidelity's web site at http://www.fidelity.com, http://www.advisor.fidelity.com, or http://www.401k.com, as applicable.
NOT FDIC INSURED • MAY LOSE VALUE • NO BANK GUARANTEE
Neither the fund nor Fidelity Distributors Corporation is a bank.
Annual Report
Performance: The Bottom Line
Average annual total return reflects the change in the value of an investment, assuming reinvestment of the class' distributions from dividend income and capital gains (the profits earned upon the sale of securities that have grown in value, if any) and assuming a constant rate of performance each year. The $10,000 table and the fund's returns do not reflect the deduction of taxes that a shareholder would pay on fund distributions or the redemption of fund shares. During periods of reimbursement by Fidelity, a fund's total return will be greater than it would be had the reimbursement not occurred. How a fund did yesterday is no guarantee of how it will do tomorrow.
Average Annual Total Returns
|
Periods ended November 30, 2013 |
Past 1 |
Past 5 |
Past 10 |
|
Institutional Class |
29.44% |
22.73% |
7.80% |
$10,000 Over 10 Years
Let's say hypothetically that $10,000 was invested in Fidelity Advisor® Stock Selector Mid Cap Fund - Institutional Class on November 30, 2003. The chart shows how the value of your investment would have changed, and also shows how the S&P MidCap 400® Index performed over the same period.
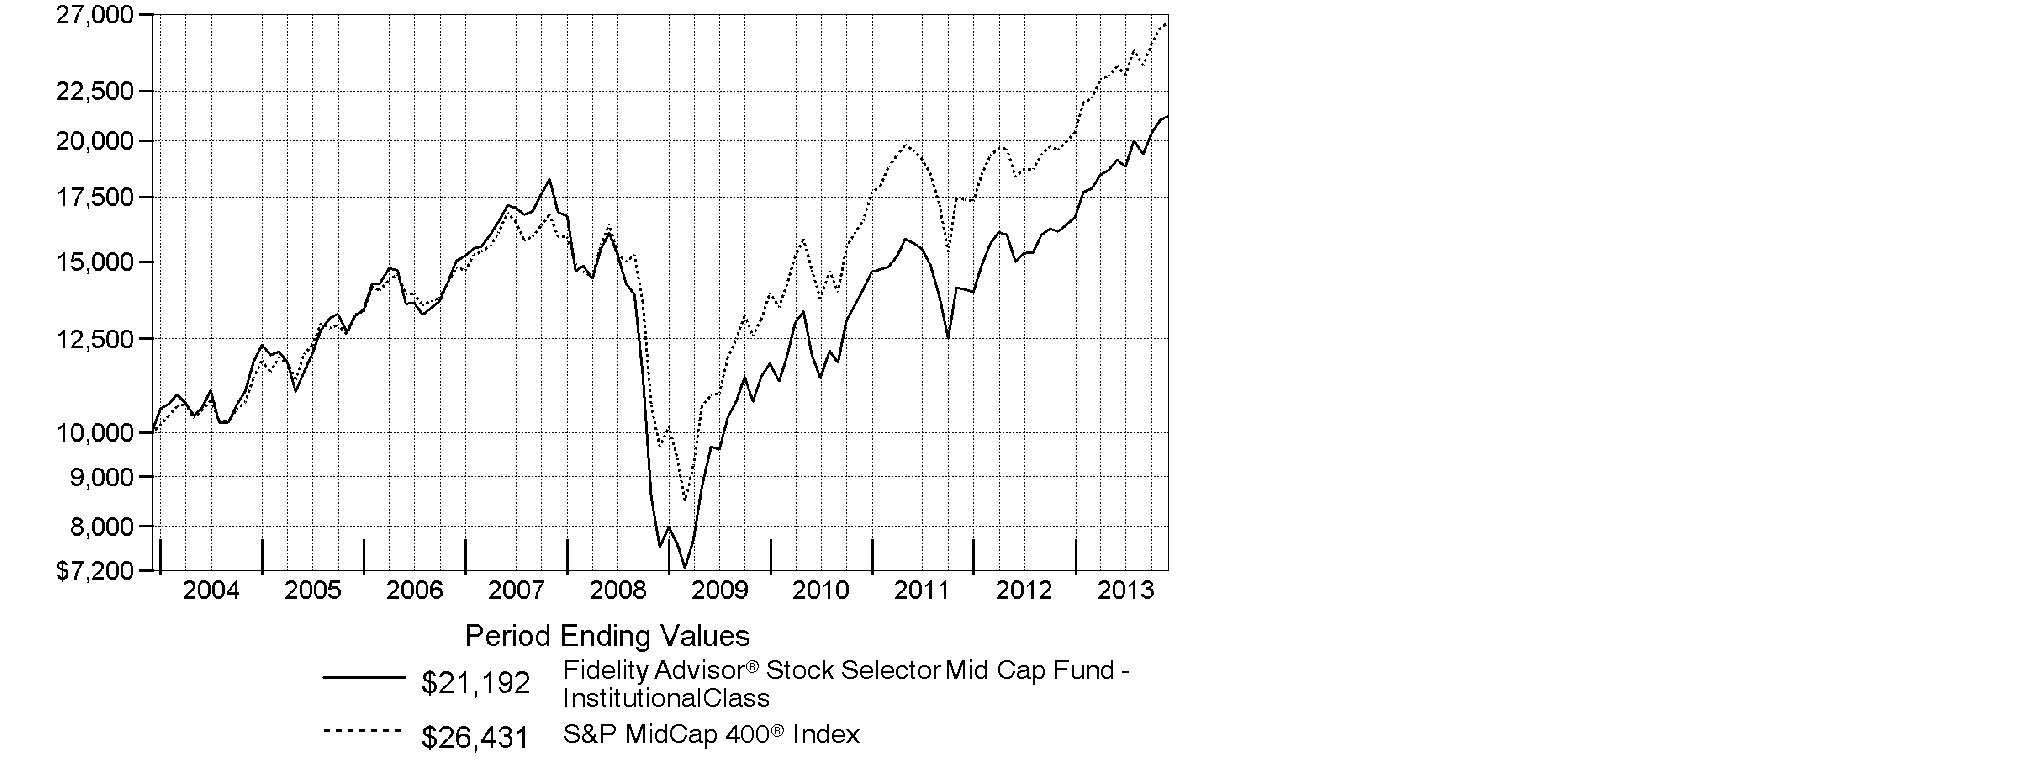
Annual Report
Management's Discussion of Fund Performance
Market Recap: With the current bull run nearing the five-year mark, equity benchmarks ripped up old records during the 12 months ending November 30, 2013. Gains were fueled by strengthening U.S. economic data, as well as generally improving economies and accommodative monetary policies worldwide. The broad S&P 500® Index reached new peaks in its 30.30% climb for the period, and the blue-chip Dow Jones Industrial AverageSM surpassed historic milestones en route to a 26.63% gain. The Nasdaq Composite Index®, up 36.73% amid a resurgence in growth-oriented stocks, closed above 4,000 for the first time since 2000. Shedding anxiety over the 2012 U.S. presidential election - and apparently confident that the federal debt-ceiling debate would be resolved - markets rose from period start through late May. News that the U.S. Federal Reserve was considering an end to its stimulative bond-buying kept stocks in flux over the summer but, by September, the Fed had set aside any imminent tapering. Despite jitters over a potential U.S. military strike in Syria and, later, an October budget impasse that briefly shuttered the federal government, volatility was subdued heading into the holidays, with investor optimism helping many markets home in on all-time highs at period end. Elsewhere, non-U.S. developed-market equities saw similar results, with the MSCI® EAFE® Index adding 24.97%.
Comments from Shadman Riaz and Eddie Yoon, two Co-Portfolio Managers of Fidelity Advisor® Stock Selector Mid Cap Fund, who are responsible for the fund's energy and health care sleeves, respectively, as part of Fidelity's Stock Selector Mid Cap Group: For the year, the fund's Institutional Class shares returned 29.44%, trailing the 32.33% gain of the S&P MidCap 400® Index. Versus the index, weak choices in industrials and information technology hurt the most, and offset strong picks in financials and health care. Nuance Communications was the fund's biggest relative detractor. The voice-recognition technology company struggled in its transition to a more subscription-heavy business model, while slowing growth and weak communication among management made matters worse, and the stock fell. Untimely positioning in specialty pharmaceuticals company Endo Health Solutions hurt, as did a stake in underperforming commercial building products maker Armstrong World Industries, which we sold from the fund. On the plus side, picks in financial helped the most by far. Japan-based diversified financials firm Monex Group was our top individual contributor, while Regeneron Pharmaceuticals - which was removed from the benchmark in May - also helped. We eliminated both positions by period end. Nuance, Armstrong and Monex were not in the index.
The views expressed above reflect those of the portfolio manager(s) only through the end of the period as stated on the cover of this report and do not necessarily represent the views of Fidelity or any other person in the Fidelity organization. Any such views are subject to change at any time based upon market or other conditions and Fidelity disclaims any responsibility to update such views. These views may not be relied on as investment advice and, because investment decisions for a Fidelity fund are based on numerous factors, may not be relied on as an indication of trading intent on behalf of any Fidelity fund.
Annual Report
Shareholder Expense Example
As a shareholder of the Fund, you incur two types of costs: (1) transaction costs, including sales charges (loads) on purchase payments or redemption proceeds, and (2) ongoing costs, including management fees, distribution and/or service (12b-1) fees and other Fund expenses. This Example is intended to help you understand your ongoing costs (in dollars) of investing in the Fund and to compare these costs with the ongoing costs of investing in other mutual funds.
The Example is based on an investment of $1,000 invested at the beginning of the period and held for the entire period (June 1, 2013 to November 30, 2013).
Actual Expenses
The first line of the accompanying table for each class of the Fund provides information about actual account values and actual expenses. You may use the information in this line, together with the amount you invested, to estimate the expenses that you paid over the period. Simply divide your account value by $1,000.00 (for example, an $8,600 account value divided by $1,000.00 = 8.6), then multiply the result by the number in the first line for a class of the Fund under the heading entitled "Expenses Paid During Period" to estimate the expenses you paid on your account during this period. A small balance maintenance fee of $12.00 that is charged once a year may apply for certain accounts with a value of less than $2,000. This fee is not included in the table below. If it was, the estimate of expenses you paid during the period would be higher, and your ending account value lower, by this amount. In addition, the Fund, as a shareholder in the underlying Fidelity Central Funds, will indirectly bear its pro-rata share of the fees and expenses incurred by the underlying Fidelity Central Funds. These fees and expenses are not included in the Fund's annualized expense ratio used to calculate the expense estimate in the table below.
Hypothetical Example for Comparison Purposes
The second line of the accompanying table for each class of the Fund provides information about hypothetical account values and hypothetical expenses based on a Class' actual expense ratio and an assumed rate of return of 5% per year before expenses, which is not the Class' actual return. The hypothetical account values and expenses may not be used to estimate the actual ending account balance or expenses you paid for the period. You may use this information to compare the ongoing costs of investing in the Fund and other funds. To do so, compare this 5% hypothetical example with the 5% hypothetical examples that appear in the shareholder reports of the other funds. A small balance maintenance fee of $12.00 that is charged once a year may apply for certain accounts with a value of less than $2,000. This fee is not included in the table below. If it was, the estimate of expenses you paid during the period would be higher, and your ending account value lower, by this amount. In addition, the Fund, as a shareholder in the underlying Fidelity Central Funds, will indirectly bear its pro-rata share of the fees and expenses incurred by the underlying Fidelity Central Funds. These fees and expenses are not included in the Fund's annualized expense ratio used to calculate the expense estimate in the table below.
Please note that the expenses shown in the table are meant to highlight your ongoing costs only and do not reflect any transaction costs. Therefore, the second line of the table is useful in comparing ongoing costs only, and will not help you determine the relative total costs of owning different funds. In addition, if these transactional costs were included, your costs would have been higher.
Annual Report
Shareholder Expense Example - continued
|
|
Annualized |
Beginning |
Ending |
Expenses Paid |
|
Class A |
.94% |
|
|
|
|
Actual |
|
$ 1,000.00 |
$ 1,108.60 |
$ 4.97 |
|
HypotheticalA |
|
$ 1,000.00 |
$ 1,020.36 |
$ 4.76 |
|
Class T |
1.15% |
|
|
|
|
Actual |
|
$ 1,000.00 |
$ 1,107.50 |
$ 6.08 |
|
HypotheticalA |
|
$ 1,000.00 |
$ 1,019.30 |
$ 5.82 |
|
Class B |
1.75% |
|
|
|
|
Actual |
|
$ 1,000.00 |
$ 1,104.10 |
$ 9.23 |
|
HypotheticalA |
|
$ 1,000.00 |
$ 1,016.29 |
$ 8.85 |
|
Class C |
1.68% |
|
|
|
|
Actual |
|
$ 1,000.00 |
$ 1,104.50 |
$ 8.86 |
|
HypotheticalA |
|
$ 1,000.00 |
$ 1,016.65 |
$ 8.49 |
|
Fidelity Stock Selector Mid Cap Fund |
.71% |
|
|
|
|
Actual |
|
$ 1,000.00 |
$ 1,110.00 |
$ 3.76 |
|
HypotheticalA |
|
$ 1,000.00 |
$ 1,021.51 |
$ 3.60 |
|
Institutional Class |
.67% |
|
|
|
|
Actual |
|
$ 1,000.00 |
$ 1,110.10 |
$ 3.54 |
|
HypotheticalA |
|
$ 1,000.00 |
$ 1,021.71 |
$ 3.40 |
A 5% return per year before expenses
B Annualized expense ratio reflects expenses net of applicable fee waivers.
* Expenses are equal to each Class' annualized expense ratio, multiplied by the average account value over the period, multiplied by 183/365 (to reflect the one-half year period).
Annual Report
Investment Changes (Unaudited)
|
Top Ten Stocks as of November 30, 2013 |
||
|
|
% of fund's |
% of fund's net assets |
|
J.B. Hunt Transport Services, Inc. |
1.9 |
1.2 |
|
Capital One Financial Corp. |
1.8 |
1.6 |
|
Hubbell, Inc. Class B |
1.7 |
1.4 |
|
AMETEK, Inc. |
1.7 |
2.0 |
|
Roper Industries, Inc. |
1.5 |
1.2 |
|
Verisk Analytics, Inc. |
1.5 |
0.9 |
|
Interactive Brokers Group, Inc. |
1.2 |
0.8 |
|
Foot Locker, Inc. |
1.2 |
0.0 |
|
SLM Corp. |
1.1 |
1.0 |
|
Raymond James Financial, Inc. |
1.1 |
0.5 |
|
|
14.7 |
|
|
Top Five Market Sectors as of November 30, 2013 |
||
|
|
% of fund's |
% of fund's net assets |
|
Financials |
22.3 |
22.3 |
|
Industrials |
16.8 |
17.7 |
|
Information Technology |
15.6 |
15.1 |
|
Consumer Discretionary |
13.9 |
12.6 |
|
Health Care |
8.9 |
9.0 |
|
Asset Allocation (% of fund's net assets) |
|||||||
|
As of November 30, 2013* |
As of May 31, 2013** |
||||||
 |
Stocks and |
|
|
Stocks and |
|
||
 |
Short-Term |
|
|
Short-Term |
|
||
|
* Foreign investments |
8.5% |
|
** Foreign investments |
8.5% |
|
||

Annual Report
Investments November 30, 2013
Showing Percentage of Net Assets
|
Common Stocks - 98.0% |
|||
|
Shares |
Value (000s) |
||
|
CONSUMER DISCRETIONARY - 13.9% |
|||
|
Distributors - 0.8% |
|||
|
LKQ Corp. (a) |
487,380 |
$ 16,157 |
|
|
Hotels, Restaurants & Leisure - 0.7% |
|||
|
Panera Bread Co. Class A (a) |
82,900 |
14,664 |
|
|
Household Durables - 2.4% |
|||
|
Jarden Corp. (a) |
411,415 |
23,138 |
|
|
NVR, Inc. (a) |
14,400 |
13,968 |
|
|
Tupperware Brands Corp. |
153,580 |
14,028 |
|
|
|
51,134 |
||
|
Internet & Catalog Retail - 0.5% |
|||
|
Liberty Media Corp. Interactive Series A (a) |
348,310 |
9,781 |
|
|
Leisure Equipment & Products - 0.5% |
|||
|
Brunswick Corp. |
237,700 |
10,863 |
|
|
Media - 0.3% |
|||
|
AMC Networks, Inc. Class A (a) |
117,900 |
7,568 |
|
|
Multiline Retail - 1.0% |
|||
|
Dollar General Corp. (a) |
173,940 |
9,904 |
|
|
Dollar Tree, Inc. (a) |
206,878 |
11,513 |
|
|
|
21,417 |
||
|
Specialty Retail - 7.4% |
|||
|
Abercrombie & Fitch Co. Class A |
123,582 |
4,236 |
|
|
American Eagle Outfitters, Inc. |
439,800 |
7,156 |
|
|
Cabela's, Inc. Class A (a) |
188,400 |
11,540 |
|
|
Dick's Sporting Goods, Inc. |
336,280 |
19,007 |
|
|
DSW, Inc. Class A |
128,400 |
5,756 |
|
|
Foot Locker, Inc. |
633,700 |
24,645 |
|
|
L Brands, Inc. |
130,315 |
8,469 |
|
|
O'Reilly Automotive, Inc. (a) |
49,810 |
6,224 |
|
|
PetSmart, Inc. |
150,260 |
11,136 |
|
|
Ross Stores, Inc. |
181,910 |
13,909 |
|
|
Sally Beauty Holdings, Inc. (a) |
550,320 |
15,486 |
|
|
Tractor Supply Co. |
253,536 |
18,561 |
|
|
Williams-Sonoma, Inc. |
213,960 |
12,649 |
|
|
|
158,774 |
||
|
Textiles, Apparel & Luxury Goods - 0.3% |
|||
|
Ralph Lauren Corp. |
42,600 |
7,465 |
|
|
TOTAL CONSUMER DISCRETIONARY |
297,823 |
||
|
Common Stocks - continued |
|||
|
Shares |
Value (000s) |
||
|
CONSUMER STAPLES - 3.6% |
|||
|
Beverages - 0.5% |
|||
|
Beam, Inc. |
101,800 |
$ 6,875 |
|
|
Monster Beverage Corp. (a) |
58,984 |
3,491 |
|
|
|
10,366 |
||
|
Food & Staples Retailing - 0.9% |
|||
|
United Natural Foods, Inc. (a) |
164,345 |
11,315 |
|
|
Whole Foods Market, Inc. |
131,842 |
7,462 |
|
|
|
18,777 |
||
|
Food Products - 2.2% |
|||
|
Hain Celestial Group, Inc. (a) |
108,400 |
8,964 |
|
|
Mead Johnson Nutrition Co. Class A |
102,300 |
8,645 |
|
|
The Hershey Co. |
83,900 |
8,129 |
|
|
TreeHouse Foods, Inc. (a) |
85,280 |
5,982 |
|
|
WhiteWave Foods Co. (a) |
741,900 |
15,780 |
|
|
|
47,500 |
||
|
TOTAL CONSUMER STAPLES |
76,643 |
||
|
ENERGY - 6.1% |
|||
|
Energy Equipment & Services - 1.8% |
|||
|
Dril-Quip, Inc. (a) |
131,100 |
14,232 |
|
|
Helmerich & Payne, Inc. |
125,980 |
9,700 |
|
|
Oil States International, Inc. (a) |
57,000 |
5,834 |
|
|
Rowan Companies PLC (a) |
254,710 |
8,818 |
|
|
|
38,584 |
||
|
Oil, Gas & Consumable Fuels - 4.3% |
|||
|
Atlas Pipeline Partners LP |
227,660 |
7,959 |
|
|
Cheniere Energy, Inc. (a) |
170,200 |
6,738 |
|
|
Cimarex Energy Co. |
200,600 |
18,973 |
|
|
Energen Corp. |
176,400 |
12,731 |
|
|
HollyFrontier Corp. |
96,570 |
4,633 |
|
|
SM Energy Co. |
197,946 |
17,447 |
|
|
Targa Resources Corp. |
82,900 |
6,722 |
|
|
Whiting Petroleum Corp. (a) |
138,900 |
8,390 |
|
|
WPX Energy, Inc. (a) |
442,880 |
8,233 |
|
|
|
91,826 |
||
|
TOTAL ENERGY |
130,410 |
||
|
Common Stocks - continued |
|||
|
Shares |
Value (000s) |
||
|
FINANCIALS - 22.3% |
|||
|
Capital Markets - 4.0% |
|||
|
ABG Sundal Collier ASA (a) |
3,100,000 |
$ 2,474 |
|
|
Ashmore Global Opportunities Ltd. (United Kingdom) |
443,737 |
3,656 |
|
|
KKR & Co. LP |
852,564 |
20,231 |
|
|
MLP AG |
1,650,000 |
11,031 |
|
|
Oaktree Capital Group LLC Class A |
112,900 |
6,291 |
|
|
Och-Ziff Capital Management Group LLC Class A |
380,000 |
5,278 |
|
|
Raymond James Financial, Inc. |
492,800 |
23,743 |
|
|
Virtus Investment Partners, Inc. (a) |
66,400 |
13,798 |
|
|
|
86,502 |
||
|
Commercial Banks - 3.4% |
|||
|
CIT Group, Inc. |
140,498 |
7,092 |
|
|
City National Corp. |
187,910 |
14,349 |
|
|
Erste Group Bank AG |
544,274 |
19,162 |
|
|
Huntington Bancshares, Inc. |
2,489,478 |
22,853 |
|
|
Synovus Financial Corp. |
2,464,089 |
8,600 |
|
|
|
72,056 |
||
|
Consumer Finance - 3.8% |
|||
|
ACOM Co. Ltd. (a) |
2,622,800 |
9,729 |
|
|
Capital One Financial Corp. |
540,800 |
38,738 |
|
|
Cash America International, Inc. |
239,527 |
9,009 |
|
|
SLM Corp. |
896,616 |
23,895 |
|
|
|
81,371 |
||
|
Diversified Financial Services - 1.2% |
|||
|
Interactive Brokers Group, Inc. |
1,065,767 |
25,845 |
|
|
Insurance - 2.0% |
|||
|
Direct Line Insurance Group PLC |
4,072,691 |
15,674 |
|
|
Fairfax Financial Holdings Ltd. (sub. vtg.) |
24,800 |
9,551 |
|
|
Fidelity National Financial, Inc. Class A |
220,000 |
6,395 |
|
|
Validus Holdings Ltd. |
269,489 |
10,793 |
|
|
|
42,413 |
||
|
Real Estate Investment Trusts - 6.7% |
|||
|
Acadia Realty Trust (SBI) |
300,580 |
7,806 |
|
|
Alexandria Real Estate Equities, Inc. |
143,875 |
9,102 |
|
|
Camden Property Trust (SBI) |
137,022 |
7,936 |
|
|
Corrections Corp. of America |
132,800 |
4,429 |
|
|
Cousins Properties, Inc. |
542,500 |
5,810 |
|
|
Equity One, Inc. |
403,833 |
9,046 |
|
|
Essex Property Trust, Inc. |
85,664 |
13,005 |
|
|
Glimcher Realty Trust |
469,064 |
4,555 |
|
|
Common Stocks - continued |
|||
|
Shares |
Value (000s) |
||
|
FINANCIALS - continued |
|||
|
Real Estate Investment Trusts - continued |
|||
|
LaSalle Hotel Properties (SBI) |
139,500 |
$ 4,369 |
|
|
Mid-America Apartment Communities, Inc. |
176,600 |
10,638 |
|
|
National Retail Properties, Inc. (d) |
344,169 |
10,927 |
|
|
Piedmont Office Realty Trust, Inc. Class A |
423,278 |
6,933 |
|
|
Rayonier, Inc. |
30,900 |
1,363 |
|
|
Redwood Trust, Inc. (d) |
449,400 |
8,350 |
|
|
Senior Housing Properties Trust (SBI) |
362,900 |
8,220 |
|
|
SL Green Realty Corp. |
145,665 |
13,178 |
|
|
Sovran Self Storage, Inc. |
64,339 |
4,294 |
|
|
Terreno Realty Corp. |
282,610 |
5,005 |
|
|
UDR, Inc. |
91,400 |
2,127 |
|
|
Weyerhaeuser Co. |
231,114 |
6,963 |
|
|
|
144,056 |
||
|
Real Estate Management & Development - 0.6% |
|||
|
Altisource Portfolio Solutions SA |
43,010 |
6,924 |
|
|
CBRE Group, Inc. (a) |
205,932 |
4,992 |
|
|
|
11,916 |
||
|
Thrifts & Mortgage Finance - 0.6% |
|||
|
Ocwen Financial Corp. (a) |
233,463 |
13,228 |
|
|
TOTAL FINANCIALS |
477,387 |
||
|
HEALTH CARE - 8.9% |
|||
|
Biotechnology - 1.1% |
|||
|
Alexion Pharmaceuticals, Inc. (a) |
74,000 |
9,213 |
|
|
Grifols SA ADR |
260,000 |
8,927 |
|
|
Medivation, Inc. (a) |
100,000 |
6,301 |
|
|
|
24,441 |
||
|
Health Care Equipment & Supplies - 1.7% |
|||
|
Boston Scientific Corp. (a) |
1,550,000 |
17,949 |
|
|
The Cooper Companies, Inc. |
140,000 |
18,444 |
|
|
|
36,393 |
||
|
Health Care Providers & Services - 2.7% |
|||
|
Catamaran Corp. (a) |
245,000 |
11,183 |
|
|
Community Health Systems, Inc. |
200,000 |
8,250 |
|
|
HCA Holdings, Inc. |
128,000 |
5,942 |
|
|
Humana, Inc. |
77,000 |
8,007 |
|
|
Common Stocks - continued |
|||
|
Shares |
Value (000s) |
||
|
HEALTH CARE - continued |
|||
|
Health Care Providers & Services - continued |
|||
|
MEDNAX, Inc. (a) |
150,000 |
$ 16,620 |
|
|
Quest Diagnostics, Inc. |
120,000 |
7,313 |
|
|
|
57,315 |
||
|
Health Care Technology - 0.5% |
|||
|
Cerner Corp. (a) |
190,000 |
10,919 |
|
|
Life Sciences Tools & Services - 0.6% |
|||
|
Illumina, Inc. (a) |
124,000 |
12,152 |
|
|
Pharmaceuticals - 2.3% |
|||
|
Actavis PLC (a) |
120,000 |
19,568 |
|
|
Perrigo Co. (d) |
90,000 |
14,030 |
|
|
Salix Pharmaceuticals Ltd. (a) |
191,000 |
16,199 |
|
|
|
49,797 |
||
|
TOTAL HEALTH CARE |
191,017 |
||
|
INDUSTRIALS - 16.8% |
|||
|
Aerospace & Defense - 1.0% |
|||
|
TransDigm Group, Inc. |
142,510 |
22,306 |
|
|
Commercial Services & Supplies - 0.4% |
|||
|
Covanta Holding Corp. |
412,561 |
7,385 |
|
|
West Corp. |
86,500 |
1,992 |
|
|
|
9,377 |
||
|
Electrical Equipment - 5.7% |
|||
|
AMETEK, Inc. |
730,090 |
35,935 |
|
|
Eaton Corp. PLC |
233,500 |
16,966 |
|
|
Hubbell, Inc. Class B |
341,540 |
36,856 |
|
|
Roper Industries, Inc. |
241,520 |
31,325 |
|
|
|
121,082 |
||
|
Machinery - 2.8% |
|||
|
Cummins, Inc. |
136,400 |
18,054 |
|
|
Ingersoll-Rand PLC |
258,907 |
18,491 |
|
|
Manitowoc Co., Inc. |
768,300 |
15,819 |
|
|
WABCO Holdings, Inc. (a) |
92,218 |
8,171 |
|
|
|
60,535 |
||
|
Professional Services - 1.5% |
|||
|
Verisk Analytics, Inc. (a) |
474,800 |
30,914 |
|
|
Road & Rail - 1.9% |
|||
|
J.B. Hunt Transport Services, Inc. |
542,940 |
40,821 |
|
|
Common Stocks - continued |
|||
|
Shares |
Value (000s) |
||
|
INDUSTRIALS - continued |
|||
|
Trading Companies & Distributors - 3.5% |
|||
|
Beacon Roofing Supply, Inc. (a) |
436,593 |
$ 16,233 |
|
|
MSC Industrial Direct Co., Inc. Class A |
300,908 |
23,125 |
|
|
W.W. Grainger, Inc. |
56,000 |
14,444 |
|
|
Watsco, Inc. |
207,300 |
19,893 |
|
|
|
73,695 |
||
|
TOTAL INDUSTRIALS |
358,730 |
||
|
INFORMATION TECHNOLOGY - 15.6% |
|||
|
Communications Equipment - 2.9% |
|||
|
Aruba Networks, Inc. (a) |
583,600 |
10,411 |
|
|
F5 Networks, Inc. (a) |
165,300 |
13,598 |
|
|
Juniper Networks, Inc. (a) |
488,900 |
9,910 |
|
|
Polycom, Inc. (a) |
824,877 |
8,867 |
|
|
Radware Ltd. (a) |
478,200 |
8,129 |
|
|
Riverbed Technology, Inc. (a) |
584,050 |
10,104 |
|
|
|
61,019 |
||
|
Computers & Peripherals - 0.9% |
|||
|
NCR Corp. (a) |
567,300 |
19,827 |
|
|
Electronic Equipment & Components - 1.3% |
|||
|
Arrow Electronics, Inc. (a) |
203,310 |
10,438 |
|
|
Ingram Micro, Inc. Class A (a) |
425,500 |
9,974 |
|
|
Jabil Circuit, Inc. |
309,300 |
6,270 |
|
|
|
26,682 |
||
|
Internet Software & Services - 2.1% |
|||
|
Bankrate, Inc. (a) |
345,342 |
6,472 |
|
|
Equinix, Inc. (a) |
79,300 |
12,744 |
|
|
Rackspace Hosting, Inc. (a)(d) |
398,400 |
15,223 |
|
|
Velti PLC (e) |
215,084 |
18 |
|
|
Yahoo!, Inc. (a) |
307,000 |
11,353 |
|
|
|
45,810 |
||
|
IT Services - 1.8% |
|||
|
Alliance Data Systems Corp. (a)(d) |
88,720 |
21,493 |
|
|
EPAM Systems, Inc. (a) |
188,100 |
6,672 |
|
|
Total System Services, Inc. |
344,600 |
10,700 |
|
|
|
38,865 |
||
|
Semiconductors & Semiconductor Equipment - 2.7% |
|||
|
Altera Corp. |
91,500 |
2,951 |
|
|
Applied Micro Circuits Corp. (a) |
312,900 |
3,927 |
|
|
Common Stocks - continued |
|||
|
Shares |
Value (000s) |
||
|
INFORMATION TECHNOLOGY - continued |
|||
|
Semiconductors & Semiconductor Equipment - continued |
|||
|
Atmel Corp. (a) |
1,064,800 |
$ 8,146 |
|
|
Broadcom Corp. Class A |
246,100 |
6,568 |
|
|
Cree, Inc. (a) |
198,500 |
11,076 |
|
|
RF Micro Devices, Inc. (a) |
1,290,200 |
6,812 |
|
|
Skyworks Solutions, Inc. (a) |
710,750 |
18,899 |
|
|
|
58,379 |
||
|
Software - 3.9% |
|||
|
Autodesk, Inc. (a) |
177,900 |
8,050 |
|
|
Citrix Systems, Inc. (a) |
203,795 |
12,089 |
|
|
Compuware Corp. |
890,800 |
9,790 |
|
|
Electronic Arts, Inc. (a) |
128,200 |
2,843 |
|
|
MICROS Systems, Inc. (a)(d) |
168,800 |
9,068 |
|
|
Nuance Communications, Inc. (a)(d) |
492,634 |
6,660 |
|
|
Parametric Technology Corp. (a) |
324,000 |
10,543 |
|
|
Rovi Corp. (a) |
502,600 |
9,248 |
|
|
SolarWinds, Inc. (a) |
92,380 |
3,089 |
|
|
Synopsys, Inc. (a) |
307,300 |
11,256 |
|
|
|
82,636 |
||
|
TOTAL INFORMATION TECHNOLOGY |
333,218 |
||
|
MATERIALS - 6.9% |
|||
|
Chemicals - 4.6% |
|||
|
Airgas, Inc. |
212,104 |
23,041 |
|
|
Albemarle Corp. |
153,782 |
10,566 |
|
|
Ashland, Inc. |
102,000 |
9,290 |
|
|
Eastman Chemical Co. |
88,970 |
6,853 |
|
|
FMC Corp. |
190,240 |
13,861 |
|
|
Sherwin-Williams Co. |
37,431 |
6,851 |
|
|
Valspar Corp. |
172,130 |
12,154 |
|
|
W.R. Grace & Co. (a) |
149,297 |
14,337 |
|
|
|
96,953 |
||
|
Containers & Packaging - 1.1% |
|||
|
Aptargroup, Inc. |
201,956 |
13,111 |
|
|
Rock-Tenn Co. Class A |
114,200 |
10,783 |
|
|
|
23,894 |
||
|
Common Stocks - continued |
|||
|
Shares |
Value (000s) |
||
|
MATERIALS - continued |
|||
|
Metals & Mining - 1.2% |
|||
|
Carpenter Technology Corp. |
171,600 |
$ 10,346 |
|
|
Reliance Steel & Aluminum Co. |
217,185 |
15,970 |
|
|
|
26,316 |
||
|
TOTAL MATERIALS |
147,163 |
||
|
TELECOMMUNICATION SERVICES - 0.3% |
|||
|
Diversified Telecommunication Services - 0.2% |
|||
|
TW Telecom, Inc. (a) |
163,511 |
4,631 |
|
|
Wireless Telecommunication Services - 0.1% |
|||
|
SBA Communications Corp. Class A (a) |
29,210 |
2,488 |
|
|
TOTAL TELECOMMUNICATION SERVICES |
7,119 |
||
|
UTILITIES - 3.6% |
|||
|
Electric Utilities - 2.1% |
|||
|
Great Plains Energy, Inc. |
405,400 |
9,624 |
|
|
OGE Energy Corp. |
595,800 |
20,507 |
|
|
PNM Resources, Inc. |
341,538 |
7,948 |
|
|
Portland General Electric Co. |
197,500 |
5,887 |
|
|
|
43,966 |
||
|
Gas Utilities - 0.8% |
|||
|
National Fuel Gas Co. |
163,851 |
11,057 |
|
|
Questar Corp. |
288,164 |
6,489 |
|
|
|
17,546 |
||
|
Independent Power Producers & Energy Traders - 0.4% |
|||
|
Black Hills Corp. |
185,300 |
9,315 |
|
|
Water Utilities - 0.3% |
|||
|
American Water Works Co., Inc. |
127,420 |
5,396 |
|
|
TOTAL UTILITIES |
76,223 |
||
|
TOTAL COMMON STOCKS (Cost $1,790,620) |
|
||
|
U.S. Treasury Obligations - 0.0% |
||||
|
|
Principal |
Value (000s) |
||
|
U.S. Treasury Bills, yield at date of purchase 0.03% to 0.04% 1/2/14 to 1/23/14 |
|
$ 295 |
$ 295 |
|
|
Money Market Funds - 4.6% |
|||
|
Shares |
|
||
|
Fidelity Cash Central Fund, 0.10% (b) |
34,823,346 |
34,823 |
|
|
Fidelity Securities Lending Cash Central Fund, 0.10% (b)(c) |
63,510,655 |
63,511 |
|
|
TOTAL MONEY MARKET FUNDS (Cost $98,334) |
|
||
|
TOTAL INVESTMENT PORTFOLIO - 102.6% (Cost $1,889,249) |
2,194,362 |
||
|
NET OTHER ASSETS (LIABILITIES) - (2.6)% |
(54,659) |
||
|
NET ASSETS - 100% |
$ 2,139,703 |
||
|
Futures Contracts |
|||||
|
|
Expiration |
Underlying |
Unrealized |
||
|
Purchased |
|||||
|
Equity Index Contracts |
|||||
|
99 CME E-mini S&P MidCap 400 Index Contracts (United States) |
Dec. 2013 |
$ 12,901 |
$ (46) |
||
|
The face value of futures purchased as a percentage of net assets is 0.6% |
|
Legend |
|
(a) Non-income producing |
|
(b) Affiliated fund that is generally available only to investment companies and other accounts managed by Fidelity Investments. The rate quoted is the annualized seven-day yield of the fund at period end. A complete unaudited listing of the fund's holdings as of its most recent quarter end is available upon request. In addition, each Fidelity Central Fund's financial statements, which are not covered by the Fund's Report of Independent Registered Public Accounting Firm, are available on the SEC's website or upon request. |
|
(c) Investment made with cash collateral received from securities on loan. |
|
(d) Security or a portion of the security is on loan at period end. |
|
(e) Restricted securities - Investment in securities not registered under the Securities Act of 1933 (excluding 144A issues). At the end of the period, the value of restricted securities (excluding 144A issues) amounted to $18,000 or 0.0% of net assets. |
|
Additional information on each restricted holding is as follows: |
|
Security |
Acquisition |
Acquisition |
|
Velti PLC |
4/19/13 |
$ 323 |
|
Affiliated Central Funds |
|
Information regarding fiscal year to date income earned by the Fund from investments in Fidelity Central Funds is as follows: |
|
Fund |
Income earned |
|
Fidelity Cash Central Fund |
$ 60 |
|
Fidelity Securities Lending Cash Central Fund |
284 |
|
Total |
$ 344 |
|
Other Information |
|
The following is a summary of the inputs used, as of November 30, 2013, involving the Fund's assets and liabilities carried at fair value. The inputs or methodology used for valuing securities may not be an indication of the risk associated with investing in those securities. For more information on valuation inputs, and their aggregation into the levels used in the table below, please refer to the Investment Valuation section in the accompanying Notes to Financial Statements. |
|
Valuation Inputs at Reporting Date: |
||||
|
Description |
Total |
Level 1 |
Level 2 |
Level 3 |
|
Investments in Securities: |
||||
|
Equities: |
||||
|
Consumer Discretionary |
$ 297,823 |
$ 297,823 |
$ - |
$ - |
|
Consumer Staples |
76,643 |
76,643 |
- |
- |
|
Energy |
130,410 |
130,410 |
- |
- |
|
Financials |
477,387 |
477,387 |
- |
- |
|
Health Care |
191,017 |
191,017 |
- |
- |
|
Industrials |
358,730 |
358,730 |
- |
- |
|
Information Technology |
333,218 |
333,200 |
18 |
- |
|
Materials |
147,163 |
147,163 |
- |
- |
|
Telecommunication Services |
7,119 |
7,119 |
- |
- |
|
Utilities |
76,223 |
76,223 |
- |
- |
|
U.S. Government and Government Agency Obligations |
295 |
- |
295 |
- |
|
Money Market Funds |
98,334 |
98,334 |
- |
- |
|
Total Investments in Securities: |
$ 2,194,362 |
$ 2,194,049 |
$ 313 |
$ - |
|
Derivative Instruments: |
||||
|
Liabilities |
||||
|
Futures Contracts |
$ (46) |
$ (46) |
$ - |
$ - |
|
Value of Derivative Instruments |
|
The following table is a summary of the Fund's value of derivative instruments by primary risk exposure as of November 30, 2013. For additional information on derivative instruments, please refer to the Derivative Instruments section in the accompanying Notes to Financial Statements. |
|
Primary Risk Exposure / |
Value |
|
|
|
Asset |
Liability |
|
Equity Risk |
||
|
Futures Contracts (a) |
$ - |
$ (46) |
|
Total Value of Derivatives |
$ - |
$ (46) |
|
(a) Reflects gross cumulative appreciation (depreciation) on futures contracts as presented in the Schedule of Investments. Only the period end receivable or payable for daily variation margin and net unrealized appreciation (depreciation) are presented in the Statement of Assets and Liabilities. |
See accompanying notes which are an integral part of the financial statements.
Annual Report
Financial Statements
Statement of Assets and Liabilities
|
Amounts in thousands (except per-share amounts) |
November 30, 2013 |
|
|
|
|
|
|
Assets |
|
|
|
Investment in securities, at value (including securities loaned of $62,228) - See accompanying schedule: Unaffiliated issuers (cost $1,790,915) |
$ 2,096,028 |
|
|
Fidelity Central Funds (cost $98,334) |
98,334 |
|
|
Total Investments (cost $1,889,249) |
|
$ 2,194,362 |
|
Receivable for investments sold |
|
22,603 |
|
Receivable for fund shares sold |
|
717 |
|
Dividends receivable |
|
1,522 |
|
Distributions receivable from Fidelity Central Funds |
|
11 |
|
Prepaid expenses |
|
6 |
|
Other receivables |
|
10 |
|
Total assets |
|
2,219,231 |
|
|
|
|
|
Liabilities |
|
|
|
Payable to custodian bank |
$ 3,640 |
|
|
Payable for investments purchased |
6,951 |
|
|
Payable for fund shares redeemed |
3,617 |
|
|
Accrued management fee |
657 |
|
|
Distribution and service plan fees payable |
644 |
|
|
Payable for daily variation margin for derivative instruments |
46 |
|
|
Other affiliated payables |
428 |
|
|
Other payables and accrued expenses |
34 |
|
|
Collateral on securities loaned, at value |
63,511 |
|
|
Total liabilities |
|
79,528 |
|
|
|
|
|
Net Assets |
|
$ 2,139,703 |
|
Net Assets consist of: |
|
|
|
Paid in capital |
|
$ 2,376,183 |
|
Distributions in excess of net investment income |
|
(2,603) |
|
Accumulated undistributed net realized gain (loss) on investments and foreign currency transactions |
|
(538,954) |
|
Net unrealized appreciation (depreciation) on investments and assets and liabilities in foreign currencies |
|
305,077 |
|
Net Assets |
|
$ 2,139,703 |
See accompanying notes which are an integral part of the financial statements.
Annual Report
Financial Statements - continued
Statement of Assets and Liabilities - continued
|
Amounts in thousands (except per-share amounts) |
November 30, 2013 |
|
|
|
|
|
|
Calculation of Maximum Offering Price Class A: |
|
$ 28.37 |
|
|
|
|
|
Maximum offering price per share (100/94.25 of $28.37) |
|
$ 30.10 |
|
Class T: |
|
$ 28.63 |
|
|
|
|
|
Maximum offering price per share (100/96.50 of $28.63) |
|
$ 29.67 |
|
Class B: |
|
$ 26.51 |
|
|
|
|
|
Class C: |
|
$ 26.52 |
|
|
|
|
|
Fidelity Stock Selector Mid Cap Fund: |
|
$ 29.56 |
|
|
|
|
|
Institutional Class: |
|
$ 29.64 |
A Redemption price per share is equal to net asset value less any applicable contingent deferred sales charge.
See accompanying notes which are an integral part of the financial statements.
Annual Report
Statement of Operations
|
Amounts in thousands |
Year ended November 30, 2013 |
|
|
|
|
|
|
Investment Income |
|
|
|
Dividends |
|
$ 26,043 |
|
Interest |
|
1 |
|
Income from Fidelity Central Funds |
|
344 |
|
Total income |
|
26,388 |
|
|
|
|
|
Expenses |
|
|
|
Management fee |
$ 11,156 |
|
|
Performance adjustment |
(2,847) |
|
|
Transfer agent fees |
4,476 |
|
|
Distribution and service plan fees |
7,433 |
|
|
Accounting and security lending fees |
618 |
|
|
Custodian fees and expenses |
62 |
|
|
Independent trustees' compensation |
11 |
|
|
Registration fees |
125 |
|
|
Audit |
67 |
|
|
Legal |
25 |
|
|
Miscellaneous |
100 |
|
|
Total expenses before reductions |
21,226 |
|
|
Expense reductions |
(552) |
20,674 |
|
Net investment income (loss) |
|
5,714 |
|
Realized and Unrealized Gain (Loss) Net realized gain (loss) on: |
|
|
|
Investment securities: |
|
|
|
Unaffiliated issuers |
286,098 |
|
|
Foreign currency transactions |
(360) |
|
|
Futures contracts |
1,479 |
|
|
Total net realized gain (loss) |
|
287,217 |
|
Change in net unrealized appreciation (depreciation) on: Investment securities |
209,055 |
|
|
Assets and liabilities in foreign currencies |
77 |
|
|
Futures contracts |
(43) |
|
|
Total change in net unrealized appreciation (depreciation) |
|
209,089 |
|
Net gain (loss) |
|
496,306 |
|
Net increase (decrease) in net assets resulting from operations |
|
$ 502,020 |
See accompanying notes which are an integral part of the financial statements.
Annual Report
Financial Statements - continued
Statement of Changes in Net Assets
|
Amounts in thousands |
Year ended |
Year ended |
|
Increase (Decrease) in Net Assets |
|
|
|
Operations |
|
|
|
Net investment income (loss) |
$ 5,714 |
$ 5,143 |
|
Net realized gain (loss) |
287,217 |
131,666 |
|
Change in net unrealized appreciation (depreciation) |
209,089 |
136,150 |
|
Net increase (decrease) in net assets resulting |
502,020 |
272,959 |
|
Distributions to shareholders from net investment income |
(8,172) |
(7,037) |
|
Distributions to shareholders from net realized gain |
(2,873) |
- |
|
Total distributions |
(11,045) |
(7,037) |
|
Share transactions - net increase (decrease) |
(34,691) |
(510,527) |
|
Total increase (decrease) in net assets |
456,284 |
(244,605) |
|
|
|
|
|
Net Assets |
|
|
|
Beginning of period |
1,683,419 |
1,928,024 |
|
End of period (including distributions in excess of net investment income of $2,603 and undistributed net investment income of $3,217, respectively) |
$ 2,139,703 |
$ 1,683,419 |
See accompanying notes which are an integral part of the financial statements.
Annual Report
Financial Highlights - Class A
|
Years ended November 30, |
2013 |
2012 |
2011 |
2010 |
2009 |
|
Selected Per-Share Data |
|
|
|
|
|
|
Net asset value, beginning of period |
$ 22.16 |
$ 19.15 |
$ 19.22 |
$ 15.75 |
$ 10.52 |
|
Income from Investment Operations |
|
|
|
|
|
|
Net investment income (loss) C |
.10 |
.09 |
.08 F |
(.02) |
.03 |
|
Net realized and unrealized gain (loss) |
6.29 |
3.02 |
(.15) |
3.55 |
5.20 |
|
Total from investment operations |
6.39 |
3.11 |
(.07) |
3.53 |
5.23 |
|
Distributions from net investment income |
(.14) |
(.10) |
- |
(.03) G |
- |
|
Distributions from net realized gain |
(.04) |
- |
- |
(.03) G |
- |
|
Total distributions |
(.18) |
(.10) |
- |
(.06) |
- |
|
Net asset value, end of period |
$ 28.37 |
$ 22.16 |
$ 19.15 |
$ 19.22 |
$ 15.75 |
|
Total Return A, B |
29.07% |
16.32% |
(.36)% |
22.48% |
49.71% |
|
Ratios to Average Net Assets D, H |
|
|
|
|
|
|
Expenses before reductions |
.95% |
.94% |
.92% |
.86% |
.83% |
|
Expenses net of fee waivers, if any |
.95% |
.94% |
.92% |
.86% |
.83% |
|
Expenses net of all reductions |
.92% |
.94% |
.91% |
.84% |
.81% |
|
Net investment income (loss) |
.39% |
.41% |
.39% F |
(.12)% |
.25% |
|
Supplemental Data |
|
|
|
|
|
|
Net assets, end of period (in millions) |
$ 692 |
$ 593 |
$ 644 |
$ 945 |
$ 906 |
|
Portfolio turnover rate E |
79% I |
72% |
198% |
141% |
244% |
A Total returns would have been lower if certain expenses had not been reduced during the applicable periods shown.
B Total returns do not include the effect of the sales charges.
C Calculated based on average shares outstanding during the period.
D Fees and expenses of any underlying Fidelity Central Funds are not included in the Fund's expense ratio. The Fund indirectly bears its proportionate share of the expenses of any underlying Fidelity Central Funds.
E Amount does not include the portfolio activity of any underlying Fidelity Central Funds.
F Investment income per share reflects a large, non-recurring dividend which amounted to $.05 per share. Excluding this non-recurring dividend, the ratio of net investment income (loss) to average net assets would have been .12%.
G The amounts shown reflect certain reclassifications related to book to tax differences that were made in the year shown.
H Expense ratios reflect operating expenses of the class. Expenses before reductions do not reflect amounts reimbursed by the investment adviser or reductions from brokerage service arrangements or reductions from other expense offset arrangements and do not represent the amount paid by the class during periods when reimbursements or reductions occur. Expenses net of fee waivers reflect expenses after reimbursement by the investment adviser but prior to reductions from brokerage service arrangements or other expense offset arrangements. Expenses net of all reductions represent the net expenses paid by the class.
I The portfolio turnover rate does not include the assets acquired in the merger.
See accompanying notes which are an integral part of the financial statements.
Annual Report
Financial Highlights - Class T
|
Years ended November 30, |
2013 |
2012 |
2011 |
2010 |
2009 |
|
Selected Per-Share Data |
|
|
|
|
|
|
Net asset value, beginning of period |
$ 22.36 |
$ 19.30 |
$ 19.41 |
$ 15.89 |
$ 10.64 |
|
Income from Investment Operations |
|
|
|
|
|
|
Net investment income (loss) C |
.04 |
.05 |
.04 F |
(.05) |
.01 |
|
Net realized and unrealized gain (loss) |
6.36 |
3.05 |
(.15) |
3.59 |
5.24 |
|
Total from investment operations |
6.40 |
3.10 |
(.11) |
3.54 |
5.25 |
|
Distributions from net investment income |
(.09) |
(.04) |
- |
- |
- |
|
Distributions from net realized gain |
(.04) |
- |
- |
(.02) G |
- |
|
Total distributions |
(.13) |
(.04) |
- |
(.02) |
- |
|
Net asset value, end of period |
$ 28.63 |
$ 22.36 |
$ 19.30 |
$ 19.41 |
$ 15.89 |
|
Total Return A, B |
28.80% |
16.12% |
(.57)% |
22.31% |
49.34% |
|
Ratios to Average Net Assets D, H |
|
|
|
|
|
|
Expenses before reductions |
1.16% |
1.14% |
1.11% |
1.03% |
1.02% |
|
Expenses net of fee waivers, if any |
1.16% |
1.14% |
1.11% |
1.03% |
1.02% |
|
Expenses net of all reductions |
1.13% |
1.13% |
1.10% |
1.01% |
.99% |
|
Net investment income (loss) |
.17% |
.22% |
.20% F |
(.30)% |
.07% |
|
Supplemental Data |
|
|
|
|
|
|
Net assets, end of period (in millions) |
$ 817 |
$ 755 |
$ 871 |
$ 1,282 |
$ 1,520 |
|
Portfolio turnover rate E |
79% I |
72% |
198% |
141% |
244% |
A Total returns would have been lower if certain expenses had not been reduced during the applicable periods shown.
B Total returns do not include the effect of the sales charges.
C Calculated based on average shares outstanding during the period.
D Fees and expenses of any underlying Fidelity Central Funds are not included in the Fund's expense ratio. The Fund indirectly bears its proportionate share of the expenses of any underlying Fidelity Central Funds.
E Amount does not include the portfolio activity of any underlying Fidelity Central Funds.
F Investment income per share reflects a large, non-recurring dividend which amounted to $.05 per share. Excluding this non-recurring dividend, the ratio of net investment income (loss) to average net assets would have been (.07)%.
G The amounts shown reflect certain reclassifications related to book to tax differences that were made in the year shown.
H Expense ratios reflect operating expenses of the class. Expenses before reductions do not reflect amounts reimbursed by the investment adviser or reductions from brokerage service arrangements or reductions from other expense offset arrangements and do not represent the amount paid by the class during periods when reimbursements or reductions occur. Expenses net of fee waivers reflect expenses after reimbursement by the investment adviser but prior to reductions from brokerage service arrangements or other expense offset arrangements. Expenses net of all reductions represent the net expenses paid by the class.
I The portfolio turnover rate does not include the assets acquired in the merger.
See accompanying notes which are an integral part of the financial statements.
Annual Report
Financial Highlights - Class B
|
Years ended November 30, |
2013 |
2012 |
2011 |
2010 |
2009 |
|
Selected Per-Share Data |
|
|
|
|
|
|
Net asset value, beginning of period |
$ 20.71 |
$ 17.94 |
$ 18.15 |
$ 14.93 |
$ 10.05 |
|
Income from Investment Operations |
|
|
|
|
|
|
Net investment income (loss) C |
(.10) |
(.07) |
(.07) F |
(.15) |
(.06) |
|
Net realized and unrealized gain (loss) |
5.90 |
2.84 |
(.14) |
3.37 |
4.94 |
|
Total from investment operations |
5.80 |
2.77 |
(.21) |
3.22 |
4.88 |
|
Distributions from net investment income |
- |
- |
- |
- |
- |
|
Distributions from net realized gain |
- |
- |
- |
- |
- |
|
Total distributions |
- |
- |
- |
- |
- |
|
Net asset value, end of period |
$ 26.51 |
$ 20.71 |
$ 17.94 |
$ 18.15 |
$ 14.93 |
|
Total Return A, B |
28.01% |
15.44% |
(1.16)% |
21.57% |
48.56% |
|
Ratios to Average Net Assets D, G |
|
|
|
|
|
|
Expenses before reductions |
1.76% |
1.73% |
1.71% |
1.63% |
1.59% |
|
Expenses net of fee waivers, if any |
1.76% |
1.73% |
1.71% |
1.63% |
1.59% |
|
Expenses net of all reductions |
1.74% |
1.73% |
1.70% |
1.61% |
1.57% |
|
Net investment income (loss) |
(.43)% |
(.38)% |
(.40)% F |
(.90)% |
(.51)% |
|
Supplemental Data |
|
|
|
|
|
|
Net assets, end of period (in millions) |
$ 21 |
$ 22 |
$ 28 |
$ 75 |
$ 131 |
|
Portfolio turnover rate E |
79% H |
72% |
198% |
141% |
244% |
A Total returns would have been lower if certain expenses had not been reduced during the applicable periods shown.
B Total returns do not include the effect of the contingent deferred sales charge.
C Calculated based on average shares outstanding during the period.
D Fees and expenses of any underlying Fidelity Central Funds are not included in the Fund's expense ratio. The Fund indirectly bears its proportionate share of the expenses of any underlying Fidelity Central Funds.
E Amount does not include the portfolio activity of any underlying Fidelity Central Funds.
F Investment income per share reflects a large, non-recurring dividend which amounted to $.05 per share. Excluding this non-recurring dividend, the ratio of net investment income (loss) to average net assets would have been (.67)%.
G Expense ratios reflect operating expenses of the class. Expenses before reductions do not reflect amounts reimbursed by the investment adviser or reductions from brokerage service arrangements or reductions from other expense offset arrangements and do not represent the amount paid by the class during periods when reimbursements or reductions occur. Expenses net of fee waivers reflect expenses after reimbursement by the investment adviser but prior to reductions from brokerage service arrangements or other expense offset arrangements. Expenses net of all reductions represent the net expenses paid by the class.
H The portfolio turnover rate does not include the assets acquired in the merger.
See accompanying notes which are an integral part of the financial statements.
Annual Report
Financial Highlights - Class C
|
Years ended November 30, |
2013 |
2012 |
2011 |
2010 |
2009 |
|
Selected Per-Share Data |
|
|
|
|
|
|
Net asset value, beginning of period |
$ 20.73 |
$ 17.95 |
$ 18.15 |
$ 14.93 |
$ 10.05 |
|
Income from Investment Operations |
|
|
|
|
|
|
Net investment income (loss) C |
(.09) |
(.06) |
(.07) F |
(.14) |
(.06) |
|
Net realized and unrealized gain (loss) |
5.91 |
2.84 |
(.13) |
3.36 |
4.94 |
|
Total from investment operations |
5.82 |
2.78 |
(.20) |
3.22 |
4.88 |
|
Distributions from net investment income |
(.02) |
- |
- |
- |
- |
|
Distributions from net realized gain |
(.01) |
- |
- |
- |
- |
|
Total distributions |
(.03) |
- |
- |
- |
- |
|
Net asset value, end of period |
$ 26.52 |
$ 20.73 |
$ 17.95 |
$ 18.15 |
$ 14.93 |
|
Total Return A, B |
28.09% |
15.49% |
(1.10)% |
21.57% |
48.56% |
|
Ratios to Average Net Assets D, G |
|
|
|
|
|
|
Expenses before reductions |
1.69% |
1.68% |
1.66% |
1.60% |
1.58% |
|
Expenses net of fee waivers, if any |
1.69% |
1.68% |
1.66% |
1.60% |
1.58% |
|
Expenses net of all reductions |
1.67% |
1.68% |
1.65% |
1.58% |
1.55% |
|
Net investment income (loss) |
(.36)% |
(.33)% |
(.35)% F |
(.86)% |
(.50)% |
|
Supplemental Data |
|
|
|
|
|
|
Net assets, end of period (in millions) |
$ 172 |
$ 141 |
$ 150 |
$ 189 |
$ 186 |
|
Portfolio turnover rate E |
79% H |
72% |
198% |
141% |
244% |
A Total returns would have been lower if certain expenses had not been reduced during the applicable periods shown.
B Total returns do not include the effect of the contingent deferred sales charge.
C Calculated based on average shares outstanding during the period.
D Fees and expenses of any underlying Fidelity Central Funds are not included in the Fund's expense ratio. The Fund indirectly bears its proportionate share of the expenses of any underlying Fidelity Central Funds.
E Amount does not include the portfolio activity of any underlying Fidelity Central Funds.
F Investment income per share reflects a large, non-recurring dividend which amounted to $.05 per share. Excluding this non-recurring dividend, the ratio of net investment income (loss) to average net assets would have been (.62)%.
G Expense ratios reflect operating expenses of the class. Expenses before reductions do not reflect amounts reimbursed by the investment adviser or reductions from brokerage service arrangements or reductions from other expense offset arrangements and do not represent the amount paid by the class during periods when reimbursements or reductions occur. Expenses net of fee waivers reflect expenses after reimbursement by the investment adviser but prior to reductions from brokerage service arrangements or other expense offset arrangements. Expenses net of all reductions represent the net expenses paid by the class.
H The portfolio turnover rate does not include the assets acquired in the merger.
See accompanying notes which are an integral part of the financial statements.
Annual Report
Financial Highlights - Fidelity Stock Selector Mid Cap Fund
|
Years ended November 30, |
2013 |
2012 G |
|
Selected Per-Share Data |
|
|
|
Net asset value, beginning of period |
$ 23.14 |
$ 21.20 |
|
Income from Investment Operations |
|
|
|
Net investment income (loss) D |
.17 |
.09 |
|
Net realized and unrealized gain (loss) |
6.54 |
1.85 |
|
Total from investment operations |
6.71 |
1.94 |
|
Distributions from net investment income |
(.25) |
- |
|
Distributions from net realized gain |
(.04) |
- |
|
Total distributions |
(.29) |
- |
|
Net asset value, end of period |
$ 29.56 |
$ 23.14 |
|
Total Return B, C |
29.36% |
9.15% |
|
Ratios to Average Net Assets E, H |
|
|
|
Expenses before reductions |
.71% |
.59% A |
|
Expenses net of fee waivers, if any |
.71% |
.59% A |
|
Expenses net of all reductions |
.69% |
.58% A |
|
Net investment income (loss) |
.62% |
.86% A |
|
Supplemental Data |
|
|
|
Net assets, end of period (in millions) |
$ 225 |
$ 1 |
|
Portfolio turnover rate F |
79% I |
72% |
A Annualized
B Total returns for periods of less than one year are not annualized.
C Total returns would have been lower if certain expenses had not been reduced during the applicable periods shown.
D Calculated based on average shares outstanding during the period.
E Fees and expenses of any underlying Fidelity Central Funds are not included in the Fund's expense ratio. The Fund indirectly bears its proportionate share of the expenses of any underlying Fidelity Central Funds.
F Amount does not include the portfolio activity of any underlying Fidelity Central Funds.
G For the period June 6, 2012 (commencement of sale of shares) to November 30, 2012.
H Expense ratios reflect operating expenses of the class. Expenses before reductions do not reflect amounts reimbursed by the investment adviser or reductions from brokerage service arrangements or reductions from other expense offset arrangements and do not represent the amount paid by the class during periods when reimbursements or reductions occur. Expense ratios before reductions for start-up periods may not be representative of longer-term operating periods. Expenses net of fee waivers reflect expenses after reimbursement by the investment adviser but prior to reductions from brokerage service arrangements or other expense offset arrangements. Expenses net of all reductions represent the net expenses paid by the class.
I The portfolio turnover rate does not include the assets acquired in the merger.
See accompanying notes which are an integral part of the financial statements.
Annual Report
Financial Highlights - Institutional Class
|
Years ended November 30, |
2013 |
2012 |
2011 |
2010 |
2009 |
|
Selected Per-Share Data |
|
|
|
|
|
|
Net asset value, beginning of period |
$ 23.14 |
$ 20.01 |
$ 20.02 |
$ 16.40 |
$ 10.92 |
|
Income from Investment Operations |
|
|
|
|
|
|
Net investment income (loss) B |
.18 |
.15 |
.14 E |
.04 |
.08 |
|
Net realized and unrealized gain (loss) |
6.56 |
3.15 |
(.15) |
3.69 |
5.40 |
|
Total from investment operations |
6.74 |
3.30 |
(.01) |
3.73 |
5.48 |
|
Distributions from net investment income |
(.20) |
(.17) |
- |
(.08) F |
- |
|
Distributions from net realized gain |
(.04) |
- |
- |
(.03) F |
- |
|
Total distributions |
(.24) |
(.17) |
- |
(.11) |
- |
|
Net asset value, end of period |
$ 29.64 |
$ 23.14 |
$ 20.01 |
$ 20.02 |
$ 16.40 |
|
Total Return A |
29.44% |
16.66% |
(.05)% |
22.86% |
50.18% |
|
Ratios to Average Net Assets C, G |
|
|
|
|
|
|
Expenses before reductions |
.67% |
.65% |
.62% |
.54% |
.50% |
|
Expenses net of fee waivers, if any |
.67% |
.65% |
.62% |
.54% |
.50% |
|
Expenses net of all reductions |
.65% |
.64% |
.61% |
.52% |
.47% |
|
Net investment income (loss) |
.66% |
.71% |
.69% E |
.20% |
.59% |
|
Supplemental Data |
|
|
|
|
|
|
Net assets, end of period (in millions) |
$ 214 |
$ 172 |
$ 234 |
$ 354 |
$ 319 |
|
Portfolio turnover rate D |
79% H |
72% |
198% |
141% |
244% |
A Total returns would have been lower if certain expenses had not been reduced during the applicable periods shown.
B Calculated based on average shares outstanding during the period.
C Fees and expenses of any underlying Fidelity Central Funds are not included in the Fund's expense ratio. The Fund indirectly bears its proportionate share of the expenses of any underlying Fidelity Central Funds.
D Amount does not include the portfolio activity of any underlying Fidelity Central Funds.
E Investment income per share reflects a large, non-recurring dividend which amounted to $.06 per share. Excluding this non-recurring dividend, the ratio of net investment income (loss) to average net assets would have been .42%.
F The amounts shown reflect certain reclassifications related to book to tax differences that were made in the year shown.
G Expense ratios reflect operating expenses of the class. Expenses before reductions do not reflect amounts reimbursed by the investment adviser or reductions from brokerage service arrangements or reductions from other expense offset arrangements and do not represent the amount paid by the class during periods when reimbursements or reductions occur. Expenses net of fee waivers reflect expenses after reimbursement by the investment adviser but prior to reductions from brokerage service arrangements or other expense offset arrangements. Expenses net of all reductions represent the net expenses paid by the class.
H The portfolio turnover rate does not include the assets acquired in the merger.
See accompanying notes which are an integral part of the financial statements.
Annual Report
Notes to Financial Statements
For the period ended November 30, 2013
(Amounts in thousands except percentages)
1. Organization.
Fidelity Advisor Stock Selector Mid Cap Fund (the Fund) is a fund of Fidelity Advisor Series I (the Trust) and is authorized to issue an unlimited number of shares. The Trust is registered under the Investment Company Act of 1940, as amended (the 1940 Act), as an open-end management investment company organized as a Massachusetts business trust. The Fund offers Class A, Class T, Class C, Fidelity Stock Selector Mid Cap Fund and Institutional Class shares, each of which, along with Class B shares, has equal rights as to assets and voting privileges. Class B shares are closed to new accounts and additional purchases, except for exchanges and reinvestments. Each class has exclusive voting rights with respect to matters that affect that class. Class B shares will automatically convert to Class A shares after a holding period of seven years from the initial date of purchase.
2. Investments in Fidelity Central Funds.
The Fund invests in Fidelity Central Funds, which are open-end investment companies generally available only to other investment companies and accounts managed by the investment adviser and its affiliates. The Fund's Schedule of Investments lists each of the Fidelity Central Funds held as of period end, if any, as an investment of the Fund, but does not include the underlying holdings of each Fidelity Central Fund. As an Investing Fund, the Fund indirectly bears its proportionate share of the expenses of the underlying Fidelity Central Funds.
The Money Market Central Funds seek preservation of capital and current income and are managed by Fidelity Investments Money Management, Inc. (FIMM), an affiliate of the investment adviser. Annualized expenses of the Money Market Central Funds as of their most recent shareholder report date are less than .01%.
A complete unaudited list of holdings for each Fidelity Central Fund is available upon request or at the Securities and Exchange Commission (the SEC) website at www.sec.gov. In addition, the financial statements of the Fidelity Central Funds, which are not covered by the Fund's Report of Independent Registered Public Accounting Firm, are available on the SEC website or upon request.
3. Significant Accounting Policies.
The financial statements have been prepared in conformity with accounting principles generally accepted in the United States of America (GAAP), which require management to make certain estimates and assumptions at the date of the financial statements. Actual results could differ from those estimates. Subsequent events, if any, through the date that the financial statements were issued have been evaluated in the preparation of
Annual Report
3. Significant Accounting Policies - continued
the financial statements. The following summarizes the significant accounting policies of the Fund:
Investment Valuation. Investments are valued as of 4:00 p.m. Eastern time on the last calendar day of the period. In accordance with valuation policies and procedures approved by the Board of Trustees (the Board), the Fund attempts to obtain prices from one or more third party pricing vendors or brokers to value its investments. When current market prices, quotations or currency exchange rates are not readily available or reliable, investments will be fair valued in good faith by the Fidelity Management & Research Company (FMR) Fair Value Committee (the Committee), in accordance with procedures adopted by the Board. Factors used in determining fair value vary by investment type and may include market or investment specific events, changes in interest rates and credit quality. The frequency with which these procedures are used cannot be predicted and they may be utilized to a significant extent. The Committee oversees the Fund's valuation policies and procedures and is responsible for approving and reporting to the Board all fair value determinations.
The Fund categorizes the inputs to valuation techniques used to value its investments into a disclosure hierarchy consisting of three levels as shown below:
Level 1 - quoted prices in active markets for identical investments
Level 2 - other significant observable inputs (including quoted prices for similar investments, interest rates, prepayment speeds, etc.)
Level 3 - unobservable inputs (including the Fund's own assumptions based on the best information available)
Valuation techniques used to value the Fund's investments by major category are as follows:
Equity securities, including restricted securities, for which market quotations are readily available, are valued at the last reported sale price or official closing price as reported by a third party pricing vendor on the primary market or exchange on which they are traded and are categorized as Level 1 in the hierarchy. In the event there were no sales during the day or closing prices are not available, securities are valued at the last quoted bid price or may be valued using the last available price and are generally categorized as Level 2 in the hierarchy. For foreign equity securities, when market or security specific events arise, comparisons to the valuation of American Depositary Receipts (ADRs), futures contracts, Exchange-Traded Funds (ETFs) and certain indexes as well as quoted prices for similar securities may be used and would be categorized as Level 2 in the hierarchy. Utilizing these techniques may result in transfers between Level 1 and Level 2. For equity securities, including restricted securities, where observable inputs are
Annual Report
Notes to Financial Statements - continued
(Amounts in thousands except percentages)
3. Significant Accounting Policies - continued
Investment Valuation - continued
limited, assumptions about market activity and risk are used and these securities may be categorized as Level 3 in the hierarchy.
Debt securities, including restricted securities, are valued based on evaluated prices received from third party pricing vendors or from brokers who make markets in such securities. For U.S. government and government agency obligations, pricing vendors utilize matrix pricing which considers yield or price of bonds of comparable quality, coupon, maturity and type as well as broker-supplied prices. When independent prices are unavailable or unreliable, debt securities may be valued utilizing pricing methodologies which consider similar factors that would be used by third party pricing vendors. Debt securities are generally categorized as Level 2 in the hierarchy but may be Level 3 depending on the circumstances.
Futures contracts are valued at the settlement price established each day by the board of trade or exchange on which they are traded and are categorized as Level 1 in the hierarchy. Investments in open-end mutual funds, including the Fidelity Central Funds, are valued at their closing net asset value (NAV) each business day and are categorized as Level 1 in the hierarchy.
Changes in valuation techniques may result in transfers in or out of an assigned level within the disclosure hierarchy. The aggregate value of investments by input level, as of November 30, 2013 is included at the end of the Fund's Schedule of Investments.
Foreign Currency. The Fund may use foreign currency contracts to facilitate transactions in foreign-denominated securities. Gains and losses from these transactions may arise from changes in the value of the foreign currency or if the counterparties do not perform under the contracts' terms.
Foreign-denominated assets, including investment securities, and liabilities are translated into U.S. dollars at the exchange rates at period end. Purchases and sales of investment securities, income and dividends received and expenses denominated in foreign currencies are translated into U.S. dollars at the exchange rate in effect on the transaction date.
The effects of exchange rate fluctuations on investments are included with the net realized and unrealized gain (loss) on investment securities. Other foreign currency transactions resulting in realized and unrealized gain (loss) are disclosed separately.
Investment Transactions and Income. For financial reporting purposes, the Fund's investment holdings and NAV include trades executed through the end of the last business day of the period. The NAV per share for processing shareholder transactions is calculated as of the close of business of the New York Stock Exchange (NYSE), normally
Annual Report
3. Significant Accounting Policies - continued
Investment Transactions and Income - continued
4:00 p.m. Eastern time and includes trades executed through the end of the prior business day. Gains and losses on securities sold are determined on the basis of identified cost and may include proceeds received from litigation. Dividend income is recorded on the ex-dividend date, except for certain dividends from foreign securities where the ex-dividend date may have passed, which are recorded as soon as the Fund is informed of the ex-dividend date. Non-cash dividends included in dividend income, if any, are recorded at the fair market value of the securities received. Distributions received on securities that represent a return of capital or capital gain are recorded as a reduction of cost of investments and/or as a realized gain. Subsequent to ex-dividend date the Fund determines the components of these distributions, based upon receipt of tax filings or other correspondence relating to the underlying investment. Interest income and distributions from the Fidelity Central Funds are accrued as earned. Interest income includes coupon interest and amortization of premium and accretion of discount on debt securities. Investment income is recorded net of foreign taxes withheld where recovery of such taxes is uncertain.
Class Allocations and Expenses. Investment income, realized and unrealized capital gains and losses, common expenses of the Fund, and certain fund-level expense reductions, if any, are allocated daily on a pro-rata basis to each class based on the relative net assets of each class to the total net assets of the Fund. Each class differs with respect to transfer agent and distribution and service plan fees incurred. Certain expense reductions may also differ by class. For the reporting period, the allocated portion of income and expenses to each class as a percent of its average net assets may vary due to the timing of recording these transactions in relation to fluctuating net assets of the classes. Expenses directly attributable to a fund are charged to that fund. Expenses attributable to more than one fund are allocated among the respective funds on the basis of relative net assets or other appropriate methods. Expense estimates are accrued in the period to which they relate and adjustments are made when actual amounts are known.
Income Tax Information and Distributions to Shareholders. Each year, the Fund intends to qualify as a regulated investment company under Subchapter M of the Internal Revenue Code, including distributing substantially all of its taxable income and realized gains. As a result, no provision for U.S. Federal income taxes is required. As of November 30, 2013, the Fund did not have any unrecognized tax benefits in the financial statements; nor is the Fund aware of any tax positions for which it is reasonably possible that the total amounts of unrecognized tax benefits will significantly change in the next twelve months. The Fund files a U.S. federal tax return, in addition to state and local tax returns as required. The Fund's federal income tax returns are subject to examination by the Internal Revenue Service (IRS) for a period of three fiscal years after they are filed.
Annual Report
Notes to Financial Statements - continued
(Amounts in thousands except percentages)
3. Significant Accounting Policies - continued
Income Tax Information and Distributions to Shareholders - continued
State and local tax returns may be subject to examination for an additional fiscal year depending on the jurisdiction. Foreign taxes are provided for based on the Fund's understanding of the tax rules and rates that exist in the foreign markets in which it invests.
Distributions are declared and recorded on the ex-dividend date. Income dividends and capital gain distributions are declared separately for each class. Income and capital gain distributions are determined in accordance with income tax regulations, which may differ from GAAP.
Capital accounts within the financial statements are adjusted for permanent book-tax differences. These adjustments have no impact on net assets or the results of operations. Temporary book-tax differences will reverse in a subsequent period.
Book-tax differences are primarily due to futures contracts, foreign currency transactions, passive foreign investment companies (PFIC), market discount, partnerships, deferred trustees compensation, capital loss carryforwards and losses deferred due to wash sales and excise tax regulations.
The federal tax cost of investment securities and unrealized appreciation (depreciation) as of period end were as follows:
|
Gross unrealized appreciation |
$ 369,401 |
|
Gross unrealized depreciation |
(63,598) |
|
Net unrealized appreciation (depreciation) on securities and other investments |
$ 305,803 |
|
|
|
|
Tax Cost |
$ 1,888,559 |
The tax-based components of distributable earnings as of period end were as follows:
|
Capital loss carryforward |
$ (539,689) |
|
Net unrealized appreciation (depreciation) |
$ 305,812 |
Capital loss carryforwards are only available to offset future capital gains of the Fund to the extent provided by regulations and may be limited. Under the Regulated Investment Company Modernization Act of 2010 (the Act), the Fund is permitted to carry forward capital losses incurred in taxable years beginning after December 22, 2010 for an unlimited period and such capital losses are required to be used prior to any losses that expire.
Annual Report
3. Significant Accounting Policies - continued
Income Tax Information and Distributions to Shareholders - continued
The capital loss carryforward information presented below, including any applicable limitation, is estimated as of fiscal period end and is subject to adjustment.
|
Fiscal year of expiration |
|
|
2015 |
$ (1,870) |
|
2016 |
(389,648) |
|
2017 |
(148,171) |
|
Total capital loss carryforward |
$ (539,689) |
The Fund acquired $12,695 of capital loss carryforwards from Fidelity Mid Cap Growth Fund and $3,970 of capital loss carryforwards from Fidelity Advisor Growth Strategies Fund when they merged into the Fund in January 2013. The losses acquired from Fidelity Advisor Growth Strategies Fund that will be available to offset future capital gains of the Fund will be limited to approximately $935 per year. As a result, at least $1,022 of the losses acquired from Fidelity Advisor Growth Strategies Fund will expire unused and is not included in the table above.
The tax character of distributions paid was as follows:
|
|
November 30, 2013 |
November 30, 2012 |
|
Ordinary Income |
$ 11,045 |
$ 7,037 |
Restricted Securities. The Fund may invest in securities that are subject to legal or contractual restrictions on resale. These securities generally may be resold in transactions exempt from registration or to the public if the securities are registered. Disposal of these securities may involve time-consuming negotiations and expense, and prompt sale at an acceptable price may be difficult. Information regarding restricted securities is included at the end of the Fund's Schedule of Investments.
New Accounting Pronouncement. The Financial Accounting Standards Board issued in December 2011, Accounting Standard Update No. 2011-11, Disclosures about Offsetting Assets and Liabilities, and in January 2013, Accounting Standards Update No. 2013-1 Clarifying the Scope of Disclosures about Offsetting Assets and Liabilities. These updates create new disclosure requirements requiring entities to disclose both gross and net information for derivatives and other financial instruments that are either offset in the Statement of Assets and Liabilities or subject to an enforceable master netting arrangement or similar agreement. The disclosure requirements are effective for annual reporting periods beginning on or after January 1, 2013, and interim periods within those annual periods. Management expects that the impact of the updates' adoption will be limited to additional financial statement disclosures as applicable.
Annual Report
Notes to Financial Statements - continued
(Amounts in thousands except percentages)
4. Derivative Instruments.
Risk Exposures and the Use of Derivative Instruments. The Fund's investment objective allows the Fund to enter into various types of derivative contracts, including futures contracts. Derivatives are investments whose value is primarily derived from underlying assets, indices or reference rates and may be transacted on an exchange or over-the-counter (OTC). Derivatives may involve a future commitment to buy or sell a specified asset based on specified terms, to exchange future cash flows at periodic intervals based on a notional principal amount, or for one party to make one or more payments upon the occurrence of specified events in exchange for periodic payments from the other party.
The Fund used derivatives to increase returns and to manage exposure to certain risks as defined below. The success of any strategy involving derivatives depends on analysis of numerous economic factors, and if the strategies for investment do not work as intended, the Fund may not achieve its objectives.
The Fund's use of derivatives increased or decreased its exposure to the following risk:
|
Equity Risk |
Equity risk relates to the fluctuations in the value of financial instruments as a result of changes in market prices (other than those arising from interest rate risk or foreign exchange risk), whether caused by factors specific to an individual investment, its issuer, or all factors affecting all instruments traded in a market or market segment. |
The Fund is also exposed to additional risks from investing in derivatives, such as liquidity risk and counterparty credit risk. Liquidity risk is the risk that the Fund will be unable to close out the derivative in the open market in a timely manner. Counterparty credit risk is the risk that the counterparty will not be able to fulfill its obligation to the Fund. Counterparty credit risk related to exchange-traded futures contracts may be mitigated by the protection provided by the exchange on which they trade.
Investing in derivatives may involve greater risks than investing in the underlying assets directly and, to varying degrees, may involve risk of loss in excess of any initial investment and collateral received and amounts recognized in the Statement of Assets and Liabilities. In addition, there may be the risk that the change in value of the derivative contract does not correspond to the change in value of the underlying instrument.
Futures Contracts. A futures contract is an agreement between two parties to buy or sell a specified underlying instrument for a fixed price at a specified future date. The Fund used futures contracts to manage its exposure to the stock markets.
Upon entering into a futures contract, a fund is required to deposit either cash or securities (initial margin) with a clearing broker in an amount equal to a certain percentage of the face value of the contract. Futures contracts are marked-to-market daily and subsequent daily payments (variation margin) are made or received by a fund depending on
Annual Report
4. Derivative Instruments - continued
Futures Contracts - continued
the daily fluctuations in the value of the futures contracts and are recorded as unrealized appreciation or (depreciation). This receivable and/or payable, if any, is included in daily variation margin for derivative instruments in the Statement of Assets and Liabilities. Realized gain or (loss) is recorded upon the expiration or closing of a futures contract.
Any open futures contracts at period end are presented in the Schedule of Investments under the caption "Futures Contracts." The underlying face amount at value reflects each contract's exposure to the underlying instrument or index at period end and is representative of volume of activity during the period.
During the period the Fund recognized net realized gain (loss) of $1,479 and a change in net unrealized appreciation (depreciation) of $(43) related to its investment in futures contracts. These amounts are included in the Statement of Operations.
5. Purchases and Sales of Investments.
Purchases and sales of securities, other than short-term securities, aggregated $1,522,901 and $1,815,166, respectively.
6. Fees and Other Transactions with Affiliates.
Management Fee. Fidelity Management & Research Company (the investment adviser) and its affiliates provide the Fund with investment management related services for which the Fund pays a monthly management fee. The management fee is the sum of an individual fund fee rate that is based on an annual rate of .30% of the Fund's average net assets and an annualized group fee rate that averaged .25% during the period. The group fee rate is based upon the average net assets of all the mutual funds advised by the investment adviser, including any mutual funds previously advised by the investment adviser that are currently advised by Fidelity SelectCo, LLC, an affiliate of the investment adviser. The group fee rate decreases as assets under management increase and increases as assets under management decrease. In addition, the management fee is subject to a performance adjustment (up to a maximum of ± .20% of the Fund's average net assets over a 36 month performance period). The upward or downward adjustment to the management fee is based on the relative investment performance of the Institutional Class of the Fund as compared to an appropriate benchmark index over the same 36 month performance period. For the reporting period, the total annual management fee rate, including the performance adjustment, was .41% of the Fund's average net assets. The performance adjustment included in the management fee rate may be higher or lower than the maximum performance adjustment rate due to the difference between the average net assets for the reporting and performance periods.
Annual Report
Notes to Financial Statements - continued
(Amounts in thousands except percentages)
6. Fees and Other Transactions with Affiliates - continued
Distribution and Service Plan Fees. In accordance with Rule 12b-1 of the 1940 Act, the Fund has adopted separate Distribution and Service Plans for each class of shares. Certain classes pay Fidelity Distributors Corporation (FDC), an affiliate of the investment adviser, separate Distribution and Service Fees, each of which is based on an annual percentage of each class' average net assets. In addition, FDC may pay financial intermediaries for selling shares of the Fund and providing shareholder support services. For the period, the Distribution and Service Fee rates, total fees and amounts retained by FDC were as follows:
|
|
Distribution |
Service |
Total Fees |
Retained |
|
Class A |
-% |
.25% |
$ 1,631 |
$ 131 |
|
Class T |
.25% |
.25% |
3,977 |
24 |
|
Class B |
.75% |
.25% |
218 |
167 |
|
Class C |
.75% |
.25% |
1,607 |
49 |
|
|
|
|
$ 7,433 |
$ 371 |
Sales Load. FDC may receive a front-end sales charge of up to 5.75% for selling Class A shares and 3.50% for selling Class T shares, some of which is paid to financial intermediaries for selling shares of the Fund. Depending on the holding period, FDC may receive contingent deferred sales charges levied on Class A, Class T, Class B, and Class C redemptions. The deferred sales charges range from 5.00% to 1.00% for Class B shares, 1.00% for Class C shares, 1.00% for certain purchases of Class A shares and .25% for certain purchases of Class T shares.
For the period, sales charge amounts retained by FDC were as follows:
|
|
Retained |
|
Class A |
$ 43 |
|
Class T |
20 |
|
Class B* |
12 |
|
Class C* |
3 |
|
|
$ 78 |
* When Class B and Class C shares are initially sold, FDC pays commissions from its own resources to financial intermediaries through which the sales
are made.
Transfer Agent Fees. Fidelity Investments Institutional Operations Company, Inc., (FIIOC), an affiliate of the investment adviser, is the transfer, dividend disbursing and shareholder servicing agent for each class of the Fund. FIIOC receives account fees and asset-based fees that vary according to the account size and type of account of the shareholders of the respective classes of the Fund. FIIOC pays for typesetting, printing and mailing of shareholder reports, except proxy statements.
Annual Report
6. Fees and Other Transactions with Affiliates - continued
Transfer Agent Fees - continued
For the period, transfer agent fees for each class were as follows:
|
|
Amount |
% of |
|
Class A |
$ 1,555 |
.24 |
|
Class T |
1,592 |
.20 |
|
Class B |
65 |
.30 |
|
Class C |
372 |
.23 |
|
Fidelity Stock Selector Mid Cap Fund |
472 |
.25 |
|
Institutional Class |
420 |
.21 |
|
|
$ 4,476 |
|
Accounting and Security Lending Fees. Fidelity Service Company, Inc. (FSC), an affiliate of the investment adviser, maintains the Fund's accounting records. The accounting fee is based on the level of average net assets for each month. Under a separate contract, FSC administers the security lending program. The security lending fee is based on the number and duration of lending transactions.
Brokerage Commissions. The Fund placed a portion of its portfolio transactions with brokerage firms which are affiliates of the investment adviser. Brokerage commissions are included in net realized gain (loss) and change in net unrealized appreciation (depreciation) in the Statement of Operations. The commissions paid to these affiliated firms were $39 for the period.
7. Committed Line of Credit.
The Fund participates with other funds managed by the investment adviser or an affiliate in a $4.25 billion credit facility (the "line of credit") to be utilized for temporary or emergency purposes to fund shareholder redemptions or for other short-term liquidity purposes. The Fund has agreed to pay commitment fees on its pro-rata portion of the line of credit, which amounted to $4 and is reflected in Miscellaneous expenses on the Statement of Operations. During the period, there were no borrowings on this line of credit.
8. Security Lending.
The Fund lends portfolio securities through a lending agent from time to time in order to earn additional income. For equity securities, a lending agent is used and may loan securities to certain qualified borrowers, including Fidelity Capital Markets (FCM), a broker-dealer affiliated with the Fund. On the settlement date of the loan, the Fund
Annual Report
Notes to Financial Statements - continued
(Amounts in thousands except percentages)
8. Security Lending - continued
receives collateral (in the form of U.S. Treasury obligations, letters of credit and/or cash) against the loaned securities and maintains collateral in an amount not less than 100% of the market value of the loaned securities during the period of the loan. The market value of the loaned securities is determined at the close of business of the Fund and any additional required collateral is delivered to the Fund on the next business day. If the borrower defaults on its obligation to return the securities loaned because of insolvency or other reasons, the Fund may apply collateral received from the borrower against the obligation. The Fund may experience delays and costs in recovering the securities loaned. Any cash collateral received is invested in the Fidelity Securities Lending Cash Central Fund. The value of loaned securities and cash collateral at period end are disclosed on the Fund's Statement of Assets and Liabilities. At period end, there were no security loans outstanding with FCM. Security lending income represents the income earned on investing cash collateral, less rebates paid to borrowers, and any lending agent fees associated with the loan, plus any premium payments received for lending certain types of securities. Security lending income is presented in the Statement of Operations as a component of income from Fidelity Central Funds. Total security lending income during the period amounted to $284, including $5 from securities loaned to FCM.
9. Expense Reductions.
The investment adviser voluntarily agreed to reimburse a portion of the Fund's Class A, Class T, Class B, Class C and Institutional Class operating expenses. During the period, this reimbursement reduced expenses as follows:
|
|
Reimbursement |
|
Class A |
$ 6 |
|
Class T |
7 |
|
Class B |
-* |
|
Class C |
2 |
|
Institutional Class |
2 |
|
|
$ 17 |
* Amount represents two hundred dollars.
Commissions paid to certain brokers with whom the investment adviser, or its affiliates, places trades on behalf of the Fund include an amount in addition to trade execution, which may be rebated back to the Fund to offset certain expenses. This amount totaled $532 for the period.
In addition, the investment adviser reimbursed a portion of the Fund's operating expenses during the period in the amount of $3.
Annual Report
10. Distributions to Shareholders.
Distributions to shareholders of each class were as follows:
|
Years ended November 30, |
2013 |
2012 A |
|
From net investment income |
|
|
|
Class A |
$ 3,606 |
$ 3,191 |
|
Class T |
2,972 |
1,890 |
|
Class C |
121 |
- |
|
Fidelity Stock Selector Mid Cap Fund |
16 |
- |
|
Institutional Class |
1,457 |
1,956 |
|
Total |
$ 8,172 |
$ 7,037 |
|
From net realized gain |
|
|
|
Class A |
$ 1,106 |
$ - |
|
Class T |
1,403 |
- |
|
Class C |
54 |
- |
|
Fidelity Stock Selector Mid Cap Fund |
3 |
- |
|
Institutional Class |
307 |
- |
|
Total |
$ 2,873 |
$ - |
A Distributions for Fidelity Stock Selector Mid Cap Fund are for the period June 6, 2012 (commencement of sale of shares) to November 30, 2012.
11. Share Transactions.
Transactions for each class of shares were as follows:
|
|
Shares |
Dollars |
||
|
Years ended November 30, |
2013 |
2012 A |
2013 |
2012 A |
|
Class A |
|
|
|
|
|
Shares sold |
1,576 |
2,534 |
$ 39,740 |
$ 52,691 |
|
Issued in exchange for shares of Fidelity Advisor Growth Strategies Fund |
483 |
- |
11,196 |
- |
|
Issued in exchange for shares of Fidelity Mid Cap Growth Fund |
410 |
- |
9,497 |
- |
|
Reinvestment of distributions |
196 |
158 |
4,309 |
2,914 |
|
Shares redeemed |
(5,036) |
(9,598) |
(125,748) |
(199,005) |
|
Net increase (decrease) |
(2,371) |
(6,906) |
$ (61,006) |
$ (143,400) |
|
Class T |
|
|
|
|
|
Shares sold |
2,840 |
3,511 |
$ 71,906 |
$ 74,253 |
|
Issued in exchange for shares of Fidelity Advisor Growth Strategies Fund |
643 |
- |
15,054 |
- |
|
Issued in exchange for shares of Fidelity Mid Cap Growth Fund |
182 |
- |
4,267 |
- |
|
Reinvestment of distributions |
188 |
96 |
4,170 |
1,803 |
|
Shares redeemed |
(9,076) |
(14,999) |
(228,859) |
(312,249) |
|
Net increase (decrease) |
(5,223) |
(11,392) |
$ (133,462) |
$ (236,193) |
Annual Report
Notes to Financial Statements - continued
(Amounts in thousands except percentages)
11. Share Transactions - continued
|
|
Shares |
Dollars |
||
|
Years ended November 30, |
2013 |
2012 A |
2013 |
2012 A |
|
Class B |
|
|
|
|
|
Shares sold |
4 |
3 |
$ 95 |
$ 54 |
|
Issued in exchange for shares of Fidelity Advisor Growth Strategies Fund |
75 |
- |
1,640 |
- |
|
Issued in exchange for shares of Fidelity Mid Cap Growth Fund |
28 |
- |
614 |
- |
|
Shares redeemed |
(363) |
(540) |
(8,472) |
(10,540) |
|
Net increase (decrease) |
(256) |
(537) |
$ (6,123) |
$ (10,486) |
|
Class C |
|
|
|
|
|
Shares sold |
236 |
225 |
$ 5,603 |
$ 4,440 |
|
Issued in exchange for shares of Fidelity Advisor Growth Strategies Fund |
209 |
- |
4,553 |
- |
|
Issued in exchange for shares of Fidelity Mid Cap Growth Fund |
219 |
- |
4,769 |
- |
|
Reinvestment of distributions |
7 |
- |
152 |
- |
|
Shares redeemed |
(993) |
(1,754) |
(23,227) |
(34,462) |
|
Net increase (decrease) |
(322) |
(1,529) |
$ (8,150) |
$ (30,022) |
|
Fidelity Stock Selector Mid Cap Fund |
|
|
|
|
|
Shares sold |
1,327 |
69 |
$ 35,648 |
$ 1,562 |
|
Issued in exchange for shares of Fidelity Mid Cap Growth Fund |
8,810 |
- |
212,139 |
- |
|
Reinvestment of distributions |
1 |
- |
16 |
- |
|
Shares redeemed |
(2,600) |
(4) |
(67,266) |
(89) |
|
Net increase (decrease) |
7,538 |
65 |
$ 180,537 |
$ 1,473 |
|
Institutional Class |
|
|
|
|
|
Shares sold |
1,231 |
1,655 |
$ 32,432 |
$ 35,850 |
|
Issued in exchange for shares of Fidelity Advisor Growth Strategies Fund |
20 |
- |
479 |
- |
|
Issued in exchange for shares of Fidelity Mid Cap Growth Fund |
37 |
- |
888 |
- |
|
Reinvestment of distributions |
68 |
93 |
1,564 |
1,794 |
|
Shares redeemed |
(1,567) |
(6,043) |
(41,850) |
(129,543) |
|
Net increase (decrease) |
(211) |
(4,295) |
$ (6,487) |
$ (91,899) |
A Share transactions for Fidelity Stock Selector Mid Cap Fund are for the period June 6, 2012 (commencement of sale of shares) to November 30, 2012.
Annual Report
12. Merger Information.
On January 11, 2013, the Fund acquired all of the assets and assumed all of the liabilities of Fidelity Advisor Growth Strategies Fund and Fidelity Mid Cap Growth Fund ("Target Funds") pursuant to agreements and plans of reorganization approved by the Board of Trustees ("The Board") on June 12, 2012. The acquisition was accomplished by an exchange of shares of each class of the Fund for corresponding shares then outstanding of the Target Funds at their net asset value on the acquisition date. The reorganization provides shareholders of the Target Funds access to a larger portfolio with a similar investment objective. The reorganization qualified as a tax-free reorganization for federal income tax purposes with no gain or loss recognized to the funds or their shareholders. The Target Funds' net assets of $32,922, including securities of $32,974 and unrealized appreciation of $2,113 for Fidelity Advisor Growth Strategies Fund; and net assets of $232,174, including securities of $233,755 and unrealized appreciation of $14,520 for Fidelity Mid Cap Growth Fund were combined with the Fund's net assets of $1,716,041 for total net assets after the acquisition of $1,981,137.
Pro forma results of operations of the combined entity for the entire period ended November 30, 2013, as though the acquisition had occurred as of the beginning of the year (rather than on the actual acquisition dates), are as follows:
|
Net investment income (loss) |
$ 6,032 |
|
Total net realized gain (loss) |
288,183 |
|
Total change in net unrealized appreciation (depreciation) |
219,225 |
|
Net increase (decrease) in net assets resulting from operations |
$ 513,440 |
Because the combined investment portfolios have been managed as a single portfolio since the acquisition was completed, it is not practicable to separate the amounts of revenue and earnings of the acquired fund that have been included in the Fund's accompanying Statement of Operations since January 11, 2013.
13. Other.
The Fund's organizational documents provide former and current trustees and officers with a limited indemnification against liabilities arising in connection with the performance of their duties to the Fund. In the normal course of business, the Fund may also enter into contracts that provide general indemnifications. The Fund's maximum exposure under these arrangements is unknown as this would be dependent on future claims that may be made against the Fund. The risk of material loss from such claims is considered remote.
Annual Report
Report of Independent Registered Public Accounting Firm
To the Trustees of Fidelity Advisor Series I and Shareholders of Fidelity Advisor Stock Selector Mid Cap Fund:
We have audited the accompanying statement of assets and liabilities of Fidelity Advisor Stock Selector Mid Cap Fund (the Fund), a fund of Fidelity Advisor Series I, including the schedule of investments, as of November 30, 2013, and the related statement of operations for the year then ended, the statement of changes in net assets for each of the two years in the period then ended, and the financial highlights for each of the five years in the period then ended. These financial statements and financial highlights are the responsibility of the Fund's management. Our responsibility is to express an opinion on these financial statements and financial highlights based on our audits.
We conducted our audits in accordance with the standards of the Public Company Accounting Oversight Board (United States). Those standards require that we plan and perform the audit to obtain reasonable assurance about whether the financial statements and financial highlights are free of material misstatement. The Fund is not required to have, nor were we engaged to perform, an audit of its internal control over financial reporting. Our audits included consideration of internal control over financial reporting as a basis for designing audit procedures that are appropriate in the circumstances, but not for the purpose of expressing an opinion on the effectiveness of the Fund's internal control over financial reporting. Accordingly, we express no such opinion. An audit also includes examining, on a test basis, evidence supporting the amounts and disclosures in the financial statements, assessing the accounting principles used and significant estimates made by management, as well as evaluating the overall financial statement presentation. Our procedures included confirmation of securities owned as of November 30, 2013, by correspondence with the custodians and brokers; where replies were not received from brokers, we performed other auditing procedures. We believe that our audits provide a reasonable basis for our opinion.
In our opinion, the financial statements and financial highlights referred to above present fairly, in all material respects, the financial position of Fidelity Advisor Stock Selector Mid Cap Fund as of November 30, 2013, the results of its operations for the year then ended, the changes in its net assets for each of the two years in the period then ended, and the financial highlights for each of the five years in the period then ended, in conformity with accounting principles generally accepted in the United States of America.
DELOITTE & TOUCHE LLP
Boston, Massachusetts
January 16, 2014
Annual Report
Trustees and Officers
The Trustees, Member of the Advisory Board, and officers of the trust and fund, as applicable, are listed below. The Board of Trustees governs the fund and is responsible for protecting the interests of shareholders. The Trustees are experienced executives who meet periodically throughout the year to oversee the fund's activities, review contractual arrangements with companies that provide services to the fund, oversee management of the risks associated with such activities and contractual arrangements, and review the fund's performance. Except for James C. Curvey, Ned C. Lautenbach, Ronald P. O'Hanley, and William S. Stavropoulos, each of the Trustees oversees 173 funds. Mr. Curvey oversees 396 funds. Mr. Lautenbach, Mr. O'Hanley, and Mr. Stavropoulos each oversees 247 funds.
The Trustees hold office without limit in time except that (a) any Trustee may resign; (b) any Trustee may be removed by written instrument, signed by at least two-thirds of the number of Trustees prior to such removal; (c) any Trustee who requests to be retired or who has become incapacitated by illness or injury may be retired by written instrument signed by a majority of the other Trustees; and (d) any Trustee may be removed at any special meeting of shareholders by a two-thirds vote of the outstanding voting securities of the trust. Each Trustee who is not an interested person (as defined in the 1940 Act) of the trust and the fund (Independent Trustee), shall retire not later than the last day of the calendar year in which his or her 75th birthday occurs. The Independent Trustees may waive this mandatory retirement age policy with respect to individual Trustees. The officers and Advisory Board Member hold office without limit in time, except that any officer and Advisory Board Member may resign or may be removed by a vote of a majority of the Trustees at any regular meeting or any special meeting of the Trustees. Except as indicated, each individual has held the office shown or other offices in the same company for the past five years.
Experience, Skills, Attributes, and Qualifications of the Fund's Trustees. The Governance and Nominating Committee has adopted a statement of policy that describes the experience, qualifications, attributes, and skills that are necessary and desirable for potential Independent Trustee candidates (Statement of Policy). The Board believes that each Trustee satisfied at the time he or she was initially elected or appointed a Trustee, and continues to satisfy, the standards contemplated by the Statement of Policy. The Governance and Nominating Committee also engages professional search firms to help identify potential Independent Trustee candidates who have the experience, qualifications, attributes, and skills consistent with the Statement of Policy. From time to time, additional criteria based on the composition and skills of the current Independent Trustees, as well as experience or skills that may be appropriate in light of future changes to board composition, business conditions, and regulatory or other developments, have also been considered by the professional search firms and the Governance and Nominating Committee. In addition, the Board takes into account the Trustees' commitment and participation in Board and committee meetings, as well as their leadership of standing and ad hoc committees throughout their tenure.
Annual Report
In determining that a particular Trustee was and continues to be qualified to serve as a Trustee, the Board has considered a variety of criteria, none of which, in isolation, was controlling. The Board believes that, collectively, the Trustees have balanced and diverse experience, qualifications, attributes, and skills, which allow the Board to operate effectively in governing the fund and protecting the interests of shareholders. Information about the specific experience, skills, attributes, and qualifications of each Trustee, which in each case led to the Board's conclusion that the Trustee should serve (or continue to serve) as a trustee of the fund, is provided below.
Board Structure and Oversight Function. James C. Curvey is an interested person (as defined in the 1940 Act) and currently serves as Chairman. The Trustees have determined that an interested Chairman is appropriate and benefits shareholders because an interested Chairman has a personal and professional stake in the quality and continuity of services provided to the fund. Independent Trustees exercise their informed business judgment to appoint an individual of their choosing to serve as Chairman, regardless of whether the Trustee happens to be independent or a member of management. The Independent Trustees have determined that they can act independently and effectively without having an Independent Trustee serve as Chairman and that a key structural component for assuring that they are in a position to do so is for the Independent Trustees to constitute a substantial majority for the Board. The Independent Trustees also regularly meet in executive session. Ned C. Lautenbach serves as Chairman of the Independent Trustees and as such (i) acts as a liaison between the Independent Trustees and management with respect to matters important to the Independent Trustees and (ii) with management prepares agendas for Board meetings.
Fidelity funds are overseen by different Boards of Trustees. The fund's Board oversees Fidelity's equity and high income funds and another Board oversees Fidelity's investment-grade bond, money market, and asset allocation funds. The asset allocation funds may invest in Fidelity funds overseen by the fund's Board. The use of separate Boards, each with its own committee structure, allows the Trustees of each group of Fidelity funds to focus on the unique issues of the funds they oversee, including common research, investment, and operational issues. On occasion, the separate Boards establish joint committees to address issues of overlapping consequences for the Fidelity funds overseen by each Board.
The Trustees operate using a system of committees to facilitate the timely and efficient consideration of all matters of importance to the Trustees, the fund, and fund shareholders and to facilitate compliance with legal and regulatory requirements and oversight of the fund's activities and associated risks. The Board, acting through its committees, has charged FMR and its affiliates with (i) identifying events or circumstances the occurrence of which could have demonstrably adverse effects on the fund's business and/or reputation; (ii) implementing processes and controls to lessen the possibility that such events or circumstances occur or to mitigate the effects of such events or circumstances if they do occur; and (iii) creating and maintaining a system designed to evaluate continuously business and market conditions in order to facilitate the identification and implementation processes described in (i) and (ii) above. Because the day-to-day operations and activities of the fund are carried out by or through FMR, its affiliates and other service providers, the fund's exposure to risks is mitigated but not eliminated by the processes overseen by the Trustees. While each of the Board's committees has responsibility for overseeing different aspects of the fund's activities, oversight is exercised primarily through the Operations, Audit, and Compliance Committees. In addition, the Independent Trustees have worked with FMR to enhance the Board's oversight of investment and financial risks, legal and regulatory risks, technology risks, and operational risks, including the development of additional risk reporting to the Board. For example, a working group comprised of Independent Trustees and FMR has worked and continues to work to review the Fidelity funds' valuation-related activities, reporting and risk management. Appropriate personnel, including but not limited to the fund's Chief Compliance Officer (CCO), FMR's internal auditor, the independent accountants, the fund's Treasurer and portfolio management personnel, make periodic reports to the Board's committees, as appropriate, including an annual review of FMR's risk management program for the Fidelity funds. The responsibilities of each standing committee, including their oversight responsibilities, are described further under "Standing Committees of the Fund's Trustees."
Annual Report
Trustees and Officers - continued
The fund's Statement of Additional Information (SAI) includes more information about the Trustees. To request a free copy, call Fidelity at 1-877-208-0098.
Interested Trustees*:
Correspondence intended for each Trustee who is an interested person may be sent to Fidelity Investments, 245 Summer Street, Boston, Massachusetts 02210.
|
Name, Year of Birth; Principal Occupations and Other Relevant Experience+ |
|
|
James C. Curvey (1935) |
|
|
Year of Election or Appointment: 2007 Trustee Chairman of the Board of Trustees |
|
|
|
Mr. Curvey also serves as Trustee of other Fidelity funds. Mr. Curvey is a Director of Fidelity Investments Money Management, Inc. (2009-present), Director of Fidelity Research & Analysis Co. (2009-present) and Director of FMR and FMR Co., Inc. (2007-present). Mr. Curvey is also Vice Chairman (2007-present) and Director of FMR LLC. In addition, Mr. Curvey serves as an Overseer for the Boston Symphony Orchestra and a member of the Trustees of Villanova University. Previously, Mr. Curvey was the Vice Chairman (2006-2007) and Director (2000-2007) of FMR Corp. |
|
Ronald P. O'Hanley (1957) |
|
|
Year of Election or Appointment: 2011 Trustee |
|
|
|
Mr. O'Hanley also serves as Trustee of other Fidelity funds. He is Director of Fidelity SelectCo, LLC (2013-present), FMR Co., Inc. (2010-present), Director of Fidelity Investments Money Management, Inc. (2010-present), Director of Fidelity Research & Analysis Company (2010-present), President of Fidelity Asset Management and Corporate Services and a Member of Fidelity's Executive Committee (2010-present). Previously, Mr. O'Hanley served as President and Chief Executive Officer of BNY Mellon Asset Management (2007-2010). Mr. O'Hanley also served as Vice Chairman of Bank New York Mellon Corp. and a member of that firm's Executive Committee. Prior to the 2007 merger of The Bank of New York and Mellon Financial Corporation, he was Vice Chairman of Mellon Financial Corporation and President and Chief Executive Officer of Mellon Asset Management. He joined Mellon in February 1997. Mr. O'Hanley currently serves as Chairman of the Boston Public Library Foundation Board of Directors and sits on the Board of Directors of Beth Israel Deaconess Medical Center, the Board of Trustees of the Marine Biological Laboratory and the Advisory Board of the Maxwell School of Citizenship and Public Administration at Syracuse University. Mr. O'Hanley also chairs the Council on Asset Management for the Financial Services Roundtable and is a member of the Board of Directors of Institutional Investor's U.S. Institute. |
* Trustees have been determined to be "Interested Trustees" by virtue of, among other things, their affiliation with the trust or various entities under common control with FMR.
+ The information above includes each Trustee's principal occupation during the last five years and other information relating to the experience, attributes, and skills relevant to each Trustee's qualifications to serve as a Trustee, which led to the conclusion that each Trustee should serve as a Trustee for the fund.
Annual Report
Trustees and Officers - continued
Independent Trustees:
Correspondence intended for each Independent Trustee (that is, the Trustees other than the Interested Trustees) may be sent to Fidelity Investments, P.O. Box 55235, Boston, Massachusetts 02205-5235.
|
Name, Year of Birth; Principal Occupations and Other Relevant Experience+ |
|
|
Dennis J. Dirks (1948) |
|
|
Year of Election or Appointment: 2005 Trustee |
|
|
|
Mr. Dirks also serves as Trustee of other Fidelity funds. Prior to his retirement in May 2003, Mr. Dirks was Chief Operating Officer and a member of the Board of The Depository Trust & Clearing Corporation (DTCC). He also served as President, Chief Operating Officer, and Board member of The Depository Trust Company (DTC) and President and Board member of the National Securities Clearing Corporation (NSCC). In addition, Mr. Dirks served as Chief Executive Officer and Board member of the Government Securities Clearing Corporation, Chief Executive Officer and Board member of the Mortgage-Backed Securities Clearing Corporation, as a Trustee and a member of the Finance Committee of Manhattan College (2005-2008), and as a Trustee and a member of the Finance Committee of AHRC of Nassau County (2006-2008). Mr. Dirks is a member of the Independent Directors Council (IDC) Governing Council (2010-present) and Board of Directors for The Brookville Center for Children's Services, Inc. (2009-present). |
|
Alan J. Lacy (1953) |
|
|
Year of Election or Appointment: 2008 Trustee |
|
|
|
Mr. Lacy also serves as Trustee of other Fidelity funds. Mr. Lacy serves as Senior Adviser (2007-present) of Oak Hill Capital Partners, L.P. (private equity). Mr. Lacy also served as Chief Executive Officer (2000-2005) and Vice Chairman (2005-2006) of Sears Holdings Corporation and Sears, Roebuck and Co. (retail). In addition, Mr. Lacy serves as a member of the Board of Directors of Dave & Buster's Entertainment, Inc. (restaurant and entertainment complexes, 2010-present), Earth Fare, Inc. (retail grocery, 2012-present), The Hillman Companies, Inc. (hardware wholesalers, 2010-present), and Bristol-Myers Squibb Company (global pharmaceuticals, 2008-present). Mr. Lacy is a member of the Board of Trustees of The National Parks Conservation Association (2006-present). Previously, Mr. Lacy served as Chairman of the Board of Trustees of the National Parks Conservation Association (2008-2011) and as a member of the Board of Directors for the Western Union Company (global money transfer, 2006-2011). |
|
Ned C. Lautenbach (1944) |
|
|
Year of Election or Appointment: 2000 Trustee Chairman of the Independent Trustees |
|
|
|
Mr. Lautenbach also serves as Trustee of other Fidelity funds. Mr. Lautenbach currently serves as the Lead Director of the Eaton Corporation Board of Directors (diversified industrial, 1997-present). Mr. Lautenbach is Chairman of the Board of Directors of the Philharmonic Center for the Arts in Naples, Florida (2012-present) and a member of the Council on Foreign Relations (1994-present). Previously, Mr. Lautenbach was a Partner/Advisory Partner at Clayton, Dubilier & Rice, LLC (private equity investment, 1998-2010), as well as a Director of Sony Corporation (2006-2007). |
|
Joseph Mauriello (1944) |
|
|
Year of Election or Appointment: 2008 Trustee |
|
|
|
Mr. Mauriello also serves as Trustee of other Fidelity funds. Prior to his retirement in January 2006, Mr. Mauriello served in numerous senior management positions including Deputy Chairman and Chief Operating Officer (2004-2005), and Vice Chairman of Financial Services (2002-2004) of KPMG LLP US (professional services, 1965-2005). Mr. Mauriello currently serves as a member of the Board of Directors of XL Group plc. (global insurance and re-insurance, 2006-present). Previously, Mr. Mauriello served as a Director of the Hamilton Funds of the Bank of New York (2006-2007) and of Arcadia Resources Inc. (health care services and products, 2007-2012). |
|
Robert W. Selander (1950) |
|
|
Year of Election or Appointment: 2011 Trustee |
|
|
|
Mr. Selander also serves as Trustee of other Fidelity funds. Previously, Mr. Selander served as a Member of the Advisory Board of other Fidelity funds (2011), and Executive Vice Chairman (2010), Chief Executive Officer (2009-2010), and President and Chief Executive Officer (1997-2009) of Mastercard, Inc. |
|
Cornelia M. Small (1944) |
|
|
Year of Election or Appointment: 2005 Trustee |
|
|
|
Ms. Small also serves as Trustee of other Fidelity funds. Ms. Small is a member of the Board of Directors (2009-present) and Chair of the Investment Committee (2010-present) of the Teagle Foundation. Ms. Small also serves on the Investment Committee of the Berkshire Taconic Community Foundation (2008-present). Previously, Ms. Small served as Chairperson (2002-2008) and a member of the Investment Committee and Chairperson (2008-2012) and a member of the Board of Trustees of Smith College. In addition, Ms. Small served as Chief Investment Officer, Director of Global Equity Investments, and a member of the Board of Directors of Scudder, Stevens & Clark and Scudder Kemper Investments. |
|
William S. Stavropoulos (1939) |
|
|
Year of Election or Appointment: 2002 Trustee Vice Chairman of the Independent Trustees |
|
|
|
Mr. Stavropoulos also serves as Trustee of other Fidelity funds. Mr. Stavropoulos serves as President and Founder of the Michigan Baseball Foundation, the Great Lakes Loons (2007-present). Mr. Stavropoulos is Chairman Emeritus of the Board of Directors of The Dow Chemical Company, where he previously served in numerous senior management positions, including President, CEO (1995-2000; 2002-2004), Chairman of the Executive Committee (2000-2006), and as a member of the Board of Directors (1990-2006). Currently, Mr. Stavropoulos is Chairman of the Board of Directors of Univar Inc. (global distributor of commodity and specialty chemicals), a Director of Teradata Corporation (data warehousing and technology solutions), and Maersk Inc. (industrial conglomerate), and a member of the Advisory Board for Metalmark Capital LLC (private equity investment, 2005-present). Mr. Stavropoulos is an operating advisor to Clayton, Dubilier & Rice, LLC (private equity investment). In addition, Mr. Stavropoulos is a member of the University of Notre Dame Advisory Council for the College of Science, a Trustee of the Rollin L. Gerstacker Foundation, and a Director of the Naples Philharmonic Center for the Arts. Previously, Mr. Stavropoulos served as a Director of Chemical Financial Corporation (bank holding company, 1993-2012) and Tyco International, Ltd. (multinational manufacturing and services, 2007-2012). |
|
David M. Thomas (1949) |
|
|
Year of Election or Appointment: 2008 Trustee |
|
|
|
Mr. Thomas also serves as Trustee of other Fidelity funds. Mr. Thomas serves as Non-Executive Chairman of the Board of Directors of Fortune Brands Home and Security (home and security products, 2011-present), and as a member of the Board of Directors of Interpublic Group of Companies, Inc. (marketing communication, 2004-present). Previously, Mr. Thomas served as Executive Chairman (2005-2006) and Chairman and Chief Executive Officer (2000-2005) of IMS Health, Inc. (pharmaceutical and healthcare information solutions), and a Director of Fortune Brands, Inc. (consumer products, 2000-2011). |
+ The information above includes each Trustee's principal occupation during the last five years and other information relating to the experience, attributes, and skills relevant to each Trustee's qualifications to serve as a Trustee, which led to the conclusion that each Trustee should serve as a Trustee for the fund.
Advisory Board Member and Officers:
Correspondence intended for each officer and Peter S. Lynch may be sent to Fidelity Investments, 245 Summer Street, Boston, Massachusetts 02210. Officers appear below in alphabetical order.
|
Name, Year of Birth; Principal Occupation |
|
|
Peter S. Lynch (1944) |
|
|
Year of Election or Appointment: 2003 Member of the Advisory Board |
|
|
|
Mr. Lynch also serves as Member of the Advisory Board of other Fidelity funds. Mr. Lynch is Vice Chairman and a Director of FMR and FMR Co., Inc. In addition, Mr. Lynch serves as a Trustee of Boston College and as the Chairman of the Inner-City Scholarship Fund. Previously, Mr. Lynch served on the Special Olympics International Board of Directors (1997-2006). |
|
Elizabeth Paige Baumann (1968) |
|
|
Year of Election or Appointment: 2012 Anti-Money Laundering (AML) Officer |
|
|
|
Ms. Baumann also serves as AML Officer of other funds. She is Chief AML Officer of FMR LLC (2012-present) and is an employee of Fidelity Investments. Previously, Ms. Baumann served as Vice President and Deputy Anti-Money Laundering Officer (2007-2012). |
|
William C. Coffey (1969) |
|
|
Year of Election or Appointment: 2009 Assistant Secretary |
|
|
|
Mr. Coffey also serves as Assistant Secretary of other funds. He is Senior Vice President and Deputy General Counsel of FMR LLC (2010-present), and is an employee of Fidelity Investments. Previously, Mr. Coffey served as Vice President and Associate General Counsel of FMR LLC (2005-2009). |
|
Jonathan Davis (1968) |
|
|
Year of Election or Appointment: 2010 Assistant Treasurer |
|
|
|
Mr. Davis also serves as Assistant Treasurer of other funds. Mr. Davis is an employee of Fidelity Investments. Previously, Mr. Davis served as Vice President and Associate General Counsel of FMR LLC (2003-2010). |
|
Adrien E. Deberghes (1967) |
|
|
Year of Election or Appointment: 2008 Deputy Treasurer |
|
|
|
Mr. Deberghes also serves as an officer of other funds. He is an employee of Fidelity Investments (2008-present). Prior to joining Fidelity Investments, Mr. Deberghes was Senior Vice President of Mutual Fund Administration at State Street Corporation (2007-2008), Senior Director of Mutual Fund Administration at Investors Bank & Trust (2005-2007), and Director of Finance for Dunkin' Brands (2000-2005). |
|
Stephanie J. Dorsey (1969) |
|
|
Year of Election or Appointment: 2010 Assistant Treasurer |
|
|
|
Ms. Dorsey also serves as an officer of other funds. She is an employee of Fidelity Investments (2008-present) and has served in other fund officer roles. Prior to joining Fidelity Investments, Ms. Dorsey served as Treasurer (2004-2008) of the JPMorgan Mutual Funds and Vice President (2004-2008) of JPMorgan Chase Bank. |
|
Scott C. Goebel (1968) |
|
|
Year of Election or Appointment: 2008 Secretary and Chief Legal Officer (CLO) |
|
|
|
Mr. Goebel serves as Secretary and CLO of other funds. Mr. Goebel also serves as Secretary of Fidelity Investments Money Management, Inc. (FIMM) (2010-present) and Fidelity Research and Analysis Company (FRAC) (2010-present); General Counsel, Secretary, and Senior Vice President of FMR (2008-present) and FMR Co., Inc. (2008-present); Chief Legal Officer of Fidelity Management & Research (Hong Kong) Limited (2008-present) and Assistant Secretary of Fidelity Management & Research (Japan) Inc. (2008-present), and Fidelity Management & Research (U.K.) Inc. (2008-present). Previously, Mr. Goebel served as Secretary and CLO of other Fidelity funds (2008-2013), Assistant Secretary of FIMM (2008-2010), FRAC (2008-2010), and certain funds (2007-2008); and as Vice President and Secretary of Fidelity Distributors Corporation (FDC) (2005-2007). Mr. Goebel has been employed by FMR LLC or an affiliate since 2001. |
|
Joseph A. Hanlon (1968) |
|
|
Year of Election or Appointment: 2012 Chief Compliance Officer |
|
|
|
Mr. Hanlon also serves as Chief Compliance Officer of other funds. Mr. Hanlon serves as Compliance Officer of FMR, FMR Co., Inc., Fidelity Investments Money Management, Inc. (FIMM), Fidelity Research and Analysis Company (FRAC), and Fidelity Management & Research (Hong Kong) (2009-present), as Senior Vice President of the Fidelity Asset Management Division (2009-present), and is an employee of Fidelity Investments. Previously, Mr. Hanlon served as Compliance Officer of Fidelity Management & Research (Japan) Inc. (2009-2013), Strategic Advisers, Inc. (2009-2013), and Fidelity Management & Research (U.K.) Inc. (2009-2013). |
|
Bruce T. Herring (1965) |
|
|
Year of Election or Appointment: 2006 Vice President of certain Equity Funds |
|
|
|
Mr. Herring also serves as Vice President of other funds. He serves as Chief Investment Officer of Fidelity Global Asset Allocation (GAA) (2013-present), Group Chief Investment Officer of FMR, and President of Fidelity Research & Analysis Company (2010-present). Previously, Mr. Herring served as Chief Investment Officer and Director of Fidelity Management & Research (U.K.) Inc. (2010-2013), Vice President (2005-2006) and Senior Vice President (2006-2007) of Fidelity Management & Research Company, Vice President of FMR Co., Inc. (2001-2007), and as a portfolio manager for Fidelity U.S. Equity Funds. |
|
Brian B. Hogan (1964) |
|
|
Year of Election or Appointment: 2009 Vice President |
|
|
|
Mr. Hogan also serves as Vice President of other funds. Mr. Hogan serves as President of FMR's Equity Division (2009-present). Previously, Mr. Hogan served as Senior Vice President, Equity Research of FMR (2006-2009) and as a portfolio manager. |
|
Chris Maher (1972) |
|
|
Year of Election or Appointment: 2013 Assistant Treasurer |
|
|
|
Mr. Maher serves as Assistant Treasurer of other funds. Mr. Maher is Vice President of Valuation Oversight and is an employee of Fidelity Investments. Previously, Mr. Maher served as Vice President of Asset Management Compliance (2013), Vice President of FMR's Program Management Group (2010-2013), and Vice President of Valuation Oversight (2008-2010). |
|
Christine Reynolds (1958) |
|
|
Year of Election or Appointment: 2008 Chief Financial Officer |
|
|
|
Ms. Reynolds also serves as Chief Financial Officer of other funds. Ms. Reynolds became President of Fidelity Pricing and Cash Management Services (FPCMS) in August 2008. Ms. Reynolds served as Chief Operating Officer of FPCMS (2007-2008). Previously, Ms. Reynolds served as President, Treasurer, and Anti-Money Laundering officer of the Fidelity funds (2004-2007). |
|
Kenneth B. Robins (1969) |
|
|
Year of Election or Appointment: 2008 President and Treasurer |
|
|
|
Mr. Robins also serves as an officer of other funds. Mr. Robins serves as Executive Vice President of Fidelity Investments Money Management, Inc. (FIMM) (2013-present) and is an employee of Fidelity Investments (2004-present). Previously, Mr. Robins served in other fund officer roles. |
|
Gary W. Ryan (1958) |
|
|
Year of Election or Appointment: 2005 Assistant Treasurer |
|
|
|
Mr. Ryan also serves as Assistant Treasurer of other funds. Mr. Ryan is an employee of Fidelity Investments and has served in other fund officer roles. Previously, Mr. Ryan served as Vice President of Fund Reporting in Fidelity Pricing and Cash Management Services (FPCMS) (1999-2005). |
|
Stephen Sadoski (1971) |
|
|
Year of Election or Appointment: 2012 Deputy Treasurer |
|
|
|
Mr. Sadoski also serves as Deputy Treasurer of other funds. He is an employee of Fidelity Investments (2012-present) and has served in another fund officer role. Prior to joining Fidelity Investments, Mr. Sadoski served as an assistant chief accountant in the Division of Investment Management of the Securities and Exchange Commission (SEC) (2009-2012) and as a senior manager at Deloitte & Touche LLP (1997-2009). |
|
Stacie M. Smith (1974) |
|
|
Year of Election or Appointment: 2013 Deputy Treasurer |
|
|
|
Ms. Smith also serves as an officer of other funds. She is an employee of Fidelity Investments (2009-present) and has served in other fund officer roles. Prior to joining Fidelity Investments, Ms. Smith served as Senior Audit Manager of Ernst & Young LLP (1996-2009). |
|
Renee Stagnone (1975) |
|
|
Year of Election or Appointment: 2013 Deputy Treasurer |
|
|
|
Ms. Stagnone also serves as Deputy Treasurer of other funds. Ms. Stagnone is an employee of Fidelity Investments. |
|
Joseph F. Zambello (1957) |
|
|
Year of Election or Appointment: 2011 Deputy Treasurer |
|
|
|
Mr. Zambello also serves as Deputy Treasurer of other funds. Mr. Zambello is an employee of Fidelity Investments. Previously, Mr. Zambello served as Vice President of FMR's Program Management Group (2009-2011) and Vice President of the Transfer Agent Oversight Group (2005-2009). |
Annual Report
Distributions (Unaudited)
Institutional Class designates 61%, and 64%; of the dividends distributed on December 14, 2012 and December 27, 2012, respectively during the fiscal year as qualifying for the dividends-received deduction for corporate shareholders.
Institutional Class designates 68%, and 79% of the dividends distributed on December 14, 2012 and December 27, 2012, respectively during the fiscal year as amounts which may be taken into account as a dividend for purposes of the maximum rate under section 1(h)(11) of the Internal Revenue Code.
The fund will notify shareholders in January 2014 of amounts for use in preparing 2013 income tax returns.
Annual Report
Board Approval of Investment Advisory Contracts and Management Fees
Fidelity Advisor Stock Selector Mid Cap Fund
Each year, the Board of Trustees, including the Independent Trustees (together, the Board), votes on the renewal of the management contract and sub-advisory agreements (together, the Advisory Contracts) for the fund. The Board, assisted by the advice of fund counsel and Independent Trustees' counsel, requests and considers a broad range of information relevant to the renewal of the Advisory Contracts throughout the year.
The Board meets regularly and, at each of its meetings, covers an extensive agenda of topics and materials and considers factors that are relevant to its annual consideration of the renewal of the fund's Advisory Contracts, including the services and support provided to the fund and its shareholders. The Board has established various standing committees, each composed of and chaired by Independent Trustees with varying backgrounds, to which the Board has assigned specific subject matter responsibilities in order to enhance effective decision-making by the Board. The Board, acting directly and through its Committees, requests and receives information concerning the annual consideration of the renewal of the fund's Advisory Contracts. The Board also meets as needed to consider matters specifically related to the Board's annual consideration of the renewal of Advisory Contracts. Members of the Board may also meet with trustees of other Fidelity funds through ad hoc joint committees to discuss certain matters relevant to the Fidelity funds.
At its July 2013 meeting, the Board, including the Independent Trustees, unanimously determined to renew the fund's Advisory Contracts. In reaching its determination, the Board considered all factors it believed relevant, including (i) the nature, extent, and quality of the services to be provided to the fund and its shareholders (including the investment performance of the fund); (ii) the competitiveness of the fund's management fee and total expense ratio relative to peer funds; (iii) the total costs of the services to be provided by and the profits to be realized by Fidelity from its relationship with the fund; (iv) the extent to which economies of scale exist and would be realized as the fund grows; and (v) whether fee levels reflect these economies of scale, if any, for the benefit of fund shareholders.
In considering whether to renew the Advisory Contracts for the fund, the Board reached a determination, with the assistance of fund counsel and Independent Trustees' counsel and through the exercise of its business judgment, that the renewal of the Advisory Contracts was in the best interests of the fund and its shareholders and that the compensation payable under the Advisory Contracts was fair and reasonable. The Board's decision to renew the Advisory Contracts was not based on any single factor, but rather was based on a comprehensive consideration of all the information provided to the Board at its meetings throughout the year. The Board, in reaching its determination to renew the Advisory Contracts, was aware that shareholders in the fund have a broad range of investment choices available to them, including a wide choice among mutual funds offered by Fidelity's competitors, and that the fund's shareholders, who have the opportunity to review and weigh the disclosure provided by the fund in its prospectus and other public disclosures, have chosen to invest in this fund, which is a part of the Fidelity family of funds.
Annual Report
Board Approval of Investment Advisory Contracts and
Management Fees - continued
Nature, Extent, and Quality of Services Provided. The Board considered the staffing within the investment adviser, Fidelity Management & Research Company (FMR), and the sub-advisers (together, the Investment Advisers) as it relates to the fund, including the backgrounds of the fund's investment personnel, and also considered the fund's investment objective, strategies, and related investment philosophy. The Independent Trustees also had discussions with senior management of Fidelity's investment operations and investment groups. The Board considered the structure of the portfolio manager compensation program and whether this structure provides appropriate incentives to act in the best interests of the fund.
Resources Dedicated to Investment Management and Support Services. The Board and the Fund Oversight and Research Committees reviewed the general qualifications and capabilities of the Investment Advisers' investment staff, including its size, education, experience, and resources, as well as the Investment Advisers' approach to recruiting, training, managing, and compensating investment personnel. The Board noted that FMR has continued to increase the resources devoted to non-U.S. offices, including expansion of Fidelity's global investment organization. The Board also noted that Fidelity's analysts have extensive resources, tools and capabilities that allow them to conduct sophisticated quantitative and fundamental analysis, as well as credit analysis of issuers, counterparties and guarantors. Further, the Board believes that Fidelity's investment professionals have sufficient access to global information and data so as to provide competitive investment results over time, and that those professionals also have access to sophisticated tools that permit them to assess portfolio construction and risk and performance attribution characteristics continuously, as well as to transmit new information and research conclusions rapidly around the world. Additionally, in its deliberations, the Board considered the Investment Advisers' trading and risk management capabilities and resources, which are an integral part of the investment management process.
Shareholder and Administrative Services. The Board considered (i) the nature, extent, quality, and cost of advisory, administrative, and shareholder services performed by the Investment Advisers and their affiliates under the Advisory Contracts and under separate agreements covering transfer agency, pricing and bookkeeping, and securities lending services for the fund; (ii) the nature and extent of the supervision of third party service providers, principally custodians and subcustodians; and (iii) the resources devoted to, and the record of compliance with, the fund's compliance policies and procedures. The Board also reviewed the allocation of fund brokerage, including allocations to brokers affiliated with the Investment Advisers, the use of brokerage commissions to pay fund expenses, and the use of "soft" commission dollars to pay for research services.
Annual Report
The Board noted that the growth of fund assets over time across the complex allows Fidelity to reinvest in the development of services designed to enhance the value or convenience of the Fidelity funds as investment vehicles. These services include 24-hour access to account information and market information through telephone representatives and over the Internet, investor education materials and asset allocation tools, and the expanded availability of Fidelity Investor Centers.
Investment in a Large Fund Family. The Board considered the benefits to shareholders of investing in a Fidelity fund, including the benefits of investing in a fund that is part of a large family of funds offering a variety of investment disciplines and providing a large variety of mutual fund investor services. The Board noted that Fidelity had taken, or had made recommendations that resulted in the Fidelity funds taking, a number of actions over the previous year that benefited particular funds, including (i) continuing to dedicate additional resources to investment research and to the support of the senior management team that oversees asset management; (ii) persisting in efforts to enhance Fidelity's global research capabilities; (iii) launching new funds and making other enhancements to meet client needs for global and income-oriented solutions; (iv) continuing to launch dedicated lower cost underlying funds to meet portfolio construction needs related to expanding underlying fund options for Fidelity funds of funds, specifically for the Freedom Fund product lines; (v) rationalizing product lines and gaining increased efficiencies through the mergers of several funds into other funds; (vi) strengthening Fidelity's index fund offerings by reducing investment minimums and adopting or lowering existing expense caps for certain funds and classes; (vii) enhancing Global Asset Allocation product offerings by launching new funds and strategies, including "open architecture" target date funds that utilize affiliated and unaffiliated sub-advisers; (viii) modifying the eligibility criteria for Institutional Class shares of Advisor funds to increase their marketability to a portion of the defined contribution plan market; (ix) creating a new low-cost retirement share class for certain Advisor funds to appeal to large retirement plans; (x) transitioning the management of certain Fidelity commodity funds to Geode Capital Management LLC, a registered commodity pool operator, while retaining administrative responsibilities for the funds; (xi) reorganizing a number of funds; and (xii) taking steps toward establishing a new Fidelity adviser to manage sector-based funds and products.
Investment Performance. The Board considered whether the fund has operated in accordance with its investment objective, as well as its record of compliance with its investment restrictions and its performance history. The Board noted that there was a portfolio management change for a sleeve of the fund in October 2012.
Annual Report
Board Approval of Investment Advisory Contracts and
Management Fees - continued
The Board took into account discussions with the Investment Advisers about fund investment performance that occur at Board meetings throughout the year. In this regard the Board noted that as part of regularly scheduled fund reviews and other reports to the Board on fund performance, the Board periodically considers annualized return information for the fund, for different time periods, measured against a securities market index ("benchmark index") and a peer group of mutual funds with similar objectives ("peer group"). In its evaluation of fund investment performance, the Board gave particular attention to information indicating changes in performance of certain Fidelity funds for specific time periods and the Investment Advisers' explanations for any overperformance or, in the case of the fund, underperformance.
In addition to reviewing absolute and relative fund performance, the Independent Trustees periodically consider the appropriateness of fund performance metrics in evaluating the results achieved. In general, the Independent Trustees believe that fund performance should be evaluated based on net performance (after fees and expenses) of both the highest performing and lowest performing classes, where applicable, compared to appropriate benchmark indices, over appropriate time periods which may include full market cycles, and compared to peer groups, as applicable, over the same periods, taking into account relevant factors including the following: general market conditions; issuer-specific information; tactical opportunities for investment; and fund cash flows and other factors.
The Independent Trustees recognize that shareholders evaluate performance on a net basis over their own holding periods, for which one-, three-, and five-year periods are used as a proxy. For this reason, the performance information reviewed by the Board also included net cumulative calendar year total return information for the fund and an appropriate benchmark index and peer group for the most recent one-, three-, and five-year periods, as shown below. Returns are shown compared to the 25th percentile (top of box) and 75th percentile (bottom of box) of the peer universe.
Annual Report
Fidelity Advisor Stock Selector Mid Cap Fund

The Board has discussed the fund's performance with FMR, including the fund's underperformance based on more recent periods ended after 2012 (which periods are not shown in the chart above) but prior to the date of the Board's approval of the renewal of the Advisory Contracts, and has engaged with FMR to consider what steps might be taken to remediate the fund's more recent underperformance.
The Board also considered that the fund's management fee is subject to upward or downward adjustment depending upon whether, and to what extent, the fund's investment performance for the performance period exceeds, or is exceeded by, a securities index, thus leading to a performance adjustment for the same period. The Board noted that the performance adjustment provides FMR with a strong economic incentive to seek to achieve superior performance for the fund's shareholders and helps to more closely align the interests of FMR and the fund's shareholders.
Based on its review, the Board concluded that the nature, extent, and quality of services provided to the fund under the Advisory Contracts should benefit the fund's shareholders.
Competitiveness of Management Fee and Total Expense Ratio. The Board considered the fund's management fee and total expense ratio compared to "mapped groups" of competitive funds and classes. Fidelity creates "mapped groups" by combining similar Lipper investment objective categories that have comparable management fee characteristics. Combining Lipper investment objective categories aids the Board's management fee and total expense ratio comparisons by broadening the competitive group used for comparison and by reducing the number of universes to which various Fidelity funds are compared.
Annual Report
Board Approval of Investment Advisory Contracts and
Management Fees - continued
Management Fee. The Board considered two proprietary management fee comparisons for the 12-month periods shown in the chart below. The group of Lipper funds used by the Board for management fee comparisons is referred to below as the "Total Mapped Group." The Total Mapped Group comparison focuses on a fund's standing in terms of gross management fees before expense reimbursements or caps, and without giving effect to the fund's performance adjustment, relative to the total universe of funds with comparable investment mandates, regardless of whether their management fee structures also are comparable. Funds with comparable investment mandates offer exposure to similar types of securities. Funds with comparable management fee structures have similar management fee contractual arrangements (e.g., flat rate charged for advisory services, all-inclusive fee rate, etc.). "TMG %" represents the percentage of funds in the Total Mapped Group that had management fees that were lower than the fund's. For example, a TMG % of 11% means that 89% of the funds in the Total Mapped Group had higher management fees than the fund. The "Asset-Size Peer Group" (ASPG) comparison focuses on a fund's standing relative to a subset of non-Fidelity funds within the Total Mapped Group that are similar in size and management fee structure. The ASPG represents at least 15% of the funds in the Total Mapped Group with comparable asset size and management fee structures, subject to a minimum of 50 funds (or all funds in the Total Mapped Group if fewer than 50). Additional information, such as the ASPG quartile in which the fund's management fee ranked and the impact of the fund's performance adjustment, is also included in the chart and considered by the Board.
Fidelity Advisor Stock Selector Mid Cap Fund

Annual Report
The Board noted that the fund's management fee ranked below the median of its Total Mapped Group and below the median of its ASPG for 2012. The Board also noted the effect of the fund's negative performance adjustment on the fund's management fee ranking.
Based on its review, the Board concluded that the fund's management fee is fair and reasonable in light of the services that the fund receives and the other factors considered.
Total Expense Ratio. In its review of each class's total expense ratio, the Board considered the fund's management fee as well as other fund or class expenses, as applicable, such as transfer agent fees, pricing and bookkeeping fees, fund-paid 12b-1 fees, and custodial, legal, and audit fees. The Board also noted the effects of any waivers and reimbursements on fees and expenses, as well as the impact of the fund's performance adjustment. As part of its review, the Board also considered the current and historical total expense ratios of each class of the fund compared to competitive fund median expenses. Each class of the fund is compared to those funds and classes in the Total Mapped Group (used by the Board for management fee comparisons) that have a similar sales load structure.
The Board noted that the total expense ratio of each class ranked below its competitive median for 2012.
Fees Charged to Other Fidelity Clients. The Board also considered Fidelity fee structures and other information with respect to clients of FMR and its affiliates, such as other mutual funds advised or subadvised by FMR or its affiliates, pension plan clients, and other institutional clients. The Board noted the findings of the 2013 ad hoc joint committee (created with the board of other Fidelity funds), which reviewed and compared Fidelity's institutional investment advisory business with its business of providing services to the Fidelity funds, including the differences in services provided, fees charged, and costs incurred, as well as competition in their respective marketplaces.
Based on its review of total expense ratios and fees charged to other Fidelity clients, the Board concluded that the total expense ratio of each class of the fund was reasonable in light of the services that the fund and its shareholders receive and the other factors considered.
Costs of the Services and Profitability. The Board considered the revenues earned and the expenses incurred by Fidelity in conducting the business of developing, marketing, distributing, managing, administering and servicing the fund and servicing the fund's shareholders. The Board also considered the level of Fidelity's profits in respect of all the Fidelity funds.
On an annual basis, FMR presents to the Board Fidelity's profitability for the fund. Fidelity calculates the profitability for each fund, as well as aggregate profitability for groups of Fidelity funds and all Fidelity funds, using a series of detailed revenue and cost allocation methodologies which originate with the books and records of Fidelity on which Fidelity's audited financial statements are based. The Audit Committee of the Board reviews any significant changes from the prior year's methodologies.
Annual Report
Board Approval of Investment Advisory Contracts and
Management Fees - continued
PricewaterhouseCoopers LLP (PwC), independent registered public accounting firm and auditor to Fidelity and certain Fidelity funds, has been engaged annually by the Board as part of the Board's assessment of Fidelity's profitability analysis. PwC's engagement includes the review and assessment of the methodologies used by Fidelity in determining the revenues and expenses attributable to Fidelity's mutual fund business, and completion of agreed-upon procedures surrounding the mathematical accuracy of fund profitability and its conformity to allocation methodologies. After considering PwC's reports issued under the engagement and information provided by Fidelity, the Board concluded that while other allocation methods may also be reasonable, Fidelity's profitability methodologies are reasonable in all material respects.
The Board also reviewed Fidelity's non-fund businesses and fall-out benefits related to the mutual fund business as well as cases where Fidelity's affiliates may benefit from or be related to the fund's business.
The Board considered the costs of the services provided by and the profits realized by Fidelity in connection with the operation of the fund and was satisfied that the profitability was not excessive in the circumstances.
Economies of Scale. The Board considered whether there have been economies of scale in respect of the management of the Fidelity funds, whether the Fidelity funds (including the fund) have appropriately benefited from any such economies of scale, and whether there is potential for realization of any further economies of scale. The Board considered the extent to which the fund will benefit from economies of scale through increased services to the fund, through waivers or reimbursements, or through fee or expense reductions. The Board also noted that in 2009, it and the board of other Fidelity funds created an ad hoc committee (the Economies of Scale Committee) to analyze whether FMR attains economies of scale in respect of the management and servicing of the Fidelity funds, whether the Fidelity funds have appropriately benefited from such economies of scale, and whether there is potential for realization of any further economies of scale.
The Board recognized that the fund's management contract incorporates a "group fee" structure, which provides for lower group fee rates as total fund assets under FMR's management increase, and for higher group fee rates as total fund assets under FMR's management decrease. FMR calculates the group fee rates based on a tiered asset "breakpoint" schedule that varies based on asset class. The Board considered that the group fee is designed to deliver the benefits of economies of scale to fund shareholders when total Fidelity fund assets increase, even if assets of any particular fund are unchanged or have declined, because some portion of Fidelity's costs are attributable to services provided to all Fidelity funds, and all funds benefit if those costs can be allocated among more assets. The Board concluded that, given the group fee structure, fund shareholders will benefit from lower management fees as assets under FMR's management increase at the fund complex level, regardless of whether Fidelity achieves any such economies of scale.
Annual Report
The Board concluded, taking into account the analysis of the Economies of Scale Committee, that economies of scale, if any, are being appropriately shared between fund shareholders and Fidelity.
Amendment to Description of Group Fee Rate. At its July 2013 meeting, the Board voted to approve an amendment to the fund's management contract to modify the description of the "group fee rate" effective August 1, 2013. The Board noted that under the prior description in the contract, the group fee rate was based on the average net assets of all registered investment companies with which FMR has management contracts. Under the contract's tiered asset breakpoint schedule, the group fee rate is lower as total fund assets under FMR's management increase, and higher as total fund assets under FMR's management decrease. The Board considered that the prior description would have excluded the assets of 64 Fidelity sector funds from the group fee rate calculation once Fidelity SelectCo, LLC, an affiliate of FMR, assumed management responsibilities for those funds. The Board noted that modifying the description of the group fee rate to continue to include the assets of those 64 funds for purposes of determining group fee rate breakpoints would avoid an immediate adverse impact on the group fee rate for any fund.
Additional Information Requested by the Board. In order to develop fully the factual basis for consideration of the Fidelity funds' Advisory Contracts, the Board requested and received additional information on certain topics, including: (i) fund performance trends and Fidelity's long-term strategies for certain funds; (ii) the potential to further rationalize the Fidelity fund lineup with the possibility of achieving savings for the funds and Fidelity; (iii) the methodology with respect to competitive fund data and peer group classifications; (iv) the arrangements with, and performance of, certain sub-advisers on behalf of the Fidelity funds, as well as certain proposed participating affiliate arrangements; (v) the realization of fall-out benefits in certain Fidelity business units; (vi) Fidelity's group fee structures, including the rationale for the individual fee rates of certain categories of funds and the definition of group assets; (vii) trends regarding industry use of performance fee structures and the performance adjustment methodologies applicable to the Fidelity funds; (viii) additional competitive analysis regarding the total expenses for certain classes; and (ix) fund profitability methodology, including Fidelity's cost allocation methodology, and the impact of certain factors on fund profitability results.
Annual Report
Board Approval of Investment Advisory Contracts and
Management Fees - continued
Based on its evaluation of all of the conclusions noted above, and after considering all factors it believed relevant, the Board ultimately concluded that the advisory fee structures are fair and reasonable, and that the fund's Advisory Contracts should be renewed.
Annual Report
Investment Adviser
Fidelity Management & Research Company
Boston, MA
Investment Sub-Advisers
FMR Co., Inc.
Fidelity Management & Research
(U.K.) Inc.
Fidelity Management & Research
(Hong Kong) Limited
Fidelity Management & Research
(Japan) Inc.
General Distributor
Fidelity Distributors Corporation
Smithfield, RI
Transfer and Service Agents
Fidelity Investments Institutional
Operations Company, Inc.
Boston, MA
Fidelity Service Company, Inc.
Boston, MA
Custodian
Brown Brothers Harriman & Co.
Boston, MA
(Fidelity Investment logo)(registered trademark)
MCI-UANN-0114 1.786696.110
(Fidelity Investment logo)(registered trademark)
Fidelity® Stock Selector
Mid Cap
Fund
(A class of Fidelity Advisor® Stock Selector Mid Cap Fund)
Annual Report
November 30, 2013
(Fidelity Cover Art)
Contents
|
Performance |
How the fund has done over time. |
|
|
Management's Discussion of Fund Performance |
The Portfolio Managers' review of fund performance and strategy. |
|
|
Shareholder Expense Example |
An example of shareholder expenses. |
|
|
Investment Changes |
A summary of major shifts in the fund's investments over the past six months. |
|
|
Investments |
A complete list of the fund's investments with their market values. |
|
|
Financial Statements |
Statements of assets and liabilities, operations, and changes in net assets, as well as financial highlights. |
|
|
Notes |
Notes to the financial statements. |
|
|
Report of Independent Registered Public Accounting Firm |
|
|
|
Trustees and Officers |
|
|
|
Distributions |
|
|
|
Board Approval of Investment Advisory Contracts and Management Fees |
|
To view a fund's proxy voting guidelines and proxy voting record for the 12-month period ended June 30, visit http://www.fidelity.com/proxyvotingresults or visit the Securities and Exchange Commission's (SEC) web site at http://www.sec.gov. You may also call 1-800-544-8544 to request a free copy of the proxy voting guidelines.
Standard & Poor's, S&P and S&P 500 are registered service marks of The McGraw-Hill Companies, Inc. and have been licensed for use by Fidelity Distributors Corporation.
Other third-party marks appearing herein are the property of their respective owners.
All other marks appearing herein are registered or unregistered trademarks or service marks of FMR LLC or an affiliated company. © 2014 FMR LLC. All rights reserved.
Annual Report
This report and the financial statements contained herein are submitted for the general information of the shareholders of the fund. This report is not authorized for distribution to prospective investors in the fund unless preceded or accompanied by an effective prospectus.
A fund files its complete schedule of portfolio holdings with the SEC for the first and third quarters of each fiscal year on Form N-Q. Forms N-Q are available on the SEC's web site at http://www.sec.gov. A fund's Forms N-Q may be reviewed and copied at the SEC's Public Reference Room in Washington, DC. Information regarding the operation of the SEC's Public Reference Room may be obtained by calling 1-800-SEC-0330. For a complete list of a fund's portfolio holdings, view the most recent holdings listing, semiannual report, or annual report on Fidelity's web site at http://www.fidelity.com, http://www.advisor.fidelity.com, or http://www.401k.com, as applicable.
NOT FDIC INSURED • MAY LOSE VALUE • NO BANK GUARANTEE
Neither the fund nor Fidelity Distributors Corporation is a bank.
Annual Report
Performance: The Bottom Line
Average annual total return reflects the change in the value of an investment, assuming reinvestment of the class' distributions from dividend income and capital gains (the profits earned upon the sale of securities that have grown in value, if any) and assuming a constant rate of performance each year. The $10,000 table and the fund's returns do not reflect the deduction of taxes that a shareholder would pay on fund distributions or the redemption of fund shares. During periods of reimbursement by Fidelity, a fund's total return will be greater than it would be had the reimbursement not occurred. How a fund did yesterday is no guarantee of how it will do tomorrow.
Average Annual Total Returns
|
Periods ended November 30, 2013 |
Past 1 |
Past 5 |
Past 10 |
|
Fidelity® Stock Selector Mid Cap Fund A |
29.36% |
22.72% |
7.79% |
A The initial offering of Fidelity Stock Selector Mid Cap Fund took place on June 6, 2012. Returns prior to June 6, 2012, are those of Institutional Class.
$10,000 Over 10 Years
Let's say hypothetically that $10,000 was invested in Fidelity® Stock Selector Mid Cap Fund, a class of the fund, on November 30, 2003. The chart shows how the value of your investment would have changed, and also shows how the S&P MidCap 400® Index performed over the same period. The initial offering of Fidelity Stock Selector Mid Cap Fund took place on June 6, 2012. See above for additional information regarding the performance of Fidelity Stock Selector Mid Cap Fund.
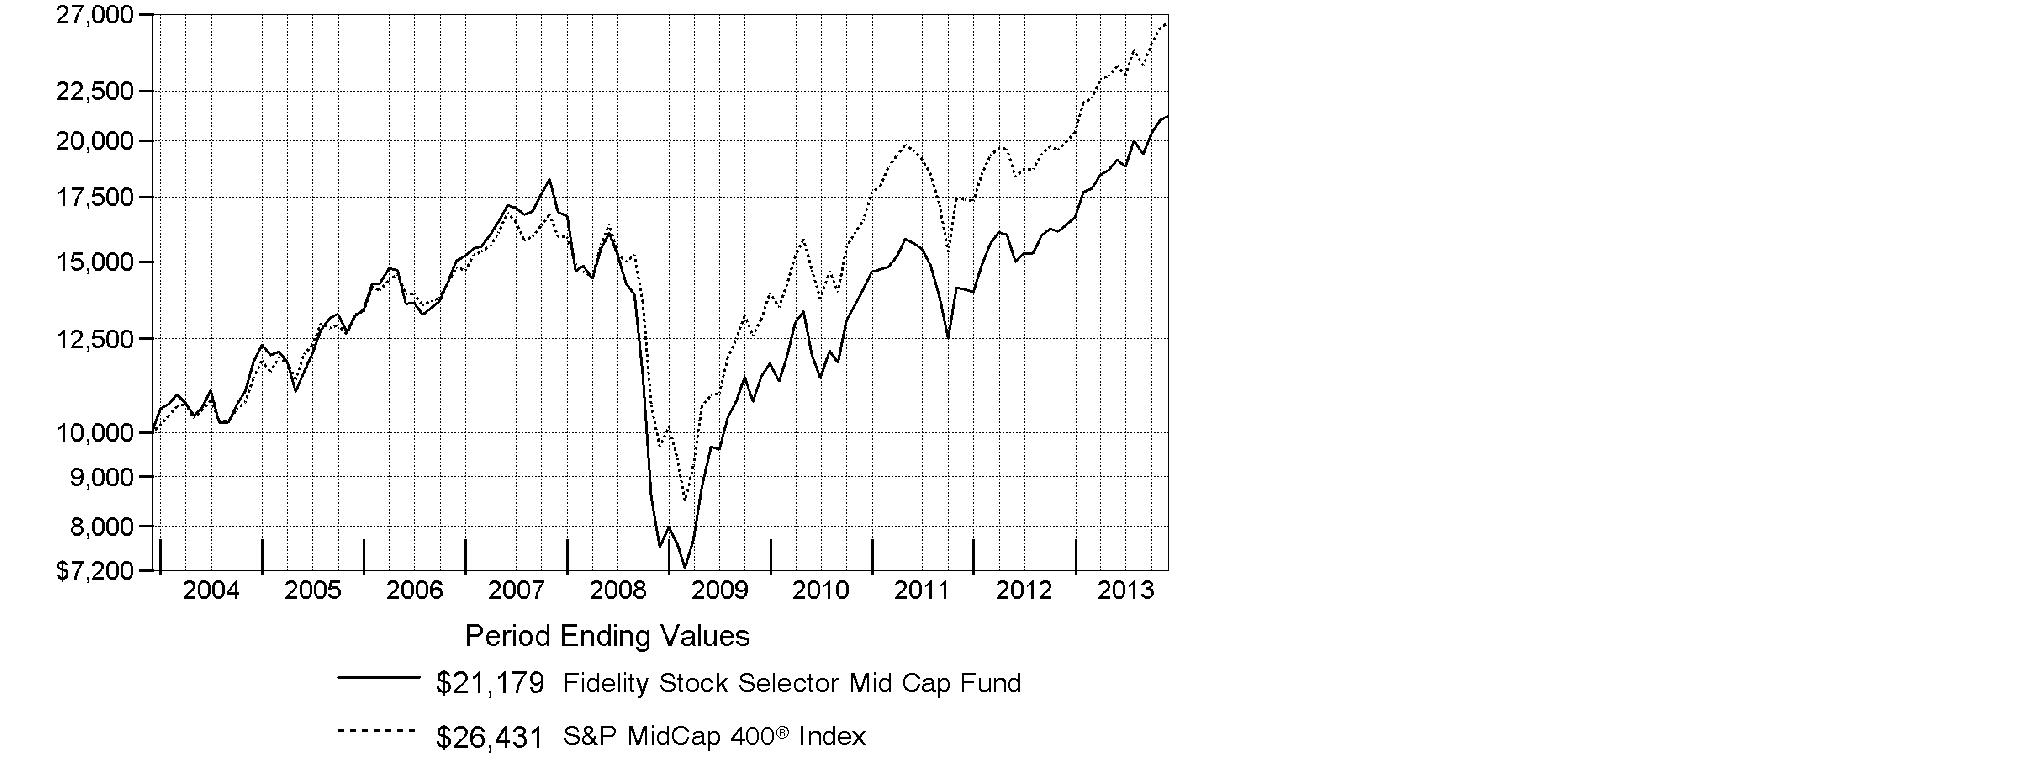
Annual Report
Management's Discussion of Fund Performance
Market Recap: With the current bull run nearing the five-year mark, equity benchmarks ripped up old records during the 12 months ending November 30, 2013. Gains were fueled by strengthening U.S. economic data, as well as generally improving economies and accommodative monetary policies worldwide. The broad S&P 500® Index reached new peaks in its 30.30% climb for the period, and the blue-chip Dow Jones Industrial AverageSM surpassed historic milestones en route to a 26.63% gain. The Nasdaq Composite Index®, up 36.73% amid a resurgence in growth-oriented stocks, closed above 4,000 for the first time since 2000. Shedding anxiety over the 2012 U.S. presidential election - and apparently confident that the federal debt-ceiling debate would be resolved - markets rose from period start through late May. News that the U.S. Federal Reserve was considering an end to its stimulative bond-buying kept stocks in flux over the summer but, by September, the Fed had set aside any imminent tapering. Despite jitters over a potential U.S. military strike in Syria and, later, an October budget impasse that briefly shuttered the federal government, volatility was subdued heading into the holidays, with investor optimism helping many markets home in on all-time highs at period end. Elsewhere, non-U.S. developed-market equities saw similar results, with the MSCI® EAFE® Index adding 24.97%.
Comments from Shadman Riaz and Eddie Yoon, two Co-Portfolio Managers of Fidelity® Stock Selector Mid Cap Fund, who are responsible for the fund's energy and health care sleeves, respectively, as part of Fidelity's Stock Selector Mid Cap Group: For the year, the fund's Retail Class shares returned 29.36%, trailing the 32.33% gain of the S&P MidCap 400® Index. Versus the index, weak choices in industrials and information technology hurt the most, and offset strong picks in financials and health care. Nuance Communications was the fund's biggest relative detractor. The voice-recognition technology company struggled in its transition to a more subscription-heavy business model, while slowing growth and weak communication among management made matters worse, and the stock fell. Untimely positioning in specialty pharmaceuticals company Endo Health Solutions hurt, as did a stake in underperforming commercial building products maker Armstrong World Industries, which we sold from the fund. On the plus side, picks in financial helped the most by far. Japan-based diversified financials firm Monex Group was our top individual contributor, while Regeneron Pharmaceuticals - which was removed from the benchmark in May - also helped. We eliminated both positions by period end. Nuance, Armstrong and Monex were not in the index.
The views expressed above reflect those of the portfolio manager(s) only through the end of the period as stated on the cover of this report and do not necessarily represent the views of Fidelity or any other person in the Fidelity organization. Any such views are subject to change at any time based upon market or other conditions and Fidelity disclaims any responsibility to update such views. These views may not be relied on as investment advice and, because investment decisions for a Fidelity fund are based on numerous factors, may not be relied on as an indication of trading intent on behalf of any Fidelity fund.
Annual Report
Shareholder Expense Example
As a shareholder of the Fund, you incur two types of costs: (1) transaction costs, including sales charges (loads) on purchase payments or redemption proceeds, and (2) ongoing costs, including management fees, distribution and/or service (12b-1) fees and other Fund expenses. This Example is intended to help you understand your ongoing costs (in dollars) of investing in the Fund and to compare these costs with the ongoing costs of investing in other mutual funds.
The Example is based on an investment of $1,000 invested at the beginning of the period and held for the entire period (June 1, 2013 to November 30, 2013).
Actual Expenses
The first line of the accompanying table for each class of the Fund provides information about actual account values and actual expenses. You may use the information in this line, together with the amount you invested, to estimate the expenses that you paid over the period. Simply divide your account value by $1,000.00 (for example, an $8,600 account value divided by $1,000.00 = 8.6), then multiply the result by the number in the first line for a class of the Fund under the heading entitled "Expenses Paid During Period" to estimate the expenses you paid on your account during this period. A small balance maintenance fee of $12.00 that is charged once a year may apply for certain accounts with a value of less than $2,000. This fee is not included in the table below. If it was, the estimate of expenses you paid during the period would be higher, and your ending account value lower, by this amount. In addition, the Fund, as a shareholder in the underlying Fidelity Central Funds, will indirectly bear its pro-rata share of the fees and expenses incurred by the underlying Fidelity Central Funds. These fees and expenses are not included in the Fund's annualized expense ratio used to calculate the expense estimate in the table below.
Hypothetical Example for Comparison Purposes
The second line of the accompanying table for each class of the Fund provides information about hypothetical account values and hypothetical expenses based on a Class' actual expense ratio and an assumed rate of return of 5% per year before expenses, which is not the Class' actual return. The hypothetical account values and expenses may not be used to estimate the actual ending account balance or expenses you paid for the period. You may use this information to compare the ongoing costs of investing in the Fund and other funds. To do so, compare this 5% hypothetical example with the 5% hypothetical examples that appear in the shareholder reports of the other funds. A small balance maintenance fee of $12.00 that is charged once a year may apply for certain accounts with a value of less than $2,000. This fee is not included in the table below. If it was, the estimate of expenses you paid during the period would be higher, and your ending account value lower, by this amount. In addition, the Fund, as a shareholder in the underlying Fidelity Central Funds, will indirectly bear its pro-rata share of the fees and expenses incurred by the underlying Fidelity Central Funds. These fees and expenses are not included in the Fund's annualized expense ratio used to calculate the expense estimate in the table below.
Please note that the expenses shown in the table are meant to highlight your ongoing costs only and do not reflect any transaction costs. Therefore, the second line of the table is useful in comparing ongoing costs only, and will not help you determine the relative total costs of owning different funds. In addition, if these transactional costs were included, your costs would have been higher.
Annual Report
|
|
Annualized |
Beginning |
Ending |
Expenses Paid |
|
Class A |
.94% |
|
|
|
|
Actual |
|
$ 1,000.00 |
$ 1,108.60 |
$ 4.97 |
|
HypotheticalA |
|
$ 1,000.00 |
$ 1,020.36 |
$ 4.76 |
|
Class T |
1.15% |
|
|
|
|
Actual |
|
$ 1,000.00 |
$ 1,107.50 |
$ 6.08 |
|
HypotheticalA |
|
$ 1,000.00 |
$ 1,019.30 |
$ 5.82 |
|
Class B |
1.75% |
|
|
|
|
Actual |
|
$ 1,000.00 |
$ 1,104.10 |
$ 9.23 |
|
HypotheticalA |
|
$ 1,000.00 |
$ 1,016.29 |
$ 8.85 |
|
Class C |
1.68% |
|
|
|
|
Actual |
|
$ 1,000.00 |
$ 1,104.50 |
$ 8.86 |
|
HypotheticalA |
|
$ 1,000.00 |
$ 1,016.65 |
$ 8.49 |
|
Fidelity Stock Selector Mid Cap Fund |
.71% |
|
|
|
|
Actual |
|
$ 1,000.00 |
$ 1,110.00 |
$ 3.76 |
|
HypotheticalA |
|
$ 1,000.00 |
$ 1,021.51 |
$ 3.60 |
|
Institutional Class |
.67% |
|
|
|
|
Actual |
|
$ 1,000.00 |
$ 1,110.10 |
$ 3.54 |
|
HypotheticalA |
|
$ 1,000.00 |
$ 1,021.71 |
$ 3.40 |
A 5% return per year before expenses
B Annualized expense ratio reflects expenses net of applicable fee waivers.
* Expenses are equal to each Class' annualized expense ratio, multiplied by the average account value over the period, multiplied by 183/365 (to reflect the one-half year period).
Annual Report
Investment Changes (Unaudited)
|
Top Ten Stocks as of November 30, 2013 |
||
|
|
% of fund's |
% of fund's net assets |
|
J.B. Hunt Transport Services, Inc. |
1.9 |
1.2 |
|
Capital One Financial Corp. |
1.8 |
1.6 |
|
Hubbell, Inc. Class B |
1.7 |
1.4 |
|
AMETEK, Inc. |
1.7 |
2.0 |
|
Roper Industries, Inc. |
1.5 |
1.2 |
|
Verisk Analytics, Inc. |
1.5 |
0.9 |
|
Interactive Brokers Group, Inc. |
1.2 |
0.8 |
|
Foot Locker, Inc. |
1.2 |
0.0 |
|
SLM Corp. |
1.1 |
1.0 |
|
Raymond James Financial, Inc. |
1.1 |
0.5 |
|
|
14.7 |
|
|
Top Five Market Sectors as of November 30, 2013 |
||
|
|
% of fund's |
% of fund's net assets |
|
Financials |
22.3 |
22.3 |
|
Industrials |
16.8 |
17.7 |
|
Information Technology |
15.6 |
15.1 |
|
Consumer Discretionary |
13.9 |
12.6 |
|
Health Care |
8.9 |
9.0 |
|
Asset Allocation (% of fund's net assets) |
|||||||
|
As of November 30, 2013* |
As of May 31, 2013** |
||||||
 |
Stocks and |
|
|
Stocks and |
|
||
 |
Short-Term |
|
|
Short-Term |
|
||
|
* Foreign investments |
8.5% |
|
** Foreign investments |
8.5% |
|
||

Annual Report
Investments November 30, 2013
Showing Percentage of Net Assets
|
Common Stocks - 98.0% |
|||
|
Shares |
Value (000s) |
||
|
CONSUMER DISCRETIONARY - 13.9% |
|||
|
Distributors - 0.8% |
|||
|
LKQ Corp. (a) |
487,380 |
$ 16,157 |
|
|
Hotels, Restaurants & Leisure - 0.7% |
|||
|
Panera Bread Co. Class A (a) |
82,900 |
14,664 |
|
|
Household Durables - 2.4% |
|||
|
Jarden Corp. (a) |
411,415 |
23,138 |
|
|
NVR, Inc. (a) |
14,400 |
13,968 |
|
|
Tupperware Brands Corp. |
153,580 |
14,028 |
|
|
|
51,134 |
||
|
Internet & Catalog Retail - 0.5% |
|||
|
Liberty Media Corp. Interactive Series A (a) |
348,310 |
9,781 |
|
|
Leisure Equipment & Products - 0.5% |
|||
|
Brunswick Corp. |
237,700 |
10,863 |
|
|
Media - 0.3% |
|||
|
AMC Networks, Inc. Class A (a) |
117,900 |
7,568 |
|
|
Multiline Retail - 1.0% |
|||
|
Dollar General Corp. (a) |
173,940 |
9,904 |
|
|
Dollar Tree, Inc. (a) |
206,878 |
11,513 |
|
|
|
21,417 |
||
|
Specialty Retail - 7.4% |
|||
|
Abercrombie & Fitch Co. Class A |
123,582 |
4,236 |
|
|
American Eagle Outfitters, Inc. |
439,800 |
7,156 |
|
|
Cabela's, Inc. Class A (a) |
188,400 |
11,540 |
|
|
Dick's Sporting Goods, Inc. |
336,280 |
19,007 |
|
|
DSW, Inc. Class A |
128,400 |
5,756 |
|
|
Foot Locker, Inc. |
633,700 |
24,645 |
|
|
L Brands, Inc. |
130,315 |
8,469 |
|
|
O'Reilly Automotive, Inc. (a) |
49,810 |
6,224 |
|
|
PetSmart, Inc. |
150,260 |
11,136 |
|
|
Ross Stores, Inc. |
181,910 |
13,909 |
|
|
Sally Beauty Holdings, Inc. (a) |
550,320 |
15,486 |
|
|
Tractor Supply Co. |
253,536 |
18,561 |
|
|
Williams-Sonoma, Inc. |
213,960 |
12,649 |
|
|
|
158,774 |
||
|
Textiles, Apparel & Luxury Goods - 0.3% |
|||
|
Ralph Lauren Corp. |
42,600 |
7,465 |
|
|
TOTAL CONSUMER DISCRETIONARY |
297,823 |
||
|
Common Stocks - continued |
|||
|
Shares |
Value (000s) |
||
|
CONSUMER STAPLES - 3.6% |
|||
|
Beverages - 0.5% |
|||
|
Beam, Inc. |
101,800 |
$ 6,875 |
|
|
Monster Beverage Corp. (a) |
58,984 |
3,491 |
|
|
|
10,366 |
||
|
Food & Staples Retailing - 0.9% |
|||
|
United Natural Foods, Inc. (a) |
164,345 |
11,315 |
|
|
Whole Foods Market, Inc. |
131,842 |
7,462 |
|
|
|
18,777 |
||
|
Food Products - 2.2% |
|||
|
Hain Celestial Group, Inc. (a) |
108,400 |
8,964 |
|
|
Mead Johnson Nutrition Co. Class A |
102,300 |
8,645 |
|
|
The Hershey Co. |
83,900 |
8,129 |
|
|
TreeHouse Foods, Inc. (a) |
85,280 |
5,982 |
|
|
WhiteWave Foods Co. (a) |
741,900 |
15,780 |
|
|
|
47,500 |
||
|
TOTAL CONSUMER STAPLES |
76,643 |
||
|
ENERGY - 6.1% |
|||
|
Energy Equipment & Services - 1.8% |
|||
|
Dril-Quip, Inc. (a) |
131,100 |
14,232 |
|
|
Helmerich & Payne, Inc. |
125,980 |
9,700 |
|
|
Oil States International, Inc. (a) |
57,000 |
5,834 |
|
|
Rowan Companies PLC (a) |
254,710 |
8,818 |
|
|
|
38,584 |
||
|
Oil, Gas & Consumable Fuels - 4.3% |
|||
|
Atlas Pipeline Partners LP |
227,660 |
7,959 |
|
|
Cheniere Energy, Inc. (a) |
170,200 |
6,738 |
|
|
Cimarex Energy Co. |
200,600 |
18,973 |
|
|
Energen Corp. |
176,400 |
12,731 |
|
|
HollyFrontier Corp. |
96,570 |
4,633 |
|
|
SM Energy Co. |
197,946 |
17,447 |
|
|
Targa Resources Corp. |
82,900 |
6,722 |
|
|
Whiting Petroleum Corp. (a) |
138,900 |
8,390 |
|
|
WPX Energy, Inc. (a) |
442,880 |
8,233 |
|
|
|
91,826 |
||
|
TOTAL ENERGY |
130,410 |
||
|
Common Stocks - continued |
|||
|
Shares |
Value (000s) |
||
|
FINANCIALS - 22.3% |
|||
|
Capital Markets - 4.0% |
|||
|
ABG Sundal Collier ASA (a) |
3,100,000 |
$ 2,474 |
|
|
Ashmore Global Opportunities Ltd. (United Kingdom) |
443,737 |
3,656 |
|
|
KKR & Co. LP |
852,564 |
20,231 |
|
|
MLP AG |
1,650,000 |
11,031 |
|
|
Oaktree Capital Group LLC Class A |
112,900 |
6,291 |
|
|
Och-Ziff Capital Management Group LLC Class A |
380,000 |
5,278 |
|
|
Raymond James Financial, Inc. |
492,800 |
23,743 |
|
|
Virtus Investment Partners, Inc. (a) |
66,400 |
13,798 |
|
|
|
86,502 |
||
|
Commercial Banks - 3.4% |
|||
|
CIT Group, Inc. |
140,498 |
7,092 |
|
|
City National Corp. |
187,910 |
14,349 |
|
|
Erste Group Bank AG |
544,274 |
19,162 |
|
|
Huntington Bancshares, Inc. |
2,489,478 |
22,853 |
|
|
Synovus Financial Corp. |
2,464,089 |
8,600 |
|
|
|
72,056 |
||
|
Consumer Finance - 3.8% |
|||
|
ACOM Co. Ltd. (a) |
2,622,800 |
9,729 |
|
|
Capital One Financial Corp. |
540,800 |
38,738 |
|
|
Cash America International, Inc. |
239,527 |
9,009 |
|
|
SLM Corp. |
896,616 |
23,895 |
|
|
|
81,371 |
||
|
Diversified Financial Services - 1.2% |
|||
|
Interactive Brokers Group, Inc. |
1,065,767 |
25,845 |
|
|
Insurance - 2.0% |
|||
|
Direct Line Insurance Group PLC |
4,072,691 |
15,674 |
|
|
Fairfax Financial Holdings Ltd. (sub. vtg.) |
24,800 |
9,551 |
|
|
Fidelity National Financial, Inc. Class A |
220,000 |
6,395 |
|
|
Validus Holdings Ltd. |
269,489 |
10,793 |
|
|
|
42,413 |
||
|
Real Estate Investment Trusts - 6.7% |
|||
|
Acadia Realty Trust (SBI) |
300,580 |
7,806 |
|
|
Alexandria Real Estate Equities, Inc. |
143,875 |
9,102 |
|
|
Camden Property Trust (SBI) |
137,022 |
7,936 |
|
|
Corrections Corp. of America |
132,800 |
4,429 |
|
|
Cousins Properties, Inc. |
542,500 |
5,810 |
|
|
Equity One, Inc. |
403,833 |
9,046 |
|
|
Essex Property Trust, Inc. |
85,664 |
13,005 |
|
|
Glimcher Realty Trust |
469,064 |
4,555 |
|
|
Common Stocks - continued |
|||
|
Shares |
Value (000s) |
||
|
FINANCIALS - continued |
|||
|
Real Estate Investment Trusts - continued |
|||
|
LaSalle Hotel Properties (SBI) |
139,500 |
$ 4,369 |
|
|
Mid-America Apartment Communities, Inc. |
176,600 |
10,638 |
|
|
National Retail Properties, Inc. (d) |
344,169 |
10,927 |
|
|
Piedmont Office Realty Trust, Inc. Class A |
423,278 |
6,933 |
|
|
Rayonier, Inc. |
30,900 |
1,363 |
|
|
Redwood Trust, Inc. (d) |
449,400 |
8,350 |
|
|
Senior Housing Properties Trust (SBI) |
362,900 |
8,220 |
|
|
SL Green Realty Corp. |
145,665 |
13,178 |
|
|
Sovran Self Storage, Inc. |
64,339 |
4,294 |
|
|
Terreno Realty Corp. |
282,610 |
5,005 |
|
|
UDR, Inc. |
91,400 |
2,127 |
|
|
Weyerhaeuser Co. |
231,114 |
6,963 |
|
|
|
144,056 |
||
|
Real Estate Management & Development - 0.6% |
|||
|
Altisource Portfolio Solutions SA |
43,010 |
6,924 |
|
|
CBRE Group, Inc. (a) |
205,932 |
4,992 |
|
|
|
11,916 |
||
|
Thrifts & Mortgage Finance - 0.6% |
|||
|
Ocwen Financial Corp. (a) |
233,463 |
13,228 |
|
|
TOTAL FINANCIALS |
477,387 |
||
|
HEALTH CARE - 8.9% |
|||
|
Biotechnology - 1.1% |
|||
|
Alexion Pharmaceuticals, Inc. (a) |
74,000 |
9,213 |
|
|
Grifols SA ADR |
260,000 |
8,927 |
|
|
Medivation, Inc. (a) |
100,000 |
6,301 |
|
|
|
24,441 |
||
|
Health Care Equipment & Supplies - 1.7% |
|||
|
Boston Scientific Corp. (a) |
1,550,000 |
17,949 |
|
|
The Cooper Companies, Inc. |
140,000 |
18,444 |
|
|
|
36,393 |
||
|
Health Care Providers & Services - 2.7% |
|||
|
Catamaran Corp. (a) |
245,000 |
11,183 |
|
|
Community Health Systems, Inc. |
200,000 |
8,250 |
|
|
HCA Holdings, Inc. |
128,000 |
5,942 |
|
|
Humana, Inc. |
77,000 |
8,007 |
|
|
Common Stocks - continued |
|||
|
Shares |
Value (000s) |
||
|
HEALTH CARE - continued |
|||
|
Health Care Providers & Services - continued |
|||
|
MEDNAX, Inc. (a) |
150,000 |
$ 16,620 |
|
|
Quest Diagnostics, Inc. |
120,000 |
7,313 |
|
|
|
57,315 |
||
|
Health Care Technology - 0.5% |
|||
|
Cerner Corp. (a) |
190,000 |
10,919 |
|
|
Life Sciences Tools & Services - 0.6% |
|||
|
Illumina, Inc. (a) |
124,000 |
12,152 |
|
|
Pharmaceuticals - 2.3% |
|||
|
Actavis PLC (a) |
120,000 |
19,568 |
|
|
Perrigo Co. (d) |
90,000 |
14,030 |
|
|
Salix Pharmaceuticals Ltd. (a) |
191,000 |
16,199 |
|
|
|
49,797 |
||
|
TOTAL HEALTH CARE |
191,017 |
||
|
INDUSTRIALS - 16.8% |
|||
|
Aerospace & Defense - 1.0% |
|||
|
TransDigm Group, Inc. |
142,510 |
22,306 |
|
|
Commercial Services & Supplies - 0.4% |
|||
|
Covanta Holding Corp. |
412,561 |
7,385 |
|
|
West Corp. |
86,500 |
1,992 |
|
|
|
9,377 |
||
|
Electrical Equipment - 5.7% |
|||
|
AMETEK, Inc. |
730,090 |
35,935 |
|
|
Eaton Corp. PLC |
233,500 |
16,966 |
|
|
Hubbell, Inc. Class B |
341,540 |
36,856 |
|
|
Roper Industries, Inc. |
241,520 |
31,325 |
|
|
|
121,082 |
||
|
Machinery - 2.8% |
|||
|
Cummins, Inc. |
136,400 |
18,054 |
|
|
Ingersoll-Rand PLC |
258,907 |
18,491 |
|
|
Manitowoc Co., Inc. |
768,300 |
15,819 |
|
|
WABCO Holdings, Inc. (a) |
92,218 |
8,171 |
|
|
|
60,535 |
||
|
Professional Services - 1.5% |
|||
|
Verisk Analytics, Inc. (a) |
474,800 |
30,914 |
|
|
Road & Rail - 1.9% |
|||
|
J.B. Hunt Transport Services, Inc. |
542,940 |
40,821 |
|
|
Common Stocks - continued |
|||
|
Shares |
Value (000s) |
||
|
INDUSTRIALS - continued |
|||
|
Trading Companies & Distributors - 3.5% |
|||
|
Beacon Roofing Supply, Inc. (a) |
436,593 |
$ 16,233 |
|
|
MSC Industrial Direct Co., Inc. Class A |
300,908 |
23,125 |
|
|
W.W. Grainger, Inc. |
56,000 |
14,444 |
|
|
Watsco, Inc. |
207,300 |
19,893 |
|
|
|
73,695 |
||
|
TOTAL INDUSTRIALS |
358,730 |
||
|
INFORMATION TECHNOLOGY - 15.6% |
|||
|
Communications Equipment - 2.9% |
|||
|
Aruba Networks, Inc. (a) |
583,600 |
10,411 |
|
|
F5 Networks, Inc. (a) |
165,300 |
13,598 |
|
|
Juniper Networks, Inc. (a) |
488,900 |
9,910 |
|
|
Polycom, Inc. (a) |
824,877 |
8,867 |
|
|
Radware Ltd. (a) |
478,200 |
8,129 |
|
|
Riverbed Technology, Inc. (a) |
584,050 |
10,104 |
|
|
|
61,019 |
||
|
Computers & Peripherals - 0.9% |
|||
|
NCR Corp. (a) |
567,300 |
19,827 |
|
|
Electronic Equipment & Components - 1.3% |
|||
|
Arrow Electronics, Inc. (a) |
203,310 |
10,438 |
|
|
Ingram Micro, Inc. Class A (a) |
425,500 |
9,974 |
|
|
Jabil Circuit, Inc. |
309,300 |
6,270 |
|
|
|
26,682 |
||
|
Internet Software & Services - 2.1% |
|||
|
Bankrate, Inc. (a) |
345,342 |
6,472 |
|
|
Equinix, Inc. (a) |
79,300 |
12,744 |
|
|
Rackspace Hosting, Inc. (a)(d) |
398,400 |
15,223 |
|
|
Velti PLC (e) |
215,084 |
18 |
|
|
Yahoo!, Inc. (a) |
307,000 |
11,353 |
|
|
|
45,810 |
||
|
IT Services - 1.8% |
|||
|
Alliance Data Systems Corp. (a)(d) |
88,720 |
21,493 |
|
|
EPAM Systems, Inc. (a) |
188,100 |
6,672 |
|
|
Total System Services, Inc. |
344,600 |
10,700 |
|
|
|
38,865 |
||
|
Semiconductors & Semiconductor Equipment - 2.7% |
|||
|
Altera Corp. |
91,500 |
2,951 |
|
|
Applied Micro Circuits Corp. (a) |
312,900 |
3,927 |
|
|
Common Stocks - continued |
|||
|
Shares |
Value (000s) |
||
|
INFORMATION TECHNOLOGY - continued |
|||
|
Semiconductors & Semiconductor Equipment - continued |
|||
|
Atmel Corp. (a) |
1,064,800 |
$ 8,146 |
|
|
Broadcom Corp. Class A |
246,100 |
6,568 |
|
|
Cree, Inc. (a) |
198,500 |
11,076 |
|
|
RF Micro Devices, Inc. (a) |
1,290,200 |
6,812 |
|
|
Skyworks Solutions, Inc. (a) |
710,750 |
18,899 |
|
|
|
58,379 |
||
|
Software - 3.9% |
|||
|
Autodesk, Inc. (a) |
177,900 |
8,050 |
|
|
Citrix Systems, Inc. (a) |
203,795 |
12,089 |
|
|
Compuware Corp. |
890,800 |
9,790 |
|
|
Electronic Arts, Inc. (a) |
128,200 |
2,843 |
|
|
MICROS Systems, Inc. (a)(d) |
168,800 |
9,068 |
|
|
Nuance Communications, Inc. (a)(d) |
492,634 |
6,660 |
|
|
Parametric Technology Corp. (a) |
324,000 |
10,543 |
|
|
Rovi Corp. (a) |
502,600 |
9,248 |
|
|
SolarWinds, Inc. (a) |
92,380 |
3,089 |
|
|
Synopsys, Inc. (a) |
307,300 |
11,256 |
|
|
|
82,636 |
||
|
TOTAL INFORMATION TECHNOLOGY |
333,218 |
||
|
MATERIALS - 6.9% |
|||
|
Chemicals - 4.6% |
|||
|
Airgas, Inc. |
212,104 |
23,041 |
|
|
Albemarle Corp. |
153,782 |
10,566 |
|
|
Ashland, Inc. |
102,000 |
9,290 |
|
|
Eastman Chemical Co. |
88,970 |
6,853 |
|
|
FMC Corp. |
190,240 |
13,861 |
|
|
Sherwin-Williams Co. |
37,431 |
6,851 |
|
|
Valspar Corp. |
172,130 |
12,154 |
|
|
W.R. Grace & Co. (a) |
149,297 |
14,337 |
|
|
|
96,953 |
||
|
Containers & Packaging - 1.1% |
|||
|
Aptargroup, Inc. |
201,956 |
13,111 |
|
|
Rock-Tenn Co. Class A |
114,200 |
10,783 |
|
|
|
23,894 |
||
|
Common Stocks - continued |
|||
|
Shares |
Value (000s) |
||
|
MATERIALS - continued |
|||
|
Metals & Mining - 1.2% |
|||
|
Carpenter Technology Corp. |
171,600 |
$ 10,346 |
|
|
Reliance Steel & Aluminum Co. |
217,185 |
15,970 |
|
|
|
26,316 |
||
|
TOTAL MATERIALS |
147,163 |
||
|
TELECOMMUNICATION SERVICES - 0.3% |
|||
|
Diversified Telecommunication Services - 0.2% |
|||
|
TW Telecom, Inc. (a) |
163,511 |
4,631 |
|
|
Wireless Telecommunication Services - 0.1% |
|||
|
SBA Communications Corp. Class A (a) |
29,210 |
2,488 |
|
|
TOTAL TELECOMMUNICATION SERVICES |
7,119 |
||
|
UTILITIES - 3.6% |
|||
|
Electric Utilities - 2.1% |
|||
|
Great Plains Energy, Inc. |
405,400 |
9,624 |
|
|
OGE Energy Corp. |
595,800 |
20,507 |
|
|
PNM Resources, Inc. |
341,538 |
7,948 |
|
|
Portland General Electric Co. |
197,500 |
5,887 |
|
|
|
43,966 |
||
|
Gas Utilities - 0.8% |
|||
|
National Fuel Gas Co. |
163,851 |
11,057 |
|
|
Questar Corp. |
288,164 |
6,489 |
|
|
|
17,546 |
||
|
Independent Power Producers & Energy Traders - 0.4% |
|||
|
Black Hills Corp. |
185,300 |
9,315 |
|
|
Water Utilities - 0.3% |
|||
|
American Water Works Co., Inc. |
127,420 |
5,396 |
|
|
TOTAL UTILITIES |
76,223 |
||
|
TOTAL COMMON STOCKS (Cost $1,790,620) |
|
||
|
U.S. Treasury Obligations - 0.0% |
||||
|
|
Principal |
Value (000s) |
||
|
U.S. Treasury Bills, yield at date of purchase 0.03% to 0.04% 1/2/14 to 1/23/14 |
|
$ 295 |
$ 295 |
|
|
Money Market Funds - 4.6% |
|||
|
Shares |
|
||
|
Fidelity Cash Central Fund, 0.10% (b) |
34,823,346 |
34,823 |
|
|
Fidelity Securities Lending Cash Central Fund, 0.10% (b)(c) |
63,510,655 |
63,511 |
|
|
TOTAL MONEY MARKET FUNDS (Cost $98,334) |
|
||
|
TOTAL INVESTMENT PORTFOLIO - 102.6% (Cost $1,889,249) |
2,194,362 |
||
|
NET OTHER ASSETS (LIABILITIES) - (2.6)% |
(54,659) |
||
|
NET ASSETS - 100% |
$ 2,139,703 |
||
|
Futures Contracts |
|||||
|
|
Expiration |
Underlying |
Unrealized |
||
|
Purchased |
|||||
|
Equity Index Contracts |
|||||
|
99 CME E-mini S&P MidCap 400 Index Contracts (United States) |
Dec. 2013 |
$ 12,901 |
$ (46) |
||
|
The face value of futures purchased as a percentage of net assets is 0.6% |
|
Legend |
|
(a) Non-income producing |
|
(b) Affiliated fund that is generally available only to investment companies and other accounts managed by Fidelity Investments. The rate quoted is the annualized seven-day yield of the fund at period end. A complete unaudited listing of the fund's holdings as of its most recent quarter end is available upon request. In addition, each Fidelity Central Fund's financial statements, which are not covered by the Fund's Report of Independent Registered Public Accounting Firm, are available on the SEC's website or upon request. |
|
(c) Investment made with cash collateral received from securities on loan. |
|
(d) Security or a portion of the security is on loan at period end. |
|
(e) Restricted securities - Investment in securities not registered under the Securities Act of 1933 (excluding 144A issues). At the end of the period, the value of restricted securities (excluding 144A issues) amounted to $18,000 or 0.0% of net assets. |
|
Additional information on each restricted holding is as follows: |
|
Security |
Acquisition |
Acquisition |
|
Velti PLC |
4/19/13 |
$ 323 |
|
Affiliated Central Funds |
|
Information regarding fiscal year to date income earned by the Fund from investments in Fidelity Central Funds is as follows: |
|
Fund |
Income earned |
|
Fidelity Cash Central Fund |
$ 60 |
|
Fidelity Securities Lending Cash Central Fund |
284 |
|
Total |
$ 344 |
|
Other Information |
|
The following is a summary of the inputs used, as of November 30, 2013, involving the Fund's assets and liabilities carried at fair value. The inputs or methodology used for valuing securities may not be an indication of the risk associated with investing in those securities. For more information on valuation inputs, and their aggregation into the levels used in the table below, please refer to the Investment Valuation section in the accompanying Notes to Financial Statements. |
|
Valuation Inputs at Reporting Date: |
||||
|
Description |
Total |
Level 1 |
Level 2 |
Level 3 |
|
Investments in Securities: |
||||
|
Equities: |
||||
|
Consumer Discretionary |
$ 297,823 |
$ 297,823 |
$ - |
$ - |
|
Consumer Staples |
76,643 |
76,643 |
- |
- |
|
Energy |
130,410 |
130,410 |
- |
- |
|
Financials |
477,387 |
477,387 |
- |
- |
|
Health Care |
191,017 |
191,017 |
- |
- |
|
Industrials |
358,730 |
358,730 |
- |
- |
|
Information Technology |
333,218 |
333,200 |
18 |
- |
|
Materials |
147,163 |
147,163 |
- |
- |
|
Telecommunication Services |
7,119 |
7,119 |
- |
- |
|
Utilities |
76,223 |
76,223 |
- |
- |
|
U.S. Government and Government Agency Obligations |
295 |
- |
295 |
- |
|
Money Market Funds |
98,334 |
98,334 |
- |
- |
|
Total Investments in Securities: |
$ 2,194,362 |
$ 2,194,049 |
$ 313 |
$ - |
|
Derivative Instruments: |
||||
|
Liabilities |
||||
|
Futures Contracts |
$ (46) |
$ (46) |
$ - |
$ - |
|
Value of Derivative Instruments |
|
The following table is a summary of the Fund's value of derivative instruments by primary risk exposure as of November 30, 2013. For additional information on derivative instruments, please refer to the Derivative Instruments section in the accompanying Notes to Financial Statements. |
|
Primary Risk Exposure / |
Value |
|
|
|
Asset |
Liability |
|
Equity Risk |
||
|
Futures Contracts (a) |
$ - |
$ (46) |
|
Total Value of Derivatives |
$ - |
$ (46) |
|
(a) Reflects gross cumulative appreciation (depreciation) on futures contracts as presented in the Schedule of Investments. Only the period end receivable or payable for daily variation margin and net unrealized appreciation (depreciation) are presented in the Statement of Assets and Liabilities. |
See accompanying notes which are an integral part of the financial statements.
Annual Report
Financial Statements
Statement of Assets and Liabilities
|
Amounts in thousands (except per-share amounts) |
November 30, 2013 |
|
|
|
|
|
|
Assets |
|
|
|
Investment in securities, at value (including securities loaned of $62,228) - See accompanying schedule: Unaffiliated issuers (cost $1,790,915) |
$ 2,096,028 |
|
|
Fidelity Central Funds (cost $98,334) |
98,334 |
|
|
Total Investments (cost $1,889,249) |
|
$ 2,194,362 |
|
Receivable for investments sold |
|
22,603 |
|
Receivable for fund shares sold |
|
717 |
|
Dividends receivable |
|
1,522 |
|
Distributions receivable from Fidelity Central Funds |
|
11 |
|
Prepaid expenses |
|
6 |
|
Other receivables |
|
10 |
|
Total assets |
|
2,219,231 |
|
|
|
|
|
Liabilities |
|
|
|
Payable to custodian bank |
$ 3,640 |
|
|
Payable for investments purchased |
6,951 |
|
|
Payable for fund shares redeemed |
3,617 |
|
|
Accrued management fee |
657 |
|
|
Distribution and service plan fees payable |
644 |
|
|
Payable for daily variation margin for derivative instruments |
46 |
|
|
Other affiliated payables |
428 |
|
|
Other payables and accrued expenses |
34 |
|
|
Collateral on securities loaned, at value |
63,511 |
|
|
Total liabilities |
|
79,528 |
|
|
|
|
|
Net Assets |
|
$ 2,139,703 |
|
Net Assets consist of: |
|
|
|
Paid in capital |
|
$ 2,376,183 |
|
Distributions in excess of net investment income |
|
(2,603) |
|
Accumulated undistributed net realized gain (loss) on investments and foreign currency transactions |
|
(538,954) |
|
Net unrealized appreciation (depreciation) on investments and assets and liabilities in foreign currencies |
|
305,077 |
|
Net Assets |
|
$ 2,139,703 |
See accompanying notes which are an integral part of the financial statements.
Annual Report
Statement of Assets and Liabilities - continued
|
Amounts in thousands (except per-share amounts) |
November 30, 2013 |
|
|
|
|
|
|
Calculation of Maximum Offering Price Class A: |
|
$ 28.37 |
|
|
|
|
|
Maximum offering price per share (100/94.25 of $28.37) |
|
$ 30.10 |
|
Class T: |
|
$ 28.63 |
|
|
|
|
|
Maximum offering price per share (100/96.50 of $28.63) |
|
$ 29.67 |
|
Class B: |
|
$ 26.51 |
|
|
|
|
|
Class C: |
|
$ 26.52 |
|
|
|
|
|
Fidelity Stock Selector Mid Cap Fund: |
|
$ 29.56 |
|
|
|
|
|
Institutional Class: |
|
$ 29.64 |
A Redemption price per share is equal to net asset value less any applicable contingent deferred sales charge.
See accompanying notes which are an integral part of the financial statements.
Annual Report
Financial Statements - continued
Statement of Operations
|
Amounts in thousands |
Year ended November 30, 2013 |
|
|
|
|
|
|
Investment Income |
|
|
|
Dividends |
|
$ 26,043 |
|
Interest |
|
1 |
|
Income from Fidelity Central Funds |
|
344 |
|
Total income |
|
26,388 |
|
|
|
|
|
Expenses |
|
|
|
Management fee |
$ 11,156 |
|
|
Performance adjustment |
(2,847) |
|
|
Transfer agent fees |
4,476 |
|
|
Distribution and service plan fees |
7,433 |
|
|
Accounting and security lending fees |
618 |
|
|
Custodian fees and expenses |
62 |
|
|
Independent trustees' compensation |
11 |
|
|
Registration fees |
125 |
|
|
Audit |
67 |
|
|
Legal |
25 |
|
|
Miscellaneous |
100 |
|
|
Total expenses before reductions |
21,226 |
|
|
Expense reductions |
(552) |
20,674 |
|
Net investment income (loss) |
|
5,714 |
|
Realized and Unrealized Gain (Loss) Net realized gain (loss) on: |
|
|
|
Investment securities: |
|
|
|
Unaffiliated issuers |
286,098 |
|
|
Foreign currency transactions |
(360) |
|
|
Futures contracts |
1,479 |
|
|
Total net realized gain (loss) |
|
287,217 |
|
Change in net unrealized appreciation (depreciation) on: Investment securities |
209,055 |
|
|
Assets and liabilities in foreign currencies |
77 |
|
|
Futures contracts |
(43) |
|
|
Total change in net unrealized appreciation (depreciation) |
|
209,089 |
|
Net gain (loss) |
|
496,306 |
|
Net increase (decrease) in net assets resulting from operations |
|
$ 502,020 |
See accompanying notes which are an integral part of the financial statements.
Annual Report
Statement of Changes in Net Assets
|
Amounts in thousands |
Year ended |
Year ended |
|
Increase (Decrease) in Net Assets |
|
|
|
Operations |
|
|
|
Net investment income (loss) |
$ 5,714 |
$ 5,143 |
|
Net realized gain (loss) |
287,217 |
131,666 |
|
Change in net unrealized appreciation (depreciation) |
209,089 |
136,150 |
|
Net increase (decrease) in net assets resulting |
502,020 |
272,959 |
|
Distributions to shareholders from net investment income |
(8,172) |
(7,037) |
|
Distributions to shareholders from net realized gain |
(2,873) |
- |
|
Total distributions |
(11,045) |
(7,037) |
|
Share transactions - net increase (decrease) |
(34,691) |
(510,527) |
|
Total increase (decrease) in net assets |
456,284 |
(244,605) |
|
|
|
|
|
Net Assets |
|
|
|
Beginning of period |
1,683,419 |
1,928,024 |
|
End of period (including distributions in excess of net investment income of $2,603 and undistributed net investment income of $3,217, respectively) |
$ 2,139,703 |
$ 1,683,419 |
See accompanying notes which are an integral part of the financial statements.
Annual Report
Financial Highlights - Class A
|
Years ended November 30, |
2013 |
2012 |
2011 |
2010 |
2009 |
|
Selected Per-Share Data |
|
|
|
|
|
|
Net asset value, beginning of period |
$ 22.16 |
$ 19.15 |
$ 19.22 |
$ 15.75 |
$ 10.52 |
|
Income from Investment Operations |
|
|
|
|
|
|
Net investment income (loss) C |
.10 |
.09 |
.08 F |
(.02) |
.03 |
|
Net realized and unrealized gain (loss) |
6.29 |
3.02 |
(.15) |
3.55 |
5.20 |
|
Total from investment operations |
6.39 |
3.11 |
(.07) |
3.53 |
5.23 |
|
Distributions from net investment income |
(.14) |
(.10) |
- |
(.03) G |
- |
|
Distributions from net realized gain |
(.04) |
- |
- |
(.03) G |
- |
|
Total distributions |
(.18) |
(.10) |
- |
(.06) |
- |
|
Net asset value, end of period |
$ 28.37 |
$ 22.16 |
$ 19.15 |
$ 19.22 |
$ 15.75 |
|
Total Return A, B |
29.07% |
16.32% |
(.36)% |
22.48% |
49.71% |
|
Ratios to Average Net Assets D, H |
|
|
|
|
|
|
Expenses before reductions |
.95% |
.94% |
.92% |
.86% |
.83% |
|
Expenses net of fee waivers, if any |
.95% |
.94% |
.92% |
.86% |
.83% |
|
Expenses net of all reductions |
.92% |
.94% |
.91% |
.84% |
.81% |
|
Net investment income (loss) |
.39% |
.41% |
.39% F |
(.12)% |
.25% |
|
Supplemental Data |
|
|
|
|
|
|
Net assets, end of period (in millions) |
$ 692 |
$ 593 |
$ 644 |
$ 945 |
$ 906 |
|
Portfolio turnover rate E |
79% I |
72% |
198% |
141% |
244% |
A Total returns would have been lower if certain expenses had not been reduced during the applicable periods shown.
B Total returns do not include the effect of the sales charges.
C Calculated based on average shares outstanding during the period.
D Fees and expenses of any underlying Fidelity Central Funds are not included in the Fund's expense ratio. The Fund indirectly bears its proportionate share of the expenses of any underlying Fidelity Central Funds.
E Amount does not include the portfolio activity of any underlying Fidelity Central Funds.
F Investment income per share reflects a large, non-recurring dividend which amounted to $.05 per share. Excluding this non-recurring dividend, the ratio of net investment income (loss) to average net assets would have been .12%.
G The amounts shown reflect certain reclassifications related to book to tax differences that were made in the year shown.
H Expense ratios reflect operating expenses of the class. Expenses before reductions do not reflect amounts reimbursed by the investment adviser or reductions from brokerage service arrangements or reductions from other expense offset arrangements and do not represent the amount paid by the class during periods when reimbursements or reductions occur. Expenses net of fee waivers reflect expenses after reimbursement by the investment adviser but prior to reductions from brokerage service arrangements or other expense offset arrangements. Expenses net of all reductions represent the net expenses paid by the class.
I The portfolio turnover rate does not include the assets acquired in the merger.
See accompanying notes which are an integral part of the financial statements.
Annual Report
Financial Highlights - Class T
|
Years ended November 30, |
2013 |
2012 |
2011 |
2010 |
2009 |
|
Selected Per-Share Data |
|
|
|
|
|
|
Net asset value, beginning of period |
$ 22.36 |
$ 19.30 |
$ 19.41 |
$ 15.89 |
$ 10.64 |
|
Income from Investment Operations |
|
|
|
|
|
|
Net investment income (loss) C |
.04 |
.05 |
.04 F |
(.05) |
.01 |
|
Net realized and unrealized gain (loss) |
6.36 |
3.05 |
(.15) |
3.59 |
5.24 |
|
Total from investment operations |
6.40 |
3.10 |
(.11) |
3.54 |
5.25 |
|
Distributions from net investment income |
(.09) |
(.04) |
- |
- |
- |
|
Distributions from net realized gain |
(.04) |
- |
- |
(.02) G |
- |
|
Total distributions |
(.13) |
(.04) |
- |
(.02) |
- |
|
Net asset value, end of period |
$ 28.63 |
$ 22.36 |
$ 19.30 |
$ 19.41 |
$ 15.89 |
|
Total Return A, B |
28.80% |
16.12% |
(.57)% |
22.31% |
49.34% |
|
Ratios to Average Net Assets D, H |
|
|
|
|
|
|
Expenses before reductions |
1.16% |
1.14% |
1.11% |
1.03% |
1.02% |
|
Expenses net of fee waivers, if any |
1.16% |
1.14% |
1.11% |
1.03% |
1.02% |
|
Expenses net of all reductions |
1.13% |
1.13% |
1.10% |
1.01% |
.99% |
|
Net investment income (loss) |
.17% |
.22% |
.20% F |
(.30)% |
.07% |
|
Supplemental Data |
|
|
|
|
|
|
Net assets, end of period (in millions) |
$ 817 |
$ 755 |
$ 871 |
$ 1,282 |
$ 1,520 |
|
Portfolio turnover rate E |
79% I |
72% |
198% |
141% |
244% |
A Total returns would have been lower if certain expenses had not been reduced during the applicable periods shown.
B Total returns do not include the effect of the sales charges.
C Calculated based on average shares outstanding during the period.
D Fees and expenses of any underlying Fidelity Central Funds are not included in the Fund's expense ratio. The Fund indirectly bears its proportionate share of the expenses of any underlying Fidelity Central Funds.
E Amount does not include the portfolio activity of any underlying Fidelity Central Funds.
F Investment income per share reflects a large, non-recurring dividend which amounted to $.05 per share. Excluding this non-recurring dividend, the ratio of net investment income (loss) to average net assets would have been (.07)%.
G The amounts shown reflect certain reclassifications related to book to tax differences that were made in the year shown.
H Expense ratios reflect operating expenses of the class. Expenses before reductions do not reflect amounts reimbursed by the investment adviser or reductions from brokerage service arrangements or reductions from other expense offset arrangements and do not represent the amount paid by the class during periods when reimbursements or reductions occur. Expenses net of fee waivers reflect expenses after reimbursement by the investment adviser but prior to reductions from brokerage service arrangements or other expense offset arrangements. Expenses net of all reductions represent the net expenses paid by the class.
I The portfolio turnover rate does not include the assets acquired in the merger.
See accompanying notes which are an integral part of the financial statements.
Annual Report
Financial Highlights - Class B
|
Years ended November 30, |
2013 |
2012 |
2011 |
2010 |
2009 |
|
Selected Per-Share Data |
|
|
|
|
|
|
Net asset value, beginning of period |
$ 20.71 |
$ 17.94 |
$ 18.15 |
$ 14.93 |
$ 10.05 |
|
Income from Investment Operations |
|
|
|
|
|
|
Net investment income (loss) C |
(.10) |
(.07) |
(.07) F |
(.15) |
(.06) |
|
Net realized and unrealized gain (loss) |
5.90 |
2.84 |
(.14) |
3.37 |
4.94 |
|
Total from investment operations |
5.80 |
2.77 |
(.21) |
3.22 |
4.88 |
|
Distributions from net investment income |
- |
- |
- |
- |
- |
|
Distributions from net realized gain |
- |
- |
- |
- |
- |
|
Total distributions |
- |
- |
- |
- |
- |
|
Net asset value, end of period |
$ 26.51 |
$ 20.71 |
$ 17.94 |
$ 18.15 |
$ 14.93 |
|
Total Return A, B |
28.01% |
15.44% |
(1.16)% |
21.57% |
48.56% |
|
Ratios to Average Net Assets D, G |
|
|
|
|
|
|
Expenses before reductions |
1.76% |
1.73% |
1.71% |
1.63% |
1.59% |
|
Expenses net of fee waivers, if any |
1.76% |
1.73% |
1.71% |
1.63% |
1.59% |
|
Expenses net of all reductions |
1.74% |
1.73% |
1.70% |
1.61% |
1.57% |
|
Net investment income (loss) |
(.43)% |
(.38)% |
(.40)% F |
(.90)% |
(.51)% |
|
Supplemental Data |
|
|
|
|
|
|
Net assets, end of period (in millions) |
$ 21 |
$ 22 |
$ 28 |
$ 75 |
$ 131 |
|
Portfolio turnover rate E |
79% H |
72% |
198% |
141% |
244% |
A Total returns would have been lower if certain expenses had not been reduced during the applicable periods shown.
B Total returns do not include the effect of the contingent deferred sales charge.
C Calculated based on average shares outstanding during the period.
D Fees and expenses of any underlying Fidelity Central Funds are not included in the Fund's expense ratio. The Fund indirectly bears its proportionate share of the expenses of any underlying Fidelity Central Funds.
E Amount does not include the portfolio activity of any underlying Fidelity Central Funds.
F Investment income per share reflects a large, non-recurring dividend which amounted to $.05 per share. Excluding this non-recurring dividend, the ratio of net investment income (loss) to average net assets would have been (.67)%.
G Expense ratios reflect operating expenses of the class. Expenses before reductions do not reflect amounts reimbursed by the investment adviser or reductions from brokerage service arrangements or reductions from other expense offset arrangements and do not represent the amount paid by the class during periods when reimbursements or reductions occur. Expenses net of fee waivers reflect expenses after reimbursement by the investment adviser but prior to reductions from brokerage service arrangements or other expense offset arrangements. Expenses net of all reductions represent the net expenses paid by the class.
H The portfolio turnover rate does not include the assets acquired in the merger.
See accompanying notes which are an integral part of the financial statements.
Annual Report
Financial Highlights - Class C
|
Years ended November 30, |
2013 |
2012 |
2011 |
2010 |
2009 |
|
Selected Per-Share Data |
|
|
|
|
|
|
Net asset value, beginning of period |
$ 20.73 |
$ 17.95 |
$ 18.15 |
$ 14.93 |
$ 10.05 |
|
Income from Investment Operations |
|
|
|
|
|
|
Net investment income (loss) C |
(.09) |
(.06) |
(.07) F |
(.14) |
(.06) |
|
Net realized and unrealized gain (loss) |
5.91 |
2.84 |
(.13) |
3.36 |
4.94 |
|
Total from investment operations |
5.82 |
2.78 |
(.20) |
3.22 |
4.88 |
|
Distributions from net investment income |
(.02) |
- |
- |
- |
- |
|
Distributions from net realized gain |
(.01) |
- |
- |
- |
- |
|
Total distributions |
(.03) |
- |
- |
- |
- |
|
Net asset value, end of period |
$ 26.52 |
$ 20.73 |
$ 17.95 |
$ 18.15 |
$ 14.93 |
|
Total Return A, B |
28.09% |
15.49% |
(1.10)% |
21.57% |
48.56% |
|
Ratios to Average Net Assets D, G |
|
|
|
|
|
|
Expenses before reductions |
1.69% |
1.68% |
1.66% |
1.60% |
1.58% |
|
Expenses net of fee waivers, if any |
1.69% |
1.68% |
1.66% |
1.60% |
1.58% |
|
Expenses net of all reductions |
1.67% |
1.68% |
1.65% |
1.58% |
1.55% |
|
Net investment income (loss) |
(.36)% |
(.33)% |
(.35)% F |
(.86)% |
(.50)% |
|
Supplemental Data |
|
|
|
|
|
|
Net assets, end of period (in millions) |
$ 172 |
$ 141 |
$ 150 |
$ 189 |
$ 186 |
|
Portfolio turnover rate E |
79% H |
72% |
198% |
141% |
244% |
A Total returns would have been lower if certain expenses had not been reduced during the applicable periods shown.
B Total returns do not include the effect of the contingent deferred sales charge.
C Calculated based on average shares outstanding during the period.
D Fees and expenses of any underlying Fidelity Central Funds are not included in the Fund's expense ratio. The Fund indirectly bears its proportionate share of the expenses of any underlying Fidelity Central Funds.
E Amount does not include the portfolio activity of any underlying Fidelity Central Funds.
F Investment income per share reflects a large, non-recurring dividend which amounted to $.05 per share. Excluding this non-recurring dividend, the ratio of net investment income (loss) to average net assets would have been (.62)%.
G Expense ratios reflect operating expenses of the class. Expenses before reductions do not reflect amounts reimbursed by the investment adviser or reductions from brokerage service arrangements or reductions from other expense offset arrangements and do not represent the amount paid by the class during periods when reimbursements or reductions occur. Expenses net of fee waivers reflect expenses after reimbursement by the investment adviser but prior to reductions from brokerage service arrangements or other expense offset arrangements. Expenses net of all reductions represent the net expenses paid by the class.
H The portfolio turnover rate does not include the assets acquired in the merger.
See accompanying notes which are an integral part of the financial statements.
Annual Report
Financial Highlights - Fidelity Stock Selector Mid Cap Fund
|
Years ended November 30, |
2013 |
2012 G |
|
Selected Per-Share Data |
|
|
|
Net asset value, beginning of period |
$ 23.14 |
$ 21.20 |
|
Income from Investment Operations |
|
|
|
Net investment income (loss) D |
.17 |
.09 |
|
Net realized and unrealized gain (loss) |
6.54 |
1.85 |
|
Total from investment operations |
6.71 |
1.94 |
|
Distributions from net investment income |
(.25) |
- |
|
Distributions from net realized gain |
(.04) |
- |
|
Total distributions |
(.29) |
- |
|
Net asset value, end of period |
$ 29.56 |
$ 23.14 |
|
Total Return B, C |
29.36% |
9.15% |
|
Ratios to Average Net Assets E, H |
|
|
|
Expenses before reductions |
.71% |
.59% A |
|
Expenses net of fee waivers, if any |
.71% |
.59% A |
|
Expenses net of all reductions |
.69% |
.58% A |
|
Net investment income (loss) |
.62% |
.86% A |
|
Supplemental Data |
|
|
|
Net assets, end of period (in millions) |
$ 225 |
$ 1 |
|
Portfolio turnover rate F |
79% I |
72% |
A Annualized
B Total returns for periods of less than one year are not annualized.
C Total returns would have been lower if certain expenses had not been reduced during the applicable periods shown.
D Calculated based on average shares outstanding during the period.
E Fees and expenses of any underlying Fidelity Central Funds are not included in the Fund's expense ratio. The Fund indirectly bears its proportionate share of the expenses of any underlying Fidelity Central Funds.
F Amount does not include the portfolio activity of any underlying Fidelity Central Funds.
G For the period June 6, 2012 (commencement of sale of shares) to November 30, 2012.
H Expense ratios reflect operating expenses of the class. Expenses before reductions do not reflect amounts reimbursed by the investment adviser or reductions from brokerage service arrangements or reductions from other expense offset arrangements and do not represent the amount paid by the class during periods when reimbursements or reductions occur. Expense ratios before reductions for start-up periods may not be representative of longer-term operating periods. Expenses net of fee waivers reflect expenses after reimbursement by the investment adviser but prior to reductions from brokerage service arrangements or other expense offset arrangements. Expenses net of all reductions represent the net expenses paid by the class.
I The portfolio turnover rate does not include the assets acquired in the merger.
See accompanying notes which are an integral part of the financial statements.
Annual Report
Financial Highlights - Institutional Class
|
Years ended November 30, |
2013 |
2012 |
2011 |
2010 |
2009 |
|
Selected Per-Share Data |
|
|
|
|
|
|
Net asset value, beginning of period |
$ 23.14 |
$ 20.01 |
$ 20.02 |
$ 16.40 |
$ 10.92 |
|
Income from Investment Operations |
|
|
|
|
|
|
Net investment income (loss) B |
.18 |
.15 |
.14 E |
.04 |
.08 |
|
Net realized and unrealized gain (loss) |
6.56 |
3.15 |
(.15) |
3.69 |
5.40 |
|
Total from investment operations |
6.74 |
3.30 |
(.01) |
3.73 |
5.48 |
|
Distributions from net investment income |
(.20) |
(.17) |
- |
(.08) F |
- |
|
Distributions from net realized gain |
(.04) |
- |
- |
(.03) F |
- |
|
Total distributions |
(.24) |
(.17) |
- |
(.11) |
- |
|
Net asset value, end of period |
$ 29.64 |
$ 23.14 |
$ 20.01 |
$ 20.02 |
$ 16.40 |
|
Total Return A |
29.44% |
16.66% |
(.05)% |
22.86% |
50.18% |
|
Ratios to Average Net Assets C, G |
|
|
|
|
|
|
Expenses before reductions |
.67% |
.65% |
.62% |
.54% |
.50% |
|
Expenses net of fee waivers, if any |
.67% |
.65% |
.62% |
.54% |
.50% |
|
Expenses net of all reductions |
.65% |
.64% |
.61% |
.52% |
.47% |
|
Net investment income (loss) |
.66% |
.71% |
.69% E |
.20% |
.59% |
|
Supplemental Data |
|
|
|
|
|
|
Net assets, end of period (in millions) |
$ 214 |
$ 172 |
$ 234 |
$ 354 |
$ 319 |
|
Portfolio turnover rate D |
79% H |
72% |
198% |
141% |
244% |
A Total returns would have been lower if certain expenses had not been reduced during the applicable periods shown.
B Calculated based on average shares outstanding during the period.
C Fees and expenses of any underlying Fidelity Central Funds are not included in the Fund's expense ratio. The Fund indirectly bears its proportionate share of the expenses of any underlying Fidelity Central Funds.
D Amount does not include the portfolio activity of any underlying Fidelity Central Funds.
E Investment income per share reflects a large, non-recurring dividend which amounted to $.06 per share. Excluding this non-recurring dividend, the ratio of net investment income (loss) to average net assets would have been .42%.
F The amounts shown reflect certain reclassifications related to book to tax differences that were made in the year shown.
G Expense ratios reflect operating expenses of the class. Expenses before reductions do not reflect amounts reimbursed by the investment adviser or reductions from brokerage service arrangements or reductions from other expense offset arrangements and do not represent the amount paid by the class during periods when reimbursements or reductions occur. Expenses net of fee waivers reflect expenses after reimbursement by the investment adviser but prior to reductions from brokerage service arrangements or other expense offset arrangements. Expenses net of all reductions represent the net expenses paid by the class.
H The portfolio turnover rate does not include the assets acquired in the merger.
See accompanying notes which are an integral part of the financial statements.
Annual Report
Notes to Financial Statements
For the period ended November 30, 2013
(Amounts in thousands except percentages)
1. Organization.
Fidelity Advisor Stock Selector Mid Cap Fund (the Fund) is a fund of Fidelity Advisor Series I (the Trust) and is authorized to issue an unlimited number of shares. The Trust is registered under the Investment Company Act of 1940, as amended (the 1940 Act), as an open-end management investment company organized as a Massachusetts business trust. The Fund offers Class A, Class T, Class C, Fidelity Stock Selector Mid Cap Fund and Institutional Class shares, each of which, along with Class B shares, has equal rights as to assets and voting privileges. Class B shares are closed to new accounts and additional purchases, except for exchanges and reinvestments. Each class has exclusive voting rights with respect to matters that affect that class. Class B shares will automatically convert to Class A shares after a holding period of seven years from the initial date of purchase.
2. Investments in Fidelity Central Funds.
The Fund invests in Fidelity Central Funds, which are open-end investment companies generally available only to other investment companies and accounts managed by the investment adviser and its affiliates. The Fund's Schedule of Investments lists each of the Fidelity Central Funds held as of period end, if any, as an investment of the Fund, but does not include the underlying holdings of each Fidelity Central Fund. As an Investing Fund, the Fund indirectly bears its proportionate share of the expenses of the underlying Fidelity Central Funds.
The Money Market Central Funds seek preservation of capital and current income and are managed by Fidelity Investments Money Management, Inc. (FIMM), an affiliate of the investment adviser. Annualized expenses of the Money Market Central Funds as of their most recent shareholder report date are less than .01%.
A complete unaudited list of holdings for each Fidelity Central Fund is available upon request or at the Securities and Exchange Commission (the SEC) website at www.sec.gov. In addition, the financial statements of the Fidelity Central Funds, which are not covered by the Fund's Report of Independent Registered Public Accounting Firm, are available on the SEC website or upon request.
3. Significant Accounting Policies.
The financial statements have been prepared in conformity with accounting principles generally accepted in the United States of America (GAAP), which require management to make certain estimates and assumptions at the date of the financial statements. Actual results could differ from those estimates. Subsequent events, if any, through the date that the financial statements were issued have been evaluated in the preparation of
Annual Report
3. Significant Accounting Policies - continued
the financial statements. The following summarizes the significant accounting policies of the Fund:
Investment Valuation. Investments are valued as of 4:00 p.m. Eastern time on the last calendar day of the period. In accordance with valuation policies and procedures approved by the Board of Trustees (the Board), the Fund attempts to obtain prices from one or more third party pricing vendors or brokers to value its investments. When current market prices, quotations or currency exchange rates are not readily available or reliable, investments will be fair valued in good faith by the Fidelity Management & Research Company (FMR) Fair Value Committee (the Committee), in accordance with procedures adopted by the Board. Factors used in determining fair value vary by investment type and may include market or investment specific events, changes in interest rates and credit quality. The frequency with which these procedures are used cannot be predicted and they may be utilized to a significant extent. The Committee oversees the Fund's valuation policies and procedures and is responsible for approving and reporting to the Board all fair value determinations.
The Fund categorizes the inputs to valuation techniques used to value its investments into a disclosure hierarchy consisting of three levels as shown below:
Level 1 - quoted prices in active markets for identical investments
Level 2 - other significant observable inputs (including quoted prices for similar investments, interest rates, prepayment speeds, etc.)
Level 3 - unobservable inputs (including the Fund's own assumptions based on the best information available)
Valuation techniques used to value the Fund's investments by major category are as follows:
Equity securities, including restricted securities, for which market quotations are readily available, are valued at the last reported sale price or official closing price as reported by a third party pricing vendor on the primary market or exchange on which they are traded and are categorized as Level 1 in the hierarchy. In the event there were no sales during the day or closing prices are not available, securities are valued at the last quoted bid price or may be valued using the last available price and are generally categorized as Level 2 in the hierarchy. For foreign equity securities, when market or security specific events arise, comparisons to the valuation of American Depositary Receipts (ADRs), futures contracts, Exchange-Traded Funds (ETFs) and certain indexes as well as quoted prices for similar securities may be used and would be categorized as Level 2 in the hierarchy. Utilizing these techniques may result in transfers between Level 1 and Level 2. For equity securities, including restricted securities, where observable inputs are
Annual Report
Notes to Financial Statements - continued
(Amounts in thousands except percentages)
3. Significant Accounting Policies - continued
Investment Valuation - continued
limited, assumptions about market activity and risk are used and these securities may be categorized as Level 3 in the hierarchy.
Debt securities, including restricted securities, are valued based on evaluated prices received from third party pricing vendors or from brokers who make markets in such securities. For U.S. government and government agency obligations, pricing vendors utilize matrix pricing which considers yield or price of bonds of comparable quality, coupon, maturity and type as well as broker-supplied prices. When independent prices are unavailable or unreliable, debt securities may be valued utilizing pricing methodologies which consider similar factors that would be used by third party pricing vendors. Debt securities are generally categorized as Level 2 in the hierarchy but may be Level 3 depending on the circumstances.
Futures contracts are valued at the settlement price established each day by the board of trade or exchange on which they are traded and are categorized as Level 1 in the hierarchy. Investments in open-end mutual funds, including the Fidelity Central Funds, are valued at their closing net asset value (NAV) each business day and are categorized as Level 1 in the hierarchy.
Changes in valuation techniques may result in transfers in or out of an assigned level within the disclosure hierarchy. The aggregate value of investments by input level, as of November 30, 2013 is included at the end of the Fund's Schedule of Investments.
Foreign Currency. The Fund may use foreign currency contracts to facilitate transactions in foreign-denominated securities. Gains and losses from these transactions may arise from changes in the value of the foreign currency or if the counterparties do not perform under the contracts' terms.
Foreign-denominated assets, including investment securities, and liabilities are translated into U.S. dollars at the exchange rates at period end. Purchases and sales of investment securities, income and dividends received and expenses denominated in foreign currencies are translated into U.S. dollars at the exchange rate in effect on the transaction date.
The effects of exchange rate fluctuations on investments are included with the net realized and unrealized gain (loss) on investment securities. Other foreign currency transactions resulting in realized and unrealized gain (loss) are disclosed separately.
Investment Transactions and Income. For financial reporting purposes, the Fund's investment holdings and NAV include trades executed through the end of the last business day of the period. The NAV per share for processing shareholder transactions is calculated as of the close of business of the New York Stock Exchange (NYSE), normally
Annual Report
3. Significant Accounting Policies - continued
Investment Transactions and Income - continued
4:00 p.m. Eastern time and includes trades executed through the end of the prior business day. Gains and losses on securities sold are determined on the basis of identified cost and may include proceeds received from litigation. Dividend income is recorded on the ex-dividend date, except for certain dividends from foreign securities where the ex-dividend date may have passed, which are recorded as soon as the Fund is informed of the ex-dividend date. Non-cash dividends included in dividend income, if any, are recorded at the fair market value of the securities received. Distributions received on securities that represent a return of capital or capital gain are recorded as a reduction of cost of investments and/or as a realized gain. Subsequent to ex-dividend date the Fund determines the components of these distributions, based upon receipt of tax filings or other correspondence relating to the underlying investment. Interest income and distributions from the Fidelity Central Funds are accrued as earned. Interest income includes coupon interest and amortization of premium and accretion of discount on debt securities. Investment income is recorded net of foreign taxes withheld where recovery of such taxes is uncertain.
Class Allocations and Expenses. Investment income, realized and unrealized capital gains and losses, common expenses of the Fund, and certain fund-level expense reductions, if any, are allocated daily on a pro-rata basis to each class based on the relative net assets of each class to the total net assets of the Fund. Each class differs with respect to transfer agent and distribution and service plan fees incurred. Certain expense reductions may also differ by class. For the reporting period, the allocated portion of income and expenses to each class as a percent of its average net assets may vary due to the timing of recording these transactions in relation to fluctuating net assets of the classes. Expenses directly attributable to a fund are charged to that fund. Expenses attributable to more than one fund are allocated among the respective funds on the basis of relative net assets or other appropriate methods. Expense estimates are accrued in the period to which they relate and adjustments are made when actual amounts are known.
Income Tax Information and Distributions to Shareholders. Each year, the Fund intends to qualify as a regulated investment company under Subchapter M of the Internal Revenue Code, including distributing substantially all of its taxable income and realized gains. As a result, no provision for U.S. Federal income taxes is required. As of November 30, 2013, the Fund did not have any unrecognized tax benefits in the financial statements; nor is the Fund aware of any tax positions for which it is reasonably possible that the total amounts of unrecognized tax benefits will significantly change in the next twelve months. The Fund files a U.S. federal tax return, in addition to state and local tax returns as required. The Fund's federal income tax returns are subject to examination by the Internal Revenue Service (IRS) for a period of three fiscal years after they are filed.
Annual Report
Notes to Financial Statements - continued
(Amounts in thousands except percentages)
3. Significant Accounting Policies - continued
Income Tax Information and Distributions to Shareholders - continued
State and local tax returns may be subject to examination for an additional fiscal year depending on the jurisdiction. Foreign taxes are provided for based on the Fund's understanding of the tax rules and rates that exist in the foreign markets in which it invests.
Distributions are declared and recorded on the ex-dividend date. Income dividends and capital gain distributions are declared separately for each class. Income and capital gain distributions are determined in accordance with income tax regulations, which may differ from GAAP.
Capital accounts within the financial statements are adjusted for permanent book-tax differences. These adjustments have no impact on net assets or the results of operations. Temporary book-tax differences will reverse in a subsequent period.
Book-tax differences are primarily due to futures contracts, foreign currency transactions, passive foreign investment companies (PFIC), market discount, partnerships, deferred trustees compensation, capital loss carryforwards and losses deferred due to wash sales and excise tax regulations.
The federal tax cost of investment securities and unrealized appreciation (depreciation) as of period end were as follows:
|
Gross unrealized appreciation |
$ 369,401 |
|
Gross unrealized depreciation |
(63,598) |
|
Net unrealized appreciation (depreciation) on securities and other investments |
$ 305,803 |
|
|
|
|
Tax Cost |
$ 1,888,559 |
The tax-based components of distributable earnings as of period end were as follows:
|
Capital loss carryforward |
$ (539,689) |
|
Net unrealized appreciation (depreciation) |
$ 305,812 |
Capital loss carryforwards are only available to offset future capital gains of the Fund to the extent provided by regulations and may be limited. Under the Regulated Investment Company Modernization Act of 2010 (the Act), the Fund is permitted to carry forward capital losses incurred in taxable years beginning after December 22, 2010 for an unlimited period and such capital losses are required to be used prior to any losses that expire.
Annual Report
3. Significant Accounting Policies - continued
Income Tax Information and Distributions to Shareholders - continued
The capital loss carryforward information presented below, including any applicable limitation, is estimated as of fiscal period end and is subject to adjustment.
|
Fiscal year of expiration |
|
|
2015 |
$ (1,870) |
|
2016 |
(389,648) |
|
2017 |
(148,171) |
|
Total capital loss carryforward |
$ (539,689) |
The Fund acquired $12,695 of capital loss carryforwards from Fidelity Mid Cap Growth Fund and $3,970 of capital loss carryforwards from Fidelity Advisor Growth Strategies Fund when they merged into the Fund in January 2013. The losses acquired from Fidelity Advisor Growth Strategies Fund that will be available to offset future capital gains of the Fund will be limited to approximately $935 per year. As a result, at least $1,022 of the losses acquired from Fidelity Advisor Growth Strategies Fund will expire unused and is not included in the table above.
The tax character of distributions paid was as follows:
|
|
November 30, 2013 |
November 30, 2012 |
|
Ordinary Income |
$ 11,045 |
$ 7,037 |
Restricted Securities. The Fund may invest in securities that are subject to legal or contractual restrictions on resale. These securities generally may be resold in transactions exempt from registration or to the public if the securities are registered. Disposal of these securities may involve time-consuming negotiations and expense, and prompt sale at an acceptable price may be difficult. Information regarding restricted securities is included at the end of the Fund's Schedule of Investments.
New Accounting Pronouncement. The Financial Accounting Standards Board issued in December 2011, Accounting Standard Update No. 2011-11, Disclosures about Offsetting Assets and Liabilities, and in January 2013, Accounting Standards Update No. 2013-1 Clarifying the Scope of Disclosures about Offsetting Assets and Liabilities. These updates create new disclosure requirements requiring entities to disclose both gross and net information for derivatives and other financial instruments that are either offset in the Statement of Assets and Liabilities or subject to an enforceable master netting arrangement or similar agreement. The disclosure requirements are effective for annual reporting periods beginning on or after January 1, 2013, and interim periods within those annual periods. Management expects that the impact of the updates' adoption will be limited to additional financial statement disclosures as applicable.
Annual Report
Notes to Financial Statements - continued
(Amounts in thousands except percentages)
4. Derivative Instruments.
Risk Exposures and the Use of Derivative Instruments. The Fund's investment objective allows the Fund to enter into various types of derivative contracts, including futures contracts. Derivatives are investments whose value is primarily derived from underlying assets, indices or reference rates and may be transacted on an exchange or over-the-counter (OTC). Derivatives may involve a future commitment to buy or sell a specified asset based on specified terms, to exchange future cash flows at periodic intervals based on a notional principal amount, or for one party to make one or more payments upon the occurrence of specified events in exchange for periodic payments from the other party.
The Fund used derivatives to increase returns and to manage exposure to certain risks as defined below. The success of any strategy involving derivatives depends on analysis of numerous economic factors, and if the strategies for investment do not work as intended, the Fund may not achieve its objectives.
The Fund's use of derivatives increased or decreased its exposure to the following risk:
|
Equity Risk |
Equity risk relates to the fluctuations in the value of financial instruments as a result of changes in market prices (other than those arising from interest rate risk or foreign exchange risk), whether caused by factors specific to an individual investment, its issuer, or all factors affecting all instruments traded in a market or market segment. |
The Fund is also exposed to additional risks from investing in derivatives, such as liquidity risk and counterparty credit risk. Liquidity risk is the risk that the Fund will be unable to close out the derivative in the open market in a timely manner. Counterparty credit risk is the risk that the counterparty will not be able to fulfill its obligation to the Fund. Counterparty credit risk related to exchange-traded futures contracts may be mitigated by the protection provided by the exchange on which they trade.
Investing in derivatives may involve greater risks than investing in the underlying assets directly and, to varying degrees, may involve risk of loss in excess of any initial investment and collateral received and amounts recognized in the Statement of Assets and Liabilities. In addition, there may be the risk that the change in value of the derivative contract does not correspond to the change in value of the underlying instrument.
Futures Contracts. A futures contract is an agreement between two parties to buy or sell a specified underlying instrument for a fixed price at a specified future date. The Fund used futures contracts to manage its exposure to the stock markets.
Upon entering into a futures contract, a fund is required to deposit either cash or securities (initial margin) with a clearing broker in an amount equal to a certain percentage of the face value of the contract. Futures contracts are marked-to-market daily and subsequent daily payments (variation margin) are made or received by a fund depending on
Annual Report
4. Derivative Instruments - continued
Futures Contracts - continued
the daily fluctuations in the value of the futures contracts and are recorded as unrealized appreciation or (depreciation). This receivable and/or payable, if any, is included in daily variation margin for derivative instruments in the Statement of Assets and Liabilities. Realized gain or (loss) is recorded upon the expiration or closing of a futures contract.
Any open futures contracts at period end are presented in the Schedule of Investments under the caption "Futures Contracts." The underlying face amount at value reflects each contract's exposure to the underlying instrument or index at period end and is representative of volume of activity during the period.
During the period the Fund recognized net realized gain (loss) of $1,479 and a change in net unrealized appreciation (depreciation) of $(43) related to its investment in futures contracts. These amounts are included in the Statement of Operations.
5. Purchases and Sales of Investments.
Purchases and sales of securities, other than short-term securities, aggregated $1,522,901 and $1,815,166, respectively.
6. Fees and Other Transactions with Affiliates.
Management Fee. Fidelity Management & Research Company (the investment adviser) and its affiliates provide the Fund with investment management related services for which the Fund pays a monthly management fee. The management fee is the sum of an individual fund fee rate that is based on an annual rate of .30% of the Fund's average net assets and an annualized group fee rate that averaged .25% during the period. The group fee rate is based upon the average net assets of all the mutual funds advised by the investment adviser, including any mutual funds previously advised by the investment adviser that are currently advised by Fidelity SelectCo, LLC, an affiliate of the investment adviser. The group fee rate decreases as assets under management increase and increases as assets under management decrease. In addition, the management fee is subject to a performance adjustment (up to a maximum of ± .20% of the Fund's average net assets over a 36 month performance period). The upward or downward adjustment to the management fee is based on the relative investment performance of the Institutional Class of the Fund as compared to an appropriate benchmark index over the same 36 month performance period. For the reporting period, the total annual management fee rate, including the performance adjustment, was .41% of the Fund's average net assets. The performance adjustment included in the management fee rate may be higher or lower than the maximum performance adjustment rate due to the difference between the average net assets for the reporting and performance periods.
Annual Report
Notes to Financial Statements - continued
(Amounts in thousands except percentages)
6. Fees and Other Transactions with Affiliates - continued
Distribution and Service Plan Fees. In accordance with Rule 12b-1 of the 1940 Act, the Fund has adopted separate Distribution and Service Plans for each class of shares. Certain classes pay Fidelity Distributors Corporation (FDC), an affiliate of the investment adviser, separate Distribution and Service Fees, each of which is based on an annual percentage of each class' average net assets. In addition, FDC may pay financial intermediaries for selling shares of the Fund and providing shareholder support services. For the period, the Distribution and Service Fee rates, total fees and amounts retained by FDC were as follows:
|
|
Distribution |
Service |
Total Fees |
Retained |
|
Class A |
-% |
.25% |
$ 1,631 |
$ 131 |
|
Class T |
.25% |
.25% |
3,977 |
24 |
|
Class B |
.75% |
.25% |
218 |
167 |
|
Class C |
.75% |
.25% |
1,607 |
49 |
|
|
|
|
$ 7,433 |
$ 371 |
Sales Load. FDC may receive a front-end sales charge of up to 5.75% for selling Class A shares and 3.50% for selling Class T shares, some of which is paid to financial intermediaries for selling shares of the Fund. Depending on the holding period, FDC may receive contingent deferred sales charges levied on Class A, Class T, Class B, and Class C redemptions. The deferred sales charges range from 5.00% to 1.00% for Class B shares, 1.00% for Class C shares, 1.00% for certain purchases of Class A shares and .25% for certain purchases of Class T shares.
For the period, sales charge amounts retained by FDC were as follows:
|
|
Retained |
|
Class A |
$ 43 |
|
Class T |
20 |
|
Class B* |
12 |
|
Class C* |
3 |
|
|
$ 78 |
* When Class B and Class C shares are initially sold, FDC pays commissions from its own resources to financial intermediaries through which the sales
are made.
Transfer Agent Fees. Fidelity Investments Institutional Operations Company, Inc., (FIIOC), an affiliate of the investment adviser, is the transfer, dividend disbursing and shareholder servicing agent for each class of the Fund. FIIOC receives account fees and asset-based fees that vary according to the account size and type of account of the shareholders of the respective classes of the Fund. FIIOC pays for typesetting, printing and mailing of shareholder reports, except proxy statements.
Annual Report
6. Fees and Other Transactions with Affiliates - continued
Transfer Agent Fees - continued
For the period, transfer agent fees for each class were as follows:
|
|
Amount |
% of |
|
Class A |
$ 1,555 |
.24 |
|
Class T |
1,592 |
.20 |
|
Class B |
65 |
.30 |
|
Class C |
372 |
.23 |
|
Fidelity Stock Selector Mid Cap Fund |
472 |
.25 |
|
Institutional Class |
420 |
.21 |
|
|
$ 4,476 |
|
Accounting and Security Lending Fees. Fidelity Service Company, Inc. (FSC), an affiliate of the investment adviser, maintains the Fund's accounting records. The accounting fee is based on the level of average net assets for each month. Under a separate contract, FSC administers the security lending program. The security lending fee is based on the number and duration of lending transactions.
Brokerage Commissions. The Fund placed a portion of its portfolio transactions with brokerage firms which are affiliates of the investment adviser. Brokerage commissions are included in net realized gain (loss) and change in net unrealized appreciation (depreciation) in the Statement of Operations. The commissions paid to these affiliated firms were $39 for the period.
7. Committed Line of Credit.
The Fund participates with other funds managed by the investment adviser or an affiliate in a $4.25 billion credit facility (the "line of credit") to be utilized for temporary or emergency purposes to fund shareholder redemptions or for other short-term liquidity purposes. The Fund has agreed to pay commitment fees on its pro-rata portion of the line of credit, which amounted to $4 and is reflected in Miscellaneous expenses on the Statement of Operations. During the period, there were no borrowings on this line of credit.
8. Security Lending.
The Fund lends portfolio securities through a lending agent from time to time in order to earn additional income. For equity securities, a lending agent is used and may loan securities to certain qualified borrowers, including Fidelity Capital Markets (FCM), a broker-dealer affiliated with the Fund. On the settlement date of the loan, the Fund
Annual Report
Notes to Financial Statements - continued
(Amounts in thousands except percentages)
8. Security Lending - continued
receives collateral (in the form of U.S. Treasury obligations, letters of credit and/or cash) against the loaned securities and maintains collateral in an amount not less than 100% of the market value of the loaned securities during the period of the loan. The market value of the loaned securities is determined at the close of business of the Fund and any additional required collateral is delivered to the Fund on the next business day. If the borrower defaults on its obligation to return the securities loaned because of insolvency or other reasons, the Fund may apply collateral received from the borrower against the obligation. The Fund may experience delays and costs in recovering the securities loaned. Any cash collateral received is invested in the Fidelity Securities Lending Cash Central Fund. The value of loaned securities and cash collateral at period end are disclosed on the Fund's Statement of Assets and Liabilities. At period end, there were no security loans outstanding with FCM. Security lending income represents the income earned on investing cash collateral, less rebates paid to borrowers, and any lending agent fees associated with the loan, plus any premium payments received for lending certain types of securities. Security lending income is presented in the Statement of Operations as a component of income from Fidelity Central Funds. Total security lending income during the period amounted to $284, including $5 from securities loaned to FCM.
9. Expense Reductions.
The investment adviser voluntarily agreed to reimburse a portion of the Fund's Class A, Class T, Class B, Class C and Institutional Class operating expenses. During the period, this reimbursement reduced expenses as follows:
|
|
Reimbursement |
|
Class A |
$ 6 |
|
Class T |
7 |
|
Class B |
-* |
|
Class C |
2 |
|
Institutional Class |
2 |
|
|
$ 17 |
* Amount represents two hundred dollars.
Commissions paid to certain brokers with whom the investment adviser, or its affiliates, places trades on behalf of the Fund include an amount in addition to trade execution, which may be rebated back to the Fund to offset certain expenses. This amount totaled $532 for the period.
In addition, the investment adviser reimbursed a portion of the Fund's operating expenses during the period in the amount of $3.
Annual Report
10. Distributions to Shareholders.
Distributions to shareholders of each class were as follows:
|
Years ended November 30, |
2013 |
2012 A |
|
From net investment income |
|
|
|
Class A |
$ 3,606 |
$ 3,191 |
|
Class T |
2,972 |
1,890 |
|
Class C |
121 |
- |
|
Fidelity Stock Selector Mid Cap Fund |
16 |
- |
|
Institutional Class |
1,457 |
1,956 |
|
Total |
$ 8,172 |
$ 7,037 |
|
From net realized gain |
|
|
|
Class A |
$ 1,106 |
$ - |
|
Class T |
1,403 |
- |
|
Class C |
54 |
- |
|
Fidelity Stock Selector Mid Cap Fund |
3 |
- |
|
Institutional Class |
307 |
- |
|
Total |
$ 2,873 |
$ - |
A Distributions for Fidelity Stock Selector Mid Cap Fund are for the period June 6, 2012 (commencement of sale of shares) to November 30, 2012.
11. Share Transactions.
Transactions for each class of shares were as follows:
|
|
Shares |
Dollars |
||
|
Years ended November 30, |
2013 |
2012 A |
2013 |
2012 A |
|
Class A |
|
|
|
|
|
Shares sold |
1,576 |
2,534 |
$ 39,740 |
$ 52,691 |
|
Issued in exchange for shares of Fidelity Advisor Growth Strategies Fund |
483 |
- |
11,196 |
- |
|
Issued in exchange for shares of Fidelity Mid Cap Growth Fund |
410 |
- |
9,497 |
- |
|
Reinvestment of distributions |
196 |
158 |
4,309 |
2,914 |
|
Shares redeemed |
(5,036) |
(9,598) |
(125,748) |
(199,005) |
|
Net increase (decrease) |
(2,371) |
(6,906) |
$ (61,006) |
$ (143,400) |
|
Class T |
|
|
|
|
|
Shares sold |
2,840 |
3,511 |
$ 71,906 |
$ 74,253 |
|
Issued in exchange for shares of Fidelity Advisor Growth Strategies Fund |
643 |
- |
15,054 |
- |
|
Issued in exchange for shares of Fidelity Mid Cap Growth Fund |
182 |
- |
4,267 |
- |
|
Reinvestment of distributions |
188 |
96 |
4,170 |
1,803 |
|
Shares redeemed |
(9,076) |
(14,999) |
(228,859) |
(312,249) |
|
Net increase (decrease) |
(5,223) |
(11,392) |
$ (133,462) |
$ (236,193) |
Annual Report
Notes to Financial Statements - continued
(Amounts in thousands except percentages)
11. Share Transactions - continued
|
|
Shares |
Dollars |
||
|
Years ended November 30, |
2013 |
2012 A |
2013 |
2012 A |
|
Class B |
|
|
|
|
|
Shares sold |
4 |
3 |
$ 95 |
$ 54 |
|
Issued in exchange for shares of Fidelity Advisor Growth Strategies Fund |
75 |
- |
1,640 |
- |
|
Issued in exchange for shares of Fidelity Mid Cap Growth Fund |
28 |
- |
614 |
- |
|
Shares redeemed |
(363) |
(540) |
(8,472) |
(10,540) |
|
Net increase (decrease) |
(256) |
(537) |
$ (6,123) |
$ (10,486) |
|
Class C |
|
|
|
|
|
Shares sold |
236 |
225 |
$ 5,603 |
$ 4,440 |
|
Issued in exchange for shares of Fidelity Advisor Growth Strategies Fund |
209 |
- |
4,553 |
- |
|
Issued in exchange for shares of Fidelity Mid Cap Growth Fund |
219 |
- |
4,769 |
- |
|
Reinvestment of distributions |
7 |
- |
152 |
- |
|
Shares redeemed |
(993) |
(1,754) |
(23,227) |
(34,462) |
|
Net increase (decrease) |
(322) |
(1,529) |
$ (8,150) |
$ (30,022) |
|
Fidelity Stock Selector Mid Cap Fund |
|
|
|
|
|
Shares sold |
1,327 |
69 |
$ 35,648 |
$ 1,562 |
|
Issued in exchange for shares of Fidelity Mid Cap Growth Fund |
8,810 |
- |
212,139 |
- |
|
Reinvestment of distributions |
1 |
- |
16 |
- |
|
Shares redeemed |
(2,600) |
(4) |
(67,266) |
(89) |
|
Net increase (decrease) |
7,538 |
65 |
$ 180,537 |
$ 1,473 |
|
Institutional Class |
|
|
|
|
|
Shares sold |
1,231 |
1,655 |
$ 32,432 |
$ 35,850 |
|
Issued in exchange for shares of Fidelity Advisor Growth Strategies Fund |
20 |
- |
479 |
- |
|
Issued in exchange for shares of Fidelity Mid Cap Growth Fund |
37 |
- |
888 |
- |
|
Reinvestment of distributions |
68 |
93 |
1,564 |
1,794 |
|
Shares redeemed |
(1,567) |
(6,043) |
(41,850) |
(129,543) |
|
Net increase (decrease) |
(211) |
(4,295) |
$ (6,487) |
$ (91,899) |
A Share transactions for Fidelity Stock Selector Mid Cap Fund are for the period June 6, 2012 (commencement of sale of shares) to November 30, 2012.
Annual Report
12. Merger Information.
On January 11, 2013, the Fund acquired all of the assets and assumed all of the liabilities of Fidelity Advisor Growth Strategies Fund and Fidelity Mid Cap Growth Fund ("Target Funds") pursuant to agreements and plans of reorganization approved by the Board of Trustees ("The Board") on June 12, 2012. The acquisition was accomplished by an exchange of shares of each class of the Fund for corresponding shares then outstanding of the Target Funds at their net asset value on the acquisition date. The reorganization provides shareholders of the Target Funds access to a larger portfolio with a similar investment objective. The reorganization qualified as a tax-free reorganization for federal income tax purposes with no gain or loss recognized to the funds or their shareholders. The Target Funds' net assets of $32,922, including securities of $32,974 and unrealized appreciation of $2,113 for Fidelity Advisor Growth Strategies Fund; and net assets of $232,174, including securities of $233,755 and unrealized appreciation of $14,520 for Fidelity Mid Cap Growth Fund were combined with the Fund's net assets of $1,716,041 for total net assets after the acquisition of $1,981,137.
Pro forma results of operations of the combined entity for the entire period ended November 30, 2013, as though the acquisition had occurred as of the beginning of the year (rather than on the actual acquisition dates), are as follows:
|
Net investment income (loss) |
$ 6,032 |
|
Total net realized gain (loss) |
288,183 |
|
Total change in net unrealized appreciation (depreciation) |
219,225 |
|
Net increase (decrease) in net assets resulting from operations |
$ 513,440 |
Because the combined investment portfolios have been managed as a single portfolio since the acquisition was completed, it is not practicable to separate the amounts of revenue and earnings of the acquired fund that have been included in the Fund's accompanying Statement of Operations since January 11, 2013.
13. Other.
The Fund's organizational documents provide former and current trustees and officers with a limited indemnification against liabilities arising in connection with the performance of their duties to the Fund. In the normal course of business, the Fund may also enter into contracts that provide general indemnifications. The Fund's maximum exposure under these arrangements is unknown as this would be dependent on future claims that may be made against the Fund. The risk of material loss from such claims is considered remote.
Annual Report
Report of Independent Registered Public Accounting Firm
To the Trustees of Fidelity Advisor Series I and Shareholders of Fidelity Advisor Stock Selector Mid Cap Fund:
We have audited the accompanying statement of assets and liabilities of Fidelity Advisor Stock Selector Mid Cap Fund (the Fund), a fund of Fidelity Advisor Series I, including the schedule of investments, as of November 30, 2013, and the related statement of operations for the year then ended, the statement of changes in net assets for each of the two years in the period then ended, and the financial highlights for each of the five years in the period then ended. These financial statements and financial highlights are the responsibility of the Fund's management. Our responsibility is to express an opinion on these financial statements and financial highlights based on our audits.
We conducted our audits in accordance with the standards of the Public Company Accounting Oversight Board (United States). Those standards require that we plan and perform the audit to obtain reasonable assurance about whether the financial statements and financial highlights are free of material misstatement. The Fund is not required to have, nor were we engaged to perform, an audit of its internal control over financial reporting. Our audits included consideration of internal control over financial reporting as a basis for designing audit procedures that are appropriate in the circumstances, but not for the purpose of expressing an opinion on the effectiveness of the Fund's internal control over financial reporting. Accordingly, we express no such opinion. An audit also includes examining, on a test basis, evidence supporting the amounts and disclosures in the financial statements, assessing the accounting principles used and significant estimates made by management, as well as evaluating the overall financial statement presentation. Our procedures included confirmation of securities owned as of November 30, 2013, by correspondence with the custodians and brokers; where replies were not received from brokers, we performed other auditing procedures. We believe that our audits provide a reasonable basis for our opinion.
In our opinion, the financial statements and financial highlights referred to above present fairly, in all material respects, the financial position of Fidelity Advisor Stock Selector Mid Cap Fund as of November 30, 2013, the results of its operations for the year then ended, the changes in its net assets for each of the two years in the period then ended, and the financial highlights for each of the five years in the period then ended, in conformity with accounting principles generally accepted in the United States of America.
DELOITTE & TOUCHE LLP
Boston, Massachusetts
January 16, 2014
Annual Report
Trustees and Officers
The Trustees, Member of the Advisory Board, and officers of the trust and fund, as applicable, are listed below. The Board of Trustees governs the fund and is responsible for protecting the interests of shareholders. The Trustees are experienced executives who meet periodically throughout the year to oversee the fund's activities, review contractual arrangements with companies that provide services to the fund, oversee management of the risks associated with such activities and contractual arrangements, and review the fund's performance. Except for James C. Curvey, Ned C. Lautenbach, Ronald P. O'Hanley, and William S. Stavropoulos, each of the Trustees oversees 173 funds. Mr. Curvey oversees 396 funds. Mr. Lautenbach, Mr. O'Hanley, and Mr. Stavropoulos each oversees 247 funds.
The Trustees hold office without limit in time except that (a) any Trustee may resign; (b) any Trustee may be removed by written instrument, signed by at least two-thirds of the number of Trustees prior to such removal; (c) any Trustee who requests to be retired or who has become incapacitated by illness or injury may be retired by written instrument signed by a majority of the other Trustees; and (d) any Trustee may be removed at any special meeting of shareholders by a two-thirds vote of the outstanding voting securities of the trust. Each Trustee who is not an interested person (as defined in the 1940 Act) of the trust and the fund (Independent Trustee), shall retire not later than the last day of the calendar year in which his or her 75th birthday occurs. The Independent Trustees may waive this mandatory retirement age policy with respect to individual Trustees. The officers and Advisory Board Member hold office without limit in time, except that any officer and Advisory Board Member may resign or may be removed by a vote of a majority of the Trustees at any regular meeting or any special meeting of the Trustees. Except as indicated, each individual has held the office shown or other offices in the same company for the past five years.
Experience, Skills, Attributes, and Qualifications of the Fund's Trustees. The Governance and Nominating Committee has adopted a statement of policy that describes the experience, qualifications, attributes, and skills that are necessary and desirable for potential Independent Trustee candidates (Statement of Policy). The Board believes that each Trustee satisfied at the time he or she was initially elected or appointed a Trustee, and continues to satisfy, the standards contemplated by the Statement of Policy. The Governance and Nominating Committee also engages professional search firms to help identify potential Independent Trustee candidates who have the experience, qualifications, attributes, and skills consistent with the Statement of Policy. From time to time, additional criteria based on the composition and skills of the current Independent Trustees, as well as experience or skills that may be appropriate in light of future changes to board composition, business conditions, and regulatory or other developments, have also been considered by the professional search firms and the Governance and Nominating Committee. In addition, the Board takes into account the Trustees' commitment and participation in Board and committee meetings, as well as their leadership of standing and ad hoc committees throughout their tenure.
Annual Report
In determining that a particular Trustee was and continues to be qualified to serve as a Trustee, the Board has considered a variety of criteria, none of which, in isolation, was controlling. The Board believes that, collectively, the Trustees have balanced and diverse experience, qualifications, attributes, and skills, which allow the Board to operate effectively in governing the fund and protecting the interests of shareholders. Information about the specific experience, skills, attributes, and qualifications of each Trustee, which in each case led to the Board's conclusion that the Trustee should serve (or continue to serve) as a trustee of the fund, is provided below.
Board Structure and Oversight Function. James C. Curvey is an interested person (as defined in the 1940 Act) and currently serves as Chairman. The Trustees have determined that an interested Chairman is appropriate and benefits shareholders because an interested Chairman has a personal and professional stake in the quality and continuity of services provided to the fund. Independent Trustees exercise their informed business judgment to appoint an individual of their choosing to serve as Chairman, regardless of whether the Trustee happens to be independent or a member of management. The Independent Trustees have determined that they can act independently and effectively without having an Independent Trustee serve as Chairman and that a key structural component for assuring that they are in a position to do so is for the Independent Trustees to constitute a substantial majority for the Board. The Independent Trustees also regularly meet in executive session. Ned C. Lautenbach serves as Chairman of the Independent Trustees and as such (i) acts as a liaison between the Independent Trustees and management with respect to matters important to the Independent Trustees and (ii) with management prepares agendas for Board meetings.
Fidelity funds are overseen by different Boards of Trustees. The fund's Board oversees Fidelity's equity and high income funds and another Board oversees Fidelity's investment-grade bond, money market, and asset allocation funds. The asset allocation funds may invest in Fidelity funds overseen by the fund's Board. The use of separate Boards, each with its own committee structure, allows the Trustees of each group of Fidelity funds to focus on the unique issues of the funds they oversee, including common research, investment, and operational issues. On occasion, the separate Boards establish joint committees to address issues of overlapping consequences for the Fidelity funds overseen by each Board.
The Trustees operate using a system of committees to facilitate the timely and efficient consideration of all matters of importance to the Trustees, the fund, and fund shareholders and to facilitate compliance with legal and regulatory requirements and oversight of the fund's activities and associated risks. The Board, acting through its committees, has charged FMR and its affiliates with (i) identifying events or circumstances the occurrence of which could have demonstrably adverse effects on the fund's business and/or reputation; (ii) implementing processes and controls to lessen the possibility that such events or circumstances occur or to mitigate the effects of such events or circumstances if they do occur; and (iii) creating and maintaining a system designed to evaluate continuously business and market conditions in order to facilitate the identification and implementation processes described in (i) and (ii) above. Because the day-to-day operations and activities of the fund are carried out by or through FMR, its affiliates and other service providers, the fund's exposure to risks is mitigated but not eliminated by the processes overseen by the Trustees. While each of the Board's committees has responsibility for overseeing different aspects of the fund's activities, oversight is exercised primarily through the Operations, Audit, and Compliance Committees. In addition, the Independent Trustees have worked with FMR to enhance the Board's oversight of investment and financial risks, legal and regulatory risks, technology risks, and operational risks, including the development of additional risk reporting to the Board. For example, a working group comprised of Independent Trustees and FMR has worked and continues to work to review the Fidelity funds' valuation-related activities, reporting and risk management. Appropriate personnel, including but not limited to the fund's Chief Compliance Officer (CCO), FMR's internal auditor, the independent accountants, the fund's Treasurer and portfolio management personnel, make periodic reports to the Board's committees, as appropriate, including an annual review of FMR's risk management program for the Fidelity funds. The responsibilities of each standing committee, including their oversight responsibilities, are described further under "Standing Committees of the Fund's Trustees."
Annual Report
Trustees and Officers - continued
The fund's Statement of Additional Information (SAI) includes more information about the Trustees. To request a free copy, call Fidelity at 1-800-544-8544.
Interested Trustees*:
Correspondence intended for each Trustee who is an interested person may be sent to Fidelity Investments, 245 Summer Street, Boston, Massachusetts 02210.
|
Name, Year of Birth; Principal Occupations and Other Relevant Experience+ |
|
|
James C. Curvey (1935) |
|
|
Year of Election or Appointment: 2007 Trustee Chairman of the Board of Trustees |
|
|
|
Mr. Curvey also serves as Trustee of other Fidelity funds. Mr. Curvey is a Director of Fidelity Investments Money Management, Inc. (2009-present), Director of Fidelity Research & Analysis Co. (2009-present) and Director of FMR and FMR Co., Inc. (2007-present). Mr. Curvey is also Vice Chairman (2007-present) and Director of FMR LLC. In addition, Mr. Curvey serves as an Overseer for the Boston Symphony Orchestra and a member of the Trustees of Villanova University. Previously, Mr. Curvey was the Vice Chairman (2006-2007) and Director (2000-2007) of FMR Corp. |
|
Ronald P. O'Hanley (1957) |
|
|
Year of Election or Appointment: 2011 Trustee |
|
|
|
Mr. O'Hanley also serves as Trustee of other Fidelity funds. He is Director of Fidelity SelectCo, LLC (2013-present), FMR Co., Inc. (2010-present), Director of Fidelity Investments Money Management, Inc. (2010-present), Director of Fidelity Research & Analysis Company (2010-present), President of Fidelity Asset Management and Corporate Services and a Member of Fidelity's Executive Committee (2010-present). Previously, Mr. O'Hanley served as President and Chief Executive Officer of BNY Mellon Asset Management (2007-2010). Mr. O'Hanley also served as Vice Chairman of Bank New York Mellon Corp. and a member of that firm's Executive Committee. Prior to the 2007 merger of The Bank of New York and Mellon Financial Corporation, he was Vice Chairman of Mellon Financial Corporation and President and Chief Executive Officer of Mellon Asset Management. He joined Mellon in February 1997. Mr. O'Hanley currently serves as Chairman of the Boston Public Library Foundation Board of Directors and sits on the Board of Directors of Beth Israel Deaconess Medical Center, the Board of Trustees of the Marine Biological Laboratory and the Advisory Board of the Maxwell School of Citizenship and Public Administration at Syracuse University. Mr. O'Hanley also chairs the Council on Asset Management for the Financial Services Roundtable and is a member of the Board of Directors of Institutional Investor's U.S. Institute. |
* Trustees have been determined to be "Interested Trustees" by virtue of, among other things, their affiliation with the trust or various entities under common control with FMR.
+ The information above includes each Trustee's principal occupation during the last five years and other information relating to the experience, attributes, and skills relevant to each Trustee's qualifications to serve as a Trustee, which led to the conclusion that each Trustee should serve as a Trustee for the fund.
Annual Report
Trustees and Officers - continued
Independent Trustees:
Correspondence intended for each Independent Trustee (that is, the Trustees other than the Interested Trustees) may be sent to Fidelity Investments, P.O. Box 55235, Boston, Massachusetts 02205-5235.
|
Name, Year of Birth; Principal Occupations and Other Relevant Experience+ |
|
|
Dennis J. Dirks (1948) |
|
|
Year of Election or Appointment: 2005 Trustee |
|
|
|
Mr. Dirks also serves as Trustee of other Fidelity funds. Prior to his retirement in May 2003, Mr. Dirks was Chief Operating Officer and a member of the Board of The Depository Trust & Clearing Corporation (DTCC). He also served as President, Chief Operating Officer, and Board member of The Depository Trust Company (DTC) and President and Board member of the National Securities Clearing Corporation (NSCC). In addition, Mr. Dirks served as Chief Executive Officer and Board member of the Government Securities Clearing Corporation, Chief Executive Officer and Board member of the Mortgage-Backed Securities Clearing Corporation, as a Trustee and a member of the Finance Committee of Manhattan College (2005-2008), and as a Trustee and a member of the Finance Committee of AHRC of Nassau County (2006-2008). Mr. Dirks is a member of the Independent Directors Council (IDC) Governing Council (2010-present) and Board of Directors for The Brookville Center for Children's Services, Inc. (2009-present). |
|
Alan J. Lacy (1953) |
|
|
Year of Election or Appointment: 2008 Trustee |
|
|
|
Mr. Lacy also serves as Trustee of other Fidelity funds. Mr. Lacy serves as Senior Adviser (2007-present) of Oak Hill Capital Partners, L.P. (private equity). Mr. Lacy also served as Chief Executive Officer (2000-2005) and Vice Chairman (2005-2006) of Sears Holdings Corporation and Sears, Roebuck and Co. (retail). In addition, Mr. Lacy serves as a member of the Board of Directors of Dave & Buster's Entertainment, Inc. (restaurant and entertainment complexes, 2010-present), Earth Fare, Inc. (retail grocery, 2012-present), The Hillman Companies, Inc. (hardware wholesalers, 2010-present), and Bristol-Myers Squibb Company (global pharmaceuticals, 2008-present). Mr. Lacy is a member of the Board of Trustees of The National Parks Conservation Association (2006-present). Previously, Mr. Lacy served as Chairman of the Board of Trustees of the National Parks Conservation Association (2008-2011) and as a member of the Board of Directors for the Western Union Company (global money transfer, 2006-2011). |
|
Ned C. Lautenbach (1944) |
|
|
Year of Election or Appointment: 2000 Trustee Chairman of the Independent Trustees |
|
|
|
Mr. Lautenbach also serves as Trustee of other Fidelity funds. Mr. Lautenbach currently serves as the Lead Director of the Eaton Corporation Board of Directors (diversified industrial, 1997-present). Mr. Lautenbach is Chairman of the Board of Directors of the Philharmonic Center for the Arts in Naples, Florida (2012-present) and a member of the Council on Foreign Relations (1994-present). Previously, Mr. Lautenbach was a Partner/Advisory Partner at Clayton, Dubilier & Rice, LLC (private equity investment, 1998-2010), as well as a Director of Sony Corporation (2006-2007). |
|
Joseph Mauriello (1944) |
|
|
Year of Election or Appointment: 2008 Trustee |
|
|
|
Mr. Mauriello also serves as Trustee of other Fidelity funds. Prior to his retirement in January 2006, Mr. Mauriello served in numerous senior management positions including Deputy Chairman and Chief Operating Officer (2004-2005), and Vice Chairman of Financial Services (2002-2004) of KPMG LLP US (professional services, 1965-2005). Mr. Mauriello currently serves as a member of the Board of Directors of XL Group plc. (global insurance and re-insurance, 2006-present). Previously, Mr. Mauriello served as a Director of the Hamilton Funds of the Bank of New York (2006-2007) and of Arcadia Resources Inc. (health care services and products, 2007-2012). |
|
Robert W. Selander (1950) |
|
|
Year of Election or Appointment: 2011 Trustee |
|
|
|
Mr. Selander also serves as Trustee of other Fidelity funds. Previously, Mr. Selander served as a Member of the Advisory Board of other Fidelity funds (2011), and Executive Vice Chairman (2010), Chief Executive Officer (2009-2010), and President and Chief Executive Officer (1997-2009) of Mastercard, Inc. |
|
Cornelia M. Small (1944) |
|
|
Year of Election or Appointment: 2005 Trustee |
|
|
|
Ms. Small also serves as Trustee of other Fidelity funds. Ms. Small is a member of the Board of Directors (2009-present) and Chair of the Investment Committee (2010-present) of the Teagle Foundation. Ms. Small also serves on the Investment Committee of the Berkshire Taconic Community Foundation (2008-present). Previously, Ms. Small served as Chairperson (2002-2008) and a member of the Investment Committee and Chairperson (2008-2012) and a member of the Board of Trustees of Smith College. In addition, Ms. Small served as Chief Investment Officer, Director of Global Equity Investments, and a member of the Board of Directors of Scudder, Stevens & Clark and Scudder Kemper Investments. |
|
William S. Stavropoulos (1939) |
|
|
Year of Election or Appointment: 2002 Trustee Vice Chairman of the Independent Trustees |
|
|
|
Mr. Stavropoulos also serves as Trustee of other Fidelity funds. Mr. Stavropoulos serves as President and Founder of the Michigan Baseball Foundation, the Great Lakes Loons (2007-present). Mr. Stavropoulos is Chairman Emeritus of the Board of Directors of The Dow Chemical Company, where he previously served in numerous senior management positions, including President, CEO (1995-2000; 2002-2004), Chairman of the Executive Committee (2000-2006), and as a member of the Board of Directors (1990-2006). Currently, Mr. Stavropoulos is Chairman of the Board of Directors of Univar Inc. (global distributor of commodity and specialty chemicals), a Director of Teradata Corporation (data warehousing and technology solutions), and Maersk Inc. (industrial conglomerate), and a member of the Advisory Board for Metalmark Capital LLC (private equity investment, 2005-present). Mr. Stavropoulos is an operating advisor to Clayton, Dubilier & Rice, LLC (private equity investment). In addition, Mr. Stavropoulos is a member of the University of Notre Dame Advisory Council for the College of Science, a Trustee of the Rollin L. Gerstacker Foundation, and a Director of the Naples Philharmonic Center for the Arts. Previously, Mr. Stavropoulos served as a Director of Chemical Financial Corporation (bank holding company, 1993-2012) and Tyco International, Ltd. (multinational manufacturing and services, 2007-2012). |
|
David M. Thomas (1949) |
|
|
Year of Election or Appointment: 2008 Trustee |
|
|
|
Mr. Thomas also serves as Trustee of other Fidelity funds. Mr. Thomas serves as Non-Executive Chairman of the Board of Directors of Fortune Brands Home and Security (home and security products, 2011-present), and as a member of the Board of Directors of Interpublic Group of Companies, Inc. (marketing communication, 2004-present). Previously, Mr. Thomas served as Executive Chairman (2005-2006) and Chairman and Chief Executive Officer (2000-2005) of IMS Health, Inc. (pharmaceutical and healthcare information solutions), and a Director of Fortune Brands, Inc. (consumer products, 2000-2011). |
+ The information above includes each Trustee's principal occupation during the last five years and other information relating to the experience, attributes, and skills relevant to each Trustee's qualifications to serve as a Trustee, which led to the conclusion that each Trustee should serve as a Trustee for the fund.
Advisory Board Member and Officers:
Correspondence intended for each officer and Peter S. Lynch may be sent to Fidelity Investments, 245 Summer Street, Boston, Massachusetts 02210. Officers appear below in alphabetical order.
|
Name, Year of Birth; Principal Occupation |
|
|
Peter S. Lynch (1944) |
|
|
Year of Election or Appointment: 2003 Member of the Advisory Board |
|
|
|
Mr. Lynch also serves as Member of the Advisory Board of other Fidelity funds. Mr. Lynch is Vice Chairman and a Director of FMR and FMR Co., Inc. In addition, Mr. Lynch serves as a Trustee of Boston College and as the Chairman of the Inner-City Scholarship Fund. Previously, Mr. Lynch served on the Special Olympics International Board of Directors (1997-2006). |
|
Elizabeth Paige Baumann (1968) |
|
|
Year of Election or Appointment: 2012 Anti-Money Laundering (AML) Officer |
|
|
|
Ms. Baumann also serves as AML Officer of other funds. She is Chief AML Officer of FMR LLC (2012-present) and is an employee of Fidelity Investments. Previously, Ms. Baumann served as Vice President and Deputy Anti-Money Laundering Officer (2007-2012). |
|
William C. Coffey (1969) |
|
|
Year of Election or Appointment: 2009 Assistant Secretary |
|
|
|
Mr. Coffey also serves as Assistant Secretary of other funds. He is Senior Vice President and Deputy General Counsel of FMR LLC (2010-present), and is an employee of Fidelity Investments. Previously, Mr. Coffey served as Vice President and Associate General Counsel of FMR LLC (2005-2009). |
|
Jonathan Davis (1968) |
|
|
Year of Election or Appointment: 2010 Assistant Treasurer |
|
|
|
Mr. Davis also serves as Assistant Treasurer of other funds. Mr. Davis is an employee of Fidelity Investments. Previously, Mr. Davis served as Vice President and Associate General Counsel of FMR LLC (2003-2010). |
|
Adrien E. Deberghes (1967) |
|
|
Year of Election or Appointment: 2008 Deputy Treasurer |
|
|
|
Mr. Deberghes also serves as an officer of other funds. He is an employee of Fidelity Investments (2008-present). Prior to joining Fidelity Investments, Mr. Deberghes was Senior Vice President of Mutual Fund Administration at State Street Corporation (2007-2008), Senior Director of Mutual Fund Administration at Investors Bank & Trust (2005-2007), and Director of Finance for Dunkin' Brands (2000-2005). |
|
Stephanie J. Dorsey (1969) |
|
|
Year of Election or Appointment: 2010 Assistant Treasurer |
|
|
|
Ms. Dorsey also serves as an officer of other funds. She is an employee of Fidelity Investments (2008-present) and has served in other fund officer roles. Prior to joining Fidelity Investments, Ms. Dorsey served as Treasurer (2004-2008) of the JPMorgan Mutual Funds and Vice President (2004-2008) of JPMorgan Chase Bank. |
|
Scott C. Goebel (1968) |
|
|
Year of Election or Appointment: 2008 Secretary and Chief Legal Officer (CLO) |
|
|
|
Mr. Goebel serves as Secretary and CLO of other funds. Mr. Goebel also serves as Secretary of Fidelity Investments Money Management, Inc. (FIMM) (2010-present) and Fidelity Research and Analysis Company (FRAC) (2010-present); General Counsel, Secretary, and Senior Vice President of FMR (2008-present) and FMR Co., Inc. (2008-present); Chief Legal Officer of Fidelity Management & Research (Hong Kong) Limited (2008-present) and Assistant Secretary of Fidelity Management & Research (Japan) Inc. (2008-present), and Fidelity Management & Research (U.K.) Inc. (2008-present). Previously, Mr. Goebel served as Secretary and CLO of other Fidelity funds (2008-2013), Assistant Secretary of FIMM (2008-2010), FRAC (2008-2010), and certain funds (2007-2008); and as Vice President and Secretary of Fidelity Distributors Corporation (FDC) (2005-2007). Mr. Goebel has been employed by FMR LLC or an affiliate since 2001. |
|
Joseph A. Hanlon (1968) |
|
|
Year of Election or Appointment: 2012 Chief Compliance Officer |
|
|
|
Mr. Hanlon also serves as Chief Compliance Officer of other funds. Mr. Hanlon serves as Compliance Officer of FMR, FMR Co., Inc., Fidelity Investments Money Management, Inc. (FIMM), Fidelity Research and Analysis Company (FRAC), and Fidelity Management & Research (Hong Kong) (2009-present), as Senior Vice President of the Fidelity Asset Management Division (2009-present), and is an employee of Fidelity Investments. Previously, Mr. Hanlon served as Compliance Officer of Fidelity Management & Research (Japan) Inc. (2009-2013), Strategic Advisers, Inc. (2009-2013), and Fidelity Management & Research (U.K.) Inc. (2009-2013). |
|
Bruce T. Herring (1965) |
|
|
Year of Election or Appointment: 2006 Vice President of certain Equity Funds |
|
|
|
Mr. Herring also serves as Vice President of other funds. He serves as Chief Investment Officer of Fidelity Global Asset Allocation (GAA) (2013-present), Group Chief Investment Officer of FMR, and President of Fidelity Research & Analysis Company (2010-present). Previously, Mr. Herring served as Chief Investment Officer and Director of Fidelity Management & Research (U.K.) Inc. (2010-2013), Vice President (2005-2006) and Senior Vice President (2006-2007) of Fidelity Management & Research Company, Vice President of FMR Co., Inc. (2001-2007), and as a portfolio manager for Fidelity U.S. Equity Funds. |
|
Brian B. Hogan (1964) |
|
|
Year of Election or Appointment: 2009 Vice President |
|
|
|
Mr. Hogan also serves as Vice President of other funds. Mr. Hogan serves as President of FMR's Equity Division (2009-present). Previously, Mr. Hogan served as Senior Vice President, Equity Research of FMR (2006-2009) and as a portfolio manager. |
|
Chris Maher (1972) |
|
|
Year of Election or Appointment: 2013 Assistant Treasurer |
|
|
|
Mr. Maher serves as Assistant Treasurer of other funds. Mr. Maher is Vice President of Valuation Oversight and is an employee of Fidelity Investments. Previously, Mr. Maher served as Vice President of Asset Management Compliance (2013), Vice President of FMR's Program Management Group (2010-2013), and Vice President of Valuation Oversight (2008-2010). |
|
Christine Reynolds (1958) |
|
|
Year of Election or Appointment: 2008 Chief Financial Officer |
|
|
|
Ms. Reynolds also serves as Chief Financial Officer of other funds. Ms. Reynolds became President of Fidelity Pricing and Cash Management Services (FPCMS) in August 2008. Ms. Reynolds served as Chief Operating Officer of FPCMS (2007-2008). Previously, Ms. Reynolds served as President, Treasurer, and Anti-Money Laundering officer of the Fidelity funds (2004-2007). |
|
Kenneth B. Robins (1969) |
|
|
Year of Election or Appointment: 2008 President and Treasurer |
|
|
|
Mr. Robins also serves as an officer of other funds. Mr. Robins serves as Executive Vice President of Fidelity Investments Money Management, Inc. (FIMM) (2013-present) and is an employee of Fidelity Investments (2004-present). Previously, Mr. Robins served in other fund officer roles. |
|
Gary W. Ryan (1958) |
|
|
Year of Election or Appointment: 2005 Assistant Treasurer |
|
|
|
Mr. Ryan also serves as Assistant Treasurer of other funds. Mr. Ryan is an employee of Fidelity Investments and has served in other fund officer roles. Previously, Mr. Ryan served as Vice President of Fund Reporting in Fidelity Pricing and Cash Management Services (FPCMS) (1999-2005). |
|
Stephen Sadoski (1971) |
|
|
Year of Election or Appointment: 2012 Deputy Treasurer |
|
|
|
Mr. Sadoski also serves as Deputy Treasurer of other funds. He is an employee of Fidelity Investments (2012-present) and has served in another fund officer role. Prior to joining Fidelity Investments, Mr. Sadoski served as an assistant chief accountant in the Division of Investment Management of the Securities and Exchange Commission (SEC) (2009-2012) and as a senior manager at Deloitte & Touche LLP (1997-2009). |
|
Stacie M. Smith (1974) |
|
|
Year of Election or Appointment: 2013 Deputy Treasurer |
|
|
|
Ms. Smith also serves as an officer of other funds. She is an employee of Fidelity Investments (2009-present) and has served in other fund officer roles. Prior to joining Fidelity Investments, Ms. Smith served as Senior Audit Manager of Ernst & Young LLP (1996-2009). |
|
Renee Stagnone (1975) |
|
|
Year of Election or Appointment: 2013 Deputy Treasurer |
|
|
|
Ms. Stagnone also serves as Deputy Treasurer of other funds. Ms. Stagnone is an employee of Fidelity Investments. |
|
Joseph F. Zambello (1957) |
|
|
Year of Election or Appointment: 2011 Deputy Treasurer |
|
|
|
Mr. Zambello also serves as Deputy Treasurer of other funds. Mr. Zambello is an employee of Fidelity Investments. Previously, Mr. Zambello served as Vice President of FMR's Program Management Group (2009-2011) and Vice President of the Transfer Agent Oversight Group (2005-2009). |
Annual Report
Distributions (Unaudited)
Retail Class designates 50%, and 64%; of the dividends distributed on December 14, 2012 and December 27, 2012, respectively during the fiscal year as qualifying for the dividends-received deduction for corporate shareholders.
Retail Class designates 57%, and 79% of the dividends distributed on December 14, 2012 and December 27, 2012, respectively during the fiscal year as amounts which may be taken into account as a dividend for purposes of the maximum rate under section 1(h)(11) of the Internal Revenue Code.
The fund will notify shareholders in January 2014 of amounts for use in preparing 2013 income tax returns.
Annual Report
Board Approval of Investment Advisory Contracts and Management Fees
Fidelity Advisor Stock Selector Mid Cap Fund
Each year, the Board of Trustees, including the Independent Trustees (together, the Board), votes on the renewal of the management contract and sub-advisory agreements (together, the Advisory Contracts) for the fund. The Board, assisted by the advice of fund counsel and Independent Trustees' counsel, requests and considers a broad range of information relevant to the renewal of the Advisory Contracts throughout the year.
The Board meets regularly and, at each of its meetings, covers an extensive agenda of topics and materials and considers factors that are relevant to its annual consideration of the renewal of the fund's Advisory Contracts, including the services and support provided to the fund and its shareholders. The Board has established various standing committees, each composed of and chaired by Independent Trustees with varying backgrounds, to which the Board has assigned specific subject matter responsibilities in order to enhance effective decision-making by the Board. The Board, acting directly and through its Committees, requests and receives information concerning the annual consideration of the renewal of the fund's Advisory Contracts. The Board also meets as needed to consider matters specifically related to the Board's annual consideration of the renewal of Advisory Contracts. Members of the Board may also meet with trustees of other Fidelity funds through ad hoc joint committees to discuss certain matters relevant to the Fidelity funds.
At its July 2013 meeting, the Board, including the Independent Trustees, unanimously determined to renew the fund's Advisory Contracts. In reaching its determination, the Board considered all factors it believed relevant, including (i) the nature, extent, and quality of the services to be provided to the fund and its shareholders (including the investment performance of the fund); (ii) the competitiveness of the fund's management fee and total expense ratio relative to peer funds; (iii) the total costs of the services to be provided by and the profits to be realized by Fidelity from its relationship with the fund; (iv) the extent to which economies of scale exist and would be realized as the fund grows; and (v) whether fee levels reflect these economies of scale, if any, for the benefit of fund shareholders.
In considering whether to renew the Advisory Contracts for the fund, the Board reached a determination, with the assistance of fund counsel and Independent Trustees' counsel and through the exercise of its business judgment, that the renewal of the Advisory Contracts was in the best interests of the fund and its shareholders and that the compensation payable under the Advisory Contracts was fair and reasonable. The Board's decision to renew the Advisory Contracts was not based on any single factor, but rather was based on a comprehensive consideration of all the information provided to the Board at its meetings throughout the year. The Board, in reaching its determination to renew the Advisory Contracts, was aware that shareholders in the fund have a broad range of investment choices available to them, including a wide choice among mutual funds offered by Fidelity's competitors, and that the fund's shareholders, who have the opportunity to review and weigh the disclosure provided by the fund in its prospectus and other public disclosures, have chosen to invest in this fund, which is a part of the Fidelity family of funds.
Annual Report
Board Approval of Investment Advisory Contracts and
Management Fees - continued
Nature, Extent, and Quality of Services Provided. The Board considered the staffing within the investment adviser, Fidelity Management & Research Company (FMR), and the sub-advisers (together, the Investment Advisers) as it relates to the fund, including the backgrounds of the fund's investment personnel, and also considered the fund's investment objective, strategies, and related investment philosophy. The Independent Trustees also had discussions with senior management of Fidelity's investment operations and investment groups. The Board considered the structure of the portfolio manager compensation program and whether this structure provides appropriate incentives to act in the best interests of the fund.
Resources Dedicated to Investment Management and Support Services. The Board and the Fund Oversight and Research Committees reviewed the general qualifications and capabilities of the Investment Advisers' investment staff, including its size, education, experience, and resources, as well as the Investment Advisers' approach to recruiting, training, managing, and compensating investment personnel. The Board noted that FMR has continued to increase the resources devoted to non-U.S. offices, including expansion of Fidelity's global investment organization. The Board also noted that Fidelity's analysts have extensive resources, tools and capabilities that allow them to conduct sophisticated quantitative and fundamental analysis, as well as credit analysis of issuers, counterparties and guarantors. Further, the Board believes that Fidelity's investment professionals have sufficient access to global information and data so as to provide competitive investment results over time, and that those professionals also have access to sophisticated tools that permit them to assess portfolio construction and risk and performance attribution characteristics continuously, as well as to transmit new information and research conclusions rapidly around the world. Additionally, in its deliberations, the Board considered the Investment Advisers' trading and risk management capabilities and resources, which are an integral part of the investment management process.
Shareholder and Administrative Services. The Board considered (i) the nature, extent, quality, and cost of advisory, administrative, and shareholder services performed by the Investment Advisers and their affiliates under the Advisory Contracts and under separate agreements covering transfer agency, pricing and bookkeeping, and securities lending services for the fund; (ii) the nature and extent of the supervision of third party service providers, principally custodians and subcustodians; and (iii) the resources devoted to, and the record of compliance with, the fund's compliance policies and procedures. The Board also reviewed the allocation of fund brokerage, including allocations to brokers affiliated with the Investment Advisers, the use of brokerage commissions to pay fund expenses, and the use of "soft" commission dollars to pay for research services.
Annual Report
The Board noted that the growth of fund assets over time across the complex allows Fidelity to reinvest in the development of services designed to enhance the value or convenience of the Fidelity funds as investment vehicles. These services include 24-hour access to account information and market information through telephone representatives and over the Internet, investor education materials and asset allocation tools, and the expanded availability of Fidelity Investor Centers.
Investment in a Large Fund Family. The Board considered the benefits to shareholders of investing in a Fidelity fund, including the benefits of investing in a fund that is part of a large family of funds offering a variety of investment disciplines and providing a large variety of mutual fund investor services. The Board noted that Fidelity had taken, or had made recommendations that resulted in the Fidelity funds taking, a number of actions over the previous year that benefited particular funds, including (i) continuing to dedicate additional resources to investment research and to the support of the senior management team that oversees asset management; (ii) persisting in efforts to enhance Fidelity's global research capabilities; (iii) launching new funds and making other enhancements to meet client needs for global and income-oriented solutions; (iv) continuing to launch dedicated lower cost underlying funds to meet portfolio construction needs related to expanding underlying fund options for Fidelity funds of funds, specifically for the Freedom Fund product lines; (v) rationalizing product lines and gaining increased efficiencies through the mergers of several funds into other funds; (vi) strengthening Fidelity's index fund offerings by reducing investment minimums and adopting or lowering existing expense caps for certain funds and classes; (vii) enhancing Global Asset Allocation product offerings by launching new funds and strategies, including "open architecture" target date funds that utilize affiliated and unaffiliated sub-advisers; (viii) modifying the eligibility criteria for Institutional Class shares of Advisor funds to increase their marketability to a portion of the defined contribution plan market; (ix) creating a new low-cost retirement share class for certain Advisor funds to appeal to large retirement plans; (x) transitioning the management of certain Fidelity commodity funds to Geode Capital Management LLC, a registered commodity pool operator, while retaining administrative responsibilities for the funds; (xi) reorganizing a number of funds; and (xii) taking steps toward establishing a new Fidelity adviser to manage sector-based funds and products.
Investment Performance. The Board considered whether the fund has operated in accordance with its investment objective, as well as its record of compliance with its investment restrictions and its performance history. The Board noted that there was a portfolio management change for a sleeve of the fund in October 2012.
Annual Report
Board Approval of Investment Advisory Contracts and
Management Fees - continued
The Board took into account discussions with the Investment Advisers about fund investment performance that occur at Board meetings throughout the year. In this regard the Board noted that as part of regularly scheduled fund reviews and other reports to the Board on fund performance, the Board periodically considers annualized return information for the fund, for different time periods, measured against a securities market index ("benchmark index") and a peer group of mutual funds with similar objectives ("peer group"). In its evaluation of fund investment performance, the Board gave particular attention to information indicating changes in performance of certain Fidelity funds for specific time periods and the Investment Advisers' explanations for any overperformance or, in the case of the fund, underperformance.
In addition to reviewing absolute and relative fund performance, the Independent Trustees periodically consider the appropriateness of fund performance metrics in evaluating the results achieved. In general, the Independent Trustees believe that fund performance should be evaluated based on net performance (after fees and expenses) of both the highest performing and lowest performing classes, where applicable, compared to appropriate benchmark indices, over appropriate time periods which may include full market cycles, and compared to peer groups, as applicable, over the same periods, taking into account relevant factors including the following: general market conditions; issuer-specific information; tactical opportunities for investment; and fund cash flows and other factors.
The Independent Trustees recognize that shareholders evaluate performance on a net basis over their own holding periods, for which one-, three-, and five-year periods are used as a proxy. For this reason, the performance information reviewed by the Board also included net cumulative calendar year total return information for the fund and an appropriate benchmark index and peer group for the most recent one-, three-, and five-year periods, as shown below. Returns are shown compared to the 25th percentile (top of box) and 75th percentile (bottom of box) of the peer universe.
Annual Report
Fidelity Advisor Stock Selector Mid Cap Fund

The Board has discussed the fund's performance with FMR, including the fund's underperformance based on more recent periods ended after 2012 (which periods are not shown in the chart above) but prior to the date of the Board's approval of the renewal of the Advisory Contracts, and has engaged with FMR to consider what steps might be taken to remediate the fund's more recent underperformance.
The Board also considered that the fund's management fee is subject to upward or downward adjustment depending upon whether, and to what extent, the fund's investment performance for the performance period exceeds, or is exceeded by, a securities index, thus leading to a performance adjustment for the same period. The Board noted that the performance adjustment provides FMR with a strong economic incentive to seek to achieve superior performance for the fund's shareholders and helps to more closely align the interests of FMR and the fund's shareholders.
Based on its review, the Board concluded that the nature, extent, and quality of services provided to the fund under the Advisory Contracts should benefit the fund's shareholders.
Competitiveness of Management Fee and Total Expense Ratio. The Board considered the fund's management fee and total expense ratio compared to "mapped groups" of competitive funds and classes. Fidelity creates "mapped groups" by combining similar Lipper investment objective categories that have comparable management fee characteristics. Combining Lipper investment objective categories aids the Board's management fee and total expense ratio comparisons by broadening the competitive group used for comparison and by reducing the number of universes to which various Fidelity funds are compared.
Annual Report
Board Approval of Investment Advisory Contracts and
Management Fees - continued
Management Fee. The Board considered two proprietary management fee comparisons for the 12-month periods shown in the chart below. The group of Lipper funds used by the Board for management fee comparisons is referred to below as the "Total Mapped Group." The Total Mapped Group comparison focuses on a fund's standing in terms of gross management fees before expense reimbursements or caps, and without giving effect to the fund's performance adjustment, relative to the total universe of funds with comparable investment mandates, regardless of whether their management fee structures also are comparable. Funds with comparable investment mandates offer exposure to similar types of securities. Funds with comparable management fee structures have similar management fee contractual arrangements (e.g., flat rate charged for advisory services, all-inclusive fee rate, etc.). "TMG %" represents the percentage of funds in the Total Mapped Group that had management fees that were lower than the fund's. For example, a TMG % of 11% means that 89% of the funds in the Total Mapped Group had higher management fees than the fund. The "Asset-Size Peer Group" (ASPG) comparison focuses on a fund's standing relative to a subset of non-Fidelity funds within the Total Mapped Group that are similar in size and management fee structure. The ASPG represents at least 15% of the funds in the Total Mapped Group with comparable asset size and management fee structures, subject to a minimum of 50 funds (or all funds in the Total Mapped Group if fewer than 50). Additional information, such as the ASPG quartile in which the fund's management fee ranked and the impact of the fund's performance adjustment, is also included in the chart and considered by the Board.
Fidelity Advisor Stock Selector Mid Cap Fund
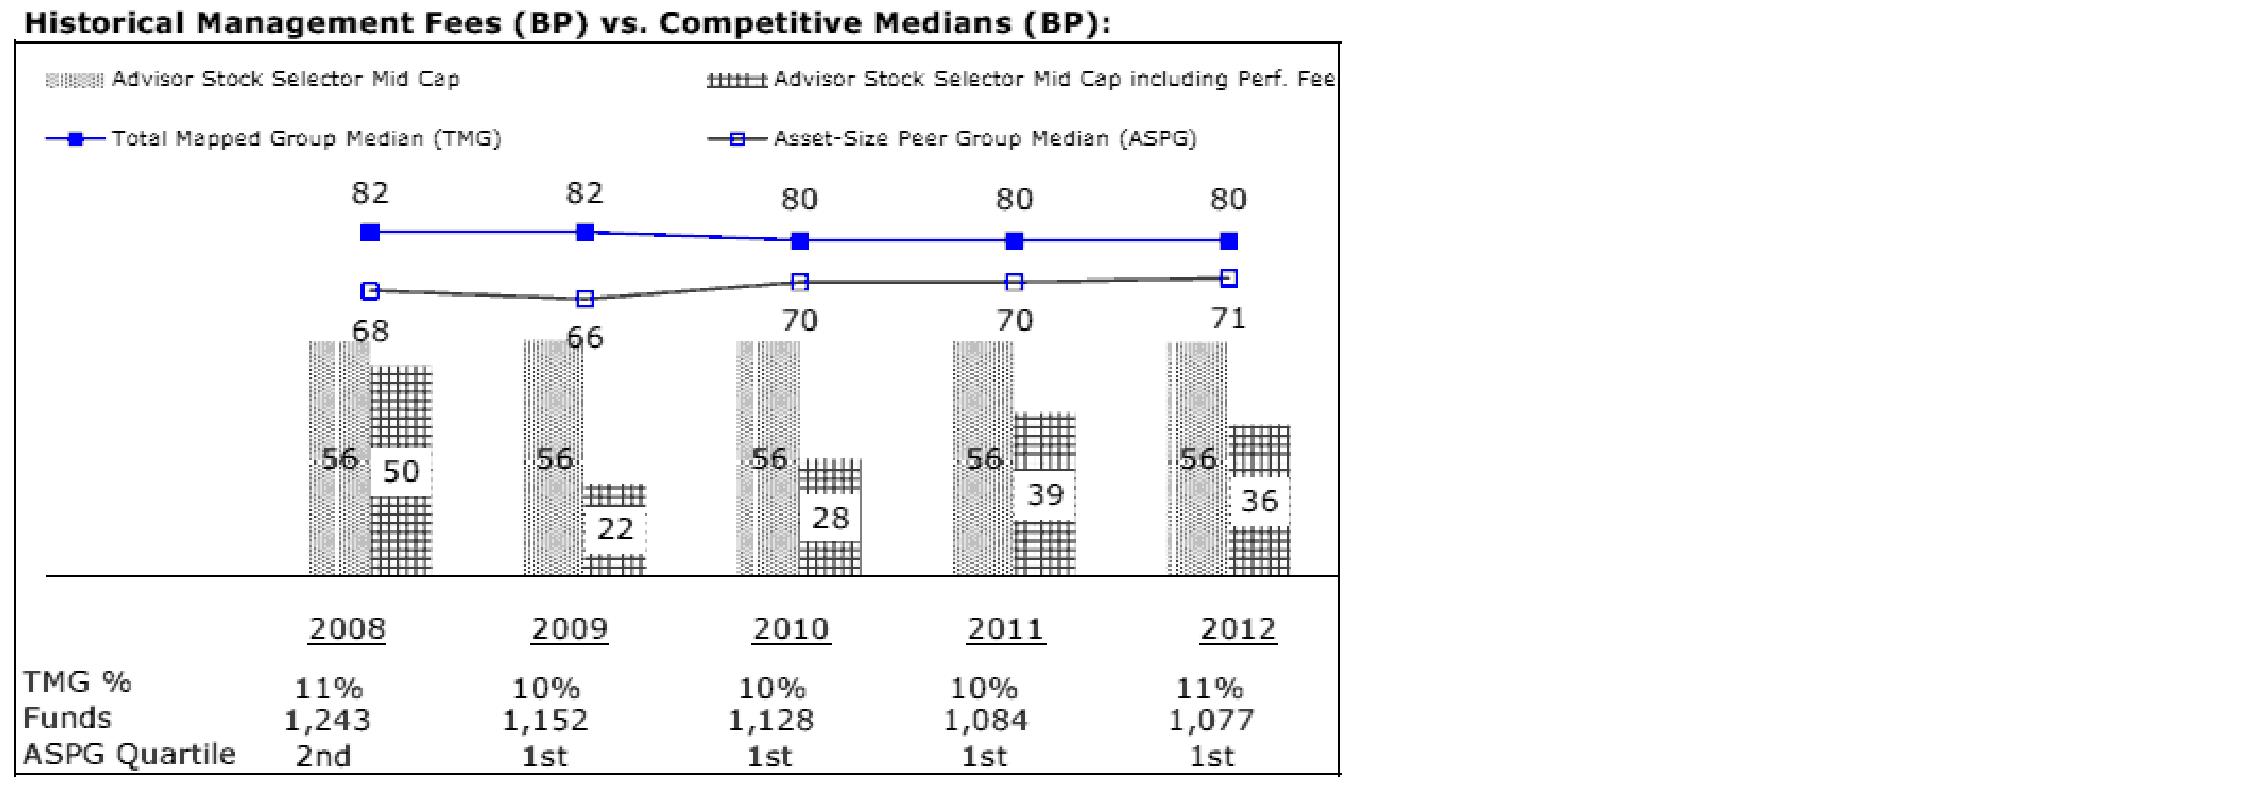
Annual Report
The Board noted that the fund's management fee ranked below the median of its Total Mapped Group and below the median of its ASPG for 2012. The Board also noted the effect of the fund's negative performance adjustment on the fund's management fee ranking.
Based on its review, the Board concluded that the fund's management fee is fair and reasonable in light of the services that the fund receives and the other factors considered.
Total Expense Ratio. In its review of each class's total expense ratio, the Board considered the fund's management fee as well as other fund or class expenses, as applicable, such as transfer agent fees, pricing and bookkeeping fees, fund-paid 12b-1 fees, and custodial, legal, and audit fees. The Board also noted the effects of any waivers and reimbursements on fees and expenses, as well as the impact of the fund's performance adjustment. As part of its review, the Board also considered the current and historical total expense ratios of each class of the fund compared to competitive fund median expenses. Each class of the fund is compared to those funds and classes in the Total Mapped Group (used by the Board for management fee comparisons) that have a similar sales load structure.
The Board noted that the total expense ratio of each class ranked below its competitive median for 2012.
Fees Charged to Other Fidelity Clients. The Board also considered Fidelity fee structures and other information with respect to clients of FMR and its affiliates, such as other mutual funds advised or subadvised by FMR or its affiliates, pension plan clients, and other institutional clients. The Board noted the findings of the 2013 ad hoc joint committee (created with the board of other Fidelity funds), which reviewed and compared Fidelity's institutional investment advisory business with its business of providing services to the Fidelity funds, including the differences in services provided, fees charged, and costs incurred, as well as competition in their respective marketplaces.
Based on its review of total expense ratios and fees charged to other Fidelity clients, the Board concluded that the total expense ratio of each class of the fund was reasonable in light of the services that the fund and its shareholders receive and the other factors considered.
Costs of the Services and Profitability. The Board considered the revenues earned and the expenses incurred by Fidelity in conducting the business of developing, marketing, distributing, managing, administering and servicing the fund and servicing the fund's shareholders. The Board also considered the level of Fidelity's profits in respect of all the Fidelity funds.
On an annual basis, FMR presents to the Board Fidelity's profitability for the fund. Fidelity calculates the profitability for each fund, as well as aggregate profitability for groups of Fidelity funds and all Fidelity funds, using a series of detailed revenue and cost allocation methodologies which originate with the books and records of Fidelity on which Fidelity's audited financial statements are based. The Audit Committee of the Board reviews any significant changes from the prior year's methodologies.
Annual Report
Board Approval of Investment Advisory Contracts and
Management Fees - continued
PricewaterhouseCoopers LLP (PwC), independent registered public accounting firm and auditor to Fidelity and certain Fidelity funds, has been engaged annually by the Board as part of the Board's assessment of Fidelity's profitability analysis. PwC's engagement includes the review and assessment of the methodologies used by Fidelity in determining the revenues and expenses attributable to Fidelity's mutual fund business, and completion of agreed-upon procedures surrounding the mathematical accuracy of fund profitability and its conformity to allocation methodologies. After considering PwC's reports issued under the engagement and information provided by Fidelity, the Board concluded that while other allocation methods may also be reasonable, Fidelity's profitability methodologies are reasonable in all material respects.
The Board also reviewed Fidelity's non-fund businesses and fall-out benefits related to the mutual fund business as well as cases where Fidelity's affiliates may benefit from or be related to the fund's business.
The Board considered the costs of the services provided by and the profits realized by Fidelity in connection with the operation of the fund and was satisfied that the profitability was not excessive in the circumstances.
Economies of Scale. The Board considered whether there have been economies of scale in respect of the management of the Fidelity funds, whether the Fidelity funds (including the fund) have appropriately benefited from any such economies of scale, and whether there is potential for realization of any further economies of scale. The Board considered the extent to which the fund will benefit from economies of scale through increased services to the fund, through waivers or reimbursements, or through fee or expense reductions. The Board also noted that in 2009, it and the board of other Fidelity funds created an ad hoc committee (the Economies of Scale Committee) to analyze whether FMR attains economies of scale in respect of the management and servicing of the Fidelity funds, whether the Fidelity funds have appropriately benefited from such economies of scale, and whether there is potential for realization of any further economies of scale.
The Board recognized that the fund's management contract incorporates a "group fee" structure, which provides for lower group fee rates as total fund assets under FMR's management increase, and for higher group fee rates as total fund assets under FMR's management decrease. FMR calculates the group fee rates based on a tiered asset "breakpoint" schedule that varies based on asset class. The Board considered that the group fee is designed to deliver the benefits of economies of scale to fund shareholders when total Fidelity fund assets increase, even if assets of any particular fund are unchanged or have declined, because some portion of Fidelity's costs are attributable to services provided to all Fidelity funds, and all funds benefit if those costs can be allocated among more assets. The Board concluded that, given the group fee structure, fund shareholders will benefit from lower management fees as assets under FMR's management increase at the fund complex level, regardless of whether Fidelity achieves any such economies of scale.
Annual Report
The Board concluded, taking into account the analysis of the Economies of Scale Committee, that economies of scale, if any, are being appropriately shared between fund shareholders and Fidelity.
Amendment to Description of Group Fee Rate. At its July 2013 meeting, the Board voted to approve an amendment to the fund's management contract to modify the description of the "group fee rate" effective August 1, 2013. The Board noted that under the prior description in the contract, the group fee rate was based on the average net assets of all registered investment companies with which FMR has management contracts. Under the contract's tiered asset breakpoint schedule, the group fee rate is lower as total fund assets under FMR's management increase, and higher as total fund assets under FMR's management decrease. The Board considered that the prior description would have excluded the assets of 64 Fidelity sector funds from the group fee rate calculation once Fidelity SelectCo, LLC, an affiliate of FMR, assumed management responsibilities for those funds. The Board noted that modifying the description of the group fee rate to continue to include the assets of those 64 funds for purposes of determining group fee rate breakpoints would avoid an immediate adverse impact on the group fee rate for any fund.
Additional Information Requested by the Board. In order to develop fully the factual basis for consideration of the Fidelity funds' Advisory Contracts, the Board requested and received additional information on certain topics, including: (i) fund performance trends and Fidelity's long-term strategies for certain funds; (ii) the potential to further rationalize the Fidelity fund lineup with the possibility of achieving savings for the funds and Fidelity; (iii) the methodology with respect to competitive fund data and peer group classifications; (iv) the arrangements with, and performance of, certain sub-advisers on behalf of the Fidelity funds, as well as certain proposed participating affiliate arrangements; (v) the realization of fall-out benefits in certain Fidelity business units; (vi) Fidelity's group fee structures, including the rationale for the individual fee rates of certain categories of funds and the definition of group assets; (vii) trends regarding industry use of performance fee structures and the performance adjustment methodologies applicable to the Fidelity funds; (viii) additional competitive analysis regarding the total expenses for certain classes; and (ix) fund profitability methodology, including Fidelity's cost allocation methodology, and the impact of certain factors on fund profitability results.
Annual Report
Board Approval of Investment Advisory Contracts and
Management Fees - continued
Based on its evaluation of all of the conclusions noted above, and after considering all factors it believed relevant, the Board ultimately concluded that the advisory fee structures are fair and reasonable, and that the fund's Advisory Contracts should be renewed.
Annual Report
Investment Adviser
Fidelity Management & Research Company Boston, MA
Investment Sub-Advisers
FMR Co., Inc.
Fidelity Management & Research
(U.K.) Inc.
Fidelity Management & Research
(Hong Kong) Limited
Fidelity Management & Research
(Japan) Inc.
General Distributor
Fidelity Distributors Corporation
Smithfield, RI
Transfer and Service Agents
Fidelity Investments Institutional
Operations Company, Inc.
Boston, MA
Fidelity Service Company, Inc.
Boston, MA
Custodian
Brown Brothers Harriman & Co.
Boston, MA
The Fidelity Telephone Connection
Mutual Fund 24-Hour Service
Exchanges/Redemptions
and Account Assistance 1-800-544-6666
Product Information 1-800-544-6666
Retirement Accounts 1-800-544-4774
(8 a.m. - 9 p.m.)
TDD Service 1-800-544-0118
for the deaf and hearing impaired
(9 a.m. - 9 p.m. Eastern time)
Fidelity Automated Service
Telephone (FAST®) 
1-800-544-5555
Automated line for quickest service
(Fidelity Investment logo)(registered trademark)
SKD-UANN-0114 1.940898.101
(Fidelity Investment logo)(registered trademark)
Fidelity® Value Strategies Fund
(A Class of Fidelity Advisor® Value
Strategies Fund)
Annual Report
November 30, 2013
(Fidelity Cover Art)
Contents
|
Performance |
How the fund has done over time. |
|
|
Management's Discussion of Fund Performance |
The Portfolio Manager's review of fund performance and strategy. |
|
|
Shareholder Expense Example |
An example of shareholder expenses. |
|
|
Investment Changes |
A summary of major shifts in the fund's investments over the past six months. |
|
|
Investments |
A complete list of the fund's investments with their market values. |
|
|
Financial Statements |
Statements of assets and liabilities, operations, and changes in net assets, as well as financial highlights. |
|
|
Notes |
Notes to the financial statements. |
|
|
Report of Independent Registered Public Accounting Firm |
|
|
|
Trustees and Officers |
|
|
|
Distributions |
|
|
|
Board Approval of Investment Advisory Contracts and Management Fees |
|
To view a fund's proxy voting guidelines and proxy voting record for the 12-month period ended June 30, visit http://www.fidelity.com/proxyvotingresults or visit the Securities and Exchange Commission's (SEC) web site at http://www.sec.gov. You may also call 1-800-544-8544 to request a free copy of the proxy voting guidelines.
Standard & Poor's, S&P and S&P 500 are registered service marks of The McGraw-Hill Companies, Inc. and have been licensed for use by Fidelity Distributors Corporation.
Other third-party marks appearing herein are the property of their respective owners.
All other marks appearing herein are registered or unregistered trademarks or service marks of FMR LLC or an affiliated company. © 2014 FMR LLC. All rights reserved.
Annual Report
This report and the financial statements contained herein are submitted for the general information of the shareholders of the fund. This report is not authorized for distribution to prospective investors in the fund unless preceded or accompanied by an effective prospectus.
A fund files its complete schedule of portfolio holdings with the SEC for the first and third quarters of each fiscal year on Form N-Q. Forms N-Q are available on the SEC's web site at http://www.sec.gov. A fund's Forms N-Q may be reviewed and copied at the SEC's Public Reference Room in Washington, DC. Information regarding the operation of the SEC's Public Reference Room may be obtained by calling 1-800-SEC-0330. For a complete list of a fund's portfolio holdings, view the most recent holdings listing, semiannual report, or annual report on Fidelity's web site at http://www.fidelity.com, http://www.advisor.fidelity.com, or http://www.401k.com, as applicable.
NOT FDIC INSURED • MAY LOSE VALUE • NO BANK GUARANTEE
Neither the fund nor Fidelity Distributors Corporation is a bank.
Annual Report
Performance: The Bottom Line
Average annual total return reflects the change in the value of an investment, assuming reinvestment of the class' distributions from dividend income and capital gains (the profits earned upon the sale of securities that have grown in value, if any) and assuming a constant rate of performance each year. The $10,000 table and the fund's returns do not reflect the deduction of taxes that a shareholder would pay on fund distributions or the redemption of fund shares. During periods of reimbursement by Fidelity, a fund's total return will be greater than it would be had the reimbursement not occurred. How a fund did yesterday is no guarantee of how it will do tomorrow.
Average Annual Total Returns
|
Periods ended November 30, 2013 |
Past 1 |
Past 5 |
Past 10 |
|
Fidelity® Value Strategies Fund |
31.14% |
25.72% |
7.62% |
$10,000 Over 10 Years
Let's say hypothetically that $10,000 was invested in Fidelity® Value Strategies Fund, a class of the fund, on November 30, 2003. The chart shows how the value of your investment would have changed, and also shows how the Russell Midcap® Value Index performed over the same period.
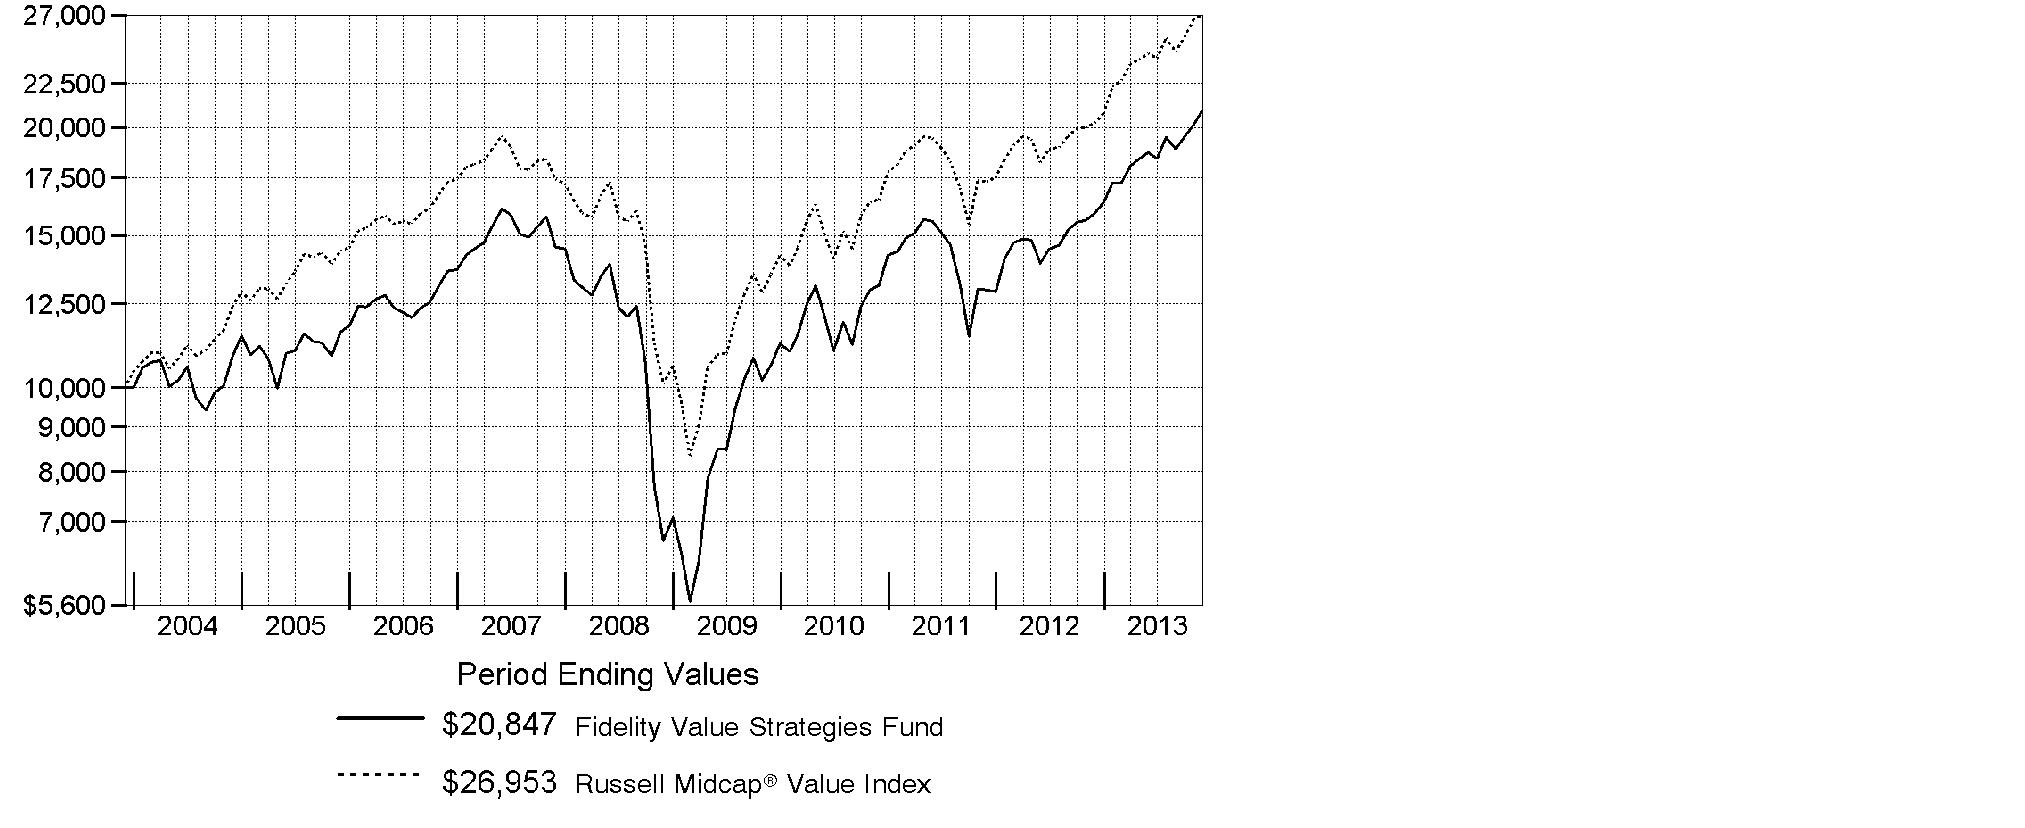
Annual Report
Management's Discussion of Fund Performance
Market Recap: With the current bull run nearing the five-year mark, equity benchmarks ripped up old records during the 12 months ending November 30, 2013. Gains were fueled by strengthening U.S. economic data, as well as generally improving economies and accommodative monetary policies worldwide. The broad S&P 500® Index reached new peaks in its 30.30% climb for the period, and the blue-chip Dow Jones Industrial AverageSM surpassed historic milestones en route to a 26.63% gain. The Nasdaq Composite Index®, up 36.73% amid a resurgence in growth-oriented stocks, closed above 4,000 for the first time since 2000. Shedding anxiety over the 2012 U.S. presidential election - and apparently confident that the federal debt-ceiling debate would be resolved - markets rose from period start through late May. News that the U.S. Federal Reserve was considering an end to its stimulative bond-buying kept stocks in flux over the summer but, by September, the Fed had set aside any imminent tapering. Despite jitters over a potential U.S. military strike in Syria and, later, an October budget impasse that briefly shuttered the federal government, volatility was subdued heading into the holidays, with investor optimism helping many markets home in on all-time highs at period end. Elsewhere, non-U.S. developed-market equities saw similar results, with the MSCI® EAFE® Index adding 24.97%.
Comments from Thomas Soviero, Portfolio Manager of Fidelity® Value Strategies Fund: For the year, the fund's Retail Class shares returned 31.14%, underperforming the 33.33% gain of the benchmark Russell Midcap® Value Index. Versus the index, the fund was held back by an 8% average stake in cash, which was a substantial drag on performance in an up market. Security selection in the food, beverage & tobacco and software & services industries also hurt. Beverage company Cott and untimely positioning in software company Symantec were among the biggest detractors, along with positions in retailer Target and pharmaceuticals company Zogenix, the latter of which we sold. On the plus side, the fund was helped by an underweighting in financials - particularly real estate - and by security selection in the materials sector. Top individual contributors included Netherlands-based chemicals company LyondellBasell Industries and video-game retailer GameStop. Overweighting automobiles & components, including an investment in auto parts manufacturer Delphi Automotive, also was a positive. Most of the stocks I've mentioned here were not in the benchmark.
The views expressed above reflect those of the portfolio manager(s) only through the end of the period as stated on the cover of this report and do not necessarily represent the views of Fidelity or any other person in the Fidelity organization. Any such views are subject to change at any time based upon market or other conditions and Fidelity disclaims any responsibility to update such views. These views may not be relied on as investment advice and, because investment decisions for a Fidelity fund are based on numerous factors, may not be relied on as an indication of trading intent on behalf of any Fidelity fund.
Annual Report
Shareholder Expense Example
As a shareholder of the Fund, you incur two types of costs: (1) transaction costs, including sales charges (loads) on purchase payments or redemption proceeds, and (2) ongoing costs, including management fees, distribution and/or service (12b-1) fees and other Fund expenses. This Example is intended to help you understand your ongoing costs (in dollars) of investing in the Fund and to compare these costs with the ongoing costs of investing in other mutual funds.
The Example is based on an investment of $1,000 invested at the beginning of the period and held for the entire period (June 1, 2013 to November 30, 2013).
Actual Expenses
The first line of the accompanying table for each class of the Fund provides information about actual account values and actual expenses. You may use the information in this line, together with the amount you invested, to estimate the expenses that you paid over the period. Simply divide your account value by $1,000.00 (for example, an $8,600 account value divided by $1,000.00 = 8.6), then multiply the result by the number in the first line for a class of the Fund under the heading entitled "Expenses Paid During Period" to estimate the expenses you paid on your account during this period. A small balance maintenance fee of $12.00 that is charged once a year may apply for certain accounts with a value of less than $2,000. This fee is not included in the table below. If it was, the estimate of expenses you paid during the period would be higher, and your ending account value lower, by this amount. In addition, the Fund, as a shareholder in the underlying Fidelity Central Funds, will indirectly bear its pro-rata share of the fees and expenses incurred by the underlying Fidelity Central Funds. These fees and expenses are not included in the Fund's annualized expense ratio used to calculate the expense estimate in the table below.
Hypothetical Example for Comparison Purposes
The second line of the accompanying table for each class of the Fund provides information about hypothetical account values and hypothetical expenses based on a Class' actual expense ratio and an assumed rate of return of 5% per year before expenses, which is not the Class' actual return. The hypothetical account values and expenses may not be used to estimate the actual ending account balance or expenses you paid for the period. You may use this information to compare the ongoing costs of investing in the Fund and other funds. To do so, compare this 5% hypothetical example with the 5% hypothetical examples that appear in the shareholder reports of the other funds. A small balance maintenance fee of $12.00 that is charged once a year may apply for certain accounts with a value of less than $2,000. This fee is not included in the table below. If it was, the estimate of expenses you paid during the period would be higher, and your ending account value lower, by this amount. In addition, the Fund, as a shareholder in the underlying Fidelity Central Funds, will indirectly bear its pro-rata share of the fees and expenses incurred by the underlying Fidelity Central Funds. These fees and expenses are not included in the Fund's annualized expense ratio used to calculate the expense estimate in the table below.
Please note that the expenses shown in the table are meant to highlight your ongoing costs only and do not reflect any transaction costs. Therefore, the second line of the table is useful in comparing ongoing costs only, and will not help you determine the relative total costs of owning different funds. In addition, if these transactional costs were included, your costs would have been higher.
Annual Report
Shareholder Expense Example - continued
|
|
Annualized |
Beginning |
Ending |
Expenses Paid |
|
Class A |
1.04% |
|
|
|
|
Actual |
|
$ 1,000.00 |
$ 1,113.10 |
$ 5.51 |
|
HypotheticalA |
|
$ 1,000.00 |
$ 1,019.85 |
$ 5.27 |
|
Class T |
1.23% |
|
|
|
|
Actual |
|
$ 1,000.00 |
$ 1,112.20 |
$ 6.51 |
|
HypotheticalA |
|
$ 1,000.00 |
$ 1,018.90 |
$ 6.23 |
|
Class B |
1.84% |
|
|
|
|
Actual |
|
$ 1,000.00 |
$ 1,108.60 |
$ 9.73 |
|
HypotheticalA |
|
$ 1,000.00 |
$ 1,015.84 |
$ 9.30 |
|
Class C |
1.78% |
|
|
|
|
Actual |
|
$ 1,000.00 |
$ 1,109.10 |
$ 9.41 |
|
HypotheticalA |
|
$ 1,000.00 |
$ 1,016.14 |
$ 9.00 |
|
Fidelity Value Strategies Fund |
.73% |
|
|
|
|
Actual |
|
$ 1,000.00 |
$ 1,114.60 |
$ 3.87 |
|
HypotheticalA |
|
$ 1,000.00 |
$ 1,021.41 |
$ 3.70 |
|
Fidelity Value Strategies Fund Class K |
.58% |
|
|
|
|
Actual |
|
$ 1,000.00 |
$ 1,115.50 |
$ 3.08 |
|
HypotheticalA |
|
$ 1,000.00 |
$ 1,022.16 |
$ 2.94 |
|
Institutional Class |
.77% |
|
|
|
|
Actual |
|
$ 1,000.00 |
$ 1,114.50 |
$ 4.08 |
|
HypotheticalA |
|
$ 1,000.00 |
$ 1,021.21 |
$ 3.90 |
A 5% return per year before expenses
B Annualized expense ratio reflects expenses net of applicable fee waivers.
* Expenses are equal to each Class' annualized expense ratio, multiplied by the average account value over the period, multiplied by 183/365 (to reflect the one-half year period).
Annual Report
Investment Changes (Unaudited)
|
Top Ten Stocks as of November 30, 2013 |
||
|
|
% of fund's |
% of fund's net assets |
|
LyondellBasell Industries NV Class A |
5.8 |
6.5 |
|
Sanofi SA sponsored ADR |
3.8 |
4.0 |
|
General Motors Co. |
3.7 |
3.4 |
|
Bank of America Corp. |
3.5 |
3.1 |
|
Symantec Corp. |
3.1 |
3.3 |
|
Apple, Inc. |
3.0 |
2.5 |
|
Delphi Automotive PLC |
2.8 |
2.6 |
|
AFLAC, Inc. |
2.4 |
2.1 |
|
The Bon-Ton Stores, Inc. |
2.2 |
2.5 |
|
U.S. Bancorp |
2.2 |
2.1 |
|
|
32.5 |
|
|
Top Five Market Sectors as of November 30, 2013 |
||
|
|
% of fund's |
% of fund's net assets |
|
Consumer Discretionary |
23.9 |
23.3 |
|
Health Care |
14.3 |
13.3 |
|
Information Technology |
12.4 |
12.5 |
|
Financials |
11.4 |
10.2 |
|
Materials |
8.8 |
10.5 |
|
Asset Allocation (% of fund's net assets) |
|||||||
|
As of November 30, 2013* |
As of May 31, 2013** |
||||||
 |
Stocks 93.9% |
|
|
Stocks 93.3% |
|
||
 |
Bonds 0.4% |
|
 |
Bonds 0.0% |
|
||
 |
Short-Term |
|
|
Short-Term |
|
||
|
* Foreign investments |
17.0% |
|
** Foreign investments |
19.5% |
|
||

Annual Report
Investments November 30, 2013
Showing Percentage of Net Assets
|
Common Stocks - 93.9% |
|||
|
Shares |
Value (000s) |
||
|
CONSUMER DISCRETIONARY - 23.9% |
|||
|
Auto Components - 3.9% |
|||
|
Delphi Automotive PLC |
719,777 |
$ 42,143 |
|
|
Tenneco, Inc. (a) |
164,524 |
9,444 |
|
|
TRW Automotive Holdings Corp. (a) |
91,400 |
7,093 |
|
|
|
58,680 |
||
|
Automobiles - 4.3% |
|||
|
Bayerische Motoren Werke AG (BMW) |
36,387 |
4,181 |
|
|
General Motors Co. (a) |
1,467,636 |
56,842 |
|
|
Volkswagen AG |
18,856 |
4,910 |
|
|
|
65,933 |
||
|
Diversified Consumer Services - 0.9% |
|||
|
Service Corp. International |
729,650 |
13,185 |
|
|
Hotels, Restaurants & Leisure - 1.7% |
|||
|
Cedar Fair LP (depositary unit) |
227,420 |
11,326 |
|
|
Wyndham Worldwide Corp. |
199,867 |
14,332 |
|
|
|
25,658 |
||
|
Household Durables - 3.3% |
|||
|
Lennar Corp. Class A (d) |
424,700 |
15,187 |
|
|
PulteGroup, Inc. |
744,504 |
13,967 |
|
|
Ryland Group, Inc. |
151,400 |
5,983 |
|
|
Standard Pacific Corp. (a) |
1,866,450 |
15,268 |
|
|
|
50,405 |
||
|
Leisure Equipment & Products - 1.0% |
|||
|
Hasbro, Inc. (d) |
266,797 |
14,359 |
|
|
Media - 1.7% |
|||
|
Omnicom Group, Inc. |
120,112 |
8,582 |
|
|
Regal Entertainment Group Class A (d) |
363,100 |
7,073 |
|
|
Valassis Communications, Inc. (d) |
349,089 |
10,249 |
|
|
|
25,904 |
||
|
Multiline Retail - 3.8% |
|||
|
Target Corp. |
374,009 |
23,910 |
|
|
The Bon-Ton Stores, Inc. (d)(e) |
1,916,017 |
34,067 |
|
|
|
57,977 |
||
|
Specialty Retail - 3.3% |
|||
|
Asbury Automotive Group, Inc. (a) |
343,641 |
17,842 |
|
|
GameStop Corp. Class A |
674,513 |
32,545 |
|
|
|
50,387 |
||
|
TOTAL CONSUMER DISCRETIONARY |
362,488 |
||
|
Common Stocks - continued |
|||
|
Shares |
Value (000s) |
||
|
CONSUMER STAPLES - 5.4% |
|||
|
Beverages - 1.9% |
|||
|
Cott Corp. (d) |
3,511,564 |
$ 29,446 |
|
|
Food & Staples Retailing - 1.1% |
|||
|
CVS Caremark Corp. |
237,100 |
15,876 |
|
|
Food Products - 1.6% |
|||
|
Bunge Ltd. |
102,214 |
8,189 |
|
|
Calavo Growers, Inc. |
232,028 |
7,153 |
|
|
SunOpta, Inc. (a) |
984,885 |
9,110 |
|
|
|
24,452 |
||
|
Household Products - 0.8% |
|||
|
Procter & Gamble Co. |
142,100 |
11,968 |
|
|
TOTAL CONSUMER STAPLES |
81,742 |
||
|
ENERGY - 5.1% |
|||
|
Energy Equipment & Services - 0.7% |
|||
|
Halliburton Co. |
183,600 |
9,672 |
|
|
Oil, Gas & Consumable Fuels - 4.4% |
|||
|
Alpha Natural Resources, Inc. (a) |
1,323,859 |
8,843 |
|
|
Denbury Resources, Inc. (a) |
1,516,780 |
25,300 |
|
|
HollyFrontier Corp. |
153,000 |
7,341 |
|
|
Marathon Oil Corp. |
151,100 |
5,446 |
|
|
The Williams Companies, Inc. |
154,500 |
5,441 |
|
|
Valero Energy Corp. |
327,300 |
14,964 |
|
|
|
67,335 |
||
|
TOTAL ENERGY |
77,007 |
||
|
FINANCIALS - 11.4% |
|||
|
Commercial Banks - 4.3% |
|||
|
CIT Group, Inc. |
157,349 |
7,943 |
|
|
Regions Financial Corp. |
778,163 |
7,572 |
|
|
U.S. Bancorp |
862,484 |
33,827 |
|
|
Wells Fargo & Co. |
377,370 |
16,612 |
|
|
|
65,954 |
||
|
Diversified Financial Services - 3.5% |
|||
|
Bank of America Corp. |
3,355,213 |
53,079 |
|
|
Insurance - 3.6% |
|||
|
AFLAC, Inc. |
549,986 |
36,503 |
|
|
Common Stocks - continued |
|||
|
Shares |
Value (000s) |
||
|
FINANCIALS - continued |
|||
|
Insurance - continued |
|||
|
American International Group, Inc. |
201,698 |
$ 10,034 |
|
|
Unum Group |
235,260 |
7,898 |
|
|
|
54,435 |
||
|
TOTAL FINANCIALS |
173,468 |
||
|
HEALTH CARE - 14.3% |
|||
|
Health Care Equipment & Supplies - 4.7% |
|||
|
Alere, Inc. (a) |
172,283 |
5,637 |
|
|
Boston Scientific Corp. (a) |
1,785,400 |
20,675 |
|
|
C.R. Bard, Inc. |
75,400 |
10,472 |
|
|
St. Jude Medical, Inc. |
463,300 |
27,066 |
|
|
Zimmer Holdings, Inc. |
87,600 |
8,008 |
|
|
|
71,858 |
||
|
Health Care Providers & Services - 2.1% |
|||
|
DaVita, Inc. (a) |
158,496 |
9,438 |
|
|
Universal Health Services, Inc. Class B |
278,914 |
22,991 |
|
|
|
32,429 |
||
|
Life Sciences Tools & Services - 1.2% |
|||
|
Agilent Technologies, Inc. |
180,700 |
9,680 |
|
|
PerkinElmer, Inc. |
207,500 |
7,893 |
|
|
|
17,573 |
||
|
Pharmaceuticals - 6.3% |
|||
|
Johnson & Johnson |
187,800 |
17,777 |
|
|
Merck & Co., Inc. |
390,800 |
19,474 |
|
|
Sanofi SA sponsored ADR |
1,088,444 |
57,502 |
|
|
|
94,753 |
||
|
TOTAL HEALTH CARE |
216,613 |
||
|
INDUSTRIALS - 7.0% |
|||
|
Aerospace & Defense - 4.9% |
|||
|
Alliant Techsystems, Inc. |
278,850 |
33,805 |
|
|
Esterline Technologies Corp. (a) |
180,022 |
15,846 |
|
|
Honeywell International, Inc. |
139,500 |
12,347 |
|
|
Textron, Inc. |
223,717 |
7,434 |
|
|
United Technologies Corp. |
47,400 |
5,255 |
|
|
|
74,687 |
||
|
Common Stocks - continued |
|||
|
Shares |
Value (000s) |
||
|
INDUSTRIALS - continued |
|||
|
Building Products - 0.5% |
|||
|
Armstrong World Industries, Inc. (a) |
143,230 |
$ 7,620 |
|
|
Electrical Equipment - 0.3% |
|||
|
Regal-Beloit Corp. |
63,554 |
4,676 |
|
|
Machinery - 1.3% |
|||
|
Blount International, Inc. (a) |
292,004 |
4,231 |
|
|
Ingersoll-Rand PLC |
208,100 |
14,863 |
|
|
|
19,094 |
||
|
TOTAL INDUSTRIALS |
106,077 |
||
|
INFORMATION TECHNOLOGY - 12.4% |
|||
|
Communications Equipment - 0.3% |
|||
|
Cisco Systems, Inc. |
204,600 |
4,348 |
|
|
Computers & Peripherals - 3.0% |
|||
|
Apple, Inc. |
80,880 |
44,975 |
|
|
IT Services - 0.6% |
|||
|
Fidelity National Information Services, Inc. |
165,730 |
8,399 |
|
|
Semiconductors & Semiconductor Equipment - 4.3% |
|||
|
KLA-Tencor Corp. |
171,180 |
10,933 |
|
|
MagnaChip Semiconductor Corp. (a) |
978,700 |
19,868 |
|
|
Micron Technology, Inc. (a) |
911,183 |
19,226 |
|
|
ON Semiconductor Corp. (a) |
1,190,970 |
8,444 |
|
|
Spansion, Inc. Class A (a) |
613,543 |
7,602 |
|
|
|
66,073 |
||
|
Software - 4.2% |
|||
|
Microsoft Corp. |
429,324 |
16,370 |
|
|
Symantec Corp. |
2,116,671 |
47,604 |
|
|
|
63,974 |
||
|
TOTAL INFORMATION TECHNOLOGY |
187,769 |
||
|
MATERIALS - 8.8% |
|||
|
Chemicals - 8.4% |
|||
|
Ashland, Inc. |
83,100 |
7,569 |
|
|
Axiall Corp. |
81,626 |
3,698 |
|
|
LyondellBasell Industries NV Class A |
1,132,092 |
87,373 |
|
|
PPG Industries, Inc. |
116,596 |
21,461 |
|
|
W.R. Grace & Co. (a) |
83,628 |
8,031 |
|
|
|
128,132 |
||
|
Common Stocks - continued |
|||
|
Shares |
Value (000s) |
||
|
MATERIALS - continued |
|||
|
Metals & Mining - 0.4% |
|||
|
Carpenter Technology Corp. |
86,796 |
$ 5,233 |
|
|
TOTAL MATERIALS |
133,365 |
||
|
TELECOMMUNICATION SERVICES - 1.1% |
|||
|
Diversified Telecommunication Services - 1.1% |
|||
|
Level 3 Communications, Inc. (a) |
558,139 |
16,979 |
|
|
UTILITIES - 4.5% |
|||
|
Electric Utilities - 0.9% |
|||
|
FirstEnergy Corp. |
231,369 |
7,550 |
|
|
NextEra Energy, Inc. |
67,700 |
5,727 |
|
|
|
13,277 |
||
|
Independent Power Producers & Energy Traders - 2.6% |
|||
|
Calpine Corp. (a) |
822,963 |
15,562 |
|
|
The AES Corp. |
1,687,800 |
24,591 |
|
|
|
40,153 |
||
|
Multi-Utilities - 1.0% |
|||
|
Sempra Energy |
179,639 |
15,887 |
|
|
TOTAL UTILITIES |
69,317 |
||
|
TOTAL COMMON STOCKS (Cost $973,195) |
|
||
|
Nonconvertible Bonds - 0.4% |
||||
|
|
Principal Amount (000s) |
|
||
|
ENERGY - 0.4% |
||||
|
Oil, Gas & Consumable Fuels - 0.4% |
||||
|
Alpha Natural Resources, Inc. 6.25% 6/1/21 (Cost $6,398) |
|
$ 7,670 |
|
|
|
Money Market Funds - 8.2% |
|||
|
Shares |
Value (000s) |
||
|
Fidelity Cash Central Fund, 0.10% (b) |
85,014,186 |
$ 85,014 |
|
|
Fidelity Securities Lending Cash Central Fund, 0.10% (b)(c) |
39,182,193 |
39,182 |
|
|
TOTAL MONEY MARKET FUNDS (Cost $124,196) |
|
||
|
TOTAL INVESTMENT PORTFOLIO - 102.5% (Cost $1,103,789) |
1,555,598 |
||
|
NET OTHER ASSETS (LIABILITIES) - (2.5)% |
(37,520) |
||
|
NET ASSETS - 100% |
$ 1,518,078 |
||
|
Legend |
|
(a) Non-income producing |
|
(b) Affiliated fund that is generally available only to investment companies and other accounts managed by Fidelity Investments. The rate quoted is the annualized seven-day yield of the fund at period end. A complete unaudited listing of the fund's holdings as of its most recent quarter end is available upon request. In addition, each Fidelity Central Fund's financial statements, which are not covered by the Fund's Report of Independent Registered Public Accounting Firm, are available on the SEC's website or upon request. |
|
(c) Investment made with cash collateral received from securities on loan. |
|
(d) Security or a portion of the security is on loan at period end. |
|
(e) Affiliated company |
|
Affiliated Central Funds |
|
Information regarding fiscal year to date income earned by the Fund from investments in Fidelity Central Funds is as follows: |
|
Fund |
Income earned |
|
Fidelity Cash Central Fund |
$ 160 |
|
Fidelity Securities Lending Cash Central Fund |
547 |
|
Total |
$ 707 |
|
Other Affiliated Issuers |
|
An affiliated company is a company in which the Fund has ownership of at least 5% of the voting securities. Fiscal year to date transactions with companies which are or were affiliates are as follows: |
|
Affiliate |
Value, |
Purchases |
Sales |
Dividend |
Value, |
|
Cott Corp. |
$ 59,355 |
$ - |
$ 27,851 |
$ 1,193 |
$ - |
|
The Bon-Ton Stores, Inc. |
11,279 |
17,226 |
- |
278 |
34,067 |
|
Total |
$ 70,634 |
$ 17,226 |
$ 27,851 |
$ 1,471 |
$ 34,067 |
|
Other Information |
|
The following is a summary of the inputs used, as of November 30, 2013, involving the Fund's assets and liabilities carried at fair value. The inputs or methodology used for valuing securities may not be an indication of the risk associated with investing in those securities. For more information on valuation inputs, and their aggregation into the levels used in the table below, please refer to the Investment Valuation section in the accompanying Notes to Financial Statements. |
|
Valuation Inputs at Reporting Date: |
||||
|
Description |
Total |
Level 1 |
Level 2 |
Level 3 |
|
Investments in Securities: |
||||
|
Equities: |
||||
|
Consumer Discretionary |
$ 362,488 |
$ 362,488 |
$ - |
$ - |
|
Consumer Staples |
81,742 |
81,742 |
- |
- |
|
Energy |
77,007 |
77,007 |
- |
- |
|
Financials |
173,468 |
173,468 |
- |
- |
|
Health Care |
216,613 |
216,613 |
- |
- |
|
Industrials |
106,077 |
106,077 |
- |
- |
|
Information Technology |
187,769 |
187,769 |
- |
- |
|
Materials |
133,365 |
133,365 |
- |
- |
|
Telecommunication Services |
16,979 |
16,979 |
- |
- |
|
Utilities |
69,317 |
69,317 |
- |
- |
|
Corporate Bonds |
6,577 |
- |
6,577 |
- |
|
Money Market Funds |
124,196 |
124,196 |
- |
- |
|
Total Investments in Securities: |
$ 1,555,598 |
$ 1,549,021 |
$ 6,577 |
$ - |
|
Distribution of investments by country or territory of incorporation, as a percentage of total net assets, is as follows (Unaudited): |
|
United States of America |
83.0% |
|
Netherlands |
5.8% |
|
France |
3.8% |
|
Bailiwick of Jersey |
2.8% |
|
Canada |
2.5% |
|
Ireland |
1.0% |
|
Others (Individually Less Than 1%) |
1.1% |
|
|
100.0% |
See accompanying notes which are an integral part of the financial statements.
Annual Report
Financial Statements
Statement of Assets and Liabilities
|
Amounts in thousands (except per-share amounts) |
November 30, 2013 |
|
|
|
|
|
|
Assets |
|
|
|
Investment in securities, at value (including securities loaned of $37,981) - See accompanying schedule: Unaffiliated issuers (cost $954,600) |
$ 1,397,335 |
|
|
Fidelity Central Funds (cost $124,196) |
124,196 |
|
|
Other affiliated issuers (cost $24,993) |
34,067 |
|
|
Total Investments (cost $1,103,789) |
|
$ 1,555,598 |
|
Receivable for fund shares sold |
|
1,266 |
|
Dividends receivable |
|
2,892 |
|
Interest receivable |
|
292 |
|
Distributions receivable from Fidelity Central Funds |
|
16 |
|
Prepaid expenses |
|
5 |
|
Other receivables |
|
2 |
|
Total assets |
|
1,560,071 |
|
|
|
|
|
Liabilities |
|
|
|
Payable for fund shares redeemed |
$ 1,644 |
|
|
Accrued management fee |
603 |
|
|
Distribution and service plan fees payable |
241 |
|
|
Other affiliated payables |
277 |
|
|
Other payables and accrued expenses |
46 |
|
|
Collateral on securities loaned, at value |
39,182 |
|
|
Total liabilities |
|
41,993 |
|
|
|
|
|
Net Assets |
|
$ 1,518,078 |
|
Net Assets consist of: |
|
|
|
Paid in capital |
|
$ 1,316,130 |
|
Undistributed net investment income |
|
9,989 |
|
Accumulated undistributed net realized gain (loss) on investments and foreign currency transactions |
|
(259,850) |
|
Net unrealized appreciation (depreciation) on investments and assets and liabilities in foreign currencies |
|
451,809 |
|
Net Assets |
|
$ 1,518,078 |
See accompanying notes which are an integral part of the financial statements.
Annual Report
Statement of Assets and Liabilities - continued
|
Amounts in thousands (except per-share amounts) |
November 30, 2013 |
|
|
|
|
|
|
Calculation of Maximum Offering Price Class A: |
|
$ 36.02 |
|
|
|
|
|
Maximum offering price per share (100/94.25 of $36.02) |
|
$ 38.22 |
|
Class T: |
|
$ 37.28 |
|
|
|
|
|
Maximum offering price per share (100/96.50 of $37.28) |
|
$ 38.63 |
|
Class B: |
|
$ 32.86 |
|
|
|
|
|
Class C: |
|
$ 32.52 |
|
|
|
|
|
Fidelity Value Strategies Fund: |
|
$ 40.28 |
|
|
|
|
|
Fidelity Value Strategies Fund Class K: |
|
$ 40.28 |
|
|
|
|
|
Institutional Class: |
|
$ 38.46 |
A Redemption price per share is equal to net asset value less any applicable contingent deferred sales charge.
See accompanying notes which are an integral part of the financial statements.
Annual Report
Financial Statements - continued
Statement of Operations
|
Amounts in thousands |
Year ended November 30, 2013 |
|
|
|
|
|
|
Investment Income |
|
|
|
Dividends (including $1,471 earned from other affiliated issuers) |
|
$ 23,949 |
|
Interest |
|
208 |
|
Income from Fidelity Central Funds |
|
707 |
|
Total income |
|
24,864 |
|
|
|
|
|
Expenses |
|
|
|
Management fee |
$ 7,835 |
|
|
Performance adjustment |
(1,028) |
|
|
Transfer agent fees |
2,821 |
|
|
Distribution and service plan fees |
2,743 |
|
|
Accounting and security lending fees |
461 |
|
|
Custodian fees and expenses |
16 |
|
|
Independent trustees' compensation |
8 |
|
|
Registration fees |
163 |
|
|
Audit |
65 |
|
|
Legal |
5 |
|
|
Miscellaneous |
9 |
|
|
Total expenses before reductions |
13,098 |
|
|
Expense reductions |
(150) |
12,948 |
|
Net investment income (loss) |
|
11,916 |
|
Realized and Unrealized Gain (Loss) Net realized gain (loss) on: |
|
|
|
Investment securities: |
|
|
|
Unaffiliated issuers |
62,499 |
|
|
Other affiliated issuers |
3,508 |
|
|
Foreign currency transactions |
4 |
|
|
Total net realized gain (loss) |
|
66,011 |
|
Change in net unrealized appreciation (depreciation) on: Investment securities |
293,438 |
|
|
Assets and liabilities in foreign currencies |
4 |
|
|
Total change in net unrealized appreciation (depreciation) |
|
293,442 |
|
Net gain (loss) |
|
359,453 |
|
Net increase (decrease) in net assets resulting from operations |
|
$ 371,369 |
See accompanying notes which are an integral part of the financial statements.
Annual Report
Statement of Changes in Net Assets
|
Amounts in thousands |
Year ended |
Year ended |
|
Increase (Decrease) in Net Assets |
|
|
|
Operations |
|
|
|
Net investment income (loss) |
$ 11,916 |
$ 539 |
|
Net realized gain (loss) |
66,011 |
42,952 |
|
Change in net unrealized appreciation (depreciation) |
293,442 |
147,048 |
|
Net increase (decrease) in net assets resulting |
371,369 |
190,539 |
|
Distributions to shareholders from net investment income |
(3,993) |
(4,679) |
|
Share transactions - net increase (decrease) |
77,974 |
(16,561) |
|
Total increase (decrease) in net assets |
445,350 |
169,299 |
|
|
|
|
|
Net Assets |
|
|
|
Beginning of period |
1,072,728 |
903,429 |
|
End of period (including undistributed net investment income of $9,989 and undistributed net investment income of $2,549, respectively) |
$ 1,518,078 |
$ 1,072,728 |
See accompanying notes which are an integral part of the financial statements.
Annual Report
Financial Highlights - Class A
|
Years ended November 30, |
2013 |
2012 |
2011 |
2010 |
2009 |
|
Selected Per-Share Data |
|
|
|
|
|
|
Net asset value, beginning of period |
$ 27.62 |
$ 22.71 |
$ 23.11 |
$ 18.77 |
$ 11.87 |
|
Income from Investment Operations |
|
|
|
|
|
|
Net investment income (loss) C |
.23 |
- F |
.13 G |
.03 H |
.06 |
|
Net realized and unrealized gain (loss) |
8.25 |
5.03 |
(.49) |
4.32 |
6.96 |
|
Total from investment operations |
8.48 |
5.03 |
(.36) |
4.35 |
7.02 |
|
Distributions from net investment income |
(.08) |
(.12) |
(.03) I |
- |
(.12) |
|
Distributions from net realized gain |
- |
- |
(.01) I |
(.01) |
- |
|
Total distributions |
(.08) |
(.12) |
(.04) |
(.01) |
(.12) |
|
Net asset value, end of period |
$ 36.02 |
$ 27.62 |
$ 22.71 |
$ 23.11 |
$ 18.77 |
|
Total Return A, B |
30.77% |
22.29% |
(1.57)% |
23.16% |
59.70% |
|
Ratios to Average Net Assets D, J |
|
|
|
|
|
|
Expenses before reductions |
1.04% |
1.21% |
1.18% |
1.08% |
1.03% |
|
Expenses net of fee waivers, if any |
1.04% |
1.21% |
1.18% |
1.08% |
1.03% |
|
Expenses net of all reductions |
1.03% |
1.21% |
1.17% |
1.07% |
1.02% |
|
Net investment income (loss) |
.73% |
-% F |
.51% G |
.12% H |
.39% |
|
Supplemental Data |
|
|
|
|
|
|
Net assets, end of period (in millions) |
$ 243 |
$ 203 |
$ 190 |
$ 221 |
$ 206 |
|
Portfolio turnover rate E |
22% |
23% |
34% |
99% |
161% |
A Total returns would have been lower if certain expenses had not been reduced during the applicable periods shown.
B Total returns do not include the effect of the sales charges.
C Calculated based on average shares outstanding during the period.
D Fees and expenses of any underlying Fidelity Central Funds are not included in the Fund's expense ratio. The Fund indirectly bears its proportionate share of the expenses of any underlying Fidelity Central Funds.
E Amount does not include the portfolio activity of any underlying Fidelity Central Funds.
F Investment income per share reflects a large, non-recurring dividend which amounted to $.07 per share. Excluding this non-recurring dividend, the ratio of net investment income (loss) to average net assets would have been (.28)%.
G Investment income per share reflects a large, non-recurring dividend which amounted to $.16 per share. Excluding this non-recurring dividend, the ratio of net investment income (loss) to average net assets would have been (.11)%.
H Investment income per share reflects a large, non-recurring dividend which amounted to $.04 per share. Excluding this non-recurring dividend, the ratio of net investment income (loss) to average net assets would have been (.05)%.
I The amounts shown reflect certain reclassifications related to book to tax differences that were made in the year shown.
J Expense ratios reflect operating expenses of the class. Expenses before reductions do not reflect amounts reimbursed by the investment adviser or reductions from brokerage service arrangements or reductions from other expense offset arrangements and do not represent the amount paid by the class during periods when reimbursements or reductions occur. Expenses net of fee waivers reflect expenses after reimbursement by the investment adviser but prior to reductions from brokerage service arrangements or other expense offset arrangements. Expenses net of all reductions represent the net expenses paid by the class.
See accompanying notes which are an integral part of the financial statements.
Annual Report
Financial Highlights - Class T
|
Years ended November 30, |
2013 |
2012 |
2011 |
2010 |
2009 |
|
Selected Per-Share Data |
|
|
|
|
|
|
Net asset value, beginning of period |
$ 28.58 |
$ 23.48 |
$ 23.90 |
$ 19.44 |
$ 12.25 |
|
Income from Investment Operations |
|
|
|
|
|
|
Net investment income (loss) C |
.18 |
(.05) F |
.08 G |
(.01) H |
.03 |
|
Net realized and unrealized gain (loss) |
8.54 |
5.22 |
(.50) |
4.48 |
7.21 |
|
Total from investment operations |
8.72 |
5.17 |
(.42) |
4.47 |
7.24 |
|
Distributions from net investment income |
(.02) |
(.07) |
- |
- |
(.05) |
|
Distributions from net realized gain |
- |
- |
- |
(.01) |
- |
|
Total distributions |
(.02) |
(.07) |
- |
(.01) |
(.05) |
|
Net asset value, end of period |
$ 37.28 |
$ 28.58 |
$ 23.48 |
$ 23.90 |
$ 19.44 |
|
Total Return A, B |
30.52% |
22.08% |
(1.76)% |
22.98% |
59.40% |
|
Ratios to Average Net Assets D, I |
|
|
|
|
|
|
Expenses before reductions |
1.23% |
1.38% |
1.35% |
1.26% |
1.24% |
|
Expenses net of fee waivers, if any |
1.23% |
1.38% |
1.35% |
1.26% |
1.24% |
|
Expenses net of all reductions |
1.22% |
1.38% |
1.35% |
1.25% |
1.22% |
|
Net investment income (loss) |
.54% |
(.17)% F |
.33% G |
(.06)% H |
.18% |
|
Supplemental Data |
|
|
|
|
|
|
Net assets, end of period (in millions) |
$ 335 |
$ 283 |
$ 274 |
$ 344 |
$ 339 |
|
Portfolio turnover rate E |
22% |
23% |
34% |
99% |
161% |
A Total returns would have been lower if certain expenses had not been reduced during the applicable periods shown.
B Total returns do not include the effect of the sales charges.
C Calculated based on average shares outstanding during the period.
D Fees and expenses of any underlying Fidelity Central Funds are not included in the Fund's expense ratio. The Fund indirectly bears its proportionate share of the expenses of any underlying Fidelity Central Funds.
E Amount does not include the portfolio activity of any underlying Fidelity Central Funds.
F Investment income per share reflects a large, non-recurring dividend which amounted to $.07 per share. Excluding this non-recurring dividend, the ratio of net investment income (loss) to average net assets would have been (.45)%.
G Investment income per share reflects a large, non-recurring dividend which amounted to $.16 per share. Excluding this non-recurring dividend, the ratio of net investment income (loss) to average net assets would have been (.29)%.
H Investment income per share reflects a large, non-recurring dividend which amounted to $.04 per share. Excluding this non-recurring dividend, the ratio of net investment income (loss) to average net assets would have been (.23)%.
I Expense ratios reflect operating expenses of the class. Expenses before reductions do not reflect amounts reimbursed by the investment adviser or reductions from brokerage service arrangements or reductions from other expense offset arrangements and do not represent the amount paid by the class during periods when reimbursements or reductions occur. Expenses net of fee waivers reflect expenses after reimbursement by the investment adviser but prior to reductions from brokerage service arrangements or other expense offset arrangements. Expenses net of all reductions represent the net expenses paid by the class.
See accompanying notes which are an integral part of the financial statements.
Annual Report
Financial Highlights - Class B
|
Years ended November 30, |
2013 |
2012 |
2011 |
2010 |
2009 |
|
Selected Per-Share Data |
|
|
|
|
|
|
Net asset value, beginning of period |
$ 25.34 |
$ 20.87 |
$ 21.37 |
$ 17.48 |
$ 11.03 |
|
Income from Investment Operations |
|
|
|
|
|
|
Net investment income (loss) C |
(.02) |
(.18) F |
(.06) G |
(.13) H |
(.05) |
|
Net realized and unrealized gain (loss) |
7.54 |
4.65 |
(.44) |
4.03 |
6.50 |
|
Total from investment operations |
7.52 |
4.47 |
(.50) |
3.90 |
6.45 |
|
Distributions from net realized gain |
- |
- |
- |
(.01) |
- |
|
Net asset value, end of period |
$ 32.86 |
$ 25.34 |
$ 20.87 |
$ 21.37 |
$ 17.48 |
|
Total Return A, B |
29.68% |
21.42% |
(2.34)% |
22.29% |
58.48% |
|
Ratios to Average Net Assets D, I |
|
|
|
|
|
|
Expenses before reductions |
1.83% |
1.97% |
1.93% |
1.83% |
1.78% |
|
Expenses net of fee waivers, if any |
1.83% |
1.97% |
1.93% |
1.83% |
1.78% |
|
Expenses net of all reductions |
1.82% |
1.97% |
1.93% |
1.82% |
1.77% |
|
Net investment income (loss) |
(.07)% |
(.76)% F |
(.25)% G |
(.64)% H |
(.36)% |
|
Supplemental Data |
|
|
|
|
|
|
Net assets, end of period (in millions) |
$ 11 |
$ 13 |
$ 16 |
$ 30 |
$ 40 |
|
Portfolio turnover rate E |
22% |
23% |
34% |
99% |
161% |
A Total returns would have been lower if certain expenses had not been reduced during the applicable periods shown.
B Total returns do not include the effect of the contingent deferred sales charge.
C Calculated based on average shares outstanding during the period.
D Fees and expenses of any underlying Fidelity Central Funds are not included in the Fund's expense ratio. The Fund indirectly bears its proportionate share of the expenses of any underlying Fidelity Central Funds.
E Amount does not include the portfolio activity of any underlying Fidelity Central Funds.
F Investment income per share reflects a large, non-recurring dividend which amounted to $.06 per share. Excluding this non-recurring dividend, the ratio of net investment income (loss) to average net assets would have been (1.04)%.
G Investment income per share reflects a large, non-recurring dividend which amounted to $.16 per share. Excluding this non-recurring dividend, the ratio of net investment income (loss) to average net assets would have been (.87)%.
H Investment income per share reflects a large, non-recurring dividend which amounted to $.03 per share. Excluding this non-recurring dividend, the ratio of net investment income (loss) to average net assets would have been (.80)%.
I Expense ratios reflect operating expenses of the class. Expenses before reductions do not reflect amounts reimbursed by the investment adviser or reductions from brokerage service arrangements or reductions from other expense offset arrangements and do not represent the amount paid by the class during periods when reimbursements or reductions occur. Expenses net of fee waivers reflect expenses after reimbursement by the investment adviser but prior to reductions from brokerage service arrangements or other expense offset arrangements. Expenses net of all reductions represent the net expenses paid by the class.
See accompanying notes which are an integral part of the financial statements.
Annual Report
Financial Highlights - Class C
|
Years ended November 30, |
2013 |
2012 |
2011 |
2010 |
2009 |
|
Selected Per-Share Data |
|
|
|
|
|
|
Net asset value, beginning of period |
$ 25.06 |
$ 20.64 |
$ 21.13 |
$ 17.29 |
$ 10.91 |
|
Income from Investment Operations |
|
|
|
|
|
|
Net investment income (loss) C |
(.01) |
(.17) F |
(.05) G |
(.12) H |
(.05) |
|
Net realized and unrealized gain (loss) |
7.47 |
4.59 |
(.44) |
3.97 |
6.43 |
|
Total from investment operations |
7.46 |
4.42 |
(.49) |
3.85 |
6.38 |
|
Distributions from net realized gain |
- |
- |
- |
(.01) |
- |
|
Net asset value, end of period |
$ 32.52 |
$ 25.06 |
$ 20.64 |
$ 21.13 |
$ 17.29 |
|
Total Return A, B |
29.77% |
21.41% |
(2.32)% |
22.25% |
58.48% |
|
Ratios to Average Net Assets D, I |
|
|
|
|
|
|
Expenses before reductions |
1.78% |
1.95% |
1.92% |
1.83% |
1.78% |
|
Expenses net of fee waivers, if any |
1.78% |
1.95% |
1.92% |
1.83% |
1.78% |
|
Expenses net of all reductions |
1.77% |
1.95% |
1.92% |
1.82% |
1.77% |
|
Net investment income (loss) |
(.02)% |
(.75)% F |
(.24)% G |
(.63)% H |
(.36)% |
|
Supplemental Data |
|
|
|
|
|
|
Net assets, end of period (in millions) |
$ 54 |
$ 43 |
$ 40 |
$ 49 |
$ 43 |
|
Portfolio turnover rate E |
22% |
23% |
34% |
99% |
161% |
A Total returns would have been lower if certain expenses had not been reduced during the applicable periods shown.
B Total returns do not include the effect of the contingent deferred sales charge.
C Calculated based on average shares outstanding during the period.
D Fees and expenses of any underlying Fidelity Central Funds are not included in the Fund's expense ratio. The Fund indirectly bears its proportionate share of the expenses of any underlying Fidelity Central Funds.
E Amount does not include the portfolio activity of any underlying Fidelity Central Funds.
F Investment income per share reflects a large, non-recurring dividend which amounted to $.06 per share. Excluding this non-recurring dividend, the ratio of net investment income (loss) to average net assets would have been (1.02)%.
G Investment income per share reflects a large, non-recurring dividend which amounted to $.16 per share. Excluding this non-recurring dividend, the ratio of net investment income (loss) to average net assets would have been (.86)%.
H Investment income per share reflects a large, non-recurring dividend which amounted to $.03 per share. Excluding this non-recurring dividend, the ratio of net investment income (loss) to average net assets would have been (.80)%.
I Expense ratios reflect operating expenses of the class. Expenses before reductions do not reflect amounts reimbursed by the investment adviser or reductions from brokerage service arrangements or reductions from other expense offset arrangements and do not represent the amount paid by the class during periods when reimbursements or reductions occur. Expenses net of fee waivers reflect expenses after reimbursement by the investment adviser but prior to reductions from brokerage service arrangements or other expense offset arrangements. Expenses net of all reductions represent the net expenses paid by the class.
See accompanying notes which are an integral part of the financial statements.
Annual Report
Financial Highlights - Fidelity Value Strategies Fund
|
Years ended November 30, |
2013 |
2012 |
2011 |
2010 |
2009 |
|
Selected Per-Share Data |
|
|
|
|
|
|
Net asset value, beginning of period |
$ 30.89 |
$ 25.37 |
$ 25.80 |
$ 20.89 |
$ 13.21 |
|
Income from Investment Operations |
|
|
|
|
|
|
Net investment income (loss) B |
.37 |
.09 E |
.22 F |
.09 G |
.11 |
|
Net realized and unrealized gain (loss) |
9.20 |
5.62 |
(.54) |
4.83 |
7.73 |
|
Total from investment operations |
9.57 |
5.71 |
(.32) |
4.92 |
7.84 |
|
Distributions from net investment income |
(.18) |
(.19) |
(.10) H |
- |
(.16) |
|
Distributions from net realized gain |
- |
- |
(.01) H |
(.01) |
- |
|
Total distributions |
(.18) |
(.19) |
(.11) |
(.01) |
(.16) |
|
Net asset value, end of period |
$ 40.28 |
$ 30.89 |
$ 25.37 |
$ 25.80 |
$ 20.89 |
|
Total Return A |
31.14% |
22.69% |
(1.29)% |
23.54% |
60.05% |
|
Ratios to Average Net Assets C, I |
|
|
|
|
|
|
Expenses before reductions |
.73% |
.89% |
.88% |
.81% |
.78% |
|
Expenses net of fee waivers, if any |
.73% |
.89% |
.88% |
.81% |
.78% |
|
Expenses net of all reductions |
.72% |
.89% |
.88% |
.80% |
.77% |
|
Net investment income (loss) |
1.03% |
.31% E |
.80% F |
.39% G |
.64% |
|
Supplemental Data |
|
|
|
|
|
|
Net assets, end of period (in millions) |
$ 681 |
$ 396 |
$ 284 |
$ 360 |
$ 237 |
|
Portfolio turnover rate D |
22% |
23% |
34% |
99% |
161% |
A Total returns would have been lower if certain expenses had not been reduced during the applicable periods shown.
B Calculated based on average shares outstanding during the period.
C Fees and expenses of any underlying Fidelity Central Funds are not included in the Fund's expense ratio. The Fund indirectly bears its proportionate share of the expenses of any underlying Fidelity Central Funds.
D Amount does not include the portfolio activity of any underlying Fidelity Central Funds.
E Investment income per share reflects a large, non-recurring dividend which amounted to $.08 per share. Excluding this non-recurring dividend, the ratio of net investment income (loss) to average net assets would have been .04%.
F Investment income per share reflects a large, non-recurring dividend which amounted to $.16 per share. Excluding this non-recurring dividend, the ratio of net investment income (loss) to average net assets would have been .18%.
G Investment income per share reflects a large, non-recurring dividend which amounted to $.04 per share. Excluding this non-recurring dividend, the ratio of net investment income (loss) to average net assets would have been .22%.
H The amounts shown reflect certain reclassifications related to book to tax differences that were made in the year shown.
I Expense ratios reflect operating expenses of the class. Expenses before reductions do not reflect amounts reimbursed by the investment adviser or reductions from brokerage service arrangements or reductions from other expense offset arrangements and do not represent the amount paid by the class during periods when reimbursements or reductions occur. Expenses net of fee waivers reflect expenses after reimbursement by the investment adviser but prior to reductions from brokerage service arrangements or other expense offset arrangements. Expenses net of all reductions represent the net expenses paid by the class.
See accompanying notes which are an integral part of the financial statements.
Annual Report
Financial Highlights - Fidelity Value Strategies Fund Class K
|
Years ended November 30, |
2013 |
2012 |
2011 |
2010 |
2009 |
|
Selected Per-Share Data |
|
|
|
|
|
|
Net asset value, beginning of period |
$ 30.89 |
$ 25.38 |
$ 25.82 |
$ 20.86 |
$ 13.23 |
|
Income from Investment Operations |
|
|
|
|
|
|
Net investment income (loss) B |
.43 |
.14 E |
.28 F |
.15 G |
.16 |
|
Net realized and unrealized gain (loss) |
9.18 |
5.61 |
(.55) |
4.82 |
7.70 |
|
Total from investment operations |
9.61 |
5.75 |
(.27) |
4.97 |
7.86 |
|
Distributions from net investment income |
(.22) |
(.24) |
(.16) H |
- |
(.23) |
|
Distributions from net realized gain |
- |
- |
(.01) H |
(.01) |
- |
|
Total distributions |
(.22) |
(.24) |
(.17) |
(.01) |
(.23) |
|
Net asset value, end of period |
$ 40.28 |
$ 30.89 |
$ 25.38 |
$ 25.82 |
$ 20.86 |
|
Total Return A |
31.34% |
22.93% |
(1.11)% |
23.81% |
60.52% |
|
Ratios to Average Net Assets C, I |
|
|
|
|
|
|
Expenses before reductions |
.58% |
.71% |
.68% |
.58% |
.51% |
|
Expenses net of fee waivers, if any |
.58% |
.71% |
.68% |
.58% |
.51% |
|
Expenses net of all reductions |
.57% |
.71% |
.68% |
.56% |
.49% |
|
Net investment income (loss) |
1.18% |
.50% E |
1.00% F |
.62% G |
.91% |
|
Supplemental Data |
|
|
|
|
|
|
Net assets, end of period (in millions) |
$ 119 |
$ 70 |
$ 47 |
$ 47 |
$ 27 |
|
Portfolio turnover rate D |
22% |
23% |
34% |
99% |
161% |
A Total returns would have been lower if certain expenses had not been reduced during the applicable periods shown.
B Calculated based on average shares outstanding during the period.
C Fees and expenses of any underlying Fidelity Central Funds are not included in the Fund's expense ratio. The Fund indirectly bears its proportionate share of the expenses of any underlying Fidelity Central Funds.
D Amount does not include the portfolio activity of any underlying Fidelity Central Funds.
E Investment income per share reflects a large, non-recurring dividend which amounted to $.08 per share. Excluding this non-recurring dividend, the ratio of net investment income (loss) to average net assets would have been .22%.
F Investment income per share reflects a large, non-recurring dividend which amounted to $.16 per share. Excluding this non-recurring dividend, the ratio of net investment income (loss) to average net assets would have been .38%.
G Investment income per share reflects a large, non-recurring dividend which amounted to $.04 per share. Excluding this non-recurring dividend, the ratio of net investment income (loss) to average net assets would have been .46%.
H The amounts shown reflect certain reclassifications related to book to tax differences that were made in the year shown.
I Expense ratios reflect operating expenses of the class. Expenses before reductions do not reflect amounts reimbursed by the investment adviser or reductions from brokerage service arrangements or reductions from other expense offset arrangements and do not represent the amount paid by the class during periods when reimbursements or reductions occur. Expenses net of fee waivers reflect expenses after reimbursement by the investment adviser but prior to reductions from brokerage service arrangements or other expense offset arrangements. Expenses net of all reductions represent the net expenses paid by the class.
See accompanying notes which are an integral part of the financial statements.
Annual Report
Financial Highlights - Institutional Class
|
Years ended November 30, |
2013 |
2012 |
2011 |
2010 |
2009 |
|
Selected Per-Share Data |
|
|
|
|
|
|
Net asset value, beginning of period |
$ 29.51 |
$ 24.26 |
$ 24.69 |
$ 19.97 |
$ 12.67 |
|
Income from Investment Operations |
|
|
|
|
|
|
Net investment income (loss) B |
.34 |
.08 E |
.22 F |
.10 G |
.11 |
|
Net realized and unrealized gain (loss) |
8.79 |
5.37 |
(.53) |
4.63 |
7.38 |
|
Total from investment operations |
9.13 |
5.45 |
(.31) |
4.73 |
7.49 |
|
Distributions from net investment income |
(.18) |
(.20) |
(.11) H |
- |
(.19) |
|
Distributions from net realized gain |
- |
- |
(.01) H |
(.01) |
- |
|
Total distributions |
(.18) |
(.20) |
(.12) |
(.01) |
(.19) |
|
Net asset value, end of period |
$ 38.46 |
$ 29.51 |
$ 24.26 |
$ 24.69 |
$ 19.97 |
|
Total Return A |
31.11% |
22.67% |
(1.30)% |
23.67% |
60.08% |
|
Ratios to Average Net Assets C, I |
|
|
|
|
|
|
Expenses before reductions |
.76% |
.90% |
.86% |
.74% |
.70% |
|
Expenses net of fee waivers, if any |
.76% |
.90% |
.86% |
.74% |
.70% |
|
Expenses net of all reductions |
.75% |
.90% |
.86% |
.73% |
.69% |
|
Net investment income (loss) |
1.00% |
.31% E |
.82% F |
.46% G |
.71% |
|
Supplemental Data |
|
|
|
|
|
|
Net assets, end of period (in millions) |
$ 74 |
$ 66 |
$ 52 |
$ 53 |
$ 48 |
|
Portfolio turnover rate D |
22% |
23% |
34% |
99% |
161% |
A Total returns would have been lower if certain expenses had not been reduced during the applicable periods shown.
B Calculated based on average shares outstanding during the period.
C Fees and expenses of any underlying Fidelity Central Funds are not included in the Fund's expense ratio. The Fund indirectly bears its proportionate share of the expenses of any underlying Fidelity Central Funds.
D Amount does not include the portfolio activity of any underlying Fidelity Central Funds.
E Investment income per share reflects a large, non-recurring dividend which amounted to $.08 per share. Excluding this non-recurring dividend, the ratio of net investment income (loss) to average net assets would have been .03%.
F Investment income per share reflects a large, non-recurring dividend which amounted to $.16 per share. Excluding this non-recurring dividend, the ratio of net investment income (loss) to average net assets would have been .20%.
G Investment income per share reflects a large, non-recurring dividend which amounted to $.04 per share. Excluding this non-recurring dividend, the ratio of net investment income (loss) to average net assets would have been .29%.
H The amounts shown reflect certain reclassifications related to book to tax differences that were made in the year shown.
I Expense ratios reflect operating expenses of the class. Expenses before reductions do not reflect amounts reimbursed by the investment adviser or reductions from brokerage service arrangements or reductions from other expense offset arrangements and do not represent the amount paid by the class during periods when reimbursements or reductions occur. Expenses net of fee waivers reflect expenses after reimbursement by the investment adviser but prior to reductions from brokerage service arrangements or other expense offset arrangements. Expenses net of all reductions represent the net expenses paid by the class.
See accompanying notes which are an integral part of the financial statements.
Annual Report
Notes to Financial Statements
For the period ended November 30, 2013
(Amounts in thousands except percentages)
1. Organization.
Fidelity Advisor Value Strategies Fund (the Fund) is a fund of Fidelity Advisor Series I (the Trust) and is authorized to issue an unlimited number of shares. The Trust is registered under the Investment Company Act of 1940, as amended (the 1940 Act), as an open-end management investment company organized as a Massachusetts business trust. The Fund offers Class A, Class T, Class C, Fidelity Value Strategies Fund, Fidelity Value Strategies Fund Class K and Institutional Class shares, each of which, along with Class B shares, has equal rights as to assets and voting privileges. Class B shares are closed to new accounts and additional purchases, except for exchanges and reinvestments. Each class has exclusive voting rights with respect to matters that affect that class. Class B shares will automatically convert to Class A shares after a holding period of seven years from the initial date of purchase.
2. Investments in Fidelity Central Funds.
The Fund invests in Fidelity Central Funds, which are open-end investment companies generally available only to other investment companies and accounts managed by the investment adviser and its affiliates. The Fund's Schedule of Investments lists each of the Fidelity Central Funds held as of period end, if any, as an investment of the Fund, but does not include the underlying holdings of each Fidelity Central Fund. As an Investing Fund, the Fund indirectly bears its proportionate share of the expenses of the underlying Fidelity Central Funds.
The Money Market Central Funds seek preservation of capital and current income and are managed by Fidelity Investments Money Management, Inc. (FIMM), an affiliate of the investment adviser. Annualized expenses of the Money Market Central Funds as of their most recent shareholder report date are less than .01%.
A complete unaudited list of holdings for each Fidelity Central Fund is available upon request or at the Securities and Exchange Commission (the SEC) website at www.sec.gov. In addition, the financial statements of the Fidelity Central Funds, which are not covered by the Fund's Report of Independent Registered Public Accounting Firm, are available on the SEC website or upon request.
3. Significant Accounting Policies.
The financial statements have been prepared in conformity with accounting principles generally accepted in the United States of America (GAAP), which require management to make certain estimates and assumptions at the date of the financial statements. Actual results could differ from those estimates. Subsequent events, if any, through the date that the financial statements were issued have been evaluated in the preparation of
Annual Report
Notes to Financial Statements - continued
(Amounts in thousands except percentages)
3. Significant Accounting Policies - continued
the financial statements. The following summarizes the significant accounting policies of the Fund:
Investment Valuation. Investments are valued as of 4:00 p.m. Eastern time on the last calendar day of the period. In accordance with valuation policies and procedures approved by the Board of Trustees (the Board), the Fund attempts to obtain prices from one or more third party pricing vendors or brokers to value its investments. When current market prices, quotations or currency exchange rates are not readily available or reliable, investments will be fair valued in good faith by the Fidelity Management & Research Company (FMR) Fair Value Committee (the Committee), in accordance with procedures adopted by the Board. Factors used in determining fair value vary by investment type and may include market or investment specific events, changes in interest rates and credit quality. The frequency with which these procedures are used cannot be predicted and they may be utilized to a significant extent. The Committee oversees the Fund's valuation policies and procedures and is responsible for approving and reporting to the Board all fair value determinations.
The Fund categorizes the inputs to valuation techniques used to value its investments into a disclosure hierarchy consisting of three levels as shown below:
Level 1 - quoted prices in active markets for identical investments
Level 2 - other significant observable inputs (including quoted prices for similar investments, interest rates, prepayment speeds, etc.)
Level 3 - unobservable inputs (including the Fund's own assumptions based on the best information available)
Valuation techniques used to value the Fund's investments by major category are as follows:
Equity securities, including restricted securities, for which market quotations are readily available, are valued at the last reported sale price or official closing price as reported by a third party pricing vendor on the primary market or exchange on which they are traded and are categorized as Level 1 in the hierarchy. In the event there were no sales during the day or closing prices are not available, securities are valued at the last quoted bid price or may be valued using the last available price and are generally categorized as Level 2 in the hierarchy. For foreign equity securities, when market or security specific events arise, comparisons to the valuation of American Depositary Receipts (ADRs), futures contracts, Exchange-Traded Funds (ETFs) and certain indexes as well as quoted prices for similar securities may be used and would be categorized as Level 2 in the hierarchy. Utilizing these techniques may result in transfers between Level 1 and Level 2. For equity securities, including restricted securities, where observable inputs are
Annual Report
3. Significant Accounting Policies - continued
Investment Valuation - continued
limited, assumptions about market activity and risk are used and these securities may be categorized as Level 3 in the hierarchy.
Debt securities, including restricted securities, are valued based on evaluated prices received from third party pricing vendors or from brokers who make markets in such securities. For corporate bonds, pricing vendors utilize matrix pricing which considers yield or price of bonds of comparable quality, coupon, maturity and type as well as broker-supplied prices. When independent prices are unavailable or unreliable, debt securities may be valued utilizing pricing methodologies which consider similar factors that would be used by third party pricing vendors. Debt securities are generally categorized as Level 2 in the hierarchy but may be Level 3 depending on the circumstances.
Investments in open-end mutual funds, including the Fidelity Central Funds, are valued at their closing net asset value (NAV) each business day and are categorized as Level 1 in the hierarchy.
Changes in valuation techniques may result in transfers in or out of an assigned level within the disclosure hierarchy. The aggregate value of investments by input level, as of November 30, 2013, is included at the end of the Fund's Schedule of Investments.
Foreign Currency. The Fund may use foreign currency contracts to facilitate transactions in foreign-denominated securities. Gains and losses from these transactions may arise from changes in the value of the foreign currency or if the counterparties do not perform under the contracts' terms.
Foreign-denominated assets, including investment securities, and liabilities are translated into U.S. dollars at the exchange rates at period end. Purchases and sales of investment securities, income and dividends received and expenses denominated in foreign currencies are translated into U.S. dollars at the exchange rate in effect on the transaction date.
The effects of exchange rate fluctuations on investments are included with the net realized and unrealized gain (loss) on investment securities. Other foreign currency transactions resulting in realized and unrealized gain (loss) are disclosed separately.
Investment Transactions and Income. For financial reporting purposes, the Fund's investment holdings and NAV include trades executed through the end of the last business day of the period. The NAV per share for processing shareholder transactions is calculated as of the close of business of the New York Stock Exchange (NYSE), normally 4:00 p.m. Eastern time and includes trades executed through the end of the prior business day. Gains and losses on securities sold are determined on the basis of identified cost and may include proceeds received from litigation. Dividend income is recorded on
Annual Report
Notes to Financial Statements - continued
(Amounts in thousands except percentages)
3. Significant Accounting Policies - continued
Investment Transactions and Income - continued
the ex-dividend date, except for certain dividends from foreign securities where the ex-dividend date may have passed, which are recorded as soon as the Fund is informed of the ex-dividend date. Non-cash dividends included in dividend income, if any, are recorded at the fair market value of the securities received. Distributions received on securities that represent a return of capital or capital gain are recorded as a reduction of cost of investments and/or as a realized gain. Subsequent to ex-dividend date the Fund determines the components of these distributions, based upon receipt of tax filings or other correspondence relating to the underlying investment. Interest income and distributions from the Fidelity Central Funds are accrued as earned. Interest income includes coupon interest and amortization of premium and accretion of discount on debt securities. Investment income is recorded net of foreign taxes withheld where recovery of such taxes is uncertain.
Class Allocations and Expenses. Investment income, realized and unrealized capital gains and losses, common expenses of the Fund, and certain fund-level expense reductions, if any, are allocated daily on a pro-rata basis to each class based on the relative net assets of each class to the total net assets of the Fund. Each class differs with respect to transfer agent and distribution and service plan fees incurred. Certain expense reductions may also differ by class. For the reporting period, the allocated portion of income and expenses to each class as a percent of its average net assets may vary due to the timing of recording these transactions in relation to fluctuating net assets of the classes. Expenses directly attributable to a fund are charged to that fund. Expenses attributable to more than one fund are allocated among the respective funds on the basis of relative net assets or other appropriate methods. Expense estimates are accrued in the period to which they relate and adjustments are made when actual amounts are known.
Income Tax Information and Distributions to Shareholders. Each year, the Fund intends to qualify as a regulated investment company under Subchapter M of the Internal Revenue Code, including distributing substantially all of its taxable income and realized gains. As a result, no provision for U.S. Federal income taxes is required. As of November 30, 2013, the Fund did not have any unrecognized tax benefits in the financial statements; nor is the Fund aware of any tax positions for which it is reasonably possible that the total amounts of unrecognized tax benefits will significantly change in the next twelve months. The Fund files a U.S. federal tax return, in addition to state and local tax returns as required. The Fund's federal income tax returns are subject to examination by the Internal Revenue Service (IRS) for a period of three fiscal years after they are filed. State and local tax returns may be subject to examination for an additional fiscal year
Annual Report
3. Significant Accounting Policies - continued
Income Tax Information and Distributions to Shareholders - continued
depending on the jurisdiction. Foreign taxes are provided for based on the Fund's understanding of the tax rules and rates that exist in the foreign markets in which it invests.
Distributions are declared and recorded on the ex-dividend date. Income dividends and capital gain distributions are declared separately for each class. Income and capital gain distributions are determined in accordance with income tax regulations, which may differ from GAAP. These differences resulted in distribution reclassifications.
Capital accounts within the financial statements are adjusted for permanent book-tax differences. These adjustments have no impact on net assets or the results of operations. Temporary book-tax differences will reverse in a subsequent period.
Book-tax differences are primarily due to foreign currency transactions, partnerships, market discount, deferred trustees compensation, capital loss carryforwards and losses deferred due to wash sales.
The federal tax cost of investment securities and unrealized appreciation (depreciation) as of period end were as follows:
|
Gross unrealized appreciation |
$ 471,566 |
|
Gross unrealized depreciation |
(21,450) |
|
Net unrealized appreciation (depreciation) on securities and other investments |
$ 450,116 |
|
|
|
|
Tax Cost |
$ 1,105,482 |
The tax-based components of distributable earnings as of period end were as follows:
|
Undistributed ordinary income |
$ 9,957 |
|
Capital loss carryforward |
$ (258,123) |
|
Net unrealized appreciation (depreciation) |
$ 450,116 |
Capital loss carryforwards are only available to offset future capital gains of the Fund to the extent provided by regulations and may be limited. Under the Regulated Investment Company Modernization Act of 2010 (the Act), the Fund is permitted to carry forward capital losses incurred in taxable years beginning after December 22, 2010 for an unlimited period and such capital losses are required to be used prior to any losses that expire.
Annual Report
Notes to Financial Statements - continued
(Amounts in thousands except percentages)
3. Significant Accounting Policies - continued
Income Tax Information and Distributions to Shareholders - continued
The capital loss carryforward information presented below, including any applicable limitation, is estimated as of fiscal period end and is subject to adjustment.
|
Fiscal year of expiration |
|
|
2016 |
$ (70,992) |
|
2017 |
(187,132) |
|
Total capital loss carryforward |
$ (258,123) |
The tax character of distributions paid was as follows:
|
|
November 30, 2013 |
November 30, 2012 |
|
Ordinary Income |
$ 3,993 |
$ 4,679 |
4. Purchases and Sales of Investments.
Purchases and sales of securities, other than short-term securities, aggregated $388,274 and $281,410, respectively.
5. Fees and Other Transactions with Affiliates.
Management Fee. Fidelity Management & Research Company (the investment adviser) and its affiliates provide the Fund with investment management related services for which the Fund pays a monthly management fee. The management fee is the sum of an individual fund fee rate that is based on an annual rate of .30% of the Fund's average net assets and an annualized group fee rate that averaged .25% during the period. The group fee rate is based upon the average net assets of all the mutual funds advised by the investment adviser, including any mutual funds previously advised by the investment adviser that are currently advised by Fidelity SelectCo, LLC, an affiliate of the investment adviser. The group fee rate decreases as assets under management increase and increases as assets under management decrease. In addition, the management fee is subject to a performance adjustment (up to a maximum of ± .20% of the Fund's average net assets over a 36 month performance period). The upward or downward adjustment to the management fee is based on the relative investment performance of Fidelity Value Strategies Fund as compared to an appropriate benchmark index over the same 36 month performance period. For the reporting period, the total annual management fee rate, including the performance adjustment, was .48% of the Fund's average net assets. The performance adjustment included in the management fee rate may be higher or lower than the maximum performance adjustment rate due to the difference between the average net assets for the reporting and performance periods.
Annual Report
5. Fees and Other Transactions with Affiliates - continued
Distribution and Service Plan Fees. In accordance with Rule 12b-1 of the 1940 Act, the Fund has adopted separate Distribution and Service Plans for each class of shares. Certain classes pay Fidelity Distributors Corporation (FDC), an affiliate of the investment adviser, separate Distribution and Service Fees, each of which is based on an annual percentage of each class' average net assets. In addition, FDC may pay financial intermediaries for selling shares of the Fund and providing shareholder support services. For the period, the Distribution and Service Fee rates, total fees and amounts retained by FDC were as follows:
|
|
Distribution |
Service |
Total Fees |
Retained |
|
Class A |
-% |
.25% |
$ 563 |
$ 10 |
|
Class T |
.25% |
.25% |
1,560 |
13 |
|
Class B |
.75% |
.25% |
119 |
90 |
|
Class C |
.75% |
.25% |
501 |
32 |
|
|
|
|
$ 2,743 |
$ 145 |
Sales Load. FDC may receive a front-end sales charge of up to 5.75% for selling Class A shares and 3.50% for selling Class T shares, some of which is paid to financial intermediaries for selling shares of the Fund. Depending on the holding period, FDC may receive contingent deferred sales charges levied on Class A, Class T, Class B, and Class C redemptions. The deferred sales charges range from 5.00% to 1.00% for Class B shares, 1.00% for Class C shares, 1.00% for certain purchases of Class A shares and .25% for certain purchases of Class T shares.
For the period, sales charge amounts retained by FDC were as follows:
|
|
Retained |
|
Class A |
$ 25 |
|
Class T |
11 |
|
Class B* |
9 |
|
Class C* |
1 |
|
|
$ 46 |
* When Class B and Class C shares are initially sold, FDC pays commissions from its own resources to financial intermediaries through which the sales are made.
Transfer Agent Fees. Fidelity Investments Institutional Operations Company, Inc., (FIIOC), an affiliate of the investment adviser, is the transfer, dividend disbursing and shareholder servicing agent for each class of the Fund. FIIOC receives account fees and asset-based fees that vary according to the account size and type of account of the shareholders of the respective classes of the Fund, except for Class K. FIIOC receives an
Annual Report
Notes to Financial Statements - continued
(Amounts in thousands except percentages)
5. Fees and Other Transactions with Affiliates - continued
Transfer Agent Fees - continued
asset-based fee of Class K's average net assets. FIIOC pays for typesetting, printing and mailing of shareholder reports, except proxy statements.
For the period, transfer agent fees for each class were as follows:
|
|
Amount |
% of |
|
Class A |
$ 581 |
.26 |
|
Class T |
621 |
.20 |
|
Class B |
36 |
.30 |
|
Class C |
128 |
.25 |
|
Fidelity Value Strategies Fund |
1,231 |
.20 |
|
Fidelity Value Strategies Fund Class K |
68 |
.05 |
|
Institutional Class |
156 |
.23 |
|
|
$ 2,821 |
|
Accounting and Security Lending Fees. Fidelity Service Company, Inc. (FSC), an affiliate of the investment adviser, maintains the Fund's accounting records. The accounting fee is based on the level of average net assets for each month. Under a separate contract, FSC administers the security lending program. The security lending fee is based on the number and duration of lending transactions.
Brokerage Commissions. The Fund placed a portion of its portfolio transactions with brokerage firms which are affiliates of the investment adviser. Brokerage commissions are included in net realized gain (loss) and change in net unrealized appreciation (depreciation) in the Statement of Operations. The commissions paid to these affiliated firms were $12 for the period.
6. Committed Line of Credit.
The Fund participates with other funds managed by the investment adviser or an affiliate in a $4.25 billion credit facility (the "line of credit") to be utilized for temporary or emergency purposes to fund shareholder redemptions or for other short-term liquidity purposes. The Fund has agreed to pay commitment fees on its pro-rata portion of the line of credit, which amounted to $3 and is reflected in Miscellaneous expenses on the Statement of Operations. During the period, there were no borrowings on this line of credit.
Annual Report
7. Security Lending.
The Fund lends portfolio securities through a lending agent from time to time in order to earn additional income. For equity securities, a lending agent is used and may loan securities to certain qualified borrowers, including Fidelity Capital Markets (FCM), a broker-dealer affiliated with the Fund. On the settlement date of the loan, the Fund receives collateral (in the form of U.S. Treasury obligations, letters of credit and/or cash) against the loaned securities and maintains collateral in an amount not less than 100% of the market value of the loaned securities during the period of the loan. The market value of the loaned securities is determined at the close of business of the Fund and any additional required collateral is delivered to the Fund on the next business day. If the borrower defaults on its obligation to return the securities loaned because of insolvency or other reasons, the Fund may apply collateral received from the borrower against the obligation. The Fund may experience delays and costs in recovering the securities loaned. Any cash collateral received is invested in the Fidelity Securities Lending Cash Central Fund. The value of loaned securities and cash collateral at period end are disclosed on the Fund's Statement of Assets and Liabilities. At period end, there were no security loans outstanding with FCM. Security lending income represents the income earned on investing cash collateral, less rebates paid to borrowers and any lending agent fees associated with the loan, plus any premium payments received for lending certain types of securities. Security lending income is presented in the Statement of Operations as a component of income from Fidelity Central Funds. Total security lending income during the period amounted to $547, including $47 from securities loaned to FCM.
8. Expense Reductions.
Commissions paid to certain brokers with whom the investment adviser, or its affiliates, places trades on behalf of the Fund include an amount in addition to trade execution, which may be rebated back to the Fund to offset certain expenses. This amount totaled $144 for the period.
In addition, the investment adviser reimbursed a portion of the Fund's operating expenses during the period in the amount of $6.
Annual Report
Notes to Financial Statements - continued
(Amounts in thousands except percentages)
9. Distributions to Shareholders.
Distributions to shareholders of each class were as follows:
|
Years ended November 30, |
2013 |
2012 |
|
From net investment income |
|
|
|
Class A |
$ 555 |
$ 998 |
|
Class T |
167 |
760 |
|
Fidelity Value Strategies Fund |
2,356 |
2,061 |
|
Fidelity Value Strategies Fund Class K |
520 |
448 |
|
Institutional Class |
395 |
412 |
|
Total |
$ 3,993 |
$ 4,679 |
10. Share Transactions.
Transactions for each class of shares were as follows:
|
|
Shares |
Dollars |
||
|
Years ended November 30, |
2013 |
2012 |
2013 |
2012 |
|
Class A |
|
|
|
|
|
Shares sold |
725 |
854 |
$ 22,684 |
$ 21,748 |
|
Reinvestment of distributions |
18 |
42 |
513 |
917 |
|
Shares redeemed |
(1,340) |
(1,927) |
(42,216) |
(48,930) |
|
Net increase (decrease) |
(597) |
(1,031) |
$ (19,019) |
$ (26,265) |
|
Class T |
|
|
|
|
|
Shares sold |
862 |
878 |
$ 28,085 |
$ 23,229 |
|
Reinvestment of distributions |
5 |
31 |
152 |
697 |
|
Shares redeemed |
(1,767) |
(2,697) |
(57,990) |
(69,951) |
|
Net increase (decrease) |
(900) |
(1,788) |
$ (29,753) |
$ (46,025) |
|
Class B |
|
|
|
|
|
Shares sold |
4 |
5 |
$ 123 |
$ 128 |
|
Shares redeemed |
(161) |
(292) |
(4,616) |
(6,718) |
|
Net increase (decrease) |
(157) |
(287) |
$ (4,493) |
$ (6,590) |
|
Class C |
|
|
|
|
|
Shares sold |
317 |
217 |
$ 8,968 |
$ 5,049 |
|
Shares redeemed |
(382) |
(454) |
(11,135) |
(10,427) |
|
Net increase (decrease) |
(65) |
(237) |
$ (2,167) |
$ (5,378) |
|
Fidelity Value Strategies Fund |
|
|
|
|
|
Shares sold |
11,897 |
5,614 |
$ 405,389 |
$ 163,914 |
|
Reinvestment of distributions |
73 |
81 |
2,266 |
1,967 |
|
Shares redeemed |
(7,881) |
(4,064) |
(279,142) |
(114,471) |
|
Net increase (decrease) |
4,089 |
1,631 |
$ 128,513 |
$ 51,410 |
Annual Report
10. Share Transactions - continued
|
|
Shares |
Dollars |
||
|
Years ended November 30, |
2013 |
2012 |
2013 |
2012 |
|
Fidelity Value Strategies Fund Class K |
|
|
|
|
|
Shares sold |
3,420 |
1,339 |
$ 116,082 |
$ 38,174 |
|
Reinvestment of distributions |
17 |
18 |
520 |
448 |
|
Shares redeemed |
(2,727) |
(943) |
(102,509) |
(26,603) |
|
Net increase (decrease) |
710 |
414 |
$ 14,093 |
$ 12,019 |
|
Institutional Class |
|
|
|
|
|
Shares sold |
776 |
903 |
$ 26,302 |
$ 25,700 |
|
Reinvestment of distributions |
11 |
17 |
327 |
392 |
|
Shares redeemed |
(1,082) |
(822) |
(35,829) |
(21,824) |
|
Net increase (decrease) |
(295) |
98 |
$ (9,200) |
$ 4,268 |
11. Other.
The Fund's organizational documents provide former and current trustees and officers with a limited indemnification against liabilities arising in connection with the performance of their duties to the Fund. In the normal course of business, the Fund may also enter into contracts that provide general indemnifications. The Fund's maximum exposure under these arrangements is unknown as this would be dependent on future claims that may be made against the Fund. The risk of material loss from such claims is considered remote.
Annual Report
Report of Independent Registered Public Accounting Firm
To the Trustees of Fidelity Advisor Series I and Shareholders of Fidelity Advisor Value Strategies Fund:
We have audited the accompanying statement of assets and liabilities of Fidelity Advisor Value Strategies Fund (the Fund), a fund of Fidelity Advisor Series I, including the schedule of investments, as of November 30, 2013, and the related statement of operations for the year then ended, the statement of changes in net assets for each of the two years in the period then ended, and the financial highlights for each of the five years in the period then ended. These financial statements and financial highlights are the responsibility of the Fund's management. Our responsibility is to express an opinion on these financial statements and financial highlights based on our audits.
We conducted our audits in accordance with the standards of the Public Company Accounting Oversight Board (United States). Those standards require that we plan and perform the audit to obtain reasonable assurance about whether the financial statements and financial highlights are free of material misstatement. The Fund is not required to have, nor were we engaged to perform, an audit of its internal control over financial reporting. Our audits included consideration of internal control over financial reporting as a basis for designing audit procedures that are appropriate in the circumstances, but not for the purpose of expressing an opinion on the effectiveness of the Fund's internal control over financial reporting. Accordingly, we express no such opinion. An audit also includes examining, on a test basis, evidence supporting the amounts and disclosures in the financial statements, assessing the accounting principles used and significant estimates made by management, as well as evaluating the overall financial statement presentation. Our procedures included confirmation of securities owned as of November 30, 2013, by correspondence with the custodians and brokers. We believe that our audits provide a reasonable basis for our opinion.
In our opinion, the financial statements and financial highlights referred to above present fairly, in all material respects, the financial position of Fidelity Advisor Value Strategies Fund as of November 30, 2013, the results of its operations for the year then ended, the changes in its net assets for each of the two years in the period then ended, and the financial highlights for each of the five years in the period then ended, in conformity with accounting principles generally accepted in the United States of America.
DELOITTE & TOUCHE LLP
Boston, Massachusetts
January 14, 2014
Annual Report
Trustees and Officers
The Trustees, Member of the Advisory Board, and officers of the trust and fund, as applicable, are listed below. The Board of Trustees governs the fund and is responsible for protecting the interests of shareholders. The Trustees are experienced executives who meet periodically throughout the year to oversee the fund's activities, review contractual arrangements with companies that provide services to the fund, oversee management of the risks associated with such activities and contractual arrangements, and review the fund's performance. Except for James C. Curvey, Ned C. Lautenbach, Ronald P. O'Hanley, and William S. Stavropoulos, each of the Trustees oversees 173 funds. Mr. Curvey oversees 396 funds. Mr. Lautenbach, Mr. O'Hanley, and Mr. Stavropoulos each oversees 247 funds.
The Trustees hold office without limit in time except that (a) any Trustee may resign; (b) any Trustee may be removed by written instrument, signed by at least two-thirds of the number of Trustees prior to such removal; (c) any Trustee who requests to be retired or who has become incapacitated by illness or injury may be retired by written instrument signed by a majority of the other Trustees; and (d) any Trustee may be removed at any special meeting of shareholders by a two-thirds vote of the outstanding voting securities of the trust. Each Trustee who is not an interested person (as defined in the 1940 Act) of the trust and the fund (Independent Trustee), shall retire not later than the last day of the calendar year in which his or her 75th birthday occurs. The Independent Trustees may waive this mandatory retirement age policy with respect to individual Trustees. The officers and Advisory Board Member hold office without limit in time, except that any officer and Advisory Board Member may resign or may be removed by a vote of a majority of the Trustees at any regular meeting or any special meeting of the Trustees. Except as indicated, each individual has held the office shown or other offices in the same company for the past five years.
Experience, Skills, Attributes, and Qualifications of the Fund's Trustees. The Governance and Nominating Committee has adopted a statement of policy that describes the experience, qualifications, attributes, and skills that are necessary and desirable for potential Independent Trustee candidates (Statement of Policy). The Board believes that each Trustee satisfied at the time he or she was initially elected or appointed a Trustee, and continues to satisfy, the standards contemplated by the Statement of Policy. The Governance and Nominating Committee also engages professional search firms to help identify potential Independent Trustee candidates who have the experience, qualifications, attributes, and skills consistent with the Statement of Policy. From time to time, additional criteria based on the composition and skills of the current Independent Trustees, as well as experience or skills that may be appropriate in light of future changes to board composition, business conditions, and regulatory or other developments, have also been considered by the professional search firms and the Governance and Nominating Committee. In addition, the Board takes into account the Trustees' commitment and participation in Board and committee meetings, as well as their leadership of standing and ad hoc committees throughout their tenure.
Annual Report
Trustees and Officers - continued
In determining that a particular Trustee was and continues to be qualified to serve as a Trustee, the Board has considered a variety of criteria, none of which, in isolation, was controlling. The Board believes that, collectively, the Trustees have balanced and diverse experience, qualifications, attributes, and skills, which allow the Board to operate effectively in governing the fund and protecting the interests of shareholders. Information about the specific experience, skills, attributes, and qualifications of each Trustee, which in each case led to the Board's conclusion that the Trustee should serve (or continue to serve) as a trustee of the fund, is provided below.
Board Structure and Oversight Function. James C. Curvey is an interested person (as defined in the 1940 Act) and currently serves as Chairman. The Trustees have determined that an interested Chairman is appropriate and benefits shareholders because an interested Chairman has a personal and professional stake in the quality and continuity of services provided to the fund. Independent Trustees exercise their informed business judgment to appoint an individual of their choosing to serve as Chairman, regardless of whether the Trustee happens to be independent or a member of management. The Independent Trustees have determined that they can act independently and effectively without having an Independent Trustee serve as Chairman and that a key structural component for assuring that they are in a position to do so is for the Independent Trustees to constitute a substantial majority for the Board. The Independent Trustees also regularly meet in executive session. Ned C. Lautenbach serves as Chairman of the Independent Trustees and as such (i) acts as a liaison between the Independent Trustees and management with respect to matters important to the Independent Trustees and (ii) with management prepares agendas for Board meetings.
Fidelity funds are overseen by different Boards of Trustees. The fund's Board oversees Fidelity's equity and high income funds and another Board oversees Fidelity's investment-grade bond, money market, and asset allocation funds. The asset allocation funds may invest in Fidelity funds overseen by the fund's Board. The use of separate Boards, each with its own committee structure, allows the Trustees of each group of Fidelity funds to focus on the unique issues of the funds they oversee, including common research, investment, and operational issues. On occasion, the separate Boards establish joint committees to address issues of overlapping consequences for the Fidelity funds overseen by each Board.
The Trustees operate using a system of committees to facilitate the timely and efficient consideration of all matters of importance to the Trustees, the fund, and fund shareholders and to facilitate compliance with legal and regulatory requirements and oversight of the fund's activities and associated risks. The Board, acting through its committees, has charged FMR and its affiliates with (i) identifying events or circumstances the occurrence of which could have demonstrably adverse effects on the fund's business and/or reputation; (ii) implementing processes and controls to lessen the possibility that such events or circumstances occur or to mitigate the effects of such events or circumstances if they do occur; and (iii) creating and maintaining a system designed to evaluate continuously business and market conditions in order to facilitate the identification and implementation processes described in (i) and (ii) above. Because the day-to-day operations and activities of the fund are carried out by or through FMR, its affiliates and other service providers, the fund's exposure to risks is mitigated but not eliminated by the processes overseen by the Trustees. While each of the Board's committees has responsibility for overseeing different aspects of the fund's activities, oversight is exercised primarily through the Operations, Audit, and Compliance Committees. In addition, the Independent Trustees have worked with FMR to enhance the Board's oversight of investment and financial risks, legal and regulatory risks, technology risks, and operational risks, including the development of additional risk reporting to the Board. For example, a working group comprised of Independent Trustees and FMR has worked and continues to work to review the Fidelity funds' valuation-related activities, reporting and risk management. Appropriate personnel, including but not limited to the fund's Chief Compliance Officer (CCO), FMR's internal auditor, the independent accountants, the fund's Treasurer and portfolio management personnel, make periodic reports to the Board's committees, as appropriate, including an annual review of FMR's risk management program for the Fidelity funds. The responsibilities of each standing committee, including their oversight responsibilities, are described further under "Standing Committees of the Fund's Trustees."
Annual Report
The fund's Statement of Additional Information (SAI) includes more information about the Trustees. To request a free copy, call Fidelity at 1-800-544-8544.
Interested Trustees*:
Correspondence intended for each Trustee who is an interested person may be sent to Fidelity Investments, 245 Summer Street, Boston, Massachusetts 02210.
|
Name, Year of Birth; Principal Occupations and Other Relevant Experience+ |
|
|
James C. Curvey (1935) |
|
|
Year of Election or Appointment: 2007 Trustee Chairman of the Board of Trustees |
|
|
|
Mr. Curvey also serves as Trustee of other Fidelity funds. Mr. Curvey is a Director of Fidelity Investments Money Management, Inc. (2009-present), Director of Fidelity Research & Analysis Co. (2009-present) and Director of FMR and FMR Co., Inc. (2007-present). Mr. Curvey is also Vice Chairman (2007-present) and Director of FMR LLC. In addition, Mr. Curvey serves as an Overseer for the Boston Symphony Orchestra and a member of the Trustees of Villanova University. Previously, Mr. Curvey was the Vice Chairman (2006-2007) and Director (2000-2007) of FMR Corp. |
|
Ronald P. O'Hanley (1957) |
|
|
Year of Election or Appointment: 2011 Trustee |
|
|
|
Mr. O'Hanley also serves as Trustee of other Fidelity funds. He is Director of Fidelity SelectCo, LLC (2013-present), FMR Co., Inc. (2010-present), Director of Fidelity Investments Money Management, Inc. (2010-present), Director of Fidelity Research & Analysis Company (2010-present), President of Fidelity Asset Management and Corporate Services and a Member of Fidelity's Executive Committee (2010-present). Previously, Mr. O'Hanley served as President and Chief Executive Officer of BNY Mellon Asset Management (2007-2010). Mr. O'Hanley also served as Vice Chairman of Bank New York Mellon Corp. and a member of that firm's Executive Committee. Prior to the 2007 merger of The Bank of New York and Mellon Financial Corporation, he was Vice Chairman of Mellon Financial Corporation and President and Chief Executive Officer of Mellon Asset Management. He joined Mellon in February 1997. Mr. O'Hanley currently serves as Chairman of the Boston Public Library Foundation Board of Directors and sits on the Board of Directors of Beth Israel Deaconess Medical Center, the Board of Trustees of the Marine Biological Laboratory and the Advisory Board of the Maxwell School of Citizenship and Public Administration at Syracuse University. Mr. O'Hanley also chairs the Council on Asset Management for the Financial Services Roundtable and is a member of the Board of Directors of Institutional Investor's U.S. Institute. |
* Trustees have been determined to be "Interested Trustees" by virtue of, among other things, their affiliation with the trust or various entities under common control with FMR.
+ The information above includes each Trustee's principal occupation during the last five years and other information relating to the experience, attributes, and skills relevant to each Trustee's qualifications to serve as a Trustee, which led to the conclusion that each Trustee should serve as a Trustee for the fund.
Annual Report
Independent Trustees:
Correspondence intended for each Independent Trustee (that is, the Trustees other than the Interested Trustees) may be sent to Fidelity Investments, P.O. Box 55235, Boston, Massachusetts 02205-5235.
|
Name, Year of Birth; Principal Occupations and Other Relevant Experience+ |
|
|
Dennis J. Dirks (1948) |
|
|
Year of Election or Appointment: 2005 Trustee |
|
|
|
Mr. Dirks also serves as Trustee of other Fidelity funds. Prior to his retirement in May 2003, Mr. Dirks was Chief Operating Officer and a member of the Board of The Depository Trust & Clearing Corporation (DTCC). He also served as President, Chief Operating Officer, and Board member of The Depository Trust Company (DTC) and President and Board member of the National Securities Clearing Corporation (NSCC). In addition, Mr. Dirks served as Chief Executive Officer and Board member of the Government Securities Clearing Corporation, Chief Executive Officer and Board member of the Mortgage-Backed Securities Clearing Corporation, as a Trustee and a member of the Finance Committee of Manhattan College (2005-2008), and as a Trustee and a member of the Finance Committee of AHRC of Nassau County (2006-2008). Mr. Dirks is a member of the Independent Directors Council (IDC) Governing Council (2010-present) and Board of Directors for The Brookville Center for Children's Services, Inc. (2009-present). |
|
Alan J. Lacy (1953) |
|
|
Year of Election or Appointment: 2008 Trustee |
|
|
|
Mr. Lacy also serves as Trustee of other Fidelity funds. Mr. Lacy serves as Senior Adviser (2007-present) of Oak Hill Capital Partners, L.P. (private equity). Mr. Lacy also served as Chief Executive Officer (2000-2005) and Vice Chairman (2005-2006) of Sears Holdings Corporation and Sears, Roebuck and Co. (retail). In addition, Mr. Lacy serves as a member of the Board of Directors of Dave & Buster's Entertainment, Inc. (restaurant and entertainment complexes, 2010-present), Earth Fare, Inc. (retail grocery, 2012-present), The Hillman Companies, Inc. (hardware wholesalers, 2010-present), and Bristol-Myers Squibb Company (global pharmaceuticals, 2008-present). Mr. Lacy is a member of the Board of Trustees of The National Parks Conservation Association (2006-present). Previously, Mr. Lacy served as Chairman of the Board of Trustees of the National Parks Conservation Association (2008-2011) and as a member of the Board of Directors for the Western Union Company (global money transfer, 2006-2011). |
|
Ned C. Lautenbach (1944) |
|
|
Year of Election or Appointment: 2000 Trustee Chairman of the Independent Trustees |
|
|
|
Mr. Lautenbach also serves as Trustee of other Fidelity funds. Mr. Lautenbach currently serves as the Lead Director of the Eaton Corporation Board of Directors (diversified industrial, 1997-present). Mr. Lautenbach is Chairman of the Board of Directors of the Philharmonic Center for the Arts in Naples, Florida (2012-present) and a member of the Council on Foreign Relations (1994-present). Previously, Mr. Lautenbach was a Partner/Advisory Partner at Clayton, Dubilier & Rice, LLC (private equity investment, 1998-2010), as well as a Director of Sony Corporation (2006-2007). |
|
Joseph Mauriello (1944) |
|
|
Year of Election or Appointment: 2008 Trustee |
|
|
|
Mr. Mauriello also serves as Trustee of other Fidelity funds. Prior to his retirement in January 2006, Mr. Mauriello served in numerous senior management positions including Deputy Chairman and Chief Operating Officer (2004-2005), and Vice Chairman of Financial Services (2002-2004) of KPMG LLP US (professional services, 1965-2005). Mr. Mauriello currently serves as a member of the Board of Directors of XL Group plc. (global insurance and re-insurance, 2006-present). Previously, Mr. Mauriello served as a Director of the Hamilton Funds of the Bank of New York (2006-2007) and of Arcadia Resources Inc. (health care services and products, 2007-2012). |
|
Robert W. Selander (1950) |
|
|
Year of Election or Appointment: 2011 Trustee |
|
|
|
Mr. Selander also serves as Trustee of other Fidelity funds. Previously, Mr. Selander served as a Member of the Advisory Board of other Fidelity funds (2011), and Executive Vice Chairman (2010), Chief Executive Officer (2009-2010), and President and Chief Executive Officer (1997-2009) of Mastercard, Inc. |
|
Cornelia M. Small (1944) |
|
|
Year of Election or Appointment: 2005 Trustee |
|
|
|
Ms. Small also serves as Trustee of other Fidelity funds. Ms. Small is a member of the Board of Directors (2009-present) and Chair of the Investment Committee (2010-present) of the Teagle Foundation. Ms. Small also serves on the Investment Committee of the Berkshire Taconic Community Foundation (2008-present). Previously, Ms. Small served as Chairperson (2002-2008) and a member of the Investment Committee and Chairperson (2008-2012) and a member of the Board of Trustees of Smith College. In addition, Ms. Small served as Chief Investment Officer, Director of Global Equity Investments, and a member of the Board of Directors of Scudder, Stevens & Clark and Scudder Kemper Investments. |
|
William S. Stavropoulos (1939) |
|
|
Year of Election or Appointment: 2002 Trustee Vice Chairman of the Independent Trustees |
|
|
|
Mr. Stavropoulos also serves as Trustee of other Fidelity funds. Mr. Stavropoulos serves as President and Founder of the Michigan Baseball Foundation, the Great Lakes Loons (2007-present). Mr. Stavropoulos is Chairman Emeritus of the Board of Directors of The Dow Chemical Company, where he previously served in numerous senior management positions, including President, CEO (1995-2000; 2002-2004), Chairman of the Executive Committee (2000-2006), and as a member of the Board of Directors (1990-2006). Currently, Mr. Stavropoulos is Chairman of the Board of Directors of Univar Inc. (global distributor of commodity and specialty chemicals), a Director of Teradata Corporation (data warehousing and technology solutions), and Maersk Inc. (industrial conglomerate), and a member of the Advisory Board for Metalmark Capital LLC (private equity investment, 2005-present). Mr. Stavropoulos is an operating advisor to Clayton, Dubilier & Rice, LLC (private equity investment). In addition, Mr. Stavropoulos is a member of the University of Notre Dame Advisory Council for the College of Science, a Trustee of the Rollin L. Gerstacker Foundation, and a Director of the Naples Philharmonic Center for the Arts. Previously, Mr. Stavropoulos served as a Director of Chemical Financial Corporation (bank holding company, 1993-2012) and Tyco International, Ltd. (multinational manufacturing and services, 2007-2012). |
|
David M. Thomas (1949) |
|
|
Year of Election or Appointment: 2008 Trustee |
|
|
|
Mr. Thomas also serves as Trustee of other Fidelity funds. Mr. Thomas serves as Non-Executive Chairman of the Board of Directors of Fortune Brands Home and Security (home and security products, 2011-present), and as a member of the Board of Directors of Interpublic Group of Companies, Inc. (marketing communication, 2004-present). Previously, Mr. Thomas served as Executive Chairman (2005-2006) and Chairman and Chief Executive Officer (2000-2005) of IMS Health, Inc. (pharmaceutical and healthcare information solutions), and a Director of Fortune Brands, Inc. (consumer products, 2000-2011). |
+ The information above includes each Trustee's principal occupation during the last five years and other information relating to the experience, attributes, and skills relevant to each Trustee's qualifications to serve as a Trustee, which led to the conclusion that each Trustee should serve as a Trustee for the fund.
Advisory Board Member and Officers:
Correspondence intended for each officer and Peter S. Lynch may be sent to Fidelity Investments, 245 Summer Street, Boston, Massachusetts 02210. Officers appear below in alphabetical order.
|
Name, Year of Birth; Principal Occupation |
|
|
Peter S. Lynch (1944) |
|
|
Year of Election or Appointment: 2003 Member of the Advisory Board |
|
|
|
Mr. Lynch also serves as Member of the Advisory Board of other Fidelity funds. Mr. Lynch is Vice Chairman and a Director of FMR and FMR Co., Inc. In addition, Mr. Lynch serves as a Trustee of Boston College and as the Chairman of the Inner-City Scholarship Fund. Previously, Mr. Lynch served on the Special Olympics International Board of Directors (1997-2006). |
|
Elizabeth Paige Baumann (1968) |
|
|
Year of Election or Appointment: 2012 Anti-Money Laundering (AML) Officer |
|
|
|
Ms. Baumann also serves as AML Officer of other funds. She is Chief AML Officer of FMR LLC (2012-present) and is an employee of Fidelity Investments. Previously, Ms. Baumann served as Vice President and Deputy Anti-Money Laundering Officer (2007-2012). |
|
William C. Coffey (1969) |
|
|
Year of Election or Appointment: 2009 Assistant Secretary |
|
|
|
Mr. Coffey also serves as Assistant Secretary of other funds. He is Senior Vice President and Deputy General Counsel of FMR LLC (2010-present), and is an employee of Fidelity Investments. Previously, Mr. Coffey served as Vice President and Associate General Counsel of FMR LLC (2005-2009). |
|
Jonathan Davis (1968) |
|
|
Year of Election or Appointment: 2010 Assistant Treasurer |
|
|
|
Mr. Davis also serves as Assistant Treasurer of other funds. Mr. Davis is an employee of Fidelity Investments. Previously, Mr. Davis served as Vice President and Associate General Counsel of FMR LLC (2003-2010). |
|
Adrien E. Deberghes (1967) |
|
|
Year of Election or Appointment: 2008 Deputy Treasurer |
|
|
|
Mr. Deberghes also serves as an officer of other funds. He is an employee of Fidelity Investments (2008-present). Prior to joining Fidelity Investments, Mr. Deberghes was Senior Vice President of Mutual Fund Administration at State Street Corporation (2007-2008), Senior Director of Mutual Fund Administration at Investors Bank & Trust (2005-2007), and Director of Finance for Dunkin' Brands (2000-2005). |
|
Stephanie J. Dorsey (1969) |
|
|
Year of Election or Appointment: 2010 Assistant Treasurer |
|
|
|
Ms. Dorsey also serves as an officer of other funds. She is an employee of Fidelity Investments (2008-present) and has served in other fund officer roles. Prior to joining Fidelity Investments, Ms. Dorsey served as Treasurer (2004-2008) of the JPMorgan Mutual Funds and Vice President (2004-2008) of JPMorgan Chase Bank. |
|
Scott C. Goebel (1968) |
|
|
Year of Election or Appointment: 2008 Secretary and Chief Legal Officer (CLO) |
|
|
|
Mr. Goebel serves as Secretary and CLO of other funds. Mr. Goebel also serves as Secretary of Fidelity Investments Money Management, Inc. (FIMM) (2010-present) and Fidelity Research and Analysis Company (FRAC) (2010-present); General Counsel, Secretary, and Senior Vice President of FMR (2008-present) and FMR Co., Inc. (2008-present); Chief Legal Officer of Fidelity Management & Research (Hong Kong) Limited (2008-present) and Assistant Secretary of Fidelity Management & Research (Japan) Inc. (2008-present), and Fidelity Management & Research (U.K.) Inc. (2008-present). Previously, Mr. Goebel served as Secretary and CLO of other Fidelity funds (2008-2013), Assistant Secretary of FIMM (2008-2010), FRAC (2008-2010), and certain funds (2007-2008); and as Vice President and Secretary of Fidelity Distributors Corporation (FDC) (2005-2007). Mr. Goebel has been employed by FMR LLC or an affiliate since 2001. |
|
Joseph A. Hanlon (1968) |
|
|
Year of Election or Appointment: 2012 Chief Compliance Officer |
|
|
|
Mr. Hanlon also serves as Chief Compliance Officer of other funds. Mr. Hanlon serves as Compliance Officer of FMR, FMR Co., Inc., Fidelity Investments Money Management, Inc. (FIMM), Fidelity Research and Analysis Company (FRAC), and Fidelity Management & Research (Hong Kong) (2009-present), as Senior Vice President of the Fidelity Asset Management Division (2009-present), and is an employee of Fidelity Investments. Previously, Mr. Hanlon served as Compliance Officer of Fidelity Management & Research (Japan) Inc. (2009-2013), Strategic Advisers, Inc. (2009-2013), and Fidelity Management & Research (U.K.) Inc. (2009-2013). |
|
Thomas C. Hense (1964) |
|
|
Year of Election or Appointment: 2008/2010 Vice President |
|
|
|
Mr. Hense also serves as Vice President of other funds (High Income (2008), Small Cap (2008), and Value (2010) funds). Previously, Mr. Hense served as a portfolio manager for Fidelity's Institutional Money Management Group (Pyramis) (2003-2008). |
|
Brian B. Hogan (1964) |
|
|
Year of Election or Appointment: 2009 Vice President |
|
|
|
Mr. Hogan also serves as Vice President of other funds. Mr. Hogan serves as President of FMR's Equity Division (2009-present). Previously, Mr. Hogan served as Senior Vice President, Equity Research of FMR (2006-2009) and as a portfolio manager. |
|
Chris Maher (1972) |
|
|
Year of Election or Appointment: 2013 Assistant Treasurer |
|
|
|
Mr. Maher serves as Assistant Treasurer of other funds. Mr. Maher is Vice President of Valuation Oversight and is an employee of Fidelity Investments. Previously, Mr. Maher served as Vice President of Asset Management Compliance (2013), Vice President of FMR's Program Management Group (2010-2013), and Vice President of Valuation Oversight (2008-2010). |
|
Christine Reynolds (1958) |
|
|
Year of Election or Appointment: 2008 Chief Financial Officer |
|
|
|
Ms. Reynolds also serves as Chief Financial Officer of other funds. Ms. Reynolds became President of Fidelity Pricing and Cash Management Services (FPCMS) in August 2008. Ms. Reynolds served as Chief Operating Officer of FPCMS (2007-2008). Previously, Ms. Reynolds served as President, Treasurer, and Anti-Money Laundering officer of the Fidelity funds (2004-2007). |
|
Kenneth B. Robins (1969) |
|
|
Year of Election or Appointment: 2008 President and Treasurer |
|
|
|
Mr. Robins also serves as an officer of other funds. Mr. Robins serves as Executive Vice President of Fidelity Investments Money Management, Inc. (FIMM) (2013-present) and is an employee of Fidelity Investments (2004-present). Previously, Mr. Robins served in other fund officer roles. |
|
Gary W. Ryan (1958) |
|
|
Year of Election or Appointment: 2005 Assistant Treasurer |
|
|
|
Mr. Ryan also serves as Assistant Treasurer of other funds. Mr. Ryan is an employee of Fidelity Investments and has served in other fund officer roles. Previously, Mr. Ryan served as Vice President of Fund Reporting in Fidelity Pricing and Cash Management Services (FPCMS) (1999-2005). |
|
Stephen Sadoski (1971) |
|
|
Year of Election or Appointment: 2012 Deputy Treasurer |
|
|
|
Mr. Sadoski also serves as Deputy Treasurer of other funds. He is an employee of Fidelity Investments (2012-present) and has served in another fund officer role. Prior to joining Fidelity Investments, Mr. Sadoski served as an assistant chief accountant in the Division of Investment Management of the Securities and Exchange Commission (SEC) (2009-2012) and as a senior manager at Deloitte & Touche LLP (1997-2009). |
|
Stacie M. Smith (1974) |
|
|
Year of Election or Appointment: 2013 Deputy Treasurer |
|
|
|
Ms. Smith also serves as an officer of other funds. She is an employee of Fidelity Investments (2009-present) and has served in other fund officer roles. Prior to joining Fidelity Investments, Ms. Smith served as Senior Audit Manager of Ernst & Young LLP (1996-2009). |
|
Renee Stagnone (1975) |
|
|
Year of Election or Appointment: 2013 Deputy Treasurer |
|
|
|
Ms. Stagnone also serves as Deputy Treasurer of other funds. Ms. Stagnone is an employee of Fidelity Investments. |
|
Joseph F. Zambello (1957) |
|
|
Year of Election or Appointment: 2011 Deputy Treasurer |
|
|
|
Mr. Zambello also serves as Deputy Treasurer of other funds. Mr. Zambello is an employee of Fidelity Investments. Previously, Mr. Zambello served as Vice President of FMR's Program Management Group (2009-2011) and Vice President of the Transfer Agent Oversight Group (2005-2009). |
Annual Report
Distributions (Unaudited)
Fidelity Value Strategies Fund designates 100% of the dividends distributed during the fiscal year as qualifying for the dividends-received deduction for corporate shareholders.
Fidelity Value Strategies Fund designates 100% of the dividends distributed during the fiscal year as amounts which may be taken into account as a dividend for purposes of the maximum rate under section 1(h)(11) of the Internal Revenue Code.
The fund will notify shareholders in January 2014 of amounts for use in preparing 2013 income tax returns.
Annual Report
Board Approval of Investment Advisory Contracts and Management Fees
Fidelity Advisor Value Strategies Fund
Each year, the Board of Trustees, including the Independent Trustees (together, the Board), votes on the renewal of the management contract and sub-advisory agreements (together, the Advisory Contracts) for the fund. The Board, assisted by the advice of fund counsel and Independent Trustees' counsel, requests and considers a broad range of information relevant to the renewal of the Advisory Contracts throughout the year.
The Board meets regularly and, at each of its meetings, covers an extensive agenda of topics and materials and considers factors that are relevant to its annual consideration of the renewal of the fund's Advisory Contracts, including the services and support provided to the fund and its shareholders. The Board has established various standing committees, each composed of and chaired by Independent Trustees with varying backgrounds, to which the Board has assigned specific subject matter responsibilities in order to enhance effective decision-making by the Board. The Board, acting directly and through its Committees, requests and receives information concerning the annual consideration of the renewal of the fund's Advisory Contracts. The Board also meets as needed to consider matters specifically related to the Board's annual consideration of the renewal of Advisory Contracts. Members of the Board may also meet with trustees of other Fidelity funds through ad hoc joint committees to discuss certain matters relevant to the Fidelity funds.
At its July 2013 meeting, the Board, including the Independent Trustees, unanimously determined to renew the fund's Advisory Contracts. In reaching its determination, the Board considered all factors it believed relevant, including (i) the nature, extent, and quality of the services to be provided to the fund and its shareholders (including the investment performance of the fund); (ii) the competitiveness of the fund's management fee and total expense ratio relative to peer funds; (iii) the total costs of the services to be provided by and the profits to be realized by Fidelity from its relationship with the fund; (iv) the extent to which economies of scale exist and would be realized as the fund grows; and (v) whether fee levels reflect these economies of scale, if any, for the benefit of fund shareholders.
In considering whether to renew the Advisory Contracts for the fund, the Board reached a determination, with the assistance of fund counsel and Independent Trustees' counsel and through the exercise of its business judgment, that the renewal of the Advisory Contracts was in the best interests of the fund and its shareholders and that the compensation payable under the Advisory Contracts was fair and reasonable. The Board's decision to renew the Advisory Contracts was not based on any single factor, but rather was based on a comprehensive consideration of all the information provided to the Board at its meetings throughout the year. The Board, in reaching its determination to renew the Advisory Contracts, was aware that shareholders in the fund have a broad range of investment choices available to them, including a wide choice among mutual funds offered by Fidelity's competitors, and that the fund's shareholders, who have the opportunity to review and weigh the disclosure provided by the fund in its prospectus and other public disclosures, have chosen to invest in this fund, which is a part of the Fidelity family of funds.
Annual Report
Nature, Extent, and Quality of Services Provided. The Board considered the staffing within the investment adviser, Fidelity Management & Research Company (FMR), and the sub-advisers (together, the Investment Advisers) as it relates to the fund, including the backgrounds of the fund's investment personnel, and also considered the fund's investment objective, strategies, and related investment philosophy. The Independent Trustees also had discussions with senior management of Fidelity's investment operations and investment groups. The Board considered the structure of the portfolio manager compensation program and whether this structure provides appropriate incentives to act in the best interests of the fund.
Resources Dedicated to Investment Management and Support Services. The Board and the Fund Oversight and Research Committees reviewed the general qualifications and capabilities of the Investment Advisers' investment staff, including its size, education, experience, and resources, as well as the Investment Advisers' approach to recruiting, training, managing, and compensating investment personnel. The Board noted that FMR has continued to increase the resources devoted to non-U.S. offices, including expansion of Fidelity's global investment organization. The Board also noted that Fidelity's analysts have extensive resources, tools and capabilities that allow them to conduct sophisticated quantitative and fundamental analysis, as well as credit analysis of issuers, counterparties and guarantors. Further, the Board believes that Fidelity's investment professionals have sufficient access to global information and data so as to provide competitive investment results over time, and that those professionals also have access to sophisticated tools that permit them to assess portfolio construction and risk and performance attribution characteristics continuously, as well as to transmit new information and research conclusions rapidly around the world. Additionally, in its deliberations, the Board considered the Investment Advisers' trading and risk management capabilities and resources, which are an integral part of the investment management process.
Shareholder and Administrative Services. The Board considered (i) the nature, extent, quality, and cost of advisory, administrative, and shareholder services performed by the Investment Advisers and their affiliates under the Advisory Contracts and under separate agreements covering transfer agency, pricing and bookkeeping, and securities lending services for the fund; (ii) the nature and extent of the supervision of third party service providers, principally custodians and subcustodians; and (iii) the resources devoted to, and the record of compliance with, the fund's compliance policies and procedures. The Board also reviewed the allocation of fund brokerage, including allocations to brokers affiliated with the Investment Advisers, the use of brokerage commissions to pay fund expenses, and the use of "soft" commission dollars to pay for research services.
Annual Report
Board Approval of Investment Advisory Contracts and
Management Fees - continued
The Board noted that the growth of fund assets over time across the complex allows Fidelity to reinvest in the development of services designed to enhance the value or convenience of the Fidelity funds as investment vehicles. These services include 24-hour access to account information and market information through telephone representatives and over the Internet, investor education materials and asset allocation tools, and the expanded availability of Fidelity Investor Centers.
Investment in a Large Fund Family. The Board considered the benefits to shareholders of investing in a Fidelity fund, including the benefits of investing in a fund that is part of a large family of funds offering a variety of investment disciplines and providing a large variety of mutual fund investor services. The Board noted that Fidelity had taken, or had made recommendations that resulted in the Fidelity funds taking, a number of actions over the previous year that benefited particular funds, including (i) continuing to dedicate additional resources to investment research and to the support of the senior management team that oversees asset management; (ii) persisting in efforts to enhance Fidelity's global research capabilities; (iii) launching new funds and making other enhancements to meet client needs for global and income-oriented solutions; (iv) continuing to launch dedicated lower cost underlying funds to meet portfolio construction needs related to expanding underlying fund options for Fidelity funds of funds, specifically for the Freedom Fund product lines; (v) rationalizing product lines and gaining increased efficiencies through the mergers of several funds into other funds; (vi) strengthening Fidelity's index fund offerings by reducing investment minimums and adopting or lowering existing expense caps for certain funds and classes; (vii) enhancing Global Asset Allocation product offerings by launching new funds and strategies, including "open architecture" target date funds that utilize affiliated and unaffiliated sub-advisers; (viii) modifying the eligibility criteria for Institutional Class shares of Advisor funds to increase their marketability to a portion of the defined contribution plan market; (ix) creating a new low-cost retirement share class for certain Advisor funds to appeal to large retirement plans; (x) transitioning the management of certain Fidelity commodity funds to Geode Capital Management LLC, a registered commodity pool operator, while retaining administrative responsibilities for the funds; (xi) reorganizing a number of funds; and (xii) taking steps toward establishing a new Fidelity adviser to manage sector-based funds and products.
Investment Performance. The Board considered whether the fund has operated in accordance with its investment objective, as well as its record of compliance with its investment restrictions and its performance history.
The Board took into account discussions with the Investment Advisers about fund investment performance that occur at Board meetings throughout the year. In this regard the Board noted that as part of regularly scheduled fund reviews and other reports to the Board on fund performance, the Board periodically considers annualized return information for the fund, for different time periods, measured against a securities market index ("benchmark index") and a peer group of mutual funds with similar objectives ("peer group"). In its evaluation of fund investment performance, the Board gave particular attention to information indicating changes in performance of certain Fidelity funds for specific time periods and the Investment Advisers' explanations for any overperformance or underperformance.
Annual Report
In addition to reviewing absolute and relative fund performance, the Independent Trustees periodically consider the appropriateness of fund performance metrics in evaluating the results achieved. In general, the Independent Trustees believe that fund performance should be evaluated based on net performance (after fees and expenses) of both the highest performing and lowest performing classes, where applicable, compared to appropriate benchmark indices, over appropriate time periods which may include full market cycles, and compared to peer groups, as applicable, over the same periods, taking into account relevant factors including the following: general market conditions; issuer-specific information; tactical opportunities for investment; and fund cash flows and other factors.
The Independent Trustees recognize that shareholders evaluate performance on a net basis over their own holding periods, for which one-, three-, and five-year periods are used as a proxy. For this reason, the performance information reviewed by the Board also included net cumulative calendar year total return information for the fund and an appropriate benchmark index and peer group for the most recent one-, three-, and five-year periods, as shown below. Returns are shown compared to the 25th percentile (top of box) and 75th percentile (bottom of box) of the peer universe.
Annual Report
Board Approval of Investment Advisory Contracts and
Management Fees - continued
Fidelity Advisor Value Strategies Fund
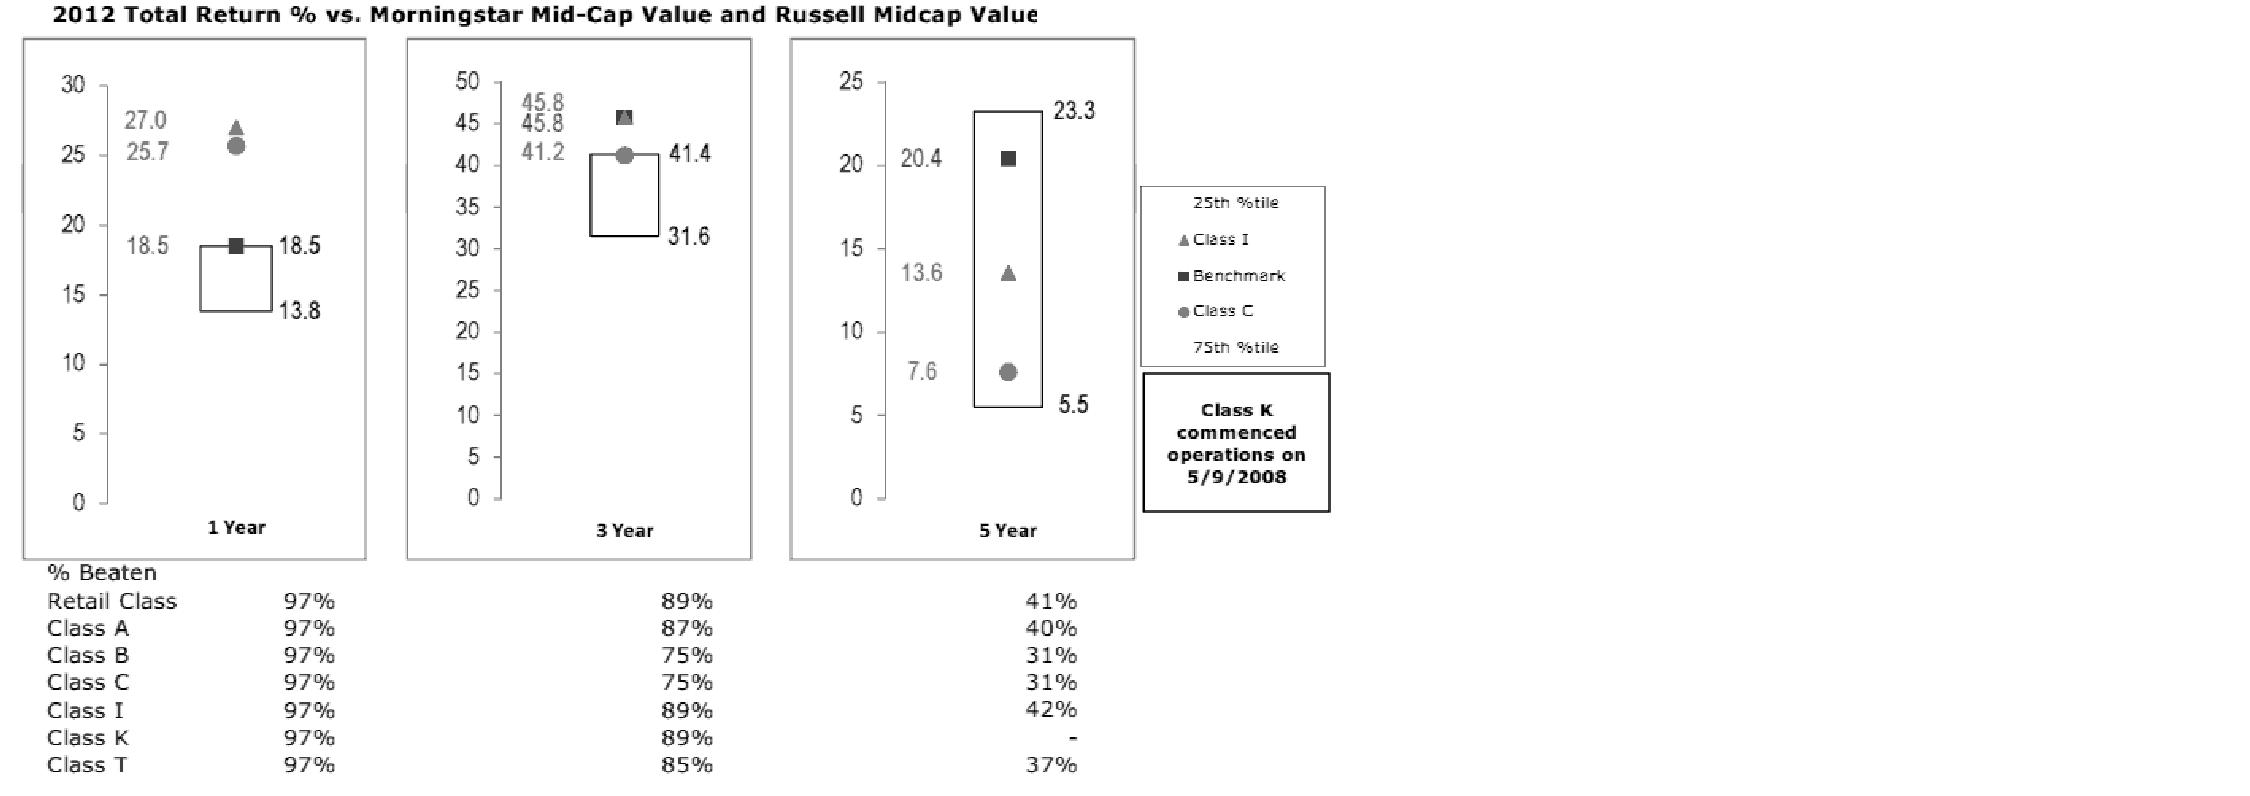
The Board also considered that the fund's management fee is subject to upward or downward adjustment depending upon whether, and to what extent, the fund's investment performance for the performance period exceeds, or is exceeded by, a securities index, thus leading to a performance adjustment for the same period. The Board noted that the performance adjustment provides FMR with a strong economic incentive to seek to achieve superior performance for the fund's shareholders and helps to more closely align the interests of FMR and the fund's shareholders.
Based on its review, the Board concluded that the nature, extent, and quality of services provided to the fund under the Advisory Contracts should benefit the fund's shareholders.
Competitiveness of Management Fee and Total Expense Ratio. The Board considered the fund's management fee and total expense ratio compared to "mapped groups" of competitive funds and classes. Fidelity creates "mapped groups" by combining similar Lipper investment objective categories that have comparable management fee characteristics. Combining Lipper investment objective categories aids the Board's management fee and total expense ratio comparisons by broadening the competitive group used for comparison and by reducing the number of universes to which various Fidelity funds are compared.
Management Fee. The Board considered two proprietary management fee comparisons for the 12-month periods shown in the chart below. The group of Lipper funds used by the Board for management fee comparisons is referred to below as the "Total Mapped Group." The Total Mapped Group comparison focuses on a fund's standing in terms of gross management fees before expense reimbursements or caps, and without giving effect to the fund's performance adjustment, relative to the total universe of funds with comparable investment mandates, regardless of whether their management fee structures also are comparable. Funds with comparable investment mandates offer exposure to similar types of securities. Funds with comparable management fee structures have similar management fee contractual arrangements (e.g., flat rate charged for advisory services, all-inclusive fee rate, etc.). "TMG %" represents the percentage of funds in the Total Mapped Group that had management fees that were lower than the fund's. For example, a TMG % of 11% means that 89% of the funds in the Total Mapped Group had higher management fees than the fund. The "Asset-Size Peer Group" (ASPG) comparison focuses on a fund's standing relative to a subset of non-Fidelity funds within the Total Mapped Group that are similar in size and management fee structure. The ASPG represents at least 15% of the funds in the Total Mapped Group with comparable asset size and management fee structures, subject to a minimum of 50 funds (or all funds in the Total Mapped Group if fewer than 50). Additional information, such as the ASPG quartile in which the fund's management fee ranked and the impact of the fund's performance adjustment, is also included in the chart and considered by the Board.
Annual Report
Fidelity Advisor Value Strategies Fund
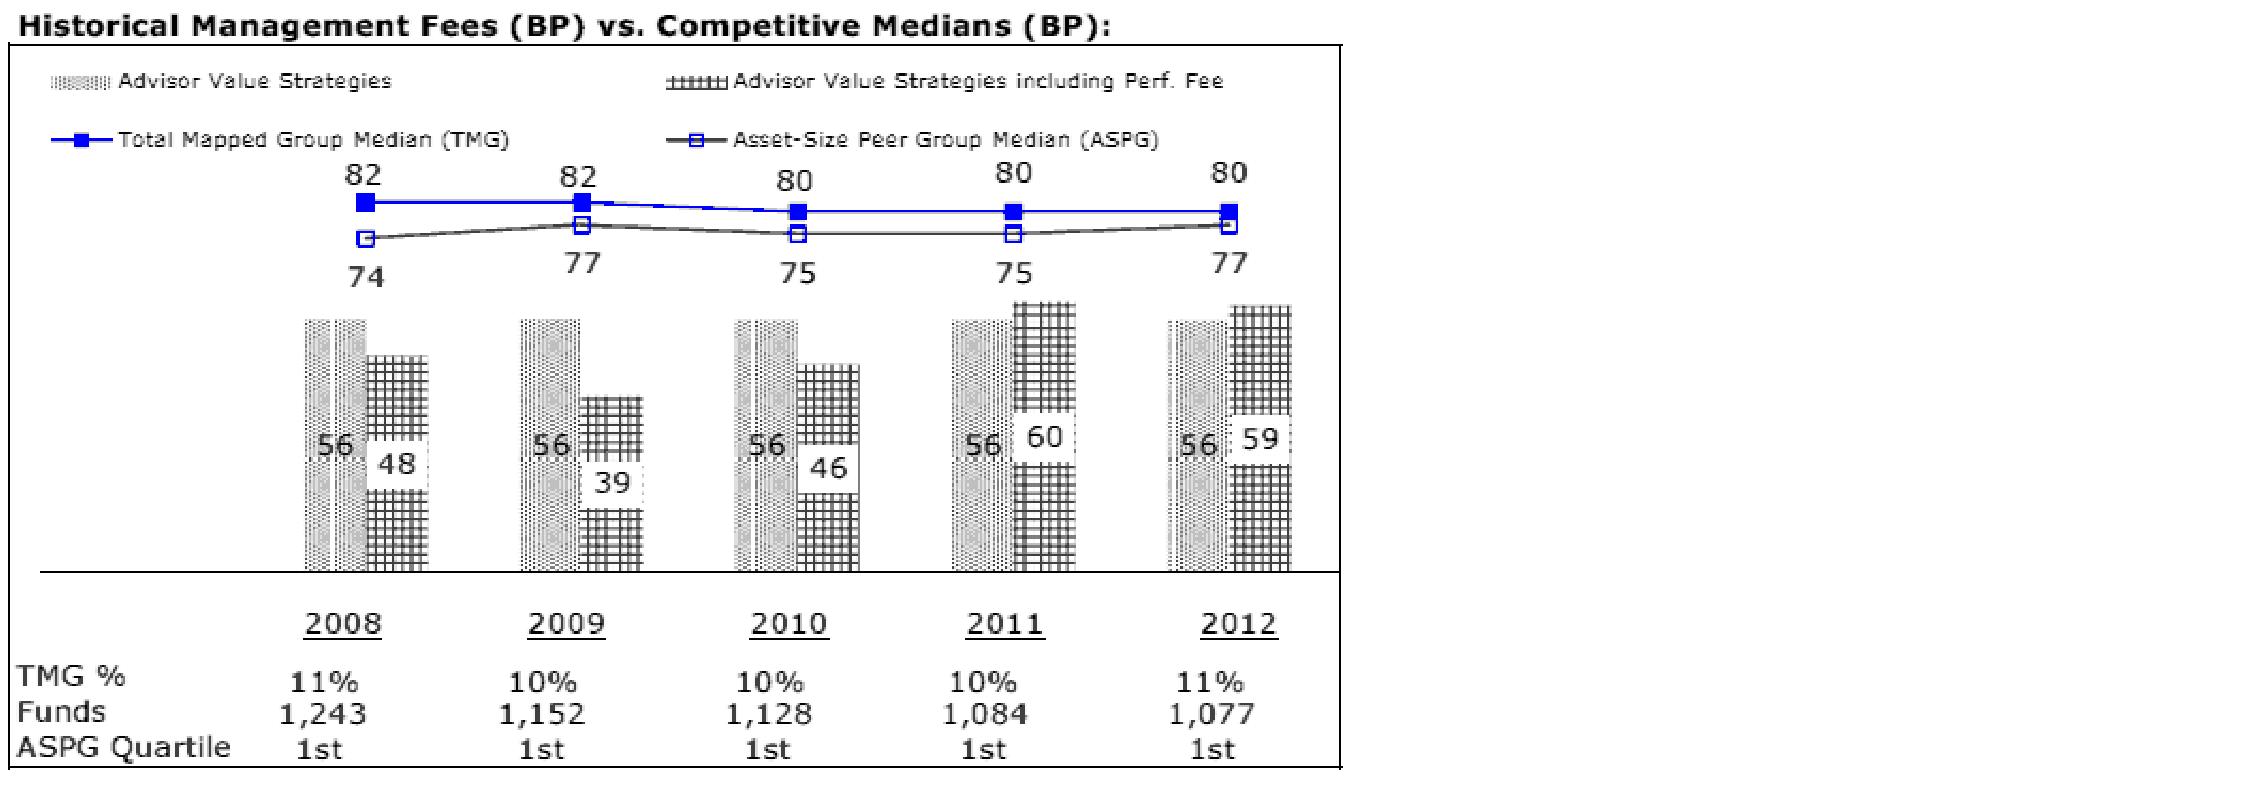
The Board noted that the fund's management fee ranked below the median of its Total Mapped Group and below the median of its ASPG for 2012. The Board also noted the effect of the fund's positive performance adjustment on the fund's management fee ranking.
Annual Report
Board Approval of Investment Advisory Contracts and
Management Fees - continued
Based on its review, the Board concluded that the fund's management fee is fair and reasonable in light of the services that the fund receives and the other factors considered.
Total Expense Ratio. In its review of each class's total expense ratio, the Board considered the fund's management fee as well as other fund or class expenses, as applicable, such as transfer agent fees, pricing and bookkeeping fees, fund-paid 12b-1 fees, and custodial, legal, and audit fees. The Board also noted the effects of any waivers and reimbursements on fees and expenses, as well as the impact of the fund's performance adjustment. As part of its review, the Board also considered the current and historical total expense ratios of each class of the fund compared to competitive fund median expenses. Each class of the fund is compared to those funds and classes in the Total Mapped Group (used by the Board for management fee comparisons) that have a similar sales load structure.
The Board noted that the total expense ratio of each of Class A, Class B, Class C, Institutional Class, the retail class, and Class K ranked below its competitive median for 2012 and the total expense ratio of Class T ranked above its competitive median for 2012. The Board considered that, in general, various factors can affect total expense ratios. The Board noted that the total expense ratio of Class T was above the competitive median primarily because of higher 12b-1 fees on Class T. Class T has a higher 12b-1 fee, but a lower front-end sales charge, than traditionally priced front-end sales charge classes. The Board considered that Class T is primarily sold load-waived in the retirement plan market where its 0.50% 12b-1 fee is comparable to competing no-load, higher 12b-1 fee classes designed specifically for retirement plans. The Board noted that the fund offers multiple classes, each of which has a different sales load and 12b-1 fee structure, and that the multiple structures are intended to offer a range of pricing options for the intermediary market. The Board also noted that the total expense ratios of the classes vary primarily by the level of their 12b-1 fees, although differences in transfer agent fees may also cause expenses to vary from class to class.
Fees Charged to Other Fidelity Clients. The Board also considered Fidelity fee structures and other information with respect to clients of FMR and its affiliates, such as other mutual funds advised or subadvised by FMR or its affiliates, pension plan clients, and other institutional clients. The Board noted the findings of the 2013 ad hoc joint committee (created with the board of other Fidelity funds), which reviewed and compared Fidelity's institutional investment advisory business with its business of providing services to the Fidelity funds, including the differences in services provided, fees charged, and costs incurred, as well as competition in their respective marketplaces.
Based on its review of total expense ratios and fees charged to other Fidelity clients, the Board concluded that the total expense ratio of each class of the fund was reasonable, although Class T was above the median of the universe presented for comparison, in light of the services that the fund and its shareholders receive and the other factors considered.
Annual Report
Costs of the Services and Profitability. The Board considered the revenues earned and the expenses incurred by Fidelity in conducting the business of developing, marketing, distributing, managing, administering and servicing the fund and servicing the fund's shareholders. The Board also considered the level of Fidelity's profits in respect of all the Fidelity funds.
On an annual basis, FMR presents to the Board Fidelity's profitability for the fund. Fidelity calculates the profitability for each fund, as well as aggregate profitability for groups of Fidelity funds and all Fidelity funds, using a series of detailed revenue and cost allocation methodologies which originate with the books and records of Fidelity on which Fidelity's audited financial statements are based. The Audit Committee of the Board reviews any significant changes from the prior year's methodologies.
PricewaterhouseCoopers LLP (PwC), independent registered public accounting firm and auditor to Fidelity and certain Fidelity funds, has been engaged annually by the Board as part of the Board's assessment of Fidelity's profitability analysis. PwC's engagement includes the review and assessment of the methodologies used by Fidelity in determining the revenues and expenses attributable to Fidelity's mutual fund business, and completion of agreed-upon procedures surrounding the mathematical accuracy of fund profitability and its conformity to allocation methodologies. After considering PwC's reports issued under the engagement and information provided by Fidelity, the Board concluded that while other allocation methods may also be reasonable, Fidelity's profitability methodologies are reasonable in all material respects.
The Board also reviewed Fidelity's non-fund businesses and fall-out benefits related to the mutual fund business as well as cases where Fidelity's affiliates may benefit from or be related to the fund's business.
The Board considered the costs of the services provided by and the profits realized by Fidelity in connection with the operation of the fund and was satisfied that the profitability was not excessive in the circumstances.
Economies of Scale. The Board considered whether there have been economies of scale in respect of the management of the Fidelity funds, whether the Fidelity funds (including the fund) have appropriately benefited from any such economies of scale, and whether there is potential for realization of any further economies of scale. The Board considered the extent to which the fund will benefit from economies of scale through increased services to the fund, through waivers or reimbursements, or through fee or expense reductions. The Board also noted that in 2009, it and the board of other Fidelity funds created an ad hoc committee (the Economies of Scale Committee) to analyze whether FMR attains economies of scale in respect of the management and servicing of the Fidelity funds, whether the Fidelity funds have appropriately benefited from such economies of scale, and whether there is potential for realization of any further economies of scale.
Annual Report
Board Approval of Investment Advisory Contracts and
Management Fees - continued
The Board recognized that the fund's management contract incorporates a "group fee" structure, which provides for lower group fee rates as total fund assets under FMR's management increase, and for higher group fee rates as total fund assets under FMR's management decrease. FMR calculates the group fee rates based on a tiered asset "breakpoint" schedule that varies based on asset class. The Board considered that the group fee is designed to deliver the benefits of economies of scale to fund shareholders when total Fidelity fund assets increase, even if assets of any particular fund are unchanged or have declined, because some portion of Fidelity's costs are attributable to services provided to all Fidelity funds, and all funds benefit if those costs can be allocated among more assets. The Board concluded that, given the group fee structure, fund shareholders will benefit from lower management fees as assets under FMR's management increase at the fund complex level, regardless of whether Fidelity achieves any such economies of scale.
The Board concluded, taking into account the analysis of the Economies of Scale Committee, that economies of scale, if any, are being appropriately shared between fund shareholders and Fidelity.
Amendment to Description of Group Fee Rate. At its July 2013 meeting, the Board voted to approve an amendment to the fund's management contract to modify the description of the "group fee rate" effective August 1, 2013. The Board noted that under the prior description in the contract, the group fee rate was based on the average net assets of all registered investment companies with which FMR has management contracts. Under the contract's tiered asset breakpoint schedule, the group fee rate is lower as total fund assets under FMR's management increase, and higher as total fund assets under FMR's management decrease. The Board considered that the prior description would have excluded the assets of 64 Fidelity sector funds from the group fee rate calculation once Fidelity SelectCo, LLC, an affiliate of FMR, assumed management responsibilities for those funds. The Board noted that modifying the description of the group fee rate to continue to include the assets of those 64 funds for purposes of determining group fee rate breakpoints would avoid an immediate adverse impact on the group fee rate for any fund.
Additional Information Requested by the Board. In order to develop fully the factual basis for consideration of the Fidelity funds' Advisory Contracts, the Board requested and received additional information on certain topics, including: (i) fund performance trends and Fidelity's long-term strategies for certain funds; (ii) the potential to further rationalize the Fidelity fund lineup with the possibility of achieving savings for the funds and Fidelity; (iii) the methodology with respect to competitive fund data and peer group classifications; (iv) the arrangements with, and performance of, certain sub-advisers on behalf of the Fidelity funds, as well as certain proposed participating affiliate arrangements; (v) the realization of fall-out benefits in certain Fidelity business units; (vi) Fidelity's group fee structures, including the rationale for the individual fee rates of certain categories of funds and the definition of group assets; (vii) trends regarding industry use of performance fee structures and the performance adjustment methodologies applicable to the Fidelity funds; (viii) additional competitive analysis regarding the total expenses for certain classes; and (ix) fund profitability methodology, including Fidelity's cost allocation methodology, and the impact of certain factors on fund profitability results.
Annual Report
Based on its evaluation of all of the conclusions noted above, and after considering all factors it believed relevant, the Board ultimately concluded that the advisory fee structures are fair and reasonable, and that the fund's Advisory Contracts should be renewed.
Annual Report
Investment Adviser
Fidelity Management & Research Company
Boston, MA
Investment Sub-Advisers
FMR Co., Inc.
Fidelity Management & Research
(U.K.) Inc.
Fidelity Management & Research
(Hong Kong) Limited
Fidelity Management & Research
(Japan) Inc.
General Distributor
Fidelity Distributors Corporation
Smithfield, RI
Transfer and Service Agents
Fidelity Investments Institutional
Operations Company, Inc.
Boston, MA
Fidelity Service Company, Inc.
Boston, MA
Custodian
Brown Brothers Harriman & Co.
Boston, MA
The Fidelity Telephone Connection
Mutual Fund 24-Hour Service
Exchanges/Redemptions and
Account Assistance 1-800-544-6666
Product Information 1-800-544-6666
Retirement Accounts 1-800-544-4774
(8 a.m. - 9 p.m.)
TDD Service 1-800-544-0118
for the deaf and hearing impaired
(9 a.m. - 9 p.m. Eastern time)
Fidelity Automated Service
Telephone (FAST®) 
1-800-544-5555
Automated line for quickest service
(Fidelity Investment logo)(registered trademark)
Corporate Headquarters
245 Summer St., Boston, MA 02210
www.fidelity.com
SOI-UANN-0114 1.786703.110
(Fidelity Investment logo)(registered trademark)
Fidelity Advisor®
Value Strategies
Fund - Class A, Class T, Class B
and Class C
Annual Report
November 30, 2013
(Fidelity Cover Art)
Contents
|
Performance |
How the fund has done over time. |
|
|
Management's Discussion of Fund Performance |
The Portfolio Manager's review of fund performance and strategy. |
|
|
Shareholder Expense Example |
An example of shareholder expenses. |
|
|
Investment Changes |
A summary of major shifts in the fund's investments over the past six months. |
|
|
Investments |
A complete list of the fund's investments with their market values. |
|
|
Financial Statements |
Statements of assets and liabilities, operations, and changes in net assets, as well as financial highlights. |
|
|
Notes |
Notes to the financial statements. |
|
|
Report of Independent Registered Public Accounting Firm |
|
|
|
Trustees and Officers |
|
|
|
Distributions |
|
|
|
Board Approval of Investment Advisory Contracts and Management Fees |
|
To view a fund's proxy voting guidelines and proxy voting record for the 12-month period ended June 30, visit http://www.fidelity.com/proxyvotingresults or visit the Securities and Exchange Commission's (SEC) web site at http://www.sec.gov. You may also call 1-877-208-0098 to request a free copy of the proxy voting guidelines.
Standard & Poor's, S&P and S&P 500 are registered service marks of The McGraw-Hill Companies, Inc. and have been licensed for use by Fidelity Distributors Corporation.
Other third-party marks appearing herein are the property of their respective owners.
All other marks appearing herein are registered or unregistered trademarks or service marks of FMR LLC or an affiliated company. © 2014 FMR LLC. All rights reserved.
Annual Report
This report and the financial statements contained herein are submitted for the general information of the shareholders of the fund. This report is not authorized for distribution to prospective investors in the fund unless preceded or accompanied by an effective prospectus.
A fund files its complete schedule of portfolio holdings with the SEC for the first and third quarters of each fiscal year on Form N-Q. Forms N-Q are available on the SEC's web site at http://www.sec.gov. A fund's Forms N-Q may be reviewed and copied at the SEC's Public Reference Room in Washington, DC. Information regarding the operation of the SEC's Public Reference Room may be obtained by calling 1-800-SEC-0330. For a complete list of a fund's portfolio holdings, view the most recent holdings listing, semiannual report, or annual report on Fidelity's web site at http://www.fidelity.com, http://www.advisor.fidelity.com, or http://www.401k.com, as applicable.
NOT FDIC INSURED • MAY LOSE VALUE • NO BANK GUARANTEE
Neither the fund nor Fidelity Distributors Corporation is a bank.
Annual Report
Performance: The Bottom Line
Average annual total return reflects the change in the value of an investment, assuming reinvestment of the class' distributions from dividend income and capital gains (the profits earned upon the sale of securities that have grown in value, if any) and assuming a constant rate of performance each year. The $10,000 table and the fund's returns do not reflect the deduction of taxes that a shareholder would pay on fund distributions or the redemption of fund shares. During periods of reimbursement by Fidelity, a fund's total return will be greater than it would be had the reimbursement not occurred. How a fund did yesterday is no guarantee of how it will do tomorrow. Returns reflect the conversion of Class B shares to Class A shares after a maximum of seven years.
Average Annual Total Returns
|
Periods ended November 30, 2013 |
Past 1 |
Past 5 |
Past 10 |
|
Class A (incl. 5.75% sales charge) |
23.25% |
23.88% |
6.69% |
|
Class T (incl. 3.50% sales charge) |
25.95% |
24.25% |
6.74% |
|
Class B (incl. contingent deferred sales charge) A |
24.68% |
24.24% |
6.74% |
|
Class C (incl. contingent deferred sales charge) B |
28.77% |
24.42% |
6.50% |
A Class B shares' contingent deferred sales charges included in the past one year, past five years, and past 10 years total return figures are 5%, 2%, and 0%, respectively.
B Class C shares' contingent deferred sales charges included in the past one year, past five years, and past 10 years total return figures are 1%, 0%, and 0%, respectively.
Annual Report
$10,000 Over 10 Years
Let's say hypothetically that $10,000 was invested in Fidelity Advisor® Value Strategies Fund - Class A on November 30, 2003, and the current 5.75% sales charge was paid. The chart shows how the value of your investment would have changed, and also shows how the Russell Midcap® Value Index performed over the same period.
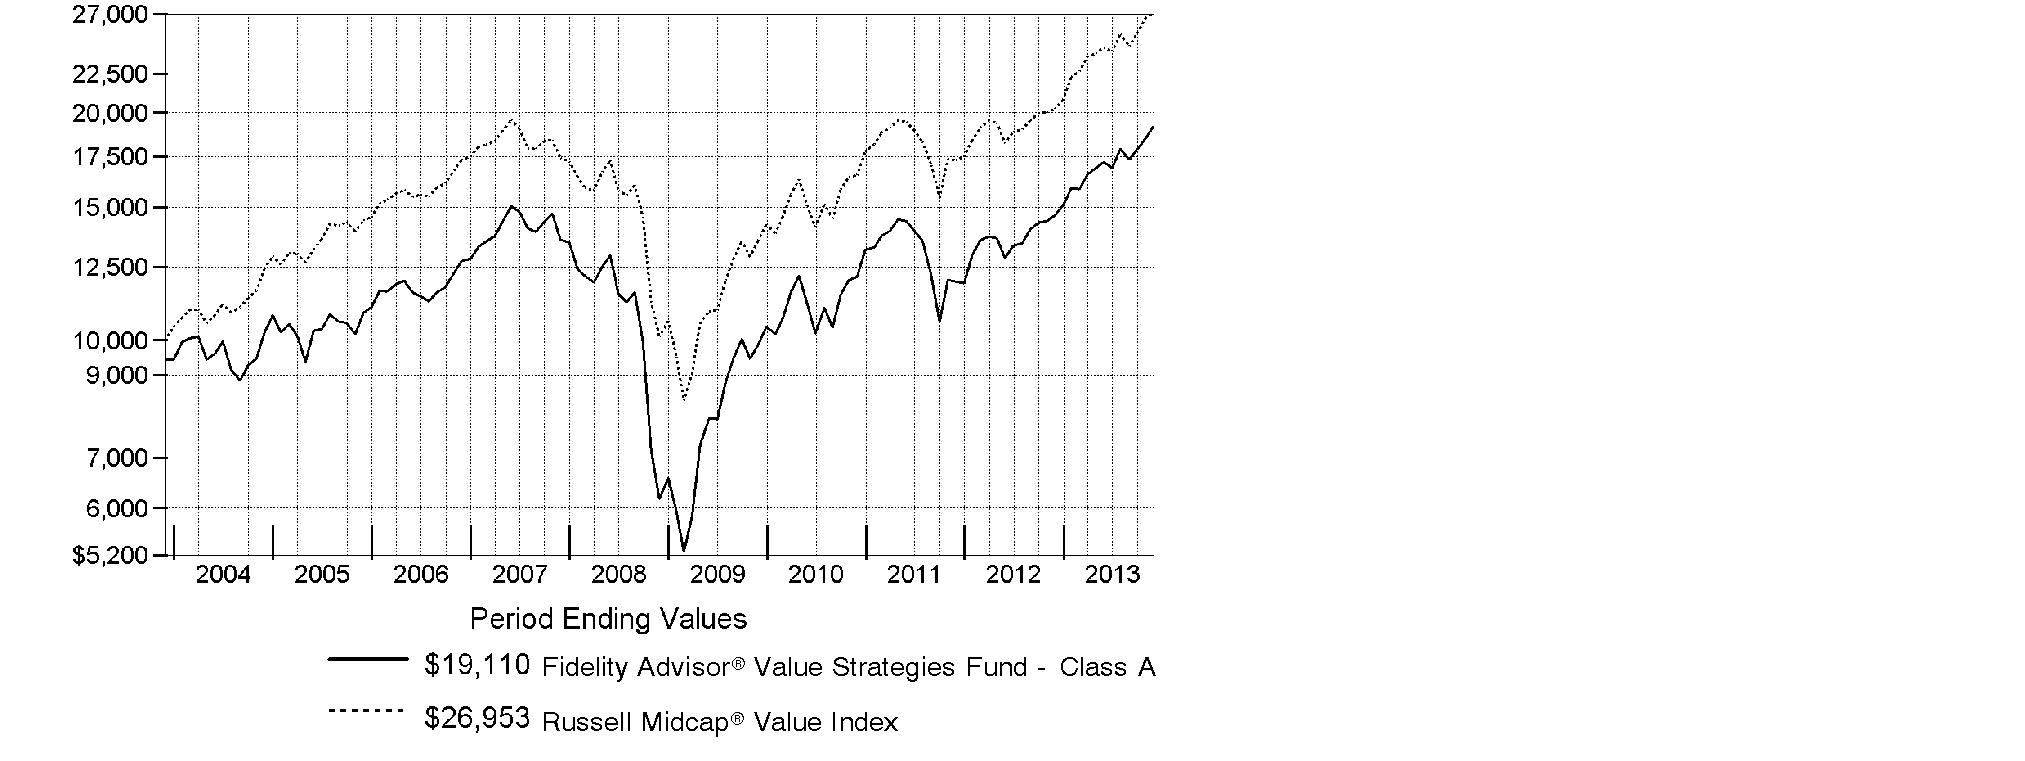
Annual Report
Management's Discussion of Fund Performance
Market Recap: With the current bull run nearing the five-year mark, equity benchmarks ripped up old records during the 12 months ending November 30, 2013. Gains were fueled by strengthening U.S. economic data, as well as generally improving economies and accommodative monetary policies worldwide. The broad S&P 500® Index reached new peaks in its 30.30% climb for the period, and the blue-chip Dow Jones Industrial AverageSM surpassed historic milestones en route to a 26.63% gain. The Nasdaq Composite Index®, up 36.73% amid a resurgence in growth-oriented stocks, closed above 4,000 for the first time since 2000. Shedding anxiety over the 2012 U.S. presidential election - and apparently confident that the federal debt-ceiling debate would be resolved - markets rose from period start through late May. News that the U.S. Federal Reserve was considering an end to its stimulative bond-buying kept stocks in flux over the summer but, by September, the Fed had set aside any imminent tapering. Despite jitters over a potential U.S. military strike in Syria and, later, an October budget impasse that briefly shuttered the federal government, volatility was subdued heading into the holidays, with investor optimism helping many markets home in on all-time highs at period end. Elsewhere, non-U.S. developed-market equities saw similar results, with the MSCI® EAFE® Index adding 24.97%.
Comments from Thomas Soviero, Portfolio Manager of Fidelity Advisor® Value Strategies Fund: For the year, the fund's Class A, Class T, Class B and Class C shares returned 30.77%, 30.52%, 29.68% and 29.77%, respectively (excluding sales charges), underperforming the 33.33% gain of the benchmark Russell Midcap® Value Index. Versus the index, the fund was held back by an 8% average stake in cash, which was a substantial drag on performance in an up market. Security selection in the food, beverage & tobacco and software & services industries also hurt. Beverage company Cott and untimely positioning in software company Symantec were among the biggest detractors, along with positions in retailer Target and pharmaceuticals company Zogenix, the latter of which we sold. On the plus side, the fund was helped by an underweighting in financials - particularly real estate - and by security selection in the materials section. Top individual contributors included Netherlands-based chemicals company LyondellBasell Industries and video-game retailer GameStop. Overweighting automobiles & components, including an investment in auto parts manufacturer Delphi Automotive, also was a positive. Most of the stocks I've mentioned here were not in the benchmark.
The views expressed above reflect those of the portfolio manager(s) only through the end of the period as stated on the cover of this report and do not necessarily represent the views of Fidelity or any other person in the Fidelity organization. Any such views are subject to change at any time based upon market or other conditions and Fidelity disclaims any responsibility to update such views. These views may not be relied on as investment advice and, because investment decisions for a Fidelity fund are based on numerous factors, may not be relied on as an indication of trading intent on behalf of any Fidelity fund.
Annual Report
Shareholder Expense Example
As a shareholder of the Fund, you incur two types of costs: (1) transaction costs, including sales charges (loads) on purchase payments or redemption proceeds, and (2) ongoing costs, including management fees, distribution and/or service (12b-1) fees and other Fund expenses. This Example is intended to help you understand your ongoing costs (in dollars) of investing in the Fund and to compare these costs with the ongoing costs of investing in other mutual funds.
The Example is based on an investment of $1,000 invested at the beginning of the period and held for the entire period (June 1, 2013 to November 30, 2013).
Actual Expenses
The first line of the accompanying table for each class of the Fund provides information about actual account values and actual expenses. You may use the information in this line, together with the amount you invested, to estimate the expenses that you paid over the period. Simply divide your account value by $1,000.00 (for example, an $8,600 account value divided by $1,000.00 = 8.6), then multiply the result by the number in the first line for a class of the Fund under the heading entitled "Expenses Paid During Period" to estimate the expenses you paid on your account during this period. A small balance maintenance fee of $12.00 that is charged once a year may apply for certain accounts with a value of less than $2,000. This fee is not included in the table below. If it was, the estimate of expenses you paid during the period would be higher, and your ending account value lower, by this amount. In addition, the Fund, as a shareholder in the underlying Fidelity Central Funds, will indirectly bear its pro-rata share of the fees and expenses incurred by the underlying Fidelity Central Funds. These fees and expenses are not included in the Fund's annualized expense ratio used to calculate the expense estimate in the table below.
Hypothetical Example for Comparison Purposes
The second line of the accompanying table for each class of the Fund provides information about hypothetical account values and hypothetical expenses based on a Class' actual expense ratio and an assumed rate of return of 5% per year before expenses, which is not the Class' actual return. The hypothetical account values and expenses may not be used to estimate the actual ending account balance or expenses you paid for the period. You may use this information to compare the ongoing costs of investing in the Fund and other funds. To do so, compare this 5% hypothetical example with the 5% hypothetical examples that appear in the shareholder reports of the other funds. A small balance maintenance fee of $12.00 that is charged once a year may apply for certain accounts with a value of less than $2,000. This fee is not included in the table below. If it was, the estimate of expenses you paid during the period would be higher, and your ending account value lower, by this amount. In addition, the Fund, as a shareholder in the underlying Fidelity Central Funds, will indirectly bear its pro-rata share of the fees and expenses incurred by the underlying Fidelity Central Funds. These fees and expenses are not included in the Fund's annualized expense ratio used to calculate the expense estimate in the table below.
Please note that the expenses shown in the table are meant to highlight your ongoing costs only and do not reflect any transaction costs. Therefore, the second line of the table is useful in comparing ongoing costs only, and will not help you determine the relative total costs of owning different funds. In addition, if these transactional costs were included, your costs would have been higher.
Annual Report
|
|
Annualized |
Beginning |
Ending |
Expenses Paid |
|
Class A |
1.04% |
|
|
|
|
Actual |
|
$ 1,000.00 |
$ 1,113.10 |
$ 5.51 |
|
HypotheticalA |
|
$ 1,000.00 |
$ 1,019.85 |
$ 5.27 |
|
Class T |
1.23% |
|
|
|
|
Actual |
|
$ 1,000.00 |
$ 1,112.20 |
$ 6.51 |
|
HypotheticalA |
|
$ 1,000.00 |
$ 1,018.90 |
$ 6.23 |
|
Class B |
1.84% |
|
|
|
|
Actual |
|
$ 1,000.00 |
$ 1,108.60 |
$ 9.73 |
|
HypotheticalA |
|
$ 1,000.00 |
$ 1,015.84 |
$ 9.30 |
|
Class C |
1.78% |
|
|
|
|
Actual |
|
$ 1,000.00 |
$ 1,109.10 |
$ 9.41 |
|
HypotheticalA |
|
$ 1,000.00 |
$ 1,016.14 |
$ 9.00 |
|
Fidelity Value Strategies Fund |
.73% |
|
|
|
|
Actual |
|
$ 1,000.00 |
$ 1,114.60 |
$ 3.87 |
|
HypotheticalA |
|
$ 1,000.00 |
$ 1,021.41 |
$ 3.70 |
|
Fidelity Value Strategies Fund Class K |
.58% |
|
|
|
|
Actual |
|
$ 1,000.00 |
$ 1,115.50 |
$ 3.08 |
|
HypotheticalA |
|
$ 1,000.00 |
$ 1,022.16 |
$ 2.94 |
|
Institutional Class |
.77% |
|
|
|
|
Actual |
|
$ 1,000.00 |
$ 1,114.50 |
$ 4.08 |
|
HypotheticalA |
|
$ 1,000.00 |
$ 1,021.21 |
$ 3.90 |
A 5% return per year before expenses
B Annualized expense ratio reflects expenses net of applicable fee waivers.
* Expenses are equal to each Class' annualized expense ratio, multiplied by the average account value over the period, multiplied by 183/365 (to reflect the one-half year period).
Annual Report
Investment Changes (Unaudited)
|
Top Ten Stocks as of November 30, 2013 |
||
|
|
% of fund's |
% of fund's net assets |
|
LyondellBasell Industries NV Class A |
5.8 |
6.5 |
|
Sanofi SA sponsored ADR |
3.8 |
4.0 |
|
General Motors Co. |
3.7 |
3.4 |
|
Bank of America Corp. |
3.5 |
3.1 |
|
Symantec Corp. |
3.1 |
3.3 |
|
Apple, Inc. |
3.0 |
2.5 |
|
Delphi Automotive PLC |
2.8 |
2.6 |
|
AFLAC, Inc. |
2.4 |
2.1 |
|
The Bon-Ton Stores, Inc. |
2.2 |
2.5 |
|
U.S. Bancorp |
2.2 |
2.1 |
|
|
32.5 |
|
|
Top Five Market Sectors as of November 30, 2013 |
||
|
|
% of fund's |
% of fund's net assets |
|
Consumer Discretionary |
23.9 |
23.3 |
|
Health Care |
14.3 |
13.3 |
|
Information Technology |
12.4 |
12.5 |
|
Financials |
11.4 |
10.2 |
|
Materials |
8.8 |
10.5 |
|
Asset Allocation (% of fund's net assets) |
|||||||
|
As of November 30, 2013* |
As of May 31, 2013** |
||||||
 |
Stocks 93.9% |
|
|
Stocks 93.3% |
|
||
 |
Bonds 0.4% |
|
 |
Bonds 0.0% |
|
||
 |
Short-Term |
|
|
Short-Term |
|
||
|
* Foreign investments |
17.0% |
|
** Foreign investments |
19.5% |
|
||

Annual Report
Investments November 30, 2013
Showing Percentage of Net Assets
|
Common Stocks - 93.9% |
|||
|
Shares |
Value (000s) |
||
|
CONSUMER DISCRETIONARY - 23.9% |
|||
|
Auto Components - 3.9% |
|||
|
Delphi Automotive PLC |
719,777 |
$ 42,143 |
|
|
Tenneco, Inc. (a) |
164,524 |
9,444 |
|
|
TRW Automotive Holdings Corp. (a) |
91,400 |
7,093 |
|
|
|
58,680 |
||
|
Automobiles - 4.3% |
|||
|
Bayerische Motoren Werke AG (BMW) |
36,387 |
4,181 |
|
|
General Motors Co. (a) |
1,467,636 |
56,842 |
|
|
Volkswagen AG |
18,856 |
4,910 |
|
|
|
65,933 |
||
|
Diversified Consumer Services - 0.9% |
|||
|
Service Corp. International |
729,650 |
13,185 |
|
|
Hotels, Restaurants & Leisure - 1.7% |
|||
|
Cedar Fair LP (depositary unit) |
227,420 |
11,326 |
|
|
Wyndham Worldwide Corp. |
199,867 |
14,332 |
|
|
|
25,658 |
||
|
Household Durables - 3.3% |
|||
|
Lennar Corp. Class A (d) |
424,700 |
15,187 |
|
|
PulteGroup, Inc. |
744,504 |
13,967 |
|
|
Ryland Group, Inc. |
151,400 |
5,983 |
|
|
Standard Pacific Corp. (a) |
1,866,450 |
15,268 |
|
|
|
50,405 |
||
|
Leisure Equipment & Products - 1.0% |
|||
|
Hasbro, Inc. (d) |
266,797 |
14,359 |
|
|
Media - 1.7% |
|||
|
Omnicom Group, Inc. |
120,112 |
8,582 |
|
|
Regal Entertainment Group Class A (d) |
363,100 |
7,073 |
|
|
Valassis Communications, Inc. (d) |
349,089 |
10,249 |
|
|
|
25,904 |
||
|
Multiline Retail - 3.8% |
|||
|
Target Corp. |
374,009 |
23,910 |
|
|
The Bon-Ton Stores, Inc. (d)(e) |
1,916,017 |
34,067 |
|
|
|
57,977 |
||
|
Specialty Retail - 3.3% |
|||
|
Asbury Automotive Group, Inc. (a) |
343,641 |
17,842 |
|
|
GameStop Corp. Class A |
674,513 |
32,545 |
|
|
|
50,387 |
||
|
TOTAL CONSUMER DISCRETIONARY |
362,488 |
||
|
Common Stocks - continued |
|||
|
Shares |
Value (000s) |
||
|
CONSUMER STAPLES - 5.4% |
|||
|
Beverages - 1.9% |
|||
|
Cott Corp. (d) |
3,511,564 |
$ 29,446 |
|
|
Food & Staples Retailing - 1.1% |
|||
|
CVS Caremark Corp. |
237,100 |
15,876 |
|
|
Food Products - 1.6% |
|||
|
Bunge Ltd. |
102,214 |
8,189 |
|
|
Calavo Growers, Inc. |
232,028 |
7,153 |
|
|
SunOpta, Inc. (a) |
984,885 |
9,110 |
|
|
|
24,452 |
||
|
Household Products - 0.8% |
|||
|
Procter & Gamble Co. |
142,100 |
11,968 |
|
|
TOTAL CONSUMER STAPLES |
81,742 |
||
|
ENERGY - 5.1% |
|||
|
Energy Equipment & Services - 0.7% |
|||
|
Halliburton Co. |
183,600 |
9,672 |
|
|
Oil, Gas & Consumable Fuels - 4.4% |
|||
|
Alpha Natural Resources, Inc. (a) |
1,323,859 |
8,843 |
|
|
Denbury Resources, Inc. (a) |
1,516,780 |
25,300 |
|
|
HollyFrontier Corp. |
153,000 |
7,341 |
|
|
Marathon Oil Corp. |
151,100 |
5,446 |
|
|
The Williams Companies, Inc. |
154,500 |
5,441 |
|
|
Valero Energy Corp. |
327,300 |
14,964 |
|
|
|
67,335 |
||
|
TOTAL ENERGY |
77,007 |
||
|
FINANCIALS - 11.4% |
|||
|
Commercial Banks - 4.3% |
|||
|
CIT Group, Inc. |
157,349 |
7,943 |
|
|
Regions Financial Corp. |
778,163 |
7,572 |
|
|
U.S. Bancorp |
862,484 |
33,827 |
|
|
Wells Fargo & Co. |
377,370 |
16,612 |
|
|
|
65,954 |
||
|
Diversified Financial Services - 3.5% |
|||
|
Bank of America Corp. |
3,355,213 |
53,079 |
|
|
Insurance - 3.6% |
|||
|
AFLAC, Inc. |
549,986 |
36,503 |
|
|
Common Stocks - continued |
|||
|
Shares |
Value (000s) |
||
|
FINANCIALS - continued |
|||
|
Insurance - continued |
|||
|
American International Group, Inc. |
201,698 |
$ 10,034 |
|
|
Unum Group |
235,260 |
7,898 |
|
|
|
54,435 |
||
|
TOTAL FINANCIALS |
173,468 |
||
|
HEALTH CARE - 14.3% |
|||
|
Health Care Equipment & Supplies - 4.7% |
|||
|
Alere, Inc. (a) |
172,283 |
5,637 |
|
|
Boston Scientific Corp. (a) |
1,785,400 |
20,675 |
|
|
C.R. Bard, Inc. |
75,400 |
10,472 |
|
|
St. Jude Medical, Inc. |
463,300 |
27,066 |
|
|
Zimmer Holdings, Inc. |
87,600 |
8,008 |
|
|
|
71,858 |
||
|
Health Care Providers & Services - 2.1% |
|||
|
DaVita, Inc. (a) |
158,496 |
9,438 |
|
|
Universal Health Services, Inc. Class B |
278,914 |
22,991 |
|
|
|
32,429 |
||
|
Life Sciences Tools & Services - 1.2% |
|||
|
Agilent Technologies, Inc. |
180,700 |
9,680 |
|
|
PerkinElmer, Inc. |
207,500 |
7,893 |
|
|
|
17,573 |
||
|
Pharmaceuticals - 6.3% |
|||
|
Johnson & Johnson |
187,800 |
17,777 |
|
|
Merck & Co., Inc. |
390,800 |
19,474 |
|
|
Sanofi SA sponsored ADR |
1,088,444 |
57,502 |
|
|
|
94,753 |
||
|
TOTAL HEALTH CARE |
216,613 |
||
|
INDUSTRIALS - 7.0% |
|||
|
Aerospace & Defense - 4.9% |
|||
|
Alliant Techsystems, Inc. |
278,850 |
33,805 |
|
|
Esterline Technologies Corp. (a) |
180,022 |
15,846 |
|
|
Honeywell International, Inc. |
139,500 |
12,347 |
|
|
Textron, Inc. |
223,717 |
7,434 |
|
|
United Technologies Corp. |
47,400 |
5,255 |
|
|
|
74,687 |
||
|
Common Stocks - continued |
|||
|
Shares |
Value (000s) |
||
|
INDUSTRIALS - continued |
|||
|
Building Products - 0.5% |
|||
|
Armstrong World Industries, Inc. (a) |
143,230 |
$ 7,620 |
|
|
Electrical Equipment - 0.3% |
|||
|
Regal-Beloit Corp. |
63,554 |
4,676 |
|
|
Machinery - 1.3% |
|||
|
Blount International, Inc. (a) |
292,004 |
4,231 |
|
|
Ingersoll-Rand PLC |
208,100 |
14,863 |
|
|
|
19,094 |
||
|
TOTAL INDUSTRIALS |
106,077 |
||
|
INFORMATION TECHNOLOGY - 12.4% |
|||
|
Communications Equipment - 0.3% |
|||
|
Cisco Systems, Inc. |
204,600 |
4,348 |
|
|
Computers & Peripherals - 3.0% |
|||
|
Apple, Inc. |
80,880 |
44,975 |
|
|
IT Services - 0.6% |
|||
|
Fidelity National Information Services, Inc. |
165,730 |
8,399 |
|
|
Semiconductors & Semiconductor Equipment - 4.3% |
|||
|
KLA-Tencor Corp. |
171,180 |
10,933 |
|
|
MagnaChip Semiconductor Corp. (a) |
978,700 |
19,868 |
|
|
Micron Technology, Inc. (a) |
911,183 |
19,226 |
|
|
ON Semiconductor Corp. (a) |
1,190,970 |
8,444 |
|
|
Spansion, Inc. Class A (a) |
613,543 |
7,602 |
|
|
|
66,073 |
||
|
Software - 4.2% |
|||
|
Microsoft Corp. |
429,324 |
16,370 |
|
|
Symantec Corp. |
2,116,671 |
47,604 |
|
|
|
63,974 |
||
|
TOTAL INFORMATION TECHNOLOGY |
187,769 |
||
|
MATERIALS - 8.8% |
|||
|
Chemicals - 8.4% |
|||
|
Ashland, Inc. |
83,100 |
7,569 |
|
|
Axiall Corp. |
81,626 |
3,698 |
|
|
LyondellBasell Industries NV Class A |
1,132,092 |
87,373 |
|
|
PPG Industries, Inc. |
116,596 |
21,461 |
|
|
W.R. Grace & Co. (a) |
83,628 |
8,031 |
|
|
|
128,132 |
||
|
Common Stocks - continued |
|||
|
Shares |
Value (000s) |
||
|
MATERIALS - continued |
|||
|
Metals & Mining - 0.4% |
|||
|
Carpenter Technology Corp. |
86,796 |
$ 5,233 |
|
|
TOTAL MATERIALS |
133,365 |
||
|
TELECOMMUNICATION SERVICES - 1.1% |
|||
|
Diversified Telecommunication Services - 1.1% |
|||
|
Level 3 Communications, Inc. (a) |
558,139 |
16,979 |
|
|
UTILITIES - 4.5% |
|||
|
Electric Utilities - 0.9% |
|||
|
FirstEnergy Corp. |
231,369 |
7,550 |
|
|
NextEra Energy, Inc. |
67,700 |
5,727 |
|
|
|
13,277 |
||
|
Independent Power Producers & Energy Traders - 2.6% |
|||
|
Calpine Corp. (a) |
822,963 |
15,562 |
|
|
The AES Corp. |
1,687,800 |
24,591 |
|
|
|
40,153 |
||
|
Multi-Utilities - 1.0% |
|||
|
Sempra Energy |
179,639 |
15,887 |
|
|
TOTAL UTILITIES |
69,317 |
||
|
TOTAL COMMON STOCKS (Cost $973,195) |
|
||
|
Nonconvertible Bonds - 0.4% |
||||
|
|
Principal Amount (000s) |
|
||
|
ENERGY - 0.4% |
||||
|
Oil, Gas & Consumable Fuels - 0.4% |
||||
|
Alpha Natural Resources, Inc. 6.25% 6/1/21 (Cost $6,398) |
|
$ 7,670 |
|
|
|
Money Market Funds - 8.2% |
|||
|
Shares |
Value (000s) |
||
|
Fidelity Cash Central Fund, 0.10% (b) |
85,014,186 |
$ 85,014 |
|
|
Fidelity Securities Lending Cash Central Fund, 0.10% (b)(c) |
39,182,193 |
39,182 |
|
|
TOTAL MONEY MARKET FUNDS (Cost $124,196) |
|
||
|
TOTAL INVESTMENT PORTFOLIO - 102.5% (Cost $1,103,789) |
1,555,598 |
||
|
NET OTHER ASSETS (LIABILITIES) - (2.5)% |
(37,520) |
||
|
NET ASSETS - 100% |
$ 1,518,078 |
||
|
Legend |
|
(a) Non-income producing |
|
(b) Affiliated fund that is generally available only to investment companies and other accounts managed by Fidelity Investments. The rate quoted is the annualized seven-day yield of the fund at period end. A complete unaudited listing of the fund's holdings as of its most recent quarter end is available upon request. In addition, each Fidelity Central Fund's financial statements, which are not covered by the Fund's Report of Independent Registered Public Accounting Firm, are available on the SEC's website or upon request. |
|
(c) Investment made with cash collateral received from securities on loan. |
|
(d) Security or a portion of the security is on loan at period end. |
|
(e) Affiliated company |
|
Affiliated Central Funds |
|
Information regarding fiscal year to date income earned by the Fund from investments in Fidelity Central Funds is as follows: |
|
Fund |
Income earned |
|
Fidelity Cash Central Fund |
$ 160 |
|
Fidelity Securities Lending Cash Central Fund |
547 |
|
Total |
$ 707 |
|
Other Affiliated Issuers |
|
An affiliated company is a company in which the Fund has ownership of at least 5% of the voting securities. Fiscal year to date transactions with companies which are or were affiliates are as follows: |
|
Affiliate |
Value, |
Purchases |
Sales |
Dividend |
Value, |
|
Cott Corp. |
$ 59,355 |
$ - |
$ 27,851 |
$ 1,193 |
$ - |
|
The Bon-Ton Stores, Inc. |
11,279 |
17,226 |
- |
278 |
34,067 |
|
Total |
$ 70,634 |
$ 17,226 |
$ 27,851 |
$ 1,471 |
$ 34,067 |
|
Other Information |
|
The following is a summary of the inputs used, as of November 30, 2013, involving the Fund's assets and liabilities carried at fair value. The inputs or methodology used for valuing securities may not be an indication of the risk associated with investing in those securities. For more information on valuation inputs, and their aggregation into the levels used in the table below, please refer to the Investment Valuation section in the accompanying Notes to Financial Statements. |
|
Valuation Inputs at Reporting Date: |
||||
|
Description |
Total |
Level 1 |
Level 2 |
Level 3 |
|
Investments in Securities: |
||||
|
Equities: |
||||
|
Consumer Discretionary |
$ 362,488 |
$ 362,488 |
$ - |
$ - |
|
Consumer Staples |
81,742 |
81,742 |
- |
- |
|
Energy |
77,007 |
77,007 |
- |
- |
|
Financials |
173,468 |
173,468 |
- |
- |
|
Health Care |
216,613 |
216,613 |
- |
- |
|
Industrials |
106,077 |
106,077 |
- |
- |
|
Information Technology |
187,769 |
187,769 |
- |
- |
|
Materials |
133,365 |
133,365 |
- |
- |
|
Telecommunication Services |
16,979 |
16,979 |
- |
- |
|
Utilities |
69,317 |
69,317 |
- |
- |
|
Corporate Bonds |
6,577 |
- |
6,577 |
- |
|
Money Market Funds |
124,196 |
124,196 |
- |
- |
|
Total Investments in Securities: |
$ 1,555,598 |
$ 1,549,021 |
$ 6,577 |
$ - |
|
Distribution of investments by country or territory of incorporation, as a percentage of total net assets, is as follows (Unaudited): |
|
United States of America |
83.0% |
|
Netherlands |
5.8% |
|
France |
3.8% |
|
Bailiwick of Jersey |
2.8% |
|
Canada |
2.5% |
|
Ireland |
1.0% |
|
Others (Individually Less Than 1%) |
1.1% |
|
|
100.0% |
See accompanying notes which are an integral part of the financial statements.
Annual Report
Financial Statements
Statement of Assets and Liabilities
|
Amounts in thousands (except per-share amounts) |
November 30, 2013 |
|
|
|
|
|
|
Assets |
|
|
|
Investment in securities, at value (including securities loaned of $37,981) - See accompanying schedule: Unaffiliated issuers (cost $954,600) |
$ 1,397,335 |
|
|
Fidelity Central Funds (cost $124,196) |
124,196 |
|
|
Other affiliated issuers (cost $24,993) |
34,067 |
|
|
Total Investments (cost $1,103,789) |
|
$ 1,555,598 |
|
Receivable for fund shares sold |
|
1,266 |
|
Dividends receivable |
|
2,892 |
|
Interest receivable |
|
292 |
|
Distributions receivable from Fidelity Central Funds |
|
16 |
|
Prepaid expenses |
|
5 |
|
Other receivables |
|
2 |
|
Total assets |
|
1,560,071 |
|
|
|
|
|
Liabilities |
|
|
|
Payable for fund shares redeemed |
$ 1,644 |
|
|
Accrued management fee |
603 |
|
|
Distribution and service plan fees payable |
241 |
|
|
Other affiliated payables |
277 |
|
|
Other payables and accrued expenses |
46 |
|
|
Collateral on securities loaned, at value |
39,182 |
|
|
Total liabilities |
|
41,993 |
|
|
|
|
|
Net Assets |
|
$ 1,518,078 |
|
Net Assets consist of: |
|
|
|
Paid in capital |
|
$ 1,316,130 |
|
Undistributed net investment income |
|
9,989 |
|
Accumulated undistributed net realized gain (loss) on investments and foreign currency transactions |
|
(259,850) |
|
Net unrealized appreciation (depreciation) on investments and assets and liabilities in foreign currencies |
|
451,809 |
|
Net Assets |
|
$ 1,518,078 |
See accompanying notes which are an integral part of the financial statements.
Annual Report
Statement of Assets and Liabilities - continued
|
Amounts in thousands (except per-share amounts) |
November 30, 2013 |
|
|
|
|
|
|
Calculation of Maximum Offering Price Class A: |
|
$ 36.02 |
|
|
|
|
|
Maximum offering price per share (100/94.25 of $36.02) |
|
$ 38.22 |
|
Class T: |
|
$ 37.28 |
|
|
|
|
|
Maximum offering price per share (100/96.50 of $37.28) |
|
$ 38.63 |
|
Class B: |
|
$ 32.86 |
|
|
|
|
|
Class C: |
|
$ 32.52 |
|
|
|
|
|
Fidelity Value Strategies Fund: |
|
$ 40.28 |
|
|
|
|
|
Fidelity Value Strategies Fund Class K: |
|
$ 40.28 |
|
|
|
|
|
Institutional Class: |
|
$ 38.46 |
A Redemption price per share is equal to net asset value less any applicable contingent deferred sales charge.
See accompanying notes which are an integral part of the financial statements.
Annual Report
Financial Statements - continued
Statement of Operations
|
Amounts in thousands |
Year ended November 30, 2013 |
|
|
|
|
|
|
Investment Income |
|
|
|
Dividends (including $1,471 earned from other affiliated issuers) |
|
$ 23,949 |
|
Interest |
|
208 |
|
Income from Fidelity Central Funds |
|
707 |
|
Total income |
|
24,864 |
|
|
|
|
|
Expenses |
|
|
|
Management fee |
$ 7,835 |
|
|
Performance adjustment |
(1,028) |
|
|
Transfer agent fees |
2,821 |
|
|
Distribution and service plan fees |
2,743 |
|
|
Accounting and security lending fees |
461 |
|
|
Custodian fees and expenses |
16 |
|
|
Independent trustees' compensation |
8 |
|
|
Registration fees |
163 |
|
|
Audit |
65 |
|
|
Legal |
5 |
|
|
Miscellaneous |
9 |
|
|
Total expenses before reductions |
13,098 |
|
|
Expense reductions |
(150) |
12,948 |
|
Net investment income (loss) |
|
11,916 |
|
Realized and Unrealized Gain (Loss) Net realized gain (loss) on: |
|
|
|
Investment securities: |
|
|
|
Unaffiliated issuers |
62,499 |
|
|
Other affiliated issuers |
3,508 |
|
|
Foreign currency transactions |
4 |
|
|
Total net realized gain (loss) |
|
66,011 |
|
Change in net unrealized appreciation (depreciation) on: Investment securities |
293,438 |
|
|
Assets and liabilities in foreign currencies |
4 |
|
|
Total change in net unrealized appreciation (depreciation) |
|
293,442 |
|
Net gain (loss) |
|
359,453 |
|
Net increase (decrease) in net assets resulting from operations |
|
$ 371,369 |
See accompanying notes which are an integral part of the financial statements.
Annual Report
Statement of Changes in Net Assets
|
Amounts in thousands |
Year ended |
Year ended |
|
Increase (Decrease) in Net Assets |
|
|
|
Operations |
|
|
|
Net investment income (loss) |
$ 11,916 |
$ 539 |
|
Net realized gain (loss) |
66,011 |
42,952 |
|
Change in net unrealized appreciation (depreciation) |
293,442 |
147,048 |
|
Net increase (decrease) in net assets resulting |
371,369 |
190,539 |
|
Distributions to shareholders from net investment income |
(3,993) |
(4,679) |
|
Share transactions - net increase (decrease) |
77,974 |
(16,561) |
|
Total increase (decrease) in net assets |
445,350 |
169,299 |
|
|
|
|
|
Net Assets |
|
|
|
Beginning of period |
1,072,728 |
903,429 |
|
End of period (including undistributed net investment income of $9,989 and undistributed net investment income of $2,549, respectively) |
$ 1,518,078 |
$ 1,072,728 |
See accompanying notes which are an integral part of the financial statements.
Annual Report
Financial Highlights - Class A
|
Years ended November 30, |
2013 |
2012 |
2011 |
2010 |
2009 |
|
Selected Per-Share Data |
|
|
|
|
|
|
Net asset value, beginning of period |
$ 27.62 |
$ 22.71 |
$ 23.11 |
$ 18.77 |
$ 11.87 |
|
Income from Investment Operations |
|
|
|
|
|
|
Net investment income (loss) C |
.23 |
- F |
.13 G |
.03 H |
.06 |
|
Net realized and unrealized gain (loss) |
8.25 |
5.03 |
(.49) |
4.32 |
6.96 |
|
Total from investment operations |
8.48 |
5.03 |
(.36) |
4.35 |
7.02 |
|
Distributions from net investment income |
(.08) |
(.12) |
(.03) I |
- |
(.12) |
|
Distributions from net realized gain |
- |
- |
(.01) I |
(.01) |
- |
|
Total distributions |
(.08) |
(.12) |
(.04) |
(.01) |
(.12) |
|
Net asset value, end of period |
$ 36.02 |
$ 27.62 |
$ 22.71 |
$ 23.11 |
$ 18.77 |
|
Total Return A, B |
30.77% |
22.29% |
(1.57)% |
23.16% |
59.70% |
|
Ratios to Average Net Assets D, J |
|
|
|
|
|
|
Expenses before reductions |
1.04% |
1.21% |
1.18% |
1.08% |
1.03% |
|
Expenses net of fee waivers, if any |
1.04% |
1.21% |
1.18% |
1.08% |
1.03% |
|
Expenses net of all reductions |
1.03% |
1.21% |
1.17% |
1.07% |
1.02% |
|
Net investment income (loss) |
.73% |
-% F |
.51% G |
.12% H |
.39% |
|
Supplemental Data |
|
|
|
|
|
|
Net assets, end of period (in millions) |
$ 243 |
$ 203 |
$ 190 |
$ 221 |
$ 206 |
|
Portfolio turnover rate E |
22% |
23% |
34% |
99% |
161% |
A Total returns would have been lower if certain expenses had not been reduced during the applicable periods shown.
B Total returns do not include the effect of the sales charges.
C Calculated based on average shares outstanding during the period.
D Fees and expenses of any underlying Fidelity Central Funds are not included in the Fund's expense ratio. The Fund indirectly bears its proportionate share of the expenses of any underlying Fidelity Central Funds.
E Amount does not include the portfolio activity of any underlying Fidelity Central Funds.
F Investment income per share reflects a large, non-recurring dividend which amounted to $.07 per share. Excluding this non-recurring dividend, the ratio of net investment income (loss) to average net assets would have been (.28)%.
G Investment income per share reflects a large, non-recurring dividend which amounted to $.16 per share. Excluding this non-recurring dividend, the ratio of net investment income (loss) to average net assets would have been (.11)%.
H Investment income per share reflects a large, non-recurring dividend which amounted to $.04 per share. Excluding this non-recurring dividend, the ratio of net investment income (loss) to average net assets would have been (.05)%.
I The amounts shown reflect certain reclassifications related to book to tax differences that were made in the year shown.
J Expense ratios reflect operating expenses of the class. Expenses before reductions do not reflect amounts reimbursed by the investment adviser or reductions from brokerage service arrangements or reductions from other expense offset arrangements and do not represent the amount paid by the class during periods when reimbursements or reductions occur. Expenses net of fee waivers reflect expenses after reimbursement by the investment adviser but prior to reductions from brokerage service arrangements or other expense offset arrangements. Expenses net of all reductions represent the net expenses paid by the class.
See accompanying notes which are an integral part of the financial statements.
Annual Report
Financial Highlights - Class T
|
Years ended November 30, |
2013 |
2012 |
2011 |
2010 |
2009 |
|
Selected Per-Share Data |
|
|
|
|
|
|
Net asset value, beginning of period |
$ 28.58 |
$ 23.48 |
$ 23.90 |
$ 19.44 |
$ 12.25 |
|
Income from Investment Operations |
|
|
|
|
|
|
Net investment income (loss) C |
.18 |
(.05) F |
.08 G |
(.01) H |
.03 |
|
Net realized and unrealized gain (loss) |
8.54 |
5.22 |
(.50) |
4.48 |
7.21 |
|
Total from investment operations |
8.72 |
5.17 |
(.42) |
4.47 |
7.24 |
|
Distributions from net investment income |
(.02) |
(.07) |
- |
- |
(.05) |
|
Distributions from net realized gain |
- |
- |
- |
(.01) |
- |
|
Total distributions |
(.02) |
(.07) |
- |
(.01) |
(.05) |
|
Net asset value, end of period |
$ 37.28 |
$ 28.58 |
$ 23.48 |
$ 23.90 |
$ 19.44 |
|
Total Return A, B |
30.52% |
22.08% |
(1.76)% |
22.98% |
59.40% |
|
Ratios to Average Net Assets D, I |
|
|
|
|
|
|
Expenses before reductions |
1.23% |
1.38% |
1.35% |
1.26% |
1.24% |
|
Expenses net of fee waivers, if any |
1.23% |
1.38% |
1.35% |
1.26% |
1.24% |
|
Expenses net of all reductions |
1.22% |
1.38% |
1.35% |
1.25% |
1.22% |
|
Net investment income (loss) |
.54% |
(.17)% F |
.33% G |
(.06)% H |
.18% |
|
Supplemental Data |
|
|
|
|
|
|
Net assets, end of period (in millions) |
$ 335 |
$ 283 |
$ 274 |
$ 344 |
$ 339 |
|
Portfolio turnover rate E |
22% |
23% |
34% |
99% |
161% |
A Total returns would have been lower if certain expenses had not been reduced during the applicable periods shown.
B Total returns do not include the effect of the sales charges.
C Calculated based on average shares outstanding during the period.
D Fees and expenses of any underlying Fidelity Central Funds are not included in the Fund's expense ratio. The Fund indirectly bears its proportionate share of the expenses of any underlying Fidelity Central Funds.
E Amount does not include the portfolio activity of any underlying Fidelity Central Funds.
F Investment income per share reflects a large, non-recurring dividend which amounted to $.07 per share. Excluding this non-recurring dividend, the ratio of net investment income (loss) to average net assets would have been (.45)%.
G Investment income per share reflects a large, non-recurring dividend which amounted to $.16 per share. Excluding this non-recurring dividend, the ratio of net investment income (loss) to average net assets would have been (.29)%.
H Investment income per share reflects a large, non-recurring dividend which amounted to $.04 per share. Excluding this non-recurring dividend, the ratio of net investment income (loss) to average net assets would have been (.23)%.
I Expense ratios reflect operating expenses of the class. Expenses before reductions do not reflect amounts reimbursed by the investment adviser or reductions from brokerage service arrangements or reductions from other expense offset arrangements and do not represent the amount paid by the class during periods when reimbursements or reductions occur. Expenses net of fee waivers reflect expenses after reimbursement by the investment adviser but prior to reductions from brokerage service arrangements or other expense offset arrangements. Expenses net of all reductions represent the net expenses paid by the class.
See accompanying notes which are an integral part of the financial statements.
Annual Report
Financial Highlights - Class B
|
Years ended November 30, |
2013 |
2012 |
2011 |
2010 |
2009 |
|
Selected Per-Share Data |
|
|
|
|
|
|
Net asset value, beginning of period |
$ 25.34 |
$ 20.87 |
$ 21.37 |
$ 17.48 |
$ 11.03 |
|
Income from Investment Operations |
|
|
|
|
|
|
Net investment income (loss) C |
(.02) |
(.18) F |
(.06) G |
(.13) H |
(.05) |
|
Net realized and unrealized gain (loss) |
7.54 |
4.65 |
(.44) |
4.03 |
6.50 |
|
Total from investment operations |
7.52 |
4.47 |
(.50) |
3.90 |
6.45 |
|
Distributions from net realized gain |
- |
- |
- |
(.01) |
- |
|
Net asset value, end of period |
$ 32.86 |
$ 25.34 |
$ 20.87 |
$ 21.37 |
$ 17.48 |
|
Total Return A, B |
29.68% |
21.42% |
(2.34)% |
22.29% |
58.48% |
|
Ratios to Average Net Assets D, I |
|
|
|
|
|
|
Expenses before reductions |
1.83% |
1.97% |
1.93% |
1.83% |
1.78% |
|
Expenses net of fee waivers, if any |
1.83% |
1.97% |
1.93% |
1.83% |
1.78% |
|
Expenses net of all reductions |
1.82% |
1.97% |
1.93% |
1.82% |
1.77% |
|
Net investment income (loss) |
(.07)% |
(.76)% F |
(.25)% G |
(.64)% H |
(.36)% |
|
Supplemental Data |
|
|
|
|
|
|
Net assets, end of period (in millions) |
$ 11 |
$ 13 |
$ 16 |
$ 30 |
$ 40 |
|
Portfolio turnover rate E |
22% |
23% |
34% |
99% |
161% |
A Total returns would have been lower if certain expenses had not been reduced during the applicable periods shown.
B Total returns do not include the effect of the contingent deferred sales charge.
C Calculated based on average shares outstanding during the period.
D Fees and expenses of any underlying Fidelity Central Funds are not included in the Fund's expense ratio. The Fund indirectly bears its proportionate share of the expenses of any underlying Fidelity Central Funds.
E Amount does not include the portfolio activity of any underlying Fidelity Central Funds.
F Investment income per share reflects a large, non-recurring dividend which amounted to $.06 per share. Excluding this non-recurring dividend, the ratio of net investment income (loss) to average net assets would have been (1.04)%.
G Investment income per share reflects a large, non-recurring dividend which amounted to $.16 per share. Excluding this non-recurring dividend, the ratio of net investment income (loss) to average net assets would have been (.87)%.
H Investment income per share reflects a large, non-recurring dividend which amounted to $.03 per share. Excluding this non-recurring dividend, the ratio of net investment income (loss) to average net assets would have been (.80)%.
I Expense ratios reflect operating expenses of the class. Expenses before reductions do not reflect amounts reimbursed by the investment adviser or reductions from brokerage service arrangements or reductions from other expense offset arrangements and do not represent the amount paid by the class during periods when reimbursements or reductions occur. Expenses net of fee waivers reflect expenses after reimbursement by the investment adviser but prior to reductions from brokerage service arrangements or other expense offset arrangements. Expenses net of all reductions represent the net expenses paid by the class.
See accompanying notes which are an integral part of the financial statements.
Annual Report
Financial Highlights - Class C
|
Years ended November 30, |
2013 |
2012 |
2011 |
2010 |
2009 |
|
Selected Per-Share Data |
|
|
|
|
|
|
Net asset value, beginning of period |
$ 25.06 |
$ 20.64 |
$ 21.13 |
$ 17.29 |
$ 10.91 |
|
Income from Investment Operations |
|
|
|
|
|
|
Net investment income (loss) C |
(.01) |
(.17) F |
(.05) G |
(.12) H |
(.05) |
|
Net realized and unrealized gain (loss) |
7.47 |
4.59 |
(.44) |
3.97 |
6.43 |
|
Total from investment operations |
7.46 |
4.42 |
(.49) |
3.85 |
6.38 |
|
Distributions from net realized gain |
- |
- |
- |
(.01) |
- |
|
Net asset value, end of period |
$ 32.52 |
$ 25.06 |
$ 20.64 |
$ 21.13 |
$ 17.29 |
|
Total Return A, B |
29.77% |
21.41% |
(2.32)% |
22.25% |
58.48% |
|
Ratios to Average Net Assets D, I |
|
|
|
|
|
|
Expenses before reductions |
1.78% |
1.95% |
1.92% |
1.83% |
1.78% |
|
Expenses net of fee waivers, if any |
1.78% |
1.95% |
1.92% |
1.83% |
1.78% |
|
Expenses net of all reductions |
1.77% |
1.95% |
1.92% |
1.82% |
1.77% |
|
Net investment income (loss) |
(.02)% |
(.75)% F |
(.24)% G |
(.63)% H |
(.36)% |
|
Supplemental Data |
|
|
|
|
|
|
Net assets, end of period (in millions) |
$ 54 |
$ 43 |
$ 40 |
$ 49 |
$ 43 |
|
Portfolio turnover rate E |
22% |
23% |
34% |
99% |
161% |
A Total returns would have been lower if certain expenses had not been reduced during the applicable periods shown.
B Total returns do not include the effect of the contingent deferred sales charge.
C Calculated based on average shares outstanding during the period.
D Fees and expenses of any underlying Fidelity Central Funds are not included in the Fund's expense ratio. The Fund indirectly bears its proportionate share of the expenses of any underlying Fidelity Central Funds.
E Amount does not include the portfolio activity of any underlying Fidelity Central Funds.
F Investment income per share reflects a large, non-recurring dividend which amounted to $.06 per share. Excluding this non-recurring dividend, the ratio of net investment income (loss) to average net assets would have been (1.02)%.
G Investment income per share reflects a large, non-recurring dividend which amounted to $.16 per share. Excluding this non-recurring dividend, the ratio of net investment income (loss) to average net assets would have been (.86)%.
H Investment income per share reflects a large, non-recurring dividend which amounted to $.03 per share. Excluding this non-recurring dividend, the ratio of net investment income (loss) to average net assets would have been (.80)%.
I Expense ratios reflect operating expenses of the class. Expenses before reductions do not reflect amounts reimbursed by the investment adviser or reductions from brokerage service arrangements or reductions from other expense offset arrangements and do not represent the amount paid by the class during periods when reimbursements or reductions occur. Expenses net of fee waivers reflect expenses after reimbursement by the investment adviser but prior to reductions from brokerage service arrangements or other expense offset arrangements. Expenses net of all reductions represent the net expenses paid by the class.
See accompanying notes which are an integral part of the financial statements.
Annual Report
Financial Highlights - Fidelity Value Strategies Fund
|
Years ended November 30, |
2013 |
2012 |
2011 |
2010 |
2009 |
|
Selected Per-Share Data |
|
|
|
|
|
|
Net asset value, beginning of period |
$ 30.89 |
$ 25.37 |
$ 25.80 |
$ 20.89 |
$ 13.21 |
|
Income from Investment Operations |
|
|
|
|
|
|
Net investment income (loss) B |
.37 |
.09 E |
.22 F |
.09 G |
.11 |
|
Net realized and unrealized gain (loss) |
9.20 |
5.62 |
(.54) |
4.83 |
7.73 |
|
Total from investment operations |
9.57 |
5.71 |
(.32) |
4.92 |
7.84 |
|
Distributions from net investment income |
(.18) |
(.19) |
(.10) H |
- |
(.16) |
|
Distributions from net realized gain |
- |
- |
(.01) H |
(.01) |
- |
|
Total distributions |
(.18) |
(.19) |
(.11) |
(.01) |
(.16) |
|
Net asset value, end of period |
$ 40.28 |
$ 30.89 |
$ 25.37 |
$ 25.80 |
$ 20.89 |
|
Total Return A |
31.14% |
22.69% |
(1.29)% |
23.54% |
60.05% |
|
Ratios to Average Net Assets C, I |
|
|
|
|
|
|
Expenses before reductions |
.73% |
.89% |
.88% |
.81% |
.78% |
|
Expenses net of fee waivers, if any |
.73% |
.89% |
.88% |
.81% |
.78% |
|
Expenses net of all reductions |
.72% |
.89% |
.88% |
.80% |
.77% |
|
Net investment income (loss) |
1.03% |
.31% E |
.80% F |
.39% G |
.64% |
|
Supplemental Data |
|
|
|
|
|
|
Net assets, end of period (in millions) |
$ 681 |
$ 396 |
$ 284 |
$ 360 |
$ 237 |
|
Portfolio turnover rate D |
22% |
23% |
34% |
99% |
161% |
A Total returns would have been lower if certain expenses had not been reduced during the applicable periods shown.
B Calculated based on average shares outstanding during the period.
C Fees and expenses of any underlying Fidelity Central Funds are not included in the Fund's expense ratio. The Fund indirectly bears its proportionate share of the expenses of any underlying Fidelity Central Funds.
D Amount does not include the portfolio activity of any underlying Fidelity Central Funds.
E Investment income per share reflects a large, non-recurring dividend which amounted to $.08 per share. Excluding this non-recurring dividend, the ratio of net investment income (loss) to average net assets would have been .04%.
F Investment income per share reflects a large, non-recurring dividend which amounted to $.16 per share. Excluding this non-recurring dividend, the ratio of net investment income (loss) to average net assets would have been .18%.
G Investment income per share reflects a large, non-recurring dividend which amounted to $.04 per share. Excluding this non-recurring dividend, the ratio of net investment income (loss) to average net assets would have been .22%.
H The amounts shown reflect certain reclassifications related to book to tax differences that were made in the year shown.
I Expense ratios reflect operating expenses of the class. Expenses before reductions do not reflect amounts reimbursed by the investment adviser or reductions from brokerage service arrangements or reductions from other expense offset arrangements and do not represent the amount paid by the class during periods when reimbursements or reductions occur. Expenses net of fee waivers reflect expenses after reimbursement by the investment adviser but prior to reductions from brokerage service arrangements or other expense offset arrangements. Expenses net of all reductions represent the net expenses paid by the class.
See accompanying notes which are an integral part of the financial statements.
Annual Report
Financial Highlights - Fidelity Value Strategies Fund Class K
|
Years ended November 30, |
2013 |
2012 |
2011 |
2010 |
2009 |
|
Selected Per-Share Data |
|
|
|
|
|
|
Net asset value, beginning of period |
$ 30.89 |
$ 25.38 |
$ 25.82 |
$ 20.86 |
$ 13.23 |
|
Income from Investment Operations |
|
|
|
|
|
|
Net investment income (loss) B |
.43 |
.14 E |
.28 F |
.15 G |
.16 |
|
Net realized and unrealized gain (loss) |
9.18 |
5.61 |
(.55) |
4.82 |
7.70 |
|
Total from investment operations |
9.61 |
5.75 |
(.27) |
4.97 |
7.86 |
|
Distributions from net investment income |
(.22) |
(.24) |
(.16) H |
- |
(.23) |
|
Distributions from net realized gain |
- |
- |
(.01) H |
(.01) |
- |
|
Total distributions |
(.22) |
(.24) |
(.17) |
(.01) |
(.23) |
|
Net asset value, end of period |
$ 40.28 |
$ 30.89 |
$ 25.38 |
$ 25.82 |
$ 20.86 |
|
Total Return A |
31.34% |
22.93% |
(1.11)% |
23.81% |
60.52% |
|
Ratios to Average Net Assets C, I |
|
|
|
|
|
|
Expenses before reductions |
.58% |
.71% |
.68% |
.58% |
.51% |
|
Expenses net of fee waivers, if any |
.58% |
.71% |
.68% |
.58% |
.51% |
|
Expenses net of all reductions |
.57% |
.71% |
.68% |
.56% |
.49% |
|
Net investment income (loss) |
1.18% |
.50% E |
1.00% F |
.62% G |
.91% |
|
Supplemental Data |
|
|
|
|
|
|
Net assets, end of period (in millions) |
$ 119 |
$ 70 |
$ 47 |
$ 47 |
$ 27 |
|
Portfolio turnover rate D |
22% |
23% |
34% |
99% |
161% |
A Total returns would have been lower if certain expenses had not been reduced during the applicable periods shown.
B Calculated based on average shares outstanding during the period.
C Fees and expenses of any underlying Fidelity Central Funds are not included in the Fund's expense ratio. The Fund indirectly bears its proportionate share of the expenses of any underlying Fidelity Central Funds.
D Amount does not include the portfolio activity of any underlying Fidelity Central Funds.
E Investment income per share reflects a large, non-recurring dividend which amounted to $.08 per share. Excluding this non-recurring dividend, the ratio of net investment income (loss) to average net assets would have been .22%.
F Investment income per share reflects a large, non-recurring dividend which amounted to $.16 per share. Excluding this non-recurring dividend, the ratio of net investment income (loss) to average net assets would have been .38%.
G Investment income per share reflects a large, non-recurring dividend which amounted to $.04 per share. Excluding this non-recurring dividend, the ratio of net investment income (loss) to average net assets would have been .46%.
H The amounts shown reflect certain reclassifications related to book to tax differences that were made in the year shown.
I Expense ratios reflect operating expenses of the class. Expenses before reductions do not reflect amounts reimbursed by the investment adviser or reductions from brokerage service arrangements or reductions from other expense offset arrangements and do not represent the amount paid by the class during periods when reimbursements or reductions occur. Expenses net of fee waivers reflect expenses after reimbursement by the investment adviser but prior to reductions from brokerage service arrangements or other expense offset arrangements. Expenses net of all reductions represent the net expenses paid by the class.
See accompanying notes which are an integral part of the financial statements.
Annual Report
Financial Highlights - Institutional Class
|
Years ended November 30, |
2013 |
2012 |
2011 |
2010 |
2009 |
|
Selected Per-Share Data |
|
|
|
|
|
|
Net asset value, beginning of period |
$ 29.51 |
$ 24.26 |
$ 24.69 |
$ 19.97 |
$ 12.67 |
|
Income from Investment Operations |
|
|
|
|
|
|
Net investment income (loss) B |
.34 |
.08 E |
.22 F |
.10 G |
.11 |
|
Net realized and unrealized gain (loss) |
8.79 |
5.37 |
(.53) |
4.63 |
7.38 |
|
Total from investment operations |
9.13 |
5.45 |
(.31) |
4.73 |
7.49 |
|
Distributions from net investment income |
(.18) |
(.20) |
(.11) H |
- |
(.19) |
|
Distributions from net realized gain |
- |
- |
(.01) H |
(.01) |
- |
|
Total distributions |
(.18) |
(.20) |
(.12) |
(.01) |
(.19) |
|
Net asset value, end of period |
$ 38.46 |
$ 29.51 |
$ 24.26 |
$ 24.69 |
$ 19.97 |
|
Total Return A |
31.11% |
22.67% |
(1.30)% |
23.67% |
60.08% |
|
Ratios to Average Net Assets C, I |
|
|
|
|
|
|
Expenses before reductions |
.76% |
.90% |
.86% |
.74% |
.70% |
|
Expenses net of fee waivers, if any |
.76% |
.90% |
.86% |
.74% |
.70% |
|
Expenses net of all reductions |
.75% |
.90% |
.86% |
.73% |
.69% |
|
Net investment income (loss) |
1.00% |
.31% E |
.82% F |
.46% G |
.71% |
|
Supplemental Data |
|
|
|
|
|
|
Net assets, end of period (in millions) |
$ 74 |
$ 66 |
$ 52 |
$ 53 |
$ 48 |
|
Portfolio turnover rate D |
22% |
23% |
34% |
99% |
161% |
A Total returns would have been lower if certain expenses had not been reduced during the applicable periods shown.
B Calculated based on average shares outstanding during the period.
C Fees and expenses of any underlying Fidelity Central Funds are not included in the Fund's expense ratio. The Fund indirectly bears its proportionate share of the expenses of any underlying Fidelity Central Funds.
D Amount does not include the portfolio activity of any underlying Fidelity Central Funds.
E Investment income per share reflects a large, non-recurring dividend which amounted to $.08 per share. Excluding this non-recurring dividend, the ratio of net investment income (loss) to average net assets would have been .03%.
F Investment income per share reflects a large, non-recurring dividend which amounted to $.16 per share. Excluding this non-recurring dividend, the ratio of net investment income (loss) to average net assets would have been .20%.
G Investment income per share reflects a large, non-recurring dividend which amounted to $.04 per share. Excluding this non-recurring dividend, the ratio of net investment income (loss) to average net assets would have been .29%.
H The amounts shown reflect certain reclassifications related to book to tax differences that were made in the year shown.
I Expense ratios reflect operating expenses of the class. Expenses before reductions do not reflect amounts reimbursed by the investment adviser or reductions from brokerage service arrangements or reductions from other expense offset arrangements and do not represent the amount paid by the class during periods when reimbursements or reductions occur. Expenses net of fee waivers reflect expenses after reimbursement by the investment adviser but prior to reductions from brokerage service arrangements or other expense offset arrangements. Expenses net of all reductions represent the net expenses paid by the class.
See accompanying notes which are an integral part of the financial statements.
Annual Report
Notes to Financial Statements
For the period ended November 30, 2013
(Amounts in thousands except percentages)
1. Organization.
Fidelity Advisor Value Strategies Fund (the Fund) is a fund of Fidelity Advisor Series I (the Trust) and is authorized to issue an unlimited number of shares. The Trust is registered under the Investment Company Act of 1940, as amended (the 1940 Act), as an open-end management investment company organized as a Massachusetts business trust. The Fund offers Class A, Class T, Class C, Fidelity Value Strategies Fund, Fidelity Value Strategies Fund Class K and Institutional Class shares, each of which, along with Class B shares, has equal rights as to assets and voting privileges. Class B shares are closed to new accounts and additional purchases, except for exchanges and reinvestments. Each class has exclusive voting rights with respect to matters that affect that class. Class B shares will automatically convert to Class A shares after a holding period of seven years from the initial date of purchase.
2. Investments in Fidelity Central Funds.
The Fund invests in Fidelity Central Funds, which are open-end investment companies generally available only to other investment companies and accounts managed by the investment adviser and its affiliates. The Fund's Schedule of Investments lists each of the Fidelity Central Funds held as of period end, if any, as an investment of the Fund, but does not include the underlying holdings of each Fidelity Central Fund. As an Investing Fund, the Fund indirectly bears its proportionate share of the expenses of the underlying Fidelity Central Funds.
The Money Market Central Funds seek preservation of capital and current income and are managed by Fidelity Investments Money Management, Inc. (FIMM), an affiliate of the investment adviser. Annualized expenses of the Money Market Central Funds as of their most recent shareholder report date are less than .01%.
A complete unaudited list of holdings for each Fidelity Central Fund is available upon request or at the Securities and Exchange Commission (the SEC) website at www.sec.gov. In addition, the financial statements of the Fidelity Central Funds, which are not covered by the Fund's Report of Independent Registered Public Accounting Firm, are available on the SEC website or upon request.
3. Significant Accounting Policies.
The financial statements have been prepared in conformity with accounting principles generally accepted in the United States of America (GAAP), which require management to make certain estimates and assumptions at the date of the financial statements. Actual results could differ from those estimates. Subsequent events, if any, through the date that the financial statements were issued have been evaluated in the preparation of
Annual Report
Notes to Financial Statements - continued
(Amounts in thousands except percentages)
3. Significant Accounting Policies - continued
the financial statements. The following summarizes the significant accounting policies of the Fund:
Investment Valuation. Investments are valued as of 4:00 p.m. Eastern time on the last calendar day of the period. In accordance with valuation policies and procedures approved by the Board of Trustees (the Board), the Fund attempts to obtain prices from one or more third party pricing vendors or brokers to value its investments. When current market prices, quotations or currency exchange rates are not readily available or reliable, investments will be fair valued in good faith by the Fidelity Management & Research Company (FMR) Fair Value Committee (the Committee), in accordance with procedures adopted by the Board. Factors used in determining fair value vary by investment type and may include market or investment specific events, changes in interest rates and credit quality. The frequency with which these procedures are used cannot be predicted and they may be utilized to a significant extent. The Committee oversees the Fund's valuation policies and procedures and is responsible for approving and reporting to the Board all fair value determinations.
The Fund categorizes the inputs to valuation techniques used to value its investments into a disclosure hierarchy consisting of three levels as shown below:
Level 1 - quoted prices in active markets for identical investments
Level 2 - other significant observable inputs (including quoted prices for similar investments, interest rates, prepayment speeds, etc.)
Level 3 - unobservable inputs (including the Fund's own assumptions based on the best information available)
Valuation techniques used to value the Fund's investments by major category are as follows:
Equity securities, including restricted securities, for which market quotations are readily available, are valued at the last reported sale price or official closing price as reported by a third party pricing vendor on the primary market or exchange on which they are traded and are categorized as Level 1 in the hierarchy. In the event there were no sales during the day or closing prices are not available, securities are valued at the last quoted bid price or may be valued using the last available price and are generally categorized as Level 2 in the hierarchy. For foreign equity securities, when market or security specific events arise, comparisons to the valuation of American Depositary Receipts (ADRs), futures contracts, Exchange-Traded Funds (ETFs) and certain indexes as well as quoted prices for similar securities may be used and would be categorized as Level 2 in the hierarchy. Utilizing these techniques may result in transfers between Level 1 and Level 2. For equity securities, including restricted securities, where observable inputs are
Annual Report
3. Significant Accounting Policies - continued
Investment Valuation - continued
limited, assumptions about market activity and risk are used and these securities may be categorized as Level 3 in the hierarchy.
Debt securities, including restricted securities, are valued based on evaluated prices received from third party pricing vendors or from brokers who make markets in such securities. For corporate bonds, pricing vendors utilize matrix pricing which considers yield or price of bonds of comparable quality, coupon, maturity and type as well as broker-supplied prices. When independent prices are unavailable or unreliable, debt securities may be valued utilizing pricing methodologies which consider similar factors that would be used by third party pricing vendors. Debt securities are generally categorized as Level 2 in the hierarchy but may be Level 3 depending on the circumstances.
Investments in open-end mutual funds, including the Fidelity Central Funds, are valued at their closing net asset value (NAV) each business day and are categorized as Level 1 in the hierarchy.
Changes in valuation techniques may result in transfers in or out of an assigned level within the disclosure hierarchy. The aggregate value of investments by input level, as of November 30, 2013, is included at the end of the Fund's Schedule of Investments.
Foreign Currency. The Fund may use foreign currency contracts to facilitate transactions in foreign-denominated securities. Gains and losses from these transactions may arise from changes in the value of the foreign currency or if the counterparties do not perform under the contracts' terms.
Foreign-denominated assets, including investment securities, and liabilities are translated into U.S. dollars at the exchange rates at period end. Purchases and sales of investment securities, income and dividends received and expenses denominated in foreign currencies are translated into U.S. dollars at the exchange rate in effect on the transaction date.
The effects of exchange rate fluctuations on investments are included with the net realized and unrealized gain (loss) on investment securities. Other foreign currency transactions resulting in realized and unrealized gain (loss) are disclosed separately.
Investment Transactions and Income. For financial reporting purposes, the Fund's investment holdings and NAV include trades executed through the end of the last business day of the period. The NAV per share for processing shareholder transactions is calculated as of the close of business of the New York Stock Exchange (NYSE), normally 4:00 p.m. Eastern time and includes trades executed through the end of the prior business day. Gains and losses on securities sold are determined on the basis of identified cost and may include proceeds received from litigation. Dividend income is recorded on
Annual Report
Notes to Financial Statements - continued
(Amounts in thousands except percentages)
3. Significant Accounting Policies - continued
Investment Transactions and Income - continued
the ex-dividend date, except for certain dividends from foreign securities where the ex-dividend date may have passed, which are recorded as soon as the Fund is informed of the ex-dividend date. Non-cash dividends included in dividend income, if any, are recorded at the fair market value of the securities received. Distributions received on securities that represent a return of capital or capital gain are recorded as a reduction of cost of investments and/or as a realized gain. Subsequent to ex-dividend date the Fund determines the components of these distributions, based upon receipt of tax filings or other correspondence relating to the underlying investment. Interest income and distributions from the Fidelity Central Funds are accrued as earned. Interest income includes coupon interest and amortization of premium and accretion of discount on debt securities. Investment income is recorded net of foreign taxes withheld where recovery of such taxes is uncertain.
Class Allocations and Expenses. Investment income, realized and unrealized capital gains and losses, common expenses of the Fund, and certain fund-level expense reductions, if any, are allocated daily on a pro-rata basis to each class based on the relative net assets of each class to the total net assets of the Fund. Each class differs with respect to transfer agent and distribution and service plan fees incurred. Certain expense reductions may also differ by class. For the reporting period, the allocated portion of income and expenses to each class as a percent of its average net assets may vary due to the timing of recording these transactions in relation to fluctuating net assets of the classes. Expenses directly attributable to a fund are charged to that fund. Expenses attributable to more than one fund are allocated among the respective funds on the basis of relative net assets or other appropriate methods. Expense estimates are accrued in the period to which they relate and adjustments are made when actual amounts are known.
Income Tax Information and Distributions to Shareholders. Each year, the Fund intends to qualify as a regulated investment company under Subchapter M of the Internal Revenue Code, including distributing substantially all of its taxable income and realized gains. As a result, no provision for U.S. Federal income taxes is required. As of November 30, 2013, the Fund did not have any unrecognized tax benefits in the financial statements; nor is the Fund aware of any tax positions for which it is reasonably possible that the total amounts of unrecognized tax benefits will significantly change in the next twelve months. The Fund files a U.S. federal tax return, in addition to state and local tax returns as required. The Fund's federal income tax returns are subject to examination by the Internal Revenue Service (IRS) for a period of three fiscal years after they are filed. State and local tax returns may be subject to examination for an additional fiscal year
Annual Report
3. Significant Accounting Policies - continued
Income Tax Information and Distributions to Shareholders - continued
depending on the jurisdiction. Foreign taxes are provided for based on the Fund's understanding of the tax rules and rates that exist in the foreign markets in which it invests.
Distributions are declared and recorded on the ex-dividend date. Income dividends and capital gain distributions are declared separately for each class. Income and capital gain distributions are determined in accordance with income tax regulations, which may differ from GAAP. These differences resulted in distribution reclassifications.
Capital accounts within the financial statements are adjusted for permanent book-tax differences. These adjustments have no impact on net assets or the results of operations. Temporary book-tax differences will reverse in a subsequent period.
Book-tax differences are primarily due to foreign currency transactions, partnerships, market discount, deferred trustees compensation, capital loss carryforwards and losses deferred due to wash sales.
The federal tax cost of investment securities and unrealized appreciation (depreciation) as of period end were as follows:
|
Gross unrealized appreciation |
$ 471,566 |
|
Gross unrealized depreciation |
(21,450) |
|
Net unrealized appreciation (depreciation) on securities and other investments |
$ 450,116 |
|
|
|
|
Tax Cost |
$ 1,105,482 |
The tax-based components of distributable earnings as of period end were as follows:
|
Undistributed ordinary income |
$ 9,957 |
|
Capital loss carryforward |
$ (258,123) |
|
Net unrealized appreciation (depreciation) |
$ 450,116 |
Capital loss carryforwards are only available to offset future capital gains of the Fund to the extent provided by regulations and may be limited. Under the Regulated Investment Company Modernization Act of 2010 (the Act), the Fund is permitted to carry forward capital losses incurred in taxable years beginning after December 22, 2010 for an unlimited period and such capital losses are required to be used prior to any losses that expire.
Annual Report
Notes to Financial Statements - continued
(Amounts in thousands except percentages)
3. Significant Accounting Policies - continued
Income Tax Information and Distributions to Shareholders - continued
The capital loss carryforward information presented below, including any applicable limitation, is estimated as of fiscal period end and is subject to adjustment.
|
Fiscal year of expiration |
|
|
2016 |
$ (70,992) |
|
2017 |
(187,132) |
|
Total capital loss carryforward |
$ (258,123) |
The tax character of distributions paid was as follows:
|
|
November 30, 2013 |
November 30, 2012 |
|
Ordinary Income |
$ 3,993 |
$ 4,679 |
4. Purchases and Sales of Investments.
Purchases and sales of securities, other than short-term securities, aggregated $388,274 and $281,410, respectively.
5. Fees and Other Transactions with Affiliates.
Management Fee. Fidelity Management & Research Company (the investment adviser) and its affiliates provide the Fund with investment management related services for which the Fund pays a monthly management fee. The management fee is the sum of an individual fund fee rate that is based on an annual rate of .30% of the Fund's average net assets and an annualized group fee rate that averaged .25% during the period. The group fee rate is based upon the average net assets of all the mutual funds advised by the investment adviser, including any mutual funds previously advised by the investment adviser that are currently advised by Fidelity SelectCo, LLC, an affiliate of the investment adviser. The group fee rate decreases as assets under management increase and increases as assets under management decrease. In addition, the management fee is subject to a performance adjustment (up to a maximum of ± .20% of the Fund's average net assets over a 36 month performance period). The upward or downward adjustment to the management fee is based on the relative investment performance of Fidelity Value Strategies Fund as compared to an appropriate benchmark index over the same 36 month performance period. For the reporting period, the total annual management fee rate, including the performance adjustment, was .48% of the Fund's average net assets. The performance adjustment included in the management fee rate may be higher or lower than the maximum performance adjustment rate due to the difference between the average net assets for the reporting and performance periods.
Annual Report
5. Fees and Other Transactions with Affiliates - continued
Distribution and Service Plan Fees. In accordance with Rule 12b-1 of the 1940 Act, the Fund has adopted separate Distribution and Service Plans for each class of shares. Certain classes pay Fidelity Distributors Corporation (FDC), an affiliate of the investment adviser, separate Distribution and Service Fees, each of which is based on an annual percentage of each class' average net assets. In addition, FDC may pay financial intermediaries for selling shares of the Fund and providing shareholder support services. For the period, the Distribution and Service Fee rates, total fees and amounts retained by FDC were as follows:
|
|
Distribution |
Service |
Total Fees |
Retained |
|
Class A |
-% |
.25% |
$ 563 |
$ 10 |
|
Class T |
.25% |
.25% |
1,560 |
13 |
|
Class B |
.75% |
.25% |
119 |
90 |
|
Class C |
.75% |
.25% |
501 |
32 |
|
|
|
|
$ 2,743 |
$ 145 |
Sales Load. FDC may receive a front-end sales charge of up to 5.75% for selling Class A shares and 3.50% for selling Class T shares, some of which is paid to financial intermediaries for selling shares of the Fund. Depending on the holding period, FDC may receive contingent deferred sales charges levied on Class A, Class T, Class B, and Class C redemptions. The deferred sales charges range from 5.00% to 1.00% for Class B shares, 1.00% for Class C shares, 1.00% for certain purchases of Class A shares and .25% for certain purchases of Class T shares.
For the period, sales charge amounts retained by FDC were as follows:
|
|
Retained |
|
Class A |
$ 25 |
|
Class T |
11 |
|
Class B* |
9 |
|
Class C* |
1 |
|
|
$ 46 |
* When Class B and Class C shares are initially sold, FDC pays commissions from its own resources to financial intermediaries through which the sales are made.
Transfer Agent Fees. Fidelity Investments Institutional Operations Company, Inc., (FIIOC), an affiliate of the investment adviser, is the transfer, dividend disbursing and shareholder servicing agent for each class of the Fund. FIIOC receives account fees and asset-based fees that vary according to the account size and type of account of the shareholders of the respective classes of the Fund, except for Class K. FIIOC receives an
Annual Report
Notes to Financial Statements - continued
(Amounts in thousands except percentages)
5. Fees and Other Transactions with Affiliates - continued
Transfer Agent Fees - continued
asset-based fee of Class K's average net assets. FIIOC pays for typesetting, printing and mailing of shareholder reports, except proxy statements.
For the period, transfer agent fees for each class were as follows:
|
|
Amount |
% of |
|
Class A |
$ 581 |
.26 |
|
Class T |
621 |
.20 |
|
Class B |
36 |
.30 |
|
Class C |
128 |
.25 |
|
Fidelity Value Strategies Fund |
1,231 |
.20 |
|
Fidelity Value Strategies Fund Class K |
68 |
.05 |
|
Institutional Class |
156 |
.23 |
|
|
$ 2,821 |
|
Accounting and Security Lending Fees. Fidelity Service Company, Inc. (FSC), an affiliate of the investment adviser, maintains the Fund's accounting records. The accounting fee is based on the level of average net assets for each month. Under a separate contract, FSC administers the security lending program. The security lending fee is based on the number and duration of lending transactions.
Brokerage Commissions. The Fund placed a portion of its portfolio transactions with brokerage firms which are affiliates of the investment adviser. Brokerage commissions are included in net realized gain (loss) and change in net unrealized appreciation (depreciation) in the Statement of Operations. The commissions paid to these affiliated firms were $12 for the period.
6. Committed Line of Credit.
The Fund participates with other funds managed by the investment adviser or an affiliate in a $4.25 billion credit facility (the "line of credit") to be utilized for temporary or emergency purposes to fund shareholder redemptions or for other short-term liquidity purposes. The Fund has agreed to pay commitment fees on its pro-rata portion of the line of credit, which amounted to $3 and is reflected in Miscellaneous expenses on the Statement of Operations. During the period, there were no borrowings on this line of credit.
Annual Report
7. Security Lending.
The Fund lends portfolio securities through a lending agent from time to time in order to earn additional income. For equity securities, a lending agent is used and may loan securities to certain qualified borrowers, including Fidelity Capital Markets (FCM), a broker-dealer affiliated with the Fund. On the settlement date of the loan, the Fund receives collateral (in the form of U.S. Treasury obligations, letters of credit and/or cash) against the loaned securities and maintains collateral in an amount not less than 100% of the market value of the loaned securities during the period of the loan. The market value of the loaned securities is determined at the close of business of the Fund and any additional required collateral is delivered to the Fund on the next business day. If the borrower defaults on its obligation to return the securities loaned because of insolvency or other reasons, the Fund may apply collateral received from the borrower against the obligation. The Fund may experience delays and costs in recovering the securities loaned. Any cash collateral received is invested in the Fidelity Securities Lending Cash Central Fund. The value of loaned securities and cash collateral at period end are disclosed on the Fund's Statement of Assets and Liabilities. At period end, there were no security loans outstanding with FCM. Security lending income represents the income earned on investing cash collateral, less rebates paid to borrowers and any lending agent fees associated with the loan, plus any premium payments received for lending certain types of securities. Security lending income is presented in the Statement of Operations as a component of income from Fidelity Central Funds. Total security lending income during the period amounted to $547, including $47 from securities loaned to FCM.
8. Expense Reductions.
Commissions paid to certain brokers with whom the investment adviser, or its affiliates, places trades on behalf of the Fund include an amount in addition to trade execution, which may be rebated back to the Fund to offset certain expenses. This amount totaled $144 for the period.
In addition, the investment adviser reimbursed a portion of the Fund's operating expenses during the period in the amount of $6.
Annual Report
Notes to Financial Statements - continued
(Amounts in thousands except percentages)
9. Distributions to Shareholders.
Distributions to shareholders of each class were as follows:
|
Years ended November 30, |
2013 |
2012 |
|
From net investment income |
|
|
|
Class A |
$ 555 |
$ 998 |
|
Class T |
167 |
760 |
|
Fidelity Value Strategies Fund |
2,356 |
2,061 |
|
Fidelity Value Strategies Fund Class K |
520 |
448 |
|
Institutional Class |
395 |
412 |
|
Total |
$ 3,993 |
$ 4,679 |
10. Share Transactions.
Transactions for each class of shares were as follows:
|
|
Shares |
Dollars |
||
|
Years ended November 30, |
2013 |
2012 |
2013 |
2012 |
|
Class A |
|
|
|
|
|
Shares sold |
725 |
854 |
$ 22,684 |
$ 21,748 |
|
Reinvestment of distributions |
18 |
42 |
513 |
917 |
|
Shares redeemed |
(1,340) |
(1,927) |
(42,216) |
(48,930) |
|
Net increase (decrease) |
(597) |
(1,031) |
$ (19,019) |
$ (26,265) |
|
Class T |
|
|
|
|
|
Shares sold |
862 |
878 |
$ 28,085 |
$ 23,229 |
|
Reinvestment of distributions |
5 |
31 |
152 |
697 |
|
Shares redeemed |
(1,767) |
(2,697) |
(57,990) |
(69,951) |
|
Net increase (decrease) |
(900) |
(1,788) |
$ (29,753) |
$ (46,025) |
|
Class B |
|
|
|
|
|
Shares sold |
4 |
5 |
$ 123 |
$ 128 |
|
Shares redeemed |
(161) |
(292) |
(4,616) |
(6,718) |
|
Net increase (decrease) |
(157) |
(287) |
$ (4,493) |
$ (6,590) |
|
Class C |
|
|
|
|
|
Shares sold |
317 |
217 |
$ 8,968 |
$ 5,049 |
|
Shares redeemed |
(382) |
(454) |
(11,135) |
(10,427) |
|
Net increase (decrease) |
(65) |
(237) |
$ (2,167) |
$ (5,378) |
|
Fidelity Value Strategies Fund |
|
|
|
|
|
Shares sold |
11,897 |
5,614 |
$ 405,389 |
$ 163,914 |
|
Reinvestment of distributions |
73 |
81 |
2,266 |
1,967 |
|
Shares redeemed |
(7,881) |
(4,064) |
(279,142) |
(114,471) |
|
Net increase (decrease) |
4,089 |
1,631 |
$ 128,513 |
$ 51,410 |
Annual Report
10. Share Transactions - continued
|
|
Shares |
Dollars |
||
|
Years ended November 30, |
2013 |
2012 |
2013 |
2012 |
|
Fidelity Value Strategies Fund Class K |
|
|
|
|
|
Shares sold |
3,420 |
1,339 |
$ 116,082 |
$ 38,174 |
|
Reinvestment of distributions |
17 |
18 |
520 |
448 |
|
Shares redeemed |
(2,727) |
(943) |
(102,509) |
(26,603) |
|
Net increase (decrease) |
710 |
414 |
$ 14,093 |
$ 12,019 |
|
Institutional Class |
|
|
|
|
|
Shares sold |
776 |
903 |
$ 26,302 |
$ 25,700 |
|
Reinvestment of distributions |
11 |
17 |
327 |
392 |
|
Shares redeemed |
(1,082) |
(822) |
(35,829) |
(21,824) |
|
Net increase (decrease) |
(295) |
98 |
$ (9,200) |
$ 4,268 |
11. Other.
The Fund's organizational documents provide former and current trustees and officers with a limited indemnification against liabilities arising in connection with the performance of their duties to the Fund. In the normal course of business, the Fund may also enter into contracts that provide general indemnifications. The Fund's maximum exposure under these arrangements is unknown as this would be dependent on future claims that may be made against the Fund. The risk of material loss from such claims is considered remote.
Annual Report
Report of Independent Registered Public Accounting Firm
To the Trustees of Fidelity Advisor Series I and Shareholders of Fidelity Advisor Value Strategies Fund:
We have audited the accompanying statement of assets and liabilities of Fidelity Advisor Value Strategies Fund (the Fund), a fund of Fidelity Advisor Series I, including the schedule of investments, as of November 30, 2013, and the related statement of operations for the year then ended, the statement of changes in net assets for each of the two years in the period then ended, and the financial highlights for each of the five years in the period then ended. These financial statements and financial highlights are the responsibility of the Fund's management. Our responsibility is to express an opinion on these financial statements and financial highlights based on our audits.
We conducted our audits in accordance with the standards of the Public Company Accounting Oversight Board (United States). Those standards require that we plan and perform the audit to obtain reasonable assurance about whether the financial statements and financial highlights are free of material misstatement. The Fund is not required to have, nor were we engaged to perform, an audit of its internal control over financial reporting. Our audits included consideration of internal control over financial reporting as a basis for designing audit procedures that are appropriate in the circumstances, but not for the purpose of expressing an opinion on the effectiveness of the Fund's internal control over financial reporting. Accordingly, we express no such opinion. An audit also includes examining, on a test basis, evidence supporting the amounts and disclosures in the financial statements, assessing the accounting principles used and significant estimates made by management, as well as evaluating the overall financial statement presentation. Our procedures included confirmation of securities owned as of November 30, 2013, by correspondence with the custodians and brokers. We believe that our audits provide a reasonable basis for our opinion.
In our opinion, the financial statements and financial highlights referred to above present fairly, in all material respects, the financial position of Fidelity Advisor Value Strategies Fund as of November 30, 2013, the results of its operations for the year then ended, the changes in its net assets for each of the two years in the period then ended, and the financial highlights for each of the five years in the period then ended, in conformity with accounting principles generally accepted in the United States of America.
DELOITTE & TOUCHE LLP
Boston, Massachusetts
January 14, 2014
Annual Report
Trustees and Officers
The Trustees, Member of the Advisory Board, and officers of the trust and fund, as applicable, are listed below. The Board of Trustees governs the fund and is responsible for protecting the interests of shareholders. The Trustees are experienced executives who meet periodically throughout the year to oversee the fund's activities, review contractual arrangements with companies that provide services to the fund, oversee management of the risks associated with such activities and contractual arrangements, and review the fund's performance. Except for James C. Curvey, Ned C. Lautenbach, Ronald P. O'Hanley, and William S. Stavropoulos, each of the Trustees oversees 173 funds. Mr. Curvey oversees 396 Funds. Mr. Lautenbach, Mr. O'Hanley, and Mr. Stavropoulos each oversees 247 funds.
The Trustees hold office without limit in time except that (a) any Trustee may resign; (b) any Trustee may be removed by written instrument, signed by at least two-thirds of the number of Trustees prior to such removal; (c) any Trustee who requests to be retired or who has become incapacitated by illness or injury may be retired by written instrument signed by a majority of the other Trustees; and (d) any Trustee may be removed at any special meeting of shareholders by a two-thirds vote of the outstanding voting securities of the trust. Each Trustee who is not an interested person (as defined in the 1940 Act) of the trust and the fund (Independent Trustee), shall retire not later than the last day of the calendar year in which his or her 75th birthday occurs. The Independent Trustees may waive this mandatory retirement age policy with respect to individual Trustees. The officers and Advisory Board Member hold office without limit in time, except that any officer and Advisory Board Member may resign or may be removed by a vote of a majority of the Trustees at any regular meeting or any special meeting of the Trustees. Except as indicated, each individual has held the office shown or other offices in the same company for the past five years.
Experience, Skills, Attributes, and Qualifications of the Fund's Trustees. The Governance and Nominating Committee has adopted a statement of policy that describes the experience, qualifications, attributes, and skills that are necessary and desirable for potential Independent Trustee candidates (Statement of Policy). The Board believes that each Trustee satisfied at the time he or she was initially elected or appointed a Trustee, and continues to satisfy, the standards contemplated by the Statement of Policy. The Governance and Nominating Committee also engages professional search firms to help identify potential Independent Trustee candidates who have the experience, qualifications, attributes, and skills consistent with the Statement of Policy. From time to time, additional criteria based on the composition and skills of the current Independent Trustees, as well as experience or skills that may be appropriate in light of future changes to board composition, business conditions, and regulatory or other developments, have also been considered by the professional search firms and the Governance and Nominating Committee. In addition, the Board takes into account the Trustees' commitment and participation in Board and committee meetings, as well as their leadership of standing and ad hoc committees throughout their tenure.
Annual Report
Trustees and Officers - continued
In determining that a particular Trustee was and continues to be qualified to serve as a Trustee, the Board has considered a variety of criteria, none of which, in isolation, was controlling. The Board believes that, collectively, the Trustees have balanced and diverse experience, qualifications, attributes, and skills, which allow the Board to operate effectively in governing the fund and protecting the interests of shareholders. Information about the specific experience, skills, attributes, and qualifications of each Trustee, which in each case led to the Board's conclusion that the Trustee should serve (or continue to serve) as a trustee of the fund, is provided below.
Board Structure and Oversight Function. James C. Curvey is an interested person (as defined in the 1940 Act) and currently serves as Chairman. The Trustees have determined that an interested Chairman is appropriate and benefits shareholders because an interested Chairman has a personal and professional stake in the quality and continuity of services provided to the fund. Independent Trustees exercise their informed business judgment to appoint an individual of their choosing to serve as Chairman, regardless of whether the Trustee happens to be independent or a member of management. The Independent Trustees have determined that they can act independently and effectively without having an Independent Trustee serve as Chairman and that a key structural component for assuring that they are in a position to do so is for the Independent Trustees to constitute a substantial majority for the Board. The Independent Trustees also regularly meet in executive session. Ned C. Lautenbach serves as Chairman of the Independent Trustees and as such (i) acts as a liaison between the Independent Trustees and management with respect to matters important to the Independent Trustees and (ii) with management prepares agendas for Board meetings.
Fidelity funds are overseen by different Boards of Trustees. The fund's Board oversees Fidelity's equity and high income funds and another Board oversees Fidelity's investment-grade bond, money market, and asset allocation funds. The asset allocation funds may invest in Fidelity funds overseen by the fund's Board. The use of separate Boards, each with its own committee structure, allows the Trustees of each group of Fidelity funds to focus on the unique issues of the funds they oversee, including common research, investment, and operational issues. On occasion, the separate Boards establish joint committees to address issues of overlapping consequences for the Fidelity funds overseen by each Board.
The Trustees operate using a system of committees to facilitate the timely and efficient consideration of all matters of importance to the Trustees, the fund, and fund shareholders and to facilitate compliance with legal and regulatory requirements and oversight of the fund's activities and associated risks. The Board, acting through its committees, has charged FMR and its affiliates with (i) identifying events or circumstances the occurrence of which could have demonstrably adverse effects on the fund's business and/or reputation; (ii) implementing processes and controls to lessen the possibility that such events or circumstances occur or to mitigate the effects of such events or circumstances if they do occur; and (iii) creating and maintaining a system designed to evaluate continuously business and market conditions in order to facilitate the identification and implementation processes described in (i) and (ii) above. Because the day-to-day operations and activities of the fund are carried out by or through FMR, its affiliates and other service providers, the fund's exposure to risks is mitigated but not eliminated by the processes overseen by the Trustees. While each of the Board's committees has responsibility for overseeing different aspects of the fund's activities, oversight is exercised primarily through the Operations, Audit, and Compliance Committees. In addition, the Independent Trustees have worked with FMR to enhance the Board's oversight of investment and financial risks, legal and regulatory risks, technology risks, and operational risks, including the development of additional risk reporting to the Board. For example, a working group comprised of Independent Trustees and FMR has worked and continues to work to review the Fidelity funds' valuation-related activities, reporting and risk management. Appropriate personnel, including but not limited to the fund's Chief Compliance Officer (CCO), FMR's internal auditor, the independent accountants, the fund's Treasurer and portfolio management personnel, make periodic reports to the Board's committees, as appropriate, including an annual review of FMR's risk management program for the Fidelity funds. The responsibilities of each standing committee, including their oversight responsibilities, are described further under "Standing Committees of the Fund's Trustees."
Annual Report
The fund's Statement of Additional Information (SAI) includes more information about the Trustees. To request a free copy, call Fidelity at 1-877-208-0098.
Interested Trustees*:
Correspondence intended for each Trustee who is an interested person may be sent to Fidelity Investments, 245 Summer Street, Boston, Massachusetts 02210.
|
Name, Year of Birth; Principal Occupations and Other Relevant Experience+ |
|
|
James C. Curvey (1935) |
|
|
Year of Election or Appointment: 2007 Trustee Chairman of the Board of Trustees |
|
|
|
Mr. Curvey also serves as Trustee of other Fidelity funds. Mr. Curvey is a Director of Fidelity Investments Money Management, Inc. (2009-present), Director of Fidelity Research & Analysis Co. (2009-present) and Director of FMR and FMR Co., Inc. (2007-present). Mr. Curvey is also Vice Chairman (2007-present) and Director of FMR LLC. In addition, Mr. Curvey serves as an Overseer for the Boston Symphony Orchestra and a member of the Trustees of Villanova University. Previously, Mr. Curvey was the Vice Chairman (2006-2007) and Director (2000-2007) of FMR Corp. |
|
Ronald P. O'Hanley (1957) |
|
|
Year of Election or Appointment: 2011 Trustee |
|
|
|
Mr. O'Hanley also serves as Trustee of other Fidelity funds. He is Director of Fidelity SelectCo, LLC (2013-present), FMR Co., Inc. (2010-present), Director of Fidelity Investments Money Management, Inc. (2010-present), Director of Fidelity Research & Analysis Company (2010-present), President of Fidelity Asset Management and Corporate Services and a Member of Fidelity's Executive Committee (2010-present). Previously, Mr. O'Hanley served as President and Chief Executive Officer of BNY Mellon Asset Management (2007-2010). Mr. O'Hanley also served as Vice Chairman of Bank New York Mellon Corp. and a member of that firm's Executive Committee. Prior to the 2007 merger of The Bank of New York and Mellon Financial Corporation, he was Vice Chairman of Mellon Financial Corporation and President and Chief Executive Officer of Mellon Asset Management. He joined Mellon in February 1997. Mr. O'Hanley currently serves as Chairman of the Boston Public Library Foundation Board of Directors and sits on the Board of Directors of Beth Israel Deaconess Medical Center, the Board of Trustees of the Marine Biological Laboratory and the Advisory Board of the Maxwell School of Citizenship and Public Administration at Syracuse University. Mr. O'Hanley also chairs the Council on Asset Management for the Financial Services Roundtable and is a member of the Board of Directors of Institutional Investor's U.S. Institute. |
* Trustees have been determined to be "Interested Trustees" by virtue of, among other things, their affiliation with the trust or various entities under common control with FMR.
+ The information above includes each Trustee's principal occupation during the last five years and other information relating to the experience, attributes, and skills relevant to each Trustee's qualifications to serve as a Trustee, which led to the conclusion that each Trustee should serve as a Trustee for the fund.
Annual Report
Independent Trustees:
Correspondence intended for each Independent Trustee (that is, the Trustees other than the Interested Trustees) may be sent to Fidelity Investments, P.O. Box 55235, Boston, Massachusetts 02205-5235.
|
Name, Year of Birth; Principal Occupations and Other Relevant Experience+ |
|
|
Dennis J. Dirks (1948) |
|
|
Year of Election or Appointment: 2005 Trustee |
|
|
|
Mr. Dirks also serves as Trustee of other Fidelity funds. Prior to his retirement in May 2003, Mr. Dirks was Chief Operating Officer and a member of the Board of The Depository Trust & Clearing Corporation (DTCC). He also served as President, Chief Operating Officer, and Board member of The Depository Trust Company (DTC) and President and Board member of the National Securities Clearing Corporation (NSCC). In addition, Mr. Dirks served as Chief Executive Officer and Board member of the Government Securities Clearing Corporation, Chief Executive Officer and Board member of the Mortgage-Backed Securities Clearing Corporation, as a Trustee and a member of the Finance Committee of Manhattan College (2005-2008), and as a Trustee and a member of the Finance Committee of AHRC of Nassau County (2006-2008). Mr. Dirks is a member of the Independent Directors Council (IDC) Governing Council (2010-present) and Board of Directors for The Brookville Center for Children's Services, Inc. (2009-present). |
|
Alan J. Lacy (1953) |
|
|
Year of Election or Appointment: 2008 Trustee |
|
|
|
Mr. Lacy also serves as Trustee of other Fidelity funds. Mr. Lacy serves as Senior Adviser (2007-present) of Oak Hill Capital Partners, L.P. (private equity). Mr. Lacy also served as Chief Executive Officer (2000-2005) and Vice Chairman (2005-2006) of Sears Holdings Corporation and Sears, Roebuck and Co. (retail). In addition, Mr. Lacy serves as a member of the Board of Directors of Dave & Buster's Entertainment, Inc. (restaurant and entertainment complexes, 2010-present), Earth Fare, Inc. (retail grocery, 2012-present), The Hillman Companies, Inc. (hardware wholesalers, 2010-present), and Bristol-Myers Squibb Company (global pharmaceuticals, 2008-present). Mr. Lacy is a member of the Board of Trustees of The National Parks Conservation Association (2006-present). Previously, Mr. Lacy served as Chairman of the Board of Trustees of the National Parks Conservation Association (2008-2011) and as a member of the Board of Directors for the Western Union Company (global money transfer, 2006-2011). |
|
Ned C. Lautenbach (1944) |
|
|
Year of Election or Appointment: 2000 Trustee Chairman of the Independent Trustees |
|
|
|
Mr. Lautenbach also serves as Trustee of other Fidelity funds. Mr. Lautenbach currently serves as the Lead Director of the Eaton Corporation Board of Directors (diversified industrial, 1997-present). Mr. Lautenbach is Chairman of the Board of Directors of the Philharmonic Center for the Arts in Naples, Florida (2012-present) and a member of the Council on Foreign Relations (1994-present). Previously, Mr. Lautenbach was a Partner/Advisory Partner at Clayton, Dubilier & Rice, LLC (private equity investment, 1998-2010), as well as a Director of Sony Corporation (2006-2007). |
|
Joseph Mauriello (1944) |
|
|
Year of Election or Appointment: 2008 Trustee |
|
|
|
Mr. Mauriello also serves as Trustee of other Fidelity funds. Prior to his retirement in January 2006, Mr. Mauriello served in numerous senior management positions including Deputy Chairman and Chief Operating Officer (2004-2005), and Vice Chairman of Financial Services (2002-2004) of KPMG LLP US (professional services, 1965-2005). Mr. Mauriello currently serves as a member of the Board of Directors of XL Group plc. (global insurance and re-insurance, 2006-present). Previously, Mr. Mauriello served as a Director of the Hamilton Funds of the Bank of New York (2006-2007) and of Arcadia Resources Inc. (health care services and products, 2007-2012). |
|
Robert W. Selander (1950) |
|
|
Year of Election or Appointment: 2011 Trustee |
|
|
|
Mr. Selander also serves as Trustee of other Fidelity funds. Previously, Mr. Selander served as a Member of the Advisory Board of other Fidelity funds (2011), and Executive Vice Chairman (2010), Chief Executive Officer (2009-2010), and President and Chief Executive Officer (1997-2009) of Mastercard, Inc. |
|
Cornelia M. Small (1944) |
|
|
Year of Election or Appointment: 2005 Trustee |
|
|
|
Ms. Small also serves as Trustee of other Fidelity funds. Ms. Small is a member of the Board of Directors (2009-present) and Chair of the Investment Committee (2010-present) of the Teagle Foundation. Ms. Small also serves on the Investment Committee of the Berkshire Taconic Community Foundation (2008-present). Previously, Ms. Small served as Chairperson (2002-2008) and a member of the Investment Committee and Chairperson (2008-2012) and a member of the Board of Trustees of Smith College. In addition, Ms. Small served as Chief Investment Officer, Director of Global Equity Investments, and a member of the Board of Directors of Scudder, Stevens & Clark and Scudder Kemper Investments. |
|
William S. Stavropoulos (1939) |
|
|
Year of Election or Appointment: 2002 Trustee Vice Chairman of the Independent Trustees |
|
|
|
Mr. Stavropoulos also serves as Trustee of other Fidelity funds. Mr. Stavropoulos serves as President and Founder of the Michigan Baseball Foundation, the Great Lakes Loons (2007-present). Mr. Stavropoulos is Chairman Emeritus of the Board of Directors of The Dow Chemical Company, where he previously served in numerous senior management positions, including President, CEO (1995-2000; 2002-2004), Chairman of the Executive Committee (2000-2006), and as a member of the Board of Directors (1990-2006). Currently, Mr. Stavropoulos is Chairman of the Board of Directors of Univar Inc. (global distributor of commodity and specialty chemicals), a Director of Teradata Corporation (data warehousing and technology solutions), and Maersk Inc. (industrial conglomerate), and a member of the Advisory Board for Metalmark Capital LLC (private equity investment, 2005-present). Mr. Stavropoulos is an operating advisor to Clayton, Dubilier & Rice, LLC (private equity investment). In addition, Mr. Stavropoulos is a member of the University of Notre Dame Advisory Council for the College of Science, a Trustee of the Rollin L. Gerstacker Foundation, and a Director of the Naples Philharmonic Center for the Arts. Previously, Mr. Stavropoulos served as a Director of Chemical Financial Corporation (bank holding company, 1993-2012) and Tyco International, Ltd. (multinational manufacturing and services, 2007-2012). |
|
David M. Thomas (1949) |
|
|
Year of Election or Appointment: 2008 Trustee |
|
|
|
Mr. Thomas also serves as Trustee of other Fidelity funds. Mr. Thomas serves as Non-Executive Chairman of the Board of Directors of Fortune Brands Home and Security (home and security products, 2011-present), and as a member of the Board of Directors of Interpublic Group of Companies, Inc. (marketing communication, 2004-present). Previously, Mr. Thomas served as Executive Chairman (2005-2006) and Chairman and Chief Executive Officer (2000-2005) of IMS Health, Inc. (pharmaceutical and healthcare information solutions), and a Director of Fortune Brands, Inc. (consumer products, 2000-2011). |
+ The information above includes each Trustee's principal occupation during the last five years and other information relating to the experience, attributes, and skills relevant to each Trustee's qualifications to serve as a Trustee, which led to the conclusion that each Trustee should serve as a Trustee for the fund.
Advisory Board Member and Officers:
Correspondence intended for each officer and Peter S. Lynch may be sent to Fidelity Investments, 245 Summer Street, Boston, Massachusetts 02210. Officers appear below in alphabetical order.
|
Name, Year of Birth; Principal Occupation |
|
|
Peter S. Lynch (1944) |
|
|
Year of Election or Appointment: 2003 Member of the Advisory Board |
|
|
|
Mr. Lynch also serves as Member of the Advisory Board of other Fidelity funds. Mr. Lynch is Vice Chairman and a Director of FMR and FMR Co., Inc. In addition, Mr. Lynch serves as a Trustee of Boston College and as the Chairman of the Inner-City Scholarship Fund. Previously, Mr. Lynch served on the Special Olympics International Board of Directors (1997-2006). |
|
Elizabeth Paige Baumann (1968) |
|
|
Year of Election or Appointment: 2012 Anti-Money Laundering (AML) Officer |
|
|
|
Ms. Baumann also serves as AML Officer of other funds. She is Chief AML Officer of FMR LLC (2012-present) and is an employee of Fidelity Investments. Previously, Ms. Baumann served as Vice President and Deputy Anti-Money Laundering Officer (2007-2012). |
|
William C. Coffey (1969) |
|
|
Year of Election or Appointment: 2009 Assistant Secretary |
|
|
|
Mr. Coffey also serves as Assistant Secretary of other funds. He is Senior Vice President and Deputy General Counsel of FMR LLC (2010-present), and is an employee of Fidelity Investments. Previously, Mr. Coffey served as Vice President and Associate General Counsel of FMR LLC (2005-2009). |
|
Jonathan Davis (1968) |
|
|
Year of Election or Appointment: 2010 Assistant Treasurer |
|
|
|
Mr. Davis also serves as Assistant Treasurer of other funds. Mr. Davis is an employee of Fidelity Investments. Previously, Mr. Davis served as Vice President and Associate General Counsel of FMR LLC (2003-2010). |
|
Adrien E. Deberghes (1967) |
|
|
Year of Election or Appointment: 2008 Deputy Treasurer |
|
|
|
Mr. Deberghes also serves as an officer of other funds. He is an employee of Fidelity Investments (2008-present). Prior to joining Fidelity Investments, Mr. Deberghes was Senior Vice President of Mutual Fund Administration at State Street Corporation (2007-2008), Senior Director of Mutual Fund Administration at Investors Bank & Trust (2005-2007), and Director of Finance for Dunkin' Brands (2000-2005). |
|
Stephanie J. Dorsey (1969) |
|
|
Year of Election or Appointment: 2010 Assistant Treasurer |
|
|
|
Ms. Dorsey also serves as an officer of other funds. She is an employee of Fidelity Investments (2008-present) and has served in other fund officer roles. Prior to joining Fidelity Investments, Ms. Dorsey served as Treasurer (2004-2008) of the JPMorgan Mutual Funds and Vice President (2004-2008) of JPMorgan Chase Bank. |
|
Scott C. Goebel (1968) |
|
|
Year of Election or Appointment: 2008 Secretary and Chief Legal Officer (CLO) |
|
|
|
Mr. Goebel serves as Secretary and CLO of other funds. Mr. Goebel also serves as Secretary of Fidelity Investments Money Management, Inc. (FIMM) (2010-present) and Fidelity Research and Analysis Company (FRAC) (2010-present); General Counsel, Secretary, and Senior Vice President of FMR (2008-present) and FMR Co., Inc. (2008-present); Chief Legal Officer of Fidelity Management & Research (Hong Kong) Limited (2008-present) and Assistant Secretary of Fidelity Management & Research (Japan) Inc. (2008-present), and Fidelity Management & Research (U.K.) Inc. (2008-present). Previously, Mr. Goebel served as Secretary and CLO of other Fidelity funds (2008-2013), Assistant Secretary of FIMM (2008-2010), FRAC (2008-2010), and certain funds (2007-2008); and as Vice President and Secretary of Fidelity Distributors Corporation (FDC) (2005-2007). Mr. Goebel has been employed by FMR LLC or an affiliate since 2001. |
|
Joseph A. Hanlon (1968) |
|
|
Year of Election or Appointment: 2012 Chief Compliance Officer |
|
|
|
Mr. Hanlon also serves as Chief Compliance Officer of other funds. Mr. Hanlon serves as Compliance Officer of FMR, FMR Co., Inc., Fidelity Investments Money Management, Inc. (FIMM), Fidelity Research and Analysis Company (FRAC), and Fidelity Management & Research (Hong Kong) (2009-present), as Senior Vice President of the Fidelity Asset Management Division (2009-present), and is an employee of Fidelity Investments. Previously, Mr. Hanlon served as Compliance Officer of Fidelity Management & Research (Japan) Inc. (2009-2013), Strategic Advisers, Inc. (2009-2013), and Fidelity Management & Research (U.K.) Inc. (2009-2013). |
|
Thomas C. Hense (1964) |
|
|
Year of Election or Appointment: 2008/2010 Vice President |
|
|
|
Mr. Hense also serves as Vice President of other funds (High Income (2008), Small Cap (2008), and Value (2010) funds). Previously, Mr. Hense served as a portfolio manager for Fidelity's Institutional Money Management Group (Pyramis) (2003-2008). |
|
Brian B. Hogan (1964) |
|
|
Year of Election or Appointment: 2009 Vice President |
|
|
|
Mr. Hogan also serves as Vice President of other funds. Mr. Hogan serves as President of FMR's Equity Division (2009-present). Previously, Mr. Hogan served as Senior Vice President, Equity Research of FMR (2006-2009) and as a portfolio manager. |
|
Chris Maher (1972) |
|
|
Year of Election or Appointment: 2013 Assistant Treasurer |
|
|
|
Mr. Maher serves as Assistant Treasurer of other funds. Mr. Maher is Vice President of Valuation Oversight and is an employee of Fidelity Investments. Previously, Mr. Maher served as Vice President of Asset Management Compliance (2013), Vice President of FMR's Program Management Group (2010-2013), and Vice President of Valuation Oversight (2008-2010). |
|
Christine Reynolds (1958) |
|
|
Year of Election or Appointment: 2008 Chief Financial Officer |
|
|
|
Ms. Reynolds also serves as Chief Financial Officer of other funds. Ms. Reynolds became President of Fidelity Pricing and Cash Management Services (FPCMS) in August 2008. Ms. Reynolds served as Chief Operating Officer of FPCMS (2007-2008). Previously, Ms. Reynolds served as President, Treasurer, and Anti-Money Laundering officer of the Fidelity funds (2004-2007). |
|
Kenneth B. Robins (1969) |
|
|
Year of Election or Appointment: 2008 President and Treasurer |
|
|
|
Mr. Robins also serves as an officer of other funds. Mr. Robins serves as Executive Vice President of Fidelity Investments Money Management, Inc. (FIMM) (2013-present) and is an employee of Fidelity Investments (2004-present). Previously, Mr. Robins served in other fund officer roles. |
|
Gary W. Ryan (1958) |
|
|
Year of Election or Appointment: 2005 Assistant Treasurer |
|
|
|
Mr. Ryan also serves as Assistant Treasurer of other funds. Mr. Ryan is an employee of Fidelity Investments and has served in other fund officer roles. Previously, Mr. Ryan served as Vice President of Fund Reporting in Fidelity Pricing and Cash Management Services (FPCMS) (1999-2005). |
|
Stephen Sadoski (1971) |
|
|
Year of Election or Appointment: 2012 Deputy Treasurer |
|
|
|
Mr. Sadoski also serves as Deputy Treasurer of other funds. He is an employee of Fidelity Investments (2012-present) and has served in another fund officer role. Prior to joining Fidelity Investments, Mr. Sadoski served as an assistant chief accountant in the Division of Investment Management of the Securities and Exchange Commission (SEC) (2009-2012) and as a senior manager at Deloitte & Touche LLP (1997-2009). |
|
Stacie M. Smith (1974) |
|
|
Year of Election or Appointment: 2013 Deputy Treasurer |
|
|
|
Ms. Smith also serves as an officer of other funds. She is an employee of Fidelity Investments (2009-present) and has served in other fund officer roles. Prior to joining Fidelity Investments, Ms. Smith served as Senior Audit Manager of Ernst & Young LLP (1996-2009). |
|
Renee Stagnone (1975) |
|
|
Year of Election or Appointment: 2013 Deputy Treasurer |
|
|
|
Ms. Stagnone also serves as Deputy Treasurer of other funds. Ms. Stagnone is an employee of Fidelity Investments. |
|
Joseph F. Zambello (1957) |
|
|
Year of Election or Appointment: 2011 Deputy Treasurer |
|
|
|
Mr. Zambello also serves as Deputy Treasurer of other funds. Mr. Zambello is an employee of Fidelity Investments. Previously, Mr. Zambello served as Vice President of FMR's Program Management Group (2009-2011) and Vice President of the Transfer Agent Oversight Group (2005-2009). |
Annual Report
Distributions (Unaudited)
Class A and Class T designates 100% of the dividends distributed during the fiscal year as qualifying for the dividends-received deduction for corporate shareholders.
Class A and Class T designates 100% of the dividend distributed during the fiscal year as amounts which may be taken into account as a dividend for purposes of the maximum rate under section 1(h)(11) of the Internal Revenue Code.
The fund will notify shareholders in January 2014 of amounts for use in preparing 2013 income tax returns.
Annual Report
Board Approval of Investment Advisory Contracts and Management Fees
Fidelity Advisor Value Strategies Fund
Each year, the Board of Trustees, including the Independent Trustees (together, the Board), votes on the renewal of the management contract and sub-advisory agreements (together, the Advisory Contracts) for the fund. The Board, assisted by the advice of fund counsel and Independent Trustees' counsel, requests and considers a broad range of information relevant to the renewal of the Advisory Contracts throughout the year.
The Board meets regularly and, at each of its meetings, covers an extensive agenda of topics and materials and considers factors that are relevant to its annual consideration of the renewal of the fund's Advisory Contracts, including the services and support provided to the fund and its shareholders. The Board has established various standing committees, each composed of and chaired by Independent Trustees with varying backgrounds, to which the Board has assigned specific subject matter responsibilities in order to enhance effective decision-making by the Board. The Board, acting directly and through its Committees, requests and receives information concerning the annual consideration of the renewal of the fund's Advisory Contracts. The Board also meets as needed to consider matters specifically related to the Board's annual consideration of the renewal of Advisory Contracts. Members of the Board may also meet with trustees of other Fidelity funds through ad hoc joint committees to discuss certain matters relevant to the Fidelity funds.
At its July 2013 meeting, the Board, including the Independent Trustees, unanimously determined to renew the fund's Advisory Contracts. In reaching its determination, the Board considered all factors it believed relevant, including (i) the nature, extent, and quality of the services to be provided to the fund and its shareholders (including the investment performance of the fund); (ii) the competitiveness of the fund's management fee and total expense ratio relative to peer funds; (iii) the total costs of the services to be provided by and the profits to be realized by Fidelity from its relationship with the fund; (iv) the extent to which economies of scale exist and would be realized as the fund grows; and (v) whether fee levels reflect these economies of scale, if any, for the benefit of fund shareholders.
In considering whether to renew the Advisory Contracts for the fund, the Board reached a determination, with the assistance of fund counsel and Independent Trustees' counsel and through the exercise of its business judgment, that the renewal of the Advisory Contracts was in the best interests of the fund and its shareholders and that the compensation payable under the Advisory Contracts was fair and reasonable. The Board's decision to renew the Advisory Contracts was not based on any single factor, but rather was based on a comprehensive consideration of all the information provided to the Board at its meetings throughout the year. The Board, in reaching its determination to renew the Advisory Contracts, was aware that shareholders in the fund have a broad range of investment choices available to them, including a wide choice among mutual funds offered by Fidelity's competitors, and that the fund's shareholders, who have the opportunity to review and weigh the disclosure provided by the fund in its prospectus and other public disclosures, have chosen to invest in this fund, which is a part of the Fidelity family of funds.
Annual Report
Nature, Extent, and Quality of Services Provided. The Board considered the staffing within the investment adviser, Fidelity Management & Research Company (FMR), and the sub-advisers (together, the Investment Advisers) as it relates to the fund, including the backgrounds of the fund's investment personnel, and also considered the fund's investment objective, strategies, and related investment philosophy. The Independent Trustees also had discussions with senior management of Fidelity's investment operations and investment groups. The Board considered the structure of the portfolio manager compensation program and whether this structure provides appropriate incentives to act in the best interests of the fund.
Resources Dedicated to Investment Management and Support Services. The Board and the Fund Oversight and Research Committees reviewed the general qualifications and capabilities of the Investment Advisers' investment staff, including its size, education, experience, and resources, as well as the Investment Advisers' approach to recruiting, training, managing, and compensating investment personnel. The Board noted that FMR has continued to increase the resources devoted to non-U.S. offices, including expansion of Fidelity's global investment organization. The Board also noted that Fidelity's analysts have extensive resources, tools and capabilities that allow them to conduct sophisticated quantitative and fundamental analysis, as well as credit analysis of issuers, counterparties and guarantors. Further, the Board believes that Fidelity's investment professionals have sufficient access to global information and data so as to provide competitive investment results over time, and that those professionals also have access to sophisticated tools that permit them to assess portfolio construction and risk and performance attribution characteristics continuously, as well as to transmit new information and research conclusions rapidly around the world. Additionally, in its deliberations, the Board considered the Investment Advisers' trading and risk management capabilities and resources, which are an integral part of the investment management process.
Shareholder and Administrative Services. The Board considered (i) the nature, extent, quality, and cost of advisory, administrative, and shareholder services performed by the Investment Advisers and their affiliates under the Advisory Contracts and under separate agreements covering transfer agency, pricing and bookkeeping, and securities lending services for the fund; (ii) the nature and extent of the supervision of third party service providers, principally custodians and subcustodians; and (iii) the resources devoted to, and the record of compliance with, the fund's compliance policies and procedures. The Board also reviewed the allocation of fund brokerage, including allocations to brokers affiliated with the Investment Advisers, the use of brokerage commissions to pay fund expenses, and the use of "soft" commission dollars to pay for research services.
Annual Report
Board Approval of Investment Advisory Contracts and
Management Fees - continued
The Board noted that the growth of fund assets over time across the complex allows Fidelity to reinvest in the development of services designed to enhance the value or convenience of the Fidelity funds as investment vehicles. These services include 24-hour access to account information and market information through telephone representatives and over the Internet, investor education materials and asset allocation tools, and the expanded availability of Fidelity Investor Centers.
Investment in a Large Fund Family. The Board considered the benefits to shareholders of investing in a Fidelity fund, including the benefits of investing in a fund that is part of a large family of funds offering a variety of investment disciplines and providing a large variety of mutual fund investor services. The Board noted that Fidelity had taken, or had made recommendations that resulted in the Fidelity funds taking, a number of actions over the previous year that benefited particular funds, including (i) continuing to dedicate additional resources to investment research and to the support of the senior management team that oversees asset management; (ii) persisting in efforts to enhance Fidelity's global research capabilities; (iii) launching new funds and making other enhancements to meet client needs for global and income-oriented solutions; (iv) continuing to launch dedicated lower cost underlying funds to meet portfolio construction needs related to expanding underlying fund options for Fidelity funds of funds, specifically for the Freedom Fund product lines; (v) rationalizing product lines and gaining increased efficiencies through the mergers of several funds into other funds; (vi) strengthening Fidelity's index fund offerings by reducing investment minimums and adopting or lowering existing expense caps for certain funds and classes; (vii) enhancing Global Asset Allocation product offerings by launching new funds and strategies, including "open architecture" target date funds that utilize affiliated and unaffiliated sub-advisers; (viii) modifying the eligibility criteria for Institutional Class shares of Advisor funds to increase their marketability to a portion of the defined contribution plan market; (ix) creating a new low-cost retirement share class for certain Advisor funds to appeal to large retirement plans; (x) transitioning the management of certain Fidelity commodity funds to Geode Capital Management LLC, a registered commodity pool operator, while retaining administrative responsibilities for the funds; (xi) reorganizing a number of funds; and (xii) taking steps toward establishing a new Fidelity adviser to manage sector-based funds and products.
Investment Performance. The Board considered whether the fund has operated in accordance with its investment objective, as well as its record of compliance with its investment restrictions and its performance history.
The Board took into account discussions with the Investment Advisers about fund investment performance that occur at Board meetings throughout the year. In this regard the Board noted that as part of regularly scheduled fund reviews and other reports to the Board on fund performance, the Board periodically considers annualized return information for the fund, for different time periods, measured against a securities market index ("benchmark index") and a peer group of mutual funds with similar objectives ("peer group"). In its evaluation of fund investment performance, the Board gave particular attention to information indicating changes in performance of certain Fidelity funds for specific time periods and the Investment Advisers' explanations for any overperformance or underperformance.
Annual Report
In addition to reviewing absolute and relative fund performance, the Independent Trustees periodically consider the appropriateness of fund performance metrics in evaluating the results achieved. In general, the Independent Trustees believe that fund performance should be evaluated based on net performance (after fees and expenses) of both the highest performing and lowest performing classes, where applicable, compared to appropriate benchmark indices, over appropriate time periods which may include full market cycles, and compared to peer groups, as applicable, over the same periods, taking into account relevant factors including the following: general market conditions; issuer-specific information; tactical opportunities for investment; and fund cash flows and other factors.
The Independent Trustees recognize that shareholders evaluate performance on a net basis over their own holding periods, for which one-, three-, and five-year periods are used as a proxy. For this reason, the performance information reviewed by the Board also included net cumulative calendar year total return information for the fund and an appropriate benchmark index and peer group for the most recent one-, three-, and five-year periods, as shown below. Returns are shown compared to the 25th percentile (top of box) and 75th percentile (bottom of box) of the peer universe.
Annual Report
Board Approval of Investment Advisory Contracts and
Management Fees - continued
Fidelity Advisor Value Strategies Fund

The Board also considered that the fund's management fee is subject to upward or downward adjustment depending upon whether, and to what extent, the fund's investment performance for the performance period exceeds, or is exceeded by, a securities index, thus leading to a performance adjustment for the same period. The Board noted that the performance adjustment provides FMR with a strong economic incentive to seek to achieve superior performance for the fund's shareholders and helps to more closely align the interests of FMR and the fund's shareholders.
Based on its review, the Board concluded that the nature, extent, and quality of services provided to the fund under the Advisory Contracts should benefit the fund's shareholders.
Competitiveness of Management Fee and Total Expense Ratio. The Board considered the fund's management fee and total expense ratio compared to "mapped groups" of competitive funds and classes. Fidelity creates "mapped groups" by combining similar Lipper investment objective categories that have comparable management fee characteristics. Combining Lipper investment objective categories aids the Board's management fee and total expense ratio comparisons by broadening the competitive group used for comparison and by reducing the number of universes to which various Fidelity funds are compared.
Management Fee. The Board considered two proprietary management fee comparisons for the 12-month periods shown in the chart below. The group of Lipper funds used by the Board for management fee comparisons is referred to below as the "Total Mapped Group." The Total Mapped Group comparison focuses on a fund's standing in terms of gross management fees before expense reimbursements or caps, and without giving effect to the fund's performance adjustment, relative to the total universe of funds with comparable investment mandates, regardless of whether their management fee structures also are comparable. Funds with comparable investment mandates offer exposure to similar types of securities. Funds with comparable management fee structures have similar management fee contractual arrangements (e.g., flat rate charged for advisory services, all-inclusive fee rate, etc.). "TMG %" represents the percentage of funds in the Total Mapped Group that had management fees that were lower than the fund's. For example, a TMG % of 11% means that 89% of the funds in the Total Mapped Group had higher management fees than the fund. The "Asset-Size Peer Group" (ASPG) comparison focuses on a fund's standing relative to a subset of non-Fidelity funds within the Total Mapped Group that are similar in size and management fee structure. The ASPG represents at least 15% of the funds in the Total Mapped Group with comparable asset size and management fee structures, subject to a minimum of 50 funds (or all funds in the Total Mapped Group if fewer than 50). Additional information, such as the ASPG quartile in which the fund's management fee ranked and the impact of the fund's performance adjustment, is also included in the chart and considered by the Board.
Annual Report
Fidelity Advisor Value Strategies Fund

The Board noted that the fund's management fee ranked below the median of its Total Mapped Group and below the median of its ASPG for 2012. The Board also noted the effect of the fund's positive performance adjustment on the fund's management fee ranking.
Annual Report
Board Approval of Investment Advisory Contracts and
Management Fees - continued
Based on its review, the Board concluded that the fund's management fee is fair and reasonable in light of the services that the fund receives and the other factors considered.
Total Expense Ratio. In its review of each class's total expense ratio, the Board considered the fund's management fee as well as other fund or class expenses, as applicable, such as transfer agent fees, pricing and bookkeeping fees, fund-paid 12b-1 fees, and custodial, legal, and audit fees. The Board also noted the effects of any waivers and reimbursements on fees and expenses, as well as the impact of the fund's performance adjustment. As part of its review, the Board also considered the current and historical total expense ratios of each class of the fund compared to competitive fund median expenses. Each class of the fund is compared to those funds and classes in the Total Mapped Group (used by the Board for management fee comparisons) that have a similar sales load structure.
The Board noted that the total expense ratio of each of Class A, Class B, Class C, Institutional Class, the retail class, and Class K ranked below its competitive median for 2012 and the total expense ratio of Class T ranked above its competitive median for 2012. The Board considered that, in general, various factors can affect total expense ratios. The Board noted that the total expense ratio of Class T was above the competitive median primarily because of higher 12b-1 fees on Class T. Class T has a higher 12b-1 fee, but a lower front-end sales charge, than traditionally priced front-end sales charge classes. The Board considered that Class T is primarily sold load-waived in the retirement plan market where its 0.50% 12b-1 fee is comparable to competing no-load, higher 12b-1 fee classes designed specifically for retirement plans. The Board noted that the fund offers multiple classes, each of which has a different sales load and 12b-1 fee structure, and that the multiple structures are intended to offer a range of pricing options for the intermediary market. The Board also noted that the total expense ratios of the classes vary primarily by the level of their 12b-1 fees, although differences in transfer agent fees may also cause expenses to vary from class to class.
Fees Charged to Other Fidelity Clients. The Board also considered Fidelity fee structures and other information with respect to clients of FMR and its affiliates, such as other mutual funds advised or subadvised by FMR or its affiliates, pension plan clients, and other institutional clients. The Board noted the findings of the 2013 ad hoc joint committee (created with the board of other Fidelity funds), which reviewed and compared Fidelity's institutional investment advisory business with its business of providing services to the Fidelity funds, including the differences in services provided, fees charged, and costs incurred, as well as competition in their respective marketplaces.
Based on its review of total expense ratios and fees charged to other Fidelity clients, the Board concluded that the total expense ratio of each class of the fund was reasonable, although Class T was above the median of the universe presented for comparison, in light of the services that the fund and its shareholders receive and the other factors considered.
Annual Report
Costs of the Services and Profitability. The Board considered the revenues earned and the expenses incurred by Fidelity in conducting the business of developing, marketing, distributing, managing, administering and servicing the fund and servicing the fund's shareholders. The Board also considered the level of Fidelity's profits in respect of all the Fidelity funds.
On an annual basis, FMR presents to the Board Fidelity's profitability for the fund. Fidelity calculates the profitability for each fund, as well as aggregate profitability for groups of Fidelity funds and all Fidelity funds, using a series of detailed revenue and cost allocation methodologies which originate with the books and records of Fidelity on which Fidelity's audited financial statements are based. The Audit Committee of the Board reviews any significant changes from the prior year's methodologies.
PricewaterhouseCoopers LLP (PwC), independent registered public accounting firm and auditor to Fidelity and certain Fidelity funds, has been engaged annually by the Board as part of the Board's assessment of Fidelity's profitability analysis. PwC's engagement includes the review and assessment of the methodologies used by Fidelity in determining the revenues and expenses attributable to Fidelity's mutual fund business, and completion of agreed-upon procedures surrounding the mathematical accuracy of fund profitability and its conformity to allocation methodologies. After considering PwC's reports issued under the engagement and information provided by Fidelity, the Board concluded that while other allocation methods may also be reasonable, Fidelity's profitability methodologies are reasonable in all material respects.
The Board also reviewed Fidelity's non-fund businesses and fall-out benefits related to the mutual fund business as well as cases where Fidelity's affiliates may benefit from or be related to the fund's business.
The Board considered the costs of the services provided by and the profits realized by Fidelity in connection with the operation of the fund and was satisfied that the profitability was not excessive in the circumstances.
Economies of Scale. The Board considered whether there have been economies of scale in respect of the management of the Fidelity funds, whether the Fidelity funds (including the fund) have appropriately benefited from any such economies of scale, and whether there is potential for realization of any further economies of scale. The Board considered the extent to which the fund will benefit from economies of scale through increased services to the fund, through waivers or reimbursements, or through fee or expense reductions. The Board also noted that in 2009, it and the board of other Fidelity funds created an ad hoc committee (the Economies of Scale Committee) to analyze whether FMR attains economies of scale in respect of the management and servicing of the Fidelity funds, whether the Fidelity funds have appropriately benefited from such economies of scale, and whether there is potential for realization of any further economies of scale.
Annual Report
Board Approval of Investment Advisory Contracts and
Management Fees - continued
The Board recognized that the fund's management contract incorporates a "group fee" structure, which provides for lower group fee rates as total fund assets under FMR's management increase, and for higher group fee rates as total fund assets under FMR's management decrease. FMR calculates the group fee rates based on a tiered asset "breakpoint" schedule that varies based on asset class. The Board considered that the group fee is designed to deliver the benefits of economies of scale to fund shareholders when total Fidelity fund assets increase, even if assets of any particular fund are unchanged or have declined, because some portion of Fidelity's costs are attributable to services provided to all Fidelity funds, and all funds benefit if those costs can be allocated among more assets. The Board concluded that, given the group fee structure, fund shareholders will benefit from lower management fees as assets under FMR's management increase at the fund complex level, regardless of whether Fidelity achieves any such economies of scale.
The Board concluded, taking into account the analysis of the Economies of Scale Committee, that economies of scale, if any, are being appropriately shared between fund shareholders and Fidelity.
Amendment to Description of Group Fee Rate. At its July 2013 meeting, the Board voted to approve an amendment to the fund's management contract to modify the description of the "group fee rate" effective August 1, 2013. The Board noted that under the prior description in the contract, the group fee rate was based on the average net assets of all registered investment companies with which FMR has management contracts. Under the contract's tiered asset breakpoint schedule, the group fee rate is lower as total fund assets under FMR's management increase, and higher as total fund assets under FMR's management decrease. The Board considered that the prior description would have excluded the assets of 64 Fidelity sector funds from the group fee rate calculation once Fidelity SelectCo, LLC, an affiliate of FMR, assumed management responsibilities for those funds. The Board noted that modifying the description of the group fee rate to continue to include the assets of those 64 funds for purposes of determining group fee rate breakpoints would avoid an immediate adverse impact on the group fee rate for any fund.
Additional Information Requested by the Board. In order to develop fully the factual basis for consideration of the Fidelity funds' Advisory Contracts, the Board requested and received additional information on certain topics, including: (i) fund performance trends and Fidelity's long-term strategies for certain funds; (ii) the potential to further rationalize the Fidelity fund lineup with the possibility of achieving savings for the funds and Fidelity; (iii) the methodology with respect to competitive fund data and peer group classifications; (iv) the arrangements with, and performance of, certain sub-advisers on behalf of the Fidelity funds, as well as certain proposed participating affiliate arrangements; (v) the realization of fall-out benefits in certain Fidelity business units; (vi) Fidelity's group fee structures, including the rationale for the individual fee rates of certain categories of funds and the definition of group assets; (vii) trends regarding industry use of performance fee structures and the performance adjustment methodologies applicable to the Fidelity funds; (viii) additional competitive analysis regarding the total expenses for certain classes; and (ix) fund profitability methodology, including Fidelity's cost allocation methodology, and the impact of certain factors on fund profitability results.
Annual Report
Based on its evaluation of all of the conclusions noted above, and after considering all factors it believed relevant, the Board ultimately concluded that the advisory fee structures are fair and reasonable, and that the fund's Advisory Contracts should be renewed.
Annual Report
Investment Adviser
Fidelity Management & Research Company
Boston, MA
Investment Sub-Advisers
FMR Co., Inc.
Fidelity Management & Research (U.K.) Inc.
Fidelity Management & Research
(Japan) Inc.
Fidelity Management & Research
(Hong Kong) Limited
General Distributor
Fidelity Distributors Corporation
Smithfield, RI
Transfer and Service Agents
Fidelity Investments Institutional Operations Company, Inc.
Boston, MA
Fidelity Service Company, Inc.
Boston, MA
Custodian
Brown Brothers Harriman & Co.
Boston, MA
(Fidelity Investment logo)(registered trademark)
SO-UANN-0114 1.786701.110
(Fidelity Investment logo)(registered trademark)
Fidelity Advisor®
Value Strategies
Fund - Institutional Class
Annual Report
November 30, 2013
(Fidelity Cover Art)
Contents
|
Performance |
How the fund has done over time. |
|
|
Management's Discussion of Fund Performance |
The Portfolio Manager's review of fund performance and strategy. |
|
|
Shareholder Expense Example |
An example of shareholder expenses. |
|
|
Investment Changes |
A summary of major shifts in the fund's investments over the past six months. |
|
|
Investments |
A complete list of the fund's investments with their market values. |
|
|
Financial Statements |
Statements of assets and liabilities, operations, and changes in net assets, as well as financial highlights. |
|
|
Notes |
Notes to the financial statements. |
|
|
Report of Independent Registered Public Accounting Firm |
|
|
|
Trustees and Officers |
|
|
|
Distributions |
|
|
|
Board Approval of Investment Advisory Contracts and Management Fees |
|
To view a fund's proxy voting guidelines and proxy voting record for the 12-month period ended June 30, visit http://www.fidelity.com/proxyvotingresults or visit the Securities and Exchange Commission's (SEC) web site at http://www.sec.gov. You may also call 1-877-208-0098 to request a free copy of the proxy voting guidelines.
Standard & Poor's, S&P and S&P 500 are registered service marks of The McGraw-Hill Companies, Inc. and have been licensed for use by Fidelity Distributors Corporation.
Other third-party marks appearing herein are the property of their respective owners.
All other marks appearing herein are registered or unregistered trademarks or service marks of FMR LLC or an affiliated company. © 2014 FMR LLC. All rights reserved.
Annual Report
This report and the financial statements contained herein are submitted for the general information of the shareholders of the fund. This report is not authorized for distribution to prospective investors in the fund unless preceded or accompanied by an effective prospectus.
A fund files its complete schedule of portfolio holdings with the SEC for the first and third quarters of each fiscal year on Form N-Q. Forms N-Q are available on the SEC's web site at http://www.sec.gov. A fund's Forms N-Q may be reviewed and copied at the SEC's Public Reference Room in Washington, DC. Information regarding the operation of the SEC's Public Reference Room may be obtained by calling 1-800-SEC-0330. For a complete list of a fund's portfolio holdings, view the most recent holdings listing, semiannual report, or annual report on Fidelity's web site at http://www.fidelity.com, http://www.advisor.fidelity.com, or http://www.401k.com, as applicable.
NOT FDIC INSURED • MAY LOSE VALUE • NO BANK GUARANTEE
Neither the fund nor Fidelity Distributors Corporation is a bank.
Annual Report
Performance: The Bottom Line
Average annual total return reflects the change in the value of an investment, assuming reinvestment of the class' distributions from dividend income and capital gains (the profits earned upon the sale of securities that have grown in value, if any) and assuming a constant rate of performance each year. The $10,000 table and the fund's returns do not reflect the deduction of taxes that a shareholder would pay on fund distributions or the redemption of fund shares. During periods of reimbursement by Fidelity, a fund's total return will be greater than it would be had the reimbursement not occurred. How a fund did yesterday is no guarantee of how it will do tomorrow.
Average Annual Total Returns
|
Periods ended November 30, 2013 |
|
Past 1 |
Past 5 |
Past 10 |
|
Institutional Class |
|
31.11% |
25.74% |
7.68% |
$10,000 Over 10 Years
Let's say hypothetically that $10,000 was invested in Fidelity Advisor® Value Strategies Fund - Institutional Class on November 30, 2003. The chart shows how the value of your investment would have changed, and also shows how the Russell Midcap® Value Index performed over the same period.
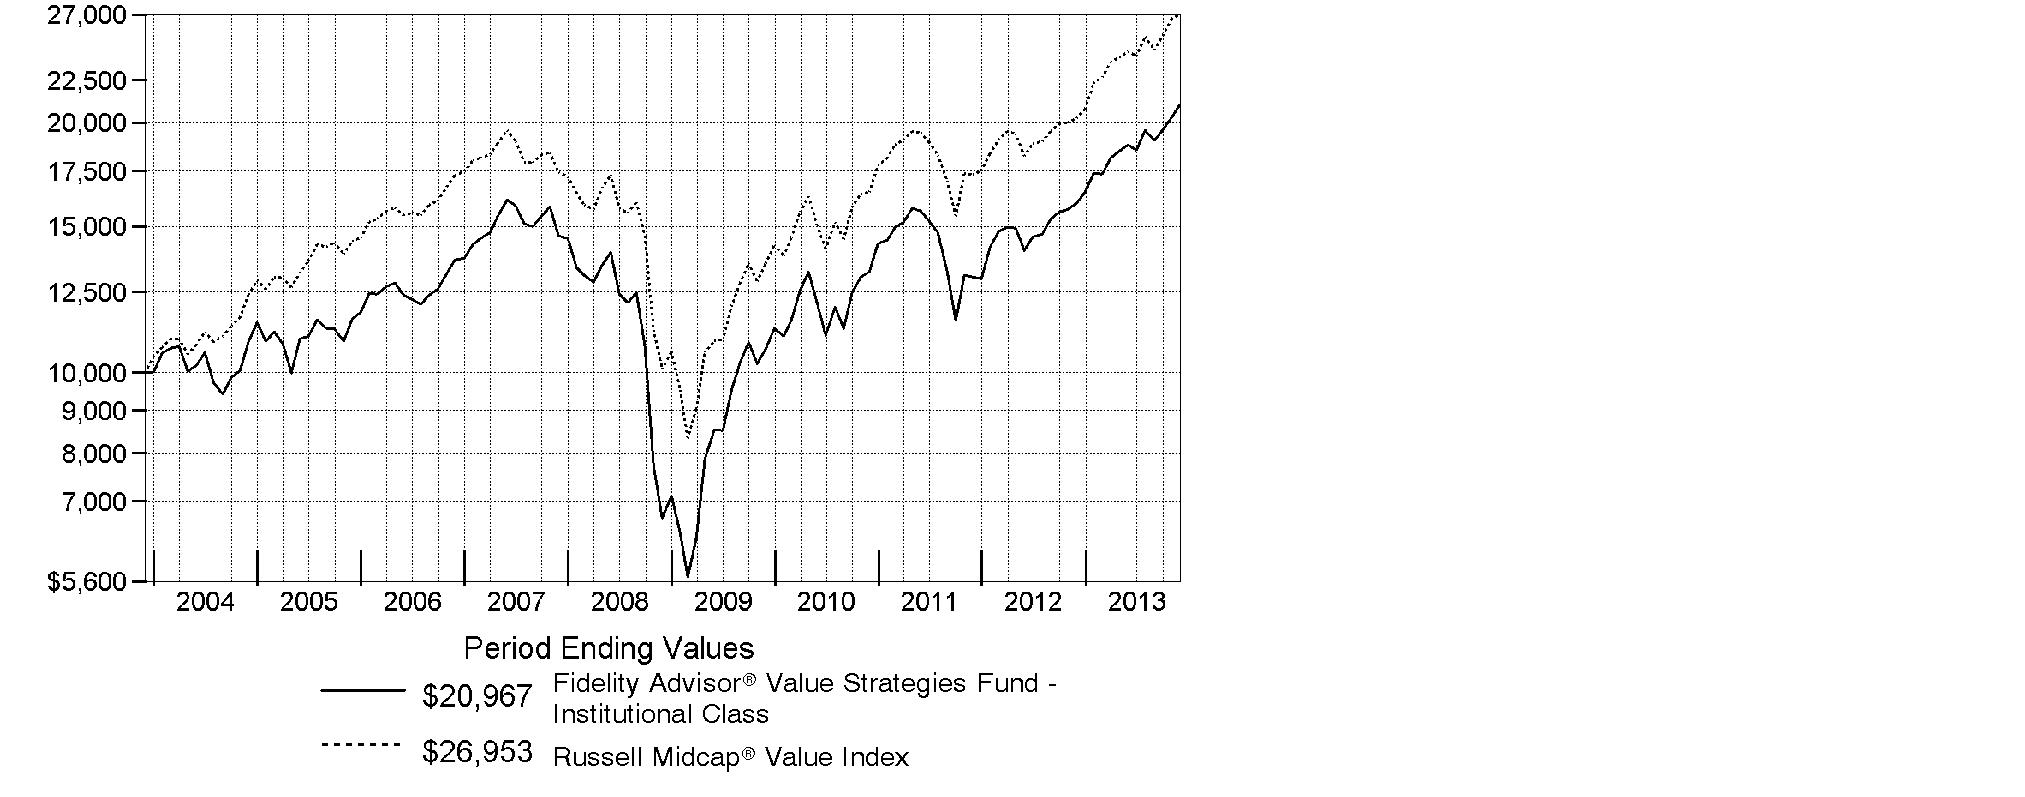
Annual Report
Management's Discussion of Fund Performance
Market Recap: With the current bull run nearing the five-year mark, equity benchmarks ripped up old records during the 12 months ending November 30, 2013. Gains were fueled by strengthening U.S. economic data, as well as generally improving economies and accommodative monetary policies worldwide. The broad S&P 500® Index reached new peaks in its 30.30% climb for the period, and the blue-chip Dow Jones Industrial AverageSM surpassed historic milestones en route to a 26.63% gain. The Nasdaq Composite Index®, up 36.73% amid a resurgence in growth-oriented stocks, closed above 4,000 for the first time since 2000. Shedding anxiety over the 2012 U.S. presidential election - and apparently confident that the federal debt-ceiling debate would be resolved - markets rose from period start through late May. News that the U.S. Federal Reserve was considering an end to its stimulative bond-buying kept stocks in flux over the summer but, by September, the Fed had set aside any imminent tapering. Despite jitters over a potential U.S. military strike in Syria and, later, an October budget impasse that briefly shuttered the federal government, volatility was subdued heading into the holidays, with investor optimism helping many markets home in on all-time highs at period end. Elsewhere, non-U.S. developed-market equities saw similar results, with the MSCI® EAFE® Index adding 24.97%.
Comments from Thomas Soviero, Portfolio Manager of Fidelity Advisor® Value Strategies Fund: For the year, the fund's Institutional Class shares returned 31.11%, underperforming the 33.33% gain of the benchmark Russell Midcap® Value Index. Versus the index, the fund was held back by an 8% average stake in cash, which was a substantial drag on performance in an up market. Security selection in the food, beverage & tobacco and software & services industries also hurt. Beverage company Cott and untimely positioning in software company Symantec were among the biggest detractors, along with positions in retailer Target and pharmaceuticals company Zogenix, the latter of which we sold. On the plus side, the fund was helped by an underweighting in financials - particularly real estate - and by security selection in the materials sector. Top individual contributors included Netherlands-based chemicals company LyondellBasell Industries and video-game retailer GameStop. Overweighting automobiles & components, including an investment in auto parts manufacturer Delphi Automotive, also was a positive. Most of the stocks I've mentioned here were not in the benchmark.
Annual Report
The views expressed above reflect those of the portfolio manager(s) only through the end of the period as stated on the cover of this report and do not necessarily represent the views of Fidelity or any other person in the Fidelity organization. Any such views are subject to change at any time based upon market or other conditions and Fidelity disclaims any responsibility to update such views. These views may not be relied on as investment advice and, because investment decisions for a Fidelity fund are based on numerous factors, may not be relied on as an indication of trading intent on behalf of any Fidelity fund.
Annual Report
Shareholder Expense Example
As a shareholder of the Fund, you incur two types of costs: (1) transaction costs, including sales charges (loads) on purchase payments or redemption proceeds, and (2) ongoing costs, including management fees, distribution and/or service (12b-1) fees and other Fund expenses. This Example is intended to help you understand your ongoing costs (in dollars) of investing in the Fund and to compare these costs with the ongoing costs of investing in other mutual funds.
The Example is based on an investment of $1,000 invested at the beginning of the period and held for the entire period (June 1, 2013 to November 30, 2013).
Actual Expenses
The first line of the accompanying table for each class of the Fund provides information about actual account values and actual expenses. You may use the information in this line, together with the amount you invested, to estimate the expenses that you paid over the period. Simply divide your account value by $1,000.00 (for example, an $8,600 account value divided by $1,000.00 = 8.6), then multiply the result by the number in the first line for a class of the Fund under the heading entitled "Expenses Paid During Period" to estimate the expenses you paid on your account during this period. A small balance maintenance fee of $12.00 that is charged once a year may apply for certain accounts with a value of less than $2,000. This fee is not included in the table below. If it was, the estimate of expenses you paid during the period would be higher, and your ending account value lower, by this amount. In addition, the Fund, as a shareholder in the underlying Fidelity Central Funds, will indirectly bear its pro-rata share of the fees and expenses incurred by the underlying Fidelity Central Funds. These fees and expenses are not included in the Fund's annualized expense ratio used to calculate the expense estimate in the table below.
Hypothetical Example for Comparison Purposes
The second line of the accompanying table for each class of the Fund provides information about hypothetical account values and hypothetical expenses based on a Class' actual expense ratio and an assumed rate of return of 5% per year before expenses, which is not the Class' actual return. The hypothetical account values and expenses may not be used to estimate the actual ending account balance or expenses you paid for the period. You may use this information to compare the ongoing costs of investing in the Fund and other funds. To do so, compare this 5% hypothetical example with the 5% hypothetical examples that appear in the shareholder reports of the other funds. A small balance maintenance fee of $12.00 that is charged once a year may apply for certain accounts with a value of less than $2,000. This fee is not included in the table below. If it was, the estimate of expenses you paid during the period would be higher, and your ending account value lower, by this amount. In addition, the Fund, as a shareholder in the underlying Fidelity Central Funds, will indirectly bear its pro-rata share of the fees and expenses incurred by the underlying Fidelity Central Funds. These fees and expenses are not included in the Fund's annualized expense ratio used to calculate the expense estimate in the table below.
Please note that the expenses shown in the table are meant to highlight your ongoing costs only and do not reflect any transaction costs. Therefore, the second line of the table is useful in comparing ongoing costs only, and will not help you determine the relative total costs of owning different funds. In addition, if these transactional costs were included, your costs would have been higher.
Annual Report
Shareholder Expense Example - continued
|
|
Annualized |
Beginning |
Ending |
Expenses Paid |
|
Class A |
1.04% |
|
|
|
|
Actual |
|
$ 1,000.00 |
$ 1,113.10 |
$ 5.51 |
|
HypotheticalA |
|
$ 1,000.00 |
$ 1,019.85 |
$ 5.27 |
|
Class T |
1.23% |
|
|
|
|
Actual |
|
$ 1,000.00 |
$ 1,112.20 |
$ 6.51 |
|
HypotheticalA |
|
$ 1,000.00 |
$ 1,018.90 |
$ 6.23 |
|
Class B |
1.84% |
|
|
|
|
Actual |
|
$ 1,000.00 |
$ 1,108.60 |
$ 9.73 |
|
HypotheticalA |
|
$ 1,000.00 |
$ 1,015.84 |
$ 9.30 |
|
Class C |
1.78% |
|
|
|
|
Actual |
|
$ 1,000.00 |
$ 1,109.10 |
$ 9.41 |
|
HypotheticalA |
|
$ 1,000.00 |
$ 1,016.14 |
$ 9.00 |
|
Fidelity Value Strategies Fund |
.73% |
|
|
|
|
Actual |
|
$ 1,000.00 |
$ 1,114.60 |
$ 3.87 |
|
HypotheticalA |
|
$ 1,000.00 |
$ 1,021.41 |
$ 3.70 |
|
Fidelity Value Strategies Fund Class K |
.58% |
|
|
|
|
Actual |
|
$ 1,000.00 |
$ 1,115.50 |
$ 3.08 |
|
HypotheticalA |
|
$ 1,000.00 |
$ 1,022.16 |
$ 2.94 |
|
Institutional Class |
.77% |
|
|
|
|
Actual |
|
$ 1,000.00 |
$ 1,114.50 |
$ 4.08 |
|
HypotheticalA |
|
$ 1,000.00 |
$ 1,021.21 |
$ 3.90 |
A 5% return per year before expenses
B Annualized expense ratio reflects expenses net of applicable fee waivers.
* Expenses are equal to each Class' annualized expense ratio, multiplied by the average account value over the period, multiplied by 183/365 (to reflect the one-half year period).
Annual Report
Investment Changes (Unaudited)
|
Top Ten Stocks as of November 30, 2013 |
||
|
|
% of fund's |
% of fund's net assets |
|
LyondellBasell Industries NV Class A |
5.8 |
6.5 |
|
Sanofi SA sponsored ADR |
3.8 |
4.0 |
|
General Motors Co. |
3.7 |
3.4 |
|
Bank of America Corp. |
3.5 |
3.1 |
|
Symantec Corp. |
3.1 |
3.3 |
|
Apple, Inc. |
3.0 |
2.5 |
|
Delphi Automotive PLC |
2.8 |
2.6 |
|
AFLAC, Inc. |
2.4 |
2.1 |
|
The Bon-Ton Stores, Inc. |
2.2 |
2.5 |
|
U.S. Bancorp |
2.2 |
2.1 |
|
|
32.5 |
|
|
Top Five Market Sectors as of November 30, 2013 |
||
|
|
% of fund's |
% of fund's net assets |
|
Consumer Discretionary |
23.9 |
23.3 |
|
Health Care |
14.3 |
13.3 |
|
Information Technology |
12.4 |
12.5 |
|
Financials |
11.4 |
10.2 |
|
Materials |
8.8 |
10.5 |
|
Asset Allocation (% of fund's net assets) |
|||||||
|
As of November 30, 2013* |
As of May 31, 2013** |
||||||
 |
Stocks 93.9% |
|
|
Stocks 93.3% |
|
||
 |
Bonds 0.4% |
|
 |
Bonds 0.0% |
|
||
 |
Short-Term |
|
|
Short-Term |
|
||
|
* Foreign investments |
17.0% |
|
** Foreign investments |
19.5% |
|
||

Annual Report
Investments November 30, 2013
Showing Percentage of Net Assets
|
Common Stocks - 93.9% |
|||
|
Shares |
Value (000s) |
||
|
CONSUMER DISCRETIONARY - 23.9% |
|||
|
Auto Components - 3.9% |
|||
|
Delphi Automotive PLC |
719,777 |
$ 42,143 |
|
|
Tenneco, Inc. (a) |
164,524 |
9,444 |
|
|
TRW Automotive Holdings Corp. (a) |
91,400 |
7,093 |
|
|
|
58,680 |
||
|
Automobiles - 4.3% |
|||
|
Bayerische Motoren Werke AG (BMW) |
36,387 |
4,181 |
|
|
General Motors Co. (a) |
1,467,636 |
56,842 |
|
|
Volkswagen AG |
18,856 |
4,910 |
|
|
|
65,933 |
||
|
Diversified Consumer Services - 0.9% |
|||
|
Service Corp. International |
729,650 |
13,185 |
|
|
Hotels, Restaurants & Leisure - 1.7% |
|||
|
Cedar Fair LP (depositary unit) |
227,420 |
11,326 |
|
|
Wyndham Worldwide Corp. |
199,867 |
14,332 |
|
|
|
25,658 |
||
|
Household Durables - 3.3% |
|||
|
Lennar Corp. Class A (d) |
424,700 |
15,187 |
|
|
PulteGroup, Inc. |
744,504 |
13,967 |
|
|
Ryland Group, Inc. |
151,400 |
5,983 |
|
|
Standard Pacific Corp. (a) |
1,866,450 |
15,268 |
|
|
|
50,405 |
||
|
Leisure Equipment & Products - 1.0% |
|||
|
Hasbro, Inc. (d) |
266,797 |
14,359 |
|
|
Media - 1.7% |
|||
|
Omnicom Group, Inc. |
120,112 |
8,582 |
|
|
Regal Entertainment Group Class A (d) |
363,100 |
7,073 |
|
|
Valassis Communications, Inc. (d) |
349,089 |
10,249 |
|
|
|
25,904 |
||
|
Multiline Retail - 3.8% |
|||
|
Target Corp. |
374,009 |
23,910 |
|
|
The Bon-Ton Stores, Inc. (d)(e) |
1,916,017 |
34,067 |
|
|
|
57,977 |
||
|
Specialty Retail - 3.3% |
|||
|
Asbury Automotive Group, Inc. (a) |
343,641 |
17,842 |
|
|
GameStop Corp. Class A |
674,513 |
32,545 |
|
|
|
50,387 |
||
|
TOTAL CONSUMER DISCRETIONARY |
362,488 |
||
|
Common Stocks - continued |
|||
|
Shares |
Value (000s) |
||
|
CONSUMER STAPLES - 5.4% |
|||
|
Beverages - 1.9% |
|||
|
Cott Corp. (d) |
3,511,564 |
$ 29,446 |
|
|
Food & Staples Retailing - 1.1% |
|||
|
CVS Caremark Corp. |
237,100 |
15,876 |
|
|
Food Products - 1.6% |
|||
|
Bunge Ltd. |
102,214 |
8,189 |
|
|
Calavo Growers, Inc. |
232,028 |
7,153 |
|
|
SunOpta, Inc. (a) |
984,885 |
9,110 |
|
|
|
24,452 |
||
|
Household Products - 0.8% |
|||
|
Procter & Gamble Co. |
142,100 |
11,968 |
|
|
TOTAL CONSUMER STAPLES |
81,742 |
||
|
ENERGY - 5.1% |
|||
|
Energy Equipment & Services - 0.7% |
|||
|
Halliburton Co. |
183,600 |
9,672 |
|
|
Oil, Gas & Consumable Fuels - 4.4% |
|||
|
Alpha Natural Resources, Inc. (a) |
1,323,859 |
8,843 |
|
|
Denbury Resources, Inc. (a) |
1,516,780 |
25,300 |
|
|
HollyFrontier Corp. |
153,000 |
7,341 |
|
|
Marathon Oil Corp. |
151,100 |
5,446 |
|
|
The Williams Companies, Inc. |
154,500 |
5,441 |
|
|
Valero Energy Corp. |
327,300 |
14,964 |
|
|
|
67,335 |
||
|
TOTAL ENERGY |
77,007 |
||
|
FINANCIALS - 11.4% |
|||
|
Commercial Banks - 4.3% |
|||
|
CIT Group, Inc. |
157,349 |
7,943 |
|
|
Regions Financial Corp. |
778,163 |
7,572 |
|
|
U.S. Bancorp |
862,484 |
33,827 |
|
|
Wells Fargo & Co. |
377,370 |
16,612 |
|
|
|
65,954 |
||
|
Diversified Financial Services - 3.5% |
|||
|
Bank of America Corp. |
3,355,213 |
53,079 |
|
|
Insurance - 3.6% |
|||
|
AFLAC, Inc. |
549,986 |
36,503 |
|
|
Common Stocks - continued |
|||
|
Shares |
Value (000s) |
||
|
FINANCIALS - continued |
|||
|
Insurance - continued |
|||
|
American International Group, Inc. |
201,698 |
$ 10,034 |
|
|
Unum Group |
235,260 |
7,898 |
|
|
|
54,435 |
||
|
TOTAL FINANCIALS |
173,468 |
||
|
HEALTH CARE - 14.3% |
|||
|
Health Care Equipment & Supplies - 4.7% |
|||
|
Alere, Inc. (a) |
172,283 |
5,637 |
|
|
Boston Scientific Corp. (a) |
1,785,400 |
20,675 |
|
|
C.R. Bard, Inc. |
75,400 |
10,472 |
|
|
St. Jude Medical, Inc. |
463,300 |
27,066 |
|
|
Zimmer Holdings, Inc. |
87,600 |
8,008 |
|
|
|
71,858 |
||
|
Health Care Providers & Services - 2.1% |
|||
|
DaVita, Inc. (a) |
158,496 |
9,438 |
|
|
Universal Health Services, Inc. Class B |
278,914 |
22,991 |
|
|
|
32,429 |
||
|
Life Sciences Tools & Services - 1.2% |
|||
|
Agilent Technologies, Inc. |
180,700 |
9,680 |
|
|
PerkinElmer, Inc. |
207,500 |
7,893 |
|
|
|
17,573 |
||
|
Pharmaceuticals - 6.3% |
|||
|
Johnson & Johnson |
187,800 |
17,777 |
|
|
Merck & Co., Inc. |
390,800 |
19,474 |
|
|
Sanofi SA sponsored ADR |
1,088,444 |
57,502 |
|
|
|
94,753 |
||
|
TOTAL HEALTH CARE |
216,613 |
||
|
INDUSTRIALS - 7.0% |
|||
|
Aerospace & Defense - 4.9% |
|||
|
Alliant Techsystems, Inc. |
278,850 |
33,805 |
|
|
Esterline Technologies Corp. (a) |
180,022 |
15,846 |
|
|
Honeywell International, Inc. |
139,500 |
12,347 |
|
|
Textron, Inc. |
223,717 |
7,434 |
|
|
United Technologies Corp. |
47,400 |
5,255 |
|
|
|
74,687 |
||
|
Common Stocks - continued |
|||
|
Shares |
Value (000s) |
||
|
INDUSTRIALS - continued |
|||
|
Building Products - 0.5% |
|||
|
Armstrong World Industries, Inc. (a) |
143,230 |
$ 7,620 |
|
|
Electrical Equipment - 0.3% |
|||
|
Regal-Beloit Corp. |
63,554 |
4,676 |
|
|
Machinery - 1.3% |
|||
|
Blount International, Inc. (a) |
292,004 |
4,231 |
|
|
Ingersoll-Rand PLC |
208,100 |
14,863 |
|
|
|
19,094 |
||
|
TOTAL INDUSTRIALS |
106,077 |
||
|
INFORMATION TECHNOLOGY - 12.4% |
|||
|
Communications Equipment - 0.3% |
|||
|
Cisco Systems, Inc. |
204,600 |
4,348 |
|
|
Computers & Peripherals - 3.0% |
|||
|
Apple, Inc. |
80,880 |
44,975 |
|
|
IT Services - 0.6% |
|||
|
Fidelity National Information Services, Inc. |
165,730 |
8,399 |
|
|
Semiconductors & Semiconductor Equipment - 4.3% |
|||
|
KLA-Tencor Corp. |
171,180 |
10,933 |
|
|
MagnaChip Semiconductor Corp. (a) |
978,700 |
19,868 |
|
|
Micron Technology, Inc. (a) |
911,183 |
19,226 |
|
|
ON Semiconductor Corp. (a) |
1,190,970 |
8,444 |
|
|
Spansion, Inc. Class A (a) |
613,543 |
7,602 |
|
|
|
66,073 |
||
|
Software - 4.2% |
|||
|
Microsoft Corp. |
429,324 |
16,370 |
|
|
Symantec Corp. |
2,116,671 |
47,604 |
|
|
|
63,974 |
||
|
TOTAL INFORMATION TECHNOLOGY |
187,769 |
||
|
MATERIALS - 8.8% |
|||
|
Chemicals - 8.4% |
|||
|
Ashland, Inc. |
83,100 |
7,569 |
|
|
Axiall Corp. |
81,626 |
3,698 |
|
|
LyondellBasell Industries NV Class A |
1,132,092 |
87,373 |
|
|
PPG Industries, Inc. |
116,596 |
21,461 |
|
|
W.R. Grace & Co. (a) |
83,628 |
8,031 |
|
|
|
128,132 |
||
|
Common Stocks - continued |
|||
|
Shares |
Value (000s) |
||
|
MATERIALS - continued |
|||
|
Metals & Mining - 0.4% |
|||
|
Carpenter Technology Corp. |
86,796 |
$ 5,233 |
|
|
TOTAL MATERIALS |
133,365 |
||
|
TELECOMMUNICATION SERVICES - 1.1% |
|||
|
Diversified Telecommunication Services - 1.1% |
|||
|
Level 3 Communications, Inc. (a) |
558,139 |
16,979 |
|
|
UTILITIES - 4.5% |
|||
|
Electric Utilities - 0.9% |
|||
|
FirstEnergy Corp. |
231,369 |
7,550 |
|
|
NextEra Energy, Inc. |
67,700 |
5,727 |
|
|
|
13,277 |
||
|
Independent Power Producers & Energy Traders - 2.6% |
|||
|
Calpine Corp. (a) |
822,963 |
15,562 |
|
|
The AES Corp. |
1,687,800 |
24,591 |
|
|
|
40,153 |
||
|
Multi-Utilities - 1.0% |
|||
|
Sempra Energy |
179,639 |
15,887 |
|
|
TOTAL UTILITIES |
69,317 |
||
|
TOTAL COMMON STOCKS (Cost $973,195) |
|
||
|
Nonconvertible Bonds - 0.4% |
||||
|
|
Principal Amount (000s) |
|
||
|
ENERGY - 0.4% |
||||
|
Oil, Gas & Consumable Fuels - 0.4% |
||||
|
Alpha Natural Resources, Inc. 6.25% 6/1/21 (Cost $6,398) |
|
$ 7,670 |
|
|
|
Money Market Funds - 8.2% |
|||
|
Shares |
Value (000s) |
||
|
Fidelity Cash Central Fund, 0.10% (b) |
85,014,186 |
$ 85,014 |
|
|
Fidelity Securities Lending Cash Central Fund, 0.10% (b)(c) |
39,182,193 |
39,182 |
|
|
TOTAL MONEY MARKET FUNDS (Cost $124,196) |
|
||
|
TOTAL INVESTMENT PORTFOLIO - 102.5% (Cost $1,103,789) |
1,555,598 |
||
|
NET OTHER ASSETS (LIABILITIES) - (2.5)% |
(37,520) |
||
|
NET ASSETS - 100% |
$ 1,518,078 |
||
|
Legend |
|
(a) Non-income producing |
|
(b) Affiliated fund that is generally available only to investment companies and other accounts managed by Fidelity Investments. The rate quoted is the annualized seven-day yield of the fund at period end. A complete unaudited listing of the fund's holdings as of its most recent quarter end is available upon request. In addition, each Fidelity Central Fund's financial statements, which are not covered by the Fund's Report of Independent Registered Public Accounting Firm, are available on the SEC's website or upon request. |
|
(c) Investment made with cash collateral received from securities on loan. |
|
(d) Security or a portion of the security is on loan at period end. |
|
(e) Affiliated company |
|
Affiliated Central Funds |
|
Information regarding fiscal year to date income earned by the Fund from investments in Fidelity Central Funds is as follows: |
|
Fund |
Income earned |
|
Fidelity Cash Central Fund |
$ 160 |
|
Fidelity Securities Lending Cash Central Fund |
547 |
|
Total |
$ 707 |
|
Other Affiliated Issuers |
|
An affiliated company is a company in which the Fund has ownership of at least 5% of the voting securities. Fiscal year to date transactions with companies which are or were affiliates are as follows: |
|
Affiliate |
Value, |
Purchases |
Sales |
Dividend |
Value, |
|
Cott Corp. |
$ 59,355 |
$ - |
$ 27,851 |
$ 1,193 |
$ - |
|
The Bon-Ton Stores, Inc. |
11,279 |
17,226 |
- |
278 |
34,067 |
|
Total |
$ 70,634 |
$ 17,226 |
$ 27,851 |
$ 1,471 |
$ 34,067 |
|
Other Information |
|
The following is a summary of the inputs used, as of November 30, 2013, involving the Fund's assets and liabilities carried at fair value. The inputs or methodology used for valuing securities may not be an indication of the risk associated with investing in those securities. For more information on valuation inputs, and their aggregation into the levels used in the table below, please refer to the Investment Valuation section in the accompanying Notes to Financial Statements. |
|
Valuation Inputs at Reporting Date: |
||||
|
Description |
Total |
Level 1 |
Level 2 |
Level 3 |
|
Investments in Securities: |
||||
|
Equities: |
||||
|
Consumer Discretionary |
$ 362,488 |
$ 362,488 |
$ - |
$ - |
|
Consumer Staples |
81,742 |
81,742 |
- |
- |
|
Energy |
77,007 |
77,007 |
- |
- |
|
Financials |
173,468 |
173,468 |
- |
- |
|
Health Care |
216,613 |
216,613 |
- |
- |
|
Industrials |
106,077 |
106,077 |
- |
- |
|
Information Technology |
187,769 |
187,769 |
- |
- |
|
Materials |
133,365 |
133,365 |
- |
- |
|
Telecommunication Services |
16,979 |
16,979 |
- |
- |
|
Utilities |
69,317 |
69,317 |
- |
- |
|
Corporate Bonds |
6,577 |
- |
6,577 |
- |
|
Money Market Funds |
124,196 |
124,196 |
- |
- |
|
Total Investments in Securities: |
$ 1,555,598 |
$ 1,549,021 |
$ 6,577 |
$ - |
|
Distribution of investments by country or territory of incorporation, as a percentage of total net assets, is as follows (Unaudited): |
|
United States of America |
83.0% |
|
Netherlands |
5.8% |
|
France |
3.8% |
|
Bailiwick of Jersey |
2.8% |
|
Canada |
2.5% |
|
Ireland |
1.0% |
|
Others (Individually Less Than 1%) |
1.1% |
|
|
100.0% |
See accompanying notes which are an integral part of the financial statements.
Annual Report
Financial Statements
Statement of Assets and Liabilities
|
Amounts in thousands (except per-share amounts) |
November 30, 2013 |
|
|
|
|
|
|
Assets |
|
|
|
Investment in securities, at value (including securities loaned of $37,981) - See accompanying schedule: Unaffiliated issuers (cost $954,600) |
$ 1,397,335 |
|
|
Fidelity Central Funds (cost $124,196) |
124,196 |
|
|
Other affiliated issuers (cost $24,993) |
34,067 |
|
|
Total Investments (cost $1,103,789) |
|
$ 1,555,598 |
|
Receivable for fund shares sold |
|
1,266 |
|
Dividends receivable |
|
2,892 |
|
Interest receivable |
|
292 |
|
Distributions receivable from Fidelity Central Funds |
|
16 |
|
Prepaid expenses |
|
5 |
|
Other receivables |
|
2 |
|
Total assets |
|
1,560,071 |
|
|
|
|
|
Liabilities |
|
|
|
Payable for fund shares redeemed |
$ 1,644 |
|
|
Accrued management fee |
603 |
|
|
Distribution and service plan fees payable |
241 |
|
|
Other affiliated payables |
277 |
|
|
Other payables and accrued expenses |
46 |
|
|
Collateral on securities loaned, at value |
39,182 |
|
|
Total liabilities |
|
41,993 |
|
|
|
|
|
Net Assets |
|
$ 1,518,078 |
|
Net Assets consist of: |
|
|
|
Paid in capital |
|
$ 1,316,130 |
|
Undistributed net investment income |
|
9,989 |
|
Accumulated undistributed net realized gain (loss) on investments and foreign currency transactions |
|
(259,850) |
|
Net unrealized appreciation (depreciation) on investments and assets and liabilities in foreign currencies |
|
451,809 |
|
Net Assets |
|
$ 1,518,078 |
See accompanying notes which are an integral part of the financial statements.
Annual Report
Statement of Assets and Liabilities - continued
|
Amounts in thousands (except per-share amounts) |
November 30, 2013 |
|
|
|
|
|
|
Calculation of Maximum Offering Price Class A: |
|
$ 36.02 |
|
|
|
|
|
Maximum offering price per share (100/94.25 of $36.02) |
|
$ 38.22 |
|
Class T: |
|
$ 37.28 |
|
|
|
|
|
Maximum offering price per share (100/96.50 of $37.28) |
|
$ 38.63 |
|
Class B: |
|
$ 32.86 |
|
|
|
|
|
Class C: |
|
$ 32.52 |
|
|
|
|
|
Fidelity Value Strategies Fund: |
|
$ 40.28 |
|
|
|
|
|
Fidelity Value Strategies Fund Class K: |
|
$ 40.28 |
|
|
|
|
|
Institutional Class: |
|
$ 38.46 |
A Redemption price per share is equal to net asset value less any applicable contingent deferred sales charge.
See accompanying notes which are an integral part of the financial statements.
Annual Report
Financial Statements - continued
Statement of Operations
|
Amounts in thousands |
Year ended November 30, 2013 |
|
|
|
|
|
|
Investment Income |
|
|
|
Dividends (including $1,471 earned from other affiliated issuers) |
|
$ 23,949 |
|
Interest |
|
208 |
|
Income from Fidelity Central Funds |
|
707 |
|
Total income |
|
24,864 |
|
|
|
|
|
Expenses |
|
|
|
Management fee |
$ 7,835 |
|
|
Performance adjustment |
(1,028) |
|
|
Transfer agent fees |
2,821 |
|
|
Distribution and service plan fees |
2,743 |
|
|
Accounting and security lending fees |
461 |
|
|
Custodian fees and expenses |
16 |
|
|
Independent trustees' compensation |
8 |
|
|
Registration fees |
163 |
|
|
Audit |
65 |
|
|
Legal |
5 |
|
|
Miscellaneous |
9 |
|
|
Total expenses before reductions |
13,098 |
|
|
Expense reductions |
(150) |
12,948 |
|
Net investment income (loss) |
|
11,916 |
|
Realized and Unrealized Gain (Loss) Net realized gain (loss) on: |
|
|
|
Investment securities: |
|
|
|
Unaffiliated issuers |
62,499 |
|
|
Other affiliated issuers |
3,508 |
|
|
Foreign currency transactions |
4 |
|
|
Total net realized gain (loss) |
|
66,011 |
|
Change in net unrealized appreciation (depreciation) on: Investment securities |
293,438 |
|
|
Assets and liabilities in foreign currencies |
4 |
|
|
Total change in net unrealized appreciation (depreciation) |
|
293,442 |
|
Net gain (loss) |
|
359,453 |
|
Net increase (decrease) in net assets resulting from operations |
|
$ 371,369 |
See accompanying notes which are an integral part of the financial statements.
Annual Report
Statement of Changes in Net Assets
|
Amounts in thousands |
Year ended |
Year ended |
|
Increase (Decrease) in Net Assets |
|
|
|
Operations |
|
|
|
Net investment income (loss) |
$ 11,916 |
$ 539 |
|
Net realized gain (loss) |
66,011 |
42,952 |
|
Change in net unrealized appreciation (depreciation) |
293,442 |
147,048 |
|
Net increase (decrease) in net assets resulting |
371,369 |
190,539 |
|
Distributions to shareholders from net investment income |
(3,993) |
(4,679) |
|
Share transactions - net increase (decrease) |
77,974 |
(16,561) |
|
Total increase (decrease) in net assets |
445,350 |
169,299 |
|
|
|
|
|
Net Assets |
|
|
|
Beginning of period |
1,072,728 |
903,429 |
|
End of period (including undistributed net investment income of $9,989 and undistributed net investment income of $2,549, respectively) |
$ 1,518,078 |
$ 1,072,728 |
See accompanying notes which are an integral part of the financial statements.
Annual Report
Financial Highlights - Class A
|
Years ended November 30, |
2013 |
2012 |
2011 |
2010 |
2009 |
|
Selected Per-Share Data |
|
|
|
|
|
|
Net asset value, beginning of period |
$ 27.62 |
$ 22.71 |
$ 23.11 |
$ 18.77 |
$ 11.87 |
|
Income from Investment Operations |
|
|
|
|
|
|
Net investment income (loss) C |
.23 |
- F |
.13 G |
.03 H |
.06 |
|
Net realized and unrealized gain (loss) |
8.25 |
5.03 |
(.49) |
4.32 |
6.96 |
|
Total from investment operations |
8.48 |
5.03 |
(.36) |
4.35 |
7.02 |
|
Distributions from net investment income |
(.08) |
(.12) |
(.03) I |
- |
(.12) |
|
Distributions from net realized gain |
- |
- |
(.01) I |
(.01) |
- |
|
Total distributions |
(.08) |
(.12) |
(.04) |
(.01) |
(.12) |
|
Net asset value, end of period |
$ 36.02 |
$ 27.62 |
$ 22.71 |
$ 23.11 |
$ 18.77 |
|
Total Return A, B |
30.77% |
22.29% |
(1.57)% |
23.16% |
59.70% |
|
Ratios to Average Net Assets D, J |
|
|
|
|
|
|
Expenses before reductions |
1.04% |
1.21% |
1.18% |
1.08% |
1.03% |
|
Expenses net of fee waivers, if any |
1.04% |
1.21% |
1.18% |
1.08% |
1.03% |
|
Expenses net of all reductions |
1.03% |
1.21% |
1.17% |
1.07% |
1.02% |
|
Net investment income (loss) |
.73% |
-% F |
.51% G |
.12% H |
.39% |
|
Supplemental Data |
|
|
|
|
|
|
Net assets, end of period (in millions) |
$ 243 |
$ 203 |
$ 190 |
$ 221 |
$ 206 |
|
Portfolio turnover rate E |
22% |
23% |
34% |
99% |
161% |
A Total returns would have been lower if certain expenses had not been reduced during the applicable periods shown.
B Total returns do not include the effect of the sales charges.
C Calculated based on average shares outstanding during the period.
D Fees and expenses of any underlying Fidelity Central Funds are not included in the Fund's expense ratio. The Fund indirectly bears its proportionate share of the expenses of any underlying Fidelity Central Funds.
E Amount does not include the portfolio activity of any underlying Fidelity Central Funds.
F Investment income per share reflects a large, non-recurring dividend which amounted to $.07 per share. Excluding this non-recurring dividend, the ratio of net investment income (loss) to average net assets would have been (.28)%.
G Investment income per share reflects a large, non-recurring dividend which amounted to $.16 per share. Excluding this non-recurring dividend, the ratio of net investment income (loss) to average net assets would have been (.11)%.
H Investment income per share reflects a large, non-recurring dividend which amounted to $.04 per share. Excluding this non-recurring dividend, the ratio of net investment income (loss) to average net assets would have been (.05)%.
I The amounts shown reflect certain reclassifications related to book to tax differences that were made in the year shown.
J Expense ratios reflect operating expenses of the class. Expenses before reductions do not reflect amounts reimbursed by the investment adviser or reductions from brokerage service arrangements or reductions from other expense offset arrangements and do not represent the amount paid by the class during periods when reimbursements or reductions occur. Expenses net of fee waivers reflect expenses after reimbursement by the investment adviser but prior to reductions from brokerage service arrangements or other expense offset arrangements. Expenses net of all reductions represent the net expenses paid by the class.
See accompanying notes which are an integral part of the financial statements.
Annual Report
Financial Highlights - Class T
|
Years ended November 30, |
2013 |
2012 |
2011 |
2010 |
2009 |
|
Selected Per-Share Data |
|
|
|
|
|
|
Net asset value, beginning of period |
$ 28.58 |
$ 23.48 |
$ 23.90 |
$ 19.44 |
$ 12.25 |
|
Income from Investment Operations |
|
|
|
|
|
|
Net investment income (loss) C |
.18 |
(.05) F |
.08 G |
(.01) H |
.03 |
|
Net realized and unrealized gain (loss) |
8.54 |
5.22 |
(.50) |
4.48 |
7.21 |
|
Total from investment operations |
8.72 |
5.17 |
(.42) |
4.47 |
7.24 |
|
Distributions from net investment income |
(.02) |
(.07) |
- |
- |
(.05) |
|
Distributions from net realized gain |
- |
- |
- |
(.01) |
- |
|
Total distributions |
(.02) |
(.07) |
- |
(.01) |
(.05) |
|
Net asset value, end of period |
$ 37.28 |
$ 28.58 |
$ 23.48 |
$ 23.90 |
$ 19.44 |
|
Total Return A, B |
30.52% |
22.08% |
(1.76)% |
22.98% |
59.40% |
|
Ratios to Average Net Assets D, I |
|
|
|
|
|
|
Expenses before reductions |
1.23% |
1.38% |
1.35% |
1.26% |
1.24% |
|
Expenses net of fee waivers, if any |
1.23% |
1.38% |
1.35% |
1.26% |
1.24% |
|
Expenses net of all reductions |
1.22% |
1.38% |
1.35% |
1.25% |
1.22% |
|
Net investment income (loss) |
.54% |
(.17)% F |
.33% G |
(.06)% H |
.18% |
|
Supplemental Data |
|
|
|
|
|
|
Net assets, end of period (in millions) |
$ 335 |
$ 283 |
$ 274 |
$ 344 |
$ 339 |
|
Portfolio turnover rate E |
22% |
23% |
34% |
99% |
161% |
A Total returns would have been lower if certain expenses had not been reduced during the applicable periods shown.
B Total returns do not include the effect of the sales charges.
C Calculated based on average shares outstanding during the period.
D Fees and expenses of any underlying Fidelity Central Funds are not included in the Fund's expense ratio. The Fund indirectly bears its proportionate share of the expenses of any underlying Fidelity Central Funds.
E Amount does not include the portfolio activity of any underlying Fidelity Central Funds.
F Investment income per share reflects a large, non-recurring dividend which amounted to $.07 per share. Excluding this non-recurring dividend, the ratio of net investment income (loss) to average net assets would have been (.45)%.
G Investment income per share reflects a large, non-recurring dividend which amounted to $.16 per share. Excluding this non-recurring dividend, the ratio of net investment income (loss) to average net assets would have been (.29)%.
H Investment income per share reflects a large, non-recurring dividend which amounted to $.04 per share. Excluding this non-recurring dividend, the ratio of net investment income (loss) to average net assets would have been (.23)%.
I Expense ratios reflect operating expenses of the class. Expenses before reductions do not reflect amounts reimbursed by the investment adviser or reductions from brokerage service arrangements or reductions from other expense offset arrangements and do not represent the amount paid by the class during periods when reimbursements or reductions occur. Expenses net of fee waivers reflect expenses after reimbursement by the investment adviser but prior to reductions from brokerage service arrangements or other expense offset arrangements. Expenses net of all reductions represent the net expenses paid by the class.
See accompanying notes which are an integral part of the financial statements.
Annual Report
Financial Highlights - Class B
|
Years ended November 30, |
2013 |
2012 |
2011 |
2010 |
2009 |
|
Selected Per-Share Data |
|
|
|
|
|
|
Net asset value, beginning of period |
$ 25.34 |
$ 20.87 |
$ 21.37 |
$ 17.48 |
$ 11.03 |
|
Income from Investment Operations |
|
|
|
|
|
|
Net investment income (loss) C |
(.02) |
(.18) F |
(.06) G |
(.13) H |
(.05) |
|
Net realized and unrealized gain (loss) |
7.54 |
4.65 |
(.44) |
4.03 |
6.50 |
|
Total from investment operations |
7.52 |
4.47 |
(.50) |
3.90 |
6.45 |
|
Distributions from net realized gain |
- |
- |
- |
(.01) |
- |
|
Net asset value, end of period |
$ 32.86 |
$ 25.34 |
$ 20.87 |
$ 21.37 |
$ 17.48 |
|
Total Return A, B |
29.68% |
21.42% |
(2.34)% |
22.29% |
58.48% |
|
Ratios to Average Net Assets D, I |
|
|
|
|
|
|
Expenses before reductions |
1.83% |
1.97% |
1.93% |
1.83% |
1.78% |
|
Expenses net of fee waivers, if any |
1.83% |
1.97% |
1.93% |
1.83% |
1.78% |
|
Expenses net of all reductions |
1.82% |
1.97% |
1.93% |
1.82% |
1.77% |
|
Net investment income (loss) |
(.07)% |
(.76)% F |
(.25)% G |
(.64)% H |
(.36)% |
|
Supplemental Data |
|
|
|
|
|
|
Net assets, end of period (in millions) |
$ 11 |
$ 13 |
$ 16 |
$ 30 |
$ 40 |
|
Portfolio turnover rate E |
22% |
23% |
34% |
99% |
161% |
A Total returns would have been lower if certain expenses had not been reduced during the applicable periods shown.
B Total returns do not include the effect of the contingent deferred sales charge.
C Calculated based on average shares outstanding during the period.
D Fees and expenses of any underlying Fidelity Central Funds are not included in the Fund's expense ratio. The Fund indirectly bears its proportionate share of the expenses of any underlying Fidelity Central Funds.
E Amount does not include the portfolio activity of any underlying Fidelity Central Funds.
F Investment income per share reflects a large, non-recurring dividend which amounted to $.06 per share. Excluding this non-recurring dividend, the ratio of net investment income (loss) to average net assets would have been (1.04)%.
G Investment income per share reflects a large, non-recurring dividend which amounted to $.16 per share. Excluding this non-recurring dividend, the ratio of net investment income (loss) to average net assets would have been (.87)%.
H Investment income per share reflects a large, non-recurring dividend which amounted to $.03 per share. Excluding this non-recurring dividend, the ratio of net investment income (loss) to average net assets would have been (.80)%.
I Expense ratios reflect operating expenses of the class. Expenses before reductions do not reflect amounts reimbursed by the investment adviser or reductions from brokerage service arrangements or reductions from other expense offset arrangements and do not represent the amount paid by the class during periods when reimbursements or reductions occur. Expenses net of fee waivers reflect expenses after reimbursement by the investment adviser but prior to reductions from brokerage service arrangements or other expense offset arrangements. Expenses net of all reductions represent the net expenses paid by the class.
See accompanying notes which are an integral part of the financial statements.
Annual Report
Financial Highlights - Class C
|
Years ended November 30, |
2013 |
2012 |
2011 |
2010 |
2009 |
|
Selected Per-Share Data |
|
|
|
|
|
|
Net asset value, beginning of period |
$ 25.06 |
$ 20.64 |
$ 21.13 |
$ 17.29 |
$ 10.91 |
|
Income from Investment Operations |
|
|
|
|
|
|
Net investment income (loss) C |
(.01) |
(.17) F |
(.05) G |
(.12) H |
(.05) |
|
Net realized and unrealized gain (loss) |
7.47 |
4.59 |
(.44) |
3.97 |
6.43 |
|
Total from investment operations |
7.46 |
4.42 |
(.49) |
3.85 |
6.38 |
|
Distributions from net realized gain |
- |
- |
- |
(.01) |
- |
|
Net asset value, end of period |
$ 32.52 |
$ 25.06 |
$ 20.64 |
$ 21.13 |
$ 17.29 |
|
Total Return A, B |
29.77% |
21.41% |
(2.32)% |
22.25% |
58.48% |
|
Ratios to Average Net Assets D, I |
|
|
|
|
|
|
Expenses before reductions |
1.78% |
1.95% |
1.92% |
1.83% |
1.78% |
|
Expenses net of fee waivers, if any |
1.78% |
1.95% |
1.92% |
1.83% |
1.78% |
|
Expenses net of all reductions |
1.77% |
1.95% |
1.92% |
1.82% |
1.77% |
|
Net investment income (loss) |
(.02)% |
(.75)% F |
(.24)% G |
(.63)% H |
(.36)% |
|
Supplemental Data |
|
|
|
|
|
|
Net assets, end of period (in millions) |
$ 54 |
$ 43 |
$ 40 |
$ 49 |
$ 43 |
|
Portfolio turnover rate E |
22% |
23% |
34% |
99% |
161% |
A Total returns would have been lower if certain expenses had not been reduced during the applicable periods shown.
B Total returns do not include the effect of the contingent deferred sales charge.
C Calculated based on average shares outstanding during the period.
D Fees and expenses of any underlying Fidelity Central Funds are not included in the Fund's expense ratio. The Fund indirectly bears its proportionate share of the expenses of any underlying Fidelity Central Funds.
E Amount does not include the portfolio activity of any underlying Fidelity Central Funds.
F Investment income per share reflects a large, non-recurring dividend which amounted to $.06 per share. Excluding this non-recurring dividend, the ratio of net investment income (loss) to average net assets would have been (1.02)%.
G Investment income per share reflects a large, non-recurring dividend which amounted to $.16 per share. Excluding this non-recurring dividend, the ratio of net investment income (loss) to average net assets would have been (.86)%.
H Investment income per share reflects a large, non-recurring dividend which amounted to $.03 per share. Excluding this non-recurring dividend, the ratio of net investment income (loss) to average net assets would have been (.80)%.
I Expense ratios reflect operating expenses of the class. Expenses before reductions do not reflect amounts reimbursed by the investment adviser or reductions from brokerage service arrangements or reductions from other expense offset arrangements and do not represent the amount paid by the class during periods when reimbursements or reductions occur. Expenses net of fee waivers reflect expenses after reimbursement by the investment adviser but prior to reductions from brokerage service arrangements or other expense offset arrangements. Expenses net of all reductions represent the net expenses paid by the class.
See accompanying notes which are an integral part of the financial statements.
Annual Report
Financial Highlights - Fidelity Value Strategies Fund
|
Years ended November 30, |
2013 |
2012 |
2011 |
2010 |
2009 |
|
Selected Per-Share Data |
|
|
|
|
|
|
Net asset value, beginning of period |
$ 30.89 |
$ 25.37 |
$ 25.80 |
$ 20.89 |
$ 13.21 |
|
Income from Investment Operations |
|
|
|
|
|
|
Net investment income (loss) B |
.37 |
.09 E |
.22 F |
.09 G |
.11 |
|
Net realized and unrealized gain (loss) |
9.20 |
5.62 |
(.54) |
4.83 |
7.73 |
|
Total from investment operations |
9.57 |
5.71 |
(.32) |
4.92 |
7.84 |
|
Distributions from net investment income |
(.18) |
(.19) |
(.10) H |
- |
(.16) |
|
Distributions from net realized gain |
- |
- |
(.01) H |
(.01) |
- |
|
Total distributions |
(.18) |
(.19) |
(.11) |
(.01) |
(.16) |
|
Net asset value, end of period |
$ 40.28 |
$ 30.89 |
$ 25.37 |
$ 25.80 |
$ 20.89 |
|
Total Return A |
31.14% |
22.69% |
(1.29)% |
23.54% |
60.05% |
|
Ratios to Average Net Assets C, I |
|
|
|
|
|
|
Expenses before reductions |
.73% |
.89% |
.88% |
.81% |
.78% |
|
Expenses net of fee waivers, if any |
.73% |
.89% |
.88% |
.81% |
.78% |
|
Expenses net of all reductions |
.72% |
.89% |
.88% |
.80% |
.77% |
|
Net investment income (loss) |
1.03% |
.31% E |
.80% F |
.39% G |
.64% |
|
Supplemental Data |
|
|
|
|
|
|
Net assets, end of period (in millions) |
$ 681 |
$ 396 |
$ 284 |
$ 360 |
$ 237 |
|
Portfolio turnover rate D |
22% |
23% |
34% |
99% |
161% |
A Total returns would have been lower if certain expenses had not been reduced during the applicable periods shown.
B Calculated based on average shares outstanding during the period.
C Fees and expenses of any underlying Fidelity Central Funds are not included in the Fund's expense ratio. The Fund indirectly bears its proportionate share of the expenses of any underlying Fidelity Central Funds.
D Amount does not include the portfolio activity of any underlying Fidelity Central Funds.
E Investment income per share reflects a large, non-recurring dividend which amounted to $.08 per share. Excluding this non-recurring dividend, the ratio of net investment income (loss) to average net assets would have been .04%.
F Investment income per share reflects a large, non-recurring dividend which amounted to $.16 per share. Excluding this non-recurring dividend, the ratio of net investment income (loss) to average net assets would have been .18%.
G Investment income per share reflects a large, non-recurring dividend which amounted to $.04 per share. Excluding this non-recurring dividend, the ratio of net investment income (loss) to average net assets would have been .22%.
H The amounts shown reflect certain reclassifications related to book to tax differences that were made in the year shown.
I Expense ratios reflect operating expenses of the class. Expenses before reductions do not reflect amounts reimbursed by the investment adviser or reductions from brokerage service arrangements or reductions from other expense offset arrangements and do not represent the amount paid by the class during periods when reimbursements or reductions occur. Expenses net of fee waivers reflect expenses after reimbursement by the investment adviser but prior to reductions from brokerage service arrangements or other expense offset arrangements. Expenses net of all reductions represent the net expenses paid by the class.
See accompanying notes which are an integral part of the financial statements.
Annual Report
Financial Highlights - Fidelity Value Strategies Fund Class K
|
Years ended November 30, |
2013 |
2012 |
2011 |
2010 |
2009 |
|
Selected Per-Share Data |
|
|
|
|
|
|
Net asset value, beginning of period |
$ 30.89 |
$ 25.38 |
$ 25.82 |
$ 20.86 |
$ 13.23 |
|
Income from Investment Operations |
|
|
|
|
|
|
Net investment income (loss) B |
.43 |
.14 E |
.28 F |
.15 G |
.16 |
|
Net realized and unrealized gain (loss) |
9.18 |
5.61 |
(.55) |
4.82 |
7.70 |
|
Total from investment operations |
9.61 |
5.75 |
(.27) |
4.97 |
7.86 |
|
Distributions from net investment income |
(.22) |
(.24) |
(.16) H |
- |
(.23) |
|
Distributions from net realized gain |
- |
- |
(.01) H |
(.01) |
- |
|
Total distributions |
(.22) |
(.24) |
(.17) |
(.01) |
(.23) |
|
Net asset value, end of period |
$ 40.28 |
$ 30.89 |
$ 25.38 |
$ 25.82 |
$ 20.86 |
|
Total Return A |
31.34% |
22.93% |
(1.11)% |
23.81% |
60.52% |
|
Ratios to Average Net Assets C, I |
|
|
|
|
|
|
Expenses before reductions |
.58% |
.71% |
.68% |
.58% |
.51% |
|
Expenses net of fee waivers, if any |
.58% |
.71% |
.68% |
.58% |
.51% |
|
Expenses net of all reductions |
.57% |
.71% |
.68% |
.56% |
.49% |
|
Net investment income (loss) |
1.18% |
.50% E |
1.00% F |
.62% G |
.91% |
|
Supplemental Data |
|
|
|
|
|
|
Net assets, end of period (in millions) |
$ 119 |
$ 70 |
$ 47 |
$ 47 |
$ 27 |
|
Portfolio turnover rate D |
22% |
23% |
34% |
99% |
161% |
A Total returns would have been lower if certain expenses had not been reduced during the applicable periods shown.
B Calculated based on average shares outstanding during the period.
C Fees and expenses of any underlying Fidelity Central Funds are not included in the Fund's expense ratio. The Fund indirectly bears its proportionate share of the expenses of any underlying Fidelity Central Funds.
D Amount does not include the portfolio activity of any underlying Fidelity Central Funds.
E Investment income per share reflects a large, non-recurring dividend which amounted to $.08 per share. Excluding this non-recurring dividend, the ratio of net investment income (loss) to average net assets would have been .22%.
F Investment income per share reflects a large, non-recurring dividend which amounted to $.16 per share. Excluding this non-recurring dividend, the ratio of net investment income (loss) to average net assets would have been .38%.
G Investment income per share reflects a large, non-recurring dividend which amounted to $.04 per share. Excluding this non-recurring dividend, the ratio of net investment income (loss) to average net assets would have been .46%.
H The amounts shown reflect certain reclassifications related to book to tax differences that were made in the year shown.
I Expense ratios reflect operating expenses of the class. Expenses before reductions do not reflect amounts reimbursed by the investment adviser or reductions from brokerage service arrangements or reductions from other expense offset arrangements and do not represent the amount paid by the class during periods when reimbursements or reductions occur. Expenses net of fee waivers reflect expenses after reimbursement by the investment adviser but prior to reductions from brokerage service arrangements or other expense offset arrangements. Expenses net of all reductions represent the net expenses paid by the class.
See accompanying notes which are an integral part of the financial statements.
Annual Report
Financial Highlights - Institutional Class
|
Years ended November 30, |
2013 |
2012 |
2011 |
2010 |
2009 |
|
Selected Per-Share Data |
|
|
|
|
|
|
Net asset value, beginning of period |
$ 29.51 |
$ 24.26 |
$ 24.69 |
$ 19.97 |
$ 12.67 |
|
Income from Investment Operations |
|
|
|
|
|
|
Net investment income (loss) B |
.34 |
.08 E |
.22 F |
.10 G |
.11 |
|
Net realized and unrealized gain (loss) |
8.79 |
5.37 |
(.53) |
4.63 |
7.38 |
|
Total from investment operations |
9.13 |
5.45 |
(.31) |
4.73 |
7.49 |
|
Distributions from net investment income |
(.18) |
(.20) |
(.11) H |
- |
(.19) |
|
Distributions from net realized gain |
- |
- |
(.01) H |
(.01) |
- |
|
Total distributions |
(.18) |
(.20) |
(.12) |
(.01) |
(.19) |
|
Net asset value, end of period |
$ 38.46 |
$ 29.51 |
$ 24.26 |
$ 24.69 |
$ 19.97 |
|
Total Return A |
31.11% |
22.67% |
(1.30)% |
23.67% |
60.08% |
|
Ratios to Average Net Assets C, I |
|
|
|
|
|
|
Expenses before reductions |
.76% |
.90% |
.86% |
.74% |
.70% |
|
Expenses net of fee waivers, if any |
.76% |
.90% |
.86% |
.74% |
.70% |
|
Expenses net of all reductions |
.75% |
.90% |
.86% |
.73% |
.69% |
|
Net investment income (loss) |
1.00% |
.31% E |
.82% F |
.46% G |
.71% |
|
Supplemental Data |
|
|
|
|
|
|
Net assets, end of period (in millions) |
$ 74 |
$ 66 |
$ 52 |
$ 53 |
$ 48 |
|
Portfolio turnover rate D |
22% |
23% |
34% |
99% |
161% |
A Total returns would have been lower if certain expenses had not been reduced during the applicable periods shown.
B Calculated based on average shares outstanding during the period.
C Fees and expenses of any underlying Fidelity Central Funds are not included in the Fund's expense ratio. The Fund indirectly bears its proportionate share of the expenses of any underlying Fidelity Central Funds.
D Amount does not include the portfolio activity of any underlying Fidelity Central Funds.
E Investment income per share reflects a large, non-recurring dividend which amounted to $.08 per share. Excluding this non-recurring dividend, the ratio of net investment income (loss) to average net assets would have been .03%.
F Investment income per share reflects a large, non-recurring dividend which amounted to $.16 per share. Excluding this non-recurring dividend, the ratio of net investment income (loss) to average net assets would have been .20%.
G Investment income per share reflects a large, non-recurring dividend which amounted to $.04 per share. Excluding this non-recurring dividend, the ratio of net investment income (loss) to average net assets would have been .29%.
H The amounts shown reflect certain reclassifications related to book to tax differences that were made in the year shown.
I Expense ratios reflect operating expenses of the class. Expenses before reductions do not reflect amounts reimbursed by the investment adviser or reductions from brokerage service arrangements or reductions from other expense offset arrangements and do not represent the amount paid by the class during periods when reimbursements or reductions occur. Expenses net of fee waivers reflect expenses after reimbursement by the investment adviser but prior to reductions from brokerage service arrangements or other expense offset arrangements. Expenses net of all reductions represent the net expenses paid by the class.
See accompanying notes which are an integral part of the financial statements.
Annual Report
Notes to Financial Statements
For the period ended November 30, 2013
(Amounts in thousands except percentages)
1. Organization.
Fidelity Advisor Value Strategies Fund (the Fund) is a fund of Fidelity Advisor Series I (the Trust) and is authorized to issue an unlimited number of shares. The Trust is registered under the Investment Company Act of 1940, as amended (the 1940 Act), as an open-end management investment company organized as a Massachusetts business trust. The Fund offers Class A, Class T, Class C, Fidelity Value Strategies Fund, Fidelity Value Strategies Fund Class K and Institutional Class shares, each of which, along with Class B shares, has equal rights as to assets and voting privileges. Class B shares are closed to new accounts and additional purchases, except for exchanges and reinvestments. Each class has exclusive voting rights with respect to matters that affect that class. Class B shares will automatically convert to Class A shares after a holding period of seven years from the initial date of purchase.
2. Investments in Fidelity Central Funds.
The Fund invests in Fidelity Central Funds, which are open-end investment companies generally available only to other investment companies and accounts managed by the investment adviser and its affiliates. The Fund's Schedule of Investments lists each of the Fidelity Central Funds held as of period end, if any, as an investment of the Fund, but does not include the underlying holdings of each Fidelity Central Fund. As an Investing Fund, the Fund indirectly bears its proportionate share of the expenses of the underlying Fidelity Central Funds.
The Money Market Central Funds seek preservation of capital and current income and are managed by Fidelity Investments Money Management, Inc. (FIMM), an affiliate of the investment adviser. Annualized expenses of the Money Market Central Funds as of their most recent shareholder report date are less than .01%.
A complete unaudited list of holdings for each Fidelity Central Fund is available upon request or at the Securities and Exchange Commission (the SEC) website at www.sec.gov. In addition, the financial statements of the Fidelity Central Funds, which are not covered by the Fund's Report of Independent Registered Public Accounting Firm, are available on the SEC website or upon request.
3. Significant Accounting Policies.
The financial statements have been prepared in conformity with accounting principles generally accepted in the United States of America (GAAP), which require management to make certain estimates and assumptions at the date of the financial statements. Actual results could differ from those estimates. Subsequent events, if any, through the date that the financial statements were issued have been evaluated in the preparation of
Annual Report
Notes to Financial Statements - continued
(Amounts in thousands except percentages)
3. Significant Accounting Policies - continued
the financial statements. The following summarizes the significant accounting policies of the Fund:
Investment Valuation. Investments are valued as of 4:00 p.m. Eastern time on the last calendar day of the period. In accordance with valuation policies and procedures approved by the Board of Trustees (the Board), the Fund attempts to obtain prices from one or more third party pricing vendors or brokers to value its investments. When current market prices, quotations or currency exchange rates are not readily available or reliable, investments will be fair valued in good faith by the Fidelity Management & Research Company (FMR) Fair Value Committee (the Committee), in accordance with procedures adopted by the Board. Factors used in determining fair value vary by investment type and may include market or investment specific events, changes in interest rates and credit quality. The frequency with which these procedures are used cannot be predicted and they may be utilized to a significant extent. The Committee oversees the Fund's valuation policies and procedures and is responsible for approving and reporting to the Board all fair value determinations.
The Fund categorizes the inputs to valuation techniques used to value its investments into a disclosure hierarchy consisting of three levels as shown below:
Level 1 - quoted prices in active markets for identical investments
Level 2 - other significant observable inputs (including quoted prices for similar investments, interest rates, prepayment speeds, etc.)
Level 3 - unobservable inputs (including the Fund's own assumptions based on the best information available)
Valuation techniques used to value the Fund's investments by major category are as follows:
Equity securities, including restricted securities, for which market quotations are readily available, are valued at the last reported sale price or official closing price as reported by a third party pricing vendor on the primary market or exchange on which they are traded and are categorized as Level 1 in the hierarchy. In the event there were no sales during the day or closing prices are not available, securities are valued at the last quoted bid price or may be valued using the last available price and are generally categorized as Level 2 in the hierarchy. For foreign equity securities, when market or security specific events arise, comparisons to the valuation of American Depositary Receipts (ADRs), futures contracts, Exchange-Traded Funds (ETFs) and certain indexes as well as quoted prices for similar securities may be used and would be categorized as Level 2 in the hierarchy. Utilizing these techniques may result in transfers between Level 1 and Level 2. For equity securities, including restricted securities, where observable inputs are
Annual Report
3. Significant Accounting Policies - continued
Investment Valuation - continued
limited, assumptions about market activity and risk are used and these securities may be categorized as Level 3 in the hierarchy.
Debt securities, including restricted securities, are valued based on evaluated prices received from third party pricing vendors or from brokers who make markets in such securities. For corporate bonds, pricing vendors utilize matrix pricing which considers yield or price of bonds of comparable quality, coupon, maturity and type as well as broker-supplied prices. When independent prices are unavailable or unreliable, debt securities may be valued utilizing pricing methodologies which consider similar factors that would be used by third party pricing vendors. Debt securities are generally categorized as Level 2 in the hierarchy but may be Level 3 depending on the circumstances.
Investments in open-end mutual funds, including the Fidelity Central Funds, are valued at their closing net asset value (NAV) each business day and are categorized as Level 1 in the hierarchy.
Changes in valuation techniques may result in transfers in or out of an assigned level within the disclosure hierarchy. The aggregate value of investments by input level, as of November 30, 2013, is included at the end of the Fund's Schedule of Investments.
Foreign Currency. The Fund may use foreign currency contracts to facilitate transactions in foreign-denominated securities. Gains and losses from these transactions may arise from changes in the value of the foreign currency or if the counterparties do not perform under the contracts' terms.
Foreign-denominated assets, including investment securities, and liabilities are translated into U.S. dollars at the exchange rates at period end. Purchases and sales of investment securities, income and dividends received and expenses denominated in foreign currencies are translated into U.S. dollars at the exchange rate in effect on the transaction date.
The effects of exchange rate fluctuations on investments are included with the net realized and unrealized gain (loss) on investment securities. Other foreign currency transactions resulting in realized and unrealized gain (loss) are disclosed separately.
Investment Transactions and Income. For financial reporting purposes, the Fund's investment holdings and NAV include trades executed through the end of the last business day of the period. The NAV per share for processing shareholder transactions is calculated as of the close of business of the New York Stock Exchange (NYSE), normally 4:00 p.m. Eastern time and includes trades executed through the end of the prior business day. Gains and losses on securities sold are determined on the basis of identified cost and may include proceeds received from litigation. Dividend income is recorded on
Annual Report
Notes to Financial Statements - continued
(Amounts in thousands except percentages)
3. Significant Accounting Policies - continued
Investment Transactions and Income - continued
the ex-dividend date, except for certain dividends from foreign securities where the ex-dividend date may have passed, which are recorded as soon as the Fund is informed of the ex-dividend date. Non-cash dividends included in dividend income, if any, are recorded at the fair market value of the securities received. Distributions received on securities that represent a return of capital or capital gain are recorded as a reduction of cost of investments and/or as a realized gain. Subsequent to ex-dividend date the Fund determines the components of these distributions, based upon receipt of tax filings or other correspondence relating to the underlying investment. Interest income and distributions from the Fidelity Central Funds are accrued as earned. Interest income includes coupon interest and amortization of premium and accretion of discount on debt securities. Investment income is recorded net of foreign taxes withheld where recovery of such taxes is uncertain.
Class Allocations and Expenses. Investment income, realized and unrealized capital gains and losses, common expenses of the Fund, and certain fund-level expense reductions, if any, are allocated daily on a pro-rata basis to each class based on the relative net assets of each class to the total net assets of the Fund. Each class differs with respect to transfer agent and distribution and service plan fees incurred. Certain expense reductions may also differ by class. For the reporting period, the allocated portion of income and expenses to each class as a percent of its average net assets may vary due to the timing of recording these transactions in relation to fluctuating net assets of the classes. Expenses directly attributable to a fund are charged to that fund. Expenses attributable to more than one fund are allocated among the respective funds on the basis of relative net assets or other appropriate methods. Expense estimates are accrued in the period to which they relate and adjustments are made when actual amounts are known.
Income Tax Information and Distributions to Shareholders. Each year, the Fund intends to qualify as a regulated investment company under Subchapter M of the Internal Revenue Code, including distributing substantially all of its taxable income and realized gains. As a result, no provision for U.S. Federal income taxes is required. As of November 30, 2013, the Fund did not have any unrecognized tax benefits in the financial statements; nor is the Fund aware of any tax positions for which it is reasonably possible that the total amounts of unrecognized tax benefits will significantly change in the next twelve months. The Fund files a U.S. federal tax return, in addition to state and local tax returns as required. The Fund's federal income tax returns are subject to examination by the Internal Revenue Service (IRS) for a period of three fiscal years after they are filed. State and local tax returns may be subject to examination for an additional fiscal year
Annual Report
3. Significant Accounting Policies - continued
Income Tax Information and Distributions to Shareholders - continued
depending on the jurisdiction. Foreign taxes are provided for based on the Fund's understanding of the tax rules and rates that exist in the foreign markets in which it invests.
Distributions are declared and recorded on the ex-dividend date. Income dividends and capital gain distributions are declared separately for each class. Income and capital gain distributions are determined in accordance with income tax regulations, which may differ from GAAP. These differences resulted in distribution reclassifications.
Capital accounts within the financial statements are adjusted for permanent book-tax differences. These adjustments have no impact on net assets or the results of operations. Temporary book-tax differences will reverse in a subsequent period.
Book-tax differences are primarily due to foreign currency transactions, partnerships, market discount, deferred trustees compensation, capital loss carryforwards and losses deferred due to wash sales.
The federal tax cost of investment securities and unrealized appreciation (depreciation) as of period end were as follows:
|
Gross unrealized appreciation |
$ 471,566 |
|
Gross unrealized depreciation |
(21,450) |
|
Net unrealized appreciation (depreciation) on securities and other investments |
$ 450,116 |
|
|
|
|
Tax Cost |
$ 1,105,482 |
The tax-based components of distributable earnings as of period end were as follows:
|
Undistributed ordinary income |
$ 9,957 |
|
Capital loss carryforward |
$ (258,123) |
|
Net unrealized appreciation (depreciation) |
$ 450,116 |
Capital loss carryforwards are only available to offset future capital gains of the Fund to the extent provided by regulations and may be limited. Under the Regulated Investment Company Modernization Act of 2010 (the Act), the Fund is permitted to carry forward capital losses incurred in taxable years beginning after December 22, 2010 for an unlimited period and such capital losses are required to be used prior to any losses that expire.
Annual Report
Notes to Financial Statements - continued
(Amounts in thousands except percentages)
3. Significant Accounting Policies - continued
Income Tax Information and Distributions to Shareholders - continued
The capital loss carryforward information presented below, including any applicable limitation, is estimated as of fiscal period end and is subject to adjustment.
|
Fiscal year of expiration |
|
|
2016 |
$ (70,992) |
|
2017 |
(187,132) |
|
Total capital loss carryforward |
$ (258,123) |
The tax character of distributions paid was as follows:
|
|
November 30, 2013 |
November 30, 2012 |
|
Ordinary Income |
$ 3,993 |
$ 4,679 |
4. Purchases and Sales of Investments.
Purchases and sales of securities, other than short-term securities, aggregated $388,274 and $281,410, respectively.
5. Fees and Other Transactions with Affiliates.
Management Fee. Fidelity Management & Research Company (the investment adviser) and its affiliates provide the Fund with investment management related services for which the Fund pays a monthly management fee. The management fee is the sum of an individual fund fee rate that is based on an annual rate of .30% of the Fund's average net assets and an annualized group fee rate that averaged .25% during the period. The group fee rate is based upon the average net assets of all the mutual funds advised by the investment adviser, including any mutual funds previously advised by the investment adviser that are currently advised by Fidelity SelectCo, LLC, an affiliate of the investment adviser. The group fee rate decreases as assets under management increase and increases as assets under management decrease. In addition, the management fee is subject to a performance adjustment (up to a maximum of ± .20% of the Fund's average net assets over a 36 month performance period). The upward or downward adjustment to the management fee is based on the relative investment performance of Fidelity Value Strategies Fund as compared to an appropriate benchmark index over the same 36 month performance period. For the reporting period, the total annual management fee rate, including the performance adjustment, was .48% of the Fund's average net assets. The performance adjustment included in the management fee rate may be higher or lower than the maximum performance adjustment rate due to the difference between the average net assets for the reporting and performance periods.
Annual Report
5. Fees and Other Transactions with Affiliates - continued
Distribution and Service Plan Fees. In accordance with Rule 12b-1 of the 1940 Act, the Fund has adopted separate Distribution and Service Plans for each class of shares. Certain classes pay Fidelity Distributors Corporation (FDC), an affiliate of the investment adviser, separate Distribution and Service Fees, each of which is based on an annual percentage of each class' average net assets. In addition, FDC may pay financial intermediaries for selling shares of the Fund and providing shareholder support services. For the period, the Distribution and Service Fee rates, total fees and amounts retained by FDC were as follows:
|
|
Distribution |
Service |
Total Fees |
Retained |
|
Class A |
-% |
.25% |
$ 563 |
$ 10 |
|
Class T |
.25% |
.25% |
1,560 |
13 |
|
Class B |
.75% |
.25% |
119 |
90 |
|
Class C |
.75% |
.25% |
501 |
32 |
|
|
|
|
$ 2,743 |
$ 145 |
Sales Load. FDC may receive a front-end sales charge of up to 5.75% for selling Class A shares and 3.50% for selling Class T shares, some of which is paid to financial intermediaries for selling shares of the Fund. Depending on the holding period, FDC may receive contingent deferred sales charges levied on Class A, Class T, Class B, and Class C redemptions. The deferred sales charges range from 5.00% to 1.00% for Class B shares, 1.00% for Class C shares, 1.00% for certain purchases of Class A shares and .25% for certain purchases of Class T shares.
For the period, sales charge amounts retained by FDC were as follows:
|
|
Retained |
|
Class A |
$ 25 |
|
Class T |
11 |
|
Class B* |
9 |
|
Class C* |
1 |
|
|
$ 46 |
* When Class B and Class C shares are initially sold, FDC pays commissions from its own resources to financial intermediaries through which the sales are made.
Transfer Agent Fees. Fidelity Investments Institutional Operations Company, Inc., (FIIOC), an affiliate of the investment adviser, is the transfer, dividend disbursing and shareholder servicing agent for each class of the Fund. FIIOC receives account fees and asset-based fees that vary according to the account size and type of account of the shareholders of the respective classes of the Fund, except for Class K. FIIOC receives an
Annual Report
Notes to Financial Statements - continued
(Amounts in thousands except percentages)
5. Fees and Other Transactions with Affiliates - continued
Transfer Agent Fees - continued
asset-based fee of Class K's average net assets. FIIOC pays for typesetting, printing and mailing of shareholder reports, except proxy statements.
For the period, transfer agent fees for each class were as follows:
|
|
Amount |
% of |
|
Class A |
$ 581 |
.26 |
|
Class T |
621 |
.20 |
|
Class B |
36 |
.30 |
|
Class C |
128 |
.25 |
|
Fidelity Value Strategies Fund |
1,231 |
.20 |
|
Fidelity Value Strategies Fund Class K |
68 |
.05 |
|
Institutional Class |
156 |
.23 |
|
|
$ 2,821 |
|
Accounting and Security Lending Fees. Fidelity Service Company, Inc. (FSC), an affiliate of the investment adviser, maintains the Fund's accounting records. The accounting fee is based on the level of average net assets for each month. Under a separate contract, FSC administers the security lending program. The security lending fee is based on the number and duration of lending transactions.
Brokerage Commissions. The Fund placed a portion of its portfolio transactions with brokerage firms which are affiliates of the investment adviser. Brokerage commissions are included in net realized gain (loss) and change in net unrealized appreciation (depreciation) in the Statement of Operations. The commissions paid to these affiliated firms were $12 for the period.
6. Committed Line of Credit.
The Fund participates with other funds managed by the investment adviser or an affiliate in a $4.25 billion credit facility (the "line of credit") to be utilized for temporary or emergency purposes to fund shareholder redemptions or for other short-term liquidity purposes. The Fund has agreed to pay commitment fees on its pro-rata portion of the line of credit, which amounted to $3 and is reflected in Miscellaneous expenses on the Statement of Operations. During the period, there were no borrowings on this line of credit.
Annual Report
7. Security Lending.
The Fund lends portfolio securities through a lending agent from time to time in order to earn additional income. For equity securities, a lending agent is used and may loan securities to certain qualified borrowers, including Fidelity Capital Markets (FCM), a broker-dealer affiliated with the Fund. On the settlement date of the loan, the Fund receives collateral (in the form of U.S. Treasury obligations, letters of credit and/or cash) against the loaned securities and maintains collateral in an amount not less than 100% of the market value of the loaned securities during the period of the loan. The market value of the loaned securities is determined at the close of business of the Fund and any additional required collateral is delivered to the Fund on the next business day. If the borrower defaults on its obligation to return the securities loaned because of insolvency or other reasons, the Fund may apply collateral received from the borrower against the obligation. The Fund may experience delays and costs in recovering the securities loaned. Any cash collateral received is invested in the Fidelity Securities Lending Cash Central Fund. The value of loaned securities and cash collateral at period end are disclosed on the Fund's Statement of Assets and Liabilities. At period end, there were no security loans outstanding with FCM. Security lending income represents the income earned on investing cash collateral, less rebates paid to borrowers and any lending agent fees associated with the loan, plus any premium payments received for lending certain types of securities. Security lending income is presented in the Statement of Operations as a component of income from Fidelity Central Funds. Total security lending income during the period amounted to $547, including $47 from securities loaned to FCM.
8. Expense Reductions.
Commissions paid to certain brokers with whom the investment adviser, or its affiliates, places trades on behalf of the Fund include an amount in addition to trade execution, which may be rebated back to the Fund to offset certain expenses. This amount totaled $144 for the period.
In addition, the investment adviser reimbursed a portion of the Fund's operating expenses during the period in the amount of $6.
Annual Report
Notes to Financial Statements - continued
(Amounts in thousands except percentages)
9. Distributions to Shareholders.
Distributions to shareholders of each class were as follows:
|
Years ended November 30, |
2013 |
2012 |
|
From net investment income |
|
|
|
Class A |
$ 555 |
$ 998 |
|
Class T |
167 |
760 |
|
Fidelity Value Strategies Fund |
2,356 |
2,061 |
|
Fidelity Value Strategies Fund Class K |
520 |
448 |
|
Institutional Class |
395 |
412 |
|
Total |
$ 3,993 |
$ 4,679 |
10. Share Transactions.
Transactions for each class of shares were as follows:
|
|
Shares |
Dollars |
||
|
Years ended November 30, |
2013 |
2012 |
2013 |
2012 |
|
Class A |
|
|
|
|
|
Shares sold |
725 |
854 |
$ 22,684 |
$ 21,748 |
|
Reinvestment of distributions |
18 |
42 |
513 |
917 |
|
Shares redeemed |
(1,340) |
(1,927) |
(42,216) |
(48,930) |
|
Net increase (decrease) |
(597) |
(1,031) |
$ (19,019) |
$ (26,265) |
|
Class T |
|
|
|
|
|
Shares sold |
862 |
878 |
$ 28,085 |
$ 23,229 |
|
Reinvestment of distributions |
5 |
31 |
152 |
697 |
|
Shares redeemed |
(1,767) |
(2,697) |
(57,990) |
(69,951) |
|
Net increase (decrease) |
(900) |
(1,788) |
$ (29,753) |
$ (46,025) |
|
Class B |
|
|
|
|
|
Shares sold |
4 |
5 |
$ 123 |
$ 128 |
|
Shares redeemed |
(161) |
(292) |
(4,616) |
(6,718) |
|
Net increase (decrease) |
(157) |
(287) |
$ (4,493) |
$ (6,590) |
|
Class C |
|
|
|
|
|
Shares sold |
317 |
217 |
$ 8,968 |
$ 5,049 |
|
Shares redeemed |
(382) |
(454) |
(11,135) |
(10,427) |
|
Net increase (decrease) |
(65) |
(237) |
$ (2,167) |
$ (5,378) |
|
Fidelity Value Strategies Fund |
|
|
|
|
|
Shares sold |
11,897 |
5,614 |
$ 405,389 |
$ 163,914 |
|
Reinvestment of distributions |
73 |
81 |
2,266 |
1,967 |
|
Shares redeemed |
(7,881) |
(4,064) |
(279,142) |
(114,471) |
|
Net increase (decrease) |
4,089 |
1,631 |
$ 128,513 |
$ 51,410 |
Annual Report
10. Share Transactions - continued
|
|
Shares |
Dollars |
||
|
Years ended November 30, |
2013 |
2012 |
2013 |
2012 |
|
Fidelity Value Strategies Fund Class K |
|
|
|
|
|
Shares sold |
3,420 |
1,339 |
$ 116,082 |
$ 38,174 |
|
Reinvestment of distributions |
17 |
18 |
520 |
448 |
|
Shares redeemed |
(2,727) |
(943) |
(102,509) |
(26,603) |
|
Net increase (decrease) |
710 |
414 |
$ 14,093 |
$ 12,019 |
|
Institutional Class |
|
|
|
|
|
Shares sold |
776 |
903 |
$ 26,302 |
$ 25,700 |
|
Reinvestment of distributions |
11 |
17 |
327 |
392 |
|
Shares redeemed |
(1,082) |
(822) |
(35,829) |
(21,824) |
|
Net increase (decrease) |
(295) |
98 |
$ (9,200) |
$ 4,268 |
11. Other.
The Fund's organizational documents provide former and current trustees and officers with a limited indemnification against liabilities arising in connection with the performance of their duties to the Fund. In the normal course of business, the Fund may also enter into contracts that provide general indemnifications. The Fund's maximum exposure under these arrangements is unknown as this would be dependent on future claims that may be made against the Fund. The risk of material loss from such claims is considered remote.
Annual Report
Report of Independent Registered Public Accounting Firm
To the Trustees of Fidelity Advisor Series I and Shareholders of Fidelity Advisor Value Strategies Fund:
We have audited the accompanying statement of assets and liabilities of Fidelity Advisor Value Strategies Fund (the Fund), a fund of Fidelity Advisor Series I, including the schedule of investments, as of November 30, 2013, and the related statement of operations for the year then ended, the statement of changes in net assets for each of the two years in the period then ended, and the financial highlights for each of the five years in the period then ended. These financial statements and financial highlights are the responsibility of the Fund's management. Our responsibility is to express an opinion on these financial statements and financial highlights based on our audits.
We conducted our audits in accordance with the standards of the Public Company Accounting Oversight Board (United States). Those standards require that we plan and perform the audit to obtain reasonable assurance about whether the financial statements and financial highlights are free of material misstatement. The Fund is not required to have, nor were we engaged to perform, an audit of its internal control over financial reporting. Our audits included consideration of internal control over financial reporting as a basis for designing audit procedures that are appropriate in the circumstances, but not for the purpose of expressing an opinion on the effectiveness of the Fund's internal control over financial reporting. Accordingly, we express no such opinion. An audit also includes examining, on a test basis, evidence supporting the amounts and disclosures in the financial statements, assessing the accounting principles used and significant estimates made by management, as well as evaluating the overall financial statement presentation. Our procedures included confirmation of securities owned as of November 30, 2013, by correspondence with the custodians and brokers. We believe that our audits provide a reasonable basis for our opinion.
In our opinion, the financial statements and financial highlights referred to above present fairly, in all material respects, the financial position of Fidelity Advisor Value Strategies Fund as of November 30, 2013, the results of its operations for the year then ended, the changes in its net assets for each of the two years in the period then ended, and the financial highlights for each of the five years in the period then ended, in conformity with accounting principles generally accepted in the United States of America.
DELOITTE & TOUCHE LLP
Boston, Massachusetts
January 14, 2014
Annual Report
Trustees and Officers
The Trustees, Member of the Advisory Board, and officers of the trust and fund, as applicable, are listed below. The Board of Trustees governs the fund and is responsible for protecting the interests of shareholders. The Trustees are experienced executives who meet periodically throughout the year to oversee the fund's activities, review contractual arrangements with companies that provide services to the fund, oversee management of the risks associated with such activities and contractual arrangements, and review the fund's performance. Except for James C. Curvey, Ned C. Lautenbach, Ronald P. O'Hanley, and William S. Stavropoulos, each of the Trustees oversees 173 funds. Mr. Curvey oversees 396 Funds. Mr. Lautenbach, Mr. O'Hanley, and Mr. Stavropoulos each oversees 247 funds.
The Trustees hold office without limit in time except that (a) any Trustee may resign; (b) any Trustee may be removed by written instrument, signed by at least two-thirds of the number of Trustees prior to such removal; (c) any Trustee who requests to be retired or who has become incapacitated by illness or injury may be retired by written instrument signed by a majority of the other Trustees; and (d) any Trustee may be removed at any special meeting of shareholders by a two-thirds vote of the outstanding voting securities of the trust. Each Trustee who is not an interested person (as defined in the 1940 Act) of the trust and the fund (Independent Trustee), shall retire not later than the last day of the calendar year in which his or her 75th birthday occurs. The Independent Trustees may waive this mandatory retirement age policy with respect to individual Trustees. The officers and Advisory Board Member hold office without limit in time, except that any officer and Advisory Board Member may resign or may be removed by a vote of a majority of the Trustees at any regular meeting or any special meeting of the Trustees. Except as indicated, each individual has held the office shown or other offices in the same company for the past five years.
Experience, Skills, Attributes, and Qualifications of the Fund's Trustees. The Governance and Nominating Committee has adopted a statement of policy that describes the experience, qualifications, attributes, and skills that are necessary and desirable for potential Independent Trustee candidates (Statement of Policy). The Board believes that each Trustee satisfied at the time he or she was initially elected or appointed a Trustee, and continues to satisfy, the standards contemplated by the Statement of Policy. The Governance and Nominating Committee also engages professional search firms to help identify potential Independent Trustee candidates who have the experience, qualifications, attributes, and skills consistent with the Statement of Policy. From time to time, additional criteria based on the composition and skills of the current Independent Trustees, as well as experience or skills that may be appropriate in light of future changes to board composition, business conditions, and regulatory or other developments, have also been considered by the professional search firms and the Governance and Nominating Committee. In addition, the Board takes into account the Trustees' commitment and participation in Board and committee meetings, as well as their leadership of standing and ad hoc committees throughout their tenure.
Annual Report
Trustees and Officers - continued
In determining that a particular Trustee was and continues to be qualified to serve as a Trustee, the Board has considered a variety of criteria, none of which, in isolation, was controlling. The Board believes that, collectively, the Trustees have balanced and diverse experience, qualifications, attributes, and skills, which allow the Board to operate effectively in governing the fund and protecting the interests of shareholders. Information about the specific experience, skills, attributes, and qualifications of each Trustee, which in each case led to the Board's conclusion that the Trustee should serve (or continue to serve) as a trustee of the fund, is provided below.
Board Structure and Oversight Function. James C. Curvey is an interested person (as defined in the 1940 Act) and currently serves as Chairman. The Trustees have determined that an interested Chairman is appropriate and benefits shareholders because an interested Chairman has a personal and professional stake in the quality and continuity of services provided to the fund. Independent Trustees exercise their informed business judgment to appoint an individual of their choosing to serve as Chairman, regardless of whether the Trustee happens to be independent or a member of management. The Independent Trustees have determined that they can act independently and effectively without having an Independent Trustee serve as Chairman and that a key structural component for assuring that they are in a position to do so is for the Independent Trustees to constitute a substantial majority for the Board. The Independent Trustees also regularly meet in executive session. Ned C. Lautenbach serves as Chairman of the Independent Trustees and as such (i) acts as a liaison between the Independent Trustees and management with respect to matters important to the Independent Trustees and (ii) with management prepares agendas for Board meetings.
Fidelity funds are overseen by different Boards of Trustees. The fund's Board oversees Fidelity's equity and high income funds and another Board oversees Fidelity's investment-grade bond, money market, and asset allocation funds. The asset allocation funds may invest in Fidelity funds overseen by the fund's Board. The use of separate Boards, each with its own committee structure, allows the Trustees of each group of Fidelity funds to focus on the unique issues of the funds they oversee, including common research, investment, and operational issues. On occasion, the separate Boards establish joint committees to address issues of overlapping consequences for the Fidelity funds overseen by each Board.
The Trustees operate using a system of committees to facilitate the timely and efficient consideration of all matters of importance to the Trustees, the fund, and fund shareholders and to facilitate compliance with legal and regulatory requirements and oversight of the fund's activities and associated risks. The Board, acting through its committees, has charged FMR and its affiliates with (i) identifying events or circumstances the occurrence of which could have demonstrably adverse effects on the fund's business and/or reputation; (ii) implementing processes and controls to lessen the possibility that such events or circumstances occur or to mitigate the effects of such events or circumstances if they do occur; and (iii) creating and maintaining a system designed to evaluate continuously business and market conditions in order to facilitate the identification and implementation processes described in (i) and (ii) above. Because the day-to-day operations and activities of the fund are carried out by or through FMR, its affiliates and other service providers, the fund's exposure to risks is mitigated but not eliminated by the processes overseen by the Trustees. While each of the Board's committees has responsibility for overseeing different aspects of the fund's activities, oversight is exercised primarily through the Operations, Audit, and Compliance Committees. In addition, the Independent Trustees have worked with FMR to enhance the Board's oversight of investment and financial risks, legal and regulatory risks, technology risks, and operational risks, including the development of additional risk reporting to the Board. For example, a working group comprised of Independent Trustees and FMR has worked and continues to work to review the Fidelity funds' valuation-related activities, reporting and risk management. Appropriate personnel, including but not limited to the fund's Chief Compliance Officer (CCO), FMR's internal auditor, the independent accountants, the fund's Treasurer and portfolio management personnel, make periodic reports to the Board's committees, as appropriate, including an annual review of FMR's risk management program for the Fidelity funds. The responsibilities of each standing committee, including their oversight responsibilities, are described further under "Standing Committees of the Fund's Trustees."
Annual Report
The fund's Statement of Additional Information (SAI) includes more information about the Trustees. To request a free copy, call Fidelity at 1-877-208-0098.
Interested Trustees*:
Correspondence intended for each Trustee who is an interested person may be sent to Fidelity Investments, 245 Summer Street, Boston, Massachusetts 02210.
|
Name, Year of Birth; Principal Occupations and Other Relevant Experience+ |
|
|
James C. Curvey (1935) |
|
|
Year of Election or Appointment: 2007 Trustee Chairman of the Board of Trustees |
|
|
|
Mr. Curvey also serves as Trustee of other Fidelity funds. Mr. Curvey is a Director of Fidelity Investments Money Management, Inc. (2009-present), Director of Fidelity Research & Analysis Co. (2009-present) and Director of FMR and FMR Co., Inc. (2007-present). Mr. Curvey is also Vice Chairman (2007-present) and Director of FMR LLC. In addition, Mr. Curvey serves as an Overseer for the Boston Symphony Orchestra and a member of the Trustees of Villanova University. Previously, Mr. Curvey was the Vice Chairman (2006-2007) and Director (2000-2007) of FMR Corp. |
|
Ronald P. O'Hanley (1957) |
|
|
Year of Election or Appointment: 2011 Trustee |
|
|
|
Mr. O'Hanley also serves as Trustee of other Fidelity funds. He is Director of Fidelity SelectCo, LLC (2013-present), FMR Co., Inc. (2010-present), Director of Fidelity Investments Money Management, Inc. (2010-present), Director of Fidelity Research & Analysis Company (2010-present), President of Fidelity Asset Management and Corporate Services and a Member of Fidelity's Executive Committee (2010-present). Previously, Mr. O'Hanley served as President and Chief Executive Officer of BNY Mellon Asset Management (2007-2010). Mr. O'Hanley also served as Vice Chairman of Bank New York Mellon Corp. and a member of that firm's Executive Committee. Prior to the 2007 merger of The Bank of New York and Mellon Financial Corporation, he was Vice Chairman of Mellon Financial Corporation and President and Chief Executive Officer of Mellon Asset Management. He joined Mellon in February 1997. Mr. O'Hanley currently serves as Chairman of the Boston Public Library Foundation Board of Directors and sits on the Board of Directors of Beth Israel Deaconess Medical Center, the Board of Trustees of the Marine Biological Laboratory and the Advisory Board of the Maxwell School of Citizenship and Public Administration at Syracuse University. Mr. O'Hanley also chairs the Council on Asset Management for the Financial Services Roundtable and is a member of the Board of Directors of Institutional Investor's U.S. Institute. |
* Trustees have been determined to be "Interested Trustees" by virtue of, among other things, their affiliation with the trust or various entities under common control with FMR.
+ The information above includes each Trustee's principal occupation during the last five years and other information relating to the experience, attributes, and skills relevant to each Trustee's qualifications to serve as a Trustee, which led to the conclusion that each Trustee should serve as a Trustee for the fund.
Annual Report
Independent Trustees:
Correspondence intended for each Independent Trustee (that is, the Trustees other than the Interested Trustees) may be sent to Fidelity Investments, P.O. Box 55235, Boston, Massachusetts 02205-5235.
|
Name, Year of Birth; Principal Occupations and Other Relevant Experience+ |
|
|
Dennis J. Dirks (1948) |
|
|
Year of Election or Appointment: 2005 Trustee |
|
|
|
Mr. Dirks also serves as Trustee of other Fidelity funds. Prior to his retirement in May 2003, Mr. Dirks was Chief Operating Officer and a member of the Board of The Depository Trust & Clearing Corporation (DTCC). He also served as President, Chief Operating Officer, and Board member of The Depository Trust Company (DTC) and President and Board member of the National Securities Clearing Corporation (NSCC). In addition, Mr. Dirks served as Chief Executive Officer and Board member of the Government Securities Clearing Corporation, Chief Executive Officer and Board member of the Mortgage-Backed Securities Clearing Corporation, as a Trustee and a member of the Finance Committee of Manhattan College (2005-2008), and as a Trustee and a member of the Finance Committee of AHRC of Nassau County (2006-2008). Mr. Dirks is a member of the Independent Directors Council (IDC) Governing Council (2010-present) and Board of Directors for The Brookville Center for Children's Services, Inc. (2009-present). |
|
Alan J. Lacy (1953) |
|
|
Year of Election or Appointment: 2008 Trustee |
|
|
|
Mr. Lacy also serves as Trustee of other Fidelity funds. Mr. Lacy serves as Senior Adviser (2007-present) of Oak Hill Capital Partners, L.P. (private equity). Mr. Lacy also served as Chief Executive Officer (2000-2005) and Vice Chairman (2005-2006) of Sears Holdings Corporation and Sears, Roebuck and Co. (retail). In addition, Mr. Lacy serves as a member of the Board of Directors of Dave & Buster's Entertainment, Inc. (restaurant and entertainment complexes, 2010-present), Earth Fare, Inc. (retail grocery, 2012-present), The Hillman Companies, Inc. (hardware wholesalers, 2010-present), and Bristol-Myers Squibb Company (global pharmaceuticals, 2008-present). Mr. Lacy is a member of the Board of Trustees of The National Parks Conservation Association (2006-present). Previously, Mr. Lacy served as Chairman of the Board of Trustees of the National Parks Conservation Association (2008-2011) and as a member of the Board of Directors for the Western Union Company (global money transfer, 2006-2011). |
|
Ned C. Lautenbach (1944) |
|
|
Year of Election or Appointment: 2000 Trustee Chairman of the Independent Trustees |
|
|
|
Mr. Lautenbach also serves as Trustee of other Fidelity funds. Mr. Lautenbach currently serves as the Lead Director of the Eaton Corporation Board of Directors (diversified industrial, 1997-present). Mr. Lautenbach is Chairman of the Board of Directors of the Philharmonic Center for the Arts in Naples, Florida (2012-present) and a member of the Council on Foreign Relations (1994-present). Previously, Mr. Lautenbach was a Partner/Advisory Partner at Clayton, Dubilier & Rice, LLC (private equity investment, 1998-2010), as well as a Director of Sony Corporation (2006-2007). |
|
Joseph Mauriello (1944) |
|
|
Year of Election or Appointment: 2008 Trustee |
|
|
|
Mr. Mauriello also serves as Trustee of other Fidelity funds. Prior to his retirement in January 2006, Mr. Mauriello served in numerous senior management positions including Deputy Chairman and Chief Operating Officer (2004-2005), and Vice Chairman of Financial Services (2002-2004) of KPMG LLP US (professional services, 1965-2005). Mr. Mauriello currently serves as a member of the Board of Directors of XL Group plc. (global insurance and re-insurance, 2006-present). Previously, Mr. Mauriello served as a Director of the Hamilton Funds of the Bank of New York (2006-2007) and of Arcadia Resources Inc. (health care services and products, 2007-2012). |
|
Robert W. Selander (1950) |
|
|
Year of Election or Appointment: 2011 Trustee |
|
|
|
Mr. Selander also serves as Trustee of other Fidelity funds. Previously, Mr. Selander served as a Member of the Advisory Board of other Fidelity funds (2011), and Executive Vice Chairman (2010), Chief Executive Officer (2009-2010), and President and Chief Executive Officer (1997-2009) of Mastercard, Inc. |
|
Cornelia M. Small (1944) |
|
|
Year of Election or Appointment: 2005 Trustee |
|
|
|
Ms. Small also serves as Trustee of other Fidelity funds. Ms. Small is a member of the Board of Directors (2009-present) and Chair of the Investment Committee (2010-present) of the Teagle Foundation. Ms. Small also serves on the Investment Committee of the Berkshire Taconic Community Foundation (2008-present). Previously, Ms. Small served as Chairperson (2002-2008) and a member of the Investment Committee and Chairperson (2008-2012) and a member of the Board of Trustees of Smith College. In addition, Ms. Small served as Chief Investment Officer, Director of Global Equity Investments, and a member of the Board of Directors of Scudder, Stevens & Clark and Scudder Kemper Investments. |
|
William S. Stavropoulos (1939) |
|
|
Year of Election or Appointment: 2002 Trustee Vice Chairman of the Independent Trustees |
|
|
|
Mr. Stavropoulos also serves as Trustee of other Fidelity funds. Mr. Stavropoulos serves as President and Founder of the Michigan Baseball Foundation, the Great Lakes Loons (2007-present). Mr. Stavropoulos is Chairman Emeritus of the Board of Directors of The Dow Chemical Company, where he previously served in numerous senior management positions, including President, CEO (1995-2000; 2002-2004), Chairman of the Executive Committee (2000-2006), and as a member of the Board of Directors (1990-2006). Currently, Mr. Stavropoulos is Chairman of the Board of Directors of Univar Inc. (global distributor of commodity and specialty chemicals), a Director of Teradata Corporation (data warehousing and technology solutions), and Maersk Inc. (industrial conglomerate), and a member of the Advisory Board for Metalmark Capital LLC (private equity investment, 2005-present). Mr. Stavropoulos is an operating advisor to Clayton, Dubilier & Rice, LLC (private equity investment). In addition, Mr. Stavropoulos is a member of the University of Notre Dame Advisory Council for the College of Science, a Trustee of the Rollin L. Gerstacker Foundation, and a Director of the Naples Philharmonic Center for the Arts. Previously, Mr. Stavropoulos served as a Director of Chemical Financial Corporation (bank holding company, 1993-2012) and Tyco International, Ltd. (multinational manufacturing and services, 2007-2012). |
|
David M. Thomas (1949) |
|
|
Year of Election or Appointment: 2008 Trustee |
|
|
|
Mr. Thomas also serves as Trustee of other Fidelity funds. Mr. Thomas serves as Non-Executive Chairman of the Board of Directors of Fortune Brands Home and Security (home and security products, 2011-present), and as a member of the Board of Directors of Interpublic Group of Companies, Inc. (marketing communication, 2004-present). Previously, Mr. Thomas served as Executive Chairman (2005-2006) and Chairman and Chief Executive Officer (2000-2005) of IMS Health, Inc. (pharmaceutical and healthcare information solutions), and a Director of Fortune Brands, Inc. (consumer products, 2000-2011). |
+ The information above includes each Trustee's principal occupation during the last five years and other information relating to the experience, attributes, and skills relevant to each Trustee's qualifications to serve as a Trustee, which led to the conclusion that each Trustee should serve as a Trustee for the fund.
Advisory Board Member and Officers:
Correspondence intended for each officer and Peter S. Lynch may be sent to Fidelity Investments, 245 Summer Street, Boston, Massachusetts 02210. Officers appear below in alphabetical order.
|
Name, Year of Birth; Principal Occupation |
|
|
Peter S. Lynch (1944) |
|
|
Year of Election or Appointment: 2003 Member of the Advisory Board |
|
|
|
Mr. Lynch also serves as Member of the Advisory Board of other Fidelity funds. Mr. Lynch is Vice Chairman and a Director of FMR and FMR Co., Inc. In addition, Mr. Lynch serves as a Trustee of Boston College and as the Chairman of the Inner-City Scholarship Fund. Previously, Mr. Lynch served on the Special Olympics International Board of Directors (1997-2006). |
|
Elizabeth Paige Baumann (1968) |
|
|
Year of Election or Appointment: 2012 Anti-Money Laundering (AML) Officer |
|
|
|
Ms. Baumann also serves as AML Officer of other funds. She is Chief AML Officer of FMR LLC (2012-present) and is an employee of Fidelity Investments. Previously, Ms. Baumann served as Vice President and Deputy Anti-Money Laundering Officer (2007-2012). |
|
William C. Coffey (1969) |
|
|
Year of Election or Appointment: 2009 Assistant Secretary |
|
|
|
Mr. Coffey also serves as Assistant Secretary of other funds. He is Senior Vice President and Deputy General Counsel of FMR LLC (2010-present), and is an employee of Fidelity Investments. Previously, Mr. Coffey served as Vice President and Associate General Counsel of FMR LLC (2005-2009). |
|
Jonathan Davis (1968) |
|
|
Year of Election or Appointment: 2010 Assistant Treasurer |
|
|
|
Mr. Davis also serves as Assistant Treasurer of other funds. Mr. Davis is an employee of Fidelity Investments. Previously, Mr. Davis served as Vice President and Associate General Counsel of FMR LLC (2003-2010). |
|
Adrien E. Deberghes (1967) |
|
|
Year of Election or Appointment: 2008 Deputy Treasurer |
|
|
|
Mr. Deberghes also serves as an officer of other funds. He is an employee of Fidelity Investments (2008-present). Prior to joining Fidelity Investments, Mr. Deberghes was Senior Vice President of Mutual Fund Administration at State Street Corporation (2007-2008), Senior Director of Mutual Fund Administration at Investors Bank & Trust (2005-2007), and Director of Finance for Dunkin' Brands (2000-2005). |
|
Stephanie J. Dorsey (1969) |
|
|
Year of Election or Appointment: 2010 Assistant Treasurer |
|
|
|
Ms. Dorsey also serves as an officer of other funds. She is an employee of Fidelity Investments (2008-present) and has served in other fund officer roles. Prior to joining Fidelity Investments, Ms. Dorsey served as Treasurer (2004-2008) of the JPMorgan Mutual Funds and Vice President (2004-2008) of JPMorgan Chase Bank. |
|
Scott C. Goebel (1968) |
|
|
Year of Election or Appointment: 2008 Secretary and Chief Legal Officer (CLO) |
|
|
|
Mr. Goebel serves as Secretary and CLO of other funds. Mr. Goebel also serves as Secretary of Fidelity Investments Money Management, Inc. (FIMM) (2010-present) and Fidelity Research and Analysis Company (FRAC) (2010-present); General Counsel, Secretary, and Senior Vice President of FMR (2008-present) and FMR Co., Inc. (2008-present); Chief Legal Officer of Fidelity Management & Research (Hong Kong) Limited (2008-present) and Assistant Secretary of Fidelity Management & Research (Japan) Inc. (2008-present), and Fidelity Management & Research (U.K.) Inc. (2008-present). Previously, Mr. Goebel served as Secretary and CLO of other Fidelity funds (2008-2013), Assistant Secretary of FIMM (2008-2010), FRAC (2008-2010), and certain funds (2007-2008); and as Vice President and Secretary of Fidelity Distributors Corporation (FDC) (2005-2007). Mr. Goebel has been employed by FMR LLC or an affiliate since 2001. |
|
Joseph A. Hanlon (1968) |
|
|
Year of Election or Appointment: 2012 Chief Compliance Officer |
|
|
|
Mr. Hanlon also serves as Chief Compliance Officer of other funds. Mr. Hanlon serves as Compliance Officer of FMR, FMR Co., Inc., Fidelity Investments Money Management, Inc. (FIMM), Fidelity Research and Analysis Company (FRAC), and Fidelity Management & Research (Hong Kong) (2009-present), as Senior Vice President of the Fidelity Asset Management Division (2009-present), and is an employee of Fidelity Investments. Previously, Mr. Hanlon served as Compliance Officer of Fidelity Management & Research (Japan) Inc. (2009-2013), Strategic Advisers, Inc. (2009-2013), and Fidelity Management & Research (U.K.) Inc. (2009-2013). |
|
Thomas C. Hense (1964) |
|
|
Year of Election or Appointment: 2008/2010 Vice President |
|
|
|
Mr. Hense also serves as Vice President of other funds (High Income (2008), Small Cap (2008), and Value (2010) funds). Previously, Mr. Hense served as a portfolio manager for Fidelity's Institutional Money Management Group (Pyramis) (2003-2008). |
|
Brian B. Hogan (1964) |
|
|
Year of Election or Appointment: 2009 Vice President |
|
|
|
Mr. Hogan also serves as Vice President of other funds. Mr. Hogan serves as President of FMR's Equity Division (2009-present). Previously, Mr. Hogan served as Senior Vice President, Equity Research of FMR (2006-2009) and as a portfolio manager. |
|
Chris Maher (1972) |
|
|
Year of Election or Appointment: 2013 Assistant Treasurer |
|
|
|
Mr. Maher serves as Assistant Treasurer of other funds. Mr. Maher is Vice President of Valuation Oversight and is an employee of Fidelity Investments. Previously, Mr. Maher served as Vice President of Asset Management Compliance (2013), Vice President of FMR's Program Management Group (2010-2013), and Vice President of Valuation Oversight (2008-2010). |
|
Christine Reynolds (1958) |
|
|
Year of Election or Appointment: 2008 Chief Financial Officer |
|
|
|
Ms. Reynolds also serves as Chief Financial Officer of other funds. Ms. Reynolds became President of Fidelity Pricing and Cash Management Services (FPCMS) in August 2008. Ms. Reynolds served as Chief Operating Officer of FPCMS (2007-2008). Previously, Ms. Reynolds served as President, Treasurer, and Anti-Money Laundering officer of the Fidelity funds (2004-2007). |
|
Kenneth B. Robins (1969) |
|
|
Year of Election or Appointment: 2008 President and Treasurer |
|
|
|
Mr. Robins also serves as an officer of other funds. Mr. Robins serves as Executive Vice President of Fidelity Investments Money Management, Inc. (FIMM) (2013-present) and is an employee of Fidelity Investments (2004-present). Previously, Mr. Robins served in other fund officer roles. |
|
Gary W. Ryan (1958) |
|
|
Year of Election or Appointment: 2005 Assistant Treasurer |
|
|
|
Mr. Ryan also serves as Assistant Treasurer of other funds. Mr. Ryan is an employee of Fidelity Investments and has served in other fund officer roles. Previously, Mr. Ryan served as Vice President of Fund Reporting in Fidelity Pricing and Cash Management Services (FPCMS) (1999-2005). |
|
Stephen Sadoski (1971) |
|
|
Year of Election or Appointment: 2012 Deputy Treasurer |
|
|
|
Mr. Sadoski also serves as Deputy Treasurer of other funds. He is an employee of Fidelity Investments (2012-present) and has served in another fund officer role. Prior to joining Fidelity Investments, Mr. Sadoski served as an assistant chief accountant in the Division of Investment Management of the Securities and Exchange Commission (SEC) (2009-2012) and as a senior manager at Deloitte & Touche LLP (1997-2009). |
|
Stacie M. Smith (1974) |
|
|
Year of Election or Appointment: 2013 Deputy Treasurer |
|
|
|
Ms. Smith also serves as an officer of other funds. She is an employee of Fidelity Investments (2009-present) and has served in other fund officer roles. Prior to joining Fidelity Investments, Ms. Smith served as Senior Audit Manager of Ernst & Young LLP (1996-2009). |
|
Renee Stagnone (1975) |
|
|
Year of Election or Appointment: 2013 Deputy Treasurer |
|
|
|
Ms. Stagnone also serves as Deputy Treasurer of other funds. Ms. Stagnone is an employee of Fidelity Investments. |
|
Joseph F. Zambello (1957) |
|
|
Year of Election or Appointment: 2011 Deputy Treasurer |
|
|
|
Mr. Zambello also serves as Deputy Treasurer of other funds. Mr. Zambello is an employee of Fidelity Investments. Previously, Mr. Zambello served as Vice President of FMR's Program Management Group (2009-2011) and Vice President of the Transfer Agent Oversight Group (2005-2009). |
Annual Report
Distributions (Unaudited)
Class I designates 100% of the dividends distributed during the fiscal year as qualifying for the dividends-received deduction for corporate shareholders.
Class I designates 100% of the dividend distributed during the fiscal year as amounts which may be taken into account as a dividend for purposes of the maximum rate under section 1(h)(11) of the Internal Revenue Code.
The fund will notify shareholders in January 2014 of amounts for use in preparing 2013 income tax returns.
Annual Report
Board Approval of Investment Advisory Contracts and Management Fees
Fidelity Advisor Value Strategies Fund
Each year, the Board of Trustees, including the Independent Trustees (together, the Board), votes on the renewal of the management contract and sub-advisory agreements (together, the Advisory Contracts) for the fund. The Board, assisted by the advice of fund counsel and Independent Trustees' counsel, requests and considers a broad range of information relevant to the renewal of the Advisory Contracts throughout the year.
The Board meets regularly and, at each of its meetings, covers an extensive agenda of topics and materials and considers factors that are relevant to its annual consideration of the renewal of the fund's Advisory Contracts, including the services and support provided to the fund and its shareholders. The Board has established various standing committees, each composed of and chaired by Independent Trustees with varying backgrounds, to which the Board has assigned specific subject matter responsibilities in order to enhance effective decision-making by the Board. The Board, acting directly and through its Committees, requests and receives information concerning the annual consideration of the renewal of the fund's Advisory Contracts. The Board also meets as needed to consider matters specifically related to the Board's annual consideration of the renewal of Advisory Contracts. Members of the Board may also meet with trustees of other Fidelity funds through ad hoc joint committees to discuss certain matters relevant to the Fidelity funds.
At its July 2013 meeting, the Board, including the Independent Trustees, unanimously determined to renew the fund's Advisory Contracts. In reaching its determination, the Board considered all factors it believed relevant, including (i) the nature, extent, and quality of the services to be provided to the fund and its shareholders (including the investment performance of the fund); (ii) the competitiveness of the fund's management fee and total expense ratio relative to peer funds; (iii) the total costs of the services to be provided by and the profits to be realized by Fidelity from its relationship with the fund; (iv) the extent to which economies of scale exist and would be realized as the fund grows; and (v) whether fee levels reflect these economies of scale, if any, for the benefit of fund shareholders.
In considering whether to renew the Advisory Contracts for the fund, the Board reached a determination, with the assistance of fund counsel and Independent Trustees' counsel and through the exercise of its business judgment, that the renewal of the Advisory Contracts was in the best interests of the fund and its shareholders and that the compensation payable under the Advisory Contracts was fair and reasonable. The Board's decision to renew the Advisory Contracts was not based on any single factor, but rather was based on a comprehensive consideration of all the information provided to the Board at its meetings throughout the year. The Board, in reaching its determination to renew the Advisory Contracts, was aware that shareholders in the fund have a broad range of investment choices available to them, including a wide choice among mutual funds offered by Fidelity's competitors, and that the fund's shareholders, who have the opportunity to review and weigh the disclosure provided by the fund in its prospectus and other public disclosures, have chosen to invest in this fund, which is a part of the Fidelity family of funds.
Annual Report
Nature, Extent, and Quality of Services Provided. The Board considered the staffing within the investment adviser, Fidelity Management & Research Company (FMR), and the sub-advisers (together, the Investment Advisers) as it relates to the fund, including the backgrounds of the fund's investment personnel, and also considered the fund's investment objective, strategies, and related investment philosophy. The Independent Trustees also had discussions with senior management of Fidelity's investment operations and investment groups. The Board considered the structure of the portfolio manager compensation program and whether this structure provides appropriate incentives to act in the best interests of the fund.
Resources Dedicated to Investment Management and Support Services. The Board and the Fund Oversight and Research Committees reviewed the general qualifications and capabilities of the Investment Advisers' investment staff, including its size, education, experience, and resources, as well as the Investment Advisers' approach to recruiting, training, managing, and compensating investment personnel. The Board noted that FMR has continued to increase the resources devoted to non-U.S. offices, including expansion of Fidelity's global investment organization. The Board also noted that Fidelity's analysts have extensive resources, tools and capabilities that allow them to conduct sophisticated quantitative and fundamental analysis, as well as credit analysis of issuers, counterparties and guarantors. Further, the Board believes that Fidelity's investment professionals have sufficient access to global information and data so as to provide competitive investment results over time, and that those professionals also have access to sophisticated tools that permit them to assess portfolio construction and risk and performance attribution characteristics continuously, as well as to transmit new information and research conclusions rapidly around the world. Additionally, in its deliberations, the Board considered the Investment Advisers' trading and risk management capabilities and resources, which are an integral part of the investment management process.
Shareholder and Administrative Services. The Board considered (i) the nature, extent, quality, and cost of advisory, administrative, and shareholder services performed by the Investment Advisers and their affiliates under the Advisory Contracts and under separate agreements covering transfer agency, pricing and bookkeeping, and securities lending services for the fund; (ii) the nature and extent of the supervision of third party service providers, principally custodians and subcustodians; and (iii) the resources devoted to, and the record of compliance with, the fund's compliance policies and procedures. The Board also reviewed the allocation of fund brokerage, including allocations to brokers affiliated with the Investment Advisers, the use of brokerage commissions to pay fund expenses, and the use of "soft" commission dollars to pay for research services.
Annual Report
Board Approval of Investment Advisory Contracts and
Management Fees - continued
The Board noted that the growth of fund assets over time across the complex allows Fidelity to reinvest in the development of services designed to enhance the value or convenience of the Fidelity funds as investment vehicles. These services include 24-hour access to account information and market information through telephone representatives and over the Internet, investor education materials and asset allocation tools, and the expanded availability of Fidelity Investor Centers.
Investment in a Large Fund Family. The Board considered the benefits to shareholders of investing in a Fidelity fund, including the benefits of investing in a fund that is part of a large family of funds offering a variety of investment disciplines and providing a large variety of mutual fund investor services. The Board noted that Fidelity had taken, or had made recommendations that resulted in the Fidelity funds taking, a number of actions over the previous year that benefited particular funds, including (i) continuing to dedicate additional resources to investment research and to the support of the senior management team that oversees asset management; (ii) persisting in efforts to enhance Fidelity's global research capabilities; (iii) launching new funds and making other enhancements to meet client needs for global and income-oriented solutions; (iv) continuing to launch dedicated lower cost underlying funds to meet portfolio construction needs related to expanding underlying fund options for Fidelity funds of funds, specifically for the Freedom Fund product lines; (v) rationalizing product lines and gaining increased efficiencies through the mergers of several funds into other funds; (vi) strengthening Fidelity's index fund offerings by reducing investment minimums and adopting or lowering existing expense caps for certain funds and classes; (vii) enhancing Global Asset Allocation product offerings by launching new funds and strategies, including "open architecture" target date funds that utilize affiliated and unaffiliated sub-advisers; (viii) modifying the eligibility criteria for Institutional Class shares of Advisor funds to increase their marketability to a portion of the defined contribution plan market; (ix) creating a new low-cost retirement share class for certain Advisor funds to appeal to large retirement plans; (x) transitioning the management of certain Fidelity commodity funds to Geode Capital Management LLC, a registered commodity pool operator, while retaining administrative responsibilities for the funds; (xi) reorganizing a number of funds; and (xii) taking steps toward establishing a new Fidelity adviser to manage sector-based funds and products.
Investment Performance. The Board considered whether the fund has operated in accordance with its investment objective, as well as its record of compliance with its investment restrictions and its performance history.
The Board took into account discussions with the Investment Advisers about fund investment performance that occur at Board meetings throughout the year. In this regard the Board noted that as part of regularly scheduled fund reviews and other reports to the Board on fund performance, the Board periodically considers annualized return information for the fund, for different time periods, measured against a securities market index ("benchmark index") and a peer group of mutual funds with similar objectives ("peer group"). In its evaluation of fund investment performance, the Board gave particular attention to information indicating changes in performance of certain Fidelity funds for specific time periods and the Investment Advisers' explanations for any overperformance or underperformance.
Annual Report
In addition to reviewing absolute and relative fund performance, the Independent Trustees periodically consider the appropriateness of fund performance metrics in evaluating the results achieved. In general, the Independent Trustees believe that fund performance should be evaluated based on net performance (after fees and expenses) of both the highest performing and lowest performing classes, where applicable, compared to appropriate benchmark indices, over appropriate time periods which may include full market cycles, and compared to peer groups, as applicable, over the same periods, taking into account relevant factors including the following: general market conditions; issuer-specific information; tactical opportunities for investment; and fund cash flows and other factors.
The Independent Trustees recognize that shareholders evaluate performance on a net basis over their own holding periods, for which one-, three-, and five-year periods are used as a proxy. For this reason, the performance information reviewed by the Board also included net cumulative calendar year total return information for the fund and an appropriate benchmark index and peer group for the most recent one-, three-, and five-year periods, as shown below. Returns are shown compared to the 25th percentile (top of box) and 75th percentile (bottom of box) of the peer universe.
Annual Report
Board Approval of Investment Advisory Contracts and
Management Fees - continued
Fidelity Advisor Value Strategies Fund

The Board also considered that the fund's management fee is subject to upward or downward adjustment depending upon whether, and to what extent, the fund's investment performance for the performance period exceeds, or is exceeded by, a securities index, thus leading to a performance adjustment for the same period. The Board noted that the performance adjustment provides FMR with a strong economic incentive to seek to achieve superior performance for the fund's shareholders and helps to more closely align the interests of FMR and the fund's shareholders.
Based on its review, the Board concluded that the nature, extent, and quality of services provided to the fund under the Advisory Contracts should benefit the fund's shareholders.
Competitiveness of Management Fee and Total Expense Ratio. The Board considered the fund's management fee and total expense ratio compared to "mapped groups" of competitive funds and classes. Fidelity creates "mapped groups" by combining similar Lipper investment objective categories that have comparable management fee characteristics. Combining Lipper investment objective categories aids the Board's management fee and total expense ratio comparisons by broadening the competitive group used for comparison and by reducing the number of universes to which various Fidelity funds are compared.
Management Fee. The Board considered two proprietary management fee comparisons for the 12-month periods shown in the chart below. The group of Lipper funds used by the Board for management fee comparisons is referred to below as the "Total Mapped Group." The Total Mapped Group comparison focuses on a fund's standing in terms of gross management fees before expense reimbursements or caps, and without giving effect to the fund's performance adjustment, relative to the total universe of funds with comparable investment mandates, regardless of whether their management fee structures also are comparable. Funds with comparable investment mandates offer exposure to similar types of securities. Funds with comparable management fee structures have similar management fee contractual arrangements (e.g., flat rate charged for advisory services, all-inclusive fee rate, etc.). "TMG %" represents the percentage of funds in the Total Mapped Group that had management fees that were lower than the fund's. For example, a TMG % of 11% means that 89% of the funds in the Total Mapped Group had higher management fees than the fund. The "Asset-Size Peer Group" (ASPG) comparison focuses on a fund's standing relative to a subset of non-Fidelity funds within the Total Mapped Group that are similar in size and management fee structure. The ASPG represents at least 15% of the funds in the Total Mapped Group with comparable asset size and management fee structures, subject to a minimum of 50 funds (or all funds in the Total Mapped Group if fewer than 50). Additional information, such as the ASPG quartile in which the fund's management fee ranked and the impact of the fund's performance adjustment, is also included in the chart and considered by the Board.
Annual Report
Fidelity Advisor Value Strategies Fund

The Board noted that the fund's management fee ranked below the median of its Total Mapped Group and below the median of its ASPG for 2012. The Board also noted the effect of the fund's positive performance adjustment on the fund's management fee ranking.
Annual Report
Board Approval of Investment Advisory Contracts and
Management Fees - continued
Based on its review, the Board concluded that the fund's management fee is fair and reasonable in light of the services that the fund receives and the other factors considered.
Total Expense Ratio. In its review of each class's total expense ratio, the Board considered the fund's management fee as well as other fund or class expenses, as applicable, such as transfer agent fees, pricing and bookkeeping fees, fund-paid 12b-1 fees, and custodial, legal, and audit fees. The Board also noted the effects of any waivers and reimbursements on fees and expenses, as well as the impact of the fund's performance adjustment. As part of its review, the Board also considered the current and historical total expense ratios of each class of the fund compared to competitive fund median expenses. Each class of the fund is compared to those funds and classes in the Total Mapped Group (used by the Board for management fee comparisons) that have a similar sales load structure.
The Board noted that the total expense ratio of each of Class A, Class B, Class C, Institutional Class, the retail class, and Class K ranked below its competitive median for 2012 and the total expense ratio of Class T ranked above its competitive median for 2012. The Board considered that, in general, various factors can affect total expense ratios. The Board noted that the total expense ratio of Class T was above the competitive median primarily because of higher 12b-1 fees on Class T. Class T has a higher 12b-1 fee, but a lower front-end sales charge, than traditionally priced front-end sales charge classes. The Board considered that Class T is primarily sold load-waived in the retirement plan market where its 0.50% 12b-1 fee is comparable to competing no-load, higher 12b-1 fee classes designed specifically for retirement plans. The Board noted that the fund offers multiple classes, each of which has a different sales load and 12b-1 fee structure, and that the multiple structures are intended to offer a range of pricing options for the intermediary market. The Board also noted that the total expense ratios of the classes vary primarily by the level of their 12b-1 fees, although differences in transfer agent fees may also cause expenses to vary from class to class.
Fees Charged to Other Fidelity Clients. The Board also considered Fidelity fee structures and other information with respect to clients of FMR and its affiliates, such as other mutual funds advised or subadvised by FMR or its affiliates, pension plan clients, and other institutional clients. The Board noted the findings of the 2013 ad hoc joint committee (created with the board of other Fidelity funds), which reviewed and compared Fidelity's institutional investment advisory business with its business of providing services to the Fidelity funds, including the differences in services provided, fees charged, and costs incurred, as well as competition in their respective marketplaces.
Based on its review of total expense ratios and fees charged to other Fidelity clients, the Board concluded that the total expense ratio of each class of the fund was reasonable, although Class T was above the median of the universe presented for comparison, in light of the services that the fund and its shareholders receive and the other factors considered.
Annual Report
Costs of the Services and Profitability. The Board considered the revenues earned and the expenses incurred by Fidelity in conducting the business of developing, marketing, distributing, managing, administering and servicing the fund and servicing the fund's shareholders. The Board also considered the level of Fidelity's profits in respect of all the Fidelity funds.
On an annual basis, FMR presents to the Board Fidelity's profitability for the fund. Fidelity calculates the profitability for each fund, as well as aggregate profitability for groups of Fidelity funds and all Fidelity funds, using a series of detailed revenue and cost allocation methodologies which originate with the books and records of Fidelity on which Fidelity's audited financial statements are based. The Audit Committee of the Board reviews any significant changes from the prior year's methodologies.
PricewaterhouseCoopers LLP (PwC), independent registered public accounting firm and auditor to Fidelity and certain Fidelity funds, has been engaged annually by the Board as part of the Board's assessment of Fidelity's profitability analysis. PwC's engagement includes the review and assessment of the methodologies used by Fidelity in determining the revenues and expenses attributable to Fidelity's mutual fund business, and completion of agreed-upon procedures surrounding the mathematical accuracy of fund profitability and its conformity to allocation methodologies. After considering PwC's reports issued under the engagement and information provided by Fidelity, the Board concluded that while other allocation methods may also be reasonable, Fidelity's profitability methodologies are reasonable in all material respects.
The Board also reviewed Fidelity's non-fund businesses and fall-out benefits related to the mutual fund business as well as cases where Fidelity's affiliates may benefit from or be related to the fund's business.
The Board considered the costs of the services provided by and the profits realized by Fidelity in connection with the operation of the fund and was satisfied that the profitability was not excessive in the circumstances.
Economies of Scale. The Board considered whether there have been economies of scale in respect of the management of the Fidelity funds, whether the Fidelity funds (including the fund) have appropriately benefited from any such economies of scale, and whether there is potential for realization of any further economies of scale. The Board considered the extent to which the fund will benefit from economies of scale through increased services to the fund, through waivers or reimbursements, or through fee or expense reductions. The Board also noted that in 2009, it and the board of other Fidelity funds created an ad hoc committee (the Economies of Scale Committee) to analyze whether FMR attains economies of scale in respect of the management and servicing of the Fidelity funds, whether the Fidelity funds have appropriately benefited from such economies of scale, and whether there is potential for realization of any further economies of scale.
Annual Report
Board Approval of Investment Advisory Contracts and
Management Fees - continued
The Board recognized that the fund's management contract incorporates a "group fee" structure, which provides for lower group fee rates as total fund assets under FMR's management increase, and for higher group fee rates as total fund assets under FMR's management decrease. FMR calculates the group fee rates based on a tiered asset "breakpoint" schedule that varies based on asset class. The Board considered that the group fee is designed to deliver the benefits of economies of scale to fund shareholders when total Fidelity fund assets increase, even if assets of any particular fund are unchanged or have declined, because some portion of Fidelity's costs are attributable to services provided to all Fidelity funds, and all funds benefit if those costs can be allocated among more assets. The Board concluded that, given the group fee structure, fund shareholders will benefit from lower management fees as assets under FMR's management increase at the fund complex level, regardless of whether Fidelity achieves any such economies of scale.
The Board concluded, taking into account the analysis of the Economies of Scale Committee, that economies of scale, if any, are being appropriately shared between fund shareholders and Fidelity.
Amendment to Description of Group Fee Rate. At its July 2013 meeting, the Board voted to approve an amendment to the fund's management contract to modify the description of the "group fee rate" effective August 1, 2013. The Board noted that under the prior description in the contract, the group fee rate was based on the average net assets of all registered investment companies with which FMR has management contracts. Under the contract's tiered asset breakpoint schedule, the group fee rate is lower as total fund assets under FMR's management increase, and higher as total fund assets under FMR's management decrease. The Board considered that the prior description would have excluded the assets of 64 Fidelity sector funds from the group fee rate calculation once Fidelity SelectCo, LLC, an affiliate of FMR, assumed management responsibilities for those funds. The Board noted that modifying the description of the group fee rate to continue to include the assets of those 64 funds for purposes of determining group fee rate breakpoints would avoid an immediate adverse impact on the group fee rate for any fund.
Additional Information Requested by the Board. In order to develop fully the factual basis for consideration of the Fidelity funds' Advisory Contracts, the Board requested and received additional information on certain topics, including: (i) fund performance trends and Fidelity's long-term strategies for certain funds; (ii) the potential to further rationalize the Fidelity fund lineup with the possibility of achieving savings for the funds and Fidelity; (iii) the methodology with respect to competitive fund data and peer group classifications; (iv) the arrangements with, and performance of, certain sub-advisers on behalf of the Fidelity funds, as well as certain proposed participating affiliate arrangements; (v) the realization of fall-out benefits in certain Fidelity business units; (vi) Fidelity's group fee structures, including the rationale for the individual fee rates of certain categories of funds and the definition of group assets; (vii) trends regarding industry use of performance fee structures and the performance adjustment methodologies applicable to the Fidelity funds; (viii) additional competitive analysis regarding the total expenses for certain classes; and (ix) fund profitability methodology, including Fidelity's cost allocation methodology, and the impact of certain factors on fund profitability results.
Annual Report
Based on its evaluation of all of the conclusions noted above, and after considering all factors it believed relevant, the Board ultimately concluded that the advisory fee structures are fair and reasonable, and that the fund's Advisory Contracts should be renewed.
Annual Report
Investment Adviser
Fidelity Management & Research Company
Boston, MA
Investment Sub-Advisers
FMR Co., Inc.
Fidelity Management & Research (U.K.) Inc.
Fidelity Management & Research
(Japan) Inc.
Fidelity Management & Research
(Hong Kong) Limited
General Distributor
Fidelity Distributors Corporation
Smithfield, RI
Transfer and Service Agents
Fidelity Investments Institutional Operations Company, Inc.
Boston, MA
Fidelity Service Company, Inc.
Boston, MA
Custodian
Brown Brothers Harriman & Co.
Boston, MA
(Fidelity Investment logo)(registered trademark)
ISO-UANN-0114 1.786702.110
Fidelity® Value Strategies Fund
Class K
(A Class of Fidelity Advisor® Value (Fidelity Investment logo)(registered trademark)
Strategies Fund)
Annual Report
November 30, 2013
(Fidelity Cover Art)
Contents
|
Performance |
How the fund has done over time. |
|
|
Management's Discussion of Fund Performance |
The Portfolio Manager's review of fund performance and strategy. |
|
|
Shareholder Expense Example |
An example of shareholder expenses. |
|
|
Investment Changes |
A summary of major shifts in the fund's investments over the past six months. |
|
|
Investments |
A complete list of the fund's investments with their market values. |
|
|
Financial Statements |
Statements of assets and liabilities, operations, and changes in net assets, as well as financial highlights. |
|
|
Notes |
Notes to the financial statements. |
|
|
Report of Independent Registered Public Accounting Firm |
|
|
|
Trustees and Officers |
|
|
|
Distributions |
|
|
|
Board Approval of Investment Advisory Contracts and Management Fees |
|
To view a fund's proxy voting guidelines and proxy voting record for the 12-month period ended June 30, visit http://www.fidelity.com/proxyvotingresults or visit the Securities and Exchange Commission's (SEC) web site at http://www.sec.gov. You may also call 1-800-835-5092 to request a free copy of the proxy voting guidelines.
Standard & Poor's, S&P and S&P 500 are registered service marks of The McGraw-Hill Companies, Inc. and have been licensed for use by Fidelity Distributors Corporation.
Other third-party marks appearing herein are the property of their respective owners.
All other marks appearing herein are registered or unregistered trademarks or service marks of FMR LLC or an affiliated company. © 2014 FMR LLC. All rights reserved.
Annual Report
This report and the financial statements contained herein are submitted for the general information of the shareholders of the fund. This report is not authorized for distribution to prospective investors in the fund unless preceded or accompanied by an effective prospectus.
A fund files its complete schedule of portfolio holdings with the SEC for the first and third quarters of each fiscal year on Form N-Q. Forms N-Q are available on the SEC's web site at http://www.sec.gov. A fund's Forms N-Q may be reviewed and copied at the SEC's Public Reference Room in Washington, DC. Information regarding the operation of the SEC's Public Reference Room may be obtained by calling 1-800-SEC-0330. For a complete list of a fund's portfolio holdings, view the most recent holdings listing, semiannual report, or annual report on Fidelity's web site at http://www.fidelity.com, http://www.advisor.fidelity.com, or http://www.401k.com, as applicable.
NOT FDIC INSURED • MAY LOSE VALUE • NO BANK GUARANTEE
Neither the fund nor Fidelity Distributors Corporation is a bank.
Annual Report
Performance: The Bottom Line
Average annual total return reflects the change in the value of an investment, assuming reinvestment of the class' distributions from dividend income and capital gains (the profits earned upon the sale of securities that have grown in value, if any) and assuming a constant rate of performance each year. The $10,000 table and the fund's returns do not reflect the deduction of taxes that a shareholder would pay on fund distributions or the redemption of fund shares. During periods of reimbursement by Fidelity, a fund's total return will be greater than it would be had the reimbursement not occurred. How a fund did yesterday is no guarantee of how it will do tomorrow.
Average Annual Total Returns
|
Periods ended November 30, 2013 |
Past 1 |
Past 5 |
Past 10 |
|
Fidelity® Value Strategies Fund Class K A |
31.34% |
25.98% |
7.75% |
A The initial offering of Fidelity® Value Strategies Fund Class K shares took place on May 9, 2008. Returns prior to May 9, 2008, are those of Fidelity Value Strategies Fund, the original class of the fund.
$10,000 Over 10 Years
Let's say hypothetically that $10,000 was invested in Fidelity Value Strategies Fund Class K on November 30, 2003. The chart shows how the value of your investment would have changed, and also shows how the Russell Midcap® Value Index performed over the same period. See footnote A above for additional information regarding the performance of Fidelity Value Strategies Fund Class K.
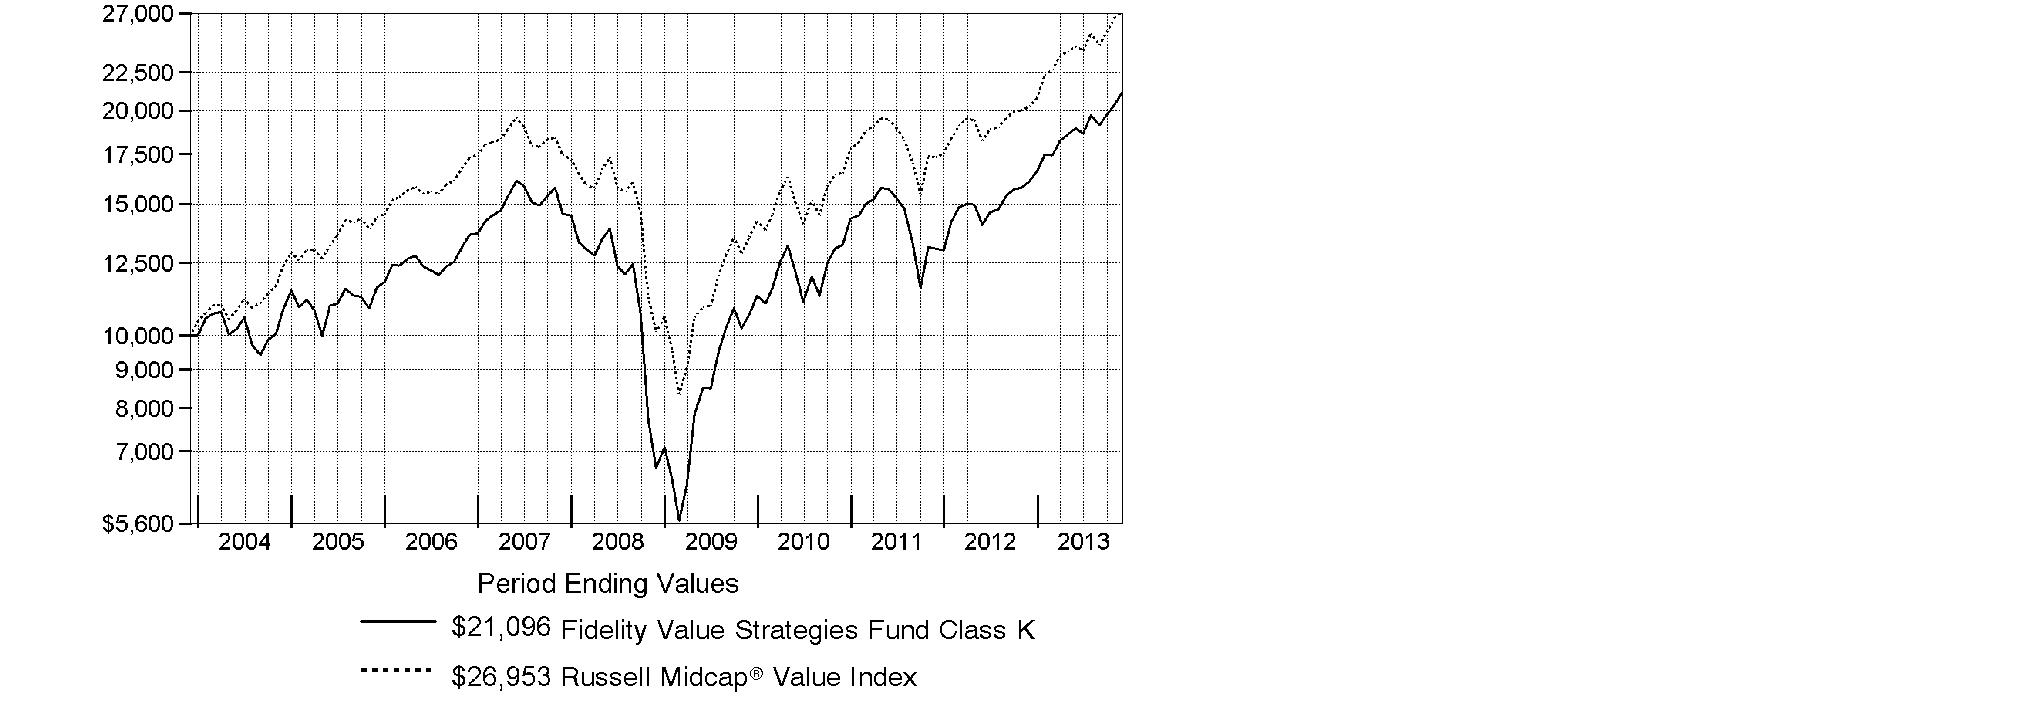
Annual Report
Management's Discussion of Fund Performance
Market Recap: With the current bull run nearing the five-year mark, equity benchmarks ripped up old records during the 12 months ending November 30, 2013. Gains were fueled by strengthening U.S. economic data, as well as generally improving economies and accommodative monetary policies worldwide. The broad S&P 500® Index reached new peaks in its 30.30% climb for the period, and the blue-chip Dow Jones Industrial AverageSM surpassed historic milestones en route to a 26.63% gain. The Nasdaq Composite Index®, up 36.73% amid a resurgence in growth-oriented stocks, closed above 4,000 for the first time since 2000. Shedding anxiety over the 2012 U.S. presidential election - and apparently confident that the federal debt-ceiling debate would be resolved - markets rose from period start through late May. News that the U.S. Federal Reserve was considering an end to its stimulative bond-buying kept stocks in flux over the summer but, by September, the Fed had set aside any imminent tapering. Despite jitters over a potential U.S. military strike in Syria and, later, an October budget impasse that briefly shuttered the federal government, volatility was subdued heading into the holidays, with investor optimism helping many markets home in on all-time highs at period end. Elsewhere, non-U.S. developed-market equities saw similar results, with the MSCI® EAFE® Index adding 24.97%.
Comments from Thomas Soviero, Portfolio Manager of Fidelity® Value Strategies Fund: For the year, the fund's Class K shares returned 31.34%, underperforming the 33.33% gain of the benchmark Russell Midcap® Value Index. Versus the index, the fund was held back by an 8% average stake in cash, which was a substantial drag on performance in an up market. Security selection in the food, beverage & tobacco and software & services industries also hurt. Beverage company Cott and untimely positioning in software company Symantec were among the biggest detractors, along with positions in retailer Target and pharmaceuticals company Zogenix, the latter of which we sold. On the plus side, the fund was helped by an underweighting in financials - particularly real estate - and by security selection in the materials sector. Top individual contributors included Netherlands-based chemicals company LyondellBasell Industries and video-game retailer GameStop. Overweighting automobiles & components, including an investment in auto parts manufacturer Delphi Automotive, also was a positive. Most of the stocks I've mentioned here were not in the benchmark.
The views expressed above reflect those of the portfolio manager(s) only through the end of the period as stated on the cover of this report and do not necessarily represent the views of Fidelity or any other person in the Fidelity organization. Any such views are subject to change at any time based upon market or other conditions and Fidelity disclaims any responsibility to update such views. These views may not be relied on as investment advice and, because investment decisions for a Fidelity fund are based on numerous factors, may not be relied on as an indication of trading intent on behalf of any Fidelity fund.
Annual Report
Shareholder Expense Example
As a shareholder of the Fund, you incur two types of costs: (1) transaction costs, including sales charges (loads) on purchase payments or redemption proceeds, and (2) ongoing costs, including management fees, distribution and/or service (12b-1) fees and other Fund expenses. This Example is intended to help you understand your ongoing costs (in dollars) of investing in the Fund and to compare these costs with the ongoing costs of investing in other mutual funds.
The Example is based on an investment of $1,000 invested at the beginning of the period and held for the entire period (June 1, 2013 to November 30, 2013).
Actual Expenses
The first line of the accompanying table for each class of the Fund provides information about actual account values and actual expenses. You may use the information in this line, together with the amount you invested, to estimate the expenses that you paid over the period. Simply divide your account value by $1,000.00 (for example, an $8,600 account value divided by $1,000.00 = 8.6), then multiply the result by the number in the first line for a class of the Fund under the heading entitled "Expenses Paid During Period" to estimate the expenses you paid on your account during this period. A small balance maintenance fee of $12.00 that is charged once a year may apply for certain accounts with a value of less than $2,000. This fee is not included in the table below. If it was, the estimate of expenses you paid during the period would be higher, and your ending account value lower, by this amount. In addition, the Fund, as a shareholder in the underlying Fidelity Central Funds, will indirectly bear its pro-rata share of the fees and expenses incurred by the underlying Fidelity Central Funds. These fees and expenses are not included in the Fund's annualized expense ratio used to calculate the expense estimate in the table below.
Hypothetical Example for Comparison Purposes
The second line of the accompanying table for each class of the Fund provides information about hypothetical account values and hypothetical expenses based on a Class' actual expense ratio and an assumed rate of return of 5% per year before expenses, which is not the Class' actual return. The hypothetical account values and expenses may not be used to estimate the actual ending account balance or expenses you paid for the period. You may use this information to compare the ongoing costs of investing in the Fund and other funds. To do so, compare this 5% hypothetical example with the 5% hypothetical examples that appear in the shareholder reports of the other funds. A small balance maintenance fee of $12.00 that is charged once a year may apply for certain accounts with a value of less than $2,000. This fee is not included in the table below. If it was, the estimate of expenses you paid during the period would be higher, and your ending account value lower, by this amount. In addition, the Fund, as a shareholder in the underlying Fidelity Central Funds, will indirectly bear its pro-rata share of the fees and expenses incurred by the underlying Fidelity Central Funds. These fees and expenses are not included in the Fund's annualized expense ratio used to calculate the expense estimate in the table below.
Please note that the expenses shown in the table are meant to highlight your ongoing costs only and do not reflect any transaction costs. Therefore, the second line of the table is useful in comparing ongoing costs only, and will not help you determine the relative total costs of owning different funds. In addition, if these transactional costs were included, your costs would have been higher.
Annual Report
Shareholder Expense Example - continued
|
|
Annualized |
Beginning |
Ending |
Expenses Paid |
|
Class A |
1.04% |
|
|
|
|
Actual |
|
$ 1,000.00 |
$ 1,113.10 |
$ 5.51 |
|
HypotheticalA |
|
$ 1,000.00 |
$ 1,019.85 |
$ 5.27 |
|
Class T |
1.23% |
|
|
|
|
Actual |
|
$ 1,000.00 |
$ 1,112.20 |
$ 6.51 |
|
HypotheticalA |
|
$ 1,000.00 |
$ 1,018.90 |
$ 6.23 |
|
Class B |
1.84% |
|
|
|
|
Actual |
|
$ 1,000.00 |
$ 1,108.60 |
$ 9.73 |
|
HypotheticalA |
|
$ 1,000.00 |
$ 1,015.84 |
$ 9.30 |
|
Class C |
1.78% |
|
|
|
|
Actual |
|
$ 1,000.00 |
$ 1,109.10 |
$ 9.41 |
|
HypotheticalA |
|
$ 1,000.00 |
$ 1,016.14 |
$ 9.00 |
|
Fidelity Value Strategies Fund |
.73% |
|
|
|
|
Actual |
|
$ 1,000.00 |
$ 1,114.60 |
$ 3.87 |
|
HypotheticalA |
|
$ 1,000.00 |
$ 1,021.41 |
$ 3.70 |
|
Fidelity Value Strategies Fund Class K |
.58% |
|
|
|
|
Actual |
|
$ 1,000.00 |
$ 1,115.50 |
$ 3.08 |
|
HypotheticalA |
|
$ 1,000.00 |
$ 1,022.16 |
$ 2.94 |
|
Institutional Class |
.77% |
|
|
|
|
Actual |
|
$ 1,000.00 |
$ 1,114.50 |
$ 4.08 |
|
HypotheticalA |
|
$ 1,000.00 |
$ 1,021.21 |
$ 3.90 |
A 5% return per year before expenses
B Annualized expense ratio reflects expenses net of applicable fee waivers.
* Expenses are equal to each Class' annualized expense ratio, multiplied by the average account value over the period, multiplied by 183/365 (to reflect the one-half year period).
Annual Report
Investment Changes (Unaudited)
|
Top Ten Stocks as of November 30, 2013 |
||
|
|
% of fund's |
% of fund's net assets |
|
LyondellBasell Industries NV Class A |
5.8 |
6.5 |
|
Sanofi SA sponsored ADR |
3.8 |
4.0 |
|
General Motors Co. |
3.7 |
3.4 |
|
Bank of America Corp. |
3.5 |
3.1 |
|
Symantec Corp. |
3.1 |
3.3 |
|
Apple, Inc. |
3.0 |
2.5 |
|
Delphi Automotive PLC |
2.8 |
2.6 |
|
AFLAC, Inc. |
2.4 |
2.1 |
|
The Bon-Ton Stores, Inc. |
2.2 |
2.5 |
|
U.S. Bancorp |
2.2 |
2.1 |
|
|
32.5 |
|
|
Top Five Market Sectors as of November 30, 2013 |
||
|
|
% of fund's |
% of fund's net assets |
|
Consumer Discretionary |
23.9 |
23.3 |
|
Health Care |
14.3 |
13.3 |
|
Information Technology |
12.4 |
12.5 |
|
Financials |
11.4 |
10.2 |
|
Materials |
8.8 |
10.5 |
|
Asset Allocation (% of fund's net assets) |
|||||||
|
As of November 30, 2013* |
As of May 31, 2013** |
||||||
 |
Stocks 93.9% |
|
|
Stocks 93.3% |
|
||
 |
Bonds 0.4% |
|
 |
Bonds 0.0% |
|
||
 |
Short-Term |
|
|
Short-Term |
|
||
|
* Foreign investments |
17.0% |
|
** Foreign investments |
19.5% |
|
||

Annual Report
Investments November 30, 2013
Showing Percentage of Net Assets
|
Common Stocks - 93.9% |
|||
|
Shares |
Value (000s) |
||
|
CONSUMER DISCRETIONARY - 23.9% |
|||
|
Auto Components - 3.9% |
|||
|
Delphi Automotive PLC |
719,777 |
$ 42,143 |
|
|
Tenneco, Inc. (a) |
164,524 |
9,444 |
|
|
TRW Automotive Holdings Corp. (a) |
91,400 |
7,093 |
|
|
|
58,680 |
||
|
Automobiles - 4.3% |
|||
|
Bayerische Motoren Werke AG (BMW) |
36,387 |
4,181 |
|
|
General Motors Co. (a) |
1,467,636 |
56,842 |
|
|
Volkswagen AG |
18,856 |
4,910 |
|
|
|
65,933 |
||
|
Diversified Consumer Services - 0.9% |
|||
|
Service Corp. International |
729,650 |
13,185 |
|
|
Hotels, Restaurants & Leisure - 1.7% |
|||
|
Cedar Fair LP (depositary unit) |
227,420 |
11,326 |
|
|
Wyndham Worldwide Corp. |
199,867 |
14,332 |
|
|
|
25,658 |
||
|
Household Durables - 3.3% |
|||
|
Lennar Corp. Class A (d) |
424,700 |
15,187 |
|
|
PulteGroup, Inc. |
744,504 |
13,967 |
|
|
Ryland Group, Inc. |
151,400 |
5,983 |
|
|
Standard Pacific Corp. (a) |
1,866,450 |
15,268 |
|
|
|
50,405 |
||
|
Leisure Equipment & Products - 1.0% |
|||
|
Hasbro, Inc. (d) |
266,797 |
14,359 |
|
|
Media - 1.7% |
|||
|
Omnicom Group, Inc. |
120,112 |
8,582 |
|
|
Regal Entertainment Group Class A (d) |
363,100 |
7,073 |
|
|
Valassis Communications, Inc. (d) |
349,089 |
10,249 |
|
|
|
25,904 |
||
|
Multiline Retail - 3.8% |
|||
|
Target Corp. |
374,009 |
23,910 |
|
|
The Bon-Ton Stores, Inc. (d)(e) |
1,916,017 |
34,067 |
|
|
|
57,977 |
||
|
Specialty Retail - 3.3% |
|||
|
Asbury Automotive Group, Inc. (a) |
343,641 |
17,842 |
|
|
GameStop Corp. Class A |
674,513 |
32,545 |
|
|
|
50,387 |
||
|
TOTAL CONSUMER DISCRETIONARY |
362,488 |
||
|
Common Stocks - continued |
|||
|
Shares |
Value (000s) |
||
|
CONSUMER STAPLES - 5.4% |
|||
|
Beverages - 1.9% |
|||
|
Cott Corp. (d) |
3,511,564 |
$ 29,446 |
|
|
Food & Staples Retailing - 1.1% |
|||
|
CVS Caremark Corp. |
237,100 |
15,876 |
|
|
Food Products - 1.6% |
|||
|
Bunge Ltd. |
102,214 |
8,189 |
|
|
Calavo Growers, Inc. |
232,028 |
7,153 |
|
|
SunOpta, Inc. (a) |
984,885 |
9,110 |
|
|
|
24,452 |
||
|
Household Products - 0.8% |
|||
|
Procter & Gamble Co. |
142,100 |
11,968 |
|
|
TOTAL CONSUMER STAPLES |
81,742 |
||
|
ENERGY - 5.1% |
|||
|
Energy Equipment & Services - 0.7% |
|||
|
Halliburton Co. |
183,600 |
9,672 |
|
|
Oil, Gas & Consumable Fuels - 4.4% |
|||
|
Alpha Natural Resources, Inc. (a) |
1,323,859 |
8,843 |
|
|
Denbury Resources, Inc. (a) |
1,516,780 |
25,300 |
|
|
HollyFrontier Corp. |
153,000 |
7,341 |
|
|
Marathon Oil Corp. |
151,100 |
5,446 |
|
|
The Williams Companies, Inc. |
154,500 |
5,441 |
|
|
Valero Energy Corp. |
327,300 |
14,964 |
|
|
|
67,335 |
||
|
TOTAL ENERGY |
77,007 |
||
|
FINANCIALS - 11.4% |
|||
|
Commercial Banks - 4.3% |
|||
|
CIT Group, Inc. |
157,349 |
7,943 |
|
|
Regions Financial Corp. |
778,163 |
7,572 |
|
|
U.S. Bancorp |
862,484 |
33,827 |
|
|
Wells Fargo & Co. |
377,370 |
16,612 |
|
|
|
65,954 |
||
|
Diversified Financial Services - 3.5% |
|||
|
Bank of America Corp. |
3,355,213 |
53,079 |
|
|
Insurance - 3.6% |
|||
|
AFLAC, Inc. |
549,986 |
36,503 |
|
|
Common Stocks - continued |
|||
|
Shares |
Value (000s) |
||
|
FINANCIALS - continued |
|||
|
Insurance - continued |
|||
|
American International Group, Inc. |
201,698 |
$ 10,034 |
|
|
Unum Group |
235,260 |
7,898 |
|
|
|
54,435 |
||
|
TOTAL FINANCIALS |
173,468 |
||
|
HEALTH CARE - 14.3% |
|||
|
Health Care Equipment & Supplies - 4.7% |
|||
|
Alere, Inc. (a) |
172,283 |
5,637 |
|
|
Boston Scientific Corp. (a) |
1,785,400 |
20,675 |
|
|
C.R. Bard, Inc. |
75,400 |
10,472 |
|
|
St. Jude Medical, Inc. |
463,300 |
27,066 |
|
|
Zimmer Holdings, Inc. |
87,600 |
8,008 |
|
|
|
71,858 |
||
|
Health Care Providers & Services - 2.1% |
|||
|
DaVita, Inc. (a) |
158,496 |
9,438 |
|
|
Universal Health Services, Inc. Class B |
278,914 |
22,991 |
|
|
|
32,429 |
||
|
Life Sciences Tools & Services - 1.2% |
|||
|
Agilent Technologies, Inc. |
180,700 |
9,680 |
|
|
PerkinElmer, Inc. |
207,500 |
7,893 |
|
|
|
17,573 |
||
|
Pharmaceuticals - 6.3% |
|||
|
Johnson & Johnson |
187,800 |
17,777 |
|
|
Merck & Co., Inc. |
390,800 |
19,474 |
|
|
Sanofi SA sponsored ADR |
1,088,444 |
57,502 |
|
|
|
94,753 |
||
|
TOTAL HEALTH CARE |
216,613 |
||
|
INDUSTRIALS - 7.0% |
|||
|
Aerospace & Defense - 4.9% |
|||
|
Alliant Techsystems, Inc. |
278,850 |
33,805 |
|
|
Esterline Technologies Corp. (a) |
180,022 |
15,846 |
|
|
Honeywell International, Inc. |
139,500 |
12,347 |
|
|
Textron, Inc. |
223,717 |
7,434 |
|
|
United Technologies Corp. |
47,400 |
5,255 |
|
|
|
74,687 |
||
|
Common Stocks - continued |
|||
|
Shares |
Value (000s) |
||
|
INDUSTRIALS - continued |
|||
|
Building Products - 0.5% |
|||
|
Armstrong World Industries, Inc. (a) |
143,230 |
$ 7,620 |
|
|
Electrical Equipment - 0.3% |
|||
|
Regal-Beloit Corp. |
63,554 |
4,676 |
|
|
Machinery - 1.3% |
|||
|
Blount International, Inc. (a) |
292,004 |
4,231 |
|
|
Ingersoll-Rand PLC |
208,100 |
14,863 |
|
|
|
19,094 |
||
|
TOTAL INDUSTRIALS |
106,077 |
||
|
INFORMATION TECHNOLOGY - 12.4% |
|||
|
Communications Equipment - 0.3% |
|||
|
Cisco Systems, Inc. |
204,600 |
4,348 |
|
|
Computers & Peripherals - 3.0% |
|||
|
Apple, Inc. |
80,880 |
44,975 |
|
|
IT Services - 0.6% |
|||
|
Fidelity National Information Services, Inc. |
165,730 |
8,399 |
|
|
Semiconductors & Semiconductor Equipment - 4.3% |
|||
|
KLA-Tencor Corp. |
171,180 |
10,933 |
|
|
MagnaChip Semiconductor Corp. (a) |
978,700 |
19,868 |
|
|
Micron Technology, Inc. (a) |
911,183 |
19,226 |
|
|
ON Semiconductor Corp. (a) |
1,190,970 |
8,444 |
|
|
Spansion, Inc. Class A (a) |
613,543 |
7,602 |
|
|
|
66,073 |
||
|
Software - 4.2% |
|||
|
Microsoft Corp. |
429,324 |
16,370 |
|
|
Symantec Corp. |
2,116,671 |
47,604 |
|
|
|
63,974 |
||
|
TOTAL INFORMATION TECHNOLOGY |
187,769 |
||
|
MATERIALS - 8.8% |
|||
|
Chemicals - 8.4% |
|||
|
Ashland, Inc. |
83,100 |
7,569 |
|
|
Axiall Corp. |
81,626 |
3,698 |
|
|
LyondellBasell Industries NV Class A |
1,132,092 |
87,373 |
|
|
PPG Industries, Inc. |
116,596 |
21,461 |
|
|
W.R. Grace & Co. (a) |
83,628 |
8,031 |
|
|
|
128,132 |
||
|
Common Stocks - continued |
|||
|
Shares |
Value (000s) |
||
|
MATERIALS - continued |
|||
|
Metals & Mining - 0.4% |
|||
|
Carpenter Technology Corp. |
86,796 |
$ 5,233 |
|
|
TOTAL MATERIALS |
133,365 |
||
|
TELECOMMUNICATION SERVICES - 1.1% |
|||
|
Diversified Telecommunication Services - 1.1% |
|||
|
Level 3 Communications, Inc. (a) |
558,139 |
16,979 |
|
|
UTILITIES - 4.5% |
|||
|
Electric Utilities - 0.9% |
|||
|
FirstEnergy Corp. |
231,369 |
7,550 |
|
|
NextEra Energy, Inc. |
67,700 |
5,727 |
|
|
|
13,277 |
||
|
Independent Power Producers & Energy Traders - 2.6% |
|||
|
Calpine Corp. (a) |
822,963 |
15,562 |
|
|
The AES Corp. |
1,687,800 |
24,591 |
|
|
|
40,153 |
||
|
Multi-Utilities - 1.0% |
|||
|
Sempra Energy |
179,639 |
15,887 |
|
|
TOTAL UTILITIES |
69,317 |
||
|
TOTAL COMMON STOCKS (Cost $973,195) |
|
||
|
Nonconvertible Bonds - 0.4% |
||||
|
|
Principal Amount (000s) |
|
||
|
ENERGY - 0.4% |
||||
|
Oil, Gas & Consumable Fuels - 0.4% |
||||
|
Alpha Natural Resources, Inc. 6.25% 6/1/21 (Cost $6,398) |
|
$ 7,670 |
|
|
|
Money Market Funds - 8.2% |
|||
|
Shares |
Value (000s) |
||
|
Fidelity Cash Central Fund, 0.10% (b) |
85,014,186 |
$ 85,014 |
|
|
Fidelity Securities Lending Cash Central Fund, 0.10% (b)(c) |
39,182,193 |
39,182 |
|
|
TOTAL MONEY MARKET FUNDS (Cost $124,196) |
|
||
|
TOTAL INVESTMENT PORTFOLIO - 102.5% (Cost $1,103,789) |
1,555,598 |
||
|
NET OTHER ASSETS (LIABILITIES) - (2.5)% |
(37,520) |
||
|
NET ASSETS - 100% |
$ 1,518,078 |
||
|
Legend |
|
(a) Non-income producing |
|
(b) Affiliated fund that is generally available only to investment companies and other accounts managed by Fidelity Investments. The rate quoted is the annualized seven-day yield of the fund at period end. A complete unaudited listing of the fund's holdings as of its most recent quarter end is available upon request. In addition, each Fidelity Central Fund's financial statements, which are not covered by the Fund's Report of Independent Registered Public Accounting Firm, are available on the SEC's website or upon request. |
|
(c) Investment made with cash collateral received from securities on loan. |
|
(d) Security or a portion of the security is on loan at period end. |
|
(e) Affiliated company |
|
Affiliated Central Funds |
|
Information regarding fiscal year to date income earned by the Fund from investments in Fidelity Central Funds is as follows: |
|
Fund |
Income earned |
|
Fidelity Cash Central Fund |
$ 160 |
|
Fidelity Securities Lending Cash Central Fund |
547 |
|
Total |
$ 707 |
|
Other Affiliated Issuers |
|
An affiliated company is a company in which the Fund has ownership of at least 5% of the voting securities. Fiscal year to date transactions with companies which are or were affiliates are as follows: |
|
Affiliate |
Value, |
Purchases |
Sales |
Dividend |
Value, |
|
Cott Corp. |
$ 59,355 |
$ - |
$ 27,851 |
$ 1,193 |
$ - |
|
The Bon-Ton Stores, Inc. |
11,279 |
17,226 |
- |
278 |
34,067 |
|
Total |
$ 70,634 |
$ 17,226 |
$ 27,851 |
$ 1,471 |
$ 34,067 |
|
Other Information |
|
The following is a summary of the inputs used, as of November 30, 2013, involving the Fund's assets and liabilities carried at fair value. The inputs or methodology used for valuing securities may not be an indication of the risk associated with investing in those securities. For more information on valuation inputs, and their aggregation into the levels used in the table below, please refer to the Investment Valuation section in the accompanying Notes to Financial Statements. |
|
Valuation Inputs at Reporting Date: |
||||
|
Description |
Total |
Level 1 |
Level 2 |
Level 3 |
|
Investments in Securities: |
||||
|
Equities: |
||||
|
Consumer Discretionary |
$ 362,488 |
$ 362,488 |
$ - |
$ - |
|
Consumer Staples |
81,742 |
81,742 |
- |
- |
|
Energy |
77,007 |
77,007 |
- |
- |
|
Financials |
173,468 |
173,468 |
- |
- |
|
Health Care |
216,613 |
216,613 |
- |
- |
|
Industrials |
106,077 |
106,077 |
- |
- |
|
Information Technology |
187,769 |
187,769 |
- |
- |
|
Materials |
133,365 |
133,365 |
- |
- |
|
Telecommunication Services |
16,979 |
16,979 |
- |
- |
|
Utilities |
69,317 |
69,317 |
- |
- |
|
Corporate Bonds |
6,577 |
- |
6,577 |
- |
|
Money Market Funds |
124,196 |
124,196 |
- |
- |
|
Total Investments in Securities: |
$ 1,555,598 |
$ 1,549,021 |
$ 6,577 |
$ - |
|
Distribution of investments by country or territory of incorporation, as a percentage of total net assets, is as follows (Unaudited): |
|
United States of America |
83.0% |
|
Netherlands |
5.8% |
|
France |
3.8% |
|
Bailiwick of Jersey |
2.8% |
|
Canada |
2.5% |
|
Ireland |
1.0% |
|
Others (Individually Less Than 1%) |
1.1% |
|
|
100.0% |
See accompanying notes which are an integral part of the financial statements.
Annual Report
Financial Statements
Statement of Assets and Liabilities
|
Amounts in thousands (except per-share amounts) |
November 30, 2013 |
|
|
|
|
|
|
Assets |
|
|
|
Investment in securities, at value (including securities loaned of $37,981) - See accompanying schedule: Unaffiliated issuers (cost $954,600) |
$ 1,397,335 |
|
|
Fidelity Central Funds (cost $124,196) |
124,196 |
|
|
Other affiliated issuers (cost $24,993) |
34,067 |
|
|
Total Investments (cost $1,103,789) |
|
$ 1,555,598 |
|
Receivable for fund shares sold |
|
1,266 |
|
Dividends receivable |
|
2,892 |
|
Interest receivable |
|
292 |
|
Distributions receivable from Fidelity Central Funds |
|
16 |
|
Prepaid expenses |
|
5 |
|
Other receivables |
|
2 |
|
Total assets |
|
1,560,071 |
|
|
|
|
|
Liabilities |
|
|
|
Payable for fund shares redeemed |
$ 1,644 |
|
|
Accrued management fee |
603 |
|
|
Distribution and service plan fees payable |
241 |
|
|
Other affiliated payables |
277 |
|
|
Other payables and accrued expenses |
46 |
|
|
Collateral on securities loaned, at value |
39,182 |
|
|
Total liabilities |
|
41,993 |
|
|
|
|
|
Net Assets |
|
$ 1,518,078 |
|
Net Assets consist of: |
|
|
|
Paid in capital |
|
$ 1,316,130 |
|
Undistributed net investment income |
|
9,989 |
|
Accumulated undistributed net realized gain (loss) on investments and foreign currency transactions |
|
(259,850) |
|
Net unrealized appreciation (depreciation) on investments and assets and liabilities in foreign currencies |
|
451,809 |
|
Net Assets |
|
$ 1,518,078 |
See accompanying notes which are an integral part of the financial statements.
Annual Report
Statement of Assets and Liabilities - continued
|
Amounts in thousands (except per-share amounts) |
November 30, 2013 |
|
|
|
|
|
|
Calculation of Maximum Offering Price Class A: |
|
$ 36.02 |
|
|
|
|
|
Maximum offering price per share (100/94.25 of $36.02) |
|
$ 38.22 |
|
Class T: |
|
$ 37.28 |
|
|
|
|
|
Maximum offering price per share (100/96.50 of $37.28) |
|
$ 38.63 |
|
Class B: |
|
$ 32.86 |
|
|
|
|
|
Class C: |
|
$ 32.52 |
|
|
|
|
|
Fidelity Value Strategies Fund: |
|
$ 40.28 |
|
|
|
|
|
Fidelity Value Strategies Fund Class K: |
|
$ 40.28 |
|
|
|
|
|
Institutional Class: |
|
$ 38.46 |
A Redemption price per share is equal to net asset value less any applicable contingent deferred sales charge.
See accompanying notes which are an integral part of the financial statements.
Annual Report
Financial Statements - continued
Statement of Operations
|
Amounts in thousands |
Year ended November 30, 2013 |
|
|
|
|
|
|
Investment Income |
|
|
|
Dividends (including $1,471 earned from other affiliated issuers) |
|
$ 23,949 |
|
Interest |
|
208 |
|
Income from Fidelity Central Funds |
|
707 |
|
Total income |
|
24,864 |
|
|
|
|
|
Expenses |
|
|
|
Management fee |
$ 7,835 |
|
|
Performance adjustment |
(1,028) |
|
|
Transfer agent fees |
2,821 |
|
|
Distribution and service plan fees |
2,743 |
|
|
Accounting and security lending fees |
461 |
|
|
Custodian fees and expenses |
16 |
|
|
Independent trustees' compensation |
8 |
|
|
Registration fees |
163 |
|
|
Audit |
65 |
|
|
Legal |
5 |
|
|
Miscellaneous |
9 |
|
|
Total expenses before reductions |
13,098 |
|
|
Expense reductions |
(150) |
12,948 |
|
Net investment income (loss) |
|
11,916 |
|
Realized and Unrealized Gain (Loss) Net realized gain (loss) on: |
|
|
|
Investment securities: |
|
|
|
Unaffiliated issuers |
62,499 |
|
|
Other affiliated issuers |
3,508 |
|
|
Foreign currency transactions |
4 |
|
|
Total net realized gain (loss) |
|
66,011 |
|
Change in net unrealized appreciation (depreciation) on: Investment securities |
293,438 |
|
|
Assets and liabilities in foreign currencies |
4 |
|
|
Total change in net unrealized appreciation (depreciation) |
|
293,442 |
|
Net gain (loss) |
|
359,453 |
|
Net increase (decrease) in net assets resulting from operations |
|
$ 371,369 |
See accompanying notes which are an integral part of the financial statements.
Annual Report
Statement of Changes in Net Assets
|
Amounts in thousands |
Year ended |
Year ended |
|
Increase (Decrease) in Net Assets |
|
|
|
Operations |
|
|
|
Net investment income (loss) |
$ 11,916 |
$ 539 |
|
Net realized gain (loss) |
66,011 |
42,952 |
|
Change in net unrealized appreciation (depreciation) |
293,442 |
147,048 |
|
Net increase (decrease) in net assets resulting |
371,369 |
190,539 |
|
Distributions to shareholders from net investment income |
(3,993) |
(4,679) |
|
Share transactions - net increase (decrease) |
77,974 |
(16,561) |
|
Total increase (decrease) in net assets |
445,350 |
169,299 |
|
|
|
|
|
Net Assets |
|
|
|
Beginning of period |
1,072,728 |
903,429 |
|
End of period (including undistributed net investment income of $9,989 and undistributed net investment income of $2,549, respectively) |
$ 1,518,078 |
$ 1,072,728 |
See accompanying notes which are an integral part of the financial statements.
Annual Report
Financial Highlights - Class A
|
Years ended November 30, |
2013 |
2012 |
2011 |
2010 |
2009 |
|
Selected Per-Share Data |
|
|
|
|
|
|
Net asset value, beginning of period |
$ 27.62 |
$ 22.71 |
$ 23.11 |
$ 18.77 |
$ 11.87 |
|
Income from Investment Operations |
|
|
|
|
|
|
Net investment income (loss) C |
.23 |
- F |
.13 G |
.03 H |
.06 |
|
Net realized and unrealized gain (loss) |
8.25 |
5.03 |
(.49) |
4.32 |
6.96 |
|
Total from investment operations |
8.48 |
5.03 |
(.36) |
4.35 |
7.02 |
|
Distributions from net investment income |
(.08) |
(.12) |
(.03) I |
- |
(.12) |
|
Distributions from net realized gain |
- |
- |
(.01) I |
(.01) |
- |
|
Total distributions |
(.08) |
(.12) |
(.04) |
(.01) |
(.12) |
|
Net asset value, end of period |
$ 36.02 |
$ 27.62 |
$ 22.71 |
$ 23.11 |
$ 18.77 |
|
Total Return A, B |
30.77% |
22.29% |
(1.57)% |
23.16% |
59.70% |
|
Ratios to Average Net Assets D, J |
|
|
|
|
|
|
Expenses before reductions |
1.04% |
1.21% |
1.18% |
1.08% |
1.03% |
|
Expenses net of fee waivers, if any |
1.04% |
1.21% |
1.18% |
1.08% |
1.03% |
|
Expenses net of all reductions |
1.03% |
1.21% |
1.17% |
1.07% |
1.02% |
|
Net investment income (loss) |
.73% |
-% F |
.51% G |
.12% H |
.39% |
|
Supplemental Data |
|
|
|
|
|
|
Net assets, end of period (in millions) |
$ 243 |
$ 203 |
$ 190 |
$ 221 |
$ 206 |
|
Portfolio turnover rate E |
22% |
23% |
34% |
99% |
161% |
A Total returns would have been lower if certain expenses had not been reduced during the applicable periods shown.
B Total returns do not include the effect of the sales charges.
C Calculated based on average shares outstanding during the period.
D Fees and expenses of any underlying Fidelity Central Funds are not included in the Fund's expense ratio. The Fund indirectly bears its proportionate share of the expenses of any underlying Fidelity Central Funds.
E Amount does not include the portfolio activity of any underlying Fidelity Central Funds.
F Investment income per share reflects a large, non-recurring dividend which amounted to $.07 per share. Excluding this non-recurring dividend, the ratio of net investment income (loss) to average net assets would have been (.28)%.
G Investment income per share reflects a large, non-recurring dividend which amounted to $.16 per share. Excluding this non-recurring dividend, the ratio of net investment income (loss) to average net assets would have been (.11)%.
H Investment income per share reflects a large, non-recurring dividend which amounted to $.04 per share. Excluding this non-recurring dividend, the ratio of net investment income (loss) to average net assets would have been (.05)%.
I The amounts shown reflect certain reclassifications related to book to tax differences that were made in the year shown.
J Expense ratios reflect operating expenses of the class. Expenses before reductions do not reflect amounts reimbursed by the investment adviser or reductions from brokerage service arrangements or reductions from other expense offset arrangements and do not represent the amount paid by the class during periods when reimbursements or reductions occur. Expenses net of fee waivers reflect expenses after reimbursement by the investment adviser but prior to reductions from brokerage service arrangements or other expense offset arrangements. Expenses net of all reductions represent the net expenses paid by the class.
See accompanying notes which are an integral part of the financial statements.
Annual Report
Financial Highlights - Class T
|
Years ended November 30, |
2013 |
2012 |
2011 |
2010 |
2009 |
|
Selected Per-Share Data |
|
|
|
|
|
|
Net asset value, beginning of period |
$ 28.58 |
$ 23.48 |
$ 23.90 |
$ 19.44 |
$ 12.25 |
|
Income from Investment Operations |
|
|
|
|
|
|
Net investment income (loss) C |
.18 |
(.05) F |
.08 G |
(.01) H |
.03 |
|
Net realized and unrealized gain (loss) |
8.54 |
5.22 |
(.50) |
4.48 |
7.21 |
|
Total from investment operations |
8.72 |
5.17 |
(.42) |
4.47 |
7.24 |
|
Distributions from net investment income |
(.02) |
(.07) |
- |
- |
(.05) |
|
Distributions from net realized gain |
- |
- |
- |
(.01) |
- |
|
Total distributions |
(.02) |
(.07) |
- |
(.01) |
(.05) |
|
Net asset value, end of period |
$ 37.28 |
$ 28.58 |
$ 23.48 |
$ 23.90 |
$ 19.44 |
|
Total Return A, B |
30.52% |
22.08% |
(1.76)% |
22.98% |
59.40% |
|
Ratios to Average Net Assets D, I |
|
|
|
|
|
|
Expenses before reductions |
1.23% |
1.38% |
1.35% |
1.26% |
1.24% |
|
Expenses net of fee waivers, if any |
1.23% |
1.38% |
1.35% |
1.26% |
1.24% |
|
Expenses net of all reductions |
1.22% |
1.38% |
1.35% |
1.25% |
1.22% |
|
Net investment income (loss) |
.54% |
(.17)% F |
.33% G |
(.06)% H |
.18% |
|
Supplemental Data |
|
|
|
|
|
|
Net assets, end of period (in millions) |
$ 335 |
$ 283 |
$ 274 |
$ 344 |
$ 339 |
|
Portfolio turnover rate E |
22% |
23% |
34% |
99% |
161% |
A Total returns would have been lower if certain expenses had not been reduced during the applicable periods shown.
B Total returns do not include the effect of the sales charges.
C Calculated based on average shares outstanding during the period.
D Fees and expenses of any underlying Fidelity Central Funds are not included in the Fund's expense ratio. The Fund indirectly bears its proportionate share of the expenses of any underlying Fidelity Central Funds.
E Amount does not include the portfolio activity of any underlying Fidelity Central Funds.
F Investment income per share reflects a large, non-recurring dividend which amounted to $.07 per share. Excluding this non-recurring dividend, the ratio of net investment income (loss) to average net assets would have been (.45)%.
G Investment income per share reflects a large, non-recurring dividend which amounted to $.16 per share. Excluding this non-recurring dividend, the ratio of net investment income (loss) to average net assets would have been (.29)%.
H Investment income per share reflects a large, non-recurring dividend which amounted to $.04 per share. Excluding this non-recurring dividend, the ratio of net investment income (loss) to average net assets would have been (.23)%.
I Expense ratios reflect operating expenses of the class. Expenses before reductions do not reflect amounts reimbursed by the investment adviser or reductions from brokerage service arrangements or reductions from other expense offset arrangements and do not represent the amount paid by the class during periods when reimbursements or reductions occur. Expenses net of fee waivers reflect expenses after reimbursement by the investment adviser but prior to reductions from brokerage service arrangements or other expense offset arrangements. Expenses net of all reductions represent the net expenses paid by the class.
See accompanying notes which are an integral part of the financial statements.
Annual Report
Financial Highlights - Class B
|
Years ended November 30, |
2013 |
2012 |
2011 |
2010 |
2009 |
|
Selected Per-Share Data |
|
|
|
|
|
|
Net asset value, beginning of period |
$ 25.34 |
$ 20.87 |
$ 21.37 |
$ 17.48 |
$ 11.03 |
|
Income from Investment Operations |
|
|
|
|
|
|
Net investment income (loss) C |
(.02) |
(.18) F |
(.06) G |
(.13) H |
(.05) |
|
Net realized and unrealized gain (loss) |
7.54 |
4.65 |
(.44) |
4.03 |
6.50 |
|
Total from investment operations |
7.52 |
4.47 |
(.50) |
3.90 |
6.45 |
|
Distributions from net realized gain |
- |
- |
- |
(.01) |
- |
|
Net asset value, end of period |
$ 32.86 |
$ 25.34 |
$ 20.87 |
$ 21.37 |
$ 17.48 |
|
Total Return A, B |
29.68% |
21.42% |
(2.34)% |
22.29% |
58.48% |
|
Ratios to Average Net Assets D, I |
|
|
|
|
|
|
Expenses before reductions |
1.83% |
1.97% |
1.93% |
1.83% |
1.78% |
|
Expenses net of fee waivers, if any |
1.83% |
1.97% |
1.93% |
1.83% |
1.78% |
|
Expenses net of all reductions |
1.82% |
1.97% |
1.93% |
1.82% |
1.77% |
|
Net investment income (loss) |
(.07)% |
(.76)% F |
(.25)% G |
(.64)% H |
(.36)% |
|
Supplemental Data |
|
|
|
|
|
|
Net assets, end of period (in millions) |
$ 11 |
$ 13 |
$ 16 |
$ 30 |
$ 40 |
|
Portfolio turnover rate E |
22% |
23% |
34% |
99% |
161% |
A Total returns would have been lower if certain expenses had not been reduced during the applicable periods shown.
B Total returns do not include the effect of the contingent deferred sales charge.
C Calculated based on average shares outstanding during the period.
D Fees and expenses of any underlying Fidelity Central Funds are not included in the Fund's expense ratio. The Fund indirectly bears its proportionate share of the expenses of any underlying Fidelity Central Funds.
E Amount does not include the portfolio activity of any underlying Fidelity Central Funds.
F Investment income per share reflects a large, non-recurring dividend which amounted to $.06 per share. Excluding this non-recurring dividend, the ratio of net investment income (loss) to average net assets would have been (1.04)%.
G Investment income per share reflects a large, non-recurring dividend which amounted to $.16 per share. Excluding this non-recurring dividend, the ratio of net investment income (loss) to average net assets would have been (.87)%.
H Investment income per share reflects a large, non-recurring dividend which amounted to $.03 per share. Excluding this non-recurring dividend, the ratio of net investment income (loss) to average net assets would have been (.80)%.
I Expense ratios reflect operating expenses of the class. Expenses before reductions do not reflect amounts reimbursed by the investment adviser or reductions from brokerage service arrangements or reductions from other expense offset arrangements and do not represent the amount paid by the class during periods when reimbursements or reductions occur. Expenses net of fee waivers reflect expenses after reimbursement by the investment adviser but prior to reductions from brokerage service arrangements or other expense offset arrangements. Expenses net of all reductions represent the net expenses paid by the class.
See accompanying notes which are an integral part of the financial statements.
Annual Report
Financial Highlights - Class C
|
Years ended November 30, |
2013 |
2012 |
2011 |
2010 |
2009 |
|
Selected Per-Share Data |
|
|
|
|
|
|
Net asset value, beginning of period |
$ 25.06 |
$ 20.64 |
$ 21.13 |
$ 17.29 |
$ 10.91 |
|
Income from Investment Operations |
|
|
|
|
|
|
Net investment income (loss) C |
(.01) |
(.17) F |
(.05) G |
(.12) H |
(.05) |
|
Net realized and unrealized gain (loss) |
7.47 |
4.59 |
(.44) |
3.97 |
6.43 |
|
Total from investment operations |
7.46 |
4.42 |
(.49) |
3.85 |
6.38 |
|
Distributions from net realized gain |
- |
- |
- |
(.01) |
- |
|
Net asset value, end of period |
$ 32.52 |
$ 25.06 |
$ 20.64 |
$ 21.13 |
$ 17.29 |
|
Total Return A, B |
29.77% |
21.41% |
(2.32)% |
22.25% |
58.48% |
|
Ratios to Average Net Assets D, I |
|
|
|
|
|
|
Expenses before reductions |
1.78% |
1.95% |
1.92% |
1.83% |
1.78% |
|
Expenses net of fee waivers, if any |
1.78% |
1.95% |
1.92% |
1.83% |
1.78% |
|
Expenses net of all reductions |
1.77% |
1.95% |
1.92% |
1.82% |
1.77% |
|
Net investment income (loss) |
(.02)% |
(.75)% F |
(.24)% G |
(.63)% H |
(.36)% |
|
Supplemental Data |
|
|
|
|
|
|
Net assets, end of period (in millions) |
$ 54 |
$ 43 |
$ 40 |
$ 49 |
$ 43 |
|
Portfolio turnover rate E |
22% |
23% |
34% |
99% |
161% |
A Total returns would have been lower if certain expenses had not been reduced during the applicable periods shown.
B Total returns do not include the effect of the contingent deferred sales charge.
C Calculated based on average shares outstanding during the period.
D Fees and expenses of any underlying Fidelity Central Funds are not included in the Fund's expense ratio. The Fund indirectly bears its proportionate share of the expenses of any underlying Fidelity Central Funds.
E Amount does not include the portfolio activity of any underlying Fidelity Central Funds.
F Investment income per share reflects a large, non-recurring dividend which amounted to $.06 per share. Excluding this non-recurring dividend, the ratio of net investment income (loss) to average net assets would have been (1.02)%.
G Investment income per share reflects a large, non-recurring dividend which amounted to $.16 per share. Excluding this non-recurring dividend, the ratio of net investment income (loss) to average net assets would have been (.86)%.
H Investment income per share reflects a large, non-recurring dividend which amounted to $.03 per share. Excluding this non-recurring dividend, the ratio of net investment income (loss) to average net assets would have been (.80)%.
I Expense ratios reflect operating expenses of the class. Expenses before reductions do not reflect amounts reimbursed by the investment adviser or reductions from brokerage service arrangements or reductions from other expense offset arrangements and do not represent the amount paid by the class during periods when reimbursements or reductions occur. Expenses net of fee waivers reflect expenses after reimbursement by the investment adviser but prior to reductions from brokerage service arrangements or other expense offset arrangements. Expenses net of all reductions represent the net expenses paid by the class.
See accompanying notes which are an integral part of the financial statements.
Annual Report
Financial Highlights - Fidelity Value Strategies Fund
|
Years ended November 30, |
2013 |
2012 |
2011 |
2010 |
2009 |
|
Selected Per-Share Data |
|
|
|
|
|
|
Net asset value, beginning of period |
$ 30.89 |
$ 25.37 |
$ 25.80 |
$ 20.89 |
$ 13.21 |
|
Income from Investment Operations |
|
|
|
|
|
|
Net investment income (loss) B |
.37 |
.09 E |
.22 F |
.09 G |
.11 |
|
Net realized and unrealized gain (loss) |
9.20 |
5.62 |
(.54) |
4.83 |
7.73 |
|
Total from investment operations |
9.57 |
5.71 |
(.32) |
4.92 |
7.84 |
|
Distributions from net investment income |
(.18) |
(.19) |
(.10) H |
- |
(.16) |
|
Distributions from net realized gain |
- |
- |
(.01) H |
(.01) |
- |
|
Total distributions |
(.18) |
(.19) |
(.11) |
(.01) |
(.16) |
|
Net asset value, end of period |
$ 40.28 |
$ 30.89 |
$ 25.37 |
$ 25.80 |
$ 20.89 |
|
Total Return A |
31.14% |
22.69% |
(1.29)% |
23.54% |
60.05% |
|
Ratios to Average Net Assets C, I |
|
|
|
|
|
|
Expenses before reductions |
.73% |
.89% |
.88% |
.81% |
.78% |
|
Expenses net of fee waivers, if any |
.73% |
.89% |
.88% |
.81% |
.78% |
|
Expenses net of all reductions |
.72% |
.89% |
.88% |
.80% |
.77% |
|
Net investment income (loss) |
1.03% |
.31% E |
.80% F |
.39% G |
.64% |
|
Supplemental Data |
|
|
|
|
|
|
Net assets, end of period (in millions) |
$ 681 |
$ 396 |
$ 284 |
$ 360 |
$ 237 |
|
Portfolio turnover rate D |
22% |
23% |
34% |
99% |
161% |
A Total returns would have been lower if certain expenses had not been reduced during the applicable periods shown.
B Calculated based on average shares outstanding during the period.
C Fees and expenses of any underlying Fidelity Central Funds are not included in the Fund's expense ratio. The Fund indirectly bears its proportionate share of the expenses of any underlying Fidelity Central Funds.
D Amount does not include the portfolio activity of any underlying Fidelity Central Funds.
E Investment income per share reflects a large, non-recurring dividend which amounted to $.08 per share. Excluding this non-recurring dividend, the ratio of net investment income (loss) to average net assets would have been .04%.
F Investment income per share reflects a large, non-recurring dividend which amounted to $.16 per share. Excluding this non-recurring dividend, the ratio of net investment income (loss) to average net assets would have been .18%.
G Investment income per share reflects a large, non-recurring dividend which amounted to $.04 per share. Excluding this non-recurring dividend, the ratio of net investment income (loss) to average net assets would have been .22%.
H The amounts shown reflect certain reclassifications related to book to tax differences that were made in the year shown.
I Expense ratios reflect operating expenses of the class. Expenses before reductions do not reflect amounts reimbursed by the investment adviser or reductions from brokerage service arrangements or reductions from other expense offset arrangements and do not represent the amount paid by the class during periods when reimbursements or reductions occur. Expenses net of fee waivers reflect expenses after reimbursement by the investment adviser but prior to reductions from brokerage service arrangements or other expense offset arrangements. Expenses net of all reductions represent the net expenses paid by the class.
See accompanying notes which are an integral part of the financial statements.
Annual Report
Financial Highlights - Fidelity Value Strategies Fund Class K
|
Years ended November 30, |
2013 |
2012 |
2011 |
2010 |
2009 |
|
Selected Per-Share Data |
|
|
|
|
|
|
Net asset value, beginning of period |
$ 30.89 |
$ 25.38 |
$ 25.82 |
$ 20.86 |
$ 13.23 |
|
Income from Investment Operations |
|
|
|
|
|
|
Net investment income (loss) B |
.43 |
.14 E |
.28 F |
.15 G |
.16 |
|
Net realized and unrealized gain (loss) |
9.18 |
5.61 |
(.55) |
4.82 |
7.70 |
|
Total from investment operations |
9.61 |
5.75 |
(.27) |
4.97 |
7.86 |
|
Distributions from net investment income |
(.22) |
(.24) |
(.16) H |
- |
(.23) |
|
Distributions from net realized gain |
- |
- |
(.01) H |
(.01) |
- |
|
Total distributions |
(.22) |
(.24) |
(.17) |
(.01) |
(.23) |
|
Net asset value, end of period |
$ 40.28 |
$ 30.89 |
$ 25.38 |
$ 25.82 |
$ 20.86 |
|
Total Return A |
31.34% |
22.93% |
(1.11)% |
23.81% |
60.52% |
|
Ratios to Average Net Assets C, I |
|
|
|
|
|
|
Expenses before reductions |
.58% |
.71% |
.68% |
.58% |
.51% |
|
Expenses net of fee waivers, if any |
.58% |
.71% |
.68% |
.58% |
.51% |
|
Expenses net of all reductions |
.57% |
.71% |
.68% |
.56% |
.49% |
|
Net investment income (loss) |
1.18% |
.50% E |
1.00% F |
.62% G |
.91% |
|
Supplemental Data |
|
|
|
|
|
|
Net assets, end of period (in millions) |
$ 119 |
$ 70 |
$ 47 |
$ 47 |
$ 27 |
|
Portfolio turnover rate D |
22% |
23% |
34% |
99% |
161% |
A Total returns would have been lower if certain expenses had not been reduced during the applicable periods shown.
B Calculated based on average shares outstanding during the period.
C Fees and expenses of any underlying Fidelity Central Funds are not included in the Fund's expense ratio. The Fund indirectly bears its proportionate share of the expenses of any underlying Fidelity Central Funds.
D Amount does not include the portfolio activity of any underlying Fidelity Central Funds.
E Investment income per share reflects a large, non-recurring dividend which amounted to $.08 per share. Excluding this non-recurring dividend, the ratio of net investment income (loss) to average net assets would have been .22%.
F Investment income per share reflects a large, non-recurring dividend which amounted to $.16 per share. Excluding this non-recurring dividend, the ratio of net investment income (loss) to average net assets would have been .38%.
G Investment income per share reflects a large, non-recurring dividend which amounted to $.04 per share. Excluding this non-recurring dividend, the ratio of net investment income (loss) to average net assets would have been .46%.
H The amounts shown reflect certain reclassifications related to book to tax differences that were made in the year shown.
I Expense ratios reflect operating expenses of the class. Expenses before reductions do not reflect amounts reimbursed by the investment adviser or reductions from brokerage service arrangements or reductions from other expense offset arrangements and do not represent the amount paid by the class during periods when reimbursements or reductions occur. Expenses net of fee waivers reflect expenses after reimbursement by the investment adviser but prior to reductions from brokerage service arrangements or other expense offset arrangements. Expenses net of all reductions represent the net expenses paid by the class.
See accompanying notes which are an integral part of the financial statements.
Annual Report
Financial Highlights - Institutional Class
|
Years ended November 30, |
2013 |
2012 |
2011 |
2010 |
2009 |
|
Selected Per-Share Data |
|
|
|
|
|
|
Net asset value, beginning of period |
$ 29.51 |
$ 24.26 |
$ 24.69 |
$ 19.97 |
$ 12.67 |
|
Income from Investment Operations |
|
|
|
|
|
|
Net investment income (loss) B |
.34 |
.08 E |
.22 F |
.10 G |
.11 |
|
Net realized and unrealized gain (loss) |
8.79 |
5.37 |
(.53) |
4.63 |
7.38 |
|
Total from investment operations |
9.13 |
5.45 |
(.31) |
4.73 |
7.49 |
|
Distributions from net investment income |
(.18) |
(.20) |
(.11) H |
- |
(.19) |
|
Distributions from net realized gain |
- |
- |
(.01) H |
(.01) |
- |
|
Total distributions |
(.18) |
(.20) |
(.12) |
(.01) |
(.19) |
|
Net asset value, end of period |
$ 38.46 |
$ 29.51 |
$ 24.26 |
$ 24.69 |
$ 19.97 |
|
Total Return A |
31.11% |
22.67% |
(1.30)% |
23.67% |
60.08% |
|
Ratios to Average Net Assets C, I |
|
|
|
|
|
|
Expenses before reductions |
.76% |
.90% |
.86% |
.74% |
.70% |
|
Expenses net of fee waivers, if any |
.76% |
.90% |
.86% |
.74% |
.70% |
|
Expenses net of all reductions |
.75% |
.90% |
.86% |
.73% |
.69% |
|
Net investment income (loss) |
1.00% |
.31% E |
.82% F |
.46% G |
.71% |
|
Supplemental Data |
|
|
|
|
|
|
Net assets, end of period (in millions) |
$ 74 |
$ 66 |
$ 52 |
$ 53 |
$ 48 |
|
Portfolio turnover rate D |
22% |
23% |
34% |
99% |
161% |
A Total returns would have been lower if certain expenses had not been reduced during the applicable periods shown.
B Calculated based on average shares outstanding during the period.
C Fees and expenses of any underlying Fidelity Central Funds are not included in the Fund's expense ratio. The Fund indirectly bears its proportionate share of the expenses of any underlying Fidelity Central Funds.
D Amount does not include the portfolio activity of any underlying Fidelity Central Funds.
E Investment income per share reflects a large, non-recurring dividend which amounted to $.08 per share. Excluding this non-recurring dividend, the ratio of net investment income (loss) to average net assets would have been .03%.
F Investment income per share reflects a large, non-recurring dividend which amounted to $.16 per share. Excluding this non-recurring dividend, the ratio of net investment income (loss) to average net assets would have been .20%.
G Investment income per share reflects a large, non-recurring dividend which amounted to $.04 per share. Excluding this non-recurring dividend, the ratio of net investment income (loss) to average net assets would have been .29%.
H The amounts shown reflect certain reclassifications related to book to tax differences that were made in the year shown.
I Expense ratios reflect operating expenses of the class. Expenses before reductions do not reflect amounts reimbursed by the investment adviser or reductions from brokerage service arrangements or reductions from other expense offset arrangements and do not represent the amount paid by the class during periods when reimbursements or reductions occur. Expenses net of fee waivers reflect expenses after reimbursement by the investment adviser but prior to reductions from brokerage service arrangements or other expense offset arrangements. Expenses net of all reductions represent the net expenses paid by the class.
See accompanying notes which are an integral part of the financial statements.
Annual Report
Notes to Financial Statements
For the period ended November 30, 2013
(Amounts in thousands except percentages)
1. Organization.
Fidelity Advisor Value Strategies Fund (the Fund) is a fund of Fidelity Advisor Series I (the Trust) and is authorized to issue an unlimited number of shares. The Trust is registered under the Investment Company Act of 1940, as amended (the 1940 Act), as an open-end management investment company organized as a Massachusetts business trust. The Fund offers Class A, Class T, Class C, Fidelity Value Strategies Fund, Fidelity Value Strategies Fund Class K and Institutional Class shares, each of which, along with Class B shares, has equal rights as to assets and voting privileges. Class B shares are closed to new accounts and additional purchases, except for exchanges and reinvestments. Each class has exclusive voting rights with respect to matters that affect that class. Class B shares will automatically convert to Class A shares after a holding period of seven years from the initial date of purchase.
2. Investments in Fidelity Central Funds.
The Fund invests in Fidelity Central Funds, which are open-end investment companies generally available only to other investment companies and accounts managed by the investment adviser and its affiliates. The Fund's Schedule of Investments lists each of the Fidelity Central Funds held as of period end, if any, as an investment of the Fund, but does not include the underlying holdings of each Fidelity Central Fund. As an Investing Fund, the Fund indirectly bears its proportionate share of the expenses of the underlying Fidelity Central Funds.
The Money Market Central Funds seek preservation of capital and current income and are managed by Fidelity Investments Money Management, Inc. (FIMM), an affiliate of the investment adviser. Annualized expenses of the Money Market Central Funds as of their most recent shareholder report date are less than .01%.
A complete unaudited list of holdings for each Fidelity Central Fund is available upon request or at the Securities and Exchange Commission (the SEC) website at www.sec.gov. In addition, the financial statements of the Fidelity Central Funds, which are not covered by the Fund's Report of Independent Registered Public Accounting Firm, are available on the SEC website or upon request.
3. Significant Accounting Policies.
The financial statements have been prepared in conformity with accounting principles generally accepted in the United States of America (GAAP), which require management to make certain estimates and assumptions at the date of the financial statements. Actual results could differ from those estimates. Subsequent events, if any, through the date that the financial statements were issued have been evaluated in the preparation of
Annual Report
Notes to Financial Statements - continued
(Amounts in thousands except percentages)
3. Significant Accounting Policies - continued
the financial statements. The following summarizes the significant accounting policies of the Fund:
Investment Valuation. Investments are valued as of 4:00 p.m. Eastern time on the last calendar day of the period. In accordance with valuation policies and procedures approved by the Board of Trustees (the Board), the Fund attempts to obtain prices from one or more third party pricing vendors or brokers to value its investments. When current market prices, quotations or currency exchange rates are not readily available or reliable, investments will be fair valued in good faith by the Fidelity Management & Research Company (FMR) Fair Value Committee (the Committee), in accordance with procedures adopted by the Board. Factors used in determining fair value vary by investment type and may include market or investment specific events, changes in interest rates and credit quality. The frequency with which these procedures are used cannot be predicted and they may be utilized to a significant extent. The Committee oversees the Fund's valuation policies and procedures and is responsible for approving and reporting to the Board all fair value determinations.
The Fund categorizes the inputs to valuation techniques used to value its investments into a disclosure hierarchy consisting of three levels as shown below:
Level 1 - quoted prices in active markets for identical investments
Level 2 - other significant observable inputs (including quoted prices for similar investments, interest rates, prepayment speeds, etc.)
Level 3 - unobservable inputs (including the Fund's own assumptions based on the best information available)
Valuation techniques used to value the Fund's investments by major category are as follows:
Equity securities, including restricted securities, for which market quotations are readily available, are valued at the last reported sale price or official closing price as reported by a third party pricing vendor on the primary market or exchange on which they are traded and are categorized as Level 1 in the hierarchy. In the event there were no sales during the day or closing prices are not available, securities are valued at the last quoted bid price or may be valued using the last available price and are generally categorized as Level 2 in the hierarchy. For foreign equity securities, when market or security specific events arise, comparisons to the valuation of American Depositary Receipts (ADRs), futures contracts, Exchange-Traded Funds (ETFs) and certain indexes as well as quoted prices for similar securities may be used and would be categorized as Level 2 in the hierarchy. Utilizing these techniques may result in transfers between Level 1 and Level 2. For equity securities, including restricted securities, where observable inputs are
Annual Report
3. Significant Accounting Policies - continued
Investment Valuation - continued
limited, assumptions about market activity and risk are used and these securities may be categorized as Level 3 in the hierarchy.
Debt securities, including restricted securities, are valued based on evaluated prices received from third party pricing vendors or from brokers who make markets in such securities. For corporate bonds, pricing vendors utilize matrix pricing which considers yield or price of bonds of comparable quality, coupon, maturity and type as well as broker-supplied prices. When independent prices are unavailable or unreliable, debt securities may be valued utilizing pricing methodologies which consider similar factors that would be used by third party pricing vendors. Debt securities are generally categorized as Level 2 in the hierarchy but may be Level 3 depending on the circumstances.
Investments in open-end mutual funds, including the Fidelity Central Funds, are valued at their closing net asset value (NAV) each business day and are categorized as Level 1 in the hierarchy.
Changes in valuation techniques may result in transfers in or out of an assigned level within the disclosure hierarchy. The aggregate value of investments by input level, as of November 30, 2013, is included at the end of the Fund's Schedule of Investments.
Foreign Currency. The Fund may use foreign currency contracts to facilitate transactions in foreign-denominated securities. Gains and losses from these transactions may arise from changes in the value of the foreign currency or if the counterparties do not perform under the contracts' terms.
Foreign-denominated assets, including investment securities, and liabilities are translated into U.S. dollars at the exchange rates at period end. Purchases and sales of investment securities, income and dividends received and expenses denominated in foreign currencies are translated into U.S. dollars at the exchange rate in effect on the transaction date.
The effects of exchange rate fluctuations on investments are included with the net realized and unrealized gain (loss) on investment securities. Other foreign currency transactions resulting in realized and unrealized gain (loss) are disclosed separately.
Investment Transactions and Income. For financial reporting purposes, the Fund's investment holdings and NAV include trades executed through the end of the last business day of the period. The NAV per share for processing shareholder transactions is calculated as of the close of business of the New York Stock Exchange (NYSE), normally 4:00 p.m. Eastern time and includes trades executed through the end of the prior business day. Gains and losses on securities sold are determined on the basis of identified cost and may include proceeds received from litigation. Dividend income is recorded on
Annual Report
Notes to Financial Statements - continued
(Amounts in thousands except percentages)
3. Significant Accounting Policies - continued
Investment Transactions and Income - continued
the ex-dividend date, except for certain dividends from foreign securities where the ex-dividend date may have passed, which are recorded as soon as the Fund is informed of the ex-dividend date. Non-cash dividends included in dividend income, if any, are recorded at the fair market value of the securities received. Distributions received on securities that represent a return of capital or capital gain are recorded as a reduction of cost of investments and/or as a realized gain. Subsequent to ex-dividend date the Fund determines the components of these distributions, based upon receipt of tax filings or other correspondence relating to the underlying investment. Interest income and distributions from the Fidelity Central Funds are accrued as earned. Interest income includes coupon interest and amortization of premium and accretion of discount on debt securities. Investment income is recorded net of foreign taxes withheld where recovery of such taxes is uncertain.
Class Allocations and Expenses. Investment income, realized and unrealized capital gains and losses, common expenses of the Fund, and certain fund-level expense reductions, if any, are allocated daily on a pro-rata basis to each class based on the relative net assets of each class to the total net assets of the Fund. Each class differs with respect to transfer agent and distribution and service plan fees incurred. Certain expense reductions may also differ by class. For the reporting period, the allocated portion of income and expenses to each class as a percent of its average net assets may vary due to the timing of recording these transactions in relation to fluctuating net assets of the classes. Expenses directly attributable to a fund are charged to that fund. Expenses attributable to more than one fund are allocated among the respective funds on the basis of relative net assets or other appropriate methods. Expense estimates are accrued in the period to which they relate and adjustments are made when actual amounts are known.
Income Tax Information and Distributions to Shareholders. Each year, the Fund intends to qualify as a regulated investment company under Subchapter M of the Internal Revenue Code, including distributing substantially all of its taxable income and realized gains. As a result, no provision for U.S. Federal income taxes is required. As of November 30, 2013, the Fund did not have any unrecognized tax benefits in the financial statements; nor is the Fund aware of any tax positions for which it is reasonably possible that the total amounts of unrecognized tax benefits will significantly change in the next twelve months. The Fund files a U.S. federal tax return, in addition to state and local tax returns as required. The Fund's federal income tax returns are subject to examination by the Internal Revenue Service (IRS) for a period of three fiscal years after they are filed. State and local tax returns may be subject to examination for an additional fiscal year
Annual Report
3. Significant Accounting Policies - continued
Income Tax Information and Distributions to Shareholders - continued
depending on the jurisdiction. Foreign taxes are provided for based on the Fund's understanding of the tax rules and rates that exist in the foreign markets in which it invests.
Distributions are declared and recorded on the ex-dividend date. Income dividends and capital gain distributions are declared separately for each class. Income and capital gain distributions are determined in accordance with income tax regulations, which may differ from GAAP. These differences resulted in distribution reclassifications.
Capital accounts within the financial statements are adjusted for permanent book-tax differences. These adjustments have no impact on net assets or the results of operations. Temporary book-tax differences will reverse in a subsequent period.
Book-tax differences are primarily due to foreign currency transactions, partnerships, market discount, deferred trustees compensation, capital loss carryforwards and losses deferred due to wash sales.
The federal tax cost of investment securities and unrealized appreciation (depreciation) as of period end were as follows:
|
Gross unrealized appreciation |
$ 471,566 |
|
Gross unrealized depreciation |
(21,450) |
|
Net unrealized appreciation (depreciation) on securities and other investments |
$ 450,116 |
|
|
|
|
Tax Cost |
$ 1,105,482 |
The tax-based components of distributable earnings as of period end were as follows:
|
Undistributed ordinary income |
$ 9,957 |
|
Capital loss carryforward |
$ (258,123) |
|
Net unrealized appreciation (depreciation) |
$ 450,116 |
Capital loss carryforwards are only available to offset future capital gains of the Fund to the extent provided by regulations and may be limited. Under the Regulated Investment Company Modernization Act of 2010 (the Act), the Fund is permitted to carry forward capital losses incurred in taxable years beginning after December 22, 2010 for an unlimited period and such capital losses are required to be used prior to any losses that expire.
Annual Report
Notes to Financial Statements - continued
(Amounts in thousands except percentages)
3. Significant Accounting Policies - continued
Income Tax Information and Distributions to Shareholders - continued
The capital loss carryforward information presented below, including any applicable limitation, is estimated as of fiscal period end and is subject to adjustment.
|
Fiscal year of expiration |
|
|
2016 |
$ (70,992) |
|
2017 |
(187,132) |
|
Total capital loss carryforward |
$ (258,123) |
The tax character of distributions paid was as follows:
|
|
November 30, 2013 |
November 30, 2012 |
|
Ordinary Income |
$ 3,993 |
$ 4,679 |
4. Purchases and Sales of Investments.
Purchases and sales of securities, other than short-term securities, aggregated $388,274 and $281,410, respectively.
5. Fees and Other Transactions with Affiliates.
Management Fee. Fidelity Management & Research Company (the investment adviser) and its affiliates provide the Fund with investment management related services for which the Fund pays a monthly management fee. The management fee is the sum of an individual fund fee rate that is based on an annual rate of .30% of the Fund's average net assets and an annualized group fee rate that averaged .25% during the period. The group fee rate is based upon the average net assets of all the mutual funds advised by the investment adviser, including any mutual funds previously advised by the investment adviser that are currently advised by Fidelity SelectCo, LLC, an affiliate of the investment adviser. The group fee rate decreases as assets under management increase and increases as assets under management decrease. In addition, the management fee is subject to a performance adjustment (up to a maximum of ± .20% of the Fund's average net assets over a 36 month performance period). The upward or downward adjustment to the management fee is based on the relative investment performance of Fidelity Value Strategies Fund as compared to an appropriate benchmark index over the same 36 month performance period. For the reporting period, the total annual management fee rate, including the performance adjustment, was .48% of the Fund's average net assets. The performance adjustment included in the management fee rate may be higher or lower than the maximum performance adjustment rate due to the difference between the average net assets for the reporting and performance periods.
Annual Report
5. Fees and Other Transactions with Affiliates - continued
Distribution and Service Plan Fees. In accordance with Rule 12b-1 of the 1940 Act, the Fund has adopted separate Distribution and Service Plans for each class of shares. Certain classes pay Fidelity Distributors Corporation (FDC), an affiliate of the investment adviser, separate Distribution and Service Fees, each of which is based on an annual percentage of each class' average net assets. In addition, FDC may pay financial intermediaries for selling shares of the Fund and providing shareholder support services. For the period, the Distribution and Service Fee rates, total fees and amounts retained by FDC were as follows:
|
|
Distribution |
Service |
Total Fees |
Retained |
|
Class A |
-% |
.25% |
$ 563 |
$ 10 |
|
Class T |
.25% |
.25% |
1,560 |
13 |
|
Class B |
.75% |
.25% |
119 |
90 |
|
Class C |
.75% |
.25% |
501 |
32 |
|
|
|
|
$ 2,743 |
$ 145 |
Sales Load. FDC may receive a front-end sales charge of up to 5.75% for selling Class A shares and 3.50% for selling Class T shares, some of which is paid to financial intermediaries for selling shares of the Fund. Depending on the holding period, FDC may receive contingent deferred sales charges levied on Class A, Class T, Class B, and Class C redemptions. The deferred sales charges range from 5.00% to 1.00% for Class B shares, 1.00% for Class C shares, 1.00% for certain purchases of Class A shares and .25% for certain purchases of Class T shares.
For the period, sales charge amounts retained by FDC were as follows:
|
|
Retained |
|
Class A |
$ 25 |
|
Class T |
11 |
|
Class B* |
9 |
|
Class C* |
1 |
|
|
$ 46 |
* When Class B and Class C shares are initially sold, FDC pays commissions from its own resources to financial intermediaries through which the sales are made.
Transfer Agent Fees. Fidelity Investments Institutional Operations Company, Inc., (FIIOC), an affiliate of the investment adviser, is the transfer, dividend disbursing and shareholder servicing agent for each class of the Fund. FIIOC receives account fees and asset-based fees that vary according to the account size and type of account of the shareholders of the respective classes of the Fund, except for Class K. FIIOC receives an
Annual Report
Notes to Financial Statements - continued
(Amounts in thousands except percentages)
5. Fees and Other Transactions with Affiliates - continued
Transfer Agent Fees - continued
asset-based fee of Class K's average net assets. FIIOC pays for typesetting, printing and mailing of shareholder reports, except proxy statements.
For the period, transfer agent fees for each class were as follows:
|
|
Amount |
% of |
|
Class A |
$ 581 |
.26 |
|
Class T |
621 |
.20 |
|
Class B |
36 |
.30 |
|
Class C |
128 |
.25 |
|
Fidelity Value Strategies Fund |
1,231 |
.20 |
|
Fidelity Value Strategies Fund Class K |
68 |
.05 |
|
Institutional Class |
156 |
.23 |
|
|
$ 2,821 |
|
Accounting and Security Lending Fees. Fidelity Service Company, Inc. (FSC), an affiliate of the investment adviser, maintains the Fund's accounting records. The accounting fee is based on the level of average net assets for each month. Under a separate contract, FSC administers the security lending program. The security lending fee is based on the number and duration of lending transactions.
Brokerage Commissions. The Fund placed a portion of its portfolio transactions with brokerage firms which are affiliates of the investment adviser. Brokerage commissions are included in net realized gain (loss) and change in net unrealized appreciation (depreciation) in the Statement of Operations. The commissions paid to these affiliated firms were $12 for the period.
6. Committed Line of Credit.
The Fund participates with other funds managed by the investment adviser or an affiliate in a $4.25 billion credit facility (the "line of credit") to be utilized for temporary or emergency purposes to fund shareholder redemptions or for other short-term liquidity purposes. The Fund has agreed to pay commitment fees on its pro-rata portion of the line of credit, which amounted to $3 and is reflected in Miscellaneous expenses on the Statement of Operations. During the period, there were no borrowings on this line of credit.
Annual Report
7. Security Lending.
The Fund lends portfolio securities through a lending agent from time to time in order to earn additional income. For equity securities, a lending agent is used and may loan securities to certain qualified borrowers, including Fidelity Capital Markets (FCM), a broker-dealer affiliated with the Fund. On the settlement date of the loan, the Fund receives collateral (in the form of U.S. Treasury obligations, letters of credit and/or cash) against the loaned securities and maintains collateral in an amount not less than 100% of the market value of the loaned securities during the period of the loan. The market value of the loaned securities is determined at the close of business of the Fund and any additional required collateral is delivered to the Fund on the next business day. If the borrower defaults on its obligation to return the securities loaned because of insolvency or other reasons, the Fund may apply collateral received from the borrower against the obligation. The Fund may experience delays and costs in recovering the securities loaned. Any cash collateral received is invested in the Fidelity Securities Lending Cash Central Fund. The value of loaned securities and cash collateral at period end are disclosed on the Fund's Statement of Assets and Liabilities. At period end, there were no security loans outstanding with FCM. Security lending income represents the income earned on investing cash collateral, less rebates paid to borrowers and any lending agent fees associated with the loan, plus any premium payments received for lending certain types of securities. Security lending income is presented in the Statement of Operations as a component of income from Fidelity Central Funds. Total security lending income during the period amounted to $547, including $47 from securities loaned to FCM.
8. Expense Reductions.
Commissions paid to certain brokers with whom the investment adviser, or its affiliates, places trades on behalf of the Fund include an amount in addition to trade execution, which may be rebated back to the Fund to offset certain expenses. This amount totaled $144 for the period.
In addition, the investment adviser reimbursed a portion of the Fund's operating expenses during the period in the amount of $6.
Annual Report
Notes to Financial Statements - continued
(Amounts in thousands except percentages)
9. Distributions to Shareholders.
Distributions to shareholders of each class were as follows:
|
Years ended November 30, |
2013 |
2012 |
|
From net investment income |
|
|
|
Class A |
$ 555 |
$ 998 |
|
Class T |
167 |
760 |
|
Fidelity Value Strategies Fund |
2,356 |
2,061 |
|
Fidelity Value Strategies Fund Class K |
520 |
448 |
|
Institutional Class |
395 |
412 |
|
Total |
$ 3,993 |
$ 4,679 |
10. Share Transactions.
Transactions for each class of shares were as follows:
|
|
Shares |
Dollars |
||
|
Years ended November 30, |
2013 |
2012 |
2013 |
2012 |
|
Class A |
|
|
|
|
|
Shares sold |
725 |
854 |
$ 22,684 |
$ 21,748 |
|
Reinvestment of distributions |
18 |
42 |
513 |
917 |
|
Shares redeemed |
(1,340) |
(1,927) |
(42,216) |
(48,930) |
|
Net increase (decrease) |
(597) |
(1,031) |
$ (19,019) |
$ (26,265) |
|
Class T |
|
|
|
|
|
Shares sold |
862 |
878 |
$ 28,085 |
$ 23,229 |
|
Reinvestment of distributions |
5 |
31 |
152 |
697 |
|
Shares redeemed |
(1,767) |
(2,697) |
(57,990) |
(69,951) |
|
Net increase (decrease) |
(900) |
(1,788) |
$ (29,753) |
$ (46,025) |
|
Class B |
|
|
|
|
|
Shares sold |
4 |
5 |
$ 123 |
$ 128 |
|
Shares redeemed |
(161) |
(292) |
(4,616) |
(6,718) |
|
Net increase (decrease) |
(157) |
(287) |
$ (4,493) |
$ (6,590) |
|
Class C |
|
|
|
|
|
Shares sold |
317 |
217 |
$ 8,968 |
$ 5,049 |
|
Shares redeemed |
(382) |
(454) |
(11,135) |
(10,427) |
|
Net increase (decrease) |
(65) |
(237) |
$ (2,167) |
$ (5,378) |
|
Fidelity Value Strategies Fund |
|
|
|
|
|
Shares sold |
11,897 |
5,614 |
$ 405,389 |
$ 163,914 |
|
Reinvestment of distributions |
73 |
81 |
2,266 |
1,967 |
|
Shares redeemed |
(7,881) |
(4,064) |
(279,142) |
(114,471) |
|
Net increase (decrease) |
4,089 |
1,631 |
$ 128,513 |
$ 51,410 |
Annual Report
10. Share Transactions - continued
|
|
Shares |
Dollars |
||
|
Years ended November 30, |
2013 |
2012 |
2013 |
2012 |
|
Fidelity Value Strategies Fund Class K |
|
|
|
|
|
Shares sold |
3,420 |
1,339 |
$ 116,082 |
$ 38,174 |
|
Reinvestment of distributions |
17 |
18 |
520 |
448 |
|
Shares redeemed |
(2,727) |
(943) |
(102,509) |
(26,603) |
|
Net increase (decrease) |
710 |
414 |
$ 14,093 |
$ 12,019 |
|
Institutional Class |
|
|
|
|
|
Shares sold |
776 |
903 |
$ 26,302 |
$ 25,700 |
|
Reinvestment of distributions |
11 |
17 |
327 |
392 |
|
Shares redeemed |
(1,082) |
(822) |
(35,829) |
(21,824) |
|
Net increase (decrease) |
(295) |
98 |
$ (9,200) |
$ 4,268 |
11. Other.
The Fund's organizational documents provide former and current trustees and officers with a limited indemnification against liabilities arising in connection with the performance of their duties to the Fund. In the normal course of business, the Fund may also enter into contracts that provide general indemnifications. The Fund's maximum exposure under these arrangements is unknown as this would be dependent on future claims that may be made against the Fund. The risk of material loss from such claims is considered remote.
Annual Report
Report of Independent Registered Public Accounting Firm
To the Trustees of Fidelity Advisor Series I and Shareholders of Fidelity Advisor Value Strategies Fund:
We have audited the accompanying statement of assets and liabilities of Fidelity Advisor Value Strategies Fund (the Fund), a fund of Fidelity Advisor Series I, including the schedule of investments, as of November 30, 2013, and the related statement of operations for the year then ended, the statement of changes in net assets for each of the two years in the period then ended, and the financial highlights for each of the five years in the period then ended. These financial statements and financial highlights are the responsibility of the Fund's management. Our responsibility is to express an opinion on these financial statements and financial highlights based on our audits.
We conducted our audits in accordance with the standards of the Public Company Accounting Oversight Board (United States). Those standards require that we plan and perform the audit to obtain reasonable assurance about whether the financial statements and financial highlights are free of material misstatement. The Fund is not required to have, nor were we engaged to perform, an audit of its internal control over financial reporting. Our audits included consideration of internal control over financial reporting as a basis for designing audit procedures that are appropriate in the circumstances, but not for the purpose of expressing an opinion on the effectiveness of the Fund's internal control over financial reporting. Accordingly, we express no such opinion. An audit also includes examining, on a test basis, evidence supporting the amounts and disclosures in the financial statements, assessing the accounting principles used and significant estimates made by management, as well as evaluating the overall financial statement presentation. Our procedures included confirmation of securities owned as of November 30, 2013, by correspondence with the custodians and brokers. We believe that our audits provide a reasonable basis for our opinion.
In our opinion, the financial statements and financial highlights referred to above present fairly, in all material respects, the financial position of Fidelity Advisor Value Strategies Fund as of November 30, 2013, the results of its operations for the year then ended, the changes in its net assets for each of the two years in the period then ended, and the financial highlights for each of the five years in the period then ended, in conformity with accounting principles generally accepted in the United States of America.
DELOITTE & TOUCHE LLP
Boston, Massachusetts
January 14, 2014
Annual Report
Trustees and Officers
The Trustees, Member of the Advisory Board, and officers of the trust and fund, as applicable, are listed below. The Board of Trustees governs the fund and is responsible for protecting the interests of shareholders. The Trustees are experienced executives who meet periodically throughout the year to oversee the fund's activities, review contractual arrangements with companies that provide services to the fund, oversee management of the risks associated with such activities and contractual arrangements, and review the fund's performance. Except for James C. Curvey, Ned C. Lautenbach, Ronald P. O'Hanley, and William S. Stavropoulos, each of the Trustees oversees 173 funds. Mr. Curvey oversees 396 funds. Mr. Lautenbach, Mr. O'Hanley, and Mr. Stavropoulos each oversees 247 funds.
The Trustees hold office without limit in time except that (a) any Trustee may resign; (b) any Trustee may be removed by written instrument, signed by at least two-thirds of the number of Trustees prior to such removal; (c) any Trustee who requests to be retired or who has become incapacitated by illness or injury may be retired by written instrument signed by a majority of the other Trustees; and (d) any Trustee may be removed at any special meeting of shareholders by a two-thirds vote of the outstanding voting securities of the trust. Each Trustee who is not an interested person (as defined in the 1940 Act) of the trust and the fund (Independent Trustee), shall retire not later than the last day of the calendar year in which his or her 75th birthday occurs. The Independent Trustees may waive this mandatory retirement age policy with respect to individual Trustees. The officers and Advisory Board Member hold office without limit in time, except that any officer and Advisory Board Member may resign or may be removed by a vote of a majority of the Trustees at any regular meeting or any special meeting of the Trustees. Except as indicated, each individual has held the office shown or other offices in the same company for the past five years.
Experience, Skills, Attributes, and Qualifications of the Fund's Trustees. The Governance and Nominating Committee has adopted a statement of policy that describes the experience, qualifications, attributes, and skills that are necessary and desirable for potential Independent Trustee candidates (Statement of Policy). The Board believes that each Trustee satisfied at the time he or she was initially elected or appointed a Trustee, and continues to satisfy, the standards contemplated by the Statement of Policy. The Governance and Nominating Committee also engages professional search firms to help identify potential Independent Trustee candidates who have the experience, qualifications, attributes, and skills consistent with the Statement of Policy. From time to time, additional criteria based on the composition and skills of the current Independent Trustees, as well as experience or skills that may be appropriate in light of future changes to board composition, business conditions, and regulatory or other developments, have also been considered by the professional search firms and the Governance and Nominating Committee. In addition, the Board takes into account the Trustees' commitment and participation in Board and committee meetings, as well as their leadership of standing and ad hoc committees throughout their tenure.
Annual Report
Trustees and Officers - continued
In determining that a particular Trustee was and continues to be qualified to serve as a Trustee, the Board has considered a variety of criteria, none of which, in isolation, was controlling. The Board believes that, collectively, the Trustees have balanced and diverse experience, qualifications, attributes, and skills, which allow the Board to operate effectively in governing the fund and protecting the interests of shareholders. Information about the specific experience, skills, attributes, and qualifications of each Trustee, which in each case led to the Board's conclusion that the Trustee should serve (or continue to serve) as a trustee of the fund, is provided below.
Board Structure and Oversight Function. James C. Curvey is an interested person (as defined in the 1940 Act) and currently serves as Chairman. The Trustees have determined that an interested Chairman is appropriate and benefits shareholders because an interested Chairman has a personal and professional stake in the quality and continuity of services provided to the fund. Independent Trustees exercise their informed business judgment to appoint an individual of their choosing to serve as Chairman, regardless of whether the Trustee happens to be independent or a member of management. The Independent Trustees have determined that they can act independently and effectively without having an Independent Trustee serve as Chairman and that a key structural component for assuring that they are in a position to do so is for the Independent Trustees to constitute a substantial majority for the Board. The Independent Trustees also regularly meet in executive session. Ned C. Lautenbach serves as Chairman of the Independent Trustees and as such (i) acts as a liaison between the Independent Trustees and management with respect to matters important to the Independent Trustees and (ii) with management prepares agendas for Board meetings.
Fidelity funds are overseen by different Boards of Trustees. The fund's Board oversees Fidelity's equity and high income funds and another Board oversees Fidelity's investment-grade bond, money market, and asset allocation funds. The asset allocation funds may invest in Fidelity funds overseen by the fund's Board. The use of separate Boards, each with its own committee structure, allows the Trustees of each group of Fidelity funds to focus on the unique issues of the funds they oversee, including common research, investment, and operational issues. On occasion, the separate Boards establish joint committees to address issues of overlapping consequences for the Fidelity funds overseen by each Board.
The Trustees operate using a system of committees to facilitate the timely and efficient consideration of all matters of importance to the Trustees, the fund, and fund shareholders and to facilitate compliance with legal and regulatory requirements and oversight of the fund's activities and associated risks. The Board, acting through its committees, has charged FMR and its affiliates with (i) identifying events or circumstances the occurrence of which could have demonstrably adverse effects on the fund's business and/or reputation; (ii) implementing processes and controls to lessen the possibility that such events or circumstances occur or to mitigate the effects of such events or circumstances if they do occur; and (iii) creating and maintaining a system designed to evaluate continuously business and market conditions in order to facilitate the identification and implementation processes described in (i) and (ii) above. Because the day-to-day operations and activities of the fund are carried out by or through FMR, its affiliates and other service providers, the fund's exposure to risks is mitigated but not eliminated by the processes overseen by the Trustees. While each of the Board's committees has responsibility for overseeing different aspects of the fund's activities, oversight is exercised primarily through the Operations, Audit, and Compliance Committees. In addition, the Independent Trustees have worked with FMR to enhance the Board's oversight of investment and financial risks, legal and regulatory risks, technology risks, and operational risks, including the development of additional risk reporting to the Board. For example, a working group comprised of Independent Trustees and FMR has worked and continues to work to review the Fidelity funds' valuation-related activities, reporting and risk management. Appropriate personnel, including but not limited to the fund's Chief Compliance Officer (CCO), FMR's internal auditor, the independent accountants, the fund's Treasurer and portfolio management personnel, make periodic reports to the Board's committees, as appropriate, including an annual review of FMR's risk management program for the Fidelity funds. The responsibilities of each standing committee, including their oversight responsibilities, are described further under "Standing Committees of the Fund's Trustees."
Annual Report
The fund's Statement of Additional Information (SAI) includes more information about the Trustees. To request a free copy, call Fidelity at 1-800-835-5092.
Interested Trustees*:
Correspondence intended for each Trustee who is an interested person may be sent to Fidelity Investments, 245 Summer Street, Boston, Massachusetts 02210.
|
Name, Year of Birth; Principal Occupations and Other Relevant Experience+ |
|
|
James C. Curvey (1935) |
|
|
Year of Election or Appointment: 2007 Trustee Chairman of the Board of Trustees |
|
|
|
Mr. Curvey also serves as Trustee of other Fidelity funds. Mr. Curvey is a Director of Fidelity Investments Money Management, Inc. (2009-present), Director of Fidelity Research & Analysis Co. (2009-present) and Director of FMR and FMR Co., Inc. (2007-present). Mr. Curvey is also Vice Chairman (2007-present) and Director of FMR LLC. In addition, Mr. Curvey serves as an Overseer for the Boston Symphony Orchestra and a member of the Trustees of Villanova University. Previously, Mr. Curvey was the Vice Chairman (2006-2007) and Director (2000-2007) of FMR Corp. |
|
Ronald P. O'Hanley (1957) |
|
|
Year of Election or Appointment: 2011 Trustee |
|
|
|
Mr. O'Hanley also serves as Trustee of other Fidelity funds. He is Director of Fidelity SelectCo, LLC (2013-present), FMR Co., Inc. (2010-present), Director of Fidelity Investments Money Management, Inc. (2010-present), Director of Fidelity Research & Analysis Company (2010-present), President of Fidelity Asset Management and Corporate Services and a Member of Fidelity's Executive Committee (2010-present). Previously, Mr. O'Hanley served as President and Chief Executive Officer of BNY Mellon Asset Management (2007-2010). Mr. O'Hanley also served as Vice Chairman of Bank New York Mellon Corp. and a member of that firm's Executive Committee. Prior to the 2007 merger of The Bank of New York and Mellon Financial Corporation, he was Vice Chairman of Mellon Financial Corporation and President and Chief Executive Officer of Mellon Asset Management. He joined Mellon in February 1997. Mr. O'Hanley currently serves as Chairman of the Boston Public Library Foundation Board of Directors and sits on the Board of Directors of Beth Israel Deaconess Medical Center, the Board of Trustees of the Marine Biological Laboratory and the Advisory Board of the Maxwell School of Citizenship and Public Administration at Syracuse University. Mr. O'Hanley also chairs the Council on Asset Management for the Financial Services Roundtable and is a member of the Board of Directors of Institutional Investor's U.S. Institute. |
* Trustees have been determined to be "Interested Trustees" by virtue of, among other things, their affiliation with the trust or various entities under common control with FMR.
+ The information above includes each Trustee's principal occupation during the last five years and other information relating to the experience, attributes, and skills relevant to each Trustee's qualifications to serve as a Trustee, which led to the conclusion that each Trustee should serve as a Trustee for the fund.
Annual Report
Independent Trustees:
Correspondence intended for each Independent Trustee (that is, the Trustees other than the Interested Trustees) may be sent to Fidelity Investments, P.O. Box 55235, Boston, Massachusetts 02205-5235.
|
Name, Year of Birth; Principal Occupations and Other Relevant Experience+ |
|
|
Dennis J. Dirks (1948) |
|
|
Year of Election or Appointment: 2005 Trustee |
|
|
|
Mr. Dirks also serves as Trustee of other Fidelity funds. Prior to his retirement in May 2003, Mr. Dirks was Chief Operating Officer and a member of the Board of The Depository Trust & Clearing Corporation (DTCC). He also served as President, Chief Operating Officer, and Board member of The Depository Trust Company (DTC) and President and Board member of the National Securities Clearing Corporation (NSCC). In addition, Mr. Dirks served as Chief Executive Officer and Board member of the Government Securities Clearing Corporation, Chief Executive Officer and Board member of the Mortgage-Backed Securities Clearing Corporation, as a Trustee and a member of the Finance Committee of Manhattan College (2005-2008), and as a Trustee and a member of the Finance Committee of AHRC of Nassau County (2006-2008). Mr. Dirks is a member of the Independent Directors Council (IDC) Governing Council (2010-present) and Board of Directors for The Brookville Center for Children's Services, Inc. (2009-present). |
|
Alan J. Lacy (1953) |
|
|
Year of Election or Appointment: 2008 Trustee |
|
|
|
Mr. Lacy also serves as Trustee of other Fidelity funds. Mr. Lacy serves as Senior Adviser (2007-present) of Oak Hill Capital Partners, L.P. (private equity). Mr. Lacy also served as Chief Executive Officer (2000-2005) and Vice Chairman (2005-2006) of Sears Holdings Corporation and Sears, Roebuck and Co. (retail). In addition, Mr. Lacy serves as a member of the Board of Directors of Dave & Buster's Entertainment, Inc. (restaurant and entertainment complexes, 2010-present), Earth Fare, Inc. (retail grocery, 2012-present), The Hillman Companies, Inc. (hardware wholesalers, 2010-present), and Bristol-Myers Squibb Company (global pharmaceuticals, 2008-present). Mr. Lacy is a member of the Board of Trustees of The National Parks Conservation Association (2006-present). Previously, Mr. Lacy served as Chairman of the Board of Trustees of the National Parks Conservation Association (2008-2011) and as a member of the Board of Directors for the Western Union Company (global money transfer, 2006-2011). |
|
Ned C. Lautenbach (1944) |
|
|
Year of Election or Appointment: 2000 Trustee Chairman of the Independent Trustees |
|
|
|
Mr. Lautenbach also serves as Trustee of other Fidelity funds. Mr. Lautenbach currently serves as the Lead Director of the Eaton Corporation Board of Directors (diversified industrial, 1997-present). Mr. Lautenbach is Chairman of the Board of Directors of the Philharmonic Center for the Arts in Naples, Florida (2012-present) and a member of the Council on Foreign Relations (1994-present). Previously, Mr. Lautenbach was a Partner/Advisory Partner at Clayton, Dubilier & Rice, LLC (private equity investment, 1998-2010), as well as a Director of Sony Corporation (2006-2007). |
|
Joseph Mauriello (1944) |
|
|
Year of Election or Appointment: 2008 Trustee |
|
|
|
Mr. Mauriello also serves as Trustee of other Fidelity funds. Prior to his retirement in January 2006, Mr. Mauriello served in numerous senior management positions including Deputy Chairman and Chief Operating Officer (2004-2005), and Vice Chairman of Financial Services (2002-2004) of KPMG LLP US (professional services, 1965-2005). Mr. Mauriello currently serves as a member of the Board of Directors of XL Group plc. (global insurance and re-insurance, 2006-present). Previously, Mr. Mauriello served as a Director of the Hamilton Funds of the Bank of New York (2006-2007) and of Arcadia Resources Inc. (health care services and products, 2007-2012). |
|
Robert W. Selander (1950) |
|
|
Year of Election or Appointment: 2011 Trustee |
|
|
|
Mr. Selander also serves as Trustee of other Fidelity funds. Previously, Mr. Selander served as a Member of the Advisory Board of other Fidelity funds (2011), and Executive Vice Chairman (2010), Chief Executive Officer (2009-2010), and President and Chief Executive Officer (1997-2009) of Mastercard, Inc. |
|
Cornelia M. Small (1944) |
|
|
Year of Election or Appointment: 2005 Trustee |
|
|
|
Ms. Small also serves as Trustee of other Fidelity funds. Ms. Small is a member of the Board of Directors (2009-present) and Chair of the Investment Committee (2010-present) of the Teagle Foundation. Ms. Small also serves on the Investment Committee of the Berkshire Taconic Community Foundation (2008-present). Previously, Ms. Small served as Chairperson (2002-2008) and a member of the Investment Committee and Chairperson (2008-2012) and a member of the Board of Trustees of Smith College. In addition, Ms. Small served as Chief Investment Officer, Director of Global Equity Investments, and a member of the Board of Directors of Scudder, Stevens & Clark and Scudder Kemper Investments. |
|
William S. Stavropoulos (1939) |
|
|
Year of Election or Appointment: 2002 Trustee Vice Chairman of the Independent Trustees |
|
|
|
Mr. Stavropoulos also serves as Trustee of other Fidelity funds. Mr. Stavropoulos serves as President and Founder of the Michigan Baseball Foundation, the Great Lakes Loons (2007-present). Mr. Stavropoulos is Chairman Emeritus of the Board of Directors of The Dow Chemical Company, where he previously served in numerous senior management positions, including President, CEO (1995-2000; 2002-2004), Chairman of the Executive Committee (2000-2006), and as a member of the Board of Directors (1990-2006). Currently, Mr. Stavropoulos is Chairman of the Board of Directors of Univar Inc. (global distributor of commodity and specialty chemicals), a Director of Teradata Corporation (data warehousing and technology solutions), and Maersk Inc. (industrial conglomerate), and a member of the Advisory Board for Metalmark Capital LLC (private equity investment, 2005-present). Mr. Stavropoulos is an operating advisor to Clayton, Dubilier & Rice, LLC (private equity investment). In addition, Mr. Stavropoulos is a member of the University of Notre Dame Advisory Council for the College of Science, a Trustee of the Rollin L. Gerstacker Foundation, and a Director of the Naples Philharmonic Center for the Arts. Previously, Mr. Stavropoulos served as a Director of Chemical Financial Corporation (bank holding company, 1993-2012) and Tyco International, Ltd. (multinational manufacturing and services, 2007-2012). |
|
David M. Thomas (1949) |
|
|
Year of Election or Appointment: 2008 Trustee |
|
|
|
Mr. Thomas also serves as Trustee of other Fidelity funds. Mr. Thomas serves as Non-Executive Chairman of the Board of Directors of Fortune Brands Home and Security (home and security products, 2011-present), and as a member of the Board of Directors of Interpublic Group of Companies, Inc. (marketing communication, 2004-present). Previously, Mr. Thomas served as Executive Chairman (2005-2006) and Chairman and Chief Executive Officer (2000-2005) of IMS Health, Inc. (pharmaceutical and healthcare information solutions), and a Director of Fortune Brands, Inc. (consumer products, 2000-2011). |
+ The information above includes each Trustee's principal occupation during the last five years and other information relating to the experience, attributes, and skills relevant to each Trustee's qualifications to serve as a Trustee, which led to the conclusion that each Trustee should serve as a Trustee for the fund.
Advisory Board Member and Officers:
Correspondence intended for each officer and Peter S. Lynch may be sent to Fidelity Investments, 245 Summer Street, Boston, Massachusetts 02210. Officers appear below in alphabetical order.
|
Name, Year of Birth; Principal Occupation |
|
|
Peter S. Lynch (1944) |
|
|
Year of Election or Appointment: 2003 Member of the Advisory Board |
|
|
|
Mr. Lynch also serves as Member of the Advisory Board of other Fidelity funds. Mr. Lynch is Vice Chairman and a Director of FMR and FMR Co., Inc. In addition, Mr. Lynch serves as a Trustee of Boston College and as the Chairman of the Inner-City Scholarship Fund. Previously, Mr. Lynch served on the Special Olympics International Board of Directors (1997-2006). |
|
Elizabeth Paige Baumann (1968) |
|
|
Year of Election or Appointment: 2012 Anti-Money Laundering (AML) Officer |
|
|
|
Ms. Baumann also serves as AML Officer of other funds. She is Chief AML Officer of FMR LLC (2012-present) and is an employee of Fidelity Investments. Previously, Ms. Baumann served as Vice President and Deputy Anti-Money Laundering Officer (2007-2012). |
|
William C. Coffey (1969) |
|
|
Year of Election or Appointment: 2009 Assistant Secretary |
|
|
|
Mr. Coffey also serves as Assistant Secretary of other funds. He is Senior Vice President and Deputy General Counsel of FMR LLC (2010-present), and is an employee of Fidelity Investments. Previously, Mr. Coffey served as Vice President and Associate General Counsel of FMR LLC (2005-2009). |
|
Jonathan Davis (1968) |
|
|
Year of Election or Appointment: 2010 Assistant Treasurer |
|
|
|
Mr. Davis also serves as Assistant Treasurer of other funds. Mr. Davis is an employee of Fidelity Investments. Previously, Mr. Davis served as Vice President and Associate General Counsel of FMR LLC (2003-2010). |
|
Adrien E. Deberghes (1967) |
|
|
Year of Election or Appointment: 2008 Deputy Treasurer |
|
|
|
Mr. Deberghes also serves as an officer of other funds. He is an employee of Fidelity Investments (2008-present). Prior to joining Fidelity Investments, Mr. Deberghes was Senior Vice President of Mutual Fund Administration at State Street Corporation (2007-2008), Senior Director of Mutual Fund Administration at Investors Bank & Trust (2005-2007), and Director of Finance for Dunkin' Brands (2000-2005). |
|
Stephanie J. Dorsey (1969) |
|
|
Year of Election or Appointment: 2010 Assistant Treasurer |
|
|
|
Ms. Dorsey also serves as an officer of other funds. She is an employee of Fidelity Investments (2008-present) and has served in other fund officer roles. Prior to joining Fidelity Investments, Ms. Dorsey served as Treasurer (2004-2008) of the JPMorgan Mutual Funds and Vice President (2004-2008) of JPMorgan Chase Bank. |
|
Scott C. Goebel (1968) |
|
|
Year of Election or Appointment: 2008 Secretary and Chief Legal Officer (CLO) |
|
|
|
Mr. Goebel serves as Secretary and CLO of other funds. Mr. Goebel also serves as Secretary of Fidelity Investments Money Management, Inc. (FIMM) (2010-present) and Fidelity Research and Analysis Company (FRAC) (2010-present); General Counsel, Secretary, and Senior Vice President of FMR (2008-present) and FMR Co., Inc. (2008-present); Chief Legal Officer of Fidelity Management & Research (Hong Kong) Limited (2008-present) and Assistant Secretary of Fidelity Management & Research (Japan) Inc. (2008-present), and Fidelity Management & Research (U.K.) Inc. (2008-present). Previously, Mr. Goebel served as Secretary and CLO of other Fidelity funds (2008-2013), Assistant Secretary of FIMM (2008-2010), FRAC (2008-2010), and certain funds (2007-2008); and as Vice President and Secretary of Fidelity Distributors Corporation (FDC) (2005-2007). Mr. Goebel has been employed by FMR LLC or an affiliate since 2001. |
|
Joseph A. Hanlon (1968) |
|
|
Year of Election or Appointment: 2012 Chief Compliance Officer |
|
|
|
Mr. Hanlon also serves as Chief Compliance Officer of other funds. Mr. Hanlon serves as Compliance Officer of FMR, FMR Co., Inc., Fidelity Investments Money Management, Inc. (FIMM), Fidelity Research and Analysis Company (FRAC), and Fidelity Management & Research (Hong Kong) (2009-present), as Senior Vice President of the Fidelity Asset Management Division (2009-present), and is an employee of Fidelity Investments. Previously, Mr. Hanlon served as Compliance Officer of Fidelity Management & Research (Japan) Inc. (2009-2013), Strategic Advisers, Inc. (2009-2013), and Fidelity Management & Research (U.K.) Inc. (2009-2013). |
|
Thomas C. Hense (1964) |
|
|
Year of Election or Appointment: 2008/2010 Vice President |
|
|
|
Mr. Hense also serves as Vice President of other funds (High Income (2008), Small Cap (2008), and Value (2010) funds). Previously, Mr. Hense served as a portfolio manager for Fidelity's Institutional Money Management Group (Pyramis) (2003-2008). |
|
Brian B. Hogan (1964) |
|
|
Year of Election or Appointment: 2009 Vice President |
|
|
|
Mr. Hogan also serves as Vice President of other funds. Mr. Hogan serves as President of FMR's Equity Division (2009-present). Previously, Mr. Hogan served as Senior Vice President, Equity Research of FMR (2006-2009) and as a portfolio manager. |
|
Chris Maher (1972) |
|
|
Year of Election or Appointment: 2013 Assistant Treasurer |
|
|
|
Mr. Maher serves as Assistant Treasurer of other funds. Mr. Maher is Vice President of Valuation Oversight and is an employee of Fidelity Investments. Previously, Mr. Maher served as Vice President of Asset Management Compliance (2013), Vice President of FMR's Program Management Group (2010-2013), and Vice President of Valuation Oversight (2008-2010). |
|
Christine Reynolds (1958) |
|
|
Year of Election or Appointment: 2008 Chief Financial Officer |
|
|
|
Ms. Reynolds also serves as Chief Financial Officer of other funds. Ms. Reynolds became President of Fidelity Pricing and Cash Management Services (FPCMS) in August 2008. Ms. Reynolds served as Chief Operating Officer of FPCMS (2007-2008). Previously, Ms. Reynolds served as President, Treasurer, and Anti-Money Laundering officer of the Fidelity funds (2004-2007). |
|
Kenneth B. Robins (1969) |
|
|
Year of Election or Appointment: 2008 President and Treasurer |
|
|
|
Mr. Robins also serves as an officer of other funds. Mr. Robins serves as Executive Vice President of Fidelity Investments Money Management, Inc. (FIMM) (2013-present) and is an employee of Fidelity Investments (2004-present). Previously, Mr. Robins served in other fund officer roles. |
|
Gary W. Ryan (1958) |
|
|
Year of Election or Appointment: 2005 Assistant Treasurer |
|
|
|
Mr. Ryan also serves as Assistant Treasurer of other funds. Mr. Ryan is an employee of Fidelity Investments and has served in other fund officer roles. Previously, Mr. Ryan served as Vice President of Fund Reporting in Fidelity Pricing and Cash Management Services (FPCMS) (1999-2005). |
|
Stephen Sadoski (1971) |
|
|
Year of Election or Appointment: 2012 Deputy Treasurer |
|
|
|
Mr. Sadoski also serves as Deputy Treasurer of other funds. He is an employee of Fidelity Investments (2012-present) and has served in another fund officer role. Prior to joining Fidelity Investments, Mr. Sadoski served as an assistant chief accountant in the Division of Investment Management of the Securities and Exchange Commission (SEC) (2009-2012) and as a senior manager at Deloitte & Touche LLP (1997-2009). |
|
Stacie M. Smith (1974) |
|
|
Year of Election or Appointment: 2013 Deputy Treasurer |
|
|
|
Ms. Smith also serves as an officer of other funds. She is an employee of Fidelity Investments (2009-present) and has served in other fund officer roles. Prior to joining Fidelity Investments, Ms. Smith served as Senior Audit Manager of Ernst & Young LLP (1996-2009). |
|
Renee Stagnone (1975) |
|
|
Year of Election or Appointment: 2013 Deputy Treasurer |
|
|
|
Ms. Stagnone also serves as Deputy Treasurer of other funds. Ms. Stagnone is an employee of Fidelity Investments. |
|
Joseph F. Zambello (1957) |
|
|
Year of Election or Appointment: 2011 Deputy Treasurer |
|
|
|
Mr. Zambello also serves as Deputy Treasurer of other funds. Mr. Zambello is an employee of Fidelity Investments. Previously, Mr. Zambello served as Vice President of FMR's Program Management Group (2009-2011) and Vice President of the Transfer Agent Oversight Group (2005-2009). |
Annual Report
Distributions (Unaudited)
Class K designates 100% of the dividends distributed during the fiscal year as qualifying for the dividends-received deduction for corporate shareholders.
Class K designates 100% of the dividends distributed during the fiscal year as amounts which may be taken into account as a dividend for purposes of the maximum rate under section 1(h)(11) of the Internal Revenue Code.
The fund will notify shareholders in January 2014 of amounts for use in preparing 2013 income tax returns.
Annual Report
Board Approval of Investment Advisory Contracts and Management Fees
Fidelity Advisor Value Strategies Fund
Each year, the Board of Trustees, including the Independent Trustees (together, the Board), votes on the renewal of the management contract and sub-advisory agreements (together, the Advisory Contracts) for the fund. The Board, assisted by the advice of fund counsel and Independent Trustees' counsel, requests and considers a broad range of information relevant to the renewal of the Advisory Contracts throughout the year.
The Board meets regularly and, at each of its meetings, covers an extensive agenda of topics and materials and considers factors that are relevant to its annual consideration of the renewal of the fund's Advisory Contracts, including the services and support provided to the fund and its shareholders. The Board has established various standing committees, each composed of and chaired by Independent Trustees with varying backgrounds, to which the Board has assigned specific subject matter responsibilities in order to enhance effective decision-making by the Board. The Board, acting directly and through its Committees, requests and receives information concerning the annual consideration of the renewal of the fund's Advisory Contracts. The Board also meets as needed to consider matters specifically related to the Board's annual consideration of the renewal of Advisory Contracts. Members of the Board may also meet with trustees of other Fidelity funds through ad hoc joint committees to discuss certain matters relevant to the Fidelity funds.
At its July 2013 meeting, the Board, including the Independent Trustees, unanimously determined to renew the fund's Advisory Contracts. In reaching its determination, the Board considered all factors it believed relevant, including (i) the nature, extent, and quality of the services to be provided to the fund and its shareholders (including the investment performance of the fund); (ii) the competitiveness of the fund's management fee and total expense ratio relative to peer funds; (iii) the total costs of the services to be provided by and the profits to be realized by Fidelity from its relationship with the fund; (iv) the extent to which economies of scale exist and would be realized as the fund grows; and (v) whether fee levels reflect these economies of scale, if any, for the benefit of fund shareholders.
In considering whether to renew the Advisory Contracts for the fund, the Board reached a determination, with the assistance of fund counsel and Independent Trustees' counsel and through the exercise of its business judgment, that the renewal of the Advisory Contracts was in the best interests of the fund and its shareholders and that the compensation payable under the Advisory Contracts was fair and reasonable. The Board's decision to renew the Advisory Contracts was not based on any single factor, but rather was based on a comprehensive consideration of all the information provided to the Board at its meetings throughout the year. The Board, in reaching its determination to renew the Advisory Contracts, was aware that shareholders in the fund have a broad range of investment choices available to them, including a wide choice among mutual funds offered by Fidelity's competitors, and that the fund's shareholders, who have the opportunity to review and weigh the disclosure provided by the fund in its prospectus and other public disclosures, have chosen to invest in this fund, which is a part of the Fidelity family of funds.
Annual Report
Board Approval of Investment Advisory Contracts and
Management Fees - continued
Nature, Extent, and Quality of Services Provided. The Board considered the staffing within the investment adviser, Fidelity Management & Research Company (FMR), and the sub-advisers (together, the Investment Advisers) as it relates to the fund, including the backgrounds of the fund's investment personnel, and also considered the fund's investment objective, strategies, and related investment philosophy. The Independent Trustees also had discussions with senior management of Fidelity's investment operations and investment groups. The Board considered the structure of the portfolio manager compensation program and whether this structure provides appropriate incentives to act in the best interests of the fund.
Resources Dedicated to Investment Management and Support Services. The Board and the Fund Oversight and Research Committees reviewed the general qualifications and capabilities of the Investment Advisers' investment staff, including its size, education, experience, and resources, as well as the Investment Advisers' approach to recruiting, training, managing, and compensating investment personnel. The Board noted that FMR has continued to increase the resources devoted to non-U.S. offices, including expansion of Fidelity's global investment organization. The Board also noted that Fidelity's analysts have extensive resources, tools and capabilities that allow them to conduct sophisticated quantitative and fundamental analysis, as well as credit analysis of issuers, counterparties and guarantors. Further, the Board believes that Fidelity's investment professionals have sufficient access to global information and data so as to provide competitive investment results over time, and that those professionals also have access to sophisticated tools that permit them to assess portfolio construction and risk and performance attribution characteristics continuously, as well as to transmit new information and research conclusions rapidly around the world. Additionally, in its deliberations, the Board considered the Investment Advisers' trading and risk management capabilities and resources, which are an integral part of the investment management process.
Shareholder and Administrative Services. The Board considered (i) the nature, extent, quality, and cost of advisory, administrative, and shareholder services performed by the Investment Advisers and their affiliates under the Advisory Contracts and under separate agreements covering transfer agency, pricing and bookkeeping, and securities lending services for the fund; (ii) the nature and extent of the supervision of third party service providers, principally custodians and subcustodians; and (iii) the resources devoted to, and the record of compliance with, the fund's compliance policies and procedures. The Board also reviewed the allocation of fund brokerage, including allocations to brokers affiliated with the Investment Advisers, the use of brokerage commissions to pay fund expenses, and the use of "soft" commission dollars to pay for research services.
Annual Report
The Board noted that the growth of fund assets over time across the complex allows Fidelity to reinvest in the development of services designed to enhance the value or convenience of the Fidelity funds as investment vehicles. These services include 24-hour access to account information and market information through telephone representatives and over the Internet, investor education materials and asset allocation tools, and the expanded availability of Fidelity Investor Centers.
Investment in a Large Fund Family. The Board considered the benefits to shareholders of investing in a Fidelity fund, including the benefits of investing in a fund that is part of a large family of funds offering a variety of investment disciplines and providing a large variety of mutual fund investor services. The Board noted that Fidelity had taken, or had made recommendations that resulted in the Fidelity funds taking, a number of actions over the previous year that benefited particular funds, including (i) continuing to dedicate additional resources to investment research and to the support of the senior management team that oversees asset management; (ii) persisting in efforts to enhance Fidelity's global research capabilities; (iii) launching new funds and making other enhancements to meet client needs for global and income-oriented solutions; (iv) continuing to launch dedicated lower cost underlying funds to meet portfolio construction needs related to expanding underlying fund options for Fidelity funds of funds, specifically for the Freedom Fund product lines; (v) rationalizing product lines and gaining increased efficiencies through the mergers of several funds into other funds; (vi) strengthening Fidelity's index fund offerings by reducing investment minimums and adopting or lowering existing expense caps for certain funds and classes; (vii) enhancing Global Asset Allocation product offerings by launching new funds and strategies, including "open architecture" target date funds that utilize affiliated and unaffiliated sub-advisers; (viii) modifying the eligibility criteria for Institutional Class shares of Advisor funds to increase their marketability to a portion of the defined contribution plan market; (ix) creating a new low-cost retirement share class for certain Advisor funds to appeal to large retirement plans; (x) transitioning the management of certain Fidelity commodity funds to Geode Capital Management LLC, a registered commodity pool operator, while retaining administrative responsibilities for the funds; (xi) reorganizing a number of funds; and (xii) taking steps toward establishing a new Fidelity adviser to manage sector-based funds and products.
Investment Performance. The Board considered whether the fund has operated in accordance with its investment objective, as well as its record of compliance with its investment restrictions and its performance history.
The Board took into account discussions with the Investment Advisers about fund investment performance that occur at Board meetings throughout the year. In this regard the Board noted that as part of regularly scheduled fund reviews and other reports to the Board on fund performance, the Board periodically considers annualized return information for the fund, for different time periods, measured against a securities market index ("benchmark index") and a peer group of mutual funds with similar objectives ("peer group"). In its evaluation of fund investment performance, the Board gave particular attention to information indicating changes in performance of certain Fidelity funds for specific time periods and the Investment Advisers' explanations for any overperformance or underperformance.
Annual Report
Board Approval of Investment Advisory Contracts and
Management Fees - continued
In addition to reviewing absolute and relative fund performance, the Independent Trustees periodically consider the appropriateness of fund performance metrics in evaluating the results achieved. In general, the Independent Trustees believe that fund performance should be evaluated based on net performance (after fees and expenses) of both the highest performing and lowest performing classes, where applicable, compared to appropriate benchmark indices, over appropriate time periods which may include full market cycles, and compared to peer groups, as applicable, over the same periods, taking into account relevant factors including the following: general market conditions; issuer-specific information; tactical opportunities for investment; and fund cash flows and other factors.
The Independent Trustees recognize that shareholders evaluate performance on a net basis over their own holding periods, for which one-, three-, and five-year periods are used as a proxy. For this reason, the performance information reviewed by the Board also included net cumulative calendar year total return information for the fund and an appropriate benchmark index and peer group for the most recent one-, three-, and five-year periods, as shown below. Returns are shown compared to the 25th percentile (top of box) and 75th percentile (bottom of box) of the peer universe.
Annual Report
Fidelity Advisor Value Strategies Fund

The Board also considered that the fund's management fee is subject to upward or downward adjustment depending upon whether, and to what extent, the fund's investment performance for the performance period exceeds, or is exceeded by, a securities index, thus leading to a performance adjustment for the same period. The Board noted that the performance adjustment provides FMR with a strong economic incentive to seek to achieve superior performance for the fund's shareholders and helps to more closely align the interests of FMR and the fund's shareholders.
Based on its review, the Board concluded that the nature, extent, and quality of services provided to the fund under the Advisory Contracts should benefit the fund's shareholders.
Competitiveness of Management Fee and Total Expense Ratio. The Board considered the fund's management fee and total expense ratio compared to "mapped groups" of competitive funds and classes. Fidelity creates "mapped groups" by combining similar Lipper investment objective categories that have comparable management fee characteristics. Combining Lipper investment objective categories aids the Board's management fee and total expense ratio comparisons by broadening the competitive group used for comparison and by reducing the number of universes to which various Fidelity funds are compared.
Management Fee. The Board considered two proprietary management fee comparisons for the 12-month periods shown in the chart below. The group of Lipper funds used by the Board for management fee comparisons is referred to below as the "Total Mapped Group." The Total Mapped Group comparison focuses on a fund's standing in terms of gross management fees before expense reimbursements or caps, and without giving effect to the fund's performance adjustment, relative to the total universe of funds with comparable investment mandates, regardless of whether their management fee structures also are comparable. Funds with comparable investment mandates offer exposure to similar types of securities. Funds with comparable management fee structures have similar management fee contractual arrangements (e.g., flat rate charged for advisory services, all-inclusive fee rate, etc.). "TMG %" represents the percentage of funds in the Total Mapped Group that had management fees that were lower than the fund's. For example, a TMG % of 11% means that 89% of the funds in the Total Mapped Group had higher management fees than the fund. The "Asset-Size Peer Group" (ASPG) comparison focuses on a fund's standing relative to a subset of non-Fidelity funds within the Total Mapped Group that are similar in size and management fee structure. The ASPG represents at least 15% of the funds in the Total Mapped Group with comparable asset size and management fee structures, subject to a minimum of 50 funds (or all funds in the Total Mapped Group if fewer than 50). Additional information, such as the ASPG quartile in which the fund's management fee ranked and the impact of the fund's performance adjustment, is also included in the chart and considered by the Board.
Annual Report
Board Approval of Investment Advisory Contracts and
Management Fees - continued
Fidelity Advisor Value Strategies Fund

The Board noted that the fund's management fee ranked below the median of its Total Mapped Group and below the median of its ASPG for 2012. The Board also noted the effect of the fund's positive performance adjustment on the fund's management fee ranking.
Annual Report
Based on its review, the Board concluded that the fund's management fee is fair and reasonable in light of the services that the fund receives and the other factors considered.
Total Expense Ratio. In its review of each class's total expense ratio, the Board considered the fund's management fee as well as other fund or class expenses, as applicable, such as transfer agent fees, pricing and bookkeeping fees, fund-paid 12b-1 fees, and custodial, legal, and audit fees. The Board also noted the effects of any waivers and reimbursements on fees and expenses, as well as the impact of the fund's performance adjustment. As part of its review, the Board also considered the current and historical total expense ratios of each class of the fund compared to competitive fund median expenses. Each class of the fund is compared to those funds and classes in the Total Mapped Group (used by the Board for management fee comparisons) that have a similar sales load structure.
The Board noted that the total expense ratio of each of Class A, Class B, Class C, Institutional Class, the retail class, and Class K ranked below its competitive median for 2012 and the total expense ratio of Class T ranked above its competitive median for 2012. The Board considered that, in general, various factors can affect total expense ratios. The Board noted that the total expense ratio of Class T was above the competitive median primarily because of higher 12b-1 fees on Class T. Class T has a higher 12b-1 fee, but a lower front-end sales charge, than traditionally priced front-end sales charge classes. The Board considered that Class T is primarily sold load-waived in the retirement plan market where its 0.50% 12b-1 fee is comparable to competing no-load, higher 12b-1 fee classes designed specifically for retirement plans. The Board noted that the fund offers multiple classes, each of which has a different sales load and 12b-1 fee structure, and that the multiple structures are intended to offer a range of pricing options for the intermediary market. The Board also noted that the total expense ratios of the classes vary primarily by the level of their 12b-1 fees, although differences in transfer agent fees may also cause expenses to vary from class to class.
Fees Charged to Other Fidelity Clients. The Board also considered Fidelity fee structures and other information with respect to clients of FMR and its affiliates, such as other mutual funds advised or subadvised by FMR or its affiliates, pension plan clients, and other institutional clients. The Board noted the findings of the 2013 ad hoc joint committee (created with the board of other Fidelity funds), which reviewed and compared Fidelity's institutional investment advisory business with its business of providing services to the Fidelity funds, including the differences in services provided, fees charged, and costs incurred, as well as competition in their respective marketplaces.
Based on its review of total expense ratios and fees charged to other Fidelity clients, the Board concluded that the total expense ratio of each class of the fund was reasonable, although Class T was above the median of the universe presented for comparison, in light of the services that the fund and its shareholders receive and the other factors considered.
Annual Report
Board Approval of Investment Advisory Contracts and
Management Fees - continued
Costs of the Services and Profitability. The Board considered the revenues earned and the expenses incurred by Fidelity in conducting the business of developing, marketing, distributing, managing, administering and servicing the fund and servicing the fund's shareholders. The Board also considered the level of Fidelity's profits in respect of all the Fidelity funds.
On an annual basis, FMR presents to the Board Fidelity's profitability for the fund. Fidelity calculates the profitability for each fund, as well as aggregate profitability for groups of Fidelity funds and all Fidelity funds, using a series of detailed revenue and cost allocation methodologies which originate with the books and records of Fidelity on which Fidelity's audited financial statements are based. The Audit Committee of the Board reviews any significant changes from the prior year's methodologies.
PricewaterhouseCoopers LLP (PwC), independent registered public accounting firm and auditor to Fidelity and certain Fidelity funds, has been engaged annually by the Board as part of the Board's assessment of Fidelity's profitability analysis. PwC's engagement includes the review and assessment of the methodologies used by Fidelity in determining the revenues and expenses attributable to Fidelity's mutual fund business, and completion of agreed-upon procedures surrounding the mathematical accuracy of fund profitability and its conformity to allocation methodologies. After considering PwC's reports issued under the engagement and information provided by Fidelity, the Board concluded that while other allocation methods may also be reasonable, Fidelity's profitability methodologies are reasonable in all material respects.
The Board also reviewed Fidelity's non-fund businesses and fall-out benefits related to the mutual fund business as well as cases where Fidelity's affiliates may benefit from or be related to the fund's business.
The Board considered the costs of the services provided by and the profits realized by Fidelity in connection with the operation of the fund and was satisfied that the profitability was not excessive in the circumstances.
Economies of Scale. The Board considered whether there have been economies of scale in respect of the management of the Fidelity funds, whether the Fidelity funds (including the fund) have appropriately benefited from any such economies of scale, and whether there is potential for realization of any further economies of scale. The Board considered the extent to which the fund will benefit from economies of scale through increased services to the fund, through waivers or reimbursements, or through fee or expense reductions. The Board also noted that in 2009, it and the board of other Fidelity funds created an ad hoc committee (the Economies of Scale Committee) to analyze whether FMR attains economies of scale in respect of the management and servicing of the Fidelity funds, whether the Fidelity funds have appropriately benefited from such economies of scale, and whether there is potential for realization of any further economies of scale.
Annual Report
The Board recognized that the fund's management contract incorporates a "group fee" structure, which provides for lower group fee rates as total fund assets under FMR's management increase, and for higher group fee rates as total fund assets under FMR's management decrease. FMR calculates the group fee rates based on a tiered asset "breakpoint" schedule that varies based on asset class. The Board considered that the group fee is designed to deliver the benefits of economies of scale to fund shareholders when total Fidelity fund assets increase, even if assets of any particular fund are unchanged or have declined, because some portion of Fidelity's costs are attributable to services provided to all Fidelity funds, and all funds benefit if those costs can be allocated among more assets. The Board concluded that, given the group fee structure, fund shareholders will benefit from lower management fees as assets under FMR's management increase at the fund complex level, regardless of whether Fidelity achieves any such economies of scale.
The Board concluded, taking into account the analysis of the Economies of Scale Committee, that economies of scale, if any, are being appropriately shared between fund shareholders and Fidelity.
Amendment to Description of Group Fee Rate. At its July 2013 meeting, the Board voted to approve an amendment to the fund's management contract to modify the description of the "group fee rate" effective August 1, 2013. The Board noted that under the prior description in the contract, the group fee rate was based on the average net assets of all registered investment companies with which FMR has management contracts. Under the contract's tiered asset breakpoint schedule, the group fee rate is lower as total fund assets under FMR's management increase, and higher as total fund assets under FMR's management decrease. The Board considered that the prior description would have excluded the assets of 64 Fidelity sector funds from the group fee rate calculation once Fidelity SelectCo, LLC, an affiliate of FMR, assumed management responsibilities for those funds. The Board noted that modifying the description of the group fee rate to continue to include the assets of those 64 funds for purposes of determining group fee rate breakpoints would avoid an immediate adverse impact on the group fee rate for any fund.
Additional Information Requested by the Board. In order to develop fully the factual basis for consideration of the Fidelity funds' Advisory Contracts, the Board requested and received additional information on certain topics, including: (i) fund performance trends and Fidelity's long-term strategies for certain funds; (ii) the potential to further rationalize the Fidelity fund lineup with the possibility of achieving savings for the funds and Fidelity; (iii) the methodology with respect to competitive fund data and peer group classifications; (iv) the arrangements with, and performance of, certain sub-advisers on behalf of the Fidelity funds, as well as certain proposed participating affiliate arrangements; (v) the realization of fall-out benefits in certain Fidelity business units; (vi) Fidelity's group fee structures, including the rationale for the individual fee rates of certain categories of funds and the definition of group assets; (vii) trends regarding industry use of performance fee structures and the performance adjustment methodologies applicable to the Fidelity funds; (viii) additional competitive analysis regarding the total expenses for certain classes; and (ix) fund profitability methodology, including Fidelity's cost allocation methodology, and the impact of certain factors on fund profitability results.
Annual Report
Board Approval of Investment Advisory Contracts and
Management Fees - continued
Based on its evaluation of all of the conclusions noted above, and after considering all factors it believed relevant, the Board ultimately concluded that the advisory fee structures are fair and reasonable, and that the fund's Advisory Contracts should be renewed.
Annual Report
Investment Adviser
Fidelity Management & Research Company
Boston, MA
Investment Sub-Advisers
FMR Co., Inc.
Fidelity Management & Research
(U.K.) Inc.
Fidelity Management & Research
(Hong Kong) Limited
Fidelity Management & Research
(Japan) Inc.
General Distributor
Fidelity Distributors Corporation
Smithfield, RI
Transfer and Service Agents
Fidelity Investments Institutional
Operations Company, Inc.
Boston, MA
Fidelity Service Company, Inc.
Boston, MA
Custodian
Brown Brothers Harriman & Co.
Boston, MA
(Fidelity Investment logo)(registered trademark)
Corporate Headquarters
245 Summer St., Boston, MA 02210
www.fidelity.com
SOI-K-UANN-0114 1.863335.105
Item 2. Code of Ethics
As of the end of the period, November 30, 2013, Fidelity Advisor Series I (the trust) has adopted a code of ethics, as defined in Item 2 of Form N-CSR, that applies to its President and Treasurer and its Chief Financial Officer. A copy of the code of ethics is filed as an exhibit to this Form N-CSR.
Item 3. Audit Committee Financial Expert
The Board of Trustees of the trust has determined that Joseph Mauriello is an audit committee financial expert, as defined in Item 3 of Form N-CSR. Mr. Mauriello is independent for purposes of Item 3 of Form N-CSR.
Item 4. Principal Accountant Fees and Services
Fees and Services
The following table presents fees billed by Deloitte & Touche LLP, the member firms of Deloitte Touche Tohmatsu, and their respective affiliates (collectively, "Deloitte Entities") in each of the last two fiscal years for services rendered to Fidelity Advisor Equity Growth Fund, Fidelity Advisor Equity Income Fund, Fidelity Advisor Equity Value Fund, Fidelity Advisor Growth & Income Fund, Fidelity Advisor Growth Opportunities Fund, Fidelity Advisor Large Cap Fund, Fidelity Advisor Series Growth Opportunities Fund, Fidelity Advisor Stock Selector Mid Cap Fund, and Fidelity Advisor Value Strategies Fund (the "Funds"):
Services Billed by Deloitte Entities
November 30, 2013 FeesA,B
|
|
Audit Fees |
Audit-Related Fees |
Tax Fees |
All Other Fees |
|
Fidelity Advisor Equity Growth Fund |
$44,000 |
$- |
$5,900 |
$1,100 |
|
Fidelity Advisor Equity Income Fund |
$43,000 |
$- |
$6,400 |
$900 |
|
Fidelity Advisor Equity Value Fund |
$48,000 |
$- |
$6,400 |
$500 |
|
Fidelity Advisor Growth & Income Fund |
$45,000 |
$- |
$5,300 |
$700 |
|
Fidelity Advisor Growth Opportunities Fund |
$50,000 |
$- |
$5,800 |
$1,000 |
|
Fidelity Advisor Large Cap Fund |
$45,000 |
$- |
$5,200 |
$700 |
|
Fidelity Advisor Series Growth Opportunities Fund |
$30,000 |
$- |
$5,800 |
$- |
|
Fidelity Advisor Stock Selector Mid Cap Fund |
$59,000 |
$- |
$4,800 |
$900 |
|
Fidelity Advisor Value Strategies Fund |
$44,000 |
$- |
$6,500 |
$800 |
November 30, 2012 FeesA,B
|
|
Audit Fees |
Audit-Related Fees |
Tax Fees |
All Other Fees |
|
Fidelity Advisor Equity Growth Fund |
$44,000 |
$- |
$5,700 |
$800 |
|
Fidelity Advisor Equity Income Fund |
$41,000 |
$- |
$5,700 |
$700 |
|
Fidelity Advisor Equity Value Fund |
$46,000 |
$- |
$6,100 |
$400 |
|
Fidelity Advisor Growth & Income Fund |
$41,000 |
$- |
$4,600 |
$600 |
|
Fidelity Advisor Growth Opportunities Fund |
$45,000 |
$- |
$5,700 |
$600 |
|
Fidelity Advisor Large Cap Fund |
$43,000 |
$- |
$4,600 |
$500 |
|
Fidelity Advisor Series Growth Opportunities Fund |
$- |
$- |
$- |
$- |
|
Fidelity Advisor Stock Selector Mid Cap Fund |
$43,000 |
$- |
$4,600 |
$600 |
|
Fidelity Advisor Value Strategies Fund |
$42,000 |
$- |
$6,300 |
$500 |
A Amounts may reflect rounding.
B Fidelity Advisor Series Growth Opportunities Fund commenced operations on November 7, 2013.
The following table presents fees billed by PricewaterhouseCoopers LLP ("PwC") in each of the last two fiscal years for services rendered to Fidelity Advisor Dividend Growth Fund, Fidelity Advisor Series Small Cap Fund, and Fidelity Advisor Small Cap Fund (the "Funds"):
Services Billed by PwC
November 30, 2013 FeesA,B
|
|
Audit Fees |
Audit-Related Fees |
Tax Fees |
All Other Fees |
|
Fidelity Advisor Dividend Growth Fund |
$57,000 |
$- |
$3,300 |
$1,800 |
|
Fidelity Advisor Series Small Cap Fund |
$23,000 |
$- |
$3,300 |
$- |
|
Fidelity Advisor Small Cap Fund |
$53,000 |
$- |
$3,300 |
$2,900 |
November 30, 2012 FeesA,B
|
|
Audit Fees |
Audit-Related Fees |
Tax Fees |
All Other Fees |
|
Fidelity Advisor Dividend Growth Fund |
$43,000 |
$- |
$3,500 |
$1,900 |
|
Fidelity Advisor Series Small Cap Fund |
$- |
$- |
$- |
$- |
|
Fidelity Advisor Small Cap Fund |
$48,000 |
$- |
$3,500 |
$3,300 |
|
|
|
|
|
|
A Amounts may reflect rounding.
B Fidelity Advisor Series Small Cap Fund commenced operations on November 7, 2013.
The following table presents fees billed by PwC and Deloitte Entities that were required to be approved by the Audit Committee for services that relate directly to the operations and financial reporting of the Funds and that are rendered on behalf of Fidelity Management & Research Company ("FMR") and entities controlling, controlled by, or under common control with FMR (not including any sub-adviser whose role is primarily portfolio management and is subcontracted with or overseen by another investment adviser) that provide ongoing services to the Funds ("Fund Service Providers"):
Services Billed by Deloitte Entities
|
|
November 30, 2013A,B |
November 30, 2012A,B |
|
Audit-Related Fees |
$795,000 |
$880,000 |
|
Tax Fees |
$- |
$- |
|
All Other Fees |
$795,000 |
$955,000 |
A Amounts may reflect rounding.
B May include amounts billed prior to the Fidelity Advisor Series Growth Opportunities Fund's commencement of operations.
Services Billed by PwC
|
|
November 30, 2013A,B |
November 30, 2012A,B |
|
Audit-Related Fees |
$4,860,000 |
$5,130,000 |
|
Tax Fees |
$- |
$- |
|
All Other Fees |
$50,000 |
$- |
A Amounts may reflect rounding.
B May include amounts billed prior to the Fidelity Advisor Series Small Cap Fund's commencement of operations.
"Audit-Related Fees" represent fees billed for assurance and related services that are reasonably related to the performance of the fund audit or the review of the fund's financial statements and that are not reported under Audit Fees.
"Tax Fees" represent fees billed for tax compliance, tax advice or tax planning that relate directly to the operations and financial reporting of the fund.
"All Other Fees" represent fees billed for services provided to the fund or Fund Service Provider, a significant portion of which are assurance related, that relate directly to the operations and financial reporting of the fund, excluding those services that are reported under Audit Fees, Audit-Related Fees or Tax Fees.
Assurance services must be performed by an independent public accountant.
* * *
The aggregate non-audit fees billed by PwC and Deloitte Entities for services rendered to the Funds, FMR (not including any sub-adviser whose role is primarily portfolio management and is subcontracted with or overseen by another investment adviser), and any Fund Service Provider for each of the last two fiscal years of the Funds are as follows:
|
Billed By |
November 30, 2013 A,B |
November 30, 2012 A,B,C |
|
PwC |
$5,455,000 |
$6,050,000 |
|
Deloitte Entities |
$1,770,000 |
$1,920,000 |
A Amounts may reflect rounding.
B May include amounts billed prior to the Fidelity Advisor Series Growth Opportunities Fund and Fidelity Advisor Series Small Cap Fund's commencement of operations.
C Reflects current period presentation.
The trust's Audit Committee has considered non-audit services that were not pre-approved that were provided by PwC and Deloitte Entities to Fund Service Providers to be compatible with maintaining the independence of PwC and Deloitte Entities in their audits of the Funds, taking into account representations from PwC and Deloitte Entities, in accordance with Public Company Accounting Oversight Board rules, regarding their independence from the Funds and their related entities and FMR's review of the appropriateness and permissibility under applicable law of such non-audit services prior to their provision to the Fund Service Providers.
Audit Committee Pre-Approval Policies and Procedures
The trust's Audit Committee must pre-approve all audit and non-audit services provided by a fund's independent registered public accounting firm relating to the operations or financial reporting of the fund. Prior to the commencement of any audit or non-audit services to a fund, the Audit Committee reviews the services to determine whether they are appropriate and permissible under applicable law.
The Audit Committee has adopted policies and procedures to, among other purposes, provide a framework for the Committee's consideration of non-audit services by the audit firms that audit the Fidelity funds. The policies and procedures require that any non-audit service provided by a fund audit firm to a Fidelity fund and any non-audit service provided by a fund auditor to a Fund Service Provider that relates directly to the operations and financial reporting of a Fidelity fund ("Covered Service") are subject to approval by the Audit Committee before such service is provided.
All Covered Services must be approved in advance of provision of the service either: (i) by formal resolution of the Audit Committee, or (ii) by oral or written approval of the service by the Chair of the Audit Committee (or if the Chair is unavailable, such other member of the Audit Committee as may be designated by the Chair to act in the Chair's absence). The approval contemplated by (ii) above is permitted where the Treasurer determines that action on such an engagement is necessary before the next meeting of the Audit Committee.
Non-audit services provided by a fund audit firm to a Fund Service Provider that do not relate directly to the operations and financial reporting of a Fidelity fund are reported to the Audit Committee on a periodic basis.
Non-Audit Services Approved Pursuant to Rule 2-01(c)(7)(i)(C) and (ii) of Regulation S-X ("De Minimis Exception")
There were no non-audit services approved or required to be approved by the Audit Committee pursuant to the De Minimis Exception during the Funds' last two fiscal years relating to services provided to (i) the Funds or (ii) any Fund Service Provider that relate directly to the operations and financial reporting of the Funds.
Item 5. Audit Committee of Listed Registrants
Not applicable.
Item 6. Investments
(a) Not applicable.
(b) Not applicable
Item 7. Disclosure of Proxy Voting Policies and Procedures for Closed-End Management Investment Companies
Not applicable.
Item 8. Portfolio Managers of Closed-End Management Investment Companies
Not applicable.
Item 9. Purchase of Equity Securities by Closed-End Management Investment Company and Affiliated Purchasers
Not applicable.
Item 10. Submission of Matters to a Vote of Security Holders
There were no material changes to the procedures by which shareholders may recommend nominees to the trust's Board of Trustees.
Item 11. Controls and Procedures
(a)(i) The President and Treasurer and the Chief Financial Officer have concluded that the disclosure controls and procedures (as defined in Rule 30a-3(c) under the Investment Company Act) for each Fund provide reasonable assurances that material information relating to such Fund is made known to them by the appropriate persons, based on their evaluation of these controls and procedures as of a date within 90 days of the filing date of this report.
(a)(ii) There was no change in a Fund's internal control over financial reporting (as defined in Rule 30a-3(d) under the Investment Company Act) that occurred during the second fiscal quarter of the period covered by this report that has materially affected, or is reasonably likely to materially affect, a Fund's internal control over financial reporting.
Item 12. Exhibits
|
(a) |
(1) |
Code of Ethics pursuant to Item 2 of Form N-CSR is filed and attached hereto as EX-99.CODE ETH. |
|
(a) |
(2) |
Certification pursuant to Rule 30a-2(a) under the Investment Company Act of 1940 (17 CFR 270.30a-2(a)) is filed and attached hereto as Exhibit 99.CERT. |
|
(a) |
(3) |
Not applicable. |
|
(b) |
|
Certification pursuant to Rule 30a-2(b) under the Investment Company Act of 1940 (17 CFR 270.30a-2(b)) is furnished and attached hereto as Exhibit 99.906CERT. |
SIGNATURES
Pursuant to the requirements of the Securities Exchange Act of 1934 and the Investment Company Act of 1940, the registrant has duly caused this report to be signed on its behalf by the undersigned, thereunto duly authorized.
Fidelity Advisor Series I
|
By: |
/s/Kenneth B. Robins |
|
|
Kenneth B. Robins |
|
|
President and Treasurer |
|
|
|
|
Date: |
January 27, 2014 |
Pursuant to the requirements of the Securities Exchange Act of 1934 and the Investment Company Act of 1940, this report has been signed below by the following persons on behalf of the registrant and in the capacities and on the dates indicated.
|
By: |
/s/Kenneth B. Robins |
|
|
Kenneth B. Robins |
|
|
President and Treasurer |
|
|
|
|
Date: |
January 27, 2014 |
|
By: |
/s/Christine Reynolds |
|
|
Christine Reynolds |
|
|
Chief Financial Officer |
|
|
|
|
Date: |
January 27, 2014 |