FALSE2024FY0000721371http://fasb.org/us-gaap/2024#GainLossOnSalesOfAssetsAndAssetImpairmentChargeshttp://fasb.org/us-gaap/2024#OtherAssetsNoncurrenthttp://fasb.org/us-gaap/2024#OtherAssetsNoncurrenthttp://fasb.org/us-gaap/2024#OtherAccruedLiabilitiesCurrenthttp://fasb.org/us-gaap/2024#OtherAccruedLiabilitiesCurrenthttp://fasb.org/us-gaap/2024#DeferredTaxAndOtherLiabilitiesNoncurrenthttp://fasb.org/us-gaap/2024#DeferredTaxAndOtherLiabilitiesNoncurrenthttp://fasb.org/us-gaap/2024#PropertyPlantAndEquipmentNethttp://fasb.org/us-gaap/2024#PropertyPlantAndEquipmentNethttp://fasb.org/us-gaap/2024#LongTermDebtAndCapitalLeaseObligationsCurrenthttp://fasb.org/us-gaap/2024#LongTermDebtAndCapitalLeaseObligationsCurrenthttp://fasb.org/us-gaap/2024#LongTermDebtAndCapitalLeaseObligationshttp://fasb.org/us-gaap/2024#LongTermDebtAndCapitalLeaseObligationshttp://fasb.org/us-gaap/2024#InterestExpensehttp://fasb.org/us-gaap/2024#InterestExpensehttp://fasb.org/us-gaap/2024#InterestExpensehttp://fasb.org/us-gaap/2024#SellingGeneralAndAdministrativeExpensehttp://fasb.org/us-gaap/2024#SellingGeneralAndAdministrativeExpensehttp://fasb.org/us-gaap/2024#SellingGeneralAndAdministrativeExpensehttp://fasb.org/us-gaap/2024#InterestExpensehttp://fasb.org/us-gaap/2024#InterestExpensehttp://fasb.org/us-gaap/2024#InterestExpenseiso4217:USDxbrli:sharesxbrli:pureiso4217:USDxbrli:sharescah:organizationutr:Ratecah:statescah:numberOfUSTerritoriescah:lawsuitcah:plaintiffiso4217:JPYiso4217:EURcah:segmentcah:Segmentscah:granteescah:vestingPeriods00007213712023-07-012024-06-3000007213712023-12-3100007213712024-07-310000721371cah:CVSHealthCorporationMemberus-gaap:CustomerConcentrationRiskMemberus-gaap:SalesRevenueNetMembercah:PharmaceuticalAndSpecialtySolutionsMember2023-07-012024-06-300000721371cah:OptumRxMemberus-gaap:CustomerConcentrationRiskMemberus-gaap:SalesRevenueNetMembercah:PharmaceuticalAndSpecialtySolutionsMember2023-07-012024-06-300000721371cah:GroupPurchasingOrganizationsMemberus-gaap:CustomerConcentrationRiskMemberus-gaap:SalesRevenueNetMember2023-07-012024-06-3000007213712024-04-012024-06-3000007213712024-06-3000007213712022-07-012023-06-3000007213712021-07-012022-06-3000007213712023-06-300000721371us-gaap:CommonStockMember2021-06-300000721371us-gaap:RetainedEarningsMember2021-06-300000721371us-gaap:TreasuryStockCommonMember2021-06-300000721371us-gaap:AccumulatedOtherComprehensiveIncomeMember2021-06-300000721371us-gaap:NoncontrollingInterestMember2021-06-3000007213712021-06-300000721371us-gaap:RetainedEarningsMember2021-07-012022-06-300000721371us-gaap:NoncontrollingInterestMember2021-07-012022-06-300000721371us-gaap:AccumulatedOtherComprehensiveIncomeMember2021-07-012022-06-300000721371us-gaap:CommonStockMember2021-07-012022-06-300000721371us-gaap:TreasuryStockCommonMember2021-07-012022-06-300000721371us-gaap:CommonStockMember2022-06-300000721371us-gaap:RetainedEarningsMember2022-06-300000721371us-gaap:TreasuryStockCommonMember2022-06-300000721371us-gaap:AccumulatedOtherComprehensiveIncomeMember2022-06-300000721371us-gaap:NoncontrollingInterestMember2022-06-3000007213712022-06-300000721371us-gaap:RetainedEarningsMember2022-07-012023-06-300000721371us-gaap:NoncontrollingInterestMember2022-07-012023-06-300000721371us-gaap:AccumulatedOtherComprehensiveIncomeMember2022-07-012023-06-300000721371us-gaap:CommonStockMember2022-07-012023-06-300000721371us-gaap:TreasuryStockCommonMember2022-07-012023-06-300000721371us-gaap:CommonStockMember2023-06-300000721371us-gaap:RetainedEarningsMember2023-06-300000721371us-gaap:TreasuryStockCommonMember2023-06-300000721371us-gaap:AccumulatedOtherComprehensiveIncomeMember2023-06-300000721371us-gaap:NoncontrollingInterestMember2023-06-300000721371us-gaap:RetainedEarningsMember2023-07-012024-06-300000721371us-gaap:NoncontrollingInterestMember2023-07-012024-06-300000721371us-gaap:AccumulatedOtherComprehensiveIncomeMember2023-07-012024-06-300000721371us-gaap:CommonStockMember2023-07-012024-06-300000721371us-gaap:TreasuryStockCommonMember2023-07-012024-06-300000721371us-gaap:CommonStockMember2024-06-300000721371us-gaap:RetainedEarningsMember2024-06-300000721371us-gaap:TreasuryStockCommonMember2024-06-300000721371us-gaap:AccumulatedOtherComprehensiveIncomeMember2024-06-300000721371us-gaap:NoncontrollingInterestMember2024-06-300000721371srt:ScenarioPreviouslyReportedMember2022-07-012023-06-300000721371srt:RestatementAdjustmentMember2022-07-012023-06-300000721371srt:ScenarioPreviouslyReportedMember2021-07-012022-06-300000721371srt:RestatementAdjustmentMember2021-07-012022-06-300000721371srt:ScenarioPreviouslyReportedMember2023-06-300000721371srt:RestatementAdjustmentMember2023-06-300000721371srt:ScenarioPreviouslyReportedMemberus-gaap:CommonStockMember2021-06-300000721371srt:RestatementAdjustmentMemberus-gaap:CommonStockMember2021-06-300000721371srt:ScenarioPreviouslyReportedMemberus-gaap:RetainedEarningsMember2021-06-300000721371srt:RestatementAdjustmentMemberus-gaap:RetainedEarningsMember2021-06-300000721371srt:ScenarioPreviouslyReportedMemberus-gaap:TreasuryStockCommonMember2021-06-300000721371srt:RestatementAdjustmentMemberus-gaap:TreasuryStockCommonMember2021-06-300000721371srt:ScenarioPreviouslyReportedMember2021-06-300000721371srt:RestatementAdjustmentMember2021-06-300000721371srt:ScenarioPreviouslyReportedMemberus-gaap:CommonStockMember2021-07-012022-06-300000721371srt:RestatementAdjustmentMemberus-gaap:CommonStockMember2021-07-012022-06-300000721371srt:ScenarioPreviouslyReportedMemberus-gaap:RetainedEarningsMember2021-07-012022-06-300000721371srt:RestatementAdjustmentMemberus-gaap:RetainedEarningsMember2021-07-012022-06-300000721371srt:ScenarioPreviouslyReportedMemberus-gaap:TreasuryStockCommonMember2021-07-012022-06-300000721371srt:RestatementAdjustmentMemberus-gaap:TreasuryStockCommonMember2021-07-012022-06-300000721371srt:ScenarioPreviouslyReportedMemberus-gaap:CommonStockMember2022-06-300000721371srt:RestatementAdjustmentMemberus-gaap:CommonStockMember2022-06-300000721371srt:ScenarioPreviouslyReportedMemberus-gaap:RetainedEarningsMember2022-06-300000721371srt:RestatementAdjustmentMemberus-gaap:RetainedEarningsMember2022-06-300000721371srt:ScenarioPreviouslyReportedMemberus-gaap:TreasuryStockCommonMember2022-06-300000721371srt:RestatementAdjustmentMemberus-gaap:TreasuryStockCommonMember2022-06-300000721371srt:ScenarioPreviouslyReportedMember2022-06-300000721371srt:RestatementAdjustmentMember2022-06-300000721371srt:ScenarioPreviouslyReportedMemberus-gaap:CommonStockMember2022-07-012023-06-300000721371srt:RestatementAdjustmentMemberus-gaap:CommonStockMember2022-07-012023-06-300000721371srt:ScenarioPreviouslyReportedMemberus-gaap:RetainedEarningsMember2022-07-012023-06-300000721371srt:RestatementAdjustmentMemberus-gaap:RetainedEarningsMember2022-07-012023-06-300000721371srt:ScenarioPreviouslyReportedMemberus-gaap:TreasuryStockCommonMember2022-07-012023-06-300000721371srt:RestatementAdjustmentMemberus-gaap:TreasuryStockCommonMember2022-07-012023-06-300000721371srt:ScenarioPreviouslyReportedMemberus-gaap:CommonStockMember2023-06-300000721371srt:RestatementAdjustmentMemberus-gaap:CommonStockMember2023-06-300000721371srt:ScenarioPreviouslyReportedMemberus-gaap:RetainedEarningsMember2023-06-300000721371srt:RestatementAdjustmentMemberus-gaap:RetainedEarningsMember2023-06-300000721371srt:ScenarioPreviouslyReportedMemberus-gaap:TreasuryStockCommonMember2023-06-300000721371srt:RestatementAdjustmentMemberus-gaap:TreasuryStockCommonMember2023-06-300000721371us-gaap:AllowanceForCreditLossMember2024-06-300000721371us-gaap:AllowanceForCreditLossMember2023-06-300000721371srt:MinimumMember2023-07-012024-06-300000721371srt:MaximumMember2023-07-012024-06-300000721371us-gaap:AllowanceForLossesOnFinanceReceivablesMember2024-06-300000721371us-gaap:AllowanceForLossesOnFinanceReceivablesMember2023-06-300000721371cah:CVSHealthCorporationMemberus-gaap:CustomerConcentrationRiskMemberus-gaap:SalesRevenueNetMembercah:PharmaceuticalAndSpecialtySolutionsMember2022-07-012023-06-300000721371cah:CVSHealthCorporationMemberus-gaap:CustomerConcentrationRiskMemberus-gaap:SalesRevenueNetMembercah:PharmaceuticalAndSpecialtySolutionsMember2021-07-012022-06-300000721371cah:CVSHealthCorporationMembercah:PharmaceuticalAndSpecialtySolutionsMember2024-06-300000721371cah:CVSHealthCorporationMembercah:PharmaceuticalAndSpecialtySolutionsMember2023-06-300000721371cah:OptumRxMemberus-gaap:CustomerConcentrationRiskMemberus-gaap:SalesRevenueNetMembercah:PharmaceuticalAndSpecialtySolutionsMember2022-07-012023-06-300000721371cah:OptumRxMemberus-gaap:CustomerConcentrationRiskMemberus-gaap:SalesRevenueNetMembercah:PharmaceuticalAndSpecialtySolutionsMember2021-07-012022-06-300000721371cah:OptumRxMembercah:PharmaceuticalAndSpecialtySolutionsMember2024-06-300000721371cah:OptumRxMembercah:PharmaceuticalAndSpecialtySolutionsMember2023-06-300000721371cah:GroupPurchasingOrganizationsMemberus-gaap:CustomerConcentrationRiskMemberus-gaap:SalesRevenueNetMember2022-07-012023-06-300000721371cah:GroupPurchasingOrganizationsMemberus-gaap:CustomerConcentrationRiskMemberus-gaap:SalesRevenueNetMember2021-07-012022-06-300000721371cah:InventoryReserveExcessAndObsoleteMember2024-06-300000721371cah:InventoryReserveExcessAndObsoleteMember2023-06-300000721371srt:MinimumMemberus-gaap:BuildingAndBuildingImprovementsMember2024-06-300000721371srt:MaximumMemberus-gaap:BuildingAndBuildingImprovementsMember2024-06-300000721371srt:MinimumMemberus-gaap:MachineryAndEquipmentMember2024-06-300000721371srt:MaximumMemberus-gaap:MachineryAndEquipmentMember2024-06-300000721371srt:MinimumMemberus-gaap:SoftwareAndSoftwareDevelopmentCostsMember2024-06-300000721371srt:MaximumMemberus-gaap:SoftwareAndSoftwareDevelopmentCostsMember2024-06-300000721371srt:MinimumMemberus-gaap:FurnitureAndFixturesMember2024-06-300000721371srt:MaximumMemberus-gaap:FurnitureAndFixturesMember2024-06-300000721371us-gaap:LandBuildingsAndImprovementsMember2024-06-300000721371us-gaap:LandBuildingsAndImprovementsMember2023-06-300000721371us-gaap:MachineryAndEquipmentMember2024-06-300000721371us-gaap:MachineryAndEquipmentMember2023-06-300000721371us-gaap:SoftwareAndSoftwareDevelopmentCostsMember2024-06-300000721371us-gaap:SoftwareAndSoftwareDevelopmentCostsMember2023-06-300000721371us-gaap:FurnitureAndFixturesMember2024-06-300000721371us-gaap:FurnitureAndFixturesMember2023-06-300000721371us-gaap:ConstructionInProgressMember2024-06-300000721371us-gaap:ConstructionInProgressMember2023-06-300000721371srt:MinimumMember2024-06-300000721371srt:MaximumMember2024-06-300000721371cah:GMPDMember2023-07-012024-06-300000721371cah:GMPDMember2022-07-012023-06-300000721371cah:GMPDMember2021-07-012022-06-300000721371cah:TransactionDataSystemInvestmentMember2024-06-300000721371cah:TotalOpioidLitigationMember2021-07-012022-06-300000721371cah:ThirdPartyPayorsAcuteCareHospitalsAndCityOfBaltimoreMember2024-06-300000721371us-gaap:PerformanceSharesMembercah:August2021Member2023-07-012024-06-300000721371us-gaap:PerformanceSharesMembercah:August2022Member2023-07-012024-06-300000721371us-gaap:PerformanceSharesMembercah:September2023Member2023-07-012024-06-300000721371us-gaap:PerformanceSharesMembercah:August2023Member2023-07-012024-06-300000721371us-gaap:PerformanceSharesMembersrt:MinimumMember2023-07-012024-06-300000721371us-gaap:PerformanceSharesMembersrt:MaximumMember2023-07-012024-06-300000721371us-gaap:ShippingAndHandlingMember2023-07-012024-06-300000721371us-gaap:ShippingAndHandlingMember2022-07-012023-06-300000721371us-gaap:ShippingAndHandlingMember2021-07-012022-06-300000721371cah:SpecialtyNetworksMember2023-07-012024-06-300000721371cah:SpecialtyNetworksMemberus-gaap:CustomerRelationshipsMember2024-06-300000721371cah:SpecialtyNetworksMembercah:TrademarksAndPatentsMember2024-06-300000721371cah:SpecialtyNetworksMemberus-gaap:DevelopedTechnologyRightsMember2024-06-300000721371cah:SpecialtyNetworksMember2024-06-300000721371cah:OutcomesDivestitureMember2023-07-012024-06-300000721371us-gaap:FairValueInputsLevel3Membercah:TransactionDataSystemInvestmentMemberus-gaap:FairValueMeasurementsNonrecurringMember2023-07-100000721371cah:CordisDivestitureMember2021-08-022021-08-020000721371cah:CordisDivestitureMember2020-07-012021-06-300000721371us-gaap:EmployeeSeveranceMember2022-06-300000721371us-gaap:FacilityClosingMember2022-06-300000721371us-gaap:EmployeeSeveranceMember2022-07-012023-06-300000721371us-gaap:FacilityClosingMember2022-07-012023-06-300000721371us-gaap:EmployeeSeveranceMember2023-06-300000721371us-gaap:FacilityClosingMember2023-06-300000721371us-gaap:EmployeeSeveranceMember2023-07-012024-06-300000721371us-gaap:FacilityClosingMember2023-07-012024-06-300000721371us-gaap:EmployeeSeveranceMember2024-06-300000721371us-gaap:FacilityClosingMember2024-06-300000721371cah:PharmaceuticalAndSpecialtySolutionsMember2022-06-300000721371cah:GMPDMember2022-06-300000721371us-gaap:AllOtherSegmentsMember2022-06-300000721371cah:PharmaceuticalAndSpecialtySolutionsMember2022-07-012023-06-300000721371us-gaap:AllOtherSegmentsMember2022-07-012023-06-300000721371cah:PharmaceuticalAndSpecialtySolutionsMember2023-06-300000721371cah:GMPDMember2023-06-300000721371us-gaap:AllOtherSegmentsMember2023-06-300000721371cah:PharmaceuticalAndSpecialtySolutionsMember2023-07-012024-06-300000721371us-gaap:AllOtherSegmentsMember2023-07-012024-06-300000721371cah:PharmaceuticalAndSpecialtySolutionsMember2024-06-300000721371cah:GMPDMember2024-06-300000721371us-gaap:AllOtherSegmentsMember2024-06-300000721371cah:OptiFreightLogisticsMember2024-06-300000721371cah:GMPDMember2024-01-010000721371cah:OptiFreightLogisticsMemberus-gaap:AllOtherSegmentsMember2024-01-010000721371cah:GMPDMember2024-01-012024-03-310000721371cah:GMPDMember2024-03-310000721371cah:GMPDMember2023-07-012023-09-300000721371cah:OutcomesDivestitureMembercah:PharmaceuticalAndSpecialtySolutionsMember2023-06-300000721371cah:IPRDTrademarksandOtherMember2024-06-300000721371us-gaap:CustomerRelationshipsMember2024-06-300000721371cah:TrademarksAndPatentsMember2024-06-300000721371us-gaap:DevelopedTechnologyRightsMember2024-06-300000721371cah:IPRDTrademarksandOtherMember2023-06-300000721371us-gaap:CustomerRelationshipsMember2023-06-300000721371cah:TrademarksAndPatentsMember2023-06-300000721371us-gaap:DevelopedTechnologyRightsMember2023-06-300000721371cah:OperatingLeaseMember2024-06-300000721371cah:FinanceLeaseMember2024-06-300000721371cah:A3.079Notesdue2024Member2024-06-300000721371cah:A3.079Notesdue2024Member2023-06-300000721371cah:A3.5Notesdue2025Member2024-06-300000721371cah:A3.5Notesdue2025Member2023-06-300000721371cah:A3.75Notesdue2026Member2024-06-300000721371cah:A3.75Notesdue2026Member2023-06-300000721371cah:A3.41Notesdue2027Member2024-06-300000721371cah:A3.41Notesdue2027Member2023-06-300000721371cah:A5.125NotesDue2029Member2024-06-300000721371cah:A5.125NotesDue2029Member2023-06-300000721371cah:A5.45NotesDue2034Member2024-06-300000721371cah:A5.45NotesDue2034Member2023-06-300000721371cah:A4.6Notesdue2043Member2024-06-300000721371cah:A4.6Notesdue2043Member2023-06-300000721371cah:A4.5Notesdue2044Member2024-06-300000721371cah:A4.5Notesdue2044Member2023-06-300000721371cah:A4.9Notesdue2045Member2024-06-300000721371cah:A4.9Notesdue2045Member2023-06-300000721371cah:A4.368Notesdue2047Member2024-06-300000721371cah:A4.368Notesdue2047Member2023-06-300000721371cah:A7.0Debenturesduefiscal2027Member2024-06-300000721371cah:A7.0Debenturesduefiscal2027Member2023-06-300000721371cah:A3.079Notesdue2024Member2023-07-012024-06-300000721371cah:A5.125NotesDue2029Member2023-07-012024-06-300000721371cah:A5.45NotesDue2034Member2023-07-012024-06-300000721371cah:A3.2Notesdue2023Member2022-07-012023-06-300000721371cah:A2.616Notesdue2022Member2021-07-012022-06-300000721371cah:FloatingRateNotesdue2022Member2021-07-012022-06-300000721371us-gaap:CommercialPaperMember2024-06-300000721371us-gaap:RevolvingCreditFacilityMember2024-06-300000721371cah:CommittedReceivablesSalesFacilityProgramMembercah:ShortTermCreditFacilitiesMember2024-06-300000721371us-gaap:LetterOfCreditMember2024-06-300000721371us-gaap:LetterOfCreditMember2023-06-300000721371cah:CommittedReceivablesSalesFacilityProgramMember2023-07-012024-06-300000721371cah:CommittedReceivablesSalesFacilityProgramMember2024-06-300000721371cah:CommittedReceivablesSalesFacilityProgramMemberus-gaap:LetterOfCreditMember2024-06-300000721371cah:CommittedReceivablesSalesFacilityProgramMemberus-gaap:LetterOfCreditMember2023-06-300000721371us-gaap:CommercialPaperMember2023-06-300000721371cah:CVSHealthCorporationMember2014-07-312014-07-310000721371cah:NewYorkOpioidStewardshipActMember2018-04-300000721371cah:NewYorkOpioidStewardshipActMember2021-06-300000721371cah:NewYorkOpioidStewardshipActMember2021-10-012021-12-310000721371cah:NewYorkOpioidStewardshipActMember2022-06-300000721371cah:NewYorkOpioidStewardshipActMember2022-07-012023-06-300000721371cah:NewYorkOpioidStewardshipActMember2023-06-300000721371cah:PharmaceuticalAndSpecialtySolutionsMember2021-10-012021-12-310000721371cah:TotalOpioidLitigationMember2024-06-300000721371cah:TotalOpioidLitigationMember2023-07-012024-06-300000721371cah:OpioidLawsuitsMember2022-06-300000721371cah:OpioidLawsuitsMember2024-06-300000721371cah:OpioidLawsuitsMemberstpr:AL2023-11-300000721371cah:OpioidLawsuitsMemberstpr:AL2023-07-012024-06-300000721371cah:OpioidLawsuitsMemberus-gaap:SubsequentEventMember2021-07-012024-07-310000721371cah:OpioidLawsuitsMemberus-gaap:SubsequentEventMember2023-08-012038-06-300000721371cah:OpioidLawsuitsMemberstpr:WV2022-07-310000721371cah:OpioidLawsuitsMembernaics:ZZ9211502022-10-310000721371cah:OpioidLawsuitsMember2024-01-012024-03-310000721371cah:TotalOpioidLitigationMember2024-01-012024-03-310000721371cah:OpioidLawsuitsMembercah:PrivatePartiesMemberus-gaap:SubsequentEventMember2024-08-080000721371cah:ClassActionLawsuitsMembercah:OpioidLawsuitsMembercah:PrivatePartiesMemberus-gaap:SubsequentEventMember2024-08-080000721371cah:ClassActionLawsuitsMembercah:OpioidLawsuitsMembercah:PrivatePartiesMember2024-06-300000721371stpr:GAcah:OpioidLawsuitsMembercah:PrivatePartiesMember2023-01-012023-03-310000721371cah:OpioidLawsuitsMember2023-07-012024-06-300000721371cah:ProductLiabilityLawsuitsMembercah:IVCApril2023AgreementMember2023-04-302023-04-300000721371cah:ProductLiabilityLawsuitsMembercah:IVCApril2023AgreementMember2023-04-300000721371cah:ProductLiabilityLawsuitsMembercah:IVCApril2023AgreementMember2023-05-012023-09-300000721371cah:ProductLiabilityLawsuitsMember2022-07-012023-06-300000721371cah:ProductLiabilityLawsuitsMembersrt:MinimumMember2024-06-300000721371cah:GMPDMember2023-07-012024-06-300000721371cah:GMPDMember2022-07-012023-06-300000721371cah:GMPDMember2021-07-012022-06-300000721371us-gaap:InternalRevenueServiceIRSMember2024-06-300000721371us-gaap:StateAndLocalJurisdictionMember2024-06-300000721371us-gaap:ForeignCountryMember2024-06-300000721371us-gaap:FairValueInputsLevel1Memberus-gaap:FairValueMeasurementsRecurringMember2024-06-300000721371us-gaap:FairValueInputsLevel2Memberus-gaap:FairValueMeasurementsRecurringMember2024-06-300000721371us-gaap:FairValueInputsLevel3Memberus-gaap:FairValueMeasurementsRecurringMember2024-06-300000721371us-gaap:FairValueMeasurementsRecurringMember2024-06-300000721371us-gaap:FairValueInputsLevel1Memberus-gaap:FairValueMeasurementsRecurringMember2023-06-300000721371us-gaap:FairValueInputsLevel2Memberus-gaap:FairValueMeasurementsRecurringMember2023-06-300000721371us-gaap:FairValueInputsLevel3Memberus-gaap:FairValueMeasurementsRecurringMember2023-06-300000721371us-gaap:FairValueMeasurementsRecurringMember2023-06-300000721371us-gaap:CrossCurrencyInterestRateContractMemberus-gaap:FairValueHedgingMemberus-gaap:DesignatedAsHedgingInstrumentMemberus-gaap:PrepaidExpensesAndOtherCurrentAssetsMember2024-06-300000721371us-gaap:CrossCurrencyInterestRateContractMemberus-gaap:FairValueHedgingMemberus-gaap:DesignatedAsHedgingInstrumentMemberus-gaap:PrepaidExpensesAndOtherCurrentAssetsMember2023-06-300000721371us-gaap:ForeignExchangeContractMemberus-gaap:CashFlowHedgingMemberus-gaap:DesignatedAsHedgingInstrumentMemberus-gaap:PrepaidExpensesAndOtherCurrentAssetsMember2024-06-300000721371us-gaap:ForeignExchangeContractMemberus-gaap:CashFlowHedgingMemberus-gaap:DesignatedAsHedgingInstrumentMemberus-gaap:PrepaidExpensesAndOtherCurrentAssetsMember2023-06-300000721371us-gaap:CrossCurrencyInterestRateContractMemberus-gaap:FairValueHedgingMemberus-gaap:DesignatedAsHedgingInstrumentMemberus-gaap:AccruedLiabilitiesMember2024-06-300000721371us-gaap:CrossCurrencyInterestRateContractMemberus-gaap:FairValueHedgingMemberus-gaap:DesignatedAsHedgingInstrumentMemberus-gaap:AccruedLiabilitiesMember2023-06-300000721371us-gaap:ForeignExchangeContractMemberus-gaap:CashFlowHedgingMemberus-gaap:DesignatedAsHedgingInstrumentMemberus-gaap:AccruedLiabilitiesMember2024-06-300000721371us-gaap:ForeignExchangeContractMemberus-gaap:CashFlowHedgingMemberus-gaap:DesignatedAsHedgingInstrumentMemberus-gaap:AccruedLiabilitiesMember2023-06-300000721371us-gaap:InterestRateSwapMemberus-gaap:FairValueHedgingMemberus-gaap:DesignatedAsHedgingInstrumentMemberus-gaap:AccruedLiabilitiesMember2024-06-300000721371us-gaap:InterestRateSwapMemberus-gaap:FairValueHedgingMemberus-gaap:DesignatedAsHedgingInstrumentMemberus-gaap:AccruedLiabilitiesMember2023-06-300000721371us-gaap:InterestRateSwapMemberus-gaap:FairValueHedgingMemberus-gaap:DesignatedAsHedgingInstrumentMember2024-06-300000721371us-gaap:InterestRateSwapMemberus-gaap:FairValueHedgingMemberus-gaap:DesignatedAsHedgingInstrumentMember2023-06-300000721371us-gaap:InterestRateSwapMemberus-gaap:FairValueHedgingMemberus-gaap:DesignatedAsHedgingInstrumentMember2022-06-300000721371us-gaap:FairValueHedgingMember2023-07-012024-06-300000721371us-gaap:InterestRateSwapMemberus-gaap:FairValueHedgingMember2024-06-300000721371us-gaap:InterestRateSwapMemberus-gaap:FairValueHedgingMember2023-06-300000721371us-gaap:InterestRateSwapMemberus-gaap:FairValueHedgingMember2023-07-012024-06-300000721371us-gaap:InterestRateSwapMemberus-gaap:FairValueHedgingMember2022-07-012023-06-300000721371us-gaap:InterestRateSwapMemberus-gaap:FairValueHedgingMember2021-07-012022-06-300000721371cah:FixedRateDebtMemberus-gaap:FairValueHedgingMember2023-07-012024-06-300000721371cah:FixedRateDebtMemberus-gaap:FairValueHedgingMember2022-07-012023-06-300000721371cah:FixedRateDebtMemberus-gaap:FairValueHedgingMember2021-07-012022-06-300000721371us-gaap:CashFlowHedgingMember2023-07-012024-06-300000721371us-gaap:ForeignExchangeContractMemberus-gaap:CashFlowHedgingMember2024-06-300000721371us-gaap:ForeignExchangeContractMemberus-gaap:CashFlowHedgingMember2023-06-300000721371us-gaap:ForeignExchangeContractMemberus-gaap:CashFlowHedgingMember2023-07-012024-06-300000721371us-gaap:ForeignExchangeContractMemberus-gaap:CashFlowHedgingMember2022-07-012023-06-300000721371us-gaap:ForeignExchangeContractMemberus-gaap:CashFlowHedgingMember2021-07-012022-06-300000721371us-gaap:ForeignExchangeContractMemberus-gaap:CashFlowHedgingMemberus-gaap:SalesMember2023-07-012024-06-300000721371us-gaap:ForeignExchangeContractMemberus-gaap:CashFlowHedgingMemberus-gaap:SalesMember2022-07-012023-06-300000721371us-gaap:ForeignExchangeContractMemberus-gaap:CashFlowHedgingMemberus-gaap:SalesMember2021-07-012022-06-300000721371us-gaap:ForeignExchangeContractMemberus-gaap:CashFlowHedgingMemberus-gaap:CostOfSalesMember2023-07-012024-06-300000721371us-gaap:ForeignExchangeContractMemberus-gaap:CashFlowHedgingMemberus-gaap:CostOfSalesMember2022-07-012023-06-300000721371us-gaap:ForeignExchangeContractMemberus-gaap:CashFlowHedgingMemberus-gaap:CostOfSalesMember2021-07-012022-06-300000721371us-gaap:ForeignExchangeContractMemberus-gaap:CashFlowHedgingMemberus-gaap:SellingGeneralAndAdministrativeExpensesMember2023-07-012024-06-300000721371us-gaap:ForeignExchangeContractMemberus-gaap:CashFlowHedgingMemberus-gaap:SellingGeneralAndAdministrativeExpensesMember2022-07-012023-06-300000721371us-gaap:ForeignExchangeContractMemberus-gaap:CashFlowHedgingMemberus-gaap:SellingGeneralAndAdministrativeExpensesMember2021-07-012022-06-300000721371us-gaap:ForwardContractsMemberus-gaap:CashFlowHedgingMember2023-07-012024-06-300000721371us-gaap:ForwardContractsMemberus-gaap:CashFlowHedgingMember2022-07-012023-06-300000721371us-gaap:ForwardContractsMemberus-gaap:CashFlowHedgingMember2021-07-012022-06-300000721371us-gaap:SellingGeneralAndAdministrativeExpensesMember2023-07-012024-06-300000721371us-gaap:SellingGeneralAndAdministrativeExpensesMember2021-07-012022-06-300000721371us-gaap:SellingGeneralAndAdministrativeExpensesMember2022-07-012023-06-300000721371us-gaap:CurrencySwapMemberus-gaap:NetInvestmentHedgingMemberus-gaap:DesignatedAsHedgingInstrumentMembercah:June2027Member2024-06-300000721371cah:June2027Member2023-07-012024-06-300000721371cah:September2025Memberus-gaap:CurrencySwapMemberus-gaap:NetInvestmentHedgingMemberus-gaap:DesignatedAsHedgingInstrumentMember2024-06-300000721371cah:June2027Memberus-gaap:CurrencySwapMemberus-gaap:NetInvestmentHedgingMemberus-gaap:DesignatedAsHedgingInstrumentMember2024-06-300000721371us-gaap:CurrencySwapMemberus-gaap:NetInvestmentHedgingMemberus-gaap:DesignatedAsHedgingInstrumentMembercah:January2023Member2024-06-300000721371cah:January2023Member2023-07-012024-06-300000721371cah:September2025Memberus-gaap:CurrencySwapMemberus-gaap:NetInvestmentHedgingMemberus-gaap:DesignatedAsHedgingInstrumentMember2023-06-300000721371cah:June2027Memberus-gaap:CurrencySwapMemberus-gaap:NetInvestmentHedgingMemberus-gaap:DesignatedAsHedgingInstrumentMember2023-06-300000721371cah:March2025Memberus-gaap:CurrencySwapMemberus-gaap:NetInvestmentHedgingMemberus-gaap:DesignatedAsHedgingInstrumentMember2023-06-300000721371cah:March2026Memberus-gaap:CurrencySwapMemberus-gaap:NetInvestmentHedgingMemberus-gaap:DesignatedAsHedgingInstrumentMember2023-06-300000721371us-gaap:CurrencySwapMemberus-gaap:NetInvestmentHedgingMemberus-gaap:DesignatedAsHedgingInstrumentMembercah:March2022Member2023-06-300000721371us-gaap:CurrencySwapMemberus-gaap:NetInvestmentHedgingMemberus-gaap:DesignatedAsHedgingInstrumentMembercah:September2018Member2023-06-300000721371cah:March2022Member2023-04-012023-06-300000721371cah:September2018Member2023-04-012023-06-300000721371cah:September2025Memberus-gaap:CurrencySwapMemberus-gaap:NetInvestmentHedgingMemberus-gaap:DesignatedAsHedgingInstrumentMember2022-06-300000721371cah:June2027Memberus-gaap:CurrencySwapMemberus-gaap:NetInvestmentHedgingMemberus-gaap:DesignatedAsHedgingInstrumentMember2022-06-300000721371us-gaap:CurrencySwapMember2022-06-300000721371us-gaap:ForeignExchangeContractMember2023-07-012024-06-300000721371us-gaap:ForeignExchangeContractMember2022-07-012023-06-300000721371us-gaap:NondesignatedMember2023-07-012024-06-300000721371us-gaap:ForeignExchangeContractMemberus-gaap:NondesignatedMember2024-06-300000721371us-gaap:ForeignExchangeContractMemberus-gaap:NondesignatedMember2023-06-300000721371us-gaap:ForeignExchangeContractMemberus-gaap:NondesignatedMemberus-gaap:OtherNonoperatingIncomeExpenseMember2023-07-012024-06-300000721371us-gaap:ForeignExchangeContractMemberus-gaap:NondesignatedMemberus-gaap:OtherNonoperatingIncomeExpenseMember2022-07-012023-06-300000721371us-gaap:ForeignExchangeContractMemberus-gaap:NondesignatedMemberus-gaap:OtherNonoperatingIncomeExpenseMember2021-07-012022-06-300000721371us-gaap:FairValueInputsLevel2Member2024-06-300000721371us-gaap:FairValueInputsLevel2Member2023-06-300000721371us-gaap:CurrencySwapMemberus-gaap:CashFlowHedgingMember2024-06-300000721371us-gaap:CurrencySwapMemberus-gaap:CashFlowHedgingMember2023-06-300000721371us-gaap:CommonClassAMember2024-06-300000721371us-gaap:CommonClassAMember2023-06-300000721371us-gaap:CommonClassBMember2024-06-300000721371us-gaap:CommonClassBMember2023-06-300000721371us-gaap:CommonClassAMember2023-07-012024-06-300000721371us-gaap:TreasuryStockCommonMember2020-07-012023-06-300000721371cah:A500MillionShareRepurchaseProgramMemberus-gaap:TreasuryStockCommonMember2023-07-012023-09-300000721371cah:A500MillionShareRepurchaseProgramMemberus-gaap:TreasuryStockCommonMember2023-07-012024-06-300000721371cah:A250MillionShareRepurchaseProgramMemberus-gaap:TreasuryStockCommonMember2023-07-012024-06-300000721371cah:A1BillionShareRepurchaseProgramMemberus-gaap:TreasuryStockCommonMember2023-07-012024-06-300000721371cah:A1BillionShareRepurchaseProgramMemberus-gaap:TreasuryStockCommonMember2022-07-012023-06-300000721371cah:A250MillionShareRepurchaseProgramMemberus-gaap:TreasuryStockCommonMember2022-07-012023-06-300000721371cah:Second250MillionShareRepurchaseProgramMemberus-gaap:TreasuryStockCommonMember2022-07-012023-06-300000721371cah:A500MillionShareRepurchaseProgramMemberus-gaap:TreasuryStockCommonMember2022-07-012023-06-300000721371cah:A500MillionShareRepurchaseProgramMemberus-gaap:TreasuryStockCommonMember2021-07-012022-06-300000721371cah:A300MillionShareRepurchaseProgramMemberus-gaap:TreasuryStockCommonMember2021-07-012022-06-300000721371cah:A200MillionShareRepurchaseProgramMemberus-gaap:TreasuryStockCommonMember2021-07-012022-06-300000721371us-gaap:AccumulatedForeignCurrencyAdjustmentIncludingPortionAttributableToNoncontrollingInterestMember2022-06-300000721371us-gaap:AccumulatedNetGainLossFromCashFlowHedgesIncludingPortionAttributableToNoncontrollingInterestMember2022-06-300000721371us-gaap:AccumulatedForeignCurrencyAdjustmentIncludingPortionAttributableToNoncontrollingInterestMember2022-07-012023-06-300000721371us-gaap:AccumulatedNetGainLossFromCashFlowHedgesIncludingPortionAttributableToNoncontrollingInterestMember2022-07-012023-06-300000721371us-gaap:AccumulatedForeignCurrencyAdjustmentIncludingPortionAttributableToNoncontrollingInterestMember2023-06-300000721371us-gaap:AccumulatedNetGainLossFromCashFlowHedgesIncludingPortionAttributableToNoncontrollingInterestMember2023-06-300000721371us-gaap:AccumulatedForeignCurrencyAdjustmentIncludingPortionAttributableToNoncontrollingInterestMember2023-07-012024-06-300000721371us-gaap:AccumulatedNetGainLossFromCashFlowHedgesIncludingPortionAttributableToNoncontrollingInterestMember2023-07-012024-06-300000721371us-gaap:AccumulatedForeignCurrencyAdjustmentIncludingPortionAttributableToNoncontrollingInterestMember2024-06-300000721371us-gaap:AccumulatedNetGainLossFromCashFlowHedgesIncludingPortionAttributableToNoncontrollingInterestMember2024-06-300000721371us-gaap:AociIncludingPortionAttributableToNoncontrollingInterestMember2024-06-300000721371us-gaap:OperatingSegmentsMembercah:PharmaceuticalAndSpecialtySolutionsMember2023-07-012024-06-300000721371us-gaap:OperatingSegmentsMembercah:PharmaceuticalAndSpecialtySolutionsMember2022-07-012023-06-300000721371us-gaap:OperatingSegmentsMembercah:PharmaceuticalAndSpecialtySolutionsMember2021-07-012022-06-300000721371us-gaap:OperatingSegmentsMembercah:GMPDMember2023-07-012024-06-300000721371us-gaap:OperatingSegmentsMembercah:GMPDMember2022-07-012023-06-300000721371us-gaap:OperatingSegmentsMembercah:GMPDMember2021-07-012022-06-300000721371us-gaap:OperatingSegmentsMemberus-gaap:AllOtherSegmentsMember2023-07-012024-06-300000721371us-gaap:OperatingSegmentsMemberus-gaap:AllOtherSegmentsMember2022-07-012023-06-300000721371us-gaap:OperatingSegmentsMemberus-gaap:AllOtherSegmentsMember2021-07-012022-06-300000721371us-gaap:OperatingSegmentsMember2023-07-012024-06-300000721371us-gaap:OperatingSegmentsMember2022-07-012023-06-300000721371us-gaap:OperatingSegmentsMember2021-07-012022-06-300000721371us-gaap:CorporateNonSegmentMember2023-07-012024-06-300000721371us-gaap:CorporateNonSegmentMember2022-07-012023-06-300000721371us-gaap:CorporateNonSegmentMember2021-07-012022-06-300000721371us-gaap:OperatingSegmentsMemberus-gaap:AllOtherSegmentsMembercah:NuclearAndPrecisionHealthSolutionsMember2023-07-012024-06-300000721371us-gaap:OperatingSegmentsMemberus-gaap:AllOtherSegmentsMembercah:NuclearAndPrecisionHealthSolutionsMember2022-07-012023-06-300000721371us-gaap:OperatingSegmentsMemberus-gaap:AllOtherSegmentsMembercah:NuclearAndPrecisionHealthSolutionsMember2021-07-012022-06-300000721371us-gaap:OperatingSegmentsMemberus-gaap:AllOtherSegmentsMembercah:AtHomeSolutionsMember2023-07-012024-06-300000721371us-gaap:OperatingSegmentsMemberus-gaap:AllOtherSegmentsMembercah:AtHomeSolutionsMember2022-07-012023-06-300000721371us-gaap:OperatingSegmentsMemberus-gaap:AllOtherSegmentsMembercah:AtHomeSolutionsMember2021-07-012022-06-300000721371us-gaap:OperatingSegmentsMemberus-gaap:AllOtherSegmentsMembercah:OptiFreightLogisticsMember2023-07-012024-06-300000721371us-gaap:OperatingSegmentsMemberus-gaap:AllOtherSegmentsMembercah:OptiFreightLogisticsMember2022-07-012023-06-300000721371us-gaap:OperatingSegmentsMemberus-gaap:AllOtherSegmentsMembercah:OptiFreightLogisticsMember2021-07-012022-06-300000721371country:US2023-07-012024-06-300000721371country:US2022-07-012023-06-300000721371country:US2021-07-012022-06-300000721371us-gaap:NonUsMember2023-07-012024-06-300000721371us-gaap:NonUsMember2022-07-012023-06-300000721371us-gaap:NonUsMember2021-07-012022-06-300000721371us-gaap:OperatingSegmentsMembercah:PharmaceuticalAndSpecialtySolutionsMember2024-06-300000721371us-gaap:OperatingSegmentsMembercah:PharmaceuticalAndSpecialtySolutionsMember2023-06-300000721371us-gaap:OperatingSegmentsMembercah:GMPDMember2024-06-300000721371us-gaap:OperatingSegmentsMembercah:GMPDMember2023-06-300000721371us-gaap:OperatingSegmentsMemberus-gaap:AllOtherSegmentsMember2024-06-300000721371us-gaap:OperatingSegmentsMemberus-gaap:AllOtherSegmentsMember2023-06-300000721371us-gaap:CorporateNonSegmentMember2024-06-300000721371us-gaap:CorporateNonSegmentMember2023-06-300000721371country:US2024-06-300000721371country:US2023-06-300000721371us-gaap:NonUsMember2024-06-300000721371us-gaap:NonUsMember2023-06-300000721371cah:A2021LTIPMember2024-06-300000721371cah:AwardsOtherThanStockOptionsMembercah:A2021LTIPMember2024-06-300000721371us-gaap:EmployeeStockOptionMembercah:A2021LTIPMember2024-06-300000721371us-gaap:EmployeeStockOptionMember2021-07-012022-06-300000721371us-gaap:EmployeeStockOptionMember2022-07-012023-06-300000721371us-gaap:EmployeeStockOptionMember2023-07-012024-06-300000721371us-gaap:RestrictedStockUnitsRSUMember2023-07-012024-06-300000721371us-gaap:RestrictedStockUnitsRSUMember2022-07-012023-06-300000721371us-gaap:RestrictedStockUnitsRSUMember2021-07-012022-06-300000721371us-gaap:PerformanceSharesMember2023-07-012024-06-300000721371us-gaap:PerformanceSharesMember2022-07-012023-06-300000721371us-gaap:PerformanceSharesMember2021-07-012022-06-300000721371us-gaap:RestrictedStockUnitsRSUMember2022-06-300000721371us-gaap:RestrictedStockUnitsRSUMember2023-06-300000721371us-gaap:RestrictedStockUnitsRSUMember2024-06-300000721371us-gaap:PerformanceSharesMember2022-06-300000721371us-gaap:PerformanceSharesMember2023-06-300000721371us-gaap:PerformanceSharesMember2024-06-3000007213712022-07-012023-03-3100007213712023-07-012024-03-310000721371srt:ScenarioPreviouslyReportedMember2023-07-012023-09-300000721371srt:RestatementAdjustmentMember2023-07-012023-09-3000007213712023-07-012023-09-300000721371srt:ScenarioPreviouslyReportedMember2023-10-012023-12-310000721371srt:RestatementAdjustmentMember2023-10-012023-12-3100007213712023-10-012023-12-310000721371srt:ScenarioPreviouslyReportedMember2024-01-012024-03-310000721371srt:RestatementAdjustmentMember2024-01-012024-03-3100007213712024-01-012024-03-310000721371srt:ScenarioPreviouslyReportedMember2022-07-012022-09-300000721371srt:RestatementAdjustmentMember2022-07-012022-09-3000007213712022-07-012022-09-300000721371srt:ScenarioPreviouslyReportedMember2022-10-012022-12-310000721371srt:RestatementAdjustmentMember2022-10-012022-12-3100007213712022-10-012022-12-310000721371srt:ScenarioPreviouslyReportedMember2023-01-012023-03-310000721371srt:RestatementAdjustmentMember2023-01-012023-03-3100007213712023-01-012023-03-310000721371us-gaap:AllowanceForCreditLossMember2023-07-012024-06-300000721371us-gaap:AllowanceForLossesOnFinanceReceivablesMember2023-07-012024-06-300000721371us-gaap:SalesReturnsAndAllowancesMember2023-06-300000721371us-gaap:SalesReturnsAndAllowancesMember2023-07-012024-06-300000721371us-gaap:SalesReturnsAndAllowancesMember2024-06-300000721371us-gaap:AllowanceForCreditLossMember2022-06-300000721371us-gaap:AllowanceForCreditLossMember2022-07-012023-06-300000721371us-gaap:AllowanceForLossesOnFinanceReceivablesMember2022-06-300000721371us-gaap:AllowanceForLossesOnFinanceReceivablesMember2022-07-012023-06-300000721371us-gaap:SalesReturnsAndAllowancesMember2022-06-300000721371us-gaap:SalesReturnsAndAllowancesMember2022-07-012023-06-300000721371us-gaap:AllowanceForCreditLossMember2021-06-300000721371us-gaap:AllowanceForCreditLossMember2021-07-012022-06-300000721371us-gaap:AllowanceForLossesOnFinanceReceivablesMember2021-06-300000721371us-gaap:AllowanceForLossesOnFinanceReceivablesMember2021-07-012022-06-300000721371us-gaap:SalesReturnsAndAllowancesMember2021-06-300000721371us-gaap:SalesReturnsAndAllowancesMember2021-07-012022-06-300000721371cah:PricingDisputesMember2023-07-012024-06-300000721371cah:PricingDisputesMember2022-07-012023-06-300000721371us-gaap:DisputesMember2021-07-012022-06-300000721371cah:PriorYearRecoveriesMember2021-07-012022-06-30
UNITED STATES
SECURITIES AND EXCHANGE COMMISSION
Washington, D.C. 20549
Form 10-K
| | | | | |
| ☑ | ANNUAL REPORT PURSUANT TO SECTION 13 OR 15(d) OF THE SECURITIES EXCHANGE ACT OF 1934 |
For the fiscal year ended June 30, 2024
or
| | | | | |
| ☐ | TRANSITION REPORT PURSUANT TO SECTION 13 OR 15(d) OF THE SECURITIES EXCHANGE ACT OF 1934 |
For the transition period from ________ to ________
Commission File Number: 1-11373
Cardinal Health, Inc.
(Exact name of registrant as specified in its charter)
| | | | | | | | | | | | | | | | | | | | |
| Ohio | | | | | | 31-0958666 |
(State or other jurisdiction of
incorporation or organization) | | (IRS Employer
Identification No.) |
| | | | | | |
| 7000 Cardinal Place | | Dublin | , | Ohio | | 43017 |
| (Address of principal executive offices) | | (Zip Code) |
| | | | | | |
| | | | (614) | | 757-5000 |
| (Registrant’s telephone number, including area code) |
| | | | | | | | |
| Securities registered pursuant to Section 12(b) of the Act: |
| | |
| Title of each class | Trading Symbol(s) | Name of each exchange on which registered |
| Common shares (without par value) | CAH | New York Stock Exchange |
| | |
| Securities registered pursuant to Section 12(g) of the Act: None |
Indicate by check mark if the registrant is a well-known seasoned issuer, as defined in Rule 405 of the Securities Act. Yes þ No o
Indicate by check mark if the registrant is not required to file reports pursuant to Section 13 or Section 15(d) of the Act. Yes o No þ
Indicate by check mark whether the registrant (1) has filed all reports required to be filed by Section 13 or 15(d) of the Securities Exchange Act of 1934 during the preceding 12 months (or for such shorter period that the registrant was required to file such reports), and (2) has been subject to such filing requirements for the past 90 days. Yes þ No o
Indicate by check mark whether the registrant has submitted electronically every Interactive Data File required to be submitted pursuant to Rule 405 of Regulation S-T (§232.405 of this chapter) during the preceding 12 months (or for such shorter period that the registrant was required to submit such files). Yes þ No ☐
Indicate by check mark whether the registrant is a large accelerated filer, an accelerated filer, a non-accelerated filer, smaller reporting company, or an emerging growth company. See the definitions of “large accelerated filer,” “accelerated filer,” “smaller reporting company,” and "emerging growth company" in Rule 12b-2 of the Exchange Act.
| | | | | | | | | | | | | | | | | |
| Large accelerated filer | þ | | Accelerated filer | ☐ | |
| Non-accelerated filer | ☐ | | Smaller reporting company | ☐ | |
| | | Emerging growth company | ☐ | |
If an emerging growth company, indicate by check mark if the registrant has elected not to use the extended transition period for complying with any new or revised financial accounting standards provided pursuant to Section 13(a) of the Exchange Act. o |
Indicate by check mark whether the registrant has filed a report on and attestation to its management’s assessment of the effectiveness of its internal control over financial reporting under Section 404(b) of the Sarbanes-Oxley Act (15 U.S.C. 7262(b)) by the registered public accounting firm that prepared or issued its audit report.
|
| þ | | | | | |
If securities are registered pursuant to Section 12(b) of the Act, indicate by check mark whether the financial statements of the registrant included in the filing reflect the correction of an error to previously issued financial statements. þ |
Indicate by check mark whether any of those error corrections are restatements that required a recovery analysis of incentive-based compensation received by any of the registrant’s executive officers during the relevant recovery period pursuant to §240.10D-1(b). þ |
Indicate by check mark whether the registrant is a shell company (as defined in Rule 12b-2 of the Exchange Act). Yes ☐ No þ
The aggregate market value of voting stock held by non-affiliates on December 31, 2023, was the following: $24,413,491,673.
The number of the registrant’s common shares, without par value, outstanding as of July 31, 2024, was the following: 243,845,343.
Documents Incorporated by Reference:
Portions of the registrant’s Definitive Proxy Statement to be filed for its 2024 Annual Meeting of Shareholders are incorporated by reference into the sections of this Form 10-K addressing the requirements of Part III of Form 10-K.
| | |
Cardinal Health Fiscal 2024 Form 10-K |
Table of Contents
| | | | | | | | |
1 | Cardinal Health | Fiscal 2024 Form 10-K | |
Introduction
References to Cardinal Health and Fiscal Years
As used in this report, "we," "our," "us," "Cardinal Health" and similar pronouns refer to Cardinal Health, Inc. and its majority-owned and consolidated subsidiaries, unless the context requires otherwise. Our fiscal year ends on June 30. References to fiscal 2025, 2024, 2023, 2022, 2021 and 2020 are to the fiscal years ended June 30, 2025, 2024, 2023, 2022, 2021 and 2020, respectively. Except as otherwise specified, information in this report is provided as of June 30, 2024.
Non-GAAP Financial Measures
In this report, we use financial measures that are derived from consolidated financial data but are not presented in our financial statements that are prepared in accordance with U.S. generally accepted accounting principles (“GAAP”). These measures are considered “non-GAAP financial measures” under the Securities and Exchange Commission (“SEC”) rules. The reasons we use these non-GAAP financial measures and the reconciliations to their most directly comparable GAAP financial measures are included in the “Explanation and Reconciliation of Non-GAAP Financial Measures” section following MD&A in this report.
Management's Discussion and Analysis ("MD&A") of Financial Condition and Results of Operations
Our MD&A within this Form 10-K generally discusses fiscal 2024 and fiscal 2023 items and year-over-year comparisons between fiscal 2024 and fiscal 2023. This Form 10-K also includes fiscal 2022 items and discussions of year-over-year comparisons between fiscal 2023 and fiscal 2022. The periods discussed in this Form 10-K have been revised herein to correct an error identified during the preparation of this Form 10-K, as well as to correct other unrelated immaterial errors. The revisions ensure comparability across all periods reflected herein. Please refer to Note 1 of the “Notes to the Consolidated Financial Statements” for additional information about these corrections. Important Information Regarding Forward-Looking Statements
This report (including information incorporated by reference) includes forward-looking statements addressing expectations, prospects, estimates and other matters that are dependent upon future events or developments. Many forward-looking statements appear in MD&A and Risk Factors, but there are others throughout this report, which may be identified by words such as “expect,” “anticipate,” “intend,” “plan,” “believe,” “will,” “should,” “could,” “would,” “project,” “continue,” “likely,” and similar expressions, and include statements reflecting future results or guidance, statements of outlook and expense accruals. These matters are subject to risks and uncertainties that could cause actual results to differ materially from those projected, anticipated or implied. The most significant of these risks and uncertainties are described in “Risk Factors” in this report and in Exhibit 99.1 to the Form 10-K included in this report. Forward-looking statements in this report speak only as of the date of this document. Except to the extent required by applicable law, we undertake no obligation to update or revise any forward-looking statement.
Available Information
Our Annual Report on Form 10-K, Quarterly Reports on Form 10-Q, Current Reports on Form 8-K and amendments to those reports are available free of charge on our website (www.cardinalhealth.com), under the “Investor Relations — Financial Reporting — SEC Filings” caption, as soon as reasonably practicable after we electronically file them with, or furnish them to, the SEC. The SEC also maintains a website (www.sec.gov) where you can search for annual, quarterly and current reports, proxy and information statements and other information regarding us and other public companies.
| | | | | | | | |
| Cardinal Health | Fiscal 2024 Form 10-K | 2 |
Management's Discussion and Analysis of Financial Condition and Results of Operations
About Cardinal Health
Cardinal Health, Inc., an Ohio corporation formed in 1979, is a global healthcare services and products company providing customized solutions for hospitals, healthcare systems, pharmacies, ambulatory surgery centers, clinical laboratories, physician offices and patients in the home. We provide pharmaceuticals and medical products and cost-effective solutions that enhance supply chain efficiency. We connect patients, providers, payers, pharmacists and manufacturers for integrated care coordination.
Effective January 1, 2024, we began operating under an updated organizational structure and re-aligned our financial reporting structure under two reportable segments: Pharmaceutical and Specialty Solutions ("Pharma") segment and Global Medical Products and Distribution ("GMPD") segment. All remaining operating segments that are not significant enough to require separate reportable segment disclosures are included in Other, which is comprised of Nuclear and Precision Health Solutions, at-Home Solutions and OptiFreight® Logistics.
Pharmaceutical and Specialty Solutions Segment
Our Pharmaceutical and Specialty Solutions segment distributes branded and generic pharmaceutical, specialty pharmaceutical and over-the-counter healthcare and consumer products in the United States. This segment also provides services to pharmaceutical manufacturers and healthcare providers for specialty pharmaceutical products; provides pharmacy management services to hospitals and operates a limited number of pharmacies, including pharmacies in community health centers; and repackages generic pharmaceuticals and over-the-counter healthcare products.
Global Medical Products and Distribution Segment
Our GMPD segment manufactures, sources and distributes Cardinal Health brand medical, surgical and laboratory products, which are sold in the United States, Canada, Europe, Asia and other markets. In addition to distributing Cardinal Health brand products, this segment also distributes a broad range of medical, surgical and laboratory products known as national brand products to hospitals, ambulatory surgery centers, clinical laboratories and other healthcare providers in the United States and Canada.
| | | | | | | | |
| Cardinal Health | Fiscal 2024 Form 10-K | 3 |
Consolidated Results
In connection with the preparation of our Consolidated Financial Statements for fiscal 2024, we identified an accounting error related to revenue recognition from third party payors within the at-Home Solutions operating segment. We evaluated the materiality of the error and determined that the impacts were not material, individually or in the aggregate, to our previously issued Consolidated Financial Statements for any of the prior quarters or annual periods in which they occurred. In this report, we present revised prior period financial statements to correct this error, as well as other unrelated immaterial errors, including an adjustment to an uncertain tax position. These other immaterial errors were previously corrected in the periods they were identified; however, they are now reflected in the periods they originated. The revisions ensure comparability across all periods reflected herein. Refer to Note 1 of the "Notes to Consolidated Financial Statements" for additional information regarding the immaterial corrections to our results of prior periods.
Overview
Revenue
Revenue increased 11 percent to $226.8 billion for fiscal 2024 and 13 percent to $205.0 billion for fiscal 2023 compared to their respective prior-year periods, primarily due to branded and specialty pharmaceutical sales growth from existing customers.
GAAP and Non-GAAP Operating Earnings/(Loss)
| | | | | | | | | | | | | | | | | | | | | | | | | | | | | |
| GAAP and Non-GAAP Operating Earnings/(Loss) | | Change |
| (in millions) | 2024 | | 2023 | | 2022 | | 2024 | | 2023 |
GAAP operating earnings/(loss) | $ | 1,243 | | | $ | 752 | | | $ | (607) | | | 65 | % | | N.M. |
| | | | | | | | | |
| | | | | | | | | |
| State opioid assessment related to prior fiscal years | — | | | (6) | | | — | | | | | |
| Shareholder cooperation agreement costs | 1 | | | 8 | | | — | | | | | |
| Restructuring and employee severance | 175 | | | 95 | | | 101 | | | | | |
| Amortization and other acquisition-related costs | 284 | | | 285 | | | 324 | | | | | |
| Impairments and (gain)/loss on disposal of assets, net | 634 | | | 1,246 | | | 2,060 | | | | | |
| Litigation (recoveries)/charges, net | 78 | | | (304) | | | 94 | | | | | |
| Non-GAAP operating earnings | $ | 2,414 | | | $ | 2,076 | | | $ | 1,973 | | | 16 | % | | 5 | % |
The sum of the components and certain computations may reflect rounding adjustments.
We had GAAP operating earnings of $1.2 billion and $752 million during fiscal 2024 and 2023, respectively, which included $675 million and $1.2 billion pre-tax non-cash goodwill impairment charges related to the GMPD segment. See the "Critical Accounting Policies and Sensitive Accounting Estimates" section of this MD&A and Note 5 of the "Notes to Consolidated Financial Statements" for additional detail. GAAP operating earnings during fiscal 2023 were favorably impacted by litigation recoveries as described further in the "Results of Operations" section of this MD&A and Note 8 of the "Notes to Consolidated Financial Statements." We had a GAAP operating loss of $607 million during fiscal 2022, which included $2.1 billion pre-tax non-cash goodwill impairment charges related to the GMPD segment. See the "Critical Accounting Policies and Sensitive Accounting Estimates" section of this MD&A and Note 5 of the "Notes to Consolidated Financial Statements" for additional detail. GAAP and Non-GAAP operating earnings increased during fiscal 2024, driven by increases in GMPD and Pharmaceutical and Specialty Solutions segment profit as described further in the "Results of Operations" section of this MD&A.
Non-GAAP operating earnings increased during fiscal 2023, driven by an increase in Pharmaceutical and Specialty Solutions segment profit, partially offset by a decrease in GMPD segment profit as described further in the "Results of Operations" section of this MD&A.
| | | | | | | | |
4 | Cardinal Health | Fiscal 2024 Form 10-K | |
GAAP and Non-GAAP Diluted EPS
| | | | | | | | | | | | | | | | | | | | | | | | | | | | | |
| GAAP and Non-GAAP diluted EPS | | Change |
| ($ per share) | 2024 (2) | | 2023 (2) | | 2022 (2)(3) | | 2024 | | 2023 |
GAAP diluted EPS (1) | $ | 3.45 | | | $ | 1.26 | | | $ | (3.37) | | | N.M. | | N.M. |
| | | | | | | | | |
| | | | | | | | | |
| State opioid assessment related to prior fiscal years | — | | | (0.02) | | | — | | | | | |
| Shareholder cooperation agreement costs | — | | | 0.02 | | | — | | | | | |
| Restructuring and employee severance | 0.54 | | | 0.28 | | | 0.27 | | | | | |
| Amortization and other acquisition-related costs | 0.85 | | | 0.80 | | | 0.87 | | | | | |
Impairments and (gain)/loss on disposal of assets, net (4) | 2.38 | | | 4.35 | | | 7.03 | | | | | |
| Litigation (recoveries)/charges, net | 0.30 | | | (0.84) | | | 0.28 | | | | | |
| Loss on early extinguishment of debt | — | | | — | | | 0.03 | | | | | |
| | | | | | | | | |
| | | | | | | | | |
Non-GAAP diluted EPS (1) | $ | 7.53 | | | $ | 5.85 | | | $ | 5.07 | | | 29 | % | | 15 | % |
The sum of the components and certain computations may reflect rounding adjustments.
(1)Diluted earnings/(loss) per share attributable to Cardinal Health, Inc. ("diluted EPS" or "diluted loss per share").
(2)The reconciling items are presented within this table net of tax. See quantification of tax effect of each reconciling item in our GAAP to Non-GAAP Reconciliations in the section titled "Explanation and Reconciliation of Non-GAAP Financial Measures."
(3)For fiscal 2022, GAAP diluted loss per share attributable to Cardinal Health, Inc. and the EPS impact from the GAAP to non-GAAP per share reconciling items are calculated using a weighted average of 279 million common shares, which excludes potentially dilutive securities from the denominator due to their anti-dilutive effects resulting from our GAAP net loss for the period. Fiscal 2022 non-GAAP diluted EPS is calculated using a weighted average of 280 million common shares, which includes potentially dilutive shares.
(4)For fiscal 2024, 2023 and 2022, impairments and (gain)/loss on disposals of assets, net includes pre-tax goodwill impairment charges of $675 million, $1.2 billion and $2.1 billion related to the GMPD segment, respectively. For fiscal 2024, 2023 and 2022, the net tax benefit related to these charges was $58 million, $92 million and $140 million, respectively, and were included in the annual effective tax rate.
The increases in fiscal 2024 and 2023 GAAP diluted EPS were primarily due to the factors impacting GAAP operating earnings. During fiscal 2024, 2023 and 2022, GAAP diluted EPS was adversely impacted by the goodwill impairment charges related to the GMPD segment, which had $(2.50), $(4.33) and $(6.97) per share after-tax impacts, respectively. See the "Critical Accounting Policies and Sensitive Accounting Estimates" section of this MD&A and Note 5 and Note 9 of the "Notes to Consolidated Financial Statements" for additional detail. During fiscal 2024, non-GAAP diluted EPS increased 29 percent to $7.53 due to the factors impacting non-GAAP operating earnings described above and a lower share count.
During fiscal 2023, non-GAAP diluted EPS increased 15 percent to $5.85 due to a lower share count, the factors impacting non-GAAP operating earnings described above and lower interest expense, net.
Cash and Equivalents
Our cash and equivalents balance was $5.1 billion at June 30, 2024 compared to $4.1 billion at June 30, 2023. During fiscal 2024, net cash provided by operating activities was $3.8 billion, which includes the impact of our annual payment of $378 million and prepayments of $239 million primarily related to the agreement to settle the vast majority of the opioid lawsuits filed by states and local governmental entities (the "National Opioid Settlement Agreement"). During fiscal 2024, we issued additional long-term debt and received net proceeds of $1.14 billion, of which $200 million is invested in short-term time deposits with initial effective maturities of more than three months and classified as prepaid expenses and other in our consolidated balance sheet as of June 30, 2024. In addition, during fiscal 2024 we deployed $1.2 billion for the Specialty Networks acquisition, $783 million for debt repayments, $750 million for share repurchases, $511 million for capital expenditures and $499 million for cash dividends.
Our cash and equivalents balance was $4.1 billion at June 30, 2023 compared to $4.7 billion at June 30, 2022. During fiscal 2023, net cash provided by operating activities was $2.8 billion, which was offset by $2.0 billion for share repurchases, $579 million for debt repayments, $525 million for cash dividends and $481 million for capital expenditures.
| | | | | | | | |
| Cardinal Health | Fiscal 2024 Form 10-K | 5 |
Significant Developments in Fiscal 2024 and Trends
Operating and Segment Reporting Structure Changes Effective January 1, 2024, we began operating under an updated organizational structure and re-aligned our financial reporting structure under two reportable segments: Pharmaceutical and Specialty Solutions segment and GMPD segment. All remaining operating segments that are not significant enough to require separate reportable segment disclosures are included in Other. The following indicates the changes from the second quarter of fiscal 2024 to the new reporting structure:
•Pharmaceutical and Specialty Solutions segment: This reportable segment is comprised of all businesses formerly within our Pharmaceutical segment except Nuclear and Precision Health Solutions.
•GMPD segment: This reportable segment is comprised of all businesses formerly within our Medical segment except at-Home Solutions and OptiFreight® Logistics.
•Other: This is comprised of the remaining operating segments, Nuclear and Precision Health Solutions, at-Home Solutions and OptiFreight® Logistics.
Our previously reported segment results have been recast to conform to our new reporting structure and reflect changes in the elimination of inter-segment revenue and allocated corporate technology and shared function expenses, which are driven by the reporting structure change.
Pharmaceutical and Specialty Solutions Segment OptumRx Contracts
On April 22, 2024, we announced that our pharmaceutical distribution contracts with OptumRx would expire at the end of June 2024. Sales to OptumRx generated 17 percent of our consolidated revenue in fiscal 2024; however, due to the class of trade, sales to OptumRx generated a meaningfully lower operating margin than the overall Pharmaceutical and Specialty Solutions segment. We expect the expiration of the OptumRx contracts to adversely impact our results of operations, including segment profit, financial condition and cash flows in fiscal 2025. In particular, we expect the unwinding of the negative net working capital associated with the contract to negatively impact operating cash flow in fiscal 2025.
Specialty Networks Acquisition
On March 18, 2024, we completed the acquisition of Specialty Networks for a purchase price of $1.2 billion in cash, subject to certain adjustments. Specialty Networks creates clinical and economic value for independent specialty providers and partners across multiple specialty group purchasing organizations ("GPOs"): UroGPO, Gastrologix and GastroGPO, and United Rheumatology. Specialty Networks’ PPS Analytics platform analyzes data from electronic medical records, practice management, imaging, and dispensing systems and transforms it into meaningful and actionable insights for providers and other stakeholders by using artificial intelligence and modern data analytics capabilities. The acquisition further expands our offerings in key therapeutic areas, accelerates our upstream data and research opportunities with biopharma manufacturers, and creates a platform for our expansion across therapeutic areas. We expect the Specialty Networks acquisition to positively impact Pharmaceutical and Specialty Solutions segment revenue and profit while increasing amortization and other acquisition-related costs during fiscal 2025 and beyond.
Branded Pharmaceuticals
During fiscal 2024, we saw increased demand for GLP-1 pharmaceuticals, and our sales increased significantly, despite periodic supply shortages. These increased sales positively impacted our Pharmaceutical segment and consolidated revenue for the year; however, GLP-1 sales did not meaningfully contribute to segment profit. Future demand for these medications is unpredictable and our ability to meet demand may be impacted by additional supply constraints.
During fiscal 2024, we began distributing commercially available COVID-19 vaccines following U.S. Food and Drug Administration (“FDA”) approval. Distribution of these vaccines had a greater than anticipated benefit to Pharmaceutical and Specialty Solutions segment profit in fiscal year 2024. Updated COVID-19 vaccines for 2025 also require FDA approval. We expect COVID-19 vaccine distribution to favorably impact Pharmaceutical and Specialty Solutions segment profit in fiscal 2025, but to a lesser extent.
Generics Program
The performance of our Pharmaceutical and Specialty Solutions segment generics program positively impacted the year-over-year comparison of Pharmaceutical and Specialty Solutions segment profit. The Pharmaceutical and Specialty Solutions segment generics program includes, among other things, the impact of generic pharmaceutical product launches, customer volumes, pricing changes, the Red Oak Sourcing, LLC venture ("Red Oak Sourcing") with CVS Health Corporation ("CVS Health") and generic pharmaceutical contract manufacturing and sourcing costs.
| | | | | | | | |
6 | Cardinal Health | Fiscal 2024 Form 10-K | |
The frequency, timing, magnitude and profit impact of generic pharmaceutical customer volumes, pricing changes, customer contract renewals, generic pharmaceutical manufacturer pricing changes and generic pharmaceutical contract manufacturing and sourcing costs all impact Pharmaceutical and Specialty Solutions segment profit and are subject to risks and uncertainties. These risks and uncertainties may impact Pharmaceutical and Specialty Solutions segment profit and consolidated operating earnings during fiscal 2025 and beyond.
Global Medical Products and Distribution Segment
Inflationary Impacts
Beginning in fiscal 2022, GMPD segment profit was negatively affected by incremental inflationary impacts, primarily related to transportation (including ocean and domestic freight), commodities and labor, and global supply chain constraints. Since that time, we have taken actions to partially mitigate these impacts, including implementing certain price increases and evolving our pricing and commercial contracting processes to provide us with greater pricing flexibility. In addition, decreases in some product-related costs have been recognized as the higher-cost inventory moved through our supply chain and was replaced by lower-cost inventory. These net inflationary impacts negatively affected GMPD segment profit during fiscal 2023. The net inflationary impacts were less significant during fiscal 2024 and had a favorable impact on GMPD segment profit on a year-over-year basis.
We expect these inflationary impacts to continue to affect GMPD segment profit in fiscal 2025 and beyond, but we expect that they will be substantially offset due to our mitigation actions. However, these inflationary costs are difficult to predict and may be greater than we expect or continue longer than our current expectations. Our actions to increase prices and evolve our contracting strategies are subject to contingencies and uncertainties and it is possible that our results of operations will be adversely impacted to a greater extent than we currently anticipate or that we may not be able to mitigate the negative impact to the extent or on the timeline we anticipate.
Volumes
GMPD segment profit was adversely impacted during fiscal 2023 in part due to lower volumes, which included our Cardinal Health brand medical products. We experienced Cardinal Health brand medical products sales growth during fiscal 2024 and expect further growth in fiscal 2025 and beyond. The timing, magnitude and profit impact of this anticipated sales growth is subject to risks and uncertainties, which may impact GMPD segment profit.
Goodwill
The change in segment structure as discussed above resulted in changes to the composition of our reporting units. Accordingly, we were required to reallocate the goodwill in reporting units affected by the change using a relative fair value approach and assess goodwill for impairment both before and after the reallocation. During the three months ended March 31, 2024, we allocated $90 million and $48 million of goodwill from the former Medical segment excluding our at-Home Solutions division (the "Medical Unit") to the GMPD reporting unit and the OptiFreight® Logistics reporting unit, respectively. We also assessed GMPD's goodwill for impairment and determined there was an impairment of GMPD’s remaining goodwill balance of $90 million, resulting in GMPD goodwill being fully impaired. See the "Critical Accounting Policies and Sensitive Accounting Estimates" section of this MD&A and Note 5 of the "Notes to Consolidated Financial Statements" for additional detail.
Shareholder Cooperation Agreement In September 2022, we entered into a Cooperation Agreement (the "Cooperation Agreement") with Elliott Associates, L.P. and Elliott International, L.P. (together, "Elliott") under which our Board of Directors (the "Board"), among other things, (1) appointed four new independent directors, including a representative from Elliott, and (2) formed an advisory Business Review Committee of the Board tasked with undertaking a comprehensive review of our strategy, portfolio, capital-allocation framework and operations. In May 2023, we extended the term of the Cooperation Agreement until the later of July 15, 2024 or until Elliott's representative ceases to serve on, or resigns from, the Board. In connection with this extension, the Board extended the term of the Business Review Committee until July 15, 2024. On that date, the Business Review Committee disbanded in accordance with its charter. The Cooperation Agreement remains in effect.
The evaluation and implementation of actions recommended by the Business Review Committee and the Board have impacted and may continue to impact our business, financial position and results of operations during fiscal 2025 and beyond. During fiscal 2024 and 2023, we incurred $1 million and $8 million of expenses related to the negotiation and finalization of the Cooperation Agreement and other consulting expenses, respectively. We have incurred, and may incur additional legal, consulting and other expenses related to the Cooperation Agreement.
| | | | | | | | |
| Cardinal Health | Fiscal 2024 Form 10-K | 7 |
| | | | | | | | |
| MD&A | Results of Operations | |
Results of Operations
Revenue
| | | | | | | | | | | | | | | | | | | | | | | | | | | | | |
| Revenue | | Change |
| (in millions) | 2024 | | 2023 | | 2022 | | 2024 | | 2023 |
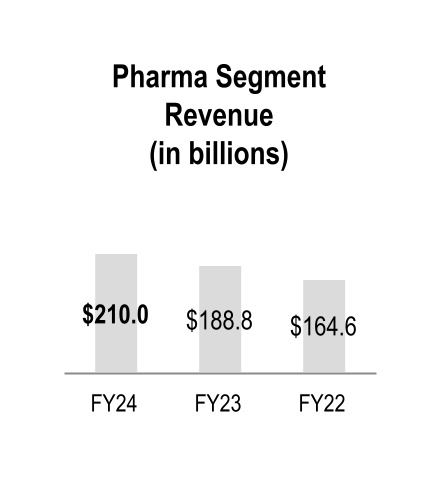
| Pharmaceutical and Specialty Solutions | $ | 210,019 | | | $ | 188,814 | | | $ | 164,596 | | | 11 | % | | 15 | % |
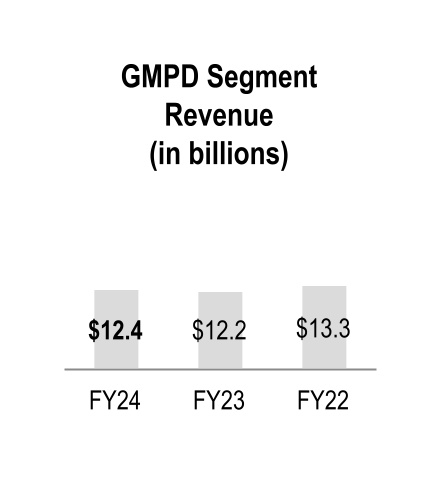
| Global Medical Products and Distribution | 12,381 | | | 12,222 | | | 13,280 | | | 1 | % | | (8) | % |
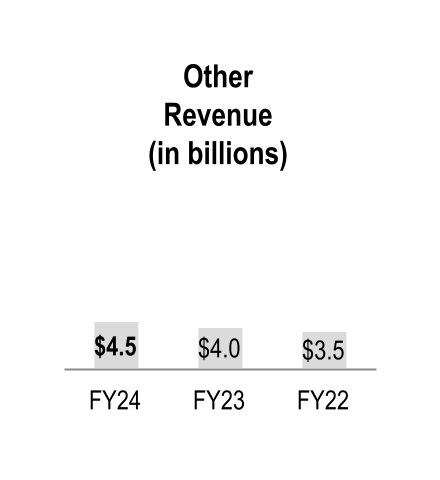
| Other | 4,512 | | | 4,021 | | | 3,518 | | | 12 | % | | 14 | % |
| Total segment revenue | 226,912 | | | 205,057 | | | 181,394 | | | 11 | % | | 13 | % |
Corporate (1) | (85) | | | (78) | | | (68) | | | N.M. | | N.M. |
| Total revenue | $ | 226,827 | | | $ | 204,979 | | | $ | 181,326 | | | 11 | % | | 13 | % |
(1)Corporate revenue consists of the elimination of inter-segment revenue and other revenue not allocated to the segments.
Fiscal 2024 Compared to Fiscal 2023
Pharmaceutical and Specialty Solutions
Fiscal 2024 Pharmaceutical and Specialty Solutions segment revenue grew by 11 percent primarily due to branded and specialty pharmaceutical sales growth largely from existing customers, which increased revenue by $20.1 billion.
Global Medical Products and Distribution
Fiscal 2024 GMPD segment revenue increased primarily due to higher volumes from existing customers, which increased revenue by $275 million. The increase was partially offset by the adverse impact of personal protective equipment ("PPE") pricing.
Other
Fiscal 2024 Other revenue increased due to growth across the at-Home Solutions, Nuclear and Precision Health Solutions and OptiFreight® Logistics operating segments.
Fiscal 2023 Compared to Fiscal 2022
Pharmaceutical and Specialty Solutions
Fiscal 2023 Pharmaceutical and Specialty Solutions segment revenue grew by 15 percent primarily due to branded and specialty pharmaceutical sales growth from existing and net new customers, which increased revenue by $24.2 billion.
Global Medical Products and Distribution
Fiscal 2023 GMPD segment revenue decreased primarily due to lower sales, largely due to an adverse impact of PPE pricing and volumes.
Other
Fiscal 2023 Other revenue increased due to growth across the Nuclear and Precision Health Solutions, at-Home Solutions and OptiFreight® Logistics operating segments.
| | | | | | | | |
8 | Cardinal Health | Fiscal 2024 Form 10-K | |
| | | | | | | | |
| MD&A | Results of Operations | |
Cost of Products Sold
Cost of products sold for fiscal 2024 and 2023 increased $21.3 billion (11 percent) and $23.3 billion (13 percent) compared to their respective prior-year periods as a result of the same factors affecting the changes in revenue and gross margin.
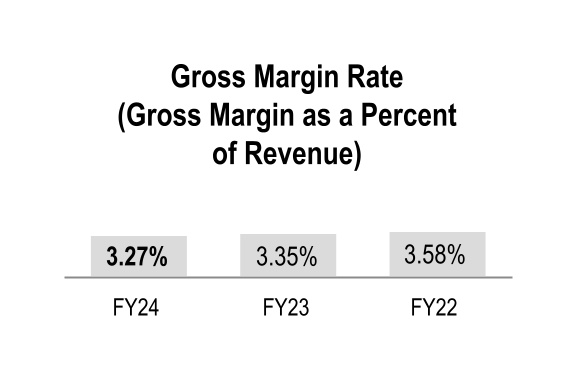
Gross Margin
| | | | | | | | | | | | | | | | | | | | | | | | | | | | | |
| Consolidated Gross Margin | | Change |
| (in millions) | 2024 | | 2023 | | 2022 | | 2024 | | 2023 |
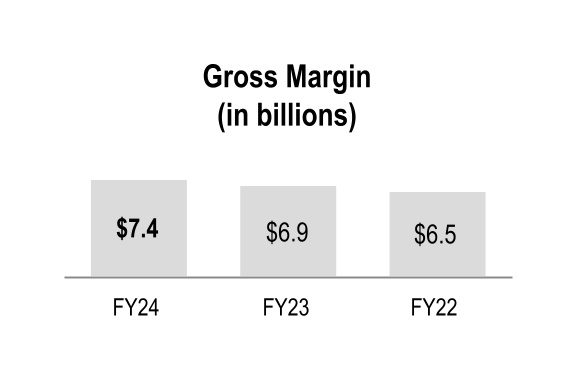
| Gross margin | $ | 7,414 | | | $ | 6,874 | | | $ | 6,484 | | | 8 | % | | 6 | % |
Fiscal 2024 Compared to Fiscal 2023
Fiscal 2024 consolidated gross margin increased primarily due to the beneficial comparison of the prior-year net inflationary impacts in the GMPD segment and the positive performance of our generics program in the Pharmaceutical and Specialty Solutions segment.
Gross margin rate declined 8 basis points during fiscal 2024 mainly due to changes in overall product mix, primarily driven by increased pharmaceutical distribution branded sales, which have a dilutive impact on our overall gross margin rate. This decline in gross margin rate was partially offset by the beneficial comparison to the prior-year net inflationary impacts in the GMPD segment.
`
Fiscal 2023 Compared to Fiscal 2022
Fiscal 2023 consolidated gross margin increased primarily due to the Pharmaceutical and Specialty Solutions segment, which reflected the positive performance of our generics program and a higher contribution from branded and specialty pharmaceutical products. This increase was partially offset by the GMPD segment, primarily driven by lower volumes and unfavorable product sales mix, partially offset by a net positive contribution from PPE.
Gross margin rate declined 23 basis points during fiscal 2023 mainly due to changes in overall product mix, primarily driven by increased pharmaceutical distribution branded sales, which have a dilutive impact on our overall gross margin rate. This decline in gross margin rate was partially offset by a net positive contribution from PPE.
| | | | | | | | |
| Cardinal Health | Fiscal 2024 Form 10-K | 9 |
| | | | | | | | |
| MD&A | Results of Operations | |
Distribution, Selling, General and Administrative ("SG&A") Expenses
| | | | | | | | | | | | | | | | | | | | | | | | | | | | | |
| SG&A Expenses | | Change |
| (in millions) | 2024 | | 2023 | | 2022 | | 2024 | | 2023 |
| SG&A expenses | $ | 5,000 | | | $ | 4,800 | | | $ | 4,512 | | | 4 | % | | 6 | % |
Fiscal 2024 Compared to Fiscal 2023
Fiscal 2024 SG&A expenses increased primarily due to compensation related costs, investment projects and higher costs to support sales growth. These increases were partially offset by the beneficial impact of enterprise-wide cost-savings measures.
Fiscal 2023 Compared to Fiscal 2022
Fiscal 2023 SG&A expenses increased primarily due to higher costs to support sales growth, compensation related costs and inflationary impacts. These increases were partially offset by the beneficial impact of enterprise-wide cost-savings measures.
| | | | | | | | |
10 | Cardinal Health | Fiscal 2024 Form 10-K | |
| | | | | | | | |
| MD&A | Results of Operations | |
We evaluate segment performance based on segment profit, among other measures. See Note 14 of the "Notes to Consolidated Financial Statements" for additional information on segment profit. | | | | | | | | | | | | | | | | | | | | | | | | | | | | | |
| Segment Profit and Operating Earnings/(Loss) | | Change |
| (in millions) | 2024 | | 2023 | | 2022 | | 2024 | | 2023 |
| Pharmaceutical and Specialty Solutions | $ | 2,015 | | | $ | 1,881 | | | $ | 1,643 | | | 7 | % | | 14 | % |
| Global Medical Products and Distribution | 92 | | | (147) | | | (64) | | | N.M. | | N.M. |
| Other | 423 | | | 396 | | | 390 | | | 7 | % | | 2 | % |
| Total segment profit | 2,530 | | | 2,130 | | | 1,969 | | | 19 | % | | 8 | % |
| Corporate | (1,287) | | | (1,378) | | | (2,576) | | | N.M. | | N.M. |
| Total consolidated operating earnings/(loss) | $ | 1,243 | | | $ | 752 | | | $ | (607) | | | 65 | % | | N.M. |
Fiscal 2024 Compared to Fiscal 2023
Pharmaceutical and Specialty Solutions
Fiscal 2024 Pharmaceutical and Specialty Solutions segment profit increased primarily due to the positive performance of our generics program.
Global Medical Products and Distribution
Fiscal 2024 GMPD segment profit increased primarily due to the beneficial comparison to the prior-year inflationary impacts, net of the effects of mitigation actions.
Other
Fiscal 2024 Other segment profit increased primarily due to the performance of OptiFreight® Logistics.
Corporate
The changes in Corporate during fiscal 2024 are due to the factors discussed in the "Other Components of Consolidated Operating Earnings/(Loss)" section that follows.
Fiscal 2023 Compared to Fiscal 2022
Pharmaceutical and Specialty Solutions
Fiscal 2023 Pharmaceutical and Specialty Solutions segment profit increased primarily due to the positive performance of our generics program and an increased contribution from branded and specialty pharmaceutical products, partially offset by inflationary impacts, primarily related to increased transportation and labor costs.
Global Medical Products and Distribution
Fiscal 2023 GMPD segment profit decreased primarily due to net inflationary impacts, lower volumes and unfavorable product sales mix, partially offset by a net positive contribution from PPE.
Other
Fiscal 2023 Other segment profit increased primarily due to the performance of OptiFreight® Logistics.
Corporate
The changes in Corporate during fiscal 2023 are due to the factors discussed in the "Other Components of Consolidated Operating Earnings/(Loss)" section that follows.
| | | | | | | | |
| Cardinal Health | Fiscal 2024 Form 10-K | 11 |
| | | | | | | | |
| MD&A | Results of Operations | |
Other Components of Consolidated Operating Earnings/(Loss) In addition to revenue, gross margin and SG&A expenses discussed previously, consolidated operating earnings/(loss) were impacted by the following:
| | | | | | | | | | | | | | | | | |
| (in millions) | 2024 | | 2023 | | 2022 |
| Restructuring and employee severance | $ | 175 | | | $ | 95 | | | $ | 101 | |
| Amortization and other acquisition-related costs | 284 | | | 285 | | | 324 | |
| Impairments and (gain)/loss on disposal of assets, net | 634 | | | 1,246 | | | 2,060 | |
| Litigation (recoveries)/charges, net | 78 | | | (304) | | | 94 | |
Restructuring and Employee Severance
Restructuring and employee severance costs in fiscal 2024, 2023 and 2022 include costs related to the implementation of certain enterprise-wide cost-savings measures, which include certain initiatives to rationalize our manufacturing operations. The increase in fiscal 2024 restructuring costs are primarily due to estimated severance costs related to these cost-savings measures and costs related to certain projects resulting from the reviews of our strategy, portfolio, capital-allocation framework and operations. During fiscal 2023 and 2022, restructuring and employee severance included costs related to the divestiture of the Cordis business. During fiscal 2022, restructuring also included facility-exit costs related to decreasing our overall office space.
Amortization and Other Acquisition-Related Costs
Amortization of acquisition-related intangible assets was $264 million, $281 million and $311 million for fiscal 2024, 2023 and 2022, respectively.
Impairments and (Gain)/Loss on Disposal of Assets, Net
During fiscal 2024, 2023 and 2022, we recognized $675 million, $1.2 billion and $2.1 billion of pre-tax non-cash goodwill impairment charges, respectively, related to our GMPD segment, as discussed further in the "Critical Accounting Policies and Sensitive Accounting Estimates" section of this MD&A and Note 5 of the "Notes to Consolidated Financial Statements." Litigation (Recoveries)/Charges, Net
During fiscal 2024, we recognized expense of $340 million in connection with opioid-related matters, including agreements in principle with counsel representing classes of third-party payors and acute care hospitals, the case brought by the City of Baltimore, and a settlement with the State of Alabama. This expense was partially offset by a benefit of $105 million related to certain prepayments and $34 million in insurance recoveries. We also recognized income of $117 million for net recoveries in class action lawsuits in which we were a class member or plaintiff.
During fiscal 2023, we recognized income of $130 million for net recoveries in class action lawsuits in which we were a class member or plaintiff. We recognized income of $103 million primarily related to a reduction of the reserve for the estimated settlement and defense costs for the Cordis OptEase and TrapEase inferior vena cava ("IVC") product liability due to the execution of certain settlement agreements. We also recognized income of $93 million due to net proceeds from the settlement of a shareholder derivative litigation matter.
During fiscal 2022, we recognized estimated losses and legal defense costs associated with the IVC filter product liability claims of $70 million. We also recognized income of $18 million for net recoveries in class action antitrust lawsuits in which we were a class member or plaintiff.
See Note 8 of the "Notes to Consolidated Financial Statements" for additional information.
| | | | | | | | |
12 | Cardinal Health | Fiscal 2024 Form 10-K | |
| | | | | | | | |
| MD&A | Results of Operations | |
Other Components of Earnings/(Loss) Before Income Taxes
In addition to the items discussed above, earnings/(loss) before income taxes was impacted by the following:
| | | | | | | | | | | | | | | | | | | | | | | | | | | | | |
| | |
| Earnings/(loss) Before Income Taxes | | Change |
| (in millions) | 2024 | | 2023 | | 2022 | | 2024 | | 2023 |
| Other (income)/expense, net | $ | (9) | | | $ | 5 | | | $ | 22 | | | N.M. | | N.M. |
| Interest expense, net | 51 | | | 84 | | | 147 | | | (39) | % | | (43) | % |
| Loss on early extinguishment of debt | — | | | — | | | 10 | | | N.M. | | N.M. |
| (Gain)/Loss on sale of equity interest in naviHealth | — | | | — | | | (2) | | | N.M. | | N.M. |
Interest Expense, Net
Fiscal 2024 and 2023 interest expense, net decreased primarily due to increased interest income from cash and equivalents. The decrease in Fiscal 2024 interest expense, net was partially offset by lower interest income from financial instruments.
Loss On Early Extinguishment of Debt
During fiscal 2022, we recognized a loss of $10 million in connection with the debt redemption as described further in Note 7 of the "Notes to Consolidated Financial Statements." Provision for Income Taxes
Fluctuations in the effective tax rates are primarily due to the impact of the goodwill impairment charges recognized in fiscal 2024, 2023 and 2022 related to the GMPD segment.
A reconciliation of the provision based on the federal statutory income tax rate to our effective income tax rate from continuing operations is as follows (see Note 9 of the "Notes to Consolidated Financial Statements" for additional information): | | | | | | | | | | | | | | |
| | 2024 (1) | 2023 (1) | | 2022 (1) |
| Provision at Federal statutory rate | 21.0 | % | 21.0 | % | | 21.0 | % |
| State and local income taxes, net of federal benefit | 3.1 | | 6.5 | | | 2.0 | |
| Tax effect of foreign operations | (1.6) | | (5.4) | | | 4.7 | |
| Nondeductible/nontaxable items | (0.1) | | (1.1) | | | 1.2 | |
| | | | |
| Impact of Divestitures | — | | (1.9) | | | (4.8) | |
| Withholding Taxes | 1.0 | | 1.0 | | | (1.1) | |
| Change in Valuation Allowances | (1.1) | | (5.1) | | | 3.5 | |
US Taxes on International Income (2) | (2.1) | | 0.6 | | | 1.9 | |
| Impact of Resolutions with IRS and other related matters | 0.4 | | 0.3 | | | 1.6 | |
| | | | |
| | | | |
| | | | |
| Opioid litigation | 1.0 | | 0.1 | | | (0.5) | |
| Goodwill Impairment | 8.7 | | 33.8 | | | (49.9) | |
| | | | |
| Other | (1.4) | | 0.2 | | | 0.9 | |
| Effective income tax rate | 28.9 | % | 50.0 | % | | (19.5) | % |
(1) This table reflects fiscal 2024 and 2023 pretax income with tax expense and fiscal 2022 pretax loss with tax expense.
(2) Includes the tax impact of Global Intangible Low-Taxed Income ("GILTI") tax, the Foreign-Derived Intangible Income deduction and other foreign income that is taxable under the U.S. tax code.
During fiscal 2024, 2023, and 2022, the effective tax rate was 28.9 percent, 50.0 percent and (19.5) percent, respectively. Included in the effective tax rate for fiscal 2024, 2023, and 2022, was $58 million, $92 million and $140 million, respectively, of benefit related to the goodwill impairment charges related to GMPD.
Ongoing Audits
We file income tax returns in the U.S. federal jurisdiction, various U.S. state jurisdictions and various foreign jurisdictions. With few exceptions, we are subject to audit by taxing authorities for fiscal 2015 through the current fiscal year. Tax laws are complex and subject to varying interpretations. New challenges related to future audits may adversely affect our effective tax rate or tax payments.
| | | | | | | | |
| Cardinal Health | Fiscal 2024 Form 10-K | 13 |
| | | | | | | | |
| MD&A | Liquidity and Capital Resources | |
Liquidity and Capital Resources
We currently believe that, based on available capital resources and projected operating cash flow, we have adequate capital resources to fund our operations and expected future cash needs as described below. If we decide to engage in one or more acquisitions, depending on the size and timing of such transactions, we may need to access capital markets for additional financing.
Cash and Equivalents
Our cash and equivalents balance was $5.1 billion at June 30, 2024 compared to $4.1 billion at June 30, 2023.
During fiscal 2024, net cash provided by operating activities was $3.8 billion, which includes the impact of our annual payment of $378 million and prepayments of $239 million primarily related to the National Opioid Settlement Agreement. During fiscal 2024, we issued additional long-term debt and received net proceeds of $1.14 billion, of which $200 million is invested in short-term time deposits with initial effective maturities of more than three months and classified as prepaid expenses and other in our consolidated balance sheet as of June 30, 2024. In addition, we deployed cash of $783 million for debt repayments, $750 million for share repurchases, $511 million for capital expenditures and $499 million for cash dividends. At June 30, 2024, our cash and equivalents were held in cash depository accounts with major banks or invested in high quality, short-term liquid investments.
On March 18, 2024, we completed the acquisition of Specialty Networks for a purchase price of $1.2 billion in cash, subject to certain adjustments. See Note 2 of the "Notes to Consolidated Financial Statements" for additional information. At June 30, 2023, our cash and equivalents were $4.1 billion. During fiscal 2023, net cash provided by operating activities was $2.8 billion, which includes the impact of our second annual payment of $372 million related to the National Opioid Settlement
Agreement. In addition, we deployed $2.0 billion for share repurchases, $579 million for debt repayments, $525 million for cash dividends and $481 million for capital expenditures.
Changes in working capital, which impact operating cash flow, can vary significantly depending on factors such as the timing of customer payments, inventory purchases, payments to vendors and tax payments in the regular course of business, as well as fluctuating working capital needs driven by customer and product mix. We expect the unwinding of the negative net working capital associated with the OptumRx contract to negatively impact operating cash flow in fiscal 2025.
The cash and equivalents balance at June 30, 2024 includes $497 million of cash and equivalents held by subsidiaries outside of the United States.
In fiscal 2024, we returned $384 million of cash held by foreign subsidiaries to the United States.
At June 30, 2024, foreign earnings of approximately $1.0 billion are considered indefinitely reinvested for working capital and other offshore investment needs. The computation of tax required if those earnings are repatriated is not practicable. For amounts not considered indefinitely reinvested, we have recorded an immaterial amount of income tax expense in our consolidated financial statements in fiscal 2024.
Other Financing Arrangements and Financial Instruments
Credit Facilities and Commercial Paper
In addition to cash and equivalents and operating cash flow, other sources of liquidity at June 30, 2024 include a $2.0 billion commercial paper program, backed by a $2.0 billion revolving credit facility. We also have a $1.0 billion committed receivables sales facility. At June 30, 2024, we had no amounts outstanding under our commercial paper program, revolving credit facility or our committed receivables sales facility. During fiscal 2024, under our commercial paper program and our committed receivables program, we had maximum combined total daily amounts outstanding of $1.3 billion.
In February 2023, we extended our revolving credit facility through February 25, 2028. In September 2022, we renewed our committed receivables sales facility program through Cardinal Health Funding, LLC ("CHF") through September 30, 2025. In September 2023, Cardinal Health 23 Funding, LLC was added as a seller under our committed receivables sales facility.
Our revolving credit and committed receivables sales facilities require us to maintain a consolidated net leverage ratio of no more
than 3.75-to-1. As of June 30, 2024, we were in compliance with this financial covenant.
Long-Term Obligations
At June 30, 2024, we had total long-term obligations, including the current portion and other short-term borrowings of $5.1 billion.
In February 2024, we issued additional debt with the aggregate principal amount of $1.15 billion to fund the repayment of all of the aggregate principal amount outstanding of our 3.5% Notes due 2024 and 3.079% Notes due 2024, at their respective maturities, and for general corporate purposes. In June 2024, we repaid the full principal of $750 million of the 3.079% Notes due 2024. The notes issued are $650 million aggregate principal amount of 5.125% Notes that mature on February 15, 2029 and $500 million aggregate principal amount of 5.45% Notes that mature on February 15, 2034. The proceeds of the notes issued, net of discounts, premiums, and debt issuance costs were $1.14 billion. A portion of the proceeds was invested in short-term time deposits of $550 million with initial effective maturities of more than three months. At June 30, 2024, we had $200 million remaining in those
| | | | | | | | |
14 | Cardinal Health | Fiscal 2024 Form 10-K | |
| | | | | | | | |
| MD&A | Liquidity and Capital Resources | |
short-term time deposits and classified as prepaid expenses and other in our consolidated balance sheets.
During fiscal 2023, we repaid the full principal of $550 million of the 3.2% Notes due 2023. The repayment was funded with available cash.
Capital Deployment
Opioid Litigation Settlement Agreement
We have $5.4 billion accrued at June 30, 2024 related to certain opioid litigation, as further described within Note 8 of the "Notes to Consolidated Financial Statements." We expect the majority of the remaining payment amounts to occur through 2038. During fiscal 2024, we paid our third annual payment of $378 million under the National Opioid Settlement Agreement. In July 2024, we made our fourth annual payment of $366 million under the National Opioid Settlement Agreement. The amounts of future annual payments may differ from the payments that we have already made. In January 2024, we made additional payments of approximately $239 million to prepay at a prenegotiated discount certain future payment amounts totaling approximately $344 million owed under each of the National Opioid Settlement Agreement, West Virginia Subdivisions Settlement Agreement and settlement agreements with Native American tribes and Cherokee Nation. The majority of the prepayment relates to the seventh annual payment due under the National Opioid Settlement Agreement. As a result of these prepayments, we recognized income of $105 million in litigation charges/(recoveries), net in our consolidated statements of earnings/(loss) during fiscal 2024.
Capital Expenditures
Capital expenditures during fiscal 2024 and 2023 were $511 million and $481 million, respectively.
We expect capital expenditures in fiscal 2025 to be approximately between $500 million and $550 million and primarily related to manufacturing and distribution infrastructure projects and technology investments.
Dividends
During fiscal 2024, we paid quarterly dividends totaling $2.00 per share, an increase of 1 percent from fiscal 2023.
On May 7, 2024, our Board of Directors approved a quarterly dividend of $0.5056 per share, or $2.02 per share on an annualized basis, which was paid on July 15, 2024, to shareholders of record on July 1, 2024.
Share Repurchases
During fiscal 2024 and 2023, we deployed $750 million and $2.0 billion, respectively, for repurchases of our common shares in the aggregate under accelerated share repurchase ("ASR") programs. We funded the ASR programs with available cash. See Note 12 of the "Notes to Consolidated Financial Statements" for additional information. On June 7, 2023, our Board of Directors approved a $3.5 billion share repurchase program, which will expire on December 31, 2027. As of June 30, 2024, we had $3.5 billion remaining under our existing share repurchase authorization.
Specialty Networks Acquisition
On March 18, 2024, we completed the acquisition of Specialty Networks for a purchase price of $1.2 billion in cash, subject to certain adjustments. See Note 2 of the "Notes to Consolidated Financial Statements" for additional information. | | | | | | | | |
| Cardinal Health | Fiscal 2024 Form 10-K | 15 |
Contractual Obligations and Cash Requirements At June 30, 2024, our contractual obligations and future cash requirements, including estimated payments due by period, were as follows:
| | | | | | | | | | | | | | | | | | | | | | | | | | | | | |
| (in millions) | 2025 | | 2026 to 2027 | | 2028 to 2029 | | There-after | | Total |
| Long-term debt and short-term borrowings (1) | $ | 401 | | | $ | 1,822 | | | $ | 644 | | | $ | 2,117 | | | $ | 4,984 | |
| Interest on long-term debt | 255 | | | 424 | | | 287 | | | 1,407 | | | 2,373 | |
| Finance lease obligations (2) | 37 | | | 52 | | | 20 | | | 9 | | | 118 | |
| | | | | | | | | |
| Operating lease obligations (3) | 134 | | | 210 | | | 130 | | | 102 | | | 576 | |
| Purchase obligations and other payments (4) | 671 | | | 483 | | | 375 | | | 165 | | | 1,694 | |
| Opioid litigation settlement agreements (5) | 643 | | | 826 | | | 507 | | | 3,310 | | | 5,286 | |
| Total contractual obligations and cash requirements (6) | $ | 2,141 | | | $ | 3,817 | | | $ | 1,963 | | | $ | 7,110 | | | $ | 15,031 | |
(1)Represents maturities of our long-term debt obligations and other short-term borrowings excluding finance lease obligations described below. See Note 7 of the “Notes to Consolidated Financial Statements” for further information. (2)Represents minimum finance lease obligations included within current portion of long-term obligations and other short-term borrowings and long-term obligations, less current portion in our consolidated balance sheets and further described in Note 6 of the “Notes to Consolidated Financial Statements.” (3)Represents minimum operating lease obligations included within other accrued liabilities and deferred income taxes and other liabilities in our
consolidated balance sheets and further described in Note 6 of the “Notes to Consolidated Financial Statements.” (4)A purchase obligation is defined as an agreement to purchase goods or services that is legally enforceable and specifies all significant terms, including fixed or minimum quantities to be purchased; fixed, minimum or variable price provisions; and approximate timing of the transaction. The purchase obligation amounts disclosed above represent estimates of the minimum for which we are obligated and the time period in which cash outflows will occur. Purchase orders and authorizations to purchase that involve no firm commitment from either party are excluded from the above table. In addition, contracts that can be unilaterally canceled with no termination fee or with proper notice are excluded from our total purchase obligations except for the amount of the termination fee or the minimum amount of goods that must be purchased during the requisite notice period. Purchase obligations and other payments also includes quarterly payments to CVS Health in connection with Red Oak Sourcing. See Note 8 of the “Notes to Consolidated Financial Statements” for additional information. (5)Represents future cash obligations under the National Opioid Settlement Agreement as well as future cash obligations under separate settlement agreements. See Note 8 of the “Notes to Consolidated Financial Statements” for additional information. (6)Long-term liabilities, such as unrecognized tax benefits, deferred taxes and other tax liabilities, have been excluded from the above table due to the inherent uncertainty of the underlying tax positions or because of the inability to reasonably estimate the timing of any cash outflows. See Note 9 of the "Notes to Consolidated Financial Statements" for further discussion of income taxes.
Recent Financial Accounting Standards
See Note 1 of the “Notes to Consolidated Financial Statements” for further information. | | | | | | | | |
16 | Cardinal Health | Fiscal 2024 Form 10-K | |
| | | | | | | | |
| MD&A | Critical Accounting Policies and Sensitive Accounting Estimates | |
Critical Accounting Policies and Sensitive Accounting Estimates
Critical accounting policies are those accounting policies that (i) can have a significant impact on our financial condition and results of operations and (ii) require the use of complex and subjective estimates based upon past experience and management’s judgment. Other people applying reasonable judgment to the same facts and circumstances could develop different estimates. Because estimates are inherently uncertain, actual results may differ. In this section, we describe the significant policies applied in preparing our consolidated financial statements that management believes are the most dependent on estimates and assumptions.
In connection with the preparation of our Consolidated Financial Statements for fiscal 2024, we identified an accounting error related to revenue recognition from third party payors within the at-Home Solutions operating segment. We evaluated the materiality of the error and determined that the impacts were not material, individually or in the aggregate, to our previously issued Consolidated Financial Statements for any of the prior quarters or annual periods in which they occurred. Amounts have been revised to correct this error, as well as other unrelated immaterial errors, including an adjustment to an uncertain tax position. These other immaterial errors were previously corrected in the periods they were identified; however, they are now reflected in the periods they originated. See Note 1 of the "Notes to Consolidated Financial Statements" for further discussion.
Allowance for Doubtful Accounts
The allowance for doubtful accounts includes general and specific reserves. We determine our allowance for doubtful accounts by reviewing accounts receivable aging, historical write-off trends, payment history, pricing discrepancies, industry trends, customer financial strength, customer credit ratings or bankruptcies. We regularly evaluate how changes in economic conditions may affect credit risks.
A hypothetical 0.1 percent increase or decrease in the reserve as a percentage of trade receivables at June 30, 2024, would result in an increase or decrease in operating earnings of $12 million. We believe the reserve maintained and expenses recorded in fiscal 2024 are appropriate.
At this time, we are not aware of any analytical findings or customer issues that are likely to lead to a significant future
increase in the allowance for doubtful accounts as a percentage of revenue. The following table presents information regarding our allowance for doubtful accounts over the past three fiscal years.
| | | | | | | | | | | | | | | | | | | |
| (in millions, except percentages) | 2024 | | 2023 | | 2022 | | |
| Allowance for doubtful accounts at beginning of period | $ | 240 | | | $ | 207 | | | $ | 176 | | | |
| Charged to costs and expenses | 108 | | | 165 | | | 110 | | | |
| Reduction to allowance for customer deductions and write-offs | (115) | | | (132) | | | (79) | | | |
| Allowance for doubtful accounts at end of period | $ | 233 | | | $ | 240 | | | $ | 207 | | | |
| Allowance as a percentage of customer receivables | 1.9 | % | | 2.2 | % | | 2.0 | % | | |
| Allowance as a percentage of revenue | 0.10 | % | | 0.12 | % | | 0.11 | % | | |
Inventories
LIFO Inventory
A portion of our inventories (50 percent and 54 percent at June 30, 2024 and 2023, respectively) are valued at the lower of cost, using the last-in, first-out ("LIFO") method, or market. These are primarily merchandise inventories at the core pharmaceutical distribution facilities within our Pharmaceutical and Specialty Solutions segment (“distribution facilities”). The LIFO impact on the consolidated statements of earnings/(loss) depends on pharmaceutical manufacturer price appreciation or deflation and our fiscal year-end inventory levels, which can be meaningfully influenced by customer buying behavior immediately preceding our fiscal year-end. Historically, prices for branded pharmaceuticals have generally tended to rise, resulting in an increase in cost of products sold, whereas prices for generic pharmaceuticals generally tend to decline, resulting in a decrease in cost of products sold.
Using LIFO, if there is a decrease in inventory levels that have experienced pharmaceutical price appreciation, the result
generally will be a decrease in future cost of products sold as our older inventory is held at a lower cost. Conversely, if there is a decrease in inventory levels that have experienced a pharmaceutical price decline, the result generally will be an increase in future cost of products sold as our older inventory is held at a higher cost.
We believe that the average cost method of inventory valuation provides a reasonable approximation of the current cost of replacing inventory within these distribution facilities. As such, the LIFO reserve is the difference between (a) inventory at the lower of LIFO cost or market and (b) inventory at replacement cost determined using the average cost method of inventory valuation. At June 30, 2024 and 2023, respectively, inventories valued at LIFO cost were $749 million and $476 million higher than the average cost value. We do not record inventories in excess of replacement cost. As such, we did not write-up the value of our inventory from average cost to LIFO cost at June 30, 2024 or 2023.
| | | | | | | | |
| Cardinal Health | Fiscal 2024 Form 10-K | 17 |
| | | | | | | | |
| MD&A | Critical Accounting Policies and Sensitive Accounting Estimates | |
FIFO Inventory
Our remaining inventory, including inventory in our GMPD segment and certain inventory in our Pharmaceutical and Specialty Solutions segment, that is not valued at the lower of LIFO cost or market is stated at the lower of cost, using the first-in, first-out ("FIFO") method, or net realizable value. We reserve for the lower of cost or net realizable value using the estimated selling prices and estimated sales demand in the ordinary course of business, less reasonably predictable costs of completion, disposal and transportation. Our estimates for selling prices and demand are inherently uncertain and if our assumptions decline in the future, additional inventory reserves may be required.
Excess and Obsolete Inventory
We reserve for inventory obsolescence using estimates based on historical experience, historical and projected sales trends,
specific categories of inventory, age and expiration dates of on-hand inventory and manufacturer return policies. Inventories presented in the consolidated balance sheets are net of reserves for excess and obsolete inventory which were $149 million and $139 million at June 30, 2024 and 2023, respectively. If actual conditions are less favorable than our assumptions, additional inventory reserves may be required.
Goodwill and Other Indefinite-Lived Intangible Assets
Purchased goodwill and intangible assets with indefinite lives are tested for impairment annually or when indicators of impairment exist. Goodwill impairment testing involves a comparison of the estimated fair value of reporting units to the respective carrying amount, which may be performed utilizing either a qualitative or quantitative assessment. Qualitative factors are first assessed to determine if it is more likely than not that the fair value of a reporting unit is less than its carrying amount. There is an option to bypass the qualitative assessment for any reporting unit in any period and proceed directly to performing the quantitative goodwill impairment test. We have elected to bypass the qualitative assessment for the annual goodwill impairment test in the current year. The quantitative goodwill impairment test involves a comparison of the estimated fair value of the reporting unit to the respective carrying amount. A reporting unit is defined as an operating segment or one level below an operating segment (also known as a component).
Goodwill impairment testing involves judgment, including the identification of reporting units, qualitative evaluation of events and circumstances to determine if it is more likely than not that an impairment exists and, if necessary, the estimation of the fair value of the applicable reporting unit. Our qualitative evaluation considers the weight of evidence and significance of all identified events and circumstances and most relevant drivers of fair value, both positive and negative, in determining whether it is more likely than not that the fair value of a reporting unit is less than its carrying amount.
Estimating the fair value of reporting units requires the use of estimates and significant judgments that are based on a number of factors including actual operating results. The use of alternate estimates and assumptions, changes in the industry or peer groups, or changes in weightings assigned to the discounted cash flow method, guideline public company method or guideline transaction method could materially affect the determination of fair value for each reporting unit and potentially result in goodwill impairment. If a reporting unit fails to achieve expected earnings or
operating cash flow, or otherwise fails to meet current financial plans, or if there were changes to any other key assumptions used in the tests, the reporting unit could incur a goodwill impairment in a future period.
As discussed in the Overview section of this MD&A, effective January 1, 2024, we implemented a new enterprise operating and segment reporting structure. The updated structure is comprised of two reportable segments: Pharmaceutical and Specialty Solutions segment and Global Medical Products and Distribution segment. All remaining operating segments that are not significant enough to require separate reportable segment disclosures are included in Other.
This change in segment structure resulted in changes to the composition of the former Medical Unit. Effective January 1, 2024, our reporting units are: Pharmaceutical and Specialty Solutions, GMPD, Nuclear and Precision Health Solutions, at-Home Solutions and OptiFreight® Logistics. GMPD and OptiFreight® Logistics comprised the former Medical Unit.
Accordingly, we allocated $90 million and $48 million of goodwill from the former Medical Unit to GMPD and OptiFreight® Logistics, respectively, based on the estimated relative fair values of the reporting units. We also assessed goodwill for impairment for these reporting units before and after the reallocation and determined there was no impairment for the Medical Unit and OptiFreight® Logistics during the three months ended March 31, 2024 as their fair values substantially exceeded their carrying values. However, the quantitative test resulted in an impairment of GMPD’s remaining goodwill balance of $90 million, resulting in GMPD goodwill being fully impaired as of March 31, 2024.
Our previously reported goodwill balances have been recast to conform to the new structure. Prior-period goodwill impairment charges related to the former Medical Unit were primarily driven by the performance and long-term financial plan assumptions of GMPD and have been fully allocated to GMPD under the new structure.
| | | | | | | | |
18 | Cardinal Health | Fiscal 2024 Form 10-K | |
| | | | | | | | |
| MD&A | Critical Accounting Policies and Sensitive Accounting Estimates | |
We also performed annual impairment testing in fiscal 2024, 2023 and 2022 for Pharmaceutical and Specialty Solutions, Nuclear and Precision Health Solutions and at-Home Solutions, and in fiscal 2024 for OptiFreight® Logistics. We concluded that there were no impairments of goodwill for these reporting units as the estimated fair value of each reporting unit exceeded its carrying amounts. GMPD had no goodwill balance remaining as of April 1, 2024. See additional detail regarding GMPD goodwill below.
During our fiscal 2024 annual impairment test, at-Home Solutions fair value exceeds its carrying amount by less than 1 percent. The decrease in at-Home Solutions fair value was primarily due to changes in operating expense estimates to better reflect the fair value from an external perspective. Our determination of estimated fair value of at-Home Solutions was based on a combination of the income-based approach (using a discount rate of 10 percent and a terminal growth rate of 3 percent) and the market-based approach. We assigned a weighting of 75 percent to the discounted cash flow method and 25 percent to the guideline public company method. The goodwill balance as of June 30, 2024 was $1.1 billion. A decrease in future cash flows, an increase in the discount rate or a decrease in the terminal growth rate, among other things, could result in a goodwill impairment for at-Home Solutions. For example, if we were to increase the discount rate by 0.5 percent to 10.5 percent, the carrying amount would have exceeded the fair value for at-Home Solutions by approximately 6 percent for fiscal 2024.
Global Medical Products and Distribution Goodwill
GMPD goodwill was fully impaired in the third quarter of fiscal 2024. Our determination of estimated fair value of GMPD was based on a combination of the income-based approach (using a discount rate of 11 percent and a terminal growth rate of 2 percent) and market-based approaches at January 1, 2024. Additionally, we assigned a weighting of 80 percent to the discounted cash flow method, 10 percent to the guideline public company method, and 10 percent to the guideline transaction method.
During the three months ended December 31, 2023, we did not identify any indicators of impairment within our reporting units.
During the three months ended September 30, 2023, we elected to bypass the qualitative assessment and perform quantitative goodwill impairment testing for the former Medical Unit due to an increase in the risk-free interest rate used in the discount rate. The carrying amount exceeded the fair value, which resulted in a pre-tax impairment charge of $585 million for the former Medical Unit, which was recognized during the three months ended September 30, 2023 and is included in impairments and (gain)/loss on disposal of assets, net in our consolidated statements of earnings/(loss). This impairment charge was driven by an increase of 1 percent in the discount rate primarily due to an increase in the risk-free interest rate.
During fiscal 2023 and 2022, we performed quantitative goodwill impairment testing for the former Medical Unit which resulted in cumulative pre-tax impairment charges $1.2 billion and $2.1 billion, respectively, which were included in impairments and (gain)/loss on disposal of assets, net in our consolidated statements of earnings/(loss).
Other indefinite-lived intangibles
The impairment test for indefinite-lived intangibles other than goodwill (primarily trademarks) involves first assessing qualitative factors to determine if it is more likely than not that the fair value of the indefinite-lived intangible asset is less than its carrying amount. If so, then a quantitative test is performed to compare the estimated fair value of the indefinite-lived intangible asset to the respective asset's carrying amount. Our qualitative evaluation requires the use of estimates and significant judgments and considers the weight of evidence and significance of all identified events and circumstances and most relevant drivers of fair value, both positive and negative, in determining whether it is more likely than not that the fair value of the indefinite-lived intangible asset is less than its carrying amount.
See Note 1 of "Notes to Consolidated Financial Statements" for additional information regarding goodwill and other intangible assets.
Loss Contingencies and Self-Insurance
We regularly review contingencies and self-insurance accruals to determine whether our accruals and related disclosures are adequate. Any adjustments for changes in reserves are recorded in the period in which the change in estimate occurs.
Loss Contingencies
We accrue for contingencies related to disputes, litigation and regulatory matters if it is probable that a liability has been incurred and the amount of the loss can be reasonably estimated. Because these matters are inherently unpredictable and unfavorable developments or outcomes can occur, assessing contingencies is highly subjective and requires judgments about future events.
Examples of such contingencies include various lawsuits related to the distribution of prescription opioid pain medications and the IVC filter lawsuits.
In connection with the opioid litigation as described further in Note 8 of the “Notes to Consolidated Financial Statements," during fiscal 2024, we have reached agreements in principle with counsel representing classes of third-party payors and acute care hospitals, and we are engaged in resolution discussions with the City of Baltimore. As of June 30, 2024, we have accrued $363 million, which reflects our current estimate of probable loss for these matters. The agreements in principle remain subject to contingencies. | | | | | | | | |
| Cardinal Health | Fiscal 2024 Form 10-K | 19 |
| | | | | | | | |
| MD&A | Critical Accounting Policies and Sensitive Accounting Estimates | |
We develop and periodically update reserve estimates for IVC claims received to date and expected to be received in the future and related costs. In April 2023, we executed a settlement agreement that, if certain conditions are satisfied, will resolve approximately 4,375 IVC filter product liability claims for $275 million. These settlements will not resolve all IVC filter product liability claims and we intend to continue to vigorously defend ourselves in the remaining lawsuits. To project future IVC claim costs, we use a methodology based largely on recent experience, including claim filing rates, blended average payout influenced by claim severity, historical sales data, implant and injury to report lag patterns and estimated defense costs.
Self-Insurance
We self-insure through a wholly-owned insurance subsidiary for employee healthcare, certain product liability matters, auto liability, property and workers' compensation and maintain insurance for losses exceeding certain limits.
Self-insurance accruals include an estimate for expected settlements on pending claims, defense costs, administrative fees,
claims adjustment costs and an estimate for claims incurred but not reported. For certain types of exposures, we develop the estimate of expected ultimate costs to settle each claim based on specific information related to each claim if available. Other estimates are based on an assessment of outstanding claims, historical analysis and current payment trends. For claims incurred but not reported, the liabilities are calculated and derived in accordance with generally accepted actuarial practices or using an estimated lag period.
The amount of loss may differ materially from these estimates. See Note 8 of the “Notes to Consolidated Financial Statements” for additional information regarding loss contingencies and product liability lawsuits.
Provision for Income Taxes
We account for income taxes using the asset and liability method. Deferred tax assets and liabilities are measured using enacted tax rates in the respective jurisdictions in which we operate. Our income tax expense, deferred income tax assets and liabilities and unrecognized tax benefits reflect management’s assessment of estimated future taxes to be paid on items in the consolidated financial statements.
The following table presents information about our tax position at June 30:
| | | | | | | | | | | | | | | |
| (in millions) | 2024 | | 2023 | | | | |
| Total deferred income tax assets (1) | $ | 1,491 | | | $ | 1,576 | | | | | |
| Valuation allowance for deferred income tax assets (2) | (300) | | | (421) | | | | | |
| Net deferred income tax assets | 1,191 | | | 1,155 | | | | | |
| Total deferred income tax liabilities | (3,163) | | | (3,164) | | | | | |
| Net deferred income tax liability | $ | (1,972) | | | $ | (2,009) | | | | | |
(1) Total deferred income tax assets included $512 million and $672 million of loss and tax credit carryforwards at June 30, 2024 and 2023, respectively.
(2) The valuation allowance primarily relates to federal, state and international loss and credit carryforwards for which the ultimate realization of future benefits is uncertain.
Expiring or unusable loss and credit carryforwards and the required valuation allowances are adjusted quarterly when it is more likely than not that at least a portion of the respective deferred tax assets will not be realized. After applying the valuation allowances, we do not anticipate any limitations on our use of any of the other net deferred income tax assets described previously.
Tax benefits from uncertain tax positions are recognized when it is more likely than not that the position will be sustained upon examination of the technical merits of the position, including resolutions of any related appeals or litigation. The amount
recognized is measured as the largest amount of tax benefit that is greater than 50 percent likely of being realized upon settlement. For tax benefits that do not qualify for recognition, we recognize a liability for unrecognized tax benefits.
We operate in a complex multinational tax environment and are subject to tax treaty arrangements and transfer pricing guidelines for intercompany transactions that are subject to interpretation. Uncertainty in a tax position may arise as tax laws are subject to interpretation.
Tax Effects of Goodwill Impairment Charges
During fiscal 2024, 2023, and 2022 we recognized cumulative pre-tax goodwill impairment charges of $675 million, $1.2 billion, and $2.1 billion, respectively, related to the GMPD segment. The net tax benefits related to these charges were $58 million, $92 million, and $140 million, respectively.
We file income tax returns in the U.S. federal jurisdiction, various U.S. state jurisdictions and various foreign jurisdictions. With few exceptions, we are subject to audit by taxing authorities for fiscal years 2015 through the current fiscal year. Tax laws are complex and subject to varying interpretations. New challenges related to future audits may adversely affect our effective tax rate or tax payments.
Our assumptions and estimates around uncertain tax positions require significant judgment; the actual amount of tax benefit related to uncertain tax positions may differ from these estimates. See Note 9 of the “Notes to Consolidated Financial Statements” for additional information regarding unrecognized tax benefits. We believe that our estimates for the valuation allowances against deferred tax assets and unrecognized tax benefits are appropriate based on current facts and circumstances. The amount we ultimately pay when matters are resolved may differ from the
| | | | | | | | |
20 | Cardinal Health | Fiscal 2024 Form 10-K | |
| | | | | | | | |
| MD&A | Critical Accounting Policies and Sensitive Accounting Estimates | |
amounts accrued. Changes in our current estimates due to unanticipated market conditions, tax law changes or other factors could have a material effect on our ability to utilize deferred tax assets. For a further discussion on Provision for Income Taxes, see Note 9 of the “Notes to the Consolidated Financial Statements.”
| | | | | | | | |
| Cardinal Health | Fiscal 2024 Form 10-K | 21 |
| | | | | | | | |
| Explanation and Reconciliation of Non-GAAP Financial Measures | | |
Explanation and Reconciliation of Non-GAAP Financial Measures
This report, including the "Fiscal 2024 Overview" section within MD&A, contains financial measures that are not calculated in accordance with GAAP.
In addition to analyzing our business based on financial information prepared in accordance with GAAP, we use these non-GAAP financial measures internally to evaluate our performance, engage in financial and operational planning and determine incentive compensation because we believe that these measures provide additional perspective on and, in some circumstances are more closely correlated to, the performance of our underlying, ongoing business. We provide these non-GAAP financial measures to investors as supplemental metrics to assist readers in assessing the effects of items and events on our financial and operating results on a year-over-year basis and in comparing our performance to that of our competitors. However, the non-GAAP financial measures that we use may be calculated differently from, and therefore may not be comparable to, similarly titled measures used by other companies. The non-GAAP financial measures disclosed by us should not be considered a substitute for, or superior to, financial measures calculated in accordance with GAAP, and the financial results calculated in accordance with GAAP and reconciliations to those financial statements set forth below should be carefully evaluated.
Exclusions from Non-GAAP Financial Measures
Management believes it is useful to exclude the following items from the non-GAAP measures presented in this report for its own and for investors’ assessment of the business for the reasons identified below:
•LIFO charges and credits are excluded because the factors that drive last-in first-out ("LIFO") inventory charges or credits, such as pharmaceutical manufacturer price appreciation or deflation and year-end inventory levels (which can be meaningfully influenced by customer buying behavior immediately preceding our fiscal year-end), are largely out of our control and cannot be accurately predicted. The exclusion of LIFO charges and credits from non-GAAP metrics facilitates comparison of our current financial results to our historical financial results and to our peer group companies’ financial results. We did not recognize any LIFO charges or credits during the periods presented.
•State opioid assessments related to prior fiscal years is the portion of state assessments for prescription opioid medications that were sold or distributed in periods prior to the period in which the expense is incurred. This portion is excluded from non-GAAP financial measures because it is retrospectively applied to sales in prior fiscal years and inclusion would obscure analysis of the current fiscal year results of our underlying, ongoing business. Additionally, while states' laws may require us to make payments on an ongoing basis, the portion of the assessment related to sales in prior periods are contemplated to be one-time, nonrecurring items. Income from state opioid assessments related to prior fiscal years represents reversals of accruals due to changes in estimates or when the underlying assessments were invalidated by a Court or reimbursed by manufacturers.
•Shareholder cooperation agreement costs includes costs such as legal, consulting and other expenses incurred in relation to the agreement (the "Cooperation Agreement") entered into among Elliott Associates, L.P., Elliott International, L.P. (together, "Elliott") and Cardinal Health, including costs incurred to negotiate and finalize the Cooperation Agreement and costs incurred by the Business Review Committee of the Board of Directors, which was formed under this Cooperation Agreement. We have excluded these costs from our non-GAAP metrics because they do not occur in or reflect the ordinary course of our ongoing business operations and may obscure analysis of trends and financial performance.
•Restructuring and employee severance costs are excluded because they are not part of the ongoing operations of our underlying business and include, but are not limited to, costs related to divestitures, closing and consolidating facilities, changing the way we manufacture or distribute our products, moving manufacturing of a product to another location, changes in production or business process outsourcing or insourcing, employee severance and realigning operations.
•Amortization and other acquisition-related costs, which include transaction costs, integration costs and changes in the fair value of contingent consideration obligations, are excluded because they are not part of the ongoing operations of our underlying business and to facilitate comparison of our current financial results to our historical financial results and to our peer group companies' financial results. Additionally, costs for amortization of acquisition-related intangible assets are non-cash amounts, which are variable in amount and frequency and are significantly impacted by the timing and size of acquisitions, so their exclusion facilitates comparison of historical, current and forecasted financial results. We also exclude other acquisition-related costs, which are directly related to an acquisition but do not meet the criteria to be recognized on the acquired entity’s initial balance sheet as part of the purchase price allocation. These costs are also significantly impacted by the timing, complexity and size of acquisitions.
| | | | | | | | |
22 | Cardinal Health | Fiscal 2024 Form 10-K | |
| | | | | | | | |
| Explanation and Reconciliation of Non-GAAP Financial Measures | | |
•Impairments and gain or loss on disposal of assets, net are excluded because they do not occur in or reflect the ordinary course of our ongoing business operations and are inherently unpredictable in timing and amount, and in the case of impairments, are non-cash amounts, so their exclusion facilitates comparison of historical, current and forecasted financial results.
•Litigation recoveries or charges, net are excluded because they often relate to events that may have occurred in prior or multiple periods, do not occur in or reflect the ordinary course of our business and are inherently unpredictable in timing and amount.
•Loss on early extinguishment of debt is excluded because it does not typically occur in the normal course of business and may obscure analysis of trends and financial performance. Additionally, the amount and frequency of this type of charge is not consistent and is significantly impacted by the timing and size of debt extinguishment transactions.
•(Gain)/Loss on sale of equity interest in naviHealth was incurred in connection with the sale of our remaining equity interest in naviHealth in fiscal 2020. The equity interest was retained in connection with the initial sale of our majority interest in naviHealth during fiscal 2019. We exclude this significant gain because gains or losses on investments of this magnitude do not typically occur in the normal course of business and are similar in nature to a gain or loss from a divestiture of a majority interest, which we exclude from non-GAAP results. The gain on the initial sale of our majority interest in naviHealth in fiscal 2019 was also excluded from our non-GAAP measures.
The tax effect for each of the items listed above is determined using the tax rate and other tax attributes applicable to the item and the jurisdiction(s) in which the item is recorded. The gross, tax and net impact of each item are presented with our GAAP to non-GAAP reconciliations.
Definitions
Growth rate calculation: growth rates in this report are determined by dividing the difference between current period results and prior period results by prior period results.
Non-GAAP operating earnings: operating earnings/(loss) excluding (1) LIFO charges/(credits), (2) state opioid assessment related to prior fiscal years, (3) shareholder cooperation agreement costs, (4) restructuring and employee severance, (5) amortization and other acquisition-related costs, (6) impairments and (gain)/loss on disposal of assets, net and (7) litigation (recoveries)/charges, net.
Non-GAAP earnings before income taxes: earnings/(loss) before income taxes excluding (1) LIFO charges/(credits), (2) state opioid assessment related to prior fiscal years, (3) shareholder cooperation agreement costs, (4) restructuring and employee severance, (5) amortization and other acquisition-related costs, (6) impairments and (gain)/loss on disposal of assets, net, (7) litigation (recoveries)/charges, net, (8) loss on early extinguishment of debt and (9) (gain)/loss on sale of equity interest in naviHealth.
Non-GAAP net earnings attributable to Cardinal Health, Inc.: net earnings/(loss) attributable to Cardinal Health, Inc. excluding (1) LIFO charges/(credits), (2) state opioid assessment related to prior fiscal years, (3) shareholder cooperation agreement costs, (4) restructuring and employee severance, (5) amortization and other acquisition-related costs, (6) impairments and (gain)/loss on disposal of assets, net, (7) litigation (recoveries)/charges, net, (8) loss on early extinguishment of debt and (9) (gain)/loss on sale of equity interest in naviHealth each net of tax.
Non-GAAP effective tax rate: provision for/(benefit from) income taxes adjusted for the tax impacts of (1) LIFO charges/(credits), (2) state opioid assessment related to prior fiscal years, (3) shareholder cooperation agreement costs, (4) restructuring and employee severance, (5) amortization and other acquisition-related costs, (6) impairments and (gain)/loss on disposal of assets, net, (7) litigation (recoveries)/charges, net, (8) loss on early extinguishment of debt and (9) (gain)/loss on sale of equity interest in naviHealth, divided by (earnings before income taxes adjusted for the nine items above).
Non-GAAP diluted earnings per share attributable to Cardinal Health, Inc.: non-GAAP net earnings attributable to Cardinal Health, Inc. divided by diluted weighted-average shares outstanding.
| | | | | | | | |
| Cardinal Health | Fiscal 2024 Form 10-K | 23 |
| | | | | | | | |
| Explanation and Reconciliation of Non-GAAP Financial Measures | | |
GAAP to Non-GAAP Reconciliations
| | | | | | | | | | | | | | | | | | | | | | | | | | | | | | | |
| (in millions, except per common share amounts) | | | Operating Earnings/(Loss) | Operating Earnings/(Loss) Growth Rate | Earnings/(Loss) Before Income Taxes | Provision for Income Taxes | Net Earnings/(Loss)1 | Net Earnings/(Loss)1 Growth Rate | Effective Tax Rate | Diluted EPS1,2 | Diluted EPS1 Growth Rate |
| | | Fiscal Year 2024 |
| GAAP | | | $ | 1,243 | | 65 | % | $ | 1,201 | | $ | 348 | | $ | 852 | | N.M. | 28.9 | % | $ | 3.45 | | N.M. |
| | | | | | | | | | | |
| Shareholder cooperation agreement costs | | | 1 | | | 1 | | — | | 1 | | | | — | | |
| Restructuring and employee severance | | | 175 | | | 175 | | 41 | | 134 | | | | 0.54 | | |
| Amortization and other acquisition-related costs | | | 284 | | | 284 | | 74 | | 210 | | | | 0.85 | | |
Impairments and (gain)/loss on disposal of assets, net 3 | | | 634 | | | 634 | | 47 | | 587 | | | | 2.38 | | |
| Litigation (recoveries)/charges, net | | | 78 | | | 78 | | 5 | | 73 | | | | 0.30 | | |
| | | | | | | | | | | |
| | | | | | | | | | | |
| | | | | | | | | | | |
| Non-GAAP | | | $ | 2,414 | | 16 | % | $ | 2,372 | | $ | 515 | | $ | 1,856 | | 21 | % | 21.7 | % | $ | 7.53 | | 29 | % |
| | | | | | | | | | | |
| | | Fiscal Year 2023 |
| GAAP | | | $ | 752 | | N.M. | $ | 663 | | $ | 332 | | $ | 330 | | N.M. | 50.0 | % | $ | 1.26 | | N.M. |
| State opioid assessment related to prior fiscal years | | | (6) | | | (6) | | (2) | | (4) | | | | (0.02) | | |
| Shareholder cooperation agreement costs | | | 8 | | | 8 | | 2 | | 6 | | | | 0.02 | | |
| Restructuring and employee severance | | | 95 | | | 95 | | 21 | | 74 | | | | 0.28 | | |
| Amortization and other acquisition-related costs | | | 285 | | | 285 | | 74 | | 211 | | | | 0.80 | | |
Impairments and (gain)/loss on disposal of assets, net 3 | | | 1,246 | | | 1,246 | | 108 | | 1,138 | | | | 4.35 | | |
| Litigation (recoveries)/charges, net | | | (304) | | | (304) | | (83) | | (221) | | | | (0.84) | | |
| | | | | | | | | | | |
| | | | | | | | | | | |
| | | | | | | | | | | |
| | | | | | | | | | | |
| Non-GAAP | | | $ | 2,076 | | 5 | % | $ | 1,987 | | $ | 452 | | $ | 1,534 | | 8 | % | 22.8 | % | $ | 5.85 | | 15 | % |
| | | | | | | | | | | |
| | | Fiscal Year 2022 |
| GAAP | | | $ | (607) | | N.M. | $ | (784) | | $ | 153 | | $ | (938) | | N.M. | (19.5) | % | $ | (3.37) | | N.M. |
| | | | | | | | | | | |
| | | | | | | | | | | |
| Restructuring and employee severance | | | 101 | | | 101 | | 26 | | 75 | | | | 0.27 | | |
| Amortization and other acquisition-related costs | | | 324 | | | 324 | | 84 | | 240 | | | | 0.87 | | |
Impairments and (gain)/loss on disposal of assets, net 3 | | | 2,060 | | | 2,060 | | 98 | | 1,962 | | | | 7.03 | | |
Litigation (recoveries)/charges, net 4,5 | | | 94 | | | 94 | | 17 | | 77 | | | | 0.28 | | |
| Loss on early extinguishment of debt | | | — | | | 10 | | 3 | | 7 | | | | 0.03 | | |
Gain on sale of equity interest in naviHealth investment | | | — | | | (2) | | — | | (2) | | | | — | | |
| | | | | | | | | | | |
| Non-GAAP | | | $ | 1,973 | | N.M. | $ | 1,804 | | $ | 381 | | $ | 1,422 | | N.M. | 21.1 | % | $ | 5.07 | | N.M. |
| | | | | | | | | | | |
1 Attributable to Cardinal Health, Inc.
2 For fiscal 2022, GAAP diluted loss per share attributable to Cardinal Health, Inc. and the EPS impact from the GAAP to non-GAAP per share reconciling items are calculated using a weighted average of 279 million common shares, which excludes potentially dilutive securities from the denominator due to their anti dilutive effects resulting from our GAAP net loss for the period. Fiscal 2022 non-GAAP diluted EPS is calculated using a weighted average of 280 million common shares, which includes potentially dilutive shares.
3 For fiscal 2024, 2023 and 2022, impairments and (gain)/loss on disposals of assets, net includes pre-tax goodwill impairment charges of $675 million, $1.2 billion and $2.1 billion related to the GMPD segment, respectively. For fiscal 2024, 2023 and 2022, the net tax benefit related to these charges was $58 million, $92 million and $140 million, respectively, and were included in the annual effective tax rate.
4 Litigation (recoveries)/charges, net includes a one-time contingent attorneys' fee of $18 million recorded during fiscal 2022 related to the finalization of the National Opioid Settlement Agreement resulting in the settlement of the vast majority of opioid lawsuits filed by state and local governmental entities. Due to the unique nature and significance of the National Opioid Settlement Agreement, and the one-time, contingent nature of the fee, this fee was included in litigation (recoveries)/charges, net.
5 Litigation (recoveries)/charges, net for fiscal 2022 does not include a $16 million judgement for lost profits related to an ordinary course intellectual property claim, which positively impacted Pharmaceutical and Specialty Solutions segment profit.
Amounts have been revised to reflect the correction of certain unrelated immaterial misstatements.
The sum of the components and certain computations may reflect rounding adjustments.
We apply varying tax rates depending on the item's nature and tax jurisdiction where it is incurred.
| | | | | | | | |
24 | Cardinal Health | Fiscal 2024 Form 10-K | |
| | | | | |
| Disclosures about Market Risk | |
Quantitative and Qualitative Disclosures About Market Risk
We are exposed to cash flow and earnings fluctuations as a result of certain market risks. These market risks primarily relate to foreign exchange, interest rate and commodity price-related changes. We maintain a hedging program to manage volatility related to some of these market exposures which employs operational, economic and derivative financial instruments in order to mitigate risk. See Note 1 and Note 11 of the “Notes to Consolidated Financial Statements” for further discussion regarding our use of derivative instruments. Foreign Exchange Rate Sensitivity
By the nature of our global operations, we are exposed to cash flow and earnings fluctuations resulting from foreign exchange rate variation. These exposures are transactional and translational in nature. The following foreign currencies represent the principal drivers of our foreign exchange exposure: Canadian dollar, euro, Thai baht, Mexican peso, Chinese renminbi, Australian dollar, British pound, Japanese yen, Philippine peso, Brazilian real, South Korean won, Costa Rican colon, Singapore dollar, Dominican peso and Indian rupee.
We apply a Value-At-Risk ("VAR") methodology to our transactional and translational exposures. The VAR model is a risk estimation tool and is not intended to represent actual losses in fair value that could be incurred.
Transactional Exposure
Transactional exposure arises from the purchase and sale of goods and services in currencies other than our functional currency or the functional currency of our subsidiaries. At the end
of each fiscal year, we perform sensitivity analyses on our forecasted transactional exposure for the upcoming fiscal year. These analyses include the estimated impact of our hedging program, which is designed to mitigate transactional exposure. Applying a VAR methodology to our transactional exposure and including the impact of our hedging program, the potential maximum loss in earnings for the upcoming fiscal year is estimated to be $13 million, which is based on a one-year horizon and a 95 percent confidence level.
Translational Exposure
We have exposure related to the translation of financial statements of our foreign operations into U.S. dollars, our functional currency. Applying a VAR methodology to our translational exposure, the potential maximum loss in earnings for the upcoming fiscal year is estimated to be $4 million, which is based on a one-year horizon and a 95 percent confidence level.
Interest Rate Sensitivity
We are exposed to changes in interest rates primarily as a result of our borrowing and investing activities to maintain liquidity and fund operations. The nature and amount of our long-term and short-term debt can be expected to fluctuate as a result of business requirements, market conditions and other factors. Our policy is to manage exposures to interest rates using a mix of fixed and floating rate debt as deemed appropriate by management. We utilize interest rate swap instruments to mitigate our exposure to interest rate movements.
As part of our risk management program related to our debt, we perform an annual sensitivity analysis on our forecasted exposure to interest rates for the upcoming fiscal year. At June 30, 2024, a hypothetical increase or decrease of 50 basis points in interest rates would result in an increase or decrease in interest expense of $8 million, respectively.
We are also exposed to market risk from changes in interest rates related to our cash and cash equivalents, which includes marketable securities that are carried at fair value in the consolidated balance sheets. The fair value of our cash and cash equivalents is subject to change primarily as a result of changes in market interest rates and investment risk related to the issuers' credit worthiness. At June 30, 2024, a hypothetical increase or decrease of 50 basis points in interest rates would result in an increase or decrease in interest income of $10 million, respectively.
| | | | | | | | |
| Cardinal Health | Fiscal 2024 Form 10-K | 25 |
| | | | | |
| Disclosures about Market Risk | |
Commodity Price Sensitivity
We are directly exposed to market price changes for certain commodities, including oil-based resins, nitrile, cotton, diesel fuel and latex. We typically purchase raw materials at either market prices or prices tied to a commodity index and some finished goods at prices based in part on a commodity price index. During fiscal 2024, the prices of certain commodities continued to experience fluctuation due to inflationary impacts.
As part of our risk management program, we perform sensitivity analysis on our forecasted direct commodity exposure for the upcoming fiscal year. Our forecasted direct commodity exposure at June 30, 2024 increased approximately $37 million from June 30,
2023. There were no outstanding commodity contracts in our hedging program at June 30, 2024.
Our forecasted direct commodity exposures for the upcoming fiscal year is $577 million. The potential gain/loss given a hypothetical 10 percent fluctuation in commodity prices, assuming pricing collectively shifts in the same direction and we are unable to change customer pricing in response to those shifts or otherwise offset, for the upcoming fiscal year is $58 million at June 30, 2024.
| | | | | | | | |
26 | Cardinal Health | Fiscal 2024 Form 10-K | |
Business
General
Cardinal Health, Inc. is a global healthcare services and products company providing customized solutions for hospitals, healthcare systems, pharmacies, ambulatory surgery centers, clinical laboratories, physician offices and patients in the home. We provide medical products and pharmaceuticals and cost-effective solutions that enhance supply chain efficiency.
Pharmaceutical and Specialty Solutions Segment
In the United States, our Pharmaceutical and Specialty Solutions segment:
▪through its Pharmaceutical Distribution division, distributes branded and generic pharmaceutical and over-the-counter healthcare and consumer products to retailers (including chain and independent drug stores and pharmacy departments of supermarkets and mass merchandisers), hospitals and other healthcare providers. This division:
▪maintains prime vendor relationships that streamline the purchasing process, resulting in greater efficiency and lower costs for our retail, hospital and other healthcare provider customers;
▪provides services to pharmaceutical manufacturers, including distribution, inventory management, data reporting, new product launch support and chargeback administration;
▪distributes specialty pharmaceutical products to hospitals and other healthcare providers and provides consulting, patient support and other services for specialty pharmaceutical products to pharmaceutical manufacturers and healthcare providers;
▪provides pharmacy management services to hospitals and operates a limited number of pharmacies, including in community health centers; and
▪repackages generic pharmaceuticals and over-the-counter healthcare products.
▪through its Specialty Solutions division:
▪distributes specialty pharmaceutical products to hospitals, specialty pharmacies, and other healthcare providers and provides consulting, patient support and other services for specialty pharmaceutical products to pharmaceutical manufacturers and healthcare providers; and
▪provides services to pharmaceutical manufacturers, including distribution, inventory management, data reporting, new product launch support and chargeback administration.
See Note 14 of the “Notes to Consolidated Financial Statements” for Pharmaceutical and Specialty Solutions segment revenue, profit and assets for fiscal 2024, 2023 and 2022. Pharmaceutical and Specialty Pharmaceutical Distribution and Services
Our Pharmaceutical Distribution division’s gross margin includes margin from our generic pharmaceutical program, from distribution services agreements with branded pharmaceutical manufacturers, including manufacturers of Specialty pharmaceutical products, and from over-the-counter healthcare and consumer products. It also includes manufacturer cash discounts.
Margin from our generic pharmaceutical program includes price discounts, rebates and service fees from manufacturers and may, in limited instances, include price appreciation. Our earnings on generic pharmaceuticals are generally highest during the period immediately following the initial launch of a product, because generic pharmaceutical selling prices are generally highest during that period and tend to decline over time.
Margin from distribution services agreements with branded pharmaceutical manufacturers is derived from compensation we receive for providing a range of distribution and related services to manufacturers. Our compensation typically is a percentage of the wholesale acquisition cost that is set by manufacturers. In addition, under a limited number of agreements, branded pharmaceutical price appreciation, which is determined by the manufacturers, also serves as part of our compensation.
Specialty pharmaceutical products include oncology, rheumatology, urology, nephrology and other pharmaceutical products. Through our Specialty Solutions division, we also distribute human-derived plasma products to hospitals, dialysis clinics, physician offices and other healthcare providers. Our use of the term “specialty pharmaceutical products” may not be comparable to the terminology used by other industry participants. We also provide consulting, patient support, logistics, group purchasing and other services to pharmaceutical manufacturers and healthcare providers.
Sourcing Venture with CVS Health Corporation
Red Oak Sourcing, LLC ("Red Oak Sourcing"), a U.S.-based generic pharmaceutical sourcing venture with CVS Health, negotiates generic pharmaceutical supply contracts on behalf of both companies. The term of Red Oak Sourcing extends through June 2029.
| | | | | | | | |
| Cardinal Health | Fiscal 2024 Form 10-K | 27 |
Global Medical Products and Distribution Segment
Our GMPD segment manufactures and sources Cardinal Health branded general and specialty medical, surgical and laboratory products and devices. These products include exam and surgical gloves; needle, syringe and sharps disposal; compression; incontinence; nutritional delivery; wound care; single-use surgical drapes, gowns and apparel; fluid suction and collection systems; urology; operating room supply; and electrode product lines. Our Cardinal Health brand products are sold directly or through third-party distributors in the United States, Canada, Europe, Asia and other markets. These Cardinal Health brand products are generally
higher-margin products. The GMPD segment also distributes a broad range of medical, surgical and laboratory products known as national brand products and provides supply chain services and solutions to hospitals, ambulatory surgery centers, clinical laboratories and other healthcare providers in the United States and Canada and this segment also assembles and sells sterile and non-sterile procedure kits.
The GMPD segment, through its Wavemark division, also provides an automated technology platform for inventory management.
Other Operating Segments
Our Nuclear and Precision Health Solutions operating segment operates nuclear pharmacies and manufacturing facilities, which manufacture, prepare and deliver radiopharmaceuticals for use in nuclear imaging, theranostics, and other procedures in hospitals and physician offices. This segment also contract manufactures a radiopharmaceutical treatment (Xofigo®) and holds the North American rights to manufacture and distribute Lymphoseek®, a radiopharmaceutical diagnostic imaging agent.
Our at-Home Solutions operating segment has two main businesses: Edgepark, a medical supplies provider that specializes
in serving patients with chronic conditions in the home; and at-Home, a business-to-business distribution service that delivers medical supplies and over-the-counter products to home medical equipment providers, home health and hospice agencies, and e-commerce providers.
Our OptiFreight® Logistics operating segment supports the shipping and logistics needs of healthcare providers by optimizing direct shipments through integrated technology solutions. This segment serves hospitals, pharmacies, labs and surgery centers.
Acquisitions and Divestitures
Acquisitions
Over the years, we have made a number of strategic acquisitions, especially in support of Cardinal Health brand medical products and specialty pharmaceutical products and services. We expect to continue to explore acquisitions in the future.
In March 2024, we completed the acquisition of Specialty Networks, a technology-enabled multi-specialty group purchasing and practice enhancement organization, for $1.2 billion in cash. We also completed several small acquisitions during the last five fiscal years.
| | | | | | | | | | | | | | | | | |
| Date | Company | Location | Lines of Business | Acquisition Price (in billions) |
| 03/18 | Specialty Networks | Cleveland, OH | UroGPO, Gastrologix, GastroGPO, and United Rheumatology. | $1.2 |
Divestitures
Over the past five fiscal years, we have also completed several divestitures, and we may explore additional divestitures in the future.
In June 2023, we signed a definitive agreement to contribute our Outcomes™ business to Transaction Data Systems ("TDS"), a portfolio company of BlackRock Long Term Private Capital and GTCR, in exchange for a minority stake in the combined entity. The transaction closed in July 2023.
In August 2021, we completed the divestiture of the Cordis business to Hellman & Freidman ("H&F") for net proceeds of $923 million in cash. We have retained certain working capital accounts and product liability for lawsuits related to IVC filters in the U.S. and Canada, as described in Note 8 of the "Notes to the Consolidated Financial Statements." We acquired the Cordis business from Johnson & Johnson for $1.9 billion in October 2015. This divestiture also included Access Closure, Inc., a manufacturer and distributor of extravascular closure devices, that we acquired for approximately $320 million in May 2014.
| | | | | | | | |
28 | Cardinal Health | Fiscal 2024 Form 10-K | |
Customers
Our largest customers, CVS Health and OptumRx, accounted for 24 percent and 17 percent of our fiscal 2024 revenue, respectively. In the aggregate, our five largest customers, including CVS Health and OptumRx, accounted for 52 percent of our fiscal 2024 revenue. As announced on April 22, 2024, OptumRx's pharmaceutical distribution contracts with us expired at the end of June 2024.
We have agreements with group purchasing organizations (“GPOs”) that act as agents to negotiate vendor contracts on
behalf of their members. Our two largest GPO relationships in terms of revenue are with Vizient, Inc. and Premier, Inc. Sales to members of these two GPOs, under numerous contracts across our businesses, collectively accounted for 16 percent of our revenue in fiscal 2024.
Suppliers
We rely on many different suppliers. During fiscal 2024, products obtained from our five largest suppliers accounted for an aggregate of 36 percent of our revenue and our largest supplier’s products accounted for approximately 9 percent of revenue.
Competition
We operate in a highly competitive environment in the distribution of pharmaceuticals and consumer healthcare products. We also operate in a highly competitive environment in the manufacturing and distribution of medical devices and surgical products. We compete on many levels, including price, service offerings, support services, customer service, breadth of product lines and product quality and efficacy.
In the Pharmaceutical and Specialty Solutions segment, we compete with wholesale distributors with national reach, including McKesson Corporation and Cencora, Inc., regional wholesale distributors, self-warehousing chains, specialty distributors, third-party logistics companies and companies that provide specialty pharmaceutical services among others. In addition, the Pharmaceutical and Specialty Solutions segment has experienced
competition from a number of organizations offering generic pharmaceuticals, including telemarketers. We also compete with manufacturers that distribute their products directly to customers.
In the GMPD segment, we compete with many diversified healthcare companies and national medical product distributors, such as Medline Industries, Inc., Owens & Minor, Inc. and Becton, Dickinson and Company, as well as regional medical product distributors and companies that are focused on specific product categories.
Our other operating segments compete with companies that operate nuclear radiopharmacies and manufacturing facilities, distribute medical products to patients' homes, and third-party logistics companies.
Human Capital Management
Employees
Through our employees, we improve the lives of people every day by solving complex healthcare problems. As of June 30, 2024, we had approximately 48,900 employees globally, of which approximately:
•18,500 are based outside the United States;
•98% are full time employees;
•32,100 worked in our distribution centers, manufacturing facilities and pharmacies;
•16,800 worked in other functions, including finance, information technology, human resources and sales; and
•10% are covered by collective bargaining agreements or similar representation. The majority of these employees are based outside the United States.
Additionally, we have engaged global professional services firms to perform certain business processes on our behalf, including within finance, information technology and human resources.
Board Oversight
Our Board of Directors assesses and monitors our corporate culture and how it enables our business strategies. To inform the Board about human capital and cultural health, we have developed and annually share with the Board a culture scorecard.
Additionally, the Human Resources and Compensation Committee of the Board of Directors (the “HRCC”) is tasked with, among other things, overseeing and advising the Board about human capital management strategies and policies, including with respect to attracting, developing, retaining and motivating management and employees; workplace diversity, equity and inclusion initiatives; employee relations; and workplace safety and culture. The HRCC
| | | | | | | | |
| Cardinal Health | Fiscal 2024 Form 10-K | 29 |
is also responsible for overseeing the management succession process.
Culture & Talent Focus
Culture
Cardinal Health’s culture is rooted in our values and behaviors and aligned to the company’s strategic framework. Providing a positive work environment supports our ability to attract, retain and develop our employees and enables business performance. We reinforce, monitor and assess our culture through a variety of programs and processes which include performance management, talent/succession planning, as well as employee engagement surveys and other listening strategies.
Talent Management and Learning
Cardinal Health’s talent management strategy has a multi-pronged approach to build capabilities, skills and competencies of leaders and employees throughout the enterprise, ensuring employees capabilities connect to business needs and outcomes. This approach includes broad based employee skill development and learning and manager development.
We monitor our turnover data on a monthly and rolling 12-month basis and benchmark against Bureau of Labor Statistics and competitor data. Although turnover levels vary by site and region, we primarily look at the connection between key operational metrics and employee turnover.
Compensation and Benefits
Our employees are essential to our success and we strive to offer comprehensive and competitive wages and benefits. The benefits we offer include annual bonuses and stock awards for eligible employees, 401(k) plans, health care and insurance benefits, paid time off, flexible work schedules, family leave, dependent care resources, employee assistance programs and many others.
Employee Feedback
Cardinal Health solicits feedback from employees through various mechanisms, including our biennial full employee engagement survey, which provides insight into the employee experience. The results of this survey are reviewed with the Board of Directors and at all levels throughout the organization.
Diversity, Equity & Inclusion
At Cardinal Health, we are focused on building a diverse workforce and an inclusive workplace that values the unique perspectives and contributions of all of our employees.
We have seven Employee Resource Groups ("ERGs") that include groups with employees of various racial and ethnic groups, members of the LGBTQ community, employees with disabilities, veterans and women, and employees who consider themselves allies. These groups work to foster an inclusive culture and help attract, develop and retain talent.
We also monitor pay equity. We define pay equity as equal pay for people of all gender identities and ethnicities who are performing substantially similar work. We have a pay equity committee, which guides the ongoing analysis and benchmarking, in regular consultation with an independent third-party, to review and help inform our salary and compensation practices. Some of the things we consider include job-related skills, tenure, experience and education level, performance rating and geography.
As of the end of fiscal year 2024, 50% of our Board of Directors were women and 25% were ethnically diverse. 50% of our executive team (made up of the CEO, his direct reports and business presidents) were women and 10% were ethnically diverse. Approximately 51% of our total employee population were women and 51% of U.S. based employees were ethnically diverse.
Worker Health & Safety
The health, safety and security of our employees and contractors is a priority for us. We employ systems designed to continually monitor our facilities and work environment to promote worker safety and identify and prevent or mitigate any potential risks. This includes procedures and equipment for security. We routinely assess facilities to closely monitor adherence to established security and safety standards. Our workers receive specialized training related to their role, work setting and equipment used in their work environment. As our processes evolve, we update relevant safety training modules, which may include new training programs.
More Information
For more information on our approach to human capital management, please refer to our annual Environmental, Social & Governance Report, which is available on our website.
Intellectual Property
We rely on a combination of trade secret, patent, copyright and trademark laws, nondisclosure and other contractual provisions and technical measures to protect our products, services and intangible assets. We hold patents, and continue to pursue patent protection throughout the world, relating to the manufacture, operation and use of various medical and surgical products, to certain distribution and logistics systems, to the production and distribution of our nuclear pharmacy products and to other service offerings. We also operate under licenses for certain proprietary
technologies, and in certain instances we license our technologies to third parties.
We believe that we have taken necessary steps to protect our proprietary rights, but no assurance can be given that we will be able to successfully enforce or protect our rights in the event that they are infringed upon by a third party. While these proprietary rights are important to our operations, we do not consider any particular patent, trademark, license, franchise or concession to be material to our overall business.
| | | | | | | | |
30 | Cardinal Health | Fiscal 2024 Form 10-K | |
Regulatory Matters
Our business is highly regulated in the United States, at both the federal and state level, and in foreign countries. Depending upon the specific business, we may be subject to regulation by government entities including:
•the U.S. Drug Enforcement Administration (the “DEA”);
•certain agencies within the U.S. Department of Health and Human Services, including the U.S. Food and Drug Administration (the “FDA”), the Centers for Medicare and Medicaid Services, the Office of Inspector General and the Office for Civil Rights;
•state and local health departments, insurance departments, Medicaid departments or other comparable state agencies;
•state and local boards of pharmacy and other controlled substance authorities;
•the U.S. Nuclear Regulatory Commission (the “NRC”);
•the U.S. Environmental Protection Agency and state environmental authorities;
•the U.S. Federal Trade Commission (the "FTC");
•U.S. Customs and Border Protection; and
•agencies comparable to those listed above in markets outside the United States.
These regulatory agencies have a variety of civil, administrative and criminal sanctions at their disposal for failure to comply with applicable legal or regulatory requirements. They can suspend our ability to manufacture and distribute products, restrict our ability to import products, require us to initiate product recalls, seize products or impose criminal, civil and administrative sanctions.
Distribution
State Boards of Pharmacy, FDA, DEA and various other state authorities regulate the marketing, purchase, storage and distribution of pharmaceutical and medical products under various federal and state statutes including the federal Prescription Drug Marketing Act of 1987, Drug Quality and Security Act of 2013 (the “DQSA”) and Controlled Substances Act (the "CSA"). The CSA governs the sale, packaging, storage and distribution of controlled substances. Wholesale distributors of controlled substances must hold valid DEA registrations and state-level licenses, meet various security and operating standards including effective anti-diversion programs and comply with the CSA. They must also comply with state requirements relating to controlled substances that differ from state to state.
The National Opioid Settlement Agreement, as described in Note 8 of the "Notes to Consolidated Financial Statements" includes injunctive relief terms related to settling distributors' controlled substance anti-diversion programs, including with respect to: (1) governance; (2) independence and training of the personnel operating our controlled substances monitoring program; (3) due diligence for new and existing customers; (4) ordering limits for certain products; and (5) suspicious order monitoring. A monitor will oversee compliance with these provisions for a period of five years. In addition, the settling distributors have engaged a third-party vendor to act as a clearinghouse for data aggregation and reporting and will fund the clearinghouse for ten years. See Note 8 of the "Notes to Consolidated Financial Statements" for more information about the National Opioid Settlement Agreement and other opioid-related matters. Manufacturing, Sourcing and Marketing
We sell our manufactured products in the United States, Canada, Europe, Asia, Latin America and other markets. The FDA and other governmental agencies in the United States, as well as foreign governmental agencies, administer requirements that cover the design, testing, safety, effectiveness, manufacturing (including good manufacturing practices), quality systems, labeling, promotion and advertising (including restrictions on promoting or advertising a product other than for the product's cleared or approved uses), distribution, importation and post-market surveillance for most of our manufactured products. We are also subject to these requirements when we source certain GMPD segment products from third-party manufacturers.
We need specific approval or clearance from, and registrations with, regulatory authorities before we can market and sell some products in the United States and certain other countries, including countries in the European Union ("EU").
In the United States, authorization to commercially market a medical device is generally received in one of two ways. The first, known as pre-market notification or the 510(k) process, requires us to demonstrate that a medical device is substantially equivalent to a legally marketed medical device. The second more rigorous process, known as pre-market approval (“PMA”), requires us to independently demonstrate that a medical device is safe and effective. Many of our Medical segment branded products are cleared through the 510(k) process and certain products must be approved through the PMA process.
In the EU, we are required to obtain CE Mark Certification in order to market medical devices. In 2017, EU regulatory bodies finalized a new Medical Device Regulation ("MDR") became effective in May 2021. Under the MDR, medical devices marketed in the EU require significant pre-market and post-market requirements.
It can be costly and time-consuming to obtain regulatory approvals, clearances and registrations of medical devices, and they might not be granted on a timely basis, if at all. For additional information, please see our Risk Factor entitled "Our business is subject to rigorous quality regulatory and licensing requirements."
Privacy and Data Protection
We are subject to various and evolving privacy laws and regulations in many jurisdictions. Because we collect, handle and maintain patient-identifiable health information, we are subject to laws that require specified privacy and security measures and that regulate the use and disclosure of such information, including the U.S. Health Insurance Portability and Accountability Act of 1996
| | | | | | | | |
| Cardinal Health | Fiscal 2024 Form 10-K | 31 |
("HIPAA"), as augmented by the Health Information Technology for Economic and Clinical Health Act as well as state laws, in the United States.
We also collect, handle and maintain other personal and financial information. Within the U.S., these activities are regulated by certain federal and state laws. Certain states have recently enacted privacy laws that grant specified rights to consumers over the use of their personal information, including increased transparency. Other states are considering adopting similar or different comprehensive privacy laws and comprehensive privacy legislation has been proposed at the U.S. federal level. Internationally, we are also subject to privacy and data protection laws that require significant compliance efforts, including the EU's General Data Protection Regulation (GDPR), Canada's Personal Information Protection and Electronic Documents Act, Japan's Act on the Protection of Personal Information and China's Personal Information Protection Law, among many others.
Nuclear Pharmacies and Related Businesses
Our nuclear pharmacies and radiopharmaceutical manufacturing facilities (including for Xofigo®) require licenses or permits and must abide by regulations issued by the NRC, applicable state boards of pharmacy and the radiologic health agency or department of health of each state in which we operate, including pharmacy sterile compounding standards and practices. In addition, our radiopharmaceutical manufacturing facilities also must comply with FDA regulations, including good manufacturing practices.
Product Tracing and Supply Chain Integrity
Title II of the DQSA, known as the Drug Supply Chain Security Act ("DSCSA") or "Track and Trace" establishes a phased-in national system for tracing pharmaceutical products through the pharmaceutical distribution supply chain to detect, prevent and rapidly respond to the introduction of drugs that may be counterfeit, diverted, stolen, adulterated, subject of a fraudulent transaction or otherwise unfit for distribution. The first phase of implementation began in 2015. Absent an FDA-approved waiver, exemption, or exception, which we have requested and other authorized trading partners may request, upon the end of the stabilization period in late November 2024, we will be required to participate in an electronic interoperable prescription drug tracing system. In addition, the FDA also has issued regulations requiring most medical device labeling to bear a unique device identifier. The MDR, described above, also introduces a new unique device identifier requirement.
Government Healthcare Programs
We are subject to U.S. federal healthcare fraud and abuse laws. These laws generally prohibit persons from soliciting, offering, receiving or paying any compensation in order to induce someone to order, recommend or purchase products or services that are in any way paid for by Medicare, Medicaid or other federally-funded healthcare programs. They also prohibit submitting any fraudulent claim for payment by the federal government. There are similar state healthcare fraud and abuse laws that apply to Medicaid and other state-funded healthcare programs. Violations of these laws
may result in criminal or civil penalties, as well as breach of contract claims and qui tam actions (false claims cases initiated by private parties purporting to act on behalf of federal or state governments).
Some of our businesses are Medicare-certified suppliers or participate in other federal and state healthcare programs, such as state Medicaid programs and the federal 340B drug pricing program. These businesses are subject to accreditation and quality standards and other rules and regulations, including applicable reporting, billing, payment and record-keeping requirements. Other businesses within each segment manufacture pharmaceutical or medical products or repackage pharmaceuticals that are purchased or reimbursed through, or are otherwise governed by, federal or state healthcare programs. Failure to comply with applicable eligibility requirements, standards and regulations could result in civil or criminal sanctions, including the loss of our ability to participate in Medicare, Medicaid and other federal and state healthcare programs. For example, during fiscal year 2022, we agreed to pay approximately $13 million to the Department of Justice and our Specialty Pharmaceutical Distribution business entered into a Corporate Integrity Agreement with the Office of Inspector General of the Department of Health and Human Services in connection with an investigation into discounts and rebates offered or provided to certain Specialty customers. See Note 8 of the "Notes to Consolidated Financial Statements" for more information on this matter. Our U.S. federal and state government contracts are subject to specific procurement requirements. Failure to comply with applicable rules or regulations or with contractual or other requirements may result in monetary damages and criminal or civil penalties as well as termination of our government contracts or our suspension or debarment from government contract work.
Environmental, Health and Safety Laws
In the United States and other countries, we are subject to various federal, state and local environmental laws, including laws regulating the production or use of hazardous substances, as well as laws relating to safe working conditions and laboratory practices. Additionally, industry participants, including us, rely on ethylene oxide ("EtO") and other compounds to sterilize certain medical products that we manufacture or distribute. Regulatory actions have been taken by certain environmental regulatory authorities to reduce EtO emissions during the sterilization and distribution process, including actions intended to regulate facilities that sterilize medical products.
Antitrust Laws
The U.S. federal government, most U.S. states and many foreign countries have laws that prohibit certain types of conduct deemed to be anti-competitive. Violations of these laws can result in various sanctions, including criminal and civil penalties. Private plaintiffs also could bring civil lawsuits against us in the United States for alleged antitrust law violations, including claims for treble damages.
| | | | | | | | |
32 | Cardinal Health | Fiscal 2024 Form 10-K | |
Laws Relating to Foreign Trade and Operations
U.S. and foreign laws require us to abide by standards relating to the import and export of finished goods, raw materials and supplies and the handling of information. We also must comply with various export control and trade embargo laws, which may require licenses or other authorizations for transactions within some countries or with some counterparties.
Similarly, we are subject to U.S. and foreign laws concerning the conduct of our foreign operations, including the U.S. Foreign Corrupt Practices Act, the U.K. Bribery Act and other foreign anti-bribery laws. Among other things, these laws generally prohibit companies and their intermediaries from offering, promising or making payments to officials of foreign governments for the purpose of obtaining or retaining business.
Other Information
Certain Commercial Practices
Although our agreements with manufacturers sometimes require us to maintain inventory levels within specified ranges, our distribution businesses are generally not required by our customers to maintain particular inventory levels other than as needed to meet service level requirements. Certain customer contracts require us to maintain sufficient inventory to meet emergency demands, but we do not believe those requirements materially affect inventory levels.
Our customer return policies generally require that the product be physically returned, subject to restocking fees. We only allow customers to return product for credit that can be added back to inventory and resold at full value, or that can be returned to vendors for credit.
We offer market payment terms to our customers.
CEO Equity Award Agreements
On August 13, 2024, the Human Resources and Compensation Committee of Cardinal Health’s board of directors approved changes to the forms of restricted share units (“RSUs”) and performance shares units (“PSUs”) agreements that are expected to be used for future RSU and PSU award grants to our Chief Executive Officer, Jason M. Hollar. Under these forms of award agreements, in the event of a termination of Mr. Hollar’s employment by Cardinal Health without “cause” (as such term is defined in the Cardinal Health, Inc. 2021 Long-Term Incentive Plan, as amended) unvested RSU awards held by Mr. Hollar will become vested on a pro-rata basis, based on the portion of the applicable vesting period which has elapsed as of the date of the termination. In addition, PSU awards will remain eligible to vest (based on actual performance) on a pro-rata basis, based on the portion of the applicable performance period which has elapsed as of the date of the termination. This description of the forms of award agreements expected to be used for Mr. Hollar’s future grants is qualified in its entirety by the text of the forms of award agreements, which are attached hereto as Exhibits 10.1.10 and 10.1.11 to this Form 10-K.
Rule 10b5-1 Plan Adoptions and Modifications
During the quarter ended June 30, 2024, no director or officer adopted, modified or terminated a "Rule 10b5-1 trading arrangement" or "non-Rule10b5-1 trading arrangement" as each term is defined in Section 408(a) of Regulation S-K under the Exchange Act.
| | | | | | | | |
| Cardinal Health | Fiscal 2024 Form 10-K | 33 |
Risk Factors
The risks described below could materially and adversely affect our results of operations, financial condition, liquidity or cash flows. These are not the only risks we face. Our businesses also could be affected by risks we do not currently consider material to our operations or of which we are not presently aware.
Legal, Regulatory & Compliance Risks
Opioid-related legal proceedings and the National Opioid Settlement Agreement we have entered into could have additional or unexpected negative effects on our results of operations or business.
Cardinal Health, along with other pharmaceutical wholesalers and other participants in the pharmaceutical supply chain, was named as a defendant in lawsuits related to the distribution of opioid pain medications. Plaintiffs in these lawsuits included state attorneys general, counties and municipalities.
In April 2022, an agreement settling the vast majority of opioid-related lawsuits filed against us by state and local governmental entities (the "National Opioid Settlement Agreement") became effective. Under the National Opioid Settlement Agreement, we agreed to pay up to approximately $6.3 billion over 18 years. The National Opioid Settlement Agreement also includes injunctive relief terms relating to distributors' controlled substance anti-diversion programs. A monitor will oversee compliance with these provisions until 2027. In addition, the distributors agreed to engage a third-party vendor to act as a clearinghouse for data aggregation and reporting, which the distributors will fund until 2032. It is possible that the maintenance of the required changes to distributors' controlled substance anti-diversion programs may result in unforeseen costs or operational challenges which could have an adverse impact on our results of operations or performance. If we are unable to comply with these requirements, or are alleged to have failed to comply with these requirements, we could incur unforeseen costs or penalties, and our financial results may be negatively impacted.
The National Opioid Settlement Agreement did not resolve all lawsuits brought by political subdivisions. We continue to engage in resolution discussions with certain nonparticipating political subdivisions. A trial in the case brought by the city of Baltimore, which is the largest remaining nonparticipating subdivision by population, is scheduled to begin in September 2024. We intend to defend ourselves vigorously against all remaining lawsuits; however, litigation is inherently unpredictable and unfavorable developments or resolutions can occur.
We are also being sued by private plaintiffs, such as unions, other health and welfare funds, hospital systems, third party payors, other healthcare providers and individuals alleging personal injury for the same activities and could be named as a defendant in additional lawsuits. We intend to vigorously defend ourselves against these lawsuits; however, legal proceedings are inherently unpredictable and it is possible that these lawsuits, either
individually or in the aggregate, could have a negative impact on our results of operations.
We have also received federal grand jury subpoenas issued in connection with investigations being conducted by the U.S. Attorney's Office for the Eastern District of New York and the Fraud Section of the U.S. Department of Justice ("DOJ"). We have also received civil subpoenas and other requests for information from other DOJ offices.
We are involved in legal proceedings with insurers related to the availability of insurance coverage for some matters described above and our ability to recover losses from our insurers is uncertain. Additionally, laws governing insurance coverage vary by state and some state courts have interpreted laws and insurance policies in ways that may negatively impact our ability to receive indemnification under our insurance policies.
Ongoing unfavorable publicity regarding the abuse or misuse of prescription opioid pain medications and the role of wholesale distributors in the supply chain of such prescription medications could continue to have an adverse effect on our reputation or results of operations.
Our business is subject to rigorous regulatory and licensing requirements.
As described in greater detail in the "Business" section, products that we manufacture, source, distribute or market must comply with U.S. federal, state and foreign and regulatory requirements. Noncompliance or concerns over noncompliance, including noncompliance by suppliers, has in the past, and may in the future result in suspension of our ability to distribute, import, manufacture or source products, recalls, safety alerts or seizures, or criminal or civil sanctions, which, in turn, could result in product liability claims and lawsuits, including class actions. If we fail to comply with regulatory requirements, or if allegations are made that we fail to comply, our results of operations and financial condition could be adversely affected.
To lawfully operate our businesses, we are required to obtain and hold permits, product registrations, licenses and other regulatory approvals from, and to comply with operating and security standards of, numerous governmental bodies. Failure to maintain or renew necessary permits, product registrations, licenses or approvals, or to comply with required standards, could have an adverse effect on our results of operations and financial condition.
We are required to comply with laws relating to healthcare fraud and abuse. The requirements of these laws are complex and subject to varying interpretations. From time to time, regulatory authorities investigate our policies or practices, and may challenge them. For example, in November 2023, we received a Civil Investigative Demand ("CID") from the Department of Justice focused on potential violations of the Anti-Kickback Statute and False Claims Act in connection with a 2022 transaction in which we purchased a group purchasing organization and a minority ownership interest in a rheumatology managed services
| | | | | | | | |
34 | Cardinal Health | Fiscal 2024 Form 10-K | |
organization. We are cooperating with this investigation. We are also periodically subject to federal or state government investigations or qui tam actions (false claims cases initiated by private parties purporting to act on behalf of federal or state governments), which could result in civil or criminal sanctions, including the loss of licenses or the ability to participate in Medicare, Medicaid and other federal and state healthcare programs or other remedial measures.
Some of our businesses are Medicare-certified suppliers or participate in other federal and state healthcare programs, such as state Medicaid programs and the federal 340B drug pricing program. In addition, some businesses manufacture pharmaceutical or medical products or repackage pharmaceuticals that are purchased or reimbursed through, or are otherwise governed by, federal or state healthcare programs. Failure to comply with applicable eligibility requirements, standards and regulations could result in civil or criminal sanctions, including the loss of our ability to participate in Medicare, Medicaid and other federal and state healthcare programs.
Private challenges to government healthcare policy may also have a significant impact on our business. For example, the federal 340B drug pricing program requires pharmaceutical manufacturers to offer discounts on certain drugs purchased by covered entities, and some of our Pharmaceutical and Specialty Solutions segment customers are covered entities or contract pharmacies for covered entities. Over a dozen pharmaceutical manufacturers have unilaterally restricted sales under the 340B drug pricing program to contract pharmacies. These practices are the subject of ongoing litigation; however, if manufacturers continue this practice and if courts uphold this practice, our customers may be adversely impacted, which could adversely impact our business.
We, and third parties acting on our behalf, collect, handle and maintain patient-identifiable health information and other sensitive personal and financial information which are subject to federal, state and foreign laws that regulate the use and disclosure of such information. Regulations currently in place continue to evolve, and they are extensive and complex. Compliance with these laws is difficult and costly. New laws in this area could further restrict our ability to collect, handle and maintain personal or patient information, or could require us to incur additional compliance costs, either of which could have an adverse impact on our results of operations. From time to time, we have become aware of certain isolated alleged violations of federal, state or foreign laws concerning privacy and data protection. When we become aware of such allegations, we investigate and, if warranted, notify affected people, entities and regulatory bodies. As a result of these violations, we have been and may in the future be subject to civil or criminal penalties, breach of contract claims, lawsuits, costs for remediation and harm to our reputation.
Industry participants, including us, rely on ethylene oxide (“EtO”) and per- and polyfluoroalkyl (“PFA”) compounds to sterilize certain medical products, including products that we manufacture or distribute. Regulatory enforcement actions have been taken by certain environmental regulatory authorities to reduce emissions of
these compounds during the sterilization and distribution process. If such measures become more widespread, we could experience increased costs to comply with reduced emissions standards and it is possible that we and other industry participants may be unable to effectively sterilize medical products, possibly resulting in supply shortages or an industry-wide reduction in surgical or medical procedures, which would negatively impact demand for our products. Such increased costs or industry-wide reductions in surgical and medical procedures would have a negative impact on our profit. Additionally, we have been named as a defendant in several lawsuits alleging personal injury as a result of EtO emissions. Additionally, we have incurred, and may incur additional costs associated with modifying certain manufacturing, distribution or replenishment facilities in accordance with state environmental regulators' actions or requirements. It is possible that these or future regulatory actions or lawsuits could adversely impact our ability to procure products to distribute, resulting in increased costs or industry supply disruptions.
Our government contracts are subject to specific procurement requirements. Failure to comply with applicable rules or regulations or with contractual or other requirements may result in monetary damages and criminal or civil penalties as well as termination of our government contracts or our suspension or debarment from government contract work.
Our global operations (including transition services in connection with divestitures) are subject to the U.S. Foreign Corrupt Practices Act ("FCPA"), the U.K. Bribery Act and similar anti-bribery laws in other jurisdictions and U.S. and foreign export control, trade embargo and customs laws. If we fail to comply, or are alleged to fail to comply, with any of these laws, we could be subject to investigations or suffer civil or criminal sanctions.
Supply chain and quality issues could adversely affect operations, profitability, cash flows, and our financial condition.
As described in the "Business" section, products that we manufacture, source, distribute or market must comply with rigorous quality requirements. In addition, no assurance can be given that we will remain in compliance with applicable FDA and other regulatory requirements. These requirements include, among others, regulations regarding manufacturing practices, labeling, advertising, and post marketing reporting, including adverse event reports and field alerts and actions. Several of our facilities and procedures and those of our suppliers are subject to ongoing regulation and periodic inspection by the FDA and other authorities. Actions resulting from non-compliance with FDA and other regulations include fines, warning letters, injunctions, civil penalties, damages, recalls, consent decrees, seizures of products, and civil litigation and/or criminal prosecution. For example, following a facility inspection in December 2023, the FDA issued a warning letter to Cardinal Health in April 2024 related to plastic syringes sourced from a third party manufacturer in China asserting these products did not have appropriate 510(k) clearance and restating some of the observations from the December 2023 inspection. We promptly took action on these
| | | | | | | | |
| Cardinal Health | Fiscal 2024 Form 10-K | 35 |
products and submitted a timely and comprehensive response to the warning letter describing our investigation and corrective actions, and we continue to cooperate with the FDA on this matter.
We are also subject to government import and export controls and regulations, including the requirement that we make a determination, based on the best information that we have available at the time, as to the country of origin of products that we source or manufacture outside the United States. U.S. Customs and Border protection may challenge our determinations, which have resulted in products being detained and supply disruptions, and which could result in the imposition of fines and penalties. In addition, the Uyghur Forced Labor Prevention Act, which went into effect in June 2022, prohibits the importation of any goods grown, produced, manufactured or mined, wholly or in part, in the Xinjiang Uyghur Autonomous Region of China unless importers can provide clear and convincing evidence that goods were not made using forced labor. We have experienced supply constraints as a result of these and similar regulations, and it is possible that our business or results of operations could be further negatively impacted by future determinations and disruptions.
Such events cause the company to incur additional time, cost and effort to ensure compliance with complex regulations. Noncompliance or concerns over noncompliance, including by suppliers, as a result of use of third party manufactures, or planned shifts in production sites, has in the past, and may in the future result in substantial modifications to our business practices and operations. These modifications can include suspension of our ability to import and distribute, refunds or recalls, total or partial shutdown of production in one or more facilities while we or our suppliers remedy any actual or potential issues, the inability to obtain future pre-market approvals or marketing authorizations, and withdrawals or suspensions of current products from the market. In addition, it can be costly and time-consuming to obtain regulatory approvals or product registrations to market a medical device or other product, and such approvals or registrations might not be granted on a timely basis, if at all. Any of these supply chain and quality-related events could be disruptive to our business and have a material adverse effect on operations, profitability, cash flows, and our financial condition.
We could be subject to adverse changes in the tax laws or challenges to our tax positions.
We are a large multinational corporation with operations in the United States and many foreign countries. As a result, we are subject to the tax laws of many jurisdictions.
From time to time, proposals are made in the United States and other jurisdictions in which we operate that could adversely affect our tax positions, effective tax rate or tax payments. Additionally, changes in tax laws or regulatory enforcement priorities may impact our tax position. Specific initiatives that may impact us include possible increases in U.S. or foreign corporate income tax rates or other changes in tax law to raise revenue, the repeal of the LIFO (last-in, first-out) method of inventory accounting for income tax purposes, the establishment or increase in taxation at the U.S. state level on the basis of gross revenues,
recommendations of the base erosion and profit shifting project undertaken by the Organization for Economic Cooperation and Development and the European Commission’s investigation into illegal state aid. In August 2022, the U.S. federal government enacted the Inflation Reduction Act, which imposed a 15 percent corporate minimum tax on certain large corporations and a 1 percent tax on share repurchases after December 31, 2022. These provisions may adversely impact our financial position and results of operations.
Additionally, in connection with the accruals taken in connection with opioid-related lawsuits in fiscal year 2021, we recorded a net tax benefit, reflecting our then-current assessment of the estimated future deductibility of the amount that may be paid. We have made reasonable estimates and recorded amounts based on management's judgment and our current understanding of the U.S. Tax Cuts and Jobs Act ("Tax Act"); however, the tax law governing deductibility was changed by the Tax Act, and these estimates require significant judgment and it is possible that they could be subject to challenges by the U.S. Internal Revenue Service ("IRS").
We also regularly review these estimates and assumptions from time to time and adjust our accruals based on our review, resulting in changes in our tax provisions/(benefit). The actual amount of tax benefit related to uncertain tax positions may differ materially from these estimates. See Note 9 of the "Notes to Consolidated Financial Statements" for more information regarding these matters. In fiscal year 2021, our provision for income taxes reflected a $424 million benefit from the tax benefits of a self-insurance pre-tax net operating loss carryback under the Coronavirus Aid, Relief and Economic Security ("CARES") Act. Also, as a result of this net operating loss carryback, we received a U.S. federal income tax refund of $966 million. This fiscal year is being audited by the IRS, and it is possible that the IRS could challenge our tax position with respect to this self-insurance loss. If they do, our effective tax rate or cash flows could be adversely impacted. Additionally, laws governing insurance coverage vary by state and some state courts have interpreted laws and insurance policies in ways that may impact our self-insurance loss, which could negatively impact our financial position.
We file income tax returns in the U.S. federal jurisdiction, various U.S. state jurisdictions and various foreign jurisdictions. Tax laws are complex and subject to varying interpretations. With few exceptions, we are subject to audit by taxing authorities for fiscal years 2015 through the current fiscal year, including a specific inquiry into a restructuring in connection with integrating the July 2017 acquisition of the Patient Recovery business from Medtronic. Proposed adjustments in ongoing audits may adversely affect our effective tax rate or tax payments.
Changes to the U.S. healthcare environment may not be favorable to us.
Over a number of years, the U.S. healthcare industry has undergone significant changes designed to increase access to medical care, improve safety and patient outcomes, contain costs
| | | | | | | | |
36 | Cardinal Health | Fiscal 2024 Form 10-K | |
and increase efficiencies. These changes include a general decline in Medicare and Medicaid reimbursement levels, efforts by healthcare insurance companies to limit or reduce payments to pharmacies and providers, the basis for payments beginning to transition from a fee-for-service model to value-based payments and risk-sharing models and the industry shifting away from traditional healthcare venues like hospitals and into clinics, physician offices and patients’ homes.
We expect the U.S. healthcare industry to continue to change significantly in the future. Possible changes include changes in legislation or regulations governing prescription pharmaceutical pricing, healthcare services, U.S.-based medical product manufacturing, mandated benefits, efforts to promote increased transparency in the pharmaceutical supply chain, drug shortages, further reduction of or limitations on governmental funding at the state or federal level or efforts by healthcare insurance companies to further limit payments for products and services. Federal, state, and local governmental entities have also continued to increase their scrutiny of the U.S. healthcare market. For example, the Federal Trade Commission has issued public requests for information related to pharmaceutical wholesalers' and group purchasing organizations' impacts on generic drug shortages and the impact of pharmacy benefits managers on drug affordability and access. Such scrutiny might expose us to additional governmental investigations, qui tam actions, and liability and could require us to make changes in our operations at additional expense. Uncertainty surrounding possible changes to the healthcare environment, including changes to regulatory enforcement priorities, may directly or indirectly adversely affect us.
Legal proceedings could adversely impact our cash flows or results of operations.
Due to the nature of our business, which includes the distribution of controlled substances and other pharmaceutical products and the sourcing, marketing and manufacturing of medical products, we regularly become involved in disputes, litigation and regulatory matters. Litigation is inherently unpredictable, disruptive, and time consuming and the unfavorable outcome of legal proceedings could adversely affect our results of operations or financial condition.
For example, we are subject to a number of lawsuits and investigations related to the national health crisis involving the abuse of opioid pain medication as described above in the Risk Factor titled "Opioid-related legal proceedings and the National Opioid Settlement Agreement we have entered into could have additional or unexpected negative effects on our results of operations or business" and in Note 8 to the "Notes to Consolidated Financial Statements." Additionally, some of the products that we distribute or manufacture have been and may in the future be alleged to cause personal injury, subjecting us to product liability claims. For example, since July 2021, we have entered into settlement agreements to settle the vast majority of product liability claims alleging personal injuries associated with the use of Cordis OptEase and TrapEase IVC filter products. Future settlements of
or judgments for product liability claims may not be covered by insurance or exceed available insurance recoveries. If this happens, and if any such settlement or judgment is in excess of any prior accruals, our results of operations and financial condition could be adversely affected.
In connection with legal proceedings, we occasionally enter into settlement agreements or become subject to consent decrees containing ongoing financial or operational obligations, including the injunctive relief provisions of the National Opioid Settlement Agreement and the Corporate Integrity Agreement mentioned above. Failure to comply with obligations under these agreements or decrees could lead to monetary or other penalties.
We might infringe intellectual property rights or our own intellectual property protections might be insufficient to protect our commercial interests.
As we expand or update our product offerings, we may not be able to timely secure intellectual property protections or customers may prefer certain of our products that are no longer subject to intellectual property protections. Such risks may harm our profit, competitive position and could have an adverse impact on results of operations.
Third parties have in the past and may in the future assert infringement claims against us. Litigation and proceedings related to intellectual property are unpredictable, and we might be required to pay significant damages, develop non-infringing products or services, obtain a license, cease selling or using allegedly infringing products or services, or incur other restrictions on our operations. Trade secret, patent, copyright, and trademark laws, nondisclosure obligations, and other contractual provisions are critical to our business. In addition to contractual and technical measures, we might institute resource-intensive litigation to protect our trade secrets, to enforce our patent, copyright, or trademark rights and to determine the scope and validity of the proprietary rights of third parties. Our efforts to protect our intellectual property might be insufficient, and non-infringing products or services equivalent or superior to ours might be developed by competitors.
Business & Operational Risks
Our business and operations depend on the proper functioning of information systems, critical facilities and distribution networks and could be negatively impacted by events outside of our control.
We rely on our and third-party service providers' information systems for a wide variety of critical operations, including to obtain, rapidly process, analyze and manage data to:
•facilitate the purchase and distribution of inventory items from numerous distribution centers;
•receive, process and ship orders on a timely basis;
•manage accurate billing and collections for thousands of customers;
•process payments to suppliers;
•facilitate manufacturing and assembly of medical products; and
•generate financial information.
| | | | | | | | |
| Cardinal Health | Fiscal 2024 Form 10-K | 37 |
Our business also depends on the proper functioning of our and our suppliers' business processes, critical facilities, including our national logistics center, and our distribution networks. Our results of operations could be adversely affected if our or a service provider's business processes, information systems, critical facilities or distribution networks are disrupted (including disruption of access), are damaged or fail, whether due to physical disruptions, such as climate change-related weather events, including wildfires, hurricanes, extreme temperatures or other natural disasters, pandemics (as they were by the COVID-19 pandemic) or power outages, systems updates, or due to cybersecurity incidents, ransomware or other actions of third parties, including labor strikes or shortages, political unrest and terrorist attacks. In addition, hardware, software, and other applications and updates procured from third parties may contain defects that have and may in the future unexpectedly restrict or prevent access to or interfere with the proper operation of our information systems and hardware. Manufacturing disruptions also can occur due to regulatory action, production quality deviations, safety issues or raw material shortages or defects, planned shifts in production sites, or because a key product or component is manufactured at a single manufacturing facility with limited alternate facilities. Additionally, we incur costs to remediate these disruptions, and it is possible that these costs could be significant.
Our ability to compete effectively is increasingly dependent on access to and interpretation of data, and we may provide services that involve hosting customer data and operating software on third-party or our own systems. Data quality impacts customer ordering, order fulfillment and higher order processing. If we fail to effectively implement and maintain data governance structures across our businesses, to effectively interpret and utilize such data, or protect the integrity of such data, including systems powered by or incorporating artificial intelligence and machine learning, our operations could be impacted, and we may be at a competitive disadvantage.
Our business and results of operations could be adversely affected if we experience a material cyber-attack or other systems breach.
Our business relies on the secure transmission, storage and hosting of patient-identifiable health information, financial information and other sensitive protected information relating to our customers, company, workforce and individuals with whom we and our customers conduct business. We have programs in place to detect, contain and respond to information security incidents. However, because the techniques used to obtain unauthorized access, disable or degrade service or sabotage systems change frequently and may be difficult to detect for long periods of time, we may be unable to anticipate these techniques or to implement adequate preventative measures. In addition, hardware, software or applications developed internally or procured from third parties may contain defects in design or manufacture or other problems beyond our control that could unexpectedly compromise information security.
Unauthorized parties have gained access in the past, and will continue to attempt to gain access, to our or a service provider's systems or facilities through fraud, social engineering or other forms of deception. We and our service providers have been the target of cyber attacks. Although we do not believe these incidents had a material impact on us, either individually or in the aggregate, similar incidents or events in the future may negatively impact our business, reputation or financial results.
Any compromise of our or a service provider's information systems, including unauthorized access to or use or disclosure of sensitive information, could adversely impact our operations, results of operations or our ability to satisfy legal or regulatory requirements, including the EU general data protection regulation (GDPR) and those related to patient-identifiable health information and other sensitive personal and financial information at the state and U.S. federal level as further described in the Risk Factor titled “Our business is subject to other rigorous regulatory and licensing requirements,” above.
In addition, insurance for losses arising from cyber-attacks or other breaches is becoming more costly and limited and may not be available to us at amounts that we historically have obtained or that we would like to obtain. It is possible that we could incur losses that may not be covered by insurance or that would exceed available insurance recoveries. If this happens, our results of operations and financial condition could be adversely affected.
Our goodwill or other long-lived assets may be further impaired, which could require us to record additional significant charges to earnings in accordance with generally accepted accounting principles.
U.S. GAAP requires us to test our goodwill for impairment on an annual basis, or more frequently if indicators for potential impairment exist. In addition, we review intangible assets with finite lives and other long-lived assets for impairment whenever events or changes in circumstances indicate that the related carrying amounts may not be recoverable.
In fiscal 2024, we performed annual impairment testing and concluded there were no impairments of goodwill for our reporting units as the estimated fair value of each reporting unit exceeded its carrying amount. However, the at-Home Solutions reporting unit estimated fair value exceeds its carrying amount by less than 1 percent and therefore, its goodwill could be impaired in future periods. The goodwill balance as of June 30, 2024 was $1.1 billion.
Impairment testing involves estimates and significant judgments by management. We believe our assumptions and estimates are reasonable and appropriate; however, additional adverse changes in key assumptions, a failure to meet expected earnings or other financial plans, or unanticipated events and circumstances, an increase in the discount rate, a decrease in the terminal growth rate, increases in tax rates, or a significant change in industry or economic trends could affect the accuracy or validity of such estimates and may result in goodwill impairment in our at-Home solutions segment. It is also possible that we may record significant charges from impairment to goodwill of other reporting
| | | | | | | | |
38 | Cardinal Health | Fiscal 2024 Form 10-K | |
units, intangibles and other long-lived assets. Any charge or charges could adversely affect our results of operations.
During fiscal 2024, 2023 and 2022, we recorded aggregate goodwill impairment charges of $675 million, $1.2 billion and $2.1 billion, respectively, related to GMPD (our former Medical unit) primarily driven by the performance and long-term financial plan assumptions. GMPD has no goodwill balance remaining at June 30, 2024.
See "Critical Accounting Policies and Sensitive Accounting Estimates" in MD&A above for more information regarding goodwill impairment testing.
Our sales and credit concentration is significant.
In fiscal year 2024, CVS Health and OptumRx were our largest customers. CVS Health accounted for 24 percent of our fiscal 2024 revenue and 22 percent of our gross trade receivable balance at June 30, 2024 and OptumRX accounted for 17 percent of our fiscal 2024 revenue. Our pharmaceutical distribution contracts with OptumRx expired at the end of June 2024. We expect our results of operations including Pharmaceutical and Specialty Solutions segment profit and operating cash flow, to be negatively impacted as a result of this expiration. Additionally, we may not be as successful as anticipated in mitigating the negative impacts from this expiration. If CVS or another significant customer reduces their purchases from us, defaults in payment to us, does not renew or terminates their agreements, whether due to an alleged default by us or otherwise, our results of operations and financial condition could be adversely affected.
Our results of operations or strategic objectives could be adversely impacted if we fail to manage and complete divestitures.
We regularly evaluate our portfolio of businesses to determine whether an asset or business may no longer help us meet our objectives or whether there may be a more advantaged owner for that business. For example, in July 2023, we contributed our Outcomes™ business to Transaction Data Systems in exchange for a minority stake in the combined entity, and in fiscal year 2022, we completed the divestiture of the Cordis business. When we decide to sell assets or a business, we may encounter difficulty finding buyers or alternative exit strategies, which could impact the achievement of our strategic objectives. We could also fail to obtain necessary regulatory approval or incur higher costs or charges than planned or incur unexpected charges and could experience greater dis-synergies than expected, which could have a negative impact on our results of operations.
Our ability to manage and complete acquisitions could impact our strategic objectives and financial condition.
From time to time, we look to acquire other businesses that expand or complement our existing businesses. For example, in March 2024, we acquired Specialty Networks, a technology-enabled multi-specialty group purchasing and practice enhancement organization for $1.2 billion. Completion of such acquisitions and the integration of acquired businesses involve a number of risks, including the following: we may overpay for a business or fail to realize the synergies, financial, strategic and other benefits we expect from the acquisition; our management’s
attention may be diverted to integration efforts; we may fail to retain key personnel of the acquired business; future developments may impair the value of our purchased goodwill or intangible assets; we may face difficulties or delays establishing, integrating or combining operations and systems, including manufacturing facilities; we may assume liabilities related to legal proceedings involving the acquired business; we may face challenges retaining the customers of the acquired business; we may require financing that may not be available on favorable terms; we may not receive regulatory approval necessary to timely complete an acquisition; or we may encounter unforeseen internal control, regulatory or compliance issues. We may also encounter other risks related to a failure to complete an acquisition, including diversion of time and resources of management and failure to achieve strategic objectives. Any of the foregoing may impact our ability to achieve anticipated benefits of an acquisition, which might have an adverse impact on results of operations and financial conditions.
Failure to effectively or efficiently complete or manage critical business processes could have unforeseen consequences.
From time to time, our businesses perform business process improvements or infrastructure modernizations or use service providers for key systems and processes, such as receiving and processing customer orders, customer service and accounts payable. For example, during fiscal 2022, our former Pharmaceutical segment implemented a replacement of certain finance and operating information systems and we have also transitioned certain finance processes to a third-party service provider. These initiatives, transitions, and improvements require an ongoing commitment of resources. If any of these initiatives or similar initiatives, including those related to artificial intelligence and machine learning, are not successfully or efficiently implemented or maintained, or if our relationship with critical third-party service providers deteriorates, we could experience negative impacts on our business, financial results and our internal control over financial reporting.
Our business could be affected by activist shareholders.
In September 2022, we entered into a Cooperation Agreement with Elliott under which our Board of Directors, among other things, (1) appointed four new independent directors, including a representative from Elliott , and (2) formed an advisory Business Review Committee of the Board, which was tasked with undertaking a comprehensive review of our strategy, portfolio, capital-allocation framework and operations. In May 2023, we extended the term of the Cooperation Agreement until the later of July 15, 2024 or until an Elliott representative ceases to serve on, or resigns from, our Board of Directors. In connection with this extension, the Board extended the term of the Business Review Committee until July 15, 2024. On that date, the Business Review Committee disbanded in accordance with its charter. The Cooperation Agreement remains in effect.
The Cooperation Agreement may create unintended consequences, such as creating uncertainty about our management, operations or future strategic direction, which could
| | | | | | | | |
| Cardinal Health | Fiscal 2024 Form 10-K | 39 |
result in the loss of future business opportunities or negatively impact our ability to attract and retain qualified talent.
It is possible that activist shareholders may, among other things, attempt to effect additional changes and exert influence over our Board of Directors and management or initiate a proxy contest, which may disrupt our operations by diverting the attention of management and the Board and be costly and time-consuming. Any such proxy contests, actions or requests, or the mere public presence of activist shareholders, may cause the market price for our shares to experience volatility, which could be significant.
Our business could be affected by events outside of our control including global climate change-related physical and transitional risks, public health crises, natural disasters, geopolitical and other catastrophic events.
The long-term impacts of climate change are widespread and difficult to predict. However, we expect to experience climate-related impacts to the business, likely driven by risks related to the physical impacts to our operations and risks related to the transition to a lower-carbon economy. Our properties may be subject to nearer-term impacts from climate change, including physical damage resulting from adverse or extreme weather. Property damage results in increased costs for repairs and may cause disruptions in operations. Transitional risks associated with climate change may cause social and human effects such as shifts in populations, increased costs for critical services such as transportation, and other adverse effects. Climate-related laws and regulations may impose costs, including increased spend associated with carbon pricing mechanisms, data gathering and reporting, third-party attestations, capital expenditures to implement lower greenhouse gas emissions technology, and other measures to reduce emissions. Additionally, the varied timing of climate-related laws and regulations and disparate regulatory approaches in various jurisdictions could complicate our compliance with climate-related laws or regulations, and methodologies for reporting climate-related data may change. We cannot predict the potential impact on our competitive position, results of operations, or financial condition. These factors may negatively impact cost or availability of certain products, commodities, or energy, and could impair our ability to secure goods and services required for the operation of our business at quantities and levels we require. A shift in customer or consumer preference towards low-carbon products and services may also place us at a competitive disadvantage if we fail to effectively adjust for these shifts. Our supply chain is subject to these same physical and transitional risks.
Events outside of our control also have, and will continue to, adversely impact our operations and financial results. These events include those related to public health crises, including epidemics or pandemics; geopolitical events or tensions, including civil unrest, trade wars, armed conflicts, or terrorism; or unstable international governments and legal systems. Among other potential affects, these events may have a disruptive and unpredictable impact on our operations and those of our suppliers and vendors, or customers, hinder manufacturing and
transportation, result in significant excess costs, lead to shifts in customer demand, or have a negative impact on capital markets. Such events are inherently unpredictable, and our responses may involve the implementation of measures which may not be as successful as intended in mitigating adverse impacts.
Industry & Economic Risks
We could continue to suffer the adverse effects of competitive pressures.
As described in greater detail in the "Business" section, we operate in markets that are highly competitive and dynamic. In addition, competitive pressures in each of our businesses may be increased by new business models, new entrants, new regulations or changes in enforcement priorities, changes in consumer demand or general competitive dynamics. Additionally, we may not be able to onboard new customers as efficiently as expect due to customer service issues or competitive service level offerings. Our businesses face continued pricing pressure from these factors, which adversely affects our margins. If we are unable to offset margin reductions caused by these pressures through steps such as sourcing or cost control measures, additional service offerings and sales of higher margin products, our results of operations could continue to be adversely affected.
Our Pharmaceutical and Specialty Solutions segment’s profit margin could be adversely affected by changes in industry or market dynamics that we are not able to accurately predict.
The frequency, timing, magnitude and profit impact of generic pharmaceutical customer purchase volumes, pricing changes, customer contract renewals, generic pharmaceutical launches and generic pharmaceutical manufacturer pricing changes, which contribute to the performance of our generic pharmaceutical program, remain uncertain. These factors have contributed to declines in some prior years and have more than offset the benefits from sourcing generic pharmaceuticals through our Red Oak Sourcing venture with CVS Health. If performance of our generic pharmaceutical program declines in future fiscal years and we are unable to offset the decline, our Pharmaceutical and Specialty Solutions segment profit and consolidated operating earnings will be adversely affected.
With respect to branded pharmaceutical products, compensation under our contractual arrangements with manufacturers for the purchase of branded pharmaceutical products is generally based on the wholesale acquisition cost set by the manufacturer. Sales prices of branded pharmaceutical products to our customers generally are a percentage discount from wholesale acquisition cost.
Additionally, almost all of our distribution services agreements with branded pharmaceutical manufacturers provide that we receive fees from the manufacturers to compensate us for services we provide them. However, under certain agreements, branded pharmaceutical price appreciation, which is determined by the manufacturers, also serves as a part of our compensation. If manufacturers change their historical approach to setting and increasing wholesale acquisition cost, decide to reduce prices, not to increase prices or to implement only small increases and we are
| | | | | | | | |
40 | Cardinal Health | Fiscal 2024 Form 10-K | |
unable to negotiate alternative ways to be compensated by manufacturers or customers for the value of our services, our margins could be adversely affected.
We depend on direct and indirect suppliers to make their
products and raw materials available to us and are subject to fluctuations in costs, availability and regulatory risk associated with these products and raw materials.
Our manufacturing businesses use oil-based resins, pulp, cotton, latex and other commodities as raw materials in many products. Prices of oil and gas also affect our distribution and transportation costs. Prices of these commodities are volatile and can fluctuate significantly, causing our costs to produce and distribute our products to fluctuate. Beginning in the fourth quarter of fiscal year 2021, we experienced higher supply chain costs, which had a negative impact on our former Medical segment profit in fiscal 2021, 2022, 2023 and current GMPD segment in 2024. Supply chain constraints also had a negative impact on sales within our former Medical segment.
We did not offset the full impact of these cost increases in fiscal year 2023 and 2024; however, we implemented certain cost reductions, price increases and surcharges to mitigate the impact. Due to competitive dynamics and contractual limitations, passing along cost increases is challenging. If we are not able to mitigate future cost increases through increased prices where necessary or if supply cost increases do not continue to normalize as expected, GMPD segment profit could be negatively impacted.
We depend on others to manufacture some products, including pharmaceuticals, that we market and distribute. Our operations are also dependent on various components, compounds, raw materials and energy supplied by others. We purchase many of these components, raw materials and energy, and source certain products from numerous suppliers in various countries. In some instances, for reasons of quality assurance, cost effectiveness, or availability, we procure certain components and raw materials from a sole supplier. Our supplier relationships could be interrupted, become less favorable to us or be terminated and the supply of these components, compounds, raw materials or products could be interrupted or become insufficient.
These supply interruptions or other disruptions in manufacturing processes could be caused by events beyond our control, including natural disasters, labor disputes, supplier facility shutdowns, defective raw materials, the impact of epidemics or pandemics, such as COVID-19, and actions by U.S. or international governments, including import or export restrictions or tariffs.
In addition, due to the stringent regulatory requirements regarding the manufacture and sourcing of our products, we may not be able to quickly establish additional or replacement sources for certain components, materials or products. A sustained supply reduction or interruption, and an inability to develop alternative and additional sources for such supply, could result in lost sales, increased cost, damage to our reputation, and may have an adverse effect on our business.
Employee attrition may have an adverse impact on our business, results of operations or internal controls.
Our ability to attract, retain and develop qualified and experienced employees, including key executives and other talent, is critical for us to meet our business objectives. We compete with many other businesses to attract and retain employees. It is possible that we could experience loss of key personnel for a variety of causes. If we do not adequately plan for succession of key roles or if we are not successful in attracting or retaining new talent, our performance or internal control over financial reporting could be adversely impacted.
Consolidation in the U.S. healthcare industry may negatively impact our results of operations.
In recent years, U.S. healthcare industry participants, including distributors, manufacturers, suppliers, healthcare providers, insurers and pharmacy chains, among others, have consolidated or formed strategic alliances. Consolidations create larger enterprises with greater negotiating power and could result in the possible loss of a customer in the situation where the combined enterprise selects one distributor from two incumbents or a reduction in our ability to market our products and services to new customers. Consolidations also impact other objectives, including our ability to use acquisitions to expand or complement our existing businesses. If this consolidation trend continues, it could adversely affect our results of operations.
Changes or uncertainty in U.S. or international trade policies and exposure to economic, political and currency and other risks could disrupt our global operations or negatively impact our financial results.
We conduct our operations in various regions of the world outside of the United States, including Europe, Asia and Latin America. Global developments can affect our business in many ways. Our global operations are affected by local economic environments, including inflation, recession and competition. Additionally, divergent or unfamiliar regulatory systems and labor markets can increase the risks and burdens of operating in numerous countries.
Our foreign operations expose us to a number of risks related to trade protection laws, tariffs, excise or other border taxes on goods sourced from certain countries or on the importation or exportation of products or raw materials. Changes or uncertainty in U.S. or international trade policies or tariffs could impact our global operations, as well as our customers and suppliers. For example, products and materials sourced, directly or indirectly, from outside the U.S., including from China, may be subject to major changes in tax or trade policy between the U.S. and countries from which we source such products and materials. These changes may include the imposition of additional tariffs or duties on imports, which may require taking certain actions such as raising prices and seeking alternative sources of supply. We may also be required to spend more money to source certain products or materials that we need or to manufacture certain of our products. This could adversely impact our business and results of operations.
In addition, we conduct our business in U.S. dollars and various functional currencies of our foreign subsidiaries. Changes in
| | | | | | | | |
| Cardinal Health | Fiscal 2024 Form 10-K | 41 |
foreign currency exchange rates could adversely affect our financial results, which are reported in U.S. dollars. We may not be able to hedge to protect us against these exposures, and any hedges may not successfully mitigate these exposures.
Geopolitical dynamics caused by political, economic, social or other conditions in foreign countries and regions may continue to impact our business and results of operations. Each of our segments have experienced increased costs in fiscal years 2022, 2023 and 2024, including for fuel, and it is possible that we could experience supply disruptions or shortages if tariffs or other protective measures are enacted.
| | | | | | | | |
42 | Cardinal Health | Fiscal 2024 Form 10-K | |
Cybersecurity
Cybersecurity Risk Management
We identify, assess, and manage risks related to cybersecurity through documented policies, standards, and procedures as part of our overall approach to cybersecurity, which is a component of our wider enterprise risk management program. Our approach to detection, mitigation, remediation, and prevention of cybersecurity risks utilizes a range of measures including, among other elements: benchmarking to generally accepted industry standards and frameworks, such as the National Institute of Standards and Technology cybersecurity framework; use of periodic tabletop exercises to promote awareness and improve internal processes; periodic penetration testing; a dedicated staff of cybersecurity professionals; and implementation of security measures and policies intended to identify as well as assist in containing and remediating cybersecurity risks. We maintain cybersecurity incident response, disaster recovery, and business continuity plans that govern activities such as preparation, detection coordination, remediation and recovery, and escalation to senior management and, where appropriate, relevant committees of the Board. These plans are routinely reviewed under the leadership of our Chief Information Security Officer ("CISO"). We also maintain mandatory employee cybersecurity and privacy compliance awareness training requirements, which are supplemented by employee engagement campaigns.
We utilize third parties to assist with, and assess the effectiveness of, our cybersecurity posture, in addition to supporting incident response and mitigation where necessary. We identify and assess third party risks associated with suppliers and service providers across a range of areas, including cybersecurity, through a third-party risk management process that incorporates, among other features, the use of risk assessments and, where appropriate, contractual requirements around evaluations, security, technology, service levels, and other terms.
To date, we are not aware of risks from cybersecurity threats, including as a result of any previous cybersecurity incidents, that have materially affected or are reasonably likely to materially affect Cardinal Health. However, the scope and impact of any future incident cannot be predicted. For more information, please see Item 1A “Risk Factors” for the risk factor entitled “Our business and results of operations could be adversely affected if we experience a material cyber-attack or other systems breach.”
Governance
Our CISO, in coordination with our Chief Information Officer (“CIO”) to whom the CISO reports, leads our approach to assessing and managing cybersecurity-related risks. Our CISO has over twenty-five years of experience in information technology (“IT”), with twenty years in IT risk management, compliance, and information security, as well as a background in leading technical infrastructure teams and roles supporting business operations.
As part of management’s oversight of our cybersecurity program, we maintain an IT risk governance process that includes multiple levels of escalation from our IT Risk Advisory Board, which meets
on a monthly basis and whose membership includes the CISO and IT functional area leadership, to an executive-level committee to help address cybersecurity risks at an enterprise level.
While the company’s Board oversees our overall risk management process, as part of its oversight, the Board has delegated certain responsibilities to committees of the Board. The Audit Committee of the Board has primary responsibility for discussing with management cybersecurity and other major IT risk exposures and management’s steps to monitor and control such exposures. In coordination with the Audit Committee, the Risk Oversight Committee of the Board monitors Cardinal Health’s compliance with applicable legal and regulatory requirements, including with respect to data privacy and security. Our Audit Committee receives quarterly updates from the CISO and CIO and the Board receives at least annual cybersecurity updates. Among other items, these updates cover a range of matters relevant to our cybersecurity program, including: the threat environment and related business risks; the state, priorities of, and investments in our cybersecurity program; the availability of cyber insurance; review of certain cybersecurity incidents that have occurred within the company and the industry; and relevant cybersecurity operational metrics.
| | | | | | | | |
| Cardinal Health | Fiscal 2024 Form 10-K | 43 |
| | | | | | | | |
| Properties and Legal Proceedings | | |
Properties
In the United States, at June 30, 2024, the Pharmaceutical and Specialty Solutions segment operated one national logistics center and a number of primary pharmaceutical and specialty distribution facilities. The GMPD segment operated medical-surgical distribution, assembly, manufacturing and other operating facilities in the United States.
At June 30, 2024, our GMPD segment also operated manufacturing facilities in Canada, Costa Rica, the Dominican Republic, Germany, Ireland, Japan, Malaysia, Malta, Mexico, Puerto Rico and Thailand.
Our Other Operating Segments operated facilities throughout the United States.
Our principal executive offices are headquartered in an owned building located at 7000 Cardinal Place in Dublin, Ohio.
We consider our operating properties to be in satisfactory condition and adequate to meet our present needs. However, we regularly evaluate operating properties and may make further additions and improvements or consolidate locations as we seek opportunities to expand or enhance the efficiency of our business.
Legal Proceedings
The legal proceedings described in Note 8 of the "Notes to Consolidated Financial Statements" are incorporated in this "Legal Proceedings" section by reference. | | | | | | | | |
44 | Cardinal Health | Fiscal 2024 Form 10-K | |
| | | | | | | | |
| Market for Registrant's Common Equity | | |
Market for Registrant's Common Equity, Related Stockholder Matters and Issuer Purchases of Equity Securities
Our common shares are listed on the New York Stock Exchange under the symbol “CAH.”
At July 31, 2024, there were approximately 6,238 shareholders of record of our common shares.
We anticipate that we will continue to pay quarterly cash dividends in the future. The payment and amount of future dividends remain, however, within the discretion of our Board of Directors and will depend upon our future earnings, financial condition, capital requirements and other factors.
Issuer Purchases of Equity Securities
| | | | | | | | | | | | | | | | | | | | | | | |
|
| | | | | | | |
| Period | Total Number
of Shares
Purchased (1) | | Average Price Paid per Share | | Total Number of Shares
Purchased
as Part of Publicly Announced Programs (2) | | Approximate
Dollar Value of
Shares That May
Yet be Purchased
Under the Programs (2)
(in millions) |
| April 2024 | 157 | | | $ | 107.32 | | | — | | | $ | 3,493 | |
| May 2024 | 128 | | | 96.95 | | | — | | | 3,493 | |
| June 2024 | 134 | | | 101.63 | | | — | | | 3,493 | |
| Total | 419 | | | $ | 102.33 | | | — | | | $ | 3,493 | |
(1)Reflects 157, 128 and 134 common shares purchased in April, May and June 2024, respectively, through a rabbi trust as investments of participants in our Deferred Compensation Plan.
(2)On June 7, 2023, our Board of Directors approved a new $3.5 billion share repurchase program which will expire on December 31, 2027. As of June 30, 2024, we had $3.5 billion authorized for share repurchases remaining under this program.
| | | | | | | | |
| Cardinal Health | Fiscal 2024 Form 10-K | 45 |
| | | | | | | | |
| Market for Registrant's Common Equity | | |
Five Year Performance Graph
The following line graph compares the cumulative total return of our common shares with the cumulative total return of the Standard & Poor’s Composite—500 Stock Index (the "S&P 500 Index") and the Standard & Poor's Composite—500 Healthcare Index (the "S&P 500 Healthcare Index"). The line graph assumes, in each case, an initial investment of $100 invested at the closing price on June 30, 2019, and is based on the market prices at the end of each fiscal year through and including June 30, 2024, and reinvestment of dividends. The S&P 500 Index and S&P 500 Healthcare Index investments are weighted on the basis of market capitalization at the beginning of each period.
| | | | | | | | | | | | | | | | | | | | |
| June 30 |
| 2019 | 2020 | 2021 | 2022 | 2023 | 2024 |
| Cardinal Health, Inc. | 100.00 | | 115.20 | | 130.61 | | 124.15 | | 230.45 | | 243.26 | |
| S&P 500 Index | 100.00 | | 107.51 | | 151.36 | | 135.29 | | 161.80 | | 201.53 | |
| S&P 500 Healthcare Index | 100.00 | | 110.90 | | 141.87 | | 146.64 | | 154.53 | | 172.57 | |
| | | | | | | | |
46 | Cardinal Health | Fiscal 2024 Form 10-K | |
Management Reports
Evaluation of Disclosure Controls and Procedures
We evaluated, with the participation of our principal executive officer and principal financial officer, the effectiveness of our disclosure controls and procedures (as defined in Rule 13a-15(e) under the Securities Exchange Act of 1934 (the "Exchange Act")) as of June 30, 2024. Based on this evaluation, our principal executive officer and principal financial officer have concluded that our disclosure controls and procedures were effective as of June 30, 2024 to provide reasonable assurance that information required to be disclosed in our reports under the Exchange Act is recorded, processed, summarized and reported within the time periods specified in the SEC rules and forms and that such information is accumulated and communicated to management as appropriate to allow timely decisions regarding required disclosure.
Management’s Report on Internal Control Over Financial Reporting
Management is responsible for establishing and maintaining adequate internal control over financial reporting as defined in Rule 13a-15(f) under the Exchange Act. Our internal control system is designed to provide reasonable assurance regarding the reliability of financial reporting and the preparation of financial statements for external purposes in accordance with generally accepted accounting principles. Because of its inherent limitations, internal control over financial reporting may not prevent or detect misstatements. Also, controls deemed effective now may become inadequate in the future because of changes in conditions, or because compliance with policies or procedures has deteriorated or been circumvented.
Management assessed the effectiveness of our internal control over financial reporting as of June 30, 2024. In making this assessment, management used the criteria established in the Internal Control-Integrated Framework issued by the Committee of Sponsoring Organizations of the Treadway Commission (2013 framework) (the “COSO criteria”). Based on management’s assessment and the COSO criteria, management believes that our internal control over financial reporting was effective as of June 30, 2024.
Our independent registered public accounting firm, Ernst & Young LLP, has issued a report on our internal control over financial reporting. Ernst & Young LLP’s report appears following this "Management Reports" section and expresses an unqualified opinion on the effectiveness of our internal control over financial reporting.
Changes in Internal Control Over Financial Reporting
There were no changes in our internal control over financial reporting during the quarter ended June 30, 2024 that have materially affected, or are reasonably likely to materially affect, our internal control over financial reporting.
| | | | | | | | |
| Cardinal Health | Fiscal 2024 Form 10-K | 47 |
Report of Independent Registered Public Accounting Firm on Internal Control Over Financial Reporting
To the Shareholders and the Board of Directors of Cardinal Health, Inc.
Opinion on Internal Control over Financial Reporting
We have audited Cardinal Health, Inc. and subsidiaries’ internal control over financial reporting as of June 30, 2024, based on criteria established in Internal Control—Integrated Framework issued by the Committee of Sponsoring Organizations of the Treadway Commission (2013 framework) (the COSO criteria). In our opinion, Cardinal Health, Inc. and subsidiaries (the Company) maintained, in all material respects, effective internal control over financial reporting as of June 30, 2024, based on the COSO criteria.
We also have audited, in accordance with the standards of the Public Company Accounting Oversight Board (United States) (PCAOB), the consolidated balance sheets of the Company as of June 30, 2024 and 2023, the related consolidated statements of earnings/(loss), comprehensive income/(loss), shareholders' equity/(deficit) and cash flows for each of the three years in the period ended June 30, 2024, and the related notes and the financial statement schedule listed in the Index at Item 15(a)(2) and our report dated August 14, 2024 expressed an unqualified opinion thereon.
Basis for Opinion
The Company’s management is responsible for maintaining effective internal control over financial reporting and for its assessment of the effectiveness of internal control over financial reporting included in the accompanying “Management’s Report on Internal Control Over Financial Reporting.” Our responsibility is to express an opinion on the Company’s internal control over financial reporting based on our audit. We are a public accounting firm registered with the PCAOB and are required to be independent with respect to the Company in accordance with the U.S. federal securities laws and the applicable rules and regulations of the Securities and Exchange Commission and the PCAOB.
We conducted our audit in accordance with the standards of the PCAOB. Those standards require that we plan and perform the audit to obtain reasonable assurance about whether effective internal control over financial reporting was maintained in all material respects.
Our audit included obtaining an understanding of internal control over financial reporting, assessing the risk that a material weakness exists, testing and evaluating the design and operating effectiveness of internal control based on the assessed risk and performing such other procedures as we considered necessary in the circumstances. We believe that our audit provides a reasonable basis for our opinion.
Definition and Limitations of Internal Control Over Financial Reporting
A company’s internal control over financial reporting is a process designed to provide reasonable assurance regarding the reliability of financial reporting and the preparation of financial statements for external purposes in accordance with generally accepted accounting principles. A company’s internal control over financial reporting includes those policies and procedures that (1) pertain to the maintenance of records that, in reasonable detail, accurately and fairly reflect the transactions and dispositions of the assets of the company; (2) provide reasonable assurance that transactions are recorded as necessary to permit preparation of financial statements in accordance with generally accepted accounting principles, and that receipts and expenditures of the company are being made only in accordance with authorizations of management and directors of the company; and (3) provide reasonable assurance regarding prevention or timely detection of unauthorized acquisition, use, or disposition of the company’s assets that could have a material effect on the financial statements.
Because of its inherent limitations, internal control over financial reporting may not prevent or detect misstatements. Also, projections of any evaluation of effectiveness to future periods are subject to the risk that controls may become inadequate because of changes in conditions, or that the degree of compliance with the policies or procedures may deteriorate.
| | |
/s/ Ernst & Young LLP |
|
| Grandview Heights, Ohio |
| August 14, 2024 |
| | | | | | | | |
48 | Cardinal Health | Fiscal 2024 Form 10-K | |
Report of Independent Registered Public Accounting Firm
To the Shareholders and the Board of Directors of Cardinal Health, Inc.
Opinion on the Financial Statements
We have audited the accompanying consolidated balance sheets of Cardinal Health, Inc. and subsidiaries (the Company) as of June 30, 2024 and 2023, the related consolidated statements of earnings/(loss), comprehensive income/(loss), shareholders' equity/(deficit) and cash flows for each of the three years in the period ended June 30, 2024, and the related notes and the financial statement schedule listed in the Index at Item 15(a)(2) (collectively referred to as the “consolidated financial statements”). In our opinion, the consolidated financial statements present fairly, in all material respects, the financial position of the Company at June 30, 2024 and 2023, and the results of its operations and its cash flows for each of the three years in the period ended June 30, 2024, in conformity with U.S. generally accepted accounting principles.
We also have audited, in accordance with the standards of the Public Company Accounting Oversight Board (United States) (PCAOB), the Company's internal control over financial reporting as of June 30, 2024, based on criteria established in Internal Control-Integrated Framework issued by the Committee of Sponsoring Organizations of the Treadway Commission (2013 framework) and our report dated August 14, 2024 expressed an unqualified opinion thereon.
Basis for Opinion
These financial statements are the responsibility of the Company's management. Our responsibility is to express an opinion on the Company’s financial statements based on our audits. We are a public accounting firm registered with the PCAOB and are required to be independent with respect to the Company in accordance with the U.S. federal securities laws and the applicable rules and regulations of the Securities and Exchange Commission and the PCAOB.
We conducted our audits in accordance with the standards of the PCAOB. Those standards require that we plan and perform the audit to obtain reasonable assurance about whether the financial statements are free of material misstatement, whether due to error or fraud. Our audits included performing procedures to assess the risks of material misstatement of the financial statements, whether due to error or fraud, and performing procedures that respond to those risks. Such procedures included examining, on a test basis, evidence regarding the amounts and disclosures in the financial statements. Our audits also included evaluating the accounting principles used and significant estimates made by management, as well as evaluating the overall presentation of the financial statements. We believe that our audits provide a reasonable basis for our opinion.
Critical Audit Matters
The critical audit matters communicated below are matters arising from the current period audit of the financial statements that were communicated or required to be communicated to the audit committee and that: (1) relate to accounts or disclosures that are material to the financial statements and (2) involved our especially challenging, subjective, or complex judgments. The communication of critical audit matters does not alter in any way our opinion on the consolidated financial statements, taken as a whole, and we are not, by communicating the critical audit matters below, providing separate opinions on the critical audit matters or on the accounts or disclosures to which they relate.
| | | | | | | | |
| Cardinal Health | Fiscal 2024 Form 10-K | 49 |
| | | | | |
| Valuation of Goodwill |
Description of the Matter
| The Company performed quantitative assessments of goodwill for the Company’s Global Medical Products and Distribution (GMPD) and at-Home Solutions reporting units during fiscal year 2024, by comparing the fair values of each of these reporting units with their respective carrying amounts. As discussed in Notes 1 and 5 to the consolidated financial statements, goodwill is tested for impairment at least annually at the reporting unit level, or when indicators of impairment exist. During fiscal 2024, the Company recognized goodwill impairment charges related to GMPD of $675 million, which represented the entire remaining amount of goodwill allocated to GMPD. There was no impairment recognized related to at-Home Solutions. Auditing management’s goodwill impairment test for GMPD and at-Home Solutions was challenging because there is significant judgement required in determining the fair values of the reporting units. In particular, the fair value estimates were sensitive to significant judgmental assumptions including the revenue growth rate, gross margin, distribution, selling, general and administrative expenses, and company-specific risk premium, which are affected by expectations about future market or economic conditions.
|
How We Addressed the Matter in Our Audit
| We obtained an understanding, evaluated the design and tested the operating effectiveness of controls over the Company’s goodwill impairment review process. For example, we tested controls over management’s review of significant judgmental assumptions, including the revenue growth rate, gross margin, distribution, selling, general and administrative expenses, and company-specific risk premium, among other assumptions.
To test the estimated fair values of GMPD and at-Home Solutions, we performed audit procedures that included, among others, evaluating methodologies used; involving our valuation specialists to assist with our procedures related to the measurement of the fair values; and testing the underlying data used by the Company in its analysis for completeness and accuracy. We compared the significant assumptions used by management to current industry and economic trends, recent historical performance, changes to customer base or product mix and other relevant factors. We assessed the historical accuracy of management’s estimates and performed sensitivity analyses of significant assumptions to evaluate the changes in the fair values of the reporting units that would result from changes in the assumptions. We evaluated the assumptions within the model and tested the model’s computational accuracy. In addition, we inspected the Company’s reconciliation of the fair value of all reporting units to the market capitalization of the Company and assessed the result. We have also assessed the adequacy of the Company’s disclosures included in Notes 1 and 5 in relation to this matter.
|
| |
| |
| |
| Uncertain Tax Positions |
Description of the Matter
| As described in Note 9 to the consolidated financial statements, the Company’s unrecognized tax benefits related to its uncertain tax positions were $981 million at June 30, 2024. Uncertain tax positions may arise as tax laws are subject to interpretation. The Company uses significant judgment in (1) determining if the tax position is more likely than not to be sustained upon examination, based on the technical merits of the position and (2) measuring the amount of tax benefit that qualifies for recognition.
Auditing management's estimate of the amount of tax benefit related to the Company's uncertain tax positions that qualified for recognition was challenging because management's estimate required significant judgment in evaluating the technical merits of the positions, including interpretations of applicable tax laws and regulations. |
How We Addressed the Matter in Our Audit
| We obtained an understanding, evaluated the design, and tested the operating effectiveness of controls over the Company’s process to assess the technical merits of its uncertain tax positions, including the Company’s assessment as to whether a tax position is more likely than not to be sustained and management’s process to measure the benefit of its tax positions.
We involved our international tax, transfer pricing, and national tax professionals in assessing the technical merits of certain of the Company’s tax positions. Depending on the nature of the specific tax position and, where applicable, developments with the relevant tax authorities relating thereto, our procedures included obtaining and examining the Company’s analysis. For example, we evaluated the underlying facts upon which the tax positions are based, and, where applicable, obtained the Company’s correspondence with local tax authorities. We used our knowledge of international and local income tax laws, as well as historical settlement activity, where applicable, with local income tax authorities, to evaluate the Company’s accounting for its uncertain tax positions. We evaluated developments in the applicable tax jurisdictions to assess potential effects on the Company’s positions. We analyzed the Company’s assumptions and data used to evaluate the appropriateness of the Company’s measurement of tax benefits. We have also evaluated the Company’s income tax disclosures in relation to these matters.
|
| |
| |
| |
| | |
/s/ Ernst & Young LLP |
| We have served as the Company's auditor since 2002. |
| Grandview Heights, Ohio |
| August 14, 2024 |
| | | | | | | | |
50 | Cardinal Health | Fiscal 2024 Form 10-K | |
Financial Statements and Supplementary Data
| | | | | |
| Page |
| |
| Consolidated Financial Statements and Schedule: | |
| |
| |
| |
| |
| |
| |
| | | | | | | | |
| Cardinal Health | Fiscal 2024 Form 10-K | 51 |
Consolidated Statements of Earnings/(Loss)
| | | | | | | | | | | | | | | | | |
| (in millions, except per common share amounts) | 2024 | | 2023 | | 2022 |
| Revenue | $ | 226,827 | | | $ | 204,979 | | | $ | 181,326 | |
| Cost of products sold | 219,413 | | | 198,105 | | | 174,842 | |
| Gross margin | 7,414 | | | 6,874 | | | 6,484 | |
| | | | | |
| Operating expenses: | | | | | |
| Distribution, selling, general and administrative expenses | 5,000 | | | 4,800 | | | 4,512 | |
| Restructuring and employee severance | 175 | | | 95 | | | 101 | |
| Amortization and other acquisition-related costs | 284 | | | 285 | | | 324 | |
| Impairments and (gain)/loss on disposal of assets, net | 634 | | | 1,246 | | | 2,060 | |
| Litigation (recoveries)/charges, net | 78 | | | (304) | | | 94 | |
| Operating earnings/(loss) | 1,243 | | | 752 | | | (607) | |
| | | | | |
| Other (income)/expense, net | (9) | | | 5 | | | 22 | |
| Interest expense, net | 51 | | | 84 | | | 147 | |
| Loss on early extinguishment of debt | — | | | — | | | 10 | |
(Gain)/Loss on sale of equity interest in naviHealth
| — | | | — | | | (2) | |
| Earnings/(loss) before income taxes | 1,201 | | | 663 | | | (784) | |
| | | | | |
Provision for income taxes | 348 | | | 332 | | | 153 | |
| Net earnings/(loss) | 853 | | | 331 | | | (937) | |
| | | | | |
| Less: Net earnings attributable to noncontrolling interests | (1) | | | (1) | | | (1) | |
| Net earnings/(loss) attributable to Cardinal Health, Inc. | $ | 852 | | | $ | 330 | | | $ | (938) | |
| | | | | |
| Earnings/(loss) per common share attributable to Cardinal Health, Inc. | | | | | |
| Basic | $ | 3.48 | | | $ | 1.27 | | | $ | (3.37) | |
| Diluted | 3.45 | | | 1.26 | | | (3.37) | |
| | | | | |
| Weighted-average number of common shares outstanding: | | | | | |
| Basic | 245 | | 261 | | 279 |
| Diluted | 247 | | 262 | | 279 |
The accompanying notes are an integral part of these consolidated statements.
| | | | | | | | |
52 | Cardinal Health | Fiscal 2024 Form 10-K | |
Consolidated Statements of Comprehensive Income/(Loss)
| | | | | | | | | | | | | | | | | |
| (in millions) | 2024 | | 2023 | | 2022 |
| Net earnings/(loss) | $ | 853 | | | $ | 331 | | | $ | (937) | |
| | | | | |
| Other comprehensive income/(loss): | | | | | |
| Foreign currency translation adjustments and other | (1) | | | (35) | | | (56) | |
| | | | | |
Net unrealized loss on derivative instruments, net of tax | (15) | | | (2) | | | (24) | |
Total other comprehensive loss, net of tax | (16) | | | (37) | | | (80) | |
| | | | | |
| Total comprehensive income/(loss) | 837 | | | 294 | | | (1,017) | |
| | | | | |
| Less: comprehensive income attributable to noncontrolling interests | (1) | | | (1) | | | (1) | |
| Total comprehensive income/(loss) attributable to Cardinal Health, Inc. | $ | 836 | | | $ | 293 | | | $ | (1,018) | |
The accompanying notes are an integral part of these consolidated statements.
| | | | | | | | |
| Cardinal Health | Fiscal 2024 Form 10-K | 53 |
Consolidated Balance Sheets
| | | | | | | | | | | |
| June 30 |
| (in millions) | 2024 | | 2023 |
| Assets | | | |
| Current assets: | | | |
| Cash and equivalents | $ | 5,133 | | | $ | 4,076 | |
| Trade receivables, net | 12,084 | | | 11,108 | |
| Inventories, net | 14,957 | | | 16,119 | |
| Prepaid expenses and other | 2,663 | | | 2,294 | |
| Assets held for sale | 47 | | | 140 | |
| Total current assets | 34,884 | | | 33,737 | |
| | | |
| Property and equipment, net | 2,529 | | | 2,461 | |
| Goodwill and other intangibles, net | 6,450 | | | 6,085 | |
| Other assets | 1,258 | | | 1,066 | |
| Total assets | $ | 45,121 | | | $ | 43,349 | |
| | | |
| Liabilities and Shareholders’ Deficit | | | |
| Current liabilities: | | | |
| Accounts payable | $ | 31,759 | | | $ | 29,934 | |
| Current portion of long-term obligations and other short-term borrowings | 434 | | | 792 | |
| Other accrued liabilities | 3,447 | | | 2,972 | |
| Liabilities related to assets held for sale | — | | | 42 | |
| Total current liabilities | 35,640 | | | 33,740 | |
| | | |
| Long-term obligations, less current portion | 4,658 | | | 3,909 | |
| Deferred income taxes and other liabilities | 8,035 | | | 8,657 | |
| | | |
| | | |
| | | |
| Shareholders’ deficit: | | | |
| Preferred shares, without par value: | | | |
Authorized—500 thousand shares, Issued—none | — | | | — | |
| Common shares, without par value: | | | |
Authorized—755 million shares, Issued— 327 million shares at June 30, 2024 and 2023 | 2,917 | | | 2,746 | |
| Accumulated deficit | (286) | | | (642) | |
Common shares in treasury, at cost: 83 million shares and 76 million shares at June 30, 2024 and 2023, respectively | (5,677) | | | (4,911) | |
| Accumulated other comprehensive loss | (167) | | | (151) | |
| Total Cardinal Health, Inc. shareholders' deficit | (3,213) | | | (2,958) | |
| Noncontrolling interests | 1 | | | 1 | |
| Total shareholders’ deficit | (3,212) | | | (2,957) | |
| Total liabilities and shareholders’ deficit | $ | 45,121 | | | $ | 43,349 | |
The accompanying notes are an integral part of these consolidated statements.
| | | | | | | | |
54 | Cardinal Health | Fiscal 2024 Form 10-K | |
Consolidated Statements of Shareholders' Equity/(Deficit)
| | | | | | | | | | | | | | | | | | | | | | | | | | | | | | | | | | | | | | | | | | | | | | | |
| Common Shares | | | | Treasury Shares | | Accumulated Other
Comprehensive
Loss | | Noncontrolling Interests | | Total
Shareholders’
Equity/(Deficit) |
| (in millions) | Shares Issued | | Amount | | Retained
Earnings/(Accumulated Deficit) | | Shares | | Amount | | | |
| Balance at June 30, 2021 | 327 | | | $ | 2,806 | | | $ | 1,033 | | | (36) | | | $ | (2,185) | | | $ | (34) | | | $ | 3 | | | $ | 1,623 | |
| Net earnings/(loss) | | | | | (938) | | | | | | | | | 1 | | | (937) | |
| Other comprehensive loss, net of tax | | | | | | | | | | | (80) | | | | | (80) | |
| | | | | | | | | | | | | | | |
| Employee stock plans activity, net of shares withheld for employee taxes | — | | | 7 | | | | | 2 | | | 57 | | | | | | | 64 | |
| Share repurchase program activity | | | | | | | (20) | | | (1,000) | | | | | | | (1,000) | |
| Dividends declared | | | | | (552) | | | | | | | | | | | (552) | |
| Other | | | | | 1 | | | | | | | | | (1) | | | — | |
| | | | | | | | | | | | | | | |
| Balance at June 30, 2022 | 327 | | | 2,813 | | | (456) | | | (54) | | | (3,128) | | | (114) | | | 3 | | | (882) | |
| Net earnings | | | | | 330 | | | | | | | | | 1 | | | 331 | |
| Other comprehensive loss, net of tax | | | | | | | | | | | (37) | | | | | (37) | |
| Purchase of noncontrolling interests | | | | | | | | | | | | | (3) | | | (3) | |
| Employee stock plans activity, net of shares withheld for employee taxes | — | | | 33 | | | | | 3 | | | 124 | | | | | | | 157 | |
| Share repurchase program activity | | | (100) | | | | | (25) | | | (1,907) | | | | | | | (2,007) | |
| Dividends declared | | | | | (515) | | | | | | | | | | | (515) | |
| Other | | | | | (1) | | | | | | | | | | | (1) | |
| | | | | | | | | | | | | | | |
| Balance at June 30, 2023 | 327 | | | 2,746 | | | (642) | | | (76) | | | (4,911) | | | (151) | | | 1 | | | (2,957) | |
| Net earnings | | | | | 852 | | | | | | | | | 1 | | | 853 | |
Other comprehensive loss, net of tax | | | | | | | | | | | (16) | | | | | (16) | |
| | | | | | | | | | | | | | | |
| Employee stock plans activity, net of shares withheld for employee taxes | — | | | 71 | | | | | 2 | | | 93 | | | | | | | 164 | |
| Share repurchase program activity | | | 100 | | | | (9) | | | (859) | | | | | | | (759) | |
| Dividends declared | | | | | (496) | | | | | | | | | | | (496) | |
| Other | | | | | | | | | | | | | (1) | | | (1) | |
| | | | | | | | | | | | | | | |
| Balance at June 30, 2024 | 327 | | | $ | 2,917 | | | $ | (286) | | | (83) | | | $ | (5,677) | | | $ | (167) | | | $ | 1 | | | $ | (3,212) | |
The accompanying notes are an integral part of these consolidated statements.
| | | | | | | | |
| Cardinal Health | Fiscal 2024 Form 10-K | 55 |
Consolidated Statements of Cash Flows
| | | | | | | | | | | | | | | | | |
| (in millions) | 2024 | | 2023 | | 2022 |
| Cash flows from operating activities: | | | | | |
| Net earnings/(loss) | $ | 853 | | | $ | 331 | | | $ | (937) | |
| Adjustments to reconcile net earnings/(loss) to net cash provided by operating activities: | | | | | |
| Depreciation and amortization | 710 | | | 692 | | | 692 | |
| Impairments and loss on sale of other investments | 2 | | | 7 | | | 24 | |
| Impairments and (gain)/loss on disposal of assets, net | 634 | | | 1,246 | | | 2,060 | |
Gain on sale of equity interest in naviHealth | — | | | — | | | (2) | |
| Loss on early extinguishment of debt | — | | | — | | | 10 | |
| Share-based compensation | 121 | | | 96 | | | 81 | |
Provision for/(benefit from) deferred income taxes | (104) | | | (40) | | | 14 | |
| Provision for bad debts | 36 | | | 55 | | | 23 | |
| | | | | |
| Change in operating assets and liabilities, net of effects from acquisitions and divestitures: | | | | | |
| Increase in trade receivables | (996) | | | (950) | | | (1,405) | |
| (Increase)/decrease in inventories | 1,115 | | | (412) | | | (1,204) | |
| Increase in accounts payable | 1,824 | | | 2,816 | | | 3,555 | |
| Other accrued liabilities and operating items, net | (433) | | | (997) | | | 264 | |
| Net cash provided by operating activities | 3,762 | | | 2,844 | | | 3,175 | |
| Cash flows from investing activities: | | | | | |
| Acquisition of subsidiaries, net of cash acquired | (1,190) | | | (10) | | | (22) | |
| Proceeds from divestitures, net of cash sold | 9 | | | — | | | 923 | |
| Additions to property and equipment | (511) | | | (481) | | | (387) | |
| Proceeds from disposal of property and equipment | 12 | | | 12 | | | 31 | |
| Purchase of investments | (4) | | | (7) | | | (78) | |
| Proceeds from investments | 1 | | | 3 | | | 29 | |
| Proceeds from net investment hedge terminations | 34 | | | 29 | | | 71 | |
| Purchase of short-term investment in time deposit | (550) | | | — | | | — | |
| Proceeds from short-term investment in time deposit | 350 | | | — | | | — | |
| Net cash provided by/(used in) investing activities | (1,849) | | | (454) | | | 567 | |
| Cash flows from financing activities: | | | | | |
| | | | | |
| | | | | |
| | | | | |
| | | | | |
| Proceeds from long-term obligations, net of issuance costs | 1,139 | | | — | | | — | |
| Purchase of noncontrolling interests | — | | | (3) | | | — | |
| | | | | |
| Reduction of long-term obligations | (783) | | | (579) | | | (885) | |
| Net tax proceeds/(withholding) from share-based compensation | 46 | | | 56 | | | (19) | |
| | | | | |
| Dividends on common shares | (499) | | | (525) | | | (559) | |
| Purchase of treasury shares | (750) | | | (2,000) | | | (1,000) | |
| Net cash used in financing activities | (847) | | | (3,051) | | | (2,463) | |
| Effect of exchange rates changes on cash and equivalents | (9) | | | (8) | | | (25) | |
| Cash reclassified from/(to) assets held for sale | — | | | — | | | 109 | |
| Net increase/(decrease) in cash and equivalents | 1,057 | | | (669) | | | 1,363 | |
| Cash and equivalents at beginning of period | 4,076 | | | 4,745 | | | 3,382 | |
| Cash and equivalents at end of period | $ | 5,133 | | | $ | 4,076 | | | $ | 4,745 | |
| Supplemental Information: | | | | | |
| Cash payments for interest | $ | 214 | | | $ | 203 | | | $ | 153 | |
| Net cash payments/(refunds) for income taxes | 191 | | | 156 | | | (766) | |
The accompanying notes are an integral part of these consolidated statements.
| | | | | | | | |
56 | Cardinal Health | Fiscal 2024 Form 10-K | |
| | | | | | | | |
| Notes to Financial Statements | | |
Notes to Consolidated Financial Statements
1. Basis of Presentation and Summary of Significant Accounting Policies
Cardinal Health, Inc. is a global healthcare services and products company providing customized solutions for hospitals, healthcare systems, pharmacies, ambulatory surgery centers, clinical laboratories and physician offices. We provide pharmaceuticals and medical products and cost-effective solutions that enhance supply chain efficiency. References to “we,” “our,” "us," and similar pronouns in these consolidated financial statements are to Cardinal Health, Inc. and its majority-owned or controlled subsidiaries, unless the context otherwise requires.
Our fiscal year ends on June 30. References to fiscal 2024, 2023 and 2022 in these consolidated financial statements are to the fiscal years ended June 30, 2024, 2023 and 2022, respectively.
Basis of Presentation
Our consolidated financial statements include the accounts of all majority-owned or consolidated subsidiaries, and all significant intercompany transactions and amounts have been eliminated. The results of businesses acquired or disposed of are included in the consolidated financial statements from the date of the acquisition or up to the date of disposal, respectively. Certain prior year amounts have been reclassified to conform to the current year presentation.
Revision of Prior Period Consolidated Financial Statements
In connection with the preparation of our Consolidated Financial Statements for fiscal 2024, we identified an accounting error related to revenue recognition from third party payors within the at-
Home Solutions operating segment. In accordance with ASC 250 – Accounting Changes and Error Corrections and Staff Accounting Bulletins No. 99 – Materiality and No. 108 – Considering the Effects of Prior Year Misstatements when Quantifying Misstatements in Current Year Financial Statements, we evaluated the materiality of the error and determined that the impacts were not material, individually or in the aggregate, to our previously issued Consolidated Financial Statements for any of the prior quarters or annual periods in which they occurred, but that correcting the error in the current period would be material to our results of operations for fiscal 2024.
We have revised our prior period financial statements to correct this error, as well as other unrelated immaterial errors, including an adjustment to an uncertain tax position. These revisions impacted each quarter of fiscal 2022, 2023 and 2024. These other immaterial errors were previously corrected in the periods they were identified; however, they are now reflected in the periods they originated. Revisions to our previously reported disclosures have been reflected in this Note; Note 3, "Divestitures"; Note 5, “Goodwill and Other Intangible Assets”; Note 6, "Leases"; Note 8, "Commitments, Contingent Liabilities and Litigation"; Note 9, "Income Taxes"; Note 12, "Shareholders' Equity/(Deficit)”; Note 13, "Earnings Per Share"; and Note 14 “Segment Information." A summary of the revisions to the previously reported financial statements is provided below and in Note 16, “Revision of Previously Issued Interim Financial Statements (Unaudited)”.
The following tables set forth our revisions to the consolidated statements of earnings/(loss) for fiscal 2023 and 2022.
| | | | | | | | | | | | | | | | | | | | | | | | | | | | | | | | | | | | | | |
| | Fiscal 2023 | | Fiscal 2022 |
| (in millions, except per common share amounts) | | As Reported | | Adjustment | | As Revised | | As Reported | | Adjustment | | As Revised |
| Revenue | | $ | 205,012 | | | $ | (33) | | | $ | 204,979 | | | $ | 181,364 | | | $ | (38) | | | $ | 181,326 | |
| Cost of products sold | | 198,123 | | | (18) | | | 198,105 | | | 174,819 | | | 23 | | | 174,842 | |
| Gross margin | | 6,889 | | | (15) | | | 6,874 | | | 6,545 | | | (61) | | | 6,484 | |
| | | | | | | | | | | | |
| | | | | | | | | | | | |
| Distribution, selling, general and administrative expenses | | 4,834 | | | (34) | | | 4,800 | | | 4,557 | | | (45) | | | 4,512 | |
| | | | | | | | | | | | |
| | | | | | | | | | | | |
| Impairments and (gain)/loss on disposal of assets, net | | 1,250 | | | (4) | | | 1,246 | | | 2,050 | | | 10 | | | 2,060 | |
| Litigation (recoveries)/charges, net | | (302) | | | (2) | | | (304) | | | 109 | | | (15) | | | 94 | |
| Operating earnings/(loss) | | 727 | | | 25 | | | 752 | | | (596) | | | (11) | | | (607) | |
| | | | | | | | | | | | |
| Other (income)/expense, net | | (4) | | | 9 | | | 5 | | | 16 | | | 6 | | | 22 | |
| Interest expense, net | | 93 | | | (9) | | | 84 | | | 149 | | | (2) | | | 147 | |
| | | | | | | | | | | | |
| | | | | | | | | | | | |
| Earnings/(loss) before income taxes | | 638 | | | 25 | | | 663 | | | (769) | | | (15) | | | (784) | |
| | | | | | | | | | | | |
| Provision for/(benefit from) income taxes | | 376 | | | (44) | | | 332 | | | 163 | | | (10) | | | 153 | |
| Net earnings/(loss) | | 262 | | | 69 | | | 331 | | | (932) | | | (5) | | | (937) | |
| | | | | | | | | | | | |
| | | | | | | | | | | | |
| Net earnings/(loss) attributable to Cardinal Health, Inc. | | 261 | | | 69 | | | 330 | | | (933) | | | (5) | | | (938) | |
| | | | | | | | | | | | |
| Earnings/(loss) per common share attributable to Cardinal Health, Inc. | | | | | | | | | | | | |
| Basic | | $ | 1.00 | | | $ | 0.27 | | | $ | 1.27 | | | $ | (3.35) | | | $ | (0.02) | | | $ | (3.37) | |
| Diluted | | 1.00 | | | 0.26 | | | 1.26 | | | (3.35) | | | (0.02) | | | (3.37) | |
| | | | | | | | |
| Cardinal Health | Fiscal 2024 Form 10-K | 57 |
| | | | | | | | |
| Notes to Financial Statements | | |
The following tables set forth our revisions to the consolidated statements of comprehensive income/(loss) for fiscal 2023 and 2022.
| | | | | | | | | | | | | | | | | | | | | | | | | | | | | | | | | | | | | | |
| | Fiscal 2023 | | Fiscal 2022 |
| (in millions) | | As Reported | | Adjustment | | As Revised | | As Reported | | Adjustment | | As Revised |
| Net earnings/(loss) | | $ | 262 | | | $ | 69 | | | $ | 331 | | | $ | (932) | | | $ | (5) | | | $ | (937) | |
| | | | | | | | | | | | |
| | | | | | | | | | | | |
| | | | | | | | | | | | |
| | | | | | | | | | | | |
| | | | | | | | | | | | |
Total comprehensive income/(loss), net of tax | | 225 | | | 69 | | | 294 | | | (1,012) | | | (5) | | | (1,017) | |
| | | | | | | | | | | | |
Total comprehensive income/(loss) attributable to Cardinal Health, Inc. | | 224 | | | 69 | | | 293 | | | (1,013) | | | (5) | | | (1,018) | |
The following tables set forth our revisions to the consolidated balance sheets for fiscal 2023.
| | | | | | | | | | | | | | | | | |
| June 30, 2023 |
| (in millions) | As Reported | | Adjustment | | As Revised |
| | | | | |
| | | | | |
| Cash and equivalents | $ | 4,043 | | | $ | 33 | | | $ | 4,076 | |
| Trade receivables, net | 11,344 | | | (236) | | | 11,108 | |
| Inventories, net | 15,940 | | | 179 | | | 16,119 | |
| Prepaid expenses and other | 2,362 | | | (68) | | | 2,294 | |
| Assets held for sale | 144 | | | (4) | | | 140 | |
| Total current assets | 33,833 | | | (96) | | | 33,737 | |
| | | | | |
| Property and equipment, net | 2,462 | | | (1) | | | 2,461 | |
| Goodwill and other intangibles, net | 6,081 | | | 4 | | | 6,085 | |
| Other assets | 1,041 | | | 25 | | | 1,066 | |
| Total assets | 43,417 | | | (68) | | | 43,349 | |
| | | | | |
| | | | | |
| | | | | |
| Accounts payable | 29,813 | | | 121 | | | 29,934 | |
| | | | | |
| Other accrued liabilities | 3,059 | | | (87) | | | 2,972 | |
| | | | | |
| Total current liabilities | 33,706 | | | 34 | | | 33,740 | |
| | | | | |
| | | | | |
| Deferred income taxes and other liabilities | 8,653 | | | 4 | | | 8,657 | |
| | | | | |
| | | | | |
| | | | | |
| | | | | |
| | | | | |
| | | | | |
| Common shares, without par value | 2,747 | | | (1) | | | 2,746 | |
| | | | | |
| Accumulated deficit | (534) | | | (108) | | | (642) | |
Common shares in treasury, at cost: 83 million shares and 76 million shares at June 30, 2024 and 2023, respectively | (4,914) | | | 3 | | | (4,911) | |
| | | | | |
| Total Cardinal Health, Inc. shareholders' deficit | (2,852) | | | (106) | | | (2,958) | |
| | | | | |
| Total shareholders’ deficit | (2,851) | | | (106) | | | (2,957) | |
| Total liabilities and shareholders’ deficit | 43,417 | | | (68) | | | 43,349 | |
The following tables set forth our revisions to the consolidated statements of shareholders' equity/(deficit) for fiscal 2023 and 2022.
| | | | | | | | | | | | | | | | | | | | | | | | | | | | | | | | | | | | | | | | | | | | | | | | | | | | | | | | | | | | | | | | | | | | | | | |
| Common Shares | | Retained Earnings/(Accumulated Deficit) | | Treasury Shares | | Total Shareholders' Deficit |
| (in millions) | As Reported | | Adjustment | | As Revised | | As Reported | | Adjustment | | As Revised | | As Reported | | Adjustment | | As Revised | | As Reported | | Adjustment | | As Revised |
| | | | | | | | | | | | | | | | | | | | | | | |
| | | | | | | | | | | | | | | | | | | | | | | |
| | | | | | | | | | | | | | | | | | | | | | | |
| | | | | | | | | | | | | | | | | | | | | | | |
| | | | | | | | | | | | | | | | | | | | | | | |
| | | | | | | | | | | | | | | | | | | | | | | |
| | | | | | | | | | | | | | | | | | | | | | | |
| | | | | | | | | | | | | | | | | | | | | | | |
| | | | | | | | | | | | | | | | | | | | | | | |
| Balance at June 30, 2021 | $ | 2,806 | | | $ | — | | | $ | 2,806 | | | $ | 1,205 | | | $ | (172) | | | $ | 1,033 | | | $ | (2,186) | | | $ | 1 | | | $ | (2,185) | | | $ | 1,794 | | | $ | (171) | | | $ | 1,623 | |
| Net earnings | — | | | — | | | — | | | (933) | | | (5) | | | (938) | | | — | | | — | | | — | | | (932) | | | (5) | | | (937) | |
| | | | | | | | | | | | | | | | | | | | | | | |
| | | | | | | | | | | | | | | | | | | | | | | |
| Employee stock plans activity, net of shares withheld for employee taxes | 7 | | | — | | | 7 | | | — | | | — | | | — | | | 58 | | | (1) | | | 57 | | | 65 | | | (1) | | | 64 | |
| | | | | | | | | | | | | | | | | | | | | | | |
| | | | | | | | | | | | | | | | | | | | | | | |
| Other | — | | | — | | | — | | | — | | | 1 | | | 1 | | | — | | | — | | | — | | | (1) | | | 1 | | | — | |
| | | | | | | | | | | | | | | | | | | | | | | |
| Balance at June 30, 2022 | 2,813 | | | — | | | 2,813 | | | (280) | | | (176) | | | (456) | | | (3,128) | | | — | | | (3,128) | | | (706) | | | (176) | | | (882) | |
| Net earnings | — | | | — | | | — | | | 261 | | | 69 | | | 330 | | | — | | | — | | | — | | | 262 | | | 69 | | | 331 | |
| | | | | | | | | | | | | | | | | | | | | | | |
| | | | | | | | | | | | | | | | | | | | | | | |
| Employee stock plans activity, net of shares withheld for employee taxes | (66) | | | 99 | | | 33 | | | — | | | — | | | — | | | 121 | | | 3 | | | 124 | | | 55 | | | 102 | | | 157 | |
| Share repurchase program activity | — | | | (100) | | | (100) | | | — | | | — | | | — | | | (1,907) | | | — | | | (1,907) | | | (1,907) | | | (100) | | | (2,007) | |
| | | | | | | | | | | | | | | | | | | | | | | |
| Other | — | | | — | | | — | | | — | | | (1) | | | (1) | | | — | | | — | | | — | | | — | | | (1) | | | (1) | |
| | | | | | | | | | | | | | | | | | | | | | | |
| Balance at June 30, 2023 | 2,747 | | | (1) | | | 2,746 | | | (534) | | | (108) | | | (642) | | | (4,914) | | | 3 | | | (4,911) | | | (2,851) | | | (106) | | | (2,957) | |
| | | | | | | | |
58 | Cardinal Health | Fiscal 2024 Form 10-K | |
| | | | | | | | |
| Notes to Financial Statements | | |
The following tables set forth our revisions to the consolidated statements of cash flows for fiscal 2023 and 2022.
| | | | | | | | | | | | | | | | | | | | | | | | | | | | | | | | | | | | | | | | | |
| | | Fiscal 2023 | | Fiscal 2022 |
| (in millions) | | | | | | | As Reported | | Adjustment | | As Revised | | As Reported | | Adjustment | | As Revised |
| Cash flows from operating activities: | | | | | | | | | | | | | | | | | |
| Net earnings/(loss) | | | | | | | $ | 262 | | | $ | 69 | | | $ | 331 | | | $ | (932) | | | $ | (5) | | | $ | (937) | |
| | | | | | | | | | | | | | | | | |
| Adjustments to reconcile net earnings/(loss) to net cash provided by operating activities: | | | | | | | | | | | | | | | | | |
| | | | | | | | | | | | | | | | | |
| | | | | | | | | | | | | | | | | |
| Impairments and (gain)/loss on disposal of assets, net | | | | | | | 1,250 | | | (4) | | | 1,246 | | | 2,050 | | | 10 | | | 2,060 | |
| | | | | | | | | | | | | | | | | |
| | | | | | | | | | | | | | | | | |
| | | | | | | | | | | | | | | | | |
| Provision for/(benefit from) deferred income taxes | | | | | | | (31) | | | (9) | | | (40) | | | 7 | | | 7 | | | 14 | |
| Provision for bad debts | | | | | | | 99 | | | (44) | | | 55 | | | 68 | | | (45) | | | 23 | |
| | | | | | | | | | | | | | | | | |
| Change in operating assets and liabilities, net of effects from acquisitions and divestitures: | | | | | | | | | | | | | | | | | |
| Increase in trade receivables | | | | | | | (947) | | | (3) | | | (950) | | | (1,526) | | | 121 | | | (1,405) | |
| Increase in inventories | | | | | | | (340) | | | (72) | | | (412) | | | (1,071) | | | (133) | | | (1,204) | |
| Increase in accounts payable | | | | | | | 2,718 | | | 98 | | | 2,816 | | | 3,428 | | | 127 | | | 3,555 | |
| Other accrued liabilities and operating items, net | | | | | | | (967) | | | (30) | | | (997) | | | 293 | | | (29) | | | 264 | |
| Net cash provided by operating activities | | | | | | | 2,839 | | | 5 | | | 2,844 | | | 3,122 | | | 53 | | | 3,175 | |
| | | | | | | | | | | | | | | | | |
| | | | | | | | | | | | | | | | | |
| | | | | | | | | | | | | | | | | |
| | | | | | | | | | | | | | | | | |
| | | | | | | | | | | | | | | | | |
| | | | | | | | | | | | | | | | | |
| | | | | | | | | | | | | | | | | |
| | | | | | | | | | | | | | | | | |
| | | | | | | | | | | | | | | | | |
| | | | | | | | | | | | | | | | | |
| | | | | | | | | | | | | | | | | |
| | | | | | | | | | | | | | | | | |
| | | | | | | | | | | | | | | | | |
| | | | | | | | | | | | | | | | | |
| | | | | | | | | | | | | | | | | |
| | | | | | | | | | | | | | | | | |
| | | | | | | | | | | | | | | | | |
| | | | | | | | | | | | | | | | | |
| | | | | | | | | | | | | | | | | |
| | | | | | | | | | | | | | | | | |
| | | | | | | | | | | | | | | | | |
| | | | | | | | | | | | | | | | | |
| | | | | | | | | | | | | | | | | |
| | | | | | | | | | | | | | | | | |
| | | | | | | | | | | | | | | | | |
| | | | | | | | | | | | | | | | | |
| | | | | | | | | | | | | | | | | |
| | | | | | | | | | | | | | | | | |
| | | | | | | | | | | | | | | | | |
| | | | | | | | | | | | | | | | | |
| | | | | | | | | | | | | | | | | |
| Net increase/(decrease) in cash and equivalents | | | | | | | (674) | | | 5 | | | (669) | | | 1,310 | | | 53 | | | 1,363 | |
| Cash and equivalents at beginning of period | | | | | | | 4,717 | | | 28 | | | 4,745 | | | 3,407 | | | (25) | | | 3,382 | |
| Cash and equivalents at end of period | | | | | | | 4,043 | | | 33 | | | 4,076 | | | 4,717 | | | 28 | | | 4,745 | |
Use of Estimates
Our consolidated financial statements are prepared in accordance with accounting principles generally accepted in the United States (“GAAP”). The preparation of financial statements in conformity with GAAP requires us to make estimates, judgments and assumptions that affect the amounts reported in the consolidated financial statements and accompanying notes. Estimates, judgments and assumptions are used in the accounting and disclosure related to, among other items, allowance for doubtful accounts, inventory valuation and reserves, goodwill and other intangible asset impairment, vendor reserves, loss contingencies (including product liability and self-insurance accruals) and income taxes. Actual amounts may differ from these estimated amounts.
Updated Segment Reporting Structure
Effective January 1, 2024, we operated under an updated organizational structure and re-aligned our reporting structure under two reportable segments: Pharmaceutical and Specialty Solutions segment and Global Medical Products and Distribution ("GMPD") segment. The remaining operating segments, Nuclear and Precision Health Solutions, at-Home Solutions and OptiFreight® Logistics, are not significant enough to require separate reportable disclosures and are included in Other. The Pharmaceutical and Specialty Solutions reportable segment consists of all businesses formerly within our Pharmaceutical segment, excluding Nuclear and Precision Health Solutions. The Global Medical Products and Distribution reportable segment consists of all businesses formerly within our Medical segment, excluding at-Home Solutions and OptiFreight® Logistics. Our previously reported segment results have been recast to conform to this re-aligned reporting structure and reflect changes in the elimination of inter-segment revenue and allocated corporate technology and shared function expenses, which are driven by the reporting structure change. See Note 14 for segment results under the new reporting structure. Cash Equivalents
We consider liquid investments purchased with an initial effective maturity of three months or less to be cash equivalents. The carrying value of cash equivalents approximates fair value.
Receivables and Allowance for Doubtful Accounts
Trade receivables are reported at their estimated collectible amounts and presented net of an allowance for doubtful accounts of $233 million and $240 million at June 30, 2024 and 2023, respectively. In addition to credit losses, the allowance also includes reserves related to customer disputes and late fees billed to customers, which are recognized within our consolidated statements of earnings/(loss) as reductions of revenue. An account is considered past due on the first day after its due date. In accordance with contract terms, we generally have the ability to charge customers service fees or higher prices if an account is considered past due. We regularly monitor past due accounts and establish appropriate reserves to cover potential losses, and consider historical experience, pricing discrepancies, the current economic environment, customer credit ratings or bankruptcies and reasonable and supportable forecasts to develop our allowance for credit losses. We review these factors quarterly to determine if any adjustments are needed to the allowance. We write off any amounts deemed uncollectible against the established allowance for doubtful accounts.
We provide financing to various customers. Such financing arrangements range from 1 year to 5 years at interest rates that are generally subject to fluctuation. Interest income on these arrangements is recognized as it is earned. The financings may be collateralized, guaranteed by third parties or unsecured. Finance notes, net and related accrued interest were $43 million (current portion $14 million) and $56 million (current portion $9 million) at June 30, 2024 and 2023, respectively, and are included in other assets (current portion is included in prepaid expenses and other) in the consolidated balance sheets. Finance notes receivable
| | | | | | | | |
| Cardinal Health | Fiscal 2024 Form 10-K | 59 |
| | | | | | | | |
| Notes to Financial Statements | | |
allowance for doubtful accounts were $3 million and $6 million at June 30, 2024 and 2023, respectively. We estimate an allowance for these financing receivables based on historical collection rates and the creditworthiness of the customer. We write off any amounts deemed uncollectible against the established allowance for doubtful accounts.
Concentrations of Credit Risk
We maintain cash depository accounts with major banks, and we invest in high quality, short-term liquid instruments, and in marketable securities. Our short-term liquid instruments mature within three months and we have not historically incurred any related losses.
Our trade receivables and finance notes and related accrued interest are exposed to a concentration of credit risk with certain large customers and with customers in the retail and healthcare sectors. Credit risk can be affected by changes in reimbursement and other economic pressures impacting the healthcare industry. With respect to customers in the retail and healthcare sectors, such credit risk is limited due to supporting collateral and the diversity of the customer base, including its wide geographic dispersion. We perform regular credit evaluations of our customers’ financial conditions and maintain reserves for losses through the established allowance for doubtful accounts. Historically, such losses have been within our expectations. Refer to the "Receivables and Allowance for Doubtful Accounts" section within this Note for additional information on the accounting treatment of reserves for allowance for doubtful accounts.
Major Customers
CVS Health Corporation ("CVS Health") and OptumRx are our only customers that individually accounted for at least 10 percent of revenue and/or gross trade receivables in fiscal 2024. These customers were primarily serviced through our Pharmaceutical and Specialty Solutions segment. Our pharmaceutical distribution contracts with OptumRx expired at the end of June 2024.
The following table summarizes historical percent of revenue and gross trade receivables from CVS Health and OptumRx:
| | | | | | | | | | | | | | | | | | | | | | | | | | | | | |
| Percent of Revenue | | Percent of Gross Trade Receivables at June 30 |
| 2024 | | 2023 | | 2022 | | 2024 | | 2023 |
| CVS Health | 24 | % | | 25 | % | | 25 | % | | 22 | % | | 23 | % |
| OptumRx | 17 | % | | 16 | % | | 16 | % | | 6 | % | | 6 | % |
We have entered into agreements with group purchasing organizations (“GPOs”) which act as purchasing agents that negotiate vendor contracts on behalf of their members. Vizient, Inc. and Premier, Inc. are our two largest GPO member relationships in terms of revenue. Sales to members of these two GPOs collectively accounted for 16 percent, 15 percent and 19 percent of revenue for fiscal 2024, 2023 and 2022, respectively. Our trade receivable balances are with individual members of the GPO, and therefore no significant concentration of credit risk exists with these types of arrangements.
Inventories
A portion of our inventories (50 percent and 54 percent at June 30, 2024 and 2023, respectively) are valued at the lower of cost, using the last-in, first-out ("LIFO") method, or market. These inventories are included within the core pharmaceutical distribution facilities of our Pharmaceutical and Specialty Solutions segment (“distribution facilities”) and are primarily merchandise inventories. The LIFO method presumes that the most recent inventory purchases are the first items sold, so LIFO helps us better match current costs and revenue. We believe that the average cost method of inventory valuation provides a reasonable approximation of the current cost of replacing inventory within the distribution facilities. As such, the LIFO reserve is the difference between (a) inventory at the lower of LIFO cost or market and (b) inventory at replacement cost determined using the average cost method of inventory valuation.
At June 30, 2024 and 2023, respectively, inventories valued at LIFO cost were $749 million and $476 million higher than the average cost value. We do not record inventories in excess of replacement cost. As such, we did not write-up the value of our inventory from average cost to LIFO cost at June 30, 2024 or 2023.
Our remaining inventory, including inventory in our GMPD segment and certain inventory in our Pharmaceutical and Specialty Solutions segment, that is not valued at the lower of LIFO cost or market is stated at the lower of cost, using the first-in, first-out method, or net realizable value. Net realizable value is defined as the estimated selling prices and estimated sales demand in the ordinary course of business, less reasonably predictable costs of completion, disposal and transportation.
We reserve for inventory obsolescence using estimates based on historical experience, historical and projected sales trends, specific categories of inventory, age and expiration dates of on-hand inventory and manufacturer return policies. Inventories presented in the consolidated balance sheets are net of reserves for excess and obsolete inventory which were $149 million and $139 million at June 30, 2024 and 2023, respectively.
Cash Discounts
Manufacturer cash discounts are recorded as a component of inventory cost and recognized as a reduction of cost of products sold as inventory is sold.
Property and Equipment
Property and equipment are carried at cost less accumulated depreciation. Property and equipment held for sale are recorded at the lower of cost less accumulated depreciation before the decision to dispose of the asset was made or fair value less cost to sell. When certain events or changes in operating conditions occur, an impairment assessment may be performed on the recoverability of the carrying amounts.
We capitalize project costs relating to computer software developed or obtained for internal use when the activities related to the project reach the application stage. Costs that are associated with the preliminary stage activities, training,
| | | | | | | | |
60 | Cardinal Health | Fiscal 2024 Form 10-K | |
| | | | | | | | |
| Notes to Financial Statements | | |
maintenance and all other post-implementation stage activities are expensed as they are incurred.
Depreciation expense is computed using the straight-line method over the estimated useful lives of the assets, including finance lease assets which are depreciated over the terms of their respective leases. We generally use the following range of useful lives for our property and equipment categories: buildings and improvements—3 to 39 years; machinery and equipment—3 to 20 years; capitalized software held for internal use—3 to 7 years; and furniture and fixtures—3 to 7 years. We recorded depreciation and amortization of capitalized software of $470 million, $441 million and $412 million for fiscal 2024, 2023 and 2022, respectively.
The following table presents the components of property and equipment, net at June 30:
| | | | | | | | | | | |
| (in millions) | 2024 | | 2023 |
| Land, building and improvements | $ | 1,879 | | | $ | 1,789 | |
| Machinery and equipment | 2,367 | | | 2,190 | |
| Capitalized software held for internal use | 1,744 | | | 1,690 | |
| Furniture and fixtures | 128 | | | 125 | |
| Construction in progress | 577 | | | 516 | |
| Total property and equipment, at cost | 6,695 | | | 6,310 | |
| Accumulated depreciation and amortization | (4,166) | | | (3,849) | |
| Property and equipment, net | $ | 2,529 | | | $ | 2,461 | |
Repairs and maintenance expenditures are expensed as incurred. Interest on long-term projects is capitalized using a rate that approximates the weighted-average interest rate on long-term obligations, which was 5 percent at June 30, 2024. The amount of capitalized interest was immaterial for all periods presented.
Business Combinations
The assets acquired and liabilities assumed in a business combination, including identifiable intangible assets, are recorded at their estimated fair values as of the acquisition date. The excess of the purchase price over the estimated fair value of the identifiable net assets acquired is recorded as goodwill. We base the fair values of identifiable intangible assets on detailed valuations that require management to make significant judgments, estimates and assumptions. Critical estimates and assumptions include: expected future cash flows for customer relationships, trade names, developed technology and other identifiable intangible assets; discount rates that reflect the risk factors associated with future cash flows; and estimates of useful lives. When an acquisition involves contingent consideration, we recognize a liability equal to the fair value of the contingent consideration obligation at the acquisition date. The estimate of fair value of a contingent consideration obligation requires subjective assumptions to be made regarding future business results, discount rates, discount periods and probabilities assigned to various potential business result scenarios. See Note 2 for additional information regarding our acquisitions. Goodwill and Other Intangible Assets
Purchased goodwill and intangible assets with indefinite lives are not amortized, but instead are tested for impairment annually or when indicators of impairment exist.
Purchased goodwill is tested for impairment at least annually. Qualitative factors are first assessed to determine if it is more likely than not that the fair value of a reporting unit is less than its carrying amount. There is an option to bypass the qualitative assessment for any reporting unit in any period and proceed directly to performing the quantitative goodwill impairment test. We have elected to bypass the qualitative assessment for our annual goodwill impairment test in the current year. The quantitative goodwill impairment test involves a comparison of the estimated fair value of the reporting unit to the respective carrying amount.
Goodwill impairment testing involves judgment, including the identification of reporting units, qualitative evaluation of events and circumstances to determine if it is more likely than not that an impairment exists, and, if necessary, the estimation of the fair value of the applicable reporting unit.
Effective January 1, 2024, we implemented a new enterprise operating and segment reporting structure. Refer to the "Updated Segment Reporting Structure" section within this Note for additional information. This change in segment structure resulted in changes to the composition of our former Medical operating segment excluding at-Home Solutions reporting unit ("Medical Unit"). Effective January 1, 2024, our reporting units are: Pharmaceutical and Specialty Solutions, GMPD, Nuclear and Precision Health Solutions, at-Home Solutions and OptiFreight® Logistics. GMPD and OptiFreight® Logistics comprised our former Medical Unit.
Fair value can be determined using market, income or cost-based approaches. Our determination of estimated fair value of the reporting units is based on a combination of the income-based and market-based approaches. Under the income-based approach, we use a discounted cash flow model in which cash flows anticipated over several future periods, plus a terminal value at the end of that time horizon, are discounted to their present value using an appropriate risk-adjusted rate of return. We use our internal forecasts to estimate future cash flows, which we believe are consistent with those of a market participant, and include an estimate of long-term growth rates based on our most recent views of the long-term outlook for each reporting unit. Actual results may differ materially from those used in our forecasts. We use discount rates that are commensurate with the risks and uncertainty inherent in the respective reporting units and in our internally-developed forecasts. During fiscal 2024, discount rates used in our reporting unit valuations ranged from 10 to 11.5 percent. Under the market-based guideline public company method, we determine fair value by comparing our reporting units to similar businesses or guideline companies whose securities are actively traded in public markets. We also use the guideline transaction method to determine fair value based on pricing multiples derived from the sale of companies that are similar to our reporting units. To further confirm fair value, we compare the aggregate fair value of our
| | | | | | | | |
| Cardinal Health | Fiscal 2024 Form 10-K | 61 |
| | | | | | | | |
| Notes to Financial Statements | | |
reporting units to our total market capitalization. Estimating the fair value of reporting units requires the use of estimates and significant judgments that are based on a number of factors including forecasted operating results. The use of alternate estimates and assumptions or changes in the industry or peer groups could materially affect the determination of fair value for each reporting unit and potentially result in goodwill impairment.
In fiscal 2024, 2023 and 2022, we performed annual impairment testing and concluded that there were no impairments of goodwill for Pharmaceutical and Specialty Solutions, Nuclear and Precision Health Solutions, at-Home Solutions, and OptiFreight® Logistics. However, there was a decline in the at-Home Solutions' estimated fair value resulting in the fair value exceeding the carrying amount by less than 1 percent during our fiscal 2024 annual impairment test. The decrease in at-Home Solutions' estimated fair value was primarily due to changes in operating expense estimates to better reflect the fair value from an external perspective. The fair values of the other three reporting units substantially exceeded their carrying amounts.
As discussed further in Note 5, during fiscal 2024, 2023 and 2022, we recognized goodwill impairment charges of $675 million, $1.2 billion and $2.1 billion, respectively, related to GMPD. These impairment charges are included in impairments and (gain)/loss on disposal of assets, net in our consolidated statements of earnings/(loss). See Note 9 for additional information regarding tax benefits related to these goodwill impairment charges. GMPD's goodwill balance was fully impaired as of March 31, 2024, therefore, no impairment test was required for this reporting unit during our fiscal 2024 annual impairment testing. The impairment test for indefinite-lived intangibles other than goodwill involves first assessing qualitative factors to determine if it is more likely than not that the fair value of the indefinite-lived intangible asset is less than its carrying amount. If so, then a quantitative test is performed to compare the estimated fair value of the indefinite-lived intangible asset to the respective asset's carrying amount. Our qualitative evaluation requires the use of estimates and significant judgments and considers the weight of evidence and significance of all identified events and circumstances and most relevant drivers of fair value, both positive and negative, in determining whether it is more likely than not that the fair value of the indefinite-lived intangible asset is less than its carrying amount.
Intangible assets with finite lives, primarily customer relationships; trademarks, trade names and patents; and developed technology, are amortized using a combination of straight-line and accelerated methods based on the expected cash flows from the assets over their estimated useful lives. We review intangible assets with finite lives for impairment whenever events or changes in circumstances indicate that the related carrying amounts may not be recoverable. Determining whether an impairment loss occurred requires a comparison of the carrying amount to the sum of the future forecasted undiscounted cash flows expected to be generated by the asset group. Actual results may differ materially from those used in our forecasts.
Assets Held for Sale
We classify assets and liabilities (the “disposal group”) as held for sale when management commits to a plan to sell the disposal group in its present condition and at a price that is reasonable in relation to its current fair value. We also consider whether an active program to locate a buyer has been initiated and if it is probable that the sale will occur within one year without significant changes to the plan to sell. Upon classification of the disposal group as held for sale, we test the assets for impairment and cease related depreciation and amortization.
On May 24, 2024, we signed an agreement to sell the West Campus Dublin, Ohio office space. The transaction is subject to certain contingencies. At June 30, 2024, we met the criteria for the related assets to be classified as held for sale. No loss was recognized during fiscal 2024 due to the expected net proceeds exceeding the carrying value of the related assets.
On June 5, 2023, we signed a definitive agreement to contribute our Outcomes™ business to Transaction Data Systems ("TDS"), a portfolio company of BlackRock Long Term Private Capital and GTCR, in exchange for a 16 percent equity interest in the combined entity. Upon signing the agreement, we met the criteria for the related assets and liabilities of the Outcomes™ business to be classified as held for sale. The transaction closed on July 10, 2023. See Note 3 for additional information. Investments
Investments in non-marketable equity securities are accounted for under the fair value, equity or net asset value method of accounting and are included in other assets in the consolidated balance sheets. For equity securities without a readily determinable fair value, we use the fair value measurement alternative and measure the securities at cost less impairment, if any, including adjustments for observable price changes in orderly transactions for an identical or similar investment of the same issuer. For investments in which we can exercise significant influence but do not control, we use the equity method of accounting. Our share of the earnings and losses are recorded in other (income)/expense, net in the consolidated statements of earnings/(loss). We monitor our investments for impairment by considering factors such as the operating performance of the investment and current economic and market conditions.
Leases
Our leases are primarily for corporate offices, distribution facilities, vehicles and equipment. We determine if an arrangement is a lease at its inception by evaluating whether the arrangement conveys the right to use an identified asset and whether we obtain substantially all of the economic benefits from and have the ability to direct the use of the asset. Our lease agreements generally do not contain any material residual value guarantees or material restrictive covenants.
Operating lease right-of-use assets and corresponding operating lease liabilities are recognized in our consolidated balance sheets at lease commencement date based on the present value of lease payments over the lease term. Operating lease expense for
| | | | | | | | |
62 | Cardinal Health | Fiscal 2024 Form 10-K | |
| | | | | | | | |
| Notes to Financial Statements | | |
operating lease assets is recognized on a straight-line basis over the lease term. As most of our leases do not provide an implicit rate, we use our collateralized incremental borrowing rate based on the information available at the lease commencement date in determining the present value of lease payments. We use the implicit rate if it is readily determinable.
Our lease agreements contain lease components and non-lease components. For all asset classes, we have elected to account for both of these components as a single lease component. We also, from time to time, sublease portions of our real estate property, resulting in sublease income. Sublease income and the related assets and cash flows are not material to the consolidated financial statements at or for the fiscal years ended June 30, 2024, 2023 and 2022.
We apply a practical expedient for short-term leases whereby we do not recognize a lease liability and right-of-use asset for leases with a term of less than 12 months. Short-term lease expense recognized in fiscal 2024, 2023 and 2022 was immaterial.
Our leases have remaining lease terms from less than 1 year up to approximately 18 years. Our lease terms may include options to extend or terminate the lease when it is reasonably certain and there is a significant economic incentive to exercise that option.
See Note 6 for additional information regarding leases. Vendor Reserves
In the ordinary course of business, our vendors may dispute deductions taken against payments otherwise due to them or assert other disputes. These disputes are researched and resolved based upon the findings of the research performed. At any given time, there are outstanding items in various stages of research and resolution. In determining appropriate reserves for areas of exposure with our vendors, we assess historical experience and current outstanding claims. We have established various levels of reserves based on the type of claim and status of review. Though the claim types are relatively consistent, we periodically update our reserve estimates to reflect actual historical experience. The ultimate outcome of certain claims may be different than our original estimate and may require an adjustment. Adjustments to vendor reserves are included in cost of products sold. In addition, the reserve balance will fluctuate due to variations of outstanding claims from period-to-period, timing of settlements and specific vendor issues. Vendor reserves were $112 million and $117 million at June 30, 2024 and 2023 respectively, excluding third-party returns. See "Third-Party Returns" section within this Note for a description of third-party returns.
Distribution Services Agreement and Other Vendor Fees
Our Pharmaceutical and Specialty Solutions segment recognizes fees received from distribution services agreements and other fees received from vendors related to the purchase or distribution of the vendors’ inventory when those fees have been earned and we are entitled to payment. Since the benefit provided to a vendor is related to the purchase and distribution of the vendor’s inventory, we recognize the fees as a reduction in the carrying value of the inventory that generated the fees, and as such, a reduction of cost of products sold in our consolidated statements of earnings/(loss) when the inventory is sold.
Loss Contingencies and Self-Insurance
Loss Contingencies
We accrue for contingencies related to disputes, litigation and regulatory matters if it is probable that a liability has been incurred and the amount of the loss can be reasonably estimated.
In connection with the opioid litigation as described further in Note 8, we recorded pre-tax charges of $5.63 billion during fiscal 2021, which were retained at Corporate. In February 2022, we and two other national distributors announced that each company had determined that a sufficient number of political subdivisions had agreed to participate in the previously disclosed settlement agreement (the "National Opioid Settlement Agreement") to settle the vast majority of the opioid lawsuits filed by states and local governmental entities. This National Opioid Settlement Agreement became effective on April 2, 2022. We have reached agreements in principle with counsel representing classes of third-party payors and acute care hospitals, and we are engaged in resolution discussions with the City of Baltimore. In connection with these matters, as of June 30, 2024, we have accrued $363 million, which reflects our current estimate of probable loss for these matters. The agreements in principle remain subject to contingencies.
We develop and periodically update reserve estimates for all litigation matters, including the Cordis OptEase and TrapEase inferior vena cava ("IVC") claims received to date and expected to be received in the future and related costs. To project future IVC claim costs, we use a methodology based largely on recent experience, including claim filing rates, blended average payout influenced by claim severity, historical sales data, implant and injury to report lag patterns and estimated defense costs.
The amount of ultimate loss may differ materially from these estimates. We recognize these estimated loss contingencies, income from favorable resolution of litigation and certain defense costs in litigation (recoveries)/charges, net in our consolidated statements of earnings/(loss). See Note 8 for additional information regarding loss contingencies and product liability lawsuits. Self-Insurance
We self-insure for employee healthcare, general liability, certain product liability matters, auto liability, property and workers' compensation. Self-insurance accruals include an estimate for expected settlements or pending claims, defense costs,
| | | | | | | | |
| Cardinal Health | Fiscal 2024 Form 10-K | 63 |
| | | | | | | | |
| Notes to Financial Statements | | |
administrative fees, claim adjustment costs and an estimate for claims incurred but not reported.
Because these matters are inherently unpredictable and unfavorable developments or resolutions can occur, assessing contingencies and other liabilities is highly subjective and requires judgments about future events. We regularly review contingencies and our self-insurance accruals to determine whether our accruals and related disclosures are adequate. Any adjustments for changes in reserves are recorded in the period in which the change in estimate occurs.
Guarantees
In the ordinary course of business, we agree to indemnify certain other parties under acquisition and disposition agreements, customer agreements, intellectual property licensing agreements and other agreements. Such indemnification obligations vary in scope and, when defined, in duration. In many cases, a maximum obligation is not explicitly stated, and therefore the overall maximum amount of the liability under such indemnification obligations cannot be reasonably estimated. Where appropriate, such indemnification obligations are recorded as a liability. Historically, we have not, individually or in the aggregate, made payments under these indemnification obligations in any material amounts. In certain circumstances, we believe that existing insurance arrangements, subject to the general deduction and exclusion provisions, would cover portions of the liability that may arise from these indemnification obligations. In addition, we believe that the likelihood of a material liability being triggered under these indemnification obligations is not probable.
From time to time we enter into agreements that obligate us to make fixed payments upon the occurrence of certain events. Such obligations primarily relate to obligations arising under acquisition transactions, where we have agreed to make payments based upon the achievement of certain financial performance measures by the acquired business. Generally, the obligation is capped at an explicit amount. There were no material obligations at June 30, 2024.
Income Taxes
We account for income taxes using the asset and liability method. Deferred tax assets and liabilities are measured using enacted tax rates in the respective jurisdictions in which we operate. We assess the realizability of deferred tax assets on a quarterly basis and provide a valuation allowance for deferred tax assets when it is more likely than not that at least a portion of the deferred tax assets will not be realized. The realizability of deferred tax assets depends on our ability to generate sufficient taxable income within the carryback or carryforward periods provided for in the tax law for each applicable tax jurisdiction and also considers all available positive and negative evidence.
Deferred taxes for non-U.S. liabilities are not provided on the unremitted earnings of subsidiaries outside of the United States when it is expected that these earnings are indefinitely reinvested.
We operate in a complex multinational tax environment and are subject to tax treaty arrangements and transfer pricing guidelines for intercompany transactions that are subject to interpretation. Uncertainty in a tax position may arise as tax laws are subject to interpretation.
Tax benefits from uncertain tax positions are recognized when it is more likely than not that the position will be sustained upon examination of the technical merits of the position, including resolutions of any related appeals or litigation processes. The amount recognized is measured as the largest amount of tax benefit that is greater than 50 percent likely of being realized upon settlement. For tax benefits that do not qualify for recognition, we recognize a liability for unrecognized tax benefits.
See Note 9 for additional information regarding income taxes. Other Accrued Liabilities
Other accrued liabilities represent various current obligations, including certain accrued operating expenses, accrued rebates and taxes payable.
Noncontrolling Interests
Noncontrolling interests represent the portion of net earnings, comprehensive income and net assets that is not attributable to Cardinal Health, Inc.
Share-Based Compensation
Share-based compensation provided to employees is recognized in the consolidated statements of earnings/(loss) based on the grant date fair value of the awards. The fair value of restricted share units ("RSUs") is determined by the grant date market price of our common shares. The fair value of performance share units ("PSUs"), which include a market-based condition, is determined using a Monte Carlo valuation model. The key assumptions for the Monte Carlo valuation model are as follows:
| | | | | | | | | |
| Award Year | Risk-Free Interest Rate (2) | Expected Volatility (3) | |
| 2022 | 5.28% | 22.77 | % | |
| 2023 | 3.12% | 32.41 | % | |
2023 Modified (1) | 5.13% | 26.58 | % | |
| 2024 | 4.66% | 23.99 | % | |
(1) There was a modification of prior year awards in fiscal 2024 that required a new Monte Carlo Simulation valuation model.
(2) Based on the U.S. Treasury yields over a term comparable to the remaining performance period.
(3) Based on historical volatility and implied volatility indications.
The compensation expense associated with nonvested PSUs is dependent on our periodic assessment of the probability of the performance goals being achieved. Based on the extent to which the performance goals are achieved and the Company's total shareholder return ("TSR") relative to the S&P 500 Health Care Index, vested shares may range from zero to 240 percent of the target award amount. Compensation expense is recognized regardless of the extent to which the market-based condition, the Company's relative TSR, is satisfied.
| | | | | | | | |
64 | Cardinal Health | Fiscal 2024 Form 10-K | |
| | | | | | | | |
| Notes to Financial Statements | | |
The compensation expense recognized for share-based awards is net of estimated forfeitures and is recognized ratably over the service period of the awards. All income tax effects of share-based awards are recognized in the consolidated statements of earnings/(loss) as awards vest or are settled. We classify share-based compensation expense in distribution, selling, general and administrative ("SG&A") expenses to correspond with the same line item as the majority of the cash compensation paid to employees. If awards are modified in connection with a restructuring activity, the incremental share-based compensation expense is classified in restructuring and employee severance. See Note 15 for additional information regarding share-based compensation. Dividends
We paid cash dividends per common share of $2.00, $1.98 and $1.96 in fiscal 2024, 2023 and 2022, respectively.
Revenue Recognition
We recognize revenue in an amount that reflects the consideration to which we expect to be entitled in exchange for the transfer of goods or services to customers.
Revenue in Pharmaceutical and Specialty Solutions, GMPD, Nuclear and Precision Health Solutions and at-Home Solutions operating segments is primarily related to the distribution of pharmaceutical and medical products, which include both manufactured and sourced products, and we recognize at a point in time when title transfers to customers and we have no further obligation to provide services related to such merchandise. OptiFreight® Logistics revenue is related to shipping, freight management and logistics management services. Service revenues are recognized over the period that services are provided to the customer. Revenues derived from services from all segments are immaterial for all periods presented.
We are generally the principal in a transaction, therefore our revenue is primarily recorded on a gross basis. When we are a principal in a transaction, we have determined that we control the ability to direct the use of the product or service prior to transfer to a customer, are primarily responsible for fulfilling the promise to provide the product or service to our customer, have discretion in establishing prices and ultimately control the transfer of the product or services provided to the customer.
In connection with the preparation of our Consolidated Financial Statements for fiscal 2024, we identified an accounting error related to revenue recognition from third party payors within the at-Home Solutions operating segment. We have revised our prior period financial statements to correct this error, as well as other unrelated immaterial errors, including an adjustment to an uncertain tax position. These revisions impacted each quarter of fiscal 2022, 2023 and 2024.
Sales Returns and Allowances
Revenue is recorded net of sales returns and allowances. Revenues are measured based on the amount of consideration that we expect to receive, reduced by estimates for return allowances, discounts, rebates and other variable consideration.
Sales returns are recorded based on estimates using historical data. Our customer return policies generally require that the product be physically returned, subject to restocking fees. We only allow customers to return products for credit in a condition suitable to be added back to inventory and resold at full value (“merchantable product”) or returned to vendors for credit. Product returns are generally consistent throughout the year and typically are not specific to any particular product or customer.
We accrue for estimated sales returns and allowances at the time of sale based upon historical customer return trends, margin rates and processing costs. Our accrual for sales returns is reflected as a reduction of revenue and cost of products sold for the sales price and cost, respectively. At June 30, 2024 and 2023, the accrual for estimated sales returns and allowances was $441 million and $474 million, respectively, which is reflected in trade receivables, net and inventories, net in the consolidated balance sheets. Sales returns and allowances were $2.2 billion, $2.2 billion and $2.4 billion, for fiscal 2024, 2023 and 2022, respectively, and the net impact on net earnings/(loss) in the consolidated statements of earnings/(loss) was immaterial in fiscal 2024, 2023 and 2022.
Third-Party Returns
We generally do not accept non-merchantable pharmaceutical product returns from our customers, so many of our customers return non-merchantable pharmaceutical products to the manufacturer through third parties. Since our customers generally do not have a direct relationship with manufacturers, our vendors pass the value of such returns to us (usually in the form of an accounts payable deduction). We, in turn, pass the value received to our customer. In certain instances, we pass the estimated value of the return to our customer prior to our receipt of the value from the vendor. Although we believe we have satisfactory protections, from time to time, we become subject to claims from customers or vendors that our administration of this overall process is deficient in some respect or our contractual terms with vendors are in conflict with our contractual terms with our customers. We maintain reserves for some of these situations based on their nature and our historical experience with their resolution.
Shipping and Handling
Shipping and handling costs are primarily included in SG&A expenses in our consolidated statements of earnings/(loss) and include all delivery expenses as well as all costs to prepare the product for shipment to the end customer. Shipping and handling costs were $866 million, $835 million and $756 million, for fiscal 2024, 2023 and 2022, respectively.
Restructuring and Employee Severance
Restructuring activities are programs that are not part of the ongoing operations of our underlying business, such as divestitures, closing and consolidating facilities, changing the way we manufacture or distribute our products, moving manufacturing of a product to another location, changes in production or business process outsourcing or insourcing, employee severance (including rationalizing headcount or other significant changes in personnel) and realigning operations (including realignment of the management structure in response to changing market conditions).
| | | | | | | | |
| Cardinal Health | Fiscal 2024 Form 10-K | 65 |
| | | | | | | | |
| Notes to Financial Statements | | |
Also included within restructuring and employee severance are employee severance costs that are not incurred in connection with a restructuring activity. See Note 4 for additional information regarding our restructuring activities. Amortization and Other Acquisition-Related Costs
We classify certain costs incurred in connection with acquisitions as amortization and other acquisition-related costs in our consolidated statements of earnings/(loss). These costs consist of amortization of acquisition-related intangible assets, transaction costs, integration costs and changes in the fair value of contingent consideration obligations. Transaction costs are incurred during the initial evaluation of a potential acquisition and primarily relate to costs to analyze, negotiate and consummate the transaction as well as due diligence activities. Integration costs relate to activities required to combine the operations of an acquired enterprise into our operations and, in the case of the significant acquisitions with international operations, to stand-up the systems and processes needed to support an expanded geographic footprint. We record changes in the fair value of contingent consideration obligations relating to acquisitions as income or expense in amortization and other acquisition-related costs. See Note 5 for additional information regarding amortization of acquisition-related intangible assets. Translation of Foreign Currencies
Financial statements of our subsidiaries outside the United States are generally measured using the local currency as the functional currency. Adjustments to translate the assets and liabilities of these foreign subsidiaries into U.S. dollars are accumulated in shareholders’ equity through accumulated and other comprehensive loss ("AOCI") utilizing period-end exchange rates. Revenues and expenses of these foreign subsidiaries are translated using average exchange rates during the year.
The foreign currency translation gains/(losses) included in AOCI at June 30, 2024 and 2023 are presented in Note 12. Foreign currency transaction gains and losses for the period are included in the consolidated statements of earnings/(loss) in the respective financial statement line item. Interest Rate, Currency and Commodity Risk
All derivative instruments are recognized at fair value on the consolidated balance sheets and all changes in fair value are recognized in net earnings or shareholders’ equity through AOCI, net of tax.
For contracts that qualify for hedge accounting treatment, the hedge contracts must be effective at reducing the risk associated with the exposure being hedged and must be designated as a hedge at the inception of the contract. Hedge effectiveness is assessed periodically. Any contract not designated as a hedge, or so designated but ineffective, is adjusted to fair value and recognized immediately in net earnings. If a fair value or cash flow hedge ceases to qualify for hedge accounting treatment, the contract continues to be carried on the balance sheet at fair value until settled and future adjustments to the contract’s fair value are recognized immediately in net earnings. If a forecasted transaction
is probable not to occur, amounts previously deferred in AOCI are recognized immediately in net earnings. Interest payments received from the cross-currency swap are excluded from the net investment hedge effectiveness assessment and are recorded in interest expense, net in the consolidated statements of earnings/(loss).
See Note 11 for additional information regarding our derivative instruments, including the accounting treatment for instruments designated as fair value, cash flow, net investment and economic hedges. Fair Value Measurements
Fair value is defined as the price that would be received upon selling an asset or the price paid to transfer a liability on the measurement date. It focuses on the exit price in the principal or most advantageous market for the asset or liability in an orderly transaction between willing market participants. A three-tier fair value hierarchy is established as a basis for considering such assumptions and for inputs used in the valuation methodologies in measuring fair value. This hierarchy requires entities to maximize the use of observable inputs and minimize the use of unobservable inputs. The three levels of inputs used to measure fair values are:
Level 1 - Observable prices in active markets for identical assets and liabilities.
Level 2 - Observable inputs other than quoted prices in active markets for identical assets and liabilities.
Level 3 - Unobservable inputs that are supported by little or no market activity and that are significant to the fair value of the assets and liabilities.
See Note 10 for additional information regarding fair value measurements. Recently Adopted Financial Accounting Standards
There were no accounting standards adopted in fiscal 2024 that had a material impact on our consolidated financial statements.
Recently Issued Financial Accounting Standards and Disclosure Rules Not Yet Adopted
We assess the adoption impacts of recently issued accounting standards by the FASB on our consolidated financial statements as well as material updates to previous assessments, if any, from our fiscal 2023 Form 10-K.
Segment Reporting
In November 2023, the FASB issued Accounting Standards Update ("ASU") 2023-07 Segment Reporting (Topic 280): Improvements to Reportable Segment Disclosures, which enhances reportable segment disclosure requirements, primarily through disclosures of significant segment expenses. This guidance will be effective for us in our fiscal 2025 Form 10-K and the guidance must be applied retrospectively to all prior periods presented. We are currently evaluating the impact of adoption of this guidance on our disclosures.
| | | | | | | | |
66 | Cardinal Health | Fiscal 2024 Form 10-K | |
| | | | | | | | |
| Notes to Financial Statements | | |
Income Tax Disclosure
In December 2023, the FASB issued ASU 2023-09 Income Taxes (Topic 740): Improvements to Income Tax Disclosures, which enhances income tax disclosures primarily related to the rate reconciliation and income taxes paid information. This guidance also includes certain other amendments to improve the effectiveness of income tax disclosures. This guidance will be effective for us in our fiscal 2026 Form 10-K and should be applied on a prospective basis, with retrospective application permitted. We are currently evaluating the impact of adoption of this guidance on our disclosures.
Climate-Related Disclosures
In March 2024, the SEC issued final rules on climate-related disclosures that will require annual disclosure of material climate-related risks and material direct greenhouse gas emissions from operations owned or controlled (Scope 1) and material indirect greenhouse gas emissions from purchased energy consumed in owned or controlled operations (Scope 2). Additionally, the rules require disclosure in the notes to the financial statements of the effects of severe weather events and other natural conditions, subject to certain financial thresholds, as well as amounts related to carbon offsets and renewable energy credits or certificates. These rules also require disclosure of climate risk oversight practices of the Board of Directors and management, and the disclosure of governance, risk management and strategy related to material climate-related risks. In April 2024, the SEC voluntarily stayed the new rules pending the completion of judicial review. We are currently evaluating the impact of adoption of these final rules on our disclosures.
2. Acquisitions
On March 18, 2024, we completed the acquisition of Specialty Networks for a purchase price of $1.2 billion in cash, subject to certain adjustments. Specialty Networks creates clinical and economic value for providers and partners across multiple specialty group purchasing organizations ("GPOs"): UroGPO, Gastrologix and GastroGPO, and United Rheumatology.
Specialty Networks’ PPS Analytics platform analyzes data from electronic medical records, practice management, imaging, and dispensing systems and transforms it into meaningful and actionable insights for providers and other stakeholders by using artificial intelligence and modern data analytics capabilities. The acquisition further expands our offering in key therapeutic areas, accelerates our upstream data and research opportunities with biopharma manufacturers, and creates a platform for our expansion across therapeutic areas.
The pro forma results of operations and the results of operations for Specialty Networks have not been separately disclosed because the effects were not significant compared to the consolidated financial statements.
Transaction costs associated with the Specialty Networks acquisition were $16 million during the fiscal year ended June 30, 2024, and are included in amortization and other acquisition-related costs in the consolidated statements of earnings/(loss).
Fair Value of Assets Acquired and Liabilities Assumed
The allocation of the purchase price for the acquisition of Specialty Networks is not yet finalized and is subject to adjustment as we complete the valuation analysis of the acquisition. The purchase price is also subject to adjustment based on working capital requirements as set forth in the acquisition agreement.
The valuation of identifiable intangible assets utilizes significant unobservable inputs and thus represents a Level 3 nonrecurring fair value measurement. The estimated fair value of the identifiable intangible assets was determined using an income-based approach, which includes market participant expectations of the cash flows that an asset could generate over its remaining useful life, discounted back to present value using an appropriate rate of return. The discount rate used to arrive at the present value of the identifiable intangible assets was 10 percent and reflects the internal rate of return and uncertainty in the cash flow projections.
The following table summarizes the estimated fair values of the assets acquired and liabilities assumed as of the acquisition date for Specialty Networks:
| | | | | |
| (in millions) | Specialty Networks |
Identifiable intangible assets: | |
Customer relationships (1) | $ | 480 | |
Trade names (2) | 15 | |
| Developed technology and Other (3) | 25 | |
| |
Total identifiable intangible assets acquired | 520 | |
| |
Identifiable net assets/(liabilities): | |
Cash and equivalents | 23 | |
Trade receivables, net | 17 | |
| |
Prepaid expenses and other | 2 | |
| |
| |
| |
Other accrued liabilities | (15) | |
Deferred income taxes and other liabilities | (127) | |
Total identifiable net assets/(liabilities) acquired | 420 | |
Goodwill | 793 | |
Total net assets acquired | $ | 1,213 | |
(1) The weighted-average useful life of customer relationships is 15 years.
(2) The weighted-average useful life of trade names is 8 years.
(3) The weighted-average useful life of developed technology and other is 8 years.
3. Divestitures
Outcomes
On June 5, 2023, we signed a definitive agreement to contribute the Outcomes™ business to TDS, a portfolio company of BlackRock Long Term Private Capital and GTCR, in exchange for a 16 percent equity interest in the combined entity. The transaction closed on July 10, 2023 and we recognized a pre-tax gain of $53 million in fiscal 2024, which was included in impairments and (gain)/loss on disposal of assets, net in our consolidated statements of earnings/(loss). This gain includes our initial recognition of an equity method investment in the combined entity
| | | | | | | | |
| Cardinal Health | Fiscal 2024 Form 10-K | 67 |
| | | | | | | | |
| Notes to Financial Statements | | |
for $147 million, which was recorded in Other Assets in our consolidated balance sheets.
We determined that the divestiture of the Outcomes™ business does not meet the criteria to be classified as discontinued operations. The Outcomes™ business operated within our former Pharmaceutical segment and its results before the divestiture are reflected within the Pharmaceutical and Specialty Solutions segment.
Cordis
In August 2021, we sold the Cordis business to Hellman & Friedman for proceeds of $923 million, net of cash transferred, and we retained certain working capital accounts and certain liabilities. Cardinal Health retained product liability associated with lawsuits and claims related to IVC filters in the U.S. and Canada, as well as authority for these matters discussed in Note 8. The Cordis business operated within our former Medical segment. We determined that the sale of the Cordis business did not meet the criteria to be classified as discontinued operations. In connection with the divestiture, we recognized a $51 million pre-tax loss in impairments and (gain)/loss on disposal of assets, net in our consolidated statement of earnings/(loss) in fiscal 2021. 4. Restructuring and Employee Severance
The following table summarizes restructuring and employee severance costs:
| | | | | | | | | | | | | | | | | |
| (in millions) | 2024 | | 2023 | | 2022 |
| Employee-related costs | $ | 95 | | | $ | 39 | | | $ | 35 | |
| Facility exit and other costs | 80 | | | 56 | | | 66 | |
| Total restructuring and employee severance | $ | 175 | | | $ | 95 | | | $ | 101 | |
Employee-related costs primarily consist of termination benefits provided to employees who have been involuntarily terminated, duplicate payroll costs and retention bonuses incurred during transition periods. Facility exit and other costs primarily consist of project consulting fees, accelerated depreciation, professional, project management and other service fees to support divestitures, costs associated with vacant facilities and certain other divestiture-related costs.
Restructuring and employee severance costs in fiscal 2024, 2023 and 2022 include costs related to the implementation of certain enterprise-wide cost-savings measures, which include certain initiatives to rationalize our manufacturing operations. The increase in fiscal 2024 restructuring and employee severance are primarily due to estimated severance costs related to these cost-savings measures and costs related to certain projects resulting from the reviews of our strategy, portfolio, capital-allocation framework and operations. During fiscal 2023 and 2022, restructuring and employee severance included costs related to the divestiture of the Cordis business. During fiscal 2022, restructuring also included facility-exit costs related to decreasing our overall office space.
The following table summarizes activity related to liabilities associated with restructuring and employee severance:
| | | | | | | | | | | | | | | | | |
| (in millions) | Employee-
Related Costs | | Facility Exit
and Other Costs | | Total |
| Balance at June 30, 2022 | $ | 56 | | | $ | 10 | | | $ | 66 | |
| Additions | 35 | | | 8 | | | 43 | |
| Payments and other adjustments | (47) | | | (16) | | | (63) | |
| Balance at June 30, 2023 | 44 | | | 2 | | | 46 | |
| Additions | 74 | | | 13 | | | 87 | |
| Payments and other adjustments | (26) | | | (10) | | | (36) | |
| Balance at June 30, 2024 | $ | 92 | | | $ | 5 | | | $ | 97 | |
5. Goodwill and Other Intangible Assets
Goodwill
The following table summarizes the changes in the carrying amount of goodwill for the two reportable segments and the remaining operating segments, included in Other and in total:
| | | | | | | | | | | | | | | | | | | | | | | |
| (in millions) | Pharmaceutical and Specialty Solutions | | Global Medical Products and Distribution (1) | | Other (2) (3) (4) | | Total |
| Balance at June 30, 2022 (5) | $ | 2,787 | | | $ | 1,899 | | | $ | 1,170 | | | $ | 5,856 | |
| Goodwill acquired, net of purchase price adjustments | — | | | 15 | | | — | | | 15 | |
| Foreign currency translation adjustments and other | (1) | | | (6) | | | — | | | (7) | |
| Goodwill Impairment | — | | | (1,227) | | | — | | | (1,227) | |
| Outcomes goodwill reclassified to assets held for sale | (24) | | | — | | | — | | | (24) | |
| Balance at June 30, 2023 | $ | 2,762 | | | $ | 681 | | | $ | 1,170 | | | $ | 4,613 | |
| Goodwill acquired, net of purchase price adjustments | 793 | | | (3) | | | — | | | 790 | |
| Foreign currency translation adjustments and other | — | | | (3) | | | — | | | (3) | |
| Goodwill Impairment | — | | | (675) | | | — | | | (675) | |
| | | | | | | |
| Balance at June 30, 2024 | $ | 3,555 | | | $ | — | | | $ | 1,170 | | | $ | 4,725 | |
(1) Prior-period goodwill impairment charges related to the former Medical segment were allocated to the GMPD segment. At June 30, 2024 and 2023, the GMPD segment accumulated goodwill impairment loss was $5.4 billion and $4.7 billion, respectively.
(2) Comprised of the remaining operating segments, Nuclear and Precision Health Solutions, at-Home Solutions and OptiFreight® Logistics.
(3) At June 30, 2024 and 2023, Other accumulated goodwill impairment loss was $829 million which was related to Nuclear and Precision Health Solutions.
(4) Reflects $48 million allocated to OptiFreight® Logistics.
| | | | | | | | |
| Cardinal Health | Fiscal 2024 Form 10-K | 68 |
| | | | | | | | |
| Notes to Financial Statements | | |
(5) Reflects a $110 million reclassification between Pharmaceutical and Specialty Solutions and Other, which does not impact our previously reported consolidated financial statements or results of our impairment tests.
The increase in the Pharmaceutical and Specialty Solutions segment goodwill is due to the Specialty Networks acquisition. Goodwill recognized in connection with this acquisition primarily represents the expected benefits from anticipated growth from new technology capabilities, synergies of integrating this business and the assembled workforce of the acquired entity.
As a result of the segment change discussed in Note 1, we allocated $90 million and $48 million of goodwill from the former Medical Unit to GMPD and OptiFreight® Logistics, respectively, based on the estimated relative fair values of the reporting units. We also assessed goodwill for impairment for these reporting units before and after the reallocation and determined there was no impairment for the Medical Unit and OptiFreight® Logistics during the three months ended March 31, 2024 as their fair values substantially exceeded their carrying values. However, the quantitative test resulted in an impairment of GMPD’s remaining goodwill balance of $90 million. Our determination of the estimated fair value of the GMPD reporting unit is based on a combination of the income-based approach (using a discount rate of 11 percent and a terminal growth rate of 2 percent), and market-based approaches. Additionally, we assigned a weighting of 80 percent to the discounted cash flow method, 10 percent to the guideline public company method, and 10 percent to the guideline transaction method. Our fair value estimates utilize significant unobservable inputs and thus represent Level 3 fair value measurements.
During the three months ended December 31, 2023, we did not identify any indicators of impairment within our reporting units. During the three months ended September 30, 2023, we elected to bypass the qualitative assessment and perform quantitative goodwill impairment testing for the former Medical Unit due to an increase in the risk-free interest rate used in the discount rate. The carrying amount exceeded the fair value, which resulted in a pre-tax impairment charge of $585 million for the former Medical Unit, which was recognized during the three months ended September 30, 2023 and is included in impairments and (gain)/loss on disposal of assets, net in our consolidated statements of earnings/(loss). This impairment charge was driven by an increase of 1 percent in the discount rate primarily due to an increase in the risk-free interest rate.
During fiscal 2023 and 2022, we performed quantitative goodwill impairment testing for the former Medical Unit which resulted in cumulative pre-tax impairment charges $1.2 billion and $2.1 billion, respectively, which were included in impairments and (gain)/loss on disposal of assets, net in our consolidated statements of earnings/(loss).
In connection with the divestiture of the Outcomes business, during fiscal 2023, we allocated and reclassified $24 million of goodwill from the Pharmaceutical and Specialty Solutions operating segment to the Outcomes disposal group based on the
estimated relative fair values of the business to be disposed of and the portion of the reporting unit that was retained.
Other Intangible Assets
The following tables summarize other intangible assets by class at June 30:
| | | | | | | | | | | | | | | | | | | | | | | |
| 2024 |
| (in millions) | Gross
Intangible | | Accumulated
Amortization | | Net
Intangible | | Weighted- Average Remaining Amortization Period (Years) |
| Indefinite-life intangibles: | | | | | | | |
| Trademarks and patents | $ | 12 | | | $ | — | | | $ | 12 | | | N/A |
| Total indefinite-life intangibles | 12 | | | — | | | 12 | | | N/A |
| Definite-life intangibles: | | | | | | | |
| Customer relationships | 3,628 | | | 2,431 | | | 1,197 | | | 11 |
| Trademarks, trade names and patents | 561 | | | 408 | | | 153 | | | 7 |
| Developed technology and other | 1,047 | | | 684 | | | 363 | | | 7 |
| Total definite-life intangibles | 5,236 | | | 3,523 | | | 1,713 | | | 10 |
| Total other intangible assets | $ | 5,248 | | | $ | 3,523 | | | $ | 1,725 | | | N/A |
| | | | | | | | | | | | | | | | | |
| 2023 |
| (in millions) | Gross
Intangible | | Accumulated
Amortization | | Net
Intangible |
| Indefinite-life intangibles: | | | | | |
| Trademarks and patents | $ | 11 | | | $ | — | | | $ | 11 | |
| Total indefinite-life intangibles | 11 | | | — | | | 11 | |
| Definite-life intangibles: | | | | | |
| Customer relationships | 3,174 | | | 2,274 | | | 900 | |
| Trademarks, trade names and patents | 546 | | | 380 | | | 166 | |
| Developed technology and other | 1,021 | | | 626 | | | 395 | |
| Total definite-life intangibles | 4,741 | | | 3,280 | | | 1,461 | |
| Total other intangible assets | $ | 4,752 | | | $ | 3,280 | | | $ | 1,472 | |
The increase in definite-life intangibles is due to the Specialty Networks acquisition. Total amortization of intangible assets was $264 million, $281 million and $311 million for fiscal 2024, 2023 and 2022, respectively. The estimated annual amortization for intangible assets for fiscal 2025 through 2029 is as follows: $255 million, $244 million, $217 million, $190 million and $186 million.
| | | | | | | | |
| Cardinal Health | Fiscal 2024 Form 10-K | 69 |
| | | | | | | | |
| Notes to Financial Statements | | |
6. Leases
The following table summarizes the components of lease cost:
| | | | | | | | | | | | | | | | | |
| | | | | |
| (in millions) | 2024 | | 2023 | | 2022 |
| Operating lease cost | $ | 120 | | | $ | 112 | | | $ | 117 | |
| | | | | |
| Finance lease cost | 39 | | | 31 | | | 23 | |
| | | | | |
| | | | | |
| | | | | |
| Variable lease cost | 31 | | | 21 | | | 13 | |
| | | | | |
| Total lease cost | $ | 190 | | | $ | 164 | | | $ | 153 | |
Variable lease cost primarily includes payments for property taxes, maintenance and insurance.
The following table summarizes supplemental balance sheet and other information related to leases at June 30:
| | | | | | | | | | | |
| (in millions) | 2024 | | 2023 |
| Operating Leases | | | |
| Operating lease right-of-use assets | $ | 475 | | | $ | 435 | |
| | | |
| Current portion of operating lease liabilities | 117 | | | 100 | |
| Long-term operating lease liabilities | 400 | | | 375 | |
| Total operating lease liabilities | 517 | | | 475 | |
| | | |
| Finance Leases | | | |
| Finance lease right-of-use assets | 102 | | | 82 | |
| | | |
| Current portion of finance lease liabilities | 33 | | | 27 | |
| Long-term finance lease liabilities | 75 | | | 59 | |
| Total finance lease liabilities | $ | 108 | | | $ | 86 | |
| | | |
| Weighted-average remaining lease term (years) | | | |
| Operating leases | 5.5 years | | 5.7 years |
| Finance leases | 4.1 years | | 4.1 years |
| | | |
| Weighted-average discount rate | | | |
| Operating leases | 4.1 | % | | 3.6 | % |
| Finance leases | 4.4 | % | | 3.1 | % |
Operating leases are included in other assets, other accrued liabilities and deferred income taxes and other liabilities in our consolidated balance sheets. Finance leases are included in property and equipment, net, current portion of long-term obligations and other short-term borrowings and long-term obligations, less current portion in our consolidated balance sheets.The following table summarizes supplemental cash flow information related to leases:
| | | | | | | | | | | | | | | | | |
| | | | | |
| (in millions) | 2024 | | 2023 | | 2022 |
| Cash paid for lease liabilities: | | | | | |
| Operating cash flows paid for operating leases | $ | 124 | | | $ | 119 | | | $ | 123 | |
| | | | | |
| Financing cash flows paid for finance leases | 36 | | | 31 | | | 21 | |
| Non-cash right-of-use assets obtained in exchange for lease obligations: | | | | | |
| New operating leases | 143 | | | 75 | | | 101 | |
| New finance leases | 55 | | | 42 | | | 28 | |
| | | | | |
Future lease payments under non-cancellable leases as of June 30, 2024 were as follows:
| | | | | | | | | | | | | | | | | | |
| (in millions) | Operating Leases | | Finance Leases | | Total | |
| | | | | | |
| 2025 | $ | 134 | | | $ | 37 | | | $ | 171 | | |
| 2026 | 114 | | | 30 | | | 144 | | |
| 2027 | 96 | | | 22 | | | 118 | | |
| 2028 | 78 | | | 13 | | | 91 | | |
| 2029 | 52 | | | 7 | | | 59 | | |
| Thereafter | 102 | | | 9 | | | 111 | | |
| Total future lease payments | 576 | | | 118 | | | 694 | | |
| | | | | | |
| Less: imputed interest | 59 | | | 10 | | | 69 | | |
| Total lease liabilities | $ | 517 | | | $ | 108 | | | $ | 625 | | |
| | | | | | |
| | | | | | |
| | | | | | |
| | | | | | |
| | | | | | |
| | | | | | |
| | | | | | |
7. Long-Term Obligations and Other Short-Term Borrowings
The following table summarizes long-term obligations and other short-term borrowings at June 30:
| | | | | | | | | | | |
| (in millions) (1) | 2024 | | 2023 |
| | | |
| | | |
| | | |
| | | |
| | | |
| | | |
| 3.079% Notes due 2024 | $ | — | | | $ | 764 | |
| 3.5% Notes due 2024 | 401 | | | 404 | |
| 3.75% Notes due 2025 | 507 | | | 513 | |
| 3.41% Notes due 2027 | 1,191 | | | 1,184 | |
| 5.125% Notes due 2029 | 644 | | | — | |
| 5.45% Notes due 2034 | 491 | | | — | |
| 4.6% Notes due 2043 | 308 | | | 306 | |
| 4.5% Notes due 2044 | 330 | | | 331 | |
| 4.9% Notes due 2045 | 423 | | | 428 | |
| 4.368% Notes due 2047 | 563 | | | 561 | |
| 7.0% Debentures due 2026 | 124 | | | 124 | |
| Other Obligations | 110 | | | 86 | |
| Total | 5,092 | | | 4,701 | |
| Less: current portion of long-term obligations and other short-term borrowings | 434 | | | 792 | |
| Long-term obligations, less current portion | $ | 4,658 | | | $ | 3,909 | |
(1) Maturities are presented on a calendar year basis.
Maturities of existing long-term obligations and other short-term borrowings for fiscal 2025 through 2029 and thereafter are as
| | | | | | | | |
70 | Cardinal Health | Fiscal 2024 Form 10-K | |
| | | | | | | | |
| Notes to Financial Statements | | |
follows: $438 million, $537 million, $1.3 billion, $13 million, $651 million and $2.1 billion.
Long-Term Debt
All the notes represent unsecured obligations of Cardinal Health, Inc. and rank equally in right of payment with all of our existing and future unsecured and unsubordinated indebtedness. The 7.0% Debentures represent unsecured obligations of Allegiance Corporation (a wholly-owned subsidiary), which Cardinal Health, Inc. has guaranteed. None of these obligations are subject to a sinking fund and the Allegiance obligations are not redeemable prior to maturity. Interest is paid pursuant to the terms of the obligations. These notes are effectively subordinated to the liabilities of our subsidiaries, including trade payables of $31.8 billion and $29.9 billion at June 30, 2024 and 2023, respectively.
During fiscal 2024, we issued additional debt with the aggregate principal amount of $1.15 billion to fund the repayment of all of the aggregate principal amount outstanding of our 3.5% Notes due 2024 and 3.079% Notes due 2024, at their respective maturities, and for general corporate purposes. During fiscal 2024, we repaid the full principal of $750 million of the 3.079% Notes due 2024 at maturity. The notes issued are $650 million aggregate principal amount of 5.125% Notes that mature on February 15, 2029 and $500 million aggregate principal amount of 5.45% Notes that mature on February 15, 2034. The proceeds of the notes issued, net of discounts, premiums, and debt issuance costs were $1.14 billion. A portion of the proceeds was invested in short-term time deposits of $550 million with initial effective maturities of more than three months. At June 30, 2024, we had $200 million remaining in those short-term time deposits and classified as prepaid expenses and other in our consolidated balance sheets.
During fiscal 2023, we repaid the full principal of $550 million of the 3.2% Notes due 2023 at maturity.
During fiscal 2022, we redeemed all outstanding $572 million principal amount of 2.616% Notes due 2022 at a redemption price equal to 100% of the principal amount and accrued but unpaid interest, plus the make-whole premium applicable to the notes. In connection with this redemption, we recorded a $10 million loss on early extinguishment of debt. We also repaid the full principal of the $282 million Floating Rate Notes due 2022 as they became due.
The repayments, redemptions and repurchases were paid for with available cash and other short-term borrowings.
If we undergo a change of control, as defined in the notes, and if the notes receive specified ratings below investment grade by each of Standard & Poor's Ratings Services, Moody’s Investors Services and Fitch Ratings, any holder of the notes, excluding the debentures, can require with respect to the notes owned by such holder, or we can offer, to repurchase the notes at 101% of the principal amount plus accrued and unpaid interest.
Other Financing Arrangements
In addition to cash and equivalents and operating cash flow, other sources of liquidity include a $2.0 billion commercial paper
program backed by a $2.0 billion revolving credit facility. We also have a $1.0 billion committed receivables sales facility.
In February 2023, we extended our $2.0 billion revolving credit facility through February 25, 2028. In September 2022, we renewed our committed receivables sales facility program through Cardinal Health Funding, LLC (“CHF”) through September 30, 2025. In September 2023, Cardinal Health 23 Funding, LLC ("CH-23 Funding") was added as a seller under our committed receivables sales facility. Each of CHF and CH-23 Funding was organized for the sole purpose of buying receivables and selling undivided interests in those receivables to third-party purchasers. Although consolidated with Cardinal Health, Inc. in accordance with GAAP, each of CHF and CH-23 Funding is a separate legal entity from Cardinal Health, Inc. and from our respective subsidiary that sells receivables to CHF or CH-23 Funding, as applicable. Each of CHF and CH-23 Funding is designed to be a special purpose, bankruptcy-remote entity whose assets are available solely to satisfy the claims of its respective creditors.
Our revolving credit and committed receivables sales facilities require us to maintain a consolidated net leverage ratio of no more than 3.75-to-1. As of June 30, 2024, we were in compliance with this financial covenant.
At June 30, 2024 and 2023, we had no amounts outstanding under the revolving credit facility; however, availability was reduced by outstanding letters of credit of $1 million at both June 30, 2024 and 2023.
During fiscal 2024, we had a daily maximum amount outstanding under our commercial paper and committed receivables programs of $1.3 billion.
We had no amounts outstanding as of June 30, 2024 under the committed receivables sales facility program; however, availability was reduced by outstanding standby letters of credit of $31 million at both June 30, 2024 and 2023.
We had no amounts outstanding under the commercial paper program as of June 30, 2024 and 2023.
The $110 million and $86 million balance of other obligations at June 30, 2024 and 2023, respectively, consisted of finance leases and short-term borrowings.
| | | | | | | | |
| Cardinal Health | Fiscal 2024 Form 10-K | 71 |
| | | | | | | | |
| Notes to Financial Statements | | |
8. Commitments, Contingent Liabilities and Litigation
Commitments
Generic Sourcing Venture with CVS Health
In July 2014, we established Red Oak Sourcing, LLC ("Red Oak Sourcing"), a U.S.-based generic pharmaceutical sourcing venture with CVS Health for an initial term of 10 years. Red Oak Sourcing negotiates generic pharmaceutical supply contracts on behalf of its participants. In August 2021, we amended our agreement to extend the term through June 2029. We are required to make quarterly payments to CVS Health for the term of the arrangement. These payments are included as purchase obligations and other payments in the "Contractual Obligations and Cash Requirements" section of MD&A.
Contingencies
New York Opioid Stewardship Act
In April 2018, the State of New York passed a budget which included the Opioid Stewardship Act (the "OSA"), which created an aggregate $100 million annual assessment on all manufacturers and distributors licensed to sell or distribute opioids in New York. Under the OSA, each licensed manufacturer and distributor was required to pay a portion of the assessment based on its share of the total morphine milligram equivalents sold or distributed in New York during the applicable calendar year, beginning in 2017. Subsequently, New York passed a new statute that modified the assessment going forward and limited the OSA to two years (2017 and 2018).
We accrue contingencies if it is probable that a liability has been incurred and the amount can be estimated. In connection with the OSA, we recorded an aggregate accrual of $41 million for calendar years 2017 and 2018 during fiscal 2021 based on the probable estimated payment amount. In the second quarter of fiscal 2022, we paid the State of New York $20 million, our portion of the assessment for calendar year 2017. At June 30, 2022, we had an accrual of $20 million, which represented our estimate of our portion of the assessment for calendar year 2018. During fiscal 2023, we recorded $6 million of income to reduce the previously estimated accrual to the invoiced amount for the calendar year 2018 assessment and we paid $11 million. At June 30, 2023, we had an outstanding liability of $3 million, which represented our best estimate of the remaining amount owed for calendar year 2018, and which was paid in full during the first quarter of fiscal 2024.
We, and other distributors, challenged the OSA as unconstitutional. In May 2024, the New York Appellate Division held that the 2017 assessment was unconstitutionally retroactive, directing a refund of assessments paid for calendar year 2017, but upheld the 2018 assessment. Both parties have appealed the decision of the New York Appellate Division to the New York Court of Appeals, the state's highest court. We have not recorded a receivable for any possible recoveries related to these assessments.
Legal Proceedings
We become involved from time to time in disputes, litigation and regulatory matters.
From time to time, we determine that products we distribute, source, manufacture or market do not meet our specifications, regulatory requirements, or published standards. When we or a regulatory agency identify a potential quality or regulatory issue, we investigate and take appropriate corrective action. Such actions have led to product recalls, costs to repair or replace affected products, temporary interruptions in product sales, restrictions on importation, product liability claims and lawsuits and can lead to action by regulators. Even absent an identified regulatory or quality issue or product recall, we can become subject to product liability claims and lawsuits.
From time to time, we become aware through employees, internal audits or other parties of possible compliance matters, such as complaints or concerns relating to accounting, internal accounting controls, financial reporting, auditing, or other ethical matters or relating to compliance with laws such as healthcare fraud and abuse, anti-corruption or anti-bribery laws. When we become aware of such possible compliance matters, we investigate internally and take appropriate corrective action. In addition, from time to time, we receive subpoenas or requests for information from various federal or state agencies relating to our business or to the business of a customer, supplier or other industry participants. Internal investigations, subpoenas or requests for information could directly or indirectly lead to the assertion of claims or the commencement of legal proceedings against us or result in sanctions.
We have been named from time to time in qui tam actions initiated by private third parties. In such actions, the private parties purport to act on behalf of federal or state governments, allege that false claims have been submitted for payment by the government and may receive an award if their claims are successful. After a private party has filed a qui tam action, the government must investigate the private party's claim and determine whether to intervene in and take control over the litigation. These actions may remain under seal while the government makes this determination. If the government declines to intervene, the private party may nonetheless continue to pursue the litigation on his or her own purporting to act on behalf of the government.
We accrue for contingencies related to disputes, litigation and regulatory matters if it is probable that a liability has been incurred and the amount of the loss can be reasonably estimated. Because these matters are inherently unpredictable and unfavorable developments or resolutions can occur, assessing contingencies is highly subjective and requires judgments about future events. We regularly review contingencies to determine whether our accruals and related disclosures are adequate. The amount of ultimate loss may differ from these estimates.
We recognize income from the favorable outcome of litigation when we receive the associated cash or assets.
We recognize estimated loss contingencies for certain litigation and regulatory matters and income from favorable resolution of
| | | | | | | | |
72 | Cardinal Health | Fiscal 2024 Form 10-K | |
| | | | | | | | |
| Notes to Financial Statements | | |
litigation in litigation (recoveries)/charges, net in our consolidated statements of earnings/(loss); however, losses and recoveries of lost profits from disputes that occur in the ordinary course of business are included within segment profit. For example, in the second quarter of fiscal 2022, our former Pharmaceutical segment profit was positively impacted by a $16 million judgment for lost profits related to an ordinary course intellectual property rights claim.
Opioid Lawsuits and Investigations
Cardinal Health, other pharmaceutical wholesalers and other participants in the pharmaceutical supply chain have been named as defendants in lawsuits related to the distribution of opioid pain medications. These lawsuits seek equitable relief and monetary damages based on a variety of legal theories, including various common law claims, such as public nuisance, negligence, unjust enrichment, personal injury, as well as violations of controlled substance laws, the Racketeer Influenced and Corrupt Organizations Act and various other statutes. Plaintiffs in these lawsuits include governmental entities, as well as private parties, such as unions and other health and welfare funds, hospital systems and other healthcare providers, businesses and individuals.
Additionally, we have received federal grand jury subpoenas issued in connection with investigations being conducted by the U.S. Attorney's Office for the Eastern District of New York and the Fraud Section of the U.S. Department of Justice ("DOJ"). We have also received civil requests for information, subpoenas and other requests from other DOJ offices. These investigations concern operation of our anti-diversion program, our anti-diversion policies and procedures and distribution of certain controlled substances. We are cooperating with these investigations. We are unable to predict the outcome of any of these investigations.
In total, as of June 30, 2024, we have $5.4 billion accrued for these matters, of which $643 million is included in other accrued liabilities and the remainder is included in deferred income taxes and other liabilities in our consolidated balance sheets. During fiscal 2024, we recognized expense of $340 million in connection with opioid-related matters, including agreements in principle with counsel representing classes of third-party payors and acute care hospitals, the case brought by the City of Baltimore, and a settlement with the State of Alabama. This expense was partially offset by a benefit of $105 million related to prepayments at a prenegotiated discount of certain future payments totaling $344 million.
Because loss contingencies are inherently unpredictable and unfavorable developments or resolutions can occur, the assessment is highly subjective and requires judgments about future events. We regularly review these opioid litigation matters to determine whether our accrual is adequate. The amount of ultimate loss may differ materially from this accrual, whether as a result of settlement discussions, a judicial decision or verdict or otherwise, but we are not able to estimate a range of reasonably possible additional losses for these matters. We continue to strongly dispute the allegations made in these lawsuits and none
of these agreements described below is an admission of liability or wrongdoing. Please see below for additional description of these matters.
States & Political Subdivisions
In 2022, we along with two other national distributors (collectively, the "Distributors") entered into the National Opioid Settlement Agreement to settle the vast majority of opioid lawsuits and claims brought by states and political subdivisions. In addition to the Distributors, parties to the National Opioid Settlement Agreement include 48 states, the District of Columbia and 5 U.S. territories. Over 99 percent of political subdivisions in settling states (by population as calculated under the National Opioid Settlement Agreement) that had brought opioid-related suits against us have chosen to join the National Opioid Settlement Agreement or have had their claims addressed by state legislation (together with settling states and territories, the “Settling Governmental Entities").
In February 2024, we finalized an agreement with the Alabama Attorney General, under which we agreed to pay approximately $123 million to the State of Alabama over a period of ten years to resolve opioid-related claims brought by the State and its political subdivisions (the "Alabama Settlement"). During fiscal 2024, we recognized a $22 million charge in litigation (recoveries)/charge, net in the consolidated statements of earnings/(loss) related to this agreement. Including the National Opioid Settlement Agreement, the Alabama Settlement and a prior settlement with the State of West Virginia, we have now resolved opioid-related claims brought by all 50 states and the District of Columbia.
Under the National Opioid Settlement Agreement, through July 2024, we have paid the Settling Governmental Entities approximately $1.9 billion which includes the January 2024 prepayment of certain future payment amounts described below. We expect to pay Settling Governmental Entities additional amounts up to $4.4 billion through 2038. The National Opioid Settlement Agreement also includes injunctive relief terms related to distributors’ controlled substance anti-diversion programs. A monitor is overseeing compliance with these provisions until 2027. In addition, the Distributors have engaged a third-party vendor to act as a clearinghouse for data aggregation and reporting, which distributors will fund for 10 years. As a result of the National Opioid Settlement Agreement, the vast majority of lawsuits brought against us by political subdivisions have been dismissed. We continue to engage in resolution discussions with certain nonparticipating political subdivisions. A trial in the case brought by the city of Baltimore, which is the largest remaining nonparticipating subdivision by population, is scheduled to begin in September 2024. We intend to defend ourselves vigorously against all remaining lawsuits.
Other Settlements
West Virginia subdivisions and Native American tribes were not a part of the National Opioid Settlement Agreement. In July 2022, a judgment in favor of the Distributors was entered in bench trial before a federal judge in West Virginia in a case brought by Cabell County and City of Huntington Plaintiffs have appealed this decision to the Fourth Circuit Court of Appeals.
| | | | | | | | |
| Cardinal Health | Fiscal 2024 Form 10-K | 73 |
| | | | | | | | |
| Notes to Financial Statements | | |
In 2022, we entered into separate agreements to settle the opioid-related claims of the majority of remaining West Virginia subdivisions and Native American Tribes for approximately $124 million over eleven years and $136 million over five years, respectively.
Prepayment of Future Payment Years
In January 2024, we made payments of approximately $239 million to prepay at a prenegotiated discount of certain future payment amounts totaling approximately $344 million owed under each of the National Opioid Settlement Agreement and the settlement agreements with West Virginia subdivisions, Native American tribes and Cherokee Nation. The majority of the prepayment relates to the seventh annual payment as due under the National Opioid Settlement Agreement. As a result of these prepayments, we recognized income of approximately $105 million in litigation charges/(recoveries), net in our consolidated statements of earnings/(loss) during fiscal 2024.
Private Plaintiffs
The National Opioid Settlement Agreement does not address claims by private parties, which includes unions and other health and welfare funds, hospital systems and other healthcare providers, businesses and individuals alleging personal injury. Lawsuits brought by private plaintiffs that were pending as of August 7, 2024 were approximately 371. Of these, 98 are purported class actions. The causes of action asserted by these plaintiffs are similar to those asserted by public plaintiffs. We are engaged in resolution discussions with certain private plaintiffs and have reached agreements in principle with counsel representing classes of third-party payors and acute care hospitals and have accrued $213 million in connection with those matters, which represents our anticipated share of those settlements. The agreements in principle remain subject to contingencies. A trial involving eight hospital plaintiffs scheduled to begin in Alabama in July 2024 was stayed pending finalization of the proposed settlement.
A trial in a case involving 21 plaintiffs began in state court in Georgia in January 2023 and concluded in March 2023 with a verdict for the company and other defendants on all claims. In July 2023, the judge denied the plaintiffs' motion for a new trial. Plaintiffs have filed a notice of appeal and defendants have filed a notice of cross-appeal. We are vigorously defending ourselves in all of these matters.
Insurance Litigation
We are involved in ongoing legal proceedings with insurers related to their obligations to reimburse us for defense and indemnity costs in connection with the lawsuits described above. During fiscal 2024, we received approximately $34 million in insurance recoveries related to these matters. We have not recorded a receivable for any additional recoveries related to these insurance litigation matters as of June 30, 2024.
Department of Justice Civil Investigative Demand
In November 2023, we received a Civil Investigative Demand ("CID") from the Department of Justice focused on potential violations of the Anti-Kickback Statute and False Claims Act in connection with a 2022 transaction in which we purchased a minority ownership interest in a rheumatology managed services organization and a group purchasing organization. We are cooperating with this investigation.
Cordis IVC Filter Matters
We have been named as a defendant in product liability lawsuits coordinated in Alameda County Superior Court in California involving claims by plaintiffs that allege personal injuries associated with the use of inferior vena cava ("IVC") filter products. These lawsuits sought a variety of remedies, including unspecified monetary damages. The divestiture of the Cordis business did not include product liability related to the IVC filters in the U.S. and Canada, which we retained.
In April 2023, we executed a settlement agreement that, if certain conditions are satisfied, will resolve approximately 4,375 claims for $275 million. This settlement agreement is subject to certain conditions, including certain opt-in thresholds. Between May and September 2023, we made settlement payments totaling $275 million into a qualified settlement fund, which will be disbursed to the plaintiffs if required conditions are satisfied. Since July 2021, while we have entered into agreements to settle the vast majority of IVC-related product liability claims, these settlements will not resolve all of them, and we intend to continue to vigorously defend ourselves in the remaining lawsuits.
We recognized income of $103 million during fiscal 2023, primarily related to a reduction of the reserve for the estimated settlement and defense costs for these matters due to the execution of the settlements noted above. At June 30, 2024, we had a total of $291 million accrued for losses and legal defense costs, related to the IVC filter product liability lawsuits in our consolidated balance sheets.
Other Civil Litigation
Generic Pharmaceutical Pricing Antitrust Litigation
In December 2019, pharmaceutical distributors including us were added as defendants in a civil class action lawsuit filed by indirect purchasers of generic drugs, such as hospitals and retail pharmacies. The indirect purchaser case is part of a multidistrict litigation consisting of multiple individual class action matters consolidated in the Eastern District of Pennsylvania. The indirect purchaser plaintiffs allege that pharmaceutical distributors encouraged manufacturers to increase prices, provided anti-competitive pricing information to manufacturers and improperly engaged in customer allocation. In May 2020, the court granted our motion to dismiss. In July 2022, the indirect purchasers filed an amended complaint and in August 2022, we filed a motion to dismiss the amended complaint. We are vigorously defending ourselves in this matter, which remains pending as of June 30, 2024.
| | | | | | | | |
74 | Cardinal Health | Fiscal 2024 Form 10-K | |
| | | | | | | | |
| Notes to Financial Statements | | |
Antitrust Litigation Proceeds
We recognized income for net recoveries in class action antitrust lawsuits in which we were a class member or plaintiff of $117 million, $130 million and $18 million during fiscal 2024, 2023 and 2022, respectively.
9. Income Taxes
Earnings/(Loss) before Income Taxes and Provision for/(Benefit From) Income Taxes
The following table summarizes earnings/(loss) before income taxes:
| | | | | | | | | | | | | | | | | |
| (in millions) | 2024 | | 2023 | | 2022 |
| U.S. operations | $ | 892 | | | $ | 316 | | | $ | (1,015) | |
| Non-U.S. operations | 309 | | | 347 | | | 231 | |
| Earnings/(loss) before income taxes | $ | 1,201 | | | $ | 663 | | | $ | (784) | |
The following table summarizes the components of provision for/(benefit from) income taxes:
| | | | | | | | | | | | | | | | | |
| (in millions) | 2024 | | 2023 | | 2022 |
| Current: | | | | | |
| Federal | $ | 305 | | | $ | 219 | | | $ | 16 | |
| State and local | 68 | | | 69 | | | 30 | |
| Non-U.S. | 79 | | | 84 | | | 93 | |
| Total current | $ | 452 | | | $ | 372 | | | $ | 139 | |
| | | | | |
| Deferred: | | | | | |
| Federal | $ | (89) | | | $ | (23) | | | $ | 42 | |
| State and local | 12 | | | 11 | | | (27) | |
| Non-U.S. | (27) | | | (28) | | | (1) | |
| Total deferred | $ | (104) | | | $ | (40) | | | $ | 14 | |
| Provision for/(benefit from) income taxes | $ | 348 | | | $ | 332 | | | $ | 153 | |
Tax Effects of Goodwill Impairment Charges
During fiscal 2024, 2023 and 2022, we recognized cumulative pre-tax goodwill impairment charges of $675 million, $1.2 billion and $2.1 billion, respectively, related to GMPD. The net tax benefits related to these charges were $58 million, $92 million and $140 million during fiscal 2024, 2023 and 2022, respectively.
Effective Tax Rate
The following table presents a reconciliation of the provision based on the federal statutory income tax rate to our effective income tax rate:
| | | | | | | | | | | | | | | | | |
| | 2024 | | 2023 | | 2022 |
| Provision at Federal statutory rate | 21.0 | % | | 21.0 | % | | 21.0 | % |
| State and local income taxes, net of federal benefit | 3.1 | | | 6.5 | | | 2.0 | |
| Tax effect of foreign operations | (1.6) | | | (5.4) | | | 4.7 | |
| Nondeductible/nontaxable items | (0.1) | | | (1.1) | | | 1.2 | |
| Impact of Divestitures | — | | | (1.9) | | | (4.8) | |
| Withholding Taxes | 1.0 | | | 1.0 | | | (1.1) | |
| Change in Valuation Allowances | (1.1) | | | (5.1) | | | 3.5 | |
US Taxes on International Income (2) | (2.1) | | | 0.6 | | | 1.9 | |
| | | | | |
| Impact of Resolutions with IRS and other related matters | 0.4 | | | 0.3 | | | 1.6 | |
| | | | | |
| | | | | |
| Opioid litigation | 1.0 | | | 0.1 | | | (0.5) | |
| Goodwill Impairment | 8.7 | | | 33.8 | | | (49.9) | |
| | | | | |
| Other | (1.4) | | | 0.2 | | | 0.9 | |
| Effective income tax rate | 28.9 | % | | 50.0 | % | | (19.5) | % |
(1) This table reflects fiscal 2024 and 2023 pretax income with tax expense, fiscal 2022 pretax loss with tax expense.
(2) Includes the tax impact of Global Intangible Low-Taxed Income ("GILTI") tax, the Foreign-Derived Intangible Income deduction and other foreign income that is taxable under the U.S. tax code.
The income tax rate was 28.9%, 50.0% and (19.5)% in fiscal 2024, 2023 and 2022, respectively. Fluctuations in the effective tax rates are primarily due to the impact of goodwill impairment in each of these fiscal years. Additionally, laws governing insurance coverage vary by state and some state courts have interpreted laws and insurance policies in ways that may impact our self-insurance loss, which could negatively impact our financial position.
Our effective tax rate has benefits from negotiated lower than statutory tax rates in select foreign jurisdictions which individually are not material to our effective tax rate but in aggregate had a favorable tax impact of approximately $23 million during fiscal 2024.
As of June 30, 2024, foreign earnings of approximately $1.0 billion are considered indefinitely reinvested for working capital and other offshore investment needs. The computation of tax required if those earnings are repatriated is not practicable. For amounts not considered indefinitely reinvested, we have recorded an immaterial amount of income tax expense in our consolidated financial statements in fiscal 2024.
Deferred Income Taxes
Deferred income taxes arise from temporary differences between financial reporting and tax reporting bases of assets and liabilities and operating loss and tax credit carryforwards for tax purposes.
| | | | | | | | |
| Cardinal Health | Fiscal 2024 Form 10-K | 75 |
| | | | | | | | |
| Notes to Financial Statements | | |
The following table presents the components of the deferred income tax assets and liabilities at June 30:
| | | | | | | | | | | |
| (in millions) | 2024 | | 2023 |
| Deferred income tax assets: | | | |
| Receivable basis difference | $ | 81 | | | $ | 74 | |
| Accrued liabilities | 749 | | | 704 | |
| Share-based compensation | 28 | | | 29 | |
| Loss and tax credit carryforwards | 512 | | | 672 | |
| Deferred tax assets related to uncertain tax positions | 45 | | | 39 | |
| Other | 76 | | | 58 | |
| Total deferred income tax assets | 1,491 | | | 1,576 | |
| Valuation allowance for deferred income tax assets | (300) | | | (421) | |
| Net deferred income tax assets | $ | 1,191 | | | $ | 1,155 | |
| | | |
| Deferred income tax liabilities: | | | |
| Inventory basis differences | $ | (1,122) | | | $ | (1,229) | |
| Property-related | (350) | | | (336) | |
| Goodwill and other intangibles | (710) | | | (624) | |
| Self-Insurance | (981) | | | (975) | |
| | | |
| Total deferred income tax liabilities | $ | (3,163) | | | $ | (3,164) | |
Net deferred income tax liability | $ | (1,972) | | | $ | (2,009) | |
Deferred income tax assets and liabilities in the preceding table, after netting by taxing jurisdiction and for uncertain tax positions, are in the following captions in the consolidated balance sheets at June 30:
| | | | | | | | | | | |
| (in millions) | 2024 | | 2023 |
| Noncurrent deferred income tax asset (1) | $ | 72 | | | $ | 53 | |
| Noncurrent deferred income tax liability (2) | (2,044) | | | (2,060) | |
| Noncurrent deferred income tax liability transferred to held for sale | — | | | (2) | |
| Net deferred income tax liability | $ | (1,972) | | | $ | (2,009) | |
(1)Included in other assets in the consolidated balance sheets.
(2)Included in deferred income taxes and other liabilities in the consolidated balance sheets.
At June 30, 2024 we had gross federal, state and international loss and credit carryforwards of $401 million, $10.7 billion and $1.1 billion, respectively, the tax effect of which is an aggregate deferred tax asset of $512 million. Substantially all of these carryforwards are available for at least three years. Approximately $288 million of the valuation allowance at June 30, 2024 applies to certain federal, state and international loss carryforwards that, in our opinion, are more likely than not to expire unutilized. However, to the extent that tax benefits related to these carryforwards are realized in the future, the reduction in the valuation allowance would reduce income tax expense.
Unrecognized Tax Benefits
We had $981 million, $1.0 billion and $948 million of unrecognized tax benefits at June 30, 2024, 2023 and 2022, respectively. The June 30, 2024, 2023 and 2022 balances include $882 million, $878 million and $866 million, respectively, of unrecognized tax
benefits that, if recognized, would have an impact on the effective tax rate. The remaining unrecognized tax benefits relate to tax positions for which ultimate deductibility is highly certain but for which there is uncertainty as to the timing of such deductibility. Recognition of these tax benefits would not affect our effective tax rate. We include the full amount of unrecognized tax benefits in deferred income taxes and other liabilities in the consolidated balance sheets. The following table presents a reconciliation of the beginning and ending amounts of unrecognized tax benefits:
| | | | | | | | | | | | | | | | | |
| (in millions) | 2024 | | 2023 | | 2022 |
| Balance at beginning of fiscal year | $ | 1,015 | | | $ | 948 | | | $ | 957 | |
| Additions for tax positions of the current year | 30 | | | 25 | | | 7 | |
| Additions for tax positions of prior years | 28 | | | 133 | | | 19 | |
| Reductions for tax positions of prior years | (87) | | | (16) | | | (19) | |
| Settlements with tax authorities | (3) | | | (73) | | | (12) | |
| Expiration of the statute of limitations | (2) | | | (2) | | | (4) | |
Balance at end of fiscal year | $ | 981 | | | $ | 1,015 | | | $ | 948 | |
It is reasonably possible that there could be a change in the amount of unrecognized tax benefits within the next 12 months due to activities of the U.S. Internal Revenue Service ("IRS") or other taxing authorities, possible settlement of audit issues, reassessment of existing unrecognized tax benefits or the expiration of statutes of limitations. We estimate that the range of the possible change in unrecognized tax benefits within the next 12 months is between zero and a net decrease of up to $20 million, exclusive of penalties and interest.
We recognize accrued interest and penalties related to unrecognized tax benefits in the provision for income taxes. At June 30, 2024, 2023 and 2022, we had $65 million, $65 million and $48 million, respectively, accrued for the payment of interest and penalties. These balances are gross amounts before any tax benefits and are included in deferred income taxes and other liabilities in the consolidated balance sheets. As a result of our IRS audit settlements and carryback claim, an immaterial amount of interest was recorded in fiscal 2024, 2023 and 2022.
Other Tax Matters
We file income tax returns in the U.S. federal jurisdiction, various U.S. state and local jurisdictions and various foreign jurisdictions. With few exceptions, we are subject to audit by taxing authorities for fiscal years 2015 through the current fiscal year.
Expiring or unusable loss and credit carryforwards and the required valuation allowances are adjusted quarterly based on available information. This information may support either an increase or a decrease in the required valuation allowance. After applying the valuation allowances, we do not anticipate any limitations on our use of any of the other net deferred income tax assets described above. We operate in a complex multinational tax environment and are subject to tax treaty arrangements and transfer pricing guidelines for intercompany transactions that are subject to interpretation. Uncertainty in a tax position may arise as tax laws are subject to interpretation.
| | | | | | | | |
76 | Cardinal Health | Fiscal 2024 Form 10-K | |
| | | | | | | | |
| Notes to Financial Statements | | |
10. Fair Value Measurements
The following tables present the fair values for assets and (liabilities) measured on a recurring basis at June 30:
| | | | | | | | | | | | | | | | | | | | | | | |
| 2024 |
| (in millions) | Level 1 | | Level 2 | | Level 3 | | Total |
| Assets: | | | | | | | |
| Cash equivalents | $ | 1,442 | | | $ | — | | | $ | — | | | $ | 1,442 | |
| | | | | | | |
| Other investments (1) | 108 | | | — | | | — | | | 108 | |
| Liabilities: | | | | | | | |
| Forward contracts (2) | — | | | (87) | | | — | | | (87) | |
| | | | | | | |
| | | | | | | |
| | | | | | | |
| | | | | | | |
| | | | | | | | | | | | | | | | | | | | | | | |
| 2023 |
| (in millions) | Level 1 | | Level 2 | | Level 3 | | Total |
| Assets: | | | | | | | |
| Cash equivalents | $ | 1,253 | | | $ | — | | | $ | — | | | $ | 1,253 | |
| | | | | | | |
| Other investments (1) | 101 | | | — | | | — | | | 101 | |
| | | | | | | |
| Liabilities: | | | | | | | |
| | | | | | | |
| Forward contracts (2) | — | | | (73) | | | — | | | (73) | |
(1)The other investments balance includes investments in mutual funds, which offset fluctuations in deferred compensation liabilities. These mutual funds invest in the equity securities of companies with both large and small market capitalization and high-quality fixed income debt securities. The fair value of these investments is determined using quoted market prices.
(2)The fair value of interest rate swaps, foreign currency contracts and net investment hedges is determined based on the present value of expected future cash flows considering the risks involved, including non-performance risk, and using discount rates appropriate for the respective maturities. Observable Level 2 inputs are used to determine the present value of expected future cash flows. The fair value of these derivative contracts, which are subject to master netting arrangements under certain circumstances, is presented on a gross basis in prepaid expenses and other, other assets, other accrued liabilities and deferred income taxes and other liabilities within the consolidated balance sheets.
Assets Measured on a Nonrecurring Basis
As discussed further in Note 3, on July 10, 2023, we closed the transaction to contribute the Outcomes™ business to TDS, a portfolio company of BlackRock Long Term Private Capital and GTCR, in exchange for a 16 percent equity interest in the combined entity. We accounted for this investment initially at its fair value using Level 3 unobservable inputs under the discounted cash flow method. Accordingly, we recognized a $147 million equity method investment at closing during the first quarter of fiscal 2024, which was recorded in Other Assets in our consolidated balance sheets.
11. Financial Instruments
We utilize derivative financial instruments to manage exposure to certain risks related to our ongoing operations. The primary risks managed through the use of derivative instruments include interest rate risk, currency exchange risk and commodity price risk. We do not use derivative instruments for trading or speculative purposes. While the majority of our derivative instruments are designated as hedging instruments, we also enter into derivative instruments that are designed to hedge a risk but are not designated as hedging
instruments. These derivative instruments are adjusted to current fair value through earnings at the end of each period. We are exposed to counterparty credit risk on all of our derivative instruments. Accordingly, we have established and maintain strict counterparty credit guidelines and only enter into derivative instruments with major financial institutions that are rated investment grade or better. We do not have significant exposure to any one counterparty and we believe the risk of loss is remote. Additionally, we do not require collateral under these agreements.
Interest Rate Risk Management
We are exposed to the impact of interest rate changes. Our objective is to manage the impact of interest rate changes on cash flows and the market value of our borrowings. We utilize a mix of debt maturities on our fixed-rate debt to manage changes in interest rates. In addition, we enter into interest rate swaps to further manage our exposure to interest rate variations related to our borrowings and to lower our overall borrowing costs.
Currency Exchange Risk Management
We conduct business in several major international currencies and are subject to risks associated with changing foreign exchange rates. Our objective is to reduce earnings and cash flow volatility associated with foreign exchange rate changes to allow management to focus its attention on business operations. Accordingly, we enter into various contracts that change in value as foreign exchange rates change to protect the value of existing foreign currency assets and liabilities, commitments and anticipated foreign currency revenue and expenses.
Commodity Price Risk Management
We are exposed to changes in the price of certain commodities. Our objective is to reduce earnings and cash flow volatility associated with forecasted purchases of these commodities to allow management to focus its attention on business operations. Accordingly, we enter into derivative contracts when possible to manage the price risk associated with certain forecasted purchases.
The following table summarizes the fair value of our assets and liabilities related to derivatives designated as hedging instruments and the respective line items in which they were recorded in the consolidated balance sheets at June 30:
| | | | | | | | | | | |
| (in millions) | 2024 | | 2023 |
| Assets: | | | |
| | | |
| | | |
| Cross-currency swap (1) | $ | 12 | | | $ | 23 | |
| Foreign currency contracts (1) | 1 | | | 5 | |
| Pay-floating interest rate swaps (1) | 3 | | | — | |
| | | |
| | | |
| Total assets | $ | 16 | | | $ | 28 | |
| | | |
| Liabilities: | | | |
| | | |
| Cross-currency swap (2) | $ | 1 | | | $ | 4 | |
| Foreign currency contracts (2) | 8 | | | 4 | |
| | | |
| Pay-floating interest rate swaps (2) | 94 | | | 93 | |
| | | |
| Total liabilities | $ | 103 | | | $ | 101 | |
| | | | | | | | |
| Cardinal Health | Fiscal 2024 Form 10-K | 77 |
| | | | | | | | |
| Notes to Financial Statements | | |
(1) Included in other assets in the consolidated balance sheets.
(2) Included in deferred income taxes and other liabilities in the consolidated balance sheets.
Fair Value Hedges
We enter into pay-floating interest rate swaps to hedge the changes in the fair value of fixed-rate debt resulting from fluctuations in interest rates. These contracts are designated and qualify as fair value hedges. Accordingly, the gain or loss recorded on the pay-floating interest rate swaps is directly offset by the change in fair value of the underlying debt. Both the derivative instrument and the underlying debt are adjusted to market value at the end of each period with any resulting gain or loss recorded in interest expense, net in the consolidated statements of earnings/(loss). During fiscal 2024, 2023 and 2022 there were no gains or losses recorded to interest expense as changes in the market value of our derivative instruments offset changes in the market value of the underlying debt.
During fiscal 2024, 2023 and 2022, we entered into pay-floating interest rate swaps with total notional amounts of $500 million, $300 million and $600 million, respectively. These swaps have been designated as fair value hedges of our fixed rate debt and are included in deferred income taxes and other liabilities in the consolidated balance sheets.
The following tables summarize the outstanding interest rate swaps designated as fair value hedges at June 30:
| | | | | | | | | | | | | | | | | |
| | 2024 |
| (in millions) | Notional Amount | | Maturity Date |
| Pay-floating interest rate swaps | $ | 1,600 | | | Jun 2027 | - | Feb 2031 |
| | | | | | | | | | | | | | | | | |
| 2023 |
| (in millions) | Notional Amount | | Maturity Date |
| Pay-floating interest rate swaps | $ | 1,100 | | | Jun 2027 | - | Sep 2030 |
The following table summarizes the gain/(loss) recognized in earnings for interest rate swaps designated as fair value hedges:
| | | | | | | | | | | | | | | | | |
| (in millions) | 2024 | | 2023 | | 2022 |
| Pay-floating interest rate swaps (1) | $ | 2 | | | $ | (50) | | | $ | (44) | |
| Fixed-rate debt (1) | (2) | | | 50 | | | 44 | |
| | | | | |
(1) Included in interest expense, net in the consolidated statements of earnings/(loss).
Cash Flow Hedges
We enter into derivative instruments to hedge our exposure to changes in cash flows attributable to interest rate, foreign currency and commodity price fluctuations associated with certain forecasted transactions. These derivative instruments are designated and qualify as cash flow hedges. Accordingly, the gain or loss on the derivative instrument is reported as a component of accumulated other comprehensive loss and reclassified into earnings in the same line item associated with the forecasted transaction and in the same period during which the hedged transaction affects earnings.
Losses currently included within accumulated other comprehensive loss associated with our cash flow hedges to be
reclassified into net earnings within the next 12 months are $6 million.
We enter into foreign currency contracts to protect the value of anticipated foreign currency revenues and expenses. At June 30, 2024 and 2023, we held contracts to hedge probable, but not firmly committed, revenue and expenses. The principal currencies hedged are the Canadian dollar, Mexican peso, Chinese renminbi, Thai baht and euro.
We enter into commodity contracts to manage the price risk associated with forecasted purchases of certain commodities used in our GMPD segment.
The following tables summarize the outstanding cash flow hedges at June 30:
| | | | | | | | | | | | | | | | | |
| | 2024 |
| (in millions) | Notional Amount | | Maturity Date |
| | | |
| Foreign currency contracts | $ | 401 | | | Jul 2024 | - | Jun 2025 |
| | | | | |
| | | | | | | | | | | | | | | | | |
| | 2023 |
| (in millions) | Notional Amount | | Maturity Date |
| | | |
| Foreign currency contracts | $ | 376 | | | Jul 2023 | - | Jun 2024 |
| | | | | |
The following table summarizes the pre-tax gain/(loss) included in OCI for derivative instruments designated as cash flow hedges:
| | | | | | | | | | | | | | | | | |
| (in millions) | 2024 | | 2023 | | 2022 |
| | | | | |
| | | | | |
| Foreign currency contracts | $ | (7) | | | $ | (2) | | | $ | 3 | |
The following table summarizes the pre-tax gain/(loss) reclassified from AOCI into earnings for derivative instruments designated as cash flow hedges:
| | | | | | | | | | | | | | | | | |
| (in millions) | 2024 | | 2023 | | 2022 |
| Foreign currency contracts (1) | $ | 1 | | | $ | 9 | | | $ | 5 | |
| Foreign currency contracts (2) | 4 | | | 2 | | | 1 | |
| Foreign currency contracts (3) | — | | | 1 | | | — | |
| Forward interest rate swaps (4) | 2 | | | 2 | | | 2 | |
| | | | | |
(1) Included in revenue in the consolidated statements of earnings/(loss).
(2) Included in cost of products sold in the consolidated statements of earnings/(loss).
(3) Included in SG&A expenses in the consolidated statements of earnings/(loss).
(4) Included in interest expense, net in the consolidated statements of earnings/(loss).
Net Investment Hedges
We hedge the foreign currency risk associated with certain net investment positions in foreign subsidiaries. To accomplish this, we enter into cross-currency swaps that are designated as hedges of net investments.
In June 2024, we terminated the ¥18 billion ($120 million) cross-currency swaps with a maturity date of June 2027 entered into in September 2023, and received net settlements in cash of $6 million, which was recorded in proceeds from net investment hedge terminations in our consolidated statements of cash flows.
| | | | | | | | |
78 | Cardinal Health | Fiscal 2024 Form 10-K | |
| | | | | | | | |
| Notes to Financial Statements | | |
In September 2023, we entered into ¥18 billion ($120 million) cross-currency swaps maturing in September 2025 and ¥18 billion ($120 million) cross-currency swaps maturing in June 2027.
In September 2023, we terminated the ¥38 billion ($300 million) cross-currency swaps entered into in January 2023 and received net settlement in cash of $28 million, recorded in proceeds from net investment hedge terminations in our consolidated statements of cash flows.
In January 2023, we entered into ¥19 billion ($150 million) cross-currency swaps maturing in September 2025 and ¥19 billion ($150 million) cross-currency swaps maturing in June 2027. In March 2023, we entered into €100 million ($107 million) cross-currency swaps maturing in March 2025, €100 million ($107 million) cross-currency swaps maturing in March 2026.
In January and March 2023, we terminated the ¥48 billion ($400 million) cross-currency swaps entered into in March 2022 and the €200 million ($233 million) cross-currency swap entered into in September 2018, respectively, and received net settlements in cash of $10 million and $19 million, respectively. These were recorded in proceeds from net investment hedge terminations in our consolidated statements of cash flows.
In March 2022, we entered into a ¥24 billion ($200 million) cross-currency swap maturing in September 2025 and a ¥24 billion ($200 million) cross-currency swap maturing in June 2027.
In March 2022, we terminated the ¥64 billion ($600 million) cross-currency swap entered into in August 2019 and received a net settlement in cash of $71 million recorded in proceeds from net investment hedge terminations in our consolidated statements of cash flows.
Cross-currency swaps designated as net investment hedges are marked-to-market using the current spot exchange rate as of the end of the period, with gains and losses included in the foreign currency translation component of accumulated other comprehensive loss until the sale or substantial liquidation of the underlying net investments. To the extent the cross-currency swaps designated as net investment hedges are not highly effective, changes in carrying value attributable to the change in spot rates are recorded in earnings.
Pre-tax gains and losses from net investment hedges recorded in the foreign currency translation component of accumulated other comprehensive loss were a $26 million gain and a $6 million loss during fiscal 2024 and 2023, respectively. Gains recognized in interest expense, net in the consolidated statements of earnings/(loss) for the portion of the net investment hedges excluded from the assessment of hedge effectiveness were $14 million and $16 million during fiscal 2024 and 2023, respectively.
Economic (Non-Designated) Hedges
We enter into foreign currency contracts to manage our foreign exchange exposure related to sales transactions, intercompany financing transactions and other balance sheet items subject to revaluation that do not meet the requirements for hedge accounting treatment. Accordingly, these derivative instruments are adjusted to current market value at the end of each period
through earnings. The gain or loss recorded on these instruments is substantially offset by the remeasurement adjustment on the foreign currency denominated asset or liability. The settlement of the derivative instrument and the remeasurement adjustment on the foreign currency denominated asset or liability are both recorded in other (income)/expense, net in the consolidated statements of earnings/(loss). The principal currencies managed through foreign currency contracts are the euro, Chinese renminbi, Canadian dollar, Indian rupee and British pound.
The following tables summarize the outstanding economic (non-designated) derivative instruments at June 30:
| | | | | | | | | | | | | | | | | |
| | 2024 |
| (in millions) | Notional Amount | | Maturity Date |
| Foreign currency contracts | $ | 178 | | | Jul 2024 |
| | | | | | | | | | | | | | | | | |
| | 2023 |
| (in millions) | Notional Amount | | Maturity Date |
| Foreign currency contracts | $ | 137 | | | Jul 2023 |
The following table summarizes the gain/(loss) recognized in earnings for economic (non-designated) derivative instruments:
| | | | | | | | | | | | | | | | | |
| (in millions) | 2024 | | 2023 | | 2022 |
Foreign currency contracts | $ | 1 | | | $ | (7) | | | $ | — | |
Fair Value of Financial Instruments
The carrying amounts of cash and equivalents, trade receivables, net, accounts payable and other accrued liabilities at June 30, 2024 and 2023 approximate fair value due to their short-term maturities.
The following table summarizes the estimated fair value of our long-term obligations and other short-term borrowings compared to the respective carrying amounts at June 30:
| | | | | | | | | | | |
| (in millions) | 2024 | | 2023 |
| Estimated fair value | $ | 4,891 | | | $ | 4,417 | |
| Carrying amount | 5,092 | | | 4,701 | |
The fair value of our long-term obligations and other short-term borrowings is estimated based on either the quoted market prices for the same or similar issues or other inputs derived from available market information, which represents a Level 2 measurement.
The following table is a summary of the fair value gain/(loss) of our derivative instruments based upon the estimated amount that we would receive (or pay), considering counter-party credit risk, to terminate the contracts at June 30:
| | | | | | | | | | | | | | | | | | | | | | | |
| 2024 | | 2023 |
| (in millions) | Notional
Amount | | Fair Value
Gain/(Loss) | | Notional
Amount | | Fair Value
Gain/(Loss) |
| Pay-floating interest rate swaps | $ | 1,600 | | | $ | (91) | | | $ | 1,100 | | | $ | (93) | |
| Foreign currency contracts | 579 | | | (7) | | | 513 | | | 1 | |
| | | | | | | |
| Cross-currency swap | 334 | | | 11 | | | 514 | | | 19 | |
| | | | | | | |
| | | | | | | | |
| Cardinal Health | Fiscal 2024 Form 10-K | 79 |
| | | | | | | | |
| Notes to Financial Statements | | |
12. Shareholders' Equity/(Deficit)
At June 30, 2024 and 2023, authorized capital shares consisted of the following: 750 million Class A common shares, without par value; 5 million Class B common shares, without par value; and 500 thousand non-voting preferred shares, without par value. The Class A common shares and Class B common shares are collectively referred to below as “common shares.” Holders of common shares are entitled to share equally in any dividends declared by the Board of Directors and to participate equally in all distributions of assets upon liquidation. Generally, the holders of Class A common shares are entitled to one vote per share, and the holders of Class B common shares are entitled to one-fifth of one vote per share on proposals presented to shareholders for vote. Under certain circumstances, the holders of Class B common shares are entitled to vote as a separate class. Only Class A common shares were outstanding at June 30, 2024 and 2023.
We repurchased $3.8 billion of our common shares, in the aggregate, through share repurchase programs during fiscal 2024, 2023 and 2022, as described below. We funded the repurchases with available cash. The common shares repurchased are held in treasury to be used for general corporate purposes.
During fiscal 2024, we repurchased 9.0 million common shares having an aggregate cost of $759 million. We repurchased 0.9 million, 5.7 million and 2.4 million common shares under multiple accelerated share repurchase ("ASR") programs with average prices paid per common share of $91.15, $88.22 and $103.67, respectively. These repurchases began on August 16, 2023 and concluded on December 13, 2023.
During fiscal 2023, we repurchased 24.6 million common shares having an aggregate cost of $2.0 billion. We repurchased 13.6 million, 3.2 million, 3.2 million and 4.6 million common shares under multiple ASR programs with average prices paid per common share of $73.36, $77.50, $77.27 and $87.18, respectively. These repurchases began on September 14, 2022 and concluded on August 16, 2023.
During fiscal 2022, we repurchased 19.5 million common shares having an aggregate cost of $1.0 billion. We repurchased 9.8 million, 6.1 million and 3.6 million common shares under multiple ASR programs with average prices paid per common share of $51.10, $49.39 and $56.02, respectively. These repurchases began on August 18, 2021 and concluded on April 18, 2022.
Accumulated Other Comprehensive Loss
The following table summarizes the changes in the balance of accumulated other comprehensive loss by component and in total:
| | | | | | | | | | | | | | | | | |
| (in millions) | Foreign
Currency
Translation
Adjustments and Other | | Unrealized
Gain/(Loss) on
Derivatives,
net of tax | | Accumulated Other
Comprehensive
Loss |
| Balance at June 30, 2022 | $ | (102) | | | $ | (12) | | | $ | (114) | |
| Other comprehensive loss, before reclassifications | (35) | | | 12 | | | (23) | |
| Amounts reclassified to earnings | — | | | (14) | | | (14) | |
Total other comprehensive loss attributable to Cardinal Health, Inc., net of tax benefit of $2 million | (35) | | | (2) | | | (37) | |
| Balance at June 30, 2023 | (137) | | | (14) | | | (151) | |
| Other comprehensive loss, before reclassifications | (1) | | | (7) | | | (8) | |
| Amounts reclassified to earnings | — | | | (8) | | | (8) | |
Total other comprehensive loss attributable to Cardinal Health, Inc., net of tax expense of $5 million | (1) | | | (15) | | | (16) | |
| Balance at June 30, 2024 | $ | (138) | | | $ | (29) | | | $ | (167) | |
13. Earnings/(Loss) Per Share Attributable to Cardinal Health, Inc.
The following table reconciles the computation of basic and diluted earnings per share attributable to Cardinal Health, Inc.:
| | | | | | | | | | | | | | | | | |
| (in millions, except per share amounts) | 2024 | | 2023 | | 2022 |
| Net earnings/(loss) | $ | 853 | | | $ | 331 | | | $ | (937) | |
| Net earnings attributable to noncontrolling interest | (1) | | | (1) | | | (1) | |
| | | | | |
| | | | | |
Net earnings/(loss) attributable to Cardinal Health, Inc. | $ | 852 | | | $ | 330 | | | $ | (938) | |
| Weighted-average common shares–basic | 245 | | | 261 | | | 279 | |
| Effect of dilutive securities: | | | | | |
| Employee stock options, restricted share units and performance share units | 2 | | | 1 | | | — | |
| Weighted-average common shares–diluted | 247 | | | 262 | | | 279 | |
| Basic earnings/(loss) per common share attributable to Cardinal Health, Inc.: | $ | 3.48 | | | $ | 1.27 | | | $ | (3.37) | |
| | | | | |
| | | | | |
| | | | | |
| | | | | |
| Diluted earnings/(loss) per common share attributable to Cardinal Health, Inc.: | 3.45 | | | 1.26 | | | (3.37) | |
| | | | | |
| | | | | |
| | | | | |
The potentially dilutive employee stock options, restricted share units and performance share units that were anti-dilutive for fiscal 2024, 2023 and 2022 were 1 million, 2 million and 5 million, respectively. During fiscal 2022, there were 1 million potentially dilutive employee stock options, restricted share units and performance share units, not included in the computation of diluted loss per common share attributable to Cardinal Health, Inc. because their effect would be anti-dilutive as a result of the net loss for the fiscal year.
| | | | | | | | |
80 | Cardinal Health | Fiscal 2024 Form 10-K | |
| | | | | | | | |
| Notes to Financial Statements | | |
14. Segment Information
Effective January 1, 2024, we operated under an updated organizational structure and re-aligned our reporting structure under two reportable segments: Pharmaceutical and Specialty Solutions segment and GMPD segment. All remaining operating segments that are not significant enough to require separate reportable segment disclosures are included in Other, which is comprised of Nuclear and Precision Health Solutions, at-Home Solutions and OptiFreight® Logistics. The factors for determining the reportable segments include the manner in which management evaluates performance for purposes of allocating resources and assessing performance combined with the nature of the individual business activities. Our previously reported segment results have been recast to conform to this re-aligned reporting structure and reflect changes in the elimination of inter-segment revenue and allocated corporate technology and shared function expenses, which are driven by the reporting structure change.
Our Pharmaceutical and Specialty Solutions segment distributes branded and generic pharmaceutical, specialty pharmaceutical and over-the-counter healthcare and consumer products in the United States. This segment also provides services to pharmaceutical manufacturers and healthcare providers for specialty pharmaceutical products; provides pharmacy management services to hospitals and operates a limited number of pharmacies, including pharmacies in community health centers; and repackages generic pharmaceuticals and over-the-counter healthcare products.
Our GMPD segment manufactures, sources and distributes Cardinal Health brand medical, surgical and laboratory products, which are sold in the United States, Canada, Europe, Asia and other markets. In addition to distributing Cardinal Health brand products, this segment also distributes a broad range of medical, surgical and laboratory products known as national brand products to hospitals, ambulatory surgery centers, clinical laboratories and other healthcare providers in the United States and Canada.
The remaining three non-reportable operating segments included in Other are Nuclear and Precision Health Solutions, at-Home Solutions and OptiFreight® Logistics. These operating segments respectively operate nuclear pharmacies and radiopharmaceutical manufacturing facilities, distribute medical products to patients' homes in the United States and provide supply chain services and solutions to our customers.
Revenue
The following table presents revenue for the two reportable segments and the remaining operating segments, included in Other, and Corporate:
| | | | | | | | | | | | | | | | | |
| (in millions) | 2024 | | 2023 | | 2022 |
| Pharmaceutical and Specialty Solutions | $ | 210,019 | | | $ | 188,814 | | | $ | 164,596 | |
| Global Medical Products and Distribution | 12,381 | | | 12,222 | | | 13,280 | |
| Other | 4,512 | | | 4,021 | | | 3,518 | |
| Total segment revenue | 226,912 | | | 205,057 | | | 181,394 | |
| Corporate (1) | (85) | | | (78) | | | (68) | |
| Total revenue | $ | 226,827 | | | $ | 204,979 | | | $ | 181,326 | |
(1)Corporate revenue consists of the elimination of inter-segment revenue and other revenue not allocated to the segments.
The following table presents revenue for the two reportable segments and disaggregated revenue within the remaining operating segments, included in Other, and Corporate:
| | | | | | | | | | | | | | | | | |
| (in millions) | 2024 | | 2023 | | 2022 |
| Pharmaceutical and Specialty Solutions | $ | 210,019 | | | $ | 188,814 | | | $ | 164,596 | |
| Global Medical Products and Distribution | 12,381 | | | 12,222 | | | 13,280 | |
Nuclear and Precision Health Solutions (2) | 1,369 | | | 1,197 | | | 911 | |
| at-Home Solutions | 2,869 | | | 2,584 | | | 2,394 | |
OptiFreight® Logistics | 274 | | | 240 | | | 213 | |
| Other | 4,512 | | | 4,021 | | | 3,518 | |
| Total segment revenue | 226,912 | | | 205,057 | | | 181,394 | |
| Corporate (1) | (85) | | | (78) | | | (68) | |
| Total revenue | $ | 226,827 | | | $ | 204,979 | | | $ | 181,326 | |
(1)Corporate revenue consists of the elimination of inter-segment revenue and other revenue not allocated to the segments.
(2)Increase in 2023 relates to new product launches and changes in revenue presentation from agent to principal for certain customer contracts.
The following table presents revenue by geographic area:
| | | | | | | | | | | | | | | | | |
| (in millions) | 2024 | | 2023 | | 2022 |
| United States | $ | 225,231 | | | $ | 203,440 | | | $ | 179,471 | |
| International | 1,681 | | | 1,617 | | | 1,923 | |
| Total segment revenue | 226,912 | | | 205,057 | | | 181,394 | |
| Corporate (1) | (85) | | | (78) | | | (68) | |
| Total revenue | $ | 226,827 | | | $ | 204,979 | | | $ | 181,326 | |
(1)Corporate revenue consists of the elimination of inter-segment revenue and other revenue not allocated to the segments.
| | | | | | | | |
| Cardinal Health | Fiscal 2024 Form 10-K | 81 |
| | | | | | | | |
| Notes to Financial Statements | | |
Segment Profit
We evaluate segment performance based on segment profit, among other measures. Segment profit is segment revenue, less segment cost of products sold, less segment distribution, selling, general and administrative ("SG&A") expenses. Segment SG&A expenses include share-based compensation expense as well as allocated corporate technology and shared functions expenses, including corporate management, corporate finance, financial and customer care shared services, human resources, information technology and legal and compliance, including certain litigation defense costs. Corporate expenses are allocated to the operating segments based on headcount, level of benefit provided and other ratable allocation methodologies. The results attributable to noncontrolling interests are recorded within segment profit.
We do not allocate the following items to our segments:
•last-in first-out, or ("LIFO"), inventory charges/(credits);
•state opioid assessment related to prior fiscal years;
•shareholder cooperation agreement costs;
•restructuring and employee severance;
•amortization and other acquisition-related costs;
•impairments and (gain)/loss on disposal of assets, net; in connection with goodwill impairment testing for the GMPD segment as discussed further in Note 5, we recognized pre-tax goodwill impairment charges of $675 million, $1.2 billion and $2.1 billion during fiscal 2024, 2023 and 2022, respectively; •litigation (recoveries)/charges, net;
•other (income)/expense, net;
•interest expense, net;
•loss on early extinguishment of debt; or
•provision for/(benefit from) income taxes
In addition, certain investment spending, certain portions of enterprise-wide incentive compensation and other spending are not allocated to the segments. Investment spending generally includes the first-year spend for certain projects that require incremental investments in the form of additional operating expenses. Because approval for these projects is dependent on executive management, we retain these expenses at Corporate. Investment spending within Corporate was $59 million, $35 million and $50 million for fiscal 2024, 2023 and 2022, respectively.
The following table presents segment profit for the two reportable segments and the remaining operating segments, included in Other, and Corporate:
| | | | | | | | | | | | | | | | | |
| (in millions) | 2024 | | 2023 | | 2022 |
| Pharmaceutical and Specialty Solutions | $ | 2,015 | | | $ | 1,881 | | | $ | 1,643 | |
| Global Medical Products and Distribution | 92 | | | (147) | | | (64) | |
Other | 423 | | | 396 | | | 390 | |
| Total segment profit | 2,530 | | | 2,130 | | | 1,969 | |
| Corporate | (1,287) | | | (1,378) | | | (2,576) | |
| Total operating earnings/(loss) | $ | 1,243 | | | $ | 752 | | | $ | (607) | |
The following tables present depreciation and amortization and additions to property and equipment for the two reportable segments and the remaining operating segments, included in Other, and Corporate:
| | | | | | | | | | | | | | | | | |
| (in millions) | 2024 | | 2023 | | 2022 |
| Pharmaceutical and Specialty Solutions | $ | 184 | | | $ | 194 | | | $ | 170 | |
| Global Medical Products and Distribution | 205 | | | 173 | | | 176 | |
| Other | 79 | | | 71 | | | 65 | |
| Corporate | 242 | | | 254 | | | 281 | |
| Total depreciation and amortization | $ | 710 | | | $ | 692 | | | $ | 692 | |
| | | | | | | | | | | | | | | | | |
| (in millions) | 2024 | | 2023 | | 2022 |
| Pharmaceutical and Specialty Solutions | $ | 76 | | | $ | 56 | | | $ | 54 | |
| Global Medical Products and Distribution | 136 | | | 191 | | | 135 | |
| Other | 81 | | | 52 | | | 30 | |
| Corporate | 218 | | | 182 | | | 168 | |
| Total additions to property and equipment | $ | 511 | | | $ | 481 | | | $ | 387 | |
The following table presents total assets for the two reportable segments and the remaining operating segments, included in Other, and Corporate at June 30:
| | | | | | | | | | | | | |
| (in millions) | 2024 | | 2023 | | |
| Pharmaceutical and Specialty Solutions | $ | 29,149 | | | $ | 27,715 | | | |
| Global Medical Products and Distribution (1) | 7,047 | | | 7,903 | | | |
| Other | 2,606 | | | 2,514 | | | |
| Corporate | 6,319 | | | 5,217 | | | |
| Total assets | $ | 45,121 | | | $ | 43,349 | | | |
(1)GMPD reflects a $675 million reduction in goodwill due to pre-tax impairment charges recorded during fiscal 2024.
The following table presents property and equipment, net by geographic area:
| | | | | | | | | | | | | |
| (in millions) | 2024 | | 2023 | | |
| United States | $ | 2,106 | | | $ | 2,025 | | | |
| International | 423 | | | 436 | | | |
| Property and equipment, net | $ | 2,529 | | | $ | 2,461 | | | |
| | | | | | | | |
82 | Cardinal Health | Fiscal 2024 Form 10-K | |
| | | | | | | | |
| Notes to Financial Statements | | |
15. Share-Based Compensation
We maintain stock incentive plans (collectively, the “Plans”) for the benefit of certain of our officers, directors and employees. At June 30, 2024, 18 million shares remain available for future grants under the Cardinal Health, Inc. 2021 Long-Term Incentive Plan ("2021 LTIP"). Under the 2021 LTIP's fungible share counting provisions, stock options are counted against the plan as one share for every share issued; awards other than stock options are counted against the plan as two and one-half shares for every share issued. This means that only 7 million shares could be issued under awards other than stock options while 18 million shares could be issued under stock options. Shares are issued out of treasury shares when stock options are exercised and when restricted share units and performance share units vest. Until the end of fiscal 2018, stock options were granted to our officers and certain employees. There were no stock options granted to employees during fiscal 2024, 2023 or 2022.
During fiscal 2024, we modified the equity incentive awards of four employees to amend provisions over involuntary termination. We recognized incremental share-based compensation expense of $9 million.
The following table provides total share-based compensation expense by type of award:
| | | | | | | | | | | | | | | | | |
| (in millions) | 2024 | | 2023 | | 2022 |
| Restricted share unit expense | $ | 77 | | | $ | 64 | | | $ | 69 | |
| Performance share unit expense | 44 | | | 32 | | | 12 | |
Total share-based compensation expense | $ | 121 | | | $ | 96 | | | $ | 81 | |
The total tax benefit related to share-based compensation was $16 million for fiscal 2024 and $12 million for both fiscal 2023 and 2022.
Restricted Share Units
Restricted share units granted under the Plans generally vest in equal annual installments over three years. Restricted share units accrue cash dividend equivalents that are payable upon vesting of the awards.
The following table summarizes all transactions related to restricted share units under the Plans:
| | | | | | | | | | | |
| (in millions, except per share amounts) | Restricted Share Units | | Weighted-Average
Grant Date Fair
Value per Share |
| Nonvested at June 30, 2022 | 2.7 | | | $ | 46.03 | |
| Granted | 1.3 | | | 70.33 | |
| Vested | (1.4) | | | 50.11 | |
| Canceled and forfeited | (0.4) | | | 58.46 | |
| Nonvested at June 30, 2023 | 2.2 | | | 57.37 | |
| Granted | 0.9 | | | 91.06 | |
| Vested | (1.2) | | | 60.47 | |
| Canceled and forfeited | (0.2) | | | 74.40 | |
| Nonvested at June 30, 2024 | 1.7 | | | $ | 70.98 | |
The following table provides additional data related to restricted share unit activity:
| | | | | | | | | | | | | | | | | |
| (in millions) | 2024 | | 2023 | | 2022 |
| Total compensation cost, net of estimated forfeitures, related to nonvested restricted share and share unit awards not yet recognized, pre-tax | $ | 71 | | | $ | 73 | | | $ | 73 | |
| Weighted-average period in years over which restricted share and share unit cost is expected to be recognized (in years) | 2 | | 2 | | 2 |
| Total fair value of shares vested during the year | $ | 63 | | | $ | 58 | | | $ | 74 | |
Performance Share Units
Performance share units generally vest over a three-year performance period based on achievement of specific performance goals. Based on the extent to which the performance goals are achieved and the Company's TSR relative to the S&P 500 Health Care Index, vested shares may range from zero to 240 percent of the target award amount. Performance share units accrue cash dividend equivalents that are payable upon vesting of the awards.
The following table summarizes all transactions related to performance share units under the Plans (based on target award amounts):
| | | | | | | | | | | |
| (in millions, except per share amounts) | Performance
Share Units | | Weighted-Average
Grant Date Fair
Value per Share |
| Nonvested at June 30, 2022 | 1.2 | | | $ | 54.32 | |
| Granted | 0.7 | | | 78.07 | |
| Vested | (0.4) | | | 59.04 | |
| Canceled and forfeited | (0.3) | | | 65.52 | |
| Nonvested at June 30, 2023 | 1.2 | | | 82.17 | |
| Granted | 0.5 | | | 94.66 | |
| Vested | (0.4) | | | 62.26 | |
| Canceled and forfeited | — | | | — | |
| Nonvested at June 30, 2024 | 1.3 | | | $ | 97.03 | |
The following table provides additional data related to performance share unit activity:
| | | | | | | | | | | | | | | | | |
| (in millions) | 2024 | | 2023 | | 2022 |
| Total compensation cost, net of estimated forfeitures, related to nonvested performance share units not yet recognized, pre-tax | $ | 46 | | | $ | 38 | | | $ | 17 | |
| Weighted-average period over which performance share unit cost is expected to be recognized (in years) | 2 | | 2 | | 2 |
| Total fair value of shares vested during the year | $ | 20 | | | $ | 23 | | | $ | 14 | |
Employee Retirement Savings Plans
Substantially all of our domestic non-union employees are eligible to be enrolled in our company-sponsored contributory retirement savings plans, which include features under Section 401(k) of the Internal Revenue Code of 1986 and provide for matching and discretionary contributions by us. The total expense for our employee retirement savings plans was $65 million, $66 million and $60 million for fiscal 2024, 2023 and 2022, respectively.
| | | | | | | | |
| Cardinal Health | Fiscal 2024 Form 10-K | 83 |
| | | | | | | | |
| Notes to Financial Statements | | |
16. Revision of Previously Issued Financial Statements (Unaudited)
The amounts below reflect the unaudited interim periods within fiscal 2024 and include the revisions to previously filed unaudited interim condensed consolidated financial data to correct immaterial prior period errors as discussed in Note 1. We intend to reflect these revisions in our Quarterly Reports to be filed on Form 10-Q in fiscal 2025. The following tables set forth our revisions to the condensed consolidated statements of earnings/(loss) for each of the first three quarters in fiscal 2024 and fiscal 2023.
| | | | | | | | | | | | | | | | | | | | | | | | | | | | | | | | | | | | | | | | | | | | | | | | | | | | | |
| Three Months Ended September 30, 2023 | | Three Months Ended December 31, 2023 | | Three Months Ended March 31, 2024 |
| (in millions, except per common share amounts) | As Reported | | Adjustment | | As Revised | | As Reported | | Adjustment | | As Revised | | As Reported | | Adjustment | | As Revised |
| Revenue | $ | 54,763 | | | $ | (113) | | | $ | 54,650 | | | $ | 57,445 | | | $ | (3) | | | $ | 57,442 | | | $ | 54,911 | | | $ | (43) | | | $ | 54,868 | |
| Cost of products sold | 52,995 | | | (88) | | | 52,907 | | | 55,599 | | | (11) | | | 55,588 | | | 52,964 | | | (31) | | | 52,933 | |
| Gross margin | 1,768 | | | (25) | | | 1,743 | | | 1,846 | | | 8 | | | 1,854 | | | 1,947 | | | (12) | | | 1,935 | |
| | | | | | | | | | | | | | | | | |
| | | | | | | | | | | | | | | | | |
| Distribution, selling, general and administrative expenses | 1,197 | | | (11) | | | 1,186 | | | 1,283 | | | (15) | | | 1,268 | | | 1,282 | | | (13) | | | 1,269 | |
| | | | | | | | | | | | | | | | | |
| | | | | | | | | | | | | | | | | |
| Impairments and (gain)/loss on disposal of assets, net | 537 | | | 4 | | | 541 | | | 1 | | | — | | | 1 | | | 84 | | | — | | | 84 | |
| Litigation (recoveries)/charges, net | (41) | | | — | | | (41) | | | (11) | | | — | | | (11) | | | 81 | | | (1) | | | 80 | |
| Operating earnings/(loss) | (14) | | | (18) | | | (32) | | | 482 | | | 23 | | | 505 | | | 367 | | | 2 | | | 369 | |
| | | | | | | | | | | | | | | | | |
| Other (income)/expense, net | (2) | | | 3 | | | 1 | | | (16) | | | 6 | | | (10) | | | (7) | | | 6 | | | (1) | |
| Interest expense, net | 14 | | | (3) | | | 11 | | | 8 | | | (5) | | | 3 | | | 33 | | | (5) | | | 28 | |
| | | | | | | | | | | | | | | | | |
| | | | | | | | | | | | | | | | | |
| Earnings/(loss) before income taxes | (26) | | | (18) | | | (44) | | | 490 | | | 22 | | | 512 | | | 341 | | | 1 | | | 342 | |
| | | | | | | | | | | | | | | | | |
| Provision for/(benefit from) income taxes | (32) | | | (1) | | | (33) | | | 136 | | | 7 | | | 143 | | | 82 | | | (2) | | | 80 | |
| Net earnings/(loss) | 6 | | | (17) | | | (11) | | | 354 | | | 15 | | | 369 | | | 259 | | | 3 | | | 262 | |
| | | | | | | | | | | | | | | | | |
| | | | | | | | | | | | | | | | | |
| Net earnings/(loss) attributable to Cardinal Health, Inc. | 5 | | | (17) | | | (12) | | | 353 | | | 15 | | | 368 | | | 258 | | | 3 | | | 261 | |
| | | | | | | | | | | | | | | | | |
| Earnings/(loss) per common share attributable to Cardinal Health, Inc. | | | | | | | | | | | | | | | | | |
| Basic | $ | 0.02 | | | $ | (0.07) | | | $ | (0.05) | | | $ | 1.44 | | | $ | 0.06 | | | $ | 1.50 | | | $ | 1.06 | | | $ | 0.01 | | | $ | 1.07 | |
| Diluted | 0.02 | | | (0.07) | | | (0.05) | | | 1.43 | | | 0.07 | | | 1.50 | | | 1.05 | | | 0.02 | | | 1.07 | |
| | | | | | | | | | | | | | | | | |
| | | | | | | | | | | | | | | | | |
| | | | | | | | | | | | | | | | | |
| | | | | | | | | | | | | | | | | |
| | | | | | | | |
84 | Cardinal Health | Fiscal 2024 Form 10-K | |
| | | | | | | | |
| Notes to Financial Statements | | |
| | | | | | | | | | | | | | | | | | | | | | | | | | | | | | | | | | | | | | | | | | | | | | | | | | | | | |
| Three Months Ended September 30, 2022 | | Three Months Ended December 31, 2022 | | Three Months Ended March 31, 2023 |
| (in millions, except per common share amounts) | As Reported | | Adjustment | | As Revised | | As Reported | | Adjustment | | As Revised | | As Reported | | Adjustment | | As Revised |
| Revenue | $ | 49,603 | | | $ | (11) | | | $ | 49,592 | | | $ | 51,469 | | | $ | (1) | | | $ | 51,468 | | | $ | 50,487 | | | $ | 11 | | | $ | 50,498 | |
| Cost of products sold | 47,989 | | | 7 | | | 47,996 | | | 49,806 | | | (22) | | | 49,784 | | | 48,702 | | | (14) | | | 48,688 | |
| Gross margin | 1,614 | | | (18) | | | 1,596 | | | 1,663 | | | 21 | | | 1,684 | | | 1,785 | | | 25 | | | 1,810 | |
| | | | | | | | | | | | | | | | | |
| | | | | | | | | | | | | | | | | |
| Distribution, selling, general and administrative expenses | 1,197 | | | (2) | | | 1,195 | | | 1,191 | | | (12) | | | 1,179 | | | 1,179 | | | (7) | | | 1,172 | |
| | | | | | | | | | | | | | | | | |
| | | | | | | | | | | | | | | | | |
| | | | | | | | | | | | | | | | | |
| Litigation (recoveries)/charges, net | 27 | | | (2) | | | 25 | | | (207) | | | — | | | (207) | | | (76) | | | — | | | (76) | |
| Operating earnings/(loss) | 137 | | | (14) | | | 123 | | | (119) | | | 33 | | | (86) | | | 572 | | | 32 | | | 604 | |
| | | | | | | | | | | | | | | | | |
| Other (income)/expense, net | 2 | | | 1 | | | 3 | | | (7) | | | 1 | | | (6) | | | — | | | 2 | | | 2 | |
| Interest expense, net | 25 | | | (1) | | | 24 | | | 25 | | | (1) | | | 24 | | | 28 | | | (2) | | | 26 | |
| | | | | | | | | | | | | | | | | |
| | | | | | | | | | | | | | | | | |
| Earnings/(loss) before income taxes | 110 | | | (14) | | | 96 | | | (137) | | | 33 | | | (104) | | | 544 | | | 32 | | | 576 | |
| | | | | | | | | | | | | | | | | |
| Provision for/(benefit from) income taxes | (1) | | | (2) | | | (3) | | | (7) | | | (20) | | | (27) | | | 197 | | | 12 | | | 209 | |
| Net earnings/(loss) | 111 | | | (12) | | | 99 | | | (130) | | | 53 | | | (77) | | | 347 | | | 20 | | | 367 | |
| | | | | | | | | | | | | | | | | |
| | | | | | | | | | | | | | | | | |
| Net earnings/(loss) attributable to Cardinal Health, Inc. | 110 | | | (12) | | | 98 | | | (130) | | | 53 | | | (77) | | | 345 | | | 20 | | | 365 | |
| | | | | | | | | | | | | | | | | |
| Earnings/(loss) per common share attributable to Cardinal Health, Inc. | | | | | | | | | | | | | | | | | |
| Basic | $ | 0.41 | | | $ | (0.05) | | | $ | 0.36 | | | $ | (0.50) | | | $ | 0.20 | | | $ | (0.30) | | | $ | 1.35 | | | $ | 0.08 | | | $ | 1.43 | |
| Diluted | 0.40 | | | (0.04) | | | 0.36 | | | (0.50) | | | 0.20 | | | (0.30) | | | 1.34 | | | 0.07 | | | 1.41 | |
| | | | | | | | | | | | | | | | | |
| | | | | | | | | | | | | | | | | |
| | | | | | | | | | | | | | | | | |
| | | | | | | | | | | | | | | | | |
The following tables set forth our revisions to the condensed consolidated statements of comprehensive income/(loss) for each of the first three quarters in fiscal 2024 and fiscal 2023.
| | | | | | | | | | | | | | | | | | | | | | | | | | | | | | | | | | | | | | | | | | | | | | | | | | | | | | | | |
| Three Months Ended September 30, 2023 | | Three Months Ended December 31, 2023 | | Three Months Ended March 31, 2024 | | | |
| (in millions) | As Reported | | Adjustment | | As Revised | | As Reported | | Adjustment | | As Revised | | As Reported | | Adjustment | | As Revised | | | |
| Net earnings/(loss) | $ | 6 | | | $ | (17) | | | $ | (11) | | | $ | 354 | | | $ | 15 | | | $ | 369 | | | $ | 259 | | | $ | 3 | | | $ | 262 | | | | |
| | | | | | | | | | | | | | | | | | | | |
| | | | | | | | | | | | | | | | | | | | |
| | | | | | | | | | | | | | | | | | | | |
| | | | | | | | | | | | | | | | | | | | |
| | | | | | | | | | | | | | | | | | | | |
Total comprehensive income/(loss), net of tax | (8) | | | (17) | | | (25) | | | 364 | | | 15 | | | 379 | | | 254 | | | 3 | | | 257 | | | | |
| | | | | | | | | | | | | | | | | | | | |
Total comprehensive income/(loss) attributable to Cardinal Health, Inc. | (9) | | | (17) | | | (26) | | | 363 | | | 15 | | | 378 | | | 253 | | | 3 | | | 256 | | | | |
| | | | | | | | | | | | | | | | | | | | |
| | | | | | | | | | | | | | | | | | | | |
| | | | | | | | | | | | | | | | | | | | |
| | | | | | | | | | | | | | | | | | | | | | | | | | | | | | | | | | | | | | | | | | | | | | | | | | | | | |
| Three Months Ended September 30, 2022 | | Three Months Ended December 31, 2022 | | Three Months Ended March 31, 2023 |
| (in millions) | As Reported | | Adjustment | | As Revised | | As Reported | | Adjustment | | As Revised | | As Reported | | Adjustment | | As Revised |
| Net earnings/(loss) | $ | 111 | | | $ | (12) | | | $ | 99 | | | $ | (130) | | | $ | 53 | | | $ | (77) | | | $ | 347 | | | $ | 20 | | | $ | 367 | |
| | | | | | | | | | | | | | | | | |
| | | | | | | | | | | | | | | | | |
| | | | | | | | | | | | | | | | | |
| | | | | | | | | | | | | | | | | |
| | | | | | | | | | | | | | | | | |
Total comprehensive income/(loss), net of tax | 49 | | | (12) | | | 37 | | | (100) | | | 53 | | | (47) | | | 351 | | | 20 | | | 371 | |
| | | | | | | | | | | | | | | | | |
Total comprehensive income/(loss) attributable to Cardinal Health, Inc. | 48 | | | (12) | | | 36 | | | (100) | | | 53 | | | (47) | | | 349 | | | 20 | | | 369 | |
| | | | | | | | | | | | | | | | | |
| | | | | | | | | | | | | | | | | |
| | | | | | | | | | | | | | | | | |
| | | | | | | | |
| Cardinal Health | Fiscal 2024 Form 10-K | 85 |
| | | | | | | | |
| Schedule II | Valuation and Qualifying Accounts | |
Cardinal Health, Inc. and Subsidiaries
Schedule II - Valuation and Qualifying Accounts
| | | | | | | | | | | | | | | | | | | | | | | | | | | | | |
| (in millions) | Balance at
Beginning of Period | | Charged to Costs
and Expenses (1) | | Charged to
Other Accounts (2) | | Deductions (3) | | Balance at
End of Period |
| Fiscal 2024 | | | | | | | | | |
| Accounts receivable | $ | 240 | | | $ | 108 | | | $ | — | | | $ | (115) | | | $ | 233 | |
| Finance notes receivable | 6 | | | 2 | | | — | | | (5) | | | 3 | |
| Sales returns and allowances | 474 | | | 2,207 | | | — | | | (2,240) | | | 441 | |
| | | | | | | | | |
| $ | 720 | | | $ | 2,317 | | | $ | — | | | $ | (2,360) | | | $ | 677 | |
| | | | | | | | | |
| Fiscal 2023 | | | | | | | | | |
| Accounts receivable | $ | 207 | | | $ | 165 | | | $ | — | | | $ | (132) | | | $ | 240 | |
| Finance notes receivable | 8 | | | — | | | — | | | (2) | | | 6 | |
| Sales returns and allowances | 617 | | | 2,217 | | | — | | | (2,360) | | | 474 | |
| | | | | | | | | |
| $ | 832 | | | $ | 2,382 | | | $ | — | | | $ | (2,494) | | | $ | 720 | |
| | | | | | | | | |
| Fiscal 2022 | | | | | | | | | |
| Accounts receivable | $ | 176 | | | $ | 109 | | | $ | 1 | | | $ | (79) | | | $ | 207 | |
| Finance notes receivable | 12 | | | 1 | | | — | | | (5) | | | 8 | |
| Sales returns and allowances | 689 | | | 2,359 | | | — | | | (2,431) | | | 617 | |
| | | | | | | | | |
| $ | 877 | | | $ | 2,469 | | | $ | 1 | | | $ | (2,515) | | | $ | 832 | |
(1)Fiscal 2024, 2023 and 2022 accounts receivable operating earnings impacts include $74 million, $109 million and $87 million, respectively, for reserves related to service charges and customer disputes, excluded from provision for bad debts on the consolidated statements of cash flows and classified as a reduction in revenue in the consolidated statements of earnings/(loss).
(2)Recoveries of amounts provided for or written off in prior years were immaterial in fiscal 2024 and 2023 and $1 million in fiscal 2022.
(3)Write-off of uncollectible accounts or actual sales returns.
Amounts have been revised to reflect the correction of certain immaterial misstatements. Refer to Note 1 of the "Notes to Consolidated Financial Statements" for additional information. The sum of the components may not equal the total due to rounding.
| | | | | | | | |
86 | Cardinal Health | Fiscal 2024 Form 10-K | |
| | | | | | | | |
| Directors, Executive Officers, and Corporate Governance | | |
Directors, Executive Officers and Corporate Governance
Information About Our Executive Officers
The following is a list of our executive officers:
| | | | | | | | |
| Name | Age | Position |
| Jason M. Hollar | 51 | Chief Executive Officer |
| Aaron E. Alt | 52 | Chief Financial Officer |
| Deborah L. Weitzman | 59 | Chief Executive Officer, Pharmaceutical and Specialty Solutions segment |
| Stephen M. Mason | 53 | Chief Executive Officer, GMPD segment |
| Ola M. Snow | 57 | Chief Human Resources Officer |
| Jessica L. Mayer | 55 | Chief Legal and Compliance Officer |
| Michelle D. Greene | 54 | Executive Vice President, Chief Information Officer and Customer Support Services |
The business experience summaries provided below for our executive officers describe positions held during the last five years (unless otherwise indicated).
Mr. Hollar has served as Chief Executive Officer since September 2022. From May 2020 through August 2022, Mr. Hollar served as Chief Financial Officer. Prior to that, Mr. Hollar served as the Executive Vice President and Chief Financial Officer of Tenneco Inc. ("Tenneco") from July 2018. From June 2017 to June 2018, Mr. Hollar was Senior Vice President Finance at Tenneco. Prior to that, Mr. Hollar served as Chief Financial Officer of Sears Holding Corporation ("Sears") from October 2016 to April 2017. Sears filed for Chapter 11 bankruptcy in October 2018.
Mr. Alt has served as Chief Financial Officer since February 2023. Prior to that, Mr. Alt served as Executive Vice President and Chief Financial Officer of Sysco Corporation from December 2020. From October 2018 to November 2020, Mr. Alt served as Senior Vice President and Chief Financial Officer of Sally Beauty Holdings, Inc. and President of Sally Beauty Supply.
Ms. Weitzman has served as Chief Executive Officer, Pharmaceutical and Specialty Solutions segment (formerly Pharmaceutical segment) since September 2022. From July 2017 until September 2022, Ms. Weitzman served as the President of our Pharmaceutical Distribution division.
Mr. Mason has served as Chief Executive Officer, GMPD segment (formerly Medical segment) since August 2019. From September 2016 through August 2019, Mr. Mason served as President of Cardinal Health at-Home Solutions within our former Medical segment.
Ms. Snow has served as Chief Human Resources Officer since October 2018. From January 2016 through September 2018, Ms. Snow served as our Senior Vice President, Human Resources, Total Rewards, Talent Acquisition and Corporate Business Partner.
Ms. Mayer has served as Chief Legal and Compliance Officer since March 2019. Ms. Mayer served as Executive Vice President, Deputy General Counsel and Secretary from September 2017 through March 2019.
Ms. Greene has served as Executive Vice President, Chief Information Officer and Customer Support Services since August 2022. From February 2021 until August 2022, Ms. Greene served as the Senior Vice President of our former Pharmaceutical segment Information Technology. Prior to joining Cardinal Health, Ms. Greene served as Vice President, Information Technology, at Masco Corporation from March 2018 through February 2021.
Directors and Corporate Governance
We have adopted Standards of Business Conduct that apply to all of our directors, officers and employees. The Standards of Business Conduct outline our corporate values and standards of integrity and behavior and are designed to protect and promote our reputation. The full text of the Standards of Business Conduct is posted on our website at www.cardinalhealth.com under “About Us — Ethics and Compliance.”
Any waiver of the Standards of Business Conduct for directors or executive officers must be approved by the Risk Oversight Committee. As required under SEC and New York Stock Exchange rules, we will disclose future amendments to our Standards of Business Conduct and waivers from the Standards of Business Conduct for our principal executive officer, principal financial officer and principal accounting officer, or persons performing similar functions, and our other executive officers and directors on our website within four business days following the date of the amendment or waiver.
| | | | | | | | |
| Cardinal Health | Fiscal 2024 Form 10-K | 87 |
| | | | | | | | |
| Directors, Executive Officers, and Corporate Governance | | |
We have adopted an Insider Trading Policy governing the purchase, sale, and/or other dispositions of our securities by directors, officers and employees and by the Company. The Insider Trading Policy is designed to promote compliance with insider trading laws, rules, and regulations and any applicable listing standards. A copy of our Insider Trading Policy is filed with this Annual Report on Form 10-K as Exhibit 19.
The other information called for by Item 10 of Form 10-K is incorporated by reference to our Definitive Proxy Statement (which will be filed with the SEC pursuant to Regulation 14A under the Exchange Act) relating to our 2024 Annual Meeting of Shareholders (our “2024 Proxy Statement”) under the captions “Corporate Governance” and “Share Ownership Information.”
The other information called for by Item 12 of Form 10-K is incorporated by reference to our 2024 Proxy Statement under the caption "Share Ownership Information."
| | | | | | | | |
88 | Cardinal Health | Fiscal 2024 Form 10-K | |
Exhibits, Financial Statement Schedules
(a)(1) The following financial statements are included in the "Financial Statements" section of this report:
| | | | | |
| Page |
| |
| Consolidated Financial Statements and Schedule: | |
| |
| |
| |
| |
| |
| |
| |
(a)(2) The following Supplemental Schedule is included in this report:
All other schedules not listed above have been omitted as not applicable or because the required information is included in the Consolidated Financial Statements or in the Notes thereto.
| | | | | |
Exhibit
Number | Exhibit Description |
| 1.1 | Underwriting Agreement, dated February 14, 2024, among Cardinal Health, Inc., BofA Securities, Inc., Goldman Sachs & Co. LLC, MUFG Securities Americas Inc. and Wells Fargo Securities, LLC (incorporated by reference to Exhibit 1.1 to Cardinal Health's Current Report on Form 8-K filed on February 20, 2024, File No. 1-11373) |
| 3.1 | |
| 3.2 | |
| 4.1 | |
| 4.2.1 | |
| 4.2.2 | |
| 4.2.3 | |
| 4.2.4 | |
| 4.2.5 | |
| 4.2.6 | |
| 4.2.7 | |
| 4.2.8 | |
| 4.2.11 | |
| 4.2.12 | |
| 4.2.13 | |
| 4.2.14 | |
| 4.2.15 | |
| | | | | | | | |
| Cardinal Health | Fiscal 2024 Form 10-K | 89 |
| | | | | |
| 4.2.16 | First Supplemental Indenture, dated as of February 20, 2024, between Cardinal Health, Inc., as issuer, and The Bank of New York Mellon Trust Company, N.A., as trustee (incorporated by reference to Exhibit 4.2 to Cardinal Health's Current Report on Form 8-K filed on February 20, 2024, File No. 1-11373) |
| 4.2.17 | |
| 4.2.18 | |
| 4.3 | |
| 4.4 | |
| 10.1.1 | |
10.1.2 | |
10.1.3 | |
10.1.4 | |
10.1.5 | |
10.1.6 | |
10.1.7 | |
10.1.8 | |
10.1.9 | |
10.1.10 | |
10.1.11 | |
10.1.12 | |
10.1.13 | |
| 10.2.1 | |
| 10.2.2 | |
| 10.2.3 | |
| 10.2.4 | |
| 10.2.5 | |
| 10.3.1 | |
| 10.3.2 | |
| 10.3.3 | |
| 10.3.4 | |
| 10.3.5 | |
| 10.3.6 | |
| 10.4.1 | |
| 10.4.2 | |
| | | | | | | | |
90 | Cardinal Health | Fiscal 2024 Form 10-K | |
| | | | | |
| 10.4.3 | |
| 10.5.1 | |
| 10.5.2 | |
| 10.5.3 | |
| 10.6.1 | |
| 10.6.2 | |
| 10.6.3 | |
| 10.6.4 | |
| 10.7 | |
| 10.8.1 | |
| 10.8.2 | |
| 10.9.1 | |
| 10.9.2 | |
| 10.9.3 | |
10.9.4 | |
10.9.5 | |
| 10.10 | |
| 10.11.1 | |
| 10.11.2 | |
| 10.11.3 | |
| 10.11.4 | |
| 10.11.5 | |
| 10.11.6 | |
| 10.11.7 | |
| 10.11.8 | |
| 10.11.9 | |
| 10.11.10 | |
| 10.11.11 | |
| 10.11.12 | |
| 10.11.13 | |
| | | | | | | | |
| Cardinal Health | Fiscal 2024 Form 10-K | 91 |
| | | | | |
| 10.11.14 | |
| 10.11.15 | |
| 10.11.16 | |
| 10.11.17 | |
| 10.11.18 | |
| 10.11.19 | |
| 10.11.20 | |
| 10.11.21 | |
| 10.11.22 | |
| 10.11.23 | |
| 10.12.1 | |
| 10.13.1 | Fourth Amended and Restated Receivables Purchase Agreement, dated as of November 1, 2013, among Cardinal Health Funding, LLC, as Seller, Griffin Capital, LLC, as Servicer, the Conduits party thereto, the Financial Institutions Party thereto, the Managing Agents party thereto, and LC Banks party thereto and the Bank of Tokyo-Mitsubishi UFJ, Ltd., New York Branch, as the Agent (incorporated by reference to Exhibit 10.1 to Cardinal Health’s Quarterly Report on Form 10-Q for the quarter ended September 30, 2013, File No. 1-11373) |
| 10.13.2 | |
| 10.13.3 | |
| 10.13.4 | |
| 10.13.5 | |
| 10.13.6 | |
| 10.13.7 | |
| 10.13.8 | |
| 10.13.7 | |
| 10.14.1 | |
| 10.14.2 | |
| 10.14.3 | |
| 10.14.4 | |
| 10.14.5 | |
| 10.14.6 | |
| 10.15.1 | |
| 10.15.2 | |
| 10.16 | |
| | | | | | | | |
92 | Cardinal Health | Fiscal 2024 Form 10-K | |
| | | | | |
| 10.17 | First Amendment to the Cooperation Agreement, dated as of May 3, 2023, by and among Elliott Associates, L.P., Elliott International, L.P., and Elliott International Capital Advisors Inc., and Cardinal Health, Inc. (incorporated by reference to Exhibit 10.1 to Cardinal Health's Form 8-K filed May 4, 2023, File No. 1-11373) |
| 19 | |
| 21.1 | |
| 23.1 | |
| 31.1 | |
| 31.2 | |
| 32.1 | |
| 97 | |
| 99.1 | |
| 101.INS | Inline XBRL Instance Document |
| 101.SCH | Inline XBRL Taxonomy Extension Schema Document |
| 101.CAL | Inline XBRL Taxonomy Extension Calculation Linkbase Document |
| 101.DEF | Inline XBRL Taxonomy Definition Linkbase Document |
| 101.LAB | Inline XBRL Taxonomy Extension Label Linkbase Document |
| 101.PRE | Inline XBRL Taxonomy Extension Presentation Linkbase Document |
| 104 | Cover Page Interactive Data File - formatted in Inline XBRL (included as Exhibit 101) |
| * Management contract or compensatory plan or arrangement. |
| | | | | | | | |
| Cardinal Health | Fiscal 2024 Form 10-K | 93 |
| | | | | | | | |
| Form 10-K Cross Reference Index | | |
Form 10-K Cross Reference Index
| | | | | | | | |
| Item | | Page(s) |
| | |
| Part 1 | |
| 1 | | |
| 1A | | |
| 1B | Unresolved Staff Comments | N/A |
| 1C | | |
| 2 | | |
| 3 | | |
| 4 | Mine Safety Disclosures | N/A |
| | |
| | |
| Part II | |
| 5 | | |
| 6 | Reserved | N/A |
| 7 | | |
| 7A | | |
| 8 | | |
| 9 | Changes in and Disagreements With Accountants on Accounting and Financial Disclosure | N/A |
| 9A | | |
| 9B | Other Information | N/A |
| | |
| Part III | |
| 10 | | |
| 11 | Executive Compensation | (a) |
| 12 | Security Ownership of Certain Beneficial Owners and Management and Related Stockholder Matters | (b) |
| 13 | Certain Relationships and Related Transactions, and Director Independence | (c) |
| 14 | Principal Accounting Fees and Services | (d) |
| | |
| Part IV | |
| 15 | | |
| 16 | Form 10-K Summary | N/A |
| | |
| | | | | | | | |
| N/A | Not applicable | |
| (a) | The information called for by Item 11 of Form 10-K is incorporated by reference to our 2024 Proxy Statement under the captions “Corporate Governance” and “Executive Compensation.” |
| (b) | The information called for by Item 12 of Form 10-K is incorporated by reference to our 2024 Proxy Statement under the captions "Executive Compensation" and "Share Ownership Information." |
| (c) | The information called for by Item 13 of Form 10-K is incorporated by reference to our 2024 Proxy Statement under the caption "Corporate Governance." |
| (d) | The information called for by Item 14 of Form 10-K is incorporated by reference to our 2024 Proxy Statement under the caption “Audit Committee Matters.” |
| | | | | | | | |
94 | Cardinal Health | Fiscal 2024 Form 10-K | |
Signatures
Pursuant to the requirements of Section 13 or 15(d) of the Securities Exchange Act of 1934, the registrant has duly caused this report to be signed on its behalf by the undersigned, thereunto duly authorized on August 14, 2024.
| | | | | | | | |
| Cardinal Health, Inc. |
| | |
| By: | /s/ JASON M. HOLLAR |
| | JASON M. HOLLAR |
| | Chief Executive Officer |
Pursuant to the requirements of the Securities Exchange Act of 1934, the registrant has duly caused this report to be signed below by the following persons on behalf of the registrant and in the capacities indicated on August 14, 2024.
| | | | | | | | |
| Name | | Title |
| /s/ JASON M. HOLLAR | | Chief Executive Officer and Director (principal executive officer) |
| Jason M. Hollar | |
|
| | |
| /s/ AARON E. ALT | | Chief Financial Officer (principal financial officer) |
| Aaron E. Alt | | |
| | |
| /s/ MARY C. SCHERER | | Senior Vice President and Chief Accounting Officer (principal accounting officer) |
| Mary C. Scherer | | |
| | |
| /s/ ROBERT W. AZELBY | | Director |
| Robert W. Azelby | | |
| | |
| /s/ STEVEN K. BARG | | Director |
| Steven K. Barg | | |
| | |
| /s/ MICHELLE M. BRENNAN | | Director |
| Michelle M. Brennan | | |
| | |
| /s/ SUJATHA CHANDRASEKARAN | | Director |
| Sujatha Chandrasekaran | | |
| | |
| /s/ SHERI H. EDISON | | Director |
| Sheri H. Edison | | |
| | |
| /s/ DAVID C. EVANS | | Director |
| David C. Evans | | |
| | |
/s/ PATRICIA A. HEMINGWAY HALL
| | Director
|
| Patricia A. Hemingway Hall | | |
| | |
| /s/ AKHIL JOHRI | | Director |
| Akhil Johri | | |
| | |
| /s/ GREGORY B. KENNY | | Director |
| Gregory B. Kenny | | |
| | |
| /s/ NANCY KILLEFER | | Director |
| Nancy Killefer | | |
| | |
| /s/ CHRISTINE A. MUNDKUR | | Director |
| Christine A. Mundkur | | |
| | |
| | | | | | | | |
| Cardinal Health | Fiscal 2024 Form 10-K | 95 |