Exhibit 99.1

STIFEL REPORTS FIRST QUARTER 2013 FINANCIAL RESULTS, RECORD NET REVENUES
Financial highlights for the three months ended March 31, 2013:
| • | Record net revenues of $441.8 million. |
| • | Non-GAAP net income of $39.9 million, or $0.58 per diluted share. |
| • | Net income of $14.6 million, or $0.21 per diluted share. |
| • | Stockholders’ equity totaled $1.9 billion and book value per share was $30.13. |
ST. LOUIS, May 9, 2013 – Stifel Financial Corp. (NYSE: SF) today reported record net revenues of $441.8 million for the three months ended March 31, 2013. The Company reported non-GAAP net income of $39.9 million, or $0.58 per diluted share. On a GAAP basis, the Company reported net income of $14.6 million, or $0.21 per diluted share for the three months ended March 31, 2013, compared with net income of $34.8 million, or $0.55 per diluted share, on net revenues of $400.3 million for the first quarter of 2012. The Company reported net income of $40.0 million, or $0.63 per diluted share, on net revenues of $417.8 million for the three months ended December 31, 2012. A reconciliation of the Company’s GAAP results to these non-GAAP measures is discussed below under “Non-GAAP Financial Measures.”
Two items significantly impacted GAAP results for the three months ended March 31, 2013:
| • | A non-cash charge of $19.2 million after-tax ($30.6 million pre-tax), or $0.28 per diluted share, related to expensing stock awards issued in connection with the acquisition of KBW. |
| • | Merger-related expenses of $6.1 million after-tax ($9.7 million pre-tax), or $0.09 per diluted share, related to the previously announced acquisitions of KBW and Miller Buckfire. |
“We are pleased with our performance for the quarter, which included record net revenues,” said Ronald J. Kruszewski, Chairman, President and CEO of Stifel.
Kruszewski continued, “While our profitability is clouded by merger-related charges, it is noteworthy that our Global Wealth Management segment posted record revenue and profitability, and our Institutional segment generated record quarterly revenue. As we work through the KBW integration process and the related expense reductions, we expect to continue to report both GAAP and non-GAAP results for the remainder of the year. Looking forward, we are focused on leveraging our new and established businesses to drive growth and profits across the platform. Additionally, we are on track this quarter to complete the acquisition of the U.S. institutional fixed income sales and trading team and hiring of the European team from Knight Capital Group.”
Summary Results of Operations (Unaudited)
| Three Months Ended | ||||||||||||||||||||
| (in 000s) | 3/31/13 | 3/31/12 | % Change |
12/31/12 | % Change |
|||||||||||||||
| Net revenues |
$ | 441,780 | $ | 400,333 | 10.4 | $ | 417,830 | 5.7 | ||||||||||||
| Net income |
$ | 14,619 | $ | 34,773 | (58.0 | ) | $ | 39,954 | (63.4 | ) | ||||||||||
| Non-GAAP net income 1 |
$ | 39,884 | $ | 34,773 | 14.7 | $ | 39,954 | (0.2 | ) | |||||||||||
| Earnings per share: |
||||||||||||||||||||
| Basic |
$ | 0.24 | $ | 0.65 | (63.1 | ) | $ | 0.74 | (67.6 | ) | ||||||||||
| Diluted |
$ | 0.21 | $ | 0.55 | (61.8 | ) | $ | 0.63 | (66.7 | ) | ||||||||||
| Non-GAAP diluted 1 |
$ | 0.58 | $ | 0.55 | 5.5 | $ | 0.63 | (7.9 | ) | |||||||||||
| Weighted average number of common shares outstanding: |
||||||||||||||||||||
| Basic |
60,054 | 53,243 | 12.8 | 53,835 | 11.6 | |||||||||||||||
| Diluted |
69,189 | 62,669 | 10.4 | 63,301 | 9.3 | |||||||||||||||
| 1 | A reconciliation of the Company’s GAAP results to these non-GAAP measures is discussed below under “Non-GAAP Financial Measures.” |
1
Business Segment Results
Summary Segment Results (Unaudited)
| Three Months Ended | ||||||||||||||||||||
| (in 000s) | 3/31/13 | 3/31/12 | % Change |
12/31/12 | % Change |
|||||||||||||||
| Net revenues: |
||||||||||||||||||||
| Global Wealth Management |
$ | 266,957 | $ | 247,608 | 7.8 | $ | 255,084 | 4.7 | ||||||||||||
| Institutional Group 2 |
176,437 | 149,244 | 18.2 | 165,056 | 6.9 | |||||||||||||||
| Other |
(1,614 | ) | 3,481 | * | (2,310 | ) | 30.1 | |||||||||||||
|
|
|
|
|
|
|
|
|
|
|
|||||||||||
| $ | 441,780 | $ | 400,333 | 10.4 | $ | 417,830 | 5.7 | |||||||||||||
|
|
|
|
|
|
|
|
|
|
|
|||||||||||
| Operating contribution:3 |
||||||||||||||||||||
| Global Wealth Management |
$ | 69,499 | $ | 68,878 | 0.9 | $ | 69,282 | 0.3 | ||||||||||||
| Institutional Group 2 |
28,137 | 24,004 | 17.2 | 21,490 | 30.9 | |||||||||||||||
| Other |
(33,944 | ) | (33,628 | ) | 0.9 | (29,705 | ) | 14.3 | ||||||||||||
|
|
|
|
|
|
|
|
|
|
|
|||||||||||
| $ | 63,692 | $ | 59,254 | 7.5 | $ | 61,067 | 4.3 | |||||||||||||
|
|
|
|
|
|
|
|
|
|
|
|||||||||||
| * | Percentage is not meaningful. |
Global Wealth Management
For the quarter ended March 31, 2013, the Global Wealth Management (“GWM”) segment generated pre-tax operating income of $69.5 million, compared with $68.8 million in the first quarter of 2012 and $69.3 million in the fourth quarter of 2012. Net revenues for the quarter were $267.0 million, compared with $247.6 million in the first quarter of 2012, and $255.1 million in the fourth quarter of 2012. The increase in net revenues both from the first quarter and fourth quarter of 2012 is primarily attributable to (1) an increase in commission revenues; (2) growth in asset management and service fees; and (3) increased net interest revenues, offset by (1) a decline in principal transactions revenues; and (2) lower investment banking revenues.
| • | The Private Client Group reported record net revenues of $243.1 million, a 5% increase compared with both the first quarter and fourth quarter of 2012. |
| • | Stifel Bank reported net revenues of $23.9 million, a 49% increase compared with the first quarter of 2012 and a 6% increase compared with the fourth quarter of 2012. |
Institutional Group
For the quarter ended March 31, 2013, the Institutional Group segment generated pre-tax operating income of $28.1 million, compared with $24.0 million in the first quarter of 2012 and $21.5 million in the fourth quarter of 2012. Net revenues for the quarter were $176.4 million, compared with $149.2 million in the first quarter of 2012 and $165.1 million in the fourth quarter of 2012. The increase in net revenues from the first quarter of 2012 was primarily attributable to (1) an increase in advisory fees; (2) the realized and unrealized gains recognized on the Company’s investment in Knight Capital Group; (3) higher equity institutional brokerage revenues; and (4) an increase in fixed income capital raising revenues, offset by (1) a decrease in equity capital raising revenues; and (2) lower fixed income institutional brokerage revenues. The increase in net revenues from the fourth quarter of 2012 was primarily attributable to (1) an increase in equity institutional brokerage revenues; (2) higher equity capital raising revenues; and (3) higher fixed income institutional brokerage revenues, offset by a decline in fixed income capital raising revenues. Net revenue growth, both year-over-year and sequentially, is attributable to the acquisitions of KBW and, to a lesser extent, Miller Buckfire.
| 2 | Results for the three months ended March 31, 2013 and December 31, 2012 includes $2.2 million and $13.4 million, respectively, in realized and unrealized gains recognized on the Company’s investment in Knight Capital Group, Inc. |
| 3 | A reconciliation of the Company’s GAAP results to these non-GAAP measures is discussed below under “Non-GAAP Financial Measures.” |
2
Institutional brokerage revenues were $97.5 million, an 8% increase compared with the first quarter of 2012 and a 16% increase compared with the fourth quarter of 2012.
| • | Equity brokerage revenues were $52.0 million, an 18% increase compared with the first quarter of 2012 and a 24% increase compared with the fourth quarter of 2012. |
| • | Fixed income brokerage revenues were $45.5 million, a 1% decrease compared with the first quarter of 2012 and a 7% increase compared with the fourth quarter of 2012. |
Investment banking revenues were $67.3 million, a 16% increase compared with the first quarter of 2012 and a 4% increase compared with the fourth quarter of 2012.
| • | Equity capital raising revenues were $24.4 million, a 23% decrease compared with the first quarter of 2012 and a 23% increase compared with the fourth quarter of 2012. |
| • | Fixed income capital raising revenues were $15.7 million, a 44% increase compared with the first quarter of 2012 and a 15% decrease compared with the fourth quarter of 2012. |
| • | Advisory fee revenues were $27.2 million, a 74% increase compared with the first quarter of 2012 and a 2% increase compared with the fourth quarter of 2012. |
Consolidated Compensation and Benefits Expenses
For the quarter ended March 31, 2013, compensation and benefits expenses were $315.7 million, which included $33.8 million related to (1) expensing stock awards issued as retention in connection with the acquisition of KBW of $30.6 million and (2) merger-related expenses of $3.2 million, compared with $254.7 million in the first quarter of 2012 and $262.2 million in the fourth quarter of 2012.
Excluding these expenses, compensation and benefits as a percentage of net revenues was 63.8% in the first quarter of 2013, compared with 63.6% in the first quarter of 2012 and 62.8% in the fourth quarter of 2012. Transition pay, which primarily consists of amortization of upfront notes, signing bonuses and retention awards, as a percentage of net revenues was 4.7% in the first quarter of 2013, compared with 4.3% in the first quarter of 2012 and 5.4% in the fourth quarter of 2012.
Consolidated Non-Compensation Operating Expenses
For the quarter ended March 31, 2013, non-compensation operating expenses were $102.7 million, which included $6.6 million of merger-related expenses, compared with $86.4 million in the first quarter of 2012 and $94.6 million in the fourth quarter of 2012.
Excluding the merger-related expenses, non-compensation operating expenses as a percentage of net revenues for the quarter ended March 31, 2013 was 21.8%, compared with 21.6% in the first quarter of 2012 and 22.6% in the fourth quarter of 2012.
Provision for Income Taxes
The effective income tax rate for the quarter ended March 31, 2013 was 37% compared with 41% in the first quarter of 2012 and 35% in the fourth quarter of 2012. The decrease in the effective rate for the three months ended March 31, 2013 from the year-ago quarter is primarily attributable to adjustments to the provision as a result of the Miller Buckfire acquisition.
3
Statement of Financial Condition (Unaudited)
Total assets increased 49% to $8.1 billion as of March 31, 2013 from $5.5 billion as of March 31, 2012. The increase is primarily attributable to growth of Stifel Bank, the Company’s bank subsidiary, which as of March 31, 2013 has grown its assets to $3.8 billion from $2.6 billion as of March 31, 2012. As of March 31, 2013, Stifel Bank’s investment portfolio of $2.4 billion increased 46% from March 31, 2012, with more than 99% of the investment portfolio comprised of investment grade securities, of which more than 71% were Government-Sponsored Enterprise guaranteed MBS or AAA-rated investments. The increase in total assets from March 31, 2012 is also attributable to the recently completed acquisition of KBW. In addition to the net assets acquired, the Company recognized goodwill of $307.9 million, which is based on preliminary estimates and is subject to change upon the completion of the valuation. The Company’s broker-dealer subsidiary’s gross assets and liabilities, including trading inventory, stock loan/borrow, receivables and payables from/to brokers, dealers and clearing organizations and clients, fluctuate with business levels and overall market conditions.
Total stockholders’ equity as of March 31, 2013 increased $560.7 million, or 42%, to $1.90 billion from $1.34 billion as of March 31, 2012. Book value per share was $30.13 as of March 31, 2013.
As of March 31, 2013, the Company reported total securities owned and investments at fair value of $3.1 billion, which included securities categorized as Level 3 of $274.6 million. The Company’s Level 3 assets include auction rate securities with a fair value of $166.6 million, private equity and partnership interests with a fair value of $82.3 million, and corporate and municipal securities with a fair value $25.7 million as of March 31, 2013. The acquisition of KBW contributed to the growth in the Company’s level 3 assets. As of March 31, 2013, the KBW entities held Level 3 assets with a fair value of $57.1 million.
4
Non-GAAP Financial Measures
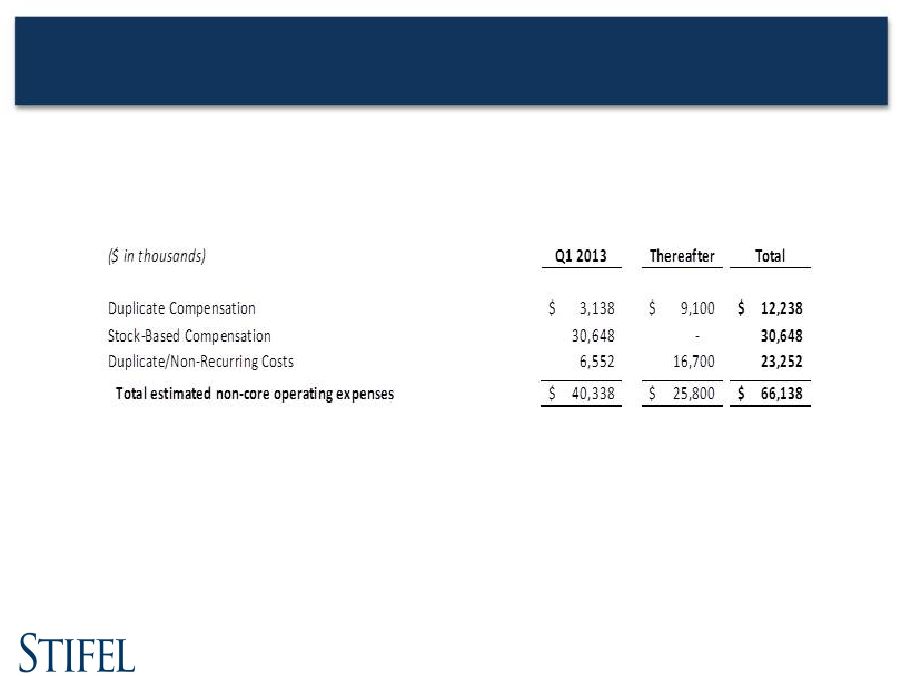
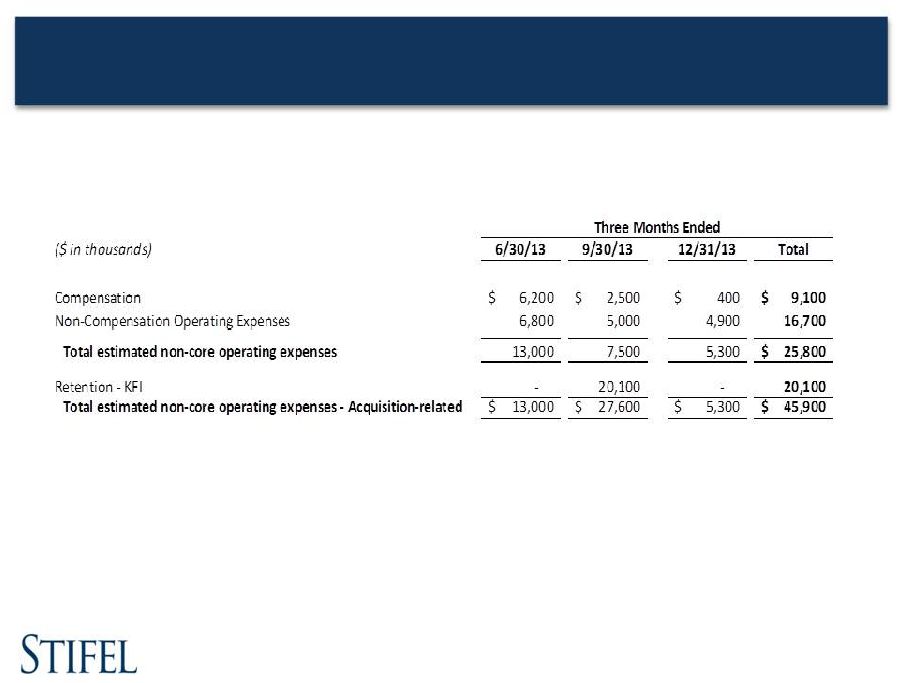
The Company utilized non-GAAP calculations of presented net revenues, compensation and benefits, non-compensation operating expenses, income before income taxes, provision for income taxes, net income, compensation and non-compensation operating expense ratios, pre-tax margin and diluted earnings per share as additional measures to aid in understanding and analyzing the Company’s financial results for the three months ended March 31, 2013. Specifically, the Company believes that the non-GAAP measures provide useful information by excluding certain items that may not be indicative of the Company’s core operating results and business outlook. The Company believes that these non-GAAP measures will allow for a better evaluation of the operating performance of the business and facilitate a meaningful comparison of the Company’s results in the current period to those in prior periods and future periods. Reference to these non-GAAP measures should not be considered as a substitute for results that are presented in a manner consistent with GAAP. These non-GAAP measures are provided to enhance investors’ overall understanding of the Company’s current financial performance. These non-GAAP amounts exclude compensation expense related to the granting of stock awards with no continuing service requirement issued as retention as part of the acquisition of KBW and certain compensation and non-compensation operating expenses associated with the acquisitions of KBW and Miller Buckfire.
A limitation of utilizing these non-GAAP measures of net revenues, compensation and benefits, non-compensation operating expenses, income before income taxes, provision for income taxes, net income, compensation and non-compensation operating expenses ratios, pre-tax margin and diluted earnings per share is that the GAAP accounting effects of these merger-related charges do in fact reflect the underlying financial results of the Company’s business and these effects should not be ignored in evaluating and analyzing its financial results. Therefore, the Company believes that GAAP measures of net revenues, compensation and benefits, non-compensation operating expenses, income before income taxes, provision for income taxes, net income, compensation and non-compensation operating expense ratios, pre-tax margin and diluted earnings per share and the same respective non-GAAP measures of the Company’s financial performance should be considered together.
The following table provides details with respect to reconciling net revenues, compensation and benefits, non-compensation operating expenses, income before income taxes, provision for income taxes, net income, compensation and non-compensation operating expense ratios, pre-tax margin and diluted earnings per share on a GAAP basis for the three months ended March 31, 2013 to the aforementioned expenses on a non-GAAP basis for the same period.
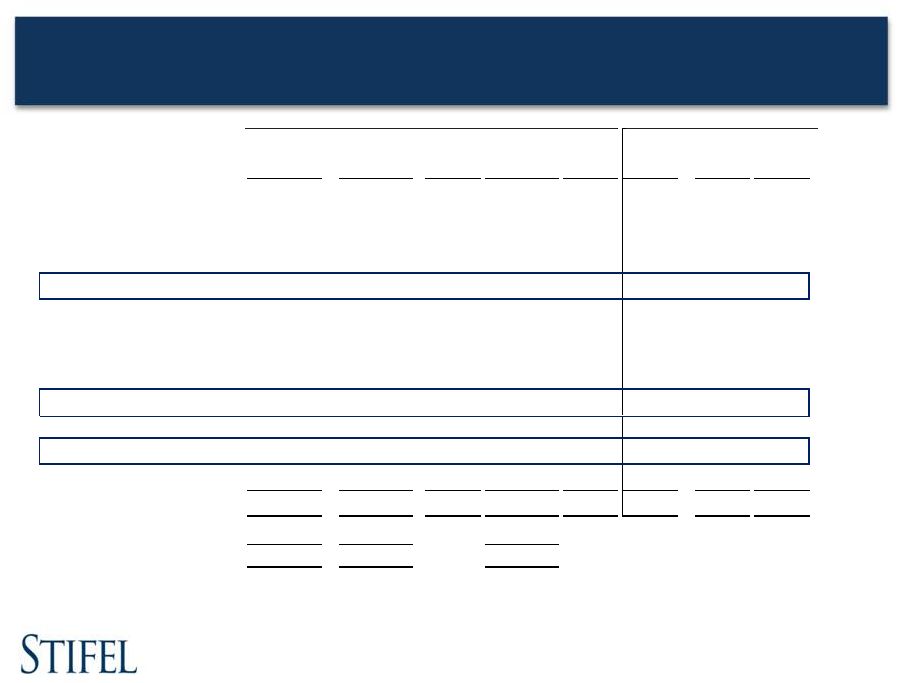
Reconciliation of GAAP to Non-GAAP Earnings (Unaudited)
| Three Months Ended March 31, 2013 | ||||||||||||
| (in 000s, except per share amounts) | GAAP | Merger- related |
Non-GAAP | |||||||||
| Net revenues |
$ | 441,780 | $ | 8 | $ | 441,788 | ||||||
| Non-interest expenses: |
||||||||||||
| Compensation and benefits |
315,727 | (33,786 | ) | 281,941 | ||||||||
| Non-compensation operating expenses |
102,707 | (6,552 | ) | 96,155 | ||||||||
|
|
|
|
|
|
|
|||||||
| Total non-interest expenses |
418,434 | (40,338 | ) | 378,096 | ||||||||
| Income before income taxes |
23,346 | 40,346 | 63,692 | |||||||||
| Provision for income taxes |
8,727 | 15,081 | 23,808 | |||||||||
|
|
|
|
|
|
|
|||||||
| Net income |
$ | 14,619 | $ | 25,265 | $ | 39,884 | ||||||
|
|
|
|
|
|
|
|||||||
| Earnings per share:: |
||||||||||||
| Basic |
$ | 0.24 | $ | 0.42 | $ | 0.66 | ||||||
| Diluted |
$ | 0.21 | $ | 0.37 | $ | 0.58 | ||||||
| As a percentage of net revenues: |
||||||||||||
| Compensation and benefits |
71.5 | 63.8 | ||||||||||
| Non-compensation operating expenses |
23.2 | 21.8 | ||||||||||
| Income before income taxes |
5.3 | 14.4 | ||||||||||
5
Conference Call Information
Stifel Financial Corp. will host its first quarter 2013 financial results conference call on Thursday, May 9, 2013, at 5:00 p.m. Eastern time. The conference call may include forward-looking statements.
All interested parties are invited to listen to Stifel’s Chairman, President, and CEO, Ronald J. Kruszewski, by dialing (877) 876-9938 and referencing conference ID #58716630. A live audio webcast of the call, as well as a presentation highlighting the Company’s results, will be available through the Company’s web site, www.stifel.com. For those who cannot listen to the live broadcast, a replay of the broadcast will be available through the above-referenced web site beginning approximately one hour following the completion of the call.
Company Information
Stifel Financial Corp. (NYSE: SF) is a financial services holding company headquartered in St. Louis, Missouri that conducts its banking, securities, and financial services business through several wholly owned subsidiaries. Stifel clients are served through Stifel, Nicolaus & Company, Incorporated in the U.S., through Stifel Nicolaus Canada Inc. in Canada, through Stifel Nicolaus Europe Limited in the United Kingdom and Europe, and through Keefe, Bruyette & Woods, Inc. in the U.S. and Europe. The Company’s broker-dealer affiliates provide securities brokerage, investment banking, trading, investment advisory, and related financial services to individual investors, professional money managers, businesses, and municipalities. Stifel Bank & Trust offers a full range of consumer and commercial lending solutions. Stifel Trust Company, N.A. offers trust and related services. To learn more about Stifel, please visit the Company’s web site at www.stifel.com.
Forward-Looking Statements
This earnings release contains certain statements that may be deemed to be “forward-looking statements” within the meaning of Section 27A of the Securities Act of 1933 and Section 21E of the Securities Exchange Act of 1934. All statements in this earnings release not dealing with historical results are forward-looking and are based on various assumptions. The forward-looking statements in this earnings release are subject to risks and uncertainties that could cause actual results to differ materially from those expressed in or implied by the statements. Factors that may cause actual results to differ materially from those contemplated by such forward-looking statements include, among other things, the following possibilities: the ability to successfully integrate acquired companies or the branch offices and financial advisors; a material adverse change in financial condition; the risk of borrower, depositor, and other customer attrition; a change in general business and economic conditions; changes in the interest rate environment, deposit flows, loan demand, real estate values, and competition; changes in accounting principles, policies, or guidelines; changes in legislation and regulation; other economic, competitive, governmental, regulatory, geopolitical, and technological factors affecting the companies’ operations, pricing, and services; and other risk factors referred to from time to time in filings made by Stifel Financial Corp. with the Securities and Exchange Commission. Forward-looking statements speak only as to the date they are made. Stifel Financial Corp. disclaims any intent or obligation to update forward-looking statements to reflect circumstances or events that occur after the date the forward-looking statements are made.
6
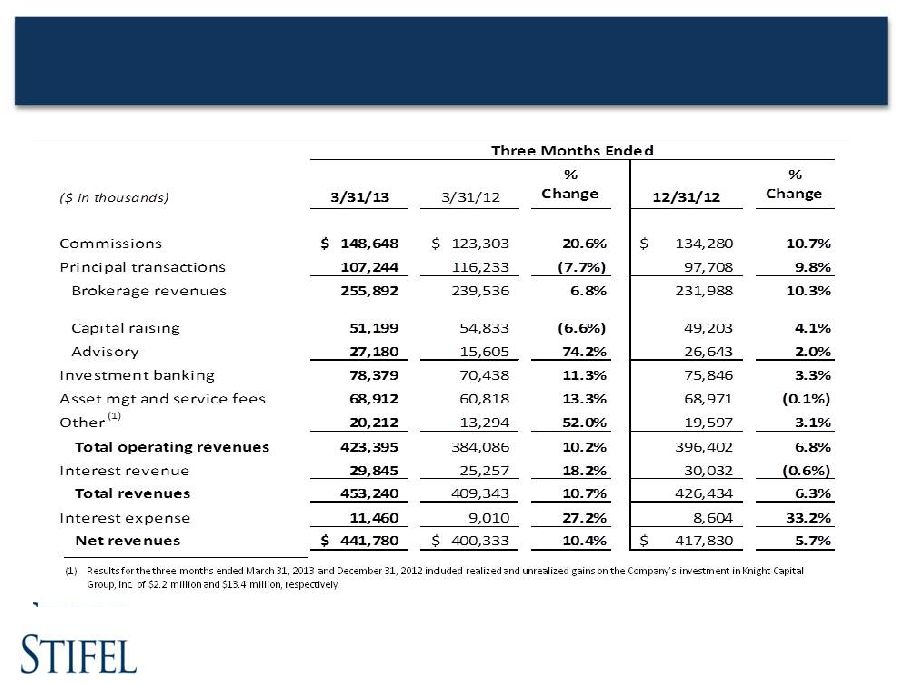
Summary Results of Operations (Unaudited)
| Three Months Ended | ||||||||||||||||||||
| (in 000s) | 3/31/13 | 3/31/12 | % Change |
12/31/12 | % Change |
|||||||||||||||
| Revenues: |
||||||||||||||||||||
| Commissions |
$ | 148,648 | $ | 123,303 | 20.6 | $ | 134,280 | 10.7 | ||||||||||||
| Principal transactions |
107,244 | 116,233 | (7.7 | ) | 97,708 | 9.8 | ||||||||||||||
| Investment banking |
78,379 | 70,438 | 11.3 | 75,846 | 3.3 | |||||||||||||||
| Asset management and service fees |
68,912 | 60,818 | 13.3 | 68,971 | (0.1 | ) | ||||||||||||||
| Other income |
20,212 | 13,294 | 52.0 | 19,597 | 3.1 | |||||||||||||||
|
|
|
|
|
|
|
|
|
|
|
|||||||||||
| Operating revenues |
423,395 | 384,086 | 10.2 | 396,402 | 6.8 | |||||||||||||||
| Interest revenue |
29,845 | 25,257 | 18.2 | 30,032 | (0.6 | ) | ||||||||||||||
|
|
|
|
|
|
|
|
|
|
|
|||||||||||
| Total revenues |
453,240 | 409,343 | 10.7 | 426,434 | 6.3 | |||||||||||||||
| Interest expense |
11,460 | 9,010 | 27.2 | 8,604 | 33.2 | |||||||||||||||
|
|
|
|
|
|
|
|
|
|
|
|||||||||||
| Net revenues |
441,780 | 400,333 | 10.4 | 417,830 | 5.7 | |||||||||||||||
|
|
|
|
|
|
|
|
|
|
|
|||||||||||
| Non-interest expenses: |
||||||||||||||||||||
| Compensation and benefits |
315,727 | 254,704 | 24.0 | 262,213 | 20.4 | |||||||||||||||
| Occupancy and equipment rental |
34,048 | 30,791 | 10.6 | 34,075 | (0.1 | ) | ||||||||||||||
| Communication and office supplies |
22,979 | 20,373 | 12.8 | 19,795 | 16.1 | |||||||||||||||
| Commission and floor brokerage |
9,058 | 7,612 | 19.0 | 7,480 | 21.1 | |||||||||||||||
| Other operating expenses |
36,622 | 27,599 | 32.7 | 33,200 | 10.3 | |||||||||||||||
|
|
|
|
|
|
|
|
|
|
|
|||||||||||
| Total non-interest expenses |
418,434 | 341,079 | 22.7 | 356,763 | 17.3 | |||||||||||||||
| Income before income taxes |
23,346 | 59,254 | (60.6 | ) | 61,067 | (61.8 | ) | |||||||||||||
| Provision for income taxes |
8,727 | 24,481 | (64.4 | ) | 21,113 | (58.7 | ) | |||||||||||||
|
|
|
|
|
|
|
|
|
|
|
|||||||||||
| Net income |
$ | 14,619 | $ | 34,773 | (58.0 | ) | $ | 39,954 | (63.4 | ) | ||||||||||
|
|
|
|
|
|
|
|
|
|
|
|||||||||||
| Earnings per share: |
||||||||||||||||||||
| Basic |
$ | 0.24 | $ | 0.65 | (63.1 | ) | $ | 0.74 | (67.6 | ) | ||||||||||
| Diluted |
$ | 0.21 | $ | 0.55 | (61.8 | ) | $ | 0.63 | (66.7 | ) | ||||||||||
| Weighted average number of common shares outstanding: |
||||||||||||||||||||
| Basic |
60,054 | 53,243 | 12.8 | 53,835 | 11.6 | |||||||||||||||
| Diluted |
69,189 | 62,669 | 10.4 | 63,301 | 9.3 | |||||||||||||||
|
|
|
|
|
|
|
|
|
|
|
|||||||||||
| (in thousands, except per share data, employee and location amounts) | ||||||||||||||||||||
| Key statistical information: | 3/31/13 | 3/31/12 | % Change |
12/31/12 | % Change |
|||||||||||||||
| Book value per share |
$ | 30.13 | $ | 25.07 | 20.2 | $ | 27.24 | 10.6 | ||||||||||||
| Financial advisors 4 |
2,063 | 2,013 | 2.5 | 2,041 | 1.1 | |||||||||||||||
| Full-time associates |
5,680 | 5,135 | 10.6 | 5,343 | 6.3 | |||||||||||||||
| Locations |
357 | 326 | 9.5 | 340 | 5.0 | |||||||||||||||
| Total client assets |
147,119,000 | 130,550,000 | 12.7 | 137,855,000 | 6.7 | |||||||||||||||
| 4 | Includes 148, 155 and 151 independent contractors at March 31, 2013 and 2012 and December 31, 2012, respectively. |
7
Global Wealth Management Segment
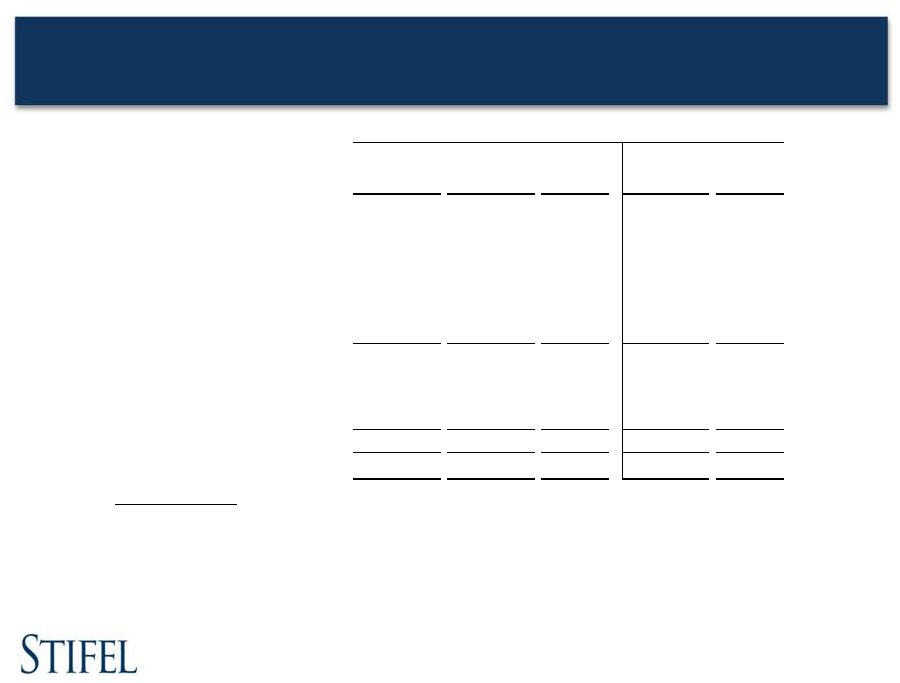
Summary Results of Operations (Unaudited)
| Three Months Ended | ||||||||||||||||||||
| (in 000s) | 3/31/13 | 3/31/12 | % Change |
12/31/12 | % Change |
|||||||||||||||
| Revenues: |
||||||||||||||||||||
| Commissions |
$ | 102,086 | $ | 91,020 | 12.2 | $ | 93,045 | 9.7 | ||||||||||||
| Principal transactions |
56,307 | 58,381 | (3.6 | ) | 54,747 | 2.8 | ||||||||||||||
| Asset management and service fees |
68,934 | 60,586 | 13.8 | 68,631 | 0.4 | |||||||||||||||
| Net interest |
21,486 | 17,642 | 21.8 | 21,195 | 1.4 | |||||||||||||||
| Investment banking |
11,103 | 12,402 | (10.5 | ) | 10,906 | 1.8 | ||||||||||||||
| Other income |
7,041 | 7,577 | (7.1 | ) | 6,560 | 7.3 | ||||||||||||||
|
|
|
|
|
|
|
|
|
|
|
|||||||||||
| Net revenues |
266,957 | 247,608 | 7.8 | 255,084 | 4.7 | |||||||||||||||
|
|
|
|
|
|
|
|
|
|
|
|||||||||||
| Non-interest expenses: |
||||||||||||||||||||
| Compensation and benefits |
157,596 | 143,351 | 9.9 | 147,029 | 7.2 | |||||||||||||||
| Non-compensation operating expenses |
39,862 | 35,379 | 12.7 | 38,773 | 2.8 | |||||||||||||||
|
|
|
|
|
|
|
|
|
|
|
|||||||||||
| Total non-interest expenses |
197,458 | 178,730 | 10.5 | 185,802 | 6.3 | |||||||||||||||
|
|
|
|
|
|
|
|
|
|
|
|||||||||||
| Income before income taxes |
$ | 69,499 | $ | 68,878 | 0.9 | $ | 69,282 | 0.3 | ||||||||||||
|
|
|
|
|
|
|
|
|
|
|
|||||||||||
| As a percentage of net revenues: |
||||||||||||||||||||
| Compensation and benefits |
59.0 | 57.9 | 57.6 | |||||||||||||||||
| Non-compensation operating expenses |
15.0 | 14.3 | 15.2 | |||||||||||||||||
| Income before income taxes |
26.0 | 27.8 | 27.2 | |||||||||||||||||
Stifel Bank & Trust (Unaudited)
Key Statistical Information
| (in 000s, except percentages) | 3/31/13 | 3/31/12 | % Change |
12/31/12 | % Change |
|||||||||||||||
| Other information: |
||||||||||||||||||||
| Assets |
$ | 3,832,281 | $ | 2,611,828 | 46.7 | $ | 3,652,633 | 4.9 | ||||||||||||
| Investment securities |
2,440,146 | 1,673,866 | 45.8 | 2,332,058 | 4.6 | |||||||||||||||
| Retained loans, net |
886,597 | 657,081 | 34.9 | 822,711 | 7.8 | |||||||||||||||
| Loans held for sale |
165,698 | 141,136 | 17.4 | 214,531 | (22.8 | ) | ||||||||||||||
| Deposits |
3,556,568 | 2,357,912 | 50.8 | 3,346,133 | 6.3 | |||||||||||||||
| Allowance as a percentage of loans |
1.01 | % | 0.87 | % | 0.99 | % | ||||||||||||||
| Non-performing assets as a percentage of total assets |
0.04 | % | 0.11 | % | 0.06 | % | ||||||||||||||
8
Institutional Group Segment
Summary Results of Operations (Unaudited)
| Three Months Ended | ||||||||||||||||||||
| (in 000s) | 3/31/13 | 3/31/12 | % Change |
12/31/12 | % Change |
|||||||||||||||
| Revenues: |
||||||||||||||||||||
| Commissions |
$ | 46,562 | $ | 32,283 | 44.2 | $ | 41,235 | 12.9 | ||||||||||||
| Principal transactions |
50,938 | 57,852 | (12.0 | ) | 42,961 | 18.6 | ||||||||||||||
| Capital raising |
40,095 | 42,431 | (5.5 | ) | 38,296 | 4.7 | ||||||||||||||
| Advisory fees |
27,180 | 15,605 | 74.2 | 26,644 | 2.0 | |||||||||||||||
|
|
|
|
|
|
|
|
|
|
|
|||||||||||
| Investment banking |
67,275 | 58,036 | 15.9 | 64,940 | 3.6 | |||||||||||||||
| Other income 5 |
11,662 | 1,073 | * | 15,920 | (26.7 | ) | ||||||||||||||
|
|
|
|
|
|
|
|
|
|
|
|||||||||||
| Net revenues |
176,437 | 149,244 | 18.2 | 165,056 | 6.9 | |||||||||||||||
|
|
|
|
|
|
|
|
|
|
|
|||||||||||
| Non-interest expenses: |
||||||||||||||||||||
| Compensation and benefits |
107,636 | 94,430 | 14.0 | 108,371 | (0.7 | ) | ||||||||||||||
| Non-compensation operating expenses |
40,664 | 30,810 | 32.0 | 35,195 | 15.5 | |||||||||||||||
|
|
|
|
|
|
|
|
|
|
|
|||||||||||
| Total non-interest expenses |
148,300 | 125,240 | 18.4 | 143,566 | 3.3 | |||||||||||||||
|
|
|
|
|
|
|
|
|
|
|
|||||||||||
| Income before income taxes |
$ | 28,137 | $ | 24,004 | 17.2 | $ | 21,490 | 30.9 | ||||||||||||
|
|
|
|
|
|
|
|
|
|
|
|||||||||||
| As a percentage of net revenues: |
||||||||||||||||||||
| Compensation and benefits |
61.0 | 63.3 | 65.7 | |||||||||||||||||
| Non-compensation operating expenses |
23.1 | 20.6 | 21.3 | |||||||||||||||||
| Income before income taxes |
15.9 | 16.1 | 13.0 | |||||||||||||||||
| * | Percentage is not meaningful. |
Institutional Group Segment
Institutional Brokerage and Investment Banking Revenues (Unaudited)
| Three Months Ended | ||||||||||||||||||||
| (in 000s) | 3/31/13 | 3/31/12 | % Change |
12/31/12 | % Change |
|||||||||||||||
| Institutional brokerage: |
||||||||||||||||||||
| Equity |
$ | 52,000 | $ | 44,171 | 17.7 | $ | 41,805 | 24.4 | ||||||||||||
| Fixed income |
45,500 | 45,964 | (1.0 | ) | 42,391 | 7.3 | ||||||||||||||
|
|
|
|
|
|
|
|
|
|
|
|||||||||||
| Institutional brokerage |
97,500 | 90,135 | 8.2 | 84,196 | 15.8 | |||||||||||||||
| Investment banking: |
||||||||||||||||||||
| Capital raising: |
||||||||||||||||||||
| Equity |
24,380 | 31,550 | (22.7 | ) | 19,830 | 22.9 | ||||||||||||||
| Fixed income |
15,715 | 10,881 | 44.4 | 18,466 | (14.9 | ) | ||||||||||||||
|
|
|
|
|
|
|
|
|
|
|
|||||||||||
| Capital raising |
40,095 | 42,431 | (5.5 | ) | 38,296 | 4.7 | ||||||||||||||
| Advisory fees |
27,180 | 15,605 | 74.2 | 26,644 | 2.0 | |||||||||||||||
|
|
|
|
|
|
|
|
|
|
|
|||||||||||
| Investment banking |
$ | 67,275 | $ | 58,036 | 15.9 | $ | 64,940 | 3.6 | ||||||||||||
|
|
|
|
|
|
|
|
|
|
|
|||||||||||
Investor Relations Contact
Sarah Anderson
(415) 364-2500, investorrelations@stifel.com
| 5 | Includes net interest and other income. |
9