Exhibit 99.1

FOR IMMEDIATE RELEASE
STIFEL FINANCIAL REPORTS SECOND QUARTER 2012 FINANCIAL RESULTS
Highlights for the three months ended June 30, 2012:
|
●
Net revenues of $374.4 million.
|
|
●
Net income of $26.1 million, or $0.42 per diluted share.
|
|
●
Stockholders' equity totaled $1.4 billion and book value
per share was $25.63.
|
Highlights for the six months ended June 30, 2012:
|
●
Net revenues of $774.7 million increased 7% from the
comparable period in 2011.
|
|
●
Net income of $60.9 million, or $0.97 per diluted share.
|
ST. LOUIS, August 8, 2012
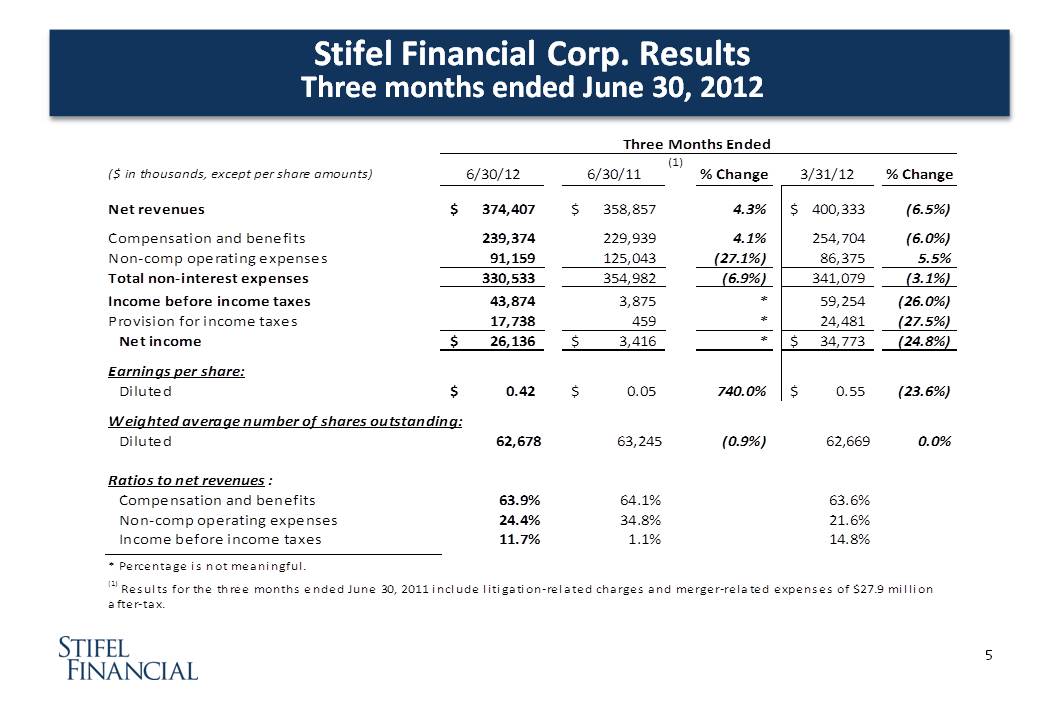
-Stifel Financial Corp. (NYSE: SF) today reported unaudited net income of
$26.1 million, or $0.42 per diluted share, on net revenues of $374.4 million
for the three months ended June 30, 2012, compared with net income of $3.4
million, or $0.05 per diluted share1,
on net revenues of $358.9 million for the second quarter of 2011.
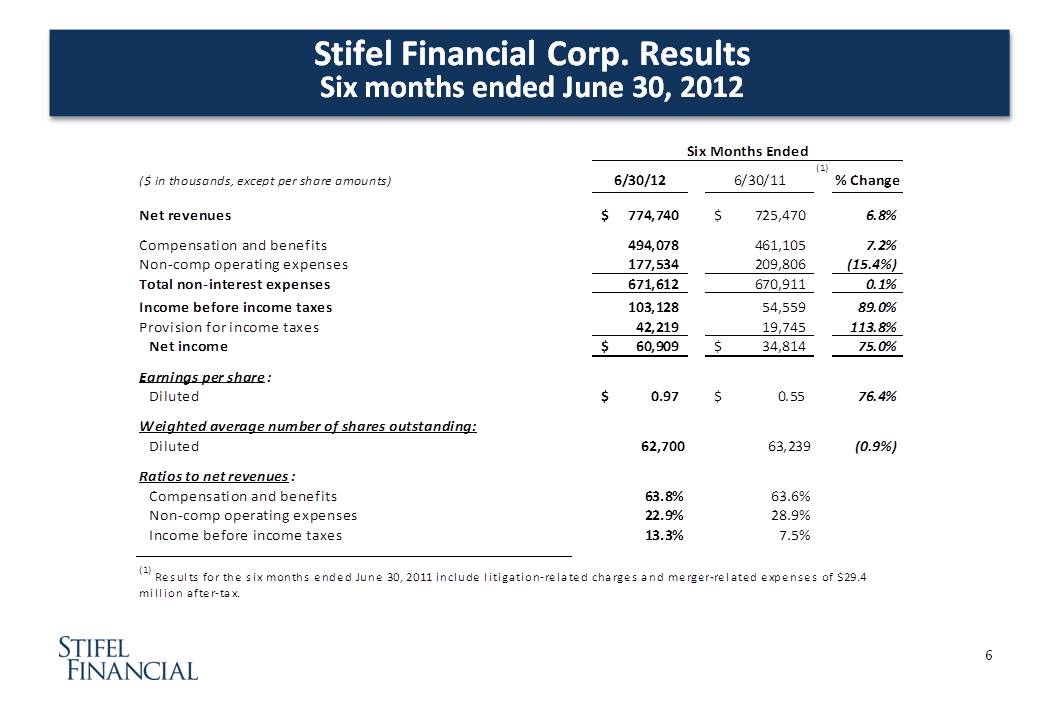
For the six months ended June 30, 2012, the company reported net income of
$60.9 million, or $0.97 per diluted share,
on net revenues of $774.7 million, compared with net income of $34.8
million, or $0.55 per diluted share1,
on net revenues of $725.5 million during the comparable period in 2011.
"The operating environment in the second quarter was challenging,
especially compared with the strong start to the year. The headwinds in the
equity and bond markets, as well as macro economic factors affected the
industry, our business and client activity. In the quarter, asset
management, investment banking advisory and Stifel Bank performed well,
while commissions stabilized, and principal transactions and equity capital
raising results were lower," commented Ronald J. Kruszewski, Chairman,
President and CEO of Stifel Financial. "Throughout this year, we have
continued to grow through investments in selected professionals and certain
businesses, namely our fixed income platform. We are well positioned with
the scale and expertise to gain market share."
|
Summary Results of Operations (Unaudited)
|
||||||||||||||||||||||||||||||||
|
Three Months Ended
|
Six Months Ended
|
|||||||||||||||||||||||||||||||
|
(in 000s)
|
6/30/12
|
6/30/11
|
% Change
|
3/31/12
|
% Change
|
6/30/12
|
6/30/11
|
% Change
|
||||||||||||||||||||||||
|
Net revenues
|
$ | 374,407 | $ | 358,857 | 4.3 | $ | 400,333 | (6.5 | ) | $ | 774,740 | $ | 725,470 | 6.8 | ||||||||||||||||||
|
Net income
|
$ | 26,136 | $ | 3,416 | * | $ | 34,773 | (24.8 | ) | $ | 60,909 | $ | 34,814 | 75.0 | ||||||||||||||||||
|
Earnings per share:
|
||||||||||||||||||||||||||||||||
|
Basic
|
$ | 0.49 | $ | 0.06 | 716.7 | $ | 0.65 | (24.6 | ) | $ | 1.14 | $ | 0.66 | 72.7 | ||||||||||||||||||
|
Diluted
|
$ | 0.42 | $ | 0.05 | 740.0 | $ | 0.55 | (23.6 | ) | $ | 0.97 | $ | 0.55 | 76.4 | ||||||||||||||||||
|
Weighted average number of common shares outstanding:
|
||||||||||||||||||||||||||||||||
|
Basic
|
53,569 | 52,932 | 1.2 | 53,243 | 0.6 | 53,406 | 52,734 | 1.3 | ||||||||||||||||||||||||
|
Diluted
|
62,678 | 63,245 | (0.9 | ) | 62,669 | - | 62,700 | 63,239 | (0.9 | ) | ||||||||||||||||||||||
|
* Percentage not meaningful.
|
||||||||||||||||||||||||||||||||
1 Included in the results for the three and six months
ended June 30, 2011 were the estimated costs of settlement and
litigation-related expenses of $27.9 million after tax, or $0.45 per
diluted share, and $29.4 million after tax, or $0.47 per diluted share,
respectively, associated with the civil lawsuit and related regulatory
investigation in connection with the previously disclosed matter
involving five Southeastern Wisconsin school districts and
merger-related expenses.
1
Business Segment Results
|
Summary Segment Results (Unaudited)
|
||||||||||||||||||||
|
Three Months Ended
|
Six Months Ended
|
|||||||||||||||||||
|
(in 000s)
|
6/30/12
|
6/30/11
|
% Change
|
3/31/12
|
% Change
|
6/30/12
|
6/30/11
|
% Change
|
||||||||||||
|
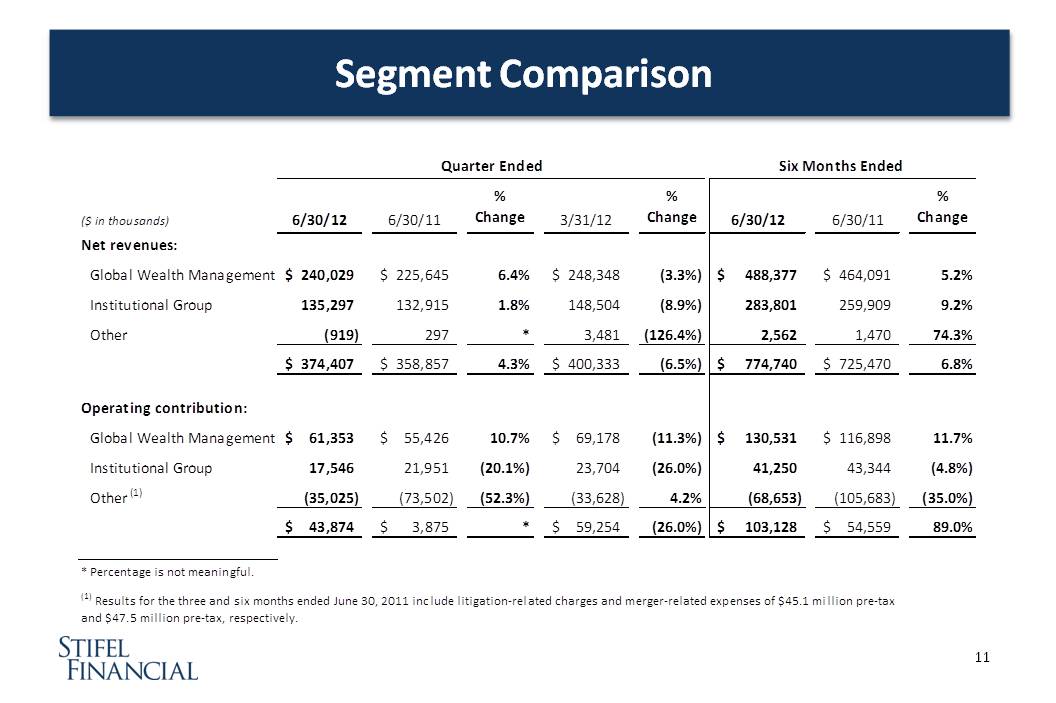
Net revenues:
|
||||||||||||||||||||
|
Global Wealth Management
|
$
|
240,029
|
$
|
225,645
|
6.4
|
$
|
248,348
|
(3.3)
|
$
|
488,377
|
$
|
464,091
|
5.2
|
|||||||
|
Institutional Group
|
135,297
|
132,915
|
1.8
|
148,504
|
(8.9)
|
283,801
|
259,909
|
9.2
|
||||||||||||
|
Other
|
(919
|
)
|
297
|
*
|
3,481
|
(126.4)
|
2,562
|
1,470
|
74.3
|
|||||||||||
|
$
|
374,407
|
$
|
358,857
|
4.3
|
$
|
400,333
|
(6.5)
|
$
|
774,740
|
$
|
725,470
|
6.8
|
||||||||
|
Operating contribution:
|
||||||||||||||||||||
|
Global Wealth Management
|
$
|
61,353
|
$
|
55,426
|
10.7
|
$
|
69,178
|
(11.3)
|
$
|
130,531
|
$
|
116,898
|
11.7
|
|||||||
|
Institutional Group
|
17,546
|
21,951
|
(20.1)
|
23,704
|
(26.0)
|
41,250
|
43,344
|
(4.8)
|
||||||||||||
|
Other
2
|
(35,025
|
)
|
(73,502
|
)
|
(52.3)
|
(33,628
|
)
|
4.2
|
(68,653
|
(105,683
|
)
|
(35.0)
|
||||||||
|
$
|
43,874
|
$
|
3,875
|
*
|
$
|
59,254
|
(26.0)
|
$
|
103,128
|
$
|
54,559
|
89.0
|
||||||||
|
* Percentage not meaningful.
|
||||||||||||||||||||
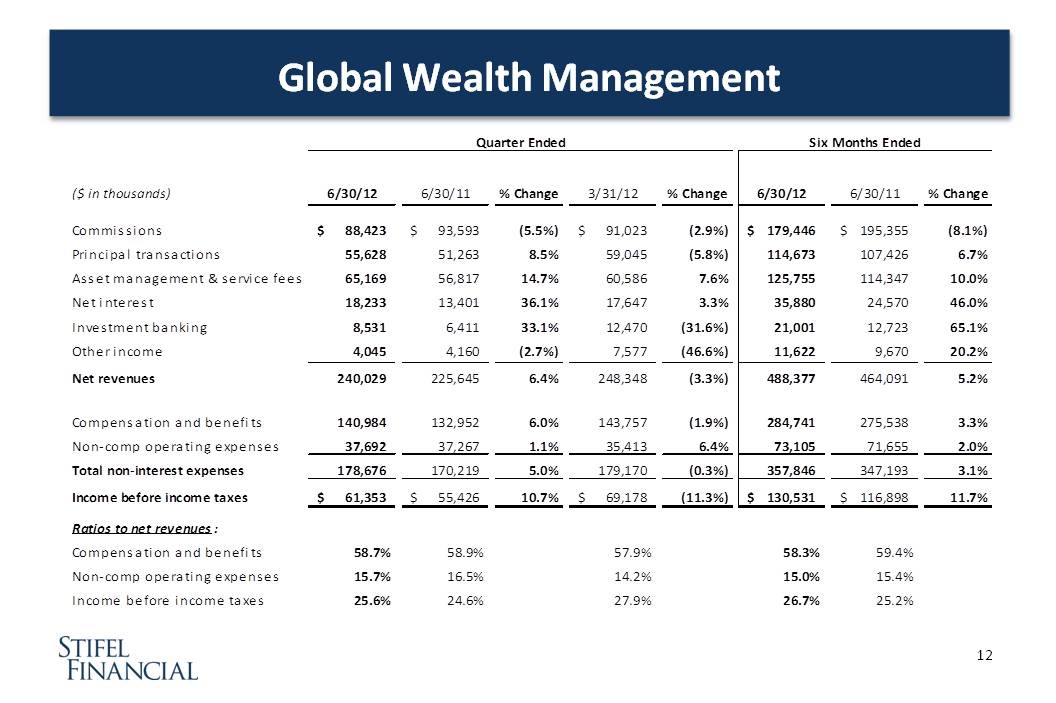
Global Wealth Management
For the
quarter ended June 30, 2012, the Global Wealth Management ("GWM")
segment generated pre-tax operating income of $61.4 million, compared
with $55.4 million in the second quarter of 2011 and $69.2 million in
the first quarter of 2012. Net revenues for the quarter were $240.0
million, compared with $225.6 million in the second quarter of 2011, and
$248.3 million in the first quarter of 2012. The increase in net
revenues over the comparable period in 2011 is primarily attributable
to: (1) growth in asset management and service fees as a result of an
increase in assets under management and positive gains in market
performance; (2) increased net interest revenues as a result of the
growth of net interest-earning assets at Stifel Bank; and (3) higher
principal transactions revenues, offset by a decrease in commissions
revenue. The decrease in net revenues from the first quarter of 2012 was
primarily attributable to: (1) a decrease in commissions and principal
transactions revenues, as a result of lower trading volumes; and (2)
lower sales credits from investment banking underwritings, offset by an
increase in asset management and service fees and net interest revenues.
|
●
The Private Client Group reported record net revenues of
$221.0 million, a 4% increase compared with the second quarter of
2011 and a 5% decrease compared with the first quarter of
2012.
|
|
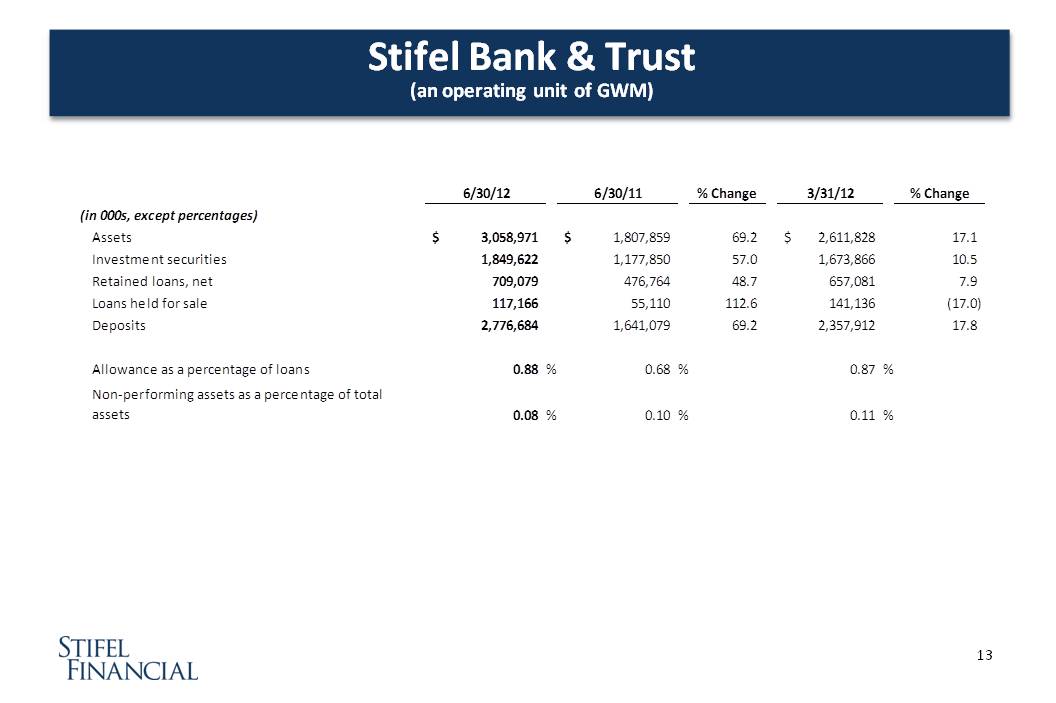
●
Stifel Bank reported net revenues of $19.0 million, a 57%
increase compared with the second quarter of 2011 and a 19%
increase compared with the first quarter of 2012.
|
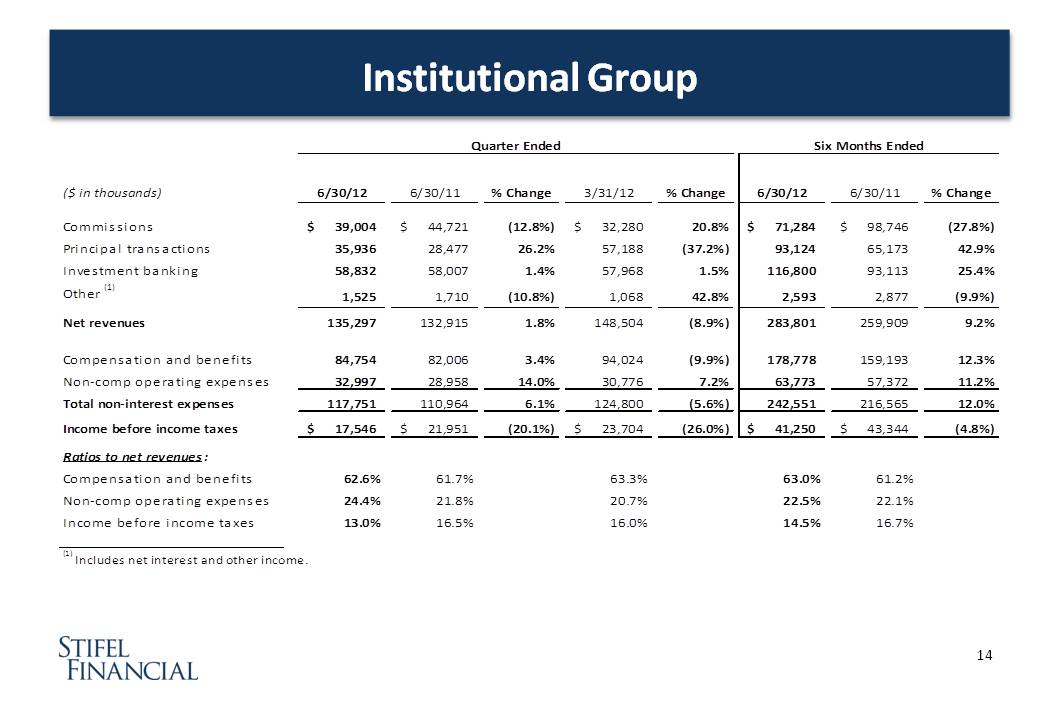
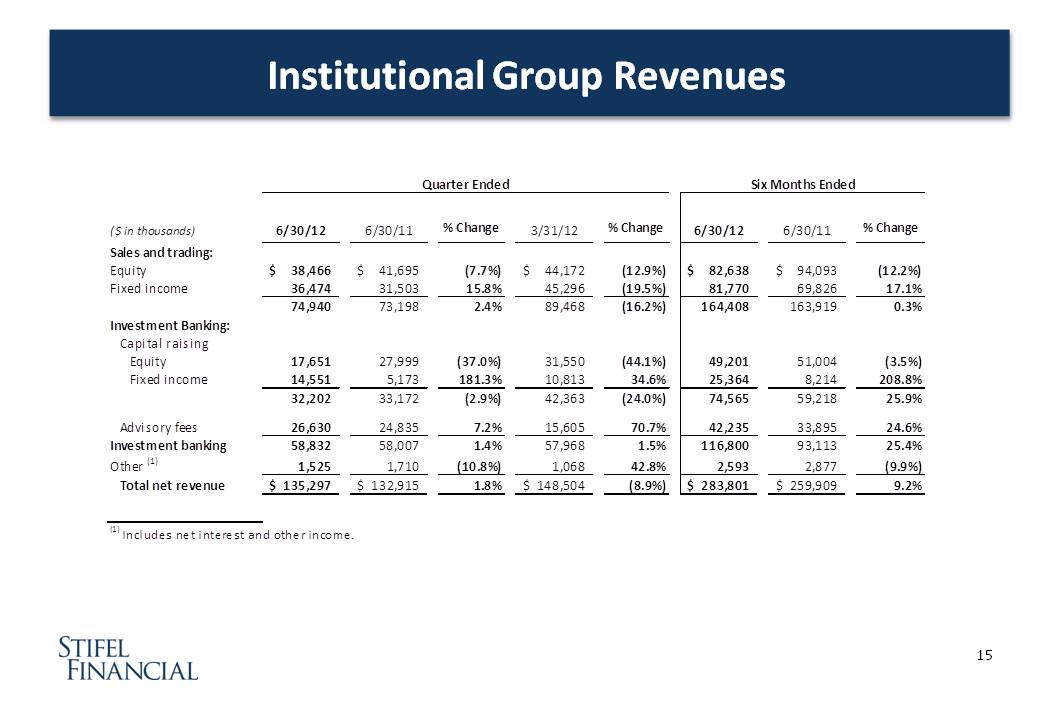
Institutional Group
For the
quarter ended June 30, 2012, the Institutional Group segment generated
pre-tax operating income of $17.5 million, compared with $22.0 million
in the second quarter of 2011 and $23.7 million in the first quarter of
2012. Net revenues for the quarter were $135.3 million, compared with
$132.9 million in the second quarter of 2011 and $148.5 million in the
first quarter of 2012. The increase in net revenues from the comparable
period in 2011 was driven by: (1) an increase in fixed income capital
raising revenues; (2) an increase in advisory fees; and (3) higher fixed
income institutional brokerage revenues, offset by a decrease in equity
capital raising revenues. The decrease in net revenues from the first
quarter of 2012 was primarily attributable to: (1) a decrease in
institutional brokerage revenues; and (2) lower equity capital raising
revenues, partially offset by an increase in advisory fees and fixed
income capital raising revenues.
2
Results for the three and six months ended June 30, 2011 include
litigation-related charges and merger-related expenses of $45.1
million pre-tax and $47.5 million pre-tax, respectively.
2
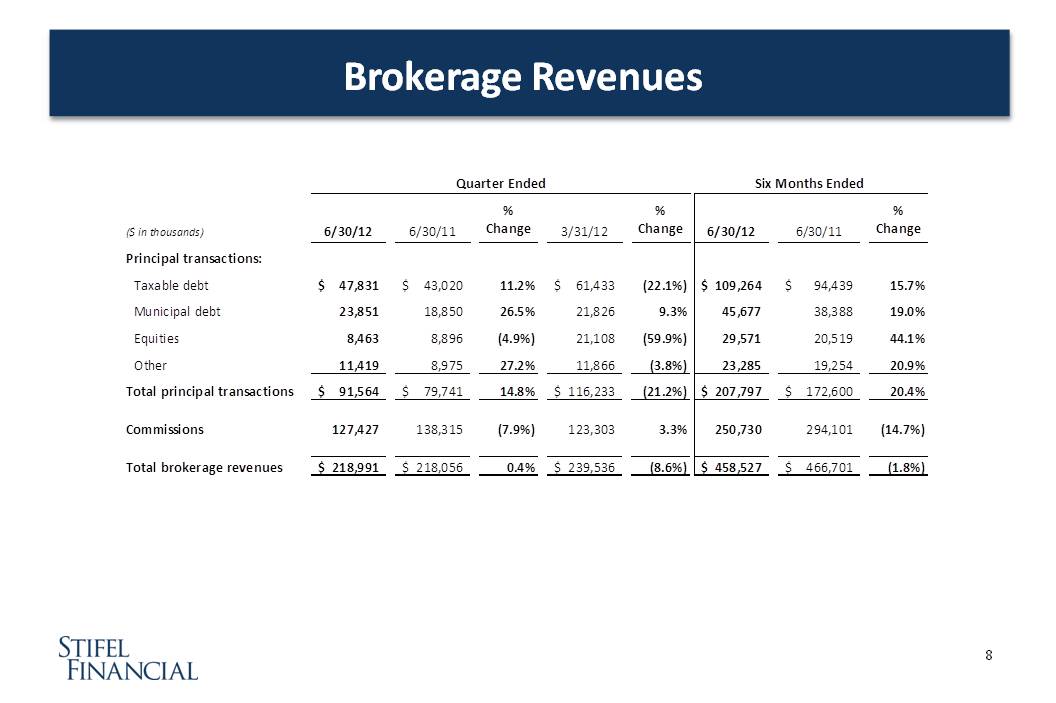
Institutional brokerage revenues were $74.9 million, a 2% increase compared
with the second quarter of 2011 and a 16% decrease compared with the first
quarter of 2012.
|
●
Equity brokerage revenues were $38.5 million, a 8%
decrease compared with the
second
quarter of 2011 and a 13% decrease compared with the first
quarter of 2012.
|
|
●
Fixed income brokerage revenues were $36.4 million, a
16% increase compared with the second quarter of 2011 and a 20%
decrease compared with the
first
quarter of 2012.
|
Investment banking revenues were $58.8 million, a 1% increase compared with
the
second
quarter of 2011 and an 2% increase compared with the first
quarter of 2012.
|
●
Equity capital raising revenues were $17.7 million, a 37%
decrease compared with the second quarter of 2011 and a 44%
decrease compared with the
first
quarter of 2012.
|
|
●
Fixed income capital raising revenues were $14.5 million,
a 181% increase compared with the second quarter of 2011 and an
35% increase compared with the
first
quarter of 2012.
|
|
●
Advisory fee revenues were $26.6 million, a 7% increase
compared with the second quarter of 2011 and a 71% increase
compared with the
first
quarter of 2012.
|
Consolidated Compensation and Benefits Expenses
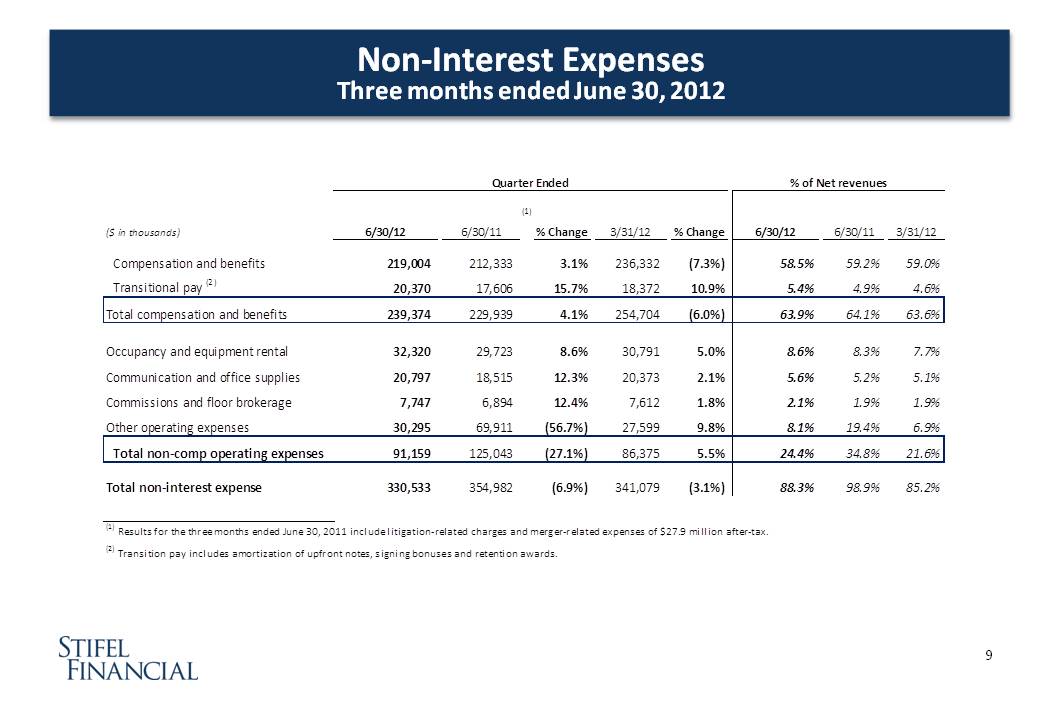
For the
quarter ended June 30, 2012, compensation and benefits expenses were
$239.4 million, compared with $229.9 million in the second quarter of
2011 and $254.7 million in the first quarter of 2012.
Compensation
and benefits as a percentage of net revenues was 64% in the second
quarter of 2012, consistent with the second quarter of 2011 and the
first quarter of 2012. Transition pay, which primarily consists of
amortization of upfront notes, signing bonuses and retention awards, as
a percentage of net revenues was 5% in the second quarter of 2012,
consistent with the second quarter of 2011 and the first quarter of
2012.
Consolidated Non-Compensation Operating Expenses
For the
quarter ended June 30, 2012, non-compensation operating expenses were
$91.2 million, compared to $125.0 million in the second quarter of 2011,
which included $43.1 million of litigation-related charges and
merger-related expenses. Non-compensation operating expenses were $86.4
million in the first quarter of 2012.
Excluding
litigation and merger-related expenses in the second quarter of 2011,
non-compensation operating expenses increased 11% in the second quarter
of 2012 compared with the second quarter of 2011 and increased 6%
compared with the first quarter of 2012.
Non-compensation operating expenses as a percentage of net revenues for
the quarter ended June 30, 2012 was 24% compared with 35%3
in the second quarter of 2011 and 22% in the first quarter of 2012. The
higher ratio in the second quarter of 2012 was driven by the impact of
increased non-compensation operating expenses on lower revenues.
Provision for Income Taxes
The
effective income tax rate for the quarter ended June 30, 2012 was 40%
compared with 12% in the second quarter of 2011 and 41% in the first
quarter of 2012.
3
Non-compensation operating expenses for the three months ended June
30, 2011 include litigation-related charges and merger-related
expenses.
3
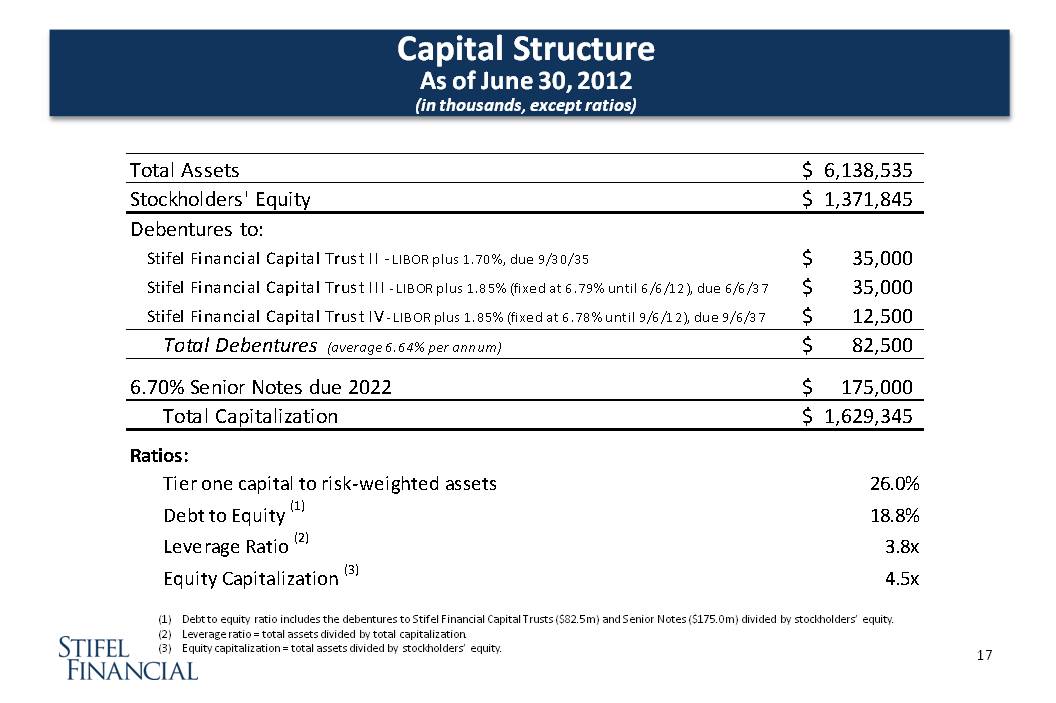
Statement of Financial Condition (Unaudited)
Total assets
increased 36% to $6.1 billion as of June 30, 2012 from $4.5 billion as
of June 30, 2011. The increase is primarily attributable to growth of
the company's bank subsidiary, which as of June 30, 2012 has grown its
assets to $3.1 billion from $1.8 billion as of June 30, 2011. As of June
30, 2012, Stifel Bank's investment portfolio of $1.8 billion has
increased 57% from June 30, 2011, with more than 99% of the investment
portfolio comprised of investment grade securities, of which more than
69% were Government-Sponsored Enterprise guaranteed MBS or AAA-rated
investments. The company's broker-dealer subsidiary's gross assets and
liabilities, including trading inventory, stock loan/borrow, receivables
and payables from/to brokers, dealers and clearing organizations and
clients, fluctuate with business levels and overall market conditions.
Total
stockholders' equity as of June 30, 2012 increased $75.4 million, or 6%,
to $1.4 billion from $1.3 billion as of June 30, 2011. Book value per
share was $25.63 as of June 30, 2012. The company has repurchased $51.2
million, or 1.8 million shares, of its common stock pursuant to existing
Board repurchase authorizations since June 30, 2011.
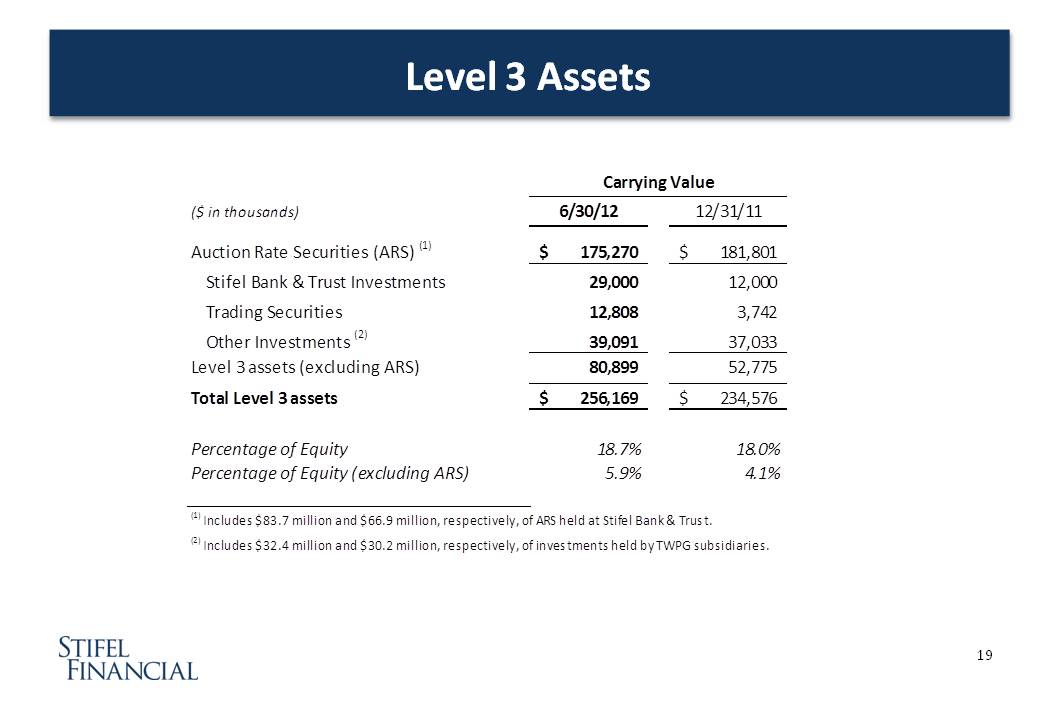
As of June
30, 2012, the company reported total securities owned and investments at
fair value of $2.3 billion, which included securities categorized as
Level 3 of $256.2 million. The company's Level 3 assets include auction
rate securities and private equity and other fixed income securities
with fair values of $175.3 million and $80.9 million, respectively, as
of June 30, 2012.
Conference Call Information
Stifel
Financial Corp. will host its second quarter 2012 financial results
conference call on Wednesday, August 8, 2012, at 5:00 p.m. Eastern time.
The conference call may include forward-looking statements.
All
interested parties are invited to listen to the company's Chairman,
President, and CEO, Ronald J. Kruszewski, by dialing (800)
651-2240 and referencing conference ID #98861040. A live audio webcast
of the call, as well as a presentation highlighting the company's
results, will be available through the company's web site,
www.stifel.com.
For those who cannot listen to the live broadcast, a replay of the
broadcast will be available through the above-referenced web site
beginning approximately one hour following the completion of the call.
Company Information
Stifel
Financial Corp. (NYSE: SF) is a financial services holding company
headquartered in St. Louis, Missouri that conducts its banking,
securities, and financial services business through several wholly owned
subsidiaries. Stifel clients are served through Stifel, Nicolaus &
Company, Incorporated in the U.S., through Stifel Nicolaus Canada Inc.
in Canada, and through Stifel Nicolaus Europe Limited in the United
Kingdom and Europe. The company's broker-dealer affiliates provide
securities brokerage, investment banking, trading, investment advisory,
and related financial services to individual investors, professional
money managers, businesses, and municipalities. Stifel Bank & Trust
offers a full range of consumer and commercial lending solutions. Stifel
Trust Company, N.A. offers trust and related services. To learn more
about Stifel Financial, please visit the company's web site at
www.stifel.com.
Forward-Looking Statements
This
earnings release contains certain statements that may be deemed to be
"forward-looking statements" within the meaning of Section 27A of the
Securities Act of 1933 and Section 21E of the Securities Exchange Act of
1934. All statements in this earnings release not dealing with
historical results are forward-looking and are based on various
assumptions. The forward-looking statements in this earnings release
are subject to risks and uncertainties that could cause actual results
to differ materially from those expressed in or implied by the
statements. Factors that may cause actual results to differ materially
from those contemplated by such forward-looking statements include,
among other things, the following possibilities: the ability to
successfully integrate acquired companies or the branch offices and
financial advisors; a material adverse change in financial condition;
the risk of borrower, depositor, and other customer attrition; a change
in general business and economic conditions; changes in the interest
rate environment, deposit flows, loan demand, real estate values, and
competition; changes in accounting principles, policies, or guidelines;
changes in legislation and regulation; other economic, competitive,
governmental, regulatory, geopolitical, and technological factors
affecting the companies' operations, pricing, and services; and other
risk factors referred to from time to time in filings made by Stifel
Financial Corp. with the Securities and Exchange
Commission. Forward-looking statements speak only as to the date they
are made. Stifel Financial Corp. disclaims any intent or obligation to
update forward-looking statements to reflect circumstances or events
that occur after the date the forward-looking statements are made.
4
|
Summary Results of Operations (Unaudited)
|
|||||||||||||||||||||||||
|
Three Months Ended
|
Six Months Ended
|
||||||||||||||||||||||||
|
(in thousands, except per share amounts)
|
6/30/12
|
6/30/11
|
% Change
|
3/31/12
|
% Change
|
6/30/12
|
6/30/11
|
% Change
|
|||||||||||||||||
|
Revenues:
|
|||||||||||||||||||||||||
|
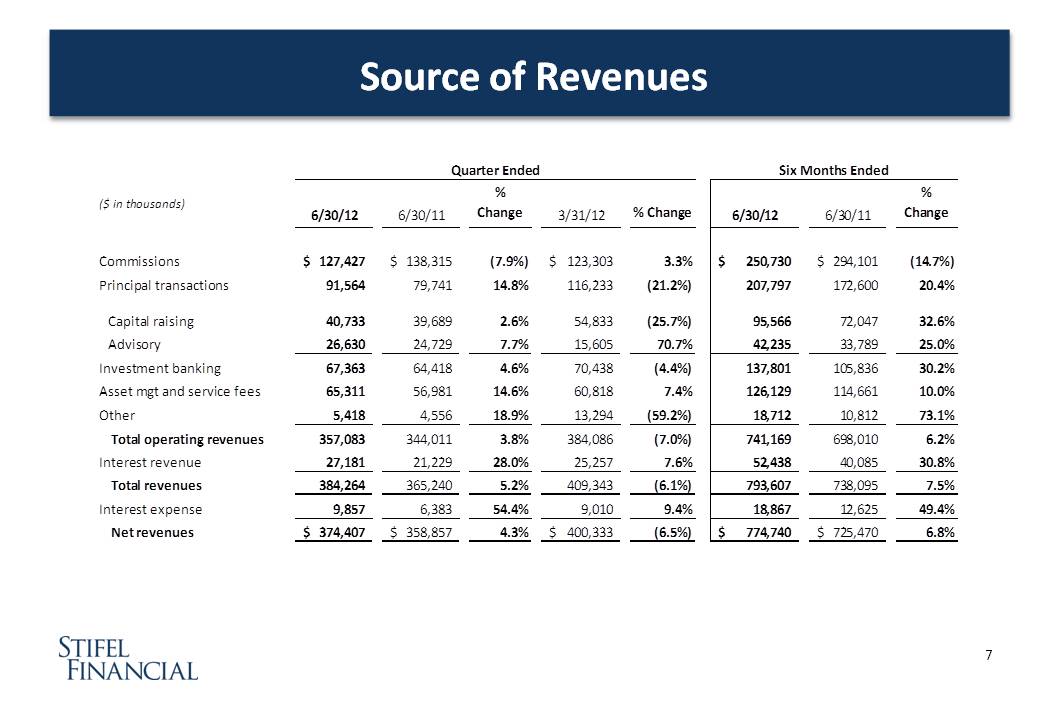
Commissions
|
$ | 127,427 | $ | 138,315 | (7.9 | ) | $ | 123,303 | 3.3 | $ | 250,730 | $ | 294,101 | (14.7 | ) | ||||||||||
|
Principal transactions
|
91,564 | 79,741 | 14.8 | 116,233 | (21.2 | ) | 207,797 | 172,600 | 20.4 | ||||||||||||||||
|
Investment banking
|
67,363 | 64,418 | 4.6 | 70,438 | (4.4 | ) | 137,801 | 105,836 | 30.2 | ||||||||||||||||
|
Asset management and service fees
|
65,311 | 56,981 | 14.6 | 60,818 | 7.4 | 126,129 | 114,661 | 10.0 | |||||||||||||||||
|
Other income
|
5,418 | 4,556 | 18.9 | 13,294 | (59.2 | ) | 18,712 | 10,812 | 73.1 | ||||||||||||||||
|
Operating revenues
|
357,083 | 344,011 | 3.8 | 384,086 | (7.0 | ) | 741,169 | 698,010 | 6.2 | ||||||||||||||||
|
Interest revenue
|
27,181 | 21,229 | 28.0 | 25,257 | 7.6 | 52,438 | 40,085 | 30.8 | |||||||||||||||||
|
Total revenues
|
384,264 | 365,240 | 5.2 | 409,343 | (6.1 | ) | 793,607 | 738,095 | 7.5 | ||||||||||||||||
|
Interest expense
|
9,857 | 6,383 | 54.4 | 9,010 | 9.4 | 18,867 | 12,625 | 49.4 | |||||||||||||||||
|
Net revenues
|
374,407 | 358,857 | 4.3 | 400,333 | (6.5 | ) | 774,740 | 725,470 | 6.8 | ||||||||||||||||
|
Non-interest expenses:
|
|||||||||||||||||||||||||
|
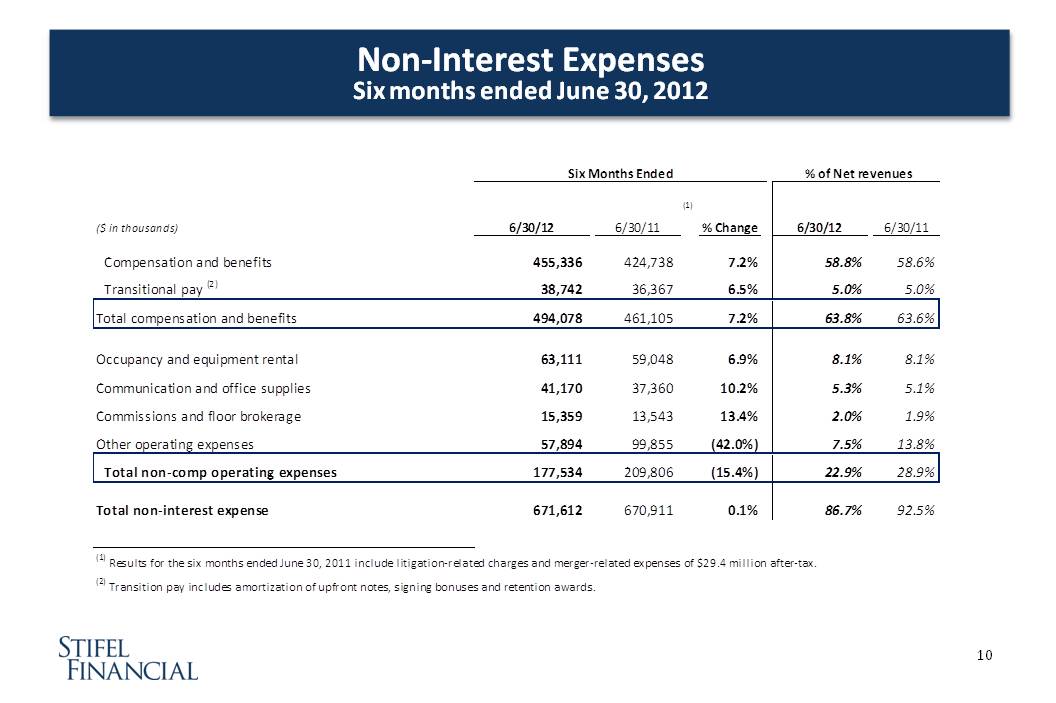
Compensation and benefits
|
239,374 | 229,939 | 4.1 | 254,704 | (6.0 | ) | 494,078 | 461,105 | 7.2 | ||||||||||||||||
|
Occupancy and equipment rental
|
32,320 | 29,723 | 8.7 | 30,791 | 5.0 | 63,111 | 59,048 | 6.9 | |||||||||||||||||
|
Communications and office supplies
|
20,797 | 18,515 | 12.3 | 20,373 | 2.1 | 41,170 | 37,360 | 10.2 | |||||||||||||||||
|
Commission and floor brokerage
|
7,747 | 6,894 | 12.4 | 7,612 | 1.8 | 15,359 | 13,543 | 13.4 | |||||||||||||||||
|
Other operating expenses
|
30,295 | 69,911 | (56.7 | ) | 27,599 | 9.8 | 57,894 | 99,855 | (42.0 | ) | |||||||||||||||
|
Total non-interest expenses
|
330,533 | 354,982 | (6.9 | ) | 341,079 | (3.1 | ) | 671,612 | 670,911 | 0.1 | |||||||||||||||
|
Income before income taxes
|
43,874 | 3,875 | * | 59,254 | (26.0 | ) | 103,128 | 54,559 | 89.0 | ||||||||||||||||
|
Provision for income taxes
|
17,738 | 459 | * | 24,481 | (27.5 | ) | 42,219 | 19,745 | 113.8 | ||||||||||||||||
|
Net income
|
$ | 26,136 | $ | 3,416 | * | $ | 34,773 | (24.8 | ) | $ | 60,909 | $ | 34,814 | 75.0 | |||||||||||
|
Earnings per share:
|
|||||||||||||||||||||||||
|
Basic
|
$ | 0.49 | $ | 0.06 | 716.7 | $ | 0.65 | (24.6 | ) | $ | 1.14 | $ | 0.66 | 72.7 | |||||||||||
|
Diluted
|
$ | 0.42 | $ | 0.05 | 740.0 | $ | 0.55 | (23.6 | ) | $ | 0.97 | $ | 0.55 | 76.4 | |||||||||||
|
Weighted average number of common shares outstanding:
|
|||||||||||||||||||||||||
|
Basic
|
53,569 | 52,932 | 1.2 | 53,243 | 0.6 | 53,406 | 52,734 | 1.3 | |||||||||||||||||
|
Diluted
|
62,678 | 63,245 | (0.9 | ) | 62,669 | - | 62,700 | 63,239 | (0.9 | ) | |||||||||||||||
|
* Percentage not meaningful.
|
|||||||||||||||||||||||||
|
(in thousands, except per share, employee and location
amounts)
|
|||||||||||||||||
|
6/30/12
|
6/30/11
|
% Change
|
3/31/12
|
% Change
|
|||||||||||||
|
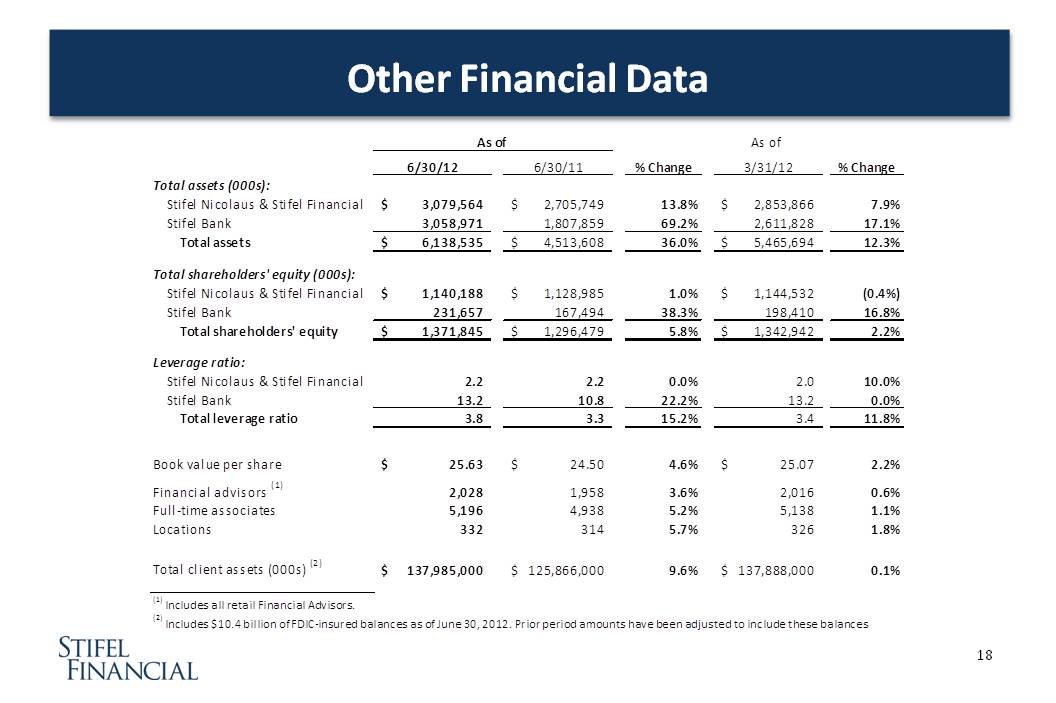
Statistical Information:
|
|||||||||||||||||
|
Book value per share
|
$ | 25.63 | $ | 24.50 | 4.6 | $ | 25.07 | 2.2 | |||||||||
|
Financial advisors
4
|
2,028 | 1,958 | 3.6 | 2,016 | 0.6 | ||||||||||||
|
Full-time associates
|
5,196 | 4,938 | 5.2 | 5,138 | 1.1 | ||||||||||||
|
Locations
|
332 | 314 | 5.7 | 326 | 1.8 | ||||||||||||
|
Total client assets5
|
$ | 137,985,000 | $ | 125,866,000 | 9.6 | $ | 137,888,000 | 0.1 | |||||||||
4 Includes 156, 160 and 155 independent contractors at June
30, 2012 and 2011 and March 31, 2012, respectively.
5 Includes
$10.4 billion of FDIC-insured balances as of June 30, 2012.
Prior period amounts have been adjusted to include these
balances.
5
|
Global Wealth Management Summary Results of Operations
(Unaudited)
|
|||||||||||||||||||||||||
|
Three Months Ended
|
Six Months Ended
|
||||||||||||||||||||||||
|
(in 000s)
|
6/30/12
|
6/30/11
|
% Change
|
3/31/12
|
% Change
|
6/30/12
|
6/30/11
|
% Change
|
|||||||||||||||||
|
Revenues:
|
|||||||||||||||||||||||||
|
Commissions
|
$ | 88,423 | $ | 93,593 | (5.5 | ) | $ | 91,023 | (2.9 | ) | $ | 179,446 | $ | 195,355 | (8.1 | ) | |||||||||
|
Principal transactions
|
55,628 | 51,263 | 8.5 | 59,045 | (5.8 | ) | 114,673 | 107,426 | 6.7 | ||||||||||||||||
|
Asset management and service fees
|
65,169 | 56,817 | 14.7 | 60,586 | 7.6 | 125,755 | 114,347 | 10.0 | |||||||||||||||||
|
Net interest
|
18,233 | 13,401 | 36.1 | 17,647 | 3.3 | 35,880 | 24,570 | 46.0 | |||||||||||||||||
|
Investment banking
|
8,531 | 6,411 | 33.1 | 12,470 | (31.6 | ) | 21,001 | 12,723 | 65.1 | ||||||||||||||||
|
Other income
|
4,045 | 4,160 | (2.7 | ) | 7,577 | (46.6 | ) | 11,622 | 9,670 | 20.2 | |||||||||||||||
|
Net revenues
|
240,029 | 225,645 | 6.4 | 248,348 | (3.3 | ) | 488,377 | 464,091 | 5.2 | ||||||||||||||||
|
Non-interest expenses:
|
|||||||||||||||||||||||||
|
Compensation and benefits
|
140,984 | 132,952 | 6.0 | 143,757 | (1.9 | ) | 284,741 | 275,538 | 3.3 | ||||||||||||||||
|
Non-compensation operating expenses
|
37,692 | 37,267 | 1.1 | 35,413 | 6.4 | 73,105 | 71,655 | 2.0 | |||||||||||||||||
|
Total non-interest expenses
|
178,676 | 170,219 | 5.0 | 179,170 | (0.3 | ) | 357,846 | 347,193 | 3.1 | ||||||||||||||||
|
Income before income taxes
|
$ | 61,353 | $ | 55,426 | 10.7 | $ | 69,178 | (11.3 | ) | $ | 130,531 | $ | 116,898 | 11.7 | |||||||||||
|
As a percentage of net revenues:
|
|||||||||||||||||||||||||
|
Compensation and benefits
|
58.7 | 58.9 | 57.9 | 58.3 | 59.4 | ||||||||||||||||||||
|
Non-compensation operating expenses
|
15.7 | 16.5 | 14.2 | 15.0 | 15.4 | ||||||||||||||||||||
|
Income before income taxes
|
25.6 | 24.6 | 27.9 | 26.7 | 25.2 | ||||||||||||||||||||
|
Stifel Bank & Trust (Unaudited)
|
||||||||||||||
|
Key Statistical Information
|
||||||||||||||
|
(in 000s, except percentages)
|
6/30/12
|
6/30/11
|
% Change
|
3/31/12
|
% Change
|
|||||||||
|
Other information:
|
||||||||||||||
|
Assets
|
$ | 3,058,971 | $ | 1,807,859 | 69.2 | $ | 2,611,828 | 17.1 | ||||||
|
Investment securities
|
1,849,622 | 1,177,850 | 57.0 | 1,673,866 | 10.5 | |||||||||
|
Retained loans, net
|
709,079 | 476,764 | 48.7 | 657,081 | 7.9 | |||||||||
|
Loans held for sale
|
117,166 | 55,110 | 112.6 | 141,136 | (17.0) | |||||||||
|
Deposits
|
2,776,684 | 1,641,079 | 69.2 | 2,357,912 | 17.8 | |||||||||
|
Allowance as a percentage of loans
|
0.88 | % | 0.68 | % | 0.87 | % | ||||||||
|
Non-performing assets as a percentage of total assets
|
0.08 | % | 0.10 | % | 0.11 | % | ||||||||
6
|
Institutional Group Summary Results of Operations
(Unaudited)
|
|||||||||||||||||||||||||
|
Three Months Ended
|
Six Months Ended
|
||||||||||||||||||||||||
|
(in 000s)
|
6/30/12
|
6/30/11
|
% Change
|
3/31/12
|
% Change
|
6/30/12
|
6/30/11
|
% Change
|
|||||||||||||||||
|
Revenues:
|
|||||||||||||||||||||||||
|
Commissions
|
$ | 39,004 | $ | 44,721 | (12.8 | ) | $ | 32,280 | 20.8 | $ | 71,284 | $ | 98,746 | (27.8 | ) | ||||||||||
|
Principal transactions
|
35,936 | 28,477 | 26.2 | 57,188 | (37.2 | ) | 93,124 | 65,173 | 42.9 | ||||||||||||||||
|
Capital raising
|
32,202 | 33,172 | (2.9 | ) | 42,363 | (24.0 | ) | 74,565 | 59,218 | 25.9 | |||||||||||||||
|
Advisory fees
|
26,630 | 24,835 | 7.2 | 15,605 | 70.7 | 42,235 | 33,895 | 24.6 | |||||||||||||||||
|
Investment banking
|
58,832 | 58,007 | 1.4 | 57,968 | 1.5 | 116,800 | 93,113 | 25.4 | |||||||||||||||||
|
Other
6
|
1,525 | 1,710 | (10.8 | ) | 1,068 | 42.8 | 2,593 | 2,877 | (9.9 | ) | |||||||||||||||
|
Net revenues
|
135,297 | 132,915 | 1.8 | 148,504 | (8.9 | ) | 283,801 | 259,909 | 9.2 | ||||||||||||||||
|
Non-interest expenses:
|
|||||||||||||||||||||||||
|
Compensation and benefits
|
84,754 | 82,006 | 3.4 | 94,024 | (9.9 | ) | 178,778 | 159,193 | 12.3 | ||||||||||||||||
|
Non-compensation operating expenses
|
32,997 | 28,958 | 14.0 | 30,776 | 7.2 | 63,773 | 57,372 | 11.2 | |||||||||||||||||
|
Total non-interest expenses
|
117,751 | 110,964 | 6.1 | 124,800 | (5.6 | ) | 242,551 | 216,565 | 12.0 | ||||||||||||||||
|
Income before income taxes
|
$ | 17,546 | $ | 21,951 | (20.1 | ) | $ | 23,704 | (26.0 | ) | $ | 41,250 | $ | 43,344 | (4.8 | ) | |||||||||
|
As a percentage of net revenues:
|
|||||||||||||||||||||||||
|
Compensation and benefits
|
62.6 | 61.7 | 63.3 | 63.0 | 61.2 | ||||||||||||||||||||
|
Non-compensation operating expenses
|
24.4 | 21.8 | 20.7 | 22.5 | 22.1 | ||||||||||||||||||||
|
Income before income taxes
|
13.0 | 16.5 | 16.0 | 14.5 | 16.7 | ||||||||||||||||||||
|
Institutional Group Brokerage & Investment Banking
Revenues (Unaudited)
|
|||||||||||||||||||||||||
|
Three Months Ended
|
Six Months Ended
|
||||||||||||||||||||||||
|
(in 000s)
|
6/30/12
|
6/30/11
|
% Change
|
3/31/12
|
% Change
|
6/30/12
|
6/30/11
|
% Change
|
|||||||||||||||||
|
Institutional brokerage:
|
|||||||||||||||||||||||||
|
Equity
|
$ | 38,466 | $ | 41,695 | (7.7 | ) | $ | 44,172 | (12.9 | ) | $ | 82,638 | $ | 94,093 | (12.2 | ) | |||||||||
|
Fixed income
|
36,474 | 31,503 | 15.8 | 45,296 | (19.5 | ) | 81,770 | 69,826 | 17.1 | ||||||||||||||||
|
Institutional brokerage
|
74,940 | 73,198 | 2.4 | 89,468 | (16.2 | ) | 164,408 | 163,919 | 0.3 | ||||||||||||||||
|
Investment banking:
|
|||||||||||||||||||||||||
|
Capital raising:
|
|||||||||||||||||||||||||
|
Equity
|
17,651 | 27,999 | (37.0 | ) | 31,550 | (44.1 | ) | 49,201 | 51,004 | (3.5 | ) | ||||||||||||||
|
Fixed income
|
14,551 | 5,173 | 181.3 | 10,813 | 34.6 | 25,364 | 8,214 | 208.8 | |||||||||||||||||
|
Capital raising
|
32,202 | 33,172 | (2.9 | ) | 42,363 | (24.0 | ) | 74,565 | 59,218 | 25.9 | |||||||||||||||
|
Advisory fees:
|
26,630 | 24,835 | 7.2 | 15,605 | 70.7 | 42,235 | 33,895 | 24.6 | |||||||||||||||||
|
Investment banking
|
$ | 58,832 | $ | 58,007 | 1.4 | $ | 57,968 | 1.5 | $ | 116,800 | $ | 93,113 | 25.4 | ||||||||||||
Investor Relations Contact
Sarah Anderson, (415) 364-2500, investorrelations@stifel.com
6 Includes net interest and other income.