EX-99.1
 Exhibit 99.1
FOR IMMEDIATE RELEASE
STIFEL FINANCIAL CORP. REPORTS THIRD QUARTER 2011 FINANCIAL RESULTS
Highlights for the three months ended September 30, 2011 compared to the three months ended September 30, 2010:
-
Net revenues of $334.2 million.
-
Net income of $22.3 million, or $0.35 per diluted share.
-
Stockholders’ equity was $1.3 billion and book value per share was $24.48 as of September 30, 2011.
Highlights for the first nine months of 2011 compared to the first nine months of 2010:
-
Net revenues of $1.1 billion increased 8% from the comparable period in 2010.
-
Net income of $57.1 million, or $1.09 per diluted share.
-
Non-GAAP net income of $86.5 million1, or $1.37 per diluted share, increased 12% from the comparable period in 2010.
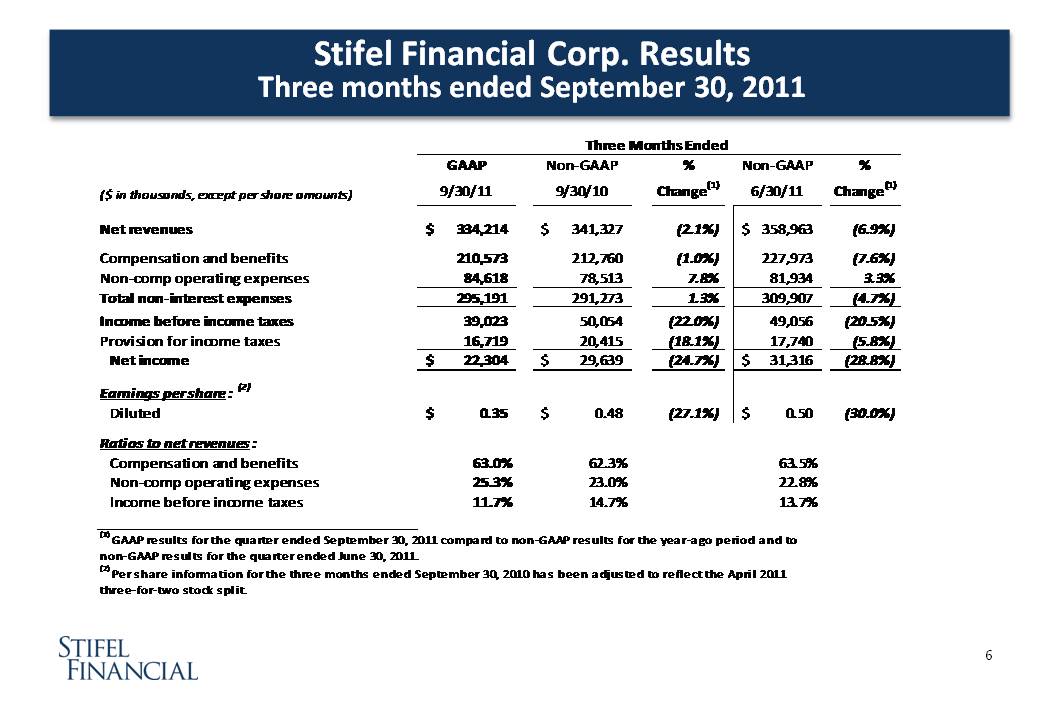
ST. LOUIS, November 9, 2011 –Stifel Financial Corp. (NYSE: SF) today reported unaudited net income of $22.3 million, or $0.35 per diluted share, on net revenues of $334.2 million for the three months ended September 30, 2011, compared with non-GAAP net income of $29.6 million1, or $0.48 per diluted share2, on net revenues of $340.4 million for the third quarter of 2010. On a GAAP basis, the company reported a net loss of $84.3 million, or $1.65 per diluted share2 for the third quarter of 2010. A reconciliation of the company’s GAAP results to these non-GAAP measures is discussed below under “Non-GAAP Financial Measures.”
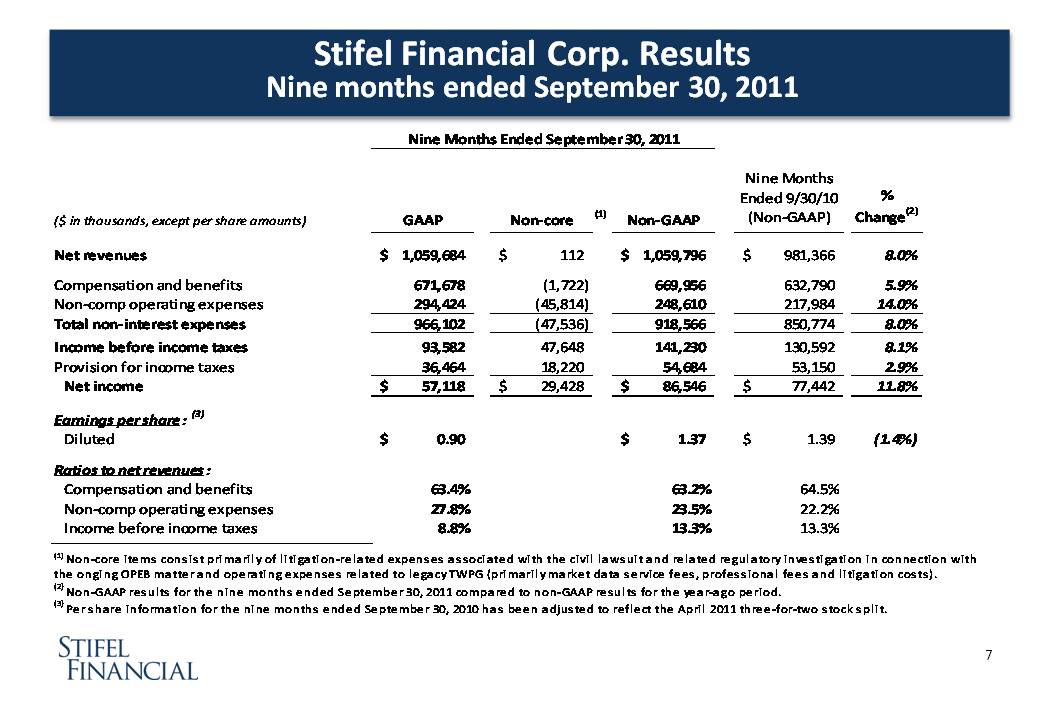
For the nine months ended September 30, 2011, the company reported non-GAAP net income of $86.5 million1, or $1.37 per diluted share, on net revenues of $1.1 billion, compared with non-GAAP net income of $77.4 million1, or $1.39 per diluted share2, on net revenues of $980.4 million during the comparable period in 2010. On a GAAP basis, the company reported unaudited net income of $57.1 million, or $0.90 per diluted share, for the nine months ended September 30, 2011, compared with an unaudited net loss of $39.5 million, or $0.82 per diluted share2, during the comparable period in 2010. A reconciliation of the company’s GAAP results to these non-GAAP measures is discussed below under “Non-GAAP Financial Measures.”
“Our third quarter demonstrates the importance of a balanced business model, particularly in a volatile environment. While not immune to the current macroeconomic headwinds, our Global Wealth Management segment generated impressive results, while the dearth of capital markets activity weighed on our investment banking revenues,” commented Ronald J. Kruszewski, Chairman, President and CEO of Stifel Financial. “Our business model and capital base are solid. We need conviction in the marketplace and lower volatility to return to the margins our firm is capable of producing. We remain focused on serving our clients and are well positioned to capitalize on the opportunities ahead.”
|
Summary Results of Operations (Unaudited)
|
|
| |
|
Three Months Ended
|
|
|
Nine Months Ended
|
|
|
(in 000s)
|
|
9/30/11
|
|
|
9/30/10
|
|
|
% Change
|
|
|
6/30/11
|
|
|
% Change
|
|
|
9/30/11
|
|
|
9/30/10
|
|
|
% Change
|
|
|
Net revenues
|
|
$ |
334,214 |
|
|
$ |
340,388 |
|
|
|
(1.8 |
) |
|
$ |
358,857 |
|
|
|
(6.9 |
) |
|
$ |
1,059,684 |
|
|
$ |
980,427 |
|
|
|
8.1 |
|
|
Net income/(loss)
|
|
$ |
22,304 |
|
|
$ |
(84,336 |
) |
|
|
* |
|
|
$ |
3,416 |
|
|
|
* |
|
|
$ |
57,118 |
|
|
$ |
(39,487 |
) |
|
|
* |
|
|
Non-GAAP net income 1
|
|
$ |
22,304 |
|
|
$ |
29,639 |
|
|
|
(24.7 |
) |
|
$ |
31,316 |
|
|
|
(28.8 |
) |
|
$ |
86,546 |
|
|
$ |
77,442 |
|
|
|
11.8 |
|
|
Earnings per share: 2
|
|
|
|
|
|
|
|
|
|
|
|
|
|
|
|
|
|
|
|
|
|
|
|
|
|
|
|
|
|
|
|
|
|
Basic
|
|
$ |
0.43 |
|
|
$ |
(1.65 |
) |
|
|
* |
|
|
$ |
0.06 |
|
|
|
* |
|
|
$ |
1.09 |
|
|
$ |
(0.82 |
) |
|
|
* |
|
|
Diluted 3
|
|
$ |
0.35 |
|
|
$ |
(1.65 |
) |
|
|
* |
|
|
$ |
0.05 |
|
|
|
* |
|
|
$ |
0.90 |
|
|
$ |
(0.82 |
) |
|
|
* |
|
|
Non-GAAP diluted 1
|
|
$ |
0.35 |
|
|
$ |
0.48 |
|
|
|
(27.1 |
) |
|
$ |
0.50 |
|
|
|
(30.0 |
) |
|
$ |
1.37 |
|
|
$ |
1.39 |
|
|
|
(1.4 |
) |
| |
|
|
|
|
|
|
|
|
|
|
|
|
|
|
|
|
|
|
|
|
|
|
|
|
|
|
|
|
|
|
|
|
|
* Not meaningful.
|
|
|
|
|
|
|
|
|
|
|
|
|
|
|
|
|
|
|
|
|
|
|
|
|
|
|
|
|
|
|
|
|
1 A reconciliation of the company’s GAAP results to these non-GAAP measures is discussed below under “Non-GAAP Financial Measures.”
2 Per share information for the three and nine months ended September 30, 2010 has been adjusted to reflect the April 2011 three-for-two stock split.
3 Earnings per diluted common share are calculated using the basic weighted average number of common shares outstanding in periods a loss is incurred.
Business Segment Results
|
Summary Segment Results (Unaudited)
|
|
| |
|
Three Months Ended
|
|
|
Nine Months Ended
|
|
|
(in 000s)
|
|
9/30/11
|
|
|
9/30/10
|
|
|
% Change
|
|
|
6/30/11
|
|
|
% Change
|
|
|
9/30/11
|
|
|
9/30/10
|
|
|
% Change
|
|
|
Net revenues: 4
|
|
|
|
|
|
|
|
|
|
|
|
|
|
|
|
|
|
|
|
|
|
|
|
|
|
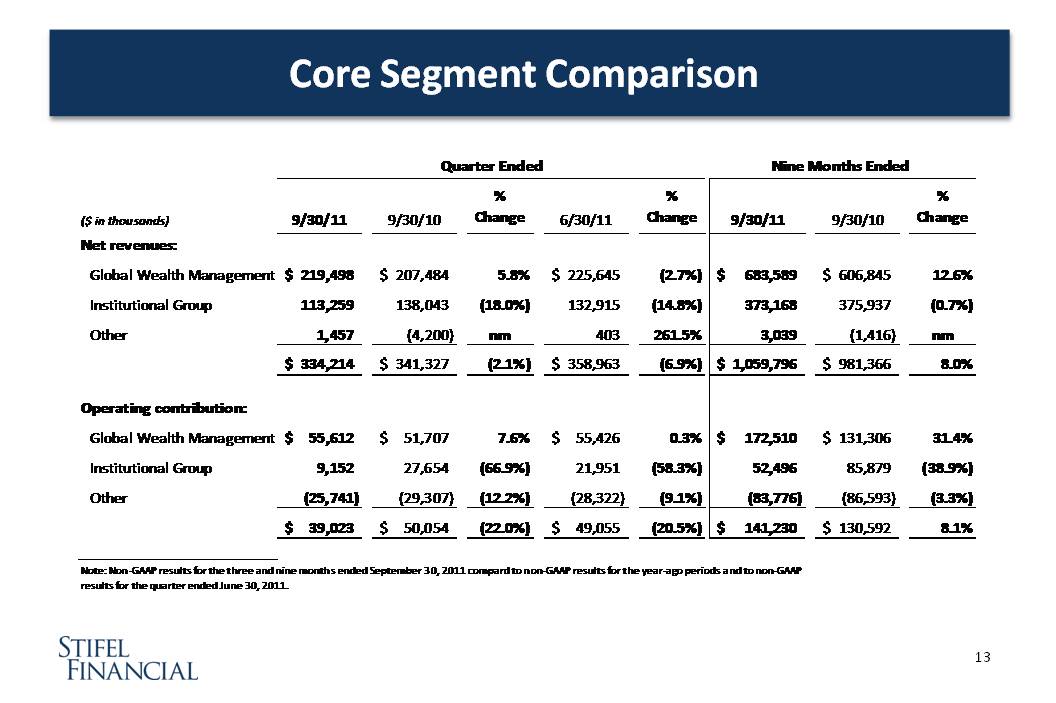
Global Wealth Management
|
|
$ |
219,498 |
|
|
$ |
207,484 |
|
|
|
5.8 |
|
|
$ |
225,645 |
|
|
|
(2.7 |
) |
|
$ |
683,589 |
|
|
$ |
606,845 |
|
|
|
12.6 |
|
|
Institutional Group
|
|
|
113,259 |
|
|
|
138,043 |
|
|
|
(18.0 |
) |
|
|
132,915 |
|
|
|
(14.8 |
) |
|
|
373,168 |
|
|
|
375,937 |
|
|
|
(0.7 |
) |
|
Other
|
|
|
1,457 |
|
|
|
(4,200 |
) |
|
|
* |
|
|
|
403 |
|
|
|
261.5 |
|
|
|
3,039 |
|
|
|
(1,416 |
) |
|
|
* |
|
| |
|
$ |
334,214 |
|
|
$ |
341,327 |
|
|
|
(2.1 |
) |
|
$ |
358,963 |
|
|
|
(6.9 |
) |
|
$ |
1,059,796 |
|
|
$ |
981,366 |
|
|
|
8.0 |
|
|
Operating contribution: 4
|
|
|
|
|
|
|
|
|
|
|
|
|
|
|
|
|
|
|
|
|
|
|
|
|
|
|
|
|
|
|
|
|
|
Global Wealth Management
|
|
$ |
55,612 |
|
|
$ |
51,707 |
|
|
|
7.6 |
|
|
$ |
55,426 |
|
|
|
0.3 |
|
|
$ |
172,510 |
|
|
$ |
131,306 |
|
|
|
31.4 |
|
|
Institutional Group
|
|
|
9,152 |
|
|
|
27,654 |
|
|
|
(66.9 |
) |
|
|
21,951 |
|
|
|
(58.3 |
) |
|
|
52,496 |
|
|
|
85,879 |
|
|
|
(38.9 |
) |
|
Other
|
|
|
(25,741 |
) |
|
|
(29,307 |
) |
|
|
(12.2 |
) |
|
|
(28,321 |
) |
|
|
(9.1 |
) |
|
|
(83,776 |
) |
|
|
(86,593 |
) |
|
|
(3.3 |
) |
| |
|
$ |
39,023 |
|
|
$ |
50,054 |
|
|
|
(22.0 |
) |
|
$ |
49,056 |
|
|
|
(20.5 |
) |
|
$ |
141,230 |
|
|
$ |
130,592 |
|
|
|
8.1 |
|
| |
|
|
|
|
|
|
|
|
|
|
|
|
|
|
|
|
|
|
|
|
|
|
|
|
|
|
|
|
|
|
|
|
|
* Not meaningful.
|
|
|
|
|
|
|
|
|
|
|
|
|
|
|
|
|
|
|
|
|
|
|
|
|
|
|
|
|
|
|
|
|
Global Wealth Management
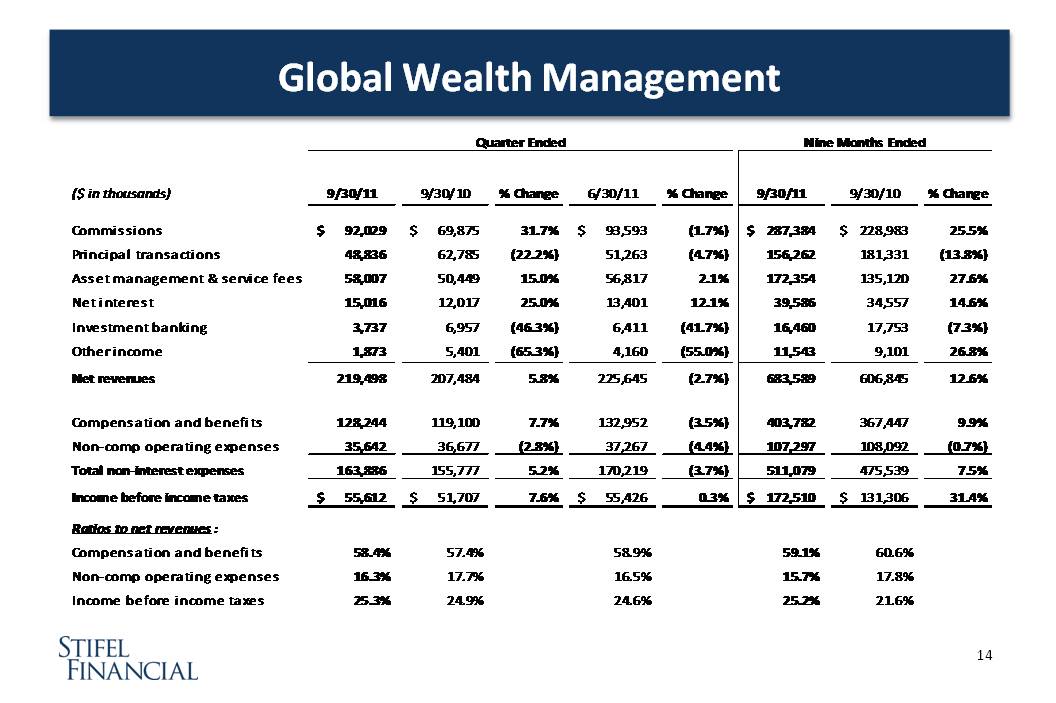
For the quarter ended September 30, 2011, the Global Wealth Management (“GWM”) segment generated pre-tax operating income of $55.6 million, compared with $51.7 million in the third quarter of 2010 and $55.4 million in the second quarter of 2011. Net revenues for the quarter were $219.5 million, compared with $207.5 million in the third quarter of 2010, and $225.6 million in the second quarter of 2011. The increase in net revenues over the comparable period in 2010 is primarily attributable to: (1) higher commission revenues as a result of increased client assets coupled with higher productivity; (2) growth in asset management and service fees as a result of an increase in assets under management and positive gains in market performance; and (3) increased net interest revenues as a result of the growth of net interest-earning assets at Stifel Bank. The decrease in net revenues from the second quarter of 2011 was primarily attributable to a decrease in commissions and principal transactions revenues, as a result of lower trading volumes and lower sales credits from investment banking underwritings.
-
The Private Client Group reported net revenues of $201.9 million, a 2%
increase compared with the third quarter of 2010 and a 5% decrease compared
with the second quarter of 2011.
-
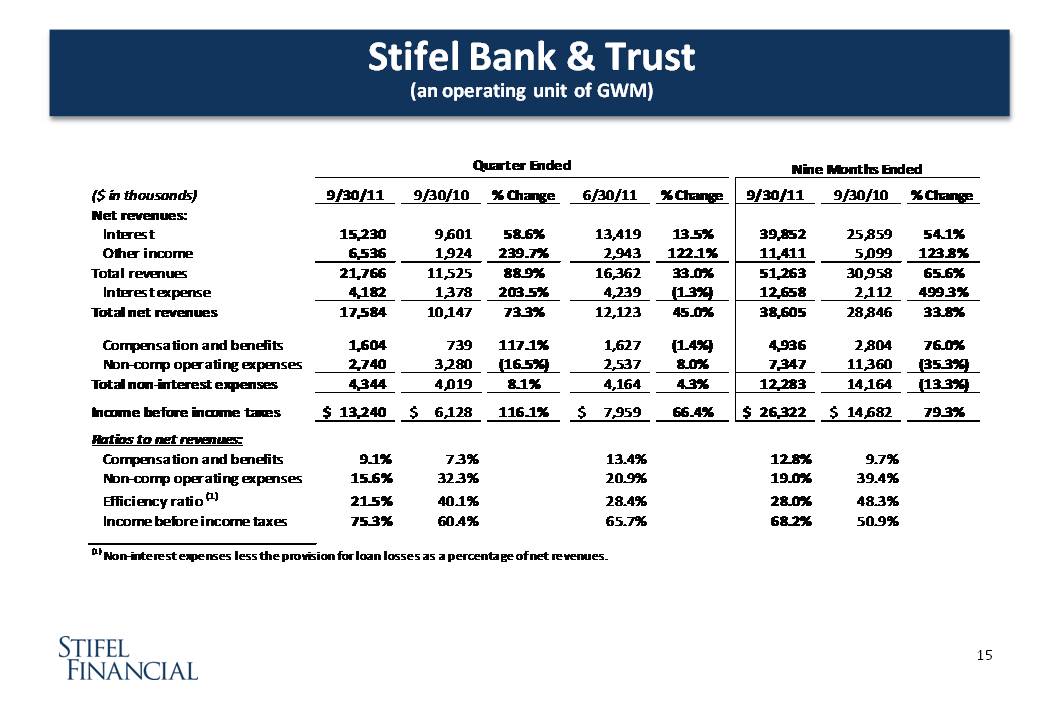
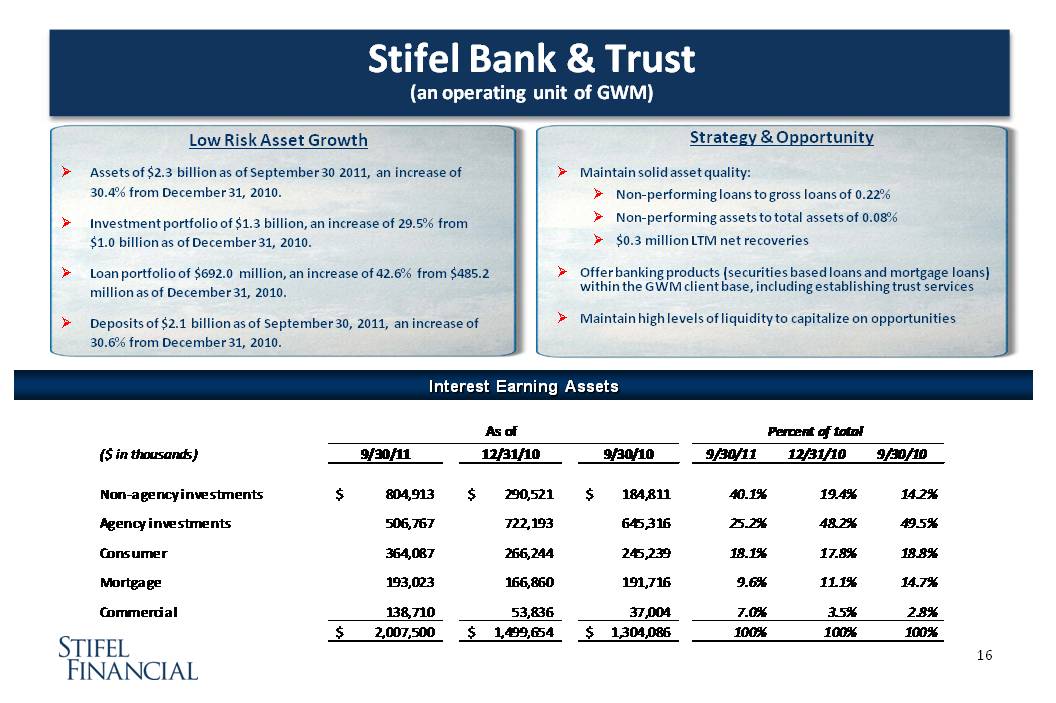
Stifel Bank reported net revenues of $17.6 million, a 73% increase compared
with the third quarter of 2010 and a 45% increase compared
with the second quarter of 2011.
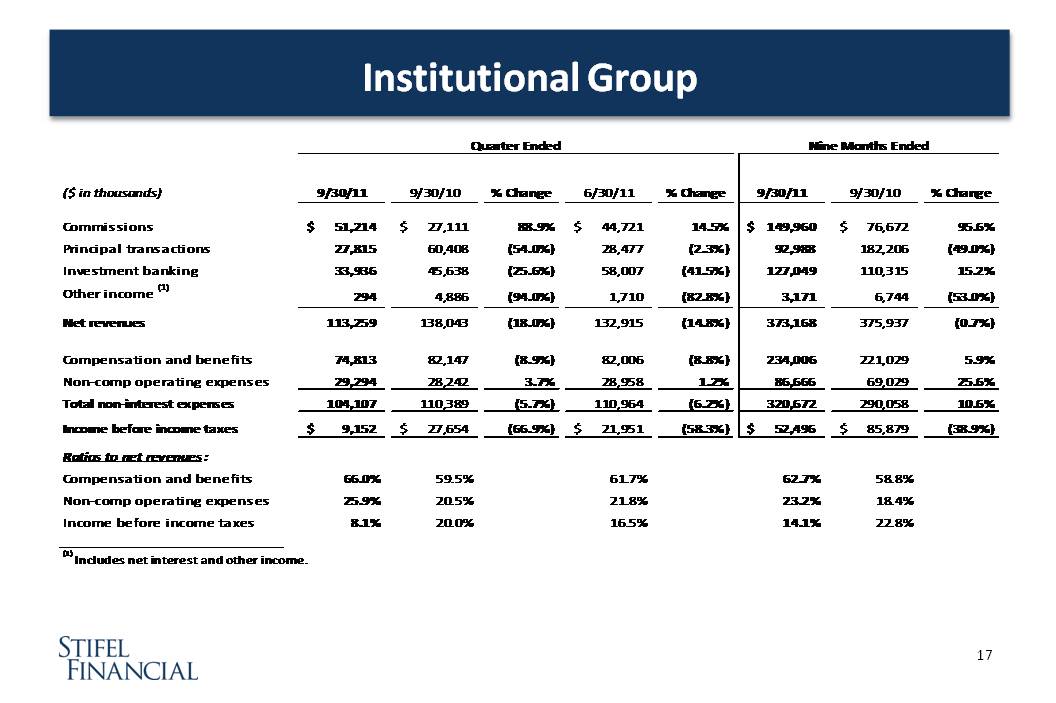
Institutional Group
For the quarter ended September 30, 2011, the Institutional Group segment generated pre-tax operating income of $9.2 million, compared with $27.7 million in the third quarter of 2010 and $22.0 million in the second quarter of 2011. Net revenues for the quarter were $113.3 million, compared with $138.0 million in the third quarter of 2010 and $132.9 million in the second quarter of 2011. The decrease in net revenues from the comparable period in 2010 was driven by a decline in advisory fees, fixed income institutional brokerage and capital raising revenues, which were negatively impacted by the challenging market conditions present during the third quarter of 2011 and lower industry-wide capital raising volumes. The decrease in net revenues from the second quarter of 2011 was primarily attributable to a decrease in advisory fees and capital raising revenues, partially offset by an increase in institutional brokerage revenues.
4 A reconciliation of the company’s GAAP results to these non-GAAP measures is discussed below under “Non-GAAP Financial Measures.”
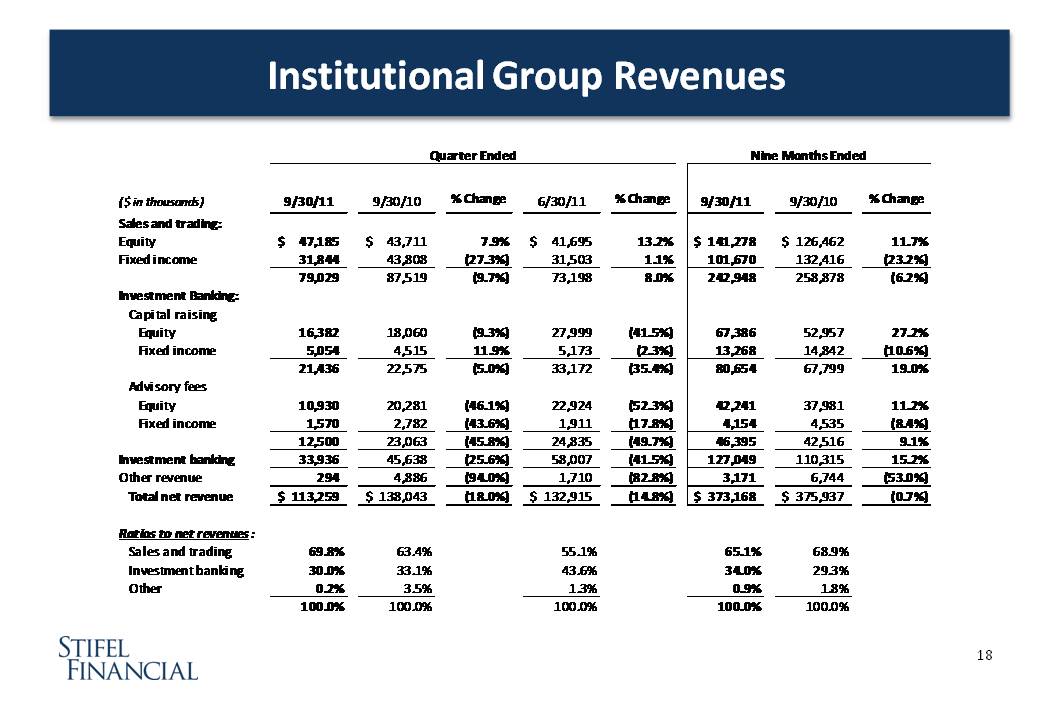
Institutional brokerage revenues were $79.0 million, a 10% decrease compared with the third quarter of 2010 and an 8% increase compared with the second quarter of 2011.
-
Equity brokerage revenues were $47.2 million, an 8% increase compared with the third quarter of 2010 and a 13% increase compared with the second quarter of 2011.
-
Fixed income brokerage
revenues were $31.8 million, a 27% decrease compared with the third
quarter of 2010 and a 1% increase compared with the second quarter
of 2011.
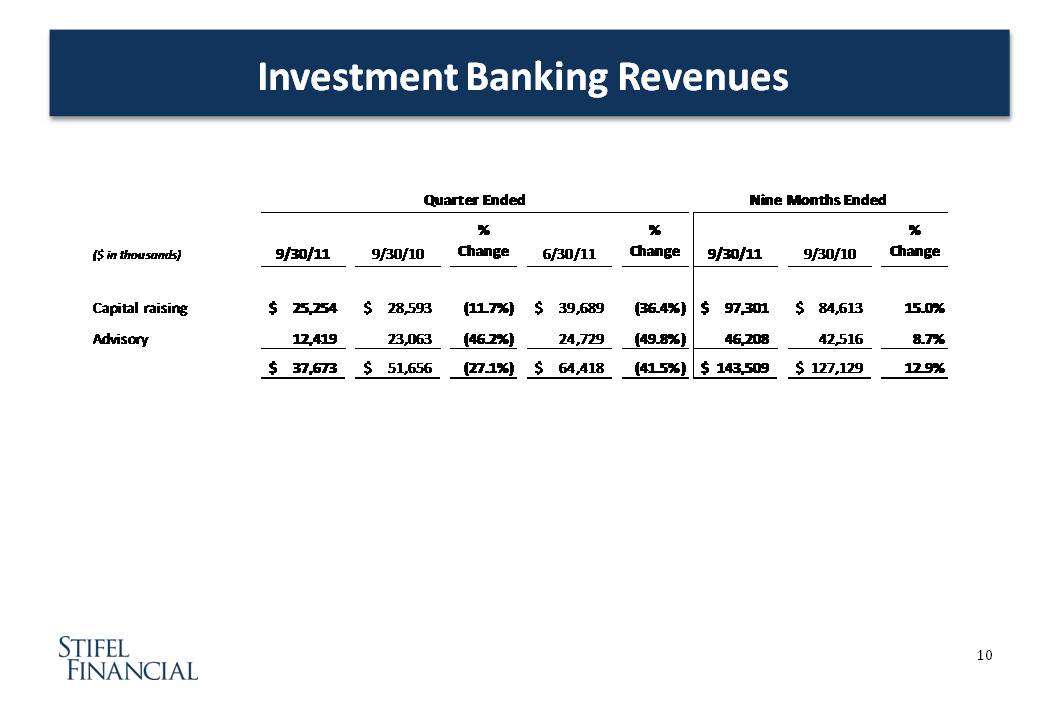
Investment banking revenues were $33.9 million, a 26% decrease compared with the third quarter of 2010 and a 42% decrease compared with the second quarter of 2011.
-
Equity capital raising revenues were $16.4 million, a 9% decrease compared with the third quarter of 2010 and a 42% decrease compared with the second quarter of 2011.
-
Fixed income capital raising revenues were $5.0 million, a 12% increase compared with the third quarter of 2010 and a 2% decrease compared with the second quarter of 2011.
-
Equity advisory fee revenues were $10.9 million, a 46% decrease compared with the third quarter of 2010, and a 52% decrease compared with the second quarter of 2011.
-
Fixed income advisory fee revenues were $1.6 million, a 44% decrease compared with the third quarter of 2010 and an 18% decrease compared with the second quarter of 2011.
Consolidated Compensation and Benefits Expenses
For the quarter ended September 30, 2011, compensation and benefits expenses were $210.6 million, compared to $395.9 million in the third quarter of 2010, which included $183.2 million related to the modification of the company’s deferred compensation plan and merger-related expenses. Compensation and benefits expenses for the second quarter of 2011 were $229.9 million, which included $2.0 million of merger-related expenses. Excluding these expenses, compensation and benefits expenses decreased 1% compared with the third quarter of 2010 and decreased 8% compared with the second quarter of 2011.
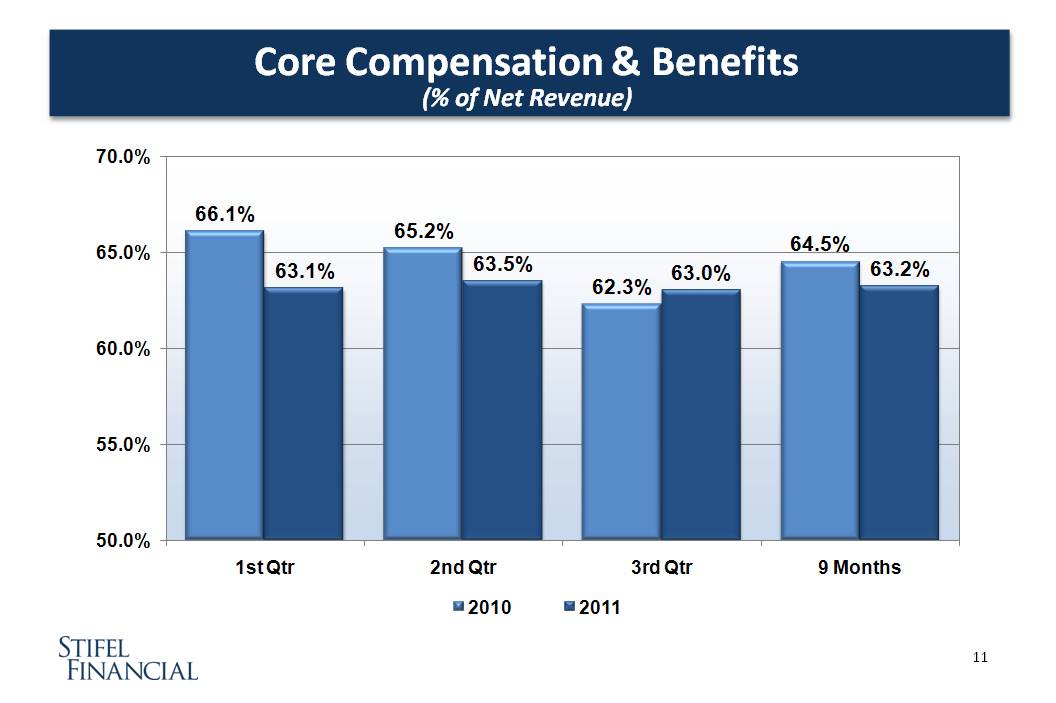
Compensation and benefits as a percentage of net revenues was 63%5 compared with 62%5 in the third quarter of 2010 and 64%5 in the second quarter of 2011. Transition pay, which primarily consists of amortization of upfront notes, signing bonuses and retention awards, as a percentage of net revenues was 5% in the third quarter of 2011 compared with 8% in the third quarter of 2010 and 5% in the second quarter of 2011.
Consolidated Non-Compensation Operating Expenses
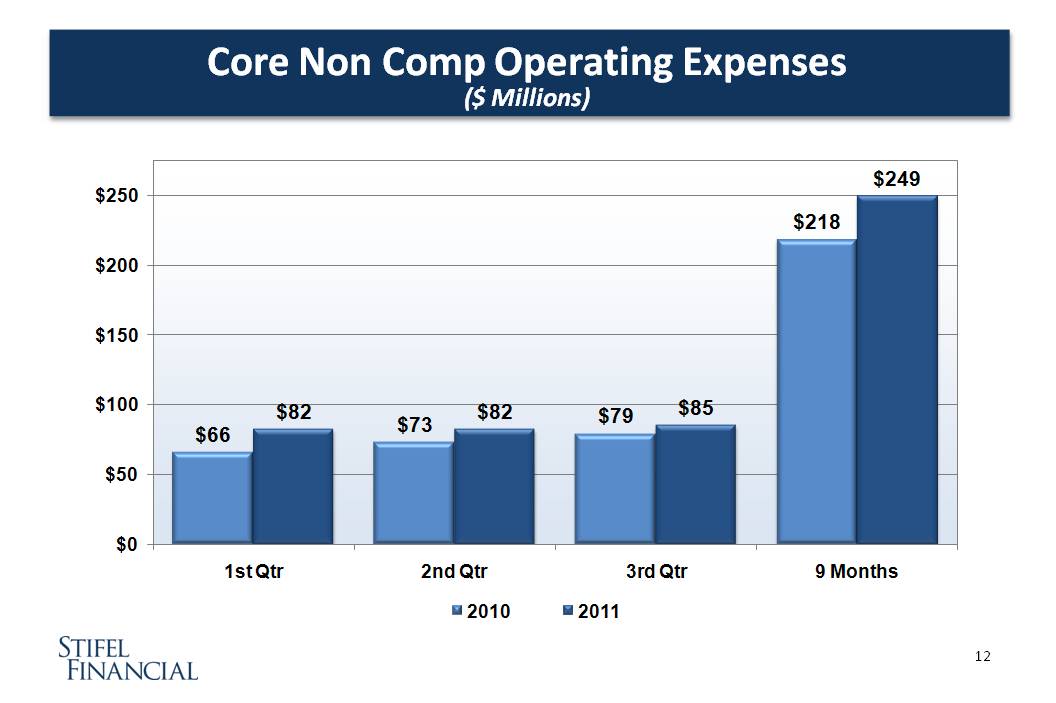
For the quarter ended September 30, 2011, non-compensation operating expenses were $84.6 million, compared to $87.0 million in the third quarter of 2010, which included $8.5 million of merger-related expenses. Non-compensation operating expenses for the second quarter of 2011 were $125.0 million, which included $43.1 million of litigation-related charges and merger-related expenses.
Excluding litigation and merger-related expenses, non-compensation operating expenses increased 8% compared with the third quarter of 2010 and increased 3% compared with the second quarter of 2011. The increase in non-compensation operating expenses is primarily attributable to an increase in expenses as a result of the merger with TWPG.
Non-compensation operating expenses as a percentage of net revenues for the quarter ended September 30, 2011 was 25%5 compared with 23%5 in the third quarter of 2010 and 23%5 in the second quarter of 2011. The higher ratio in the third quarter of 2011 was driven by the impact of increased non-compensation operating expenses on lower revenues.
Provision for Income Taxes
The effective income tax rate for the quarter ended September 30, 2011 was 43% compared with 41% for the comparable period in 2010. The provision for income taxes for the three months ended September 30, 2011 increased primarily as a result of adjustments to the company’s uncertain tax positions.
5 A reconciliation of the company’s GAAP results to these non-GAAP measures is discussed below under “Non-GAAP Financial Measures.”
Statement of Financial Condition (Unaudited)
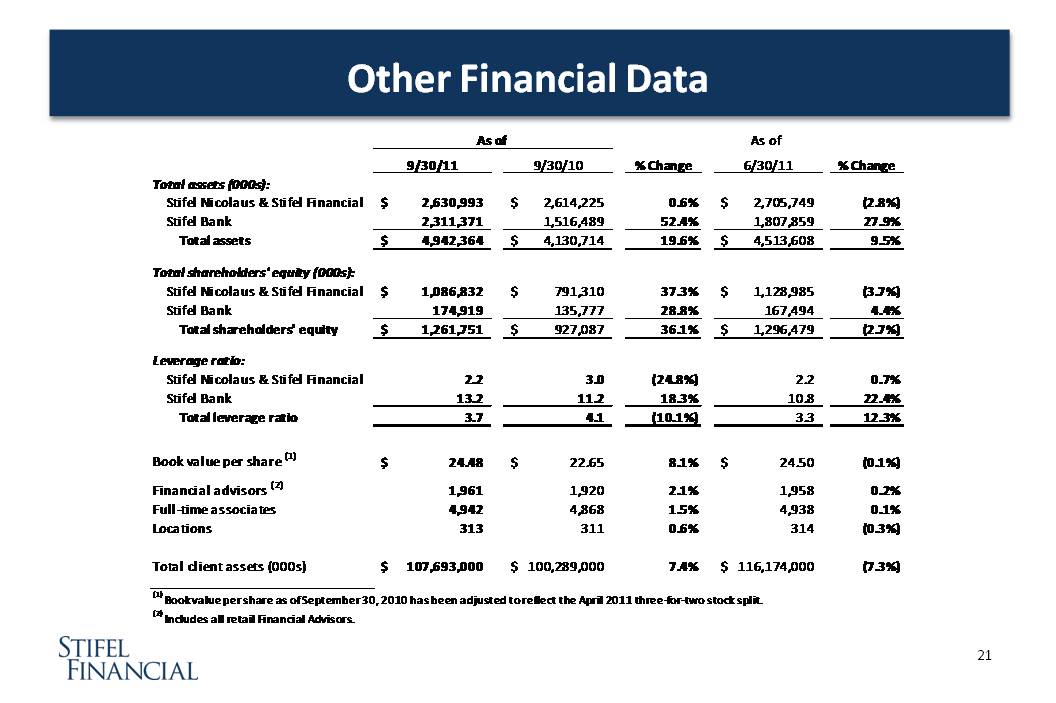
Total assets increased 18% to $4.9 billion as of September 30, 2011 from $4.2 billion as of September 30, 2010. The increase is primarily attributable to growth of the company’s bank subsidiary, which as of September 30, 2011 has grown its assets to $2.3 billion from $1.5 billion as of September 30, 2010. As of September 30, 2011, Stifel Bank’s investment portfolio of $1.3 billion has increased 58% from September 30, 2010, with more than 99% of the investment portfolio comprised of investment grade securities, of which more than 67% were GSE guaranteed MBS or AAA rated investments. The company’s broker-dealer subsidiary’s gross assets and liabilities, including trading inventory, stock loan/borrow, receivables and payables from/to brokers, dealers and clearing organizations and clients, fluctuate with business levels and overall market conditions. The company has no exposure to non-U.S. sovereign debt.
Total stockholders’ equity as of September 30, 2011 increased $49.2 million, or 4%, to $1.3 billion from $1.2 billion as of September 30, 2010. Book value per share was $24.48 as of September 30, 2011. The company repurchased $48.5 million, or 1.7 million shares6, of its common stock pursuant to existing Board repurchase authorizations since September 30, 2010. On November 7, 2011, the Board authorized the repurchase of an additional 3.0 million shares. Under existing Board authorizations at November 7, 2011, we are permitted to buy an additional 4.3 million shares.
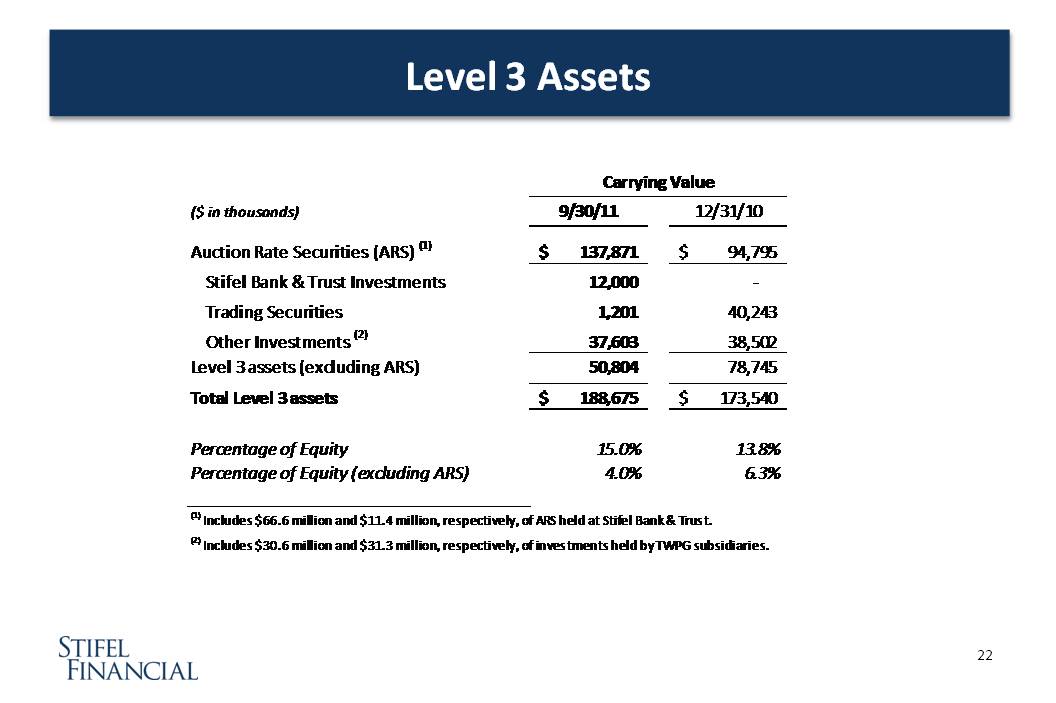
As of September 30, 2011, the company reported total securities owned and investments at fair value of $2.0 billion, which included securities categorized as Level 3 of $188.7 million. The company’s Level 3 assets include auction rate securities and private equity and other fixed income securities with fair values of $137.9 million and $50.8 million, respectively, as of September 30, 2011.
Non-GAAP Financial Measures
The company utilized non-GAAP calculations of presented net revenues, compensation and benefits, non-compensation operating expenses, income before income taxes, provision for income taxes, net income, compensation and non-compensation operating expense ratios, pre-tax margin and diluted earnings per share as an additional measure to aid in understanding and analyzing the company’s financial results for the three and nine months ended September 30, 2011, the three months ended June 30, 2011 and the three and nine months ended September 30, 2010. Specifically, the company believes that the non-GAAP measures provide useful information by excluding certain items that may not be indicative of the company’s core operating results and business outlook. The company believes that these non-GAAP measures will allow for a better evaluation of the operating performance of the business and facilitate a meaningful comparison of the company’s results in the current period to those in prior periods and future periods. Reference to these non-GAAP measures should not be considered as a substitute for results that are presented in a manner consistent with GAAP. These non-GAAP measures are provided to enhance investors' overall understanding of the company’s current financial performance. These non-GAAP amounts exclude litigation-related expenses associated with the civil lawsuit and related regulatory investigation in connection with the ongoing matter with five Southeastern Wisconsin school districts, compensation expense related to the acceleration of deferred compensation as a result of the modification of the company’s deferred compensation plan and certain compensation and non-compensation operating expenses associated with the merger of TWPG.
A limitation of utilizing these non-GAAP measures of net revenues, compensation and benefits, non-compensation operating expenses, income before income taxes, provision for income taxes, net income, compensation and non-compensation operating expenses ratios, pre-tax margin and diluted earnings per share is that the GAAP accounting effects of these merger-related charges do in fact reflect the underlying financial results of the company’s business and these effects should not be ignored in evaluating and analyzing its financial results. Therefore, the company believes that GAAP measures of net revenues, compensation and benefits, non-compensation operating expenses, income before income taxes, provision for income taxes, net income, compensation and non-compensation operating expense ratios, pre-tax margin and diluted earnings per share and the same respective non-GAAP measures of the company’s financial performance should be considered together.
6 Share information has been adjusted to reflect the April 2011 three-for-two stock split.
The following tables provide details with respect to reconciling net revenues, compensation and benefits, non-compensation operating expenses, income before income taxes, provision for income taxes, net income, compensation and benefits and non-compensation operating expense ratios, pre-tax margin and diluted earnings per share on a GAAP basis for the three and nine months ended September 30, 2011, the three months ended June 30, 2011, and the three and nine months ended September 30, 2010 to the aforementioned expenses on a non-GAAP basis for the same periods.
| |
|
Reconciliation of GAAP to Non-GAAP Earnings (Unaudited)
|
|
| |
|
(in thousands, except per share amounts)
|
|
| |
|
Three Months Ended September 30, 2011
|
|
|
Nine Months Ended September 30, 2011
|
|
| |
|
GAAP
|
|
|
Non-core
|
|
|
Non-GAAP
|
|
|
GAAP
|
|
|
Non-core 7
|
|
|
Non-GAAP
|
|
| |
|
|
|
|
|
|
|
|
|
|
|
|
|
|
|
|
|
|
|
Net revenues
|
|
$ |
334,214 |
|
|
$ |
— |
|
|
$ |
334,214 |
|
|
$ |
1,059,684 |
|
|
$ |
112 |
|
|
$ |
1,059,796 |
|
| |
|
|
|
|
|
|
|
|
|
|
|
|
|
|
|
|
|
|
|
|
|
|
|
|
|
Non-interest expenses:
|
|
|
|
|
|
|
|
|
|
|
|
|
|
|
|
|
|
|
|
|
|
|
|
|
|
Compensation and benefits
|
|
|
210,573 |
|
|
|
— |
|
|
|
210,573 |
|
|
|
671,678 |
|
|
|
(1,722 |
) |
|
|
669,956 |
|
|
Non-compensation operating expenses
|
|
|
84,618 |
|
|
|
— |
|
|
|
84,618 |
|
|
|
294,424 |
|
|
|
(45,814 |
) |
|
|
248,610 |
|
|
Total non-interest expenses
|
|
|
295,191 |
|
|
|
— |
|
|
|
295,191 |
|
|
|
966,102 |
|
|
|
(47,536 |
) |
|
|
918,566 |
|
|
Income before income taxes
|
|
|
39,023 |
|
|
|
— |
|
|
|
39,023 |
|
|
|
93,582 |
|
|
|
47,648 |
|
|
|
141,230 |
|
|
Provision for income taxes
|
|
|
16,719 |
|
|
|
— |
|
|
|
16,719 |
|
|
|
36,464 |
|
|
|
18,220 |
|
|
|
54,684 |
|
|
Net income
|
|
$ |
22,304 |
|
|
$ |
— |
|
|
$ |
22,304 |
|
|
$ |
57,118 |
|
|
$ |
29,428 |
|
|
$ |
86,546 |
|
| |
|
|
|
|
|
|
|
|
|
|
|
|
|
|
|
|
|
|
|
|
|
|
|
|
|
Earnings per share:
|
|
|
|
|
|
|
|
|
|
|
|
|
|
|
|
|
|
|
|
|
|
|
|
|
|
Diluted
|
|
$ |
0.35 |
|
|
|
|
|
|
$ |
0.35 |
|
|
$ |
0.90 |
|
|
|
|
|
|
$ |
1.37 |
|
| |
|
|
|
|
|
|
|
|
|
|
|
|
|
|
|
|
|
|
|
|
|
|
|
|
|
As a percentage of net revenues:
|
|
|
|
|
|
|
|
|
|
|
|
|
|
|
|
|
|
|
|
|
|
|
|
|
|
Compensation and benefits
|
|
|
63.0 |
% |
|
|
|
|
|
|
63.0 |
% |
|
|
63.4 |
% |
|
|
|
|
|
|
63.2 |
% |
|
Non-compensation operating expenses
|
|
|
25.3 |
% |
|
|
|
|
|
|
25.3 |
% |
|
|
27.8 |
% |
|
|
|
|
|
|
23.5 |
% |
|
Income before income taxes
|
|
|
11.7 |
% |
|
|
|
|
|
|
11.7 |
% |
|
|
8.8 |
% |
|
|
|
|
|
|
13.3 |
% |
| |
|
Reconciliation of GAAP to Non-GAAP Earnings (Unaudited)
|
|
| |
|
(in thousands, except per share amounts)
|
|
| |
|
Three Months Ended September 30, 2010
|
|
|
Nine Months Ended September 30, 2010
|
|
| |
|
GAAP
|
|
|
Non-core 7
|
|
|
Non-GAAP
|
|
|
GAAP
|
|
|
Non-core 7
|
|
|
Non-GAAP
|
|
| |
|
|
|
|
|
|
|
|
|
|
|
|
|
|
|
|
|
|
|
Net revenues
|
|
$ |
340,388 |
|
|
$ |
939 |
|
|
$ |
341,327 |
|
|
$ |
980,427 |
|
|
$ |
939 |
|
|
$ |
981,366 |
|
| |
|
|
|
|
|
|
|
|
|
|
|
|
|
|
|
|
|
|
|
|
|
|
|
|
|
Non-interest expenses:
|
|
|
|
|
|
|
|
|
|
|
|
|
|
|
|
|
|
|
|
|
|
|
|
|
|
Compensation and benefits
|
|
|
395,936 |
|
|
|
(183,176 |
) |
|
|
212,760 |
|
|
|
819,085 |
|
|
|
(186,295 |
) |
|
|
632,790 |
|
|
Non-compensation operating expenses
|
|
|
87,008 |
|
|
|
(8,495 |
) |
|
|
78,513 |
|
|
|
228,388 |
|
|
|
(10,404 |
) |
|
|
217,984 |
|
|
Total non-interest expenses
|
|
|
482,944 |
|
|
|
(191,671 |
) |
|
|
291,273 |
|
|
|
1,047,473 |
|
|
|
(196,699 |
) |
|
|
850,774 |
|
|
Income/(loss) before income taxes
|
|
|
(142,556 |
) |
|
|
192,610 |
|
|
|
50,054 |
|
|
|
(67,046 |
) |
|
|
197,638 |
|
|
|
130,592 |
|
|
Provision for income taxes/(benefit)
|
|
|
(58,220 |
) |
|
|
78,635 |
|
|
|
20,415 |
|
|
|
(27,559 |
) |
|
|
80,709 |
|
|
|
53,150 |
|
|
Net income/(loss)
|
|
$ |
(84,336 |
) |
|
$ |
113,975 |
|
|
$ |
29,639 |
|
|
$ |
(39,487 |
) |
|
$ |
116,929 |
|
|
$ |
77,442 |
|
| |
|
|
|
|
|
|
|
|
|
|
|
|
|
|
|
|
|
|
|
|
|
|
|
|
|
Earnings per share: 8
|
|
|
|
|
|
|
|
|
|
|
|
|
|
|
|
|
|
|
|
|
|
|
|
|
|
Diluted
|
|
$ |
(1.65 |
) |
|
|
|
|
|
$ |
0.48 |
|
|
$ |
(0.82 |
) |
|
|
|
|
|
$ |
1.39 |
|
| |
|
|
|
|
|
|
|
|
|
|
|
|
|
|
|
|
|
|
|
|
|
|
|
|
|
As a percentage of net revenues:
|
|
|
|
|
|
|
|
|
|
|
|
|
|
|
|
|
|
|
|
|
|
|
|
|
|
Compensation and benefits
|
|
|
116.3 |
% |
|
|
|
|
|
|
62.3 |
% |
|
|
83.5 |
% |
|
|
|
|
|
|
64.5 |
% |
|
Non-compensation operating expenses
|
|
|
25.6 |
% |
|
|
|
|
|
|
23.0 |
% |
|
|
23.3 |
% |
|
|
|
|
|
|
22.2 |
% |
|
Income/(loss) before income taxes
|
|
|
(41.9 |
)% |
|
|
|
|
|
|
14.7 |
% |
|
|
(6.8 |
)% |
|
|
|
|
|
|
13.3 |
% |
7 Non-core items for the nine months ended September 30, 2011 include litigation-related expenses associated with the civil lawsuit and related regulatory investigation in connection with the ongoing matter with five Southeastern Wisconsin school districts and certain merger-related expenses related to the merger with TWPG. Non-core items for the three and nine months ended September 30, 2010 include certain merger-related expenses related to the merger with TWPG.
8 Per share information has been adjusted to reflect the April 2011 three-for-two stock split.
|
Reconciliation of GAAP to Non-GAAP Earnings (Unaudited)
|
|
|
(in thousands, except per share amounts)
|
|
| |
|
Three Months Ended June 30, 2011
|
|
| |
|
GAAP
|
|
|
Non-core 9
|
|
|
Non-GAAP
|
|
| |
|
|
|
|
|
|
|
|
|
|
Net revenues
|
|
$ |
358,857 |
|
|
$ |
106 |
|
|
$ |
358,963 |
|
| |
|
|
|
|
|
|
|
|
|
|
|
|
|
Non-interest expenses:
|
|
|
|
|
|
|
|
|
|
|
|
|
|
Compensation and benefits
|
|
|
229,939 |
|
|
|
(1,966 |
) |
|
|
227,973 |
|
|
Non-compensation operating expenses
|
|
|
125,043 |
|
|
|
(43,109 |
) |
|
|
81,934 |
|
|
Total non-interest expenses
|
|
|
354,982 |
|
|
|
(45,075 |
) |
|
|
309,907 |
|
|
Income before income taxes
|
|
|
3,875 |
|
|
|
45,181 |
|
|
|
49,056 |
|
|
Provision for income taxes
|
|
|
459 |
|
|
|
17,281 |
|
|
|
17,740 |
|
|
Net income
|
|
$ |
3,416 |
|
|
$ |
27,900 |
|
|
$ |
31,316 |
|
| |
|
|
|
|
|
|
|
|
|
|
|
|
|
Earnings per share:
|
|
|
|
|
|
|
|
|
|
|
|
|
|
Diluted
|
|
$ |
0.05 |
|
|
|
|
|
|
$ |
0.50 |
|
| |
|
|
|
|
|
|
|
|
|
|
|
|
|
As a percentage of net revenues:
|
|
|
|
|
|
|
|
|
|
|
|
|
|
Compensation and benefits
|
|
|
64.1 |
% |
|
|
|
|
|
|
63.5 |
% |
|
Non-compensation operating expenses
|
|
|
34.8 |
% |
|
|
|
|
|
|
22.8 |
% |
|
Income before income taxes
|
|
|
1.1 |
% |
|
|
|
|
|
|
13.7 |
% |
9 Non-core items for the three months ended June 30, 2011 include litigation-related expenses associated with the civil lawsuit and related regulatory investigation in connection with the ongoing matter with five Southeastern Wisconsin school districts and certain merger-related expenses related to the merger with TWPG.
Conference Call Information
Stifel Financial Corp. will host its third quarter 2011 financial results conference call on Wednesday, November 9, 2011, at 5:00 p.m. Eastern time. The conference call may include forward-looking statements.
All interested parties are invited to listen to the company’s Chairman, President, and CEO, Ronald J. Kruszewski, by dialing (888) 676-3684 and referencing conference ID #25587443. A live audio webcast of the call, as well as a presentation highlighting the company’s results, will be available through the company's web site, www.stifel.com. For those who cannot listen to the live broadcast, a replay of the broadcast will be available through the above-referenced web site beginning approximately one hour following the completion of the call.
Company Information
Stifel Financial Corp. (NYSE: SF) is a financial holding company headquartered in St. Louis, Missouri that conducts its banking, securities, and financial services business through several wholly owned subsidiaries. Stifel clients are primarily served in the U.S. through 318 offices in 44 states, and the District of Columbia through Stifel, Nicolaus & Company, Incorporated and Thomas Weisel Partners LLC, and in Canada through Stifel Nicolaus Canada Inc. Clients in the United Kingdom and Europe are served through offices of Stifel Nicolaus Europe Limited. Each of the broker-dealer affiliates provide securities brokerage, investment banking, trading, investment advisory, and related financial services to individual investors, professional money managers, businesses, and municipalities. Stifel Bank & Trust offers a full range of consumer and commercial lending solutions. To learn more about Stifel, please visit the company’s web site at www.stifel.com.
Forward-Looking Statements
This earnings release contains certain statements that may be deemed to be “forward-looking statements” within the meaning of Section 27A of the Securities Act of 1933 and Section 21E of the Securities Exchange Act of 1934. All statements in this earnings release not dealing with historical results are forward-looking and are based on various assumptions. The forward-looking statements in this earnings release are subject to risks and uncertainties that could cause actual results to differ materially from those expressed in or implied by the statements. Factors that may cause actual results to differ materially from those contemplated by such forward-looking statements include, among other things, the following possibilities: the ability to successfully integrate acquired companies or the branch offices and financial advisors; a material adverse change in financial condition; the risk of borrower, depositor, and other customer attrition; a change in general business and economic conditions; changes in the interest rate environment, deposit flows, loan demand, real estate values, and competition; changes in accounting principles, policies, or guidelines; changes in legislation and regulation; other economic, competitive, governmental, regulatory, geopolitical, and technological factors affecting the companies’ operations, pricing, and services; and other risk factors referred to from time to time in filings made by Stifel Financial Corp. with the Securities and Exchange Commission. Forward-looking statements speak only as to the date they are made. Stifel Financial Corp. disclaims any intent or obligation to update forward-looking statements to reflect circumstances or events that occur after the date the forward-looking statements are made.
|
Summary Results of Operations (Unaudited)
|
|
| |
|
Three Months Ended
|
|
|
Nine Months Ended
|
|
|
(in thousands, except per share amounts)
|
|
9/30/11
|
|
|
9/30/10
|
|
|
% Change
|
|
|
6/30/11
|
|
|
% Change
|
|
|
9/30/11
|
|
|
9/30/10
|
|
|
% Change
|
|
|
Revenues:
|
|
|
|
|
|
|
|
|
|
|
|
|
|
|
|
|
|
|
|
|
|
|
|
|
|
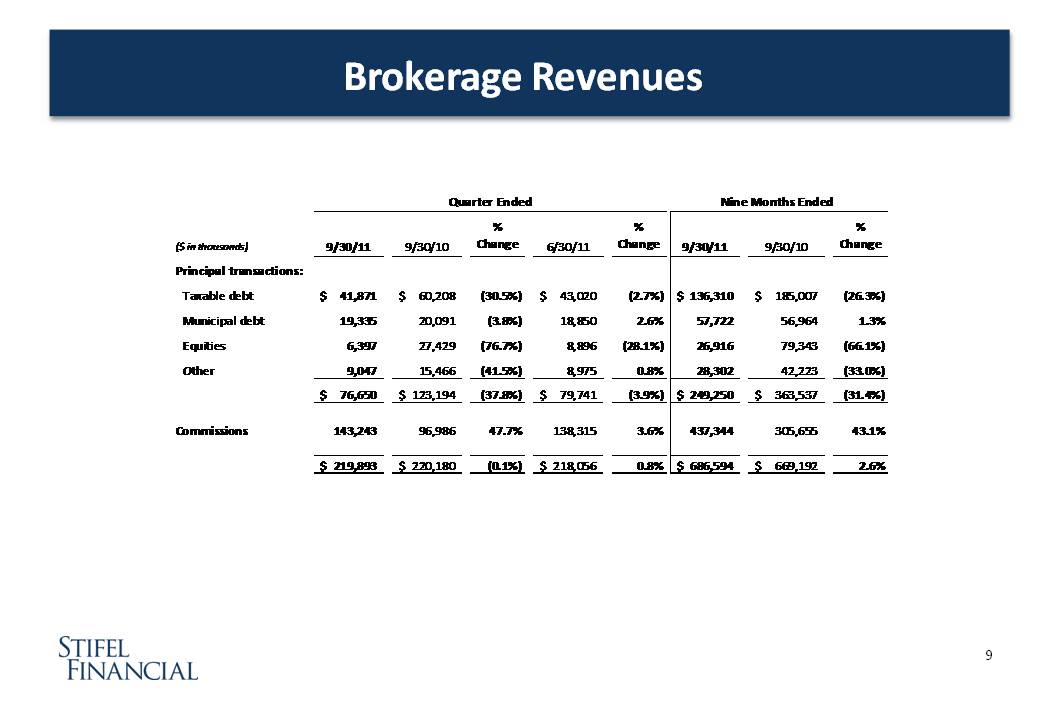
Commissions
|
|
$ |
143,243 |
|
|
$ |
96,986 |
|
|
|
47.7 |
|
|
$ |
138,315 |
|
|
|
3.6 |
|
|
$ |
437,344 |
|
|
$ |
305,655 |
|
|
|
43.1 |
|
|
Principal transactions
|
|
|
76,650 |
|
|
|
123,194 |
|
|
|
(37.8 |
) |
|
|
79,741 |
|
|
|
(3.9 |
) |
|
|
249,250 |
|
|
|
363,537 |
|
|
|
(31.4 |
) |
|
Asset management
|
|
|
58,253 |
|
|
|
50,876 |
|
|
|
14.5 |
|
|
|
56,981 |
|
|
|
2.2 |
|
|
|
172,914 |
|
|
|
136,117 |
|
|
|
27.0 |
|
|
Investment banking
|
|
|
37,673 |
|
|
|
51,656 |
|
|
|
(27.1 |
) |
|
|
64,418 |
|
|
|
(41.5 |
) |
|
|
143,509 |
|
|
|
127,129 |
|
|
|
12.9 |
|
|
Other income
|
|
|
540 |
|
|
|
3,656 |
|
|
|
(85.2 |
) |
|
|
4,556 |
|
|
|
(88.1 |
) |
|
|
11,352 |
|
|
|
9,358 |
|
|
|
21.3 |
|
|
Operating revenues
|
|
|
316,359 |
|
|
|
326,368 |
|
|
|
(3.1 |
) |
|
|
344,011 |
|
|
|
(8.1 |
) |
|
|
1,014,369 |
|
|
|
941,796 |
|
|
|
7.7 |
|
|
Interest revenue
|
|
|
24,161 |
|
|
|
17,718 |
|
|
|
36.4 |
|
|
|
21,229 |
|
|
|
13.8 |
|
|
|
64,246 |
|
|
|
47,019 |
|
|
|
36.6 |
|
|
Total revenues
|
|
|
340,520 |
|
|
|
344,086 |
|
|
|
(1.0 |
) |
|
|
365,240 |
|
|
|
(6.8 |
) |
|
|
1,078,615 |
|
|
|
988,815 |
|
|
|
9.1 |
|
|
Interest expense
|
|
|
6,306 |
|
|
|
3,698 |
|
|
|
70.5 |
|
|
|
6,383 |
|
|
|
(1.2 |
) |
|
|
18,931 |
|
|
|
8,388 |
|
|
|
125.7 |
|
|
Net revenues
|
|
|
334,214 |
|
|
|
340,388 |
|
|
|
(1.8 |
) |
|
|
358,857 |
|
|
|
(6.9 |
) |
|
|
1,059,684 |
|
|
|
980,427 |
|
|
|
8.1 |
|
|
Non-interest expenses:
|
|
|
|
|
|
|
|
|
|
|
|
|
|
|
|
|
|
|
|
|
|
|
|
|
|
|
|
|
|
|
|
|
|
Compensation and benefits
|
|
|
210,573 |
|
|
|
395,936 |
|
|
|
(46.8 |
) |
|
|
229,939 |
|
|
|
(8.4 |
) |
|
|
671,678 |
|
|
|
819,085 |
|
|
|
(18.0 |
) |
|
Occupancy and equipment rental
|
|
|
30,914 |
|
|
|
29,559 |
|
|
|
4.6 |
|
|
|
29,723 |
|
|
|
4.0 |
|
|
|
89,962 |
|
|
|
81,012 |
|
|
|
11.0 |
|
|
Communications and office supplies
|
|
|
18,838 |
|
|
|
19,877 |
|
|
|
(5.2 |
) |
|
|
18,515 |
|
|
|
1.7 |
|
|
|
56,198 |
|
|
|
50,220 |
|
|
|
11.9 |
|
|
Commission and floor brokerage
|
|
|
7,400 |
|
|
|
7,972 |
|
|
|
(7.2 |
) |
|
|
6,894 |
|
|
|
7.3 |
|
|
|
20,943 |
|
|
|
18,988 |
|
|
|
10.3 |
|
|
Other operating expenses
|
|
|
27,466 |
|
|
|
29,600 |
|
|
|
(7.2 |
) |
|
|
69,911 |
|
|
|
(60.7 |
) |
|
|
127,321 |
|
|
|
78,168 |
|
|
|
62.9 |
|
|
Total non-interest expenses
|
|
|
295,191 |
|
|
|
482,944 |
|
|
|
(38.9 |
) |
|
|
354,982 |
|
|
|
(16.8 |
) |
|
|
966,102 |
|
|
|
1,047,473 |
|
|
|
(7.8 |
) |
| |
|
|
|
|
|
|
|
|
|
|
|
|
|
|
|
|
|
|
|
|
|
|
|
|
|
|
|
|
|
|
|
|
|
Income/(loss) before income taxes
|
|
|
39,023 |
|
|
|
(142,556 |
) |
|
|
* |
|
|
|
3,875 |
|
|
|
* |
|
|
|
93,582 |
|
|
|
(67,046 |
) |
|
|
* |
|
|
Provision for income taxes/(benefit)
|
|
|
16,719 |
|
|
|
(58,220 |
) |
|
|
* |
|
|
|
459 |
|
|
|
* |
|
|
|
36,464 |
|
|
|
(27,559 |
) |
|
|
* |
|
|
Net income/(loss)
|
|
$ |
22,304 |
|
|
$ |
(84,336 |
) |
|
|
* |
|
|
$ |
3,416 |
|
|
|
* |
|
|
$ |
57,118 |
|
|
$ |
(39,487 |
) |
|
|
* |
|
| |
|
|
|
|
|
|
|
|
|
|
|
|
|
|
|
|
|
|
|
|
|
|
|
|
|
|
|
|
|
|
|
|
|
Earnings per share: 10
|
|
|
|
|
|
|
|
|
|
|
|
|
|
|
|
|
|
|
|
|
|
|
|
|
|
|
|
|
|
|
|
|
|
Basic
|
|
$ |
0.43 |
|
|
$ |
(1.65 |
) |
|
|
* |
|
|
$ |
0.06 |
|
|
|
* |
|
|
$ |
1.09 |
|
|
$ |
(0.82 |
) |
|
|
* |
|
|
Diluted 11
|
|
$ |
0.35 |
|
|
$ |
(1.65 |
) |
|
|
* |
|
|
$ |
0.05 |
|
|
|
* |
|
|
$ |
0.90 |
|
|
$ |
(0.82 |
) |
|
|
* |
|
| |
|
|
|
|
|
|
|
|
|
|
|
|
|
|
|
|
|
|
|
|
|
|
|
|
|
|
|
|
|
|
|
|
|
Weighted average number of common shares outstanding: 10
|
|
|
|
|
|
|
|
|
|
|
|
|
|
|
|
|
|
|
|
|
|
|
|
|
|
|
|
|
|
|
|
|
|
Basic
|
|
|
52,367 |
|
|
|
51,201 |
|
|
|
2.3 |
|
|
|
52,932 |
|
|
|
(1.1 |
) |
|
|
52,610 |
|
|
|
47,865 |
|
|
|
9.9 |
|
|
Diluted
|
|
|
63,152 |
|
|
|
61,834 |
|
|
|
2.1 |
|
|
|
63,245 |
|
|
|
(0.1 |
) |
|
|
63,174 |
|
|
|
55,593 |
|
|
|
13.6 |
|
| |
|
|
|
|
|
|
|
|
|
|
|
|
|
|
|
|
|
|
|
|
|
|
|
|
|
|
|
|
|
|
|
|
|
* Not meaningful.
|
|
|
|
|
|
|
|
|
|
|
|
|
|
|
|
|
|
|
|
|
|
|
|
|
|
|
|
|
|
|
|
|
|
(in thousands, except per share, employee and location amounts)
|
|
| |
|
9/30/11
|
|
|
9/30/10
|
|
|
% Change
|
|
|
6/30/11
|
|
|
% Change
|
|
|
Statistical Information:
|
|
|
|
|
|
|
|
|
|
|
|
|
|
|
|
|
Book value per share 10
|
|
$ |
24.48 |
|
|
$ |
22.65 |
|
|
|
8.1 |
|
|
$ |
24.50 |
|
|
|
(0.1 |
) |
|
Financial advisors 12
|
|
|
1,961 |
|
|
|
1,920 |
|
|
|
2.1 |
|
|
|
1,958 |
|
|
|
0.2 |
|
|
Full-time associates
|
|
|
4,942 |
|
|
|
4,868 |
|
|
|
1.5 |
|
|
|
4,938 |
|
|
|
0.1 |
|
|
Locations
|
|
|
313 |
|
|
|
311 |
|
|
|
0.6 |
|
|
|
314 |
|
|
|
(0.3 |
) |
|
Total client assets
|
|
$ |
107,693,000 |
|
|
$ |
100,289,000 |
|
|
|
7.4 |
|
|
$ |
116,174,000 |
|
|
|
(7.3 |
) |
|
Global Wealth Management Summary Results of Operations (Unaudited)
|
|
| |
|
Three Months Ended
|
|
|
Nine Months Ended
|
|
|
(in 000s)
|
|
9/30/11
|
|
|
9/30/10
|
|
|
% Change
|
|
|
6/30/11
|
|
|
% Change
|
|
|
9/30/11
|
|
|
9/30/10
|
|
|
% Change
|
|
|
Revenues:
|
|
|
|
|
|
|
|
|
|
|
|
|
|
|
|
|
|
|
|
|
|
|
|
|
|
Commissions
|
|
$ |
92,029 |
|
|
$ |
69,875 |
|
|
|
31.7 |
|
|
$ |
93,593 |
|
|
|
(1.7 |
) |
|
$ |
287,384 |
|
|
$ |
228,983 |
|
|
|
25.5 |
|
|
Principal transactions
|
|
|
48,836 |
|
|
|
62,785 |
|
|
|
(22.2 |
) |
|
|
51,263 |
|
|
|
(4.7 |
) |
|
|
156,262 |
|
|
|
181,331 |
|
|
|
(13.8 |
) |
|
Asset management and service fees
|
|
|
58,007 |
|
|
|
50,449 |
|
|
|
15.0 |
|
|
|
56,817 |
|
|
|
2.1 |
|
|
|
172,354 |
|
|
|
135,120 |
|
|
|
27.6 |
|
|
Net interest
|
|
|
15,016 |
|
|
|
12,017 |
|
|
|
25.0 |
|
|
|
13,401 |
|
|
|
12.1 |
|
|
|
39,586 |
|
|
|
34,557 |
|
|
|
14.6 |
|
|
Investment banking
|
|
|
3,737 |
|
|
|
6,957 |
|
|
|
(46.3 |
) |
|
|
6,411 |
|
|
|
(41.7 |
) |
|
|
16,460 |
|
|
|
17,753 |
|
|
|
(7.3 |
) |
|
Other income
|
|
|
1,873 |
|
|
|
5,401 |
|
|
|
(65.3 |
) |
|
|
4,160 |
|
|
|
(55.0 |
) |
|
|
11,543 |
|
|
|
9,101 |
|
|
|
26..8 |
|
|
Net revenues
|
|
|
219,498 |
|
|
|
207,484 |
|
|
|
5.8 |
|
|
|
225,645 |
|
|
|
(2.7 |
) |
|
|
683,589 |
|
|
|
606,845 |
|
|
|
12.6 |
|
|
Non-interest expenses:
|
|
|
|
|
|
|
|
|
|
|
|
|
|
|
|
|
|
|
|
|
|
|
|
|
|
|
|
|
|
|
|
|
|
Compensation and benefits
|
|
|
128,244 |
|
|
|
119,100 |
|
|
|
7.7 |
|
|
|
132,952 |
|
|
|
(3.5 |
) |
|
|
403,782 |
|
|
|
367,447 |
|
|
|
9.9 |
|
|
Non-compensation operating expenses
|
|
|
35,642 |
|
|
|
36,677 |
|
|
|
(2.8 |
) |
|
|
37,267 |
|
|
|
(4.4 |
) |
|
|
107,297 |
|
|
|
108,092 |
|
|
|
(0.7 |
) |
|
Total non-interest expenses
|
|
|
163,886 |
|
|
|
155,777 |
|
|
|
5.2 |
|
|
|
170,219 |
|
|
|
(3.7 |
) |
|
|
511,079 |
|
|
|
475,539 |
|
|
|
7.5 |
|
|
Income before income taxes
|
|
$ |
55,612 |
|
|
$ |
51,707 |
|
|
|
7.6 |
|
|
$ |
55,426 |
|
|
|
0.3 |
|
|
$ |
172,510 |
|
|
$ |
131,306 |
|
|
|
31.4 |
|
| |
|
|
|
|
|
|
|
|
|
|
|
|
|
|
|
|
|
|
|
|
|
|
|
|
|
|
|
|
|
|
|
|
|
As a percentage of net revenues:
|
|
|
|
|
|
|
|
|
|
|
|
|
|
|
|
|
|
|
|
|
|
|
|
|
|
|
|
|
|
|
|
|
|
Compensation and benefits
|
|
|
58.4 |
|
|
|
57.4 |
|
|
|
|
|
|
|
58.9 |
|
|
|
|
|
|
|
59.1 |
|
|
|
60.6 |
|
|
|
|
|
|
Non-compensation operating expenses
|
|
|
16.3 |
|
|
|
17.7 |
|
|
|
|
|
|
|
16.5 |
|
|
|
|
|
|
|
15.7 |
|
|
|
17.8 |
|
|
|
|
|
|
Income before income taxes
|
|
|
25.3 |
|
|
|
24.9 |
|
|
|
|
|
|
|
24.6 |
|
|
|
|
|
|
|
25.2 |
|
|
|
21.6 |
|
|
|
|
|
|
Stifel Bank & Trust (Unaudited)
|
|
|
(in thousands)
|
|
| |
9/30/11
|
|
|
9/30/10
|
|
|
% Change
|
|
|
6/30/11
|
|
|
% Change
|
|
|
Other information:
|
|
|
|
|
|
|
|
|
|
|
|
|
|
|
|
|
|
Assets
|
|
|
$ |
2,311,371 |
|
|
$ |
1,516,484 |
|
|
|
52.4 |
|
|
$ |
1,807,859 |
|
|
|
27.9 |
|
|
Investment securities
|
|
|
|
1,311,680 |
|
|
|
830,127 |
|
|
|
58.0 |
|
|
|
1,074,114 |
|
|
|
22.1 |
|
|
Retained loans, net
|
|
|
|
567,341 |
|
|
|
364,732 |
|
|
|
55.6 |
|
|
|
476,764 |
|
|
|
19.0 |
|
|
Loans held for sale, net
|
|
|
|
114,452 |
|
|
|
106,788 |
|
|
|
7.2 |
|
|
|
55,110 |
|
|
|
107.7 |
|
|
Deposits
|
|
|
|
2,120,763 |
|
|
|
1,375,984 |
|
|
|
54.1 |
|
|
|
1,641,079 |
|
|
|
29.2 |
|
| |
|
|
|
|
|
|
|
|
|
|
|
|
|
|
|
|
|
|
|
|
|
|
Allowance as a percentage of loans 13
|
|
|
|
0.67 |
% |
|
|
0.50 |
% |
|
|
|
|
|
|
0.68 |
% |
|
|
|
|
|
Non-performing assets as a percentage of total assets
|
|
|
|
0.08 |
% |
|
|
0.16 |
% |
|
|
|
|
|
|
0.10 |
% |
|
|
|
|
10 Per share and share information for the three and nine months ended September 30, 2010 has been adjusted to reflect the April 2011 three-for-two stock split.
11 Earnings per diluted common share are calculated using the basic weighted average number of common shares outstanding in periods a loss is incurred.
12 Includes 160, 165 and 160 independent contractors at September 30, 2011 and 2010 and June 30, 2011, respectively.
13 Excluding acquired loans of $134.4 million, $174.8 million and $140.6 million, the allowance as a percentage of gross loans totaled 0.88%, 0.95% and 0.96% as of September 30, 2011 and 2010 and June 30, 2011, respectively.
|
Institutional Group Summary Results of Operations (Unaudited)
|
|
| |
|
Three Months Ended
|
|
|
Nine Months Ended
|
|
|
(in 000s)
|
|
9/30/11
|
|
|
9/30/10
|
|
|
% Change
|
|
|
6/30/11
|
|
|
% Change
|
|
|
9/30/11
|
|
|
9/30/10
|
|
|
% Change
|
|
|
Revenues:
|
|
|
|
|
|
|
|
|
|
|
|
|
|
|
|
|
|
|
|
|
|
|
|
|
|
Commissions
|
|
$ |
51,214 |
|
|
$ |
27,111 |
|
|
|
88.9 |
|
|
$ |
44,721 |
|
|
|
14.5 |
|
|
$ |
149,960 |
|
|
$ |
76,672 |
|
|
|
95.6 |
|
|
Principal transactions
|
|
|
27,815 |
|
|
|
60,408 |
|
|
|
(54.0 |
) |
|
|
28,477 |
|
|
|
(2.3 |
) |
|
|
92,988 |
|
|
|
182,206 |
|
|
|
(49.0 |
) |
| |
|
|
|
|
|
|
|
|
|
|
|
|
|
|
|
|
|
|
|
|
|
|
|
|
|
|
|
|
|
|
|
|
|
Capital raising
|
|
|
21,436 |
|
|
|
22,575 |
|
|
|
(5.0 |
) |
|
|
33,172 |
|
|
|
(35.4 |
) |
|
|
80,654 |
|
|
|
67,799 |
|
|
|
19.0 |
|
|
Advisory fees
|
|
|
12,500 |
|
|
|
23,063 |
|
|
|
(45.8 |
) |
|
|
24,835 |
|
|
|
(49.7 |
) |
|
|
46,395 |
|
|
|
42,516 |
|
|
|
9.1 |
|
|
Investment banking
|
|
|
33,936 |
|
|
|
45,638 |
|
|
|
(25.6 |
) |
|
|
58,007 |
|
|
|
(41.5 |
) |
|
|
127,049 |
|
|
|
110,315 |
|
|
|
15.2 |
|
|
Other income 14
|
|
|
294 |
|
|
|
4,886 |
|
|
|
(94.0 |
) |
|
|
1,710 |
|
|
|
(82.8 |
) |
|
|
3,171 |
|
|
|
6,744 |
|
|
|
(53.0 |
) |
|
Net revenues
|
|
|
113,259 |
|
|
|
138,043 |
|
|
|
(18.0 |
) |
|
|
132,915 |
|
|
|
(14.8 |
) |
|
|
373,168 |
|
|
|
375,937 |
|
|
|
(0.7 |
) |
|
Non-interest expenses:
|
|
|
|
|
|
|
|
|
|
|
|
|
|
|
|
|
|
|
|
|
|
|
|
|
|
|
|
|
|
|
|
|
|
Compensation and benefits
|
|
|
74,813 |
|
|
|
82,147 |
|
|
|
(8.9 |
) |
|
|
82,006 |
|
|
|
(8.8 |
) |
|
|
234,006 |
|
|
|
221,029 |
|
|
|
5.9 |
|
|
Non-compensation operating expenses
|
|
|
29,294 |
|
|
|
28,242 |
|
|
|
3.7 |
|
|
|
28,958 |
|
|
|
1.2 |
|
|
|
86,666 |
|
|
|
69,029 |
|
|
|
25.6 |
|
|
Total non-interest expenses
|
|
|
104,107 |
|
|
|
110,389 |
|
|
|
(5.7 |
) |
|
|
110,964 |
|
|
|
(6.2 |
) |
|
|
320,672 |
|
|
|
290,058 |
|
|
|
10.6 |
|
|
Income before income taxes
|
|
$ |
9,152 |
|
|
$ |
27,654 |
|
|
|
(66.9 |
) |
|
$ |
21,951 |
|
|
|
(58.3 |
) |
|
$ |
52,496 |
|
|
$ |
85,879 |
|
|
|
(38.9 |
) |
| |
|
|
|
|
|
|
|
|
|
|
|
|
|
|
|
|
|
|
|
|
|
|
|
|
|
|
|
|
|
|
|
|
|
As a percentage of net revenues:
|
|
|
|
|
|
|
|
|
|
|
|
|
|
|
|
|
|
|
|
|
|
|
|
|
|
|
|
|
|
|
|
|
|
Compensation and benefits
|
|
|
66.0 |
|
|
|
59.5 |
|
|
|
|
|
|
|
61.7 |
|
|
|
|
|
|
|
62.7 |
|
|
|
58.8 |
|
|
|
|
|
|
Non-compensation operating expenses
|
|
|
25.9 |
|
|
|
20.5 |
|
|
|
|
|
|
|
21.8 |
|
|
|
|
|
|
|
23.2 |
|
|
|
18.4 |
|
|
|
|
|
|
Income before income taxes
|
|
|
8.1 |
|
|
|
20.0 |
|
|
|
|
|
|
|
16.5 |
|
|
|
|
|
|
|
14.1 |
|
|
|
22.8 |
|
|
|
|
|
|
Institutional Group Brokerage & Investment Banking Revenues (Unaudited)
|
|
| |
|
Three Months Ended
|
|
|
Nine Months Ended
|
|
|
(in 000s)
|
|
9/30/11
|
|
|
9/30/10
|
|
|
% Change
|
|
|
6/30/11
|
|
|
% Change
|
|
|
9/30/11
|
|
|
9/30/10
|
|
|
% Change
|
|
|
Institutional brokerage:
|
|
|
|
|
|
|
|
|
|
|
|
|
|
|
|
|
|
|
|
|
|
|
|
|
|
Equity
|
|
$ |
47,185 |
|
|
$ |
43,711 |
|
|
|
7.9 |
|
|
$ |
41,695 |
|
|
|
13.2 |
|
|
$ |
141,278 |
|
|
$ |
126,462 |
|
|
|
11.7 |
|
|
Fixed income
|
|
|
31,844 |
|
|
|
43,808 |
|
|
|
(27.3 |
) |
|
|
31,503 |
|
|
|
1.1 |
|
|
|
101,670 |
|
|
|
132,416 |
|
|
|
(23.2 |
) |
|
Institutional brokerage
|
|
|
79,029 |
|
|
|
87,519 |
|
|
|
(9.7 |
) |
|
|
73,198 |
|
|
|
8.0 |
|
|
|
242,948 |
|
|
|
258,878 |
|
|
|
(6.2 |
) |
| |
|
|
|
|
|
|
|
|
|
|
|
|
|
|
|
|
|
|
|
|
|
|
|
|
|
|
|
|
|
|
|
|
|
Investment banking:
|
|
|
|
|
|
|
|
|
|
|
|
|
|
|
|
|
|
|
|
|
|
|
|
|
|
|
|
|
|
|
|
|
|
Capital raising:
|
|
|
|
|
|
|
|
|
|
|
|
|
|
|
|
|
|
|
|
|
|
|
|
|
|
|
|
|
|
|
|
|
|
Equity
|
|
|
16,382 |
|
|
|
18,060 |
|
|
|
(9.3 |
) |
|
|
27,999 |
|
|
|
(41.5 |
) |
|
|
67,386 |
|
|
|
52,957 |
|
|
|
27.2 |
|
|
Fixed income
|
|
|
5,054 |
|
|
|
4,515 |
|
|
|
11.9 |
|
|
|
5,173 |
|
|
|
(2.3 |
) |
|
|
13,268 |
|
|
|
14,842 |
|
|
|
(10.6 |
) |
|
Capital raising
|
|
|
21,436 |
|
|
|
22,575 |
|
|
|
(5.0 |
) |
|
|
33,172 |
|
|
|
(35.4 |
) |
|
|
80,654 |
|
|
|
67,799 |
|
|
|
19.0 |
|
|
Advisory fees:
|
|
|
|
|
|
|
|
|
|
|
|
|
|
|
|
|
|
|
|
|
|
|
|
|
|
|
|
|
|
|
|
|
|
Equity
|
|
|
10,930 |
|
|
|
20,281 |
|
|
|
(46.1 |
) |
|
|
22,924 |
|
|
|
(52.3 |
) |
|
|
42,241 |
|
|
|
37,981 |
|
|
|
11.2 |
|
|
Fixed income
|
|
|
1,570 |
|
|
|
2,782 |
|
|
|
(43.6 |
) |
|
|
1,911 |
|
|
|
(17.8 |
) |
|
|
4,154 |
|
|
|
4,535 |
|
|
|
(8.4 |
) |
|
Advisory fees
|
|
|
12,500 |
|
|
|
23,063 |
|
|
|
(45.8 |
) |
|
|
24,835 |
|
|
|
(49.7 |
) |
|
|
46,395 |
|
|
|
42,516 |
|
|
|
9.1 |
|
|
Investment banking
|
|
$ |
33,936 |
|
|
$ |
45,638 |
|
|
|
(25.6 |
) |
|
$ |
58,007 |
|
|
|
(41.5 |
) |
|
$ |
127,049 |
|
|
$ |
110,315 |
|
|
|
15.2 |
|
Investor Relations Contact
Sarah Anderson, (415) 364-2500, investorrelations@stifel.com
14 Includes net interest and other income.