Matrix
Advisors Value Fund, Inc.
Core Financial
Statements
June
30, 2024
UNITED STATES
SECURITIES AND EXCHANGE COMMISSION
Washington, D.C. 20549
FORM
CERTIFIED SHAREHOLDER REPORT OF REGISTERED
MANAGEMENT INVESTMENT COMPANIES
Investment Company Act file number 811-03758
(Exact name of registrant as specified in charter)
10 Bank
Street, Suite 590, White Plains, NY 10606
(Address of principal executive offices) (Zip code)
David A. Katz
10 Bank Street, Suite 590
White Plains,
NY 10606
(Name and address of agent for service)
1(800) 366-6223
Registrant’s telephone number, including area code
Date of fiscal year end: June 30
Date of reporting period:
Item 1. Reports to Stockholders.
| (a) |
 |
|
 |
|
|
||
|
Annual Shareholder Report |
|
|
Fund Name
|
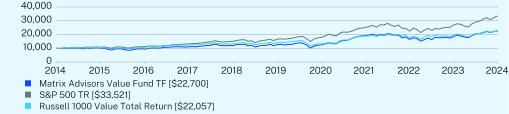
Costs of a $10,000 investment
|
Costs paid as a percentage of a $10,000 investment
|
|
Matrix Advisors Value Fund
|
$
|
|
| Matrix Advisors Value Fund | PAGE 1 | TSR_AR_57681T102 |
|
|
1 Year
|
5 Year
|
10 Year
|
|
|
|
|
|
|
|
|
|
|
|
|
|
|
|
| * |
|
Net Assets
|
$
|
|
Number of Holdings
|
|
|
Net Advisory Fee
|
$
|
|
Portfolio Turnover
|
|
|
Top Sectors
|
(% of net assets)
|
|
Information Technology
|
|
|
Financials
|
|
|
Communication Services
|
|
|
Health Care
|
|
|
Industrials
|
|
|
Consumer Discretionary
|
|
|
Consumer Staples
|
|
|
Utilities
|
|
|
Cash & Other
|
-
|
|
Top 10 Issuers
|
(% of net assets)
|
|
Microsoft Corp.
|
|
|
Alphabet, Inc.
|
|
|
Apple, Inc.
|
|
|
Amazon.com, Inc.
|
|
|
Meta Platforms, Inc.
|
|
|
The Goldman Sachs Group, Inc.
|
|
|
JPMorgan Chase & Co.
|
|
|
QUALCOMM, Inc.
|
|
|
Morgan Stanley
|
|
|
The Bank Of New York Mellon Corp.
|
|
| Matrix Advisors Value Fund | PAGE 2 | TSR_AR_57681T102 |
| (b) | Not applicable. |
Item 2. Code of Ethics.
The registrant has adopted a code of ethics that applies to the registrant’s principal executive officer and principal financial officer. The registrant has not made any substantive amendments to its code of ethics during the period covered by this report. The registrant has not granted any waivers from any provisions of the code of ethics during the period covered by this report.
The registrant undertakes to provide to any person without charge, upon request, a copy of its code of ethics by mail when they call the registrant at 1-800-366-6223.
Item 3. Audit Committee Financial Expert.
The registrant’s board of directors has determined that there is at least one audit committee financial expert serving on its audit committee. Messrs. Kieszek and Tucker are the “audit committee financial experts” and are considered to be “independent” as each term is defined in Item 3(a)(2) of Form N-CSR.
Item 4. Principal Accountant Fees and Services.
The registrant has engaged its principal accountant to perform audit services, audit-related services, tax services and other services during the past two fiscal years. “Audit fees” are fees billed for professional services rendered by the principal accountant for the audit of the registrant’s annual financial statements or services that are normally provided by the accountant in connection with statutory and regulatory filings or engagements for those fiscal years. “Tax fees” refer to professional services rendered by the principal accountant for tax compliance, tax advice, and tax planning. There were no “other services” provided by the principal accountant during the last two fiscal years. The following table details the aggregate fees billed for each of the last two fiscal years by the principal accountant.
| FYE 6/30/2024 | FYE 6/30/2023 | |
| (a) Audit Fees | $18,000 | $18,000 |
| (b) Audit-Related Fees | $0 | $0 |
| (c) Tax Fees | $2,800 | $2,800 |
| (d) All Other Fees | $0 | $0 |
(e)(1) The audit committee has adopted pre-approval policies and procedures that require the audit committee to pre-approve all audit and non-audit services of the registrant, including services provided to any entity affiliated with the registrant.
(e)(2) The percentage of fees billed by Tait, Weller & Baker LLP, the registrant’s principal accountant, applicable to non-audit services pursuant to waiver of pre-approval requirement for each of the last two fiscal years were as follows:
| FYE 6/30/2024 | FYE 6/30/2023 | |
| Audit-Related Fees | 0% | 0% |
| Tax Fees | 0% | 0% |
| All Other Fees | 0% | 0% |
(f) During the audit of the registrant’s financial statements, none of the hours were attributed to work performed by persons other than full-time permanent employees of the principal accountant.
(g) The following table indicates the non-audit fees billed or expected to be billed by the registrant’s accountant for services to the registrant and rendered to the registrant’s investment adviser (not including any sub-adviser whose role is primarily portfolio management and is subcontracted with or overseen by another investment adviser), and any entity controlling, controlled by, or under common control with the investment adviser that provides ongoing services to the registrant for each of the last two fiscal years on behalf of the Fund.
| Non-Audit Related Fees | FYE 6/30/2024 | FYE 6/30/2023 |
| Registrant | 0 | 0 |
| Registrant’s Investment Adviser | 0 | 0 |
(h) Not applicable.
(i) Not applicable.
(j) Not applicable.
Item 5. Audit Committee of Listed Registrants.
Not Applicable.
Item 6. Investments.
| (a) | Schedule of Investments is included within the financial statements filed under Item 7 of this report. |
| (b) | Not Applicable. |
Item 7. Financial Statements and Financial Highlights for Open-End Investment Companies.
| (a) |
|
|
|
|
|
|
|
|
|
|
|
|
Shares |
|
|
Value |
|
COMMON
STOCKS - 100.1% |
|
|
|
|
||
|
Aerospace/Defense
- 4.9% |
|
|
|
|
||
|
L3Harris
Technologies, Inc. |
|
|
8,200 |
|
|
$ 1,841,556
|
|
RTX
Corp. |
|
|
13,900 |
|
|
1,395,421
|
|
|
|
|
|
3,236,977
| ||
|
Bank
(Money Center) - 4.5% |
|
|
|
|
||
|
JPMorgan
Chase & Co. |
|
|
14,600 |
|
|
2,952,996
|
|
Bank
(Processing) - 3.6% |
|
|
|
|
||
|
The
Bank Of New York Mellon Corp. |
|
|
40,000 |
|
|
2,395,600
|
|
Bank
(Regional) - 2.7% |
|
|
|
|
||
|
The
PNC Financial Services Group, Inc. |
|
|
11,400 |
|
|
1,772,472
|
|
Bank
(Super Regional) - 6.1% |
|
|
|
|
||
|
US
Bancorp |
|
|
47,120 |
|
|
1,870,664
|
|
Wells
Fargo & Co. |
|
|
35,600 |
|
|
2,114,284
|
|
|
|
|
|
3,984,948
| ||
|
Building
Material and Supplies Dealers - 0.9% |
|
|
|
|
||
|
Lowe’s
Cos., Inc. |
|
|
2,550 |
|
|
562,173
|
|
Business
Support Services - 3.5% |
|
|
|
|
||
|
PayPal
Holdings, Inc.(a) |
|
|
39,900 |
|
|
2,315,397
|
|
Cable
TV - 2.8% |
|
|
|
|
||
|
Comcast
Corp. - Class A |
|
|
47,000 |
|
|
1,840,520
|
|
Computer
and Peripherals - 5.2% |
|
|
|
|
||
|
Apple,
Inc. |
|
|
16,300 |
|
|
3,433,106
|
|
Computer
Software and Services - 8.3% |
|
|
|
|
||
|
Microsoft
Corp. |
|
|
12,150 |
|
|
5,430,443
|
|
Data
Processing - 1.4% |
|
|
|
|
||
|
Fiserv,
Inc.(a) |
|
|
6,000 |
|
|
894,240
|
|
Drug
- 2.7% |
|
|
|
|
||
|
AbbVie,
Inc. |
|
|
10,300 |
|
|
1,766,656
|
|
Drug
Store - 1.0% |
|
|
|
|
||
|
CVS
Health Corp. |
|
|
11,400 |
|
|
673,284
|
|
Electric
Utility - 0.4% |
|
|
|
|
||
|
American
Electric Power Co., Inc. |
|
|
3,000 |
|
|
263,220
|
|
Electrical
Component - 3.5% |
|
|
|
|
||
|
TE
Connectivity Ltd. |
|
|
15,200 |
|
|
2,286,536
|
|
Food
Products - 1.4% |
|
|
|
|
||
|
Tyson
Foods, Inc. - Class A |
|
|
16,500 |
|
|
942,810
|
|
Insurance
Carriers - 3.1% |
|
|
|
|
||
|
UnitedHealth
Group, Inc. |
|
|
4,050 |
|
|
2,062,503
|
|
|
|
|
|
|
|
|
|
|
|
1 |
|
|
|
|
|
|
|
|
|
|
|
|
|
|
Shares |
|
|
Value |
|
COMMON
STOCKS - (Continued) |
|
|
|
|
||
|
Internet
- 13.0% |
|
|
|
|
||
|
Alphabet,
Inc. - Class C |
|
|
28,425 |
|
|
$5,213,713
|
|
Meta
Platforms, Inc. - Class A |
|
|
6,600 |
|
|
3,327,852
|
|
|
|
|
|
8,541,565
| ||
|
Internet
(Retail) - 5.1% |
|
|
|
|
||
|
Amazon.com,
Inc. (a) |
|
|
17,450 |
|
|
3,372,212
|
|
Medical
- Biomedical - 0.8% |
|
|
|
|
||
|
Medtronic
PLC |
|
|
6,600 |
|
|
519,486
|
|
Medical
Supplies - 3.8% |
|
|
|
|
||
|
Becton
Dickinson & Co. |
|
|
3,000 |
|
|
701,130
|
|
Zimmer
Biomet Holdings, Inc. |
|
|
16,400 |
|
|
1,779,892
|
|
|
|
|
|
2,481,022
| ||
|
Precision
Instruments - 2.5% |
|
|
|
|
||
|
Thermo
Fisher Scientific, Inc. |
|
|
3,000 |
|
|
1,659,000
|
|
Securities
Brokerage - 8.5% |
|
|
|
|
||
|
Morgan
Stanley |
|
|
27,150 |
|
|
2,638,709
|
|
The
Goldman Sachs Group, Inc. |
|
|
6,575 |
|
|
2,974,004
|
|
|
|
|
|
5,612,713
| ||
|
Semiconductor
- 4.1% |
|
|
|
|
||
|
QUALCOMM,
Inc. |
|
|
13,350 |
|
|
2,659,053
|
|
Telecommunications
(Equipment) - 2.7% |
|
|
|
|
||
|
Cisco
Systems, Inc. |
|
|
37,500 |
|
|
1,781,625
|
|
Transportation
- Services - 3.6% |
|
|
|
|
||
|
FedEx
Corp. |
|
|
7,900 |
|
|
2,368,736
|
|
TOTAL
COMMON STOCKS
(Cost
$29,587,839) |
|
|
|
|
65,809,293
| |
|
SHORT-TERM
INVESTMENTS - 0.1% |
|
|
|
|
||
|
Money
Market Funds - 0.1% |
|
|
|
|
||
|
First
American Government Obligations Fund - Class X, 5.23%(b) |
|
|
80,135 |
|
|
80,135
|
|
TOTAL
SHORT-TERM INVESTMENTS
(Cost
$80,135) |
|
|
|
|
80,135
| |
|
TOTAL
INVESTMENTS - 100.2%
(Cost
$29,667,974) |
|
|
|
|
$65,889,428
| |
|
Liabilities
in Excess of Other Assets - (0.2)% |
|
|
|
|
(117,929)
| |
|
TOTAL
NET ASSETS - 100.0% |
|
|
|
|
$65,771,499 | |
|
|
|
|
|
|
|
|
|
(a) |
Non-income producing
security. |
|
(b) |
The rate shown represents
the 7-day effective yield as of June 30, 2024. |
|
|
|
2 |
|
|
|
|
|
|
|
|
ASSETS: |
|
|
|
|
Investments
in securities, at value (cost $29,667,974) |
|
|
$65,889,428
|
|
Receivables: |
|
|
|
|
Dividends
and interest |
|
|
44,357
|
|
Fund
shares sold |
|
|
633
|
|
Prepaid
expenses |
|
|
16,120
|
|
Total
assets |
|
|
65,950,538
|
|
LIABILITIES: |
|
|
|
|
Payables: |
|
|
|
|
Investments
purchased |
|
|
59,973
|
|
Due
to advisor |
|
|
44,641
|
|
Fund
shares purchased |
|
|
1,500
|
|
Accrued
expenses: |
|
|
|
|
Audit
fees |
|
|
20,800
|
|
Fund
administration fees |
|
|
15,573
|
|
Transfer
agent fees |
|
|
10,555
|
|
Reports
to shareholders |
|
|
8,310
|
|
Legal
fees |
|
|
5,507
|
|
Accounting
fees |
|
|
4,711
|
|
Custody
fees |
|
|
2,377
|
|
Other
expenses |
|
|
5,092
|
|
Total
liabilities |
|
|
179,039
|
|
NET
ASSETS |
|
|
$65,771,499
|
|
Number
of shares authorized |
|
|
30,000,000
|
|
Number
of shares, $0.01 par value, issued and outstanding |
|
|
692,392
|
|
Net
Asset Value, Offering Price and Redemption Price Per Share |
|
|
$94.99
|
|
COMPONENTS
OF NET ASSETS: |
|
|
|
|
Paid
in capital |
|
|
$28,150,315
|
|
Total
distributable earnings |
|
|
37,621,184
|
|
Net
Assets |
|
|
$65,771,499 |
|
|
|
|
|
|
|
|
3 |
|
|
|
|
|
|
|
|
INVESTMENT
INCOME |
|
|
|
|
INCOME |
|
|
|
|
Dividends |
|
|
$1,130,242
|
|
Interest |
|
|
6,636
|
|
Total
income |
|
|
1,136,878
|
|
EXPENSES |
|
|
|
|
Advisory
fees |
|
|
449,158
|
|
Fund
administration fees |
|
|
83,365
|
|
Transfer
agent and accounting fees |
|
|
64,428
|
|
Professional
fees |
|
|
50,984
|
|
Federal
and state registration fees |
|
|
30,535
|
|
Custody
fees |
|
|
14,723
|
|
Reports
to shareholders |
|
|
11,494
|
|
Director
fees |
|
|
8,618
|
|
Other
expenses |
|
|
7,951
|
|
Total
expenses |
|
|
721,256
|
|
Less:
expense reimbursement by advisor |
|
|
(128,368)
|
|
Net
expenses |
|
|
592,888
|
|
Net
investment income |
|
|
543,990
|
|
REALIZED
AND UNREALIZED GAIN (LOSS) ON INVESTMENTS |
|
|
|
|
Net
realized gain on investments |
|
|
1,687,492
|
|
Net
change in unrealized appreciation/depreciation on investments |
|
|
10,013,532
|
|
Net
realized and unrealized gain on investments |
|
|
11,701,024
|
|
NET
INCREASE IN NET ASSETS RESULTING FROM OPERATIONS |
|
|
$12,245,014 |
|
|
|
|
|
|
|
|
4 |
|
|
|
|
|
|
| |||
|
|
|
|
Year Ended
June 30, | |||
|
|
|
|
2024 |
|
|
2023 |
|
INCREASE
(DECREASE) IN NET ASSETS |
|
|
|
|
||
|
OPERATIONS: |
|
|
|
|
||
|
Net
investment income |
|
|
$543,990 |
|
|
$525,241
|
|
Net
realized gain (loss) on investments |
|
|
1,687,492 |
|
|
(166,636)
|
|
Net
change in net unrealized appreciation/depreciation on investments |
|
|
10,013,532 |
|
|
6,290,755
|
|
Net
increase in net assets resulting from operations |
|
|
12,245,014 |
|
|
6,649,360
|
|
NET
DISTRIBUTIONS TO SHAREHOLDERS |
|
|
(1,068,279) |
|
|
(2,493,445)
|
|
CAPITAL
SHARE TRANSACTIONS: |
|
|
|
|
||
|
Proceeds
from shares sold |
|
|
568,220 |
|
|
732,493
|
|
Proceeds
from reinvestment of distributions |
|
|
906,931 |
|
|
2,087,636
|
|
Cost
of shares redeemed |
|
|
(3,757,048) |
|
|
(2,938,825)
|
|
Net
decrease from capital share transactions |
|
|
(2,281,897) |
|
|
(118,696)
|
|
Total
increase in net assets |
|
|
8,894,838 |
|
|
4,037,219
|
|
NET
ASSETS |
|
|
|
|
||
|
Beginning
of year |
|
|
$56,876,661 |
|
|
$52,839,442
|
|
End
of year |
|
|
$65,771,499 |
|
|
$56,876,661
|
|
CHANGE
IN SHARES |
|
|
|
|
||
|
Shares
outstanding, beginning of year |
|
|
719,691 |
|
|
719,127
|
|
Shares
sold |
|
|
6,782 |
|
|
9,661
|
|
Shares
issued on reinvestment of distributions |
|
|
10,686 |
|
|
30,077
|
|
Shares
redeemed |
|
|
(44,767) |
|
|
(39,174)
|
|
Shares
outstanding, end of year |
|
|
692,392 |
|
|
719,691 |
|
|
|
|
|
|
|
|
|
|
|
5 |
|
|
|
|
|
|
| ||||||||||||
|
|
|
|
Years Ended
June 30, | ||||||||||||
|
|
2024 |
|
|
2023 |
|
|
2022 |
|
|
2021 |
|
|
2020 | ||
|
Net
asset value, beginning of year |
|
|
$79.03 |
|
|
$73.48 |
|
|
$96.30 |
|
|
$64.74 |
|
|
$68.01
|
|
Income
(loss) from investment operations: |
|
|
|
|
|
|
|
|
|
|
|||||
|
Net
investment income(a) |
|
|
0.77 |
|
|
0.73 |
|
|
0.78 |
|
|
0.87 |
|
|
1.12
|
|
Net
realized and unrealized gain (loss) on investments |
|
|
16.72 |
|
|
8.33 |
|
|
(12.88) |
|
|
33.05 |
|
|
(1.37)
|
|
Total
from investment operations |
|
|
17.49 |
|
|
9.06 |
|
|
(12.10) |
|
|
33.92 |
|
|
(0.25)
|
|
Less
distributions: |
|
|
|
|
|
|
|
|
|
|
|||||
|
Dividends
from net investment income |
|
|
(0.98) |
|
|
(0.60) |
|
|
(0.78) |
|
|
(1.49) |
|
|
(0.67)
|
|
Distributions
from net realized gain |
|
|
(0.55) |
|
|
(2.91) |
|
|
(9.94) |
|
|
(0.87) |
|
|
(2.35)
|
|
Total
distributions |
|
|
(1.53) |
|
|
(3.51) |
|
|
(10.72) |
|
|
(2.36) |
|
|
(3.02)
|
|
Net
asset value, end of year |
|
|
$94.99 |
|
|
$79.03 |
|
|
$73.48 |
|
|
$96.30 |
|
|
$64.74
|
|
Total
return |
|
|
22.36
% |
|
|
12.99
% |
|
|
(14.61)% |
|
|
53.33
% |
|
|
(0.82)%
|
|
Ratios/supplemental
data: |
|
|
|
|
|
|
|
|
|
|
|||||
|
Net
assets, end of year (millions) |
|
|
$65.8 |
|
|
$56.9 |
|
|
$52.8 |
|
|
$65.2 |
|
|
$48.1
|
|
Ratio
of operating expenses to average net assets: |
|
|
|
|
|
|
|
|
|
|
|||||
|
Before
expense reimbursement |
|
|
1.20% |
|
|
1.23% |
|
|
1.16% |
|
|
1.21% |
|
|
1.23%
|
|
After
expense reimbursement |
|
|
0.99% |
|
|
0.99% |
|
|
0.99% |
|
|
0.99% |
|
|
0.99%
|
|
Ratio
of net investment income to average
net
assets: |
|
|
|
|
|
|
|
|
|
|
|||||
|
Before
expense reimbursement |
|
|
0.69% |
|
|
0.73% |
|
|
0.68% |
|
|
0.87% |
|
|
1.44%
|
|
After
expense reimbursement |
|
|
0.90% |
|
|
0.97% |
|
|
0.85% |
|
|
1.09% |
|
|
1.68%
|
|
Portfolio
turnover rate |
|
|
20% |
|
|
22% |
|
|
23% |
|
|
24% |
|
|
28% |
|
|
|
|
|
|
|
|
|
|
|
|
|
|
|
|
|
|
(a) |
Calculated using the
average shares method. |
|
|
|
6 |
|
|
|
A. |
Security Valuation.
Securities traded on a national securities exchange, except those listed on the NASDAQ Stock Market, LLC (“NASDAQ”), are valued
at the last reported sales price at the close of regular trading on each day the exchanges are open for trading (generally 4:00 p.m, Eastern
time). Securities traded on NASDAQ are valued at the NASDAQ Official Closing Price, which may not necessarily represent the last sale
price. Quotations of foreign securities, currencies and other assets denominated in foreign currencies are translated into U.S. dollars
at the exchange rate of such currencies against the U.S. dollar, as provided by on independent pricing service or reporting agency. Foreign
currency exchange rates generally are valued at the last sale price at the close on an exchange on which the security is primarily traded.
Securities traded on an exchange for which there have been no sales are valued at the mean between the last reported bid and the asked
quotes, or the last sale price when appropriate. |
|
B. |
Shares Valuation.
The NAV per share of the Fund is calculated by dividing the sum of the value of the securities held by the Fund, plus cash or other assets,
minus all liabilities (including estimated accrued expenses), by the total number of shares outstanding of the Fund, rounded to the nearest
cent. The Fund’s shares will not be priced on the days on which the New York Stock Exchange (“NYSE”) is closed for trading.
The offering and redemption price per share of the Fund is equal to the Fund’s NAV per share. |
|
C. |
Federal Income
Taxes. The Fund has elected to be treated as a “regulated investment company” under Subchapter M of the Internal Revenue
Code of 1986, as amended. The Fund intends to distribute substantially all of its taxable income and any capital gains less any applicable
capital loss carryforwards. Accordingly, no provision for Federal income taxes has been made in the accompanying financial statements. |
|
|
|
7 |
|
|
|
D. |
Use of Estimates.
The preparation of financial statements in conformity with U.S. GAAP requires management to make estimates and assumptions that affect
the reported amounts of assets and liabilities and disclosure of contingent assets and liabilities at the date of the financial statements
and the reported amounts of revenues and expenses during the reporting period. Actual results could differ from these estimates. |
|
E. |
Security Transactions,
Investment Income, and Distributions. Security transactions are accounted for on the trade date. The Fund will distribute net investment
income and net capital gains, if any, at least annually. Dividend income and distributions to shareholders are recorded on the ex-dividend
date, and interest income is recognized on the accrual basis. Realized gains and losses are evaluated on the basis of identified costs.
Premiums and discounts on the purchase of securities are amortized/accreted using the effective interest method. U.S. GAAP requires that
permanent financial reporting and tax differences be reclassified in the capital accounts. |
|
F. |
Indemnification
Obligations. Under the Fund’s organizational documents, its current and former Officers and Directors are indemnified against
certain liabilities arising out of the performance of their duties to the Fund. In addition, in the normal course of business, the Fund
enters into contracts that contain a variety of representations and warranties that provide general indemnifications. The Fund’s
maximum exposure under these arrangements is unknown as this would involve future claims that may be made against the Fund that have not
yet occurred or that would be covered by other parties. |
|
G. |
Subsequent
Events. The Fund has evaluated subsequent events through the issuance of the Fund’s financial statements and has determined
that no events have occurred that require disclosure in these financial statements. |
|
|
|
8 |
|
|
|
| ||||||
|
June 30, | ||||||
|
2025 |
|
|
2026 |
|
|
2027 |
|
$111,340 |
|
|
$127,806 |
|
|
$128,368 |
|
|
|
|
|
|
|
|
|
|
|
|
|
|
|
|
|
|
|
|
Purchases |
|
|
Sales |
|
Common
Stock |
|
|
$11,911,454 |
|
|
$14,672,514 |
|
|
|
|
|
|
|
|
|
|
|
|
|
|
Cost
of investments for tax purposes |
|
|
$29,667,974
|
|
Gross
tax unrealized appreciation |
|
|
36,468,182
|
|
Gross
tax unrealized depreciation |
|
|
(246,728)
|
|
Net
tax unrealized appreciation on investments |
|
|
36,221,454
|
|
Undistributed
ordinary income |
|
|
267,844
|
|
Undistributed
long-term capital gains |
|
|
1,131,886
|
|
Total
Distributable Earnings |
|
|
1,399,730
|
|
Other
accumulated gains (losses) |
|
|
—
|
|
Total
Accumulated Earnings/Losses |
|
|
$37,621,184 |
|
|
|
|
|
|
|
|
9 |
|
|
|
|
|
|
| |||
|
|
|
|
June 30,
| |||
|
|
2024 |
|
|
2023 | ||
|
Distributions
Paid From: |
|
|
|
|
||
|
Ordinary
Income* |
|
|
$684,262 |
|
|
$426,230
|
|
Long-Term
Capital Gain |
|
|
$384,017 |
|
|
$2,067,215
|
|
|
|
$1,068,279 |
|
|
$2,493,445 | |
|
|
|
|
|
|
|
|
|
* |
For tax purposes, short-term capital gains are
considered ordinary income. |
|
|
|
|
|
|
|
|
|
|
|
|
|
|
|
|
|
|
Level 1 |
|
|
Level 2 |
|
|
Level 3 |
|
|
Total |
|
Equity |
|
|
|
|
|
|
|
|
||||
|
Common
Stocks* |
|
|
$60,809,293 |
|
|
$ — |
|
|
$ — |
|
|
$60,809,293
|
|
Total
Equity |
|
|
$60,809,293 |
|
|
$— |
|
|
$— |
|
|
$60,809,293
|
|
Short-Term
Investments |
|
|
$80,135 |
|
|
$— |
|
|
$— |
|
|
$80,135
|
|
Total
Investments in Securities |
|
|
$65,889,428 |
|
|
$— |
|
|
$— |
|
|
$65,889,428 |
|
|
|
|
|
|
|
|
|
|
|
|
|
|
|
* |
Please refer to the Schedule of Investments for
a breakout of common stocks by industry classifications. |
|
|
|
10 |
|
|
|
|
|
11 |
|
|
|
|
|
12 |
|
|
|
|
|
13 |
|
|
| (b) | Financial Highlights are included within the financial statements filed under Item 7 of this report. |
Item 8. Changes in and Disagreements with Accountants for Open-End Investment Companies.
There were no changes in or disagreements with accountants during the period covered by this report.
Item 9. Proxy Disclosure for Open-End Investment Companies.
There were no matters submitted to a vote of shareholders during the period covered by this report.
Item 10. Remuneration Paid to Directors, Officers, and Others of Open-End Investment Companies.
See the Statement of Operations within Item 7(a) of this report.
Item 11. Statement Regarding Basis for Approval of Investment Advisory Contract.
Not applicable (to be included in registrant’s Form N-CSR for the fiscal period ending December 31, 2024).
Item 12. Disclosure of Proxy Voting Policies and Procedures for Closed-End Management Investment Companies.
Not applicable to open-end investment companies.
Item 13. Portfolio Managers of Closed-End Management Investment Companies.
Not applicable to open-end investment companies.
Item 14. Purchases of Equity Securities by Closed-End Management Investment Company and Affiliated Purchasers.
Not applicable to open-end investment companies.
Item 15. Submission of Matters to a Vote of Security Holders.
There have been no material changes to the procedures by which shareholders may recommend nominees to the registrant’s board of directors.
Item 16. Controls and Procedures.
| (a) | The Registrant’s President and Treasurer have reviewed the Registrant’s disclosure controls and procedures (as defined in Rule 30a-3(c) under the Investment Company Act of 1940 (the “Act”)) as of a date within 90 days of the filing of this report, as required by Rule 30a-3(b) under the Act and Rules 13a-15(b) or 15d-15(b) under the Securities Exchange Act of 1934. Based on their review, such officers have concluded that the disclosure controls and procedures are effective in ensuring that information required to be disclosed in this report is appropriately recorded, processed, summarized and reported and made known to them by others within the Registrant and by the Registrant’s service provider. |
| (b) | There were no changes in the Registrant’s internal control over financial reporting (as defined in Rule 30a-3(d) under the Act) that occurred during the period covered by this report that have materially affected, or are reasonably likely to materially affect, the Registrant’s internal control over financial reporting. |
Item 17. Disclosure of Securities Lending Activities for Closed-End Management Investment Companies
Not applicable to open-end investment companies.
Item 18. Recovery of Erroneously Awarded Compensation.
Not applicable
Item 19. Exhibits.
| (a) | (1) The code of ethics that is the subject of the disclosure required by Item 2 incorporated by reference to the Registrant's Form N-CSRS filed March 9, 2018. |
(2) Any policy required by the listing standards adopted pursuant to Rule 10D-1 under the Exchange Act (17 CFR 240.10D-1) by the registered national securities exchange or registered national securities association upon which the registrant’s securities are listed. Not applicable.
(4) Any written solicitation to purchase securities under Rule 23c-1 under the Act sent or given during the period covered by the report by or on behalf of the registrant to 10 or more persons. Not applicable.
(5) Change in the registrant’s independent public accountant. Provide the information called for by Item 4 of Form 8-K under the Exchange Act (17 CFR 249.308). Unless otherwise specified by Item 4, or related to and necessary for a complete understanding of information not previously disclosed, the information should relate to events occurring during the reporting period. Not applicable.
| (b) | Certifications pursuant to Section 906 of the Sarbanes-Oxley Act of 2002. Furnished herewith. |
SIGNATURES
Pursuant to the requirements of the Securities Exchange Act of 1934 and the Investment Company Act of 1940, the registrant has duly caused this report to be signed on its behalf by the undersigned, thereunto duly authorized.
| (Registrant) | Matrix Advisors Value Fund, Inc. | ||
| By (Signature and Title)* | /s/ David A. Katz | ||
| David A. Katz, Principal Executive Officer/Principal Financial Officer | |||
| Date | 9/6/24 |
Pursuant to the requirements of the Securities Exchange Act of 1934 and the Investment Company Act of 1940, this report has been signed below by the following persons on behalf of the registrant and in the capacities and on the dates indicated.
| By (Signature and Title)* | /s/ David A. Katz | ||
| David A. Katz, Principal Executive Officer/Principal Financial Officer |
| Date | 9/6/24 |
* Print the name and title of each signing officer under his or her signature.