UNITED STATES
SECURITIES AND EXCHANGE COMMISSION
Washington, D.C. 20549
FORM
| | QUARTERLY REPORT PURSUANT TO SECTION 13 OR 15(d) OF THE SECURITIES EXCHANGE ACT OF 1934 |
For the quarterly period ended
or
| | TRANSITION REPORT PURSUANT TO SECTION 13 OR 15(d) OF THE SECURITIES EXCHANGE ACT OF 1934 |
For the transition period from to .
| Commission file number | |
HECLA MINING COMPANY
(Exact name of registrant as specified in its Charter)
| | | |||
| State or Other Jurisdiction of | I.R.S. Employer | |||
| Incorporation or Organization | Identification No. | |||
| | ||||
| | | |||
| Address of Principal Executive Offices | Zip Code | |||
| | ||||
| Registrant's Telephone Number, Including Area Code | ||||
Securities registered pursuant to Section 12(b) of the Act:
| Title of each class | Trading Symbol(s) | Name of each exchange on which registered |
| | | |
| Series B Cumulative Convertible Preferred Stock, par value $0.25 per share | | |
Indicate by check mark whether the registrant: (1) has filed all reports required to be filed by Section 13 or 15(d) of the Securities Exchange Act of 1934 during the preceding 12 months (or for such shorter period that the registrant was required to file such reports), and (2) has been subject to such filing requirements for the past 90 days.
Indicate by check mark whether the registrant has submitted electronically every Interactive Data File required to be submitted pursuant to Rule 405 of Regulation S-T (§ 232.405 of this chapter) during the preceding 12 months (or for such shorter period that the registrant was required to submit such files).
Indicate by check mark whether the registrant is a large accelerated filer, an accelerated filer, a non-accelerated filer, a smaller reporting company, or an emerging growth company. See the definitions of “large accelerated filer,” “accelerated filer,” “smaller reporting company,” and “emerging growth company” in Rule 12b-2 of the Exchange Act.
| Accelerated filer ☐ | |
| Non-accelerated filer ☐ | Smaller reporting company |
| Emerging growth company |
If an emerging growth company, indicate by check mark if the registrant has elected not to use the extended transition period for complying with any new or revised financial accounting standards provided pursuant to Section 13(a) of the Exchange Act. .
Indicate by check mark whether the registrant is a shell company (as defined in Rule 12b-2 of the Exchange Act).
Yes
Indicate the number of shares outstanding of each of the issuer’s classes of common stock, as of the latest practicable date.
| Class | Shares Outstanding August 3, 2021 | |
| Common stock, par value $0.25 per share | |
Hecla Mining Company and Subsidiaries
Form 10-Q
For the Quarter Ended June 30, 2021
INDEX*
*Items 2, 3 and 5 of Part II are omitted as they are not applicable.
Part I - Financial Information
Item 1. Financial Statements
Hecla Mining Company and Subsidiaries
Condensed Consolidated Statements of Operations and Comprehensive Income (Loss) (Unaudited)
(Dollars and shares in thousands, except for per-share amounts)
| Three Months Ended | Six Months Ended | |||||||||||||||
| June 30, 2021 | June 30, 2020 | June 30, 2021 | June 30, 2020 | |||||||||||||
| Sales of products | $ | $ | $ | $ | ||||||||||||
| Cost of sales and other direct production costs | ||||||||||||||||
| Depreciation, depletion and amortization | ||||||||||||||||
| Total cost of sales | ||||||||||||||||
| Gross profit | ||||||||||||||||
| Other operating expenses: | ||||||||||||||||
| General and administrative | ||||||||||||||||
| Exploration | ||||||||||||||||
| Pre-development | ||||||||||||||||
| Other operating expense | ||||||||||||||||
| Provision for closed operations and environmental matters | ||||||||||||||||
| Ramp-up and suspension costs | ||||||||||||||||
| Foundation grant | ||||||||||||||||
| Total other operating expenses | ||||||||||||||||
| Income (loss) from operations | ( | ) | ||||||||||||||
| Other income (expense): | ||||||||||||||||
| Gain on exchange of investments | ||||||||||||||||
| Unrealized (loss) gain on investments | ( | ) | ( | ) | ||||||||||||
| Loss on derivative contracts | ( | ) | ( | ) | ( | ) | ( | ) | ||||||||
| Net foreign exchange (loss) gain | ( | ) | ( | ) | ( | ) | ||||||||||
| Other expense | ( | ) | ( | ) | ( | ) | ( | ) | ||||||||
| Interest expense | ( | ) | ( | ) | ( | ) | ( | ) | ||||||||
| Total other expense | ( | ) | ( | ) | ( | ) | ( | ) | ||||||||
| (Loss) income before income and mining taxes | ( | ) | ( | ) | ( | ) | ||||||||||
| Income and mining tax benefit (provision) | ( | ) | ||||||||||||||
| Net income (loss) | ( | ) | ( | ) | ||||||||||||
| Preferred stock dividends | ( | ) | ( | ) | ( | ) | ( | ) | ||||||||
| Income (loss) applicable to common shareholders | $ | $ | ( | ) | $ | $ | ( | ) | ||||||||
| Comprehensive income (loss): | ||||||||||||||||
| Net income (loss) | $ | $ | ( | ) | $ | $ | ( | ) | ||||||||
| Change in fair value of derivative contracts designated as hedge transactions | ( | ) | ||||||||||||||
| Comprehensive income (loss) | $ | $ | ( | ) | $ | $ | ( | ) | ||||||||
| Basic income (loss) per common share after preferred dividends (in cents) | ) | ) | ||||||||||||||
| Diluted income (loss) per common share after preferred dividends (in cents) | ) | ) | ||||||||||||||
| Weighted average number of common shares outstanding - basic | ||||||||||||||||
| Weighted average number of common shares outstanding - diluted | ||||||||||||||||
| Cash dividends declared per common share (in cents) | ||||||||||||||||
The accompanying notes are an integral part of the interim condensed consolidated financial statements.
Hecla Mining Company and Subsidiaries
Condensed Consolidated Statements of Cash Flows (Unaudited)
(In thousands)
| Six Months Ended | ||||||||
| June 30, 2021 | June 30, 2020 | |||||||
| Operating activities: | ||||||||
| Net income (loss) | $ | $ | ( | ) | ||||
| Non-cash elements included in net income (loss): | ||||||||
| Depreciation, depletion and amortization | ||||||||
| Write-down to stockpile inventory | ||||||||
| Gain on sale of investments | ( | ) | ||||||
| Unrealized loss (gain) on investments | ( | ) | ||||||
| Provision for reclamation and closure costs | ||||||||
| Stock compensation | ||||||||
| Deferred income taxes | ( | ) | ( | ) | ||||
| Amortization of loan origination fees and loss on extinguishment of debt | ||||||||
| Loss on derivative contracts | ||||||||
| Foreign exchange loss (gain) | ( | ) | ||||||
| Foundation grant | ||||||||
| Other non-cash items, net | ||||||||
| Change in assets and liabilities: | ||||||||
| Accounts receivable | ( | ) | ( | ) | ||||
| Inventories | ( | ) | ||||||
| Other current and non-current assets | ( | ) | ||||||
| Accounts payable and accrued liabilities | ( | ) | ( | ) | ||||
| Accrued payroll and related benefits | ( | ) | ||||||
| Accrued taxes | ( | ) | ||||||
| Accrued reclamation and closure costs and other non-current liabilities | ( | ) | ||||||
| Cash provided by operating activities | ||||||||
| Investing activities: | ||||||||
| Additions to properties, plants, equipment and mineral interests | ( | ) | ( | ) | ||||
| Proceeds from disposition of properties, plants and equipment | ||||||||
| Purchases of investments | ( | ) | ||||||
| Net cash used in investing activities | ( | ) | ( | ) | ||||
| Financing activities: | ||||||||
| Acquisition of treasury shares | ( | ) | ( | ) | ||||
| Dividends paid to common stockholders | ( | ) | ( | ) | ||||
| Dividends paid to preferred stockholders | ( | ) | ( | ) | ||||
| Credit facility fees paid | ( | ) | ( | ) | ||||
| Borrowings on debt | ||||||||
| Repayments of debt | ( | ) | ||||||
| Repayments of finance leases | ( | ) | ( | ) | ||||
| Net cash (used in) provided by financing activities | ( | ) | ||||||
| Effect of exchange rates on cash | ( | ) | ( | ) | ||||
| Net increase in cash, cash equivalents and restricted cash and cash equivalents | ||||||||
| Cash, cash equivalents and restricted cash and cash equivalents at beginning of period | ||||||||
| Cash, cash equivalents and restricted cash and cash equivalents at end of period | $ | $ | ||||||
| Supplemental disclosure of cash flow information: | ||||||||
| Cash paid for interest | $ | $ | ||||||
| Cash paid for income and mining taxes | $ | $ | ||||||
| Significant non-cash investing and financing activities: | ||||||||
| Addition of finance lease obligations and right-of-use assets | $ | $ | ||||||
| Payment of accrued compensation in stock | $ | $ | ||||||
| Accounts receivable for proceeds on exchange of investments | $ | $ | ||||||
The accompanying notes are an integral part of the interim condensed consolidated financial statements.
Hecla Mining Company and Subsidiaries
Condensed Consolidated Balance Sheets (Unaudited)
(In thousands, except shares)
| June 30, 2021 | December 31, 2020 | |||||||
| ASSETS | ||||||||
| Current assets: | ||||||||
| Cash and cash equivalents | $ | $ | ||||||
| Accounts receivable: | ||||||||
| Trade | ||||||||
| Other, net | ||||||||
| Inventories: | ||||||||
| Concentrates, doré, and stockpiled ore | ||||||||
| Materials and supplies | ||||||||
| Derivatives assets | ||||||||
| Other current assets | ||||||||
| Total current assets | ||||||||
| Investments | ||||||||
| Restricted cash | ||||||||
| Properties, plants, equipment and mineral interests, net | ||||||||
| Operating lease right-of-use assets | ||||||||
| Deferred income taxes | ||||||||
| Derivatives assets | ||||||||
| Other non-current assets | ||||||||
| Total assets | $ | $ | ||||||
| LIABILITIES | ||||||||
| Current liabilities: | ||||||||
| Accounts payable and accrued liabilities | $ | $ | ||||||
| Accrued payroll and related benefits | ||||||||
| Accrued taxes | ||||||||
| Finance leases | ||||||||
| Operating leases | ||||||||
| Accrued interest | ||||||||
| Derivatives liabilities | ||||||||
| Other current liabilities | ||||||||
| Accrued reclamation and closure costs | ||||||||
| Total current liabilities | ||||||||
| Finance leases | ||||||||
| Operating leases | ||||||||
| Accrued reclamation and closure costs | ||||||||
| Long-term debt | ||||||||
| Deferred tax liability | ||||||||
| Pension liability | ||||||||
| Derivatives liabilities | ||||||||
| Other non-current liabilities | ||||||||
| Total liabilities | ||||||||
| Commitments and contingencies (Notes 4, 7, 8, and 10) | ||||||||
| STOCKHOLDERS' EQUITY | ||||||||
| Preferred stock, shares authorized: | ||||||||
| Series B preferred stock, cent par value, shares issued and outstanding, liquidation preference — | ||||||||
| Common stock, cent par value, authorized shares; issued June 30, 2021 — shares and December 31, 2020 — shares | ||||||||
| Capital surplus | ||||||||
| Accumulated deficit | ( | ) | ( | ) | ||||
| Accumulated other comprehensive loss | ( | ) | ( | ) | ||||
| Less treasury stock, at cost; June 30, 2021 — shares and December 31, 2020 — shares issued and held in treasury | ( | ) | ( | ) | ||||
| Total stockholders’ equity | ||||||||
| Total liabilities and stockholders’ equity | $ | $ | ||||||
The accompanying notes are an integral part of the interim condensed consolidated financial statements.
Hecla Mining Company and Subsidiaries
Condensed Consolidated Statements of Changes in Stockholders’ Equity (Unaudited)
(Dollars are in thousands, except for share and per share amounts)
| Three Months Ended June 30, 2021 | ||||||||||||||||||||||||||||
| Series B Preferred Stock | Common Stock | Capital Surplus | Accumulated Deficit | Accumulated Other Comprehensive Loss, net | Treasury Stock | Total | ||||||||||||||||||||||
| Balances, April 1, 2021 | $ | $ | $ | $ | ( | ) | $ | ( | ) | $ | ( | ) | $ | |||||||||||||||
| Net income | ||||||||||||||||||||||||||||
| Restricted stock units granted | ||||||||||||||||||||||||||||
| Restricted stock units distributed ( shares) | ( | ) | ( | ) | ( | ) | ||||||||||||||||||||||
| Common stock dividends declared ( cents per common share) | ( | ) | ( | ) | ||||||||||||||||||||||||
| Series B Preferred Stock dividends declared ( cents per share) | ( | ) | ( | ) | ||||||||||||||||||||||||
| Common stock issued for 401(k) match ( shares) | ||||||||||||||||||||||||||||
| Common stock issued to directors ( shares) | ||||||||||||||||||||||||||||
| Other comprehensive income | ||||||||||||||||||||||||||||
| Balances, June 30, 2021 | $ | $ | $ | $ | ( | ) | $ | ( | ) | $ | ( | ) | $ | |||||||||||||||
| Three Months Ended June 30, 2020 | ||||||||||||||||||||||||||||
| Series B Preferred Stock | Common Stock | Capital Surplus | Accumulated Deficit | Accumulated Other Comprehensive Loss, net | Treasury Stock | Total | ||||||||||||||||||||||
| Balances, April 1, 2020 | $ | $ | $ | $ | ( | ) | $ | ( | ) | $ | ( | ) | $ | |||||||||||||||
| Net loss | ( | ) | ( | ) | ||||||||||||||||||||||||
| Restricted stock units granted | ||||||||||||||||||||||||||||
| Restricted stock units distributed ( shares) | ( | ) | ( | ) | ( | ) | ||||||||||||||||||||||
| Common stock dividends declared ( cent per common share) | ( | ) | ( | ) | ||||||||||||||||||||||||
| Series B Preferred Stock dividends declared ( cents per share) | ( | ) | ( | ) | ||||||||||||||||||||||||
| Common stock issued for 401(k) match ( shares) | ||||||||||||||||||||||||||||
| Common stock issued for employee incentive compensation ( shares) | ( | ) | ||||||||||||||||||||||||||
| Common stock issued to pension plans ( shares) | ||||||||||||||||||||||||||||
| Treasury shares issued to charitable foundation ( shares) | ( | ) | ||||||||||||||||||||||||||
| Other comprehensive income | ||||||||||||||||||||||||||||
| Balances, June 30, 2020 | $ | $ | $ | $ | ( | ) | $ | ( | ) | $ | ( | ) | $ | |||||||||||||||
| Six Months Ended June 30, 2021 | ||||||||||||||||||||||||||||
| Series B Preferred Stock | Common Stock | Capital Surplus | Accumulated Deficit | Accumulated Other Comprehensive Loss, net | Treasury Stock | Total | ||||||||||||||||||||||
| Balances, January 1, 2021 | $ | $ | $ | $ | ( | ) | $ | ( | ) | $ | ( | ) | $ | |||||||||||||||
| Net income | ||||||||||||||||||||||||||||
| Restricted stock units granted | ||||||||||||||||||||||||||||
| Restricted stock units distributed ( shares) | ( | ) | ( | ) | ( | ) | ||||||||||||||||||||||
| Common stock dividends declared ( cents per common share) | ( | ) | ( | ) | ||||||||||||||||||||||||
| Series B Preferred Stock dividends declared ( per share) | ( | ) | ( | ) | ||||||||||||||||||||||||
| Common stock issued for 401(k) match ( shares) | ||||||||||||||||||||||||||||
| Common stock issued to pension plans ( shares) | ||||||||||||||||||||||||||||
| Common stock issued to directors ( shares) | ||||||||||||||||||||||||||||
| Other comprehensive loss | ||||||||||||||||||||||||||||
| Balances, June 30, 2021 | $ | $ | $ | $ | ( | ) | $ | ( | ) | $ | ( | ) | $ | |||||||||||||||
| Six Months Ended June 30, 2020 | ||||||||||||||||||||||||||||
| Series B Preferred Stock | Common Stock | Capital Surplus | Accumulated Deficit | Accumulated Other Comprehensive Loss, net | Treasury Stock | Total | ||||||||||||||||||||||
| Balances, January 1, 2020, as revised (see Note 1) | $ | $ | $ | $ | ( | ) | $ | ( | ) | $ | ( | ) | $ | |||||||||||||||
| Net loss | ( | ) | ( | ) | ||||||||||||||||||||||||
| Restricted stock units granted | ||||||||||||||||||||||||||||
| Restricted stock units distributed ( shares) | ( | ) | ( | ) | ( | ) | ||||||||||||||||||||||
| Common stock dividends declared ( cent per common share) | ( | ) | ( | ) | ||||||||||||||||||||||||
| Series B Preferred Stock dividends declared ( per share) | ( | ) | ( | ) | ||||||||||||||||||||||||
| Common stock issued for 401(k) match ( shares) | ||||||||||||||||||||||||||||
| Common stock issued for employee incentive compensation ( shares) | ( | ) | ||||||||||||||||||||||||||
| Common stock issued to pension plans ( shares) | ||||||||||||||||||||||||||||
| Treasury shares issued to charitable foundation ( shares) | ( | ) | ||||||||||||||||||||||||||
| Other comprehensive loss | ( | ) | ( | ) | ||||||||||||||||||||||||
| Balances, June 30, 2020 | $ | $ | $ | $ | ( | ) | $ | ( | ) | $ | ( | ) | $ | |||||||||||||||
The accompanying notes are an integral part of the interim condensed consolidated financial statements.
Note 1. Basis of Preparation of Financial Statements
The accompanying unaudited interim condensed consolidated financial statements of Hecla Mining Company and its subsidiaries (collectively, “Hecla,” “the Company,” “we,” “our,” or “us,” except where the context requires otherwise) have been prepared in accordance with the instructions to Form 10-Q and do not include all information and disclosures required annually by generally accepted accounting principles in the United States (“GAAP”). Therefore, this information should be read in conjunction with Hecla Mining Company’s consolidated financial statements and notes contained in our annual report on Form 10-K for the year ended December 31, 2020 (“2020 Form 10-K”). The consolidated December 31, 2020 balance sheet data was derived from our audited consolidated financial statements. The information furnished herein reflects all adjustments that are, in the opinion of management, necessary for a fair statement of the results for the interim periods reported. All such adjustments are, in the opinion of management, of a normal recurring nature. Operating results for the three- and six-month periods ended June 30, 2021 are not necessarily indicative of the results that may be expected for the year ending December 31, 2021.
The 2019 novel strain of coronavirus (“COVID-19”) was characterized as a global pandemic by the World Health Organization on March 11, 2020, and COVID-19 resulted in travel restrictions and business slowdowns or shutdowns in affected areas. In late March 2020, the Government of Quebec ordered the mining industry to reduce to minimum operations as part of the fight against COVID-19, causing us to suspend our Casa Berardi operations from March 24, 2020 until April 15, 2020 when mining operations resumed. In early April 2020, the Government of Mexico issued a similar order causing us to suspend our San Sebastian operations until May 30, 2020. In addition, restrictions imposed by the State of Alaska in late March 2020 caused us to revise the normal operating procedures for staffing operations at Greens Creek. These suspension orders impacted us in the first half of 2020 by curtailing our expected production of gold at Casa Berardi by approximately
We have taken precautionary measures to mitigate the impact of COVID-19, including implementing operational plans and practices. As long as they are required, the operational practices implemented could have an adverse impact on our operating results due to deferred production and revenues or additional costs. We continue to monitor the rapidly evolving situation and guidance from federal, state, local and foreign governments and public health authorities and may take additional actions based on their recommendations. The extent of the impact of COVID-19 on our business and financial results will also depend on future developments, including the duration and spread of the outbreak and the success of the current vaccination programs being rolled out within the markets in which we operate and the related impact on prices, demand, creditworthiness and other market conditions and governmental reactions, all of which are highly uncertain.
Correction of an Immaterial Error
During the first quarter of 2021 we reclassified certain state mining income taxes from Cost of sales and other direct production costs to Income and mining tax provision prospectively effective January 1, 2021. The reclassification required us to recognize previously unrecognized deferred taxes. The impact of this was an adjustment of $
Note 2. Business Segments and Sales of Products
We discover, acquire and develop mines and other mineral interests and produce and market concentrates, carbon material and doré which contain silver, gold, lead and zinc. We are currently organized and managed in segments, which represent our operating units: the Greens Creek unit, the Lucky Friday unit, the Casa Berardi unit, the San Sebastian exploration unit, and the Nevada Operations unit.
General corporate activities not associated with operating units and their various exploration activities, as well as discontinued operations and idle properties, are presented as “other.” Interest expense, interest income and income and mining taxes are considered general corporate items, and are not allocated to our segments.
The following tables present information about our reportable segments for the three and six months ended June 30, 2021 and 2020 (in thousands):
| Three Months Ended June 30, | Six Months Ended June 30, | |||||||||||||||
| 2021 | 2020 | 2021 | 2020 | |||||||||||||
| Net sales to unaffiliated customers: | ||||||||||||||||
| Greens Creek | $ | $ | $ | $ | ||||||||||||
| Lucky Friday | ||||||||||||||||
| Casa Berardi | ||||||||||||||||
| San Sebastian | ||||||||||||||||
| Nevada Operations | ||||||||||||||||
| $ | $ | $ | $ | |||||||||||||
| Income (loss) from operations: | ||||||||||||||||
| Greens Creek | $ | $ | $ | $ | ||||||||||||
| Lucky Friday | ( | ) | ( | ) | ||||||||||||
| Casa Berardi | ( | ) | ( | ) | ||||||||||||
| San Sebastian | ( | ) | ( | ) | ( | ) | ( | ) | ||||||||
| Nevada Operations | ( | ) | ( | ) | ( | ) | ||||||||||
| Other | ( | ) | ( | ) | ( | ) | ( | ) | ||||||||
| $ | $ | $ | $ | ( | ) | |||||||||||
The following table presents identifiable assets by reportable segment as of June 30, 2021 and December 31, 2020 (in thousands):
| June 30, 2021 | December 31, 2020 | |||||||
| Identifiable assets: | ||||||||
| Greens Creek | $ | $ | ||||||
| Lucky Friday | ||||||||
| Casa Berardi | ||||||||
| San Sebastian | ||||||||
| Nevada Operations | ||||||||
| Other | ||||||||
| $ | $ | |||||||
Sales of products by metal for the three- and six-month periods ended June 30, 2021 and 2020 were as follows (in thousands):
| Three Months Ended June 30, | Six Months Ended June 30, | |||||||||||||||
| 2021 | 2020 | 2021 | 2020 | |||||||||||||
| Silver | $ | $ | $ | $ | ||||||||||||
| Gold | ||||||||||||||||
| Lead | ||||||||||||||||
| Zinc | ||||||||||||||||
| Less: Smelter and refining charges | ( | ) | ( | ) | ( | ) | ( | ) | ||||||||
| $ | $ | $ | $ | |||||||||||||
Sales of products included net losses of $
Note 3. Income and Mining Taxes
Major components of our income and mining tax benefit (provision) for the three and six months ended June 30, 2021 and 2020 are as follows (in thousands):
| Three Months Ended | Six Months Ended | |||||||||||||||
| June 30, | June 30, | |||||||||||||||
| 2021 | 2020 | 2021 | 2020 | |||||||||||||
| Current: | ||||||||||||||||
| Domestic | $ | ( | ) | $ | ( | ) | $ | ( | ) | $ | ( | ) | ||||
| Foreign | ( | ) | ( | ) | ( | ) | ( | ) | ||||||||
| Total current income and mining tax provision | ( | ) | ( | ) | ( | ) | ( | ) | ||||||||
| Deferred: | ||||||||||||||||
| Domestic | ||||||||||||||||
| Foreign | ( | ) | ||||||||||||||
| Total deferred income and mining tax benefit | ||||||||||||||||
| Total income and mining tax benefit (provision) | $ | $ | ( | ) | $ | $ | ||||||||||
The income and mining tax benefit (provision) for the three and six months ended June 30, 2021 and 2020 varies from the amounts that would have resulted from applying the statutory tax rates to pre-tax income due primarily to the impact of taxation in foreign jurisdictions and reversal of the valuation allowance portion related to net operating loss utilization. The valuation allowance reversed for utilization of net operating loss carryforward for the three and six months ended June 30, 2021 totaled $
Effective January 1, 2021, we prospectively reclassified certain income based state and provincial taxes from Cost of Sales and other direct production costs to Income and mining tax benefit (provision). The income and mining tax benefit for the three and six months ended June 30, 2021 decreased by $
Note 4. Employee Benefit Plans
We sponsor defined benefit pension plans covering substantially all U.S. employees. Net periodic pension cost for the plans consisted of the following for the three and six months ended June 30, 2021 and 2020 (in thousands):
| Three Months Ended June 30, | Six Months Ended June 30, | |||||||||||||||
| 2021 | 2020 | 2021 | 2020 | |||||||||||||
| Service cost | $ | $ | $ | $ | ||||||||||||
| Interest cost | ||||||||||||||||
| Expected return on plan assets | ( | ) | ( | ) | ( | ) | ( | ) | ||||||||
| Amortization of prior service cost | ||||||||||||||||
| Amortization of net loss | ||||||||||||||||
| Net periodic pension cost | $ | $ | $ | $ | ||||||||||||
For the three- and six-month periods ended June 30, 2021 and 2020, the service cost component of net periodic pension cost is included in the same line items of our condensed consolidated financial statements as other employee compensation costs. The net expense related to all other components of net periodic pension cost of $
In January 2021, we contributed $
Note 5. Income (Loss) Per Common Share
We calculate basic income (loss) per common share on the basis of the weighted average number of shares of common stock outstanding during the period. Diluted income (loss) per share is calculated using the weighted average number of shares of common stock outstanding during the period plus the effect of potential dilutive common shares during the period using the treasury stock and if-converted methods.
Potential dilutive shares of common stock include outstanding unvested restricted stock awards, stock units, warrants and convertible preferred stock for periods in which we have reported net income. For periods in which we report net losses, potential dilutive shares of common stock are excluded, as their conversion and exercise would be anti-dilutive.
The following table represents net income (loss) per common share – basic and diluted (in thousands, except income (loss) per share):
| Three Months Ended June 30, | Six Months Ended June 30, | |||||||||||||||
| 2021 | 2020 | 2021 | 2020 | |||||||||||||
| Numerator | ||||||||||||||||
| Net income (loss) | $ | $ | ( | ) | $ | $ | ( | ) | ||||||||
| Preferred stock dividends | ( | ) | ( | ) | ( | ) | ( | ) | ||||||||
| Net income (loss) applicable to common shares | $ | $ | ( | ) | $ | $ | ( | ) | ||||||||
| Denominator | ||||||||||||||||
| Basic weighted average common shares | ||||||||||||||||
| Dilutive restricted stock units, warrants and deferred shares | ||||||||||||||||
| Diluted weighted average common shares | ||||||||||||||||
| Basic income (loss) per common share (in cents) | ) | ) | ||||||||||||||
| Diluted income (loss) per common share (in cents) | ) | ) | ||||||||||||||
Diluted income (loss) per share for the three and six months ended June 30, 2021 and 2020 excludes the potential effects of outstanding shares of our convertible preferred stock, as their conversion would have no effect on the calculation of dilutive shares.
For the three months ended June 30, 2021, the calculation of diluted income per common share included (i)
Note 6. Stockholders’ Equity
Stock-based Compensation Plans
In June 2021, the board of directors granted the following restricted stock unit awards to our employees:
| • | |
| • | |
| • | |
Stock-based compensation expense will be recognized on a straight-line basis over the vesting period of the respective award. Total stock-based compensation expense of $
In June 2021, the board of directors granted performance-based share awards to certain executive employees. The value of the awards (if any) will be based on the ranking of the market performance of our common stock relative to that of a group of peer companies over the -year measurement period ending December 31, 2023. The number of shares to be issued will be based on the value of the awards divided by the share price at grant date. The expense related to the performance-based awards will be recognized on a straight-line base over the months following the date of the award.
Stock-based compensation expense for restricted stock unit and performance-based grants to employees and shares issued to non-employee directors totaled $
In connection with the vesting of restricted stock units and other stock grants, employees have in the past, at their election and when permitted by us, chosen to satisfy their minimum tax withholding obligations through net share settlement, pursuant to which the Company withholds the number of shares necessary to satisfy such withholding obligations and pays the obligations in cash. As a result, in the first six months of 2021 we withheld
Common Stock Dividends
During May 2021, our Board of Directors approved an increase in our silver-linked dividend policy by cent per year, and on May 5, 2021 and August 4, 2021, declared quarterly cash dividends of cents per share of common stock, consisting of
| Quarterly Average Realized Silver Price ($ per ounce) | Quarterly Silver- Linked Dividend (cents per share) | Annualized Silver- Linked Dividend (cents per share) | Annualized Minimum Dividend (cents per share) | Annualized Dividends per Share: Silver- Linked and Minimum (cents per share) | |||||||||||||||
| $ | 25 | ||||||||||||||||||
| $ | 30 | ||||||||||||||||||
| $ | 35 | ||||||||||||||||||
| $ | 40 | ||||||||||||||||||
| $ | 45 | ||||||||||||||||||
| $ | 50 | ||||||||||||||||||
At-The-Market Equity Distribution Agreement
Pursuant to an equity distribution agreement dated February 18, 2021, we may offer and sell up to
Note 7. Debt, Credit Facility and Leases
Our debt as of June 30, 2021 and December 31, 2020 consisted of our
| June 30, 2021 | ||||||||||||
| Senior Notes | IQ Notes | Total | ||||||||||
| Principal | $ | $ | $ | |||||||||
| Unamortized discount/premium and issuance costs | ( | ) | ( | ) | ||||||||
| Long-term debt balance | $ | $ | $ | |||||||||
| December 31, 2020 | ||||||||||||
| Senior Notes | IQ Notes | Total | ||||||||||
| Principal | $ | $ | $ | |||||||||
| Unamortized discount/premium and issuance costs | ( | ) | ( | ) | ||||||||
| Long-term debt balance | $ | $ | $ | |||||||||
The following table summarizes the scheduled annual future payments, including interest, for our Senior Notes, IQ Notes, and finance and operating leases as of June 30, 2021 (in thousands). The amounts for the IQ Notes are stated in U.S. dollars (“USD”) based on the USD/Canadian dollar (“CAD”) exchange rate as of June 30, 2021.
| Twelve-month period ending June 30, | Senior Notes | IQ Notes | Finance Leases | Operating Leases | ||||||||||||
| 2022 | $ | $ | $ | $ | ||||||||||||
| 2023 | ||||||||||||||||
| 2024 | ||||||||||||||||
| 2025 | ||||||||||||||||
| 2026 | ||||||||||||||||
| Thereafter | ||||||||||||||||
| Total | $ | $ | $ | $ | ||||||||||||
Credit Facility
In July 2018, we entered into a $
We are also able to obtain letters of credit under the facility, and for any such letters we are required to pay a participation fee of between
We believe we were in compliance with all covenants under the credit agreement as of June 30, 2021.
Note 8. Derivative Instruments
General
Our current risk management policy provides that up to
| • | our future foreign currency-related operating cost exposure for years into the future may be hedged and for potential additional programs to manage other foreign currency-related exposure areas; |
| • | our planned lead and zinc metals price exposure for five years into the future, with certain other limitations, to be covered under derivatives programs that would establish prices to be realized on future metals sales; and |
| • | our planned silver and gold metals price exposure for five years into the future, with certain other limitations, to be covered under derivatives programs that would establish a floor, but not a ceiling, for prices to be realized on future metals sales. We currently do not utilized such programs. |
These instruments expose us to (i) credit risk in the form of non-performance by counterparties for contracts in which the contract price exceeds the spot price of the hedged commodity or foreign currency and (ii) price risk to the extent that the spot price exceeds the contract price for quantities of our production and/or forecasted costs covered under contract positions.
Foreign Currency
Our wholly-owned subsidiary owning the Casa Berardi operation is a USD-functional entity which routinely incurs expenses denominated in CAD. Such expenses expose us to exchange rate fluctuations between the USD and CAD. We have a program to manage our exposure to fluctuations in the exchange rate between the USD and CAD for this subsidiary's' future operating costs denominated in CAD. The program utilizes forward contracts to buy CAD, and each contract is designated as a cash flow hedge. As of June 30, 2021, we have
As of June 30, 2021 and December 31, 2020, we recorded the following balances for the fair value of the contracts (in millions):
| June 30, | December 31, | |||||||
| Balance sheet line item: | 2021 | 2020 | ||||||
| Current derivatives assets | $ | $ | ||||||
| Non-current derivatives assets | ||||||||
Net unrealized gains of approximately $
Metals Prices
We are currently using financially-settled forward contracts to manage the exposure to:
| • | changes in prices of silver, gold, zinc and lead contained in our concentrate shipments between the time of shipment and final settlement; and |
| • | changes in prices of zinc and lead (but not silver and gold) contained in our forecasted future concentrate shipments. |
The following tables summarize the quantities of metals committed under forward sales contracts at June 30, 2021 and December 31, 2020:
| June 30, 2021 | Ounces/pounds under contract (in 000's) | Average price per ounce/pound | ||||||||||||||||||||||||||||||
| Silver | Gold | Zinc | Lead | Silver | Gold | Zinc | Lead | |||||||||||||||||||||||||
| (ounces) | (ounces) | (pounds) | (pounds) | (ounces) | (ounces) | (pounds) | (pounds) | |||||||||||||||||||||||||
| Contracts on provisional sales | ||||||||||||||||||||||||||||||||
| 2021 settlements | $ | $ | $ | $ | ||||||||||||||||||||||||||||
| Contracts on forecasted sales | ||||||||||||||||||||||||||||||||
| 2021 settlements | — | — | N/A | N/A | $ | $ | ||||||||||||||||||||||||||
| 2022 settlements | — | — | N/A | N/A | $ | $ | ||||||||||||||||||||||||||
| 2023 settlements | — | — | N/A | N/A | $ | $ | ||||||||||||||||||||||||||
| 2024 settlements | — | — | — | N/A | N/A | $ | N/A | |||||||||||||||||||||||||
| December 31, 2020 | Ounces/pounds under contract (in 000's) | Average price per ounce/pound | ||||||||||||||||||||||||||||||
| Silver | Gold | Zinc | Lead | Silver | Gold | Zinc | Lead | |||||||||||||||||||||||||
| (ounces) | (ounces) | (pounds) | (pounds) | (ounces) | (ounces) | (pounds) | (pounds) | |||||||||||||||||||||||||
| Contracts on provisional sales | ||||||||||||||||||||||||||||||||
| 2021 settlements | $ | $ | $ | $ | ||||||||||||||||||||||||||||
| Contracts on forecasted sales | ||||||||||||||||||||||||||||||||
| 2021 settlements | — | — | N/A | N/A | $ | $ | ||||||||||||||||||||||||||
| 2022 settlements | — | — | — | N/A | N/A | $ | N/A | |||||||||||||||||||||||||
In June 2019, we began utilizing financially-settled put option contracts to manage the exposure of our forecasted future gold and silver sales to potential declines in market prices for those metals. These put contracts gave us the option, but not the obligation, to realize established prices on quantities of silver and gold to be sold in the future. As of December 31, 2020, we had put contracts that provided average floor prices of $
These forward and put option contracts are not designated as hedges for accounting purposes and are adjusted to fair value through earnings each period.
We recorded the following balances for the fair value of the forward contracts as of June 30, 2021 and forward and put option contracts as of December 31, 2020 (in millions):
| June 30, 2021 | December 31, 2020 | |||||||||||||||||||||||
| Balance sheet line item: | Contracts in an asset position | Contracts in a liability position | Net asset (liability) | Contracts in an asset position | Contracts in a liability position | Net asset (liability) | ||||||||||||||||||
| Current derivatives assets | $ | $ | ( | ) | $ | $ | $ | ( | ) | $ | ||||||||||||||
| Non-current derivatives assets | ( | ) | ||||||||||||||||||||||
| Current derivatives liabilities | ( | ) | ( | ) | ( | ) | ( | ) | ||||||||||||||||
| Non-current derivatives liabilities | ( | ) | ( | ) | ||||||||||||||||||||
We recognized net losses of $
We recognized net losses of $
Credit-risk-related Contingent Features
Certain of our derivative contracts contain cross default provisions which provide that a default under our revolving credit agreement would cause a default under the derivative contract. As of June 30, 2021, we have not posted any collateral related to these contracts. The fair value of derivatives in a net liability position related to these agreements was $
Note 9. Fair Value Measurement
Accounting guidance has established a hierarchy for inputs used to measure assets and liabilities at fair value on a recurring basis. The three levels included in the hierarchy are:
Level 1: quoted prices in active markets for identical assets or liabilities;
Level 2: significant other observable inputs; and
Level 3: significant unobservable inputs.
The table below sets forth our assets and liabilities that were accounted for at fair value on a recurring basis and the fair value calculation input hierarchy level that we have determined applies to each asset and liability category (in thousands).
| Description | Balance at June 30, 2021 | Balance at December 31, 2020 | Input Hierarchy Level | ||||||
| Assets: | |||||||||
| Cash and cash equivalents: | |||||||||
| Money market funds and other bank deposits | $ | $ | Level 1 | ||||||
| Current and non-current investments | |||||||||
| Equity securities | Level 1 | ||||||||
| Trade accounts receivable: | |||||||||
| Receivables from provisional concentrate sales | Level 2 | ||||||||
| Restricted cash balances: | |||||||||
| Certificates of deposit and other deposits | Level 1 | ||||||||
| Derivative contracts - current and non-current derivatives assets: | |||||||||
| Foreign exchange contracts | Level 2 | ||||||||
| Metal forward and put option contracts | Level 2 | ||||||||
| Total assets | $ | $ | |||||||
| Liabilities: | |||||||||
| Derivative contracts - current derivatives liabilities and other non-current liabilities: | |||||||||
| Foreign exchange contracts | $ | $ | Level 2 | ||||||
| Metal forward and put option contracts | Level 2 | ||||||||
| Total liabilities | $ | $ | |||||||
Cash and cash equivalents consist primarily of money market funds and are valued at cost, which approximates fair value, and a small portion consists of municipal bonds having maturities of less than 90 days, which are recorded at fair value.
Current and non-current restricted cash balances consist primarily of certificates of deposit, U.S. Treasury securities, and other deposits and are valued at cost, which approximates fair value.
Our non-current available for sale securities consist of marketable equity securities of companies in the mining industry which are valued using quoted market prices for each security.
Trade accounts receivable from provisional concentrate sales are subject to final pricing and valued using quoted prices based on forward curves for the particular metals. The embedded derivative contained in our concentrate sales is adjusted to fair market value through earnings each period prior to final settlement.
We use financially-settled forward contracts to manage exposure to changes in the exchange rate between USD and CAD, and the impact on CAD-denominated operating costs incurred at our Casa Berardi unit (see Note 8 for more information). The fair value of each contract represents the present value of the difference between the forward exchange rate for the contract settlement period as of the measurement date and the contract settlement exchange rate.
We use financially-settled forward contracts to manage the exposure to changes in prices of silver, gold, zinc and lead contained in our concentrate shipments that have not reached final settlement. We also use financially-settled forward and put option contracts to manage the exposure to changes in prices of silver, gold, zinc and lead contained in our forecasted future sales (see Note 8 for more information). The fair value of each forward contract represents the present value of the difference between the forward metal price for the contract settlement period as of the measurement date and the contract settlement metal price. The fair value of each put option contract is measured using the Black-Scholes pricing model, with inputs for the period-end metal price and assumed metal price volatility and discount rate.
At June 30, 2021, our Senior Notes, which had a carrying value of $
Note 10. Commitments, Contingencies and Obligations
General
We follow GAAP guidance in determining our accruals and disclosures with respect to loss contingencies, and evaluate such accruals and contingencies for each reporting period. Accordingly, estimated losses from loss contingencies are accrued by a charge to income when information available prior to issuance of the financial statements indicates that it is probable that a liability could be incurred and the amount of the loss can be reasonably estimated. Legal expenses associated with the contingency are expensed as incurred. If a loss contingency is not probable or reasonably estimable, disclosure of the loss contingency is made in the financial statements when it is at least reasonably possible that a material loss could be incurred.
Johnny M Mine Area near San Mateo, McKinley County and San Mateo Creek Basin, New Mexico
In May 2011, the EPA made a formal request to Hecla Mining Company for information regarding the Johnny M Mine Area near San Mateo, McKinley County, New Mexico, and asserted that Hecla Mining Company may be responsible under the Comprehensive Environmental Response, Compensation and Liability Act (“CERCLA”) for environmental remediation and past costs the EPA has incurred at the site. Mining at the Johnny M Mine was conducted for a limited period of time by a predecessor of our subsidiary, Hecla Limited. In August 2012, Hecla Limited and the EPA entered into a Settlement Agreement and Administrative Order on Consent for Removal Action (“Consent Order”), pursuant to which Hecla Limited agreed to pay (i) $
The Johnny M Mine is in an area known as the San Mateo Creek Basin (“SMCB”), which is an approximately 321 square mile area in New Mexico that contains numerous legacy uranium mines and mills. In addition to Johnny M, Hecla Limited's predecessor was involved at other mining sites within the SMCB. The EPA appears to have deferred consideration of listing the SMCB site on CERCLA’s National Priorities List “Superfund”) by removing the site from its emphasis list, and is working with various potentially responsible parties (“PRPs”) at the site in order to study and potentially address perceived groundwater issues within the SMCB. The EE/CA discussed above relates primarily to contaminated rock and soil at the Johnny M site, not groundwater and not elsewhere within the SMCB site. It is possible that Hecla Limited’s liability at the Johnny M Site, and for any other mine site within the SMCB at which Hecla Limited's predecessor may have operated, will be greater than our current accrual of $9.0 million due to the increased scope of required remediation.
In July 2018, the EPA informed Hecla Limited that it and several other PRPs may be liable for cleanup of the SMCB site or for costs incurred by the EPA in cleaning up the site. The EPA stated it has incurred approximately $
Carpenter Snow Creek and Barker-Hughesville Sites in Montana
In July 2010, the EPA made a formal request to Hecla Mining Company for information regarding the Carpenter Snow Creek Superfund site located in Cascade County, Montana. The Carpenter Snow Creek site is located in a historic mining district, and in the early 1980s Hecla Limited leased 6 mining claims and performed limited exploration activities at the site. Hecla Limited terminated the mining lease in 1988.
In June 2011, the EPA informed Hecla Limited that it believes Hecla Limited, and several other PRPs, may be liable for cleanup of the site or for costs incurred by the EPA in cleaning up the site. The EPA stated in the letter that it has incurred approximately $
In February 2017, the EPA made a formal request to Hecla Mining Company for information regarding the Barker-Hughesville Mining District Superfund site located in Judith Basin and Cascade Counties, Montana. Hecla Limited submitted a response in April 2017. The Barker-Hughesville site is located in a historic mining district, and between approximately June and December 1983, Hecla Limited was party to an agreement with another mining company under which limited exploration activities occurred at or near the site.
In August 2018, the EPA informed Hecla Limited that it and several other PRPs may be liable for cleanup of the site or for costs incurred by the EPA in cleaning up the site. The EPA did not include an amount of its alleged response costs to date. Hecla Limited cannot with reasonable certainty estimate the amount or range of liability, if any, relating to this matter because of, among other reasons, the lack of information concerning past or anticipated future costs at the site and the relative contributions of contamination by various other PRPs.
Claim for Indemnification Against CoCa Mines, Inc.
In 1991, Hecla Limited acquired CoCa Mines, Inc. (“CoCa”) and its subsidiary Creede Resources, Inc. (“CRI”). CoCa and CRI previously operated in the State of Colorado, but presently have limited assets and operations. Between 2014 and 2019, a PRP alleged that CoCa and CRI are required by a 1989 agreement to indemnify it for certain environmental costs and liabilities it may incur with respect to the Nelson Tunnel/Commodore Waste Rock Pile Superfund site in Creede, Colorado. In 2016, without admitting any liability, Hecla Limited, CoCa and CRI entered into a Consent Decree with the United States and the State of Colorado settling any regulatory liability they may have had at the site. On October 30, 2019, the PRP filed a lawsuit in Mineral County, Colorado alleging, among other things, that CoCa and CRI are in breach of contract for failure to indemnify the PRP for its liability to the U.S. under CERCLA with respect to the site. In addition, the lawsuit names Hecla Limited as a defendant in its role as the shareholder of CoCa. The PRP seeks in excess of $
Litigation Related to Klondex Acquisition
On May 24, 2019, a purported Hecla stockholder filed a putative class action lawsuit in U.S. District Court for the Southern District of New York against Hecla and certain of our executive officers, one of whom is also a director. The complaint, purportedly brought on behalf of all purchasers of Hecla common stock from March 19, 2018 through and including May 8, 2019, asserts claims under Sections 10(b) and 20(a) of the Securities Exchange Act of 1934 and Rule 10b-5 promulgated thereunder and seeks, among other things, damages and costs and expenses. Specifically, the complaint alleges that Hecla, under the authority and control of the individual defendants, made certain material false and misleading statements and omitted certain material information regarding Hecla’s Nevada Operations unit. The complaint alleges that these misstatements and omissions artificially inflated the market price of Hecla common stock during the class period, thus purportedly harming investors. Filings with the court regarding our motion to dismiss the lawsuit were completed in the first quarter of 2021. We cannot predict the outcome of this lawsuit or estimate damages if plaintiffs were to prevail. We believe that these claims are without merit and intend to defend them vigorously.
Debt
See Note 7 for information on the commitments related to our debt arrangements as of June 30, 2021.
Other Commitments
Our contractual obligations as of June 30, 2021 included approximately $
Other Contingencies
We also have certain other contingencies resulting from litigation, claims, EPA investigations, and other commitments and are subject to a variety of environmental and safety laws and regulations incident to the ordinary course of business. We currently have no basis to conclude that any or all of such contingencies will materially affect our financial position, results of operations or cash flows. However, in the future, there may be changes to these contingencies, or additional contingencies may occur, any of which might result in an accrual or a change in current accruals recorded by us, and there can be no assurance that their ultimate disposition will not have a material adverse effect on our financial position, results of operations or cash flows.
Note 11. Developments in Accounting Pronouncements
Accounting Standards Updates Adopted
In December 2019, the FASB issued ASU No. 2019-12 Income Taxes (Topic 740): Simplifying the Accounting for Income Taxes. The update contains a number of provisions intended to simplify the accounting for income taxes. The update is effective for fiscal years beginning after December 15, 2020, with early adoption permitted. We adopted the update as of January 1, 2021, which did not have a material impact on our consolidated financial statements or disclosures.
Accounting Standards Updates to Become Effective in Future Periods
In August 2020, the FASB issued ASU No. 2020-06 Debt - Debt with Conversion and Other Options (Subtopic 470-20) and Derivatives and Hedging—Contracts in Entity’s Own Equity (Subtopic 815-40): Accounting for Convertible Instruments and Contracts in an Entity’s Own Equity. The update is to address issues identified as a result of the complexity associated with applying generally accepted accounting principles for certain financial instruments with characteristics of liabilities and equity. The update is effective for fiscal years beginning after December 15, 2021, including interim periods within those fiscal years and with early adoption permitted. We are evaluating the impact of this update on our consolidated financial statements.
Forward-Looking Statements
Certain statements contained in this Form 10-Q, including in Management’s Discussion and Analysis of Financial Condition and Results of Operations and Quantitative and Qualitative Disclosures About Market Risk, are intended to be covered by the safe harbor provided for under Section 27A of the Securities Act of 1933, as amended, and Section 21E of the Securities Exchange Act of 1934, as amended. Our forward-looking statements include our current expectations and projections about future results, performance, results of litigation, prospects and opportunities, including reserves and other mineralization. We have tried to identify these forward-looking statements by using words such as “may,” “will,” “expect,” “anticipate,” “believe,” “intend,” “feel,” “plan,” “estimate,” “project,” “forecast” and similar expressions. These forward-looking statements are based on information currently available to us and are expressed in good faith and believed to have a reasonable basis. However, our forward-looking statements are subject to a number of risks, uncertainties and other factors that could cause our actual results, performance, prospects or opportunities to differ materially from those expressed in, or implied by, these forward-looking statements.
These risks, uncertainties and other factors include, but are not limited to, those set forth under Part I, Item 1A. – Risk Factors in our annual report filed on Form 10-K for the year ended December 31, 2020 (“2020 Form 10-K”). Given these risks and uncertainties, readers are cautioned not to place undue reliance on our forward-looking statements. All subsequent written and oral forward-looking statements attributable to Hecla Mining Company or to persons acting on our behalf are expressly qualified in their entirety by these cautionary statements. Except as required by federal securities laws, we do not intend to update or revise any forward-looking statements, whether as a result of new information, future events or otherwise.
Item 2. Management's Discussion and Analysis of Financial Condition and Results of Operations
In this Management’s Discussion and Analysis of Financial Condition and Results of Operations (“MD&A”), “Hecla,” “the Company,” “we,” “us” and “our” refer to Hecla Mining Company and its consolidated subsidiaries, except where the context requires otherwise. You should read this discussion in conjunction with our consolidated financial statements, the related MD&A and the discussion of our Business and Properties in our 2020 Form 10-K filed with the United States Securities and Exchange Commission (the “SEC”). The results of operations reported and summarized below are not necessarily indicative of future operating results (refer to “Forward-Looking Statements” above for further discussion). References to “Notes” are Notes included in our Notes to Condensed Consolidated Financial Statements (Unaudited). Throughout MD&A, all references to losses or income per share are on a diluted basis.
Overview
Established in 1891 in northern Idaho’s Silver Valley, we believe we are the oldest operating precious metals mining company in the United States and the largest silver producer in the United States. Our corporate offices are in Coeur d’Alene, Idaho and Vancouver, British Columbia. Our production profile includes:
| • |
concentrates containing silver, gold, lead and zinc, which are shipped to various smelters or sold to metal traders; |
| • |
unrefined doré containing gold and silver, which is sold to refiners or further refined before sale of the metals to traders; and |
| • |
carbon material containing gold and silver, which is sold to third-party processors. |
Our operating properties comprise our five business segments for financial reporting purposes: the Greens Creek operating unit on Admiralty Island in Alaska, the Lucky Friday operating unit in Idaho, the Casa Berardi operating unit in Quebec, Canada, the San Sebastian exploration unit in Durango, Mexico, and the Nevada Operations unit in northern Nevada. Since our operating mines are located in the United States, Canada, and Mexico, we believe they have low or relatively moderate political risk, and less economic risk than mines located in other parts of the world. Our exploration interests are also in the United States, Canada, and Mexico, and are located in historical mining districts. The map below shows the locations of our operating units, our exploration and pre-development projects, as well as our corporate offices located in Coeur d'Alene, Idaho and Vancouver, British Columbia.
Our current business strategy is to focus our financial and human resources in the following areas:
| • |
rapidly responding to the threats from the COVID-19 pandemic to protect our workforce, operations and communities while maintaining liquidity; |
| • |
operating our properties safely, in an environmentally responsible manner, and cost-effectively; |
| • |
improving operations at our units, which includes incurring costs for new technologies and equipment that may not result in measurable benefits; |
| • |
expanding our proven and probable reserves and production capacity at our units; |
| • |
conducting our business with financial stewardship to preserve our financial position in varying metals price and operational environments; |
| • |
advancing permitting of the Rock Creek and Montanore projects; |
| • |
maintaining and investing in exploration and pre-development projects in the vicinities of eleven mining districts and projects we believe to be under-explored and under-invested: North Idaho's Silver Valley in the historic Coeur d'Alene Mining District; our Greens Creek unit on Alaska's Admiralty Island located near Juneau; the silver-producing district near Durango, Mexico; in the vicinity of our Casa Berardi mine and the Heva-Hosco project in the Abitibi region of northwestern Quebec, Canada; our projects located in two districts in northern Nevada; the Rock Creek and Montanore projects in northwestern Montana; the Kinskuch property in British Columbia, Canada; the Republic district in northeastern Washington; and the Creede district of southwestern Colorado; and |
| • |
continuing to seek opportunities to acquire or invest in mining properties and companies. |
The COVID-19 outbreak impacted our operations in 2020, including adversely impacting our expected production of gold at Casa Berardi, and has continued to impact our operations in 2021. We incurred additional costs of approximately $1.0 million in the first half of 2021 and $2.3 million for the full year of 2020 related to quarantining employees at Greens Creek, which started in late March 2020. See each segment section below for information on how those operations have been impacted by COVID-19. To mitigate the impact of COVID-19, we have taken precautionary measures, including implementing operational plans and practices. As long as they are required, the operational practices implemented could continue to have an adverse impact on our operating results due to additional costs or deferred production and revenues. There is uncertainty related to the potential additional impacts COVID-19 could have on our operations and financial results for the remainder of 2021. In our 2020 Form 10-K, see Item IA. Risk Factors - Natural disasters, public health crises (including COVID-19), political crises, and other catastrophic events or other events outside of our control may materially and adversely affect our business or financial results and COVID-19 virus pandemic may heighten other risks for information on how restrictions related to COVID-19 have recently affected some of our operations.
A number of key factors may impact the execution of our strategy, including regulatory issues and metals prices. Metals prices can be very volatile and are influenced by a number of factors beyond our control (except on a limited basis through the use of derivative contracts). See Item 7. Critical Accounting Estimates in our 2020 Form 10-K. The average realized prices of silver, gold lead and zinc were higher in the first six months of 2021 than in the comparable period last year, as illustrated by the table in Results of Operations below. While we believe longer-term global economic and industrial trends could result in continued demand for the metals we produce, prices have been volatile and there can be no assurance that current prices will continue.
Volatility in global financial markets and other factors can pose a significant challenge to our ability to access credit and equity markets, should we need to do so, and to predict sales prices for our products. To help mitigate this challenge, we utilize forward contracts to manage exposure to declines in the prices of (i) silver, gold, zinc and lead contained in our concentrates that have been shipped but have not yet settled, and (ii) the zinc and lead content that we forecast in future concentrate shipments. We have also utilized put option contracts to manage exposure to declines in the prices of silver and gold in our forecasted future sales of those metals. In addition, we have in place a $250 million revolving credit agreement, of which $19.9 million was used as of June 30, 2021 for letters of credit, leaving approximately $230.1 million available for borrowing.
We strive to achieve excellent mine safety and health performance. We seek to implement this goal by: training employees in safe work practices; establishing, following and improving safety standards; investigating accidents, incidents and losses to avoid recurrence; involving employees in the establishment of safety standards; and participating in the National Mining Association’s CORESafety program. We attempt to implement reasonable best practices with respect to mine safety and emergency preparedness. We work with MSHA to address issues outlined in its investigations and inspections and continue to evaluate our safety practices. There can be no assurance that our practices will mitigate or eliminate all safety risks. Achieving and maintaining compliance with MSHA regulations will be challenging and may increase our operating costs. See Item 1A. Risk Factors - We face substantial governmental regulation, including the Mine Safety and Health Act, various environmental laws and regulations and the 1872 Mining Law in our 2020 Form 10-K.
Another challenge for us is the risk associated with environmental litigation and ongoing reclamation activities. As described in Item 1A. Risk Factors in our 2020 Form 10-K and in Note 10 of Notes to Condensed Consolidated Financial Statements (Unaudited), it is possible that our estimate of these liabilities (and our ability to estimate liabilities in general) may change in the future, affecting our strategic plans. We are involved in various environmental legal matters and the estimate of our environmental liabilities and liquidity needs, as well as our strategic plans, may be significantly impacted as a result of these matters or new matters that may arise. We strive for compliance with applicable laws and regulations and attempt to resolve environmental litigation on terms as favorable to us as possible.
Consolidated Results of Operations
Sales of products by metal for the three- and six-month periods ended June 30, 2021 and 2020 were as follows:
| Three Months Ended June 30, |
Six Months Ended June 30, |
|||||||||||||||
| (in thousands) |
2021 |
2020 |
2021 |
2020 |
||||||||||||
| Silver |
$ | 92,765 | $ | 61,756 | $ | 170,525 | $ | 99,328 | ||||||||
| Gold |
86,078 | 89,212 | 187,487 | 179,906 | ||||||||||||
| Lead |
22,223 | 12,454 | 38,116 | 18,874 | ||||||||||||
| Zinc |
30,037 | 21,455 | 59,228 | 38,762 | ||||||||||||
| Less: smelter charges |
(13,120 | ) | (18,522 | ) | (26,521 | ) | (33,590 | ) | ||||||||
| Sales of products |
$ | 217,983 | $ | 166,355 | $ | 428,835 | $ | 303,280 | ||||||||
The fluctuations in sales for the second quarter and first six months of 2021 compared to the same periods of 2020 were primarily due to the following two reasons:
| • |
Higher average realized prices for silver, gold, lead and zinc in the second quarter and first half of 2021 compared to the same periods of 2020. These price variances are illustrated in the following table: |
| Three Months Ended June 30, |
Six Months Ended June 30, |
||||||||||||||||
| 2021 |
2020 |
2021 |
2020 |
||||||||||||||
| Silver – |
London PM Fix ($/ounce) |
$ | 26.69 | $ | 16.33 | $ | 26.49 | $ | 16.63 | ||||||||
| Realized price per ounce |
$ | 27.14 | $ | 18.44 | $ | 26.45 | $ | 16.75 | |||||||||
| Gold – |
London PM Fix ($/ounce) |
$ | 1,816 | $ | 1,711 | $ | 1,807 | $ | 1,647 | ||||||||
| Realized price per ounce |
$ | 1,825 | $ | 1,736 | $ | 1,795 | $ | 1,658 | |||||||||
| Lead – |
LME Final Cash Buyer ($/pound) |
$ | 0.96 | $ | 0.76 | $ | 0.94 | $ | 0.80 | ||||||||
| Realized price per pound |
$ | 1.04 | $ | 0.78 | $ | 0.99 | $ | 0.78 | |||||||||
| Zinc – |
LME Final Cash Buyer ($/pound) |
$ | 1.32 | $ | 0.89 | $ | 1.29 | $ | 0.93 | ||||||||
| Realized price per pound |
$ | 1.35 | $ | 0.89 | $ | 1.34 | $ | 0.89 | |||||||||
Average realized prices typically differ from average market prices primarily because concentrate sales are generally recorded as revenues at the time of shipment at forward prices for the estimated month of settlement, which differ from average market prices. Due to the time elapsed between shipment of concentrates and final settlement with the customers, we must estimate the prices at which sales of our metals will be settled. Previously recorded sales are adjusted to estimated settlement metals prices each period through final settlement. For the second quarter and first six months of 2021, we recorded net positive price adjustments to provisional settlements of $3.1 million and $3.6 million, respectively, compared to net positive price adjustments to provisional settlements of $7.0 million and $9.6 million, respectively, in the second quarter and first six months of 2020. The price adjustments related to silver, gold, zinc and lead contained in our concentrate shipments were partially offset by gains and losses on forward contracts for those metals. See Note 8 of Notes to Condensed Consolidated Financial Statements (Unaudited) for more information. The gains and losses on these contracts are included in revenues and impact the realized prices for silver, gold, lead and zinc. Realized prices are calculated by dividing gross revenues for each metal (which include the price adjustments and gains and losses on the forward contracts discussed above) by the payable quantities of each metal included in concentrate, doré and carbon material shipped during the period.
| • |
Higher quantities of silver and lead sold as a result of higher production of those metals, partially offset by lower gold volume, in the second quarter and first half of 2021. Zinc volume was lower in the second quarter of 2021 and higher in the first half of 2021 compared to the same periods of 2020. See The Greens Creek Segment, The Lucky Friday Segment, The Casa Berardi Segment, The San Sebastian Segment and The Nevada Operations Segment sections below for more information on metal production and sales volumes at each of our operating segments. Total metals production and sales volumes for each period are shown in the following table: |
| Three Months Ended June 30, |
Six Months Ended June 30, |
||||||||||||||||
| 2021 |
2020 |
2021 |
2020 |
||||||||||||||
| Silver - |
Ounces produced |
3,524,783 | 3,403,781 | 6,984,229 | 6,649,250 | ||||||||||||
| Payable ounces sold |
3,415,464 | 3,348,639 | 6,445,490 | 5,930,918 | |||||||||||||
| Gold - |
Ounces produced |
59,139 | 59,982 | 111,143 | 118,774 | ||||||||||||
| Payable ounces sold |
47,168 | 51,398 | 104,454 | 108,501 | |||||||||||||
| Lead - |
Tons produced |
11,540 | 8,977 | 22,244 | 14,087 | ||||||||||||
| Payable tons sold |
10,663 | 8,026 | 19,331 | 12,156 | |||||||||||||
| Zinc - |
Tons produced |
17,211 | 17,855 | 33,318 | 30,702 | ||||||||||||
| Payable tons sold |
11,143 | 11,989 | 22,170 | 21,825 | |||||||||||||
The difference between what we report as “ounces/tons produced” and “payable ounces/tons sold” is attributable to the difference between the quantities of metals contained in the concentrates we produce versus the portion of those metals actually paid for by our customers according to the terms of our sales contracts. Differences can also arise from inventory changes incidental to shipping schedules, or variances in ore grades which impact the amount of metals contained in concentrates produced and sold.
Sales, total cost of sales, gross profit, Cash Cost, After By-product Credits, per Ounce (“Cash Cost”) (non-GAAP) and All-In Sustaining Cost, After By-product Credits, per Ounce (“AISC”) (non-GAAP) at our operating units for the three- and six-months ended June 30, 2021 and 2020 were as follows (in thousands, except for Cash Cost and AISC):
| Silver |
Gold |
|||||||||||||||||||||||||||
| Greens Creek |
Lucky Friday |
San Sebastian |
Total Silver (2) |
Casa Berardi |
Nevada Operations |
Total Gold |
||||||||||||||||||||||
| Three Months Ended June 30, 2021: |
||||||||||||||||||||||||||||
| Sales |
$ | 113,763 | $ | 39,645 | $ | 3 | $ | 153,411 | $ | 56,122 | $ | 8,450 | $ | 64,572 | ||||||||||||||
| Total cost of sales |
(55,488 | ) | (27,901 | ) | (1 | ) | (83,390 | ) | (57,340 | ) | (17,993 | ) | (75,333 | ) | ||||||||||||||
| Gross profit |
$ | 58,275 | $ | 11,744 | $ | 2 | $ | 70,021 | $ | (1,218 | ) | $ | (9,543 | ) | $ | (10,761 | ) | |||||||||||
| Cash Cost per silver or gold ounce (1) |
$ | (2.64 | ) | $ | 8.07 | $ | — | $ | 0.18 | $ | 1,199 | $ | 1,369 | $ | 1,254 | |||||||||||||
| AISC per silver or gold ounce (1) |
$ | 0.68 | $ | 14.10 | $ | — | $ | 7.54 | $ | 1,434 | $ | 1,386 | $ | 1,419 | ||||||||||||||
| Three Months Ended June 30, 2020: |
||||||||||||||||||||||||||||
| Sales |
$ | 84,890 | $ | 11,455 | $ | 4,934 | $ | 101,279 | $ | 50,005 | $ | 15,071 | $ | 65,076 | ||||||||||||||
| Total cost of sales |
(57,672 | ) | (11,455 | ) | (4,010 | ) | (73,137 | ) | (45,582 | ) | (13,557 | ) | (59,139 | ) | ||||||||||||||
| Gross profit |
$ | 27,218 | $ | — | $ | 924 | $ | 28,142 | $ | 4,423 | $ | 1,514 | $ | 5,937 | ||||||||||||||
| Cash Cost per silver or gold ounce (1) |
$ | 5.19 | $ | — | $ | 1.14 | $ | 4.97 | $ | 919 | $ | 694 | $ | 846 | ||||||||||||||
| AISC per silver or gold ounce (1) |
$ | 7.11 | $ | — | $ | 1.85 | $ | 9.33 | $ | 1,077 | $ | 769 | $ | 977 | ||||||||||||||
| Silver |
Gold |
|||||||||||||||||||||||||||
| Greens Creek |
Lucky Friday |
San Sebastian |
Total Silver (2) |
Casa Berardi |
Nevada Operations |
Total Gold |
||||||||||||||||||||||
| Six Months Ended June 30, 2021: |
||||||||||||||||||||||||||||
| Sales |
$ | 212,172 | $ | 68,767 | $ | 176 | $ | 281,115 | $ | 129,033 | $ | 18,687 | $ | 147,720 | ||||||||||||||
| Total cost of sales |
(108,668 | ) | (50,696 | ) | (95 | ) | (159,459 | ) | (119,856 | ) | (25,448 | ) | (145,304 | ) | ||||||||||||||
| Gross profit |
$ | 103,504 | $ | 18,071 | $ | 81 | $ | 121,656 | $ | 9,177 | $ | (6,761 | ) | $ | 2,416 | |||||||||||||
| Cash Cost per silver or gold ounce (1) |
$ | (1.65 | ) | $ | 7.85 | $ | — | $ | 0.79 | $ | 1,106 | $ | 1,371 | $ | 1,161 | |||||||||||||
| AISC per silver or gold ounce (1) |
$ | 1.14 | $ | 14.17 | $ | — | $ | 7.38 | $ | 1,347 | $ | 1,393 | $ | 1,357 | ||||||||||||||
| Six Months Ended June 30, 2020: |
||||||||||||||||||||||||||||
| Sales |
$ | 138,724 | $ | 14,285 | $ | 14,860 | $ | 167,869 | $ | 96,177 | $ | 39,234 | $ | 135,411 | ||||||||||||||
| Total cost of sales |
(106,853 | ) | (14,287 | ) | (12,311 | ) | (133,451 | ) | (93,907 | ) | (30,471 | ) | (124,378 | ) | ||||||||||||||
| Gross profit |
$ | 31,871 | $ | (2 | ) | $ | 2,549 | $ | 34,418 | $ | 2,270 | $ | 8,763 | $ | 11,033 | |||||||||||||
| Cash Cost per silver or gold ounce (1) |
$ | 5.41 | $ | — | $ | 5.09 | $ | 5.38 | $ | 1,081 | $ | 716 | $ | 952 | ||||||||||||||
| AISC per silver or gold ounce (1) |
$ | 7.51 | $ | — | $ | 5.65 | $ | 10.10 | $ | 1,327 | $ | 787 | $ | 1,135 | ||||||||||||||
| (1) |
A reconciliation of these non-GAAP measures to cost of sales and other direct production costs and depreciation, depletion and amortization, the most comparable GAAP measure, can be found below in Reconciliation of Cost of Sales and Other Direct Production Costs and Depreciation, Depletion and Amortization (GAAP) to Cash Cost, Before By-product Credits and Cash Cost, After By-product Credits (non-GAAP) and All-In Sustaining Cost, Before By-product Credits and All-In Sustaining Cost, After By-product Credits (non-GAAP). |
| (2) |
The calculation of AISC, After By-product Credits, Per Ounce for our consolidated silver properties includes corporate costs for general and administrative expense and sustaining exploration and capital costs. |
While revenue from zinc, lead and gold by-products is significant, we believe that identification of silver as the primary product of Greens Creek, Lucky Friday and San Sebastian is appropriate because:
| • |
silver has historically accounted for a higher proportion of revenue than any other metal and is expected to do so in the future; |
| • |
we have historically presented these units as a primary silver producer, based on the original analysis that justified putting the project into production, and believe that consistency in disclosure is important to our investors regardless of the relationships of metals prices and production from year to year; |
| • |
metallurgical treatment maximizes silver recovery; |
| • |
the Greens Creek and Lucky Friday deposits are massive sulfide deposits containing an unusually high proportion of silver; and in most of their working areas, Greens Creek and Lucky Friday utilize selective mining methods in which silver is the metal targeted for highest recovery. |
Accordingly, we believe the identification of gold, lead and zinc as by-product credits at Greens Creek, Lucky Friday and San Sebastian is appropriate because of their lower economic value compared to silver and due to the fact that silver is the primary product we intend to produce. In addition, we have not consistently received sufficient revenue from any single by-product metal to warrant classification of such as a co-product.
We periodically review our revenues to ensure that reporting of primary products and by-products is appropriate. Because for Greens Creek, Lucky Friday and San Sebastian we consider zinc, lead and gold to be by-products of our silver production, the values of these metals offset operating costs within our calculations of Cash Cost, After By-product Credits, per Silver Ounce and AISC, After By-product Credits, per Silver Ounce.
We believe the identification of silver as a by-product credit is appropriate at Casa Berardi and Nevada Operations because of its lower economic value compared to gold and due to the fact that gold is the primary product we intend to produce there. In addition, we do not receive sufficient revenue from silver at Casa Berardi to warrant classification of such as a co-product. Because we consider silver to be a by-product of our gold production at Casa Berardi and Nevada Operations, the value of silver offsets operating costs within our calculations of Cash Cost, After By-product Credits, per Gold Ounce and AISC, After By-product Credits, per Gold Ounce.
For the second quarter and first six months of 2021, we recorded income applicable to common shareholders of $0.6 million (0.1 cent per basic common share) and $19.5 million (3.6 cents per basic common share), respectively, compared to losses applicable to common shareholders of $14.2 million (2.7 cents per basic common share) and $31.5 million (6.0 cents per basic common share) for the second quarter and first six months of 2020, respectively. The following factors contributed to the results for the second quarter and first six months of 2021 compared to the same periods in 2020:
| • |
Variances in gross profit (loss) at our operating units as illustrated in the table above. See The Greens Creek Segment, The Lucky Friday Segment, The Casa Berardi Segment, The San Sebastian Segment and The Nevada Operations Segment sections below. |
| • |
There were no ramp-up costs at Lucky Friday during the second quarter and first half of 2021 due to the return to full production in the fourth quarter of 2020, compared to ramp up costs of $5.2 million and $13.3 million in the second quarter and first half of 2020, respectively. See The Lucky Friday Segment section below. |
| • |
Lower interest expense by $7.1 million in the first half of 2021 compared to the first half of 2020, with the decrease due to the following items in 2020: (i) interest recognized on both our 7.25% Senior Notes due February 15, 2028 (“Senior Notes”) and our previously-outstanding 6.875% Senior Notes that were due in 2021 (“2021 Notes”) for an overlapping period of almost one month, as the Senior Notes were issued on February 19, 2020 and the 2021 Notes were redeemed on March 19, 2020, (ii) $1.7 million in unamortized initial purchaser discount on the 2021 Notes recognized as expense upon their redemption and (iii) reduced debt, as no amounts were drawn on our revolving credit facility during the first half of 2021. We utilized the facility during the first half of 2020 to mitigate potential impacts of COVID-19, with all amounts repaid by the end of the third quarter of 2020. |
| • |
Net foreign exchange losses of $1.9 million and $4.0 million in the second quarter and first half of 2021, respectively, versus a net loss of $3.2 million and net gain of $3.4 million, respectively, in the second quarter and first half of 2020. The variances are primarily related to the impact of changes in the CAD-to-USD exchange rate on the remeasurement of our net monetary liabilities in Quebec. During the first half of 2021, the CAD strengthened relative to the USD, resulting in a higher USD value for our net monetary liabilities denominated in CAD and a foreign exchange loss for the period. However, the CAD weakened relative to the USD during the first half of 2020. |
| • |
Higher other operating expense by $2.2 million and $4.9 million in the second quarter and first half of 2021, respectively, compared to the same periods of 2020 due to costs incurred to identify and implement potential operational improvements at Casa Berardi and Lucky Friday. |
| • |
Provision for closed operations and environmental matters increased by $3.2 million in the first half of 2021 compared to the first half of 2020 primarily due to a $2.9 million increase in the accrual for estimated costs at the Johnny M site in New Mexico in the first quarter of 2021 (see Note 10 of Notes to Condensed Consolidated Financial Statements (Unaudited) for more information). |
| • |
General and administrative expense increased by $4.1 million and $3.2 million in the second quarter and first half of 2021, respectively, compared to the same periods of 2020 primarily due to timing of issuance of shares to directors and higher accrued incentive compensation expense. |
| • |
An unrealized loss on investments in other mining companies of $0.8 million in the second quarter of 2021 compared to a gain of $6.4 million in the second quarter of 2020. In the first half of 2021, we had a net loss on investments of $3.1 million, comprised of a $4.3 million unrealized loss and a $1.2 million gain on exchange of investments, compared to an unrealized loss of $5.4 million in the first half of 2020. |
| • |
Exploration and pre-development expense increased by $8.7 million and $12.3 million in the second quarter and first half of 2021, respectively, compared to the same periods in 2020. In the first half of 2021, exploration was primarily at our San Sebastian, Casa Berardi, Greens Creek and Nevada Operations units, while pre-development expense included $2.3 million related to development of the decline to allow drilling of the Hatter Graben area in Nevada. |
| • |
Losses on base metal derivatives contracts of $17.3 million in the second quarter of 2021 and $16.8 million in the first half of 2021, compared to losses of $14.0 million in the second quarter and $6.1 million in the first half of 2020. See Note 8 of Notes to Condensed Consolidated Financial Statements (Unaudited) for more information. |
| • |
Income and mining tax benefits of $4.8 million and $0.2 million for the second quarter and six-month period ended June 30, 2021, respectively, compared to an income tax provision of $0.6 million and benefit of $0.4 million, respectively, for the same periods in 2020. The benefits in the 2021 periods are primarily the result of losses in Nevada and Mexico, along with losses in Quebec in the second quarter of 2021, and are net of provisions for reclassification of certain income-based state and provincial taxes from Cost of sales and other direct production costs to Income and mining tax provision (see Note 3 of Notes to Condensed Consolidated Financial Statements (Unaudited) for more information). |
| • |
In June 2020, we gifted 650,000 shares of our common stock valued at $2.0 million at the time of the gift to the Hecla Charitable Foundation (the “Foundation”), and recognized expense for that amount in the second quarter of 2020. The Foundation is a 501(c)(3) entity established in 2007 to provide grants and disburse funds for educational and charitable purposes to qualifying organizations in order to promote the social, environmental and economic sustainability and development of the communities where we have operations and activities. |
The Greens Creek Segment
| Dollars are in thousands (except per ounce and per ton amounts) |
Three Months Ended June 30, |
Six Months Ended June 30, |
||||||||||||||
| 2021 |
2020 |
2021 |
2020 |
|||||||||||||
| Sales |
$ | 113,763 | $ | 84,890 | $ | 212,172 | $ | 138,724 | ||||||||
| Cost of sales and other direct production costs |
(40,996 | ) | (44,684 | ) | (79,355 | ) | (81,436 | ) | ||||||||
| Depreciation, depletion and amortization |
(14,492 | ) | (12,988 | ) | (29,313 | ) | (25,417 | ) | ||||||||
| Cost of sales and other direct production costs and depreciation, depletion and amortization |
(55,488 | ) | (57,672 | ) | (108,668 | ) | (106,853 | ) | ||||||||
| Gross profit |
$ | 58,275 | $ | 27,218 | $ | 103,504 | $ | 31,871 | ||||||||
| Tons of ore milled |
214,931 | 215,275 | 409,011 | 414,079 | ||||||||||||
| Production: |
||||||||||||||||
| Silver (ounces) |
2,558,447 | 2,753,919 | 5,143,317 | 5,529,626 | ||||||||||||
| Gold (ounces) |
12,859 | 13,104 | 26,125 | 25,377 | ||||||||||||
| Zinc (tons) |
14,610 | 16,184 | 27,964 | 28,671 | ||||||||||||
| Lead (tons) |
5,627 | 5,889 | 10,551 | 11,087 | ||||||||||||
| Payable metal quantities sold: |
||||||||||||||||
| Silver (ounces) |
2,471,833 | 2,753,736 | 4,719,107 | 4,847,456 | ||||||||||||
| Gold (ounces) |
11,820 | 12,355 | 22,367 | 22,676 | ||||||||||||
| Zinc (tons) |
9,215 | 10,650 | 18,311 | 20,302 | ||||||||||||
| Lead (tons) |
4,619 | 5,233 | 8,264 | 8,693 | ||||||||||||
| Ore grades: |
||||||||||||||||
| Silver ounces per ton |
14.52 | 15.56 | 15.23 | 16.19 | ||||||||||||
| Gold ounces per ton |
0.08 | 0.08 | 0.09 | 0.08 | ||||||||||||
| Zinc percent |
7.6 | % |
8.2 | % |
7.6 | % |
7.6 | % |
||||||||
| Lead percent |
3.1 | % |
3.3 | % |
3.1 | % |
3.2 | % |
||||||||
| Total production cost per ton |
$ | 171.13 | $ | 171.03 | $ | 176.58 | $ | 178.18 | ||||||||
| Cash Cost, After By-product Credits, Per Silver Ounce (1) |
$ | (2.64 | ) | $ | 5.19 | $ | (1.65 | ) | $ | 5.41 | ||||||
| AISC, After By-Product Credits, per Silver Ounce (1) |
$ | 0.68 | $ | 7.11 | $ | 1.14 | $ | 7.51 | ||||||||
| (1) |
A reconciliation of these non-GAAP measures to cost of sales and other direct production costs and depreciation, depletion and amortization, the most comparable GAAP measure, can be found below in Reconciliation of Cost of Sales and Other Direct Production Costs and Depreciation, Depletion and Amortization (GAAP) to Cash Cost, Before By-product Credits and Cash Cost, After By-product Credits (non-GAAP) and All-In Sustaining Cost, Before By-product Credits and All-In Sustaining Cost, After By-product Credits (non-GAAP). |
The $31.1 million and $71.6 million increases in gross profit for the second quarter and first six months of 2021, respectively, compared to the same periods of 2020 were primarily due to: (i) higher realized prices for silver, gold, lead and zinc, (ii) lower concentrate treatment costs of $6.0 million and $11.7 million for the second quarter and six month periods, respectively, primarily as a result of favorable changes in smelter terms, with approximately $4.0 million of the variance for the six month period expected to be non-recurring and (iii) reclassification of Alaska mine license tax from cost of sales and other direct production costs to income and mining tax provision for the 2021 periods. See Note 1 of Notes to Condensed Consolidated Financial Statements (Unaudited) for more information. Cost of sales and other direct production costs for the second quarter and first half of 2020 included $1.3 million and $1.5 million, respectively, for Alaska mine license tax. The impacts of the factors above were partially offset by lower metal sales volume due to lower production and the timing of concentrate shipments.
The charts below illustrate the factors contributing to the variances in Cash Cost, After By-product Credits, Per Silver Ounce for the second quarter and first six months of 2021 compared to the same periods of 2020.
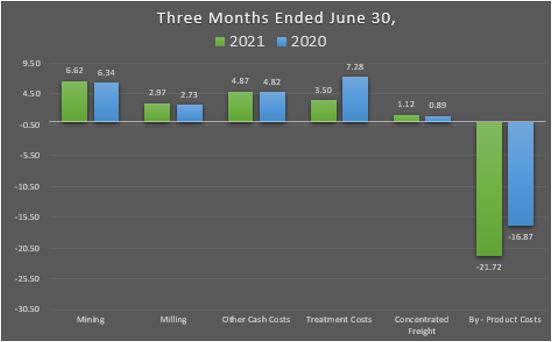
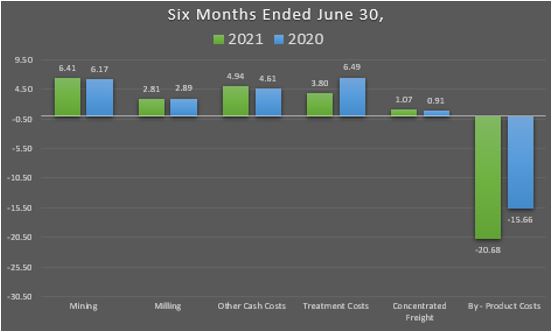
The following table summarizes the components of Cash Cost, After By-product Credits, per Silver Ounce:
| Three Months Ended June 30, |
Six Months Ended June 30, |
|||||||||||||||
| 2021 |
2020 |
2021 |
2020 |
|||||||||||||
| Cash Cost, Before By-product Credits, per Silver Ounce |
$ | 19.08 | $ | 22.06 | $ | 19.03 | $ | 21.07 | ||||||||
| By-product credits |
(21.72 | ) | (16.87 | ) | (20.68 | ) | (15.66 | ) | ||||||||
| Cash Cost, After By-product Credits, per Silver Ounce |
$ | (2.64 | ) | $ | 5.19 | $ | (1.65 | ) | $ | 5.41 | ||||||
The following table summarizes the components of AISC, After By-product Credits, per Silver Ounce:
| Three Months Ended June 30, |
Six Months Ended June 30, |
|||||||||||||||
| 2021 |
2020 |
2021 |
2020 |
|||||||||||||
| AISC, Before By-product Credits, per Silver Ounce |
$ | 22.40 | $ | 23.98 | $ | 21.82 | $ | 23.17 | ||||||||
| By-product credits |
(21.72 | ) | (16.87 | ) | (20.68 | ) | (15.66 | ) | ||||||||
| AISC, After By-product Credits, per Silver Ounce |
$ | 0.68 | $ | 7.11 | $ | 1.14 | $ | 7.51 | ||||||||
The decrease in Cash Costs and AISC, After By-product Credits, per Silver Ounce for the second quarter and first six months of 2021 compared to 2020 was primarily due to higher by-product credits, lower treatment costs and reclassification of mine license tax from production costs to income and mining tax provision effective January 1, 2021.
Restrictions imposed by the State of Alaska beginning in late March 2020 in response to the COVID-19 virus pandemic, including the requirement for employees returning to Alaska to self-quarantine for 14 days (changed in June 2020 to 7 days), has caused us to revise the normal operating procedures and incur additional costs for staffing operations at Greens Creek. The changes at Greens Creek have not materially impacted our operations to date; however, restrictions could have a material impact if they continue longer than anticipated or become broader.
The Lucky Friday Segment
| Dollars are in thousands (except per ounce and per ton amounts) |
Three Months Ended June 30, |
Six Months Ended June 30, |
||||||||||||||
| 2021 |
2020 |
2021 |
2020 |
|||||||||||||
| Sales |
$ | 39,645 | $ | 11,455 | $ | 68,767 | $ | 14,285 | ||||||||
| Cost of sales and other direct production costs |
(20,499 | ) | (9,561 | ) | (36,958 | ) | (12,091 | ) | ||||||||
| Depreciation, depletion and amortization |
(7,402 | ) | (1,894 | ) | (13,738 | ) | (2,196 | ) | ||||||||
| Cost of sales and other direct production costs and depreciation, depletion and amortization |
(27,901 | ) | (11,455 | ) | (50,696 | ) | (14,287 | ) | ||||||||
| Gross profit |
$ | 11,744 | $ | — | $ | 18,071 | $ | (2 | ) | |||||||
| Tons of ore milled |
82,442 | 44,682 | 163,513 | 54,901 | ||||||||||||
| Production: |
||||||||||||||||
| Silver (ounces) |
913,294 | 469,537 | 1,777,195 | 565,285 | ||||||||||||
| Lead (tons) |
5,913 | 3,088 | 11,693 | 3,783 | ||||||||||||
| Zinc (tons) |
2,601 | 1,671 | 5,354 | 2,031 | ||||||||||||
| Payable metal quantities sold: |
||||||||||||||||
| Silver (ounces) |
934,258 | 424,348 | 1,698,081 | 525,449 | ||||||||||||
| Lead (tons) |
6,045 | 2,793 | 11,067 | 3,463 | ||||||||||||
| Zinc (tons) |
1,929 | 1,339 | 3,859 | 1,523 | ||||||||||||
| Ore grades: |
||||||||||||||||
| Silver ounces per ton |
11.60 | 10.99 | 11.39 | 10.78 | ||||||||||||
| Lead percent |
7.55 | % |
7.33 | % |
7.53 | % |
7.31 | % |
||||||||
| Zinc percent |
3.44 | % |
4.07 | % |
3.57 | % |
4.03 | % |
||||||||
| Total production cost per ton |
$ | 199.48 | $ | 198.48 | $ | 188.30 | $ | 221.61 | ||||||||
| Cash Cost, After By-product Credits, per Silver Ounce (1) |
$ | 8.07 | $ | — | $ | 7.85 | $ | — | ||||||||
| AISC, After By-product Credits, per Silver Ounce (1) |
$ | 14.10 | $ | — | $ | 14.17 | $ | — | ||||||||
| (1) |
A reconciliation of these non-GAAP measures to cost of sales and other direct production costs and depreciation, depletion and amortization, the most comparable GAAP measure, can be found below in Reconciliation of Cost of Sales and Other Direct Production Costs and Depreciation, Depletion and Amortization (GAAP) to Cash Cost, Before By-product Credits and Cash Cost, After By-product Credits (non-GAAP) and All-In Sustaining Cost, Before By-product Credits and All-In Sustaining Cost, After By-product Credits (non-GAAP). |
The increases in gross profit, ore tonnage and metals production in the second quarter and first six months of 2021 compared to the same periods in 2020 are the result of returning to full production during the fourth quarter of 2020 (discussed further below). Gross profit was also impacted by higher realized prices for silver, lead and zinc in the second quarter and first six months of 2021 compared to the same periods in 2020.
The charts below illustrate the factors contributing to Cash Cost, After By-product Credits, Per Silver Ounce for the second quarter and first six months of 2021. Total production costs and Cash Cost and AISC, After By-product Credits, Per Silver Ounce are not presented for the second quarter and first six months of 2020, as production was limited during the ramp-up after the strike (discussed below) and results are not comparable.
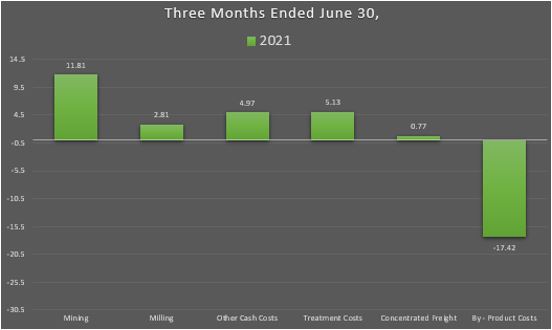
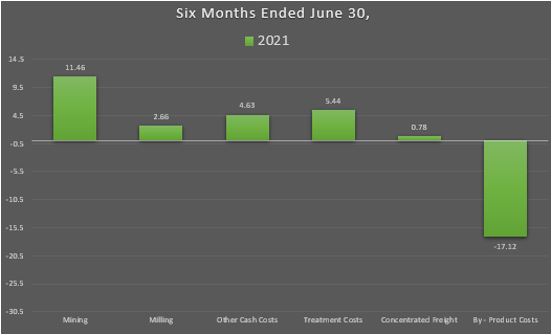
The following table summarizes the components of Cash Cost, After By-product Credits, per Silver Ounce:
| Three Months Ended June 30, |
Six Months Ended June 30, |
|||||||
| 2021 |
2021 |
|||||||
| Cash Cost, Before By-product Credits, per Silver Ounce |
$ | 25.49 | $ | 24.97 | ||||
| By-product credits |
(17.42 | ) | (17.12 | ) | ||||
| Cash Cost, After By-product Credits, per Silver Ounce |
$ | 8.07 | $ | 7.85 | ||||
The following table summarizes the components of AISC, After By-product Credits, per Silver Ounce:
| Three Months Ended June 30, |
Six Months Ended June 30, |
|||||||
| 2021 |
2021 |
|||||||
| AISC, Before By-product Credits, per Silver Ounce |
$ | 31.52 | $ | 31.29 | ||||
| By-product credits |
(17.42 | ) | (17.12 | ) | ||||
| AISC, After By-product Credits, per Silver Ounce |
$ | 14.10 | $ | 14.17 | ||||
Following settlement of the strike by unionized employees at Lucky Friday in early 2020, we commenced restaffing and ramp-up procedures and the mine returned to full production in the fourth quarter of 2020. Costs related to ramp-up activities totaled $5.2 million and $13.3 million in the second quarter and first half of 2020, respectively, which included non-cash depreciation expense of $2.3 million and $4.1 million, respectively, and are included in a separate line item on our consolidated statements of operations. These ramp-up costs are excluded from the calculation of gross profit, Cash Cost, After By-product Credits, per Silver Ounce and AISC, After By-product Credits, per Silver Ounce, when presented.
The Casa Berardi Segment
| Dollars are in thousands (except per ounce and per ton amounts) |
Three Months Ended June 30, |
Six Months Ended June 30, |
||||||||||||||
| 2021 |
2020 |
2021 |
2020 |
|||||||||||||
| Sales |
$ | 56,122 | $ | 50,005 | $ | 129,033 | $ | 96,177 | ||||||||
| Cost of sales and other direct production costs |
(36,430 | ) | (28,301 | ) | (73,405 | ) | (60,229 | ) | ||||||||
| Depreciation, depletion and amortization |
(20,910 | ) | (17,281 | ) | (46,451 | ) | (33,678 | ) | ||||||||
| Cost of sales and other direct production costs and depreciation, depletion and amortization |
(57,340 | ) | (45,582 | ) | (119,856 | ) | (93,907 | ) | ||||||||
| Gross (loss) profit |
$ | (1,218 | ) | $ | 4,423 | $ | 9,177 | $ | 2,270 | |||||||
| Tons of ore milled |
374,683 | 280,420 | 743,086 | 612,038 | ||||||||||||
| Production: |
||||||||||||||||
| Gold (ounces) |
31,333 | 30,756 | 67,523 | 57,508 | ||||||||||||
| Silver (ounces) |
7,917 | 5,495 | 18,592 | 11,429 | ||||||||||||
| Payable metal quantities sold: |
||||||||||||||||
| Gold (ounces) |
30,615 | 28,754 | 71,484 | 57,836 | ||||||||||||
| Silver (ounces) |
8,059 | 4,383 | 16,774 | 12,806 | ||||||||||||
| Ore grades: |
||||||||||||||||
| Gold ounces per ton |
0.10 | 0.13 | 0.11 | 0.12 | ||||||||||||
| Silver ounces per ton |
0.03 | 0.02 | 0.03 | 0.02 | ||||||||||||
| Total production cost per ton |
$ | 99.36 | $ | 99.17 | $ | 99.52 | $ | 100.07 | ||||||||
| Cash Cost, After By-product Credits, per Gold Ounce (1) |
$ | 1,199 | $ | 919 | $ | 1,106 | $ | 1,081 | ||||||||
| AISC, After By-product Credits, per Gold Ounce (1) |
$ | 1,434 | $ | 1,077 | $ | 1,347 | $ | 1,327 | ||||||||
| (1) |
A reconciliation of these non-GAAP measures to cost of sales and other direct production costs and depreciation, depletion and amortization, the most comparable GAAP measure, can be found below in Reconciliation of Cost of Sales and Other Direct Production Costs and Depreciation, Depletion and Amortization (GAAP) to Cash Cost, Before By-product Credits and Cash Cost, After By-product Credits (non-GAAP) and All-In Sustaining Cost, Before By-product Credits and All-In Sustaining Cost, After By-product Credits (non-GAAP). |
Gross profit decreased by $5.6 million and increased by $6.9 million for the second quarter and first half of 2021, respectively, compared to the same periods of 2020. The decrease for the second quarter was due to higher cost of sales resulting from increased production costs due to: (i) higher ore tonnage, (ii) mill contractor costs related to maintenance and optimization activities, and (iii) higher underground maintenance costs resulting from repairs and replacements of major components for the production fleet. The impact of higher costs of sales was partially offset by increased sales due to higher average realized gold prices and volume. The increase in gross profit for the six month period was due to higher sales, partially offset by higher cost of sales resulting primarily from the same factors impacting the second quarter results. Mill throughput increased by 34% and 21% in the second quarter and first half of 2021 compared to the same periods of 2020, with the lower production in the 2020 periods partially due to a government COVID-19-related order. We suspended operations at Casa Berardi from March 24, 2020 until April 15, 2020, in response to the Government of Quebec’s COVID-19 order for the mining industry.
Total capital additions increased by $7.9 million and $13.2 million in the second quarter and first six months of 2021, respectively, compared to the same periods of 2020 primarily due to growth capital costs incurred for development of the new 160 zone open pit mine. Limited ore production from the 160 zone pit is expected to begin in the fourth quarter of 2021.
The charts below illustrate the factors contributing to Cash Cost, After By-product Credits, Per Gold Ounce for the second quarter and first half of 2021 and 2020:
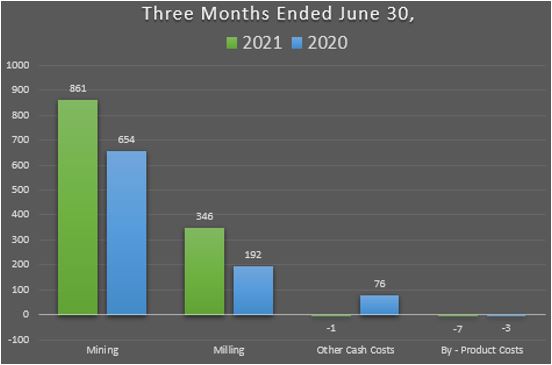
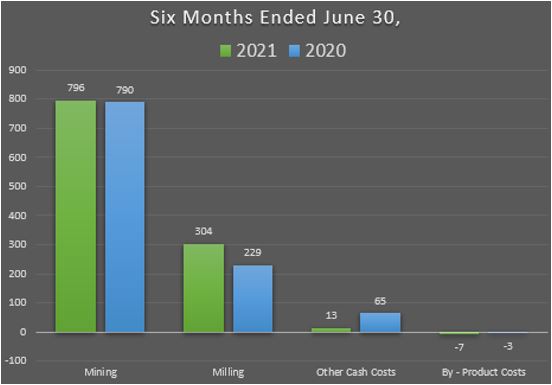
The following table summarizes the components of Cash Cost, After By-product Credits, per Gold Ounce:
| Three Months Ended June 30, |
Six Months Ended June 30, |
|||||||||||||||
| 2021 |
2020 |
2021 |
2020 |
|||||||||||||
| Cash Cost, Before By-product Credits, per Gold Ounce |
$ | 1,206 | $ | 922 | $ | 1,113 | $ | 1,084 | ||||||||
| By-product credits |
(7 | ) | (3 | ) | (7 | ) | (3 | ) | ||||||||
| Cash Cost, After By-product Credits, per Gold Ounce |
$ | 1,199 | $ | 919 | $ | 1,106 | $ | 1,081 | ||||||||
The following table summarizes the components of AISC, After By-product Credits, per Gold Ounce:
| Three Months Ended June 30, |
Six Months Ended June 30, |
|||||||||||||||
| 2021 |
2020 |
2021 |
2020 |
|||||||||||||
| AISC, Before By-product Credits, per Gold Ounce |
$ | 1,441 | $ | 1,080 | $ | 1,354 | $ | 1,330 | ||||||||
| By-product credits |
(7 | ) | (3 | ) | (7 | ) | (3 | ) | ||||||||
| AISC, After By-product Credits, per Gold Ounce |
$ | 1,434 | $ | 1,077 | $ | 1,347 | $ | 1,327 | ||||||||
The increase in Cash Cost and AISC, After By-product Credits, per Gold Ounce for the second quarter and first half of 2021 compared to the same periods in 2020 was primarily due to higher production costs, as discussed above, partially offset by higher gold production, with AISC, After By-product Credits, per Gold Ounce also impacted by higher sustaining capital and exploration spending.
The San Sebastian Segment
| Dollars are in thousands (except per ounce and per ton amounts) |
Three Months Ended June 30, |
Six Months Ended June 30, |
||||||||||||||
| 2021 |
2020 |
2021 |
2020 |
|||||||||||||
| Sales |
$ | 3 | $ | 4,934 | $ | 176 | $ | 14,860 | ||||||||
| Cost of sales and other direct production costs |
(1 | ) | (3,115 | ) | (95 | ) | (9,943 | ) | ||||||||
| Depreciation, depletion and amortization |
— | (895 | ) | — | (2,368 | ) | ||||||||||
| Cost of sales and other direct production costs and depreciation, depletion and amortization |
(1 | ) | (4,010 | ) | (95 | ) | (12,311 | ) | ||||||||
| Gross profit (loss) |
$ | 2 | $ | 924 | $ | 81 | $ | 2,549 | ||||||||
| Tons of ore milled |
— | 21,647 | — | 57,123 | ||||||||||||
| Production: |
||||||||||||||||
| Silver (ounces) |
— | 158,842 | — | 505,467 | ||||||||||||
| Gold (ounces) |
— | 1,331 | — | 4,133 | ||||||||||||
| Payable metal quantities sold: |
||||||||||||||||
| Silver (ounces) |
100 | 162,780 | 3,493 | 516,476 | ||||||||||||
| Gold (ounces) |
— | 1,220 | 47 | 4,044 | ||||||||||||
| Ore grades: |
||||||||||||||||
| Silver ounces per ton |
— | 7.96 | — | 9.63 | ||||||||||||
| Gold ounces per ton |
— | 0.07 | — | 0.09 | ||||||||||||
| Total production cost per ton |
$ | — | $ | 100.12 | $ | — | $ | 148.50 | ||||||||
| Cash Cost, After By-product Credits, per Silver Ounce (1) |
$ | — | $ | 1.14 | $ | — | $ | 5.09 | ||||||||
| AISC, After By-product Credits, per Silver Ounce (1) |
$ | — | $ | 1.85 | $ | — | $ | 5.65 | ||||||||
| (1) |
A reconciliation of these non-GAAP measures to cost of sales and other direct production costs and depreciation, depletion and amortization, the most comparable GAAP measure, can be found below in Reconciliation of Cost of Sales and Other Direct Production Costs and Depreciation, Depletion and Amortization (GAAP) to Cash Cost, Before By-product Credits and Cash Cost, After By-product Credits (non-GAAP) and All-In Sustaining Cost, Before By-product Credits and All-In Sustaining Cost, After By-product Credits (non-GAAP). |
The $0.9 million and $2.5 million decreases in gross profit for the second quarter and first half of 2021, respectively, compared to the same periods in 2020 are primarily due to lower metal volumes. Mining at San Sebastian was completed in the third quarter of 2020, and milling was completed in the fourth quarter of 2020, with exploration and evaluation activities ongoing.
Suspension-related costs at San Sebastian totaling $0.6 million and $1.4 million for the second quarter and first six months of 2021, respectively, are reported in a separate line item on our consolidated statements of operations and excluded from the calculations of cost of sales and other direct production costs and depreciation, depletion and amortization, total production costs and Cash Cost and AISC, After By-product Credits, per Silver Ounce.
The charts below illustrate the factors contributing to Cash Cost, After By-product Credits, Per Silver Ounce for the second quarter and first half of 2020:
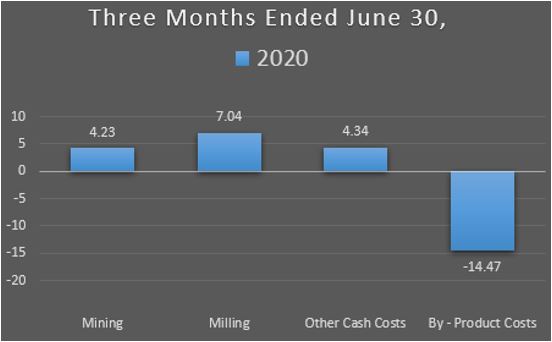
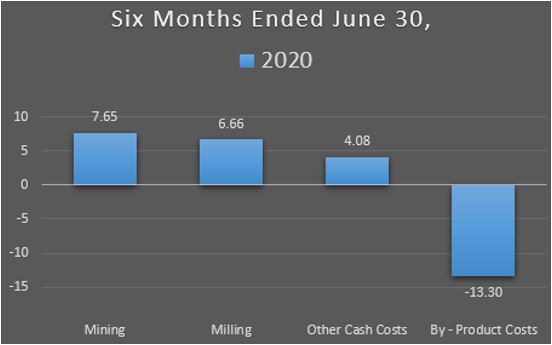
The following table summarizes the components of Cash Cost, After By-product Credits, per Silver Ounce:
| Three Months Ended June 30, |
Six Months Ended June 30, |
|||||||
| 2020 |
2020 |
|||||||
| Cash Cost, Before By-product Credits, per Silver Ounce |
$ | 15.61 | $ | 18.39 | ||||
| By-product credits |
(14.47 | ) | (13.30 | ) | ||||
| Cash Cost, After By-product Credits, per Silver Ounce |
$ | 1.14 | $ | 5.09 | ||||
The following table summarizes the components of AISC, After By-product Credits, per Silver Ounce:
| Three Months Ended June 30, |
Six Months Ended June 30, |
|||||||
| 2020 |
2020 |
|||||||
| AISC, Before By-product Credits, per Silver Ounce |
$ | 16.32 | $ | 18.95 | ||||
| By-product credits |
(14.47 | ) | (13.30 | ) | ||||
| AISC, After By-product Credits, per Silver Ounce |
$ | 1.85 | $ | 5.65 | ||||
The Nevada Operations Segment
| Dollars are in thousands (except per ounce and per ton amounts) |
Three Months Ended June 30, |
Six Months Ended June 30, |
||||||||||||||
| 2021 |
2020 |
2021 |
2020 |
|||||||||||||
| Sales |
$ | 8,450 | $ | 15,071 | $ | 18,687 | $ | 39,234 | ||||||||
| Cost of sales and other direct production costs |
(12,394 | ) | (7,192 | ) | (17,216 | ) | (15,041 | ) | ||||||||
| Depreciation, depletion and amortization |
(5,599 | ) | (6,365 | ) | (8,232 | ) | (15,430 | ) | ||||||||
| Cost of sales and other direct production costs and depreciation, depletion and amortization |
(17,993 | ) | (13,557 | ) | (25,448 | ) | (30,471 | ) | ||||||||
| Gross (loss) profit |
$ | (9,543 | ) | $ | 1,514 | $ | (6,761 | ) | $ | 8,763 | ||||||
| Tons of ore milled |
38,947 | 10,686 | 55,406 | 27,984 | ||||||||||||
| Production: |
||||||||||||||||
| Gold (ounces) |
14,947 | 14,791 | 17,495 | 31,756 | ||||||||||||
| Silver (ounces) |
45,125 | 15,988 | 45,125 | 37,443 | ||||||||||||
| Payable metal quantities sold: |
||||||||||||||||
| Gold (ounces) |
4,732 | 9,068 | 10,555 | 23,944 | ||||||||||||
| Silver (ounces) |
1,214 | 3,392 | 8,035 | 28,731 | ||||||||||||
| Ore grades: |
||||||||||||||||
| Gold ounces per ton |
0.410 | 1.519 | 0.343 | 1.232 | ||||||||||||
| Silver ounces per ton |
1.24 | 2.07 | 0.88 | 1.70 | ||||||||||||
| Production cost per ton |
$ | 161.50 | $ | 1,172.66 | $ | 220.68 | $ | 892.09 | ||||||||
| Cash Cost, After By-product Credits, per Gold Ounce (1) |
$ | 1,369 | $ | 694 | $ | 1,371 | $ | 716 | ||||||||
| AISC, After By-product Credits, per Gold Ounce (1) |
$ | 1,386 | $ | 769 | $ | 1,393 | $ | 787 | ||||||||
| (1) |
A reconciliation of these non-GAAP measures to cost of sales and other direct production costs and depreciation, depletion and amortization, the most comparable GAAP measure, can be found below in Reconciliation of Cost of Sales and Other Direct Production Costs and Depreciation, Depletion and Amortization (GAAP) to Cash Cost, Before By-product Credits and Cash Cost, After By-product Credits (non-GAAP) and All-In Sustaining Cost, Before By-product Credits and All-In Sustaining Cost, After By-product Credits (non-GAAP). |
The decreases in gross profit for the second quarter and first half of 2021 compared to the same periods of 2020 were primarily the result of lower sales volumes and increased write-downs of ore stockpile to net realizable value. Processing of the stockpiled non-refractory ore at the Midas mill and third-party processing of a bulk sample of refractory ore in a roaster commenced at the end of the first quarter of 2021 and was completed in the second quarter. We also expect to process an additional approximately 10,000 tons of Fire Creek refractory ore at the third-party facility in the second half of 2021. The write-downs of ore stockpile inventory totaled approximately $9.4 million and $9.6 million in the second quarter and first half of 2021, respectively, compared to $1.5 million in such write-downs in the first half of 2020, with no portion of that amount recognized in the second quarter of 2020. During the second half of 2020, all ore mined at the Nevada Operations was stockpiled, with no ore milled and no production reported during that period. Mining of non-refractory ore at Fire Creek in areas where development has already been performed was completed in the fourth quarter of 2020. Fire Creek was placed on care-and-maintenance in the second quarter of 2021 after processing of the remaining non-refractory ore stockpile.
Production was suspended at the Hollister mine in the third quarter of 2019 and at the Midas mine and Aurora mill in late 2019. Suspension-related costs at the Nevada Operations unit totaling $5.2 million and $8.8 million for the second quarter and first six months of 2021, respectively, and $2.7 million and $6.7 million in the second quarter and first six months of 2020, respectively, are reported in a separate line item on our consolidated statements of operations and excluded from the calculations of cost of sales and other direct production costs and depreciation, depletion and amortization, total production costs per ton and Cash Cost and AISC, After By-product Credits, per Gold Ounce.
Total production costs per ton were lower by 86% and 75%, respectively, for the second quarter and first six months of 2021, respectively, due to higher mill throughput and lower mining and milling costs, as mine production was lower and mill throughput for the 2021 periods was from stockpiled material, including refractory ore processed at a third-party facility.
The charts below illustrate the factors contributing to Cash Cost, After By-product Credits, Per Gold Ounce for the second quarter and first half of 2021 compared to the same periods of 2020:
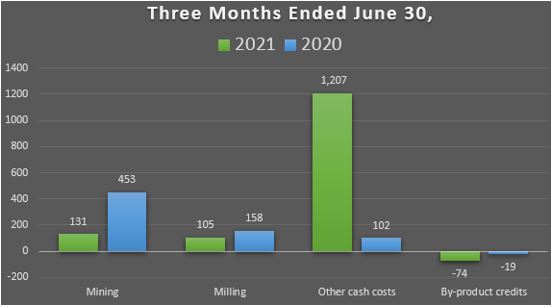
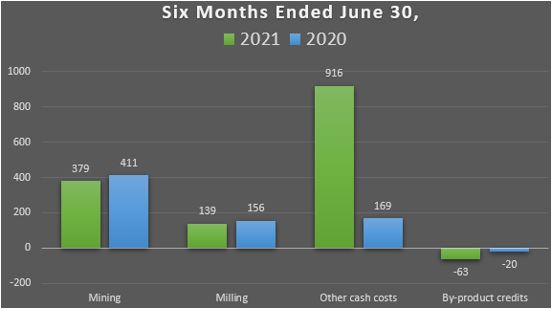
The following table summarizes the components of Cash Cost, After By-product Credits, per Gold Ounce:
| Three Months Ended June 30, |
Six Months Ended June 30, |
|||||||||||||||
| 2021 |
2020 |
2021 |
2020 |
|||||||||||||
| Cash Cost, Before By-product Credits, per Gold Ounce |
$ | 1,443 | 713 | $ | 1,434 | 736 | ||||||||||
| By-product credits |
(74 | ) | (19 | ) | (63 | ) | (20 | ) | ||||||||
| Cash Cost, After By-product Credits, per Gold Ounce |
$ | 1,369 | $ | 694 | $ | 1,371 | $ | 716 | ||||||||
The following table summarizes the components of AISC, After By-product Credits, per Gold Ounce:
| Three Months Ended June 30, |
Six Months Ended June 30, |
|||||||||||||||
| 2021 |
2020 |
2021 |
2020 |
|||||||||||||
| AISC, Before By-product Credits, per Gold Ounce |
$ | 1,460 | $ | 788 | $ | 1,456 | $ | 807 | ||||||||
| By-product credits |
(74 | ) | (19 | ) | (63 | ) | (20 | ) | ||||||||
| AISC, After By-product Credits, per Gold Ounce |
$ | 1,386 | $ | 769 | $ | 1,393 | $ | 787 | ||||||||
The increases in Cash Costs and AISC, After By-product Credits, per Gold ounce in the second quarter and first half of 2021 compared to the same periods of 2020 were due to higher other costs for the second quarter and first six months of 2021 compared to the same periods of 2020, which included the cost of previously-stockpiled ore processed in 2021.
See Item 1A. Risk Factors - Operation, Development, Exploration and Acquisition Risks in our 2020 Form 10-K for a discussion of certain risks relating to our recent and ongoing analysis of the carrying value of the Nevada assets.
Corporate Matters
Employee Benefit Plans
Our defined benefit pension plans provide a significant benefit to our employees, but represent a significant liability to us. The liability recorded for the underfunded status of our plans was $31.0 million and $44.9 million as of June 30, 2021 and December 31, 2020, respectively. In January 2021, we contributed $16.8 million in shares of our common stock to our supplemental executive retirement plan (“SERP”), and expect to contribute approximately $0.8 million in cash to the SERP in 2021. We do not expect to be required to contribute to our defined benefit pension plans in 2021, but may choose to do so. While the economic variables which will determine future funding requirements are uncertain, we expect contributions to continue to be required in future years under current plan provisions, and we periodically examine the plans for affordability and competitiveness. See Note 9 of Notes to Consolidated Financial Statements in our 2020 Form 10-K for more information.
Income Taxes
During the second quarter and first six months of 2021, income and mining tax benefits of approximately $4.8 million and $0.2 million, respectively, resulted effective tax rates of (1.1)% and 119.3%, respectively, for those periods. This compares to an income and mining tax provision of $0.6 and a benefit of $0.4 million, or effective tax rates of (4.7)% and 1.4%, for the second quarter and first six months of 2020, respectively. The comparability of our income and mining tax (provision) benefit and effective tax rate for the reported periods was impacted by multiple factors, primarily: (i) mining taxes; (ii) variations in our income before income taxes; (iii) geographic distribution of that income; (iv) foreign exchange rates; (v) percentage depletion; (vi) the non-recognition of tax assets; and (vii) the reclassification of the Alaska mine license tax effective January 1, 2021, which increased our income and mining tax provision by $6.5 million. Therefore, the effective tax rate will fluctuate, sometimes significantly, period to period.
Each reporting period we assess our deferred tax balances based on a review of long-range forecasts and quarterly activity. A valuation allowance is provided for deferred tax assets for which it is more likely than not that the related tax benefits will not be realized. We analyze our deferred tax assets and, if it is determined that we will not realize all or a portion of our deferred tax assets, we will record or increase a valuation allowance. Conversely, if it is determined we will ultimately more likely than not be able to realize all or a portion of the related benefits for which a valuation allowance has been provided, all or a portion of the related valuation allowance will be reduced. There are a number of factors that impact our ability to realize our deferred tax assets. For additional information, please see Note 3 of Notes to Condensed Consolidated Financial Statements (Unaudited) and Item 1A - Risk Factors in our 2020 10-K.
Reconciliation of Cost of Sales and Other Direct Production Costs and Depreciation, Depletion and Amortization (GAAP) to Cash Cost, Before By-product Credits and Cash Cost, After By-product Credits (non-GAAP) and All-In Sustaining Cost, Before By-product Credits and All-In Sustaining Cost, After By-product Credits (non-GAAP)
The tables below present reconciliations between the most comparable GAAP measure of cost of sales and other direct production costs and depreciation, depletion and amortization to the non-GAAP measures of (i) Cash Cost, Before By-product Credits, (ii) Cash Cost, After By-product Credits, (iii) AISC, Before By-product Credits and (iv) AISC, After By-product Credits for our operations at the Greens Creek, Lucky Friday, San Sebastian, Casa Berardi and Nevada Operations units and for the Company for the three- and six-month periods ended June 30, 2021 and 2020.
Cash Cost, After By-product Credits, per Ounce and AISC, After By-product Credits, per Ounce are measures developed by precious metals companies (including the Silver Institute and the World Gold Council) in an effort to provide a uniform standard for comparison purposes. There can be no assurance, however, that these non-GAAP measures as we report them are the same as those reported by other mining companies.
Cash Cost, After By-product Credits, per Ounce is an important operating statistic that we utilize to measure each mine's operating performance. We use AISC, After By-product Credits, per Ounce as a measure of our mines' net cash flow after costs for exploration, pre-development, reclamation, and sustaining capital. This is similar to the Cash Cost, After By-product Credits, per Ounce non-GAAP measure we report, but also includes on-site exploration, reclamation, and sustaining capital costs. Current GAAP measures used in the mining industry, such as cost of goods sold, do not capture all the expenditures incurred to discover, develop and sustain silver and gold production. Cash Cost, After By-product Credits, per Ounce and AISC, After By-product Credits, per Ounce also allow us to benchmark the performance of each of our mines versus those of our competitors. As a silver and gold mining company, we also use these statistics on an aggregate basis - aggregating the Greens Creek, Lucky Friday and San Sebastian mines - to compare our performance with that of other silver mining companies, and aggregating Casa Berardi and Nevada Operations for comparison with other gold mining companies. Similarly, these statistics are useful in identifying acquisition and investment opportunities as they provide a common tool for measuring the financial performance of other mines with varying geologic, metallurgical and operating characteristics.
Cash Cost, Before By-product Credits and AISC, Before By-product Credits include all direct and indirect operating cash costs related directly to the physical activities of producing metals, including mining, processing and other plant costs, third-party refining expense, on-site general and administrative costs, royalties and mining production taxes. AISC, Before By-product Credits for each mine also includes on-site exploration, reclamation, and sustaining capital costs. AISC, Before By-product Credits for our consolidated silver properties also includes corporate costs for general and administrative expense and sustaining exploration and capital costs. By-product credits include revenues earned from all metals other than the primary metal produced at each unit. As depicted in the tables below, by-product credits comprise an essential element of our silver unit cost structure, distinguishing our silver operations due to the polymetallic nature of their orebodies.
In addition to the uses described above, Cash Cost, After By-product Credits, per Ounce and AISC, After By-product Credits, per Ounce provide management and investors an indication of operating cash flow, after consideration of the average price received from production. We also use these measurements for the comparative monitoring of performance of our mining operations period-to-period from a cash flow perspective.
The Casa Berardi, Nevada Operations and combined gold properties information below reports Cash Cost, After By-product Credits, per Gold Ounce and AISC, After By-product Credits, per Gold Ounce for the production of gold, their primary product, and by-product revenues earned from silver, which is a by-product at Casa Berardi and Nevada Operations. Only costs and ounces produced relating to units with the same primary product are combined to represent Cash Cost, After By-product Credits, per Ounce and AISC, After By-product Credits, per Ounce. Thus, the gold produced at our Casa Berardi and Nevada Operations units is not included as a by-product credit when calculating Cash Cost, After By-product Credits, per Silver Ounce and AISC, After By-product Credits, per Silver Ounce for the total of Greens Creek, Lucky Friday and San Sebastian, our combined silver properties. Similarly, the silver produced at our other three units is not included as a by-product credit when calculating the gold metrics for Casa Berardi and Nevada Operations.
| In thousands (except per ounce amounts) |
Three Months Ended June 30, 2021 |
|||||||||||||||||||
| Greens Creek |
Lucky Friday(2) |
San Sebastian(3) |
Corporate(4) |
Total Silver |
||||||||||||||||
| Cost of sales and other direct production costs and depreciation, depletion and amortization |
$ | 55,488 | 27,901 | $ | 1 | $ | 83,390 | |||||||||||||
| Depreciation, depletion and amortization |
(14,492 | ) | (7,402 | ) | — | (21,894 | ) | |||||||||||||
| Treatment costs |
8,924 | 4,686 | — | 13,610 | ||||||||||||||||
| Change in product inventory |
(435 | ) | (1,596 | ) | — | (2,031 | ) | |||||||||||||
| Reclamation and other costs |
(672 | ) | (325 | ) | (1 | ) | (998 | ) | ||||||||||||
| Cash Cost, Before By-product Credits (1) |
48,813 | 23,264 | — | 72,077 | ||||||||||||||||
| Reclamation and other costs |
847 | 264 | — | 1,111 | ||||||||||||||||
| Sustaining exploration |
1,300 | — | — | 450 | 1,750 | |||||||||||||||
| Sustaining capital |
6,339 | 5,244 | — | — | 11,583 | |||||||||||||||
| General and administrative |
11,104 | 11,104 | ||||||||||||||||||
| AISC, Before By-product Credits (1) |
57,299 | 28,772 | — | 97,625 | ||||||||||||||||
| By-product credits: |
||||||||||||||||||||
| Zinc |
(26,510 | ) | (5,093 | ) | — | (31,603 | ) | |||||||||||||
| Gold |
(20,438 | ) | — | — | (20,438 | ) | ||||||||||||||
| Lead |
(8,605 | ) | (10,799 | ) | $ | — | (19,404 | ) | ||||||||||||
| Total By-product credits |
(55,553 | ) | (15,892 | ) | — | (71,445 | ) | |||||||||||||
| Cash Cost, After By-product Credits |
$ | (6,740 | ) | $ | 7,372 | $ | — | $ | 632 | |||||||||||
| AISC, After By-product Credits |
$ | 1,746 | $ | 12,880 | $ | — | $ | 26,180 | ||||||||||||
| Divided by ounces produced |
2,558 | 913 | — | 3,471 | ||||||||||||||||
| Cash Cost, Before By-product Credits, per Ounce |
$ | 19.08 | $ | 25.49 | $ | — | $ | 20.76 | ||||||||||||
| By-product credits per ounce |
(21.72 | ) | (17.42 | ) | — | (20.58 | ) | |||||||||||||
| Cash Cost, After By-product Credits, per Ounce |
$ | (2.64 | ) | $ | 8.07 | $ | — | $ | 0.18 | |||||||||||
| AISC, Before By-product Credits, per Ounce |
$ | 22.40 | $ | 31.52 | $ | — | $ | 28.12 | ||||||||||||
| By-product credits per ounce |
(21.72 | ) | (17.42 | ) | — | (20.58 | ) | |||||||||||||
| AISC, After By-product Credits, per Ounce |
$ | 0.68 | $ | 14.10 | $ | — | $ | 7.54 | ||||||||||||
| In thousands (except per ounce amounts) |
Three months ended June 30, 2021 |
|||||||||||
| Casa Berardi (5) |
Nevada Operations (6) |
Total Gold |
||||||||||
| Cost of sales and other direct production costs and depreciation, depletion and amortization |
$ | 57,340 | $ | 17,993 | $ | 75,333 | ||||||
| Depreciation, depletion and amortization |
(20,910 | ) | (5,599 | ) | (26,509 | ) | ||||||
| Treatment costs |
535 | 1,719 | 2,254 | |||||||||
| Change in product inventory |
1,015 | 12,583 | 13,598 | |||||||||
| Reclamation and other costs |
(215 | ) | (218 | ) | (433 | ) | ||||||
| Exclusion of Nevada Operations costs |
— | (4,914 | ) | (4,914 | ) | |||||||
| Cash Cost, Before By-product Credits (1) |
37,765 | 21,564 | 59,329 | |||||||||
| Reclamation and other costs |
215 | 218 | 433 | |||||||||
| Sustaining exploration |
1,103 | — | 1,103 | |||||||||
| Sustaining capital |
6,064 | 44 | 6,108 | |||||||||
| AISC, Before By-product Credits (1) |
45,147 | 21,826 | 66,973 | |||||||||
| By-product credits: |
||||||||||||
| Silver |
(209 | ) | (1,103 | ) | (1,312 | ) | ||||||
| Total By-product credits |
(209 | ) | (1,103 | ) | (1,312 | ) | ||||||
| Cash Cost, After By-product Credits |
$ | 37,556 | $ | 20,461 | $ | 58,017 | ||||||
| AISC, After By-product Credits |
$ | 44,938 | $ | 20,723 | $ | 65,661 | ||||||
| Divided by ounces produced |
31 | 15 | 46 | |||||||||
| Cash Cost, Before By-product Credits, per Ounce |
$ | 1,206 | $ | 1,443 | $ | 1,282 | ||||||
| By-product credits per ounce |
(7 | ) | (74 | ) | (28 | ) | ||||||
| Cash Cost, After By-product Credits, per Ounce |
$ | 1,199 | $ | 1,369 | $ | 1,254 | ||||||
| AISC, Before By-product Credits, per Ounce |
$ | 1,441 | $ | 1,460 | $ | 1,447 | ||||||
| By-product credits per ounce |
(7 | ) | (74 | ) | (28 | ) | ||||||
| AISC, After By-product Credits, per Ounce |
$ | 1,434 | $ | 1,386 | $ | 1,419 | ||||||
| In thousands (except per ounce amounts) |
Three months ended June 30, 2021 |
|||||||||||
| Total Silver |
Total Gold |
Total |
||||||||||
| Cost of sales and other direct production costs and depreciation, depletion and amortization |
$ | 83,390 | $ | 75,333 | $ | 158,723 | ||||||
| Depreciation, depletion and amortization |
(21,894 | ) | (26,509 | ) | (48,403 | ) | ||||||
| Treatment costs |
13,610 | 2,254 | 15,864 | |||||||||
| Change in product inventory |
(2,031 | ) | 13,598 | 11,567 | ||||||||
| Reclamation and other costs |
(998 | ) | (433 | ) | (1,431 | ) | ||||||
| Exclusion of Nevada Operations costs |
— | (4,914 | ) | (4,914 | ) | |||||||
| Cash Cost, Before By-product Credits (1) |
72,077 | 59,329 | 131,406 | |||||||||
| Reclamation and other costs |
1,111 | 433 | 1,544 | |||||||||
| Sustaining exploration |
1,750 | 1,103 | 2,853 | |||||||||
| Sustaining capital |
11,583 | 6,108 | 17,691 | |||||||||
| General and administrative |
11,104 | — | 11,104 | |||||||||
| AISC, Before By-product Credits (1) |
97,625 | 66,973 | 164,598 | |||||||||
| By-product credits: |
||||||||||||
| Zinc |
(31,603 | ) | — | (31,603 | ) | |||||||
| Gold |
(20,438 | ) | — | (20,438 | ) | |||||||
| Lead |
(19,404 | ) | — | (19,404 | ) | |||||||
| Silver |
— | (1,312 | ) | (1,312 | ) | |||||||
| Total By-product credits |
(71,445 | ) | (1,312 | ) | (72,757 | ) | ||||||
| Cash Cost, After By-product Credits |
$ | 632 | $ | 58,017 | $ | 58,649 | ||||||
| AISC, After By-product Credits |
$ | 26,180 | $ | 65,661 | $ | 91,841 | ||||||
| Divided by ounces produced |
3,471 | 46 | ||||||||||
| Cash Cost, Before By-product Credits, per Ounce |
$ | 20.76 | $ | 1,282 | ||||||||
| By-product credits per ounce |
(20.58 | ) | (28 | ) | ||||||||
| Cash Cost, After By-product Credits, per Ounce |
$ | 0.18 | $ | 1,254 | ||||||||
| AISC, Before By-product Credits, per Ounce |
$ | 28.12 | $ | 1,447 | ||||||||
| By-product credits per ounce |
(20.58 | ) | (28 | ) | ||||||||
| AISC, After By-product Credits, per Ounce |
$ | 7.54 | $ | 1,419 | ||||||||
| In thousands (except per ounce amounts) |
Three Months Ended June 30, 2020 |
|||||||||||||||||||
| Greens Creek |
Lucky Friday(2) |
San Sebastian |
Corporate(4) |
Total Silver |
||||||||||||||||
| Cost of sales and other direct production costs and depreciation, depletion and amortization |
$ | 57,672 | $ | 11,455 | $ | 4,010 | $ | 73,137 | ||||||||||||
| Depreciation, depletion and amortization |
(12,988 | ) | (1,894 | ) | (895 | ) | (15,777 | ) | ||||||||||||
| Treatment costs |
20,016 | 3,032 | 47 | 23,095 | ||||||||||||||||
| Change in product inventory |
(4,020 | ) | (118 | ) | (398 | ) | (4,536 | ) | ||||||||||||
| Reclamation and other costs |
93 | — | (296 | ) | (203 | ) | ||||||||||||||
| Exclusion of Lucky Friday cash costs |
— | (12,475 | ) | — | (12,475 | ) | ||||||||||||||
| Cash Cost, Before By-product Credits (1) |
60,773 | — | 2,468 | 63,241 | ||||||||||||||||
| Reclamation and other costs |
789 | — | 114 | 903 | ||||||||||||||||
| Sustaining exploration |
— | — | — | 314 | 314 | |||||||||||||||
| Sustaining capital |
4,501 | — | (1 | ) | — | 4,500 | ||||||||||||||
| General and administrative |
6,979 | 6,979 | ||||||||||||||||||
| AISC, Before By-product Credits (1) |
66,063 | — | 2,581 | 75,937 | ||||||||||||||||
| By-product credits: |
||||||||||||||||||||
| Zinc |
(19,913 | ) | — | — | (19,913 | ) | ||||||||||||||
| Gold |
(19,427 | ) | — | (2,287 | ) | (21,714 | ) | |||||||||||||
| Lead |
(7,133 | ) | — | — | (7,133 | ) | ||||||||||||||
| Total By-product credits |
(46,473 | ) | — | (2,287 | ) | (48,760 | ) | |||||||||||||
| Cash Cost, After By-product Credits |
$ | 14,300 | $ | — | $ | 181 | $ | 14,481 | ||||||||||||
| AISC, After By-product Credits |
$ | 19,590 | $ | — | $ | 294 | $ | 27,177 | ||||||||||||
| Divided by ounces produced |
2,754 | — | 158 | 2,912 | ||||||||||||||||
| Cash Cost, Before By-product Credits, per Ounce |
$ | 22.06 | $ | — | $ | 15.61 | $ | 21.71 | ||||||||||||
| By-product credits per ounce |
(16.87 | ) | — | (14.47 | ) | (16.74 | ) | |||||||||||||
| Cash Cost, After By-product Credits, per Ounce |
$ | 5.19 | $ | — | $ | 1.14 | $ | 4.97 | ||||||||||||
| AISC, Before By-product Credits, per Ounce |
$ | 23.98 | $ | — | $ | 16.32 | $ | 26.07 | ||||||||||||
| By-product credits per ounce |
(16.87 | ) | — | (14.47 | ) | (16.74 | ) | |||||||||||||
| AISC, After By-product Credits, per Ounce |
$ | 7.11 | $ | — | $ | 1.85 | $ | 9.33 | ||||||||||||
| In thousands (except per ounce amounts) |
Three Months Ended June 30, 2020 |
|||||||||||
| Casa Berardi |
Nevada Operations |
Total Gold |
||||||||||
| Cost of sales and other direct production costs and depreciation, depletion and amortization |
$ | 45,582 | $ | 13,557 | $ | 59,139 | ||||||
| Depreciation, depletion and amortization |
(17,281 | ) | (6,365 | ) | (23,646 | ) | ||||||
| Treatment costs |
558 | 19 | 577 | |||||||||
| Change in product inventory |
(400 | ) | 3,669 | 3,269 | ||||||||
| Reclamation and other costs |
(92 | ) | (328 | ) | (420 | ) | ||||||
| Cash Cost, Before By-product Credits (1) |
28,367 | 10,552 | 38,919 | |||||||||
| Reclamation and other costs |
94 | 327 | 421 | |||||||||
| Sustaining exploration |
467 | — | 467 | |||||||||
| Sustaining capital |
4,278 | 774 | 5,052 | |||||||||
| AISC, Before By-product Credits (1) |
33,206 | 11,653 | 44,859 | |||||||||
| By-product credits: |
||||||||||||
| Silver |
(92 | ) | (282 | ) | (374 | ) | ||||||
| Total By-product credits |
(92 | ) | (282 | ) | (374 | ) | ||||||
| Cash Cost, After By-product Credits |
$ | 28,275 | $ | 10,270 | $ | 38,545 | ||||||
| AISC, After By-product Credits |
$ | 33,114 | $ | 11,371 | $ | 44,485 | ||||||
| Divided by ounces produced |
31 | 15 | 46 | |||||||||
| Cash Cost, Before By-product Credits, per Ounce |
$ | 922 | $ | 713 | $ | 854 | ||||||
| By-product credits per ounce |
(3 | ) | (19 | ) | (8 | ) | ||||||
| Cash Cost, After By-product Credits, per Ounce |
$ | 919 | $ | 694 | $ | 846 | ||||||
| AISC, Before By-product Credits, per Ounce |
$ | 1,080 | $ | 788 | $ | 985 | ||||||
| By-product credits per ounce |
(3 | ) | (19 | ) | (8 | ) | ||||||
| AISC, After By-product Credits, per Ounce |
$ | 1,077 | $ | 769 | $ | 977 | ||||||
| In thousands (except per ounce amounts) |
Three Months Ended June 30, 2020 |
|||||||||||
| Total Silver |
Total Gold |
Total |
||||||||||
| Cost of sales and other direct production costs and depreciation, depletion and amortization |
$ | 73,137 | $ | 59,139 | $ | 132,276 | ||||||
| Depreciation, depletion and amortization |
(15,777 | ) | (23,646 | ) | (39,423 | ) | ||||||
| Treatment costs |
23,095 | 577 | 23,672 | |||||||||
| Change in product inventory |
(4,536 | ) | 3,269 | (1,267 | ) | |||||||
| Reclamation and other costs |
(203 | ) | (420 | ) | (623 | ) | ||||||
| Exclusion of Lucky Friday cash costs |
(12,475 | ) | — | (12,475 | ) | |||||||
| Cash Cost, Before By-product Credits (1) |
63,241 | 38,919 | 102,160 | |||||||||
| Reclamation and other costs |
903 | 421 | 1,324 | |||||||||
| Sustaining exploration |
314 | 467 | 781 | |||||||||
| Sustaining capital |
4,500 | 5,052 | 9,552 | |||||||||
| General and administrative |
6,979 | — | 6,979 | |||||||||
| AISC, Before By-product Credits (1) |
75,937 | 44,859 | 120,796 | |||||||||
| By-product credits: |
||||||||||||
| Zinc |
(19,913 | ) | — | (19,913 | ) | |||||||
| Gold |
(21,714 | ) | — | (21,714 | ) | |||||||
| Lead |
(7,133 | ) | — | (7,133 | ) | |||||||
| Silver |
(374 | ) | (374 | ) | ||||||||
| Total By-product credits |
(48,760 | ) | (374 | ) | (49,134 | ) | ||||||
| Cash Cost, After By-product Credits |
$ | 14,481 | $ | 38,545 | $ | 53,026 | ||||||
| AISC, After By-product Credits |
$ | 27,177 | $ | 44,485 | $ | 71,662 | ||||||
| Divided by ounces produced |
2,912 | 46 | ||||||||||
| Cash Cost, Before By-product Credits, per Ounce |
$ | 21.71 | $ | 854 | ||||||||
| By-product credits per ounce |
(16.74 | ) | (8 | ) | ||||||||
| Cash Cost, After By-product Credits, per Ounce |
$ | 4.97 | $ | 846 | ||||||||
| AISC, Before By-product Credits, per Ounce |
$ | 26.07 | $ | 985 | ||||||||
| By-product credits per ounce |
(16.74 | ) | (8 | ) | ||||||||
| AISC, After By-product Credits, per Ounce |
$ | 9.33 | $ | 977 | ||||||||
| In thousands (except per ounce amounts) |
Six Months Ended June 30, 2021 |
|||||||||||||||||||
| Greens Creek |
Lucky Friday(2) |
San Sebastian (3) |
Corporate(4) |
Total Silver |
||||||||||||||||
| Cost of sales and other direct production costs and depreciation, depletion and amortization |
$ | 108,668 | $ | 50,696 | $ | 95 | $ | 159,459 | ||||||||||||
| Depreciation, depletion and amortization |
(29,313 | ) | (13,738 | ) | — | (43,051 | ) | |||||||||||||
| Treatment costs |
19,465 | 9,664 | — | 29,129 | ||||||||||||||||
| Change in product inventory |
(34 | ) | (1,689 | ) | — | (1,723 | ) | |||||||||||||
| Reclamation and other costs |
(932 | ) | (559 | ) | (95 | ) | (1,586 | ) | ||||||||||||
| Cash Cost, Before By-product Credits (1) |
97,854 | 44,374 | — | 142,228 | ||||||||||||||||
| Reclamation and other costs |
1,695 | 528 | 2,223 | |||||||||||||||||
| Sustaining exploration |
1,423 | — | — | 885 | 2,308 | |||||||||||||||
| Sustaining capital |
11,231 | 10,698 | — | 21,929 | ||||||||||||||||
| General and administrative |
19,111 | 19,111 | ||||||||||||||||||
| AISC, Before By-product Credits (1) |
112,203 | 55,600 | — | 187,799 | ||||||||||||||||
| By-product credits: |
||||||||||||||||||||
| Zinc |
(49,277 | ) | (9,846 | ) | — | (59,123 | ) | |||||||||||||
| Gold |
(41,434 | ) | — | — | (41,434 | ) | ||||||||||||||
| Lead |
(15,625 | ) | (20,574 | ) | — | (36,199 | ) | |||||||||||||
| Total By-product credits |
(106,336 | ) | (30,420 | ) | — | (136,756 | ) | |||||||||||||
| Cash Cost, After By-product Credits |
$ | (8,482 | ) | $ | 13,954 | $ | — | $ | 5,472 | |||||||||||
| AISC, After By-product Credits |
$ | 5,867 | $ | 25,180 | $ | — | $ | 51,043 | ||||||||||||
| Divided by ounces produced |
5,143 | 1,777 | 6,920 | |||||||||||||||||
| Cash Cost, Before By-product Credits, per Ounce |
$ | 19.03 | $ | 24.97 | $ | — | $ | 20.55 | ||||||||||||
| By-product credits per ounce |
(20.68 | ) | (17.12 | ) | — | (19.76 | ) | |||||||||||||
| Cash Cost, After By-product Credits, per Ounce |
$ | (1.65 | ) | $ | 7.85 | $ | — | $ | 0.79 | |||||||||||
| AISC, Before By-product Credits, per Ounce |
$ | 21.82 | $ | 31.29 | $ | — | $ | 27.14 | ||||||||||||
| By-product credits per ounce |
(20.68 | ) | (17.12 | ) | — | (19.76 | ) | |||||||||||||
| AISC, After By-product Credits, per Ounce |
$ | 1.14 | $ | 14.17 | $ | — | $ | 7.38 | ||||||||||||
| In thousands (except per ounce amounts) |
Six Months Ended June 30, 2021 |
|||||||||||
| Casa Berardi (5) |
Nevada Operations (6) |
Total Gold |
||||||||||
| Cost of sales and other direct production costs and depreciation, depletion and amortization |
$ | 119,856 | $ | 25,448 | $ | 145,304 | ||||||
| Depreciation, depletion and amortization |
(46,451 | ) | (8,232 | ) | (54,683 | ) | ||||||
| Treatment costs |
1,249 | 1,730 | 2,979 | |||||||||
| Change in product inventory |
968 | 11,499 | 12,467 | |||||||||
| Reclamation and other costs |
(423 | ) | (245 | ) | (668 | ) | ||||||
| Exclusion of Nevada Operations costs |
— | (5,103 | ) | (5,103 | ) | |||||||
| Cash Cost, Before By-product Credits (1) |
75,199 | 25,097 | 100,296 | |||||||||
| Reclamation and other costs |
423 | 245 | 668 | |||||||||
| Sustaining exploration |
2,010 | — | 2,010 | |||||||||
| Sustaining capital |
13,822 | 133 | 13,955 | |||||||||
| AISC, Before By-product Credits (1) |
91,454 | 25,475 | 116,929 | |||||||||
| By-product credits: |
||||||||||||
| Silver |
(487 | ) | (1,103 | ) | (1,590 | ) | ||||||
| Total By-product credits |
(487 | ) | (1,103 | ) | (1,590 | ) | ||||||
| Cash Cost, After By-product Credits |
$ | 74,712 | $ | 23,994 | $ | 98,706 | ||||||
| AISC, After By-product Credits |
$ | 90,967 | $ | 24,372 | $ | 115,339 | ||||||
| Divided by ounces produced |
68 | 17 | 85 | |||||||||
| Cash Cost, Before By-product Credits, per Ounce |
$ | 1,113 | $ | 1,434 | $ | 1,180 | ||||||
| By-product credits per ounce |
(7 | ) | (63 | ) | (19 | ) | ||||||
| Cash Cost, After By-product Credits, per Ounce |
$ | 1,106 | $ | 1,371 | $ | 1,161 | ||||||
| AISC, Before By-product Credits, per Ounce |
$ | 1,354 | $ | 1,456 | $ | 1,376 | ||||||
| By-product credits per ounce |
(7 | ) | (63 | ) | (19 | ) | ||||||
| AISC, After By-product Credits, per Ounce |
$ | 1,347 | $ | 1,393 | $ | 1,357 | ||||||
| In thousands (except per ounce amounts) |
Six Months Ended June 30, 2021 |
|||||||||||
| Total Silver |
Total Gold |
Total |
||||||||||
| Cost of sales and other direct production costs and depreciation, depletion and amortization |
$ | 159,459 | $ | 145,304 | $ | 304,763 | ||||||
| Depreciation, depletion and amortization |
(43,051 | ) | (54,683 | ) | (97,734 | ) | ||||||
| Treatment costs |
29,129 | 2,979 | 32,108 | |||||||||
| Change in product inventory |
(1,723 | ) | 12,467 | 10,744 | ||||||||
| Reclamation and other costs |
(1,586 | ) | (668 | ) | (2,254 | ) | ||||||
| Exclusion of Nevada Operations costs |
— | (5,103 | ) | (5,103 | ) | |||||||
| Cash Cost, Before By-product Credits (1) |
142,228 | 100,296 | 242,524 | |||||||||
| Reclamation and other costs |
2,223 | 668 | 2,891 | |||||||||
| Sustaining exploration |
2,308 | 2,010 | 4,318 | |||||||||
| Sustaining capital |
21,929 | 13,955 | 35,884 | |||||||||
| General and administrative |
19,111 | — | 19,111 | |||||||||
| AISC, Before By-product Credits (1) |
187,799 | 116,929 | 304,728 | |||||||||
| By-product credits: |
||||||||||||
| Zinc |
(59,123 | ) | — | (59,123 | ) | |||||||
| Gold |
(41,434 | ) | — | (41,434 | ) | |||||||
| Lead |
(36,199 | ) | — | (36,199 | ) | |||||||
| Silver |
(1,590 | ) | (1,590 | ) | ||||||||
| Total By-product credits |
(136,756 | ) | (1,590 | ) | (138,346 | ) | ||||||
| Cash Cost, After By-product Credits |
$ | 5,472 | $ | 98,706 | $ | 104,178 | ||||||
| AISC, After By-product Credits |
$ | 51,043 | $ | 115,339 | $ | 166,382 | ||||||
| Divided by ounces produced |
6,920 | 85 | ||||||||||
| Cash Cost, Before By-product Credits, per Ounce |
$ | 20.55 | $ | 1,180 | ||||||||
| By-product credits per ounce |
(19.76 | ) | (19 | ) | ||||||||
| Cash Cost, After By-product Credits, per Ounce |
$ | 0.79 | $ | 1,161 | ||||||||
| AISC, Before By-product Credits, per Ounce |
$ | 27.14 | $ | 1,376 | ||||||||
| By-product credits per ounce |
(19.76 | ) | (19 | ) | ||||||||
| AISC, After By-product Credits, per Ounce |
$ | 7.38 | $ | 1,357 | ||||||||
| In thousands (except per ounce amounts) |
Six Months Ended June 30, 2020 |
|||||||||||||||||||
| Greens Creek |
Lucky Friday(2) |
San Sebastian |
Corporate(4) |
Total Silver |
||||||||||||||||
| Cost of sales and other direct production costs and depreciation, depletion and amortization |
$ | 106,853 | $ | 14,287 | $ | 12,311 | $ | 133,451 | ||||||||||||
| Depreciation, depletion and amortization |
(25,417 | ) | (2,196 | ) | (2,368 | ) | (29,981 | ) | ||||||||||||
| Treatment costs |
35,842 | 3,464 | 151 | 39,457 | ||||||||||||||||
| Change in product inventory |
(1,150 | ) | 796 | (145 | ) | (499 | ) | |||||||||||||
| Reclamation and other costs |
413 | — | (658 | ) | (245 | ) | ||||||||||||||
| Exclusion of Lucky Friday cash costs |
— | (16,351 | ) | — | (16,351 | ) | ||||||||||||||
| Cash Cost, Before By-product Credits (1) |
116,541 | — | 9,291 | 125,832 | ||||||||||||||||
| Reclamation and other costs |
1,577 | — | 228 | 1,805 | ||||||||||||||||
| Sustaining exploration |
4 | — | — | 664 | 668 | |||||||||||||||
| Sustaining capital |
10,011 | — | 55 | — | 10,066 | |||||||||||||||
| General and administrative |
15,918 | 15,918 | ||||||||||||||||||
| AISC, Before By-product Credits (1) |
128,133 | — | 9,574 | 154,289 | ||||||||||||||||
| By-product credits: |
||||||||||||||||||||
| Zinc |
(35,939 | ) | — | — | (35,939 | ) | ||||||||||||||
| Gold |
(36,624 | ) | (6,716 | ) | (43,340 | ) | ||||||||||||||
| Lead |
(14,059 | ) | — | — | (14,059 | ) | ||||||||||||||
| Total By-product credits |
(86,622 | ) | — | (6,716 | ) | (93,338 | ) | |||||||||||||
| Cash Cost, After By-product Credits |
$ | 29,919 | $ | — | $ | 2,575 | $ | 32,494 | ||||||||||||
| AISC, After By-product Credits |
$ | 41,511 | $ | — | $ | 2,858 | $ | 60,951 | ||||||||||||
| Divided by ounces produced |
5,530 | — | 505 | 6,035 | ||||||||||||||||
| Cash Cost, Before By-product Credits, per Ounce |
$ | 21.07 | $ | — | $ | 18.39 | $ | 20.85 | ||||||||||||
| By-product credits per ounce |
(15.66 | ) | — | (13.30 | ) | (15.47 | ) | |||||||||||||
| Cash Cost, After By-product Credits, per Ounce |
$ | 5.41 | $ | — | $ | 5.09 | $ | 5.38 | ||||||||||||
| AISC, Before By-product Credits, per Ounce |
$ | 23.17 | $ | — | $ | 18.95 | $ | 25.57 | ||||||||||||
| By-product credits per ounce |
(15.66 | ) | — | (13.30 | ) | (15.47 | ) | |||||||||||||
| AISC, After By-product Credits, per Ounce |
$ | 7.51 | $ | — | $ | 5.65 | $ | 10.10 | ||||||||||||
| In thousands (except per ounce amounts) |
Six Months Ended June 30, 2020 |
|||||||||||
| Casa Berardi |
Nevada Operations |
Total Gold |
||||||||||
| Cost of sales and other direct production costs and depreciation, depletion and amortization |
$ | 93,907 | $ | 30,471 | $ | 124,378 | ||||||
| Depreciation, depletion and amortization |
(33,678 | ) | (15,430 | ) | (49,108 | ) | ||||||
| Treatment costs |
1,132 | 45 | 1,177 | |||||||||
| Change in product inventory |
1,208 | 8,949 | 10,157 | |||||||||
| Reclamation and other costs |
(189 | ) | (654 | ) | (843 | ) | ||||||
| Cash Cost, Before By-product Credits (1) |
62,380 | 23,381 | 85,761 | |||||||||
| Reclamation and other costs |
190 | 654 | 844 | |||||||||
| Sustaining exploration |
1,158 | — | 1,158 | |||||||||
| Sustaining capital |
12,784 | 1,600 | 14,384 | |||||||||
| AISC, Before By-product Credits (1) |
76,512 | 25,635 | 102,147 | |||||||||
| By-product credits: |
||||||||||||
| Silver |
(192 | ) | (635 | ) | (827 | ) | ||||||
| Total By-product credits |
(192 | ) | (635 | ) | (827 | ) | ||||||
| Cash Cost, After By-product Credits |
$ | 62,188 | $ | 22,746 | $ | 84,934 | ||||||
| AISC, After By-product Credits |
$ | 76,320 | $ | 25,000 | $ | 101,320 | ||||||
| Divided by ounces produced |
58 | 32 | 90 | |||||||||
| Cash Cost, Before By-product Credits, per Ounce |
$ | 1,084 | $ | 736 | $ | 961 | ||||||
| By-product credits per ounce |
(3 | ) | (20 | ) | (9 | ) | ||||||
| Cash Cost, After By-product Credits, per Ounce |
$ | 1,081 | $ | 716 | $ | 952 | ||||||
| AISC, Before By-product Credits, per Ounce |
$ | 1,330 | $ | 807 | $ | 1,144 | ||||||
| By-product credits per ounce |
(3 | ) | (20 | ) | (9 | ) | ||||||
| AISC, After By-product Credits, per Ounce |
$ | 1,327 | $ | 787 | $ | 1,135 | ||||||
| In thousands (except per ounce amounts) |
Six Months Ended June 30, 2020 |
|||||||||||
| Total Silver |
Total Gold |
Total |
||||||||||
| Cost of sales and other direct production costs and depreciation, depletion and amortization |
$ | 133,451 | $ | 124,378 | $ | 257,829 | ||||||
| Depreciation, depletion and amortization |
(29,981 | ) | (49,108 | ) | (79,089 | ) | ||||||
| Treatment costs |
39,457 | 1,177 | 40,634 | |||||||||
| Change in product inventory |
(499 | ) | 10,157 | 9,658 | ||||||||
| Reclamation and other costs |
(245 | ) | (843 | ) | (1,088 | ) | ||||||
| Exclusion of Lucky Friday cash costs |
(16,351 | ) | — | (16,351 | ) | |||||||
| Cash Cost, Before By-product Credits (1) |
125,832 | 85,761 | 211,593 | |||||||||
| Reclamation and other costs |
1,805 | 844 | 2,649 | |||||||||
| Sustaining exploration |
668 | 1,158 | 1,826 | |||||||||
| Sustaining capital |
10,066 | 14,384 | 24,450 | |||||||||
| General and administrative |
15,918 | — | 15,918 | |||||||||
| AISC, Before By-product Credits (1) |
154,289 | 102,147 | 256,436 | |||||||||
| By-product credits: |
||||||||||||
| Zinc |
(35,939 | ) | — | (35,939 | ) | |||||||
| Gold |
(43,340 | ) | — | (43,340 | ) | |||||||
| Lead |
(14,059 | ) | — | (14,059 | ) | |||||||
| Silver |
(827 | ) | (827 | ) | ||||||||
| Total By-product credits |
(93,338 | ) | (827 | ) | (94,165 | ) | ||||||
| Cash Cost, After By-product Credits |
$ | 32,494 | $ | 84,934 | $ | 117,428 | ||||||
| AISC, After By-product Credits |
$ | 60,951 | $ | 101,320 | $ | 162,271 | ||||||
| Divided by ounces produced |
6,035 | 90 | ||||||||||
| Cash Cost, Before By-product Credits, per Ounce |
$ | 20.85 | $ | 961 | ||||||||
| By-product credits per ounce |
(15.47 | ) | (9 | ) | ||||||||
| Cash Cost, After By-product Credits, per Ounce |
$ | 5.38 | $ | 952 | ||||||||
| AISC, Before By-product Credits, per Ounce |
$ | 25.57 | $ | 1,144 | ||||||||
| By-product credits per ounce |
(15.47 | ) | (9 | ) | ||||||||
| AISC, After By-product Credits, per Ounce |
$ | 10.10 | $ | 1,135 | ||||||||
| (1) |
Includes all direct and indirect operating costs related to the physical activities of producing metals, including mining, processing and other plant costs, third-party refining and marketing expense, on-site general and administrative costs and royalties, before by-product revenues earned from all metals other than the primary metal produced at each unit. AISC, Before By-product Credits also includes on-site exploration, reclamation, and sustaining capital costs. |
| (2) |
The unionized employees at Lucky Friday were on strike from March 2017 until January 2020, and production at Lucky Friday was limited from the start of the strike until the ramp-up was substantially completed in the fourth quarter of 2020. Costs related to ramp-up activities totaling $9.2 million, along with $4.1 million in non-cash depreciation expense, in the first half of 2020 have been excluded from the calculations of cost of sales and other direct production costs and depreciation, depletion and amortization, Cash Cost, Before By-product Credits, Cash Cost, After By-product Credits, AISC, Before By-product Credits, and AISC, After By-product Credits. |
| (3) |
Mining at San Sebastian was completed in the third quarter of 2020, and milling was completed in the fourth quarter of 2020. Suspension-related costs at San Sebastian totaling $1.4 million for the first half of 2021 are reported in a separate line item on our consolidated statements of operations and excluded from the calculations of cost of sales and other direct production costs and depreciation, depletion and amortization, Cash Cost, Before By-product Credits, Cash Cost, After By-product Credits, AISC, Before By-product Credits, and AISC, After By-product Credits. |
| (4) |
AISC, Before By-product Credits for our consolidated silver properties includes corporate costs for general and administrative expense, exploration and sustaining capital. |
| (5) |
In late March 2020, the Government of Quebec ordered the mining industry to reduce to minimum operations as part of the fight against the COVID-19 virus, causing us to suspend our Casa Berardi operations from approximately March 24 until April 15, when limited mining operations resumed, resulting in reduced mill throughput. Suspension-related costs totaling $1.6 million for the first half of 2020 are reported in a separate line item on our consolidated statements of operations and excluded from the calculations of cost of sales and other direct production costs and depreciation, depletion and amortization, Cash Cost, Before By-product Credits, Cash Cost, After By-product Credits, AISC, Before By-product Credits, and AISC, After By-product Credits. |
| (6) |
Production was suspended at the Hollister and Midas mines and Aurora mill in the latter part of 2019. Suspension-related costs at Nevada Operations totaling $8.8 million and $6.7 million for the first halves of 2021 and 2020, respectively, are reported in a separate line item on our consolidated statements of operations and excluded from the calculations of cost of sales and other direct production costs and depreciation, depletion and amortization, Cash Cost, Before By-product Credits, Cash Cost, After By-product Credits, AISC, Before By-product Credits, and AISC, After By-product Credits. |
Financial Liquidity and Capital Resources
We have a disciplined cash management strategy of maintaining financial flexibility to execute our capital priorities and provide long-term value to our shareholders. Consistent with that strategy, we aim to reduce our net debt and maintain sufficient liquidity to fund debt service costs, operations, capital development and exploration projects, while returning cash to stockholders through dividends and potential share repurchases.
At June 30, 2021, we had $181.5 million in cash and cash equivalents, of which $16.8 million was held in foreign subsidiaries' local currency that we anticipate utilizing for near-term operating, exploration or capital costs by those foreign subsidiaries. We also have USD cash and cash equivalent balances held by our foreign subsidiaries that, if repatriated, may be subject to withholding taxes. We expect that there would be no additional tax burden upon repatriation after considering the cash cost associated with the withholding taxes. We believe that our liquidity and capital resources from our U.S. operations are adequate to fund our U.S. operations and corporate activities.
Our liquid assets include (in millions):
| June 30, 2021 |
December 31, 2020 |
|||||||
| Cash and cash equivalents held in U.S. dollars |
$ | 164.7 | $ | 116.4 | ||||
| Cash and cash equivalents held in foreign currency |
16.8 | 13.4 | ||||||
| Total cash and cash equivalents |
181.5 | 129.8 | ||||||
| Marketable equity securities - non-current |
11.1 | 19.3 | ||||||
| Total cash, cash equivalents and investments |
$ | 192.6 | $ | 149.1 | ||||
Cash and cash equivalents increased by $51.7 million in the first six months of 2021. Cash held in foreign currencies represents balances in Canadian dollars and Mexican pesos, with the $3.4 million increase in the first half of 2021 resulting from increases in CAD and Mexican Pesos (“MXN”) held. The value of non-current marketable equity securities decreased by $8.2 million.
On February 19, 2020, we completed an offering of Senior Notes in the total principal amount of USD$475 million. The Senior Notes are due February 15, 2028 and bear interest at a rate of 7.25% per year from the most recent payment date on which interest has been paid or provided for. In July 2020, we agreed to issue our Series 2020-A Senior Notes due July 9, 2025 (the “IQ Notes”) for CAD$50 million (approximately USD$36.8 million at the time of the transaction) in aggregate principal amount, which mature in July 2025 and bear interest at a rate of 6.515% per year. We also have a $250 million revolving credit facility, with interest payable on amounts drawn at an annual rate of between 2.25% and 4.00% over the London Interbank Offered Rate, or between 1.25% and 3.00% over an alternative base rate. There was no amount outstanding under the revolving credit facility as of June 30, 2021, with the exception of $19.9 million utilized for letters of credit. See Note 7 of Notes to Condensed Consolidated Financial Statements (Unaudited) for more information on our debt arrangements.
We continue to address the COVID-19 outbreak and face uncertainty related to the potential additional impact it could have on our operations. It is possible that future restrictions at any of our operations could have a material adverse impact on operations or financial results beyond 2021. We have taken precautionary measures to mitigate the impact of COVID-19, including implementing revised operational plans. As long as they are required, the revised operational practices could continue to have an adverse impact on our operating results due to deferred production and revenues or additional costs. If required, increasing or prolonged restrictions on our operations could require access to additional sources of liquidity, which may not be available to us. See Item 1A. Risk Factors - Natural disasters, public health crises, political crises (including COVID-19), and other catastrophic events or other events outside of our control may materially and adversely affect our business or financial results and COVID-19 virus pandemic may heighten other risks in our 2020 Form 10-K for information on how restrictions related to COVID-19 have affected some of our operations.
Pursuant to our common stock dividend policy described in Note 6 of Notes to Condensed Consolidated Financial Statements (Unaudited) and Note 10 of Notes to Consolidated Financial Statements in our 2020 Form 10-K, our Board of Directors declared and paid dividends on common stock totaling $10.7 million in the first half of 2021 and $2.6 million in the first half of 2020. Our dividend policy has a silver-linked component which ties the amount of declared common stock dividends to our realized silver price for the preceding quarter. Another component of our common stock dividend policy anticipates paying an annual minimum dividend. During May 2021, our Board of Directors approved an increase in our silver-linked dividend by 1 cent per year, and in May and August 2021, approved, along with the minimum dividend of 0.375 cent per share, quarterly silver-linked dividends of 0.75 cent per share based on the realized silver price of $25.66 and $27.14 in the first and second quarters of 2021, respectively. For illustrative purposes only, the table below summarizes potential dividend amounts under our dividend policy.
| Quarterly Average Realized Silver Price ($ per ounce) |
Quarterly Silver- Linked Dividend (cents per share) |
Annualized Silver- Linked Dividend (cents per share) |
Annualized Minimum Dividend (cents per share) |
Annualized Dividends per Share: Silver- Linked and Minimum (cents per share) |
|||||||||||||||
| $ | 25 | 0.75 | 3 | 1.5 | 4.5 | ||||||||||||||
| $ | 30 | 1.25 | 5 | 1.5 | 6.5 | ||||||||||||||
| $ | 35 | 2.25 | 9 | 1.5 | 10.5 | ||||||||||||||
| $ | 40 | 3.25 | 13 | 1.5 | 14.5 | ||||||||||||||
| $ | 45 | 4.25 | 17 | 1.5 | 18.5 | ||||||||||||||
| $ | 50 | 5.25 | 21 | 1.5 | 22.5 | ||||||||||||||
The declaration and payment of dividends on common stock is at the sole discretion of our board of directors, and there can be no assurance that we will continue to declare and pay common stock dividends in the future.
Pursuant to our stock repurchase program described in Note 10 of Notes to Consolidated Financial Statements in our 2020 Form 10-K, we are authorized to repurchase up to 20 million shares of our outstanding common stock from time to time in open market or privately negotiated transactions, depending on prevailing market conditions and other factors. The repurchase program may be modified, suspended or discontinued by us at any time. Whether or not we engage in repurchases from time to time may depend on a variety of factors, including not only price and cash resources, but customary black-out restrictions, whether we have any material inside information, limitations on share repurchases or cash usage that may be imposed by our credit agreement or in connection with issuances of securities, alternative uses for cash, applicable law, and other investment opportunities from time to time. As of June 30, 2021 and December 31, 2020, 934,100 shares had been purchased in prior periods at an average price of $3.99 per share, leaving 19.1 million shares that may yet be purchased under the program. We have not repurchased any shares since June 2014. The closing price of our common stock at August 3, 2021, was $6.62 per share.
Pursuant to an equity distribution agreement dated February 18, 2021, we may offer and sell up to 60 million shares of our common stock from time to time to or through sales agents in “at-the-market” (ATM) offerings. Sales of the shares, if any, will be made by means of ordinary brokers transactions or as otherwise agreed between the Company and the agents as principals. Whether or not we engage in sales from time to time may depend on a variety of factors, including share price, our cash resources, customary black-out restrictions, and whether we have any material inside information. The agreement can be terminated by us at any time. Any shares issued under the equity distribution agreement are registered under the Securities Act of 1933, as amended, pursuant to a shelf registration statement on Form S-3. No shares have been sold under the agreement as of June 30, 2021.
We may defer some capital investment and/or exploration and pre-development activities, engage in asset sales or secure additional capital if necessary to maintain liquidity. We also may pursue additional acquisition opportunities, which could require additional equity issuances or other forms of financing. There can be no assurance that such financing will be available to us.
As a result of our current cash balances, the performance of our current and expected operations, current metals prices, proceeds from potential at-the-market sales of common stock, and availability of our revolving credit facility, we believe we will be able to meet our obligations and other potential cash requirements during the next 12 months from the date of this report. Our obligations and other uses of cash may include, but are not limited to: debt service obligations related to the Senior Notes and IQ Notes; principal and interest payments under our revolving credit facility; deferral of revenues, care-and-maintenance and other costs related to addressing the impacts of COVID-19 on our operations; capital expenditures at our operations; potential acquisitions of other mining companies or properties; regulatory matters; litigation; potential repurchases of our common stock under the program described above; and payment of dividends on common stock, if declared by our board of directors. We currently estimate a total of approximately $120 million will be spent in 2021 on capital expenditures, primarily for equipment, infrastructure, and development at our mines, including $49.0 million already incurred as of June 30, 2021 and excluding $7.5 million for the acquisition of royalty interests at our operations. We also estimate exploration and pre-development expenditures will total approximately $48.5 million in 2021, including $17.9 million already incurred as of June 30, 2021. Our expenditures for these items and our related plans for 2021 may change based upon our financial position, metals prices, and other considerations. Our ability to fund the activities described above will depend on our operating performance, metals prices, our ability to estimate revenues and costs, sources of liquidity available to us, including the revolving credit facility, and other factors. A sustained downturn in metals prices, significant increase in operational or capital costs or other uses of cash, our inability to access the credit facility or the sources of liquidity discussed above, or other factors beyond our control could impact our plans.
| Six Months Ended |
||||||||
| June 30, 2021 |
June 30, 2020 |
|||||||
| Cash provided by operating activities (in millions) |
$ | 124.2 | $ | 42.5 | ||||
Cash provided by operating activities in the first half of 2021 of $124.2 million represented an $81.7 million increase compared to the $42.5 million provided by operating activities in the first half of 2020. The variance was the result of higher net income, as adjusted for non-cash items, a reduction to inventory and a smaller decrease to accounts payable, partially offset by an increase to accounts receivable and lower accrued payroll and related benefits and taxes.
| Six Months Ended |
||||||||
| June 30, 2021 |
June 30, 2020 |
|||||||
| Cash used in investing activities (in millions) |
$ | (53.2 | ) | $ | (31.1 | ) | ||
During the first half of 2021, we invested $53.3 million in capital expenditures, including $7.5 million for the acquisition of royalty interests at our operations and excluding $3.1 million in non-cash finance lease additions, an increase of $22.6 million compared to the same period in 2020. The variance was primarily due to increased spending at Casa Berardi.
| Six Months Ended |
||||||||
| June 30, 2021 |
June 30, 2020 |
|||||||
| Cash (used in) provided by financing activities (in millions) |
$ | (19.4 | ) | $ | 4.0 | |||
In the first half of 2020, we received $469.5 million in net proceeds from the issuance of our Senior Notes and drew $210.0 million on our revolving credit facility, and had debt repayments of $506.5 million for redemption of our 2021 Notes and $160.0 million for our revolving credit facility. We had no borrowings or repayments of debt in the first half of 2021. During the first six months of 2021 and 2020, we paid cash dividends on our common stock totaling $10.7 million and $2.6 million, respectively, and cash dividends of $0.3 million on our Series B Preferred Stock during each of those periods, with the increase in common stock dividends resulting from higher realized silver prices and amendments to our dividend policy discussed above. We made repayments on our finance leases of $3.8 million and $2.8 million in the six-month periods ended June 30, 2021 and 2020, respectively. We acquired treasury shares for $4.5 million and $2.7 million in the first half of 2021 and 2020, respectively, as a result of employees' elections to utilize net share settlement to satisfy their tax withholding obligations related to incentive compensation paid in stock and vesting of restricted stock units.
The effect of changes in foreign exchange rates resulted in a $28 thousand decrease in cash and cash equivalents in the first half of 2021 compared to a decrease of $1.8 million in the first half of 2020, with the variance due to strengthening of the CAD and MXN relative to the USD in the 2021 period.
Contractual Obligations, Contingent Liabilities and Commitments
The table below presents our fixed, non-cancelable contractual obligations and commitments primarily related to our Senior Notes, IQ Notes, credit facility, outstanding purchase orders, certain capital expenditures and lease arrangements as of June 30, 2021 (in thousands):
| Payments Due By Period |
||||||||||||||||||||
| Less than 1 year |
1-3 years |
4-5 years |
More than 5 years |
Total |
||||||||||||||||
| Purchase obligations (1) |
$ | 16,841 | — | — | $ | — | $ | 16,841 | ||||||||||||
| Contractual obligations (2) |
1,357 | — | — | — | 1,357 | |||||||||||||||
| Credit facility(3) |
1,726 | 1,050 | — | — | 2,776 | |||||||||||||||
| Finance lease commitments (4) |
6,793 | 8,084 | 1,276 | — | 16,153 | |||||||||||||||
| Operating lease commitments (5) |
3,423 | 4,133 | 1,065 | 2,084 | 10,705 | |||||||||||||||
| Supplemental executive retirement plan (6) |
759 | 1,740 | 2,704 | 6,617 | 11,820 | |||||||||||||||
| Senior Notes (7) |
34,438 | 68,875 | 68,875 | 530,960 | 703,148 | |||||||||||||||
| IQ Notes (8) |
2,536 | 5,071 | 41,517 | — | 49,124 | |||||||||||||||
| Total contractual cash obligations |
$ | 67,873 | $ | 88,953 | $ | 115,437 | $ | 539,661 | $ | 811,924 | ||||||||||
| (1) |
Consists of open purchase orders of approximately $6.8 million at the Greens Creek unit, $0.6 million at the Casa Berardi unit, $5.8 million at the Lucky Friday unit and $3.6 million at the Nevada Operations unit. |
| (2) |
As of June 30, 2021, we were committed to approximately $1.4 million for various items at Greens Creek. |
| (3) |
We have a $250 million revolving credit agreement under which we are required to pay a standby fee of between 0.5625% and 1.00% per annum on undrawn amounts and interest of between 2.25% and 4.00% over the London Interbank Offered Rate or between 1.25% and 3.00% over an alternative base rate on drawn amounts under the revolving credit agreement. We had $19.9 million in letters of credit outstanding as of June 30, 2021. The amounts in the table above assume no additional amounts will be drawn in future periods, and include only the standby fee on the current undrawn balance. For more information on our credit facility, see Note 7 of Notes to Condensed Consolidated Financial Statements (Unaudited). |
| (4) |
Includes scheduled finance lease payments of $15.8 million, $0.2 million and $0.2 million (including interest), respectively, for equipment at our Greens Creek, Casa Berardi and Nevada Operations units. |
| (5) |
We enter into operating leases in the normal course of business. Substantially all lease agreements have fixed payment terms based on the passage of time. Some lease agreements provide us with the option to renew the lease or purchase the leased property. Our future operating lease obligations would change if we exercised these renewal options and if we entered into additional operating lease arrangements. |
| (6) |
We sponsor defined benefit pension plans covering substantially all U.S. employees and provide certain post-retirement benefits for qualifying retired employees, along with a supplemental executive retirement plan (“SERP”). These amounts represent our estimate of the future benefit payment requirements for the next 10 years for the SERP as of June 30, 2021. However, in January 2021, we contributed $16.8 million in shares of our common stock to the SERP in order to fund future benefit payments. We believe we will have future funding requirements related to our defined benefit pension plans and benefit payment obligations for the SERP beyond 10 years; however, such funding requirements are not fixed in nature and are difficult to estimate, as they involve significant assumptions. See Note 4 of Notes to Condensed Consolidated Financial Statements (Unaudited) for more information. |
| (7) |
On February 19, 2020, we completed an offering of $475 million in aggregate principal amount of our Senior Notes due February 15, 2028. The Senior Notes bear interest at a rate of 7.25% per year from the original date of issuance or the most recent payment date to which interest has been paid or provided for. Interest on the Senior Notes is payable on February 15 and August 15 of each year, commencing August 15, 2020. See Note 7 of Notes to Condensed Consolidated Financial Statements (Unaudited) for more information. |
| (8) |
On July 9, 2020, we entered into a note purchase agreement pursuant to which we issued our IQ Notes for CAD$50 million (approximately USD$36.8 million at the time of the transaction) in aggregate principal amount. The IQ Notes were issued at a premium of 103.65%, or CAD$1.8 million, implying an effective annual yield of 5.74% and an aggregate principal amount to be repaid of CAD$48.2 million. The IQ Notes were issued in four equal installments of CAD$12.5 million on July 9, August 9, September 9 and October 9, 2020. The IQ Notes bear interest on amounts outstanding at a rate of 6.515% per year, payable on January 9 and July 9 of each year, commencing January 9, 2021. See Note 7 of Notes to Condensed Consolidated Financial Statements (Unaudited) for more information. |
We record liabilities for costs associated with mine closure, reclamation of land and other environmental matters. At June 30, 2021, our liabilities for these matters totaled $120.6 million. Future expenditures related to closure, reclamation and environmental expenditures at our sites are difficult to estimate, although we anticipate we will incur expenditures relating to these obligations over the next 30 years. For additional information relating to our environmental obligations, see Note 10 of Notes to Condensed Consolidated Financial Statements (Unaudited).
Off-Balance Sheet Arrangements
At June 30, 2021, we had no existing off-balance sheet arrangements, as defined under SEC regulations, that have or are reasonably likely to have a current or future effect on our financial condition, revenues or expenses, results of operations, liquidity, capital expenditures or capital resources that are material to investors.
Guarantor Subsidiaries
Presented below are Hecla’s unaudited interim condensed consolidating financial statements as required by Rule 3-10 of Regulation S-X of the Securities Exchange Act of 1934, as amended, resulting from the guarantees by certain of Hecla's subsidiaries of the Senior Notes and IQ Notes (see Note 7 of Notes to Condensed Consolidated Financial Statements (Unaudited) for more information). The Guarantors consist of the following of Hecla's 100%-owned subsidiaries: Hecla Limited; Silver Hunter Mining Company; Rio Grande Silver, Inc.; Hecla MC Subsidiary, LLC; Hecla Silver Valley, Inc.; Burke Trading, Inc.; Hecla Montana, Inc.; Revett Silver Company; RC Resources, Inc.; Troy Mine Inc.; Revett Exploration, Inc.; Revett Holdings, Inc.; Mines Management, Inc.; Newhi, Inc.; Montanore Minerals Corp.; Hecla Alaska LLC; Hecla Greens Creek Mining Company; Hecla Admiralty Company; Hecla Juneau Mining Company; Klondex Holdings Inc.; Klondex Gold & Silver Mining Co.; Klondex Midas Holdings Limited; Klondex Aurora Mine Inc.; Klondex Hollister Mine Inc; and Hecla Quebec, Inc. We completed the offering of the Senior Notes on February 19, 2020 under our shelf registration statement previously filed with the SEC. We issued the IQ Notes in four equal tranches between July and October 2020.
The unaudited interim condensed consolidating financial statements below have been prepared from our financial information on the same basis of accounting as the unaudited interim condensed consolidated financial statements set forth elsewhere in this report. Investments in the subsidiaries are accounted for under the equity method. Accordingly, the entries necessary to consolidate Hecla, the Guarantors, and our non-guarantor subsidiaries are reflected in the intercompany eliminations column. In the course of preparing consolidated financial statements, we eliminate the effects of various transactions conducted between Hecla and its subsidiaries and among the subsidiaries. While valid at an individual subsidiary level, such activities are eliminated in consolidation because, when taken as a whole, they do not represent business activity with third-party customers, vendors, and other parties. Examples of such eliminations include the following:
| • |
Investments in subsidiaries. The acquisition of a company results in an investment in debt or equity capital on the records of the parent company and a contribution to debt or equity capital on the records of the subsidiary. Such investments and capital contributions are eliminated in consolidation. |
| • |
Capital contributions. Certain of Hecla's subsidiaries do not generate cash flow, either at all or that is sufficient to meet their capital needs, and their cash requirements are routinely met with inter-company advances from their parent companies. Generally on an annual basis, when not otherwise intended as debt, the boards of directors of such parent companies declare contributions of capital to their subsidiary companies, which increase the parents' investment and the subsidiaries' additional paid-in capital. In consolidation, investments in subsidiaries and related additional paid-in capital are eliminated. |
| • |
Debt. At times, inter-company debt agreements have been established between certain of Hecla's subsidiaries and their parents. The related debt liability and receivable balances, accrued interest expense (if any) and income activity (if any), and payments of principal and accrued interest amounts (if any) by the subsidiary companies to their parents are eliminated in consolidation. |
| • |
Dividends. Certain of Hecla's subsidiaries which generate cash flow routinely provide cash to their parent companies through inter-company transfers. On at least an annual basis, the boards of directors of such subsidiary companies declare dividends to their parent companies, which reduces the subsidiaries' retained earnings and increases the parents' dividend income. In consolidation, such activity is eliminated. |
| • |
Deferred taxes. Our ability to realize deferred tax assets and liabilities is considered for two consolidated tax groups of subsidiaries within the United States: The Nevada U.S. Group and the Hecla U.S. Group. Within each tax group, all subsidiaries' estimated future taxable income contributes to the ability of their tax group to realize all such assets and liabilities. However, when Hecla's subsidiaries are viewed independently, we use the separate return method to assess the realizability of each subsidiary's deferred tax assets and whether a valuation allowance is required against such deferred tax assets. In some instances, a parent company or subsidiary may possess deferred tax assets whose realization depends on the future taxable incomes of other subsidiaries on a consolidated-return basis, but would not be considered realizable if such parent or subsidiary filed on a separate stand-alone basis. In such a situation, a valuation allowance is assessed on that subsidiary's deferred tax assets, with the resulting adjustment reported in the eliminations column of the guarantor and parent's financial statements, as is the case in the unaudited interim financial statements set forth below. The separate return method can result in significant eliminations of deferred tax assets and liabilities and related income tax provisions and benefits. Non-current deferred tax asset balances are included in other non-current assets on the consolidating balance sheets and make up a large portion of that item, particularly for the guarantor balances. |
Separate financial statements of the Guarantors are not presented because the guarantees by the Guarantors are joint and several and full and unconditional, except for certain customary release provisions, including: (1) the sale or disposal of all or substantially all of the assets of the Guarantor; (2) the sale or other disposition of the capital stock of the Guarantor; (3) the Guarantor is designated as an unrestricted entity in accordance with the applicable provisions of the indenture; (4) Hecla ceases to be a borrower as defined in the indenture; and (5) upon legal or covenant defeasance or satisfaction and discharge of the indenture.
Unaudited Interim Condensed Consolidating Balance Sheets
| As of June 30, 2021 |
||||||||||||||||||||
| Parent |
Guarantors |
Non- Guarantors |
Eliminations |
Consolidated |
||||||||||||||||
| (in thousands) |
||||||||||||||||||||
| Assets |
||||||||||||||||||||
| Cash and cash equivalents |
$ | 138,813 | $ | 15,030 | $ | 27,651 | $ | — | $ | 181,494 | ||||||||||
| Other current assets |
6,219 | 141,702 | 1,763 | — | 149,684 | |||||||||||||||
| Properties, plants, equipment and mineral interests, net |
1,913 | 2,295,175 | 8,271 | — | 2,305,359 | |||||||||||||||
| Intercompany receivable (payable) |
(149,795 | ) | (320,140 | ) | 215,068 | 254,867 | — | |||||||||||||
| Investments in subsidiaries |
1,778,747 | — | — | (1,778,747 | ) | — | ||||||||||||||
| Other non-current assets |
311,126 | 20,260 | (122,180 | ) | (174,505 | ) | 34,701 | |||||||||||||
| Total assets |
$ | 2,087,023 | $ | 2,152,027 | $ | 130,573 | $ | (1,698,385 | ) | $ | 2,671,238 | |||||||||
| Liabilities and Stockholders' Equity |
||||||||||||||||||||
| Current liabilities |
$ | (192,819 | ) | $ | 201,683 | $ | 5,705 | $ | 114,832 | $ | 129,401 | |||||||||
| Long-term debt |
508,611 | 15,104 | 169 | — | 523,884 | |||||||||||||||
| Non-current portion of accrued reclamation |
— | 106,035 | 6,616 | — | 112,651 | |||||||||||||||
| Non-current deferred tax liability |
15,961 | 161,690 | — | (34,470 | ) | 143,181 | ||||||||||||||
| Other non-current liabilities |
34,588 | 6,151 | 700 | — | 41,439 | |||||||||||||||
| Stockholders' equity |
1,720,682 | 1,661,364 | 117,383 | (1,778,747 | ) | 1,720,682 | ||||||||||||||
| Total liabilities and stockholders' equity |
$ | 2,087,023 | $ | 2,152,027 | $ | 130,573 | $ | (1,698,385 | ) | $ | 2,671,238 | |||||||||
Unaudited Interim Condensed Consolidating Statements of Operations
| Three Months Ended June 30, 2021 |
||||||||||||||||||||
| Parent |
Guarantors |
Non- Guarantors |
Eliminations |
Consolidated |
||||||||||||||||
| (in thousands) |
||||||||||||||||||||
| Revenues |
$ | (3,319 | ) | $ | 221,302 | $ | — | $ | — | $ | 217,983 | |||||||||
| Cost of sales |
1,412 | (111,732 | ) | — | — | (110,320 | ) | |||||||||||||
| Depreciation, depletion, amortization |
— | (48,403 | ) | — | — | (48,403 | ) | |||||||||||||
| General and administrative |
(6,636 | ) | (4,468 | ) | — | — | (11,104 | ) | ||||||||||||
| Exploration and pre-development |
(14 | ) | (11,227 | ) | — | — | (11,241 | ) | ||||||||||||
| Gain on derivative contracts |
(17,313 | ) | — | — | — | (17,313 | ) | |||||||||||||
| Equity in earnings of subsidiaries |
14,854 | — | — | (14,854 | ) | — | ||||||||||||||
| Other expense |
14,515 | (20,292 | ) | (1,087 | ) | (16,795 | ) | (23,659 | ) | |||||||||||
| Income (loss) before income taxes |
3,499 | 25,180 | (1,087 | ) | (31,649 | ) | (4,057 | ) | ||||||||||||
| (Provision) benefit from income taxes |
(2,714 | ) | (9,239 | ) | — | 16,795 | 4,842 | |||||||||||||
| Net income (loss) |
785 | 15,941 | (1,087 | ) | (14,854 | ) | 785 | |||||||||||||
| Preferred stock dividends |
(138 | ) | — | — | — | (138 | ) | |||||||||||||
| Income (loss) applicable to common stockholders |
647 | 15,941 | (1,087 | ) | (14,854 | ) | 647 | |||||||||||||
| Net income (loss) |
785 | 15,941 | (1,087 | ) | (14,854 | ) | 785 | |||||||||||||
| Changes in comprehensive income (loss) |
1,620 | — | — | — | 1,620 | |||||||||||||||
| Comprehensive income (loss) |
$ | 2,405 | $ | 15,941 | $ | (1,087 | ) | $ | (14,854 | ) | $ | 2,405 | ||||||||
| Six Months Ended June 30, 2021 |
||||||||||||||||||||
| Parent |
Guarantors |
Non-Guarantors |
Eliminations |
Consolidated |
||||||||||||||||
| (in thousands) |
||||||||||||||||||||
| Revenues |
$ | (473 | ) | $ | 429,135 | $ | 173 | $ | — | $ | 428,835 | |||||||||
| Cost of sales |
1,971 | (208,892 | ) | (108 | ) | — | (207,029 | ) | ||||||||||||
| Depreciation, depletion, amortization |
— | (97,734 | ) | — | — | (97,734 | ) | |||||||||||||
| General and administrative |
(9,749 | ) | (9,247 | ) | (115 | ) | — | (19,111 | ) | |||||||||||
| Exploration and pre-development |
(14 | ) | (16,119 | ) | (1,798 | ) | — | (17,931 | ) | |||||||||||
| Loss on derivative contracts |
(16,840 | ) | — | — | — | (16,840 | ) | |||||||||||||
| Equity in earnings of subsidiaries |
29,420 | — | — | (29,420 | ) | — | ||||||||||||||
| Other expense |
18,807 | (39,248 | ) | (6,189 | ) | (24,012 | ) | (50,642 | ) | |||||||||||
| Income (loss) before income taxes |
23,122 | 57,895 | (8,037 | ) | (53,432 | ) | 19,548 | |||||||||||||
| (Provision) benefit from income taxes |
(3,366 | ) | (21,089 | ) | 651 | 24,012 | 208 | |||||||||||||
| Net income (loss) |
19,756 | 36,806 | (7,386 | ) | (29,420 | ) | 19,756 | |||||||||||||
| Preferred stock dividends |
(276 | ) | — | — | — | (276 | ) | |||||||||||||
| Income (loss) applicable to common stockholders |
19,480 | 36,806 | (7,386 | ) | (29,420 | ) | 19,480 | |||||||||||||
| Net income (loss) |
19,756 | 36,806 | (7,386 | ) | (29,420 | ) | 19,756 | |||||||||||||
| Changes in comprehensive income (loss) |
3,452 | — | — | — | 3,452 | |||||||||||||||
| Comprehensive income (loss) |
$ | 23,208 | $ | 36,806 | $ | (7,386 | ) | $ | (29,420 | ) | $ | 23,208 | ||||||||
Unaudited Interim Condensed Consolidating Statements of Cash Flows
| Six Months Ended June 30, 2021 |
||||||||||||||||||||
| Parent |
Guarantors |
Non- Guarantors |
Eliminations |
Consolidated |
||||||||||||||||
| (in thousands) |
||||||||||||||||||||
| Cash flows from operating activities |
$ | 16,543 | $ | 175,384 | $ | (11,312 | ) | $ | (56,375 | ) | $ | 124,240 | ||||||||
| Cash flows from investing activities: |
||||||||||||||||||||
| Additions to properties, plants, and equipment |
— | (53,694 | ) | 383 | — | (53,311 | ) | |||||||||||||
| Other investing activities, net |
(39,058 | ) | 88 | 43 | 39,058 | 131 | ||||||||||||||
| Cash flows from financing activities: |
||||||||||||||||||||
| Dividends paid to stockholders |
(10,991 | ) | — | — | — | (10,991 | ) | |||||||||||||
| Payments on debt |
— | (3,770 | ) | — | — | (3,770 | ) | |||||||||||||
| Other financing activity |
83,063 | (114,376 | ) | 9,389 | 17,317 | (4,607 | ) | |||||||||||||
| Effect of exchange rate changes on cash |
— | (4 | ) | (24 | ) | — | (28 | ) | ||||||||||||
| Changes in cash, cash equivalents and restricted cash and cash equivalents |
49,557 | 3,628 | (1,521 | ) | — | 51,664 | ||||||||||||||
| Beginning cash, cash equivalents and restricted cash and cash equivalents |
89,256 | 12,455 | 29,172 | — | 130,883 | |||||||||||||||
| Ending cash, cash equivalents and restricted cash and cash equivalents |
$ | 138,813 | $ | 16,083 | $ | 27,651 | $ | — | $ | 182,547 | ||||||||||
Item 3. Quantitative and Qualitative Disclosures About Market Risk
The following discussion about our exposure to market risks and risk management activities includes forward-looking statements that involve risks and uncertainties, as well as summarizes the financial instruments held by us at June 30, 2021, which are sensitive to changes in commodity prices and foreign exchange rates and are not held for trading purposes. Actual results could differ materially from those projected in the forward-looking statements. In the normal course of business, we also face risks that are either non-financial or non-quantifiable (See Item 1A. – Risk Factors of our 2020 Form 10-K).
Metals Prices
Changes in the market prices of silver, gold, lead and zinc can significantly affect our profitability and cash flow. Metal prices can and often do fluctuate widely and are affected by numerous factors beyond our control (see Item 1A – Risk Factors – A substantial or extended decline in metals prices would have a material adverse effect on us in our 2020 Form 10-K). We utilize financially-settled forward and put option contracts to manage our exposure to changes in prices for silver, gold, zinc and lead.
Provisional Sales
Sales of all metals products sold directly to customers, including by-product metals, are recorded as revenues when all performance obligations have been completed and the transaction price can be determined or reasonably estimated. For concentrate sales, revenues are generally recorded at the time of shipment at forward prices for the estimated month of settlement. Due to the time elapsed between shipment to the customer and the final settlement with the customer we must estimate the prices at which sales of our metals will be settled. Previously recorded sales are adjusted to estimated settlement metals prices until final settlement by the customer. Changes in metals prices between shipment and final settlement will result in changes to revenues previously recorded upon shipment. Metals prices can and often do fluctuate widely and are affected by numerous factors beyond our control (see Item 1A – Risk Factors – A substantial or extended decline in metals prices would have a material adverse effect on us in our 2020 Form 10-K). At June 30, 2021, metals contained in concentrate sales and exposed to future price changes totaled 2.7 million ounces of silver, 7,921 ounces of gold, 9,842 tons of zinc, and 6,447 tons of lead. If the price for each metal were to change by 10%, the change in the total value of the concentrates sold would be approximately $12.3 million. As discussed in Note 8 of Notes to Condensed Consolidated Financial Statements (Unaudited), we utilize a program designed and intended to mitigate the risk of negative price adjustments with limited mark-to-market financially-settled forward contracts for our silver, gold, zinc and lead sales.
Commodity-Price Risk Management
See Note 8 of Notes to Condensed Consolidated Financial Statements (Unaudited) and Item 7A. Quantitative and Qualitative Disclosures About Market Risk in our 2020 Form 10-K for a description of our commodity-price risk management program.
Foreign Currency Risk Management
We operate or have mining interests in Canada and Mexico, which exposes us to risks associated with fluctuations in the exchange rates between the USD and the CAD and MXN, respectively. We have determined the functional currency for our Canadian and Mexican operations is the USD. As such, foreign exchange gains and losses associated with the re-measurement of monetary assets and liabilities from CAD and MXN to USD are recorded to earnings each period. For the six months ended June 30, 2021 and 2020, we recognized a net foreign exchange loss of $4.0 million and gain of $3.4 million, respectively. Foreign currency exchange rates are influenced by a number of factors beyond our control. A 10% change in the exchange rate between the USD and CAD from the rate at June 30, 2021 would have resulted in a change of approximately $10.8 million in our net foreign exchange gain or loss. A 10% change in the exchange rate between the USD and MXN from the rate at June 30, 2021 would have resulted in a change of approximately $0.1 million in our net foreign exchange gain or loss. We do not hedge the remeasurement of monetary assets and liabilities. We do hedge some of our operating and capital costs denominated in foreign currency.
See Note 8 of Notes to Condensed Consolidated Financial Statements (Unaudited) and Note 11 of Notes to Consolidated Financial Statements in our 2020 Form 10-K for a description of our foreign currency risk management.
Item 4. Controls and Procedures
An evaluation was performed under the supervision and with the participation of our management, including the Chief Executive Officer (“CEO”) and Chief Financial Officer (“CFO”), of the effectiveness of the design and operation of our disclosure controls and procedures as required by Securities Exchange Act Rules 13a-15(e) and 15d-15(e) as of the end of the period covered by this report. Based on that evaluation, our CEO and CFO concluded that our disclosure controls and procedures, including controls and procedures designed to ensure that information required to be disclosed by us is accumulated and communicated to our management (including our CEO and CFO), were effective as of June 30, 2021, in assuring them in a timely manner that material information required to be disclosed in this report has been properly recorded, processed, summarized and reported. There were no changes in our internal control over financial reporting during the quarter ended June 30, 2021, that have materially affected, or are reasonably likely to materially affect, our internal control over financial reporting.
Internal control systems, no matter how well designed and operated, have inherent limitations. Therefore, even a system which is determined to be effective cannot provide absolute assurance that all control issues have been detected or prevented. Our systems of internal controls are designed to provide reasonable assurance with respect to financial statement preparation and presentation.
Hecla Mining Company and Subsidiaries
For information concerning legal proceedings, refer to Note 10 of Notes to Condensed Consolidated Financial Statements (Unaudited), which is incorporated by reference into this Item 1.
Item 1A. – Risk Factors of our annual report filed on Form 10-K for the year ended December 31, 2020 sets forth information relating to important risks and uncertainties that could materially adversely affect our business, financial condition or operating results.
Item 4. Mine Safety Disclosures
The information concerning mine safety violations or other regulatory matters required by Section 1503(a) of the Dodd-Frank Wall Street Reform and Consumer Protection Act and Item 104 of Regulation S-K is included in exhibit 95 to this Quarterly Report.
Hecla Mining Company and Wholly Owned Subsidiaries
Form 10-Q – June 30, 2021
Index to Exhibits
| 10.1 |
| 31.1 |
Certification pursuant to Section 302 of the Sarbanes-Oxley Act of 2002. * |
| 31.2 |
Certification pursuant to Section 302 of the Sarbanes-Oxley Act of 2002. * |
| 32.1 |
Certification pursuant to Section 906 of the Sarbanes-Oxley Act of 2002. * |
| 32.2 |
Certification pursuant to Section 906 of the Sarbanes-Oxley Act of 2002. * |
| 95 |
Mine safety information listed in Section 1503 of the Dodd-Frank Act. * |
| 101.INS |
Inline XBRL Instance Document - The instance document does not appear in the Interactive Data File because its XBRL tags are embedded within the Inline XBRL document. ** |
| 101.SCH |
Inline XBRL Taxonomy Extension Schema.** |
| 101.CAL |
Inline XBRL Taxonomy Extension Calculation.** |
| 101.DEF |
Inline XBRL Taxonomy Extension Definition.** |
| 101.LAB |
Inline XBRL Taxonomy Extension Labels.** |
| 101.PRE |
Inline XBRL Taxonomy Extension Presentation.** |
| 104 |
Interactive Data File (formatted as Inline XBRL and contained in Exhibit 101) |
___________________
* Filed herewith.
** XBRL information is furnished and not filed or a part of a registration statement or prospectus for purposes of Sections 11 or 12 of the Securities Act of 1933, as amended, is deemed not filed for purposes of Section 18 of the Securities and Exchange Act of 1934, as amended, and otherwise is not subject to liability under these sections.
Items 2, 3 and 5 of Part II are not applicable and are omitted from this report.
Pursuant to the requirements of the Securities Exchange Act of 1934, the registrant has duly caused this report to be signed on its behalf by the undersigned thereunto duly authorized.
| HECLA MINING COMPANY |
|||
| (Registrant) |
|||
| Date: |
August 5, 2021 |
By: |
/s/ Phillips S. Baker, Jr. |
| Phillips S. Baker, Jr., President, |
|||
| Chief Executive Officer and Director |
|||
| Date: |
August 5, 2021 |
By: |
/s/ Russell D. Lawlar |
| Russell D. Lawlar, Senior Vice President, |
|||
| Chief Financial Officer and Treasurer |
|||