MEMBER FDIC
First Quarter 2017
2
This presentation contains or incorporates statements that we believe are forward-looking statements within the meaning of the Private
Securities Litigation Reform Act of 1995. Forward-looking statements generally relate to our financial condition, results of operations, plans,
objectives, outlook for earnings, revenues, expenses, capital and liquidity levels and ratios, asset levels, asset quality, financial position, and
other matters regarding or affecting S&T and its future business and operations. Forward looking statements are typically identified by words
or phrases such as “will likely result,” “expect”, “anticipate,” “estimate,” “forecast,” “project,” “intend”, “ believe”, “assume”, “strategy”, “trend”,
“plan”, “outlook”, “outcome”, “continue”, “remain”, “potential,” “opportunity”, “believe”, “comfortable”, “current”, “position”, “maintain”, “sustain”,
“seek”, “achieve” and variations of such words and similar expressions, or future or conditional verbs such as will, would, should, could or
may. Although we believe the assumptions upon which these forward-looking statements are based are reasonable, any of these
assumptions could prove to be inaccurate and the forward-looking statements based on these assumptions could be incorrect. The matters
discussed in these forward-looking statements are subject to various risks, uncertainties and other factors that could cause actual results and
trends to differ materially from those made, projected, or implied in or by the forward-looking statements depending on a variety of
uncertainties or other factors including, but not limited to: credit losses; cyber-security concerns; rapid technological developments and
changes; sensitivity to the interest rate environment including a prolonged period of low interest rates, a rapid increase in interest rates or a
change in the shape of the yield curve; a change in spreads on interest-earning assets and interest-bearing liabilities; regulatory supervision
and oversight; legislation affecting the financial services industry as a whole, and S&T, in particular; the outcome of pending and future
litigation and governmental proceedings; increasing price and product/service competition; the ability to continue to introduce competitive new
products and services on a timely, cost-effective basis; managing our internal growth and acquisitions; the possibility that the anticipated
benefits from acquisitions cannot be fully realized in a timely manner or at all, or that integrating the acquired operations will be more difficult,
disruptive or costly than anticipated; containing costs and expenses; reliance on significant customer relationships; general economic or
business conditions; deterioration of the housing market and reduced demand for mortgages; deterioration in the overall macroeconomic
conditions or the state of the banking industry that could warrant further analysis of the carrying value of goodwill and could result in an
adjustment to its carrying value resulting in a non-cash charge to net income; re-emergence of turbulence in significant portions of the global
financial and real estate markets that could impact our performance, both directly, by affecting our revenues and the value of our assets and
liabilities, and indirectly, by affecting the economy generally and access to capital in the amounts, at the times and on the terms required to
support our future businesses. Many of these factors, as well as other factors, are described in our filings with the SEC. Forward-looking
statements are based on beliefs and assumptions using information available at the time the statements are made. We caution you not to
unduly rely on forward-looking statements because the assumptions, beliefs, expectations and projections about future events may, and often
do, differ materially from actual results. Any forward-looking statement speaks only as to the date on which it is made, and we undertake no
obligation to update any forward-looking statement to reflect developments occurring after the statement is made.
Forward Looking Statement
and Risk Factors
3
Non-GAAP Financial Measures
In addition to the results of operations presented in accordance with Generally Accepted Accounting
Principles (GAAP), S&T management uses and this presentation contains or references certain non-
GAAP financial measures, such as net interest income on a fully taxable equivalent basis. S&T believes
these financial measures provide information useful to investors in understanding our operational
performance and business and performance trends which facilitate comparisons with the performance of
others in the financial services industry. Although S&T believes that these non-GAAP financial measures
enhance investors’ understanding of S&T’s business and performance, these non-GAAP financial
measures should not be considered an alternative to GAAP. The non-GAAP financial measures contained
therein should be read in conjunction with the audited financial statements and analysis as presented in
the Annual Report on Form 10-K as well as the unaudited financial statements and analyses as presented
in the respective Quarterly Reports on Forms 10-Q for S&T Bancorp, Inc. and subsidiaries.
4
Corporate Profile
4
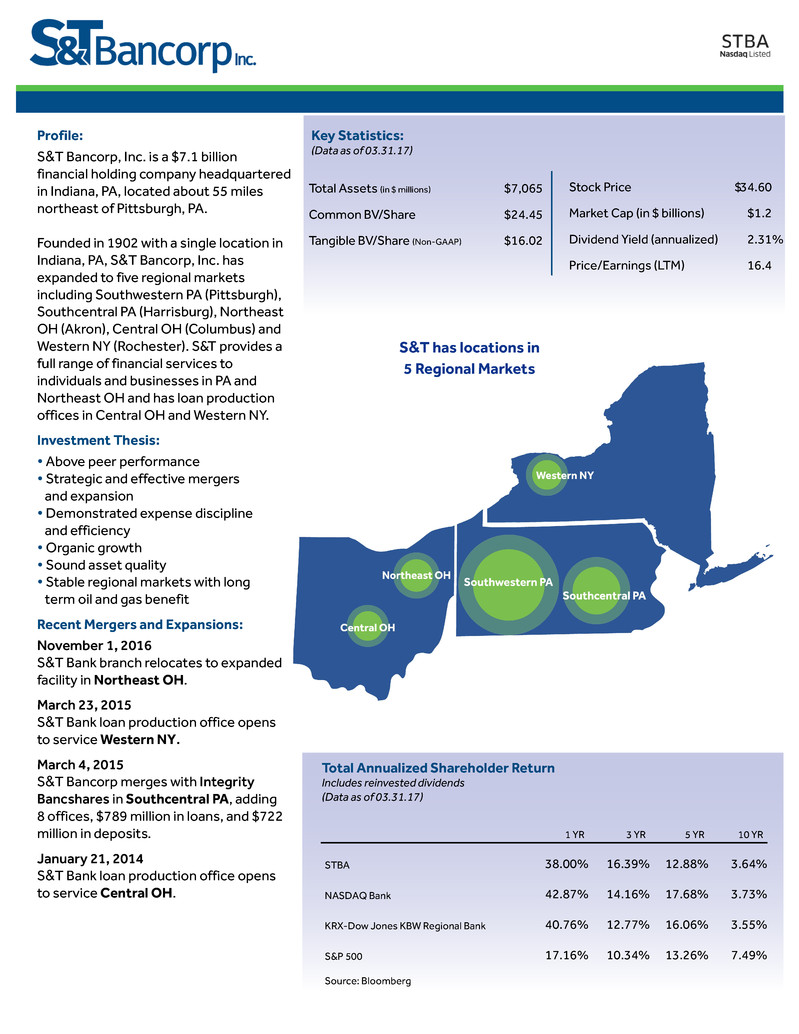
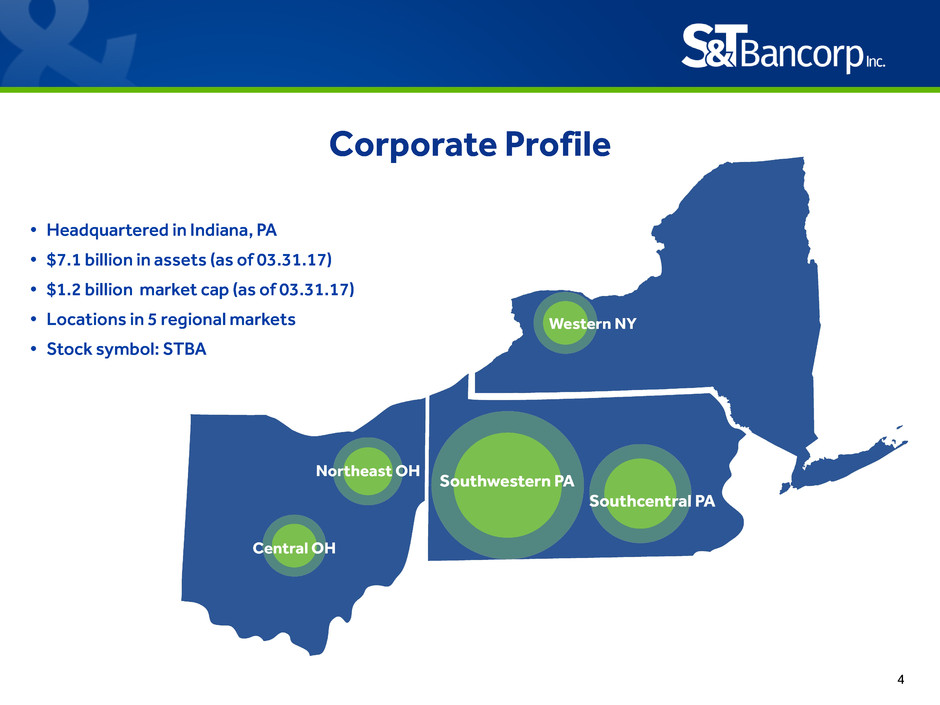
• Headquartered in Indiana, PA
• $7.1 billion in assets (as of 03.31.17)
• $1.2 billion market cap (as of 03.31.17)
• Locations in 5 regional markets
• Stock symbol: STBA
5
Performance Summary
(1) Annualized for quarterly data
(2)Refer to appendix for reconciliation of Non-GAAP financial measures
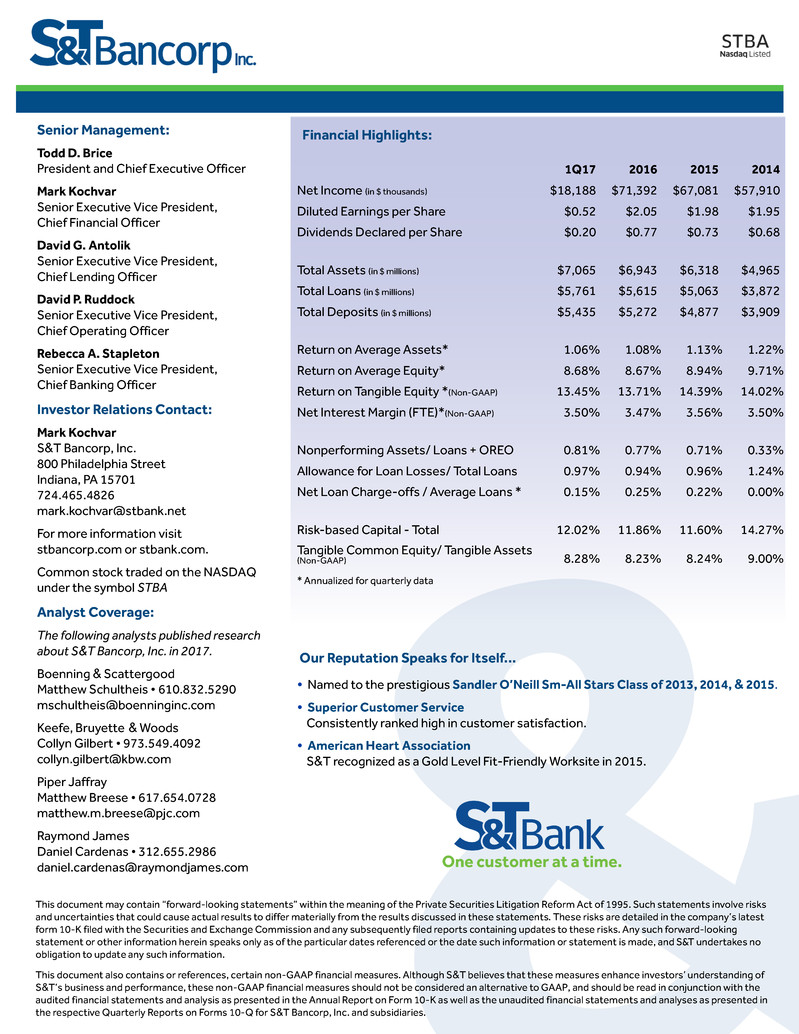
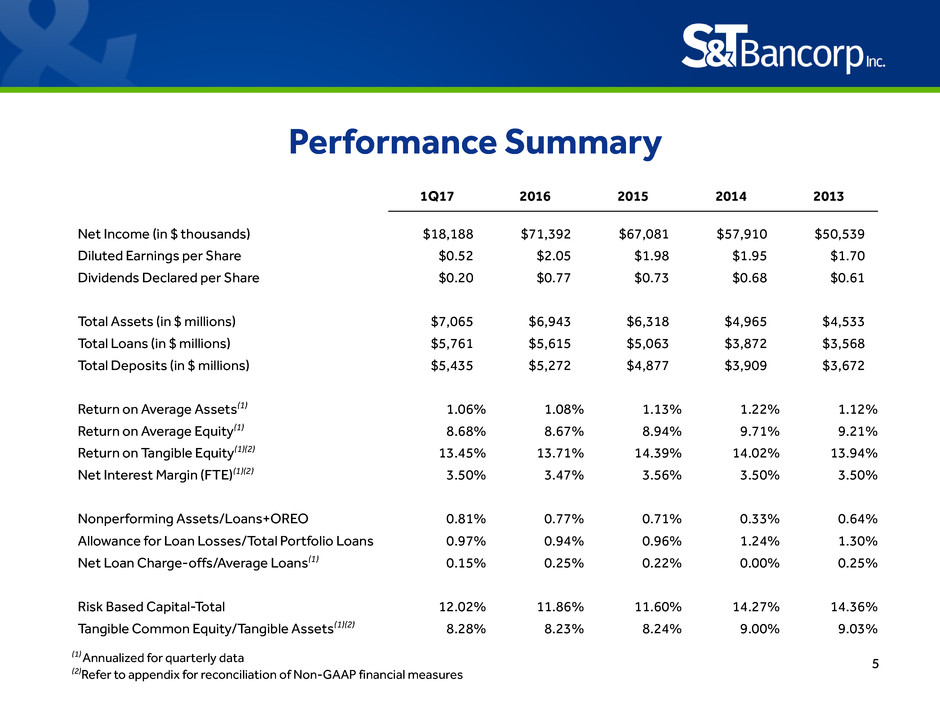
1Q17 2016 2015 2014 2013
Net Income (in $ thousands) $18,188 $71,392 $67,081 $57,910 $50,539
Diluted Earnings per Share $0.52 $2.05 $1.98 $1.95 $1.70
Dividends Declared per Share $0.20 $0.77 $0.73 $0.68 $0.61
Total Assets (in $ millions) $7,065 $6,943 $6,318 $4,965 $4,533
Total Loans (in $ millions) $5,761 $5,615 $5,063 $3,872 $3,568
Total Deposits (in $ millions) $5,435 $5,272 $4,877 $3,909 $3,672
Return on Average Assets(1) 1.06% 1.08% 1.13% 1.22% 1.12%
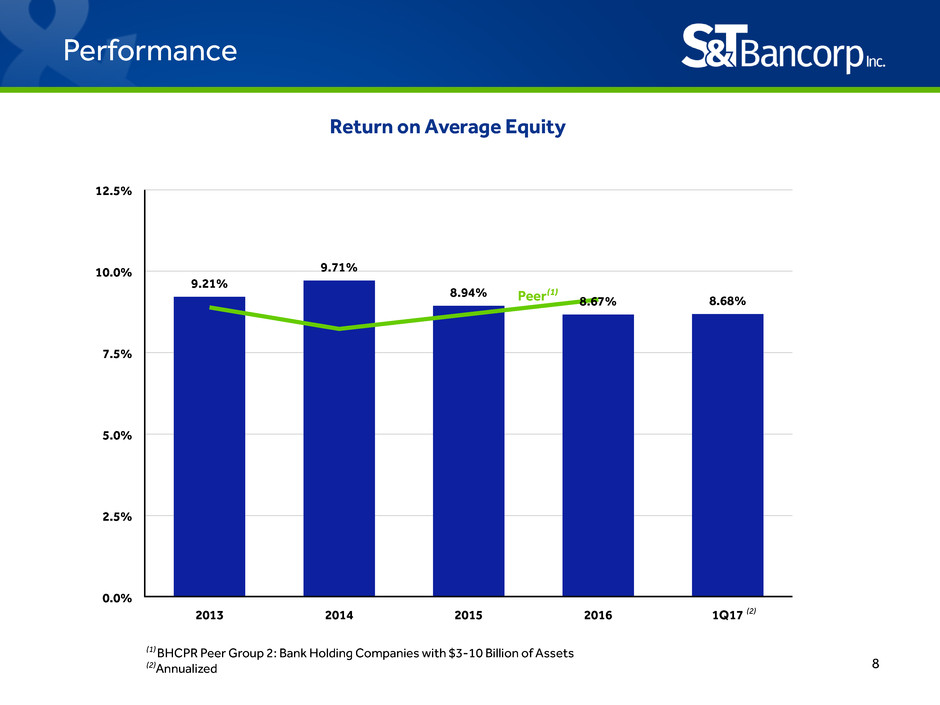
Return on Average Equity(1) 8.68% 8.67% 8.94% 9.71% 9.21%
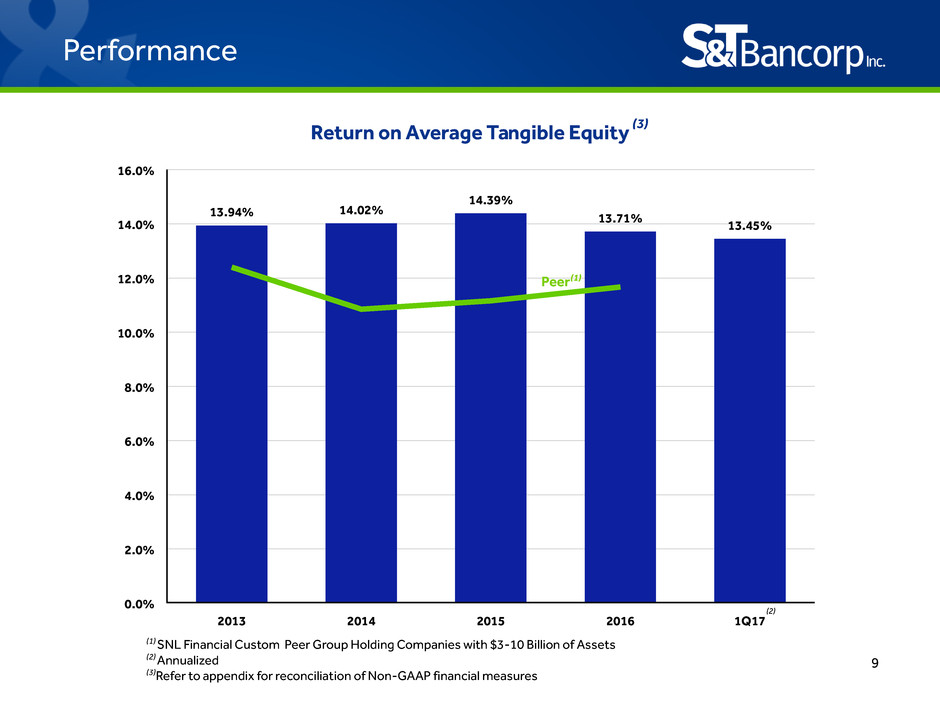
Return on Tangible Equity(1)(2) 13.45% 13.71% 14.39% 14.02% 13.94%
Net Interest Margin (FTE)(1)(2) 3.50% 3.47% 3.56% 3.50% 3.50%
Nonperforming Assets/Loans+OREO 0.81% 0.77% 0.71% 0.33% 0.64%
Allowance for Loan Losses/Total Portfolio Loans 0.97% 0.94% 0.96% 1.24% 1.30%
Net Loan Charge-offs/Average Loans(1) 0.15% 0.25% 0.22% 0.00% 0.25%
Risk Based Capital-Total 12.02% 11.86% 11.60% 14.27% 14.36%
Tangible Common Equity/Tangible Assets(1)(2) 8.28% 8.23% 8.24% 9.00% 9.03%
6
STBA Investment Thesis
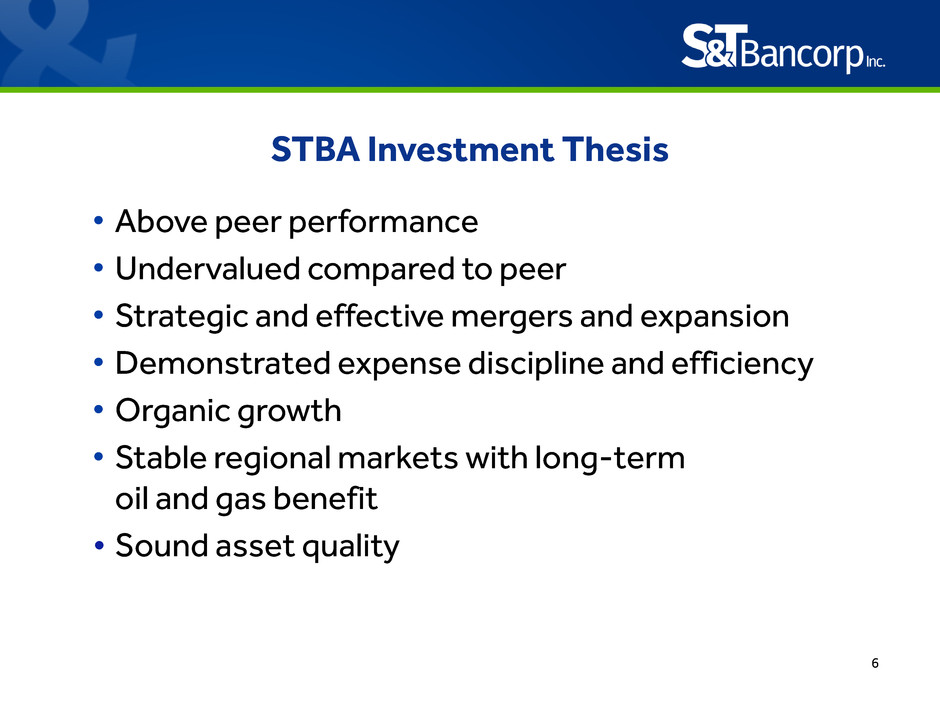
• Above peer performance
• Undervalued compared to peer
• Strategic and effective mergers and expansion
• Demonstrated expense discipline and efficiency
• Organic growth
• Stable regional markets with long-term
oil and gas benefit
• Sound asset quality
7
Peer
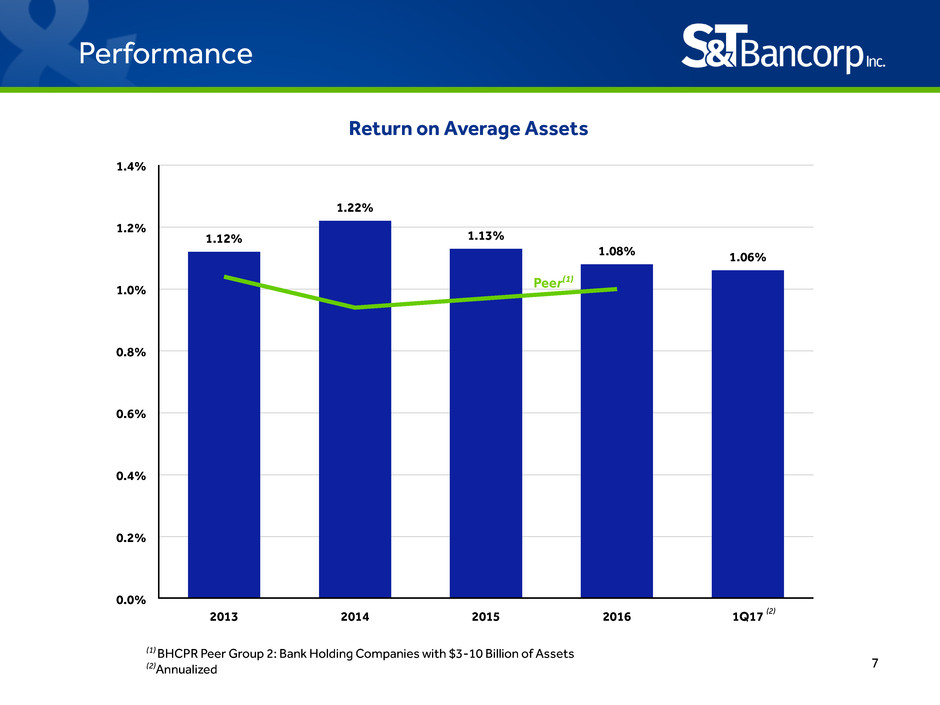
Return on Average Assets
1.4%
1.2%
1.0%
0.8%
0.6%
0.4%
0.2%
0.0%
2013 2014 2015 2016 1Q17
1.12%
1.22%
1.13%
1.08% 1.06%
(1) BHCPR Peer Group 2: Bank Holding Companies with $3-10 Billion of Assets
(2)Annualized
Performance
Peer(1)
(2)
8
Performance
Return on Average Equity
12.5%
10.0%
7.5%
5.0%
2.5%
0.0%
2013 2014 2015 2016 1Q17
9.21%
9.71%
8.94%
8.67% 8.68%
(1) BHCPR Peer Group 2: Bank Holding Companies with $3-10 Billion of Assets
(2)Annualized
Peer(1)
(2)
9
Performance
Return on Average Tangible Equity
16.0%
14.0%
12.0%
10.0%
8.0%
6.0%
4.0%
2.0%
0.0%
2013 2014 2015 2016 1Q17
13.94% 14.02%
14.39%
13.71% 13.45%
(1) SNL Financial Custom Peer Group Holding Companies with $3-10 Billion of Assets
(2) Annualized
(3)Refer to appendix for reconciliation of Non-GAAP financial measures
Peer(1)
(2)
(3)
10
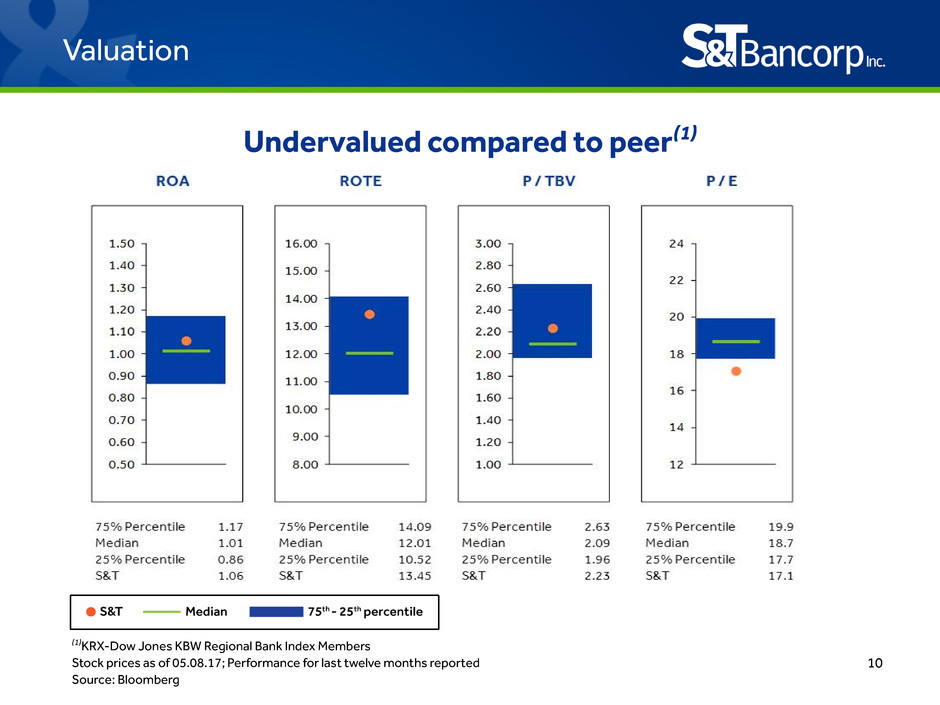
Undervalued compared to peer(1)
Valuation
(1)KRX-Dow Jones KBW Regional Bank Index Members
Stock prices as of 05.08.17; Performance for last twelve months reported
Source: Bloomberg
11
NASDAQ Bank S&P 500
KRX Regional Bank S&T Bancorp
Stock Price Change (%)
60
50
40
30
20
10
0
-10
Pr
ic
e
C
ha
ng
e(
%
)
M
ar
16
Ap
r1
6
M
ay
16
Ju
n
16
Ju
l1
6
Au
g
16
Se
p
16
O
ct
16
N
ov
16
D
ec
16
Ja
n
17
Fe
b
17
M
ar
17
Valuation
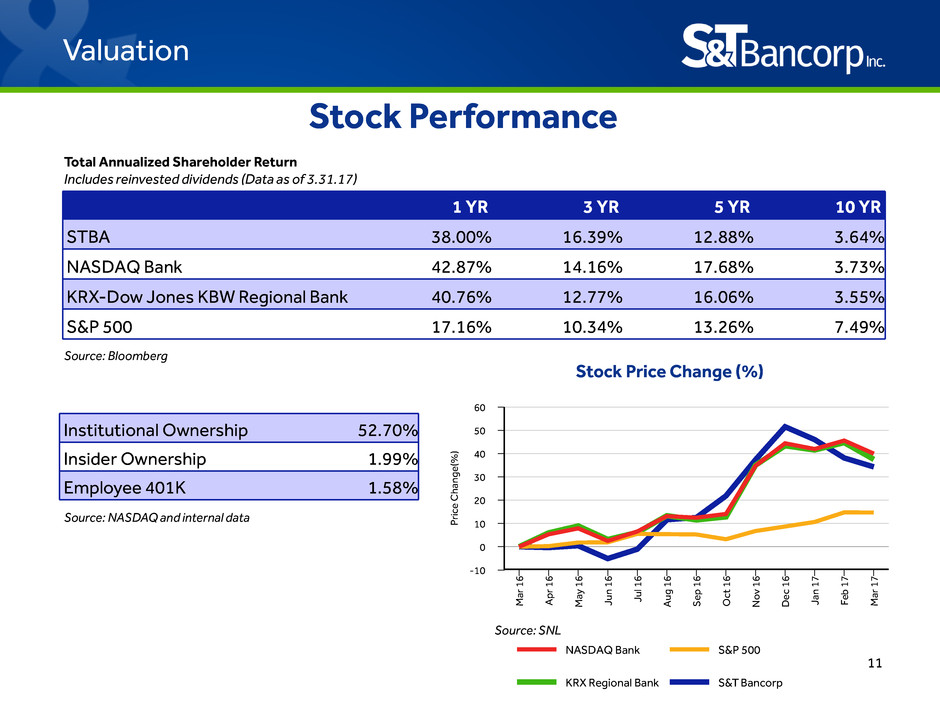
1 YR 3 YR 5 YR 10 YR
STBA 38.00% 16.39% 12.88% 3.64%
NASDAQ Bank 42.87% 14.16% 17.68% 3.73%
KRX-Dow Jones KBW Regional Bank 40.76% 12.77% 16.06% 3.55%
S&P 500 17.16% 10.34% 13.26% 7.49%
Institutional Ownership 52.70%
Insider Ownership 1.99%
Employee 401K 1.58%
Source: NASDAQ and internal data
Source: Bloomberg
Total Annualized Shareholder Return
Includes reinvested dividends (Data as of 3.31.17)
Stock Performance
Source: SNL
12
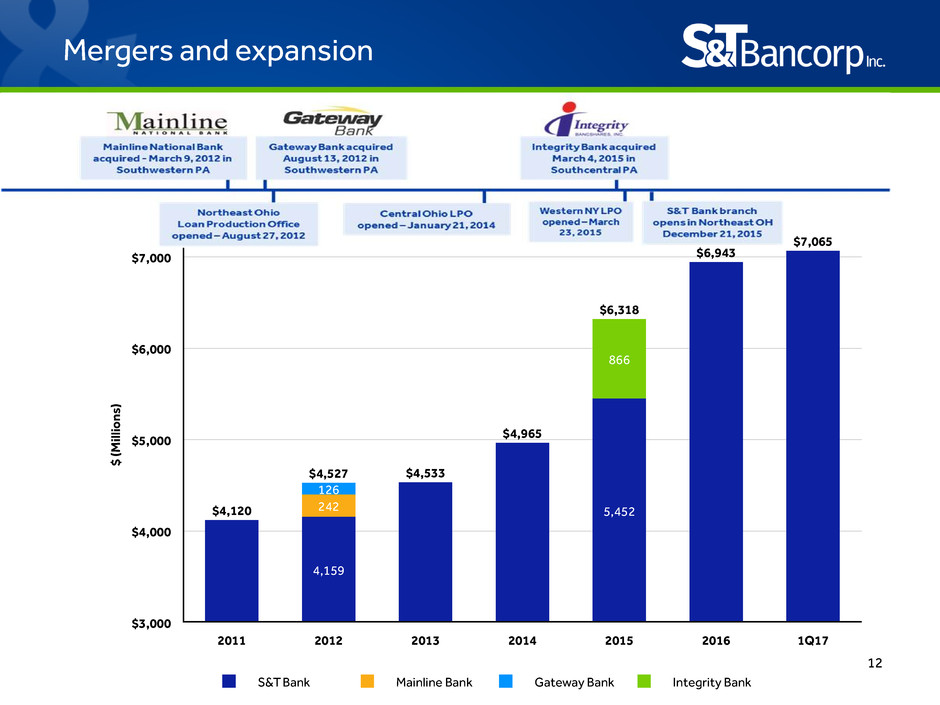
Mergers and expansion
S&T Bank Mainline Bank Gateway Bank Integrity Bank
$7,000
$6,000
$5,000
$4,000
$3,000
$
(M
ill
io
ns
)
2011 2012 2013 2014 2015 2016 1Q17
$4,120
4,159
$4,533
$4,965
5,452
$6,943
$7,065
242
126
$4,527
866
$6,318
13
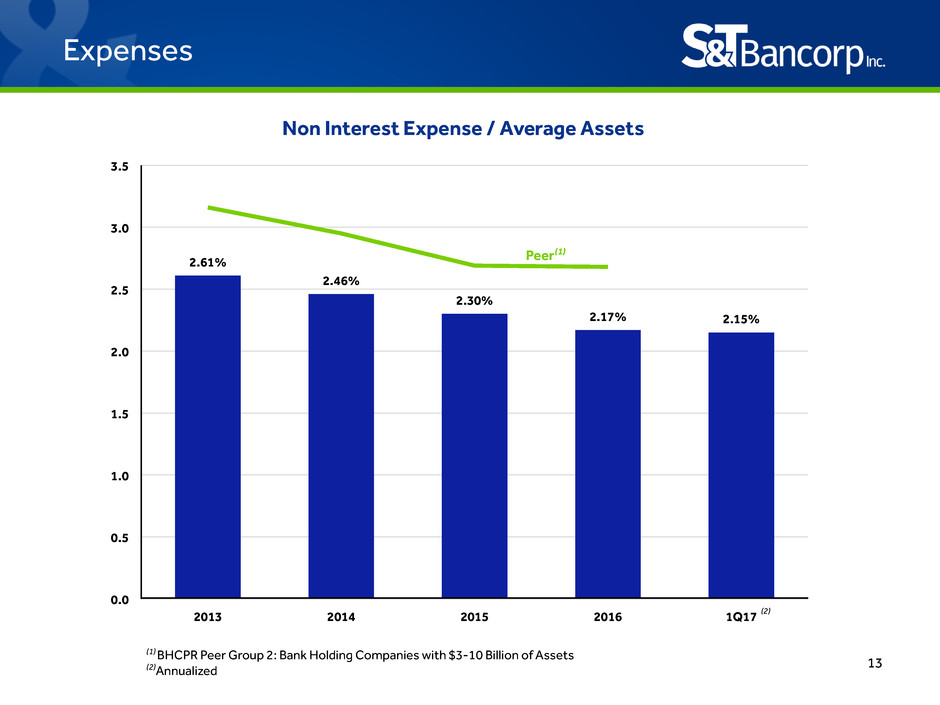
Expenses
Non Interest Expense / Average Assets
3.5
3.0
2.5
2.0
1.5
1.0
0.5
0.0
2013 2014 2015 2016 1Q17
2.61%
2.46%
2.30%
2.17% 2.15%
(1) BHCPR Peer Group 2: Bank Holding Companies with $3-10 Billion of Assets
(2)Annualized
Peer(1)
(2)
14
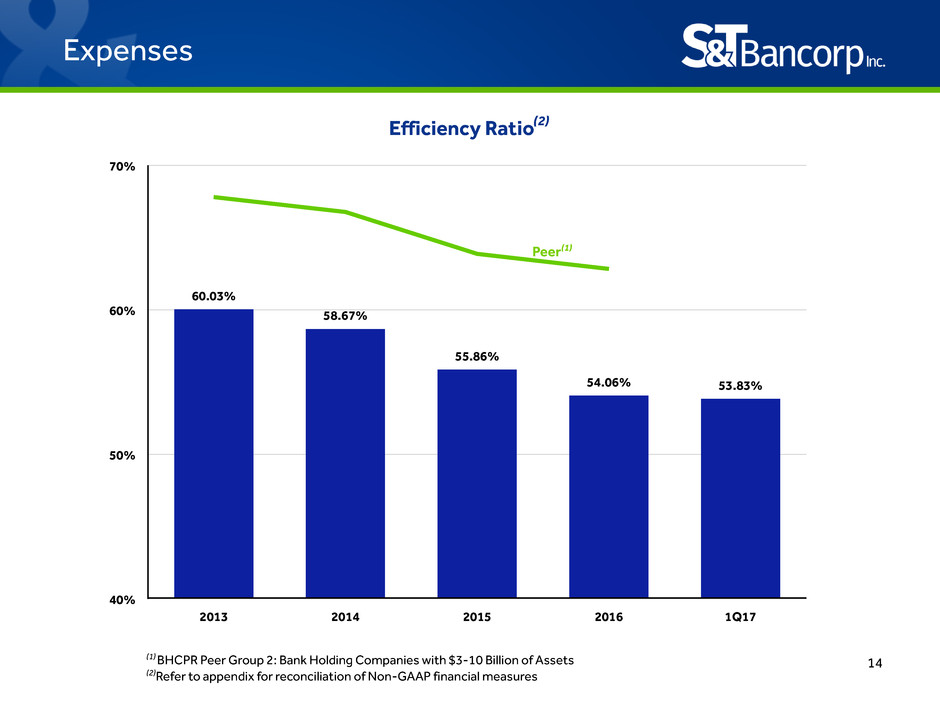
Expenses
Efficiency Ratio
70%
60%
50%
40%
2013 2014 2015 2016 1Q17
60.03%
58.67%
55.86%
54.06% 53.83%
Peer(1)
(1) BHCPR Peer Group 2: Bank Holding Companies with $3-10 Billion of Assets
(2)Refer to appendix for reconciliation of Non-GAAP financial measures
(2)
15
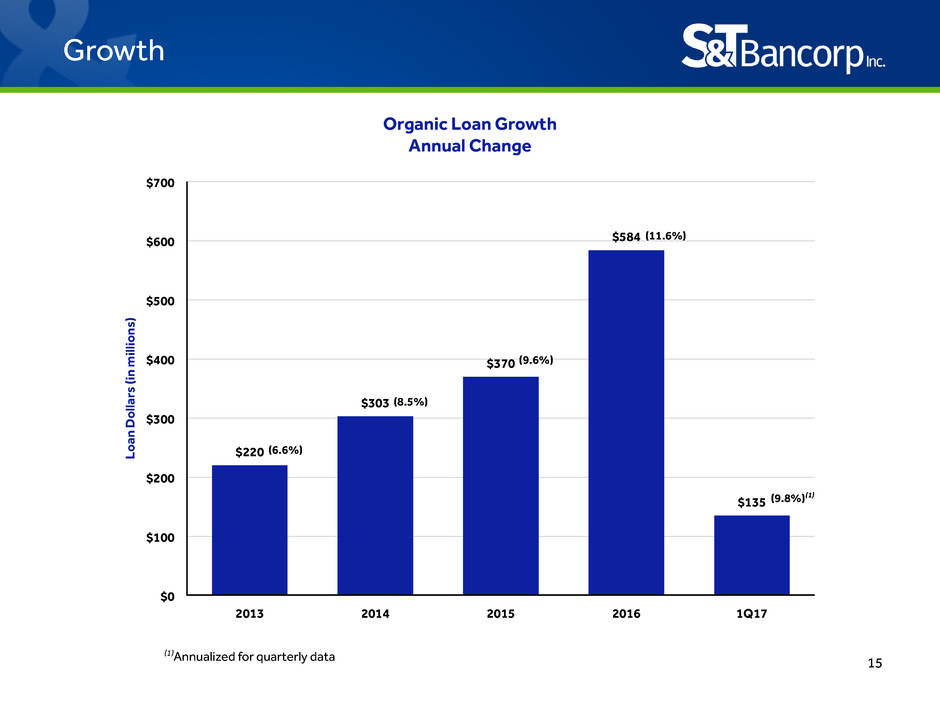
Organic Loan Growth
Annual Change
$700
$600
$500
$400
$300
$200
$100
$0
Lo
an
D
ol
la
rs
(in
m
ill
io
ns
)
2013 2014 2015 2016 1Q17
$220
$303
$370
$584
$135
Growth
(1)Annualized for quarterly data
(8.5%)
(9.6%)
(11.6%)
(9.8%)(1)
(6.6%)
16
Markets
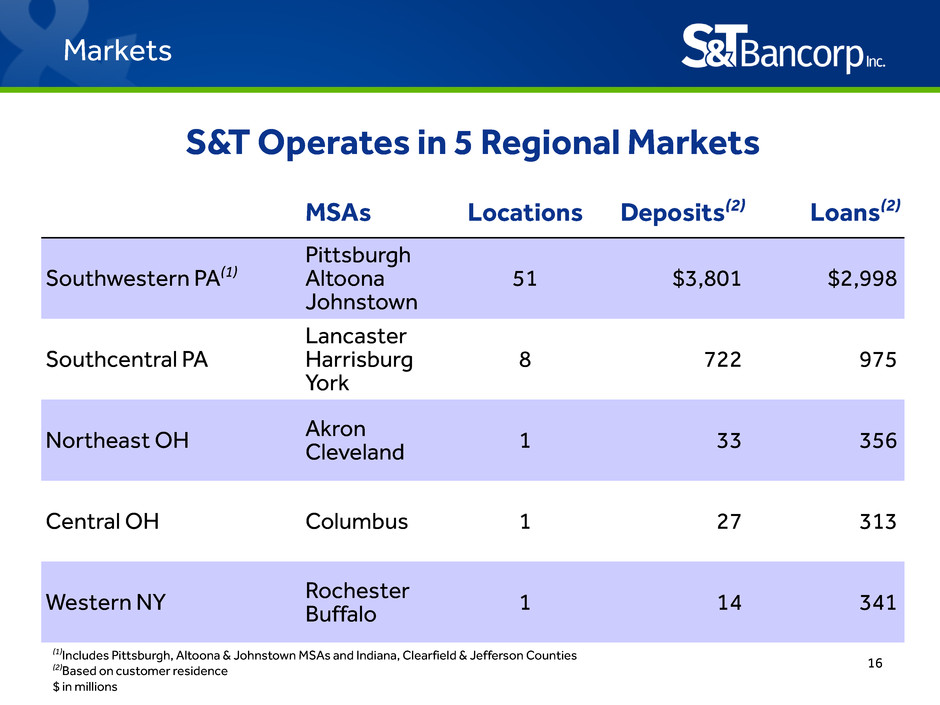
S&T Operates in 5 Regional Markets
MSAs Locations Deposits(2) Loans(2)
Southwestern PA(1)
Pittsburgh
Altoona
Johnstown
51 $3,801 $2,998
Southcentral PA
Lancaster
Harrisburg
York
8 722 975
Northeast OH AkronCleveland 1 33 356
Central OH Columbus 1 27 313
Western NY RochesterBuffalo 1 14 341
(1)Includes Pittsburgh, Altoona & Johnstown MSAs and Indiana, Clearfield & Jefferson Counties
(2)Based on customer residence
$ in millions
17
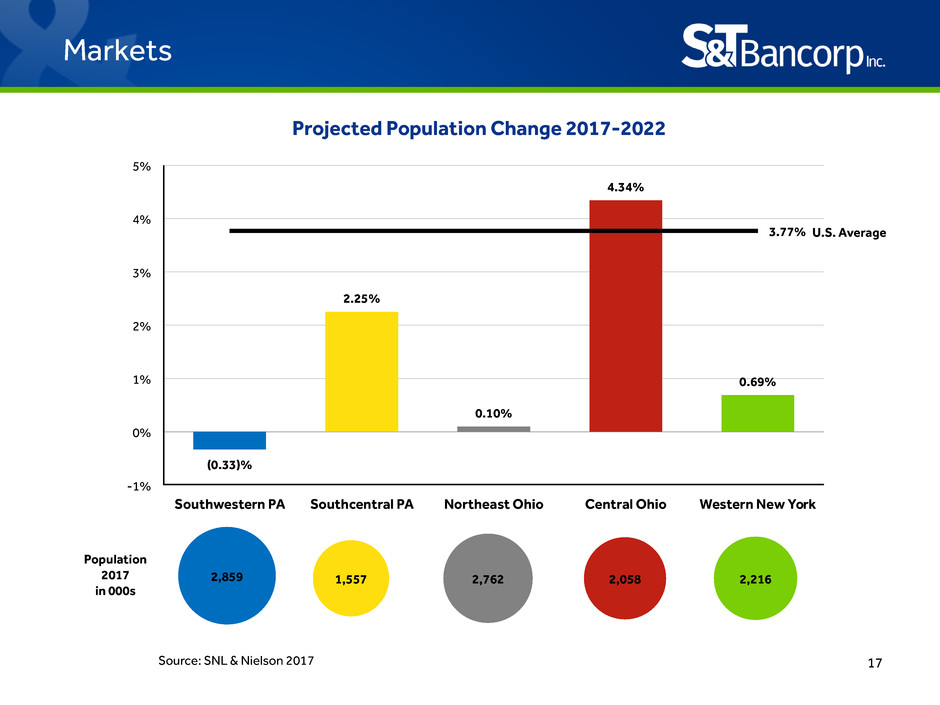
Projected Population Change 2017-2022
5%
4%
3%
2%
1%
0%
-1%
Southwestern PA Southcentral PA Northeast Ohio Central Ohio Western New York
(0.33)%
2.25%
0.10%
4.34%
0.69%
3.77%
2,859 1,557 2,762 2,058 2,216
Source: SNL & Nielson 2017
Population
2017
in 000s
Markets
U.S. Average
18
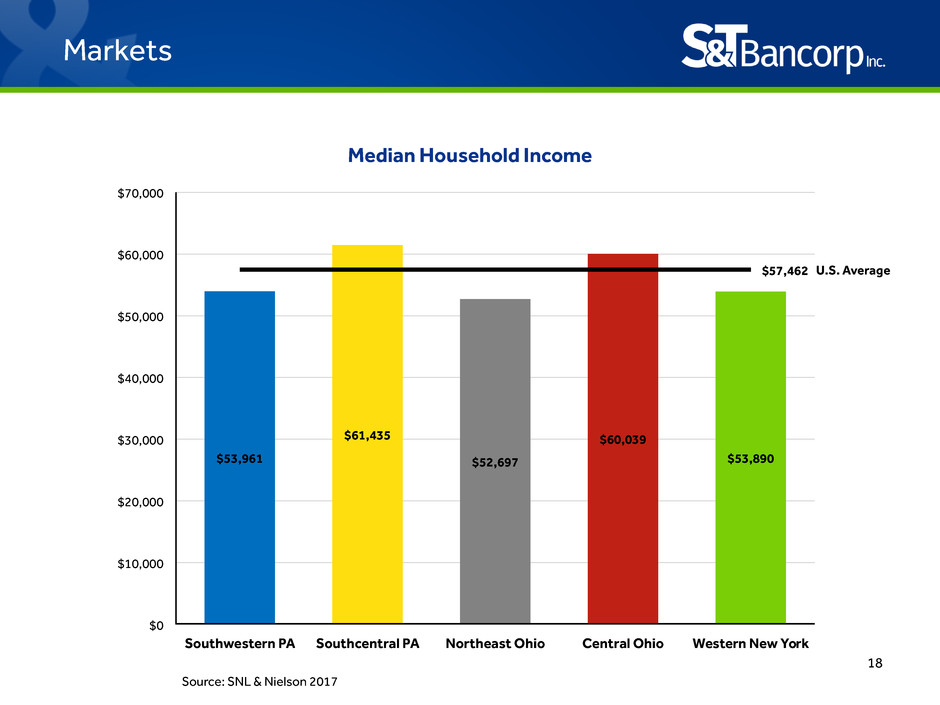
Median Household Income
$70,000
$60,000
$50,000
$40,000
$30,000
$20,000
$10,000
$0
Southwestern PA Southcentral PA Northeast Ohio Central Ohio Western New York
$53,961
$61,435
$52,697
$60,039
$53,890
$57,462 U.S. Average
Source: SNL & Nielson 2017
Markets
19
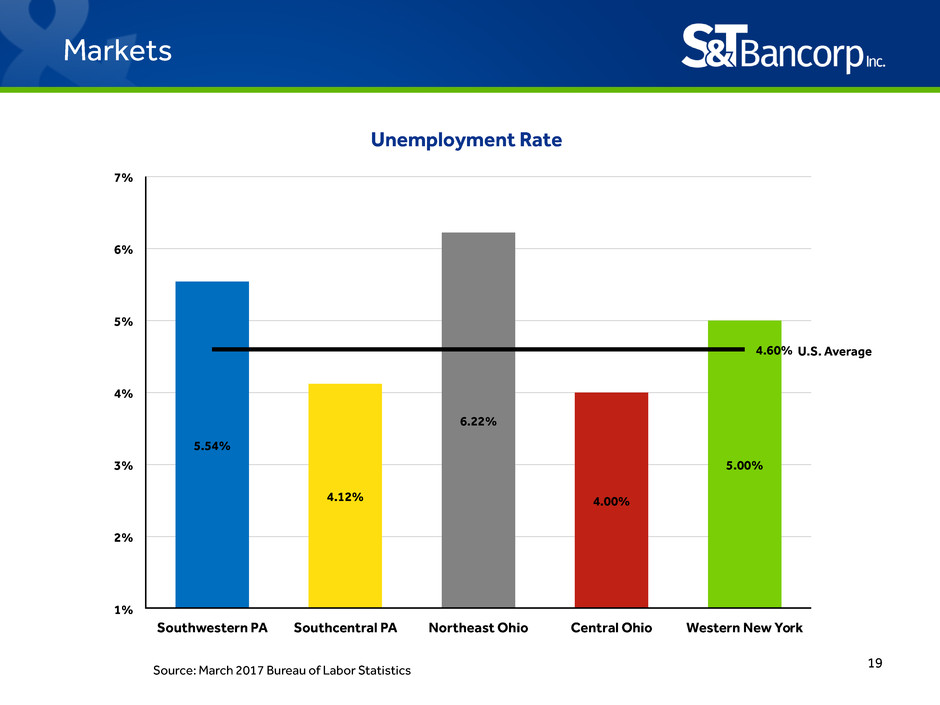
Unemployment Rate
7%
6%
5%
4%
3%
2%
1%
Southwestern PA Southcentral PA Northeast Ohio Central Ohio Western New York
5.54%
4.12%
6.22%
4.00%
5.00%
4.60%
Source: March 2017 Bureau of Labor Statistics
U.S. Average
Markets
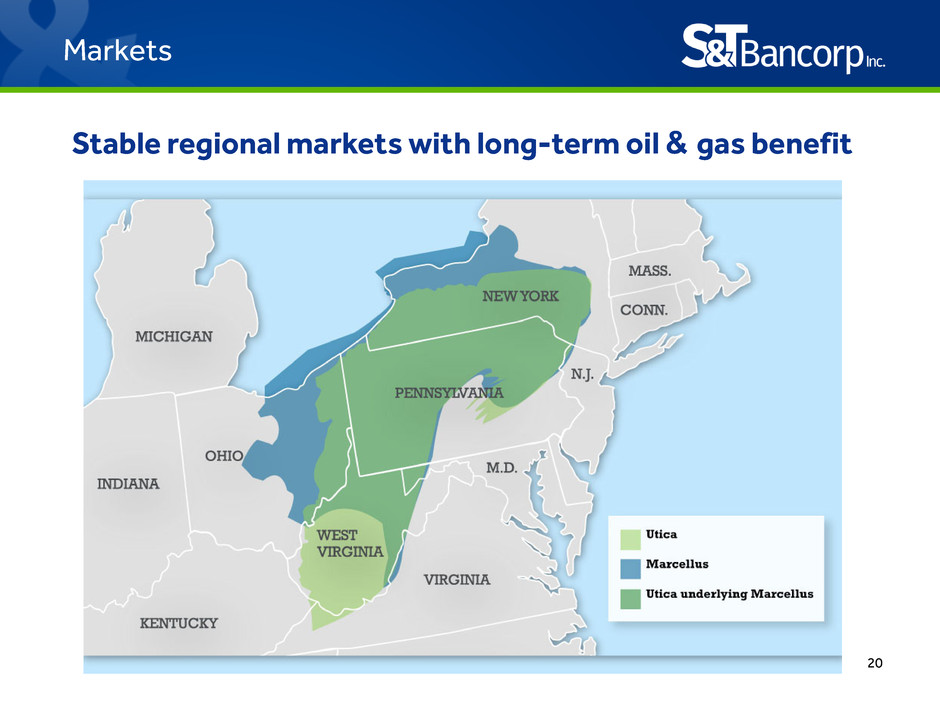
20
Stable regional markets with long-term oil & gas benefit
Markets
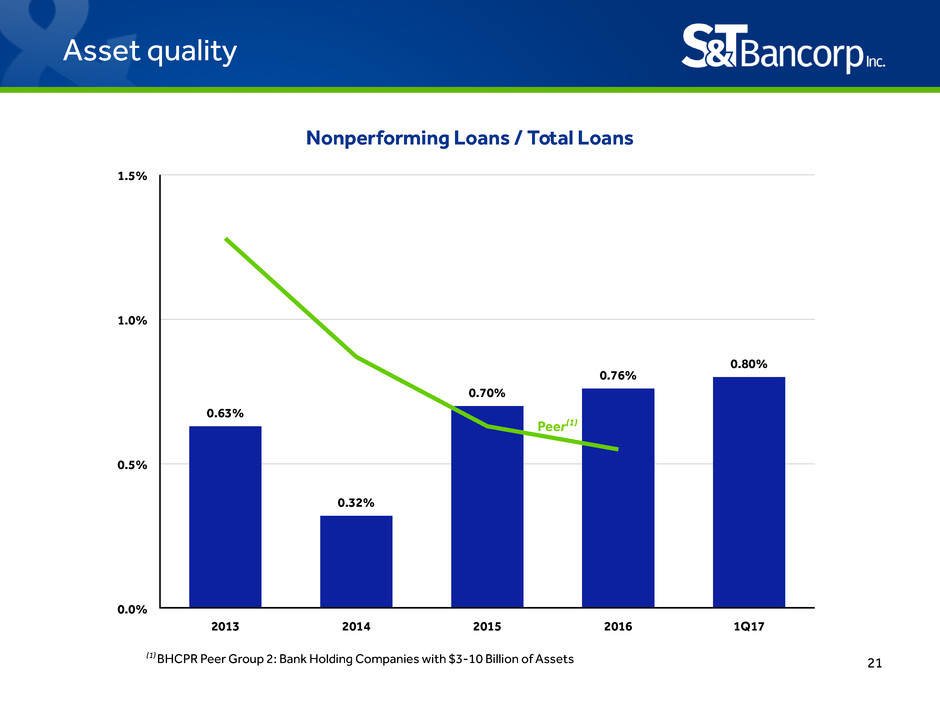
21
Asset quality
Nonperforming Loans / Total Loans
1.5%
1.0%
0.5%
0.0%
2013 2014 2015 2016 1Q17
0.63%
0.32%
0.70%
0.76%
0.80%
(1) BHCPR Peer Group 2: Bank Holding Companies with $3-10 Billion of Assets
Peer(1)
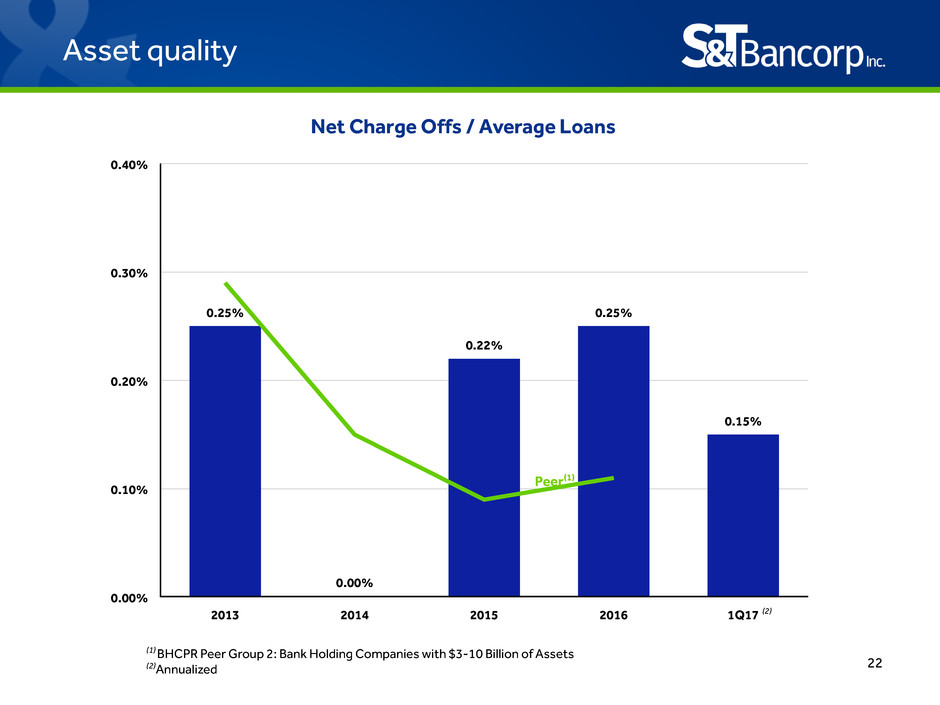
22
Asset quality
Net Charge Offs / Average Loans
0.40%
0.30%
0.20%
0.10%
0.00%
2013 2014 2015 2016 1Q17
0.25%
0.00%
0.22%
0.25%
0.15%
(1) BHCPR Peer Group 2: Bank Holding Companies with $3-10 Billion of Assets
(2)Annualized
Peer(1)
(2)
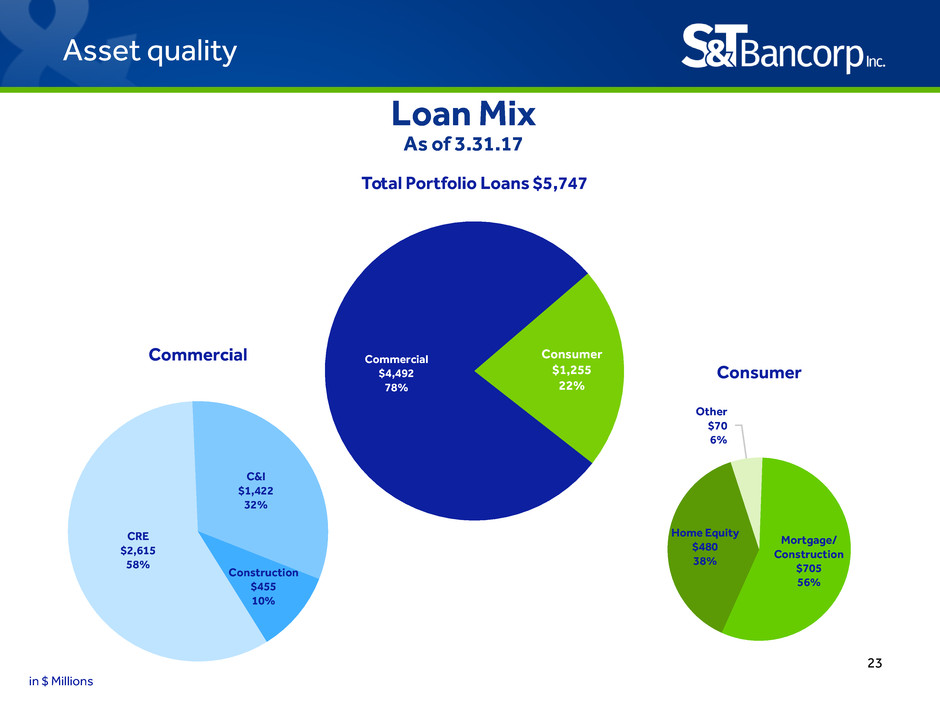
23
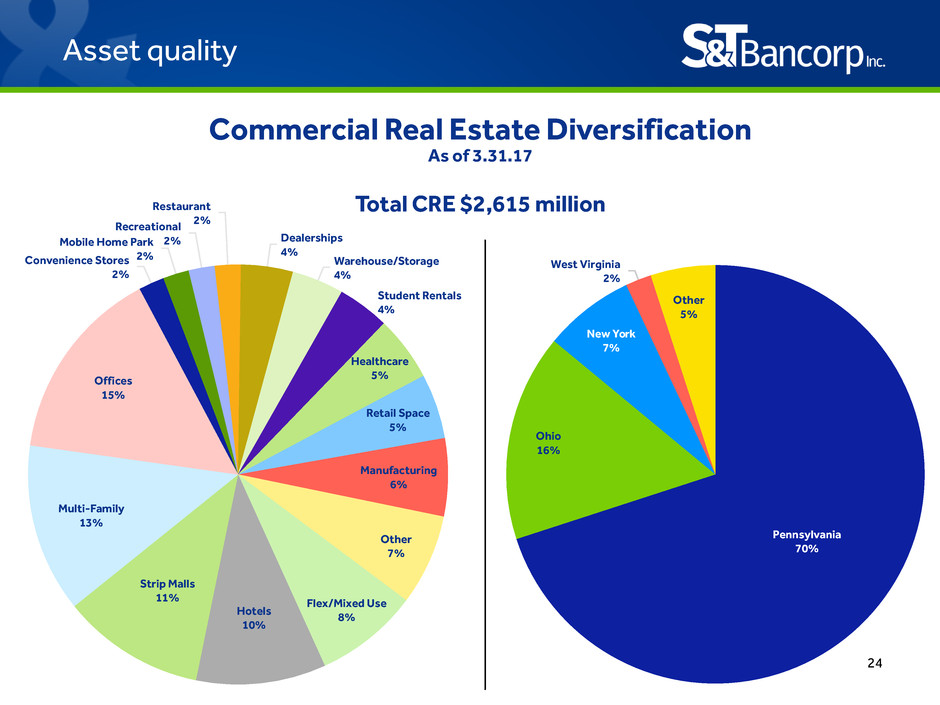
Consumer
Mortgage/
Construction
$705
56%
Home Equity
$480
38%
Other
$70
6%
Commercial
CRE
$2,615
58%
C&I
$1,422
32%
Construction
$455
10%
Asset quality
Total Portfolio Loans $5,747
Commercial
$4,492
78%
Consumer
$1,255
22%
Loan Mix
As of 3.31.17
in $ Millions
24
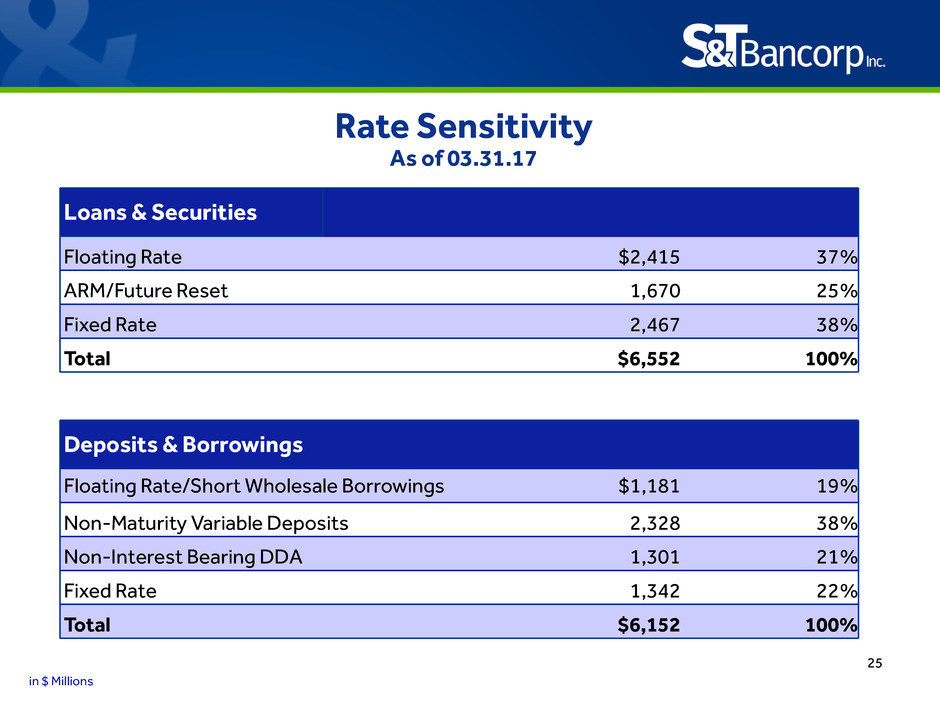
Pennsylvania
70%
Ohio
16%
New York
7%
West Virginia
2%
Other
5%
Asset quality
Convenience Stores
2%
Mobile Home Park
2%
Recreational
2%
Restaurant
2%
Dealerships
4%
Warehouse/Storage
4%
Student Rentals
4%
Healthcare
5%
Retail Space
5%
Manufacturing
6%
Other
7%
Flex/Mixed Use
8%Hotels10%
Strip Malls
11%
Multi-Family
13%
Offices
15%
Commercial Real Estate Diversification
As of 3.31.17
Total CRE $2,615 million
25
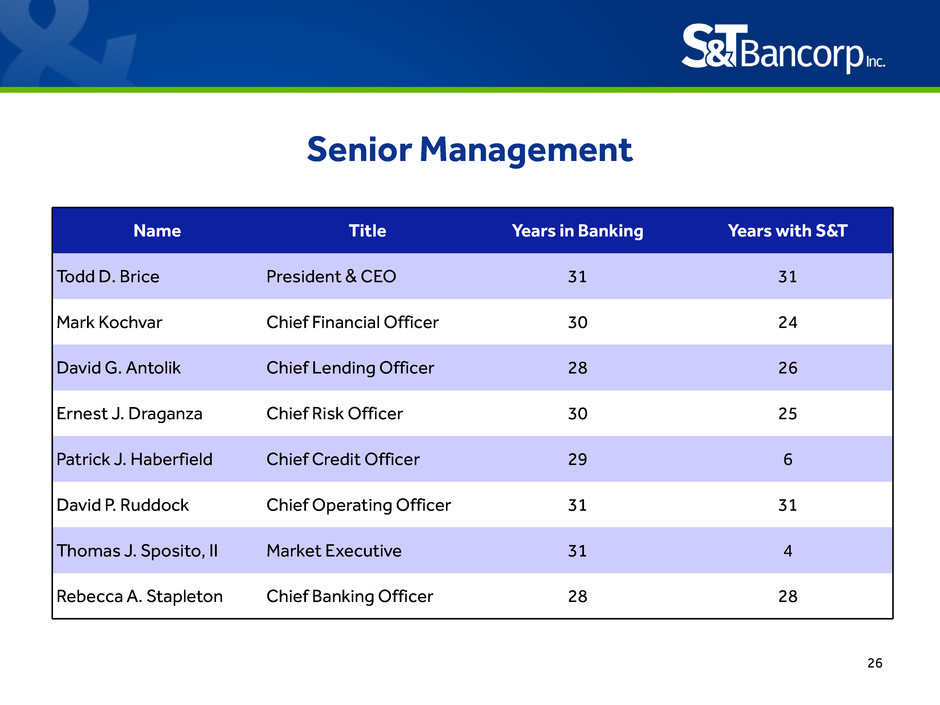
Loans & Securities
Floating Rate $2,415 37%
ARM/Future Reset 1,670 25%
Fixed Rate 2,467 38%
Total $6,552 100%
Deposits & Borrowings
Floating Rate/Short Wholesale Borrowings $1,181 19%
Non-Maturity Variable Deposits 2,328 38%
Non-Interest Bearing DDA 1,301 21%
Fixed Rate 1,342 22%
Total $6,152 100%
Rate Sensitivity
As of 03.31.17
in $ Millions
26
Senior Management
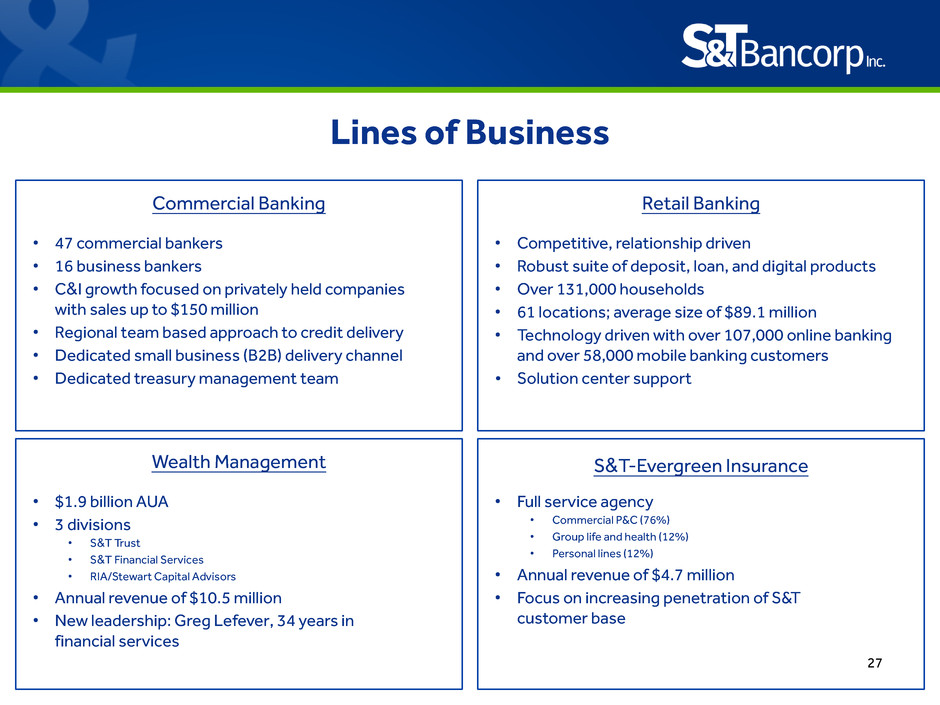
Name Title Years in Banking Years with S&T
Todd D. Brice President & CEO 31 31
Mark Kochvar Chief Financial Officer 30 24
David G. Antolik Chief Lending Officer 28 26
Ernest J. Draganza Chief Risk Officer 30 25
Patrick J. Haberfield Chief Credit Officer 29 6
David P. Ruddock Chief Operating Officer 31 31
Thomas J. Sposito, II Market Executive 31 4
Rebecca A. Stapleton Chief Banking Officer 28 28
27
Lines of Business
Commercial Banking
• 47 commercial bankers
• 16 business bankers
• C&I growth focused on privately held companies
with sales up to $150 million
• Regional team based approach to credit delivery
• Dedicated small business (B2B) delivery channel
• Dedicated treasury management team
Retail Banking
• Competitive, relationship driven
• Robust suite of deposit, loan, and digital products
• Over 131,000 households
• 61 locations; average size of $89.1 million
• Technology driven with over 107,000 online banking
and over 58,000 mobile banking customers
• Solution center support
S&T-Evergreen Insurance
• Full service agency
• Commercial P&C (76%)
• Group life and health (12%)
• Personal lines (12%)
• Annual revenue of $4.7 million
• Focus on increasing penetration of S&T
customer base
Wealth Management
• $1.9 billion AUA
• 3 divisions
• S&T Trust
• S&T Financial Services
• RIA/Stewart Capital Advisors
• Annual revenue of $10.5 million
• New leadership: Greg Lefever, 34 years in
financial services
28
The Right Size
• Big enough to:
• Provide full complement of products and services
• Access technology
• Access capital markets
• Attract talent
• Expand – mergers and acquisitions/de novo
• Small enough to:
• Stay close to our customers
• Understand our markets
• Be responsive
29
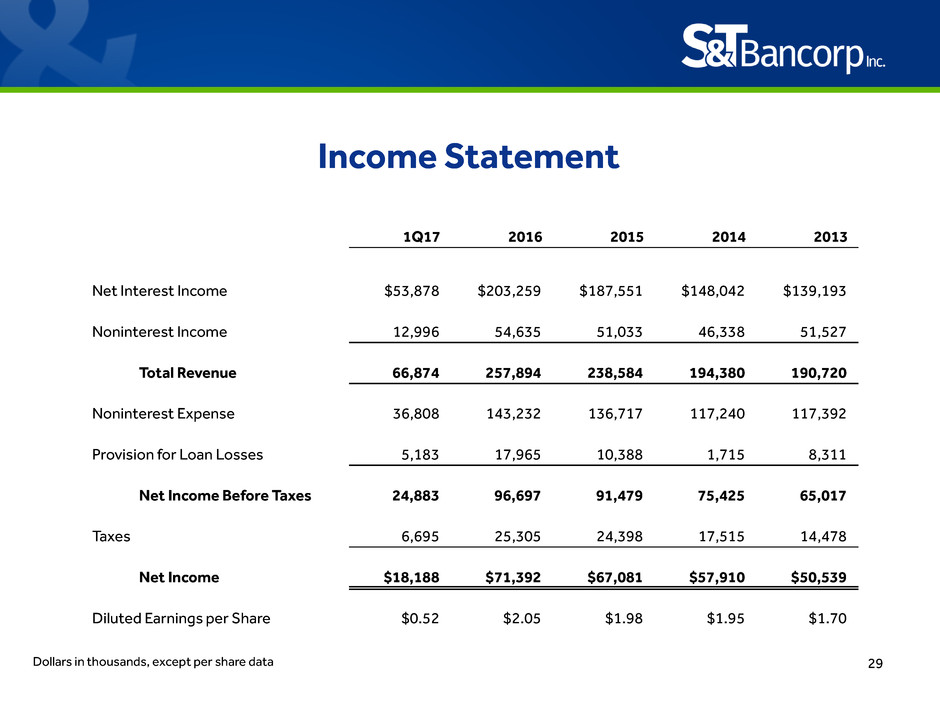
Income Statement
Dollars in thousands, except per share data
1Q17 2016 2015 2014 2013
Net Interest Income $53,878 $203,259 $187,551 $148,042 $139,193
Noninterest Income 12,996 54,635 51,033 46,338 51,527
Total Revenue 66,874 257,894 238,584 194,380 190,720
Noninterest Expense 36,808 143,232 136,717 117,240 117,392
Provision for Loan Losses 5,183 17,965 10,388 1,715 8,311
Net Income Before Taxes 24,883 96,697 91,479 75,425 65,017
Taxes 6,695 25,305 24,398 17,515 14,478
Net Income $18,188 $71,392 $67,081 $57,910 $50,539
Diluted Earnings per Share $0.52 $2.05 $1.98 $1.95 $1.70
30
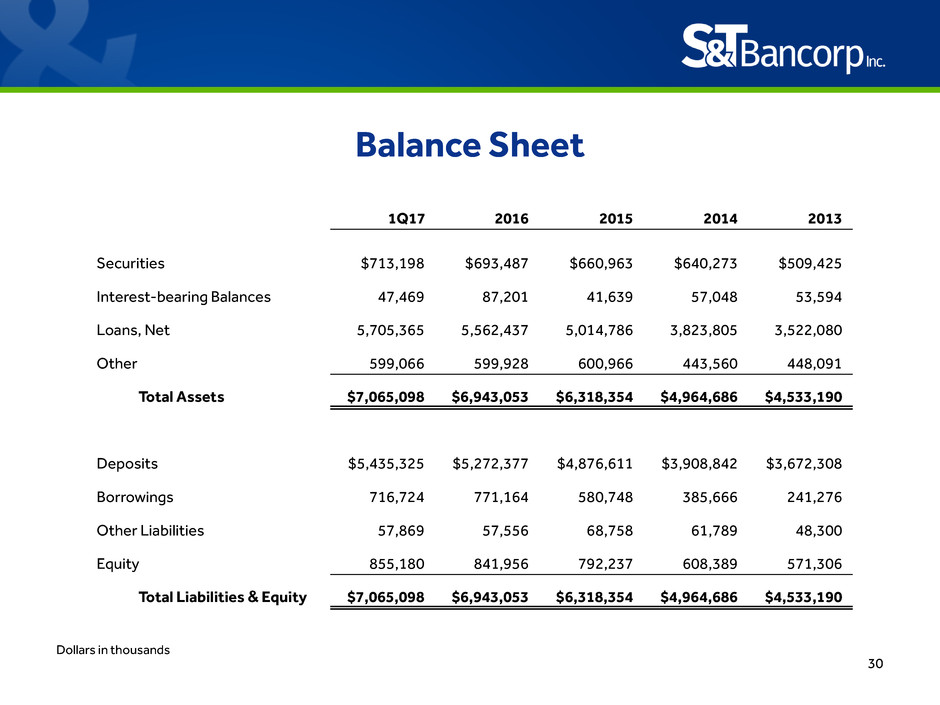
Balance Sheet
Dollars in thousands
1Q17 2016 2015 2014 2013
Securities $713,198 $693,487 $660,963 $640,273 $509,425
Interest-bearing Balances 47,469 87,201 41,639 57,048 53,594
Loans, Net 5,705,365 5,562,437 5,014,786 3,823,805 3,522,080
Other 599,066 599,928 600,966 443,560 448,091
Total Assets $7,065,098 $6,943,053 $6,318,354 $4,964,686 $4,533,190
Deposits $5,435,325 $5,272,377 $4,876,611 $3,908,842 $3,672,308
Borrowings 716,724 771,164 580,748 385,666 241,276
Other Liabilities 57,869 57,556 68,758 61,789 48,300
Equity 855,180 841,956 792,237 608,389 571,306
Total Liabilities & Equity $7,065,098 $6,943,053 $6,318,354 $4,964,686 $4,533,190
31
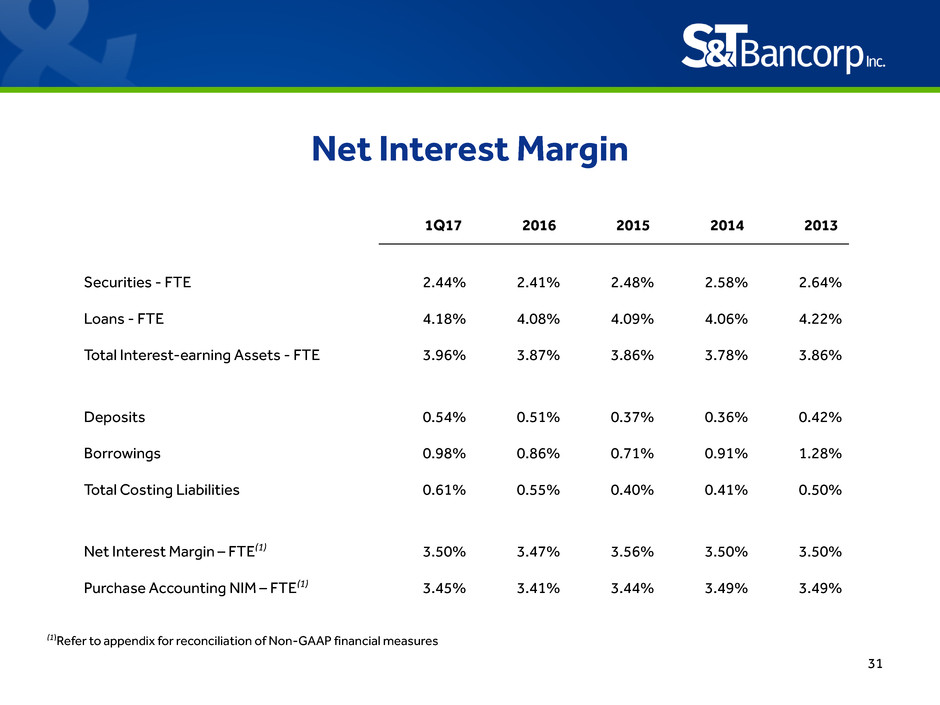
Net Interest Margin
(1)Refer to appendix for reconciliation of Non-GAAP financial measures
1Q17 2016 2015 2014 2013
Securities - FTE 2.44% 2.41% 2.48% 2.58% 2.64%
Loans - FTE 4.18% 4.08% 4.09% 4.06% 4.22%
Total Interest-earning Assets - FTE 3.96% 3.87% 3.86% 3.78% 3.86%
Deposits 0.54% 0.51% 0.37% 0.36% 0.42%
Borrowings 0.98% 0.86% 0.71% 0.91% 1.28%
Total Costing Liabilities 0.61% 0.55% 0.40% 0.41% 0.50%
Net Interest Margin – FTE(1) 3.50% 3.47% 3.56% 3.50% 3.50%
Purchase Accounting NIM – FTE(1) 3.45% 3.41% 3.44% 3.49% 3.49%
32
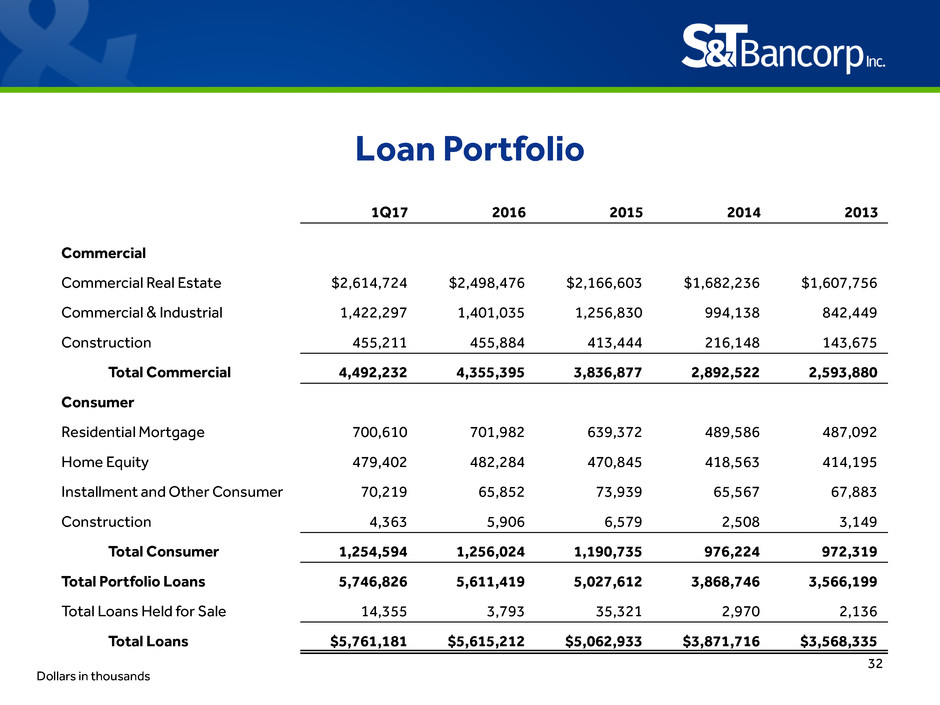
Loan Portfolio
Dollars in thousands
1Q17 2016 2015 2014 2013
Commercial
Commercial Real Estate $2,614,724 $2,498,476 $2,166,603 $1,682,236 $1,607,756
Commercial & Industrial 1,422,297 1,401,035 1,256,830 994,138 842,449
Construction 455,211 455,884 413,444 216,148 143,675
Total Commercial 4,492,232 4,355,395 3,836,877 2,892,522 2,593,880
Consumer
Residential Mortgage 700,610 701,982 639,372 489,586 487,092
Home Equity 479,402 482,284 470,845 418,563 414,195
Installment and Other Consumer 70,219 65,852 73,939 65,567 67,883
Construction 4,363 5,906 6,579 2,508 3,149
Total Consumer 1,254,594 1,256,024 1,190,735 976,224 972,319
Total Portfolio Loans 5,746,826 5,611,419 5,027,612 3,868,746 3,566,199
Total Loans Held for Sale 14,355 3,793 35,321 2,970 2,136
Total Loans $5,761,181 $5,615,212 $5,062,933 $3,871,716 $3,568,335
33
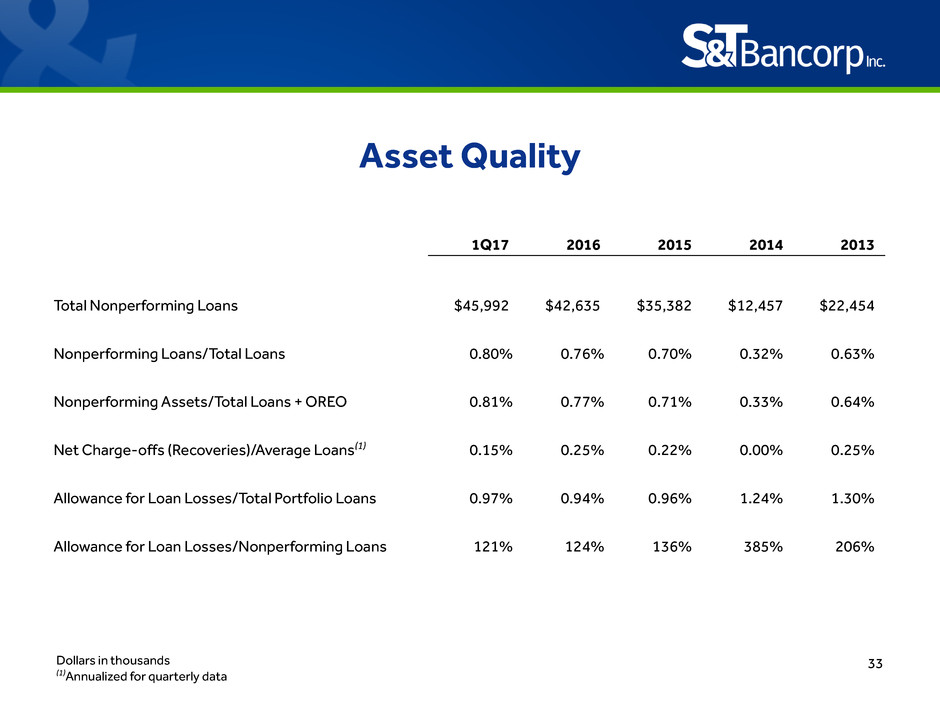
Asset Quality
Dollars in thousands
(1)Annualized for quarterly data
1Q17 2016 2015 2014 2013
Total Nonperforming Loans $45,992 $42,635 $35,382 $12,457 $22,454
Nonperforming Loans/Total Loans 0.80% 0.76% 0.70% 0.32% 0.63%
Nonperforming Assets/Total Loans + OREO 0.81% 0.77% 0.71% 0.33% 0.64%
Net Charge-offs (Recoveries)/Average Loans(1) 0.15% 0.25% 0.22% 0.00% 0.25%
Allowance for Loan Losses/Total Portfolio Loans 0.97% 0.94% 0.96% 1.24% 1.30%
Allowance for Loan Losses/Nonperforming Loans 121% 124% 136% 385% 206%
34
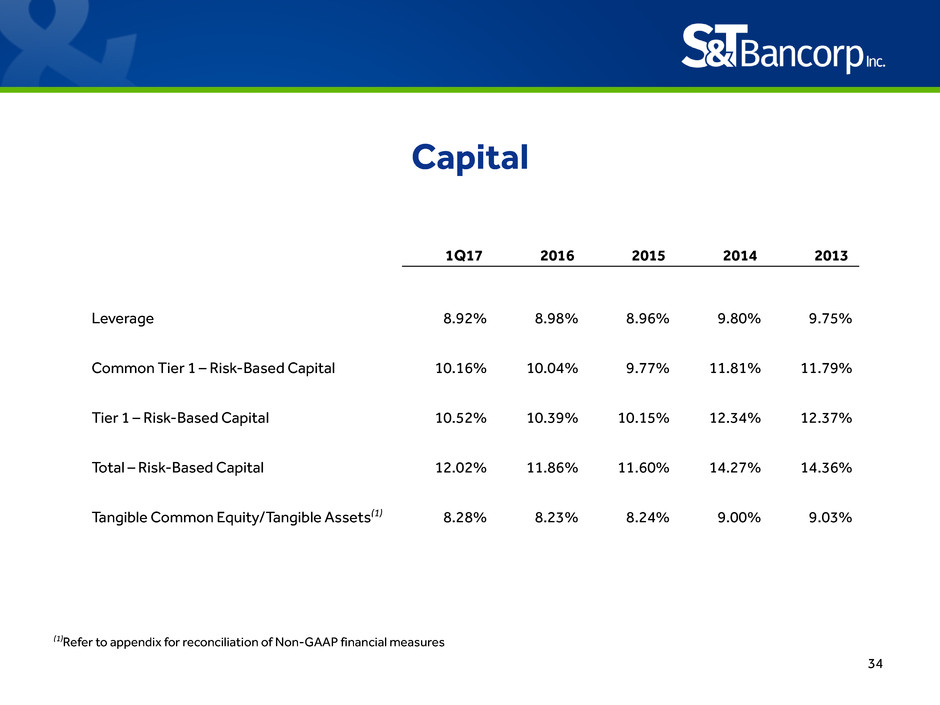
Capital
(1)Refer to appendix for reconciliation of Non-GAAP financial measures
1Q17 2016 2015 2014 2013
Leverage 8.92% 8.98% 8.96% 9.80% 9.75%
Common Tier 1 – Risk-Based Capital 10.16% 10.04% 9.77% 11.81% 11.79%
Tier 1 – Risk-Based Capital 10.52% 10.39% 10.15% 12.34% 12.37%
Total – Risk-Based Capital 12.02% 11.86% 11.60% 14.27% 14.36%
Tangible Common Equity/Tangible Assets(1) 8.28% 8.23% 8.24% 9.00% 9.03%
35
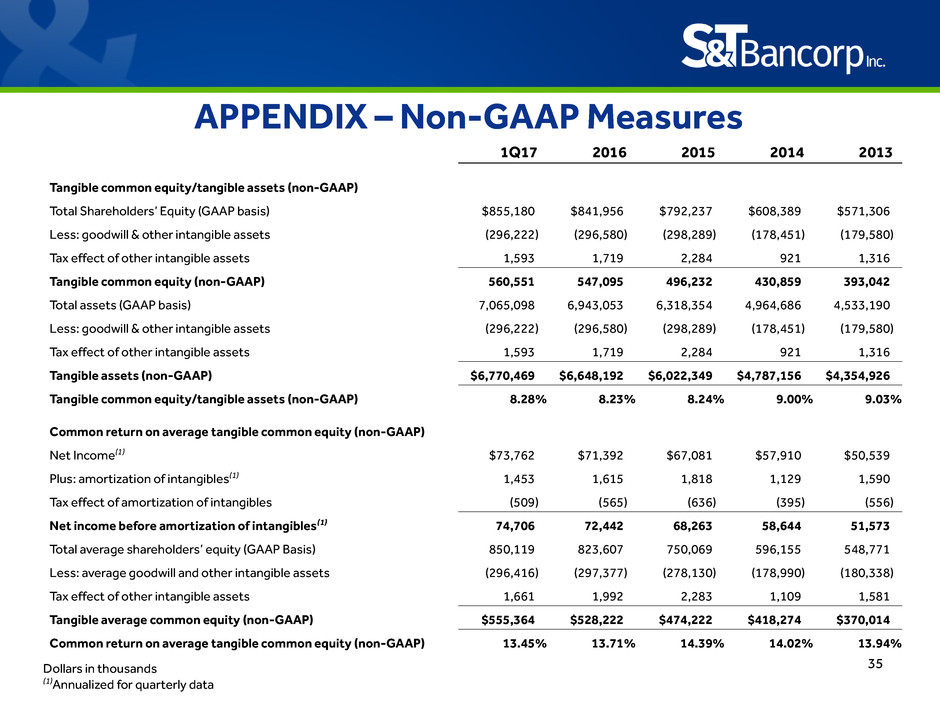
APPENDIX – Non-GAAP Measures
1Q17 2016 2015 2014 2013
Tangible common equity/tangible assets (non-GAAP)
Total Shareholders’ Equity (GAAP basis) $855,180 $841,956 $792,237 $608,389 $571,306
Less: goodwill & other intangible assets (296,222) (296,580) (298,289) (178,451) (179,580)
Tax effect of other intangible assets 1,593 1,719 2,284 921 1,316
Tangible common equity (non-GAAP) 560,551 547,095 496,232 430,859 393,042
Total assets (GAAP basis) 7,065,098 6,943,053 6,318,354 4,964,686 4,533,190
Less: goodwill & other intangible assets (296,222) (296,580) (298,289) (178,451) (179,580)
Tax effect of other intangible assets 1,593 1,719 2,284 921 1,316
Tangible assets (non-GAAP) $6,770,469 $6,648,192 $6,022,349 $4,787,156 $4,354,926
Tangible common equity/tangible assets (non-GAAP) 8.28% 8.23% 8.24% 9.00% 9.03%
Common return on average tangible common equity (non-GAAP)
Net Income(1) $73,762 $71,392 $67,081 $57,910 $50,539
Plus: amortization of intangibles(1) 1,453 1,615 1,818 1,129 1,590
Tax effect of amortization of intangibles (509) (565) (636) (395) (556)
Net income before amortization of intangibles(1) 74,706 72,442 68,263 58,644 51,573
Total average shareholders’ equity (GAAP Basis) 850,119 823,607 750,069 596,155 548,771
Less: average goodwill and other intangible assets (296,416) (297,377) (278,130) (178,990) (180,338)
Tax effect of other intangible assets 1,661 1,992 2,283 1,109 1,581
Tangible average common equity (non-GAAP) $555,364 $528,222 $474,222 $418,274 $370,014
Common return on average tangible common equity (non-GAAP) 13.45% 13.71% 14.39% 14.02% 13.94%
Dollars in thousands
(1)Annualized for quarterly data
36
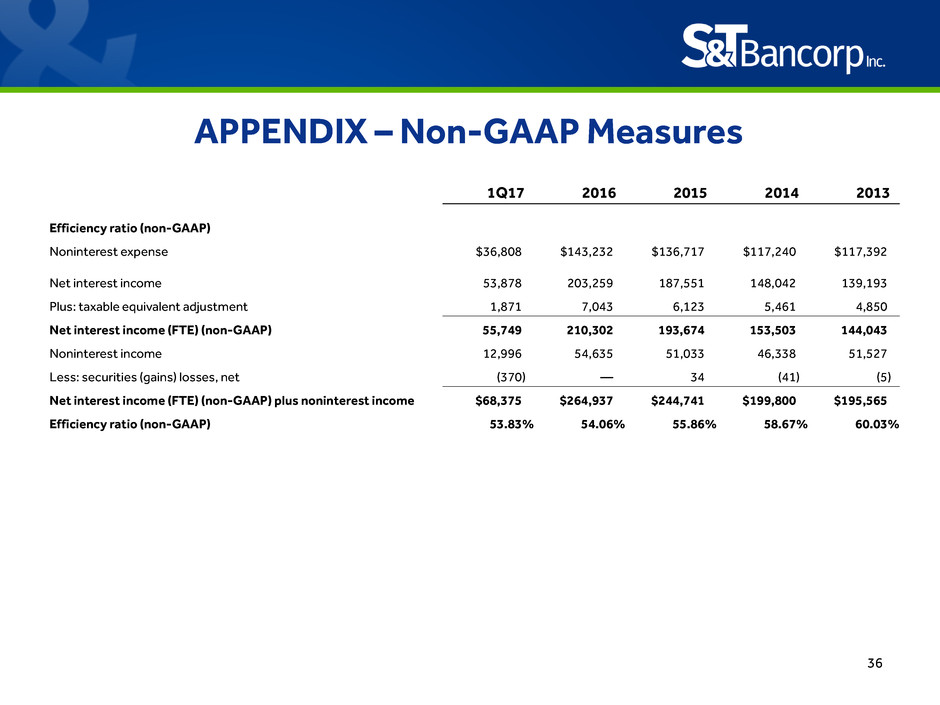
1Q17 2016 2015 2014 2013
Efficiency ratio (non-GAAP)
Noninterest expense $36,808 $143,232 $136,717 $117,240 $117,392
Net interest income 53,878 203,259 187,551 148,042 139,193
Plus: taxable equivalent adjustment 1,871 7,043 6,123 5,461 4,850
Net interest income (FTE) (non-GAAP) 55,749 210,302 193,674 153,503 144,043
Noninterest income 12,996 54,635 51,033 46,338 51,527
Less: securities (gains) losses, net (370) — 34 (41) (5)
Net interest income (FTE) (non-GAAP) plus noninterest income $68,375 $264,937 $244,741 $199,800 $195,565
Efficiency ratio (non-GAAP) 53.83% 54.06% 55.86% 58.67% 60.03%
APPENDIX – Non-GAAP Measures
37
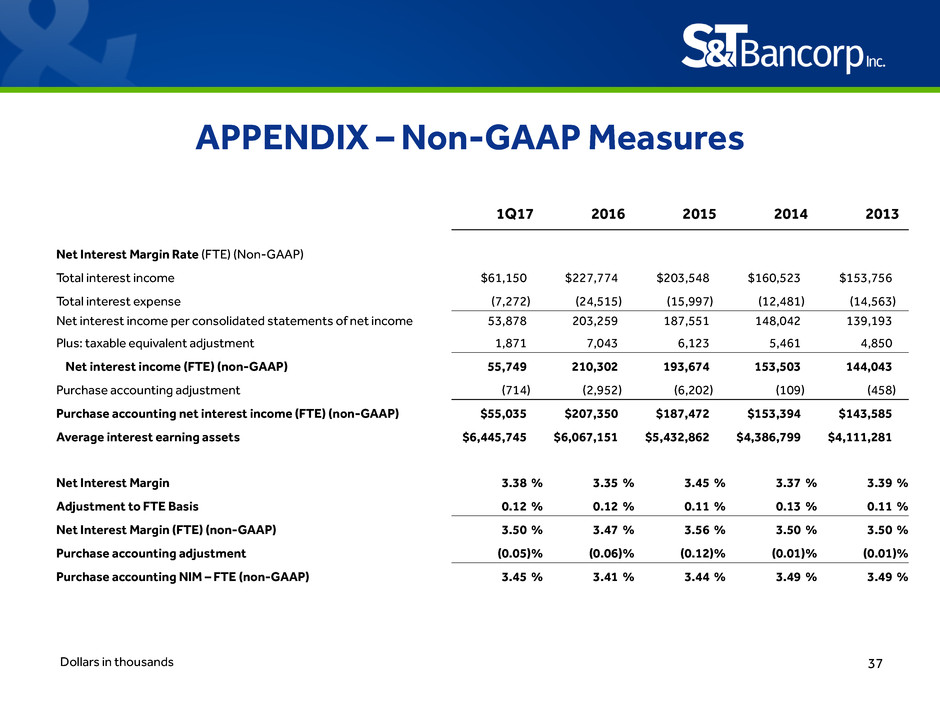
APPENDIX – Non-GAAP Measures
1Q17 2016 2015 2014 2013
Net Interest Margin Rate (FTE) (Non-GAAP)
Total interest income $61,150 $227,774 $203,548 $160,523 $153,756
Total interest expense (7,272) (24,515) (15,997) (12,481) (14,563)
Net interest income per consolidated statements of net income 53,878 203,259 187,551 148,042 139,193
Plus: taxable equivalent adjustment 1,871 7,043 6,123 5,461 4,850
Net interest income (FTE) (non-GAAP) 55,749 210,302 193,674 153,503 144,043
Purchase accounting adjustment (714) (2,952) (6,202) (109) (458)
Purchase accounting net interest income (FTE) (non-GAAP) $55,035 $207,350 $187,472 $153,394 $143,585
Average interest earning assets $6,445,745 $6,067,151 $5,432,862 $4,386,799 $4,111,281
Net Interest Margin 3.38 % 3.35 % 3.45 % 3.37 % 3.39 %
Adjustment to FTE Basis 0.12 % 0.12 % 0.11 % 0.13 % 0.11 %
Net Interest Margin (FTE) (non-GAAP) 3.50 % 3.47 % 3.56 % 3.50 % 3.50 %
Purchase accounting adjustment (0.05)% (0.06)% (0.12)% (0.01)% (0.01)%
Purchase accounting NIM – FTE (non-GAAP) 3.45 % 3.41 % 3.44 % 3.49 % 3.49 %
Dollars in thousands

MEMBER FDIC
First Quarter 2017
