Exhibit 99.1

| Table of contents | |||
| BCE Inc. 2019 First Quarter Shareholder Report |
| Table of contents |
| Management’s discussion and analysis | 1 | |||
| 1 |
Overview |
2 | ||
| 1.1 | Financial highlights | 2 | ||
| 1.2 | Key corporate and business developments | 4 | ||
| 1.3 | Assumptions | 4 | ||
| 2 | Consolidated financial analysis | 5 | ||
| 2.1 | BCE consolidated income statements | 5 | ||
| 2.2 | Customer connections | 5 | ||
| 2.3 | Operating revenues | 6 | ||
| 2.4 | Operating costs | 7 | ||
| 2.5 | Net earnings | 7 | ||
| 2.6 | Adjusted EBITDA | 8 | ||
| 2.7 | Severance, acquisition and other costs | 8 | ||
| 2.8 | Depreciation and amortization | 8 | ||
| 2.9 | Finance costs | 8 | ||
| 2.10 | Other income (expense) | 9 | ||
| 2.11 | Income taxes | 9 | ||
| 2.12 | Net earnings attributable to common shareholders and EPS | 9 | ||
| 3 | Business segment analysis | 10 | ||
| 3.1 | Bell Wireless | 10 | ||
| 3.2 | Bell Wireline | 14 | ||
| 3.3 | Bell Media | 18 | ||
| 4 | Financial and capital management | 20 | ||
| 4.1 | Net debt | 20 | ||
| 4.2 | Outstanding share data | 20 | ||
| 4.3 | Cash flows | 21 | ||
| 4.4 | Post-employment benefit plans | 22 | ||
| 4.5 | Financial risk management | 22 | ||
| 4.6 | Credit ratings | 24 | ||
| 4.7 | Liquidity | 24 | ||
| 5 | Quarterly financial information | 25 | ||
| 6 | Regulatory environment | 26 | ||
| 7 | Business risks | 27 | ||
| 8 | Accounting policies, financial measures and controls | 29 | ||
| 8.1 | Our accounting policies | 29 | ||
| 8.2 | Non-GAAP financial measures and key performance indicators (KPIs) | 31 | ||
| 8.3 | Controls and procedures | 33 | ||
| Consolidated financial statements | 34 | |||
| Consolidated income statements | 34 | |||
| Consolidated statements of comprehensive income | 35 | |||
| Consolidated statements of financial position | 36 | |||
| Consolidated statements of changes in equity | 37 | |||
| Consolidated statements of cash flows | 38 | |||
| Notes to consolidated financial statements | 39 | |||
| Note 1 | Corporate information | 39 | ||
| Note 2 | Basis of presentation and significant accounting policies | 39 | ||
| Note 3 | Adoption of IFRS 16 | 40 | ||
| Note 4 | Business acquisitions and dispositions | 41 | ||
| Note 5 | Segmented information | 41 | ||
| Note 6 | Operating costs | 42 | ||
| Note 7 | Severance, acquisition and other costs | 43 | ||
| Note 8 | Other income (expense) | 43 | ||
| Note 9 | Earnings per share | 43 | ||
| Note 10 | Post-employment benefit plans | 44 | ||
| Note 11 | Financial assets and liabilities | 44 | ||
| Note 12 | Share capital | 46 | ||
| Note 13 | Share-based payments | 46 | ||
|
MD&A |
|||
|
BCE Inc. 2019 First Quarter Shareholder Report |
| Management’s discussion and analysis |
In this management’s discussion and analysis (MD&A), we, us, our, BCE and the company mean, as the context may require, either BCE Inc. or, collectively, BCE Inc., Bell Canada, their subsidiaries, joint arrangements and associates. Bell means, as the context may require, either Bell Canada or, collectively, Bell Canada, its subsidiaries, joint arrangements and associates.
All amounts in this MD&A are in millions of Canadian dollars, except where noted. Please refer to section 8.2, Non-GAAP financial measures and key performance indicators (KPIs) on pages 31 to 33 for a list of defined non-GAAP financial measures and KPIs.
Please refer to BCE’s unaudited consolidated financial statements for the first quarter of 2019 (Q1 2019 Financial Statements) when reading this MD&A. We also encourage you to read BCE’s MD&A for the year ended December 31, 2018 dated March 7, 2019 (BCE 2018 Annual MD&A). In preparing this MD&A, we have taken into account information available to us up to May 1, 2019, the date of this MD&A, unless otherwise stated.
You will find more information about us, including BCE’s annual information form for the year ended December 31, 2018 dated March 7, 2019 (BCE 2018 AIF) and recent financial reports, including the BCE 2018 Annual MD&A, on BCE’s website at BCE.ca, on SEDAR at sedar.com and on EDGAR at sec.gov.
This MD&A comments on our business operations, performance, financial position and other matters for the three months (Q1) ended March 31, 2019 and 2018.
| CAUTION REGARDING FORWARD-LOOKING STATEMENTS |
This MD&A, and in particular, but without limitation, the section and sub-sections entitled Assumptions, section 1.2, Key corporate and business developments, section 3.2, Bell Wireline - Key business developments, section 3.3, Bell Media - Key business developments and section 4.1, Net debt, contain forward-looking statements. These forward-looking statements include, without limitation, statements relating to our network deployment and capital investment plans, BCE’s 2019 annualized common share dividend, the expected improvement in BCE’s net debt leverage ratio, BCE’s business outlook, objectives, plans and strategic priorities, and other statements that do not refer to historical facts. A statement we make is forward-looking when it uses what we know and expect today to make a statement about the future. Forward-looking statements are typically identified by the words assumption, goal, guidance, objective, outlook, project, strategy, target, and other similar expressions or future or conditional verbs such as aim, anticipate, believe, could, expect, intend, may, plan, seek, should, strive and will. All such forward-looking statements are made pursuant to the safe harbour provisions of applicable Canadian securities laws and of the United States (U.S.) Private Securities Litigation Reform Act of 1995.
Unless otherwise indicated by us, forward-looking statements in this MD&A describe our expectations as at May 1, 2019 and, accordingly, are subject to change after that date. Except as may be required by applicable securities laws, we do not undertake any obligation to update or revise any forward-looking statements, whether as a result of new information, future events or otherwise.
Forward-looking statements, by their very nature, are subject to inherent risks and uncertainties and are based on several assumptions both general and specific, which give rise to the possibility that actual results or events could differ materially from our expectations expressed in, or implied by, such forward-looking statements and that our business outlook, objectives, plans and strategic priorities may not be achieved. These statements are not guarantees of future performance or events, and we caution you against relying on any of these forward-looking statements. Forward-looking statements are presented in this MD&A for the purpose of assisting investors and others in understanding our objectives, strategic priorities and business outlook as well as our anticipated operating environment. Readers are cautioned, however, that such information may not be appropriate for other purposes.
We have made certain economic, market and operational assumptions in preparing the forward-looking statements contained in this MD&A and, in particular, but without limitation, the forward-looking statements contained in the previously mentioned sections of this MD&A. These assumptions include, without limitation, the assumptions described in the section and sub-sections of this MD&A entitled Assumptions, which sections are incorporated by reference in this cautionary statement. We believe that our assumptions were reasonable at May 1, 2019. If our assumptions turn out to be inaccurate, our actual results could be materially different from what we expect.
Important risk factors including, without limitation, competitive, regulatory, security, technological, operational, economic, financial and other risks that could cause actual results or events to differ materially from those expressed in, or implied by, the previously-mentioned forward looking statements and other forward-looking statements contained in this MD&A, include, but are not limited to, the risks described or referred to in section 7, Business risks, which section is incorporated by reference in this cautionary statement.
We caution readers that the risks described in the previously mentioned section and in other sections of this MD&A are not the only ones that could affect us. Additional risks and uncertainties not currently known to us or that we currently deem to be immaterial may also have a material adverse effect on our financial position, financial performance, cash flows, business or reputation. Except as otherwise indicated by us, forward-looking statements do not reflect the potential impact of any special items or of any dispositions, monetizations, mergers, acquisitions, other business combinations or other transactions that may be announced or that may occur after May 1, 2019. The financial impact of these transactions and special items can be complex and depends on facts particular to each of them. We therefore cannot describe the expected impact in a meaningful way, or in the same way we present known risks affecting our business.
|
1 |
|||
|
1 |
MD&A | Overview | |
| BCE Inc. 2019 First Quarter Shareholder Report |
| 1 Overview |
As required, we adopted International Financial Reporting Standard (IFRS) 16 – Leases effective January 1, 2019, as described in section 8.1, Our accounting policies. We adopted IFRS 16 using a modified retrospective approach whereby the financial statements of prior periods presented were not restated and continue to be reported under International Accounting Standard (IAS) 17 – Leases, as permitted by the specific transition provisions of IFRS 16. The cumulative effect of the initial adoption of IFRS 16 was reflected as an adjustment to the deficit at January 1, 2019.
Under IFRS 16, most leases are recognized on the statement of financial position as right-of-use assets within property, plant and equipment, with a corresponding lease liability within debt. Under IFRS 16, expenses related to these leases are recorded in depreciation and interest expense, whereas under IAS 17, operating lease expenses were recorded in operating costs. Under IFRS 16, repayments of principal for these leases are recorded in repayment of long-term debt within cash flows from financing activities and the interest component is recorded in interest paid within cash flows from operating activities. Previously, under IAS 17, operating lease payments were recorded within cash flows from operating activities.
To align with changes in how we manage our business and assess performance, the operating results of The Source (Bell) Electronics Inc. (The Source) are now entirely included within our Wireless segment effective January 1, 2019, with prior periods restated for comparative purposes. Previously, The Source’s results were included within our Wireless and Wireline segments.
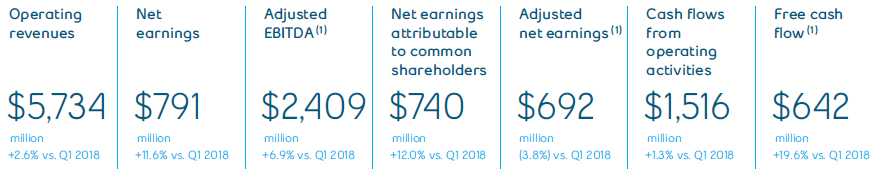
| 1.1 Financial highlights |
BCE Q1 2019 SELECTED QUARTERLY INFORMATION
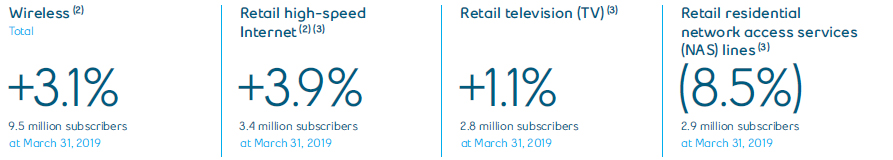
| BCE CUSTOMER CONNECTIONS |
| (1) | Adjusted EBITDA, adjusted net earnings and free cash flow are non-GAAP financial measures and do not have any standardized meaning under IFRS. Therefore, they are unlikely to be comparable to similar measures presented by other issuers. See section 8.2, Non-GAAP financial measures and key performance indicators (KPIs) – Adjusted EBITDA and adjusted EBITDA margin, Adjusted net earnings and adjusted EPS and Free cash flow and dividend payout ratio in this MD&A for more details, including reconciliations to the most comparable IFRS financial measure. |
| (2) | At the beginning of Q1 2019, we adjusted our wireless subscriber base to remove 167,929 subscribers (72,231 postpaid and 95,698 prepaid) as follows: (A) 65,798 subscribers (19,195 postpaid and 46,603 prepaid), due to the completion of the shutdown of the code division multiple access (CDMA) network on April 30, 2019, (B) 49,095 prepaid subscribers as a result of a change to our deactivation policy, mainly from 120 days for Bell/Virgin Mobile Canada (Virgin Mobile) and 150 days for Lucky Mobile to 90 days, (C) 43,670 postpaid subscribers relating to Internet of Things (IoT) due to the further refinement of our subscriber definition as a result of technology evolution, and (D) 9,366 postpaid fixed wireless Internet subscribers which were transferred to our retail high-speed Internet subscriber base. |
| (3) | As of January 1, 2019, we are no longer reporting wholesale subscribers in our Internet, TV and residential NAS subscriber bases reflecting our focus on the retail market. Consequently, we restated previously reported 2018 subscribers for comparability. |
| 2 | |||
|
1 |
MD&A | Overview | |
|
BCE Inc. 2019 First Quarter Shareholder Report |
BCE INCOME STATEMENTS – SELECTED INFORMATION
| Q1 2019 | Q1 2018 | $ CHANGE | % CHANGE | |||||
|
Operating revenues |
||||||||
|
Service |
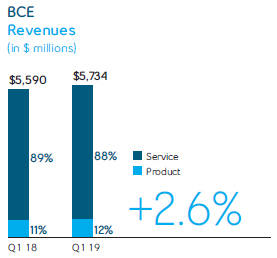
5,045 | 4,964 | 81 | 1.6 | % | |||
|
Product |
689 | 626 | 63 | 10.1 | % | |||
|
Total operating revenues |
5,734 | 5,590 | 144 | 2.6 | % | |||
|
Operating costs |
(3,325 | ) | (3,336 | ) | 11 | 0.3 | % | |
|
Adjusted EBITDA |
2,409 | 2,254 | 155 | 6.9 | % | |||
|
Adjusted EBITDA margin (1) |
42.0 | % | 40.3 | % | 1.7 | pts | ||
|
Net earnings attributable to: |
||||||||
|
Common shareholders |
740 | 661 | 79 | 12.0 | % | |||
|
Preferred shareholders |
38 | 36 | 2 | 5.6 | % | |||
|
Non-controlling interest |
13 | 12 | 1 | 8.3 | % | |||
|
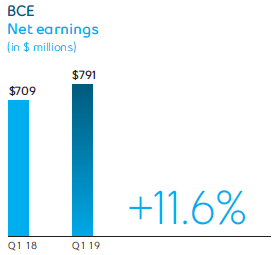
Net earnings |
791 | 709 | 82 | 11.6 | % | |||
|
Adjusted net earnings |
692 | 719 | (27 | ) | (3.8 | %) | ||
|
Net earnings per common share (EPS) |
0.82 | 0.73 | 0.09 | 12.3 | % | |||
|
Adjusted EPS (1) |
0.77 | 0.80 | (0.03 | ) | (3.8 | %) |
| (1) | Adjusted EBITDA margin and adjusted EPS are non-GAAP financial measures and do not have any standardized meaning under IFRS. Therefore, they are unlikely to be comparable to similar measures presented by other issuers. See section 8.2, Non-GAAP financial measures and key performance indicators (KPIs) – Adjusted EBITDA and adjusted EBITDA margin and Adjusted net earnings and adjusted EPS in this MD&A for more details, including reconciliations to the most comparable IFRS financial measure. |
| BCE STATEMENTS OF CASH FLOWS – SELECTED INFORMATION |
| Q1 2019 | Q1 2018 | $ CHANGE | % CHANGE | |||||
| Cash flows from operating activities | 1,516 | 1,496 | 20 | 1.3 | % | |||
| Capital expenditures | (850 | ) | (931 | ) | 81 | 8.7 | % | |
| Free cash flow | 642 | 537 | 105 | 19.6 | % |
| Q1 2019 FINANCIAL HIGHLIGHTS |
BCE revenues grew 2.6% in Q1 2019, compared to last year, resulting from higher service and product revenues of 1.6% and 10.1%, respectively, driven by greater wireless and wireline revenues, offset by a modest decline in our media revenues. The year-over-year increase in service revenues was attributable to continued growth in our wireless, Internet, and Internet protocol television (IPTV) subscribers, as well as growth in our business market resulting from higher Internet protocol (IP) connectivity and business solutions services revenue, including the contribution from the acquisition of Axia NetMedia Corporation (Axia). This more than offset the ongoing erosion in our voice, satellite TV and legacy data revenues. The year-over-year increase in product revenues reflected higher sales of premium wireless devices and greater equipment sales to the government sector.
Net earnings increased by 11.6% in the first quarter of 2019, compared to the same period last year, due to higher adjusted EBITDA and higher other income, mainly as a result of net mark-to-market gains on derivatives used to economically hedge equity settled share-based compensation plans. This was partly offset by higher depreciation expense, finance costs, income taxes and severance, acquisition and other costs. The adoption of IFRS 16 did not have a significant impact on net earnings.
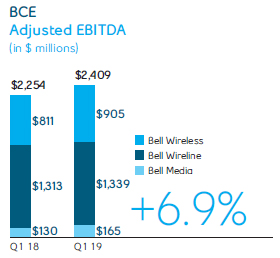
Adjusted EBITDA increased by 6.9% in Q1 2019, compared to last year, reflecting the favourable impact from the adoption of IFRS 16, as well as growth across all three of our segments driven by the flow-through of our revenue growth coupled with continued cost containment driving lower labour and media programming and production costs, moderated by higher cost of goods sold resulting from greater wireless handset sales and higher equipment sales to the government sector.
BCE’s EPS of $0.82 in Q1 2019 increased by $0.09 compared to the same period last year.
Excluding the impact of severance, acquisition and other costs, net mark-to-market gains (losses) on derivatives used to economically hedge equity settled share-based compensation plans, net (losses) gains on investments, early debt redemption costs and impairment charges, adjusted net earnings in the first quarter of 2019 was $692 million, or $0.77 per common share, compared to $719 million, or $0.80 per common share, for the same period last year.
Cash flows from operating activities in the first quarter of 2019 increased by $20 million, compared to Q1 2018, due mainly to higher adjusted EBITDA, which reflects the favourable impact from the adoption of IFRS 16, partly offset by a decrease in cash from working capital, higher interest paid, which reflects the unfavourable impact from the adoption of IFRS 16, and higher severance and other costs paid.
Free cash flow in Q1 2019 increased by $105 million, compared to the same period last year, mainly due to higher cash flows from operating activities, excluding acquisition and other costs paid, and lower capital expenditures.
|
3 |
|||
|
1 |
MD&A | Overview | |
| BCE Inc. 2019 First Quarter Shareholder Report |
| 1.2 Key corporate and business developments |
| COMMON SHARE DIVIDEND INCREASE |
On February 6, 2019, BCE’s board of directors approved a 5%, or 15 cents per share, increase in the annual common share dividend from $3.02 per share to $3.17 per share, effective with BCE’s 2019 first quarter dividend paid on April 15, 2019 to common shareholders of record on March 15, 2019. This dividend increase represents BCE’s 15th increase to its annual common share dividend since the fourth quarter of 2008, representing a total increase of 117%.
| BELL NAMED ONE OF CANADA’S BEST DIVERSITY EMPLOYERS |
For the third year in a row, Bell has been named one of Canada’s Best Diversity Employers in Mediacorp’s 2019 report on workplace diversity and inclusion. The award recognizes Bell’s commitment to providing an inclusive and accessible workplace that reflects Canada’s diversity and highlights our wide range of programs to enable women, persons with disabilities, Indigenous Peoples, visible minorities and other groups in their career development, and also recognizes our workplace mental health leadership.
| BELL RECOGNIZED FOR CORPORATE RESPONSIBILITY LEADERSHIP |
Bell continued to strengthen its reputation as a corporate responsibility leader with new recognition for its social sustainability reporting and environmental stewardship.
In February 2019, Finance Montréal’s Finance and Sustainability Initiative awarded Bell with Best Sustainability Report in the Technology and Communications category based on a comprehensive review of publicly traded Canadian companies.
Bell was also ranked on the CDP’s Climate Change A List of the world’s leading businesses for environmental performance. Bell is the only Canadian communications company to make the list.
| 1.3 Assumptions |
As at the date of this MD&A, our forward-looking statements set out in the BCE 2018 Annual MD&A, as updated or supplemented in this MD&A, are based on certain assumptions including, without limitation, the following economic and market assumptions as well as the various assumptions referred to under the sub-sections entitled Assumptions set out in section 3, Business segment analysis of this MD&A.
ASSUMPTIONS ABOUT THE CANADIAN ECONOMY
- A slower rate of economic growth, given the Bank of Canada’s most recent estimated growth in Canadian gross domestic product of 1.2% in 2019, representing a decrease from the earlier estimate of 1.7%
- Employment gains expected to continue in 2019, as the overall level of business investment is expected to grow but remain variable
- Interest rates expected to remain at or near current levels
- Canadian dollar expected to remain at near current levels. Further movements may be impacted by the degree of strength of the U.S. dollar, interest rates and changes in commodity prices
MARKET ASSUMPTIONS
- A consistently high level of wireline and wireless competition in consumer, business and wholesale markets
- Higher, but slowing, wireless industry penetration and smartphone adoption
- A shrinking data and voice connectivity market as business customers migrate to lower-priced traditional telecommunications solutions or alternative over-the-top (OTT) competitors
- Advertising market expected to be impacted by audience declines and variable demand
- Continued escalation of media content costs to secure TV programming
- Ongoing linear TV subscriber erosion, due to growing cord-cutter and cord-never customer segments
| 4 | |||
|
2 |
MD&A | Consolidated financial analysis | |
|
BCE Inc. 2019 First Quarter Shareholder Report |
| 2 Consolidated financial analysis |
This section provides detailed information and analysis about BCE’s performance in Q1 2019 compared with Q1 2018. It focuses on BCE’s consolidated operating results and provides financial information for our Bell Wireless, Bell Wireline and Bell Media business segments. For further discussion and analysis of our business segments, refer to section 3, Business segment analysis.
| 2.1 BCE consolidated income statements |
| Q1 2019 | Q1 2018 | $ CHANGE | % CHANGE | ||||||
Operating revenues | |||||||||
Service | 5,045 | 4,964 | 81 | 1.6 | % | ||||
Product | 689 | 626 | 63 | 10.1 | % | ||||
Total operating revenues | 5,734 | 5,590 | 144 | 2.6 | % | ||||
Operating costs | (3,325 | ) | (3,336 | ) | 11 | 0.3 | % | ||
Adjusted EBITDA | 2,409 | 2,254 | 155 | 6.9 | % | ||||
Adjusted EBITDA margin | 42.0 | % | 40.3 | % | 1.7 | pts | |||
Severance, acquisition and other costs | (24 | ) | – | (24 | ) | n.m. | |||
Depreciation | (882 | ) | (780 | ) | (102 | ) | (13.1 | %) | |
Amortization | (221 | ) | (212 | ) | (9 | ) | (4.2 | %) | |
Finance costs | |||||||||
Interest expense | (283 | ) | (240 | ) | (43 | ) | (17.9 | %) | |
Interest on post-employment benefit obligations | (16 | ) | (17 | ) | 1 | 5.9 | % | ||
Other income (expense) | 101 | (61 | ) | 162 | n.m. | ||||
Income taxes | (293 | ) | (235 | ) | (58 | ) | (24.7 | %) | |
Net earnings | 791 | 709 | 82 | 11.6 | % | ||||
Net earnings attributable to: |
|||||||||
Common shareholders | 740 | 661 | 79 | 12.0 | % | ||||
Preferred shareholders | 38 | 36 | 2 | 5.6 | % | ||||
Non-controlling interest |
13 | 12 | 1 | 8.3 | % | ||||
Net earnings | 791 | 709 | 82 | 11.6 | % | ||||
Adjusted net earnings | 692 | 719 | (27 | ) | (3.8 | %) | |||
EPS | 0.82 | 0.73 | 0.09 | 12.3 | % | ||||
Adjusted EPS | 0.77 | 0.80 | (0.03 | ) | (3.8 | %) |
| n.m.: not meaningful |
| 2.2 Customer connections |
BCE NET ACTIVATIONS (LOSSES)
| Q1 2019 | Q1 2018 | % CHANGE | |||||
Wireless subscribers | 38,282 | 44,377 | (13.7 | %) | |||
Postpaid | 50,204 | 68,487 | (26.7 | %) | |||
Prepaid | (11,922 | ) | (24,110 | ) | 50.6 | % | |
Retail high-speed Internet subscribers (1) | 22,671 | 18,156 | 24.9 | % | |||
Retail TV subscribers (1) | (1,560 | ) | (10,354 | ) | 84.9 | % | |
IPTV | 20,916 | 13,573 | 54.1 | % | |||
Satellite | (22,476 | ) | (23,927 | ) | 6.1 | % | |
Total growth services | 59,393 | 52,179 | 13.8 | % | |||
Wireline retail residential NAS lines (1) | (66,779 | ) | (56,071 | ) | (19.1 | %) | |
Total services | (7,386 | ) | (3,892 | ) | (89.8 | %) |
| (1) | As of January 1, 2019, we are no longer reporting wholesale subscribers in our Internet, TV and residential NAS subscriber bases reflecting our focus on the retail market. Consequently, we restated previously reported 2018 subscribers for comparability. |
|
5 |
|||
|
2 |
MD&A | Consolidated financial analysis | |
|
BCE Inc. 2019 First Quarter Shareholder Report |
TOTAL BCE CUSTOMER CONNECTIONS
| Q1 2019 | Q1 2018 | % CHANGE | |||||
Wireless subscribers (1) | 9,480,835 | 9,195,048 | 3.1 | % | |||
Postpaid (1) | 8,808,189 | 8,471,021 | 4.0 | % | |||
Prepaid (1) | 672,646 | 724,027 | (7.1 | %) | |||
Retail high-speed Internet subscribers (1)(2) | 3,442,411 | 3,311,931 | 3.9 | % | |||
Retail TV subscribers (2) | 2,764,851 | 2,734,498 | 1.1 | % | |||
IPTV | 1,696,622 | 1,578,489 | 7.5 | % | |||
Satellite | 1,068,229 | 1,156,009 | (7.6 | %) | |||
Total growth services | 15,688,097 | 15,241,477 | 2.9 | % | |||
Wireline retail residential NAS lines (2) | 2,894,029 | 3,163,618 | (8.5 | %) | |||
Total services | 18,582,126 | 18,405,095 | 1.0 | % |
| (1) | At the beginning of Q1 2019, we adjusted our wireless subscriber base to remove 167,929 subscribers (72,231 postpaid and 95,698 prepaid) as follows: (A) 65,798 subscribers (19,195 postpaid and 46,603 prepaid), due to the completion of the shutdown of the CDMA network on April 30, 2019, (B) 49,095 prepaid subscribers as a result of a change to our deactivation policy, mainly from 120 days for Bell/Virgin Mobile and 150 days for Lucky Mobile to 90 days, (C) 43,670 postpaid subscribers relating to IoT due to the further refinement of our subscriber definition as a result of technology evolution, and (D) 9,366 postpaid fixed wireless Internet subscribers which were transferred to our retail high-speed Internet subscriber base. |
| (2) | As of January 1, 2019, we are no longer reporting wholesale subscribers in our Internet, TV and residential NAS subscriber bases reflecting our focus on the retail market. Consequently, we restated previously reported 2018 subscribers for comparability. |
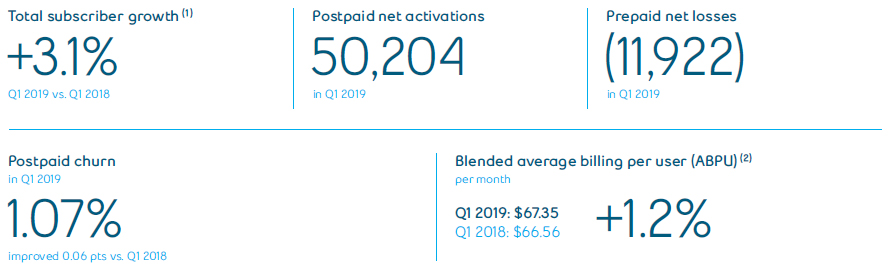
BCE added 59,393 net new customer connections to its growth services in Q1 2019, representing a 13.8% increase over Q1 2018. This consisted of:
- 50,204 postpaid wireless customers, and 11,922 prepaid wireless net customer losses
- 22,671 retail high-speed Internet customers
- 20,916 retail IPTV customers and 22,476 retail satellite TV net customer losses
Retail residential NAS net losses were 66,779 in Q1 2019, an increase of 19.1% over Q1 2018.
Total BCE customer connections across all services increased by 1.0% in Q1 2019 compared to last year, driven by increases in our growth services customer base, offset in part by the continued erosion in traditional retail residential NAS lines.
At March 31, 2019, BCE customer connections totaled 18,582,126, comprising:
- 9,480,835 wireless subscribers, up 3.1% compared to Q1 2018, comprised of 8,808,189 postpaid subscribers, an increase of 4.0% over last year, and 672,646 prepaid subscribers, down 7.1% year over year
- 3,442,411 retail high-speed Internet subscribers, 3.9% higher year over year
- 2,764,851 total retail TV subscribers, up 1.1% compared to Q1 2018, comprising 1,696,622 retail IPTV customers, up 7.5% year over year, and 1,068,229 retail satellite subscribers, down 7.6% compared to Q1 2018
- 2,894,029 retail residential NAS lines, a decline of 8.5% compared to Q1 2018
| 2.3 Operating revenues |
| Q1 2019 | Q1 2018 | $ CHANGE | % CHANGE | ||||||
Bell Wireless | 2,112 | 2,021 | 91 | 4.5 | % | ||||
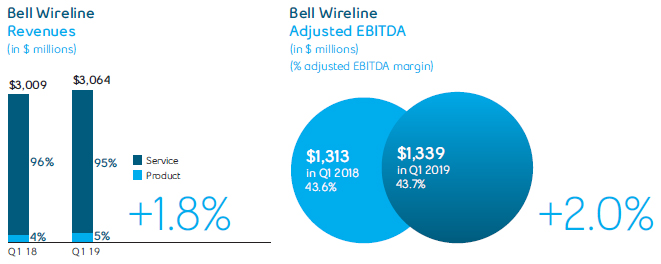
Bell Wireline | 3,064 | 3,009 | 55 | 1.8 | % | ||||
Bell Media | 745 | 749 | (4 | ) | (0.5 | %) | |||
Inter-segment eliminations | (187 | ) | (189 | ) | 2 | 1.1 | % | ||
Total BCE operating revenues | 5,734 | 5,590 | 144 | 2.6 | % |
BCE
Total operating revenues at BCE increased by 2.6% in Q1 2019, compared to Q1 2018, attributable to growth in both our Bell Wireless and Bell Wireline segments, offset in part by a modest decline in our Bell Media segment. Total operating revenues consisted of service revenues of $5,045 million and product revenues of $689 million in Q1 2019, which grew by 1.6% and 10.1%, respectively, year over year. Wireless operating revenues increased by 4.5% in Q1 2019, driven by both service revenue growth of 3.4% and product revenue growth of 7.7%. Wireline operating revenues increased by 1.8% due to service revenue growth of 1.1% from higher data revenues, moderated by lower voice and other services revenue. The growth in wireline operating revenues also reflected a 20.0% year-over-year increase in product revenues. Bell Media operating revenues declined by 0.5% in Q1 2019 due to lower advertising revenue.
| 6 | |||
|
2 |
MD&A | Consolidated financial analysis | |
|
BCE Inc. 2019 First Quarter Shareholder Report |
| 2.4 Operating costs |

| Q1 2019 | Q1 2018 | $ CHANGE | % CHANGE | ||||||
Bell Wireless | (1,207 | ) | (1,210 | ) | 3 | 0.2 | % | ||
Bell Wireline | (1,725 | ) | (1,696 | ) | (29 | ) | (1.7 | %) | |
Bell Media | (580 | ) | (619 | ) | 39 | 6.3 | % | ||
Inter-segment eliminations | 187 | 189 | (2 | ) | (1.1 | %) | |||
Total BCE operating costs | (3,325 | ) | (3,336 | ) | 11 | 0.3 | % |
| (1) | Cost of revenues includes costs of wireless devices and other equipment sold, network and content costs, and payments to other carriers. |
| (2) | Labour costs (net of capitalized costs) include wages, salaries and related taxes and benefits, post-employment benefit plans service cost, and other labour costs, including contractor and outsourcing costs. |
| (3) | Other operating costs include marketing, advertising and sales commission costs, bad debt expense, taxes other than income taxes, information technology (IT) costs, professional service fees and rent. |
BCE
Total BCE operating costs decreased by 0.3% in Q1 2019, compared to Q1 2018, resulting from lower costs in media of 6.3% and wireless of 0.2%, offset in part by higher costs in wireline of 1.7%. These results reflected the favourable impact from the adoption of IFRS 16 in 2019.
| 2.5 Net earnings |
Net earnings increased by 11.6% in the first quarter of 2019, compared to the same period last year, due to higher adjusted EBITDA and higher other income, mainly as a result of net mark-to-market gains on derivatives used to economically hedge equity settled share-based compensation plans. This was partly offset by higher depreciation expense, finance costs, income taxes and severance, acquisition and other costs. The adoption of IFRS 16 did not have a significant impact on net earnings.
|
7 |
|||
|
2 |
MD&A | Consolidated financial analysis | |
| BCE Inc. 2019 First Quarter Shareholder Report |
| 2.6 Adjusted EBITDA |
| Q1 2019 | Q1 2018 | $ CHANGE | % CHANGE | ||||||
Bell Wireless | 905 | 811 | 94 | 11.6 | % | ||||
Bell Wireline | 1,339 | 1,313 | 26 | 2.0 | % | ||||
Bell Media | 165 | 130 | 35 | 26.9 | % | ||||
Total BCE adjusted EBITDA | 2,409 | 2,254 | 155 | 6.9 | % |
BCE
BCE’s adjusted EBITDA grew by 6.9% in Q1 2019, compared to Q1 2018, attributable to increases across all three of our segments of 11.6% in wireless, 2.0% in wireline and 26.9% in media. The increase in adjusted EBITDA reflected growth in revenues, as well as lower operating expenses. This resulted in an adjusted EBITDA margin of 42.0% in Q1 2019, compared to 40.3% experienced last year, mainly driven by the favourable impact from the adoption of IFRS 16 in 2019, effective cost management, and the year-over-year favourability related to the 2018 Canadian Radio-television and Telecommunications Commission (CRTC) retroactive decision on wholesale wireless domestic roaming rates, partly offset by greater low-margin product sales in our total revenue base.
| 2.7 Severance, acquisition and other costs |
2019
Severance, acquisition and other costs of $24 million in the first quarter of 2019 included:
- Severance costs related to workforce reduction initiatives of $7 million
- Acquisition and other costs of $17 million
2018
Severance, acquisition and other costs were nil in the first quarter of 2018.
| 2.8 Depreciation and amortization |
DEPRECIATION
Depreciation in Q1 2019 increased by $102 million compared to Q1 2018, due mainly to the adoption of IFRS 16 and a higher asset base as we continued to invest in our broadband and wireless networks as well as our IPTV service.
AMORTIZATION
Amortization in Q1 2019 increased by $9 million compared to Q1 2018, mainly due to a higher asset base.
| 2.9 Finance costs |
INTEREST EXPENSE
Interest expense in the first quarter of 2019 increased by $43 million compared to the same period last year, due mainly to the adoption of IFRS 16, higher average debt levels and higher interest rates on notes payable under commercial paper programs and loans securitized by trade receivables.
INTEREST ON POST-EMPLOYMENT BENEFIT OBLIGATIONS
Interest on our post-employment benefit obligations is based on market conditions that existed at the beginning of the year. On January 1, 2019, the discount rate was 3.8% compared to 3.6% on January 1, 2018.
In the first quarter of 2019, interest expense on post-employment benefit obligations decreased by $1 million compared to the same period last year, due to a lower post-employment benefit obligation at the beginning of the year, partly offset by a higher discount rate.
The impacts of changes in market conditions during the year are recognized in other comprehensive income (loss) (OCI).
| 8 | |||
|
2 |
MD&A | Consolidated financial analysis | |
|
BCE Inc. 2019 First Quarter Shareholder Report |
| 2.10 Other income (expense) |
2019
Other income of $101 million in the first quarter of 2019 included net mark-to-market gains on derivatives used to economically hedge equity settled share-based compensation plans.
2018
Other expense of $61 million included net mark-to-market losses on derivatives used to economically hedge equity settled share-based compensation plans, partly offset by income from our equity investments.
| 2.11 Income taxes |
Income taxes in the first quarter of 2019 increased by $58 million compared to the same period last year, due to higher taxable income in Q1 2019 and uncertain tax positions favourably resolved in Q1 2018.
| 2.12 Net earnings attributable to common shareholders and EPS |
Net earnings attributable to common shareholders of $740 million in the first quarter of 2019 increased by 12.0%, compared to the same period last year, due to higher adjusted EBITDA and higher other income, mainly as a result of net mark-to-market gains on derivatives used to economically hedge equity settled share-based compensation plans. This was partly offset by higher depreciation expense, finance costs, income taxes and severance, acquisition and other costs. The adoption of IFRS 16 did not have a significant impact on net earnings.
BCE’s EPS of $0.82 in Q1 2019 increased by $0.09 compared to the same period last year.
Excluding the impact of severance, acquisition and other costs, net mark-to-market gains (losses) on derivatives used to economically hedge equity settled share-based compensation plans, net (losses) gains on investments, early debt redemption costs and impairment charges, adjusted net earnings in the first quarter of 2019 was $692 million, or $0.77 per common share, compared to $719 million, or $0.80 per common share, for the same period last year.
|
9 |
|||
|
3 |
MD&A |
Business segment analysis Bell Wireless |
|
| BCE Inc. 2019 First Quarter Shareholder Report |
| 3 Business segment analysis |
| 3.1 Bell Wireless |
KEY BUSINESS DEVELOPMENTS
FEDERAL AUCTION OF 600 MHZ SPECTRUM
Bell decided not to acquire any 600 megahertz (MHz) low-band wireless spectrum in the recently concluded spectrum auction by Innovation, Science and Economic Development Canada (ISED). Bell has spectrum assets in the low, mid and high frequency bands in both urban and rural locations. Given the supply of other low-band spectrum that Bell already possesses, spectrum in the 600 MHz band is not required for Bell to deliver broadband Fourth Generation (4G) and Fifth Generation (5G) services. Similar to Bell, the company’s main U.S. peers chose not to own any 600 MHz spectrum in their markets. Bell’s existing low-band spectrum, combined with network enhancements like cell splitting, enables the company to deliver mobile broadband service for significantly less capital than buying 600 MHz spectrum.
SHUTDOWN OF CDMA WIRELESS NETWORK
On April 30, 2019, Bell completed the previously announced shutdown of its legacy CDMA wireless network. Bell began winding down its CDMA network in 2017 as its national Long-term Evolution (LTE) coverage accelerated. Customers in CDMA coverage areas were transitioned to Bell’s 4G LTE network, which now covers more than 99% of the Canadian population. The shutdown of its CDMA network also enables Bell to “re-farm” additional low band spectrum for 5G services.
BELL TOPS MOBILE SPEED RANKINGS
In its Canada: State of Mobile Networks report, network analysis firm Tutela found that Bell LTE delivers the fastest upload and download speeds of any major mobile network in Canada. Based on 13.4 million anonymous measurements for more than 171,000 Canadian mobile devices, Tutela’s report also gave Bell Mobility top scores for consistent connection quality. This result reflects Bell’s industry-leading investments in the latest mobile technology, including LTE Advanced (LTE-A) and Gigabit LTE, as well as the strength of the Bell broadband fibre backbone that interconnects our wireless sites.
LUCKY MOBILE AND VIRGIN MOBILE PREPAID AT DOLLARAMA
Bell’s Lucky Mobile and Virgin Mobile Canada now offer prepaid wireless service at value retailer Dollarama Inc.’s (Dollarama) more than 1,200 locations across Canada. The exclusive partnership enables budget-conscious Canadians to purchase a Lucky or Virgin Mobile prepaid SIM card at Dollarama and activate on their own mobile device with no activation fee. With talk and text plans starting at just $10 per month, Lucky Mobile has proven exceptionally popular with Canadians looking for low-cost wireless access, welcoming the most net new prepaid customers in 2018.
| FINANCIAL PERFORMANCE ANALYSIS |
Q1 2019 PERFORMANCE HIGHLIGHTS

| 10 | |||
|
3 |
MD&A |
Business segment analysis Bell Wireless |
|
|
BCE Inc. 2019 First Quarter Shareholder Report |
| (1) | At the beginning of Q1 2019, we adjusted our wireless subscriber base to remove 167,929 subscribers (72,231 postpaid and 95,698 prepaid) as follows: (A) 65,798 subscribers (19,195 postpaid and 46,603 prepaid), due to the completion of the shutdown of the CDMA network on April 30, 2019, (B) 49,095 prepaid subscribers as a result of a change to our deactivation policy, mainly from 120 days for Bell/Virgin Mobile and 150 days for Lucky Mobile to 90 days, (C) 43,670 postpaid subscribers relating to IoT due to the further refinement of our subscriber definition as a result of technology evolution, and (D) 9,366 postpaid fixed wireless Internet subscribers which were transferred to our retail high-speed Internet subscriber base. |
| (2) | Our Q1 2018 blended ABPU was adjusted to exclude the unfavourable retroactive impact of the CRTC decision on wholesale wireless domestic roaming rates of $14 million. |
BELL WIRELESS RESULTS
REVENUES
| Q1 2019 | Q1 2018 | $ CHANGE | % CHANGE | ||||||
External service revenues | 1,554 | 1,502 | 52 | 3.5 | % | ||||
Inter-segment service revenues | 12 | 12 | – | – | |||||
Total operating service revenues | 1,566 | 1,514 | 52 | 3.4 | % | ||||
External product revenues | 545 | 506 | 39 | 7.7 | % | ||||
Inter-segment product revenues | 1 | 1 | – | – | |||||
Total operating product revenues | 546 | 507 | 39 | 7.7 | % | ||||
Total Bell Wireless revenues | 2,112 | 2,021 | 91 | 4.5 | % |
Bell Wireless operating revenues increased by 4.5% in Q1 2019, compared to Q1 2018, due to both higher service and product revenues.
- Service revenues increased by 3.4% in the current quarter, compared to the same period last year, driven by the continued growth in our postpaid subscriber base and the year-over-year favourability related to the 2018 CRTC retroactive decision on wholesale wireless domestic roaming rates of $14 million
- Product revenues increased by 7.7% in the current quarter, compared to the same period in 2018, due to increased sales of premium handsets with higher retail prices, partly offset by lower upgrade volumes
OPERATING COSTS AND ADJUSTED EBITDA
| Q1 2019 | Q1 2018 | $ CHANGE | % CHANGE | ||||||
Operating costs | (1,207 | ) | (1,210 | ) | 3 | 0.2 | % | ||
Adjusted EBITDA | 905 | 811 | 94 | 11.6 | % | ||||
Total adjusted EBITDA margin | 42.9 | % | 40.1 | % | 2.8 | pts |
Bell Wireless operating costs decreased by 0.2% in Q1 2019, compared to Q1 2018, as a result of:
- The favourable impact from the adoption of IFRS 16 in 2019
- Lower advertising expense, due in part to the higher spend last year during the PyeongChang 2018 Winter Olympics
- Reduced labour costs driven by cost saving initiatives
These factors were partly offset by:
- Increased product cost of goods sold driven by higher sales volumes and increased handset costs
- Higher network operating costs due to increased cell site builds along with the expansion of network capacity to support subscriber growth and increased data consumption
Bell Wireless adjusted EBITDA increased by 11.6% in Q1 2019, compared to the same period last year, due to the flow-through of revenue growth and lower operating expenses. Adjusted EBITDA margin, based on wireless operating revenues, of 42.9% improved by 2.8 pts in the current quarter, compared to 40.1% in Q1 2018, driven by the favourable impact from the adoption of IFRS 16 in 2019, the year-over-year favourability related to the 2018 CRTC retroactive decision on wholesale wireless domestic roaming rates, along with higher service revenue flow-through, partly offset by a greater proportion of low-margin product sales in our total revenue base.
|
11 |
|||
|
3 |
MD&A |
Business segment analysis Bell Wireless |
|
|
BCE Inc. 2019 First Quarter Shareholder Report |
BELL WIRELESS OPERATING METRICS
| Q1 2019 | Q1 2018 | CHANGE | % CHANGE | ||||||
Blended ABPU ($/month) (1) | 67.35 | 66.56 | 0.79 | 1.2 | % | ||||
Gross activations | 410,301 | 404,790 | 5,511 | 1.4 | % | ||||
Postpaid | 320,558 | 347,319 | (26,761 | ) | (7.7 | %) | |||
Prepaid | 89,743 | 57,471 | 32,272 | 56.2 | % | ||||
Net activations (losses) | 38,282 | 44,377 | (6,095 | ) | (13.7 | %) | |||
Postpaid | 50,204 | 68,487 | (18,283 | ) | (26.7 | %) | |||
Prepaid | (11,922 | ) | (24,110 | ) | 12,188 | 50.6 | % | ||
Blended churn % (average per month) | 1.31 | % | 1.31 | % | – | ||||
Postpaid | 1.07 | % | 1.13 | % | 0.06 | pts | |||
Prepaid | 4.49 | % | 3.40 | % | (1.09 | ) pts | |||
Subscribers (2) | 9,480,835 | 9,195,048 | 285,787 | 3.1 | % | ||||
Postpaid (2) | 8,808,189 | 8,471,021 | 337,168 | 4.0 | % | ||||
Prepaid (2) | 672,646 | 724,027 | (51,381 | ) | (7.1 | %) |
| (1) | Our Q1 2018 blended ABPU was adjusted to exclude the unfavourable retroactive impact of the CRTC decision on wholesale wireless domestic roaming rates of $14 million. |
| (2) | At the beginning of Q1 2019, we adjusted our wireless subscriber base to remove 167,929 subscribers (72,231 postpaid and 95,698 prepaid) as follows: (A) 65,798 subscribers (19,195 postpaid and 46,603 prepaid), due to the completion of the shutdown of the CDMA network on April 30, 2019, (B) 49,095 prepaid subscribers as a result of a change to our deactivation policy, mainly from 120 days for Bell/Virgin Mobile and 150 days for Lucky Mobile to 90 days, (C) 43,670 postpaid subscribers relating to IoT due to the further refinement of our subscriber definition as a result of technology evolution, and (D) 9,366 postpaid fixed wireless Internet subscribers which were transferred to our retail high-speed Internet subscriber base. |
Blended ABPU of $67.35 increased by 1.2% in Q1 2019, compared to the same period last year, driven by:
- A greater proportion of customers choosing higher-value monthly plans with greater data allotments, coupled with rate increases
- The favourable impact from the subscriber base adjustments
These factors were partly offset by:
- Lower data and voice overages due to increased customer adoption of monthly plans with greater data allotments and voice minutes
- Lower ABPU generated from our long term mobile services contract with Shared Services Canada (SSC)
- The dilutive impact from the continued growth in prepaid customers from Lucky Mobile, our low-cost prepaid mobile service
Total gross wireless activations increased by 1.4% in Q1 2019, compared to the same period in 2018, due to higher prepaid gross activations offset in part by lower postpaid gross activations.
- Postpaid gross activations decreased by 7.7% in this quarter, compared to the same period last year, mainly due to lower year-over-year customer additions from our contract with SSC as the migration process nears completion. Prior year gross additions also benefited from aggressive holiday promotions that carried over into Q1 2018.
- Prepaid gross activations increased by 56.2% in the current quarter, compared to the same period last year, driven by the ongoing growth of Lucky Mobile
Blended wireless churn of 1.31% remained stable in Q1 2019, compared to Q1 2018.
- Postpaid churn of 1.07% improved by 0.06 pts this quarter, compared to the same period in 2018, due to the favourable impact of our ongoing investments in customer retention and network speeds and better promotional pricing discipline in the marketplace
- Prepaid churn of 4.49% increased by 1.09 pts in the current quarter, compared to the same period in 2018, driven by the prepaid subscriber adjustments and higher customer deactivations, mainly due to greater competitive intensity in the prepaid market and the impact from the harmonization of our prepaid deactivation policy across all Bell Wireless brands from 120 days for Bell and Virgin Mobile and 150 days for Lucky Mobile to 90 days
Net activations decreased by 13.7% in the current quarter, compared to the same period in Q1 2018, due to lower net postpaid activations, partly offset by less prepaid net losses.
- Postpaid net activations decreased by 26.7% in Q1 2019, compared to the same period last year, driven by lower gross activations, offset in part by less customer deactivations
- Prepaid net losses improved by 12,188 or 50.6% in Q1 2019, compared to the same period in 2018, driven by higher gross activations, moderated by greater customer deactivations.
Wireless subscribers at March 31, 2019 totaled 9,480,835, an increase of 3.1% from 9,195,048 subscribers reported at the end of Q1 2018. This was comprised of 8,808,189 postpaid subscribers, an increase of 4.0% from Q1 2018, and 672,646 prepaid subscribers, a decline of 7.1% from Q1 2018. The proportion of Bell Wireless customers subscribing to our postpaid service increased by 1 pt year over year to 93% in Q1 2019.
At the beginning of Q1 2019, we adjusted our wireless subscriber base to remove 167,929 subscribers (72,231 postpaid and 95,698 prepaid) as follows:
- 65,798 subscribers (19,195 postpaid and 46,603 prepaid), due to the completion of the shutdown of the CDMA network on April 30, 2019
- 49,095 prepaid subscribers as a result of a change to our deactivation policy, mainly from 120 days for Bell/Virgin Mobile and 150 days for Lucky Mobile to 90 days
- 43,670 postpaid subscribers relating to IoT due to the further refinement of our subscriber definition as a result of the technology evolution
- 9,366 postpaid fixed wireless Internet subscribers which were transferred to our retail high-speed Internet subscriber base
| 12 | |||
|
3 |
MD&A |
Business segment analysis Bell Wireless |
|
|
BCE Inc. 2019 First Quarter Shareholder Report |
| ASSUMPTIONS |
As at the date of this MD&A, our forward-looking statements set out in the BCE 2018 Annual MD&A, as updated or supplemented in this MD&A, are based on certain assumptions including, without limitation, the following assumptions and the assumptions referred to in each of the other business segment discussions set out in this section 3, Business segment analysis, as well as the economic and market assumptions referred to in section 1.3, Assumptions, of this MD&A.
- Maintain our market share of incumbent wireless postpaid net additions
- Higher prepaid customer net additions
- Continued adoption of smartphone devices, tablets and data applications, as well as the introduction of more 4G LTE and LTE-A devices and new data services
- Higher subscriber acquisition and retention spending, driven by higher handset costs and more customer device upgrades
- Improving blended ABPU, driven by a higher postpaid smartphone mix, increased data consumption on 4G LTE and LTE-A networks, and higher access rates partly offset by the impact of a higher prepaid mix in our overall subscriber base and the impact from Bell Mobility’s SSC contract
- Expansion of the LTE-A network coverage to approximately 94% of the Canadian population, and continued 5G preparations with network technology trials, as well as the deployment of small cells and equipping all new sites with fibre
- Ability to monetize increasing data usage and customer subscriptions to new data services
- No material financial, operational or competitive consequences of changes in regulations affecting our wireless business
|
13 |
|||
|
3 |
MD&A |
Business segment analysis Bell Wireline |
|
| BCE Inc. 2019 First Quarter Shareholder Report |
| 3.2 Bell Wireline |
KEY BUSINESS DEVELOPMENTS
EXPANSION OF WIRELESS HOME INTERNET SERVICE
Bell announced the continued expansion of its innovative Wireless Home Internet broadband service to more Ontario communities in Muskoka and Haliburton County, Quinte West and Hastings, Lennox and Addington, the Kawartha Lakes region and Northumberland, Prince Edward and Peterborough Counties. Bell Wireless Home Internet is designed to provide affordable broadband access to residents in smaller towns and unserved and underserved rural communities. The 5G-capable technology operates in the 3500 MHz spectrum band on Bell’s advanced LTE wireless network. Now available in more than 60 communities in Ontario and Québec, Bell’s Wireless Home Internet service is expected to reach more than 200,000 additional households in 138 centres this year.
FIBE TV APP AVAILABLE ON CHROMECAST
Bell continued to enhance its TV services with more ways to enjoy Fibe TV and Alt TV. In March 2019, we made the Fibe TV app available on Google Chromecast, which plugs into a TV’s high-definition multimedia interface port. Also available on Amazon Fire TV, Android TV and Apple TV, the Fibe TV app provides multiple options to bring Fibe TV and Alt TV to all screens.
BBM EXPANDS CLOUD SERVICES WITH GOOGLE
Bell Business Markets (BBM) and Google have
introduced new hybrid cloud connectivity for business customers to connect to
the Google Cloud Platform globally via direct fibre connections on Bell’s
private network. The new service joins the Bell Cloud Connect portfolio of cloud
and data centre solutions with partners including Amazon Web Services, IBM and
Microsoft.
| FINANCIAL PERFORMANCE ANALYSIS |
Q1 2019 PERFORMANCE HIGHLIGHTS

| (1) | As of January 1, 2019, we are no longer reporting wholesale subscribers in our Internet, TV and residential NAS subscriber bases reflecting our focus on the retail market. Consequently, we restated previously reported 2018 subscribers for comparability. |
| (2) | At the beginning of Q1 2019, our retail high-speed Internet subscriber base was increased by 9,366 subscribers due to the transfer of fixed wireless Internet subscribers from our wireless segment. |
| 14 | |||
|
3 |
MD&A |
Business segment analysis Bell Wireline |
|
|
BCE Inc. 2019 First Quarter Shareholder Report |
BELL WIRELINE RESULTS
REVENUES
| Q1 2019 | Q1 2018 | $ CHANGE | % CHANGE | ||||||
Data | 1,885 | 1,820 | 65 | 3.6 | % | ||||
Voice | 907 | 948 | (41 | ) | (4.3 | %) | |||
Other services | 59 | 63 | (4 | ) | (6.3 | %) | |||
Total external service revenues | 2,851 | 2,831 | 20 | 0.7 | % | ||||
Inter-segment service revenues | 69 | 58 | 11 | 19.0 | % | ||||
Total operating service revenues | 2,920 | 2,889 | 31 | 1.1 | % | ||||
Data | 133 | 104 | 29 | 27.9 | % | ||||
Equipment and other | 11 | 16 | (5 | ) | (31.3 | %) | |||
Total external product revenues | 144 | 120 | 24 | 20.0 | % | ||||
Inter-segment product revenues | – | – | – | – | |||||
Total operating product revenues | 144 | 120 | 24 | 20.0 | % | ||||
Total Bell Wireline revenues | 3,064 | 3,009 | 55 | 1.8 | % |
Bell Wireline operating revenues grew by 1.8% in Q1 2019, compared to last year, driven by both higher data services and product revenues, partly offset by lower voice and other services revenues.
Bell Wireline operating service revenues increased by 1.1% in Q1 2019, compared to prior year.
- Data revenues increased by 3.6% in Q1 2019, compared to Q1 2018, due to:
- Higher Internet and IPTV subscriber bases coupled with rate increases
- Greater IP connectivity and business solutions services sales to enterprise customers, including the contribution from the acquisition of Axia in August 2018
These factors were partly offset by:
- Increased acquisition, retention and bundle discounts on residential services due to aggressive offers from cable competitors
- The ongoing decline in our satellite TV subscriber base
- Continued legacy data erosion due in part to migrations to IP-based services
- Voice revenues declined by 4.3% in Q1 2019, compared to Q1 2018, driven by:
- Ongoing NAS line erosion from technological substitution to wireless and Internet-based services
- Large business customer conversions to IP-based data services
- Lower usage of traditional long distance services by residential and business customers
- Competitive pricing pressures within our business market
These factors were partly offset by:
- The flow-through of 2018 residential pricing changes
- Greater sales of international wholesale long distance minutes
Bell Wireline operating product revenues grew by 20.0% in Q1 2019, compared to Q1 2018, attributable to increased demand for equipment from the government sector.
OPERATING COSTS AND ADJUSTED EBITDA
| Q1 2019 |
Q1 2018 | $ CHANGE | % CHANGE | ||||||
Operating costs | (1,725 | ) | (1,696 | ) | (29 | ) | (1.7 | %) | |
Adjusted EBITDA | 1,339 | 1,313 | 26 | 2.0 | % | ||||
Adjusted EBITDA margin | 43.7 | % | 43.6 | % | 0.1 | pts |
Bell Wireline operating costs increased by 1.7% in Q1 2019, compared to Q1 2018, due to:
- Higher cost of goods sold resulting from higher product sales
- Greater payments to other carriers associated with increased sales of international wholesale long distance minutes
- The acquisition of Axia
- Higher programming and content costs in our TV business driven by rate increases
These factors were partly offset by:
- The favourable impact from the adoption of IFRS 16 in 2019
- Decreased labour costs attributable to workforce reductions, lower call volumes to our customer service centres and vendor contract savings
- Lower advertising expense in our residential market due to greater spend last year during the PyeongChang 2018 Winter Olympics
|
15 |
|||
|
3 |
MD&A |
Business segment analysis Bell Wireline |
|
|
BCE Inc. 2019 First Quarter Shareholder Report |
Bell Wireline adjusted EBITDA increased
by 2.0% in Q1 2019, compared to the same period last year, driven by
the flow-through of the revenue growth, moderated by higher operating
expenses. Adjusted EBITDA margin increased to 43.7% in Q1 2019, compared
to 43.6% achieved in Q1 2018 as a result of the favourable impact from
the adoption of IFRS 16 in 2019, partly offset by more low-margin
product sales in the total revenue base.
BELL WIRELINE OPERATING METRICS
DATA
Retail high-speed Internet
| Q1 2019 | Q1 2018 | CHANGE | % CHANGE | ||||||
Retail net activations (1) | 22,671 | 18,156 | 4,515 | 24.9 | % | ||||
Retail subscribers (1)(2) | 3,442,411 | 3,311,931 | 130,480 | 3.9 | % |
| (1) | As of January 1, 2019, we are no longer reporting wholesale subscribers in our Internet subscriber base reflecting our focus on the retail market. Consequently, we restated previously reported 2018 subscribers for comparability. |
| (2) | At the beginning of Q1 2019, our retail high-speed Internet subscriber base was increased by 9,366 subscribers due to the transfer of fixed wireless Internet subscribers from our wireless segment. |
Retail high-speed Internet subscriber net activations increased by 24.9% in Q1 2019, compared to last year, resulting from greater activations in our expanding fibre-to-the-premise (FTTP) and fixed wireless-to-the-home (WTTH) footprint, coupled with higher pull-through from our application-based live TV service Alt TV. This was partly offset by greater deactivations attributable to aggressive offers from cable competitors, along with a larger number of residential customers coming off promotional offers.
Retail high-speed Internet subscribers totaled 3,442,411 at March 31, 2019, up 3.9% from the end of Q1 of 2018. At the beginning of Q1 2019, our retail high-speed Internet subscriber base was increased by 9,366 subscribers due to the transfer of fixed wireless Internet subscribers from our wireless segment.
Retail TV
| Q1 2019 | Q1 2018 | CHANGE | % CHANGE | ||||||
Retail net subscriber (losses) activations (1) | (1,560 | ) | (10,354 | ) | 8,794 | 84.9 | % | ||
IPTV | 20,916 | 13,573 | 7,343 | 54.1 | % | ||||
Satellite | (22,476 | ) | (23,927 | ) | 1,451 | 6.1 | % | ||
Total retail subscribers (1) | 2,764,851 | 2,734,498 | 30,353 | 1.1 | % | ||||
IPTV | 1,696,622 | 1,578,489 | 118,133 | 7.5 | % | ||||
Satellite | 1,068,229 | 1,156,009 | (87,780 | ) | (7.6 | %) |
| (1) | As of January 1, 2019, we are no longer reporting wholesale subscribers in our TV subscriber base reflecting our focus on the retail market. Consequently, we restated previously reported 2018 subscribers for comparability. |
Retail IPTV net subscriber activations increased by 54.1% in Q1 2019, compared to last year, resulting from continued growth in activations from Alt TV and the benefit from the ongoing expansion of our FTTP footprint, which is enabling more competitive service bundles.
Retail satellite TV net customer losses improved by 6.1% in Q1 2019, compared to last year, driven by fewer deactivations, attributable to a more mature subscriber base geographically better-suited for satellite TV service, partly offset by lower gross activations due to aggressive cable offers in our non-FTTP footprint.
Total retail TV net subscriber losses (IPTV and satellite TV combined) improved by 84.9% in Q1 2019, compared to Q1 2018, due to higher IPTV net activations and fewer satellite TV net losses.
Retail IPTV subscribers at March 31, 2019 totaled 1,696,622, up 7.5% from 1,578,489 subscribers reported at the end of Q1 2018.
Retail satellite TV subscribers at March 31, 2019 totaled 1,068,229, down 7.6% from 1,156,009 subscribers at the end of the same period last year.
Total retail TV subscribers (IPTV and satellite TV combined) at March 31, 2019 were 2,764,851, representing a 1.1% increase since the end of Q1 2018.
VOICE
| Q1 2019 | Q1 2018 | CHANGE | % CHANGE | ||||||
Retail residential NAS lines net losses (1) | (66,779 | ) | (56,071 | ) | (10,708 | ) | (19.1 | %) | |
Retail residential NAS lines (1) | 2,894,029 | 3,163,618 | (269,589 | ) | (8.5 | %) |
| (1) | As of January 1, 2019, we are no longer reporting wholesale subscribers in our residential NAS subscriber base reflecting our focus on the retail market. Consequently, we restated previously reported 2018 subscribers for comparability. |
Retail residential NAS net losses increased by 19.1% in Q1 2019, compared to prior year, due to lower activations driven by continued wireless and Internet-based technology substitution, combined with fewer new activations as the market shifts its focus increasingly towards two-product Internet and TV service bundles. This was partly offset by lower customer deactivations reflecting a reduced number of customers coming off promotional offers.
Retail residential NAS subscribers at March 31, 2019 totaled 2,894,029, a 8.5% decline compared to the 3,163,618 subscribers reported at the end of Q1 2018. This represents a significant decline over the 5.8% subscriber base erosion experienced in Q1 2018, due to greater wireless and Internet-based technology substitution.
| 16 | |||
|
3 |
MD&A |
Business segment analysis Bell Wireline |
|
|
BCE Inc. 2019 First Quarter Shareholder Report |
| ASSUMPTIONS |
As at the date of this MD&A, our forward-looking statements set out in the BCE 2018 Annual MD&A, as updated or supplemented in this MD&A, are based on certain assumptions including, without limitation, the following assumptions and the assumptions referred to in each of the other business segment discussions set out in this section 3, Business segment analysis, as well as the economic and market assumptions referred to in section 1.3, Assumptions, of this MD&A.
- Positive full-year adjusted EBITDA growth
- Continued growth in retail residential IPTV and Internet subscribers
- Increasing wireless and Internet-based technological substitution
- Residential services household average revenue per user growth from increased penetration of multi-product households and price increases
- Continued aggressive residential service bundle offers from cable TV competitors in our local wireline areas
- Continued large business customer migration to IP-based systems
- Ongoing competitive repricing pressures in our business and wholesale markets
- Continued competitive intensity in our small and mid-sized business markets as cable operators and other telecommunications competitors continue to intensify their focus on business customers
- Traditional high-margin product categories challenged by large global cloud and OTT providers of business voice and data solutions expanding into Canada with on-demand services
- Accelerating customer adoption of OTT services resulting in downsizing of TV packages
- Further deployment of direct fibre to more homes and businesses within our wireline footprint and an acceleration in our fixed WTTH rural buildout
- Growing consumption of OTT TV services and on-demand streaming video, as well as the proliferation of devices, such as tablets, that consume large quantities of bandwidth, will require considerable ongoing capital investment
- Realization of cost savings related to management workforce reductions including attrition and retirements, lower contracted rates from our suppliers, operating efficiencies enabled by a growing direct fibre footprint, changes in consumer behaviour and product innovation, as well as the realization of additional synergies from the next phases of integration of Manitoba Telecom Services Inc.
- No material financial, operational or competitive consequences of changes in regulations affecting our wireline business
|
17 |
|||
|
3 |
MD&A |
Business segment analysis Bell Media |
|
| BCE Inc. 2019 First Quarter Shareholder Report |
| 3.3 Bell Media |
KEY BUSINESS DEVELOPMENTS
LAUNCH OF STARZ IN CANADA
On March 5, 2019, Bell Media officially launched STARZ in Canada, delivering a slate of the bold, diverse, and genre-bending programming that has already established the channel as one of the leading pay TV services in the United States. STARZ is now the Canadian home of all new STARZ original programming, select library titles, and classic films from all eras. STARZ is available across two linear TV channels (following the rebrand of Pay TV channel Encore as STARZ on March 1), the subscription video-on-demand platforms of participating TV providers, and via the STARZ streaming service which is available directly to all Canadians with access to the Internet as an add-on to Crave. The STARZ streaming service can be accessed via Crave.ca, the Crave app on iOS and Android, and Apple TV Generation 4, with additional platforms rolling out in the coming months.
LAUNCH OF DAY PASS SUBSCRIPTIONS TO TSN DIRECT AND RDS DIRECT
On March 4, 2019, TSN and RDS launched Day Pass subscriptions to their TSN Direct and RDS Direct streaming services. The all-new, single-day subscription option is the first of its kind in Canada, providing full access to TSN and RDS channels for 24 hours with no contract. Through their Month Pass or Day Pass subscriptions, viewers can watch on a multitude of platforms including computers, tablets, mobile devices, and Apple TV, with TSN Direct also available on Samsung SmartTV and Xbox One, and more platforms to be announced soon.
BELL MEDIA RECOGNIZED FOR EXCELLENCE IN PROGRAMMING
Bell Media and its production partners were honoured with 55 awards by the Academy of Canadian Cinema and Television at the recent annual Canadian Screen Awards, which recognizes excellence in Canadian film, TV and digital media productions. Overall, Bell Media was recognized with 34 awards in the TV and digital categories, more than any other private broadcaster, with wins in major categories including Best Limited Series for Cardinal, Best Direction – Comedy for Letterkenny, Best Reality/Competition Program or Series for The Amazing Race Canada and Best National Newscast for CTV National News with Lisa LaFlamme. TSN once again won more awards than all other sports broadcasters combined, scoring seven wins in the eight categories they were nominated in, including Best Sports Host for James Duthie and Best Play-By-Play Announcer for Chris Cuthbert. Bell Media-supported films won 21 awards, including Best Motion Picture and Performance by an Actress in a Leading Role.
| FINANCIAL PERFORMANCE ANALYSIS |
Q1 2019 PERFORMANCE HIGHLIGHTS

REVENUES
| Q1 2019 | Q1 2018 | $ CHANGE | % CHANGE | ||||||
Total external revenues | 640 | 631 | 9 | 1.4 | % | ||||
Inter-segment revenues | 105 | 118 | (13 | ) | (11.0 | %) | |||
Total Bell Media revenues | 745 | 749 | (4 | ) | (0.5 | %) |
Bell Media operating revenues decreased by 0.5% in Q1 2019, compared to Q1 2018, driven by lower advertising revenues while subscriber revenues remained stable year over year.
- Advertising revenues decreased in Q1 2019, compared to last year, mainly driven by:
- Decreased radio advertising revenues from ongoing market softness
These factors were partly offset by:
- Higher specialty TV advertising revenues mainly from entertainment and news specialty
- The recapture of advertising dollars following the shift last year to the principal broadcaster of the PyeongChang 2018 Winter Olympics
- Subscriber revenues were essentially flat in Q1 2019, compared to last year, mainly due to:
- Continued growth in Crave, our pay TV and streaming service, driven by direct-to-consumer subscriber growth and rate increases
- Ongoing ramp-up in TSN and RDS Direct, our direct-to-consumer sports streaming services that were launched in June 2018
These factors were largely offset by a decline in specialty and pay TV subscribers.
| 18 | |||
|
3 |
MD&A |
Business segment analysis Bell Media |
|
|
BCE Inc. 2019 First Quarter Shareholder Report |
OPERATING COSTS AND ADJUSTED EBITDA
| Q1 2019 | Q1 2018 | $ CHANGE | % CHANGE | ||||||
Operating costs | (580 | ) | (619 | ) | 39 | 6.3 | % | ||
Adjusted EBITDA | 165 | 130 | 35 | 26.9 | % | ||||
Adjusted EBITDA margin | 22.1 | % | 17.4 | % | 4.7 | pts |
Bell Media operating costs decreased by 6.3% in Q1 2019, compared to the same period last year, driven by the favourable impact from the adoption of IFRS 16 in the current year, effective containment of programming and production costs, and lower labour costs, partly offset by the continued investment in content for our Crave products.
Bell Media adjusted EBITDA increased by 26.9% in Q1 2019, compared to Q1 2018, as the lower operating expenses more than offset the decline in operating revenues.
BELL MEDIA OPERATING METRICS
- CTV maintained its #1 ranking as the most-watched network in Canada for the 15th winter season in a row, with 11 of the top 20 programs nationally among total viewers. CTV had more shows in the Winter Top 20 than all the networks combined.
- Bell Media maintained its leadership position in the specialty and pay TV market, with its English specialty and pay TV properties reaching 83% of all Canadian English specialty and pay viewers and its French specialty and pay TV properties reaching 72% of French language TV viewers in an average week. Bell Media also ranked first with TSN, Canada’s most-watched specialty TV channel among total viewers, and RDS, the top French-language sports network for key viewers aged 25 to 54.
- Bell Media continued to rank first in digital media among Canadian broadcast and video network competitors, and sixth among online properties in the country, with 21.4 million unique visitors per month, reaching 69% of the digital audience
- Bell Media remained Canada’s top radio broadcaster, reaching over 15.9 million listeners who spent nearly 71 million hours tuned in each week
- Astral is one of Canada’s leading out-of-home advertising companies, reaching 14 million consumers weekly, with an offering of five innovative product lines and owning more than 30,000 advertising faces, strategically located in key urban cities across the country
| ASSUMPTIONS |
As at the date of this MD&A, our forward-looking statements set out in the BCE 2018 Annual MD&A, as updated or supplemented in this MD&A, are based on certain assumptions including, without limitation, the following assumptions and the assumptions referred to in each of the other business segment discussions set out in this section 3, Business segment analysis, as well as the economic and market assumptions referred to in section 1.3, Assumptions, of this MD&A.
- Revenue performance expected to reflect further Crave subscriber growth, flow-through of broadcasting distribution undertaking rate increases, and strategic pricing on advertising sales
- Operating cost growth driven by higher programming costs, excluding IFRS 16, mainly due to continued investment in Crave content
- Continued scaling of Crave and sports direct-to-consumer products
- Ability to successfully acquire and produce highly rated programming and differentiated content
- Building and maintaining strategic supply arrangements for content across all screens and platforms
- Monetization of content rights and Bell Media properties across all platforms
- TV unbundling and growth in OTT viewing expected to result in lower subscriber levels for many Bell Media video properties
- No material financial, operational or competitive consequences of changes in regulations affecting our media business
|
19 |
|||
|
4 |
MD&A | Financial and capital management | |
| BCE Inc. 2019 First Quarter Shareholder Report |
| 4 Financial and capital management |
This section tells you how we manage our cash and capital resources to carry out our strategy and deliver financial results. It provides an analysis of our financial condition, cash flows and liquidity on a consolidated basis.
| 4.1 Net debt (1) |
| MARCH 31, 2019 | DECEMBER 31, 2018 | $ CHANGE | % CHANGE | ||||||
Debt due within one year | 5,485 | 4,645 | 840 | 18.1 | % | ||||
Long-term debt | 22,016 | 19,760 | 2,256 | 11.4 | % | ||||
Preferred shares (2) | 2,002 | 2,002 | – | – | |||||
Cash and cash equivalents | (668 | ) | (425 | ) | (243 | ) | (57.2 | %) | |
Net debt | 28,835 | 25,982 | 2,853 | 11.0 | % |
The increase of $3,096 million in total debt comprised of debt due within one year and long-term debt was due to:
- an increase in our lease liabilities of $2,304 million as a result of the adoption of IFRS 16 on January 1, 2019
- an increase in our notes payable (net of repayments) of $567 million
- a net increase of $225 million in our lease liabilities and other debt
The increase in cash and cash equivalents of $243 million was due mainly to:
- $642 million of free cash flow
- $394 million of debt issuances (net of repayments)
Partly offset by:
- $678 million of dividends paid on BCE common shares
- $76 million paid for the purchase on the open market of shares for the settlement of share-based payments
- $29 million acquisition and other costs paid
On March 31, 2019, our net debt leverage ratio(1) was 2.98 times adjusted EBITDA. The increase reflects a one-time increase due to the adoption of IFRS 16 which increased net debt by $2,304 million on January 1, 2019. The net debt leverage ratio is expected to improve through the end of 2019 as the trailing twelve-month adjusted EBITDA will reflect the full positive impact of higher adjusted EBITDA under IFRS 16.
| 4.2 Outstanding share data |
| COMMON SHARES OUTSTANDING | NUMBER OF SHARES | ||
Outstanding, January 1, 2019 | 898,200,415 | ||
Shares issued under employee stock option plan | 389,543 | ||
Shares issued under employee savings plan (ESP) | 185,139 | ||
Outstanding, March 31, 2019 | 898,775,097 |
| STOCK OPTIONS OUTSTANDING | NUMBER OF OPTIONS | WEIGHTED AVERAGE EXERCISE PRICE ($) | |||
Outstanding, January 1, 2019 | 14,072,332 | 56 | |||
Granted | 3,343,317 | 58 | |||
Exercised (3) | (389,543 | ) | 48 | ||
Forfeited | (33,613 | ) | 58 | ||
Outstanding, March 31, 2019 | 16,992,493 | 57 | |||
Exercisable, March 31, 2019 | 6,817,960 | 55 |
| (1) | Net debt and net debt leverage ratio are non-GAAP financial measures and do not have a standardized meaning under IFRS. Therefore, they are unlikely to be comparable to similar measures presented by other issuers. See section 8.2, Non-GAAP financial measures and key performance indicators (KPIs) – Net debt and Net debt leverage ratio in this MD&A for more details including reconciliations to the most comparable IFRS financial measure. |
| (2) | 50% of outstanding preferred shares of $4,004 million in 2019 and 2018 are classified as debt consistent with the treatment by some credit rating agencies. |
| (3) | The weighted average share price for options exercised during the three months ended March 31, 2019 was $58. |
| 20 | |||
|
4 |
MD&A | Financial and capital management | |
|
BCE Inc. 2019 First Quarter Shareholder Report |
| 4.3 Cash flows |
| Q1 2019 | Q1 2018 | $ CHANGE | % CHANGE | ||||||
Cash flows from operating activities | 1,516 | 1,496 | 20 | 1.3 | % | ||||
Capital expenditures | (850 | ) | (931 | ) | 81 | 8.7 | % | ||
Cash dividends paid on preferred shares | (26 | ) | (33 | ) | 7 | 21.2 | % | ||
Cash dividends paid by subsidiaries to non-controlling interest | (27 | ) | (13 | ) | (14 | ) | n.m. | ||
Acquisition and other costs paid | 29 | 18 | 11 | 61.1 | % | ||||
Free cash flow | 642 | 537 | 105 | 19.6 | % | ||||
Business acquisitions | – | (223 | ) | 223 | 100.0 | % | |||
Acquisition and other costs paid | (29 | ) | (18 | ) | (11 | ) | (61.1 | %) | |
Acquisition of spectrum licences | – | (36 | ) | 36 | 100.0 | % | |||
Disposition of intangibles and other assets | – | 68 | (68 | ) | (100.0 | %) | |||
Other investing activities | (24 | ) | (35 | ) | 11 | 31.4 | % | ||
Net issuance of debt instruments | 394 | 1,236 | (842 | ) | (68.1 | %) | |||
Issue of common shares | 20 | 1 | 19 | n.m. | |||||
Repurchase of common shares | – | (175 | ) | 175 | 100.0 | % | |||
Purchase of shares for settlement of share-based payments | (76 | ) | (88 | ) | 12 | 13.6 | % | ||
Cash dividends paid on common shares | (678 | ) | (646 | ) | (32 | ) | (5.0 | %) | |
Return of capital to non-controlling interest | – | (29 | ) | 29 | 100.0 | % | |||
Other financing activities | (6 | ) | (18 | ) | 12 | 66.7 | % | ||
Net increase in cash and cash equivalents | 243 | 574 | (331 | ) | (57.7 | %) |
| n.m.: not meaningful |
| CASH FLOWS FROM OPERATING ACTIVITIES AND FREE CASH FLOW |
Cash flows from operating activities in the first quarter of 2019 increased by $20 million, compared to Q1 2018, due mainly to higher adjusted EBITDA, which reflects the favourable impact from the adoption of IFRS 16, partly offset by a decrease in cash from working capital, higher interest paid, which reflects the unfavourable impact from the adoption of IFRS 16, and higher severance and other costs paid.
Free cash flow in the first quarter of 2019 increased by $105 million compared to the same period last year, mainly due to higher cash flows from operating activities, excluding acquisition and other costs paid, and lower capital expenditures.
| CAPITAL EXPENDITURES |
| Q1 2019 | Q1 2018 | $ CHANGE | % CHANGE | ||||||
Bell Wireless | 151 | 167 | 16 | 9.6 | % | ||||
Capital intensity ratio | 7.1 | % | 8.3 | % | 1.2 | pts | |||
Bell Wireline | 674 | 744 | 70 | 9.4 | % | ||||
Capital intensity ratio | 22.0 | % | 24.7 | % | 2.7 | pts | |||
Bell Media | 25 | 20 | (5 | ) | (25.0 | %) | |||
Capital intensity ratio | 3.4 | % | 2.7 | % | (0.7 | ) pts | |||
BCE | 850 | 931 | 81 | 8.7 | % | ||||
Capital intensity ratio | 14.8 | % | 16.7 | % | 1.9 | pts |
BCE capital expenditures declined by 8.7% or $81 million to $850 million in Q1 2019, compared to the same period last year. Capital expenditures as a percentage of revenue (capital intensity ratio) also declined to 14.8% in Q1 2019, compared to 16.7% in Q1 2018. The decrease in capital expenditures was driven by lower spending in Bell Wireline and Bell Wireless, partly offset by higher spending in Bell Media. The year-over-year decrease reflected:
- Lower capital investments in our wireline segment of $70 million in Q1 2019, driven primarily by the timing of our capital spending as we continue to focus on the deployment of FTTP to more homes and businesses and the rollout of fixed WTTH to rural locations in Ontario and Québec
- Reduced capital spending in our wireless segment of $16 million in Q1 2019, as we are well advanced in the build-out of our LTE-A network which reached 91% of the Canadian population at March 31, 2019. We also continued to invest in spectrum carrier aggregation, and the deployment of wireless small-cells to optimize mobile coverage, signal quality and data backhaul.
- Higher capital spending at Bell Media of $5 million in Q1 2019, due to greater investment in our digital platforms
|
21 |
|||
|
4 |
MD&A | Financial and capital management | |
| BCE Inc. 2019 First Quarter Shareholder Report |
| BUSINESS ACQUISITIONS |
On January 5, 2018, BCE acquired all of the issued and outstanding shares of AlarmForce Industries Inc. (AlarmForce) for a total consideration of $182 million, of which $181 million was paid in cash and the remaining $1 million through the issuance of 22,531 BCE common shares.
| DISPOSITION OF INTANGIBLE AND OTHER ASSETS |
During Q1 2018, BCE sold AlarmForce’s approximate 39,000 customer accounts in British Columbia, Alberta and Saskatchewan to Telus Communications Inc. for total proceeds of approximately $68 million.
| DEBT INSTRUMENTS |
2019
In the first quarter of 2019, we issued $394 million of debt, net of repayments. This included the issuances (net of repayments) of $567 million of notes payable, partly offset by net payments of leases and other debt of $173 million.
2018
In the first quarter of 2018, we issued
$1,236 million of debt, net of repayments. This included the issuances
of Series M-47 MTN debentures and Series US-1 Notes at Bell Canada with
total principal amounts of $500 million and US $750 million (CAD $967
million), respectively. These issuances were partly offset by the
repayments (net of issuances) of $57 million of notes payable and
payments of finance leases and other debt of $174 million.
| REPURCHASE OF COMMON SHARES |
In Q1 2018, BCE repurchased and cancelled 3,085,697 common shares for a total cost of $175 million through a normal course issuer bid. Of the total cost, $69 million represented stated capital and $3 million represented the reduction of the contributed surplus attributable to these common shares. The remaining $103 million was charged to the deficit.
| CASH DIVIDENDS PAID ON COMMON SHARES |
In the first quarter of 2019, cash dividends paid on common shares increased by $32 million compared to Q1 2018 due to a higher dividend paid in Q1 2019 of $0.7550 per common share compared to $0.7175 per common share in Q1 2018.
| 4.4 Post-employment benefit plans |
For the three months ended March 31, 2019, we recorded an increase in our post-employment benefit obligations and a loss, before taxes, in OCI of $127 million. This was due to a lower actual discount rate of 3.3% at March 31, 2019, as compared to 3.8% at December 31, 2018, partly offset by a higher-than-expected return on plan assets in 2019.
For the three months ended March 31, 2018, we recorded an increase in our post-employment benefit obligations and a loss, before taxes, in OCI of $154 million. This was due to a lower-than-expected return on plan assets. The discount rate at March 31, 2018 was 3.6%, unchanged from December 31, 2017.
| 4.5 Financial risk management |
| FAIR VALUE |
The following table provides the fair value details of financial instruments measured at amortized cost in the statements of financial position.
| MARCH 31, 2019 | DECEMBER 31, 2018 | ||||||||||
| CARRYING | FAIR | CARRYING | FAIR | ||||||||
| CLASSIFICATION | FAIR VALUE METHODOLOGY | VALUE | VALUE | VALUE | VALUE | ||||||
| CRTC tangible benefits obligation | Trade payables and other liabilities and non-current liabilities | Present value of estimated future cash flows discounted using observable market interest rates | 51 | 51 |
| 61 |
| 61 |
| ||
CRTC deferral account obligation | Trade payables and other liabilities and non-current liabilities | Present value of estimated future cash flows discounted using observable market interest rates | 84 |
| 88 |
| 108 |
| 112 |
| |
| Debt securities and other debt | Debt due within one year and long-term debt | Quoted market price of debt | 18,165 | 19,956 | 18,188 | 19,178 | |||||
Finance leases (1) | Debt due within one year and long-term debt | Present value of future cash flows discounted using observable market interest rates | – | – | 2,097 | 2,304 | |||||
| (1) | Upon adoption of IFRS 16 on January 1, 2019, fair value disclosures are no longer required for leases. |
| 22 | |||
|
4 |
MD&A | Financial and capital management | |
|
BCE Inc. 2019 First Quarter Shareholder Report |
The following table provides the fair value details of financial instruments measured at fair value in the statements of financial position.
|
CLASSIFICATION |
CARRYING VALUE OF ASSET (LIABILITY) |
FAIR VALUE |
|||||||
|
QUOTED PRICES IN ACTIVE MARKETS FOR IDENTICAL ASSETS (LEVEL 1) |
OBSERVABLE MARKET DATA (LEVEL 2)(1) |
NON-OBSERVABLE MARKET INPUTS (LEVEL 3)(2) |
|||||||
|
March 31, 2019 |
|
||||||||
|
Publicly-traded and privately-held investments(3) |
Other non-current assets |
111 |
|
2 |
|
– |
|
109 |
|
|
Derivative financial instruments |
Other current assets, trade payables and other liabilities, other non-current assets and liabilities |
81 |
|
– |
|
81 |
|
– |
|
|
Maple Leaf Sports & Entertainment Ltd. (MLSE) financial liability(4) |
Trade payables and other liabilities |
(135 |
) |
– |
|
– |
|
(135 |
) |
|
Other |
Other non-current assets and liabilities |
46 | – | 117 | (71 | ) | |||
|
December 31, 2018 |
|
||||||||
|
Publicly-traded and privately-held investments(3) |
Other non-current assets |
110 |
|
1 |
|
– |
|
109 |
|
|
Derivative financial instruments |
Other current assets, trade payables and other liabilities, other non-current assets and liabilities |
181 |
|
– |
|
181 |
|
– |
|
|
MLSE financial liability(4) |
Trade payables and other liabilities |
(135 |
) |
– |
|
– |
|
(135 |
) |
|
Other |
Other non-current assets and liabilities |
43 | – | 114 | (71 | ) | |||
| (1) | Observable market data such as equity prices, interest rates, swap rate curves and foreign currency exchange rates. |
| (2) | Non-observable market inputs such as discounted cash flows and earnings multiples. A reasonable change in our assumptions would not result in a significant increase (decrease) to our level 3 financial instruments. |
| (3) | Unrealized gains and losses are recorded in OCI and impairment charges are recorded in Other income (expense) in the income statements. |
| (4) | Represents BCE’s obligation to repurchase the BCE Master Trust Fund’s (Master Trust Fund) 9% interest in MLSE at a price not less than an agreed minimum price should the Master Trust Fund exercise its put option. The obligation to repurchase is marked to market each reporting period and the gain or loss is recorded in Other income (expense) in the income statements. The option has been exercisable since 2017. |
| CURRENCY EXPOSURES |
We use forward contracts, options and cross currency basis swaps to manage foreign currency risk related to anticipated purchases and sales and certain foreign currency debt.
A 10% depreciation (appreciation) in the value of the Canadian dollar relative to the U.S. dollar would result in a loss (gain) of $7 million ($2 million) recognized in net earnings at March 31, 2019 and a gain (loss) of $134 million ($126 million) recognized in Other comprehensive loss at March 31, 2019, with all other variables held constant.
A 10% depreciation (appreciation) in the value of the Canadian dollar relative to the Philippines Peso would result in a gain (loss) of $4 million in Other comprehensive loss at March 31, 2019, with all other variables held constant.
The following table provides further details on our outstanding foreign currency forward contracts and options as at March 31, 2019.
|
|
AMOUNT |
|
AMOUNT |
|
|
|
| TYPE OF HEDGE |
BUY CURRENCY |
TO RECEIVE |
SELL CURRENCY |
TO PAY |
MATURITY |
HEDGED ITEM |
| Cash flow |
USD |
2,754 |
CAD |
3,653 |
2019 |
Commercial paper |
| Cash flow |
USD |
589 |
CAD |
732 |
2019 |
Anticipated transactions |
| Cash flow |
PHP |
1,303 |
CAD |
32 |
2019 |
Anticipated transactions |
| Cash flow |
PHP |
932 |
CAD |
23 |
2020 |
Anticipated transactions |
| Cash flow |
USD |
362 |
CAD |
462 |
2020-2021 |
Anticipated transactions |
| Economic |
USD |
90 |
CAD |
114 |
2019 |
Anticipated transactions |
| Economic – put options |
USD |
45 |
CAD |
56 |
2019 |
Anticipated transactions |
| Economic – put options | USD | 81 | CAD | 101 | 2020 |
Anticipated transactions |
| Economic – call options |
USD |
48 |
CAD |
60 |
2020 |
Anticipated transactions |
|
23 |
|||
|
4 |
MD&A | Financial and capital management | |
| BCE Inc. 2019 First Quarter Shareholder Report |
| INTEREST RATE EXPOSURES |
A 1% increase (decrease) in interest rates would result in a decrease (increase) of $37 million in net earnings at March 31, 2019.
| EQUITY PRICE EXPOSURES |
We use equity forward contracts on BCE’s common shares to economically hedge the cash flow exposure related to the settlement of equity settled share-based compensation plans and the equity price risk related to a cash-settled share-based payment plan. The fair value of our equity forward contracts at March 31, 2019 was an asset of $27 million.
A 5% increase (decrease) in the market price of BCE’s common shares at March 31, 2019 would result in a gain (loss) of $38 million recognized in net earnings, with all other variables held constant.
| 4.6 Credit ratings |
BCE’s and Bell Canada’s key credit ratings remain unchanged from those described in the BCE 2018 Annual MD&A.
| 4.7 Liquidity |
Our cash requirements remain substantially unchanged from those described in the BCE 2018 Annual MD&A.
LITIGATION
RECENT DEVELOPMENTS IN LEGAL PROCEEDINGS
The following is an update to the legal proceedings described in the BCE 2018 AIF under section 8, Legal proceedings.
PURPORTED CLASS ACTION CONCERNING CELLULAR USAGE AND HEALTH RISK
On February 22, 2019, a group of defendants including Bell Mobility Inc. filed an application in the Supreme Court of British Columbia to dismiss the action on the basis that it is an abuse of process, and alternatively for want of prosecution. On March 19, 2019, the plaintiff formally brought an end to the action with the filing of a Notice of Discontinuance in relation to the totality of the claims. Accordingly, this legal proceeding is now concluded.
| 24 | |||
|
5 |
MD&A | Quarterly financial information | |
|
BCE Inc. 2019 First Quarter Shareholder Report |
| 5 Quarterly financial information |
BCE’s Q1 2019 Financial Statements were prepared in accordance with IFRS, as issued by the International Accounting Standards Board (IASB), under IAS 34, Interim Financial Reporting and were approved by BCE’s board of directors on May 1, 2019.
As required, we adopted IFRS 16 – Leases effective January 1, 2019, as described in section 8.1, Our accounting policies. We adopted IFRS 16 using a modified retrospective approach whereby the financial statements of prior periods presented were not restated and continue to be reported under IAS 17 – Leases, as permitted by the specific transition provisions of IFRS 16. The cumulative effect of the initial adoption of IFRS 16 was reflected as an adjustment to the deficit at January 1, 2019.
The following table, which was also prepared in accordance with IFRS, shows selected consolidated financial data of BCE for the eight most recent completed quarters.
| 2019 |
2018 | 2017 | |||||||||||||||
| Q1 | Q4 | Q3 | Q2 | Q1 | Q4 | Q3 | Q2 | ||||||||||
Operating revenues | |||||||||||||||||
Service | 5,045 | 5,231 | 5,117 | 5,129 | 4,964 | 5,152 | 5,054 | 5,078 | |||||||||
Product | 689 | 984 | 760 | 657 | 626 | 884 | 643 | 610 | |||||||||
Total operating revenues | 5,734 | 6,215 | 5,877 | 5,786 | 5,590 | 6,036 | 5,697 | 5,688 | |||||||||
Adjusted EBITDA | 2,409 | 2,394 | 2,457 | 2,430 | 2,254 | 2,329 | 2,405 | 2,382 | |||||||||
Severance, acquisition and other costs | (24 | ) | (58 | ) | (54 | ) | (24 | ) | – | (47 | ) | (23 | ) | (36 | ) | ||
Depreciation | (882 | ) | (799 | ) | (779 | ) | (787 | ) | (780 | ) | (783 | ) | (760 | ) | (767 | ) | |
Amortization | (221 | ) | (216 | ) | (220 | ) | (221 | ) | (212 | ) | (208 | ) | (207 | ) | (210 | ) | |
Net earnings | 791 | 642 | 867 | 755 | 709 | 698 | 850 | 814 | |||||||||
Net earnings attributable to common shareholders | 740 | 606 | 814 | 704 | 661 | 656 | 803 | 765 | |||||||||
Net earnings per common share | |||||||||||||||||
Basic and diluted | 0.82 | 0.68 | 0.90 | 0.79 | 0.73 | 0.72 | 0.90 | 0.85 | |||||||||
Weighted average number of common shares outstanding – basic (millions) | 898.4 | 898.1 | 898.0 | 898.0 | 900.2 | 900.6 | 900.4 | 900.1 | |||||||||
|
25 |
|||
|
6 |
MD&A | Regulatory environment | |
| BCE Inc. 2019 First Quarter Shareholder Report |
| 6 Regulatory environment |
The following is an update to the regulatory initiatives and proceedings described in the BCE 2018 Annual MD&A under section 3.3, Principal business risks and section 8, Regulatory environment.
| RADIOCOMMUNICATION ACT |
FEDERAL AUCTION OF 600 MHZ SPECTRUM
Bell decided not to acquire any 600 MHz low-band wireless spectrum in the recently concluded spectrum auction by ISED. Bell has spectrum assets in the low, mid and high frequency bands in both urban and rural locations. Given the supply of other low-band spectrum that Bell already possesses, spectrum in the 600 MHz band is not required for Bell to deliver broadband 4G and 5G services. Similar to Bell, the company’s main U.S. peers chose not to own any 600 MHz spectrum in their markets. Bell’s existing low-band spectrum, combined with network enhancements like cell splitting, enables the company to deliver mobile broadband service for significantly less capital than buying 600 MHz spectrum.
| 26 | |||
|
7 |
MD&A | Business risks | |
|
BCE Inc. 2019 First Quarter Shareholder Report |
| 7 Business risks |
A risk is the possibility that an event might happen in the future that could have a negative effect on our financial position, financial performance, cash flows, business or reputation. Part of managing our business is to understand what these potential risks could be and to mitigate them where we can.
The actual effect of any event could be materially different from what we currently anticipate. The risks described in this MD&A are not the only ones that could affect us. Additional risks and uncertainties not currently known to us or that we currently deem to be immaterial may also materially and adversely affect our financial position, financial performance, cash flows, business or reputation.
In the BCE 2018 Annual MD&A, we provided a detailed review of risks that could affect our financial position, financial performance, cash flows, business or reputation and that could cause actual results or events to differ materially from our expectations expressed in or implied by our forward-looking statements. This detailed description of risks is updated in this MD&A. The risks described in the BCE 2018 Annual MD&A, as updated in this MD&A, include, without limitation, risks associated with:
- the intensity of competitive activity, including from new and emerging competitors, coupled with new product launches, and the resulting impact on the cost of retaining existing customers and attracting new ones, as well as on our market shares, service volumes and pricing strategies
- the level of technological substitution and the presence of alternative service providers contributing to reduced utilization of our traditional wireline services
- the adverse effect of the fundamental separation of content and connectivity, which is changing our TV and media ecosystems and may accelerate the disconnection of TV services and the reduction of TV spending, as well as the fragmentation of, and changes in, the advertising market
- competition with global competitors, in addition to traditional Canadian TV competitors, for programming content, which could drive significant increases in content acquisition costs and challenge our ability to secure key content
- the proliferation of content piracy impacting subscriber growth and our ability to monetize products and services, as well as creating bandwidth pressure
- adverse economic and financial market conditions, a declining level of retail and commercial activity, and the resulting negative impact on the demand for, and prices of, our products and services and the level of bad debts
- regulatory initiatives, proceedings and decisions, government consultations and government positions that affect us and influence our business, including, in particular, those relating to mandatory access to networks, spectrum auctions, consumer-related codes of conduct, approval of acquisitions, broadcast licensing and foreign ownership requirements
- the inability to protect our physical and non-physical assets, including networks, IT systems, offices, corporate stores and sensitive information, from events such as information security attacks, unauthorized access or entry, fire and natural disasters
- the failure to optimize network and IT deployment and upgrade timelines, accurately assess the potential of new technologies, or invest and evolve in the appropriate direction
- the failure to continue investment in next-generation capabilities in a disciplined and strategic manner
- the inability to drive a positive customer experience in all aspects of our engagement with customers
- the complexity in our operations resulting from multiple technology platforms, billing systems, sales channels, marketing databases and a myriad of rate plans, promotions and product offerings
- the failure to maintain optimal network operating performance in the context of significant increases in capacity demands on our Internet and wireless networks
- the failure to implement or maintain highly effective IT systems supported by an effective governance and operating framework
- the risk that we may need to incur significant capital expenditures beyond our capital intensity target in order to provide additional capacity and reduce network congestion
- the failure to generate anticipated benefits from our corporate restructurings, system replacements and upgrades, staff reductions, process redesigns and the integration of business acquisitions
- events affecting the functionality of, and our ability to protect, test, maintain and replace, our networks, IT systems, equipment and other facilities
- in-orbit and other operational risks to which the satellites used to provide our satellite TV services are subject
- our dependence on third-party suppliers, outsourcers and consultants to provide an uninterrupted supply of the products and services we need to operate our business, deploy new network and other technologies and offer new products and services, as well as to comply with various obligations
- changes to our base of suppliers or outsourcers that we may decide or be required to implement
- the failure of our vendor selection, governance and oversight processes established to seek to ensure full risk transparency associated with existing and new suppliers
- security and data leakage exposure if security control protocols affecting our suppliers are bypassed
- the quality of our products and services and the extent to which they may be subject to manufacturing defects or fail to comply with applicable government regulations and standards
- the failure to attract and retain employees with the appropriate skill sets and to drive their performance in a safe environment
- labour disruptions
- the inability to access adequate sources of capital and generate sufficient cash flows from operations to meet our cash requirements, fund capital expenditures and provide for planned growth
- uncertainty as to whether dividends will be declared by BCE’s board of directors, whether the dividend on common shares will be increased, or whether BCE’s dividend payout policy will be maintained
- the inability to manage various credit, liquidity and market risks
- pension obligation volatility and increased contributions to post-employment benefit plans
- new or higher taxes due to new tax laws or changes thereto or in the interpretation thereof, and the inability to predict the outcome of government audits
|
27 |
|||
|
7 |
MD&A | Business risks | |
|
BCE Inc. 2019 First Quarter Shareholder Report |
- the failure to reduce costs as well as unexpected increases in costs
- the failure to evolve practices to effectively monitor and control fraudulent activities
- unfavourable resolution of legal proceedings and, in particular, class actions
- new or unfavourable changes in applicable laws and the failure to proactively address our legal and regulatory obligations
- health concerns about radiofrequency emissions from wireless communications devices and equipment
- the inability to maintain customer service and our networks operational in the event of epidemics, pandemics or other health risks
- the failure to recognize and adequately respond to climate change concerns or public and governmental expectations on environmental matters
We caution that the foregoing list of risk factors is not exhaustive and other factors could also adversely affect our results.
Please see section 9, Business risks of the BCE 2018 Annual MD&A for a more complete description of the above-mentioned and other risks, which section, and the other sections of the BCE 2018 Annual MD&A referred to therein, are incorporated by reference in this section 7.
In addition, please also see section 4.7, Liquidity – Litigation in this MD&A for an update to the legal proceedings described in the BCE 2018 AIF, which section 4.7 is incorporated by reference in this section 7. Please also see section 6, Regulatory environment in this MD&A for an update to the regulatory initiatives and proceedings described in the BCE 2018 Annual MD&A, which section 6 is incorporated by reference in this section 7.
Except for the updates set out in section 4.7, Liquidity – Litigation and in section 6, Regulatory environment in this MD&A, the risks described in the BCE 2018 Annual MD&A remain substantially unchanged.
| 28 | |||
|
8 |
MD&A | Accounting policies, financial measures and controls | |
|
BCE Inc. 2019 First Quarter Shareholder Report |
| 8 Accounting policies, financial measures and controls |
| 8.1 Our accounting policies |
BCE’s Q1 2019 Financial Statements were prepared in accordance with IFRS, as issued by the IASB, under IAS 34 – Interim Financial Reporting and were approved by BCE’s board of directors on May 1, 2019. These financial statements were prepared using the same basis of presentation, accounting policies and methods of computations as outlined in Note 2, Significant accounting policies in BCE’s consolidated financial statements for the year ended December 31, 2018, except as noted below. BCE’s Q1 2019 Financial Statements do not include all of the notes required in the annual financial statements.
| ADOPTION OF NEW ACCOUNTING STANDARDS |
IFRS 16
As required, we adopted IFRS 16 – Leases effective January 1, 2019. We adopted IFRS 16 using a modified retrospective approach whereby the financial statements of prior periods presented were not restated and continue to be reported under IAS 17 – Leases, as permitted by the specific transition provisions of IFRS 16. The cumulative effect of the initial adoption of IFRS 16 was reflected as an adjustment to the deficit at January 1, 2019.
Under IAS 17, leases of property, plant and equipment were recognized as finance leases when we obtained substantially all the risks and rewards of ownership of the underlying assets. All other leases were classified as operating leases. IFRS 16 eliminates the distinction between operating and finance leases for lessees, requiring instead that we recognize a right-of-use asset and a lease liability at lease commencement for all leases, with certain exceptions permitted through elections and practical expedients. Accounting for leases previously classified as finance leases and lessor accounting remains largely unchanged under IFRS 16.
We recognized lease liabilities at January 1, 2019 for leases previously classified as operating leases, measured at the present value of lease payments using our incremental borrowing rate at that date. Property, plant and equipment includes the corresponding right-of-use assets also recognized at January 1, 2019. The right-of-use assets were generally measured at an amount equal to the lease liability, adjusted by the amount of any prepaid or accrued lease payments relating to that lease recognized in the balance sheet as at December 31, 2018. In certain cases, the right-of-use assets were measured as though IFRS 16 had been applied since the lease commencement date. A depreciation charge for right-of-use assets is recorded in Depreciation and an interest expense on lease liabilities is recorded in Finance costs in the income statement.
As permitted by IFRS 16, we elected not to recognize lease liabilities and right-of-use assets for short-term leases and leases of low value assets, which will continue to be expensed on a straight-line basis over the lease term. We have also applied certain practical expedients to facilitate the initial adoption and ongoing application of IFRS 16:
- We generally do not separate non-lease components from related lease components. Each lease component and any associated non-lease components are accounted for as a single lease component
- We apply a single incremental borrowing rate to a portfolio of leases with similar characteristics
- As an alternative to performing an impairment review, we adjusted right-of-use assets for any onerous lease provisions recognized in the balance sheet at December 31, 2018
- We applied the exemption not to recognize right-of-use assets and liabilities for certain leases with a remaining term of 12 months or less as of January 1, 2019
- We used hindsight when determining the lease term when the lease contracts contain options to extend or terminate the lease
|
29 |
|||
|
8 |
MD&A | Accounting policies, financial measures and controls | |
| BCE Inc. 2019 First Quarter Shareholder Report |
| ADOPTION OF IFRS 16 |
Upon adoption of IFRS 16 on January 1, 2019, we recognized right-of-use assets of $2,257 million within property, plant and equipment, and lease liabilities of $2,304 million within debt, with an increase to our deficit of $19 million. These amounts were recognized in addition to assets under finance leases of $1,947 million and the corresponding finance lease liabilities of $2,097 million at December 31, 2018 under IAS 17. As a result, on January 1, 2019, our total right-of-use assets and lease liabilities amounted to $4,204 million and $4,401 million, respectively. The table below shows the impacts of adopting IFRS 16 on our January 1, 2019 consolidated statement of financial position.
| DECEMBER 31, 2018 AS REPORTED | IFRS 16 IMPACTS | JANUARY 1, 2019 UPON ADOPTION OF IFRS 16 | |||||
Prepaid expenses | 244 | (55 | ) | 189 | |||
Other current assets | 329 | 9 | 338 | ||||
Property, plant and equipment | 24,844 | 2,257 | 27,101 | ||||
Other non-current assets | 847 | 17 | 864 | ||||
Trade payables and other liabilities | 3,941 | (10 | ) | 3,931 | |||
Debt due within one year | 4,645 | 293 | 4,938 | ||||
Long-term debt | 19,760 | 2,011 | 21,771 | ||||
Deferred tax liabilities | 3,163 | (7 | ) | 3,156 | |||
Other non-current liabilities | 997 | (39 | ) | 958 | |||
Deficit | (4,937 | ) | (19 | ) | (4,956 | ) | |
Non-controlling interest | 326 | (1 | ) | 325 |
BCE’s operating lease commitments at December 31, 2018 were $1,612 million. The difference between operating lease commitments at December 31, 2018 and lease liabilities of $2,304 million upon adoption of IFRS 16 at January 1, 2019, is due mainly to an increase of $1,122 million related to renewal options reasonably certain to be exercised, an increase of $112 million mainly related to non-monetary transactions and a decrease of ($542) million as a result of discounting applied to future lease payments, which was determined using a weighted-average incremental borrowing rate of 3.49% at January 1, 2019.
SIGNIFICANT ACCOUNTING POLICIES – LEASES
The following accounting policy applies as of January 1, 2019 following the adoption of IFRS 16. Prior to January 1, 2019, we continued to apply IAS 17 as disclosed in our 2018 annual consolidated financial statements, as permitted by the specific transition provisions of IFRS 16.
We enter into leases for network infrastructure and equipment, land and buildings in the normal course of business. Lease contracts are typically made for fixed periods but may include purchase, renewal or termination options. Leases are negotiated on an individual basis and contain a wide range of different terms and conditions.
We assess whether a contract contains a lease at inception of the contract. A lease contract conveys the right to control the use of an identified asset for a period in exchange for consideration. We recognize lease liabilities with corresponding right-of-use assets for all lease agreements, except for short-term leases and leases of low value assets, which are expensed on a straight-line basis over the lease term. Consideration in a contract is allocated to lease and non-lease components on a relative stand-alone value basis. We generally account for lease components and any associated non-lease components as a single lease component.
Lease liabilities are initially measured at the present value of the lease payments that are not paid at the commencement date, discounted using our incremental borrowing rate, unless the rate implicit in the lease is readily determinable. We apply a single incremental borrowing rate to a portfolio of leases with similar characteristics. Lease payments included in the measurement of the lease liability comprise:
- Fixed (and in-substance fixed) lease payments, less any lease incentives
- Variable lease payments that depend on an index or rate
- Payments expected under residual value guarantees and payments relating to purchase options and renewal option periods that are reasonably certain to be exercised (or periods subject to termination options that are not reasonably certain to be exercised)
Lease liabilities are subsequently measured at amortized cost using the effective interest method. Lease liabilities are remeasured, with a corresponding adjustment to the related right-of-use assets, when there is a change in variable lease payments arising from a change in an index or rate, or when we change our assessment of whether purchase, renewal or termination options will be exercised.
Right-of-use assets are measured at cost, comprised of the initial measurement of the corresponding lease liabilities, lease payments made at or before the commencement date and any initial direct costs. They are subsequently depreciated on a straight-line basis and reduced by impairment losses, if any. Right-of-use assets may also be adjusted to reflect the remeasurement of related lease liabilities. If we obtain ownership of the leased asset by the end of the lease term or the cost of the right-of-use asset reflects the exercise of a purchase option, we depreciate the right-of-use asset from the lease commencement date to the end of the useful life of the underlying asset. Otherwise, we depreciate the right-of-use asset from the commencement date to the earlier of the end of the useful life of the underlying asset or the end of the lease term.
Variable lease payments that do not depend on an index or rate are not included in the measurement of lease liabilities and right-of-use assets. The related payments are expensed in Operating costs in the period in which the event or condition that triggers those payments occurs.
| 30 | |||
|
8 |
MD&A | Accounting policies, financial measures and controls | |
|
BCE Inc. 2019 First Quarter Shareholder Report |
| ESTIMATES AND KEY JUDGMENTS |
SIGNIFICANT JUDGEMENTS AND ESTIMATES RELATING TO THE APPLICATION OF IFRS 16
The application of IFRS 16 requires BCE to make judgments and estimates that affect the measurement of right-of-use assets and liabilities. In determining the lease term, we must consider all facts and circumstances that create an economic incentive to exercise renewal options (or not exercise termination options). Assessing whether a contract includes a lease also requires judgment. Estimates are required to determine the appropriate discount rate used to measure lease liabilities.
| 8.2 Non-GAAP financial measures and key performance indicators (KPIs) |
This section describes the non-GAAP financial measures and KPIs we use in this MD&A to explain our financial results. It also provides reconciliations of the non-GAAP financial measures to the most comparable IFRS financial measures.
| ADJUSTED EBITDA AND ADJUSTED EBITDA MARGIN |
The terms adjusted EBITDA and adjusted EBITDA margin do not have any standardized meaning under IFRS. Therefore, they are unlikely to be comparable to similar measures presented by other issuers.
We define adjusted EBITDA as operating revenues less operating costs, as shown in BCE’s consolidated income statements. Adjusted EBITDA for BCE’s segments is the same as segment profit as reported in Note 5, Segmented information, in BCE’s Q1 2019 Financial Statements. We define adjusted EBITDA margin as adjusted EBITDA divided by operating revenues.
We use adjusted EBITDA and adjusted EBITDA margin to evaluate the performance of our businesses as they reflect their ongoing profitability. We believe that certain investors and analysts use adjusted EBITDA to measure a company’s ability to service debt and to meet other payment obligations or as a common measurement to value companies in the telecommunications industry. We believe that certain investors and analysts also use adjusted EBITDA and adjusted EBITDA margin to evaluate the performance of our businesses. Adjusted EBITDA is also one component in the determination of short-term incentive compensation for all management employees.
Adjusted EBITDA and adjusted EBITDA margin have no directly comparable IFRS financial measure. Alternatively, the following table provides a reconciliation of net earnings to adjusted EBITDA.
| Q1 2019 | Q1 2018 | ||||
Net earnings | 791 | 709 | |||
Severance, acquisition and other costs | 24 | – | |||
Depreciation | 882 | 780 | |||
Amortization | 221 | 212 | |||
Finance costs | |||||
Interest expense | 283 | 240 | |||
Interest on post-employment benefit obligations | 16 | 17 | |||
Other (income) expense | (101 | ) | 61 | ||
Income taxes | 293 | 235 | |||
Adjusted EBITDA | 2,409 | 2,254 | |||
BCE operating revenues | 5,734 | 5,590 | |||
Adjusted EBITDA margin | 42.0 | % | 40.3 | % |
| ADJUSTED NET EARNINGS AND ADJUSTED EPS |
The terms adjusted net earnings and adjusted EPS do not have any standardized meaning under IFRS. Therefore, they are unlikely to be comparable to similar measures presented by other issuers.
We define adjusted net earnings as net earnings attributable to common shareholders before severance, acquisition and other costs, net mark-to-market losses (gains) on derivatives used to economically hedge equity settled share-based compensation plans, net losses (gains) on investments, early debt redemption costs and impairment charges, net of tax and non-controlling interest (NCI). We define adjusted EPS as adjusted net earnings per BCE common share.
We use adjusted net earnings and adjusted EPS, and we believe that certain investors and analysts use these measures, among other ones, to assess the performance of our businesses without the effects of severance, acquisition and other costs, net mark-to-market losses (gains) on derivatives used to economically hedge equity settled share-based compensation plans, net losses (gains) on investments, early debt redemption costs and impairment charges, net of tax and NCI. We exclude these items because they affect the comparability of our financial results and could potentially distort the analysis of trends in business performance. Excluding these items does not imply they are non-recurring.
The most comparable IFRS financial measures are net earnings attributable to common shareholders and EPS.
|
31 |
|||
|
8 |
MD&A | Accounting policies, financial measures and controls | |
|
BCE Inc. 2019 First Quarter Shareholder Report |
The following table is a reconciliation
of net earnings attributable to common shareholders and EPS to adjusted
net earnings on a consolidated basis and per BCE common share (adjusted
EPS), respectively.
| Q1 2019 | Q1 2018 | ||||||||
| TOTAL | PER SHARE | TOTAL | PER SHARE | ||||||
Net earnings attributable to common shareholders | 740 | 0.82 | 661 | 0.73 | |||||
Severance, acquisition and other costs | 18 | 0.02 | (1 | ) | – | ||||
Net mark-to-market (gains) losses on derivatives used to economically hedge equity settled share-based compensation plans | (73 | ) | (0.07 | ) | 56 | 0.07 | |||
Net losses on investments | 4 | – | – | – | |||||
Impairment charges | 3 | – | 3 | – | |||||
Adjusted net earnings | 692 | 0.77 | 719 | 0.80 | |||||
| FREE CASH FLOW AND DIVIDEND PAYOUT RATIO |
The terms free cash flow and dividend payout ratio do not have any standardized meaning under IFRS. Therefore, they are unlikely to be comparable to similar measures presented by other issuers.
We define free cash flow as cash flows from operating activities, excluding acquisition and other costs paid (which include significant litigation costs) and voluntary pension funding, less capital expenditures, preferred share dividends and dividends paid by subsidiaries to NCI. We exclude acquisition and other costs paid and voluntary pension funding because they affect the comparability of our financial results and could potentially distort the analysis of trends in business performance. Excluding these items does not imply they are non-recurring.
We consider free cash flow to be an important indicator of the financial strength and performance of our businesses because it shows how much cash is available to pay dividends on common shares, repay debt and reinvest in our company. We believe that certain investors and analysts use free cash flow to value a business and its underlying assets and to evaluate the financial strength and performance of our businesses. The most comparable IFRS financial measure is cash flows from operating activities.
We define dividend payout ratio as dividends paid on common shares divided by free cash flow. We consider dividend payout ratio to be an important indicator of the financial strength and performance of our businesses because it shows the sustainability of the company’s dividend payments.
The following table is a reconciliation of cash flows from operating activities to free cash flow on a consolidated basis.
| Q1 2019 | Q1 2018 | ||||
Cash flows from operating activities | 1,516 | 1,496 | |||
Capital expenditures | (850 | ) | (931 | ) | |
Cash dividends paid on preferred shares | (26 | ) | (33 | ) | |
Cash dividends paid by subsidiaries to NCI | (27 | ) | (13 | ) | |
Acquisition and other costs paid | 29 | 18 | |||
Free cash flow | 642 | 537 |
| NET DEBT |
The term net debt does not have any standardized meaning under IFRS. Therefore, it is unlikely to be comparable to similar measures presented by other issuers.
We define net debt as debt due within one year plus long-term debt and 50% of preferred shares, less cash and cash equivalents, as shown in BCE’s consolidated statements of financial position. We include 50% of outstanding preferred shares in our net debt as it is consistent with the treatment by certain credit rating agencies.
We consider net debt to be an important indicator of the company’s financial leverage because it represents the amount of debt that is not covered by available cash and cash equivalents. We believe that certain investors and analysts use net debt to determine a company’s financial leverage.
Net debt has no directly comparable IFRS financial measure, but rather is calculated using several asset and liability categories from the statements of financial position, as shown in the following table.
| MARCH 31, 2019 | DECEMBER 31, 2018 | ||||
Debt due within one year | 5,485 | 4,645 | |||
Long-term debt | 22,016 | 19,760 | |||
50% of outstanding preferred shares | 2,002 | 2,002 | |||
Cash and cash equivalents | (668 | ) | (425 | ) | |
Net debt | 28,835 | 25,982 |
| 32 | |||
|
8 |
MD&A | Accounting policies, financial measures and controls | |
|
BCE Inc. 2019 First Quarter Shareholder Report |
| NET DEBT LEVERAGE RATIO |
The net debt leverage ratio does not have any standardized meaning under IFRS. Therefore, it is unlikely to be comparable to similar measures presented by other issuers. We use, and believe that certain investors and analysts use, the net debt leverage ratio as a measure of financial leverage.
The net debt leverage ratio represents
net debt divided by adjusted EBITDA. For the purposes of calculating our
net debt leverage ratio, adjusted EBITDA is twelve-month trailing
adjusted EBITDA.
| ADJUSTED EBITDA TO NET INTEREST EXPENSE RATIO |
The ratio of adjusted EBITDA to net interest expense does not have any standardized meaning under IFRS. Therefore, it is unlikely to be comparable to similar measures presented by other issuers. We use, and believe that certain investors and analysts use, the adjusted EBITDA to net interest expense ratio as a measure of financial health of the company.
The adjusted EBITDA to net interest expense ratio represents adjusted EBITDA divided by net interest expense. For the purposes of calculating our adjusted EBITDA to net interest expense ratio, adjusted EBITDA is twelve-month trailing adjusted EBITDA. Net interest expense is twelve-month trailing net interest expense as shown in our statements of cash flows, plus 50% of declared preferred share dividends as shown in our income statements.
| KPIs |
In addition to the non-GAAP financial measures described previously, we use a number of KPIs to measure the success of our strategic imperatives. These KPIs are not accounting measures and may not be comparable to similar measures presented by other issuers.
|
KPI |
DEFINITION |
|
ABPU |
Average billing per user (ABPU) or subscriber approximates the average amount billed to customers on a monthly basis, which is used to track our recurring billing streams. Wireless blended ABPU is calculated by dividing certain customer billings by the average subscriber base for the specified period and is expressed as a dollar unit per month. |
|
Capital intensity |
Capital expenditures divided by operating revenues. |
|
Churn |
Churn is the rate at which existing subscribers cancel their services. It is a measure of our ability to retain our customers. Wireless churn is calculated by dividing the number of deactivations during a given period by the average number of subscribers in the base for the specified period and is expressed as a percentage per month. |
|
Subscriber unit |
Wireless subscriber unit is comprised of an active revenue-generating unit (e.g. mobile device, tablet or wireless Internet products), with a unique identifier (typically International Mobile Equipment Identity (IMEI) number), that has access to our wireless networks. We report wireless subscriber units in two categories: postpaid and prepaid. Prepaid subscriber units are considered active for a period of 90 days (previously 120 to 150 days) following the expiry of the subscriber’s prepaid balance.
Wireline subscriber unit consists of an active revenue-generating unit with access to our services, including retail Internet, satellite TV, IPTV, and/or NAS. A subscriber is included in our subscriber base when the service has been installed and is operational at the customer premise and a billing relationship has been established.
|
| 8.3 Controls and procedures |
CHANGES IN INTERNAL CONTROL OVER FINANCIAL REPORTING
No changes were made in our internal control over financial reporting during the quarter ended March 31, 2019 that have materially affected, or are reasonably likely to materially affect, our internal control over financial reporting. The adoption of IFRS 16, Leases, effective January 1, 2019, required the implementation of new accounting systems and processes, which changed the company’s internal controls over lease recognition. We continue to review the design of these controls and do not expect significant changes to our internal control over financial reporting due to the adoption of the new standard in 2019.
|
33 |
|||
| Consolidated financial statements | |||
| BCE Inc. 2019 First Quarter Shareholder Report |
| Consolidated financial statements |
| Consolidated income statements |
|
FOR THE PERIOD ENDED (IN MILLIONS OF CANADIAN DOLLARS, EXCEPT SHARE AMOUNTS) (UNAUDITED) | NOTE | MARCH 31, 2019 | MARCH 31, 2018 | ||||
Operating revenues | 5 | 5,734 | 5,590 | ||||
Operating costs | 5, 6 | (3,325 | ) | (3,336 | ) | ||
Severance, acquisition and other costs | 7 | (24 | ) | – | |||
Depreciation | (882 | ) | (780 | ) | |||
Amortization | (221 | ) | (212 | ) | |||
Finance costs | |||||||
Interest expense | (283 | ) | (240 | ) | |||
Interest on post-employment benefit obligations | 10 | (16 | ) | (17 | ) | ||
Other income (expense) | 8 | 101 | (61 | ) | |||
Income taxes | (293 | ) | (235 | ) | |||
Net earnings | 791 | 709 | |||||
Net earnings attributable to: | |||||||
Common shareholders | 740 | 661 | |||||
Preferred shareholders | 38 | 36 | |||||
Non-controlling interest | 13 | 12 | |||||
Net earnings | 791 | 709 | |||||
Net earnings per common share – basic and diluted | 9 | 0.82 | 0.73 | ||||
Weighted average number of common shares outstanding – basic (millions) | 898.4 | 900.2 |
| 34 | |||
| Consolidated financial statements | |||
|
BCE Inc. 2019 First Quarter Shareholder Report |
| Consolidated statements of comprehensive income |
| FOR THE PERIOD ENDED (IN MILLIONS OF CANADIAN DOLLARS) (UNAUDITED) | MARCH 31, 2019 | MARCH 31, 2018 | |||
Net earnings | 791 | 709 | |||
Other comprehensive loss, net of income taxes | |||||
Items that will be subsequently reclassified to net earnings | |||||
Net change in value of derivatives designated as cash flow hedges, net of income taxes of $20 million and ($3) million for the three months ended March 31, 2019 and 2018, respectively | (54 | ) | 7 | ||
Items that will not be reclassified to net earnings | |||||
Actuarial losses on post-employment benefit plans, net of income taxes of $34 million and $42 million for the three months ended March 31, 2019 and 2018, respectively (1) | (93 | ) | (112 | ) | |
Net change in value of derivatives designated as cash flow hedges, net of income taxes of $4 million and ($7) million for the three months ended March 31, 2019 and 2018, respectively | (12 | ) | 19 | ||
Other comprehensive loss | (159 | ) | (86 | ) | |
Total comprehensive income | 632 | 623 | |||
Total comprehensive income attributable to: | |||||
Common shareholders | 583 | 574 | |||
Preferred shareholders | 38 | 36 | |||
Non-controlling interest |
| 11 | 13 | ||
Total comprehensive income | 632 | 623 |
| (1) | The discount rate used to value our post-employment benefit obligations at March 31, 2019 was 3.3% compared to 3.8% at December 31, 2018. The discount rate used to value our post-employment benefit obligations at March 31, 2018 and at December 31, 2017 was 3.6%. |
|
35 |
|||
| Consolidated financial statements | |||
| BCE Inc. 2019 First Quarter Shareholder Report |
| Consolidated statements of financial position |
| (IN MILLIONS OF CANADIAN DOLLARS) (UNAUDITED) | NOTE | MARCH 31, 2019 | DECEMBER 31, 2018 | ||||
ASSETS | |||||||
Current assets | |||||||
Cash | 546 | 425 | |||||
Cash equivalents | 122 | – | |||||
Trade and other receivables | 2,937 | 3,006 | |||||
Inventory | 472 | 432 | |||||
Contract assets | 978 | 987 | |||||
Contract costs | 383 | 370 | |||||
Prepaid expenses | 350 | 244 | |||||
Other current assets | 246 | 329 | |||||
Total current assets | 6,034 | 5,793 | |||||
Non-current assets | |||||||
Contract assets | 477 | 506 | |||||
Contract costs | 331 | 337 | |||||
Property, plant and equipment | 27,276 | 24,844 | |||||
Intangible assets | 13,269 | 13,205 | |||||
Deferred tax assets | 129 | 112 | |||||
Investments in associates and joint ventures | 803 | 798 | |||||
Other non-current assets | 864 | 847 | |||||
Goodwill | 4 | 10,657 | 10,658 | ||||
Total non-current assets | 53,806 | 51,307 | |||||
Total assets | 59,840 | 57,100 | |||||
LIABILITIES | |||||||
Current liabilities | |||||||
Trade payables and other liabilities | 3,610 | 3,941 | |||||
Contract liabilities | 733 | 703 | |||||
Interest payable | 203 | 196 | |||||
Dividends payable | 735 | 691 | |||||
Current tax liabilities | 218 | 253 | |||||
Debt due within one year | 5,485 | 4,645 | |||||
Total current liabilities | 10,984 | 10,429 | |||||
Non-current liabilities | |||||||
Contract liabilities | 204 | 196 | |||||
Long-term debt | 22,016 | 19,760 | |||||
Deferred tax liabilities | 3,159 | 3,163 | |||||
Post-employment benefit obligations | 10 | 1,998 | 1,866 | ||||
Other non-current liabilities | 941 | 997 | |||||
Total non-current liabilities | 28,318 | 25,982 | |||||
Total liabilities | 39,302 | 36,411 | |||||
EQUITY | |||||||
Equity attributable to BCE shareholders | |||||||
Preferred shares | 4,004 | 4,004 | |||||
Common shares | 12 | 20,067 | 20,036 | ||||
Contributed surplus | 1,153 | 1,170 | |||||
Accumulated other comprehensive income | 20 | 90 | |||||
Deficit | (5,015 | ) | (4,937 | ) | |||
Total equity attributable to BCE shareholders | 20,229 | 20,363 | |||||
Non-controlling interest | 309 | 326 | |||||
Total equity | 20,538 | 20,689 | |||||
Total liabilities and equity | 59,840 | 57,100 |
| 36 | |||
| Consolidated financial statements | |||
|
BCE Inc. 2019 First Quarter Shareholder Report |
| Consolidated statements of changes in equity |
| ATTRIBUTABLE TO BCE SHAREHOLDERS | ||||||||||||||||||
| FOR THE PERIOD ENDED MARCH 31, 2019 (IN MILLIONS OF CANADIAN DOLLARS) (UNAUDITED) | NOTE | PREFERRED SHARES | COMMON SHARES | CONTRI- BUTED SURPLUS | ACCUMU- LATED OTHER COMPRE-HENSIVE INCOME (LOSS) | DEFICIT | TOTAL | NON- CONTROL- LING INTEREST |
TOTAL EQUITY | |||||||||
Balance at December 31, 2018 | 4,004 | 20,036 | 1,170 | 90 | (4,937 | ) | 20,363 | 326 | 20,689 | |||||||||
Adoption of IFRS 16 | 2, 3 | – | – | – | – | (19 | ) | (19 | ) | (1 | ) | (20 | ) | |||||
Balance at January 1, 2019 | 4,004 | 20,036 | 1,170 | 90 | (4,956 | ) | 20,344 | 325 | 20,669 | |||||||||
Net earnings | – | – | – | – | 778 | 778 | 13 | 791 | ||||||||||
Other comprehensive loss | – | – | – | (65 | ) | (92 | ) | (157 | ) | (2 | ) | (159 | ) | |||||
Total comprehensive (loss) income | – | – | – | (65 | ) | 686 | 621 | 11 | 632 | |||||||||
Common shares issued under employee stock option plan |
– |
20 |
(1 | ) |
– |
– |
19 |
– |
19 | |||||||||
Common shares issued under employee savings plan (ESP) | – | 10 | – | – | – | 10 | – | 10 | ||||||||||
Other share-based compensation | – | 1 | (16 | ) | – | 5 | (10 | ) | – | (10 | ) | |||||||
Dividends declared on BCE common and preferred shares | – | – | – | – | (750 | ) | (750 | ) | – | (750 | ) | |||||||
Dividends declared by subsidiaries to non-controlling interest | – | – | – | – | – | – | (27 | ) | (27 | ) | ||||||||
Settlement of cash flow hedges transferred to the cost basis of hedged items | – | – | – | (5 | ) | – | (5 | ) | – | (5 | ) | |||||||
Balance at March 31, 2019 | 4,004 | 20,067 | 1,153 | 20 | (5,015 | ) | 20,229 | 309 | 20,538 | |||||||||
| ATTRIBUTABLE TO BCE SHAREHOLDERS | ||||||||||||||||||
| FOR THE PERIOD ENDED MARCH 31, 2018 (IN MILLIONS OF CANADIAN DOLLARS) (UNAUDITED) | NOTE | PREFERRED SHARES | COMMON SHARES | CONTRI- BUTED SURPLUS | ACCUMU- LATED OTHER COMPRE-HENSIVE (LOSS) INCOME | DEFICIT | TOTAL | NON- CONTROL- LING INTEREST |
TOTAL EQUITY | |||||||||
Balance at December 31, 2017 | 4,004 | 20,091 | 1,162 | (17 | ) | (4,938 | ) | 20,302 | 323 | 20,625 | ||||||||
Adoption of IFRS 9 | – | – | – | – | (4 | ) | (4 | ) | – | (4 | ) | |||||||
Balance at January 1, 2018 | 4,004 | 20,091 | 1,162 | (17 | ) | (4,942 | ) | 20,298 | 323 | 20,621 | ||||||||
Net earnings | – | – | – | – | 697 | 697 | 12 | 709 | ||||||||||
Other comprehensive income (loss) | – | – | – | 25 | (112 | ) | (87 | ) | 1 | (86 | ) | |||||||
Total comprehensive income | – | – | – | 25 | 585 | 610 | 13 | 623 | ||||||||||
Common shares issued under employee stock option plan | – | 3 | – | – | – | 3 | – | 3 | ||||||||||
Other share-based compensation | – | – | (18 | ) | – | (14 | ) | (32 | ) | – | (32 | ) | ||||||
Repurchase of common shares | 12 | – | (69 | ) | (3 | ) | – | (103 | ) | (175 | ) | – | (175 | ) | ||||
Common shares issued for the acquisition of AlarmForce Industries Inc. (AlarmForce) | 4 | – | 1 | – | – | – | 1 | – | 1 | |||||||||
Dividends declared on BCE common and preferred shares | – | – | – | – | (714 | ) | (714 | ) | – | (714 | ) | |||||||
Dividends declared by subsidiaries to non-controlling interest | – | – | – | – | – | – | (3 | ) | (3 | ) | ||||||||
Settlement of cash flow hedges transferred to the cost basis of hedged items | – | – | – | 1 | – | 1 | – | 1 | ||||||||||
Return of capital to non-controlling interest | – | – | – | – | (4 | ) | (4 | ) | (25 | ) | (29 | ) | ||||||
Balance at March 31, 2018 | 4,004 | 20,026 | 1,141 | 9 | (5,192 | ) | 19,988 | 308 | 20,296 | |||||||||
|
37 |
|||
| Consolidated financial statements | |||
| BCE Inc. 2019 First Quarter Shareholder Report |
| Consolidated statements of cash flows |
| FOR THE PERIOD ENDED (IN MILLIONS OF CANADIAN DOLLARS) (UNAUDITED) | NOTE | MARCH 31, 2019 | MARCH 31, 2018 | ||||
Cash flows from operating activities | |||||||
Net earnings | 791 | 709 | |||||
Adjustments to reconcile net earnings to cash flows from operating activities | |||||||
Severance, acquisition and other costs | 7 | 24 | – | ||||
Depreciation and amortization | 1,103 | 992 | |||||
Post-employment benefit plans cost | 10 | 85 | 90 | ||||
Net interest expense | 278 | 238 | |||||
Losses on investments | 8 | 4 | – | ||||
Income taxes | 293 | 235 | |||||
Contributions to post-employment benefit plans | (81 | ) | (87 | ) | |||
Payments under other post-employment benefit plans | (18 | ) | (19 | ) | |||
Severance and other costs paid | (66 | ) | (35 | ) | |||
Interest paid | (267 | ) | (236 | ) | |||
Income taxes paid (net of refunds) | (289 | ) | (284 | ) | |||
Acquisition and other costs paid | (29 | ) | (18 | ) | |||
Net change in operating assets and liabilities | (312 | ) | (89 | ) | |||
Cash flows from operating activities |
1,516 | 1,496 | |||||
Cash flows used in investing activities | |||||||
Capital expenditures | (850 | ) | (931 | ) | |||
Business acquisitions | 4 | – | (223 | ) | |||
Disposition of intangibles and other assets | 4 | – | 68 | ||||
Acquisition of spectrum licences | – | (36 | ) | ||||
Other investing activities | (24 | ) | (35 | ) | |||
Cash flows used in investing activities |
(874 | ) | (1,157 | ) | |||
Cash flows used in financing activities | |||||||
Increase (decrease) in notes payable | 567 | (57 | ) | ||||
Increase in securitized trade receivables | 31 | – | |||||
Issue of long-term debt | – | 1,466 | |||||
Repayment of long-term debt | (204 | ) | (173 | ) | |||
Issue of common shares | 20 | 1 | |||||
Purchase of shares for settlement of share-based payments | (76 | ) | (88 | ) | |||
Repurchase of common shares | 12 | – | (175 | ) | |||
Cash dividends paid on common shares | (678 | ) | (646 | ) | |||
Cash dividends paid on preferred shares | (26 | ) | (33 | ) | |||
Cash dividends paid by subsidiaries to non-controlling interest | (27 | ) | (13 | ) | |||
Return of capital to non-controlling interest | – | (29 | ) | ||||
Other financing activities | (6 | ) | (18 | ) | |||
Cash flows (used in) from financing activities | (399 | ) | 235 | ||||
Net increase in cash | 121 | 233 | |||||
Cash at beginning of period | 425 | 442 | |||||
Cash at end of period | 546 | 675 | |||||
Net increase in cash equivalents |
122 | 341 | |||||
Cash equivalents at beginning of period |
– | 183 | |||||
Cash equivalents at end of period | 122 | 524 |
| 38 | |||
| Notes to consolidated financial statements | |||
|
BCE Inc. 2019 First Quarter Shareholder Report |
| Notes to consolidated financial statements |
These consolidated interim financial statements (financial statements) should be read in conjunction with BCE’s 2018 annual consolidated financial statements, approved by BCE’s board of directors on March 7, 2019.
These notes are unaudited.
We, us, our, BCE and the company mean, as the context may require, either BCE Inc. or, collectively, BCE Inc., Bell Canada, their subsidiaries, joint arrangements and associates.
| Note 1 | Corporate information |
BCE is incorporated and domiciled in Canada. BCE’s head office is located at 1, Carrefour Alexander-Graham-Bell, Verdun, Québec, Canada. BCE is a telecommunications and media company providing wireless, wireline, Internet and television (TV) services to residential, business and wholesale customers nationally across Canada. Our Bell Media segment provides conventional TV, specialty TV, pay TV, streaming services, digital media services, radio broadcasting services and out-of-home (OOH) advertising services to customers nationally across Canada.
| Note 2 | Basis of presentation and significant accounting policies |
These financial statements were prepared in accordance with International Financial Reporting Standards (IFRS), as issued by the International Accounting Standards Board (IASB), under International Accounting Standard (IAS) 34 – Interim Financial Reporting and were approved by BCE’s board of directors on May 1, 2019. These financial statements were prepared using the same basis of presentation, accounting policies and methods of computation as outlined in Note 2, Significant accounting policies in our consolidated financial statements for the year ended December 31, 2018, except as noted below and as described in Note 3, Adoption of IFRS 16.
These financial statements do not include all of the notes required in annual financial statements.
All amounts are in millions of Canadian dollars, except where noted.
| ADOPTION OF NEW ACCOUNTING STANDARDS |
IFRS 16
As required, we adopted IFRS 16 – Leases effective January 1, 2019. We adopted IFRS 16 using a modified retrospective approach whereby the financial statements of prior periods presented were not restated and continue to be reported under IAS 17 – Leases, as permitted by the specific transition provisions of IFRS 16. The cumulative effect of the initial adoption of IFRS 16 was reflected as an adjustment to the deficit at January 1, 2019.
Under IAS 17, leases of property, plant and equipment were recognized as finance leases when we obtained substantially all the risks and rewards of ownership of the underlying assets. All other leases were classified as operating leases. IFRS 16 eliminates the distinction between operating and finance leases for lessees, requiring instead that we recognize a right-of-use asset and a lease liability at lease commencement for all leases, with certain exceptions permitted through elections and practical expedients. Accounting for leases previously classified as finance leases and lessor accounting remains largely unchanged under IFRS 16.
We recognized lease liabilities at January 1, 2019 for leases previously classified as operating leases, measured at the present value of lease payments using our incremental borrowing rate at that date. Property, plant and equipment includes the corresponding right-of-use assets also recognized at January 1, 2019. The right-of-use assets were generally measured at an amount equal to the lease liability, adjusted by the amount of any prepaid or accrued lease payments relating to that lease recognized in the balance sheet as at December 31, 2018. In certain cases, the right-of-use assets were measured as though IFRS 16 had been applied since the lease commencement date. A depreciation charge for right-of-use assets is recorded in Depreciation and an interest expense on lease liabilities is recorded in Finance costs in the income statement.
As permitted by IFRS 16, we elected not to recognize lease liabilities and right-of-use assets for short-term leases and leases of low value assets, which will continue to be expensed on a straight-line basis over the lease term. We have also applied certain practical expedients to facilitate the initial adoption and ongoing application of IFRS 16:
- We generally do not separate non-lease components from related lease components. Each lease component and any associated non-lease components are accounted for as a single lease component
- We apply a single incremental borrowing rate to a portfolio of leases with similar characteristics
- As an alternative to performing an impairment review, we adjusted right-of-use assets for any onerous lease provisions recognized in the balance sheet at December 31, 2018
- We applied the exemption not to recognize right-of-use assets and liabilities for certain leases with a remaining term of 12 months or less as of January 1, 2019
- We used hindsight when determining the lease term when the lease contracts contain options to extend or terminate the lease
|
39 |
|||
| Notes to consolidated financial statements | |||
| BCE Inc. 2019 First Quarter Shareholder Report |
| Note 3 | Adoption of IFRS 16 |
Upon adoption of IFRS 16 on January 1, 2019, we recognized right-of-use assets of $2,257 million within property, plant and equipment, and lease liabilities of $2,304 million within debt, with an increase to our deficit of $19 million. These amounts were recognized in addition to assets under finance leases of $1,947 million and the corresponding finance lease liabilities of $2,097 million at December 31, 2018 under IAS 17. As a result, on January 1, 2019, our total right-of-use assets and lease liabilities amounted to $4,204 million and $4,401 million, respectively. The table below shows the impacts of adopting IFRS 16 on our January 1, 2019 consolidated statement of financial position.
| DECEMBER 31, 2018 AS REPORTED | IFRS 16 IMPACTS | JANUARY 1, 2019 UPON ADOPTION OF IFRS 16 | |||||
Prepaid expenses | 244 | (55 | ) | 189 | |||
Other current assets | 329 | 9 | 338 | ||||
Property, plant and equipment | 24,844 | 2,257 | 27,101 | ||||
Other non-current assets | 847 | 17 | 864 | ||||
Trade payables and other liabilities | 3,941 | (10 | ) | 3,931 | |||
Debt due within one year | 4,645 | 293 | 4,938 | ||||
Long-term debt | 19,760 | 2,011 | 21,771 | ||||
Deferred tax liabilities | 3,163 | (7 | ) | 3,156 | |||
Other non-current liabilities | 997 | (39 | ) | 958 | |||
Deficit | (4,937 | ) | (19 | ) | (4,956 | ) | |
Non-controlling interest | 326 | (1 | ) | 325 |
BCE’s operating lease commitments at December 31, 2018 were $1,612 million. The difference between operating lease commitments at December 31, 2018 and lease liabilities of $2,304 million upon adoption of IFRS 16 at January 1, 2019, is due mainly to an increase of $1,122 million related to renewal options reasonably certain to be exercised, an increase of $112 million mainly related to non-monetary transactions and a decrease of ($542) million as a result of discounting applied to future lease payments, which was determined using a weighted-average incremental borrowing rate of 3.49% at January 1, 2019.
| 2018 ACCOUNTING POLICIES UPDATED FOR IFRS 16 |
| SIGNIFICANT ACCOUNTING POLICIES – LEASES |
The following accounting policy applies as of January 1, 2019 following the adoption of IFRS 16. Prior to January 1, 2019, we continued to apply IAS 17 as disclosed in our 2018 annual consolidated financial statements, as permitted by the specific transition provisions of IFRS 16.
We enter into leases for network infrastructure and equipment, land and buildings in the normal course of business. Lease contracts are typically made for fixed periods but may include purchase, renewal or termination options. Leases are negotiated on an individual basis and contain a wide range of different terms and conditions.
We assess whether a contract contains a lease at inception of the contract. A lease contract conveys the right to control the use of an identified asset for a period in exchange for consideration. We recognize lease liabilities with corresponding right-of-use assets for all lease agreements, except for short-term leases and leases of low value assets, which are expensed on a straight-line basis over the lease term. Consideration in a contract is allocated to lease and non-lease components on a relative stand-alone value basis. We generally account for lease components and any associated non-lease components as a single lease component.
Lease liabilities are initially measured at the present value of the lease payments that are not paid at the commencement date, discounted using our incremental borrowing rate, unless the rate implicit in the lease is readily determinable. We apply a single incremental borrowing rate to a portfolio of leases with similar characteristics. Lease payments included in the measurement of the lease liability comprise:
- Fixed (and in-substance fixed) lease payments, less any lease incentives
- Variable lease payments that depend on an index or rate
- Payments expected under residual value guarantees and payments relating to purchase options and renewal option periods that are reasonably certain to be exercised (or periods subject to termination options that are not reasonably certain to be exercised)
Lease liabilities are subsequently measured at amortized cost using the effective interest method. Lease liabilities are remeasured, with a corresponding adjustment to the related right-of-use assets, when there is a change in variable lease payments arising from a change in an index or rate, or when we change our assessment of whether purchase, renewal or termination options will be exercised.
Right-of-use assets are measured at cost, comprised of the initial measurement of the corresponding lease liabilities, lease payments made at or before the commencement date and any initial direct costs. They are subsequently depreciated on a straight-line basis and reduced by impairment losses, if any. Right-of-use assets may also be adjusted to reflect the remeasurement of related lease liabilities. If we obtain ownership of the leased asset by the end of the lease term or the cost of the right-of-use asset reflects the exercise of a purchase option, we depreciate the right-of-use asset from the lease commencement date to the end of the useful life of the underlying asset. Otherwise, we depreciate the right-of-use asset from the commencement date to the earlier of the end of the useful life of the underlying asset or the end of the lease term.
Variable lease payments that do not depend on an index or rate are not included in the measurement of lease liabilities and right-of-use assets. The related payments are expensed in Operating costs in the period in which the event or condition that triggers those payments occurs.
| 40 | |||
| Notes to consolidated financial statements | |||
|
BCE Inc. 2019 First Quarter Shareholder Report |
| ESTIMATES AND KEY JUDGMENTS |
SIGNIFICANT JUDGMENTS AND ESTIMATES RELATING TO THE APPLICATION OF IFRS 16
The application of IFRS 16 requires BCE to make judgments and estimates that affect the measurement of right-of-use assets and liabilities. In determining the lease term, we must consider all facts and circumstances that create an economic incentive to exercise renewal options (or not exercise termination options). Assessing whether a contract includes a lease also requires judgment. Estimates are required to determine the appropriate discount rate used to measure lease liabilities.
| Note 4 | Business acquisitions and dispositions |
2018
| ACQUISITION OF ALARMFORCE |
On January 5, 2018, BCE acquired all of the issued and outstanding shares of AlarmForce for a total consideration of $182 million, of which $181 million was paid in cash and the remaining $1 million through the issuance of 22,531 BCE common shares.
Subsequent to the acquisition of AlarmForce, on January 5, 2018, BCE sold AlarmForce’s approximate 39,000 customer accounts in British Columbia, Alberta and Saskatchewan to Telus Communications Inc. for total proceeds of approximately $68 million.
AlarmForce provides security alarm monitoring, personal emergency response monitoring, video surveillance and related services to residential and commercial subscribers. The acquisition of AlarmForce supports our strategic expansion in the Smart Home marketplace.
AlarmForce is included in our Bell Wireline segment in our consolidated financial statements.
For the three months ended March 31, 2018, operating revenues of $12 million from AlarmForce are included in the consolidated income statements from the date of acquisition. Net earnings for the three months ended March 31, 2018 were not significant. These amounts reflect the amortization of certain elements of the purchase price allocation and related tax adjustments.
| Note 5 | Segmented information |
Our results are reported in three segments: Bell Wireless, Bell Wireline and Bell Media. Our segments reflect how we manage our business and how we classify our operations for planning and measuring performance.
To align with changes in how we manage our business and assess performance, the operating results of The Source (Bell) Electronics Inc. (The Source) are now entirely included within our Wireless segment effective January 1, 2019, with prior periods restated for comparative purposes. Previously, The Source’s results were included within our Wireless and Wireline segments.
The following tables present financial information by segment for the three month periods ended March 31, 2019 and 2018.
| FOR THE THREE MONTH PERIOD ENDED MARCH 31, 2019 | NOTE | BELL WIRELESS | BELL WIRELINE | BELL MEDIA | INTERSEGMENT ELIMINATIONS | BCE | |||||||
Operating revenues | |||||||||||||
External customers | 2,099 | 2,995 | 640 | – | 5,734 | ||||||||
Inter-segment | 13 | 69 | 105 | (187 | ) | – | |||||||
Total operating revenues | 2,112 | 3,064 | 745 | (187 | ) | 5,734 | |||||||
Operating costs | 6 | (1,207 | ) | (1,725 | ) | (580 | ) | 187 | (3,325 | ) | |||
Segment profit (1) | 905 | 1,339 | 165 | – | 2,409 | ||||||||
Severance, acquisition and other costs | 7 | (24 | ) | ||||||||||
Depreciation and amortization | (1,103 | ) | |||||||||||
Finance costs | |||||||||||||
Interest expense | (283 | ) | |||||||||||
Interest on post-employment benefit obligations | 10 | (16 | ) | ||||||||||
Other income | 8 | 101 | |||||||||||
Income taxes | (293 | ) | |||||||||||
Net earnings | 791 |
(1) The chief operating decision maker uses primarily one measure of profit to make decisions and assess performance, being operating revenues less operating costs.
|
41 |
|||
| Notes to consolidated financial statements | |||
| BCE Inc. 2019 First Quarter Shareholder Report |
| FOR THE THREE MONTH PERIOD ENDED MARCH 31, 2018 | NOTE | BELL WIRELESS | BELL WIRELINE | BELL MEDIA | INTERSEGMENT ELIMINATIONS | BCE | |||||||
Operating revenues | |||||||||||||
External customers | 2,008 | 2,951 | 631 | – | 5,590 | ||||||||
Inter-segment | 13 | 58 | 118 | (189 | ) | – | |||||||
Total operating revenues | 2,021 | 3,009 | 749 | (189 | ) | 5,590 | |||||||
Operating costs | 6 | (1,210 | ) | (1,696 | ) | (619 | ) | 189 | (3,336 | ) | |||
Segment profit (1) | 811 | 1,313 | 130 | – | 2,254 | ||||||||
Severance, acquisition and other costs | 7 | – | |||||||||||
Depreciation and amortization | (992 | ) | |||||||||||
Finance costs | |||||||||||||
Interest expense | (240 | ) | |||||||||||
Interest on post-employment benefit obligations | 10 | (17 | ) | ||||||||||
Other expense | 8 | (61 | ) | ||||||||||
Income taxes | (235 | ) | |||||||||||
Net earnings | 709 |
| (1) | The chief operating decision maker uses primarily one measure of profit to make decisions and assess performance, being operating revenues less operating costs. |
| REVENUES BY SERVICES AND PRODUCTS |
| FOR THE PERIOD ENDED MARCH 31 | 2019 | 2018 | |||
Services (1) | |||||
Wireless | 1,554 | 1,502 | |||
Data | 1,885 | 1,820 | |||
Voice | 907 | 948 | |||
Media | 640 | 631 | |||
Other services | 59 | 63 | |||
Total services |
5,045 | 4,964 | |||
Products (2) | |||||
Wireless | 545 | 506 | |||
Data | 133 | 104 | |||
Equipment and other | 11 | 16 | |||
Total products | 689 | 626 | |||
Total operating revenues | 5,734 | 5,590 |
| (1) | Our service revenues are generally recognized over time. |
| (2) | Our product revenues are generally recognized at a point in time. |
| Note 6 | Operating costs |
| FOR THE PERIOD ENDED MARCH 31 | NOTE | 2019 | 2018 | ||||
Labour costs | |||||||
Wages, salaries and related taxes and benefits (1) | (1,059 | ) | (1,060 | ) | |||
Post-employment benefit plans service cost (net of capitalized amounts) | 10 | (69 | ) | (73 | ) | ||
Other labour costs (2) | (229 | ) | (248 | ) | |||
Less: | |||||||
Capitalized labour (1) | 244 | 244 | |||||
Total labour costs | (1,113 | ) | (1,137 | ) | |||
Cost of revenues (1)(3) | (1,745 | ) | (1,707 | ) | |||
Other operating costs (1)(4) | (467 | ) | (492 | ) | |||
Total operating costs | (3,325 | ) | (3,336 | ) |
| (1) | We have reclassified amounts from the previous period to make them consistent with the presentation for the current period. |
| (2) | Other labour costs include contractor and outsourcing costs. |
| (3) | Cost of revenues includes costs of wireless devices and other equipment sold, network and content costs, and payments to other carriers. |
| (4) | Other operating costs include marketing, advertising and sales commission costs, bad debt expense, taxes other than income taxes, information technology costs, professional service fees and rent. |
| 42 | |||
| Notes to consolidated financial statements | |||
|
BCE Inc. 2019 First Quarter Shareholder Report |
| Note 7 | Severance, acquisition and other costs |
| FOR THE PERIOD ENDED MARCH 31 | 2019 | 2018 | |||
Severance | (7 | ) | (9 | ) | |
Acquisition and other | (17 | ) | 9 | ||
Total severance, acquisition and other costs | (24 | ) | – |
| SEVERANCE COSTS |
Severance costs consist of charges related to involuntary and voluntary employee terminations.
| ACQUISITION AND OTHER COSTS |
Acquisition and other costs consist of transaction costs, such as legal and financial advisory fees, related to completed or potential acquisitions, employee severance costs related to the purchase of a business, the costs to integrate acquired companies into our operations and litigation costs, when they are significant.
| Note 8 | Other income (expense) |
| FOR THE PERIOD ENDED MARCH 31 | 2019 | 2018 | |||
Net mark-to-market gains (losses) on derivatives used to economically hedge equity settled share-based compensation plans | 100 | (77 | ) | ||
Equity income from investments in associates and joint ventures | 11 | 17 | |||
(Losses) gains on retirements and disposals of property, plant and equipment and intangible assets | (5 | ) | 1 | ||
Impairment of assets | (4 | ) | (4 | ) | |
Losses on investments | (4 | ) | – | ||
Other | 3 | 2 | |||
Total other income (expense) | 101 | (61 | ) |
| Note 9 | Earnings per share |
The following table shows the components used in the calculation of basic and diluted earnings per common share for earnings attributable to common shareholders.
| FOR THE PERIOD ENDED MARCH 31 | 2019 | 2018 | |||
Net earnings attributable to common shareholders – basic | 740 | 661 | |||
Dividends declared per common share (in dollars) | 0.7925 | 0.7550 | |||
Weighted average number of common shares outstanding (in millions) | |||||
Weighted average number of common shares outstanding – basic | 898.4 | 900.2 | |||
|
Assumed exercise of stock options (1) | 0.3 | 0.4 | |||
Weighted average number of common shares outstanding – diluted (in millions) | 898.7 | 900.6 |
| (1) | The calculation of the assumed exercise of stock options includes the effect of the average unrecognized future compensation cost of dilutive options. It excludes options for which the exercise price is higher than the average market value of a BCE common share. The number of excluded options was 12,703,673 for the first quarter of 2019, compared to 9,472,068 for the first quarter of 2018. |
|
43 |
|||
| Notes to consolidated financial statements | |||
| BCE Inc. 2019 First Quarter Shareholder Report |
| Note 10 | Post-employment benefit plans |
POST-EMPLOYMENT BENEFIT PLANS COST |
We provide pension and other benefits for most of our employees. These include defined benefit (DB) pension plans, defined contribution (DC) pension plans and other post-employment benefits (OPEBs).
COMPONENTS OF POST-EMPLOYMENT BENEFIT PLANS SERVICE COST
| FOR THE PERIOD ENDED MARCH 31 | 2019 | 2018 | |||
DB pension | (48 | ) | (53 | ) | |
DC pension | (34 | ) | (33 | ) | |
OPEBs | (1 | ) | (1 | ) | |
Less: | |||||
Capitalized benefit plans cost | 14 | 14 | |||
Total post-employment benefit plans service cost included in operating costs | (69 | ) | (73 | ) | |
Other costs recognized in severance, acquisition and other costs | – | (4 | ) | ||
Total post-employment benefit plans service cost | (69 | ) | (77 | ) |
COMPONENTS OF POST-EMPLOYMENT BENEFIT PLANS FINANCING COST
| FOR THE PERIOD ENDED MARCH 31 | 2019 | 2018 | |||
DB pension | (5 | ) | (6 | ) | |
OPEBs | (11 | ) | (11 | ) | |
Total interest on post-employment benefit obligations | (16 | ) | (17 | ) |
| Note 11 | Financial assets and liabilities |
| FAIR VALUE |
The following table provides the fair value details of financial instruments measured at amortized cost in the statements of financial position.
| MARCH 31, 2019 | DECEMBER 31, 2018 | |||||||||
| CARRYING | FAIR | CARRYING | FAIR | |||||||
| CLASSIFICATION | FAIR VALUE METHODOLOGY | VALUE | VALUE | VALUE | VALUE | |||||
CRTC tangible benefits obligation | Trade payables and other liabilities and non-current liabilities | Present value of estimated future cash flows discounted using observable market interest rates | 51 | 51 |
| 61 |
| 61 |
| |
CRTC deferral account obligation | Trade payables and other liabilities and non-current liabilities | Present value of estimated future cash flows discounted using observable market interest rates | 84 |
| 88 |
| 108 |
| 112 |
|
| Debt securities and other debt | Debt due within one year and long-term debt | Quoted market price of debt | 18,165 | 19,956 | 18,188 | 19,178 | ||||
Finance leases (1) | Debt due within one year and long-term debt | Present value of future cash flows discounted using observable market interest rates | – | – | 2,097 | 2,304 | ||||
| (1) | Upon adoption of IFRS 16 on January 1, 2019, fair value disclosures are no longer required for leases. |
| 44 | |||
| Notes to consolidated financial statements | |||
|
BCE Inc. 2019 First Quarter Shareholder Report |
The following table provides the fair value details of financial instruments measured at fair value in the statements of financial position.
|
CLASSIFICATION |
CARRYING VALUE OF ASSET (LIABILITY) |
FAIR VALUE |
|||||||
|
QUOTED PRICES IN ACTIVE MARKETS FOR IDENTICAL ASSETS (LEVEL 1) |
OBSERVABLE MARKET DATA (LEVEL 2)(1) |
NON-OBSERVABLE MARKET INPUTS (LEVEL 3)(2) |
|||||||
|
March 31, 2019 |
|
||||||||
|
Publicly-traded and privately-held investments |
Other non-current assets |
111 |
|
2 |
|
– |
|
109 |
|
|
Derivative financial instruments |
Other current assets, trade payables and other liabilities, other non-current assets and liabilities |
81 |
|
– |
|
81 |
|
– |
|
|
Maple Leaf Sports & Entertainment Ltd. MLSE financial liability(3) |
Trade payables and other liabilities |
(135 |
) |
– |
|
– |
|
(135 |
) |
|
Other |
Other non-current assets and liabilities |
46 | – | 117 | (71 | ) | |||
|
December 31, 2018 |
|
||||||||
|
Publicly-traded and privately-held investments |
Other non-current assets |
110 |
|
1 |
|
– |
|
109 |
|
|
Derivative financial instruments |
Other current assets, trade payables and other liabilities, other non-current assets and liabilities |
181 |
|
– |
|
181 |
|
– |
|
|
MLSE financial liability(3) |
Trade payables and other liabilities |
(135 |
) |
– |
|
– |
|
(135 |
) |
|
Other |
Other non-current assets and liabilities |
43 |
– | 114 | (71 | ) | |||
| (1) | Observable market data such as equity prices, interest rates, swap rate curves and foreign currency exchange rates. |
| (2) | Non-observable market inputs such as discounted cash flows and earnings multiples. A reasonable change in our assumptions would not result in a significant increase (decrease) to our level 3 financial instruments. |
| (3) | Represents BCE’s obligation to repurchase the BCE Master Trust Fund’s (Master Trust Fund) 9% interest in MLSE at a price not less than an agreed minimum price should the Master Trust Fund exercise its put option. The obligation to repurchase is marked to market each reporting period and the gain or loss is recorded in Other income (expense) in the income statements. The option has been exercisable since 2017. |
| CURRENCY EXPOSURES |
We use forward contracts, options and cross currency basis swaps to manage foreign currency risk related to anticipated purchases and sales and certain foreign currency debt.
A 10% depreciation (appreciation) in the value of the Canadian dollar relative to the U.S. dollar would result in a loss (gain) of $7 million ($2 million) recognized in net earnings at March 31, 2019 and a gain (loss) of $134 million ($126 million) recognized in Other comprehensive loss at March 31, 2019, with all other variables held constant.
A 10% depreciation (appreciation) in the value of the Canadian dollar relative to the Philippines Peso would result in a gain (loss) of $4 million in Other comprehensive loss at March 31, 2019, with all other variables held constant.
The following table provides further details on our outstanding foreign currency forward contracts and options as at March 31, 2019.
| TYPE OF HEDGE |
BUY CURRENCY |
AMOUNT TO RECEIVE |
SELL CURRENCY |
AMOUNT TO PAY |
MATURITY |
HEDGED ITEM |
||||||
| Cash flow |
USD |
2,754 |
CAD |
3,653 |
2019 |
Commercial paper |
||||||
| Cash flow |
USD |
589 |
CAD |
732 |
2019 |
Anticipated transactions |
||||||
| Cash flow |
PHP |
1,303 |
CAD |
32 |
2019 |
Anticipated transactions |
||||||
| Cash flow |
PHP |
932 |
CAD |
23 |
2020 |
Anticipated transactions |
||||||
| Cash flow |
USD |
362 |
CAD |
462 |
2020-2021 |
Anticipated transactions |
||||||
| Economic |
USD |
90 |
CAD |
114 |
2019 |
Anticipated transactions |
||||||
| Economic – put options | USD | 45 | CAD | 56 | 2019 |
Anticipated transactions |
||||||
| Economic – put options |
USD |
81 |
CAD |
101 |
2020 |
Anticipated transactions |
||||||
| Economic – call options |
USD |
48 |
CAD |
60 |
2020 |
Anticipated transactions |
| INTEREST RATE EXPOSURES |
A 1% increase (decrease) in interest rates would result in a decrease (increase) of $37 million in net earnings at March 31, 2019.
|
45 |
|||
| Notes to consolidated financial statements | |||
| BCE Inc. 2019 First Quarter Shareholder Report |
| EQUITY PRICE EXPOSURES |
We use equity forward contracts on BCE’s common shares to economically hedge the cash flow exposure related to the settlement of equity settled share-based compensation plans and the equity price risk related to a cash-settled share-based payment plan. The fair value of our equity forward contracts at March 31, 2019 was an asset of $27 million.
A 5% increase (decrease) in the market price of BCE’s common shares at March 31, 2019 would result in a gain (loss) of $38 million recognized in net earnings, with all other variables held constant.
| Note 12 | Share capital |
NORMAL COURSE ISSUER BID PROGRAM (NCIB) |
In Q1 2018, BCE repurchased and canceled 3,085,697 common shares for a total cost of $175 million through a NCIB. Of the total cost, $69 million represented stated capital and $3 million represented the reduction of the contributed surplus attributable to these common shares. The remaining $103 million was charged to the deficit.
| Note 13 | Share-based payments |
The following share-based payment amounts are included in the income statements as operating costs.
| FOR THE PERIOD ENDED MARCH 31 | 2019 | 2018 | |||
ESP | (7 | ) | (7 | ) | |
Restricted share units (RSUs) and performance share units (PSUs) | (20 | ) | (19 | ) | |
Other (1) | (4 | ) | (4 | ) | |
Total share-based payments | (31 | ) | (30 | ) |
| (1) | Includes deferred share plan (DSP), deferred share units (DSUs) and stock options. |
The following tables summarize the change in outstanding ESP shares, RSUs/PSUs, DSUs and stock options for the period ended March 31, 2019.
ESP
| NUMBER OF ESP SHARES | |||
Unvested contributions, January 1, 2019 | 1,120,426 | ||
Contributions (1) | 171,567 | ||
Dividends credited | 14,959 | ||
Vested | (151,899 | ) | |
Forfeited | (38,224 | ) | |
Unvested contributions, March 31, 2019 | 1,116,829 |
| (1) | The weighted average fair value of the shares contributed during the three months ended March 31, 2019 was $57. |
RSUs/PSUs
| NUMBER OF RSUs/PSUs | |||
Outstanding, January 1, 2019 | 2,812,697 | ||
Granted (1) | 966,426 | ||
Dividends credited | 38,180 | ||
Settled | (906,164 | ) | |
Forfeited | (28,641 | ) | |
Outstanding, March 31, 2019 | 2,882,498 |
| (1) | The weighted average fair value of the RSUs/PSUs granted during the three months ended March 31, 2019 was $58. |
| 46 | |||
| Notes to consolidated financial statements | |||
|
BCE Inc. 2019 First Quarter Shareholder Report |
DSUs
| NUMBER OF DSUs | |||
Outstanding, January 1, 2019 | 4,391,997 | ||
Issued (1) | 50,349 | ||
Settlement of RSUs/PSUs | 146,960 | ||
Dividends credited | 59,452 | ||
Settled | (67,908 | ) | |
Outstanding, March 31, 2019 | 4,580,850 |
| (1) | The weighted average fair value of the DSUs issued during the three months ended March 31, 2019 was $58. |
STOCK OPTIONS
| NUMBER OF OPTIONS | WEIGHTED AVERAGE EXERCISE PRICE ($) | ||||
Outstanding, January 1, 2019 | 14,072,332 | 56 | |||
Granted | 3,343,317 | 58 | |||
Exercised (1) | (389,543 | ) | 48 | ||
Forfeited | (33,613 | ) | 58 | ||
Outstanding, March 31, 2019 | 16,992,493 | 57 | |||
Exercisable, March 31, 2019 | 6,817,960 | 55 |
| (1) | The weighted average share price for options exercised during the three months ended March 31, 2019 was $58. |
ASSUMPTIONS USED IN STOCK OPTION PRICING MODEL
The fair value of options granted was determined using a variation of a binomial option pricing model that takes into account factors specific to the share incentive plans, such as the vesting period. The following table shows the principal assumptions used in the valuation.
| 2019 | |||
Weighted average fair value per option granted | $2.34 | ||
Weighted average share price | $58 | ||
Weighted average exercise price | $58 | ||
Expected dividend growth | 5 | % | |
Expected volatility | 14 | % | |
Risk-free interest rate | 2 | % | |
Expected life (years) | 4 |
Expected dividend growth was assumed to be commensurate with BCE’s dividend growth strategy. Expected volatility is based on the historical volatility of BCE’s share price. The risk-free rate used is equal to the yield available on Government of Canada bonds at the date of grant with a term equal to the expected life of the options.
|
47 |
|
This document has been filed by BCE Inc.
with the Canadian provincial securities regulatory authorities and the
U.S. Securities and Exchange Commission. It can be found on BCE Inc.’s
website at BCE.ca, on SEDAR at www.sedar.com and on EDGAR at www.sec.gov,
and is available upon request from:
INVESTOR RELATIONS e-mail: investor.relations@bce.ca BCE.ca
Pour obtenir un exemplaire de la version française de ce document, contactez les Relations avec les investisseurs. |
For further information concerning BCE Inc.’s Dividend Reinvestment and Stock Purchase Plan (DRP), direct deposit of dividend payments, the elimination of multiple mailings or the receipt of quarterly reports, please contact:
AST TRUST COMPANY (CANADA) tel: 416
682-3861 or 1 800 561-0934
|
![]()