Financial report
Financial |
||||||
report |
||||||
CEO comment |
2 |
|||||
| |
||||||
Business in 2021 |
4 |
|||||
| |
||||||
Letter from the Chair of the Board |
11 |
|||||
| |
||||||
Board of Directors’ report |
12 |
|||||
| |
||||||
Report of independent registered public accounting firm |
28 |
|||||
| |
||||||
Report of independent registered public accounting firm |
29 |
|||||
| |
||||||
Consolidated financial statements and notes |
31 |
|||||
| |
||||||
Report of independent registered public accounting firm |
83 |
|||||
| |
||||||
Management’s report on internal control over financial reporting |
84 |
|||||
| |
||||||
Risk factors |
85 |
|||||
| |
||||||
Five-year summaries |
100 |
|||||
| |
||||||
Alternative performance measures |
102 |
|||||
| |
||||||
The Ericsson share |
107 |
|||||
| |
||||||
Corporate |
||||||
Governance |
||||||
report |
||||||
Regulation and compliance |
2 |
|||||
| |
||||||
Governance structure |
4 |
|||||
| |
||||||
General Meetings of shareholders |
5 |
|||||
| |
||||||
Nomination Committee |
6 |
|||||
| |
||||||
Board of Directors |
6 |
|||||
| |
||||||
Committees of the Board of Directors |
9 |
|||||
| |
||||||
Remuneration to Board members |
11 |
|||||
| |
||||||
Members of the Board of Directors |
12 |
|||||
| |
||||||
Management |
16 |
|||||
| |
||||||
Members of the Executive Team |
20 |
|||||
| |
||||||
Auditor |
24 |
|||||
| |
||||||
Internal control over financial reporting |
24 |
|||||
| |
||||||
Remuneration |
||||||
report |
||||||
Statement from the Chair of the Remuneration Committee |
1 |
|||||
| |
||||||
Introduction |
2 |
|||||
| |
||||||
Remuneration 2021 at a glance |
3 |
|||||
| |
||||||
Total remuneration to the President and CEO and Executive Vice Presidents |
5 |
|||||
| |
||||||
Variable remuneration |
6 |
|||||
| |
||||||
Comparative information on the change of remuneration and Company performance |
12 |
|||||
| |
||||||
| • | The Financial report, including CEO comment, business strategy, the consolidated financial statements and notes of the Company |
| • | The Corporate Governance report |
| • | The Remuneration report |
| Financial report 2021 |
||||
| |
||||
This is Ericsson |
1 |
|||
| |
||||
CEO comment |
2 |
|||
| |
||||
Business strategy – Creating long-term value |
4 |
|||
| |
||||
Business model – Customer focus and technology leadership |
8 |
|||
| |
||||
Letter from the Chair of the Board |
11 |
|||
| |
||||
Board of Directors’ report |
12 |
|||
| |
||||
Board Assurance |
27 |
|||
| |
||||
Report of independent registered public accounting firm |
28 |
|||
| |
||||
Report of independent registered public accounting firm |
29 |
|||
| |
||||
Consolidated financial statements |
31 |
|||
| |
||||
Notes to the consolidated financial statements |
38 |
|||
| |
||||
Report of independent registered public accounting firm |
83 |
|||
| |
||||
Management’s report on internal control over financial reporting |
84 |
|||
| |
||||
Risk factors |
85 |
|||
| |
||||
Forward-looking statements |
99 |
|||
| |
||||
Five-year summary – Financial information |
100 |
|||
| |
||||
Five-year summary – Non-financial information |
101 |
|||
| |
||||
Alternative performance measures |
102 |
|||
| |
||||
The Ericsson share |
107 |
|||
| |
||||
Shareholder information |
111 |
|||
| |
||||
Financial terminology |
112 |
|||
| |
||||
Glossary |
113 |
|||
| |
||||
| 1 Financial Report 2021 | This is Ericsson | Ericsson Annual Report on Form 20-F 2021 | |||
| 2 Financial Report 2021 | CEO comment | Ericsson Annual Report on Form 20-F 2021 | |||
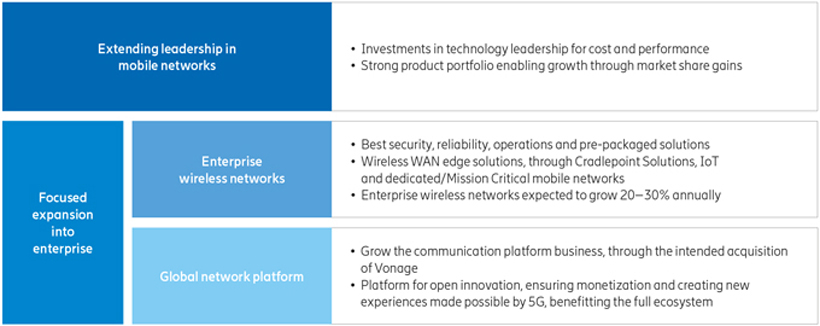
Fulfilling our purpose of creating connections that make the unimaginable possible is based on our leading technology position. During 2021, we capitalized on the strength of our core infrastructure business and continued to build a foundation for growth that takes advantage of new opportunities in enterprise digitalization. |
 | |||
| I’m excited about what lies ahead for Ericsson. Our core business is strong and growing. During 2021 we delivered on our strategy of technology leadership in mobile infrastructure by expanding our market share and improving gross margins. A decade ago, 4G digitalized the consumers’ world. With 5G, we now have a platform that is revolutionizing enterprises, anything from how first responders work to new types of applications available to consumers. We believe that addressing these additional segments offers the wireless infrastructure market solid long-term growth prospects. In addition to growing in our core business, we are also pursuing opportunities in the enterprise space – leveraging the strength of our mobile technology. As enterprises increasingly choose wireless as their primary source of connectivity, we continue to provide pre-packaged solutions for wireless enterprise networking. These include dedicated networks, wireless WAN and IoT connectivity. We see strong future growth potential in this area and are increasing our investments to capture this opportunity. Going forward, the capabilities of 4G and 5G networks will increasingly be accessed through open cloud interfaces. To address this, we will build a global network platform for open innovation. A market for 4G application development already exists but with 5G, the capabilities and opportunities are markedly greater. In 2021, we took a significant step by announcing our ambition to acquire Vonage, |
a global provider of cloud-based communications with over 120,000 enterprise customers and more than one million registered developers. Through Vonage, we intend to also offer unified communication and contact center platforms to our existing customer base. Longer term we will expose 5G capabilities through a global network platform to stimulate innovation on top of the network. We plan to run Vonage as a new business area and will invest in growing its business. This follows the same integration approach taken with Cradlepoint, which is performing well, in line with our acquisition plans, despite a delayed uptake of 5G devices. Business performance In 2021, we continued our strategy execution and cemented a position as a global 5G leader. Our strong product portfolio and deep R&D capabilities supported market share gains despite considerably lower sales volumes in Mainland China. By year-end, Ericsson supplied 108 out of 200 live 5G networks. More importantly, our solutions performed well in the field, earning top honors in multiple third-party benchmarks of network performance. In line with sales growth, we strengthened our profitability, underscored by a strong reported gross margin of 43.4% and a reported EBIT margin of 13.7%. Our cash generation reached new records for the business, with free cash flow before M&A of SEK 32.1 billion. In 2021, we increased the number of employees in R&D by 1,210 and invested a total of SEK 42.1 billion in this area – an increase |
from SEK 39.7 billion in 2020. We will continue to increase investments in our 5G portfolio, including in our orchestration offerings, to further position us in a future world of open standards and technologies. 5G market 5G isn’t just a new generation of mobile technology, it’s transforming our world. For consumers, higher bandwidth, lower latency and more security and reliability are supporting new use cases such as e-health, connected vehicles and immersive cloud gaming. 5G fixed wireless access is also gaining momentum as many countries look to rapidly build out high-capacity broadband and close the digital divide. For enterprises, 5G is enabling organizations to optimize value chains and minimize costs and emissions related to operations and logistics. Worldwide, there were estimated to be 660 million 5G subscriptions at the end of 2021, making 5G the fastest deployed mobile generation ever. It is clear that the pandemic accelerated digitalization, confirmed the criticality of digital infrastructure and further redefined our relationship to work, education and one another. During 2021, governments around the world continued to make wireless infrastructure the cornerstone of their pandemic recovery and economic growth plans. Innovation and openness Ericsson continues to stand up for free and open markets. We are part of a thriving ecosystem of innovators that provides others with access to our technology. Our patent portfolio is world | ||
| 3 Financial Report 2021 | CEO comment | Ericsson Annual Report on Form 20-F 2021 | |||
| 4 Financial Report 2021 | Business strategy | Ericsson Annual Report on Form 20-F 2021 | |||
| Selective |
||||
| Product-led growth aligned with our streamlined portfolio and focusing on existing and targeted customers |
||||
| Disciplined |
||||
| Commercial and financial discipline and excellence in contract execution |
||||
| Profitable |
||||
| Growth is managed for value creation to support Group financial targets |
||||
| • | Capture new revenue streams and new opportunities made possible by 5G and Internet of Things (IoT). |
| • | Improve end-customer experience and network performance – the main differentiators among telecom operators. |
| • | Provide our enterprise customers with pre-packaged solutions, bringing best security, reliability and ease of operation. |
| • | Relentless efficiency improvements to lower the cost of delivering increased traffic in the networks. |

| 5 Financial Report 2021 | Business strategy | Ericsson Annual Report on Form 20-F 2021 | |||
| 6 Financial Report 2021 | Business strategy | Ericsson Annual Report on Form 20-F 2021 | |||

| 7 Financial Report 2021 | Business strategy | Ericsson Annual Report on Form 20-F 2021 | |||


 |
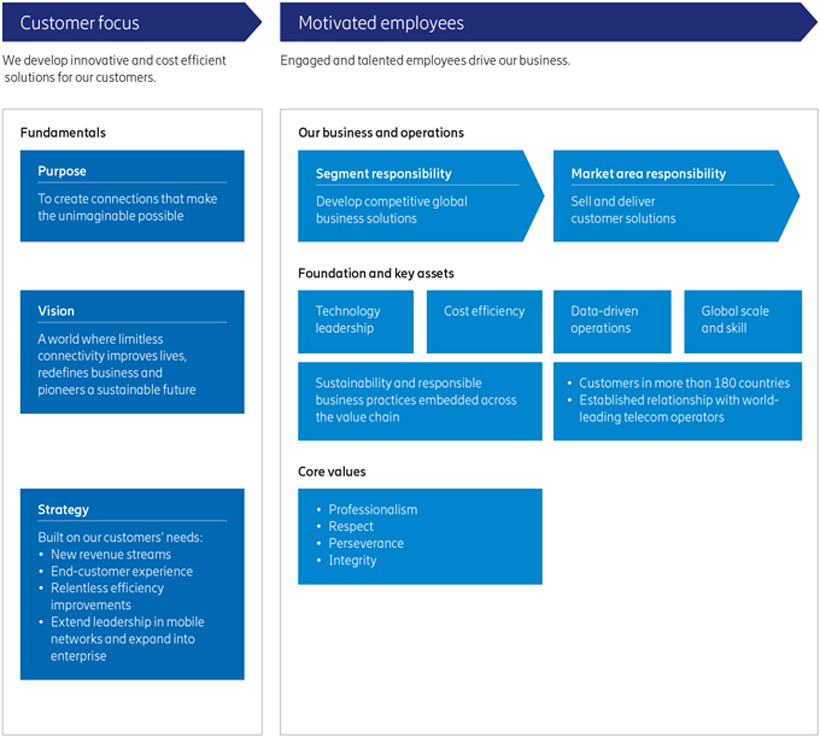
Five market areas Our market is divided into five geographical market areas. The market areas are responsible for selling and delivering products and solutions that are developed in our segments. Close cooperation with our customers is key. In line with the strategy, the market areas have responsibility to ensure that we stay close to our customers while maintaining central guidelines and governance structures. |
|||
| 8 Financial Report 2021 | Business model | Ericsson Annual Report on Form 20-F 2021 | |||
| 9 Financial Report 2021 | Business model | Ericsson Annual Report on Form 20-F 2021 | |||
| 10 Financial Report 2021 | Business model | Ericsson Annual Report on Form 20-F 2021 | |||
| Networks |
Offering |
Business model |
||||||
| Networks offers a multi-technology capable Radio Access Network (RAN) solution for all network spectrum bands, including integrated high-performing hardware and software. The offering also includes a cloud-native RAN portfolio, a transport portfolio, passive and active antenna solutions and a complete service portfolio covering network deployment and support. |
Networks business is primarily based on a transactional model, where Ericsson develops, sells, licenses and delivers hardware, software and services. Networks business also includes recurring revenue streams such as customer support and certain software revenues. |
|||||||
| Digital Services |
Offering |
Business model |
||||||
| Digital Services provides software-based solutions for business support (BSS), operational support (OSS), communication services, core networks, and cloud infrastructure. The focus is on cloud-native and automation solutions supporting our customers’ 4G and growing 5G consumer and enterprise business. |
Digital Services develops, sells, and delivers solutions, based on software and services. The contracts are typically software license and systems integration based. Digital Services business includes recurring revenue from software licenses and support. |
|||||||
| Managed Services |
Offering |
Business model |
||||||
| Managed Services provides Networks and IT Managed Services, Network Design and Optimization, and Application Development and Maintenance to telecom operators. These are delivered through the AI-driven Ericsson Operations Engine, a set of capabilities that transform operations to enhance customer experience, drive agile service creation and optimize costs in multi-vendor environments. |
Ericsson Operations Engine Base Pack contracts are typically multi-year outsourcing agreements. Value Pack contracts are part of an outsourcing agreement or sold stand-alone to telecom operators. Software is sold either as a license or aaS (as-a-Service). |
|||||||
| Emerging Business and Other |
Offering |
Business model |
||||||
| Emerging Business and Other supports enterprises by providing reliable and secure cellular solutions that are easy to use, adopt and scale for global and local needs. |
Emerging Business and Other is mainly a platform business with aaS (as-a-Service) |
|||||||
| 11 Financial Report 2021 | Letter from the Chair of the Board | Ericsson Annual Report on Form 20-F 2021 | |||

| 12 Financial Report 2021 | Board of Directors’ report | Ericsson Annual Report on Form 20-F 2021 | |||
Contents | ||
| 12 |
Business in 2021 | |
| 13 |
Financial highlights | |
| 16 |
Business results – Segments | |
| 18 |
Business results – Market areas | |
| 19 |
Corporate Governance | |
| 19 |
Material contracts | |
| 19 |
Risk management | |
| 19 |
Sourcing and supply | |
| 20 |
Sustainability and Corporate Responsibility | |
| 20 |
Security and Privacy | |
| 20 |
US FCPA settlement | |
| 20 |
Legal proceedings | |
| 21 |
Parent Company | |
| 21 |
Share information | |
| 21 |
Proposed disposition of earnings | |
| 22 |
Guidelines for Remuneration to Group Management | |
| 27 |
Board assurance | |

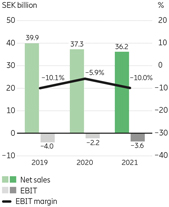
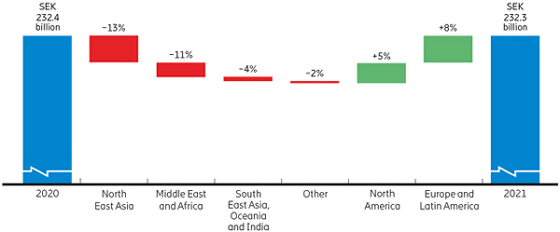
| – | Group organic sales grew by 4%, with an increase in Networks organic sales of 7%. Reported sales were stable at SEK 232.3 billion. The loss of market share in Mainland China impacted sales by SEK -7.7 billion. and the growth rate by -3 percentage points, meaning that excluding Mainland China organic sales growth was 8%. |
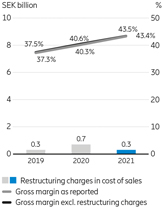
| – | Reported gross margin was 43.4% (40.3%), driven primarily by strengthened operational leverage in Networks. |
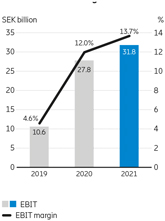
| – | Reported EBIT margin improved to 13.7% (12.0%). |
| – | EBIT margin excluding restructuring charges improved to 13.9% (12.5%), reaching the 2022 group target already in 2021. |
| – | Reported net income was SEK 23.0 (17.6) billion. Earnings per share (EPS) diluted was SEK 6.81 (5.26). |
| – | Free cash flow before M&A amounted to SEK 32.1 (22.3) billion. Net cash was SEK 65.8 (41.9) billion on December 31, 2021. |
| – | The Board of Directors proposes a dividend for 2021 of SEK 2.50 (2.00) per share to the AGM. |
| 13 Financial Report 2021 | Board of Directors’ report | Ericsson Annual Report on Form 20-F 2021 | |||
| 14 Financial Report 2021 | Board of Directors’ report | Ericsson Annual Report on Form 20-F 2021 | |||


| 15 Financial Report 2021 | Board of Directors’ report | Ericsson Annual Report on Form 20-F 2021 | |||


| Most recent three-year average seasonality | ||||||||||||||||
| First quarter |
Second quarter |
Third quarter |
Fourth quarter |
|||||||||||||
| Sequential change, sales | -26% | 11% | 3% | 21% | ||||||||||||
| Share of annual sales | 21% | 24% | 25% | 30% | ||||||||||||
| Capital expenditures 2019–2021 | ||||||||||||
| SEK billion | 2021 | 2020 | 2019 | |||||||||
| Capital expenditures | 3.7 | 4.5 | 5.1 | |||||||||
| Of which in Sweden |
1.5 |
1.9 |
2.0 |
|||||||||
| Share of annual sales | 1.6% | 1.9% | 2.3% | |||||||||
| 16 Financial Report 2021 | Board of Directors’ report | Ericsson Annual Report on Form 20-F 2021 | |||


| 17 Financial Report 2021 | Board of Directors’ report | Ericsson Annual Report on Form 20-F 2021 | |||
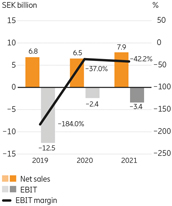
| Breakdown of EBIT in segment Emerging Business and Other |
||||||||
| SEK billion | Full year 2021 |
Full year 2020 |
||||||
Segment EBIT |
-3.4 |
-2.4 |
||||||
| of which Emerging Business, iconective, media businesses, Cradlepoint and common costs | -3.4 | -2.6 | ||||||
| of which SEC and DOJ resolution costs | 0.0 | 0.3 | ||||||
| of which costs for ST-Ericsson wind-down | 0.0 | -0.1 | ||||||
| of which a refund of social security costs in Sweden | 0.0 | 0.0 | ||||||
| of which a Nokia settlement related to the 2019 resolution with SEC and DOJ | -0.8 | 0.0 | ||||||
| of which revaluation of Ericsson Ventures investments, a data center divestment and an impairment write-off |
0.8 | 0.0 | ||||||
| – | Emerging Business, including IoT, iconectiv, Cradlepoint and New businesses |
| – | Media businesses, including Red Bee Media and a 49% ownership of MediaKind. |
| 18 Financial Report 2021 | Board of Directors’ report | Ericsson Annual Report on Form 20-F 2021 | |||
| 19 Financial Report 2021 | Board of Directors’ report | Ericsson Annual Report on Form 20-F 2021 | |||
| 20 Financial Report 2021 | Board of Directors’ report | Ericsson Annual Report on Form 20-F 2021 | |||
| 21 Financial Report 2021 | Board of Directors’ report | Ericsson Annual Report on Form 20-F 2021 | |||
| – | Increased current and non-current liabilities to subsidiaries of SEK 22.1 billion. |
| – | Decreased current and non-current receivables from subsidiaries of SEK 0.7 billion. |
| – | Shareholder contributions to subsidiaries of SEK 6.4 billion. |
| – | Impairment of investments in subsidiaries of SEK 1.3 billion. |
| – | Increased gross cash of SEK 23.5 billion. |
| Amount to be paid to the shareholders |
SEK 8,335,379,338 | |||
| Amount to be retained by the |
||||
| Parent Company |
SEK 26,649,074,267 | |||
| Total non-restricted equity ofthe Parent Company |
SEK 34,984,453, 605 |
| 22 Financial Report 2021 | Board of Directors’ report | Ericsson Annual Report on Form 20-F 2021 | |||
| |
| – | attract and retain highly competent, performing and motivated people that have the ability, experience and skill to deliver on the Ericsson strategy, |
| – | encourage behavior consistent with Ericsson’s culture and core values, |
| – | ensure fairness in reward by delivering total remuneration that is appropriate but not excessive, and clearly explained, |
| – | have a total compensation mix of fixed pay, variable pay and benefits that is competitive where Ericsson competes for talent, and |
| – | encourage variable remuneration which aligns employees with clear and relevant targets, reinforces their performance and enables flexible remuneration costs. |
1) |
Information for 2021 can be found in the Remuneration report and in note G2, “Information regarding members of the Board of Directors and Group management” and note G3, “Share-based compensation” in the Financial report. |
| 23 Financial Report 2021 | Board of Directors’ report | Ericsson Annual Report on Form 20-F 2021 | |||
| Element and purpose | Operation | Opportunity | Performance measures | |||
| Fixed salary Fixed compensation paid at set times. Purpose: – attract and retain the executive talent required to implement Ericsson’s strategy, – deliver part of the annual compensation in a predictable format. |
Salaries shall normally be reviewed annually in January. Salaries shall be set taking into account: – Ericsson’s overall business performance, – business performance of the Unit that the individual leads, – year-on-year – external economic environment, – size and complexity of the position, – external market data, – pay and conditions for other employees based in locations considered to be relevant to the role. When setting fixed salaries, the impact on total remuneration, including pensions and associated costs, shall be taken into consideration. |
There is no maximum salary level; however, salary increases (as a % of existing salary) for most Group Management members would normally be in line with the external market practices, employees in relevant locations and performance of the individual. There are circumstances where higher salary increases could be awarded. For example, where: – a new Group Management member has been appointed at a below- market salary, in which case larger increases may be awarded in following years, subject to strong individual performance, – the Group Management member has been promoted or has had an increase in responsibilities, – an individual’s salary has fallen significantly behind market practice. |
This element of the package does not require achievement of any specific performance targets. However, individual performance and capability shall be taken into account along with business performance when determining fixed salary levels and any salary increases. | |||
| Short-term variable compensation (STV) STV is a variable compensation plan that shall be measured and paid over a single year. Purpose: – align members of Group Management with clear and relevant targets to Ericsson’s strategy and sustainable long-term interests, – provide individuals an earning opportunity for performance at flexible cost to the Company. |
The STV shall be paid in cash every year after the Committee and, as applicable, the Board have reviewed and approved performance against targets which are normally determined at the start of each year for each member of Group Management. The Board and the Committee reserve the right to: – revise any or all of the STV targets at any time, – adjust the STV targets retroactively under extraordinary circumstances, – reduce or cancel STV if Ericsson faces severe economic difficulties, for instance in circumstances as serious as no dividend being paid, – adjust STV in the event that the results of the STV targets are not a true reflection of business performance, – reduce or cancel STV for individuals either whose performance evaluation or whose documented performance feedback is below an acceptable level or who are on performance counselling. Malus and clawback The Board and the Committee shall have the right in their discretion to: – deny, in whole or in part, the entitlement of an individual to the STV payout in case an individual has acted in breach of Ericsson’s Code of Business Ethics. – claim repayment in whole or in part the STV paid in case an individual has acted in breach of Ericsson’s Code of Business Ethics. – reclaim STV paid to an individual on incorrect grounds such as restatement of financial results due to incorrect financial reporting, non-compliance with a financial reporting requirement etc. |
Target pay-out opportunity for any financial year may be up to 150% of annual fixed salary of the individual. This shall normally be determined in line with the external market practices of the country of employment.Maximum pay-out shall be up to two times the target pay-out opportunity (i.e. 300% of annual fixed salary).1) 2) |
The STV shall be based on measures linked to the annual business plan which in itself is linked to Ericsson’s long-term strategy and sustainability. Measures shall include financial targets at Group, Business Area or Market Area level (for relevant members of Group Management). Other potential measures may include strategic targets, operational targets, employee engagement targets, customer satisfaction targets, sustainability and corporate responsibility targets or other lead indicator targets. A maximum of four STV targets shall be assigned to an individual in total for a financial year. Financial targets shall comprise at least 75% of the target bonus opportunity with a minimum of 40% being defined at Group level. The minimum weighting for an STV target shall be 20%. Performance of all STV targets shall be tested over a one-year performance period (financial year).The STV measures and targets shall be determined by the Committee for the members of Group Management other than the President and CEO. The Board has the mandate to define STV measures and targets for the President and CEO, should STV be introduced for the President and CEO. | |||
| 24 Financial Report 2021 | Board of Directors’ report | Ericsson Annual Report on Form 20-F 2021 | |||
| Element and purpose | Operation | Opportunity | Performance measures | |||
| Pension Contributions paid towards retirement fund. Purpose: – attract and retain the executive talent required to implement Ericsson’s strategy, – facilitate planning for retirement by way of providing competitive retirement arrangements in line with local market practices. |
The operation of the pension plan shall follow competitive practice in the individual’s home country and may contain various supplementary plans in addition to any national system for social security. Pension plans should be defined contribution plans unless the individual concerned is subject to defined benefit pension plan under mandatory collective agreement provisions or mandatory local regulations. In some special circumstances where individuals cannot participate in the local pension plans of their home countries of employment: – cash equivalent to pension may be provided as a taxable benefit, or – contributions may be made to an international pension fund on behalf of the individual on a cost-neutral basis. |
Since 2011, members of Group Management in Sweden participate in the defined contribution plan (ITP1) which applies for the wider workforce in Sweden. The pension contribution for ITP1 is capped at 30% of pensionable salary which includes fixed salary and STV paid in cash. According to the local collective bargaining agreement in Sweden, the members of Group Management are also entitled to an additional pension contribution for part-time retirement for which the cap is determined during the union negotiations for all the local employees. Members of Group Management employed outside of Sweden may participate in the local market competitive pension arrangements that apply in their home countries in line with what is offered to other employees in the same country. In all cases the annual pension contributions shall be capped at 70% of annual fixed salary. 3) |
None | |||
| Other benefits Additional tangible or intangible compensation paid annually which do not fall under fixed salary, short-term and long-term variable compensation or pension. Purpose: – attract and retain the executive talent required to implement Ericsson’s strategy, – deliver part of the annual compensation in a predictable format. |
Benefits offered shall take into account the competitive practices in the individual’s country of employment and should be in line with what is offered to other senior employees in the same country and may evolve year on year. Benefits may for example include company phones, company cars, medical and other insurance benefits, tax support, travel, Company gifts and any international relocation and/or commuting benefits if the individual is required to relocate and/or commute internationally to execute the requirements of the role. |
Benefit opportunities shall be set in line with competitive market practices and shall reflect what is offered to other senior employees in the individual’s country of employment. The levels of benefits provided may vary year on year depending on the cost of the provision of benefits to the Company. Other benefits shall be capped at 10% of annual fixed salary for members of Group Management located in Sweden. Additional benefits and allowances for members of Group Management who are commuters into Sweden or who are on long-term assignment (“LTA”) in countries other than their home countries of employment, shall be determined in line with the Company’s international mobility policy which may include (but is not limited to) commuting or relocation costs; cost of living adjustment, housing, home travel or education allowance; tax and social security equalization assistance. |
None | |||
1) |
For most of the current members of Group Management, the current STV target opportunity is below 50% of the annual fixed salary. |
2) |
At present the President & CEO does not participate in STV. The Board has the mandate to decide to include the President and CEO in STV in the future. In doing so the Board shall: |
| – | determine the STV opportunity for the President and CEO within the ranges mentioned above and in line with the external market practices of the country of employment, keeping the STV opportunity of the other members of Group Management under consideration, |
| – | reduce the LTV opportunity in relation to the STV opportunity, keeping the total target cash compensation consisting of fixed salary, STV and LTV unchanged. |
| Should the Board decide to introduce STV for the President and CEO, the details will be disclosed in the Remuneration Report for the relevant year. |
3) |
Since most of the current members of Group Management are currently under ITP1 coverage, their pension contributions are currently capped at 30% of pensionable salary and the additional pension contribution for part-time retirement mandated by the local collective bargaining agreement in Sweden. |
| 25 Financial Report 2021 | Board of Directors’ report | Ericsson Annual Report on Form 20-F 2021 | |||
| – | The targets for the STV shall be set each year either by the Board or the Committee as appropriate for the members of the Group Management. In determining the targets, the Board and the Committee shall take into account Ericsson’s focused business strategy, which is built on technology leadership, product-led solutions and global scale, along with internal annual and long-term business plans. Therefore, all members of Group Management shall have one or more Group financial targets derived from the long-term financial targets which amount to at least 40% of the target STV opportunity. At least 75% of the target STV opportunity shall be linked to financial measures. The Board and the Committee, as applicable, may also choose to include other operational, strategic, employee engagement, customer satisfaction or sustainability and corporate responsibility or other lead indicator measures to support the delivery of the business plan. For certain roles such targets may be supplemented by targets for the relevant Business Area, Market Area or Group Function. |
| – | Maximum pay-out shall be achievable for truly outstanding performance and exceptional value creation. |
| – | At the end of the performance period for each STV cycle, the Board and the Committee shall assess performance versus the measures and determine the formula-based outcome using the financial information made public by the Company for the financial targets. The Board has the discretion to adjust targets and the subsequent outcome in the event that they cease to be relevant or stretching or to enhance shareholder value. Adjustments shall normally only occur in the event of a major change (e.g. an acquisition or divestment) and shall be on the basis that the new target shall be no more or less difficult to achieve. |
| – | The role being taken on. |
| – | The level and type of remuneration opportunity received at a previous employer. |
| – | The geography in which the candidate is being recruited from and whether any relocation allowance is required. |
| – | The skills, experience and caliber of the candidate. |
| – | The circumstances of the candidate. |
| – | The current external market and salary practice. |
| – | Internal relativities. |
| 26 Financial Report 2021 | Board of Directors’ report | Ericsson Annual Report on Form 20-F 2021 | |||
| Board of Directors’ discretions The Board upon recommendation from the Committee may in a specific case decide to temporarily deviate from these Guidelines in whole or in part based on its full discretion in unusual circumstances such as: – upon change of the President and CEO in accordance with recruitment policy for new members of Group Management, |
– upon material changes in the Company structure, organization, ownership and business (for example takeover, acquisition, merger, demerger etc.) which may require adjustments in STV and LTV or other elements to ensure continuity of Group Management, and – in any other circumstances, provided that the deviation is required to serve the long-term interests and sustainability of the Company or to assure its financial viability. |
The Committee is responsible for preparing matters for resolution by the Board, and this includes matters relating to deviations from these Guidelines. Any such deviation will be disclosed in the Remuneration Report for the relevant year. | ||
| 27 Financial Report 2021 | Board of Directors’ report | Ericsson Annual Report on Form 20-F 2021 | |||
| 28 Financial Report 2021 | Report of independent registered public accounting firm | Ericsson Annual Report on Form 20-F 2021 | |||
| 29 Financial Report 2021 | Report of independent registered public accounting firm | Ericsson Annual Report on Form 20-F 2021 | |||
| 30 Financial Report 2021 | Report of independent registered public accounting firm | Ericsson Annual Report on Form 20-F 2021 | |||
| – | We tested the effectiveness of the Company’s controls over revenue recognition with particular focus on the controls related to the identification of performance obligations within revenue contracts and determination of the timing of recognition for each revenue obligation including the reviews performed by the Company’s central board for material and complex deals. |
| – | We tested a sample of significant contracts to assess management’s judgments and estimates related to the identification of performance obligations and determination of the timing of recognition for each revenue obligation based on the contract. |
| – | We tested a sample of revenue transactions recorded during the year by tracing them to supporting evidence of delivery and acceptance and assessed the judgments and estimates for revenue recorded in the period by comparing it to contractual terms such as, delivery terms, transaction prices including variable considerations, discounts and incentive agreements. |
| – | We tested a sample of ongoing negotiations with existing customers and analyzed reversals of revenue subsequent to year end for indicators of unrecorded discounts and concessions during the period. |
| – | We tested the effectiveness of the Company’s controls over goodwill impairment evaluation and determination of the recoverable amount with particular focus on the controls over management’s preparation and review of assumptions for future sales growth, operating income, working capital, capital expenditure requirements and method for determining the discount rate used. |
| – | We evaluated management’s ability to accurately forecast future sales growth and operating income by comparing actual results to management’s historical forecasts, the Company’s historical results, external analyst reports and internal communications to management and the Board of Directors. |
| – | With the assistance of our fair value specialists, we evaluated the discount rates, including testing the underlying source information and the mathematical accuracy of the calculations, and developing a range of independent estimates and comparing those to the discount rates selected by management. |
| 31 Financial Report 2021 | Consolidated financial statements with notes | Ericsson Annual Report on Form 20-F 2021 | |||
| Consolidated financial statements | ||||
| 32 |
Consolidated income statement | |||
| 32 |
Consolidated statement of comprehensive income (loss) | |||
| 33 |
Consolidated balance sheet | |||
| 34 |
Consolidated statement of cash flows | |||
| 35 |
Consolidated statement of changes in equity | |||
| Notes to the consolidated financial statements | ||||
| 38 |
A |
Basis of presentation | ||
| 38 |
A1 | Significant accounting policies | ||
| 45 |
A2 | Critical accounting estimates and judgments | ||
| 48 |
B |
Business and operations | ||
| 48 |
B1 | Segment information | ||
| 51 |
B2 | Net sales | ||
| 51 |
B3 | Expenses by nature | ||
| 51 |
B4 | Other operating income and expenses | ||
| 51 |
B5 | Inventories | ||
| 51 |
B6 | Customer contract related balances | ||
| 52 |
B7 | Other current receivables | ||
| 52 |
B8 | Trade payables | ||
| 52 |
B9 | Other current liabilities | ||
| 52 |
C |
Long-term assets | ||
| 52 |
C1 | Intangible assets | ||
| 54 |
C2 | Property, plant and equipment | ||
| 55 |
C3 | Leases | ||
| 56 |
D |
Obligations | ||
| 56 |
D1 | Provisions | ||
| 57 |
D2 | Contingent liabilities | ||
| 57 |
D3 | Assets pledged as collateral | ||
| 57 |
D4 | Contractual obligations | ||
| 58 |
E |
Group structure | ||
| 58 |
E1 | Equity | ||
| 59 |
E2 | Business combinations | ||
| 60 |
E3 | Associated companies | ||
| 61 |
F |
Financial instruments | ||
| 61 |
F1 | Financial risk management | ||
| 66 |
F2 | Financial income and expenses | ||
| 66 |
F3 | Financial assets, non-current | ||
| 67 |
F4 | Interest-bearing liabilities | ||
| 68 |
G |
Employee related | ||
| 68 |
G1 | Post-employment benefits | ||
| 72 |
G2 | Information regarding members of the Board of Directors and Group management | ||
| 74 |
G3 | Share-based compensation | ||
| 79 |
G4 | Employee information | ||
| 80 |
H |
Other | ||
| 80 |
H1 | Taxes | ||
| 81 |
H2 | Earnings per share | ||
| 81 |
H3 | Statement of cash flows | ||
| 82 |
H4 | Related party transactions | ||
| 82 |
H5 | Fees to auditors | ||
| 82 |
H6 | Events after the reporting period | ||
| Ericsson Annual Report on Form 20F 2021 | Financials – Consolidated financial statements | 32 |
| January–December, SEK million | Notes | 2021 | 2020 | 2019 | ||||||||||||||||||||||||
| Net sales |
B1, B2 |
|||||||||||||||||||||||||||
| Cost of sales |
( |
( |
( |
|||||||||||||||||||||||||
| Gross income |
||||||||||||||||||||||||||||
| Research and development expenses |
( |
( |
( |
|||||||||||||||||||||||||
| Selling and administrative expenses |
( |
( |
( |
|||||||||||||||||||||||||
| Impairment losses on trade receivables |
F1 |
( |
||||||||||||||||||||||||||
| Operating expenses |
( |
( |
( |
|||||||||||||||||||||||||
| Other operating income |
B4 |
|||||||||||||||||||||||||||
| Other operating expenses |
B4 |
( |
( |
( |
||||||||||||||||||||||||
| Share in earnings of joint ventures and associated companies |
B1, E3 |
( |
( |
( |
||||||||||||||||||||||||
| Earnings before financial items and income tax (EBIT) |
B1 |
|||||||||||||||||||||||||||
| Financial income and expenses, net |
F2 |
( |
( |
( |
||||||||||||||||||||||||
| Income after financial items |
||||||||||||||||||||||||||||
| Income tax |
H1 |
( |
( |
( |
||||||||||||||||||||||||
| Net income |
||||||||||||||||||||||||||||
| Net income (loss) attributable to: |
||||||||||||||||||||||||||||
| Owners of the Parent Company |
||||||||||||||||||||||||||||
| Non-controlling interests |
( |
|||||||||||||||||||||||||||
| Other information |
||||||||||||||||||||||||||||
| Average number of shares, basic (million) |
H2 |
|||||||||||||||||||||||||||
| Earnings per share attributable to owners of the Parent Company, basic (SEK) 1) |
H2 |
|||||||||||||||||||||||||||
| Earnings per share attributable to owners of the Parent Company, diluted (SEK) 1) |
H2 |
|||||||||||||||||||||||||||
1) |
Based on net income attributable to owners of the Parent Company. |
| January–December, SEK million | 2021 | 2020 | 2019 | |||||||||||||||||||||
| Net income |
||||||||||||||||||||||||
| Other comprehensive income (loss) |
||||||||||||||||||||||||
| Items that will not be reclassified to profit or loss |
||||||||||||||||||||||||
| Remeasurements of defined benefits pension plans including asset ceiling |
( |
( |
||||||||||||||||||||||
| Revaluation of borrowings due to change in credit risk |
( |
|||||||||||||||||||||||
| Tax on items that will not be reclassified to profit or loss |
( |
|||||||||||||||||||||||
| Items that have been or may be reclassified to profit or loss |
||||||||||||||||||||||||
| Cash flow hedge reserve |
||||||||||||||||||||||||
| Gains/losses arising during the period |
( |
( |
||||||||||||||||||||||
| Reclassification adjustments on gains/losses included in profit or loss |
( |
— | ||||||||||||||||||||||
| Translation reserves |
||||||||||||||||||||||||
| Changes in translation reserves |
( |
|||||||||||||||||||||||
| Reclassification to profit and loss |
||||||||||||||||||||||||
| Share of other comprehensive income of JV and associated companies |
( |
|||||||||||||||||||||||
| Tax on items that have been or may be reclassified to profit or loss |
( |
|||||||||||||||||||||||
| Other comprehensive income (loss), net of tax |
( |
( |
||||||||||||||||||||||
| Total comprehensive income (loss) |
( |
|||||||||||||||||||||||
| Total comprehensive income (loss) attributable to: |
||||||||||||||||||||||||
| Owners of the Parent Company |
( |
|||||||||||||||||||||||
| Non-controlling interests |
( |
|||||||||||||||||||||||
| Ericsson Annual Report on Form 20F 2021 | Financials – Consolidated financial statements | 33 |
| SEK million | Notes | Dec 31 2021 |
Dec 31 2020 |
|||||||||||||||||||||
| Assets |
||||||||||||||||||||||||
| Non-current assets |
||||||||||||||||||||||||
| Intangible assets |
C1 |
|||||||||||||||||||||||
| Capitalized development expenses |
||||||||||||||||||||||||
| Goodwill |
||||||||||||||||||||||||
| Intellectual property rights, brands and other intangible assets |
||||||||||||||||||||||||
| Property, plant and equipment |
C2 |
|||||||||||||||||||||||
| Right-of-use |
C3 |
|||||||||||||||||||||||
| Financial assets |
||||||||||||||||||||||||
| Equity in joint ventures and associated companies |
E3 |
|||||||||||||||||||||||
| Other investments in shares and participations |
F3 |
|||||||||||||||||||||||
| Customer finance, non-current |
B6, F1 |
|||||||||||||||||||||||
| Interest-bearing securities, non-current |
F1, F3 |
|||||||||||||||||||||||
| Other financial assets, non-current |
F3 |
|||||||||||||||||||||||
| Deferred tax assets |
H1 |
|||||||||||||||||||||||
| Current assets |
||||||||||||||||||||||||
| Inventories |
B5 |
|||||||||||||||||||||||
| Contract assets |
B6, F1 |
|||||||||||||||||||||||
| Trade receivables |
B6, F1 |
|||||||||||||||||||||||
| Customer finance, current |
B6, F1 |
|||||||||||||||||||||||
| Current tax assets |
||||||||||||||||||||||||
| Other current receivables |
B7 |
|||||||||||||||||||||||
| Interest-bearing securities, current |
F1 |
|||||||||||||||||||||||
| Cash and cash equivalents |
H3 |
|||||||||||||||||||||||
| Total assets |
||||||||||||||||||||||||
| Equity and liabilities |
||||||||||||||||||||||||
| Equity |
||||||||||||||||||||||||
| Capital stock |
E1 |
|||||||||||||||||||||||
| Additional paid in capital |
E1 |
|||||||||||||||||||||||
| Other reserves |
E1 |
( |
||||||||||||||||||||||
| Retained earnings |
E1 |
|||||||||||||||||||||||
| Equity attributable to owners of the Parent Company |
E1 |
|||||||||||||||||||||||
| Non-controlling interests |
E1 |
( |
( |
|||||||||||||||||||||
| Non-current liabilities |
||||||||||||||||||||||||
| Post-employment benefits |
G1 |
|||||||||||||||||||||||
| Provisions, non-current |
D1 |
|||||||||||||||||||||||
| Deferred tax liabilities |
H1 |
|||||||||||||||||||||||
| Borrowings, non-current |
F4 |
|||||||||||||||||||||||
| Lease liabilities, non-current |
C3 |
|||||||||||||||||||||||
| Other non-current liabilities |
||||||||||||||||||||||||
| Current liabilities |
||||||||||||||||||||||||
| Provisions, current |
D1 |
|||||||||||||||||||||||
| Borrowings, current |
F4 |
|||||||||||||||||||||||
| Lease liabilities, current |
C3 |
|||||||||||||||||||||||
| Contract liabilities |
B6 |
|||||||||||||||||||||||
| Trade payables |
B8 |
|||||||||||||||||||||||
| Current tax liabilities |
||||||||||||||||||||||||
| Other current liabilities |
B9 |
|||||||||||||||||||||||
| Total equity and liabilities |
||||||||||||||||||||||||
| Ericsson Annual Report on Form 20F 2021 | Financials – Consolidated financial statements |
3 4 |
| January–December, SEK million | Notes | 2021 | 2020 | 2019 | ||||||||||||||||||||||||||||||||
| Operating activities |
||||||||||||||||||||||||||||||||||||
| Net income |
||||||||||||||||||||||||||||||||||||
| Adjustments to reconcile net income to cash |
H3 |
|||||||||||||||||||||||||||||||||||
| Changes in operating net assets |
||||||||||||||||||||||||||||||||||||
| Inventories |
( |
|||||||||||||||||||||||||||||||||||
| Customer finance, current and non-current |
( |
|||||||||||||||||||||||||||||||||||
| Trade receivables and contract assets |
( |
|||||||||||||||||||||||||||||||||||
| Trade payables |
( |
|||||||||||||||||||||||||||||||||||
| Provisions and post-employment benefits |
( |
( |
( |
|||||||||||||||||||||||||||||||||
| Contract liabilities |
( |
( |
||||||||||||||||||||||||||||||||||
| Other operating assets and liabilities, net |
( |
( |
||||||||||||||||||||||||||||||||||
( |
||||||||||||||||||||||||||||||||||||
| Interest received |
||||||||||||||||||||||||||||||||||||
| Interest paid |
( |
( |
( |
|||||||||||||||||||||||||||||||||
| Taxes paid |
( |
( |
( |
|||||||||||||||||||||||||||||||||
| Cash flow from operating activities |
||||||||||||||||||||||||||||||||||||
| Investing activities |
||||||||||||||||||||||||||||||||||||
| Investments in property, plant and equipment |
C2 |
( |
( |
( |
||||||||||||||||||||||||||||||||
| Sales of property, plant and equipment |
||||||||||||||||||||||||||||||||||||
| Acquisitions of subsidiaries and other operations |
H3, E2 |
( |
( |
( |
||||||||||||||||||||||||||||||||
| Divestments of subsidiaries and other operations |
H3, E2 |
|||||||||||||||||||||||||||||||||||
| Product development |
C1 |
( |
( |
( |
||||||||||||||||||||||||||||||||
| Purchase of interest-bearing securities |
( |
( |
( |
|||||||||||||||||||||||||||||||||
| Sale of interest-bearing securities |
||||||||||||||||||||||||||||||||||||
| Other investing activities |
( |
( |
||||||||||||||||||||||||||||||||||
| Cash flow from investing activities |
( |
( |
( |
|||||||||||||||||||||||||||||||||
| Financing activities |
||||||||||||||||||||||||||||||||||||
| Proceeds from issuance of borrowings |
F4 |
|||||||||||||||||||||||||||||||||||
| Repayment of borrowings |
F4 |
( |
( |
( |
||||||||||||||||||||||||||||||||
| Sale of own shares |
||||||||||||||||||||||||||||||||||||
| Dividends paid |
( |
( |
( |
|||||||||||||||||||||||||||||||||
| Repayment of lease liabilities |
F4 |
( |
( |
( |
||||||||||||||||||||||||||||||||
| Other financing activities |
( |
( |
||||||||||||||||||||||||||||||||||
| Cash flow from financing activities |
( |
( |
( |
|||||||||||||||||||||||||||||||||
| Effect of exchange rate changes on cash |
( |
|||||||||||||||||||||||||||||||||||
| Net change in cash and cash equivalents |
( |
|||||||||||||||||||||||||||||||||||
| Cash and cash equivalents, beginning of period |
||||||||||||||||||||||||||||||||||||
| Cash and cash equivalents, end of period |
H3 |
|||||||||||||||||||||||||||||||||||
| Ericsson Annual Report on Form 20F 2021 | Financials – Consolidated financial statements | 35 |
| SEK million | Capital stock | Additional paid in capital |
Other reserves |
Retained earnings |
Stockholders’ equity |
Non-controlling interests |
Total equity | |||||||||||||||||||||
| January 1, 2021 |
( |
( |
||||||||||||||||||||||||||
| Net income |
— |
— |
— |
|||||||||||||||||||||||||
| Other comprehensive income (loss) |
||||||||||||||||||||||||||||
| Items that will not be reclassified to profit or loss |
||||||||||||||||||||||||||||
| Remeasurements of defined benefit pension plans including asset ceiling |
— | — | — | |||||||||||||||||||||||||
| Revaluation of borrowings due to change in credit risk |
— | — | — | — | ||||||||||||||||||||||||
| Tax on items that will not be reclassified to profit or loss |
— | — | ( |
( |
( |
( |
( |
|||||||||||||||||||||
Items that have been or may be reclassified to profit or loss |
||||||||||||||||||||||||||||
| Cash flow hedge reserve |
||||||||||||||||||||||||||||
| Gains/losses arising during the period |
— | — | ( |
— | ( |
— | ( |
|||||||||||||||||||||
| Reclassification to profit and loss |
— | — | ( |
— | ( |
— | ( |
|||||||||||||||||||||
| Translation reserves 1) |
||||||||||||||||||||||||||||
| Changes in translation reserves |
— | — | — | ( |
||||||||||||||||||||||||
| Reclassification to profit and loss |
— | — | — | — | ||||||||||||||||||||||||
| Share of other comprehensive income of JV and associated companies | — | — | — | — | ||||||||||||||||||||||||
| Tax on items that have been or may be reclassified to profit or loss | — | — | — | — | ||||||||||||||||||||||||
| Other comprehensive income (loss), net of tax |
— |
— |
( |
|||||||||||||||||||||||||
| Total comprehensive income (loss) |
— |
— |
||||||||||||||||||||||||||
| Transactions with owners |
||||||||||||||||||||||||||||
| Sale of own shares |
— | — | — | — | ||||||||||||||||||||||||
| Long-term variable compensation plans |
— | — | — | — | ||||||||||||||||||||||||
| Dividends paid 2) |
— | — | — | ( |
( |
( |
( |
|||||||||||||||||||||
| Transactions with non-controlling interest |
— | — | — | ( |
( |
( |
( |
|||||||||||||||||||||
| December 31, 2021 |
( |
|||||||||||||||||||||||||||
1) |
Changes in cumulative translation adjustments include changes regarding revaluation of goodwill in local currency of SEK (SEK - in 2020 and SEK divested /liquidated companies, SEK |
2) |
Dividends paid per share amounted to SEK |
| Ericsson Annual Report on Form 20F 2021 | Financials – Consolidated financial statements | 36 |
| SEK million | Capital stock | Additional paid in capital |
Other reserves |
Retained earnings |
Stockholders’ equity |
Non-controlling interests |
Total equity | |||||||||||||||||||||
| January 1, 2020 |
( |
|||||||||||||||||||||||||||
| Net income |
— | — | — | |||||||||||||||||||||||||
| Other comprehensive income (loss) |
||||||||||||||||||||||||||||
| Items that will not be reclassified to profit or loss |
||||||||||||||||||||||||||||
| Remeasurements of defined benefit pension plans including asset ceiling |
— | — | — | ( |
( |
( |
( |
|||||||||||||||||||||
| Revaluation of borrowings due to change in credit risk |
— | — | — | — | ||||||||||||||||||||||||
| Tax on items that will not be reclassified to profit or loss |
— | — | ( |
|||||||||||||||||||||||||
Items that have been or may be reclassified to profit or loss |
||||||||||||||||||||||||||||
| Cash flow hedge reserve |
||||||||||||||||||||||||||||
| Gains/losses arising during the period |
— | — | — | — | ||||||||||||||||||||||||
| Reclassification to profit and loss |
— | — | — | — | ||||||||||||||||||||||||
| Translation reserves |
||||||||||||||||||||||||||||
| Changes in translation reserves |
— | — | ( |
— | ( |
( |
||||||||||||||||||||||
| Reclassification to profit and loss |
— | — | — | — | ||||||||||||||||||||||||
| Share of other comprehensive income of JV and associated companies | — | — | ( |
— | ( |
— | ( |
|||||||||||||||||||||
| Tax on items that have been or may be reclassified to profit or loss | — | — | ( |
— | ( |
— | ( |
|||||||||||||||||||||
| Other comprehensive income (loss), net of tax |
— |
— |
( |
( |
( |
( |
||||||||||||||||||||||
| Total comprehensive income (loss) |
— |
— |
( |
|||||||||||||||||||||||||
| Transactions with owners |
||||||||||||||||||||||||||||
| Sale of own shares |
— | — | — | — | ||||||||||||||||||||||||
| Long-term variable compensation plans |
— | — | — | — | ||||||||||||||||||||||||
| Dividends paid |
— | — | — | ( |
( |
( |
( |
|||||||||||||||||||||
| December 31, 2020 |
( |
( |
||||||||||||||||||||||||||
Ericsson Annual Report on Form 20F 2021 |
Financials – Consolidated financial statements |
37 |
| SEK million | Capital stock | Additional paid in capital |
Other reserves |
Retained earnings |
Stockholders’ equity |
Non-controlling interests |
Total equity | |||||||||||||||||||||
| January 1, 2019 |
||||||||||||||||||||||||||||
| Opening balance adjustment due to IFRS 16 |
— | — | — | ( |
( |
— | ( |
|||||||||||||||||||||
| January 1, 2019, adjusted |
||||||||||||||||||||||||||||
| Net income (loss) |
— |
— |
— |
( |
||||||||||||||||||||||||
| Other comprehensive income (loss) |
||||||||||||||||||||||||||||
Items that will not be reclassified to profit or loss |
||||||||||||||||||||||||||||
Remeasurements of defined benefit pension plans including asset ceiling |
— | — | — | ( |
( |
— | ( |
|||||||||||||||||||||
| Revaluation of borrowings due to change in credit risk | — | — | ( |
— | ( |
— | ( |
|||||||||||||||||||||
| Tax on items that will not be reclassified to profit or loss | — | — | — | |||||||||||||||||||||||||
Items that have been or may be reclassified to profit or loss |
||||||||||||||||||||||||||||
| Cash flow hedge reserve |
||||||||||||||||||||||||||||
| Gains/losses arising during the period |
— | — | ( |
— | ( |
— | ( |
|||||||||||||||||||||
| Translation reserves |
||||||||||||||||||||||||||||
| Changes in translation reserves |
— | — | — | |||||||||||||||||||||||||
| Reclassification to profit and loss |
— | — | — | — | ||||||||||||||||||||||||
| Share of other comprehensive income of JV and associated companies | — | — | — | — | ||||||||||||||||||||||||
| Tax on items that have been or may be reclassified to profit or loss | — | — | — | — | ||||||||||||||||||||||||
Other comprehensive income (loss), net of tax |
— |
— |
( |
( |
( |
|||||||||||||||||||||||
| Total comprehensive income (loss) |
— |
— |
( |
( |
( |
( |
||||||||||||||||||||||
| Transactions with owners |
||||||||||||||||||||||||||||
| Sale of own shares |
— | — | — | — | ||||||||||||||||||||||||
| Long-term variable compensation plans |
— | — | — | — | ||||||||||||||||||||||||
| Dividends paid |
— | — | — | ( |
( |
( |
( |
|||||||||||||||||||||
| Transactions with non-controlling interests |
— | — | — | ( |
( |
( |
||||||||||||||||||||||
| December 31, 2019 |
( |
|||||||||||||||||||||||||||
| Ericsson Annual Report on Form 20F 2021 | Financials – Notes to the Consolidated financial statements | 38 |
 |
Significant accounting policies |
- |
Interests and tax cash flows are presented as separate line items within the “Cash flow from operating activities.” Previously, interests and tax cash flows were subsumed within various lines in the sections “Adjustments to reconcile net income to cash” and “Changes in operating net assets,” and only disclosed in note H3 “Statement of cash flow.” Prior years have been represented and there is no impact on cash flows from operating activities. |
- |
Net movements in cash collaterals received and bank borrowings less than 3 months (used for short term liquidity purposes) are presented within “Other financing activities” since these balances fluctuate over a short duration, therefore it is neither practical nor useful to present their gross movements on the cash flow statement. |
| Cash flow from financing activities in prior years have been restated accordingly, resulting in a reclassification between the lines “Proceeds from issuance of borrowings,” “Repayment of borrowings” and “Other financing activities,” with no net effect on total cash flow from financing activities. | |
| - | Purchases and sales of interest-bearing securities are presented on a gross basis to improve the visibility of cash flows. Cash flow from investing activities in prior years have been restated accordingly, resulting in new lines for “Purchase of interest-bearing securities” and “Sale of interest-bearing securities”. |
Ericsson Annual Report on Form 20F 2021 |
Financials – Notes to the Consolidated financial statements |
39 |
| Ericsson Annual Report on Form 20F 2021 | Financials – Notes to the Consolidated financial statements | 4 0 |
| Ericsson Annual Report on Form 20F 2021 | Financials – Notes to the Consolidated financial statements | 4 1 |
| Ericsson Annual Report on Form 20F 2021 | Financials – Notes to the Consolidated financial statements |
4 2 |
| Ericsson Annual Report on Form 20F 2021 | Financials – Notes to the Consolidated financial statements |
4 3 |
| Ericsson Annual Report on Form 20F 2021 | Financials – Notes to the Consolidated financial statements | 4 4 |
| Ericsson Annual Report on Form 20F 2021 | Financials – Notes to the Consolidated financial statements | 4 5 |
| – | Interest Rate Benchmark Reform Phase 2, Amendments to IFRS 9, IAS 39, IFRS 7, IFRS 4 and IFRS 16 (the Phase 2 Amendments) |
| – | Amendments to IFRS 16 Leases: Covid-19-related e 2021 |
| – | Amendments to IFRS 4 Insurance Contracts: Extension of the Temporary Exemption from Applying IFRS 9 |
| – | Amendments to “IFRS 3 Business Combinations” – Reference to the Conceptual Framework. |
| – | “IAS 16 Property, Plant and Equipment – Proceeds before Intended Use”, which prohibits entities deducting from the cost of an item of property, plant and equipment, any proceeds from selling items produced while bringing that asset to the location and condition necessary for it to be capable of operating in the manner intended by management. Instead, an entity recognizes the proceeds from selling such items, and the costs of producing those items, in profit or loss. |
| – | Amendments to “IAS 37 Provisions, Contingent Liabilities and Contingent Assets” to specify which costs an entity needs to include when assessing whether a contract is onerous or loss-making. The amendments apply a “directly related cost approach.” The costs that relate directly to a contract to provide goods or services include both incremental costs and an allocation of costs directly related to contract activities. General and administrative costs do not relate directly to a contract and are excluded unless they are explicitly chargeable to the counterparty under the contract. |
| – | Annual improvements to IFRS 2018-2020. |
| – | The “IFRS 17 Insurance contracts” which establishes principles for the recognition, measurements, presentation and disclosure of insurance contracts. The Company has finalized its evaluation and concluded that the impact on financial result or position from adopting IFRS 17 is immaterial. |
| – | Presentation of Financial Statements: Classification of Liabilities as Current or Non-current |
| – | Amendments to IAS 1 Presentation of Financial Statements and IFRS Practice Statement 2: Disclosure of Accounting policies . |
| – | Amendments to IAS 8 Accounting policies, Changes in Accounting Estimates and Errors: Definition of Accounting Estimates |
| – | Amendments to IAS 12 Income Taxes: Deferred Tax related to Assets and Liabilities arising from a Single Transaction. |
 |
Critical accounting estimates and judgments |
| – | Key sources of estimation uncertainty |
| – | Judgments management has made in the process of applying the Company’s accounting policies. |
| Ericsson Annual Report on Form 20F 2021 | Financials – Notes to the Consolidated financial statements | 4 6 |
| Ericsson Annual Report on Form 20F 2021 | Financials – Notes to the Consolidated financial statements |
4 7 |
| Ericsson Annual Report on Form 20F 2021 | Financials – Notes to the Consolidated financial statements | 4 8 |
 |
Segment information |
| – | Networks |
| – | Digital Services |
| – | Managed Services |
| – | Emerging Business and Other. |
– |
Emerging Business, including IoT, iconectiv, Cradlepoint and New businesses |
| – | Media businesses, including Red Bee Media and a |
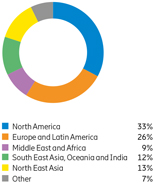
| – | Europe and Latin America |
| – | Middle East and Africa |
| – | North America |
| – | North East Asia |
| – | South East Asia, Oceania and India. |
Operating segments 2021 |
| |||||||||||||||||||||||
| Networks | Digital Services |
Managed Services |
Emerging Business and Other |
Total Segments |
Group | |||||||||||||||||||
| Segment sales |
||||||||||||||||||||||||
| Net sales |
||||||||||||||||||||||||
| Gross income |
||||||||||||||||||||||||
| Gross margin (%) |
||||||||||||||||||||||||
| Earnings (loss) before financial items and income tax (EBIT) |
( |
( |
||||||||||||||||||||||
| EBIT margin (%) |
( |
( |
||||||||||||||||||||||
| Financial income and expenses, net |
( |
|||||||||||||||||||||||
| Income after financial items |
||||||||||||||||||||||||
| Income tax |
( |
|||||||||||||||||||||||
| Net income |
||||||||||||||||||||||||
| Other segment items |
||||||||||||||||||||||||
| Share in earnings of JV and associated companies |
( |
( |
( |
|||||||||||||||||||||
| Amortizations |
( |
( |
( |
( |
( |
( |
||||||||||||||||||
| Depreciations |
( |
( |
( |
( |
( |
( |
||||||||||||||||||
| Impairment losses |
( |
( |
( |
( |
( |
( |
||||||||||||||||||
| Restructuring charges |
( |
( |
( |
( |
( |
( |
||||||||||||||||||
| Gains/losses on investments and sale of operations |
— | ( |
||||||||||||||||||||||
| Ericsson Annual Report on Form 20F 2021 | Financials – Notes to the Consolidated financial statements |
4 9 |
| Operating segments 2020 | ||||||||||||||||||||||||
| Networks | Digital Services |
Managed Services |
Emerging Business and Other |
Total Segments |
Group | |||||||||||||||||||
| Segment sales |
||||||||||||||||||||||||
| Net sales |
||||||||||||||||||||||||
| Gross income |
||||||||||||||||||||||||
| Gross margin (%) |
||||||||||||||||||||||||
| Earnings (loss) before financial items and income tax (EBIT) |
( |
( |
||||||||||||||||||||||
| EBIT margin (%) |
( |
( |
||||||||||||||||||||||
| Financial income and expenses, net |
( |
|||||||||||||||||||||||
| Income after financial items |
||||||||||||||||||||||||
| Income tax |
( |
|||||||||||||||||||||||
| Net income |
||||||||||||||||||||||||
| Other segment items |
||||||||||||||||||||||||
| Share in earnings of JV and associated companies |
( |
( |
( |
|||||||||||||||||||||
| Amortizations |
( |
( |
( |
( |
( |
( |
||||||||||||||||||
| Depreciations |
( |
( |
( |
( |
( |
( |
||||||||||||||||||
| Impairment losses |
( |
( |
( |
( |
( |
( |
||||||||||||||||||
| Restructuring charges |
( |
( |
( |
( |
( |
( |
||||||||||||||||||
| Gains/losses on investments and sale of operations |
( |
( |
( |
( |
||||||||||||||||||||
| Operating segments 2019 | ||||||||||||||||||||||||
| Networks | Digital Services |
Managed Services |
Emerging Business and Other |
Total Segments |
Group | |||||||||||||||||||
| Segment sales |
||||||||||||||||||||||||
| Net sales |
||||||||||||||||||||||||
| Gross income |
||||||||||||||||||||||||
| Gross margin (%) |
||||||||||||||||||||||||
| Earnings (loss) before financial items and income tax (EBIT) 1) |
( |
( |
||||||||||||||||||||||
| EBIT margin (%) |
( |
( |
||||||||||||||||||||||
| Financial income and expenses, net |
( |
|||||||||||||||||||||||
| Income after financial items |
||||||||||||||||||||||||
| Income tax |
( |
|||||||||||||||||||||||
| Net income |
||||||||||||||||||||||||
| Other segment items |
||||||||||||||||||||||||
| Share in earnings of JV and associated companies |
( |
( |
( |
|||||||||||||||||||||
| Amortizations |
( |
( |
( |
( |
( |
( |
||||||||||||||||||
| Depreciations |
( |
( |
( |
( |
( |
( |
||||||||||||||||||
| Impairment losses |
( |
( |
( |
( |
( |
( |
||||||||||||||||||
| Restructuring charges |
( |
( |
( |
( |
( |
( |
||||||||||||||||||
| Gains/losses on investments and sale of operations |
( |
( |
( |
|||||||||||||||||||||
| Products and Services by Segments | ||||||||||||||||||||
| Networks | Digital Services |
Managed Services |
Emerging Business and Other |
Total Segments |
||||||||||||||||
| 2021 |
||||||||||||||||||||
| Products |
||||||||||||||||||||
| Services |
||||||||||||||||||||
| Total |
||||||||||||||||||||
| 2020 |
||||||||||||||||||||
| Products |
||||||||||||||||||||
| Services |
||||||||||||||||||||
| Total |
||||||||||||||||||||
| 2019 |
||||||||||||||||||||
| Products |
||||||||||||||||||||
| Services |
||||||||||||||||||||
| Total |
||||||||||||||||||||
| Ericsson Annual Report on Form 20F 2021 | Financials – Notes to the Consolidated financial statements | 5 0 |
| Market area 2021 | ||||||||||||||||||||||||
| Net sales | Non-current assets 4) |
|||||||||||||||||||||||
| Networks | Digital Services |
Managed Services |
Emerging Business and Other |
Total | Total | |||||||||||||||||||
| South East Asia, Oceania and India |
||||||||||||||||||||||||
| North East Asia 3) |
||||||||||||||||||||||||
| North America 2) |
||||||||||||||||||||||||
| Europe and Latin America 1) |
||||||||||||||||||||||||
| Middle East and Africa |
||||||||||||||||||||||||
| Other 1) 2) 3) 5) |
||||||||||||||||||||||||
| Total |
||||||||||||||||||||||||
| 1) Of which in EU 5) |
||||||||||||||||||||||||
| Of which in Sweden 5) |
||||||||||||||||||||||||
| 2) Of which in the United States 5) |
||||||||||||||||||||||||
| 3) Of which in Japan 5) |
||||||||||||||||||||||||
| 3) Of which in China 5) |
||||||||||||||||||||||||
4) |
Total non-current assets excluding financial instruments, deferred tax assets, and post-employment benefit assets. |
5) |
Including IPR licencing revenue reported under Other Market area which is allocated based on the country location of the customer. Other sales are attributed to countries based on the destination of products or services delivered. |
| |
| Market area 2020 |
||||||||||||||||||||||||
| Net sales | Non-current assets 4) |
|||||||||||||||||||||||
| Networks | Digital Services |
Managed Services |
Emerging Business and Other |
Total | Total | |||||||||||||||||||
| South East Asia, Oceania and India |
||||||||||||||||||||||||
| North East Asia 3) |
||||||||||||||||||||||||
| North America 2) |
||||||||||||||||||||||||
| Europe and Latin America 1) |
||||||||||||||||||||||||
| Middle East and Africa |
||||||||||||||||||||||||
| Other 1) 2) 3) 5) |
||||||||||||||||||||||||
| Total |
||||||||||||||||||||||||
| 1) Of which in EU 5) |
||||||||||||||||||||||||
| Of which in Sweden 5) |
||||||||||||||||||||||||
| 2) Of which in the United States 5) |
||||||||||||||||||||||||
| 3) Of which in Japan 5) |
||||||||||||||||||||||||
| 3) Of which in China 5) |
||||||||||||||||||||||||
4) |
Total non-current assets excluding financial instruments, deferred tax assets, and post-employment benefit assets. |
5) |
Including IPR licencing revenue reported under Other Market area which is allocated based on the country location of the customer. Other sales are attributed to countries based on the destination of products or services delivered. |
| Market area 2019 | ||||||||||||||||||||||||
| Net sales | Non-current assets 4) |
|||||||||||||||||||||||
| Networks | Digital Services |
Managed Services |
Emerging Business and Other |
Total | Total | |||||||||||||||||||
| South East Asia, Oceania and India |
||||||||||||||||||||||||
| North East Asia 3) |
||||||||||||||||||||||||
| North America 2) |
||||||||||||||||||||||||
| Europe and Latin America 1) |
||||||||||||||||||||||||
| Middle East and Africa |
||||||||||||||||||||||||
| Other 1) 2) 3) 5) |
||||||||||||||||||||||||
| Total |
||||||||||||||||||||||||
| 1) Of which in EU 5) |
||||||||||||||||||||||||
| Of which in Sweden 5) |
||||||||||||||||||||||||
| 2) Of which in the United States 5) |
||||||||||||||||||||||||
| 3) Of which in Japan 5) |
||||||||||||||||||||||||
| 3) Of which in China 5) |
||||||||||||||||||||||||
4) |
Total non-current assets excluding financial instruments, deferred tax assets, and post-employment benefit assets. |
5) |
Including IPR licencing revenue reported under Other Market area which is allocated based on the country location of the customer. Other sales are attributed to countries based on the destination of products or services delivered. |
| Ericsson Annual Report on Form 20F 2021 | Financials – Notes to the Consolidated financial statements |
5 1 |
 |
Net sales |
Net sales |
||||||||||||
| 2021 | 2020 | 2019 | ||||||||||
| Hardware |
||||||||||||
| Software |
||||||||||||
| Services |
||||||||||||
| Net sales |
||||||||||||
| Of which IPR licensing revenues |
||||||||||||
| Of which export sales from Sweden |
||||||||||||
 |
Expenses by nature |
Expenses by nature |
||||||||||||
| 2021 | 2020 | 2019 | ||||||||||
| Goods and services |
||||||||||||
| Employee remuneration |
||||||||||||
| Amortizations and depreciations |
||||||||||||
| Impairments, obsolescence allowances and revaluation |
||||||||||||
| Inventory increase, net |
( |
( |
( |
|||||||||
| Additions to capitalized development |
( |
( |
( |
|||||||||
Expenses charged to cost of sales and operating expenses |
||||||||||||
Restructuring charges by function |
||||||||||||
| 2021 | 2020 | 2019 | ||||||||||
| Cost of sales |
||||||||||||
| R&D expenses |
||||||||||||
| Selling and administrative expenses |
||||||||||||
| Total restructuring charges |
||||||||||||
 |
Other operating income and expenses |
Other operating income and expenses |
||||||||||||
| 2021 | 2020 | 2019 | ||||||||||
| Other operating income |
||||||||||||
| Gains on sales of intangible assets and PP&E |
||||||||||||
| Gains on investments and sale of operations 1) |
||||||||||||
| Other operating income |
||||||||||||
| Total other operating income |
||||||||||||
| Other operating expenses |
||||||||||||
| Losses on sales of intangible assets and PP&E |
( |
— | — | |||||||||
| Losses on investments and sale of operations 1) |
( |
( |
( |
|||||||||
| Impairment of goodwill 2) |
( |
— | — | |||||||||
| Other operating expenses 3) |
( |
( |
( |
|||||||||
| Total other operating expenses |
( |
( |
( |
|||||||||
1) |
Includes revaluation gains of Ericsson Ventures investments of SEK in 202 . Information about divestments is presented in note E2 “Business combinations.” 1 |
2) |
For more information about the impairment of goodwill, see note C1 “Intangible assets.” |
3) |
Includes cost of SEK - - in 2019 related to the resolution of the US SEC and DOJ resolution. |
 |
Inventories |
Inventories |
||||||||
| 2021 | 2020 | |||||||
| Raw materials, components, consumables and manufacturing work in progress | ||||||||
| Finished products |
||||||||
| Contract work in progress |
||||||||
| Inventories, net |
||||||||
Movements in obsolescence allowances |
||||||||
| 2021 | 2020 | |||||||
| Opening balance |
||||||||
| Additions, net |
||||||||
| Utilization |
( |
( |
||||||
| Translation differences |
( |
|||||||
| Closing balance |
||||||||
 |
Customer contract related balances |
Trade receivables, customer finance, contract assets and contract liabilities |
||||||||
| 2021 | 2020 | |||||||
| Customer finance credits |
||||||||
| Trade receivables |
||||||||
| Contract assets |
||||||||
| Contract liabilities |
||||||||
Revenue recognized in the period |
||||||||
| 2021 | 2020 | |||||||
| Revenue recognized in the year relating to the opening contract liability balance | ||||||||
| Revenue recognized relating to performance obligations satisfied, or partially satisfied, in prior reporting periods | ( |
|||||||
| Transaction price allocated to the remaining performance obligations |
| |||||||
| 2021 | 2020 | |||||||
| Aggregate amount of transaction price allocated to unsatisfied, or partially unsatisfied, performance obligations | ||||||||
| Ericsson Annual Report on Form 20F 2021 | Financials – Notes to the Consolidated financial statements | 5 2 |
 |
Other current receivables |
| Other current receivables |
||||||||
| 2021 | 2020 | |||||||
| Prepaid expenses |
||||||||
| Advance payments to suppliers |
||||||||
| Derivative assets 1) |
||||||||
| Other taxes 2) |
||||||||
| Other |
||||||||
| Total |
||||||||
1) |
See also note F1 “Financial risk management.” |
2) |
As of 2021, current tax assets are presented as a separate line item in the balance sheet and are no longer included in “Other taxes” in the table above. The comparison year has been updated accordingly. Other taxes mainly include VAT receivables. |
 |
Trade payables |
| Trade payables |
||||||||
| 2021 | 2020 | |||||||
| Trade payables to associated companies and joint ventures | ||||||||
| Trade payables, excluding associated companies and joint ventures 1) |
||||||||
| Total |
||||||||
1) |
Of the trade payable amount SEK |
 |
Other current liabilities |
| Other current liabilities |
||||||||
| 2021 | 2020 | |||||||
| Accrued interest |
||||||||
| Accrued expenses |
||||||||
| Of which employee-related |
||||||||
| Of which supplier-related |
||||||||
| Of which other 1) |
||||||||
| Derivative liabilities 2) |
||||||||
| Other 3) 4) |
||||||||
| Total |
||||||||
1) |
Major balance relates to accrued expenses for customer projects. |
2) |
See also note F1 “Financial risk management.” |
3) |
Includes items such as VAT and other payroll deductions. |
| |
|
| 4) |
As of 2021, current tax liabilities are presented as a separate line item on the balance sheet and are no longer included in “Other” in the table above. The comparison year has been updated accordingly. |
| |
 |
Intangible assets |
| Intangible assets |
||||||||||||||||||||||||||
| 2021 | 2020 | |||||||||||||||||||||||||
| Capitalized development expenses |
Goodwill | IPR 1) , brandsand other intangible assets |
Capitalized development expenses |
Goodwill | IPR 1) , brandsand other intangible assets |
|||||||||||||||||||||
| Cost |
||||||||||||||||||||||||||
| Opening balance | ||||||||||||||||||||||||||
| Acquisitions/capitalization | — | — | ||||||||||||||||||||||||
| Balances regarding acquired/divested business 2) |
— | ( |
— | |||||||||||||||||||||||
| Sales/disposals | — | — | ( |
( |
— | ( |
||||||||||||||||||||
| Translation differences | ( |
( |
( |
|||||||||||||||||||||||
Closing balance |
||||||||||||||||||||||||||
Accumulated amortizations |
||||||||||||||||||||||||||
| Opening balance | ( |
— | ( |
( |
— | ( |
||||||||||||||||||||
| Amortizations | ( |
— | ( |
( |
— | ( |
||||||||||||||||||||
| Balances regarding divested business 2) |
— | — | — | — | — | |||||||||||||||||||||
| Sales/disposals | — | — | — | |||||||||||||||||||||||
| Translation differences | ( |
— | ( |
— | ||||||||||||||||||||||
Closing balance |
( |
— |
( |
( |
— |
( |
||||||||||||||||||||
Accumulated impairment losses |
||||||||||||||||||||||||||
| Opening balance | ( |
( |
( |
( |
( |
( |
||||||||||||||||||||
| Impairment losses | — | ( |
( |
— | — | ( |
||||||||||||||||||||
| Translation differences | — | — | ( |
— | — | |||||||||||||||||||||
Closing balance |
( |
( |
( |
( |
( |
( |
||||||||||||||||||||
Net carrying value |
||||||||||||||||||||||||||
1) |
Intellectual property rights. |
2) |
For more information on acquired/divested businesses, see note E2 “Business combinations.” |
| Ericsson Annual Report on Form 20F 2021 | Financials – Notes to the Consolidated financial statements | 5 3 |
| – | Sales growth |
| – | Development of EBIT (based on EBIT margin or cost of goods sold and operating expenses relative to sales) |
| – | Related development of working capital and capital expenditure requirements. |
| – | By 2026, about 35 years after the introduction of digital mobile technology, it is predicted that there will be |
| – | The number of mobile subscriptions is estimated to grow from around |
| – | The number of 5G subscriptions is forecasted to reach |
| – | By 2026, about point-of-sale |
| – | Cellular IoT is predicted to grow from |
| – | Mobile data traffic volume is estimated to increase by around three times in the period 2022–2026. The mobile traffic is driven by smartphone users and video traffic. Smartphone traffic will grow by around three times, and mobile video traffic is forecasted to grow by around |
Post-tax discount rates (%) |
||||||||
| CGU | 2021 | 2020 | ||||||
Networks |
||||||||
Digital Services |
||||||||
Managed Services |
||||||||
Cradlepoint |
N/A | |||||||
iconectiv |
||||||||
Emodo |
||||||||
Red Bee Media |
||||||||
| Ericsson Annual Report on Form 20F 2021 | Financials – Notes to the Consolidated financial statements | 5 4 |
 |
Property, plant and equipment |
| Real estate | Machinery and other technical assets |
Other equipment, tools and installations |
Construction in progress and advance payments |
Total | ||||||||||||||||
Cost |
||||||||||||||||||||
Opening balance |
||||||||||||||||||||
Additions |
||||||||||||||||||||
Balances regarding acquired/divested business |
( |
( |
||||||||||||||||||
Sales/disposals |
( |
( |
( |
( |
( |
|||||||||||||||
Reclassifications |
( |
|||||||||||||||||||
Translation differences |
||||||||||||||||||||
Closing balance |
||||||||||||||||||||
Accumulated depreciations |
||||||||||||||||||||
Opening balance |
( |
( |
( |
( |
||||||||||||||||
Depreciations |
( |
( |
( |
( |
||||||||||||||||
Balances regarding divested business |
||||||||||||||||||||
Sales/disposals |
||||||||||||||||||||
Reclassifications |
( |
|||||||||||||||||||
Translation differences |
( |
( |
( |
( |
||||||||||||||||
Closing balance |
( |
( |
( |
( |
||||||||||||||||
Accumulated impairment losses |
||||||||||||||||||||
Opening balance |
( |
( |
( |
( |
||||||||||||||||
Impairment losses |
( |
( |
( |
( |
||||||||||||||||
Sales/disposals |
||||||||||||||||||||
Translation differences |
( |
( |
( |
( |
||||||||||||||||
Closing balance |
( |
( |
( |
( |
||||||||||||||||
Net carrying value |
||||||||||||||||||||
| Real estate | Machinery and other technical assets |
Other equipment, tools and installations |
Construction in progress and advance payments |
Total | ||||||||||||||||
Cost |
||||||||||||||||||||
Opening balance |
||||||||||||||||||||
Additions |
||||||||||||||||||||
Balances regarding acquired/divested business |
( |
|||||||||||||||||||
Sales/disposals |
( |
( |
( |
( |
( |
|||||||||||||||
Reclassifications |
( |
|||||||||||||||||||
Translation differences |
( |
( |
( |
( |
( |
|||||||||||||||
Closing balance |
||||||||||||||||||||
Accumulated depreciation |
||||||||||||||||||||
Opening balance |
( |
( |
( |
( |
||||||||||||||||
Depreciations |
( |
( |
( |
( |
||||||||||||||||
Balances regarding divested business |
||||||||||||||||||||
Sales/disposals |
||||||||||||||||||||
Reclassification |
( |
|||||||||||||||||||
Translation differences |
||||||||||||||||||||
Closing balance |
( |
( |
( |
( |
||||||||||||||||
Accumulated impairment losses |
||||||||||||||||||||
Opening balance |
( |
( |
( |
( |
||||||||||||||||
Impairment losses |
( |
( |
( |
( |
( |
|||||||||||||||
Sales/disposals |
||||||||||||||||||||
Translation differences |
||||||||||||||||||||
Closing balance |
( |
( |
( |
( |
||||||||||||||||
Net carrying value |
||||||||||||||||||||
| Ericsson Annual Report on Form 20F 2021 | Financials – Notes to the Consolidated financial statements |
5 5 |
 |
Leases |
| 2021 | 2020 | |||||||||||||||||||||||||||||||
| Real estate | Vehicles | Other | Total | Real estate | Vehicles | Other | Total | |||||||||||||||||||||||||
| Cost |
||||||||||||||||||||||||||||||||
| Opening balance |
||||||||||||||||||||||||||||||||
| Additions |
— | |||||||||||||||||||||||||||||||
| Balances regarding acquired/divested business |
( |
( |
— | ( |
— | — | ||||||||||||||||||||||||||
| Terminations |
( |
( |
— | ( |
( |
( |
— | ( |
||||||||||||||||||||||||
| Translation differences |
— | ( |
( |
— | ( |
|||||||||||||||||||||||||||
| Closing balance |
||||||||||||||||||||||||||||||||
| Accumulated depreciations |
||||||||||||||||||||||||||||||||
| Opening balance |
( |
( |
( |
( |
( |
( |
( |
( |
||||||||||||||||||||||||
| Depreciations |
( |
( |
( |
( |
( |
( |
( |
( |
||||||||||||||||||||||||
| Balances regarding divested business |
— | — | — | |||||||||||||||||||||||||||||
| Terminations |
— | — | ||||||||||||||||||||||||||||||
| Translation differences |
( |
( |
— | ( |
||||||||||||||||||||||||||||
| Closing balance |
( |
( |
( |
( |
( |
( |
( |
( |
||||||||||||||||||||||||
| Accumulated impairment losses |
||||||||||||||||||||||||||||||||
| Opening balance |
( |
— | — | ( |
( |
— | — | ( |
||||||||||||||||||||||||
| Impairment losses |
— | — | — | — | ( |
— | — | ( |
||||||||||||||||||||||||
| Terminations |
— | — | — | — | ||||||||||||||||||||||||||||
| Translation differences |
( |
— | — | ( |
— | — | ||||||||||||||||||||||||||
| Closing balance |
( |
— |
— |
( |
( |
— |
— |
( |
||||||||||||||||||||||||
| Financial sublease |
||||||||||||||||||||||||||||||||
| Opening balance |
( |
— | — | ( |
( |
— | — | ( |
||||||||||||||||||||||||
| Derecognition |
— | — | — | — | ( |
— | — | ( |
||||||||||||||||||||||||
| Translation differences |
( |
— | — | ( |
— | — | ||||||||||||||||||||||||||
| Closing balance |
( |
— |
— |
( |
( |
— |
— |
( |
||||||||||||||||||||||||
| Net carrying value |
||||||||||||||||||||||||||||||||
| 2021 | 2020 | |||||||
| Repayments of the lease liabilities 1) |
( |
) | ( |
) | ||||
| Interest expense of the lease liabilities |
( |
) | ( |
) | ||||
Low-value asset not included in the measurement of the liabilities |
( |
) | ( |
) | ||||
| Variable lease payments not included in the measurement of the lease liabilities | ( |
) | ( |
) | ||||
| Total cash outflow |
( |
) |
( |
) | ||||
1) |
Including advance payments. |
| Financial leases | Operating leases | |||||||
| 2022 |
||||||||
| 2023 |
||||||||
| 2024 |
||||||||
| 2025 |
||||||||
| 2026 |
||||||||
| 2027 and later |
||||||||
| Total |
||||||||
| Ericsson Annual Report on Form 20F 2021 | Financials – Notes to the Consolidated financial statements | 5 6 |
 |
Provisions |
| Provisions |
||||||||||||||||||||||||||||
| Restructuring | Customer related |
Supplier related |
Warranty | Share-based payments |
Other | Total | ||||||||||||||||||||||
| 2021 |
||||||||||||||||||||||||||||
| Opening balance |
||||||||||||||||||||||||||||
| Additions |
||||||||||||||||||||||||||||
| Reversal of excess amounts |
( |
( |
( |
( |
( |
( |
( |
|||||||||||||||||||||
| Charge d to income statement |
||||||||||||||||||||||||||||
| Utilization |
( |
( |
( |
( |
( |
( |
( |
|||||||||||||||||||||
| Reclassifications |
( |
( |
( |
— | ( |
|||||||||||||||||||||||
| Translation differences |
||||||||||||||||||||||||||||
| Closing balance |
||||||||||||||||||||||||||||
| Of which current provisions |
||||||||||||||||||||||||||||
| Of which non-current provisions |
— |
|||||||||||||||||||||||||||
| 2020 |
||||||||||||||||||||||||||||
| Opening balance |
||||||||||||||||||||||||||||
| Additions |
||||||||||||||||||||||||||||
| Reversal of excess amounts |
( |
( |
( |
( |
( |
( |
( |
|||||||||||||||||||||
| Charge d to income statement |
||||||||||||||||||||||||||||
| Utilization |
( |
( |
( |
( |
( |
( |
( |
|||||||||||||||||||||
| Reclassifications |
( |
( |
( |
( |
( |
|||||||||||||||||||||||
| Translation differences |
( |
( |
( |
( |
( |
( |
( |
|||||||||||||||||||||
| Closing balance |
||||||||||||||||||||||||||||
| Of which current provisions |
||||||||||||||||||||||||||||
| Of which non-current provisions |
— |
— |
||||||||||||||||||||||||||
Ericsson Annual Report on Form 20F 2021 |
Financials – Notes to the Consolidated financial statements | 5 7 |
 |
Contingent liabilities |
| Contingent liabilities | ||||||||
| 2021 | 2020 | |||||||
| Contingent liabilities |
||||||||
| Total |
||||||||
 |
Assets pledged as collateral |
| Assets pledged as collateral |
||||||||
| 2021 | 2020 | |||||||
| Chattel mortgages 1) |
||||||||
| Bank deposits 2) |
||||||||
| Total |
||||||||
1) |
See also note G1 “Post-employment benefits.” |
2) |
See also note F1 “Financial risk management.” |
 |
Contractual obligations |
| Contractual obligations 2021 |
||||||||||||||||||||
| Payment due by period | ||||||||||||||||||||
| <1 | 1–3 | 3–5 | >5 | |||||||||||||||||
| SEK billion | year | years | years | years | Total | |||||||||||||||
| Current and non-current debt 1) |
||||||||||||||||||||
| Lease obligations 2) |
||||||||||||||||||||
| Other non-current liabilities |
||||||||||||||||||||
| Purchase obligations 3) |
||||||||||||||||||||
| Trade payables |
||||||||||||||||||||
| Commitments for customer finance 4) |
||||||||||||||||||||
| Derivatives liabilities 4) |
||||||||||||||||||||
| Total |
||||||||||||||||||||
| Contractual obligations 2020 | ||||||||||||||||||||
| Payment due by period | ||||||||||||||||||||
| <1 | 1–3 | 3–5 | >5 | |||||||||||||||||
| SEK billion | year | years | years | years | Total | |||||||||||||||
| Current and non-current debt 1) |
||||||||||||||||||||
| Lease obligations 2) |
||||||||||||||||||||
| Other non-current liabilities |
||||||||||||||||||||
| Purchase obligations 3) |
||||||||||||||||||||
| Trade payables |
||||||||||||||||||||
| Commitments for customer finance 4) |
||||||||||||||||||||
| Derivatives liabilities 4) |
||||||||||||||||||||
| Total |
||||||||||||||||||||
1) |
Current and non-current debt, including interest commitments. |
2) |
Future lease obligations, nominal lease liability, see also note C3 “Leases.” |
3) |
The amounts of purchase obligations are gross, before deduction of any related provisions. |
4) |
See also note F1 “Financial risk management.” |
| Ericsson Annual Report on Form 20F 2021 | Financials – Notes to the Consolidated financial statements | 5 8 |
 |
Equity |
| Capital stock | ||||||||
| Parent Company | Number of shares | Capital stock (SEK million) |
||||||
| Class A shares | ||||||||
| Class B shares | ||||||||
Total |
||||||||
| Number of shares |
||||||||
| Number of shares | Capital stock (SEK million) |
|||||||
Number of shares Jan 1, 2021 |
||||||||
Number of shares Dec 31, 2021 |
||||||||
| Other reserves | ||||||||||||||||||||||||||||||||
| 2021 | 2020 | |||||||||||||||||||||||||||||||
| Translation reserves |
Cash flow hedge reserve |
Revaluation of borrowings |
Total other reserves |
Translation reserves |
Cash flow hedge reserve |
Revaluation of borrowings |
Total other reserves |
|||||||||||||||||||||||||
Opening balance |
( |
( |
( |
( |
( |
|||||||||||||||||||||||||||
Other comprehensive income |
||||||||||||||||||||||||||||||||
Items that will not be reclassified to profit or loss |
||||||||||||||||||||||||||||||||
Revaluation of borrowings due to change in credit risk |
||||||||||||||||||||||||||||||||
Tax on items that will not be reclassified to profit or loss |
( |
( |
( |
( |
||||||||||||||||||||||||||||
Items that have been or may be reclassified to profit or loss |
||||||||||||||||||||||||||||||||
Cash flow hedges |
||||||||||||||||||||||||||||||||
Gains/losses arising during the period |
( |
( |
||||||||||||||||||||||||||||||
Reclassification to profit and loss |
( |
( |
||||||||||||||||||||||||||||||
Translation reserves |
||||||||||||||||||||||||||||||||
Changes in translation reserves |
( |
( |
||||||||||||||||||||||||||||||
Reclassification to profit and loss |
||||||||||||||||||||||||||||||||
| Share of other comprehensive income of JV and associated companies | ( |
( |
||||||||||||||||||||||||||||||
| Tax on items that have been or may be reclassified to profit or loss | ( |
( |
||||||||||||||||||||||||||||||
Other comprehensive income, net of tax |
( |
( |
( |
|||||||||||||||||||||||||||||
Total comprehensive income |
( |
( |
( |
|||||||||||||||||||||||||||||
Closing balance |
( |
( |
( |
( |
( |
|||||||||||||||||||||||||||
| Ericsson Annual Report on Form 20F 2021 | Financials – Notes to the Consolidated financial statements | 59 |
 |
Business combinations |
| Acquisitions 2019–2021 | ||||||||||||
| 2021 | 2020 | 2019 | ||||||||||
Consideration |
||||||||||||
Cash and cash equivalents |
||||||||||||
Others |
||||||||||||
Total consideration |
||||||||||||
Net assets (liabilities) acquired |
||||||||||||
Cash and cash equivalents |
||||||||||||
Property, plant and equipment |
||||||||||||
Right-of-use |
||||||||||||
Intangible assets |
( |
|||||||||||
Investments in associates |
||||||||||||
Other assets |
||||||||||||
Provisions, incl. post-employment benefits |
( |
( |
||||||||||
Other liabilities |
( |
( |
( |
|||||||||
Total identifiable net assets (liabilities) |
( |
|||||||||||
Costs recognized in net income |
||||||||||||
Goodwill |
||||||||||||
Total |
||||||||||||
Acquisition-related costs 1) |
||||||||||||
1) |
Acquisition-related costs are included in Selling and administrative expenses in the consolidated income statement. |
| Divestments 2019–2021 | ||||||||||||
| 2021 | 2020 | 2019 | ||||||||||
Proceeds |
||||||||||||
Cash and cash equivalents |
||||||||||||
Shares in associated companies |
||||||||||||
Total Proceeds |
||||||||||||
Net assets disposed of |
||||||||||||
Property, plant and equipment |
||||||||||||
Right-of-use |
||||||||||||
Investments in associates |
||||||||||||
Intangible assets |
||||||||||||
Goodwill |
( |
|||||||||||
Other assets |
||||||||||||
Provisions, incl. post-employment benefits |
( |
( |
||||||||||
Other liabilities |
( |
|||||||||||
Total net assets |
||||||||||||
Net gains/losses from divestments |
( |
|||||||||||
Shares in associated companies |
( |
|||||||||||
Cash flow effect |
||||||||||||
| Ericsson Annual Report on Form 20F 2021 | Financials – Notes to the Consolidated financial statements | 60 |
Acquisitions 2019–2021 |
||||
| Company | Description | Transaction date | ||
Push-to-talk (MC-PTT) solutions. |
||||
Divestments 2019–2021 |
||||
| Company | Description | Transaction date | ||
 |
Associated companies |
| Equity in associated companies |
||||||||
| 2021 | 2020 | |||||||
| Opening balance |
||||||||
| Investments |
||||||||
| Share in earnings |
( |
( |
||||||
| Distribution of capital stock |
( |
|||||||
| Taxes |
( |
( |
||||||
| Dividends |
( |
( |
||||||
| Translation differences |
( |
|||||||
| Closing balance |
||||||||
Ericsson Annual Report on Form 20F 2021 |
Financials – Notes to the Consolidated financial statements |
61 |
 |
Financial risk management |
Capital objectives-related information, SEK billion |
| |||||||
2021 |
2020 |
|||||||
| Free cash flow before M&A 1) |
||||||||
| Positive net cash 1) |
||||||||
| Credit rating |
||||||||
| Fitch |
||||||||
| Standard & Poor’s |
||||||||
| Moody´s |
||||||||
| Currency exposure, SEK billion |
| |||||||||||||||||||||||
| Exposure currency |
Sales translation exposure |
Sales transaction exposure |
Sales net exposure |
Cost translation exposure |
Cost transaction exposure 1) |
Cost net exposure |
||||||||||||||||||
| USD 2) |
( |
( |
( |
|||||||||||||||||||||
| EUR |
( |
( |
||||||||||||||||||||||
| JPY |
— | ( |
— | ( |
||||||||||||||||||||
| CAD |
— | — | ||||||||||||||||||||||
| CNY |
— | ( |
( |
|||||||||||||||||||||
| TWD |
— | ( |
— | ( |
||||||||||||||||||||
| INR |
( |
( |
( |
|||||||||||||||||||||
| GBP |
( |
( |
( |
( |
||||||||||||||||||||
| AUD |
( |
( |
( |
|||||||||||||||||||||
1) |
External purchases in foreign currency translated to functional currency. |
2) |
Sales transaction exposure in 2021 includes volume in the cash flow hedge of USD |
| Ericsson Annual Report on Form 20F 2021 | Financials – Notes to the Consolidated financial statements | 6 2 |
| Sensitivity to interest rate increase of 1 basis point, SEK million |
| |||||||||||||||||||||||
| < 3M | 3–12M | 1–3Y | 3–5Y | >5Y | Total | |||||||||||||||||||
| Interest-bearing assets | ( |
( |
( |
|||||||||||||||||||||
| Interest-bearing liabilities 1) |
||||||||||||||||||||||||
| Derivatives |
||||||||||||||||||||||||
| Total |
( |
( |
||||||||||||||||||||||
1) |
Borrowings are included as they are designated FVTPL. |
| |
| Outstanding derivatives |
| |||||||||||||||||||
| 2021 | Gross amount recognized |
Offset | Net amount presented |
Related amounts not offset – collaterals |
Net | |||||||||||||||
Currency derivatives 1) |
||||||||||||||||||||
| Assets |
( |
|||||||||||||||||||
| Liabilities |
( |
( |
( |
|||||||||||||||||
Interest rate derivatives |
||||||||||||||||||||
| Assets |
( |
— | ||||||||||||||||||
| Liabilities |
( |
( |
— | ( |
||||||||||||||||
| 2020 |
|
|
|
|
|
|
|
|
|
|
|
|
|
|
|
|
|
|
|
|
Currency derivatives 1) |
||||||||||||||||||||
| Assets |
( |
( |
||||||||||||||||||
| Liabilities |
( |
( |
— | ( |
||||||||||||||||
Interest rate derivatives |
||||||||||||||||||||
| Assets |
( |
— | ||||||||||||||||||
| Liabilities |
( |
( |
— | ( |
||||||||||||||||
1) |
Currency derivatives designated as cash flow hedge of SEK |
| Foreign exchange forward contracts | ||||||||||||
| 2021 |
< 3 months |
3 – 12 months |
> 1 year | Total | ||||||||
| Notional Amount (USD millions) |
||||||||||||
Average forward rate (SEK/USD) |
||||||||||||
| – | Avoid credit losses through establishing internal standard credit approval routines in all the Company’s legal entities |
| – | Ensure monitoring and risk mitigation of defaulting accounts, i.e. events of non-payment |
| – | Ensure efficient credit management within the Company and thereby improve days sales outstanding and cash flow |
| – | Define escalation path and approval process for customer credit limits. |
| Ericsson Annual Report on Form 20F 2021 | Financials – Notes to the Consolidated financial statements | 6 3 |
| Movements in allowances for impairment of trade receivables and contract assets | | |||||||
| 2021 | 2020 | |||||||
| Opening balance |
||||||||
| Increase / (decrease) in allowance |
( |
|||||||
| Write-offs |
( |
( |
||||||
| Translation difference |
( |
|||||||
| Closing balance 1) |
||||||||
1) |
Of which SEK |
| Aging analysis of gross values of trade receivables and contracts assets by risk category |
||||||||||||||||||||||||
| Days past dues | ||||||||||||||||||||||||
2021 |
Not due |
1-90 |
91-180 |
181-360 |
>360 | Total |
||||||||||||||||||
| Country risk: Low |
||||||||||||||||||||||||
| Country risk: Medium |
||||||||||||||||||||||||
| Country risk: High |
||||||||||||||||||||||||
| Total |
||||||||||||||||||||||||
| |
|
Days past dues | ||||||||||||||||||||||
2020 |
Not due |
1-90 |
91-180 |
181-360 |
>360 | Total |
||||||||||||||||||
| Country risk: Low |
||||||||||||||||||||||||
| Country risk: Medium |
||||||||||||||||||||||||
| Country risk: High |
||||||||||||||||||||||||
| Total |
||||||||||||||||||||||||
| Outstanding customer finance credit risk exposure 1) |
|
|||||||
| 2021 | 2020 | |||||||
| Fair value of customer finance credits |
||||||||
| Financial guarantees for third-parties |
||||||||
| Accrued interest |
||||||||
| Maximum exposure to credit risk |
||||||||
| Less third-party risk coverage |
( |
( |
||||||
| The Company’s risk exposure, less third-party risk coverage |
||||||||
1) |
This table has been adjusted to show the maximum exposure to credit risk. |
| Ericsson Annual Report on Form 20F 2021 |
Financials – Notes to the Consolidated financial statements |
6 4 |
| Customer finance fair value reconciliation |
||||||||
| 2021 | 2020 | |||||||
| Opening balance |
||||||||
| Additions |
||||||||
| Disposals/repayments |
( |
( |
||||||
| Revaluation/amortization of interest |
( |
|||||||
| Translation difference |
( |
|||||||
| Closing balance |
||||||||
| Of which non-current |
||||||||
| Cash, cash equivalents, interest bearing securities and derivative assets |
||||||||||||||||||||||||
| 2021 | Rating or equivalent |
< 3 M | 3–12 M | 1–5 Y | >5 Y | Total | ||||||||||||||||||
| Bank deposits |
||||||||||||||||||||||||
| Other financial institutions |
||||||||||||||||||||||||
Type of issuer: |
||||||||||||||||||||||||
| Governments | AA/AAA | |||||||||||||||||||||||
| Corporates | A2/P2 | |||||||||||||||||||||||
| Mortgage institutes |
AAA | |||||||||||||||||||||||
| Derivative assets |
||||||||||||||||||||||||
| |
|
|
|
|
|
|
|
|
|
|
|
|
|
|
|
|
|
| ||||||
| 2020 | Rating or equivalent |
< 3 M | 3–12 M | 1–5 Y | >5 Y | Total | ||||||||||||||||||
| Bank deposits | ||||||||||||||||||||||||
| Other financial institutions |
||||||||||||||||||||||||
| Type of issuer: |
||||||||||||||||||||||||
| Governments | AAA | |||||||||||||||||||||||
| Corporates | A2/P2 | |||||||||||||||||||||||
| Mortgage institutes | AAA | |||||||||||||||||||||||
| Derivative assets | ||||||||||||||||||||||||
| Funding programs 1) |
||||||||||||
| Amount | Utilized | Unutilized | ||||||||||
| Euro Medium (USD million) |
( |
|||||||||||
| SEC Registered program (USD million) 2) |
||||||||||||
1) |
There are no financial covenants related to these programs. |
2) |
Program amount indeterminate. |
| |
| Committed credit facilities | ||||||
| Amount |
Utili zed |
U nu tiliz e d | ||||
| Multi-currency revolving credit facility (USD million) |
| Ericsson Annual Report on Form 20F 2021 | Financials – Consolidated financial statements | 6 5 |
| – | Quoted market prices – level 1 |
| – | Valuation technique using observable inputs – level 2 |
| – | Valuation technique using significant unobservable inputs – level 3 |
| Reconciliation of Level 3 fair value items |
|
|
| |
| |
|
Investment in shares and participations |
| |
| Opening balance |
||||
| Additions |
||||
| Disposals |
( |
|||
| Gain or losses 1) |
||||
| Transfers to level 1 2) |
( |
|||
| Closing balance |
||||
1) |
Table shows net gains or losses recognized in Other operating income or expense s , of which SEK |
2) |
Transfer between hierarchies is recognized from the date of change in circumstances that resulted in the transfer. Transfer in the year relates to an investment that was converted into listed equity shares. Unrealized gain of SEK million was recognized in Other operating income as a gain on Level 1 asset, excluded from the gain or loss presented in the table above. |
| Financial instruments | ||||||||||||||||||||||||||||||||||||||||
| 2021 | 2020 | |||||||||||||||||||||||||||||||||||||||
| Amortized | Fair | Fair value hierarchy level | Amortized | Fair | Fair value hierarchy level | |||||||||||||||||||||||||||||||||||
SEK billion |
cost | value | Level 1 | Level 2 | Level 3 | cost | value | Level 1 | Level 2 | Level 3 | ||||||||||||||||||||||||||||||
| Assets at fair value through profit or loss |
||||||||||||||||||||||||||||||||||||||||
| Customer finance |
— | — | — | — | — | — | ||||||||||||||||||||||||||||||||||
| Interest bearing securities |
— | — | — | — | — | — | ||||||||||||||||||||||||||||||||||
| Cash equivalents 1) |
— | — | — | — | — | — | ||||||||||||||||||||||||||||||||||
| Other financial assets |
— | — | — | — | — | |||||||||||||||||||||||||||||||||||
| Other current assets |
— | — | — | — | — | — | ||||||||||||||||||||||||||||||||||
| Assets at fair value through OCI |
||||||||||||||||||||||||||||||||||||||||
| Trade receivable |
— | — | — | — | — | — | ||||||||||||||||||||||||||||||||||
| Assets at amortized cost |
||||||||||||||||||||||||||||||||||||||||
| Interest bearing securities |
— | — | — | — | — | — | — | — | ||||||||||||||||||||||||||||||||
| Cash equivalents 1) |
— | — | — | — | — | — | — | — | ||||||||||||||||||||||||||||||||
| Other financial assets |
— | — | — | — | — | — | — | — | ||||||||||||||||||||||||||||||||
| Financial assets |
||||||||||||||||||||||||||||||||||||||||
| Financial liabilities at designated FVTPL |
||||||||||||||||||||||||||||||||||||||||
| Parent Company borrowings |
— | ( |
( |
( |
— | — | ( |
( |
( |
— | ||||||||||||||||||||||||||||||
| Financial liabilities at FVTPL |
||||||||||||||||||||||||||||||||||||||||
| Other current liabilities |
— | ( |
— | ( |
— | — | ( |
— | ( |
— | ||||||||||||||||||||||||||||||
| Liabilities at amortized cost |
||||||||||||||||||||||||||||||||||||||||
| Trade payables |
( |
— | — | — | — | ( |
— | — | — | — | ||||||||||||||||||||||||||||||
| Borrowings |
( |
— | — | — | — | ( |
— | — | — | — | ||||||||||||||||||||||||||||||
| Financial liabilities |
( |
( |
( |
( |
||||||||||||||||||||||||||||||||||||
1) |
Total Cash and cash equivalent is SEK |
| Ericsson Annual Report on Form 20F 2021 | Financials – Notes to the Consolidated financial statements | 6 6 |
 |
Financial income and expenses |
| 2021 | 2020 | 2019 | ||||||||||
| Contractual interest on financial assets 1) |
||||||||||||
| of which on financial assets at amortized cost 1) |
||||||||||||
| Net revaluation gains and losses on financial assets |
( |
( |
||||||||||
| Other financial income 1) |
||||||||||||
| Financial income |
||||||||||||
| Contractual interest on financial liabilities 1) |
( |
( |
( |
|||||||||
| of which on financial liabilities at amortized cost 1) |
( |
( |
( |
|||||||||
| Net revaluation gains and losses on financial liabilities |
( |
|||||||||||
| Lease interest expense |
( |
( |
( |
|||||||||
| Other financial expenses 1) |
( |
( |
( |
|||||||||
| Financial expenses |
( |
( |
( |
|||||||||
| Net foreign exchange gains/losses |
( |
( |
||||||||||
| Financial income and expenses, net |
( |
( |
( |
|||||||||
| Net gains and losses on financial instruments exclude effect of foreign exchange translations: |
||||||||||||
| Financial instruments at fair value through profit or loss 2) |
( |
( |
||||||||||
| Financial liabilities designated at fair value through profit or loss |
( |
( |
||||||||||
1) |
Prior years’ contractual interest income and expenses are re-presented to improve the analysis of returns on assets and funding costs. This resulted in reclassifications between contractual interest on financial assets and other financial income, and between contractual interest on financial liabilities and other financial expenses, with no impact in the total amount of Financial income and Financial expenses, respectively. |
2) |
Excludes net gain from revaluation of customer finance receivables of SEK s . |
 |
Financial assets, non-current |
| Financial assets, non-current |
||||||||||||||||||||||||||
| 2021 | 2020 | |||||||||||||||||||||||||
| Other investments in shares and participations |
Interest- bearing securities, non-current |
Other financial assets, non-current |
Other investments in shares and participations |
Interest- bearing securities, non-current |
Other financial assets, non-current |
|||||||||||||||||||||
| Opening balance |
||||||||||||||||||||||||||
| Additions |
||||||||||||||||||||||||||
| Disposals/repayments/deductions |
( |
( |
( |
( |
( |
( |
||||||||||||||||||||
| Change in value in funded pension plans 1) |
||||||||||||||||||||||||||
| Revaluation |
( |
( |
( |
|||||||||||||||||||||||
| Reclassification |
( |
( |
( |
( |
( |
|||||||||||||||||||||
| Translation differences |
( |
( |
||||||||||||||||||||||||
| Closing balance |
||||||||||||||||||||||||||
1) |
This amount includes asset ceiling. For further information, see note G1 “Post-employment benefits.” |
| Ericsson Annual Report on Form 20F 2021 | Financials – Notes to the Consolidated financial statements | 6 7 |
 |
Interest-bearing liabilities |
| 2021 | 2020 | |||||||
| Borrowings, current |
||||||||
| Current part of non-current borrowings |
||||||||
| Other borrowings, current |
||||||||
| Total borrowings, current |
||||||||
| Borrowings, non-current |
||||||||
| Notes and bond loans |
||||||||
| Other borrowings, non-current |
||||||||
| Total borrowings, non-current |
||||||||
| Total interest-bearing liabilities |
||||||||
| 2021 | 2020 | |||||||
| Opening balance |
||||||||
| Cash flows |
||||||||
| Proceeds from issuance of borrowings |
||||||||
| Repayment of borrowings |
( |
( |
||||||
| Other financing activities |
( |
|||||||
| Lease payments |
( |
( |
||||||
| Non-cash changes |
||||||||
| Effect of foreign exchange movement |
( |
|||||||
| Revaluation due to changes in credit risk |
( |
( |
||||||
| Other changes in fair value |
( |
|||||||
| Acquisition of new lease contracts |
||||||||
| Other non-cash movements |
( |
( |
||||||
| Closing balance |
||||||||
| Issued-maturing | Nominal amount |
Coupon | Currency | Maturity |
Carrying value (SEK million) 2021 |
Changes in fair value due to changes in credit risk 2021 |
Cumulative changes in fair value due to changes in credit risk 2021 |
Carrying value (SEK million) 2020 |
||||||||||||||||||||||||
| Notes and bond loans |
||||||||||||||||||||||||||||||||
| 2012–2022 |
( |
|||||||||||||||||||||||||||||||
| 2017–2021 |
— | ( |
— | |||||||||||||||||||||||||||||
| 2017–2024 |
( |
|||||||||||||||||||||||||||||||
| 2017–2025 1) |
||||||||||||||||||||||||||||||||
| 2020–2030 1) |
||||||||||||||||||||||||||||||||
| 2021–2029 |
( |
( |
— | |||||||||||||||||||||||||||||
| Total notes and bond loans |
( |
|||||||||||||||||||||||||||||||
| Bilateral loans |
||||||||||||||||||||||||||||||||
| 2017–2023 2) |
||||||||||||||||||||||||||||||||
| 2019–2024 3) |
||||||||||||||||||||||||||||||||
| 2019–2025 2) |
||||||||||||||||||||||||||||||||
| 2021–2028 3) |
( |
( |
— | |||||||||||||||||||||||||||||
| Total bilateral loans |
||||||||||||||||||||||||||||||||
1) |
Private Placement, Swedish Export Credit Corporation (SEK). |
2) |
Nordic Investment Bank (NIB), R&D project financing. |
3) |
European Investment Bank (EIB), R&D project financing. |
| Ericsson Annual Report on Form 20F 2021 | Financials – Notes to the Consolidated financial statements | 6 8 |
 |
Post-employment benefits |
| – | A defined benefit plan, known as ITP 2 (occupational pension for salaried employees in manufacturing industries and trade), complemented by a defined contribution plan, known as ITPK (supplementary retirement benefits). This is a final salary-based plan. |
| – | A defined contribution plan, known as ITP 1, for employees born in 1979 or later. |
| – | A defined contribution plan ITP 1 or alternative ITP, for employees earning more than 10 income base amount and who have opted out of the defined benefit plan ITP 2, where rules are set by the Company and approved by each employee selected to participate. |
| Ericsson Annual Report on Form 20F 2021 | Financials – Notes to the Consolidated financial statements | 6 9 |
| Amount recognized in the Consolidated balance sheet | ||||||||||||||||||||
| Sweden | US | UK | Other | Total | ||||||||||||||||
| 2021 |
||||||||||||||||||||
| Defined benefit obligation (DBO) |
||||||||||||||||||||
| Fair value of plan assets |
||||||||||||||||||||
| Deficit/surplus (+/–) |
( |
|||||||||||||||||||
| Plans with net surplus, excluding asset ceiling 1) |
— | |||||||||||||||||||
| Provision for post-employment benefits 2) |
||||||||||||||||||||
| 2020 |
||||||||||||||||||||
| Defined benefit obligation (DBO) |
||||||||||||||||||||
| Fair value of plan assets |
||||||||||||||||||||
| Deficit/surplus (+/–) |
( |
|||||||||||||||||||
| Plans with net surplus, excluding asset ceiling 1) |
— | |||||||||||||||||||
| Provision for post-employment benefits 2) |
||||||||||||||||||||
1) |
Plans with a net surplus, i.e., where plan assets exceed DBO, are reported as Other financial assets, non-current, see note F3 “Financial assets, non-current.” The asset ceiling increased during the year to SEK |
2) |
Plans with net liabilities are reported in the balance sheet as Post-employment benefits, non-current. |
| Pension costs for defined contribution plans and defined benefit plans | ||||||||||||||||||||
| Sweden | US | UK | Other | Total | ||||||||||||||||
| 2021 |
||||||||||||||||||||
| Pension cost for defined contribution plans |
||||||||||||||||||||
| Pension cost for defined benefit plans 1) |
( |
|||||||||||||||||||
| Total |
||||||||||||||||||||
| Total pension cost expressed as a percentage of wages and salaries |
||||||||||||||||||||
| 2020 |
||||||||||||||||||||
| Pension cost for defined contribution plans |
||||||||||||||||||||
| Pension cost for defined benefit plans |
( |
|||||||||||||||||||
| Total |
||||||||||||||||||||
| Total pension cost expressed as a percentage of wages and salaries |
||||||||||||||||||||
| 2019 |
||||||||||||||||||||
| Pension cost for defined contribution plans |
||||||||||||||||||||
| Pension cost for defined benefit plans |
( |
( |
||||||||||||||||||
| Total |
||||||||||||||||||||
| Total pension cost expressed as a percentage of wages and salaries |
||||||||||||||||||||
1) |
For the UK plans, negative cost was due to interest income of SEK |
| Ericsson Annual Report on Form 20F 2021 | Financials – Notes to the Consolidated financial statements | 7 0 |
| Change in the net defined benefit obligation | ||||||||||||||||||||||||
| Present value of obligation 2021 1) |
Fair value of plan assets 2021 |
Total 2021 |
Present value of obligation 2020 1) |
Fair value of plan assets 2020 |
Total 2020 |
|||||||||||||||||||
| Opening balance |
( |
( |
||||||||||||||||||||||
| Included in the income statement 2) |
||||||||||||||||||||||||
| Current service cost |
— | — | ||||||||||||||||||||||
| Past service cost and gains and losses on settlements |
— | ( |
— | ( |
||||||||||||||||||||
| Interest cost/income (+/–) |
( |
( |
||||||||||||||||||||||
| Taxes and administrative expenses |
— | — | ||||||||||||||||||||||
| Other |
( |
( |
||||||||||||||||||||||
( |
( |
|||||||||||||||||||||||
| Remeasurements |
||||||||||||||||||||||||
| Return on plan assets excluding amounts in interest expense/income |
— | ( |
( |
— | ( |
( |
||||||||||||||||||
| Actuarial gains/losses (–/+) arising from changes in demographic assumptions | ( |
— | ( |
— | ||||||||||||||||||||
| Actuarial gains/losses (–/+) arising from changes in financial assumptions |
( |
— | ( |
— | ||||||||||||||||||||
| Experience-based gains/losses (–/+) |
— | — | ||||||||||||||||||||||
( |
( |
( |
||||||||||||||||||||||
| Other changes |
||||||||||||||||||||||||
| Translation difference |
( |
( |
( |
|||||||||||||||||||||
| Contributions and payments from: |
||||||||||||||||||||||||
| Employers 3) |
( |
( |
( |
( |
( |
( |
||||||||||||||||||
| Plan participants |
( |
( |
||||||||||||||||||||||
| Payments from plans: |
||||||||||||||||||||||||
| Benefit payments |
( |
— | ( |
— | ||||||||||||||||||||
| Settlements |
( |
( |
( |
( |
||||||||||||||||||||
| Business combinations and divestments |
( |
( |
||||||||||||||||||||||
| Closing balance |
( |
( |
||||||||||||||||||||||
1) |
The weighted average duration of DBO is |
2) |
Excludes the impact of the asset ceiling of SEK |
3) |
The expected contribution to the plans is SEK |
| Present value of the defined benefit obligation | ||||||||||||||||||||
| Sweden | US | UK | Other | Total | ||||||||||||||||
| 2021 |
||||||||||||||||||||
| DBO, closing balance |
||||||||||||||||||||
| Of which partially or fully funded |
||||||||||||||||||||
| Of which unfunded |
— |
— |
||||||||||||||||||
| 2020 |
||||||||||||||||||||
| DBO, closing balance |
||||||||||||||||||||
| Of which partially or fully funded |
||||||||||||||||||||
| Of which unfunded |
— |
— |
||||||||||||||||||
| Asset allocation by asset type and geography 1) |
||||||||||||||||||||||||
| Sweden | US | UK | Other | Total | |
Of which unquoted 2) |
| |||||||||||||||||
| 2021 |
||||||||||||||||||||||||
| Cash and cash equivalents |
% | |||||||||||||||||||||||
| Equity securities |
% | |||||||||||||||||||||||
| Debt securities |
% | |||||||||||||||||||||||
| Real estate |
— | % | ||||||||||||||||||||||
| Investment funds |
— | % | ||||||||||||||||||||||
| Assets held by insurance company |
— | — | — | % | ||||||||||||||||||||
| Other |
( |
% | ||||||||||||||||||||||
| Total |
||||||||||||||||||||||||
| Of which real estate occupied by the Company |
— |
— |
— |
— |
— |
|||||||||||||||||||
| Of which securities issued by the Company |
— |
— |
— |
— |
— |
|||||||||||||||||||
| 2020 |
||||||||||||||||||||||||
| Cash and cash equivalents |
% | |||||||||||||||||||||||
| Equity securities |
% | |||||||||||||||||||||||
| Debt securities |
% | |||||||||||||||||||||||
| Real estate |
— | % | ||||||||||||||||||||||
| Investment funds |
% | |||||||||||||||||||||||
| Assets held by insurance company |
— | — | — | % | ||||||||||||||||||||
| Other |
% | |||||||||||||||||||||||
| Total |
||||||||||||||||||||||||
| Of which real estate occupied by the Company |
— |
— |
— |
— |
— |
|||||||||||||||||||
| Of which securities issued by the Company |
— |
— |
— |
— |
— |
|||||||||||||||||||
1) |
Asset class is presented based on the underlying exposure of the investment. This includes direct investment in securities or investment through pooled funds that invests in an asset class. |
2) |
Unquoted refers to assets classified as fair value level 2 and 3. Amounts reported in prior year included only level 3 assets, hence re-presented for comparison purposes. Unquoted assets comprise mainly investments in pooled investment vehicles. |
| Ericsson Annual Report on Form 20F 2021 | Financials – Notes to the Consolidated financial statements | 7 1 |
| Financial and demographic actuarial assumptions | 2021 | 2020 | ||||||||||||||||||||||||
| Sweden | US | UK | Sweden | US | UK | |||||||||||||||||||||
| Financial assumptions |
||||||||||||||||||||||||||
| Discount rate |
||||||||||||||||||||||||||
| Inflation rate |
||||||||||||||||||||||||||
| Salary increase rate |
— | — | ||||||||||||||||||||||||
| Demographic assumptions |
||||||||||||||||||||||||||
| Life expectancy after age 65 in years |
||||||||||||||||||||||||||
| Total remeasurements in Other comprehensive income related to post-employment benefits |
|
|||||||
| 2021 | 2020 | |||||||
| Actuarial gains and losses (+/–) |
( |
|||||||
| The effect of asset ceiling |
||||||||
| Swedish special payroll taxes |
( |
|||||||
| Total |
( |
|||||||
| Sensitivity analysis of significant actuarial assumptions |
2021 | |||||||||||
Impact on the DBO of a change in assumptions |
Sweden | US | UK | |||||||||
| Financial assumptions |
||||||||||||
| Discount rate -0.5% |
||||||||||||
| Discount rate +0.5% |
( |
( |
( |
|||||||||
| Inflation rate -0.5% |
( |
— | ( |
|||||||||
| Inflation rate +0.5% |
— | |||||||||||
| Salary increase rate -0 . 5% |
( |
— | — | |||||||||
| Salary increase rate +0 . 5% |
— | — | ||||||||||
| Demographic assumptions |
||||||||||||
| Longevity - 1 year |
( |
( |
( |
|||||||||
| Longevity + 1 year |
||||||||||||
| Ericsson Annual Report on Form 20F 2021 | Financials – Notes to the Consolidated financial statements | 72 |
 |
Information regarding members of the Board of Directors and Group management |
| SEK | Board fees | Number of synthetic shares/portion of Board fee |
Value at grant date of synthetic shares allocated in 2021 |
Number of previously allocated synthetic shares outstanding |
Net change in value of synthetic shares 1) |
Committee fees |
Total fees paid in cash 2) |
Total remuneration 2021 |
||||||||||||||||||||||||
| A | B | C | (A+B+C) | |||||||||||||||||||||||||||||
| Board member |
||||||||||||||||||||||||||||||||
| Ronnie Leten |
( |
|||||||||||||||||||||||||||||||
| Helena Stjernholm |
||||||||||||||||||||||||||||||||
| Jacob Wallenberg |
||||||||||||||||||||||||||||||||
| Jon Fredrik Baksaas |
( |
|||||||||||||||||||||||||||||||
| Jan Carlson |
||||||||||||||||||||||||||||||||
| Nora Denzel |
||||||||||||||||||||||||||||||||
| Börje Ekholm |
— | — | — | — | — | — | ||||||||||||||||||||||||||
| Eric A. Elzvik |
||||||||||||||||||||||||||||||||
| Kurt Jofs |
— | — | ( |
|||||||||||||||||||||||||||||
| Kristin S. Rinne |
||||||||||||||||||||||||||||||||
| Employee Representatives |
||||||||||||||||||||||||||||||||
| Torbjörn Nyman |
— | — | — | — | ||||||||||||||||||||||||||||
| Anders Ripa 4) |
— | — | — | — | ||||||||||||||||||||||||||||
| Kjell-Åke Soting |
— | — | — | — | ||||||||||||||||||||||||||||
| Roger Svensson 5) |
— | — | — | — | ||||||||||||||||||||||||||||
| Per Holmberg (deputy) 6) |
— | — | — | — | — | |||||||||||||||||||||||||||
| Ulf Rosberg (deputy) 7) |
— | — | — | — | — | |||||||||||||||||||||||||||
| Loredana Roslund (deputy) |
— | — | — | — | — | |||||||||||||||||||||||||||
| Total |
3) | |||||||||||||||||||||||||||||||
1) |
The difference in value as of the time for payment, compared to December 31, 2020, for synthetic shares allocated in 2016 (for which payment was made in 2021). The difference in value as of December 31, 2021 compared to December 31, 2020, for synthetic shares allocated in 2017, 2018, 2019 and 2020. Calculated on a share price of SEK |
2) |
Committee fee and cash portion of the Board fee. |
3) |
Excluding social security charges in the amount of SEK |
4) |
Appointed employee representative Board member as of March 30, 2021, previously deputy employee representative Board member |
5) |
Resigned as employee representative Board member as of March 30, 2021. |
6) |
Resigned as deputy employee representative Board member as of November 3, 2021. |
7) |
Appointed deputy employee representative Board member as of March 30, 2021. |
| – | The Chair of the Board was entitled to a Board fee of SEK |
| – | The other Directors elected by the Annual General Meeting were entitled to a fee of SEK non-employee members of the Audit and Compliance Committee were entitled to a fee of SEK non-employee members of these Committees were entitled to a fee of SEK |
| – | Members of the Board, who are not employees of the Company, have not received any remuneration other than the fees and synthetic shares as above. None of the Directors have entered into a service contract with the Parent Company or any of its subsidiaries, providing for termination benefits. |
| – | Members and deputy members of the Board who are Ericsson employees received no remuneration or benefits other than their entitlements as employees and a fee to the employee representatives and their deputies of SEK |
| – | non-employee Directors may choose to receive the Board fee (i.e., exclusive of Committee fee) as follows: i) 25% of the Board fee in cash and 75% in the form of synthetic shares, with a value corresponding to 75% of the Board fee at the time of allocation, ii) 50% in cash and 50% in the form of synthetic shares, or iii) 75% in cash and 25% in the form of synthetic shares. Directors may also choose not to participate in the synthetic share program and receive 100% of the Board fee in cash |
| Ericsson Annual Report on Form 20F 2021 | Financials – Notes to the Consolidated financial statements | 73 |
| SEK | President and CEO 2021 |
President and CEO 2020 |
Other members of ET 2021 |
Other members of ET 2020 |
Total 2021 | Total 2020 | ||||||||||||||||||
| Salary 1) |
||||||||||||||||||||||||
| Termination benefits |
— | — | — | — | — | — | ||||||||||||||||||
| Annual variable remuneration provision earned for the year |
— | — | ||||||||||||||||||||||
| Long-term variable compensation provision |
||||||||||||||||||||||||
| Pension costs 2) |
||||||||||||||||||||||||
| Other benefits 3) |
||||||||||||||||||||||||
| Social charges and taxes 3) |
||||||||||||||||||||||||
| Total |
||||||||||||||||||||||||
1) |
Includes compensation for unused vacation days. |
2) |
Includes cash payments to the President and CEO in lieu of defined contribution payment in a cost neutral way to Ericsson. |
3) |
Other benefits and Social charges and taxes for other members of ET 2020 adjusted due to clerical error. |
| – | Fredrik Jejdling was appointed Executive Vice President by the Board of Directors effective November 7, 2017. He did not substitute the President and CEO as the deputy to the President and CEO in 2021. Information regarding Fredrik Jejdling is included in the group “Other members of ET.” The details of Fredrik Jejdling’s remuneration in 2021 can be found in the Remuneration report 2021. |
| – | Arun Bansal was appointed as Executive Vice President by the Board of Directors effective June 10, 2020. He did not substitute the President and CEO as the deputy to the President and CEO in 2021. Information regarding Arun Bansal is included in the group “Other members of ET.” The details of Arun Bansal’s remuneration in 2021 corresponding to the period after he was appointed as Executive Vice President can be found in the Remuneration report 2021. |
| – | The group “Other members of ET 2021” and “Other members of ET 2020 comprises of the following 14 persons: MajBritt Arfert, Arun Bansal, Xavier Dedullen, Erik Ekudden, Niklas Heuveldop, Chris Houghton, Fredrik Jejdling, Jan Karlsson, Peter Laurin, Stella Medlicott, Carl Mellander, Nunzio Mirtillo, Fadi Pharaon and Åsa Tamsons. |
| – |
The salary stated in the table for the President and CEO and other members of the ET includes vacation pay paid during 2021 as well as other contracted compensation expenses in 2021. |
| – |
“Long-term variable compensation provision” refers to the compensation costs for full year 2021 for all outstanding share-based plans. |
| – | Ericsson’s commitments for defined benefit based pensions as of December 31, 2021, for other members of ET under IAS 19 amounted to 2021: SEK |
| – | For previous Presidents and CEOs, the Company has made provisions for defined benefit pension plans in connection with their active service periods within the Company. |
| Ericsson Annual Report on Form 20F 2021 | Financials – Notes to the Consolidated financial statements | 74 |
 |
Share-based compensation |
| – | Share-settled programs, the total compensation expense is calculated based on the fair value (FV) at grant date and recognized over the service period of |
| – | Cash-settled plans, the accounting principles are the same as for any other accruals or provisions. Prior to payout an accrual or provision is recognized every period based on the present period’s best estimate of the total amount. Any difference between total payout and the sum of accruals of provisions is recognized in the income statement in the period of final payout. |
| Program Year |
Target | Criteria | Weight | Performance Period | Vesting Opportunity (linear pro-rata) |
Achievement | Achieved Vesting Level | |||||||||||||
| 2021 |
2021 Group operating income (EBIT) |
Range (SEK billion): 15.0–24.0 |
SEK |
2) |
||||||||||||||||
| 2021 |
Absolute TSR | |||||||||||||||||||
| 2021 |
Relative TSR | Ranking of Ericsson: 6–2 |
1) |
|||||||||||||||||
| 2021 Total |
||||||||||||||||||||
| 2020 |
2020 Group operating income (EBIT) |
Range (SEK billion): 19.1–27.9 |
SEK |
3) |
||||||||||||||||
| 2020 |
Absolute TSR | Range: 6%–14% |
||||||||||||||||||
| 2020 |
Relative TSR | Ranking of Ericsson: 6–2 |
1) |
|||||||||||||||||
| 2020 Total |
||||||||||||||||||||
| 2019 |
2019 Group operating income (EBIT) |
Range (SEK billion): 10.0–20.0 |
SEK |
4) |
||||||||||||||||
| 2019 |
Absolute TSR | |||||||||||||||||||
| 2019 |
Relative TSR | Ranking of Ericsson: 7–2 |
1) |
|||||||||||||||||
| 2019 Total |
||||||||||||||||||||
| 2018 |
2018 Group operating income (EBIT) |
Range (SEK billion): 4.6–9.6 |
SEK |
5) |
||||||||||||||||
| 2018 |
Absolute TSR | |||||||||||||||||||
| 2018 |
Relative TSR | Ranking of Ericsson: 7–2 |
1) |
|||||||||||||||||
| 2018 Total |
||||||||||||||||||||
1) |
The portion of the Performance Share Awards granted to a participant based on the relative TSR performance condition is subject to fulfilment of the related performance criteria over the performance period compared to Peer Groups consisting of |
2) |
Excludes restructuring charges and items not included in target performance criterion. |
3) |
Excludes restructuring charges. |
4) |
Excludes fines and similar related to the United States Department of Justice (DOJ) / Securities and Exchange Commission (SEC) resolution . |
5) |
Excludes restructuring charges and the provisions taken in Q4 2018 related to the revised BSS strategy. |
| Ericsson Annual Report on Form 20F 2021 | Financials – Notes to the Consolidated financial statements | 75 |
| Ericsson Annual Report on Form 20F 2021 | Financials – Notes to the Consolidated financial statements | 76 |
| Number of shares and synthetic shares |
| |||||||||||||||||||||||||||||||||||||||||||
| (million) |
Executive team programs |
Of which the President and CEO |
||||||||||||||||||||||||||||||||||||||||||
Share-settled programs |
LTV 2021 |
LTV 2020 |
LTV 2019 |
LTV 2018 |
Total |
LTV 2021 |
LTV 2020 |
LTV 2019 |
LTV 2018 |
Total |
||||||||||||||||||||||||||||||||||
| Maximum shares required |
— | — | — | — | — | |||||||||||||||||||||||||||||||||||||||
| Granted shares |
||||||||||||||||||||||||||||||||||||||||||||
| Outstanding number of shares beginning of 2021 | — | — | ||||||||||||||||||||||||||||||||||||||||||
| Exercised during 2021 |
— | — | — | ( |
( |
— | — | — | ( |
( |
||||||||||||||||||||||||||||||||||
| Forfeited during 2021 |
— | — | — | — | — | — | — | — | — | — | ||||||||||||||||||||||||||||||||||
| Increase due to performance condition 2021 | — | ( |
— | — | ( |
— | ||||||||||||||||||||||||||||||||||||||
| Outstanding number of shares end of 2021 | — | — | ||||||||||||||||||||||||||||||||||||||||||
Executive performance program |
Key contributors plans |
|||||||||||||||||||||||||||||||||||||||||||
Cash-settled plan |
EPP 2021 |
EPP 2020 |
EPP 2019 |
EPP 2018 |
Total |
KC 2021 |
KC 2020 |
KC 2019 |
KC 2018 |
Total |
||||||||||||||||||||||||||||||||||
| Synthetic shares |
— | — | ||||||||||||||||||||||||||||||||||||||||||
| Ericsson Annual Report on Form 20F 2021 | Financials – Notes to the Consolidated financial statements | 77 |
| Compensation expense for LTV 2018-2021 |
||||||||||
Share-settled programs |
2021 |
2020 |
2019 |
2018 |
Total | |||||
| LTV 2021 |
— | — | — | |||||||
| LTV 2020 |
— | — | ||||||||
| LTV 2019 |
— | |||||||||
| LTV 2018 |
||||||||||
| Total executive team programs |
||||||||||
| Of which the President and CEO |
||||||||||
| Cash-settled plans |
||||||||||
| EPP 2021 |
— | — | — | |||||||
| EPP 2020 |
— | — | ||||||||
| EPP 2019 |
— | |||||||||
| EPP 2018 |
||||||||||
| Total executive performance plans |
||||||||||
| KC 2021 |
— | — | — | |||||||
| KC 2020 |
— | — | ||||||||
| KC 2019 |
— | |||||||||
| KC 2018 |
||||||||||
| Total key contributor plans |
||||||||||
| Total cash-settled plans |
||||||||||
| Total compensation expense |
||||||||||
| Fair values (SEK) |
||||||||||||||||
| Executive team programs |
LTV 2021 |
LTV 2020 |
LTV 2019 |
LTV 2018 |
||||||||||||
| Share price at grant |
||||||||||||||||
| Fair value Absolute TSR |
||||||||||||||||
| Fair value Relative TSR |
||||||||||||||||
| Fair value Group operating income (EBIT) |
||||||||||||||||
| Executive performance plans |
EPP 2021 |
EPP 2020 |
EPP 2019 |
EPP 2018 |
||||||||||||
| Fair value Absolute TSR |
||||||||||||||||
| Fair value Relative TSR |
||||||||||||||||
| Fair value Group operating income (EBIT) |
||||||||||||||||
| Key contributor plans |
KC 2021 |
KC 2020 |
KC 2019 |
KC 2018 |
||||||||||||
| Fair value - Tranche 1 |
— | |||||||||||||||
| Fair value - Tranche 2 |
— | |||||||||||||||
| Fair value - Tranche 3 |
— | |||||||||||||||
| Fair value |
— | — | — |
| Ericsson Annual Report on Form 20F 2021 | Financials – Notes to the Consolidated financial statements | 78 |
| Ericsson share purchase plan |
||||||||||
| Eligible employees |
Number of counties with ESPP |
Number of participants |
Take-up rate – percent of eligible employees |
|||||||
| Ericsson Annual Report on Form 20F 2021 | Financials – Notes to the Consolidated financial statements | 79 |
 |
Employee information |
| Average number of employees by gender and market area |
||||||||||||||||||||||||
| 2021 | 2020 | |||||||||||||||||||||||
| Women | Men | Total | Women | Men | Total | |||||||||||||||||||
| South East Asia, Oceania and India |
||||||||||||||||||||||||
| North East Asia |
||||||||||||||||||||||||
| North America |
||||||||||||||||||||||||
| Europe and Latin America 1) |
||||||||||||||||||||||||
| Middle East and Africa |
||||||||||||||||||||||||
| Total |
||||||||||||||||||||||||
| 1) Of which in EU |
||||||||||||||||||||||||
| Of which in Sweden |
||||||||||||||||||||||||
| Number of employees by market area at year- end |
| |||||||||||
| 2021 | 2020 | |||||||||||
| South East Asia, Oceania and India |
||||||||||||
| North East Asia |
||||||||||||
| North America |
||||||||||||
| Europe and Latin America 1) |
||||||||||||
| Middle East and Africa |
||||||||||||
| Total |
||||||||||||
| 1) Of which in EU |
||||||||||||
| Of which in Sweden |
||||||||||||
| Number of employees by gender and age at year-end 2021 |
| |||||||||||
| Women | Men | Percent of total |
||||||||||
| Under 25 years old |
||||||||||||
| 25–35 years old |
||||||||||||
| 36–45 years old |
||||||||||||
| 46–55 years old |
||||||||||||
| Over 55 years old |
||||||||||||
| Percent of total |
||||||||||||
| Employee movements |
||||||||||||
| 2021 | 2020 | |||||||||||
| Headcount at year-end |
||||||||||||
| Employees who have left the Company |
||||||||||||
| Employees who have joined the Company |
||||||||||||
| Temporary employees |
||||||||||||
| Wages and salaries and social security expenses |
| |||||||
| (SEK million) | 2021 | 2020 | ||||||
| Wages and salaries |
||||||||
| Social security expenses |
||||||||
| Of which pension costs |
||||||||
| Remuneration to Board members and Presidents in subsidiaries |
| |||||||
| (SEK million) | 2021 | 2020 | ||||||
| Salary and other remuneration |
||||||||
| Of which annual variable remuneration |
||||||||
| Pension costs 1) |
||||||||
1) |
Pension costs are over and above any social security charges and taxes. |
| Board members, Presidents and Group management by gender at year end |
| |||||||||||||||
2021 |
2020 |
|||||||||||||||
| Women | Men | Women | Men | |||||||||||||
| Parent Company |
||||||||||||||||
| Board members and President |
||||||||||||||||
| Group Management |
||||||||||||||||
| Subsidiaries |
||||||||||||||||
| Board members and Presidents |
||||||||||||||||
| Ericsson Annual Report on Form 20F 2021 | Financials – Notes to the Consolidated financial statements | 80 |
 |
Taxes |
| Income taxes recognized in the income statement |
| |||||||||||
| 2021 | 2020 | 2019 | ||||||||||
| Current income taxes for the year |
( |
( |
( |
|||||||||
| Current income taxes related to prior years | ( |
( |
( |
|||||||||
| Deferred tax income/expense (+/–) |
( |
( |
||||||||||
| Share of taxes in joint ventures and associated companies | ( |
( |
( |
|||||||||
| Income tax expense |
( |
( |
( |
|||||||||
| Reconciliation of Swedish income tax rate with effective tax rate |
| |||||||||||
| 2021 | 2020 | 2019 | ||||||||||
| Calculated tax expense at Swedish tax rate ( |
( |
( |
( |
|||||||||
| Effect of foreign tax rates |
( |
( |
( |
|||||||||
| Current income taxes related to prior years | ( |
( |
( |
|||||||||
| Remeasurement of tax loss carry-forwards | ( |
( |
||||||||||
| Remeasurement of deductible temporary differences | ||||||||||||
| Withholding tax expense |
( |
( |
||||||||||
| Reversal of impaired withholding tax |
||||||||||||
| Tax effect of non-deductible expenses |
( |
( |
( |
|||||||||
| Tax effect of non-taxable income |
||||||||||||
| Tax effect of changes in tax rates |
( |
( |
||||||||||
| Income tax expense |
( |
( |
( |
|||||||||
| Effective tax rate |
||||||||||||
| Tax effects of temporary differences and tax loss carry-forwards |
| |||||||||||
| Deferred tax assets |
Deferred tax liabilities |
Net balance |
||||||||||
| 2021 |
||||||||||||
| Intangible assets and property, plant and equipment | ||||||||||||
| Current assets |
||||||||||||
| Post-employment benefits |
||||||||||||
| Provisions |
— | |||||||||||
| Deferred tax credits |
— | |||||||||||
| Other |
||||||||||||
| Loss carry-forwards |
— | |||||||||||
| Deferred tax assets/liabilities |
||||||||||||
| Netting of assets/liabilities |
( |
( |
||||||||||
| Deferred tax balances, net |
||||||||||||
| 2020 |
||||||||||||
| Intangible assets and property, plant and equipment | ||||||||||||
| Current assets |
||||||||||||
| Post-employment benefits |
||||||||||||
| Provisions |
— | |||||||||||
| Deferred tax credits |
— | |||||||||||
| Other |
||||||||||||
| Loss carry-forwards |
— | |||||||||||
| Deferred tax assets/liabilities |
||||||||||||
| Netting of assets/liabilities |
( |
( |
||||||||||
| Deferred tax balances, net |
||||||||||||
| Changes in deferred taxes, net |
||||||||
| 2021 | 2020 | |||||||
| Opening balance, net |
||||||||
| Recognized in net income (loss) |
( |
|||||||
| Recognized in other comprehensive income |
( |
|||||||
| Acquisitions/divestments of subsidiaries |
( |
|||||||
| Deferred tax credits utilization |
( |
|||||||
| Translation difference |
( |
|||||||
| Closing balance, net |
||||||||
| Ericsson Annual Report on Form 20F 2021 | Financials – Notes to the Consolidated financial statements | 81 |
Tax loss carry-forwards |
||||||||
| Year of expiration | Tax loss carry- forwards |
Tax value |
||||||
2022 |
||||||||
2023 |
||||||||
2024 |
||||||||
2025 |
||||||||
2026 |
||||||||
2027 or later (also includes unlimited carry-forwards) |
||||||||
Total |
||||||||
 |
Earnings per share |
Earnings per share |
||||||||||||
| 2021 | 2020 | 2019 | ||||||||||
Basic |
||||||||||||
| Net income attributable to owners of the Parent Company (SEK million) | ||||||||||||
| Average number of shares outstanding, basic (millions) | ||||||||||||
Earnings per share, basic (SEK) |
||||||||||||
Diluted |
||||||||||||
| Net income attributable to owners of the Parent Company (SEK million) | ||||||||||||
| Average number of shares outstanding, basic (millions) | ||||||||||||
| Dilutive effect for stock purchase (millions) | ||||||||||||
| Average number of shares outstanding, diluted (millions) | ||||||||||||
Earnings per share, diluted (SEK) |
||||||||||||
 |
Statement of cash flows |
Adjustments to reconcile net income to cash |
||||||||||||
| 2021 | 2020 | 2019 | ||||||||||
Property, plant and equipment |
||||||||||||
| Depreciations | ||||||||||||
| Impairment losses | ||||||||||||
Total |
||||||||||||
Right-of-use |
||||||||||||
| Depreciations | ||||||||||||
| Impairment losses | ||||||||||||
Total |
||||||||||||
Intangible assets |
||||||||||||
Amortizations |
||||||||||||
| Capitalized development expenses | ||||||||||||
| Intellectual Property Rights, brands and other intangible assets | ||||||||||||
Total amortizations |
||||||||||||
Impairments |
||||||||||||
| Capitalized development expenses | ||||||||||||
| Intellectual Property Rights, brands and other intangible assets | ||||||||||||
| Goodwill | ||||||||||||
Total impairments |
||||||||||||
Total |
||||||||||||
Total depreciation, amortization and impairment losses on property, plant and equipment and intangible assets |
||||||||||||
| Taxes | ||||||||||||
| Dividends from joint ventures/associated companies 1) |
||||||||||||
| Undistributed earnings in joint ventures/ associated companies 1) |
||||||||||||
| Gains/losses on investments and sale of operations, intangible assets and PP&E, net 2) |
( |
( |
||||||||||
| Other non-cash items 3) |
||||||||||||
Total adjustments to reconcile net income to cash |
||||||||||||
1) |
See note E3 “Associated companies.” |
2) |
Includes revaluation gains and losses on investments, see note B4 “Other operating income and expense s .” |
3) |
Relates mainly to unrealized foreign exchange, gains/losses on financial instruments. |
| Ericsson Annual Report on Form 20F 2021 | Financials – Notes to the Consolidated financial statements | 82 |
Acquisitions/divestments of subsidiaries and other operations |
||||||||
| Acquisitions | Divestments | |||||||
2021 |
||||||||
| Cash flow from business combinations 1) |
( |
|||||||
| Acquisitions/divestments of other investments | ( |
|||||||
Total |
( |
|||||||
2020 |
||||||||
| Cash flow from business combinations 1) |
( |
|||||||
| Acquisitions/divestments of other investments | ( |
|||||||
Total |
( |
|||||||
2019 |
||||||||
| Cash flow from business combinations 1) |
( |
|||||||
| Acquisitions/divestments of other investments | ( |
|||||||
Total |
( |
|||||||
1) |
See also note E2 “Business combinations.” |
 |
Related party transactions |
 |
Fees to auditors |
Fees to auditors |
||||||||||||
2021 |
Deloitte |
Others |
Total |
|||||||||
Audit fees |
||||||||||||
Audit-related fees |
||||||||||||
Tax fees |
||||||||||||
Other fees |
||||||||||||
Total |
||||||||||||
2020 |
Deloitte | Others | Total | |||||||||
Audit fees |
||||||||||||
Audit-related fees |
— | |||||||||||
Tax fees |
||||||||||||
Other fees |
||||||||||||
Total |
||||||||||||
2019 |
PwC | Others | Total | |||||||||
Audit fees |
||||||||||||
Audit-related fees |
— | |||||||||||
Tax fees |
||||||||||||
Other fees |
||||||||||||
Total |
||||||||||||
 |
Events after the reporting period |
| 83 Financial Report 2021 | Report of independent registered public accounting firm | Ericsson Annual Report on Form 20-F 2021 | |||
| 84 Financial Report 2021 | Management’s report on internal control over financial reporting | Ericsson Annual Report on Form 20-F 2021 | |||
| – | pertain to the maintenance of records that, in reasonable detail, accurately and fairly reflect the transactions and dispositions of the assets of the Company; |
| – | provide reasonable assurance that transactions are recorded as necessary to permit preparation of financial statements in accordance with International Financial Reporting Standards (IFRS), and that receipts and expenditures of the Company are being made only in accordance with authorizations of management and directors of the Company; and |
| – | provide reasonable assurance regarding prevention or timely detection of unauthorized acquisition, use or disposition of the Company’s assets that could have a material effect on the financial statements. |
| 85 Financial Report 2021 | Risk factors | Ericsson Annual Report on Form 20-F 2021 | |||
| 85 | Risks related to business activities and industry | |
| 92 | Risks related to Ericsson’s financial situation | |
| 93 | Legal and regulatory risk | |
| 96 | Internal control risk | |
| 97 | Environmental, social and governance risk | |
1 |
Risks related to business activities and industry |
| 86 Financial Report 2021 | Risk factors | Ericsson Annual Report on Form 20-F 2021 | |||
| – | Reduced or loss of sales and market share, e.g. in China, Ukraine and Russia and weakened market position |
| – | Reduced or lost market access |
| – | Decreased ability for unrestricted use of Ericsson’s global supply chain for all markets, e.g. as a result of import or export restrictions in the US and China |
| – | Increased trade restrictions, including economic sanctions and export controls, tariffs and increased costs which may not be recoverable |
| – | Separation of global standards for mobile telecommunication |
| – | Sourcing restrictions and constraints for access to hardware and software products and components |
| – | Reduced efficiency in R&D and restrictions in use of R&D resources |
| – | Deferrals of purchases, with lower revenues not fully compensated through reduced costs |
| – | Excess and obsolete inventories and excess manufacturing capacity |
| – | Financial difficulties or failures among Ericsson’s suppliers |
| – | Impairment losses related to Ericsson’s intangible assets as a result of lower forecasted sales of certain products |
| – | Increased difficulties in forecasting sales and financial results as well as increased volatility in Ericsson’s reported results. |
| – | Reduced demand for products and services, resulting in increased price competition or deferrals of purchases, with lower revenues not fully compensated through reduced costs |
| – | Excess and obsolete inventories and excess manufacturing capacity |
| – | Financial difficulties or failures among Ericsson’s suppliers |
| – | Increased demand for customer finance, difficulties in collection of accounts receivable and increased risk of counter party failures |
| – | Impairment losses related to Ericsson’s intangible assets as a result of lower forecasted sales of certain products |
| – | Increased difficulties in forecasting sales and financial results as well as increased volatility in Ericsson’s reported results |
| – | Changes in the value in the Company’s pension plan assets resulting from, for example, adverse equity and credit market developments and/ or increased pension liabilities resulting from, for example, lower discount rates. Such development may trigger additional pension trust capitalization needs negatively affecting the company’s cash balance |
| – | End user demand could also be adversely affected by reduced consumer spending on technology, changed operator pricing, security breaches and trust issues. |
| 87 Financial Report 2021 | Risk factors | Ericsson Annual Report on Form 20-F 2021 | |||
| – | Insufficiencies of technologies and products acquired, such as unexpected quality problems |
| – | Difficulties in the integration of the operations, technologies, products and personnel of the acquired company |
| – | Risks of entering markets in which the Company has no or limited prior experience |
| – | Potential loss of key employees |
| 88 Financial Report 2021 | Risk factors | Ericsson Annual Report on Form 20-F 2021 | |||
| – | Diversion of management’s attention away from other business concerns |
| – | Expenses of any undisclosed or potential legal liabilities of the acquired company, including failure to comply with laws or regulations. |
| – | Difficulties in the separation of the operations, technologies, products and personnel of the business divested |
| – | Potential loss of key employees |
| – | Expenses of any undisclosed or potential legal liabilities of the business divested. |
| 89 Financial Report 2021 | Risk factors | Ericsson Annual Report on Form 20-F 2021 | |||
| 90 Financial Report 2021 | Risk factors | Ericsson Annual Report on Form 20-F 2021 | |||
| 91 Financial Report 2021 | Risk factors | Ericsson Annual Report on Form 20-F 2021 | |||
| 92 Financial Report 2021 | Risk factors | Ericsson Annual Report on Form 20-F 2021 | |||
2 |
Risks related to Ericsson’s financial situation |
| – | Increasing Ericsson’s vulnerability to general economic and industry conditions |
| – | Requiring a substantial portion of cash flow from operations to be dedicated to the payment of principal and interest on the Company’s indebted-ness, thereby reducing Ericsson’s ability to use its cash flow to fund the Company’s operations, capital expenditures and future business opportunities |
| – | Restricting us from making strategic acquisitions or causing us to make non-strategic divestitures |
| – | Limiting Ericsson’s ability to obtain additional financing for adjusted working capital, capital expenditures, debt service requirements, acquisitions and general corporate or other purposes |
| – | Limiting the Company’s ability to adjust to changing market conditions and placing us at a competitive disadvantage compared to Ericsson’s competitors. |
| 93 Financial Report 2021 | Risk factors | Ericsson Annual Report on Form 20-F 2021 | |||
3 |
Legal and regulatory risk |
| 94 Financial Report 2021 | Risk factors | Ericsson Annual Report on Form 20-F 2021 | |||
| 95 Financial Report 2021 | Risk factors | Ericsson Annual Report on Form 20-F 2021 | |||
| 96 Financial Report 2021 | Risk factors | Ericsson Annual Report on Form 20-F 2021 | |||
4 |
Internal control risk |
| 97 Financial Report 2021 | Risk factors | Ericsson Annual Report on Form 20-F 2021 | |||
5 |
Environmental, social and governance risk |
| 98 Financial Report 2021 | Risk factors | Ericsson Annual Report on Form 20-F 2021 | |||
| 99 Financial Report 2021 | Forward-looking statements | Ericsson Annual Report on Form 20-F 2021 | |||
| – | Our goals, strategies, planning assumptions and operational or financial performance expectations |
| – | Industry trends, future characteristics and development of the markets in which we operate |
| – | Our future liquidity, capital resources, capital expenditures, cost savings and profitability |
| – | The expected demand for our existing and new products and services as well as plans to launch new products and services including research and development expenditures |
| – | The ability to deliver on future plans and to realize potential for future growth |
| – | The expected operational or financial performance of strategic cooperation activities and joint ventures |
| – | The time until acquired entities and businesses will be integrated and accretive to income |
| – | Technology and industry trends including the regulatory and standardization environment in which we operate, competition and our customer structure. |
| 100 Financial Report 2021 | Five-year summary – Financial information | Ericsson Annual Report on Form 20-F 2021 | |||
Five-year summary |
||||||||||||||||||||||||
2021 |
Change |
2020 |
2019 |
2018 |
2017 |
|||||||||||||||||||
Income statement and cash flow items, SEK million |
||||||||||||||||||||||||
Net sales 1) |
232,314 |
0% |
232,390 |
227,216 |
210,838 |
205,378 |
||||||||||||||||||
Operating expenses 1) |
–69,071 |
4% |
–66,280 |
–64,215 |
–66,848 |
–70,563 |
||||||||||||||||||
EBIT (loss) 1) |
31,780 |
14% |
27,808 |
10,564 |
1,242 |
–34,743 |
||||||||||||||||||
Net income (loss) 1) |
22,980 |
30% |
17,623 |
1,840 |
–6,276 |
–32,433 |
||||||||||||||||||
Cash flow from operating activities |
39,065 |
35% |
28,933 |
16,873 |
9,342 |
9,601 |
||||||||||||||||||
Year-end position, SEK million |
||||||||||||||||||||||||
Total assets 1) |
305,614 |
13% |
271,530 |
276,383 |
268,761 |
259,882 |
||||||||||||||||||
Property, plant and equipment |
13,580 |
1% |
13,383 |
13,850 |
12,849 |
12,857 |
||||||||||||||||||
Stockholders’ equity 1) |
108,775 |
25% |
86,674 |
82,559 |
86,978 |
96,935 |
||||||||||||||||||
Non-controlling interests |
–1,676 |
– |
–1,497 |
–681 |
7w92 |
636 |
||||||||||||||||||
Per share indicators |
||||||||||||||||||||||||
Earnings (loss) per share, basic, SEK 1) |
6.82 |
30% |
5.26 |
0.67 |
–1.98 |
–9.94 |
||||||||||||||||||
Earnings (loss) per share, diluted, SEK 1) |
6.81 |
29% |
5.26 |
0.67 |
–1.98 |
–9.94 |
||||||||||||||||||
Dividends per share, SEK 2) |
2.50 |
25% |
2.00 |
1.50 |
1.00 |
1.00 |
||||||||||||||||||
Dividends per share, USD 2) |
0.23 |
44% |
0.16 |
0.16 |
0.11 |
0.12 |
||||||||||||||||||
Number of shares outstanding (in millions) |
||||||||||||||||||||||||
| end of period, basic |
3,330 |
0% |
3,328 |
3,314 |
3,297 |
3,284 |
||||||||||||||||||
| average, basic |
3,329 |
0% |
3,323 |
3,306 |
3,291 |
3,277 |
||||||||||||||||||
| average, diluted |
3,332 |
0% |
3,326 |
3,320 |
3,318 |
3,317 |
||||||||||||||||||
Other information, SEK million |
||||||||||||||||||||||||
Additions to property, plant and equipment |
3,663 |
–18% |
4,493 |
5,118 |
3,975 |
3,877 |
||||||||||||||||||
Depreciations and write-downs/impairments of property, plant and equipment |
3,872 |
–6% |
4,114 |
3,947 |
3,843 |
6,314 |
||||||||||||||||||
Acquisitions/capitalization/divestments of intangible assets |
1,723 |
–85% |
11,817 |
–13,692 |
2,315 |
1,759 |
||||||||||||||||||
Amortizations and write-downs/impairments of intangible assets |
2,820 |
33% |
2,126 |
2,593 |
4,475 |
21,578 |
||||||||||||||||||
Research and development expenses 1) |
42,074 |
6% |
39,714 |
38,815 |
38,909 |
37,887 |
||||||||||||||||||
| as percentage of net sales |
18.1% |
– |
17.1% |
17.1% |
18.5% |
18.4% |
||||||||||||||||||
Inventory turnover days |
88 |
13% |
78 |
77 |
70 |
66 |
||||||||||||||||||
Alternative Performance Measures (APMs) 3) |
||||||||||||||||||||||||
Sales growth adjusted for comparable units and currency |
4% |
– |
5% |
4% |
1% |
– |
||||||||||||||||||
Gross margin 1) |
43.4% |
– |
40.3% |
37.3% |
32.3% |
23.3% |
||||||||||||||||||
Gross margin excluding restructuring charges 1) |
43.5% |
– |
40.6% |
37.5% |
35.2% |
25.9% |
||||||||||||||||||
EBIT margin 1) |
13.7% |
– |
12.0% |
4.6% |
0.6% |
–16.9% |
||||||||||||||||||
EBIT margin excluding restructuring charges 1) |
13.9% |
– |
12.5% |
5.0% |
4.4% |
–12.8% |
||||||||||||||||||
EBITA margin 1) |
14.3% |
– |
12.5% |
5.1% |
1.4% |
–8.8% |
||||||||||||||||||
EBITA margin excluding restructuring charges 1) |
14.6% |
– |
13.1% |
5.5% |
5.2% |
–4.7% |
||||||||||||||||||
Restructuring charges, SEK million |
549 |
–58% |
1,306 |
798 |
8,015 |
8,501 |
||||||||||||||||||
Free cash flow before M&A, SEK million |
32,056 |
44% |
22,261 |
7,633 |
4,253 |
4,833 |
||||||||||||||||||
Free cash flow after M&A, SEK million |
32,115 |
154% |
12,663 |
6,128 |
2,968 |
5,109 |
||||||||||||||||||
Capital employed, SEK million 1) |
184,283 |
14% |
161,990 |
165,273 |
149,615 |
155,625 |
||||||||||||||||||
Return on equity 1) |
23.2% |
– |
20.7% |
2.6% |
–7.1% |
–28.1% |
||||||||||||||||||
Return on capital employed 1) |
18.4% |
– |
17.0% |
6.7% |
0.8% |
–20.4% |
||||||||||||||||||
Equity ratio 1) |
35.0% |
– |
31.4% |
29.6% |
32.7% |
37.5% |
||||||||||||||||||
Capital turnover 1) |
1.3 |
–7% |
1.4 |
1.4 |
1.4 |
1.2 |
||||||||||||||||||
Adjusted working capital, SEK million 1) |
59,667 |
31% |
45,613 |
48,821 |
52,508 |
56,439 |
||||||||||||||||||
Gross cash, SEK million |
97,608 |
35% |
72,045 |
72,192 |
68,996 |
67,702 |
||||||||||||||||||
Net cash, SEK million |
65,777 |
57% |
41,885 |
34,496 |
35,871 |
34,657 |
||||||||||||||||||
Adjusted earnings (loss) per share, SEK |
7.26 |
25% |
5.83 |
1.07 |
0.27 |
–3.24 |
||||||||||||||||||
Statistical data, year-end |
||||||||||||||||||||||||
Number of employees |
101,322 |
0% |
100,824 |
99,417 |
95,359 |
100,735 |
||||||||||||||||||
| of which in Sweden |
14,183 |
8% |
13,173 |
12,730 |
12,502 |
13,864 |
||||||||||||||||||
Export sales from Sweden, SEK million 1) |
140,898 |
7% |
132,269 |
120,822 |
109,969 |
87,463 |
||||||||||||||||||
1) |
2017 is restated due to implementation of IFRS 15 “Revenue from Contracts with Customers.” |
2) |
For 2021, as proposed by the Board of Directors. |
3) |
A reconciliation to the most directly reconcilable line items in the financial statements for 2021 and four comparison years is available on pages 102–106. |
| 101 Financial Report 2021 | Five-year summary – Non-financial information |
Ericsson Annual Report on Form 20-F 2021 | |||
Five-year summary |
||||||||||||||||||||||||
2021 |
Change |
2020 |
2019 |
2018 |
2017 |
|||||||||||||||||||
Employees |
||||||||||||||||||||||||
| Employee headcount at year-end |
101,322 |
0% |
100,824 |
99,417 |
95,359 |
100,735 |
||||||||||||||||||
| Average number of employees |
100,757 |
2% |
98,589 |
94,503 |
97,843 |
107,369 |
||||||||||||||||||
| Employees who have left the Company |
11,631 |
48% |
7,839 |
11,078 |
16,630 |
21,791 |
||||||||||||||||||
| Employees who have joined the Company |
12,129 |
31% |
9,246 |
15,136 |
11,254 |
11,062 |
||||||||||||||||||
Employee diversity by age at year-end (%) |
||||||||||||||||||||||||
| Under 25 years old |
3 |
0% |
3 |
3 |
3 |
4 |
||||||||||||||||||
| 25–35 years old |
31 |
–6% |
33 |
35 |
36 |
37 |
||||||||||||||||||
| 36–45 years old |
34 |
0% |
34 |
32 |
32 |
32 |
||||||||||||||||||
| 46–55 years old |
23 |
5% |
22 |
22 |
22 |
21 |
||||||||||||||||||
| Over 55 years old |
9 |
13% |
8 |
8 |
7 |
7 |
||||||||||||||||||
Female representation (%) |
||||||||||||||||||||||||
| All employees |
25 |
0% |
25 |
25 |
23 |
25 |
||||||||||||||||||
| Line managers |
21 |
0% |
21 |
20 |
20 |
20 |
||||||||||||||||||
| Executive population |
36 |
13% |
32 |
32 |
31 |
27 |
||||||||||||||||||
| Executive Team |
20 |
0% |
20 |
20 |
27 |
36 |
||||||||||||||||||
| Board of Directors |
23 |
0% |
23 |
23 |
23 |
43 |
||||||||||||||||||
Compliance concerns, sensitive business and information security |
||||||||||||||||||||||||
| Total number of reported compliance concerns |
1,059 |
14% |
933 |
538 |
445 |
412 |
||||||||||||||||||
| Total number of cases reviewed in the Sensitive business process |
722 |
–13% |
828 |
651 |
587 |
846 |
||||||||||||||||||
| Total number of information security and privacy incidents reported |
2,463 |
–3% |
2,533 |
3,840 |
3,312 |
3,235 |
||||||||||||||||||
Occupational health and safety |
||||||||||||||||||||||||
| Number of fatalities – Ericsson employees |
1 |
– |
0 |
0 |
0 |
0 |
||||||||||||||||||
| Number of fatalities – Supply chain and public |
13 |
86% |
7 |
11 |
14 |
23 |
||||||||||||||||||
| Number of major incidents – Ericsson employees |
56 |
–15% |
66 |
122 |
83 |
1) |
||||||||||||||||||
| Number of major incidents – Supply chain and public |
50 |
39% |
36 |
57 |
33 |
1) |
||||||||||||||||||
| Number of lost workday incidents – Ericsson employees |
77 |
–14% |
90 |
180 |
143 |
1) |
||||||||||||||||||
| Number of lost workday incident – Supply chain and public |
68 |
28% |
53 |
87 |
61 |
1) |
||||||||||||||||||
Responsible management of suppliers |
||||||||||||||||||||||||
| Tier one suppliers risk assessed (%) 2) |
99 |
0% |
99 |
98 |
47 |
– |
||||||||||||||||||
Energy consumption (facility energy usage) (GWh) |
||||||||||||||||||||||||
| Electricity and cooling – non-renewable |
189 |
4% |
182 |
255 |
299 |
347 |
||||||||||||||||||
| Electricity and cooling – renewable |
391 |
0% |
390 |
333 |
335 |
357 |
||||||||||||||||||
| District heating |
26 |
13% |
23 |
26 |
33 |
33 |
||||||||||||||||||
| Local heating and backup electricity |
25 |
–24% |
33 |
50 |
49 |
45 |
||||||||||||||||||
| Energy intensity (GWh/net sales SEK billion) |
2.7 |
0% |
2.7 |
2.9 |
3.4 |
3.8 |
||||||||||||||||||
Waste, product take-back and water |
||||||||||||||||||||||||
| Waste generated at facilities (tonnes) |
6,777 |
–2% |
6,916 |
11,013 |
10,217 |
11,755 |
||||||||||||||||||
| of which recycled (%) |
67 |
38% |
49 |
44 |
34 |
38 |
||||||||||||||||||
| Product take-back (tonnes) |
8,849 |
–13% |
10,204 |
8,403 |
8,380 |
12,252 |
||||||||||||||||||
| of which recycled or re-used (%) |
96 |
1% |
95 |
93 |
93 |
94 |
||||||||||||||||||
| Total water consumption (Mm 3 ) |
1.2 |
–20% |
1.5 |
1.5 |
1.6 |
1.8 |
||||||||||||||||||
Green House Gas Emissions (CO 2 e) (Ktonne) |
||||||||||||||||||||||||
| Direct emissions – Scope 1 |
38 |
–5% |
40 |
49 |
54 |
73 |
||||||||||||||||||
| Indirect emissions – Scope 2 (market based) |
58 |
–22% |
74 |
124 |
134 |
156 |
||||||||||||||||||
| Other indirect emissions – Scope 3 3) |
34,637 |
–5% |
36,605 |
35,877 |
– |
– |
||||||||||||||||||
| Emissions intensity (Ktonnes CO2e/net sales SEK billion) |
||||||||||||||||||||||||
| Scope 1 |
0.16 |
–8% |
0.17 |
0.22 |
0.26 |
0.36 |
||||||||||||||||||
| Scope 2 (market based) |
0.25 |
–22% |
0.32 |
0.55 |
0.64 |
0.76 |
||||||||||||||||||
1) |
Due to limitations in data availability, reporting on major incidents and lost-time incident broken down on employees and supply chain/public for 2017 is not possible. |
2) |
The process was formalized in 2018 wherefore comparative figures before that year are not available. |
3) |
Scope of reporting has been updated during 2021 wherefore comparable figures for 2018 and 2017 are not available. |
| 102 Financial Report 2021 | Alternative performance measures | Ericsson Annual Report on Form 20-F 2021 | |||
Adjusted earnings (loss) per share 1) |
||||||||||||||||||||
SEK |
2021 |
2020 |
2019 |
2018 |
2017 |
|||||||||||||||
Earnings (loss) per share, diluted |
6.81 |
5.26 |
0.67 |
–1.98 |
–9.94 |
|||||||||||||||
Restructuring charges |
0.13 |
0.30 |
0.18 |
1.88 |
1.93 |
|||||||||||||||
Amortizations and write-downs of acquired intangibles |
0.32 |
0.27 |
0.22 |
0.37 |
4.77 |
|||||||||||||||
Adjusted earnings (loss) per share |
7.26 |
5.83 |
1.07 |
0.27 |
–3.24 |
|||||||||||||||
1) |
2017 is restated due to implementation of IFRS 15 “Revenue from Contracts with Customers.” |
Definition |
Reason to use | |
| Adjusted earnings (loss) per share (EPS), diluted, excluding amortizations and write-downs of acquired intangible assets and excluding restructuring charges. | Restructuring charges vary between years. This measurement gives an indication of the performance without restructuring and without the impact of amortizations and write-downs of acquired intangible assets from acquired companies. |
Adjusted working capital 1) |
||||||||||||||||||||
SEK million |
2021 |
2020 |
2019 |
2018 |
2017 |
|||||||||||||||
Current assets |
174,805 |
149,795 |
153,914 |
161,167 |
153,423 |
|||||||||||||||
Current non-interest-bearing provisions and liabilities |
||||||||||||||||||||
| Provisions, current |
–5,782 |
–7,580 |
–8,244 |
–10,537 |
–6,283 |
|||||||||||||||
| Contract liabilities |
–32,834 |
–26,440 |
–29,041 |
–29,348 |
–29,076 |
|||||||||||||||
| Trade payables |
–35,684 |
–31,988 |
–30,403 |
–29,883 |
–26,320 |
|||||||||||||||
| Current tax liabilities 2) |
–2,917 |
–4,486 |
– |
– |
– |
|||||||||||||||
| Other current liabilities 2) |
–37,921 |
–33,688 |
–37,405 |
–38,891 |
–35,305 |
|||||||||||||||
Adjusted working capital |
59,667 |
45,613 |
48,821 |
52,508 |
56,439 |
|||||||||||||||
1) |
2017 is restated due to implementation of IFRS 15 “Revenue from Contracts with Customers.” |
2) |
As from 2021 current tax liabilities is presented as a separate line item in the balance sheet and the comparison year 2020 has been updated accordingly. For 2017– 2019 the current tax liabilities is included in other current liabilities. |
Definition |
Reason to use | |
| Current assets less current non-interest-bearing provisions and liabilities (which include: current provisions, contract liabilities, trade payables, current tax liabilities and other current liabilities). |
Due to the need to optimize cash generation to create value for Ericsson’s shareholders, management focuses on working capital and reducing lead times between orders booked and cash received. |
| 103 Financial Report 2021 | Alternative performance measures | Ericsson Annual Report on Form 20-F 2021 | |||
Capital employed 1) |
||||||||||||||||||||
SEK million |
2021 |
2020 |
2019 |
2018 |
2017 |
|||||||||||||||
Total assets |
305,614 |
271,530 |
276,383 |
268,761 |
259,882 |
|||||||||||||||
Non-interest-bearing provisions and liabilities |
||||||||||||||||||||
| Provisions, non-current |
3,722 |
2,886 |
2,679 |
5,471 |
3,596 |
|||||||||||||||
| Deferred tax liabilities |
884 |
1,089 |
1,224 |
670 |
901 |
|||||||||||||||
| Other non-current liabilities |
1,587 |
1,383 |
2,114 |
4,346 |
2,776 |
|||||||||||||||
| Provisions, current |
5,782 |
7,580 |
8,244 |
10,537 |
6,283 |
|||||||||||||||
| Contract liabilities |
32,834 |
26,440 |
29,041 |
29,348 |
29,076 |
|||||||||||||||
| Trade payables |
35,684 |
31,988 |
30,403 |
29,883 |
26,320 |
|||||||||||||||
| Current tax liabilities 2) |
2,917 |
4,486 |
– |
– |
– |
|||||||||||||||
| Other current liabilities 2) |
37,921 |
33,688 |
37,405 |
38,891 |
35,305 |
|||||||||||||||
Capital employed |
184,283 |
161,990 |
165,273 |
149,615 |
155,625 |
|||||||||||||||
1) |
2017 is restated due to implementation of IFRS 15 “Revenue from Contracts with Customers.” |
2) |
As from 2021 current tax liabilities is presented as a separate line item in the balance sheet and the comparison year 2020 has been updated accordingly. For 2017–2019 the current tax liabilities is included in other current liabilities. |
Definition |
Reason to use | |
| Total assets less non-interest-bearing provisions and liabilities. |
Capital employed represents the value of the balance sheet assets that contributes to revenue and profit generation. It is also used in the calculation of return on capital employed. |
Capital turnover 1) |
||||||||||||||||||||
SEK million |
2021 |
2020 |
2019 |
2018 |
2017 |
|||||||||||||||
Net sales |
232,314 |
232,390 |
227,216 |
210,838 |
205,378 |
|||||||||||||||
Average capital employed |
||||||||||||||||||||
| Capital employed at beginning of period |
161,990 |
165,273 |
149,615 |
155,625 |
185,666 |
|||||||||||||||
| Capital employed at end of period |
184,283 |
161,990 |
165,273 |
149,615 |
155,625 |
|||||||||||||||
| Average capital employed |
173,137 |
163,632 |
157,444 |
152,620 |
170,646 |
|||||||||||||||
Capital turnover (times) |
1.3 |
1.4 |
1.4 |
1.4 |
1.2 |
|||||||||||||||
1) |
2017 is restated due to implementation of IFRS 15 “Revenue from Contracts with Customers.” |
Definition |
Reason to use | |
| Net sales divided by average capital employed. | Capital turnover indicates how effectively investment capital is used to generate revenues. |
EBITA and EBITA margin / EBITA and EBITA margin excluding restructuring charges 1) |
||||||||||||||||||||
SEK million |
2021 |
2020 |
2019 |
2018 |
2017 |
|||||||||||||||
Net income (loss) |
22,980 |
17,623 |
1,840 |
–6,276 |
–32,433 |
|||||||||||||||
Income tax |
6,270 |
9,589 |
6,922 |
4,813 |
–3,525 |
|||||||||||||||
Financial income and expenses, net |
2,530 |
596 |
1,802 |
2,705 |
1,215 |
|||||||||||||||
Amortizations and write-downs of acquired intangibles |
1,477 |
1,220 |
1,038 |
1,662 |
16,652 |
|||||||||||||||
EBITA (loss) |
33,257 |
29,028 |
11,602 |
2,904 |
–18,091 |
|||||||||||||||
Net sales |
232,314 |
232,390 |
227,216 |
210,838 |
205,378 |
|||||||||||||||
EBITA margin (%) |
14.3% |
12.5% |
5.1% |
1.4% |
–8.8% |
|||||||||||||||
Restructuring charges |
549 |
1,306 |
798 |
8,015 |
8,501 |
|||||||||||||||
EBITA (loss) excluding restructuring charges |
33,806 |
30,334 |
12,400 |
10,919 |
–9,590 |
|||||||||||||||
EBITA margin excluding restructuring charges (%) |
14.6% |
13.1% |
5.5% |
5.2% |
–4.7% |
|||||||||||||||
1) |
2017 is restated due to implementation of IFRS 15 “Revenue from Contracts with Customers.” |
Definition |
Reason to use | |
| Earnings (loss) before interest, taxes, amortizations and write-downs of acquired intangibles, as a percentage of net sales. Reported EBITA (loss) excluding restructuring charges as a percentage of net sales. |
Amortizations and write-downs of intangible assets are normally non-cash items in the annual income statement, EBITA margin % gives an indication of the financial performance without the impact from acquired companies. The Company’s view is that EBITA margin excluding restructuring charges gives a fair view of the profitability of the ongoing business. |
| 104 Financial Report 2021 | Alternative performance measures | Ericsson Annual Report on Form 20-F 2021 | |||
EBIT and EBIT margin / EBIT and EBIT margin excluding restructuring charges 1) |
||||||||||||||||||||
SEK million |
2021 |
2020 |
2019 |
2018 |
2017 |
|||||||||||||||
EBIT (loss) |
31,780 |
27,808 |
10,564 |
1,242 |
–34,743 |
|||||||||||||||
Net sales |
232,314 |
232,390 |
227,216 |
210,838 |
205,378 |
|||||||||||||||
EBIT margin (%) |
13.7% |
12.0% |
4.6% |
0.6% |
–16.9% |
|||||||||||||||
Restructuring charges |
549 |
1,306 |
798 |
8,015 |
8,501 |
|||||||||||||||
EBIT (loss) excluding restructuring charges |
32,329 |
29,114 |
11,362 |
9,257 |
–26,242 |
|||||||||||||||
EBIT margin excluding restructuring charges (%) |
13.9% |
12.5% |
5.0% |
4.4% |
–12.8% |
|||||||||||||||
1) |
2017 is restated due to implementation of IFRS 15 “Revenue from Contracts with Customers.” |
Definition |
Reason to use | |
| Reported EBIT (loss) as a percentage of net sales. Reported EBIT (loss) excluding restructuring charges as a percentage of net sales. | EBIT margin shows the EBIT in percentage of net sales. EBIT margin is a key internal measure as the Company believes that it provides users of the financial statements with a better understanding of the Group’s financial performance both short and long term. The Company’s view is that EBIT margin excluding restructuring charges gives a fair view of the profitability of the ongoing business. |
Equity ratio 1) |
||||||||||||||||||||
SEK million |
2021 |
2020 |
2019 |
2018 |
2017 |
|||||||||||||||
Total equity |
107,099 |
85,177 |
81,878 |
87,770 |
97,571 |
|||||||||||||||
Total assets |
305,614 |
271,530 |
276,383 |
268,761 |
259,882 |
|||||||||||||||
Equity ratio (%) |
35.0% |
31.4% |
29.6% |
32.7% |
37.5% |
|||||||||||||||
1) |
2017 is restated due to implementation of IFRS 15 “Revenue from Contracts with Customers.” |
Definition |
Reason to use | |
| Equity expressed as a percentage of total assets. | An equity ratio above 40% is one of the company’s capital targets. This supports financial flexibility and independence to operate and manage variations in working capital needs as well as to capitalize on business opportunities. |
Free cash flow before M&A / Free cash flow after M&A |
||||||||||||||||||||
SEK million |
2021 |
2020 |
2019 |
2018 |
2017 |
|||||||||||||||
Cash flow from operating activities |
39.065 |
28,933 |
16,873 |
9,342 |
9,601 |
|||||||||||||||
Net capital expenditures and other investments (excluding M&A) |
||||||||||||||||||||
| Investments in property, plant and equipment |
–3,663 |
–4,493 |
–5,118 |
–3,975 |
–3,877 |
|||||||||||||||
| Sales of property, plant and equipment |
115 |
254 |
744 |
334 |
1,016 |
|||||||||||||||
| Product development |
–962 |
–817 |
–1,545 |
–925 |
–1,444 |
|||||||||||||||
| Other investing activities |
–131 |
801 |
–331 |
–523 |
–463 |
|||||||||||||||
| Repayment of lease liabilities |
–2,368 |
–2,417 |
–2,990 |
– |
– |
|||||||||||||||
Free cash flow before M&A |
32,056 |
22,261 |
7,633 |
4,253 |
4,833 |
|||||||||||||||
| Acquisitions of subsidiaries and other operations |
–389 |
–9,657 |
–1,753 |
–1,618 |
–289 |
|||||||||||||||
| Divestments of subsidiaries and other operations |
448 |
59 |
248 |
333 |
565 |
|||||||||||||||
Free cash flow after M&A |
32,115 |
12,663 |
6,128 |
2,968 |
5,109 |
|||||||||||||||
Definition |
Reason to use | |
| Free cash flow before M&A: Cash flow from operating activities less net capital expenditures, other investments (excluding M&A) and repayment of lease liabilities. Free cash flow after M&A: Cash flow from operating activities less net capital expenditures, other investments and repayment of lease liabilities. | Free cash flow before M&A represents the cash that the Company generates after capital expenditures, other investments and repayment of lease liabilities. The Company believes that free cash flow before M&A is a good way of reflecting the cash flows generated by the Company that can be used to expand the business, invest in subsidiaries, pay dividends and reduce debt. Free cash flow after M&A represents the cash that the Company generates after capital expenditures, other investments, repayment of lease liabilities and acquisitions/divestments of subsidiaries. The Company believes that free cash flow after M&A is a good way of reflecting the cash flows generated by the company that can be used to expand the business, pay dividends and reduce debt. |
| 105 Financial Report 2021 | Alternative performance measures | Ericsson Annual Report on Form 20-F 2021 | |||
| Gross cash |
||||||||||||||||||||
SEK million |
2021 |
2020 |
2019 |
2018 |
2017 |
|||||||||||||||
Cash and cash equivalents |
54,050 |
43,612 |
45,079 |
38,389 |
35,884 |
|||||||||||||||
Interest-bearing securities, current |
12,932 |
6,820 |
6,759 |
6,625 |
6,713 |
|||||||||||||||
Interest-bearing securities, non-current |
30,626 |
21,613 |
20,354 |
23,982 |
25,105 |
|||||||||||||||
Gross cash |
97,608 |
72,045 |
72,192 |
68,996 |
67,702 |
|||||||||||||||
Definition |
Reason to use | |
| Cash and cash equivalents plus interest-bearing securities (current and non-current). |
Gross cash is showing total available cash and interest-bearing securities and is a parameter for calculating the net cash position. |
| Gross margin and Gross margin excluding restructuring charges 1) |
||||||||||||||||||||
SEK million |
2021 |
2020 |
2019 |
2018 |
2017 |
|||||||||||||||
Gross income |
100,749 |
93,724 |
84,824 |
68,200 |
47,927 |
|||||||||||||||
Net sales |
232,314 |
232,390 |
227,216 |
210,838 |
205,378 |
|||||||||||||||
Gross margin (%) |
43.4% |
40.3% |
37.3% |
32.3% |
23.3% |
|||||||||||||||
Restructuring charges included in cost of sales |
273 |
725 |
337 |
5,938 |
5,242 |
|||||||||||||||
Gross income excluding restructuring charges |
101,022 |
94,449 |
85,161 |
74,138 |
53,169 |
|||||||||||||||
Gross margin excluding restructuring charges (%) |
43.5% |
40.6% |
37.5% |
35.2% |
25.9% |
|||||||||||||||
1) |
2017 is restated due to implementation of IFRS 15 “Revenue from Contracts with Customers.” |
Definition |
Reason to use | |
| Reported gross income as a percentage of net sales. Reported gross income excluding restructuring charges as a percentage of net sales. | Gross margin shows the difference between net sales and cost of sales, in percentage of net sales. Gross margin is impacted by several factors such as business mix, service share, price development and cost reductions. Gross margin is an important internal measure and this number is also provided in the income statement as the Company believes that it provides users of the financial statements with a better understanding of the Group’s business development. The Company’s view is that gross margin excluding restructuring charges gives a fair view of the profitability of the ongoing business. |
| Net cash |
||||||||||||||||||||
SEK million |
2021 |
2020 |
2019 |
2018 |
2017 |
|||||||||||||||
Cash and cash equivalents |
54,050 |
43,612 |
45,079 |
38,389 |
35,884 |
|||||||||||||||
+ Interest-bearing securities, current |
12,932 |
6,820 |
6,759 |
6,625 |
6,713 |
|||||||||||||||
+ Interest-bearing securities, non-current |
30,626 |
21,613 |
20,354 |
23,982 |
25,105 |
|||||||||||||||
– Borrowings, current |
9,590 |
7,942 |
9,439 |
2,255 |
2,545 |
|||||||||||||||
– Borrowings, non-current |
22,241 |
22,218 |
28,257 |
30,870 |
30,500 |
|||||||||||||||
Net cash |
65,777 |
41,885 |
34,496 |
35,871 |
34,657 |
|||||||||||||||
Definition |
Reason to use | |
| Cash and cash equivalents plus interest-bearing securities (current and non-current) less borrowings (current and non-current). |
A positive net cash position that is larger than the pension liability is one of the company’s capital targets. This creates financial flexibility and independence to operate and manage variations in working capital needs. |
| Operating expenses, excluding restructuring charges |
||||||||||||||||||||
SEK million |
2021 |
2020 |
2019 |
2018 |
2017 |
|||||||||||||||
Operating expenses |
–69,071 |
–66,280 |
–64,215 |
–66,848 |
–70,563 |
|||||||||||||||
Restructuring charges included in R&D expenses |
137 |
411 |
344 |
1,293 |
2,307 |
|||||||||||||||
Restructuring charges included in selling and administrative expenses |
139 |
170 |
117 |
784 |
952 |
|||||||||||||||
Operating expenses, excluding restructuring charges |
–68,795 |
–65,699 |
–63,754 |
–64,771 |
–67,304 |
|||||||||||||||
Definition |
Reason to use | |
| Reported operating expenses, excluding restructuring charges. | Restructuring charges vary between years and in order to analyse trends in reported expenses overtime, restructuring charges are excluded. |
| 106 Financial Report 2021 | Alternative performance measures | Ericsson Annual Report on Form 20-F 2021 | |||
| Return on capital employed 1) |
||||||||||||||||||||
SEK million |
2021 |
2020 |
2019 |
2018 |
2017 |
|||||||||||||||
EBIT (loss) |
31,780 |
27,808 |
10,564 |
1,242 |
–34,743 |
|||||||||||||||
Average capital employed |
||||||||||||||||||||
| Capital employed at beginning of period |
161,990 |
165,273 |
149,615 |
155,625 |
185,667 |
|||||||||||||||
| Capital employed at end of period |
184,283 |
161,990 |
165,273 |
149,615 |
155,625 |
|||||||||||||||
| Average capital employed |
173,137 |
163,632 |
157,444 |
152,620 |
170,646 |
|||||||||||||||
Return on capital employed (%) |
18.4% |
17.0% |
6.7% |
0.8% |
–20.4% |
|||||||||||||||
Definition |
Reason to use | |
| Reported EBIT (loss) as a percentage of average capital employed. | Return on capital employed is a measure of the profitability after taking into account the amount of capital used. A higher return on capital employed indicates a more efficient use of capital. |
| Return on equity 1) |
||||||||||||||||||||
SEK million |
2021 |
2020 |
2019 |
2018 |
2017 |
|||||||||||||||
Net income (loss) attributable to owners of the Parent Company |
22,694 |
17,483 |
2,223 |
–6,530 |
–32,576 |
|||||||||||||||
Average stockholders’ equity |
||||||||||||||||||||
| Stockholders’ equity, beginning of period 2) |
86,674 |
82,559 |
86,729 |
95,952 |
134,582 |
|||||||||||||||
| Stockholders’ equity, end of period |
108,775 |
86,674 |
82,559 |
86,978 |
96,935 |
|||||||||||||||
| Average stockholders’ equity |
97,725 |
84,617 |
84,644 |
91,465 |
115,759 |
|||||||||||||||
Return on equity (%) |
23.2% |
20.7% |
2.6% |
–7.1% |
–28.1% |
|||||||||||||||
Definition |
Reason to use | |
| Net income (loss) attributable to owners of the Parent Company as a percentage of average stockholders’ equity. | Return on equity is a measure of the profitability in relation to the book value of shareholder equity. Return on equity is a measure of how investments are used to generate earnings growth. |
| Sales growth adjusted for comparable units and currency |
||||||||||||||||||||
SEK million |
2021 |
2020 |
2019 |
2018 |
||||||||||||||||
Net sales |
232,314 |
232,390 |
227,216 |
210,838 |
||||||||||||||||
| Acquired/divested business |
–1,201 |
–1,362 |
–96 |
– |
||||||||||||||||
| Net FX impact |
11,607 |
7,796 |
–10,675 |
–4,232 |
||||||||||||||||
Comparable net sales, excluding FX impact |
242,720 |
238,824 |
216,445 |
206,606 |
||||||||||||||||
Comparable net sales adjusted for acquired/divested business |
232,390 |
227,132 |
208,130 |
– |
||||||||||||||||
Sales growth adjusted for comparable units and currency (%) |
4% |
5% |
4% |
1% |
||||||||||||||||
Definition |
Reason to use | |
| Sales growth adjusted for the impact of acquisitions and divestments as well as the effects of foreign currency fluctuations. Also named organic sales. | Ericsson’s presentation currency is SEK while the total revenues are mainly in other currencies. Reported sales growth is dependent on fluctuations in SEK versus other currencies and in addition acquired or divested business can have an impact on reported net sales. Sales growth adjusted for comparable units and currency shows the underlying sales development without these parameters. |
| 107 Financial Report 2021 | The Ericsson share | Ericsson Annual Report on Form 20-F 2021 | |||
| Share trading on different market places (class B shares)  |
With the implementation of the Mifid directive in the EU, share trading became heavily fragmented across a large number of venues and trading categories. Trading on MTFs (multilateral trading facilities) and other venues gained market shares from stock exchanges such as Nasdaq Stockholm. In the last few years however, following a series of merger and acquisitions among trading venues, trading has become more concentrated. According to Nasdaq, trading in Stockholm represented 53% of total trading in 2021. Total trading in Ericsson B shares on all venues combined has decreased over the past five years from 7.9 billion shares in 2017 to 5.2 billion shares in 2021. Over the same period, trading of Ericsson ADS in the US has increased from 1.2 billion shares in 2017 to 1.6 billion shares. |
The Ericsson share |
| Share/ADS listings |
| Nasdaq Stockholm |
| NASDAQ New York |
| Share data | ||||
| Total number of shares in issue | 3,334,151,735 | |||
| of which Class A shares, each carrying one vote 1) |
261,755,983 |
|||
| of which Class B shares, each carrying one tenth of one vote 1) |
3,072,395,752 |
|||
| Ericsson treasury shares, Class B | 4,009,306 | |||
| Quotient value | SEK 5.00 | |||
| Market capitalization, December 31, 2021 | SEK 333 billion | |||
| ICB (Industry Classification Benchmark) | 9,500 | |||
1) |
Both classes of shares have the same rights of participation in the net assets and earnings. |
| Ticker codes | ||||
| Nasdaq Stockholm | ERIC A/ERIC B | |||
| NASDAQ New York | ERIC | |||
| Bloomberg Nasdaq Stockholm | ERICA SS/ERICB SS | |||
| Bloomberg Nasdaq | ERIC US | |||
| Reuters Nasdaq Stockholm | ERICa.ST/ERICb.ST | |||
| Reuters Nasdaq | ERIC.O | |||
| Changes in number of shares and capital stock 2017–2021 |
||||||||||
| Number of shares | Share capital (SEK) | |||||||||
| 2017 | May 10, new issue (Class C shares, later converted to Class B-shares) 1) |
3,000,000 | 15,000,000 | |||||||
| 2017 | December 31 | 3,334,151,735 | 16,670,758,678 | |||||||
| 2018 | December 31 | 3,334,151,735 | 16,670,758,678 | |||||||
| 2019 | December 31 | 3,334,151,735 | 16,670,758,678 | |||||||
| 2020 | December 31 | 3,334,151,735 | 16,670,758,678 | |||||||
| 2021 | December 31 | 3,334,151,735 | 16,670,758,678 | |||||||
1) |
The AGM 2017 resolved to issue 3,000,000 Class C shares for the Long-Term Variable Compensation Program 2017. In accordance with an authorization from the AGM, in the second quarter 2017, the Board of Directors resolved to repurchase the new issued shares, which were subsequently converted into Class B shares. The quotient value of the repurchased shares was SEK 5, totaling SEK 15 million, representing less than 0.1% of capital stock, and the acquisition cost was approximately SEK 15.1 million. |
| Share performance indicators |
||||||||||||||||||||
2021 |
2020 |
2019 |
2018 |
2017 4) |
||||||||||||||||
Earnings (loss) per share, diluted (SEK) 1) |
6.81 |
5.26 |
0.67 |
–1.98 |
–9.94 |
|||||||||||||||
Adjusted earnings (loss) per share (SEK) 2) |
7.26 |
5.83 |
1.07 |
0.27 |
–3.24 |
|||||||||||||||
Dividend per share (SEK) 3) |
2.50 |
2.00 |
1.50 |
1.00 |
1.00 |
|||||||||||||||
Total shareholder return (%) |
4 |
22 |
6 |
47 |
3 |
|||||||||||||||
P/E ratio |
15 |
19 |
122 |
n/a |
n/a |
|||||||||||||||
1) |
Calculated on average number of shares outstanding, diluted. |
2) |
EPS, diluted, excluding amortizations and write-downs of acquired intangible assets, and excluding restructuring charges, SEK. A reconcilation of Alternative performance measures is available on pages 102–106. |
3) |
For 2021 as proposed by the Board of Directors. |
| 4) | 2017 is restated due to implementation of IFRS 15 “Revenue from Contracts with Customers”. |
| 108 Financial Report 2021 | The Ericsson share | Ericsson Annual Report on Form 20-F 2021 | |||
| Share prices on Nasdaq Stockholm |
|
|||||||||||||||||||
(SEK) |
2021 |
2020 |
2019 |
2018 |
2017 |
|||||||||||||||
Class A at last day of trading |
100.20 |
105.40 |
85.40 |
77.40 |
53.25 |
|||||||||||||||
Class A high (Feb 15, 2021) |
128.80 |
119.00 |
96.80 |
85.20 |
64.80 |
|||||||||||||||
Class A low (Nov 3, 2021) |
91.90 |
64.10 |
74.70 |
49.05 |
44.17 |
|||||||||||||||
Class B at last day of trading |
99.79 |
99.98 |
81.56 |
77.92 |
53.85 |
|||||||||||||||
Class B high (Apr 21, 2021) |
121.80 |
110.15 |
96.74 |
85.66 |
64.95 |
|||||||||||||||
Class B low (Nov 3, 2021) |
91.00 |
59.54 |
74.02 |
49.04 |
43.75 |
|||||||||||||||
| Share prices on NASDAQ New York |
|
|||||||||||||||||||
(USD) |
2021 |
2020 |
2019 |
2018 |
2017 |
|||||||||||||||
ADS at last day of trading |
10.87 |
11.95 |
8.78 |
8.88 |
6.68 |
|||||||||||||||
ADS high (Jan 27, 2021) |
15.32 |
12.20 |
10.46 |
9.45 |
7.47 |
|||||||||||||||
ADS low (Dec 3, 2021) |
9.93 |
6.15 |
7.58 |
6.00 |
5.52 |
|||||||||||||||
| Share prices on Nasdaq Stockholm and NASDAQ New York |
||||||||||||||||||||||||||||||||
Nasdaq Stockholm |
NASDAQ New York |
|||||||||||||||||||||||||||||||
SEK per Class A share |
SEK per Class B share |
USD per ADS 1) |
||||||||||||||||||||||||||||||
Period |
High |
Low |
High |
Low |
High |
Low |
||||||||||||||||||||||||||
| Annual high and low |
||||||||||||||||||||||||||||||||
2017 |
64.80 |
44.17 |
64.95 |
43.75 |
7.47 |
5.52 |
||||||||||||||||||||||||||
2018 |
85.20 |
49.05 |
85.66 |
49.04 |
9.45 |
6.00 |
||||||||||||||||||||||||||
2019 |
96.80 |
74.70 |
96.74 |
74.02 |
10.45 |
7.58 |
||||||||||||||||||||||||||
2020 |
119.00 |
64.10 |
110.15 |
59.54 |
12.61 |
6.15 |
||||||||||||||||||||||||||
2021 |
128.80 |
91.90 |
121.80 |
91.00 |
15.32 |
9.93 |
||||||||||||||||||||||||||
| Quarterly high and low |
||||||||||||||||||||||||||||||||
2020 First Quarter |
96.10 |
64.10 |
89.22 |
59.54 |
9.24 |
6.15 |
||||||||||||||||||||||||||
2020 Second Quarter |
100.60 |
77.40 |
91.78 |
77.60 |
9.88 |
7.62 |
||||||||||||||||||||||||||
2020 Third Quarter |
114.80 |
92.50 |
105.10 |
85.40 |
12.10 |
9.20 |
||||||||||||||||||||||||||
2020 Fourth Quarter |
119.00 |
100.40 |
110.15 |
93.42 |
12.61 |
10.50 |
||||||||||||||||||||||||||
2021 First Quarter |
128.80 |
105.40 |
118.05 |
96.90 |
15.32 |
11.55 |
||||||||||||||||||||||||||
2021 Second Quarter |
122.60 |
104.40 |
121.80 |
104.90 |
14.39 |
12.40 |
||||||||||||||||||||||||||
2021 Third Quarter |
116.00 |
95.40 |
116.16 |
95.58 |
13.40 |
10.88 |
||||||||||||||||||||||||||
2021 Fourth Quarter |
107.00 |
91.90 |
107.04 |
91.00 |
12.24 |
9.93 |
||||||||||||||||||||||||||
| Monthly high and low |
||||||||||||||||||||||||||||||||
August 2021 |
105.00 |
97.90 |
104.78 |
97.78 |
12.00 |
11.16 |
||||||||||||||||||||||||||
September 2021 |
104.80 |
95.40 |
104.48 |
95.58 |
12.13 |
10.88 |
||||||||||||||||||||||||||
October 2021 |
107.00 |
93.20 |
107.04 |
92.92 |
12.24 |
10.82 |
||||||||||||||||||||||||||
November 2021 |
98.70 |
91.90 |
98.59 |
91.00 |
11.19 |
9.94 |
||||||||||||||||||||||||||
December 2021 |
100.60 |
92.20 |
99.99 |
91.16 |
11.02 |
9.93 |
||||||||||||||||||||||||||
January 2022 |
116.40 |
99.70 |
115.38 |
97.01 |
12.39 |
10.54 |
||||||||||||||||||||||||||
| 1) One ADS = 1 Class B share. |
Source: Nasdaq Stockholm and NASDAQ New York. |
| 109 Financial Report 2021 | The Ericsson share | Ericsson Annual Report on Form 20-F 2021 | |||
| The Executive Team and Board members, ownership |
|
|||||||||||
| Number of Class A shares |
Number of Class B shares |
Voting rights, percent |
||||||||||
The Executive Team and Board members as a group ( 30 persons) |
1,708 |
3,077,014 |
0.05% |
|||||||||

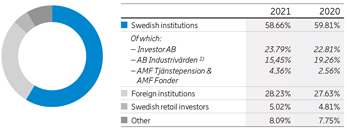
1) |
Together with SHB Pensionsstiftelse and Pensionkassan SHB Tjänstepensionsförening. |
| Number of shares 1) |
||||||||||||||||||||||||
Holding |
No. of shareholders |
No. of A shares |
No. of B shares |
Percentage of share capital |
Percentage of voting rights |
Market value (MSEK) |
||||||||||||||||||
1–500 |
339,582 |
1,476,912 |
42,268,120 |
1.31% |
1.00% |
4,365,922 |
||||||||||||||||||
501–1,000 |
38,180 |
986,204 |
28,029,100 |
0.87% |
0.67% |
2,895,842 |
||||||||||||||||||
1,001–5,000 |
37,886 |
2,805,648 |
79,845,443 |
2.48% |
1.90% |
8,248,903 |
||||||||||||||||||
5,001–10,000 |
4,762 |
1,050,198 |
32,985,657 |
1.02% |
0.76% |
3,396,869 |
||||||||||||||||||
10,001–15,000 |
1,266 |
373,924 |
15,224,160 |
0.47% |
0.33% |
1,556,686 |
||||||||||||||||||
15,001–20,000 |
599 |
311,008 |
10,431,025 |
0.32% |
0.24% |
1,072,075 |
||||||||||||||||||
20,001– |
1,626 |
254,752,089 |
2,863,287,988 |
93.52% |
95.09% |
311,253,668 |
||||||||||||||||||
| Total, December 31, 2021 2) |
423,904 |
261,755,983 |
3,072,395,752 |
100% |
100% |
332,822,322 |
||||||||||||||||||
1) |
Source: Euroclear. |
2) |
Includes a nominee reporting discrepancy of 324,264 shares. |
| Largest shareholders December 31, 2020 and percentage of voting rights December 31, 2021, 2020 and 2019 |
|
|||||||||||||||||||||||||||||||
| Identity of person or group 1) |
Number of Class A shares |
Of total Class A shares percent |
Number of Class B shares |
Of total Class B shares percent |
Of total Class A+B shares percent |
2021 Voting rights percent |
2020 Voting rights percent |
2019 Voting rights percent |
||||||||||||||||||||||||
| Investor AB | 120,762,803 | 46.14 | 145,982,932 | 4.75 | 8.00 | 23.79 | 22.81 | 22.53 | ||||||||||||||||||||||||
| AB Industrivärden | 86,052,615 | 32.88 | 1,000,000 | 0.03 | 2.61 | 15.14 | 15.14 | 15.14 | ||||||||||||||||||||||||
| AMF Tjänstepension & AMF Fonder | 20,650,000 | 7.89 | 41,849,713 | 1.36 | 1.87 | 4.36 | 2.56 | 2.71 | ||||||||||||||||||||||||
| Cevian Capital | 339,228 | 0.13 | 151,386,082 | 4.93 | 4.55 | 2.72 | 3.25 | 4.99 | ||||||||||||||||||||||||
| BlackRock Institutional Trust Company, N.A. | 522 | 0.00 | 137,111,236 | 4.46 | 4.11 | 2.41 | 2.35 | 2.16 | ||||||||||||||||||||||||
| Swedbank Robur Fonder AB 2) |
8,277 | 0.00 | 127,530,652 | 4.15 | 3.83 | 2.24 | 2.31 | 2.33 | ||||||||||||||||||||||||
| AFA Försäkring AB | 11,484,600 | 4.39 | 1,881,329 | 0.06 | 0.40 | 2.05 | 1.99 | 2.06 | ||||||||||||||||||||||||
| PRIMECAP Management Company | 0 | 0.00 | 105,576,247 | 3.44 | 3.17 | 1.86 | 2.18 | 2.32 | ||||||||||||||||||||||||
| The Vanguard Group, Inc. | 867,142 | 0.33 | 80,337,772 | 2.61 | 2.44 | 1.56 | 1.42 | 1.46 | ||||||||||||||||||||||||
| Livförsäkringsbolaget Skandia, ömsesidigt | 4,417,721 | 1.69 | 23,875,322 | 0.78 | 0.85 | 1.20 | 1.17 | 1.18 | ||||||||||||||||||||||||
| Fidelity International | 0 | 0.00 | 59,948,762 | 1.95 | 1.80 | 1.05 | 0.79 | 0.57 | ||||||||||||||||||||||||
| Tredje AP Fonden | 4,253,533 | 1.62 | 15,657,855 | 0.51 | 0.60 | 1.02 | 0.44 | 0.53 | ||||||||||||||||||||||||
| State Street Global Advisors (US) | 0 | 0.00 | 53,785,677 | 1.75 | 1.61 | 0.95 | 0.97 | 1.03 | ||||||||||||||||||||||||
| Handelsbanken Asset Management | 11,352 | 0.00 | 52,624,728 | 1.71 | 1.58 | 0.93 | 0.89 | 1.25 | ||||||||||||||||||||||||
| Norges Bank Investment Management (NBIM) | 260,203 | 0.10 | 48,011,969 | 1.56 | 1.45 | 0.89 | 1.03 | 1.49 | ||||||||||||||||||||||||
| Others | 12,647,987 | 4.83 | 2,025,835,476 | 65.94 | 61.14 | 37.83 | 40.71 | 38.24 | ||||||||||||||||||||||||
| Total |
261,755,983 |
100 |
3,072,395,752 |
100 |
100 |
100 |
100 |
100 |
||||||||||||||||||||||||
1) |
Source: Nasdaq |
2) |
In 2019 Annual report, Folksam’s holdings were included in Swedbank Robur Fonder AB’s holdings for 2019, which is why Swedbank Robur Fonder AB’s holdings were then stated as 3.07% of the voting rights and 5.24% of the number of shares for 2019. |
| 110 Financial Report 2021 | The Ericsson share | Ericsson Annual Report on Form 20-F 2021 | |||
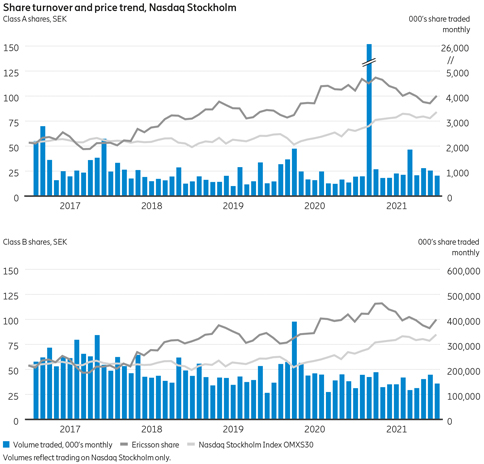
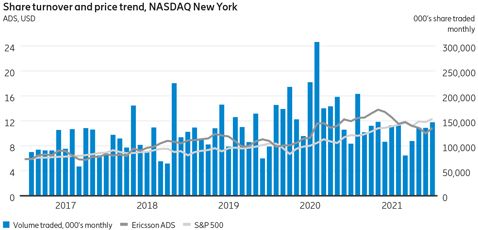
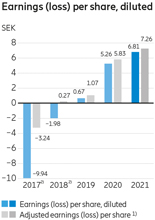
1) |
EPS, diluted, excl. restructuring charges, amortizations and write-downs of acquired intangible assets, SEK. A reconciliation of Alternative performance measures is available on pages 102–106. |
2) |
2017 is restated due to implementation of IFRS 15 “Revenue from Contracts with Customers”. |

1) |
For 2021 as proposed by the Board of Directors. |
| 111 Financial Report 2021 | Shareholder information | Ericsson Annual Report on Form 20-F 2021 | |||
| – | March 25, 2022 |
| – | Q1, April 14, 2022 |
| – | Q2, July 14, 2022 |
| – | Q3, October 20, 2022 |
| – | Q4, January 20, 2023 |
| – | March, 2023 |
| 112 Financial Report 2021 | Financial terminology | Ericsson Annual Report on Form 20-F 2021 | |||
| Exchange rates in consolidation | ||||||||
| January–December | ||||||||
| 2021 | 2020 | |||||||
| SEK/EUR |
||||||||
| Average rate 1) |
10.15 | 10.46 | ||||||
| Closing rate |
10.24 | 10.06 | ||||||
| SEK/USD |
||||||||
| Average rate 1) |
8.56 | 9.14 | ||||||
| Closing rate |
9.05 | 8.19 | ||||||
1) |
Average for the year for disclosure purpose only. Period income and expenses for each income statement are translated at period average exchange rates. |
1) |
For additional information of certain financial terms, see Alternative performance measures on pages 102–106. |
| 113 Financial Report 2021 | Glossary | Ericsson Annual Report on Form 20-F 2021 | |||

Corporate Governance report 2021 |
||||||
Regulation and compliance |
2 |
|||||
Governance structure |
4 |
|||||
General Meetings of shareholders |
5 |
|||||
Nomination Committee |
6 |
|||||
Board of Directors |
6 |
|||||
Committees of the Board of Directors |
9 |
|||||
Remuneration to Board members |
11 |
|||||
Members of the Board of Directors |
12 |
|||||
Management |
16 |
|||||
Members of the Executive Team |
20 |
|||||
Auditor |
24 |
|||||
Internal control over financial reporting |
24 |
|||||
| This Corporate Governance report is rendered as a separate report added to the Financial Report in accordance with the Annual Accounts Act ((SFS 1995:1554) Chapter 6, Sections 6 and 8) and the Swedish Corporate Governance Code. The report has been reviewed by Ericsson’s auditor in accordance with the Annual Accounts Act. A report from the auditor is appended here to. |
||||||
| 1 Corporate Governance report 2021 | Ericsson Annual Report on Form 20-F 2021 | |||
| 2 Corporate Governance report 2021 | Ericsson Annual Report on Form 20-F 2021 | |||
| – | The Swedish Companies Act |
| – | Applicable EU regulations |
| – | The Nordic Main Market Rulebook for Issuers of Shares, Nasdaq Nordic |
| – | The Swedish Corporate Governance Code (the Code) |
| – | The NASDAQ Stock Market Rules, including applicable NASDAQ New York corporate governance requirements (subject to certain exemptions principally reflecting mandatory Swedish legal requirements) |
| – | Applicable requirements of the US Securities and Exchange Commission (SEC). |
| – | The Code of Business Ethics |
| – | Group Steering Documents, including Group policies and directives, instructions and business processes for approval, control and risk management |
| – | The Code of Conduct for Business Partners |
| Compliance with regulations |
||||
| Compliance with the Swedish Corporate Governance Code The Code is based on the principle of “comply or explain” and is published on the website of the Swedish Corporate Governance Board, which administers the Code: www.corporategovernanceboard.se. Ericsson does not report any deviations from the rules of the Code in 2021. |
Compliance with applicable stock exchange rules There has been no infringement by Ericsson of applicable stock exchange rules and no breach of good practice on the securities market reported by the disciplinary committee of Nasdaq Stockholm or the Swedish Securities Council in 2021. |
| 3 Corporate Governance report 2021 | Ericsson Annual Report on Form 20-F 2021 | |||
| 2019 Resolutions with US Authorities In 2019, Ericsson announced the resolution of investigations by the US Department of Justice (DOJ) and the Securities and Exchange Commission (SEC) regarding the Company’s compliance with the US Foreign Corrupt Practices Act (FCPA). As part of the Deferred Prosecution Agreement (DPA) with the DOJ and consent judgment with the SEC, Ericsson agreed to engage an independent compliance monitor for a period of three years while the Company continues to undertake significant reforms to strengthen its Ethics & Compliance Program. In 2020, the three-year period for the monitorship commenced with the appointment of Dr. Andreas Pohlmann of the firm Pohlmann & Company – Compliance and Governance Advisory LLP as Ericsson’s monitor. The monitor’s main responsibilities include reviewing Ericsson’s compliance with the terms of the resolution and evaluating the Company’s progress in implementing and operating its enhanced compliance program and accompanying controls as |
well as providing recommendations for improvements. On October 21, 2021 Ericsson received correspondence from the DOJ stating its determination that the Company had breached its obligations under the DPA by failing to provide certain documents and factual information. At this time we cannot provide further details about the determination by the DOJ and cannot predict the outcome of the resolution of this matter. Ericsson has taken steps to avoid a recurrence of the issues that led to the breach determination. Ericsson is committed to cooperating openly and fully with the DOJ and its Independent Compliance Monitor consistent with all terms set out in the DPA. The Code of Business Ethics Ericsson’s newly revised and enhanced Code of Business Ethics (COBE), launched in 2021, outlines the Company’s fundamental ethical principles and expectations. COBE is designed to ensure that the Company pursues business with a strong sense of integrity and reflects |
the Company’s commitment to conducting business responsibly, consistent with all internationally recognized human rights principles and the applicable laws and regulations where the Company operates. COBE is applicable to all individuals performing work for Ericsson and under its control (including employees, the Board of Directors, the President and CEO, and consultants and contractors) and has been translated into 43 languages to ensure that it is understood by all. Everyone working for the Company has an individual responsibility to ensure that their business practices adhere to COBE. The Company reviews and updates COBE’s content periodically, and runs an acknowledgment process regularly, including during 2021, to ensure that everyone working for Ericsson has read and understood it. New employees and individuals starting work for Ericsson are also required to acknowledge their understanding of COBE upon their recruitment or on the first day of their assignment. | ||
| Ericsson’s core values |
||||
Professionalism |
Respect |
The Company’s core values are the foundation of its culture. They guide employees’ daily work, in how they relate to each other and the world around them and in the way the Company does business. The Code of Business Ethics and the Code of Conduct for Business Partners can be found on Ericsson’s website. | ||
| Perseverance |
Integrity |
|||
| 4 Corporate Governance report 2021 | Ericsson Annual Report on Form 20-F 2021 | |||
| Governance structure Shareholders may exercise their decision-making rights in Telefonaktiebolaget LM Ericsson (the “Parent Company”) at General Meetings of shareholders. A Nomination Committee is appointed each year by the major shareholders in accordance with the Instruction for the Nomination Committee adopted by the Annual General Meeting of shareholders. The tasks of the Nomination Committee include the proposal of Board members and external auditor for election by the Annual General Meeting of shareholders and proposal of Board member and auditor remuneration. In addition to the Board members elected by shareholders, the Board of Directors consists of employee representatives and their deputies who the unions have the right to appoint under Swedish law. The Board of Directors is ultimately responsible for the strategy and the organization of Ericsson and the management of its operations. The President and CEO, appointed by the Board of Directors, is responsible for handling the day-to-day |
The external auditor of Ericsson is appointed by the shareholders at the General Meeting of shareholders. Ownership structure As of December 31, 2021, the Parent Company had 423,904 registered shareholders, of which 411,093 were resident or located in Sweden (according to the share register kept by Euroclear Sweden AB). Swedish institutions held approximately 58.66% of the votes. The largest shareholders as of December 31, 2021 were Investor AB with approximately 23.79% of the votes (8.00% of the shares) and AB Industrivärden (together with Svenska Handelsbankens Pensionsstiftelse and Pensionskassan SHB Tjänstepensionsförening) with approximately 15.45% of the votes (2.95% of the shares) and AMF Tjänstepension & AMF Fonder with approximately 4.36% of the votes (1.87% of the shares). A significant number of the shares held by foreign investors are nominee-registered, i.e., held of record by banks, brokers and/or nominees. This means that the actual shareholder is not displayed in the share register or included in the shareholding statistics. |
More information on Ericsson’s shareholders can be found in the chapter “The Ericsson share” in the Financial Report. Shares and voting rights The share capital of the Parent Company consists of two classes of shares listed on Nasdaq Stockholm: A and B shares. Each Class A share carries one vote, and each Class B share carries one tenth of one vote. Class A and B shares entitle the holder to the same proportion of assets and earnings and carry equal rights to dividends. The Parent Company may also issue Class C shares, which are converted into Class B shares to create treasury stock to finance and hedge long-term variable compensation programs resolved by the General Meeting of shareholders. In the US, the Ericsson Class B shares are listed on NASDAQ New York in the form of American Depositary Shares (ADS) evidenced by American Depositary Receipts (ADR). Each ADS represents one Class B share. The members of the Board of Directors and the Executive Team have the same voting rights on shares as other shareholders holding the same class of shares. | ||
 |
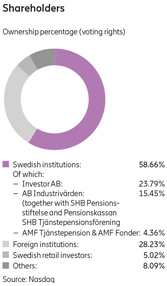 | |||
| 5 Corporate Governance report 2021 | Ericsson Annual Report on Form 20-F 2021 | |||
| – | Amendment of the articles of association |
| – | Resolution to transfer treasury stock to employees participating in long-term variable compensation programs. |
| – | Payment of a dividend of SEK 2.00 per share to be paid in two instalments |
| – | Re-election of Ronnie Leten as Chair of the Board of Directors |
| – | Re-election of other members of the Board of Directors: Jon Fredrik Baksaas, Jan Carlson, Eric A. Elzvik, Nora Denzel, Börje Ekholm, Kurt Jofs, Kristin S. Rinne, Helena Stjernholm and Jacob Wallenberg |
| – | Approval of Board of Directors’ fees, in accordance with the Nomination Committee’s proposal: |
| - | Chair: SEK 4,225,000 (previously SEK 4,075,000) |
| - | Other non-employee Board members: SEK 1,060,000 each (previously SEK 1,020,000) |
| - | Chair of the Audit and Compliance Committee: SEK 420,000 (previously SEK 400,000) |
| - | Other non-employee members of the Audit and Compliance Committee: SEK 270,000 each (previously SEK 250,000) |
| - | Chairs of the Finance Committee, the Remuneration Committee and the Technology and Science Committee: SEK 205,000 each (previously SEK 200,000) |
| - | Other non-employee members of the Finance Committee, the Remuneration Committee and the Technology and Science Committee: SEK 180,000 each (previously SEK 175,000) |
| – | Approval for part of the Directors’ fees to be paid in the form of synthetic shares |
| – | Appointment of Deloitte AB as auditor for the period up until the end of the AGM 2022 |
| – | Amendment of the articles of association |
| – | Implementation of a Long-Term Variable Compensation Program 2021 (LTV 2021) for the Executive Team. |
| Contact the Board of Directors |
Annual General Meeting 2022 |
|||
| Telefonaktiebolaget LM Ericsson |
Ericsson’s AGM 2022 will take place on March | |||
| The Board of Directors Secretariat |
29, 2022. Further information is available on | |||
| SE-164 83 Stockholm |
Ericsson’s website. | |||
| Sweden |
||||
| boardsecretariat@ericsson.com |
| 6 Corporate Governance report 2021 | Ericsson Annual Report on Form 20-F 2021 | |||
| – | Representatives of the four largest shareholders by voting power by the end of the month in which the AGM was held, and |
| – | The Chair of the Board of Directors. |
| – | Johan Forssell (Investor AB), Chair of the Nomination Committee |
| – | Karl Åberg (AB Industrivärden) |
| – | Anders Oscarsson (AMF Tjänstepension & AMF Fonder) |
| – | Jonas Synnergren (Cevian Capital Partners Limited) |
| – | Ronnie Leten (the Chair of the Board of Directors). |
| – | Remuneration to non-employee Directors elected by the AGM and remuneration to the auditor |
| – | Appointment of auditor, whereby candidates are selected in cooperation with the Audit and Compliance Committee of the Board |
| – | Election of Chair at the AGM |
| – | Changes to the Instruction for the Nomination Committee (if any). |
| Contact the Nomination Committee |
Proposals to the Nomination Committee |
|||
| Telefonaktiebolaget LM Ericsson |
Shareholders may submit proposals to the | |||
| The Nomination Committee |
Nomination Committee at any time but should | |||
| c/o The Board of Directors Secretariat |
do so in due time before the AGM to ensure | |||
| SE-164 83 Stockholm |
that the proposals can be considered by the | |||
| Sweden |
Committee. Further information is available on | |||
| nomination.committee@ericsson.com |
Ericsson’s website. | |||
| |
||||
| 7 Corporate Governance report 2021 | Ericsson Annual Report on Form 20-F 2021 | |||
– |
Fourth-quarter and full-year financial results meeting |
| Following the end of the calendar year, the Board held a meeting which focused on the |
| The Board’s annual work cycle 2021 The annual cycle applied to the Board’s work allows the Board to appropriately address its duties during the year. It also facilitates the organization in aligning its global processes to allow appropriate Board involvement. |
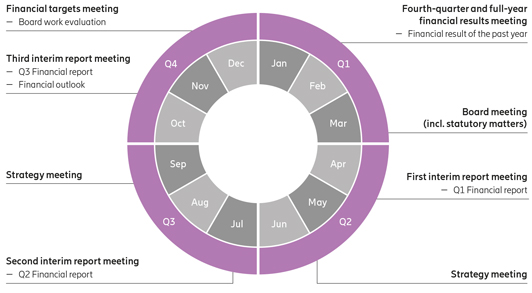 |
| 8 Corporate Governance report 2021 | Ericsson Annual Report on Form 20-F 2021 | |||
| financial results of the entire year 2020 and handled the fourth-quarter financial report. |
– |
Board meeting (incl. statutory matters) |
| A Board meeting was held in connection with the AGM 2021. Members of each of the Board Committees were appointed and the Board resolved on signatory powers. |
– |
First interim report meeting |
| At the first interim report meeting, the Board addressed the interim financial report for the first quarter of the year. |
– |
Strategy meeting |
| A Board meeting was held to address particular strategic matters in further detail. |
– |
Second interim report meeting |
| At the second interim report meeting, the Board addressed the interim financial report for the second quarter of the year. |
– |
Strategy meeting |
| A Board meeting was held, in essence dedicated to short-term and long-term strategies of the Group, with particular focus on merger & acquisitions. |
– |
Third interim report meeting |
| At the third interim report meeting, the Board addressed the interim financial report for the third quarter of the year and the financial outlook. |
– |
Financial targets meeting |
| A Board meeting was held, e.g., for the Board to address the financial targets. At this meeting, the results of the Board evaluation were presented to and discussed by the Board. |
Board of Directors | ||||||
13 Directors | ||||||
| Audit and Compliance Committee (4 Directors) Oversight of financial reporting Oversight of internal control Oversight of auditing Oversight of the Group’s Ethics & Compliance program |
Finance Committee (4 Directors) Finance strategy |
Remuneration Committee (4 Directors) Guidelines for remuneration to Group management Long-Term Variable Remuneration Executive remuneration |
Technology and Science Committee (5 Directors) Technology strategy and planning Technology ecosystem and partnerships Science direction | |||
| 9 Corporate Governance report 2021 | Ericsson Annual Report on Form 20-F 2021 | |||
| – | The scope and accuracy of the financial statements |
| – | Compliance with material legal and regulatory requirements |
| – | Internal control over financial reporting |
| – | Risk management |
| – | The effectiveness and appropriateness of the Group’s compliance programs including the Ethics & Compliance (E&C) Program. |
| Members of the Committees of the Board of Directors |
||||||
Audit and Compliance Committee |
Finance Committee |
Remuneration Committee |
Technology and Science Committee Kristin S. Rinne (Chair) Jan Carlson Nora Denzel Kurt Jofs Anders Ripa | |||
Eric A. Elzvik (Chair) |
Ronnie Leten (Chair) |
Jon Fredrik Baksaas (Chair) | ||||
Jan Carlson |
Anders Ripa |
Kurt Jofs | ||||
Kurt Jofs |
Helena Stjernholm |
Ronnie Leten | ||||
Torbjörn Nyman |
Jacob Wallenberg |
Kjell-Åke Soting | ||||
| 10 Corporate Governance report 2021 | Ericsson Annual Report on Form 20-F 2021 | |||
| – | Reviewing and preparing, for resolution by the Board, proposals on salary and other remuneration, including retirement compensation, for the President and CEO |
| – | Reviewing and preparing, for resolution by the Board, proposals to the AGM on Guidelines for remuneration to the Executive Team |
| – | Reviewing and preparing, for resolution by the Board, proposals to the AGM on the Long-Term Variable Compensation Program (LTV) and similar equity arrangements |
| – | Approving proposals on salary and other remuneration, including retirement compensation, for the members of the Executive Team (other than the President and CEO) |
| – | Approving proposals on target levels for the short-term variable compensation (STV) for the members of the Executive Team (other than the President and CEO) |
| – | Approving pay-out of the STV for the members of the Executive Team members (other than the President and CEO), based on achievements and performance. |
| 11 Corporate Governance report 2021 | Ericsson Annual Report on Form 20-F 2021 | |||
| – | Reviewing and preparing for consideration and/or resolution by the Board, matters related to technology strategy and planning for the Group, monitoring the Group’s |
| technology ecosystem, relationships and partnerships |
| – | Reviewing and preparing for consideration and/or resolution by the Board, matters related to science direction and influence on a geopolitical level. |
| – | Network evolution |
| – | Semiconductor industry |
| – | Artificial Intelligence |
| – | Cloud and edge technologies |
| – | Energy and sustainability. |
| Directors’ attendance and fees 2021 | ||||||||||||||||||||||||||||
| Fees resolved by the AGM 2021 | Number of Board/Committee meetings attended in 2021 | |||||||||||||||||||||||||||
| Board member | Board fees, SEK 1) |
Committee fees, SEK |
Board | Audit and Compliance- Committee |
Finance Committee |
Remun. Committee |
Tech. and Science Committee |
|||||||||||||||||||||
| Ronnie Leten | 4,225,000 | 385,000 | 18 | 4 | 8 | |||||||||||||||||||||||
| Helena Stjernholm | 1,060,000 | 180,000 | 18 | 4 | ||||||||||||||||||||||||
| Jacob Wallenberg | 1,060,000 | 180,000 | 18 | 4 | ||||||||||||||||||||||||
| Jon Fredrik Baksaas | 1,060,000 | 205,000 | 18 | 8 | ||||||||||||||||||||||||
| Jan Carlson | 1,060,000 | 450,000 | 18 | 10 | 4 | |||||||||||||||||||||||
| Nora Denzel | 1,060,000 | 180,000 | 18 | 4 | ||||||||||||||||||||||||
| Börje Ekholm | – 2) |
– | 18 | |||||||||||||||||||||||||
| Eric A. Elzvik | 1,060,000 | 420,000 | 18 | 11 | ||||||||||||||||||||||||
| Kurt Jofs | 1,060,000 | 630,000 | 18 | 11 | 8 | 4 | ||||||||||||||||||||||
| Kristin S. Rinne | 1,060,000 | 205,000 | 18 | 4 | ||||||||||||||||||||||||
| Torbjörn Nyman | 27,000 3) |
16,500 3) |
18 | 11 | ||||||||||||||||||||||||
| Anders Ripa 4) |
27,000 3) |
9,000 3) |
18 | 3 | 3 | |||||||||||||||||||||||
| Kjell-Åke Soting | 27,000 3) |
12,000 3) |
18 | 8 | ||||||||||||||||||||||||
| Roger Svensson 5) |
4,500 3) |
3,000 3) |
3 | 1 | 1 | |||||||||||||||||||||||
| Per Holmberg 6) |
21,000 3) |
– | 14 | |||||||||||||||||||||||||
| Ulf Rosberg 7) |
22,500 3) |
– | 15 | |||||||||||||||||||||||||
| Loredana Roslund | 27,000 3) |
– | 18 | |||||||||||||||||||||||||
Total number of meetings |
18 |
11 |
4 |
8 |
4 |
|||||||||||||||||||||||
1) |
Non-employee Directors can choose to receive part of their Board fee (exclusive of Committee fees) in the form of synthetic shares. |
2) |
Board member remuneration resolved by the AGM is only for non-employee Directors elected by the shareholders. |
3) |
Employee representative Board members and their deputies are not entitled to a Board fee, but instead get paid compensation in the amount of SEK 1,500 per attended Board and Committee meeting. |
4) |
Appointed employee representative Board member as of March 30, 2021 (previously deputy employee representative Board member). |
5) |
Resigned as employee representative Board member as of March 30, 2021. |
6) |
Resigned as deputy employee representative Board member as of November 3, 2021. |
7) |
Appointed deputy employee representative Board member as of March 30, 2021. |
| 12 Corporate Governance report 2021 | Ericsson Annual Report on Form 20-F 2021 | |||
 |
 |
 |
 | |||||||||
Ronnie Leten |
Helena Stjernholm |
Jacob Wallenberg |
Jon Fredrik Baksaas | |||||||||
| Chair of the Board of Directors, Chair of the Finance Committee, Member of the Remuneration Committee | Deputy Chair of the Board of Directors, Member of the Finance Committee | Deputy Chair of the Board of Directors, Member of the Finance Committee | Chair of the Remuneration Committee | |||||||||
| |
|
|
| |||||||||
First elected |
First elected |
First elected |
First elected | |||||||||
| 2018 | 2016 | 2011 | 2017 | |||||||||
| |
|
|
| |||||||||
Born |
Born |
Born |
Born | |||||||||
| 1956 | 1970 | 1956 | 1954 | |||||||||
| |
|
|
| |||||||||
Education |
Education |
Education |
Education | |||||||||
| Master of Science in Applied Economics, University of Hasselt, Belgium. | Master of Business Administration, Stockholm School of Economics, Sweden. | Bachelor of Science in Economics and Master of Business Administration, Wharton School, University of Pennsylvania, USA. Officer of the Reserve, Swedish Navy. | Master of Science in Economics, NHH Norwegian School of Economics & Business Administration, Norway. | |||||||||
| |
|
|
| |||||||||
Nationality |
Nationality |
Nationality |
Nationality | |||||||||
| Belgium | Sweden | Sweden | Norway | |||||||||
| |
|
|
| |||||||||
Board Chair |
Board Chair |
Board Chair |
Board Chair | |||||||||
| Epiroc AB and Piab | – | Investor AB | Statnett SA and DNV GL Group AS | |||||||||
Deputy Board Chair |
||||||||||||
| ABB Ltd., FAM and Patricia Industries | ||||||||||||
| |
|
|
| |||||||||
Board Member |
Board Member |
Board Member |
Board Member | |||||||||
| – | AB Industrivärden, AB Volvo and Sandvik AB | The Knut and Alice Wallenberg Foundation, Wallenberg Investments AB and Nasdaq Inc. | Svenska Handelsbanken AB. | |||||||||
| |
|
|
| |||||||||
Holdings in Ericsson |
Holdings in Ericsson |
Holdings in Ericsson |
Holdings in Ericsson | |||||||||
| 100,000 Class B shares 1) , 128,452 call options 2) . and 94,954 synthetic shares 3) . |
20,060 Class B shares 1) and 32,208 synthetic shares 3) . |
427,703 Class B shares 1) and 48,315 synthetic shares 3) . |
42,999 synthetic shares 3) . | |||||||||
| |
|
|
| |||||||||
| Principal work experience and other information |
Principal work experience and other information |
Principal work experience and other information |
Principal work experience and other information | |||||||||
| President and CEO of Atlas Copco AB 2009–2017 and various leadership positions within the Atlas Copco Group 1997–2009 and 1985–1995. Previous positions include plant manager of Tenneco Automotive Inc., Belgium, 1995–1997 and various positions within General Biscuits 1979–1985. | President and CEO of AB Industrivärden since 2015. Partner in the private equity firm IK Investment Partners (2008– 2015), with responsibility for the Stockholm office from 2011 to 2015. Investment Manager at IK Investment Partners (1998–2008). Previous experience as consultant for Bain & Company (1997–1998). | Chair of the Board of Investor AB since 2005. President and CEO of SEB in 1997 and Chair of SEB’s Board of Directors 1998–2005. Executive Vice President and CFO of Investor AB 1990–1993. Honorary Chair of IBLAC (Mayor of Shanghai’s International Business Leaders Advisory Council) and member of the steering committee of the European Round Table of Industrialists, Deputy Chair of the Swedish-American Chamber of Commerce US, member of the International Advisory Board of the Atlantic Council, Washington DC, member of the International Business Council of the World Economic Forum, Trilateral Commission and the Advisory Board of Tsinghua University. | President and CEO of Telenor Group (2002–2015). Previous positions within the Telenor Group since 1989, including Deputy CEO, CFO and CEO of TBK AS. Positions before Telenor include CFO of Aker AS, finance director of Stolt Nielsen Seaway AS and controller at Det Norske Veritas, Norway and Japan. Member of the GSMA Board (2008–2016) and Chair of the GSMA Board (2014–2016). | |||||||||
| |
|
|
| |||||||||
1) |
The number of shares and ADS includes holdings by related persons, if applicable. |
2) |
Call options issued by Investor AB entitling to purchase Ericsson Class B shares. |
3) |
Since 2008, the AGM has each year resolved that part of the Board fee may be received in the form of synthetic shares. A synthetic share is a right to receive in the future a payment corresponding to the value of the Class B share in Ericsson at the time of payment. Please see page 11 for further information. |
| 13 Corporate Governance report 2021 | Ericsson Annual Report on Form 20-F 2021 | |||
 |
 |
 |
 | |||||||||
Jan Carlson |
Nora Denzel |
Börje Ekholm |
Eric A. Elzvik | |||||||||
| Member of the Audit and Compliance Committee and the Technology and Science Committee | Member of the Technology and Science Committee | President, CEO and Member of the Board | Chair of the Audit and Compliance Committee | |||||||||
| |
|
|
| |||||||||
First elected |
First elected |
First elected |
First elected | |||||||||
| 2017 | 2013 | 2006 | 2017 | |||||||||
| |
|
|
| |||||||||
Born |
Born |
Born |
Born | |||||||||
| 1960 | 1962 | 1963 | 1960 | |||||||||
| |
|
|
| |||||||||
Education |
Education |
Education |
Education | |||||||||
| Master of Science degree in Engineering Physics and Electrical Engineering, the University of Linköping, Sweden. | Master of Business Administration, Santa Clara University, USA. Bachelor of Science in Computer Science, State University of New York, USA. | Master of Science in Electrical Engineering, KTH Royal Institute of Technology, Stockholm, Sweden. Master of Business Administration, INSEAD, France. | Master of Business Administration, Stockholm School of Economics, Sweden. | |||||||||
| |
|
|
| |||||||||
Nationality |
Nationality |
Nationality |
Nationality | |||||||||
| Sweden | USA and Ireland | Sweden and USA | Sweden and Switzerland | |||||||||
| |
|
|
| |||||||||
Board Chair |
Board Chair |
Board Chair |
Board Chair | |||||||||
| Autoliv Inc. and Veoneer Inc. | – | – | Global Connect Group | |||||||||
| |
|
|
| |||||||||
Board Member |
Board Member |
Board Member |
Board Member | |||||||||
| – | Advanced Micro Devices Inc., NortonLifeLock Inc. and SUSE | Alibaba Group and Trimble Inc. | Landis+Gyr Group AG, AB Volvo and VFS Global | |||||||||
| |
|
|
| |||||||||
Holdings in Ericsson |
Holdings in Ericsson |
Holdings in Ericsson |
Holdings in Ericsson | |||||||||
| 7,900 Class B shares 1) and 48,315 synthetic shares 2) . |
3,850 ADS 1) and 16,102 synthetic shares 2) |
260,351 Class B shares, 1,009,000 ADS 1) and 2,000,000 call options 3) . |
10,000 Class B shares 1) and 16,102 synthetic shares 2) | |||||||||
| |
|
|
| |||||||||
| Principal work experience and other information |
Principal work experience and other information |
Principal work experience and other information |
Principal work experience and other information | |||||||||
| Chair and President and CEO of Veoneer Inc. since June 2018. President and CEO of Autoliv Inc. 2007–2018 and Chair of Autoliv Inc. since 2014. Previous positions within the Autoliv Group since 1999, including President Autoliv Europe, Vice President Engineering of Autoliv and President Autoliv Electronics. Previous positions include President of Saab Combitech and of Swedish Gate Array. | CEO (interim) of Outerwall Inc. (January 2015–August 2015). Senior Vice President Big Data, Marketing and Social Product Design and General Manager QuickBooks Payroll Division (2008– 2012). Previous positions include Senior Vice President and General Manager of HP’s Global Software, Storage and Consulting Divisions (2000–2006), Senior Vice President Product Operations Legato Systems (bought by Dell EMC) and various engineering, marketing and executive positions at IBM. Non- Profit board member of the National Association of Corporate Directors (NACD) Northern California Chapter. | President and CEO of Telefonaktiebolaget LM Ericsson since 2017. CEO of Patricia Industries, a division within Investor AB (2015–2017). President and CEO of Investor AB (2005–2015). Formerly Head of Investor Growth Capital Inc. and New Investments. Previous positions at Novare Kapital AB and McKinsey & Co Inc. Holds honorary Doctorate at KTH Royal Institute of Technology, Sweden. Since 2017, member of the Steering Committee of the World Economic Forum Digital Communication Governors. Member of the Board of the Swedish-American Chamber of Commerce New York. | CFO and member of the Group Executive Committee of ABB Ltd (2013–2017). Division CFO ABB Discrete Automation & Motion (2010–2012) and division CFO Automation Products Division (2006–2010). Previous positions within the ABB Group since 1984, including senior management positions within finance, mergers & acquisitions and new ventures. Currently, senior industrial advisor to EQT. | |||||||||
| |
|
|
|
1) |
The number of shares and ADS includes holdings by related persons, if applicable. |
2) |
Since 2008, the AGM has each year resolved that part of the Board fee may be received in the form of synthetic shares. A synthetic share is a right to receive in the future a payment corresponding to the value of the Class B share in Ericsson at the time of payment. Please see page 11 for further information. |
3) |
Call options issued by AB Industrivärden (1,000,000 call options) and Investor AB (1,000,000 call options), each entitling the purchase of one Ericsson B share from AB Industrivärden/Investor AB respectively (further information is available in the Notes to the consolidated financial statements – note G2 “Information regarding members of the Board of Directors and Group management” in the Financial Report). |
| 14 Corporate Governance report 2021 | Ericsson Annual Report on Form 20-F 2021 | |||
 |
 |
|||||||||||
Kurt Jofs |
Kristin S. Rinne |
|||||||||||
| Member of the Remuneration Committee, the Audit and Compliance Committee and the Technology and Science Committee | Chair of the Technology and Science Committee | |||||||||||
| |
|
|||||||||||
First elected |
First elected |
|||||||||||
| 2018 | 2016 | |||||||||||
| |
|
|||||||||||
Born |
Born |
|||||||||||
| 1958 | 1954 | |||||||||||
| |
|
|||||||||||
Education |
Education |
|||||||||||
| Master of Science in Engineering, Royal Institute of Technology, Stockholm, Sweden. | Bachelor of Arts, Washburn University, USA. | |||||||||||
| |
|
|||||||||||
Nationality |
Nationality |
|||||||||||
| Sweden | USA | |||||||||||
| |
|
|||||||||||
Board Chair |
Board Chair |
|||||||||||
| – | – | |||||||||||
| |
|
|||||||||||
Board Member |
Board Member |
|||||||||||
| AB Volvo, Feal AB and Arjeplog Hotel Silverhatten AB | Synchronoss | |||||||||||
| |
|
|||||||||||
Holdings in Ericsson |
Holdings in Ericsson |
|||||||||||
| 50,450 Class B shares 1) and 19,378 synthetic shares 2) . |
22,666 synthetic shares 2) . |
|||||||||||
| |
|
|||||||||||
| Principal work experience and other information |
Principal work experience and other information |
|||||||||||
| Entrepreneur and investor with extensive experience in various industries. Previous positions include Executive Vice President and responsible for Ericsson’s Networks business 2003–2008, CEO of Segerström & Svensson 1999–2001. CEO of Linjebuss 1996–1999, and various positions within ABB and Ericsson. | Previously Senior Vice President, Network Technology, Network Architecture & Planning, at AT&T (2007–2014). CTO of Cingular Wireless (2005–2007) and VP Technology & New Product Development of Cingular Wireless (2000–2005). Previous positions within Southwestern Bell and SBC (1976–2000). Trustee of Washburn University Foundation. Member of the Advisory Board of Link Labs. | |||||||||||
| |
|
1) |
The number of shares and ADS includes holdings by related person, if applicable. |
2) |
Since 2008, the AGM has each year resolved that part of the Board fee may be received in the form of synthetic shares. A synthetic share is a right to receive in the future a payment corresponding to the value of the Class B share in Ericsson at the time of payment. Please see page 11 for further information. |
| 15 Corporate Governance report 2021 | Ericsson Annual Report on Form 20-F 2021 | |||
 |
 |
 |
||||||||||
Torbjörn Nyman |
Anders Ripa |
Kjell-Åke Soting |
||||||||||
| Employee representative, Member of the Audit and Compliance Committee | Employee representative, Member of the Finance Committee and of the Technology and Science Committee | Employee representative, Member of the Remuneration Committee | ||||||||||
| |
|
|
||||||||||
First appointed |
First appointed |
First appointed |
||||||||||
| 2017 | 2017 | 2016 | ||||||||||
| |
|
|
||||||||||
Born |
Born |
Born |
||||||||||
| 1961 | 1962 | 1963 | ||||||||||
| |
|
|
||||||||||
Appointed by |
Appointed by |
Appointed by |
||||||||||
| LO, the Swedish Trade Union Confederation | PTK | PTK | ||||||||||
| |
|
|
||||||||||
Nationality |
Nationality |
Nationality |
||||||||||
| Sweden | Sweden | Sweden | ||||||||||
| |
|
|
||||||||||
Holdings in Ericsson |
Holdings in Ericsson |
Holdings in Ericsson |
||||||||||
| 33,828 Class B shares 1) . |
2,377 Class B shares and 1,708 Class A shares 1) . |
9,107 Class B shares 1) . |
||||||||||
| |
|
|
||||||||||
Employed since |
Employed since |
Employed since |
||||||||||
| 1996 Working as ICT Strategic Product Manager within Business Area Networks. |
1998 Working as Security Advisor for Mission Critical Networks within Business Area Networks. |
1996 Working as Global SQA Manager within Business Area Networks. |
||||||||||
| |
|
|
||||||||||
 |
 |
|||||||||||
Ulf Rosberg |
Loredana Roslund |
|||||||||||
| Employee representative – Deputy | Employee representative – Deputy | |||||||||||
| |
|
|||||||||||
First appointed |
First appointed |
|||||||||||
| 2021 | 2017 | |||||||||||
| |
|
|||||||||||
Born |
Born |
|||||||||||
| 1964 | 1967 | |||||||||||
| |
|
|||||||||||
Appointed by |
Appointed by |
|||||||||||
| PTK | PTK | |||||||||||
| |
|
|||||||||||
Nationality |
Nationality |
|||||||||||
| Sweden | Sweden | |||||||||||
| |
|
|||||||||||
Holdings in Ericsson |
Holdings in Ericsson |
|||||||||||
| 10 Class B shares 1) . |
2,271 Class B shares 1) . |
|||||||||||
| |
|
|||||||||||
Employed since |
Employed since |
|||||||||||
| 1985 Working as System Manager within R&D, Business Area Networks. |
1994 Working as Project Manager within R&D, Business Area Networks. |
Börje Ekholm was the only Director who held an operational management position at Ericsson in 2021. Per Holmberg left his position as deputy Employee representative of the Board of Directors on November 3, 2021. | ||||||||||
| |
|
|||||||||||
| 16 Corporate Governance report 2021 | Ericsson Annual Report on Form 20-F 2021 | |||
| – | Define Group strategies and policies, drive corporate agenda and establish a strong corporate culture |
| – | Determine targets for operational units, allocate resources and monitor unit performance |
| – | Secure operational excellence and realize global synergies through efficient organization of the Group. |
| – | To fulfill the objectives of Ericsson’s major stakeholders (customers, shareholders, employees) |
| – | Within established risk limits and with reliable internal control (win with integrity) |
| – | In compliance with relevant applicable laws, listing requirements, governance codes and corporate responsibilities. |
| – | Management and control |
| – | Ericsson business processes |
| – | Organization and resources, culture. |

| 17 Corporate Governance report 2021 | Ericsson Annual Report on Form 20-F 2021 | |||

| 18 Corporate Governance report 2021 | Ericsson Annual Report on Form 20-F 2021 | |||

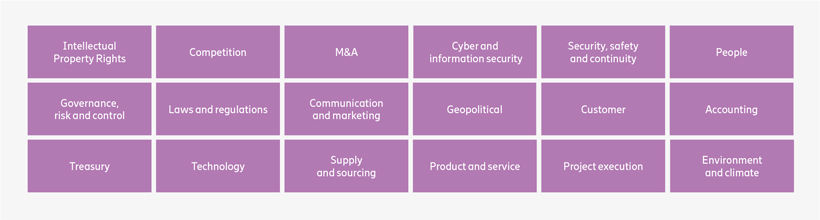
| 19 Corporate Governance report 2021 | Ericsson Annual Report on Form 20-F 2021 | |||
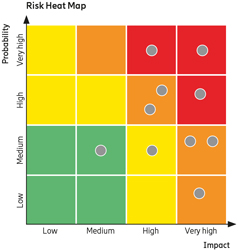
Risk Description |
Treatment plan | |
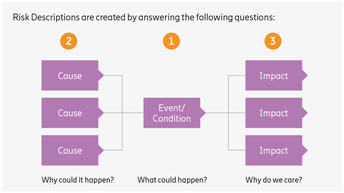 |
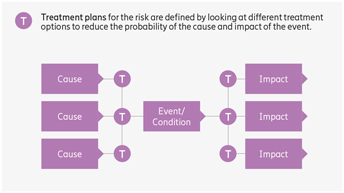 | |
| 20 Corporate Governance report 2021 | Ericsson Annual Report on Form 20-F 2021 | |||
 |
 |
 |
 | |||||||||
Börje Ekholm |
Fredrik Jejdling |
Arun Bansal |
MajBritt Arfert | |||||||||
| President and Chief Executive Officer (CEO) (since 2017) | Executive Vice President, Business Area Networks (since 2017) | Executive Vice President (since 2020), Market Area Europe & Latin America (since 2017) |
Senior Vice President, Chief People Officer (CPO) (since 2017) | |||||||||
| |
|
|
| |||||||||
– |
Functions |
Functions |
Functions | |||||||||
| Head of Business Area Networks and Head of Segment Networks | Head of Market Area Europe & Latin America | Head of Group Function People | ||||||||||
| |
|
|
| |||||||||
Born |
Born |
Born |
Born | |||||||||
| 1963 | 1969 | 1968 | 1963 | |||||||||
| |
|
|
| |||||||||
Education |
Education |
Education |
Education | |||||||||
| Master of Science in Electrical Engineering, KTH Royal Institute of Technology, Stockholm, Sweden. Master of Business Administration, INSEAD, France. |
Master of Science in Economics and Business Administration, Stockholm School of Economics, Sweden. | Bachelor of Engineering (Electronics), University of Jiwaji, India, and Postgraduate Diploma in Marketing, Indira Gandhi National Open University, India. | Bachelor of Human Resources, University of Gothenburg, Sweden. | |||||||||
| |
|
|
| |||||||||
Nationality |
Nationality |
Nationality |
Nationality | |||||||||
| Sweden and USA | Sweden | India | Sweden | |||||||||
| |
|
|
| |||||||||
Board Member: |
Board Member |
Board Member |
Board Member | |||||||||
| Telefonaktiebolaget LM Ericsson, Alibaba Group and Trimble Inc. | Teknikföretagen and the Confederation of Swedish Enterprise |
OPCOM Cables Sdn Bhd, Malaysia and Mycronic AB Sweden | – | |||||||||
| |
|
|
| |||||||||
Holdings in Ericsson 1) |
Holdings in Ericsson 1) |
Holdings in Ericsson 1) |
Holdings in Ericsson 1) | |||||||||
| 260,351 Class B shares, 1,009,000 ADS and 2,000,000 call options 2) . |
72,767 Class B shares. | 100,771 Class B shares and 18,078 ADS. | 51,021 Class B shares. | |||||||||
| |
|
|
| |||||||||
Background |
Background |
Background |
Background | |||||||||
| CEO of Patricia Industries, a division within Investor AB (2015–2017). President and CEO of Investor AB (2005–2015). Formerly Head of Investor Growth Capital Inc. and New Investments. Previous positions at Novare Kapital AB and McKinsey & Co Inc. Since 2017, member of the Steering Committee of the World Economic Forum Digital Communication Governors. Member of the Board of the Swedish-American Chamber of Commerce New York. | Senior Vice President and Head of Business Unit Network Services (2016–2017). Has held a variety of positions in commercial operations and financials, including Head of Region Sub-Saharan Africa, Head of Region India, and Head of Sales and Finance for Business Unit Global Services. Previous positions include senior positions with LUX Asia Pacific and Tele2 Group. |
Various senior management positions, including Senior Vice President (2016–2017), Head of Business Unit-Radio (2014-2016), Head of South East Asia & Oceania and Country Manager in Indonesia and Bangladesh. Lived and worked across multiple countries and markets, including Malaysia, Sweden, Singapore, UK and USA. | Acting Head of Group Function Human Resources (November 2016–March 2017). Previously Head of Human Resources Ericsson Sweden (2015–2016) and Vice President and Head of Human Resources Business Unit Support Solutions (2007–2015). Has held various senior global positions in Ericsson including Head of Human Resources Business Unit Broadband Networks, Head of Human Resources Microwave Systems as well as a position as Head of Human Resources and Internal Communicatins at Sony Ericsson Germany. |
1) |
The number of shares and ADS includes holdings by related persons, if applicable. |
2) |
Call options issued by AB Industrivärden (1,000,000 call options) and Investor AB (1,000,000 call options), each entitling the purchase of one Ericsson B share from AB Industrivärden/Investor AB respectively (further information is available in the Notes to the consolidated financial statements – note G2 “Information regarding members of the Board of Directors and the Group management” in the Financial Report). |
| 21 Corporate Governance report 2021 | Ericsson Annual Report on Form 20-F 2021 | |||
 |
 |
 |
 | |||||||||
Xavier Dedullen |
Erik Ekudden |
Niklas Heuveldop |
Chris Houghton | |||||||||
| Senior Vice President, Chief Legal Officer, and secretary of the Board of Directors of Telefonaktiebolaget LM Ericsson (since 2018) | Senior Vice President, Chief Technology Officer (CTO) (since 2018) | Senior Vice President, Market Area North America (since 2017) | Senior Vice President, Market Area North East Asia (since 2017) | |||||||||
| |
|
|
| |||||||||
Functions |
Functions |
Functions |
Functions | |||||||||
| Head of Group Function Legal Affairs & Compliance | Head of Group Function Technology | Head of Market Area North America | Head of Market Area North East Asia | |||||||||
| |
|
|
| |||||||||
Born |
Born |
Born |
Born | |||||||||
| 1964 | 1968 | 1968 | 1966 | |||||||||
| |
|
|
| |||||||||
Education |
Education |
Education |
Education | |||||||||
| Master of Laws (LL.M), New York University School of Law, USA, Master of Laws (Lic. Jur), KU University of Leuven, Belgium, and Bachelor in Law, Facultés Notre Dame de la Paix, Belgium. | Master of Science in Electrical Engineering, KTH Royal Institute of Technology, Stockholm, Sweden. | Master of Science in Industrial Engineering and Management, the Linköping Institute of Technology, Sweden. | Bachelor of Law, Huddersfield Polytechnic, United Kingdom. | |||||||||
| |
|
|
| |||||||||
Nationality |
Nationality |
Nationality |
Nationality | |||||||||
| Belgium | Sweden | Sweden | United Kingdom | |||||||||
| |
|
|
| |||||||||
Board Member |
Board Member |
Board Member |
Board Member | |||||||||
| – | – | The Swedish-American Chamber of Commerce New York and CTIA – US wireless industry trade association | – | |||||||||
| |
|
|
| |||||||||
Holdings in Ericsson 1) |
Holdings in Ericsson 1) |
Holdings in Ericsson 1) |
Holdings in Ericsson 1) | |||||||||
| 44,923 Class B shares. | 31,198 Class B shares and 9,118 ADS. | 82,209 Class B shares and 13,908 ADS. | 96,963 Class B shares. | |||||||||
| |
|
|
| |||||||||
Background |
Background |
Background |
Background | |||||||||
| Previously Group General Counsel at Holcim Ltd (2013–2018) with responsibility for the Legal and Compliance functions, based in Switzerland. Started career in private practice in New York in 1988 followed by various in-house positions of increasing seniority in the banking, power and telecom industries, based in the UK, Hong Kong and Switzerland. Prior to joining Holcim Ltd, worked at Verizon (2004–2013) most recently as Vice President International – Legal and External Affairs. |
Group Chief Technology Officer and Head of Technology and Architecture within Group Function Technology and Emerging Business (July 2017–March 2018). Joined Ericsson in 1993 and has held various management positions in the company, including Head of Technology Strategy, Chief Technology Officer Americas in Santa Clara US, and Head of Standardization and Industry. Member of the Royal Swedish Academy of Engineering Sciences (IVA). Since 2020, member of the Broadband Commission for Sustainable Development and member of the board of IVA’s Näringslivsråd. | Senior Vice President, Chief Strategy Officer and Head of Group Function Technology & Emerging Business (April 2017–March 2018). Previous positions include Chief Customer Officer and Head of Group Function Sales (2016–2017) and senior leadership positions across Europe and the Americas, including Head of Global Customer Unit AT&T and Head of Market Unit Central America and Caribbean. Previous positions outside Ericsson include CEO of ServiceFactory and COO of WaterCove Networks. | Head of Region North East Asia (2015–2017). Has also previously held management positions within Ericsson, including Head of Region India, Head of Customer Unit UK and Ireland and various management positions within Ericsson in China, Hungary, India, Ireland, Japan, Sweden and the UK. |
1) |
The number of shares and ADS includes holdings by related persons, if applicable. |
| 22 Corporate Governance report 2021 | Ericsson Annual Report on Form 20-F 2021 | |||
 |
 |
 |
 | |||||||||
Jan Karlsson |
Peter Laurin |
Stella Medlicott |
Carl Mellander | |||||||||
| Senior Vice President, Business Area Digital Services (since 2018) | Senior Vice President, Business Area Managed Services (since 2017) | Senior Vice President, Chief Marketing and Communications Officer (CMO and CCO) (since 2019) | Senior Vice President, Chief Financial Officer (CFO) (since 2017) | |||||||||
| |
|
|
| |||||||||
Functions |
Functions |
Functions |
Functions | |||||||||
| Head of Business Area Digital Services and Head of Segment Digital Services | Head of Business Area Managed Services and Head of Segment Managed Services |
Head of Group Function Marketing & Corporate Relations | Head of Group Function Finance & Common Functions | |||||||||
| |
|
|
| |||||||||
Born |
Born |
Born |
Born | |||||||||
| 1966 | 1971 | 1969 | 1964 | |||||||||
| |
|
|
| |||||||||
Education |
Education |
Education |
Education | |||||||||
| Bachelor in Business Administration, ESSEC Business School, France. | Master of Technology, Chalmers University of Technology, Sweden, and Master of Business Administration, Gothenburg School of Economics and Commercial Law, Sweden. | Bachelors of Arts (Hons) degree in Social Science, University of Lincoln (known at that time as University of Humberside), United Kingdom and Postgraduate Diploma in Marketing, Chartered Institute of Marketing, United Kingdom. |
Bachelor of Arts in Business Administration and Economics, Stockholm University, Sweden; and East- and South East Asia Program, Lund University, Sweden | |||||||||
| |
|
|
| |||||||||
Nationality |
Nationality |
Nationality |
Nationality | |||||||||
| Sweden | Sweden | United Kingdom | Sweden | |||||||||
| |
|
|
| |||||||||
Board Member |
Board Member |
Board Member |
Board Member | |||||||||
| TM Forum | ByggVesta AB | – | International Chamber of Commerce (ICC) Sweden | |||||||||
| |
|
|
| |||||||||
Holdings in Ericsson 1) |
Holdings in Ericsson 1) |
Holdings in Ericsson 1) |
Holdings in Ericsson 1) | |||||||||
| 1,368 Class B-shares and 6,964 ADS. |
3,775 Class B shares. | 7,572 Class B shares. | 91,461 Class B shares. | |||||||||
| |
|
|
| |||||||||
Background |
Background |
Background |
Background | |||||||||
| Acting Head of Business Area Digital Services February–July 2018. Previous Head of Solution Area BSS within Business Area Digital Services. Before joining Ericsson early 2017 Jan Karlsson was the CEO of DigitalRoute, an ISV focusing on data collection & pre-processing across Telco and Non-telco verticals. |
Head of Region Northern Europe and Central Asia. Previous management positions within Ericsson include Head of Ericsson’s Global Customer Unit Vodafone (2013–2016) and various executive positions in North America, Asia and Europe. Previous external roles include positions in Arthur D. Little and Mediatude Ltd. | Vice President of Marketing, Communications and Government Relations for Ericsson Market Area Europe and Latin America July 2017–June 2019. Prior to joining Ericsson, Stella Medlicott was Chief Marketing Officer at Red Bee Media, which was acquired by Ericsson in May 2014. She has over 25 years of marketing experience in major IT, telecoms and media companies including two years at Technicolor as VP Marketing and ten years at Siemens Communications as Global VP Marketing. | Acting Chief Financial Officer and Head of Group Function Finance and Common Functions (July 2016– March 2017). Previous positions within Ericsson include Vice President and Group Treasurer, and Head of Finance in Region Western and Central Europe. Also held Head of Finance/CFO positions within the telecom operator space and defence industry. |
1) |
The number of shares and ADS includes holdings by related persons, if applicable. |
| 23 Corporate Governance report 2021 | Ericsson Annual Report on Form 20-F 2021 | |||
 |
 |
 |
||||||||||
Nunzio Mirtillo |
Fadi Pharaon |
Åsa Tamsons |
||||||||||
| Senior Vice President, Market Area South East Asia, Oceania & India (since 2017) | Senior Vice President, Market Area Middle East & Africa (since 2019) | Senior Vice President, Business Area Technologies & New Businesses (since 2018) | ||||||||||
| |
|
|
||||||||||
Functions |
Functions |
Functions |
||||||||||
| Head of Market Area South East Asia, Oceania & India | Head of Market Area Middle East & Africa | Head of Business Area Technologies & New Businesses and Head of Segment Emerging Business and Other | ||||||||||
| |
|
|
||||||||||
Born |
Born |
Born |
||||||||||
| 1961 | 1972 | 1981 | ||||||||||
| |
|
|
||||||||||
Education |
Education |
Education |
||||||||||
| Master in Electronic Engineering, Sapienza University, Italy. | Master of Science in Computer Science, KTH Royal Institute of Technology, Sweden and a Master of Business Administration, Heriot Watt University, Edinburgh Business School, Scotland. |
Master of Business Administration, Stockholm School of Economics, Sweden. | ||||||||||
| |
|
|
||||||||||
Nationality |
Nationality |
Nationality |
||||||||||
| Italy | Sweden and Lebanon | Sweden | ||||||||||
| |
|
|
||||||||||
Board Member |
Board Member |
Board Member |
||||||||||
| – | – |
CNH Industrial | ||||||||||
| |
|
|
||||||||||
Holdings in Ericsson 1) |
Holdings in Ericsson 1) |
Holdings in Ericsson 1) |
||||||||||
| 130,189 Class B shares. | 334 Class B shares and 1,138 ADS. | 35,311 Class B shares. | ||||||||||
| |
|
|
||||||||||
Background |
Background |
Background |
||||||||||
| Previously Head of Region Mediterranean. Previous management positions within Ericsson include Head of Sales Networks for Western Europe within Business Unit Networks, Head of Business Operations in Market Unit South East Europe and Key Account Manager for Wind Italy, Vodafone Italy and other customers. | Vice President of Networks & Managed Services (presales and commercial management) within Market Area Europe & Latin America. Previous management positions within Ericsson include Head of Presales and Strategy for Ericsson Region South East Asia & Oceania, and Country Manager for Ericsson Singapore and Brunei. | Head of Business Area Technology and Emerging Business (April–September 2018) and Group Strategy and M&A. Previously Partner at McKinsey & Company, serving high-tech and telecommunications companies worldwide on growth strategies, digital and commercial transformations. Before joining Ericsson lived and work in the US, Brazil, France, Sweden and Singapore. |
1) |
The number of shares and ADS includes holdings by related persons, if applicable. |
| 24 Corporate Governance report 2021 | Ericsson Annual Report on Form 20-F 2021 | |||
| – | Updating the Board of Directors regarding the planning, scope and content of the annual audit work |
| – | Reviewing the interim reports to assess that the financial statements are presented fairly in all material respects and providing review opinions over the interim reports for the third and fourth quarters and the year-end financial statements |
| – | Providing an audit opinion over the Annual Report |
| – | Advising the Board of Directors of non-audit services performed, the consideration paid and other issues that determine the auditor’s independence. |
| – | Transparent |
| – | Consistent |
| – | Simple |
| – | Relevant |
| – | Timely ad-hoc information, such as press releases on important events, performed in a timely manner |
| – | Fair and equal |
| – | Complete |
| – | An archive of annual and interim reports |
| – | Access to recent news. |
| 25 Corporate Governance report 2021 | Ericsson Annual Report on Form 20-F 2021 | |||
| – | Steering documents, such as policies and directives, and the Code of Business Ethics |
| – | A strong corporate culture |
| – | The Company’s organization and mode of operations, with well-defined roles and responsibilities and delegations of authority |
| – | Several well-defined Group-wide processes for planning, operations and support. |
| – | Changes to laws |
| – | Financial reporting standards and listing requirements, such as IFRS and SOX. |
| 26 Corporate Governance report 2021 | Ericsson Annual Report on Form 20-F 2021 | |||
| – | Are conducted by Group or local management, and |
| – | Relate to corruption, questionable accounting, deficiencies in the internal control of accounting or auditing matters, or otherwise seriously affect vital interests of the Group or personal health and safety. |

| Remuneration report 2021 |
||||||
Statement from the Chair of the Remuneration Committee |
1 |
|||||
Introduction |
2 |
|||||
Remuneration 2021 at a glance |
3 |
|||||
Total remuneration to the President and CEO and Executive Vice Presidents |
5 |
|||||
Variable remuneration |
6 |
|||||
| Short term variable compensation (STV) |
6 |
|||||
| Long-term variable compensation (LTV) |
7 |
|||||
| Shareholding guidelines for the Executive Team |
12 |
|||||
Comparative information on the change of remuneration and company performance |
12 |
|||||
| The Report has been prepared in accordance with Chapter 8, Sections 53 a and 53 b of the Swedish Companies Act (2005:551) and the Remuneration Rules (December 1, 2020) issued by the Swedish Corporate Governance Board. Information required under Chapter 5, Sections 40–44 of the Annual Accounts Act (1995:1554) is available in note G1–G4 in the Financial report. Information on the work of the Remuneration Committee during 2021 is set out in the Corporate Governance report, which is available on page 10 in the Corporate Governance report. |
||||||
| 1 Remuneration report 2021 | Ericsson Annual Report on Form 20-F 2021 | |||
| 2 Remuneration report 2021 | Ericsson Annual Report on Form 20-F 2021 | |||
| – | Attract and retain highly competent, high performing, and motivated people that have the ability, experience and skill to deliver on the Ericsson strategy, |
| – | Encourage behavior consistent with Ericsson’s culture, core values and Ethics and Compliance Program, |
| – | Ensure fairness in reward by delivering total remuneration that is appropriate but not excessive, and clearly explained, |
| – | Have a total compensation mix of fixed pay, variable pay and benefits that is competitive where Ericsson competes for talent, and |
| – | Encourage variable remuneration which aligns employees with clear and relevant targets, reinforces their performance and enables flexible remuneration costs. |
| – | Total compensation review was conducted in January 2021, taking into account the total remuneration, resulting in: |
| – | An increase of the short term variable compensation (STV) target opportunity level to 40% and increase of the maximum opportunity level to 80% for all members of the ET excluding the President and CEO |
| – | An increase of the LTV grant level to 190% for the President and CEO. |
| – | Achieved vesting level of the LTV 2019 determined to be 126.35%, based on the pre-agreed performance criteria; Group operating income (EBIT), relative and absolute total shareholder return (TSR). |
| – | Achieved vesting level for the LTV 2021 Group operating income (EBIT) performance criteria was determined to be 200%. |
| 3 Remuneration report 2021 | Ericsson Annual Report on Form 20-F 2021 | |||
Purpose and link to strategy |
Key features |
Execution during the financial year that ended on December 31, 2021 | ||||
Fixed salary |
Support the attraction and retention of executive talent required to implement Ericsson’s strategy. | Deliver part of the annual compensation in a predictable format. Salaries are normally reviewed annually in January taking into account: – Ericsson’s overall business performance, – business performance of the unit that the individual leads, – year-on-year – external economic environment, – size and complexity of the position, – external market data, – pay and conditions for other employees based in locations considered to be relevant to the role. When setting fixed salaries, the impact on total remuneration is also taken into consideration. |
President and CEO: fixed annual salary of SEK 17,720,460 corresponding to an increase of 5% compared to 2020. EVP and Head of Business Area Networks: fixed annual salary of SEK 8,339,494, corresponding to an increase of 5% compared to 2020. EVP and Head of Market Area Europe & Latin America: fixed salary of INR 68,985,000, corresponding to an increase of 9.5% compared to 2020. | |||
Other benefits |
Provide market competitive benefits to support the attraction and retention of executive talent required to implement Ericsson’s strategy. | Benefits are set in line with competitive market practices in the individual’s country of employment. The levels of benefits provided may vary year on year depending on the cost of the provision of benefits to the Company. Benefits are capped at 10% of the annual fixed salary for members of the ET located in Sweden. Benefits for members of the ET who are on long-term international assignment (LTA) in countries other than their home countries of employment, are determined in line with the Company’s global international mobility policy which may include (but is not limited to) commuting or relocation costs; cost of living adjustment, housing, home travel and education allowance; tax and social security equalization assistance. |
President and CEO: other benefits to a value of SEK 555,688 EVP and Head of Business Area Networks: other benefits to a value of SEK 14,980. EVP and Head of Market Area Europe & Latin America: other benefits to a value of SEK 1,345,055. | |||
Pension |
Offer long term financial security and planning for retirement by way of providing competitive retirement arrangements in line with local market practices. | The pension plans follow competitive practice in the individual’s home country. Pension plans for the President and CEO and the EVPs are defined contribution plans. |
Company pension contribution: – President and CEO: SEK 9,569,049 – EVP and Head of Business Area Networks: SEK 4,314,186, – EVP and Head of Market Area Europe & Latin America: SEK 985,340 | |||
Short term variable compensation (STV) |
Set clear and relevant targets for the ET that are aligned with Ericsson’s strategy and sustainable long-term interests. Provide individuals an earning opportunity for performance at flexible cost to the Company. |
The President and CEO is not entitled to any STV. Target opportunity is at 40% of fixed salary and maximum is 80% of fixed salary for the EVPs. Performance measures, weightings and target levels are set annually. Subject to malus and clawback. |
Outcome of STV 2021: – EVP and Head of Business Area Networks: 100% of the maximum opportunity – EVP and Head of Market Area Europe & Latin America: 100% of the maximum opportunity. | |||
Long term variable compensation (LTV) |
Align the long-term interests of the members of the ET with those of shareholders. Rewards consistent with long-term performance in line with Ericsson’s business strategy. Provide individuals with long-term compensation for long-term commitment and value creation in alignment with shareholder interests. |
Awards granted after AGM approval. Award levels are determined as percentage of fixed salary: – For the President and CEO 190% of fixed salary. – For the EVPs 50% of fixed salary. Performance measures, weightings and targets levels are presented to the AGM for approval. Three-year vesting period. Subject to malus and clawback. |
Achieved vesting of LTV 2019 at 126.35% of target. | |||
| 4 Remuneration report 2021 | Ericsson Annual Report on Form 20-F 2021 | |||
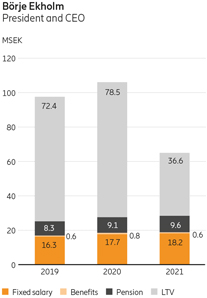 |
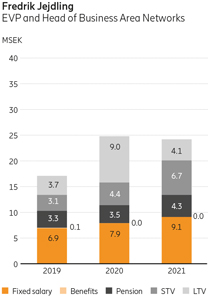 |
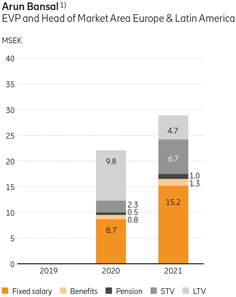 1) Arun Bansal was appointed Executive Vice President in June 2020. Information disclosed covers the time period from June 1, 2020. |
| STV The information presented for 2021 covers the financial year 2021, and the information for 2020 and 2019 covers the financial years 2020 and 2019, respectively. |
LTV The information presented for 2021 include information on LTV 2019 that will vest during 2022. Information presented for 2020 and 2019 include information on vested programs LTV 2018 and LTV 2017, respectively. |
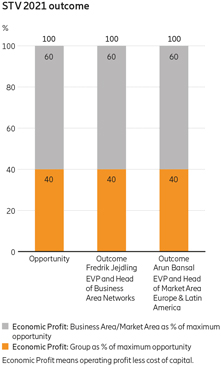 |
 |
 |
| 5 Remuneration report 2021 | Ericsson Annual Report on Form 20-F 2021 | |||
| Total remuneration to the President and CEO and Executive Vice Presidents | ||||||||||||||||||||||||||||||||||||||
| Fixed remuneration | Variable remuneration | |||||||||||||||||||||||||||||||||||||
| Name and position | Financial year |
Fixed salary (incl. vaca- tion pay) |
Other benefits 1) |
One-year variable 2) |
Multi-year variable 3) |
Additional arrange- ments 4) |
Pension 5) |
Total remuneration 6) |
Proportion of fixed remuneration 7) |
Proportion of variable remuneration 8) |
||||||||||||||||||||||||||||
| Börje Ekholm President and CEO |
2021 |
18,208,859 | 555,688 | – | 36,630,457 | – | 9,569,049 | 64,964,053 | 44% | 56% | ||||||||||||||||||||||||||||
| 2020 |
17,727,726 | 770,276 | – | 78,475,833 | – | 9,113,376 | 106,087,211 | 26% | 74% | |||||||||||||||||||||||||||||
| 2019 |
16,299,080 | 600,572 | – | 72,397,175 | – | 8,284,891 | 97,581,719 | 26% | 74% | |||||||||||||||||||||||||||||
| Fredrik Jejdling EVP and Head of Business Area Networks |
2021 |
9,129,087 | 14,980 | 6,671,595 | 4,092,344 | – | 4,314,186 | 24,222,193 | 56% | 44% | ||||||||||||||||||||||||||||
| 2020 |
7,925,971 | 22,110 | 4,415,425 | 9,025,678 | – | 3,457,409 | 24,846,592 | 46% | 54% | |||||||||||||||||||||||||||||
| 2019 9) |
6,933,652 | 142,305 | 3,085,500 | 3,724,945 | – | 3,282,635 | 17,169,037 | 60% | 40% | |||||||||||||||||||||||||||||
| Arun Bansal EVP and Head of Market Area Europe & Latin America 10,11) |
2021 |
15,158,407 | 1,345,055 | 6,727,226 | 4,741,209 | – | 985,340 | 28,957,237 | 60% | 40% | ||||||||||||||||||||||||||||
| 2020 11) |
8,673,843 | 840,273 | 2,253,084 | 9,844,590 | – | 516,344 | 22,128,134 | 45% | 55% | |||||||||||||||||||||||||||||
| 2019 11) |
– | – | – | – | – | – | – | – | – | |||||||||||||||||||||||||||||
1) |
For further information about other benefits, see table regarding the Execution of fixed remuneration and pension to the President and CEO and the Executive Vice Presidents. |
2) |
Amounts represent STV that was earned during the financial year that is paid the following year, i.e. for 2021 amounts represent STV 2021, for 2020 amount represents STV 2020 and for 2019 amout represents STV 2019 |
3) |
Amounts represent the LTV for which all performance periods lapsed during the financial year and the Executive Performance Stock Plan (EPSP) share matching that took place during the financial year. For 2021 amounts represent LTV 2019, for 2020 amounts represent LTV 2018 and for 2019 amounts represents LTV 2017. Amounts are calculated based on the numbers of Performance Share Awards that will vest at the end of the vesting period multiplied by the volume weighted average of the five last trading days of each financial year. The 2016 EPSP was settled and closed with the final delivery of the remaining performance matching shares to the participants on August 17, 2020. The 2016 EPSP performance period ended December 31, 2018, and since 2016 no EPSP has been introduced for members of the ET. The details of the EPSP are explained in the notes to the consolidated financial statements – note G3 share-based compensation, page 73 in the Financial report 2020. |
4) |
Amounts represent discretionary additional arrangements approved by the Remuneration Committee or the Board of Directors that was made during the financial year |
5) |
Amounts represent cash in lieu of pension (for the President and CEO) or pension contributions (for the EVPs) paid during the financial year. |
6) |
Amounts represent the sum of Fixed remuneration, Variable remuneration, Additional arrangements and Pension. |
7) |
Amounts represent the sum of Fixed remuneration and Pension divided by Total remuneration. |
8) |
Amounts represent the sum of Variable remuneration and Additional arrangements divided by Total remuneration. |
9) |
Pension regarding 2019 updated compared to Remuneration report 2020 due to a typo, other amounts, including Total remuneration, remain the same. |
10) |
Any remuneration in foreign currency has been translated to SEK at average exchange rates for the year. |
11) |
Arun Bansal was appointed EVP in June 2020. Fixed salary, Other benefits, One-year variable, Additional arrangements and Pension are calculated on a pro-rata basis based on the time period June 1 – December 31, 2020. With regards to multi-year variable, it constitutes LTV 2018 and EPSP share matching for the time period June 1 – December 31, 2020. |
Fixed salary |
Other benefits |
Pension | ||||
| Börje Ekholm President and CEO |
During the yearly total compensation review the Board of Directors resolved in a salary increase of 5% from January 1, 2021 for the President and CEO. The increase reflects the performance of the President and CEO up until the end of 2020. The fixed salary level deemed appropriate in relation to the responsibility of being the President and CEO of a leading global ICT solutions provider compared to the compensation packages of President and CEOs of similar international companies. |
In accordance with the Company’s Swedish benefits policy, Börje Ekholm is entitled to a company car or a cash allowance and other ordinary benefits as other employees in Sweden. Due to Börje Ekholm being resident of the USA he is also entitled to a US medical insurance as well as tax advisory services with regards to his income statement. |
Börje Ekholm receives a cash payment in lieu of a defined contribution pension, because it is not possible to enroll him in the Swedish defined contribution pension plan (ITP1) due to his residency in the USA. The cash payment is treated as salary for the purposes of tax and social security and is made in a way which is cost neutral for Ericsson. Because Börje Ekholm’s remuneration package does not include an STV component, and because incentive payments in cash are included as part of the pensionable income under Swedish rules, it was agreed in his employment contract that his pension contribution would include an additional premium over annual fixed salary to take into account an assumed STV on-target opportunity. | |||
| Fredrik Jejdling EVP and Head of Business Area Networks |
The salary level reflects Fredrik Jejdling’s responsibility as head of Ericsson’s largest segment Networks. The salary level is deemed competitive with regards to the external market of both other EVPs of leading global ICT solutions providers as well as smaller sized companies’ President and CEOs. |
In accordance with the Company’s Swedish benefits policy, Fredrik Jejdling is entitled to a company car or a cash allowance and other ordinary benefits as other employees in Sweden. |
In accordance with Ericsson’s pension guidelines, Fredrik Jejdling participates in the defined contribution plan ITP1. He is not entitled to any other retirement benefit outside of the rules and regulations in the ITP. | |||
| Arun Bansal EVP and Head of Market Area Europe & Latin America |
The fixed salary reflects Arun Bansal’s responsibility as head of two major geographies, both Europe and Latin America. His salary level is deemed competitive to reflect his responsibility. Arun Bansal is currently on LTA in the United Kingdom from his original employment in India. In accordance with best practice for international assignments, his compensation is set with a “home base approach”. |
As Arun Bansal is on LTA, he is entitled to benefits in line with Ericsson’s international mobility policy such as housing allowance, transportation allowance, home travel, tax and social security equalization assistance and medical insurance. |
In accordance with Ericsson’s pension guidelines and according to his employment contract, Arun Bansal is eligible for Ericsson’s LTA pension plan, International Pension Plan (IPP) and annual pension contribution is paid into Interben Trustees Limited in 2021. | |||
| 6 Remuneration report 2021 | Ericsson Annual Report on Form 20-F 2021 | |||
| – | At Group level for heads of Group functions, |
| – | As a combination of Group level and business area level for heads of business areas, |
| – | As a combination of Group level and market area level for heads of market areas. |
| EVP and Head of Business Area Networks – Fredrik Jejdling (STV 2021) | ||||||||||||||||||||||||
| Threshold performance level (as % of target) |
Target performance level |
Maximum performance level (as % of target) |
Actual Performance (as % of target) |
|||||||||||||||||||||
| Measure | Weighting | SEK outcome at threshold performance |
SEK outcome at target performance |
SEK outcome at maximum performance |
SEK outcome at actual performance |
|||||||||||||||||||
| Group Economic Profit 1) |
40% | |
36% |
|
100% | 196% | 264% | |||||||||||||||||
| |
SEK 0 |
|
SEK 1,334,319 | SEK 2,668,638 | SEK 2,668,638 | |||||||||||||||||||
| Business Area Networks Economic Profit 1) |
60% | |
82% |
|
100% | 118% | 149% | |||||||||||||||||
| |
SEK 0 |
|
SEK 2,001,479 | SEK 4,002,957 | SEK 4,002,957 | |||||||||||||||||||
| Total |
100% |
SEK 0 |
SEK 3,335,798 |
SEK 6,671,595 |
SEK 6,671,595 |
|||||||||||||||||||
| EVP and Head of Market Area Europe & Latin America – Arun Bansal (STV 2021) | ||||||||||||||||||||||||
| Threshold performance level (as % of target) |
Target performance level |
Maximum performance level (as % of target) |
Actual Performance (as % of target) |
|||||||||||||||||||||
| Measure | Weighting | SEK outcome at threshold performance |
SEK outcome at target performance |
SEK outcome at maximum performance |
SEK outcome at actual performance |
|||||||||||||||||||
| Group Economic Profit 1) |
40% | |
36% |
|
100% | 196% | 264% | |||||||||||||||||
| |
SEK 0 |
|
SEK 1,345,445 | SEK 2,690,890 | SEK 2,690,890 | |||||||||||||||||||
| Market Area Europe & Latin America Economic Profit 1) |
60% | |
77% |
|
100% | 119% | 123% | |||||||||||||||||
| |
SEK 0 |
|
SEK 2,018,168 | SEK 4,036,336 | SEK 4,036,336 | |||||||||||||||||||
| Total |
100% |
SEK 0 |
SEK 3,363,613 |
SEK 6,727,226 |
SEK 6,727,226 |
|||||||||||||||||||
| 7 Remuneration report 2021 | Ericsson Annual Report on Form 20-F 2021 | |||
| – | the Company’s financial results and position; |
| – | conditions on the stock market; and/or |
| – | other circumstances and reasons as the Board considers appropriate. |
| Grant information Long-Term Variable compensation program 2021 (LTV 2021) | ||||||||||||||||||||
| Participant | Grant value 1) |
Grant value as percentage of annual base salary 2) |
Number of Performance Share Awards granted 3) |
Percentage of grant subject to performance condition 4) |
Maximum number of possible performance awards vesting 5) |
|||||||||||||||
| Börje Ekholm |
33,668,874 | 190% | 308,323 | 100% | 616,646 | |||||||||||||||
| Fredrik Jejdling |
4,169,747 | 50% | 38,184 | 100% | 76,368 | |||||||||||||||
| Arun Bansal |
3,944,866 | 50% | 36,125 | 100% | 72,250 | |||||||||||||||
1) |
Amounts represent base entitlement amount in SEK. |
2) |
Numbers represent base entitlement amount as percentage of the annual base salary at grant date. |
3) |
Calculated as the respective grant value divided by the volume weighted average of the market price of Ericsson B shares on Nasdaq Stockholm during the five trading days immediately following the publication of the Company’s interim report for the fourth quarter 2020. |
4) |
All Performance Share Awards are subject to challenging performance criteria that are measured over pre-determined performance periods, ranging from one to three years. Performance criteria for LTV 2021 are: (i) Group operating income (EBIT) target (weight 50%) that is measured over the period January 1, 2021 to December 31, 2021; (ii) Absolute TSR development (weight 30%) ranging from 6–14% compounded annual growth rate; (iii) Relative TSR development (weight 20%) for the Ericsson B share, ranking 6–2 against 11 peer companies, measured over the period January 1, 2021 to December 31, 2023. The performance criteria for LTV 2021 along with the details on how the performance criteria will be calculated and measured are explained in minutes from the AGM 2021 under Item 16. |
5) |
The maximum number of shares that could vest will result in a dilution of approximately 0.1% of the total number of outstanding shares. The effect on important key figures is only marginal. |
| 8 Remuneration report 2021 | Ericsson Annual Report on Form 20-F 2021 | |||
| LTV 2021 performance criteria | ||||||||||||||||||||||
| Program | Performance criterion | Criteria | Weight | Performance period |
Vesting opportunity (linear pro rata) |
Achievement | Achieved vesting level 1) |
|||||||||||||||
| LTV 2021 |
2021 Group Operating income (EBIT) |
Range (SEK billion) 15.0–24.0 |
50% | Jan 1, 2021– Dec 31, 2021 |
0–200% | SEK 27.4 billion 2) |
200.00% | |||||||||||||||
| LTV 2021 |
Absolute TSR |
Range 6–14% |
30% |
Jan 1, 2021– Dec 31, 2023 |
0–200% |
– |
– |
|||||||||||||||
| LTV 2021 |
Relative TSR |
Ranking of Ericsson 6–2 |
20% |
Jan 1, 2021– Dec 31, 2023 |
0–200% |
– |
– |
|||||||||||||||
| Total |
100% |
0–200% |
||||||||||||||||||||
1) |
The Board of Directors resolved on the achieved vesting level for the 2021 Group operating income (EBIT) performance criterion as 200% for this portion of the Performance Share Awards granted based on the 2021 Group operating income (EBIT) outcome. For further information regarding the number or Performance Share Awards earned for each of the President and CEO and the EVPs, see table Long-Term Variable compensation (LTV) to the President and CEO and the Executive Vice Presidents. Vesting of the Performance Share Awards will occur at the end of the vesting period in 2024. |
2) |
Excludes restructuring charges and items not included in target performance criterion. |
| LTV 2019 performance criteria | ||||||||||||||||||||||
| Program | Performance criterion 1) |
Criteria | Weight | Performance period |
Vesting opportunity (linear pro rata) |
Achievement | Achieved vesting level 2) |
|||||||||||||||
| LTV 2019 |
2019 Group Operating income (EBIT) |
Range (SEK billion) 10.0–20.0 |
50% | Jan 1, 2019– Dec 31, 2019 |
0–200% | SEK 20.4 billion | 200.00% 1) |
|||||||||||||||
| LTV 2019 |
Absolute TSR | Range 6%–14% | 30% | Jan 1, 2019– Dec 31, 2021 |
0–200% | 9.00% | 74.89% 2) |
|||||||||||||||
| LTV 2019 |
Relative TSR | Ranking of Ericsson 7–2 |
20% | Jan 1, 2019– Dec 31, 2021 |
0–200% | 6.52 out of 12 | 19.39% 2) |
|||||||||||||||
| Total |
100% |
0–200% |
126.35% |
|||||||||||||||||||
1) |
As communicated in the Annual Report 2019, the Board of Directors resolved on the achieved vesting level for the 2019 Group operating income (EBIT) performance criterion as 200% for this portion of the Performance Share Awards granted based on a 2019 Group operating income (EBIT) outcome excluding fines and similar related to the United States Department of Justice (DOJ)/Securities and Exchange Commission (SEC) resolution. |
2) |
The Board of Directors resolved on the achieved vesting levels for the absolute TSR and relative TSR development performance criteria as 74.89% and 19.39% respectively based on the achievement results of 9.00% absolute TSR and 6.52 ranking for relative TSR, which resulted in an overall achieved vesting level of 126.35% for LTV 2019. Vesting of Performance Share Awards will occur at the end of the vesting period in 2022. For further information regarding the number or Performance Share Awards earned for each of the President and CEO and the EVPs, see table Long-Term Variable compensation (LTV) to the President and CEO and the Executive Vice Presidents. |
| 9 Remuneration report 2021 | Ericsson Annual Report on Form 20-F 2021 | |||
| Long-Term Variable compensation (LTV) to the President and CEO and the Executive Vice Presidents | |
|||||||||||||||||||||||||||||||||||||||||||||||
| Main conditions of share award plans | Information regarding reported financial year | |||||||||||||||||||||||||||||||||||||||||||||||
| Maximum | ||||||||||||||||||||||||||||||||||||||||||||||||
| number of | Performance | Year-end |
||||||||||||||||||||||||||||||||||||||||||||||
| Perfor- | possible | Performance | Share Awards | Performance | balance, earned | |||||||||||||||||||||||||||||||||||||||||||
| mance | Performance | Performance | Share Awards | still subject to | Share Awards | Performance | ||||||||||||||||||||||||||||||||||||||||||
| Performance | Perfor- | period | share awards | Share Awards | Opening | earned during | performance | vested during | Share Awards | |||||||||||||||||||||||||||||||||||||||
| Name and | criterion | Grant | mance | end | Vesting | granted | vesting | balance | the year | condition (value | the year (value | unvested (value | ||||||||||||||||||||||||||||||||||||
| position | Program | (weight) 1) |
date 2) |
period 3) |
date 4) |
Date 5) |
(value in SEK) 6) |
(value in SEK) 7) |
(value in SEK) 8) |
(value in SEK) 9) |
in SEK) 10) |
in SEK) 11) |
in SEK) 12) |
|||||||||||||||||||||||||||||||||||
| Börje Ekholm President and CEO |
LTV 2021 | Group Operating income (EBIT) (50%) |
|
2021- 05-03 |
|
1 year | |
2021- 12-31 |
|
|
2024- 05-03 |
|
|
154,161 (16,834,437) |
|
|
308,322 (33,668,874) |
|
|
308,322 (30,594,792) |
|
|
308,322 (30,594,792) |
| ||||||||||||||||||||||||
| TSR performance criteria (50%) |
|
2021- 05-03 |
|
3 years | |
2023- 12-31 |
|
|
2024- 05-03 |
|
|
154,162 (16,834,437) |
|
|
308,324 (33,668,874) |
|
|
308,324 (30,594,991) |
|
|||||||||||||||||||||||||||||
| LTV 2020 | Group Operating income (EBIT) (50%) |
|
2020- 04-01 |
|
1 year | |
2020- 12-31 |
|
|
2023- 04-01 |
|
|
194 830 (15,188,966) |
|
|
389,660 (30,377,932) |
|
|
389,660 (38,245,129) |
|
|
389,660 (38,665,962) |
| |||||||||||||||||||||||||
| TSR performance criteria (50%) |
|
2020- 04-01 |
|
3 years | |
2022- 12-31 |
|
|
2023- 04-01 |
|
|
194,830 (15,188,966) |
|
|
389,660 (30,377,932) |
|
|
389,660 (38,665,962) |
|
|||||||||||||||||||||||||||||
| LTV 2019 13) |
Group Operating income (EBIT) (50%) |
|
2019- 05-18 |
|
1 year | |
2019- 12-31 |
|
|
2022- 05-18 |
|
|
146,087 (13,808,151) |
|
|
292,174 (27,616,302) |
|
|
292,174 (28,676,878) |
|
|
292,174 (28,992,426) |
| |||||||||||||||||||||||||
| TSR performance criteria (50%) |
|
2019- 05-18 |
|
3 years | |
2021- 12-31 |
|
|
2022- 05-18 |
|
|
146,087 (13,808,151) |
|
|
292,174 (27,616,302) |
|
|
76,973 (7,638,031) |
|
|
76,973 (7,638,031) |
| ||||||||||||||||||||||||||
| LTV 2018 | Group Operating income (EBIT) (50%) |
|
2018- 05-18 |
|
1 year | |
2018- 12-31 |
|
|
2021- 05-18 |
|
|
199,888 (13,150,620 |
|
|
399,776 (26,301,240) |
|
|
399,776 (39,238,014) |
|
|
399,776 (44,391,247) |
|
|||||||||||||||||||||||||
| TSR performance criteria (50%) |
|
2018- 05-18 |
|
3 years | |
2020- 12-31 |
|
|
2021- 05-18 |
|
|
199,887 (13,150,620) |
|
|
399,774 (26,301,240) |
|
|
399,774 (39,237,818) |
|
|
399,774 (44,391,024) |
|
||||||||||||||||||||||||||
Total |
1,389,932 (117,964,348) |
2,779,864 (235,928,696) |
1,481,384 (145,397,840) |
385,295 (38 232 823) |
697,984 (69,260,952) |
799,550 (88,782,271) |
1,067,129 (105,891,211) |
|||||||||||||||||||||||||||||||||||||||||
1) |
The TSR performance criteria includes both the absolute and the relative performance criteria for each respective program. |
2) |
Grant date represents the date at which the initial grant was made. |
3) |
Performance period represents the period over which each performance criterion will be measured. |
4) |
Performance period end date represents the date when the performance period ends. |
5) |
Vesting date represents the date of which the Performance Share Awards, if any, will vest and entitle the participants to receive shares free of charge. |
6) |
Numbers represent the number of initial Performance Share Awards that were granted at the grant date. SEK values represent the equivalent value at the grant date. |
7) |
Numbers represent the maximum number of Performance Share Awards that could be earned for each performance criterion. SEK values represent the equivalent value at the grant date. |
8) |
Numbers represent the balance at the beginning of the year, which includes earned Performance Share Awards for previous year(s) that are yet to vest. SEK values are calculated as the number of earned Performance Share Awards multiplied by the volume weighted average share price of the five last trading days for the previous financial year. |
9) |
Numbers represent the number of Performance Share Awards earned that had a performance period ending during the financial year. SEK values are calculated as the number of earned Performance Share Awards multiplied by the volume weighted average share price of the five last trading days for the financial year. |
10) |
Numbers represent the maximum number of outstanding Performance Share Awards that are still subject to an ongoing performance period. SEK values are calculated as the number of outstanding Performance Share Awards that are still subject to an ongoing performance period multiplied by the volume weighted average share price of the five last trading days for the financial year. |
11) |
Numbers represent the number of Performance Share Awards that had a vesting period ending during the financial year and which entitled the participant to receive shares free of charge. SEK values represent the actual value of shares given to the participant at the vesting date. |
12) |
Numbers represent the balance at the end of the year, which includes earned Performance Share Awards for the financial year and previously earned Performance Share Awards that are yet to vest. SEK values are calculated as the number of earned Performance Share Awards multiplied by the volume weighted average share price of the five last trading days for the financial year. |
13) |
LTV 2019 maximum number of possible Performance Share Awards vesting updated compared to Remuneration report 2020 due to a typo. Opening balance and Year-end balance, earned Performance Share Awards unvested adjusted accordingly. |
| 10 Remuneration report 2021 | Ericsson Annual Report on Form 20-F 2021 | |||
| Main conditions of share award plans | Information regarding reported financial year | |||||||||||||||||||||||||||||||||||||||||||||||
| Maximum | ||||||||||||||||||||||||||||||||||||||||||||||||
| number of | Performance | Year-end |
||||||||||||||||||||||||||||||||||||||||||||||
| Perfor- | possible | Performance | Share Awards | Performance | balance, earned | |||||||||||||||||||||||||||||||||||||||||||
| mance | Performance | Performance | Share Awards | still subject to | Share Awards | Performance | ||||||||||||||||||||||||||||||||||||||||||
| Performance | Perfor- | period | share awards | Share Awards | Opening | earned during | performance | vested during | Share Awards | |||||||||||||||||||||||||||||||||||||||
| Name and | criterion | Grant | mance | end | Vesting | granted | vesting | balance | the year | condition (value | the year (value | unvested (value | ||||||||||||||||||||||||||||||||||||
| position | Program | (weight) 1) |
date 2) |
period 3) |
date 4) |
Date 5) |
(value in SEK) 6) |
(value in SEK) 7) |
(value in SEK) 8) |
(value in SEK) 9) |
in SEK) 10) |
in SEK) 11) |
in SEK) 12) |
|||||||||||||||||||||||||||||||||||
| Fredrik Jejdling EVP and Head of Business Area Networks |
LTV 2021 | Group Operating income (EBIT) (50%) |
|
2021- 05-03 |
|
1 year | |
2021- 12-31 |
|
|
2024- 05-03 |
|
|
19,092 (2,084,874) |
|
|
38,184 (4,169,747) |
|
|
38,184 (3,788,998) |
|
|
38,184 (3,788,998) |
| ||||||||||||||||||||||||
| TSR performance criteria (50%) |
|
2021- 05-03 |
|
3 years | |
2023- 12-31 |
|
|
2024- 05-03 |
|
|
19,092 (2,084,874) |
|
|
38,184 (4,169,747) |
|
|
(38,184) (3,788,998) |
|
|||||||||||||||||||||||||||||
| LTV 2020 | Group Operating income (EBIT) (50%) |
|
2020- 04-01 |
|
1 year | |
2020- 12-31 |
|
|
2023- 04-01 |
|
|
22,262 (1,735,594) |
|
|
44,524 (3,471,188) |
|
|
44,524 (4,370,031) |
|
|
44,524 (4,418,117) |
| |||||||||||||||||||||||||
| TSR performance criteria (50%) |
|
2020- 04-01 |
|
3 years | |
2022- 12-31 |
|
|
2023- 04-01 |
|
|
22,263 (1,735,594 |
|
|
44,526 (3,471,188) |
|
|
44,526 (4,418,315) |
|
|||||||||||||||||||||||||||||
| LTV 2019 | Group Operating income (EBIT) (50%) |
|
2019- 05-18 |
|
1 year | |
2019- 12-31 |
|
|
2022- 05-18 |
|
|
16,321 (1,542,750) |
|
|
32,642 (3,085,500) |
|
|
32,642 (3,203,812) |
|
|
32,642 (3,239,066) |
| |||||||||||||||||||||||||
| TSR performance criteria (50%) |
|
2019- 05-18 |
|
3 years | |
2021- 12-31 |
|
|
2022- 05-18 |
|
|
16,322 (1,542,750) |
|
|
32,644 (3,085,500) |
|
|
8,599 (853,279) |
|
|
8,599 (853,279) |
| ||||||||||||||||||||||||||
| LTV 2018 | Group Operating income (EBIT) (50%) |
|
2018- 05-18 |
|
1 year | |
2018- 12-31 |
|
|
2021- 05-18 |
|
|
22,991 (1,512,500) |
|
|
45,982 (3,025,000) |
|
|
45,982 (4,513,133) |
|
|
45,982 (5,105,855) |
|
|||||||||||||||||||||||||
| TSR performance criteria (50%) |
|
2018- 05-18 |
|
3 years | |
2020- 12-31 |
|
|
2021- 05-18 |
|
|
22,988 (1,512,500) |
|
|
45,976 (3,025,000) |
|
|
45 976 (4,512,544) |
|
|
45 976 (5,105,189) |
|
||||||||||||||||||||||||||
Total |
161 331 (13 751 435) |
322 662 (27 502 870) |
169 124 (16 599 521) |
46 783 (4 642 277) |
82 710 (8 207 313) |
91,958 (10,211,044) |
123,949 (12,299,459) |
|||||||||||||||||||||||||||||||||||||||||
1) |
The TSR performance criteria includes both the absolute and the relative performance criteria for each respective program. |
2) |
Grant date represents the date at which the initial grant was made. |
3) |
Performance period represents the period over which each performance criterion will be measured. |
4) |
Performance period end date represents the date when the performance period ends. |
5) |
Vesting date represents the date of which the Performance Share Awards, if any, will vest and entitle the participants to receive shares free of charge. |
6) |
Numbers represent the number of initial Performance Share Awards that were granted at the grant date. SEK values represent the equivalent value at the grant date. |
7) |
Numbers represent the maximum number of Performance Share Awards that could be earned for each performance criterion. SEK values represent the equivalent value at the grant date. |
8) |
Numbers represent the balance at the beginning of the year, which includes earned Performance Share Awards for previous year(s) that are yet to vest. SEK values are calculated as the number of earned Performance Share Awards multiplied by the volume weighted average share price of the five last trading days for the previous financial year. |
9) |
Numbers represent the number of Performance Share Awards earned that had a performance period ending during the financial year. SEK values are calculated as the number of earned Performance Share Awards multiplied by the volume weighted average share price of the five last trading days for the financial year. |
10) |
Numbers represent the maximum number of outstanding Performance Share Awards that are still subject to an ongoing performance period. SEK values are calculated as the number of outstanding Performance Share Awards that are still subject to an ongoing performance period multiplied by the volume weighted average share price of the five last trading days for the financial year. |
11) |
Numbers represent the number of Performance Share Awards that had a vesting period ending during the financial year and which entitled the participant to receive shares free of charge. SEK values represent the actual value of shares given to the participant at the vesting date. |
12) |
Numbers represent the balance at the end of the year, which includes earned Performance Share Awards for the financial year and previously earned Performance Share Awards that are yet to vest. SEK values are calculated as the number of earned Performance Share Awards multiplied by the volume weighted average share price of the five last trading days for the financial year. |
| 11 Remuneration report 2021 | Ericsson Annual Report on Form 20-F 2021 | |||
| Main conditions of share award plans | Information regarding reported financial year | |||||||||||||||||||||||||||||||||||||||||||||||
| Maximum | ||||||||||||||||||||||||||||||||||||||||||||||||
| number of | Performance | Year-end |
||||||||||||||||||||||||||||||||||||||||||||||
| Perfor- | possible | Performance | Share Awards | Performance | balance, earned | |||||||||||||||||||||||||||||||||||||||||||
| mance | Performance | Performance | Share Awards | still subject to | Share Awards | Performance | ||||||||||||||||||||||||||||||||||||||||||
| Performance | Perfor- | period | share awards | Share Awards | Opening | earned during | performance | vested during | Share Awards | |||||||||||||||||||||||||||||||||||||||
| Name and | criterion | Grant | mance | end | Vesting | granted | vesting | balance | the year | condition (value | the year (value | unvested (value | ||||||||||||||||||||||||||||||||||||
| position | Program | (weight) 1) |
date 2) |
period 3) |
date 4) |
Date 5) |
(value in SEK) 6) |
(value in SEK) 7) |
(value in SEK) 8) |
(value in SEK) 9) |
in SEK) 10) |
in SEK) 11) |
in SEK) 12) |
|||||||||||||||||||||||||||||||||||
| Arun Bansal EVP and Head of Market Area Europe & Latin America |
LTV 2021 | Group Operating income (EBIT) (50%) |
|
2021- 05-03 |
|
1 year | |
2021- 12-31 |
|
|
2024- 05-03 |
|
|
18,062 (1,972,433) |
|
|
36,124 (3,944,866) |
|
|
36,124 (3,584,585) |
|
|
36,124 (3,584,585) |
| ||||||||||||||||||||||||
| TSR performance criteria (50%) |
|
2021- 05-03 |
|
3 years | |
2023- 12-31 |
|
|
2024- 05-03 |
|
|
18,063 (1,972,433) |
|
|
36,126 (3,944,866) |
|
|
36,126 (3,584,783) |
|
|||||||||||||||||||||||||||||
| LTV 2020 | Group Operating income (EBIT) (50%) |
|
2020- 04-01 |
|
1 year | |
2020- 12-31 |
|
|
2023- 04-01 |
|
|
27,399 (2,136,026) |
|
|
54,798 (4,272,052) |
|
|
54,798 (5,378,424) |
|
|
54,798 (5,437,606) |
| |||||||||||||||||||||||||
| TSR performance criteria (50%) |
|
2020- 04-01 |
|
3 years | |
2022- 12-31 |
|
|
2023- 04-01 |
|
|
27,398 (2,136,026) |
|
|
54,796 (4,272,052) |
|
|
54,796 (5,437,407) |
|
|||||||||||||||||||||||||||||
| LTV 2019 | Group Operating income (EBIT) (50%) |
|
2019- 05-18 |
|
1 year | |
2019- 12-31 |
|
|
2022- 05-18 |
|
|
18,909 (1,787,323) |
|
|
37,818 (3,574,646) |
|
|
37,818 (3,711,837) |
|
|
37,818 (3,752,680) |
| |||||||||||||||||||||||||
| TSR performance criteria (50%) |
|
2019- 05-18 |
|
3 years | |
2021- 12-31 |
|
|
2022- 05-18 |
|
|
18,909 (1,787,323) |
|
|
37,818 (3,574,646) |
|
|
9,962 (988,529) |
|
|
9,962 (988,529) |
| ||||||||||||||||||||||||||
| LTV 2018 | Group Operating income (EBIT) (50%) |
|
2018- 05-18 |
|
1 year | |
2018- 12-31 |
|
|
2021- 05-18 |
|
|
24,745 (1,627,930) |
|
|
49,490 (3,255,860) |
|
|
49,490 (4,857,444) |
|
|
49,490 (5,495,384) |
|
|||||||||||||||||||||||||
| TSR performance criteria (50%) |
|
2018- 05-18 |
|
3 years | |
2020- 12-31 |
|
|
2021- 05-18 |
|
|
24,743 (1,627,930) |
|
|
49,486 (3,255,860) |
|
|
49,486 (4,857,051) |
|
|
49,486 (5,494,940) |
|
||||||||||||||||||||||||||
Total |
178,228 (15,047,424) |
356,456 (30,094,848) |
191,592 (18,804,755) |
46,086 (4,573,114) |
90,922 (9,022,190) |
98,976 (10,990,325) |
138,702 (13,763,399) |
|||||||||||||||||||||||||||||||||||||||||
1) |
The TSR performance criteria includes both the absolute and the relative performance criteria for each respective program. |
2) |
Grant date represents the date at which the initial grant was made. |
3) |
Performance period represents the period over which each performance criterion will be measured. |
4) |
Performance period end date represents the date when the performance period ends. |
5) |
Vesting date represents the date of which the Performance Share Awards, if any, will vest and entitle the participants to receive shares free of charge. |
6) |
Numbers represent the number of initial Performance Share Awards that were granted at the grant date. SEK values represent the equivalent value at the grant date. |
7) |
Numbers represent the maximum number of Performance Share Awards that could be earned for each performance criterion. SEK values represent the equivalent value at the grant date. |
8) |
Numbers represent the balance at the beginning of the year, which includes earned Performance Share Awards for previous year(s) that are yet to vest. SEK values are calculated as the number of earned Performance Share Awards multiplied by the volume weighted average share price of the five last trading days for the previous financial year. |
9) |
Numbers represent the number of Performance Share Awards earned that had a performance period ending during the financial year. SEK values are calculated as the number of earned Performance Share Awards multiplied by the volume weighted average share price of the five last trading days for the financial year. |
10) |
Numbers represent the maximum number of outstanding Performance Share Awards that are still subject to an ongoing performance period. SEK values are calculated as the number of outstanding Performance Share Awards that are still subject to an ongoing performance period multiplied by the volume weighted average share price of the five last trading days for the financial year. |
11) |
Numbers represent the number of Performance Share Awards that had a vesting period ending during the financial year and which entitled the participant to receive shares free of charge. SEK values represent the actual value of shares given to the participant at the vesting date. |
12) |
Numbers represent the balance at the end of the year, which includes earned Performance Share Awards for the financial year and previously earned Performance Share Awards that are yet to vest. SEK values are calculated as the number of earned Performance Share Awards multiplied by the volume weighted average share price of the five last trading days for the financial year. |
| 12 Remuneration report 2021 | Ericsson Annual Report on Form 20-F 2021 | |||
| – | The President and CEO is required to build up and maintain a shareholding equivalent to at least 200% of his gross annual base salary. |
| – | The other members of the ET are required to build up and maintain a shareholding equivalent to at least 75% of their gross annual base salaries. |
| – | any interests in Ericsson B shares held or acquired directly by the member of the ET, |
| – | any vested but unexercised options (post-tax, post-exercise cost value), |
| – | any equity awards held by the member of the ET where performance and/or employment conditions have been met, but which are subject to a holding period (on a post-tax basis). |
| Comparative table on the change of remuneration and company performance over the last three reported financial years | ||||||||||||||||||||||||||||||
| Ericsson performance | ||||||||||||||||||||||||||||||
| Remuneration for the President and CEO and Executive Vice Presidents |
Börje Ekholm President and CEO |
Fredrik Jejdling EVP and Head of Business Area Networks |
Arun Bansal EVP and Head of Market Area Europe & Latin America 3) |
Average remuneration to employees on a full-time equivalent basis 4) |
Group operating income (EBIT) |
Group net sales | Share Price as per December 31 of the financial year |
|||||||||||||||||||||||
| 2021 (% change YoY) |
Fixed remuneration 1) |
18,764,547 (1%) | 9,144,067 (15%) | 16,503,462 (73%) | 889,538 (13%) | 31,780 (14%) | 232,314 (–0.03%) | |
99.79 (2.20%) |
| ||||||||||||||||||||
| Variable remuneration 2) |
88,782,271 (22%) | 14,626,469 (122%) | 14,763,028 (11248%) | 295,193 (–1%) | ||||||||||||||||||||||||||
| 2020 (% change YoY) |
Fixed remuneration 1) |
18,498,002 (13%) | 7,948,081 (15%) | 9,514,116 | 790,295 (–23%) | 27,808 (163%) | 232,390 (2.28%) | |
97.64 (19.72%) |
| ||||||||||||||||||||
| Variable remuneration 2) |
72,507,054 | 6,595,909 (103%) | 130,096 | 299,589 (25%) | ||||||||||||||||||||||||||
| 2019 |
Fixed remuneration 1) |
16,299,080 | 6,933,652 | – | 1,030,185 | 10,564 | 227,216 | 81.56 | ||||||||||||||||||||||
| Variable remuneration 2) |
0 | 3,244,887 | – | 238,913 | ||||||||||||||||||||||||||
| Comments | |
LTV 2018 vested and shares were transferred in may 2021. |
|
|
LTV 2018 vested and shares were transferred in may 2021. |
|
|
LTV 2018 vested and shares were transferred in may 2021. Information disclosed and compared from date of appointment as EVP. |
|
|
During 2021 the delayed annual salary review for 2020 took place with a company sponsored retroactive effect, increasing the remuneration paid to other employees. A majority of employees in the parent company does not have variable remuneration. |
|
||||||||||||||||||
1) |
Fixed remuneration includes fixed salary and other benefits. |
2) |
Variable remuneration for the President and CEO and the EVPs include STV and LTV, as applicable. For the employees of the Company, the variable remuneration includes short- and long-term variable compensation. For comparability reasons, the variable remuneration represents numbers vested during the financial year, since performance evaluations and long-term variable compensation programs for other employees that have performance periods ending during the financial year 2021 are yet to be finalized. |
3) |
Arun Bansal was appointed EVP in June, 2020. Information disclosed covers the time period after June 1 2020. |
4) |
Employees of Telefonaktiebolaget LM Ericsson, excluding the President and CEO and the other members of the ET employed within the Company. |
| Ericsson Annual Report on Form 20-F 2021 | ||||
| The registrant hereby certifies that it meets all of the requirements for filing on Form 20-F and that it has duly caused and authorized the undersigned to sign this Annual Report on its behalf.TELEFONAKTIEBOLAGET LM ERICSSON March 25, 2022 |
| By: | /s/ Jonas Stringberg | |||||
| Jonas Stringberg | ||||||
| Head of Group Controlling and External Reporting | ||||||
| By: | /s/ Carl Mellander | |||||
| Carl Mellander | ||||||
| Executive Vice President and Chief Financial Officer | ||||||