ANNUAL CERTIFIED SHAREHOLDER REPORT
UNITED STATES
SECURITIES AND EXCHANGE COMMISSION
Washington, D.C. 20549
FORM N-CSR
CERTIFIED SHAREHOLDER REPORT OF REGISTERED
MANAGEMENT INVESTMENT COMPANIES
Investment Company Act file number 811-3706
----------------------------------------------
AMERICAN CENTURY CALIFORNIA TAX-FREE AND MUNICIPAL FUNDS
--------------------------------------------------------------------------------
(Exact name of registrant as specified in charter)
4500 MAIN STREET, KANSAS CITY, MISSOURI 64111
--------------------------------------------------------------------------------
(Address of principal executive offices) (Zip code)
CHARLES A. ETHERINGTON, 4500 MAIN STREET, KANSAS CITY, MISSOURI 64111
--------------------------------------------------------------------------------
(Name and address of agent for service)
Registrant's telephone number, including area code: 816-531-5575
----------------------------
Date of fiscal year end: 08-31
-------------------------------------------------------
Date of reporting period: 08-31-2008
------------------------------------------------------
ITEM 1. REPORTS TO STOCKHOLDERS.
[front cover]
ANNUAL REPORT
AUGUST 31, 2008
[american century investments logo and text logo]
AMERICAN CENTURY INVESTMENTS
CALIFORNIA TAX-FREE MONEY MARKET FUND
CALIFORNIA TAX-FREE BOND FUND
PRESIDENT'S LETTER
[photo of Jonathan Thomas]
JONATHAN THOMAS
Dear Investor,
At American Century Investments®, we are committed to helping you reach your
financial goals. Your success is the ultimate measure of our performance.
That's why we focus on achieving superior investment results and building
long-term relationships with investors like you.
Part of that relationship is to clearly communicate investment results and
what influenced them. To help you monitor your investment with us, we take
pride in providing you with the annual report for the American Century®
California Tax-Free Money Market and California Tax-Free Bond funds for the 12
months ended August 31, 2008. We also recommend americancentury.com, where we
provide company news, quarterly portfolio commentaries, investment views, and
other useful information.
As noted on the website, 2008 marks the 50th anniversary of American Century
Investments. Since 1958, we've worked to make wise decisions with your
interests as our guide. Fifty years also means that we've met the challenges
of previous economic downturns. As we've crossed those hurdles and earned your
trust, our growth in assets under management has given us the resources to
offer a wide array of financial products and services, including a
well-diversified lineup of portfolios that provides you with many choices in
these uncertain times.
Though our offerings are diverse, they share several key qualities, including
our disciplined investment approach and active, team-based management. Strict
adherence to our processes and long-term strategies allows us to stay focused
during volatile periods. Investors in our portfolios also benefit from the sum
of our investment teams' expertise as they share research and information.
We'll continue to work hard to earn your trust. Thank you for your continued
support.
Sincerely,
/s/Jonathan Thomas
Jonathan S. Thomas
President and Chief Executive Officer
American Century Investments
TABLE OF CONTENTS
Market Perspective. . . . . . . . . . . . . . . . . . . . . . . . . . 2
U.S. Fixed-Income Total Returns. . . . . . . . . . . . . . . . . . . 2
CALIFORNIA TAX-FREE MONEY MARKET
Performance . . . . . . . . . . . . . . . . . . . . . . . . . . . . . 3
Portfolio Commentary. . . . . . . . . . . . . . . . . . . . . . . . . 4
Yields . . . . . . . . . . . . . . . . . . . . . . . . . . . . . . . 4
Portfolio Composition by Credit Rating . . . . . . . . . . . . . . . 5
Portfolio Composition by Maturity. . . . . . . . . . . . . . . . . . 5
Schedule of Investments . . . . . . . . . . . . . . . . . . . . . . . 6
CALIFORNIA TAX-FREE BOND
Performance . . . . . . . . . . . . . . . . . . . . . . . . . . . . . 12
Portfolio Commentary. . . . . . . . . . . . . . . . . . . . . . . . . 14
Portfolio at a Glance. . . . . . . . . . . . . . . . . . . . . . . . 14
Yields . . . . . . . . . . . . . . . . . . . . . . . . . . . . . . . 14
Portfolio Composition by Credit Rating . . . . . . . . . . . . . . . 15
Top Five Sectors . . . . . . . . . . . . . . . . . . . . . . . . . . 15
Schedule of Investments . . . . . . . . . . . . . . . . . . . . . . . 16
Shareholder Fee Examples. . . . . . . . . . . . . . . . . . . . . . . 26
FINANCIAL STATEMENTS
Statement of Assets and Liabilities . . . . . . . . . . . . . . . . . 28
Statement of Operations . . . . . . . . . . . . . . . . . . . . . . . 29
Statement of Changes in Net Assets. . . . . . . . . . . . . . . . . . 30
Notes to Financial Statements . . . . . . . . . . . . . . . . . . . . 31
Financial Highlights. . . . . . . . . . . . . . . . . . . . . . . . . 35
Report of Independent Registered Public Accounting Firm . . . . . . . 37
OTHER INFORMATION
Management. . . . . . . . . . . . . . . . . . . . . . . . . . . . . . 38
Approval of Management Agreements for California
Tax-Free Money Market and California Tax-Free Bond. . . . . . . . . 41
Additional Information. . . . . . . . . . . . . . . . . . . . . . . . 46
Index Definitions . . . . . . . . . . . . . . . . . . . . . . . . . . 47
The opinions expressed in the Market Perspective and each of the Portfolio
Commentaries reflect those of the portfolio management team as of the date of
the report, and do not necessarily represent the opinions of American Century
Investments or any other person in the American Century Investments
organization. Any such opinions are subject to change at any time based upon
market or other conditions and American Century Investments disclaims any
responsibility to update such opinions. These opinions may not be relied upon
as investment advice and, because investment decisions made by American
Century Investments funds are based on numerous factors, may not be relied
upon as an indication of trading intent on behalf of any American Century
Investments fund. Security examples are used for representational purposes
only and are not intended as recommendations to purchase or sell securities.
Performance information for comparative indices and securities is provided to
American Century Investments by third party vendors. To the best of American
Century Investments' knowledge, such information is accurate at the time of
printing.
MARKET PERSPECTIVE
[photo of Chief Investment Officer]
By G. David MacEwen, Chief Investment Officer, Fixed Income
QUALITY RULES IN CHALLENGING CLIMATE
Against a backdrop of widespread credit and liquidity problems, coupled with
strong market volatility, investors favored higher-quality securities during
the 12 months ended August 31, 2008. Treasuries significantly outperformed
non-Treasury securities, including municipals. Credit-related risk aversion
hurt the lower-quality sectors of the market.
The Federal Reserve (the Fed) faced the dual--and conflicting--challenges of
keeping recession at bay and fending off inflation. For much of the period,
the Fed favored anti-recessionary measures, cutting the federal funds target
rate by 3.25 percentage points between September 2007 and April 2008. The Fed
also enacted a series of emergency lending programs targeting a wider spectrum
of borrowers. As oil and other commodity prices reached record highs, the Fed
seemed to refocus on inflation, holding interest rates steady during the last
four months of the reporting period. Inflation, as measured by the one-year
change in the Consumer Price Index, ended the period at 5.4%.
CREDIT WOES REACH MUNICIPAL MARKET
The credit-market turmoil that originated in the subprime mortgage market
worked its way into the usually calm municipal bond market. Extensive
financial-sector deleveraging, forced selling among hedge funds, and an
increase in deficit financing created a supply surge among municipal bonds.
These factors, combined with ratings downgrades for several municipal bond
insurers, led to historic underperformance for municipals relative to
Treasuries. They also reversed a two-year flattening trend for the municipal
yield curve, which steepened during the period. In February, certain
investment-grade municipal yields reached 121% of comparable Treasury yields.
(The ratio historically has been 85% to 90%.)
Although performance rebounded in subsequent months, the municipal/Treasury
yield ratio remained above its historic range--usually an indication of an
attractive buying opportunity. We believe municipal yields at 100% or more of
Treasuries offer sufficient long-term appreciation potential to overcome
near-term economic, financial, and credit risks. Furthermore, an overhaul of
the credit-ratings scales, which Moody's will launch in October, should show
investment-grade municipals typically have higher credit quality than
investment-grade corporate securities.
U.S. Fixed Income Total Returns
For the 12 months ended August 31, 2008
LEHMAN BROTHERS MUNICIPAL MARKET INDICES
Municipal Bond 4.48%
3-Year Municipal Bond 6.60%
5-Year General Obligation (GO) Bond 7.07%
Long-Term Municipal Bond 0.62%
Non-Investment-Grade Municipal Bond -4.37%
TAXABLE MARKET RETURNS
Lehman Brothers U.S. Aggregate Index 5.86%
Lehman Brothers U.S. Treasury Index 8.65%
3-Month Treasury Bill 3.16%
10-Year Treasury Note 9.84%
------
2
PERFORMANCE
California Tax-Free Money Market
Total Returns as of August 31, 2008
Average Annual Returns
Since Inception
1 year 5 years 10 years Inception Date
CALIFORNIA TAX-FREE
MONEY MARKET 2.38%(1) 2.07% 2.09% 3.11% 11/9/83
LIPPER CALIFORNIA
TAX-EXEMPT MONEY MARKET
FUNDS
AVERAGE RETURNS(2) 2.06% 1.92% 1.95% 3.22%(3) --
Fund's Lipper Ranking
as of 8/31/08(2) 15 of 71 16 of 57 7 of 39 2 of 2(3) --
Fund's Lipper Ranking
as of 9/30/08(2) 13 of 71 15 of 57 7 of 39 2 of 2(3) --
(1) Fund returns would have been lower if American Century Investments had not
voluntarily waived a portion of its management fees.
(2) Data provided by Lipper Inc. - A Reuters Company. © 2008 Reuters. All
rights reserved. Any copying, republication or redistribution of Lipper
content, including by caching, framing or similar means, is expressly
prohibited without the prior written consent of Lipper. Lipper shall not be
liable for any errors or delays in the content, or for any actions taken in
reliance thereon.
Lipper Fund Performance -- Performance data is total return, and is
preliminary and subject to revision.
Lipper Rankings -- Rankings are based only on the universe shown and are
based on average annual total returns. This listing might not represent the
complete universe of funds tracked by Lipper.
The data contained herein has been obtained from company reports, financial
reporting services, periodicals and other resources believed to be reliable.
Although carefully verified, data on compilations is not guaranteed by Lipper
and may be incomplete. No offer or solicitations to buy or sell any of the
securities herein is being made by Lipper.
(3) Since 11/30/83, the date nearest the fund's inception for which data are
available.
Data presented reflect past performance. Past performance is no guarantee of
future results. Current performance may be higher or lower than the
performance shown. To obtain performance data current to the most recent month
end, please call 1-800-345-2021 or visit americancentury.com. Investment
income may be subject to certain state and local taxes and, depending on your
tax status, the federal alternative minimum tax (AMT). Capital gains are not
exempt from state and federal income tax.
An investment in the fund is not insured or guaranteed by the Federal Deposit
Insurance Corporation or any other government agency. Although the fund seeks
to preserve the value of your investment at $1.00 per share, it is possible to
lose money by investing in the fund.
The 7-day current yield more closely reflects the current earnings of the fund
than the total return.
------
3
PORTFOLIO COMMENTARY
California Tax-Free Money Market
Portfolio Managers: Todd Pardula and Steven Permut
PERFORMANCE SUMMARY
California Tax-Free Money Market returned 2.38% for the 12 months ended August
31, 2008, outpacing the 2.06% average return of the 71 funds in Lipper Inc.'s
California Tax-Exempt Money Market Funds category. The fund maintained its
solid performance run, finishing the period ranked among the top quartile of
the Lipper peer group. This performance is particularly noteworthy because,
unlike many of our peers, we do not own any securities subject to the federal
alternative minimum tax (AMT). AMT securities typically offer higher yields.
FED ACTION, FLIGHT TO QUALITY PUSHED YIELDS LOWER
As the 12-month period began, all eyes were on the sagging housing and
mortgage sectors. Credit and liquidity concerns took hold of the financial
markets, sending U.S. economic growth prospects tumbling. In an effort to
energize the markets, bolster liquidity, and stimulate the struggling economy,
the Federal Reserve (the Fed) took extraordinary measures during the reporting
period. On the monetary policy front, the Fed cut the federal funds target
rate by 3.25 percentage points, despite soaring commodity prices and mounting
inflationary pressures.
The Fed's easing campaign, combined with a massive flight to quality caused by
subprime-related contagion, sparked a rally among Treasury securities. The
yield on the three-month Treasury bill, a standard money market benchmark,
declined from 4.12% on August 31, 2007, to 1.72% on August 29, 2008.
Municipal money market yields experienced similar declines. California
Tax-Free Money Market's seven-day current yield fell from 3.47% to 1.32%
during the 12-month period.
DOWNGRADES, FORCED SELLING CHALLENGED MARKET
The write-downs of subprime-backed securities and investment vehicles led to
negative ratings outlooks and downgrades for several monoline insurers.
Although some securities within our portfolio were insured by these companies,
we eliminated our exposure to the monolines during the second quarter of 2008.
Our stringent and thorough research efforts indicated the underlying issuers
were of high credit quality, even without the insurance, but the insurer
downgrades made those securities ineligible for our fund.
Yields as of August 31, 2008(1)
7-Day Current Yield
1.32%
7-Day Effective Yield
1.33%
7-Day Tax-Equivalent Current Yields(2)
31.98% Tax Bracket 1.94%
34.70% Tax Bracket 2.02%
39.23% Tax Bracket 2.17%
41.05% Tax Bracket 2.24%
(1) The yields presented reflect the waiver of a portion of the fund's
management fees. Without such waiver, the 7-day yields would have been lower.
(2) The tax brackets indicated are for combined state and federal income tax.
Actual tax-equivalent yields may be lower, if alternative minimum tax is
applicable.
------
4
California Tax-Free Money Market
Municipal investors faced an additional challenge when hedge funds and other
highly leveraged investors had to sell billions of dollars in municipal
securities to cover outflows and meet margin calls. The resulting
supply/demand imbalance caused municipal ratios to rise to historic levels. In
particular, yields on short-term auction-rate securities (ARS) skyrocketed
into double digits as investors questioned their liquidity and credit quality.
None of our money market funds owned ARS, because ARS are not eligible for use
in money market funds.
PORTFOLIO STRATEGY
We continued to emphasize floating-rate notes throughout much of the period.
Our focus on floaters afforded us the flexibility to capture periodic rate
spikes while maintaining liquidity. It also accounted for the fund's
outperformance during the period.
After steadily declining through May 2008, the fund's weighted average
maturity (WAM) spiked during the final three months of the period. This was
not the result of an interest-rate call; rather, it was due to our desire to
keep the portfolio fully invested in an environment of limited supply. As the
financial sector turmoil continued to unfold, many of the banks providing
letter-of-credit protection for floating-rate securities were downgraded or
removed from the fund's approved list. The banks still meeting our investment
criteria had reached capacity. Therefore, to stay invested, we had to purchase
one-year notes issued by various municipalities within California, which
caused the fund's WAM to increase. These longer-term securities, which usually
trade near 65% of LIBOR (a widely used short-term interest rate benchmark),
traded at lower ratios this year because of increased demand.
OUTLOOK
We believe the weakening U.S. economy and the need to stimulate the struggling
banking sector may force the Fed to cut interest rates further. With the
credit markets still stressed, we will look for opportunities to enhance the
fund's liquidity. The October launch of a global ratings scale for bonds
should lead to ratings upgrades for many municipal securities, possibly
increasing the pool of eligible investments.
Portfolio Composition by Credit Rating
% of fund % of fund
investments investments
as of as of
8/31/08 2/29/08
A-1+ 82% 75%
A-1 18% 25%
Portfolio Composition by Maturity
% of fund % of fund
investments investments
as of as of
8/31/08 2/29/08
1-30 days 86% 90%
31-90 days -- 1%
91-180 days 1% 9%
More than 180 days 13% --
------
5
SCHEDULE OF INVESTMENTS
California Tax-Free Money Market
AUGUST 31, 2008
Principal Amount Value
Municipal Securities -- 99.4%
CALIFORNIA -- 99.1%
$ 2,000,000 ABAG Finance Auth. for Nonprofit Corps.
Multifamily Housing Rev., Series 2002 A, (The
Arbors Apartments), VRDN, 1.85%, 9/3/08 (FNMA)
(SBBPA: FNMA) $ 2,000,000
5,270,000 ABAG Finance Auth. for Nonprofit Corps. Rev.,
(Francis Parker School), VRDN, 1.67%, 9/4/08
(LOC: Bank of New York) 5,270,000
3,980,000 ABAG Finance Auth. for Nonprofit Corps. Rev.,
(Institute Defense Analyses), VRDN, 1.75%, 9/4/08
(LOC: Branch & Banking Trust) 3,980,000
4,000,000 ABAG Finance Auth. for Nonprofit Corps. Rev.,
(The Branson School), VRDN, 1.67%, 9/4/08 (LOC:
Allied Irish Bank plc) 4,000,000
5,000,000 ABAG Finance Auth. for Nonprofit Corps. Rev.,
(The Thacher School), VRDN, 1.98%, 9/4/08 (SBBPA:
Keybank, N.A.) 5,000,000
1,350,000 ABAG Finance Auth. for Nonprofit Corps. Rev.,
Series 2005 A, (San Francisco University High
School), VRDN, 1.67%, 9/4/08 (LOC: Allied Irish
Bank plc) 1,350,000
4,950,000 ABAG Finance Auth. for Nonprofit Corps. Rev.,
Series 2006 A, (Elder Care Alliance of San
Francisco), VRDN, 1.60%, 9/4/08 (LOC: Citibank
N.A.) 4,950,000
3,000,000 ABN AMRO Munitops Certificate Trust GO, Series
2005-63, VRDN, 1.91%, 9/4/08 (FSA) (SBBPA: Bank
of America N.A.) (Acquired 3/20/08, Cost
$3,000,000)(1) 3,000,000
1,450,000 Alameda Public Financing Auth. Multifamily
Housing Rev., Series 2005 A, (Eagle
Village/Parrot Village Apartments), VRDN, 1.67%,
9/4/08 (LOC: FNMA) 1,450,000
3,100,000 Anaheim Union High School District COP, (School
Facility Bridge Funding), VRDN, 3.00%, 9/4/08
(FSA) (SBBPA: Wachovia Bank N.A.) 3,100,000
Principal Amount Value
$ 4,040,000 Apple Valley COP, (Public Facilities Financing),
VRDN, 1.79%, 9/4/08 (LOC: Union Bank of
California and California State Teacher's
Retirement) $ 4,040,000
7,970,000 Austin Trust Various States GO, Series 2008-1154,
VRDN, 1.91%, 9/4/08 (BHAC) (SBBPA: Bank of
America, N.A.) (Acquired 6/20/08, Cost
$7,970,000)(1) 7,970,000
6,665,000 Austin Trust Various States GO, Series
2008-3039X, VRDN, 1.91%, 9/4/08 (BHAC) (SBBPA:
Bank of America, N.A.) (Acquired 6/20/08, Cost
$6,665,000)(1) 6,665,000
2,500,000 Austin Trust Various States GO, Series 2008-3318,
VRDN, 1.96%, 9/4/08 (AGC) (SBBPA: Bank of
America, N.A.) 2,500,000
5,145,000 Austin Trust Various States GO, Series 2008-3501,
VRDN, 1.91%, 9/4/08 (FSA) (SBBPA: Bank of
America, N.A.) 5,145,000
6,665,000 Austin Trust Various States Rev., Series
2008-1168, VRDN, 1.78%, 9/4/08 (BHAC) (SBBPA:
Bank of America, N.A.) 6,665,000
6,500,000 Austin Trust Various States Rev., Series
2008-3305, VRDN, 1.78%, 9/4/08 (SBBPA: Bank of
America, N.A.) (Acquired 6/26/08, Cost
$6,500,000)(1) 6,500,000
3,000,000 Azusa Unified School District COP, (2004 School
Facility Bridge Funding Program), VRDN, 3.00%,
9/4/08 (FSA) (SBBPA: Dexia Credit Local) 3,000,000
2,800,000 Azusa Unified School District COP, (2004 School
Facility Bridge Funding Program), VRDN, 3.00%,
9/4/08 (FSA) (SBBPA: Dexia Credit Local) 2,800,000
2,300,000 Barstow Multifamily Housing Rev., (Desert Vista
Apartments), VRDN, 1.63%, 9/3/08 (LOC: FHLB) 2,300,000
7,500,000 California Communities Tax & Revenue Anticipation
Note Program Rev., Series 2008 A-3, 3.00%,
6/30/09 (FSA) 7,583,009
------
6
California Tax-Free Money Market
Principal Amount Value
$ 5,245,000 California Department of Water Resources Rev.,
Series 2008-D143, (MERLOTs), VRDN, 1.90%, 9/3/08
(SBBPA: Wachovia Bank N.A.) (Acquired 5/9/08,
Cost $5,245,000)(1) $ 5,245,000
7,605,000 California Educational Facilities Auth. Rev.,
Series 2002 B, (Art Center Design College), VRDN,
1.85%, 9/4/08 (LOC: Allied Irish Bank plc) 7,605,000
2,125,000 California Educational Facilities Auth. Rev.,
Series 2008-2495, (PUTTERs), VRDN, 1.82%, 9/4/08
(SBBPA: JPMorgan Chase Bank N.A.) (Acquired
1/31/08, Cost $2,125,000)(1) 2,125,000
4,990,000 California Enterprise Development Auth. Rev.,
(Community Hospice Inc.), VRDN, 1.79%, 9/4/08
(LOC: Bank of New York) 4,990,000
8,000,000 California Enterprise Development Auth. Rev.,
(Humane Society Silicon Valley), VRDN, 1.79%,
9/4/08 (LOC: U.S. Bank N.A.) 8,000,000
2,000,000 California GO, Series 2003 C3, VRDN, 1.55%,
9/4/08 (LOC: Landesbank Hessen-Thuringen
Girozentrale, Bank of America N.A. and Bank of
Nova Scotia) 2,000,000
1,200,000 California GO, Series 2003 C4, VRDN, 1.58%,
9/4/08 (LOC: Landesbank Hessen-Thuringen
Girozentrale, Bank of America N.A., and Bank of
Nova Scotia) 1,200,000
750,000 California GO, Series 2004 A9, (Weekly
Kindergarten University), VRDN, 1.58%, 9/4/08
(LOC: Citibank N.A. and California State
Teacher's Retirement) 750,000
350,000 California GO, Series 2005 A3, VRDN, 1.54%,
9/3/08 (LOC: Bank of America N.A.) 350,000
3,000,000 California GO, Series 2005 B6, VRDN, 2.50%,
9/2/08 (LOC: KBC Bank N.V.) 3,000,000
2,980,000 California GO, Series 2006-1255, VRDN, 1.89%,
9/4/08 (BHAC) (SBBPA: JPMorgan Chase Bank N.A.)
(Acquired 8/18/08, Cost $2,980,000)(1) 2,980,000
Principal Amount Value
$ 6,500,000 California Health Facilities Financing Auth.
Rev., Series 2006 C, (Kaiser Permanente), VRDN,
1.60%, 9/3/08 $ 6,500,000
3,000,000 California Infrastructure & Economic Development
Bank Rev., (Country Schools), VRDN, 1.79%, 9/4/08
(LOC: Bank of New York) 3,000,000
4,450,000 California Infrastructure & Economic Development
Bank Rev., (Humane Society), VRDN, 1.88%, 9/4/08
(LOC: Comercia Bank) 4,450,000
2,830,000 California Infrastructure & Economic Development
Bank Rev., (Rural Community Assistance), VRDN,
1.81%, 9/4/08 (LOC: Bank of the West) 2,830,000
3,400,000 California Infrastructure & Economic Development
Bank Rev., (St. Margaret's Episcopal School),
VRDN, 1.67%, 9/4/08 (LOC: Allied Irish Bank plc) 3,400,000
4,000,000 California Infrastructure & Economic Development
Bank Rev., Series 2007 A, (Tobinworld), VRDN,
1.88%, 9/4/08 (LOC: Comerica Bank) 4,000,000
4,000,000 California Infrastructure & Economic Development
Bank Rev., Series 2008 A, (California Independent
System Operator Corporation), 4.00%, 2/1/09 4,029,494
3,010,000 California Infrastructure & Economic Development
Bank Rev., Series 2008 A, (Hillview Mental
Health), VRDN, 1.88%, 9/4/08 (LOC: Comerica Bank) 3,010,000
2,400,000 California Infrastructure & Economic Development
Bank Rev., Series 2008 C, (Orange County
Performing Arts Center), VRDN, 1.70%, 9/4/08
(LOC: Allied Irish Bank plc) 2,400,000
1,500,000 California Municipal Finance Auth. Rev., (Gideon
Hausner Jewish Day School), VRDN, 1.62%, 9/4/08
(LOC: U.S. Bank N.A.) 1,500,000
13,000,000 California School Cash Reserve Program Auth. COP,
Series 2008 A, (2008-2009 TRANS), 3.00%, 7/6/09
(LOC: U.S. Bank N.A.) (GIC: Natixis) 13,146,200
------
7
California Tax-Free Money Market
Principal Amount Value
$10,935,000 California State University Rev., Series
2006-1435, (PUTTERs), VRDN, 1.94%, 9/4/08 (LOC:
JPMorgan Chase & Co.) (Acquired 2/21/08-3/24/08,
Cost $10,935,000)(1) $ 10,935,000
7,500,000 California Statewide Communities Development
Auth. Multifamily Housing Rev., Series 2008-2680,
(PUTTERs), VRDN, 1.94%, 9/4/08 (LOC: JPMorgan
Chase Bank N.A.) (Acquired 4/4/08, Cost
$7,500,000)(1) 7,500,000
9,000,000 California Statewide Communities Development
Auth. Rev., (House Ear Institute), VRDN, 1.88%,
9/4/08 (LOC: City National Bank) 9,000,000
10,000,000 California Statewide Communities Development
Auth. Rev., (Retirement Housing Foundation
Obligated Group), VRDN, 1.60%, 9/4/08 (LOC: KBC
Bank N.V.) 10,000,000
7,000,000 California Statewide Communities Development
Auth. Rev., Series 2003 D, (Kaiser Permanente),
VRDN, 1.46%, 9/3/08 7,000,000
7,500,000 California Statewide Communities Development
Auth. Rev., Series 2004 M, (Kaiser Permanente),
VRDN, 1.60%, 9/3/08 7,500,000
5,300,000 California Statewide Communities Development
Auth. Rev., Series 2008 A, (Rady Children's
Hospital - San Diego), VRDN, 1.43%, 9/4/08 (LOC:
Allied Irish Bank plc) 5,300,000
2,200,000 Carlsbad Unified School District COP, (School
Facility Bridge Funding), VRDN, 3.00%, 9/4/08
(FSA) (SBBPA: Wachovia Bank N.A.) 2,200,000
1,800,000 Castaic Union School District COP, (School
Facility Bridge Funding), VRDN, 3.00%, 9/4/08
(FSA) (SBBPA: Dexia Credit Local) 1,800,000
5,250,000 Chaffey Community College District GO, Series
2008-2718, (PUTTERs), VRDN, 2.34%, 9/4/08 (SBBPA:
JPMorgan Chase Bank N.A.) (Acquired 4/4/08, Cost
$5,250,000)(1) 5,250,000
Principal Amount Value
$ 3,235,000 City of Baldwin Park COP, (Street Improvement
Program), VRDN, 1.84%, 9/3/08 (LOC: Allied Irish
Bank plc) $ 3,235,000
1,000,000 City of Fremont COP, (1991 Fire Stations
Financing), VRDN, 1.90%, 9/4/08 (LOC: KBC Bank
N.V.) 1,000,000
300,000 City of Hanford Sewer System Rev., Series 1996 A,
VRDN, 1.88%, 9/4/08 (LOC: Union Bank of
California N.A.) 300,000
6,040,000 City of Moreno Valley COP, (1997 City Hall
Refinancing), VRDN, 1.79%, 9/4/08 (LOC: Union
Bank of California N.A. and California State
Teacher's Retirement) 6,040,000
900,000 City of Novato Multifamily Housing Rev., (Nova-Ro
III Senior Housing), VRDN, 1.60%, 9/4/08 (LOC:
Bank of the West) 900,000
11,045,000 City of Reedley COP, VRDN, 1.82%, 9/4/08 (LOC:
U.S. Bank N.A.) 11,045,000
5,600,000 City of Vallejo Water Rev., Series 2001 A, VRDN,
1.70%, 9/3/08 (LOC: JPMorgan Chase Bank N.A.) 5,600,000
20,350,000 City of Whittier Rev., (Whittier College), VRDN,
2.06%, 9/4/08 (RADIAN) (LOC: Keybank, N.A.)
(SBBPA: Bank of New York) 20,350,000
7,000,000 Coachella Valley Unified School District COP,
(2006 School Financing), VRDN, 1.86%, 9/4/08
(FSA) (SBBPA: Dexia Credit Local) 7,000,000
5,000,000 Delano COP, (Delano Regional Medical Center),
VRDN, 1.84%, 9/4/08 (LOC: Comerica Bank) 5,000,000
6,000,000 Deutsche Bank SPEARs/LIFERs Trust Various States
GO, Series 2006 DB-416, VRDN, 1.82%, 9/4/08 (LOC:
Deutsche Bank AG) (Acquired 10/18/07, Cost
$6,000,000)(1) 6,000,000
8,120,000 Deutsche Bank SPEARs/LIFERs Trust Various States
GO, Series 2007 DB-382, VRDN, 1.82%, 9/4/08 (LOC:
Deutsche Bank AG) (Acquired 12/10/07, Cost
$8,120,000)(1) 8,120,000
------
8
California Tax-Free Money Market
Principal Amount Value
$ 1,630,000 Deutsche Bank SPEARs/LIFERs Trust Various States
GO, Series 2007 DB-386, VRDN, 1.84%, 9/4/08 (LOC:
Deutsche Bank AG) $ 1,630,000
1,485,000 Deutsche Bank SPEARs/LIFERs Trust Various States
Tax Allocation Rev., Series 2007 DB-394, VRDN,
1.85%, 9/4/08 (LOC: Deutsche Bank AG) 1,485,000
7,500,000 Diamond Bar Public Financing Auth. Lease Rev.,
Series 2002 A, (Community/Senior Center), VRDN,
1.90%, 9/3/08 (LOC: Union Bank of California N.A.) 7,500,000
6,160,000 Eastern Municipal Water District Water & Sewer
Rev. COP, Series 2008 A, VRDN, 1.63%, 9/4/08
(SBBPA: Wells Fargo Bank N.A.) 6,160,000
6,000,000 Eastern Municipal Water District Water & Sewer
Rev. COP, Series 2008 E, VRDN, 1.65%, 9/3/08
(SBBPA: Lloyds TSB Bank plc) 6,000,000
5,375,000 El Monte COP, Series 2003 A, (Community
Improvement), VRDN, 1.79%, 9/4/08 (LOC: Union
Bank of California N.A. and California State
Teacher's Retirement) 5,375,000
3,530,000 Golden State Tobacco Securitization Corp.
Settlement Rev., (PA 1236), VRDN, 1.82%, 9/4/08
(SBBPA: Bank of New York) (Acquired 1/15/04, Cost
$3,530,000)(1) 3,530,000
3,085,000 Hesperia Unified School District COP, (2004
Interim School Facility Funding Program), VRDN,
2.10%, 9/4/08 (FSA) (SBBPA: Dexia Credit Local) 3,085,000
2,700,000 Huntington Beach Union High School District COP,
(2003 School Facility Bridge Funding Program),
VRDN, 3.00%, 9/4/08 (FSA) (SBBPA: Dexia Credit
Local) 2,700,000
33,445,000 Inland Valley Development Agency Tax Allocation
Rev., VRDN, 1.90%, 9/3/08 (LOC: Union Bank of
California N.A. and California State Teacher's
Retirement) 33,445,000
Principal Amount Value
$ 1,150,000 Lake Elsinore Recreation Auth. Rev., Series 2000
A, (Public Facilities), VRDN, 1.75%, 9/3/08 (LOC:
California State Teacher's Retirement) $ 1,150,000
4,270,000 Lakeside Union School District COP, (2006 School
Facility Bridge Funding Program), VRDN, 2.10%,
9/4/08 (AGC) (SBBPA: Dexia Credit Local) 4,270,000
900,000 Los Angeles COP, Series 2006 A, (Notre Dame High
School), VRDN, 1.67%, 9/4/08 (LOC: Allied Irish
Bank plc) 900,000
5,000,000 Los Angeles County Tax & Rev. Anticipation Notes
Rev., Series 2008 A, 3.00%, 6/30/09 5,057,828
25,000,000 Los Angeles Tax & Rev. Anticipation Notes GO,
3.00%, 6/30/09 25,296,167
2,000,000 Los Angeles Unified School District GO, Series
2000 D, (Election of 1997), 5.50%, 7/1/09 2,062,288
8,000,000 Los Angeles Unified School District Tax & Rev.
Anticipation Notes GO, Series 2008 A, 3.00%,
7/30/09 8,106,313
3,000,000 Los Angeles Wastewater System Rev., Series 2008
G, VRDN, 1.64%, 9/4/08 (LOC: Bank of America N.A.) 3,000,000
5,200,000 Murrieta Valley Unified School District COP,
(2005 School Facility Bridge Funding Program),
VRDN, 3.00%, 9/4/08 (FSA) (SBBPA: Dexia Credit
Local) 5,200,000
1,000,000 Palm Desert Community Facilities District No.
91-1 Special Tax Rev., (Indian Ridge Public
Improvements), 4.00%, 10/1/08 (FSA) 1,000,720
4,980,000 Puttable Floating Option Tax-Exempt Receipts,
VRDN, 1.86%, 9/4/08 (LOC: Dexia Credit Local) 4,980,000
2,400,000 Puttable Floating Option Tax-Exempt Receipts,
VRDN, 1.86%, 9/4/08 (LOC: Dexia Credit Local) 2,400,000
24,000,000 RBC Municipal Products Inc. Trust Tax Allocation
Rev., Series 2008 E5, VRDN, 1.84%, 9/4/08 (LOC:
Royal Bank of Canada) (Acquired 5/29/08-7/1/08,
Cost $24,000,000)(1) 24,000,000
------
9
California Tax-Free Money Market
Principal Amount Value
$ 4,330,000 San Bernardino County Multifamily Housing Auth.
Rev., Series 1993 A, (Rialto Heritage), VRDN,
1.81%, 9/4/08 (LOC: FHLB) $ 4,330,000
4,150,000 San Diego County & School District Tax & Revenue
Anticipation Notes, Series 2008 A, 3.50%, 6/30/09 4,215,213
3,800,000 San Diego County COP, VRDN, 1.82%, 9/4/08 (LOC:
Comerica Bank) 3,800,000
4,465,000 San Diego County Water Auth. COP, Series
2008-2873, (PUTTERs), VRDN, 2.09%, 9/4/08 (FSA)
(SBBPA: JPMorgan Chase Bank N.A.) (Acquired
5/22/08, Cost $4,465,000)(1) 4,465,000
10,000,000 San Diego Unified School District Tax & Rev.
Anticipation Notes GO, Series 2008 A, 3.00%,
7/1/09 10,111,902
5,640,000 San Francisco City & County GO, Series 2008 D93,
VRDN, 2.15%, 9/3/08 (SBBPA: Wachovia Bank N.A.)
(Acquired 6/12/08, Cost $5,640,000)(1) 5,640,000
7,560,000 San Francisco City & County Redevelopment Agency
Community Facilities District No. 4 Rev.,
(Mission Bay North Public Improvements), VRDN,
1.67%, 9/4/08 (LOC: Bank of America N.A.) 7,560,000
1,300,000 San Francisco City & County Redevelopment Agency
Rev., (South Harbor), VRDN, 1.90%, 9/4/08 (LOC:
Dexia Credit Local) 1,300,000
5,100,000 San Jacinto Unified School District COP, Series
2006 A, (2006 School Facility Bridge Funding
Program), VRDN, 3.00%, 9/4/08 (FSA) (SBBPA: Dexia
Credit Local) 5,100,000
6,585,000 Sequoia Union High School District GO, Series
2008 D232, VRDN, 2.05%, 9/3/08 (FSA) (SBBPA:
Wachovia Bank N.A.) (Acquired 6/26/08, Cost
$6,585,000)(1) 6,585,000
1,300,000 Stockton Public Financing Auth. Lease Rev.,
Series 2007 A, (Building Acquisition Financing),
VRDN, 2.10%, 9/4/08 (AGC) (SBBPA: Dexia Credit
Local) 1,300,000
Principal Amount Value
$ 5,200,000 Three Valleys Municipal Water District COP,
(Miramar Water Treatment, Water Transmission and
Hydroelectric Generating Facilities), VRDN,
1.65%, 9/3/08 (LOC: Wells Fargo Bank N.A) $ 5,200,000
800,000 Triunfo County Sanitation District Rev., VRDN,
1.78%, 9/3/08 (LOC: BNP Paribas) 800,000
1,100,000 University of California Rev., Series 2008-2475,
(PUTTERs), VRDN, 1.82%, 9/4/08 (SBBPA: JPMorgan
Chase Bank N.A.) (Acquired 1/31/08, Cost
$1,100,000)(1) 1,100,000
2,975,000 Victor Valley Community College District COP,
(Capital Improvement Refinancing), VRDN, 1.65%,
9/4/08 (LOC: BNP Paribas and Union Bank of
California N.A.) 2,975,000
25,000,000 Victorville Joint Powers Financing Auth. Lease
Rev., Series 2007 A, (Cogeneration Facility),
VRDN, 1.79%, 9/4/08 (LOC: Fortis Bank SA N.V.) 25,000,000
1,185,000 West Covina Redevelopment Agency Rev., (Lakes
Public Parking), VRDN, 1.70%, 9/3/08 (LOC: Allied
Irish Bank plc) 1,185,000
5,000,000 West Hills Community College District COP, VRDN,
1.57%, 9/3/08 (LOC: Union Bank of California N.A.) 5,000,000
3,770,000 Western Placer Unified School District COP,
Series 2004 A, (School Facilities), VRDN, 2.00%,
9/4/08 (FSA) (SBBPA: Dexia Credit Local) 3,770,000
-------------
574,624,134
-------------
PUERTO RICO -- 0.3%
2,000,000 Puerto Rico Highway & Transportation Auth. Rev.,
VRDN, 1.84%, 9/4/08 (LOC: Dexia Credit Local)
(Acquired 6/13/08, Cost $2,000,000)(1) 2,000,000
-------------
TOTAL INVESTMENT SECURITIES -- 99.4% 576,624,134
-------------
OTHER ASSETS AND LIABILITIES -- 0.6% 3,425,050
-------------
TOTAL NET ASSETS -- 100.0% $580,049,184
=============
------
10
California Tax-Free Money Market
Notes to Schedule of Investments
ABAG = Association of Bay Area Governments
AGC = Assured Guaranty Corporation
Ambac = Ambac Assurance Corporation
BHAC = Berkshire Hathaway Assurance Corporation
COP = Certificates of Participation
FGIC = Financial Guaranty Insurance Co.
FHLB = Federal Home Loan Bank
FNMA = Federal National Mortgage Association
FSA = Financial Security Assurance, Inc.
GIC = Guaranteed Investment Contract
GO = General Obligation
LIFERs = Long Inverse Floating Exempt Receipts
LOC = Letter of Credit
MERLOTs = Municipal Exempt Receipts Liquidity Optional Tenders
PUTTERs = Puttable Tax-Exempt Receipts
RADIAN = Radian Asset Assurance, Inc.
SBBPA = Standby Bond Purchase Agreement
SPEARs = Short Puttable Exempt Adjustable Receipts
VRDN = Variable Rate Demand Note. Interest reset date is indicated. Rate
shown is effective August 31, 2008.
(1) Security was purchased under Rule 144A of the Securities Act of 1933 or is
a private placement and, unless registered under the Act or exempted from
registration, may only be sold to qualified institutional investors. The
aggregate value of restricted securities at August 31, 2008, was $119,610,000,
which represented 20.6% of total net assets. None of the restricted securities
are considered to be illiquid.
See Notes to Financial Statements.
------
11
PERFORMANCE
California Tax-Free Bond
Total Returns as of August 31, 2008
Average Annual Returns
Since Inception
1 year 5 years 10 years Inception Date
CALIFORNIA
TAX-FREE BOND 4.42% 3.49% 4.06% 5.78% 11/9/83
LEHMAN BROTHERS
5-YEAR GO INDEX 7.07% 3.86% 4.58% 6.38%(1) --
LIPPER CALIFORNIA
INTERMEDIATE MUNICIPAL
DEBT FUNDS
AVERAGE RETURNS(2) 3.65% 3.17% 4.01% 5.78%(3) --
Fund's Lipper Ranking
as of 8/31/08(2) 16 of 43 12 of 40 10 of 19 1 of 1(3) --
Fund's Lipper Ranking
as of 9/30/08(2) 15 of 43 13 of 40 12 of 19 1 of 1(3) --
(1) Since 10/31/83, the date nearest the fund's inception for which data are
available.
(2) Data provided by Lipper Inc. - A Reuters Company. © 2008 Reuters. All
rights reserved. Any copying, republication or redistribution of Lipper
content, including by caching, framing or similar means, is expressly
prohibited without the prior written consent of Lipper. Lipper shall not be
liable for any errors or delays in the content, or for any actions taken in
reliance thereon.
Lipper Fund Performance -- Performance data is total return, and is
preliminary and subject to revision.
Lipper Rankings -- Rankings are based only on the universe shown and are
based on average annual total returns. This listing might not represent the
complete universe of funds tracked by Lipper.
The data contained herein has been obtained from company reports, financial
reporting services, periodicals and other resources believed to be reliable.
Although carefully verified, data on compilations is not guaranteed by Lipper
and may be incomplete. No offer or solicitations to buy or sell any of the
securities herein is being made by Lipper.
(3) Since 11/10/83, the date nearest the fund's inception for which data are
available.
Data presented reflect past performance. Past performance is no guarantee of
future results. Current performance may be higher or lower than the
performance shown. Investment return and principal value will fluctuate, and
redemption value may be more or less than original cost. To obtain performance
data current to the most recent month end, please call 1-800-345-2021 or visit
americancentury.com. As interest rates rise, bond values will decline.
Investment income may be subject to certain state and local taxes and,
depending on your tax status, the federal alternative minimum tax (AMT).
Capital gains are not exempt from state and federal income tax.
Data assumes reinvestment of dividends and capital gains, and none of the
charts reflect the deduction of taxes that a shareholder would pay on fund
distributions or the redemption of fund shares. Returns for the index are
provided for comparison. The fund's total returns include operating expenses
(such as transaction costs and management fees) that reduce returns, while the
total returns of the index do not.
------
12
California Tax-Free Bond
Growth of $10,000 Over 10 Years
$10,000 investment made August 31, 1998
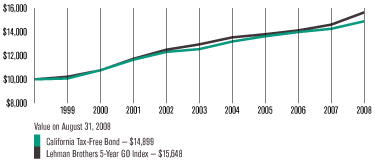
One-Year Returns Over 10 Years
Periods ended August 31
1999 2000 2001 2002 2003 2004 2005 2006 2007 2008
California
Tax-Free Bond 0.74% 6.95% 8.22% 5.63% 1.91% 5.13% 3.36% 2.58% 1.98% 4.42%
Lehman
Brothers
5-Year
GO Index 2.21% 5.33% 8.99% 6.56% 3.57% 4.58% 1.96% 2.32% 3.44% 7.07%
Data presented reflect past performance. Past performance is no guarantee of
future results. Current performance may be higher or lower than the
performance shown. Investment return and principal value will fluctuate, and
redemption value may be more or less than original cost. To obtain performance
data current to the most recent month end, please call 1-800-345-2021 or visit
americancentury.com. As interest rates rise, bond values will decline.
Investment income may be subject to certain state and local taxes and,
depending on your tax status, the federal alternative minimum tax (AMT).
Capital gains are not exempt from state and federal income tax.
Data assumes reinvestment of dividends and capital gains, and none of the
charts reflect the deduction of taxes that a shareholder would pay on fund
distributions or the redemption of fund shares. Returns for the index are
provided for comparison. The fund's total returns include operating expenses
(such as transaction costs and management fees) that reduce returns, while the
total returns of the index do not.
------
13
PORTFOLIO COMMENTARY
California Tax-Free Bond
Portfolio Managers: Alan Kruss, Joseph Gotelli, and Steven Permut
PERFORMANCE SUMMARY
California Tax-Free Bond returned 4.42% for the 12 months ended August 31,
2008. By comparison, the Lehman Brothers 5-Year General Obligation Bond Index
returned 7.07%. For the same period, the California Intermediate Municipal
Debt Funds tracked by Lipper had an average return of 3.65%. See page 12 for
additional performance comparisons.
Though the portfolio enjoyed its best absolute fiscal-year return since 2004,
the period was marked by sharp volatility (see page 2). In that environment,
the fund and Lipper group average underperformed the Lehman Index because
short-term general obligation bonds, whose performance the index measures,
were among the best-performing segments of the market.
YIELD CURVE POSITIONING CONTRIBUTED
The portfolio benefited from the yield curve steepening bias we had in place
using municipal bonds and two- and 30-year Treasury futures. The difference in
yield between two- and 30-year AAA municipal general obligation notes
increased from 103 to 268 basis points (a basis point equals 0.01%) during the
year, while the Treasury curve steepened from 66 to 217 basis points. Those
changes were a result of rapidly falling yields on short-term securities
(because of Fed rate cuts and a flight to safety), while inflation concerns
kept yields on longer-term notes and bonds from declining as much.
SECTOR TRADES HELPED
A number of our sector trades during the year added value, including our
underweight position in airline and tobacco bonds--two volatile, poorly
performing sectors during the fiscal year. In addition, we took advantage of
the dislocations in the market to trade up into high-quality revenue bonds in
less economically sensitive segments of the economy. For example, we bought
some essential service water and sewer bonds, as well as education bonds
issued by Stanford University. Water and education were two of the
best-performing segments of the market for the 12 months. Another way we added
yield and performance to the portfolio was buying newly minted bonds--toward
the end of the period, new issues came to market at very attractive levels as
the dealer community was less willing to underwrite securities onto their own
balance sheets.
Portfolio at a Glance
As of As of
8/31/08 8/31/07
Weighted Average Maturity 9.1 years 7.3 years
Average Duration (Modified) 5.1 years 5.0 years
Yields as of August 31, 2008
30-Day SEC Yield
3.18%
30-Day Tax-Equivalent Yields*
31.98% Tax Bracket 4.68%
34.70% Tax Bracket 4.87%
39.23% Tax Bracket 5.23%
41.05% Tax Bracket 5.39%
*The tax brackets indicated are for combined state and federal income tax.
Actual tax-equivalent yields may be lower, if alternative minimum tax is
applicable.
------
14
California Tax-Free Bond
CREDIT POSITIONING DETRACTED
Despite these positives, our credit allocation detracted from performance.
Credit spreads (the difference in yield between lower- and higher-rated bonds)
widened at a time when we had an overweight position in credit-sensitive
bonds. Other things being equal, wider credit spreads mean lower-rated bonds
lag.
What's more, we began the period with a sizable overweight in insured bonds
(greater than 60% of assets at one point). Insured securities underperformed
because of concern that losses on subprime loans in other parts of the bond
insurers' business would affect the backing they provide for many municipal
bonds. The insurers' difficulties had no effect on the underlying quality of
the municipal bonds they backed, but the initial sell-off and liquidity
premium meant insured bonds trailed the rest of the market.
MANAGEMENT CHANGE
In July, Portfolio Manager Joseph Gotelli joined the California Tax-Free Bond
management team. Mr. Gotelli brings six years of municipal bond investment
experience and joins Alan Kruss as a portfolio manager on California Tax-Free
Bond, reflecting our team approach to managing portfolios.
OUTLOOK
"We've been saying for some time that we believe this is an excellent buying
opportunity for investors with a long-term horizon and the patience to ride
out short-term volatility," says Steven Permut, portfolio manager and head of
the municipal bond team. "We still believe that's true because the larger
credit crunch has hurt municipal bonds for reasons that have little or nothing
to do with market fundamentals. But that also means the municipal market
probably won't rebound in a meaningful way until we see real progress on
resolving the credit crisis. In the meantime, we'll continue to manage our
portfolios conservatively while looking for bonds with compelling yield and
credit characteristics."
Portfolio Composition by Credit Rating
% of fund % of fund
investments investments
as of as of
8/31/08 2/29/08
AAA 35% 65%
AA 37% 10%
A 12% 7%
BBB 12% 14%
Not Rated 4% 4%
Ratings provided by independent research companies. These ratings are listed
in Standard & Poor's format even if they were provided by other sources.
Top Five Sectors as of August 31, 2008
% of fund
investments
General Obligation (GO) 22%
Prerefunded 16%
Electric Revenue 12%
Certificates of Participation (COPs)/Leases 10%
Special Tax Revenue 8%
------
15
SCHEDULE OF INVESTMENTS
California Tax-Free Bond
AUGUST 31, 2008
Principal Amount Value
Municipal Securities -- 99.1%
CALIFORNIA -- 92.8%
$ 5,565,000 Acalanes Union High School District GO, Series
2005 B, 5.25%, 8/1/24 (FSA) $ 5,871,670
1,185,000 Alameda County COP, (Santa Rita Jail), 5.375%,
6/1/09 (MBIA)(1)(2) 1,202,775
1,385,000 Alameda County COP, Series 2001 A, 5.375%,
12/1/15 (MBIA) 1,491,728
1,700,000 Anaheim Redevelopment Agency Tax Allocation
Rev., Series 2007 A, (Anaheim Merged
Redevelopment Area), 5.00%, 2/1/31 (FSA) 1,721,607
1,000,000 Antelope Valley Community College District GO,
5.00%, 8/1/18 (MBIA) 1,073,680
1,000,000 Antelope Valley Community College District GO,
Series 2007 C, (Election of 2004), 5.00%, 8/1/24
(MBIA) 1,028,970
2,000,000 Antelope Valley Community College District GO,
Series 2007 C, (Election of 2004), 5.00%, 8/1/25
(MBIA) 2,049,980
1,000,000 Antelope Valley Community College District GO,
Series 2007 C, (Election of 2004), 5.00%, 8/1/26
(MBIA) 1,021,620
2,050,000 Austin Trust Various States Rev., Series
2008-1167, VRDN, 1.91%, 9/4/08 (FSA) (LIQ FAC:
Bank of America, N.A.) (Acquired
7/21/08-8/29/08, Cost $2,050,000)(3) 2,050,000
1,240,000 Banning Financing Auth. Rev., (Electric System),
5.00%, 6/1/21 (XLCA) 1,253,752
1,305,000 Banning Financing Auth. Rev., (Electric System),
5.00%, 6/1/22 (XLCA) 1,312,256
1,000,000 Banning Utility Auth. Rev., (Refunding and
Improvement Projects), 5.25%, 11/1/35 (FGIC) 980,070
4,650,000 California Department of Water Resources Power
Supply Rev., Series 2002 A, 5.25%, 5/1/12
(MBIA)(2) 5,061,711
9,345,000 California Department of Water Resources Power
Supply Rev., Series 2002 A, 5.375%, 5/1/12,
Prerefunded at 101% of Par (XLCA)(1)(2) 10,396,685
Principal Amount Value
$ 3,750,000 California Department of Water Resources Power
Supply Rev., Series 2002 A, 5.50%, 5/1/12(2) $ 4,117,350
5,000,000 California Department of Water Resources Power
Supply Rev., Series 2008 H, 5.00%, 5/1/21(2) 5,262,150
2,500,000 California Department of Water Resources Power
Supply Rev., Series 2008 K, 5.00%, 5/1/18 2,726,825
15,000 California Department of Water Resources Water
System Rev., (Central Valley), 5.50%, 12/1/11,
Prerefunded at 100% of Par(1) 16,506
1,235,000 California Department of Water Resources Water
System Rev., (Central Valley), 5.50%, 12/1/17 1,340,494
8,825,000 California Economic Recovery GO, Series 2004 A,
5.00%, 7/1/12 (MBIA)(2) 9,573,536
5,000,000 California Economic Recovery GO, Series 2004 A,
5.25%, 7/1/14 5,589,750
5,000,000 California Economic Recovery GO, Series 2008 B,
5.00%, 3/1/10 5,215,550
4,000,000 California Educational Facilities Auth. Rev.,
(Golden Gate University), 5.50%, 10/1/18(2) 4,020,520
1,020,000 California Educational Facilities Auth. Rev.,
(Scripps College), 5.25%, 8/1/11, Prerefunded at
100% of Par (GO of University)(1) 1,106,119
275,000 California Educational Facilities Auth. Rev.,
Series 2000 B, (Pooled College & University),
6.625%, 6/1/10, Prerefunded at 101% of Par(1) 298,169
1,330,000 California Educational Facilities Auth. Rev.,
Series 2000 B, (Pooled College & University),
6.625%, 6/1/10, Prerefunded at 101% of Par(1) 1,442,053
2,500,000 California Educational Facilities Auth. Rev.,
Series 2004 C, (Lutheran University), 5.00%,
10/1/24 2,352,275
250,000 California Educational Facilities Auth. Rev.,
Series 2008 A, (Chapman University), VRDN,
2.25%, 9/2/08 (LOC: Bank of America, N.A.) 250,000
------
16
California Tax-Free Bond
Principal Amount Value
$ 5,000,000 California Educational Facilities Auth. Rev.,
Series 2008 T4, (Stanford University), 5.00%,
3/15/14(2) $ 5,535,200
4,480,000 California GO, 6.00%, 10/1/09 (Ambac-TCRS) (Bank
of New York)(2) 4,679,898
2,500,000 California GO, 5.00%, 12/1/09 (Ambac-TCRS) (Bank
of New York) 2,594,150
3,000,000 California GO, 5.00%, 3/1/10 (XLCA-ICR) 3,129,690
3,350,000 California GO, 5.75%, 4/1/10 (Ambac-TCRS) (Bank
of New York) 3,537,064
2,350,000 California GO, 5.25%, 10/1/10, Prerefunded at
100% of Par (FGIC-TCRS)(1) 2,506,205
7,650,000 California GO, 5.25%, 10/1/10, Prerefunded at
100% of Par (FGIC-TCRS)(1)(2) 8,105,098
1,000,000 California GO, 5.50%, 3/1/11 (XLCA-ICR) 1,072,550
5,000,000 California GO, 5.50%, 4/1/12 (MBIA)(2) 5,414,199
4,000,000 California GO, 5.00%, 2/1/14, Prerefunded at
100% of Par(1)(2) 4,432,560
5,000,000 California GO, 5.125%, 2/1/14, Prerefunded at
100% of Par(1)(2) 5,571,900
5,000,000 California GO, 5.00%, 3/1/14(2) 5,429,200
7,780,000 California GO, 5.25%, 11/1/15(2) 8,403,333
7,590,000 California GO, 5.00%, 6/1/16(2) 8,151,431
5,000,000 California GO, 5.25%, 3/1/38(2) 5,003,700
10,000,000 California GO, 5.00%, 4/1/38(2) 9,787,799
2,000,000 California Health Facilities Financing Auth.
Rev., Series 1998 A, (Kaiser Permanente), 5.25%,
6/1/11 (FSA)(1) 2,044,680
2,520,000 California Health Facilities Financing Auth.
Rev., Series 2008 A, (Sutter Health), 5.00%,
8/15/38 2,388,985
1,000,000 California Health Facilities Financing Auth.
Rev., Series 2008 A3, (Stanford Hospital), VRDN,
3.45%, 6/15/11 1,015,050
2,910,000 California Housing Finance Agency Rev., Series
2000 D, (Multifamily Housing), VRDN, 2.45%,
9/2/08 (GO of Agency) (SBBPA: Landesbank
Hessen-Thuringen Girozentrale and California
State Teacher's Retirement) 2,910,000
Principal Amount Value
$ 1,000,000 California Infrastructure & Economic Development
Bank Rev., Series 2000 A, (Scripps Research
Institute), 5.625%, 7/1/20 $ 1,012,370
5,000,000 California Infrastructure & Economic Development
Bank Rev., Series 2003 A, (Bay Area Toll Bridges
Seismic Retrofit 1st Lien), 5.125%, 7/1/26,
Prerefunded at 100% of Par (Ambac)(1)(2) 5,523,100
1,075,000 California Infrastructure & Economic Development
Bank Rev., Series 2006 A, (California Science
Center Phase II), 4.25%, 5/1/13 (FGIC) 1,113,840
2,500,000 California Infrastructure & Economic Development
Bank Rev., Series 2008 A, (California
Independent System Operator Corp.), 5.00%, 2/1/13 2,686,375
1,350,000 California Infrastructure & Economic Development
Bank Rev., Series 2008 B, (The RAND Corp.),
VRDN, 2.25%, 9/2/08 (LOC: Bank of America, N.A.) 1,350,000
1,075,000 California Mobilehome Park Financing Auth. Rev.,
Series 2000 A, (Union City Tropics), 5.375%,
8/15/10, Prerefunded at 102% of Par (ACA)(1) 1,164,032
1,605,000 California Mobilehome Park Financing Auth. Rev.,
Series 2006 A, (Union City Tropics), 3.80%,
12/15/11 1,619,092
1,145,000 California Municipal Finance Auth. Rev., (Loma
Linda University), 5.00%, 4/1/23 1,162,530
2,000,000 California Municipal Finance Auth. Rev., (Loma
Linda University), 5.00%, 4/1/28 2,008,920
1,450,000 California Public Works Board Lease Rev., Series
2005 A, (Department General Services -
Butterfield), 5.00%, 6/1/15 1,557,822
2,165,000 California Public Works Board Lease Rev., Series
2006 A, (Various California State University
Projects), 5.00%, 10/1/11 2,304,946
1,000,000 California Public Works Board Lease Rev., Series
2006 F, (Department of Corrections and
Rehabilitation - Monterey County State Prison),
5.25%, 11/1/18 (FGIC) 1,091,160
------
17
California Tax-Free Bond
Principal Amount Value
$ 650,000 California Special Districts Association Finance
Corp. COP, Series 2005 RR, 5.00%, 8/1/25 (XLCA) $ 664,469
1,000,000 California State University Fresno Association
Inc. Rev., (Auxiliary Organization Event
Center), 5.00%, 7/1/12(1) 1,089,980
3,100,000 California State University Fresno Association,
Inc. Rev., (Auxiliary Organization Event
Center), 5.25%, 7/1/12, Prerefunded at 101% of
Par(1) 3,435,265
1,500,000 California State University Fresno Association,
Inc. Rev., (Auxiliary Organization Event
Center), 6.00%, 7/1/12, Prerefunded at 101% of
Par(1) 1,703,130
1,250,000 California State University System Rev., Series
2002 A, 5.375%, 11/1/18 (Ambac) 1,325,975
1,695,000 California Statewide Communities Development
Auth. Rev., Series 2002 B, 5.20%, 10/1/18 (FSA) 1,804,836
2,250,000 California Statewide Communities Development
Auth. Rev., Series 2007 A, (California Baptist
University), 5.30%, 11/1/18 2,209,118
2,500,000 California Statewide Communities Development
Auth. Rev., Series 2007 A, (California Baptist
University), 5.40%, 11/1/27 2,286,400
5,000,000 California Statewide Communities Development
Auth. Rev., Series 2007 A, (Front Porch
Communities and Services), 5.125%, 4/1/37
(Acquired 5/23/07, Cost $5,059,250)(3) 4,225,500
1,000,000 California Statewide Communities Development
Auth. Rev., Series 2007 A, (Henry Mayo Newhall
Memorial Hospital), 5.00%, 10/1/20 (California
Mortgage Insurance) 1,005,030
5,000,000 California Statewide Communities Development
Auth. Rev., Series 2007 A, (Valleycare Health
System), 4.80%, 7/15/17 4,677,300
1,000,000 California Statewide Communities Development
Auth. Rev., Series 2007 A, (Valleycare Health
System), 5.00%, 7/15/22 867,860
Principal Amount Value
$ 2,500,000 California Statewide Communities Development
Auth. Rev., Series 2007 B, (Adventist Health
System/West), 5.00%, 3/1/37 (AGC) $ 2,473,750
1,000,000 California Statewide Communities Development
Auth. Rev., Series 2008 D, (Catholic Healthcare
West), 5.50%, 7/1/31 990,300
1,000,000 Calleguas-Las Virgines Public Financing Auth.
Rev., Series 2007 A, (Municipal Water District),
5.00%, 7/1/20 (FGIC) 1,052,910
3,115,000 Capistrano Unified School District Special Tax
Rev., (Community Facilities District No. 87-1),
5.00%, 9/1/18 (Ambac) 3,310,591
1,130,000 Carson Redevelopment Agency Tax Allocation Rev.,
(Redevelopment Project Area No. 1), 5.50%,
10/1/11 (MBIA) 1,210,298
2,100,000 Castaic Lake Water Agency Rev. COP, Series 2001
A, 5.375%, 8/1/17 (MBIA) 2,239,608
1,245,000 Central California Joint Powers Health Financing
Auth. COP, (Community Hospitals), 5.125%,
2/1/09(1) 1,263,028
675,000 Central California Joint Powers Health Financing
Auth. COP, (Community Hospitals), 5.25%,
2/1/10(1) 706,509
860,000 Central California Joint Powers Health Financing
Auth. COP, (Community Hospitals), 5.25%, 2/1/10,
Prerefunded at 101% of Par(1) 907,893
1,595,000 Chabot Las Positas Community College District
COP, 5.50%, 12/1/10 (FSA)(1) 1,657,572
1,070,000 Chaffey Community College District GO, Series
2002 A, 4.25%, 7/1/11 (FSA) 1,122,484
1,765,000 Chaffey Community College District GO, Series
2007 C, (Election of 2002), 5.00%, 6/1/20 (MBIA) 1,884,773
2,160,000 Chaffey Community College District GO, Series
2007 C, (Election of 2002), 5.00%, 6/1/21 (MBIA) 2,290,248
1,000,000 Chaffey Community College District GO, Series
2007 C, (Election of 2002), 5.00%, 6/1/22 (MBIA) 1,052,050
------
18
California Tax-Free Bond
Principal Amount Value
$ 2,810,000 Chino Basin Regional Financing Auth. Rev.,
Series 2008 A, (Inland Empire Utilities Agency),
5.00%, 11/1/33 (Ambac) $ 2,762,399
3,000,000 Chino Ontario Upland Water Facilities Auth. COP,
Series 1997 A, (Agua de Lejos), 5.20%, 10/1/15
(FGIC) 3,050,280
3,255,000 City of Riverside Water Rev., Series 2008 B,
5.00%, 10/1/38 (FSA) 3,298,650
2,065,000 Coast Community College District GO, Series 2006
B, (Election of 2002), 5.00%, 8/1/17 (FSA) 2,271,789
2,300,000 Eastern Municipal Water District Water & Sewer
Rev. COP, Series 2001 A, 5.25%, 7/1/13 (FGIC) 2,429,766
1,000,000 Eastern Municipal Water District Water & Sewer
Rev. COP, Series 2008 H, 5.00%, 7/1/24 1,032,910
1,020,000 El Segundo Unified School District GO, 5.375%,
9/1/12, Prerefunded at 100% of Par (FGIC)(1) 1,132,802
1,095,000 El Segundo Unified School District GO, 5.375%,
9/1/12, Prerefunded at 100% of Par (FGIC)(1) 1,216,096
1,000,000 Folsom Cordova Unified School District No. 2
Facilities Improvement GO, Series 2002 A,
5.375%, 10/1/15 (MBIA) 1,081,370
1,225,000 Folsom Cordova Unified School District No. 2
Facilities Improvement GO, Series 2002 A,
5.375%, 10/1/16 (MBIA) 1,324,678
1,225,000 Folsom Public Financing Auth. Lease Rev., (City
Hall & Community Center), 5.25%, 10/1/14 (FSA) 1,324,176
1,290,000 Folsom Public Financing Auth. Lease Rev., (City
Hall & Community Center), 5.25%, 10/1/15 (FSA) 1,394,438
10,000,000 Foothill/Eastern Transportation Corridor Agency
Toll Road Rev., Series 1995 A, 7.30%,
1/1/26(1)(4) 4,341,800
1,250,000 Foothill-De Anza Community College District GO,
Series 2007 B, (Election of 2006), 5.00%, 8/1/17
(Ambac) 1,379,588
Principal Amount Value
$ 4,000,000 Foothill-De Anza Community College District GO,
Series 2007 B, (Election of 2006), 5.00%, 8/1/27
(Ambac) $ 4,118,800
1,150,000 Franklin-McKinley School District GO, Series
2005 A, (Election of 2004), 5.00%, 8/1/15,
Prerefunded at 100% of Par (FGIC)(1) 1,273,982
2,550,000 Fremont Union High School District GO, Series
2000 B, 5.25%, 9/1/10, Prerefunded at 100% of
Par(1) 2,711,670
2,500,000 Glendora Unified School District GO, Series 2006
A, (Election of 2005), 5.25%, 8/1/30 (MBIA) 2,550,200
4,940,000 Golden State Tobacco Securitization Corp.
Settlement Rev., Series 2003 A1, 6.75%, 6/1/13,
Prerefunded at 100% of Par(1) 5,713,504
5,500,000 Golden State Tobacco Securitization Corp.
Settlement Rev., Series 2007 A1, 5.75%, 6/1/47 4,604,270
5,000,000 Golden State Tobacco Securitization Corp.
Settlement Rev., Series 2007 A1, 5.125%, 6/1/47 3,735,600
1,300,000 Hercules Redevelopment Agency Tax Allocation
Rev., Series 2007 A, 5.00%, 8/1/12 (Ambac) 1,382,225
1,360,000 Hercules Redevelopment Agency Tax Allocation
Rev., Series 2007 A, 5.00%, 8/1/13 (Ambac) 1,453,119
2,700,000 Hillsborough City School District GO, (Bond
Anticipation Notes), 3.60%, 9/1/13(4)(5) 2,260,710
1,190,000 Imperial Irrigation District COP, (Water
Systems), 5.50%, 7/1/09 (Ambac) 1,221,226
1,675,000 Imperial Irrigation District COP, (Water
Systems), 5.50%, 7/1/16 (Ambac) 1,772,904
1,000,000 Inglewood Redevelopment Agency Tax Allocation
Rev., Series 2007 A1, 5.00%, 5/1/23 (Ambac) 999,930
825,000 Irvine Unified School District Financing Auth.
Special Tax Rev., Series 2006 A, (Group II),
4.50%, 9/1/13 816,808
635,000 Irvine Unified School District Financing Auth.
Special Tax Rev., Series 2006 A, (Group II),
4.75%, 9/1/16 617,290
------
19
California Tax-Free Bond
Principal Amount Value
$ 790,000 Irvine Unified School District Financing Auth.
Special Tax Rev., Series 2006 A, (Group II),
5.00%, 9/1/20 $ 755,287
2,715,000 Irvine Unified School District Special Tax Rev.,
(Community Facilities District No. 86-1), 5.50%,
11/1/10 (Ambac) 2,775,653
110,000 Lancaster Financing Auth. Tax Allocation Rev.,
(Projects No. 5 & 6), 3.80%, 2/1/10 109,941
120,000 Lancaster Financing Auth. Tax Allocation Rev.,
(Projects No. 5 & 6), 4.00%, 2/1/11 119,832
125,000 Lancaster Financing Auth. Tax Allocation Rev.,
(Projects No. 5 & 6), 4.30%, 2/1/13 124,201
475,000 Lancaster Financing Auth. Tax Allocation Rev.,
(Projects No. 5 & 6), 5.30%, 2/1/24 462,299
500,000 Lancaster Financing Auth. Tax Allocation Rev.,
(Projects No. 5 & 6), 5.40%, 2/1/29 483,765
2,030,000 Long Beach Bond Finance Auth. Lease Rev., (Plaza
Parking Facility), 5.25%, 11/1/16 2,125,613
750,000 Long Beach Bond Finance Auth. Tax Allocation
Rev., Series 2002 A, (North Long Beach
Redevelopment), 5.00%, 8/1/10 (Ambac) 780,938
905,000 Long Beach Bond Finance Auth. Tax Allocation
Rev., Series 2002 A, (North Long Beach
Redevelopment), 5.00%, 8/1/11 (Ambac) 954,476
2,500,000 Los Altos School District GO, 5.00%, 8/1/19
(Ambac) 2,684,575
1,030,000 Los Angeles Community Redevelopment Agency
Parking System Rev., (Cinerama Dome Public
Package), 5.30%, 7/1/13 (ACA) (LOC: Wells Fargo
Bank N.A.) 984,423
1,155,000 Los Angeles Convention and Exhibition Center
Auth. Lease Rev., Series 1993 A, 6.00%, 8/15/10
(MBIA-IBC) 1,237,698
3,000,000 Los Angeles County Metropolitan Transportation
Auth. Sales Tax Rev., Series 2001 B, (Proposal
A), 5.25%, 7/1/13 (FSA) 3,219,600
Principal Amount Value
$ 6,680,000 Los Angeles County Metropolitan Transportation
Auth. Sales Tax Rev., Series 2001 B, (Proposal
A), 5.25%, 7/1/16 (FSA) $ 7,168,975
750,000 Los Angeles Department of Airports Rev., Series
2008 C, (Los Angeles International Airport),
5.00%, 5/15/18 799,373
3,130,000 Los Angeles Department of Water & Power Rev.,
Series 2001 AA1, (Power System), 5.25%, 7/1/10
(MBIA) 3,302,181
5,000,000 Los Angeles Department of Water & Power Rev.,
Series 2006 A1, (Water System), 5.00%, 7/1/36
(Ambac) 5,015,750
1,000,000 Los Angeles Municipal Improvement Corp. Lease
Rev., Series 2007 A, (Capital Equipment), 5.00%,
8/1/14 (FGIC) 1,078,970
3,500,000 Los Angeles Unified School District GO, 5.50%,
7/1/12 (MBIA) 3,844,225
5,000,000 Los Angeles Unified School District GO, Series
2002 E, (Election of 1997), 5.00%, 7/1/11 (MBIA) 5,324,750
2,500,000 Los Angeles Unified School District GO, Series
2003 F, (Election of 1997), 5.00%, 7/1/16 (FSA) 2,707,725
2,285,000 Los Angeles Unified School District GO, Series
2005 A1, 5.00%, 7/1/25 (FGIC) 2,335,270
1,390,000 Los Gatos-Saratoga Joint Union High School
District GO, Series 2002 C, (Election of 1998),
5.375%, 6/1/12, Prerefunded at 101% of Par
(FSA)(1) 1,548,988
575,000 Lynwood Public Financing Auth. Lease Rev.,
Series 2003 A, (Public Capital Improvement),
4.125%, 9/1/12 (Ambac) 594,406
2,920,000 Metropolitan Water District of Southern
California Rev., Series 2001 A, 5.125%, 7/1/09(1) 3,006,724
1,520,000 Mojave Unified School District No. 1 Facilities
Improvement GO, 5.25%, 8/1/20 (FGIC) 1,611,793
1,485,000 Mountain View COP, (Capital Projects), 5.25%,
8/1/18 1,578,807
4,065,000 M-S-R Public Power Agency Rev., Series 2007 K,
(San Juan), 5.00%, 7/1/12 (MBIA) 4,361,379
------
20
California Tax-Free Bond
Principal Amount Value
$ 2,305,000 M-S-R Public Power Agency Rev., Series 2007 K,
(San Juan), 5.00%, 7/1/13 (MBIA) $ 2,491,152
1,000,000 M-S-R Public Power Agency Rev., Series 2007 K,
(San Juan), 5.00%, 7/1/14 (MBIA) 1,085,420
1,550,000 Murrieta Valley Unified School District Public
Financing Auth. Special Tax Rev., Series 2006 A,
4.00%, 9/1/09 (AGC) 1,572,010
1,255,000 Murrieta Valley Unified School District Public
Financing Auth. Special Tax Rev., Series 2006 A,
4.00%, 9/1/11 (AGC) 1,288,634
1,745,000 Murrieta Valley Unified School District Public
Financing Auth. Special Tax Rev., Series 2006 A,
4.00%, 9/1/12 (AGC) 1,795,099
1,690,000 Murrieta Valley Unified School District Public
Financing Auth. Special Tax Rev., Series 2006 A,
4.00%, 9/1/13 (AGC) 1,733,720
1,085,000 Murrieta Valley Unified School District Public
Financing Auth. Special Tax Rev., Series 2006 A,
4.00%, 9/1/14 (AGC) 1,107,253
3,945,000 Oceanside Community Development Commission Tax
Allocation Rev., (Downtown Redevelopment),
5.20%, 9/1/17 3,918,411
1,225,000 Oceanside COP, Series 2003 A, 5.00%, 4/1/11
(Ambac) 1,292,167
1,310,000 Oceanside COP, Series 2003 A, 5.00%, 4/1/12
(Ambac) 1,394,482
650,000 Orange County Community Facilities District
Special Tax Rev., Series 2005 A, (No.
04-1-Ladera Ranch), 3.50%, 8/15/10 646,763
760,000 Orange County Community Facilities District
Special Tax Rev., Series 2005 A, (No.
04-1-Ladera Ranch), 3.80%, 8/15/11 753,213
825,000 Orange County Community Facilities District
Special Tax Rev., Series 2005 A, (No.
04-1-Ladera Ranch), 3.90%, 8/15/12 812,056
700,000 Orange County Community Facilities District
Special Tax Rev., Series 2005 A, (No.
04-1-Ladera Ranch), 4.10%, 8/15/13 687,939
Principal Amount Value
$ 1,135,000 Orange County Community Facilities District
Special Tax Rev., Series 2005 A, (No.
04-1-Ladera Ranch), 4.25%, 8/15/14 $ 1,117,964
275,000 Orange County Improvement Bond Act of 1915
Special Assessment, (Newport Coast Phase IV
Assessment District No. 01-1), 4.30%, 9/2/14 269,539
325,000 Orange County Improvement Bond Act of 1915
Special Assessment, (Newport Coast Phase IV
Assessment District No. 01-1), 4.45%, 9/2/15 315,718
250,000 Orange County Improvement Bond Act of 1915
Special Assessment, (Newport Coast Phase IV
Assessment District No. 01-1), 4.55%, 9/2/16 239,718
1,805,000 Orange County Public Financing Auth. Lease Rev.,
(Juvenile Justice Center Facility), 5.375%,
6/1/15 (Ambac) 1,957,468
1,000,000 Orange County Public Financing Auth. Lease Rev.,
(Juvenile Justice Center Facility), 5.375%,
6/1/16 (Ambac) 1,084,470
3,030,000 Orange County Public Financing Auth. Lease Rev.,
(Juvenile Justice Center Facility), 5.375%,
6/1/17 (Ambac) 3,285,944
2,750,000 Orange County Sanitation District COP, Series
2007 B, 5.00%, 2/1/26 (FSA) 2,827,935
1,570,000 Paramount Unified School District GO, (Election
of 2006), 5.25%, 8/1/25 (FSA) 1,661,610
1,760,000 Paramount Unified School District GO, (Election
of 2006), 5.25%, 8/1/26 (FSA) 1,856,061
1,150,000 Perris Public Financing Auth. Tax Allocation
Rev., 5.35%, 10/1/36 1,039,669
1,830,000 Pomona Public Financing Auth. Tax Allocation
Rev., Series 2001 AD, (Merged Redevelopment),
4.75%, 2/1/13 (MBIA) 1,906,238
1,720,000 Poway Redevelopment Agency Tax Allocation Rev.,
(Paguay), 5.25%, 6/15/26 (Ambac) 1,747,589
1,170,000 Poway Unified School District Public Financing
Auth. Special Tax Rev., 5.00%, 9/15/19 (Ambac) 1,232,150
------
21
California Tax-Free Bond
Principal Amount Value
$ 1,215,000 Poway Unified School District Public Financing
Auth. Special Tax Rev., 5.00%, 9/15/20 (Ambac) $ 1,264,742
1,505,000 Rancho Mirage Joint Powers Financing Auth. Rev.,
Series 2007 A, (Eisenhower Medical Center),
5.00%, 7/1/15 1,570,392
1,000,000 Rancho Mirage Joint Powers Financing Auth. Rev.,
Series 2007 A, (Eisenhower Medical Center),
5.00%, 7/1/21 991,520
1,395,000 Richmond Joint Powers Financing Auth. Lease
Rev., (Refunding & Civic Center), VRDN, 4.125%,
11/25/09 (Ambac) (SBBPA: Dexia Credit Local) 1,395,000
1,000,000 Riverside County COP, Series 2007 A, (Public
Safety Communication), 5.00%, 11/1/14 (Ambac) 1,090,220
2,000,000 Riverside County COP, Series 2007 A, (Public
Safety Communication), 5.00%, 11/1/15 (Ambac) 2,184,760
8,000,000 Sacramento City Financing Auth. Lease Rev.,
Series 1993 A, 5.40%, 11/1/20 (Ambac) 8,576,239
2,500,000 Sacramento City Financing Auth. Rev., 5.00%,
12/1/16 (FGIC) 2,687,725
4,045,000 Sacramento City Financing Auth. Rev., Series
2002 A, (City Hall), 5.25%, 12/1/12, Prerefunded
at 100% of Par (FSA)(1) 4,492,296
1,245,000 Sacramento City Financing Auth. Rev., Series
2002 A, (City Hall), 5.25%, 12/1/15 (FSA) 1,344,700
3,800,000 Sacramento County Sanitation District Financing
Auth. Rev., Series 2000 A, 5.10%, 12/1/09 3,947,782
3,105,000 Sacramento Municipal Utility District Electric
Rev., Series 1997 K, 5.70%, 7/1/17 (Ambac) 3,520,045
5,005,000 Sacramento Municipal Utility District Electric
Rev., Series 2001 O, 5.25%, 8/15/11 (MBIA) 5,339,484
3,000,000 Sacramento Municipal Utility District Electric
Rev., Series 2003 S, 5.00%, 11/15/11 (MBIA) 3,190,770
Principal Amount Value
$ 1,005,000 San Bernardino County Redevelopment Agency Tax
Allocation Rev., Series 2005 A, (San Sevaine
Redevelopment), 5.00%, 9/1/15 (RADIAN) $ 1,021,201
1,695,000 San Buenaventura City COP, Series 2002 B, 5.50%,
1/1/15 (Ambac) 1,832,685
1,790,000 San Buenaventura City COP, Series 2002 B, 5.50%,
1/1/16 (Ambac) 1,935,402
1,280,000 San Diego Public Facilities Financing Auth. Tax
Allocation Rev., Series 2007 B, (Southcrest and
Central Imperial Redevelopment), 5.125%, 10/1/22
(RADIAN) 1,211,674
2,030,000 San Diego Redevelopment Agency Tax Allocation
Rev., (Horton Plaza), 5.70%, 11/1/17 2,081,623
2,635,000 San Diego Redevelopment Agency Tax Allocation
Rev., (Horton Plaza), 5.80%, 11/1/21 2,678,583
710,000 San Diego Redevelopment Agency Tax Allocation
Rev., (North Park), 5.90%, 9/1/25 716,525
3,375,000 San Francisco City & County Airports Commission
Rev., Series 2008-34D, (San Francisco
International Airport), 5.00%, 5/1/17 (AGC) 3,654,551
2,000,000 San Francisco City & County Airports Commission
Rev., Series 2008-34D, (San Francisco
International Airport), 5.00%, 5/1/18 (AGC) 2,154,680
2,680,000 San Mateo County Transportation District Sales
Tax Rev., Series 1993 A, 5.25%, 6/1/18 (MBIA) 3,000,876
1,500,000 San Mateo Union High School District GO, 5.00%,
9/1/24 (FSA) 1,541,460
1,000,000 San Ramon Valley Unified School District GO,
(Election of 2002), 5.00%, 8/1/21 (MBIA) 1,043,130
2,085,000 Santa Ana Community Redevelopment Agency Tax
Allocation Rev., Series 2003 B, (South Main
Street Redevelopment), 5.00%, 9/1/13 (FGIC) 2,241,041
3,350,000 Santa Barbara County COP, 5.375%, 10/1/17 (Ambac) 3,632,606
2,000,000 Santa Clara County Financing Auth. Lease Rev.,
Series 2008 A, (VMC Refunding), 5.00%, 11/15/16 2,204,280
------
22
California Tax-Free Bond
Principal Amount Value
$ 2,075,000 Santa Clara Valley Water District COP, Series
2000 A, 5.20%, 2/1/09, Prerefunded at 102% of
Par(1) $ 2,146,920
430,000 Santa Fe Springs Community Development
Commission Tax Allocation Rev., Series 2002 A,
5.375%, 9/1/16 (MBIA) 454,910
690,000 Santa Fe Springs Community Development
Commission Tax Allocation Rev., Series 2002 A,
5.375%, 9/1/10, Prerefunded at 101% of Par
(MBIA)(1) 742,626
1,250,000 Santa Monica-Malibu Unified School District GO,
5.25%, 8/1/13 1,389,875
1,205,000 Scotts Valley COP, 4.00%, 10/1/15 (FSA) 1,247,223
1,370,000 Scotts Valley COP, 4.25%, 10/1/18 (FSA) 1,405,771
2,780,000 Scotts Valley Redevelopment Agency Tax
Allocation Rev., 5.00%, 8/1/29 (Ambac) 2,823,507
420,000 Shasta Lake Public Finance Auth. Rev., 3.75%,
4/1/09 420,449
1,000,000 Shasta Lake Public Finance Auth. Rev., 4.00%,
4/1/12 986,820
1,530,000 Shasta Lake Public Finance Auth. Rev., 4.50%,
4/1/15 1,504,281
2,400,000 Shasta Lake Public Finance Auth. Rev., 5.00%,
4/1/19 2,342,112
2,130,000 Shasta Lake Public Finance Auth. Rev., 5.00%,
4/1/22 2,024,991
1,135,000 Solano County COP, 5.00%, 11/1/13 (MBIA) 1,227,128
2,000,000 South Orange County Public Financing Auth.
Special Tax Rev., Series 2003 A, (Senior Lien),
5.00%, 9/1/12 (MBIA) 2,149,920
1,080,000 South Tahoe Joint Powers Financing Auth. Rev.,
Series 2005 A, (Redevelopment Project Area No.
1), 5.00%, 10/1/13 (Ambac) 1,158,376
1,195,000 South Tahoe Joint Powers Financing Auth. Rev.,
Series 2005 A, (Redevelopment Project Area No.
1), 5.00%, 10/1/15 (Ambac) 1,286,035
1,310,000 South Tahoe Joint Powers Financing Auth. Rev.,
Series 2005 A, (Redevelopment Project Area No.
1), 5.00%, 10/1/17 (Ambac) 1,382,915
Principal Amount Value
$ 1,445,000 South Tahoe Joint Powers Financing Auth. Rev.,
Series 2005 A, (Redevelopment Project Area No.
1), 5.00%, 10/1/19 (Ambac) $ 1,496,630
2,000,000 Southern California Public Power Auth. Rev.,
6.75%, 7/1/10 (GIC: PNC Bank) 2,162,660
5,000,000 Southern California Public Power Auth. Rev.,
Series 2002 A, (Southern Transmission), 5.25%,
7/1/17 (FSA) 5,365,399
3,325,000 Southern California Public Power Auth. Rev.,
Series 2002 A, (Southern Transmission), 5.25%,
7/1/18 (FSA) 3,536,470
2,875,000 Southern California Public Power Auth. Rev.,
Series 2008 A, (Southern Transmission), 5.00%,
7/1/22 2,997,389
1,975,000 Southwestern Community College District GO,
5.625%, 8/1/11, Prerefunded at 101% of Par
(Ambac)(1) 2,183,442
2,770,000 Stockton Community Facilities District Special
Tax Rev., (No. 1 Weston Ranch), 5.40%, 9/1/09,
Prerefunded at 102% of Par(1) 2,923,541
325,000 Stockton Community Facilities District Special
Tax Rev., (No. 1 Weston Ranch), 5.50%, 9/1/09,
Prerefunded at 102% of Par(1) 343,337
2,700,000 Stockton Public Financing Auth. Rev., Series
2006 A, (Redevelopment), 5.00%, 9/1/25 (RADIAN) 2,539,863
785,000 Turlock Health Facility COP, (Emanuel Medical
Center, Inc.), 4.25%, 10/15/09 791,147
820,000 Turlock Health Facility COP, (Emanuel Medical
Center, Inc.), 4.50%, 10/15/10 834,063
895,000 Turlock Health Facility COP, (Emanuel Medical
Center, Inc.), 5.00%, 10/15/12 916,382
985,000 Turlock Health Facility COP, (Emanuel Medical
Center, Inc.), 5.00%, 10/15/14 996,859
1,035,000 Turlock Health Facility COP, Series 2004 A,
(Emanuel Medical Center, Inc.), 5.50%, 10/15/15 1,065,263
------
23
California Tax-Free Bond
Principal Amount Value
$ 1,090,000 Turlock Health Facility COP, Series 2004 A,
(Emanuel Medical Center, Inc.), 5.50%, 10/15/16 $ 1,112,628
1,150,000 Turlock Health Facility COP, Series 2004 A,
(Emanuel Medical Center, Inc.), 5.50%, 10/15/17 1,164,226
2,175,000 Turlock Irrigation District Rev., Series 2003 A,
5.00%, 1/1/13 (MBIA) 2,341,475
1,000,000 University of California Regents Medical Center
Pooled Rev., Series 2008 D, 5.00%, 5/15/27 1,023,330
1,000,000 Val Verde Unified School District COP, 5.00%,
1/1/14 (FGIC)(1) 1,107,050
1,000,000 Val Verde Unified School District COP, 5.25%,
1/1/15, Prerefunded at 100% of Par (FGIC)(1) 1,127,430
1,145,000 Val Verde Unified School District COP, 5.25%,
1/1/15, Prerefunded at 100% of Par (FGIC)(1) 1,290,907
1,415,000 Val Verde Unified School District COP, 5.25%,
1/1/15, Prerefunded at 100% of Par (FGIC)(1) 1,595,313
2,505,000 Val Verde Unified School District COP, 5.25%,
1/1/15, Prerefunded at 100% of Par (FGIC)(1) 2,824,212
2,640,000 Val Verde Unified School District COP, 5.25%,
1/1/15, Prerefunded at 100% of Par (FGIC)(1) 2,976,415
2,980,000 Val Verde Unified School District COP, 5.25%,
1/1/15, Prerefunded at 100% of Par (FGIC)(1) 3,359,741
3,000,000 Ventura County Public Financing COP, 4.75%,
8/15/11 (FSA) 3,060,240
1,000,000 Vista Unified School District GO, Series 2007 C,
(Election of 2002), 5.00%, 8/1/25 (FSA) 1,040,850
5,530,000 West Basin Municipal Water District COP, Series
2008 B, 5.00%, 8/1/22 (AGC) 5,673,393
1,500,000 West Sacramento Financing Auth. Special Tax
Rev., Series 2006 A, 5.00%, 9/1/18 (XLCA) 1,513,755
1,500,000 West Sacramento Financing Auth. Special Tax
Rev., Series 2006 A, 5.00%, 9/1/19 (XLCA) 1,495,844
Principal Amount Value
$ 1,500,000 West Sacramento Financing Auth. Special Tax
Rev., Series 2006 A, 5.00%, 9/1/20 (XLCA) $ 1,479,630
-------------
566,661,281
-------------
GUAM -- 0.8%
5,000,000 Guam Government Limited Obligation Rev., Series
2001 A, 5.00%, 12/1/09 (FSA) 5,156,900
-------------
NORTHERN MARIANA ISLANDS -- 0.5%
1,555,000 Northern Mariana Islands GO, Series 2000 A,
5.50%, 6/1/09 (ACA) 1,570,176
1,430,000 Northern Mariana Islands GO, Series 2000 A,
5.75%, 6/1/10 (ACA) 1,456,956
-------------
3,027,132
-------------
PUERTO RICO -- 4.3%
500,000 Puerto Rico Electric Power Auth. Rev., Series
1999 FF, 5.25%, 7/1/09 (MBIA)(1) 514,730
1,000,000 Puerto Rico Electric Power Auth. Rev., Series
1999 FF, 5.25%, 7/1/09 (MBIA) 1,021,950
3,700,000 Puerto Rico Electric Power Auth. Rev., Series
2002 II, 5.375%, 7/1/12, Prerefunded at 101% of
Par (MBIA)(1) 4,121,281
2,655,000 Puerto Rico Electric Power Auth. Rev., Series
2002 KK, 5.25%, 7/1/13 (FSA) 2,883,436
3,140,000 Puerto Rico Electric Power Auth. Rev., Series
2002 KK, 5.50%, 7/1/14 (FSA) 3,468,884
5,000,000 Puerto Rico GO, Series 2002 A, (Public
Improvement), 5.50%, 7/1/17 (XLCA) 5,203,650
1,750,000 Puerto Rico GO, Series 2004 A, (Public
Improvement), 5.00%, 7/1/12 1,770,283
2,500,000 Puerto Rico Government Development Bank Rev.,
Series 2006 B, (Senior Notes), 5.00%, 12/1/15 2,555,500
1,500,000 Puerto Rico Infrastructure Financing Auth.
Special Tax Rev., Series 2006 B, 4.50%, 7/1/11 1,532,025
3,090,000 Puerto Rico Public Buildings Auth. Rev., Series
1995 A, (Government Facilities), 6.25%, 7/1/09
(Ambac Commonwealth Guaranteed) 3,170,371
-------------
26,242,110
-------------
------
24
California Tax-Free Bond
Principal Amount Value
U.S. VIRGIN ISLANDS -- 0.7%
$ 1,270,000 Virgin Islands Public Finance Auth. Rev.,
(Virgin Islands Gross Receipts Taxes Loan Note),
5.00%, 10/1/18 (FGIC) $ 1,316,355
1,050,000 Virgin Islands Public Finance Auth. Rev., Series
1998 A (Senior Lien), 5.50%, 10/1/13 1,061,403
500,000 Virgin Islands Public Finance Auth. Rev., Series
2004 A, (Virgin Islands Matching Fund Loan Note
& Senior Lien), 5.00%, 10/1/14 512,365
170,000 Virgin Islands Public Finance Auth. Rev., Series
2004 A, (Virgin Islands Matching Fund Loan Note
& Senior Lien), 5.25%, 10/1/15 175,166
Principal Amount Value
$ 500,000 Virgin Islands Public Finance Auth. Rev., Series
2004 A, (Virgin Islands Matching Fund Loan Note
& Senior Lien), 5.25%, 10/1/16 $ 512,265
1,000,000 Virgin Islands Public Finance Auth. Rev., Series
2004 A, (Virgin Islands Matching Fund Loan Note
& Senior Lien), 5.25%, 10/1/20 998,180
-------------
4,575,734
-------------
TOTAL INVESTMENT SECURITIES -- 99.1%
(Cost $594,391,038) 605,663,157
-------------
OTHER ASSETS AND LIABILITIES -- 0.9% 5,312,374
-------------
TOTAL NET ASSETS -- 100.0% $610,975,531
=============
Futures Contracts
Underlying Face Amount Unrealized
Contracts Purchased Expiration Date at Value Gain (Loss)
398 U.S. Treasury
2-Year Notes December 2008 $84,487,938 $30,198
Underlying Face Amount Unrealized
Contracts Sold Expiration Date at Value Gain (Loss)
115 U.S. Long Bond December 2008 $13,490,938 $(34,423)
Notes to Schedule of Investments
ACA = American Capital Access
AGC = Assured Guaranty Corporation
Ambac = Ambac Assurance Corporation
Ambac -- TCRS = Ambac Assurance Corporation -- Transferable Custodial Receipts
COP = Certificates of Participation
FGIC = Financial Guaranty Insurance Co.
FGIC-TCRS = Financial Guaranty Insurance Co. -- Transferable Custodial Receipts
FSA = Financial Security Assurance, Inc.
GIC = Guaranteed Investment Contract
GO = General Obligation
LIQ FAC = Liquidity Facilities
LOC = Letter of Credit
MBIA = MBIA Insurance Corporation
MBIA-IBC = MBIA Insurance Corporation - Insured Bond Certificates
M-S-R = Modesto, Stockton, Redding
RADIAN = Radian Asset Assurance, Inc.
SBBPA = Standby Bond Purchase Agreement
VRDN = Variable Rate Demand Note. Interest reset date is indicated. Rate shown
is effective August 31, 2008.
XLCA = XL Capital Ltd.
XLCA-ICR = XL Capital Ltd. -- Insured Custodial Receipts
(1) Escrowed to maturity in U.S. government securities or state and local
government securities.
(2) Security, or a portion thereof, has been segregated for futures contracts
and/or when-issued securities.
(3) Security was purchased under Rule 144A of the Securities Act of 1933 or is
a private placement and, unless registered under the Act or exempted from
registration, may only be sold to qualified institutional investors. The
aggregate value of restricted securities at August 31, 2008, was $6,275,500,
which represented 1.0% of total net assets.
(4) Security is a zero-coupon municipal bond. The rate indicated is the yield
to maturity at purchase. Zero-coupon securities are issued at a substantial
discount from their value at maturity.
(5) When-issued security.
See Notes to Financial Statements.
------
25
SHAREHOLDER FEE EXAMPLES (UNAUDITED)
Fund shareholders may incur two types of costs: (1) transaction costs,
including sales charges (loads) on purchase payments and redemption/exchange
fees; and (2) ongoing costs, including management fees; distribution and
service (12b-1) fees; and other fund expenses. This example is intended to
help you understand your ongoing costs (in dollars) of investing in your fund
and to compare these costs with the ongoing cost of investing in other mutual
funds.
The example is based on an investment of $1,000 made at the beginning of the
period and held for the entire period from March 1, 2008 to August 31, 2008.
ACTUAL EXPENSES
The table provides information about actual account values and actual expenses
for each class. You may use the information, together with the amount you
invested, to estimate the expenses that you paid over the period. First,
identify the share class you own. Then simply divide your account value by
$1,000 (for example, an $8,600 account value divided by $1,000 = 8.6), then
multiply the result by the number under the heading "Expenses Paid During
Period" to estimate the expenses you paid on your account during this period.
If you hold Investor Class shares of any American Century Investments fund, or
Institutional Class shares of the American Century Diversified Bond Fund, in
an American Century Investments account (i.e., not a financial intermediary or
retirement plan account), American Century Investments may charge you a $12.50
semiannual account maintenance fee if the value of those shares is less than
$10,000. We will redeem shares automatically in one of your accounts to pay
the $12.50 fee. In determining your total eligible investment amount, we will
include your investments in all PERSONAL ACCOUNTS (including American Century
Investments Brokerage accounts) registered under your Social Security number.
PERSONAL ACCOUNTS include individual accounts, joint accounts, UGMA/UTMA
accounts, personal trusts, Coverdell Education Savings Accounts and IRAs
(including traditional, Roth, Rollover, SEP-, SARSEP- and SIMPLE-IRAs), and
certain other retirement accounts. If you have only business, business
retirement, employer-sponsored or American Century Investments Brokerage
accounts, you are currently not subject to this fee. We will not charge the
fee as long as you choose to manage your accounts exclusively online. If you
are subject to the Account Maintenance Fee, your account value could be
reduced by the fee amount.
HYPOTHETICAL EXAMPLE FOR COMPARISON PURPOSES
The table also provides information about hypothetical account values and
hypothetical expenses based on the actual expense ratio of each class of your
fund and an assumed rate of return of 5% per year before expenses, which is
not the actual return of a fund's share class. The hypothetical account values
and expenses may not be used to estimate the actual ending account balance or
expenses you paid for the period. You may use this information to compare the
ongoing costs of investing in your fund and other funds. To do so, compare
this 5% hypothetical example with the 5% hypothetical examples that appear in
the shareholder reports of the other funds.
------
26
Please note that the expenses shown in the table are meant to highlight your
ongoing costs only and do not reflect any transactional costs, such as sales
charges (loads) or redemption/exchange fees. Therefore, the table is useful in
comparing ongoing costs only, and will not help you determine the relative
total costs of owning different funds. In addition, if these transactional
costs were included, your costs would have been higher.
Beginning
Account Ending Expenses Paid Annualized
Value Account During Period(1) Expense
3/1/08 Value 8/31/08 3/1/08 - 8/31/08 Ratio(1)
California Tax-Free Money Market
Actual
(after waiver)(2) $1,000 $1,009.30 $2.37 0.47%
Actual
(before waiver) $1,000 $1,009.30(3) $2.58 0.51%
Hypothetical (after
waiver)(2) $1,000 $1,022.77 $2.39 0.47%
Hypothetical (before
waiver) $1,000 $1,022.57 $2.59 0.51%
California Tax-Free Bond
Actual $1,000 $1,036.90 $2.51 0.49%
Hypothetical $1,000 $1,022.67 $2.49 0.49%
(1) Expenses are equal to the fund's annualized expense ratio listed in the
table above, multiplied by the average account value over the period,
multiplied by 184, the number of days in the most recent fiscal half-year,
divided by 366, to reflect the one-half year period.
(2) During the six months ended August 31, 2008, the investment advisor waived
a portion of the fund's management fee.
(3) Ending account value assumes the return earned after waiver. The return
would have been lower had fees not been waived and would have resulted in a
lower ending account value.
------
27
STATEMENT OF ASSETS AND LIABILITIES
AUGUST 31, 2008
California Tax-Free California
Money Market Tax-Free Bond
ASSETS
Investment securities -- at value (cost of
$576,624,134 and $594,391,038,
respectively) $576,624,134 $605,663,157
Cash 2,062,260 --
Receivable for investments sold -- 317,565
Receivable for variation margin on futures
contracts -- 107,379
Interest receivable 1,541,135 7,774,581
Prepaid portfolio insurance 45,760 --
------------- -------------
580,273,289 613,862,682
------------- -------------
LIABILITIES
Disbursements in excess of demand deposit
cash -- 77,361
Payable for investments purchased -- 2,259,495
Accrued management fees 209,560 248,001
Dividends payable 14,545 302,294
------------- -------------
224,105 2,887,151
------------- -------------
NET ASSETS $580,049,184 $610,975,531
============= =============
CAPITAL SHARES
Outstanding (unlimited number of shares
authorized) 580,053,792 55,767,860
============= =============
NET ASSET VALUE PER SHARE $1.00 $10.96
============= =============
NET ASSETS CONSIST OF:
Capital paid in $580,049,184 $604,846,144
Undistributed net investment income -- 1,575
Accumulated net realized loss
on investment transactions -- (5,140,082)
Net unrealized appreciation
on investments -- 11,267,894
------------- -------------
$580,049,184 $610,975,531
============= =============
See Notes to Financial Statements.
------
28
STATEMENT OF OPERATIONS
YEAR ENDED AUGUST 31, 2008
California Tax-Free California
Money Market Tax-Free Bond
INVESTMENT INCOME (LOSS)
INCOME:
Interest $15,974,117 $26,379,638
------------- -------------
EXPENSES:
Management fees 2,803,419 2,874,457
Trustees' fees and expenses 27,440 24,168
Portfolio insurance 95,559 --
Other expenses 749 2,212
------------- -------------
2,927,167 2,900,837
------------- -------------
Amount waived (239,471) --
------------- -------------
2,687,696 2,900,837
------------- -------------
NET INVESTMENT INCOME (LOSS) 13,286,421 23,478,801
------------- -------------
REALIZED AND UNREALIZED GAIN (LOSS)
NET REALIZED GAIN (LOSS) ON:
Investment transactions 44,508 (6,734,329)
Futures transactions -- 4,064,164
------------- -------------
44,508 (2,670,165)
------------- -------------
CHANGE IN NET UNREALIZED
APPRECIATION (DEPRECIATION) ON:
Investments -- 4,193,627
Futures -- 284,297
------------- -------------
-- 4,477,924
------------- -------------
NET REALIZED AND UNREALIZED
GAIN (LOSS) 44,508 1,807,759
------------- -------------
NET INCREASE (DECREASE) IN NET ASSETS
RESULTING FROM OPERATIONS $13,330,929 $25,286,560
============= =============
See Notes to Financial Statements.
------
29
STATEMENT OF CHANGES IN NET ASSETS
YEARS ENDED AUGUST 31, 2008 AND AUGUST 31, 2007
California Tax-Free California
Money Market Tax-Free Bond
Increase
(Decrease) in Net
Assets 2008 2007 2008 2007
OPERATIONS
Net investment
income (loss) $ 13,286,421 $ 16,346,373 $ 23,478,801 $ 18,283,634
Net realized gain
(loss) 44,508 209,764 (2,670,165) (64,212)
Change in net
unrealized
appreciation
(depreciation) -- -- 4,477,924 (9,738,042)
------------- ------------- ------------ -------------
Net increase
(decrease) in net
assets resulting
from operations 13,330,929 16,556,137 25,286,560 8,481,380
------------- ------------- ------------ -------------
DISTRIBUTIONS TO SHAREHOLDERS
From net
investment income (13,286,421) (16,346,373) (23,478,801) (18,283,634)
From net realized
gains (173,341) -- -- --
------------- ------------- ------------ -------------
Decrease in net
assets from
distributions (13,459,762) (16,346,373) (23,478,801) (18,283,634)
------------- ------------- ------------ -------------
CAPITAL SHARE TRANSACTIONS
Proceeds from
shares sold 310,311,383 323,506,954 120,299,092 98,352,774
Issued in
connection with
acquisition (Note
7) -- -- 124,217,258 --
Proceeds from
reinvestment of
distributions 12,578,608 15,446,784 18,991,692 14,416,916
Payments for
shares redeemed (295,058,722) (316,829,559) (116,586,293) (72,773,764)
------------- ------------- ------------ -------------
Net increase
(decrease) in net
assets from
capital share
transactions 27,831,269 22,124,179 146,921,749 39,995,926
------------- ------------- ------------ -------------
NET INCREASE
(DECREASE) IN NET
ASSETS 27,702,436 22,333,943 148,729,508 30,193,672
NET ASSETS
Beginning of period 552,346,748 530,012,805 462,246,023 432,052,351
------------- ------------- ------------ -------------
End of period $ 580,049,184 $ 552,346,748 $ 610,975,531 $462,246,023
============= ============= ============= =============
Undistributed net
investment income -- -- $1,575 --
============= ============= ============= =============
TRANSACTIONS
IN SHARES OF THE
FUNDS
Sold 310,311,383 323,506,954 10,931,066 8,865,796
Issued in
connection with
acquisition (Note
7) -- -- 11,372,787 --
Issued in
reinvestment of
distributions 12,578,608 15,446,784 1,731,627 1,299,357
Redeemed (295,058,722) (316,829,559) (10,606,944) (6,573,731)
------------- ------------- ------------ -------------
Net increase
(decrease) in
shares of
the funds 27,831,269 22,124,179 13,428,536 3,591,422
============= ============= ============= =============
See Notes to Financial Statements.
------
30
NOTES TO FINANCIAL STATEMENTS
AUGUST 31, 2008
1. ORGANIZATION AND SUMMARY OF SIGNIFICANT ACCOUNTING POLICIES
ORGANIZATION -- American Century California Tax-Free and Municipal Funds (the
trust) is registered under the Investment Company Act of 1940 (the 1940 Act)
as an open-end management investment company. California Tax-Free Money Market
Fund (Tax-Free Money Market) and California Tax-Free Bond Fund (Tax-Free Bond)
(collectively, the funds) are two funds in a series issued by the trust.
Tax-Free Money Market is diversified under Rule 2a-7 of the 1940 Act. Tax-Free
Bond is diversified under the 1940 Act. The funds' investment objectives are
to seek safety of principal and high current income that is exempt from
federal and California income taxes. Tax-Free Money Market invests primarily
in municipal obligations with very short-term maturities. Tax-Free Bond
invests primarily in municipal obligations of all maturity ranges. The
following is a summary of the funds' significant accounting policies.
SECURITY VALUATIONS -- Securities of Tax-Free Money Market are valued at
amortized cost, which approximates current market value. Securities of
Tax-Free Bond are valued at current market value as provided by a commercial
pricing service or at the mean of the most recent bid and asked prices. Debt
securities maturing within 60 days at the time of purchase may be valued at
cost, plus or minus any amortized discount or premium. If an event occurs
after the value of a security was established but before net asset value per
share was determined that was likely to materially change the net asset value,
that security would be valued as determined in accordance with procedures
adopted by the Board of Trustees. If the funds determine that the market price
of a portfolio security is not readily available, or that the valuation
methods mentioned above do not reflect the security's fair value, such
security is valued as determined by the Board of Trustees or its designee, in
accordance with procedures adopted by the Board of Trustees, if such
determination would materially impact a fund's net asset value. Certain other
circumstances may cause the funds to use alternative procedures to value a
security such as: a security has been declared in default; trading in a
security has been halted during the trading day; or there is a foreign market
holiday and no trading will commence.
SECURITY TRANSACTIONS -- For financial reporting purposes, security
transactions are accounted for as of the trade date. Net realized gains and
losses are determined on the identified cost basis, which is also used for
federal income tax purposes.
INVESTMENT INCOME -- Interest income is recorded on the accrual basis and
includes accretion of discounts and amortization of premiums.
WHEN-ISSUED AND FORWARD COMMITMENTS -- The funds may engage in securities
transactions on a when-issued or forward commitment basis. Under these
arrangements, the securities' prices and yields are fixed on the date of the
commitment, but payment and delivery are scheduled for a future date. During
this period, securities are subject to market fluctuations. The funds will
segregate cash, cash equivalents or other appropriate liquid securities on
their records in amounts sufficient to meet the purchase price.
FUTURES CONTRACTS -- Tax-Free Bond may enter into futures contracts in order
to manage the fund's exposure to changes in market conditions. One of the
risks of entering into futures contracts is the possibility that the change in
value of the contract may not correlate with the changes in value of the
underlying securities. Upon entering into a futures contract, Tax-Free Bond is
required to deposit either cash or securities in an amount equal to a certain
percentage of the contract value (initial margin). Subsequent payments
(variation margin) are made or received daily, in cash, by Tax-Free Bond. The
variation margin is equal to the daily change in the contract value and is
recorded as unrealized gains and losses. Tax-Free Bond recognizes a realized
gain or loss when the contract is closed or expires. Net realized and
unrealized gains or losses occurring during the holding period of futures
contracts are a component of realized gain (loss) on futures transactions and
unrealized appreciation (depreciation) on futures, respectively.
INCOME TAX STATUS -- It is each fund's policy to distribute substantially all
net investment income and net realized gains to shareholders and to otherwise
qualify as a regulated investment company under provisions of the Internal
Revenue Code. The funds have adopted the provisions of Financial Accounting
Standards Board Interpretation No. 48, "Accounting for Income Taxes" during
the current fiscal year. The funds are no longer subject to examination by tax
authorities for years prior to 2005. At this time, management believes there
are no uncertain tax positions which, based on their technical merit, would
not be sustained upon examination and for which it is reasonably possible that
the total
------
31
amounts of unrecognized tax benefits will significantly change in the next
twelve months. Accordingly, no provision has been made for federal or state
income taxes. Interest and penalties associated with any federal or state
income tax obligations, if any, are recorded as interest expense.
DISTRIBUTIONS TO SHAREHOLDERS -- Distributions from net investment income are
declared daily and paid monthly. Distributions from net realized gains, if
any, are generally declared and paid annually.
INDEMNIFICATIONS -- Under the trust's organizational documents, its officers
and trustees are indemnified against certain liabilities arising out of the
performance of their duties to the funds. In addition, in the normal course of
business, the funds enter into contracts that provide general
indemnifications. The funds' maximum exposure under these arrangements is
unknown as this would involve future claims that may be made against the
funds. The risk of material loss from such claims is considered by management
to be remote.
USE OF ESTIMATES -- The financial statements are prepared in conformity with
accounting principles generally accepted in the United States of America,
which may require management to make certain estimates and assumptions at the
date of the financial statements. Actual results could differ from these
estimates.
2. FEES AND TRANSACTIONS WITH RELATED PARTIES
MANAGEMENT FEES -- The trust has entered into a Management Agreement with
American Century Investment Management, Inc. (ACIM) (the investment advisor),
under which ACIM provides the funds with investment advisory and management
services in exchange for a single, unified management fee (the fee). The
Agreement provides that all expenses of the funds, except brokerage
commissions, taxes, portfolio insurance, interest, fees and expenses of those
trustees who are not considered "interested persons" as defined in the 1940
Act (including counsel fees) and extraordinary expenses, will be paid by ACIM.
The fee is computed and accrued daily based on the daily net assets of each
specific class of shares of each fund and paid monthly in arrears. The fee
consists of (1) an Investment Category Fee based on the daily net assets of
the funds and certain other accounts managed by the investment advisor that
are in the same broad investment category as each fund and (2) a Complex Fee
based on the assets of all the funds in the American Century Investments
family of funds. The rates for the Investment Category Fee range from 0.1570%
to 0.2700% for Tax-Free Money Market and from 0.1625% to 0.2800% for Tax-Free
Bond. The rates for the Complex Fee range from 0.2500% to 0.3100%. From
September 1, 2007 to July 31, 2008, ACIM voluntarily agreed to waive 0.04% of
its management fee for Tax-Free Money Market. Effective August 1, 2008, ACIM
voluntarily agreed to waive 0.06% of its management fee for Tax-Free Money
Market. The effective annual management fee for Tax-Free Money Market for the
year ended August 31, 2008 was 0.49% before waiver and 0.45% after waiver. The
effective annual management fee was 0.48% for Tax-Free Bond for the year ended
August 31, 2008.
MONEY MARKET INSURANCE -- Tax-Free Money Market, along with other money market
funds managed by ACIM, has entered into an insurance agreement with Ambac
Assurance Corporation (Ambac). Ambac provides limited coverage for certain
loss events including issuer defaults as to payment of principal or interest
and insolvency of a credit enhancement provider. Tax-Free Money Market pays
annual premiums to Ambac, which are amortized daily over one year. For the
year ended August 31, 2008, the annualized ratio of money market insurance
expense to average net assets was 0.02%.
RELATED PARTIES -- Certain officers and trustees of the trust are also
officers and/or directors of American Century Companies, Inc. (ACC), the
parent of the trust's investment advisor, ACIM, the distributor of the trust,
American Century Investment Services, Inc., and the trust's transfer agent,
American Century Services, LLC.
Prior to December 12, 2007, Tax-Free Bond had a bank line of credit agreement
with JPMorgan Chase Bank (JPMCB). JPMCB is a custodian of the funds and a
wholly owned subsidiary of JPMorgan Chase & Co. (JPM). JPM is an equity
investor in ACC.
3. INVESTMENT TRANSACTIONS
All investment transactions for Tax-Free Money Market were considered
short-term during the year ended August 31, 2008.
Purchases and sales of investment securities, excluding short-term
investments, for the year ended August 31, 2008, were $281,396,642 and
$212,700,757, respectively, for Tax-Free Bond.
------
32
4. BANK LINE OF CREDIT
Effective December 12, 2007, Tax-Free Bond, along with certain other funds
managed by ACIM or American Century Global Investment Management, Inc.
(ACGIM), has a $500,000,000 unsecured bank line of credit agreement with Bank
of America, N.A. Prior to December 12, 2007, Tax-Free Bond, along with certain
other funds managed by ACIM or ACGIM, had a $500,000,000 unsecured bank line
of credit agreement with JPMCB. Tax-Free Bond may borrow money for temporary
or emergency purposes to fund shareholder redemptions. Borrowings under the
agreement, which is subject to annual renewal, bear interest at the Federal
Funds rate plus 0.40%. Tax-Free Bond did not borrow from either line during
the year ended August 31, 2008.
5. RISK FACTORS
The funds concentrate their investments in a single state and therefore may
have more exposure to credit risk related to the state of California than a
fund with a broader geographical diversification. Income may be subject to
state and local taxes and, if applicable, the alternative minimum tax.
6. FEDERAL TAX INFORMATION
The tax character of distributions paid during the years ended August 31, 2008
and August 31, 2007 were as follows:
Tax-Free Money Market Tax-Free Bond
2008 2007 2008 2007
DISTRIBUTIONS PAID FROM
Exempt income $13,291,025 $16,346,373 $23,477,398 $18,281,473
Taxable ordinary income $12,012 -- $1,403 $2,161
Long-term
capital gains $156,725 -- -- --
The book-basis character of distributions made during the year from net
investment income or net realized gains may differ from their ultimate
characterization for federal income tax purposes. These differences reflect
the differing character of certain income items and net realized gains and
losses for financial statement and tax purposes, and may result in
reclassification among certain capital accounts on the financial statements.
As of August 31, 2008, the components of distributable earnings on a tax-basis
and the federal tax cost of investments were as follows:
Tax-Free Money Market Tax-Free Bond
Federal tax cost of investments $576,624,134 $594,391,038
============= =============
Gross tax appreciation of investments -- $16,115,790
Gross tax depreciation of investments -- (4,843,671)
------------- -------------
Net tax appreciation (depreciation)
of investments -- $11,272,119
============= =============
Undistributed ordinary income -- $1,575
Accumulated capital losses -- $(2,459,480)
Capital loss deferrals -- $(2,684,827)
The cost of investments for federal income tax purposes was the same as the
cost for financial statement purposes. The difference between book-basis and
tax-basis unrealized appreciation (depreciation) is attributable primarily to
the realization for tax purposes of unrealized gain (loss) for certain futures
contracts.
The accumulated capital losses listed above represent net capital loss
carryovers that may be used to offset future realized capital gains for
federal income tax purposes. The capital loss carryovers expire as follows:
2011 2013 2014 2015 2016
Tax-Free Bond $(905,757) $(405,593) $(447,343) $(426,064) $(274,723)
------
33
The capital loss deferrals listed on the previous page represent net capital
losses incurred in the ten-month period ended August 31, 2008. The funds have
elected to treat such losses as having been incurred in the following fiscal
year for federal income tax purposes.
7. REORGANIZATION PLAN
On December 8, 2006, the Board of Trustees approved a plan of reorganization
(the reorganization) pursuant to which Tax-Free Bond acquired all of the
assets of California Limited-Term Tax-Free Fund (Limited-Term), one fund in a
series issued by the trust, in exchange for shares of equal value of Tax-Free
Bond and the assumption by Tax-Free Bond of certain of Limited-Term's ordinary
course liabilities. The financial statements and performance history of
Tax-Free Bond was carried over in the post-reorganization. The reorganization
was effective after the close of business on August 31, 2007. New shares in
connection with the reorganization were issued by Tax-Free Bond on September
4, 2007.
The acquisition was accomplished by a tax-free exchange of 11,372,787 shares
of Tax-Free Bond for 12,057,363 outstanding shares of Limited-Term. The net
assets of Limited-Term and Tax-Free Bond immediately before the acquisition
were $124,217,258 and $462,246,023, respectively. Limited-Term's unrealized
appreciation of $404,931 was combined with that of Tax-Free Bond. Immediately
after the acquisition, the combined net assets were $586,463,281. Tax-Free
Bond acquired accumulated capital losses and capital loss deferrals of
$(1,633,013) and $(212,243), respectively, from Limited-Term.
8. RECENTLY ISSUED ACCOUNTING STANDARDS
The Financial Accounting Standards Board (FASB) issued Statement of Financial
Accounting Standards No. 157, "Fair Value Measurements" (FAS 157), in
September 2006, which is effective for fiscal years beginning after November
15, 2007. FAS 157 defines fair value, establishes a framework for measuring
fair value and expands the required financial statement disclosures about fair
value measurements. The adoption of FAS 157 will not materially impact the
determination of fair value.
In March 2008, the FASB issued Statement of Financial Accounting Standards No.
161, "Disclosures about Derivative Instruments and Hedging Activities -- an
amendment of FASB Statement No. 133" (FAS 161). FAS 161 is effective for
fiscal years beginning after November 15, 2008. FAS 161 amends and expands
disclosures about derivative instruments and hedging activities. FAS 161
requires qualitative disclosures about the objectives and strategies of
derivative instruments, quantitative disclosures about the fair value amounts
of and gains and losses on derivative instruments, and disclosures of
credit-risk-related contingent features in hedging activities. Management is
currently evaluating the impact that adopting FAS 161 will have on the
financial statement disclosures.
9. OTHER TAX INFORMATION (UNAUDITED)
The following information is provided pursuant to provisions of the Internal
Revenue Code.
The funds hereby designate the following exempt interest and long-term capital
gain distributions, or up to the maximum amount allowable, for the fiscal year
ended August 31, 2008.
Tax-Free Money Market Tax-Free Bond
Exempt interest distributions $13,276,480 $23,369,502
Long-term capital gains $156,725 --
10. SUBSEQUENT EVENT
On October 3, 2008, the Board of Trustees approved Tax-Free Money Market to
participate in the U.S. Treasury Department's Temporary Guarantee Program for
Money Market Funds (the program). The program provides coverage to eligible
shareholders for share balances held in participating money market funds as of
the close of business on September 19, 2008 and provides coverage through
December 19, 2008. Participation in the program requires Tax-Free Money Market
to pay an upfront fee of 0.01% of the net assets as of the close of business
on September 19, 2008. Participation in any extensions of the program by the
U.S. Treasury Department will be evaluated by the Board of Trustees.
------
34
FINANCIAL HIGHLIGHTS
California Tax-Free Money Market
For a Share Outstanding Throughout the Years Ended August 31
2008 2007 2006 2005 2004
PER-SHARE DATA
Net Asset Value, Beginning
of Period $1.00 $1.00 $1.00 $1.00 $1.00
-------- -------- -------- -------- --------
Income From
Investment Operations
Net Investment
Income (Loss) 0.02 0.03 0.03 0.02 0.01
-------- -------- -------- -------- --------
Distributions
From Net
Investment Income (0.02) (0.03) (0.03) (0.02) (0.01)
From Net Realized Gains --(1) -- -- -- --
-------- -------- -------- -------- --------
Total Distributions (0.02) (0.03) (0.03) (0.02) (0.01)
-------- -------- -------- -------- --------
Net Asset Value,
End of Period $1.00 $1.00 $1.00 $1.00 $1.00
======== ======== ======== ======== ========
TOTAL RETURN(2) 2.38% 3.16% 2.70% 1.54% 0.58%
RATIOS/SUPPLEMENTAL DATA
Ratio of Operating Expenses
to Average
Net Assets 0.47%(3) 0.49%(3) 0.52%(3) 0.52% 0.52%
Ratio of Operating Expenses
to Average
Net Assets (Before Expense
Waiver) 0.51% 0.51% 0.52% 0.52% 0.52%
Ratio of Net Investment
Income (Loss) to
Average Net Assets 2.32%(3) 3.12%(3) 2.64%(3) 1.53% 0.57%
Ratio of Net Investment
Income (Loss) to
Average Net Assets (Before
Expense Waiver) 2.28% 3.10% 2.64% 1.53% 0.57%
Net Assets, End of Period
(in thousands) $580,049 $552,347 $530,013 $617,356 $600,882
(1) Per-share amount was less than $0.005.
(2) Total return assumes reinvestment of net investment income and capital
gains distributions, if any.
(3) Effective August 1, 2006, the investment advisor voluntarily agreed to
waive a portion of its management fee.
See Notes to Financial Statements.
------
35
California Tax-Free Bond
For a Share Outstanding Throughout the Years Ended August 31
2008 2007 2006 2005 2004
PER-SHARE DATA
Net Asset Value, Beginning
of Period $10.92 $11.15 $11.33 $11.41 $11.28
-------- -------- -------- -------- --------
Income From
Investment Operations
Net Investment
Income (Loss) 0.44 0.45 0.46 0.46 0.44
Net Realized and
Unrealized Gain (Loss) 0.04 (0.23) (0.18) (0.08) 0.13
-------- -------- -------- -------- --------
Total From
Investment Operations 0.48 0.22 0.28 0.38 0.57
-------- -------- -------- -------- --------
Distributions
From Net
Investment Income (0.44) (0.45) (0.46) (0.46) (0.44)
From Net Realized Gains -- -- --(1) -- --
-------- -------- -------- -------- --------
Total Distributions (0.44) (0.45) (0.46) (0.46) (0.44)
-------- -------- -------- -------- --------
Net Asset Value,
End of Period $10.96 $10.92 $11.15 $11.33 $11.41
======== ======== ======== ======== ========
TOTAL RETURN(2) 4.42% 1.98% 2.58% 3.36% 5.13%
RATIOS/SUPPLEMENTAL DATA
Ratio of Operating Expenses
to Average
Net Assets 0.49% 0.49% 0.49% 0.49% 0.50%
Ratio of Net Investment
Income (Loss) to
Average Net Assets 3.96% 4.06% 4.13% 4.02% 3.87%
Portfolio Turnover Rate 41% 41% 34% 34% 20%
Net Assets, End of Period
(in thousands) $610,976 $462,246 $432,052 $435,887 $418,655
(1) Per-share amount was less than $0.005.
(2) Total return assumes reinvestment of net investment income and capital
gains distributions, if any.
See Notes to Financial Statements.
------
36
REPORT OF INDEPENDENT REGISTERED PUBLIC ACCOUNTING FIRM
To the Directors of the American Century California Tax-Free and Municipal
Funds and Shareholders of the California Tax-Free Money Market Fund and
California Tax-Free Bond Fund:
In our opinion, the accompanying statements of assets and liabilities,
including the schedules of investments, and the related statements of
operations and of changes in net assets and the financial highlights present
fairly, in all material respects, the financial position of the California
Tax-Free Money Market Fund and California Tax-Free Bond Fund (two of the four
funds in the American Century California Tax-Free and Municipal Funds,
hereafter referred to as the "Funds") at August 31, 2008, the results of each
of their operations for the year then ended, the changes in each of their net
assets for each of the two years in the period then ended and the financial
highlights for each of the five years in the period then ended, in conformity
with accounting principles generally accepted in the United States of America.
These financial statements and financial highlights (hereafter referred to as
"financial statements") are the responsibility of the Funds' management; our
responsibility is to express an opinion on these financial statements based on
our audits. We conducted our audits of these financial statements in
accordance with the standards of the Public Company Accounting Oversight Board
(United States). Those standards require that we plan and perform the audit to
obtain reasonable assurance about whether the financial statements are free of
material misstatement. An audit includes examining, on a test basis, evidence
supporting the amounts and disclosures in the financial statements, assessing
the accounting principles used and significant estimates made by management,
and evaluating the overall financial statement presentation. We believe that
our audits, which included confirmation of securities at August 31, 2008 by
correspondence with the custodian and brokers, provide a reasonable basis for
our opinion.
PricewaterhouseCoopers LLP
Kansas City, Missouri
October 14, 2008
------
37
MANAGEMENT
The individuals listed below serve as trustees or officers of the funds. Each
trustee serves until his or her successor is duly elected and qualified or
until he or she retires. Effective March 2004, mandatory retirement age for
independent trustees is 73. However, the mandatory retirement age may be
extended for a period not to exceed two years with the approval of the
remaining independent trustees. Those listed as interested trustees are
"interested" primarily by virtue of their engagement as directors and/or
officers of, or ownership interest in, American Century Companies, Inc. (ACC)
or its wholly owned, direct or indirect, subsidiaries, including the funds'
investment advisor, American Century Investment Management, Inc. (ACIM or the
advisor); the funds' principal underwriter, American Century Investment
Services, Inc. (ACIS); and the funds' transfer agent, American Century
Services, LLC (ACS).
The other trustees (more than three-fourths of the total number) are
independent; that is, they have never been employees, directors or officers
of, and have no financial interest in, ACC or any of its wholly owned, direct
or indirect, subsidiaries, including ACIM, ACIS, and ACS. The trustees serve
in this capacity for eight registered investment companies in the American
Century Investments family of funds.
All persons named as officers of the funds also serve in similar capacities
for the other 14 investment companies in the American Century Investments
family of funds advised by ACIM or American Century Global Investment
Management, Inc. (ACGIM), a wholly owned subsidiary of ACIM, unless otherwise
noted. Only officers with policy-making functions are listed. No officer is
compensated for his or her service as an officer of the funds. The listed
officers are interested persons of the funds and are appointed or re-appointed
on an annual basis.
INTERESTED TRUSTEE
JONATHAN S. THOMAS, 4500 Main Street, Kansas City, MO 64111
YEAR OF BIRTH: 1963
POSITION(S) HELD WITH FUNDS: Trustee (since 2007) and President (since 2007)
PRINCIPAL OCCUPATION(S) DURING PAST 5 YEARS: President and Chief Executive
Officer, ACC (March 2007 to present); Chief Administrative Officer, ACC
(February 2006 to February 2007); Executive Vice President, ACC (November 2005
to February 2007). Also serves as: President, Chief Executive Officer and
Director, ACS; Executive Vice President, ACIM and ACGIM; Director, ACIM,
ACGIM, ACIS and other ACC subsidiaries; Managing Director, Morgan Stanley
(March 2000 to November 2005)
NUMBER OF PORTFOLIOS IN FUND COMPLEX OVERSEEN BY TRUSTEE: 111
OTHER DIRECTORSHIPS HELD BY TRUSTEE: None
INDEPENDENT TRUSTEES
JOHN FREIDENRICH, 1665 Charleston Road, Mountain View, CA 94043
YEAR OF BIRTH: 1937
POSITION(S) HELD WITH FUNDS: Trustee (since 2005)
PRINCIPAL OCCUPATION(S) DURING PAST 5 YEARS: Member and Manager, Regis
Management Company, LLC (money management firm) (April 2004 to present);
Partner and Founder, Bay Partners (venture capital firm) (1976 to 2006)
NUMBER OF PORTFOLIOS IN FUND COMPLEX OVERSEEN BY TRUSTEE: 41
OTHER DIRECTORSHIPS HELD BY TRUSTEE: None
------
38
RONALD J. GILSON, 1665 Charleston Road, Mountain View, CA 94043
YEAR OF BIRTH: 1946
POSITION(S) HELD WITH FUNDS: Trustee (since 1995) and Chairman of the Board
(since 2005)
PRINCIPAL OCCUPATION(S) DURING PAST 5 YEARS: Charles J. Meyers Professor of
Law and Business, Stanford Law School (1979 to present); Marc and Eva Stern
Professor of Law and Business, Columbia University School of Law (1992 to
present)
NUMBER OF PORTFOLIOS IN FUND COMPLEX OVERSEEN BY TRUSTEE: 41
OTHER DIRECTORSHIPS HELD BY TRUSTEE: None
FREDERICK L.A. GRAUER, 1665 Charleston Road, Mountain View, CA 94043
YEAR OF BIRTH: 1946
POSITION(S) HELD WITH FUNDS: Trustee (since 2008)
PRINCIPAL OCCUPATION(S) DURING PAST 5 YEARS: Senior Advisor, Barclays Global
Investors (asset manager) (2003 to present)
NUMBER OF PORTFOLIOS IN FUND COMPLEX OVERSEEN BY TRUSTEE: 41
OTHER DIRECTORSHIPS HELD BY TRUSTEE: None
PETER F. PERVERE, 1665 Charleston Road, Mountain View, CA 94043
YEAR OF BIRTH: 1947
POSITION(S) HELD WITH FUNDS: Trustee (since 2007)
PRINCIPAL OCCUPATION(S) DURING PAST 5 YEARS: Retired, formerly Vice President
and Chief Financial Officer, Commerce One, Inc. (software and services
provider)
NUMBER OF PORTFOLIOS IN FUND COMPLEX OVERSEEN BY TRUSTEE: 41
OTHER DIRECTORSHIPS HELD BY TRUSTEE: Director, Intraware, Inc.
MYRON S. SCHOLES, 1665 Charleston Road, Mountain View, CA 94043
YEAR OF BIRTH: 1941
POSITION(S) HELD WITH FUNDS: Trustee (since 1980)
PRINCIPAL OCCUPATION(S) DURING PAST 5 YEARS: Chairman, Platinum Grove Asset
Management, L.P. (asset manager) (1999 to present); Frank E. Buck Professor of
Finance-Emeritus, Stanford Graduate School of Business (1996 to present)
NUMBER OF PORTFOLIOS IN FUND COMPLEX OVERSEEN BY TRUSTEE: 41
OTHER DIRECTORSHIPS HELD BY TRUSTEE: Director, Dimensional Fund Advisors
(investment advisor, 1982 to present)
JOHN B. SHOVEN, 1665 Charleston Road, Mountain View, CA 94043
YEAR OF BIRTH: 1947
POSITION(S) HELD WITH FUNDS: Trustee (since 2002)
PRINCIPAL OCCUPATION(S) DURING PAST 5 YEARS: Professor of Economics, Stanford
University (1973 to present)
NUMBER OF PORTFOLIOS IN FUND COMPLEX OVERSEEN BY TRUSTEE: 41
OTHER DIRECTORSHIPS HELD BY TRUSTEE: Chairman of the Board, Cadence Design
Systems (2005 to present); (Director, Exponent (2007 to present)
JEANNE D. WOHLERS, 1665 Charleston Road, Mountain View, CA 94043
YEAR OF BIRTH: 1945
POSITION(S) HELD WITH FUNDS: Trustee (since 1984)
PRINCIPAL OCCUPATION(S) DURING PAST 5 YEARS: Retired
NUMBER OF PORTFOLIOS IN FUND COMPLEX OVERSEEN BY TRUSTEE: 41
OTHER DIRECTORSHIPS HELD BY TRUSTEE: None
------
39
OFFICERS
BARRY FINK, 4500 Main Street, Kansas City, MO 64111
YEAR OF BIRTH: 1955
POSITION(S) HELD WITH FUNDS: Executive Vice President (since 2007)
PRINCIPAL OCCUPATION(S) DURING PAST 5 YEARS: Chief Operating Officer and
Executive Vice President, ACC (September 2007 to present); President, ACS
(October 2007 to present); Managing Director, Morgan Stanley (2000 to 2007);
Global General Counsel, Morgan Stanley (2000 to 2006). Also serves as:
Director, ACC, ACS, ACIS and other ACC subsidiaries
MARYANNE ROEPKE, 4500 Main Street, Kansas City, MO 64111
YEAR OF BIRTH: 1956
POSITION(S) HELD WITH FUNDS: Chief Compliance Officer (since 2006) and Senior
Vice President (since 2000)
PRINCIPAL OCCUPATION(S) DURING PAST 5 YEARS: Chief Compliance Officer, ACIM,
ACGIM and ACS (August 2006 to present); Assistant Treasurer, ACC (January 1995
to August 2006); and Treasurer and Chief Financial Officer, various American
Century Investments funds (July 2000 to August 2006). Also serves as: Senior
Vice President, ACS
CHARLES A. ETHERINGTON, 4500 Main Street, Kansas City, MO 64111
YEAR OF BIRTH: 1957
POSITION(S) HELD WITH FUNDS: General Counsel (since 2007) and Senior Vice
President (since 2006)
PRINCIPAL OCCUPATION(S) DURING PAST 5 YEARS: Attorney, ACC (February 1994 to
present); Vice President, ACC (November 2005 to present); General Counsel, ACC
(March 2007 to present). Also serves as: General Counsel, ACIM, ACGIM, ACS,
ACIS and other ACC subsidiaries; and Senior Vice President, ACIM, ACGIM and ACS
ROBERT LEACH, 4500 Main Street, Kansas City, MO 64111
YEAR OF BIRTH: 1966
POSITION(S) HELD WITH FUNDS: Vice President, Treasurer and Chief Financial
Officer (all since 2006)
PRINCIPAL OCCUPATION(S) DURING PAST 5 YEARS: Vice President, ACS (February
2000 to present); and Controller, various American Century Investments funds
(1997 to September 2006)
JON ZINDEL, 4500 Main Street, Kansas City, MO 64111
YEAR OF BIRTH: 1967
POSITION(S) HELD WITH FUNDS: Tax Officer (since 2000)
PRINCIPAL OCCUPATION(S) DURING PAST 5 YEARS: Chief Financial Officer and Chief
Accounting Officer, ACC (March 2007 to present); Vice President, ACC (October
2001 to present); Vice President, certain ACC subsidiaries (October 2001 to
August 2006); Vice President, Corporate Tax, ACS (April 1998 to August 2006).
Also serves as: Chief Financial Officer, Chief Accounting Officer and Senior
Vice President, ACIM, ACGIM, ACS and other ACC subsidiaries; and Chief
Accounting Officer and Senior Vice President, ACIS
The SAI has additional information about the funds' trustees and is available
without charge, upon request, by calling 1-800-345-2021.
------
40
APPROVAL OF MANAGEMENT AGREEMENTS
California Tax-Free Money Market and California Tax-Free Bond
Under Section 15(c) of the Investment Company Act, contracts for investment
advisory services are required to be reviewed, evaluated and approved by a
majority of a fund's independent directors or trustees (the "Directors") each
year. At American Century Investments, this process is referred to as the
"15(c) Process." The board oversees on a continuous basis and evaluates at its
quarterly meetings, directly and through the committees of the board, the
nature and quality of significant services provided by the advisor, the
investment performance of the funds, shareholder services, audit and
compliance functions and a variety of other matters relating to fund
operations. Each year, it also holds a special meeting in connection with
determining whether to renew the contracts for advisory services, to review
fund performance, shareholder services, adviser profitability, audit and
compliance matters, and other fund operational matters.
Under a Securities and Exchange Commission rule, each fund is required to
disclose in its annual or semiannual report, as appropriate, the material
factors and conclusions that formed the basis for the board's approval or
renewal of any advisory agreements within the fund's most recently completed
fiscal half-year period.
ANNUAL CONTRACT REVIEW PROCESS
As part of the annual 15(c) Process, the Directors reviewed extensive data and
information compiled by the advisor and certain independent providers of
evaluative data (the "15(c) Providers") concerning California Tax-Free Money
Market and California Tax-Free Bond (the "funds") and the services provided to
the funds under the management agreement. The information considered and the
discussions held at the meetings included, but were not limited to:
* the nature, extent and quality of investment management, shareholder
services and other services provided to the funds;
* reports on the wide range of programs and services the advisor provides to
the funds and its shareholders on a routine and non-routine basis;
* information about the compliance policies, procedures, and regulatory
experience of the advisor;
* data comparing the cost of owning the funds to the cost of owning a similar
fund;
* data comparing the funds' performance to appropriate benchmarks and/or a
peer group of other mutual funds with similar investment objectives and
strategies;
* financial data showing the profitability of the funds to the advisor and the
overall profitability of the advisor; and
* data comparing services provided and charges to other investment management
clients of the advisor.
In keeping with its practice, the Directors at a special meeting and at a
regularly scheduled quarterly meeting reviewed and discussed the information
provided by the advisor throughout the year and to negotiate with the advisor
the renewal of the management agreement, including the setting of the
applicable advisory fee. The board had the benefit of the advice of its
independent counsel throughout the period.
------
41
FACTORS CONSIDERED
The Directors considered all of the information provided by the advisor, an
independent data provider, and the board's independent counsel, and evaluated
such information for each fund for which the board has responsibility. The
Directors did not identify any single factor as being all-important or
controlling, and each Director may have attributed different levels of
importance to different factors. In deciding to renew the agreement under the
terms ultimately determined by the board to be appropriate, the Directors'
decision was based on the following factors.
NATURE, EXTENT AND QUALITY OF SERVICES -- GENERALLY. Under the management
agreement, the advisor is responsible for providing or arranging for all
services necessary for the operation of the funds. The board noted that under
the management agreement, the advisor provides or arranges at its own expense
a wide variety of services including:
* fund construction and design
* portfolio security selection
* initial capitalization/funding
* securities trading
* custody of fund assets
* daily valuation of the funds' portfolio
* shareholder servicing and transfer agency, including shareholder
confirmations, recordkeeping and communications
* legal-services
* regulatory and portfolio compliance
* financial reporting
* marketing and distribution
The Directors noted that many of these services have expanded over time both
in terms of quantity and complexity in response to shareholder demands,
competition in the industry, changing distribution channels and the changing
regulatory environment. In performing their evaluation, the Directors
considered information received in connection with the annual review, as well
as information provided on an ongoing basis at their regularly scheduled board
and committee meetings.
INVESTMENT MANAGEMENT SERVICES. The nature of the investment management
services provided is quite complex and allows fund shareholders access to
professional money management, instant diversification of their investments
within an asset class, the opportunity to easily diversify among asset
classes, and liquidity. In evaluating investment performance, the board
expects the advisor to manage the funds in accordance with its investment
objectives and approved strategies. In providing these services, the advisor
utilizes teams of investment professionals (portfolio managers, analysts,
research assistants, and securities traders) who require extensive information
------
42
technology, research, training, compliance and other systems to conduct their
business. At each quarterly meeting and at the special meeting to consider
renewal of the advisory contract, the Directors, directly and through its
Portfolio Committee, reviews investment performance information for the funds,
together with comparative information for appropriate benchmarks and peer
groups of funds managed similarly to the funds. If performance concerns are
identified, the Directors discuss with the advisor the reasons for such
results (e.g., market conditions, security and sector selection) and any
efforts being undertaken to improve performance. California Tax-Free Money
Market's performance for both the one and three year periods was above the
median for its peer group. California Tax-Free Bond's performance fell below
the median for its peer group for both the one- and three-year periods during
the past year. The board discussed the fund's performance with the advisor and
was satisfied with the efforts being undertaken by the advisor.
SHAREHOLDER AND OTHER SERVICES. The advisor provides the funds with a
comprehensive package of transfer agency, shareholder, and other services. The
Directors, directly and through the various Committees of the Board, review
reports and evaluations of such services at their regular quarterly meetings
and at its special meeting to consider renewal of the Advisory Contract,
including the annual meeting concerning contract review, and reports to the
board. These reports include, but are not limited to, information regarding
the operational efficiency and accuracy of the shareholder and transfer agency
services provided, staffing levels, shareholder satisfaction (as measured by
external as well as internal sources), technology support, new products and
services offered to fund shareholders, securities trading activities,
portfolio valuation services, auditing services, and legal and operational
compliance activities. Certain aspects of shareholder and transfer agency
service level efficiency and the quality of securities trading activities are
measured by independent third party providers and are presented in comparison
to other fund groups not managed by the advisor.
COSTS OF SERVICES PROVIDED AND PROFITABILITY. The advisor provides detailed
information concerning its cost of providing various services to the fund, its
profitability in managing the fund, its overall profitability, and its
financial condition. The Directors have reviewed with the advisor the
methodology used to prepare this financial information. This financial
information regarding the advisor is considered in order to evaluate the
advisor's financial condition, its ability to continue to provide services
under the management agreement, and the reasonableness of the current
management fee.
ETHICS. The Directors generally consider the advisor's commitment to providing
quality services to shareholders and to conducting its business ethically.
They noted that the advisor's practices generally meet or exceed industry best
practices.
ECONOMIES OF SCALE. The Directors review reports provided by the advisor on
economies of scale for the complex as a whole and the year-over-year changes
in revenue, costs, and profitability. The Directors concluded that economies
of scale are difficult to measure and predict with precision, especially on a
fund-by-fund basis. This analysis is also complicated by the additional
services and content provided by the advisor and its reinvestment in its
ability to provide and expand those services. Accordingly, the Directors also
seek to evaluate economies of scale by reviewing other information, such as
year-over-year profitability of the advisor generally, the profitability of
its management of the funds specifically, and the expenses incurred by the
advisor in providing various functions to the funds. The Directors believe the
advisor is appropriately sharing economies of scale through its competitive
fee structure,
------
43
fee breakpoints as the fund complex and the funds increase in size, and
through reinvestment in its business to provide shareholders additional
content and services. In particular, separate breakpoint schedules based on
the size of the entire fund complex and on the size of the funds reflect the
complexity of assessing economies of scale.
COMPARISON TO OTHER FUNDS' FEES. The funds pay the advisor a single,
all-inclusive (or unified) management fee for providing all services necessary
for the management and operation of the funds, other than brokerage expenses,
taxes, interest, extraordinary expenses, and the fees and expenses of the
funds' independent directors (including their independent legal counsel).
Under the unified fee structure, the advisor is responsible for providing all
investment advisory, custody, audit, administrative, compliance,
recordkeeping, marketing and shareholder services, or arranging and
supervising third parties to provide such services. By contrast, most other
funds are charged a variety of fees, including an investment advisory fee, a
transfer agency fee, an administrative fee, distribution charges and other
expenses. Other than their investment advisory fees and Rule 12b-1
distribution fees, all other components of the total fees charged by these
other funds may be increased without shareholder approval. The board believes
the unified fee structure is a benefit to fund shareholders because it clearly
discloses to shareholders the cost of owning fund shares, and, since the
unified fee cannot be increased without a vote of fund shareholders, it shifts
to the advisor the risk of increased costs of operating the funds and provides
a direct incentive to minimize administrative inefficiencies. Part of the
Directors' analysis of fee levels involves reviewing certain evaluative data
compiled by an independent provider and comparing the funds' unified fee to
the total expense ratio of other funds in the funds' peer group. The unified
fee charged to shareholders of California Tax-Free Money Market was below the
median of the total expense ratios of its peer group. The unified fee charged
to shareholders of California Tax-Free Bond was the lowest of the total
expense ratios of its peer group.
COMPARISON TO FEES AND SERVICES PROVIDED TO OTHER CLIENTS OF THE ADVISOR. The
Directors also requested and received information from the advisor concerning
the nature of the services, fees, and profitability of its advisory services
to advisory clients other than the funds. They observed that these varying
types of client accounts require different services and involve different
regulatory and entrepreneurial risks than the management of the funds. The
Directors analyzed this information and concluded that the fees charged and
services provided to the funds were reasonable by comparison.
COLLATERAL BENEFITS DERIVED BY THE ADVISOR. The Directors reviewed information
from the advisor concerning collateral benefits it receives as a result of its
relationship with the funds. They concluded that the advisor's primary
business is managing mutual funds and it generally does not use fund or
shareholder information to generate profits in other lines of business, and
therefore does not derive any significant collateral benefits from them. The
Directors noted that the advisor receives proprietary research from broker
dealers that execute fund portfolio transactions and concluded that this
research is likely to benefit fund shareholders. The Directors also determined
that the advisor is able to provide investment management services to certain
clients other than the funds, at least in part, due to its existing
infrastructure built to serve the fund complex. The Directors concluded,
however, that the assets of those other clients are not material to the
analysis and, in any event, are included with the assets of the funds to
determine breakpoints in the funds' fee schedule, provided they are managed
using the same investment team and strategy.
------
44
CONCLUSIONS OF THE DIRECTORS
As a result of this process, the Directors, in the absence of particular
circumstances and assisted by the advice of legal counsel that is independent
of the advisor, taking into account all of the factors discussed above and the
information provided by the advisor and others concluded that the investment
management agreements between each of California Tax-Free Bond and the advisor
is fair and reasonable in light of the services provided and should be renewed.
The Directors negotiated a renewal of the one-year waiver by the advisor of a
portion of the management fee of California Tax-Free Money Market that was in
place last year. These changes were proposed by the Directors based on their
review of the fund's percentile rank in its peer group universe and the fact
that the Directors seek as a general rule to have total expense ratios of
existing fixed income and money market funds in the lowest 25th percentile of
the fees of comparable funds. Although the adviser agreed to such a waiver in
the past, the adviser argued this year that it was no longer appropriate.
After discussions with the Directors, the adviser agreed to continue the
waiver for another year. Also as part of this negotiation, the adviser and the
Directors concluded that it would be appropriate to discuss over the coming
year the possibility of changes in the overall fee structure of the fund. The
renewal of the fee waiver, effective August 1, 2008, will result in a lowering
of the management fee of the fund by 6 basis points. Following these
negotiations with the advisor, the Directors concluded that the investment
management agreement between the fund and the advisor is fair and reasonable
in light of the services provided and should be renewed.
------
45
ADDITIONAL INFORMATION
PROXY VOTING GUIDELINES
American Century Investment Management, Inc., the funds' investment advisor,
is responsible for exercising the voting rights associated with the securities
purchased and/or held by the funds. A description of the policies and
procedures the advisor uses in fulfilling this responsibility is available
without charge, upon request, by calling 1-800-345-2021. It is also available
on American Century Investments' website at americancentury.com and on the
Securities and Exchange Commission's website at sec.gov. Information regarding
how the investment advisor voted proxies relating to portfolio securities
during the most recent 12-month period ended June 30 is available on the
"About Us" page at americancentury.com. It is also available at sec.gov.
QUARTERLY PORTFOLIO DISCLOSURE
The funds file their complete schedule of portfolio holdings with the
Securities and Exchange Commission (SEC) for the first and third quarters of
each fiscal year on Form N-Q. The funds' Forms N-Q are available on the SEC's
website at sec.gov, and may be reviewed and copied at the SEC's Public
Reference Room in Washington, DC. Information on the operation of the Public
Reference Room may be obtained by calling 1-800-SEC-0330. The funds also make
their complete schedule of portfolio holdings for the most recent quarter of
their fiscal year available on their website at americancentury.com and, upon
request, by calling 1-800-345-2021.
------
46
INDEX DEFINITIONS
The following indices are used to illustrate investment market, sector, or
style performance or to serve as fund performance comparisons. They are not
investment products available for purchase.
The LEHMAN BROTHERS 3-YEAR MUNICIPAL BOND INDEX is composed of those
securities included in the Lehman Brothers Municipal Bond Index that are
investment-grade and have maturities between two and four years.
The LEHMAN BROTHERS 5-YEAR GENERAL OBLIGATION (GO) INDEX is composed of
investment-grade U.S. municipal securities, with maturities of four to six
years, that are general obligations of a state or local government.
The LEHMAN BROTHERS LONG-TERM MUNICIPAL BOND INDEX is composed of those
securities included in the Lehman Brothers Municipal Bond Index that have
maturities greater than 22 years.
The LEHMAN BROTHERS MUNICIPAL BOND INDEX is a market value-weighted index
designed for the long-term tax-exempt bond market.
The LEHMAN BROTHERS NON-INVESTMENT-GRADE MUNICIPAL BOND INDEX is composed of
non-investment grade U.S. municipal securities with a remaining maturity of
one year or more.
The LEHMAN BROTHERS U.S. AGGREGATE INDEX represents securities that are
taxable, registered with the Securities and Exchange Commission, and U.S.
dollar-denominated. The index covers the U.S. investment-grade fixed-rate bond
market, with index components for government and corporate securities,
mortgage pass-through securities, and asset-backed securities.
The LEHMAN BROTHERS U.S. TREASURY INDEX is composed of those securities
included in the Lehman Brothers U.S. Aggregate Index that are public
obligations of the U.S. Treasury with a remaining maturity of one year or more.
------
47
NOTES
------
48
CONTACT US
AMERICANCENTURY.COM
AUTOMATED INFORMATION LINE . . . . . . . . . . . . . . . 1-800-345-8765
INVESTOR SERVICES REPRESENTATIVE . . . . . . . . . . . . 1-800-345-2021 or
816-531-5575
BUSINESS, NOT-FOR-PROFIT, EMPLOYER-SPONSORED
RETIREMENT PLANS . . . . . . . . . . . . . . . . . . . . 1-800-345-3533
BANKS AND TRUST COMPANIES, BROKER-DEALERS,
FINANCIAL PROFESSIONALS, INSURANCE COMPANIES . . . . . . 1-800-345-6488
TELECOMMUNICATIONS DEVICE FOR THE DEAF . . . . . . . . . 1-800-634-4113
AMERICAN CENTURY CALIFORNIA TAX-FREE AND MUNICIPAL FUNDS
INVESTMENT ADVISOR:
American Century Investment Management, Inc.
Kansas City, Missouri
This report and the statements it contains are submitted for the general
information of our shareholders. The report is not authorized for distribution to
prospective investors unless preceded or accompanied by an effective prospectus.
American Century Investment Services, Inc., Distributor
©2008 American Century Proprietary Holdings, Inc. All rights reserved.
0810
CL-ANN-61598N
ANNUAL REPORT
AUGUST 31, 2008
[american century investments logo and text logo]
AMERICAN CENTURY INVESTMENTS
CALIFORNIA LONG-TERM TAX-FREE FUND
CALIFORNIA HIGH-YIELD MUNICIPAL FUND
PRESIDENT'S LETTER
[photo of Jonathan Thomas]
JONATHAN THOMAS
Dear Investor,
At American Century Investments®, we are committed to helping you reach your
financial goals. Your success is the ultimate measure of our performance.
That's why we focus on achieving superior investment results and building
long-term relationships with investors like you.
Part of that relationship is to clearly communicate investment results and
what influenced them. To help you monitor your investment with us, we take
pride in providing you with the annual report for the American Century®
California Long-Term Tax-Free and California High-Yield Municipal funds for
the 12 months ended August 31, 2008. We also recommend americancentury.com,
where we provide company news, quarterly portfolio commentaries, investment
views, and other useful information.
As noted on the website, 2008 marks the 50th anniversary of American Century
Investments. Since 1958, we've worked to make wise decisions with your
interests as our guide. Fifty years also means that we've met the challenges
of previous economic downturns. As we've crossed those hurdles and earned your
trust, our growth in assets under management has given us the resources to
offer a wide array of financial products and services, including a
well-diversified lineup of portfolios that provides you with many choices in
these uncertain times.
Though our offerings are diverse, they share several key qualities, including
our disciplined investment approach and active, team-based management. Strict
adherence to our processes and long-term strategies allows us to stay focused
during volatile periods. Investors in our portfolios also benefit from the sum
of our investment teams' expertise as they share research and information.
We'll continue to work hard to earn your trust. Thank you for your continued
support.
Sincerely,
/s/Jonathan Thomas
Jonathan S. Thomas
President and Chief Executive Officer
American Century Investments
TABLE OF CONTENTS
Market Perspective. . . . . . . . . . . . . . . . . . . . . . . . . . 2
U.S. Fixed-Income Total Returns. . . . . . . . . . . . . . . . . . . 2
CALIFORNIA LONG-TERM TAX-FREE
Performance . . . . . . . . . . . . . . . . . . . . . . . . . . . . . 3
Portfolio Commentary. . . . . . . . . . . . . . . . . . . . . . . . . 5
Portfolio at a Glance. . . . . . . . . . . . . . . . . . . . . . . . 5
Yields . . . . . . . . . . . . . . . . . . . . . . . . . . . . . . . 5
Portfolio Composition by Credit Rating . . . . . . . . . . . . . . . 6
Top Five Sectors . . . . . . . . . . . . . . . . . . . . . . . . . . 6
Schedule of Investments . . . . . . . . . . . . . . . . . . . . . . . 7
CALIFORNIA HIGH-YIELD MUNICIPAL
Performance . . . . . . . . . . . . . . . . . . . . . . . . . . . . . 12
Portfolio Commentary. . . . . . . . . . . . . . . . . . . . . . . . . 14
Portfolio at a Glance. . . . . . . . . . . . . . . . . . . . . . . . 14
Yields . . . . . . . . . . . . . . . . . . . . . . . . . . . . . . . 14
Portfolio Composition by Credit Rating . . . . . . . . . . . . . . . 15
Top Five Sectors . . . . . . . . . . . . . . . . . . . . . . . . . . 15
Schedule of Investments . . . . . . . . . . . . . . . . . . . . . . . 16
Shareholder Fee Examples. . . . . . . . . . . . . . . . . . . . . . . 25
FINANCIAL STATEMENTS
Statement of Assets and Liabilities . . . . . . . . . . . . . . . . . 27
Statement of Operations . . . . . . . . . . . . . . . . . . . . . . . 28
Statement of Changes in Net Assets. . . . . . . . . . . . . . . . . . 29
Notes to Financial Statements . . . . . . . . . . . . . . . . . . . . 30
Financial Highlights. . . . . . . . . . . . . . . . . . . . . . . . . 36
Report of Independent Registered Public Accounting Firm . . . . . . . 44
OTHER INFORMATION
Management. . . . . . . . . . . . . . . . . . . . . . . . . . . . . . 45
Approval of Management Agreements for California Long-Term
Tax-Free and California High-Yield Municipal . . . . . . . . . . . . 48
Additional Information. . . . . . . . . . . . . . . . . . . . . . . . 52
Index Definitions . . . . . . . . . . . . . . . . . . . . . . . . . . 53
The opinions expressed in the Market Perspective and each of the Portfolio
Commentaries reflect those of the portfolio management team as of the date of
the report, and do not necessarily represent the opinions of American Century
Investments or any other person in the American Century Investments
organization. Any such opinions are subject to change at any time based upon
market or other conditions and American Century Investments disclaims any
responsibility to update such opinions. These opinions may not be relied upon
as investment advice and, because investment decisions made by American
Century Investments funds are based on numerous factors, may not be relied
upon as an indication of trading intent on behalf of any American Century
Investments fund. Security examples are used for representational purposes
only and are not intended as recommendations to purchase or sell securities.
Performance information for comparative indices and securities is provided to
American Century Investments by third party vendors. To the best of American
Century Investments' knowledge, such information is accurate at the time of
printing.
MARKET PERSPECTIVE
[photo of Chief Investment Officer]
By G. David MacEwen, Chief Investment Officer, Fixed Income
QUALITY RULES IN CHALLENGING CLIMATE
Against a backdrop of widespread credit and liquidity problems, coupled with
strong market volatility, investors favored higher-quality securities during
the 12 months ended August 31, 2008. Treasuries significantly outperformed
non-Treasury securities, including municipals. Credit-related risk aversion
hurt the lower-quality sectors of the market.
The Federal Reserve (the Fed) faced the dual--and conflicting--challenges of
keeping recession at bay and fending off inflation. For much of the period,
the Fed favored anti-recessionary measures, cutting the federal funds target
rate by 3.25 percentage points between September 2007 and April 2008. The Fed
also enacted a series of emergency lending programs targeting a wider spectrum
of borrowers. As oil and other commodity prices reached record highs, the Fed
seemed to refocus on inflation, holding interest rates steady during the last
four months of the reporting period. Inflation, as measured by the one-year
change in the Consumer Price Index, ended the period at 5.4%.
CREDIT WOES REACH MUNICIPAL MARKET
The credit-market turmoil that originated in the subprime mortgage market
worked its way into the usually calm municipal bond market. Extensive
financial-sector deleveraging, forced selling among hedge funds, and an
increase in deficit financing created a supply surge among municipal bonds.
These factors, combined with ratings downgrades for several municipal bond
insurers, led to historic underperformance for municipals relative to
Treasuries. They also reversed a two-year flattening trend for the municipal
yield curve, which steepened during the period. In February, certain
investment-grade municipal yields reached 121% of comparable Treasury yields.
(The ratio historically has been 85% to 90%.)
Although performance rebounded in subsequent months, the municipal/Treasury
yield ratio remained above its historic range--usually an indication of an
attractive buying opportunity. We believe municipal yields at 100% or more of
Treasuries offer sufficient long-term appreciation potential to overcome
near-term economic, financial, and credit risks. Furthermore, an overhaul of
the credit-ratings scales, which Moody's will launch in October, should show
investment-grade municipals typically have higher credit quality than
investment-grade corporate securities.
U.S. Fixed Income Total Returns
For the 12 months ended August 31, 2008
LEHMAN BROTHERS MUNICIPAL MARKET INDICES
Municipal Bond 4.48%
3-Year Municipal Bond 6.60%
5-Year General Obligation (GO) Bond 7.07%
Long-Term Municipal Bond 0.62%
Non-Investment-Grade Municipal Bond -4.37%
TAXABLE MARKET RETURNS
Lehman Brothers U.S. Aggregate Index 5.86%
Lehman Brothers U.S. Treasury Index 8.65%
3-Month Treasury Bill 3.16%
10-Year Treasury Note 9.84%
------
2
PERFORMANCE
California Long-Term Tax-Free
Total Returns as of August 31, 2008
Average Annual Returns
Since Inception
1 year 5 years 10 years Inception Date
INVESTOR CLASS 3.29% 3.90% 4.25% 6.78% 11/9/83
LEHMAN BROTHERS
LONG-TERM MUNICIPAL
BOND INDEX 0.62% 4.88% 4.96% 8.29%(1) --
LIPPER CALIFORNIA
MUNICIPAL DEBT FUNDS
AVERAGE RETURNS(2) 1.25% 3.67% 3.83% 6.79%(3) --
Investor Class's
Lipper Ranking
as of 8/31/08(2) 18 of 116 41 of 100 15 of 71 1 of 1(3) --
as of 9/30/08(2) 18 of 120 33 of 100 16 of 71 1 of 1(3) --
A Class
No sales charge* -- -- -- 1.57%(4)
With sales charge* -- -- -- -2.97%(4) 9/28/07
B Class
No sales charge* -- -- -- 0.87%(4)
With sales charge* -- -- -- -4.13%(4) 9/28/07
C Class
No sales charge* -- -- -- 0.87%(4)
With sales charge* -- -- -- -0.10%(4) 9/28/07
*Sales charges include initial sales charges and contingent deferred sales
charges (CDSCs), as applicable. A Class shares have a 4.50% maximum initial
sales charge for fixed-income funds and may be subject to a maximum CDSC of
1.00%. B Class shares redeemed within six years of purchase are subject to a
CDSC that declines from 5.00% during the first year after purchase to 0.00%
the sixth year after purchase. C Class shares redeemed within 12 months of
purchase are subject to a maximum CDSC of 1.00%. The SEC requires that mutual
funds provide performance information net of maximum sales charges in all
cases where charges could be applied.
(1) Since 10/31/83, the date nearest the Investor Class's inception for which
data are available.
(2) Data provided by Lipper Inc. - A Reuters Company. © 2008 Reuters. All
rights reserved. Any copying, republication or redistribution of Lipper
content, including by caching, framing or similar means, is expressly
prohibited without the prior written consent of Lipper. Lipper shall not be
liable for any errors or delays in the content, or for any actions taken in
reliance thereon.
Lipper Fund Performance -- Performance data is total return, and is
preliminary and subject to revision.
Lipper Rankings -- Rankings are based only on the universe shown and are
based on average annual total returns. This listing might not represent the
complete universe of funds tracked by Lipper.
The data contained herein has been obtained from company reports, financial
reporting services, periodicals and other resources believed to be reliable.
Although carefully verified, data on compilations is not guaranteed by Lipper
and may be incomplete. No offer or solicitations to buy or sell any of the
securities herein is being made by Lipper.
(3) Since 11/10/83, the date nearest the Investor Class's inception for which
data are available.
(4) Total returns for periods less than one year are not annualized.
Data presented reflect past performance. Past performance is no guarantee of
future results. Current performance may be higher or lower than the
performance shown. Investment return and principal value will fluctuate, and
redemption value may be more or less than original cost. To obtain performance
data current to the most recent month end, please call 1-800-345-2021 or visit
americancentury.com. As interest rates rise, bond values will decline.
Investment income may be subject to certain state and local taxes and,
depending on your tax status, the federal alternative minimum tax (AMT).
Capital gains are not exempt from state and federal income tax.
Unless otherwise indicated, performance reflects Investor Class shares;
performance for other share classes will vary due to differences in fee
structure. For information about other share classes available, please consult
the prospectus. Data assumes reinvestment of dividends and capital gains, and
none of the charts reflect the deduction of taxes that a shareholder would pay
on fund distributions or the redemption of fund shares. Returns for the index
are provided for comparison. The fund's total returns include operating
expenses (such as transaction costs and management fees) that reduce returns,
while the total returns of the index do not.
------
3
California Long-Term Tax-Free
Growth of $10,000 Over 10 Years
$10,000 investment made August 31, 1998
One-Year Returns Over 10 Years
Periods ended August 31
1999 2000 2001 2002 2003 2004 2005 2006 2007 2008
Investor Class -1.86% 7.79% 10.55% 5.14% 1.81% 6.83% 5.38% 2.89% 1.24% 3.29%
Lehman Brothers
Long-Term
Municipal Bond
Index -2.14% 7.34% 12.35% 5.62% 2.62% 9.24% 10.52% 4.08% 0.36% 0.62%
Data presented reflect past performance. Past performance is no guarantee of
future results. Current performance may be higher or lower than the
performance shown. Investment return and principal value will fluctuate, and
redemption value may be more or less than original cost. To obtain performance
data current to the most recent month end, please call 1-800-345-2021 or visit
americancentury.com. As interest rates rise, bond values will decline.
Investment income may be subject to certain state and local taxes and,
depending on your tax status, the federal alternative minimum tax (AMT).
Capital gains are not exempt from state and federal income tax.
Unless otherwise indicated, performance reflects Investor Class shares;
performance for other share classes will vary due to differences in fee
structure. For information about other share classes available, please consult
the prospectus. Data assumes reinvestment of dividends and capital gains, and
none of the charts reflect the deduction of taxes that a shareholder would pay
on fund distributions or the redemption of fund shares. Returns for the index
are provided for comparison. The fund's total returns include operating
expenses (such as transaction costs and management fees) that reduce returns,
while the total returns of the index do not.
------
4
PORTFOLIO COMMENTARY
California Long-Term Tax-Free
Portfolio Managers: Dave MacEwen, Steven Permut, and Joseph Gotelli
PERFORMANCE SUMMARY
California Long-Term Tax-Free returned 3.29%* in the 12 months ended August
31, 2008. By comparison, the Lehman Brothers Long-Term Municipal Bond Index
returned 0.62%, while the California Municipal Debt Funds tracked by Lipper
had an average return of 1.25%. See page 3 for additional performance
comparisons.
The portfolio's absolute return is indicative of the sharp volatility that
limited returns for long-term municipal bonds in the last 12 months (see page
2). In terms of contribution to the fund's return, our duration, yield curve,
and sector trades helped performance, while our credit allocation limited
relative results.
DURATION, CURVE POSITION HELPED
We typically manage the portfolio's duration (price sensitivity to interest
rate changes) conservatively, keeping it in a narrow band around that of our
benchmark--we prefer to add value through individual security selection and
credit research. During a year of extraordinary market volatility, we kept
duration slightly short of our benchmark. Having a slightly shorter duration
compared with the Lehman Brothers index helped relative results.
In addition, the portfolio benefited from the yield curve steepening bias we
had in place using municipal bonds and two- and 30-year Treasury futures. The
difference in yield between two- and 30-year AAA municipal general obligation
notes increased from 103 to 268 basis points (a basis point equals 0.01%)
during the year, while the Treasury curve steepened from 66 to 217 basis
points. Those changes were a result of rapidly falling yields on short-term
securities (because of Fed rate cuts and a flight to safety), while inflation
concerns kept yields on longer-term notes and bonds from declining as much.
IMPROVING SECTOR, RISK/REWARD PROFILE
We took advantage of the volatility and dislocations in the market to add some
investment-grade bonds at attractive spreads. Another way we added yield and
performance to the portfolio was buying newly minted bonds--new issues in this
period came to market at very attractive levels as the dealer community was
less willing to underwrite securities on their own balance sheets. These
trades should help the portfolio's yield in the short run, and improve our
risk/return profile longer term.
Portfolio at a Glance
As of As of
8/31/08 8/31/07
Weighted Average Maturity 16.8 years 13.9 years
Average Duration (Modified) 8.0 years 7.4 years
Yields as of August 31, 2008
30-Day SEC Yield
Investor Class 4.04%
A Class 3.62%
B Class 3.04%
C Class 3.04%
Investor Class 30-Day Tax-Equivalent Yields(1)
31.98% Tax Bracket 5.94%
34.70% Tax Bracket 6.19%
39.23% Tax Bracket 6.65%
41.05% Tax Bracket 6.85%
(1) The tax brackets indicated are for combined state and federal income tax.
Actual tax-equivalent yields may be lower, if alternative minimum tax is
applicable.
*All fund returns referenced in this commentary are for Investor Class shares.
------
5
California Long-Term Tax-Free
A number of our sector trades during the year added value, including our
underweight position in airline and tobacco bonds--two volatile, poorly
performing sectors during the fiscal year. In addition, we took advantage of
the dislocations in the market to trade up into high-quality revenue bonds in
less economically sensitive segments of the economy.
CREDIT POSITIONING DETRACTED
The fund's relative performance would have been even better but for our credit
allocation. Credit spreads (the difference in yield between lower- and
higher-rated bonds) widened at a time when we had an overweight position in
credit-sensitive bonds. Other things being equal, wider credit spreads mean
lower-rated bonds lag.
What's more, we began the period with a sizable overweight in insured bonds
(about 50% of assets at one point). Insured securities underperformed because
of concern that losses on subprime loans in other parts of the bond insurers'
business would affect the backing they provide for many municipal bonds. The
insurers' difficulties had no effect on the underlying quality of the
municipal bonds they backed, but the initial selloff and liquidity premium
meant insured bonds trailed the rest of the market.
MANAGEMENT CHANGE
In July, Portfolio Manager Joseph Gotelli joined Dave MacEwen and Steven
Permut as a portfolio manager on California Long-Term Tax-Free. Mr. Gotelli
brings six years of municipal bond investment experience at Franklin Templeton
Investments.
OUTLOOK
"We've been saying for some time that we believe this is an excellent buying
opportunity for investors with a long-term horizon and the patience to ride
out short-term volatility," says Steven Permut, a portfolio manager and head
of the municipal bond team. "We still believe that's true because the larger
credit crunch has hurt municipal bonds for reasons that have little or nothing
to do with market fundamentals. But that also means the municipal market
probably won't rebound in a meaningful way until we see real progress on
resolving the credit crisis. In the meantime, we'll continue to manage our
duration and sector allocation conservatively while looking for bonds with
compelling yield and credit characteristics."
Portfolio Composition by Credit Rating
% of fund % of fund
investments investments
as of as of
8/31/08 2/29/08
AAA 24% 53%
AA 43% 9%
A 23% 22%
BBB 9% 14%
Not Rated 1% 2%
Ratings provided by independent research companies. These ratings are listed
in Standard & Poor's format even if they were provided by other sources.
Top Five Sectors as of August 31, 2008
% of fund
investments
Certificates of Participation (COPs)/Leases 22%
Water/Sewer/Gas Revenue 14%
Prerefunded 12%
General Obligation (GO) 12%
Hospital Revenue 9%
------
6
SCHEDULE OF INVESTMENTS
California Long-Term Tax-Free
AUGUST 31, 2008
Principal Amount Value
Municipal Securities -- 98.4%
CALIFORNIA -- 97.4%
$ 3,445,000 ABAG Tax Allocation Rev., Series 2007 A, 5.00%,
9/1/33 (Ambac)(1) $ 3,440,108
2,100,000 Anaheim Redevelopment Agency Tax Allocation Rev.,
Series 2007 A, (Anaheim Merged Redevelopment
Project Area), 5.00%, 2/1/31 (FSA) 2,126,691
5,235,000 Antioch Public Financing Auth. Lease Rev., Series
2002 A, (Municipal Facilities), 5.50%, 1/1/32
(MBIA)(1) 5,377,392
4,730,000 Antioch Public Financing Auth. Lease Rev., Series
2002 B, (Municipal Facilities), 5.625%, 1/1/22
(MBIA)(1) 4,919,011
6,005,000 Antioch Public Financing Auth. Lease Rev., Series
2002 B, (Municipal Facilities), 5.625%, 1/1/27
(MBIA)(1) 6,208,269
1,100,000 Austin Trust Various States Rev., Series
2008-1167, VRDN, 1.91%, 9/4/08 (FSA) (LIQ FAC:
Bank of America, N.A.) (Acquired 8/25/08, Cost
$1,100,000)(2) 1,100,000
1,395,000 Avenal Public Financing Auth. Rev., 5.00%,
9/1/25(1) 1,377,702
610,000 Banning COP, (Wastewater System Refunding &
Improvement), 8.00%, 1/1/19 (Ambac) 716,311
1,205,000 Berryessa Union School District GO, Series 2001 B,
(Election of 1999), 5.375%, 8/1/11, Prerefunded at
101% of Par (FSA)(1)(3) 1,323,705
1,205,000 Berryessa Union School District GO, Series 2001 B,
(Election of 1999), 5.375%, 8/1/11, Prerefunded at
101% of Par (FSA)(1)(3) 1,323,705
3,500,000 Big Bear Lake Water Rev., 6.00%, 4/1/22 (MBIA)(1) 3,992,415
5,000,000 California County Tobacco Securitization Agency
Rev., (Gold Country Settlement Funding Corp.),
5.25%, 6/1/46(1) 3,808,300
3,480,000 California Department of Water Resources Power
Supply Rev., Series 2002 A, 5.50%, 5/1/14
(Ambac)(1) 3,791,495
Principal Amount Value
$ 5,000,000 California Department of Water Resources Power
Supply Rev., Series 2008 H, 5.00%, 5/1/22 (FSA)(1) $ 5,262,150
5,000,000 California Economic Recovery GO, Series 2004 A,
5.25%, 7/1/14 (FGIC)(1) 5,575,550
5,000,000 California Economic Recovery GO, Series 2008 A,
5.00%, 1/1/11(1) 5,312,600
2,000,000 California Educational Facilities Auth. Rev.,
(University of Pacific), 5.25%, 5/1/34(1) 2,010,320
8,570,000 California Educational Facilities Auth. Rev.,
(University of Southern California), 5.50%,
10/1/27(1) 8,831,899
1,920,000 California Educational Facilities Auth. Rev.,
(Western University Health Sciences), 6.00%,
10/1/12, Prerefunded at 100% of Par(1)(3) 2,172,422
1,220,000 California Educational Facilities Auth. Rev.,
Series 2004 C, (Lutheran University), 5.00%,
10/1/29(1) 1,110,334
5,000,000 California Educational Facilities Auth. Rev.,
Series 2007 A, (Claremont Graduate University),
5.00%, 3/1/42(1) 4,788,650
3,000,000 California GO, 6.125%, 10/1/11 (Ambac-TCRS)(1) 3,276,360
2,000,000 California GO, 5.00%, 2/1/14, Prerefunded at 100%
of Par(1)(3) 2,216,280
7,300,000 California GO, 5.00%, 11/1/32(1) 7,248,827
8,000,000 California GO, 5.00%, 6/1/34(1) 7,900,080
6,000,000 California GO, 5.00%, 11/1/37(1) 5,882,220
7,000,000 California GO, 5.00%, 4/1/38(1) 6,851,460
3,000,000 California Health Facilities Financing Auth. Rev.,
Series 1989 A, (Kaiser Permanente), 7.15%,
10/1/09(4) 2,919,300
7,165,000 California Health Facilities Financing Auth. Rev.,
Series 1993 C, (St. Francis Memorial Hospital),
5.875%, 11/1/23(1)(3) 8,401,249
5,000,000 California Health Facilities Financing Auth. Rev.,
Series 2008 J, (Catholic Healthcare West), 5.625%,
7/1/32(1) 5,005,200
------
7
California Long-Term Tax-Free
Principal Amount Value
$ 1,000,000 California Infrastructure & Economic Development
Bank Rev., (Performing Arts Center of Los Angeles
County), 5.00%, 12/1/37 $ 981,820
4,000,000 California Public Works Board Lease Rev., Series
1993 A, (Department of Corrections), 5.00%,
12/1/19 (Ambac) 4,177,720
2,400,000 California Public Works Board Lease Rev., Series
2003 C, (Department of Corrections), 5.00%, 6/1/24 2,416,344
6,000,000 California Public Works Board Lease Rev., Series
2005 A, (Department of General Services -
Butterfield), 5.25%, 6/1/30(1) 6,046,980
2,835,000 California Public Works Board Lease Rev., Series
2006 E, (University of California Research),
5.00%, 10/1/31 2,855,497
9,500,000 California Public Works Board Lease Rev., Series
2006 G, (California State University), 5.00%,
11/1/31(1) 9,371,084
2,590,000 California Public Works Board Lease Rev., Series
2006 G, (Physical Science Replacement Building,
Wing A, Los Angeles Campus), 5.00%, 11/1/26 2,604,841
9,815,000 California Statewide Communities Development Auth.
Rev., Series 1998 A, (Sherman Oaks Project),
5.00%, 8/1/22 (Ambac/California Mortgage
Insurance)(1) 10,162,843
12,050,000 California Statewide Communities Development Auth.
Rev., Series 2001 C, (Kaiser Permanente), VRDN,
5.25%, 8/1/16(1) 12,023,971
1,000,000 California Statewide Communities Development Auth.
Rev., Series 2005 A, (Thomas Jefferson School of
Law), 4.875%, 10/1/15, Prerefunded at 100% of
Par(3) 1,062,070
5,000,000 California Statewide Communities Development Auth.
Rev., Series 2006 B, (Kaiser Permanente), 5.25%,
3/1/45 4,865,400
3,000,000 California Statewide Communities Development Auth.
Rev., Series 2008 C, (Catholic Healthcare West),
5.625%, 7/1/35 2,989,440
Principal Amount Value
$ 5,695,000 Capistrano Unified School District Special Tax
Rev., (Community Facilities District No. 88-1),
6.50%, 9/1/14 (FSA) $ 5,812,203
1,125,000 Carlsbad Unified School District GO, Series 2007
A, (Election of 2006), 5.25%, 8/1/32 (MBIA) 1,147,433
1,520,000 Castaic Lake Water Agency COP, Series 1994 A,
(Water System Improvement), 7.00%, 8/1/12 (MBIA) 1,742,862
5,725,000 City of Escondido COP, 5.00%, 9/1/30 (Ambac) 5,657,216
3,255,000 City of Riverside Water Rev., Series 2008 B,
5.00%, 10/1/38 (FSA) 3,298,650
7,000,000 City of Vista COP, (Community Projects), 5.00%,
5/1/37 (MBIA)(1) 6,843,060
1,320,000 Coalinga Public Financing Auth. Local Obligation
Rev., Series 1998 A, 6.375%, 9/15/21 (Ambac) 1,581,730
2,615,000 Concord Joint Powers Financing Auth. Lease Rev.,
(Concord Avenue Parking Structure), 5.125%, 3/1/23 2,678,152
2,205,000 Concord Joint Powers Financing Auth. Lease Rev.,
(Police Facilities), 5.25%, 8/1/13 2,363,076
1,890,000 Contra Costa Water District Rev., Series 1992 E,
6.25%, 10/1/12 (Ambac) 2,025,230
4,500,000 Eastern Municipal Water District Water & Sewer
Rev. COP, Series 2008 H, 5.00%, 7/1/33 4,486,995
3,590,000 Fontana Redevelopment Agency Tax Allocation Rev.,
(Sierra Corridor Commercial Redevelopment
Project), 5.50%, 9/1/34 3,526,637
2,000,000 Foothill-De Anza Community College District GO,
Series 2007 A, (Election of 2006), 5.00%, 8/1/27
(Ambac) 2,059,400
2,225,000 Fresno Sewer Rev., Series 1993 A1, 6.25%, 9/1/14
(Ambac) 2,445,097
7,000,000 Gilroy Unified School District COP, (2008 School
Facilities Projects), 5.25%, 4/1/39 (AGC) 7,010,080
------
8
California Long-Term Tax-Free
Principal Amount Value
$19,070,000 Golden State Tobacco Securitization Corp.
Settlement Rev., Series 2007 A1, 5.75%, 6/1/47(1) $ 15,964,259
4,705,000 Hillsborough School District GO, Series 2006 B,
(Election of 2002), 4.86%, 9/1/29(4) 1,603,088
5,010,000 Hillsborough School District GO, Series 2006 B,
(Election of 2002), 4.87%, 9/1/30(4) 1,608,210
5,335,000 Hillsborough School District GO, Series 2006 B,
(Election of 2002), 4.88%, 9/1/31(4) 1,612,557
5,000,000 Huntington Beach Union High School District GO,
(Election of 2004), 5.00%, 8/1/31 (MBIA)(4) 1,480,700
9,350,000 Imperial Irrigation District COP, (Water Systems),
5.50%, 7/1/29 (Ambac) 9,560,094
98,000 Irvine Improvement Bond Act of 1915 Special
Assessment, Series 2007 A, (Reassessment District
No. 85-7), VRDN, 2.25%, 9/2/08 (FSA) (SBBPA: Dexia
Credit Local) 98,000
1,815,000 Kern High School District GO, 7.15%, 8/1/14
(MBIA)(3) 2,229,256
1,340,000 Kern High School District GO, Series 1992 C,
(Election of 1990), 6.25%, 8/1/13 (MBIA)(3) 1,558,581
3,630,000 Kern High School District GO, Series 1993 D,
7.00%, 8/1/17 (MBIA)(3) 4,278,971
1,250,000 Lancaster Financing Auth. Rev., (Projects No. 5 &
6), 5.60%, 2/1/34 1,226,675
5,190,000 Lancaster Financing Auth. Tax Allocation Rev.,
(School District), 5.00%, 2/1/37 4,608,253
1,335,000 Little Lake City School District GO, Series 2000
A, 6.125%, 7/1/10, Prerefunded at 101% of Par
(FSA)(3) 1,449,183
2,240,000 Lodi Unified School District COP, Series 2005 A,
(Aspire), 5.00%, 8/1/32 (FGIC) 2,190,989
1,605,000 Long Beach Bond Finance Auth. Lease Rev., (Plaza
Parking Facility), 5.25%, 11/1/21 1,648,223
4,370,000 Los Angeles Department of Airports Rev., Series
2008 C, (Los Angeles International Airport),
5.25%, 5/15/21 4,582,819
8,000,000 Metropolitan Water District of Southern California
Rev., 5.75%, 8/10/18 8,901,120
Principal Amount Value
$ 3,000,000 Metropolitan Water District of Southern California
Rev., Series 2006 B, 4.375%, 7/1/37 $ 2,745,000
8,635,000 M-S-R Public Power Agency Rev., Series 1989 D,
(San Juan), 6.75%, 7/1/20 (MBIA)(3) 10,332,036
1,000,000 New Haven Unified School District GO, 12.00%,
8/1/18 (FSA) 1,677,210
6,000,000 Northern Inyo County Local Hospital District GO,
5.60%, 8/1/35 5,789,700
6,110,000 Oakland Redevelopment Agency Tax Allocation Rev.,
(Central District), 5.50%, 2/1/14 (Ambac) 6,548,270
1,680,000 Oceanside COP, Series 2003 A, 5.25%, 4/1/17 (Ambac) 1,767,763
1,000,000 Orange County Community Facilities District No.
2004-1 Special Tax Rev., Series 2005 A, (Ladera
Ranch), 5.20%, 8/15/34 920,600
850,000 Orange County Improvement Bond Act of 1915 Special
Assessment, (Newport Coast Phase IV Assessment
District No. 01-1), 5.00%, 9/2/26 769,777
1,250,000 Orange County Improvement Bond Act of 1915 Special
Assessment, (Newport Coast Phase IV Assessment
District No. 01-1), 5.05%, 9/2/33 1,114,213
3,100,000 Oxnard School District GO, Series 2001 A, 5.75%,
8/1/22 (MBIA) 3,383,216
2,240,000 Pasadena COP, (Old Pasadena Parking Facility),
6.25%, 1/1/18 2,555,683
1,150,000 Perris Public Financing Auth. Tax Allocation Rev.,
5.35%, 10/1/36 1,039,669
2,500,000 Pico Rivera Water Auth. Rev., Series 1999 A,
(Water Systems), 5.50%, 5/1/29 (MBIA) 2,696,800
1,000,000 Pomona Unified School District GO, Series 2000 A,
6.55%, 8/1/29 (MBIA) 1,170,300
1,000,000 Pomona Unified School District GO, Series 2001 A,
6.15%, 8/1/30 (MBIA) 1,098,980
1,110,000 Poway Redevelopment Agency Tax Allocation, (Paguay
Redevelopment), 5.375%, 12/15/20 (Ambac) 1,182,672
------
9
California Long-Term Tax-Free
Principal Amount Value
$ 1,580,000 Riverside Redevelopment Agency Rev., Series 2004
A, (Housing Set-Aside Tax Allocation), 5.00%,
8/1/28 (FGIC) $ 1,542,933
1,500,000 Sacramento City Financing Auth. Lease Rev., Series
1993 A, 5.40%, 11/1/20 (Ambac) 1,608,045
1,000,000 Saddleback Valley Unified School District Public
Financing Auth. Special Tax Rev., Series 1997 A,
6.00%, 9/1/16 (FSA) 1,172,240
4,640,000 San Diego County COP, (Burnham Institute), 6.25%,
9/1/09, Prerefunded at 101% of Par(3) 4,890,746
10,400,000 San Diego County COP, Linked Security, ARC, YCC,
5.625%, 9/1/12 (Ambac)(1) 10,604,567
2,715,000 San Marcos Public Facilities Auth. Tax Allocation
Rev., Series 2000 A, (Tax Increment Project Area
3), 6.75%, 10/1/10, Prerefunded at 102% of Par(3) 3,028,094
3,535,000 San Mateo County Joint Powers Financing Auth.
Lease Rev., Series 1993 A, (Capital Projects
Program), 6.50%, 7/1/15 (MBIA) 4,088,722
4,000,000 San Mateo County Joint Powers Financing Auth.
Lease Rev., Series 1993 A, (Capital Projects
Program), 6.00%, 7/1/19 (MBIA) 4,649,920
3,355,000 Santa Barbara County Waterfront GO, 5.50%, 10/1/22
(Ambac) 3,547,812
2,000,000 Santa Margarita-Dana Point Auth. Rev., Series 1994
B, (Improvement Districts 3, 3A, 4, 4A), 7.25%,
8/1/14 (MBIA) 2,429,560
2,470,000 Shasta Lake Public Finance Auth. Rev., 5.00%,
4/1/25 2,293,444
2,500,000 South Coast Air Quality Management District
Building Corp. Rev., (Installment Sale
Headquarters), 6.00%, 8/1/11 (Ambac) 2,670,875
2,705,000 South Gate COP, Series 2002 A, 5.50%, 9/1/21
(Ambac) 2,868,166
2,000,000 South Orange County Public Financing Auth. Special
Tax Rev., Series 1994 A, (Senior Lien), 7.00%,
9/1/11 (MBIA) 2,202,260
Principal Amount Value
$ 7,315,000 Southern California Public Power Auth. Rev.,
(Multiple Projects), 6.75%, 7/1/12 (FSA-CR)(1) $ 8,396,742
3,730,000 Southern California Public Power Auth. Rev.,
(Multiple Projects), 6.75%, 7/1/13 (FSA-CR) 4,359,102
1,195,000 Stanton Redevelopment Agency Tax Allocation Rev.,
(Community Development), 5.45%, 12/1/17 (Ambac) 1,226,201
2,000,000 Taft Public Financing Auth. Lease Rev., Series
1997 A, (Community Correctional Facility
Acquisition), 6.05%, 1/1/17 2,160,460
2,885,000 Torrance COP, Series 2005 B, (Refinancing & Public
Improvement), 5.25%, 6/1/34 (Ambac) 2,913,273
1,215,000 Turlock Health Facility COP, (Emanuel Medical
Center, Inc.), 5.50%, 10/15/18 1,220,553
1,285,000 Turlock Health Facility COP, (Emanuel Medical
Center, Inc.), 5.50%, 10/15/19 1,279,629
2,500,000 Ukiah Electric Rev., 6.25%, 6/1/18 (MBIA) 2,826,350
630,000 University of California Rev., Series 2004 A,
(UCLA Medical Center), 5.50%, 5/15/12, Prerefunded
at 101% of Par (Ambac)(3) 702,072
370,000 University of California Rev., Series 2004 A,
(UCLA Medical Center), 5.50%, 5/15/24 (Ambac) 388,852
1,445,000 Walnut Valley Unified School District GO, Series
1992 B, 6.00%, 8/1/10 (Ambac)(3) 1,554,806
2,490,000 Watsonville Insured Hospital Rev., Series 1996 A,
(Community Hospital), 6.20%, 7/1/12 (California
Mortgage Insurance)(3) 2,697,915
3,190,000 Woodland COP, (Wastewater System Reference),
5.75%, 3/1/12 (Ambac) 3,367,174
------------
426,589,216
------------
PUERTO RICO -- 1.0%
4,000,000 Puerto Rico Electric Power Auth. Rev., Series 2002
II, 5.375%, 7/1/12, Prerefunded at 101% of Par
(XLCA)(3) 4,436,800
------------
TOTAL MUNICIPAL SECURITIES
(Cost $424,905,864) 431,026,016
------------
------
10
California Long-Term Tax-Free
Principal Amount Value
Municipal Derivatives -- 0.2%
CALIFORNIA -- 0.2%
$ 1,000,000 San Diego County Water Auth. Rev. COP,
(Registration Rites), Yield Curve Notes, Inverse
Floater, 5.68%, 4/22/09 (FGIC/GO of Authority)(5)
(Cost $1,004,276) $ 1,048,090
------------
TOTAL INVESTMENT SECURITIES -- 98.6%
(Cost $425,910,140) 432,074,106
------------
OTHER ASSETS AND LIABILITIES -- 1.4% 6,333,524
------------
TOTAL NET ASSETS -- 100.0% $438,407,630
============
Futures Contracts
Underlying Face Unrealized
Contracts Purchased Expiration Date Amount at Value Gain (Loss)
792 U.S. Treasury
2-Year Notes December 2008 $168,126,750 $60,094
============ ============
Underlying Face Unrealized
Contracts Sold Expiration Date Amount at Value Gain (Loss)
229 U.S. Long Bond December 2008 $26,864,563 $(68,500)
============ ============
Notes to Schedule of Investments
ABAG = Association of Bay Area Governments
AGC = Assured Guaranty Corporation
Ambac = Ambac Assurance Corporation
Ambac-TCRS = Ambac Assurance Corporation-Transferable Custodial Receipts
ARC = Auction Rate Certificate
COP = Certificates of Participation
FGIC = Financial Guaranty Insurance Co.
FSA = Financial Security Assurance, Inc.
FSA-CR = Financial Security Assurance, Inc.- Custodial Receipts
GO = General Obligation
LIQ FAC = Liquidity Facilities
MBIA = MBIA Insurance Corporation
M-S-R = Modesto, Stockton, Redding
SBBPA = Standby Bond Purchase Agreement
VRDN = Variable Rate Demand Note. Interest reset date is indicated. Rate
shown is effective August 31, 2008.
XLCA = XL Capital Ltd.
YCC = Yield Curve Certificate
(1) Security, or a portion thereof, has been segregated for futures contracts.
(2) Security was purchased under Rule 144A of the Securities Act of 1933 or is
a private placement and, unless registered under the Act or exempted from
registration, may only be sold to qualified institutional investors. The
aggregate value of restricted securities at August 31, 2008, was $1,100,000,
which represented 0.3% of total net assets.
(3) Escrowed to maturity in U.S. government securities or state and local
government securities.
(4) Security is a zero-coupon municipal bond. The rate indicated is the yield
to maturity at purchase. Zero-coupon securities are issued at a substantial
discount from their value at maturity.
(5) Inverse floaters have interest rates that move inversely to market
interest rates. Inverse floaters typically have durations longer than
long-term bonds, which may cause their value to be more volatile than
long-term bonds when interest rates change. Final maturity is indicated.
See Notes to Financial Statements.
------
11
PERFORMANCE
California High-Yield Municipal
Total Returns as of August 31, 2008
Average Annual Returns
Since Inception
1 year 5 years 10 years Inception Date
INVESTOR CLASS 0.81% 4.72% 4.92% 5.99% 12/30/86
LEHMAN BROTHERS
LONG-TERM MUNICIPAL
BOND INDEX 0.62% 4.88% 4.96% 7.02%(1) --
LIPPER CALIFORNIA
MUNICIPAL DEBT FUNDS
AVERAGE RETURNS(2) 1.25% 3.67% 3.83% 5.78%(1) --
Investor Class's
Lipper Ranking
as of 8/31/08(2) 88 of 116 3 of 100 1 of 71 6 of 23(1) --
as of 9/30/08(2) 75 of 120 3 of 100 1 of 71 6 of 23(1) --
A Class
No sales charge* 0.55% 4.46% -- 4.26%
With sales charge* -4.00% 3.51% -- 3.41% 1/31/03
B Class
No sales charge* -0.20% 3.68% -- 3.49%
With sales charge* -4.20% 3.51% -- 3.33% 1/31/03
C Class -0.20% 3.70% -- 3.53% 1/31/03
*Sales charges include initial sales charges and contingent deferred sales
charges (CDSCs), as applicable. A Class shares have a 4.50% maximum initial
sales charge for fixed-income funds and may be subject to a maximum CDSC of
1.00%. B Class shares redeemed within six years of purchase are subject to a
CDSC that declines from 5.00% during the first year after purchase to 0.00%
the sixth year after purchase. C Class shares redeemed within 12 months of
purchase are subject to a maximum CDSC of 1.00%. The SEC requires that mutual
funds provide performance information net of maximum sales charges in all
cases where charges could be applied.
(1) Since 12/31/86, the date nearest the Investor Class's inception for which
data are available.
(2) Data provided by Lipper Inc. - A Reuters Company. © 2008 Reuters. All
rights reserved. Any copying, republication or redistribution of Lipper
content, including by caching, framing or similar means, is expressly
prohibited without the prior written consent of Lipper. Lipper shall not be
liable for any errors or delays in the content, or for any actions taken in
reliance thereon.
Lipper Fund Performance -- Performance data is total return, and is
preliminary and subject to revision.
Lipper Rankings -- Rankings are based only on the universe shown and are
based on average annual total returns. This listing might not represent the
complete universe of funds tracked by Lipper.
The data contained herein has been obtained from company reports, financial
reporting services, periodicals and other resources believed to be reliable.
Although carefully verified, data on compilations is not guaranteed by Lipper
and may be incomplete. No offer or solicitations to buy or sell any of the
securities herein is being made by Lipper.
Data presented reflect past performance. Past performance is no guarantee of
future results. Current performance may be higher or lower than the
performance shown. Investment return and principal value will fluctuate, and
redemption value may be more or less than original cost. To obtain performance
data current to the most recent month end, please call 1-800-345-2021 or visit
americancentury.com. As interest rates rise, bond values will decline. In
addition, the lower-rated securities in which the fund invests are subject to
greater credit risk, default risk and liquidity risk. Investment income may be
subject to certain state and local taxes and, depending on your tax status,
the federal alternative minimum tax (AMT). Capital gains are not exempt from
state and federal income tax.
Unless otherwise indicated, performance reflects Investor Class shares;
performance for other share classes will vary due to differences in fee
structure. For information about other share classes available, please consult
the prospectus. Data assumes reinvestment of dividends and capital gains, and
none of the charts reflect the deduction of taxes that a shareholder would pay
on fund distributions or the redemption of fund shares. Returns for the index
are provided for comparison. The fund's total returns include operating
expenses (such as transaction costs and management fees) that reduce returns,
while the total returns of the index do not.
------
12
California High-Yield Municipal
Growth of $10,000 Over 10 Years
$10,000 investment made August 31, 1998
One-Year Returns Over 10 Years
Periods ended August 31
1999 2000 2001 2002 2003 2004 2005 2006 2007 2008
Investor Class 0.26% 6.70% 9.50% 6.07% 3.35% 8.48% 9.65% 3.80% 1.22% 0.81%
Lehman Brothers
Long-Term
Municipal Bond
Index -2.14% 7.34% 12.35% 5.62% 2.62% 9.24% 10.52% 4.08% 0.36% 0.62%
Data presented reflect past performance. Past performance is no guarantee of
future results. Current performance may be higher or lower than the
performance shown. Investment return and principal value will fluctuate, and
redemption value may be more or less than original cost. To obtain performance
data current to the most recent month end, please call 1-800-345-2021 or visit
americancentury.com. As interest rates rise, bond values will decline. In
addition, the lower-rated securities in which the fund invests are subject to
greater credit risk, default risk and liquidity risk. Investment income may be
subject to certain state and local taxes and, depending on your tax status,
the federal alternative minimum tax (AMT). Capital gains are not exempt from
state and federal income tax.
Unless otherwise indicated, performance reflects Investor Class shares;
performance for other share classes will vary due to differences in fee
structure. For information about other share classes available, please consult
the prospectus. Data assumes reinvestment of dividends and capital gains, and
none of the charts reflect the deduction of taxes that a shareholder would pay
on fund distributions or the redemption of fund shares. Returns for the index
are provided for comparison. The fund's total returns include operating
expenses (such as transaction costs and management fees) that reduce returns,
while the total returns of the index do not.
------
13
PORTFOLIO COMMENTARY
California High-Yield Municipal
Portfolio Manager: Steven Permut
PERFORMANCE SUMMARY
California High-Yield Municipal returned 0.81%* in the 12 months ended August
31, 2008. By comparison, the Lehman Brothers Long-Term Municipal Bond Index
returned 0.62%, while the California Municipal Debt Funds tracked by Lipper
had an average return of 1.25%.
The portfolio trailed the average return of the Lipper group--which includes
investment-grade portfolios--during a year when lower-rated and non-rated
municipal bonds, such as those in which the fund invests, had negative returns
(see page 2). Nevertheless, California High-Yield Municipal's average annual
returns ranked #3 and #1 in its Lipper group for the five- and 10-year periods
ended August 31, 2008, respectively. However, both the fund and Lipper group
average outperformed the Lehman Index because the longest-term municipal
bonds, whose performance the index measures, were the worst-performing segment
of the investment-grade market. See page 12 for additional performance
comparisons.
In terms of positive contributions to return, the fund's performance was aided
by a relatively short duration, yield curve positioning, sector allocation,
and credit exposure decisions.
HIGH-YIELD UNDERPERFORMED
High-yield municipal bonds endured a difficult 12 months, in which the Lehman
Brothers Non-Investment-Grade Municipal Bond Index returned -4.37%. The
underperformance of high-yield bonds followed more from what we consider an
irrational panic affecting the broad municipal market rather than changes in
credit fundamentals. These systemic issues included the downgrade of a number
of municipal bond insurers, as well as the forced selling and a lack of
liquidity resulting from deleveraging by hedge funds and other important
market players. Because high-yield municipals tend to be less liquid (less
easily bought and sold) than investment-grade bonds, their price declines
tended to be greater.
DURATION, CURVE POSITIONING CONTRIBUTED
The portfolio benefited from having a shorter duration (less sensitivity to
interest rate changes) than the benchmark. In particular, it helped that early
in the fiscal year we reduced our exposure to the longest-term municipal
bonds, which lagged shorter-duration securities. That's because much of the
forced selling in the market was concentrated in long bonds.
Portfolio at a Glance
As of As of
8/31/08 8/31/07
Weighted Average Maturity 17.2 years 15.7 years
Average Duration (Modified) 7.0 years 7.9 years
Yields as of August 31, 2008
30-Day SEC Yield
Investor Class 4.15%
A Class 3.72%
B Class 3.15%
C Class 3.15%
Investor Class 30-Day Tax-Equivalent Yields(1)
31.98% Tax Bracket 6.10%
34.70% Tax Bracket 6.36%
39.23% Tax Bracket 6.83%
41.05% Tax Bracket 7.04%
(1) The tax brackets indicated are for combined state and federal income tax.
Actual tax-equivalent yields may be lower, if alternative minimum tax is
applicable.
*All fund returns referenced in this commentary are for Investor Class shares.
------
14
California High-Yield Municipal
Performance also benefited from our yield curve steepening bias using
municipal bonds and two- and 10-year Treasury futures. The difference in yield
between two- and 10-year AAA municipal general obligation notes increased from
42 to 158 basis points (a basis point equals 0.01%) during the year, while the
Treasury curve steepened from 39 to 145 basis points.
SECTOR, CREDIT TRADES HELPED
It helped performance to trade up in credit quality over the course of the
year, going from 44% of assets in non-rated bonds at the beginning of the
fiscal year to less than 35% by the end. Nevertheless, this allocation in
non-rated bonds was greater than that of our index and peers.
A number of our sector trades during the year added value, as it helped to
reduce our exposure to land-based deals and trade into high-quality revenue
bonds in less economically sensitive segments of the economy. For example, we
bought some essential service water and sewer bonds, as well as education
bonds issued by Stanford and Columbia Universities. Water and education were
two of the best-performing segments of the market. In addition, we added some
auction-rate bonds with very attractive yields after distress in that market
during February. Finally, the portfolio's performance also benefited from our
underweight position in airline bonds, which were the worst-performing segment
of the high-yield market by far.
OUTLOOK
"Broad underperformance meant high-yield municipals finished the period at
very attractive levels relative to investment-grade municipals and fully
taxable investments, making this an excellent buying opportunity," said Steven
Permut. "In addition, we believe the indiscriminate selling presents
compelling opportunities to add value through credit research, because good
bonds were thrown out with the bad. But it's probably also true that the
municipal market won't rebound in a meaningful way until we see real progress
on resolving the credit crisis. In the meantime, we'll continue to manage our
duration and sector allocation conservatively while looking for bonds with
compelling yield and credit characteristics."
Portfolio Composition by Credit Rating
% of fund % of fund
investments investments
as of as of
8/31/08 2/29/08
AAA 27% 40%
AA 20% 10%
A 13% 8%
BBB 8% 9%
Not Rated 32% 33%
Ratings provided by independent research companies. These ratings are listed
in Standard & Poor's format even if they were provided by other sources.
Top Five Sectors as of August 31, 2008
% of fund
investments
Land Secured 27%
Prerefunded 14%
General Obligation (GO) 9%
Sales Tax Revenue 7%
Tax Allocation Revenue 5%
------
15
SCHEDULE OF INVESTMENTS
California High-Yield Municipal
AUGUST 31, 2008
Principal Amount Value
Municipal Securities -- 99.0%
CALIFORNIA -- 96.6%
$ 3,000,000 ABAG Finance Auth. for Nonprofit Corps. COP,
(Eskaton Gold River Lodge), 6.375%, 11/15/08,
Prerefunded at 102% of Par(1) $ 3,089,010
695,000 ABAG Finance Auth. for Nonprofit Corps. COP,
(Eskaton Gold River Lodge), 6.375%, 11/15/08,
Prerefunded at 102% of Par(1) 713,654
1,000,000 ABC Unified School District GO, Series 2000 B,
6.14%, 8/1/21 (FGIC)(2) 520,330
2,000,000 Alameda Public Financing Auth. Local Agency
Special Assessment Rev., Series 1996 A,
(Community Facilities District No. 1), 7.00%,
8/1/19 2,013,420
2,600,000 Aliso Viejo Community Facilities District No.
2005-01 Special Tax Rev., (Glenwood at Aliso
Viejo), 6.00%, 9/1/38 2,583,880
1,200,000 Anaheim Public Financing Auth. Lease Rev., Series
1997 A, (Public Improvements) 6.00%, 9/1/24 (FSA) 1,373,820
1,700,000 Anaheim Redevelopment Agency Tax Allocation Rev.,
Series 2007 A, (Anaheim Merged Redevelopment
Project Area), 5.00%, 2/1/31 (FSA) 1,721,607
3,515,000 Austin Trust Various States Rev., Series
2008-1167, VRDN, 1.91%, 9/4/08 (FSA) (LIQ FAC:
Bank of America, N.A.) (Acquired 8/6/08-8/28/08,
Cost $3,515,000)(3) 3,515,000
1,000,000 Austin Trust Various States Rev., Series
2008-3305, VRDN, 1.78%, 9/4/08 (LIQ FAC: Bank of
America, N.A.) (Acquired 8/29/08, Cost
$1,000,000)(3) 1,000,000
2,875,000 Beaumont Financing Auth. Local Agency Special Tax
Rev., Series 2004 D, 5.80%, 9/1/35 2,767,015
1,490,000 Beaumont Financing Auth. Local Agency Special Tax
Rev., Series 2005 B, 5.40%, 9/1/35 1,351,847
855,000 Beaumont Financing Auth. Local Agency Special Tax
Rev., Series 2005 C, 5.50%, 9/1/29 800,938
4,000,000 Beaumont Financing Auth. Local Agency Special Tax
Rev., Series 2005 C, 5.50%, 9/1/35 3,565,880
Principal Amount Value
$ 2,700,000 Beaumont Financing Auth. Local Agency Special Tax
Rev., Series 2006 A, (Improvement Area No. 19C),
5.35%, 9/1/36 $ 2,237,463
1,050,000 Beaumont Financing Auth. Local Agency Special Tax
Rev., Series 2008 A, (Improvement Area No. 19C),
6.875%, 9/1/36 1,059,755
1,190,000 Berryessa Unified School District GO, Series 2000
A, 6.18%, 8/1/21 (FSA)(2) 644,694
1,220,000 Berryessa Unified School District GO, Series 2000
A, 6.05%, 8/1/22 (FSA)(2) 622,664
1,000,000 Berryessa Unified School District GO, Series 2000
A, 6.06%, 8/1/23 (FSA)(2) 480,670
4,500,000 California Department of Water Resources Power
Supply Rev., Series 2008 H, 5.00%, 5/1/22(4) 4,706,955
2,500,000 California Department of Water Resources Water
System Rev., Series 2008 AE, (Central Valley),
5.00%, 12/1/23 2,658,575
4,000,000 California Economic Recovery GO, Series 2004 A,
5.25%, 7/1/14 (FGIC)(4) 4,460,440
15,000,000 California Economic Recovery GO, Series 2008 A,
5.00%, 1/1/11(4) 15,937,800
13,950,000 California Economic Recovery GO, Series 2008 B,
VRDN, 5.00%, 3/1/11(4) 14,820,619
1,505,000 California Educational Facilities Auth. Rev.,
(Western University Health Sciences), 6.00%,
10/1/12, Prerefunded at 100% of Par(1) 1,697,249
5,000,000 California GO, 5.00%, 3/1/16(4) 5,439,650
2,225,000 California GO, 5.00%, 3/1/17 2,408,919
5,000,000 California GO, 5.00%, 4/1/17(4) 5,414,300
5,000,000 California GO, 5.00%, 4/1/18(4) 5,385,700
2,500,000 California GO, 5.25%, 8/1/32 (FSA) 2,615,150
4,000,000 California Health Facilities Financing Auth.
Rev., Series 1989 A, (Kaiser Permanente), 7.15%,
10/1/12 (Ambac-TCRS)(2)(4) 3,482,120
1,500,000 California Health Facilities Financing Auth.
Rev., Series 2008 A, (Scripps Health), 5.50%,
10/1/20 1,575,165
------
16
California High-Yield Municipal
Principal Amount Value
$ 5,000,000 California Health Facilities Financing Auth.
Rev., Series 2008 A, (Sutter Health), 5.50%,
8/15/16(4) $ 5,475,900
5,000,000 California Health Facilities Financing Auth.
Rev., Series 2008 A, (Sutter Health), 5.25%,
8/15/22(4) 5,172,400
3,700,000 California Health Facilities Financing Auth.
Rev., Series 2008 A3, (Stanford Hospital), VRDN,
3.45%, 6/15/11 3,755,685
2,500,000 California Infrastructure & Economic Development
Bank Rev., Series 2008 A, (California Independent
System Operator Corporation), 5.00%, 2/1/13 2,686,375
3,000,000 California Infrastructure & Economic Development
Bank Rev., Series 2008 B, (The RAND Corporation),
VRDN, 2.25%, 9/2/08 (LOC: Bank of America,
N.A.)(4) 3,000,000
4,410,000 California Mobilehome Park Financing Auth. Rev.,
Series 2000 B, (Union City Tropics), 7.30%,
8/15/10, Prerefunded at 102% of Par(1) 4,907,536
1,905,000 California Mobilehome Park Financing Auth. Rev.,
Series 2001 B, (Rancho Vallecitos - San Marcos),
6.75%, 11/15/36 1,888,141
6,345,000 California Mobilehome Park Financing Auth. Rev.,
Series 2003 B, (Palomar Estates E&W), 7.00%,
9/15/36(4) 6,439,223
2,000,000 California Mobilehome Park Financing Auth. Rev.,
Series 2006 B, (Union City Tropics), 5.50%,
12/15/41 1,746,920
1,000,000 California Municipal Finance Auth. Rev., Series
2008 A, (Biola University), 5.875%, 10/1/34 1,002,120
2,000,000 California Public Works Board Lease Rev., Series
1993 D, (Department of Corrections), 5.25%,
6/1/15 (FSA) 2,192,200
6,000,000 California Public Works Board Lease Rev., Series
2005 A, (Department of General Services -
Butterfield), 5.25%, 6/1/30(4) 6,046,980
1,305,000 California State and Local Government Financing
Auth. Rev., Series 1997 B, (Marin Valley Mobile
Country), 7.50%, 10/1/24 1,323,113
Principal Amount Value
$ 4,630,000 California State University Fresno Association,
Inc. Rev., (Auxiliary Organization Event Center),
6.00%, 7/1/12, Prerefunded at 101% of Par(1)(4) $ 5,256,995
2,455,000 California State University Fresno Association,
Inc. Rev., (Auxiliary Organization Event Center),
7.00%, 7/1/12, Prerefunded at 101% of Par(1) 2,863,954
10,000,000 California State University Rev., Series 2005 C,
(Systemwide Financing Program), 5.00%, 11/1/30
(MBIA)(4) 10,071,199
2,550,000 California Statewide Communities Development
Auth. COP, (Sonoma County Indian Health), 6.40%,
9/1/29 2,573,282
5,000,000 California Statewide Communities Development
Auth. Rev., (CHF - Irvine, LLC - UCI East Campus
Apartments, Phase II), 6.00%, 5/15/40 5,037,850
1,070,000 California Statewide Communities Development
Auth. Rev., (Drew School), 5.30%, 10/1/37 872,831
1,945,000 California Statewide Communities Development
Auth. Rev., (Thomas Jefferson School of Law),
7.75%, 10/1/11, Prerefunded at 101% of Par(1) 2,228,931
4,000,000 California Statewide Communities Development
Auth. Rev., Series 2001 C, (Kaiser Permanente),
VRDN, 5.25%, 8/1/16 3,991,360
9,000,000 California Statewide Communities Development
Auth. Rev., Series 2007 A, (California Baptist
University), 5.50%, 11/1/38 7,906,410
10,000,000 California Statewide Communities Development
Auth. Rev., Series 2007 A, (Front Porch
Communities and Services), 5.125%, 4/1/37
(Acquired 5/23/07, Cost $10,118,500)(3) 8,451,000
2,500,000 California Statewide Communities Development
Auth. Rev., Series 2007 A, (Lancer Educational
Student Housing), 5.625%, 6/1/33 2,205,775
------
17
California High-Yield Municipal
Principal Amount Value
$ 2,000,000 California Statewide Communities Development
Auth. Rev., Series 2007 A, (Valleycare Health
System), 5.125%, 7/15/31 $ 1,639,840
3,330,000 California Statewide Communities Development
Auth. Rev., Series 2007 B, (Kaiser Permanente),
VRDN, 2.65%, 10/1/08, resets quarterly at 67% of
the 3-month LIBOR plus 0.78% with no caps 2,419,245
2,000,000 California Statewide Communities Development
Auth. Special Tax Rev., Series 2007 A, (Community
Facilities District No. 2007-01 Orinda Wilder),
6.00%, 9/1/29 1,929,500
6,250,000 Capistrano Unified School District Special Tax
Rev., (Community Facilities District No. 90-2),
6.00%, 9/1/33 6,286,125
1,000,000 Carmel Unified School District GO, 5.50%, 8/1/25
(MBIA) 1,041,230
1,700,000 Chino Valley Unified School District COP, Series
2001 A, 5.375%, 9/1/20 (FSA) 1,814,019
2,140,000 Chula Vista Community Facilities District No.
01-1 Area A Special Tax Rev., 6.10%, 9/1/10,
Prerefunded at 102% of Par(1) 2,342,530
3,600,000 Chula Vista Community Facilities District No.
06-1 Area A Special Tax Rev., (Eastlake Woods),
6.20%, 9/1/33 3,619,152
7,715,000 Chula Vista Community Facilities District No.
99-1 Special Tax Rev., (Otay Ranch Spa One),
7.625%, 9/1/09, Prerefunded at 102% of Par(1) 8,311,292
1,775,000 City of Lincoln Community Facilities District No.
2003-1 Special Tax Rev., (Lincoln Crossing),
6.00%, 9/1/13, Prerefunded at 102% of Par(1) 2,054,793
2,500,000 City of Redding Electric System Rev. COP, Series
2008 A, 5.00%, 6/1/30 (FSA) 2,532,575
3,105,000 City of Tracy Community Facilities District No.
2006-1 Special Tax Rev., (NEI Phase II), 5.75%,
9/1/36 2,613,013
1,780,000 Clovis Public Financing Auth. Lease Rev.,
(Corporate Yard), 5.375%, 3/1/20 (Ambac) 1,871,670
Principal Amount Value
$ 460,000 Corcoran COP, 8.75%, 6/1/16 (Acquired 4/28/92,
Cost $460,000)(3) $ 536,250
2,000,000 Corona Department of Water & Power COP, 5.00%,
9/1/35 (MBIA) 1,950,800
1,150,000 Duarte Unified School District GO, Series 1999 B,
6.08%, 11/1/23 (FSA)(2) 546,032
2,355,000 Duarte Unified School District GO, Series 2006 E,
(Election of 1998), 5.07%, 11/1/28 (FSA)(2) 837,744
4,500,000 Eastern Municipal Water District Water & Sewer
Rev. COP, Series 2008 H, 5.00%, 7/1/33 4,486,995
1,910,000 El Dorado County Community Facilities District
No. 1992-1 Special Tax Rev., 5.60%, 9/1/09 1,952,459
2,500,000 El Dorado County Community Facilities District
No. 2001-1 Special Tax Rev., 6.30%, 9/1/31 2,499,675
3,500,000 El Dorado County Community Facilities District
No. 2005-1 Special Tax Rev., 5.25%, 9/1/35 3,007,760
5,000,000 Fillmore Redevelopment Agency Tax Allocation
Rev., Series 2006 A, (Central City
Redevelopment), 5.375%, 5/1/31 4,548,900
4,225,000 Florin Resource Conservation District COP, Series
1999 A, (Elk Grove Water Works), 6.75%, 9/1/09,
Prerefunded at 102% of Par(1) 4,519,778
2,450,000 Folsom Community Facilities District No. 7
Special Tax Rev., 5.75%, 9/1/14 2,520,977
1,640,000 Folsom Community Facilities District No. 10
Special Tax Rev., 7.00%, 9/1/09, Prerefunded at
102% of Par(1) 1,755,554
2,610,000 Folsom Community Facilities District No. 10
Special Tax Rev., 7.00%, 9/1/24 2,684,750
6,500,000 Folsom Community Facilities District No. 14
Special Tax Rev., 6.30%, 9/1/11, Prerefunded at
102% of Par(1) 7,321,015
3,725,000 Folsom Public Financing Auth. Special Assessment
Rev., Series 1997 A, 6.875%, 9/2/19 3,726,490
3,000,000 Foothill-De Anza Community College District GO,
6.16%, 8/1/21 (MBIA)(2) 1,578,810
------
18
California High-Yield Municipal
Principal Amount Value
$ 3,000,000 Fullerton Community Facilities District No. 1
Special Tax Rev., (Amerige Heights), 6.20%, 9/1/32 $ 3,040,740
5,000,000 Fullerton Unified School District Special Tax
Rev., (Community Facilities District No.2001-1),
6.375%, 9/1/31(4) 5,115,750
2,630,000 Glendale Unified School District GO, Series 1999
C, 6.00%, 9/1/22 (FSA) 2,734,437
3,660,000 Golden State Tobacco Securitization Corp.
Settlement Rev., Series 2003 A1, 6.25%, 6/1/13,
Prerefunded at 100% of Par(1) 3,993,280
5,005,000 Golden State Tobacco Securitization Corp.
Settlement Rev., Series 2003 A1, 6.75%, 6/1/13,
Prerefunded at 100% of Par(1)(4) 5,788,683
6,500,000 Golden State Tobacco Securitization Corp.
Settlement Rev., Series 2007 A1, 5.125%, 6/1/47(4) 4,856,280
3,080,000 Hawaiian Gardens COP, Series 2000 A, 8.00%,
6/1/10, Prerefunded at 102% of Par(1) 3,408,882
2,455,000 Hawaiian Gardens Redevelopment Agency Tax
Allocation Rev., Series 2006 B, (Redevelopment
Project No. 1), 5.40%, 12/1/25 2,296,530
2,670,000 Hemet Unified School District Special Tax Rev.,
(Community Facilities District No. 2005-2),
5.25%, 9/1/30 2,456,106
1,510,000 Hemet Unified School District Special Tax Rev.,
(Community Facilities District No. 2005-2),
5.25%, 9/1/35 1,367,879
3,500,000 Hesperia Public Financing Auth. Tax Allocation
Rev., Series 2007 A, (Redevelopment and Housing),
5.50%, 9/1/32 (XLCA) 3,378,025
2,025,000 Hesperia Public Financing Auth. Tax Allocation
Rev., Series 2007 A, (Redevelopment and Housing),
5.50%, 9/1/37 (XLCA) 1,926,585
2,000,000 Highland Special Tax Rev., (Community Facilities
District No. 01-1), 6.45%, 9/1/28 2,020,920
3,345,000 Hillsborough School District GO, Series 2006 B,
(Election of 2002), 4.84%, 9/1/28(2) 1,205,739
Principal Amount Value
$ 5,000,000 Huntington Beach Union High School District GO,
(Election of 2004), 5.00%, 8/1/31 (MBIA)(2) $ 1,480,700
5,000,000 Imperial Irrigation District COP, (Water
Systems), 5.50%, 7/1/29 (Ambac)(4) 5,112,350
2,185,000 Imperial Irrigation District Rev., Series 2008 A,
(Electric Systems), 5.00%, 11/1/33 2,166,296
500,000 Independent Cities Lease Finance Auth. Rev.,
Series 2006 B, (San Juan Mobile Estates), 5.55%,
5/15/31 454,135
1,150,000 Independent Cities Lease Finance Auth. Rev.,
Series 2006 B, (San Juan Mobile Estates), 5.85%,
5/15/41 1,052,676
3,430,000 Independent Cities Lease Finance Auth. Rev.,
Series 2007 A, (Santa Rosa Leisure Mobilehome
Park), 5.70%, 11/15/47 3,168,120
12,750,000 Irvine Improvement Bond Act of 1915 Special
Assessment, Series 2007 A, (Reassessment District
No. 85-7), VRDN, 2.25%, 9/2/08 (FSA) (SBBPA:
Dexia Credit Local) 12,749,999
5,000,000 Irvine Unified School District Financing Auth.
Special Tax Rev., Series 2005 A, 5.00%, 9/1/34
(Ambac)(4) 4,630,300
8,550,000 Kern Community College Safety, Repair and
Improvement District GO, (Election of 2002),
4.56%, 11/1/30 (FSA)(2) 2,676,749
1,000,000 Laguna Salada Union School District GO, Series
2000 C, 6.12%, 8/1/29 (FGIC)(2) 332,690
1,225,000 Lake Elsinore Community Facilities District No.
2004-3 Special Tax Rev., Series 2005 A, (Rosetta
Canyon Improvement Area No. 1), 5.25%, 9/1/35 1,094,660
5,000,000 Lake Elsinore Community Facilities District No.
2004-3 Special Tax Rev., Series 2006 A, (Rosetta
Canyon Improvement Area No. 2), 5.25%, 9/1/37 4,446,850
1,100,000 Lake Elsinore Community Facilities District No.
2005-1 Special Tax Rev., Series 2006 A,
(Serenity), 5.35%, 9/1/36 994,653
------
19
California High-Yield Municipal
Principal Amount Value
$ 5,000,000 Lake Elsinore Community Facilities District No.
2005-2 Special Tax Rev., Series 2005 A,
(Alberhill Ranch Improvement Area A), 5.45%,
9/1/36 $ 4,411,400
2,020,000 Lake Elsinore Community Facilities District No.
2006-2 Special Tax Rev., Series 2006 A,
(Viscaya), 5.40%, 9/1/36 1,802,810
2,500,000 Lake Elsinore School Financing Auth. Special Tax
Rev., (Horsethief Canyon), 5.625%, 9/1/16 2,534,450
2,245,000 Lake Elsinore Unified School District Special Tax
Rev., (Community Facilities District No. 2005-1,
Improvement Area A), 5.40%, 9/1/35 2,050,628
1,310,000 Los Angeles Community Facilities District No. 3
Special Tax Rev., (Cascades Business Park and
Golf Course), 6.40%, 9/1/22 1,317,022
2,000,000 Los Angeles Department of Airports Rev., Series
2008 C, (Los Angeles International Airport),
5.25%, 5/15/25 2,061,220
5,455,000 Manteca Unified School District GO, (Election of
2004), 4.92%, 8/1/30 (MBIA)(2) 1,663,993
2,100,000 Menifee Union School District Special Tax Rev.,
(Community Facilities District No. 2005-2),
5.375%, 9/1/36 1,880,025
1,825,000 Milpitas Improvement Bond Act 1915 Special
Assessment, Series 1996 A, (Local Improvement
District No. 18), 6.75%, 9/2/16 1,837,958
4,000,000 Moreno Valley Unified School District Special Tax
Rev., (Community Facilities District No. 2002-1),
6.20%, 9/1/32 3,972,840
1,920,000 Murrieta Community Facilities District No. 2000-2
Special Tax Rev., Series 2004 A, (The Oaks
Improvement Area), 6.00%, 9/1/34 1,888,973
4,100,000 Murrieta Improvement Bond Act of 1915 Special Tax
Rev., (Community Facilities District No. 2000-1),
6.375%, 9/1/30 4,196,678
480,000 Murrieta Valley Unified School District Special
Tax Rev., (Community Facilities District No.
2002-4, Improvement Area B), 5.45%, 9/1/38 422,102
Principal Amount Value
$ 3,500,000 Oceanside Community Development Commission Tax
Allocation Rev., (Downtown Redevelopment), 5.70%,
9/1/25(4) $ 3,427,305
2,890,000 Oceanside Community Facilities District Special
Tax Rev., Series 2002 A, (No. 2001-1 Morrow Hills
Development), 6.20%, 9/1/32 2,870,377
1,000,000 Oceanside Community Facilities District Special
Tax Rev., Series 2004 A, (No. 2001-1 Morrow Hills
Development), 5.50%, 9/1/29 904,820
2,000,000 Orange County Community Facilities District No.
1999-1 Special Tax Rev., Series 1999 A, (Ladera
Ranch), 6.50%, 8/15/09, Prerefunded at 102% of
Par(1) 2,132,020
2,200,000 Orange County Community Facilities District No.
1999-1 Special Tax Rev., Series 1999 A, (Ladera
Ranch), 6.70%, 8/15/09, Prerefunded at 102% of
Par(1) 2,349,402
2,300,000 Orange County Community Facilities District No.
2004-1 Special Tax Rev., Series 2005 A, (Ladera
Ranch), 5.20%, 8/15/34 2,117,380
4,900,000 Orange County Sanitation District COP, Series
2000 A, VRDN, 2.25%, 9/2/08 (SBBPA: Dexia Public
Finance Bank) 4,900,000
2,500,000 Orange County Sanitation District COP, Series
2000 B, VRDN, 2.25%, 9/2/08 (SBBPA: Dexia Public
Finance Bank) 2,500,000
3,000,000 Oxnard School District GO, Series 2001 A, 5.75%,
8/1/30 (MBIA) 3,181,140
1,150,000 Pacifica COP, (Public Safety Building), 5.80%,
11/1/09, Prerefunded at 102% of Par (MBIA)(1) 1,213,860
10,000,000 Palmdale Water District COP, 5.00%, 10/1/34 (FGIC) 9,729,599
2,525,000 Palomar Pomerado Health Care District COP,
(Indian Health Council, Inc.), 6.25%, 10/1/29 2,538,862
3,775,000 Palomar Pomerado Health Care District COP, Series
2006 A, VRDN, 3.04%, 9/2/08 (FSA) 3,775,000
------
20
California High-Yield Municipal
Principal Amount Value
$ 1,390,000 Perris Community Facilities District No. 3
Special Tax Rev., Series 2005 A, (Improvement
Area No. 2), 5.30%, 9/1/35 $ 1,203,434
3,000,000 Perris Public Financing Auth. Special Tax Rev.,
Series 2004 A, 6.125%, 9/1/34 3,033,030
2,210,000 Perris Public Financing Auth. Special Tax Rev.,
Series 2008 A, 6.60%, 9/1/38 2,244,564
1,050,000 Perris Public Financing Auth. Tax Allocation
Rev., 5.35%, 10/1/36 949,263
1,000,000 Perris Union High School District GO, Series 2000
A, 6.40%, 9/1/24 (FGIC)(2) 426,200
1,000,000 Perris Union High School District GO, Series 2000
A, 6.40%, 3/1/25 (FGIC)(2) 413,670
2,900,000 Pittsburg Redevelopment Agency Tax Allocation
Rev., (Los Medanos Community Development), 6.20%,
8/1/25 (Ambac)(2) 1,146,457
2,640,000 Placer Union High School District GO, Series 2000
A, (Election of 1999), 6.20%, 8/1/16 (FGIC)(2) 1,873,714
1,600,000 Placer Union High School District GO, Series 2000
A, (Election of 1999), 6.28%, 8/1/18 (FGIC)(2) 1,010,464
2,925,000 Placer Union High School District GO, Series 2000
A, (Election of 1999), 6.35%, 8/1/21 (FGIC)(2) 1,521,965
2,100,000 Placer Union High School District GO, Series 2000
A, (Election of 1999), 6.37%, 8/1/22 (FGIC)(2) 1,026,207
3,525,000 Placer Union High School District GO, Series 2000
A, (Election of 1999), 6.39%, 8/1/23 (FGIC)(2) 1,619,632
1,000,000 Placer Union High School District GO, Series 2000
A, (Election of 1999), 6.40%, 8/1/24 (FGIC)(2) 432,100
4,835,000 Pleasant Valley School District-Ventura County
GO, Series 2002 A, 5.85%, 8/1/31 (MBIA) 5,185,247
1,055,000 Pomona Public Financing Auth. Rev., Series 2007
AX, (Merged Redevelopment), 5.00%, 2/1/23 983,482
Principal Amount Value
$ 1,100,000 Pomona Public Financing Auth. Rev., Series 2007
AX, (Merged Redevelopment), 5.00%, 2/1/24 $ 1,020,041
1,155,000 Pomona Public Financing Auth. Rev., Series 2007
AX, (Merged Redevelopment), 5.00%, 2/1/25 1,060,798
2,800,000 Pomona Public Financing Auth. Rev., Series 2007
AX, (Merged Redevelopment), 5.00%, 2/1/32 2,477,300
3,000,000 Rancho Cordova Community Facilities District No.
2003-1 Special Tax Rev., (Sunridge Anatolia),
5.375%, 9/1/37 2,612,730
2,000,000 Rancho Cordova Community Facilities District No.
2003-1 Special Tax Rev., (Sunridge Anatolia),
5.50%, 9/1/37 1,774,740
7,000,000 Rancho Cordova Community Facilities District No.
2004-1 Special Tax Rev., (Sunridge Park Area),
6.125%, 9/1/37 6,283,550
1,460,000 Rialto Community Facilities District No. 2006-1
Special Tax Rev., (Elm Park), 5.35%, 9/1/36 1,275,996
1,970,000 Richmond Joint Powers Financing Auth. Lease Rev.,
(Refunding and Civic Center), VRDN, 4.125%,
11/25/09 (Ambac) (SBBPA: Dexia Credit Local) 1,970,000
240,000 Richmond Joint Powers Financing Auth. Rev.,
Series 1995 A, (Lease and Gas Tax), 5.25%, 5/15/13 240,322
2,365,000 Riverside County COP, (County Administrative
Center Annex), 5.75%, 11/1/31 (MBIA) 2,533,861
2,040,000 Riverside County Improvement Bond Act of 1915
Special Assessment, (District No. 168 -
Rivercrest), 6.70%, 9/2/26 2,092,652
2,000,000 Riverside Unified School District Special Tax
Rev., (Community Facilities District No. 13,
Improvement Area 1), 5.375%, 9/1/34 1,756,780
4,765,000 Riverside Unified School District Special Tax
Rev., Series 2000 A, (Community Facilities
District No. 7), 7.00%, 9/1/10, Prerefunded at
102% of Par(1) 5,315,691
------
21
California High-Yield Municipal
Principal Amount Value
$ 1,000,000 Riverside Unified School District Special Tax
Rev., Series 2005 A, (Community Facilities
District No. 15, Improvement Area 2), 5.25%,
9/1/30 $ 891,690
4,315,000 Rohnert Park Finance Auth. Rev., Series 2001 A,
(Las Casitas de Sonoma), 6.40%, 4/15/36 4,342,487
5,000,000 Romoland School District Special Tax Rev.,
(Community Facilities District No. 1, Improvement
Area 1), 5.40%, 9/1/36 4,378,900
2,600,000 Roseville Special Tax Rev., (The Fountains
Community Facilities District No. 1, Public
Facilities), 6.125%, 9/1/38 2,481,856
645,000 Sacramento County Community Facilities District
No. 1 Special Tax Rev., (Elliot Ranch), 5.70%,
9/1/08 645,084
1,500,000 Sacramento County Community Facilities District
No. 1 Special Tax Rev., (Elliot Ranch), 6.30%,
9/1/21 1,507,635
4,035,000 Sacramento County Community Facilities District
No. 2005-2 Special Tax Rev., Series 2007 A,
(North Vineyard Station No. 1), 6.00%, 9/1/37 3,856,572
4,000,000 Sacramento Municipal Utilities District Electric
Rev., Series 1997 K, 5.25%, 7/1/24 (Ambac) 4,243,560
4,000,000 Sacramento Special Tax Rev., (North Natomas
Community Facilities), 6.30%, 9/1/26 4,038,520
1,975,000 San Buenaventura City COP, (Wastewater Revenue),
5.00%, 3/1/29 (MBIA) 1,981,597
3,765,000 San Diego County Improvement Bond Act of 1915
Special Assessment (Reassessment District No.
97-1 - 4-S Ranch), 6.25%, 9/2/12 3,832,770
3,000,000 San Francisco City and County Airports Commission
Rev., Series 2008-34D, (San Francisco
International Airport), 5.25%, 5/1/26 (AGC/FSA) 3,033,810
1,250,000 San Francisco City and County Redevelopment
Agency Lease Rev., (George R. Moscone), 7.05%,
7/1/13(2) 1,045,313
Principal Amount Value
$ 2,790,000 San Marcos Public Facilities Auth. Special Tax
Rev., Series 2004 A, 5.45%, 9/1/24 $ 2,698,934
3,005,000 Santa Barbara County Water COP Rev., 5.50%,
9/1/22 (Ambac) 3,177,066
2,875,000 Santa Monica Redevelopment Agency Tax Allocation
Rev., Series 2006 A, (Earthquake Recovery
Redevelopment), 5.00%, 7/1/28 (FGIC) 2,867,640
7,755,000 Shasta Lake Public Finance Auth. Rev.,
(Electrical Enterprise), 6.25%, 4/1/13,
Prerefunded at 102% of Par(1) 9,078,158
2,160,000 Soledad Improvement Bond Act of 1915 Special
Assessment, (Diamond Ridge Assessment District
No. 2002-01), 6.75%, 9/2/33 2,249,986
500,000 Southern California Public Power Auth. Rev.,
(Multi-Projects), 6.75%, 7/1/10 (FSA-CR) 541,705
2,400,000 Southern California Public Power Auth. Rev.,
(Transmission), 6.35%, 7/1/14 (MBIA-IBC)(2) 1,937,520
1,250,000 Southern California Public Power Auth. Rev.,
(Transmission), 6.35%, 7/1/15 (MBIA-IBC)(2) 959,175
5,750,000 Southern California Public Power Auth. Rev.,
Series 2008 A, (Transmission), 5.00%, 7/1/22 5,994,778
4,195,000 Stockton Community Facilities District Special
Tax Rev., (Spanos Park West No. 2001-1), 6.375%,
9/1/12, Prerefunded at 102% of Par(1) 4,848,623
5,000,000 Sunnyvale Special Tax Rev., (Community Facilities
District No. 1), 7.75%, 8/1/32 5,150,150
2,690,000 Tahoe-Truckee Unified School District GO, Series
1999 A, (Improvement District No. 2), 6.19%,
8/1/22 (FGIC)(2) 1,314,522
2,220,000 Tahoe-Truckee Unified School District GO, Series
1999 A, (Improvement District No. 2), 6.19%,
8/1/23 (FGIC)(2) 1,020,023
2,000,000 Turlock Health Facility COP, Series 2007 B,
(Emanuel Medical Center, Inc.), 5.50%, 10/15/37 1,799,800
------
22
California High-Yield Municipal
Principal Amount Value
$ 5,000,000 Tustin Community Facilities District No. 06-1
Special Tax Rev., Series 2007 A, (Tustin
Legacy/Columbus Villages), 6.00%, 9/1/36 $ 4,969,800
1,300,000 Tustin Community Facilities District No. 07-1
Special Tax Rev., (Tustin Legacy/Retail Center),
6.00%, 9/1/37 1,292,031
2,000,000 Tustin Unified School District Special Tax Rev.,
(Community Facilities District No. 97-1), 6.375%,
9/1/08, Prerefunded at 102% of Par(1) 2,040,520
1,500,000 University of California Rev., Series 2003 A,
5.00%, 5/15/23 (Ambac) 1,537,815
2,500,000 Val Verde Unified School District Special Tax
Rev., (Community Facilities District No. 1,
Improvement Area A), 5.40%, 9/1/30 2,360,275
2,600,000 Val Verde Unified School District Special Tax
Rev., (Community Facilities District No. 1,
Improvement Area A), 5.45%, 9/1/36 2,402,218
2,500,000 West Basin Municipal Water District COP, Series
2003 A, 5.00%, 8/1/30 (MBIA) 2,503,150
1,000,000 West Sacramento Special Tax Rev., (Community
Facilities District No. 10), 6.20%, 9/1/09,
Prerefunded at 102% of Par(1) 1,060,660
3,235,000 West Sacramento Special Tax Rev., (Community
Facilities District No. 10), 6.75%, 9/1/09,
Prerefunded at 102% of Par(1) 3,448,834
1,740,000 West Sacramento Special Tax Rev., (Community
Facilities District No. 20), 5.30%, 9/1/35 1,545,311
2,080,000 Westlands Water District COP, Series 2005 A,
5.00%, 9/1/25 (MBIA) 2,092,605
3,545,000 Yosemite Community College District GO, Series
2008 C, (Election of 2004), 4.33%, 8/1/16 (FSA)(2) 2,587,283
Principal Amount Value
$ 6,020,000 Yosemite Community College District GO, Series
2008 C, (Election of 2004), 4.97%, 8/1/20 (FSA)(2) $ 3,471,975
2,270,000 Yuba City Redevelopment Agency Tax Allocation
Rev., 5.70%, 9/1/24 2,178,247
2,000,000 Yuba City Redevelopment Agency Tax Allocation
Rev., 6.00%, 9/1/31 1,931,140
1,860,000 Yuba City Redevelopment Agency Tax Allocation
Rev., 5.375%, 9/1/32 (RADIAN) 1,710,902
2,895,000 Yuba City Unified School District GO, 6.05%,
9/1/24 (FGIC)(2) 1,226,206
1,500,000 Yuba City Unified School District GO, 6.05%,
3/1/25 (FGIC)(2) 616,530
------------
608,716,586
------------
PUERTO RICO -- 2.4%
1,145,000 Puerto Rico Commonwealth GO, Series 2006 A,
(Public Improvement), 5.25%, 7/1/30 1,144,920
7,800,000 Puerto Rico Electric Power Auth. Rev., Series
2007 UU, VRDN, 2.57%, 10/1/08, resets quarterly
at 67% of the 3-month LIBOR plus 0.70% with no
caps 6,163,950
10,000,000 Puerto Rico Sales Tax Financing Corp. Rev.,
Series 2007 A, VRDN, 2.81%, 11/3/08, resets
quarterly at 67% of the 3-month LIBOR plus 0.93%
with no caps 7,702,500
------------
15,011,370
------------
TOTAL INVESTMENT SECURITIES -- 99.0%
(Cost $632,487,343) 623,727,956
------------
OTHER ASSETS AND LIABILITIES -- 1.0% 5,985,076
------------
TOTAL NET ASSETS -- 100.0% $629,713,032
============
Futures Contracts
Underlying Face Unrealized
Contracts Purchased Expiration Date Amount at Value Gain (Loss)
433 U.S. Treasury
2-Year Notes December 2008 $91,917,781 $ 32,854
============ ============
Underlying Face Unrealized
Contracts Sold Expiration Date Amount at Value Gain (Loss)
219 U.S. Long Bond December 2008 $25,691,438 $(65,508)
============ ============
------
23
California High-Yield Municipal
Notes to Schedule of Investments
ABAG = Association of Bay Area Governments
AGC = Assured Guaranty Corporation
Ambac = Ambac Assurance Corporation
Ambac-TCRS = Ambac Assurance Corporation-Transferable Custodial Receipts
COP = Certificates of Participation
FGIC = Financial Guaranty Insurance Co.
FSA = Financial Security Assurance, Inc.
FSA-CR = Financial Security Assurance, Inc.- Custodial Receipts
GO = General Obligation
LIBOR = London Interbank Offered Rate
LIQ FAC = Liquidity Facilities
LOC = Letter of Credit
MBIA = MBIA Insurance Corporation
MBIA-IBC = MBIA Insurance Corporation-Insured Bond Certificates
RADIAN = Radian Asset Assurance, Inc.
resets = The frequency with which a security's coupon changes, based on
current market conditions or an underlying index. The more frequently a
security resets, the less risk the investor is taking that the coupon will
vary significantly from current market rates.
SBBPA = Standby Bond Purchase Agreement
VRDN = Variable Rate Demand Note. Interest reset date is indicated. Rate shown
is effective August 31, 2008.
XLCA = XL Capital Ltd.
(1) Escrowed to maturity in U.S. government securities or state and local
government securities.
(2) Security is a zero-coupon municipal bond. The rate indicated is the yield
to maturity at purchase. Zero-coupon securities are issued at a substantial
discount from their value at maturity.
(3) Security was purchased under Rule 144A of the Securities Act of 1933 or is
a private placement and, unless registered under the Act or exempted from
registration, may only be sold to qualified institutional investors. The
aggregate value of restricted securities at August 31, 2008, was $13,502,250,
which represented 2.1% of total net assets.
(4) Security, or a portion thereof, has been segregated for futures contracts.
See Notes to Financial Statements.
------
24
SHAREHOLDER FEE EXAMPLES (UNAUDITED)
Fund shareholders may incur two types of costs: (1) transaction costs,
including sales charges (loads) on purchase payments and redemption/exchange
fees; and (2) ongoing costs, including management fees; distribution and
service (12b-1) fees; and other fund expenses. This example is intended to
help you understand your ongoing costs (in dollars) of investing in your fund
and to compare these costs with the ongoing cost of investing in other mutual
funds.
The example is based on an investment of $1,000 made at the beginning of the
period and held for the entire period from March 1, 2008 to August 31, 2008.
ACTUAL EXPENSES
The table provides information about actual account values and actual expenses
for each class. You may use the information, together with the amount you
invested, to estimate the expenses that you paid over the period. First,
identify the share class you own. Then simply divide your account value by
$1,000 (for example, an $8,600 account value divided by $1,000 = 8.6), then
multiply the result by the number under the heading "Expenses Paid During
Period" to estimate the expenses you paid on your account during this period.
If you hold Investor Class shares of any American Century Investments fund, or
Institutional Class shares of the American Century Diversified Bond Fund, in
an American Century Investments account (i.e., not a financial intermediary or
retirement plan account), American Century Investments may charge you a $12.50
semiannual account maintenance fee if the value of those shares is less than
$10,000. We will redeem shares automatically in one of your accounts to pay
the $12.50 fee. In determining your total eligible investment amount, we will
include your investments in all PERSONAL ACCOUNTS (including American Century
Investments Brokerage accounts) registered under your Social Security number.
PERSONAL ACCOUNTS include individual accounts, joint accounts, UGMA/UTMA
accounts, personal trusts, Coverdell Education Savings Accounts and IRAs
(including traditional, Roth, Rollover, SEP-, SARSEP- and SIMPLE-IRAs), and
certain other retirement accounts. If you have only business, business
retirement, employer-sponsored or American Century Investments Brokerage
accounts, you are currently not subject to this fee. We will not charge the
fee as long as you choose to manage your accounts exclusively online. If you
are subject to the Account Maintenance Fee, your account value could be
reduced by the fee amount.
HYPOTHETICAL EXAMPLE FOR COMPARISON PURPOSES
The table also provides information about hypothetical account values and
hypothetical expenses based on the actual expense ratio of each class of your
fund and an assumed rate of return of 5% per year before expenses, which is
not the actual return of a fund's share class. The hypothetical account values
and expenses may not be used to estimate the actual ending account balance or
expenses you paid for the period. You may use this information to compare the
ongoing costs of investing in your fund and other funds. To do so, compare
this 5% hypothetical example with the 5% hypothetical examples that appear in
the shareholder reports of the other funds.
------
25
Please note that the expenses shown in the table are meant to highlight your
ongoing costs only and do not reflect any transactional costs, such as sales
charges (loads) or redemption/exchange fees. Therefore, the table is useful in
comparing ongoing costs only, and will not help you determine the relative
total costs of owning different funds. In addition, if these transactional
costs were included, your costs would have been higher.
Beginning Ending
Account Account Expenses Paid
Value Value During Period* Annualized
3/1/08 8/31/08 3/1/08 - 8/31/08 Expense Ratio*
California Long-Term Tax-Free
ACTUAL
Investor Class $1,000 $1,048.80 $2.52 0.49%
A Class $1,000 $1,047.50 $3.81 0.74%
B Class $1,000 $1,043.50 $7.65 1.49%
C Class $1,000 $1,043.50 $7.65 1.49%
HYPOTHETICAL
Investor Class $1,000 $1,022.67 $2.49 0.49%
A Class $1,000 $1,021.42 $3.76 0.74%
B Class $1,000 $1,017.65 $7.56 1.49%
C Class $1,000 $1,017.65 $7.56 1.49%
California High-Yield Municipal
ACTUAL
Investor Class $1,000 $1,049.20 $2.68 0.52%
A Class $1,000 $1,047.90 $3.96 0.77%
B Class $1,000 $1,044.00 $7.81 1.52%
C Class $1,000 $1,044.00 $7.81 1.52%
HYPOTHETICAL
Investor Class $1,000 $1,022.52 $2.64 0.52%
A Class $1,000 $1,021.27 $3.91 0.77%
B Class $1,000 $1,017.50 $7.71 1.52%
C Class $1,000 $1,017.50 $7.71 1.52%
*Expenses are equal to the class's annualized expense ratio listed in the
table above, multiplied by the average account value over the period,
multiplied by 184, the number of days in the most recent fiscal half-year,
divided by 366, to reflect the one-half year period.
------
26
STATEMENT OF ASSETS AND LIABILITIES
AUGUST 31, 2008
California
California High-Yield
Long-Term Tax-Free Municipal
ASSETS
Investment securities, at value (cost
of $425,910,140 and $632,487,343,
respectively) $432,074,106 $623,727,956
Cash 4,327,857 --
Receivable for investments sold 911,260 216,500
Receivable for capital shares sold -- 50,710
Receivable for variation margin on
futures contracts 213,796 174,043
Interest receivable 6,018,911 11,295,016
------------- -------------
443,545,930 635,464,225
------------- -------------
LIABILITIES
Disbursements in excess of demand
deposit cash -- 211,010
Payable for investments purchased 4,430,475 4,430,475
Payable for capital shares redeemed -- 215,002
Accrued management fees 178,295 269,422
Distribution fees payable 747 25,500
Service fees (and distribution
fees -- A Class) payable 1,525 36,604
Dividends payable 527,258 563,180
------------- -------------
5,138,300 5,751,193
------------- -------------
NET ASSETS $438,407,630 $629,713,032
============= =============
NET ASSETS CONSIST OF:
Capital paid in $434,351,878 $650,119,371
Undistributed net investment income 126,023 --
Accumulated net realized loss on
investment transactions (2,225,831) (11,614,298)
Net unrealized appreciation
(depreciation) on investments 6,155,560 (8,792,041)
------------- -------------
$438,407,630 $629,713,032
============= =============
INVESTOR CLASS
Net assets $431,008,135 $455,741,263
Shares outstanding 39,797,919 47,959,136
Net asset value per share $10.83 $9.50
A CLASS
Net assets $6,165,646 $133,479,868
Shares outstanding 569,315 14,046,331
Net asset value per share $10.83 $9.50
Maximum offering price (net asset value
divided by 0.955) $11.34 $9.95
B CLASS
Net assets $25,219 $1,209,332
Shares outstanding 2,329 127,265
Net asset value per share $10.83 $9.50
C CLASS
Net assets $1,208,630 $39,282,569
Shares outstanding 111,601 4,133,173
Net asset value per share $10.83 $9.50
See Notes to Financial Statements.
------
27
STATEMENT OF OPERATIONS
YEAR ENDED AUGUST 31, 2008
California California
Long-Term Tax-Free High-Yield Municipal
INVESTMENT INCOME (LOSS)
INCOME:
Interest $22,500,961 $ 34,108,453
------------- -------------
EXPENSES:
Management fees 2,140,044 3,232,273
Distribution fees:
B Class 173 10,228
C Class 2,821 292,061
Service fees:
B Class 57 3,409
C Class 940 97,354
Distribution and service
fees -- A Class 6,108 346,349
Trustees' fees and expenses 21,286 30,419
Other expenses 1,584 3,877
------------- -------------
2,173,013 4,015,970
------------- -------------
NET INVESTMENT INCOME (LOSS) 20,327,948 30,092,483
------------- -------------
REALIZED AND UNREALIZED GAIN (LOSS)
NET REALIZED GAIN (LOSS) ON:
Investment transactions (4,643,333) (11,859,976)
Futures and swaps transactions 2,489,803 2,696,610
------------- -------------
(2,153,530) (9,163,366)
------------- -------------
CHANGE IN NET UNREALIZED APPRECIATION
(DEPRECIATION) ON:
Investments (4,258,403) (16,944,883)
Futures and swaps 213,370 367,412
------------- -------------
(4,045,033) (16,577,471)
------------- -------------
NET REALIZED AND UNREALIZED
GAIN (LOSS) (6,198,563) (25,740,837)
------------- -------------
NET INCREASE (DECREASE) IN NET ASSETS
RESULTING FROM OPERATIONS $14,129,385 $ 4,351,646
============= =============
See Notes to Financial Statements.
------
28
STATEMENT OF CHANGES IN NET ASSETS
YEARS ENDED AUGUST 31, 2008 AND AUGUST 31, 2007
California Long-Term California High-Yield
Tax-Free Municipal
Increase
(Decrease) in
Net Assets 2008 2007 2008 2007
OPERATIONS
Net investment
income (loss) $ 20,327,948 $ 20,080,761 $ 30,092,483 $ 27,689,417
Net realized
gain (loss) (2,153,530) 60,404 (9,163,366) 400,329
Change in net
unrealized
appreciation
(depreciation) (4,045,033) (14,427,733) (16,577,471) (23,383,877)
------------- ------------- ------------- -------------
Net increase
(decrease) in net
assets resulting
from operations 14,129,385 5,713,432 4,351,646 4,705,869
------------- ------------- ------------- -------------
DISTRIBUTIONS TO SHAREHOLDERS
From net
investment income:
Investor Class (20,203,854) (20,079,843) (22,069,515) (20,885,775)
A Class (106,999) -- (6,447,288) (5,359,920)
B Class (837) -- (53,221) (50,395)
C Class (13,642) -- (1,522,459) (1,393,327)
From net realized
gains:
Investor Class -- (737,478) -- --
------------- ------------- ------------- -------------
Decrease in net
assets from
distributions (20,325,332) (20,817,321) (30,092,483) (27,689,417)
------------- ------------- ------------- -------------
CAPITAL SHARE TRANSACTIONS
Net increase
(decrease) in net
assets from
capital share
transactions 2,545,279 11,162,447 (2,915,320) 152,328,607
------------- ------------- ------------- -------------
NET INCREASE
(DECREASE) IN
NET ASSETS (3,650,668) (3,941,442) (28,656,157) 129,345,059
NET ASSETS
Beginning of period 442,058,298 445,999,740 658,369,189 529,024,130
------------- ------------- ------------- -------------
End of period $438,407,630 $442,058,298 $629,713,032 $658,369,189
============= ============= ============= =============
Accumulated
undistributed
net investment
income (loss) $126,023 $(2,616) -- --
============= ============= ============= =============
See Notes to Financial Statements.
------
29
NOTES TO FINANCIAL STATEMENTS
AUGUST 31, 2008
1. ORGANIZATION AND SUMMARY OF SIGNIFICANT ACCOUNTING POLICIES
ORGANIZATION -- American Century California Tax-Free and Municipal Funds (the
trust) is registered under the Investment Company Act of 1940 (the 1940 Act)
as an open-end management investment company. California Long-Term Tax-Free
Fund (Long-Term) and California High-Yield Municipal Fund (High-Yield
Municipal) are two funds in a series issued by the trust. Long-Term is
diversified under the 1940 Act. High-Yield Municipal is nondiversified under
the 1940 Act. Long-Term's investment objective is to seek safety of principal
and high current income that is exempt from federal and California income
taxes. Long-Term invests primarily in long-term investment-grade municipal
obligations. High-Yield Municipal's investment objective is to seek high
current income that is exempt from federal and California income taxes.
High-Yield Municipal pursues this objective by investing a portion of its
assets in lower-rated and unrated municipal securities. The following is a
summary of the funds' significant accounting policies.
MULTIPLE CLASS -- The funds are authorized to issue the Investor Class, the A
Class, the B Class and the C Class. The A Class may incur an initial sales
charge. The A Class, B Class and C Class may be subject to a contingent
deferred sales charge. The share classes differ principally in their
respective sales charges and distribution and shareholder servicing expenses
and arrangements. All shares of the fund represent an equal pro rata interest
in the net assets of the class to which such shares belong, and have identical
voting, dividend, liquidation and other rights and the same terms and
conditions, except for class specific expenses and exclusive rights to vote on
matters affecting only individual classes. Income, non-class specific
expenses, and realized and unrealized capital gains and losses of the fund are
allocated to each class of shares based on their relative net assets. Sale of
Long-Term's A Class, B Class and C Class commenced on September 28, 2007.
SECURITY VALUATIONS -- Debt securities maturing in greater than 60 days at the
time of purchase are valued at current market value as provided by a
commercial pricing service or at the mean of the most recent bid and asked
prices. Debt securities maturing within 60 days at the time of purchase may be
valued at cost, plus or minus any amortized discount or premium. If an event
occurs after the value of a security was established but before the net asset
value per share was determined that was likely to materially change the net
asset value, that security would be valued as determined in accordance with
procedures adopted by the Board of Trustees. If the funds determine that the
market price of a portfolio security is not readily available, or that the
valuation methods mentioned above do not reflect the security's fair value,
such security is valued as determined by the Board of Trustees or its
designee, in accordance with procedures adopted by the Board of Trustees, if
such determination would materially impact a fund's net asset value. Certain
other circumstances may cause the funds to use alternative procedures to value
a security such as: a security has been declared in default; trading in a
security has been halted during the trading day; or there is a foreign market
holiday and no trading will commence.
SECURITY TRANSACTIONS -- For financial reporting purposes, security
transactions are accounted for as of the trade date. Net realized gains and
losses are determined on the identified cost basis, which is also used for
federal income tax purposes.
INVESTMENT INCOME -- Interest income is recorded on the accrual basis and
includes accretion of discounts and amortization of premiums.
WHEN-ISSUED AND FORWARD COMMITMENTS -- The funds may engage in securities
transactions on a when-issued or forward commitment basis. Under these
arrangements, the securities' prices and yields are fixed on the date of the
commitment, but payment and delivery are scheduled for a future date. During
this period, securities are subject to market fluctuations. The funds will
segregate cash, cash equivalents or other appropriate liquid securities on
their records in amounts sufficient to meet the purchase price.
------
30
FUTURES CONTRACTS -- The funds may enter into futures contracts in order to
manage the funds' exposure to changes in market conditions. One of the risks
of entering into futures contracts is the possibility that the change in value
of the contract may not correlate with the changes in value of the underlying
securities. Upon entering into a futures contract, the funds are required to
deposit either cash or securities in an amount equal to a certain percentage
of the contract value (initial margin). Subsequent payments (variation margin)
are made or received daily, in cash, by the funds. The variation margin is
equal to the daily change in the contract value and is recorded as unrealized
gains and losses. The funds recognize a realized gain or loss when the
contract is closed or expires. Net realized and unrealized gains or losses
occurring during the holding period of futures contracts are a component of
realized gain (loss) on futures and swaps transactions and unrealized
appreciation (depreciation) on futures and swaps, respectively.
SWAP AGREEMENTS -- The funds may enter into swap agreements in order to
attempt to obtain or preserve a particular return or spread at a lower cost
than obtaining a return or spread through purchases and/or sales of
instruments in other markets; protect against currency fluctuations; attempt
to manage duration to protect against any increase in the price of securities
the funds anticipate purchasing at a later date; or gain exposure to certain
markets in the most economical way possible. A basic swap agreement is a
contract in which two parties agree to exchange the returns earned or realized
on predetermined investments or instruments. The funds will segregate cash,
cash equivalents or other appropriate liquid securities on their records in
amounts sufficient to meet requirements. Unrealized gains are reported as an
asset and unrealized losses are reported as a liability on the Statement of
Assets and Liabilities. Swap agreements are valued daily and changes in value,
including the periodic amounts of interest to be paid or received on swaps,
are recorded as unrealized appreciation (depreciation) on futures and swaps.
Realized gain or loss is recorded upon receipt or payment of a periodic
settlement or termination of swap agreements. The risks of entering into swap
agreements include the possible lack of liquidity, failure of the counterparty
to meet its obligations, and that there may be unfavorable changes in the
underlying investments and instruments.
INCOME TAX STATUS -- It is each fund's policy to distribute substantially all
net investment income and net realized gains to shareholders and to otherwise
qualify as a regulated investment company under provisions of the Internal
Revenue Code. The funds have adopted the provisions of Financial Accounting
Standards Board Interpretation No. 48, "Accounting for Income Taxes" during
the current fiscal year. The funds are no longer subject to examination by tax
authorities for years prior to 2005. At this time, management believes there
are no uncertain tax positions which, based on their technical merit, would
not be sustained upon examination and for which it is reasonably possible that
the total amounts of unrecognized tax benefits will significantly change in
the next twelve months. Accordingly, no provision has been made for federal or
state income taxes. Interest and penalties associated with any federal or
state income tax obligations, if any, are recorded as interest expense.
DISTRIBUTIONS TO SHAREHOLDERS -- Distributions from net investment income are
declared daily and paid monthly. Distributions from net realized gains, if
any, are generally declared and paid annually.
INDEMNIFICATIONS -- Under the trust's organizational documents, its officers
and trustees are indemnified against certain liabilities arising out of the
performance of their duties to the funds. In addition, in the normal course of
business, the funds enter into contracts that provide general
indemnifications. The funds' maximum exposure under these arrangements is
unknown as this would involve future claims that may be made against the
funds. The risk of material loss from such claims is considered by management
to be remote.
USE OF ESTIMATES -- The financial statements are prepared in conformity with
accounting principles generally accepted in the United States of America,
which may require management to make certain estimates and assumptions at the
date of the financial statements. Actual results could differ from these
estimates.
------
31
2. FEES AND TRANSACTIONS WITH RELATED PARTIES
MANAGEMENT FEES -- The trust has entered into a Management Agreement with
American Century Investment Management, Inc., (ACIM) (the investment advisor)
under which ACIM provides the funds with investment advisory and management
services in exchange for a single, unified management fee (the fee) per class.
The Agreement provides that all expenses of the funds, except brokerage
commissions, taxes, interest, fees and expenses of those trustees who are not
considered "interested persons" as defined in the 1940 Act (including counsel
fees) and extraordinary expenses, will be paid by ACIM. The fee is computed
and accrued daily based on the daily net assets of each specific class of
shares of each fund and paid monthly in arrears. The fee consists of (1) an
Investment Category Fee based on the daily net assets of the funds and certain
other accounts managed by the investment advisor that are in the same broad
investment category as each fund and (2) a Complex Fee based on the assets of
all the funds in the American Century Investments family of funds. The rates
for the Investment Category Fee range from 0.1625% to 0.2800% for Long-Term
and from 0.1925% to 0.3100% for High-Yield Municipal. The rates for the
Complex Fee range from 0.2500% to 0.3100%. The effective annual management fee
for each class of Long-Term and High-Yield Municipal for the year ended August
31, 2008 was 0.48% and 0.51%, respectively.
DISTRIBUTION AND SERVICE FEES -- The Board of Trustees has adopted a separate
Master Distribution and Individual Shareholder Services Plan for each of the A
Class, B Class and C Class (collectively, the plans), pursuant to Rule 12b-1
of the 1940 Act. The plans provide that the A Class will pay American Century
Investment Services, Inc. (ACIS) an annual distribution and service fee of
0.25%. The plans provide that the B Class and the C Class will each pay ACIS
an annual distribution fee of 0.75% and service fee of 0.25%. The fees are
computed and accrued daily based on each class's daily net assets and paid
monthly in arrears. The fees are used to pay financial intermediaries for
distribution and individual shareholder services. Fees incurred under the
plans during the year ended August 31, 2008, are detailed in the Statement of
Operations.
RELATED PARTIES -- Certain officers and trustees of the trust are also
officers and/or directors of American Century Companies, Inc. (ACC), the
parent of the trust's investment advisor, ACIM, the distributor of the trust,
ACIS, and the trust's transfer agent, American Century Services, LLC.
Prior to December 12, 2007, the funds had a bank line of credit agreement with
JPMorgan Chase Bank (JPMCB). JPMCB is a custodian of the funds and a wholly
owned subsidiary of JPMorgan Chase & Co. (JPM). JPM is an equity investor in
ACC.
3. INVESTMENT TRANSACTIONS
Investment transactions, excluding short-term investments, for the year ended
August 31, 2008, were as follows:
Long-Term High-Yield Municipal
Purchases $126,670,989 $185,386,066
Proceeds from sales $123,235,556 $199,817,953
------
32
4. CAPITAL SHARE TRANSACTIONS
Transactions in shares of the funds were as follows (unlimited number of
shares authorized):
Year ended Year ended
August 31, 2008(1) August 31, 2007
Shares Amount Shares Amount
Long-Term
INVESTOR CLASS
Sold 2,284,090 $ 25,125,048 4,361,210 $ 49,324,886
Issued in
reinvestment of
distributions 1,257,874 13,731,585 1,272,217 14,387,292
Redeemed (3,991,365) (43,762,286) (4,653,351) (52,549,731)
------------- ------------- ------------ -------------
(449,401) (4,905,653) 980,076 11,162,447
------------- ------------- ------------ -------------
A CLASS N/A
Sold 590,594 6,431,130
Issued in
reinvestment of
distributions 3,974 42,989
Redeemed (25,253) (270,232)
------------- ------------- ------------ -------------
569,315 6,203,887
------------- ------------- ------------ -------------
B CLASS N/A
Sold 2,253 25,003
Issued in
reinvestment of
distributions 76 837
------------- ------------- ------------ -------------
2,329 25,840
------------- ------------- ------------ -------------
C CLASS N/A
Sold 113,252 1,239,078
Issued in
reinvestment of
distributions 670 7,245
Redeemed (2,321) (25,118)
------------- ------------- ------------ -------------
111,601 1,221,205
------------- ------------- ------------ -------------
Net increase
(decrease) 233,844 $ 2,545,279 980,076 $ 11,162,447
============= ============= ============ =============
High-Yield Municipal
INVESTOR CLASS
Sold 11,413,438 $ 110,295,711 11,802,861 $120,763,745
Issued in
reinvestment of
distributions 1,720,436 16,589,054 1,492,505 15,250,725
Redeemed (12,386,981) (120,187,199) (5,709,704) (58,279,673)
------------- ------------- ------------ -------------
746,893 6,697,566 7,585,662 77,734,797
------------- ------------- ------------ -------------
A CLASS
Sold 5,713,242 55,497,720 9,477,355 96,807,687
Issued in
reinvestment of
distributions 439,735 4,241,145 374,179 3,820,481
Redeemed (6,984,393) (67,914,673) (3,797,742) (38,634,857)
------------- ------------- ------------ -------------
(831,416) (8,175,808) 6,053,792 61,993,311
------------- ------------- ------------ -------------
B CLASS
Sold 3,270 32,002 25,417 260,030
Issued in
reinvestment of
distributions 2,513 24,262 2,101 21,463
Redeemed (25,383) (244,626) (3,920) (39,997)
------------- ------------- ------------ -------------
(19,600) (188,362) 23,598 241,496
------------- ------------- ------------ -------------
C CLASS
Sold 1,191,026 11,499,082 1,823,758 18,681,934
Issued in
reinvestment of
distributions 71,098 685,480 58,463 596,819
Redeemed (1,383,313) (13,433,278) (680,026) (6,919,750)
------------- ------------- ------------ -------------
(121,189) (1,248,716) 1,202,195 12,359,003
------------- ------------- ------------ -------------
Net increase
(decrease) (225,312) $ (2,915,320) 14,865,247 $152,328,607
============= ============= ============ =============
(1) September 28, 2007 (commencement of sale) through August 31, 2008 for
Long-Term's A Class, B Class and C Class.
------
33
5. BANK LINE OF CREDIT
Effective December 12, 2007, the funds, along with certain other funds managed
by ACIM or American Century Global Investment Management, Inc. (ACGIM), have a
$500,000,000 unsecured bank line of credit agreement with Bank of America,
N.A. Prior to December 12, 2007, the funds, along with certain other funds
managed by ACIM or ACGIM, had a $500,000,000 unsecured bank line of credit
agreement with JPMCB. The funds may borrow money for temporary or emergency
purposes to fund shareholder redemptions. Borrowings under the agreement,
which is subject to annual renewal, bear interest at the Federal Funds rate
plus 0.40%. The funds did not borrow from either line during the year ended
August 31, 2008.
6. RISK FACTORS
The funds concentrate their investments in a single state and therefore may
have more exposure to credit risk related to the state of California than a
fund with a broader geographical diversification. Income may be subject to
state and local taxes and, if applicable, the alternative minimum tax.
High-Yield Municipal invests primarily in lower-rated debt securities, which
are subject to substantial risks including price volatility, liquidity risk,
and default risk.
7. FEDERAL TAX INFORMATION
The tax character of distributions paid during the years ended August 31, 2008
and August 31, 2007 were as follows:
Long-Term High-Yield Municipal
2008 2007 2008 2007
DISTRIBUTIONS PAID FROM
Exempt income $20,325,332 $20,076,962 $30,092,483 $27,684,051
Taxable ordinary income -- $5,497 -- $5,366
Long-term
capital gains -- $734,862 -- --
The book-basis character of distributions made during the year from net
investment income or net realized gains may differ from their ultimate
characterization for federal income tax purposes. These differences reflect
the differing character of certain income items and net realized gains and
losses for financial statement and tax purposes, and may result in
reclassification among certain capital accounts on the financial statements.
As of August 31, 2008, the components of distributable earnings on a tax-basis
and the federal tax cost of investments were as follows:
Long-Term High-Yield Municipal
Federal tax cost of investments $425,910,140 $632,487,343
============= =============
Gross tax appreciation of investments $ 16,703,590 $ 15,256,354
Gross tax depreciation of investments (10,539,624) (24,015,741)
------------- -------------
Net tax appreciation (depreciation)
of investments $ 6,163,966 $ (8,759,387)
============= =============
U
ndistributed taxable ordinary income $126,023 --
Accumulated capital losses $(102,794) $(2,910,449)
Capital loss deferrals $(2,131,443) $(8,736,503)
The cost of investments for federal income tax purposes was the same as the
cost for financial reporting purposes. The difference between book-basis and
tax-basis unrealized appreciation (depreciation) is attributable primarily to
the realization for tax purposes of unrealized gains (losses) for certain
futures contracts.
------
34
The accumulated capital losses listed on the previous page represent net
capital loss carryovers that may be used to offset future realized capital
gains for federal income tax purposes. The capital loss carryovers expire as
follows:
2009 2015 2016
Long-Term -- $(102,794) --
High-Yield Municipal $(994,039) $(1,856,960) $(59,450)
The capital loss deferrals listed on the previous page represent net capital
losses incurred in the ten-month period ended August 31, 2008. The funds have
elected to treat such losses as having been incurred in the following fiscal
year for federal income tax purposes.
8. RECENTLY ISSUED ACCOUNTING STANDARDS
The Financial Accounting Standards Board (FASB) issued Statement of Financial
Accounting Standards No. 157, "Fair Value Measurements" (FAS 157), in
September 2006, which is effective for fiscal years beginning after November
15, 2007. FAS 157 defines fair value, establishes a framework for measuring
fair value and expands the required financial statement disclosures about fair
value measurements. The adoption of FAS 157 will not materially impact the
determination of fair value.
In March 2008, the FASB issued Statement of Financial Accounting Standards No.
161, "Disclosures about Derivative Instruments and Hedging Activities -- an
amendment of FASB Statement No. 133" (FAS 161). FAS 161 is effective for
fiscal years beginning after November 15, 2008. FAS 161 amends and expands
disclosures about derivative instruments and hedging activities. FAS 161
requires qualitative disclosures about the objectives and strategies of
derivative instruments, quantitative disclosures about the fair value amounts
of and gains and losses on derivative instruments, and disclosures of
credit-risk-related contingent features in hedging activities. Management is
currently evaluating the impact that adopting FAS 161 will have on the
financial statement disclosures.
9. OTHER TAX INFORMATION (UNAUDITED)
The following information is provided pursuant to provisions of the Internal
Revenue Code.
The funds hereby designate exempt interest distributions, or up to the maximum
amount allowable, for the fiscal year ended August 31, 2008, as follows:
Long-Term High-Yield Municipal
Exempt interest distributions $20,214,585 $30,089,836
------
35
FINANCIAL HIGHLIGHTS
California Long-Term Tax-Free
Investor Class
For a Share Outstanding Throughout the Years Ended August 31
2008 2007 2006 2005 2004
PER-SHARE DATA
Net Asset Value, Beginning
of Period $10.98 $11.36 $11.78 $11.69 $11.43
-------- -------- -------- -------- --------
Income From
Investment Operations
Net Investment
Income (Loss) 0.51 0.51 0.51 0.52 0.51
Net Realized
and Unrealized
Gain (Loss) (0.15) (0.36) (0.19) 0.09 0.26
-------- -------- -------- -------- --------
Total From
Investment Operations 0.36 0.15 0.32 0.61 0.77
-------- -------- -------- -------- --------
Distributions
From Net
Investment Income (0.51) (0.51) (0.51) (0.52) (0.51)
From Net Realized Gains -- (0.02) (0.23) -- --(1)
-------- -------- -------- -------- --------
Total Distributions (0.51) (0.53) (0.74) (0.52) (0.51)
-------- -------- -------- -------- --------
Net Asset Value,
End of Period $10.83 $10.98 $11.36 $11.78 $11.69
======== ======== ======== ======== ========
TOTAL RETURN(2) 3.29% 1.24% 2.89% 5.38% 6.83%
RATIOS/SUPPLEMENTAL DATA
Ratio of Operating Expenses
to Average
Net Assets 0.49% 0.49% 0.49% 0.49% 0.50%
Ratio of Net Investment
Income (Loss) to
Average Net Assets 4.60% 4.48% 4.46% 4.40% 4.39%
Portfolio Turnover Rate 29% 18% 33% 36% 19%
Net Assets, End of Period
(in thousands) $431,008 $442,058 $446,000 $475,954 $468,891
(1) Per-share amount was less than $0.005.
(2) Total return assumes reinvestment of net investment income and capital
gains distributions, if any. The total return of the classes may not precisely
reflect the class expense differences because of the impact of calculating the
net asset values to two decimal places. If net asset values were calculated to
three decimal places, the total return differences would more closely reflect
the class expense differences. The calculation of net asset values to two
decimal places is made in accordance with SEC guidelines and does not result
in any gain or loss of value between one class and another.
See Notes to Financial Statements.
------
36
California Long-Term Tax-Free
A Class
For a Share Outstanding Throughout the Period Indicated
2008(1)
PER-SHARE DATA
Net Asset Value, Beginning of Period $11.10
--------
Income From Investment Operations
Net Investment Income (Loss) 0.44
Net Realized and Unrealized Gain (Loss) (0.27)
--------
Total From Investment Operations 0.17
--------
Distributions
From Net Investment Income (0.44)
--------
Net Asset Value, End of Period $10.83
========
TOTAL RETURN(2) 1.57%
RATIOS/SUPPLEMENTAL DATA
Ratio of Operating Expenses to Average Net Assets 0.74%(3)
Ratio of Net Investment Income (Loss) to Average Net Assets 4.41%(3)
Portfolio Turnover Rate 29%(4)
Net Assets, End of Period (in thousands) $6,166
(1) September 28, 2007 (commencement of sale) through August 31, 2008.
(2) Total return assumes reinvestment of net investment income and capital
gains distributions, if any, and does not reflect applicable sales charges.
Total returns for periods less than one year are not annualized. The total
return of the classes may not precisely reflect the class expense differences
because of the impact of calculating the net asset values to two decimal
places. If net asset values were calculated to three decimal places, the total
return differences would more closely reflect the class expense differences.
The calculation of net asset values to two decimal places is made in
accordance with SEC guidelines and does not result in any gain or loss of
value between one class and another.
(3) Annualized.
(4) Portfolio turnover is calculated at the fund level. Percentage indicated
was calculated for the year ended August 31, 2008.
See Notes to Financial Statements.
------
37
California Long-Term Tax-Free
B Class
For a Share Outstanding Throughout the Period Indicated
2008(1)
PER-SHARE DATA
Net Asset Value, Beginning of Period $11.10
--------
Income From Investment Operations
Net Investment Income (Loss) 0.36
Net Realized and Unrealized Gain (Loss) (0.27)
--------
Total From Investment Operations 0.09
--------
Distributions
From Net Investment Income (0.36)
--------
Net Asset Value, End of Period $10.83
========
TOTAL RETURN(2) 0.87%
RATIOS/SUPPLEMENTAL DATA
Ratio of Operating Expenses to Average Net Assets 1.49%(3)
Ratio of Net Investment Income (Loss) to Average Net Assets 3.64%(3)
Portfolio Turnover Rate 29%(4)
Net Assets, End of Period (in thousands) $25
(1) September 28, 2007 (commencement of sale) through August 31, 2008.
(2) Total return assumes reinvestment of net investment income and capital
gains distributions, if any, and does not reflect applicable sales charges.
Total returns for periods less than one year are not annualized. The total
return of the classes may not precisely reflect the class expense differences
because of the impact of calculating the net asset values to two decimal
places. If net asset values were calculated to three decimal places, the total
return differences would more closely reflect the class expense differences.
The calculation of net asset values to two decimal places is made in
accordance with SEC guidelines and does not result in any gain or loss of
value between one class and another.
(3) Annualized.
(4) Portfolio turnover is calculated at the fund level. Percentage indicated
was calculated for the year ended August 31, 2008.
See Notes to Financial Statements.
------
38
California Long-Term Tax-Free
C Class
For a Share Outstanding Throughout the Period Indicated
2008(1)
PER-SHARE DATA
Net Asset Value, Beginning of Period $11.10
--------
Income From Investment Operations
Net Investment Income (Loss) 0.36
Net Realized and Unrealized Gain (Loss) (0.27)
--------
Total From Investment Operations 0.09
--------
Distributions
From Net Investment Income (0.36)
--------
Net Asset Value, End of Period $10.83
========
TOTAL RETURN(2) 0.87%
RATIOS/SUPPLEMENTAL DATA
Ratio of Operating Expenses to Average Net Assets 1.49%(3)
Ratio of Net Investment Income (Loss) to Average Net Assets 3.72%(3)
Portfolio Turnover Rate 29%(4)
Net Assets, End of Period (in thousands) $1,209
(1) September 28, 2007 (commencement of sale) through August 31, 2008.
(2) Total return assumes reinvestment of net investment income and capital
gains distributions, if any, and does not reflect applicable sales charges.
Total returns for periods less than one year are not annualized. The total
return of the classes may not precisely reflect the class expense differences
because of the impact of calculating the net asset values to two decimal
places. If net asset values were calculated to three decimal places, the total
return differences would more closely reflect the class expense differences.
The calculation of net asset values to two decimal places is made in
accordance with SEC guidelines and does not result in any gain or loss of
value between one class and another.
(3) Annualized.
(4) Portfolio turnover is calculated at the fund level. Percentage indicated
was calculated for the year ended August 31, 2008.
See Notes to Financial Statements.
------
39
California High-Yield Municipal
Investor Class
For a Share Outstanding Throughout the Years Ended August 31
2008 2007 2006 2005 2004
PER-SHARE DATA
Net Asset Value, Beginning
of Period $9.90 $10.25 $10.36 $9.93 $9.65
-------- -------- -------- -------- --------
Income From
Investment Operations
Net Investment
Income (Loss) 0.48 0.48 0.49 0.51 0.52
Net Realized
and Unrealized
Gain (Loss) (0.40) (0.35) (0.11) 0.43 0.28
-------- -------- -------- -------- --------
Total From
Investment Operations 0.08 0.13 0.38 0.94 0.80
-------- -------- -------- -------- --------
Distributions
From Net
Investment Income (0.48) (0.48) (0.49) (0.51) (0.52)
-------- -------- -------- -------- --------
Net Asset Value,
End of Period $9.50 $9.90 $10.25 $10.36 $9.93
======== ======== ======== ======== ========
TOTAL RETURN(1) 0.81% 1.22% 3.80% 9.65% 8.48%
RATIOS/SUPPLEMENTAL DATA
Ratio of Operating Expenses
to Average
Net Assets 0.52% 0.52% 0.52% 0.52% 0.53%
Ratio of Net Investment
Income (Loss) to
Average Net Assets 4.91% 4.70% 4.80% 4.99% 5.30%
Portfolio Turnover Rate 31% 17% 25% 13% 19%
Net Assets, End of Period
(in thousands) $455,741 $467,477 $406,063 $377,534 $332,434
(1) Total return assumes reinvestment of net investment income and capital
gains distributions, if any. The total return of the classes may not precisely
reflect the class expense differences because of the impact of calculating the
net asset values to two decimal places. If net asset values were calculated to
three decimal places, the total return differences would more closely reflect
the class expense differences. The calculation of net asset values to two
decimal places is made in accordance with SEC guidelines and does not result
in any gain or loss of value between one class and another.
See Notes to Financial Statements.
------
40
California High-Yield Municipal
A Class
For a Share Outstanding Throughout the Years Ended August 31
2008 2007 2006 2005 2004
PER-SHARE DATA
Net Asset Value, Beginning
of Period $9.90 $10.25 $10.36 $9.93 $9.65
-------- -------- -------- -------- --------
Income From
Investment Operations
Net Investment
Income (Loss) 0.45 0.46 0.46 0.48 0.50
Net Realized
and Unrealized
Gain (Loss) (0.40) (0.35) (0.11) 0.43 0.28
-------- -------- -------- -------- --------
Total From
Investment Operations 0.05 0.11 0.35 0.91 0.78
-------- -------- -------- -------- --------
Distributions
From Net
Investment Income (0.45) (0.46) (0.46) (0.48) (0.50)
-------- -------- -------- -------- --------
Net Asset Value,
End of Period $9.50 $9.90 $10.25 $10.36 $9.93
======== ======== ======== ======== ========
TOTAL RETURN(1) 0.55% 0.97% 3.54% 9.38% 8.21%
RATIOS/SUPPLEMENTAL DATA
Ratio of Operating Expenses
to Average
Net Assets 0.77% 0.77% 0.77% 0.77% 0.78%
Ratio of Net Investment
Income (Loss) to
Average Net Assets 4.66% 4.45% 4.55% 4.74% 5.05%
Portfolio Turnover Rate 31% 17% 25% 13% 19%
Net Assets, End of Period
(in thousands) $133,480 $147,314 $90,421 $39,608 $11,499
(1) Total return assumes reinvestment of net investment income and capital
gains distributions, if any, and does not reflect applicable sales charges.
The total return of the classes may not precisely reflect the class expense
differences because of the impact of calculating the net asset values to two
decimal places. If net asset values were calculated to three decimal places,
the total return differences would more closely reflect the class expense
differences. The calculation of net asset values to two decimal places is made
in accordance with SEC guidelines and does not result in any gain or loss of
value between one class and another.
See Notes to Financial Statements.
------
41
California High-Yield Municipal
B Class
For a Share Outstanding Throughout the Years Ended August 31
2008 2007 2006 2005 2004
PER-SHARE DATA
Net Asset Value, Beginning
of Period $9.90 $10.25 $10.36 $9.93 $9.65
-------- -------- -------- -------- --------
Income From
Investment Operations
Net Investment
Income (Loss) 0.38 0.38 0.39 0.40 0.42
Net Realized
and Unrealized
Gain (Loss) (0.40) (0.35) (0.11) 0.43 0.28
-------- -------- -------- -------- --------
Total From
Investment Operations (0.02) 0.03 0.28 0.83 0.70
-------- -------- -------- -------- --------
Distributions
From Net
Investment Income (0.38) (0.38) (0.39) (0.40) (0.42)
-------- -------- -------- -------- --------
Net Asset Value,
End of Period $9.50 $9.90 $10.25 $10.36 $9.93
======== ======== ======== ======== ========
TOTAL RETURN(1) (0.20)% 0.22% 2.77% 8.57% 7.40%
RATIOS/SUPPLEMENTAL DATA
Ratio of Operating Expenses
to Average
Net Assets 1.52% 1.52% 1.52% 1.52% 1.53%
Ratio of Net Investment
Income (Loss) to
Average Net Assets 3.91% 3.70% 3.80% 3.99% 4.30%
Portfolio Turnover Rate 31% 17% 25% 13% 19%
Net Assets, End of Period
(in thousands) $1,209 $1,454 $1,263 $1,158 $866
(1) Total return assumes reinvestment of net investment income and capital
gains distributions, if any, and does not reflect applicable sales charges.
The total return of the classes may not precisely reflect the class expense
differences because of the impact of calculating the net asset values to two
decimal places. If net asset values were calculated to three decimal places,
the total return differences would more closely reflect the class expense
differences. The calculation of net asset values to two decimal places is made
in accordance with SEC guidelines and does not result in any gain or loss of
value between one class and another.
See Notes to Financial Statements.
------
42
California High-Yield Municipal
C Class
For a Share Outstanding Throughout the Years Ended August 31
2008 2007 2006 2005 2004
PER-SHARE DATA
Net Asset Value, Beginning
of Period $9.90 $10.25 $10.36 $9.93 $9.65
-------- -------- -------- -------- --------
Income From
Investment Operations
Net Investment
Income (Loss) 0.38 0.38 0.39 0.40 0.43
Net Realized
and Unrealized
Gain (Loss) (0.40) (0.35) (0.11) 0.43 0.28
-------- -------- -------- -------- --------
Total From
Investment Operations (0.02) 0.03 0.28 0.83 0.71
-------- -------- -------- -------- --------
Distributions
From Net
Investment Income (0.38) (0.38) (0.39) (0.40) (0.43)
-------- -------- -------- -------- --------
Net Asset Value,
End of Period $9.50 $9.90 $10.25 $10.36 $9.93
======== ======== ======== ======== ========
TOTAL RETURN(1) (0.20%) 0.22% 2.76% 8.56% 7.49%
RATIOS/SUPPLEMENTAL DATA
Ratio of Operating Expenses
to Average
Net Assets 1.52% 1.52% 1.52% 1.52% 1.48%
Ratio of Net Investment
Income (Loss) to
Average Net Assets 3.91% 3.70% 3.80% 3.99% 4.35%
Portfolio Turnover Rate 31% 17% 25% 13% 19%
Net Assets, End of Period
(in thousands) $39,283 $42,125 $31,276 $17,499 $7,416
(1) Total return assumes reinvestment of net investment income and capital
gains distributions, if any, and does not reflect applicable sales charges.
The total return of the classes may not precisely reflect the class expense
differences because of the impact of calculating the net asset values to two
decimal places. If net asset values were calculated to three decimal places,
the total return differences would more closely reflect the class expense
differences. The calculation of net asset values to two decimal places is made
in accordance with SEC guidelines and does not result in any gain or loss of
value between one class and another.
See Notes to Financial Statements.
------
43
REPORT OF INDEPENDENT REGISTERED PUBLIC ACCOUNTING FIRM
To the Directors of the American Century California Tax-Free and Municipal
Funds and Shareholders of the California Long-Term Tax-Free Fund and
California High-Yield Municipal Fund:
In our opinion, the accompanying statements of assets and liabilities,
including the schedules of investments, and the related statements of
operations and of changes in net assets and the financial highlights present
fairly, in all material respects, the financial position of the California
Long-Term Tax-Free Fund and California High-Yield Municipal Fund (two of the
four funds in the American Century California Tax-Free and Municipal Funds,
hereafter referred to as the "Funds") at August 31, 2008, the results of each
of their operations for the year then ended, the changes in each of their net
assets for each of the two years in the period then ended and the financial
highlights for each of the five years in the period then ended, in conformity
with accounting principles generally accepted in the United States of America.
These financial statements and financial highlights (hereafter referred to as
"financial statements") are the responsibility of the Funds' management; our
responsibility is to express an opinion on these financial statements based on
our audits. We conducted our audits of these financial statements in
accordance with the standards of the Public Company Accounting Oversight Board
(United States). Those standards require that we plan and perform the audit to
obtain reasonable assurance about whether the financial statements are free of
material misstatement. An audit includes examining, on a test basis, evidence
supporting the amounts and disclosures in the financial statements, assessing
the accounting principles used and significant estimates made by management,
and evaluating the overall financial statement presentation. We believe that
our audits, which included confirmation of securities at August 31, 2008 by
correspondence with the custodian and brokers, provide a reasonable basis for
our opinion.
PricewaterhouseCoopers LLP
Kansas City, Missouri
October 14, 2008
------
44
MANAGEMENT
The individuals listed below serve as trustees or officers of the funds. Each
trustee serves until his or her successor is duly elected and qualified or
until he or she retires. Effective March 2004, mandatory retirement age for
independent trustees is 73. However, the mandatory retirement age may be
extended for a period not to exceed two years with the approval of the
remaining independent trustees. Those listed as interested trustees are
"interested" primarily by virtue of their engagement as directors and/or
officers of, or ownership interest in, American Century Companies, Inc. (ACC)
or its wholly owned, direct or indirect, subsidiaries, including the funds'
investment advisor, American Century Investment Management, Inc. (ACIM or the
advisor); the funds' principal underwriter, American Century Investment
Services, Inc. (ACIS); and the funds' transfer agent, American Century
Services, LLC (ACS).
The other trustees (more than three-fourths of the total number) are
independent; that is, they have never been employees, directors or officers
of, and have no financial interest in, ACC or any of its wholly owned, direct
or indirect, subsidiaries, including ACIM, ACIS, and ACS. The trustees serve
in this capacity for eight registered investment companies in the American
Century Investments family of funds.
All persons named as officers of the funds also serve in similar capacities
for the other 14 investment companies in the American Century Investments
family of funds advised by ACIM or American Century Global Investment
Management, Inc. (ACGIM), a wholly owned subsidiary of ACIM, unless otherwise
noted. Only officers with policy-making functions are listed. No officer is
compensated for his or her service as an officer of the funds. The listed
officers are interested persons of the funds and are appointed or re-appointed
on an annual basis.
INTERESTED TRUSTEE
JONATHAN S. THOMAS, 4500 Main Street, Kansas City, MO 64111
YEAR OF BIRTH: 1963
POSITION(S) HELD WITH FUNDS: Trustee (since 2007) and President (since 2007)
PRINCIPAL OCCUPATION(S) DURING PAST 5 YEARS: President and Chief Executive
Officer, ACC (March 2007 to present); Chief Administrative Officer, ACC
(February 2006 to February 2007); Executive Vice President, ACC (November 2005
to February 2007). Also serves as: President, Chief Executive Officer and
Director, ACS; Executive Vice President, ACIM and ACGIM; Director, ACIM,
ACGIM, ACIS and other ACC subsidiaries; Managing Director, Morgan Stanley
(March 2000 to November 2005)
NUMBER OF PORTFOLIOS IN FUND COMPLEX OVERSEEN BY TRUSTEE: 111
OTHER DIRECTORSHIPS HELD BY TRUSTEE: None
INDEPENDENT TRUSTEES
JOHN FREIDENRICH, 1665 Charleston Road, Mountain View, CA 94043
YEAR OF BIRTH: 1937
POSITION(S) HELD WITH FUNDS: Trustee (since 2005)
PRINCIPAL OCCUPATION(S) DURING PAST 5 YEARS: Member and Manager, Regis
Management Company, LLC (money management firm) (April 2004 to present);
Partner and Founder, Bay Partners (venture capital firm) (1976 to 2006)
NUMBER OF PORTFOLIOS IN FUND COMPLEX OVERSEEN BY TRUSTEE: 41
OTHER DIRECTORSHIPS HELD BY TRUSTEE: None
------
45
RONALD J. GILSON, 1665 Charleston Road, Mountain View, CA 94043
YEAR OF BIRTH: 1946
POSITION(S) HELD WITH FUNDS: Trustee (since 1995) and Chairman of the Board
(since 2005)
PRINCIPAL OCCUPATION(S) DURING PAST 5 YEARS: Charles J. Meyers Professor of
Law and Business, Stanford Law School (1979 to present); Marc and Eva Stern
Professor of Law and Business, Columbia University School of Law (1992 to
present)
NUMBER OF PORTFOLIOS IN FUND COMPLEX OVERSEEN BY TRUSTEE: 41
OTHER DIRECTORSHIPS HELD BY TRUSTEE: None
FREDERICK L.A. GRAUER, 1665 Charleston Road, Mountain View, CA 94043
YEAR OF BIRTH: 1946
POSITION(S) HELD WITH FUNDS: Trustee (since 2008)
PRINCIPAL OCCUPATION(S) DURING PAST 5 YEARS: Senior Advisor, Barclays Global
Investors (asset manager) (2003 to present)
NUMBER OF PORTFOLIOS IN FUND COMPLEX OVERSEEN BY TRUSTEE: 41
OTHER DIRECTORSHIPS HELD BY TRUSTEE: None
PETER F. PERVERE, 1665 Charleston Road, Mountain View, CA 94043
YEAR OF BIRTH: 1947
POSITION(S) HELD WITH FUNDS: Trustee (since 2007)
PRINCIPAL OCCUPATION(S) DURING PAST 5 YEARS: Retired, formerly Vice President
and Chief Financial Officer, Commerce One, Inc. (software and services
provider)
NUMBER OF PORTFOLIOS IN FUND COMPLEX OVERSEEN BY TRUSTEE: 41
OTHER DIRECTORSHIPS HELD BY TRUSTEE: Director, Intraware, Inc.
MYRON S. SCHOLES, 1665 Charleston Road, Mountain View, CA 94043
YEAR OF BIRTH: 1941
POSITION(S) HELD WITH FUNDS: Trustee (since 1980)
PRINCIPAL OCCUPATION(S) DURING PAST 5 YEARS: Chairman, Platinum Grove Asset
Management, L.P. (asset manager) (1999 to present); Frank E. Buck Professor of
Finance-Emeritus, Stanford Graduate School of Business (1996 to present)
NUMBER OF PORTFOLIOS IN FUND COMPLEX OVERSEEN BY TRUSTEE: 41
OTHER DIRECTORSHIPS HELD BY TRUSTEE: Director, Dimensional Fund Advisors
(investment advisor, 1982 to present)
JOHN B. SHOVEN, 1665 Charleston Road, Mountain View, CA 94043
YEAR OF BIRTH: 1947
POSITION(S) HELD WITH FUNDS: Trustee (since 2002)
PRINCIPAL OCCUPATION(S) DURING PAST 5 YEARS: Professor of Economics, Stanford
University (1973 to present)
NUMBER OF PORTFOLIOS IN FUND COMPLEX OVERSEEN BY TRUSTEE: 41
OTHER DIRECTORSHIPS HELD BY TRUSTEE: Chairman of the Board, Cadence Design
Systems (2005 to present); (Director, Exponent (2007 to present)
JEANNE D. WOHLERS, 1665 Charleston Road, Mountain View, CA 94043
YEAR OF BIRTH: 1945
POSITION(S) HELD WITH FUNDS: Trustee (since 1984)
PRINCIPAL OCCUPATION(S) DURING PAST 5 YEARS: Retired
NUMBER OF PORTFOLIOS IN FUND COMPLEX OVERSEEN BY TRUSTEE: 41
OTHER DIRECTORSHIPS HELD BY TRUSTEE: None
------
46
OFFICERS
BARRY FINK, 4500 Main Street, Kansas City, MO 64111
YEAR OF BIRTH: 1955
POSITION(S) HELD WITH FUNDS: Executive Vice President (since 2007)
PRINCIPAL OCCUPATION(S) DURING PAST 5 YEARS: Chief Operating Officer and
Executive Vice President, ACC (September 2007 to present); President, ACS
(October 2007 to present); Managing Director, Morgan Stanley (2000 to 2007);
Global General Counsel, Morgan Stanley (2000 to 2006). Also serves as:
Director, ACC, ACS, ACIS and other ACC subsidiaries
MARYANNE ROEPKE, 4500 Main Street, Kansas City, MO 64111
YEAR OF BIRTH: 1956
POSITION(S) HELD WITH FUNDS: Chief Compliance Officer (since 2006) and Senior
Vice President (since 2000)
PRINCIPAL OCCUPATION(S) DURING PAST 5 YEARS: Chief Compliance Officer, ACIM,
ACGIM and ACS (August 2006 to present); Assistant Treasurer, ACC (January 1995
to August 2006); and Treasurer and Chief Financial Officer, various American
Century Investments funds (July 2000 to August 2006). Also serves as: Senior
Vice President, ACS
CHARLES A. ETHERINGTON, 4500 Main Street, Kansas City, MO 64111
YEAR OF BIRTH: 1957
POSITION(S) HELD WITH FUNDS: General Counsel (since 2007) and Senior Vice
President (since 2006)
PRINCIPAL OCCUPATION(S) DURING PAST 5 YEARS: Attorney, ACC (February 1994 to
present); Vice President, ACC (November 2005 to present); General Counsel, ACC
(March 2007 to present). Also serves as: General Counsel, ACIM, ACGIM, ACS,
ACIS and other ACC subsidiaries; and Senior Vice President, ACIM, ACGIM and ACS
ROBERT LEACH, 4500 Main Street, Kansas City, MO 64111
YEAR OF BIRTH: 1966
POSITION(S) HELD WITH FUNDS: Vice President, Treasurer and Chief Financial
Officer (all since 2006)
PRINCIPAL OCCUPATION(S) DURING PAST 5 YEARS: Vice President, ACS (February
2000 to present); and Controller, various American Century Investments funds
(1997 to September 2006)
JON ZINDEL, 4500 Main Street, Kansas City, MO 64111
YEAR OF BIRTH: 1967
POSITION(S) HELD WITH FUNDS: Tax Officer (since 2000)
PRINCIPAL OCCUPATION(S) DURING PAST 5 YEARS: Chief Financial Officer and Chief
Accounting Officer, ACC (March 2007 to present); Vice President, ACC (October
2001 to present); Vice President, certain ACC subsidiaries (October 2001 to
August 2006); Vice President, Corporate Tax, ACS (April 1998 to August 2006).
Also serves as: Chief Financial Officer, Chief Accounting Officer and Senior
Vice President, ACIM, ACGIM, ACS and other ACC subsidiaries; and Chief
Accounting Officer and Senior Vice President, ACIS
The SAI has additional information about the funds' trustees and is available
without charge, upon request, by calling 1-800-345-2021.
------
47
APPROVAL OF MANAGEMENT AGREEMENTS
California Long-Term Tax-Free and California High-Yield Municipal
Under Section 15(c) of the Investment Company Act, contracts for investment
advisory services are required to be reviewed, evaluated and approved by a
majority of a fund's independent directors or trustees (the "Directors") each
year. At American Century Investments, this process is referred to as the
"15(c) Process." The board oversees on a continuous basis and evaluates at its
quarterly meetings, directly and through the committees of the board, the
nature and quality of significant services provided by the advisor, the
investment performance of the funds, shareholder services, audit and
compliance functions and a variety of other matters relating to fund
operations. Each year, it also holds a special meeting in connection with
determining whether to renew the contracts for advisory services, to review
fund performance, shareholder services, adviser profitability, audit and
compliance matters, and other fund operational matters.
Under a Securities and Exchange Commission rule, each fund is required to
disclose in its annual or semiannual report, as appropriate, the material
factors and conclusions that formed the basis for the board's approval or
renewal of any advisory agreements within the fund's most recently completed
fiscal half-year period.
ANNUAL CONTRACT REVIEW PROCESS
As part of the annual 15(c) Process, the Directors reviewed extensive data and
information compiled by the advisor and certain independent providers of
evaluative data (the "15(c) Providers") concerning California Long-Term
Tax-Free and California High-Yield Municipal (the "funds") and the services
provided to the funds under the management agreement. The information
considered and the discussions held at the meetings included, but were not
limited to:
* the nature, extent and quality of investment management, shareholder
services and other services provided to the funds;
* reports on the wide range of programs and services the advisor provides to
the funds and its shareholders on a routine and non-routine basis;
* information about the compliance policies, procedures, and regulatory
experience of the advisor;
* data comparing the cost of owning the funds to the cost of owning a similar
fund;
* data comparing the funds' performance to appropriate benchmarks and/or a
peer group of other mutual funds with similar investment objectives and
strategies;
* financial data showing the profitability of the funds to the advisor and the
overall profitability of the advisor; and
* data comparing services provided and charges to other investment management
clients of the advisor.
In keeping with its practice, the Directors at a special meeting and at a
regularly scheduled quarterly meeting reviewed and discussed the information
provided by the advisor throughout the year and to negotiate with the advisor
the renewal of the management agreement, including the setting of the
applicable advisory fee. The board had the benefit of the advice of its
independent counsel throughout the period.
------
48
FACTORS CONSIDERED
The Directors considered all of the information provided by the advisor, an
independent data provider, and the board's independent counsel, and evaluated
such information for each fund for which the board has responsibility. The
Directors did not identify any single factor as being all-important or
controlling, and each Director may have attributed different levels of
importance to different factors. In deciding to renew the agreement under the
terms ultimately determined by the board to be appropriate, the Directors'
decision was based on the following factors.
NATURE, EXTENT AND QUALITY OF SERVICES -- GENERALLY. Under the management
agreement, the advisor is responsible for providing or arranging for all
services necessary for the operation of the funds. The board noted that under
the management agreement, the advisor provides or arranges at its own expense
a wide variety of services including:
* fund construction and design
* portfolio security selection
* initial capitalization/funding
* securities trading
* custody of fund assets
* daily valuation of the funds' portfolio
* shareholder servicing and transfer agency, including shareholder
confirmations, recordkeeping and communications
* legal-services
* regulatory and portfolio compliance
* financial reporting
* marketing and distribution
The Directors noted that many of these services have expanded over time both
in terms of quantity and complexity in response to shareholder demands,
competition in the industry, changing distribution channels and the changing
regulatory environment. In performing their evaluation, the Directors
considered information received in connection with the annual review, as well
as information provided on an ongoing basis at their regularly scheduled board
and committee meetings.
INVESTMENT MANAGEMENT SERVICES. The nature of the investment management
services provided is quite complex and allows fund shareholders access to
professional money management, instant diversification of their investments
within an asset class, the opportunity to easily diversify among asset
classes, and liquidity. In evaluating investment performance, the board
expects the advisor to manage the funds in accordance with its investment
objectives and approved strategies. In providing these services, the advisor
utilizes teams of investment professionals (portfolio managers, analysts,
research assistants, and securities traders) who require extensive information
technology, research, training, compliance and other systems to conduct their
business.
------
49
At each quarterly meeting and at the special meeting to consider renewal of
the advisory contract, the Directors, directly and through its Portfolio
Committee, reviews investment performance information for the funds, together
with comparative information for appropriate benchmarks and peer groups of
funds managed similarly to the funds. If performance concerns are identified,
the Directors discuss with the advisor the reasons for such results (e.g.,
market conditions, security and sector selection) and any efforts being
undertaken to improve performance. The funds' performance fell below the
median for their respective peer groups for both the one- and three-year
periods during the past year. The board discussed the funds' performance with
the advisor and was satisfied with the efforts being undertaken by the advisor.
SHAREHOLDER AND OTHER SERVICES. The advisor provides the funds with a
comprehensive package of transfer agency, shareholder, and other services. The
Directors, directly and through the various Committees of the Board, review
reports and evaluations of such services at their regular quarterly meetings
and at its special meeting to consider renewal of the Advisory Contract,
including the annual meeting concerning contract review, and reports to the
board. These reports include, but are not limited to, information regarding
the operational efficiency and accuracy of the shareholder and transfer agency
services provided, staffing levels, shareholder satisfaction (as measured by
external as well as internal sources), technology support, new products and
services offered to fund shareholders, securities trading activities,
portfolio valuation services, auditing services, and legal and operational
compliance activities. Certain aspects of shareholder and transfer agency
service level efficiency and the quality of securities trading activities are
measured by independent third party providers and are presented in comparison
to other fund groups not managed by the advisor.
COSTS OF SERVICES PROVIDED AND PROFITABILITY. The advisor provides detailed
information concerning its cost of providing various services to the fund, its
profitability in managing the fund, its overall profitability, and its
financial condition. The Directors have reviewed with the advisor the
methodology used to prepare this financial information. This financial
information regarding the advisor is considered in order to evaluate the
advisor's financial condition, its ability to continue to provide services
under the management agreement, and the reasonableness of the current
management fee.
ETHICS. The Directors generally consider the advisor's commitment to providing
quality services to shareholders and to conducting its business ethically.
They noted that the advisor's practices generally meet or exceed industry best
practices.
ECONOMIES OF SCALE. The Directors review reports provided by the advisor on
economies of scale for the complex as a whole and the year-over-year changes
in revenue, costs, and profitability. The Directors concluded that economies
of scale are difficult to measure and predict with precision, especially on a
fund-by-fund basis. This analysis is also complicated by the additional
services and content provided by the advisor and its reinvestment in its
ability to provide and expand those services. Accordingly, the Directors also
seek to evaluate economies of scale by reviewing other information, such as
year-over-year profitability of the advisor generally, the profitability of
its management of the funds specifically, and the expenses incurred by the
advisor in providing various functions to the funds. The Directors believe the
advisor is appropriately sharing economies of scale through its competitive
fee structure, fee breakpoints as the fund complex and the funds increase in
size, and through reinvestment in its business to provide shareholders
additional content and services. In particular, separate breakpoint schedules
based on the size of the entire fund complex and on the size of the funds
reflect the complexity of assessing economies of scale.
------
50
COMPARISON TO OTHER FUNDS' FEES. The funds pay the advisor a single,
all-inclusive (or unified) management fee for providing all services necessary
for the management and operation of the funds, other than brokerage expenses,
taxes, interest, extraordinary expenses, and the fees and expenses of the
funds' independent directors (including their independent legal counsel).
Under the unified fee structure, the advisor is responsible for providing all
investment advisory, custody, audit, administrative, compliance,
recordkeeping, marketing and shareholder services, or arranging and
supervising third parties to provide such services. By contrast, most other
funds are charged a variety of fees, including an investment advisory fee, a
transfer agency fee, an administrative fee, distribution charges and other
expenses. Other than their investment advisory fees and Rule 12b-1
distribution fees, all other components of the total fees charged by these
other funds may be increased without shareholder approval. The board believes
the unified fee structure is a benefit to fund shareholders because it clearly
discloses to shareholders the cost of owning fund shares, and, since the
unified fee cannot be increased without a vote of fund shareholders, it shifts
to the advisor the risk of increased costs of operating the funds and provides
a direct incentive to minimize administrative inefficiencies. Part of the
Directors' analysis of fee levels involves reviewing certain evaluative data
compiled by an independent provider and comparing the funds' unified fee to
the total expense ratio of other funds in the funds' peer group. The unified
fee charged to shareholders of California Long-Term Tax-Free and California
High-Yield Municipal was in the lowest quartile of the total expense ratios of
their peer groups.
COMPARISON TO FEES AND SERVICES PROVIDED TO OTHER CLIENTS OF THE ADVISOR. The
Directors also requested and received information from the advisor concerning
the nature of the services, fees, and profitability of its advisory services
to advisory clients other than the funds. They observed that these varying
types of client accounts require different services and involve different
regulatory and entrepreneurial risks than the management of the funds. The
Directors analyzed this information and concluded that the fees charged and
services provided to the funds were reasonable by comparison.
COLLATERAL BENEFITS DERIVED BY THE ADVISOR. The Directors reviewed information
from the advisor concerning collateral benefits it receives as a result of its
relationship with the funds. They concluded that the advisor's primary
business is managing mutual funds and it generally does not use fund or
shareholder information to generate profits in other lines of business, and
therefore does not derive any significant collateral benefits from them. The
Directors noted that the advisor receives proprietary research from
broker-dealers that execute fund portfolio transactions and concluded that
this research is likely to benefit fund shareholders. The Directors also
determined that the advisor is able to provide investment management services
to certain clients other than the funds, at least in part, due to its existing
infrastructure built to serve the fund complex. The Directors concluded,
however, that the assets of those other clients are not material to the
analysis and, in any event, are included with the assets of the funds to
determine breakpoints in the funds' fee schedule, provided they are managed
using the same investment team and strategy.
CONCLUSIONS OF THE DIRECTORS
As a result of this process, the Directors, in the absence of particular
circumstances and assisted by the advice of legal counsel that is independent
of the advisor, taking into account all of the factors discussed above and the
information provided by the advisor and others concluded that the investment
management agreement between the fund and the advisor is fair and reasonable
in light of the services provided and should be renewed.
------
51
ADDITIONAL INFORMATION
PROXY VOTING GUIDELINES
American Century Investment Management, Inc., the funds' investment advisor,
is responsible for exercising the voting rights associated with the securities
purchased and/or held by the funds. A description of the policies and
procedures the advisor uses in fulfilling this responsibility is available
without charge, upon request, by calling 1-800-345-2021. It is also available
on American Century Investments' website at americancentury.com and on the
Securities and Exchange Commission's website at sec.gov. Information regarding
how the investment advisor voted proxies relating to portfolio securities
during the most recent 12-month period ended June 30 is available on the
"About Us" page at americancentury.com. It is also available at sec.gov.
QUARTERLY PORTFOLIO DISCLOSURE
The funds file their complete schedule of portfolio holdings with the
Securities and Exchange Commission (SEC) for the first and third quarters of
each fiscal year on Form N-Q. The funds' Forms N-Q are available on the SEC's
website at sec.gov, and may be reviewed and copied at the SEC's Public
Reference Room in Washington, DC. Information on the operation of the Public
Reference Room may be obtained by calling 1-800-SEC-0330. The funds also make
their complete schedule of portfolio holdings for the most recent quarter of
their fiscal year available on their website at americancentury.com and, upon
request, by calling 1-800-345-2021.
------
52
INDEX DEFINITIONS
The following indices are used to illustrate investment market, sector, or
style performance or to serve as fund performance comparisons. They are not
investment products available for purchase.
The LEHMAN BROTHERS 3-YEAR MUNICIPAL BOND INDEX is composed of those
securities included in the Lehman Brothers Municipal Bond Index that are
investment-grade and have maturities between two and four years.
The LEHMAN BROTHERS 5-YEAR GENERAL OBLIGATION (GO) INDEX is composed of
investment-grade U.S. municipal securities, with maturities of four to six
years, that are general obligations of a state or local government.
The LEHMAN BROTHERS LONG-TERM MUNICIPAL BOND INDEX is composed of those
securities included in the Lehman Brothers Municipal Bond Index that have
maturities greater than 22 years.
The LEHMAN BROTHERS MUNICIPAL BOND INDEX is a market value-weighted index
designed for the long-term tax-exempt bond market.
The LEHMAN BROTHERS NON-INVESTMENT-GRADE MUNICIPAL BOND INDEX is composed of
non-investment grade U.S. municipal securities with a remaining maturity of
one year or more.
The LEHMAN BROTHERS U.S. AGGREGATE INDEX represents securities that are
taxable, registered with the Securities and Exchange Commission, and U.S.
dollar-denominated. The index covers the U.S. investment-grade fixed-rate bond
market, with index components for government and corporate securities,
mortgage pass-through securities, and asset-backed securities.
The LEHMAN BROTHERS U.S. TREASURY INDEX is composed of those securities
included in the Lehman Brothers U.S. Aggregate Index that are public
obligations of the U.S. Treasury with a remaining maturity of one year or more.
------
53
NOTES
------
54
NOTES
------
55
NOTES
------
56
[back cover]
CONTACT US
AMERICANCENTURY.COM
AUTOMATED INFORMATION LINE . . . . . . . . . . . . . . . 1-800-345-8765
INVESTOR SERVICES REPRESENTATIVE . . . . . . . . . . . . 1-800-345-2021 or
816-531-5575
INVESTORS USING ADVISORS . . . . . . . . . . . . . . . . 1-800-378-9878
BUSINESS, NOT-FOR-PROFIT, EMPLOYER-SPONSORED
RETIREMENT PLANS . . . . . . . . . . . . . . . . . . . . 1-800-345-3533
BANKS AND TRUST COMPANIES, BROKER-DEALERS,
FINANCIAL PROFESSIONALS, INSURANCE COMPANIES . . . . . . 1-800-345-6488
TELECOMMUNICATIONS DEVICE FOR THE DEAF . . . . . . . . . 1-800-634-4113
AMERICAN CENTURY CALIFORNIA TAX-FREE AND MUNICIPAL FUNDS
INVESTMENT ADVISOR:
American Century Investment Management, Inc.
Kansas City, Missouri
This report and the statements it contains are submitted for the general
information of our shareholders. The report is not authorized for distribution to
prospective investors unless preceded or accompanied by an effective prospectus.
American Century Investment Services, Inc., Distributor
©2008 American Century Proprietary Holdings, Inc. All rights reserved.
0810
CL-ANN-61599N
ITEM 2. CODE OF ETHICS.
(a) The registrant has adopted a Code of Ethics for Senior Financial Officers
that applies to the registrant's principal executive officer, principal
financial officer, principal accounting officer, and persons performing
similar functions.
(b) No response required.
(c) None.
(d) None.
(e) Not applicable.
(f) The registrant's Code of Ethics for Senior Financial Officers was filed as
Exhibit 12 (a)(1) to American Century Asset Allocation Portfolios, Inc.'s
Annual Certified Shareholder Report on Form N-CSR, File No. 811-21591, on
September 29, 2005, and is incorporated herein by reference.
ITEM 3. AUDIT COMMITTEE FINANCIAL EXPERT.
(a)(1) The registrant's board has determined that the registrant has at least
one audit committee financial expert serving on its audit committee.
(a)(2) Peter F. Pervere, Jeanne D. Wohlers and Ronald J. Gilson are the
registrant's designated audit committee financial experts. They are
"independent" as defined in Item 3 of Form N-CSR.
(a)(3) Not applicable.
(b) No response required.
(c) No response required.
(d) No response required.
ITEM 4. PRINCIPAL ACCOUNTANT FEES AND SERVICES.
(a) Audit Fees.
The aggregate fees billed for each of the last two fiscal years for professional
services rendered by the principal accountant for the audit of the registrant's
annual financial statements or services that are normally provided by the
accountant in connection with statutory and regulatory filings or engagements
for those fiscal years were as follows:
FY 2007: $93,907
FY 2008: $85,356
(b) Audit-Related Fees.
The aggregate fees billed in each of the last two fiscal years for assurance and
related services by the principal accountant that are reasonably related to the
performance of the audit of the registrant's financial statements and are not
reported under paragraph (a) of this Item were as follows:
For services rendered to the registrant:
FY 2007: $0
FY 2008: $0
Fees required to be approved pursuant to paragraph (c)(7)(ii) of Rule
2-01 of Regulation S-X (relating to certain engagements for non-audit
services with the registrant's investment adviser and its affiliates):
FY 2007: $0
FY 2008: $0
(c) Tax Fees.
The aggregate fees billed in each of the last two fiscal years for professional
services rendered by the principal accountant for tax compliance, tax advice,
and tax planning were as follows:
For services rendered to the registrant:
FY 2007: $0
FY 2008: $0
Fees required to be approved pursuant to paragraph (c)(7)(ii) of Rule
2-01 of Regulation S-X (relating to certain engagements for non-audit
services with the registrant's investment adviser and its affiliates):
FY 2007: $0
FY 2008: $0
(d) All Other Fees.
The aggregate fees billed in each of the last two fiscal years for products and
services provided by the principal accountant, other than the services reported
in paragraphs (a) through (c) of this Item were as follows:
For services rendered to the registrant:
FY 2007: $0
FY 2008: $0
Fees required to be approved pursuant to paragraph (c)(7)(ii) of Rule
2-01 of Regulation S-X (relating to certain engagements for non-audit
services with the registrant's investment adviser and its affiliates):
FY 2007: $0
FY 2008: $0
(e)(1) In accordance with paragraph (c)(7)(i)(A) of Rule 2-01 of Regulation
S-X, before the accountant is engaged by the registrant to render audit
or non-audit services, the engagement is approved by the registrant's
audit committee. Pursuant to paragraph (c)(7)(ii) of Rule 2-01 of
Regulation S-X, the registrant's audit committee also pre-approves its
accountant's engagements for non-audit services with the registrant's
investment adviser, its parent company, and any entity controlled by,
or under common control with the investment adviser that provides
ongoing services to the registrant, if the engagement relates directly
to the operations and financial reporting of the registrant.
(e)(2) All services described in each of paragraphs (b) through (d) of this
Item were pre-approved before the engagement by the registrant's audit
committee pursuant to paragraph (c)(7)(i)(A) of Rule 2-01 of Regulation
S-X. Consequently, none of such services were required to be approved
by the audit committee pursuant to paragraph (c)(7)(i)(C).
(f) The percentage of hours expended on the principal accountant's
engagement to audit the registrant's financial statements for the most
recent fiscal year that were attributed to work performed by persons
other than the principal accountant's full-time, permanent employees
was less than 50%.
(g) The aggregate non-audit fees billed by the registrant's accountant for
services rendered to the registrant, and rendered to the registrant's
investment adviser (not including any sub-adviser whose role is
primarily portfolio management and is subcontracted with or overseen by
another investment adviser), and any entity controlling, controlled by,
or under common control with the adviser that provides ongoing services
to the registrant for each of the last two fiscal years of the
registrant were as follows:
FY 2007: $96,897
FY 2008: $90,000
(h) The registrant's investment adviser and accountant have notified the
registrant's audit committee of all non-audit services that were
rendered by the registrant's accountant to the registrant's investment
adviser, its parent company, and any entity controlled by, or under
common control with the investment adviser that provides services to
the registrant, which services were not required to be pre-approved
pursuant to paragraph (c)(7)(ii) of Rule 2-01 of Regulation S-X. The
notification provided to the registrant's audit committee included
sufficient details regarding such services to allow the registrant's
audit committee to consider the continuing independence of its
principal accountant.
ITEM 5. AUDIT COMMITTEE OF LISTED REGISTRANTS.
Not applicable.
ITEM 6. INVESTMENTS.
(a) The schedule of investments is included as part of the report to
stockholders filed under Item 1 of this Form.
(b) Not applicable.
ITEM 7. DISCLOSURE OF PROXY VOTING POLICIES AND PROCEDURES FOR CLOSED-END
MANAGEMENT INVESTMENT COMPANIES.
Not applicable.
ITEM 8. PORTFOLIO MANAGERS OF CLOSED-END MANAGEMENT INVESTMENT COMPANIES.
Not applicable.
ITEM 9. PURCHASES OF EQUITY SECURITIES BY CLOSED-END MANAGEMENT INVESTMENT
COMPANY AND AFFILIATED PURCHASERS.
Not applicable.
ITEM 10. SUBMISSION OF MATTERS TO A VOTE OF SECURITY HOLDERS.
During the reporting period, there were no material changes to the procedures by
which shareholders may recommend nominees to the registrant's board.
ITEM 11. CONTROLS AND PROCEDURES.
(a) The registrant's principal executive officer and principal financial
officer have concluded that the registrant's disclosure controls and
procedures (as defined in Rule 30a-3(c) under the Investment Company Act of
1940) are effective based on their evaluation of these controls and
procedures as of a date within 90 days of the filing date of this report.
(b) There were no changes in the registrant's internal control over financial
reporting (as defined in Rule 30a-3(d) under the Investment Company Act of
1940) that occurred during the registrant's second fiscal quarter of the
period covered by this report that have materially affected, or are
reasonably likely to materially affect, the registrant's internal control
over financial reporting.
ITEM 12. EXHIBITS.
(a)(1) Registrant's Code of Ethics for Senior Financial Officers, which is the
subject of the disclosure required by Item 2 of Form N-CSR, was filed
as Exhibit 12(a)(1) to American Century Asset Allocation Portfolios,
Inc.'s Certified Shareholder Report on Form N-CSR, File No. 811-21591,
on September 29, 2005.
(a)(2) Separate certifications by the registrant's principal executive officer
and principal financial officer, pursuant to Section 302 of the
Sarbanes-Oxley Act of 2002 and Rule 30a-2(a) under the Investment
Company Act of 1940, are filed and attached hereto as Exhibit
99.302CERT.
(a)(3) Not applicable.
(b) A certification by the registrant's chief executive officer and chief
financial officer, pursuant to Section 906 of the Sarbanes-Oxley Act of
2002, is furnished and attached hereto as Exhibit 99.906CERT.
SIGNATURES
Pursuant to the requirements of the Securities Exchange Act of 1934 and the
Investment Company Act of 1940, the registrant has duly caused this report to be
signed on its behalf by the undersigned, thereunto duly authorized.
Registrant: AMERICAN CENTURY CALIFORNIA TAX-FREE AND MUNICIPAL FUNDS
By: /s/ Jonathan S. Thomas
--------------------------------------------
Name: Jonathan S. Thomas
Title: President
Date: October 30, 2008
Pursuant to the requirements of the Securities Exchange Act of 1934 and the
Investment Company Act of 1940, this report has been signed below by the
following persons on behalf of the registrant and in the capacities and on the
dates indicated.
By: /s/ Jonathan S. Thomas
--------------------------------------------
Name: Jonathan S. Thomas
Title: President
(principal executive officer)
Date: October 30, 2008
By: /s/ Robert J. Leach
--------------------------------------------
Name: Robert J. Leach
Title: Vice President, Treasurer, and
Chief Financial Officer
(principal financial officer)
Date: October 30, 2008