false--12-31Q220240000716634http://fasb.org/us-gaap/2024#SecuredOvernightFinancingRateSofrOvernightIndexSwapRateMemberhttp://fasb.org/us-gaap/2024#SecuredOvernightFinancingRateSofrOvernightIndexSwapRateMemberhttp://fasb.org/us-gaap/2024#InterestExpensehttp://fasb.org/us-gaap/2024#InterestExpenseP10YP1Y0000716634us-gaap:TreasuryStockCommonMember2024-06-300000716634us-gaap:TreasuryStockCommonMember2024-03-310000716634us-gaap:TreasuryStockCommonMember2023-12-310000716634us-gaap:TreasuryStockCommonMember2023-06-300000716634us-gaap:TreasuryStockCommonMember2023-03-310000716634us-gaap:TreasuryStockCommonMember2022-12-310000716634us-gaap:CommonClassAMember2023-01-012023-06-300000716634us-gaap:CommonClassAMemberrdi:CommonStockSharesOutstandingMember2024-04-012024-06-300000716634us-gaap:CommonClassAMemberrdi:CommonStockSharesOutstandingMember2024-01-012024-03-310000716634us-gaap:CommonClassAMemberrdi:CommonStockSharesOutstandingMember2023-04-012023-06-300000716634us-gaap:CommonClassAMemberrdi:CommonStockSharesOutstandingMember2023-01-012023-03-310000716634us-gaap:RetainedEarningsMember2024-06-300000716634us-gaap:ParentMember2024-06-300000716634us-gaap:NoncontrollingInterestMember2024-06-300000716634us-gaap:AdditionalPaidInCapitalMember2024-06-300000716634us-gaap:RetainedEarningsMember2024-03-310000716634us-gaap:ParentMember2024-03-310000716634us-gaap:NoncontrollingInterestMember2024-03-310000716634us-gaap:AdditionalPaidInCapitalMember2024-03-310000716634us-gaap:AccumulatedOtherComprehensiveIncomeMember2024-03-3100007166342024-03-310000716634us-gaap:RetainedEarningsMember2023-12-310000716634us-gaap:ParentMember2023-12-310000716634us-gaap:NoncontrollingInterestMember2023-12-310000716634us-gaap:AdditionalPaidInCapitalMember2023-12-310000716634us-gaap:RetainedEarningsMember2023-06-300000716634us-gaap:ParentMember2023-06-300000716634us-gaap:NoncontrollingInterestMember2023-06-300000716634us-gaap:AdditionalPaidInCapitalMember2023-06-300000716634us-gaap:AccumulatedOtherComprehensiveIncomeMember2023-06-300000716634us-gaap:RetainedEarningsMember2023-03-310000716634us-gaap:ParentMember2023-03-310000716634us-gaap:NoncontrollingInterestMember2023-03-310000716634us-gaap:AdditionalPaidInCapitalMember2023-03-310000716634us-gaap:AccumulatedOtherComprehensiveIncomeMember2023-03-3100007166342023-03-310000716634us-gaap:RetainedEarningsMember2022-12-310000716634us-gaap:ParentMember2022-12-310000716634us-gaap:NoncontrollingInterestMember2022-12-310000716634us-gaap:AdditionalPaidInCapitalMember2022-12-310000716634us-gaap:AccumulatedOtherComprehensiveIncomeMember2022-12-310000716634us-gaap:AccumulatedTranslationAdjustmentMember2024-06-300000716634us-gaap:AccumulatedOtherComprehensiveIncomeMember2024-06-300000716634us-gaap:AccumulatedNetUnrealizedInvestmentGainLossMember2024-06-300000716634us-gaap:AccumulatedGainLossNetCashFlowHedgeParentMember2024-06-300000716634us-gaap:AccumulatedDefinedBenefitPlansAdjustmentMember2024-06-300000716634us-gaap:AccumulatedTranslationAdjustmentMember2023-12-310000716634us-gaap:AccumulatedOtherComprehensiveIncomeMember2023-12-310000716634us-gaap:AccumulatedNetUnrealizedInvestmentGainLossMember2023-12-310000716634us-gaap:AccumulatedDefinedBenefitPlansAdjustmentMember2023-12-310000716634us-gaap:CommonClassAMember2022-01-012022-12-310000716634us-gaap:CommonClassAMember2022-12-310000716634rdi:SeniorExecutivesMemberus-gaap:CommonClassAMember2024-06-062024-06-060000716634srt:DirectorMemberus-gaap:CommonClassAMember2024-01-012024-06-300000716634us-gaap:CommonClassAMember2023-01-012023-12-310000716634rdi:TwoThousandTwentyStockIncentivePlanMemberus-gaap:CommonClassAMember2024-06-300000716634rdi:TwoThousandTwentyStockIncentivePlanMemberus-gaap:CommonClassAMember2024-01-012024-06-300000716634rdi:TwoThousandTwentyStockIncentivePlanMemberus-gaap:CommonClassAMember2023-12-072023-12-070000716634rdi:AwardDate8Memberus-gaap:RestrictedStockUnitsRSUMember2024-06-300000716634rdi:AwardDate12Memberus-gaap:RestrictedStockUnitsRSUMember2024-06-300000716634rdi:AwardDate11Memberus-gaap:RestrictedStockUnitsRSUMember2024-06-300000716634rdi:AwardDate10Memberus-gaap:RestrictedStockUnitsRSUMember2024-06-300000716634us-gaap:RestrictedStockUnitsRSUMember2023-12-310000716634srt:ManagementMemberrdi:AwardDate8Memberus-gaap:RestrictedStockUnitsRSUMember2024-01-012024-06-300000716634srt:ManagementMemberrdi:AwardDate12Memberus-gaap:RestrictedStockUnitsRSUMember2024-01-012024-06-300000716634srt:ManagementMemberrdi:AwardDate11Memberus-gaap:RestrictedStockUnitsRSUMember2024-01-012024-06-300000716634srt:ManagementMemberrdi:AwardDate10Memberus-gaap:RestrictedStockUnitsRSUMember2024-01-012024-06-300000716634srt:DirectorMemberrdi:AwardDate9Memberus-gaap:RestrictedStockUnitsRSUMember2024-01-012024-06-300000716634us-gaap:RestrictedStockUnitsRSUMemberus-gaap:ShareBasedCompensationAwardTrancheTwoMember2024-01-012024-06-300000716634us-gaap:RestrictedStockUnitsRSUMemberus-gaap:ShareBasedCompensationAwardTrancheOneMember2024-01-012024-06-300000716634us-gaap:RestrictedStockUnitsRSUMemberrdi:TwoThousandTwentyStockIncentivePlanMember2024-01-012024-06-300000716634srt:DirectorMemberus-gaap:RestrictedStockUnitsRSUMember2024-01-012024-06-300000716634rdi:AwardDate9Memberus-gaap:RestrictedStockUnitsRSUMember2024-01-012024-06-300000716634rdi:AwardDate12Memberus-gaap:RestrictedStockUnitsRSUMember2024-01-012024-06-300000716634srt:ManagementMemberus-gaap:RestrictedStockUnitsRSUMember2023-01-012023-12-310000716634srt:DirectorMemberus-gaap:RestrictedStockUnitsRSUMember2023-01-012023-12-310000716634rdi:AwardDate8Memberus-gaap:RestrictedStockUnitsRSUMember2024-01-012024-06-300000716634rdi:AwardDate11Memberus-gaap:RestrictedStockUnitsRSUMember2024-01-012024-06-300000716634rdi:AwardDate10Memberus-gaap:RestrictedStockUnitsRSUMember2024-01-012024-06-300000716634us-gaap:RestrictedStockUnitsRSUMember2023-01-012023-12-310000716634srt:ExecutiveOfficerMemberus-gaap:RestrictedStockUnitsRSUMemberus-gaap:ShareBasedCompensationAwardTrancheTwoMember2021-04-302021-04-300000716634srt:ExecutiveOfficerMemberus-gaap:RestrictedStockUnitsRSUMemberus-gaap:ShareBasedCompensationAwardTrancheOneMember2021-04-302021-04-300000716634srt:ChiefExecutiveOfficerMemberus-gaap:RestrictedStockUnitsRSUMemberus-gaap:ShareBasedCompensationAwardTrancheTwoMember2021-04-302021-04-300000716634srt:ChiefExecutiveOfficerMemberus-gaap:RestrictedStockUnitsRSUMemberus-gaap:ShareBasedCompensationAwardTrancheOneMember2021-04-302021-04-300000716634srt:MinimumMemberrdi:TwoThousandTwentyStockIncentivePlanMember2024-01-012024-06-300000716634srt:MaximumMemberrdi:TwoThousandTwentyStockIncentivePlanMember2024-01-012024-06-300000716634srt:ExecutiveOfficerMemberus-gaap:RestrictedStockUnitsRSUMember2024-01-012024-06-300000716634srt:ChiefExecutiveOfficerMemberus-gaap:RestrictedStockUnitsRSUMember2024-01-012024-06-300000716634srt:DirectorMember2024-01-012024-06-300000716634rdi:SeniorExecutivesMember2024-01-012024-06-300000716634us-gaap:IntersegmentEliminationMember2024-04-012024-06-300000716634us-gaap:IntersegmentEliminationMember2024-01-012024-06-300000716634us-gaap:IntersegmentEliminationMember2023-04-012023-06-300000716634us-gaap:IntersegmentEliminationMember2023-01-012023-06-300000716634rdi:RotoruaCinemaBuildingMemberus-gaap:DisposalGroupHeldforsaleNotDiscontinuedOperationsMember2024-06-300000716634rdi:CourtenayCentralEtcMemberus-gaap:DisposalGroupHeldforsaleNotDiscontinuedOperationsMember2024-06-300000716634rdi:TrentonAvenueWilliamsportPennsylvaniaMemberus-gaap:DisposalGroupDisposedOfBySaleNotDiscontinuedOperationsMember2023-06-300000716634rdi:CulverCityLosAngelesMemberus-gaap:DisposalGroupHeldforsaleNotDiscontinuedOperationsMember2023-05-310000716634us-gaap:LeaseholdImprovementsMember2024-06-300000716634us-gaap:LandMember2024-06-300000716634us-gaap:FurnitureAndFixturesMember2024-06-300000716634us-gaap:ConstructionInProgressMember2024-06-300000716634us-gaap:BuildingAndBuildingImprovementsMember2024-06-300000716634us-gaap:LeaseholdImprovementsMember2023-12-310000716634us-gaap:FurnitureAndFixturesMember2023-12-310000716634us-gaap:ConstructionInProgressMember2023-12-310000716634us-gaap:BuildingAndBuildingImprovementsMember2023-12-310000716634us-gaap:RetainedEarningsMember2024-04-012024-06-300000716634us-gaap:RetainedEarningsMember2024-01-012024-03-310000716634us-gaap:RetainedEarningsMember2023-04-012023-06-300000716634us-gaap:RetainedEarningsMember2023-01-012023-03-310000716634us-gaap:NoncontrollingInterestMember2024-04-012024-06-300000716634us-gaap:AccumulatedOtherComprehensiveIncomeMember2024-04-012024-06-300000716634us-gaap:AccumulatedTranslationAdjustmentMember2024-01-012024-06-300000716634us-gaap:AccumulatedNetUnrealizedInvestmentGainLossMember2024-01-012024-06-300000716634us-gaap:AccumulatedDefinedBenefitPlansAdjustmentMember2024-01-012024-06-300000716634us-gaap:NoncontrollingInterestMember2024-01-012024-03-310000716634us-gaap:AccumulatedOtherComprehensiveIncomeMember2024-01-012024-03-310000716634us-gaap:NoncontrollingInterestMember2023-04-012023-06-300000716634us-gaap:AccumulatedOtherComprehensiveIncomeMember2023-04-012023-06-300000716634us-gaap:NoncontrollingInterestMember2023-01-012023-03-310000716634us-gaap:AccumulatedOtherComprehensiveIncomeMember2023-01-012023-03-310000716634us-gaap:InterestRateContractMemberus-gaap:DesignatedAsHedgingInstrumentMember2024-04-012024-06-300000716634us-gaap:DesignatedAsHedgingInstrumentMember2024-04-012024-06-300000716634us-gaap:InterestRateContractMemberus-gaap:DesignatedAsHedgingInstrumentMember2024-01-012024-06-300000716634us-gaap:DesignatedAsHedgingInstrumentMember2024-01-012024-06-300000716634us-gaap:InterestRateContractMemberus-gaap:DesignatedAsHedgingInstrumentMember2023-04-012023-06-300000716634us-gaap:InterestRateContractMemberus-gaap:DesignatedAsHedgingInstrumentMember2023-01-012023-06-300000716634us-gaap:OperatingSegmentsMemberrdi:RealEstateSegmentMember2024-04-012024-06-300000716634us-gaap:OperatingSegmentsMemberrdi:CinemaExhibitionSegmentMember2024-04-012024-06-300000716634us-gaap:OperatingSegmentsMember2024-04-012024-06-300000716634us-gaap:OperatingSegmentsMemberrdi:RealEstateSegmentMember2024-01-012024-06-300000716634us-gaap:OperatingSegmentsMemberrdi:CinemaExhibitionSegmentMember2024-01-012024-06-300000716634us-gaap:OperatingSegmentsMember2024-01-012024-06-300000716634us-gaap:OperatingSegmentsMemberrdi:RealEstateSegmentMember2023-04-012023-06-300000716634us-gaap:OperatingSegmentsMemberrdi:CinemaExhibitionSegmentMember2023-04-012023-06-300000716634us-gaap:OperatingSegmentsMember2023-04-012023-06-300000716634us-gaap:OperatingSegmentsMemberrdi:RealEstateSegmentMember2023-01-012023-06-300000716634us-gaap:OperatingSegmentsMemberrdi:CinemaExhibitionSegmentMember2023-01-012023-06-300000716634us-gaap:OperatingSegmentsMember2023-01-012023-06-300000716634rdi:SuttonHillPropertiesMember2024-04-012024-06-300000716634rdi:AustraliaCountryCinemasMember2024-04-012024-06-300000716634rdi:SuttonHillPropertiesMember2023-04-012023-06-300000716634rdi:AustraliaCountryCinemasMember2023-04-012023-06-300000716634rdi:SuttonHillPropertiesMember2023-01-012023-06-300000716634rdi:AustraliaCountryCinemasMember2023-01-012023-06-300000716634rdi:SuttonHillPropertiesMember2024-06-300000716634rdi:SuttonHillCapitalLlcMember2024-06-300000716634rdi:ShadowViewLandAndFarmingLlcMember2024-06-300000716634rdi:AustraliaCountryCinemasMember2024-06-300000716634us-gaap:RevolvingCreditFacilityMemberrdi:NationalAustraliaBankAustralianCorporateTermLoanAndRevolverTierThreeMember2024-06-300000716634rdi:NationalAustraliaBankAustralianCorporateTermLoanAndRevolverTierThreeMemberrdi:CoreFacilityMember2024-06-300000716634rdi:NationalAustraliaBankAustralianCorporateTermLoanAndRevolverTierThreeMember2024-06-300000716634rdi:CorporateLoanFacilityMember2024-06-300000716634rdi:NationalAustraliaBankGuaranteeFacilityMember2024-04-040000716634rdi:BankGuaranteeFacilityMember2024-06-300000716634rdi:RealEstateRevenueMembersrt:MinimumMember2024-06-300000716634rdi:RealEstateRevenueMembersrt:MaximumMember2024-06-300000716634srt:MinimumMember2024-06-300000716634srt:MaximumMember2024-06-300000716634rdi:RialtoCinemasMember2024-04-012024-06-300000716634rdi:MtGravattCinemaMember2024-04-012024-06-300000716634rdi:RialtoCinemasMember2024-01-012024-06-300000716634rdi:MtGravattCinemaMember2024-01-012024-06-300000716634rdi:RialtoCinemasMember2023-04-012023-06-300000716634rdi:MtGravattCinemaMember2023-04-012023-06-300000716634rdi:RialtoCinemasMember2023-01-012023-06-300000716634rdi:MtGravattCinemaMember2023-01-012023-06-300000716634rdi:BusinessSegmentCinemaMember2024-01-012024-06-300000716634rdi:BusinessSegmentRealEstateMember2024-06-300000716634rdi:BusinessSegmentCinemaMember2024-06-300000716634rdi:BusinessSegmentRealEstateMember2023-12-310000716634rdi:BusinessSegmentCinemaMember2023-12-310000716634us-gaap:TradeNamesMember2024-06-300000716634us-gaap:OtherIntangibleAssetsMember2024-06-300000716634rdi:BeneficialLeasesMember2024-06-300000716634us-gaap:TradeNamesMember2023-12-310000716634rdi:BeneficialLeasesMember2023-12-310000716634us-gaap:FairValueInputsLevel3Memberus-gaap:FairValueMeasurementsNonrecurringMember2024-06-300000716634us-gaap:CarryingReportedAmountFairValueDisclosureMemberus-gaap:FairValueMeasurementsNonrecurringMember2024-06-300000716634us-gaap:FairValueMeasurementsNonrecurringMember2024-06-300000716634us-gaap:FairValueInputsLevel3Memberus-gaap:FairValueMeasurementsNonrecurringMember2023-12-310000716634us-gaap:CarryingReportedAmountFairValueDisclosureMemberus-gaap:FairValueMeasurementsNonrecurringMember2023-12-310000716634us-gaap:FairValueMeasurementsNonrecurringMember2023-12-310000716634rdi:RialtoCinemasMember2023-12-310000716634rdi:MtGravattCinemaMember2023-12-310000716634rdi:RialtoCinemasMember2024-06-300000716634rdi:MtGravattCinemaMember2024-06-300000716634us-gaap:StockOptionMember2024-06-300000716634us-gaap:RestrictedStockUnitsRSUMember2024-06-300000716634us-gaap:DesignatedAsHedgingInstrumentMember2024-06-300000716634us-gaap:DesignatedAsHedgingInstrumentMember2023-12-310000716634us-gaap:DesignatedAsHedgingInstrumentMember2023-04-012023-06-300000716634us-gaap:DesignatedAsHedgingInstrumentMember2023-01-012023-06-300000716634us-gaap:InterestRateContractMember2023-04-012023-06-300000716634us-gaap:InterestRateContractMember2023-01-012023-06-300000716634us-gaap:CorporateNonSegmentMember2024-04-012024-06-300000716634us-gaap:CorporateNonSegmentMember2024-01-012024-06-300000716634us-gaap:CorporateNonSegmentMember2023-04-012023-06-300000716634us-gaap:CorporateNonSegmentMember2023-01-012023-06-300000716634rdi:UnitedStatesBankOfAmericaCreditFacilityMember2024-03-272024-03-270000716634rdi:CorporateLoanFacilityMember2024-01-012024-06-300000716634rdi:NationalAustraliaBankGuaranteeFacilityMember2024-01-012024-06-300000716634rdi:NationalAustraliaBankBridgeFacilityMember2024-01-012024-06-300000716634rdi:NewZealandCorporateCreditFacilityMemberrdi:BankBillSwapBidRateMember2024-06-300000716634rdi:PurchaseMoneyPromissoryNoteMember2019-09-180000716634srt:MinimumMemberrdi:UnitedStateCorporateOfficeTermLoanMember2023-12-310000716634srt:MaximumMemberrdi:UnitedStateCorporateOfficeTermLoanMember2023-12-310000716634srt:MinimumMemberrdi:UnitedStateCorporateOfficeTermLoanMember2023-01-012023-12-310000716634srt:MaximumMemberrdi:UnitedStateCorporateOfficeTermLoanMember2023-01-012023-12-310000716634rdi:EmeraldCreekCapitalMember2024-06-300000716634rdi:UnitedStatesBankOfAmericaCreditFacilityMemberus-gaap:PrimeRateMember2024-01-012024-06-300000716634rdi:UnitedStatesBankOfAmericaCreditFacilityMemberrdi:FloorRateMember2024-01-012024-06-300000716634rdi:NationalAustraliaBankAustralianCorporateTermLoanAndRevolverTierThreeMember2024-01-012024-06-300000716634rdi:AustralianNabBankGuaranteeFacilityTier3Member2024-01-012024-06-300000716634rdi:SantanderBankMember2024-06-300000716634rdi:RealEstateRevenueMember2024-04-012024-06-300000716634rdi:CinemaMember2024-04-012024-06-300000716634rdi:RealEstateRevenueMember2024-01-012024-06-300000716634rdi:CinemaMember2024-01-012024-06-300000716634rdi:RealEstateRevenueMember2023-04-012023-06-300000716634rdi:CinemaMember2023-04-012023-06-300000716634rdi:RealEstateRevenueMember2023-01-012023-06-300000716634rdi:CinemaMember2023-01-012023-06-300000716634rdi:OtherRealEstateProjectsMemberrdi:OperatingAndInvestingPropertiesMember2024-06-300000716634rdi:CinemaDevelopmentsAndImprovementsMemberrdi:OperatingAndInvestingPropertiesMember2024-06-300000716634rdi:OperatingAndInvestingPropertiesMember2024-06-300000716634rdi:OtherRealEstateProjectsMemberrdi:OperatingAndInvestingPropertiesMember2023-12-310000716634rdi:CourtenayCentralDevelopmentMemberrdi:OperatingAndInvestingPropertiesMember2023-12-310000716634rdi:CinemaDevelopmentsAndImprovementsMemberrdi:OperatingAndInvestingPropertiesMember2023-12-310000716634rdi:OperatingAndInvestingPropertiesMember2023-12-310000716634us-gaap:CommonClassBMemberrdi:CommonStockSharesOutstandingMember2024-06-300000716634us-gaap:CommonClassAMemberrdi:CommonStockSharesOutstandingMember2024-06-300000716634us-gaap:CommonClassBMemberrdi:CommonStockSharesOutstandingMember2024-03-310000716634us-gaap:CommonClassAMemberrdi:CommonStockSharesOutstandingMember2024-03-310000716634us-gaap:CommonClassBMemberrdi:CommonStockSharesOutstandingMember2023-12-310000716634us-gaap:CommonClassAMemberrdi:CommonStockSharesOutstandingMember2023-12-310000716634us-gaap:CommonClassBMemberrdi:CommonStockSharesOutstandingMember2023-06-300000716634us-gaap:CommonClassAMemberrdi:CommonStockSharesOutstandingMember2023-06-300000716634us-gaap:CommonClassBMemberrdi:CommonStockSharesOutstandingMember2023-03-310000716634us-gaap:CommonClassAMemberrdi:CommonStockSharesOutstandingMember2023-03-310000716634us-gaap:CommonClassBMemberrdi:CommonStockSharesOutstandingMember2022-12-310000716634us-gaap:CommonClassAMemberrdi:CommonStockSharesOutstandingMember2022-12-310000716634us-gaap:CommonClassBMember2024-06-300000716634us-gaap:CommonClassAMember2024-06-300000716634us-gaap:CommonClassBMember2023-12-310000716634us-gaap:CommonClassAMember2023-12-3100007166342022-12-3100007166342023-06-300000716634rdi:CannonParkEtcMemberus-gaap:DisposalGroupHeldforsaleNotDiscontinuedOperationsMember2024-05-310000716634rdi:TrentonAvenueWilliamsportPennsylvaniaMemberus-gaap:DisposalGroupDisposedOfBySaleNotDiscontinuedOperationsMemberus-gaap:LandMember2023-06-300000716634us-gaap:OtherIntangibleAssetsMember2024-04-012024-06-300000716634rdi:BeneficialLeaseMember2024-04-012024-06-300000716634us-gaap:OtherIntangibleAssetsMember2024-01-012024-06-300000716634rdi:BeneficialLeaseMember2024-01-012024-06-300000716634us-gaap:OtherIntangibleAssetsMember2023-04-012023-06-300000716634rdi:BeneficialLeaseMember2023-04-012023-06-300000716634us-gaap:OtherIntangibleAssetsMember2023-01-012023-06-300000716634rdi:BeneficialLeaseMember2023-01-012023-06-300000716634us-gaap:StockOptionMember2024-04-012024-06-300000716634us-gaap:RestrictedStockUnitsRSUMember2024-04-012024-06-300000716634us-gaap:StockOptionMember2024-01-012024-06-300000716634us-gaap:RestrictedStockUnitsRSUMember2024-01-012024-06-300000716634us-gaap:StockOptionMember2023-04-012023-06-300000716634us-gaap:RestrictedStockUnitsRSUMember2023-04-012023-06-300000716634us-gaap:StockOptionMember2023-01-012023-06-300000716634us-gaap:RestrictedStockUnitsRSUMember2023-01-012023-06-300000716634us-gaap:ParentMember2024-04-012024-06-300000716634us-gaap:AdditionalPaidInCapitalMember2024-04-012024-06-300000716634us-gaap:ParentMember2024-01-012024-03-310000716634us-gaap:AdditionalPaidInCapitalMember2024-01-012024-03-3100007166342024-01-012024-03-310000716634us-gaap:ParentMember2023-04-012023-06-300000716634us-gaap:AdditionalPaidInCapitalMember2023-04-012023-06-300000716634us-gaap:ParentMember2023-01-012023-03-310000716634us-gaap:AdditionalPaidInCapitalMember2023-01-012023-03-3100007166342023-01-012023-03-310000716634us-gaap:BuildingAndBuildingImprovementsMember2024-06-300000716634us-gaap:BuildingAndBuildingImprovementsMember2023-12-310000716634rdi:PurchaseMoneyPromissoryNoteMemberus-gaap:CommonClassAMember2019-09-182019-09-180000716634rdi:PurchaseMoneyPromissoryNoteMember2019-09-182019-09-180000716634rdi:CulverCityLosAngelesMemberus-gaap:DisposalGroupHeldforsaleNotDiscontinuedOperationsMember2023-05-012023-05-310000716634rdi:CulverCityLosAngelesMemberus-gaap:DisposalGroupDisposedOfBySaleNotDiscontinuedOperationsMember2024-02-230000716634rdi:CulverCityLosAngelesMemberus-gaap:DisposalGroupDisposedOfBySaleNotDiscontinuedOperationsMember2023-05-310000716634us-gaap:LandMember2023-12-310000716634rdi:ConstructionInProgressIncludingCapitalizedInterestMember2023-12-310000716634rdi:RotoruaCinemaBuildingMemberus-gaap:DisposalGroupHeldforsaleNotDiscontinuedOperationsMember2024-06-012024-06-300000716634rdi:CourtenayCentralEtcMemberus-gaap:DisposalGroupHeldforsaleNotDiscontinuedOperationsMember2024-06-012024-06-300000716634rdi:CannonParkEtcMemberus-gaap:DisposalGroupHeldforsaleNotDiscontinuedOperationsMember2024-05-012024-05-310000716634rdi:TrentonAvenueWilliamsportPennsylvaniaMemberus-gaap:DisposalGroupDisposedOfBySaleNotDiscontinuedOperationsMemberus-gaap:LandMember2023-06-012023-06-300000716634srt:ManagementMemberus-gaap:RestrictedStockUnitsRSUMember2024-01-012024-06-300000716634us-gaap:AccumulatedOtherComprehensiveIncomeMember2024-01-012024-06-300000716634us-gaap:AccumulatedGainLossNetCashFlowHedgeParentMember2024-01-012024-06-300000716634rdi:EmeraldCreekCapitalMember2024-01-012024-06-300000716634rdi:SuttonHillPropertiesMember2024-01-012024-06-300000716634rdi:ShadowViewLandAndFarmingLlcMember2024-01-012024-06-300000716634rdi:AustraliaCountryCinemasMember2024-01-012024-06-300000716634rdi:SuttonHillPropertiesMember2023-01-012023-12-310000716634rdi:ShadowViewLandAndFarmingLlcMember2023-01-012023-12-310000716634rdi:AustraliaCountryCinemasMember2023-01-012023-12-310000716634rdi:UnitedStatesUnionSquareLineOfCreditMember2024-06-300000716634rdi:UnitedStatesBankOfAmericaCreditFacilityMember2024-06-300000716634rdi:TrustPreferredSecuritiesMember2024-06-300000716634rdi:PurchaseMoneyPromissoryNoteMember2024-06-300000716634rdi:NewZealandCorporateCreditFacilityMember2024-06-300000716634rdi:NationalAustraliaBankAustralianCorporateTermLoanMember2024-06-300000716634rdi:NationalAustraliaBankAustralianCorporateLoanFacilityMember2024-06-300000716634rdi:NabBridgeFacilityMember2024-06-300000716634rdi:MinettaAndOrpheumTheatresLoanMember2024-06-300000716634rdi:UnitedStatesUnionSquareLineOfCreditMember2023-12-310000716634rdi:UnitedStatesBankOfAmericaCreditFacilityMember2023-12-310000716634rdi:UnitedStateCorporateOfficeTermLoanMember2023-12-310000716634rdi:UnitedStateCinemasOneTwoThreeTermLoanMember2023-12-310000716634rdi:TrustPreferredSecuritiesMember2023-12-310000716634rdi:PurchaseMoneyPromissoryNoteMember2023-12-310000716634rdi:NewZealandCorporateCreditFacilityMember2023-12-310000716634rdi:NationalAustraliaBankAustralianCorporateTermLoanMember2023-12-310000716634rdi:MinettaAndOrpheumTheatresLoanMember2023-12-310000716634rdi:AustralianNabBankGuaranteeFacilityTier3Member2024-06-300000716634rdi:CourtenayCentralDevelopmentMemberrdi:OperatingAndInvestingPropertiesMember2024-01-012024-06-300000716634currency:NZDrdi:SpotRateMember2024-04-012024-06-300000716634currency:NZDrdi:AverageRateMember2024-04-012024-06-300000716634currency:AUDrdi:SpotRateMember2024-04-012024-06-300000716634currency:AUDrdi:AverageRateMember2024-04-012024-06-300000716634currency:NZDrdi:SpotRateMember2024-01-012024-06-300000716634currency:NZDrdi:AverageRateMember2024-01-012024-06-300000716634currency:AUDrdi:SpotRateMember2024-01-012024-06-300000716634currency:AUDrdi:AverageRateMember2024-01-012024-06-300000716634currency:NZDrdi:SpotRateMember2023-04-012023-06-300000716634currency:NZDrdi:AverageRateMember2023-04-012023-06-300000716634currency:AUDrdi:SpotRateMember2023-04-012023-06-300000716634currency:AUDrdi:AverageRateMember2023-04-012023-06-300000716634currency:NZDrdi:SpotRateMember2023-01-012023-12-310000716634currency:NZDrdi:AverageRateMember2023-01-012023-12-310000716634currency:AUDrdi:SpotRateMember2023-01-012023-12-310000716634currency:AUDrdi:AverageRateMember2023-01-012023-12-310000716634currency:NZDrdi:SpotRateMember2023-01-012023-06-300000716634currency:NZDrdi:AverageRateMember2023-01-012023-06-300000716634currency:AUDrdi:SpotRateMember2023-01-012023-06-300000716634currency:AUDrdi:AverageRateMember2023-01-012023-06-300000716634us-gaap:OtherIntangibleAssetsMember2023-12-3100007166342023-04-012023-06-300000716634rdi:LosAngelesMember2024-06-3000007166342024-06-300000716634srt:ScenarioForecastMemberrdi:UnitedStatesBankOfAmericaCreditFacilityMember2025-01-012025-01-010000716634rdi:UnitedStateCinemasOneTwoThreeTermLoanMember2024-06-300000716634rdi:NewZealandCorporateCreditFacilityMemberus-gaap:SubsequentEventMember2024-08-132024-08-130000716634rdi:UnitedStatesUnionSquareLineOfCreditMember2024-01-012024-06-300000716634rdi:UnitedStatesBankOfAmericaCreditFacilityMember2024-01-012024-06-300000716634rdi:UnitedStateCorporateOfficeTermLoanMember2024-01-012024-06-300000716634rdi:UnitedStateCinemasOneTwoThreeTermLoanMember2024-01-012024-06-300000716634rdi:TrustPreferredSecuritiesMember2024-01-012024-06-300000716634rdi:PurchaseMoneyPromissoryNoteMember2024-01-012024-06-300000716634rdi:NewZealandCorporateCreditFacilityMember2024-01-012024-06-300000716634rdi:NationalAustraliaBankAustralianCorporateTermLoanMember2024-01-012024-06-300000716634rdi:NabBridgeFacilityMember2024-01-012024-06-300000716634rdi:MinettaAndOrpheumTheatresLoanMember2024-01-012024-06-300000716634rdi:UnitedStatesUnionSquareLineOfCreditMember2023-01-012023-12-310000716634rdi:UnitedStatesBankOfAmericaCreditFacilityMember2023-01-012023-12-310000716634rdi:UnitedStateCorporateOfficeTermLoanMember2023-01-012023-12-310000716634rdi:UnitedStateCinemasOneTwoThreeTermLoanMember2023-01-012023-12-310000716634rdi:TrustPreferredSecuritiesMember2023-01-012023-12-310000716634rdi:PurchaseMoneyPromissoryNoteMember2023-01-012023-12-310000716634rdi:NewZealandCorporateCreditFacilityMember2023-01-012023-12-310000716634rdi:NationalAustraliaBankAustralianCorporateTermLoanMember2023-01-012023-12-310000716634rdi:MinettaAndOrpheumTheatresLoanMember2023-01-012023-12-3100007166342023-01-012023-12-310000716634rdi:AustralianNabBankGuaranteeFacilityTier3Member2024-06-2800007166342023-01-012023-06-300000716634rdi:OtherRealEstateProjectsMemberrdi:OperatingAndInvestingPropertiesMember2024-01-012024-06-300000716634rdi:CinemaDevelopmentsAndImprovementsMemberrdi:OperatingAndInvestingPropertiesMember2024-01-012024-06-300000716634rdi:OperatingAndInvestingPropertiesMember2024-01-012024-06-3000007166342023-12-3100007166342024-04-012024-06-300000716634us-gaap:CommonClassBMember2024-01-012024-06-300000716634us-gaap:CommonClassAMember2024-01-012024-06-300000716634us-gaap:CommonClassBMember2024-08-130000716634us-gaap:CommonClassAMember2024-08-1300007166342024-01-012024-06-30iso4217:USDxbrli:sharesutr:acreutr:sqftrdi:propertyrdi:itemxbrli:pureiso4217:NZDiso4217:AUDiso4217:USDxbrli:shares
UNITED STATES
SECURITIES AND EXCHANGE COMMISSION
Washington, D.C. 20549
_____________________________________________________
FORM 10-Q
(Mark One)
| |
þ | QUARTERLY REPORT PURSUANT TO SECTION 13 OR 15(D) OF THE SECURITIES EXCHANGE ACT OF 1934 |
For the quarterly period ended: June 30, 2024
OR
| |
¨ | TRANSITION REPORT PURSUANT TO SECTION 13 OR 15(D) OF THE SECURITIES EXCHANGE ACT OF 1934 |
For the transition period from ___________ to ___________
Commission file number 1-8625

READING INTERNATIONAL, INC.
(Exact name of Registrant as specified in its charter)
| |
Nevada State or other jurisdiction of incorporation or organization) | 95-3885184 (IRS Employer Identification Number) |
189 Second Avenue, Suite 2S New York, New York (Address of principal executive offices) | 10003 (Zip Code) |
Registrant’s telephone number, including area code: (213) 235-2240
Securities registered pursuant to Section 12(b) of the Act:
| | | | |
Title of each class | | Trading Symbol | | Name of each exchange on which registered |
Class A Nonvoting Common Stock, $0.01 par value | | RDI | | The Nasdaq Stock Market LLC |
Class B Voting Common Stock, $0.01 par value | | RDIB | | The Nasdaq Stock Market LLC |
Indicate by check mark whether the registrant (1) has filed all reports required to be filed by Section 13 or 15(d) of the Securities Exchange Act of 1934 during the preceding 12 months (or for such shorter period that the registrant was required to file such reports), and (2) has been subject to such filing requirements for the past 90 days. Yes þ No ¨
Indicate by check mark whether the registrant has submitted electronically every Interactive Data File required to be submitted and posted pursuant to Rule 405 of Regulation S-T (§ 232.405 of this chapter) during the preceding 12 months (or for such shorter period that the registrant was required to submit and post such files). Yes þ No ¨
Indicate by check mark whether the registrant is a large accelerated filer, an accelerated filer, a non-accelerated filer, a smaller reporting company, or an emerging growth company. See definitions of “large accelerated filer,” “accelerated filer,” “smaller reporting company,” and “emerging growth company” in Rule 12b-2 of the Exchange Act.
Large Accelerated Filer ¨ Accelerated Filer ¨ Non-Accelerated Filer þ Smaller Reporting Company þ Emerging Growth Company ¨
If an emerging growth company, indicate by check mark if the registrant has elected not to use the extended transition period for complying with any new or revised financial accounting standards provided pursuant to Section 13(a) of the Exchange Act. ¨
Indicate by check mark whether the registrant is a shell company (as defined in Rule 12b-2 of the Exchange Act). Yes ¨ No þ
Indicate the number of shares outstanding of each of the issuer’s classes of common stock, as of the latest practicable date. As of August 13, 2024, there were 20,745,594 shares of Class A Nonvoting Common Stock, $0.01 par value per share, and 1,680,590 shares of Class B Voting Common Stock, $0.01 par value per share, outstanding.
READING INTERNATIONAL, INC. AND SUBSIDIARIES
TABLE OF CONTENTS
PART 1 – FINANCIAL INFORMATION
Item 1 - Financial Statements
READING INTERNATIONAL, INC.
CONSOLIDATED BALANCE SHEETS
(U.S. dollars in thousands, except share information)
| | | | | | |
| | | | | | |
| | June 30, | | December 31, |
| | 2024 | | 2023 |
ASSETS | | (unaudited) | | | |
Current Assets: | | | | | | |
Cash and cash equivalents | | $ | 9,242 | | $ | 12,906 |
Restricted cash | | | 1,485 | | | 2,535 |
Receivables | | | 7,647 | | | 7,561 |
Inventories | | | 1,347 | | | 1,648 |
Prepaid and other current assets | | | 2,485 | | | 2,881 |
Land and property held for sale | | | 36,446 | | | 11,179 |
Total current assets | | | 58,652 | | | 38,710 |
Operating property, net | | | 225,473 | | | 262,417 |
Operating lease right-of-use assets | | | 168,546 | | | 181,542 |
Investment and development property, net | | | — | | | 8,789 |
Investment in unconsolidated joint ventures | | | 4,428 | | | 4,756 |
Goodwill | | | 25,023 | | | 25,535 |
Intangible assets, net | | | 1,899 | | | 2,038 |
Deferred tax asset, net | | | 2,109 | | | 299 |
Other assets | | | 8,725 | | | 8,965 |
Total assets | | $ | 494,855 | | $ | 533,051 |
LIABILITIES AND STOCKHOLDERS' EQUITY | | | | | | |
Current Liabilities: | | | | | | |
Accounts payable and accrued liabilities | | $ | 44,392 | | $ | 43,828 |
Film rent payable | | | 4,911 | | | 6,038 |
Debt - current portion | | | 58,401 | | | 34,484 |
Subordinated debt - current portion | | | 198 | | | 586 |
Taxes payable - current | | | 2,088 | | | 1,376 |
Deferred revenue | | | 10,027 | | | 10,993 |
Operating lease liabilities - current portion | | | 21,797 | | | 23,047 |
Other current liabilities | | | 6,625 | | | 6,731 |
Total current liabilities | | | 148,439 | | | 127,083 |
Debt - long-term portion | | | 123,347 | | | 146,605 |
Derivative financial instruments - non-current portion | | | 98 | | | — |
Subordinated debt, net | | | 27,283 | | | 27,172 |
Noncurrent tax liabilities | | | 6,418 | | | 6,586 |
Operating lease liabilities - non-current portion | | | 168,246 | | | 180,898 |
Other liabilities | | | 11,493 | | | 11,711 |
Total liabilities | | $ | 485,324 | | $ | 500,055 |
Commitments and contingencies (Note 15) | | | | | | |
Stockholders’ equity: | | | | | | |
Class A non-voting common shares, par value $0.01, 100,000,000 shares authorized, | | | | | | |
33,681,705 issued and 20,745,594 outstanding at June 30, 2024 and | | | | | | |
33,602,627 issued and 20,666,516 outstanding at December 31, 2023 | | | 238 | | | 237 |
Class B voting common shares, par value $0.01, 20,000,000 shares authorized and | | | | | | |
1,680,590 issued and outstanding at June 30, 2024 and December 31, 2023 | | | 17 | | | 17 |
Nonvoting preferred shares, par value $0.01, 12,000 shares authorized and no issued | | | | | | |
or outstanding shares at June 30, 2024 and December 31, 2023 | | | — | | | — |
Additional paid-in capital | | | 156,529 | | | 155,402 |
Retained earnings/(deficits) | | | (102,058) | | | (79,489) |
Treasury shares | | | (40,407) | | | (40,407) |
Accumulated other comprehensive income | | | (4,325) | | | (2,673) |
Total Reading International, Inc. stockholders’ equity | | | 9,994 | | | 33,087 |
Noncontrolling interests | | | (463) | | | (91) |
Total stockholders’ equity | | | 9,531 | | | 32,996 |
Total liabilities and stockholders’ equity | | $ | 494,855 | | $ | 533,051 |
See accompanying Notes to the Unaudited Consolidated Financial Statements.
READING INTERNATIONAL, INC.
CONSOLIDATED STATEMENTS OF INCOME
(Unaudited; U.S. dollars in thousands, except per share data)
| | | | | | | | | | | | |
| | | | | | | | | | | | |
| | Quarter Ended | | Six Months Ended |
| | June 30, | | June 30, |
| | 2024 | | 2023 | | 2024 | | 2023 |
Revenue | | | | | | | | | | | | |
Cinema | | $ | 42,942 | | $ | 61,056 | | $ | 84,213 | | $ | 103,042 |
Real estate | | | 3,867 | | | 3,999 | | | 7,648 | | | 7,819 |
Total revenue | | | 46,809 | | | 65,055 | | | 91,861 | | | 110,861 |
Costs and expenses | | | | | | | | | | | | |
Cinema | | | (39,418) | | | (51,364) | | | (80,138) | | | (93,019) |
Real estate | | | (2,461) | | | (2,104) | | | (4,696) | | | (4,319) |
Depreciation and amortization | | | (4,011) | | | (4,689) | | | (8,216) | | | (9,329) |
General and administrative | | | (5,271) | | | (5,109) | | | (10,693) | | | (10,288) |
Total costs and expenses | | | (51,161) | | | (63,266) | | | (103,743) | | | (116,955) |
Operating income (loss) | | | (4,352) | | | 1,789 | | | (11,882) | | | (6,094) |
Interest expense, net | | | (5,252) | | | (4,874) | | | (10,537) | | | (8,991) |
Gain (loss) on sale of assets | | | 9 | | | — | | | (1,116) | | | — |
Other income (expense) | | | (216) | | | (86) | | | 123 | | | 91 |
Income (loss) before income tax expense and equity earnings of unconsolidated joint ventures | | | (9,811) | | | (3,171) | | | (23,412) | | | (14,994) |
Equity earnings of unconsolidated joint ventures | | | 119 | | | 207 | | | 94 | | | 226 |
Income (loss) before income taxes | | | (9,692) | | | (2,964) | | | (23,318) | | | (14,768) |
Income tax benefit (expense) | | | 156 | | | 103 | | | 379 | | | 583 |
Net income (loss) | | $ | (9,536) | | $ | (2,861) | | $ | (22,939) | | $ | (14,185) |
Less: net income (loss) attributable to noncontrolling interests | | | (195) | | | (83) | | | (370) | | | (296) |
Net income (loss) attributable to Reading International, Inc. | | $ | (9,341) | | $ | (2,778) | | $ | (22,569) | | $ | (13,889) |
Basic earnings (loss) per share | | $ | (0.42) | | $ | (0.12) | | $ | (1.01) | | $ | (0.63) |
Diluted earnings (loss) per share | | $ | (0.42) | | $ | (0.12) | | $ | (1.01) | | $ | (0.63) |
Weighted average number of shares outstanding–basic | | | 22,413,617 | | | 22,262,214 | | | 22,379,881 | | | 22,183,618 |
Weighted average number of shares outstanding–diluted | | | 23,246,591 | | | 23,502,506 | | | 23,294,887 | | | 23,423,910 |
See accompanying Notes to the Unaudited Consolidated Financial Statements.
READING INTERNATIONAL, INC.
CONSOLIDATED STATEMENTS OF COMPREHENSIVE INCOME
(Unaudited; U.S. dollars in thousands)
| | | | | | | | | | | | |
| | | | | | | | | | | | |
| | Quarter Ended | | Six Months Ended |
| | June 30, | | June 30, |
| | 2024 | | 2023 | | 2024 | | 2023 |
Net income (loss) | | $ | (9,536) | | $ | (2,861) | | $ | (22,939) | | $ | (14,185) |
Foreign currency translation gain (loss) | | | 932 | | | (589) | | | (1,659) | | | (1,352) |
Gain (loss) on cash flow hedges | | | (98) | | | (205) | | | (98) | | | (788) |
Other | | | 52 | | | 53 | | | 102 | | | 107 |
Comprehensive income (loss) | | | (8,650) | | | (3,602) | | | (24,594) | | | (16,218) |
Less: net income (loss) attributable to noncontrolling interests | | | (195) | | | (83) | | | (370) | | | (296) |
Less: comprehensive income (loss) attributable to noncontrolling interests | | | — | | | (1) | | | (1) | | | (2) |
Comprehensive income (loss) | | $ | (8,455) | | | (3,518) | | $ | (24,223) | | $ | (15,920) |
See accompanying Notes to the Unaudited Consolidated Financial Statements.
READING INTERNATIONAL, INC.
CONSOLIDATED STATEMENTS OF CASH FLOWS
(Unaudited; U.S. dollars in thousands)
| | | | | | |
| | | | | | |
| | Six Months Ended |
| | June 30, |
| | 2024 | | 2023 |
Operating Activities | | | | | | |
Net income (loss) | | $ | (22,939) | | $ | (14,185) |
Adjustments to reconcile net income (loss) to net cash provided by operating activities: | | | | | | |
Equity earnings of unconsolidated joint ventures | | | (94) | | | (226) |
Distributions of earnings from unconsolidated joint ventures | | | 329 | | | 338 |
(Gain) loss recognized on foreign currency transactions | | | (66) | | | — |
(Gain) loss on sale of assets | | | 1,116 | | | — |
Amortization of operating leases | | | 9,089 | | | 9,290 |
Amortization of finance leases | | | 21 | | | 15 |
Change in operating lease liabilities | | | (9,903) | | | (10,059) |
Purchase of derivative instruments | | | — | | | — |
Change in net deferred tax assets | | | (1,824) | | | (31) |
Depreciation and amortization | | | 8,216 | | | 9,329 |
Other amortization | | | 829 | | | 753 |
Stock based compensation expense | | | 1,134 | | | 751 |
Net changes in operating assets and liabilities: | | | | | | |
Receivables | | | (151) | | | 719 |
Prepaid and other assets | | | 414 | | | (1,341) |
Payments for accrued pension | | | (342) | | | (171) |
Accounts payable and accrued expenses | | | 1,918 | | | (2,540) |
Film rent payable | | | (1,069) | | | (25) |
Taxes payable | | | 758 | | | 1,512 |
Deferred revenue and other liabilities | | | (593) | | | (2,937) |
Net cash provided by (used in) operating activities | | | (13,157) | | | (8,808) |
Investing Activities | | | | | | |
Purchases of and additions to operating and investment properties | | | (2,175) | | | (3,430) |
Contributions to unconsolidated joint ventures | | | (30) | | | — |
Proceeds from sale of assets | | | 9,603 | | | — |
Net cash provided by (used in) investing activities | | | 7,398 | | | (3,430) |
Financing Activities | | | | | | |
Repayment of borrowings | | | (11,391) | | | (3,258) |
Repayment of finance lease principal | | | (20) | | | (16) |
Proceeds from borrowings | | | 12,980 | | | 3,154 |
Capitalized borrowing costs | | | (438) | | | (349) |
(Cash paid) proceeds from the settlement of employee share transactions | | | (6) | | | (243) |
Net cash provided by (used in) financing activities | | | 1,125 | | | (712) |
Effect of exchange rate on cash and restricted cash | | | (80) | | | (188) |
Net increase (decrease) in cash and cash equivalents and restricted cash | | | (4,714) | | | (13,138) |
Cash and cash equivalents and restricted cash at the beginning of the period | | | 15,441 | | | 34,979 |
Cash and cash equivalents and restricted cash at the end of the period | | $ | 10,727 | | $ | 21,841 |
| | | | | | |
Cash and cash equivalents and restricted cash consists of: | | | | | | |
Cash and cash equivalents | | $ | 9,242 | | $ | 15,511 |
Restricted cash | | | 1,485 | | | 6,330 |
| | $ | 10,727 | | $ | 21,841 |
| | | | | | |
| | | | | | |
| | | | | | |
Supplemental Disclosures | | | | | | |
Interest paid | | $ | 9,608 | | $ | 7,724 |
Income taxes (refunded) paid | | | 1,029 | | | (728) |
Non-Cash Transactions | | | | | | |
Additions to operating and investing properties through accrued expenses | | | 2,736 | | | 3,255 |
See accompanying Notes to the Unaudited Consolidated Financial Statements.
READING INTERNATIONAL, INC.
NOTES TO CONSOLIDATED FINANCIAL STATEMENTS (Unaudited)
Note 1 – Description of Business and Segment Reporting
Our Company
Reading International, Inc., a Nevada corporation (“RDI” and collectively with our consolidated subsidiaries and corporate predecessors, the “Company,” “Reading,” and “we,” “us,” or “our”) was incorporated in 1999. Our businesses, owned and operated through our various subsidiaries, consist primarily of:
the development, ownership, and operation of cinemas in the United States, Australia, and New Zealand; and
the development, ownership, operation and/or rental of retail, commercial and live venue real estate assets in Australia, New Zealand, and the United States.
Business Segments
Reported below are the operating segments of our Company for which separate financial information is available and evaluated regularly by the Chief Executive Officer, the chief operating decision-maker of our Company. As part of our real estate activities, we hold undeveloped land in urban and suburban centers in the United States and New Zealand.
The table below summarizes the results of operations for each of our business segments for the quarter and six months ended June 30, 2024, and 2023, respectively. Operating expense includes costs associated with the day-to-day operations of the cinemas and the management of rental properties, including our live theatre assets.
| | | | | | | | | | | | |
| | | | | | | | | | | | |
| | Quarter Ended | | Six Months Ended |
| | June 30, | | June 30, |
(Dollars in thousands) | | 2024 | | 2023 | | 2024 | | 2023 |
Revenue: | | | | | | | | | | | | |
Cinema exhibition | | $ | 42,941 | | $ | 61,055 | | $ | 84,213 | | $ | 103,042 |
Real estate | | | 5,013 | | | 5,217 | | | 9,946 | | | 10,282 |
Inter-segment elimination | | | (1,146) | | | (1,218) | | | (2,298) | | | (2,463) |
| | $ | 46,808 | | $ | 65,054 | | $ | 91,861 | | $ | 110,861 |
Segment operating income (loss): | | | | | | | | | | | | |
Cinema exhibition | | $ | (1,270) | | $ | 4,474 | | $ | (5,435) | | $ | (141) |
Real estate | | | 946 | | | 1,286 | | | 1,837 | | | 2,291 |
| | $ | (324) | | $ | 5,760 | | $ | (3,598) | | $ | 2,150 |
A reconciliation of segment operating income to income before income taxes is as follows:
| | | | | | | | | | | | |
| | | | | | | | | | | | |
| | Quarter Ended | | Six Months Ended |
| | June 30, | | June 30, |
(Dollars in thousands) | | 2024 | | 2023 | | 2024 | | 2023 |
Segment operating income (loss) | | $ | (324) | | $ | 5,760 | | $ | (3,598) | | $ | 2,150 |
Unallocated corporate expense | | | | | | | | | | | | |
Depreciation and amortization expense | | | (99) | | | (176) | | | (201) | | | (355) |
General and administrative expense | | | (3,929) | | | (3,794) | | | (8,083) | | | (7,889) |
Interest expense, net | | | (5,252) | | | (4,875) | | | (10,537) | | | (8,991) |
Equity earnings of unconsolidated joint ventures | | | 119 | | | 207 | | | 94 | | | 226 |
Gain (loss) on sale of assets | | | 9 | | | — | | | (1,116) | | | — |
Other income (expense) | | | (216) | | | (86) | | | 123 | | | 91 |
Income (loss) before income tax expense | | $ | (9,692) | | $ | (2,964) | | $ | (23,318) | | $ | (14,768) |
Note 2 – Summary of Significant Accounting Policies
Basis of Consolidation
The accompanying consolidated financial statements include the accounts of our Company’s wholly-owned subsidiaries as well as majority-owned subsidiaries that our Company controls and should be read in conjunction with our Company’s Annual Report on Form 10-K as of and for the year ended December 31, 2023 (“2023 Form 10-K”). All significant intercompany balances and transactions have been eliminated on consolidation. These consolidated financial statements were prepared in accordance with accounting principles generally accepted in the United States of America (“U.S. GAAP”) for interim reporting with the instructions for Form 10-Q and Rule 10-01 of Regulation S-X of the Securities and Exchange Commission (“SEC”). As such, they do not include all information and footnotes required by U.S. GAAP for complete financial statements. We believe that we have included all normal and recurring adjustments necessary for a fair presentation of the results for the interim period.
Operating results for the quarter and six months ended June 30, 2024, are not necessarily indicative of the results that may be expected for the year ending December 31, 2024.
Use of Estimates
The preparation of consolidated financial statements in conformity with U.S. GAAP requires management to make estimates and assumptions that affect the amounts reported in the consolidated financial statements and footnotes thereto. Significant estimates include (i) projections we make regarding the recoverability and impairment of our assets (including goodwill and intangibles), (ii) valuations of our derivative instruments, (iii) recoverability of our deferred tax assets, (iv) estimation of breakage and redemption experience rates, which drive how we recognize breakage on our gift card and gift certificates, and revenue from our customer loyalty program, and (v) estimation of our Incremental Borrowing Rate (“IBR”) as relates to the valuation of our right-of-use assets and lease liabilities. Actual results may differ from those estimates.
Note 3 – Liquidity and Impairment Assessment
Going Concern
We continue to evaluate the going concern assertion required by ASC 205-40 Going Concern as it relates to our Company. The evaluation of the going concern assertion involves firstly considering whether it is probable that our Company has sufficient resources, as at the issue date of the financial statements, to meet its obligations as they fall due for twelve months following the issue date. Should it be probable that there are not sufficient resources, we must determine whether it is probable that our plans will mitigate the consequential going concern substantial doubt. Our evaluation is informed by current liquidity positions, debt obligations, our beliefs about the recovery of the global cinema industry, cash flow estimates, known capital and other expenditure requirements and commitments and our current business plan and strategies. Our Company’s business plan - two businesses (real estate and cinema) in three countries (Australia, New Zealand and the U.S.) - has served us well since the onset of COVID-19 and is key to management’s overall evaluation of ASC 205-40 Going Concern.
As of the end of the second quarter, 2024, we have $58.6 million of debt due in twelve months. We have cash of $9.2 million and negative working capital of $89.8 million, inclusive of land and property held for sale of $36.4 million (based on book as opposed to fair market value). In order to alleviate doubt that our Company will be able to generate sufficient cash flows for the coming twelve-months, these loans need to be refinanced and our revenues and net income need to increase through improved operations and asset monetization.
In April 2024, we exercised our first option to extend our Union Square financing facility, extending the maturity date of that loan ($47.1 million at June 30, 2024) to May 6, 2025. We also obtained an extension of our NAB facility ($66.8 million at June 30, 2024), extending the maturity date of that loan to July 31, 2026. This extension also included a bridge loan in the amount of $13.4 million, maturing on March 31, 2025, subject to prepayment obligations from the net sales proceeds of certain assets. We are in discussions with Santander to extend the maturity date of that loan ($8.0 million) and believe that we will be able to reach mutually acceptable terms with respect to our Cinemas 123 ($21.0 million, due third quarter of 2024) and our Westpac ($8.4 million, due first quarter of 2025) credit facilities.
We believe that the global cinema industry will continue to improve in the last half of 2024 and 2025. This belief underpins our forecasts and cash flow projections. Our forecasts rely upon, among other things, the market reception to current films such as Inside Out 2, Twisters, Deadpool and Wolverine, and Despicable Me 4, the current industry movie release schedule, which demonstrates an increased number of movies to be released from the major studios and other distributors and an improvement in the quality of the movie titles, and the public’s demonstrable desire to attend movies in a theatrical environment. These named factors are both out of Management’s control and are material, individually and in the aggregate, to the realization of Management’s forecasts and expectations. In the event that our forecasts and cash flow estimates, and our reasonable refinancing expectations, do not come to fruition to the extent needed to provide sufficient funding, we are willing and able to pursue additional asset monetizations. Since 2021, we have demonstrated our ability to complete such real estate asset monetizations.
In conclusion, as of the date of issuance of these financial statements, based on our evaluation of ASC 205-40 Going Concern and the current conditions and events, considered in the aggregate, and our various plans for enhancing liquidity and the extent to which those plans are progressing, we conclude that our plans are probable of being implemented and that they alleviate the substantial doubt about our Company’s ability to continue as a going concern.
Impairment Considerations
Our Company considers that the events and factors described above constitute impairment indicators under ASC 360 Property, Plant and Equipment. At December 31, 2023, our Company performed a quantitative recoverability test of the carrying values of all its asset groups. Our Company estimated the undiscounted future cash flows expected to result from the use of these asset groups and found that no impairment charge was necessary. The financial performance of our cinemas has been improving, despite the challenges described above, and particularly the ongoing impacts of the WGA and SAG strikes on the first six months of 2024. This improved performance at an asset group level, and the impact of this performance on our impairment modelling, resulted in no impairment charges being recognized for the first six months of 2024. Actual performance against our forecasts is dependent on several variables and conditions, many of which are subject to the uncertainties associated with among other things, the factors presented above, and as a result, actual results may materially differ from management’s estimates.
Our Company also considers that the events and factors described above continue to constitute impairment indicators under ASC 350 Intangibles – Goodwill and Other. Our Company performed a quantitative goodwill impairment test and determined that our goodwill was not impaired as of December 31, 2023. The test was performed at a reporting unit level by comparing each reporting unit’s carrying value, including goodwill, to its fair value. The fair value of each reporting unit was assessed using a discounted cash flow model based on the budgetary revisions performed by management in response to COVID-19 and the developing market conditions. Given the continuing improvements in trading conditions, taking into account the actual and expecting impacts of the WGA and SAG strikes, no impairment charges were recorded in the first six months of 2024. Actual performance against our forecasts is dependent on several variables and conditions, including among other things, the factors presented above, and as a result, actual results may materially differ from management’s estimates.
Note 4 – Operations in Foreign Currency
We have significant assets in Australia and New Zealand. Historically, we have conducted our Australian and New Zealand operations (collectively “foreign operations”) on a self-funding basis, where we use cash flows generated by our foreign operations to pay for the expenses of those foreign operations. However, in recent periods, cash flows from our overseas operations have been used to cover our domestic general and administrative costs, interest expense, and loss from our domestic cinema operations. Our Australian and New Zealand assets and liabilities are translated from their functional currencies of Australian dollar (“AU$”) and New Zealand dollar (“NZ$”), respectively, to the U.S. dollar based on the exchange rate as of June 30, 2024. The carrying value of the assets and liabilities of our foreign operations fluctuates as a result of changes in the exchange rates between the functional currencies of the foreign operations and the U.S. dollar. The translation adjustments are accumulated in the Accumulated Other Comprehensive Income in the Consolidated Balance Sheets.
We take a global view of our financial resources and are flexible in making use of resources from one jurisdiction in other jurisdictions.
Presented in the table below are the currency exchange rates for Australia and New Zealand:
| | | | | | | | | |
| | | | | | | | | |
| Foreign Currency / USD |
| As of and
for the
quarter
ended | | As of and
for the
six months ended | | As of and
for the
twelve months
ended | | As of and
for the
quarter
ended | | As of and
for the
six months ended |
| June 30, 2024 | | December 31, 2023 | | June 30, 2023 |
Spot Rate | | | | | | | | | |
Australian Dollar | 0.6677 | | 0.6828 | | 0.6663 |
New Zealand Dollar | 0.6096 | | 0.6340 | | 0.6133 |
Average Rate | | | | | | | | | |
Australian Dollar | 0.6591 | | 0.6582 | | 0.6647 | | 0.6681 | | 0.6761 |
New Zealand Dollar | 0.6054 | | 0.6089 | | 0.6145 | | 0.6186 | | 0.6243 |
Note 5 – Earnings Per Share
Basic earnings per share (“EPS”) is calculated by dividing the net income attributable to our Company by the weighted average number of common shares outstanding during the period. Diluted EPS is calculated by dividing the net income attributable to our Company by the weighted average number of common and common equivalent shares outstanding during the period and is calculated using the treasury stock method for equity-based compensation awards.
The following table sets forth the computation of basic and diluted EPS and a reconciliation of the weighted average number of common and common equivalent shares outstanding:
| | | | | | | | | | | | |
| | | | | | | | | | | | |
| | Quarter Ended | | Six Months Ended |
| | June 30, | | June 30, |
(Dollars in thousands, except share data) | | 2024 | | 2023 | | 2024 | | 2023 |
Numerator: | | | | | | | | | | | | |
Net income (loss) attributable to Reading International, Inc. | | $ | (9,341) | | $ | (2,778) | | $ | (22,569) | | $ | (13,889) |
Denominator: | | | | | | | | | | | | |
Weighted average number of common stock – basic | | | 22,413,617 | | | 22,262,214 | | | 22,379,881 | | | 22,183,618 |
Weighted average dilutive impact of awards | | | 832,974 | | | 1,240,292 | | | 915,006 | | | 1,240,292 |
Weighted average number of common stock – diluted | | | 23,246,591 | | | 23,502,506 | | | 23,294,887 | | | 23,423,910 |
Basic earnings (loss) per share | | $ | (0.42) | | $ | (0.12) | | $ | (1.01) | | $ | (0.63) |
Diluted earnings (loss) per share | | $ | (0.42) | | $ | (0.12) | | $ | (1.01) | | $ | (0.63) |
Awards excluded from diluted earnings (loss) per share | | | 207,657 | | | 205,122 | | | 207,657 | | | 205,122 |
Our weighted average number of common stock - basic increased, primarily as a result of the vesting of restricted stock units. We did not repurchase any shares of Class A Common Stock during the first six months of 2024 or 2023.
207,657 shares issuable under stock options and restricted stock units were excluded from the computation of diluted net income (loss) per share in periods when their effect was anti-dilutive; either because our Company incurred a net loss for the period, or the exercise price of the options was greater than the average market price of the common stock during the period, or the effect was anti-dilutive as a result of applying the treasury stock method.
Note 6 – Property and Equipment
Operating Property, net
Property associated with our operating activities as at June 30, 2024 and December 31, 2023, is summarized as follows:
| | | | | | |
| | | | | | |
| | June 30, | | December 31, |
(Dollars in thousands) | | 2024 | | 2023 |
Land | | $ | 47,745 | | $ | 61,095 |
Building and improvements | | | 169,838 | | | 205,821 |
Leasehold improvements | | | 50,508 | | | 53,984 |
Fixtures and equipment | | | 148,602 | | | 155,156 |
Construction-in-progress | | | 2,418 | | | 4,290 |
Total cost | | | 419,111 | | | 480,346 |
Less: accumulated depreciation | | | (193,638) | | | (217,929) |
Operating property, net | | $ | 225,473 | | $ | 262,417 |
Depreciation expense for operating property was $4.0 million and $8.1 million for the quarter and six months ended June 30, 2024, respectively, as compare to $4.7 million and $9.3 million for the quarter and six months ended June 30, 2023.
Investment and Development Property, net
Our investment and development property as of June 30, 2024 and December 31, 2023, is summarized below:
| | | | | | |
| | | | | | |
| | June 30, | | December 31, |
(Dollars in thousands) | | 2024 | | 2023 |
Land | | $ | — | | $ | 3,856 |
Construction-in-progress (including capitalized interest) | | | — | | | 4,933 |
Investment and development property | | $ | — | | $ | 8,789 |
Construction-in-Progress – Operating and Investment Properties
Construction-in-Progress balances are included in both our operating and development properties. The balances of our major projects along with the movements for the six months ended June 30, 2024, are shown below:
| | | | | | | | | | | | | | | | | | |
| | | | | | | | | | | | | | | | | | |
(Dollars in thousands) | | Balance,
December 31,
2023 | | Additions during the period | | Completed
during the
period | | Transferred to Held for Sale | | Foreign
currency
translation | | Balance,
June 30,
2024 |
Courtenay Central development | | | 6,412 | | | — | | | — | | | (6,089) | | | (323) | | | — |
Cinema developments and improvements | | | 1,658 | | | 172 | | | (132) | | | (60) | | | (7) | | | 1,631 |
Other real estate projects | | | 1,153 | | | 403 | | | (371) | | | (387) | | | (11) | | | 787 |
Total | | $ | 9,223 | | $ | 575 | | $ | (503) | | $ | (6,536) | | $ | (341) | | $ | 2,418 |
2024 Real Estate Monetizations
Between the fourth quarter of 2020 and the fourth quarter of 2023, we classified as assets held for sale disposal groups and thereafter monetized the following real estate assets: The Auburn/Redyard Entertainment Themed Center (“ETC”), Manukau (land), Coachella (land), the Royal George Theatre, our property in Maitland, New South Wales, our Invercargill, New Zealand cinema and associated ancillary land, and our office building in Culver City (sold in February 2024).
In the second quarter of 2023, we classified our 2483 Trenton Avenue, Williamsport, Pennsylvania, as held for sale. In the second quarter of 2024, we further classified as held for sale our Cannon Park ETC, our Courtenay Central ETC and associated land and improvements, and our Rotorua land and improvements.
A ‘disposal group’ represents assets to be disposed of in a single transaction. A disposal group may represent a single asset, or multiple assets. Discussed below are those real estate transactions affecting the presentation in our consolidated balance sheet as of June 30, 2024 and 2023, and the profitability determination in our consolidated statements of income for the six months ended June 30, 2024, and 2023.
Culver City, Los Angeles
In May 2023, we classified our Culver City administrative building, commonly known as 5995 Sepulveda Blvd., as held for sale. Our book value (as opposed to fair value) of the property was $10.8 million, being the lower of cost and fair value less costs to sell. No adjustments to the book value of the assets contained within this disposal group were required. The disposal group consisted of land, a building and various leasehold improvements. The sale was completed on February 23, 2024, at a gross sales price of $10.0 million. The proceeds were used to discharge the $8.3 million first mortgage on the property.
The loss on sale of this property is calculated as follows:
| | | |
| | March 31 |
(Dollars in thousands) | | 2024 |
Sales price | | $ | 10,000 |
Net book value | | | (10,800) |
Loss on sale, gross of direct costs | | | (800) |
Direct sale costs incurred | | | (325) |
Loss on sale, net of direct costs | | $ | (1,125) |
Disposal Groups Held for Sale
Cannon Park ETC
In May 2024, we classified our Cannon Park ETC in Townsville, Queensland, Australia, as held for sale at the lower of cost and fair value less costs to sell. The disposal group consists of our Cannon Park City Center and Cannon Park Discount Center properties, comprising approximately 9.4-acres. The current book value (as opposed to fair value) of the property is $18.8 million. No adjustments to the book value of the assets contained within this disposal group were required. We expect to complete the sale within 12 months.
Wellington, New Zealand
In June 2024, we classified our Courtenay Central ETC in Wellington, New Zealand, as held for sale at the lower of cost and fair value less costs to sell. The disposal group consists of our Courtenay Central cinema and retail property, along with our Tory and
Wakefield Street car parks. The current book value (as opposed to fair value) of the property is $15.8 million. No adjustments to the book value of the assets contained within this disposal group were required. We expect to complete the sale within 12 months.
Reading Cinema in Rotorua, New Zealand
In June 2024, we classified the land and improvements constituting our Rotorua cinema in Rotorua, New Zealand, as held for sale at the lower of cost and fair value less costs to sell. The disposal group consists of our land, cinema building and the associated improvements. The current book value (as opposed to fair value) of the property is $1.4 million. No adjustments to the book value of the assets contained within this disposal group were required. We expect to complete the sale within 12 months.
2483 Trenton Avenue, Williamsport, Pennsylvania
In June 2023, we classified our industrial property at 2483 Trenton Avenue, Williamsport, Pennsylvania, as held for sale at the lower of cost and fair value less costs to sell. The current book value (as opposed to fair value) of the property is $460,000. The property is part of our historic railroad operations, consisting of land and an 18,000 square foot industrial building, and certain rail bed improvements. No adjustments to the book value of the assets contained within this disposal group were required. We continue to hold this property as held for sale, and sales efforts continue as we work to resolve certain easement issues. The property continues to meet the ASC 360 held for sale criteria.
Note 7 – Leases
In all leases, whether we are the lessor or lessee, we define lease term as the non-cancellable term of the lease plus any renewals covered by renewal options that are reasonably certain of exercise based on our assessment of economic factors relevant to the lessee. The non-cancellable term of the lease commences on the date the lessor makes the underlying property in the lease available to the lessee, irrespective of when lease payments begin under the contract.
As Lessee
We have operating leases for certain cinemas, and finance leases for certain equipment assets. Our leases have remaining lease terms of 1 to 25 years, with certain leases having options to extend up to a further 20 years. Lease payments for our cinema operating leases consist of fixed base rent, and for certain leases, variable lease payments consisting of contracted percentages of revenue, changes in the relevant CPI, and/or other contracted financial metrics.
The components of lease expense were as follows:
| | | | | | | | | | | | |
| | Quarter Ended | | Six Months Ended |
| | June 30, | | June 30, |
(Dollars in thousands) | | 2024 | | 2023 | | 2024 | | 2023 |
Lease cost | | | | | | | | | | | | |
Finance lease cost: | | | | | | | | | | | | |
Amortization of right-of-use assets | | $ | 10 | | $ | 8 | | $ | 21 | | $ | 15 |
Interest on lease liabilities | | | 1 | | | — | | | 3 | | | 1 |
Operating lease cost | | | 7,732 | | | 8,226 | | | 15,606 | | | 16,408 |
Variable lease cost | | | 678 | | | 399 | | | 1,200 | | | 669 |
Total lease cost | | $ | 8,421 | | $ | 8,633 | | $ | 16,830 | | $ | 17,093 |
Supplemental cash flow information related to leases is as follows:
| | | | | | |
| | Six Months Ended |
| | June 30, |
(Dollars in thousands) | | 2024 | | 2023 |
Cash flows relating to lease cost | | | | | | |
Cash paid for amounts included in the measurement of lease liabilities: | | | | | | |
Operating cash flows for finance leases | | $ | 22 | | $ | 17 |
Operating cash flows for operating leases | | | 12,924 | | | 16,849 |
Right-of-use assets obtained in exchange for new operating lease liabilities | | | — | | | 1,633 |
Supplemental balance sheet information related to leases is as follows:
| | | | | | |
| | June 30, | | December 31, |
(Dollars in thousands) | | 2024 | | 2023 |
Operating leases | | | | | | |
Operating lease right-of-use assets | | $ | 168,546 | | $ | 181,542 |
Operating lease liabilities - current portion | | | 21,797 | | | 23,047 |
Operating lease liabilities - non-current portion | | | 168,246 | | | 180,898 |
Total operating lease liabilities | | $ | 190,043 | | $ | 203,945 |
Finance leases | | | | | | |
Property plant and equipment, gross | | | 228 | | | 232 |
Accumulated depreciation | | | (166) | | | (177) |
Property plant and equipment, net | | $ | 62 | | $ | 55 |
Other current liabilities | | | 41 | | | 40 |
Other long-term liabilities | | | 22 | | | 43 |
Total finance lease liabilities | | $ | 63 | | $ | 83 |
| | | | | | |
Other information | | | | | | |
Weighted-average remaining lease term - finance leases | | | 2 | | | 2 |
Weighted-average remaining lease term - operating leases | | | 11 | | | 11 |
Weighted-average discount rate - finance leases | | | 7.07% | | | 7.07% |
Weighted-average discount rate - operating leases | | | 4.63% | | | 4.62% |
The maturities of our leases were as follows:
| | | | | | |
(Dollars in thousands) | | Operating
leases | | Finance
leases |
2024 | | $ | 30,207 | | $ | 44 |
2025 | | | 29,007 | | | 22 |
2026 | | | 26,751 | | | — |
2027 | | | 23,446 | | | — |
2028 | | | 21,288 | | | — |
Thereafter | | | 112,162 | | | — |
Total lease payments | | $ | 242,861 | | $ | 66 |
Less imputed interest | | | (52,818) | | | (3) |
Total | | $ | 190,043 | | $ | 63 |
As Lessor
We have entered into various leases as a lessor for our owned real estate properties. These leases vary in length between 1 and 20 years, with certain leases containing options to extend at the behest of the applicable tenants. Lease components consist of fixed base rent, and for certain leases, variable lease payments consisting of contracted percentages of revenue, changes in the relevant CPI, and/or other contracted financial metrics. None of our leases grant any right to the tenant to purchase the underlying asset.
Lease income relating to operating lease payments was as follows:
| | | | | | | | | | | | |
| | Quarter Ended | | Six Months Ended |
| | June 30, | | June 30, |
(Dollars in thousands) | | 2024 | | 2023 | | 2024 | | 2023 |
Components of lease income | | | | | | | | | | | | |
Lease payments | | $ | 2,701 | | | 2,765 | | $ | 5,425 | | $ | 5,392 |
Variable lease payments | | | 279 | | | 176 | | | 423 | | | 393 |
Total lease income | | $ | 2,980 | | $ | 2,941 | | $ | 5,848 | | $ | 5,786 |
The book value of underlying assets under operating leases from owned assets was as follows:
| | | | | | | | | | | | |
| | | | | | | | June 30, | | December 31, |
(Dollars in thousands) | | | | | | | | 2024 | | 2023 |
Building and improvements | | | | | | | | | | | | |
Gross balance | | | | | | | | $ | 115,569 | | $ | 127,222 |
Accumulated depreciation | | | | | | | | | (20,961) | | | (23,270) |
Net Book Value | | | | | | | | $ | 94,608 | | $ | 103,952 |
The minimum contractual rent payments due on our leases were as follows:
| | | | | | | | | | | | |
(Dollars in thousands) | | | | | | | | | | | Operating
leases |
2024 | | | | | | | | | | | $ | 4,311 |
2025 | | | | | | | | | | | | 8,751 |
2026 | | | | | | | | | | | | 7,303 |
2027 | | | | | | | | | | | | 6,520 |
2028 | | | | | | | | | | | | 6,568 |
Thereafter | | | | | | | | | | | | 21,323 |
Total | | | | | | | | | | | $ | 54,776 |
Note 8 – Goodwill and Intangible Assets
The table below summarizes goodwill by business segment as of June 30, 2024, and December 31, 2023.
| | | | | | | | | |
| | | | | | | | | |
(Dollars in thousands) | | Cinema | | Real Estate | | Total |
Balance at December 31, 2023 | | $ | 20,311 | | $ | 5,224 | | $ | 25,535 |
Foreign currency translation adjustment | | | (512) | | | — | | | (512) |
Balance at June 30, 2024 | | $ | 19,799 | | $ | 5,224 | | $ | 25,023 |
Our Company is required to test goodwill and other intangible assets for impairment on an annual basis and, if current events or circumstances require them, on an interim basis. Our next annual evaluation of goodwill and other intangible assets is scheduled during the fourth quarter of 2024. To test the impairment of goodwill, our Company compares the fair value of each reporting unit to its carrying amount, including the goodwill, to determine if there is potential goodwill impairment. A reporting unit is generally one level below the operating segment. As of June 30, 2024, we were not aware that any events indicating potential impairment of goodwill had occurred outside of those described at Note 3 – Liquidity and Impairment Assessment.
The tables below summarize intangible assets other than goodwill, as of June 30, 2024, and December 31, 2023, respectively.
| | | | | | | | | | | | |
| | | | | | | | | | | | |
| | As of June 30, 2024 |
(Dollars in thousands) | | Beneficial
Leases | | Trade
Name | | Other
Intangible
Assets | | Total |
Gross carrying amount | | $ | 10,459 | | $ | 9,024 | | $ | 4,380 | | $ | 23,863 |
Less: Accumulated amortization | | | (10,285) | | | (8,032) | | | (3,647) | | | (21,964) |
Net intangible assets other than goodwill | | $ | 174 | | $ | 992 | | $ | 733 | | $ | 1,899 |
| | | | | | | | | | | | |
| | | | | | | | | | | | |
| | As of December 31, 2023 |
(Dollars in thousands) | | Beneficial
Leases | | Trade
Name | | Other
Intangible
Assets | | Total |
Gross carrying amount | | $ | 11,283 | | $ | 9,024 | | $ | 4,400 | | $ | 24,707 |
Less: Accumulated amortization | | | (11,089) | | | (7,961) | | | (3,611) | | | (22,661) |
Less: Impairments | | | — | | | — | | | (8) | | | (8) |
Net intangible assets other than goodwill | | $ | 194 | | $ | 1,063 | | $ | 781 | | $ | 2,038 |
Beneficial leases obtained in business combinations where we are the landlord are amortized over the life of the relevant leases. Trade names are amortized based on the accelerated amortization method over their estimated useful life of 30 years, and other intangible assets are amortized over their estimated useful lives of up to 30 years (except for transferrable liquor licenses, which are indefinite-lived assets). The table below summarizes the amortization expense of intangible assets for the quarter and six months ended June 30, 2024
| | | | | | | | | | | | |
| | | | | | | | | | | | |
| | Quarter Ended | | Six Months Ended |
| | June 30, | | June 30, |
(Dollars in thousands) | | 2024 | | 2023 | | 2024 | | 2023 |
Beneficial lease amortization | | $ | 21 | | $ | 21 | | $ | 43 | | $ | 43 |
Other amortization | | | 60 | | | 54 | | | 97 | | | 101 |
Total intangible assets amortization | | $ | 81 | | $ | 75 | | $ | 140 | | $ | 144 |
Note 9 – Investments in Unconsolidated Joint Ventures
Our investments in unconsolidated joint ventures are accounted for under the equity method of accounting.
The table below summarizes our active investment holdings in two (2) unconsolidated joint ventures as of June 30, 2024, and December 31, 2023:
| | | | | | | | |
| | | | | | | | |
| | | | June 30, | | December 31, |
(Dollars in thousands) | | Interest | | 2024 | | 2023 |
Rialto Cinemas | | 50.0% | | $ | 768 | | $ | 848 |
Mt. Gravatt | | 33.3% | | | 3,660 | | | 3,908 |
Total investments | | | | $ | 4,428 | | $ | 4,756 |
For the quarter and six months ended June 30, 2024 and 2023, the recognized share of equity earnings from our investments in unconsolidated joint ventures are as follows:
| | | | | | | | | | | | |
| | | | | | | | | | | | |
| | Quarter Ended | | Six Months Ended |
| | June 30, | | June 30, |
(Dollars in thousands) | | 2024 | | 2023 | | 2024 | | 2023 |
Rialto Cinemas | | $ | (9) | | $ | 1 | | $ | (77) | | $ | (39) |
Mt. Gravatt | | | 128 | | | 206 | | | 171 | | | 265 |
Total equity earnings | | $ | 119 | | $ | 207 | | $ | 94 | | $ | 226 |
Note 10 – Prepaid and Other Assets
Prepaid and other assets are summarized as follows:
| | | | | | |
| | | | | | |
| | June 30, | | December 31, |
(Dollars in thousands) | | 2024 | | 2023 |
Prepaid and other current assets | | | | | | |
Prepaid expenses | | $ | 1,436 | | $ | 1,813 |
Prepaid taxes | | | 295 | | | 802 |
Income taxes receivable | | | 435 | | | — |
Deposits | | | 301 | | | 249 |
Investments in marketable securities | | | 18 | | | 17 |
Total prepaid and other current assets | | $ | 2,485 | | $ | 2,881 |
Other non-current assets | | | | | | |
Other non-cinema and non-rental real estate assets | | | 674 | | | 674 |
Investment in Reading International Trust I | | | 838 | | | 838 |
Straight-line rent asset | | | 7,202 | | | 7,445 |
Long-term deposits | | | 11 | | | 8 |
Total other non-current assets | | $ | 8,725 | | $ | 8,965 |
Note 11 – Income Taxes
The interim provision for income taxes is different from the amount determined by applying the U.S. federal statutory rate to consolidated income or loss before taxes. The differences are attributable to foreign tax rate differential, unrecognized tax benefits, and change in valuation allowance. Our effective tax rate was 1.6% and 3.9% for the six months ended June 30, 2024 and 2023, respectively.
The difference is primarily due to an increase in unrecognized tax benefits in 2024. The forecasted effective tax rate is updated each quarter as new information becomes available.
Note 12 – Borrowings
Our Company’s borrowings at June 30, 2024 and December 31, 2023, net of deferred financing costs and including the impact of interest rate derivatives on effective interest rates, are summarized below:
| | | | | | | | | | | | | | | |
| | | | | | | | | | | | | | | |
| | As of June 30, 2024 |
(Dollars in thousands) | | Maturity Date | | Contractual
Facility | | Balance,
Gross | | Balance,
Net(1) | | Stated
Interest Rate | | Effective
Interest
Rate |
Denominated in USD | | | | | | | | | | | | | | | |
Trust Preferred Securities (US) | | April 30, 2027 | | $ | 27,913 | | $ | 27,913 | | $ | 27,283 | | 9.59% | | 9.59% |
Bank of America Credit Facility (US) | | August 18, 2025 | | | 17,750 | | | 17,750 | | | 17,680 | | 11.50% | | 11.50% |
Cinemas 1, 2, 3 Term Loan (US) | | October 1, 2024 | | | 20,855 | | | 20,855 | | | 20,770 | | 8.83% | | 8.83% |
Minetta & Orpheum Theatres Loan (US) | | June 1, 2024 | | | 8,000 | | | 8,000 | | | 7,984 | | 7.00% | | 7.00% |
Union Square Financing (US) | | May 6, 2025 | | | 55,000 | | | 47,141 | | | 46,938 | | 12.54% | | 12.54% |
Purchase Money Promissory Note (US) | | September 18, 2024 | | | 198 | | | 198 | | | 198 | | 5.00% | | 5.00% |
Denominated in foreign currency ("FC") (2) | | | | | | | | | | | | | | | |
NAB Corporate Term Loan (AU) | | July 31, 2026 | | | 66,770 | | | 66,770 | | | 66,610 | | 6.09% | | 6.09% |
NAB Bridge Facility (AU) | | March 31, 2025 | | | 13,354 | | | 13,354 | | | 13,329 | | 6.12% | | 6.12% |
Westpac Bank Corporate (NZ) | | January 1, 2025 | | | 8,437 | | | 8,437 | | | 8,437 | | 8.20% | | 8.20% |
| | | | $ | 218,277 | | $ | 210,418 | | $ | 209,229 | | | | |
(1)Net of deferred financing costs amounting to $1.2 million.
(2)The contractual facilities and outstanding balances of the foreign currency denominated borrowings were translated into U.S. dollars based on the applicable exchange rates as of June 30, 2024.
| | | | | | | | | | | | | | | |
| | | | | | | | | | | | | | | |
| | As of December 31, 2023 |
(Dollars in thousands) | | Maturity Date | | Contractual
Facility | | Balance,
Gross | | Balance,
Net(1) | | Stated
Interest
Rate | | Effective
Interest
Rate |
Denominated in USD | | | | | | | | | | | | | | | |
Trust Preferred Securities (US) | | April 30, 2027 | | $ | 27,913 | | $ | 27,913 | | $ | 27,172 | | 9.65% | | 9.65% |
Bank of America Credit Facility (US)(3) | | September 4, 2024 | | | 20,200 | | | 20,200 | | | 20,080 | | 11.00% | | 11.00% |
Cinemas 1, 2, 3 Term Loan (US) | | October 1, 2024 | | | 21,008 | | | 21,008 | | | 20,780 | | 8.84% | | 8.84% |
Minetta & Orpheum Theatres Loan (US) | | June 1, 2024 | | | 8,000 | | | 8,000 | | | 8,000 | | 8.34% | | 8.34% |
U.S. Corporate Office Term Loan (US) | | January 1, 2027 | | | 8,401 | | | 8,401 | | | 8,356 | | 4.64% / 4.44% | | 4.64% / 4.44% |
Union Square Financing (US) | | May 6, 2024 | | | 55,000 | | | 47,141 | | | 46,925 | | 12.53% | | 12.53% |
Purchase Money Promissory Note (US) | | September 18, 2024 | | | 586 | | | 586 | | | 586 | | 5.00% | | 5.00% |
Denominated in foreign currency ("FC")(2) | | | | | | | | | | | | | | | |
NAB Corporate Term Loan (AU) | | July 31, 2025 | | | 68,276 | | | 68,276 | | | 68,173 | | 6.11% | | 6.11% |
Westpac Bank Corporate (NZ) | | January 1, 2025 | | | 8,775 | | | 8,775 | | | 8,775 | | 8.20% | | 8.20% |
Total | | | | $ | 218,159 | | $ | 210,300 | | $ | 208,847 | | | | |
(1)Net of deferred financing costs amounting to $1.5 million.
(2)The contractual facilities and outstanding balances of the foreign currency denominated borrowings were translated into U.S. dollars based on the applicable exchange rates as of December 31, 2023.
(3)This financing facility was extended after December 31, 2023.
Our loan arrangements are presented, net of the deferred financing costs, on the face of our consolidated balance sheet as follows:
| | | | | | |
| | | | | | |
| | June 30, | | December 31, |
Balance Sheet Caption (Dollars in thousands) | | 2024 | | 2023 |
Debt - current portion | | $ | 58,401 | | $ | 34,484 |
Debt - long-term portion | | | 123,347 | | | 146,605 |
Subordinated debt - current portion | | | 198 | | | 586 |
Subordinated debt - long-term portion | | | 27,283 | | | 27,172 |
Total borrowings | | $ | 209,229 | | $ | 208,847 |
Bank of America Credit Facility
Our Bank of America facility was amended on March 27, 2024, to among other terms and conditions, (i) extend the Maturity Date to August 18, 2025, (ii) require a $275,000 principal paydown, (iii) eliminate the minimum liquidity covenant, (iv) reduce the principal amortization amounts and provide a principal holiday period, and (v) require certain paydowns on the sale of certain real estate assets.
Interest is charged at 3.0% above the Bank of America Prime rate, which itself has a floor of 1.0%. Payment-in-kind interest at a rate of 0.5% commenced on January 1, 2024, and will continue until December 31, 2024, increasing to 1.5% on January 1, 2025, until the facility is repaid in full. This loan is subject to mandatory prepayment out of a portion of the net proceeds realized by us in the event that we determine to sell certain specified assets.
Minetta and Orpheum Theatres Loan
On November 1, 2023, our $8.0 million loan with Santander Bank, which is secured by our Minetta and Orpheum Theatres, matured. On January 26, 2024, we extended this loan for a further six months to June 1, 2024. We are in discussions with Santander to extend the maturity date of this loan.
Cinemas 1,2,3 Term Loan
Our Cinemas 1,2,3 Term Loan is held by Sutton Hill Properties LLC (“SHP”), a 75% owned subsidiary of RDI. On September 29, 2023, we extended the maturity of this loan from October 3, 2023, to October 1, 2024. The loan is with Valley National Bank, carries an interest rate of 3.50% above monthly SOFR, with a floor of 7.50%, and includes provisions for a prepaid interest reserve.
Union Square Financing
On May 7, 2021, we closed on a new three year $55.0 million loan facility with Emerald Creek Capital secured by our 44 Union Square property and certain limited guarantees. Following the phase out of LIBOR, the facility bears a variable interest rate of TERM SOFR plus 6.9% and includes provisions for a prepaid interest and property tax reserve fund. On April 23, 2024, we executed the first 12 month extension on this loan, taking the maturity to May 6, 2025. The loan has one remaining 12-month option to extend, and may be repaid at any time, without the payment of any premium. As this option is within our control, we will continue to keep the loan classified as long-term.
Purchase Money Promissory Note
On September 18, 2019, we purchased for $5.5 million 407,000 shares of our Class A Common Stock in a privately negotiated transaction under our Share Repurchase Program. Of this amount, $3.5 million was paid by the issuance of a Purchase Money Promissory Note, which bears an interest rate of 5.0% per annum, payable in equal quarterly payments of principal plus accrued interest. The Purchase Money Promissory Note matures on September 18, 2024.
U.S. Corporate Office Term Loan
We repaid this $8.4 million loan in full in February 2024, with a portion of the proceeds from the sale of our Culver City office building.
Debt denominated in foreign currencies
Westpac Bank Corporate Credit Facility (NZ)
Our Westpac Corporate Credit Facility for NZ$13.8 million matures on January 1, 2025. The facility currently carries an interest rate and line of credit charge of 2.40% above the Bank Bill Bid Rate and 1.65% respectively. Westpac has waived the requirement to test certain covenants for each quarter since the third quarter of 2020, including the quarter ending June 30, 2024.
On August 13, 2024, we increased the limit on this facility by NZ$5.0 million to NZ$18.8 million. The maturity date remains January 1, 2025. See Note 20 Subsequent Events.
Australian NAB Corporate Term Loan (AU)
Prior to March 31, 2024, our Revolving Corporate Markets Loan Facility with National Australia Bank (“NAB”) matured on July 31, 2025. It consisted of (i) an AU$100.0 million Corporate Loan facility at 1.75% above BBSY, of which AU $60.0 million was revolving and AU$40.0 million was core and (ii) a Bank Guarantee Facility of AU$5.0 million at a rate of 1.9% per annum.
On April 4, 2024, we amended this facility, which now matures on July 31, 2026. As part of the amendment, we obtained an additional AU$20.0 million bridge facility which matures on March 31, 2025 (or earlier, upon the sale of certain assets), and modified certain covenants. We are also required, from March 31, 2025, to make quarterly repayments of AU$1.5 million against the AU$100.0 million Corporate Loan facility, until maturity date, representing permanent reductions in that facility’s ceiling. The bank guarantee facility was reduced to AU$3.0 million. No other changes were made.
Effective June 28, 2024, we entered into an Interest Rate Hedging Agreement with NAB on AU$50.0 million of the Corporate Loan Facility with the Termination date on July 31, 2026. The Interest Rate Collar transaction has a floor of 4.18% and a cap of 4.78%.
Note 13 – Other Liabilities
Other liabilities are summarized as follows:
| | | | | | |
| | | | | | |
| | June 30, | | December 31, |
(Dollars in thousands) | | 2024 | | 2023 |
Current liabilities | | | | | | |
Lease liability | | $ | 5,900 | | $ | 5,900 |
Accrued pension | | | 532 | | | 684 |
Security deposit payable | | | 119 | | | 74 |
Finance lease liabilities | | | 41 | | | 40 |
Other | | | 33 | | | 33 |
Other current liabilities | | $ | 6,625 | | $ | 6,731 |
Other liabilities | | | | | | |
Lease make-good provision | | | 6,018 | | | 6,050 |
Accrued pension | | | 2,542 | | | 2,646 |
Deferred rent liability | | | 1,255 | | | 1,314 |
Environmental reserve | | | 1,656 | | | 1,656 |
Acquired leases | | | — | | | 2 |
Finance lease liabilities | | | 22 | | | 43 |
Other non-current liabilities | | $ | 11,493 | | $ | 11,711 |
Pension Liability – Supplemental Executive Retirement Plan
Details of our Supplemental Executive Retirement Plan are disclosed in Note 13 – Pension and Other Liabilities in our 2023 Form 10-K.
Included in our current and non-current liabilities are accrued pension costs of $3.1 million on June 30, 2024. The benefits of our pension plan are fully vested and therefore no service costs were recognized for the quarter and six months ended June 30, 2024, and 2023. Our pension plan is unfunded.
During the quarter and six months ended June 30, 2024, the interest cost was $42,000 and $86,000, respectively, and the actuarial loss was $52,000 and $104,000, respectively. During the quarter and six months ended June 30, 2023, the interest cost was $50,000 and $99,000, respectively, and the actuarial loss was $51,000 and $103,000, respectively.
Note 14 – Accumulated Other Comprehensive Income
The following table summarizes the changes in each component of accumulated other comprehensive income attributable to RDI:
| | | | | | | | | | | | | | |
| | | | | | | | | | | | | | |
(Dollars in thousands) | Foreign
Currency
Items | | Unrealized
Gain (Losses)
on Available-
for-Sale
Investments | | Accrued
Pension
Service Costs | | Hedge
Accounting
Reserve | | Total |
Balance at January 1, 2024 | $ | (986) | | $ | (18) | | $ | (1,669) | | $ | — | | $ | (2,673) |
| | | | | | | | | | | | | | |
Change related to derivatives | | | | | | | | | | | | | | |
Total change in hedge fair value recorded in Other Comprehensive Income | | — | | | — | | | — | | | (98) | | | (98) |
Amounts reclassified from accumulated other comprehensive income | | — | | | — | | | — | | | — | | | — |
Net change related to derivatives | | — | | | — | | | — | | | (98) | | | (98) |
| | | | | | | | | | | | | | |
Net current-period other comprehensive income (loss) | | (1,659) | | | 1 | | | 104 | | | (98) | | | (1,652) |
Balance at June 30, 2024 | $ | (2,645) | | $ | (17) | | $ | (1,565) | | $ | (98) | | $ | (4,325) |
Note 15 – Commitments and Contingencies
Litigation Matters
We are currently involved in certain legal proceedings and, to the extent required, have accrued estimates of probable and estimable losses for the resolution of these claims, including legal costs.
Where we are the plaintiffs, we accrue legal fees as incurred on an on-going basis and make no provision for any potential settlement amounts until received. In Australia, the prevailing party is usually entitled to recover its attorneys’ fees, which recoveries typically work out to be approximately 60% of the amounts actually spent where first-class legal counsel is engaged at customary rates. Where we are a plaintiff, we have likewise made no provision for the liability for the defendant’s attorneys’ fees in the event we are determined not to be the prevailing party.
Where we are the defendants, we accrue for probable damages that insurance may not cover as they become known and can be reasonably estimated, as permitted under ASC 450-20 Loss Contingencies. In our opinion, any claims and litigation in which we are currently involved are not reasonably likely to have a material adverse effect on our business, results of operations, financial position, or liquidity. It is possible, however, that future results of the operations for any particular quarterly or annual period could be materially affected by the ultimate outcome of the legal proceedings. From time to time, we are involved with claims and lawsuits arising in the ordinary course of our business that may include contractual obligations, insurance claims, tax claims, employment matters, and anti-trust issues, among other matters.
Environmental and Asbestos Claims on Reading Legacy Operations
Certain of our subsidiaries were historically involved in railroad operations, coal mining, and manufacturing. Also, certain of these subsidiaries appear in the chain-of-title of properties that may suffer from pollution. Accordingly, certain of these subsidiaries have, from time to time, been named in and may in the future be named in various actions brought under applicable environmental laws. Also, we are in the real estate development business and may encounter from time to time environmental conditions at properties that we have acquired for development and which will need to be addressed in the future as part of the development process. These environmental conditions can increase the cost of such projects and adversely affect the value and potential for profit of such projects. We do not currently believe that our exposure under applicable environmental laws is material in amount.
From time to time, there are claims brought against us relating to the exposure of former employees to asbestos and/or coal dust. These are generally covered by an insurance settlement reached in September 1990 with our insurance providers. However, this insurance settlement does not cover litigation by people who were not employees of our historic railroad operations and who may claim direct or second-hand exposure to asbestos, coal dust and/or other chemicals or elements now recognized as potentially causing cancer in humans. Our known exposure to these types of claims, asserted or probable of being asserted, is not material.
Note 16 – Non-controlling Interests
These are composed of the following enterprises:
Australia Country Cinemas Pty Ltd. - 25% noncontrolling interest owned by Panorama Group International Pty Ltd;
Shadow View Land and Farming, LLC - 50% noncontrolling membership interest owned by the estate of Mr. James J. Cotter, Sr. (the “Cotter Estate”); and,
Sutton Hill Properties, LLC - 25% noncontrolling interest owned by Sutton Hill Capital, LLC (which in turn is 50% owned by the Cotter Estate).
The components of noncontrolling interests are as follows:
| | | | | | |
| | | | | | |
| | June 30, | | December 31, |
(Dollars in thousands) | | 2024 | | 2023 |
Australian Country Cinemas, Pty Ltd | | $ | 64 | | $ | 76 |
Shadow View Land and Farming, LLC | | | (2) | | | (2) |
Sutton Hill Properties, LLC | | | (525) | | | (165) |
Noncontrolling interests in consolidated subsidiaries | | $ | (463) | | $ | (91) |
The components of income attributable to noncontrolling interests are as follows:
| | | | | | | | | | | | |
| | | | | | | | | | | | |
| | Quarter Ended | | Six Months Ended |
| | June 30, | | June 30, |
(Dollars in thousands) | | 2024 | | 2023 | | 2024 | | 2023 |
Australian Country Cinemas, Pty Ltd | | $ | 3 | | $ | 25 | | $ | (9) | | $ | 35 |
Shadow View Land and Farming, LLC | | | — | | | — | | | — | | | — |
Sutton Hill Properties, LLC | | | (198) | | | (108) | | | (361) | | | (331) |
Net income (loss) attributable to noncontrolling interests | | $ | (195) | | $ | (83) | | $ | (370) | | $ | (296) |
Summary of Controlling and Noncontrolling Stockholders’ Equity
A summary of the changes in controlling and noncontrolling stockholders’ equity is as follows:
| | | | | | | | | | | | | | | | | | | | |
| Common Stock | | | Retained | | | Accumulated | Reading | | | | |
| Class A | Class A | Class B | Class B | Additional | Earnings | | | Other | International Inc. | | | Total |
| Non-Voting | Par | Voting | Par | Paid-In | (Accumulated | Treasury | Comprehensive | Stockholders’ | Noncontrolling | Stockholders’ |
(Dollars in thousands, except shares) | Shares | Value | Shares | Value | Capital | Deficit) | Shares | Income (Loss) | Equity | Interests | Equity |
At January 1, 2024 | 20,664 | $ | 237 | 1,681 | $ | 17 | $ | 155,402 | $ | (79,489) | $ | (40,407) | $ | (2,673) | $ | 33,087 | $ | (91) | $ | 32,996 |
Net income (loss) | — | | — | — | | — | | — | | (13,228) | | — | | — | | (13,228) | | (175) | | (13,403) |
Other comprehensive income, net | — | | — | — | | — | | — | | — | | — | | (2,538) | | (2,538) | | (3) | | (2,541) |
Share-based compensation expense | — | | — | — | | — | | 678 | | — | | — | | — | | 678 | | -- | | 678 |
Restricted Stock Units | 9 | | — | — | | — | | (2) | | — | | — | | — | | (2) | | -- | | (2) |
At March 31, 2024 | 20,673 | $ | 237 | 1,681 | $ | 17 | $ | 156,078 | $ | (92,717) | $ | (40,407) | $ | (5,211) | $ | 17,997 | $ | (269) | $ | 17,728 |
Net income | — | | — | — | | — | | — | | (9,341) | | — | | — | | (9,341) | | (195) | | (9,536) |
Other comprehensive income, net | — | | — | — | | — | | — | | — | | — | | 886 | | 886 | | 1 | | 887 |
Share-based compensation expense | — | | — | — | | — | | 456 | | — | | — | | — | | 456 | | -- | | 456 |
Restricted Stock Units | 72 | | 1 | — | | — | | (5) | | — | | — | | — | | (4) | | -- | | (4) |
At June 30, 2024 | 20,745 | $ | 238 | 1,681 | $ | 17 | $ | 156,529 | $ | (102,058) | $ | (40,407) | $ | (4,325) | $ | 9,994 | $ | (463) | $ | 9,531 |
| | | | | | | | | | | | | | | | | | | | |
| Common Stock | | | Retained | | | Accumulated | Reading | | | | |
| Class A | Class A | Class B | Class B | Additional | Earnings | | | Other | International Inc. | | | Total |
| Non-Voting | Par | Voting | Par | Paid-In | (Accumulated | Treasury | Comprehensive | Stockholders’ | Noncontrolling | Stockholders’ |
(Dollars in thousands, except shares) | Shares | Value | Shares | Value | Capital | Deficit) | Shares | Income (Loss) | Equity | Interests | Equity |
At January 1, 2023 | 20,410 | $ | 235 | 1,680 | $ | 17 | $ | 153,784 | $ | (48,816) | $ | (40,407) | $ | (1,957) | $ | 62,856 | $ | 423 | $ | 63,279 |
Net income (loss) | — | | — | — | | — | | — | | (11,111) | | — | | — | | (11,111) | | (213) | | (11,324) |
Other comprehensive income, net | — | | — | — | | — | | — | | — | | — | | (1,293) | | (1,293) | | (1) | | (1,294) |
Share-based compensation expense | — | | — | — | | — | | 443 | | — | | — | | — | | 443 | | — | | 443 |
Restricted Stock Units | 89 | | — | — | | — | | (132) | | — | | — | | — | | (132) | | — | | (132) |
At March 31, 2023 | 20,499 | $ | 235 | 1,680 | $ | 17 | $ | 154,095 | $ | (59,927) | $ | (40,407) | $ | (3,250) | $ | 50,763 | $ | 209 | $ | 50,972 |
Net income | — | | — | — | | — | | — | | (2,778) | | — | | — | | (2,778) | | (83) | | (2,861) |
Other comprehensive income, net | — | | — | — | | — | | — | | — | | — | | (740) | | (740) | | (1) | | (741) |
Share-based compensation expense | — | | — | — | | — | | 308 | | — | | — | | — | | 308 | | — | | 308 |
Restricted Stock Units | 92 | | 1 | — | | — | | (113) | | — | | — | | — | | (112) | | — | | (112) |
At June 30, 2023 | 20,591 | $ | 236 | 1,680 | $ | 17 | $ | 154,290 | $ | (62,705) | $ | (40,407) | $ | (3,990) | $ | 47,441 | $ | 125 | $ | 47,566 |
Note 17 – Stock-Based Compensation and Stock Repurchases
Employee and Director Stock Incentive Plan
2020 Stock Incentive Plan
On November 4, 2020, the Company enacted the 2020 Stock Incentive Plan, which was also approved by the Company’s stockholders on December 8, 2020 (as amended, the “2020 Plan”). Under the 2020 Plan, the number of permitted authorized shares for issuance was originally set at 1,250,000, plus any shares reserved for awards outstanding under the 2010 Plan that were subsequently forfeited (for instance, through a then outstanding out of the money option) or if the related shares are repurchased, a corresponding number of shares would automatically become available for issuance under the 2020 Plan. On December 7, 2023, the Company’s stockholders, upon recommendation of the Company’s board of directors, approved the First Amendment to the 2020 Stock Incentive Plan, increasing the number of Class A Common Stock reserved for issuance under the 2020 Plan by an additional 971,807 shares.
Under the 2020 Plan, the Company may grant stock options and other share-based payment awards of our Class A Common Stock to eligible employees, directors and consultants. At June 30, 2024, there were 1,486,907 shares of Class A Common Stock available for issuance under the 2020 Plan, which includes shares from the 2010 Plan that become available for issuance due to the forfeiture of then outstanding out of the money stock options.
Stock options are granted at exercise prices equal to the grant-date market prices and typically expire on either the fifth or tenth anniversary of the grant date. In contrast to a stock option where the grantee buys our Company’s share at an exercise price determined on the grant date, a restricted stock unit (“RSU”) entitles the grantee to receive one share for every RSU based on a vesting plan, typically between one year and four years from grant. As discussed further below, a performance component has been added to
certain of the RSUs or options granted to management. At the time the options are exercised or RSUs vest and are settled, at the discretion of management, we will issue treasury shares or make a new issuance of shares to the option or RSU holder.
Stock Options
We have estimated the grant-date fair value of our stock options using the Black-Scholes option-valuation model, which takes into account assumptions such as the dividend yield, the risk-free interest rate, the expected stock price volatility, and the expected life of the options. We expensed the estimated grant-date fair values of options over the vesting period on a straight-line basis. Based on our historical experience, the “deemed exercise” of expiring in-the-money options and the relative market price to strike price of the options, we have not estimated any forfeitures of vested or unvested options.
Stock options to purchase 207,657 shares of Class A Common Stock were issued to the Board of Directors upon their reelection to the Board in December 2023 for their services for their 2024 term. No other stock options were granted in 2023. On June 6, 2024, we issued options to purchase 1,264,603 shares of Class A Common Stock to our senior executives. These options have a one-year vesting and a ten-year term and were granted in lieu of cash bonuses which would otherwise have been paid under our Company's Incentive Compensation Program. No other stock options were granted during the two quarters of 2024.
For the quarter and six months ended June 30, 2024, we recorded a compensation expense of $115,000 and $164,000 respectively, with respect to our prior stock option grants. For the quarter and six months ended June 30, 2023, we recorded a compensation expense of and $9,000 and $18,000 respectively, with respect to our prior stock option grants At June 30, 2024, the total unrecognized estimated compensation expense related to non-vested stock options was $815,000, which we expect to recognize over a weighted average vesting period of 1.03 years. The intrinsic, unrealized value of all options outstanding vested and expected to vest, at June 30, 2024, was nil, as the closing price of our Class A Common Stock on that date was $1.42.
The following table summarizes the number of options outstanding and exercisable as of June 30, 2024, and December 31, 2023:
| | | | | | | | | | |
| | | | | | | | | | |
| | Outstanding Stock Options - Class A Shares |
| | Number
of Options | | Weighted
Average
Exercise Price | | Weighted
Average
Remaining
Years of
Contractual
Life | | Aggregate
Intrinsic
Value |
| | Class A | | Class A | | Class A | | Class A |
Balance - December 31, 2022 | | 327,498 | | $ | 15.87 | | 1.24 | | $ | — |
Granted | | 207,657 | | | 1.92 | | — | | | — |
Exercised | | — | | | — | | — | | | — |
Forfeited | | (122,376) | | | — | | — | | | — |
Balance - December 31, 2023 | | 412,779 | | $ | 14.19 | | 1.79 | | $ | — |
Granted | | 1,264,603 | | | 1.47 | | — | | | — |
Exercised | | — | | | — | | — | | | — |
Forfeited | | (205,122) | | | — | | — | | | — |
Balance - June 30, 2024 | | 1,472,260 | | $ | 1.73 | | 9.87 | | $ | — |
Restricted Stock Units
The following table summarizes the status of RSUs granted to date as of June 30, 2024:
| | | | | | | | | | | | |
| | | | | | | | | | | | |
| | Restricted Stock Units |
| | RSU Grants (in units) | | | | Vested, | | Unvested, | | Forfeited, |
Grant Date | | Directors | | Management | | Total
Grants | | June 30, 2024 | | June 30, 2024 | | June 30, 2024 |
| | | | | | | | | | | | |
Opening balance | | 265,755 | | 793,353 | | 1,059,108 | | 944,946 | | 50,259 | | 63,904 |
| | | | | | | | | | | | |
April 18, 2022 | | — | | 428,899 | | 428,899 | | 151,033 | | 230,601 | | 47,265 |
December 15, 2022 | | 73,683 | | — | | 73,683 | | 73,683 | | — | | — |
April 11, 2023 | | — | | 413,536 | | 413,536 | | 146,714 | | 257,790 | | 9,032 |
April 21, 2023 | | — | | 237,719 | | 237,719 | | 79,328 | | 149,866 | | 8,525 |
April 28, 2023 | | — | | 20,427 | | 20,427 | | 5,109 | | 15,318 | | — |
| | | | | | | | | | | | |
Total | | 339,438 | | 1,893,934 | | 2,233,372 | | 1,400,813 | | 703,834 | | 128,726 |
Time vested RSU awards to management typically vest 25% on the anniversary of the grant date and the remainder over a period of four years. Beginning in 2020, a performance component has been added to certain management equity grants, which vest on the third anniversary of their grant date based on the achievement of certain performance metrics. From 2021 onwards, RSUs have two vesting structures, which include time vesting and performance vesting. The majority of RSUs vest 75% evenly over a period of four years, with the remaining 25% contingent upon the achievement of certain performance metrics, vesting in full on the third anniversary of the date of the grant. In the case of our Chief Executive Officer, RSUs vest 50% evenly over a period of four years with the remaining 50%, contingent upon the achievement of certain performance metrics, vesting in full on the third anniversary of the grant date. On April 11 and April 21, 2023, the Board of Directors determined that our Company was not in a position to pay cash bonuses that would otherwise have been earned by certain members of management under our Company’s Incentive Compensation Plan for 2022, and authorized the issuance in lieu of such cash bonuses 85,139 RSUs, which vested on April 11, 2024 and 52,360 RSUs, which vested on April 21, 2024. No RSUs were granted during the remainder of 2023 or the first two quarters of 2024, however, the Compensation Committee has not completed its final review of 2024 incentive compensation.
For the quarter and six months ended June 30, 2024, we recorded compensation expense of $341,000 and $1.0 million, respectively. For the quarter and six months ended June 30, 2023, we recorded compensation expense of $299,000, and $733,000, respectively. The total unrecognized compensation expense related to the non-vested RSUs was $2.6 million as of June 30, 2024, which we expect to recognize over a weighted average vesting period of 1.17 years.
Stock Repurchase Program
Our Stock Repurchase Program expired on March 10, 2024. It has not been renewed. No stock has been repurchased by our Company since March 10, 2020.
Note 18 – Hedge Accounting
As of June 30, 2024, our Company held derivative instruments to the notional value of $33.4 million. The changes in fair value of that instrument were recorded in Other Comprehensive Income and released into interest expense in the same period(s) in which the hedged transactions affect earnings. As of December 31, 2023, our Company held no derivative instruments. In the quarter and six months ended June 30, 2024 and June 30, 2023, respectively, the derivative instruments affected Comprehensive Income as follows:
| | | | | | | | | | | | | |
(Dollars in thousands) | Location of Loss Recognized in Income on Derivatives | | Amount of Loss (Gain) Recognized in Income on Derivatives |
| | | Quarter Ended June 30 | | Six Months Ended June 30 |
| | | | 2024 | | | 2023 | | | 2024 | | | 2023 |
Interest rate contracts | Interest expense | | $ | — | | $ | (19) | | $ | — | | $ | (786) |
Total | | | $ | — | | $ | (19) | | $ | — | | $ | (786) |
| | | | | | | | | | | | |
| | Loss (Gain) Recognized in OCI on Derivatives (Effective Portion) |
(Dollars in thousands) | | Amount | | Amount |
| | Quarter Ended June 30 | | Six Months Ended June 30 |
| | | 2024 | | | 2023 | | | 2024 | | | 2023 |
Interest rate contracts | | $ | 98 | | $ | (16) | | $ | 98 | | $ | 2 |
Total | | $ | 98 | | $ | (16) | | $ | 98 | | $ | 2 |
| | | | | | | | | | | | |
| | Loss (Gain) Reclassified from OCI into Income (Effective Portion) |
Line Item | | Amount | | Amount |
| | Quarter Ended June 30 | | Six Months Ended June 30 |
| | | 2024 | | | 2023 | | | 2024 | | | 2023 |
Interest expense | | $ | — | | $ | (220) | | $ | — | | $ | (785) |
Total | | $ | — | | $ | (220) | | $ | — | | $ | (785) |
Note 19 – Fair Value Measurements
ASC 820, Fair Value Measurement establishes a fair value hierarchy that prioritizes the inputs to valuation techniques used to measure fair value. The statement requires that assets and liabilities carried at fair value be classified and disclosed in one of the following three categories:
Level 1: Quoted market prices in active markets for identical assets or liabilities;
Level 2: Quoted prices for similar instruments in active markets; quoted prices for identical or similar instruments in markets that are not active; and model-derived valuations in which all significant inputs and significant value drivers are observable in active markets; and,
Level 3: Valuations derived from valuation techniques in which one or more significant inputs or significant value drivers are unobservable.
The following tables summarize our financial liabilities that are carried at cost and measured at fair value on a non-recurring basis as of June 30, 2024, and December 31, 2023, by level within the fair value hierarchy.
| | | | | | | | | | | | | | | |
| | | | | | | | | | | | | | | |
| | | | | Fair Value Measurement at June 30, 2024 |
(Dollars in thousands) | | Carrying
Value(1) | | Level 1 | | Level 2 | | Level 3 | | Total |
Notes payable | | $ | 182,307 | | $ | — | | $ | — | | $ | 183,045 | | $ | 183,045 |
Subordinated debt | | | 28,111 | | | — | | | — | | | 27,771 | | | 27,771 |
| | $ | 210,418 | | $ | — | | $ | — | | $ | 210,816 | | $ | 210,816 |
| | | | | | | | | | | | | | | |
| | | | | | | | | | | | | | | |
| | | | | Fair Value Measurement at December 31, 2023 |
(Dollars in thousands) | | Carrying
Value(1) | | Level 1 | | Level 2 | | Level 3 | | Total |
Notes payable | | $ | 181,801 | | $ | — | | $ | — | | $ | 148,325 | | $ | 148,325 |
Subordinated debt | | | 28,499 | | | — | | | — | | | 27,832 | | | 27,832 |
| | $ | 210,300 | | $ | — | | $ | — | | $ | 176,157 | | $ | 176,157 |
(1)These balances are presented before any deduction for deferred financing costs.
The following is a description of the valuation methodologies used to estimate the fair value of our financial assets and liabilities. There have been no changes in the methodologies used as of June 30, 2024, and December 31, 2023.
Level 1 investments in marketable securities primarily consist of investments associated with the ownership of marketable securities in U.S. and New Zealand. These investments are valued based on observable market quotes on the last trading date of the reporting period.
Level 2 derivative financial instruments are valued based on discounted cash flow models that incorporate observable inputs such as interest rates and yield curves from the derivative counterparties. The credit valuation adjustments associated with our non-performance risk and counterparty credit risk are incorporated in the fair value estimates of our derivatives. As of June 30, 2024, and December 31, 2023, we concluded that the credit valuation adjustments were not significant to the overall valuation of our derivatives.
Level 3 borrowings include our secured and unsecured notes payable, trust preferred securities and other debt instruments. The borrowings are valued based on discounted cash flow models that incorporate appropriate market discount rates. We calculated the market discount rate by obtaining period-end treasury rates for fixed-rate debt, or LIBOR for variable-rate debt, for maturities that correspond to the maturities of our debt, adding appropriate credit spreads derived from information obtained from third-party financial institutions. These credit spreads take into account factors such as our credit rate, debt maturity, types of borrowings, and the loan-to-value ratios of the debt.
Our Company’s financial instruments also include cash, cash equivalents, receivables and accounts payable. The carrying values of these financial instruments approximate the fair values due to their short maturities. Additionally, there were no transfers of assets and liabilities between levels 1, 2, or 3 during the quarter and six months ended June 30, 2024, and June 30, 2023.
Note 20 – Subsequent Events
On August 12, 2024, the date for the closing of our acquisition of the ground lessee’s interest in the land and improvements constituting our Village East Theatre was extended to November 30, 2024, and our sublease of that facility was extended until September 1, 2026.
On August 13, 2024, we increased the limit of the Westpac Corporate Credit Facility by NZ$5.0 million to NZ$18.8 million.
This MD&A should be read in conjunction with the accompanying unaudited consolidated financial statements included in Part I, Item 1 (Financial Statements). The foregoing discussions and analyses contain certain forward-looking statements. Please refer to the “Cautionary Statement Regarding Forward-Looking Statements” included at the conclusion of this section and our “Risk Factors” set forth in our 2023 Form 10-K, Part 1 – Financial Information, Item 1A and the Risk Factors set out below.
Item 2 – Management’s Discussion and Analysis (“MD&A”) of Financial Condition and Results of Operations
The MD&A should be read in conjunction with our consolidated financial statements and related notes in this Report.
Business Overview & Updates
We continue to be optimistic about the current trajectory of our cinema business and the cinema industry as a whole. Although we remain positive, we are currently, and have in recent years, been impacted by multiple factors, such as COVID – 19, the 2023 Hollywood Strikes and current macroeconomic situations such as inflation, interest rates, labor increases and the declining value of the Australian and New Zealand dollars. These factors are largely beyond our control, and continue to adversely impact the profitability of our global cinema segment when compared to pre-pandemic levels:
Cinema patronage levels have not yet returned to pre-pandemic levels;
Inflationary pressures, ongoing supply chain issues, mandatory minimum wage increases, increased operating expenses all arising post-pandemic continue to push up our variable costs while we encounter consumer resistance to higher ticket prices;
Increased fixed costs for third party cinema rents, some of which are increasing due to fixed rent escalations, some of which are fixed and some of which are adjusted by reference to changes in the cost-of-living index, which are exacerbated by having to also pay COVID-19 related rent deferrals for the periods of time when our operations were closed or restricted;
Reserve banks in the U.S., Australia and New Zealand have increased interest rates causing our cost of borrowing to increase materially;
Decreases in exchange rates for the Australian and New Zealand currencies when compared to the U.S. Dollar; and
General market and economic conditions.
In addition to the above factors negatively influencing the profitability of our global cinema business, we continue to feel the repercussions of the 2023 Hollywood Strikes on our second quarter 2024 operations. Several notable movie titles initially slated for 2024 have been postponed to 2025, including Captain America: Brave New World, Thunderbolts, Disney’s Snow White, Elio, Mission: Impossible 8, SpongeBob SquarePants, and James Cameron’s eagerly awaited Avatar sequel. While certain second quarter 2024 movies such as Kingdom of the Planet of the Apes, Bad Boys: Ride or Die and Inside Out 2 delivered impressive box office performances, they did not save the second quarter of 2024 in comparison to the same period in 2023. Three recent releases, in addition to Inside Out 2, which is now the highest grossing animated movie of all time worldwide, have exceeded box office expectations, but were released either late in the second quarter, or in the third quarter of 2024 and, consequently, did not materially impact our results in the first two quarters: Despicable Me 4 (global box office to date of $809 million), Twisters (global box office to date of $312 million) and Deadpool & Wolverine (global box office to date of $1.0 billion). However, the remaining 2024 film lineup looks strong, featuring highly anticipated releases expected to continue driving audiences to our big screens, including: Joker: Folie a Deux, Wicked, Moana 2, Gladiator 2 and Mufasa: Lion King. Even though we continue to monitor the above factors, we are optimistic about the long-term outlook for our industry for several reasons: (i) more product is being produced catering to niche cinema audiences, like those for concert films and faith-based movies, (ii) major studios and distributors, including streaming platforms such as Amazon, Apple TV and Netflix recognize the economic importance of the theatrical movie release window not only for its contribution to box office revenues, but also as a platform to publicize and differentiate their product from other product available on cable or through streaming, and (iii) the attendance levels of certain highly anticipated, well marketed movies have demonstrated that moviegoers will leave their homes for a night at the movies at attendance rates comparable to pre-pandemic blockbusters.
We continue to work with our landlords to address our occupancy costs, which are high at current revenue levels. Acknowledging that that there is an excess of cinemas in the U.S, we have been assessing our U.S. holdings and intend to continue to close non-performing locations where reasonable accommodations cannot be worked out with the applicable landlord. Since the beginning of the fourth quarter of 2022, we have not renewed our leases at three locations in Hawaii, one location in Texas and one location in Northern California (all of which suffered from negative theater level cash flow). While from time to time in these negotiations, certain of our existing U.S. cinema landlords have engaged in legal proceedings, in each such pending case, we have reached tentative agreements as to revised going forward lease terms, which agreements are currently being documented. We continue to be confident that in the coming years, our cinema revenue will once again support our real estate development ventures. We have one project in Australia for eight screens in the pipeline today.
Recognizing our needs for administrative space reduced in 2024, we streamlined our operations by divesting our administrative building in Culver City, California, freeing up $1.2 million in cash after covering mortgage settlements, brokerage commissions, and transactional fees. It is our expectation that this asset disposition will yield savings of approximately $1.5 million in operational and holding expenses between now and the end of 2025. At the present time, we are managing our California overhead by working remotely, while we work to relocate in less expensive right-sized space.
Additionally, we anticipate sustained improvements in the operational performance of our cinemas as our global circuit continues its recovery. One driving factor for this optimism is the ongoing expansion and refinement of our Food and Beverage (“F&B”) menus. Notably, as mentioned above, in 2023, we can sell beer and wine in 100% of our U.S. cinemas and can sell liquor in all, but three, U.S. Cinemas. We are in the process of seeking the licenses to sell liquor at each of these U.S. Cinemas, along with beer and wine. Looking ahead, we are committed to obtaining liquor licenses and enriching our F&B offerings across our circuits in Australia and New Zealand. This strategic focus displays our dedication to enhancing the overall cinema experience for our valued customers.
Recent Box Office Improvements
Despite the impact from the 2023 Hollywood Strikes, the box office revenue of certain movies released during the second quarter of 2024 demonstrated strength. As mentioned above, sequel movies such as Inside Out 2, Kingdom of the Planet of the Apes, and Bad Boys: Ride or Die delivered record breaking results. Inside Out 2 has soared to over $1.5 billion in worldwide box office, becoming the highest grossing animated movie worldwide of all time. This Disney sequel’s domestic opening in June 2024 increased over 71% from the initial movie released in 2015 and became Pixar’s top-grossing movie of all time. Kingdom of the Planet of the Apes currently has a worldwide gross of over $397 million, becoming the 2nd best domestic 20th Century Studios movie ever. With a worldwide gross of over $400 million, Bad Boys Ride or Die, the fourth movie in the series, has now helped the franchise reach over $1.2 billion worldwide. Further growing the second quarter 2024 box office, Civil War brought in over $122 million making it A24’s 2nd highest-grossing movie behind Everything, Everywhere, All at Once.
The achievement of these films not only reinforces our confidence in the enduring strength of the global cinema industry but also highlights its resilience in the face of past and continuing challenges such as rising operating expenses, labor shortages, changes to movie release dates and supply chain disruptions. As we enter the third quarter of 2024, we are ready to build on this momentum with another exciting movie lineup. Audiences have already been treated to Inside Out 2, Despicable Me 4 and Twisters and now Deadpool & Wolverine. Despicable Me 4 grossed almost $809 million worldwide, catapulting the franchise to over a $5 billion worldwide gross, making it the 3rd highest movie of 2024 at the domestic box office. Twisters had a positive impact at the box office by having a domestic opening gross of over $81 million and over a 97% increase from its 1996 domestic opening.
Again, we look forward to a diverse range of upcoming releases for the remainder of 2024, including (i) Beetlejuice Beetlejuice, Transformers One, Joker: Folie a Deux, Venom: the Last Dance, Wicked, Moana 2, Gladiator 2, Mufasa: Lion King and Sonic the Hedgehog 3 and (ii) critically acclaimed films from specialty distributors, including, without limitation, director John Crowley’s We Live in Time, director Andrea Arnold’s Bird, director RaMell Ross’ Nickel Boys, director Luca Guadagnino’s Queer, director James Mangold’s A Complete Unknown and director Pedro Almodovar’s The Room Next Door.
Real Estate Developments
In the United States, during the first quarter of 2024, we sold our underutilized administrative office building in Culver City, California for $10.0 million.
With respect to our 44 Union Square property in New York City, during the first quarter we engaged a new leasing broker, George Comfort & Sons (www.gcomfort.com), to head the leasing efforts for the remaining space at 44 Union Square. While the space was originally designed for office uses, given the dramatic presence of the property on Union Square, the rebound in foot traffic being enjoyed by Union Square and our building’s significant branding potential, we are considering, a range of uses beyond traditional office tenants, including short term and special purpose uses.
As of June 30, 2024, all of our tenants (excluding one tenant completing refurbishment upgrade works and one tenant completing make good works) were currently open for business at our Australian and New Zealand properties. Most of the rentable retail portions of our Courtenay Central location in New Zealand continue to be closed due to seismic concerns, however one tenant remains open and trading. Furthermore, there is also one tenant trading on our Wakefield property. Our open land areas in Wellington are generating parking revenues.
Due to our liquidity needs, our development endeavors have largely been put on hold. Our limited capital expenditures during 2023 and the first half of 2024 have been largely focused on the enhancement of our existing cinemas. To increase our liquidity, in addition to our industrial property in Williamsport, Pennsylvania, the Company has listed for sale its property assets in (i) Townsville (Queensland), Australia, (ii) Wellington, New Zealand and (iii) Rotorua, New Zealand.
Company Overview
We are an internationally diversified company principally focused on the development, ownership, and operation of entertainment and real estate assets in the United States, Australia, and New Zealand. Currently, we operate in two business segments:
Cinema exhibition, through our 60 cinemas as of June 30, 2024.
Real estate, including real estate development and the rental of retail, commercial, and live theatre assets.
We believe these two business segments complement and support one another. Prior to COVID-19, we used cash flows generated by our cinema operations to fund the front-end cash demands of our real estate development business. Post pandemic, we relied more upon income from our real estate assets, and tapped into the imbedded value in those assets, to support our Company through the COVID-19 crisis. As the impact of residual macroeconomic issues diminishes and the movie release schedule improves in terms of both quality and
quantity thereby enticing patrons back to our cinemas, we believe that we will once again be able to rely on the cash flows generated by our cinema portfolio. For example, a 100-basis point reduction in rates would save us $2 million per year.
Despite our confidence in the long-term viability of the cinema industry, in light of our upcoming liquidity needs due to debt maturities and other factors, we have identified certain real estate assets to monetize and will be exploring the monetization of other properties to the extent our liquidity needs require. We are steadfast in our belief that our two-pronged, diversified international business strategy will keep carrying our Company through these difficult times as we continue to navigate the uncertainty and challenges posed by the recent macroeconomic obstacles. See Note 3 – Liquidity and Impairment Assessment.
Key Performance Indicators
Food and Beverage Spend Per Patron
A key performance indicator utilized by management in our cinema segment is F&B Spend Per Patron (“SPP”). This metric is calculated by dividing our post-tax Food & Beverage Revenues by the number of cinema attendees during a specific period.
One of our strategic priorities has been to continue upgrading the food and beverage menu at several of our global cinemas. As of June 30, 2024, we have a total of 38 theater locations with elevated food and beverage menus (i.e. menus that are beyond traditional popcorn, soda, and candy). We use SPP to assess our food and beverage performance compared to our competitors. While various factors like labor and cost of goods affect our F&B profitability, SPP indicates our ability to maintain strong top-line performance. It also reflects our success in generating additional revenue by promoting and selling supplementary products to our customers during their visits. Furthermore, this metric helps us evaluate how well we differentiate our F&B offerings from competitors. Management uses F&B SPP to adjust pricing strategies, measure the effectiveness of marketing initiatives, optimize menu offerings, and ensure that prices remain accessible to our customers.
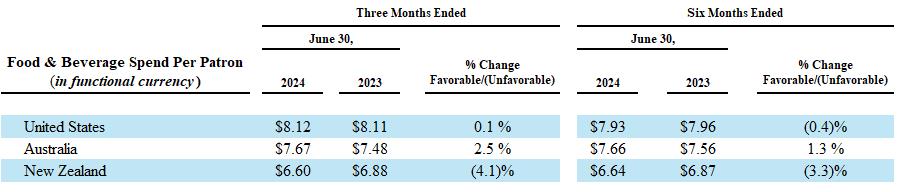
Average Ticket Price per Patron
Another key performance indicator used by management in our cinema segment is Average Ticket Price (“ATP”) per Patron, which is calculated based on our total Box Office Revenues on a post-tax basis divided by our cinema attendance during a specific period. ATP measures our operational cinema performance when compared to that of our competitors. ATP is a useful metric for evaluating our ability to achieve a strong top line performance, gauging the effectiveness of our cinemas’ pricing strategies and our ability to entice customers back to our theaters. Management uses ATP to adjust and inform ticket pricing schemes for our individual theaters, measures the effectiveness of our content programming, and ensures that price barriers are not created for our guests.
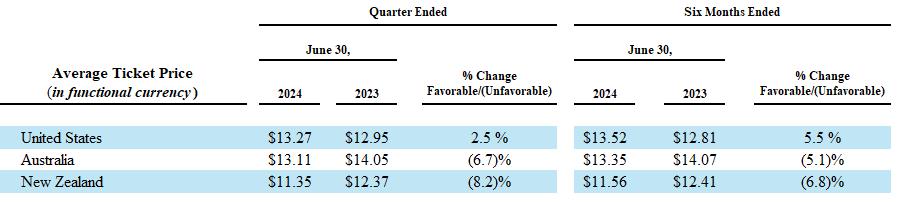
Real Estate Key Performance Indicators
The key performance indicators used by management in our real estate segment with respect to our properties held for rent (other than our Live Theatres) are net operating income, occupancy factor (the percentage of the net rentable area of our properties that is leased) and average lease duration. Set forth in the table below is a comparison of these indicators for the second quarter and six months ended June 30, 2024 compared to the corresponding periods in 2023. As a matter of clarification, we have not included in our calculation of net rentable area available for lease any space that is closed for renovation or redevelopment (such as our Courtenay Central property).
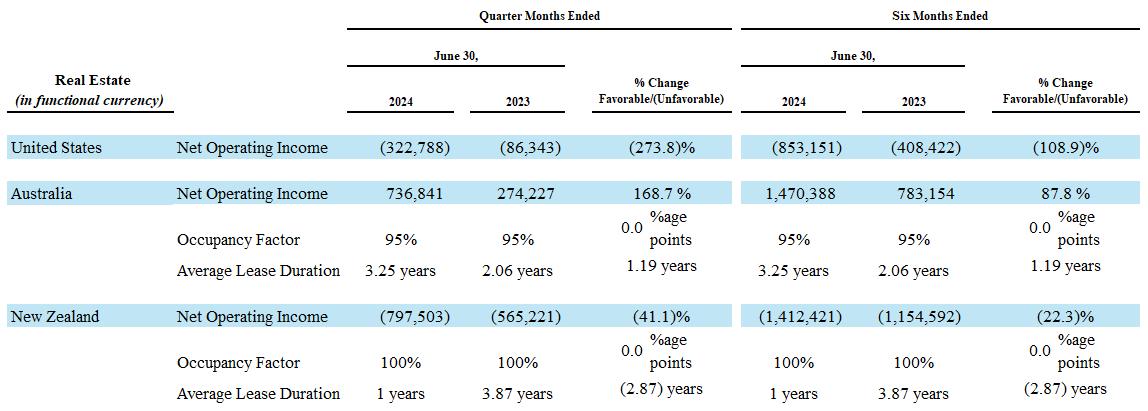
In the case of our Live Theatres, with respect to key performance indicators, we primarily look to the live theater rental revenue and ancillary income from the theatres. This key performance indicator represents box office revenues less amounts paid to producers for license fee settlements, plus ancillary income earned by us from certain theater operations. Our live theater rental revenue and ancillary income for the second quarter of 2024 was $415,814 which decreased from $566,196 in the second quarter of 2023.
Historically, in the case of our development properties (such as 44 Union Square in New York City and our various international properties sch as Newmarket Village in Australia), we have no specific key performance standards to compare performance from period to period. Rather we continue to analyze budgets and projections and compare actual results to budgeted or projected results from time to time.
Cinema Exhibition Overview
We operate our worldwide cinema exhibition businesses through various subsidiaries under various brands:
in the U.S., under the Reading Cinemas, Consolidated Theatres and Angelika Film Center brands.
in Australia, under the Reading Cinemas, Angelika, and, for our one unconsolidated joint venture theatre, Event Cinemas brands.
in New Zealand, under the Reading Cinemas and our two unconsolidated joint venture theatres, Rialto Cinemas brands.
Shown in the following table are the number of locations and screens in our cinema circuit in each country, by state/territory/region, our cinema brands, and our interest in the underlying assets as of June 30, 2024.
| | | | | | | | | | | | |
| | | | | | | | | | | | |
| | State / Territory / | | Location | | Screen | | Interest in Asset
Underlying the Cinema | | |
Country | | Region | | Count | | Count | | Leased | | Owned | | Operating Brands |
United States | | Hawaii | | 6 | | 74 | | 6 | | | | Consolidated Theatres |
| | California | | 6 | | 72 | | 6 | | | | Reading Cinemas, Angelika Film Center |
| | New York | | 3 | | 16 | | 2 | | 1 | | Angelika Film Center |
| | Texas | | 1 | | 8 | | 1 | | | | Angelika Film Center |
| | New Jersey | | 1 | | 12 | | 1 | | | | Reading Cinemas |
| | Virginia | | 1 | | 8 | | 1 | | | | Angelika Film Center |
| | Washington, D.C. | | 1 | | 3 | | 1 | | | | Angelika Film Center |
| | U.S. Total | | 19 | | 193 | | 18 | | 1 | | |
Australia | | Victoria | | 9 | | 62 | | 9 | | | | Reading Cinemas |
| | New South Wales | | 6 | | 44 | | 6 | | | | Reading Cinemas |
| | Queensland | | 7 | | 64 | | 4 | | 3 | | Reading Cinemas, Angelika Cinemas, Event Cinemas(1) |
| | Western Australia | | 4 | | 27 | | 3 | | 1 | | Reading Cinemas |
| | South Australia | | 2 | | 15 | | 2 | | | | Reading Cinemas |
| | Tasmania | | 2 | | 14 | | 2 | | | | Reading Cinemas, State Cinema by Angelika |
| | Australia Total | | 30 | | 226 | | 26 | | 4 | | |
New Zealand | | Wellington | | 2 | | 15 | | 1 | | 1 | | Reading Cinemas |
| | Otago | | 3 | | 15 | | 2 | | 1 | | Reading Cinemas, Rialto Cinemas(2) |
| | Auckland | | 2 | | 15 | | 2 | | | | Reading Cinemas, Rialto Cinemas(2) |
| | Canterbury | | 1 | | 8 | | 1 | | | | Reading Cinemas |
| | Southland | | 1 | | 5 | | 1 | | | | Reading Cinemas |
| | Bay of Plenty | | 1 | | 5 | | | | 1 | | Reading Cinemas |
| | Hawke's Bay | | 1 | | 4 | | | | 1 | | Reading Cinemas |
| | New Zealand Total | | 11 | | 67 | | 7 | | 4 | | |
GRAND TOTAL | | | | 60 | | 486 | | 51 | | 9 | | |
(1)Our Company has a 33.3% unincorporated joint venture interest in a 16-screen cinema located in Mt. Gravatt, Queensland managed by Event Cinemas.
(2)Our Company is a 50% joint venture partner in two New Zealand Rialto Cinemas, with a total of 13 screens. We are responsible for the booking of these cinemas and our joint venture partner, Event Cinemas, manages their day-to-day operations.
Our cinema revenues consist primarily of cinema ticket sales, F&B sales, screen advertising, gift card sales, cinema rentals, and online convenience fee revenue generated by the sale of our cinema tickets through our websites and mobile apps. Cinema operating expenses consist of the costs directly attributable to the operation of the cinemas, including (i) film rent expense, (ii) operating costs, such as employment costs and utilities, and (iii) occupancy costs. Cinema revenues and certain expenses fluctuate with the availability of quality first run films and the number of weeks such first run films stay in the market. For a breakdown of our current cinema assets that we own and/or manage, please refer to Part I, Item 1 – Our Business of our 2023 Form 10-K. We now present a discussion of recent material developments.
Cinema Additions and Pipeline
The latest additions to our cinema portfolio as of June 30, 2024, were as follows:
Armadale, Western Australia, Australia: On January 13, 2023, we took over an existing six-screen cinema in Armadale, Australia, a suburb of Perth in Western Australia.
South City Square, Brisbane, Australia: On August 24, 2023, we launched our first-ever Angelika Cinemas outside of the United States at South City Square in Woolloongabba, Brisbane. The location operates as an eight-screen complex, featuring elevated food and beverage offerings (including alcoholic beverages), and recliner seating. Three of the auditoriums, known as Soho Lounge cinemas, offer table-service.
Busselton, Western Australia, Australia: On September 22, 2023, we opened a five-screen complex in the newly expanded Busselton Central Shopping Centre precinct of Busselton, Western Australia. The state-of-the-art complex features a TITAN LUXE screen, elevated food and beverage offerings, and recliner seating.
Our Board has authorized management to proceed with the negotiation of lease for one new state-of-the-art cinema, located in Noosa, Queensland, Australia.
Cinema Upgrades
As of June 30, 2024, the upgrades to our cinema circuits’ film exhibition technology and amenities over the years are as summarized in the following table:
| | | |
| | | |
| Location Count | | Screen
Count |
Screen Format | | | |
Digital (all cinemas in our cinema circuit) | 60 | | 486 |
IMAX | 1 | | 1 |
TITAN XC and TITAN LUXE | 26 | | 32 |
Dine-in Service | | | |
Gold Lounge (AU/NZ)(1) | 11 | | 29 |
Premium (AU/NZ)(2) | 17 | | 45 |
Spotlight (U.S.)(3) | 1 | | 6 |
Upgraded Food & Beverage menu (U.S.)(4) | 16 | | n/a |
Premium Seating (features recliner seating) | 33 | | 198 |
Liquor Licenses (5) | 46 | | n/a |
(1)Gold Lounge: This is our "First Class Full Dine-in Service" in our Australian and New Zealand cinemas, which includes an upgraded F&B menu (with alcoholic beverages), luxury recliner seating features (intimate 25-50 seat cinemas) and waiter service.
(2)Premium Service: This is our "Business Class Dine-in Service" in our Australian and New Zealand cinemas, which typically includes upgraded F&B menu (some with alcoholic beverages) and may include luxury recliner seating features (less intimate 80-seat cinemas), but no waiter service.
(3)Spotlight Service: Our first dine-in cinema concept in the U.S. at Reading Cinemas in Murrieta, California. Six of our 17 auditoriums at this cinema feature waiter service before the movie begins with a full F&B menu, luxury recliner seating, and laser focus on customer service. Our Spotlight service has been temporarily suspended since the initial COVID-19 shutdown.
(4)Upgraded Food & Beverage Menu: Features an elevated F&B menu including a menu of locally inspired and freshly prepared items that go beyond traditional concessions, which we have worked with former Food Network executives to create. The elevated menu also includes beer, wine and/or spirits at most of our locations.
(5)Liquor Licenses: Licenses are applicable at each cinema location, rather than each cinema auditorium. As of today, we (i) have licenses in 100% of our cinemas operating in the U.S. to sell beer and wine and (ii) we are working to add liquor to our licenses in our three New York City cinemas. In Australia, 83% of our cinemas are licensed and we have one liquor licenses pending. In New Zealand, 33% of our cinemas are licensed and we have zero liquor licenses pending.
Recent Enhancements
United States
Renovation Work: As of June 30, 2024, we have converted 110 of our 193 U.S. auditoriums to luxury recliner seating. As of the date of this Report, we are engaging in discussions with certain landlords in the U.S. about tenant allowances to upgrade certain U.S. cinemas.
Australia and New Zealand
Rouse Hill renovation: Our Reading Cinema in Rouse Hill (NSW) will undergo a lease obligated refurbishment focusing on the foyer, concessions, including the introduction of hot food offerings, and the addition of another all reclining Premium auditorium. The preliminary drawings have been completed and we are developing construction drawings for applicable approvals.
Angelika Film Centre, South City Square: Australia’s first Angelika opened on August 24, 2023 in the Woolloongabba (Queensland) South City Square development. The complex offers eight screens, all reclining seating, and exceptional hot food and liquor offerings.
Other Cinema Upgrades: In addition, during the three-year period of 2021 to 2023, we improved our Reading Cinemas in Sunbury (VIC) and the State Cinema (TAS) in Australia.
During 2024, we will continue to focus on the enhancement of our proprietary online ticketing and Food & Beverage capabilities, together with improving and expanding our social media platforms and interfaces. These are intended to enhance the convenience of our offerings and to promote guest affinity with the experiences and products we offer.
Cinema Closures
On May 7, 2023, The Hutt Pop-Up in New Zealand was permanently closed due to the expiration of our lease for that location. We chose not to continue the cinema as it was only brought online as a “pop up” to address a temporary opening in the market. Since the fourth quarter of 2022, we have closed five cinema locations, all of which were loss makers: three in Hawaii, one in Northern California and one in Texas.
Real Estate Overview
Through our various subsidiaries, we engage in the real estate business through the development, ownership, rental or licensing to third parties of retail, commercial, and live theatre assets. Our real estate business is intended to create long-term value for our stockholders through the continuous improvement and development of our investment and operating properties, including our ETCs, and has, in recent times and will over the next 12 months, assist our liquidity needs through various asset monetizations. In addition to owning the fee interests in nine of our cinemas (as presented in the table under Cinema Exhibition Overview), as of June 30, 2024, we:
own our 44 Union Square property in Manhattan comprised of retail and office space which is currently in the lease-up phase. The cellar, ground floor, and second floor of the building are now fully leased to Petco, which is in occupancy of its premises on a full rent paying basis;
own and operate two ETCs known as Newmarket Village (in a suburb of Brisbane) and the Belmont Common (in a suburb of Perth)in Australia;
own and operate another ETC known as Cannon Park in Townsville, Australia, which is currently held for sale;
own property assets in Wellington, New Zealand, (including Courtenay Central , historically operated as an ETC), which are all currently held for sale;
own and operate our administrative office building in South Melbourne, Australia;
own and operate the fee interests in two developed commercial properties in Manhattan improved with live theatres comprised of a single stage in each location;
own a 75% managing member interest in a limited liability company which in turn owns the fee interest in and improvements constituting our Cinemas 1,2,3 located in Manhattan;
own an approximately 26.6-acre property in Williamsport, Pennsylvania, which is currently being held for sale; and
own approximately 201-acres principally in Pennsylvania from our legacy railroad business, including the Reading Viaduct in downtown Philadelphia;
For a breakdown of our real estate assets, made current by our discussion below, please refer to Part I, Item 1 – Our Business of our 2023 Form 10-K. We now present a discussion of recent material developments.
Real Estate Held for Development
The combination of the COVID-19 pandemic, the lack of any material U.S. public pandemic financial assistance due to our public company status, the 2023 Hollywood Strike, increased interest rates, inflation, increased labor costs, and decreases in the value of the Australian Dollar and New Zealand Dollar vise a vise the U.S. Dollar, have significantly impacted our cinema operations and necessitated capital conservation to sustain our cinema operations and service our debt. This has required us to rethink our real estate business plan and to monetize a number of properties that had pre-COVID been slated for long term development.
To date, we have monetized the following property assets:
(i)Our non-income producing land holdings in Coachella, California and Manukau, New Zealand;
(ii)Our Redyard ETC in Auburn, Australia
(iii)Our Royal George live theatre complex in Chicago (slated for redevelopment, and now being redeveloped for residential purposes by the new owner);
(iv)The land underlying our cinema in Invercargill, New Zealand;
(v)Our non-competitive four-screen strata title cinema in Maitland, Australia; and
(vi)Our administrative office building in Culver City, California.
These properties were identified for sale and sold in significant part because of (i) our need for liquidity due to the circumstances referred to above, (ii) the amount of capital required to materially increase their value in the immediate to mid-term, (iii) they were either non-income producing or provided immaterial cash flow and (iv) in the case of our Culver City office building, the property was not required for our operations because it exceeded our office size requirements
As of the date of this Report, we have classified the following properties as held for sale:
(i)The land underlying our cinema in Rotorua, New Zealand;
(ii)Our approximately 3.7 acre five-parcel assemblage in the entertainment center of Wellington, New Zealand, which includes the Courtenay Central building;
(iii)Our ETC properties in Townsville (QLD) in Australia known as Cannon Park; and
(iv)Our industrial land in Williamsport, Pennsylvania (also currently non-income producing).
In the case of Rotorua, Courtenay Central and Cannon Park, if the potential buyer elects to have a cinema use on the property, we intend to lease back our existing Reading Cinema or a potentially new cinema, in the event the potential buyer elects to build a new cinema.
Our remaining assets held for development include the Cinemas 1,2,3 in Manhattan, and our various historic railroad properties, the principal of these being our holding in downtown Philadelphia, which is discussed in greater detail below.
United States:
44 Union Square Redevelopment (New York, N.Y.) – On January 27, 2022, we finalized a long-term lease agreement with Petco, securing occupancy of the cellar, ground floor, and second floor of the building, amounting to 42% of the leasable area. Petco commenced full-rent, cash-paying occupancy and officially opened its doors to the public on June 1, 2023. During mid-March 2024, we engaged George Comfort & Sons as our exclusive leasing broker for the remaining space. Originally designated for office use, the property's striking presence in Union Square, coupled with the resurgence of foot traffic in the area, and its exceptional branding potential, prompt us to explore a spectrum of uses beyond traditional office tenants. This includes consideration for short-term and special-purpose arrangements.
Minetta Lane Theatre (New York, N.Y.) – Prior to the pandemic, our theater hosted Audible productions featuring a limited cast and special live performances streamed on the Audible platform. Public performances resumed on October 8, 2021, after an approximate 1.5-year hiatus due to the COVID-19 pandemic, during which we provided certain abatements. Audible has since resumed full operations and extended its license agreement with us through March 15, 2026, with an option to extend for an additional year.
Orpheum Theatre (New York, N.Y.) – Before COVID-19, our Orpheum Theatre was home to STOMP. While shows ceased from April 2020 to June 2021 due to the pandemic, performances afterward were intermittent. During this time, we provided certain abatements. STOMP concluded its 30-year run at our theater on January 8, 2023. Under our termination agreement, we retain the rights to host any future productions of the show. Following STOMP's departure, new productions such as The Empire Strips Back and Comedian Rachel Bloom's Death, Let Me Do My Show brought fresh excitement to audiences during 2023. During the first quarter of 2024, the Orpheum hosted Eddie Izzard’s Hamlet which had a four-week run through April 14, 2024. And, on September 14, 2024 performances of The Big Gay Jamboree begin at the Orpheum. This new show from a book by Marla Mindelle, the co-author and original star of the Off Broadway hit musical-comedy Titanique is being produced by (i) LuckyChap, the producing team, which includes Margot Robbie, behind Barbie and Saltburn and (ii) multiple-Tony-winning Broadway producing veterans Sue Wagner and John Johnson (Stereophonic, Lempicka).
Cinemas 1,2,3 (New York, N.Y.) – Currently operated as the Cinemas 123 by Angelika, we have historically treated this property as an asset held for long term development. However, in light of a variety of factors, such as market conditions in Manhattan for real estate assets, cost of capital and demands on our liquidity, we have begun to explore alternatives for this property. These alternatives may include, again by way of example, the bringing in of a capital partner, the entering into a long-term ground lease (which could serve as the basis for medium to long term finance), and/or the sale (in whole or in part) of our interest in the property.
The Philadelphia Viaduct and Adjacent Properties (Philadelphia, Pennsylvania) – This continues to be an area of focus in 2024 as we continue our efforts to develop and maximize the potential of our real estate holdings in Philadelphia. Since 2023, we have resumed work on this project, particularly concentrating on the Reading Viaduct—an 0.7-mile-long raised rail bed and bridge system spanning the Callowhill and Poplar neighborhoods, extending to Vine Street in the heart of the city's Central Business District, near the proposed new home of the Philadelphia 76ers. Comprising approximately 6.5 acres of land, along with various connecting bridges over public streets and sidewalks, the Reading Viaduct represents a significant contiguous land holding unobstructed by public thoroughfares. While there has been interest from the City of Philadelphia and the City Center District in acquiring the Reading Viaduct for park purposes, no concrete steps have been taken to proceed with condemnation or transfer of the property. We are currently evaluating whether a dedicated public park is the most beneficial use of the space. While a public park and pedestrian corridor, similar to the New York High Line, could be integral to the Viaduct's development, we are also exploring mixed-use options such as residential, retail, and entertainment developments. Recent developments in the area, such as the announcement of a $158 million federal grant for the Chinatown Stitch project in mid-March 2024, further highlight the potential of the Reading Viaduct. This project aims to reconnect the Chinatown community and surrounding neighborhoods by capping the Vine Street Expressway I-676, which directly intersects with the Reading Viaduct at Vine Street. We believe that capping the expressway at our property would significantly enhance the attractiveness and viability of the Reading Viaduct for future development.
Australia:
Newmarket Village ETC (Brisbane, Australia) – Through 2024 and into 2025 we plan to continue operating our Newmarket Village ETC, which includes Reading Cinemas as an anchor tenant Our site includes a 23,218 square foot parcel adjacent to the center, improved with an office building. Over the next few years, we will be evaluating different development options for this space. As of the date of this Report, the combined center and office building is 99% leased.
Cannon Park Center ETC, (Queensland, Australia) – We own two adjoining properties in Townsville, Queensland, Australia, (Cannon Park City Center and Cannon Park Discount Center) comprising approximately 9.4-acres which we operate as our Cannon Park Center ETC. The total gross leasable area of the two properties is 126,368 square feet. Our six-screen Reading Cinema is an anchor tenant. These properties are currently 94% leased. This property is currently being marketed for sale.
The Belmont Common, (Belmont, Perth, Australia) – The total gross leasable area of the Belmont Common is 60,116 square feet. Our ten-screen Reading Cinema is the anchor tenant with six third-party tenants. The site is currently 100% leased.
New Zealand:
Wellington, New Zealand, including Courtenay Central. – Our Wellington properties include five contiguous parcels representing approximately 161,082 square feet of land located in the entertainment core of Wellington and within walking distance and offering direct views of Wellington Harbor. Assembled over a period of years, we believe our properties represent the largest commercial assemblage available anywhere in Wellington. After recently encountering certain challenges with our development plans, we engaged JLL as our exclusive sales agent to market these key property assets that represent a once-in-a-lifetime development opportunity for a well-capitalized buyer. All five contiguous parcels are currently being marketed for sale by JLL.
Taking into account this generational development opportunity, together with, among other things, (i) the June 2023 opening of Takina, Wellington’s first and state-of-the-art Convention and Exhibition Center (wcec.co.nz) directly across the street from our properties, (ii) the loosening of certain height and density restrictions, and (iii) the lack of comparable building sites, we believe the international and local market will support a compelling sales price, despite the current interest rate environment.
It is our intention to structure any monetization transaction to preserve for us the right to lease or operate any cinema that is built or operated on the assemblage, in the future.
For a complete list of our principal properties, see Part I, Item 2 – Properties under the heading “Investment and Development Property” in our 2023 Form 10-K”
Corporate Matters
Refer to Part I – Financial Information, Item 1 – Notes to Consolidated Financial Statements-- Note 17 – Stock-Based Compensation and Stock Repurchases for details regarding our stock repurchase program and Board, Executive and Employee stock-based remuneration programs.
Please refer to our 2023 Form 10-K for more details on our cinema and real estate segments.
RESULTS OF OPERATIONS
The table below summarizes the results of operations for each of our principal business segments along with the non-segment information for the quarter and six months ended June 30, 2024, and June 30, 2023, respectively:
| | | | | | | | | | | | | | | | | | | | | |
| | | Quarter Ended | | % Change | | Six Months Ended | | % Change |
(Dollars in thousands) | | June 30,
2024 | | June 30,
2023 | | Fav/
(Unfav) | | June 30,
2024 | | June 30,
2023 | | Fav/
(Unfav) |
SEGMENT RESULTS | | | | | | | | | | | | | | | | | | | | |
| Revenue | | | | | | | | | | | | | | | | | | | | |
| Cinema exhibition | | $ | 42,941 | | | 61,055 | | (30) | % | | $ | 84,213 | | $ | 103,042 | | (18) | % |
| Real estate | | | 5,013 | | | 5,217 | | (4) | % | | | 9,946 | | | 10,282 | | (3) | % |
| Inter-segment elimination | | | (1,146) | | | (1,218) | | 6 | % | | | (2,298) | | | (2,463) | | 7 | % |
| Total revenue | | | 46,808 | | | 65,054 | | (28) | % | | | 91,861 | | | 110,861 | | (17) | % |
| Operating expense | | | | | | | | | | | | | | | | | | | | |
| Cinema exhibition | | | (40,564) | | | (52,581) | | 23 | % | | | (82,436) | | | (95,482) | | 14 | % |
| Real estate | | | (2,461) | | | (2,104) | | (17) | % | | | (4,696) | | | (4,319) | | (9) | % |
| Inter-segment elimination | | | 1,146 | | | 1,218 | | (6) | % | | | 2,298 | | | 2,463 | | (7) | % |
| Total operating expense | | | (41,879) | | | (53,467) | | 22 | % | | | (84,834) | | | (97,338) | | 13 | % |
| Depreciation and amortization | | | | | | | | | | | | | | | | | | | | |
| Cinema exhibition | | | (2,554) | | | (2,894) | | 12 | % | | | (5,141) | | | (5,768) | | 11 | % |
| Real estate | | | (1,358) | | | (1,619) | | 16 | % | | | (2,874) | | | (3,206) | | 10 | % |
| Total depreciation and amortization | | | (3,912) | | | (4,513) | | 13 | % | | | (8,015) | | | (8,974) | | 11 | % |
| General and administrative expense | | | | | | | | | | | | | | | | | | | | |
| Cinema exhibition | | | (1,093) | | | (1,106) | | 1 | % | | | (2,071) | | | (1,933) | | (7) | % |
| Real estate | | | (248) | | | (208) | | (19) | % | | | (539) | | | (466) | | (16) | % |
| Total general and administrative expense | | | (1,341) | | | (1,314) | | (2) | % | | | (2,610) | | | (2,399) | | (9) | % |
| Segment operating income | | | | | | | | | | | | | | | | | | | | |
| Cinema exhibition | | | (1,270) | | | 4,474 | | (>100) | % | | | (5,435) | | | (141) | | (>100) | % |
| Real estate | | | 946 | | | 1,286 | | (26) | % | | | 1,837 | | | 2,291 | | (20) | % |
| Total segment operating income (loss) | | $ | (324) | | $ | 5,760 | | (>100) | % | | $ | (3,598) | | $ | 2,150 | | (>100) | % |
NON-SEGMENT RESULTS | | | | | | | | | | | | | | | | | | |
| Depreciation and amortization expense | | | (99) | | | (176) | | 44 | % | | | (201) | | | (355) | | 43 | % |
| General and administrative expense | | | (3,929) | | | (3,794) | | (4) | % | | | (8,083) | | | (7,889) | | (2) | % |
| Interest expense, net | | | (5,252) | | | (4,875) | | (8) | % | | | (10,537) | | | (8,991) | | (17) | % |
| Equity earnings of unconsolidated joint ventures | | | 119 | | | 207 | | (43) | % | | | 94 | | | 226 | | (58) | % |
| Gain (loss) on sale of assets | | | 9 | | | — | | — | % | | | (1,116) | | | — | | - | % |
| Other income (expense) | | | (216) | | | (86) | | (>100) | % | | | 123 | | | 91 | | 35 | % |
| Income before income taxes | | | (9,692) | | | (2,964) | | (>100) | % | | | (23,318) | | | (14,768) | | (58) | % |
| Income tax benefit (expense) | | | 156 | | | 103 | | 51 | % | | | 379 | | | 583 | | (35) | % |
Net income (loss) | | | (9,536) | | | (2,861) | | (>100) | % | | | (22,939) | | | (14,185) | | (62) | % |
| Less: net income (loss) attributable to noncontrolling interests | | | (195) | | | (83) | | (>100) | % | | | (370) | | | (296) | | (25) | % |
Net income (loss) attributable to Reading International, Inc. | | $ | (9,341) | | $ | (2,778) | | (>100) | % | | $ | (22,569) | | $ | (13,889) | | (62) | % |
Basic earnings (loss) per share | | $ | (0.42) | | $ | (0.12) | | (>100) | % | | $ | (1.01) | | $ | (0.63) | | (60) | % |
Consolidated and Non-Segment Results:
Second Quarter Net Results
Revenue
Revenue for the quarter ended June 30, 2024, decreased by $18.2 million, to $46.8 million, compared to the same period in the prior year, primarily due to (i) a weaker movie slate due to the negative impacts of the 2023 Hollywood Strikes, (ii) decreased U.S. and New Zealand property rent revenue, in part due to loss of third party rent revenue from our Culver City Office building, due to the abandonment by that tenant of their premises at the building in July 2023 (we subsequently sold the property in February 2024), (iii) lower U.S. live theatre revenue, and (iv) a softening of the AU/NZ foreign exchange rates.
Revenue for the six months ended June 30, 2024, decreased by $19.0 million, to $91.9 million, when compared to the same period in the prior year. This decrease is attributable to lower cinema performances in all countries, as a result of a weaker film slate and a decline in attendance, and reduced rent income in the U.S. and New Zealand.
Segment Operating Income/(Loss)
Our total segment operating income for the quarter ended June 30, 2024, decreased by $6.1 million, from a gain of $5.8 million to a loss of $0.3 million, primarily due to a weaker film slate, and lower U.S. and NZ rent revenue.
Our total segment operating income for the six months ended June 30, 2024, decreased by $5.7 million, from an income of $2.2 million to a loss of $3.6 million, primarily due to (i) weakened cinema performance, as attendance declined year-over-year, (ii) a loss in third party rent revenue as the result of the abandonment of the third party tenant of its premises in July 2023, and (iii) an increase in general and administrative expenses.
During the second quarter of 2024, both the Australia and New Zealand dollars devalued against the U.S. dollar. The average Australia dollar exchange rate against the U.S. dollar for the second quarter of 2024 decreased 1.3% compared to the same period in 2023. The average New Zealand dollar exchange rate against the U.S. dollar for the second quarter of 2024 decreased 2.1% compared to the same period in 2023. The devaluation of the Australia and New Zealand currencies negatively impacts segment operating income and positively impacts segment operating loss in U.S. dollar terms.
Net Income/(Loss)
Our net loss attributable to Reading International, Inc. for the quarter ended June 30, 2024, increased by $6.6 million, from a loss of $2.8 million to a loss of $9.3 million, when compared to the same period in the prior year, primarily due to weakened cinema and real estate performance along with increased interest expense.
For the six months ended June 30, 2024, net loss attributable to Reading International, Inc. increased by $8.7 million, from a loss of $13.9 million to a loss of $22.6 million, when compared to the same period in the prior year primarily due to decreased segment results, increased interest expense, and a loss on the sale of our Culver City office building.
Income Tax Expense
Income tax benefit for the three months ended June 30, 2024, increased by $0.1 million compared to the equivalent prior-year period. The change between 2024 and 2023 is primarily related to an increase in pretax loss in 2024, offset by an increase in reserve for valuation allowance in 2024.
Income tax benefit for the six months ended June 30, 2024, decreased by $0.2 million compared to the equivalent prior-year period. The change between 2024 and 2023 is primarily related to an increase in reserve for valuation allowance in 2024, partially offset by an increase in pretax loss in 2024.
Business Segment Results
Cinema Exhibition
The following table details our cinema exhibition segment operating results for the quarter and six months ended June 30, 2024, and June 30, 2023, respectively:
| | | | | | | | | | | | | | | | | | | | |
| | | Quarter Ended | | Six Months Ended | | Fav/(Unfav) |
(Dollars in thousands) | June 30,
2024 | % of Revenue | June 30,
2023 | % of Revenue | | June 30,
2024 | % of Revenue | June 30,
2023 | % of Revenue | | Quarter
Ended | Six Months Ended |
REVENUE | | | | | | | | | | | | | | | | | | |
| United States | Admissions revenue | $ | 11,681 | 27% | $ | 18,712 | 31% | | $ | 23,922 | 28% | $ | 30,755 | 30% | | (38) | % | (22) | % |
| | Food & beverage revenue | | 7,452 | 17% | | 11,998 | 20% | | | 14,413 | 17% | | 19,445 | 19% | | (38) | % | (26) | % |
| | Advertising and other revenue | | 2,347 | 5% | | 3,307 | 5% | | | 4,450 | 5% | | 5,626 | 5% | | (29) | % | (21) | % |
| | | $ | 21,480 | 50% | $ | 34,017 | 56% | | $ | 42,785 | 51% | $ | 55,826 | 54% | | (37) | % | (23) | % |
| Australia | Admissions revenue | $ | 10,851 | 25% | $ | 14,138 | 23% | | $ | 21,113 | 25% | $ | 24,509 | 24% | | (23) | % | (14) | % |
| | Food & beverage revenue | | 6,348 | 15% | | 7,526 | 12% | | | 12,114 | 14% | | 13,160 | 13% | | (16) | % | (8) | % |
| | Advertising and other revenue | | 1,344 | 3% | | 1,276 | 2% | | | 2,640 | 3% | | 2,482 | 2% | | 5 | % | 6 | % |
| | | $ | 18,543 | 43% | $ | 22,940 | 38% | | $ | 35,867 | 43% | $ | 40,151 | 39% | | (19) | % | (11) | % |
| New Zealand | Admissions revenue | $ | 1,744 | 4% | $ | 2,516 | 4% | | $ | 3,344 | 4% | $ | 4,321 | 4% | | (31) | % | (23) | % |
| | Food & beverage revenue | | 1,013 | 2% | | 1,400 | 2% | | | 1,923 | 2% | | 2,391 | 2% | | (28) | % | (20) | % |
| | Advertising and other revenue | | 161 | 0% | | 185 | 0% | | | 294 | 0% | | 353 | 0% | | (13) | % | (17) | % |
| | | $ | 2,918 | 7% | $ | 4,101 | 7% | | $ | 5,561 | 7% | $ | 7,065 | 7% | | (29) | % | (21) | % |
| | | | | | | | | | | | | | | | | | | | |
| Total revenue | $ | 42,941 | 100% | $ | 61,058 | 100% | | $ | 84,213 | 100% | $ | 103,042 | 100% | | (30) | % | (18) | % |
OPERATING EXPENSE | | | | | | | | | | | | | | | | | | |
| United States | Film rent and advertising cost | $ | (6,272) | 15% | $ | (10,450) | 17% | | $ | (12,411) | 15% | $ | (16,689) | 16% | | 40 | % | 26 | % |
| | Food & beverage cost | | (2,012) | 5% | | (3,149) | 5% | | | (3,918) | 5% | | (5,130) | 5% | | 36 | % | 24 | % |
| | Occupancy expense | | (3,206) | 7% | | (6,389) | 10% | | | (8,993) | 11% | | (12,503) | 12% | | 50 | % | 28 | % |
| | Other operating expense | | (9,089) | 21% | | (10,893) | 18% | | | (18,097) | 21% | | (20,791) | 20% | | 17 | % | 13 | % |
| | | $ | (20,579) | 48% | $ | (30,881) | 51% | | $ | (43,419) | 52% | $ | (55,113) | 53% | | 33 | % | 21 | % |
| Australia | Film rent and advertising cost | $ | (4,947) | 12% | $ | (6,704) | 11% | | $ | (9,395) | 11% | $ | (11,070) | 11% | | 26 | % | 15 | % |
| | Food & beverage cost | | (1,435) | 3% | | (1,528) | 3% | | | (2,709) | 3% | | (2,737) | 3% | | 6 | % | 1 | % |
| | Occupancy expense | | (4,538) | 11% | | (4,480) | 7% | | | (8,940) | 11% | | (8,771) | 9% | | (1) | % | (2) | % |
| | Other operating expense | | (6,163) | 14% | | (5,707) | 9% | | | (12,324) | 15% | | (11,528) | 11% | | (8) | % | (7) | % |
| | | $ | (17,083) | 40% | $ | (18,419) | 30% | | $ | (33,368) | 40% | $ | (34,106) | 33% | | 7 | % | 2 | % |
| New Zealand | Film rent and advertising cost | $ | (752) | 2% | $ | (1,201) | 2% | | $ | (1,434) | 2% | $ | (1,974) | 2% | | 37 | % | 27 | % |
| | Food & beverage cost | | (225) | 1% | | (266) | 0% | | | (430) | 1% | | (458) | 0% | | 15 | % | 6 | % |
| | Occupancy expense | | (783) | 2% | | (776) | 1% | | | (1,543) | 2% | | (1,565) | 2% | | (1) | % | 1 | % |
| | Other operating expense | | (1,141) | 3% | | (1,041) | 2% | | | (2,242) | 3% | | (2,266) | 2% | | (10) | % | 1 | % |
| | | $ | (2,901) | 7% | $ | (3,284) | 5% | | $ | (5,649) | 7% | $ | (6,263) | 6% | | 12 | % | 10 | % |
| | | | | | | | | | | | | | | | | | | | |
| Total operating expense | $ | (40,563) | 94% | $ | (52,584) | 86% | | $ | (82,436) | 98% | $ | (95,482) | 93% | | 23 | % | 14 | % |
DEPRECIATION, AMORTIZATION, IMPAIRMENT AND GENERAL AND ADMINISTRATIVE EXPENSE | | | | | | | | | | | | | | | | | | |
| United States | Depreciation and amortization | $ | (1,250) | 3% | $ | (1,579) | 3% | | $ | (2,521) | 3% | $ | (3,062) | 3% | | 21 | % | 18 | % |
| | Impairment of long-lived assets | | — | 0% | | — | 0% | | | — | 0% | | — | 0% | | (>100) | % | (>100) | % |
| | General and administrative expense | | (739) | 2% | | (743) | 1% | | | (1,372) | 2% | | (1,165) | 1% | | 1 | % | (18) | % |
| | | $ | (1,989) | 5% | $ | (2,322) | 4% | | $ | (3,893) | 5% | $ | (4,227) | 4% | | 14 | % | 8 | % |
| Australia | Depreciation and amortization | $ | (1,192) | 3% | $ | (1,174) | 2% | | $ | (2,382) | 3% | $ | (2,419) | 2% | | (2) | % | 2 | % |
| | Impairment expense | | — | 0% | | — | 0% | | | — | 0% | | — | 0% | | - | % | - | % |
| | General and administrative expense | | (355) | 1% | | (363) | 1% | | | (699) | 1% | | (768) | 1% | | 2 | % | 9 | % |
| | | $ | (1,547) | 4% | $ | (1,537) | 3% | | $ | (3,081) | 4% | $ | (3,187) | 3% | | (1) | % | 3 | % |
| New Zealand | Depreciation and amortization | $ | (112) | 0% | $ | (141) | 0% | | $ | (238) | 0% | $ | (287) | 0% | | 21 | % | 17 | % |
| | Impairment expense | | — | 0% | | — | 0% | | | — | 0% | | — | 0% | | - | % | - | % |
| | General and administrative expense | | — | 0% | | — | 0% | | | — | 0% | | — | 0% | | - | % | - | % |
| | | $ | (112) | 0% | $ | (141) | 0% | | $ | (238) | 0% | $ | (287) | 0% | | 21 | % | 17 | % |
| | | | | | | | | | | | | | | | | | | | |
| Total depreciation, amortization, general and administrative expense | $ | (3,648) | 8% | $ | (4,000) | 7% | | $ | (7,212) | 9% | $ | (7,701) | 7% | | 9 | % | 6 | % |
OPERATING INCOME (LOSS) – CINEMA | | | | | | | | | | | | | | | | | | |
| United States | $ | (1,088) | (3)% | $ | 814 | 1% | | $ | (4,527) | (5)% | $ | (3,514) | (3)% | | (>100) | % | (29) | % |
| Australia | | (87) | (0)% | | 2,984 | 5% | | | (582) | (1)% | | 2,858 | 3% | | (>100) | % | (>100) | % |
| New Zealand | | (95) | (0)% | | 676 | 1% | | | (326) | (0)% | | 515 | 0% | | (>100) | % | (>100) | % |
| Total Cinema operating income (loss) | $ | (1,270) | (3)% | $ | 4,474 | 7% | | $ | (5,435) | (6)% | $ | (141) | (0)% | | (>100) | % | (>100) | % |
Second Quarter Results
Revenue
For the quarter ended June 30, 2024, cinema revenue decreased by $18.1 million, to $42.9 million compared to the same period in the prior year. This decrease was primarily due to (i) weaker movie slate as a result of the 2023 Hollywood Strikes, and (ii) weakening of AU/NZ foreign exchange rates.
For the six months ended June 30, 2024, cinema revenue decreased by $18.8 million, to $84.2 million compared to the same period in the prior year. This decrease was primarily driven by (i) weaker movie slates, and (ii) and lower Average Ticket Price in AU and NZ, along with (iii) a weakening of AU/NZ foreign exchange rates. This was offset by a higher Average Ticket Price in the U.S and higher F&B per capita in Australia.
Cinema Segment Operating Income/(Loss)
Cinema segment operating income for the quarter ended June 30, 2024, decreased by $5.7 million, from an income of $4.5 million to a loss of $1.3 million when compared to the same period in the prior year. This decline of Operating Income is due to a decrease in cinema revenue for all countries as a result of the 2023 Hollywood Strikes.
Cinema segment operating loss for the six months ended June 30, 2024, increased by $5.3 million, to a loss of $5.4 million when compared to the same period in the prior year primarily due to the same reasons as above.
Operating expense
Operating expenses for the quarter ended June 30, 2024, decreased by $12.0 million, to $40.6 million, compared to the same quarter in the prior year. Operating expenses for the six months ended June 30, 2024, decreased by $13.0 million, to $82.4 million, compared to the same time period in the prior year. These decreases were due to, decreased film rent expense, decreased food & beverage cost, and decreased U.S. occupancy costs offset by increased Australia occupancy and other operating expenses.
Real Estate
The following table details our real estate segment operating results for the quarters and six months ended June 30, 2024 and June 30, 2023, respectively:
| | | | | | | | | | | | | | | | | | | | |
| | | | | | | | | | | | | | | | | % Change |
| | | Quarter Ended | | Six Months Ended | | Fav/(Unfav) |
(Dollars in thousands) | June 30,
2024 | % of
Revenue | June 30,
2023 | % of
Revenue | | June 30,
2024 | % of
Revenue | June 30,
2023 | % of
Revenue | | Quarter Ended | Six Months Ended |
REVENUE | | | | | | | | | | | | | | | | | | |
| United States | Live theatre rental and ancillary income | $ | 416 | 8% | $ | 566 | 11% | | $ | 828 | 8% | $ | 906 | 9% | | (27) | % | (9) | % |
| | Property rental income | | 1,067 | 21% | | 1,268 | 24% | | | 2,139 | 22% | | 2,483 | 24% | | (16) | % | (14) | % |
| | | | 1,483 | 30% | | 1,834 | 35% | | | 2,967 | 30% | | 3,389 | 33% | | (19) | % | (12) | % |
| Australia | Property rental income | | 3,177 | 63% | | 2,991 | 57% | | | 6,261 | 63% | | 6,128 | 60% | | 6 | % | 2 | % |
| New Zealand | Property rental income | | 353 | 7% | | 392 | 8% | | | 718 | 7% | | 765 | 7% | | (10) | % | (6) | % |
| | | | | | | | | | | | | | | | | | | | |
| Total revenue | | $ | 5,013 | 100% | $ | 5,217 | 100% | | $ | 9,946 | 100% | $ | 10,282 | 100% | | (4) | % | (3) | % |
OPERATING EXPENSE | | | | | | | | | | | | | | | | | | |
| United States | Live theatre cost | $ | (227) | 5% | $ | (181) | 3% | | $ | (410) | 4% | $ | (353) | 3% | | (25) | % | (16) | % |
| | Property cost | | (359) | 7% | | (225) | 4% | | | (778) | 8% | | (666) | 6% | | (60) | % | (17) | % |
| | Occupancy expense | | (212) | 4% | | (240) | 5% | | | (456) | 5% | | (483) | 5% | | 12 | % | 6 | % |
| | | | (798) | 16% | | (646) | 12% | | | (1,644) | 17% | | (1,502) | 15% | | (24) | % | (9) | % |
| Australia | Property cost | | (651) | 13% | | (593) | 11% | | | (1,172) | 12% | | (1,105) | 11% | | (10) | % | (6) | % |
| | Occupancy expense | | (478) | 10% | | (489) | 9% | | | (967) | 10% | | (972) | 9% | | 2 | % | 1 | % |
| | | | (1,129) | 23% | | (1,082) | 21% | | | (2,139) | 22% | | (2,077) | 20% | | (4) | % | (3) | % |
| New Zealand | Property cost | | (423) | 8% | | (276) | 5% | | | (692) | 7% | | (538) | 5% | | (53) | % | (29) | % |
| | Occupancy expense | | (111) | 2% | | (100) | 2% | | | (221) | 2% | | (202) | 2% | | (11) | % | (9) | % |
| | | | (534) | 11% | | (376) | 7% | | | (913) | 9% | | (740) | 7% | | (42) | % | (23) | % |
| | | | | | | | | | | | | | | | | | | | |
| Total operating expense | | $ | (2,461) | 49% | $ | (2,104) | 40% | | $ | (4,696) | 47% | $ | (4,319) | 42% | | (17) | % | (9) | % |
DEPRECIATION, AMORTIZATION, GENERAL AND ADMINISTRATIVE EXPENSE | | | | | | | | | | | | | | | | | | |
| United States | Depreciation and amortization | $ | (677) | 14% | $ | (795) | 15% | | $ | (1,416) | 14% | $ | (1,534) | 15% | | 15 | % | 8 | % |
| | General and administrative expense | | (212) | 4% | | (160) | 3% | | | (480) | 5% | | (337) | 3% | | (33) | % | (42) | % |
| | | | (889) | 18% | | (955) | 18% | | | (1,896) | 19% | | (1,871) | 18% | | 7 | % | (1) | % |
| Australia | Depreciation and amortization | $ | (551) | 11% | $ | (635) | 12% | | $ | (1,142) | 11% | $ | (1,283) | 12% | | 13 | % | 11 | % |
| | General and administrative expense | | (36) | 1% | | (49) | 1% | | | (59) | 1% | | (129) | 1% | | 27 | % | 54 | % |
| | | | (587) | 12% | | (684) | 13% | | | (1,201) | 12% | | (1,412) | 14% | | 14 | % | 15 | % |
| New Zealand | Depreciation and amortization | | (130) | 3% | | (189) | 4% | | | (316) | 3% | | (389) | 4% | | 31 | % | 19 | % |
| | General and administrative expense | | — | 0% | | 1 | (0)% | | | — | 0% | | — | 0% | | 100 | % | - | % |
| | | | (130) | 3% | | (188) | 4% | | | (316) | 3% | | (389) | 4% | | 31 | % | 19 | % |
| Total depreciation, amortization, general and administrative expense | $ | (1,606) | 32% | $ | (1,827) | 35% | | $ | (3,413) | 34% | $ | (3,672) | 36% | | 12 | % | 7 | % |
OPERATING INCOME (LOSS) - REAL ESTATE | | | | | | | | | | | | | | | | | | |
| United States | $ | (204) | (4)% | $ | 233 | 4% | | $ | (573) | (6)% | $ | 16 | 0% | | (>100) | % | (>100) | % |
| Australia | | 1,461 | 29% | | 1,225 | 23% | | | 2,921 | 29% | | 2,639 | 26% | | 19 | % | 11 | % |
| New Zealand | | (311) | (6)% | | (172) | (3)% | | | (511) | (5)% | | (364) | (4)% | | (81) | % | (40) | % |
| Total real estate operating income (loss) | $ | 946 | 19% | $ | 1,286 | 25% | | $ | 1,837 | 18% | $ | 2,291 | 22% | | (26) | % | (20) | % |
Second Quarter Results
Revenue
Real estate revenue for the quarter ended June 30, 2024, decreased slightly by $0.2 million, to $5.0 million, compared to the same period in the prior year. This rent revenue decrease was primarily due to intercompany rent income loss from the sale of our Maitland property
in the fourth quarter of 2023 and the third party and intercompany rent income loss from our Culver City headquarter building due to the abandonment by that tenant of their premises at the building in July 2023 (we subsequently sold the property in February 2024). Additionally, as a result of the Orpheum Theater being “dark” for May and June 2024, there was a decrease in Live theater rental and ancillary income contributing to the real estate revenue being $0.2 million lower compared to the same period in the prior year.
For the six months ended June 30, 2024, real estate revenue decreased by $0.3 million, to $9.9 million, compared to the same period in the prior year. Aligning with the second quarter of 2024, the small decrease was due to the decrease in U.S. rental income, partially offset by the increase in rental income in Australia.
Real Estate Segment Income/(Loss)
Real estate segment operating income for the quarter ended June 30, 2024 decreased by $0.3 million to $0.9 million, compared to the same period in the prior year. This change was primarily due to the loss in income from the sale of our (i) Culver City office building in February 2024 and (ii) Maitland (NSW) property in October 2023.
For the six months ended June 30, 2024, real estate segment operating income decreased by $0.5 million, to $1.8 million, compared to the same period in the prior year. This decrease in operating income was due to reduction in U.S. and NZ’s rental income. This decrease was similarly driven by the loss of income from the sale of our (i) Culver City office building in February 2024 and (ii) Maitland (NSW) property sold in October 2023.
LIQUIDITY AND CAPITAL RESOURCES
Our Financing Strategy
Prior to the COVID-19 pandemic, we used cash generated from operations and other excess cash to the extent not needed to fund capital investments contemplated by our business plan, to pay down our loans and credit facilities. This provided us with availability under our loan facilities for future use and thereby, reduced interest charges. On a periodic basis, we reviewed the maturities of our borrowing arrangements and negotiated renewals and extensions where necessary.
However, disruptions to our cinema cash flow caused by the (i) COVID-19 pandemic and government efforts to address the pandemic, (ii) the historic rise in interest rates and inflation which occurred following the pandemic and (iii) the 2023 Hollywood Strikes, we have needed to defer capital expenditures and to rely on borrowings and the proceeds of asset monetizations to cover our costs of operations, pay interest expense and pay down debt. Since March 31, 2020, we have paid down our institutional debt by $52.6 million.
Our bank loans with Bank of America, NAB, and Westpac require that our Company comply with certain covenants. Furthermore, our Company’s use of loan funds from NAB and Westpac is limited due to limitations on the expatriation of funds from Australia and New Zealand to the United States. We believe that our lenders understand that we are doing everything that can reasonably be done, and that, generally speaking, our relationships with our lenders are good.
While our Company believes that there will be recovery in the global cinema business, we still face macroeconomic headwinds such as increased interest rates, inflation, supply chain issues and increased film rent, labor and operating costs, many of which are beyond our control. We are closely monitoring our debt maturity dates to arrange necessary amendments. As of June 30, 2024, we have debt of $58.8 million coming due in the next 12 months.
If our Company is unable to generate sufficient cash flow in the upcoming months, we will be required to adopt one or more alternatives, such as reducing, delaying or eliminating planned capital expenditures, monetizing additional assets, restructuring our debt and/or our lease obligations or finding additional sources of liquidity (such as additional borrowings). In February 2024, we sold our Culver City office building for $10.0 million. While we incurred a loss of $1.1 million on the transaction, we were able to reduce debt by $8.4 million and to free up cash in the amount of $1.2 million which was used to support operational activities. Further, due to the scope and extent of office vacancies in Los Angeles County, we anticipate that we will be able to save approximately $1.5 million between now and the end of 2025 by moving to other premises. We listed as an asset held for sale our industrial property in Williamsport, Pennsylvania. This property was historically used as a rail yard, and, accordingly, has direct access to the area’s rail system. We carry the property on our books at a book value (the lower of cost or market, as opposed to fair market value) of $0.5 million. This asset was selected since it is currently for our Company non-income producing and, based on recent appraisals, we believe that it would free up amounts of cash.
In order to further bolster our liquidity and capital resources, in this second quarter 2024, we have classified our Cannon Park property in Townsville, Australia and our Wellington property assemblage in New Zealand, with book values of $18.8 million and $17.2 million, respectively, as properties held for sale. Our Wellington assemblage consists of five parcels aggregating 161,082 square feet located in the entertainment center of Wellington and within walking distance of the Wellington harbor. We are also looking to monetize the land under certain of our other New Zealand cinemas, while retaining leases of the cinemas located upon such parcels.
For more information about our borrowings, please refer to Part I – Financial Information, Item 1 – Notes to Consolidated Financial Statements-- Note 12 – Borrowings. For more information about our efforts to manage our liquidity issues, see Part I- Financial Information, Item 1 – Notes to Consolidated Financial Statements – Note 3 – Liquidity and Impairment Assessment.
The changes in cash and cash equivalents for the six months ended June 30, 2024, and June 30, 2023, respectively, are discussed as follows:
| | | | | | | | | |
| | | | | | | | | |
| | Six Months Ended | | | |
| | June 30, | | | |
(Dollars in thousands) | | 2024 | | 2023 | | % Change |
Net cash provided by (used in) operating activities | | $ | (13,157) | | $ | (8,808) | | (49) | % |
Net cash provided by (used in) investing activities | | | 7,398 | | | (3,430) | | >100 | % |
Net cash provided by (used in) financing activities | | | 1,125 | | | (712) | | >100 | % |
Effect of exchange rate on cash and restricted cash | | | (80) | | | (188) | | 57 | % |
Increase (decrease) in cash and cash equivalents and restricted cash | | $ | (4,714) | | $ | (13,138) | | 64 | % |
Operating activities
Cash used in operating activities for the six months ended June 30, 2024, increased by $4.3 million, to $13.2 million compared to cash used in the same period of prior year of $8.8 million. This was primarily driven by an increase in Net Loss and offset by an operating liabilities increase from accounts payable.
Investing activities
Cash provided in investing activities during the six months ended June 30, 2024 was $7.4 million compared to cash used in the same period of prior year of $3.4 million. This was due to $9.7 million proceeds from sale of the Culver City office building in February 2024.
Financing activities
Cash provided in financing activities for the six months ended June 30, 2024, increased by $1.8 million, to $1.1 million compared to cash used in the same prior year period. This was primarily due to the new bridge loan of $13.0 million from NAB on April 10, 2024, partially offset by the payoff of the Citizens loan of $8.4 million, following the sale of the Culver City office buildings and additional $0.3 million debt repayments that was required when our Bank of America Credit Facility was amended on March 27, 2024.
The table below presents the changes in our total available resources (cash and borrowings), debt-to-equity ratio, working capital, and other relevant information addressing our liquidity for the six months ended June 30, 2024, and preceding four years:
| | | | | | | | | | | | | | | |
| | | | | | | | | | | | | | | |
| | As of and
for the
6-Months
Ended | | Year Ended December 31 |
($ in thousands) | | June 30, 2024 | | 2023 | | 2022 | | 2021 | | 2020 |
Total Resources (cash and borrowings) | | | | | | | | | | | | | | | |
Cash and cash equivalents (unrestricted) | | $ | 9,242 | | $ | 12,906 | | $ | 29,947 | | $ | 83,251 | | $ | 26,826 |
Unused borrowing facility | | | 7,859 | | | 7,859 | | | 12,000 | | | 12,000 | | | 15,490 |
Restricted for capital projects | | | 7,859 | | | 7,859 | | | 12,000 | | | 12,000 | | | 9,377 |
Unrestricted capacity | | | — | | | — | | | — | | | — | | | 6,113 |
Total resources at period end | | | 17,101 | | | 20,765 | | | 41,947 | | | 95,251 | | | 42,316 |
Total unrestricted resources at period end | | | 9,242 | | | 12,906 | | | 29,947 | | | 83,251 | | | 32,939 |
Debt-to-Equity Ratio | | | | | | | | | | | | | | | |
Total contractual facility | | $ | 218,277 | | $ | 218,159 | | $ | 227,633 | | $ | 248,948 | | $ | 300,449 |
Total debt (gross of deferred financing costs) | | | 210,418 | | | 210,300 | | | 215,633 | | | 236,948 | | | 284,959 |
Current | | | 58,599 | | | 35,070 | | | 38,026 | | | 12,060 | | | 42,299 |
Non-current | | | 151,819 | | | 175,230 | | | 177,607 | | | 224,888 | | | 242,660 |
Finance lease liabilities | | | 63 | | | 83 | | | 209 | | | — | | | — |
Total book equity | | | 9,531 | | | 32,996 | | | 63,279 | | | 105,060 | | | 81,173 |
Debt-to-equity ratio | | | 22.08 | | | 6.37 | | | 3.41 | | | 2.26 | | | 3.51 |
Changes in Working Capital | | | | | | | | | | | | | | | |
Working capital (deficit)(1) | | $ | (89,787) | | $ | (88,373) | | $ | (74,152) | | $ | (6,673) | | $ | (64,140) |
Current ratio | | | 0.40 | | | 0.30 | | | 0.39 | | | 0.94 | | | 0.47 |
Capital Expenditures (including acquisitions) | | $ | 2,175 | | $ | 4,711 | | $ | 9,780 | | $ | 14,428 | | $ | 16,759 |
(1)Our working capital is reported as a deficit, as we receive revenue from our cinema business ahead of the time that we have to pay our associated liabilities. We use the money we receive to pay down our borrowings in the first instance.
As of June 30, 2024, we had $9.2 million in unrestricted cash and cash equivalents compared to $12.9 million on December 31, 2023. On June 30, 2024, our total outstanding borrowings were $210.4 million compared to $210.3 million on December 31, 2023.
We manage our cash, investments, and capital structure to meet the short-term and long-term obligations of our business, while maintaining financial flexibility and liquidity. We forecast, analyze, and monitor our cash flows to enable investment and financing within the overall constraints of our financial strategy. In the past, we used cash generated from operations and other excess cash to the extent not needed for any capital expenditures, to pay down our loans and credit facilities providing us some flexibility on our available loan facilities for future use and thereby, reducing interest charges.
CONTRACTUAL OBLIGATIONS, COMMITMENTS AND CONTINGENCIES
The following table provides information with respect to the maturities and scheduled principal repayments of our recorded contractual obligations and certain of our commitments and contingencies, either recorded or off-balance sheet, as of June 30, 2024:
| | | | | | | | | | | | | | | | | | | | | |
| | | | | | | | | | | | | | | | | | | | | |
(Dollars in thousands) | | 2024 | | 2025 | | 2026 | | 2027 | | 2028 | | Thereafter | | Total |
Debt(1) | | $ | 31,855 | | $ | 87,688 | | $ | 62,764 | | $ | — | | $ | — | | $ | — | | $ | 182,307 |
Operating leases, including imputed interest | | | 30,207 | | | 29,007 | | | 26,751 | | | 23,446 | | | 21,288 | | | 112,162 | | | 242,861 |
Finance leases, including imputed interest | | | 44 | | | 22 | | | — | | | — | | | — | | | — | | | 66 |
Subordinated debt(1) | | | 198 | | | — | | | — | | | 27,913 | | | — | | | — | | | 28,111 |
Pension liability | | | 263 | | | 547 | | | 576 | | | 607 | | | 638 | | | 443 | | | 3,074 |
Interest on pension liability | | | 79 | | | 137 | | | 108 | | | 77 | | | 45 | | | 11 | | | 457 |
Estimated interest on debt (2) | | | 9,346 | | | 10,737 | | | 5,238 | | | 1,313 | | | — | | | — | | | 26,634 |
Village East purchase option(3) | | | 5,900 | | | — | | | — | | | — | | | — | | | — | | | 5,900 |
Total | | $ | 77,892 | | $ | 128,138 | | $ | 95,437 | | $ | 53,356 | | $ | 21,971 | | $ | 112,616 | | $ | 489,410 |
(1)Information is presented gross of deferred financing costs.
(2)Estimated interest on debt is based on the anticipated loan balances for future periods and current applicable interest rates.
(3)Represents the lease liability of the option associated with the ground lease purchase of the Village East Cinema, which on November 4, 2022, we modified to settle on or before July 1, 2024.
Litigation
We are currently involved in certain legal proceedings and, as required, have accrued estimates of probable and estimable losses for the resolution of these claims.
Please refer to Part I, Item 3 – Legal Proceedings in our 2023 Form 10-K for more information. There have been no material changes to our litigation since our 2023 Form 10-K, except as set forth in Notes to Consolidated Financial Statements-- Note 15 – Commitments and Contingencies included herein in Part I – Financial Information, Item 1 – Financial Statements on this Quarterly Report on Form 10-Q. This note sets out our litigation accounting policies.
Off-Balance Sheet Arrangements
There are no off-balance sheet arrangements or obligations (including contingent obligations) that have, or are reasonably likely to have, a current or future material effect on our financial condition, changes in the financial condition, revenue or expense, results of operations, liquidity, capital expenditures or capital resources.
CRITICAL ACCOUNTING POLICIES
We believe that the application of the following accounting policies requires significant judgments and estimates in the preparation of our Consolidated Financial Statements and hence, are critical to our business operations and the understanding of our financial results:
(i) Impairment of Long-lived Assets (other than Goodwill and Intangible Assets with indefinite lives) – we evaluate our long-lived assets and finite-lived intangible assets using historical and projected data of cash flows as our primary indicator of potential impairment and we take into consideration the seasonality of our business. If the sum of the estimated, undiscounted future cash flows is less than the carrying amount of the asset, then an impairment is recognized for the amount by which the carrying value of the asset exceeds its estimated fair value based on an appraisal or a discounted cash flow calculation. For certain non-income producing properties or for those assets with no consistent historical or projected cash flows, we obtain appraisals or other evidence to evaluate whether there are impairment indicators for these assets.
No impairment losses were recorded for long-lived and finite-lived intangible assets for the quarter ended June 30, 2024.
(ii) Impairment of Goodwill and Intangible Assets with indefinite lives – goodwill and intangible assets with indefinite useful lives are not amortized, but instead, tested for impairment at least annually on a reporting unit basis. The impairment evaluation is based on the present value of estimated future cash flows of each reporting unit plus the expected terminal value. There are significant assumptions and estimates used in determining the future cash flows and terminal value. The most significant
assumptions include our cost of debt and cost of equity assumptions that comprise the weighted average cost of capital for each reporting unit. Accordingly, actual results could vary materially from such estimates.
No impairment losses were recorded for goodwill and indefinite-lived intangible assets for the quarter ended June 30, 2024.
CAUTIONARY STATEMENT REGARDING FORWARD-LOOKING STATEMENTS
Our statements in this quarterly report, including the documents incorporated herein by reference, contain a variety of forward-looking statements as defined by the Securities Litigation Reform Act of 1995. Forward-looking statements can be identified by words such as: "may," "will," "expect," "believe," "intend," "future," and "anticipate" and similar references to future periods. Examples of forward-looking statements include, among others, our expectations regarding renovations and addition of cinemas; our beliefs regarding the impact of the 2023 Hollywood Strikes on the cinema business; our expected operating results, including our ultimate return to pre-pandemic type results; our expectations regarding the recovery and future of the cinema exhibition industry, including the strength of movies anticipated for release in the future; our expectations regarding people returning to our theatres and continuing to use discretionary funds on entertainment outside of the home; our beliefs regarding the impact of our cinema-anchored real estate developments; our beliefs regarding the success of our diversified business strategy; our beliefs regarding the future of the Reading Viaduct; our expectations regarding the impact of streaming and mobile video services on the cinema exhibition industry; our belief regarding the attractiveness of 44 Union Square to potential tenants and ability to lease space on acceptable terms; our expectations regarding the timing of the completions our renovation projects; our expectations regarding the effects of our enhanced F&B offerings on our operating results; our expectations regarding credit facility covenant compliance and our ability to continue to obtain necessary covenant waivers and loan extensions on terms acceptable to us; and our expectations of our liquidity and capital requirements and the allocation of funds; our expectations regarding our ability timely monetize certain assets and to generate sufficient cash proceeds from such sales; and our expectations concerning our ability to negotiate arrangements with our landlords to abate and/or defer the payment of rent.
Forward-looking statements are neither historical facts nor assurances of future performance. Instead, they are based only on our current beliefs, expectations and assumptions regarding the future of our business, future plans and strategies, projections, anticipated events and trends, the economy and other future conditions. Because forward-looking statements relate to the future, they are subject to inherent uncertainties, risks and changes in circumstances that are difficult to predict and many of which are outside of our control. Our actual results and financial condition may differ materially from those indicated in the forward-looking statements. Therefore, you should not rely on any of these forward-looking statements. Important factors that could cause our actual results and financial condition to differ materially from those indicated in the forward-looking statements include, among others, the following:
with respect to our cinema and live theatre operations:
reduced consumer demand due to inflationary pressures;
the adverse continuing effects of external events of the past COVID-19 pandemic and Hollywood Strikes on our Company’s results from operations, liquidity, cash flows, financial condition, and access to credit markets;
the adverse continuing impact of the COVID-19 pandemic or other contagious diseases on short-term and/or long-term entertainment, leisure and discretionary spending habits and practices of our patrons;
the decrease in attendance at our cinemas and theatres due to (i) increased ticket prices (ii) a change in consumer
behavior in favor of alternative forms or mediums of entertainment, and (iii) limited availability of wide release content;
reduction in operating margins (or negative operating margins) due to (i) decreased attendance, (ii) limited availability of wide release content, and (iii.) increased operating expenses;
unwillingness of employees to report to work due to the adverse effects of contagious diseases or to otherwise conduct work under any revised work environment protocols;
competition from cinema operators who have successfully used debtor laws to reduce their debt and/or rent exposure;
the uncertainty as to the scope and extent of our government's responses to future outbreak of infectious diseases;
the disruptions or reductions in the utilization of entertainment, shopping, and hospitality venues, as well as in our operations, due to pandemics, epidemics, widespread health emergencies, or outbreaks of infectious diseases or to changing consumer tastes and habits;
the number and attractiveness to moviegoers of the films released in future periods, and potential changes in release dates for motion pictures;
the lack of availability of films in the short- or long-term as a result of (i) major film distributors releasing scheduled films on alternative channels or (ii) disruptions of film production or (iii) rescheduling of movie releases into later periods, as most currently experienced due to the effects of the 2023 Hollywood Strikes;
the amount of money spent by film distributors to promote their motion pictures;
the licensing fees and terms required by film distributors from motion picture exhibitors in order to exhibit their films;
the comparative attractiveness of motion pictures as a source of entertainment and willingness and/or ability of consumers (i) to spend their dollars on entertainment and (ii) to spend their entertainment dollars on movies in an outside-the-home environment;
the extent to which we encounter competition from other cinema exhibitors, from other sources of outside-the-home entertainment, and from inside-the-home entertainment options, such as “home cinemas” and competitive film product distribution technology, such as, streaming, cable, satellite broadcast, video on demand platforms, and Blu-ray/DVD rentals and sales;
our ability to continue to obtain, to the extent needed, waivers or other financial accommodations from our lenders and landlords;
the impact of major movies being released directly to one of the multitudes of streaming services available;
the impact of certain competitors’ subscription or advance pay programs;
the failure of our new initiatives to gain significant customer acceptance and use or to generate meaningful profits;
the cost and impact of improvements to our cinemas, such as improved seating, enhanced F&B offerings, and other improvements;
the ability to negotiate favorable rent abatement, deferral and repayment terms with our landlords (which may include lenders who have foreclosed on the collateral held by our prior landlords);
disruptions during cinema improvements;
in the U.S., the impact of the termination and phase-out of the so called “Paramount Decree;”
the risk of damage and/or disruption of cinema businesses from earthquakes as certain of our operations are in geologically active areas;
the impact of protests, demonstrations, and civil unrest on, among other things, government policy, consumer willingness to go to the movies;
labor shortages and increased labor costs related to such shortages and to increasingly costly labor laws and regulations applicable to part time non-exempt workers. Disruptions in film supply and film marketing due to the 2023 Hollywood Strikes; and
the ability to negotiate terms and conditions, including price, for the asset monetization transactions for the assets we have held for sale as of June 30, 2024.
with respect to our real estate development and operation activities:
the increased costs of wages, supplies, services and other development expenses from inflation;
the impact on tenants from inflationary pressures;
uncertainty as to governmental responses to infectious diseases;
the rental rates and capitalization rates applicable to the markets in which we operate and the quality of properties that we own;
the ability to negotiate and execute lease agreements with material tenants;
the extent to which we can obtain on a timely basis the various land use approvals and entitlements needed to develop our properties;
the risks and uncertainties associated with real estate development;
the availability and cost of labor and materials;
the ability to obtain all permits to construct improvements;
the ability to finance improvements, including, but not limited to increased cost of borrowing and tightened lender credit policies;
the disruptions to our business from construction and/or renovations;
the possibility of construction delays, work stoppage, and material shortage;
competition for development sites and tenants;
environmental remediation issues;
the extent to which our cinemas can continue to serve as an anchor tenant that will, in turn, be influenced by the same factors as will influence generally the results of our cinema operations;
the increased depreciation and amortization expense as construction projects transition to leased real property;
the ability to negotiate and execute joint venture opportunities and relationships;
the risk of damage and/or disruption of real estate businesses from earthquakes as certain of our operations are in geologically active areas;
the disruptions or reductions in the utilization of entertainment, shopping and hospitality venues, as well as in our operations, due to pandemics, epidemics, widespread health emergencies, or outbreaks of infectious diseases, or to changing consumer tastes and habits; and
the impact of protests, demonstrations, and civil unrest on government policy, consumer willingness to visit shopping centers.
with respect to our operations generally as an international company involved in both the development and operation of cinemas and the development and operation of real estate and previously engaged for many years in the railroad business in the United States:
our ability to renew, extend, renegotiate or replace our loans that mature in 2024 and beyond, and the impact of increasing interest rates;
our ability to grow our Company and provide value to our stockholders;
our ongoing access to borrowed funds and capital and the interest that must be paid on that debt and the returns that must be paid on such capital, and our ability to borrow funds to help cover the cessation of cash flows we experienced during the COVID-19 pandemic;
our ability to reallocate funds among jurisdictions to meet short-term liquidity needs;
the relative values of the currency used in the countries in which we operate;
changes in government regulation, including by way of example, the costs resulting from the requirements of Sarbanes-Oxley and other increased regulatory requirements;
our labor relations and costs of labor (including future government requirements with respect to minimum wages, shift scheduling, the use of consultants, pension liabilities, disability insurance and health coverage, and vacations and leave);
our exposure from time to time to legal claims and to uninsurable risks, such as those related to our historic railroad operations, including potential environmental claims and health-related claims relating to alleged exposure to asbestos or other substances now or in the future recognized as being possible causes of cancer or other health related problems, and class actions and private attorney general wage and hour and/or safe workplace-based claims;
our exposure to cybersecurity risks, including misappropriation of customer information or other breaches of information security;
the impact of future major outbreaks of contagious diseases;
the availability of employees and/or their ability or willingness to conduct work under any revised work environment protocols;
the increased risks related to employee matters, including increased employment litigation and claims relating to terminations or furloughs caused by cinema and ETC closures;
our ability to generate significant cash flow from operations if our cinemas and/or ETCs continue to experience demand at levels significantly lower than historical levels, which could lead to a substantial increase in indebtedness and negatively impact our ability to comply with the financial covenants, if applicable, in our debt agreements;
our ability to comply with credit facility covenants and our ability to obtain necessary covenant waivers and necessary credit facility amendments;
changes in future effective tax rates and the results of currently ongoing and future potential audits by taxing authorities having jurisdiction over our various companies;
inflationary pressures on labor and supplies, and supply chain disruptions;
changes in applicable accounting policies and practices;
changes in future effective tax rates and the results of currently ongoing and future potential audits by taxing authorities having jurisdiction over our various companies;
the impact of the conflict events occurring in Eastern Europe and the threats of potential conflicts in the Asia-Pacific region; and
the impact of the conflict events occurring in Israel and the threats of other potential conflicts in the Middle East.
The above list is not necessarily exhaustive, as business is by definition unpredictable and risky, and subject to influence by numerous factors outside of our control, such as changes in government regulation or policy, competition, interest rates, supply, technological innovation, changes in consumer taste and fancy, weather, earthquakes, pandemics, and the extent to which consumers in our markets have the economic wherewithal to spend money on beyond-the-home entertainment. Refer to Item 1A - Risk Factors, as well as the risk factors set forth in any other filings made under the Securities Act of 1934, as amended, including any of our Quarterly Reports on Form 10-Q, for more information.
Given the variety and unpredictability of the factors that will ultimately influence our businesses and our results of operation, no guarantees can be given that any of our forward-looking statements will ultimately prove to be correct. Actual results will undoubtedly vary and there is no guarantee as to how our securities will perform either when considered in isolation or when compared to other securities or investment opportunities.
Forward-looking statements made by us in this quarter report are based only on information currently available to us and are current only as of the date of this Quarterly Report on Form 10-Q for the period ended June 30, 2024. We undertake no obligation to publicly update or to revise any of our forward-looking statements, whether as a result of new information, future events or otherwise, except as may be required under applicable law. Accordingly, you should always note the date to which our forward-looking statements speak.
.
Item 3 – Quantitative and Qualitative Disclosure about Market Risk
The SEC requires that registrants include information about potential effects of changes in currency exchange and interest rates in their filings. Several alternatives, all with some limitations, have been offered. We base the following discussion on a sensitivity analysis that models the effects of fluctuations in currency exchange rates and interest rates. This analysis is constrained by several factors, including the following:
It is based on a single point in time; and
It does not include the effects of other complex market reactions that would arise from the changes modeled.
Although the results of such an analysis may be useful as a benchmark, they should not be viewed as forecasts.
Currency Risk
While we report our earnings and net assets in U.S. dollars, substantial portions of our revenue and of our obligations are denominated in either Australian or New Zealand dollars. The value of these currencies can vary significantly compared to the U.S. dollar and compared to each other. We do not hedge the currency risk, but rather have relied upon the natural hedges that exist as a result of the fact that our film costs are typically fixed as a percentage of the box office, and our local operating costs and obligations are likewise typically denominated in local currencies. However, we do have intercompany debt and our ability to service this debt could be adversely impacted by declines in the relative value of the Australian and New Zealand dollars compared to the U.S. dollar. Also, our use of local borrowings to mitigate the business risk of currency fluctuations has reduced our flexibility to move cash between jurisdictions. Set forth below is a chart of the exchange ratios between these two currencies in relation to US dollars since 1996:
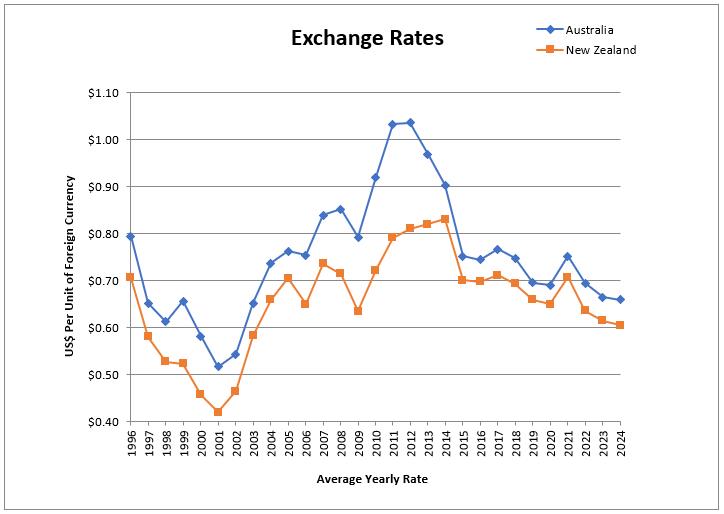
In recent periods, we have paid material intercompany dividends and have repaid intercompany debt, using these proceeds to fund capital investment in the United States. Accordingly, our debt levels in Australia are higher than they would have been if funds had not been returned for such purposes. On a company wide basis, this means that a reduction in the relative strength of the U.S. dollar versus
the Australian dollar and/or the New Zealand dollar would effectively raise the overall cost of our borrowing and capital and make it more expensive to return funds from the United States to Australia and New Zealand.
Our Company transacts business in Australia and New Zealand and is subject to risks associated with fluctuating foreign currency exchange rates. During the second quarter of 2024, the average Australian dollar and New Zealand dollar weakened against the U.S. dollar by 1.3% and 2.1%, respectively, compared to the same prior year period.
At June 30, 2024, approximately 36.9% and 8.9% of our assets were invested in assets denominated in Australian dollars (Reading Entertainment Australia) and New Zealand dollars (Reading New Zealand), respectively, including approximately $5.4 million in cash and cash equivalents. At December 31, 2023, approximately 36.4% and 8.9% of our assets were invested in assets denominated in Australian dollars (Reading Entertainment Australia) and New Zealand dollars (Reading New Zealand), respectively, including approximately $5.8 million in cash and cash equivalents.
Our policy in Australia and New Zealand is to match revenues and expenses, whenever possible, in local currencies. As a result, we have procured a majority of our expenses in Australia and New Zealand in local currencies. Despite this natural hedge, recent movements in foreign currencies and the current holding of U.S. dollars by certain Australian and New Zealand subsidiaries have had an effect on our current earnings. The effect of the translation adjustment on our assets and liabilities noted in our other comprehensive income was an increase of $0.9 million for the quarter ended June 30, 2024. As we continue to progress our acquisition and development activities in Australia and New Zealand, no assurances can be given that the foreign currency effect on our earnings will not be material in the future.
Historically, our policy has been to borrow in local currencies to finance the development and construction of our long-term assets in Australia and New Zealand. As a result, the borrowings in local currencies have provided somewhat of a natural hedge against the foreign currency exchange exposure. We have also historically paid management fees to the U.S. to cover a portion of our domestic overhead. The fluctuations of the Australian and New Zealand currencies, however, may impact our ability to rely on such funding for ongoing support of our domestic overhead.
We record unrealized foreign currency translation gains or losses that could materially affect our financial position. As of June 30, 2024, and December 31, 2023, the balance of cumulative foreign currency translation adjustments were approximately a ($2.6) million loss and ($1.0) million loss, respectively.
Interest Rate Risk
Our exposure to interest rate risk arises out of our long-term floating-rate borrowings. To manage the risk, we utilize interest rate derivative contracts to convert certain floating-rate borrowings into fixed-rate borrowings. It is our Company’s policy to enter into interest rate derivative transactions only to the extent considered necessary to meet its objectives as stated above. Our Company does not enter into these transactions or any other hedging transactions for speculative purposes.
Historically, we maintain most of our cash and cash equivalent balances in short-term money market instruments with original maturities of three months or less. Due to the short-term nature of such investments, a change of 1% in short-term interest rates would not have a material effect on our financial condition. The negative spread between our borrowing costs and earned interest will exacerbate as we hold cash to provide a safety net to meet our expenses.
We have a combination of fixed and variable interest rate loans. In connection with our variable interest rate loans, a change of approximately 1% in short-term interest rates would have resulted in an approximate $506,000 increase or decrease in our quarterly interest expense.
For further discussion on market risks, please refer to Part I, Item 1A – Risk Factors included on our 2023 Form 10-K.
Item 4 – Controls and Procedures
We maintain disclosure controls and procedures that are designed to ensure that information required to be disclosed in our Company’s reports filed under the Securities Exchange Act of 1934, as amended (the “Exchange Act”), is recorded, processed, summarized and reported within the time periods specified in the SEC’s rules and forms and that such information is accumulated and communicated to our management, including our Chief Executive Officer and Chief Financial Officer, as appropriate, to allow for timely decisions regarding required disclosure. In designing and evaluating the disclosure controls and procedures, management recognizes that any controls and procedures, no matter how well designed and operated, can provide only reasonable assurance of achieving the desired control objectives, and our management is required to apply its judgment in evaluating the cost-benefit relationship of possible controls and procedures.
Under the supervision and with the participation of our management, including our principal executive officer and principal financial officer, we conducted an evaluation of our disclosure controls and procedures, as such, term is defined under Rule 13a-15(e) promulgated under the Exchange Act. Based upon that evaluation, we concluded that, as of June 30, 2024, our disclosure controls and procedures were effective.
Changes in Internal Control over Financial Reporting
There were no other changes in our internal control over financial reporting (as defined in Rule 13a-15(f) and 15d-15(f) under the Exchange Act) that occurred during the second quarter ended June 30, 2024, that have materially affected, or are reasonably likely to materially affect, our internal control over financial reporting.
PART II – Other Information
Item 1 – Legal Proceedings
The information required under Part II, Item 1 (Legal Proceedings) is incorporated by reference to the information contained in Notes to Consolidated Financial Statements-- Note 15 – Commitments and Contingencies included herein in Part I – Financial Information, Item 1 – Financial Statements on this Quarterly Report on Form 10-Q.
For further details on our legal proceedings, please refer to Part I, Item 3 – Legal Proceedings, contained in our 2023 Form 10-K.
Item 1A – Risk Factors
There have been no material changes to the risk factors we previously disclosed in Item 1A of our 2023 Form 10-K.
We encourage investors to review the risks and uncertainties relating to our business disclosed under the heading Risk Factors or otherwise in the 2023 Form 10-K, as well as those contained in Part I – Forward-Looking Statements thereof, as revised or supplemented by our Quarterly Reports filed with the SEC since the filing of the 2023 Form 10-K.
Item 2 – Sales of Equity Securities and Use of Proceeds
None.
Item 3 – Defaults upon Senior Securities
None.
Item 4 – Mine Safety Disclosure
Not applicable.
Item 5 – Other Information
During the quarter ended June 30, 2024, no director or officer of the Company adopted or terminated a “Rule 10b5-1 trading arrangement” or a “non-Rule 10b5-1 trading arrangement” (in each case, as defined in Item 408 of Regulation S-K).
Item 6 – Exhibits
10
1
| |
10.1*† | Amendment Deed dated April 4, 2024, between National Australia Bank Limited and Reading Entertainment Australia Pty Ltd. |
10.2*† | First Omnibus Loan Modification and Extension Agreement dated April 23, 2024, by and between Reading Tammany Owner LLC and US Development, LLC, collectively as borrower, and Emerald Creek Capital 3, LLC, as administrative agent and collateral agent for the lender. |
31.1* | Certification of the Principal Executive Officer Pursuant to Section 302 of the Sarbanes-Oxley Act of 2002. |
31.2* | Certification of the Principal Financial Officer Pursuant to Section 302 of the Sarbanes-Oxley Act of 2002. |
32** | Certifications Pursuant to Section 906 of the Sarbanes-Oxley Act of 2002. |
101 | The following material from our Company’s Quarterly Report on Form 10-Q for the quarter ended June 30, 2024, formatted in iXBRL (Inline Extensible Business Reporting Language): (i) Consolidated Balance Sheets, (ii) Consolidated Statements of Income, (iii) Consolidated Statements of Comprehensive Income, (iv) Consolidated Statements of Cash Flows, and (v) the Notes to the Consolidated Financial Statements. |
104 | Cover Page Interactive Data File (formatted in iXBRL and contained in Exhibit 101) |
___________________
+ Filed or furnished herewith
† Certain portions of this exhibit have been omitted pursuant to Items 601(a)(5) and 601(b)(10)(iv) of Regulation S-K. Information in this exhibit that has been omitted has been noted in this document with a placeholder identified by the mark “[***]”. The Company hereby agrees to furnish a copy of any omitted schedules or exhibits to the SEC upon request.”
* Filed herewith
** Furnished herewith
SIGNATURES
Pursuant to the requirements of the Securities Exchange Act of 1934, the Registrant has duly caused this report to be signed on its behalf by the undersigned thereunto duly authorized.
READING INTERNATIONAL, INC.
Date: August 14, 2024
By: /s/ Ellen M. Cotter
Ellen M. Cotter
President and Chief Executive Officer
Date: August 14, 2024
By: /s/ Gilbert Avanes
Gilbert Avanes
Executive Vice President, Chief Financial Officer and Treasurer