UNITED STATES
SECURITIES AND EXCHANGE COMMISSION
WASHINGTON, D.C. 20549
FORM
(Mark One)
ANNUAL REPORT PURSUANT TO SECTION 13 OR 15(d) OF THE SECURITIES EXCHANGE ACT OF 1934 |
For the fiscal year ended
or
TRANSITION REPORT PURSUANT TO SECTION 13 OR 15(d) OF THE SECURITIES EXCHANGE ACT OF 1934 |
For the transition period from _____________ to ___________.
Commission File Number
(Exact name of Registrant as specified in its charter)
(State or other jurisdiction of incorporation or organization) |
(I.R.S. Employer Identification No.) |
(Address of principal executive offices) |
(Zip Code) |
Registrant's telephone number, including area code
Securities registered pursuant to Section 12(b) of the Act:
Title of each class |
|
Trading Symbol(s) |
|
Name of each exchange on which registered |
|
|
Securities registered pursuant to Section 12(g) of the Act: None
Indicate by check mark if the Registrant is a well-known seasoned issuer, as defined in Rule 405 of the Securities Act. Yes ☐
Indicate by check mark if the Registrant is not required to file reports pursuant to Section 13 or 15(d) of the Act. Yes ☐
Indicate by check mark whether the Registrant: (1) has filed all reports required to be filed by Section 13 or 15(d) of the Securities Exchange Act of 1934 during the preceding 12 months (or for such shorter period that the Registrant was required to file such reports), and (2) has been subject to such filing requirements for the past 90 days.
Indicate by check mark whether the Registrant has submitted electronically every Interactive Data File required to be submitted pursuant to Rule 405 of Regulation S-T (§232.405 of this chapter) during the preceding 12 months (or for such shorter period that the Registrant was required to submit such files).
Indicate by check mark whether the Registrant is a large accelerated filer, an accelerated filer, a non-accelerated filer, a smaller reporting company, or an emerging growth company. See the definitions of "large accelerated filer," "accelerated filer," "smaller reporting company," and "emerging growth company" in Rule 12b-2 of the Exchange Act.
Large accelerated filer |
☐ |
|
|
☒ |
|
Non-accelerated filer |
☐ |
|
|
Smaller reporting company |
|
Emerging growth company |
|
|
|
|
If an emerging growth company, indicate by check mark if the Registrant has elected not to use the extended transition period for complying with any new or revised financial accounting standards provided pursuant to Section 13(a) of the Exchange Act. ☐
Indicate by checkmark whether the Registrant has filed a report on and attestation to its management’s assessment of the effectiveness of its internal control over financial reporting under Section 404(b) of the Sarbanes-Oxley Act (15 U.S.C. 7262(b)) by the registered public accounting firm that prepared or issued its audit report.
If securities are registered pursuant to Section 12(b) of the Act, indicate by check mark whether the financial statements of the Registrant included in the filing reflect the correction of an error to previously issued financial statements.
Indicate by check mark whether any of those error corrections are restatements that required a recovery analysis of incentive-based compensation received by any of the Registrant’s executive officers during the relevant recovery period pursuant to § 240.10D-1(b). ☐
Indicate by checkmark whether the Registrant is a shell company (as defined in Rule 12b-2 of the Act). Yes ☐ No
The aggregate market value of the Registrant’s Common Stock held by non-affiliates of the Registrant, based on the closing price of the shares of common stock on the NYSE Stock Market on September 30, 2023, was approximately $
As of June 5, 2024, the number of shares of the Registrant’s Common Stock outstanding was
DOCUMENTS INCORPORATED BY REFERENCE
Portions of the Registrant's definitive Proxy Statement, to be filed in connection with the Registrant's 2024 Annual Meeting of Stockholders to be held on August 20, 2024, are incorporated by reference into Part III, Items 10, 11, 12, 13 and 14 of this report.
Table of Contents
GRAHAM CORPORATION
Annual Report on Form 10-K
Year Ended March 31, 2024
PART I |
|
PAGE |
|
|
|
|
2 |
|
Item 1 |
3 |
|
Item 1A |
8 |
|
Item 1B |
21 |
|
Item 1C |
21 |
|
Item 2 |
23 |
|
Item 3 |
23 |
|
Item 4 |
23 |
|
|
|
|
PART II |
|
|
|
|
|
Item 5 |
24 |
|
Item 6 |
24 |
|
Item 7 |
Management’s Discussion and Analysis of Financial Condition and Results of Operations |
25 |
Item 7A |
37 |
|
Item 8 |
39 |
|
Item 9 |
Changes in and Disagreements with Accountants on Accounting and Financial Disclosure |
72 |
Item 9A |
72 |
|
Item 9B |
74 |
|
Item 9C |
Disclosure Regarding Foreign Jurisdictions That Prevent Inspections |
74 |
|
|
|
PART III |
|
|
|
|
|
Item 10 |
75 |
|
Item 11 |
75 |
|
Item 12 |
Security Ownership of Certain Beneficial Owners and Management and Related Stockholder Matters |
75 |
Item 13 |
Certain Relationships and Related Transactions, and Director Independence |
75 |
Item 14 |
75 |
|
|
|
|
PART IV |
|
|
|
|
|
Item 15 |
76 |
|
Item 16 |
79 |
1
Cautionary Note Regarding Forward-Looking Statements
This Annual Report on Form 10-K (the "Form 10-K") and other documents we file with the Securities and Exchange Commission ("SEC") include forward-looking statements within the meaning of Section 27A of the Securities Act of 1933, as amended, and Section 21E of the Securities Exchange Act of 1934, as amended. All statements other than statements of historical fact are forward-looking statements for purposes of this Form 10-K. These statements involve known and unknown risks, uncertainties and other factors that may cause actual results to be materially different from any future results implied by the forward-looking statements. Forward-looking statements are indicated by words such as "anticipate," "believe," "continue," "could," "estimate," "can," "may," "might," "intend," "expect," "plan," "goal," "predict," "project," "outlook," "encourage," "potential," "should," "will," “strive,” “future,” and similar words and expressions.
Forward-looking statements are not a guarantee of future performance and involve risks and uncertainties, and there are certain important factors that could cause our actual results to differ, possibly materially, from expectations or estimates reflected in such forward-looking statements including those described in the "Risk Factors" and elsewhere in this Form 10-K. Undue reliance should not be placed on our forward-looking statements. New risks and uncertainties arise from time to time and we cannot predict these events or how they may affect us and cause actual results to differ materially from those expressed or implied by our forward-looking statements. Therefore, you should not rely on our forward-looking statements as predictions of future events. When considering these risks, uncertainties and assumptions, you should keep in mind the cautionary statements contained in this Form 10-K and any documents incorporated herein by reference. You should read this document and the documents that we reference in this Form 10-K completely and with the understanding that our actual future results may be materially different from what we expect. All forward-looking statements attributable to us are expressly qualified by these cautionary statements.
All forward-looking statements included in this Form 10-K are made only as of the date indicated or as of the date of this Form 10-K. Except as required by law, we undertake no obligation to update or announce any revisions to forward-looking statements contained in this Form 10-K, whether as a result of new information, future events or otherwise.
2
PART I
(Dollar amounts in thousands except per share data)
Item 1. Business
Graham Corporation ("we," "us," "our" or the "Company") is a global leader in the design and manufacture of mission critical fluid, power, heat transfer and vacuum technologies for the defense, space, energy and process industries. We design and manufacture custom-engineered vacuum, heat transfer, cryogenic pump and turbomachinery technologies. For the defense industry, our equipment is used in nuclear and non-nuclear propulsion, power, fluid transfer, and thermal management systems. For the space industry our equipment is used in propulsion, power and energy management systems, and for life support systems. We supply equipment for vacuum, heat transfer and fluid transfer applications used in energy and new energy markets including oil refining, cogeneration, and multiple alternative and clean power applications including hydrogen. For the chemical and petrochemical industries, our equipment is used in fertilizer, ethylene, methanol and downstream chemical facilities.
Our corporate headquarters is located with our production facilities in Batavia, New York, where surface condensers and ejectors are designed, engineered, and manufactured for the defense, energy and petrochemical markets. Our wholly-owned subsidiary, Barber-Nichols, LLC ("BN"), based in Arvada, Colorado, designs, develops, manufactures and sells specialty turbomachinery products for the space, aerospace, cryogenic, defense and energy markets. In November 2023, we acquired P3 Technologies, LLC ("P3"), located in Jupiter, Florida (See "Acquisition" below). We also have wholly-owned foreign subsidiaries, Graham Vacuum and Heat Transfer Technology Co., Ltd. ("GVHTT"), located in Suzhou, China and Graham India Private Limited ("GIPL"), located in Ahmedabad, India. GVHTT provides sales and engineering support for us throughout Southeast Asia. GIPL provides sales and engineering support for us in India and the Middle East.
We were incorporated in Delaware in 1983 and are the successor to Graham Manufacturing Co., Inc., which was incorporated in New York in 1936. Our stock is traded on the NYSE under the ticker symbol "GHM".
Our fiscal year ends on March 31 of each year. We refer to our fiscal year, which ended March 31, 2024, as fiscal 2024. Likewise, we refer to our fiscal years that will end or have ended March 31, 2025, March 31, 2023 and March 31, 2022 as fiscal 2025, fiscal 2023 and fiscal 2022, respectively.
Acquisition - On November 9, 2023, we completed our acquisition of P3, a privately-owned custom turbomachinery engineering, product development, and manufacturing business located in Jupiter, Florida that serves the space, new energy, defense and medical industries. We believe this acquisition advances our growth strategy, further diversifies our market and product offerings, and broadens our turbomachinery solutions. P3 will be managed through BN, is highly complementary to BN's technology, and enhances its turbomachinery solutions.
Our Products, Customers and Markets
We manufacture high quality, highly reliable custom-engineered products for critical applications:
3
Our products are used in a wide range of applications, including:
Our principal customers include tier one and tier two suppliers to the defense and aerospace industry, refineries, petrochemical plants, large engineering companies that build installations for companies in the energy and process industries (or Engineering Procurement Contractors, and original equipment manufacturers ("OEM"). A representative list of our customers include: Aerojet Rocketdyne, Air Liquide, Applied Research Laboratory at Pennsylvania State University, Aramco, Bechtel Plant Machinery Inc., Blue Origin, Boeing, CERN, China State-owned Refiners, Cummins, DuPont, Dow Chemical, General Atomics, General Dynamics, ExxonMobil, Fluor Corporation, Jacobs Engineering Group Inc., Kairos Power, Koch Fertilizer ENID LLC, Lockheed Martin, MHI Compressor International Corporation, NASA, Newport News Shipbuilding, Northrop Grumman, Oak Ridge National Laboratory, Raytheon Technologies, Rolls-Royce North America, SAIC, Sierra Space, U.S. Navy, United Launch Alliance, and Varian.
Our products are sold by a team of sales engineers whom we employ directly. Two customers each accounted for more than 10% of our revenue in the fiscal 2024. As a result of our diversification efforts to more extensively support the U.S. Navy and the acquisition of BN, we have increased our concentration in domestic and defense sales. Domestic sales accounted for approximately 84% of total sales in fiscal 2024, while sales to the defense industry were 54%.
4
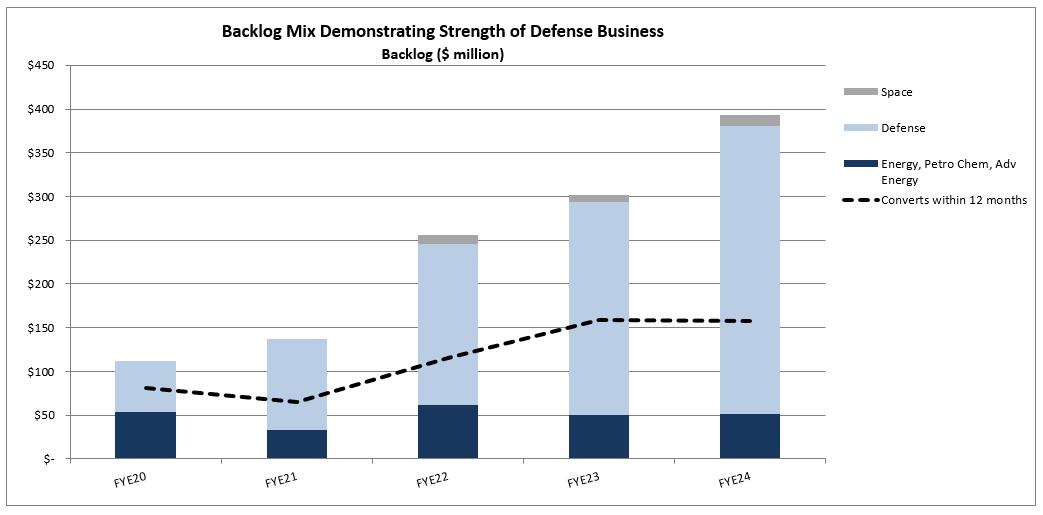
Our backlog at March 31, 2024 was $390,868 compared with $301,734 at March 31, 2023. For more information on this performance indicator see "Orders, Backlog and Book-to-Bill Ratio" below.
Our Strengths
Our core strengths include:
Our Strategy
Our strategy is to build a diversified business that provides mission critical, high compliance products requiring exceptional engineering know-how and a highly-skilled and engaged workforce. We expect to accomplish this by pursuing niche applications in markets with enduring tailwinds that reward differentiated engineered product and full lifecycle scope of work with higher margins. Over the last few years, we have transitioned from a highly cyclical energy business to a diversified company serving multiple markets including the defense, space and alternative energy industries. Our long-term goal is to drive 8% to 10% average annualized organic revenue growth and low to mid-teen adjusted EBITDA margins by the fiscal year ended March 31, 2027. We expect to accomplish our goals through the development of our full lifecycle product model serving multiple markets while leveraging business unit synergies to optimize profitability and stability. Additionally, we believe we must develop a highly engaged team that will drive continual
5
improvement for the long term. Executed effectively, we expect our strategy to create more enduring, recurring opportunities and profitable growth.
Fiscal 2023 and 2024 were characterized by continual improvement and increasing profitability and formed the initial steps along our path to achieve our fiscal 2027 goals. We remain focused on our strategy which will continue to advance in fiscal 2025 in step with our progress. Our priorities are our targeted markets, operational excellence, and serving our stakeholders. As we generate cash, we also will instill strong capital discipline with smart capital deployment in our strategic thinking. We plan to:
We have not reconciled non-GAAP forward-looking adjusted EBITDA margin to its most directly comparable GAAP measure, as permitted by Item 10(e)(1)(i)(B) of Regulation S-K. Such reconciliation would require unreasonable efforts to estimate and quantify various necessary GAAP components largely because forecasting or predicting our future operating results is subject to many factors out of our control or not readily predictable.
Competition
Our business is highly competitive. The principal bases on which we compete include technology, price, performance, reputation, delivery, and quality. Our competitors listed in alphabetical order by market include:
North America |
||
|
||
Market |
|
Principal Competitors |
|
|
|
Navy Nuclear Propulsion Program / Defense |
|
DC Fabricators; Joseph Oat; PCC; Triumph Aerospace; Xylem |
|
|
|
Refining vacuum distillation |
|
Croll Reynolds Company, Inc.; Gardner Denver, Inc.; GEA Wiegand GmbH |
|
|
|
Chemicals/petrochemicals |
|
Croll Reynolds Company, Inc.; Gardner Denver, Inc.; Schutte Koerting |
|
|
|
Turbomachinery OEM – defense and aerospace/space |
|
Ametek, Inc.; Concepts NREC; Curtiss Wright; Florida Turbine Technologies; Honeywell; Kratos Defense & Security Solns |
|
|
|
Turbomachinery OEM – refining, petrochemical |
|
Donghwa Entec Co., Ltd..; KEMCO; Oeltechnik GmbH |
|
|
|
Turbomachinery OEM – power and power producer
|
|
Holtec; KEMCO; Maarky Thermal Systems; Thermal Engineering International (USA), Inc. |
|
|
|
|
|
|
international |
||
|
||
Market |
|
Principal Competitors |
|
|
|
Refining vacuum distillation |
|
Edwards, Ltd.; Gardner Denver, Inc.; GEA Wiegand GmbH; Korting Hannover AG; Westlake Vacuum |
|
|
|
Chemicals/petrochemicals |
|
Croll Reynolds Company, Inc.; Edwards, Ltd.; Gardner Denver, Inc.; GEA Wiegand GmbH; Korting Hannover AG; |
|
|
|
Turbomachinery OEM – refining, petrochemical |
|
Chem Process Systems; Donghwa Entec Co., Ltd.; Hangzhou Turbine Equipment Co., Ltd.; KEMCO; Mazda (India); |
|
|
|
Turbomachinery OEM – power and power producer |
|
Chem Process Systems; Holtec; KEMCO; Mazda (India); SPX Heat Transfer; Thermal Engineering International |
6
Intellectual Property
Our success depends in part on our ability to protect our proprietary technologies. We rely on a combination of patent, copyright, trademark, trade secret laws, and contractual confidentiality provisions to establish and protect our proprietary rights. We also depend heavily on the brand recognition of the Graham and Barber-Nichols names in the marketplace. Additionally, with the acquisition of P3, we added scalable and adaptable patent-protected intellectual property that we intend to leverage across our customer base. This includes P3's patented multi-channel diffuser ("MCD") and self-contained actuating magnetic pump ("SCAMP"). P3's MCD technology improves the efficiency of pumps and compressors by increasing pressure recovery and measurably increasing operating range. The MCD can be used in new designs or retrofit applications and can work with any pump or compressor that utilizes a centrifugal impeller. SCAMP is a family of positive displacement pumps for low flow, high pressure cryogenic applications compatible with oxygen, hydrogen, methane and nitrogen.
Availability of Raw Materials
As discussed more fully in Item 1A “Risk Factors” of this report, inflation has accelerated in the U.S. and globally due in part to global supply chain issues, a rise in energy prices, labor shortages, and strong consumer demand. Additionally, international conflicts and other geopolitical events, including the ongoing war between Russia and the Ukraine and the Israel-Hamas war, have further contributed to increased supply chain costs due to shortages in raw materials, increased costs for transportation and energy, and disruptions in supply chains. The inflationary environment has increased the cost of our raw materials and labor, which impacted our financial results, especially given that a large percentage of our contracts are fixed-price in nature. To help mitigate this risk, we place orders for raw materials when the purchase orders are received from the customer to lock-in raw material pricing.
Working Capital Practices
Our business does not require us to carry significant amounts of inventory or materials beyond what is needed for work in process. We negotiate progress payments from our customers on our large projects to finance costs incurred. We do not provide rights to return goods, or payment terms to customers that we consider to be extended in the context of the industries we serve. We do provide for warranty claims, which historically have not had a material impact on our results of operations.
Government and Environmental Regulation
We are subject to a variety of laws, rules and regulations in numerous jurisdictions within the U.S. and in each of the countries where we conduct business. We are committed to conducting our business in accordance with all applicable laws, rules and regulations. These laws, rules and regulations cover several diverse areas including government contracting rules, environmental matters, employee health and safety, data and privacy protection, foreign anti-corruption practices, anti-bribery, and anti-trust provisions.
We believe that a focus on environmental stewardship is important to the work we do every day to serve our customers, create value for our stockholders, and benefit our global community. We have taken steps to improve energy efficiencies and air quality and manage water consumption and waste. These efforts are focused on reducing our impact on the environment. We have enhanced our Environmental, Social and Governance ("ESG") strategy to align with the broader transformation of our business. Our executive management team recognizes the importance of embedding environmental and social priorities within our business operations and approved an enhanced and modernized ESG strategy intended to drive additional progress on initiatives that promote sustainability and increase transparency. We have also established an ESG working group, which is responsible for leading our ESG strategy and monitoring our corporate social responsibility and environmental sustainability initiatives. We do not expect environmental costs or contingencies to be material or to have a material adverse effect on our financial performance. Due to risks in these areas, we cannot provide assurance that we will not incur material costs or liabilities in the future, which could adversely affect us.
Seasonality
No material part of our business is seasonal in nature. However, our energy business is highly cyclical as it depends on the willingness of our customers to invest in major capital projects. To help mitigate this risk, we have taken steps to diversify our business into the defense industry including the acquisition of BN and P3. For fiscal 2024, sales to the defense industry accounted for approximately 54% of our total sales compared with approximately 25% prior to the acquisition of BN. Conversely, sales to the refining industry, which are more cyclical in nature, represented approximately 16% of revenue in fiscal 2024 compared with approximately 40% prior to the acquisition.
Research and Development Activities
During fiscal 2024, fiscal 2023 and fiscal 2022, we spent $3,944, $4,144 and $3,845, respectively, on research and development ("R&D") activities. The majority of our R&D is funded by our customers and is specific to help solve our customers’ problems in order to improve efficiencies, address challenging environments, or redesign for form and function. Additionally, we may be engineering new products and services for our customers and investing to improve existing products and services.
7
Human Capital Resources
As of March 31, 2024, we had 595 employees of which 17 are located outside of the U.S. We believe that our relationship with our employees is good.
At Graham, we believe our most important asset is our people. We are committed to fostering and embracing a Graham community in which employees share a mutual understanding and respect for each other. We are committed to creating a work environment which embraces inclusion regardless of race, color, religion, gender, sexual orientation, gender identity, national origin, age, genetic information, marital status, pregnancy, childbirth, disability, veteran status, medical conditions, or any protected status.
Corporate Governance and Available Information
We maintain a website located at www.grahamcorp.com. On our website, we provide links that contain the reports, proxy statements and other information we file electronically with the SEC. Printed copies of all documents we file with the SEC are available free of charge for any stockholder who makes a request. Such requests should be made to our Corporate Secretary at our corporate headquarters. The other information found on our website is not part of this or any other report we file with, or furnish to, the SEC.
Item 1A. Risk Factors
Our business and operations are subject to numerous risks, many of which are described below and elsewhere in this Form 10-K. If any of the events described below or elsewhere in this Form 10-K occur, our business and results of operations could be harmed. Additional risks and uncertainties that are not presently known to us, or which we currently deem to be immaterial, could also harm our business and results of operations.
Risks Related to our Business
We may experience customer concentration risk related to strategic growth for U.S. Navy projects.
During fiscal 2024, sales to the defense industry continued to grow and represented 54% of our business compared with 42% and 51% of sales to the defense industry in fiscal 2023 and 2022, respectively. While these projects are spread across multiple contractors and programs for the U.S. Navy, the end customer for these projects is the same. This concentration of business could add additional risk to us should there be a disruption, short or long term, in the funding for these projects or our participation in these defense programs.
The loss of, or significant reduction or delay in, purchases by our largest customers could reduce our revenue and adversely affect our results of operations.
While we may have only two customers that each represent over 10% of revenue in any one year, a small number of customers have accounted for a substantial portion of our historical net sales. For example, sales to our top ten customers, who can vary each year, accounted for 57%, 46% and 42% of consolidated net sales in fiscal 2024, fiscal 2023, and fiscal 2022, respectively. We expect that a limited number of customers will continue to represent a substantial portion of our sales for the foreseeable future. The loss of any of our major customers, a decrease or delay in orders or anticipated spending by such customers, or a delay in the production of existing orders could materially adversely affect our revenues and results of operations.
The size of our contracts with the U.S. Navy may produce volatility in short term financial results.
We believe our strategy to increase the penetration of U.S. Navy related opportunities, which are often much larger contracts than our commercial contracts, can, on occasion, be delayed before or during the revenue recognition cycle. If we are unable to reallocate resources to other projects, we may see an increase in volatility in our near-term financial results that may impact our ability to effectively provide accurate investor guidance.
8
Efforts to reduce large U.S. federal budget deficits could result in government cutbacks or shifts in focus in defense spending or in reduced incentives to pursue alternative energy projects, resulting in reduced demand for our products, which could harm our business and results of operations.
Our business strategy calls for us to continue to pursue defense-related projects as well as projects for end users in the alternative energy markets in the U.S. In recent years, the U.S. federal government has incurred large budget deficits. In the event that U.S. federal government defense spending is reduced or alternative energy related incentives are reduced or eliminated in an effort to reduce federal budget deficits, projects related to defense or alternative energy may decrease demand for our products. The impact of such reductions could have a material adverse effect on our business and results of operations, as well as our growth opportunities.
U.S. Navy orders are subject to annual government funding. A disruption in funding or a lapse in funding could materially and adversely impact our business.
One of our growth strategies is to increase our penetration of U.S. Navy-related opportunities. Projects for the U.S. Navy and its contractors generally have a much longer order-to-shipment time period than our commercial orders. The time between the awarding of an order and the completion of shipment can take three to seven years. Annual government funding is required to continue the production of this equipment. Disruption of government funding, short or long term, could impact the ability for us to continue our production activity on these orders. Since this business is expected to remain significant as a percentage of our overall business, such a disruption, should it occur, could adversely impact the sales and profitability of our business.
In addition, the U.S. has previously experienced lapses in federal appropriations, which had, in the past, a short-term effect on our business. Any such future lapse (each, a "Government Shutdown") could negatively affect our ability to ship finished products to customers. We rely on federal government personnel, who are not able to perform their duties during a Government Shutdown, to conduct routine business processes related to the inspection and delivery of our products, process export licenses for us, and perform other services for us that, when disrupted, may prevent us from timely shipping products outside the U.S. If we are unable to timely ship our products outside the U.S., there could be a material adverse impact on our results of operations and business. Moreover, our inability to ship products, or the perception by customers that we might not be able to timely ship our products in the future, may cause such customers to look to foreign competitors to fulfill their demand. If our customers look to foreign competitors to source equipment of the type we manufacture, there could be a material and adverse impact on our results of operations and business.
Our efforts to expand our U.S. Navy business and changes in the competitive environment for U.S. Navy procurement could materially and adversely impact our ability to grow this portion of our business.
Over the past few years, we have expanded our business and the opportunities where we bid related to U.S. Navy projects. Certain of our business expansions have relied, and in the future may rely, on awards or grants for capital expenditures related to build-outs to support this business. If we are unable to meet the required milestone achievements for these build-outs in a timely way, we may be exposed to penalties or other added costs.
In addition, our increased market share has caused an adverse share position for some of our competitors for these products. Competitor response to our market penetration is possible. Our customers may also raise concerns about their supplier concentration issues and the risk exposure related to this concentration. As the U.S. Navy is looking to expand its fleet, there is also a risk that their facilities, their supply chain, or our supply chain may not be able to support this expansion. This could adversely impact our ability to grow this portion of our business. Further, the bidding process related to these U.S. Navy projects requires us to devote a certain amount of time and resources to prepare bids and proposals and there is no assurance that we will recoup those investments.
Contract liabilities for large U.S. Navy contracts may be beyond our normal insurance coverage and a claim could have an adverse impact on our financial results.
We are diligent at managing ongoing risks related to projects and the requirements of our customers. In addition, we secure business insurance coverage to minimize the impact of a major failure or liability related to our customers. Due to certain U.S. government procurement policies, we may take on the risk of a liability for large U.S. Navy projects in excess of our insurance coverage and at a level which is higher than our commercial projects. A claim related to one of these projects could have an adverse impact on our financial results.
New technology used by the ships for the U.S. Navy may delay projects and may impact our ability to grow this portion of our business.
Certain U.S. Navy vessels are implementing new technologies, unrelated to any of the equipment that we provide. If there is a complication or delay to any ship caused by this new technology, it may delay the procurement and fabrication of future vessels, which could have a negative impact on our business.
Our exposure to fixed-price contracts and the timely completion of such contracts could negatively impact our results of operations.
A substantial portion of our sales is derived from fixed-price contracts, which may involve long-term fixed-price commitments by us to our customers. While we believe our contract management processes are strong, we nevertheless could experience difficulties
9
in executing large contracts, including but not limited to, estimating errors, cost overruns, supplier failures and customer disputes. For example, in fiscal 2022, we experienced material cost overruns related to defense contracts at our Batavia, NY facility. To the extent that any of our fixed-price contracts are delayed, our subcontractors fail to perform, contract counterparties successfully assert claims against us, the original cost estimates in these or other contracts prove to be inaccurate, or the contracts do not permit us to pass increased costs on to our customers, our profitability may decrease or losses may be incurred which, in turn, could have a material adverse effect on our business and results of operations. For our U.S. Navy projects, these fixed-priced contracts have order to shipment periods which can exceed five years. This additional time-based risk, which we believe is manageable, increases the likelihood of cost fluctuation, which could have a material adverse effect on our business and results of operation.
Zero defect and other unfavorable provisions in government contracts, some of which are customary, may subject our business to material limitations, restrictions and uncertainties and may have a material adverse impact on our financial condition and operating results.
Government contracts contain provisions that provide the U.S. government with substantial rights and remedies, many of which are not typically found in commercial contracts, including provisions that allow the U.S. government to inspect our products and unilaterally determine whether additional work is required to be completed to remedy any deemed deficiencies; to terminate existing contracts, in whole or in part, for any reason or no reason; unilaterally reduce or modify the government’s obligations under such contracts without our consent; decline to exercise an option to continue a contract or exercise an option to purchase only the minimum amount, if any, specified in a contract; take actions that result in a longer development timeline than expected; and change the course of a program in a manner that differs from the contract’s original terms or from our desired plan.
Generally, government contracts contain provisions permitting unilateral termination or modification, in whole or in part, at the U.S. government’s convenience. Under general principles of government contracting law, if the U.S. government terminates a contract for convenience, the government contractor may recover only its incurred or committed costs, settlement expenses and profit on work completed prior to the termination. If the U.S. government terminates a contract for default, the government contractor is entitled to recover costs incurred and associated profits on accepted items only and may be liable for excess costs incurred by the government in procuring undelivered items from another source. In addition, government contracts normally contain additional requirements that may increase our costs of doing business, reduce our profits, and expose us to liability for failure to comply with these terms and conditions. These requirements include, for example, unilateral inspection rights and the requirement that we complete additional work to remedy any deemed deficiency; specialized accounting systems unique to government contracts; mandatory financial audits and potential liability for price adjustments or recoupment of government funds after such funds have been spent; mandatory internal control systems and policies; and mandatory socioeconomic compliance requirements, including labor standards, non-discrimination and affirmative action programs, and environmental compliance requirements. If we fail to maintain compliance with these requirements, we may be subject to potential contract liability and to termination of our government contracts.
Furthermore, any agreements and subcontracts with third parties, including suppliers, consultants, and other third-party contractors that we enter into in order to satisfy our contractual obligations pursuant to our agreements with the U.S. government must also be compliant with the terms of our government contract. Negotiating and entering into such arrangements can be time-consuming and we may not be able to reach agreement with such third parties. Any delay or inability to enter into such arrangements or entering into such arrangements in a manner that is non-compliant with the terms of our government contract may result in violations of our contract.
Government contracts are subject to extensive regulation and failure to comply with such regulations may have a material adverse impact on our financial condition and operating results.
U.S. government contracts are subject to extensive regulations such as the Federal Acquisition Regulation ("FAR"), the Truth in Negotiations Act, the Cost Accounting Standards ("CAS"), the Service Contract Act and Department of Defense security regulations. Failure to comply with any of these regulations and other government requirements may result in contract price adjustments, financial penalties or contract termination. Our U.S. government contracts are also subject to audits, cost reviews and investigations by U.S. government oversight agencies such as the U.S. Defense Contract Audit Agency (the "DCAA"). The DCAA reviews the adequacy of, and our compliance with, our internal controls and policies (including our labor, billing, accounting, purchasing, estimating, compensation and management information systems). The DCAA also has the ability to review how we have accounted for costs under the FAR and CAS. The DCAA presents its findings to the Defense Contract Management Agency ("DCMA"). Should the DCMA determine that we have not complied with the terms of our contract and applicable statutes and regulations, or if they believe that we have engaged in inappropriate accounting or other activities, payments to us may be disallowed or we could be required to refund previously collected payments. Additionally, we may be subject to criminal and civil penalties, suspension or debarment from future government contracts, and qui tam litigation brought by private individuals on behalf of the U.S. government under the False Claims Act, which could include claims for treble damages. These suits may remain under seal (and hence, be unknown to us) for some time while the government decides whether to intervene on behalf of the qui tam plaintiff. Our failure to comply with regulations applicable to government contracts could have a material adverse impact on our financial condition and operating results.
10
The markets we serve include the petroleum refining and petrochemical industries. These industries are both highly cyclical in nature and dependent on the prices of crude oil and natural gas. As a result, volatility in the prices of oil and natural gas may negatively impact our operating results.
A portion of our revenue is derived from the sale of our products to companies in the chemical, petrochemical, and petroleum refining industries, or to firms that design and construct facilities for these industries. These industries are highly cyclical, and are subject to the prices of crude oil and natural gas. The prices of crude oil and natural gas have historically had periods when they have been very volatile, as evidenced by the extreme volatility in oil prices over the past few years, in part due to the COVID-19 pandemic, the Ukraine-Russia war, the Israel-Hamas war, political uncertainty and agendas, and macroeconomic impacts. During times of significant volatility in the market for crude oil or natural gas, our customers often refrain from placing orders until the market stabilizes and future demand projections are clearer. If our customers refrain from placing orders with us, our revenue would decline and there could be a material adverse effect on our business and results of operations. Further, our commercial customers in these markets confront competing budget priorities and may have more limited resources for the types of products and services we provide. As a result, there may be fewer projects available for us to compete for and the pricing environment is anticipated to remain challenging. A sustained deterioration in any of the chemical, petrochemical, and petroleum refining industries we serve, would materially and adversely affect our business and operating results because our customers would not likely have the resources necessary to purchase our products, nor would they likely have the need to build additional facilities or improve existing facilities.
The relative costs of oil, natural gas, nuclear power, hydropower and numerous forms of alternative energy production, and transitions in consumer demand toward different types of energy, may have a material and adverse impact on our business and operating results.
Global and regional energy supply comes from many sources, including oil, natural gas, coal, hydro, nuclear, solar, wind, geothermal and biomass, among others. A cost or supply shift among these sources could negatively impact our business opportunities. A demand shift, where technological advances or consumer preferences favor the utilization of one or a few sources of energy may also impact the demand for our products. Changes in consumer demand, including some driven by governmental and political preferences, toward electric, compressed natural gas, and hydrogen vehicles may impact our business. We have products which can support certain technologies, while other technologies will not require our equipment. We expect that the systemic changes in the energy markets, which are influenced by the increasing use by consumers of alternative fuels and government policies to stimulate their usage, will lead to demand growth for fossil-based fuels that is less than the global growth rate, which may affect our business and financial results in a materially adverse way. In addition, governmental policy can affect the relative importance of various forms of energy sources. For example, non-fossil based sources may receive government tax incentives to foster investment. If these incentives become more prominent, our refinery and petrochemical businesses could be negatively impacted.
Climate change and greenhouse gas regulations may affect our customers’ investment decisions.
Our traditional energy markets are undergoing significant transition due to concern over the risk of climate change. While we expect that fossil fuels will continue to be an important component in the global energy industry for many years to come, there are significant changes in the priorities for capital investments by our customers and the regions in which those investments are being made. A number of countries have adopted, or are considering the adoption of, regulatory frameworks to reduce greenhouse gas emissions. These restrictions may affect our customers' ability and willingness to invest in new facilities or to re-invest in current operations. These requirements could impact the cost of our customers’ products, lengthen project implementation times, and reduce demand for hydrocarbons, as well as shift hydrocarbon demand toward lower-carbon sources. Any of the foregoing could adversely impact the demand for our products, which in turn could have an adverse effect on our business and results of operations.
Our reputation, ability to do business, and financial results may be materially and adversely impacted by improper conduct by any of our employees, agents or business partners.
We cannot provide assurance that our internal controls and compliance systems will always protect us from acts committed by our employees, agents or business partners (or of businesses we acquire or partner with) that would violate U.S. laws or the laws of the applicable jurisdiction where we do business, including, among others, laws governing payments to government officials, bribery, fraud, kickbacks and false claims, pricing, sales and marketing practices, conflicts of interest, competition, export and import compliance, money laundering and data privacy. In particular, the U.S. Foreign Corrupt Practices Act ("FCPA") and similar anti-bribery laws in other jurisdictions generally prohibit companies and their intermediaries from making improper payments to government officials for the purpose of obtaining or retaining business. Any such improper actions or allegations of such acts could damage our reputation and subject us to civil or criminal investigations in the U.S. and in other jurisdictions and related shareholder lawsuits, if any, could lead to substantial civil and criminal, monetary and non-monetary penalties, and could cause us to incur significant legal and investigatory fees. In addition, we rely on our suppliers to adhere to our supplier standards of conduct and violations of such standards of conduct could occur that could have a material and adverse effect on our financial statements. See Note 17 to our consolidated financial statements included in Item 8 of Part II of this Annual Report on Form 10-K for additional information.
11
Many of our large international customers are nationalized or state-owned businesses. Any failure to comply with the FCPA could adversely impact our competitive position and subject us to penalties and other adverse consequences, which could harm our business and results of operations.
We are subject to the FCPA, which generally prohibits U.S. companies from engaging in bribery or making other prohibited payments to foreign officials for the purpose of obtaining or retaining business. Recent years have seen a substantial increase in the global enforcement of anti-corruption laws, with more frequent voluntary self-disclosures by companies, aggressive investigations and enforcement proceedings by both the Department of Justice and the SEC resulting in record fines and penalties, increased enforcement activity by non-U.S. regulators, and increases in criminal and civil proceedings brought against companies and individuals. Many foreign companies, including some of our competitors, are not subject to these prohibitions. Corruption, extortion, bribery, pay-offs, theft and other fraudulent practices occur from time-to-time in certain of the jurisdictions in which we may operate or sell our products. We strictly prohibit our employees and agents from engaging in such conduct and have established procedures, controls and training to prevent such conduct from occurring. However, we operate in many parts of the world that are recognized as having governmental corruption problems to some degree and where strict compliance with anti-corruption laws may conflict with local customs and practices, and it is possible that our employees or agents will engage in such conduct and that we might be held responsible. Despite our training and compliance programs, we cannot assure you that our internal control policies and procedures always will protect us from unauthorized reckless or criminal acts committed by our employees or agents. In the event that we believe or have reason to believe that our employees or agents have or may have violated applicable anti-corruption laws, including the FCPA, we may be required to investigate or have outside counsel investigate the relevant facts and circumstances, which can be expensive and requires significant time and attention from senior management. If our employees or other agents are alleged or are found to have engaged in such practices, we could incur significant costs and penalties or other consequences that may have a material adverse effect on our business, financial condition and results of operations. See Note 17 to our consolidated financial statements included in Item 8 of Part II of this Annual Report on Form 10-K for additional information.
Our business is highly competitive. If we are unable to successfully implement our business strategy and compete against entities with greater resources than us or against competitors who have a relative cost advantage, we risk losing market share to current and future competitors.
We encounter competition in all of our markets. Some of our present and potential competitors may have greater financial, marketing, technical or manufacturing resources. Our competitors may also be able to respond more quickly to new technologies or processes and changes in customer demands and they may be able to devote greater resources towards the development, promotion and sale of their products. Certain competitors may also have a cost advantage compared to us due to their geography or changes in relative currency values and may compete against us based on price. This may affect our ability to secure new business and maintain our level of profitability. As our markets continue to grow, and new market opportunities expand, we could see a shift in pricing as a result of facing competitors with lower production costs, which may have a material adverse impact on our results of operations and financial results. In addition, our current and potential competitors may make strategic acquisitions or establish cooperative relationships among themselves or with third parties that increase their ability to address the needs of our customers. Moreover, customer buying patterns can change if customers become more price sensitive and accepting of lower cost suppliers. If we cannot compete successfully against current or future competitors, our business will be materially adversely affected.
Customer focus on short-term costs versus prioritizing quality and brand recognition, could harm our business and negatively impact our financial results.
Although we have long-term relationships with many of our customers and with many engineering, procurement and construction companies, the project management requirements, pricing levels and costs to support each customer and customer type are often different. Our customers have historically focused on the quality of the engineering and product solutions which we have provided to them, which may come at a higher cost. Because our customers are unable to predict the length of the time period for the economic viability of their plants, there has been more of a focus on relative importance of cost versus quality which looks at short-term costs instead of total long-term cost of operations.
In addition, customers in emerging markets which are driving global demand growth may also place less emphasis on our high quality and brand name than do customers in the U.S. and certain other industrialized countries where we compete. If we are forced to compete for business with customers that place less emphasis on quality and brand recognition than our current customers, our results of operations could be materially adversely affected.
A change in the structure of our markets, including through consolidation, could harm our business and negatively impact our financial results.
There are strong and long-standing relationships throughout the supply chain between the many parties involved in serving the end user of our products. A change in the landscape between engineering and procurement companies, original equipment suppliers, others in the supply chain, and/or with the end users could have a material adverse effect on our business and results of operations. These changes, or others, might occur through industry consolidations such as mergers, acquisitions or other business partnerships, and could have a material impact on our business and negatively impact our financial results.
12
Our acquisition strategy may not be successful or may increase business risk.
The success of our acquisition strategy will depend, in part, on our ability to identify suitable companies or businesses to purchase and then successfully negotiate and close acquisition transactions. In addition, our success depends in part on our ability to integrate acquisitions and realize the anticipated benefits from combining the acquisition with our historical business, operations and management. We cannot provide any assurances that we will be able to complete any acquisitions and then successfully integrate the business and operations of those acquisitions without encountering difficulties, including unanticipated costs, issues or liabilities, difficulty in retaining customers and supplier or other relationships, failure to retain key employees, diversion of our management’s attention, failure to integrate information and accounting systems, or establish and maintain proper internal control over financial reporting. Moreover, as part of the integration process, we must incorporate an acquisition’s existing business culture and compensation structure with our existing business. We also need to utilize key personnel who may be distracted from the core business. If we are not able to efficiently integrate an acquisition’s business and operations into our organization in a timely and efficient manner, or at all, the anticipated benefits of the acquisition may not be realized, or it may take longer to realize these benefits than we expect, either of which could have a material adverse effect on our business or results of operations.
If we fail to successfully integrate the operations of P3, our financial condition and results of operations could be adversely affected.
On November 9, 2023, we acquired P3, a privately-owned custom turbomachinery engineering, product development, and manufacturing business that serves the space, new energy and medical industries. We cannot provide any assurances that we will be able to integrate the operations of P3 without encountering difficulties, including unanticipated costs, difficulty in retaining customers and supplier or other relationships, failure to retain key employees, diversion of management's attention, failure to integrate our information and accounting systems, or establish and maintain proper internal control over financial reporting, any of which would harm our business and results of operations.
Furthermore, we may not realize the revenue and net income that we expect to achieve or that would justify our investment in P3 and we may incur costs in excess of what we anticipate. To effectively manage our expected future growth, we must continue to successfully manage our integration of P3 and continue to improve our operational systems, internal procedures, accounts receivable and management, financial and operational controls. If we fail in any of these areas, our business and results of operations could be harmed.
Our acquisition of P3 might subject us to unknown and unforeseen liabilities.
P3 may have unknown liabilities, including but not limited to, product liability, workers' compensation liability, tax liability and liability for improper business practices. Although we are entitled to indemnification from the seller of P3 for these and other matters, we could experience difficulty enforcing those obligations or we could incur material liabilities for the past activities of P3 in excess of these indemnification obligations. Such liabilities and related legal or other costs could harm our business or results of operations.
We have foreign operations and a percentage of our sales occur outside of the U.S. As a result, we are subject to the economic, political, regulatory and other risks of international operations.
For fiscal 2024, 16% of our revenue was from customers located outside of the U.S. Moreover, through our subsidiaries, we maintain a sales and engineering support office in China and a sales and engineering support office in India. We intend to continue to expand our international operations to the extent that suitable opportunities become available. Our foreign operations and sales could be adversely affected as a result of:
13
We are subject to foreign currency fluctuations which may adversely affect our operating results.
We are exposed to the risk of currency fluctuations between the U.S. dollar and the currencies of the countries in which we sell our products to the extent that such sales are not based in U.S. dollars - primarily the Chinese RMB and India INR. Currency movements can affect sales in several ways, the foremost being our ability to compete for orders against foreign competitors that base their prices on relatively weaker currencies. Strength of the U.S. dollar compared with the Euro, India, or Asian currencies may put us in a less competitive position. Business lost due to competition for orders against competitors using a relatively weaker currency cannot be quantified. In addition, cash can be adversely impacted by the conversion of sales made by us in a foreign currency to U.S. dollars. While we may enter into currency exchange rate hedges from time to time to mitigate these types of fluctuations, we cannot remove all fluctuations or hedge all exposures and our earnings could be adversely impacted by changes in currency exchange rates. In addition, if the counter-parties to such exchange contracts do not fulfill their obligations to deliver the contractual foreign currencies, we could be at risk for fluctuations, if any, required to settle the obligation. Any of the foregoing could adversely affect our business and results of operations. At March 31, 2024, we held no forward foreign currency exchange contracts.
Our future success may be affected by our current and future indebtedness.
As of March 31, 2024, we had $0 outstanding under our revolving credit facility with Wells Fargo Bank, National Association ("Wells Fargo"). We may borrow additional funds in the future to support our growth and working capital needs. Pursuant to our revolving credit facility with Wells Fargo, we are required to provide financial information and reports while complying with other financial covenants. In the future, should we be out of compliance with our revolving credit facility, there can be no assurance that we would be able to obtain waivers or renegotiate our credit facilities in a timely manner, on acceptable terms or at all. If we were not able to obtain a covenant waiver under our debt facilities or renegotiate such facilities, we could be in default of such agreements, and in the event of such default our lender could demand immediate repayment of amounts outstanding. There can be no assurance that we would have sufficient cash, or be able to raise sufficient debt or equity capital, or divest assets, to refinance or repay such facility or facilities in the event of such demand. As a result, the failure to obtain covenant waivers or renegotiate our facilities as described above would have a material adverse effect on us and our ability to service our debt obligations.
The impact of potential changes in customs and trade policies and tariffs imposed by the U.S. and those imposed in response by other countries, including China, as well as rapidly changing trade relations, could materially and adversely affect our business and results of operations.
The U.S. government has made proposals that are intended to address trade imbalances, which include encouraging increased production in the U.S. These proposals could result in increased customs duties and the renegotiation of some U.S. trade agreements. Changes in U.S. and foreign governments’ trade policies have resulted and may continue to result in tariffs on imports into, and exports from, the U.S. In the past, the U.S. imposed tariffs on imports from several countries, including China, Canada, the European Union and Mexico. In response, China, Canada and the European Union have proposed or implemented their own tariffs on certain exports from the U.S. into those countries. Tariffs affecting our products and product components, including raw materials we use, particularly electronic components, high-end steel and steel related products, may add significant costs to us and make our products more expensive. Potential future changes in trade policies could result in customers changing their behavior in project procurement, due to uncertainty related to timely execution and/or import and export restrictions. As a result, our products could become less attractive to customers outside the U.S. due to U.S. import tariffs on our raw materials and our profit margins would be negatively impacted. Accordingly, continued tariffs may weaken relationships with certain trading partners and may adversely affect our financial performance and results of operations. When beneficial to us, we may consider alternate sourcing options, including offshore subcontracting, in order to minimize the impact of the tariffs. Because we conduct aspects of our business in China through our subsidiary, potential reductions in trade with China and diminished relationships between China and the U.S., as well as the continued escalation of tariffs, could have a material adverse effect on our business and results of operations.
The operations of our subsidiary in China may be adversely affected by China’s evolving economic, political and social conditions.
We conduct our business in China primarily through our wholly-owned subsidiary. The results of operations and future prospects of our subsidiary in China may be adversely affected by, among other things, changes in China's political, economic and social conditions, changes in the relationship between China and its western trade partners, changes in policies of the Chinese government, changes in laws and regulations or in the interpretation of existing laws and regulations, changes in foreign exchange regulations, measures that may be introduced to control inflation, such as interest rate increases and changes in the rates or methods of taxation. In
14
addition, changes in demand could result from increased competition from local Chinese manufacturers who have cost advantages or who may be preferred suppliers for Chinese end users. Also, China's commercial laws, regulations and interpretations applicable to non-Chinese owned market participants, such as us, are continually changing. These laws, regulations and interpretations could impose restrictions on our ownership or the operation of our interests in China and have a material adverse effect on our business and results of operations.
Intellectual property rights are difficult to enforce in China and India, which could harm our business.
Commercial law in China is relatively undeveloped compared with the commercial law in many of our other major markets and limited protection of intellectual property is available in China as a practical matter. Similarly, proprietary information may not be afforded the same protection in India as it is in our other major markets with more comprehensive intellectual property laws. Although we take precautions in the operations of our subsidiaries to protect our intellectual property, any local design or manufacture of products that we undertake could subject us to an increased risk that unauthorized parties will be able to copy or otherwise obtain or use our intellectual property, which could harm our business. We may also have limited legal recourse in the event we encounter patent or trademark infringers, which could have a material adverse effect on our business and results of operations.
Uncertainties with respect to the legal system in China may adversely affect the operations of our subsidiary in that country.
Our subsidiary in China is subject to laws and regulations applicable to foreign investment in China. There are uncertainties regarding the interpretation and enforcement of laws, rules and policies in China. The legal system in China is based on written statutes, and prior court decisions have limited precedential value. Because many laws and regulations are relatively new and the Chinese legal system is still evolving, the interpretations of many laws, regulations and rules are not always uniform. Moreover, the relative inexperience of China's judiciary system creates additional uncertainty as to the outcome of any litigation, and the interpretation of statutes and regulations may be subject to government policies reflecting domestic political agendas. Finally, enforcement of existing laws or contracts based on existing law may be uncertain and sporadic. For the preceding reasons, it may be difficult for us to obtain timely or equitable enforcement of laws ostensibly designed to protect companies like ours, which could have a material adverse effect on our business and results of operations.
Regulation of foreign investment in India may adversely affect the operations of our Indian subsidiary.
Our subsidiary in India is subject to laws and regulations applicable to foreign investment in India. India regulates ownership of Indian companies by foreign entities. These regulations may apply to our funding of our Indian operating subsidiary. For example, the government of India has set out criteria for foreign investments in India, including requirements with respect to downstream investments by companies in India which are owned or controlled by foreign entities and the transfer of ownership or control of companies in India in certain industries. These requirements may adversely affect our ability to operate our Indian subsidiary. There can be no assurance that we will be able to obtain any required approvals for future acquisitions, investments or operations in India, or that we will be able to obtain such approvals on satisfactory terms.
Changes in U.S. and foreign energy policy regulations could adversely affect our business.
Energy policy in the U.S. and other countries where we sell our products is evolving rapidly and we anticipate that energy policy will continue to be an important legislative priority in the jurisdictions where we sell our products. It is difficult, if not impossible, to predict the changes in energy policy that could occur, as they may be related to changes in political administration, public policy or other factors. The elimination of, or a change in, any of the current rules and regulations in any of our markets could create a regulatory environment that makes our end users less likely to purchase our products, which could have a material adverse effect on our business. Government subsidies or taxes, which favor or disfavor certain energy sources compared with others, could have a material adverse effect on our business and operating results.
Near-term income statement impact from competitive contracts could adversely affect our operating results.
During weaker market periods, we may choose to be more aggressive in pricing certain competitive projects to protect or gain market share or to maintain or increase the utilization of our facilities. In these situations, it is possible that an incrementally profitable order, while increasing contribution, may be unprofitable from an accounting perspective when including fixed manufacturing costs. In these situations, we are required to recognize the financial loss at the time of order acceptance, or as soon as our cost estimates are updated, whichever occurs first. It is possible we may accumulate losses either on a large project or more than one project such that, in a short time period, for example a reporting quarter, these losses may have a meaningful impact on the earnings for that period.
Our operating results could be adversely affected by customer contract cancellations and delays.
15
Adverse economic or specific project conditions can lead to a project being placed on hold or cancelled by our customers. We had one material project cancelled in both fiscal 2024 and fiscal 2023, and no material projects cancelled in fiscal 2022. We had no projects on hold at March 31, 2024.
We attempt to mitigate the risk of cancellation by structuring contracts with our customers to maximize the likelihood that progress payments made to us for individual projects cover the costs we have incurred. As a result, we do not believe we have a significant cash exposure to projects which may be cancelled. Open orders are reviewed continuously through communications with customers. If it becomes evident to us that a project is delayed well beyond its original shipment date, management will move the project into "placed on hold" (i.e., suspended) category. Furthermore, if a project is cancelled by our customer, it is removed from our backlog.
The value of our backlog as of March 31, 2024 was $390,868. Our backlog can be significantly affected by the timing of large orders. The amount of our backlog at March 31, 2024 is not necessarily indicative of future backlog levels or the rate at which our backlog will be recognized as sales. Although historically the amount of modifications and terminations of our orders has not been material compared with our total contract volume, customers can, and sometimes do, terminate or modify their orders. This generally occurs more often in times of end market or capital market turmoil. We cannot predict whether cancellations will occur or accelerate in the future. Although certain of our contracts in backlog may contain provisions allowing for us to assess cancellation charges to our customers to compensate us for costs incurred on cancelled contracts, cancellations of purchase orders or modifications made to existing contracts could substantially and materially reduce our backlog and, consequently, our future sales and results of operations. Moreover, delay of contract execution by our customers can result in volatility in our operating results.
Our current backlog contains a number of large orders from the U.S. Navy. In addition, we are continuing to pursue business in this end market which offers large multi-year projects which have an added risk profile beyond that of our historic customer base. A delay, long-term extension or cancellation of any of these projects could have a material adverse effect on our business and results of operations.
Further, certain defense contracts we secure may be designated a program of highest national priority requiring production preference over commercial orders which could impact our commercial backlog and result in production delays. As a result, commercial customers could seek damages, including liquidated damages, as performance penalties and there may be a negative impact to the willingness of customers to place future orders with us due to a concern that orders may be subordinated to such contracts.
Our customers’ ability and willingness to make progress payments may be impacted by any extended downturn in their markets which could adversely impact their financial stability and increase the risk to us of uncollectible accounts receivables.
The financial strength of our customers can be impacted by a severe or lengthy downturn in their markets which could lead to additional risk in our ability to collect outstanding accounts receivables. We attempt to mitigate this risk with the utilization of progress payments for many projects, but certain industries, end markets and geographies are not as willing to make progress payments. Certain projects require a small portion of the total payments to be held until the customer's facility is fully operational, which can be in excess of one year beyond our delivery of equipment to them. This additional time may add risk to our ability to collect on the outstanding accounts receivables.
We may experience losses if we are unable to collect on our accounts receivables if our customers are unable or unwilling to pay their invoices in a timely manner or at all.
Our customers, even those we have had a long-standing business relationship with, may at any time experience economic hardship which could cause those customers to be unwilling or unable to pay their invoices in a timely manner or at all. In addition, a number of our customers may have limited resources and may not have a history of creditworthiness that we can audit to determine reliability for payment of accounts receivable. For example, many of our customers and the key players within the space and new energy industries, which are unproven markets, have not yet achieved profitability, have incurred significant losses since inception, and may be unable to achieve profitability when expected, if at all. As such, our ability to predict and plan for future revenue and operations within the space and new energy industries is subject to risk. Due to the variable nature of sales and orders within the space and new energy industries, our future revenue and growth in these industries is uncertain and may materially and adversely impact our results of operations.
To the extent a company is unable or unwilling to fulfill their obligations to us, it could result in a material and adverse impact to our results of operations. Even if they are financially solvent and stable and we are successful in securing a commercial relationship with them, their business plans for future programs may be inherently uncertain and unpredictable, and less structured than other companies. If any of our customers suffers significant financial difficulties, insolvency or bankruptcy, they may be unable to pay us in a timely manner or at all. It is also possible that our customers may contest their obligations to pay us, including under bankruptcy laws or otherwise. Even if our customers do not contest their obligations to pay us, if our customers are unable to pay us in a timely manner, it could materially and adversely impact our ability to collect accounts receivable. Moreover, we may have to negotiate significant discounts and/or extended financing terms with these customers in such a situation in an attempt to secure outstanding payments or partial payment. Accordingly, if we are unable to collect upon our accounts receivable as they come due in an efficient and timely manner, our business, financial condition or results of operations may be materially and adversely affected.
16
Given our size and the specialization of our business, if we lose any member of our management, technical or sales team and we experience difficulty in finding a qualified replacement, our business could be harmed.
Competition for qualified management, including our executive management, and key technical and sales personnel in our industry is intense. Moreover, our technology is highly specialized, and it may be difficult to replace the loss of any of our key technical and sales personnel. Many of the companies with which we compete for management and key technical and sales personnel have greater financial and other resources than we do or are located in geographic areas which may be considered by some to be more desirable places to live. If we are not able to retain any of our key management, including our executive management, technical or sales personnel, due to competition, retirement or any other reason for leaving, it could have a material adverse effect on our business and results of operations.
If we become subject to product liability, warranty or other claims, our results of operations and financial condition could be adversely affected.
The manufacture and sale of our products exposes us to potential product liability claims, including those that may arise from failure to meet product specifications, misuse or malfunction of our products, design flaws in our products, or use of our products with systems not manufactured or sold by us. For example, our equipment is installed in facilities that operate dangerous processes and the misapplication, improper installation or failure of our equipment may result in exposure to potentially hazardous substances, personal injury, or property damage. In addition, BN produces certain products in large quantities which could also expose us to potential product warranty and liability claims.
Provisions contained in our contracts with customers that attempt to limit our damages may not be enforceable or may fail to protect us from liability for damages and we may not negotiate such contractual limitations of liability in certain circumstances. Our liability insurance may not cover all liabilities and our historical experience may not reflect liabilities we may face in the future. Our risk of liability may increase as we manufacture more complex or larger projects. We also may not be able to continue to maintain such liability insurance at a reasonable cost or on reasonable terms, or at all. Any material liability not covered by provisions in our contracts or by insurance could have a material adverse effect on our business and financial condition.
Furthermore, if a customer suffers damage as a result of an event related to one of our products, even if we are not at fault, they may reduce their business with us. We may also incur significant warranty claims which are not covered by insurance. In the event a customer ceases doing business with us as a result of a product malfunction or defect, perceived or actual, or if we incur significant warranty costs in the future, there could be a material adverse effect on our business and results of operations.
Security threats and other sophisticated computer intrusions could harm our information systems, which in turn could harm our business and financial results.
We utilize information systems and computer technology throughout our business. We store sensitive data, classified data, proprietary information and perform engineering designs and calculations on these systems. Threats to these systems, and the laws and regulations governing security of data, including personal data, on information systems and otherwise held by companies is evolving and adding layers of complexity in the form of new requirements and increasing costs of attempting to protect information systems and data and complying with new cybersecurity regulations. Information systems are subject to numerous and evolving cybersecurity threats and sophisticated computer crimes, which pose a risk to the stability and security of our information systems, computer technology, and business. Global cybersecurity threats can range from uncoordinated individual attempts to gain unauthorized access to our information systems and computer technology to sophisticated and targeted measures known as advanced persistent threats and ransomware. The techniques used in these attacks change frequently and may be difficult to detect for periods of time and we may face difficulties in anticipating and implementing adequate preventative measures. The potential consequences of a material cybersecurity incident and its effects include financial loss, reputational damage, the inability to conduct business, litigation with third parties, theft of intellectual property, fines levied by the Federal Trade Commission or other government agencies, diminution in the value of our investment in research, development and engineering, and increased cybersecurity protection and remediation costs due to the increasing sophistication and proliferation of threats, which in turn could adversely affect our competitiveness and results of operations. A failure or breach in security could expose our company as well as our customers and suppliers to risks of misuse of information, compromising confidential information and technology, destruction of data, production disruptions, ransom payments, and other business risks which could damage our reputation, competitive position and financial results of our operations. Further, our technology resources may be strained due to an increase in the number of remote users. Cybersecurity laws and regulations continue to evolve and are increasingly demanding, both in the U.S. and globally, which adds compliance complexity and may increase our costs of compliance and expose us to reputational damage or litigation, monetary damages, regulatory enforcement actions, or fines in one or more jurisdictions. While we carry cyber insurance, we cannot be certain that our coverage will be adequate for liabilities actually incurred, that insurance will continue to be available to us on economically reasonable terms or at all, or that any insurer will not deny coverage as to any future claim. In addition, defending ourselves against these threats may increase costs or slow operational efficiencies of our business. If any of the foregoing were to occur, it could have a material adverse effect on our business and results of operations.
If third parties infringe upon our intellectual property or if we were to infringe upon the intellectual property of third parties, we may expend significant resources enforcing or defending our rights or suffer competitive injury.
17
Our success depends in part on our proprietary technology. We rely on a combination of patent, copyright, trademark, trade secret laws and confidentiality provisions to establish and protect our proprietary rights. If we fail to successfully enforce our intellectual property rights, our competitive position could suffer. We may also be required to spend significant resources to monitor and police our intellectual property rights. Similarly, if we were found to have infringed upon the intellectual property rights of others, our competitive position could suffer. Furthermore, other companies may develop technologies that are similar or superior to our technologies, duplicate or reverse engineer our technologies or design around our proprietary technologies. Any of the foregoing could have a material adverse effect on our business and results of operations.
In some instances, litigation may be necessary to enforce our intellectual property rights and protect our proprietary information, or to defend against claims by third parties that our products infringe upon their intellectual property rights. Any litigation or claims brought by or against us, whether with or without merit, could result in substantial costs to us and divert the attention of our management, which could materially harm our business and results of operations. In addition, any intellectual property litigation or claims against us could result in the loss or compromise of our intellectual property and proprietary rights, subject us to significant liabilities, require us to seek licenses on unfavorable terms, prevent us from manufacturing or selling certain products or require us to redesign certain products, any of which could have a material adverse effect on our business and results of operations.
Our enterprise resource planning system utilized at our facilities in Batavia, NY is aging, and we may experience issues from implementation of a new enterprise resource planning system.
We have an enterprise resource planning system (“ERP”) to assist with the collection, storage, management and interpretation of data from our business activities to support future growth and to integrate significant processes. Our ERP at our Batavia, NY operations is aging and we began implementing a new ERP during fiscal 2024. ERP implementations are complex, distracting to the business and management, and time-consuming and involve substantial expenditures on system software and implementation activities, as well as changes in business processes. Our ERP is critical to our ability to accurately maintain books and records, record transactions, provide important information to our management and prepare our consolidated financial statements. ERP implementations also require the transformation of business and financial processes in order to reap the benefits of the new ERP; any such transformation involves risks inherent in the conversion to a new computer system, including loss of information and potential disruption to our normal operations. Any disruptions, delays or deficiencies in the design and implementation of our new ERP could adversely affect our ability to process orders, provide services and customer support, send invoices and track payments, fulfill contractual obligations, or otherwise operate our business. Additionally, if the ERP does not operate as intended, the effectiveness of our internal control over financial reporting could be adversely affected or our ability to assess it adequately could be delayed. Further, we may not realize the benefits we anticipate should all or part of the ERP upgrade implementation process prove to be ineffective. Accordingly, such events may disrupt or reduce the efficiency of our entire operations and have a material adverse effect on our operating results and cash flows.
Our growth is contingent upon expanding our manufacturing facilities in Arvada, CO and Batavia, NY If we are unable to expand our manufacturing facilities in Arvada or Batavia our results of operations and financial condition may be adversely affected and/or we may not be able to meet our growth goals and objectives.
As a manufacturer, our ability to grow revenue is constrained by our ability to expand our manufacturing facilities. Our BN campus is landlocked and there are limited opportunities to expand our manufacturing footprint in Arvada, CO. If we are unable to expand in Arvada our growth may be limited, we may be required to relocate our campus or we may have to incur substantial capital expenditures to redevelop our Arvada campus. Further, we are currently expanding our Batavia, NY campus by constructing a new 30,000 square foot manufacturing facility funded primarily from a strategic investment from one of our defense customers. If we are unable to timely complete the new manufacturing facility we may not be able to meet our planned production schedule for U.S. Navy projects, which could delay the completion of projects in our backlog or reduce the number of U.S. Navy projects we receive in the future, and could cause us to incur significant cost overruns. Any of these risks associated with our ability to grow our manufacturing facilities could adversely affect our results of operations and financial condition.
We face potential liability from asbestos exposure and similar claims that could result in substantial costs to us as well as divert attention of our management, which could have a material adverse effect on our business and results of operations.
We are a defendant in a number of lawsuits alleging illnesses from exposure to asbestos or asbestos-containing products and seeking unspecified compensatory and punitive damages. We cannot predict with certainty the outcome of these lawsuits or whether we could become subject to any similar, related or additional lawsuits in the future. In addition, because some of our products are used in systems that handle toxic or hazardous substances, any failure or alleged failure of our products in the future could result in litigation against us. For example, a claim could be made under various regulations for the adverse consequences of environmental contamination. Any litigation brought against us, whether with or without merit, could result in substantial costs to us as well as divert the attention of our management, which could have a material adverse effect on our business and results of operations.
The terms of our revolving credit facility restrict our ability to pay dividends, and we may not be able to pay dividends in the future.
Our revolving credit facility with Wells Fargo contains terms that restrict our ability to declare or pay dividends. Any determination by our Board of Directors regarding dividends in the future will depend on a variety of factors, including our future
18
financial performance, organic growth opportunities, general economic conditions and financial, competitive, regulatory, and other factors, many of which are beyond our control. There can be no guarantee that we will pay dividends in the future.
Provisions contained in our certificate of incorporation and bylaws could impair or delay stockholders' ability to change our management and Board of Directors, and could discourage takeover transactions that some stockholders might consider to be in their best interests.
Provisions of our certificate of incorporation and bylaws could impede attempts by our stockholders to remove or replace our management and Board of Directors, and could discourage others from initiating a potential merger, takeover or other change of control transaction, including a potential transaction at a premium over the market price of our common stock, that our stockholders might consider to be in their best interests. Such provisions include:
Risks Related to the Impacts of Macroeconomic Events
Disruptions or delays in our supply chains could adversely affect our results of operations and financial performance.
Historically, we have not maintained inventories of materials beyond what is needed for current work in progress. The raw materials that we source come from a wide variety of domestic and international suppliers. Global sourcing of many of the products we sell is an important factor in our financial results. Reliance on our suppliers for these products exposes us to volatility in the prices and availability of these materials. Disruptions in our supply chain, especially for an extended period of time, could impact our ability to meet customer requirements and our financial performance could be materially and adversely impacted.
Macroeconomic impacts, including rising inflation, a slowdown in the economy, or a recession or expectation of a recession, may result in increased costs of operations and negatively impact the credit and securities markets generally, which could have a material adverse effect on our results of operations and the market price of our common stock.
Current and future conditions in the economy have an inherent degree of uncertainty and are impacted by political, market, health and social events or conditions. As a result, it is difficult to estimate the level of growth or contraction for the economy as a whole and in the specific markets in which we participate. Current economic uncertainty and market volatility is anticipated to continue as a
19
result of higher inflation, increased interest rates, supply chain disruptions, fluctuating foreign currency exchange rates and other geopolitical events. An inflationary environment can increase our cost of labor, as well as other operating costs, which may have a material and adverse impact on our financial results, especially given that a large percentage of our contracts are fixed-price in nature. In addition, economic conditions could impact and reduce the number of customers who purchase our products or services as credit becomes more expensive or unavailable. Although interest rates have increased, inflation may continue. Further, protracted uncertainty related to interest rates could have a negative effect on the securities markets generally which may, in turn, have a material and adverse effect on the market price of our common stock.
Our business, financial condition and results of operations in the past have been and may in the future be adversely affected by public health issues.
Our business, financial condition and results of operations in the past have been and in the future may be adversely affected as a result of a global health crisis, such as the COVID-19 pandemic. A global health crisis could impact our employees, suppliers, customers, financing sources or others’ ability to conduct business, or negatively affect consumer and business confidence or the global economy. A public health crisis has affected, and could affect in the future, large segments of the global economy, including the markets we operate in, disrupting global supply chains, resulting in significant travel and transport restrictions, and creating significant disruption of the financial markets. Economic uncertainty as a result of any global health crisis could negatively affect our business, suppliers, distribution channels, and customers, including as a result of business shutdowns or disruptions for an indefinite period of time, reduced operations, restrictions on shipping, fabricating or installing products, reduced consumer demand, or customers’ ability to make payments. As a result of public health crises, we may experience additional operating costs due to increased challenges with our workforce (including as a result of illness, absenteeism or government orders), implement further precautionary measures to protect the health of our workforce, experience increased project cancellations or projects put on hold, and reduced access to supplies, capital, and fundamental support services (such as shipping and transportation). Any resulting financial impact from a global health crisis cannot be fully estimated at this time, but may materially and adversely affect our business, financial condition, or results of operations.
For example, due to a potential reduction in throughput capacity related to a global pandemic, such as that experienced with the COVID-19 pandemic, we may not be able to deliver products to customers on a timely basis. Certain contracts in our backlog may contain provisions for a buyer to recover liquidated damages if our delivery is past contractual delivery dates, and such liquidated damages claimed by a customer could adversely affect our financial performance.
In addition, we operate and compete globally and the response to global health crises by domestic and foreign governments has been and may be in the future varied and those differences may impact our competitiveness. There are uncertain political climates in the regions where our subsidiaries operate, and governmental action in those regions may result in the temporary closure or limited operations of our subsidiaries. Government assistance during a pandemic may also differ between private and public companies, which may provide an advantage to one compared with another. This may affect our competitive position and could disrupt the market access and success of our business compared with other current or new competitors which could have a material adverse impact on our financial condition or results of operation.
The extent to which our operations may be impacted by any global health situation will depend largely on future developments which are highly uncertain and we are unable to predict the ultimate impact that it may have on our business, future results of operations, financial position or cash flows.
We rely on the performance of highly skilled personnel, including our engineers, production, and technology professionals and increasing competition for such personnel, as well as labor shortages, could adversely affect our business.
The successful implementation of our business strategy depends, in part, on our ability to attract and retain a skilled and talented workforce. Because of the complex nature of many of our products and services, we are generally dependent on a thoroughly trained and highly skilled workforce, including, for example, our engineers and welders. In many of the geographies where we operate, we face a potential shortage of qualified employees.
A number of factors may adversely affect the labor force available to us or increase labor costs, including high employment levels, government regulations, rising inflation rates, and labor shortages. The increasing competition for highly skilled and talented employees could result in higher compensation costs, difficulties in maintaining a capable workforce, and leadership succession planning challenges. Although we believe we will be able to attract, train and retain talented personnel and replace key personnel should the need arise, if we are unable to hire and retain employees capable of performing at a high-level, or if mitigation measures we may take to respond to a decrease in labor availability, such as overtime and third-party outsourcing, have unintended negative effects, our business could be adversely affected. A sustained labor shortage, lack of skilled labor, or increased turnover or labor inflation could lead to increased costs, such as increased overtime to meet demand and increased wage rates to attract and retain employees, which could negatively affect our ability to efficiently operate our manufacturing and distribution facilities and overall business and have other material adverse effects on our business, financial condition, and consolidated results of operations. We may also lose new employees to our competitors in any of our markets before we realize the benefit of our investment in recruiting and training them. If we do not succeed in attracting well-qualified employees or retaining and motivating existing employees, our business would be materially and adversely affected.
20
Item 1B. Unresolved Staff Comments
Not applicable.
Item 1C. Cybersecurity
Risk Management and Strategy
We have developed and implemented cybersecurity risk management procedures (“CRMP”) intended to protect the confidentiality, integrity, and availability of our critical systems and information. Our CRMP consists of procedures designed for Graham Corporation and certain subsidiaries and separate procedures designed specifically for Barber-Nichols (“BN”). Our CRMP includes cybersecurity incident response plans (“IRPs”) for Graham Corporation and BN. The purpose of the IRPs are to provide a structured and systematic incident response process for all Information Security Incidents that affect any of our or our subsidiaries’ information technology systems, network, or data, including data of ours and our subsidiaries held, or IT services provided by, third-party vendors or other service providers.
Our CRMP is integrated into our overall enterprise risk management program. We have designated our Senior IT Manager to oversee the implementation and maintenance of the IRP for Graham Corporation. For BN, we have designated BN’s IT Manager to implement and maintain the IRP for BN. Our IT personnel at Graham Corporation and BN have over 50 years of combined experience in the field of cybersecurity and are responsible for the management of our cybersecurity and data privacy programs. Among other information security duties, the Senior IT Manager and IT Manager are responsible for the following for Graham Corporation and BN, respectively:
Our cybersecurity risk management program includes:
We have developed processes to identify and oversee risks from cybersecurity threats associated with our third-party service providers, which includes the information security team assisting with and assessing cybersecurity robustness during vendor onboarding as well as risk-based monitoring of vendors on an ongoing basis.
We may be the subject of cyber incidents in the future. See Item 1A, Risk Factors for more information about the risk posed to us by cybersecurity threats.
Governance
Our Audit Committee, through their responsibilities designated to them in the Audit Committee Charter, oversees cybersecurity risk management as part of its risk oversight function and oversees management’s implementation of our CRMP.
21
The Audit Committee receives periodic reports from management and the IT Managers for Graham Corporation and BN on our cybersecurity risks at least annually. In addition, management updates the Audit Committee, as necessary, regarding any material cybersecurity incidents, as well as any incidents with lesser impact potential.
Our management team is responsible for assessing and managing our material risks from cybersecurity threats. Our Senior IT Manager and IT Manager regularly inform our management team of all aspects related to cybersecurity risks and incidents. This is designed to ensure that the highest levels of management are kept abreast of the cybersecurity posture and potential risks facing the Company. The team has primary responsibility for our overall cybersecurity risk management program and supervises both our internal cybersecurity personnel and our retained cybersecurity consultants.
Our management team supervises efforts to prevent, detect, mitigate, and remediate cybersecurity risks and incidents through various means, which may include briefings from internal security personnel; threat intelligence and other information obtained from governmental, public, or private sources, including external consultants engaged by us; and alerts and reports produced by security tools deployed in the IT environment.
22
Item 2. Properties
As of March 31, 2024, we conducted our business from the following locations.
|
Location |
|
Products/Operations |
|
Square Footage |
|
|
Owned or Leased |
|
1 |
Batavia, NY |
|
Corporate Headquarters |
|
|
43,000 |
|
|
Owned |
2 |
Batavia, NY |
|
Manufacturing, Warehousing and R&D |
|
|
270,000 |
|
|
Owned |
3 |
Arvada, CO |
|
Office |
|
|
18,000 |
|
|
Leased |
4 |
Arvada, CO |
|
Manufacturing and Warehousing |
|
|
83,000 |
|
|
Leased |
5 |
Houston, TX |
|
Sales Office |
|
|
1,500 |
|
|
Leased |
6 |
Jupiter, FL |
|
Manufacturing and R&D |
|
|
16,900 |
|
|
Leased |
7 |
Suzhou, China |
|
Sales and Engineering |
|
|
4,900 |
|
|
Leased |
8 |
Ahmedabad, India |
|
Sales and Engineering |
|
|
800 |
|
|
Leased |
We believe that our properties are generally in good condition, are well maintained, and are suitable and adequate to carry on our business. During fiscal 2024, we received a $13,500 strategic investment from a major defense customer to expand and enhance our Batavia, NY production capabilities. This expansion will include the construction of a new 30,000 square foot manufacturing facility beginning in fiscal 2025 on our existing campus, and the purchase of production and automated welding equipment. We also anticipate that additional manufacturing space will be needed over the next several years in order to support our organic growth at BN. We believe we will be able to obtain or build this additional space on commercially reasonable terms.
Item 3. Legal Proceedings
The information required by this Item 3 is contained in Note 17 to our consolidated financial statements included in Item 8 of Part II of this Annual Report on Form 10-K and is incorporated herein by reference.
Item 4. Mine Safety Disclosures
Not applicable.
23
PART II
(Amounts in thousands, except per share data)
Item 5. Market for Registrant's Common Equity, Related Stockholder Matters and Issuer Purchases of Equity Securities
Our common stock is traded on the NYSE exchange under the symbol "GHM". As of June 5, 2024, there were 10,871 shares of our common stock outstanding held by approximately 289 stockholders of record.
Subject to the rights of any preferred stock we may then have outstanding, the holders of our common stock are entitled to receive dividends as may be declared from time to time by our Board of Directors out of funds legally available for the payment of dividends. Our revolving credit facility with Wells Fargo contains terms that restrict our ability to declare or pay dividends. Any determination by our Board of Directors regarding dividends in the future will depend on a variety of factors, including our future financial performance, organic growth opportunities, general economic conditions and financial, competitive, regulatory, and other factors, many of which are beyond our control. We did not pay any dividends during fiscal 2024 and have no current intention to pay dividends in the future. There can be no guarantee that we will pay dividends in the future.
Item 6. Reserved
24
Item 7. Management's Discussion and Analysis of Financial Condition and Results of Operations
(Amounts in thousands, except per share data)
Overview
We are a global leader in the design and manufacture of mission critical fluid, power, heat transfer and vacuum technologies for the defense, space, energy and process industries. We design and manufacture custom-engineered vacuum, heat transfer, cryogenic pump and turbomachinery technologies. For the defense industry, our equipment is used in nuclear and non-nuclear propulsion, power, fluid transfer, and thermal management systems. For the space industry, our equipment is used in propulsion, power and energy management systems, and for life support systems. We supply equipment for vacuum, heat transfer and fluid transfer applications used in energy and new energy markets including oil refining, cogeneration, and multiple alternative and clean power applications including hydrogen. For the chemical and petrochemical industries, our equipment is used in fertilizer, ammonia, ethylene, methanol, and downstream chemical facilities.
Our brands are built upon engineering expertise and close customer collaboration to design, develop, and produce mission critical equipment and systems that enable our customers to meet their economic and operational objectives. Continual improvement of our processes and systems to ensure qualified and compliant equipment are hallmarks of our brand. Our early engagement with customers and support until the end of service life are values upon which our brands are built.
Our corporate headquarters is located with our production facilities in Batavia, New York, where surface condensers and ejectors are designed, engineered, and manufactured for the defense, energy and petrochemical industries. Our wholly-owned subsidiary, Barber-Nichols, LLC ("BN"), based in Arvada, Colorado, designs, develops, manufactures, and sells specialty turbomachinery products for the space aerospace, cryogenic, defense and energy markets. In November 2023, we acquired P3 Technologies, LLC ("P3"), located in Jupiter, Florida (See "Acquisition" below). We also have wholly-owned foreign subsidiaries, Graham Vacuum and Heat Transfer Technology Co., Ltd. ("GVHTT"), located in Suzhou, China and Graham India Private Limited ("GIPL"), located in Ahmedabad, India. GVHTT provides sales and engineering support for us throughout Southeast Asia. GIPL provides sales and engineering support for us in India and the Middle East.
This management's discussion and analysis of financial condition and results of operations omits a comparative discussion regarding the fiscal year ended March 31, 2023 versus the fiscal year ended March 31, 2022. Such information is located in Item 7 – Management's Discussion and Analysis of Financial Condition and Results of Operations of our Annual Report on Form 10-K for the fiscal year ended March 31, 2023.
Our fiscal year ends on March 31 of each year. We refer to our fiscal year, which ended March 31, 2024, as fiscal 2024. Likewise, we refer to our fiscal years that will end or have ended March 31, 2025, March 31, 2023, and March 31, 2022, as fiscal 2025, fiscal 2023, and fiscal 2022, respectively.
Acquisition
On November 9, 2023, we completed our acquisition of P3, a privately-owned custom turbomachinery engineering, product development, and manufacturing business located in Jupiter, Florida that serves the space, new energy, defense, and medical industries. We believe this acquisition advances our growth strategy, further diversifies our market and product offerings, and broadens our turbomachinery solutions. P3 will be managed through BN and is highly complementary to BN's technology and enhances its turbomachinery solutions.
The purchase price for P3 was $11,238 and was comprised of 125 shares of our common stock, representing a value of $1,930, and cash consideration of $7,098, subject to certain potential adjustments, including a customary working capital adjustment. The cash consideration was funded through borrowings on our line of credit. The purchase agreement included a contingent earn-out dependent upon certain financial measures of P3 post-acquisition, in which the sellers are eligible to receive up to $3,000 in additional cash consideration. See Note 2 to the Consolidated Financial Statements included in Item 8 of Part II of this Annual Report on Form 10-K.
Key Results
Key results for fiscal 2024 include the following:
25
26
Current Market Conditions
Demand for our equipment and systems for the defense industry is expected to remain strong and continue to expand, based on defense budget plans, accelerated ship build schedules due to geopolitical tensions, the projected build schedule of submarines, aircraft carriers and undersea propulsion and power systems and the solutions we provide. In addition to U.S. Navy applications, we also provide specialty pumps, turbines, compressors, and controllers for various fluid and thermal management systems used in Department of Defense radar, laser, electronics, and power systems. We have built a leading position, and in some instances a sole source position, for certain systems and equipment for the defense industry.
Our traditional energy markets are undergoing significant transition. While we expect that fossil fuels will continue to be an important component in the global energy industry for many years to come, there are significant changes in the priorities for capital investments by our customers and the regions in which those investments are being made. We expect that the systemic changes in the energy markets, which are influenced by the increasing use by consumers of alternative fuels and government policies to stimulate their usage, will lead to demand growth for fossil-based fuels that is less than the global growth rate. The timing and catalyst for a recovery in this market remains uncertain. Accordingly, we believe that in the near term the quantity of projects available for us to compete for will remain low and that new project pricing will remain challenging. Additionally, we believe that the majority of orders in our traditional energy markets will be outside the United States.
Of note, over the last few years we have experienced an increase in our energy and chemical aftermarket orders primarily from the domestic market. Aftermarket orders have historically been a leading indicator of future capital investment by our customers in their facilities for upgrades and expansions. However, if a capital investment upturn were to occur, we do not expect the next cycle to be as robust as years past due to the factors discussed above and are expected to be stronger in our international markets such as China and India.
The alternative and clean energy opportunities for our heat transfer, power production and fluid transfer systems are expected to continue to grow. We assist in designing, developing and producing equipment for hydrogen production, distribution and fueling systems, concentrated solar power and storage, small modular nuclear systems, bioenergy products, and geothermal power generation with lithium extraction. We are positioning the Company to be a more significant contributor as these markets continue to develop.
Over the long-term, we expect that population growth, an expanding global middle class, and an increasing desire for improved quality of life and access to consumer products will drive increased demand for industrial goods within the plastics and resins value chain along with fertilizers and related products. As such, we expect investment in new global chemical and petrochemical capacity will improve and drive growth in demand for our products and services.
Our turbomachinery, pumps, and cryogenic products and market access provide revenue and growth potential in the commercial space/aerospace markets. The commercial space market has grown and evolved rapidly, and we provide rocket engine turbopump systems and components to many of the launch providers for satellites. We expect that in the long-term, extended space exploration will become more prevalent, and we anticipate that our thermal/fluid management and environmental control and life support system turbomachinery will play important roles. We are also participating in future aerospace power and propulsion system development through supply of fluid and thermal management systems components. Small power dense systems are imperative for these applications, and we believe our technology and expertise will enable us to achieve sales growth in this market as well. Sales and orders to the space industry are variable in nature and many of our customers, who are key players in the industry, have yet to achieve profitability and may be unable to continue operations without additional funding similar to Virgin Orbit. Thus, future revenue and growth to this market can be uncertain and may negatively impact our business.
27
As illustrated below, we have succeeded over the last several years with our strategy to increase our participation in the defense market and diversify our revenue to not be as reliant on our legacy refining and petrochemical markets. The defense market comprised 84% of our total backlog at March 31, 2024.
Results of Operations
For an understanding of the significant factors that influenced our performance, the following discussion should be read in conjunction with our consolidated financial statements and the notes to our consolidated financial statements included in Item 8 of Part II of this Annual Report on Form 10-K.
The following table summarizes our results of operations for the periods indicated:
|
|
Year Ended March 31, |
|
|
Change |
|
|||||||||
|
|
2024 |
|
|
2023 |
|
|
$ |
|
% |
|
||||
Net sales |
|
$ |
185,533 |
|
|
$ |
157,118 |
|
|
$ |
28,415 |
|
|
18 |
% |
Gross profit |
|
$ |
40,585 |
|
|
$ |
25,408 |
|
|
$ |
15,177 |
|
|
60 |
% |
Gross profit margin |
|
|
21.9 |
% |
|
|
16.2 |
% |
|
|
|
|
|
||
SG&A expense (1) |
|
$ |
33,583 |
|
|
$ |
24,158 |
|
|
$ |
9,425 |
|
|
39 |
% |
SG&A as a percent of sales |
|
|
18.1 |
% |
|
|
15.4 |
% |
|
|
|
|
|
||
Net income (loss) |
|
$ |
4,556 |
|
|
$ |
367 |
|
|
$ |
4,189 |
|
|
1141 |
% |
Diluted income (loss) per share |
|
$ |
0.42 |
|
|
$ |
0.03 |
|
|
$ |
0.39 |
|
|
1300 |
% |
Total assets |
|
$ |
233,879 |
|
|
$ |
203,918 |
|
|
$ |
29,961 |
|
|
15 |
% |
28
Fiscal 2024 Compared with Fiscal 2023
The following tables provides our net sales by product line and geographic region including the percentage of total sales and change in comparison to the prior year for each category and period presented:
|
Year Ended |
|
|
|
|
|
|
|
|||||||||||||
|
March 31, |
|
|
Change |
|
||||||||||||||||
Market |
2024 |
|
% |
|
|
2023 |
|
% |
|
|
$ |
|
|
% |
|
||||||
Refining |
$ |
29,087 |
|
|
16 |
% |
|
$ |
27,270 |
|
|
17 |
% |
|
$ |
1,817 |
|
|
|
7 |
% |
Chemical/Petrochemical |
|
20,893 |
|
|
11 |
% |
|
|
21,950 |
|
|
14 |
% |
|
|
(1,057 |
) |
|
|
-5 |
% |
Space |
|
13,282 |
|
|
7 |
% |
|
|
21,180 |
|
|
13 |
% |
|
|
(7,898 |
) |
|
|
-37 |
% |
Defense |
|
99,493 |
|
|
54 |
% |
|
|
65,327 |
|
|
42 |
% |
|
|
34,166 |
|
|
|
52 |
% |
Other |
|
22,778 |
|
|
12 |
% |
|
|
21,391 |
|
|
14 |
% |
|
|
1,387 |
|
|
|
6 |
% |
Net sales |
$ |
185,533 |
|
|
100 |
% |
|
$ |
157,118 |
|
|
100 |
% |
|
$ |
28,415 |
|
|
|
18 |
% |
|
|
|
|
|
|
|
|
|
|
|
|
|
|
|
|
||||||
Geographic Region |
|
|
|
|
|
|
|
|
|
|
|
|
|
|
|
||||||
United States |
$ |
155,908 |
|
|
84 |
% |
|
$ |
127,519 |
|
|
81 |
% |
|
$ |
28,389 |
|
|
|
22 |
% |
International |
|
29,625 |
|
|
16 |
% |
|
|
29,599 |
|
|
19 |
% |
|
|
26 |
|
|
|
0 |
% |
Net sales |
$ |
185,533 |
|
|
100 |
% |
|
$ |
157,118 |
|
|
100 |
% |
|
$ |
28,415 |
|
|
|
18 |
% |
Net sales of $185,533 for fiscal 2024 increased 18% over the prior year period. Approximately $2,206 of this increase was due to the acquisition of P3 in fiscal 2024 and was primarily attributable to the space industry. Excluding P3, organic growth was 17% over the prior year. This increase was primarily due to sales to the defense industry, which increased $34,166 versus the prior year period primarily due to an improved mix of higher margin defense projects, increased capacity and direct labor, better execution, and the timing of material receipts. Partially offsetting this increase was a $7,898 decline in space sales primarily due to the timing of projects, as well as the loss of Virgin Orbit as a customer in April 2023. During fiscal 2023, approximately $5,300 of space revenue related to Virgin Orbit. Net sales also benefited in fiscal 2024 from strong growth in aftermarket sales to the defense, refining, and petrochemical markets, which increased $12,935 in comparison to the prior year.
Our gross margin for fiscal 2024 was 21.9% compared with 16.2% for fiscal 2023. This increase reflected the increased leverage on fixed overhead costs due to the higher volume of sales discussed above, as well as an improved mix of sales related to higher margin defense and aftermarket sales, and better execution and pricing on defense contracts, partially offset by higher incentive compensation in comparison with the prior year. Additionally, during fiscal 2024 we submitted for the Employee Retention Credit which benefited our gross profit by approximately $700. In fiscal 2023, we completed four first article U.S. Navy projects. The remaining two first article projects were completed and shipped during fiscal 2024.
Changes in SG&A expense for fiscal year 2024 compared to fiscal year 2023 are as follows:
|
|
Change YTD FY24 vs. YTD FY23 |
|
|
BN Performance Bonus |
|
$ |
4,258 |
|
Performance-based compensation |
|
|
2,227 |
|
Professional fees |
|
|
2,183 |
|
Equity-based compensation |
|
|
473 |
|
Acquisition costs |
|
|
375 |
|
Amortization of intangibles |
|
|
271 |
|
ERP implementation costs |
|
|
241 |
|
P3 Technologies |
|
|
213 |
|
Bad Debt expense |
|
|
(1,154 |
) |
All other |
|
|
338 |
|
Total SG&A change |
|
$ |
9,425 |
|
In connection with the acquisition of BN, we entered into a Performance Bonus Agreement to provide employees of BN with a supplemental performance-based award based on the achievement of BN performance objectives for fiscal years ending March 31, 2024, 2025, and 2026, which can range between $2,000 to $4,000 per year plus any applicable employer related taxes. This bonus is in addition to the normal employee bonus program at BN and will expire after fiscal 2026. The increase in performance-based compensation is primarily due to the improved performance in fiscal 2024 compared to fiscal 2023. The increase in professional fees over the prior year primarily relates to the increasing complexity in our business associated with our growth and international operations, including the investigation by the Audit Committee of our Board of Directors related to GIPL. See Note 17 to the Consolidated Financial Statements included in Item 8 of Part II of this Annual Report on Form 10-K and the "Commitments and Contingencies" section below.
29
The remainder of this increase was primarily due to costs associated with the acquisition of P3 and the implementation of a new ERP system at our Batavia location. Partially offsetting these increases was lower bad debt expense in connection with the Virgin Orbit bankruptcy.
Net interest expense for fiscal 2024 was $248 compared to $939 in fiscal 2023 primarily due to lower debt levels compared to the prior year partially offset by higher interest rates.
Our effective tax rate for fiscal 2024 was 18%, compared with 35% for fiscal 2023. This decrease was primarily due to higher tax credits recognized in fiscal 2024 due to higher income levels and increased investment in research and development, as well as discrete tax expense recognized in fiscal 2023 related to the vesting of restricted stock awards, and a higher mix of income in higher tax rate foreign jurisdictions in fiscal 2023 compared to fiscal 2024. Our expected effective tax rate for fiscal 2025 is approximately 20% to 22%.
The net result of the above is that net income and net income per diluted share for fiscal 2024 were $4,556 and $0.42 per share, respectively, compared with $367 and $0.03 per share, respectively, for fiscal 2023. Adjusted net income and adjusted net income per diluted share for fiscal 2024 were $6,796 and $0.63 per share, respectively, compared with $2,519 and $0.24 per share, respectively, for fiscal 2023. See "Non-GAAP Measures" below for important information about these measures and a reconciliation of adjusted net income and adjusted net income per diluted share to the comparable GAAP amount.
Non-GAAP Measures
Adjusted net income before net interest expense, income taxes, depreciation and amortization ("EBITDA"), adjusted net income, and adjusted net income per diluted share are provided for information purposes only and are not measures of financial performance under accounting principles generally accepted in the U.S. ("GAAP"). Management believes the presentation of these financial measures reflecting non-GAAP adjustments provides important supplemental information to investors and other users of our financial statements in evaluating the operating results of the Company. In particular, those charges and credits that are not directly related to our operating performance, and are not reflective of our underlying business particularly in light of their unpredictable nature. These non-GAAP disclosures have limitations as analytical tools, should not be viewed as a substitute for net income or net income per diluted share determined in accordance with GAAP, and should not be considered in isolation or as a substitute for analysis of our results as reported under GAAP, nor are they necessarily comparable to non-GAAP performance measures that may be presented by other companies. In addition, supplemental presentation should not be construed as an inference that our future results will be unaffected by similar adjustments to net income or net income per diluted share determined in accordance with GAAP. Adjusted EBITDA, adjusted net income and adjusted net income per diluted share are key metrics used by management and our board of directors to assess the Company’s financial and operating performance and adjusted net income and adjusted EBITDA is a basis for a significant portion of management's performance-based compensation.
Adjusted EBITDA excludes charges for depreciation, amortization, interest expense, taxes, acquisition related expenses, equity-based compensation, debt amendment costs, ERP implementation costs, and other unusual/nonrecurring expenses. Adjusted net income and adjusted net income per diluted share exclude intangible amortization, acquisition related expenses, other unusual/nonrecurring expenses and the related tax impacts of those adjustments.
A reconciliation of adjusted EBITDA, adjusted net income, and adjusted net income per diluted share to net income in accordance with GAAP is as follows:
30
|
Year Ended |
|
|||||
|
March 31, |
|
|||||
|
2024 |
|
|
2023 |
|
||
Net income |
$ |
4,556 |
|
|
$ |
367 |
|
Acquisition & integration costs |
|
432 |
|
|
|
54 |
|
Equity-based compensation |
|
1,279 |
|
|
|
806 |
|
Debt amendment costs |
|
781 |
|
|
|
194 |
|
Employee Retention Tax Credit |
|
(702 |
) |
|
|
- |
|
ERP Implementation costs |
|
241 |
|
|
|
- |
|
Net interest expense |
|
248 |
|
|
|
939 |
|
Income taxes |
|
1,018 |
|
|
|
194 |
|
Depreciation & amortization |
|
5,432 |
|
|
|
5,987 |
|
Adjusted EBITDA(1) |
$ |
13,285 |
|
|
$ |
8,541 |
|
|
|
|
|
|
|
||
Net Sales |
|
185,533 |
|
|
|
157,118 |
|
Net income as a % of revenue |
|
2.5 |
% |
|
|
0.2 |
% |
Adjusted EBITDA as a % of revenue |
|
7.2 |
% |
|
|
5.4 |
% |
|
|
|
|
|
|
||
(1) Beginning in the fourth quarter of fiscal 2024, Adjusted EBITDA no longer excludes the BN Performance Bonus, but now excludes the impact of non-cash equity-based compensation expense in order to be more consistent with market practice. Prior period results have been adjusted to reflect these changes on a comparable basis. The BN Performance Bonus expense was $4.3 million for fiscal 2024 and $0 for fiscal 2023 and will continue through fiscal 2026. |
|
||||||
|
Year Ended |
|
|||||
|
March 31, |
|
|||||
|
2024 |
|
|
2023 |
|
||
Net income |
$ |
4,556 |
|
|
$ |
367 |
|
Acquisition & integration costs |
|
432 |
|
|
|
54 |
|
Amortization of intangible assets |
|
2,157 |
|
|
|
2,476 |
|
Debt amendment costs |
|
781 |
|
|
|
194 |
|
Employee Retention Tax Credit |
|
(702 |
) |
|
|
- |
|
ERP Implementation costs |
|
241 |
|
|
|
- |
|
Tax impact of adjustments(1) |
|
(669 |
) |
|
|
(572 |
) |
Adjusted net income(2) |
$ |
6,796 |
|
|
$ |
2,519 |
|
|
|
|
|
|
|
||
GAAP net income per diluted share |
$ |
0.42 |
|
|
$ |
0.03 |
|
Adjusted net income per diluted share |
$ |
0.63 |
|
|
$ |
0.24 |
|
Diluted weighted average common shares outstanding |
|
10,844 |
|
|
|
10,654 |
|
|
|
|
|
|
|
||
(1) Applies a normalized tax rate to non-GAAP adjustments, which are pre-tax, based upon the statutory tax rate of 23%. |
|
||||||
(2) Beginning in the fourth quarter of fiscal 2024, Adjusted Net Income no longer excludes the BN Performance Bonus. The BN Performance Bonus expense, net-of-tax, was $3.3 million for fiscal 2024 and $0 for fiscal 2023 and will continue through fiscal 2026. |
|
||||||
Acquisition and integration costs are incremental costs that are directly related to the BN and P3 acquisitions. These costs may include, among other things, professional, consulting and other fees, system integration costs, and fair value adjustments relating to contingent consideration. Debt Amendment Costs consists of accelerated write-offs of unamortized deferred debt issuance costs and discounts, prepayment penalties, and attorney fees in connection with the amendment of our credit facility. The Employee Retention Tax Credit reflects payroll tax amounts expected to be recovered due to COVID-19 relief programs and is not expected to recur in the future. ERP Implementation Costs relate to consulting costs incurred in connection with the ERP system being implemented throughout our Batavia, N.Y facility in order to enhance efficiency and productivity and are not expected to recur once the project is completed.
31
Liquidity and Capital Resources
The following discussion should be read in conjunction with our consolidated statements of cash flows and consolidated balance sheets appearing in Item 8 of Part II of this Annual Report on Form 10-K:
|
|
March 31, |
|
|||||
|
|
2024 |
|
|
2023 |
|
||
Cash and cash equivalents |
|
$ |
16,939 |
|
|
$ |
18,257 |
|
Working capital(1) |
|
|
8,112 |
|
|
|
23,904 |
|
Working capital ratio(2) |
|
|
1.1 |
|
|
|
1.3 |
|
Net cash provided by operating activities for fiscal 2024 was $28,119 compared with $13,914 for fiscal 2023. This increase was primarily due to higher profitability during fiscal 2024 and a reduction in working capital as a result of the change in payment terms related to large defense customers during fiscal 2024 and stronger financial discipline. Additionally, cash provided by operating activities benefited approximately $22,000 from net customer deposits received on long-term U.S. Navy defense contracts that will require cash expenditures over the next 12 to 24 months. Customer deposits, net of unbilled revenue was $43,972 at March 31, 2024 compared to $6,358 at March 31, 2023.
Capital expenditures for the fiscal 2024 were $9,226 versus $3,749 over the comparable period in fiscal 2023. Fiscal 2024 capital expenditures were primarily for machinery and equipment, as well as for buildings and leasehold improvements to fund our growth and productivity improvement initiatives and includes expenditures related to the expansion of production capabilities at our Batavia facility, which is primarily being funded by a $13,500 strategic investment from one of our defense customers. Capital expenditures for fiscal 2025 are expected to be between $10,000 to $15,000 of which approximately half is related to the Batavia facility defense expansion. The remaining capital expenditures for fiscal 2025 are discretionary. We estimate that our maintenance capital spend is approximately $2,000 per year.
Cash and cash equivalents were $16,939 at March 31, 2024 compared with $18,257 at March 31, 2023, as cash provided by operating activities was used to fund capital expenditures, the P3 acquisition, and repayment of debt. At March 31, 2024, approximately $6,552 of our cash and cash equivalents was used to secure our letters of credit and $1,992 of our cash was held by our subsidiaries in China and India.
On October 13, 2023, we terminated our revolving credit facility and repaid our term loan with Bank of America and entered into a new five-year revolving credit facility with Wells Fargo that provides a $35,000 line of credit that automatically increases to $50,000 upon the Company satisfying specified covenants (the "New Revolving Credit Facility"). As of March 31, 2024, there were no borrowings and $1,890 letters of credit outstanding on the New Revolving Credit Facility and the amount available to borrow was $33,110, subject to interest and leverage covenants.
The New Revolving Credit Facility contains customary terms and conditions, including representations and warranties and affirmative and negative covenants, as well as financial covenants for the benefit of Wells Fargo, which require us to maintain (i) a consolidated total leverage ratio not to exceed 3.50:1.00 and (ii) a consolidated fixed charge coverage ratio of at least 1.20:1.00, in both cases computed in accordance with the definitions and requirements specified in the New Revolving Credit Facility. As of March 31, 2024, we were in compliance with the financial covenants of the New Revolving Credit Facility and our leverage ratio as calculated in accordance with the terms of the New Revolving Credit Facility was 0.5x.
Borrowings under the New Revolving Credit Facility bear interest at a rate equal to, at our option, either (i) a forward-looking term rate based on the secured overnight financing rate ("SOFR") for the applicable interest period, subject to a floor of 0.0% per annum or (ii) a base rate determined by reference to the highest of (a) the rate of interest per annum publicly announced by Wells Fargo as its prime rate, (b) the federal funds rate plus 0.50% per annum and (c) one-month term SOFR plus 1.00% per annum, subject to a floor of 1.00% per annum, plus, in each case, an applicable margin. The applicable margins range between (i) 1.25% per annum and 2.50% per annum in the case of any term SOFR loan and (ii) 0.25% per annum and 1.50% per annum in the case of any base rate loan, in each case based upon our then-current consolidated total leverage ratio; provided, however, for a period of one year following the closing date, the applicable margin shall be set at 1.25% per annum in the case of any term SOFR loan and 0.25% per annum in the case of any base rate loan. As of March 31, 2024, the SOFR rate was 5.34%.
Our revolving credit facility with Wells Fargo contains terms that restrict our ability to declare or pay dividends. Any determination by our Board of Directors regarding dividends in the future will depend on a variety of factors, including our future financial performance, organic growth opportunities, general economic conditions and financial, competitive, regulatory, and other factors, many of which are beyond our control. We did not pay any dividends during fiscal 2024 and have no current intention to pay dividends in the future. There can be no guarantee that we will pay dividends in the future.
32
In connection with the termination of the old revolving credit facility and term loan with Bank of America, the Company paid $752 in exit costs and recognized an extinguishment charge of $726. (See Note 9 to the Consolidated Financial Statements included in Item 8 of Part II of this Annual Report on Form 10-K).
We did not have any off-balance sheet arrangements as of March 31, 2024 other than letters of credit incurred in the ordinary course of business.
We believe that cash generated from operations, combined with the liquidity provided by available financing capacity under our credit facility, will be adequate to meet our cash needs for the immediate future.
Stockholders' Equity
The following discussion should be read in conjunction with our consolidated statements of changes in stockholders' equity that can be found in Item 8 of Part II of this Annual Report on Form 10-K. The following table shows the balance of stockholders' equity on the dates indicated:
March 31, 2024 |
|
|
March 31, 2023 |
|
||
$ |
105,566 |
|
|
$ |
96,933 |
|
Orders, Backlog and Book-to-Bill Ratio
In addition to the non-GAAP measures discussed above, management uses the following key performance metrics to analyze and measure the Company’s financial performance and results of operations: orders, backlog, and book-to-bill ratio. Management uses orders and backlog as measures of current and future business and financial performance and these may not be comparable with measures provided by other companies. Orders represent written communications received from customers requesting the Company to provide products and/or services. Backlog is defined as the total dollar value of net orders received for which revenue has not yet been recognized. Management believes tracking orders and backlog are useful as it often times is a leading indicator of future performance. In accordance with industry practice, contracts may include provisions for cancellation, termination, or suspension at the discretion of the customer.
The book-to-bill ratio is an operational measure that management uses to track the growth prospects of the Company. The Company calculates the book-to-bill ratio for a given period as net orders divided by net sales.
Given that each of orders, backlog and book-to-bill ratio is an operational measure and that the Company's methodology for calculating orders, backlog and book-to-bill ratio does not meet the definition of a non-GAAP measure, as that term is defined by the U.S. Securities and Exchange Commission, a quantitative reconciliation for each is not required or provided.
The following table provides our orders by market and geographic region including the percentage of total orders and change in comparison to the prior year for each category and period presented:
|
Year Ended |
|
|
|
|
|
|
|
|||||||||||||
|
March 31, |
|
|
Change |
|
||||||||||||||||
Market |
2024 |
|
% |
|
|
2023 |
|
% |
|
|
$ |
|
|
% |
|
||||||
Refining |
$ |
33,245 |
|
|
12 |
% |
|
$ |
29,276 |
|
|
14 |
% |
|
$ |
3,969 |
|
|
|
14 |
% |
Chemical/Petrochemical |
|
23,749 |
|
|
9 |
% |
|
|
15,306 |
|
|
8 |
% |
|
|
8,443 |
|
|
|
55 |
% |
Space |
|
16,825 |
|
|
6 |
% |
|
|
15,160 |
|
|
7 |
% |
|
|
1,665 |
|
|
|
11 |
% |
Defense |
|
177,410 |
|
|
66 |
% |
|
|
116,714 |
|
|
58 |
% |
|
|
60,696 |
|
|
|
52 |
% |
Other |
|
17,218 |
|
|
6 |
% |
|
|
26,230 |
|
|
13 |
% |
|
|
(9,012 |
) |
|
|
-34 |
% |
Total orders |
$ |
268,447 |
|
|
100 |
% |
|
$ |
202,686 |
|
|
100 |
% |
|
$ |
65,761 |
|
|
|
32 |
% |
|
|
|
|
|
|
|
|
|
|
|
|
|
|
|
|
||||||
Geographic Region |
|
|
|
|
|
|
|
|
|
|
|
|
|
|
|
||||||
United States |
$ |
231,317 |
|
|
86 |
% |
|
$ |
167,984 |
|
|
83 |
% |
|
$ |
63,333 |
|
|
|
38 |
% |
International |
|
37,130 |
|
|
14 |
% |
|
|
34,702 |
|
|
17 |
% |
|
|
2,428 |
|
|
|
7 |
% |
Total orders |
$ |
268,447 |
|
|
100 |
% |
|
$ |
202,686 |
|
|
100 |
% |
|
$ |
65,761 |
|
|
|
32 |
% |
Orders booked in fiscal 2024 were $268,447 compared to $202,686 in fiscal 2023. This increase was primarily driven by growth in defense, refining and petrochemical aftermarket, space, and new energy customers. Noteworthy orders during fiscal 2024 included the following:
33
For fiscal 2024, our book-to-bill ratio was 1.4x. We believe the strategic investment and increased level of repeat U.S. Navy orders received during the fiscal year validates the investments we made, our position as a key supplier to the defense industry and our customer’s confidence in our execution. Additionally, we believe the strong aftermarket orders are relevant because they historically have been a leading indicator of a cyclical upturn in capital project orders in the refining and chemical/petrochemical markets. However, we do not expect the next cycle to be as robust as years past due to the factors discussed above under "Current Market Conditions."
Orders to the U.S. represented 86% of total orders for fiscal 2024 and is relatively consistent with the prior year. These orders were primarily to the defense and space markets, which represented 66% and 6% of orders, respectively, and are U.S. based.
The following table provides our backlog by market, including the percentage of total backlog, for each category and period presented:
|
|
March 31, |
|
|
|
|
March 31, |
|
|
|
Change |
|
|||||||||
Market |
|
2024 |
|
% |
|
|
2023 |
|
% |
|
$ |
|
|
% |
|
||||||
Refining |
|
$ |
29,526 |
|
|
8 |
% |
|
$ |
26,142 |
|
|
9 |
% |
$ |
3,384 |
|
|
|
13 |
% |
Chemical/Petrochemical |
|
|
11,276 |
|
|
3 |
% |
|
|
7,842 |
|
|
3 |
% |
|
3,434 |
|
|
|
44 |
% |
Space |
|
|
10,651 |
|
|
3 |
% |
|
|
8,242 |
|
|
3 |
% |
|
2,409 |
|
|
|
29 |
% |
Defense |
|
|
328,389 |
|
|
84 |
% |
|
|
243,628 |
|
|
81 |
% |
|
84,761 |
|
|
|
35 |
% |
Other |
|
|
11,026 |
|
|
3 |
% |
|
|
15,880 |
|
|
5 |
% |
|
(4,854 |
) |
|
|
-31 |
% |
Total backlog |
|
$ |
390,868 |
|
|
100 |
% |
|
$ |
301,734 |
|
|
100 |
% |
$ |
89,134 |
|
|
|
30 |
% |
Backlog was $390,868 at March 31, 2024, an increase of 30% compared with $301,734 at March 31, 2023. Approximately 35% to 40% of orders currently in our backlog are expected to be converted to sales within one year and 25% to 30% after one year but within two years. The majority of the orders that are expected to convert beyond twelve months are for the defense industry, specifically the U.S. Navy that have a long conversion cycle (up to six years).
Outlook
We are providing the following fiscal 2025 outlook:
Net Sales |
|
$200 million to $210 million |
Gross Profit |
|
22% - 23% of sales |
SG&A Expenses(1) |
|
16.5% - 17.5% of sales |
Tax Rate |
|
20% to 22% |
Adjusted EBITDA(2) |
|
$16.5 million to $19.5 million |
Capital Expenditures |
|
$10.0 million to $15.0 million |
|
|
|
(1) Includes approximately $6.5 million to $7.5 million of BN Performance Bonus, equity-based compensation, and ERP conversion costs included in SG&A expense. |
||
(2) Excludes net interest expense, income taxes, depreciation and amortization from net income, as well as approximately $2.0 million to $3.0 million of equity-based compensation and ERP conversion costs included in SG&A expense. |
||
See "Cautionary Note Regarding Forward-Looking Statements" and "Non-GAAP Measures" above for additional information about forward-looking statements and non-GAAP measures. We have not reconciled non-GAAP forward-looking Adjusted EBITDA to its most directly comparable GAAP measure, as permitted by Item 10(e)(1)(i)(B) of Regulation S-K. Such reconciliation would require unreasonable efforts to estimate and quantify various necessary GAAP components largely because forecasting or predicting our future operating results is subject to many factors out of our control or not readily predictable.
We have made significant progress with the advancements in our business, which we believe puts us on schedule in achieving our fiscal 2027 goals of 8% to 10% average annualized organic revenue growth and Adjusted EBITDA margins in the low to mid-teens.
34
Our expectations for sales and profitability assume that we will be able to operate our production facilities at planned capacity, have access to our global supply chain including our subcontractors, do not experience significant global health related disruptions, and assumes no further impact from Virgin Orbit or any other unforeseen events.
Contingencies and Commitments
We have been named as a defendant in lawsuits alleging personal injury from exposure to asbestos allegedly contained in or accompanying our products. We are a co-defendant with numerous other defendants in these lawsuits and intend to vigorously defend ourselves against these claims. The claims in our current lawsuits are similar to those made in previous asbestos lawsuits that named us as a defendant. Such previous lawsuits either were dismissed when it was shown that we had not supplied products to the plaintiffs’ places of work, or were settled by us for immaterial amounts.
During the third quarter of fiscal 2024, the Audit Committee of the Board of Directors, with the assistance of external counsel and forensic professionals, concluded an investigation into a whistleblower complaint received regarding GIPL. The investigation identified both evidence supporting the complaint and other misconduct by employees. The other misconduct totaled $150 over a period of four years and was isolated to GIPL. All involved employees have been terminated and we have implemented remedial actions, including strengthening our compliance program and internal controls. As a result of the investigation, during the third quarter of fiscal 2024, the statutory auditor and bookkeeper of GIPL tendered their resignations and new firms were appointed. We have voluntarily reported the findings of our investigation to the appropriate authorities in India and the U.S. Department of Justice and the Securities and Exchange Commission. Although the resolutions of these matters are inherently uncertain, we do not believe any remaining impact will be material to our overall consolidated results of operations, financial position, or cash flows.
As of March 31, 2024, we are subject to the claims noted above, as well as other legal proceedings and potential claims that have arisen in the ordinary course of business. Although the outcome of the lawsuits, legal proceedings or potential claims to which we are or may become a party cannot be determined and an estimate of the reasonably possible loss or range of loss cannot be made for the majority of the claims, we do not believe that the outcomes, either individually or in the aggregate, will have a material adverse effect on our results of operations, financial position or cash flows. See Note 17 to our consolidated financial statements included in Item 8 of Part II of this Annual Report on Form 10-K for additional information.
Critical Accounting Policies
The discussion and analysis of our financial condition and results of operations are based upon the consolidated financial statements and the notes to consolidated financial statements included in Item 8 of Part II of this Annual Report on Form 10-K, which have been prepared in accordance with GAAP.
Critical accounting policies are defined as those that reflect significant judgments and uncertainties and could potentially result in materially different results under different assumptions and conditions.
Revenue Recognition. The Company accounts for revenue in accordance with Accounting Standard Codification 606, "Revenue from Contracts with Customers" ("ASC 606").
We recognize revenue on all contracts when control of the product is transferred to the customer. Control is generally transferred when products are shipped, title is transferred, significant risks of ownership have transferred, we have rights to payment, and rewards of ownership pass to the customer. Customer acceptance may also be a factor in determining whether control of the product has transferred. Although revenue on the majority of our contracts, as measured by number of contracts, is recognized upon shipment to the customer, revenue on larger contracts, which are fewer in number but generally represent the majority of revenue, is recognized over time as these contracts meet specific criteria in ASC 606. Revenue from contracts that is recognized upon shipment accounted for approximately 23% of revenue in fiscal 2024. Revenue from contracts that is recognized over time accounted for approximately 77% of revenue in fiscal 2024. We recognize revenue over time when contract performance results in the creation of a product for which we do not have an alternative use and the contract includes an enforceable right to payment in an amount that corresponds directly with the value of the performance completed. To measure progress towards completion on performance obligations for which revenue is recognized over time the Company utilizes an input method based upon a ratio of direct labor hours incurred to date to management’s estimate of the total labor hours to be incurred on each contract, or cost incurred to date to management's estimate of the total cost to be incurred on each contract, or an output method based upon completion of operational milestones, depending upon the nature of the contract.
Business Combinations and Intangible Assets. Assets and liabilities acquired in a business combination are recorded at their estimated fair values at the acquisition date. The fair value of identifiable intangible assets is based upon detailed valuations that use various assumptions made by management. Goodwill is recorded when the purchase price exceeds the estimated fair value of the net identifiable tangible and intangible assets acquired. Definite lived intangible assets are amortized over their estimated useful lives and
35
are assessed for impairment if certain indicators are present. Goodwill and intangible assets deemed to have indefinite lives are not amortized but are subject to impairment testing annually or earlier if an event or change in circumstances indicates that the fair value of a reporting unit or the indefinite lived asset may have been reduced below its carrying value.
Pension and Postretirement Benefits. Defined benefit pension and other postretirement benefit costs and obligations are dependent on actuarial assumptions used in calculating such amounts. These assumptions are reviewed annually and include the discount rate, long-term expected rate of return on plan assets, salary growth, healthcare cost trend rate and other economic and demographic factors. We base the discount rate assumption for our plans on the FTSE Pension Liability Above-Median AA-Index. The long-term expected rate of return on plan assets is based on the plan’s asset allocation, historical returns and expectations as to future returns that are expected to be realized over the estimated remaining life of the plan liabilities that will be funded with the plan assets. The salary growth assumptions are determined based on long-term actual experience and future and near-term outlook. The healthcare cost trend rate assumptions are based on historical cost and payment data, the near-term outlook, and an assessment of likely long-term trends.
Critical Accounting Estimates and Judgments
We have evaluated the accounting policies used in the preparation of the consolidated financial statements and the notes to consolidated financial statements included in Item 8 of Part II of this Annual Report on Form 10-K and believe those policies to be reasonable and appropriate.
We believe that the most critical accounting estimates used in the preparation of our consolidated financial statements relate to labor hour estimates, total cost, and establishment of operational milestones which are used to recognize revenue over time, accounting for contingencies, under which we accrue a loss when it is probable that a liability has been incurred and the amount can be reasonably estimated, accounting for business combinations and intangible assets, and accounting for pensions and other postretirement benefits.
As discussed above under the heading "Critical Accounting Policies", we recognize a majority of our revenue using an over-time recognition method. The key estimate for the over-time recognition model is total labor, total cost and operational milestones to be incurred on each contract and to the extent that these estimates change, it may significantly impact revenue recognized in each period.
Contingencies, by their nature, relate to uncertainties that require us to exercise judgment both in assessing the likelihood that a liability has been incurred as well as in estimating the amount of potential loss. For more information on these matters, see the notes to consolidated financial statements included in Item 8 of Part II of this Annual Report on Form 10-K.
As discussed above under the heading "Critical Accounting Policies", we allocate the purchase price of an acquired company, including when applicable, the acquisition date fair value of contingent consideration between tangible and intangible assets acquired and liabilities assumed from the acquired business based on their estimated fair values, with the residual of the purchase price recorded as goodwill. Third party appraisal firms and other consultants are engaged to assist management in determining the fair values of certain assets acquired and liabilities assumed. Estimating fair values requires significant judgments, estimates and assumptions, including but not limited to discount rates, future cash flows and the economic lives of trade names, technology, customer relationships, and property, plant and equipment. These estimates are based on historical experience and information obtained from the management of the acquired company and are inherently uncertain.
During fiscal 2022, we completed the acquisition of BN for an aggregate purchase price of $72,014. We identified and assigned value to identifiable intangible assets of customer relationships, technology and technical know-how, backlog and trade name, and estimated the useful lives over which these intangible assets would be amortized. The estimates of fair values of these identifiable intangible assets were based upon discounted cash flow models, which include assumptions such as forecasted cash flows, customer attrition rates, discount rates, and royalty rates. The fair value estimates resulted in identifiable intangible assets, in the aggregate, of $32,500. The resulting goodwill, in the aggregate, from this acquisition was $23,523. For more information on these matters, see the notes to consolidated financial statements included in Item 8 of Part II of this Annual Report on Form 10-K.
During fiscal 2024, we completed the acquisition of P3 for an aggregate purchase price of $11,238. We identified and assigned value to identifiable intangible assets of customer relationships, technology and technical know-how and trade name, and estimated the useful lives over which these intangible assets would be amortized. The estimates of fair values of these identifiable intangible assets were based upon the Multi Period Excess Earnings method, which incorporates assumptions regarding retention rate, new customer growth and customer related costs, as well as a Relief from Royalty method, which develops a market based royalty rate used to reflect the after tax royalty savings attributable to owning the intangible asset. The fair value estimates resulted in identifiable intangible assets, in the aggregate, of $7,200. The resulting goodwill, in the aggregate, from this acquisition was $1,997. For more information on these matters, see the notes to consolidated financial statements included in Item 8 of Part II of this Annual Report on Form 10-K.
36
Accounting for pensions and other postretirement benefits involves estimating the cost of benefits to be provided well into the future and attributing that cost over the time period each employee works. To accomplish this, assumptions are made about inflation, investment returns, mortality, turnover, medical costs and discount rates. These assumptions are reviewed annually.
The discount rate used in accounting for pensions and other postretirement benefits expense (income) is determined in conjunction with our actuary by reference to a current yield curve and by considering the timing and amount of projected future benefit payments. The discount rate assumption for fiscal 2024 was 5.03% for our defined benefit pension plans and 4.76% for our other postretirement benefit plan. A reduction in the discount rate of 50 basis points, with all other assumptions held constant, would have increased fiscal 2024 net periodic benefit expense for our defined benefit pension plans and other postretirement benefit plan by approximately $211 and ($0.1), respectively.
The expected return on plan assets assumption of 5.75% used in accounting for our pension plan is determined by evaluating the mix of investments that comprise plan assets and external forecasts of future long-term investment returns. A reduction in the rate of return of 50 basis points, with other assumptions held constant, would have increased fiscal 2024 net periodic pension expense by approximately $161.
During fiscal 2024 and fiscal 2023, the pension plan extinguished liabilities for vested benefits of certain participants through the purchase of nonparticipating annuity contracts with a third-party insurance company. As a result of these transactions, in fiscal 2024 and fiscal 2023, the projected benefit obligation and plan assets each decreased $1,452 and $1,383, respectively.
As part of our ongoing financial reporting process, a collaborative effort is undertaken involving our managers with functional responsibilities for financial, credit, tax, engineering, manufacturing and benefit matters, and outside advisors such as lawyers, consultants and actuaries. We believe that the results of this effort provide management with the necessary information on which to base their judgments and to develop the estimates and assumptions used to prepare the financial statements.
We believe that the amounts recorded in the consolidated financial statements included in Item 8 of Part II of this Annual Report on Form 10-K related to revenue, contingencies, pensions, other postretirement benefits and other matters requiring the use of estimates and judgments are reasonable, although actual outcomes could differ materially from our estimates.
New Accounting Pronouncements
In the normal course of business, management evaluates all new Accounting Standards Updates (“ASU”) and other accounting pronouncements issued by the Financial Accounting Standards Board (“FASB”), SEC, or other authoritative accounting bodies to determine the potential impact they may have on the Company’s Consolidated Financial Statements. Other than those discussed in the Consolidated Financial Statements, management does not expect any of the recently issued accounting pronouncements, which have not already been adopted, to have a material impact on the Company’s Consolidated Financial Statements. For discussion of the newly issued accounting pronouncements see ''Accounting and reporting changes'' in Note 1 to the Consolidated Financial Statements included in Item 8 of Part II of this Annual Report on Form 10-K.
Item 7A. Quantitative and Qualitative Disclosures About Market Risk
The principal market risks (i.e., the risk of loss arising from market changes) to which we are exposed are foreign currency exchange rates, price risk, and interest rate risk.
The assumptions applied in preparing the following qualitative and quantitative disclosures regarding foreign currency exchange rate, price risk and interest rate risk are based upon volatility ranges experienced by us in relevant historical periods, our current knowledge of the marketplace, and our judgment of the probability of future volatility based upon the historical trends and economic conditions of the markets in which we operate.
Foreign Currency
International consolidated sales for fiscal 2024 were 16% of total sales. Operating in markets throughout the world exposes us to movements in currency exchange rates. Currency movements can affect sales in several ways, the foremost being our ability to compete for orders against foreign competitors that base their prices on relatively weaker currencies. Business lost due to competition for orders against competitors using a relatively weaker currency cannot be quantified. In addition, cash can be adversely impacted by the conversion of sales made by us in a foreign currency to U.S. dollars. In fiscal 2024, substantially all sales by us and our wholly owned subsidiaries, for which we were paid, were denominated in the local currency of the respective subsidiary (U.S. dollars, Chinese RMB, or India INR). For fiscal 2024, foreign currency exchange rate fluctuations reduced our cash balances by $53 primarily due to the strengthening of the U.S. dollar relative to the Chinese RMB and India INR.
37
We have limited exposure to foreign currency purchases. In fiscal 2024, our purchases in foreign currencies represented 4% of the cost of products sold. At certain times, we may enter into forward foreign currency exchange agreements to hedge our exposure against potential unfavorable changes in foreign currency values on significant sales and purchase contracts negotiated in foreign currencies. Forward foreign currency exchange contracts were not used in fiscal 2024 and as of March 31, 2024, we held no forward foreign currency contracts.
Price Risk
Operating in a global marketplace requires us to compete with other global manufacturers which, in some instances, benefit from lower production costs and more favorable economic conditions. Although we believe that our customers differentiate our products on the basis of our manufacturing quality, engineering experience, and customer service, among other things, such lower production costs and more favorable economic conditions mean that our competitors are able to offer products similar to ours at lower prices. In extreme market downturns, we typically see depressed price levels. Additionally, we have faced, and may continue to face, significant cost inflation, specifically in labor costs, raw materials, and other supply chain costs due to increased demand for raw materials and resources caused by the broad disruption of the global supply chain, including those associated with the impact of COVID-19. International conflicts or other geopolitical events, including the 2022 Russian invasion of Ukraine and the Israel-Hamas war, may further contribute to increased supply chain costs due to shortages in raw materials, increased costs for transportation and energy, disruptions in supply chains, and heightened inflation. Further escalation of geopolitical tensions may also lead to changes to foreign exchange rates and financial markets, any of which may adversely affect our business and supply chain, and consequently our results of operation. While there could ultimately be a material impact on our operations and liquidity, at the time of this report, the impact could not be determined.
Interest Rate Risk
In order to fund our strategic growth objectives, including acquisitions, we borrow funds under our revolving credit facility through Wells Fargo that bears interest at a variable rate. As part of our risk management activities, we evaluate the use of interest rate derivatives to add stability to interest expense and to manage our exposure to interest rate movements. As of March 31, 2024, we had $0 variable rate debt outstanding on our revolving credit facility and no interest rate derivatives outstanding. See "Debt" in Note 9 to the Consolidated Financial Statements included in Item 8 of Part II of this Annual Report on Form 10-K for more information on our debt arrangement.
38
Item 8. Financial Statements and Supplementary Data
INDEX TO FINANCIAL STATEMENTS
Consolidated Financial Statements: |
Page |
Report of Independent Registered Public Accounting Firm (PCAOB ID 000 |
40 |
Consolidated Statements of Operations for the years ended March 31, 2024, 2023 and 2022 |
42 |
|
43 |
|
44 |
Consolidated Statements of Cash Flows for the years ended March 31, 2024, 2023 and 2022 |
45 |
|
46 |
|
47 |
39
REPORT OF INDEPENDENT REGISTERED PUBLIC ACCOUNTING FIRM
To the stockholders and the Board of Directors of Graham Corporation
Opinion on the Financial Statements
We have audited the accompanying consolidated balance sheets of Graham Corporation and subsidiaries (the "Company") as of March 31, 2024 and 2023; the related consolidated statements of operations, comprehensive (loss) income, changes in stockholders' equity, and cash flows, for each of the three years in the period ended March 31, 2024 and the related notes and the schedule listed in the Index at Item 15 (collectively referred to as the "financial statements"). In our opinion, the financial statements present fairly, in all material respects, the financial position of the Company as of March 31, 2024 and 2023, and the results of its operations and its cash flows for each of the three years in the period ended March 31, 2024, in conformity with accounting principles generally accepted in the United States of America.
We have also audited, in accordance with the standards of the Public Company Accounting Oversight Board (United States) (PCAOB), the Company's internal control over financial reporting as of March 31, 2024, based on criteria established in Internal Control — Integrated Framework (2013) issued by the Committee of Sponsoring Organizations of the Treadway Commission and our report dated June 7, 2024, expressed an unqualified opinion on the Company's internal control over financial reporting.
Basis for Opinion
These financial statements are the responsibility of the Company's management. Our responsibility is to express an opinion on the Company's financial statements based on our audits. We are a public accounting firm registered with the PCAOB and are required to be independent with respect to the Company in accordance with the U.S. federal securities laws and the applicable rules and regulations of the Securities and Exchange Commission and the PCAOB.
We conducted our audits in accordance with the standards of the PCAOB. Those standards require that we plan and perform the audit to obtain reasonable assurance about whether the financial statements are free of material misstatement, whether due to error or fraud. Our audits included performing procedures to assess the risks of material misstatement of the financial statements, whether due to error or fraud, and performing procedures that respond to those risks. Such procedures included examining, on a test basis, evidence regarding the amounts and disclosures in the financial statements. Our audits also included evaluating the accounting principles used and significant estimates made by management, as well as evaluating the overall presentation of the financial statements. We believe that our audits provide a reasonable basis for our opinion.
Critical Audit Matter
The critical audit matter communicated below is a matter arising from the current-period audit of the financial statements that was communicated or required to be communicated to the audit committee and that (1) relates to accounts or disclosures that are material to the financial statements and (2) involved our especially challenging, subjective, or complex judgments. The communication of critical audit matters does not alter in any way our opinion on the financial statements, taken as a whole, and we are not, by communicating the critical audit matter below, providing a separate opinion on the critical audit matter or on the accounts or disclosures to which it relates.
Revenue Recognition — Over time Revenue – Refer to Notes 1 and 3 to the financial statements
Critical Audit Matter Description
The Company recognizes a majority of its revenue over time when contract performance results in the creation of a product for which the Company does not have an alternative use and the contract includes an enforceable right to payment in an amount that corresponds directly with the value of the performance completed. To measure progress towards completion on performance obligations for which revenue is recognized over time the Company primarily utilizes an input method based upon a ratio of direct labor hours incurred to date to management’s estimate of the total direct labor hours to be incurred at completion on each contract or an input method based upon a ratio of direct costs incurred to date to management’s estimate of total costs to be incurred at the completion of each contract. Revenue from contracts that is recognized over time accounted for approximately 77% of revenue in fiscal 2024.
40
We identified revenue associated with certain in-process contracts recognized over time utilizing an input method as a critical audit matter because of the judgments necessary for management to estimate total direct labor hours or costs, at completion. An extensive audit effort and a high degree of auditor judgment was required when performing audit procedures to audit management’s estimates of total direct labor hours or total costs at completion used to recognize revenue over time and evaluating the results of those procedures.
How the Critical Audit Matter Was Addressed in the Audit
Our audit procedures related to management’s estimate of total direct labor hours or total costs, at completion, for in-process contracts recognized over time included the following, among others:
June 7, 2024
We have served as the Company's auditor since 1993.
41
CONSOLIDATED STATEMENTS OF OPERATIONS
(Dollar amounts in thousands, except per share data)
|
|
Years Ended March 31, |
|
|||||||||
|
|
2024 |
|
|
2023 |
|
|
2022 |
|
|||
|
|
|
|
|||||||||
Net sales |
|
$ |
|
|
$ |
|
|
$ |
|
|||
Cost of products sold |
|
|
|
|
|
|
|
|
|
|||
Gross profit |
|
|
|
|
|
|
|
|
|
|||
Operating expenses and income: |
|
|
|
|
|
|
|
|
|
|||
Selling, general and administrative |
|
|
|
|
|
|
|
|
|
|||
Selling, general and administrative - amortization |
|
|
|
|
|
|
|
|
|
|||
Other operating expense (income), net |
|
|
|
|
|
|
|
|
( |
) |
||
Operating income (loss) |
|
|
|
|
|
|
|
|
( |
) |
||
Other expenses and income: |
|
|
|
|
|
|
|
|
|
|||
Loss on extinguishment of debt |
|
|
|
|
|
|
|
|
|
|||
Other expense (income), net |
|
|
|
|
|
( |
) |
|
|
( |
) |
|
Interest expense, net |
|
|
|
|
|
|
|
|
|
|||
Total other expenses and income |
|
|
|
|
|
|
|
|
( |
) |
||
Income (loss) before provision (benefit) for income taxes |
|
|
|
|
|
|
|
|
( |
) |
||
Provision (benefit) for income taxes |
|
|
|
|
|
|
|
|
( |
) |
||
Net Income (loss) |
|
$ |
|
|
$ |
|
|
$ |
( |
) |
||
Per share data: |
|
|
|
|
|
|
|
|
|
|||
Basic: |
|
|
|
|
|
|
|
|
|
|||
Net income (loss) |
|
$ |
|
|
$ |
|
|
$ |
( |
) |
||
Diluted: |
|
|
|
|
|
|
|
|
|
|||
Net income (loss) |
|
$ |
|
|
$ |
|
|
$ |
( |
) |
||
Average common shares outstanding: |
|
|
|
|
|
|
|
|
|
|||
Basic |
|
|
|
|
|
|
|
|
|
|||
Diluted |
|
|
|
|
|
|
|
|
|
|||
Dividends declared per share |
|
$ |
|
|
$ |
|
|
$ |
|
|||
See Notes to Consolidated Financial Statements.
42
CONSOLIDATED STATEMENTS OF COMPREHENSIVE INCOME (LOSS)
(Dollar amounts in thousands)
|
|
Years Ended March 31, |
|
|||||||||
|
|
2024 |
|
|
2023 |
|
|
2022 |
|
|||
|
|
|
|
|||||||||
Net income (loss) |
|
$ |
|
|
$ |
|
|
$ |
( |
) |
||
Other comprehensive income (loss): |
|
|
|
|
|
|
|
|
|
|||
Foreign currency translation adjustment |
|
|
( |
) |
|
|
( |
) |
|
|
|
|
Defined benefit pension and other postretirement plans, net of income tax |
|
|
|
|
|
( |
) |
|
|
|
||
Total other comprehensive income (loss) |
|
|
|
|
|
( |
) |
|
|
|
||
Total comprehensive income (loss) |
|
$ |
|
|
$ |
( |
) |
|
$ |
( |
) |
|
See Notes to Consolidated Financial Statements.
43
CONSOLIDATED BALANCE SHEETS
(Dollar amounts in thousands, except per share data)
|
|
March 31, |
|
|||||
|
|
2024 |
|
|
2023 |
|
||
|
|
|
|
|||||
Assets |
|
|
|
|
|
|
||
Current assets: |
|
|
|
|
|
|
||
Cash and cash equivalents |
|
$ |
|
|
$ |
|
||
Trade accounts receivable, net of allowances ($ |
|
|
|
|
|
|
||
Unbilled revenue |
|
|
|
|
|
|
||
Inventories |
|
|
|
|
|
|
||
Prepaid expenses and other current assets |
|
|
|
|
|
|
||
Total current assets |
|
|
|
|
|
|
||
Property, plant and equipment, net |
|
|
|
|
|
|
||
Prepaid pension asset |
|
|
|
|
|
|
||
Operating lease assets |
|
|
|
|
|
|
||
Goodwill |
|
|
|
|
|
|
||
Customer relationships |
|
|
|
|
|
|
||
Technology and technical know-how, net |
|
|
|
|
|
|
||
Other intangible assets, net |
|
|
|
|
|
|
||
Deferred income tax asset |
|
|
|
|
|
|
||
Other assets |
|
|
|
|
|
|
||
Total assets |
|
$ |
|
|
$ |
|
||
Liabilities and stockholders’ equity |
|
|
|
|
|
|
||
Current liabilities: |
|
|
|
|
|
|
||
Current portion of long-term debt |
|
$ |
|
|
$ |
|
||
Current portion of finance lease obligations |
|
|
|
|
|
|
||
Accounts payable |
|
|
|
|
|
|
||
Accrued compensation |
|
|
|
|
|
|
||
Accrued expenses and other current liabilities |
|
|
|
|
|
|
||
Customer deposits |
|
|
|
|
|
|
||
Operating lease liabilities |
|
|
|
|
|
|
||
Income taxes payable |
|
|
|
|
|
|
||
Total current liabilities |
|
|
|
|
|
|
||
Long-term debt |
|
|
|
|
|
|
||
Finance lease obligations |
|
|
|
|
|
|
||
Operating lease liabilities |
|
|
|
|
|
|
||
Accrued pension and postretirement benefit liabilities |
|
|
|
|
|
|
||
Other long-term liabilities |
|
|
|
|
|
|
||
Total liabilities |
|
|
|
|
|
|
||
|
|
|
|
|
|
|||
Stockholders’ equity: |
|
|
|
|
|
|
||
Preferred stock, $ |
|
|
|
|
|
|
||
Common stock, $ |
|
|
|
|
|
|
||
Capital in excess of par value |
|
|
|
|
|
|
||
Retained earnings |
|
|
|
|
|
|
||
Accumulated other comprehensive loss |
|
|
( |
) |
|
|
( |
) |
Treasury stock ( |
|
|
( |
) |
|
|
( |
) |
Total stockholders’ equity |
|
|
|
|
|
|
||
Total liabilities and stockholders’ equity |
|
$ |
|
|
$ |
|
||
`
See Notes to Consolidated Financial Statements.
44
CONSOLIDATED STATEMENTS OF CASH FLOWS
(Dollar amounts in thousands)
|
|
Years Ended March 31, |
|
|||||||||
|
|
2024 |
|
|
2023 |
|
|
2022 |
|
|||
|
|
|
|
|||||||||
Operating activities: |
|
|
|
|
|
|
|
|
|
|||
Net income (loss) |
|
$ |
|
|
$ |
|
|
$ |
( |
) |
||
Adjustments to reconcile net income (loss) to net cash provided (used) by |
|
|
|
|
|
|
|
|
|
|||
Depreciation |
|
|
|
|
|
|
|
|
|
|||
Amortization |
|
|
|
|
|
|
|
|
|
|||
Virgin Orbit reserves |
|
|
|
|
|
|
|
|
|
|||
Amortization of unrecognized prior service cost and actuarial losses |
|
|
|
|
|
|
|
|
|
|||
Amortization of debt issuance costs |
|
|
|
|
|
|
|
|
|
|||
Equity-based compensation expense |
|
|
|
|
|
|
|
|
|
|||
(Gain) loss on disposal or sale of property, plant and equipment |
|
|
( |
) |
|
|
|
|
|
|
||
Change in fair value of contingent consideration |
|
|
|
|
|
|
|
|
( |
) |
||
Loss on extinguishment of debt |
|
|
|
|
|
|
|
|
|
|||
Deferred income taxes |
|
|
( |
) |
|
|
( |
) |
|
|
( |
) |
(Increase) decrease in operating assets: |
|
|
|
|
|
|
|
|
|
|||
Accounts receivable |
|
|
( |
) |
|
|
|
|
|
( |
) |
|
Unbilled revenue |
|
|
|
|
|
( |
) |
|
|
|
||
Inventories |
|
|
( |
) |
|
|
( |
) |
|
|
|
|
Income taxes receivable |
|
|
|
|
|
|
|
|
( |
) |
||
Prepaid expenses and other current and non-current assets |
|
|
( |
) |
|
|
( |
) |
|
|
( |
) |
Operating lease assets |
|
|
|
|
|
|
|
|
|
|||
Prepaid pension asset |
|
|
( |
) |
|
|
( |
) |
|
|
( |
) |
Increase (decrease) in operating liabilities: |
|
|
|
|
|
|
|
|
|
|||
Accounts payable |
|
|
|
|
|
|
|
|
( |
) |
||
Accrued compensation, accrued expenses and other current and |
|
|
|
|
|
|
|
|
|
|||
Customer deposits |
|
|
|
|
|
|
|
|
|
|||
Operating lease liabilities |
|
|
( |
) |
|
|
( |
) |
|
|
( |
) |
Long-term portion of accrued compensation, accrued pension |
|
|
( |
) |
|
|
( |
) |
|
|
|
|
Net cash provided (used) by operating activities |
|
|
|
|
|
|
|
|
( |
) |
||
Investing activities: |
|
|
|
|
|
|
|
|
|
|||
Purchase of property, plant and equipment |
|
|
( |
) |
|
|
( |
) |
|
|
( |
) |
Proceeds from disposal of property, plant and equipment |
|
|
|
|
|
|
|
|
|
|||
Redemption of investments at maturity |
|
|
|
|
|
|
|
|
|
|||
Acquisition of P3 Technologies, LLC, net of cash acquired |
|
|
( |
) |
|
|
|
|
|
|
||
Acquisition of Barber-Nichols, LLC, net of cash acquired |
|
|
|
|
|
|
|
|
( |
) |
||
Net cash used by investing activities |
|
|
( |
) |
|
|
( |
) |
|
|
( |
) |
Financing activities: |
|
|
|
|
|
|
|
|
|
|||
Principal repayments on debt |
|
|
( |
) |
|
|
( |
) |
|
|
( |
) |
Proceeds from the issuance of debt |
|
|
|
|
|
|
|
|
|
|||
Principal repayments on finance lease obligations |
|
|
( |
) |
|
|
( |
) |
|
|
( |
) |
Repayments on lease financing obligations |
|
|
( |
) |
|
|
( |
) |
|
|
( |
) |
Payment of debt exit costs |
|
|
( |
) |
|
|
|
|
|
|
||
Payment of debt issuance costs |
|
|
( |
) |
|
|
( |
) |
|
|
( |
) |
Issuance of common stock |
|
|
|
|
|
|
|
|
|
|||
Dividends paid |
|
|
|
|
|
|
|
|
( |
) |
||
Purchase of treasury stock |
|
|
( |
) |
|
|
( |
) |
|
|
( |
) |
Net cash (used) provided by financing activities |
|
|
( |
) |
|
|
( |
) |
|
|
|
|
Effect of exchange rate changes on cash |
|
|
( |
) |
|
|
( |
) |
|
|
|
|
Net (decrease) increase in cash and cash equivalents |
|
|
( |
) |
|
|
|
|
|
( |
) |
|
Cash and cash equivalents at beginning of year |
|
|
|
|
|
|
|
|
|
|||
Cash and cash equivalents at end of year |
|
$ |
|
|
$ |
|
|
$ |
|
|||
See Notes to Consolidated Financial Statements.
45
CONSOLIDATED STATEMENTS OF CHANGES IN STOCKHOLDERS' EQUITY
Years Ended March 31, 2024, 2023 and 2022
(Dollar and share amounts in thousands)
|
|
Common Stock |
|
|
Capital in |
|
|
|
|
|
Accumulated |
|
|
|
|
|
Total |
|
||||||||||
|
|
|
|
|
Par |
|
|
Excess of |
|
|
Retained |
|
|
Comprehensive |
|
|
Treasury |
|
|
Stockholders' |
|
|||||||
|
|
Shares |
|
|
Value |
|
|
Par Value |
|
|
Earnings |
|
|
Loss |
|
|
Stock |
|
|
Equity |
|
|||||||
Balance at March 31, 2021 |
|
|
|
|
$ |
|
|
$ |
|
|
$ |
|
|
$ |
( |
) |
|
$ |
( |
) |
|
$ |
|
|||||
Comprehensive income (loss) |
|
|
|
|
|
|
|
|
|
|
|
( |
) |
|
|
|
|
|
|
|
|
( |
) |
|||||
Issuance of shares |
|
|
|
|
|
|
|
( |
) |
|
|
|
|
|
|
|
|
|
|
|
— |
|
||||||
Forfeiture of shares |
|
|
( |
) |
|
|
( |
) |
|
|
|
|
|
|
|
|
|
|
|
|
|
|
— |
|
||||
Dividends |
|
|
|
|
|
|
|
|
|
|
|
( |
) |
|
|
|
|
|
|
|
|
( |
) |
|||||
Recognition of equity-based compensation expense |
|
|
|
|
|
|
|
|
|
|
|
|
|
|
|
|
|
|
|
|
|
|||||||
Purchase of treasury stock |
|
|
|
|
|
|
|
|
|
|
|
|
|
|
|
|
|
( |
) |
|
|
( |
) |
|||||
Issuance of treasury stock |
|
|
|
|
|
|
|
|
( |
) |
|
|
|
|
|
|
|
|
|
|
|
|
||||||
Balance at March 31, 2022 |
|
|
|
|
|
|
|
|
|
|
|
|
|
|
( |
) |
|
|
( |
) |
|
|
|
|||||
Comprehensive income (loss) |
|
|
|
|
|
|
|
|
|
|
|
|
|
|
( |
) |
|
|
|
|
|
( |
) |
|||||
Issuance of shares |
|
|
|
|
|
|
|
|
— |
|
|
|
|
|
|
|
|
|
|
|
|
— |
|
|||||
Forfeiture of shares |
|
|
( |
) |
|
|
( |
) |
|
|
|
|
|
|
|
|
|
|
|
|
|
|
— |
|
||||
Recognition of equity-based compensation expense |
|
|
|
|
|
|
|
|
|
|
|
|
|
|
|
|
|
|
|
|
|
|||||||
Purchase of treasury stock |
|
|
|
|
|
|
|
|
|
|
|
|
|
|
|
|
|
( |
) |
|
|
( |
) |
|||||
Issuance of treasury stock |
|
|
|
|
|
|
|
|
( |
) |
|
|
|
|
|
|
|
|
|
|
|
|
||||||
Balance at March 31, 2023 |
|
|
|
|
|
|
|
|
|
|
|
|
|
|
( |
) |
|
|
( |
) |
|
|
|
|||||
Comprehensive income (loss) |
|
|
|
|
|
|
|
|
|
|
|
|
|
|
|
|
|
|
|
|
|
|||||||
Issuance of shares |
|
|
|
|
|
|
|
|
|
|
|
|
|
|
|
|
|
( |
) |
|
|
|
||||||
Forfeiture of shares |
|
|
( |
) |
|
|
( |
) |
|
|
|
|
|
|
|
|
|
|
|
|
|
|
— |
|
||||
Recognition of equity-based compensation expense |
|
|
|
|
|
|
|
|
|
|
|
|
|
|
|
|
|
|
|
|
|
|||||||
Purchase of treasury stock |
|
|
|
|
|
|
|
|
|
|
|
|
|
|
|
|
|
( |
) |
|
|
( |
) |
|||||
Balance at March 31, 2024 |
|
|
|
|
$ |
|
|
$ |
|
|
$ |
|
|
$ |
( |
) |
|
$ |
( |
) |
|
$ |
|
|||||
See Notes to Consolidated Financial Statements.
46
NOTES TO CONSOLIDATED FINANCIAL STATEMENTS
Years Ended March 31, 2024, 2023 and 2022
(Amounts in thousands, except per share data)
Note 1 - The Company and Its Accounting Policies:
Graham Corporation, and its operating subsidiaries, (together, the "Company"), is a global leader in the design and manufacture of mission critical fluid, power, heat transfer and vacuum technologies for the defense, space, energy and process industries. The Company acquired Barber-Nichols, LLC ("BN") in June 2021. The accompanying Consolidated Financial Statements include BN at March 31, 2024, 2023 and for the period June 1, 2021 through March 31, 2024. The Company acquired P3 Technologies, LLC ("P3") in November 2023. The accompanying Consolidated Financial Statements include P3 at March 31, 2024 and for the period of November 9, 2023 through March 31, 2024. The Company's significant accounting policies are set forth below.
The Company's fiscal years ended March 31, 2024, 2023 and 2022 are referred to as "fiscal 2024," "fiscal 2023" and "fiscal 2022," respectively.
Principles of consolidation and use of estimates in the preparation of consolidated financial statements
The consolidated financial statements include the accounts of the Company and its wholly-owned subsidiaries, BN, located in Arvada, CO, P3, located in Jupiter, FL, Graham Vacuum and Heat Transfer Technology (Suzhou) Co., Ltd., located in China, and Graham India Private Limited ("GIPL"), located in India. All intercompany balances, transactions and profits are eliminated in consolidation.
The preparation of consolidated financial statements in conformity with accounting principles generally accepted in the U.S. ("GAAP") requires management to make estimates and assumptions that affect the reported amounts of assets and liabilities and disclosure of contingent assets and liabilities at the date of the financial statements, as well as the related revenues and expenses during the reporting period. Actual amounts could differ from those estimated.
Translation of foreign currencies
Assets and liabilities of the Company's foreign subsidiaries are translated into U.S. dollars at currency exchange rates in effect at year end and revenues and expenses are translated at average exchange rates in effect for the year. Gains and losses resulting from foreign currency transactions are included in results of operations. The Company's sales and purchases in foreign currencies are not material to the overall consolidated financial statements. Therefore, foreign currency transaction gains and losses have not historically impacted the Company's financial results materially. Gains and losses resulting from translation of the foreign subsidiaries balance sheets are included in a separate component of stockholders' equity. Translation adjustments are not adjusted for income taxes since they relate to an investment, which is permanent in nature.
Revenue recognition
The Company accounts for revenue in accordance with Accounting Standard Codification 606, "Revenue from Contracts with Customers" ("ASC 606").
The Company recognizes revenue on all contracts when control of the product is transferred to the customer. Control is generally transferred when products are shipped, title is transferred, significant risks of ownership have transferred, the Company has rights to payment, and rewards of ownership pass to the customer. Customer acceptance may also be a factor in determining whether control of the product has transferred. Although revenue on the majority of the Company’s contracts, as measured by number of contracts, is recognized upon shipment to the customer, revenue on larger contracts, which are fewer in number but generally represent the majority of revenue, is recognized over time as these contracts meet specific criteria in ASC 606.
Unbilled revenue (contract assets) in the Consolidated Balance Sheets represents revenue recognized that has not been billed to customers on contracts in which revenue is recognized over time. All progress payments exceeding unbilled revenue are presented as customer deposits (contract liabilities) in the Consolidated Balance Sheets.
Cash and cash equivalents
Cash and cash equivalents consist of cash and highly liquid, short-term investments with maturities at the time of purchase of three months or less.
47
Trade Accounts receivable, net of allowances
Trade accounts receivable are recorded at the invoiced amount and do not bear interest. The provision for credit losses is the Company's best estimate of the amount of probable credit losses in the Company's existing accounts receivable; however, changes in circumstances relating to accounts receivable may result in a requirement for additional provisions in the future.
Shipping and handling fees and costs
Shipping and handling fees billed to the customer are recorded in Net sales and the related costs incurred for shipping and handling are included in Cost of products sold.
Inventories
Inventories are stated at the lower of cost or net realizable value, using the average cost method.
Property, plant, equipment and depreciation
Property, plant and equipment are stated at cost net of accumulated depreciation. Major additions and improvements are capitalized, while maintenance and repairs are charged to expense as incurred. Depreciation is provided based upon the estimated useful lives, or lease term if shorter, under the straight-line method. Estimated useful lives range from approximately to
Business combinations
The Company records its business combinations under the acquisition method of accounting. Under the acquisition method of accounting, the Company allocates the purchase price of each acquisition to the tangible and identifiable intangible assets acquired and liabilities assumed based on their respective fair values at the date of acquisition. The fair value of identifiable intangible assets is based upon detailed valuations that use various assumptions made by management. Any excess of the purchase price over the fair value of the net tangible and intangible assets acquired is allocated to goodwill. Direct acquisition-related costs are expensed as incurred.
48
Goodwill
Goodwill represents the excess of the purchase price over the fair value of identifiable net tangible and intangible assets acquired in a business combination.
Goodwill is not amortized, but is reviewed for impairment at least annually or more frequently if impairment indicators arise. Goodwill is evaluated for impairment by first performing a qualitative assessment to determine whether a quantitative goodwill test is necessary. If it is determined, based on qualitative factors, that the fair value of the reporting unit may be more likely than not less than its carrying amount, or if significant adverse changes in the Company's future financial performance occur that could materially impact fair value, a quantitative goodwill impairment test would be required. Additionally, the Company can elect to forgo the qualitative assessment and perform the quantitative test. If the qualitative assessment indicates that the quantitative analysis should be performed, or if management elects to bypass a qualitative assessment, the Company then evaluates goodwill for impairment by comparing the fair value of the reporting unit to its carrying amount, including goodwill.
Intangible Assets
Acquired intangible assets other than goodwill consist of backlog, customer relationships, technology and technical know-how and tradenames. Backlog and trade names are included in the line item Other intangible assets, net in the Consolidated Balance Sheet. The Company amortizes a portion of its Technology and technical know-how, tradenames, and Customer relationships in Selling, general and administrative expense on a straight line basis over each of their estimated useful lives of eight to twenty years. Backlog and a portion of Technology and technical know-how are amortized in Cost of products sold over the projected conversion period of four to ten years which is based on management estimates at the time of purchase. All other intangibles have indefinite lives and are not amortized.
Impairment of long-lived assets
The Company assesses the impairment of definite-lived long-lived assets or asset groups when events or changes in circumstances indicate that the carrying value may not be recoverable. Factors that are considered in deciding when to perform an impairment review include: a significant decrease in the market price of the asset or asset group; a significant adverse change in the extent or manner in which a long-lived asset or asset group is being used or in its physical condition; an accumulation of costs significantly in excess of the amount originally expected for the acquisition or construction; a current-period operating or cash flow loss combined with a history of operating or cash flow losses or a projection or forecast that demonstrates continuing losses associated with the use of a long-lived asset or asset group; or a current expectation that, more likely than not, a long-lived asset or asset group will be sold or otherwise disposed of significantly before the end of its previously estimated useful life. The term more likely than not refers to a level of likelihood that is more than
Recoverability potential is measured by comparing the carrying amount of the asset or asset group to its related total future undiscounted cash flows. If the carrying value is not recoverable through related cash flows, the asset or asset group is considered to be impaired. Impairment is measured by comparing the asset or asset group's carrying amount to its fair value. When it is determined that useful lives of assets are shorter than originally estimated, and no impairment is present, the rate of depreciation is accelerated in order to fully depreciate the assets over their new shorter useful lives.
Goodwill and intangible assets with indefinite lives are tested annually for impairment. The Company assesses goodwill for impairment by comparing the fair value of its reporting units to their carrying amounts. If the fair value of a reporting unit is less than its carrying value, an impairment loss is recorded to the extent that the implied fair value of the goodwill within the reporting unit is less than its carrying value. Fair values for reporting units are determined based on a weighted combination of the market approach and the income approach using discounted cash flows. Indefinite lived intangible assets are assessed for impairment by comparing the fair value of the asset to its carrying value.
Other Long-Term Assets
include service based cloud computing software implementation costs of $
Product warranties
The Company estimates the costs that may be incurred under its product warranties and records a liability in the amount of such costs at the time revenue is recognized. The reserve for product warranties is based upon past claims experience and ongoing
49
evaluations of any specific probable claims from customers. A reconciliation of the changes in the product warranty liability is presented in Note 7.
Research and development
Research and development costs are expensed as incurred. The Company incurred estimated research and development costs of $
Income taxes
The Company recognizes deferred income tax assets and liabilities for the expected future tax consequences of events that have been recognized in the Company's financial statements or tax returns. Deferred income tax assets and liabilities are determined based on the difference between the financial statement and tax bases of assets and liabilities using currently enacted tax rates. The Company evaluates the available evidence about future taxable income and other possible sources of realization of deferred income tax assets and records a valuation allowance to reduce deferred income tax assets to an amount that represents the Company's best estimate of the amount of such deferred income tax assets that more likely than not will be realized.
The Company accounts for uncertain tax positions using a "more likely than not" recognition threshold. The evaluation of uncertain tax positions is based on factors including, but not limited to, changes in tax law, the measurement of tax positions taken or expected to be taken in tax returns, the effective resolution of matters subject to audit, new audit activity and changes in facts or circumstances related to a tax position. These tax positions are evaluated on a quarterly basis. It is the Company's policy to recognize any interest related to uncertain tax positions in interest expense and any penalties related to uncertain tax positions in selling, general and administrative expense.
The Company files federal and state income tax returns in several U.S. and non-U.S. domestic and foreign jurisdictions. In most tax jurisdictions, returns are subject to examination by the relevant tax authorities for a number of years after the returns have been filed.
Equity-based compensation
50
Income (loss) per share data
Basic income (loss) per share is computed by dividing net income (loss) by the weighted average number of common shares outstanding for the period. Diluted income (loss) per share is calculated by dividing net income (loss) by the weighted average number of common shares outstanding and, when applicable, potential common shares outstanding during the period.
A reconciliation of the numerators and denominators of basic and diluted income (loss) per share is presented below:
|
|
Year ended March 31, |
|
|||||||||
|
|
2024 |
|
|
2023 |
|
|
2022 |
|
|||
Basic income (loss) per share: |
|
|
|
|
|
|
|
|
|
|||
Numerator: |
|
|
|
|
|
|
|
|
|
|||
Net income (loss) |
|
$ |
|
|
$ |
|
|
$ |
( |
) |
||
Denominator: |
|
|
|
|
|
|
|
|
|
|||
Weighted average common shares outstanding |
|
|
|
|
|
|
|
|
|
|||
Basic income (loss) per share |
|
$ |
|
|
$ |
|
|
$ |
( |
) |
||
|
|
|
|
|
|
|
|
|
|
|||
Diluted income (loss) per share: |
|
|
|
|
|
|
|
|
|
|||
Numerator: |
|
|
|
|
|
|
|
|
|
|||
Net income (loss) |
|
$ |
|
|
$ |
|
|
$ |
( |
) |
||
Denominator: |
|
|
|
|
|
|
|
|
|
|||
Weighted average common shares outstanding |
|
|
|
|
|
|
|
|
|
|||
Restricted stock units outstanding |
|
|
|
|
|
|
|
|
— |
|
||
Weighted average common and potential common |
|
|
|
|
|
|
|
|
|
|||
Diluted income (loss) per share |
|
$ |
|
|
$ |
|
|
$ |
( |
) |
||
None of the options to purchase shares of common stock which totaled
Cash flow statement
Interest and income taxes paid as well as non-cash investing and financing activities are as follows:
|
|
Year ended March 31, |
|
|||||||||
|
|
2024 |
|
|
2023 |
|
|
2022 |
|
|||
Interest paid |
|
$ |
|
|
$ |
|
|
$ |
|
|||
Income taxes paid |
|
|
|
|
|
|
|
|
|
|||
Pension and other post retirement income (loss) adjustments, net of income tax |
|
|
|
|
|
( |
) |
|
|
|
||
Issuance of treasury stock to the Employee Stock Purchase Plan (See Note 13) |
|
|
|
|
|
|
|
|
|
|||
Capital purchases recorded in accounts payable |
|
|
|
|
|
|
|
|
|
|||
Issuance of treasury shares as part of the consideration of the acquisition |
|
|
|
|
|
|
|
|
|
|||
Accumulated other comprehensive income (loss)
Comprehensive income (loss) is comprised of net income and other comprehensive income or loss items, which are accumulated as a separate component of stockholders' equity. For the Company, other comprehensive income or loss items include foreign currency translation adjustments and pension and other postretirement benefit adjustments.
Fair value measurements
Fair value is defined as the price that would be received to sell an asset or paid to transfer a liability (i.e. the "exit price") in an orderly transaction between market participants at the measurement date. The accounting standard for fair value establishes a hierarchy for inputs used in measuring fair value that maximizes the use of observable inputs and minimizes the use of unobservable inputs by requiring that the most observable inputs be used when available. Observable inputs are inputs that market participants would use in pricing the asset or liability developed based on market data obtained from sources independent of the Company. Unobservable inputs
51
are inputs that reflect the Company's assumptions about the assumptions market participants would use in pricing the asset or liability developed based on the best information available in the circumstances. The hierarchy is broken down into three levels based on the reliability of inputs as follows:
Level 1 – Valuations based on quoted prices in active markets for identical assets or liabilities that the Company has the ability to access. Since valuations are based on quoted prices that are readily and regularly available in an active market, valuation of these products does not entail a significant degree of judgment.
Level 2 – Valuations determined from quoted prices for similar assets or liabilities in active markets, quoted prices for identical instruments in markets that are not active or by model-based techniques in which all significant inputs are observable in the market.
Level 3 – Valuations based on inputs that are unobservable and significant to the overall fair value measurement. The degree of judgment exercised in determining fair value is greatest for instruments categorized in Level 3.
The availability of observable inputs can vary and is affected by a wide variety of factors, including, the type of asset/liability, whether the asset/liability is established in the marketplace, and other characteristics particular to the transaction. To the extent that valuation is based on models or inputs that are less observable or unobservable in the market, the determination of fair value requires more judgment. In certain cases, the inputs used to measure fair value may fall into different levels of the fair value hierarchy. In such cases, for disclosure purposes the level in the fair value hierarchy within which the fair value measurement in its entirety falls is determined based on the lowest level input that is significant to the fair value measurement in its entirety.
Fair value is a market-based measure considered from the perspective of a market participant rather than an entity-specific measure. Therefore, even when market assumptions are not readily available, assumptions are required to reflect those that market participants would use in pricing the asset or liability at the measurement date.
Use of Estimates
The preparation of financial statements in conformity with GAAP requires management to make estimates and assumptions that affect the reported amounts of assets and liabilities and disclosure of contingent assets and liabilities at the date of the financial statements and reported amounts of sales and expenses during the reporting period. Actual results could differ materially from those estimates.
Accounting and reporting changes
In the normal course of business, management evaluates all new Accounting Standards Updates and other accounting pronouncements issued by the Financial Accounting Standards Board, Securities and Exchange Commission, or other authoritative accounting bodies to determine the potential impact they may have on the Company’s Consolidated Financial Statements. Other than those discussed below, management does not expect any of the recently issued accounting pronouncements, which have not already been adopted, to have a material impact on the Company’s Consolidated Financial Statements.
In November 2023, the FASB issued ASU 2023-07, Segment Reporting (Topic 280)-Improvements to Reportable Segment Disclosures. The ASU enhances disclosure of significant segment expenses by requiring disclosure of significant segment expenses regularly provided to the chief operating decision maker, extend certain annual disclosures to interim periods, and permits more than one measure of segment profit or loss to be reported under certain conditions. The amendments are effective for the Company in years beginning after December 15, 2023, and interim periods within years beginning after December 15, 2024. The Company is currently evaluating the impact that the adoption of this ASU will have on its consolidated financial statements.
In December 2023, the FASB issued ASU 2023-09, Income Taxes (Topic 740)-Improvements to Income Tax Disclosures. The ASU requires additional quantitative and qualitative income tax disclosures to allow readers of the consolidated financial statements to assess how the Company’s operations, related tax risks and tax planning affect its tax rate and prospects for future cash flows. For public business entities, the ASU is effective for annual periods beginning after December 15, 2024. The Company is currently evaluating the impact that the adoption of this ASU will have on its consolidated financial statements.
Note 2 - Acquisition
On November 9, 2023, the Company completed its acquisition of P3, a privately-owned custom turbomachinery engineering, product development, and manufacturing business located in Jupiter, FL that serves the space, new energy, defense, and medical industries. The Company believes this acquisition advances its growth strategy, further diversifies its market and product offerings, and
52
broadens its turbomachinery solutions. P3 will be managed through the Company's Barber-Nichols, LLC subsidiary and is highly complementary to BN's technology and enhances its turbomachinery solutions.
This transaction was accounted for as a business combination which requires that assets acquired and liabilities assumed be recognized at their fair value as of the acquisition date. The purchase price of $
Balance at November 9, 2023 |
|
$ |
|
|
Change in fair value |
|
|
|
|
Payments |
|
|
|
|
Balance at March 31, 2024 |
|
$ |
|
The change in fair value of the contingent earn-out liability was included in Other operating (income) expense, net in the Consolidated Statements of Operations. Acquisition and integration costs of $
The cost of the acquisition was allocated to the assets acquired and liabilities assumed based upon their estimated fair value at the date of acquisition and the amount exceeding the fair value of $
53
|
|
Before Adjustment of Preliminary Allocation of Purchase Price |
|
|
|
|
|
After Adjustment of Final Allocation of Purchase Price |
|
|||
|
|
November 9, |
|
|
|
|
|
March 31, |
|
|||
|
|
2023 |
|
|
Adjustments |
|
|
2024 |
|
|||
Assets acquired: |
|
|
|
|
|
|
|
|
|
|||
Cash and cash equivalents |
|
$ |
|
|
$ |
|
|
$ |
|
|||
Trade accounts receivable, net of allowances |
|
|
|
|
|
|
|
|
|
|||
Unbilled revenue |
|
|
|
|
|
|
|
|
|
|||
Inventories |
|
|
|
|
|
|
|
|
|
|||
Prepaid expenses and other current assets |
|
|
|
|
|
|
|
|
|
|||
Property, plant & equipment, net |
|
|
|
|
|
|
|
|
|
|||
Operating lease assets |
|
|
|
|
|
|
|
|
|
|||
Goodwill |
|
|
|
|
|
|
|
|
|
|||
Customer relationships |
|
|
|
|
|
|
|
|
|
|||
Technology and technical know-how |
|
|
|
|
|
|
|
|
|
|||
Tradename |
|
|
|
|
|
|
|
|
|
|||
Deferred income tax asset |
|
|
|
|
|
( |
) |
|
|
|
||
Total assets acquired |
|
|
|
|
|
|
|
|
|
|||
Liabilities assumed: |
|
|
|
|
|
|
|
|
|
|||
Accrued compensation |
|
|
|
|
|
|
|
|
|
|||
Customer deposits |
|
|
|
|
|
|
|
|
|
|||
Operating lease liabilities |
|
|
|
|
|
|
|
|
|
|||
Total liabilities assumed |
|
|
|
|
|
|
|
|
|
|||
Purchase price |
|
$ |
|
|
$ |
|
|
$ |
|
|||
The fair value of acquisition-related intangible assets includes customer relationships, technology and technical know-how, and tradename. The tradename is included in the line item "Other intangible assets, net" in the Consolidated Balance Sheets. The fair value of customer relationships was calculated using an income approach, specifically the Multi Period Excess Earnings method, which incorporates assumptions regarding retention rate, new customer growth and customer related costs. The fair value of tradename and technology and technical know-how were both calculated using a Relief from Royalty method, which develops a market based royalty rate used to reflect the after tax royalty savings attributable to owning the intangible asset.
Customer relationships and tradename are amortized in Selling, general and administrative expense on a straight line basis over their estimated useful lives of eight years and three years respectively. Technology and technical know-how is amortized in Cost of products sold on a straight line basis over its estimated useful life of ten years.
The Consolidated Statement of Operations for the year ended March 31, 2024 includes net sales of P3 of $
|
|
For the Year Ended |
|
|
|||||
|
|
March 31, |
|
|
|||||
|
|
2024 |
|
|
2023 |
|
|
||
Net sales |
|
$ |
|
|
$ |
|
|
||
Net income (loss) |
|
|
|
|
|
( |
) |
|
|
Earnings per share |
|
|
|
|
|
|
|
||
Basic |
|
$ |
|
|
$ |
|
|
||
Diluted |
|
$ |
|
|
$ |
|
|
||
54
The unaudited pro forma information presents the combined operating results of Graham Corporation and P3 with the results prior to the acquisition date adjusted to include the pro forma impact of the adjustment of depreciation of fixed assets based on the preliminary purchase price allocation, the adjustment to interest expense reflecting the cash paid in connection with the acquisition, including acquisition-related expenses, at the Company’s weighted average interest rate, amortization expense related to the fair value adjustments for intangible assets, non-recurring acquisition-related costs and the impact of income taxes on the pro forma adjustments utilizing the applicable statutory tax rate.
Note 3 – Revenue Recognition:
The Company recognizes revenue on all contracts when control of the product is transferred to the customer. Control is generally transferred when products are shipped, title is transferred, significant risks of ownership have transferred, the Company has rights to payment, and rewards of ownership pass to the customer.
The following tables present the Company's net sales disaggregated by market and geographic area:
|
|
Year ended March 31, |
|
|||||||||
Market |
|
2024 |
|
|
2023 |
|
|
2022 |
|
|||
Refining |
|
$ |
|
|
$ |
|
|
$ |
|
|||
Chemical/Petrochemical |
|
|
|
|
|
|
|
|
|
|||
Defense |
|
|
|
|
|
|
|
|
|
|||
Space |
|
|
|
|
|
|
|
|
|
|||
Other Commercial |
|
|
|
|
|
|
|
|
|
|||
Net sales |
|
$ |
|
|
$ |
|
|
$ |
|
|||
|
|
Year ended March 31, |
|
|||||||||
Geographic Area |
|
2024 |
|
|
2023 |
|
|
2022 |
|
|||
Asia |
|
$ |
|
|
$ |
|
|
$ |
|
|||
Canada |
|
|
|
|
|
|
|
|
|
|||
Middle East |
|
|
|
|
|
|
|
|
|
|||
South America |
|
|
|
|
|
|
|
|
|
|||
U.S. |
|
|
|
|
|
|
|
|
|
|||
All other |
|
|
|
|
|
|
|
|
|
|||
Net sales |
|
$ |
|
|
$ |
|
|
$ |
|
|||
The final destination of products shipped is the basis used to determine net sales by geographic area. No sales were made to the terrorist sponsoring nations of Cuba, Iran, North Korea or Syria.
A performance obligation represents a promise in a contract to provide a distinct good or service to a customer. The Company accounts for a contract when it has approval and commitment from both parties, the rights of the parties are identified, payment terms are identified, the contract has commercial substance and collectability of consideration is probable. Transaction price reflects the amount of consideration to which the Company expects to be entitled in exchange for transferred products. A contract’s transaction price is allocated to each distinct performance obligation and revenue is recognized as the performance obligation is satisfied. In certain cases, the Company may separate a contract into more than one performance obligation, while in other cases, several products may be part of a fully integrated solution and are bundled into a single performance obligation. If a contract is separated into more than one performance obligation, the Company allocates the total transaction price to each performance obligation in an amount based on the estimated relative standalone selling prices of the promised goods underlying each performance obligation. The Company has made an accounting policy election to exclude from the measurement of the contract price all taxes assessed by government authorities that are collected by the Company from its customers. The Company does not adjust the contract price for the effects of a financing component if the Company expects, at contract inception, that the period between when a product is transferred to a customer and when the customer pays for the product will be one year or less.
The Company recognizes revenue over time when contract performance results in the creation of a product for which the Company does not have an alternative use and the contract includes an enforceable right to payment in an amount that corresponds directly with the value of the performance completed. To measure progress towards completion on performance obligations for which revenue is recognized over time the Company utilizes an input method based upon a ratio of direct labor hours incurred to date to management’s estimate of the total labor hours to be incurred on each contract, an input method based upon a ratio of total contract costs
55
incurred to date to management's estimate of the total contract costs to be incurred or an output method based upon completion of operational milestones, depending upon the nature of the contract. The Company has established the systems and procedures essential to developing the estimates required to account for performance obligations over time. These procedures include monthly review by management of costs incurred, progress towards completion, identified risks and opportunities, sourcing determinations, changes in estimates of costs yet to be incurred, availability of materials, and execution by subcontractors. Sales and earnings are adjusted on a cumulative catch-up basis in current accounting periods based upon revisions in the contract value due to pricing changes and estimated costs at completion. Losses on contracts are recognized immediately when evident to management. Revenue on the majority of the Company’s contracts, as measured by number of contracts, is recognized upon shipment to the customer. Revenue on larger contracts, which are fewer in number but generally represent the majority of revenue, is recognized over time as these contracts meet specific criteria established in ASC 606.
|
|
Year ended March 31, |
|
|||||||||
|
|
2024 |
|
|
2023 |
|
|
2022 |
|
|||
|
|
|
|
|
|
|
|
|
|
|||
Revenue recognized over time |
|
|
% |
|
|
% |
|
|
% |
|||
Revenue recognized at shipment |
|
|
% |
|
|
% |
|
|
% |
|||
The timing of revenue recognition, invoicing and cash collections affect trade accounts receivable, unbilled revenue (contract assets) and customer deposits (contract liabilities) on the Consolidated Balance Sheets. Unbilled revenue represents revenue on contracts that is recognized over time and exceeds the amount that has been billed to the customer. Unbilled revenue is separately presented in the Consolidated Balance Sheets. The Company may receive a progress payment from a customer, which is recorded as a customer deposit or have an unconditional right to receive a customer deposit prior to revenue being recognized. Because the performance obligations related to such customer deposits may not have been satisfied, a contract liability is recorded and an offsetting asset of equal amount is recorded as a trade accounts receivable until the deposit is collected. Customer deposits are separately presented in the Consolidated Balance Sheets. Customer deposits are not considered a significant financing component as they are generally received less than one year before the product is completed or used to procure specific material on a contract, as well as related overhead costs incurred during design and construction.
Net contract assets (liabilities) consisted of the following:
|
|
March 31, 2024 |
|
|
March 31, 2023 |
|
|
Change |
|
|
Change due to amounts acquired |
|
|
Change due to revenue recognized |
|
|
Change due to invoicing customers/ |
|
||||||
|
|
|
|
|
|
|
|
|
|
|
|
|
|
|
|
|
|
|
||||||
Unbilled revenue (contract assets) |
|
$ |
|
|
$ |
|
|
$ |
( |
) |
|
$ |
|
|
$ |
|
|
$ |
( |
) |
||||
Customer deposits (contract liabilities) |
|
|
( |
) |
|
|
( |
) |
|
|
( |
) |
|
|
( |
) |
|
|
|
|
|
( |
) |
|
Net contract (liabilities) assets |
|
$ |
( |
) |
|
$ |
( |
) |
|
$ |
( |
) |
|
|
|
|
|
|
|
|
|
|||
|
|
|
|
|
|
|
|
|
|
|
|
|
|
|
|
|
|
|
||||||
Contract liabilities at March 31, 2024 and 2023 include $
Receivables billed but not paid under retainage provisions in the Company’s customer contracts were $
The Company's remaining unsatisfied performance obligations represent a measure of the total dollar value of work to be performed on contracts awarded and in progress. The Company also refers to this measure as backlog. As of March 31, 2024, the Company had remaining unsatisfied performance obligations of $
56
Note 4 – Inventories:
Major classifications of inventories are as follows:
|
|
March 31, |
|
|||||
|
|
2024 |
|
|
2023 |
|
||
Raw materials and supplies |
|
$ |
|
|
$ |
|
||
Work in process |
|
|
|
|
|
|
||
Finished products |
|
|
|
|
|
|
||
|
|
$ |
|
|
$ |
|
||
Note 5 – Property, Plant and Equipment:
Major classifications of property, plant and equipment are as follows:
|
|
March 31, |
|
|||||
|
|
2024 |
|
|
2023 |
|
||
Land and land improvements |
|
$ |
|
|
$ |
|
||
Buildings and leasehold improvements |
|
|
|
|
|
|
||
Machinery and equipment |
|
|
|
|
|
|
||
Construction in progress |
|
|
|
|
|
|
||
|
|
|
|
|
|
|
||
Less – accumulated depreciation and amortization |
|
|
|
|
|
|
||
|
|
$ |
|
|
$ |
|
||
Depreciation expense in fiscal 2024, fiscal 2023 and fiscal 2022 was $
Note 6 – Intangible Assets:
Intangible assets are comprised of the following:
|
|
Weighted Average Amortization Period |
|
Gross Carrying Amount |
|
|
Accumulated Amortization |
|
|
Net Carrying Amount |
|
|||
At March 31, 2024 |
|
|
|
|
|
|
|
|
|
|
|
|||
Intangibles subject to amortization: |
|
|
|
|
|
|
|
|
|
|
|
|||
Customer relationships |
|
|
$ |
|
|
$ |
|
|
$ |
|
||||
Technology and technical know-how |
|
|
|
|
|
|
|
|
|
|
||||
Backlog |
|
|
|
|
|
|
|
|
|
|
||||
Tradename |
|
|
|
|
|
|
|
|
|
|
||||
|
|
|
|
$ |
|
|
$ |
|
|
$ |
|
|||
|
|
|
|
|
|
|
|
|
|
|
|
|||
Intangibles not subject to amortization: |
|
|
|
|
|
|
|
|
|
|
|
|||
Tradename |
|
|
$ |
|
|
$ |
— |
|
|
$ |
|
|||
|
|
|
|
$ |
|
|
$ |
— |
|
|
$ |
|
||
57
|
|
Weighted Average Amortization Period |
|
Gross Carrying Amount |
|
|
Accumulated Amortization |
|
|
Net Carrying Amount |
|
|||
At March 31, 2023 |
|
|
|
|
|
|
|
|
|
|
|
|||
Intangibles subject to amortization: |
|
|
|
|
|
|
|
|
|
|
|
|||
Customer relationships |
|
|
$ |
|
|
$ |
|
|
$ |
|
||||
Technology and technical know-how |
|
|
|
|
|
|
|
|
|
|
||||
Backlog |
|
|
|
|
|
|
|
|
|
|
||||
|
|
|
|
$ |
|
|
$ |
|
|
$ |
|
|||
|
|
|
|
|
|
|
|
|
|
|
|
|||
Intangibles not subject to amortization: |
|
|
|
|
|
|
|
|
|
|
|
|||
Tradename |
|
|
$ |
|
|
$ |
— |
|
|
$ |
|
|||
|
|
|
|
$ |
|
|
$ |
— |
|
|
$ |
|
||
A portion of Technology and technical know-how, tradenames, and Customer relationships are amortized in Selling, general and administrative expense on a straight line basis over each of their estimated useful lives. Backlog and a portion of technology and technical know-how are amortized in Cost of products sold over the projected conversion period based on management estimates at time of purchase. Intangible asset amortization was $
|
|
Annual Amortization |
|
|
2025 |
|
$ |
|
|
2026 |
|
|
|
|
2027 |
|
|
|
|
2028 |
|
|
|
|
2029 |
|
|
|
|
2030 and thereafter |
|
|
|
|
Total intangible amortization |
|
$ |
|
|
Note 7 – Product Warranty Liability:
A reconciliation of the changes in product warranty liability is as follows:
|
|
Year ended March 31, |
|
|||||
|
|
2024 |
|
|
2023 |
|
||
Balance at beginning of year |
|
$ |
|
|
$ |
|
||
Expense for product warranties |
|
|
|
|
|
|
||
Product warranty claims paid |
|
|
( |
) |
|
|
( |
) |
Balance at end of year |
|
$ |
|
|
$ |
|
||
The product warranty liability is included in the line item Accrued expenses and other current liabilities in the Consolidated Balance Sheets.
Note 8 - Leases:
The Company leases certain manufacturing facilities, office space, machinery and office equipment. An arrangement is considered to contain a lease if it conveys the right to use and control an identified asset for a period of time in exchange for consideration. If it is determined that an arrangement contains a lease, then a classification of a lease as operating or finance is determined by evaluating the five criteria outlined in the lease accounting guidance at inception. Leases generally have remaining terms of
58
and the Company does not sublease to any third parties. As of March 31, 2024, the Company did not have any material leases that have been signed but not commenced.
Right-of-use ("ROU") lease assets and lease liabilities are recognized based on the present value of the future minimum lease payments over the lease term at commencement date. ROU assets represent the Company’s right to use an underlying asset for the lease term and lease liabilities represent the Company’s obligation to make payments in exchange for that right of use. Finance lease ROU assets and operating lease ROU assets are included in the line items Property, plant and equipment, net and Operating lease assets, respectively, in the Consolidated Balance Sheets. The current portion and non-current portion of finance and operating lease liabilities are all presented separately in the Consolidated Balance Sheets.
The Company previously entered into operating leases with Ascent Properties Group, LLC ("Ascent"), a limited liability company of which our Chief Executive Officer holds a majority interest, for an office and manufacturing building in Arvada, CO as well as machinery and equipment. During fiscal 2023, the Company entered into an additional lease with Ascent for another manufacturing building in Arvada, CO. In connection with such leases, the Company made fixed minimum lease payments to the lessor of $
The discount rate implicit within the Company's leases is generally not readily determinable, and therefore, the Company uses an incremental borrowing rate in determining the present value of lease payments based on rates available at commencement.
The weighted average remaining lease term and discount rate for finance and operating leases are as follows:
|
|
March 31, |
|
|||||
|
|
2024 |
|
|
2023 |
|
||
Finance Leases |
|
|
|
|
|
|
||
Weighted-average remaining lease term in years |
|
|
|
|
|
|
||
Weighted-average discount rate |
|
|
% |
|
|
% |
||
|
|
|
|
|
|
|
||
Operating Leases |
|
|
|
|
|
|
||
Weighted-average remaining lease term in years |
|
|
|
|
|
|
||
Weighted-average discount rate |
|
|
% |
|
|
% |
||
The components of lease expense are as follows:
|
|
Year Ended March 31, |
|
|||||
|
|
2024 |
|
|
2023 |
|
||
Finance lease cost: |
|
|
|
|
|
|
||
Amortization of right-of-use assets |
|
$ |
|
|
$ |
|
||
Interest on lease liabilities |
|
|
|
|
|
|
||
Operating lease cost |
|
|
|
|
|
|
||
Short-term lease cost |
|
|
|
|
|
|
||
Total lease cost |
|
$ |
|
|
$ |
|
||
Operating lease costs during fiscal 2024, fiscal 2023 and fiscal 2022 were included within Cost of sales and Selling, general and administrative expenses.
As of March 31, 2024, future minimum payments required under non-cancelable leases are:
|
|
Operating |
|
|
Finance |
|
||
2025 |
|
$ |
|
|
$ |
|
||
2026 |
|
|
|
|
|
|
||
2027 |
|
|
|
|
|
|
||
2028 |
|
|
|
|
|
|
||
2029 and thereafter |
|
|
|
|
|
|
||
Total lease payments |
|
|
|
|
|
|
||
|
|
|
|
|
|
|
||
Less – amount representing interest |
|
|
|
|
|
|
||
Present value of net minimum lease payments |
|
$ |
|
|
$ |
|
||
59
ROU assets obtained in exchange for new operating lease liabilities were $
Note 9 - Debt:
On October 13, 2023, the Company terminated its revolving credit facility and repaid its term loan with Bank of America and entered into a new
Long term debt is comprised of the following:
|
|
March 31, |
|
|
|
|
2023 |
|
|
Bank of America term loan |
|
$ |
|
|
Less: unamortized debt issuance costs |
|
|
( |
) |
|
|
|
|
|
Less: current portion |
|
|
|
|
Total |
|
$ |
|
|
The New Revolving Credit Facility contains customary terms and conditions, including representations and warranties and affirmative and negative covenants, as well as financial covenants for the benefit of Wells Fargo, which require the Company to maintain (i) a consolidated total leverage ratio not to exceed
Borrowings under the New Revolving Credit Facility bear interest at a rate equal to, at the Company’s
The Company is required to pay a quarterly commitment fee on the unused portion of the New Revolving Credit Facility during the applicable quarter at a per annum rate also determined by reference to the Company’s then-current consolidated total leverage ratio, which fee ranges between
In connection with the termination of the old revolving credit facility and term loan with Bank of America, the Company paid $
As of March 31, 2024, $
60
Note 10 - Financial Instruments and Derivative Financial Instruments:
Concentrations of Credit Risk
Financial instruments that potentially subject the Company to concentrations of credit risk consist principally of cash, cash equivalents, and trade accounts receivable. The Company places its cash, cash equivalents with high credit quality financial institutions, and evaluates the credit worthiness of these financial institutions on a regular basis. Concentrations of credit risk with respect to trade accounts receivable are limited due to the large number of customers comprising the Company's customer base and their geographic dispersion. At March 31, 2024 and 2023, the Company had no significant concentrations of credit risk.
Letters of Credit
The Company has entered into standby letter of credit agreements with financial institutions relating to the guarantee of future performance on certain contracts. At March 31, 2024 and 2023, the Company was contingently liable on outstanding standby letters of credit aggregating $
Fair Value of Financial Instruments
The estimates of the fair value of financial instruments are summarized as follows:
Cash and cash equivalents: The carrying amount of cash and cash equivalents approximates fair value due to the short-term maturity of these instruments and are considered Level 1 assets in the fair value hierarchy.
Short-term and long-term debt: The carrying values of credit facilities with variable rates of interest approximates fair values and is considered a Level 2 liability in the fair value hierarchy.
Note 11 – Income Taxes:
An analysis of the components of income (loss) before provision (benefit) for income taxes is presented below:
|
|
Year ended March 31, |
|
|||||||||
|
|
2024 |
|
|
2023 |
|
|
2022 |
|
|||
United States |
|
$ |
|
|
$ |
( |
) |
|
$ |
( |
) |
|
Asia |
|
|
|
|
|
|
|
|
|
|||
Income (loss) before provision (benefit) for income taxes |
|
$ |
|
|
$ |
|
|
$ |
( |
) |
||
The provision (benefit) for income taxes consists of:
|
|
Year ended March 31, |
|
|||||||||
|
|
2024 |
|
|
2023 |
|
|
2022 |
|
|||
Current: |
|
|
|
|
|
|
|
|
|
|||
Federal |
|
$ |
|
|
$ |
|
|
$ |
( |
) |
||
State |
|
|
|
|
|
|
|
|
|
|||
Foreign |
|
|
|
|
|
|
|
|
|
|||
|
|
|
|
|
|
|
|
|
|
|||
Deferred: |
|
|
|
|
|
|
|
|
|
|||
Federal |
|
|
( |
) |
|
|
( |
) |
|
|
( |
) |
State |
|
|
|
|
|
( |
) |
|
|
( |
) |
|
Foreign |
|
|
( |
) |
|
|
|
|
|
( |
) |
|
Changes in valuation allowance |
|
|
( |
) |
|
|
( |
) |
|
|
( |
) |
|
|
|
( |
) |
|
|
( |
) |
|
|
( |
) |
Total provision (benefit) for income taxes |
|
$ |
|
|
$ |
|
|
$ |
( |
) |
||
61
The reconciliation of the provision (benefit) calculated using the U.S. federal tax rate with the provision (benefit) for income taxes presented in the consolidated financial statements is as follows:
|
|
Year ended March 31, |
|
|||||||||
|
|
2024 |
|
|
2023 |
|
|
2022 |
|
|||
Provision (benefit) for income taxes at federal rate |
|
$ |
|
|
$ |
|
|
$ |
( |
) |
||
State taxes |
|
|
|
|
|
|
|
|
( |
) |
||
Charges not deductible for income tax purposes |
|
|
|
|
|
|
|
|
|
|||
Stock based compensation |
|
|
( |
) |
|
|
|
|
|
|
||
Research and development tax credits |
|
|
( |
) |
|
|
( |
) |
|
|
( |
) |
Valuation allowance |
|
|
( |
) |
|
|
( |
) |
|
|
( |
) |
Effect of foreign tax rate |
|
|
|
|
|
|
|
|
|
|||
Nondeductible fringe benefits |
|
|
|
|
|
|
|
|
|
|||
162(m) |
|
|
|
|
|
|
|
|
|
|||
Foreign withholding tax |
|
|
|
|
|
|
|
|
|
|||
Foreign-derived intangible income deduction |
|
|
( |
) |
|
|
|
|
|
( |
) |
|
Global intangible low-taxed income |
|
|
( |
) |
|
|
|
|
|
|
||
Other |
|
|
|
|
|
|
|
|
( |
) |
||
Provision (benefit) for income taxes |
|
$ |
|
|
$ |
|
|
$ |
( |
) |
||
The net deferred income tax asset (liability) recorded in the Consolidated Balance Sheets results from differences between financial statement and tax reporting of income and deductions. A summary of the composition of the Company's net deferred income tax asset (liability) follows:
|
|
March 31, |
|
|||||
|
|
2024 |
|
|
2023 |
|
||
Depreciation |
|
$ |
( |
) |
|
$ |
( |
) |
Accrued compensation |
|
|
|
|
|
|
||
Goodwill |
|
|
( |
) |
|
|
( |
) |
Prepaid pension asset |
|
|
( |
) |
|
|
( |
) |
Accrued pension liability |
|
|
|
|
|
|
||
Accrued postretirement benefits |
|
|
|
|
|
|
||
Compensated absences |
|
|
|
|
|
|
||
Inventories |
|
|
|
|
|
( |
) |
|
Warranty liability |
|
|
|
|
|
|
||
Accrued expenses |
|
|
|
|
|
|
||
Equity-based compensation |
|
|
|
|
|
|
||
Allowance for doubtful accounts |
|
|
|
|
|
|
||
Operating lease assets |
|
|
( |
) |
|
|
( |
) |
Operating lease liabilities |
|
|
|
|
|
|
||
Acquisition costs |
|
|
|
|
|
|
||
Intangible assets |
|
|
|
|
|
|
||
New York State investment tax credit |
|
|
|
|
|
|
||
Research and development tax credit |
|
|
|
|
|
|
||
Research and development credit carryforward |
|
|
|
|
|
|
||
Net operating loss carryforwards |
|
|
|
|
|
|
||
Capital loss carryforward |
|
|
|
|
|
|
||
Other |
|
|
( |
) |
|
|
( |
) |
|
|
|
|
|
|
|
||
Less: Valuation allowance |
|
|
( |
) |
|
|
( |
) |
Total |
|
$ |
|
|
$ |
|
||
Deferred income taxes include the impact of state investment tax credits of $
In assessing the realizability of deferred tax assets, management considers, within each taxing jurisdiction, whether it is more likely than not that some portion or all of the deferred tax assets will not be realized. Management considers the scheduled reversal of deferred tax liabilities, projected future taxable income and tax planning strategies in making this assessment. Based on the consideration
62
of the weight of both positive and negative evidence, management determined that a portion of the deferred tax assets as of March 31, 2024 and 2023 related to certain state investment tax credits and the capital loss related to Energy Steel would not be realized, and recorded a valuation allowance of $
The Company files federal and state income tax returns in several domestic and international jurisdictions. In most tax jurisdictions, returns are subject to examination by the relevant tax authorities for a number of years after the returns have been filed. The Company is subject to U.S. federal examination for tax years
Note 12 – Employee Benefit Plans:
Retirement Plans
The Company has a qualified defined benefit plan covering Batavia based employees hired prior to January 1, 2003, which is non-contributory. Benefits are based on the employee's years of service and average earnings for the
The components of pension (benefit) cost are:
|
|
Year ended March 31, |
|
|||||||||
|
|
2024 |
|
|
2023 |
|
|
2022 |
|
|||
Service cost during the period |
|
$ |
|
|
$ |
|
|
$ |
|
|||
Interest cost on projected benefit obligation |
|
|
|
|
|
|
|
|
|
|||
Expected return on assets |
|
|
( |
) |
|
|
( |
) |
|
|
( |
) |
Amortization of: |
|
|
|
|
|
|
|
|
|
|||
Actuarial loss |
|
|
|
|
|
|
|
|
|
|||
Net pension cost (benefit) |
|
$ |
|
|
$ |
( |
) |
|
$ |
( |
) |
|
The components of net pension (benefit) cost other than the service cost component are included in Other expense (income), net in the Consolidated Statements of Operations.
The weighted average actuarial assumptions used to determine net pension cost are:
|
|
Year ended March 31, |
|
|||||||||
|
|
2024 |
|
|
2023 |
|
|
2022 |
|
|||
Discount rate |
|
|
% |
|
|
% |
|
|
% |
|||
Rate of increase in compensation levels |
|
|
% |
|
|
% |
|
|
% |
|||
Long-term rate of return on plan assets |
|
|
% |
|
|
% |
|
|
% |
|||
The expected long-term rate of return is based on the mix of investments that comprise plan assets and external forecasts of future long-term investment returns, historical returns, correlations and market volatilities.
The Company does
63
Changes in the Company's benefit obligation, plan assets and funded status for the pension plan are presented below:
|
|
Year ended March 31, |
|
|||||
|
|
2024 |
|
|
2023 |
|
||
Change in the benefit obligation |
|
|
|
|
|
|
||
Projected benefit obligation at beginning of year |
|
$ |
|
|
$ |
|
||
Service cost |
|
|
|
|
|
|
||
Interest cost |
|
|
|
|
|
|
||
Actuarial loss |
|
|
( |
) |
|
|
( |
) |
Benefit payments |
|
|
( |
) |
|
|
( |
) |
Liability released through annuity purchase |
|
|
( |
) |
|
|
( |
) |
Projected benefit obligation at end of year |
|
$ |
|
|
$ |
|
||
|
|
|
|
|
|
|
||
|
|
|
|
|
|
|
||
Change in fair value of plan assets |
|
|
|
|
|
|
||
Fair value of plan assets at beginning of year |
|
$ |
|
|
$ |
|
||
Actual return on plan assets |
|
|
|
|
|
( |
) |
|
Benefit and administrative expense payments |
|
|
( |
) |
|
|
( |
) |
Annuities purchased |
|
|
( |
) |
|
|
( |
) |
Fair value of plan assets at end of year |
|
$ |
|
|
$ |
|
||
|
|
|
|
|
|
|
||
Funded status |
|
|
|
|
|
|
||
Funded status at end of year |
|
$ |
|
|
$ |
|
||
Amount recognized in the Consolidated Balance Sheets |
|
$ |
|
|
$ |
|
||
The weighted average actuarial assumptions used to determine the benefit obligation are:
|
|
March 31, |
|
|||||
|
|
2024 |
|
|
2023 |
|
||
Discount rate |
|
|
% |
|
|
% |
||
Rate of increase in compensation levels |
|
|
% |
|
|
% |
||
During fiscal 2024 and fiscal 2023, the pension plan released liabilities for vested benefits of certain participants through the purchase of nonparticipating annuity contracts with a third-party insurance company. As a result of these transactions, in fiscal 2024 and fiscal 2023, the projected benefit obligation and plan assets decreased $
Amounts recognized in accumulated other comprehensive loss, net of income tax, consist of:
|
|
March 31, |
|
|||||
|
|
2024 |
|
|
2023 |
|
||
Net actuarial loss |
|
$ |
|
|
$ |
|
||
The increase in accumulated other comprehensive loss, net of income tax, consists of:
|
|
March 31, |
|
|||||
|
|
2024 |
|
|
2023 |
|
||
Net actuarial loss arising during the year |
|
$ |
|
|
$ |
|
||
Amortization of actuarial loss |
|
|
( |
) |
|
|
( |
) |
|
|
$ |
( |
) |
|
$ |
|
|
64
The following benefit payments, which reflect future service, are expected to be paid during the fiscal years ending March 31:
2025 |
|
$ |
|
|
2026 |
|
|
|
|
2027 |
|
|
|
|
2028 |
|
|
|
|
2029 |
|
|
|
|
2030-2034 |
|
|
|
|
Total |
|
$ |
|
The weighted average asset allocation of the plan assets by asset category is as follows:
|
|
|
|
|
March 31, |
|
||||||
Asset Category |
|
Target Allocation |
|
|
2024 |
|
|
2023 |
|
|||
Equity securities |
|
|
% |
|
|
% |
|
|
% |
|||
Debt securities |
|
|
% |
|
|
% |
|
|
% |
|||
|
|
|
|
|
|
% |
|
|
% |
|||
The investment strategy of the plan is to generate a consistent total investment return sufficient to pay present and future plan benefits to retirees, while minimizing the long-term cost to the Company. Target allocations for asset categories are used to earn a reasonable rate of return, provide required liquidity and minimize the risk of large losses. Targets are adjusted when considered necessary to reflect trends and developments within the overall investment environment.
The fair values of the Company's pension plan assets at March 31, 2024 and 2023, by asset category, are as follows:
|
|
|
|
|
Fair Value Measurements Using |
|
||||||||||
Asset Category |
|
At |
|
|
Quoted prices in |
|
|
Significant other |
|
|
Significant |
|
||||
Cash |
|
$ |
|
|
$ |
|
|
$ |
— |
|
|
$ |
— |
|
||
|
|
|
|
|
|
|
|
|
|
|
|
|
||||
Equity securities: |
|
|
|
|
|
|
|
|
|
|
|
|
||||
U.S. companies |
|
|
|
|
|
|
|
|
— |
|
|
|
— |
|
||
International companies |
|
|
|
|
|
|
|
|
— |
|
|
|
— |
|
||
|
|
|
|
|
|
|
|
|
|
|
|
|
||||
Fixed income: |
|
|
|
|
|
|
|
|
|
|
|
|
||||
Corporate bond funds |
|
|
|
|
|
|
|
|
|
|
|
|
||||
Long-term |
|
|
|
|
|
|
|
|
— |
|
|
|
— |
|
||
|
|
$ |
|
|
$ |
|
|
$ |
— |
|
|
$ |
— |
|
||
|
|
|
|
|
Fair Value Measurements Using |
|
||||||||||
Asset Category |
|
At |
|
|
Quoted prices in |
|
|
Significant other |
|
|
Significant |
|
||||
Cash |
|
$ |
|
|
$ |
|
|
$ |
— |
|
|
$ |
— |
|
||
|
|
|
|
|
|
|
|
|
|
|
|
|
||||
Equity securities: |
|
|
|
|
|
|
|
|
|
|
|
|
||||
U.S. companies |
|
|
|
|
|
|
|
|
— |
|
|
|
— |
|
||
International companies |
|
|
|
|
|
|
|
|
— |
|
|
|
— |
|
||
|
|
|
|
|
|
|
|
|
|
|
|
|
||||
Fixed income: |
|
|
|
|
|
|
|
|
|
|
|
|
||||
Corporate bond funds |
|
|
|
|
|
|
|
|
|
|
|
|
||||
Long-term |
|
|
|
|
|
|
|
|
— |
|
|
|
— |
|
||
|
|
$ |
|
|
$ |
|
|
$ |
— |
|
|
$ |
— |
|
||
The fair value of Level 1 pension assets is obtained by reference to the last quoted price of the respective security on the market which it trades. See Note 1 to the Consolidated Financial Statements.
65
On February 4, 2003, the Company closed the defined benefit plan to all employees hired on or after January 1, 2003. In place of the defined benefit plan, these employees participate in the Company's domestic defined contribution plan. The Company contributes a fixed percentage of employee compensation to this plan on an annual basis for these employees. The Company's contribution to the defined contribution plan for these employees in fiscal 2024, fiscal 2023 and fiscal 2022 was $
The Company has an unfunded Supplemental Executive Retirement Plan ("SERP") which provides retirement benefits associated with wages in excess of the legislated qualified plan maximums. Pension expense recorded in fiscal 2024, fiscal 2023, and fiscal 2022 related to this plan was $
The Company has a domestic defined contribution plan (401(k)) covering substantially all employees. The Company provides
Other Postretirement Benefits
In addition to providing pension benefits, the Company has a plan in the U.S. that provides health care benefits for eligible retirees and eligible survivors of retirees. The Company's share of the medical premium cost has been capped at $
On February 4, 2003, the Company terminated postretirement health care benefits for its U.S. employees. Benefits payable to retirees of record on April 1, 2003 remained unchanged.
The components of postretirement benefit expense are:
|
|
Year ended March 31, |
|
|||||||||
|
|
2024 |
|
|
2023 |
|
|
2022 |
|
|||
Interest cost on accumulated benefit obligation |
|
$ |
|
|
$ |
|
|
$ |
|
|||
Amortization of actuarial loss |
|
|
|
|
|
|
|
|
|
|||
Net postretirement benefit expense |
|
$ |
|
|
$ |
|
|
$ |
|
|||
Net postretirement benefit expense is included in Other (expense) income, net in the Consolidated Statements of Operations.
The weighted average discount rates used to develop the net postretirement benefit cost were
66
Changes in the Company's benefit obligation, plan assets and funded status for the plan are as follows:
|
|
Year ended March 31, |
|
|||||
|
|
2024 |
|
|
2023 |
|
||
Change in the benefit obligation |
|
|
|
|
|
|
||
Projected benefit obligation at beginning of year |
|
$ |
|
|
$ |
|
||
Interest cost |
|
|
|
|
|
|
||
Actuarial gain |
|
|
( |
) |
|
|
( |
) |
Benefit payments |
|
|
( |
) |
|
|
( |
) |
Projected benefit obligation at end of year |
|
$ |
|
|
$ |
|
||
Change in fair value of plan assets |
|
|
|
|
|
|
||
Fair value of plan assets at beginning of year |
|
$ |
— |
|
|
$ |
— |
|
Employer contribution |
|
|
|
|
|
|
||
Benefit payments |
|
|
( |
) |
|
|
( |
) |
Fair value of plan assets at end of year |
|
$ |
— |
|
|
$ |
— |
|
|
|
|
|
|
|
|
||
Funded status |
|
|
|
|
|
|
||
Funded status at end of year |
|
$ |
( |
) |
|
$ |
( |
) |
Amount recognized in the Consolidated Balance Sheets |
|
$ |
( |
) |
|
$ |
( |
) |
The weighted average actuarial assumptions used to develop the accrued postretirement benefit obligation were:
|
|
March 31, |
|
|||||
|
|
2024 |
|
|
2023 |
|
||
Discount rate |
|
|
% |
|
|
% |
||
Medical care cost trend rate |
|
|
% |
|
|
% |
||
The medical care cost trend rate used in the actuarial computation ultimately reduces to
The current portion of the accrued postretirement benefit obligation of $
Amounts recognized in accumulated other comprehensive loss, net of income tax, consist of:
|
|
March 31, |
|
|||||
|
|
2024 |
|
|
2023 |
|
||
Net actuarial (gain) loss |
|
$ |
( |
) |
|
$ |
|
|
The decrease in accumulated other comprehensive loss, net of income tax, consists of:
|
|
March 31, |
|
|||||
|
|
2024 |
|
|
2023 |
|
||
Net actuarial gain arising during the year |
|
$ |
( |
) |
|
$ |
( |
) |
Amortization of actuarial loss |
|
|
( |
) |
|
|
( |
) |
|
|
$ |
( |
) |
|
$ |
( |
) |
The following benefit payments are expected to be paid during the fiscal years ending March 31:
2025 |
|
$ |
|
|
2026 |
|
|
|
|
2027 |
|
|
|
|
2028 |
|
|
|
|
2029 |
|
|
|
|
2030-2034 |
|
|
|
|
Total |
|
$ |
|
67
Note 13 - Stock Compensation Plans:
The 2020 Graham Corporation Equity Incentive Plan (the "2020 Plan") provides for the issuance of
The following grants of restricted stock units ("RSUs"), performance stock units ("PSUs"), and restricted stock awards ("RSAs") were awarded:
|
|
Vest |
|
|
Vest Per Year |
|
|
Vest |
|
|
|
|||
|
|
Anniversary (1) |
|
|
Over |
|
|
Anniversary (1) |
|
|
|
|||
|
|
|
|
|
Officers and |
|
|
Officers and |
|
|
Total Shares |
|||
Year Ended March 31, |
|
Directors |
|
|
Key Employees |
|
|
Key Employees |
|
|
Awarded |
|||
2024 |
|
|
|
|
|
|
|
|
|
|
|
|||
Time Vesting RSUs |
|
|
|
|
|
|
|
|
||||||
Performance Vesting PSUs |
|
|
|
|
|
|
|
|
|
|||||
2023 |
|
|
|
|
|
|
|
|
|
|
|
|||
Time Vesting RSUs |
|
|
|
|
|
|
|
|||||||
Performance Vesting PSUs |
|
|
|
|
|
|
|
|
|
|||||
2022 |
|
|
|
|
|
|
|
|
|
|
|
|||
Time Vested RSAs |
|
|
|
|
|
|
|
|
||||||
Performance Vested RSAs |
|
|
|
|
|
|
|
|
|
|||||
(1)
Stock-based compensation cost and the related tax benefits were as follows:
|
|
Stock-Based |
|
|
Related |
|
||
Year Ended March 31, |
|
Compensation Cost |
|
|
Tax Benefits |
|
||
2024 |
|
|
|
|
|
|
||
2023 |
|
|
|
|
|
|
||
2022 |
|
|
|
|
|
|
||
The following table summarizes information about the Company's stock option awards during, fiscal 2023 and fiscal 2022:
|
|
|
|
|
Weighted |
|
|
|
|
|
||
|
|
Shares |
|
|
Average |
|
|
Weighted |
|
Aggregate |
||
|
|
Under |
|
|
Exercise |
|
|
Average Remaining |
|
Intrinsic |
||
|
|
Option |
|
|
Price |
|
|
Contractual Term |
|
Value |
||
Outstanding at March 31, 2021 |
|
|
|
|
|
|
|
|
|
|
||
Exercised |
|
|
|
|
|
|
|
|
|
|
||
Expired |
|
|
( |
) |
|
|
|
|
|
|
|
|
Outstanding at March 31, 2022 |
|
|
|
|
|
|
|
|
|
|
||
Exercised |
|
|
|
|
|
|
|
|
|
|
||
Expired |
|
|
( |
) |
|
|
|
|
|
|
|
|
Outstanding at March 31, 2023 |
|
|
|
|
|
|
|
|
|
|
||
|
|
|
|
|
|
|
|
|
|
|
||
Vested or expected to vest at March 31, 2023 |
|
|
|
|
|
|
|
|
|
|
||
|
|
|
|
|
|
|
|
|
|
|
||
Exercisable at March 31, 2023 |
|
|
|
|
|
|
|
|
|
|
||
As of March 31, 2024, there was $
68
The following table summarizes information about the Company's RSAs, RSUs, and PSUs granted during fiscal 2024, fiscal 2023 and fiscal 2022:
|
|
Number of RSAs, RSUs and PSUs |
|
|
Weighted Average |
|
|
Aggregate |
|
|||
Non-vested at March 31, 2021 |
|
|
|
|
|
|
|
|
|
|||
Granted |
|
|
|
|
|
|
|
|
|
|||
Vested |
|
|
( |
) |
|
|
|
|
|
|
||
Forfeited |
|
|
( |
) |
|
|
|
|
|
|
||
Non-vested at March 31, 2022 |
|
|
|
|
|
|
|
|
|
|||
Granted |
|
|
|
|
|
|
|
|
|
|||
Vested |
|
|
( |
) |
|
|
|
|
|
|
||
Forfeited |
|
|
( |
) |
|
|
|
|
|
|
||
Non-vested at March 31, 2023 |
|
|
|
|
|
|
|
|
|
|||
Granted |
|
|
|
|
|
|
|
|
|
|||
Vested |
|
|
( |
) |
|
|
|
|
|
|
||
Forfeited |
|
|
( |
) |
|
|
|
|
|
|
||
Non-vested at March 31, 2024 |
|
|
|
|
|
|
|
$ |
|
|||
The Company has an Employee Stock Purchase Plan, as amended (the "ESPP"), which allows eligible employees to purchase shares of the Company's common stock at a discount of up to
|
|
Issued from |
|
|
Issued from |
|
|
Stock-Based |
|
|
Related |
|
||||
Year Ended March 31, |
|
Treasury Shares |
|
|
Common Stock |
|
|
Compensation Cost |
|
|
Tax Benefits |
|
||||
2024 |
|
|
|
|
|
|
|
|
|
|
|
|
||||
2023 |
|
|
|
|
|
|
|
|
|
|
|
|
||||
2022 |
|
|
|
|
|
|
|
|
|
|
|
|
||||
Note 14 – Changes in Accumulated Other Comprehensive Loss:
The changes in accumulated other comprehensive loss by component for fiscal 2024 and fiscal 2023 are:
|
|
Pension and Other Postretirement |
|
|
Foreign |
|
|
Total |
|
|||
Balance at April 1, 2022 |
|
|
( |
) |
|
|
|
|
|
( |
) |
|
Other comprehensive income before reclassifications |
|
|
( |
) |
|
|
( |
) |
|
|
( |
) |
Amounts reclassified from accumulated other |
|
|
|
|
|
|
|
|
|
|||
Net current-period other comprehensive income |
|
|
( |
) |
|
|
( |
) |
|
|
( |
) |
Balance at March 31, 2023 |
|
|
( |
) |
|
|
|
|
|
( |
) |
|
Other comprehensive income before reclassifications |
|
|
|
|
|
( |
) |
|
|
( |
) |
|
Amounts reclassified from accumulated other |
|
|
|
|
|
|
|
|
|
|||
Net current-period other comprehensive income |
|
|
|
|
|
( |
) |
|
|
|
||
Balance at March 31, 2024 |
|
$ |
( |
) |
|
$ |
( |
) |
|
$ |
( |
) |
69
The reclassifications out of accumulated other comprehensive loss by component are as follows:
Year ended March 31, 2024
Details about Accumulated Other |
|
Amounts Reclassified from |
|
|
|
Affected Line Item in the |
|
Pension and other postretirement benefit items: |
|
|
|
|
|
|
|
Amortization of unrecognized prior service |
|
$ |
— |
|
|
|
|
Amortization of actuarial loss |
|
|
( |
) |
(1) |
|
|
|
|
|
( |
) |
|
|
Income before provision for income taxes |
|
|
|
( |
) |
|
|
Provision for income taxes |
|
|
$ |
( |
) |
|
|
Net income |
Year ended March 31, 2023
Details about Accumulated Other |
|
Amounts Reclassified from |
|
|
|
Affected Line Item in the |
|
Pension and other postretirement benefit items: |
|
|
|
|
|
|
|
Amortization of unrecognized prior service |
|
$ |
— |
|
|
|
|
Amortization of actuarial loss |
|
|
( |
) |
(1) |
|
|
|
|
|
( |
) |
|
|
Income before provision for income taxes |
|
|
|
( |
) |
|
|
Provision for income taxes |
|
|
$ |
( |
) |
|
|
Net income |
Note 15 - Segment Information:
The Company has
See Note 3 to the Consolidated Financial Statements for net sales by market and geographic area.
In fiscal 2024, the Company had
Note 16 – Purchase of Treasury Stock:
On January 29, 2015, the Company’s Board of Directors authorized a stock repurchase program. Under the stock repurchase program the Company is permitted to repurchase up to $
Note 17 – Commitments and Contingencies:
The Company has been named as a defendant in lawsuits alleging personal injury from exposure to asbestos allegedly contained in, or accompanying, products made by the Company. The Company is a co-defendant with numerous other defendants in these lawsuits and intends to vigorously defend itself against these claims. The claims in the Company’s current lawsuits are similar to those made in previous asbestos-related suits that named the Company as a defendant, which either were dismissed when it was shown that the Company had not supplied products to the plaintiffs’ places of work or were settled for immaterial amounts. The Company cannot provide any assurances that any pending or future matters will be resolved in the same manner as previous lawsuits.
70
During the third quarter of fiscal 2024, the Audit Committee of the Board of Directors, with the assistance of external counsel and forensic professionals, concluded an investigation into a whistleblower complaint received regarding GIPL. The investigation identified both evidence supporting the complaint and other misconduct by employees. The other misconduct totaled $
As of March 31, 2024, the Company was subject to the claims noted above, as well as other legal proceedings and potential claims that have arisen in the ordinary course of business. Although the outcome of the lawsuits, legal proceedings or potential claims to which the Company is, or may become, a party to cannot be determined and an estimate of the reasonably possible loss or range of loss cannot be made for the majority of the claims, management does not believe that the outcomes, either individually or in the aggregate, will have a material effect on the Company’s results of operations, financial position or cash flows.
Note 18 - Other Operating (Income) Expense, Net:
During the fourth quarter ended March 31, 2024, the Company adjusted the earn-out value related to the acquisition of P3 (see Note 2), therefore the Company recognized a change in fair value of the contingent liability in the amount $
On November 29, 2021, the Company and Jeffrey F. Glajch entered into a Severance and Transition Agreement (the "Agreement") pursuant to which Mr. Glajch agreed to retire from his position the earlier of June 30, 2022 or as of a date upon which the Company and Mr. Glajch otherwise mutually agreed. On March 27, 2022, the Company and Mr. Glajch entered into an Amended and Restated Severance and Transition Agreement (the "Amended Agreement") in which Mr. Glajch agreed to retire on April 15, 2022. Mr. Glajch agreed to provide certain transition-related services to the Company for a period of nine months following the date of separation. The Amended Agreement also provides that the company will pay Mr. Glajch a severance payment in an amount equal to nine months of Mr. Glajch's base salary commencing in April 2022 as well as health care premiums. As a result, expense of $
On August 9, 2021, the Company and James R. Lines entered into a Severance and Transition Agreement (the "Transition Agreement") pursuant to which Mr. Lines resigned from his position as the Company's Chief Executive Officer and as a member of the Board of Directors, and from positions he holds with all Company subsidiaries and affiliates, effective as of the close of business on August 31, 2021. The Transition Agreement provides that for a period of 18 months following the separation date, Mr. Lines is paid his base salary as well as health care premiums. As a result, expense of $
During the second quarter ended September 30, 2021, the Company terminated the earn-out agreement related to the acquisition of BN, therefore the Company recognized a change in fair value of the contingent liability in the amount $
71
Item 9. Changes in and Disagreements with Accountants on Accounting and Financial Disclosure
Not applicable.
Item 9A. Controls and Procedures
Conclusion Regarding Disclosure Controls and Procedures
Management, including our President and Chief Executive Officer (principal executive officer) and Vice President–Finance and Chief Financial Officer (principal financial officer) has evaluated the effectiveness of the design and operation of our disclosure controls and procedures as of the end of the period covered by this Form 10-K. Based upon, and as of the date of that evaluation, our President and Chief Executive Officer and Vice President–Finance and Chief Financial Officer (principal financial officer) concluded that the disclosure controls and procedures were effective, in all material respects, to ensure that information required to be disclosed in the reports we file and submit under the Securities Exchange Act of 1934, as amended (the "Exchange Act"), is (i) recorded, processed, summarized and reported as and when required and (ii) is accumulated and communicated to our management, including our President and Chief Executive Officer and Vice President-Finance and Chief Financial Officer, as appropriate, to allow timely decisions regarding required disclosure.
Changes in Internal Control Over Financial Reporting
Other than the events discussed under the section entitled "P3 Technologies, LLC Acquisition" below, there has been no change to our internal control over financial reporting during the fourth quarter of the fiscal year covered by this Annual Report on Form 10-K that has materially affected, or that is reasonably likely to materially affect our internal control over financial reporting.
P3 Technologies, LLC Acquisition
On November 9, 2023, we acquired P3 Technologies, LLC, a privately-owned custom turbomachinery engineering, product development, and manufacturing business that serves the space, new energy and medical industries. For additional information regarding the acquisition, refer to Note 2 to the Consolidated Financial Statements included in Item 8 in this Annual Report on Form 10-K and Management’s Discussion and Analysis of Financial Condition and Results of Operations included in Item 7 in this Annual Report on Form 10-K. Based on the recent completion of this acquisition and, pursuant to the Securities and Exchange Commission’s guidance that an assessment of a recently acquired business may be omitted from the scope of an assessment for a period not to exceed one year form the date of acquisition, the scope of our assessment of the effectiveness of internal control over financial reporting as of the end of the period covered by this report does not include P3 Technologies, LLC.
We are in the process of implementing our internal control structure over P3 Technologies, LLC and we expect that this effort will be completed during the fiscal year ending March 31, 2025.
Management's Annual Report on Internal Control over Financial Reporting
Management is responsible for establishing and maintaining adequate internal control over financial reporting, as such term is defined in Exchange Act Rule 13a-15(f). A control system, no matter how well conceived and operated, can provide only reasonable, not absolute, assurance that the objectives of the control system are met. Because of the inherent limitations in all control systems, no evaluation of controls can provide absolute assurance that all control issues and instances of fraud, if any, within our organization have been detected. These inherent limitations include the realities that judgments in decision-making can be faulty, and that breakdowns can occur because of simple error or mistake. Additionally, controls can be circumvented by the individual acts of some persons, by collusion of two or more people, or by management override. The design of any system of controls is also based in part upon certain assumptions about the likelihood of future events, and there can be no assurance that any design will succeed in achieving our stated goals under all potential future conditions. Moreover, over time controls may become inadequate because of changes in conditions, or the degree of compliance with the policies or procedures may deteriorate. Because of the inherent limitations in the design of an internal control system, misstatements due to error or fraud may occur and not be detected. However, these inherent limitations are known features of the financial reporting process. Therefore, it is possible to design into the process safeguards to reduce, though not eliminate, this risk.
Under the supervision and with the participation of management, including our President and Chief Executive Officer (principal executive officer) and Vice President–Finance and Chief Financial Officer (principal financial officer) we conducted an assessment of the effectiveness of our internal control over financial reporting based on the framework established in Internal Control–Integrated Framework (2013) issued by the Committee of Sponsoring Organizations of the Treadway Commission. Based on the assessment under this framework, management concluded that our internal control over financial reporting was effective as of March 31, 2024.
The effectiveness of our internal control over financial reporting as of March 31, 2024 has been audited by
72
REPORT OF INDEPENDENT REGISTERED PUBLIC ACCOUNTING FIRM
To the stockholders and the Board of Directors of Graham Corporation
Opinion on Internal Control over Financial Reporting
We have audited the internal control over financial reporting of Graham Corporation and subsidiaries (the “Company”) as of March 31, 2024, based on criteria established in Internal Control — Integrated Framework (2013) issued by the Committee of Sponsoring Organizations of the Treadway Commission (COSO). In our opinion, the Company maintained, in all material respects, effective internal control over financial reporting as of March 31, 2024, based on criteria established in Internal Control — Integrated Framework (2013) issued by COSO.
We have also audited, in accordance with the standards of the Public Company Accounting Oversight Board (United States) (PCAOB), the consolidated financial statements as of and for the year ended March 31, 2024, of the Company and our report dated June 7, 2024, expressed an unqualified opinion on those financial statements.
As described in Management’s Report on Internal Control over Financial Reporting, management excluded from its assessment the internal control over financial reporting at P3 Technologies, LLC, which was acquired on November 9, 2023, and whose financial statements constitute 5% and 5% of net and total assets, respectively, 1% of revenues, and less than 1% of net income of the consolidated financial statement amounts as of and for the year ended March 31, 2024. Accordingly, our audit did not include the internal control over financial reporting at P3 Technologies, LLC.
Basis for Opinion
The Company’s management is responsible for maintaining effective internal control over financial reporting and for its assessment of the effectiveness of internal control over financial reporting. Our responsibility is to express an opinion on the Company’s internal control over financial reporting based on our audit. We are a public accounting firm registered with the PCAOB and are required to be independent with respect to the Company in accordance with the U.S. federal securities laws and the applicable rules and regulations of the Securities and Exchange Commission and the PCAOB.
We conducted our audit in accordance with the standards of the PCAOB. Those standards require that we plan and perform the audit to obtain reasonable assurance about whether effective internal control over financial reporting was maintained in all material respects. Our audit included obtaining an understanding of internal control over financial reporting, assessing the risk that a material weakness exists, testing and evaluating the design and operating effectiveness of internal control based on the assessed risk, and performing such other procedures as we considered necessary in the circumstances. We believe that our audit provides a reasonable basis for our opinion.
Definition and Limitations of Internal Control over Financial Reporting
A company’s internal control over financial reporting is a process designed to provide reasonable assurance regarding the reliability of financial reporting and the preparation of financial statements for external purposes in accordance with generally accepted accounting principles. A company’s internal control over financial reporting includes those policies and procedures that (1) pertain to the maintenance of records that, in reasonable detail, accurately and fairly reflect the transactions and dispositions of the assets of the company; (2) provide reasonable assurance that transactions are recorded as necessary to permit preparation of financial statements in accordance with generally accepted accounting principles, and that receipts and expenditures of the company are being made only in accordance with authorizations of management and directors of the company; and (3) provide reasonable assurance regarding prevention or timely detection of unauthorized acquisition, use, or disposition of the company’s assets that could have a material effect on the financial statements.
Because of its inherent limitations, internal control over financial reporting may not prevent or detect misstatements. Also, projections of any evaluation of effectiveness to future periods are subject to the risk that controls may become inadequate because of changes in conditions, or that the degree of compliance with the policies or procedures may deteriorate.
Rochester, New York
June 7, 2024
We have served as the Company's auditor since 1993.
73
Item 9B. Other Information
Item 9C. Disclosure Regarding Foreign Jurisdictions That Prevent Inspections
Not applicable.
74
PART III
Item 10. Directors, Executive Officers and Corporate Governance
Except as otherwise stated specifically in this response to Item 10, the information required by this Item 10 is incorporated herein by reference from the statements under the headings "Election of Directors," "Executive Officers," and "Corporate Governance" contained in our proxy statement for our 2024 Annual Meeting of Stockholders, to be filed within 120 days after the year ended March 31, 2024. The information required by Item 10 regarding compliance with Section 16(a) of the Securities Exchange Act of 1934 is incorporated by reference, if necessary, from the information under the heading “Delinquent Section 16(a) Reports” contained in our proxy statement for our 2024 Annual Meeting of Stockholders, to be filed within 120 days after the year ended March 31, 2024.
Code of Ethics. We have adopted a Code of Business Conduct and Ethics applicable to our principal executive officer, principal financial officer, and principal accounting officer. Our Code of Business Conduct and Ethics also applies to all of our other employees and to our directors. Our Code of Business Conduct and Ethics is available on our website located at www.grahamcorp.com by clicking on the "Corporate Governance" heading in the "Investor Relations" tab. We intend to post any amendments to or waivers from our Code of Business Conduct and Ethics that apply to our principal executive officer, principal financial officer, principal accounting officer, controller, or persons performing similar functions, on our website.
Item 11. Executive Compensation
The information required by this Item 11 is incorporated herein by reference from the statements under the headings "Executive Compensation," "Pay Versus Performance,” and "Director Compensation" contained in our proxy statement for our 2024 Annual Meeting of Stockholders, to be filed within 120 days after the year ended March 31, 2024.
Item 12. Security Ownership of Certain Beneficial Owners and Management and Related Stockholder Matters
Except as set forth below, the information required by this Item 12 is incorporated herein by reference from the statements under the headings "Security Ownership of Certain Beneficial Owners" and "Security Ownership of Management" contained in our proxy statement for our 2024 Annual Meeting of Stockholders, to be filed within 120 days after the year ended March 31, 2024.
Securities Authorized for Issuance under Equity Compensation Plans
as of March 31, 2024
|
|
Equity Compensation Plan Information |
|
|
|||||||||
Plan Category |
|
Number of securities to |
|
|
Weighted average exercise |
|
|
Number of securities remaining |
|
|
|||
|
|
(a) |
|
|
(b) |
|
|
(c) |
|
|
|||
Equity compensation plans approved by security |
|
|
313,145 |
|
|
$ |
— |
|
|
|
557,207 |
|
(1) |
Equity compensation plans not approved by |
|
|
— |
|
|
|
— |
|
|
|
— |
|
|
Total |
|
|
313,145 |
|
|
$ |
— |
|
|
|
557,207 |
|
|
(1) Includes 133,434 shares remaining available under our Employee Stock Purchase Plan
Item 13. Certain Relationships and Related Transactions, and Director Independence
The information required by this Item 13 is incorporated herein by reference from the statements under the headings "Certain Relationships and Related Transactions" and "Corporate Governance" contained in our proxy statement for our 2024 Annual Meeting of Stockholders, to be filed within 120 days after the year ended March 31, 2024.
Item 14. Principal Accounting Fees and Services
The information required by this Item 14 is incorporated herein by reference from the statements under the heading "Ratification of the Appointment of our Independent Registered Public Accounting Firm" contained in our proxy statement for our 2024 Annual Meeting of Stockholders, to be filed within 120 days after the year ended March 31, 2024.
75
Part IV
Item 15. Exhibits, Financial Statement Schedules
We have filed our Consolidated Financial Statements in Part II, Item 8 of this Form 10-K and have listed such financial statements in the Index to Financial Statements included in Item 8. In addition, the financial statement schedule entitled "Schedule II - Valuation and Qualifying Accounts" is filed as part of this Form 10-K under this Item 15.
All other schedules have been omitted since the required information is not present or is not present in amounts sufficient to require submission of the schedule, or because the information required is included in the Consolidated Financial Statements and notes thereto.
INDEX TO EXHIBITS
(3) |
Articles of Incorporation and By-Laws |
|
|
3.1 |
|
|
3.2 |
|
(4) |
Instrument Defining the Rights of Security Holders, including Indentures |
|
|
4.1 |
|
(10) |
Material Contracts |
|
# |
10.1 |
|
# |
10.2 |
|
# |
10.3 |
|
# |
10.4 |
|
# |
10.5 |
|
# |
10.6 |
|
# |
10.7 |
|
# |
10.8 |
|
# |
10.9 |
|
# |
10.10 |
|
# |
10.11 |
|
76
# |
10.12 |
|
# |
10.13 |
|
# |
10.14 |
|
# |
10.15 |
|
# |
10.16 |
|
# |
10.17 |
|
# |
10.18 |
|
# |
10.19 |
|
# |
10.20 |
|
# |
10.21 |
|
# |
10.22 |
|
# |
10.23 |
|
# |
10.24 |
|
# |
10.25 |
|
|
10.26 |
|
|
10.27 |
|
|
10.28 |
|
|
10.29 |
77
|
10.30 |
|
(21) |
Subsidiaries of the registrant |
|
* |
21.1 |
|
(23) |
Consents of Experts and Counsel |
|
* |
23.1 |
|
(31) |
Rule 13a-14(a)/15d-14(a) Certifications |
|
* |
31.1 |
|
* |
31.2 |
|
(32) |
Section 1350 Certifications |
|
** |
32.1 |
|
(97) |
Policy Relating to Recovery of Erroneously Awarded Compensation |
|
* |
97.1 |
Graham Corporation Policy for the Recovery of Erroneously Awarded Compensation |
(101) |
Interactive Data File |
|
* |
101.INS |
Inline XBRL Instance Document – the instance document does not appear in the Interactive Data File because its XBRL tags are embedded within the Inline XBRL document. |
* |
101.SCH |
Inline XBRL Taxonomy Extension Schema Document |
* |
101.CAL |
Inline XBRL Taxonomy Extension Calculation Linkbase Document |
* |
101.DEF |
Inline XBRL Taxonomy Definitions Linkbase Document |
* |
101.LAB |
Inline XBRL Taxonomy Extension Label Linkbase Document |
* |
101.PRE |
Inline XBRL Taxonomy Extension Presentation Linkbase Document |
(104) |
Cover Page Interactive Data File embedded within the Inline XBRL document |
|
* |
Exhibits filed with this report. |
|
** |
Exhibit furnished with this report. |
|
# |
Management contract or compensatory plan. |
|
78
GRAHAM CORPORATION AND SUBSIDIARIES
SCHEDULE II - VALUATION AND QUALIFYING ACCOUNTS
(In Thousands)
|
|
Balance at |
|
|
Charged to |
|
|
Charged to |
|
|
|
|
|
Balance at |
|
|||||
|
|
Beginning |
|
|
Costs and |
|
|
Other |
|
|
|
|
|
End of |
|
|||||
Description |
|
of Period |
|
|
Expenses |
|
|
Accounts |
|
|
Deductions |
|
|
Period |
|
|||||
Year ended March 31, 2024 |
|
|
|
|
|
|
|
|
|
|
|
|
|
|
|
|||||
Reserves deducted from the asset to which they apply: |
|
|
|
|
|
|
|
|
|
|
|
|
|
|
|
|||||
Reserve for doubtful accounts receivable |
|
$ |
|
|
$ |
|
|
$ |
|
|
$ |
( |
) |
|
$ |
|
||||
Product warranty liability |
|
$ |
|
|
$ |
|
|
$ |
|
|
$ |
( |
) |
|
$ |
|
||||
|
|
|
|
|
|
|
|
|
|
|
|
|
|
|
|
|||||
Year ended March 31, 2023 |
|
|
|
|
|
|
|
|
|
|
|
|
|
|
|
|||||
Reserves deducted from the asset to which they apply: |
|
|
|
|
|
|
|
|
|
|
|
|
|
|
|
|||||
Reserve for doubtful accounts receivable |
|
$ |
|
|
$ |
|
|
$ |
|
|
$ |
( |
) |
|
$ |
|
||||
Reserves included in the balance sheet caption "accrued |
|
$ |
|
|
$ |
|
|
$ |
|
|
$ |
( |
) |
|
$ |
|
||||
Product warranty liability |
|
$ |
|
|
$ |
|
|
$ |
|
|
$ |
( |
) |
|
$ |
|
||||
|
|
|
|
|
|
|
|
|
|
|
|
|
|
|
|
|||||
Year ended March 31, 2022 |
|
|
|
|
|
|
|
|
|
|
|
|
|
|
|
|||||
Reserves deducted from the asset to which they apply: |
|
|
|
|
|
|
|
|
|
|
|
|
|
|
|
|||||
Reserve for doubtful accounts receivable |
|
$ |
|
|
$ |
|
|
$ |
|
|
$ |
( |
) |
|
$ |
|
||||
Reserves included in the balance sheet caption "accrued |
|
$ |
|
|
$ |
|
|
$ |
|
|
$ |
( |
) |
|
$ |
|
||||
Product warranty liability |
|
$ |
|
|
$ |
|
|
$ |
|
|
$ |
( |
) |
|
$ |
|
||||
Amounts under the column labeled "Charged to Other Accounts" above represent amounts acquired in the BN acquisition.
Item 16. Form 10-K Summary
None.
79
SIGNATURES
Pursuant to the requirements of Section 13 or 15(d) of the Securities Exchange Act of 1934, the registrant has duly caused this annual report to be signed on its behalf by the undersigned, thereunto duly authorized.
|
GRAHAM CORPORATION |
|
|
|
|
June 7, 2024 |
By: |
/s/ Christopher J. Thome |
|
|
Christopher J. Thome |
|
|
Vice President-Finance, |
|
|
Chief Financial Officer, Chief Accounting Officer and Corporate Secretary |
Pursuant to the requirements of the Securities Exchange Act of 1934, this report has been signed below by the following persons on behalf of the registrant and in the capacities and on the dates indicated.
Signature |
|
|
|
|
|
|
|
/s/ Daniel J. Thoren |
|
President and Chief Executive Officer and |
June 7, 2024 |
Daniel J. Thoren |
|
Director (Principal Executive Officer) |
|
|
|
|
|
/s/ Christopher J. Thome |
|
Vice President-Finance, Chief |
June 7, 2024 |
Christopher J. Thome |
|
Financial Officer, Chief Accounting Officer and Corporate Secretary |
|
|
|
(Principal Financial Officer and Principal Accounting Officer) |
|
|
|
|
|
/s/ James J. Barber |
|
Director |
June 7, 2024 |
James J. Barber |
|
|
|
|
|
|
|
/s/ Alan Fortier |
|
Director |
June 7, 2024 |
Alan Fortier |
|
|
|
|
|
|
|
/s/ Cari L. Jaroslawsky |
|
Director |
June 7, 2024 |
Cari L. Jaroslawsky |
|
|
|
|
|
|
|
/s/ Jonathan W. Painter |
|
Director and Chairman of the Board |
June 7, 2024 |
Jonathan W. Painter |
|
|
|
|
|
|
|
/s/ Lisa M. Schnorr |
|
Director |
June 7, 2024 |
Lisa M. Schnorr |
|
|
|
|
|
|
|
/s/ Troy A. Stoner |
|
Director |
June 7, 2024 |
Troy A. Stoner |
|
|
|
80