FOR IMMEDIATE RELEASE
|
Media Contact:
Christine Needles
Global Corporate Communications
Christine.Needles@interface.com
+1 404-491-4660
|
Investor Contact:
Bruce Hausmann
Chief Financial Officer
Bruce.Hausmann@interface.com
+1 770-437-6802
|
Interface Reports First Quarter 2019 Results
Q1 Net Sales Up 24%; Q1 Organic Sales Up 2%
Q1 GAAP EPS $0.12; Q1 Adjusted EPS $0.14
ATLANTA – April 24, 2019 – Interface, Inc. (Nasdaq: TILE), a worldwide commercial flooring company and global leader in
sustainability, today announced results for the first quarter ended March 31, 2019.
“We started off 2019 with another solid quarter, in line with our expectations. We continue to deliver on our value creation strategy and remain
on track to achieve our 2019 objectives,” said Jay Gould, CEO of Interface. “First quarter organic sales were up 2% as anticipated. The marketplace response to our Carbon Neutral Floors™ program has been very positive, allowing us to take share in
carpet tile in key markets and drive growth in LVT. The integration of nora systems into the Interface family is generating promising results with nora® rubber flooring sales up 9% in local currency versus the prior year period. Our strategic
investment in nora, the transformation of our selling system, and advancements in our manufacturing capabilities are successfully fueling growth. Overall, we
delivered adjusted EPS of $0.14.”
First Quarter 2019 Financial Summary
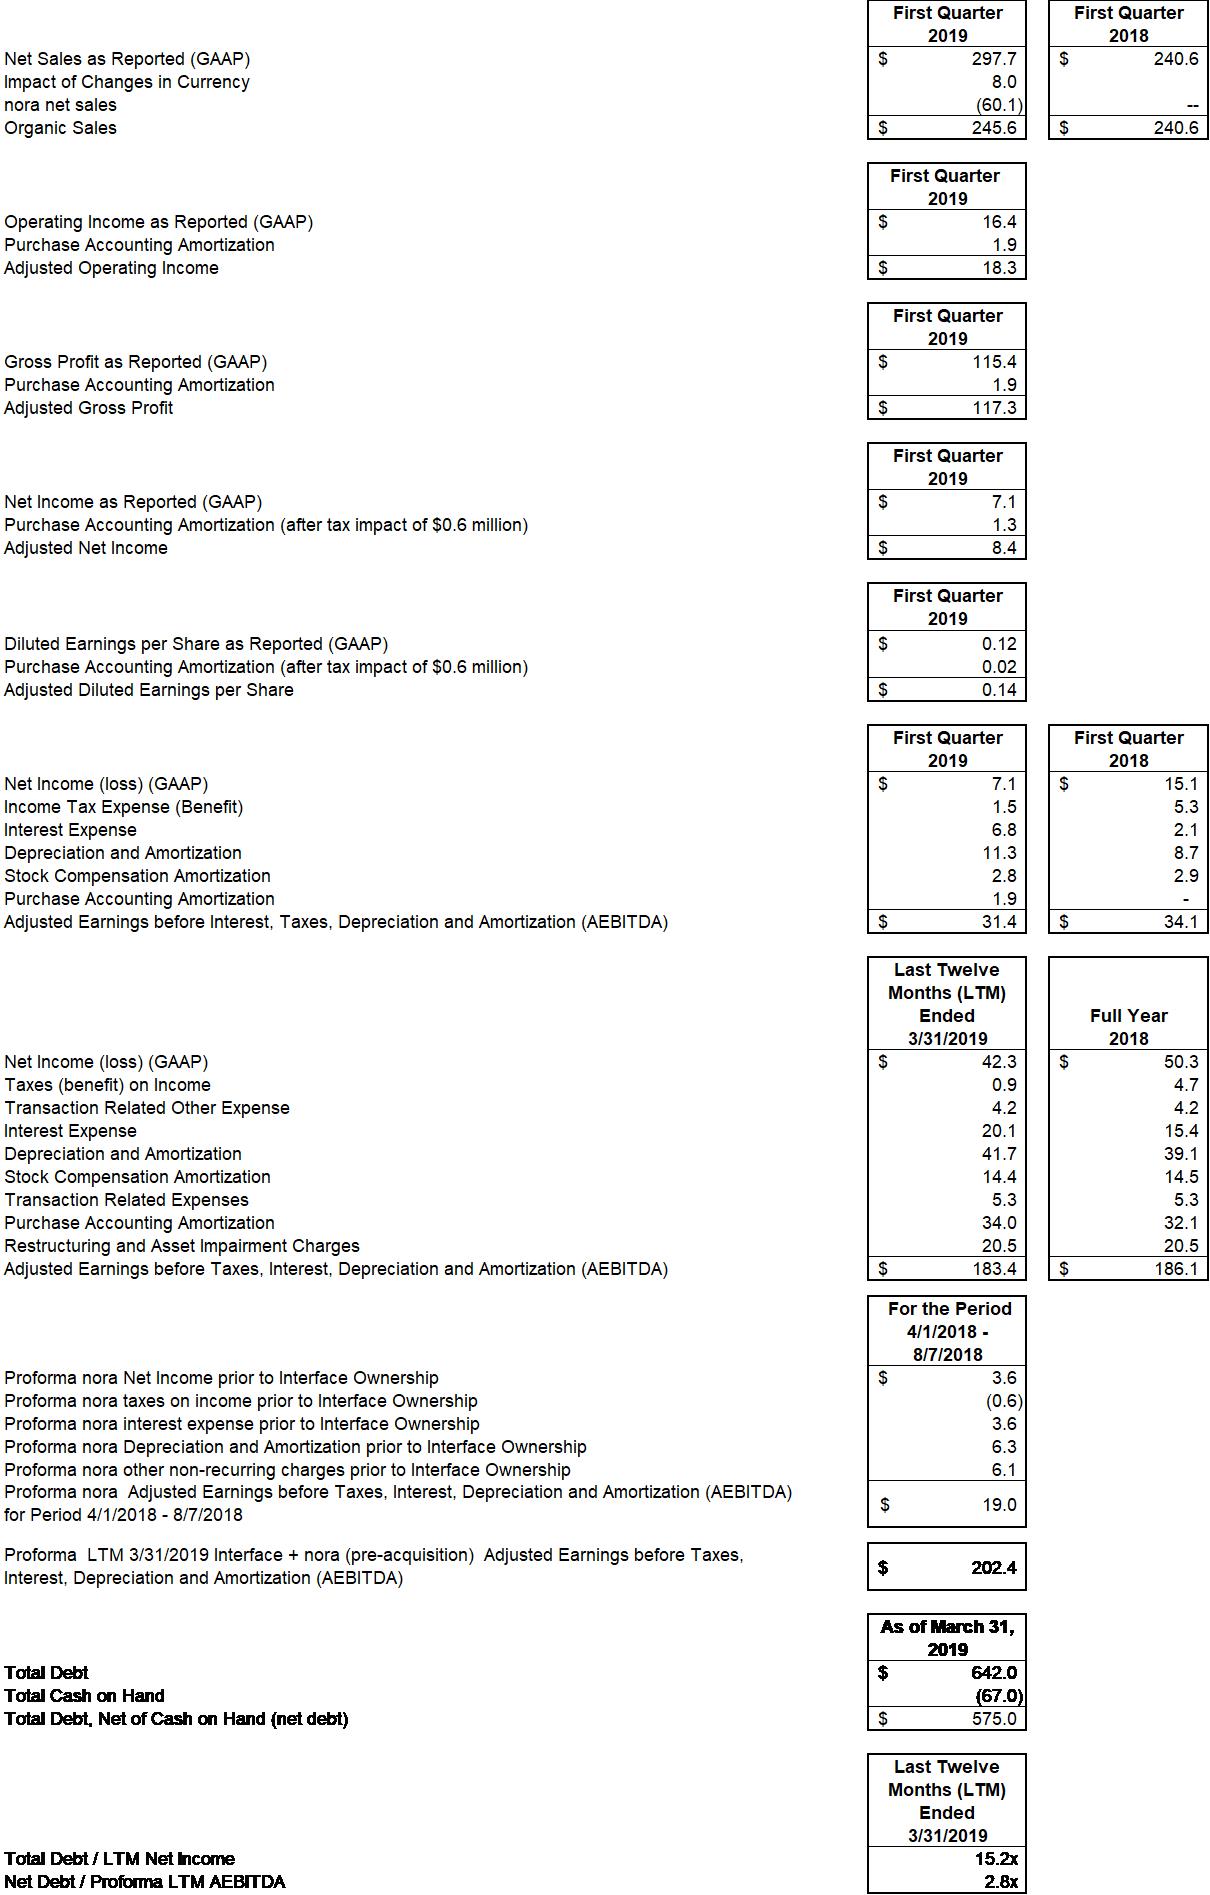
Sales: First quarter net sales were $298
million, up 24% versus $241 million in the prior year period. Organic sales were up 2% year-over-year .
Nora contributed $60 million of net sales in the quarter, up 9% in local currency compared to the stand-alone business in first quarter of 2018.
Operating Income: First quarter
operating income was $16 million, compared with $23 million in the prior year period. First quarter 2019 adjusted operating income was $18 million. As expected and
previously communicated, Interface’s first quarter adjusted operating income included a non-recurring investment to bring the company’s global sales organization together to accelerate the nora integration, advance its selling system
transformation, and engage every front-line seller in the company’s sustainability mission – Climate TakeBack™ – which is activated through its Carbon Neutral Floors program.
Gross profit margin was 38.8% in the first quarter, which included $2 million of nora purchase accounting amortization. Adjusted gross profit
margin was 39.4%, an increase of 50 basis points over gross margin for the prior year period.
First quarter SG&A expenses were in line with expectations at $99 million, or 33% of sales.
Net Income and EPS: The company recorded net income in the first quarter of 2019 of $7 million, or $0.12 per diluted share, compared to first quarter 2018 net income of $15 million, or
$0.25 per diluted share. First quarter 2019 adjusted net income was $8 million, or $0.14 per diluted share.
Adjusted EBITDA: In the first quarter of
2019, adjusted EBITDA was $31 million compared to $34 million in the prior year period.
Fiscal Year 2019 Outlook
Looking ahead to the full year of 2019, Interface is targeting to achieve:
|
·
|
Total net sales growth, including nora, of 14 – 16%,
which includes 200 basis points of currency headwinds.
|
|
·
|
Organic sales growth from carpet and LVT of 2 – 4%
|
|
·
|
Adjusted gross profit margin of 40 – 40.5%
|
|
·
|
Adjusted SG&A expenses of 28 – 28.5% as a percentage of net sales
|
Full year company interest and other expenses are projected to be $29 million to $30 million, and the effective tax rate is anticipated to be
approximately 28%. Diluted share count is anticipated to be approximately sixty million shares. Capital expenditures for the full year are forecasted to be $65 million to $75 million.
For the remaining portion of the year, the company anticipates adjusted EPS to be spread relatively evenly in the second, third and fourth
quarters.
Webcast and Conference Call Information
The company will host a conference call tomorrow morning, April 25, at 9:00 a.m. Eastern Time, to discuss its first quarter 2019 results. The
conference call will be simultaneously broadcast live over the Internet.
Listeners may access the conference call live over the Internet at: https://event.on24.com/wcc/r/1956457/20B8460DA561A57B1FAE74BC5D3D2A09, or through the company's website at: http://investors.interface.com.
The archived version of the webcast will be available at these sites for one year beginning approximately one hour after the call ends.
Non-GAAP Financial Measures
Interface provides adjusted earnings per share, adjusted net income, adjusted operating income, organic sales and organic sales growth, adjusted
SG&A expenses, net debt, and adjusted EBITDA as additional information regarding its actual and projected operating results in this press release. These measures are not in accordance with – or alternatives to – GAAP, and may be different from
non-GAAP measures used by other companies. Adjusted EPS, adjusted net income, adjusted SG&A expenses, and adjusted operating income exclude nora purchase accounting amortization . Organic sales and organic sales growth exclude nora sales and
the impact of foreign currency fluctuations. Net debt is total debt less cash on hand. Adjusted EBITDA is GAAP net income excluding interest expense, taxes on income, depreciation and amortization, stock compensation amortization, restructuring
and asset impairment charges, and nora transaction related expenses such as purchase accounting amortization, transaction related expenses, and transaction related other expenses. This news release should be read in conjunction with the company's Current Report on Form 8-K furnished today to the U.S. Securities & Exchange Commission, which explains why Interface believes presentation of these non-GAAP
measures provides useful information to investors, as well as any additional material purposes for which Interface uses these non-GAAP measures.
About Interface
Interface, Inc. is a global flooring company specializing in carbon neutral carpet tile and resilient flooring, including luxury vinyl tile
(LVT) and nora® rubber flooring. We help our customers create high-performance interior spaces that support well-being, productivity, and creativity, as well as the sustainability of the planet. Our mission, Climate Take Back™, invites you to join
us as we commit to operating in a way that is restorative to the planet and creates a climate fit for life.
Learn more about Interface at interface.com and blog.interface.com, our nora brand at nora.com, and our FLOR® brand at FLOR.com.
Follow us on Twitter, YouTube, Facebook, Pinterest, LinkedIn, Instagram, and Vimeo.
Safe Harbor Statement under the Private
Securities Litigation Reform Act of 1995:
Except for historical information contained herein, the other matters set forth in this news release are forward-looking statements. Forward-looking statements include, without limitation, information under the heading “Fiscal Year 2019 Outlook” in this news release, and any
expectations regarding the effect of the nora acquisition on the Company’s results. Forward-looking statements may be identified by words such as “may,” “expect,” “forecast,” “anticipate,” “intend,” “plan,” “believe,” “could,” “seek,” “project,”
“estimate,” “target,” “will” and similar expressions. The forward-looking statements set forth above involve a number of risks and uncertainties that could cause actual results to differ materially from any such statement, including: the risk that
the Company may have overestimated the future contribution of the nora business to the Company’s combined results; risks related to integration of the combined businesses; risks related to the increased indebtedness the Company incurred to complete
the acquisition; risks related to the increased reliance on international business the Company will experience; and risks and uncertainties associated with economic conditions in the commercial interiors industry. Additional risks and uncertainties
that may cause actual results to differ materially from those predicted in forward-looking statements also include, but are not limited to the following subheadings in “Risk Factors” in the Company's Annual Report on Form 10-K for the fiscal year
ended December 30, 2018: “Sales of our principal products have been and may continue to be affected by adverse economic cycles in the renovation and construction of
commercial and institutional buildings”; “We compete with a large number of manufacturers in the highly competitive floorcovering products market, and some of these competitors have greater financial resources than we do. We may face challenges
competing on price, making investments in our business , or competing on product design”; “Our success depends significantly upon the efforts, abilities and continued service of our senior management executives, our principal design consultant and
other key personnel (including sales personnel), and our loss of any of them could affect us adversely”; “Our substantial international operations are subject to various political, economic and other uncertainties that could adversely affect our
business results, including by restrictive taxation or other government regulation and by foreign currency fluctuations”; “The uncertainty surrounding the implementation and effect of the U.K. exiting the European Union, and related negative
developments in the European Union could adversely affect our business, results of operations or financial condition”; “Large increases in the cost of petroleum-based raw materials could adversely affect us if we are unable to pass these cost
increases through to our customers”; “Unanticipated termination or interruption of any of our arrangements with our primary third party suppliers of synthetic fiber or our sole third party supplier for luxury vinyl tile (“LVT”) could have a
material adverse effect on us”; “If we fail to realize the expected synergies and other benefits of the nora acquisition, our results of operations and stock price may be negatively affected”; “We have a significant amount of indebtedness, which
could have important negative consequences to us”; “The market price of our common stock has been volatile and the value of your investment may decline”; “Our earnings in a future period could be adversely affected by non-cash
adjustments to goodwill, if a future test of goodwill assets indicates a material impairment of those assets”; “Changes to our facilities could disrupt our operations”; “Our business operations could suffer significant losses from
natural disasters, catastrophes, fire or other unexpected events”; and “Disruptions to or failures of our information technology systems could adversely effect on our business.”
Any forward-looking statements are made pursuant to the Private Securities Litigation Reform Act of 1995 and, as such,
speak only as of the date made. The Company assumes no responsibility to update or revise forward-looking statements made in this press release and cautions readers not to place undue reliance on any such forward-looking statements.
- TABLES FOLLOW -
|
Consolidated Condensed Statements of Operations
|
Three Months Ended
|
|||||||
|
(In thousands, except per share data)
|
3/31/19
|
4/1/18
|
||||||
|
Net Sales
|
$
|
297,688
|
$
|
240,563
|
||||
|
Cost of Sales
|
182,290
|
146,981
|
||||||
|
Gross Profit
|
115,398
|
93,582
|
||||||
|
Selling, General & Administrative Expenses
|
99,011
|
70,594
|
||||||
|
Operating Income
|
16,387
|
22,988
|
||||||
|
Interest Expense
|
6,793
|
2,094
|
||||||
|
Other Expense, Net
|
1,014
|
519
|
||||||
|
Income Before Taxes
|
8,580
|
20,375
|
||||||
|
Income Tax Expense
|
1,521
|
5,291
|
||||||
|
Net Income
|
$
|
7,059
|
$
|
15,084
|
||||
|
Earnings Per Share – Basic
|
$
|
0.12
|
$
|
0.25
|
||||
|
Earnings Per Share – Diluted
|
$
|
0.12
|
$
|
0.25
|
||||
|
Common Shares Outstanding – Basic
|
59,632
|
59,671
|
||||||
|
Common Shares Outstanding – Diluted
|
59,642
|
59,717
|
||||||
|
Consolidated Condensed Balance Sheets
|
||||||||
|
(in thousands)
|
3/31/19
|
12/30/18
|
||||||
|
Assets
|
||||||||
|
Cash
|
$
|
66,972
|
$
|
80,989
|
||||
|
Accounts Receivable
|
164,976
|
179,004
|
||||||
|
Inventory
|
285,738
|
258,657
|
||||||
|
Other Current Assets
|
46,799
|
40,229
|
||||||
|
Total Current Assets
|
564,485
|
558,879
|
||||||
|
Property, Plant & Equipment
|
300,405
|
292,888
|
||||||
|
Operating Lease Right-of-Use Lease Asset
|
113,640
|
--
|
||||||
|
Goodwill and Intangible Assets
|
334,059
|
343,542
|
||||||
|
Other Assets
|
92,478
|
89,335
|
||||||
|
Total Assets
|
$
|
1,405,067
|
$
|
1,284,644
|
||||
|
Liabilities
|
||||||||
|
Accounts Payable
|
72,994
|
66,301
|
||||||
|
Accrued Liabilities
|
112,409
|
125,971
|
||||||
|
Current Portion of Operating Lease Liabilities
|
16,014
|
--
|
||||||
|
Current Portion of Long-Term Debt
|
31,105
|
31,315
|
||||||
|
Total Current Liabilities
|
232,522
|
223,587
|
||||||
|
Long-Term Debt
|
610,895
|
587,266
|
||||||
|
Operating Lease Liabilities
|
97,316
|
--
|
||||||
|
Other Long-Term Liabilities
|
114,675
|
119,128
|
||||||
|
Total Liabilities
|
1,055,408
|
929,981
|
||||||
|
Shareholders’ Equity
|
349,659
|
354,663
|
||||||
|
Total Liabilities and Shareholders’ Equity
|
$
|
1,405,067
|
$
|
1,284,644
|
||||
|
Consolidated Condensed Statements of Cash Flows
|
Three Months Ended
|
|||||||||||||||
|
(In thousands)
|
3/31/19
|
4/1/18
|
||||||||||||||
|
Net Income
|
$
|
7,059
|
$
|
15,084
|
||||||||||||
|
Depreciation and Amortization
|
11,344
|
8,731
|
||||||||||||||
|
Stock Compensation Amortization
|
2,817
|
2,858
|
||||||||||||||
|
Amortization of Acquired Intangible Assets
|
1,909
|
--
|
||||||||||||||
|
Deferred Income Taxes and Other Items
|
(6,088
|
)
|
1,800
|
|||||||||||||
|
Change in Working Capital
|
||||||||||||||||
|
Accounts Receivable
|
13,729
|
6,338
|
||||||||||||||
|
Inventories
|
(28,855
|
)
|
(17,240
|
)
|
||||||||||||
|
Prepaids and Other Current Assets
|
(5,692
|
)
|
(16,273
|
)
|
||||||||||||
|
Accounts Payable and Accrued Expenses
|
(7,924
|
)
|
(7,077
|
)
|
||||||||||||
|
Cash Used in Operating Activities
|
(11,701
|
)
|
(5,779
|
)
|
||||||||||||
|
Cash Used in Investing Activities
|
(20,012
|
)
|
(7,167
|
)
|
||||||||||||
|
Cash Provided by (Used in) Financing Activities
|
17,640
|
(5,756
|
)
|
|||||||||||||
|
Effect of Exchange Rate Changes on Cash
|
56
|
(478
|
)
|
|||||||||||||
|
Net Decrease in Cash
|
$
|
(14,017
|
)
|
$
|
(19,180
|
)
|
||||||||||
Reconciliation of Non-GAAP Performance Measures to GAAP Performance Measures
(in millions, except per share amounts)
The impacts of changes in foreign currency presented in the tables are calculated based on applying the prior year period's average foreign
currency exchange rates to the current year period.
The Company believes that the above non-GAAP performance measures, which management uses in managing and evaluating the Company’s business,
may provide users of the Company’s financial information with additional meaningful basis for comparing the Company’s current results and results in a prior period, as these measures reflect factors that are unique to one period relative to the
comparable period. However, these non‑GAAP performance measures should be viewed in addition to, and not as an alternative for, the Company’s reported results under accounting principles generally accepted in the United States. Tax effects
identified above (when applicable) are calculated using the statutory tax rate for the jurisdictions in which the charge or income occurred.
# # #