 1 Keefe, Bruyette & Woods Investor Conference Presentation Exhibit 99.1 |
 2 This presentation may contain forward-looking statements regarding Renasant Corporation. All forward-looking statements involve risk and uncertainty and actual results could differ materially from the anticipated results or other expectations expressed in the forward-looking statements. A
discussion of factors that could cause actual results to differ
materially from those expressed in the forward-looking statements is included in the Company’s filings with the United
States Securities and Exchange Commission. |
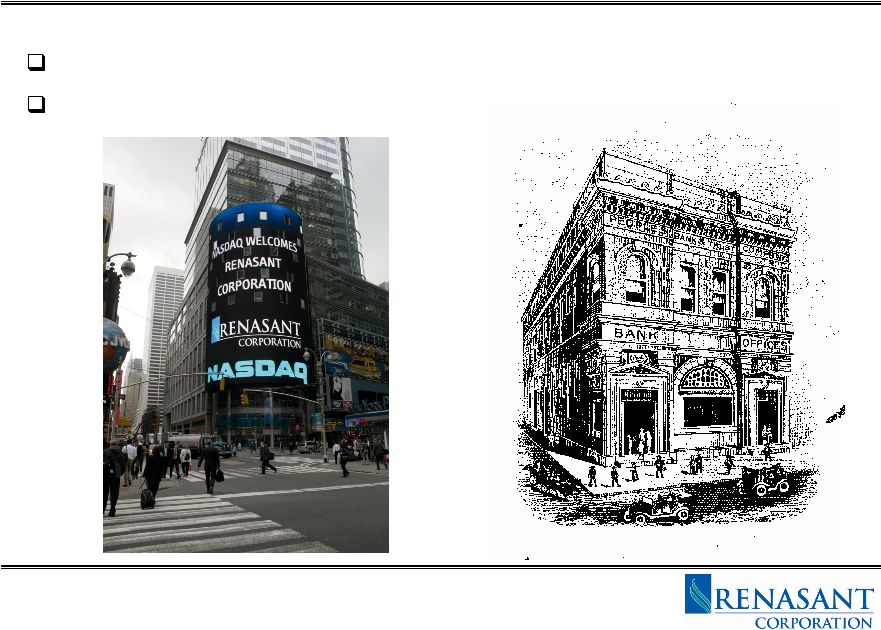 3 NASDAQ Global Select Market 102 Year Old Community Bank Renasant Corporation Background |
 4 Parent of Renasant Bank, and Renasant Insurance $2.5 billion in assets Operate 61 banking and insurance offices in 38 cities in Mississippi, Tennessee and Alabama Insurance agency - $35 million annual P & C and Life premium Mortgage Lending Division - Over $400 million annual originations Wealth Management Division - Over $450 million assets under management Recent Acquisitions: Renasant Bancshares, July 2004; Heritage Financial Holding Corporation, January 2005 Profile |
 5 Attractive Markets Solid Financial Performance Quality Credit Prudent Growth Strategies Capable Management Team Key Investment Points |
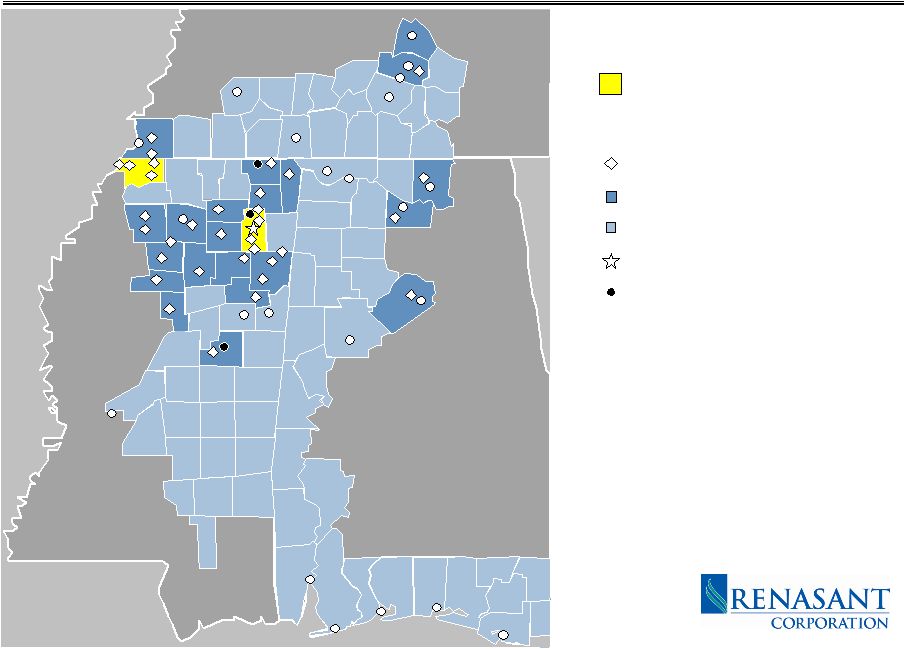 Renasant Bank Offices Current Market Target Market Corporate Headquarters Renasant Insurance Offices TENNESSEE MISSISSIPPI ALABAMA FLORIDA Jackson Madison Tuscaloosa Oxford Brentwood Murfreesboro Nashville Huntsville Birmingham Decatur Muscle Shoals Florence Corinth Tupelo Memphis Cordova Germantown Hernando Horn Lake Southaven Louisville Columbus Starkville Mobile Pensacola Panama City Grenada Attractive Markets Pre 2004 Key Markets Destin Gulf Shores Franklin |
 7 Attractive Markets Pre 2004 Key Markets Available Deposits Market Growth Market Share Tupelo 1.3 Billion 8% 22% DeSoto County 1.2 Billion 8% 5% Total 2.5 Billion |
 8 Attractive Markets Acquisitions 2004 Renasant Bancshares Assets: $226 Million Deposits: $185 Million Loans: $172 Million Offices: Germantown, Cordova, TN 2005 Heritage Financial Holding Corporation Assets: $540 Million Deposits: $381 Million Loans: $391 Million Offices: Birmingham (3), Huntsville (2), Decatur (3), Alabama De Novo 2005 Nashville, TN - Limited Service Bank 2005 Oxford, MS – Full Service Bank 2005 East Memphis – Full Service Bank 2006 Collierville – Full Service Bank |
 Renasant Bank Offices Current Market Target Market Corporate Headquarters Renasant Insurance Offices TENNESSEE MISSISSIPPI ALABAMA FLORIDA Jackson Madison Tuscaloosa Oxford Brentwood Murfreesboro Nashville Huntsville Birmingham Decatur Muscle Shoals Florence Corinth Tupelo Memphis Cordova Germantown Hernando Horn Lake Southaven Louisville Columbus Starkville Mobile Pensacola Panama City Grenada Attractive Markets Key Growth Markets Gulf Shores Franklin Destin As of 6/30/06 approximately 71% of loans and 60% of deposits are held in our key growth markets. |
 10 Attractive Markets Current Key Markets Available Deposits Deposit Growth Deposit Share Tupelo 1.3 Billion 8% 24% DeSoto County 1.2 Billion 8% 5% Birmingham 14.7 Billion 8% 1% Decatur 1.1 Billion 3% 13% Huntsville/Madison 5.5 Billion 8% 3% Germantown 1.3 Billion 10% 15% Oxford .5 Billion 12% 0% Collierville .5 Billion 10% 0% Memphis/Cordova 21 Billion 10% 0% Nashville/Brentwood 13.5 Billion 11% 0% Total 60.6 Billion |
 11 Attractive Markets Alabama Birmingham - • 3.1% Unemployment Rate • 6.3% and 10.4% growth in income and housing over the past quarter on record • 10 th Hottest Location for Business Expansion in the U.S. Huntsville - • Salaries.com listed as best value for salaries and cost of living • #1 Mid-market in the south - Southern Business & Development Magazine • B.R.A.C. – 4,000 Military / 10,000 Civilian Families to relocate here Decatur - • Home to 20 fortune 500 Companies • BRAC to relocate here as well |
 12 Tennessee Memphis - • Ranked #7 for hottest cities for business expansion and #7 for real estate markets by Expansion Management Magazine • 10 Renasant locations within Memphis MSA • Key distribution hub of the mid-south as well as the entire nation Nashville - • Major companies relocating headquarters to this region • Hottest city for business expansion 2 years in a row by Expansion Management Magazine • Over 401 major business relocations over the past 3 years Attractive Markets |
 13 Attractive Markets Mississippi DeSoto County - • Fastest growing county
in Mississippi • Highest median household
income in the State Oxford - • One of the nation’s hottest real
estate markets • Average home valued at $214,000 Tupelo - • Ranked 2 nd in the Nation
as “most active micropolitan area
for new and expanding industries.” |
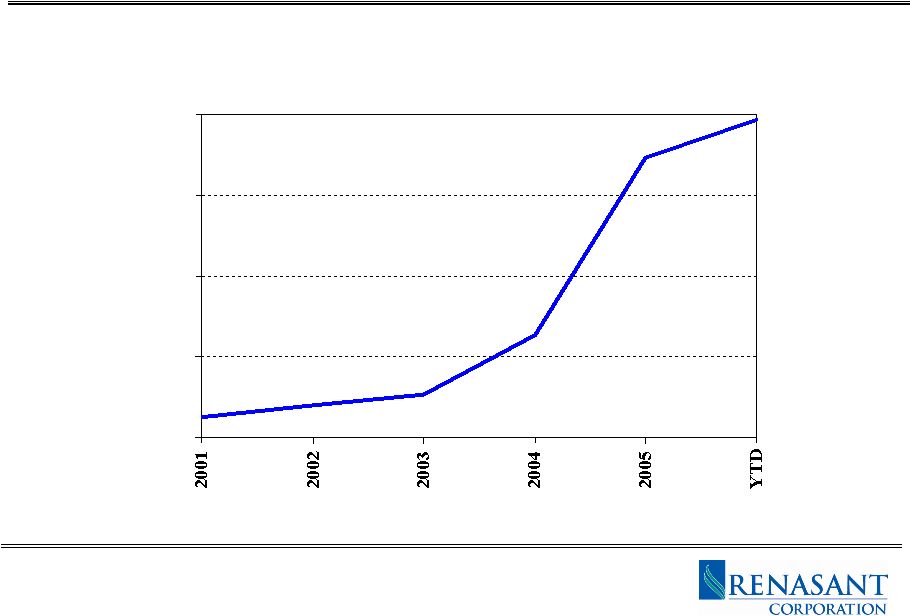
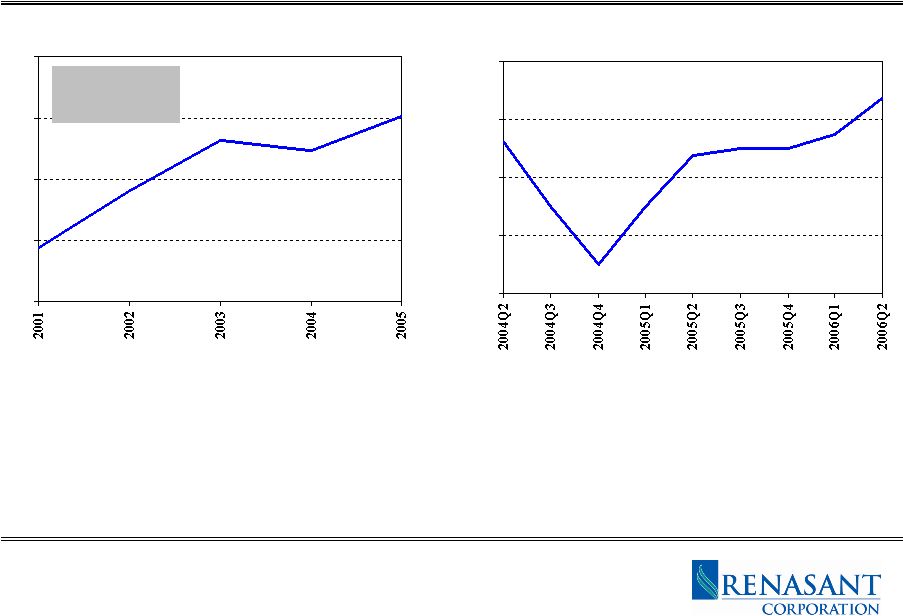
 14 Total Loans ($ Millions) Solid Financial Performance: Loan Growth Does not include mortgage loans held for sale. Year to date as of 6/30/06. 700 1,000 1,300 1,600 1,900 |
 15 Loan Growth by Market State Trailing 12 Month Loan Growth Tennessee $86 Million
Mississippi $18
Million Alabama $33 Million
Total Growth $137 Million |
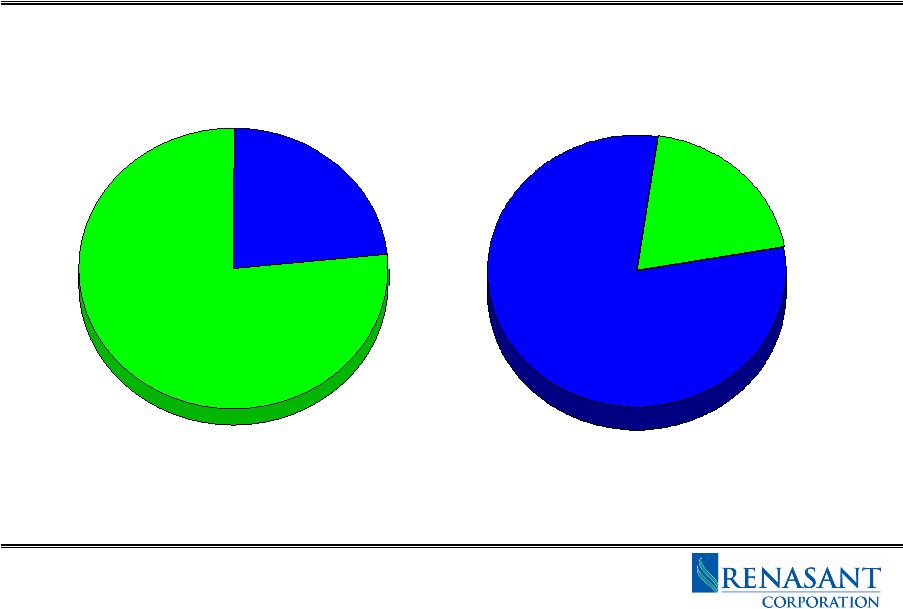 16 77 % 23 % Loan Composition – June 2006 Solid Financial Performance Commercial Consumer Real Estate Non- Real Estate 82 % 18 % |
 17 Total Deposits ($ Millions) Solid Financial Performance: Deposit Growth Year to date as of 6/30/06. 1,000 1,250 1,500 1,750 2,000 |
 18 Deposit Growth by Market State Trailing 12 Month Deposit Growth Tennessee $58 Million Mississippi $133 Million Alabama $28 Million Total Growth $219 Million |
 19 Solid Financial Performance Deposit-Composition-–-June-2006 80% Core Deposits 28% 12% 14% 25% 21% Time >/= $100K Savings/ MMkt Non-Int. Demand Interest Bearing Time < $100K |
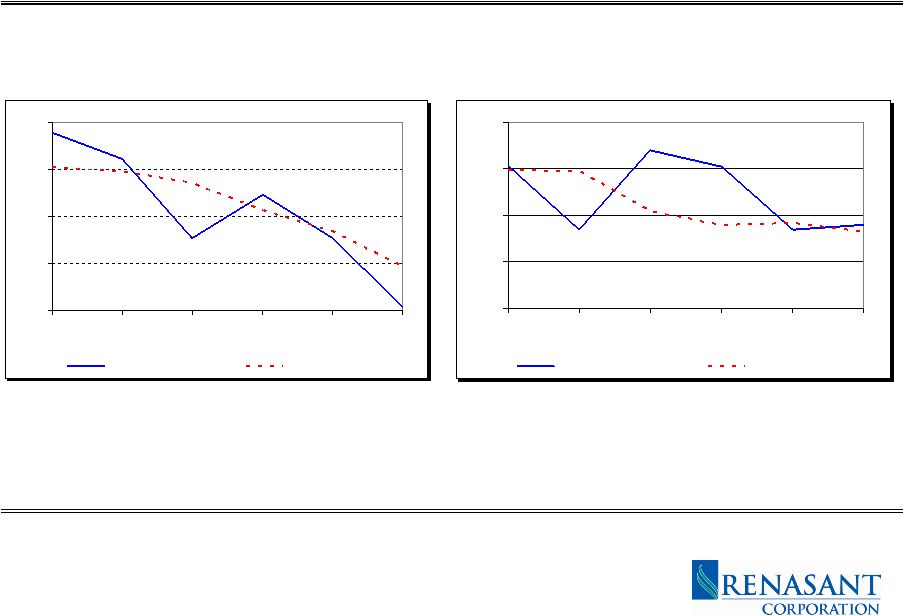
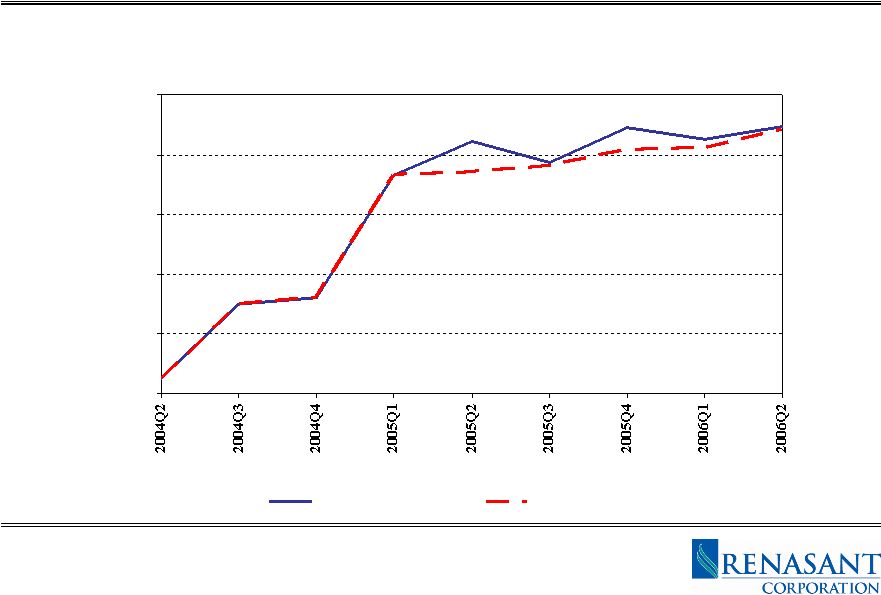 20 Quarterly Net-Interest Income ($000) Solid Financial Performance: Growing Net-Interest Income 12,000 14,000 16,000 18,000 20,000 22,000 Net Interest Income Excluding SOP 03-3 |
 21 Solid Financial Performance: Net Interest Margin Year to date for the six months ended 6/30/06. Net Interest Margin (%) 3.80 4.00 4.20 4.40 4.60 4.80 NIM Excluding SOP 03-3 |
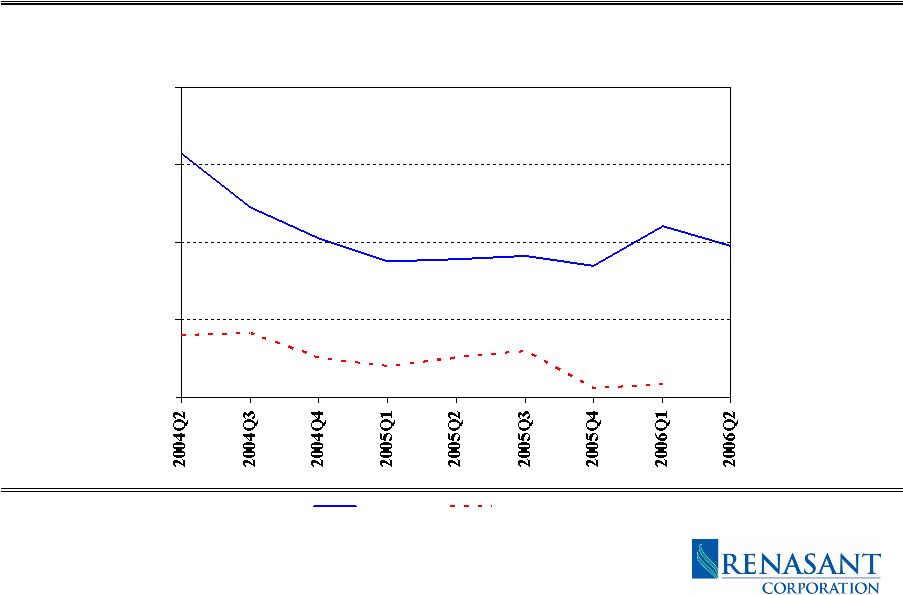 22 1.00 1.40 1.80 2.20 2.60 RNST Peer Average Solid Financial Performance: Non-Interest Income /Average Assets Source: SNL Financial and Company reports. Peer group includes publicly traded banks headquartered in AL, AR, FL, GA,
LA, MS and TN with assets between $1 billion and $10 billion, excluding merger targets. Non-Interest Income /Average Assets (%) - Annualized |
 23 2006 Non Interest Income / Average Assets Mississippi Division 3.23% Tennessee Division 0.28% Alabama Division 1.46% Solid Financial Performance: Fee Income Opportunity |
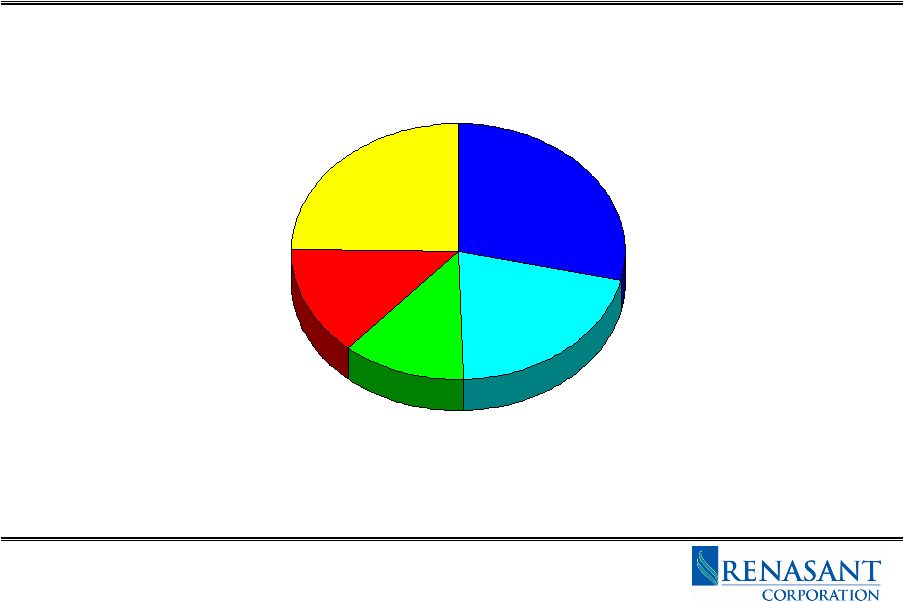
 24 Solid Financial Performance: Fee Income Composition Loan = 25% Deposit = 42% Mortgage Loan = 13% Insurance = 8% Trust and Wealth Management = 6% Other = 6% |
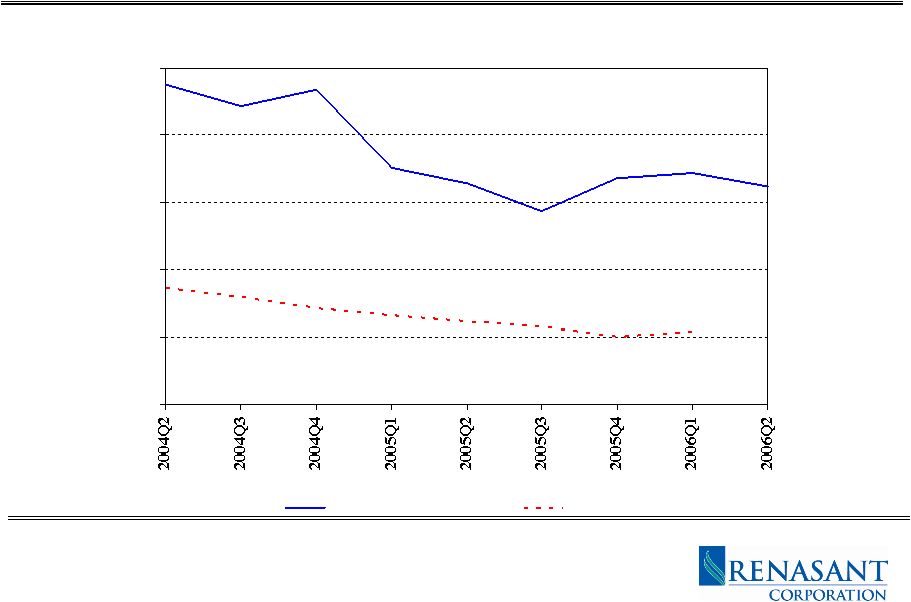 25 2.75 3.00 3.25 3.50 3.75 4.00 RNST Peer Average Solid Financial Performance: Non-Interest Expense /Average Assets Non-Interest Expense /Average Assets (%) - Annualized Source: SNL Financial and Company reports. Peer group includes publicly traded banks headquartered in AL, AR, FL, GA,
LA, MS and TN with assets between $1 billion and $10 billion, excluding merger targets. |
 26 0.40 0.48 0.56 0.64 0.72 1.40 1.70 2.00 2.30 2.60 Annual Earnings per Share ($) Thru 2005 5 YR CAGR = 14% 10 YR CAGR = 8% Solid Financial Performance: Improving Trend in EPS Quarterly Earnings per Share ($) |
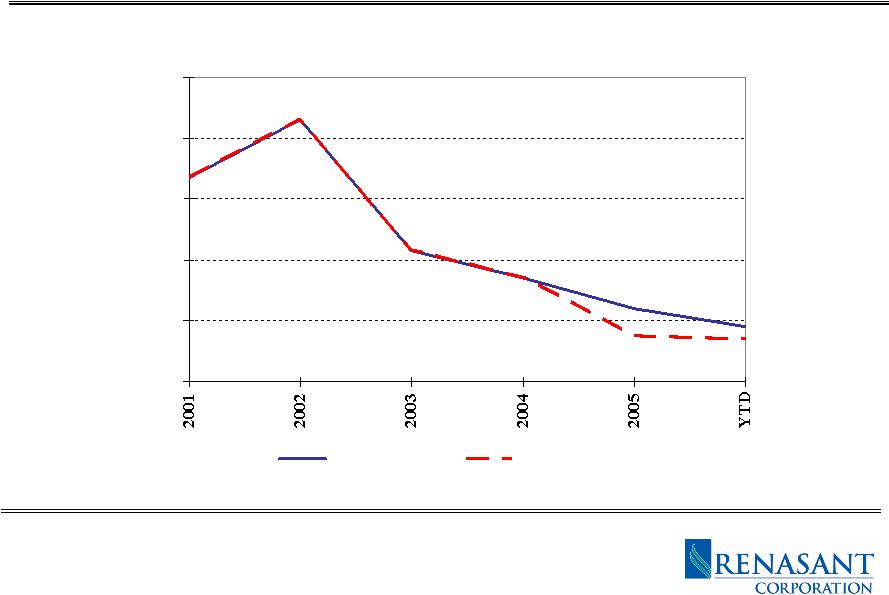
 27 0.00 0.13 0.26 0.39 0.52 2001 2002 2003 2004 2005 YTD RNST Peer Average 0.00 0.25 0.50 0.75 1.00 2001 2002 2003 2004 2005 YTD RNST Peer Average NPLs + 90 / Loans (%) NCOs / Avg Loans (%) Quality Credit Source: SNL Financial and Company reports. Peer group includes publicly traded banks headquartered in AL, AR, FL, GA,
LA, MS and TN with assets between $1 billion and $10 billion, excluding merger targets. Net charge off data annualized. RNST year to date as of or for the six months ended 6/30/06. Peer data
year to date as of or for the three months ended 3/31/06. |
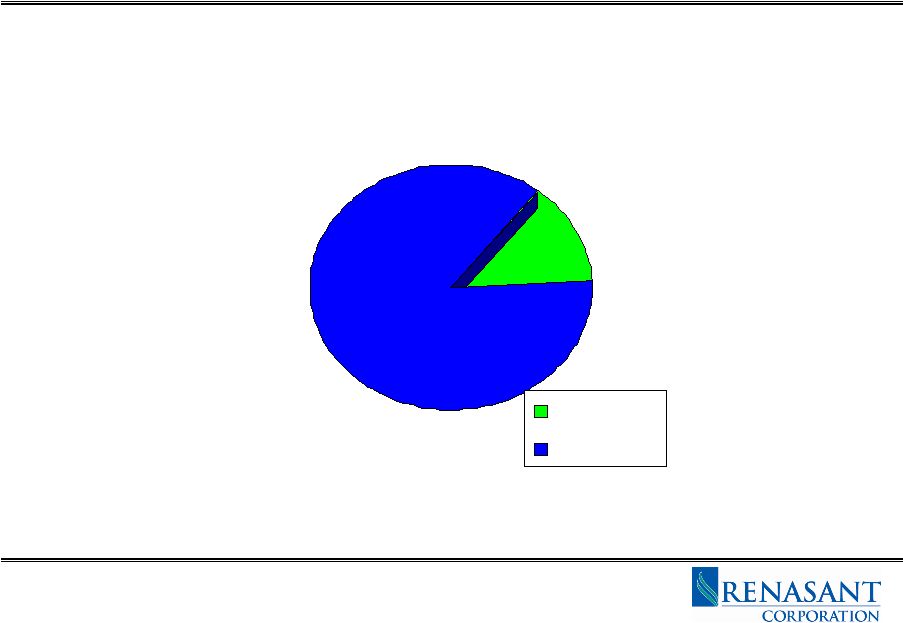 28 Outstanding Loan Concentration for June 2006 Largest Loan Outstanding to One Borrower - $13.5 million Average Loan over $2 million - $3.5 million Average Commercial Credit - $168,250 Quality Credit 14% 86% $2M Plus Other |
 29 Prudent Growth Strategies Loans • Key Hires of Commercial Relationship Officers • HELOC referrals from Mortgage Lending Division Core Deposits • High Performance Business and Consumer Checking • Renasant Relationship Account • Cash Management Services Wealth Management • Expanding-Private-Client-Financial-Services-Center--One-Stop-Shop-staffed-with CPA,-CFP,-Trust-Relationship-Officer,-and-Lender • Expand-Renasant-Financial-Services-–-Retail-Investment-Sales
Mortgage Lending • Expanding wholesale in Memphis and Nashville • Expanding retail in Memphis, Birmingham and Nashville Insurance • Strategic Alliances • Bank Integration |
 30 Prudent Growth Strategies De Novo Plans • Birmingham, AL 2007 • Huntsville, AL 2007 • Oxford, MS 2007 • Nashville, TN 2007 |
 31 Name Title Experience E. Robinson McGraw Chairman and CEO – Renasant Bank & Renasant Corporation 36 years Frank Cianciola President- Renasant Tennessee 29 years Steve Corban Senior Executive Vice President- 25 Years General Counsel Jim Gray Senior Executive Vice President-CIO 27 years Stuart Johnson Senior Executive Vice President-CFO 28 years Harold Livingston Senior Executive Vice President- Chief Credit Officer 33 years Larry Mathews President-Renasant Alabama 29 years Claude Springfield, III Senior Executive Vice President- Chief Credit Policy Officer 36 years Mitch Waycaster President- Renasant Mississippi 26 years Average Years of Experience 30 years Capable Management Team |
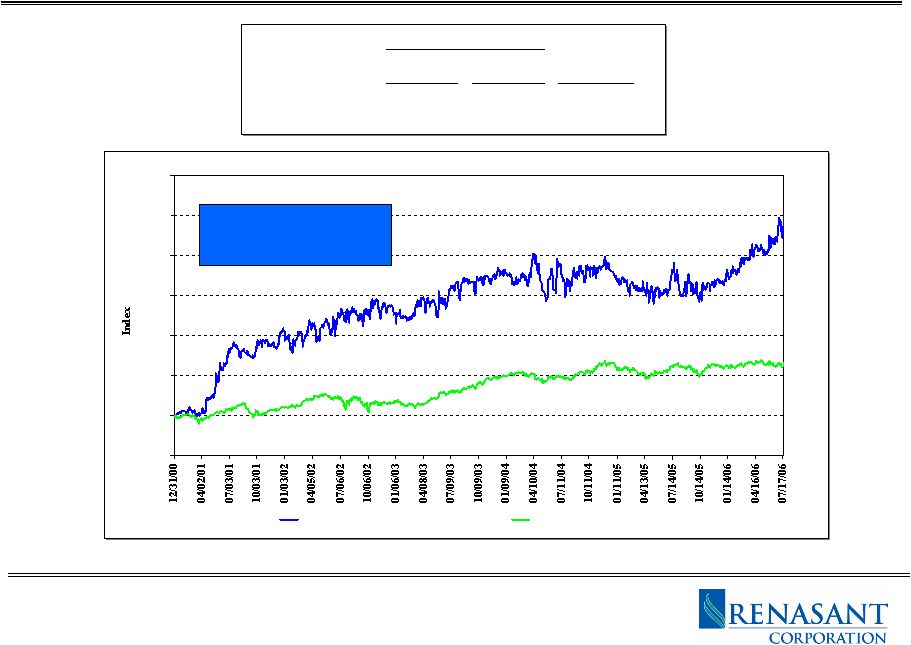 32 50 100 150 200 250 300 350 400 RNST NASDAQ Bank Index 19 years of Dividend Increases Price Performance and Shareholder Return Since 12/31/2000 Price Total Dividend Performance Return (1) Yield RNST 251 % 308 % 2.18 % NASDAQ Bank Index 66 83 2.34 Source: Bloomberg. Data as of 7/19/06. Prices are adjusted for stock splits and dividends. (1) Includes reinvestment of dividends. |
 33 Fair Valuation Est 2006 Est 2006 Price / Dividend GAAP P/E Cash P/E Book Yield RNST 16.7 x 16.1 x 181 % 2.2 % Peer Average 16.8 16.3 209 1.9 Source: SNL Financial. Pricing data as of 7/19/06. Earnings estimates are consensus of Wall Street analysts' estimates as
compiled by First Call. Cash basis ratios calculated by adding
back latest quarter before-tax amortization annualized. Peer
group includes publicly traded banks headquartered in AL, AR, FL, GA, LA, MS and TN with assets between $1 billion and $10 billion, excluding merger targets. |
 34 Attractive Markets Solid Financial Performance Quality Credit Prudent Growth Strategies Capable Management Team Key Investment Points |
 35 Nasdaq:RNST www.renasant.com Jim Gray Stuart Johnson Senior Executive Vice President-CIO Senior Executive Vice President-CFO 662-680-1217 662-680-1472 jimg@renasant.com stuartj@renasant.com |