 Investor Presentation 2009 Exhibit 99.1 |
 2 This presentation contains forward looking statements concerning Valley’s future business outlook,
financial condition and operating results. Generally, the words "will," "may,"
"should," "continue," "believes," "expects,"
"anticipates" or similar expressions identify forward looking statements. Readers are
advised not to place undue reliance on these forward looking statements as they are influenced
by certain risk factors and unpredictable events. The foregoing contains forward-looking statements within the meaning of the Private Securities
Litigation Reform Act of 1995. Such statements are not historical facts and include expressions
about management’s confidence and strategies and management’s expectations about new
and existing programs and products, relationships, opportunities, taxation, technology and
market conditions. These statements may be identified by such forward-looking terminology
as “expect,” “believe,” “view,” “opportunity,”
“allow,” “continues,” “reflects,” “typically,” “usually,” “anticipate,” or similar statements or variations of such terms. Such forward-looking statements involve certain risks and uncertainties.
Actual results may differ materially from such forward-looking statements. Factors that may
cause actual results to differ materially from those contemplated by such forward-looking
statements include, but are not limited to those factors disclosed in Valley’s Annual
Report on Form 10-K for the year ended December 31, 2008. NOTE: Valley disclaims any obligation to update or revise forward looking statements for any reason.
Information For Investors And Shareholders |
 3 Investor Presentation History of Valley National Bank Organic Growth and Acquisitions Valley National Bank Today About Us Executive Management Footprint and Demographics Balance Sheet Composition Loans Securities Shareholder Returns Recent Highlights Credit Culture Non-Performing Assets Net Charge-Offs Delinquencies Additional Information |
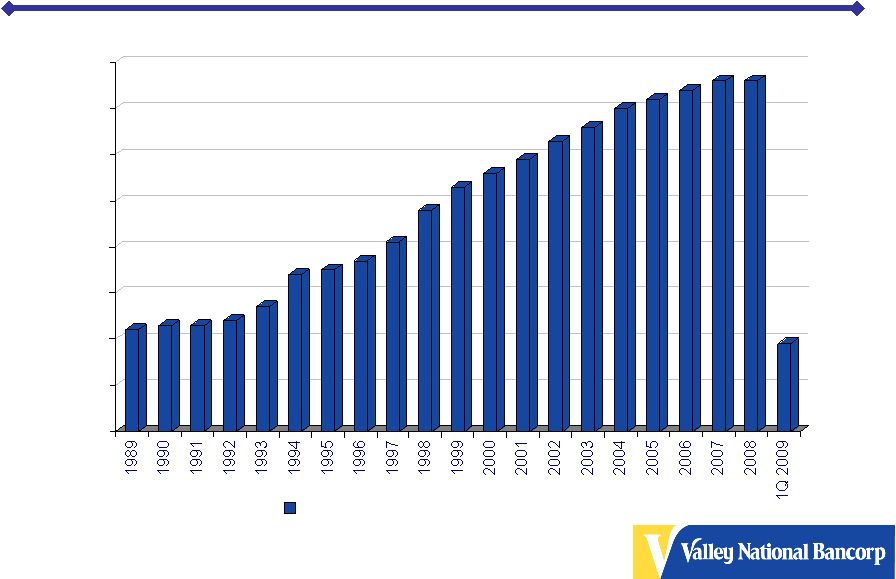
 4 $- $2,000 $4,000 $6,000 $8,000 $10,000 $12,000 $14,000 $16,000 1989 1990 1991 1992 1993 1994 1995 1996 1997 1998 1999 2000 2001 2002 2003 2004 2005 2006 2007 2008 Organic Assets Assets Acquired History of Valley National Bank Founded in 1927 Over the past 82 years, Valley has grown organically and through the acquisition of 28 financial institutions CAGR = Compounded annual growth rate Organic CAGR = 9.03% Total CAGR = 12.08% |
 5 Valley National Bank Today Regional Bank Holding Company Over $14.4 Billion in Assets Headquartered in Wayne, New Jersey 44 Largest United States Chartered Commercial Bank Largest Commercial Bank Headquartered in New Jersey Operates 194 Branches in 132 Communities Serving 14 counties throughout Northern and Central New Jersey, Manhattan, Brooklyn and Queens Big Bank – Act Like Small Privately Owned Company Sound Asset Quality Strong Financial Performance Consistent Shareholder Returns Currently Traded on the NYSE (VLY) th |
 6 Executive Management Office of the Chairman Seven senior executives offering strong senior management succession Tenured at Valley for a combined 169 years 24 years on average Backgrounds include: Regulatory experience CEO’s of acquired financial institutions Senior executives with national exposure working for local NJ/NY companies Mortgage banking & thrift experience |
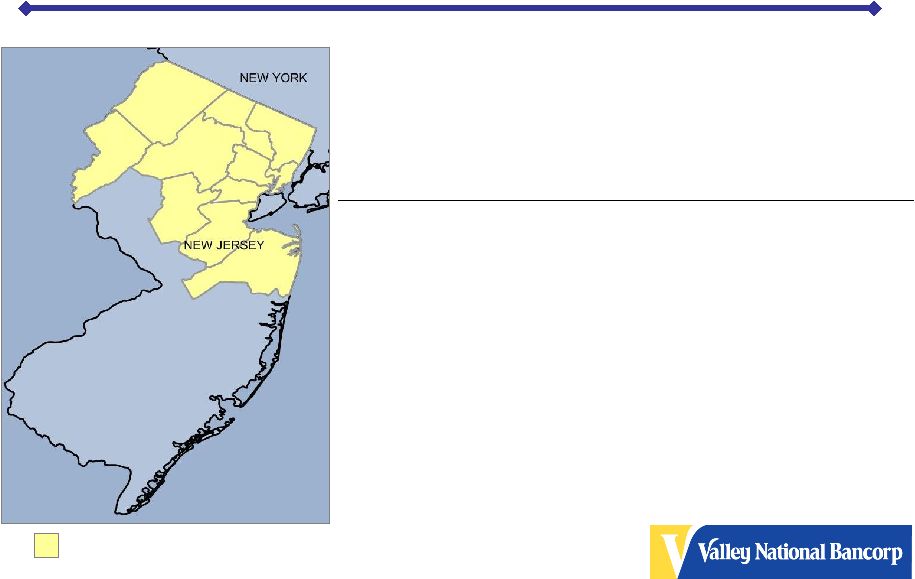 7 Footprint & Demographics New Jersey’s Marketplace $224,096,843 $72,646 8,890,186 NJ Total $68,108,730 $67,085 2,962,682 Balance of NJ Marketplace $155,988,113 $77,942 5,927,504 Valley’s NJ Marketplace Total Market Deposits (thousands) Median Household Income Population Region Valley’s NJ Marketplace *Source: SNL Financial Inc. |
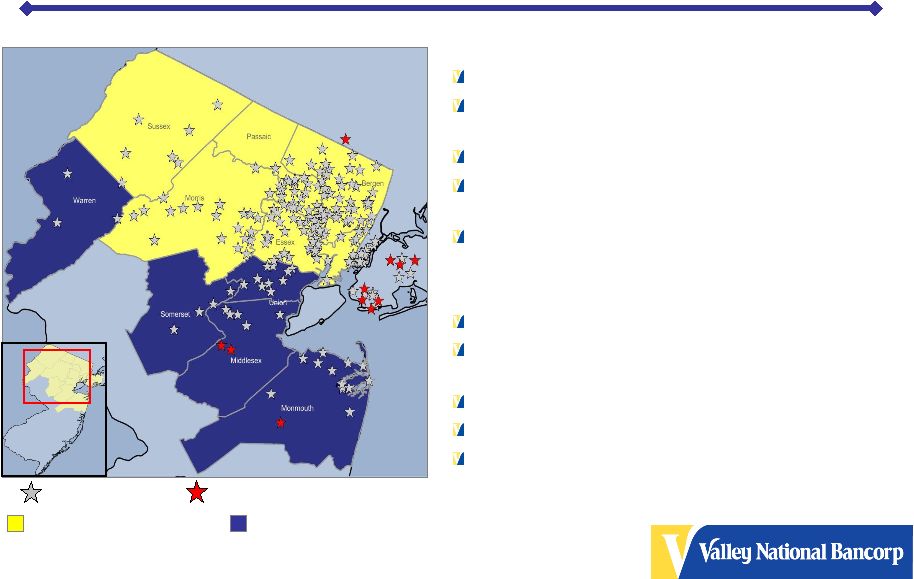 8 Valley’s Emerging NJ Market Valley’s Core NJ Market Place Branches Under Construction Current Branches Footprint & Demographics Valley’s Core New Jersey Market Total Market Deposits - $98,096,065 Market Average Deposits per Branch $68,264 Valley Branches – 139 Valley Branches with Deposits Greater than Market Average – 28 Valley’s Market Share - 7.01% Valley’s Emerging New Jersey Market Total Market Deposits - $56,182,451 Market Average Deposits per Branch $60,557 Existing Valley Branches – 36 Branches Under Construction – 4 Valley’s Market Share – 1.66% *Source: SNL Financial Inc. |
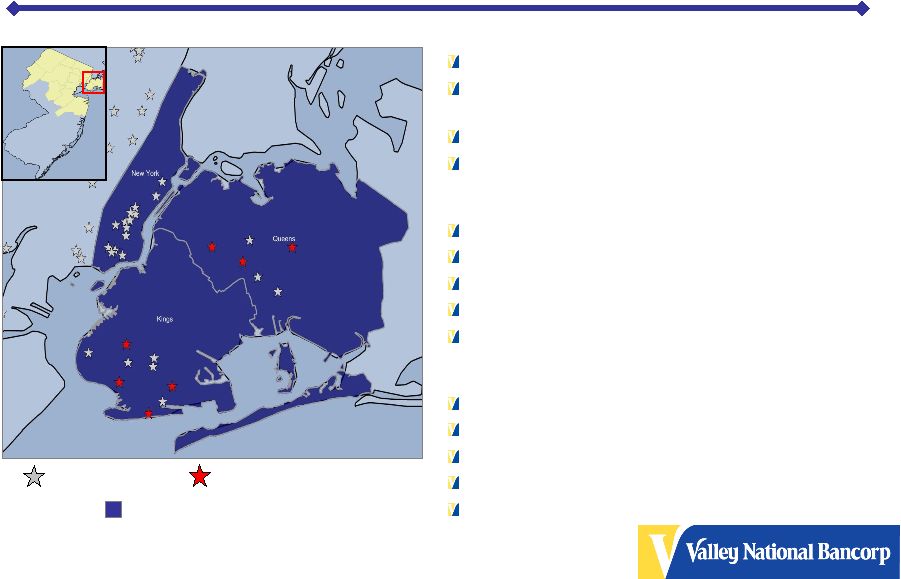 9 Footprint & Demographics Valley’s Emerging Manhattan Market Total Market Deposits - $384,229,192 Market Average Deposits per Branch $561,460 Existing Valley Branches – 14 Valley’s Market Share – 0.30% Valley’s Emerging Queens Market Total Market Deposits - $32,311,175 Market Average Deposits per Branch $94,299 Existing Valley Branches – 3 Branches Under Construction - 3 Valley’s Market Share – 0.18% Valley’s Emerging Brooklyn/Kings Market Total Market Deposits - $29,787,925 Market Average Deposits per Branch $95,524 Existing Valley Branches – 5 Branches Under Construction - 4 Valley’s Market Share – 0.35% Valley’s Emerging NYC Markets Branches Under Construction Current Branches *Source: SNL Financial Inc. |
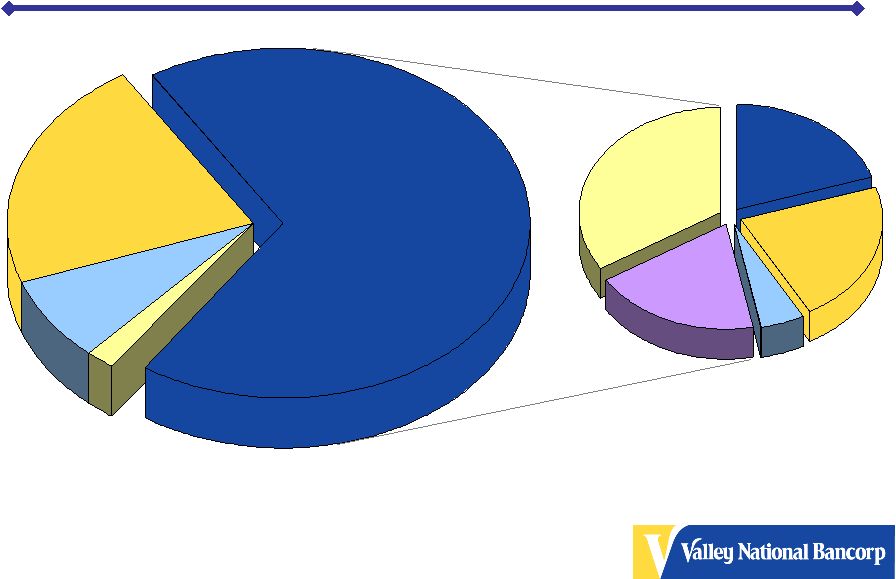 10 Asset and Loan Composition Loans 68% Cash & Securities 23% Other Assets 7%* Intangible Assets 2% Total Assets = $14.4 Billion *Other Assets includes bank owned branch locations carried at a cost estimated to be $200 million under market value As of 03/31/09 Commercial Loans 19% Construction Loans 5% Residential Mortgages 22% Commercial Mortgages 34% Consumer Loans 20% Total Loans = $9.8 Billion |
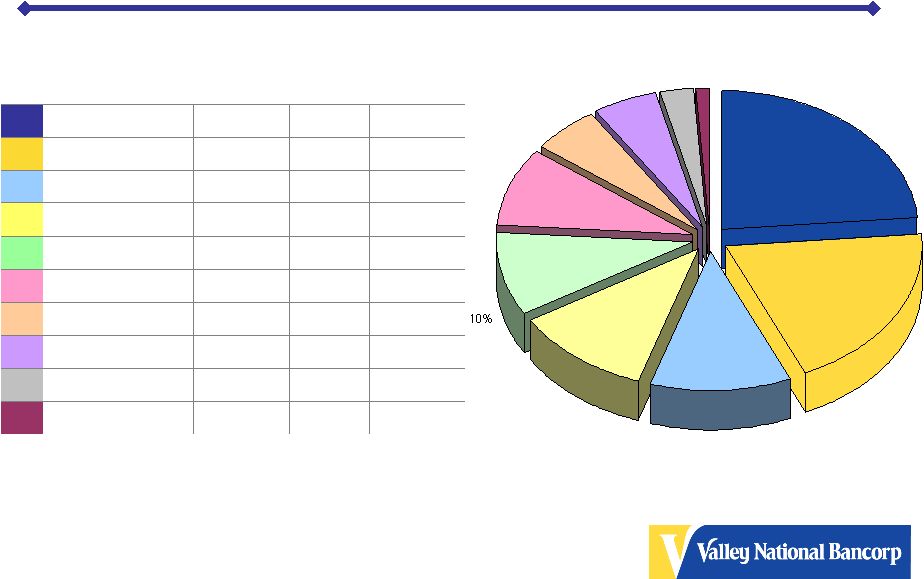 11 Total Commercial Real Estate - $3,666MM * Total CRE loan balance is based on Valley’s internal loan hierarchy
structure and does not reflect loan classifications reported in Valley’s
SEC and bank regulatory reports. As of 12/31/08 23% 19% 12% 12% 9% 6% 5% 3% 1% 1% 3% 5% 6% 9% 10% 11% 12% 20% 23% % of Total 52% 59% 48% 58% 53% 43% 55% 48% 52% 52% LTV 354 Apartments 423 Office 424 Mixed Use 725 Industrial 839 Retail 50 Other 114 Land Loans 188 Specialty 211 Healthcare 338 Residential $ Amount (Millions) Primary Property Type Commercial Real Estate Composition |
 12 CRE Property Valuation Stress Test 20% Decrease in Valuation Less than 50% 80% and Greater 50% - 79% 5% 80% and Greater 56% 50% to 79% 40% Less than 50% % of Total Loans with Current LTV LTV Categories 32% 80% and Greater 40% 50% to 79% 28% Less than 50% % of Total Loans with 20% Decrease in Property Valuation LTV Categories As of 12/31/08 Current LTV Less than 50% 80% and Greater 50% - 79% |
 13 25% 23% 20% 12% 6% 5% 5% 4% Total Retail Property Types - $839MM 12% Auto Dealership 20% Multi-Tenanted Retail – No Anchor 23% Single Tenant Retail 25% Multi-Tenanted Retail – Anchor % of Retail Property Type Retail Property Type Private Education Facilities Private & Public Clubs Other Food Establishments 4% 5% 5% 6% As of 12/31/08 Commercial Real Composition |
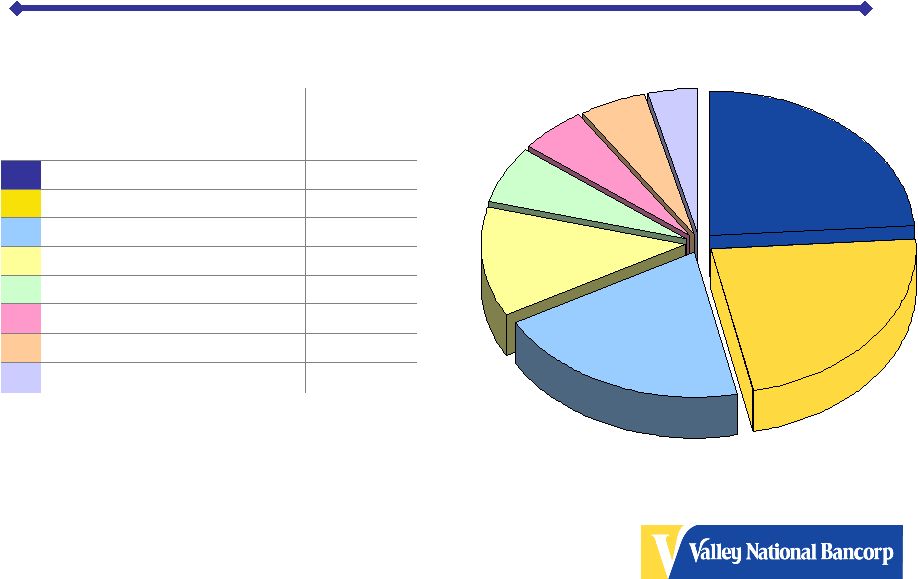
 14 Investment Portfolio GSE MBS (FNMA/FHLMC) 41% GSE MBS (GNMA) 21% Single Issuer Trust Preferred 12% Other 11% (Fed Reserve & Federal Home Loan Bank, FDIC
Guaranteed Corp Bonds) State, County, Municipals 8% Private Label MBS 5% Corporate Bonds 2% Investment Portfolio = $2.6 Billion As of 03/31/09 State, County, Municipals Corporate Bonds Other Single Issuer Trust Preferred Private Label MBS GSE MBS (GNMA) GSE MBS (FNMA/FHLMC) |
 15 AAA Rated Not Rated AA Rated A Rated Non-Investment Grade BBB Rated Securities by Investment Grade As of 12/31/08 AAA Rated 76% AA Rated 7% A Rated 8% BBB Rated 2% Non-Investment Grade <1% Not Rated 6% |
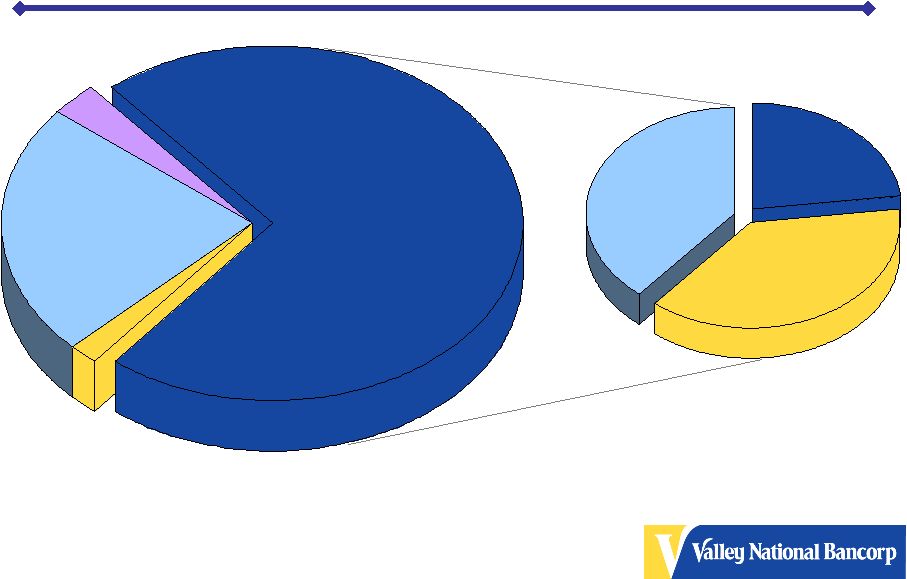 16 Deposits and Borrowings Composition Total Deposits 72% Short-term borrowings 2% Long-term borrowings 23% Other Liabilities 3% Total Liabilities = $13.0 Billion As of 03/31/09 Non-Interest Bearing 23% Interest Bearing 38% Time Deposits 39% Total Deposits = $9.4 Billion |
  17 * Per share data reflects the 5% common stock dividend declared on April 14, 2009. **1Q 2009, 2008 and 2007 include $1.4 million, $49.9 million and $10.4 million, respectively, in after tax other than temporary impairment charges on investment securities. Historical Financial Data (1989-3/2009)* (Dollars in millions, except for share data) 1Q 2009 14,430 $ 37.4 $
0.23 $
1.03 % 10.83 % 0.19 $
5/09 - 5% Stock Dividend 2008 14,718 93.6 0.67 0.69 8.74 0.76 5/08 - 5% Stock Dividend 2007 12,749 153.2 1.15 1.25 16.43 0.76 5/07 - 5% Stock Dividend 2006 12,395 163.7 1.21 1.33 17.24 0.74 5/06 - 5% Stock Dividend 2005 12,436 163.4 1.23 1.39 19.17 0.72 5/05 - 5% Stock Dividend 2004 10,763 154.4 1.22 1.51 22.77 0.70 5/04 - 5% Stock Dividend 2003 9,873 153.4 1.21 1.63 24.21 0.66 5/03 - 5% Stock Dividend 2002 9,148 154.6 1.17 1.78 23.59 0.63 5/02 - 5:4 Stock Split 2001 8,590 135.2 0.99 1.68 19.70 0.59 5/01 - 5% Stock Dividend 2000 6,426 106.8 0.95 1.72 20.28 0.56 5/00 - 5% Stock Dividend 1999 6,360 106.3 0.89 1.75 18.35 0.53 5/99 - 5% Stock Dividend 1998 5,541 97.3 0.86 1.82 18.47 0.48 5/98 - 5:4 Stock Split 1997 5,091 85.0 0.78 1.67 18.88 0.41 5/97 - 5% Stock Dividend 1996 4,687 67.5 0.69 1.47 17.23 0.37 5/96 - 5% Stock Dividend 1995 4,586 62.6 0.63 1.40 16.60 0.35 5/95 - 5% Stock Dividend 1994 3,744 59.0 0.70 1.60 20.03 0.34 5/94 - 10% Stock Dividend 1993 3,605 56.4 0.68 1.62 21.42 0.27 4/93 - 5:4 Stock Split 1992 3,357 43.4 0.53 1.36 19.17 0.24 4/92 - 3:2 Stock Split 1991 3,055 31.7 0.39 1.29 15.40 0.23 1990 2,149 28.6 0.35 1.44 14.54 0.23 1989 1,975 36.0 0.44 1.92 19.93 0.22 Year End Total Assets Net Income Common Stock Splits and Dividends Diluted Earnings Per Common Share Return on Average Assets Return on Average Equity Cash Dividends Declared Per Common Share Shareholder Returns |
 18 Shareholder Returns 100% -13% -25% 6% -10% -45% -17% -35% -56% -80% -60% -40% -20% 0% 20% 40% 60% 80% 100% 10 Year Total Return 5 Year Total Return 1 Year Total Return VLY S&P 500 KBW Bank Index Source: Bloomberg *10 yr and 5 yr total returns through 12/31/08 **1 yr total return through 4/9/09 |
 19 Valley’s 1Q 2009 Highlights Credit Quality Total 30+ day delinquencies: 1.34% Out of approximately 24,000 residential mortgages and home equity loans, only 0.91% were past due 30 days or more Net charge-offs were only $7.2 million or 0.29% of average total loans Total non-performing loans were only 0.48% of total loans Other Events 1Q Net Income was $37.4 million or $0.23 per diluted EPS* Analysts’ Mean Estimates: $0.20 per diluted EPS** Continued strong capital ratios OTTI credit impairment charge (after tax) of $1.4 million or less than $0.01 per diluted EPS* *Earnings per Common Share ** Not adjusted for recently declared 5% stock dividend |
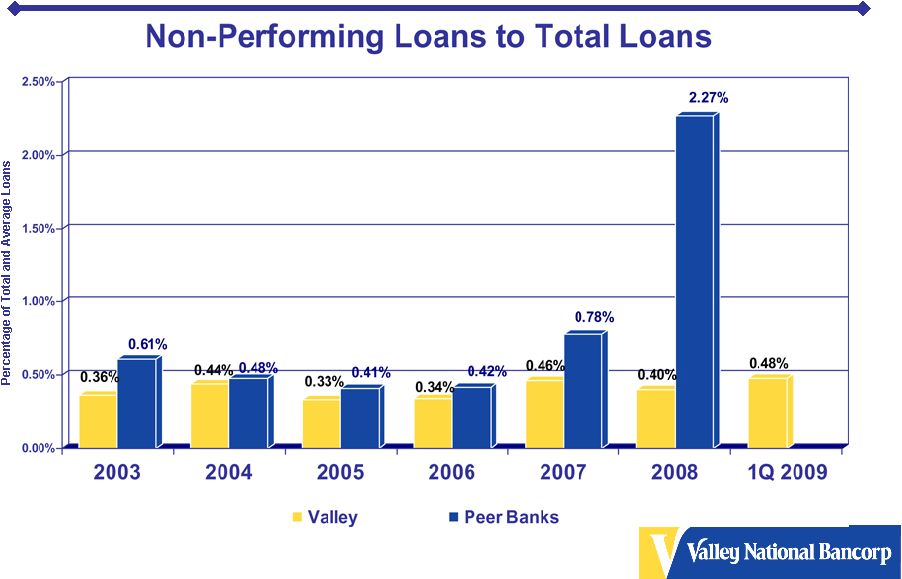 20 Loan Quality 2003 - 2008 |
       21 Net Charge-offs to Average Loans* -0.20% 0.00% 0.20% 0.40% 0.60% 0.80% 1.00% 1.20% 1.40% 1.60% 1.80% Valley Total Loans FDIC Insured Commercial Banks Total Loans Valley Residential Mortgages FDIC Insured Commercial Banks Residential Mortgages Valley Home Equity FDIC Insured Commercial Banks Home Equity *Source – FDIC Recession |
 22 Valley’s Long-Term Objectives
Maintain a quality balance sheet Manage balance sheet, not be managed by balance sheet growth Continue to produce strong operating results Minimize earnings volatility Maintain strong capital position Consistently generate solid shareholder returns |
 23 Valley National Bank Additional Information |
 24 History of Valley National Bank Founded in 1927 as The Passaic Park Trust Co. 1956 Purchased The Bank of Allwood - Clifton 1976 The Name Valley National Bank Chosen 1976 Acquired The Bank of Wayne 1977 Acquired Bankers National Bank - Elmwood Park 1981 Acquired Liberty National Bank - Hillsdale 1982 Acquired Fair Lawn State Bank 1983 Formed Valley National Bancorp 1984 Purchased First National Bank & Trust Co. of Kearny 1990 Purchased Mayflower Savings Bank - Livingston 1991 Acquired the Deposits from RTC for North Jersey Savings - Clifton First Jersey Savings - Wyckoff Nutley Savings Yorkwood Savings (Warren) 1992 Acquired Powder Mill Bank - Morris Plains 1993 Acquired People's Bank - Fairfield 1994 Acquired Rock Bank - N. Plainfield 1995 Acquired American Union Bank – Union 1995 Acquired Lakeland Savings Bank – Succasunna 1997 Acquired Midland Bancorp – Paramus 1998 Acquired Wayne Bancorp 1999 Acquired Commonwealth All Service Title Agency 1999 Acquired Ramapo Financial Corporation – Wayne 1999 Acquired New Century Asset Management Co. 2000 Acquired Hallmark Capital Management, Inc. 2001 Acquired Merchants Bank of New York 2001 Formed Valley Commercial Capital, LLC 2002 Acquired Masters Coverage Corp. 2002 Acquired NIA/Lawyers Title Agency, LLC 2005 Acquired Shrewsbury State Bank 2005 Acquired NorCrown Bank – Livingston 2008 Acquired Greater Community Bank - Totowa Valley’s 28 acquisitions have included commercial banks, savings and loans banks, title agencies, asset management companies and an insurance company among others |
 25 Valley National Bank Today Subsidiaries include: Mortgage servicing company $3.2 billion in serviced mortgages Title insurance agency Asset management advisors (SEC registered) and Trust services $786 million in assets under management All-line insurance agency Offers property, casualty, life and health insurance Commercial equipment leasing & financing for general aviation aircrafts Healthcare equipment leasing |
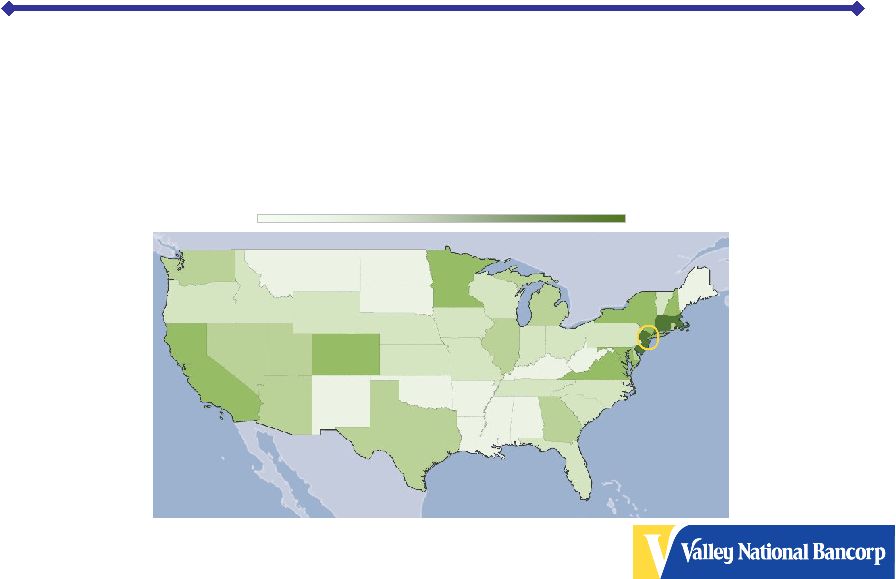 26 Footprint & Demographics $54,749 United States $58,692 New York $72,646 New Jersey Median Household Income* Least Income Most Income *Source: SNL Financial Inc. |
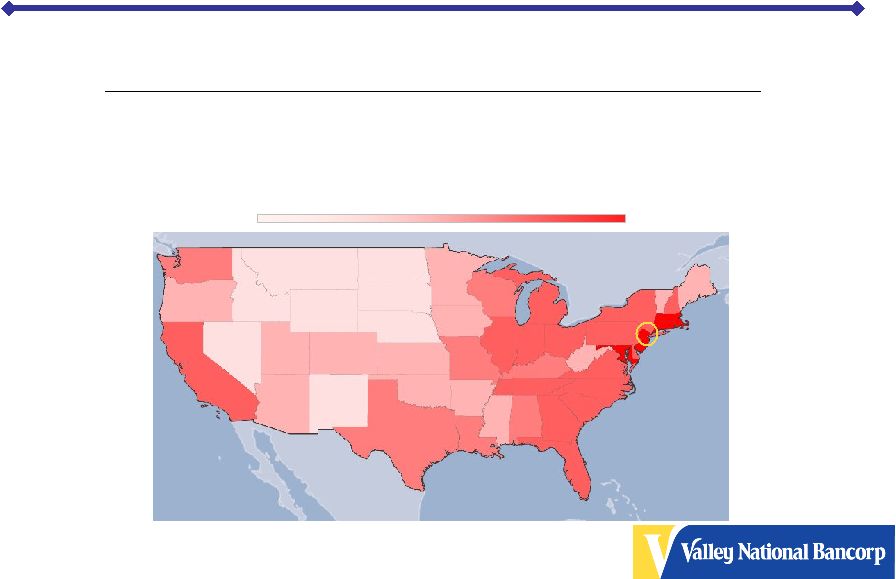 27 (Most Densely Populated State) Footprint & Demographics Least Densely Populated Most Densely Populated Per km Per square mile Country/State New York New Jersey United States 33.28 86.2 157.81 408.7 452.16 1,171.1 Population Density* *Source: SNL Financial Inc. 2 |
 28 Executive Management Gerald Lipkin Chairman of the Board, President & Chief Executive Officer Tenured with Valley since 1975 Chairman and Chief Executive Officer since 1989 President since 1996 As chairman, has been instrumental the acquisition of 22 financial institutions Vice Chairman and Member of the Executive Committee of the New Jersey Bankers Association Career in banking since 1963 Former Deputy Regional Administrator, New York Region, U.S. Comptroller of the Currency |
 29 Executive Management Tenured with Valley since 1990 Senior Vice President and Controller in 1998 Executive Vice President since 2000 Oversees Finance, Accounting, Treasury, Wealth Management & Shareholder Relations Career in banking since 1976 Residential Financial Corporation – Commercial Mortgage Broker Suburban Savings and Loan – Executive Vice President Employed at both local and national CPA Firms Member American Institute of CPA’s and New Jersey State Society of CPA’s Alan Eskow Executive Vice President Chief Financial Officer |
 30 Executive Management Tenured with Valley since 1977 Executive Officer since 1990 Oversees Retail Banking Network of 194 Branches, Bank Operations, Information Technology and Administration Provided oversight for the 3 most recent acquisitions of Greater Community Bank, Shrewsbury State Bank and NorCrown Bank Career in banking since 1977 Held a variety of positions with the bank, including Branch Banking, Lending and Operations Peter Crocitto Executive Vice President Chief Operating Officer |
 31 Executive Management Tenured with Valley since 1997 Executive Officer in since 1997 Oversees Commercial Lending, Commercial Real Estate Lending, SBA, Community Lending, Aircraft Finance, Leasing, Cash Management, Government Banking, Legal and Special Assets Career in banking since 1969 Former President and CEO of Midland Bancorporation and Midland Bank and Trust for 6 years Former President and CEO of First Jersey National Bank/Central (subsidiary of First Jersey National Corp ) for 5 years Robert Meyer Executive Vice President Chief Commercial Lending Officer |
 32 Executive Management Tenured with Valley since 1996 Executive Officer since 1998 Oversees Residential 1 st & 2 nd Mortgage, Auto, Floor Plan, Credit/Debit Cards, Personal Loans and Auto Loan Servicing Oversees mortgage loan servicing subsidiary servicing $3.2 billion in mortgage loans (purchased and originated) Career in banking since 1970 Executive VP of America’s largest, privately held Realtor’s mortgage
affiliate Over 37 years of mortgage lending / banking experience Al Engel Executive Vice President Chief Retail Lending Officer |
 33 Executive Management Tenured with Valley since 1991 Executive since 1991 Oversees Information Technology, Bank Operations, Facilities and Security Former President of Wealth Management and head of Retail Banking Career in banking since 1969 Former President & CEO of Pilgrim State Bank for 3 years Former President & COO of 1 National Bank & Trust Co. of Kearny for
18 years Robert Mulligan First Senior Vice President Chief Administrative Officer st |
 34 Executive Management Tenured with Valley since 1990 Executive Officer since 1992 Oversees all credit risk exposure within the Bank Former Head of New Jersey Commercial Lending Division and Former Chief Credit Policy and Administration Officer Career in banking since 1968 National Bank Examiner, U.S. Comptroller of the Currency for over 10 years Director, EVP and Chief Credit Officer Peoples National Bank of North Jersey President and CEO of two de novo Banks Robert Farrell First Senior Vice President Chief Credit Officer |
 35 Asset & Income Growth $- $20 $40 $60 $80 $100 $120 $140 $160 $180 $- $2,000 $4,000 $6,000 $8,000 $10,000 $12,000 $14,000 $16,000 $18,000 Net Income Total Assets *Annualized Net Income for 1Q 2009 |
 36 Shareholder Returns $0.00 $0.10 $0.20 $0.30 $0.40 $0.50 $0.60 $0.70 $0.80 Dividend Per Common Share |
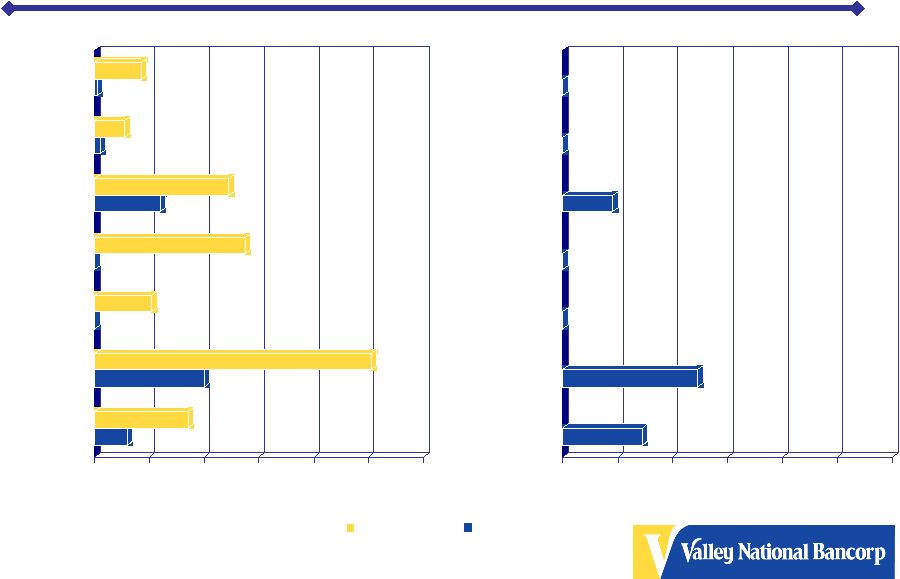 37 Net Charge-offs to Average Loans* *Source - SNL Financial As of 12/31/08 Peer group consists of banks with total assets between $3 billion and $50 billion
2003 - 2008 1Q 2009 0.12% 0.34% 0.40% 1.01% 0.00% 0.21% 0.00% 0.55% 0.24% 0.49% 0.02% 0.11% 0.01% 0.17% 0.00% 0.20% 0.40% 0.60% 0.80% 1.00% 1.20% Net Charge-offs to Average Loans (%) Total Loans Consumer Home Equity Construction & Development Commercial Loans Commercial Real Estate 1-4 Family Peer Group 0.29% 0.49% 0.00% 0.00% 0.18% 0.00% 0.00% 0.00% 0.20% 0.40% 0.60% 0.80% 1.00% 1.20% Net Charge-offs to Average Loans (%) Total Loans Consumer Home Equity Construction & Development Commercial Loans Commercial Real Estate 1-4 Family Valley |
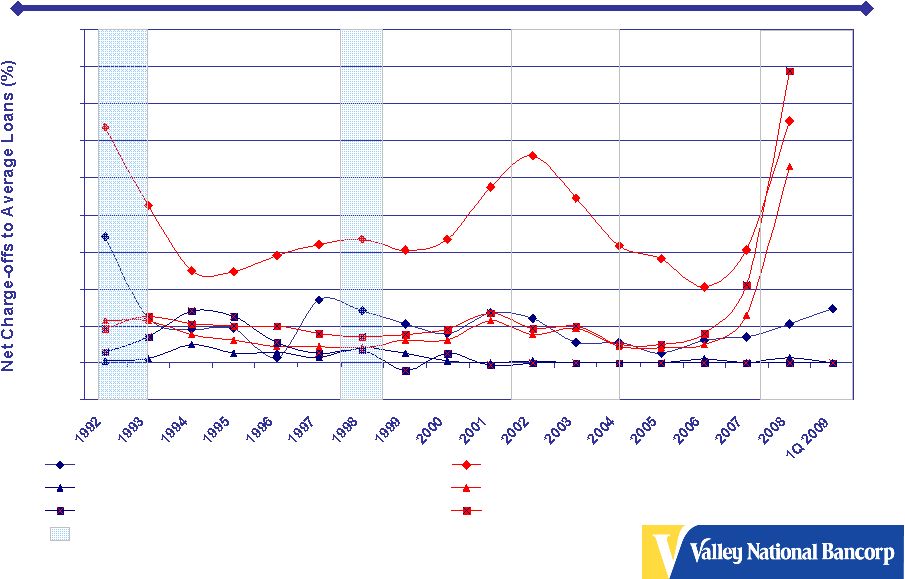
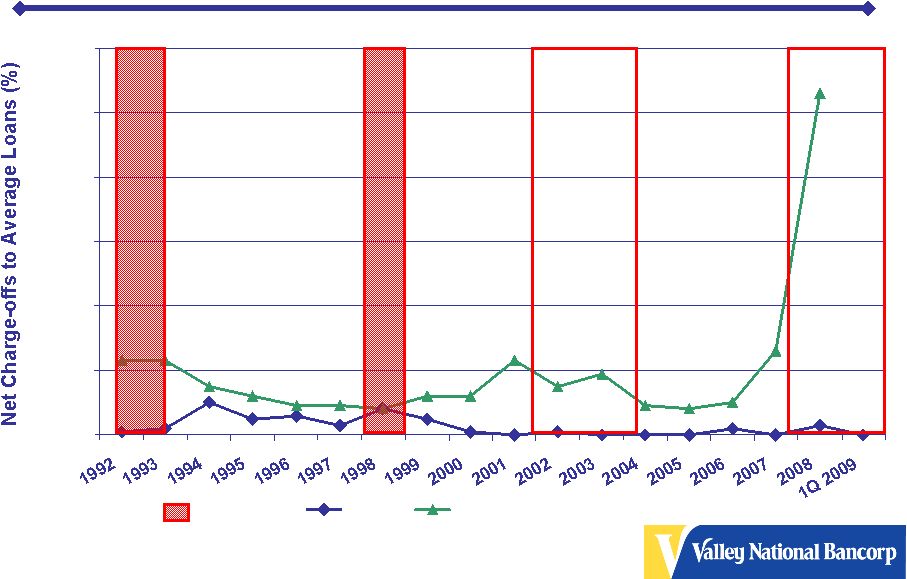
       38 Net Charge-offs to Average Loans* 0.00% 0.20% 0.40% 0.60% 0.80% 1.00% 1.20% 1.40% Valley FDIC Insured Commercial Banks Total Loan Portfolio *Source – FDIC Recession |
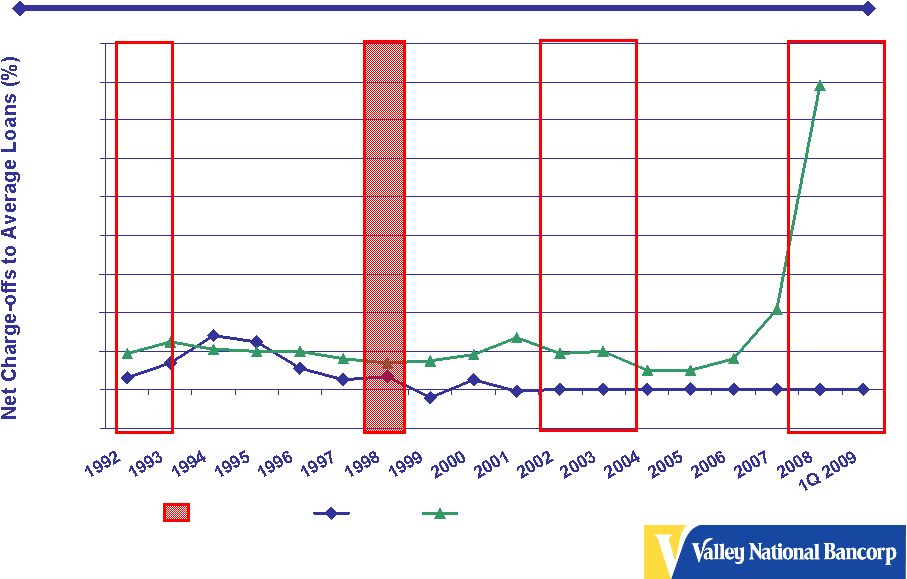
       39 Net Charge-offs to Average Loans 0.00% 0.20% 0.40% 0.60% 0.80% 1.00% 1.20% Valley FDIC Insured Commercial Banks Residential Mortgages *Valley’s increase between 1993 – 1997 is mainly attributable to acquisitions Source – FDIC Recession |
          40 Net Charge-offs to Average Loans -0.20% 0.00% 0.20% 0.40% 0.60% 0.80% 1.00% 1.20% 1.40% 1.60% 1.80% Valley FDIC Insured Commercial Banks Home Equity Recession *Valley’s increase between 1993 – 1997 is mainly attributable to acquisitions Source – FDIC |
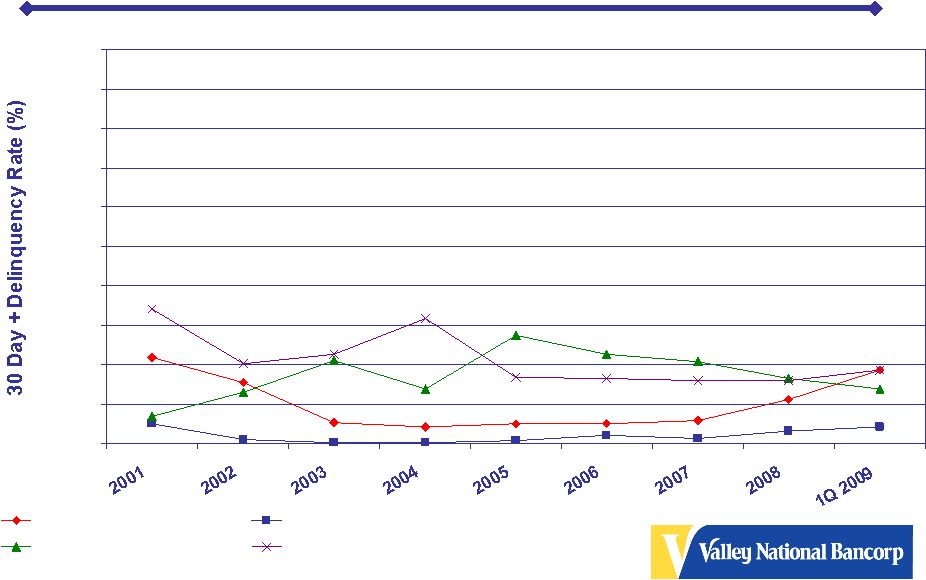 41 0.00% 0.50% 1.00% 1.50% 2.00% 2.50% 3.00% 3.50% 4.00% 4.50% 5.00% Residential Mortgages Home Equity Commercial Mortgages Commercial Loans* 30 Day + Delinquency Trend * Excludes SBA Loans |
 42 1 2 3 Residential Mtg. Customer Profile 746 Current FICO Score 44% Current Mark to Market Loan to Value 59% Original Loan to Value Residential Customer 1 Valley customer profile reflects a portfolio review conducted by an independent 3 party in September 2008 of Valley’s Fannie Mae eligible conforming loans. 2 Reflects December 31, 2008 MBA data 3 Reflects December 31, 2008 delinquency rates 4 Reflects December 31, 2008 ABA Home Equity Loan data 30 day + Delinquency Rate Valley Customer Profile 0.21% 3.14% 4 Home Equity Loans 23.89% 7.88% Industry N/A Sub-prime Loans 0.94% Residential Mortgage Valley rd |
 43 For More Information Log onto our web site: www.valleynationalbank.com Visit our kids site: www.vnbkids.com E-mail requests to: dgrenz@valleynationalbank.com Call Shareholder Relations at: (973) 305-3380 Write to: Valley National Bank 1455 Valley Road Wayne, New Jersey 07470 Attn: Dianne M. Grenz, First Senior Vice President Director of Marketing, Shareholder & Public Relations Log onto our website above or www.sec.gov to obtain free copies of documents filed by Valley with the SEC |