Pay vs Performance Disclosure
|
12 Months Ended |
|
Dec. 31, 2023
USD ($)
|
Dec. 31, 2022
USD ($)
|
Dec. 31, 2021
USD ($)
|
Dec. 31, 2020
USD ($)
|
| Pay vs Performance Disclosure |
|
|
|
|
| Pay vs Performance Disclosure, Table |
Pay Versus Performance Table for 2023
| |
|
|
|
|
|
|
|
|
|
|
|
|
|
|
|
|
|
Value of Initial Fixed $100 Investment |
|
|
|
|
|
|
|
|
|
|
Year
|
|
Summary Compensation Table Total for PEO (1)
|
|
|
Compensation Actually Paid to PEO (2)
|
|
|
Average Summary Compensation Table Total for Non-PEO NEOs(3)
|
|
|
Average Summary Compensation Actually Paid to Non-PEO NEOs(4)
|
|
|
TSR (5)
|
|
|
Peer Group TSR(6)
|
|
|
Net
Income (7) (thousands)
|
|
|
Core Return on Average Assets (8)
|
|
|
(a)
|
|
(b)
|
|
|
(c)
|
|
|
(d)
|
|
|
(e)
|
|
|
(f)
|
|
|
(g)
|
|
|
(h)
|
|
|
(i)
|
|
|
2023
|
|
$ |
3,509,048 |
|
|
$ |
3,189,968 |
|
|
$ |
1,048,246 |
|
|
$ |
1,001,064 |
|
|
$ |
97.9 |
|
|
$ |
124.5 |
|
|
$ |
87,003 |
|
|
|
0.93 |
% |
|
2022
|
|
|
4,006,115 |
|
|
|
2,703,464 |
|
|
|
1,255,457 |
|
|
|
1,041,643 |
|
|
|
99.8 |
|
|
|
113.4 |
|
|
|
125,211 |
|
|
|
1.47 |
|
|
2021
|
|
|
3,068,986 |
|
|
|
5,282,254 |
|
|
|
1,046,208 |
|
|
|
1,597,023 |
|
|
|
131.9 |
|
|
|
132.2 |
|
|
|
130,353 |
|
|
|
1.70 |
|
|
2020
|
|
|
2,848,393 |
|
|
|
2,878,128 |
|
|
|
970,211 |
|
|
|
1,021,790 |
|
|
|
78.6 |
|
|
|
88.2 |
|
|
|
71,289 |
|
|
|
1.16 |
|
| |
(1)
|
The dollar amounts reported in column (b) are the amounts of total compensation reported for Frank Sorrentino III (our Chairman and CEO) for each corresponding year in the “Total” column of the “Summary Compensation Table for 2023.”
|
| |
(2)
|
The dollar amounts reported in column (c) represent the amount of “compensation actually paid” to Mr. Sorrentino, as computed in accordance with Item 402(v) of SEC Regulation S-K. The dollar amounts reported do not reflect the actual amount of compensation earned by or paid to Mr. Sorrentino during the applicable year. In accordance with the requirements of Item 402(v) of SEC Regulation S-K, the following adjustments were made to Mr. Sorrentino total compensation for each year to determine the compensation actually paid to Mr. Sorrentino:
|
|
|
|
|
| PEO Total Compensation Amount |
$ 3,509,048
|
$ 4,006,115
|
$ 3,068,986
|
$ 2,848,393
|
| PEO Actually Paid Compensation Amount |
$ 3,189,968
|
2,703,464
|
5,282,254
|
2,878,128
|
| Adjustment To PEO Compensation, Footnote |
| |
|
2023
|
|
|
Summary Compensation Table Total:
|
|
$ |
3,509,048 |
|
|
Deduction for amount reported in “Stock Awards” column of the Summary Compensation Table:
|
|
|
(1,476,571 |
) |
|
Addition of fair value at fiscal year (FY) end, of equity awards granted during the FY that remained outstanding:
|
|
|
1,886,684 |
|
|
Addition of change in fair value at FY end versus prior FY end for awards granted in a prior FY that remained outstanding:
|
|
|
(84,863 |
) |
|
Addition of change in fair value at vesting date versus prior FY end for awards granted in a prior FY that vested during the FY:
|
|
|
(574,644 |
) |
|
Deduction for values reported in the “Change in Pension Value and Nonqualified Deferred Compensation Earnings” column of the Summary Compensation Table:
|
|
|
(182,004 |
) |
|
Addition of service costs and prior service costs:
|
|
|
112,318 |
|
|
Compensation Actually Paid (CAP)
|
|
$ |
3,189,968 |
|
| |
(3)
|
The dollar amounts reported in column (d) represent the average of the amounts reported for the Company’s Named Executed Officers (“NEOs”) as a group (excluding Mr. Sorrentino) in the “Total” column of the “Summary Compensation Table for 2023” in each applicable year. The names of the NEOs (excluding Mr. Sorrentino) included for the purpose of calculating the average amounts in each applicable year are William S. Burns, Elizabeth Magennis, Christopher Ewing, Mark Zurlini and Sharif Alexandre for 2023; William S. Burns, Elizabeth Magennis, Christopher Ewing and Michael O’Malley for 2022; William S. Burns, Elizabeth Magennis, Christopher Ewing and Laura Criscione for 2021.
|
| |
(4)
|
The dollar amounts reported in column (e) represent the average amount of “compensation actually paid” to the NEOs as a group (excluding Mr. Sorrentino), as computed in accordance with Item 402(v) of SEC Regulation S-K. The names of the NEOs (excluding Mr. Sorrentino) included for the purpose of calculating the average amounts in each applicable year are William S. Burns, Elizabeth Magennis, Christopher Ewing, Mark Zurlini and Sharif Alexandre for 2023; William S. Burns, Elizabeth Magennis, Christopher Ewing and Michael O’Malley for 2022; William S. Burns, Elizabeth Magennis, Christopher Ewing and Laura Criscione for 2021. The dollar amounts reported do not reflect the actual average amount of compensation earned by or paid to the NEOs as a group (excluding Mr. Sorrentino) during the applicable year. In accordance with the requirements of Item 402(v) of SEC Regulation S-K, the following adjustments were made to average total compensation for the NEOs as a group (excluding Mr. Sorrentino) for each year to determine the compensation actually paid, using the same methodology described above in footnote (2):
|
|
|
|
|
| Non-PEO NEO Average Total Compensation Amount |
$ 1,048,246
|
1,255,457
|
1,046,208
|
970,211
|
| Non-PEO NEO Average Compensation Actually Paid Amount |
$ 1,001,064
|
1,041,643
|
1,597,023
|
1,021,790
|
| Adjustment to Non-PEO NEO Compensation Footnote |
| |
|
2023
|
|
|
Summary Compensation Table Total:
|
|
$ |
1,048,246 |
|
|
Deduction for amount reported in “Stock Awards” column of the Summary Compensation Table:
|
|
|
(279,100 |
) |
|
Addition of fair value at fiscal year (FY) end, of equity awards granted during the FY that remained outstanding:
|
|
|
363,069 |
|
|
Addition of change in fair value at FY end versus prior FY end for awards granted in a prior FY that remained outstanding:
|
|
|
(15,009 |
) |
|
Addition of change in fair value at vesting date versus prior FY end for awards granted in a prior FY that vested during the FY:
|
|
|
(99,770 |
) |
|
Deduction for values reported in the “Change in Pension Value and Nonqualified Deferred Compensation Earnings” column of the Summary Compensation Table:
|
|
|
(41,943 |
) |
|
Addition of service costs and prior service costs:
|
|
|
25,572 |
|
|
Compensation Actually Paid (CAP)
|
|
$ |
1,001,064 |
|
| |
(5)
|
Cumulative TSR is calculated by dividing the sum of the cumulative amount of dividends for the measurement period (determined in accordance with Item 402(v) of SEC Regulation S-K), assuming dividend reinvestment, and the difference between the Company’s common share price at the end and the beginning of the measurement period by the Company’s common share price at the beginning of the measurement period.
|
| |
(6)
|
Represents the weighted peer group cumulative TSR, weighted according to the respective companies’ stock market capitalization at the beginning of each measurement period for which a return is indicated. The peer group used for this purpose is the Company’s peer group as defined in the section captioned “EXECUTIVE COMPENSATION – Compensation Discussion and Analysis.” The same financial services holding companies were included in the Company’s Compensation Peer Group disclosed in the section captioned “EXECUTIVE COMPENSATION – Compensation Discussion and Analysis” in the Company’s Proxy Statement for each of the 2022 Annual Meeting and the 2021 Annual Meeting of Shareholders.
|
| |
(7)
|
The dollar amounts reported represent the amount of net income (in thousands) reflected in the Company’s audited consolidated financial statements for the applicable year.
|
|
|
|
|
| Compensation Actually Paid vs. Total Shareholder Return |
Compensation Actually Paid Versus Company Performance
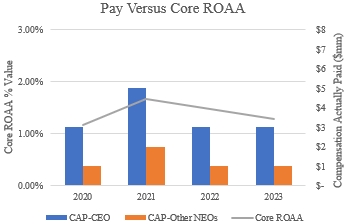
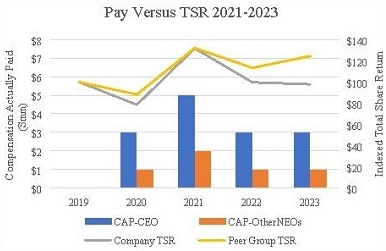
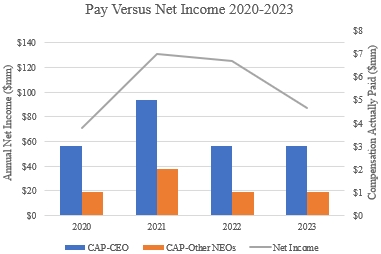
The following charts provide a clear, visual depiction of the relationships between CAP for our CEO and the average CAP for our Other NEOs, to aspects of the Company’s financial performance.
|
CEO and Average Other NEOs
CAP vs. Company TSR and Peer Group TSR
|
CEO and Average Other NEOs
CAP vs. GAAP Net Income
|
|
|
|
CEO and Average Other NEOs
CAP vs. Core ROAA %

|
|
|
|
| Tabular List, Table |
| |
(8)
|
While the Company uses numerous financial and non-financial performance measures for the purpose of evaluating performance for the Company’s compensation programs, we have determined that Core Return on Average Assets (“Core ROAA”) is the financial performance measure that, in Company's opinion, represents the most important performance measure (that is not otherwise required to be disclosed in this table) we used to link compensation actually paid to the Company’s NEOs for the most recently completed fiscal year to the Company's performance. Core ROAA is defined as core income as a percentage of average assets. Core income is defined as net income after taxes and before extraordinary items, less net income attributable to noncontrolling interest, gain on sale of held-to-maturity and available-for-sale securities, amortization of intangibles, goodwill and nonrecurring items. Examples of nonrecurring items include, but are not limited to, merger charges, loss on debt extinguishment, and gains on sales of branches. Our Compensation Committee believes Core ROAA is the most comprehensive and consistent measure of profitability and the least likely to be impacted by items that can conflict with optimal performance. Set forth below are the most important financial performance measures we used to link compensation actually paid to the CEO and Other NEOs to our performance for the year ended December 31, 2023:
● Core ROAA
● Efficiency Ratio
● Attainment of a target tangible book value per share.
|
|
|
|
|
| Total Shareholder Return Amount |
$ 97.9
|
99.8
|
131.9
|
78.6
|
| Peer Group Total Shareholder Return Amount |
124.5
|
113.4
|
132.2
|
88.2
|
| Net Income (Loss) |
$ 87,003,000
|
$ 125,211,000
|
$ 130,353,000
|
$ 71,289,000
|
| Company Selected Measure Amount |
0.0093
|
0.0147
|
0.017
|
0.0116
|
| Measure:: 1 |
|
|
|
|
| Pay vs Performance Disclosure |
|
|
|
|
| Name |
Core ROAA
|
|
|
|
| Measure:: 2 |
|
|
|
|
| Pay vs Performance Disclosure |
|
|
|
|
| Name |
Efficiency Ratio
|
|
|
|
| Measure:: 3 |
|
|
|
|
| Pay vs Performance Disclosure |
|
|
|
|
| Name |
Attainment of a target tangible book value per share
|
|
|
|
| PEO Deduction for amount reported in “Stock Awards” column of the Summary Compensation Table [Member] |
|
|
|
|
| Pay vs Performance Disclosure |
|
|
|
|
| Adjustment to Compensation, Amount |
$ (1,476,571)
|
|
|
|
| PEO Addition of fair value at fiscal year (FY) end, of equity awards granted during the FY that remained outstanding [Member] |
|
|
|
|
| Pay vs Performance Disclosure |
|
|
|
|
| Adjustment to Compensation, Amount |
1,886,684
|
|
|
|
| PEO Addition of change in fair value at FY end versus prior FY end for awards granted in a prior FY that remained outstanding [Member] |
|
|
|
|
| Pay vs Performance Disclosure |
|
|
|
|
| Adjustment to Compensation, Amount |
(84,863)
|
|
|
|
| PEO Addition of change in fair value at vesting date versus prior FY end for awards granted in a prior FY that vested during the FY [Member] |
|
|
|
|
| Pay vs Performance Disclosure |
|
|
|
|
| Adjustment to Compensation, Amount |
(574,644)
|
|
|
|
| PEO Deduction for values reported in the “Change in Pension Value and Nonqualified Deferred Compensation Earnings” column of the Summary Compensation Table [Member] |
|
|
|
|
| Pay vs Performance Disclosure |
|
|
|
|
| Adjustment to Compensation, Amount |
(182,004)
|
|
|
|
| PEO Addition of service costs and prior service costs [Member] |
|
|
|
|
| Pay vs Performance Disclosure |
|
|
|
|
| Adjustment to Compensation, Amount |
112,318
|
|
|
|
| NEO Deduction for amount reported in “Stock Awards” column of the Summary Compensation Table [Member] |
|
|
|
|
| Pay vs Performance Disclosure |
|
|
|
|
| Adjustment to Compensation, Amount |
(279,100)
|
|
|
|
| NEO Addition of fair value at fiscal year (FY) end, of equity awards granted during the FY that remained outstanding [Member] |
|
|
|
|
| Pay vs Performance Disclosure |
|
|
|
|
| Adjustment to Compensation, Amount |
363,069
|
|
|
|
| NEO Addition of change in fair value at FY end versus prior FY end for awards granted in a prior FY that remained outstanding [Member] |
|
|
|
|
| Pay vs Performance Disclosure |
|
|
|
|
| Adjustment to Compensation, Amount |
(15,009)
|
|
|
|
| NEO Addition of change in fair value at vesting date versus prior FY end for awards granted in a prior FY that vested during the FY [Member] |
|
|
|
|
| Pay vs Performance Disclosure |
|
|
|
|
| Adjustment to Compensation, Amount |
(99,770)
|
|
|
|
| NEO Deduction for values reported in the “Change in Pension Value and Nonqualified Deferred Compensation Earnings” column of the Summary Compensation Table [Member] |
|
|
|
|
| Pay vs Performance Disclosure |
|
|
|
|
| Adjustment to Compensation, Amount |
(41,943)
|
|
|
|
| NEO Addition of service costs and prior service costs [Member] |
|
|
|
|
| Pay vs Performance Disclosure |
|
|
|
|
| Adjustment to Compensation, Amount |
$ 25,572
|
|
|
|


