EX-99.1
Exhibit 99.1
FOR IMMEDIATE RELEASE
May 8, 2012
Analyst Contacts: Max Kuniansky, (702) 402-5627
Britta Carlson, (702) 402-5624
Media Contact: Karl Walquist,
(775) 834-3891
NV Energy Reports First Quarter Earnings, Increases Dividend 31% and Initiates Earnings Guidance
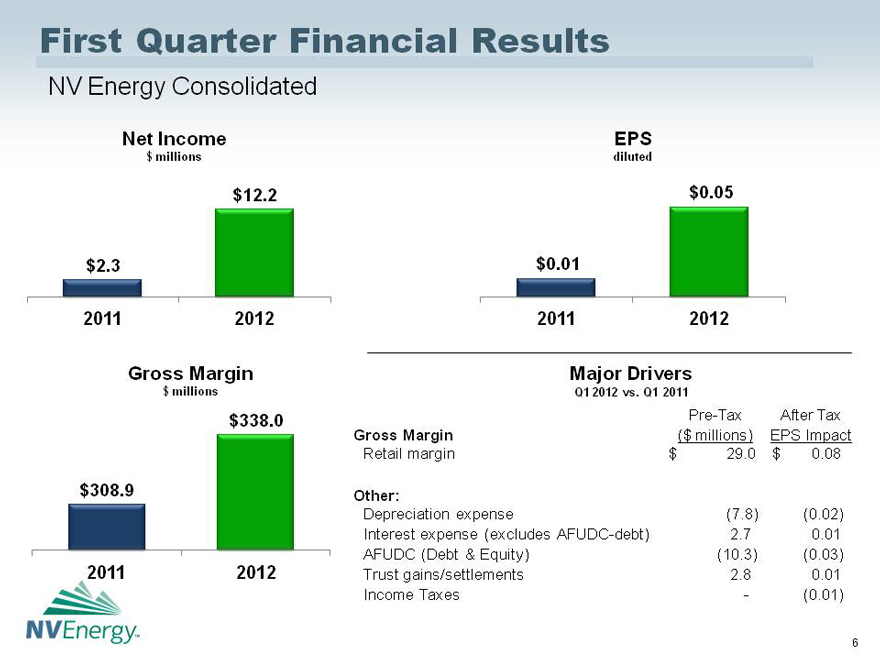
Las Vegas – NV Energy, Inc. (NYSE: NVE) today announced financial results for the three months ended March 31, 2012.
NV Energy, Inc.
Consolidated Results
Three Months Ended March 31,
|
|
|
|
|
|
|
| Net Income |
|
EPS |
| ($ in millions) |
|
(diluted) |
| 2012 |
|
2011 |
|
2012 |
|
2011 |
| $12.2 |
|
$2.3 |
|
$0.05 |
|
$0.01 |
“Results for the first quarter met our expectations,” said Michael Yackira, NV Energy president and chief
executive officer. “Earnings increased despite mild weather, largely due to higher income associated with our investment in the Harry Allen generating station. Operating and maintenance expenses were virtually unchanged, reflecting the
continued success of our cost control efforts.”
Dividend Increase and Earnings Guidance
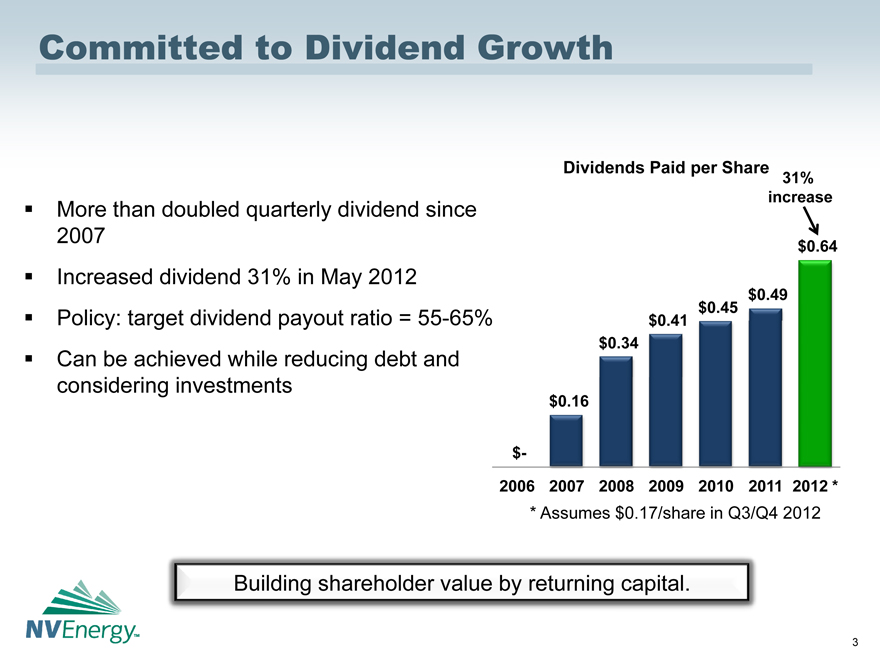
The Company also announced that its board of directors has declared a cash dividend of $0.17 per share, payable June 20, 2012 to shareholders of
record on June 5, 2012. The company paid a quarterly dividend of $0.13 per share in March 2012. Assuming continuation of the $0.17 quarterly payment for the remainder of this year, total dividends for 2012 would be $0.64 per share, a 31 percent
increase compared to the $0.49 paid in 2011.
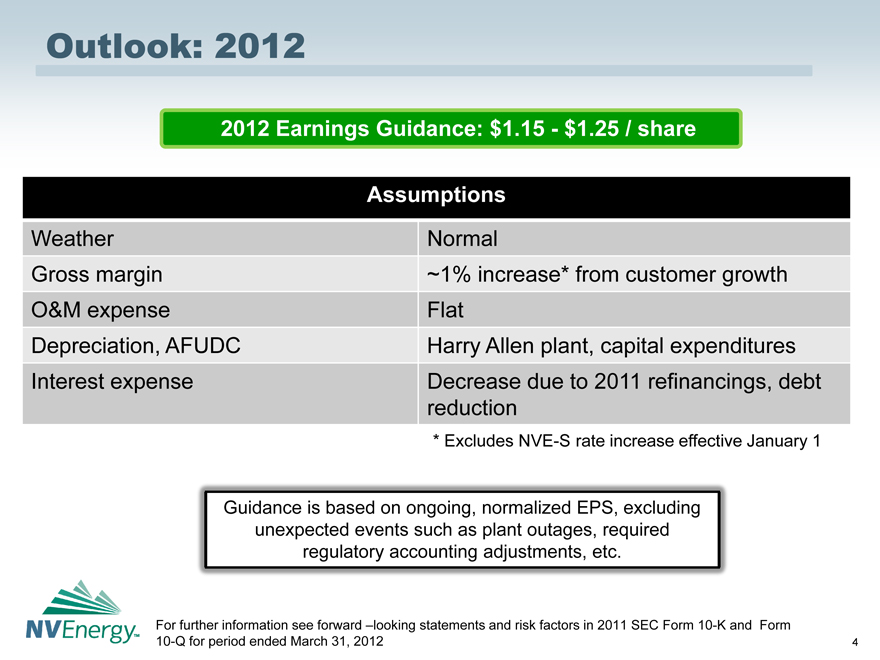
“The dividend increase we announce today demonstrates our confidence that NV Energy is
entering a period of more stable earnings and sustained free cash flow,” said Mr. Yackira. “In 2012, we expect to earn between $1.15 and $1.25 per share, resulting in a dividend payout ratio of approximately 50 percent.
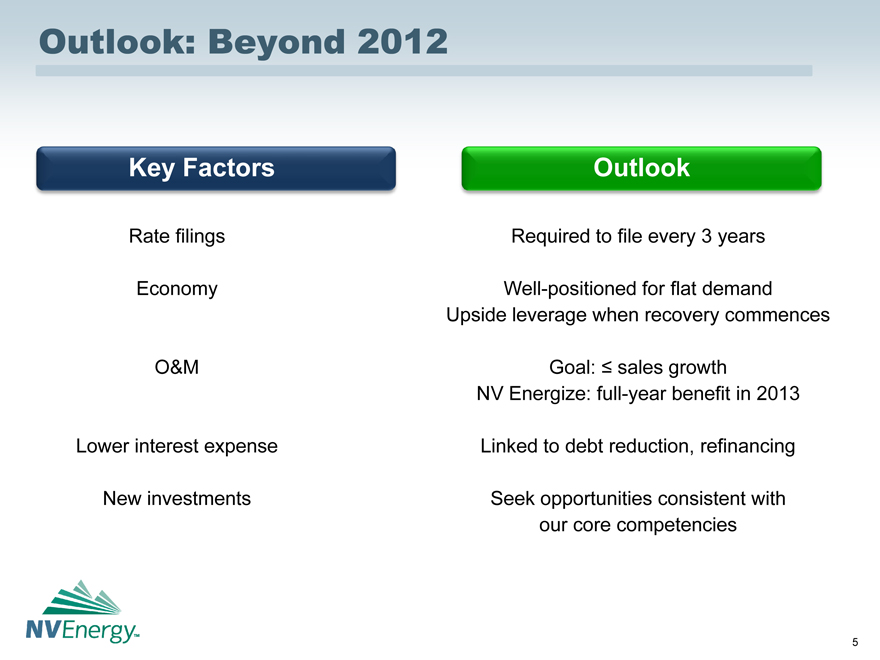
“Our policy will be to target a dividend payout ratio in the range of 55 to 65 percent. Given our current expectations for earnings and cash flow,
this should allow us to increase dividends by about 10 percent annually for the next few years. Thereafter, our policy will be to grow dividends in line with sustainable earnings growth,” Mr. Yackira said. “Earnings and free cash flow
should be sufficient to achieve our target payout ratio while reducing debt, strengthening our capital structure and considering potential new investments.”
With the increase announced today, NV Energy has more than doubled its dividend since reinstating it in July 2007 at $0.08 per share. During this period the company also:
| |
• |
|
successfully completed a major generation expansion plan, |
| |
• |
|
reduced reliance on purchased power, |
| |
• |
|
increased its commitment to renewable energy, |
| |
• |
|
expanded customer energy efficiency and conservation programs, and |
| |
• |
|
began installing smart meters system-wide. |
Key factors expected to drive financial results in 2012 and beyond are shown in the “First Quarter 2012: Financial Results” presentation posted on www.nvenergy.com this morning.
Management’s earnings expectations assume normal weather and other drivers listed in the presentation. The declaration of future
dividends is at the discretion of the Board of Directors and is subject to numerous factors that ordinarily affect dividend policy, including the results of NV Energy operations and its financial position as well as general economic and business
conditions.
Webcast Scheduled for 7 a.m. PDT today, Tuesday, May 8, 2012
Senior management of NV Energy will review the company’s first quarter 2012 financial results and other matters during a conference call and live
webcast today, Tuesday, May 8, at 7 a.m. Pacific Daylight Time.
The webcast will be accessible on the NV Energy website at:
www.nvenergy.com.
A taped replay will be available on the company’s website and by telephone for approximately 30 days. To listen
to the replay by telephone, call (800) 475-6701. International callers should dial (320) 365-3844. Use the conference call access code, 244930.
May 16 Investor Meeting and Webcast
NV Energy’s senior management will
host a meeting with the financial community on Wednesday, May 16, 2012 in New York. The presentation will be accessible to the public via webcast on www.nvenergy.com.
Headquartered in Las Vegas, NV Energy, Inc. is a holding company whose principal subsidiaries, Nevada Power Company and Sierra Pacific Power Company, are doing business as NV Energy. Serving a combined
45,592 square-mile service territory, NV Energy provides a wide range of energy services and products to approximately 2.4 million citizens of Nevada and nearly 40 million tourists annually.
This press release may contain forward-looking statements within the meaning of the Private Securities Litigation Reform Act of 1995 regarding the future
performance of NV Energy, Inc. and its subsidiaries, Nevada Power Company and Sierra Pacific Power Company both d/b/a NV Energy. Forward-looking statements include earnings guidance and estimates or forecasts of operating and financial metrics.
These statements reflect current expectations of future conditions and events and as such are subject to a variety of risks, uncertainties and assumptions that could cause actual results to differ materially from current expectations. These risks,
uncertainties and assumptions include, but are not limited to, NV Energy Inc.’s ability to maintain access to the capital markets, NV Energy Inc.’s ability to receive dividends from its subsidiaries, the financial performance of NV Energy
Inc.’s subsidiaries, particularly Nevada Power Company and Sierra Pacific Power Company both d/b/a NV Energy, and the discretion of NV Energy Inc.’s Board of Directors with respect to the payment of future dividends based on its periodic
review of factors that ordinarily affect dividend policy, such as current and prospective financial condition, earnings and liquidity, prospective business conditions, regulatory factors, and dividend restrictions in NV Energy Inc.’s and its
subsidiaries’ financing agreements. For Nevada Power Company and Sierra Pacific Power Company both d/b/a NV Energy, these risks and uncertainties include, but are not limited to, future economic conditions both nationally and regionally,
changes in the rate of industrial, commercial and residential growth in their service territories, their ability to procure sufficient renewable energy sources in each compliance year to satisfy the Nevada Renewable Energy Portfolio Standard,
changes in environmental laws and regulations, construction risks, including but not limited to those associated with the ON Line project, their ability to maintain access to the capital markets for general corporate purposes and to finance
construction projects, employee workforce factors, unseasonable weather, drought, wildfire and other natural phenomena, explosions, fires, accidents, mechanical breakdowns that may occur while operating and maintaining an electric and natural gas
system, their ability to purchase sufficient fuel, natural gas and power to meet their power demands and natural gas demands for Sierra Pacific Power Company d/b/a NV Energy, financial market conditions, and unfavorable rulings in their pending
and future regulatory filings. Further risks, uncertainties and assumptions that may cause actual results to differ from current expectations pertain to weather conditions, customer and sales growth, plant outages, operations and maintenance
expense, depreciation and allowance for funds used during construction, interest rates and expense, cash flow and regulatory matters. Additional cautionary statements regarding other risk factors that could have an effect on the future performance
of NV Energy, Inc., Nevada Power Company and Sierra Pacific Power Company both d/b/a NV Energy are contained in their Annual Reports on Form 10-K for the year ended December 31, 2011, each filed with the Securities and Exchange Commission. NV
Energy Inc., Nevada Power Company and Sierra Pacific Power Company both d/b/a NV Energy undertake no obligation to release publicly the result of any revisions to these forward-looking statements that may be made to reflect events or circumstances
after the date hereof or to reflect the occurrence of unanticipated events.
NV ENERGY, INC.
CONSOLIDATED STATEMENTS OF COMPREHENSIVE INCOME
(Dollars in Thousands, Except Share Amounts)
(Unaudited)
|
|
|
|
|
|
|
|
|
| |
|
Three Months
Ended
March 31, |
|
| |
|
2012 |
|
|
2011 |
|
| OPERATING REVENUES |
|
$ |
611,420 |
|
|
$ |
640,983 |
|
|
|
|
| OPERATING EXPENSES: |
|
|
|
|
|
|
|
|
| Fuel for power generation |
|
|
117,035 |
|
|
|
146,338 |
|
| Purchased power |
|
|
117,116 |
|
|
|
135,016 |
|
| Gas purchased for resale |
|
|
31,617 |
|
|
|
52,632 |
|
| Deferred energy |
|
|
(11,739 |
) |
|
|
(1,952 |
) |
| Energy efficiency program costs |
|
|
19,425 |
|
|
|
— |
|
| Other operating expenses |
|
|
103,601 |
|
|
|
105,974 |
|
| Maintenance |
|
|
32,526 |
|
|
|
29,762 |
|
| Depreciation and amortization |
|
|
90,862 |
|
|
|
83,102 |
|
| Taxes other than income |
|
|
14,509 |
|
|
|
16,245 |
|
|
|
|
|
|
|
|
|
|
| Total Operating Expenses |
|
|
514,952 |
|
|
|
567,117 |
|
|
|
|
|
|
|
|
|
|
| OPERATING INCOME |
|
|
96,468 |
|
|
|
73,866 |
|
|
|
|
| OTHER INCOME (EXPENSE): |
|
|
|
|
|
|
|
|
| Interest expense
(net of AFUDC-debt: $1,595 and $6,210) |
|
|
(77,931 |
) |
|
|
(77,343 |
) |
| Interest income (expense) on regulatory items |
|
|
(2,202 |
) |
|
|
(888 |
) |
| AFUDC-equity |
|
|
1,932 |
|
|
|
7,642 |
|
| Other income |
|
|
4,194 |
|
|
|
2,984 |
|
| Other expense |
|
|
(3,060 |
) |
|
|
(4,656 |
) |
|
|
|
|
|
|
|
|
|
| Total Other Income (Expense) |
|
|
(77,067 |
) |
|
|
(72,261 |
) |
|
|
|
|
|
|
|
|
|
| Income Before Income Tax Expense |
|
|
19,401 |
|
|
|
1,605 |
|
|
|
|
| Income tax expense (benefit) |
|
|
7,228 |
|
|
|
(725 |
) |
|
|
|
|
|
|
|
|
|
|
|
|
| NET INCOME |
|
|
12,173 |
|
|
|
2,330 |
|
|
|
|
| Other comprehensive income (loss): |
|
|
|
|
|
|
|
|
| Change in compensation retirement benefits liability and amortization
(Net of taxes $(89) and $(615)) |
|
|
155 |
|
|
|
1,142 |
|
| Change in market value of risk management assets and liabilities
(Net of taxes $141 in 2012) |
|
|
(246 |
) |
|
|
— |
|
|
|
|
|
|
|
|
|
|
| OTHER COMPREHENSIVE INCOME (LOSS) |
|
|
(91 |
) |
|
|
1,142 |
|
|
|
|
| COMPREHENSIVE INCOME |
|
$ |
12,082 |
|
|
$ |
3,472 |
|
|
|
|
|
|
|
|
|
|
| Amount per share basic and diluted |
|
|
|
|
|
|
|
|
| Net income per share - basic and diluted |
|
$ |
0.05 |
|
|
$ |
0.01 |
|
|
|
|
| Weighted Average Shares of Common Stock Outstanding - basic |
|
|
235,999,750 |
|
|
|
235,526,425 |
|
|
|
|
|
|
|
|
|
|
| Weighted Average Shares of Common Stock Outstanding - diluted |
|
|
237,526,863 |
|
|
|
236,784,658 |
|
|
|
|
|
|
|
|
|
|
| Dividends Declared Per Share of Common Stock |
|
$ |
0.13 |
|
|
$ |
0.12 |
|
|
|
|
|
|
|
|
|
|
NV ENERGY, INC.
CONSOLIDATED BALANCE SHEETS
(Dollars in Thousands, Except Share Amounts)
(Unaudited)
|
|
|
|
|
|
|
|
|
|
|
| |
|
March 31, |
|
|
December 31, |
|
| |
|
2012 |
|
|
2011 |
|
| ASSETS |
|
|
|
|
|
|
|
|
|
|
|
| Current Assets: |
|
|
|
|
|
|
|
|
| Cash and cash equivalents |
|
$ |
100,335 |
|
|
$ |
145,944 |
|
| Accounts receivable less allowance for uncollectible accounts: |
|
|
|
|
|
|
|
|
| 2012 - $6,453; 2011 - $8,150 |
|
|
325,388 |
|
|
|
355,091 |
|
| Materials, supplies and fuel, at average cost |
|
|
130,628 |
|
|
|
129,663 |
|
| Current income taxes receivable |
|
|
82 |
|
|
|
82 |
|
| Deferred income taxes |
|
|
117,079 |
|
|
|
104,958 |
|
| Other current assets |
|
|
49,802 |
|
|
|
36,782 |
|
|
|
|
|
|
|
|
|
|
| Total Current Assets |
|
|
723,314 |
|
|
|
772,520 |
|
|
|
|
|
|
|
|
|
|
|
|
|
| Utility Property: |
|
|
|
|
|
|
|
|
| Plant in service |
|
|
11,955,428 |
|
|
|
11,923,717 |
|
| Construction work-in-progress |
|
|
556,170 |
|
|
|
487,427 |
|
|
|
|
|
|
|
|
|
|
| Total |
|
|
12,511,598 |
|
|
|
12,411,144 |
|
| Less accumulated provision for depreciation |
|
|
3,240,688 |
|
|
|
3,184,071 |
|
|
|
|
|
|
|
|
|
|
| Total Utility Property, Net |
|
|
9,270,910 |
|
|
|
9,227,073 |
|
|
|
|
| Investments and other property, net |
|
|
59,273 |
|
|
|
57,021 |
|
|
|
|
| Deferred Charges and Other Assets: |
|
|
|
|
|
|
|
|
| Deferred energy |
|
|
99,566 |
|
|
|
102,525 |
|
| Regulatory assets |
|
|
1,174,069 |
|
|
|
1,186,127 |
|
| Regulatory asset for pension plans |
|
|
212,259 |
|
|
|
215,656 |
|
| Other deferred charges and assets |
|
|
88,020 |
|
|
|
74,206 |
|
|
|
|
|
|
|
|
|
|
| Total Deferred Charges and Other Assets |
|
|
1,573,914 |
|
|
|
1,578,514 |
|
|
|
|
|
|
|
|
|
|
|
|
|
| TOTAL ASSETS |
|
$ |
11,627,411 |
|
|
$ |
11,635,128 |
|
|
|
|
|
|
|
|
|
|
(Continued)
NV ENERGY, INC.
CONSOLIDATED BALANCE SHEETS
(Dollars in Thousands, Except Share Amounts)
(Unaudited)
|
|
|
|
|
|
|
|
|
| |
|
March
31,
2012 |
|
|
December
31,
2011 |
|
| |
|
| LIABILITIES AND SHAREHOLDERS’ EQUITY |
|
|
|
|
|
|
|
|
|
|
|
| Current Liabilities: |
|
|
|
|
|
|
|
|
| Current maturities of long-term debt |
|
$ |
138,048 |
|
|
$ |
139,985 |
|
| Accounts payable |
|
|
270,828 |
|
|
|
312,990 |
|
| Accrued expenses |
|
|
97,816 |
|
|
|
128,144 |
|
| Deferred energy |
|
|
233,071 |
|
|
|
245,164 |
|
| Other current liabilities |
|
|
68,489 |
|
|
|
65,572 |
|
|
|
|
|
|
|
|
|
|
| Total Current Liabilities |
|
|
808,252 |
|
|
|
891,855 |
|
|
|
|
|
|
|
|
|
|
|
|
|
| Long-term debt |
|
|
5,035,066 |
|
|
|
5,008,931 |
|
|
|
|
| Commitments and Contingencies |
|
|
|
|
|
|
|
|
|
|
|
| Deferred Credits and Other Liabilities: |
|
|
|
|
|
|
|
|
| Deferred income taxes |
|
|
1,311,996 |
|
|
|
1,306,510 |
|
| Deferred investment tax credit |
|
|
15,500 |
|
|
|
16,140 |
|
| Accrued retirement benefits |
|
|
94,572 |
|
|
|
92,351 |
|
| Regulatory liabilities |
|
|
503,911 |
|
|
|
486,259 |
|
| Other deferred credits and liabilities |
|
|
470,633 |
|
|
|
427,003 |
|
|
|
|
|
|
|
|
|
|
| Total Deferred Credits and Other Liabilities |
|
|
2,396,612 |
|
|
|
2,328,263 |
|
|
|
|
|
|
|
|
|
|
|
|
|
| Shareholders’ Equity: |
|
|
|
|
|
|
|
|
| Common stock, $1.00 par value; 350 million shares authorized 235,999,750 issued and outstanding for 2012 and 2011 |
|
|
236,000 |
|
|
|
236,000 |
|
| Other paid-in capital |
|
|
2,713,736 |
|
|
|
2,713,736 |
|
| Retained earnings |
|
|
445,770 |
|
|
|
464,277 |
|
| Accumulated other comprehensive loss |
|
|
(8,025 |
) |
|
|
(7,934 |
) |
|
|
|
|
|
|
|
|
|
| Total Shareholders’ Equity |
|
|
3,387,481 |
|
|
|
3,406,079 |
|
|
|
|
|
|
|
|
|
|
|
|
|
| TOTAL LIABILITIES AND SHAREHOLDERS’ EQUITY |
|
$ |
11,627,411 |
|
|
$ |
11,635,128 |
|
|
|
|
|
|
|
|
|
|
(Concluded)
NV ENERGY, INC.
CONSOLIDATED CASH FLOW HIGHLIGHTS AND OPERATING STATISTICS
(unaudited)
CONSOLIDATED CASH FLOW HIGHLIGHTS
(dollars in thousands)
|
|
|
|
|
|
|
|
|
|
|
|
|
| |
|
Three Months Ended March 31, |
|
| |
|
2012 |
|
|
2011 |
|
|
Change from
Prior Year |
|
| Net Cash from Operating Activities |
|
$ |
67,316 |
|
|
$ |
85,523 |
|
|
|
(21.3 |
)% |
|
|
|
|
|
|
|
|
|
|
|
|
|
| Additions to Utility Plant (Excluding AFUDC-Equity) |
|
$ |
(115,817 |
) |
|
$ |
(144,097 |
) |
|
|
(19.6 |
)% |
|
|
|
|
|
|
|
|
|
|
|
|
|
ELECTRIC SALES - MWh’s
(in thousands)
|
|
|
|
|
|
|
|
|
|
|
|
|
|
|
|
|
| |
|
Three Months Ended March 31, |
|
| |
|
2012 |
|
|
2011 |
|
|
Change from
Prior Year |
|
|
Change in
Average
Customers |
|
| Residential |
|
|
2,136 |
|
|
|
2,123 |
|
|
|
0.6 |
% |
|
|
1.3 |
% |
| Commercial |
|
|
1,616 |
|
|
|
1,570 |
|
|
|
2.9 |
% |
|
|
(0.3 |
)% |
| Industrial |
|
|
2,285 |
|
|
|
2,300 |
|
|
|
(0.7 |
)% |
|
|
(2.6 |
)% |
|
|
|
|
|
|
|
|
|
|
|
|
|
|
|
|
|
| TOTAL RETAIL |
|
|
6,037 |
|
|
|
5,993 |
|
|
|
0.7 |
% |
|
|
1.1 |
% |
|
|
|
|
|
|
|
|
|
|
|
|
|
|
|
|
|
GAS SALES - Dth
(in thousands)
|
|
|
|
|
|
|
|
|
|
|
|
|
| |
|
Three Months Ended March 31, |
|
| |
|
2012 |
|
|
2011 |
|
|
Change from
Prior Year |
|
| Residential |
|
|
3,708 |
|
|
|
3,962 |
|
|
|
(6.4 |
)% |
| Commercial |
|
|
1,879 |
|
|
|
2,001 |
|
|
|
(6.1 |
)% |
| Industrial |
|
|
476 |
|
|
|
571 |
|
|
|
(16.6 |
)% |
|
|
|
|
|
|
|
|
|
|
|
|
|
| TOTAL RETAIL |
|
|
6,063 |
|
|
|
6,534 |
|
|
|
(7.2 |
)% |
|
|
|
|
|
|
|
|
|
|
|
|
|
ELECTRIC SOURCES - MWh’s
(in thousands)
|
|
|
|
|
|
|
|
|
|
|
|
|
| |
|
Three Months Ended March 31, |
|
| |
|
2012 |
|
|
2011 |
|
|
Change from
Prior Year |
|
| Generated |
|
|
4,465 |
|
|
|
3,822 |
|
|
|
16.8 |
% |
| Purchased |
|
|
2,037 |
|
|
|
2,682 |
|
|
|
(24.0 |
)% |
|
|
|
|
|
|
|
|
|
|
|
|
|
| TOTAL |
|
|
6,502 |
|
|
|
6,504 |
|
|
|
|
|
|
|
|
|
|
|
|
|
|
|
|
|
|
DEGREE DAYS
|
|
|
|
|
|
|
|
|
|
|
|
|
|
|
|
|
| |
|
Three Months Ended March 31, |
|
| |
|
2012 |
|
|
2011 |
|
|
Change from
Prior Year |
|
|
Normal |
|
| SOUTH |
|
|
|
|
|
|
|
|
|
|
|
|
|
|
|
|
| Heating |
|
|
924 |
|
|
|
1,046 |
|
|
|
(11.7 |
)% |
|
|
1,035 |
|
| Cooling |
|
|
41 |
|
|
|
32 |
|
|
|
28.1 |
% |
|
|
29 |
|
|
|
|
|
|
| NORTH |
|
|
|
|
|
|
|
|
|
|
|
|
|
|
|
|
| Heating |
|
|
2,128 |
|
|
|
2,315 |
|
|
|
(8.1 |
)% |
|
|
2,228 |
|
| Cooling |
|
|
— |
|
|
|
— |
|
|
|
— |
% |
|
|
— |
|
NEVADA POWER COMPANY
CONSOLIDATED STATEMENTS OF COMPREHENSIVE LOSS
(Dollars in Thousands)
(unaudited)
|
|
|
|
|
|
|
|
|
| |
|
Three Months
Ended
March 31, |
|
| |
|
2012 |
|
|
2011 |
|
| OPERATING REVENUES |
|
$ |
395,688 |
|
|
$ |
390,068 |
|
|
|
|
| OPERATING EXPENSES: |
|
|
|
|
|
|
|
|
| Fuel for power generation |
|
|
80,549 |
|
|
|
101,070 |
|
| Purchased power |
|
|
81,531 |
|
|
|
95,566 |
|
| Deferred energy |
|
|
2,171 |
|
|
|
6,730 |
|
| Energy efficiency program costs |
|
|
15,774 |
|
|
|
— |
|
| Other operating expenses |
|
|
66,462 |
|
|
|
65,101 |
|
| Maintenance |
|
|
23,073 |
|
|
|
22,337 |
|
| Depreciation and amortization |
|
|
64,990 |
|
|
|
57,673 |
|
| Taxes other than income |
|
|
8,454 |
|
|
|
10,058 |
|
|
|
|
|
|
|
|
|
|
| Total Operating Expenses |
|
|
343,004 |
|
|
|
358,535 |
|
|
|
|
|
|
|
|
|
|
| OPERATING INCOME |
|
|
52,684 |
|
|
|
31,533 |
|
|
|
|
| OTHER INCOME (EXPENSE): |
|
|
|
|
|
|
|
|
| Interest expense
(net of AFUDC-debt: $1,179 and $5,790) |
|
|
(54,405 |
) |
|
|
(52,033 |
) |
| Interest income (expense) on regulatory items |
|
|
(2,016 |
) |
|
|
635 |
|
| AFUDC-equity |
|
|
1,413 |
|
|
|
7,098 |
|
| Other income |
|
|
1,709 |
|
|
|
1,546 |
|
| Other expense |
|
|
(1,346 |
) |
|
|
(2,732 |
) |
|
|
|
|
|
|
|
|
|
| Total Other Expense |
|
|
(54,645 |
) |
|
|
(45,486 |
) |
|
|
|
|
|
|
|
|
|
| Loss Before Income Tax Expense |
|
|
(1,961 |
) |
|
|
(13,953 |
) |
|
|
|
| Income tax benefit |
|
|
(645 |
) |
|
|
(4,933 |
) |
|
|
|
|
|
|
|
|
|
|
|
|
| NET LOSS |
|
|
(1,316 |
) |
|
|
(9,020 |
) |
|
|
|
| Other comprehensive income (loss): |
|
|
|
|
|
|
|
|
| Change in compensation retirement benefits liability and amortization
(Net of taxes $(32) and $(405)) |
|
|
63 |
|
|
|
753 |
|
|
|
|
|
|
|
|
|
|
|
|
|
| COMPREHENSIVE LOSS |
|
$ |
(1,253 |
) |
|
$ |
(8,267 |
) |
|
|
|
|
|
|
|
|
|
NEVADA POWER COMPANY
CONSOLIDATED OPERATING STATISTICS
(unaudited)
ELECTRIC SALES - MWh’s
(in thousands)
|
|
|
|
|
|
|
|
|
|
|
|
|
|
|
|
|
| |
|
Three Months Ended March 31, |
|
| |
|
2012 |
|
|
2011 |
|
|
Change from
Prior Year |
|
|
Change in
Average
Customers |
|
| Residential |
|
|
1,536 |
|
|
|
1,528 |
|
|
|
0.5 |
% |
|
|
1.5 |
% |
| Commercial |
|
|
957 |
|
|
|
915 |
|
|
|
4.6 |
% |
|
|
0.1 |
% |
| Industrial |
|
|
1,652 |
|
|
|
1,697 |
|
|
|
(2.7 |
)% |
|
|
(2.5 |
)% |
|
|
|
|
|
|
|
|
|
|
|
|
|
|
|
|
|
| TOTAL RETAIL |
|
|
4,145 |
|
|
|
4,140 |
|
|
|
0.1 |
% |
|
|
1.4 |
% |
|
|
|
|
|
|
|
|
|
|
|
|
|
|
|
|
|
ELECTRIC SOURCES - MWh’s
(in thousands)
|
|
|
|
|
|
|
|
|
|
|
|
|
| |
|
Three Months Ended March 31, |
|
| |
|
2012 |
|
|
2011 |
|
|
Change from
Prior Year |
|
| Generated |
|
|
3,287 |
|
|
|
2,773 |
|
|
|
18.5 |
% |
| Purchased |
|
|
1,026 |
|
|
|
1,583 |
|
|
|
(35.2 |
)% |
|
|
|
|
|
|
|
|
|
|
|
|
|
| TOTAL |
|
|
4,313 |
|
|
|
4,356 |
|
|
|
|
|
|
|
|
|
|
|
|
|
|
|
|
|
|
SIERRA PACIFIC POWER COMPANY
CONSOLIDATED STATEMENTS OF COMPREHENSIVE INCOME
(Dollars in Thousands)
(unaudited)
|
|
|
|
|
|
|
|
|
| |
|
Three Months Ended
March 31, |
|
| |
|
2012 |
|
|
2011 |
|
| OPERATING REVENUES: |
|
| Electric |
|
$ |
169,806 |
|
|
$ |
178,617 |
|
| Gas |
|
|
45,922 |
|
|
|
72,294 |
|
|
|
|
|
|
|
|
|
|
| Total Operating Revenues |
|
|
215,728 |
|
|
|
250,911 |
|
|
|
|
|
|
|
|
|
|
|
|
|
| OPERATING EXPENSES: |
|
|
|
|
|
|
|
|
| Fuel for power generation |
|
|
36,486 |
|
|
|
45,268 |
|
| Purchased power |
|
|
35,585 |
|
|
|
39,450 |
|
| Gas purchased for resale |
|
|
31,617 |
|
|
|
52,632 |
|
| Deferral of energy - electric - net |
|
|
(12,670 |
) |
|
|
(11,931 |
) |
| Deferral of energy - gas - net |
|
|
(1,240 |
) |
|
|
3,249 |
|
| Energy efficiency program costs |
|
|
3,651 |
|
|
|
— |
|
| Other operating expenses |
|
|
36,432 |
|
|
|
40,216 |
|
| Maintenance |
|
|
9,453 |
|
|
|
7,425 |
|
| Depreciation and amortization |
|
|
25,872 |
|
|
|
25,429 |
|
| Taxes other than income |
|
|
5,863 |
|
|
|
6,024 |
|
|
|
|
|
|
|
|
|
|
| Total Operating Expenses |
|
|
171,049 |
|
|
|
207,762 |
|
|
|
|
|
|
|
|
|
|
| OPERATING INCOME |
|
|
44,679 |
|
|
|
43,149 |
|
|
|
|
| OTHER INCOME (EXPENSE): |
|
|
|
|
|
|
|
|
| Interest expense
(net of AFUDC-debt: $416 and $420) |
|
|
(16,973 |
) |
|
|
(16,946 |
) |
| Interest income (expense) on regulatory items |
|
|
(186 |
) |
|
|
(1,523 |
) |
| AFUDC-equity |
|
|
519 |
|
|
|
544 |
|
| Other income |
|
|
2,183 |
|
|
|
1,264 |
|
| Other expense |
|
|
(1,335 |
) |
|
|
(1,594 |
) |
|
|
|
|
|
|
|
|
|
| Total Other Income (Expense) |
|
|
(15,792 |
) |
|
|
(18,255 |
) |
|
|
|
|
|
|
|
|
|
| Income Before Income Tax Expense |
|
|
28,887 |
|
|
|
24,894 |
|
|
|
|
| Income tax expense |
|
|
10,243 |
|
|
|
8,318 |
|
|
|
|
|
|
|
|
|
|
|
|
|
| NET INCOME |
|
|
18,644 |
|
|
|
16,576 |
|
|
|
|
| Other comprehensive income: |
|
|
|
|
|
|
|
|
| Change in compensation retirement benefits liability and amortization
(Net of taxes $(23) and $(841)) |
|
|
42 |
|
|
|
1,561 |
|
|
|
|
|
|
|
|
|
|
|
|
|
| COMPREHENSIVE INCOME |
|
$ |
18,686 |
|
|
$ |
18,137 |
|
|
|
|
|
|
|
|
|
|
SIERRA PACIFIC POWER COMPANY
CONSOLIDATED OPERATING STATISTICS
(unaudited)
ELECTRIC SALES - MWh’s
(in thousands)
|
|
|
|
|
|
|
|
|
|
|
|
|
|
|
|
|
| |
|
Three Months Ended March 31, |
|
| |
|
2012 |
|
|
2011 |
|
|
Change from
Prior Year |
|
|
Change in
Average
Customers |
|
| Residential |
|
|
600 |
|
|
|
595 |
|
|
|
0.8 |
% |
|
|
0.6 |
% |
| Commercial |
|
|
659 |
|
|
|
655 |
|
|
|
0.6 |
% |
|
|
(1.1 |
)% |
| Industrial |
|
|
633 |
|
|
|
603 |
|
|
|
5.0 |
% |
|
|
(3.7 |
)% |
|
|
|
|
|
|
|
|
|
|
|
|
|
|
|
|
|
| TOTAL RETAIL |
|
|
1,892 |
|
|
|
1,853 |
|
|
|
2.1 |
% |
|
|
0.3 |
% |
|
|
|
|
|
|
|
|
|
|
|
|
|
|
|
|
|
GAS SALES - Dth
(in thousands)
|
|
|
|
|
|
|
|
|
|
|
|
|
|
|
| |
|
Three Months Ended March 31, |
|
| |
|
2012 |
|
|
2011 |
|
|
Change from
Prior Year |
|
| Residential |
|
|
3,708 |
|
|
|
3,962 |
|
|
|
(6.4 |
)% |
| Commercial |
|
|
1,879 |
|
|
|
2,001 |
|
|
|
(6.1 |
)% |
| Industrial |
|
|
476 |
|
|
|
571 |
|
|
|
(16.6 |
)% |
|
|
|
|
|
|
|
|
|
|
|
|
|
| TOTAL RETAIL |
|
|
6,063 |
|
|
|
6,534 |
|
|
|
(7.2 |
)% |
|
|
|
|
|
|
|
|
|
|
|
|
|
ELECTRIC SOURCES - MWh’s
(in thousands)
|
|
|
|
|
|
|
|
|
|
|
|
|
|
|
| |
|
Three Months Ended March 31, |
|
| |
|
2012 |
|
|
2011 |
|
|
Change from
Prior Year |
|
| Generated |
|
|
1,178 |
|
|
|
1,049 |
|
|
|
12.3 |
% |
| Purchased |
|
|
1,011 |
|
|
|
1,099 |
|
|
|
(8.0 |
)% |
|
|
|
|
|
|
|
|
|
|
|
|
|
| TOTAL |
|
|
2,189 |
|
|
|
2,148 |
|
|
|
|
|
|
|
|
|
|
|
|
|
|
|
|
|
|
Consolidated gross margin is presented by NV Energy, Inc. in order to provide information that management
believes aids the reader in determining how profitable the Utilities’ electric and gas businesses are at the most fundamental level. Consolidated gross margin, which is a “non-GAAP financial measure” as defined in accordance with SEC
rules, provides a measure of income available to support the other operating expenses of the business and is utilized by management in its analysis of its business.
NV Energy, Inc. believes presenting consolidated gross margin allows the reader to assess the impact of the Utilities’ regulatory treatment and their overall regulatory environment on a consistent
basis. Consolidated gross margin, as a percentage of revenue, is primarily impacted by the fluctuations in regulated utility electric and natural gas supply costs versus the fixed rates collected from utility customers. While these fluctuating costs
impact gross margin as a percentage of revenue, they only impact gross margin amounts if the costs cannot be passed through to utility customers. Consolidated gross margin, which NV Energy, Inc. calculates as operating revenues less energy and
energy efficiency program costs, provides a measure of income available to support the other operating expenses of the Utilities. Consolidated gross margin changes are based primarily on the Utilities’ general base rate adjustments (which are
required to be filed by statute every three years). Reconciliations between GAAP operating income and gross margin are provided in the table herein. These non-GAAP measures should not be considered as substitutes for the GAAP measures.
NV Energy, Inc.
Consolidated Gross Margin
(dollars in thousands)
|
|
|
|
|
|
|
|
|
|
|
|
|
| |
|
Three Months Ended March 31, |
|
| |
|
2012 |
|
|
2011 |
|
|
Change from
Prior Year
% |
|
| Operating Revenues: |
|
$ |
611,420 |
|
|
$ |
640,983 |
|
|
|
(4.6 |
)% |
|
|
|
|
| Energy Costs: |
|
|
|
|
|
|
|
|
|
|
|
|
| Fuel for power generation |
|
|
117,035 |
|
|
|
146,338 |
|
|
|
(20.0 |
)% |
| Purchased power |
|
|
117,116 |
|
|
|
135,016 |
|
|
|
(13.3 |
)% |
| Gas purchased for resale |
|
|
31,617 |
|
|
|
52,632 |
|
|
|
(39.9 |
)% |
| Deferred energy |
|
|
(11,739 |
) |
|
|
(1,952 |
) |
|
|
501.4 |
% |
| Energy efficiency program costs |
|
|
19,425 |
|
|
|
— |
|
|
|
N/A |
|
|
|
|
|
|
|
|
|
|
|
|
|
|
|
|
$ |
273,454 |
|
|
$ |
332,034 |
|
|
|
(17.6 |
)% |
|
|
|
|
|
|
|
|
|
|
|
|
|
|
|
|
|
| Gross Margin |
|
$ |
337,966 |
|
|
$ |
308,949 |
|
|
|
9.4 |
% |
|
|
|
|
|
|
|
|
|
|
|
|
|
|
|
|
|
| Other operating expenses |
|
|
103,601 |
|
|
|
105,974 |
|
|
|
|
|
| Maintenance |
|
|
32,526 |
|
|
|
29,762 |
|
|
|
|
|
| Depreciation and amortization |
|
|
90,862 |
|
|
|
83,102 |
|
|
|
|
|
| Taxes other than income |
|
|
14,509 |
|
|
|
16,245 |
|
|
|
|
|
|
|
|
|
|
|
|
|
|
|
|
|
|
|
|
|
|
| Operating Income |
|
$ |
96,468 |
|
|
$ |
73,866 |
|
|
|
30.6 |
% |
|
|
|
|
|
|
|
|
|
|
|
|
|