UNITED STATES
SECURITIES AND EXCHANGE COMMISSION
WASHINGTON, D. C. 20549
FORM N-CSRS
Investment Company Act file number: 811-03632
Deutsche Tax Free Trust
(Exact Name of Registrant as Specified in Charter)
345 Park Avenue
New York, NY 10154-0004
(Address of Principal Executive Offices) (Zip Code)
Registrant’s Telephone Number, including Area Code: (212) 250-3220
Paul Schubert
60 Wall Street
New York, NY 10005
(Name and Address of Agent for Service)
|
Date of fiscal year end:
|
5/31
|
|
Date of reporting period:
|
11/30/2014
|
|
ITEM 1.
|
REPORT TO STOCKHOLDERS
|

November 30, 2014
Semiannual Report
to Shareholders
Deutsche Intermediate Tax/AMT Free Fund
(formerly DWS Intermediate Tax/AMT Free Fund)
Contents
|
3 Letter to Shareholders
4 Performance Summary
8 Portfolio Management Team
9 Portfolio Summary
10 Investment Portfolio
32 Statement of Assets and Liabilities
34 Statement of Operations
35 Statement of Changes in Net Assets
36 Financial Highlights
43 Notes to Financial Statements
51 Information About Your Fund's Expenses
53 Advisory Agreement Board Considerations and Fee Evaluation
58 Account Management Resources
60 Privacy Statement
|
This report must be preceded or accompanied by a prospectus. To obtain a summary prospectus, if available, or prospectus for any of our funds, refer to the Account Management Resources information provided in the back of this booklet. We advise you to consider the fund's objectives, risks, charges and expenses carefully before investing. The summary prospectus and prospectus contain this and other important information about the fund. Please read the prospectus carefully before you invest.
Bond investments are subject to interest-rate, credit, liquidity and market risks to varying degrees. When interest rates rise, bond prices generally fall. Credit risk refers to the ability of an issuer to make timely payments of principal and interest. Although the fund seeks income that is exempt from federal income taxes, a portion of the fund’s distributions may be subject to federal, state and local taxes, including the alternative minimum tax. See the prospectus for details.
Deutsche Asset & Wealth Management represents the asset management and wealth management activities conducted by Deutsche Bank AG or any of its subsidiaries, including the Advisor and DeAWM Distributors, Inc.
NOT FDIC/NCUA INSURED NO BANK GUARANTEE MAY LOSE VALUE NOT A DEPOSIT NOT INSURED BY ANY FEDERAL GOVERNMENT AGENCY
Dear Shareholder:
I am very pleased to tell you that the DWS funds have been renamed Deutsche funds, aligning more closely with the Deutsche Asset & Wealth Management brand. We are proud to adopt the Deutsche name — a brand that fully represents the global access, discipline and intelligence that support all of our products and services.
Deutsche Asset & Wealth Management combines the asset management and wealth management divisions of Deutsche Bank to deliver a comprehensive suite of active, passive and alternative investment capabilities. Your investment in the Deutsche funds means you have access to the thought leadership and resources of one of the world’s largest and most influential financial institutions.
In conjunction with your fund’s name change, please note that the Deutsche funds’ Web address has changed as well. The former dws-investments.com is now deutschefunds.com.
In addition, key service providers have been renamed as follows:
|
Former Name
|
New name, effective August 11, 2014
|
|
DWS Investments Distributors, Inc.
|
DeAWM Distributors, Inc.
|
|
DWS Trust Company
|
DeAWM Trust Company
|
|
DWS Investments Service Company
|
DeAWM Service Company
|
These changes have no effect on the day-to-day management of your investment, and there is no action required on your part. You will continue to experience the benefits that come from our decades of experience, in-depth research and worldwide network of investment professionals.
Thanks for your continued support. We appreciate your trust and the opportunity to put our capabilities to work for you.
Best regards,


Brian Binder
President, Deutsche Funds
|
Class A
|
6-Month‡
|
1-Year
|
5-Year
|
10-Year
|
|
Average Annual Total Returns as of 11/30/14
|
||||
|
Unadjusted for Sales Charge
|
1.58%
|
6.33%
|
4.00%
|
3.99%
|
|
Adjusted for the Maximum Sales Charge (max 2.75% load)
|
–1.21%
|
3.41%
|
3.42%
|
3.70%
|
|
Barclays 7-Year Municipal Bond Index†
|
1.71%
|
5.69%
|
4.62%
|
4.77%
|
|
Average Annual Total Returns as of 9/30/14 (most recent calendar quarter end)
|
||||
|
Unadjusted for Sales Charge
|
6.30%
|
3.70%
|
3.88%
|
|
|
Adjusted for the Maximum Sales Charge (max 2.75% load)
|
3.38%
|
3.12%
|
3.60%
|
|
|
Barclays 7-Year Municipal Bond Index†
|
5.51%
|
4.45%
|
4.67%
|
|
|
Class B
|
6-Month‡
|
1-Year
|
5-Year
|
10-Year
|
|
Average Annual Total Returns as of 11/30/14
|
||||
|
Unadjusted for Sales Charge
|
1.19%
|
5.52%
|
3.17%
|
3.17%
|
|
Adjusted for the Maximum Sales Charge (max 4.00% CDSC)
|
–2.81%
|
2.52%
|
3.00%
|
3.17%
|
|
Barclays 7-Year Municipal Bond Index†
|
1.71%
|
5.69%
|
4.62%
|
4.77%
|
|
Average Annual Total Returns as of 9/30/14 (most recent calendar quarter end)
|
||||
|
Unadjusted for Sales Charge
|
5.49%
|
2.87%
|
3.06%
|
|
|
Adjusted for the Maximum Sales Charge (max 4.00% CDSC)
|
2.49%
|
2.69%
|
3.06%
|
|
|
Barclays 7-Year Municipal Bond Index†
|
5.51%
|
4.45%
|
4.67%
|
|
|
Class C
|
6-Month‡
|
1-Year
|
5-Year
|
10-Year
|
|
Average Annual Total Returns as of 11/30/14
|
||||
|
Unadjusted for Sales Charge
|
1.20%
|
5.53%
|
3.23%
|
3.20%
|
|
Adjusted for the Maximum Sales Charge (max 1.00% CDSC)
|
0.20%
|
5.53%
|
3.23%
|
3.20%
|
|
Barclays 7-Year Municipal Bond Index†
|
1.71%
|
5.69%
|
4.62%
|
4.77%
|
|
Average Annual Total Returns as of 9/30/14 (most recent calendar quarter end)
|
||||
|
Unadjusted for Sales Charge
|
5.41%
|
2.89%
|
3.09%
|
|
|
Adjusted for the Maximum Sales Charge (max 1.00% CDSC)
|
5.41%
|
2.89%
|
3.09%
|
|
|
Barclays 7-Year Municipal Bond Index†
|
5.51%
|
4.45%
|
4.67%
|
|
|
Class S
|
6-Month‡
|
1-Year
|
5-Year
|
10-Year
|
|
Average Annual Total Returns as of 11/30/14
|
||||
|
No Sales Charges
|
1.62%
|
6.50%
|
4.19%
|
4.19%
|
|
Barclays 7-Year Municipal Bond Index†
|
1.71%
|
5.69%
|
4.62%
|
4.77%
|
|
Average Annual Total Returns as of 9/30/14 (most recent calendar quarter end)
|
||||
|
No Sales Charges
|
6.56%
|
3.87%
|
4.08%
|
|
|
Barclays 7-Year Municipal Bond Index†
|
5.51%
|
4.45%
|
4.67%
|
|
|
Institutional Class
|
6-Month‡
|
1-Year
|
5-Year
|
Life of Class*
|
|
Average Annual Total Returns as of 11/30/14
|
||||
|
No Sales Charges
|
1.64%
|
6.52%
|
4.28%
|
4.20%
|
|
Barclays 7-Year Municipal Bond Index†
|
1.71%
|
5.69%
|
4.62%
|
4.70%
|
|
Average Annual Total Returns as of 9/30/14 (most recent calendar quarter end)
|
||||
|
No Sales Charges
|
6.49%
|
3.96%
|
4.22%
|
|
|
Barclays 7-Year Municipal Bond Index†
|
5.51%
|
4.45%
|
4.70%
|
|
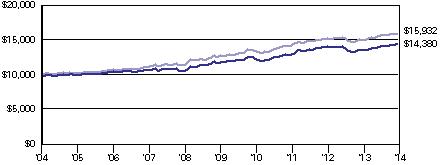
Performance in the Average Annual Total Returns table(s) above and the Growth of an Assumed $10,000 Investment line graph that follows is historical and does not guarantee future results. Investment return and principal fluctuate, so your shares may be worth more or less when redeemed. Current performance may differ from performance data shown. Please visit deutschefunds.com for the Fund's most recent month-end performance. Fund performance includes reinvestment of all distributions. Unadjusted returns do not reflect sales charges and would have been lower if they had.
The gross expense ratios of the Fund, as stated in the fee table of the prospectus dated October 1, 2014 are 0.78%, 1.60%, 1.55%, 0.63% and 0.52% for Class A, Class B, Class C, Class S and Institutional Class shares, respectively, and may differ from the expense ratios disclosed in the Financial Highlights tables in this report.
Index returns do not reflect any fees or expenses and it is not possible to invest directly into an index.
Performance figures do not reflect the deduction of taxes that a shareholder would pay on fund distributions or the redemption of fund shares.
A portion of the Fund's distributions may be subject to federal, state and local taxes.
|
Growth of an Assumed $10,000 Investment (Adjusted for Maximum Sales Charge)
|
 |
 |
|
Yearly periods ended November 30
|
The Fund's growth of an assumed $10,000 investment is adjusted for the maximum sales charge of 2.75%. This results in a net initial investment of $9,725.
The growth of $10,000 is cumulative.
Performance of other share classes will vary based on the sales charges and the fee structure of those classes.
* Institutional Class shares commenced operations on December 20, 2004. The performance shown for the index is for the time period of December 31, 2004 through November 30, 2014 (through September 30, 2014 for the most recent calendar quarter end returns), which is based on the performance period of the life of Institutional Class.
† The Barclays 7-Year Municipal Bond Index is an unmanaged, total return subset of the Barclays Municipal Bond Index. It includes maturities of six to eight years.
‡ Total returns shown for periods less than one year are not annualized.
|
Class A
|
Class B
|
Class C
|
Class S
|
Institutional Class
|
||||||||||||||||
|
Net Asset Value
|
||||||||||||||||||||
|
11/30/14
|
$ | 11.98 | $ | 11.99 | $ | 11.98 | $ | 11.98 | $ | 11.98 | ||||||||||
|
5/31/14
|
$ | 11.94 | $ | 11.95 | $ | 11.94 | $ | 11.95 | $ | 11.95 | ||||||||||
|
Distribution Information as of 11/30/14
|
||||||||||||||||||||
|
Income Dividends, Six Months
|
$ | .15 | $ | .10 | $ | .10 | $ | .16 | $ | .16 | ||||||||||
|
November Income Dividend
|
$ | .0228 | $ | .0154 | $ | .0155 | $ | .0253 | $ | .0257 | ||||||||||
|
SEC 30-day Yield‡‡
|
.94 | % | .22 | % | .23 | % | 1.22 | % | 1.25 | % | ||||||||||
|
Tax Equivalent Yield‡‡
|
1.66 | % | .39 | % | .41 | % | 2.16 | % | 2.21 | % | ||||||||||
|
Current Annualized Distribution Rate‡‡
|
2.28 | % | 1.54 | % | 1.55 | % | 2.53 | % | 2.57 | % | ||||||||||
‡‡ The SEC yield is net investment income per share earned over the month ended November 30, 2014, shown as an annualized percentage of the maximum offering price per share on the last day of the period. The SEC yield is computed in accordance with a standardized method prescribed by the Securities and Exchange Commission. The SEC yield would have been 0.93%, 0.13%, 0.19% and 1.14% for Classes A, B, C and S shares, respectively, had certain expenses not been reduced. Tax equivalent yield is based on the Fund's yield and a marginal federal income tax rate of 43.4%. Current annualized distribution rate is the latest monthly dividend shown as an annualized percentage of net asset value on November 30, 2014. Distribution rate simply measures the level of dividends and is not a complete measure of performance. The current annualized distribution rate would have been 2.27%, 1.45%, 1.51% and 2.45% for Classes A, B, C and S shares, respectively, had certain expenses not been reduced. Yields and distribution rates are historical, not guaranteed and will fluctuate.
Philip G. Condon, Managing Director
Co-Lead Portfolio Manager of the fund. Began managing the fund in 1998.
— Joined Deutsche Asset & Wealth Management in 1983.
— Vice Chairman of Deutsche Asset & Wealth Management, Americas; formerly, Head of Municipal Bonds.
— BA and MBA, University of Massachusetts at Amherst.
Ashton P. Goodfield, CFA, Managing Director
Co-Lead Portfolio Manager of the fund. Began managing the fund in 1990.
— Joined Deutsche Asset & Wealth Management in 1986.
— Co-Head of Municipal Bonds.
— BA, Duke University.
Matthew J. Caggiano, CFA, Managing Director
Co-Lead Portfolio Manager of the fund. Began managing the fund in 2014.
— Joined Deutsche Asset & Wealth Management in 1989.
— BS, Pennsylvania State University; MS, Boston College.
Effective October 1, 2014, Peter Aloisi was added as a portfolio manager of the fund, joining the current portfolio management team.
Peter Aloisi, CFA, Assistant Vice President
Portfolio Manager of the fund. Began managing the fund in 2014.
— Joined Deutsche Asset & Wealth Management in 2010 with five years of industry experience; previously, served as an Associate at Banc of America Securities.
— Municipal Portfolio Manager and Trader: Boston.
— BA and MBA, Boston College.
|
Principal Amount ($)
|
Value ($)
|
|||||||
|
Municipal Bonds and Notes 102.5%
|
||||||||
|
Alabama 0.8%
|
||||||||
|
Alabama, State Public School & College Authority Revenue:
|
||||||||
|
Series B, 5.0%, 1/1/2024
|
9,680,000 | 11,915,596 | ||||||
|
Series A, 5.0%, 5/1/2024
|
3,000,000 | 3,439,230 | ||||||
| 15,354,826 | ||||||||
|
Alaska 1.0%
|
||||||||
|
Alaska, State Housing Finance Corp., Mortgage Revenue, Series A, 4.0%, 6/1/2040
|
3,115,000 | 3,319,188 | ||||||
|
Alaska, State Housing Finance Corp., State Capital Project Bonds II, Series D, 5.0%, 12/1/2026
|
5,515,000 | 6,642,818 | ||||||
|
Valdez, AK, Marine Terminal Revenue, Exxon Pipeline Co. Project, Series A, 0.05%*, 12/1/2033
|
9,200,000 | 9,200,000 | ||||||
| 19,162,006 | ||||||||
|
Arizona 3.6%
|
||||||||
|
Arizona, Health Facilities Authority Revenue, Banner Health, Series A, 5.0%, 1/1/2020
|
3,000,000 | 3,257,220 | ||||||
|
Arizona, Salt River Pima-Maricopa, Indian Community, 0.26%*, 10/1/2026, LOC: Bank of America NA
|
3,955,000 | 3,955,000 | ||||||
|
Arizona, State Transportation Board Excise Tax Revenue, Maricopa County Regional Area Road, Prerefunded 7/1/2019 @ 100, 5.0%, 7/1/2025
|
3,000,000 | 3,518,790 | ||||||
|
Arizona, State Transportation Board, Excise Tax Revenue, 5.0%, 7/1/2022 (a)
|
6,500,000 | 7,908,160 | ||||||
|
Arizona, Water Infrastructure Finance Authority Revenue, Series A, Prerefunded 10/1/2018 @ 100, 5.0%, 10/1/2024
|
4,000,000 | 4,630,960 | ||||||
|
Arizona, Water Infrastructure Finance Authority Revenue, Water Quality:
|
||||||||
|
Series A, 5.0%, 10/1/2025 (a)
|
10,765,000 | 13,324,917 | ||||||
|
Series A, Prerefunded 10/1/2020 @ 100, 5.0%, 10/1/2030
|
3,750,000 | 4,512,187 | ||||||
|
Chandler, AZ, General Obligation, 4.0%, 7/1/2022
|
3,000,000 | 3,423,000 | ||||||
|
Maricopa County, AZ, Industrial Development Authority, Hospital Facility Revenue, Samaritan Health Services, Series B, ETM, 6.0%, 12/1/2019, INS: NATL
|
2,055,000 | 2,315,780 | ||||||
|
Phoenix, AZ, Civic Improvement Corp., Airport Revenue, Series A, 5.0%, 7/1/2028
|
4,000,000 | 4,547,840 | ||||||
|
Phoenix, AZ, Civic Improvement Corp., Wastewater System Revenue, 5.5%, 7/1/2022
|
2,545,000 | 2,933,316 | ||||||
|
Phoenix, AZ, General Obligation, Series B, 5.0%, 7/1/2018
|
10,000,000 | 11,114,100 | ||||||
|
Pima County, AZ, Sewer Revenue, Series A, 5.0%, 7/1/2021
|
650,000 | 778,759 | ||||||
| 66,220,029 | ||||||||
|
California 9.6%
|
||||||||
|
California, Bay Area Toll Authority, Toll Bridge Revenue, San Francisco Bay Area:
|
||||||||
|
Series F-1, 5.0%, 4/1/2028
|
10,000,000 | 11,420,500 | ||||||
|
Series F-1, 5.25%, 4/1/2029
|
2,500,000 | 2,884,650 | ||||||
|
California, Health Facilities Financing Authority Revenue, Catholic Healthcare West, Series A, 6.0%, 7/1/2029
|
4,000,000 | 4,734,200 | ||||||
|
California, State Department of Water Resources, Center Valley Project, Water Systems, Series AT, 0.34%**, Mandatory Put 12/1/2017 @ 100, 12/1/2035
|
14,285,000 | 14,283,572 | ||||||
|
California, State Economic Recovery:
|
||||||||
|
Series A, 5.25%, 7/1/2021
|
1,820,000 | 2,141,194 | ||||||
|
Series A, Prerefunded 7/1/2019 @ 100, 5.25%, 7/1/2021
|
3,180,000 | 3,795,298 | ||||||
|
California, State General Obligation, 5.25%, 10/1/2025
|
10,000,000 | 11,767,800 | ||||||
|
California, State General Obligation, Various Purposes:
|
||||||||
|
5.25%, 9/1/2027
|
10,000,000 | 11,950,400 | ||||||
|
5.75%, 4/1/2027
|
5,000,000 | 5,958,400 | ||||||
|
6.0%, 4/1/2018
|
1,700,000 | 1,994,287 | ||||||
|
6.0%, 3/1/2033
|
3,765,000 | 4,608,887 | ||||||
|
California, State Municipal Finance Authority, Solid Waste Revenue, Republic Services, Inc., 0.3%*, Mandatory Put 1/2/2015 @ 100, 9/1/2021
|
2,365,000 | 2,365,047 | ||||||
|
California, State Pollution Control Financing Authority, Solid Waste Disposal Revenue, Republic Services, Inc., Series B, 0.3%*, Mandatory Put 2/2/2015 @ 100, 8/1/2024
|
4,000,000 | 4,000,000 | ||||||
|
California, State Public Works Board, Lease Revenue, Capital Projects, Series I-1, 6.25%, 11/1/2021
|
7,000,000 | 8,641,990 | ||||||
|
California, State Public Works Board, Lease Revenue, Department of General Services, Buildings 8 & 9, Series A, 6.125%, 4/1/2028
|
2,000,000 | 2,401,540 | ||||||
|
California, State Public Works Board, Lease Revenue, Judicial Council Projects, Series A, 5.0%, 3/1/2024
|
1,000,000 | 1,185,330 | ||||||
|
California, University Revenues, Limited Project, Series E, 5.0%, 5/15/2021
|
5,000,000 | 5,934,500 | ||||||
|
Los Angeles, CA, Department of Airports Revenue, Los Angeles International Airport, Series A, 5.0%, 5/15/2031
|
10,000,000 | 11,364,900 | ||||||
|
Los Angeles, CA, General Obligation:
|
||||||||
|
Series A, Prerefunded 9/1/2015 @ 100, 5.0%, 9/1/2019, INS: AGMC
|
6,340,000 | 6,572,995 | ||||||
|
Series A, Prerefunded 9/1/2015 @ 100, 5.0%, 9/1/2020, INS: AGMC
|
5,915,000 | 6,132,376 | ||||||
|
Orange County, CA, Airport Revenue, Series A, 5.25%, 7/1/2025
|
3,000,000 | 3,465,330 | ||||||
|
Sacramento, CA, Municipal Utility District, Electric Revenue, Series U, 5.0%, 8/15/2023, INS: AGMC
|
7,000,000 | 7,968,800 | ||||||
|
San Diego, CA, Public Facilities Financing Authority, Sewer Revenue, Series A, 5.125%, 5/15/2029
|
4,000,000 | 4,598,280 | ||||||
|
San Diego, CA, Public Facilities Financing Authority, Water Revenue:
|
||||||||
|
Series A, 5.25%, 8/1/2027
|
5,000,000 | 5,873,400 | ||||||
|
Series A, 5.25%, 8/1/2028
|
5,000,000 | 5,898,400 | ||||||
|
San Francisco, CA, City & County Airports Commission, International Airport Revenue, Series E, 5.25%, 5/1/2024
|
9,000,000 | 10,484,730 | ||||||
|
San Francisco, CA, City & County Airports Commission, International Airport Revenue, Governmental Purpose:
|
||||||||
|
Series C, 5.0%, 5/1/2025
|
2,000,000 | 2,294,260 | ||||||
|
Series C, 5.0%, 5/1/2026
|
2,850,000 | 3,256,752 | ||||||
|
South Orange County, CA, Public Finance Authority, Special Tax Revenue, Foothill Area, Series A, 5.25%, 8/15/2016, INS: NATL
|
6,260,000 | 6,286,292 | ||||||
|
Turlock, CA, Public Financing Authority Revenue, 5.25%, 9/1/2015
|
10,000 | 10,035 | ||||||
|
Ventura County, CA, Certificates of Participation, Public Financing Authority III, 6.0%, 8/15/2026
|
3,370,000 | 3,971,208 | ||||||
| 178,245,353 | ||||||||
|
Colorado 1.1%
|
||||||||
|
Aurora, CO, Water Improvement Revenue, First Lien, Series A, 5.0%, 8/1/2021, INS: AMBAC
|
7,000,000 | 7,751,240 | ||||||
|
Colorado, Health Facilities Authority Revenue, Sisters Leavenworth, Series A, 5.25%, 1/1/2025
|
2,500,000 | 2,875,075 | ||||||
|
Colorado, State Building Excellent School Today, Certificate of Participation, Series G, 5.0%, 3/15/2025
|
3,285,000 | 3,796,869 | ||||||
|
Colorado, University Enterprise System Revenue, Series A, Prerefunded 6/1/2019 @ 100, 5.5%, 6/1/2023
|
1,000,000 | 1,193,330 | ||||||
|
Denver City & County, CO, Airport Revenue System:
|
||||||||
|
Series B, 5.0%, 11/15/2020
|
500,000 | 594,030 | ||||||
|
Series B, 5.0%, 11/15/2021
|
500,000 | 597,380 | ||||||
|
Series B, 5.0%, 11/15/2022
|
2,350,000 | 2,821,684 | ||||||
| 19,629,608 | ||||||||
|
Connecticut 1.4%
|
||||||||
|
Connecticut, State General Obligation, Series C, Prerefunded 6/1/2016 @ 100, 5.0%, 6/1/2017, INS: AGMC
|
3,170,000 | 3,392,534 | ||||||
|
Connecticut, State Special Tax Obligation Revenue, Transportation Infrastructure:
|
||||||||
|
Series A, 5.0%, 9/1/2025
|
10,000,000 | 12,209,000 | ||||||
|
Series A, 5.0%, 10/1/2027
|
8,000,000 | 9,538,960 | ||||||
| 25,140,494 | ||||||||
|
Delaware 0.3%
|
||||||||
|
Delaware, Transportation Authority Revenue, 5.0%, 9/1/2024
|
5,115,000 | 5,940,919 | ||||||
|
District of Columbia 1.1%
|
||||||||
|
District of Columbia, Income Tax Revenue, Series A, 5.0%, 12/1/2023
|
5,000,000 | 5,869,850 | ||||||
|
District of Columbia, Income Tax Secured Revenue, Series B, 0.34%, 12/1/2017
|
15,000,000 | 15,000,000 | ||||||
| 20,869,850 | ||||||||
|
Florida 5.3%
|
||||||||
|
Broward County, FL, Airport System Revenue:
|
||||||||
|
Series P-2, 5.0%, 10/1/2021
|
4,825,000 | 5,765,730 | ||||||
|
Series Q-1, 5.0%, 10/1/2021
|
1,200,000 | 1,433,964 | ||||||
|
Broward County, FL, Water & Sewer Utility Revenue, Series A, 5.0%, 10/1/2024
|
2,745,000 | 3,117,771 | ||||||
|
Dade County, FL, Health Facilities Authority Hospital Revenue, Baptist Hospital of Miami Project, Series A, ETM, 5.75%, 5/1/2021, INS: NATL
|
2,815,000 | 3,267,117 | ||||||
|
Florida, Citizens Property Insurance Corp.:
|
||||||||
|
Series A-1, 5.0%, 6/1/2020
|
7,275,000 | 8,500,328 | ||||||
|
Series A-1, 5.0%, 6/1/2021
|
5,090,000 | 5,997,802 | ||||||
|
Florida, Housing Finance Corp. Revenue, Homeowner Mortgage Special Program, Series A, 5.0%, 7/1/2028
|
1,545,000 | 1,651,142 | ||||||
|
Jacksonville, FL, Sales Tax Revenue, Better Jacksonville, 5.0%, 10/1/2021
|
1,335,000 | 1,593,162 | ||||||
|
Jacksonville, FL, Water & Sewer System Revenue, Series A, 5.0%, 10/1/2026
|
5,000,000 | 6,044,750 | ||||||
|
Lee County, FL, School Board Certificates of Participation, Series A, 5.0%, 8/1/2027
|
4,360,000 | 5,144,233 | ||||||
|
Miami-Dade County, FL, Aviation Revenue:
|
||||||||
|
Series B, 5.0%, 10/1/2024
|
4,000,000 | 4,576,480 | ||||||
|
Series A, 5.75%, 10/1/2026
|
8,000,000 | 9,427,840 | ||||||
|
Miami-Dade County, FL, Aviation Revenue, Miami International Airport:
|
||||||||
|
Series A-1, 5.5%, 10/1/2025
|
3,000,000 | 3,538,020 | ||||||
|
Series A-1, 5.5%, 10/1/2026
|
4,400,000 | 5,173,256 | ||||||
|
Miami-Dade County, FL, School Board, Certificates of Participation, Series A, 5.0%, 5/1/2019, INS: NATL
|
3,000,000 | 3,298,890 | ||||||
|
Miami-Dade County, FL, Water & Sewer Systems Revenue, 5.0%, 10/1/2027, INS: AGC
|
10,000,000 | 11,450,000 | ||||||
|
Orlando & Orange County, FL, Expressway Authority Revenue:
|
||||||||
|
Series B, 5.0%, 7/1/2022
|
2,000,000 | 2,401,960 | ||||||
|
Series A, 5.0%, 7/1/2028
|
7,500,000 | 8,475,525 | ||||||
|
South Florida, Water Management District, Certificates of Participation, 5.0%, 10/1/2018, INS: AMBAC
|
4,000,000 | 4,327,280 | ||||||
|
South Miami, FL, Health Facilities Authority, Hospital Revenue, Baptist Health South Florida Group, 5.0%, 8/15/2021
|
2,500,000 | 2,771,525 | ||||||
| 97,956,775 | ||||||||
|
Georgia 4.5%
|
||||||||
|
Athens-Clarke County, GA, Unified Government Development Authority Revenue, University of Georgia Athletic Association, Series B, 0.05%*, 7/1/2035, LOC: Bank of America NA
|
2,050,000 | 2,050,000 | ||||||
|
Atlanta, GA, Airport Passenger Facility Charge Revenue, Series B, 5.0%, 1/1/2021
|
8,345,000 | 9,733,608 | ||||||
|
Atlanta, GA, Airport Revenue, Series C, 5.75%, 1/1/2023
|
2,460,000 | 3,007,867 | ||||||
|
Atlanta, GA, Metropolitan Rapid Transit Authority, Sales Tax Revenue, Second Indenture, Series B, 0.32%**, Mandatory Put 7/1/2017 @ 100, 7/1/2025
|
4,285,000 | 4,284,314 | ||||||
|
Atlanta, GA, Water & Wastewater Revenue:
|
||||||||
|
Series B, 5.0%, 11/1/2022
|
3,000,000 | 3,629,970 | ||||||
|
Series B, 5.25%, 11/1/2027, INS: AGMC
|
10,000,000 | 12,243,000 | ||||||
|
DeKalb County, GA, Water & Sewer Revenue, Series A, 5.25%, 10/1/2029
|
10,300,000 | 12,076,441 | ||||||
|
Gainesville & Hall County, GA, Hospital Authority Revenue, Anticipation Certificates, Northeast Georgia Healthcare, Series B, 5.5%, 2/15/2029
|
8,900,000 | 10,157,481 | ||||||
|
Georgia, Main Street Natural Gas, Inc., Gas Project Revenue, Series A, 5.5%, 9/15/2024, GTY: Merrill Lynch & Co., Inc.
|
1,705,000 | 2,046,784 | ||||||
|
Georgia, Municipal Electric Authority, Comb Cycle Project:
|
||||||||
|
Series A, 5.0%, 11/1/2022
|
1,000,000 | 1,205,000 | ||||||
|
Series A, 5.0%, 11/1/2027
|
1,000,000 | 1,150,210 | ||||||
|
Georgia, Municipal Electric Authority, General Resolution Projects, Series A, 5.25%, 1/1/2019
|
2,500,000 | 2,909,050 | ||||||
|
Georgia, Municipal Electric Authority, Project One, Series A, 5.0%, 1/1/2021
|
3,420,000 | 4,043,261 | ||||||
|
Georgia, State Municipal Electric Authority, Series GG, 5.0%, 1/1/2022
|
10,000,000 | 12,036,500 | ||||||
|
Georgia, State Road & Tollway Authority Revenue, Federal Highway Grant Anticipation Bonds, Series A, 5.0%, 6/1/2021
|
2,500,000 | 2,872,125 | ||||||
| 83,445,611 | ||||||||
|
Guam 0.1%
|
||||||||
|
Guam, Government Limited Obligation Revenue, Section 30, Series A, 5.375%, 12/1/2024
|
1,000,000 | 1,104,620 | ||||||
|
Hawaii 1.2%
|
||||||||
|
Hawaii, State Airports Systems Revenue:
|
||||||||
|
Series A, 5.25%, 7/1/2027
|
2,335,000 | 2,712,429 | ||||||
|
Series A, 5.25%, 7/1/2028
|
5,010,000 | 5,802,682 | ||||||
|
Series A, 5.25%, 7/1/2029
|
3,155,000 | 3,646,076 | ||||||
|
Hawaii, State General Obligation, Series DK, 5.0%, 5/1/2021
|
9,000,000 | 10,168,380 | ||||||
| 22,329,567 | ||||||||
|
Illinois 7.3%
|
||||||||
|
Chicago, IL, Core City General Obligation, Capital Appreciation Project, Series A, 5.3%, 1/1/2016, INS: NATL
|
1,100,000 | 1,152,393 | ||||||
|
Chicago, IL, O'Hare International Airport Revenue:
|
||||||||
|
Series D, 5.0%, 1/1/2023
|
6,540,000 | 7,823,475 | ||||||
|
Series C, 5.25%, 1/1/2030, INS: AGC
|
10,000,000 | 11,248,800 | ||||||
|
Chicago, IL, Park District, Harbor Facilities, Series D, 5.0%, 1/1/2024
|
1,000,000 | 1,199,910 | ||||||
|
Chicago, IL, Waterworks Revenue:
|
||||||||
|
4.0%, 11/1/2021
|
1,000,000 | 1,102,710 | ||||||
|
5.0%, 11/1/2021
|
500,000 | 585,885 | ||||||
|
Illinois, Metropolitan Pier & Exposition Authority Revenue, McCormick Place Project, Series B, 5.0%, 12/15/2026
|
5,000,000 | 5,728,600 | ||||||
|
Illinois, Municipal Electric Agency Power Supply, Series A, 5.25%, 2/1/2018, INS: NATL
|
2,000,000 | 2,191,200 | ||||||
|
Illinois, Railsplitter Tobacco Settlement Authority Revenue:
|
||||||||
|
5.0%, 6/1/2019
|
3,500,000 | 4,008,760 | ||||||
|
5.25%, 6/1/2020
|
3,000,000 | 3,521,100 | ||||||
|
Illinois, Regional Transportation Authority, Series A, 5.5%, 7/1/2024, INS: NATL
|
5,000,000 | 6,173,650 | ||||||
|
Illinois, State Finance Authority Revenue, Northwestern University, Series C, 0.04%*, 12/1/2034
|
6,800,000 | 6,800,000 | ||||||
|
Illinois, State Finance Authority Revenue, University of Chicago, Series A, 5.0%, 10/1/2026
|
6,330,000 | 7,639,993 | ||||||
|
Illinois, State Finance Authority Revenue, University of Chicago Medical Center, Series D-1, 0.04%*, 8/1/2043, LOC: PNC Bank NA
|
35,000,000 | 35,000,000 | ||||||
|
Illinois, State General Obligation:
|
||||||||
|
Series A, 5.0%, 4/1/2015
|
4,500,000 | 4,569,255 | ||||||
|
5.5%, 7/1/2024
|
2,000,000 | 2,298,560 | ||||||
|
Illinois, State Toll Highway Authority Revenue:
|
||||||||
|
Series D, 5.0%, 1/1/2024 (a)
|
11,840,000 | 14,303,194 | ||||||
|
Series A, 5.0%, 1/1/2027
|
1,250,000 | 1,441,488 | ||||||
|
Series A, 5.0%, 1/1/2028
|
1,250,000 | 1,431,775 | ||||||
|
Series A-1, 5.25%, 1/1/2030
|
5,000,000 | 5,734,550 | ||||||
|
Illinois, State Unemployment Insurance Fund, Building Receipts Revenue, Series B, 5.0%, 12/15/2019
|
1,120,000 | 1,148,526 | ||||||
|
Illinois, Will, Grundy Etc. Counties, Community College District Number 525, Joliet Jr. College, 6.25%, 6/1/2021
|
1,000,000 | 1,166,660 | ||||||
|
Rockford-Concord Commons, IL, Housing Facility, Concord Commons Project, Series A, 6.15%, 11/1/2022
|
895,000 | 897,246 | ||||||
|
University of Illinois, Higher Education Revenue, Auxiliary Facilities System:
|
||||||||
|
Series A, 5.5%, 4/1/2015, INS: AMBAC
|
3,860,000 | 3,930,792 | ||||||
|
Series A, 5.5%, 4/1/2016, INS: AMBAC
|
3,580,000 | 3,822,796 | ||||||
| 134,921,318 | ||||||||
|
Indiana 1.3%
|
||||||||
|
Indiana, State Finance Authority Revenue, State Revolving Fund Program, Series B, 5.0%, 2/1/2029
|
2,240,000 | 2,615,917 | ||||||
|
Indiana, Transportation Finance Authority Highway Revenue, Series A, 5.5%, 12/1/2022
|
10,000,000 | 12,178,800 | ||||||
|
Indiana, Wastewater Utility Revenue, CWA Authority Project, Series A, 5.0%, 10/1/2027
|
1,565,000 | 1,821,096 | ||||||
|
Indianapolis, IN, Local Public Improvement Bond Bank, Series K, 5.0%, 6/1/2026
|
5,355,000 | 6,162,427 | ||||||
|
Jasper County, IN, Pollution Control Revenue, Northern Indiana Public Service, Series C, 5.85%, 4/1/2019, INS: NATL
|
2,000,000 | 2,281,240 | ||||||
| 25,059,480 | ||||||||
|
Iowa 0.6%
|
||||||||
|
Iowa, State Finance Authority, Health Facilities Revenue, Iowa Health System, 5.25%, 2/15/2029, INS: AGC
|
10,000,000 | 11,211,200 | ||||||
|
Kansas 0.7%
|
||||||||
|
Kansas, State Development Finance Authority Hospital Revenue, Adventist Health, 5.5%, 11/15/2022
|
4,470,000 | 5,215,596 | ||||||
|
Kansas, State Development Finance Authority Revenue, Sisters Leavenworth, Series A, 5.25%, 1/1/2025
|
7,500,000 | 8,528,175 | ||||||
| 13,743,771 | ||||||||
|
Kentucky 0.5%
|
||||||||
|
Kentucky, Asset/Liability Commission Agency Revenue, Federal Highway Trust, First Series, 5.25%, 9/1/2019, INS: NATL
|
1,000,000 | 1,179,350 | ||||||
|
Kentucky, State Economic Development Finance Authority, Solid Waste Disposal Revenue, Republic Services, Inc. Project, Series B, 0.3%*, Mandatory Put 3/2/2015 @ 100, 4/1/2031
|
2,000,000 | 2,000,000 | ||||||
|
Louisville & Jefferson County, KY, Metropolitan Government Revenue, Catholic Health Initiatives:
|
||||||||
|
Series A, 5.0%, 12/1/2023
|
2,600,000 | 3,015,116 | ||||||
|
Series A, 5.0%, 12/1/2024
|
3,000,000 | 3,449,760 | ||||||
| 9,644,226 | ||||||||
|
Louisiana 0.6%
|
||||||||
|
East Baton Rouge Parish, LA, Industrial Development Board, Inc. Revenue, Exxon Mobil Project, Gulf Opportunity Zone, Series A, 0.05%*, 8/1/2035
|
7,000,000 | 7,000,000 | ||||||
|
Louisiana, Local Government Environmental Facilities & Community Development Authority, LCTCS Facilities Corp. Project, Series B, 5.0%, 10/1/2027, INS: AGC
|
1,365,000 | 1,479,373 | ||||||
|
Louisiana, Regional Transit Authority, Sales Tax Revenue, 5.0%, 12/1/2025, INS: AGMC
|
1,550,000 | 1,781,694 | ||||||
| 10,261,067 | ||||||||
|
Maine 0.5%
|
||||||||
|
Maine, Health & Higher Educational Facilities Authority Revenue, Series A, 5.25%, 7/1/2031
|
8,040,000 | 9,145,580 | ||||||
|
Maryland 2.4%
|
||||||||
|
Carroll County, MD, General Obligation, 5.0%, 11/1/2022
|
5,330,000 | 6,545,986 | ||||||
|
Maryland, General Obligation, State & Local Facilities Loan, Series 2, Prerefunded 8/1/2017 @ 100, 5.0%, 8/1/2019
|
5,000,000 | 5,589,450 | ||||||
|
Maryland, State Health & Higher Educational Facilities Authority Revenue, Pooled Loan Program, Series D, 144A, 0.06%*, 1/1/2029, LOC: Bank of America NA
|
14,735,000 | 14,735,000 | ||||||
|
Montgomery County, MD, General Obligation, Series B, 5.0%, 11/1/2022
|
15,000,000 | 18,484,050 | ||||||
| 45,354,486 | ||||||||
|
Massachusetts 3.6%
|
||||||||
|
Massachusetts, Metropolitan Boston Transit Parking Corp., Systemwide Parking Revenue, Senior Lien, 5.0%, 7/1/2028
|
3,760,000 | 4,349,906 | ||||||
|
Massachusetts, State Consolidated Loan, Series D-2, 0.35%**, Mandatory Put 8/1/2017 @ 100, 8/1/2043
|
15,000,000 | 14,999,100 | ||||||
|
Massachusetts, State Development Finance Agency Revenue, Harvard University, Series B-3, 5.0%, 1/1/2022
|
9,210,000 | 10,976,294 | ||||||
|
Massachusetts, State Development Finance Agency Revenue, Partners Healthcare System, Inc., Series M-3, 0.6%**, Mandatory Put 1/30/2018 @ 100, 7/1/2038
|
4,975,000 | 4,974,055 | ||||||
|
Massachusetts, State General Obligation:
|
||||||||
|
Series C, 5.0%, 8/1/2022
|
7,000,000 | 8,509,830 | ||||||
|
Series D, 5.5%, 11/1/2015, INS: NATL
|
1,000,000 | 1,049,670 | ||||||
|
Massachusetts, State Health & Educational Facilities Authority Revenue, Suffolk University, Series A, 6.0%, 7/1/2024
|
5,000,000 | 5,879,950 | ||||||
|
Massachusetts, State Housing Finance Agency, Series 162, 2.75%, 12/1/2041
|
1,195,000 | 1,230,300 | ||||||
|
Massachusetts, State School Building Authority, Sales Tax Revenue, Series B, 5.0%, 10/15/2027
|
7,000,000 | 8,313,410 | ||||||
|
Massachusetts, State Water Resources Authority, Series C, 5.0%, 8/1/2029
|
6,000,000 | 6,938,640 | ||||||
| 67,221,155 | ||||||||
|
Michigan 2.0%
|
||||||||
|
Brighton, MI, School District General Obligation, Series II, Zero Coupon, 5/1/2016, INS: AMBAC
|
5,000,000 | 4,941,000 | ||||||
|
Detroit, MI, City School District Building & Site:
|
||||||||
|
Series A, 5.0%, 5/1/2020
|
3,110,000 | 3,560,733 | ||||||
|
Series A, 5.0%, 5/1/2021
|
2,100,000 | 2,408,322 | ||||||
|
Michigan, State Building Authority Revenue, Facilities Program, Series II-A, 5.0%, 10/15/2024
|
1,610,000 | 1,869,210 | ||||||
|
Michigan, State Finance Authority Revenue, Unemployment Obligation Assessment, Series B, 5.0%, 7/1/2021
|
11,825,000 | 13,471,158 | ||||||
|
Michigan, State Hospital Finance Authority Revenue, Ascension Health Senior Credit Group, Series B, 5.0%, 11/15/2025
|
5,920,000 | 6,747,024 | ||||||
|
Michigan, State Trunk Line, 5.0%, 11/1/2024
|
3,000,000 | 3,416,970 | ||||||
| 36,414,417 | ||||||||
|
Minnesota 1.0%
|
||||||||
|
Minneapolis & St. Paul, MN, Metropolitan Airports Commission, Airport Revenue:
|
||||||||
|
Series A, 5.0%, 1/1/2027
|
2,000,000 | 2,355,360 | ||||||
|
Series A, 5.0%, 1/1/2028
|
3,500,000 | 4,088,175 | ||||||
|
Minnesota, State General Fund Revenue, Series B, 5.0%, 3/1/2023
|
5,945,000 | 7,145,236 | ||||||
|
Minnesota, State General Obligation, Prerefunded 6/1/2016 @ 100, 5.0%, 6/1/2020
|
4,535,000 | 4,852,677 | ||||||
| 18,441,448 | ||||||||
|
Mississippi 2.0%
|
||||||||
|
Mississippi, Business Financial Corp., Mississippi Retirement Facilities Revenue, Wesley Manor, Series A, 5.45%, 5/20/2034
|
2,325,000 | 2,326,162 | ||||||
|
Mississippi, Development Bank Special Obligation, Department of Corrections:
|
||||||||
|
Series C, 5.25%, 8/1/2027
|
6,110,000 | 7,063,588 | ||||||
|
Series D, 5.25%, 8/1/2027
|
5,000,000 | 5,780,350 | ||||||
|
Mississippi, Home Corp., Single Family Mortgage Revenue, Series C-1, 5.6%, 6/1/2038
|
1,985,000 | 2,101,559 | ||||||
|
Mississippi, State Business Finance Comission, Gulf Opportunity Zone, Chevron U.S.A., Inc. Project:
|
||||||||
|
Series C, 0.05%*, 12/1/2030, GTY: Chevron Corp.
|
10,000,000 | 10,000,000 | ||||||
|
Series F, 144A, 0.05%*, 11/1/2035, GTY: Chevron Corp.
|
6,500,000 | 6,500,000 | ||||||
|
Rankin County, MS, School District General Obligation, 5.25%, 2/1/2015, INS: NATL
|
2,845,000 | 2,869,894 | ||||||
| 36,641,553 | ||||||||
|
Missouri 0.5%
|
||||||||
|
Cape Girardeau County, MO, Industrial Development Authority, St. Francis Medical Center:
|
||||||||
|
Series A, 5.0%, 6/1/2022
|
1,570,000 | 1,845,142 | ||||||
|
Series A, 5.0%, 6/1/2023
|
1,375,000 | 1,599,634 | ||||||
|
Missouri, Hospital & Healthcare Revenue, Health & Educational Facilities Authority, Washington University, Series A, 5.5%, 6/15/2016
|
3,200,000 | 3,456,864 | ||||||
|
Missouri, State Housing Development Commission, Single Family Mortgage Revenue, Homeownership Loan Program, Series D, 4.8%, 3/1/2040
|
1,130,000 | 1,197,122 | ||||||
|
Missouri, State Housing Development Commission, Single Family Mortgage Revenue, Special Homeownership Loan Program Market Bonds, Series E-1, 5.0%, 11/1/2027
|
695,000 | 744,825 | ||||||
| 8,843,587 | ||||||||
|
Nebraska 0.5%
|
||||||||
|
Nebraska, State Investment Finance Authority, Single Family Housing Revenue:
|
||||||||
|
Series E, 3.0%, 3/1/2043
|
2,040,000 | 2,121,049 | ||||||
|
Series C, 4.5%, 9/1/2043
|
7,230,000 | 7,675,224 | ||||||
| 9,796,273 | ||||||||
|
Nevada 1.5%
|
||||||||
|
Clark County, NV, Board Bank:
|
||||||||
|
5.0%, 6/1/2024
|
3,040,000 | 3,464,050 | ||||||
|
5.0%, 6/1/2025
|
3,190,000 | 3,634,973 | ||||||
|
Clark County, NV, Flood Control:
|
||||||||
|
5.0%, 11/1/2021 (a)
|
2,915,000 | 3,504,238 | ||||||
|
5.0%, 11/1/2022 (a)
|
3,215,000 | 3,900,567 | ||||||
|
Clark County, NV, General Obligation, Series A, 5.0%, 12/1/2026
|
3,025,000 | 3,477,994 | ||||||
|
Nevada, State Unemployment Compensation Fund, Special Revenue, 4.0%, 12/1/2015
|
4,300,000 | 4,466,797 | ||||||
|
Washoe County, NV, School District, Series A, 5.0%, 6/1/2026
|
4,855,000 | 5,919,798 | ||||||
| 28,368,417 | ||||||||
|
New Hampshire 0.4%
|
||||||||
|
New Hampshire, State Health & Education Facilities Authority Revenue, Easter Seals Rehabilitation Center, Series A, 0.05%*, 12/1/2034, LOC: Citizens Bank of NH
|
4,200,000 | 4,200,000 | ||||||
|
New Hampshire, State Turnpike Systems:
|
||||||||
|
Series B, 5.0%, 2/1/2020
|
1,575,000 | 1,849,648 | ||||||
|
Series B, 5.0%, 2/1/2024
|
1,775,000 | 2,077,123 | ||||||
| 8,126,771 | ||||||||
|
New Jersey 2.8%
|
||||||||
|
New Jersey, Economic Development Authority Revenue, School Facilities Construction, Series O, Prerefunded 3/1/2015 @ 100, 5.0%, 3/1/2017
|
3,300,000 | 3,341,646 | ||||||
|
New Jersey, State Building Authority, Series A, 5.0%, 6/15/2015
|
1,740,000 | 1,784,196 | ||||||
|
New Jersey, State Economic Development Authority Revenue:
|
||||||||
|
5.0%, 6/15/2020
|
2,500,000 | 2,840,675 | ||||||
|
5.0%, 6/15/2021
|
5,000,000 | 5,705,100 | ||||||
|
5.0%, 6/15/2023
|
4,000,000 | 4,554,200 | ||||||
|
New Jersey, State Economic Development Authority Revenue, School Facilities Construction:
|
||||||||
|
Series W, 5.0%, 3/1/2019
|
935,000 | 1,027,247 | ||||||
|
Series W, Prerefunded 3/1/2018 @ 100, 5.0%, 3/1/2019
|
2,065,000 | 2,342,102 | ||||||
|
Series NN, 5.0%, 3/1/2025
|
5,000,000 | 5,583,150 | ||||||
|
Series NN, 5.0%, 3/1/2026
|
2,500,000 | 2,769,375 | ||||||
|
New Jersey, State Transportation Trust Fund Authority:
|
||||||||
|
Series B, 5.25%, 6/15/2025
|
5,000,000 | 5,694,150 | ||||||
|
Series B, 5.25%, 6/15/2026
|
5,000,000 | 5,658,850 | ||||||
|
New Jersey, State Turnpike Authority, Series B-2, 0.524%**, Mandatory Put 1/1/2017 @ 100, 1/1/2024
|
11,250,000 | 11,251,800 | ||||||
| 52,552,491 | ||||||||
|
New Mexico 0.1%
|
||||||||
|
New Mexico, Mortgage Finance Authority, Single Family Mortgage:
|
||||||||
|
"I", Series E, 5.3%, 9/1/2040
|
1,010,000 | 1,034,886 | ||||||
|
"I", Series D, 5.35%, 9/1/2040
|
865,000 | 923,855 | ||||||
|
Series I-B-2, 5.65%, 9/1/2039
|
475,000 | 517,973 | ||||||
| 2,476,714 | ||||||||
|
New York 9.6%
|
||||||||
|
Long Island, NY, Power Authority, Series C, 0.04%*, 5/1/2033, LOC: Barclays Bank PLC
|
805,000 | 805,000 | ||||||
|
Nassau County, NY, Sewer & Storm Water Finance Authority Systems Revenue, Series A, 5.0%, 10/1/2023
|
3,000,000 | 3,704,070 | ||||||
|
New York, Metropolitan Transportation Authority Revenue:
|
||||||||
|
Series D-2B, 0.708%**, Mandatory Put 5/15/2018 @ 100, 11/1/2032, INS: AGMC
|
4,200,000 | 4,230,030 | ||||||
|
Series B-2, 5.0%, 11/15/2021
|
5,000,000 | 5,963,500 | ||||||
|
New York, Metropolitan Transportation Authority, Dedicated Tax Fund, Series A-2B, 0.62%**, Mandatory Put 11/1/2019 @ 100, 11/1/2031
|
5,000,000 | 4,999,000 | ||||||
|
New York, Sales Tax Asset Receivable Corp., Fiscal 2015, Series A, 5.0%, 10/15/2026
|
5,930,000 | 7,331,733 | ||||||
|
New York, State Dormitory Authority Revenues, Non-State Supported Debt, Memorial Sloan-Kettering, Series 1, 4.0%, 7/1/2021
|
1,500,000 | 1,697,280 | ||||||
|
New York, State Dormitory Authority Revenues, Non-State Supported Debt, Mount Sinai School of Medicine, Series A, 5.0%, 7/1/2021
|
1,000,000 | 1,149,700 | ||||||
|
New York, State Dormitory Authority, State Personal Income Tax Revenue:
|
||||||||
|
Series A, 5.0%, 3/15/2019
|
5,000,000 | 5,474,500 | ||||||
|
Series A, 5.0%, 12/15/2021
|
3,000,000 | 3,622,290 | ||||||
|
Series A, 5.0%, 2/15/2022
|
2,065,000 | 2,497,143 | ||||||
|
New York, State Environmental Facilities Corp., State Clean Water & Drinking Revolving Funds, New York City Municipal Water Finance Authority Projects, 5.0%, 6/15/2029
|
10,000,000 | 11,627,700 | ||||||
|
New York, State Thruway Authority, Series J, 5.0%, 1/1/2028
|
10,000,000 | 11,785,600 | ||||||
|
New York, State Thruway Authority General Revenue, Junior Indebtedness, Series A, 5.0%, 5/1/2019
|
2,690,000 | 3,109,748 | ||||||
|
New York, Tobacco Settlement Financing Corp. Revenue, Asset Backed, Series B, 5.0%, 6/1/2020
|
1,250,000 | 1,335,200 | ||||||
|
New York, Utility Debt Securitization Authority, Restructuring Revenue, Series TE, 5.0%, 12/15/2016
|
18,000,000 | 18,041,760 | ||||||
|
New York City, NY, Municipal Water Finance Authority, Water & Sewer Revenue, Series AA, 5.0%, 6/15/2021
|
10,000,000 | 11,419,100 | ||||||
|
New York City, NY, Municipal Water Finance Authority, Water & Sewer Systems Revenue, Series DD-3B, 0.04%*, 6/15/2043, SPA: State Street Bank & Trust Co.
|
11,300,000 | 11,300,000 | ||||||
|
New York City, NY, Transitional Finance Authority Revenue, Future Tax Secured:
|
||||||||
|
Series A-4, 0.04%*, 11/1/2029, SPA: TD Bank NA
|
5,300,000 | 5,300,000 | ||||||
|
Series B1, 5.0%, 11/1/2027
|
750,000 | 896,355 | ||||||
|
Series B1, 5.0%, 11/1/2028
|
1,175,000 | 1,391,552 | ||||||
|
Series D-1, 5.0%, 11/1/2028
|
9,715,000 | 11,310,592 | ||||||
|
Series E-1, 5.0%, 2/1/2029
|
3,055,000 | 3,570,103 | ||||||
|
Series B1, 5.0%, 11/1/2029
|
935,000 | 1,101,374 | ||||||
|
New York, NY, General Obligation:
|
||||||||
|
Series J, 5.0%, 8/1/2023
|
6,250,000 | 7,550,500 | ||||||
|
Series F, 5.0%, 8/1/2024
|
9,000,000 | 10,593,630 | ||||||
|
Series B, 5.0%, 8/1/2026
|
2,870,000 | 3,446,468 | ||||||
|
Series D-1, 5.0%, 8/1/2029
|
8,620,000 | 10,074,884 | ||||||
|
Triborough, NY, Bridge & Tunnel Authority Revenues:
|
||||||||
|
Series B, 0.04%*, 1/1/2032, LOC: State Street Bank & Trust Co.
|
2,550,000 | 2,550,000 | ||||||
|
Series ABCD-4, 0.39%**, 1/1/2018, INS: AGMC
|
3,665,000 | 3,671,963 | ||||||
|
Series A, 5.0%, 11/15/2028
|
4,975,000 | 5,858,212 | ||||||
| 177,408,987 | ||||||||
|
North Carolina 2.2%
|
||||||||
|
Charlotte, NC, Airport Revenue, Series A, 5.5%, 7/1/2034
|
1,000,000 | 1,153,380 | ||||||
|
Charlotte-Mecklenburg, NC, Hospital Authority, Health Care Systems Revenue, Carolinas Healthcare, Series C, 0.04%*, 1/15/2026, LOC: U.S. Bank NA
|
2,000,000 | 2,000,000 | ||||||
|
North Carolina, Eastern Municipal Power Agency Systems Revenue, Series B, 5.0%, 1/1/2026
|
4,200,000 | 4,767,798 | ||||||
|
North Carolina, Electric Revenue, Catawba Municipal Power Agency No. 1, Series A, 5.25%, 1/1/2020
|
2,000,000 | 2,229,900 | ||||||
|
North Carolina, State Capital Improvement Obligation, Series A, 5.0%, 5/1/2024
|
10,745,000 | 12,529,744 | ||||||
|
North Carolina, State Limited Obligation:
|
||||||||
|
Series C, 5.0%, 5/1/2022
|
5,000,000 | 6,060,450 | ||||||
|
Series B, 5.0%, 6/1/2024
|
10,000,000 | 12,339,800 | ||||||
| 41,081,072 | ||||||||
|
North Dakota 0.1%
|
||||||||
|
Fargo, ND, Sanford Health Systems Revenue, 5.5%, 11/1/2021
|
1,250,000 | 1,506,288 | ||||||
|
Ohio 2.4%
|
||||||||
|
Cleveland, OH, Airport Systems Revenue, Series A, 5.0%, 1/1/2027
|
3,000,000 | 3,325,050 | ||||||
|
Columbus, OH, General Obligation, Series 1, 5.0%, 7/1/2023
|
5,125,000 | 6,305,954 | ||||||
|
Lucas County, OH, Hospital Revenue, Promedica Healthcare, Series D, 5.0%, 11/15/2024
|
2,800,000 | 3,219,244 | ||||||
|
Ohio, American Municipal Power, Inc. Revenue, Fremont Energy Center Project:
|
||||||||
|
Series B, 5.0%, 2/15/2020
|
1,130,000 | 1,326,631 | ||||||
|
Series B, 5.0%, 2/15/2021
|
1,300,000 | 1,536,912 | ||||||
|
Ohio, State Capital Facilities Lease Appropriation- Administration Building Fund Projects, Series A, 5.0%, 10/1/2022
|
2,355,000 | 2,836,433 | ||||||
|
Ohio, State Higher Educational Facility Commission Revenue, Cleveland Clinic Health, Series A, 5.25%, 1/1/2021
|
2,150,000 | 2,399,228 | ||||||
|
Ohio, State Higher Educational Facility Commission Revenue, Summa Health Systems 2010 Project, 5.5%, 11/15/2030, INS: AGMC
|
5,000,000 | 5,760,200 | ||||||
|
Ohio, State Higher Educational Facility Commission, Cleveland Clinic Health System, Series B-3, 0.04%*, 1/1/2039, LIQ: U.S. Bank NA
|
9,160,000 | 9,160,000 | ||||||
|
Ohio, State Housing Finance Agency, Residential Mortgage Revenue, Mortgage-Backed Securities Program, Series E, 5.0%, 9/1/2039
|
750,000 | 802,433 | ||||||
|
Ohio, State Solid Waste Revenue, Republic Services, Inc. Project, 0.3%*, Mandatory Put 3/2/2015 @ 100, 11/1/2035
|
4,000,000 | 4,000,000 | ||||||
|
Ohio, State Turnpike Commission, Infrastructure Projects, Series A-1, 5.25%, 2/15/2029
|
1,310,000 | 1,529,857 | ||||||
|
Ohio, Water & Sewer Revenue, Water Development Authority, Pure Water Improvement Project, Series B, 5.5%, 6/1/2015, INS: AGMC
|
2,280,000 | 2,342,540 | ||||||
| 44,544,482 | ||||||||
|
Oklahoma 0.1%
|
||||||||
|
Oklahoma, Ordinance Works Authority, Ralston Purina Project, 6.3%, 9/1/2015
|
1,500,000 | 1,507,050 | ||||||
|
Oregon 1.7%
|
||||||||
|
Clackamas County, OR, North Clackamas School District No. 12, Convertible Deferred Interest, Series B, 5.0%, 6/15/2027, INS: AGMC
|
6,535,000 | 7,147,656 | ||||||
|
Oregon, State Department of Administrative Services Lottery Revenue, Series A, 5.25%, 4/1/2028
|
2,000,000 | 2,382,000 | ||||||
|
Oregon, State General Obligation:
|
||||||||
|
Series L, 5.0%, 5/1/2025
|
3,000,000 | 3,549,120 | ||||||
|
Series J, 5.0%, 5/1/2029
|
5,425,000 | 6,364,122 | ||||||
|
Port of Portland, OR, Airport Revenue, Passenger Facility Charge, Portland International Airport:
|
||||||||
|
Series A, 5.5%, 7/1/2026
|
4,025,000 | 4,656,603 | ||||||
|
Series A, 5.5%, 7/1/2029
|
7,000,000 | 8,005,620 | ||||||
| 32,105,121 | ||||||||
|
Pennsylvania 1.8%
|
||||||||
|
Pennsylvania, Commonwealth Systems of Higher Education, University of Pittsburgh Capital Project, Series B, 5.5%, 9/15/2024
|
1,000,000 | 1,164,030 | ||||||
|
Pennsylvania, Saint Mary Hospital Authority, Health System Revenue, Catholic Health East, Series A, 5.0%, 11/15/2021
|
8,000,000 | 9,402,160 | ||||||
|
Pennsylvania, State Economic Development Financing Authority Revenue, UPMC Obligated Group, Series A, 5.0%, 2/1/2028
|
3,000,000 | 3,488,160 | ||||||
|
Pennsylvania, State Economic Development Financing Authority, Solid Waste Disposal, Republic Services, Inc., Series B, 0.3%*, Mandatory Put 1/2/2015 @ 100, 12/1/2030
|
5,070,000 | 5,070,203 | ||||||
|
Pennsylvania, State Economic Development Financing Authority, Unemployment Compensation Revenue, Series B, 5.0%, 7/1/2021
|
2,215,000 | 2,480,800 | ||||||
|
Pennsylvania, State Turnpike Commission Revenue:
|
||||||||
|
Series B-1, 0.93%**, 12/1/2020
|
3,000,000 | 3,018,450 | ||||||
|
Series B, 1.2%**, 12/1/2019
|
500,000 | 511,550 | ||||||
|
Series C, 5.5%, 12/1/2026
|
2,120,000 | 2,583,157 | ||||||
|
Series C, 5.5%, 12/1/2027
|
2,820,000 | 3,424,608 | ||||||
|
Series C, 5.5%, 12/1/2028
|
1,000,000 | 1,208,790 | ||||||
|
Philadelphia, PA, Redevelopment Authority, Multi-Family Housing Revenue, Woodstock, 5.45%, 2/1/2023
|
415,000 | 420,681 | ||||||
| 32,772,589 | ||||||||
|
Puerto Rico 0.0%
|
||||||||
|
Puerto Rico, Sales Tax Financing Corp., Sales Tax Revenue, Series A, Prerefunded 8/1/2019 @ 100, 5.5%, 8/1/2028
|
45,000 | 53,770 | ||||||
|
Rhode Island 0.3%
|
||||||||
|
Rhode Island, State & Providence Plantations, Construction Capital Development Loan, Series A, 5.0%, 8/1/2017, INS: AGMC
|
5,000,000 | 5,375,250 | ||||||
|
South Carolina 0.2%
|
||||||||
|
Greenwood County, SC, Hospital Revenue, Self Regional Healthcare, Series B, 5.0%, 10/1/2025
|
2,755,000 | 3,140,865 | ||||||
|
Tennessee 0.6%
|
||||||||
|
Tennessee, Housing Development Agency, Residential Financing Program Revenue, Series 1C, 3.0%, 7/1/2038
|
6,635,000 | 6,986,058 | ||||||
|
Tennessee, State Housing Development Agency, Homeownership Program:
|
||||||||
|
Series 2C, 4.0%, 7/1/2038
|
2,215,000 | 2,441,772 | ||||||
|
Series 1C, 4.5%, 7/1/2037
|
2,330,000 | 2,608,085 | ||||||
| 12,035,915 | ||||||||
|
Texas 16.7%
|
||||||||
|
Allen, TX, Independent School District, 5.0%, 2/15/2025
|
1,640,000 | 1,932,527 | ||||||
|
Alvin, TX, Independent School District, School House, Series B, 2.0%, Mandatory Put 8/15/2015 @ 100, 2/15/2039
|
3,750,000 | 3,793,987 | ||||||
|
Comal, TX, Independent School District, School Building Improvements, 5.25%, 2/1/2020
|
2,330,000 | 2,610,951 | ||||||
|
Cypress-Fairbanks, TX, Independent School District, School House Building Improvements:
|
||||||||
|
5.0%, 2/15/2019
|
1,300,000 | 1,426,568 | ||||||
|
5.0%, 2/15/2021
|
1,850,000 | 2,028,229 | ||||||
|
Dallas, TX, Area Rapid Transit, Sales Tax Revenue, Series A, 5.0%, 12/1/2021 (a)
|
3,750,000 | 4,524,187 | ||||||
|
Dallas, TX, Certificates Obligation, 5.0%, 2/15/2021
|
1,955,000 | 2,350,047 | ||||||
|
Dallas, TX, Waterworks & Sewer Systems Revenue:
|
||||||||
|
5.0%, 10/1/2029
|
4,000,000 | 4,635,040 | ||||||
|
5.0%, 10/1/2030
|
5,000,000 | 5,793,800 | ||||||
|
Dallas-Fort Worth, TX, International Airport Revenue, Series B, 5.0%, 11/1/2028
|
5,000,000 | 5,698,700 | ||||||
|
Del Valle, TX, Independent School District, Series A, 5.0%, 6/15/2025
|
3,730,000 | 4,577,232 | ||||||
|
El Paso, TX, Independent School District, School Building Improvements, 5.0%, 8/15/2022
|
4,885,000 | 5,572,564 | ||||||
|
Fort Bend, TX, Independent School District, 5.0%, 8/15/2026
|
2,000,000 | 2,276,020 | ||||||
|
Fort Worth, TX, Independent School District, School Building, 5.0%, 2/15/2028
|
9,210,000 | 10,717,585 | ||||||
|
Goose Creek, TX, Consolidated Independent School District, School Building, Series B, 2.0%, Mandatory Put 8/14/2015 @ 100, 2/15/2040
|
3,250,000 | 3,288,123 | ||||||
|
Gulf Coast, TX, Waste Disposal Authority, Exxon Mobil Project, 0.05%*, 6/1/2020
|
4,000,000 | 4,000,000 | ||||||
|
Harris County, TX, Cultural Education Facilities Finance Corp. Revenue, Memorial Herman Hospital Health System:
|
||||||||
|
Series B, 0.35%**, 6/1/2015
|
1,000,000 | 1,000,300 | ||||||
|
Series B, 0.63%**, Mandatory Put 12/1/2019 @ 100, 12/1/2042
|
6,000,000 | 6,000,840 | ||||||
|
Harris County, TX, Flood Control District, Contract Tax, Series A, 5.0%, 10/1/2029
|
5,000,000 | 5,778,950 | ||||||
|
Harris County, TX, Metropolitan Transit Authority, Sales & Use Tax, Series A, 5.0%, 11/1/2031
|
2,795,000 | 3,230,768 | ||||||
|
Harris County, TX, Permanent Improvement, Series A, 5.0%, 10/1/2028
|
10,000,000 | 11,617,500 | ||||||
|
Houston, TX, Airport Systems Revenue:
|
||||||||
|
Series B, 5.0%, 7/1/2026
|
4,000,000 | 4,622,680 | ||||||
|
Series B, 5.0%, 7/1/2027
|
9,600,000 | 11,084,928 | ||||||
|
Series A, 5.25%, 7/1/2029
|
8,000,000 | 8,951,280 | ||||||
|
Houston, TX, Public Improvement:
|
||||||||
|
Series A, 5.0%, 3/1/2022
|
4,000,000 | 4,833,120 | ||||||
|
Series A, 5.0%, 3/1/2026
|
11,000,000 | 12,820,000 | ||||||
|
Houston, TX, Utility Systems Revenue:
|
||||||||
|
Series C, 5.0%, 5/15/2022
|
2,000,000 | 2,422,160 | ||||||
|
Series A, 5.25%, 11/15/2028
|
2,500,000 | 2,981,575 | ||||||
|
Humble, TX, Independent School District, School Building, Series A, 5.0%, 2/15/2029
|
1,335,000 | 1,557,278 | ||||||
|
Lewisville, TX, Independent School District, School Building, 5.0%, 8/15/2026
|
6,360,000 | 7,294,538 | ||||||
|
Longview, TX, Independent School District, School Building Improvements, 5.0%, 2/15/2022
|
2,000,000 | 2,288,580 | ||||||
|
Lubbock, TX, General Obligation, 5.0%, 2/15/2029
|
2,000,000 | 2,292,860 | ||||||
|
North Texas, Tollway Authority Revenue, First Tier:
|
||||||||
|
Series A, 5.0%, 1/1/2025
|
1,480,000 | 1,754,732 | ||||||
|
Series E-3, 5.75%*, Mandatory Put 1/1/2016 @ 100, 1/1/2038
|
4,900,000 | 5,169,451 | ||||||
|
Series A, 6.0%, 1/1/2022
|
7,000,000 | 8,047,830 | ||||||
|
North Texas, Tollway Authority Revenue, Special Projects Systems:
|
||||||||
|
Series D, 5.25%, 9/1/2027
|
9,080,000 | 10,806,834 | ||||||
|
Series A, 5.5%, 9/1/2028
|
1,240,000 | 1,494,324 | ||||||
|
Pasadena, TX, Independent School District, 5.0%, 2/15/2027
|
6,960,000 | 8,039,078 | ||||||
|
Plano, TX, General Obligation, 5.0%, 9/1/2029
|
1,635,000 | 1,857,638 | ||||||
|
San Antonio, TX, Electric & Gas Revenue, Series A, 5.25%, 2/1/2026
|
7,000,000 | 8,092,210 | ||||||
|
San Antonio, TX, Water Systems Revenue, Junior Lien, Series E, 5.0%, 5/15/2027
|
1,900,000 | 2,253,989 | ||||||
|
Tarrant County, TX, Cultural Education Facilities Finance Corp. Revenue, Texas Health Resources:
|
||||||||
|
Series A, 5.0%, 2/15/2018
|
2,000,000 | 2,189,500 | ||||||
|
Series A, 5.0%, 2/15/2019
|
2,480,000 | 2,713,492 | ||||||
|
Series A, 5.0%, 2/15/2020
|
6,180,000 | 6,747,880 | ||||||
|
Tarrant County, TX, Cultural Education Facilities Finance Corp., Hospital Revenue, Scott & White Healthcare, 5.25%, 8/15/2023
|
2,500,000 | 2,913,300 | ||||||
|
Texas, Dallas-Fort Worth International Airport Revenue:
|
||||||||
|
Series A, 5.0%, 11/1/2018
|
1,000,000 | 1,150,430 | ||||||
|
Series A, 5.0%, 11/1/2019
|
1,250,000 | 1,461,975 | ||||||
|
Series D, 5.0%, 11/1/2024
|
2,250,000 | 2,610,968 | ||||||
|
Series C, 5.0%, 11/1/2025
|
4,605,000 | 5,327,110 | ||||||
|
Series C, 5.0%, 11/1/2026
|
3,290,000 | 3,794,028 | ||||||
|
Texas, Grapevine-Colleyville Independent School District Building, 5.0%, 8/15/2031
|
3,465,000 | 4,000,239 | ||||||
|
Texas, SA Energy Acquisition Public Facility Corp., Gas Supply Revenue:
|
||||||||
|
5.25%, 8/1/2017, GTY: The Goldman Sachs Group, Inc.
|
5,690,000 | 6,280,508 | ||||||
|
5.5%, 8/1/2020, GTY: The Goldman Sachs Group, Inc.
|
3,790,000 | 4,381,429 | ||||||
|
Texas, State Department of Housing & Community Affairs, Residential Mortgage Revenue, Series A, 5.375%, 1/1/2039
|
3,150,000 | 3,426,476 | ||||||
|
Texas, State Municipal Gas Acquisition & Supply Corp., III Gas Supply Revenue, 5.0%, 12/15/2022
|
5,000,000 | 5,862,650 | ||||||
|
Texas, State Transportation Commission Revenue, First Tier, 5.0%, 4/1/2022
|
10,000,000 | 10,987,800 | ||||||
|
Texas, State Transportation Commission, State Highway Fund Revenue, Series B, 0.4%**, Mandatory Put 4/1/2017 @ 100, 4/1/2032
|
3,000,000 | 3,007,320 | ||||||
|
Texas, State Transportation Commission-Highway Improvement, 5.0%, 4/1/2026
|
10,000,000 | 12,260,300 | ||||||
|
Texas, State Veterans Housing Assistance Program, Fund II, Series A, 5.25%, 12/1/2023
|
4,000,000 | 4,697,840 | ||||||
|
Texas, Water Development Board Revenue, State Revolving Fund:
|
||||||||
|
Series A, 5.0%, 7/15/2020
|
3,150,000 | 3,493,949 | ||||||
|
Series B, 5.25%, 7/15/2021
|
3,000,000 | 3,346,020 | ||||||
|
West Harris County, TX, Regional Water Authority, Water Systems Revenue:
|
||||||||
|
5.0%, 12/15/2026
|
2,640,000 | 2,934,888 | ||||||
|
5.0%, 12/15/2027
|
2,770,000 | 3,068,246 | ||||||
|
5.0%, 12/15/2028
|
2,905,000 | 3,207,411 | ||||||
|
Williamson County, TX, Limited Tax-Park, 3.0%*, Mandatory Put 8/15/2015 @ 100, 8/15/2034
|
7,500,000 | 7,635,750 | ||||||
| 309,018,512 | ||||||||
|
Utah 0.2%
|
||||||||
|
Riverton, UT, Hospital Revenue, IHC Health Services, Inc., 5.0%, 8/15/2020
|
2,825,000 | 3,263,977 | ||||||
|
Virgin Islands 0.1%
|
||||||||
|
Virgin Islands, Public Finance Authority Revenue, Series B, 5.0%, 10/1/2019
|
1,250,000 | 1,410,163 | ||||||
|
Virginia 0.3%
|
||||||||
|
Virginia, State College Building Authority, Educational Facilities Revenue, Public Higher Education, 5.0%, 9/1/2026
|
5,055,000 | 6,143,898 | ||||||
|
Washington 5.9%
|
||||||||
|
King County, WA, Housing Authority, Summerfield Apartments Project, 0.05%*, 9/1/2035, LOC: U.S. Bank NA
|
2,875,000 | 2,875,000 | ||||||
|
King County, WA, Public Hospital District No. 2:
|
||||||||
|
5.0%, 12/1/2021
|
6,670,000 | 7,868,466 | ||||||
|
5.0%, 12/1/2022
|
6,865,000 | 8,109,899 | ||||||
|
Seattle, WA, Municipal Light & Power Revenue, Series B, 5.0%, 2/1/2025
|
7,250,000 | 8,329,308 | ||||||
|
Seattle, WA, Water System Revenue:
|
||||||||
|
5.0%, 2/1/2020
|
3,870,000 | 4,356,691 | ||||||
|
5.0%, 2/1/2025, INS: AGMC
|
5,695,000 | 6,192,287 | ||||||
|
Washington, State Economic Development Finance Authority, Solid Waste Dispensary Revenue, Waste Management, Inc., Series D, 1.25%, 11/1/2017
|
3,000,000 | 3,016,290 | ||||||
|
Washington, State General Obligation:
|
||||||||
|
Series R-2014A, 3.0%, 7/1/2015
|
5,000,000 | 5,085,600 | ||||||
|
Series 2011-A, 5.0%, 8/1/2028
|
15,000,000 | 17,358,750 | ||||||
|
Series 2011-A, 5.0%, 8/1/2031
|
17,845,000 | 20,449,478 | ||||||
|
Series A, 5.0%, 8/1/2032
|
14,000,000 | 16,170,560 | ||||||
|
Washington, State Housing Finance Commission, Homeownership Program, Series A, 4.7%, 10/1/2028
|
710,000 | 756,171 | ||||||
|
Washington, State Motor Vehicle Fuel Tax:
|
||||||||
|
Series B, Prerefunded 7/1/2017 @ 100, 5.0%, 7/1/2025, INS: AGMC
|
2,000,000 | 2,227,880 | ||||||
|
Series 2010-B, 5.0%, 8/1/2027
|
6,000,000 | 6,892,920 | ||||||
| 109,689,300 | ||||||||
|
West Virginia 0.2%
|
||||||||
|
West Virginia, Transportation/Tolls Revenue, 5.25%, 5/15/2015, INS: NATL
|
2,940,000 | 3,009,061 | ||||||
|
Wisconsin 1.8%
|
||||||||
|
Wisconsin, State Clean Water Revenue:
|
||||||||
|
Series 1, 5.0%, 6/1/2031
|
2,500,000 | 2,889,700 | ||||||
|
Series 3, 5.5%, 6/1/2025
|
5,000,000 | 5,740,500 | ||||||
|
Wisconsin, State General Appropriation Revenue, Series A, 6.0%, 5/1/2026
|
5,000,000 | 5,978,100 | ||||||
|
Wisconsin, State General Obligation:
|
||||||||
|
Series 1, 5.0%, 5/1/2027
|
3,000,000 | 3,574,530 | ||||||
|
Series A, 5.25%, 5/1/2026
|
3,500,000 | 4,174,555 | ||||||
|
Wisconsin, State Health & Educational Facilities Authority Revenue, Children's Hospital of Wisconsin, Series B, 5.375%, 8/15/2024
|
1,000,000 | 1,146,140 | ||||||
|
Wisconsin, State Transportation Revenue:
|
||||||||
|
Series 2, 5.0%, 7/1/2023 (a)
|
2,500,000 | 3,057,350 | ||||||
|
Series 2, 5.0%, 7/1/2026 (a)
|
5,000,000 | 6,060,150 | ||||||
| 32,621,025 | ||||||||
|
% of Net Assets
|
Value ($)
|
|||||||
|
Total Investment Portfolio (Cost $1,783,270,398)†
|
102.5 | 1,900,310,937 | ||||||
|
Other Assets and Liabilities, Net
|
(2.5 | ) | (46,576,335 | ) | ||||
|
Net Assets
|
100.0 | 1,853,734,602 | ||||||
* Variable rate demand notes are securities whose interest rates are reset periodically at market levels. These securities are often payable on demand and are shown at their current rates as of November 30, 2014.
** Floating rate securities' yields vary with a designated market index or market rate, such as the coupon-equivalent of the U.S. Treasury Bill rate. These securities are shown at their current rate as of November 30, 2014.
† The cost for federal income tax purposes was $1,782,547,362. At November 30, 2014, net unrealized appreciation for all securities based on tax cost was $117,763,575. This consisted of aggregate gross unrealized appreciation for all securities in which there was an excess of value over tax cost of $118,210,360 and aggregate gross unrealized depreciation for all securities in which there was an excess of tax cost over value of $446,785.
(a) When-issued security.
144A: Security exempt from registration under Rule 144A of the Securities Act of 1933. These securities may be resold in transactions exempt from registration, normally to qualified institutional buyers.
AGC: Assured Guaranty Corp.
AGMC: Assured Guaranty Municipal Corp.
AMBAC: Ambac Financial Group, Inc.
ETM: Bonds bearing the description ETM (escrow to maturity) are collateralized usually by U.S. Treasury securities which are held in escrow and used to pay principal and interest on bonds so designated.
GTY: Guaranty Agreement
INS: Insured
LIQ: Liquidity Facility
LOC: Letter of Credit
NATL: National Public Finance Guarantee Corp.
Prerefunded: Bonds which are prerefunded are collateralized usually by U.S. Treasury securities which are held in escrow and used to pay principal and interest on tax-exempt issues and to retire the bonds in full at the earliest refunding date.
SPA: Standby Bond Purchase Agreement
Fair Value Measurements
Various inputs are used in determining the value of the Fund's investments. These inputs are summarized in three broad levels. Level 1 includes quoted prices in active markets for identical securities. Level 2 includes other significant observable inputs (including quoted prices for similar securities, interest rates, prepayment speeds and credit risk). Level 3 includes significant unobservable inputs (including the Fund's own assumptions in determining the fair value of investments). The level assigned to the securities valuations may not be an indication of the risk or liquidity associated with investing in those securities.
The following is a summary of the inputs used as of November 30, 2014 in valuing the Fund's investments. For information on the Fund's policy regarding the valuation of investments, please refer to the Security Valuation section of Note A in the accompanying Notes to Financial Statements.
|
Assets
|
Level 1
|
Level 2
|
Level 3
|
Total
|
||||||||||||
|
Municipal Investments (b)
|
$ | — | $ | 1,900,310,937 | $ | — | $ | 1,900,310,937 | ||||||||
|
Total
|
$ | — | $ | 1,900,310,937 | $ | — | $ | 1,900,310,937 | ||||||||
There have been no transfers between fair value measurement levels during the period ended November 30, 2014.
(b) See Investment Portfolio for additional detailed categorizations.
The accompanying notes are an integral part of the financial statements.
|
as of November 30, 2014 (Unaudited)
|
||||
|
Assets
|
||||
|
Investments in securities, at value (cost $1,783,270,398)
|
$ | 1,900,310,937 | ||
|
Receivable for investments sold
|
1,853,325 | |||
|
Receivable for Fund shares sold
|
3,060,841 | |||
|
Interest receivable
|
20,752,815 | |||
|
Other assets
|
88,948 | |||
|
Total assets
|
1,926,066,866 | |||
|
Liabilities
|
||||
|
Cash overdraft
|
814,153 | |||
|
Payable for investments purchased
|
12,521,682 | |||
|
Payable for investments purchased — when-issued securities
|
56,131,253 | |||
|
Payable for Fund shares redeemed
|
485,612 | |||
|
Distributions payable
|
880,085 | |||
|
Accrued management fee
|
420,260 | |||
|
Accrued Trustees' fees
|
11,681 | |||
|
Other accrued expenses and payables
|
1,067,538 | |||
|
Total liabilities
|
72,332,264 | |||
|
Net assets, at value
|
$ | 1,853,734,602 | ||
|
Net Assets Consist of
|
||||
|
Undistributed net investment income
|
787,127 | |||
|
Net unrealized appreciation (depreciation) on investments
|
117,040,539 | |||
|
Accumulated net realized gain (loss)
|
(17,922,215 | ) | ||
|
Paid-in capital
|
1,753,829,151 | |||
|
Net assets, at value
|
$ | 1,853,734,602 | ||
The accompanying notes are an integral part of the financial statements.
|
Statement of Assets and Liabilities as of November 30, 2014 (Unaudited) (continued)
|
||||
|
Net Asset Value
|
||||
|
Class A
Net Asset Value and redemption price per share ($319,928,971 ÷ 26,705,757 outstanding shares of beneficial interest, $.01 par value, unlimited number of shares authorized)
|
$ | 11.98 | ||
|
Maximum offering price per share (100 ÷ 97.25 of $11.98)
|
$ | 12.32 | ||
|
Class B
Net Asset Value, offering and redemption price (subject to contingent deferred sales charge) per share ($340,391 ÷ 28,393 outstanding shares of beneficial interest, $.01 par value, unlimited number of shares authorized)
|
$ | 11.99 | ||
|
Class C
Net Asset Value, offering and redemption price (subject to contingent deferred sales charge) per share ($72,837,702 ÷ 6,082,359 outstanding shares of beneficial interest, $.01 par value, unlimited number of shares authorized)
|
$ | 11.98 | ||
|
Class S
Net Asset Value, offering and redemption price per share ($673,439,553 ÷ 56,202,737 outstanding shares of beneficial interest, $.01 par value, unlimited number of shares authorized)
|
$ | 11.98 | ||
|
Institutional Class
Net Asset Value, offering and redemption price per share ($787,187,985 ÷ 65,690,797 outstanding shares of beneficial interest, $.01 par value, unlimited number of shares authorized)
|
$ | 11.98 | ||
The accompanying notes are an integral part of the financial statements.
|
for the six months ended November 30, 2014 (Unaudited)
|
||||
|
Investment Income
|
||||
|
Income:
Interest
|
$ | 27,318,599 | ||
|
Expenses:
Management fee
|
2,635,814 | |||
|
Administration fee
|
836,766 | |||
|
Services to shareholders
|
954,903 | |||
|
Distribution and service fees
|
774,384 | |||
|
Custodian fee
|
9,760 | |||
|
Professional fees
|
58,086 | |||
|
Reports to shareholders
|
41,175 | |||
|
Registration fees
|
59,414 | |||
|
Trustees' fees and expenses
|
36,295 | |||
|
Other
|
50,081 | |||
|
Total expenses before expense reductions
|
5,456,678 | |||
|
Expense reductions
|
(240,167 | ) | ||
|
Total expenses after expense reductions
|
5,216,511 | |||
|
Net investment income
|
22,102,088 | |||
|
Realized and Unrealized Gain (Loss)
|
||||
|
Net realized gain (loss) from investments
|
130,575 | |||
|
Change in net unrealized appreciation (depreciation) on investments
|
5,424,868 | |||
|
Net gain (loss)
|
5,555,443 | |||
|
Net increase (decrease) in net assets resulting from operations
|
$ | 27,657,531 | ||
The accompanying notes are an integral part of the financial statements.
|
Increase (Decrease) in Net Assets
|
Six Months Ended November 30, 2014 (Unaudited)
|
Year Ended May 31, 2014
|
||||||
|
Operations:
Net investment income
|
$ | 22,102,088 | $ | 46,297,472 | ||||
|
Operations:
Net investment income
|
$ | 22,102,088 | $ | 46,297,472 | ||||
|
Net realized gain (loss)
|
130,575 | (15,643,821 | ) | |||||
|
Change in net unrealized appreciation (depreciation)
|
5,424,868 | (2,756,674 | ) | |||||
|
Net increase (decrease) in net assets resulting from operations
|
27,657,531 | 27,896,977 | ||||||
|
Distributions to shareholders from:
Net investment income:
Class A
|
(4,016,261 | ) | (9,750,401 | ) | ||||
|
Class B
|
(3,722 | ) | (14,092 | ) | ||||
|
Class C
|
(636,164 | ) | (1,591,483 | ) | ||||
|
Class S
|
(9,118,058 | ) | (19,545,974 | ) | ||||
|
Institutional Class
|
(8,248,508 | ) | (15,233,341 | ) | ||||
|
Total distributions
|
(22,022,713 | ) | (46,135,291 | ) | ||||
|
Fund share transactions:
Proceeds from shares sold
|
430,862,313 | 546,190,897 | ||||||
|
Reinvestment of distributions
|
18,659,042 | 36,884,798 | ||||||
|
Payments for shares redeemed
|
(209,717,319 | ) | (858,446,287 | ) | ||||
|
Net increase (decrease) in net assets from Fund share transactions
|
239,804,036 | (275,370,592 | ) | |||||
|
Increase (decrease) in net assets
|
245,438,854 | (293,608,906 | ) | |||||
|
Net assets at beginning of period
|
1,608,295,748 | 1,901,904,654 | ||||||
|
Net assets at end of period (including undistributed net investment income of $787,127 and $707,752, respectively)
|
$ | 1,853,734,602 | $ | 1,608,295,748 | ||||
The accompanying notes are an integral part of the financial statements.
|
Years Ended May 31,
|
||||||||||||||||||||||||
|
Class A
|
Six Months Ended 11/30/14 (Unaudited)
|
2014
|
2013
|
2012
|
2011
|
2010
|
||||||||||||||||||
|
Selected Per Share Data
|
||||||||||||||||||||||||
|
Net asset value, beginning of period
|
$ | 11.94 | $ | 11.99 | $ | 12.07 | $ | 11.40 | $ | 11.46 | $ | 11.15 | ||||||||||||
|
Income from investment operations:
Net investment income
|
.15 | .31 | .30 | .35 | .36 | .40 | ||||||||||||||||||
|
Net realized and unrealized gain (loss)
|
.04 | (.05 | ) | (.08 | ) | .67 | (.06 | ) | .32 | |||||||||||||||
|
Total from investment operations
|
.19 | .26 | .22 | 1.02 | .30 | .72 | ||||||||||||||||||
|
Less distributions from:
Net investment income
|
(.15 | ) | (.31 | ) | (.30 | ) | (.35 | ) | (.36 | ) | (.40 | ) | ||||||||||||
|
Net realized gains
|
— | — | — | — | — | (.01 | ) | |||||||||||||||||
|
Total distributions
|
(.15 | ) | (.31 | ) | (.30 | ) | (.35 | ) | (.36 | ) | (.41 | ) | ||||||||||||
|
Net asset value, end of period
|
$ | 11.98 | $ | 11.94 | $ | 11.99 | $ | 12.07 | $ | 11.40 | $ | 11.46 | ||||||||||||
|
Total Return (%)a
|
1.58 | b** | 2.25 | 1.80 | 9.08 | 2.71 | 6.58 | |||||||||||||||||
|
Ratios to Average Net Assets and Supplemental Data
|
||||||||||||||||||||||||
|
Net assets, end of period ($ millions)
|
320 | 335 | 466 | 426 | 349 | 296 | ||||||||||||||||||
|
Ratio of expenses before expense reductions (including interest expense) (%)
|
.79 | * | .78 | .78 | .78 | .76 | c | .79 | c | |||||||||||||||
|
Ratio of expenses after expense reductions (including interest expense) (%)
|
.79 | * | .78 | .78 | .78 | .76 | c | .79 | c | |||||||||||||||
|
Ratio of expenses after expense reductions (excluding interest expense) (%)
|
.79 | * | .78 | .78 | .78 | .76 | .77 | |||||||||||||||||
|
Ratio of net investment income (loss) (%)
|
2.48 | * | 2.66 | 2.45 | 2.99 | 3.21 | 3.51 | |||||||||||||||||
|
Portfolio turnover rate (%)
|
33 | ** | 67 | 35 | 48 | 50 | 59 | |||||||||||||||||
|
a Total return does not reflect the effect of any sales charges.
b Total return would have been lower had certain expenses not been reduced.
c Interest expense represents interest and fees on short-term floating rate notes issued in conjunction with inverse floating rate securities. Interest income from such transactions is included in income from investment operations.
* Annualized
** Not annualized
|
||||||||||||||||||||||||
|
Years Ended May 31,
|
||||||||||||||||||||||||
|
Class B
|
Six Months Ended 11/30/14 (Unaudited)
|
2014
|
2013
|
2012
|
2011
|
2010
|
||||||||||||||||||
|
Selected Per Share Data
|
||||||||||||||||||||||||
|
Net asset value, beginning of period
|
$ | 11.95 | $ | 12.00 | $ | 12.08 | $ | 11.41 | $ | 11.47 | $ | 11.16 | ||||||||||||
|
Income from investment operations:
Net investment income
|
.10 | .22 | .20 | .26 | .27 | .30 | ||||||||||||||||||
|
Net realized and unrealized gain (loss)
|
.04 | (.05 | ) | (.08 | ) | .67 | (.06 | ) | .32 | |||||||||||||||
|
Total from investment operations
|
.14 | .17 | .12 | .93 | .21 | .62 | ||||||||||||||||||
|
Less distributions from:
Net investment income
|
(.10 | ) | (.22 | ) | (.20 | ) | (.26 | ) | (.27 | ) | (.30 | ) | ||||||||||||
|
Net realized gains
|
— | — | — | — | — | (.01 | ) | |||||||||||||||||
|
Total distributions
|
(.10 | ) | (.22 | ) | (.20 | ) | (.26 | ) | (.27 | ) | (.31 | ) | ||||||||||||
|
Net asset value, end of period
|
$ | 11.99 | $ | 11.95 | $ | 12.00 | $ | 12.08 | $ | 11.41 | $ | 11.47 | ||||||||||||
|
Total Return (%)a
|
1.19 | b** | 1.46 | b | 1.00 | 8.20 | 1.87 | 5.68 | ||||||||||||||||
|
Ratios to Average Net Assets and Supplemental Data
|
||||||||||||||||||||||||
|
Net assets, end of period ($ millions)
|
.3 | 1 | 1 | 1 | 2 | 2 | ||||||||||||||||||
|
Ratio of expenses before expense reductions (including interest expense) (%)
|
1.65 | * | 1.60 | 1.56 | 1.57 | 1.58 | c | 1.61 | c | |||||||||||||||
|
Ratio of expenses after expense reductions (including interest expense) (%)
|
1.54 | * | 1.56 | 1.56 | 1.57 | 1.58 | c | 1.61 | c | |||||||||||||||
|
Ratio of expenses after expense reductions (excluding interest expense) (%)
|
1.54 | * | 1.56 | 1.56 | 1.57 | 1.58 | 1.59 | |||||||||||||||||
|
Ratio of net investment income (loss) (%)
|
1.73 | * | 1.88 | 1.67 | 2.20 | 2.39 | 2.69 | |||||||||||||||||
|
Portfolio turnover rate (%)
|
33 | ** | 67 | 35 | 48 | 50 | 59 | |||||||||||||||||
|
a Total return does not reflect the effect of any sales charges.
b Total return would have been lower had certain expenses not been reduced.
c Interest expense represents interest and fees on short-term floating rate notes issued in conjunction with inverse floating rate securities. Interest income from such transactions is included in income from investment operations.
* Annualized
** Not annualized
|
||||||||||||||||||||||||
|
Years Ended May 31,
|
||||||||||||||||||||||||
|
Class C
|
Six Months Ended 11/30/14 (Unaudited)
|
2014
|
2013
|
2012
|
2011
|
2010
|
||||||||||||||||||
|
Selected Per Share Data
|
||||||||||||||||||||||||
|
Net asset value, beginning of period
|
$ | 11.94 | $ | 11.99 | $ | 12.07 | $ | 11.40 | $ | 11.46 | $ | 11.15 | ||||||||||||
|
Income from investment operations:
Net investment income
|
.10 | .22 | .21 | .26 | .27 | .31 | ||||||||||||||||||
|
Net realized and unrealized gain (loss)
|
.04 | (.05 | ) | (.08 | ) | .67 | (.06 | ) | .32 | |||||||||||||||
|
Total from investment operations
|
.14 | .17 | .13 | .93 | .21 | .63 | ||||||||||||||||||
|
Less distributions from:
Net investment income
|
(.10 | ) | (.22 | ) | (.21 | ) | (.26 | ) | (.27 | ) | (.31 | ) | ||||||||||||
|
Net realized gains
|
— | — | — | — | — | (.01 | ) | |||||||||||||||||
|
Total distributions
|
(.10 | ) | (.22 | ) | (.21 | ) | (.26 | ) | (.27 | ) | (.32 | ) | ||||||||||||
|
Net asset value, end of period
|
$ | 11.98 | $ | 11.94 | $ | 11.99 | $ | 12.07 | $ | 11.40 | $ | 11.46 | ||||||||||||
|
Total Return (%)a
|
1.20 | b** | 1.48 | b | 1.03 | 8.26 | 1.91 | 5.76 | ||||||||||||||||
|
Ratios to Average Net Assets and Supplemental Data
|
||||||||||||||||||||||||
|
Net assets, end of period ($ millions)
|
73 | 76 | 106 | 92 | 66 | 57 | ||||||||||||||||||
|
Ratio of expenses before expense reductions (including interest expense) (%)
|
1.56 | * | 1.55 | 1.54 | 1.53 | 1.55 | c | 1.57 | c | |||||||||||||||
|
Ratio of expenses after expense reductions (including interest expense) (%)
|
1.54 | * | 1.54 | 1.54 | 1.53 | 1.55 | c | 1.57 | c | |||||||||||||||
|
Ratio of expenses after expense reductions (excluding interest expense) (%)
|
1.54 | * | 1.54 | 1.54 | 1.53 | 1.55 | 1.55 | |||||||||||||||||
|
Ratio of net investment income (%)
|
1.73 | * | 1.90 | 1.69 | 2.23 | 2.42 | 2.73 | |||||||||||||||||
|
Portfolio turnover rate (%)
|
33 | ** | 67 | 35 | 48 | 50 | 59 | |||||||||||||||||
|
a Total return does not reflect the effect of any sales charges.
b Total return would have been lower had certain expenses not been reduced.
c Interest expense represents interest and fees on short-term floating rate notes issued in conjunction with inverse floating rate securities. Interest income from such transactions is included in income from investment operations.
* Annualized
** Not annualized
|
||||||||||||||||||||||||
|
Years Ended May 31,
|
||||||||||||||||||||||||
|
Class S
|
Six Months Ended 11/30/14 (Unaudited)
|
2014
|
2013
|
2012
|
2011
|
2010
|
||||||||||||||||||
|
Selected Per Share Data
|
||||||||||||||||||||||||
|
Net asset value, beginning of period
|
$ | 11.95 | $ | 11.99 | $ | 12.07 | $ | 11.41 | $ | 11.47 | $ | 11.15 | ||||||||||||
|
Income from investment operations:
Net investment income
|
.16 | .34 | .32 | .37 | .38 | .41 | ||||||||||||||||||
|
Net realized and unrealized gain (loss)
|
.03 | (.05 | ) | (.08 | ) | .66 | (.06 | ) | .33 | |||||||||||||||
|
Total from investment operations
|
.19 | .29 | .24 | 1.03 | .32 | .74 | ||||||||||||||||||
|
Less distributions from:
Net investment income
|
(.16 | ) | (.33 | ) | (.32 | ) | (.37 | ) | (.38 | ) | (.41 | ) | ||||||||||||
|
Net realized gains
|
— | — | — | — | — | (.01 | ) | |||||||||||||||||
|
Total distributions
|
(.16 | ) | (.33 | ) | (.32 | ) | (.37 | ) | (.38 | ) | (.42 | ) | ||||||||||||
|
Net asset value, end of period
|
$ | 11.98 | $ | 11.95 | $ | 11.99 | $ | 12.07 | $ | 11.41 | $ | 11.47 | ||||||||||||
|
Total Return (%)
|
1.62 | a** | 2.57 | a | 1.97 | a | 9.17 | a | 2.88 | a | 6.81 | |||||||||||||
|
Ratios to Average Net Assets and Supplemental Data
|
||||||||||||||||||||||||
|
Net assets, end of period ($ millions)
|
673 | 663 | 809 | 749 | 667 | 590 | ||||||||||||||||||
|
Ratio of expenses before expense reductions (including interest expense) (%)
|
.61 | * | .63 | .61 | .61 | .63 | b | .64 | b | |||||||||||||||
|
Ratio of expenses after expense reductions (including interest expense) (%)
|
.54 | * | .57 | .61 | .60 | .59 | b | .64 | b | |||||||||||||||
|
Ratio of expenses after expense reductions (excluding interest expense) (%)
|
.54 | * | .57 | .61 | .60 | .59 | .62 | |||||||||||||||||
|
Ratio of net investment income (%)
|
2.72 | * | 2.88 | 2.62 | 3.16 | 3.38 | 3.66 | |||||||||||||||||
|
Portfolio turnover rate (%)
|
33 | ** | 67 | 35 | 48 | 50 | 59 | |||||||||||||||||
|
a Total return would have been lower had certain expenses not been reduced.
b Interest expense represents interest and fees on short-term floating rate notes issued in conjunction with inverse floating rate securities. Interest income from such transactions is included in income from investment operations.
* Annualized
** Not annualized
|
||||||||||||||||||||||||
|
Years Ended May 31,
|
||||||||||||||||||||||||
|
Institutional Class
|
Six Months Ended 11/30/14 (Unaudited)
|
2014
|
2013
|
2012
|
2011
|
2010
|
||||||||||||||||||
|
Selected Per Share Data
|
||||||||||||||||||||||||
|
Net asset value, beginning of period
|
$ | 11.95 | $ | 12.00 | $ | 12.08 | $ | 11.41 | $ | 11.47 | $ | 11.15 | ||||||||||||
|
Income (loss) from investment operations:
Net investment income
|
.16 | .34 | .33 | .38 | .39 | .43 | ||||||||||||||||||
|
Net realized and unrealized gain (loss)
|
.03 | (.05 | ) | (.08 | ) | .67 | (.06 | ) | .33 | |||||||||||||||
|
Total from investment operations
|
.19 | .29 | .25 | 1.05 | .33 | .76 | ||||||||||||||||||
|
Less distributions from:
Net investment income
|
(.16 | ) | (.34 | ) | (.33 | ) | (.38 | ) | (.39 | ) | (.43 | ) | ||||||||||||
|
Net realized gains
|
— | — | — | — | — | (.01 | ) | |||||||||||||||||
|
Total distributions
|
(.16 | ) | (.34 | ) | (.33 | ) | (.38 | ) | (.39 | ) | (.44 | ) | ||||||||||||
|
Net asset value, end of period
|
$ | 11.98 | $ | 11.95 | $ | 12.00 | $ | 12.08 | $ | 11.41 | $ | 11.47 | ||||||||||||
|
Total Return (%)
|
1.64 | ** | 2.53 | 2.07 | 9.37 | 2.98 | 6.95 | |||||||||||||||||
|
Ratios to Average Net Assets and Supplemental Data
|
||||||||||||||||||||||||
|
Net assets, end of period ($ millions)
|
787 | 534 | 520 | 401 | 304 | 230 | ||||||||||||||||||
|
Ratio of expenses (including interest expense) (%)
|
.51 | * | .52 | .51 | .50 | .49 | a | .51 | a | |||||||||||||||
|
Ratio of expenses (excluding interest expense) (%)
|
.51 | * | .52 | .51 | .50 | .49 | .49 | |||||||||||||||||
|
Ratio of net investment income (%)
|
2.75 | * | 2.93 | 2.71 | 3.26 | 3.48 | 3.79 | |||||||||||||||||
|
Portfolio turnover rate (%)
|
33 | ** | 67 | 35 | 48 | 50 | 59 | |||||||||||||||||
|
a Interest expense represents interest and fees on short-term floating rate notes issued in conjunction with inverse floating rate securities. Interest income from such transactions is included in income from investment operations.
* Annualized
** Not annualized
|
||||||||||||||||||||||||
A. Organization and Significant Accounting Policies
Deutsche Intermediate Tax/AMT Free Fund (formerly DWS Intermediate Tax/AMT Free Fund) (the "Fund") is a diversified series of Deutsche Tax Free Trust (formerly DWS Tax Free Trust) (the "Trust"), which is registered under the Investment Company Act of 1940, as amended (the "1940 Act"), as an open-end management investment company organized as a Massachusetts business trust.
The Fund offers multiple classes of shares which provide investors with different purchase options. Class A shares are offered to investors subject to an initial sales charge. Class B shares of the Fund are closed to new purchases, except exchanges or the reinvestment of dividends or other distributions. Class B shares were offered to investors without an initial sales charge and are subject to higher ongoing expenses than Class A shares and a contingent deferred sales charge payable upon certain redemptions. Class B shares automatically convert to Class A shares six years after issuance. Class C shares are offered to investors without an initial sales charge but are subject to higher ongoing expenses than Class A shares and a contingent deferred sales charge payable upon certain redemptions within one year of purchase. Class C shares do not automatically convert into another class. Institutional Class shares are generally available only to qualified institutions, are not subject to initial or contingent deferred sales charges and generally have lower ongoing expenses than other classes. Class S shares are not subject to initial or contingent deferred sales charges and are only available to a limited group of investors.
Investment income, realized and unrealized gains and losses, and certain fund-level expenses and expense reductions, if any, are borne pro rata on the basis of relative net assets by the holders of all classes of shares, except that each class bears certain expenses unique to that class such as distribution and service fees, services to shareholders and certain other class-specific expenses. Differences in class-level expenses may result in payment of different per share dividends by class. All shares of the Fund have equal rights with respect to voting subject to class-specific arrangements.
The Fund's financial statements are prepared in accordance with accounting principles generally accepted in the United States of America which require the use of management estimates. Actual results could differ from those estimates. The policies described below are followed consistently by the Fund in the preparation of its financial statements.
Security Valuation. Investments are stated at value determined as of the close of regular trading on the New York Stock Exchange on each day the exchange is open for trading.
Various inputs are used in determining the value of the Fund's investments. These inputs are summarized in three broad levels. Level 1 includes quoted prices in active markets for identical securities. Level 2 includes other significant observable inputs (including quoted prices for similar securities, interest rates, prepayment speeds and credit risk). Level 3 includes significant unobservable inputs (including the Fund's own assumptions in determining the fair value of investments). The level assigned to the securities valuations may not be an indication of the risk or liquidity associated with investing in those securities.
Municipal debt securities are valued at prices supplied by independent pricing services approved by the Fund's Board. Such services may use various pricing techniques which take into account appropriate factors such as yield, quality, coupon rate, maturity, type of issue, trading characteristics, prepayment speeds and other data, as well as broker quotes. If the pricing services are unable to provide valuations, debt securities are valued at the average of the most recent reliable bid quotations or evaluated prices, as applicable, obtained from broker-dealers. These securities are generally categorized as Level 2.
Securities and other assets for which market quotations are not readily available or for which the above valuation procedures are deemed not to reflect fair value are valued in a manner that is intended to reflect their fair value as determined in accordance with procedures approved by the Board and are generally categorized as Level 3. In accordance with the Fund's valuation procedures, factors considered in determining value may include, but are not limited to, the type of the security; the size of the holding; the initial cost of the security; the existence of any contractual restrictions on the security's disposition; the price and extent of public trading in similar securities of the issuer or of comparable companies; quotations or evaluated prices from broker-dealers and/or pricing services; information obtained from the issuer, analysts, and/or the appropriate stock exchange (for exchange-traded securities); an analysis of the company's or issuer's financial statements; an evaluation of the forces that influence the issuer and the market(s) in which the security is purchased and sold; and with respect to debt securities, the maturity, coupon, creditworthiness, currency denomination and the movement of the market in which the security is normally traded. The value determined under these procedures may differ from published values for the same securities.
Disclosure about the classification of fair value measurements is included in a table following the Fund's Investment Portfolio.
When-Issued/Delayed Delivery Securities. The Fund may purchase securities with delivery or payment to occur at a later date beyond the normal settlement period. At the time the Fund enters into a commitment to purchase a security, the transaction is recorded and the value of the security is reflected in the net asset value. The price of such security and the date when the security will be delivered and paid for are fixed at the time the transaction is negotiated. The value of the security may vary with market fluctuations. No interest accrues to the Fund until payment takes place. At the time the Fund enters into this type of transaction, it is required to segregate cash or other liquid assets at least equal to the amount of the commitment.
Certain risks may arise upon entering into when-issued or delayed delivery securities from the potential inability of counterparties to meet the terms of their contracts or if the issuer does not issue the securities due to political, economic or other factors. Additionally, losses may arise due to changes in the value of the underlying securities.
Federal Income Taxes. The Fund's policy is to comply with the requirements of the Internal Revenue Code, as amended, which are applicable to regulated investment companies, and to distribute all of its taxable and tax-exempt income to its shareholders.
Under the Regulated Investment Company Modernization Act of 2010, net capital losses incurred post-enactment may be carried forward indefinitely, and their character is retained as short-term and/or long-term. Previously, net capital losses were carried forward for eight years and treated as short-term losses. As a transition rule, the Act requires that post-enactment net capital losses be used before pre-enactment net capital losses.
At May 31, 2014, the Fund had a net tax basis capital loss carryforward of approximately $18,719,000, including $1,320,000 of pre-enactment losses, which may be applied against any realized net taxable capital gains of each succeeding year until fully utilized or until May 31, 2018, the expiration date, whichever occurs first; and approximately $17,399,000 of post-enactment losses, which may be applied against realized net taxable capital gains indefinitely, including short-term losses ($10,914,000) and long-term losses ($6,485,000).
The Fund has reviewed the tax positions for the open tax years as of May 31, 2014 and has determined that no provision for income tax and/or uncertain tax provisions is required in the Fund's financial statements. The Fund's federal tax returns for the prior three fiscal years remain open subject to examination by the Internal Revenue Service.
Distribution of Income and Gains. Net investment income of the Fund is declared as a daily dividend and is distributed to shareholders monthly. Net realized gains from investment transactions, in excess of available capital loss carryforwards, would be taxable to the Fund if not distributed, and, therefore, will be distributed to shareholders at least annually. The Fund may also make additional distributions for tax purposes if necessary.
The timing and characterization of certain income and capital gain distributions are determined annually in accordance with federal tax regulations which may differ from accounting principles generally accepted in the United States of America. These differences primarily relate to certain securities sold at a loss and accretion of market discount on debt securities. As a result, net investment income (loss) and net realized gain (loss) on investment transactions for a reporting period may differ significantly from distributions during such period. Accordingly, the Fund may periodically make reclassifications among certain of its capital accounts without impacting the net asset value of the Fund.
The tax character of current year distributions will be determined at the end of the current fiscal year.
Expenses. Expenses of the Trust arising in connection with a specific fund are allocated to that fund. Other Trust expenses which cannot be directly attributed to a fund are apportioned among the funds in the Trust based upon the relative net assets or other appropriate measures.
Contingencies. In the normal course of business, the Fund may enter into contracts with service providers that contain general indemnification clauses. The Fund's maximum exposure under these arrangements is unknown as this would involve future claims that may be made against the Fund that have not yet been made. However, based on experience, the Fund expects the risk of loss to be remote.
Other. Investment transactions are accounted for on a trade date plus one basis for daily net asset value calculations. However, for financial reporting purposes, investment transactions are reported on trade date. Interest income is recorded on the accrual basis. Realized gains and losses from investment transactions are recorded on an identified cost basis. All premiums and discounts are amortized/accreted for financial reporting purposes.
B. Purchases and Sales of Securities
During the six months ended November 30, 2014, purchases and sales of investment securities (excluding short-term investments) aggregated $862,883,984 and $553,313,713, respectively.
C. Related Parties
Management Agreement. Under the Investment Management Agreement with Deutsche Investment Management Americas Inc. ("DIMA" or the "Advisor"), an indirect, wholly owned subsidiary of Deutsche Bank AG, the Advisor directs the investments of the Fund in accordance with its investment objectives, policies and restrictions. The Advisor determines the securities, instruments and other contracts relating to investments to be purchased, sold or entered into by the Fund.
The management fee payable under the Investment Management Agreement is at an annualized rate (exclusive of any applicable waivers/reimbursements) of 0.315% of the Fund's average daily net assets, computed and accrued daily and payable monthly.
For the period from June 1, 2014 through September 30, 2015, the Advisor has contractually agreed to waive its fees and/or reimburse certain operating expenses of the Fund to the extent necessary to maintain the operating expenses (excluding certain expenses such as extraordinary expenses, taxes, brokerage and interest) of each of class as follows:
|
Class A
|
.79%
|
|
Class B
|
1.54%
|
|
Class C
|
1.54%
|
|
Class S
|
.54%
|
|
Institutional Class
|
.54%
|
For the six months ended November 30, 2014, fees waived and/or expenses reimbursed for each class are as follows:
|
Class A
|
$ | 4,276 | ||
|
Class B
|
235 | |||
|
Class C
|
7,289 | |||
|
Class S
|
228,367 | |||
| $ | 240,167 |
Administration Fee. Pursuant to an Administrative Services Agreement, DIMA provides most administrative services to the Fund. For all services provided under the Administrative Services Agreement, the Fund pays the Advisor an annual fee ("Administration Fee") of 0.10% of the Fund's average daily net assets, computed and accrued daily and payable monthly. For the six months ended November 30, 2014, the Administration Fee was $836,766, of which $148,436 is unpaid.
Service Provider Fees. DeAWM Service Company ("DSC"), an affiliate of the Advisor, is the transfer agent, dividend-paying agent and shareholder service agent of the Fund. Pursuant to a sub-transfer agency agreement between DSC and DST Systems, Inc. ("DST"), DSC has delegated certain transfer agent, dividend-paying agent and shareholder service agent functions to DST. DSC compensates DST out of the shareholder servicing fee it receives from the Fund. For the six months ended November 30, 2014, the amounts charged to the Fund by DSC were as follows:
|
Services to Shareholders
|
Total Aggregated
|
Unpaid at November 30, 2014
|
||||||
|
Class A
|
$ | 6,405 | $ | 3,628 | ||||
|
Class B
|
104 | 61 | ||||||
|
Class C
|
2,074 | 1,543 | ||||||
|
Class S
|
13,481 | 18,047 | ||||||
|
Institutional Class
|
2,257 | 13,646 | ||||||
| $ | 24,321 | $ | 36,925 | |||||
Distribution and Service Fees. Under the Fund's Class B and Class C 12b-1 Plans, DeAWM Distributors, Inc. ("DDI"), an affiliate of the Advisor, receives a fee ("Distribution Fee") of 0.75% of average daily net assets of each of Class B and C shares. In accordance with the Fund's Underwriting and Distribution Services Agreement, DDI enters into related selling group agreements with various firms at various rates for sales of Class B and C shares. For the six months ended November 30, 2014, the Distribution Fee was as follows:
|
Distribution Fee
|
Total Aggregated
|
Unpaid at November 30, 2014
|
||||||
|
Class B
|
$ | 1,624 | $ | 218 | ||||
|
Class C
|
278,061 | 44,812 | ||||||
| $ | 279,685 | $ | 45,030 | |||||
In addition DDI provides information and administrative services for a fee ("Service Fee") to Class A, B and C shareholders at an annual rate of up to 0.25% of average daily net assets for each such class. DDI in turn has various agreements with financial services firms that provide these services and pays these fees based upon the assets of shareholder accounts the firms service. For the six months ended November 30, 2014, the Service Fee was as follows:
|
Service Fee
|
Total Aggregated
|
Unpaid at November 30, 2014
|
Annualized
Rate
|
|||||||||
|
Class A
|
$ | 401,523 | $ | 197,077 | .25 | % | ||||||
|
Class B
|
539 | 246 | .25 | % | ||||||||
|
Class C
|
92,637 | 45,816 | .25 | % | ||||||||
| $ | 494,699 | $ | 243,139 | |||||||||
Underwriting Agreement and Contingent Deferred Sales Charge. DDI is the principal underwriter for the Fund. Underwriting commissions paid in connection with the distribution of Class A shares for the six months ended November 30, 2014 aggregated $5,576.
In addition, DDI receives any contingent deferred sales charge ("CDSC") from Class B share redemptions occurring within six years of purchase and Class C share redemptions occurring within one year of purchase. There is no such charge upon redemption of any share appreciation or reinvested dividends. The CDSC is based on declining rates ranging from 4% to 1% for Class B and 1% for Class C, of the value of the shares redeemed. For the six months ended November 30, 2014, the CDSC for Class B and C shares aggregated $7 and $659, respectively. A deferred sales charge of up to 0.50% is assessed on certain redemptions of Class A shares. For the six months ended November 30, 2014, DDI received $2 for Class A shares.
Typesetting and Filing Service Fees. Under an agreement with DIMA, DIMA is compensated for providing typesetting and certain regulatory filing services to the Fund. For the six months ended November 30, 2014, the amount charged to the Fund by DIMA included in the Statement of Operations under "Reports to shareholders" aggregated $11,407, of which $9,300 is unpaid.
Trustees' Fees and Expenses. The Fund paid retainer fees to each Trustee not affiliated with the Advisor, plus specified amounts to the Board Chairperson and Vice Chairperson and to each committee Chairperson.
D. Line of Credit
The Fund and other affiliated funds (the "Participants") share in a $400 million revolving credit facility provided by a syndication of banks. The Fund may borrow for temporary or emergency purposes, including the meeting of redemption requests that otherwise might require the untimely disposition of securities. The Participants are charged an annual commitment fee which is allocated based on net assets, among each of the Participants. Interest is calculated at a rate per annum equal to the sum of the Federal Funds Rate plus 1.25 percent plus if LIBOR exceeds the Federal Funds Rate the amount of such excess. The Fund may borrow up to a maximum of 33 percent of its net assets under the agreement. The Fund had no outstanding loans at November 30, 2014.
E. Share Transactions
The following table summarizes share and dollar activity in the Fund:
|
Six Months Ended
November 30, 2014
|
Year Ended
May 31, 2014
|
|||||||||||||||
|
Shares
|
Dollars
|
Shares
|
Dollars
|
|||||||||||||
|
Shares sold
|
||||||||||||||||
|
Class A
|
1,791,498 | $ | 21,399,819 | 4,857,946 | $ | 56,508,669 | ||||||||||
|
Class B
|
44 | 531 | 4,350 | 50,202 | ||||||||||||
|
Class C
|
392,716 | 4,686,305 | 780,647 | 9,069,344 | ||||||||||||
|
Class S
|
6,951,372 | 83,067,066 | 14,626,755 | 170,056,279 | ||||||||||||
|
Institutional Class
|
26,921,448 | 321,708,592 | 26,691,507 | 310,506,403 | ||||||||||||
| $ | 430,862,313 | $ | 546,190,897 | |||||||||||||
|
Shares issued to shareholders in reinvestment of distributions
|
||||||||||||||||
|
Class A
|
293,863 | $ | 3,511,175 | 724,514 | $ | 8,408,607 | ||||||||||
|
Class B
|
260 | 3,114 | 986 | 11,454 | ||||||||||||
|
Class C
|
36,059 | 430,582 | 93,199 | 1,081,098 | ||||||||||||
|
Class S
|
566,500 | 6,770,393 | 1,130,819 | 13,143,148 | ||||||||||||
|
Institutional Class
|
664,502 | 7,943,778 | 1,224,805 | 14,240,491 | ||||||||||||
| $ | 18,659,042 | $ | 36,884,798 | |||||||||||||
|
Shares redeemed
|
||||||||||||||||
|
Class A
|
(3,433,563 | ) | $ | (40,985,704 | ) | (16,381,868 | ) | $ | (190,037,251 | ) | ||||||
|
Class B
|
(19,935 | ) | (238,185 | ) | (28,568 | ) | (333,954 | ) | ||||||||
|
Class C
|
(706,741 | ) | (8,431,284 | ) | (3,335,512 | ) | (38,597,894 | ) | ||||||||
|
Class S
|
(6,829,925 | ) | (81,684,906 | ) | (27,706,418 | ) | (320,400,623 | ) | ||||||||
|
Institutional Class
|
(6,563,784 | ) | (78,377,240 | ) | (26,622,255 | ) | (309,076,565 | ) | ||||||||
| $ | (209,717,319 | ) | $ | (858,446,287 | ) | |||||||||||
|
Net increase (decrease)
|
||||||||||||||||
|
Class A
|
(1,348,202 | ) | $ | (16,074,710 | ) | (10,799,408 | ) | $ | (125,119,975 | ) | ||||||
|
Class B
|
(19,631 | ) | (234,540 | ) | (23,232 | ) | (272,298 | ) | ||||||||
|
Class C
|
(277,966 | ) | (3,314,397 | ) | (2,461,666 | ) | (28,447,452 | ) | ||||||||
|
Class S
|
687,947 | 8,152,553 | (11,948,844 | ) | (137,201,196 | ) | ||||||||||
|
Institutional Class
|
21,022,166 | 251,275,130 | 1,294,057 | 15,670,329 | ||||||||||||
| $ | 239,804,036 | $ | (275,370,592 | ) | ||||||||||||
As an investor of the Fund, you incur two types of costs: ongoing expenses and transaction costs. Ongoing expenses include management fees, distribution and service (12b-1) fees and other Fund expenses. Examples of transaction costs include sales charges (loads), redemption fees and account maintenance fees, which are not shown in this section. The following tables are intended to help you understand your ongoing expenses (in dollars) of investing in the Fund and to help you compare these expenses with the ongoing expenses of investing in other mutual funds. In the most recent six-month period, Class A, B, C and S shares limited these expenses; had they not done so, expenses would have been higher. The example in the table is based on an investment of $1,000 invested at the beginning of the six-month period and held for the entire period (June 1, 2014 to November 30, 2014).
The tables illustrate your Fund's expenses in two ways:
—Actual Fund Return. This helps you estimate the actual dollar amount of ongoing expenses (but not transaction costs) paid on a $1,000 investment in the Fund using the Fund's actual return during the period. To estimate the expenses you paid over the period, simply divide your account value by $1,000 (for example, an $8,600 account value divided by $1,000 = 8.6), then multiply the result by the number in the "Expenses Paid per $1,000" line under the share class you hold.
—Hypothetical 5% Fund Return. This helps you to compare your Fund's ongoing expenses (but not transaction costs) with those of other mutual funds using the Fund's actual expense ratio and a hypothetical rate of return of 5% per year before expenses. Examples using a 5% hypothetical fund return may be found in the shareholder reports of other mutual funds. The hypothetical account values and expenses may not be used to estimate the actual ending account balance or expenses you paid for the period.
Please note that the expenses shown in these tables are meant to highlight your ongoing expenses only and do not reflect any transaction costs. The "Expenses Paid per $1,000" line of the tables is useful in comparing ongoing expenses only and will not help you determine the relative total expense of owning different funds. Subject to certain exceptions, an account maintenance fee of $20.00 assessed once per calendar year for Classes A, B, C and S shares may apply for accounts with balances less than $10,000. This fee is not included in these tables. If it was, the estimate of expenses paid for Classes A, B, C and S shares during the period would be higher, and account value during the period would be lower, by this amount.
|
Expenses and Value of a $1,000 Investment for the six months ended November 30, 2014 (Unaudited)
|
||||||||||||||||||||
|
Actual Fund Return
|
Class A
|
Class B
|
Class C
|
Class S
|
Institutional Class
|
|||||||||||||||
|
Beginning Account Value 6/1/14
|
$ | 1,000.00 | $ | 1,000.00 | $ | 1,000.00 | $ | 1,000.00 | $ | 1,000.00 | ||||||||||
|
Ending Account Value 11/30/14
|
$ | 1,015.80 | $ | 1,011.90 | $ | 1,012.00 | $ | 1,016.20 | $ | 1,016.40 | ||||||||||
|
Expenses Paid per $1,000*
|
$ | 3.99 | $ | 7.77 | $ | 7.77 | $ | 2.73 | $ | 2.58 | ||||||||||
|
Hypothetical 5% Fund Return
|
Class A
|
Class B
|
Class C
|
Class S
|
Institutional Class
|
|||||||||||||||
|
Beginning Account Value 6/1/14
|
$ | 1,000.00 | $ | 1,000.00 | $ | 1,000.00 | $ | 1,000.00 | $ | 1,000.00 | ||||||||||
|
Ending Account Value 11/30/14
|
$ | 1,021.11 | $ | 1,017.35 | $ | 1,017.35 | $ | 1,022.36 | $ | 1,022.51 | ||||||||||
|
Expenses Paid per $1,000*
|
$ | 4.00 | $ | 7.79 | $ | 7.79 | $ | 2.74 | $ | 2.59 | ||||||||||
* Expenses are equal to the Fund's annualized expense ratio for each share class, multiplied by the average account value over the period, multiplied by 183 (the number of days in the most recent six-month period), then divided by 365.
|
Annualized Expense Ratios
|
Class A
|
Class B
|
Class C
|
Class S
|
Institutional Class
|
|
Deutsche Intermediate Tax/AMT Free Fund
|
.79%
|
1.54%
|
1.54%
|
.54%
|
.51%
|
For more information, please refer to the Fund's prospectus.
For an analysis of the fees associated with an investment in the Fund or similar funds, please refer to http://apps.finra.org/fundanalyzer/1/fa.aspx.
The Board of Trustees approved the renewal of Deutsche Intermediate Tax/AMT Free Fund’s investment management agreement (the "Agreement") with Deutsche Investment Management Americas Inc. ("DIMA") in September 2014.
In terms of the process that the Board followed prior to approving the Agreement, shareholders should know that:
— In September 2014, all of the Fund’s Trustees were independent of DIMA and its affiliates.
— The Trustees met frequently during the past year to discuss fund matters and dedicated a substantial amount of time to contract review matters. Over the course of several months, the Board’s Contract Committee, in coordination with the Board’s Fixed Income and Asset Allocation Oversight Committee, reviewed comprehensive materials received from DIMA, independent third parties and independent counsel. These materials included an analysis of the Fund’s performance, fees and expenses, and profitability compiled by a fee consultant retained by the Fund’s Independent Trustees (the "Fee Consultant"). The Board also received extensive information throughout the year regarding performance of the Fund.
— The Independent Trustees regularly meet privately with counsel to discuss contract review and other matters. In addition, the Independent Trustees were advised by the Fee Consultant in the course of their review of the Fund’s contractual arrangements and considered a comprehensive report prepared by the Fee Consultant in connection with their deliberations.
— In connection with reviewing the Agreement, the Board also reviewed the terms of the Fund’s Rule 12b-1 plan, distribution agreement, administrative services agreement, transfer agency agreement and other material service agreements.
— Based on its evaluation of the information provided, the Contract Committee presented its findings and recommendations to the Board. The Board then reviewed the Contract Committee’s findings and recommendations.
In connection with the contract review process, the Contract Committee and the Board considered the factors discussed below, among others. The Board also considered that DIMA and its predecessors have managed the Fund since its inception, and the Board believes that a long-term relationship with a capable, conscientious advisor is in the best interests of the Fund. The Board considered, generally, that shareholders chose to invest or remain invested in the Fund knowing that DIMA managed the Fund, and that the Agreement was approved by the Fund's shareholders. DIMA is part of Deutsche Bank AG ("DB"), a major global banking institution that is engaged in a wide range of financial services. The Board believes that there are advantages to being part of a global asset management business that offers a wide range of investing expertise and resources, including hundreds of portfolio managers and analysts with research capabilities in many countries throughout the world.
As part of the contract review process, the Board carefully considered the fees and expenses of each Deutsche fund overseen by the Board in light of the fund’s performance. In many cases, this led to the negotiation and implementation of expense caps. As part of these negotiations, the Board indicated that it would consider relaxing these caps in future years following sustained improvements in performance, among other considerations.
In 2012, DB combined its Asset Management (of which DIMA was a part) and Wealth Management divisions into a new Asset and Wealth Management ("AWM") division. DB has advised the Independent Trustees that the U.S. asset management business is a critical and integral part of DB, and that DB will continue to invest in AWM a significant portion of the savings it has realized by combining its Asset and Wealth Management divisions, including ongoing enhancements to AWM’s investment capabilities. DB also has confirmed its commitment to maintaining strong legal and compliance groups within the AWM division.
While shareholders may focus primarily on fund performance and fees, the Fund’s Board considers these and many other factors, including the quality and integrity of DIMA’s personnel and such other issues as back-office operations, fund valuations, and compliance policies and procedures.
Nature, Quality and Extent of Services. The Board considered the terms of the Agreement, including the scope of advisory services provided under the Agreement. The Board noted that, under the Agreement, DIMA provides portfolio management services to the Fund and that, pursuant to a separate administrative services agreement, DIMA provides administrative services to the Fund. The Board considered the experience and skills of senior management and investment personnel, the resources made available to such personnel, the ability of DIMA to attract and retain high-quality personnel, and the organizational depth and stability of DIMA. The Board reviewed the Fund’s performance over short-term and long-term periods and compared those returns to various agreed-upon performance measures, including market index(es) and a peer universe compiled by the Fee Consultant using information supplied by Morningstar Direct ("Morningstar"), an independent fund data service. The Board also noted that it has put into place a process of identifying "Focus Funds" (e.g., funds performing poorly relative to a peer universe), and receives more frequent reporting and information from DIMA regarding such funds, along with DIMA’s plans to address underperformance. The Board believes this process is an effective manner of identifying and addressing underperforming funds. Based on the information provided, the Board noted that for the one-, three- and five-year periods ended December 31, 2013, the Fund’s performance (Class A shares) was in the 4th quartile, 3rd quartile and 3rd quartile, respectively, of the applicable Morningstar universe (the 1st quartile being the best performers and the 4th quartile being the worst performers). The Board also observed that the Fund has underperformed its benchmark in the one-, three- and five-year periods ended December 31, 2013. The Board noted the disappointing investment performance of the Fund in recent periods and continued to discuss with senior management of DIMA the factors contributing to such underperformance and actions being taken to improve performance. The Board observed that the Fund had experienced improved relative performance during the first seven months of 2014. The Board recognized the efforts by DIMA in recent years to enhance its investment platform and improve long-term performance across the Deutsche fund complex.
Fees and Expenses. The Board considered the Fund’s investment management fee schedule, operating expenses and total expense ratios, and comparative information provided by Lipper Inc. ("Lipper") and the Fee Consultant regarding investment management fee rates paid to other investment advisors by similar funds (1st quartile being the most favorable and 4th quartile being the least favorable). With respect to management fees paid to other investment advisors by similar funds, the Board noted that the contractual fee rates paid by the Fund, which include a 0.10% fee paid to DIMA under the Fund’s administrative services agreement, were lower than the median (2nd quartile) of the applicable Lipper peer group (based on Lipper data provided as of December 31, 2013). The Board noted that the Fund’s Class A shares total (net) operating expenses (excluding 12b-1 fees) were expected to be higher than the median (3rd quartile) of the applicable Lipper expense universe (based on Lipper data provided as of December 31, 2013, and analyzing Lipper expense universe Class A (net) expenses less any applicable 12b-1 fees) ("Lipper Universe Expenses"). The Board also reviewed data comparing each share class’s total (net) operating expenses to the applicable Lipper Universe Expenses. The Board also considered how the Fund’s total (net) operating expenses compared to the total (net) operating expenses of a more customized peer group selected by Lipper (based on such factors as asset size). The Board noted that the expense limitations agreed to by DIMA helped to ensure that the Fund’s total (net) operating expenses would remain competitive. The Board considered the Fund’s management fee rate as compared to fees charged by DIMA to comparable funds and considered differences between the Fund and the comparable funds. The information requested by the Board as part of its review of fees and expenses also included information about institutional accounts and funds offered primarily to European investors ("Deutsche Europe funds") managed by DIMA and its affiliates. The Board noted that DIMA indicated that it does not manage any institutional accounts or Deutsche Europe funds comparable to the Fund.
On the basis of the information provided, the Board concluded that management fees were reasonable and appropriate in light of the nature, quality and extent of services provided by DIMA.
Profitability. The Board reviewed detailed information regarding revenues received by DIMA under the Agreement. The Board considered the estimated costs and pre-tax profits realized by DIMA from advising the Deutsche U.S. mutual funds ("Deutsche Funds"), as well as estimates of the pre-tax profits attributable to managing the Fund in particular. The Board also received information regarding the estimated enterprise-wide profitability of DIMA and its affiliates with respect to all fund services in totality and by fund. The Board and the Fee Consultant reviewed DIMA’s methodology in allocating its costs to the management of the Fund. Based on the information provided, the Board concluded that the pre-tax profits realized by DIMA in connection with the management of the Fund were not unreasonable.
Economies of Scale. The Board considered whether there are economies of scale with respect to the management of the Fund and whether the Fund benefits from any economies of scale. The Board concluded that the Fund’s fee schedule represents an appropriate sharing between the Fund and DIMA of such economies of scale as may exist in the management of the Fund at current asset levels.
Other Benefits to DIMA and Its Affiliates. The Board also considered the character and amount of other incidental benefits received by DIMA and its affiliates, including any fees received by DIMA for administrative services provided to the Fund and any fees received by an affiliate of DIMA for distribution services. The Board also considered benefits to DIMA related to brokerage and soft-dollar allocations, including allocating brokerage to pay for research generated by parties other than the executing broker dealers, which pertain primarily to funds investing in equity securities, along with the incidental public relations benefits to DIMA related to Deutsche Funds advertising and cross-selling opportunities among DIMA products and services. The Board concluded that management fees were reasonable in light of these fallout benefits.
Compliance. The Board considered the significant attention and resources dedicated by DIMA to documenting and enhancing its compliance processes in recent years. The Board noted in particular (i) the experience and seniority of DIMA’s and the Fund’s chief compliance officer; (ii) the large number of DIMA compliance personnel; and (iii) the substantial commitment of resources by DIMA and its affiliates to compliance matters.
Based on all of the information considered and the conclusions reached, the Board unanimously determined that the continuation of the Agreement is in the best interests of the Fund. In making this determination, the Board did not give particular weight to any single factor identified above. The Board considered these factors over the course of numerous meetings, certain of which were in executive session with only the Independent Trustees and counsel present. It is possible that individual Trustees may have weighed these factors differently in reaching their individual decisions to approve the continuation of the Agreement.
|
For More Information
|
The automated telephone system allows you to access personalized account information and obtain information on other Deutsche funds using either your voice or your telephone keypad. Certain account types within Classes A, B, C and S also have the ability to purchase, exchange or redeem shares using this system.
For more information, contact your financial advisor. You may also access our automated telephone system or speak with a Shareholder Service representative by calling:
(800) 728-3337
|
|
|
Web Site
|
deutschefunds.com
View your account transactions and balances, trade shares, monitor your asset allocation, subscribe to fund and account updates by e-mail, and change your address, 24 hours a day.
Obtain prospectuses and applications, blank forms, interactive worksheets, news about Deutsche funds, retirement planning information, and more.
|
|
|
Written Correspondence
|
Deutsche Asset & Wealth Management
PO Box 219151
Kansas City, MO 64121-9151
|
|
|
Proxy Voting
|
The fund's policies and procedures for voting proxies for portfolio securities and information about how the fund voted proxies related to its portfolio securities during the 12-month period ended June 30 are available on our Web site — deutschefunds.com (click on "proxy voting"at the bottom of the page) — or on the SEC's Web site — sec.gov. To obtain a written copy of the fund's policies and procedures without charge, upon request, call us toll free at (800) 728-3337.
|
|
|
Portfolio Holdings
|
Following the fund's fiscal first and third quarter-end, a complete portfolio holdings listing is filed with the SEC on Form N-Q. This form will be available on the SEC's Web site at sec.gov, and it also may be reviewed and copied at the SEC's Public Reference Room in Washington, D.C. Information on the operation of the SEC's Public Reference Room may be obtained by calling (800) SEC-0330. The fund's portfolio holdings are also posted on deutschefunds.com from time to time. Please see the fund's current prospectus for more information.
|
|
|
Principal Underwriter
|
If you have questions, comments or complaints, contact:
DeAWM Distributors, Inc.
222 South Riverside Plaza
Chicago, IL 60606-5808
(800) 621-1148
|
|
|
Investment Management
|
Deutsche Investment Management Americas Inc. ("DIMA" or the "Advisor"), which is part of Deutsche Asset & Wealth Management, is the investment advisor for the fund. DIMA and its predecessors have more than 80 years of experience managing mutual funds and DIMA provides a full range of investment advisory services to both institutional and retail clients.
DIMA is an indirect, wholly owned subsidiary of Deutsche Bank AG. Deutsche Bank AG is a major global banking institution engaged in a wide variety of financial services, including investment management, retail, private and commercial banking, investment banking and insurance.
Deutsche Asset & Wealth Management is the retail brand name in the U.S. for the wealth management and asset management activities of Deutsche Bank AG and DIMA. Deutsche Asset & Wealth Management is committed to delivering the investing expertise, insight and resources of this global investment platform to American investors.
|
|
|
Class A
|
Class B
|
Class C
|
Class S
|
Institutional Class
|
||
|
Nasdaq Symbol
|
SZMAX
|
SZMBX
|
SZMCX
|
SCMTX
|
SZMIX
|
|
|
CUSIP Number
|
25159H 108
|
25159H 207
|
25159H 306
|
25159H 405
|
25159H 504
|
|
|
Fund Number
|
445
|
645
|
745
|
2045
|
1445
|
|
FACTS
|
What Does Deutsche Asset & Wealth Management Do With Your Personal Information?
|
||||
|
Why?
|
Financial companies choose how they share your personal information. Federal law gives consumers the right to limit some but not all sharing. Federal law also requires us to tell you how we collect, share and protect your personal information. Please read this notice carefully to understand what we do.
|
||||
|
What?
|
The types of personal information we collect and share can include:
— Social Security number
— Account balances
— Purchase and transaction history
— Bank account information
— Contact information such as mailing address, e-mail address and telephone number
|
||||
|
How?
|
All financial companies need to share customers' personal information to run their everyday business. In the section below, we list the reasons financial companies can share their customers' personal information, the reasons Deutsche Asset & Wealth Management chooses to share and whether you can limit this sharing.
|
||||
|
Reasons we can share your personal information
|
Does Deutsche Asset & Wealth Management share?
|
Can you limit this sharing?
|
|||
|
For our everyday business purposes — such as to process your transactions, maintain your account(s), respond to court orders or legal investigations
|
Yes
|
No
|
|||
|
For our marketing purposes — to offer our products and services to you
|
Yes
|
No
|
|||
|
For joint marketing with other financial companies
|
No
|
We do not share
|
|||
|
For our affiliates' everyday business purposes — information about your transactions and experiences
|
No
|
We do not share
|
|||
|
For our affiliates' everyday business purposes — information about your creditworthiness
|
No
|
We do not share
|
|||
|
For non-affiliates to market to you
|
No
|
We do not share
|
|||
|
Questions?
|
Call (800) 728-3337 or e-mail us at service@db.com
|
||||
|
Who we are
|
||||
|
Who is providing this notice?
|
DeAWM Distributors, Inc.; Deutsche Investment Management Americas Inc.; DeAWM Trust Company; the Deutsche Funds
|
|||
|
What we do
|
||||
|
How does Deutsche Asset & Wealth Management protect my personal information?
|
To protect your personal information from unauthorized access and use, we use security measures that comply with federal law. These measures include computer safeguards and secured files and buildings.
|
|||
|
How does Deutsche Asset & Wealth Management collect my personal information?
|
We collect your personal information, for example. When you:
— open an account
— give us your contact information
— provide bank account information for ACH or wire transactions
— tell us where to send money
— seek advice about your investments
|
|||
|
Why can't I limit all sharing?
|
Federal law gives you the right to limit only
— sharing for affiliates' everyday business purposes — information about your creditworthiness
— affiliates from using your information to market to you
— sharing for non-affiliates to market to you
State laws and individual companies may give you additional rights to limit sharing.
|
|||
|
Definitions
|
||||
|
Affiliates
|
Companies related by common ownership or control. They can be financial or non-financial companies. Our affiliates include financial companies with the DWS or Deutsche Bank ("DB") name, such as DB AG Frankfurt and DB Alex Brown.
|
|||
|
Non-affiliates
|
Companies not related by common ownership or control. They can be financial and non-financial companies.
Non-affiliates we share with include account service providers, service quality monitoring services, mailing service providers and verification services to help in the fight against money laundering and fraud.
|
|||
|
Joint marketing
|
A formal agreement between non-affiliated financial companies that together market financial products or services to you. Deutsche Asset & Wealth Management does not jointly market.
|
|||
|
Rev. 08/2014
|
||||

|
ITEM 2.
|
CODE OF ETHICS
|
|
|
Not applicable.
|
||
|
ITEM 3.
|
AUDIT COMMITTEE FINANCIAL EXPERT
|
|
|
Not applicable
|
||
|
ITEM 4.
|
PRINCIPAL ACCOUNTANT FEES AND SERVICES
|
|
|
Not applicable
|
||
|
ITEM 5.
|
AUDIT COMMITTEE OF LISTED REGISTRANTS
|
|
|
Not applicable
|
||
|
ITEM 6.
|
SCHEDULE OF INVESTMENTS
|
|
|
Not applicable
|
||
|
ITEM 7.
|
DISCLOSURE OF PROXY VOTING POLICIES AND PROCEDURES FOR CLOSED-END MANAGEMENT INVESTMENT COMPANIES
|
|
|
Not applicable
|
||
|
ITEM 8.
|
PORTFOLIO MANAGERS OF CLOSED-END MANAGEMENT INVESTMENT COMPANIES
|
|
|
Not applicable
|
||
|
ITEM 9.
|
PURCHASES OF EQUITY SECURITIES BY CLOSED-END MANAGEMENT INVESTMENT COMPANY AND AFFILIATED PURCHASERS
|
|
|
Not applicable
|
||
|
ITEM 10.
|
SUBMISSION OF MATTERS TO A VOTE OF SECURITY HOLDERS
|
|
|
There were no material changes to the procedures by which shareholders may recommend nominees to the Fund’s Board. The primary function of the Nominating and Governance Committee is to identify and recommend individuals for membership on the Board and oversee the administration of the Board Governance Guidelines. Shareholders may recommend candidates for Board positions by forwarding their correspondence by U.S. mail or courier service to Kenneth C. Froewiss, Independent Chairman, Deutsche Mutual Funds, P.O. Box 390601, Cambridge, MA 02139.
|
||
|
ITEM 11.
|
CONTROLS AND PROCEDURES
|
|
|
(a)
|
The Chief Executive and Financial Officers concluded that the Registrant’s Disclosure Controls and Procedures are effective based on the evaluation of the Disclosure Controls and Procedures as of a date within 90 days of the filing date of this report.
|
|
|
(b)
|
There have been no changes in the registrant’s internal control over financial reporting that occurred during the second fiscal quarter of the period covered by this report that has materially affected, or is reasonably likely to materially affect, the registrant’s internal controls over financial reporting.
|
|
|
ITEM 12.
|
EXHIBITS
|
|
|
(a)(1)
|
Not applicable
|
|
|
(a)(2)
|
Certification pursuant to Rule 30a-2(a) under the Investment Company Act of 1940 (17 CFR 270.30a-2(a)) is filed and attached hereto as Exhibit 99.CERT.
|
|
|
(b)
|
Certification pursuant to Rule 30a-2(b) under the Investment Company Act of 1940 (17 CFR 270.30a-2(b)) is furnished and attached hereto as Exhibit 99.906CERT.
|
|
SIGNATURES
Pursuant to the requirements of the Securities Exchange Act of 1934 and the Investment Company Act of 1940, the registrant has duly caused this report to be signed on its behalf by the undersigned, thereunto duly authorized.
|
Registrant:
|
Deutsche Intermediate Tax/AMT Free Fund, a series of Deutsche Tax Free Trust
|
|
By:
|
/s/Brian E. Binder
Brian E. Binder
President
|
|
Date:
|
January 29, 2015
|
Pursuant to the requirements of the Securities Exchange Act of 1934 and the Investment Company Act of 1940, this report has been signed below by the following persons on behalf of the registrant and in the capacities and on the dates indicated.
|
By:
|
/s/Brian E. Binder
Brian E. Binder
President
|
|
Date:
|
January 29, 2015
|
|
By:
|
/s/Paul Schubert
Paul Schubert
Chief Financial Officer and Treasurer
|
|
Date:
|
January 29, 2015
|