UNITED STATES
SECURITIES AND EXCHANGE COMMISSION
WASHINGTON, D. C. 20549
FORM N-CSRS
Investment Company Act file number: 811-03632
DWS Tax Free Trust
(Exact Name of Registrant as Specified in Charter)
345 Park Avenue
New York, NY 10154-0004
(Address of Principal Executive Offices) (Zip Code)
Registrant’s Telephone Number, including Area Code: (212) 250-3220
Paul Schubert
60 Wall Street
New York, NY 10005
(Name and Address of Agent for Service)|
Date of fiscal year end:
|
5/31
|
|
Date of reporting period:
|
11/30/2011
|
|
ITEM 1.
|
REPORT TO STOCKHOLDERS
|
|
NOVEMBER 30, 2011
Semiannual Report
to Shareholders
|
|
DWS Intermediate Tax/AMT Free Fund
|
 |
Contents
|
4 Performance Summary
8 Information About Your Fund's Expenses
10 Portfolio Summary
12 Investment Portfolio
29 Statement of Assets and Liabilities
31 Statement of Operations
32 Statement of Changes in Net Assets
33 Financial Highlights
38 Notes to Financial Statements
47 Investment Management Agreement Approval
51 Summary of Management Fee Evaluation by Independent Fee Consultant
55 Account Management Resources
56 Privacy Statement
|
This report must be preceded or accompanied by a prospectus. To obtain a summary prospectus, if available, or prospectus for any of our funds, refer to the Account Management Resources information provided in the back of this booklet. We advise you to consider the fund's objectives, risks, charges and expenses carefully before investing. The summary prospectus and prospectus contain this and other important information about the fund. Please read the prospectus carefully before you invest.
Bond investments are subject to interest-rate and credit risks. When interest rates rise, bond prices generally fall. Credit risk refers to the ability of an issuer to make timely payments of principal and interest. Although the fund seeks income that is federally tax-free, a portion of the fund's distributions may be subject to federal, state and local taxes, including the alternative minimum tax. See the prospectus for details.
DWS Investments is part of Deutsche Bank's Asset Management division and, within the U.S., represents the retail asset management activities of Deutsche Bank AG, Deutsche Bank Trust Company Americas, Deutsche Investment Management Americas Inc. and DWS Trust Company.
NOT FDIC/NCUA INSURED NO BANK GUARANTEE MAY LOSE VALUE NOT A DEPOSIT NOT INSURED BY ANY FEDERAL GOVERNMENT AGENCY
|
Average Annual Total Returns as of 11/30/11
|
||||||
|
Unadjusted for Sales Charge
|
6-Month*
|
1-Year
|
3-Year
|
5-Year
|
10-Year
|
|
|
Class A
|
3.52%
|
5.57%
|
6.63%
|
4.46%
|
4.17%
|
|
|
Class B
|
3.02%
|
4.66%
|
5.72%
|
3.60%
|
3.34%
|
|
|
Class C
|
3.02%
|
4.66%
|
5.78%
|
3.67%
|
3.37%
|
|
|
Adjusted for the Maximum Sales Charge
|
||||||
|
Class A (max 2.75% load)
|
0.67%
|
2.67%
|
5.65%
|
3.88%
|
3.88%
|
|
|
Class B (max 4.00% CDSC)
|
-0.98%
|
1.66%
|
5.12%
|
3.43%
|
3.34%
|
|
|
Class C (max 1.00% CDSC)
|
2.02%
|
4.66%
|
5.78%
|
3.67%
|
3.37%
|
|
|
No Sales Charges
|
Life of Institutional Class*
|
|||||
|
Class S
|
3.52%
|
5.67%
|
6.77%
|
4.64%
|
4.38%
|
N/A
|
|
Institutional Class
|
3.57%
|
5.78%
|
6.88%
|
4.76%
|
N/A
|
4.31%
|
|
Barclays Capital 7-Year Municipal Bond Index+
|
3.88%
|
6.35%
|
7.41%
|
5.85%
|
5.33%
|
5.11%
|
* Total returns shown for periods less than one year are not annualized.
|
Average Annual Total Returns as of 9/30/11 (most recent calendar quarter end)
|
|||||
|
Unadjusted for Sales Charge
|
1-Year
|
3-Year
|
5-Year
|
10-Year
|
|
|
Class A
|
2.88%
|
6.81%
|
4.63%
|
4.12%
|
|
|
Class B
|
2.06%
|
5.93%
|
3.79%
|
3.30%
|
|
|
Class C
|
2.06%
|
6.02%
|
3.83%
|
3.33%
|
|
|
Adjusted for the Maximum Sales Charge
|
|||||
|
Class A (max 2.75% load)
|
0.05%
|
5.82%
|
4.04%
|
3.83%
|
|
|
Class B (max 4.00% CDSC)
|
-0.93%
|
5.33%
|
3.61%
|
3.30%
|
|
|
Class C (max 1.00% CDSC)
|
2.06%
|
6.02%
|
3.83%
|
3.33%
|
|
|
No Sales Charges
|
Life of Institutional Class*
|
||||
|
Class S
|
3.06%
|
7.02%
|
4.83%
|
4.34%
|
N/A
|
|
Institutional Class
|
3.16%
|
7.13%
|
4.94%
|
N/A
|
4.40%
|
|
Barclays Capital 7-Year Municipal Bond Index+
|
4.65%
|
7.83%
|
5.95%
|
5.25%
|
5.14%
|
* Institutional Class shares commenced operations on December 20, 2004. Index returns began on December 31, 2004.
Performance in the Average Annual Total Returns table(s) above and the Growth of an Assumed $10,000 Investment line graph that follows is historical and does not guarantee future results. Investment return and principal fluctuate, so your shares may be worth more or less when redeemed. Current performance may differ from performance data shown. Please visit www.dws-investments.com for the Fund's most recent month-end performance. Fund performance includes reinvestment of all distributions. Unadjusted returns do not reflect sales charges and would have been lower if they had.
The gross expense ratios of the Fund, as stated in the fee table of the prospectus dated October 1, 2011 are 0.76%, 1.58%, 1.55%, 0.63% and 0.49% for Class A, Class B, Class C, Class S and Institutional Class shares, respectively, and may differ from the expense ratios disclosed in the Financial Highlights tables in this report.
Index returns do not reflect any fees or expenses and it is not possible to invest directly into an index.
Performance figures do not reflect the deduction of taxes that a shareholder would pay on fund distributions or the redemption of fund shares.
A portion of the Fund's distributions may be subject to federal, state and local taxes.
|
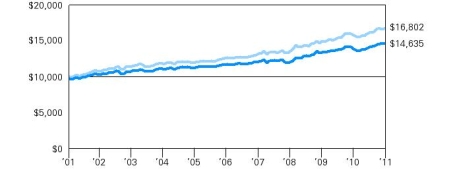
Growth of an Assumed $10,000 Investment (Adjusted for Maximum Sales Charge)
|
|
[] DWS Intermediate Tax/AMT Free Fund — Class A
[] Barclays Capital 7-Year Municipal Bond Index+
|
 |
|
Yearly periods ended November 30
|
The Fund's growth of an assumed $10,000 investment is adjusted for the maximum sales charge of 2.75%. This results in a net initial investment of $9,725.
The growth of $10,000 is cumulative.
Performance of other share classes will vary based on the sales charges and the fee structure of those classes.
+ The Barclays Capital 7-Year Municipal Bond Index is an unmanaged, total return subset of the Barclays Capital Municipal Bond Index. It includes maturities of six to eight years.
|
Net Asset Value and Distribution Information
|
||||||||||||||||||||
|
Class A
|
Class B
|
Class C
|
Class S
|
Institutional Class
|
||||||||||||||||
|
Net Asset Value:
11/30/11
|
$ | 11.62 | $ | 11.62 | $ | 11.61 | $ | 11.62 | $ | 11.62 | ||||||||||
|
5/31/11
|
$ | 11.40 | $ | 11.41 | $ | 11.40 | $ | 11.41 | $ | 11.41 | ||||||||||
|
Distribution Information:
Six Months as of 11/30/11:
Income Dividends
|
$ | .18 | $ | .13 | $ | .13 | $ | .19 | $ | .19 | ||||||||||
|
November Income Dividend
|
$ | .0292 | $ | .0216 | $ | .0222 | $ | .0307 | $ | .0314 | ||||||||||
|
SEC 30-day Yield++ as of 11/30/11
|
1.97 | % | 1.25 | % | 1.29 | % | 2.18 | % | 2.25 | % | ||||||||||
|
Tax Equivalent Yield++ as of 11/30/11
|
3.03 | % | 1.92 | % | 1.98 | % | 3.35 | % | 3.46 | % | ||||||||||
|
Current Annualized Distribution Rate++ as of 11/30/11
|
3.02 | % | 2.23 | % | 2.29 | % | 3.17 | % | 3.24 | % | ||||||||||
++ The SEC yield is net investment income per share earned over the month ended November 30, 2011, shown as an annualized percentage of the maximum offering price per share on the last day of the period. The SEC yield is computed in accordance with a standardized method prescribed by the Securities and Exchange Commission. Tax equivalent yield is based on the Fund's yield and a marginal federal income tax rate of 35%. Current annualized distribution rate is the latest monthly dividend shown as an annualized percentage of net asset value on November 30, 2011. Distribution rate simply measures the level of dividends and is not a complete measure of performance. Yields and distribution rates are historical, not guaranteed, and will fluctuate.
|
Morningstar Rankings — Municipal National Intermediate Funds Category as of 11/30/11
|
||||
|
Period
|
Rank
|
Number of Fund Classes Tracked
|
Percentile Ranking (%)
|
|
|
Class A
1-Year
|
117
|
of
|
246
|
47
|
|
3-Year
|
140
|
of
|
208
|
67
|
|
5-Year
|
60
|
of
|
185
|
32
|
|
10-Year
|
74
|
of
|
134
|
55
|
|
Class B
1-Year
|
199
|
of
|
246
|
81
|
|
3-Year
|
183
|
of
|
208
|
88
|
|
5-Year
|
142
|
of
|
185
|
76
|
|
10-Year
|
122
|
of
|
134
|
91
|
|
Class C
1-Year
|
198
|
of
|
246
|
80
|
|
3-Year
|
179
|
of
|
208
|
86
|
|
5-Year
|
141
|
of
|
185
|
76
|
|
10-Year
|
121
|
of
|
134
|
90
|
|
Class S
1-Year
|
106
|
of
|
246
|
43
|
|
3-Year
|
131
|
of
|
208
|
63
|
|
5-Year
|
38
|
of
|
185
|
20
|
|
10-Year
|
53
|
of
|
134
|
39
|
|
Institutional Class
1-Year
|
89
|
of
|
246
|
36
|
|
3-Year
|
127
|
of
|
208
|
61
|
|
5-Year
|
29
|
of
|
185
|
16
|
Source: Morningstar, Inc. Rankings are historical and do not guarantee future results. Rankings are based on total return unadjusted for sales charges with distributions reinvested. If sales charges had been included, rankings might have been less favorable.
As an investor of the Fund, you incur two types of costs: ongoing expenses and transaction costs. Ongoing expenses include management fees, distribution and service (12b-1) fees and other Fund expenses. Examples of transaction costs include sales charges (loads), redemption fees and account maintenance fees, which are not shown in this section. The following tables are intended to help you understand your ongoing expenses (in dollars) of investing in the Fund and to help you compare these expenses with the ongoing expenses of investing in other mutual funds. In the most recent six-month period, Class S shares limited these expenses; had it not done so, expenses would have been higher. The example in the table is based on an investment of $1,000 invested at the beginning of the six-month period and held for the entire period (June 1, 2011 to November 30, 2011).
The tables illustrate your Fund's expenses in two ways:
·Actual Fund Return. This helps you estimate the actual dollar amount of ongoing expenses (but not transaction costs) paid on a $1,000 investment in the Fund using the Fund's actual return during the period. To estimate the expenses you paid over the period, simply divide your account value by $1,000 (for example, an $8,600 account value divided by $1,000 = 8.6), then multiply the result by the number in the "Expenses Paid per $1,000" line under the share class you hold.
· Hypothetical 5% Fund Return. This helps you to compare your Fund's ongoing expenses (but not transaction costs) with those of other mutual funds using the Fund's actual expense ratio and a hypothetical rate of return of 5% per year before expenses. Examples using a 5% hypothetical fund return may be found in the shareholder reports of other mutual funds. The hypothetical account values and expenses may not be used to estimate the actual ending account balance or expenses you paid for the period.
Please note that the expenses shown in these tables are meant to highlight your ongoing expenses only and do not reflect any transaction costs. The "Expenses Paid per $1,000" line of the tables is useful in comparing ongoing expenses only and will not help you determine the relative total expense of owning different funds. An account maintenance fee of $6.25 per quarter for Class S shares may apply for certain accounts whose balances do not meet the applicable minimum initial investment. This fee is not included in these tables. If it was, the estimate of expenses paid for Class S shares during the period would be higher, and account value during the period would be lower, by this amount.
|
Expenses and Value of a $1,000 Investment for the six months ended November 30, 2011
|
||||||||||||||||||||
|
Actual Fund Return
|
Class A
|
Class B
|
Class C
|
Class S
|
Institutional Class
|
|||||||||||||||
|
Beginning Account Value 6/1/11
|
$ | 1,000.00 | $ | 1,000.00 | $ | 1,000.00 | $ | 1,000.00 | $ | 1,000.00 | ||||||||||
|
Ending Account Value 11/30/11
|
$ | 1,035.20 | $ | 1,030.20 | $ | 1,030.20 | $ | 1,035.20 | $ | 1,035.70 | ||||||||||
|
Expenses Paid per $1,000*
|
$ | 3.92 | $ | 7.92 | $ | 7.92 | $ | 3.05 | $ | 2.54 | ||||||||||
|
Hypothetical 5% Fund Return
|
Class A
|
Class B
|
Class C
|
Class S
|
Institutional Class
|
|||||||||||||||
|
Beginning Account Value 6/1/11
|
$ | 1,000.00 | $ | 1,000.00 | $ | 1,000.00 | $ | 1,000.00 | $ | 1,000.00 | ||||||||||
|
Ending Account Value 11/30/11
|
$ | 1,021.15 | $ | 1,017.20 | $ | 1,017.20 | $ | 1,022.00 | $ | 1,022.50 | ||||||||||
|
Expenses Paid per $1,000*
|
$ | 3.89 | $ | 7.87 | $ | 7.87 | $ | 3.03 | $ | 2.53 | ||||||||||
* Expenses are equal to the Fund's annualized expense ratio for each share class, multiplied by the average account value over the period, multiplied by the number of days in the most recent six-month period, then divided by 366.
|
Annualized Expense Ratios
|
Class A
|
Class B
|
Class C
|
Class S
|
Institutional Class
|
|||||||||||||||
|
DWS Intermediate Tax/AMT Free Fund
|
.77 | % | 1.56 | % | 1.56 | % | .60 | % | .50 | % | ||||||||||
For more information, please refer to the Fund's prospectus.
|
Asset Allocation (As a % of Investment Portfolio)
|
11/30/11
|
5/31/11
|
||||||
|
Revenue Bonds
|
60 | % | 63 | % | ||||
|
General Obligation Bonds
|
26 | % | 25 | % | ||||
|
Lease Obligations
|
7 | % | 7 | % | ||||
|
ETM/Prerefunded
|
7 | % | 5 | % | ||||
| 100 | % | 100 | % | |||||
|
Quality
|
11/30/11
|
5/31/11
|
||||||||
|
AAA
|
17 | % | 18 | % | ||||||
|
AA
|
49 | % | 49 | % | ||||||
| A | 27 | % | 26 | % | ||||||
|
BBB
|
7 | % | 7 | % | ||||||
| 100 | % | 100 | % | |||||||
|
Interest Rate Sensitivity
|
11/30/11
|
5/31/11
|
|
Effective Maturity
|
6.1 years
|
6.2 years
|
|
Effective Duration
|
5.4 years
|
5.7 years
|
Effective maturity is the weighted average of the maturity date of bonds held by the Fund taking into consideration any available maturity shortening features.
Effective duration is an approximate measure of the Fund's sensitivity to interest rate changes taking into consideration any maturity shortening features.
Asset allocation and interest rate sensitivity are subject to change.
The quality ratings represent the lower of Moody's Investors Service, Inc. ("Moody's") or Standard & Poor's Corporation ("S&P") credit ratings. The ratings of Moody's and S&P represent their opinions as to the quality of the securities they rate. Credit quality measures a bond issuer's ability to repay interest and principal in a timely manner. Ratings are relative and subjective and are not absolute standards of quality. Credit quality does not remove market risk and is subject to change.
|
Top Five State Allocations (As a % of Investment Portfolio)
|
11/30/11
|
5/31/11
|
|
Texas
|
20%
|
20%
|
|
California
|
16%
|
16%
|
|
Washington
|
6%
|
5%
|
|
Florida
|
5%
|
7%
|
|
New York
|
5%
|
4%
|
Top five state allocations are subject to change.
For more complete details about the Fund's investment portfolio, see page 12. A quarterly Fact Sheet is available upon request. Please see the Account Management Resources section for contact information.
Following the Fund's fiscal first and third quarter-end, a complete portfolio holdings listing is filed with the SEC on Form N-Q. The form will be available on the SEC's Web site at www.sec.gov, and it also may be reviewed and copied at the SEC's Public Reference Room in Washington, D.C. Information on the operation of the SEC's Public Reference Room may be obtained by calling (800) SEC-0330. The Fund's portfolio holdings are also posted on www.dws-investments.com from time to time. Please see the Fund's current prospectus for more information.
|
Principal Amount ($)
|
Value ($)
|
|||||||
|
Municipal Bonds and Notes 101.2%
|
||||||||
|
Alabama 0.2%
|
||||||||
|
Alabama, State Public School & College Authority Revenue, Series A, 5.0%, 5/1/2024
|
3,000,000 | 3,380,430 | ||||||
|
Arizona 2.4%
|
||||||||
|
Arizona, Health Facilities Authority Revenue, Banner Health, Series A, 5.0%, 1/1/2020
|
3,000,000 | 3,324,900 | ||||||
|
Arizona, State Transportation Board Excise Tax Revenue, Maricopa County Regional Area Road, 5.0%, 7/1/2025
|
3,000,000 | 3,373,980 | ||||||
|
Arizona, Water Infrastructure Finance Authority Revenue, Series A, 5.0%, 10/1/2024
|
4,000,000 | 4,538,600 | ||||||
|
Arizona, Water Infrastructure Finance Authority Revenue, Water Quality, Series A, 5.0%, 10/1/2030
|
3,750,000 | 4,151,625 | ||||||
|
Maricopa County, AZ, Industrial Development Authority, Hospital Facility Revenue, Samaritan Health Services, Series B, ETM, 6.0%, 12/1/2019, INS: NATL
|
3,025,000 | 3,570,861 | ||||||
|
Phoenix, AZ, Civic Improvement Corp., Airport Revenue, Series A, 5.0%, 7/1/2028
|
4,000,000 | 4,188,880 | ||||||
|
Phoenix, AZ, Civic Improvement Corp., Wastewater System Revenue, 5.5%, 7/1/2022
|
2,545,000 | 3,040,028 | ||||||
|
Phoenix, AZ, General Obligation, Series B, 5.0%, 7/1/2018
|
10,000,000 | 11,765,900 | ||||||
| 37,954,774 | ||||||||
|
California 15.8%
|
||||||||
|
California, ABAG Finance Authority for Non-Profit Corp., Multi-Family Housing Revenue, Amber Court Apartments, Series A, 0.11%*, 12/15/2032, LIQ: Fannie Mae
|
2,150,000 | 2,150,000 | ||||||
|
California, Bay Area Toll Authority, Toll Bridge Revenue, San Francisco Bay Area:
|
||||||||
|
Series F-1, 5.0%, 4/1/2028
|
10,000,000 | 10,764,800 | ||||||
|
Series F-1, 5.25%, 4/1/2029
|
2,500,000 | 2,717,550 | ||||||
|
California, Department of Water Resources Power Supply Revenue, Series A, Prerefunded 5/1/2012 @ 101, 5.5%, 5/1/2015, INS: AMBAC
|
10,000,000 | 10,321,200 | ||||||
|
California, Electric Revenue, Department of Water Resources & Power Supply, Series A, Prerefunded 5/1/2012 @ 101, 5.875%, 5/1/2016
|
7,000,000 | 7,235,830 | ||||||
|
California, General Obligation, Economic Recovery, Series A, 5.25%, 7/1/2014, INS: FGIC, NATL
|
10,000,000 | 11,129,900 | ||||||
|
California, Health Facilities Financing Authority Revenue, Catholic Healthcare West, Series A, 6.0%, 7/1/2029
|
4,000,000 | 4,367,040 | ||||||
|
California, Infrastructure & Economic Development Bank Revenue, Clean Water, State Revolving Fund, 5.0%, 10/1/2017
|
6,735,000 | 6,980,289 | ||||||
|
California, State Department of Water Resources, Power Supply Revenue, Series M, 5.0%, 5/1/2013
|
10,295,000 | 10,955,733 | ||||||
|
California, State Department Water Resources Center, Valley Project Revenue:
|
||||||||
|
Series Y, 5.25%, 12/1/2016, INS: FGIC, NATL
|
2,955,000 | 3,152,039 | ||||||
|
Series Y, Prerefunded 6/1/2013 @ 100, 5.25%, 12/1/2016, INS: FGIC
|
45,000 | 48,308 | ||||||
|
California, State Economic Recovery, Series A, 5.25%, 7/1/2021
|
5,000,000 | 5,839,350 | ||||||
|
California, State General Obligation, Various Purposes:
|
||||||||
|
5.25%, 10/1/2025
|
10,000,000 | 10,899,900 | ||||||
|
5.25%, 9/1/2027
|
10,000,000 | 10,912,000 | ||||||
|
5.75%, 4/1/2027
|
5,000,000 | 5,583,250 | ||||||
|
6.0%, 4/1/2018
|
1,700,000 | 2,046,375 | ||||||
|
6.0%, 3/1/2033
|
3,765,000 | 4,226,288 | ||||||
|
California, State Health Facilities Financing Authority Revenue, Catholic Healthcare West, Series A, 4.0%, 3/1/2014
|
700,000 | 734,881 | ||||||
|
California, State Kindergarten, Series A-8, 0.11%*, 5/1/2034, LOC: Citibank NA & California State Teacher's Retirement System
|
3,000,000 | 3,000,000 | ||||||
|
California, State Pollution Control Financing Authority, Solid Waste Disposal Revenue, Republic Services, Inc., Series B, 0.7%, Mandatory Put 2/1/2012 @ 100, 8/1/2024
|
2,500,000 | 2,500,175 | ||||||
|
California, State Public Works Board, Lease Revenue, Capital Projects, Series I-1, 6.25%, 11/1/2021
|
7,000,000 | 8,081,850 | ||||||
|
California, State Public Works Board, Lease Revenue, Department of General Services, Buildings 8 & 9, Series A, 6.125%, 4/1/2028
|
2,000,000 | 2,182,100 | ||||||
|
California, Statewide Communities Development Authority Revenue, Certificates of Participation, Cedars-Sinai Medical Center, 6.5%, 8/1/2012
|
1,570,000 | 1,609,376 | ||||||
|
California, Statewide Communities Development Authority Revenue, LA County Museum Art, Series B, 0.07%*, 12/1/2037, LOC: Union Bank NA
|
10,000,000 | 10,000,000 | ||||||
|
California, University Revenues, Limited Project, Series E, 5.0%, 5/15/2021
|
5,000,000 | 5,917,500 | ||||||
|
Fremont, CA, Certificates of Participation, Refinancing Capital, 0.12%*, 8/1/2038, LOC: U.S. Bank NA
|
800,000 | 800,000 | ||||||
|
Los Angeles, CA, Department of Airports Revenue, Los Angeles International Airport, Series A, 5.0%, 5/15/2031
|
10,000,000 | 10,611,900 | ||||||
|
Los Angeles, CA, General Obligation:
|
||||||||
|
Series A, 5.0%, 9/1/2019, INS: AGMC
|
6,340,000 | 7,134,782 | ||||||
|
Series A, 5.0%, 9/1/2020, INS: AGMC
|
5,915,000 | 6,624,327 | ||||||
|
Los Angeles, CA, School District General Obligation, Prerefunded 7/1/2013 @ 100, 5.5%, 7/1/2015, INS: NATL
|
4,000,000 | 4,325,200 | ||||||
|
Los Angeles, CA, Unified School District, Series A, Prerefunded 7/1/2013 @ 100, 5.0%, 7/1/2022, INS: AGMC
|
1,400,000 | 1,502,760 | ||||||
|
Oakland-Alameda County, CA, Coliseum Authority Lease Revenue, Coliseum Project, Series C-1, 0.11%*, 2/1/2025, LOC: Bank of New York Mellon & California State Teacher's Retirement System
|
3,000,000 | 3,000,000 | ||||||
|
Orange County, CA, Airport Revenue, Series A, 5.25%, 7/1/2025
|
3,000,000 | 3,318,630 | ||||||
|
Sacramento, CA, Municipal Utility District, Electric Revenue, Series U, 5.0%, 8/15/2023, INS: AGMC
|
7,000,000 | 7,799,190 | ||||||
|
San Diego County, CA, Regional Airport Authority Revenue:
|
||||||||
|
Series A, 5.0%, 7/1/2029
|
7,245,000 | 7,523,860 | ||||||
|
Series A, 5.0%, 7/1/2030
|
5,000,000 | 5,160,050 | ||||||
|
San Diego, CA, Public Facilities Financing Authority, Sewer Revenue, Series A, 5.125%, 5/15/2029
|
4,000,000 | 4,313,040 | ||||||
|
San Diego, CA, Public Facilities Financing Authority, Water Revenue:
|
||||||||
|
Series A, 5.25%, 8/1/2027
|
5,000,000 | 5,572,000 | ||||||
|
Series A, 5.25%, 8/1/2028
|
5,000,000 | 5,541,500 | ||||||
|
San Francisco, CA, City & County Airports Commission, International Airport Revenue, Series E, 5.25%, 5/1/2024
|
9,000,000 | 10,003,680 | ||||||
|
San Francisco, CA, City & County Airports Commission, International Airport Revenue, Governmental Purpose:
|
||||||||
|
Series C, 5.0%, 5/1/2025
|
2,000,000 | 2,166,240 | ||||||
|
Series C, 5.0%, 5/1/2026
|
2,850,000 | 3,036,190 | ||||||
|
San Joaquin Hills, CA, Transportation/Tolls Revenue, Transportation Corridor Agency, Toll Road Revenue, Series A, Zero Coupon, 1/15/2012, INS: NATL
|
825,000 | 820,050 | ||||||
|
San Jose, CA, Multi-Family Housing Revenue, Brookwood Terrace Family Apartments LP, Series B-2, 0.11%*, 1/1/2014, LOC: JPMorgan Chase Bank
|
1,000,000 | 1,000,000 | ||||||
|
South Orange County, CA, Public Finance Authority, Special Tax Revenue, Foothill Area, Series A, 5.25%, 8/15/2016, INS: FGIC, NATL
|
6,260,000 | 6,748,656 | ||||||
|
Stockton, CA, Public Financing Authority, Water Revenue, Delta Water Supply Project, Series A, 0.1%*, 10/1/2040, LOC: Union Bank
|
1,300,000 | 1,300,000 | ||||||
|
Turlock, CA, Public Financing Authority Revenue, 5.25%, 9/1/2015
|
20,000 | 20,036 | ||||||
|
Ventura County, CA, Certificates of Participation, Public Financing Authority III, 6.0%, 8/15/2026
|
3,370,000 | 3,799,978 | ||||||
| 245,477,803 | ||||||||
|
Colorado 1.1%
|
||||||||
|
Aurora, CO, Water Improvement Revenue, First Lien, Series A, 5.0%, 8/1/2021, INS: AMBAC
|
7,000,000 | 7,938,070 | ||||||
|
Colorado, Health Facilities Authority Revenue, Sisters Leavenworth, Series A, 5.25%, 1/1/2025
|
2,500,000 | 2,736,600 | ||||||
|
Colorado, Housing Finance Authority, Multi-Family Insured Mortgage, Series C-3, 5.7%, 10/1/2021
|
70,000 | 70,092 | ||||||
|
Colorado, Housing Finance Authority, Single Family Program, Series A-3, 6.5%, 5/1/2016
|
10,000 | 10,407 | ||||||
|
Colorado, State Building Excellent School Today, Certificate of Participation, Series G, 5.0%, 3/15/2025 (a)
|
3,285,000 | 3,642,014 | ||||||
|
Colorado, State Educational & Cultural Facilities Authority, National Jewish Federation Bond Program, Series A1, 0.12%*, 9/1/2033, LOC: Bank of America NA
|
1,400,000 | 1,400,000 | ||||||
|
Colorado, University Enterprise System Revenue, Series A, 5.5%, 6/1/2023
|
1,000,000 | 1,179,050 | ||||||
| 16,976,233 | ||||||||
|
Connecticut 0.2%
|
||||||||
|
Connecticut, State General Obligation, Series C, 5.0%, 6/1/2017, INS: AGMC
|
3,170,000 | 3,660,177 | ||||||
|
Delaware 0.4%
|
||||||||
|
Delaware, Transportation Authority Revenue, 5.0%, 9/1/2024
|
5,115,000 | 5,907,774 | ||||||
|
District of Columbia 0.9%
|
||||||||
|
District of Columbia, Bond Anticipation Notes, Pilot Arthur Revenue, 4.0%, 12/1/2012
|
3,705,000 | 3,827,154 | ||||||
|
District of Columbia, Income Tax Revenue, Series A, 5.0%, 12/1/2023
|
5,000,000 | 5,827,600 | ||||||
|
District of Columbia, Water & Sewer, Public Utility Revenue, 6.0%, 10/1/2013, INS: AGMC
|
3,630,000 | 3,981,384 | ||||||
| 13,636,138 | ||||||||
|
Florida 5.5%
|
||||||||
|
Broward County, FL, Water & Sewer Utility Revenue, Series A, 5.0%, 10/1/2024
|
2,745,000 | 3,060,373 | ||||||
|
Dade County, FL, Health Facilities Authority Hospital Revenue, Baptist Hospital of Miami Project, Series A, ETM, 5.75%, 5/1/2021, INS: NATL
|
3,730,000 | 4,474,284 | ||||||
|
Florida, Housing Finance Corp. Revenue, Homeowner Mortgage Special Program, Series A, 5.0%, 7/1/2028
|
2,630,000 | 2,835,140 | ||||||
|
Florida, Hurricane Catastrophe Fund Finance Corp. Revenue, Series A, 5.0%, 7/1/2012
|
7,200,000 | 7,388,280 | ||||||
|
Florida, State Department of Environmental Protection Preservation Revenue, Series C, 4.0%, 7/1/2012
|
6,740,000 | 6,887,539 | ||||||
|
Miami-Dade County, FL, Aviation Revenue:
|
||||||||
|
Series B, 5.0%, 10/1/2024
|
4,000,000 | 4,249,760 | ||||||
|
Series A, 5.75%, 10/1/2026
|
8,000,000 | 8,851,120 | ||||||
|
Miami-Dade County, FL, Aviation Revenue, Miami International Airport:
|
||||||||
|
Series A-1, 5.5%, 10/1/2025
|
3,000,000 | 3,307,350 | ||||||
|
Series A-1, 5.5%, 10/1/2026
|
4,400,000 | 4,837,096 | ||||||
|
Miami-Dade County, FL, School Board, Certificates of Participation, Series A, 5.0%, 5/1/2019, INS: FGIC, NATL
|
3,000,000 | 3,263,850 | ||||||
|
Miami-Dade County, FL, Water & Sewer Systems Revenue, 5.0%, 10/1/2027, INS: AGMC
|
10,000,000 | 11,071,000 | ||||||
|
Orlando & Orange County, FL, Expressway Authority Revenue:
|
||||||||
|
Series A, 5.0%, 7/1/2028
|
7,500,000 | 7,986,900 | ||||||
|
Series C, 5.0%, 7/1/2030
|
10,000,000 | 10,538,200 | ||||||
|
South Florida, Water Management District, Certificates of Participation, 5.0%, 10/1/2018, INS: AMBAC
|
4,000,000 | 4,451,360 | ||||||
|
South Miami, FL, Health Facilities Authority, Hospital Revenue, Baptist Health South Florida Group, 5.0%, 8/15/2021
|
2,500,000 | 2,744,725 | ||||||
|
St. John's County, FL, Industrial Development Authority Revenue, Series A, 5.5%, 3/1/2017, INS: NATL
|
185,000 | 185,355 | ||||||
| 86,132,332 | ||||||||
|
Georgia 4.1%
|
||||||||
|
Appling County, GA, Development Authority Pollution Control Revenue, Oglethorpe Power Hatch Project, Series A, 2.5%, Mandatory Put 3/1/2013 @ 100, 1/1/2038
|
6,000,000 | 6,072,000 | ||||||
|
Atlanta, GA, Airport Passenger Facility Charge Revenue, Series B, 5.0%, 1/1/2021
|
8,345,000 | 9,512,799 | ||||||
|
Atlanta, GA, Airport Revenue, Series C, 5.75%, 1/1/2023
|
2,460,000 | 2,896,970 | ||||||
|
Atlanta, GA, Water & Wastewater Revenue, Series B, 5.25%, 11/1/2027, INS: AGMC
|
10,000,000 | 11,353,400 | ||||||
|
Columbus, GA, Water & Sewer Revenue, 5.25%, 5/1/2015, INS: AGMC
|
1,000,000 | 1,062,220 | ||||||
|
Fulton Dekalb, GA, Hospital Authority, Hospital Revenue Certificates, 5.25%, 1/1/2016, INS: AGMC
|
8,500,000 | 9,105,795 | ||||||
|
Gainesville & Hall County, GA, Hospital Authority Revenue, Anticipation Certificates, Northeast Georgia Healthcare, Series B, 5.5%, 2/15/2029
|
8,900,000 | 9,162,639 | ||||||
|
Georgia, Main Street Natural Gas, Inc., Gas Project Revenue, Series A, 5.5%, 9/15/2024
|
1,705,000 | 1,699,664 | ||||||
|
Georgia, Municipal Electric Authority Power Revenue, Series 2005-Y, 6.4%, 1/1/2013, INS: AMBAC
|
2,160,000 | 2,217,067 | ||||||
|
Georgia, Municipal Electric Authority, Comb Cycle Project, Series A, 5.0%, 11/1/2027
|
1,000,000 | 1,078,650 | ||||||
|
Georgia, Municipal Electric Authority, General Resolution Projects, Series A, 5.25%, 1/1/2019
|
2,500,000 | 2,960,800 | ||||||
|
Georgia, Municipal Electric Authority, Project One, Series A, 5.0%, 1/1/2021
|
3,420,000 | 3,964,806 | ||||||
|
Georgia, State Road & Tollway Authority Revenue, Federal Highway Grant Anticipation Bonds, Series A, 5.0%, 6/1/2021
|
2,500,000 | 2,912,875 | ||||||
| 63,999,685 | ||||||||
|
Guam 0.1%
|
||||||||
|
Guam, Government Limited Obligation Revenue, Section 30, Series A, 5.375%, 12/1/2024
|
1,000,000 | 1,027,400 | ||||||
|
Hawaii 1.7%
|
||||||||
|
Hawaii, State Airports Systems Revenue:
|
||||||||
|
Series A, 5.25%, 7/1/2027
|
2,335,000 | 2,530,253 | ||||||
|
Series A, 5.25%, 7/1/2028
|
5,010,000 | 5,387,603 | ||||||
|
Series A, 5.25%, 7/1/2029
|
3,155,000 | 3,367,016 | ||||||
|
Hawaii, State General Obligation:
|
||||||||
|
Series EC, 5.0%, 12/1/2013 (a)
|
4,455,000 | 4,857,955 | ||||||
|
Series DK, 5.0%, 5/1/2021
|
9,000,000 | 10,455,210 | ||||||
| 26,598,037 | ||||||||
|
Illinois 4.3%
|
||||||||
|
Chicago, IL, Core City General Obligation, Capital Appreciation Project, Series A, 5.3%, 1/1/2016, INS: NATL
|
1,100,000 | 1,235,058 | ||||||
|
Chicago, IL, Higher Education Revenue, City Colleges, Zero Coupon, 1/1/2014, INS: FGIC, NATL
|
11,570,000 | 11,054,903 | ||||||
|
Chicago, IL, O'Hare International Airport Revenue, Series C, 5.25%, 1/1/2030, INS: AGC
|
10,000,000 | 10,590,200 | ||||||
|
Du Page County, IL, Special Services Area No. 11, 6.75%, 1/1/2014
|
320,000 | 333,981 | ||||||
|
Du Page County, IL, Special Services Area No. 26, Bruce Lake Subdivision, General Obligation:
|
||||||||
|
5.0%, 1/1/2013
|
65,000 | 65,084 | ||||||
|
5.15%, 1/1/2014
|
65,000 | 65,075 | ||||||
|
5.25%, 1/1/2016
|
150,000 | 150,094 | ||||||
|
5.5%, 1/1/2012
|
35,000 | 35,076 | ||||||
|
5.5%, 1/1/2019
|
255,000 | 255,041 | ||||||
|
5.75%, 1/1/2022
|
300,000 | 298,623 | ||||||
|
Illinois, Municipal Electric Agency Power Supply, Series A, 5.25%, 2/1/2018, INS: FGIC, NATL
|
2,000,000 | 2,273,620 | ||||||
|
Illinois, Railsplitter Tobacco Settlement Authority Revenue, 5.0%, 6/1/2019
|
3,500,000 | 3,808,875 | ||||||
|
Illinois, Regional Transportation Authority, Series A, 5.5%, 7/1/2024, INS: FGIC, NATL
|
5,000,000 | 5,915,500 | ||||||
|
Illinois, State General Obligation, 5.0%, 1/1/2024
|
5,000,000 | 5,200,350 | ||||||
|
Illinois, State Toll Highway Authority Revenue, Series A-1, 5.25%, 1/1/2030
|
5,000,000 | 5,330,150 | ||||||
|
Illinois, Transportation/Tolls Revenue, State Toll Highway Authority, Series A, 5.5%, 1/1/2013, INS: AGMC
|
2,200,000 | 2,302,124 | ||||||
|
Illinois, Will, Grundy Etc. Counties, Community College District Number 525, Joliet Jr. College, 6.25%, 6/1/2021
|
1,000,000 | 1,192,270 | ||||||
|
Rockford-Concord Commons, IL, Housing Facility, Concord Commons Project, Series A, 6.15%, 11/1/2022
|
1,110,000 | 1,111,709 | ||||||
|
Rosemont, IL, Core City General Obligation:
|
||||||||
|
Series A, Zero Coupon, 12/1/2013, INS: FGIC, NATL
|
3,865,000 | 3,722,188 | ||||||
|
Series A, Zero Coupon, 12/1/2014, INS: FGIC, NATL
|
4,000,000 | 3,746,320 | ||||||
|
University of Illinois, Higher Education Revenue, Auxiliary Facilities System:
|
||||||||
|
Series A, 5.5%, 4/1/2015, INS: AMBAC
|
3,860,000 | 4,350,838 | ||||||
|
Series A, 5.5%, 4/1/2016, INS: AMBAC
|
3,580,000 | 4,125,664 | ||||||
| 67,162,743 | ||||||||
|
Indiana 2.2%
|
||||||||
|
Indiana, Finance Authority, Water Utility Revenue, Citizens Energy, 3.0%, 10/1/2014
|
1,800,000 | 1,860,948 | ||||||
|
Indiana, State Finance Authority Revenue, State Revolving Fund Program, Series B, 5.0%, 2/1/2029
|
2,240,000 | 2,523,450 | ||||||
|
Indiana, State Finance Authority, Economic Development Revenue, Republic Services, Inc. Project, Series B, 0.8%, Mandatory Put 12/1/2012 @ 100, 5/1/2028
|
2,500,000 | 2,500,000 | ||||||
|
Indiana, Transportation Finance Authority Highway Revenue, Series A, 5.5%, 12/1/2022
|
10,000,000 | 12,255,500 | ||||||
|
Indianapolis, IN, City Core General Obligation, Local Improvements, Series B, 6.0%, 1/10/2013
|
1,305,000 | 1,338,956 | ||||||
|
Indianapolis, IN, Local Public Improvement Bond Bank, Series K, 5.0%, 6/1/2026
|
5,355,000 | 5,562,292 | ||||||
|
Indianapolis, IN, State Agency Revenue Lease, Local Improvements, Series D, 6.75%, 2/1/2014
|
5,340,000 | 5,626,758 | ||||||
|
Jasper County, IN, Pollution Control Revenue, Northern Indiana Public Service, Series C, 5.85%, 4/1/2019, INS: NATL
|
2,000,000 | 2,308,100 | ||||||
| 33,976,004 | ||||||||
|
Iowa 0.7%
|
||||||||
|
Iowa, Finance Authority, Health Facilities Revenue, Iowa Health System, 5.25%, 2/15/2029, INS: AGC
|
10,000,000 | 10,510,100 | ||||||
|
Kansas 1.3%
|
||||||||
|
Johnson County, KS, School District General Obligation, Unified School District No. 231, Series A, 5.25%, 10/1/2014, INS: AGMC
|
2,220,000 | 2,491,795 | ||||||
|
Kansas, State Department of Transportation Highway Revenue, Series B-3, 0.09%*, 9/1/2019, SPA: Barclays Bank PLC
|
3,800,000 | 3,800,000 | ||||||
|
Kansas, State Development Finance Authority Hospital Revenue, Adventist Health, 5.5%, 11/15/2022
|
4,470,000 | 5,132,722 | ||||||
|
Kansas, State Development Finance Authority Revenue, Sisters Leavenworth, Series A, 5.25%, 1/1/2025
|
7,500,000 | 8,155,500 | ||||||
| 19,580,017 | ||||||||
|
Kentucky 0.1%
|
||||||||
|
Kentucky, Asset/Liability Commission Agency Revenue, Federal Highway Trust, First Series, 5.25%, 9/1/2019, INS: NATL
|
1,000,000 | 1,214,520 | ||||||
|
Louisiana 0.6%
|
||||||||
|
Louisiana, Local Government Environmental Facilities & Community Development Authority, LCTCS Facilities Corp. Project, Series B, 5.0%, 10/1/2027, INS: AGC
|
1,365,000 | 1,443,269 | ||||||
|
Louisiana, Regional Transit Authority, Sales Tax Revenue, 5.0%, 12/1/2025, INS: AGMC
|
1,550,000 | 1,702,474 | ||||||
|
Louisiana, Sales & Special Tax Revenue, Regional Transportation Authority, Series A, 144A, 7.95%, 12/1/2013, INS: FGIC, NATL
|
2,815,000 | 3,112,067 | ||||||
|
Louisiana, State Offshore Terminal Authority, Deepwater Port Revenue, Loop LLC Project, Series B-1, 1.875%, Mandatory Put 10/1/2013 @ 100, 10/1/2040
|
3,250,000 | 3,283,182 | ||||||
| 9,540,992 | ||||||||
|
Maine 0.5%
|
||||||||
|
Maine, Health & Higher Educational Facilities Authority Revenue, Series A, 5.25%, 7/1/2031
|
8,040,000 | 8,369,318 | ||||||
|
Maryland 0.8%
|
||||||||
|
Maryland, General Obligation, State & Local Facilities Loan, Series 2, 5.0%, 8/1/2019
|
5,000,000 | 5,876,250 | ||||||
|
Maryland, State & Local Facilities Loan, Series 2, 5.0%, 8/1/2013
|
1,125,000 | 1,211,760 | ||||||
|
Montgomery County, MD, Anticipation Notes, Series A, 0.1%*, 6/1/2026, SPA: Wells Fargo Bank NA
|
5,000,000 | 5,000,000 | ||||||
| 12,088,010 | ||||||||
|
Massachusetts 3.7%
|
||||||||
|
Boston, MA, Deutsches Altenheim, Inc., Series A, 5.95%, 10/1/2018
|
310,000 | 317,009 | ||||||
|
Holyoke, MA, Gas & Electric Department Revenue, Series A, 5.375%, 12/1/2016, INS: NATL
|
1,260,000 | 1,296,779 | ||||||
|
Massachusetts, Development Finance Agency, Human Services Provider, Seven Hills Foundation & Affiliates, 4.85%, 9/1/2013, INS: Radian
|
130,000 | 130,339 | ||||||
|
Massachusetts, Metropolitan Boston Transit Parking Corp., Systemwide Parking Revenue, Senior Lien, 5.0%, 7/1/2028
|
3,760,000 | 4,061,477 | ||||||
|
Massachusetts, Municipal Wholesale Electric Co., Power Supply Systems Revenue, Nuclear Project No. 4, Series A, 5.25%, 7/1/2014, INS: NATL
|
5,915,000 | 5,990,771 | ||||||
|
Massachusetts, State Development Finance Agency Revenue, Babson College, Series A, 0.1%*, 10/1/2032, LOC: Citizens Bank
|
1,850,000 | 1,850,000 | ||||||
|
Massachusetts, State Development Finance Agency Revenue, Harvard University, Series B-3, 5.0%, 1/1/2022
|
9,210,000 | 11,276,356 | ||||||
|
Massachusetts, State Development Finance Agency Revenue, YMCA of Greater Worcester, 0.11%*, 9/1/2041, LOC: TD Bank NA
|
1,500,000 | 1,500,000 | ||||||
|
Massachusetts, State Federal Highway, Grant Anticipation Notes, Series A, ETM, 5.25%, 12/15/2012
|
5,050,000 | 5,311,439 | ||||||
|
Massachusetts, State General Obligation, Series D, 5.5%, 11/1/2015, INS: NATL
|
1,000,000 | 1,169,630 | ||||||
|
Massachusetts, State Health & Educational Facilities Authority Revenue, Suffolk University, Series A, 6.0%, 7/1/2024
|
5,000,000 | 5,417,150 | ||||||
|
Massachusetts, State School Building Authority, Sales Tax Revenue, Series B, 5.0%, 10/15/2027
|
7,000,000 | 7,860,720 | ||||||
|
Massachusetts, State Water Resources Authority, Series C, 5.0%, 8/1/2029 (a)
|
9,755,000 | 10,781,714 | ||||||
| 56,963,384 | ||||||||
|
Michigan 2.2%
|
||||||||
|
Brighton, MI, School District General Obligation, Series II, Zero Coupon, 5/1/2016, INS: AMBAC
|
5,000,000 | 4,465,400 | ||||||
|
Detroit, MI, Sewer Disposal Revenue, Series C-1, 7.0%, 7/1/2027, INS: AGMC
|
10,000,000 | 11,735,000 | ||||||
|
Michigan, Finance Authority, Trinity Health Corp., Series A, 3.0%, 12/1/2012
|
290,000 | 296,815 | ||||||
|
Michigan, State Building Authority Revenue, Facilities Program, Series II-A, 5.0%, 10/15/2024
|
1,610,000 | 1,771,676 | ||||||
|
Michigan, State Hospital Finance Authority Revenue, Ascension Health Senior Credit Group, Series B, 5.0%, 11/15/2025
|
5,920,000 | 6,351,272 | ||||||
|
Michigan, State Trunk Line, 5.0%, 11/1/2024
|
3,000,000 | 3,336,660 | ||||||
|
Michigan, Water & Sewer Revenue, Municipal Bond Authority, Prerefunded 10/1/2012 @ 100, 5.375%, 10/1/2016
|
6,670,000 | 6,955,610 | ||||||
| 34,912,433 | ||||||||
|
Minnesota 1.0%
|
||||||||
|
Minnesota, State General Obligation, 5.0%, 6/1/2020
|
4,535,000 | 5,190,625 | ||||||
|
Minnesota, State Trunk Highway, Series B, 4.0%, 10/1/2013
|
6,000,000 | 6,395,280 | ||||||
|
Minnesota, Tobacco Securitization Authority, Tobacco Settlement Revenue, Series B, 5.25%, 3/1/2024
|
3,020,000 | 3,208,508 | ||||||
| 14,794,413 | ||||||||
|
Mississippi 1.4%
|
||||||||
|
Mississippi, Business Financial Corp., Mississippi Retirement Facilities Revenue, Wesley Manor, Series A, 5.45%, 5/20/2034
|
2,500,000 | 2,322,750 | ||||||
|
Mississippi, Development Bank Special Obligation, Department of Corrections:
|
||||||||
|
Series C, 5.25%, 8/1/2027
|
6,110,000 | 6,662,222 | ||||||
|
Series D, 5.25%, 8/1/2027
|
5,000,000 | 5,451,900 | ||||||
|
Mississippi, Home Corp., Single Family Mortgage Revenue, Series C-1, 5.6%, 6/1/2038
|
4,225,000 | 4,508,455 | ||||||
|
Rankin County, MS, School District General Obligation, 5.25%, 2/1/2015, INS: NATL
|
2,845,000 | 3,188,904 | ||||||
| 22,134,231 | ||||||||
|
Missouri 0.5%
|
||||||||
|
Bridgeton, MO, Industrial Development Authority, Facilities Revenue, Mizpah Assisted Living, Series A, 5.25%, 12/20/2019
|
105,000 | 106,346 | ||||||
|
Missouri, Hospital & Healthcare Revenue, Health & Educational Facilities Authority, Washington University, Series A, 5.5%, 6/15/2016
|
3,200,000 | 3,820,960 | ||||||
|
Missouri, State Housing Development Commission, Single Family Mortgage Revenue, Homeownership Loan Program, Series D, 4.8%, 3/1/2040
|
2,090,000 | 2,229,528 | ||||||
|
Missouri, State Housing Development Commission, Single Family Mortgage Revenue, Special Homeownership Loan Program Market Bonds, Series E-1, 5.0%, 11/1/2027
|
1,150,000 | 1,246,853 | ||||||
| 7,403,687 | ||||||||
|
Nebraska 0.1%
|
||||||||
|
Omaha, NE, School District General Obligation, Series A, ETM, 6.5%, 12/1/2013
|
1,500,000 | 1,678,095 | ||||||
|
Nevada 1.1%
|
||||||||
|
Clark County, NV, Airport Revenue, Series 08-E, 5.0%, 7/1/2012
|
1,975,000 | 2,026,054 | ||||||
|
Clark County, NV, Airport Systems Revenue, Series E-2, 5.0%, 7/1/2012
|
2,570,000 | 2,633,813 | ||||||
|
Clark County, NV, Board Bank:
|
||||||||
|
5.0%, 6/1/2024
|
3,040,000 | 3,339,865 | ||||||
|
5.0%, 6/1/2025
|
3,190,000 | 3,449,762 | ||||||
|
Clark County, NV, General Obligation, Series A, 5.0%, 12/1/2026
|
3,025,000 | 3,252,934 | ||||||
|
Clark County, NV, School District, Series A, 4.5%, 6/15/2012, INS: AMBAC
|
2,200,000 | 2,249,038 | ||||||
| 16,951,466 | ||||||||
|
New Jersey 2.0%
|
||||||||
|
New Jersey, Economic Development Authority Revenue, Cigarette Tax, 5.375%, 6/15/2014
|
2,280,000 | 2,411,830 | ||||||
|
New Jersey, Economic Development Authority Revenue, School Facilities Construction:
|
||||||||
|
Series O, 5.0%, 3/1/2017
|
3,300,000 | 3,642,441 | ||||||
|
Series W, 5.0%, 3/1/2019
|
3,000,000 | 3,398,850 | ||||||
|
New Jersey, State Educational Facilities Authority Revenue, Seton Hall University, Series D, 0.08%*, 7/1/2037, LOC: TD Bank NA
|
3,430,000 | 3,430,000 | ||||||
|
New Jersey, State Transit Corp., Certificate of Participation, Federal Transit Administration Grants, Series A, 5.0%, 9/15/2016, INS: FGIC, NATL
|
7,000,000 | 7,544,320 | ||||||
|
New Jersey, State Transportation Trust Fund Authority:
|
||||||||
|
Series B, 5.25%, 6/15/2025 (a)
|
5,000,000 | 5,485,400 | ||||||
|
Series B, 5.25%, 6/15/2026 (a)
|
5,000,000 | 5,448,150 | ||||||
| 31,360,991 | ||||||||
|
New Mexico 0.3%
|
||||||||
|
New Mexico, Mortgage Finance Authority, Single Family Mortgage:
|
||||||||
|
Class I, Series E, 5.3%, 9/1/2040
|
1,740,000 | 1,891,450 | ||||||
|
Class I, Series D, 5.35%, 9/1/2040
|
1,665,000 | 1,806,408 | ||||||
|
Series I-B-2, 5.65%, 9/1/2039
|
895,000 | 975,935 | ||||||
| 4,673,793 | ||||||||
|
New York 4.6%
|
||||||||
|
New York, Dormitory Authority, St. Joseph's Hospital, 5.25%, 7/1/2018, INS: NATL
|
405,000 | 405,409 | ||||||
|
New York, Metropolitan Transportation Authority Revenue, Series A, 5.5%, 11/15/2014, INS: AMBAC
|
5,000,000 | 5,581,050 | ||||||
|
New York, State Dormitory Authority Personal Income Tax Revenue, Series A, 5.0%, 3/15/2019
|
5,000,000 | 5,734,600 | ||||||
|
New York, State Dormitory Authority Revenues, Non-State Supported Debt, Mount Sinai School of Medicine, Series A, 5.0%, 7/1/2021
|
1,000,000 | 1,129,770 | ||||||
|
New York, State Environmental Facilities Corp., State Clean Water & Drinking Revolving Funds, New York City Municipal Water Finance Authority Projects, 5.0%, 6/15/2029
|
10,000,000 | 11,139,000 | ||||||
|
New York, Tobacco Settlement Financing Corp.:
|
||||||||
|
Series B, 4.0%, 6/1/2013
|
6,250,000 | 6,555,562 | ||||||
|
Series A-1, 5.5%, 6/1/2018
|
2,630,000 | 2,684,757 | ||||||
|
Series A-1, Prerefunded 6/1/2012 @ 100, 5.5%, 6/1/2018
|
7,370,000 | 7,565,084 | ||||||
|
New York City, NY, Municipal Water Finance Authority, Water & Sewer Revenue, Series AA, 5.0%, 6/15/2021
|
10,000,000 | 11,509,700 | ||||||
|
New York City, NY, Transitional Finance Authority Revenue, Future Tax Secured, Series D-1, 5.0%, 11/1/2028
|
12,770,000 | 14,146,478 | ||||||
|
New York, NY, General Obligation:
|
||||||||
|
Series J, 5.25%, 5/15/2015, INS: NATL
|
115,000 | 126,875 | ||||||
|
Series J, Prerefunded 5/15/2014 @ 100, 5.25%, 5/15/2015, INS: NATL
|
3,885,000 | 4,331,348 | ||||||
|
Oneida County, NY, Industrial Development Agency Revenue, Civic Facilities, 5.0%, 3/1/2014, LOC: HSBC Bank PLC
|
370,000 | 373,637 | ||||||
| 71,283,270 | ||||||||
|
North Carolina 1.4%
|
||||||||
|
Charlotte, NC, Airport Revenue, Series A, 5.5%, 7/1/2034
|
1,000,000 | 1,070,890 | ||||||
|
North Carolina, Eastern Municipal Power Agency Systems Revenue, Series B, 5.0%, 1/1/2026
|
4,200,000 | 4,476,822 | ||||||
|
North Carolina, Electric Revenue, Catawba Municipal Power Agency No. 1, Series A, 5.25%, 1/1/2020
|
2,000,000 | 2,304,420 | ||||||
|
North Carolina, Electric Revenue, Municipal Power Agency, Series F, 5.5%, 1/1/2016
|
1,000,000 | 1,045,640 | ||||||
|
North Carolina, State Capital Improvement Obligation, Series A, 5.0%, 5/1/2024
|
10,745,000 | 12,346,112 | ||||||
| 21,243,884 | ||||||||
|
North Dakota 0.2%
|
||||||||
|
Fargo, ND, Sanford Health Systems Revenue:
|
||||||||
|
4.0%, 11/1/2012
|
1,600,000 | 1,648,160 | ||||||
|
5.5%, 11/1/2021
|
1,250,000 | 1,423,100 | ||||||
| 3,071,260 | ||||||||
|
Ohio 3.3%
|
||||||||
|
Akron, Bath & Copley, OH, Joint Township Hospital District Revenue, Health Care Facility, Summner Project, 1.0%*, 12/1/2032, LOC: KBC Bank NV
|
1,700,000 | 1,700,000 | ||||||
|
Lucas County, OH, Hospital Revenue, Promedica Healthcare, Series D, 5.0%, 11/15/2024 (a)
|
2,800,000 | 2,981,888 | ||||||
|
Ohio, Capital Housing Corp. Mortgage, Georgetown Section 8, Series A, 6.625%, 7/1/2022
|
620,000 | 621,203 | ||||||
|
Ohio, State Higher Education:
|
||||||||
|
Series A, 5.0%, 2/1/2013
|
3,650,000 | 3,843,924 | ||||||
|
Series A, 5.0%, 5/1/2013
|
6,500,000 | 6,915,955 | ||||||
|
Ohio, State Higher Educational Facility Commission Revenue, Cleveland Clinic Health, Series A, 5.25%, 1/1/2021
|
2,150,000 | 2,401,378 | ||||||
|
Ohio, State Higher Educational Facility Commission Revenue, Summa Health Systems 2010 Project, 5.5%, 11/15/2030, INS: AGMC
|
5,000,000 | 5,203,850 | ||||||
|
Ohio, State Highway Capital Improvement, Series P, 5.0%, 5/1/2013
|
7,000,000 | 7,452,690 | ||||||
|
Ohio, State Housing Finance Agency, Residential Mortgage Revenue, Mortgage-Backed Securities Program, Series E, 5.0%, 9/1/2039
|
1,535,000 | 1,645,505 | ||||||
|
Ohio, State Water Development Authority, Solid Waste Revenue, Waste Management, Inc. Project, 1.75%, 6/1/2013
|
3,000,000 | 3,018,900 | ||||||
|
Ohio, State Water Development Authority, Water Pollution Control Revenue, Water Quality-Loan Fund, 5.0%, 6/1/2013
|
1,000,000 | 1,069,240 | ||||||
|
Ohio, University of Akron, General Receipts, Series A, 5.0%, 1/1/2028, INS: AGMC
|
4,725,000 | 5,033,401 | ||||||
|
Ohio, Water & Sewer Revenue, Water Development Authority, Pure Water Improvement Project, Series B, 5.5%, 6/1/2015, INS: AGMC
|
2,280,000 | 2,634,175 | ||||||
|
Ross County, OH, Hospital Revenue, Adena Health System, 5.75%, 12/1/2022
|
5,750,000 | 6,282,220 | ||||||
| 50,804,329 | ||||||||
|
Oklahoma 0.1%
|
||||||||
|
Oklahoma, Ordinance Works Authority, Ralston Purina Project, 6.3%, 9/1/2015
|
1,500,000 | 1,504,905 | ||||||
|
Oregon 2.1%
|
||||||||
|
Clackamas County, OR, North Clackamas School District No. 12, Convertible Deferred Interest, Series B, 5.0%, 6/15/2027, INS: AGMC
|
6,535,000 | 7,088,188 | ||||||
|
Oregon, State Department of Administrative Services Lottery Revenue, Series A, 5.25%, 4/1/2028
|
2,000,000 | 2,294,620 | ||||||
|
Oregon, State Department of Administrative Services, Certificates of Participation, Series A, 5.0%, 5/1/2012
|
1,875,000 | 1,912,463 | ||||||
|
Oregon, State General Obligation:
|
||||||||
|
Series L, 5.0%, 5/1/2025
|
3,000,000 | 3,507,330 | ||||||
|
Series J, 5.0%, 5/1/2029
|
5,425,000 | 6,126,452 | ||||||
|
Port of Portland, OR, Airport Revenue, Passenger Facility Charge, Portland International Airport:
|
||||||||
|
Series A, 5.5%, 7/1/2026
|
4,025,000 | 4,493,188 | ||||||
|
Series A, 5.5%, 7/1/2029
|
7,000,000 | 7,651,070 | ||||||
| 33,073,311 | ||||||||
|
Pennsylvania 1.4%
|
||||||||
|
Allegheny County, PA, Airport Revenue, San Authority, Prerefunded 12/1/2011 @ 101, 5.375%, 12/1/2015, INS: NATL
|
3,370,000 | 3,404,172 | ||||||
|
Erie, PA, Higher Education Building Authority, Gannon University Project, Series E, 5.2%, 7/15/2016
|
795,000 | 796,431 | ||||||
|
Lancaster, PA, Sewer Authority Revenue, ETM, 6.0%, 4/1/2012
|
10,000 | 10,195 | ||||||
|
Montgomery County, PA, Redevelopment Authority, Multi-Family Housing Revenue, Forge Gate Apartments Project, Series A, 0.14%*, 8/15/2031, LIQ: Fannie Mae
|
1,510,000 | 1,510,000 | ||||||
|
Pennsylvania, Commonwealth Systems of Higher Education, University of Pittsburgh Capital Project, Series B, 5.5%, 9/15/2024
|
1,000,000 | 1,179,370 | ||||||
|
Pennsylvania, Delaware River Junction Toll Bridge, Commonwealth of Pennsylvania Bridge Revenue, 5.25%, 7/1/2013
|
1,000,000 | 1,063,190 | ||||||
|
Pennsylvania, Higher Educational Facilities Authority, College & University Revenue, University of the Arts, 5.5%, 3/15/2013, INS: Radian
|
545,000 | 546,123 | ||||||
|
Pennsylvania, Higher Educational Facility Authority, Health Services Revenue, Allegheny Delaware Valley Obligation, Series C, 5.875%, 11/15/2018, INS: NATL
|
1,450,000 | 1,409,313 | ||||||
|
Philadelphia, PA, Airport Revenue, Series A, 5.25%, 6/15/2030
|
10,890,000 | 11,475,555 | ||||||
|
Philadelphia, PA, Redevelopment Authority, Multi-Family Housing Revenue, Woodstock, 5.45%, 2/1/2023
|
530,000 | 535,825 | ||||||
|
Williamsport, PA, Multi-Family Housing Authority, Series A, 5.25%, 1/1/2015, INS: NATL
|
370,000 | 370,969 | ||||||
| 22,301,143 | ||||||||
|
Puerto Rico 1.7%
|
||||||||
|
Commonwealth of Puerto Rico, Public Improvement, Series A, 5.25%, 7/1/2012
|
2,000,000 | 2,045,840 | ||||||
|
Puerto Rico, Electric Power Authority Revenue, Series UU, 5.0%, 7/1/2019, INS: NATL
|
3,000,000 | 3,301,170 | ||||||
|
Puerto Rico, Public Buildings Authority Revenue, Government Facilities, Series M, 6.0%, 7/1/2020
|
3,045,000 | 3,405,132 | ||||||
|
Puerto Rico, Sales Tax Financing Corp., Sales Tax Revenue:
|
||||||||
|
Series A, 5.25%, 8/1/2027
|
11,965,000 | 12,672,132 | ||||||
|
Series A, 5.5%, 8/1/2028
|
5,000,000 | 5,325,950 | ||||||
| 26,750,224 | ||||||||
|
Rhode Island 0.4%
|
||||||||
|
Rhode Island, State & Providence Plantations, Construction Capital Development Loan, Series A, 5.0%, 8/1/2017, INS: AGMC
|
5,000,000 | 5,732,700 | ||||||
|
South Carolina 0.5%
|
||||||||
|
South Carolina, Water & Sewer Revenue, Grand Strand Water & Sewer Authority:
|
||||||||
|
Prerefunded 6/1/2012 @ 100, 5.375%, 6/1/2015, INS: AGMC
|
3,705,000 | 3,801,145 | ||||||
|
Prerefunded 6/1/2012 @ 100, 5.375%, 6/1/2016, INS: AGMC
|
3,900,000 | 4,001,205 | ||||||
| 7,802,350 | ||||||||
|
Tennessee 0.9%
|
||||||||
|
Blount County, TN, Public Building Authority, Local Government Public Improvement, City of Alcoa, Series E-5-B, 0.13%*, 6/1/2042, LOC: Branch Banking & Trust
|
3,000,000 | 3,000,000 | ||||||
|
Johnson City, TN, Hospital & Healthcare Revenue, Medical Center Hospital, ETM, 5.5%, 7/1/2013, INS: NATL
|
3,305,000 | 3,567,087 | ||||||
|
Memphis & Shelby Counties, TN, Sports, Expo & Entertainment Revenue, Sports Authority Memphis Arena Project, Series A, Prerefunded 11/1/2012 @ 100, 5.5%, 11/1/2015, INS: AMBAC
|
3,545,000 | 3,715,656 | ||||||
|
Nashville & Davidson Counties, TN, Water & Sewer Revenue, Series B, 5.25%, 1/1/2013, INS: FGIC, NATL
|
3,310,000 | 3,484,735 | ||||||
| 13,767,478 | ||||||||
|
Texas 20.3%
|
||||||||
|
Alief, TX, Independent School District, School Building, 5.0%, 2/15/2013
|
1,000,000 | 1,056,390 | ||||||
|
Allen, TX, Independent School District, 5.0%, 2/15/2025
|
1,640,000 | 1,895,135 | ||||||
|
Brownsville, TX, Electric Revenue, ETM, 6.25%, 9/1/2014, INS: NATL
|
3,275,000 | 3,586,583 | ||||||
|
Comal, TX, Independent School District, School Building Improvements, 5.25%, 2/1/2020
|
2,330,000 | 2,756,996 | ||||||
|
Cypress-Fairbanks, TX, Independent School District, School House Building Improvements:
|
||||||||
|
5.0%, 2/15/2019
|
1,300,000 | 1,535,690 | ||||||
|
5.0%, 2/15/2021
|
1,850,000 | 2,157,137 | ||||||
|
Dallas, TX, Waterworks & Sewer Systems Revenue:
|
||||||||
|
5.0%, 10/1/2029
|
4,000,000 | 4,425,240 | ||||||
|
5.0%, 10/1/2030
|
5,000,000 | 5,491,800 | ||||||
|
El Paso, TX, Independent School District, School Building Improvements, 5.0%, 8/15/2022
|
4,885,000 | 5,624,687 | ||||||
|
Fort Bend, TX, Independent School District, 5.0%, 8/15/2026
|
2,000,000 | 2,226,560 | ||||||
|
Fort Worth, TX, Independent School District, School Building, 5.0%, 2/15/2028
|
9,210,000 | 10,501,426 | ||||||
|
Harris County, TX, Flood Control District, Contract Tax:
|
||||||||
|
Series A, 5.0%, 10/1/2029
|
5,000,000 | 5,511,600 | ||||||
|
Series A, 5.0%, 10/1/2030
|
5,000,000 | 5,468,100 | ||||||
|
Harris County, TX, Metropolitan Transit Authority, Sales & Use Tax:
|
||||||||
|
Series A, 5.0%, 11/1/2030
|
2,600,000 | 2,829,970 | ||||||
|
Series A, 5.0%, 11/1/2031
|
2,795,000 | 3,025,476 | ||||||
|
Harris County, TX, Permanent Improvement, Series A, 5.0%, 10/1/2028
|
10,000,000 | 11,143,200 | ||||||
|
Harris County, TX, Port Houston Authority, Series D-1, 5.0%, 10/1/2035
|
12,190,000 | 13,235,658 | ||||||
|
Houston, TX, Airport Systems Revenue:
|
||||||||
|
Series B, 5.0%, 7/1/2013
|
500,000 | 531,840 | ||||||
|
Series B, 5.0%, 7/1/2026
|
4,000,000 | 4,324,040 | ||||||
|
Series A, 5.25%, 7/1/2029
|
8,000,000 | 8,533,120 | ||||||
|
Houston, TX, Public Improvement, Series A, 5.0%, 3/1/2026
|
8,000,000 | 8,840,560 | ||||||
|
Houston, TX, Utility Systems Revenue, Series A, 5.25%, 11/15/2028
|
2,500,000 | 2,808,350 | ||||||
|
Houston, TX, Water & Sewer Revenue:
|
||||||||
|
Series A, Prerefunded 12/1/2011 @ 100, 5.5%, 12/1/2015, INS: AGMC
|
8,250,000 | 8,251,237 | ||||||
|
Series B, Prerefunded 12/1/2012 @ 100, 5.75%, 12/1/2016, INS: AMBAC
|
1,000,000 | 1,054,400 | ||||||
|
Houston, TX, Water & Sewer Revenue, Water Conveyance Systems Contract, Series J, 6.25%, 12/15/2013, INS: AMBAC
|
2,500,000 | 2,675,975 | ||||||
|
Humble, TX, Independent School District, School Building, Series A, 5.0%, 2/15/2029
|
1,335,000 | 1,474,254 | ||||||
|
Lewisville, TX, Independent School District, School Building, 5.0%, 8/15/2026
|
6,360,000 | 7,256,188 | ||||||
|
Longview, TX, Independent School District, School Building Improvements, 5.0%, 2/15/2022
|
2,000,000 | 2,308,840 | ||||||
|
Lubbock, TX, Electric Light & Power Systems Revenue, 4.0%, 4/15/2012
|
500,000 | 506,795 | ||||||
|
Lubbock, TX, General Obligation, 5.0%, 2/15/2029
|
2,000,000 | 2,192,220 | ||||||
|
McAllen, TX, General Obligation Certificates, 4.0%, 2/15/2012
|
600,000 | 604,728 | ||||||
|
North Texas, Tollway Authority Revenue, First Tier:
|
||||||||
|
Series E-3, 5.75%, Mandatory Put 1/1/2016 @ 100, 1/1/2038
|
4,900,000 | 5,606,041 | ||||||
|
Series A, 6.0%, 1/1/2022
|
7,000,000 | 8,015,490 | ||||||
|
Series L-2, 6.0%, Mandatory Put 1/1/2013 @ 100, 1/1/2038
|
6,000,000 | 6,330,960 | ||||||
|
North Texas, Tollway Authority Revenue, Special Projects Systems:
|
||||||||
|
Series D, 5.25%, 9/1/2027
|
9,080,000 | 10,101,046 | ||||||
|
Series A, 5.5%, 9/1/2028
|
1,240,000 | 1,388,378 | ||||||
|
Pasadena, TX, Independent School District:
|
||||||||
|
5.0%, 2/15/2027
|
6,960,000 | 7,785,804 | ||||||
|
5.0%, 2/15/2028
|
5,930,000 | 6,588,586 | ||||||
|
Plano, TX, General Obligation, 5.0%, 9/1/2029
|
1,635,000 | 1,816,191 | ||||||
|
Plano, TX, Independent School District, 5.0%, 2/15/2013
|
2,500,000 | 2,640,975 | ||||||
|
Richardson, TX, General Obligation, 4.0%, 2/15/2012
|
500,000 | 503,960 | ||||||
|
San Antonio, TX, Electric & Gas Revenue, Series A, 5.25%, 2/1/2026
|
7,000,000 | 7,905,380 | ||||||
|
San Antonio, TX, General Improvement, Series 2006, 5.5%, 8/1/2014, INS: FGIC, NATL
|
3,000,000 | 3,387,570 | ||||||
|
Tarrant County, TX, Cultural Education Facilities Finance Corp. Revenue, Ascension Health Senior Credit Group, Series D, 5.0%, 11/15/2029
|
5,000,000 | 5,211,450 | ||||||
|
Tarrant County, TX, Cultural Education Facilities Finance Corp. Revenue, Texas Health Resources:
|
||||||||
|
Series A, 5.0%, 2/15/2018
|
2,000,000 | 2,230,160 | ||||||
|
Series A, 5.0%, 2/15/2019
|
2,480,000 | 2,728,843 | ||||||
|
Series A, 5.0%, 2/15/2020
|
6,180,000 | 6,734,593 | ||||||
|
Tarrant County, TX, Cultural Education Facilities Finance Corp., Hospital Revenue, Scott & White Healthcare, 5.25%, 8/15/2023
|
2,500,000 | 2,729,275 | ||||||
|
Texas, Dallas-Fort Worth International Airport Revenue:
|
||||||||
|
Series A, 5.0%, 11/1/2018
|
1,000,000 | 1,187,260 | ||||||
|
Series A, 5.0%, 11/1/2019
|
1,250,000 | 1,488,675 | ||||||
|
Series D, 5.0%, 11/1/2024
|
2,250,000 | 2,487,893 | ||||||
|
Series C, 5.0%, 11/1/2025
|
4,605,000 | 5,061,632 | ||||||
|
Series C, 5.0%, 11/1/2026
|
3,290,000 | 3,541,060 | ||||||
|
Texas, Grapevine-Colleyville Independent School District Building, 5.0%, 8/15/2031
|
3,465,000 | 3,813,059 | ||||||
|
Texas, Lower Colorado River Authority Revenue, Series A, 5.875%, 5/15/2014, INS: AGMC
|
540,000 | 542,354 | ||||||
|
Texas, Lower Colorado River Authority, Transmission Contract Revenue, LCRA Transmission Services, 5.0%, 5/15/2030
|
5,000,000 | 5,211,650 | ||||||
|
Texas, Midtown Redevelopment Authority, Tax Increment Contract Revenue, 4.0%, 1/1/2014
|
625,000 | 652,169 | ||||||
|
Texas, Municipal Gas Acquisition & Supply Corp. I, Gas Supply Revenue, Series A, 5.0%, 12/15/2012
|
5,000,000 | 5,208,500 | ||||||
|
Texas, Municipal Power Agency Revenue:
|
||||||||
|
Zero Coupon, 9/1/2014, INS: NATL
|
1,760,000 | 1,700,424 | ||||||
|
ETM, Zero Coupon, 9/1/2014, INS: NATL
|
40,000 | 39,082 | ||||||
|
Texas, SA Energy Acquisition Public Facility Corp., Gas Supply Revenue:
|
||||||||
|
5.25%, 8/1/2017
|
5,690,000 | 5,808,466 | ||||||
|
5.5%, 8/1/2020
|
3,790,000 | 3,886,304 | ||||||
|
Texas, State Department of Housing & Community Affairs, Residential Mortgage Revenue, Series A, 5.375%, 1/1/2039
|
6,770,000 | 7,160,223 | ||||||
|
Texas, State Public Finance Authority Revenue, Unemployment Compensation, Series A, 5.0%, 1/1/2013
|
4,175,000 | 4,385,044 | ||||||
|
Texas, State Transportation Commission Revenue, First Tier, 5.0%, 4/1/2022
|
10,000,000 | 11,369,800 | ||||||
|
Texas, State Veterans Housing Assistance Program, Fund II, Series A, 5.25%, 12/1/2023
|
4,000,000 | 4,796,400 | ||||||
|
Texas, Transportation Commission Turnpike Systems Revenue, 2.75%, Mandatory Put 2/15/2013 @ 100, 8/15/2042
|
5,000,000 | 5,065,150 | ||||||
|
Texas, Water & Sewer Revenue, 5.375%, 3/1/2015, INS: AGMC
|
3,710,000 | 3,928,408 | ||||||
|
Texas, Water Development Board Revenue, State Revolving Fund:
|
||||||||
|
Series B, Prerefunded 7/15/2014 @ 100, 5.0%, 7/15/2017
|
3,000,000 | 3,344,910 | ||||||
|
Series A, 5.0%, 7/15/2020
|
3,150,000 | 3,662,505 | ||||||
|
Series B, 5.25%, 7/15/2021
|
3,000,000 | 3,515,670 | ||||||
|
University of Texas, Financing Systems, Series A, 5.0%, 8/15/2013
|
3,725,000 | 4,015,401 | ||||||
|
West Harris County, TX, Regional Water Authority, Water Systems Revenue:
|
||||||||
|
5.0%, 12/15/2026
|
2,640,000 | 2,839,716 | ||||||
|
5.0%, 12/15/2027
|
2,770,000 | 2,957,861 | ||||||
|
5.0%, 12/15/2028
|
2,905,000 | 3,079,445 | ||||||
| 316,287,958 | ||||||||
|
Utah 0.2%
|
||||||||
|
Intermountain Power Agency, UT, Power Supply Revenue, Series A, ETM, 6.15%, 7/1/2014, INS: NATL
|
575,000 | 609,264 | ||||||
|
Riverton, UT, Hospital Revenue, IHC Health Services, Inc., 5.0%, 8/15/2020
|
2,825,000 | 3,212,392 | ||||||
| 3,821,656 | ||||||||
|
Virgin Islands 0.2%
|
||||||||
|
Virgin Islands, Public Finance Authority Revenue, Series B, 5.0%, 10/1/2019
|
1,250,000 | 1,361,650 | ||||||
|
Virgin Islands, Water & Power Authority, Electric Systems Revenue, Series A, 4.0%, 7/1/2012
|
1,000,000 | 1,014,460 | ||||||
| 2,376,110 | ||||||||
|
Virginia 0.6%
|
||||||||
|
Albemarle County, VA, Economic Development Authority, Hospital Revenue, Martha Jefferson Hospital, Series B, 0.13%*, 10/1/2048, LOC: Branch Banking & Trust
|
5,500,000 | 5,500,000 | ||||||
|
Richmond, VA, Metro Expressway Authority, ETM, 7.0%, 10/15/2013, INS: AMBAC
|
525,000 | 566,081 | ||||||
|
Virginia, State College Building Authority, Educational Facilities Revenue, 21st Century College & Equipment, Series F-1, 5.0%, 2/1/2013
|
1,355,000 | 1,428,550 | ||||||
|
Virginia, State College Building Authority, Educational Facilities Revenue, University of Richmond Project, 0.12%*, 11/1/2036, SPA: Wells Fargo Bank NA
|
1,550,000 | 1,550,000 | ||||||
|
Virginia, State Public School Authority, Series A, 5.0%, 8/1/2013
|
1,000,000 | 1,076,950 | ||||||
| 10,121,581 | ||||||||
|
Washington 6.0%
|
||||||||
|
King County, WA, General Obligation, Series A, 4.0%, 12/1/2011
|
1,610,000 | 1,610,177 | ||||||
|
Seattle, WA, Municipal Light & Power Revenue, Series B, 5.0%, 2/1/2025
|
7,250,000 | 8,215,845 | ||||||
|
Seattle, WA, Water System Revenue:
|
||||||||
|
5.0%, 2/1/2020
|
3,870,000 | 4,521,011 | ||||||
|
5.0%, 2/1/2025, INS: AGMC
|
5,695,000 | 6,225,318 | ||||||
|
Washington, Electric Revenue, Public Power Supply System, Nuclear Project No. 2, Series A, 6.3%, 7/1/2012
|
1,000,000 | 1,035,460 | ||||||
|
Washington, Energy Northwest Electric Revenue, Project 1, Series A, 5.0%, 7/1/2013 (a)
|
3,260,000 | 3,409,797 | ||||||
|
Washington, State Economic Development Finance Authority, Solid Waste Dispensary Revenue, Waste Management, Inc., Series D, 2.0%, Mandatory Tender 9/2/2014 @ 100, 11/1/2017
|
5,000,000 | 5,016,500 | ||||||
|
Washington, State General Obligation:
|
||||||||
|
Series 2011-A, 5.0%, 8/1/2028
|
15,000,000 | 17,206,800 | ||||||
|
Series 2011-A, 5.0%, 8/1/2031
|
17,845,000 | 19,837,930 | ||||||
|
Series A, 5.0%, 8/1/2032
|
14,000,000 | 15,130,220 | ||||||
|
Washington, State Housing Finance Commission, Homeownership Program, Series A, 4.7%, 10/1/2028
|
1,355,000 | 1,448,360 | ||||||
|
Washington, State Motor Vehicle Fuel Tax:
|
||||||||
|
Series B, 5.0%, 7/1/2025, INS: AGMC
|
2,000,000 | 2,228,540 | ||||||
|
Series 2010-B, 5.0%, 8/1/2027
|
6,000,000 | 6,840,720 | ||||||
| 92,726,678 | ||||||||
|
West Virginia 0.2%
|
||||||||
|
West Virginia, Transportation/Tolls Revenue, 5.25%, 5/15/2015, INS: FGIC, NATL
|
2,940,000 | 3,334,136 | ||||||
|
Wisconsin 1.9%
|
||||||||
|
Wisconsin, Health & Educational Facilities, Viterbo College, Inc. Project:
|
||||||||
|
Series A, 5.75%, 2/1/2012, LOC: U.S. Bank NA
|
65,000 | 65,236 | ||||||
|
Series A, 6.0%, 2/1/2017, LOC: U.S. Bank NA
|
405,000 | 407,232 | ||||||
|
Wisconsin, State Clean Water Revenue:
|
||||||||
|
Series 1, 5.0%, 6/1/2031
|
2,500,000 | 2,705,850 | ||||||
|
Series 3, 5.5%, 6/1/2025
|
5,000,000 | 5,712,250 | ||||||
|
Wisconsin, State General Appropriation Revenue, Series A, 6.0%, 5/1/2026
|
5,000,000 | 5,844,250 | ||||||
|
Wisconsin, State General Obligation:
|
||||||||
|
Series C, Prerefunded 5/1/2012 @ 100, 5.25%, 5/1/2016, INS: NATL
|
7,705,000 | 7,866,882 | ||||||
|
Series A, 5.25%, 5/1/2026
|
3,500,000 | 4,065,530 | ||||||
|
Wisconsin, State Health & Educational Facilities Authority Revenue, Aurora Health Care, Series B, 5.0%, 7/15/2013
|
2,000,000 | 2,092,160 | ||||||
|
Wisconsin, State Health & Educational Facilities Authority Revenue, Children's Hospital of Wisconsin, Series B, 5.375%, 8/15/2024
|
1,000,000 | 1,105,281 | ||||||
| 29,864,671 | ||||||||
|
% of Net Assets
|
Value ($)
|
|||||||
|
Total Investment Portfolio (Cost $1,504,267,240)+
|
101.2 | 1,573,932,624 | ||||||
|
Other Assets and Liabilities, Net
|
(1.2 | ) | (18,081,472 | ) | ||||
|
Net Assets
|
100.0 | 1,555,851,152 | ||||||
* Variable rate demand notes are securities whose interest rates are reset periodically at market levels. These securities are often payable on demand and are shown at their current rates as of November 30, 2011.
+ The cost for federal income tax purposes was $1,503,935,172. At November 30, 2011, net unrealized appreciation for all securities based on tax cost was $69,997,452. This consisted of aggregate gross unrealized appreciation for all securities in which there was an excess of value over tax cost of $70,994,930 and aggregate gross unrealized depreciation for all securities in which there was an excess of tax cost over value of $997,478.
(a) When-issued security.
144A: Security exempt from registration under Rule 144A of the Securities Act of 1933. These securities may be resold in transactions exempt from registration, normally to qualified institutional buyers.
AGC: Assured Guaranty Corp.
AGMC: Assured Guaranty Municipal Corp.
AMBAC: Ambac Financial Group, Inc.
ETM: Bonds bearing the description ETM (escrow to maturity) are collateralized usually by U.S. Treasury securities which are held in escrow and used to pay principal and interest on bonds so designated.
FGIC: Financial Guaranty Insurance Co.
INS: Insured
LIQ: Liquidity Agreement
LOC: Letter of Credit
NATL: National Public Finance Guarantee Corp.
Prerefunded: Bonds which are prerefunded are collateralized usually by U.S. Treasury securities which are held in escrow and used to pay principal and interest on tax-exempt issues and to retire the bonds in full at the earliest refunding date.
Radian: Radian Asset Assurance, Inc.
SPA: Standby Bond Purchase Agreement
Fair Value Measurements
Various inputs are used in determining the value of the Fund's investments. These inputs are summarized in three broad levels. Level 1 includes quoted prices in active markets for identical securities. Level 2 includes other significant observable inputs (including quoted prices for similar securities, interest rates, prepayment speeds and credit risk). Level 3 includes significant unobservable inputs (including the Fund's own assumptions in determining the fair value of investments). The inputs or methodology used for valuing securities are not necessarily an indication of the risk associated with investing in those securities.
The following is a summary of the inputs used as of November 30, 2011 in valuing the Fund's investments. For information on the Fund's policy regarding the valuation of investments, please refer to the Security Valuation section of Note A in the accompanying Notes to Financial Statements.
|
Assets
|
Level 1
|
Level 2
|
Level 3
|
Total
|
||||||||||||
|
Municipal Investments (b)
|
$ | — | $ | 1,573,932,624 | $ | — | $ | 1,573,932,624 | ||||||||
|
Total
|
$ | — | $ | 1,573,932,624 | $ | — | $ | 1,573,932,624 | ||||||||
There have been no transfers between Level 1 and Level 2 fair value measurements during the period ended November 30, 2011.
(b) See Investment Portfolio for additional detailed categorizations.
The accompanying notes are an integral part of the financial statements.
|
as of November 30, 2011 (Unaudited)
|
||||
|
Assets
|
||||
|
Investments in securities, at value (cost $1,504,267,240)
|
$ | 1,573,932,624 | ||
|
Receivable for investments sold
|
532,169 | |||
|
Receivable for Fund shares sold
|
4,517,452 | |||
|
Interest receivable
|
19,902,637 | |||
|
Other assets
|
62,984 | |||
|
Total assets
|
1,598,947,866 | |||
|
Liabilities
|
||||
|
Cash overdraft
|
1,190,988 | |||
|
Payable for investments purchased — when-issued securities
|
36,421,424 | |||
|
Payable for Fund shares redeemed
|
3,290,073 | |||
|
Distributions payable
|
807,901 | |||
|
Accrued management fee
|
400,057 | |||
|
Other accrued expenses and payables
|
986,271 | |||
|
Total liabilities
|
43,096,714 | |||
|
Net assets, at value
|
$ | 1,555,851,152 | ||
|
Net Assets Consist of
|
||||
|
Undistributed net investment income
|
741,792 | |||
|
Net unrealized appreciation (depreciation) on investments
|
69,665,384 | |||
|
Accumulated net realized gain (loss)
|
(5,084,222 | ) | ||
|
Paid-in capital
|
1,490,528,198 | |||
|
Net assets, at value
|
$ | 1,555,851,152 | ||
The accompanying notes are an integral part of the financial statements.
|
Statement of Assets and Liabilities as of November 30, 2011 (Unaudited) (continued)
|
||||
|
Net Asset Value
|
||||
|
Class A
Net Asset Value and redemption price per share ($358,894,386 ÷ 30,898,935 outstanding shares of beneficial interest, $.01 par value, unlimited number of shares authorized)
|
$ | 11.62 | ||
|
Maximum offering price per share (100 ÷ 97.25 of $11.62)
|
$ | 11.95 | ||
|
Class B
Net Asset Value, offering and redemption price (subject to contingent deferred sales charge) per share ($1,405,060 ÷ 120,866 outstanding shares of beneficial interest, $.01 par value, unlimited number of shares authorized)
|
$ | 11.62 | ||
|
Class C
Net Asset Value, offering and redemption price (subject to contingent deferred sales charge) per share ($73,875,332 ÷ 6,362,542 outstanding shares of beneficial interest, $.01 par value, unlimited number of shares authorized)
|
$ | 11.61 | ||
|
Class S
Net Asset Value, offering and redemption price per share ($727,785,856 ÷ 62,644,762 outstanding shares of beneficial interest, $.01 par value, unlimited number of shares authorized)
|
$ | 11.62 | ||
|
Institutional Class
Net Asset Value, offering and redemption price per share ($393,890,518 ÷ 33,898,796 outstanding shares of beneficial interest, $.01 par value, unlimited number of shares authorized)
|
$ | 11.62 | ||
The accompanying notes are an integral part of the financial statements.
|
for the six months ended November 30, 2011 (Unaudited)
|
||||
|
Investment Income
|
||||
|
Income:
Interest
|
$ | 28,313,498 | ||
|
Expenses:
Management fee
|
2,297,176 | |||
|
Administration fee
|
731,003 | |||
|
Services to shareholders
|
802,555 | |||
|
Distribution and service fees
|
784,239 | |||
|
Custodian fee
|
7,680 | |||
|
Professional fees
|
44,448 | |||
|
Reports to shareholders
|
57,340 | |||
|
Registration fees
|
111,873 | |||
|
Trustees' fees and expenses
|
35,746 | |||
|
Other
|
72,045 | |||
|
Total expenses before expense reductions
|
4,944,105 | |||
|
Expense reductions
|
(83,144 | ) | ||
|
Total expenses before expense reductions
|
4,860,961 | |||
|
Net investment income
|
23,452,537 | |||
|
Realized and Unrealized Gain (Loss)
|
||||
|
Net realized gain (loss) from investments
|
(95,915 | ) | ||
|
Change in net unrealized appreciation (depreciation) on investments
|
26,569,859 | |||
|
Net gain (loss)
|
26,473,944 | |||
|
Net increase (decrease) in net assets resulting from operations
|
$ | 49,926,481 | ||
The accompanying notes are an integral part of the financial statements.
|
Increase (Decrease) in Net Assets
|
Six Months Ended November 30, 2011 (Unaudited)
|
Year Ended May 31, 2011
|
||||||
|
Operations:
Net investment income
|
$ | 23,452,537 | $ | 44,467,730 | ||||
|
Net realized gain (loss)
|
(95,915 | ) | (3,079,098 | ) | ||||
|
Change in net unrealized appreciation (depreciation)
|
26,569,859 | (8,357,887 | ) | |||||
|
Net increase (decrease) in net assets resulting from operations
|
49,926,481 | 33,030,745 | ||||||
|
Distributions to shareholders from:
Net investment income:
Class A
|
(5,405,464 | ) | (11,496,944 | ) | ||||
|
Class B
|
(17,409 | ) | (40,397 | ) | ||||
|
Class C
|
(801,560 | ) | (1,588,575 | ) | ||||
|
Class S
|
(11,488,848 | ) | (21,824,340 | ) | ||||
|
Institutional Class
|
(5,692,456 | ) | (9,391,378 | ) | ||||
|
Total distributions
|
(23,405,737 | ) | (44,341,634 | ) | ||||
|
Fund share transactions:
Proceeds from shares sold
|
333,000,351 | 690,122,865 | ||||||
|
Reinvestment of distributions
|
16,502,628 | 30,728,151 | ||||||
|
Payments for shares redeemed
|
(207,295,993 | ) | (497,293,127 | ) | ||||
|
Net increase (decrease) in net assets from Fund share transactions
|
142,206,986 | 223,557,889 | ||||||
|
Increase from regulatory settlements (see Note F)
|
— | 359 | ||||||
|
Increase (decrease) in net assets
|
168,727,730 | 212,247,359 | ||||||
|
Net assets at beginning of period
|
1,387,123,422 | 1,174,876,063 | ||||||
|
Net assets at end of period (including undistributed net investment income of $741,792 and $694,992, respectively)
|
$ | 1,555,851,152 | $ | 1,387,123,422 | ||||
The accompanying notes are an integral part of the financial statements.
| Years Ended May 31, | ||||||||||||||||||||||||
|
Class A
|
Six Months Ended 11/30/11 (Unaudited)
|
2011
|
2010
|
2009
|
2008
|
2007
|
||||||||||||||||||
|
Selected Per Share Data
|
||||||||||||||||||||||||
|
Net asset value, beginning of period
|
$ | 11.40 | $ | 11.46 | $ | 11.15 | $ | 11.06 | $ | 11.00 | $ | 11.06 | ||||||||||||
|
Income from investment operations:
Net investment income
|
.18 | .36 | .40 | .42 | .42 | .43 | ||||||||||||||||||
|
Net realized and unrealized gain (loss)
|
.22 | (.06 | ) | .32 | .12 | .06 | (.05 | ) | ||||||||||||||||
|
Total from investment operations
|
.40 | .30 | .72 | .54 | .48 | .38 | ||||||||||||||||||
|
Less distributions from:
Net investment income
|
(.18 | ) | (.36 | ) | (.40 | ) | (.42 | ) | (.42 | ) | (.43 | ) | ||||||||||||
|
Net realized gains
|
— | — | (.01 | ) | (.03 | ) | (.00 | )*** | (.01 | ) | ||||||||||||||
|
Total distributions
|
(.18 | ) | (.36 | ) | (.41 | ) | (.45 | ) | (.42 | ) | (.44 | ) | ||||||||||||
|
Net asset value, end of period
|
$ | 11.62 | $ | 11.40 | $ | 11.46 | $ | 11.15 | $ | 11.06 | $ | 11.00 | ||||||||||||
|
Total Return (%)a
|
3.52 | ** | 2.71 | 6.58 | 5.06 | 4.46 | b | 3.41 | b | |||||||||||||||
|
Ratios to Average Net Assets and Supplemental Data
|
||||||||||||||||||||||||
|
Net assets, end of period ($ millions)
|
359 | 349 | 296 | 152 | 119 | 80 | ||||||||||||||||||
|
Ratio of expenses before expense reductions (including interest expense) (%)c
|
.77 | * | .76 | .79 | .84 | .93 | .79 | |||||||||||||||||
|
Ratio of expenses after expense reductions (including interest expense) (%)c
|
.77 | * | .76 | .79 | .84 | .93 | .79 | |||||||||||||||||
|
Ratio of expenses after expense reductions (excluding interest expense) (%)
|
.77 | * | .76 | .77 | .78 | .80 | .79 | |||||||||||||||||
|
Ratio of net investment income (%)
|
3.10 | * | 3.21 | 3.51 | 3.84 | 3.83 | 3.87 | |||||||||||||||||
|
Portfolio turnover rate (%)
|
22 | ** | 50 | 59 | 61 | 59 | 45 | |||||||||||||||||
|
a Total return does not reflect the effect of any sales charges.
b Total return would have been lower had certain expenses not been reduced.
c Interest expense represents interest and fees on short-term floating rate notes issued in conjunction with inverse floating rate securities. Interest income from such transactions is included in income from investment operations.
* Annualized
** Not annualized
*** Amount is less than $.005.
|
||||||||||||||||||||||||
| Years Ended May 31, | ||||||||||||||||||||||||
|
Class B
|
Six Months Ended 11/30/11 (Unaudited)
|
2011
|
2010
|
2009
|
2008
|
2007
|
||||||||||||||||||
|
Selected Per Share Data
|
||||||||||||||||||||||||
|
Net asset value, beginning of period
|
$ | 11.41 | $ | 11.47 | $ | 11.16 | $ | 11.07 | $ | 11.01 | $ | 11.07 | ||||||||||||
|
Income from investment operations:
Net investment income
|
.13 | .27 | .30 | .33 | .34 | .35 | ||||||||||||||||||
|
Net realized and unrealized gain (loss)
|
.21 | (.06 | ) | .32 | .12 | .06 | (.06 | ) | ||||||||||||||||
|
Total from investment operations
|
.34 | .21 | .62 | .45 | .40 | .29 | ||||||||||||||||||
|
Less distributions from:
Net investment income
|
(.13 | ) | (.27 | ) | (.30 | ) | (.33 | ) | (.34 | ) | (.34 | ) | ||||||||||||
|
Net realized gains
|
— | — | (.01 | ) | (.03 | ) | (.00 | )*** | (.01 | ) | ||||||||||||||
|
Total distributions
|
(.13 | ) | (.27 | ) | (.31 | ) | (.36 | ) | (.34 | ) | (.35 | ) | ||||||||||||
|
Net asset value, end of period
|
$ | 11.62 | $ | 11.41 | $ | 11.47 | $ | 11.16 | $ | 11.07 | $ | 11.01 | ||||||||||||
|
Total Return (%)a
|
3.02 | ** | 1.87 | 5.68 | 4.22 | 3.65 | b | 2.62 | b | |||||||||||||||
|
Ratios to Average Net Assets and Supplemental Data
|
||||||||||||||||||||||||
|
Net assets, end of period ($ millions)
|
1 | 2 | 2 | 2 | 3 | 5 | ||||||||||||||||||
|
Ratio of expenses before expense reductions (including interest expense) (%)c
|
1.56 | * | 1.58 | 1.61 | 1.64 | 1.72 | 1.58 | |||||||||||||||||
|
Ratio of expenses after expense reductions (including interest expense) (%)c
|
1.56 | * | 1.58 | 1.61 | 1.64 | 1.70 | 1.54 | |||||||||||||||||
|
Ratio of expenses after expense reductions (excluding interest expense) (%)
|
1.56 | * | 1.58 | 1.59 | 1.58 | 1.57 | 1.54 | |||||||||||||||||
|
Ratio of net investment income (%)
|
2.31 | * | 2.39 | 2.69 | 3.04 | 3.06 | 3.12 | |||||||||||||||||
|
Portfolio turnover rate (%)
|
22 | ** | 50 | 59 | 61 | 59 | 45 | |||||||||||||||||
|
a Total return does not reflect the effect of any sales charges.
b Total return would have been lower had certain expenses not been reduced.
c Interest expense represents interest and fees on short-term floating rate notes issued in conjunction with inverse floating rate securities. Interest income from such transactions is included in income from investment operations.
* Annualized
** Not annualized
*** Amount is less than $.005.
|
||||||||||||||||||||||||
| Years Ended May 31, | ||||||||||||||||||||||||
|
Class C
|
Six Months Ended 11/30/11 (Unaudited)
|
2011
|
2010
|
2009
|
2008
|
2007
|
||||||||||||||||||
|
Selected Per Share Data
|
||||||||||||||||||||||||
|
Net asset value, beginning of period
|
$ | 11.40 | $ | 11.46 | $ | 11.15 | $ | 11.06 | $ | 11.00 | $ | 11.06 | ||||||||||||
|
Income from investment operations:
Net investment income
|
.13 | .27 | .31 | .34 | .34 | .35 | ||||||||||||||||||
|
Net realized and unrealized gain (loss)
|
.21 | (.06 | ) | .32 | .12 | .06 | (.06 | ) | ||||||||||||||||
|
Total from investment operations
|
.34 | .21 | .63 | .46 | .40 | .29 | ||||||||||||||||||
|
Less distributions from:
Net investment income
|
(.13 | ) | (.27 | ) | (.31 | ) | (.34 | ) | (.34 | ) | (.34 | ) | ||||||||||||
|
Net realized gains
|
— | — | (.01 | ) | (.03 | ) | (.00 | )*** | (.01 | ) | ||||||||||||||
|
Total distributions
|
(.13 | ) | (.27 | ) | (.32 | ) | (.37 | ) | (.34 | ) | (.35 | ) | ||||||||||||
|
Net asset value, end of period
|
$ | 11.61 | $ | 11.40 | $ | 11.46 | $ | 11.15 | $ | 11.06 | $ | 11.00 | ||||||||||||
|
Total Return (%)a
|
3.02 | ** | 1.91 | 5.76 | 4.27 | 3.69 | b | 2.62 | b | |||||||||||||||
|
Ratios to Average Net Assets and Supplemental Data
|
||||||||||||||||||||||||
|
Net assets, end of period ($ millions)
|
74 | 66 | 57 | 22 | 11 | 9 | ||||||||||||||||||
|
Ratio of expenses before expense reductions (including interest expense) (%)c
|
1.56 | * | 1.55 | 1.57 | 1.61 | 1.69 | 1.57 | |||||||||||||||||
|
Ratio of expenses after expense reductions (including interest expense) (%)c
|
1.56 | * | 1.55 | 1.57 | 1.61 | 1.68 | 1.54 | |||||||||||||||||
|
Ratio of expenses after expense reductions (excluding interest expense) (%)
|
1.56 | * | 1.55 | 1.55 | 1.55 | 1.55 | 1.54 | |||||||||||||||||
|
Ratio of net investment income (%)
|
2.31 | * | 2.42 | 2.73 | 3.07 | 3.08 | 3.12 | |||||||||||||||||
|
Portfolio turnover rate (%)
|
22 | ** | 50 | 59 | 61 | 59 | 45 | |||||||||||||||||
|
a Total return does not reflect the effect of any sales charges.
b Total return would have been lower had certain expenses not been reduced.
c Interest expense represents interest and fees on short-term floating rate notes issued in conjunction with inverse floating rate securities. Interest income from such transactions is included in income from investment operations.
* Annualized
** Not annualized
*** Amount is less than $.005.
|
||||||||||||||||||||||||
|
Years Ended May 31,
|
||||||||||||||||||||||||
|
Class S
|
Six Months Ended 11/30/11 (Unaudited)
|
2011
|
2010
|
2009
|
2008
|
2007
|
||||||||||||||||||
|
Selected Per Share Data
|
||||||||||||||||||||||||
|
Net asset value, beginning of period
|
$ | 11.41 | $ | 11.47 | $ | 11.15 | $ | 11.07 | $ | 11.00 | $ | 11.06 | ||||||||||||
|
Income from investment operations:
Net investment income
|
.19 | .38 | .41 | .44 | .44 | .46 | ||||||||||||||||||
|
Net realized and unrealized gain (loss)
|
.21 | (.06 | ) | .33 | .11 | .07 | (.06 | ) | ||||||||||||||||
|
Total from investment operations
|
.40 | .32 | .74 | .55 | .51 | .40 | ||||||||||||||||||
|
Less distributions from:
Net investment income
|
(.19 | ) | (.38 | ) | (.41 | ) | (.44 | ) | (.44 | ) | (.45 | ) | ||||||||||||
|
Net realized gains
|
— | — | (.01 | ) | (.03 | ) | (.00 | )*** | (.01 | ) | ||||||||||||||
|
Total distributions
|
(.19 | ) | (.38 | ) | (.42 | ) | (.47 | ) | (.44 | ) | (.46 | ) | ||||||||||||
|
Net asset value, end of period
|
$ | 11.62 | $ | 11.41 | $ | 11.47 | $ | 11.15 | $ | 11.07 | $ | 11.00 | ||||||||||||
|
Total Return (%)
|
3.52 | a** | 2.88 | a | 6.81 | 5.16 | 4.75 | a | 3.65 | a | ||||||||||||||
|
Ratios to Average Net Assets and Supplemental Data
|
||||||||||||||||||||||||
|
Net assets, end of period ($ millions)
|
728 | 667 | 590 | 397 | 381 | 389 | ||||||||||||||||||
|
Ratio of expenses before expense reductions (including interest expense) (%)b
|
.62 | * | .63 | .64 | .65 | .75 | .57 | |||||||||||||||||
|
Ratio of expenses after expense reductions (including interest expense) (%)b
|
.60 | * | .59 | .64 | .65 | .74 | .55 | |||||||||||||||||
|
Ratio of expenses after expense reductions (excluding interest expense) (%)
|
.60 | * | .59 | .62 | .59 | .61 | .55 | |||||||||||||||||
|
Ratio of net investment income (%)
|
3.27 | * | 3.38 | 3.66 | 4.03 | 4.02 | 4.11 | |||||||||||||||||
|
Portfolio turnover rate (%)
|
22 | ** | 50 | 59 | 61 | 59 | 45 | |||||||||||||||||
|
a Total return would have been lower had certain expenses not been reduced.
b Interest expense represents interest and fees on short-term floating rate notes issued in conjunction with inverse floating rate securities. Interest income from such transactions is included in income from investment operations.
* Annualized
** Not annualized
*** Amount is less than $.005.
|
||||||||||||||||||||||||
|
Years Ended May 31,
|
||||||||||||||||||||||||
|
Institutional Class
|
Six Months Ended 11/30/11 (Unaudited)
|
2011
|
2010
|
2009
|
2008
|
2007
|
||||||||||||||||||
|
Selected Per Share Data
|
||||||||||||||||||||||||
|
Net asset value, beginning of period
|
$ | 11.41 | $ | 11.47 | $ | 11.15 | $ | 11.07 | $ | 11.00 | $ | 11.07 | ||||||||||||
|
Income (loss) from investment operations:
Net investment income
|
.19 | .39 | .43 | .45 | .46 | .46 | ||||||||||||||||||
|
Net realized and unrealized gain (loss)
|
.21 | (.06 | ) | .33 | .11 | .07 | (.06 | ) | ||||||||||||||||
|
Total from investment operations
|
.40 | .33 | .76 | .56 | .53 | .40 | ||||||||||||||||||
|
Less distributions from:
Net investment income
|
(.19 | ) | (.39 | ) | (.43 | ) | (.45 | ) | (.46 | ) | (.46 | ) | ||||||||||||
|
Net realized gains
|
— | — | (.01 | ) | (.03 | ) | (.00 | )*** | (.01 | ) | ||||||||||||||
|
Total distributions
|
(.19 | ) | (.39 | ) | (.44 | ) | (.48 | ) | (.46 | ) | (.47 | ) | ||||||||||||
|
Net asset value, end of period
|
$ | 11.62 | $ | 11.41 | $ | 11.47 | $ | 11.15 | $ | 11.07 | $ | 11.00 | ||||||||||||
|
Total Return (%)
|
3.57 | ** | 2.98 | 6.95 | 5.27 | 4.88 | 3.61 | |||||||||||||||||
|
Ratios to Average Net Assets and Supplemental Data
|
||||||||||||||||||||||||
|
Net assets, end of period ($ millions)
|
394 | 304 | 230 | 119 | 147 | 150 | ||||||||||||||||||
|
Ratio of expenses (including interest expense) (%)a
|
.50 | * | .49 | .51 | .55 | .62 | .50 | |||||||||||||||||
|
Ratio of expenses (excluding interest expense) (%)
|
.50 | * | .49 | .49 | .49 | .49 | .50 | |||||||||||||||||
|
Ratio of net investment income (%)
|
3.37 | * | 3.48 | 3.79 | 4.13 | 4.14 | 4.16 | |||||||||||||||||
|
Portfolio turnover rate (%)
|
22 | ** | 50 | 59 | 61 | 59 | 45 | |||||||||||||||||
|
a Interest expense represents interest and fees on short-term floating rate notes issued in conjunction with inverse floating rate securities. Interest income from such transactions is included in income from investment operations.
* Annualized
** Not annualized
*** Amount is less than $.005.
|
||||||||||||||||||||||||
A. Organization and Significant Accounting Policies
DWS Intermediate Tax/AMT Free Fund (the "Fund") is a diversified series of DWS Tax Free Trust (the "Trust"), which is registered under the Investment Company Act of 1940, as amended (the "1940 Act"), as an open-end management investment company organized as a Massachusetts business trust.
The Fund offers multiple classes of shares which provide investors with different purchase options. Class A shares are offered to investors subject to an initial sales charge. Class B shares of the Fund are closed to new purchases, except exchanges or the reinvestment of dividends or other distributions. Class B shares were offered to investors without an initial sales charge and are subject to higher ongoing expenses than Class A shares and a contingent deferred sales charge payable upon certain redemptions. Class B shares automatically convert to Class A shares six years after issuance. Class C shares are offered to investors without an initial sales charge but are subject to higher ongoing expenses than Class A shares and a contingent deferred sales charge payable upon certain redemptions within one year of purchase. Class C shares do not automatically convert into another class. Institutional Class shares are offered to a limited group of investors, are not subject to initial or contingent deferred sales charges and generally have lower ongoing expenses than other classes. Class S shares are not subject to initial or contingent deferred sales charges and are generally not available to new investors except under certain circumstances.
Investment income, realized and unrealized gains and losses, and certain fund-level expenses and expense reductions, if any, are borne pro rata on the basis of relative net assets by the holders of all classes of shares, except that each class bears certain expenses unique to that class such as distribution and service fees, services to shareholders and certain other class-specific expenses. Differences in class-level expenses may result in payment of different per share dividends by class. All shares of the Fund have equal rights with respect to voting subject to class-specific arrangements.
The Fund's financial statements are prepared in accordance with accounting principles generally accepted in the United States of America which require the use of management estimates. Actual results could differ from those estimates. The policies described below are followed consistently by the Fund in the preparation of its financial statements.
Security Valuation. Investments are stated at value determined as of the close of regular trading on the New York Stock Exchange on each day the exchange is open for trading.
Various inputs are used in determining the value of the Fund's investments. These inputs are summarized in three broad levels. Level 1 includes quoted prices in active markets for identical securities. Level 2 includes other significant observable inputs (including quoted prices for similar securities, interest rates, prepayment speeds, and credit risk). Level 3 includes significant unobservable inputs (including the Fund's own assumptions in determining the fair value of investments). The inputs or methodology used for valuing securities are not necessarily an indication of the risk associated with investing in those securities.
Municipal debt securities are valued at prices supplied by independent pricing services approved by the Fund's Board. If the pricing services are unable to provide valuations, securities are valued at the most recent bid quotation or evaluated price, as applicable, obtained from one or more broker-dealers. Such services may use various pricing techniques which take into account appropriate factors such as yield, quality, coupon rate, maturity, type of issue, trading characteristics and other data, as well as broker quotes. These securities are generally categorized as Level 2.
Securities and other assets for which market quotations are not readily available or for which the above valuation procedures are deemed not to reflect fair value are valued in a manner that is intended to reflect their fair value as determined in accordance with procedures approved by the Board and are generally categorized as Level 3. In accordance with the Fund's valuation procedures, factors used in determining value may include, but are not limited to, the type of the security; the size of the holding; the initial cost of the security; the existence of any contractual restrictions on the security's disposition; the price and extent of public trading in similar securities of the issuer or of comparable companies; quotations or evaluated prices from broker-dealers and/or pricing services; information obtained from the issuer, analysts, and/or the appropriate stock exchange (for exchange-traded securities); an analysis of the company's or issuer's financial statements; an evaluation of the forces that influence the issuer and the market(s) in which the security is purchased and sold and with respect to debt securities; the maturity, coupon, creditworthiness, currency denomination and the movement of the market in which the security is normally traded. The value determined under these procedures may differ from published values for the same securities.
Disclosure about the classification of fair value measurements is included in a table following the Fund's Investment Portfolio.
New Accounting Pronouncement. In May 2011, Accounting Standards Update 2011-04 (ASU 2011-04), Amendments to Achieve Common Fair Value Measurement and Disclosure Requirements in U.S. GAAP and IFRSs, was issued and is effective during interim and annual periods beginning after December 15, 2011. ASU 2011-04 amends Accounting Standards Codification (ASC) Topic 820, Fair Value Measurement. The amendments are the result of the work by the Financial Accounting Standards Board and the International Accounting Standards Board to develop common requirements for measuring fair value and for disclosing information about fair value measurements in accordance with GAAP. Management is currently evaluating the application of ASU 2011-04 and its impact, if any, on the Fund's financial statements.
Inverse Floaters. The Fund may invest in inverse floaters. Inverse floaters are debt instruments with a weekly floating rate of interest that bears an inverse relationship to changes in the short-term interest rate market. Inverse floaters are created by depositing a fixed-rate municipal bond into a special purpose trust (the "Trust"). In turn the Trust issues a short-term floating rate note and an inverse floater. The income stream from the underlying bond in the Trust is divided between the floating rate note and the inverse floater. The income provided by the inverse floater bears an inverse relationship with the short-term rate paid to the floating rate note holder. The short-term floating rate note is issued in a face amount equal to some fraction of the underlying bond's par amount and is paid to a third party, usually a tax-exempt money market fund, at rates that generally reset weekly. The inverse floater earns all of the interest from the underlying fixed-rate bond less the amount of interest paid on the floating rate note and the expenses of the Trust. The inverse floater represents an investment in the underlying bond on a leveraged basis; the Fund bears all of the price risk of the underlying bond in the Trust and receives all the benefits from any potential appreciation of the underlying bond's value.
By holding the inverse floater, the Fund has the right to collapse the Trust by causing the holders of the floating rate instrument to tender their notes at par and have the broker transfer the underlying bond to the Fund. The floating rate note holder can also elect to tender the note for redemption at par at each reset date. The Fund accounts for these transactions as a form of secured borrowing, by reflecting the value of the underlying bond in the investments of the Fund and the amount owed to the floating rate note holder as a liability under the caption "Payable for floating rate notes issued" in the Statement of Assets and Liabilities. Income earned on the underlying bond is included in interest income, and interest paid on the floaters and the expenses of the Trust are included in "Interest expense and fees on floating rate notes issued" in the Statement of Operations.
The Fund may enter into shortfall and forbearance agreements by which the Fund agrees to reimburse the Trust, in certain circumstances, for the difference between the liquidation value of the underlying bond held by the Trust and the liquidation value of the floating rate notes plus any shortfalls in interest cash flows. This could potentially expose the Fund to losses in excess of the value of the Fund's inverse floater investments. In addition, the value of inverse floaters may decrease significantly when interest rates increase. The market for inverse floaters may be more volatile and less liquid than other municipal bonds of comparable maturity. The Trust could be terminated outside of the Fund's control, resulting in a reduction of leverage and disposal of portfolio investments at inopportune times and prices. Investments in inverse floaters generally involve greater risk than in an investment in fixed-rate bonds.
The Fund had no floating rate notes issued during the six months ended November 30, 2011.
Federal Income Taxes. The Fund's policy is to comply with the requirements of the Internal Revenue Code, as amended, which are applicable to regulated investment companies, and to distribute all of its taxable and tax-exempt income to its shareholders.
At May 31, 2011, the Fund had a net tax basis capital loss carryforward of approximately $1,320,000, which may be applied against any realized net taxable capital gains of each succeeding year until fully utilized or until May 31, 2018, the expiration date, whichever occurs first.
In addition, from November 1, 2010 through May 31, 2011, the Fund incurred approximately $3,960,000 of net realized capital losses. As permitted by tax regulations, the Fund intends to elect to defer these losses and treat them as arising in the fiscal year ending May 31, 2012.
On December 22, 2010, the Regulated Investment Company Modernization Act of 2010 (the "Act") was enacted. Under the Act, net capital losses may be carried forward indefinitely, and their character is retained as short-term and/or long-term losses. Previously, net capital losses were carried forward for eight years and treated as short-term losses. As a transition rule, the Act requires that post-enactment net capital losses be used before pre-enactment net capital losses. As a result of this ordering rule, pre-enactment capital loss carryforwards may expire unused, whereas under the previous rules these losses may have been utilized. This change is effective for fiscal years beginning after the date of enactment.
The Fund has reviewed the tax positions for the open tax years as of May 31, 2011 and has determined that no provision for income tax is required in the Fund's financial statements. The Fund's federal tax returns for the prior three fiscal years remain open subject to examination by the Internal Revenue Service.
Distribution of Income and Gains. Net investment income of the Fund is declared as a daily dividend and is distributed to shareholders monthly. Net realized gains from investment transactions, in excess of available capital loss carryforwards, would be taxable to the Fund if not distributed, and, therefore, will be distributed to shareholders at least annually.
The timing and characterization of certain income and capital gains distributions are determined annually in accordance with federal tax regulations which may differ from accounting principles generally accepted in the United States of America. These differences primarily relate to certain securities sold at a loss and accretion of market discount on debt securities. As a result, net investment income (loss) and net realized gain (loss) on investment transactions for a reporting period may differ significantly from distributions during such period. Accordingly, the Fund may periodically make reclassifications among certain of its capital accounts without impacting the net asset value of the Fund.
The tax character of current year distributions will be determined at the end of the current fiscal year.
Expenses. Expenses of the Trust arising in connection with a specific fund are allocated to that fund. Other Trust expenses which cannot be directly attributed to a fund are apportioned among the funds in the Trust.
Contingencies. In the normal course of business, the Fund may enter into contracts with service providers that contain general indemnification clauses. The Fund's maximum exposure under these arrangements is unknown as this would involve future claims that may be made against the Fund that have not yet been made. However, based on experience, the Fund expects the risk of loss to be remote.
Other. Investment transactions are accounted for on a trade date plus one basis for daily net asset value calculations. However, for financial reporting purposes, investment transactions are reported on trade date. Interest income is recorded on the accrual basis. Realized gains and losses from investment transactions are recorded on an identified cost basis. All premiums and discounts are amortized/accreted for financial reporting purposes.
B. Purchases and Sales of Securities
During the six months ended November 30, 2011, purchases and sales of investment securities (excluding short-term investments) aggregated $508,888,173 and $327,920,901, respectively.
C. Related Parties
Management Agreement. Under the Investment Management Agreement with Deutsche Investment Management Americas Inc. ("DIMA" or the "Advisor"), an indirect, wholly owned subsidiary of Deutsche Bank AG, the Advisor directs the investments of the Fund in accordance with its investment objectives, policies and restrictions. The Advisor determines the securities, instruments and other contracts relating to investments to be purchased, sold or entered into by the Fund.
The management fee payable under the Investment Management Agreement is at an annual rate of 0.315% of the Fund's average daily net assets, computed and accrued daily and payable monthly.
For the period from June 1, 2011 through September 30, 2012, the Advisor has contractually agreed to waive its fees and/or reimburse certain operating expenses of Class S shares to the extent necessary to maintain the operating expenses (excluding certain expenses such as extraordinary expenses, taxes, brokerage and interest) at 0.60%.
Administration Fee. Pursuant to an Administrative Services Agreement, DIMA provides most administrative services to the Fund. For all services provided under the Administrative Services Agreement, the Fund pays the Advisor an annual fee ("Administration Fee") of 0.10% of the Fund's average daily net assets, computed and accrued daily and payable monthly. For the six months ended November 30, 2011, the Administration Fee was $731,003, of which $127,002 is unpaid.
Service Provider Fees. DWS Investments Service Company ("DISC"), an affiliate of the Advisor, is the transfer agent, dividend-paying agent and shareholder service agent of the Fund. Pursuant to a sub-transfer agency agreement between DISC and DST Systems, Inc. ("DST"), DISC has delegated certain transfer agent, dividend-paying agent and shareholder service agent functions to DST. DISC compensates DST out of the shareholder servicing fee it receives from the Fund. For the six months ended November 30, 2011, the amounts charged to the Fund by DISC were as follows:
|
Services to Shareholders
|
Total Aggregated
|
Waived
|
Unpaid at November 30, 2011
|
|||||||||
|
Class A
|
$ | 10,187 | $ | — | $ | 4,988 | ||||||
|
Class B
|
183 | — | 110 | |||||||||
|
Class C
|
4,209 | — | 2,932 | |||||||||
|
Class S
|
53,924 | 53,924 | — | |||||||||
|
Institutional Class
|
18,178 | — | 8,526 | |||||||||
| $ | 86,681 | $ | 53,924 | $ | 16,556 | |||||||
In addition, the Advisor reimbursed $29,220 of sub-recordkeeping expenses for Class S shares.
Distribution and Service Fees. Under the Fund's Class B and Class C 12b-1 Plans, DWS Investments Distributors, Inc. ("DIDI"), an affiliate of the Advisor, receives a fee ("Distribution Fee") of 0.75% of average daily net assets of each of Class B and C shares. In accordance with the Fund's Underwriting and Distribution Services Agreement, DIDI enters into related selling group agreements with various firms at various rates for sales of Class B and C shares. For the six months ended November 30, 2011, the Distribution Fee was as follows:
|
Distribution Fee
|
Total Aggregated
|
Unpaid at November 30, 2011
|
||||||
|
Class B
|
$ | 5,660 | $ | 944 | ||||
|
Class C
|
260,157 | 44,826 | ||||||
| $ | 265,817 | $ | 45,770 | |||||
In addition DIDI provides information and administrative services for a fee ("Service Fee") to Class A, B and C shareholders at an annual rate of up to 0.25% of average daily net assets for each such class. DIDI in turn has various agreements with financial services firms that provide these services and pays these fees based upon the assets of shareholder accounts the firms service. For the six months ended November 30, 2011, the Service Fee was as follows:
|
Service Fee
|
Total Aggregated
|
Unpaid at November 30, 2011
|
Annualized Effective Rate
|
|||||||||
|
Class A
|
$ | 429,982 | $ | 139,692 | .25 | % | ||||||
|
Class B
|
1,886 | 605 | .25 | % | ||||||||
|
Class C
|
86,554 | 30,022 | .25 | % | ||||||||
| $ | 518,422 | $ | 170,319 | |||||||||
Underwriting Agreement and Contingent Deferred Sales Charge. DIDI is the principal underwriter for the Fund. Underwriting commissions paid in connection with the distribution of Class A shares for the six months ended November 30, 2011 aggregated $18,811.
In addition, DIDI receives any contingent deferred sales charge ("CDSC") from Class B share redemptions occurring within six years of purchase and Class C share redemptions occurring within one year of purchase. There is no such charge upon redemption of any share appreciation or reinvested dividends. The CDSC is based on declining rates ranging from 4% to 1% for Class B and 1% for Class C, of the value of the shares redeemed. For the six months ended November 30, 2011, the CDSC for Class B and C shares aggregated $2,067 and $5,823, respectively. A deferred sales charge of up to 0.50% is assessed on certain redemptions of Class A shares. For the six months ended November 30, 2011, DIDI received $3,520 for Class A shares.
Typesetting and Filing Service Fees. Under an agreement with DIMA, DIMA is compensated for providing typesetting and certain regulatory filing services to the Fund. For the six months ended November 30, 2011, the amount charged to the Fund by DIMA included in the Statement of Operations under "reports to shareholders" aggregated $13,115, of which $11,265 is unpaid.
Trustees' Fees and Expenses. The Fund paid each Trustee not affiliated with the Advisor retainer fees plus specified amounts for various committee services and for the Board Chairperson.
D. Line of Credit
The Fund and other affiliated funds (the "Participants") share in a $450 million revolving credit facility provided by a syndication of banks. The Fund may borrow for temporary or emergency purposes, including the meeting of redemption requests that otherwise might require the untimely disposition of securities. The Participants are charged an annual commitment fee which is allocated based on net assets, among each of the Participants. Interest is calculated at a rate per annum equal to the sum of the Federal Funds Rate plus 1.25 percent plus if LIBOR exceeds the Federal Funds Rate the amount of such excess. The Fund may borrow up to a maximum of 33 percent of its net assets under the agreement. The Fund had no outstanding loans at November 30, 2011.
E. Share Transactions
The following table summarizes share and dollar activity in the Fund:
|
Six Months Ended
November 30, 2011
|
Year Ended
May 31, 2011
|
|||||||||||||||
|
Shares
|
Dollars
|
Shares
|
Dollars
|
|||||||||||||
|
Shares sold
|
||||||||||||||||
|
Class A
|
4,964,032 | $ | 57,467,485 | 18,565,954 | $ | 212,275,170 | ||||||||||
|
Class B
|
4,396 | 51,288 | 7,389 | 85,696 | ||||||||||||
|
Class C
|
1,257,447 | 14,561,493 | 2,437,164 | 27,903,350 | ||||||||||||
|
Class S
|
10,556,893 | 121,860,628 | 24,528,224 | 278,449,494 | ||||||||||||
|
Institutional Class
|
12,015,387 | 139,059,457 | 15,095,476 | 171,409,155 | ||||||||||||
| $ | 333,000,351 | $ | 690,122,865 | |||||||||||||
|
Shares issued to shareholders in reinvestment of distributions
|
||||||||||||||||
|
Class A
|
390,675 | $ | 4,522,326 | 791,857 | $ | 8,995,642 | ||||||||||
|
Class B
|
1,141 | 13,223 | 2,506 | 28,484 | ||||||||||||
|
Class C
|
42,714 | 494,521 | 81,447 | 924,273 | ||||||||||||
|
Class S
|
560,358 | 6,488,688 | 1,084,548 | 12,329,185 | ||||||||||||
|
Institutional Class
|
430,209 | 4,983,870 | 744,214 | 8,450,567 | ||||||||||||
| $ | 16,502,628 | $ | 30,728,151 | |||||||||||||
|
Shares redeemed
|
||||||||||||||||
|
Class A
|
(5,030,135 | ) | $ | (58,210,393 | ) | (14,565,174 | ) | $ | (163,455,856 | ) | ||||||
|
Class B
|
(23,719 | ) | (273,835 | ) | (27,935 | ) | (316,691 | ) | ||||||||
|
Class C
|
(687,616 | ) | (7,944,821 | ) | (1,754,774 | ) | (19,667,824 | ) | ||||||||
|
Class S
|
(6,986,575 | ) | (80,910,245 | ) | (18,566,095 | ) | (209,093,806 | ) | ||||||||
|
Institutional Class
|
(5,175,217 | ) | (59,956,699 | ) | (9,294,601 | ) | (104,758,950 | ) | ||||||||
| $ | (207,295,993 | ) | $ | (497,293,127 | ) | |||||||||||
|
Net increase (decrease)
|
||||||||||||||||
|
Class A
|
324,572 | $ | 3,779,418 | 4,792,637 | $ | 57,814,956 | ||||||||||
|
Class B
|
(18,182 | ) | (209,324 | ) | (18,040 | ) | (202,511 | ) | ||||||||
|
Class C
|
612,545 | 7,111,193 | 763,837 | 9,159,799 | ||||||||||||
|
Class S
|
4,130,676 | 47,439,071 | 7,046,677 | 81,684,873 | ||||||||||||
|
Institutional Class
|
7,270,379 | 84,086,628 | 6,545,089 | 75,100,772 | ||||||||||||
| $ | 142,206,986 | $ | 223,557,889 | |||||||||||||
F. Regulatory Settlements
On December 21, 2006, the Advisor settled proceedings with the SEC and the New York Attorney General regarding alleged improper trading of fund shares. In accordance with the distribution plan, developed by a distribution consultant, settlement proceeds were distributed to affected shareholders of the Fund, and unclaimed proceeds were then paid to the Fund in the amount of $359. This payment is included in "Increase from regulatory settlements" in the Statement of Changes in Net Assets for the year ended May 31, 2011. The amount of the payment was less than 0.01% of the Fund's average net assets, thus having no impact on total return.
The Board of Trustees approved the renewal of DWS Intermediate Tax/AMT Free Fund's investment management agreement (the "Agreement") with Deutsche Investment Management Americas Inc. ("DWS") in September 2011.
In terms of the process that the Board followed prior to approving the Agreement, shareholders should know that:
· In September 2011, all of the Fund's Trustees were independent of DWS and its affiliates.
· The Trustees met frequently during the past year to discuss fund matters and dedicated a substantial amount of time to contract review matters. Over the course of several months, the Board's Contract Committee, in coordination with the Board's Fixed Income and Quant Oversight Committee, reviewed comprehensive materials received from DWS, independent third parties and independent counsel. These materials included an analysis of the Fund's performance, fees and expenses, and profitability compiled by the Fund's independent fee consultant. The Board also received extensive information throughout the year regarding performance of the Fund.
· The Independent Trustees regularly meet privately with their independent counsel to discuss contract review and other matters. In addition, the Independent Trustees were also advised by the Fund's independent fee consultant in the course of their review of the Fund's contractual arrangements and considered a comprehensive report prepared by the independent fee consultant in connection with their deliberations (the "IFC Report").
· In connection with reviewing the Agreement, the Board also reviewed the terms of the Fund's Rule 12b-1 plan, distribution agreement, administrative services agreement, transfer agency agreement and other material service agreements.
· Based on its evaluation of the information provided, the Contract Committee presented its findings and recommendations to the Board. The Board then reviewed the Contract Committee's findings and recommendations.
In connection with the contract review process, the Contract Committee and the Board considered the factors discussed below, among others. The Board also considered that DWS and its predecessors have managed the Fund since its inception, and the Board believes that a long-term relationship with a capable, conscientious advisor is in the best interests of the Fund. The Board considered, generally, that shareholders chose to invest or remain invested in the Fund knowing that DWS managed the Fund, and that the Agreement was approved by the Fund's shareholders. DWS is part of Deutsche Bank, a major global banking institution that is engaged in a wide range of financial services. The Board believes that there are significant advantages to being part of a global asset management business that offers a wide range of investing expertise and resources, including hundreds of portfolio managers and analysts with research capabilities in many countries throughout the world.
While shareholders may focus primarily on fund performance and fees, the Fund's Board considers these and many other factors, including the quality and integrity of DWS's personnel and such other issues as back-office operations, fund valuations, and compliance policies and procedures.
Nature, Quality and Extent of Services. The Board considered the terms of the Agreement, including the scope of advisory services provided under the Agreement. The Board noted that, under the Agreement, DWS provides portfolio management services to the Fund and that, pursuant to a separate administrative services agreement, DWS provides administrative services to the Fund. The Board considered the experience and skills of senior management and investment personnel, the resources made available to such personnel, the ability of DWS to attract and retain high-quality personnel, and the organizational depth and stability of DWS. The Board reviewed the Fund's performance over short-term and long-term periods and compared those returns to various agreed-upon performance measures, including market indices and a peer universe compiled by the independent fee consultant using information supplied by Lipper Inc. ("Lipper"). The Board also noted that it has put into place a process of identifying "Focus Funds" (e.g., funds performing poorly relative to their benchmark or a peer universe compiled by an independent fund data service), and receives more frequent reporting and information from DWS regarding such funds, along with DWS's remedial plans to address underperformance. The Board believes this process is an effective manner of identifying and addressing underperforming funds. Based on the information provided, the Board noted that for the one-, three- and five-year periods ended December 31, 2010, the Fund's performance (Class A shares) was in the 4th quartile, 2nd quartile and 2nd quartile, respectively, of the applicable Lipper universe (the 1st quartile being the best performers and the 4th quartile being the worst performers). The Board also observed that the Fund has underperformed its benchmark in the one-, three- and five-year periods ended December 31, 2010. The Board noted the disappointing investment performance of the Fund in recent periods and continued to discuss with senior management of DWS the factors contributing to such underperformance and actions being taken to improve performance. The Board recognized that DWS has made significant changes in its investment processes in recent years in an effort to improve long-term performance.
On the basis of this evaluation and the ongoing review of investment results by the Board, the Board concluded that the nature, quality and extent of services provided by DWS historically have been and continue to be satisfactory.
Fees and Expenses. The Board considered the Fund's investment management fee schedule, operating expenses, and total expense ratios, and comparative information provided by Lipper and the independent fee consultant regarding investment management fee rates paid to other investment advisors by similar funds (1st quartile being the most favorable and 4th quartile being the least favorable). With respect to management fees paid to other investment advisors by similar funds, the Board noted that the contractual fee rates paid by the Fund, which include a 0.10% fee paid to DWS under the Fund's administrative services agreement, were lower than the median (2nd quartile) of the applicable Lipper peer group (based on Lipper data provided as of December 31, 2010). The Board noted that the Fund's Class A shares total (net) operating expenses (excluding 12b-1 fees) were expected to be lower than the median (2nd quartile) of the applicable Lipper expense universe (based on Lipper data provided as of December 31, 2010, and analyzing Lipper expense universe Class A expenses less any applicable 12b-1 fees) ("Lipper Universe Expenses"). The Board also reviewed data comparing each share class's total (net) operating expenses to the applicable Lipper Universe Expenses. The Board considered the Fund's management fee rate as compared to fees charged by DWS and certain of its affiliates for comparable mutual funds and considered differences in fund and fee structures between the DWS Funds. The Board also considered how the Fund's total (net) operating expenses compared to the total (net) operating expenses of a more customized peer group selected by Lipper (based on such factors as asset size). The Board also noted that the expense limitation agreed to by DWS helped to ensure that the Fund's total (net) operating expenses would remain competitive.
The information considered by the Board as part of its review of management fees included information regarding fees charged by DWS and its affiliates to similar institutional accounts and to similar funds offered primarily to European investors ("DWS Europe funds"), in each case as applicable. The Board observed that advisory fee rates for institutional accounts generally were lower than the management fees charged by similarly managed DWS U.S. mutual funds ("DWS Funds"), but also took note of the differences in services provided to DWS Funds as compared to institutional accounts. In the case of DWS Europe funds, the Board observed that fee rates for DWS Europe funds generally were higher than for similarly managed DWS Funds, but noted that differences in the types of services provided to DWS Funds relative to DWS Europe funds made it difficult to compare such fees.
On the basis of the information provided, the Board concluded that management fees were reasonable and appropriate in light of the nature, quality and extent of services provided by DWS.
Profitability. The Board reviewed detailed information regarding revenues received by DWS under the Agreement. The Board considered the estimated costs and pre-tax profits realized by DWS from advising the DWS Funds, as well as estimates of the pre-tax profits attributable to managing the Fund in particular. The Board also received information regarding the estimated enterprise-wide profitability of DWS and its affiliates with respect to all fund services in totality and by fund. The Board and the independent fee consultant reviewed DWS's methodology in allocating its costs to the management of the Fund. Based on the information provided, the Board concluded that the pre-tax profits realized by DWS in connection with the management of the Fund were not unreasonable. The Board also reviewed information regarding the profitability of certain similar investment management firms. The Board noted that while information regarding the profitability of such firms is limited (and in some cases is not necessarily prepared on a comparable basis), DWS and its affiliates' overall profitability with respect to the DWS fund complex (after taking into account distribution and other services provided to the funds by DWS and its affiliates) was lower than the overall profitability levels of many comparable firms for which such data was available.
Economies of Scale. The Board considered whether there are economies of scale with respect to the management of the Fund and whether the Fund benefits from any economies of scale. The Board concluded that the Fund's fee schedule represents an appropriate sharing between the Fund and DWS of such economies of scale as may exist in the management of the Fund at current asset levels.
Other Benefits to DWS and Its Affiliates. The Board also considered the character and amount of other incidental benefits received by DWS and its affiliates, including any fees received by DWS for administrative services provided to the Fund and any fees received by an affiliate of DWS for distribution services. The Board also considered benefits to DWS related to brokerage and soft-dollar allocations, including allocating brokerage to pay for research generated by parties other than the executing broker dealers, which pertain primarily to funds investing in equity securities, along with the incidental public relations benefits to DWS related to DWS Funds advertising and cross-selling opportunities among DWS products and services. The Board concluded that management fees were reasonable in light of these fallout benefits.
Compliance. The Board considered the significant attention and resources dedicated by DWS to documenting and enhancing its compliance processes in recent years. The Board noted in particular (i) the experience and seniority of both DWS's chief compliance officer and the Fund's chief compliance officer; (ii) the large number of DWS compliance personnel; and (iii) the substantial commitment of resources by DWS and its affiliates to compliance matters.
Based on all of the information considered and the conclusions reached, the Board unanimously determined that the continuation of the Agreement is in the best interests of the Fund. In making this determination, the Board did not give particular weight to any single factor identified above. The Board considered these factors over the course of numerous meetings, certain of which were in executive session with only the Independent Trustees and their counsel present. It is possible that individual Trustees may have weighed these factors differently in reaching their individual decisions to approve the continuation of the Agreement.
September 26, 2011
Pursuant to an Order entered into by Deutsche Investment Management Americas and affiliates (collectively, "DeAM") with the Attorney General of New York, I, Thomas H. Mack, have been appointed the Independent Fee Consultant for the DWS Funds (formerly the DWS Scudder Funds). My duties include preparing an annual written evaluation of the management fees DeAM charges the Funds, considering among other factors the management fees charged by other mutual fund companies for like services, management fees DeAM charges other clients for like services, DeAM's costs of supplying services under the management agreements and related profit margins, possible economies of scale if a Fund grows larger, and the nature and quality of DeAM's services, including fund performance. This report summarizes my evaluation for 2011, including my qualifications, the evaluation process for each of the DWS Funds, consideration of certain complex-level factors, and my conclusions. I served in substantially the same capacity in 2007, 2008, 2009 and 2010.
Qualifications
For more than 35 years I have served in various professional capacities within the investment management business. I have held investment analysis and advisory positions, including securities analyst, portfolio strategist and director of investment policy with a large investment firm. I have also performed business management functions, including business development, financial management and marketing research and analysis.
Since 1991, I have been an independent consultant within the asset management industry. I have provided services to over 125 client organizations, including investment managers, mutual fund boards, product distributors and related organizations. Over the past ten years I have completed a number of assignments for mutual fund boards, specifically including assisting boards with management contract renewal.
I hold a Master of Business Administration degree, with highest honors, from Harvard University and Master of Science and Bachelor of Science (highest honors) degrees from the University of California at Berkeley. I am an independent director and audit committee financial expert for two closed-end mutual funds and have served in various leadership and financial oversight capacities with non-profit organizations.
Evaluation of Fees for each DWS Fund
My work focused primarily on evaluating, fund-by-fund, the fees charged to each of the 109 mutual fund portfolios in the DWS Fund family. For each Fund, I considered each of the key factors mentioned above, as well as any other relevant information. In doing so I worked closely with the Funds' Independent Directors in their annual contract renewal process, as well as in their approval of contracts for several new funds (documented separately).
In evaluating each Fund's fees, I reviewed comprehensive materials provided by or on behalf of DeAM, including expense information prepared by Lipper Analytical, comparative performance information, profitability data, manager histories, and other materials. I also accessed certain additional information from the Lipper and Morningstar databases and drew on my industry knowledge and experience.
To facilitate evaluating this considerable body of information, I prepared for each Fund a document summarizing the key data elements in each area as well as additional analytics discussed below. This made it possible to consider each key data element in the context of the others.
In the course of contract renewal, DeAM agreed to implement a number of fee and expense adjustments requested by the Independent Directors which will favorably impact future fees and expenses, and my evaluation includes the effects of these changes.
Fees and Expenses Compared with Other Funds
The competitive fee and expense evaluation for each fund focused on two primary comparisons:
The Fund's contractual management fee (the advisory fee plus the administration fee where applicable) compared with those of a group of typically 12-15 funds in the same Lipper investment category (e.g. Large Capitalization Growth) having similar distribution arrangements and being of similar size.
The Fund's total expenses compared with a broader universe of funds from the same Lipper investment category and having similar distribution arrangements.
These two comparisons provide a view of not only the level of the fee compared with funds of similar scale but also the total expense the Fund bears for all the services it receives, in comparison with the investment choices available in the Fund's investment category and distribution channel. The principal figure-of-merit used in these comparisons was the subject Fund's percentile ranking against peers.
DeAM's Fees for Similar Services to Others
DeAM provided management fee schedules for all of its US domiciled fund and non-fund investment management accounts in any of the investment categories where there is a DWS Fund. These similar products included the other DWS Funds, non-fund pooled accounts, institutional accounts and sub-advisory accounts. Using this information, I calculated for each Fund the fee that would be charged to each similar product, at the subject Fund's asset level.
Evaluating information regarding non-fund products is difficult because there are varying levels of services required for different types of accounts, with mutual funds generally requiring considerably more regulatory and administrative types of service as well as having more frequent cash flows than other types of accounts. Also, while mutual fund fees for similar fund products can be expected to be similar, there will be some differences due to different pricing conditions in different distribution channels (e.g. retail funds versus those used in variable insurance products), differences in underlying investment processes and other factors.
Costs and Profit Margins
DeAM provided a detailed profitability analysis for each Fund. After making some adjustments so that the presentation would be more comparable to the available industry figures, I reviewed profit margins from investment management alone, from investment management plus other fund services (excluding distribution) provided to the Funds by DeAM (principally shareholder services), and DeAM profits from all sources, including distribution. A later section comments on overall profitability.
Economies of Scale
Economies of scale — an expected decline in management cost per dollar of fund assets as fund assets grow — are very rarely quantified and documented because of inherent difficulties in collecting and analyzing relevant data. However, in virtually every investment category that I reviewed, larger funds tend to have lower fees and lower total expenses than smaller funds. To see how each DWS Fund compares with this industry observation, I reviewed:
The trend in Fund assets over the last five years and the accompanying trend in total expenses. This shows if the Fund has grown and, if so, whether total expense (management fees as well as other expenses) have declined as a percent of assets.
Whether the Fund has break-points in its management fee schedule, the extent of the fee reduction built into the schedule and the asset levels where the breaks take effect, and in the case of a sub-advised Fund how the Fund's break-points compare with those of the sub-advisory fee schedule.
How the Fund's contractual fee schedule compares with trends in the industry data. To accomplish this, I constructed a chart showing how actual latest-fiscal-year contractual fees of the Fund and of other similar funds relate to average fund assets, with the subject Fund's contractual fee schedule superimposed.
Quality of Service — Performance
The quality-of-service evaluation focused on investment performance, which is the principal result of the investment management service. Each Fund's performance was reviewed over the past 1, 3, 5 and 10 years, as applicable, and compared with that of other funds in the same investment category and with a suitable market index.
In addition, I calculated and reviewed risk-adjusted returns relative to an index of similar mutual funds' returns and a suitable market index. The risk-adjusted returns analysis provides a way of determining the extent to which the Fund's return comparisons are mainly the product of investment value-added (or lack thereof) or alternatively taking considerably more or less risk than is typical in its investment category.
I also received and considered the history of portfolio manager changes for each Fund, as this provided an important context for evaluating the performance results.
Complex-Level Considerations
While this evaluation was conducted mainly at the individual fund level, there are some issues relating to the reasonableness of fees that can alternatively be considered across the whole fund complex:
I reviewed DeAM's profitability analysis for all DWS Funds, with a view toward determining if the allocation procedures used were reasonable and how profit levels compared with public data for other investment managers.
I considered whether DeAM and affiliates receive any significant ancillary or "fall-out" benefits that should be considered in interpreting the direct profitability results. These would be situations where serving as the investment manager of the Funds is beneficial to another part of the Deutsche Bank organization.
I considered how aggregated DWS Fund expenses had varied over the years, by asset class and in the context of trends in asset levels.
I reviewed the structure of the DeAM organization, trends in staffing levels, and information on compensation of investment management and other professionals compared with industry data.
Findings
Based on the process and analysis discussed above, which included reviewing a wide range of information from management and external data sources and considering among other factors the fees DeAM charges other clients, the fees charged by other fund managers, DeAM's costs and profits associated with managing the Funds, economies of scale, possible fall-out benefits, and the nature and quality of services provided, in my opinion the management fees charged the DWS Funds are reasonable.

Thomas H. Mack
President, Thomas H. Mack & Co., Inc.
|
For More Information
|
The automated telephone system allows you to access personalized account information and obtain information on other DWS funds using either your voice or your telephone keypad. Certain account types within Classes A, B, C and S also have the ability to purchase, exchange or redeem shares using this system.
For more information, contact your financial advisor. You may also access our automated telephone system or speak with a DWS Investments representative by calling the appropriate number below:
For shareholders of Classes A, B, C and Institutional Class:
(800) 621-1048
For shareholders of Class S:
(800) 728-3337
|
|
|
Web Site
|
www.dws-investments.com
View your account transactions and balances, trade shares, monitor your asset allocation, and change your address, 24 hours a day.
Obtain prospectuses and applications, blank forms, interactive worksheets, news about DWS funds, subscription to fund updates by e-mail, retirement planning information, and more.
|
|
|
Written Correspondence
|
DWS Investments
PO Box 219151
Kansas City, MO 64121-9151
|
|
|
Proxy Voting
|
The fund's policies and procedures for voting proxies for portfolio securities and information about how the fund voted proxies related to its portfolio securities during the 12-month period ended June 30 are available on our Web site — www.dws-investments.com (click on "proxy voting"at the bottom of the page) — or on the SEC's Web site — www.sec.gov. To obtain a written copy of the fund's policies and procedures without charge, upon request, call us toll free at (800) 621-1048.
|
|
|
Principal Underwriter
|
If you have questions, comments or complaints, contact:
DWS Investments Distributors, Inc.
222 South Riverside Plaza
Chicago, IL 60606-5808
(800) 621-1148
|
|
|
Class A
|
Class B
|
Class C
|
Class S
|
Institutional Class
|
||
|
Nasdaq Symbol
|
SZMAX
|
SZMBX
|
SZMCX
|
SCMTX
|
SZMIX
|
|
|
CUSIP Number
|
23337X-103
|
23337X-202
|
23337X-301
|
23337X-509
|
23337X-707
|
|
|
Fund Number
|
445
|
645
|
745
|
2045
|
1445
|
|
FACTS
|
What Does DWS Investments Do With Your Personal Information?
|
|
Why?
|
Financial companies choose how they share your personal information. Federal law gives consumers the right to limit some but not all sharing. Federal law also requires us to tell you how we collect, share and protect your personal information. Please read this notice carefully to understand what we do.
|
|
What?
|
The types of personal information we collect and share can include:
· Social Security number
· Account balances
· Purchase and transaction history
· Bank account information
· Contact information such as mailing address, e-mail address and telephone number
|
|
How?
|
All financial companies need to share customers' personal information to run their everyday business. In the section below, we list the reasons financial companies can share their customers' personal information, the reasons DWS Investments chooses to share and whether you can limit this sharing.
|
|
Reasons we can share your personal information
|
Does DWS Investments share?
|
Can you limit this sharing?
|
|
For our everyday business purposes — such as to process your transactions, maintain your account(s), respond to court orders or legal investigations
|
Yes
|
No
|
|
For our marketing purposes — to offer our products and services to you
|
Yes
|
No
|
|
For joint marketing with other financial companies
|
No
|
We do not share
|
|
For our affiliates' everyday business purposes — information about your transactions and experiences
|
No
|
We do not share
|
|
For our affiliates' everyday business purposes — information about your creditworthiness
|
No
|
We do not share
|
|
For non-affiliates to market to you
|
No
|
We do not share
|
|
Questions?
|
Call (800) 621-1048 or e-mail us at dws-investments.info@dws.com
|
|
Who we are
|
|
|
Who is providing this notice?
|
DWS Investments Distributors, Inc.; Deutsche Investment Management Americas, Inc.; DeAM Investor Services, Inc.; DWS Trust Company; the DWS Funds
|
|
What we do
|
|
|
How does DWS Investments protect my personal information?
|
To protect your personal information from unauthorized access and use, we use security measures that comply with federal law. These measures include computer safeguards and secured files and buildings.
|
|
How does DWS Investments collect my personal information?
|
We collect your personal information, for example. When you:
· open an account
· give us your contact information
· provide bank account information for ACH or wire transactions
· tell us where to send money
· seek advice about your investments
|
|
Why can't I limit all sharing?
|
Federal law gives you the right to limit only
· sharing for affiliates' everyday business purposes — information about your creditworthiness
· affiliates from using your information to market to you
· sharing for nonaffiliates to market to you
State laws and individual companies may give you additional rights to limit sharing.
|
|
Definitions
|
|
|
Affiliates
|
Companies related by common ownership or control. They can be financial or non-financial companies. Our affiliates include financial companies with the DWS or Deutsche Bank ("DB") name, such as DB AG Frankfurt and DB Alex Brown.
|
|
Non-affiliates
|
Companies not related by common ownership or control. They can be financial and non-financial companies.
Non-affiliates we share with include account service providers, service quality monitoring services, mailing service providers and verification services to help in the fight against money laundering and fraud.
|
|
Joint marketing
|
A formal agreement between non-affiliated financial companies that together market financial products or services to you. DWS Investments does not jointly market.
|
|
Rev. 09/2011
|
||
Notes
Notes
Notes

|
ITEM 2.
|
CODE OF ETHICS
|
|
|
Not applicable.
|
||
|
ITEM 3.
|
AUDIT COMMITTEE FINANCIAL EXPERT
|
|
|
Not applicable
|
||
|
ITEM 4.
|
PRINCIPAL ACCOUNTANT FEES AND SERVICES
|
|
|
Not applicable
|
||
|
ITEM 5.
|
AUDIT COMMITTEE OF LISTED REGISTRANTS
|
|
|
Not applicable
|
||
|
ITEM 6.
|
SCHEDULE OF INVESTMENTS
|
|
|
Not applicable
|
||
|
ITEM 7.
|
DISCLOSURE OF PROXY VOTING POLICIES AND PROCEDURES FOR CLOSED-END MANAGEMENT INVESTMENT COMPANIES
|
|
|
Not applicable
|
||
|
ITEM 8.
|
PORTFOLIO MANAGERS OF CLOSED-END MANAGEMENT INVESTMENT COMPANIES
|
|
|
Not applicable
|
||
|
ITEM 9.
|
PURCHASES OF EQUITY SECURITIES BY CLOSED-END MANAGEMENT INVESTMENT COMPANY AND AFFILIATED PURCHASERS
|
|
|
Not applicable
|
||
|
ITEM 10.
|
SUBMISSION OF MATTERS TO A VOTE OF SECURITY HOLDERS
|
|
|
There were no material changes to the procedures by which shareholders may recommend nominees to the Fund’s Board. The primary function of the Nominating and Governance Committee is to identify and recommend individuals for membership on the Board and oversee the administration of the Board Governance Guidelines. Shareholders may recommend candidates for Board positions by forwarding their correspondence by U.S. mail or courier service to Paul K. Freeman, Independent Chairman, DWS Funds, P.O. Box 101833, Denver, CO 80250-1833.
|
||
|
ITEM 11.
|
CONTROLS AND PROCEDURES
|
|
|
(a)
|
The Chief Executive and Financial Officers concluded that the Registrant’s Disclosure Controls and Procedures are effective based on the evaluation of the Disclosure Controls and Procedures as of a date within 90 days of the filing date of this report.
|
|
|
(b)
|
There have been no changes in the registrant’s internal control over financial reporting that occurred during the second fiscal quarter of the period covered by this report that has materially affected, or is reasonably likely to materially affect, the registrant’s internal controls over financial reporting.
|
|
|
ITEM 12.
|
EXHIBITS
|
|
|
(a)(1)
|
Certification pursuant to Rule 30a-2(a) under the Investment Company Act of 1940 (17 CFR 270.30a-2(a)) is filed and attached hereto as Exhibit 99.CERT.
|
|
|
(b)
|
Certification pursuant to Rule 30a-2(b) under the Investment Company Act of 1940 (17 CFR 270.30a-2(b)) is furnished and attached hereto as Exhibit 99.906CERT.
|
|
Form N-CSRS Item F
SIGNATURES
Pursuant to the requirements of the Securities Exchange Act of 1934 and the Investment Company Act of 1940, the registrant has duly caused this report to be signed on its behalf by the undersigned, thereunto duly authorized.
|
Registrant:
|
DWS Intermediate Tax/AMT Free Fund, a series of DWS Tax Free Trust
|
|
By:
|
/s/W. Douglas Beck
W. Douglas Beck
President
|
|
Date:
|
January 30, 2012
|
Pursuant to the requirements of the Securities Exchange Act of 1934 and the Investment Company Act of 1940, this report has been signed below by the following persons on behalf of the registrant and in the capacities and on the dates indicated.
|
By:
|
/s/W. Douglas Beck
W. Douglas Beck
President
|
|
Date:
|
January 30, 2012
|
|
By:
|
/s/Paul Schubert
Paul Schubert
Chief Financial Officer and Treasurer
|
|
Date:
|
January 30, 2012
|