false2024Q2000071140410/31http://fasb.org/us-gaap/2024#DebtCurrenthttp://fasb.org/us-gaap/2024#LongTermDebtAndCapitalLeaseObligationsxbrli:sharesiso4217:USDiso4217:USDxbrli:sharesxbrli:purecoo:installmentcoo:interest_rate_swap_contract00007114042023-11-012024-04-3000007114042024-05-2400007114042024-02-012024-04-3000007114042023-02-012023-04-3000007114042022-11-012023-04-3000007114042024-02-162024-02-1600007114042024-04-3000007114042023-10-310000711404coo:CommonStockExcludingTreasuryStockParNetValueMember2022-10-310000711404us-gaap:TreasuryStockCommonMember2022-10-310000711404coo:TreasuryStockParNetValueMember2022-10-310000711404us-gaap:AdditionalPaidInCapitalMember2022-10-310000711404us-gaap:AccumulatedOtherComprehensiveIncomeMember2022-10-310000711404us-gaap:RetainedEarningsMember2022-10-310000711404us-gaap:NoncontrollingInterestMember2022-10-3100007114042022-10-310000711404us-gaap:RetainedEarningsMember2022-11-012023-01-3100007114042022-11-012023-01-310000711404us-gaap:AccumulatedOtherComprehensiveIncomeMember2022-11-012023-01-310000711404coo:CommonStockExcludingTreasuryStockParNetValueMember2022-11-012023-01-310000711404us-gaap:AdditionalPaidInCapitalMember2022-11-012023-01-310000711404us-gaap:TreasuryStockCommonMember2022-11-012023-01-310000711404coo:CommonStockExcludingTreasuryStockParNetValueMember2023-01-310000711404us-gaap:TreasuryStockCommonMember2023-01-310000711404coo:TreasuryStockParNetValueMember2023-01-310000711404us-gaap:AdditionalPaidInCapitalMember2023-01-310000711404us-gaap:AccumulatedOtherComprehensiveIncomeMember2023-01-310000711404us-gaap:RetainedEarningsMember2023-01-310000711404us-gaap:NoncontrollingInterestMember2023-01-3100007114042023-01-310000711404us-gaap:RetainedEarningsMember2023-02-012023-04-300000711404us-gaap:AccumulatedOtherComprehensiveIncomeMember2023-02-012023-04-300000711404coo:CommonStockExcludingTreasuryStockParNetValueMember2023-02-012023-04-300000711404us-gaap:AdditionalPaidInCapitalMember2023-02-012023-04-300000711404us-gaap:TreasuryStockCommonMember2023-02-012023-04-300000711404coo:CommonStockExcludingTreasuryStockParNetValueMember2023-04-300000711404us-gaap:TreasuryStockCommonMember2023-04-300000711404coo:TreasuryStockParNetValueMember2023-04-300000711404us-gaap:AdditionalPaidInCapitalMember2023-04-300000711404us-gaap:AccumulatedOtherComprehensiveIncomeMember2023-04-300000711404us-gaap:RetainedEarningsMember2023-04-300000711404us-gaap:NoncontrollingInterestMember2023-04-3000007114042023-04-300000711404coo:CommonStockExcludingTreasuryStockParNetValueMember2023-10-310000711404us-gaap:TreasuryStockCommonMember2023-10-310000711404coo:TreasuryStockParNetValueMember2023-10-310000711404us-gaap:AdditionalPaidInCapitalMember2023-10-310000711404us-gaap:AccumulatedOtherComprehensiveIncomeMember2023-10-310000711404us-gaap:RetainedEarningsMember2023-10-310000711404us-gaap:NoncontrollingInterestMember2023-10-310000711404us-gaap:RetainedEarningsMember2023-11-012024-01-3100007114042023-11-012024-01-310000711404us-gaap:AccumulatedOtherComprehensiveIncomeMember2023-11-012024-01-310000711404coo:CommonStockExcludingTreasuryStockParNetValueMember2023-11-012024-01-310000711404us-gaap:AdditionalPaidInCapitalMember2023-11-012024-01-310000711404us-gaap:TreasuryStockCommonMember2023-11-012024-01-310000711404coo:CommonStockExcludingTreasuryStockParNetValueMember2024-01-310000711404us-gaap:TreasuryStockCommonMember2024-01-310000711404coo:TreasuryStockParNetValueMember2024-01-310000711404us-gaap:AdditionalPaidInCapitalMember2024-01-310000711404us-gaap:AccumulatedOtherComprehensiveIncomeMember2024-01-310000711404us-gaap:RetainedEarningsMember2024-01-310000711404us-gaap:NoncontrollingInterestMember2024-01-3100007114042024-01-310000711404us-gaap:RetainedEarningsMember2024-02-012024-04-300000711404us-gaap:AccumulatedOtherComprehensiveIncomeMember2024-02-012024-04-300000711404coo:CommonStockExcludingTreasuryStockParNetValueMember2024-02-012024-04-300000711404us-gaap:AdditionalPaidInCapitalMember2024-02-012024-04-300000711404us-gaap:TreasuryStockCommonMember2024-02-012024-04-300000711404coo:CommonStockExcludingTreasuryStockParNetValueMember2024-04-300000711404us-gaap:TreasuryStockCommonMember2024-04-300000711404coo:TreasuryStockParNetValueMember2024-04-300000711404us-gaap:AdditionalPaidInCapitalMember2024-04-300000711404us-gaap:AccumulatedOtherComprehensiveIncomeMember2024-04-300000711404us-gaap:RetainedEarningsMember2024-04-300000711404us-gaap:NoncontrollingInterestMember2024-04-3000007114042024-02-160000711404coo:CookMedicalMember2023-11-012023-11-010000711404coo:CookMedicalMembercoo:PayablesFirstInstallmentMember2023-11-012023-11-010000711404coo:CookMedicalMembercoo:PayablesSecondInstallmentMember2023-11-012023-11-010000711404coo:CookMedicalMember2023-11-022024-04-300000711404coo:CookMedicalMemberus-gaap:TechnologyBasedIntangibleAssetsMember2023-11-010000711404us-gaap:CustomerRelationshipsMembercoo:CookMedicalMember2023-11-010000711404coo:CookMedicalMember2023-11-0100007114042022-03-012022-03-310000711404coo:SightGlassVisionIncMember2022-03-310000711404coo:EssilorInternationalSASMember2022-03-012022-03-310000711404coo:SightGlassVisionIncMember2022-02-280000711404us-gaap:CustomerRelationshipsMember2024-04-300000711404us-gaap:CustomerRelationshipsMember2023-10-310000711404coo:CompositeMember2024-04-300000711404coo:CompositeMember2023-10-310000711404us-gaap:TechnologyBasedIntangibleAssetsMember2024-04-300000711404us-gaap:TechnologyBasedIntangibleAssetsMember2023-10-310000711404us-gaap:TrademarksMember2024-04-300000711404us-gaap:TrademarksMember2023-10-310000711404coo:LicenseAndDistributionRightsAndOtherMember2024-04-300000711404coo:LicenseAndDistributionRightsAndOtherMember2023-10-310000711404us-gaap:LineOfCreditMemberus-gaap:RevolvingCreditFacilityMember2024-04-300000711404us-gaap:LineOfCreditMemberus-gaap:RevolvingCreditFacilityMember2023-10-310000711404us-gaap:MediumTermNotesMember2024-04-300000711404us-gaap:MediumTermNotesMember2023-10-310000711404coo:OtherDebtMember2024-04-300000711404coo:OtherDebtMember2023-10-310000711404us-gaap:LineOfCreditMembercoo:TermLoanFacility2021Member2021-12-170000711404us-gaap:LineOfCreditMembercoo:TermLoanFacility2021Member2024-04-300000711404us-gaap:LineOfCreditMemberus-gaap:RevolvingCreditFacilityMembercoo:CreditAgreement2020Member2020-04-010000711404coo:TermLoanFacility2020Memberus-gaap:LineOfCreditMembercoo:CreditAgreement2020Member2020-04-010000711404us-gaap:LineOfCreditMembercoo:RevolvingCreditFacilityAndTermLoanFacility2020Membercoo:CreditAgreement2020Member2020-04-010000711404coo:TermLoanFacility2020Memberus-gaap:LineOfCreditMembercoo:CreditAgreement2020Member2024-04-300000711404us-gaap:LineOfCreditMemberus-gaap:RevolvingCreditFacilityMembercoo:CreditAgreement2020Member2024-04-300000711404us-gaap:LineOfCreditMembercoo:RevolvingCreditFacilityAndTermLoanFacility2020Membercoo:CreditAgreement2020Member2024-04-300000711404coo:CreditAgreement2024Memberus-gaap:LineOfCreditMemberus-gaap:RevolvingCreditFacilityMemberus-gaap:SubsequentEventMember2024-05-010000711404coo:CreditAgreement2024Memberus-gaap:LineOfCreditMemberus-gaap:RevolvingCreditFacilityMemberus-gaap:SubsequentEventMember2024-05-012024-05-010000711404us-gaap:EmployeeStockOptionMember2024-02-012024-04-300000711404us-gaap:EmployeeStockOptionMember2023-02-012023-04-300000711404us-gaap:EmployeeStockOptionMember2023-11-012024-04-300000711404us-gaap:EmployeeStockOptionMember2022-11-012023-04-300000711404us-gaap:RestrictedStockUnitsRSUMember2024-02-012024-04-300000711404us-gaap:RestrictedStockUnitsRSUMember2023-02-012023-04-300000711404us-gaap:RestrictedStockUnitsRSUMember2023-11-012024-04-300000711404us-gaap:RestrictedStockUnitsRSUMember2022-11-012023-04-300000711404us-gaap:SellingGeneralAndAdministrativeExpensesMember2024-02-012024-04-300000711404us-gaap:SellingGeneralAndAdministrativeExpensesMember2023-02-012023-04-300000711404us-gaap:SellingGeneralAndAdministrativeExpensesMember2023-11-012024-04-300000711404us-gaap:SellingGeneralAndAdministrativeExpensesMember2022-11-012023-04-300000711404us-gaap:CostOfSalesMember2024-02-012024-04-300000711404us-gaap:CostOfSalesMember2023-02-012023-04-300000711404us-gaap:CostOfSalesMember2023-11-012024-04-300000711404us-gaap:CostOfSalesMember2022-11-012023-04-300000711404us-gaap:ResearchAndDevelopmentExpenseMember2024-02-012024-04-300000711404us-gaap:ResearchAndDevelopmentExpenseMember2023-02-012023-04-300000711404us-gaap:ResearchAndDevelopmentExpenseMember2023-11-012024-04-300000711404us-gaap:ResearchAndDevelopmentExpenseMember2022-11-012023-04-300000711404us-gaap:AccumulatedTranslationAdjustmentMember2022-10-310000711404us-gaap:AccumulatedDefinedBenefitPlansAdjustmentMember2022-10-310000711404us-gaap:AccumulatedGainLossNetCashFlowHedgeParentMember2022-10-310000711404us-gaap:AccumulatedTranslationAdjustmentMember2022-11-012023-04-300000711404us-gaap:AccumulatedDefinedBenefitPlansAdjustmentMember2022-11-012023-04-300000711404us-gaap:AccumulatedGainLossNetCashFlowHedgeParentMember2022-11-012023-04-300000711404us-gaap:AccumulatedTranslationAdjustmentMember2023-04-300000711404us-gaap:AccumulatedDefinedBenefitPlansAdjustmentMember2023-04-300000711404us-gaap:AccumulatedGainLossNetCashFlowHedgeParentMember2023-04-300000711404us-gaap:AccumulatedTranslationAdjustmentMember2023-10-310000711404us-gaap:AccumulatedDefinedBenefitPlansAdjustmentMember2023-10-310000711404us-gaap:AccumulatedGainLossNetCashFlowHedgeParentMember2023-10-310000711404us-gaap:AccumulatedTranslationAdjustmentMember2023-11-012024-04-300000711404us-gaap:AccumulatedDefinedBenefitPlansAdjustmentMember2023-11-012024-04-300000711404us-gaap:AccumulatedGainLossNetCashFlowHedgeParentMember2023-11-012024-04-300000711404us-gaap:AccumulatedTranslationAdjustmentMember2024-04-300000711404us-gaap:AccumulatedDefinedBenefitPlansAdjustmentMember2024-04-300000711404us-gaap:AccumulatedGainLossNetCashFlowHedgeParentMember2024-04-3000007114042017-03-3100007114042023-02-102023-02-100000711404coo:ToricAndMultifocalMemberus-gaap:OperatingSegmentsMembercoo:CoopervisionSegmentMember2024-02-012024-04-300000711404coo:ToricAndMultifocalMemberus-gaap:OperatingSegmentsMembercoo:CoopervisionSegmentMember2023-02-012023-04-300000711404coo:ToricAndMultifocalMemberus-gaap:OperatingSegmentsMembercoo:CoopervisionSegmentMember2023-11-012024-04-300000711404coo:ToricAndMultifocalMemberus-gaap:OperatingSegmentsMembercoo:CoopervisionSegmentMember2022-11-012023-04-300000711404us-gaap:OperatingSegmentsMembercoo:CoopervisionSegmentMembercoo:SphereOtherMember2024-02-012024-04-300000711404us-gaap:OperatingSegmentsMembercoo:CoopervisionSegmentMembercoo:SphereOtherMember2023-02-012023-04-300000711404us-gaap:OperatingSegmentsMembercoo:CoopervisionSegmentMembercoo:SphereOtherMember2023-11-012024-04-300000711404us-gaap:OperatingSegmentsMembercoo:CoopervisionSegmentMembercoo:SphereOtherMember2022-11-012023-04-300000711404us-gaap:OperatingSegmentsMembercoo:CoopervisionSegmentMember2024-02-012024-04-300000711404us-gaap:OperatingSegmentsMembercoo:CoopervisionSegmentMember2023-02-012023-04-300000711404us-gaap:OperatingSegmentsMembercoo:CoopervisionSegmentMember2023-11-012024-04-300000711404us-gaap:OperatingSegmentsMembercoo:CoopervisionSegmentMember2022-11-012023-04-300000711404us-gaap:OperatingSegmentsMembercoo:OfficeAndSurgicalMembercoo:CoopersurgicalSegmentMember2024-02-012024-04-300000711404us-gaap:OperatingSegmentsMembercoo:OfficeAndSurgicalMembercoo:CoopersurgicalSegmentMember2023-02-012023-04-300000711404us-gaap:OperatingSegmentsMembercoo:OfficeAndSurgicalMembercoo:CoopersurgicalSegmentMember2023-11-012024-04-300000711404us-gaap:OperatingSegmentsMembercoo:OfficeAndSurgicalMembercoo:CoopersurgicalSegmentMember2022-11-012023-04-300000711404coo:FertilityMemberus-gaap:OperatingSegmentsMembercoo:CoopersurgicalSegmentMember2024-02-012024-04-300000711404coo:FertilityMemberus-gaap:OperatingSegmentsMembercoo:CoopersurgicalSegmentMember2023-02-012023-04-300000711404coo:FertilityMemberus-gaap:OperatingSegmentsMembercoo:CoopersurgicalSegmentMember2023-11-012024-04-300000711404coo:FertilityMemberus-gaap:OperatingSegmentsMembercoo:CoopersurgicalSegmentMember2022-11-012023-04-300000711404us-gaap:OperatingSegmentsMembercoo:CoopersurgicalSegmentMember2024-02-012024-04-300000711404us-gaap:OperatingSegmentsMembercoo:CoopersurgicalSegmentMember2023-02-012023-04-300000711404us-gaap:OperatingSegmentsMembercoo:CoopersurgicalSegmentMember2023-11-012024-04-300000711404us-gaap:OperatingSegmentsMembercoo:CoopersurgicalSegmentMember2022-11-012023-04-300000711404us-gaap:CorporateNonSegmentMember2024-02-012024-04-300000711404us-gaap:CorporateNonSegmentMember2023-02-012023-04-300000711404us-gaap:CorporateNonSegmentMember2023-11-012024-04-300000711404us-gaap:CorporateNonSegmentMember2022-11-012023-04-300000711404us-gaap:OperatingSegmentsMembercoo:CoopervisionSegmentMember2024-04-300000711404us-gaap:OperatingSegmentsMembercoo:CoopervisionSegmentMember2023-10-310000711404us-gaap:OperatingSegmentsMembercoo:CoopersurgicalSegmentMember2024-04-300000711404us-gaap:OperatingSegmentsMembercoo:CoopersurgicalSegmentMember2023-10-310000711404us-gaap:CorporateNonSegmentMember2024-04-300000711404us-gaap:CorporateNonSegmentMember2023-10-310000711404country:US2024-02-012024-04-300000711404country:US2023-02-012023-04-300000711404country:US2023-11-012024-04-300000711404country:US2022-11-012023-04-300000711404srt:EuropeMember2024-02-012024-04-300000711404srt:EuropeMember2023-02-012023-04-300000711404srt:EuropeMember2023-11-012024-04-300000711404srt:EuropeMember2022-11-012023-04-300000711404coo:RestOfWorldExcludingUnitedStatesAndEuropeMember2024-02-012024-04-300000711404coo:RestOfWorldExcludingUnitedStatesAndEuropeMember2023-02-012023-04-300000711404coo:RestOfWorldExcludingUnitedStatesAndEuropeMember2023-11-012024-04-300000711404coo:RestOfWorldExcludingUnitedStatesAndEuropeMember2022-11-012023-04-300000711404country:US2024-04-300000711404country:US2023-10-310000711404srt:EuropeMember2024-04-300000711404srt:EuropeMember2023-10-310000711404coo:RestOfWorldExcludingUnitedStatesAndEuropeMember2024-04-300000711404coo:RestOfWorldExcludingUnitedStatesAndEuropeMember2023-10-310000711404us-gaap:ForeignExchangeForwardMember2024-04-300000711404us-gaap:InterestRateSwapMember2024-04-300000711404us-gaap:InterestRateSwapMember2023-11-012024-04-300000711404us-gaap:InterestExpenseMemberus-gaap:InterestRateSwapMember2024-02-012024-04-300000711404us-gaap:InterestExpenseMemberus-gaap:InterestRateSwapMember2023-02-012023-04-300000711404us-gaap:InterestExpenseMemberus-gaap:InterestRateSwapMember2023-11-012024-04-300000711404us-gaap:InterestExpenseMemberus-gaap:InterestRateSwapMember2022-11-012023-04-300000711404coo:AccumulatedGainLossNetCashFlowHedgeBeforeTaxParentMember2024-01-310000711404coo:AccumulatedGainLossNetCashFlowHedgeBeforeTaxParentMember2023-01-310000711404coo:AccumulatedGainLossNetCashFlowHedgeBeforeTaxParentMember2023-10-310000711404coo:AccumulatedGainLossNetCashFlowHedgeBeforeTaxParentMember2022-10-310000711404us-gaap:AccumulatedGainLossNetCashFlowHedgeParentMember2024-02-012024-04-300000711404us-gaap:AccumulatedGainLossNetCashFlowHedgeParentMember2023-02-012023-04-300000711404coo:AccumulatedGainLossNetCashFlowHedgeBeforeTaxParentMember2024-04-300000711404coo:AccumulatedGainLossNetCashFlowHedgeBeforeTaxParentMember2023-04-30
UNITED STATES
SECURITIES AND EXCHANGE COMMISSION
Washington, D.C. 20549
_____________________________________________________________
FORM 10-Q
_____________________________________________________________
| | | | | |
| ☒ | Quarterly Report Pursuant to Section 13 or 15(d) of the Securities Exchange Act of 1934 |
For the quarterly period ended April 30, 2024
| | | | | |
| ☐ | Transition Report Pursuant to Section 13 or 15(d) of the Securities Exchange Act of 1934 |
For the transition period from to
Commission File Number 1-8597
_____________________________________________________________
The Cooper Companies, Inc.
(Exact name of registrant as specified in its charter)
_____________________________________________________________
| | | | | |
| Delaware | 94-2657368 |
(State or other jurisdiction of
incorporation or organization) | (I.R.S. Employer
Identification No.) |
6101 Bollinger Canyon Road, Suite 500,
San Ramon, California 94583
(Address of principal executive offices) (Zip Code)
(925) 460-3600
(Registrant’s telephone number, including area code)
_____________________________________________________________
Securities registered pursuant to Section 12(b) of the Act:
| | | | | | | | | | | | | | |
| Title of each class | | Trading Symbol | | Name of each exchange on which registered |
Common Stock, $0.10 par value | | COO | | Nasdaq Global Select Market |
Indicate by check mark whether the registrant (1) has filed all reports required to be filed by Section 13 or 15(d) of the Securities Exchange Act of 1934 during the preceding 12 months (or for such shorter period that the registrant was required to file such reports), and (2) has been subject to such filing requirements for the past 90 days. Yes ☒ No ☐
Indicate by check mark whether the registrant has submitted electronically every Interactive Data File required to be submitted pursuant to Rule 405 of Regulation S-T (§232.405 of this chapter) during the preceding 12 months (or for such shorter period that the registrant was required to submit such files). Yes ☒ No ☐
Indicate by check mark whether the registrant is a large accelerated filer, an accelerated filer, a non-accelerated filer, a smaller reporting company, or emerging growth company. See definitions of “large accelerated filer,” “accelerated filer,” “smaller reporting company” and "emerging growth company" in Rule 12b-2 of the Exchange Act.
| | | | | | | | | | | | | | |
| Large accelerated filer | ☒ | | Accelerated filer | ☐ |
| Non-accelerated filer | ☐ | | Smaller reporting company | ☐ |
| Emerging growth company | ☐ | | | |
If an emerging growth company, indicate by check mark if the registrant has elected not to use the extended transition period for complying with any new or revised financial accounting standards provided pursuant to Section 13(a) of the Exchange Act. ☐
Indicate by check mark whether the registrant is a shell company (as defined in Rule 12b-2 of the Exchange Act.): Yes ☐ No ☒
On May 24, 2024, 199,119,880 shares of Common Stock, $0.10 par value, were outstanding.
INDEX
| | | | | | | | |
| | | Page No. |
| PART I. | | |
| | |
| Item 1. | | |
| | |
| | |
| | |
| | |
| | |
| | |
| | |
| | |
| | |
| | |
| | |
| Item 2. | | |
| | |
| Item 3. | | |
| | |
| Item 4. | | |
| | |
| PART II. | | |
| | |
| Item 1. | | |
| | |
| Item 1A. | | |
| | |
| Item 2. | | |
| | |
| Item 3. | | |
| | |
| Item 4. | | |
| | |
| Item 5. | | |
| | |
| Item 6. | | |
| |
| |
PART I. FINANCIAL INFORMATION
Item 1. Unaudited Financial Statements
THE COOPER COMPANIES, INC. AND SUBSIDIARIES
Consolidated Condensed Statements of Income and Comprehensive Income
Periods Ended April 30,
(In millions, except for earnings per share)
(Unaudited)
| | | | | | | | | | | | | | | | | | | | | | | |
| Three Months | | Six Months |
| | 2024 | | 2023 | | 2024 | | 2023 |
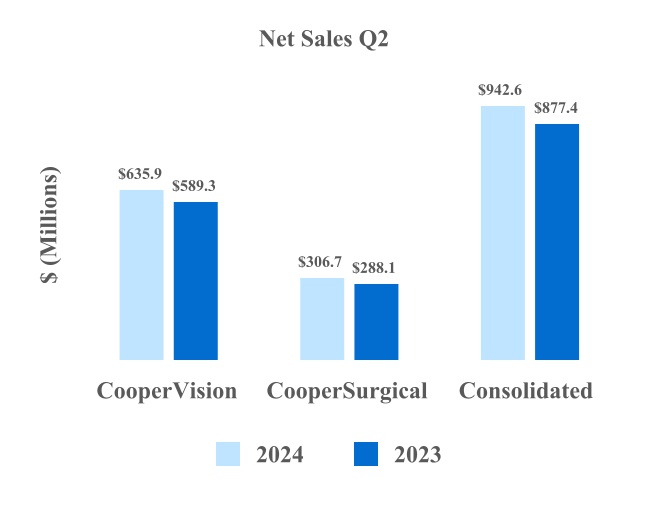
| Net sales | $ | 942.6 | | | $ | 877.4 | | | $ | 1,874.2 | | | $ | 1,735.9 | |
| Cost of sales | 311.4 | | | 294.5 | | | 619.2 | | | 594.5 | |
| Gross profit | 631.2 | | | 582.9 | | | 1,255.0 | | | 1,141.4 | |
| Selling, general and administrative expense | 380.3 | | | 407.5 | | | 761.2 | | | 738.4 | |
| Research and development expense | 38.9 | | | 32.6 | | | 78.4 | | | 64.2 | |
| Amortization of intangibles | 50.3 | | | 46.5 | | | 100.6 | | | 93.0 | |
| | | | | | | |
| | | | | | | |
| Operating income | 161.7 | | | 96.3 | | | 314.8 | | | 245.8 | |
| Interest expense | 28.9 | | | 26.1 | | | 58.8 | | | 52.2 | |
| | | | | | | |
| | | | | | | |
Other expense, net | 2.8 | | | 4.6 | | | 6.0 | | | 5.9 | |
| Income before income taxes | 130.0 | | | 65.6 | | | 250.0 | | | 187.7 | |
Provision for income taxes (Note 6) | 41.1 | | | 25.8 | | | 79.9 | | | 63.3 | |
| Net income | $ | 88.9 | | | $ | 39.8 | | | $ | 170.1 | | | $ | 124.4 | |
| | | | | | | |
| | | | | | | |
Earnings per share (Note 7)*: | | | | | | | |
| Basic | $ | 0.45 | | | $ | 0.20 | | | $ | 0.86 | | | $ | 0.63 | |
| Diluted | $ | 0.44 | | | $ | 0.20 | | | $ | 0.85 | | | $ | 0.63 | |
Number of shares used to compute earnings per share*: | | | | | | | |
| Basic | 198.9 | | | 197.9 | | | 198.6 | | | 197.7 | |
| Diluted | 200.5 | | | 199.2 | | | 200.2 | | | 198.9 | |
| Other comprehensive income, net of tax: | | | | | | | |
| Cash flow hedges | $ | 21.4 | | | $ | (5.5) | | | $ | (6.6) | | | $ | (26.5) | |
| Foreign currency translation adjustment | (22.0) | | | (14.5) | | | 37.8 | | | 69.5 | |
| | | | | | | |
| | | | | | | |
| | | | | | | |
| | | | | | | |
| Comprehensive income | $ | 88.3 | | | $ | 19.8 | | | $ | 201.3 | | | $ | 167.4 | |
*All periods presented have been adjusted to reflect the four-for-one stock split effected on February 16, 2024. Refer to Note 1. General for further information.
The accompanying notes are an integral part of these Consolidated Condensed Financial Statements.
THE COOPER COMPANIES, INC. AND SUBSIDIARIES
Consolidated Condensed Balance Sheets
(In millions, unaudited)
| | | | | | | | | | | |
| April 30, 2024 | | October 31, 2023 |
| ASSETS | | | |
| Current assets: | | | |
| Cash and cash equivalents | $ | 112.4 | | | $ | 120.8 | |
Trade accounts receivable, net of allowance for credit losses of $39.9 at April 30, 2024, and $31.3 at October 31, 2023 | 688.7 | | | 609.7 | |
Inventories (Note 3) | 775.4 | | | 735.6 | |
| Prepaid expense and other current assets | 282.5 | | | 238.8 | |
| | | |
| Total current assets | 1,859.0 | | | 1,704.9 | |
| Property, plant and equipment, net | 1,709.3 | | | 1,632.6 | |
| Goodwill | 3,761.3 | | | 3,624.5 | |
Other intangibles, net (Note 4) | 1,796.9 | | | 1,710.3 | |
| Deferred tax assets | 2,283.7 | | | 2,349.5 | |
| Other assets | 637.2 | | | 637.1 | |
| Total assets | $ | 12,047.4 | | | $ | 11,658.9 | |
| LIABILITIES AND STOCKHOLDERS’ EQUITY | | | |
| Current liabilities: | | | |
Short-term debt (Note 5) | $ | 41.7 | | | $ | 45.4 | |
| Accounts payable | 230.7 | | | 261.9 | |
| Employee compensation and benefits | 144.7 | | | 174.8 | |
| Deferred revenue | 121.7 | | | 123.6 | |
| Other current liabilities | 413.7 | | | 363.3 | |
| | | |
| Total current liabilities | 952.5 | | | 969.0 | |
Long-term debt (Note 5) | 2,671.3 | | | 2,523.8 | |
| Deferred tax liabilities | 94.2 | | | 101.5 | |
| Long-term tax payable | 59.0 | | | 90.2 | |
| Deferred revenue | 188.6 | | | 184.2 | |
Other liabilities | 277.9 | | | 239.2 | |
| Total liabilities | $ | 4,243.5 | | | $ | 4,107.9 | |
Contingencies (Note 10) | | | |
Stockholders’ equity*: | | | |
Preferred stock, $0.10 par value, 1.0 shares authorized, zero shares issued or outstanding | — | | | — | |
Common stock, $0.10 par value, 480.0 shares authorized, 216.8 issued and 199.1 outstanding at April 30, 2024, and 215.8 issued and 198.1 outstanding at October 31, 2023 | 21.7 | | | 21.6 | |
| Additional paid-in capital | 1,866.7 | | | 1,817.2 | |
| Accumulated other comprehensive loss | (422.6) | | | (453.8) | |
| Retained earnings | 7,046.2 | | | 6,876.1 | |
Treasury stock at cost: 17.7 shares at April 30, 2024, and 17.7 shares at October 31, 2023 | (708.3) | | | (710.3) | |
| Total Cooper stockholders’ equity | 7,803.7 | | | 7,550.8 | |
| Noncontrolling interests | 0.2 | | | 0.2 | |
Stockholders’ equity (Note 9) | 7,803.9 | | | 7,551.0 | |
| Total liabilities and stockholders’ equity | $ | 12,047.4 | | | $ | 11,658.9 | |
| | | |
*All periods presented have been adjusted to reflect the four-for-one stock split effected on February 16, 2024. Refer to Note 1. General for further information.
The accompanying notes are an integral part of these Consolidated Condensed Financial Statements.
THE COOPER COMPANIES, INC. AND SUBSIDIARIES
Consolidated Condensed Statements of Stockholders' Equity
(In millions, unaudited)
| | | | | | | | | | | | | | | | | | | | | | | | | | | | | | | | | | | | | | | | | | | | | | | | | | | | | | | | | | | |
| | Common Shares | | Treasury Stock | | Additional Paid-In Capital | | Accumulated
Other
Comprehensive
Loss | | Retained Earnings | | Treasury Stock | | Noncontrolling Interests | | Total
Stockholders'
Equity |
| Shares | | Amount | Shares | | Amount |
| Balance at November 1, 2022* | 197.4 | | | $ | 19.7 | | | 17.8 | | | $ | 1.8 | | | $ | 1,749.4 | | | $ | (466.8) | | | $ | 6,584.9 | | | $ | (714.5) | | | $ | 0.2 | | | $ | 7,174.7 | |
| Net income | — | | | — | | | — | | | — | | | — | | | — | | | 84.6 | | | — | | | — | | | 84.6 | |
| Other comprehensive income, net of tax | — | | | — | | | — | | | — | | | — | | | 63.0 | | | — | | | — | | | — | | | 63.0 | |
| Issuance of common stock for stock plans, net and employee stock purchase plan | 0.4 | | | — | | | — | | | — | | | (2.5) | | | — | | | — | | | 1.2 | | | — | | | (1.3) | |
Dividends on common stock ($0.03 per share) | — | | | — | | | — | | | — | | | — | | | — | | | (1.5) | | | — | | | — | | | (1.5) | |
| Share-based compensation expense | — | | | — | | | — | | | — | | | 16.2 | | | — | | | — | | | — | | | — | | | 16.2 | |
| | | | | | | | | | | | | | | | | | | |
| Balance at January 31, 2023* | 197.8 | | | $ | 19.7 | | | 17.8 | | | $ | 1.8 | | | $ | 1,763.1 | | | $ | (403.8) | | | $ | 6,668.0 | | | $ | (713.3) | | | $ | 0.2 | | | $ | 7,335.7 | |
| Net income | — | | | — | | | — | | | — | | | — | | | — | | | 39.8 | | | — | | | — | | | 39.8 | |
| Other comprehensive income (loss), net of tax | — | | | — | | | — | | | — | | | — | | | (20.0) | | | — | | | — | | | — | | | (20.0) | |
| Issuance of common stock for stock plans, net and employee stock purchase plan | 0.2 | | | 0.1 | | | — | | | — | | | 6.7 | | | — | | | — | | | 1.0 | | | — | | | 7.8 | |
| Share-based compensation expense | — | | | — | | | — | | | — | | | 14.7 | | | — | | | — | | | — | | | — | | | 14.7 | |
| | | | | | | | | | | | | | | | | | | |
| Balance at April 30, 2023* | 198.0 | | | $ | 19.8 | | | 17.8 | | | $ | 1.8 | | | $ | 1,784.5 | | | $ | (423.8) | | | $ | 6,707.8 | | | $ | (712.3) | | | $ | 0.2 | | | $ | 7,378.0 | |
| | | | | | | | | | | | | | | | | | | |
| | | | | | | | | | | | | | | | | | | |
| | | | | | | | | | | | | | | | | | | |
| | | | | | | | | | | | | | | | | | | |
| | | | | | | | | | | | | | | | | | | |
| | | | | | | | | | | | | | | | | | | |
*All periods presented have been adjusted to reflect the four-for-one stock split effected on February 16, 2024. Refer to Note 1. General for further information.
The accompanying notes are an integral part of these Consolidated Condensed Financial Statements.
THE COOPER COMPANIES, INC. AND SUBSIDIARIES
Consolidated Condensed Statements of Stockholders' Equity
(In millions, unaudited)
| | | | | | | | | | | | | | | | | | | | | | | | | | | | | | | | | | | | | | | | | | | | | | | | | | | | | | | | | | | |
| Common Shares | | Treasury Stock | | Additional Paid-In Capital | | Accumulated
Other
Comprehensive
Loss | | Retained Earnings | | Treasury Stock | | Noncontrolling Interests | | Total
Stockholders'
Equity |
| Shares | | Amount | Shares | | Amount |
| Balance at November 1, 2023* | 198.1 | | | $ | 19.8 | | | 17.7 | | | $ | 1.8 | | | $ | 1,817.2 | | | $ | (453.8) | | | $ | 6,876.1 | | | $ | (710.3) | | | $ | 0.2 | | | $ | 7,551.0 | |
| Net income | — | | | — | | | — | | | — | | | — | | | — | | | 81.2 | | | — | | | — | | | 81.2 | |
| Other comprehensive income, net of tax | — | | | — | | | — | | | — | | | — | | | 31.8 | | | — | | | — | | | — | | | 31.8 | |
| Issuance of common stock for stock plans, net and employee stock purchase plan | 0.6 | | | — | | | — | | | — | | | 6.6 | | | | | — | | | 1.1 | | | — | | | 7.7 | |
| | | | | | | | | | | | | | | | | | | |
| Share-based compensation expense | — | | | — | | | — | | | — | | | 23.6 | | | — | | | — | | | — | | | — | | | 23.6 | |
| Balance at January 31, 2024* | 198.7 | | | $ | 19.8 | | | 17.7 | | | $ | 1.8 | | | $ | 1,847.4 | | | $ | (422.0) | | | $ | 6,957.3 | | | $ | (709.2) | | | $ | 0.2 | | | $ | 7,695.3 | |
| Net income | — | | | — | | | — | | | — | | | — | | | — | | | 88.9 | | | — | | | — | | | 88.9 | |
| Other comprehensive income (loss), net of tax | — | | | — | | | — | | | — | | | — | | | (0.6) | | | — | | | — | | | — | | | (0.6) | |
| Issuance of common stock for stock plans, net and employee stock purchase plan | 0.4 | | | 0.1 | | | — | | | — | | | 2.5 | | | — | | | — | | | 0.9 | | | — | | | 3.5 | |
| Share-based compensation expense | — | | | — | | | — | | | — | | | 16.8 | | | — | | | — | | | — | | | — | | | 16.8 | |
| | | | | | | | | | | | | | | | | | | |
| Balance at April 30, 2024* | 199.1 | | | $ | 19.9 | | | 17.7 | | | $ | 1.8 | | | $ | 1,866.7 | | | $ | (422.6) | | | $ | 7,046.2 | | | $ | (708.3) | | | $ | 0.2 | | | $ | 7,803.9 | |
| | | | | | | | | | | | | | | | | | | |
| | | | | | | | | | | | | | | | | | | |
| | | | | | | | | | | | | | | | | | | |
| | | | | | | | | | | | | | | | | | | |
| | | | | | | | | | | | | | | | | | | |
| | | | | | | | | | | | | | | | | | | |
| | | | | | | | | | | | | | | | | | | |
*All periods presented have been adjusted to reflect the four-for-one stock split effected on February 16, 2024. Refer to Note 1. General for further information.
The accompanying notes are an integral part of these Consolidated Condensed Financial Statements.
THE COOPER COMPANIES, INC. AND SUBSIDIARIES
Consolidated Condensed Statements of Cash Flows
Six Months Ended April 30,
(In millions, unaudited) | | | | | | | | | | | |
| 2024 | | 2023 |
| Cash flows from operating activities: | | | |
| Net income | $ | 170.1 | | | $ | 124.4 | |
| Depreciation and amortization | 195.1 | | | 180.5 | |
| | | |
| Change in fair value of contingent consideration | — | | | (31.8) | |
| Accrual for acquisition termination fee | — | | | 45.0 | |
| Net changes in operating capital | (252.7) | | | (103.0) | |
| | | |
| Other non-cash items | 121.2 | | | 75.7 | |
| Net cash provided by operating activities | 233.7 | | | 290.8 | |
| Cash flows from investing activities: | | | |
| Purchases of property, plant and equipment | (192.2) | | | (156.6) | |
| Acquisitions of businesses and assets, net of cash acquired, and other | (206.7) | | | (38.7) | |
| | | |
| Net cash used in investing activities | (398.9) | | | (195.3) | |
| Cash flows from financing activities: | | | |
| Proceeds from long-term debt, net of issuance costs | 1,403.1 | | | 1,199.3 | |
| Repayments of long-term debt | (1,256.4) | | | (985.5) | |
Net repayments of short-term debt | (2.0) | | | (342.5) | |
Net proceeds related to share-based compensation awards | 6.8 | | | 2.1 | |
| Dividends on common stock | — | | | (1.5) | |
| | | |
| Issuance of common stock for employee stock purchase plan | 3.7 | | | 3.7 | |
| | | |
Net cash provided by (used in) financing activities | 155.2 | | | (124.4) | |
| Effect of exchange rate changes on cash, cash equivalents and restricted cash | 1.7 | | | 2.4 | |
Net decrease in cash, cash equivalents, and restricted cash | (8.3) | | | (26.5) | |
| Cash, cash equivalents, and restricted cash at beginning of period | 120.9 | | | 138.6 | |
| Cash, cash equivalents, and restricted cash at end of period | $ | 112.6 | | | $ | 112.1 | |
| Reconciliation of cash flow information: | | | |
| Cash and cash equivalents | $ | 112.4 | | | $ | 111.9 | |
| Restricted cash included in other current assets | 0.2 | | | 0.2 | |
| | | |
| Total cash, cash equivalents, and restricted cash | $ | 112.6 | | | $ | 112.1 | |
The accompanying notes are an integral part of these Consolidated Condensed Financial Statements.
THE COOPER COMPANIES, INC. AND SUBSIDIARIES
Notes to Consolidated Condensed Financial Statements
(Unaudited)
Note 1. General
The accompanying Consolidated Condensed Financial Statements of The Cooper Companies, Inc. and its subsidiaries have been prepared in accordance with generally accepted accounting principles in the United States (GAAP) for interim financial information and with the requirements of Regulation S-X, Rule 10-01 for financial statements required to be filed as a part of this Quarterly Report on Form 10-Q. Unless the context requires otherwise, terms "the Company", "we", "us", and "our" are used to refer collectively to The Cooper Companies, Inc. and its subsidiaries.
The accompanying Consolidated Condensed Financial Statements and related notes are unaudited and should be read in conjunction with the audited Consolidated Financial Statements of the Company and related notes as contained in the Company’s Annual Report on Form 10-K for the fiscal year ended October 31, 2023. The Consolidated Condensed Financial Statements include all adjustments (consisting only of normal recurring adjustments) and accruals necessary in the judgment of management for a fair presentation of the results for the interim periods presented.
Accounting Policies
There have been no material changes to our significant accounting policies1 described in our Annual Report on Form 10-K for the fiscal year ended October 31, 2023.
Estimates
The preparation of Consolidated Condensed Financial Statements in conformity with GAAP requires management to make estimates and assumptions that affect the reported amounts of assets and liabilities and disclosure of contingent assets and liabilities at the date of the financial statements, as well as the reported amounts of net sales and expenses during the reporting period. Actual results could differ from those estimates. The Company continually monitors and evaluates the estimates used as additional information becomes available. Adjustments will be made to these provisions periodically to reflect new facts and circumstances that may indicate that historical experience may not be indicative of current and/or future results.
Stock Split
On February 16, 2024, the Company effected a four-for-one stock split of its outstanding shares of common stock. The par value of the common stock remains at $0.10 per share. Accordingly, an amount equal to the par value of the increased shares resulting from the stock split was reclassified from "Additional paid-in capital" to "Common stock". All share and per share information has been retroactively adjusted to reflect the stock split for all periods presented.
Accounting Pronouncements Issued But Not Yet Adopted
In December 2023, the Financial Accounting Standards Board (FASB) issued ASU 2023-09, Income Taxes (Topic 740): Improvements to Income Tax Disclosures. This ASU requires public entities to disclose specific categories in the effective tax rate reconciliation and additional information for reconciling items that exceed a quantitative threshold. The guidance also requires all disaggregated information pertaining to taxes paid, net of refunds received, for federal, state and foreign income taxes. The new guidance is effective for fiscal years beginning after December 15, 2024, with the option to apply prospectively or retrospectively. Early adoption is permitted. We are currently evaluating the impact that the adoption of this guidance will have on our consolidated financial statements and disclosures.
In November 2023, the FASB issued ASU 2023-07, Segment Reporting (Topic 280): Improvements to Reportable Segment Disclosures, which enhances the disclosures required for operating segments in our annual and interim consolidated financial statements. The ASU is effective for us beginning on November 1, 2024, and will be applied retrospectively. Early adoption is permitted. We are currently evaluating the impact of adopting this ASU on our consolidated financial statements and disclosures.
Note 2. Acquisitions and Joint Venture
All acquisitions were funded by cash generated from operations or facility borrowings.
On November 1, 2023, CooperSurgical completed the acquisition of select Cook Medical assets focused primarily on the obstetrics, doppler monitoring, and gynecology surgery markets. The purchase price of the acquisition was $300.0 million, with $200.0 million paid at closing and two cash payments of $50.0 million each to be paid on November 1, 2024, and November 1, 2025. The present value of the acquisition purchase price was $291.6 million, which is included in the Company's balance sheet.
1 To further clarify the policy detailed in our Annual Report on Form 10-K for the fiscal year ended October 31, 2023, the current portion of the deferred revenue balances at the beginning of each period presented were generally fully recognized in a ratable manner in the subsequent 12-month period. We recognized revenue of approximately $31.0 million and $62.0 million for the three and six months ended April 30, 2024, respectively, that was included in the deferred revenue balance at January 31, 2024, and October 31, 2023. We recognized revenue of approximately $27.0 million and $50.0 million for the three and six months ended April 30, 2023, respectively, that was included in the deferred revenue balance at January 31, 2023, and October 31, 2022.
THE COOPER COMPANIES, INC. AND SUBSIDIARIES
Notes to Consolidated Condensed Financial Statements
(Unaudited)
Assets acquired primarily comprised of $157.9 million of technologies, $26.6 million of customer relationship related intangibles, and $107.2 million of goodwill. The goodwill is deductible for tax purposes.
Joint Venture
CooperVision and Essilor International SAS (Essilor) executed a Contribution Agreement and a Stock Purchase Agreement (the “Agreements”) in March 2022 to form a joint venture in SightGlass Vision, Inc. (SGV), which is a medical device company developing spectacle lenses for myopia management. Essilor paid CooperVision $52.1 million in exchange for a 50% interest in SGV and their proportionate share of the revenue payments. As part of the Agreements, each party contributed their interest in SGV and $10 million in cash. Prior to March 2022, CooperVision owned 100% of SGV.
Further information regarding the joint venture is included in the notes to our consolidated financial statements in our Annual Report on Form 10-K for the fiscal year ended October 31, 2023.
Note 3. Inventories
| | | | | | | | | | | |
| (In millions) | April 30, 2024 | | October 31, 2023 |
| Raw materials | $ | 212.8 | | | $ | 207.3 | |
| Work-in-process | 23.1 | | | 19.0 | |
| Finished goods | 539.5 | | | 509.3 | |
| Total inventories | $ | 775.4 | | | $ | 735.6 | |
Note 4. Intangible Assets
Intangible assets consisted of the following:
| | | | | | | | | | | | | | | | | | | | | | | | | | | | | |
| | April 30, 2024 | | October 31, 2023 | | |
| (In millions) | Gross
Carrying
Amount | | Accumulated
Amortization | | Gross
Carrying
Amount | | Accumulated
Amortization | | Weighted-Average Amortization Period (in years) |
| | | | | | | | | |
| Intangible assets with definite lives: | | | | | | | | | |
| Customer relationships | $ | 1,122.8 | | | $ | 372.2 | | | $ | 1,099.2 | | | $ | 345.8 | | | 19 |
| Composite intangible asset | 1,061.9 | | | 460.2 | | | 1,061.9 | | | 424.8 | | | 15 |
| Technology | 653.2 | | | 361.1 | | | 494.5 | | | 335.4 | | | 12 |
| Trademarks | 204.2 | | | 83.3 | | | 208.9 | | | 81.1 | | | 15 |
| License and distribution rights and other | 47.7 | | | 25.4 | | | 51.6 | | | 28.0 | | | 11 |
| 3,089.8 | | | $ | 1,302.2 | | | 2,916.1 | | | $ | 1,215.1 | | | 16 |
| Less: accumulated amortization and translation | 1,302.2 | | | | | 1,215.1 | | | | | |
| Intangible assets with definite lives, net | 1,787.6 | | | | | 1,701.0 | | | | | |
Intangible assets with indefinite lives, net (1) | 9.3 | | | | | 9.3 | | | | | |
| Total other intangibles, net | $ | 1,796.9 | | | | | $ | 1,710.3 | | | | | |
(1) Intangible assets with indefinite lives include technology and trademarks.
Balances include foreign currency translation adjustments.
THE COOPER COMPANIES, INC. AND SUBSIDIARIES
Notes to Consolidated Condensed Financial Statements
(Unaudited)
As of April 30, 2024, the estimate of future amortization expenses for intangible assets with definite lives is as follows:
| | | | | |
| Fiscal Years: | (In millions) |
| Remainder of 2024 | $ | 97.3 | |
| 2025 | 187.7 | |
| 2026 | 180.1 | |
| 2027 | 165.8 | |
| 2028 | 161.2 | |
| Thereafter | 995.5 | |
| Total remaining amortization for intangible assets with definite lives | $ | 1,787.6 | |
There was no impairment of goodwill or intangible assets recorded in the six months ended April 30, 2024.
Note 5. Financing Arrangements
The Company had outstanding debt as follows:
| | | | | | | | | | | |
| (In millions) | April 30, 2024 | | October 31, 2023 |
| Short-term debt, excluding financing leases | $ | 40.7 | | | $ | 44.4 | |
| Financing lease liabilities | 1.0 | | | 1.0 | |
| Short-term debt | $ | 41.7 | | | $ | 45.4 | |
| | | |
| Revolving credit | $ | 320.0 | | | $ | 172.6 | |
| Term loans | 2,350.0 | | | 2,350.0 | |
| Other | 0.2 | | | 0.2 | |
| Less: unamortized debt issuance cost | (1.9) | | | (2.4) | |
| Long-term debt, excluding financing leases | 2,668.3 | | | 2,520.4 | |
| Financing lease liabilities | 3.0 | | | 3.4 | |
| Long-term debt | $ | 2,671.3 | | | $ | 2,523.8 | |
| Total debt | $ | 2,713.0 | | | $ | 2,569.2 | |
Additional information regarding our indebtedness is included in our notes to our consolidated financial statements in our Annual Report on Form 10-K for the fiscal year ended October 31, 2023. The carrying value of the Company's revolving credit facility and term loans approximates fair value based on current market rates (Level 2). As of April 30, 2024, the Company was in compliance with all debt covenants.
Term Loan Agreement on December 17, 2021
On December 17, 2021, the Company entered into a Term Loan Agreement (the 2021 Credit Agreement) by and among the Company, the lenders from time to time party thereto, and PNC Bank, National Association, as administrative agent. The 2021 Credit Agreement provides for a term loan facility (the 2021 Term Loan Facility) in an aggregate principal amount of $1.5 billion, which, unless terminated earlier, matures on December 17, 2026.
On April 30, 2024, the Company had $1.5 billion outstanding under the 2021 Term Loan Facility and the interest rate was 6.43%.
Revolving Credit and Term Loan Agreement on April 1, 2020
On April 1, 2020, the Company entered into a Revolving Credit and Term Loan Agreement (the 2020 Credit Agreement), among the Company, CooperVision International Holding Company, LP, CooperSurgical Netherlands B.V., CooperVision Holding Kft, the lenders from time to time party thereto, and KeyBank National Association, as administrative agent. The 2020 Credit Agreement provides for (a) a multicurrency revolving credit facility (the 2020 Revolving Credit Facility) in an aggregate principal amount of $1.29 billion and (b) a term loan facility (the 2020 Term Loan Facility) in an aggregate principal amount of $850.0 million, each of which, unless terminated earlier, mature on April 1, 2025. The Company has an uncommitted option to increase
THE COOPER COMPANIES, INC. AND SUBSIDIARIES
Notes to Consolidated Condensed Financial Statements
(Unaudited)
the revolving credit facility or establish a new term loan in an aggregate amount up to $1.605 billion. On April 30, 2024, the Company had $850.0 million outstanding under the 2020 Term Loan Facility and $320.0 million outstanding under the 2020 Revolving Credit Facility. The interest rate on the 2020 Term Loan Facility and the 2020 Revolving Credit Facility was 6.42% at April 30, 2024.
Subsequent Event
On May 1, 2024, the Company entered into a Revolving Credit Agreement (the 2024 Credit Agreement), among the Company, CooperVision International Limited, the lenders from time to time party thereto, and PNC Bank, National Association, as administrative agent. The 2024 Credit Agreement provides for a multicurrency revolving credit facility (the 2024 Revolving Credit Facility) in an aggregate principal amount of $2.3 billion which, unless terminated earlier, matures on May 1, 2029. On May 1, 2024, the Company used $1.170 billion under the 2024 Revolving Credit Facility to fully repay all borrowings outstanding under the 2020 Term Loan Facility and the 2020 Revolving Credit Facility, and terminated the 2020 Credit Agreement.
On May 1, 2024, in connection with the Company's entry into the 2024 Credit Agreement, the Company also entered into Amendment No. 2 to the 2021 Credit Agreement, modifying the 2021 Credit Agreement by, among other things, conforming certain provisions therein to those contained in the 2024 Credit Agreement.
Note 6. Income Taxes
The effective tax rates for the three months ended April 30, 2024, and 2023, were 31.6% and 39.3%, respectively. The effective tax rates for the six months ended April 30, 2024, and 2023, were 32.0% and 33.7%, respectively. The decreases were primarily due to changes in the geographic composition of pre-tax earnings, partially offset by an increase in the UK statutory tax rate from 19% to 25%.
Note 7. Earnings Per Share
| | | | | | | | | | | | | | | | | | | | | | | |
| Periods Ended April 30, | Three Months | | Six Months |
| (In millions, except per share amounts) | 2024 | | 2023 | | 2024 | | 2023 |
| Net income | $ | 88.9 | | | $ | 39.8 | | | $ | 170.1 | | | $ | 124.4 | |
| Basic: | | | | | | | |
| Weighted-average common shares | 198.9 | | | 197.9 | | | 198.6 | | | 197.7 | |
| Basic earnings per share | $ | 0.45 | | | $ | 0.20 | | | $ | 0.86 | | | $ | 0.63 | |
| Diluted: | | | | | | | |
| Weighted-average common shares | 198.9 | | | 197.9 | | | 198.6 | | | 197.7 | |
| Effect of dilutive stock plans | 1.6 | | | 1.3 | | | 1.6 | | | 1.2 | |
Diluted weighted-average common shares | 200.5 | | | 199.2 | | | 200.2 | | | 198.9 | |
| Diluted earnings per share | $ | 0.44 | | | $ | 0.20 | | | $ | 0.85 | | | $ | 0.63 | |
The following table sets forth stock options to purchase our common stock and restricted stock units that were not included in the diluted earnings per share calculation because their effect would have been antidilutive for the periods presented:
| | | | | | | | | | | | | | | | | | | | | | | |
| Periods Ended April 30, | Three Months | | Six Months |
| (In thousands, except exercise prices) | 2024 | | 2023 | | 2024 | | 2023 |
| Stock option shares excluded | 833 | | | 1,252 | | | 833 | | | 1,252 | |
| Exercise prices | $82.46 - $101.54 | | $75.03 - $101.54 | | $82.46 - $101.54 | | $75.03 - $101.54 |
| Restricted stock units excluded | 3 | | | 248 | | | 22 | | | 268 | |
Note 8. Share-Based Compensation
The Company has several stock plans that are described in the Company’s Annual Report on Form 10‑K for the fiscal year ended October 31, 2023. The compensation expense and related income tax benefit recognized in our Consolidated Condensed Statements of Income and Comprehensive Income for share-based awards, including the Employee Stock Purchase Plan, were as follows:
THE COOPER COMPANIES, INC. AND SUBSIDIARIES
Notes to Consolidated Condensed Financial Statements
(Unaudited)
| | | | | | | | | | | | | | | | | | | | | | | |
| Periods Ended April 30, | Three Months | | Six Months |
| (In millions) | 2024 | | 2023 | | 2024 | | 2023 |
| Selling, general and administrative expense | $ | 15.4 | | | $ | 13.4 | | | $ | 37.2 | | | $ | 27.8 | |
| Cost of sales | 1.1 | | | 0.9 | | | 2.3 | | | 2.0 | |
| Research and development expense | 0.7 | | | 0.8 | | | 1.6 | | | 1.6 | |
| Total share-based compensation expense | $ | 17.2 | | | $ | 15.1 | | | $ | 41.1 | | | $ | 31.4 | |
| Related income tax benefit | $ | 1.5 | | | $ | 1.6 | | | $ | 4.8 | | | $ | 3.3 | |
| | | | | | | |
Note 9. Stockholders' Equity
Analysis of Changes in Accumulated Other Comprehensive Loss:
| | | | | | | | | | | | | | | | | | | | | | | |
| (In millions) | Foreign Currency Translation Adjustment | | Minimum Pension Liability | | Derivative Instruments | | Total |
| Balance at October 31, 2022 | $ | (555.0) | | | $ | (6.2) | | | $ | 94.4 | | | $ | (466.8) | |
| Gross change in value | 69.5 | | | — | | | (35.0) | | | 34.5 | |
| Tax effect | — | | | — | | | 8.5 | | | 8.5 | |
| Balance at April 30, 2023 | $ | (485.5) | | | $ | (6.2) | | | $ | 67.9 | | | $ | (423.8) | |
| | | | | | | |
| Balance at October 31, 2023 | $ | (538.0) | | | $ | (3.2) | | | $ | 87.4 | | | $ | (453.8) | |
| Gross change in value | 37.8 | | | — | | | (8.7) | | | 29.1 | |
| Tax effect | — | | | — | | | 2.1 | | | 2.1 | |
| Balance at April 30, 2024 | $ | (500.2) | | | $ | (3.2) | | | $ | 80.8 | | | $ | (422.6) | |
Share Repurchases
In March 2017, the authorization under the 2012 Share Repurchase Program was increased to $1.0 billion by the Company's Board of Directors. As of April 30, 2024, $256.4 million remains authorized for repurchase.
During the three and six months ended April 30, 2024, and 2023, there were no share repurchases.
Dividends
In December 2023, the Company's Board of Directors decided to end the declaration of the semiannual dividend.
The Company paid a semiannual dividend of approximately $1.5 million or 3 cents per share, on February 10, 2023, to stockholders of record on January 23, 2023.
Note 10. Contingencies and Commitments
The Company is involved in various lawsuits, claims and other legal matters from time to time that arise in the ordinary course of conducting business, including matters involving our products, intellectual property, supplier relationships, distributors, competitor relationships, employees and other matters. The Company does not believe that the ultimate resolution of these proceedings or claims pending against it could have a material adverse effect on its financial condition or results of operations. At each reporting period, the Company evaluates whether or not a potential loss amount or a potential range of loss is probable and reasonably estimable under ASC 450, Contingencies. Legal fees are expensed as incurred.
As of April 30, 2024, the Company entered into an additional lease that has not yet commenced in order to expand capacity. The undiscounted lease payments are estimated at $73.0 million for a lease that will commence beginning in fiscal 2025 for a term of 25 years.
THE COOPER COMPANIES, INC. AND SUBSIDIARIES
Notes to Consolidated Condensed Financial Statements
(Unaudited)
Note 11. Business Segment Information
The following tables present revenue and other financial information by reportable segment:
Segment information:
| | | | | | | | | | | | | | | | | | | | | | | |
| Periods Ended April 30, | Three Months | | Six Months |
| (In millions) | 2024 | | 2023 | | 2024 | | 2023 |
| CooperVision net sales by category: | | | | | | | |
Toric and multifocal | $ | 310.3 | | | $ | 280.4 | | | $ | 607.6 | | | $ | 542.0 | |
Sphere, other | 325.6 | | | 308.9 | | | 649.8 | | | 628.6 | |
| | | | | | | |
| | | | | | | |
| Total CooperVision net sales | $ | 635.9 | | | $ | 589.3 | | | $ | 1,257.4 | | | $ | 1,170.6 | |
| CooperSurgical net sales by category: | | | | | | | |
| Office and surgical | $ | 182.9 | | | $ | 163.0 | | | $ | 374.0 | | | $ | 328.2 | |
| Fertility | 123.8 | | | 125.1 | | | 242.8 | | | 237.1 | |
| CooperSurgical net sales | 306.7 | | | 288.1 | | | 616.8 | | | 565.3 | |
| Total net sales | $ | 942.6 | | | $ | 877.4 | | | $ | 1,874.2 | | | $ | 1,735.9 | |
| Operating income (loss): | | | | | | | |
| CooperVision | $ | 160.2 | | | $ | 137.9 | | | $ | 315.0 | | | $ | 298.0 | |
| CooperSurgical | 21.6 | | | (24.3) | | | 45.6 | | | (18.5) | |
| Corporate | (20.1) | | | (17.3) | | | (45.8) | | | (33.7) | |
| Total operating income | 161.7 | | | 96.3 | | | 314.8 | | | 245.8 | |
| Interest expense | 28.9 | | | 26.1 | | | 58.8 | | | 52.2 | |
| | | | | | | |
| | | | | | | |
| Other expense, net | 2.8 | | | 4.6 | | | 6.0 | | | 5.9 | |
| Income before income taxes | $ | 130.0 | | | $ | 65.6 | | | $ | 250.0 | | | $ | 187.7 | |
| | | | | | | | | | | |
| (In millions) | April 30, 2024 | | October 31, 2023 |
| Total identifiable assets: | | | |
| CooperVision | $ | 7,115.3 | | | $ | 7,044.0 | |
| CooperSurgical | 4,691.6 | | | 4,351.8 | |
| Corporate | 240.5 | | | 263.1 | |
| Total | $ | 12,047.4 | | | $ | 11,658.9 | |
Geographic information:
| | | | | | | | | | | | | | | | | | | | | | | |
| Periods Ended April 30, | Three Months | | Six Months |
| (In millions) | 2024 | | 2023 | | 2024 | | 2023 |
| Net sales to unaffiliated customers by country of domicile: | | | | | | | |
| United States | $ | 479.0 | | | $ | 443.1 | | | $ | 949.4 | | | $ | 877.9 | |
| Europe | 276.7 | | | 249.5 | | | 553.3 | | | 497.7 | |
| Rest of world | 186.9 | | | 184.8 | | | 371.5 | | | 360.3 | |
| Total | $ | 942.6 | | | $ | 877.4 | | | $ | 1,874.2 | | | $ | 1,735.9 | |
THE COOPER COMPANIES, INC. AND SUBSIDIARIES
Notes to Consolidated Condensed Financial Statements
(Unaudited)
| | | | | | | | | | | |
| (In millions) | April 30, 2024 | | October 31, 2023 |
| Net property, plant and equipment by country of domicile: | | | |
| United States | $ | 1,071.7 | | | $ | 1,027.6 | |
| Europe | 360.1 | | | 325.9 | |
| Rest of world | 277.5 | | | 279.1 | |
| Total | $ | 1,709.3 | | | $ | 1,632.6 | |
Note 12. Financial Derivatives and Hedging
As of April 30, 2024, the notional amount of outstanding foreign currency forward contracts was $45.7 million. The resulting impact on our Consolidated Financial Statements from currency hedging activities was not significant for the three and six months ended April 30, 2024, and April 30, 2023.
As of April 30, 2024, the Company has 8 interest rate swap contracts that have a total notional amount of $1.6 billion and remaining maturities of less than four years.
The following table summarizes the amounts recognized with respect to our derivative instruments within the accompanying Consolidated Condensed Statements of Income and Comprehensive Income:
| | | | | | | | | | | | | | | | | | | | | | | | | | | | | |
| Periods Ended April 30, | | | Three Months | | Six Months |
| (In millions) | | | 2024 | | 2023 | | 2024 | | 2023 |
| Derivatives designated as cash flow hedges | | Location of (Gain)/Loss Recognized on Derivatives | | | | | | | |
| Interest rate swap contracts | | Interest expense (income) | $ | (13.6) | | | $ | (9.9) | | | $ | (27.2) | | | $ | (18.2) | |
| | | | | | | | | |
| | | | | | | | | |
| | | | | | | | | |
The cumulative pre-tax impact of the gain on derivatives designated for hedge accounting is recognized in "Accumulated other comprehensive loss". The following table details the changes in the cumulative pre-tax impact of the gain on derivatives designated for hedge accounting:
| | | | | | | | | | | | | | | | | | | | | | | | | | |
| Periods Ended April 30, | | Three Months | | Six Months |
| (In millions) | | 2024 | | 2023 | | 2024 | | 2023 |
| Beginning balance gain | | $ | 78.3 | | | $ | 96.7 | | | $ | 115.1 | | | $ | 124.5 | |
Amount recognized in accumulated other comprehensive income on interest rate swap contracts, gross | | 41.7 | | | 2.7 | | | 18.5 | | | (16.8) | |
Amount reclassified from accumulated other comprehensive income into earnings, gross | | (13.6) | | | (9.9) | | | (27.2) | | | (18.2) | |
Ending balance gain | | $ | 106.4 | | | $ | 89.5 | | | $ | 106.4 | | | $ | 89.5 | |
The amount recognized in other comprehensive income on interest rate swap contracts was $31.8 million and $13.8 million, net of tax, for the three and six months ended April 30, 2024, respectively, and $2.0 million and $(12.7) million, net of tax, for the three and six months ended April 30, 2023, respectively.
The amount reclassified from other comprehensive income into earnings was $(10.4) million and $(20.4) million, net of tax, for the three and six months ended April 30, 2024, respectively, and $(7.5) million and $(13.8) million, net of tax, for the three and six months ended April 30, 2023, respectively.
Refer to Note 9. Stockholders' Equity for amounts presented net of the related tax impact in "Accumulated other comprehensive loss."
The Company expects that $(50.3) million recorded as a component of "Accumulated other comprehensive loss" will be realized in the Consolidated Condensed Statements of Income over the next twelve months and the amount will vary depending on prevailing interest rates.
THE COOPER COMPANIES, INC. AND SUBSIDIARIES
Item 2. Management’s Discussion and Analysis of Financial Condition
and Results of Operations
Note numbers refer to “Notes to Consolidated Condensed Financial Statements” in Item 1. Unaudited Financial Statements.
Forward-Looking Statements
This Quarterly Report on Form 10-Q contains “forward-looking statements” within the meaning of Section 27A of the Securities Act of 1933, Section 21E of the Securities Exchange Act of 1934 and the Private Securities Litigation Reform Act of 1995. These include statements relating to plans, prospects, goals, strategies, future actions, events or performance and other statements which are other than statements of historical fact, including: statements regarding the expected impact of global macroeconomic conditions, and statements regarding acquisitions (including the acquired companies' financial position, market position, product development and business strategy, expected cost synergies, expected timing and benefits of the transaction, difficulties in integrating entities or operations, as well as estimates of our and the acquired entities' future expenses, sales and earnings per share) that are forward-looking. In addition, all statements regarding anticipated growth in our net sales, anticipated effects of any product recalls, anticipated market conditions, planned product launches, restructuring or business transition expectations, regulatory plans, and expected results of operations and integration of any acquisition are forward-looking. To identify these statements, look for words like “believes,” “outlook,” “probable,” “expects,” “may,” “will,” “should,” “could,” “seeks,” “intends,” “plans,” “estimates” or “anticipates” and similar words or phrases. Forward-looking statements necessarily depend on assumptions, data or methods that may be incorrect or imprecise and are subject to risks and uncertainties. Among the factors that could cause our actual results and future actions to differ materially from those described in forward-looking statements are:
•Adverse changes in the global or regional general business, political and economic conditions, including the impact of continuing uncertainty and instability of certain countries, man-made or natural disasters and pandemic conditions, that could adversely affect our global markets, and the potential adverse economic impact and related uncertainty caused by these items.
•The impact of international conflicts and the global response to international conflicts on the global economy, European economy, financial markets, energy markets, currency rates and our ability to supply product to, or through, affected countries.
•Our substantial and expanding international operations and the challenges of managing an organization spread throughout multiple countries and complying with a variety of legal, compliance and regulatory requirements.
•Foreign currency exchange rate and interest rate fluctuations including the risk of fluctuations in the value of foreign currencies or interest rates that would decrease our net sales and earnings.
•Our existing and future variable rate indebtedness and associated interest expense is impacted by rate increases, which could adversely affect our financial health or limit our ability to borrow additional funds.
•Changes in tax laws, examinations by tax authorities, and changes in our geographic composition of income.
•Acquisition-related adverse effects including the failure to successfully achieve the anticipated net sales, margins and earnings benefits of acquisitions, integration delays or costs and the requirement to record significant adjustments to the preliminary fair value of assets acquired and liabilities assumed within the measurement period, required regulatory approvals for an acquisition not being obtained or being delayed or subject to conditions that are not anticipated, adverse impacts of changes to accounting controls and reporting procedures, contingent liabilities or indemnification obligations, increased leverage and lack of access to available financing (including financing for the acquisition or refinancing of debt owed by us on a timely basis and on reasonable terms).
•Compliance costs and potential liability in connection with U.S. and foreign laws and health care regulations pertaining to privacy and security of personal information, such as HIPAA and the California Consumer Privacy Act (CCPA) in the U.S. and the General Data Protection Regulation (GDPR) requirements in Europe, including but not limited to those resulting from data security breaches.
•A major disruption in the operations of our manufacturing, accounting and financial reporting, research and development, distribution facilities or raw material supply chain due to challenges associated with integration of acquisitions, man-made or natural disasters, pandemic conditions, cybersecurity incidents or other causes.
•A major disruption in the operations of our manufacturing, accounting and financial reporting, research and development or distribution facilities due to the failure to perform by third-party vendors, including cloud computing providers or other technological problems, including any related to our information systems maintenance, enhancements or new system deployments, integrations or upgrades.
•Market consolidation of large customers globally through mergers or acquisitions resulting in a larger proportion or concentration of our business being derived from fewer customers.
•Disruptions in supplies of raw materials, particularly components used to manufacture our silicone hydrogel lenses.
•New U.S. and foreign government laws and regulations, and changes in existing laws, regulations and enforcement guidance, which affect areas of our operations including, but not limited to, those affecting the health care industry, including the contact lens industry specifically and the medical device or pharmaceutical industries generally, including
THE COOPER COMPANIES, INC. AND SUBSIDIARIES
Item 2. Management’s Discussion and Analysis of Financial Condition
and Results of Operations
but not limited to the EU Medical Devices Regulation (MDR) and the EU In Vitro Diagnostic Medical Devices Regulation (IVDR).
•Legal costs, insurance expenses, settlement costs and the risk of an adverse decision, prohibitive injunction or settlement related to product liability, patent infringement, contractual disputes, or other litigation.
•Limitations on sales following product introductions due to poor market acceptance.
•New competitors, product innovations or technologies, including but not limited to, technological advances by competitors, new products and patents attained by competitors, and competitors' expansion through acquisitions.
•Reduced sales, loss of customers, reputational harm and costs and expenses, including from claims and litigation related to product recalls and warning letters.
•Failure to receive, or delays in receiving, regulatory approvals or certifications for products.
•Failure of our customers and end users to obtain adequate coverage and reimbursement from third-party payers for our products and services.
•The requirement to provide for a significant liability or to write off, or accelerate depreciation on, a significant asset, including goodwill, other intangible assets and idle manufacturing facilities and equipment.
•The success of our research and development activities and other start-up projects.
•Dilution to earnings per share from acquisitions or issuing stock.
•Impact and costs incurred from changes in accounting standards and policies.
•Risks related to environmental laws and requirements applicable to our facilities, products or manufacturing processes, including evolving regulations regarding the use of hazardous substances or chemicals in our products.
•Risks related to environmental, social and corporate governance (ESG) issues, including those related to climate change and sustainability.
•Other events described in our Securities and Exchange Commission filings, including the “Business” and “Risk Factors” sections in our Annual Report on Form 10-K for the fiscal year ended October 31, 2023, as such Risk Factors may be updated in quarterly filings including updates made in this filing.
We caution investors that forward-looking statements reflect our analysis only on their stated date. We disclaim any intent to update them except as required by law.
THE COOPER COMPANIES, INC. AND SUBSIDIARIES
Item 2. Management’s Discussion and Analysis of Financial Condition
and Results of Operations
Results of Operations
In this section, we discuss the results of our operations for the second quarter of fiscal 2024 ended April 30, 2024, compared with the same period of fiscal 2023. We discuss our cash flows and current financial condition under “Capital Resources and Liquidity.” Within the tables presented, percentages are calculated based on the underlying whole-dollar amounts and, therefore, may not recalculate exactly from the rounded numbers used for disclosure purposes.
Outlook
We are optimistic about the long-term prospects for the worldwide contact lens and general health care markets, and the resilience of and growth prospects for our businesses and products. However, we face significant risks and uncertainties in our global operating environment as further described in the Part II, Item 1A "Risk Factors" herein. These risks include uncertain global and regional business, political and economic conditions, including but not limited to those associated with man-made or natural disasters, pandemic conditions, inflation, foreign exchange rate fluctuations, regulatory developments, supply chain disruptions, and escalating global trade barriers. These risks and uncertainties have adversely affected our sales, cash flow and performance in the past and could further adversely affect our future sales, cash flow and performance.
CooperVision - We compete in the worldwide contact lens market with our spherical, toric, multifocal, and toric multifocal contact lenses offered in materials like silicone hydrogel Aquaform technology. We believe that there will be lower contact lens wearer dropout rates as technology improves and enhances the wearing experience through a combination of improved designs and materials and the growth of preferred modalities such as single-use and monthly wearing options. CooperVision also competes in the myopia management and specialty eye care contact lens markets with myopia management contact lenses using its ActivControl technology and with products such as orthokeratology (ortho-k) and scleral lenses. CooperVision has U.S. Food and Drug Administration (FDA) approval for its MiSight 1 day lens, which is the first and only FDA-approved product indicated to slow the progression of myopia in children with treatment initiated between the ages of 8-12. Further, CooperVision has Chinese National Medical Products Administration (NMPA) approval for its MiSight 1 day lens for use in China. CooperVision is focused on greater worldwide market penetration using recently introduced products, and we continue to expand our presence in existing and emerging markets, including through acquisitions.
Our ability to compete successfully with a full range of silicone hydrogel products is an important factor to achieving our desired future levels of sales growth and profitability. CooperVision manufactures and markets a wide variety of silicone hydrogel contact lenses. Our single-use silicone hydrogel product franchises, clariti, MyDay and MyDay Energys remain a focus as we expect increasing demand for these products, as well as future single-use products, as the global contact lens market continues to shift to this modality. Outside of single-use, the Biofinity and Avaira Vitality product families comprise our focus in the FRP, or frequent replacement product, market which encompasses the monthly and two-week modalities. Included in this segment are unique products such as Biofinity Energys, which helps individuals with digital eye fatigue.
CooperSurgical - Our CooperSurgical business competes in the fertility and women's health care market through its diversified portfolio of products and services, including fertility products and services, medical devices, cryostorage (such as cord blood and cord tissue storage) and contraception. CooperSurgical has established its market presence and distribution system by developing products and acquiring companies, products and services that complement its business model.
Competitive factors in the segments in which CooperSurgical competes include technological and scientific advances, product quality and availability, price and customer service (including response time and effective communication of product information to physicians, consumers, fertility clinics and hospitals).
We protect our products through patents and trademark registrations, both in the United States and in international markets. We monitor competitive products trademark use worldwide and, when determined appropriate, we have enforced and plan to continue to enforce and defend our patent and trademark rights. We also rely upon trade secrets, licenses, technical know-how and continuing technological innovation to develop and maintain our competitive position.
CooperVision, CooperSurgical, and other trade names, trademarks or service marks of Cooper and its subsidiaries appearing in this report are the property of Cooper and its subsidiaries. Trade names, trademarks and service marks of the other companies appearing in this report are the property of their respective holders.
THE COOPER COMPANIES, INC. AND SUBSIDIARIES
Item 2. Management’s Discussion and Analysis of Financial Condition
and Results of Operations
Net Sales
CooperVision Net Sales
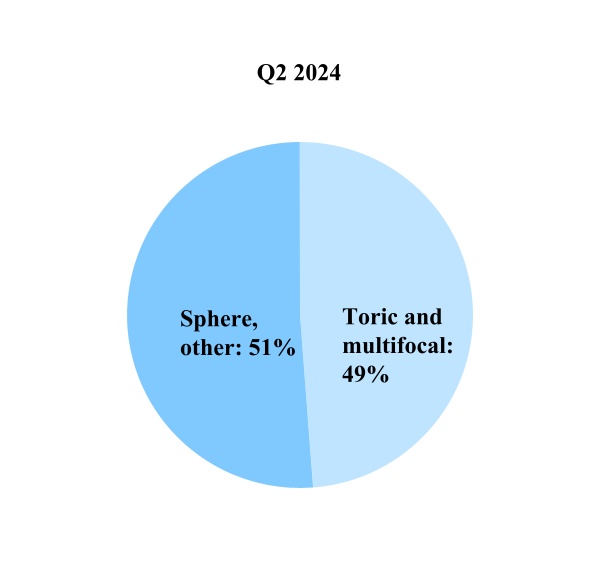
The contact lens market has two major product categories:
•Toric and multifocal lenses including lenses that, in addition to correcting near- and farsightedness, address more complex visual defects such as astigmatism and presbyopia by adding optical properties of cylinder and axis, which correct for irregularities in the shape of the cornea; and
•Spherical lenses, including lenses that correct near- and farsightedness uncomplicated by more complex visual defects, myopia management lenses, which slow the progression of and correct myopia in age-appropriate children, and other specialty lenses.
CooperVision Net Sales by Category
| | | | | | | | | | | | | | | | | | | |
| | | | | | | |
| Three Months Ended April 30, | | | | | | | 2024 vs 2023
% Change |
| ($ in millions) | | 2024 | | | 2023 | |
| Toric and multifocal | | $ | 310.3 | | | | $ | 280.4 | | | 11 | % |
| Sphere, other | | 325.6 | | | | 308.9 | | | 5 | % |
| | $ | 635.9 | | | | $ | 589.3 | | | 8 | % |
THE COOPER COMPANIES, INC. AND SUBSIDIARIES
Item 2. Management’s Discussion and Analysis of Financial Condition
and Results of Operations
| | | | | | | | | | | | | | | | | | | |
| | | | | | | |
| Six Months Ended April 30, | | | | | | | 2024 vs 2023
% Change |
| ($ in millions) | | 2024 | | | 2023 | |
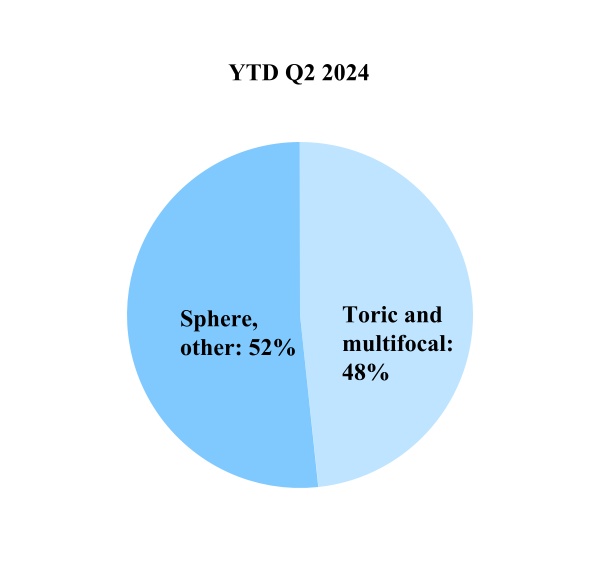
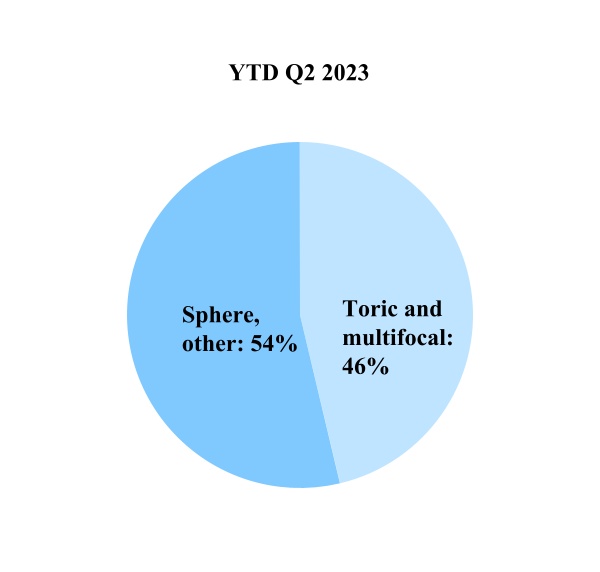
| Toric and multifocal | | $ | 607.6 | | | | $ | 542.0 | | | 12 | % |
| Sphere, other | | 649.8 | | | | 628.6 | | | 3 | % |
| | $ | 1,257.4 | | | | $ | 1,170.6 | | | 7 | % |
In the three and six months ended April 30, 2024, the growth experienced across most categories was partially offset by unfavorable foreign exchange rate fluctuations of approximately $11.1 million and $6.7 million, respectively.
•Toric and multifocal grew primarily through the success of MyDay and Biofinity.
•Sphere, other grew primarily through MyDay, MiSight, and Biofinity.
•"Other" products represented approximately 1% of net sales in the three and six months ended April 30, 2024, and 2023, respectively.
CooperVision Net Sales by Geography
CooperVision competes in the worldwide soft contact lens market and services in three primary regions: the Americas, EMEA (Europe, Middle East and Africa) and Asia Pacific.
| | | | | | | | | | | | | | | | | | | | | | | | | | | | | | | | | | | | | | |
| | | | | | | | | | | | |
| Periods Ended April 30, | | Three Months | | Six Months |
| ($ in millions) | | 2024 | | 2023 | | 2024 vs 2023
% Change | | 2024 | | 2023 | | 2024 vs 2023
% Change |
| Americas | | $ | 264.4 | | | $ | 243.3 | | | 9 | % | | $ | 517.0 | | | $ | 484.8 | | | 7 | % |
| EMEA | | 237.0 | | | 210.0 | | | 13 | % | | 475.2 | | | 424.4 | | | 12 | % |
| Asia Pacific | | 134.5 | | | 136.0 | | | (1) | % | | 265.2 | | | 261.4 | | | 1 | % |
| | $ | 635.9 | | | $ | 589.3 | | | 8 | % | | $ | 1,257.4 | | | $ | 1,170.6 | | | 7 | % |
CooperVision's growth in net sales across all regions was primarily attributable to market gains of silicone hydrogel contact lenses. Refer to CooperVision Net Sales by Category above for further discussion.
THE COOPER COMPANIES, INC. AND SUBSIDIARIES
Item 2. Management’s Discussion and Analysis of Financial Condition
and Results of Operations
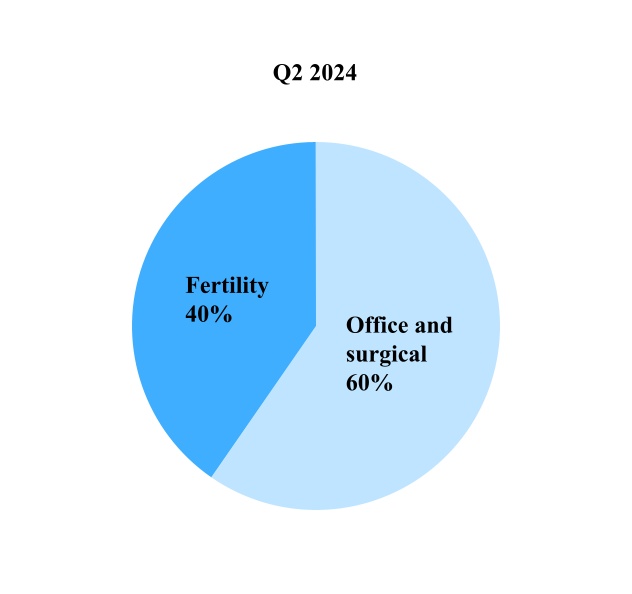
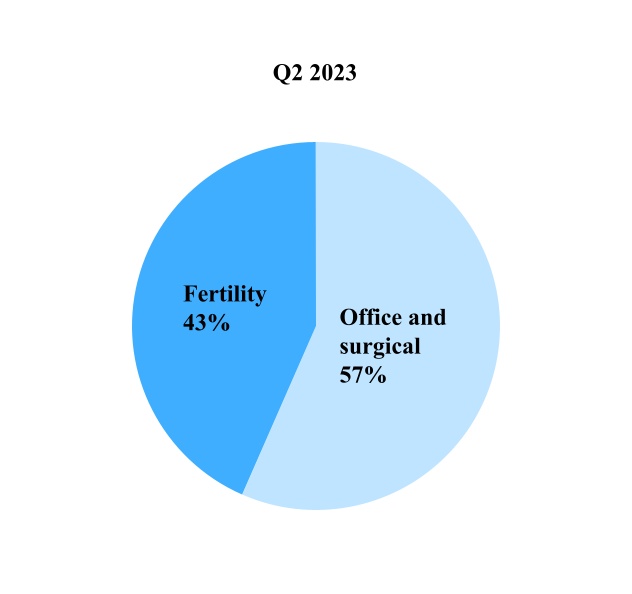
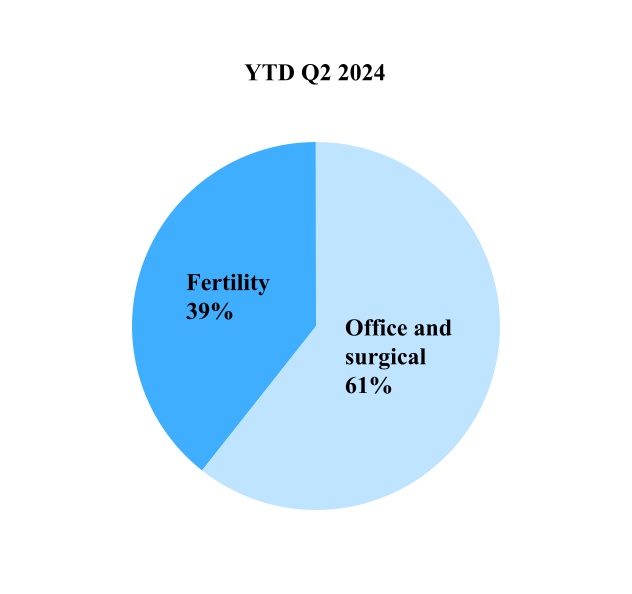
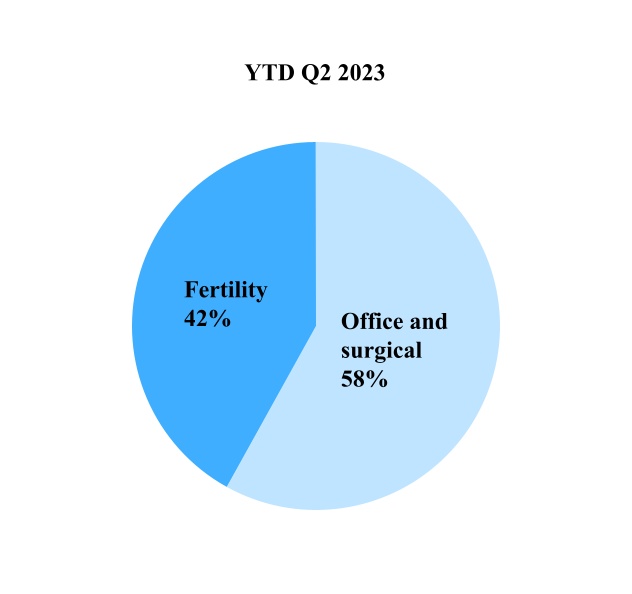
CooperSurgical Net Sales by Category
CooperSurgical supplies the fertility and women's health care market with a diversified portfolio of products and services in two categories:
•Office and surgical offerings include products that facilitate surgical and non-surgical procedures that are commonly performed primarily by obstetricians and gynecologists in hospitals, surgical centers, and medical offices. This includes medical devices, cryostorage (such as cord blood and cord tissue storage), and contraception.
•Fertility offerings include highly specialized products and services that target the IVF process, including diagnostics testing with a goal to make fertility treatment safer, more efficient and convenient. This includes fertility consumables and equipment, donor gamete services, and genomic services (including genetic testing).
The chart below shows the percentage of net sales of office and surgical and fertility.
| | | | | | | | | | | | | | | | | | | |
| | | | | | | |
| Three Months Ended April 30, | | | | | | 2024 vs 2023
% Change | |
| ($ in millions) | | 2024 | | 2023 | | |
| Office and surgical | | $ | 182.9 | | | $ | 163.0 | | | 12 | % | |
| Fertility | | 123.8 | | | 125.1 | | | (1) | % | |
| | $ | 306.7 | | | $ | 288.1 | | | 6 | % | |
THE COOPER COMPANIES, INC. AND SUBSIDIARIES
Item 2. Management’s Discussion and Analysis of Financial Condition
and Results of Operations
| | | | | | | | | | | | | | | | | | | |
| | | | | | | |
| Six Months Ended April 30, | | | | | | 2024 vs 2023
% Change | |
| ($ in millions) | | 2024 | | 2023 | | |
| Office and surgical | | $ | 374.0 | | | $ | 328.2 | | | 14 | % | |
| Fertility | | 242.8 | | | 237.1 | | | 2 | % | |
| | $ | 616.8 | | | $ | 565.3 | | | 9 | % | |
In the three months ended April 30, 2024, office and surgical net sales increased primarily due to the addition of Cook Medical on November 1, 2023, and an increase in revenue from Paragard. Fertility net sales remained relatively flat compared to the three months ended April 30, 2023.
In the six months ended April 30, 2024, office and surgical net sales increased primarily due to the addition of Cook Medical on November 1, 2023, and an increase in revenue from Paragard. Fertility net sales increased due to an increase in revenue from consumable products and genomic services, partially offset by a decrease in revenue from gamete services.
The above growth experienced across all categories was partially offset by unfavorable foreign exchange rate fluctuations of approximately $4.0 million and $6.7 million for the three and six months ended April 30, 2024, respectively.
Gross Margin
Consolidated gross margin increased in the three and six months ended April 30, 2024, to 67% compared to 66% in the three and six months ended April 30, 2023, primarily driven by efficiency gains and price.
THE COOPER COMPANIES, INC. AND SUBSIDIARIES
Item 2. Management’s Discussion and Analysis of Financial Condition
and Results of Operations
Selling, General and Administrative (SGA) Expenses
| | | | | | | | | | | | | | | | | | | | | | | | | | | | | | | | |
| | | | | | | | | | |
| Three Months Ended April 30, | | | | | | | | | | 2024 vs 2023
% Change |
| ($ in millions) | | 2024 | | % Net Sales | | 2023 | | % Net Sales | |
| CooperVision | | $ | 226.6 | | | 36 | % | | $ | 221.8 | | | 38 | % | | 2 | % |
| CooperSurgical | | 133.6 | | | 44 | % | | 168.4 | | | 58 | % | | (21) | % |
| Corporate | | 20.1 | | | — | | | 17.3 | | | — | | | 17 | % |
| | $ | 380.3 | | | 40 | % | | $ | 407.5 | | | 46 | % | | (7) | % |
| | | | | | | | | | |
| Six Months Ended April 30, | | | | | | | | | | 2024 vs 2023
% Change |
| ($ in millions) | | 2024 | | % Net Sales | | 2023 | | % Net Sales | |
| CooperVision | | $ | 447.4 | | | 36 | % | | $ | 409.1 | | | 35 | % | | 9 | % |
| CooperSurgical | | 268.0 | | | 43 | % | | 295.6 | | | 52 | % | | (9) | % |
| Corporate | | 45.8 | | | — | | | 33.7 | | | — | | | 36 | % |
| | $ | 761.2 | | | 41 | % | | $ | 738.4 | | | 43 | % | | 3 | % |
CooperVision's SGA expenses increased in the three months ended April 30, 2024, compared to the three months ended April 30, 2023, due to increases in advertising and marketing activities. The increase in the six months ended April 30, 2024, was primarily due to $31.8 million release of contingent consideration liability associated with SightGlass Vision's regulatory approval milestone in the six months ended April 30, 2023.
CooperSurgical's SGA expenses decreased in the three and six months ended April 30, 2024, compared to the three and six months ended April 30, 2023, primarily due to an accrual of $45.0 million associated with the payment of a termination fee under an asset purchase agreement related to Cook Medical’s reproductive health business in the three and six months ended April 30, 2023, partially offset by an increase in selling activities and distribution costs.
Corporate SGA expenses increased in the three and six months ended April 30, 2024, compared to the three and six months ended April 30, 2023, primarily due to share-based compensation related expenses.
Research and Development (R&D) Expenses
| | | | | | | | | | | | | | | | | | | | | | | | | | | | | | | | |
| | | | | | | | | | |
| Three Months Ended April 30, | | | | | | | | | | 2024 vs 2023
% Change |
| ($ in millions) | | 2024 | | % Net Sales | | 2023 | | % Net Sales | |
| CooperVision | | $ | 20.9 | | | 3 | % | | $ | 16.9 | | | 3 | % | | 24 | % |
| CooperSurgical | | 18.0 | | | 6 | % | | 15.7 | | | 5 | % | | 14 | % |
| | $ | 38.9 | | | 4 | % | | $ | 32.6 | | | 4 | % | | 19 | % |
| | | | | | | | | | |
| Six Months Ended April 30, | | | | | | | | | | 2024 vs 2023
% Change |
| ($ in millions) | | 2024 | | % Net Sales | | 2023 | | % Net Sales | |
| CooperVision | | $ | 41.6 | | | 3 | % | | $ | 33.6 | | | 3 | % | | 24 | % |
| CooperSurgical | | 36.8 | | | 6 | % | | 30.6 | | | 5 | % | | 20 | % |
| | $ | 78.4 | | | 4 | % | | $ | 64.2 | | | 4 | % | | 22 | % |
CooperVision's R&D expenses increased in the three and six months ended April 30, 2024, compared to the three and six months ended April 30, 2023, primarily due to myopia management programs and timing of R&D projects. CooperVision's R&D activities are primarily focused on the development of contact lenses, manufacturing technology and process enhancements.
CooperSurgical's R&D expenses increased in the three and six months ended April 30, 2024, compared to the three and six months ended April 30, 2023, mainly due to project spend and European Medical Device Regulation costs. CooperSurgical's R&D activities are focused on developing and refining diagnostic and therapeutic products including medical interventions, surgical devices and fertility solutions.
THE COOPER COMPANIES, INC. AND SUBSIDIARIES
Item 2. Management’s Discussion and Analysis of Financial Condition
and Results of Operations
Amortization Expense
| | | | | | | | | | | | | | | | | | | | | | | | | | | | | |
| | | | | | | | | |
| Three Months Ended April 30, | | | | | | | | | 2024 vs 2023
% Change |
| ($ in millions) | 2024 | | % Net Sales | | 2023 | | % Net Sales | |
| CooperVision | $ | 7.7 | | | 1 | % | | $ | 8.3 | | | 1 | % | | (7) | % |
| CooperSurgical | 42.6 | | | 14 | % | | 38.2 | | | 13 | % | | 12 | % |
| $ | 50.3 | | | 5 | % | | $ | 46.5 | | | 5 | % | | 8 | % |
| | | | | | | | | |
| Six Months Ended April 30, | | | | | | | | | 2024 vs 2023
% Change |
| ($ in millions) | 2024 | | % Net Sales | | 2023 | | % Net Sales | |
| CooperVision | $ | 15.4 | | | 1 | % | | $ | 16.7 | | | 1 | % | | (7) | % |
| CooperSurgical | 85.2 | | | 14 | % | | 76.3 | | | 14 | % | | 12 | % |
| $ | 100.6 | | | 5 | % | | $ | 93.0 | | | 5 | % | | 8 | % |
CooperVision's amortization expense for the three and six months ended April 30, 2024, remained relatively flat year over year. CooperSurgical's amortization expense increased in the three and six months ended April 30, 2024, compared to the three and six months ended April 30, 2023, primarily due to the amortization of intangible assets recently acquired through acquisitions.
Operating Income
| | | | | | | | | | | | | | | | | | | | | | | | | | | | | |
| | | | | | | | | |
| Three Months Ended April 30, | | | | | | | | | 2024 vs 2023
% Change |
| ($ in millions) | 2024 | | % Net Sales | | 2023 | | % Net Sales | |
| CooperVision | $ | 160.2 | | | 25 | % | | $ | 137.9 | | | 23 | % | | 16 | % |
| CooperSurgical | 21.6 | | | 7 | % | | (24.3) | | | (8) | % | | 189 | % |
| Corporate | (20.1) | | | — | | | (17.3) | | | — | | | 17 | % |
| $ | 161.7 | | | 17 | % | | $ | 96.3 | | | 11 | % | | 68 | % |
| | | | | | | | | |
| Six Months Ended April 30, | | | | | | | | | 2024 vs 2023
% Change |
| ($ in millions) | 2024 | | % Net Sales | | 2023 | | % Net Sales | |
| CooperVision | $ | 315.0 | | | 25 | % | | $ | 298.0 | | | 25 | % | | 6 | % |
| CooperSurgical | 45.6 | | | 7 | % | | (18.5) | | | (3) | % | | 346 | % |
| Corporate | (45.8) | | | — | | | (33.7) | | | — | | | 36 | % |
| $ | 314.8 | | | 17 | % | | $ | 245.8 | | | 14 | % | | 28 | % |
CooperVision's operating income increased in the three and six months ended April 30, 2024, compared to the three and six months ended April 30, 2023, primarily due to a net increase in net sales, partially offset by a net increase in operating expenses.
CooperSurgical's operating income in the three and six months ended April 30, 2024, compared to operating loss in the three and six months ended April 30, 2023, was primarily due to an accrual of $45.0 million associated with the payment of a termination fee under an asset purchase agreement related to Cook Medical’s reproductive health business in the three and six months ended April 30, 2023.
Corporate operating loss increased in the three and six months ended April 30, 2024, compared to the three and six months ended April 30, 2023, primarily due to higher share-based compensation expenses.
THE COOPER COMPANIES, INC. AND SUBSIDIARIES
Item 2. Management’s Discussion and Analysis of Financial Condition
and Results of Operations
Interest Expense
| | | | | | | | | | | | | | | | | | | | | | | | | | | | | |
| | | | | | | | | |
| Three Months Ended April 30, | | | | | | | | | 2024 vs 2023
% Change |
| ($ in millions) | 2024 | | % Net Sales | | 2023 | | % Net Sales | |
| Interest expense | $ | 28.9 | | | 3 | % | | $ | 26.1 | | | 3 | % | | 11 | % |
| | | | | | | | | |
| Six Months Ended April 30, | | | | | | | | | 2024 vs 2023
% Change |
| ($ in millions) | 2024 | | % Net Sales | | 2023 | | % Net Sales | |
| Interest expense | $ | 58.8 | | | 3 | % | | $ | 52.2 | | | 3 | % | | 13 | % |
Interest expense increased during the three and six months ended April 30, 2024, compared to the three and six months ended April 30, 2023, primarily due to higher debt balances and higher interest rates.
Other Expense, Net
| | | | | | | | | | | | | | | | | | | | | | | | | | |
| Periods Ended April 30, | | Three Months | | Six Months |
| ($ in millions) | | 2024 | | 2023 | | 2024 | | 2023 |
| | | | | | | | |
| Foreign exchange loss (gain) | | $ | 2.5 | | | $ | 2.8 | | | 3.7 | | | $ | 1.8 | |
Other expense, net | | 0.3 | | | 1.8 | | | 2.3 | | | 4.1 | |
| | $ | 2.8 | | | $ | 4.6 | | | $ | 6.0 | | | $ | 5.9 | |
Foreign exchange loss is primarily associated with the weakening of the U.S. dollar against foreign currencies and the effect on intercompany receivables during the three and six months ended April 30, 2024.
Other expense, net decreased in the three and six months ended April 30, 2024, compared to the three and six months ended April 30, 2023, primarily due to a decrease in loss on minority investments.
Provision for Income Taxes
The effective tax rates for the three months ended April 30, 2024, and 2023, were 31.6% and 39.3%, respectively. The effective tax rates for the six months ended April 30, 2024, and 2023, were 32.0% and 33.7%, respectively. The decreases were primarily due to changes in the geographic composition of pre-tax earnings, partially offset by an increase in the UK statutory tax rate from 19% to 25%.
THE COOPER COMPANIES, INC. AND SUBSIDIARIES
Item 2. Management’s Discussion and Analysis of Financial Condition
and Results of Operations
Capital Resources and Liquidity
Working capital on April 30, 2024, and October 31, 2023, was $906.5 million and $735.9 million, respectively. The increase in working capital was primarily due to an increase in trade accounts receivable mainly due to higher sales and timing of collections, an increase in prepaid expenses and other current assets, and an increase in inventories.
Cash Flow | | | | | | | | | | | | | | |
| ($ in millions) | | April 30, 2024 | | April 30, 2023 |
| Operating activities | | $ | 233.7 | | | $ | 290.8 | |
| Investing activities | | (398.9) | | | (195.3) | |
| Financing activities | | 155.2 | | | (124.4) | |
Effect of exchange rate changes on cash, cash equivalents, restricted cash | | 1.7 | | | 2.4 | |
Net decrease in cash, cash equivalents, and restricted cash | | $ | (8.3) | | | $ | (26.5) | |
Operating Cash Flow
Cash provided by operating activities in the first six months of fiscal 2024 decreased compared to the first six months of fiscal 2023, primarily due to net changes in operating capital, including a decrease in accrued liabilities and an increase in accounts receivable, partially offset by net changes in other non-cash items and the $31.8 million release of contingent consideration liability associated with SightGlass Vision's regulatory approval milestone in the first six months of fiscal 2023.
Investing Cash Flow
Cash used in investing activities in the first six months of fiscal 2024 increased compared to the first six months of fiscal 2023, primarily attributable to $200.0 million cash paid for the Cook Medical acquisition in the first six months of fiscal 2024, and an increase in purchases of property, plant and equipment.
Financing Cash Flow
Cash provided by financing activities in the first six months of fiscal 2024 was primarily attributable to $200.0 million drawn on the 2020 revolving credit to pay for the Cook Medical acquisition, partially offset by repayments on the 2020 revolving credit.
Cash used in financing activities in the first six months of fiscal 2023 was primarily due to repayments of $338.0 million on the 2021 364-day term loan, partially offset by $215.0 million of funds drawn on the 2020 revolving credit.
The following is a summary of the maximum commitments and the net amounts available to us under different credit facilities as of April 30, 2024:
| | | | | | | | | | | | | | | | | | | | | | | | | | | | | | | | |
| (In millions) | | Facility Limit | | Outstanding Borrowings | | Outstanding Letters of Credit | | Total Amount Available | | Maturity Date |
| | | | | | | | | | |
| Revolving Credit: | | | | | | | | | | |
| 2020 Revolving Credit | | $ | 1,290.0 | | | $ | 320.0 | | | $ | 2.3 | | | $ | 967.7 | | | April 1, 2025 |
| Term loan: | | | | | | | | | | |
| 2020 Term Loan | | 850.0 | | | 850.0 | | | n/a | | — | | | April 1, 2025 |
| 2021 Term Loan | | 1,500.0 | | | 1,500.0 | | | n/a | | — | | | December 17, 2026 |
| Total | | $ | 3,640.0 | | | $ | 2,670.0 | | | $ | 2.3 | | | $ | 967.7 | | | |
As of April 30, 2024, the Company was in compliance with all debt covenants. On May 1, 2024, the Company entered into a Revolving Credit Agreement (the 2024 Credit Agreement). The Company drew on the 2024 Credit Agreement to fully repay borrowings outstanding under the 2020 Term Loan and 2020 Revolving Credit Facility and terminated the 2020 Credit Agreement. See Note 5. Financing Arrangements of the Consolidated Condensed Financial Statements for further information.
Considering recent market conditions, we have re-evaluated our operating cash flows and cash requirements and continue to believe that current cash, cash equivalents, future cash flow from operating activities and cash available under our 2024 Credit
THE COOPER COMPANIES, INC. AND SUBSIDIARIES
Item 2. Management’s Discussion and Analysis of Financial Condition
and Results of Operations
Agreement will be sufficient to meet our anticipated cash needs, including working capital needs, capital expenditures and contractual obligations for at least 12 months from the issuance date of the Consolidated Condensed Financial Statements included in this quarterly report. To the extent additional funds are necessary to meet our liquidity needs such as for acquisitions, share repurchases or other activities as we execute our business strategy, we anticipate that additional funds could be obtained through the incurrence of additional indebtedness, additional equity financings or a combination of these potential sources of funds; however, such financing may not be available on favorable terms, or at all.
Share Repurchase
In March 2017, the authorization under the 2012 Share Repurchase Program was increased to $1.0 billion by the Company's Board of Directors. As of April 30, 2024, $256.4 million remains authorized for repurchase.
During the six months ended April 30, 2024, and 2023, there were no share repurchases.
Dividends
In December 2023, the Company's Board of Directors decided to end the declaration of the semiannual dividend.
Stock Split
On February 16, 2024, the Company effected a four-for-one stock split of its outstanding shares of common stock. All share and per share information has been retroactively adjusted to reflect the stock split for all periods presented. The par value of the common stock remains $0.10 per share.
Estimates and Critical Accounting Policies
Information regarding estimates and critical accounting policies is included in Management's Discussion and Analysis in our Form 10-K for the fiscal year ended October 31, 2023. There have been no material changes in our policies2 from those previously discussed in our Form 10-K for the fiscal year ended October 31, 2023.
Accounting Pronouncements
Information regarding new accounting pronouncements is included in Note 1. General of the Consolidated Condensed Financial Statements of this Quarterly Report on Form 10-Q.
2 To further clarify the policy detailed in our Annual Report on Form 10-K for the fiscal year ended October 31, 2023, the current portion of the deferred revenue balances at the beginning of each period presented were generally fully recognized in a ratable manner in the subsequent 12-month period. We recognized revenue of approximately $31.0 million and $62.0 million for the three and six months ended April 30, 2024, respectively, that was included in the deferred revenue balance at January 31, 2024, and October 31, 2023.We recognized revenue of approximately $27.0 million and $50.0 million for the three and six months ended April 30, 2023, respectively, that was included in the deferred revenue balance at January 31, 2023, and October 31, 2022.
THE COOPER COMPANIES, INC. AND SUBSIDIARIES
Item 3. Quantitative and Qualitative Disclosure About Market Risk
We are exposed to market risks that relate principally to changes in interest rates and foreign currency fluctuations. We do not enter into derivative financial instrument transactions for speculative purposes.
Foreign Currency Exchange Risk
We operate multiple foreign subsidiaries that manufacture and market our products worldwide. As a result, our earnings, cash flow and financial position are exposed to foreign currency risk from foreign currency denominated receivables and payables, sales transactions, capital expenditures and net investment in certain foreign operations. Most of our operations outside the United States have their local currency as their functional currency. We have exposure to multiple foreign currencies, including, among others, the British pound, Euro and Japanese yen. We have taken steps to minimize our balance sheet exposure by entering into foreign currency forward contracts to minimize the short-term impact of foreign currency exchange rate fluctuations on certain trade and intercompany receivables and payables.
At April 30, 2024, a uniform hypothetical 10% increase or decrease in the foreign currency exchange rates in comparison to the value of the U.S. dollar would have resulted in a corresponding increase or decrease of approximately $28.3 million in operating income for the fiscal quarter ended April 30, 2024. See Note 12. Financial Derivatives and Hedging of the Consolidated Condensed Financial Statements for further information.
Interest Rate Risk
We are exposed to risks associated with changes in interest rates, as the interest rates on our revolving lines of credit and term loans may vary with the federal funds rate and SOFR. As of April 30, 2024, we had outstanding debt for an aggregate carrying amount of $2.7 billion. We have entered, and in the future may enter, into interest rate swaps to manage interest rate risk.
Our ultimate realized gain or loss with respect to interest rate fluctuations will depend on interest rates, the exposures that arise during the period and our hedging strategies at that time. As an example, if interest rates were to increase or decrease by 1% or 100 basis points, the quarterly interest expense would not have a material impact, based on average debt outstanding, after consideration of our interest rate swap contracts, during the second quarter of fiscal 2024. See Note 5. Financing Arrangements of the Consolidated Condensed Financial Statements for further information.
Item 4. Controls and Procedures
Evaluation of Disclosure Controls and Procedures
Based on management’s evaluation (with the participation of our Chief Executive Officer (our Principal Executive Officer) and Chief Financial Officer (our Principal Financial Officer)), as of the end of the period covered by this report, our Chief Executive Officer and Chief Financial Officer have concluded that our disclosure controls and procedures (as defined in Rules 13a-15(e) and 15d-15(e) under the Securities Exchange Act of 1934, as amended, (the Exchange Act)) are effective to provide reasonable assurance that information required to be disclosed by us in reports that we file or submit under the Exchange Act is recorded, processed, summarized and reported within the time periods specified in Securities and Exchange Commission rules and forms and is accumulated and communicated to management, including our Chief Executive Officer and Chief Financial Officer, as appropriate to allow timely decisions regarding required disclosure.
Changes in Internal Control over Financial Reporting
There have been no changes in our internal control over financial reporting identified in connection with the evaluation required by Rule 13a-15(d) and 15d-15(d) of the Exchange Act that occurred during our second quarter of fiscal 2024, that have materially affected, or are reasonably likely to materially affect, our internal control over financial reporting.
THE COOPER COMPANIES, INC. AND SUBSIDIARIES
PART II—OTHER INFORMATION
Item 1. Legal Proceedings
Information regarding legal proceedings is included in Note 10. Contingencies of the Consolidated Condensed Financial Statements of this Quarterly Report on Form 10-Q.
Item 1A. Risk Factors
Our business faces significant risks. These risks include those described below and may include additional risks and uncertainties not presently known to us or that we currently deem immaterial. Our business, financial condition and results of operations could be materially adversely affected by any of these risks, and the trading prices of our common stock could decline by virtue of these risks. These risks should be read in conjunction with the other information in this report.
Risk factors describing the major risks to our business can be found under Item 1A. Risk Factors in our Annual Report on Form 10-K for the fiscal year ended October 31, 2023. There have been no material changes to the risk factors previously disclosed in our Annual Report on Form 10-K for the fiscal year ended October 31, 2023.
Item 2. Unregistered Sales of Equity Securities and Use of Proceeds
In March 2017, the authorization under the 2012 Stock Repurchase Program was increased to $1.0 billion by the Company's Board of Directors. As of April 30, 2024, $256.4 million remains authorized for repurchase.
During the six months ended April 30, 2024, and 2023, there were no share repurchases.
Item 3. Defaults Upon Senior Securities
None.
Item 4. Mine Safety Disclosures
Not applicable.
Item 5. Other Information
During the six months ended April 30, 2024, no director or officer of the Company adopted or terminated a Rule 10b5-1 trading arrangement or non-Rule 10b5-1 trading arrangement, as each term is defined in Item 408(a) of Regulation S-K.
THE COOPER COMPANIES, INC. AND SUBSIDIARIES
Item 6. Exhibits
| | | | | | | | | | | | | | |
| | Incorporated by Reference |
Exhibit Number | Description of Document | Form | Exhibit | Filing Date/
Period End
Date |
| | | | |
10.1# | | | | |
| | | | |
10.2# | | | | |
| | | | |
10.3# | | | | |
| | | | |
| 10.4 | | 8-K | 10.1 | 5/1/2024 |
| | | | |
| 10.5 | Amendment No. 2, dated as of May 1, 2024, to the Term Loan Agreement, dated as of December 17, 2021, by and among The Cooper Companies, Inc., the lenders party thereto, and PNC Bank, National Association, as the administrative agent | 8-K | 10.2 | 5/1/2024 |
| | | | |
| 31.1 | | | | |
| | | | |
| 31.2 | | | | |
| | | | |
| 32.1 | | | | |
| | | | |
| 32.2 | | | | |
| | | | |
| 101.1 | The following materials from the Company's Quarterly Report on Form 10-Q for the three and six months period ended April 30, 2024 formatted in Inline XBRL (Extensible Business Reporting Language): (i) Consolidated Condensed Statements of Income and Comprehensive Income, (ii) Consolidated Condensed Balance Sheets, (iii) Consolidated Condensed Statements of Stockholders' Equity, (iv) Consolidated Condensed Statements of Cash Flows and (v) related Notes to Consolidated Condensed Financial Statements. | | | |
| | | | |
| 104.1 | Cover Page Interactive Data File (embedded within the Inline XBRL document) | | | |
| | | | |
| | | | |
# Indicates management contract or compensatory plan.
THE COOPER COMPANIES, INC. AND SUBSIDIARIES
SIGNATURES
Pursuant to the requirements of the Securities Exchange Act of 1934, the Registrant has duly caused this report to be signed on its behalf by the undersigned thereunto duly authorized.
| | | | | |
| The Cooper Companies, Inc. |
| (Registrant) |
| |
Date: May 31, 2024 | /s/ Brian G. Andrews |
| Brian G. Andrews |
| Executive Vice President, Chief Financial Officer and Treasurer
(Principal Financial Officer) |
| |
| |
| |
Date: May 31, 2024 | /s/ Agostino Ricupati |
| Agostino Ricupati |
| Senior Vice President and Chief Accounting Officer (Principal Accounting Officer) |