OMB APPROVAL
OMB Number: 3235-0570
Expires: August 31, 2010
Estimated average burden hours per response...18.9
UNITED STATES SECURITIES AND EXCHANGE COMMISSION
Washington, DC 20549
FORM N-CSR
CERTIFIED SHAREHOLDER REPORT OF REGISTERED
MANAGEMENT INVESTMENT COMPANIES
Investment Company Act file number 811-3615
Madison Mosaic Equity Trust
(Exact name of registrant as specified in charter)
550 Science Drive, Madison, WI 53711
(Address of principal executive offices)(Zip code)
W. Richard Mason
Madison/Mosaic Legal and Compliance Department
8777 N. Gainey Center Drive, Suite 220
Scottsdale, AZ 85258
(Name and address of agent for service)
Registrant's telephone number, including area code: 608-274-0300
Date of fiscal year end: December 31
Date of reporting period: June 30, 2009
Form N-CSR is to be used by management investment companies to file reports with the Commission not later than 10 days after the transmission to stockholders of any report that is required to be transmitted to stockholders under Rule 30e-1 under the Investment Company Act of 1940 (17 CFR 270.30e-1). The Commission may use the information provided on Form N-CSR in its regulatory, disclosure review, inspoection, and policymaking roles.
A registrant is required to disclose the information specified by Form N-CSR, and the Commission will make this information public. A registrant is not required to respond to the collection of information contained in Form N-CSR unless the Form displays a currently valid Office of Management and Budget ("OMB") control number. Please direct comments concerning the accuracy of the information collection burden estimate and any suggestions for reducing the burden to Secretary, Securities and Exchange Commission, 100 F Street, NE, Washington, DC 20549-0609. The OMB has reviewed this collection of information under the clearance requirements of 44 U.S.C. s 3507.
Semi-Annual Report (unaudited)
June 30, 2009
Madison Mosaic Equity Trust
- Investors Fund
- Balanced Fund
- Mid-Cap Fund
- Disciplined Equity Fund
- Small/Mid-Cap Fund
Madison Mosaic Funds
(Madison Mosaic Logo)
www.mosaicfunds.com
Contents
|
Portfolio Manager Review |
|
|
Performance Review |
1 |
|
Market in Review |
1 |
|
Outlook |
1 |
|
Interview with lead equity manager Jay Sekelsky |
2 |
|
Investors Fund |
2 |
|
Balanced Fund |
4 |
|
Disciplined Equity Fund |
6 |
|
Mid-Cap Fund |
7 |
|
Small/Mid-Cap Fund |
9 |
|
Portfolio of Investments |
|
|
Investors Fund |
10 |
|
Balanced Fund |
11 |
|
Disciplined Equity Fund |
13 |
|
Mid-Cap Fund |
15 |
|
Small/Mid-Cap Fund |
16 |
|
Statements of Assets and Liabilities |
18 |
|
Statements of Operations |
19 |
|
Statements of Changes in Net Assets |
20 |
|
Financial Highlights |
22 |
|
Notes to Financial Statements |
25 |
|
Fund Expenses |
30 |
Madison Mosaic Equity Trust June 30, 2009
Portfolio Manager Review
Performance Review
The six-month period ended June 30, 2009 showed gains for all the funds in Equity Trust in a period of exceptional volatility. Our primary benchmark indices were down sharply through early March and then rebounded robustly, with the large-cap S&P 500 ending the sixth-month period up 3.16% and the Russell Midcap¨ Index a positive 9.96%. Mosaic Investors was up 9.46% for the six-month period, while Mosaic Midcap rose 5.22%. Mosaic Balanced gained 7.64%, while the all-sector Disciplined Equity Fund beat its S&P 500 benchmark with an 8.74% return. Our newest fund, Small/Mid-Cap Fund, which was launched at the beginning of the period, got off to a very strong start with a return of 10.80%, well ahead of its benchmark, the Russell 2500¨ Index, which saw a 6.52% return.
Market in Review
The wild ride for stock investors during the first half of 2009 can be traced by the path of the S&P 500, which is often used as a proxy for the overall market. The Index began the year with the same downward momentum that characterized 2008, when the market dropped a record-setting -37.0%. The Index fell an additional 25% by March
9, before turning upward, at one point hitting a 40% rally. By June 30, the Index had made up its early losses, finishing with a deceivingly average-looking year-to-date 3.16%.
The market was buffeted by unprecedented financial woes, the subsequent massive governmental stimulus and wide swings of investor psychology. In the fall of 2008 the collapse of Lehman Brothers and the subsequent massive interventions from the Federal government raised hopes that the worst was behind. But as we entered the first months of 2009 a new wave of uncertainty gripped the market. The new administration’s announcements of dramatic and sizable support initiatives were
not enough to overcome the continuing negative economic and corporate news. The economy, as measured by GDP, was dropping at an annualized 6% rate, and employment fell at a record-setting pace. The crisis in the housing market showed no sign of abating and the domestic automobile business was in freefall. It was no wonder consumer sentiment hit a new low while investor sentiment could be summed up in one word: fearful.
From the market lows in early March, the S&P rallied strongly through most of the remaining period, ending the six months in positive territory for the first half of 2009. This rebound was not so much driven by good news as it was by diminishing worry. In other words, investors who were once worried about the collapse of the global financial system and another great depression were beginning to believe that the economic problems were deep, but not fathomless. By the later part
of the period, some of the important economic indicators showed signs of bottoming and other problem areas showed decreasing losses. These signs, however modest, were eagerly noted by investors looking for hints of recovery and as we entered the second half of the period, the market sentiment shifted from fear to hope.
Outlook
After watching the market drop and then rebound during the past six months the question remains: Is this the beginning of a new bull market or a rally within a bear market? The answer may lie in an old market adage which describes rallies following a bear market: "First comes price, then comes optimism and then comes earnings." The price piece of this equation can be seen in the S&P 500’s 37% rally from the March low through period end. Optimism improved markedly since
Madison Mosaic Equity Trust 1
Portfolio Manager Review (continued)
the bleak days of early March, when there was real fear of a total collapse of the global financial system. However, positive earnings news remained sparse, leading us to the conclusion that it is too early to confidently categorize the latest rally. For the market to truly transition into a new bull market phase we need evidence of a return to positive revenue and earnings growth and at period end we simply were not there yet. We do expect overall corporate earnings to improve in
2010, but the rate and the breadth are subject to many variables. As a result, we continue to concentrate our portfolios in shares of high-quality companies with superior competitive advantages, strong balance sheets and positive free cash flow generation. These companies can be a source of stability if volatility increases while still providing upside if, in fact, a new bull market is upon us.
Interview with lead equity manager Jay Sekelsky (photo of Jay Sekelsky)
Can you summarize the performance of the funds in Equity Trust for the first six months of 2009?
We’ve just completed one of those rare six-month periods in which you could see the power of both a rampant bear and a raging bull. Historically, our risk-conscious style has shown relative strength in down markets while typically lagging in steep up markets. Over this six-month period the funds did not exactly follow this formula. Our large-cap portfolios (Investors, Disciplined Equity and the equity portion of Balanced) outperformed their benchmarks in the down market, and outperformed on the up side as well, which was particularly gratifying. Mid-Cap, which did beat the broader market as measured by the S&P 500, could not keep up with its benchmark Russell Midcap¨ Index, which was led by lower-quality and more speculative stocks. Our newest fund, Mosaic Small/Mid-Cap, was well ahead of its benchmark. After the dismal returns of 2008, any positive returns would have been welcome, but it was particularly gratifying to see such overall strong performance during a period in which our style has often lagged.
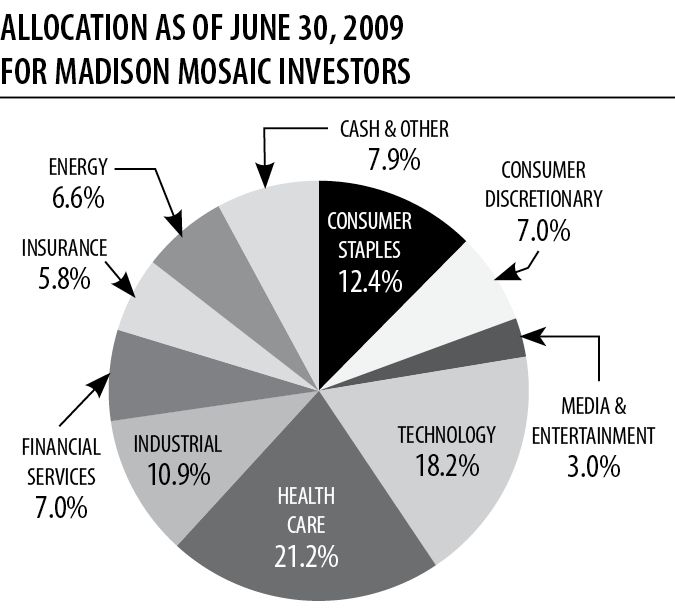
MADISON MOSAIC INVESTORS
How did the fund perform for the first six months of 2009?
Mosaic Investors was up 9.46% for the period ended June 30, 2009. This return was well ahead of the return of the S&P 500, which rose 3.16%. This return also outdistanced the fund’s peer group, represented by the Lipper Large-Cap Core Index, which rose 5.35%. This discrepancy was largely due to stock selection, and to a lesser extent, sector positioning. The fund had especially good results from the Financial Sector which led the market in the second half of the period advancing 35.1%. We were overweight in financials going into this rally, and took some profits as we headed into the latter part of the period.
Have you made any significant changes to the portfolio since December 31, 2008?
Volatility can be unnerving to investors, but it is actually a boon for stock pickers. Emotional selling can drive down the price of all companies, regardless of their individual merits. As a result we’ve been more active over the first half of 2009 than we’ve been historically. We’ve tried to take advantage of these opportunities and this naturally produces some trading. For instance, we added to our high-quality financial holdings in the first quarter as the market took down share prices indiscriminately and reaped some of those profits in the second quarter. The Consumer Staples and Health Care Sectors lagged over the second
2 Semi-annual Report • June 30, 2009
Portfolio Manager Review (continued)
quarter, and we found opportunities in these areas, trimming names like Wells Fargo and adding companies including PepsiCo and Baxter. Baxter produces health care products and devices. As a result, the portfolio looked a little more defensive at the end of the period than it would have looked halfway through it.
In terms of percentages, at the beginning of the period we held 19.1% of the portfolio in financial stocks, compared to our benchmark’s 13.3%, and by the end of the period had trimmed these to 12.8%, underweight the index’s closing allocation of 13.6%. In terms of specific holdings, we sold all of our shares in Aflac and American Express. In the Consumer Discretionary Sector the fund benefited from a timely swap, selling flooring specialist Mohawk for Walt Disney
Company, which reported better than expected second quarter earnings.
An example of an opportunistic buy was the addition of dental supply company Dentsply. We’ve admired the company for some time and have held it in the past. The market weakness brought it back within our valuation target, and we expect the company to be well positioned as it supplies an aging domestic population as well as an increasingly affluent global market.
What holdings were the strongest contributors to fund performance?
Contributions to the portfolio were broad based with outperformance primarily due to individual stock selection. The strongest returns within the portfolio were in the Information Technology sector, which was the leading S&P sector as well. Within our Tech Sector holdings, Google showed the best first half 2009 performance, with its
share price rising 37%. The fund also had solid contributions from Check Point, Cisco Systems and EMC Corp. An area of particular relative strength was Health Care which was led by our holdings in mid-cap health-care stocks.
While Industrials were negative as a total S&P Sector, we had a contribution to performance from this sector that was positive, led by Expeditors International (which was sold after hitting our price target) and ABB Ltd. Expeditors is a leading facilitator for international shipping and ABB Ltd. provides hardware for the electrical utility industry. While the Energy Sector slumped -3.2% for the sector, our holdings produced positive returns for the period, led by Schlumberger,
the world’s leading oilfield services provider.
Although consumer spending was rattled by the economic crisis and unemployment, we did get a boost from individual holdings in the sector, including Staples, Best Buy and Comcast.
What holdings were the largest constraints on performance?
We can’t really point to any one sector as a problem area. We actually had positive relative contributions from all but one of the sectors in which we had significant exposure. Even the sectors we didn’t own helped as Telecommunication Services and Utilities had losses for the period, helping the portfolio’s performance relative to the market. Unfortunately, we did have individual companies with negative returns for the period, including Jacobs Engineering, Health Care stock Zimmer Holdings, Target Corporation and specialty insurer Markel.
What is your outlook for the remainder of 2009 and beyond?
We’re optimistic but cautious looking forward. When we add up the positives and negatives, the recipe is there for improving revenue growth, although it must be said that you have to take some of these corporate statistics with a grain of salt, since the comparisons will be to some of the worst quarterly performance on record. As the economy improves we should get margin improvement, but what we really are waiting to see is revenue growth. Margins should look better since productivity continues to improve
Madison Mosaic Equity Trust 3
Portfolio Manager Review (continued)
while wage inflation is controlled by the high unemployment rate. Companies have done a great job in trimming excess expenses and getting lean. Better revenue growth would signal that the economy is recovering, which when combined with solid margins could be a big plus for the market. On top of this, we still see a large amount of money on the sidelines, waiting for evidence of better fundamentals. We’re not calling for a huge return for the markets in 2009, but any progress
will be welcome after the deep losses of 2008.

TOP TEN STOCK HOLDINGS AS OF JUNE 30, 2009
FOR MADISON MOSAIC INVESTORS
|
% of net assets |
|
|
Cisco Systems Inc. |
4.28% |
|
Microsoft Corp. |
3.73% |
|
Google Inc. - CL A |
3.35% |
|
Berkshire Hathaway Inc. - CL B |
3.33% |
|
Diageo PLC - ADR |
3.24% |
|
Baxter International |
3.15% |
|
Waste Management Inc. |
3.03% |
|
Comcast Corp. - Special CL A |
3.00% |
|
Wells Fargo & Co. |
2.99% |
|
3M Company |
2.98% |
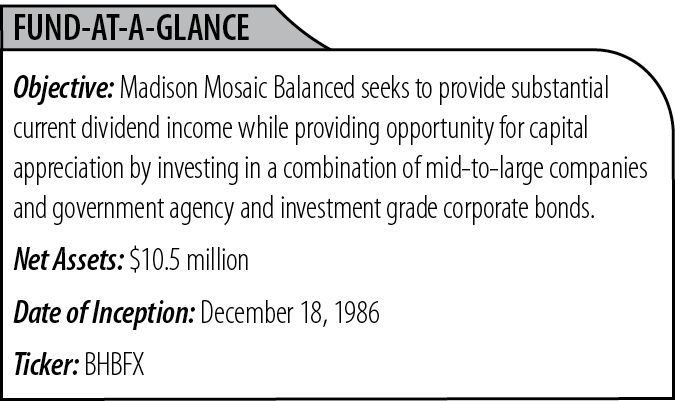
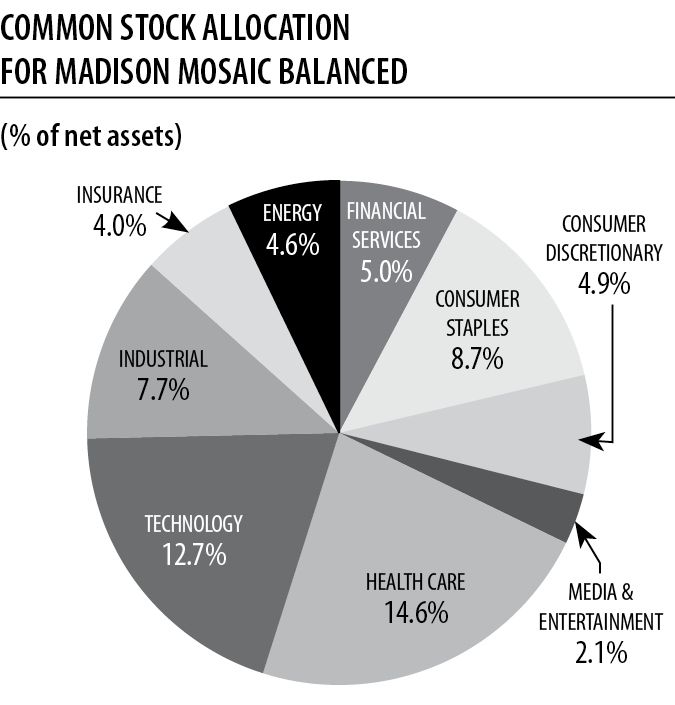
MADISON MOSAIC BALANCED
How did Mosaic Balanced perform for the six-month period?
Mosaic Balanced returned 7.64% for the six months, with strong results from the stock holdings overriding modest returns from the bond allocation. As with our Investors Fund, we had broad contributions from all sectors and a wide variety of stocks, while our portfolio of actively managed intermediate bonds was positive for the period. Over the course of the six months the Fund outperformed the Lipper Mixed Asset Allocation Growth Index, which showed a return of 6.57%.
Have you made any significant changes to the portfolio since December 31, 2008?
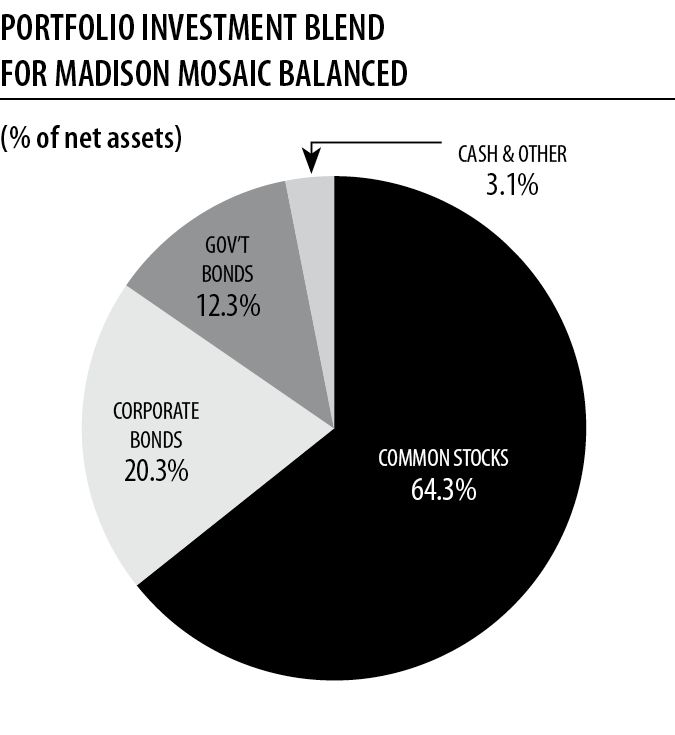
The stock holdings of Balanced mirror the holdings of Mosaic Investors as discussed above. These holdings continue to focus on solid, well-established domestic companies that have proven their earning ability through difficult times. One of the factors in our management of Balanced is the mix of stocks and bonds, with 70% being the highest allowable percentage of stocks. We began the period holding 60% stocks and finished the period with 64.3% in stocks, which reflects the relative appreciation of equities over bonds. On the bond side, we maintained our preference for high-quality corporate bonds over government issuances. We have also decreased the duration of the bonds slightly, from 3.44 years at the beginning of the period to 3.38 years at the end.
How did the stock holdings in Balanced contribute to overall performance?
The stock holdings in Balanced were solidly positive for the period as the stock market moved from deep losses to a steep recovery within the six-month period. The holdings mirror the stocks held in Mosaic Investors, discussed at some length above.
4 Semi-annual Report • June 30, 2009
Portfolio Manager Review (continued)
How did the bond holdings in Balanced contribute to overall performance?
Our bond holdings were positive for the period, benefiting from our position in the intermediate range of the yield curve. Our emphasis on corporate bonds was rewarded as their valuation, when compared to Treasuries, improved as the period progressed.
TOP FIVE STOCK AND FIXED INCOME HOLDINGS AS OF JUNE 30, 2009 FOR MADISON MOSAIC BALANCED
|
% of net assets |
|
|
Top Five Stock Holdings |
|
|
Cisco Systems Inc. |
3.07% |
|
Microsoft Corp. |
2.51% |
|
Google Inc. - CL A |
2.42% |
|
Berkshire Hathaway Inc. - CL B |
2.34% |
|
Diageo PLC - ADR |
2.26% |
|
% of net assets |
|
|
Top Five Fixed Income Holdings |
|
|
Fannie Mae, 6.625%, 11/15/10 |
2.05% |
|
Federal Home Loan Bank, 4.375%, 9/17/10 |
1.99% |
|
International Lease Finance, 4.875%, 9/1/10 |
1.70% |
|
AT&T Broadband, 8.375%, 3/15/13 |
1.63% |
|
UnitedHealth Group, 5%, 8/15/14 |
1.62% |
Madison Mosaic Equity Trust 5
Portfolio Manager Review (continued)
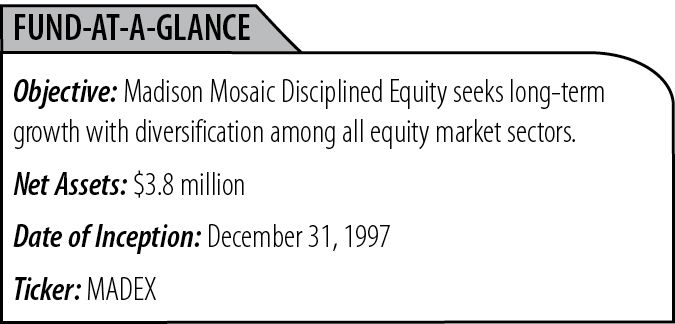
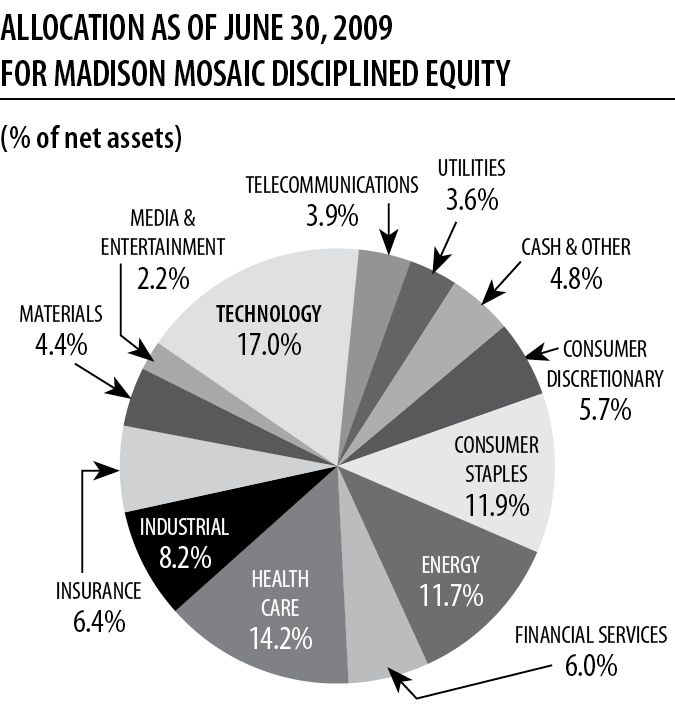
MADISON MOSAIC DISCIPLINED EQUITY
How would you characterize the performance of Disciplined Equity for the period?
We handily beat our S&P 500 benchmark’s return of 3.16% with an 8.74% return. We believe this was an excellent result, particularly during a period in which we saw a sharp market recovery led by smaller, more speculative companies. The fund also was ahead of its peer group, represented by the Lipper Large-Cap Core Index, which rose 5.35%.
Have you made any significant changes to the portfolio since December 31, 2008?
As with our other portfolios, we looked at the broad market decline as an opportunity to add great companies at reasonable valuations. In Consumer Discretionary we sold flooring company Mohawk while adding Walt Disney Company, which fits our definition of a company with great brand identity and exceptional barriers to entry. In Energy we sold Unit Corp. and added Apache Corp. In the Financial Sector we sold Aflac and American Express and in Technology, Adobe and Apple.
What holdings had the largest impact on this period’s performance?
Following our sector-neutral strategy, which tends to keep our allocations in line with the S&P 500, any performance discrepancy is typically a stock-picking issue. This was certainly true in the first six months of 2009, when our holdings outperformed their relative sectors in seven out of the ten S&P Sectors. And even in those
three sectors, our underperformance was only a fraction of a percent. Our best relative returns were in Energy and Industrials. Our weakest sector return on a relative basis was in Financials.
Among our strongest stocks were Tech Sector holdings Adobe (which was sold during the period), Check Point Software and Cisco Systems. Two of our energy holdings were major contributors: ConocoPhillips and Transocean Inc. We sold Transocean during the period. Among our weakest were PepsiCo and joint-replacement producer Zimmer Holdings.
TOP TEN STOCK HOLDINGS AS OF JUNE 30, 2009
FOR MADISON MOSAIC DISCIPLINED EQUITY
|
% of net assets |
|
|
Cisco Systems Inc. |
4.19% |
|
Microsoft Corp. |
4.04% |
|
Hewlett-Packard Co. |
2.73% |
|
Procter & Gamble |
2.67% |
|
Exxon Mobil Corp. |
2.63% |
|
Johnson & Johnson |
2.54% |
|
ConocoPhillips Inc. |
2.51% |
|
Schlumberger Limited |
2.28% |
|
Novartis AG - ADR |
2.26% |
|
Comcast Corp. Special - CL A |
2.24% |
6 Semi-annual Report • June 30, 2009
Portfolio Manager Review (continued)
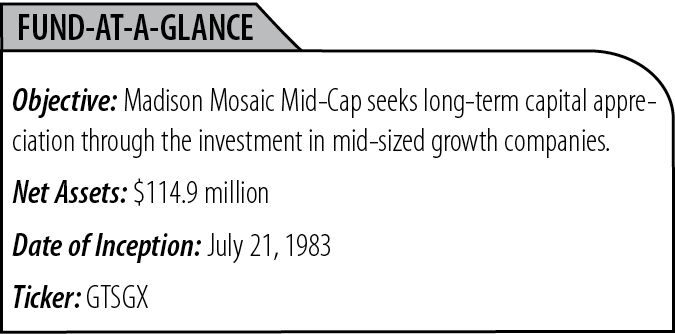
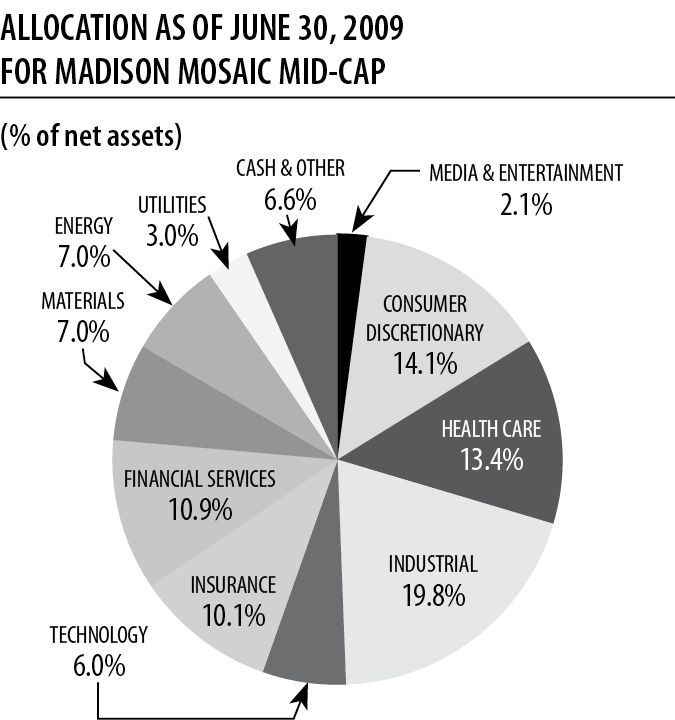
MADISON MOSAIC MID-CAP
An interview with Rich Eisinger, co-manager of Madison Mosaic Mid-Cap. (Photo of Rich Eisinger)
How would you characterize the performance of Mosaic Mid-Cap so far in 2009?
While any positive performance is a welcome relief from 2008, the first half of 2009 was not a market in which we outperformed. However, when I look back over the quarter, I don’t believe this is cause for concern. To the extent a rally is concentrated in more speculative issues, we are not likely to fully participate. By speculative, I mean companies with leveraged balance sheets generated better returns than those with solid balance sheets. Companies with lower S&P quality rankings outperformanced those with the highest rankings. Some of the same factors that helped us last year, such as a lack of exposure to credit in our financial holdings, hurt us during the stock market rally that took hold over the second half of the period. We remain confident that in the long run we own solid companies with talented management teams who will produce value in the long run. Our total return for the first six months was 5.22%, which was higher than the broader market’s, as indicated by the S&P 500’s 3.16% return.
Did you make any significant changes to the portfolio since December 31, 2008?
While we didn’t make any dramatic sector reallocations over the period, we did have some gradual shifts. As always, these are driven not by macro economic allocation strategies, but through the individual fundamentals of the companies we sell or add. We saw our consumer exposure drop, which fits our overall sense that the American
consumer has been hit hard by the economic crisis and growing unemployment. On top of this, the consumer deleveraging process is still in its early stages, leaving us skeptical about a fast rebound. We also added to our energy holdings.
Before I give some examples of buys and sells, let me reemphasize that we work very hard to own companies which are positioned well for long-term success. We like to own these companies for multiple years, longer if fundamentals and valuation allow. All of the companies whose holdings were in the top ten from the beginning of the period remained a part of our portfolio as of June 30.
As I mentioned above, we did rotate some assets from the Consumer sectors to Energy. Among our new holdings are EOG Resources, a major oil and natural gas producer, and Apache Corporation. Apache is an impressive company with deep oil and gas reserves concentrated in stable parts of the world. Apache has increased production in ten of the past eleven years and our entry share price was approximately half of the stock valuation from just a year previous.
We also bought Kirby, the leader in the domestic barge business. The company has a seasoned and proven management team. The recent supply/demand imbalance in the barge business drove the stock price down. We believe that patient investors will be rewarded in the event the expected economic recovery emerges. We also sold Clorox, which did very well for us on a relative basis, but we are concerned that budget-minded consumers will shift purchases to private-label brands. Another sale
was Donaldson, a high-quality industrial company concerned with filters, which we owned for a short period during which the stock went on a run and we felt valuation got ahead of itself.
Madison Mosaic Equity Trust 7
Portfolio Manager Review (continued)
What holdings were the strongest contributors to fund performance?
Most of our positive performance during the period came from three sectors: Consumer Discretionary, Energy and Industrials. These were also among the higher-producing index sectors. We also had positive returns from our technology holdings, even as these stocks did not keep pace with the overall sector. Our best relative performance was
in the Industrial Sector, where we benefited from an emphasis on non-smokestack industrial companies, such as Iron Mountain, the document and data-storage firm.
Our top returning holdings were led by CarMax, whose stock had an amazing 86% total return for the six months. We also saw strong returns from Bed, Bath & Beyond and a number of our industrial holdings, including Copart and Donaldson.
What holdings were the largest constraints on performance?
The most important factor in this period’s relative performance was what we didn’t own. A quick look at the performance of companies based on their S&P quality ratings explains a good deal of the story. Over the first six months of 2009, the performance of companies rated A+, A and A- were: 4.46%, -1.98% and 3.30%, while
the often highly leveraged companies in the C&D categories returned 58.64%.
We were underweight the Technology Sector which led the mid-cap index with a 23.8% return. In addition, we tend not to own the more cyclical companies that led the sector. Some of the factors which helped us last year were a drag in the first half of 2009. For instance, in the financial sector we had significant insurance exposure, rather than credit-sensitive institutions. It was the credit-sensitive companies which bounced back the strongest. We had negative contributions from
Markel and Odyssey Re and also from industrial holding Waste Management, and Covanta from the Utility Sector.
TOP TEN STOCK HOLDINGS AS OF JUNE 30, 2009
FOR MADISON MOSAIC MID-CAP
|
% of net assets |
|
|
Markel Corp. |
3.77% |
|
Laboratory Corp. of America Holdings |
3.70% |
|
Brookfield Asset Management Inc. |
3.52% |
|
Odyssey Re Holdings Corp. |
3.35% |
|
Zebra Technologies Corp. - CL A |
3.30% |
|
Covanta Holding Corp. |
3.04% |
|
Jacobs Engineering Group Inc. |
2.97% |
|
Brown & Brown, Inc. |
2.94% |
|
Zimmer Holdings Inc. |
2.88% |
|
Copart, Inc. |
2.81% |
8 Semi-annual Report • June 30, 2009
Portfolio Manager Review (concluded)
MADISON MOSAIC SMALL/MID-CAP
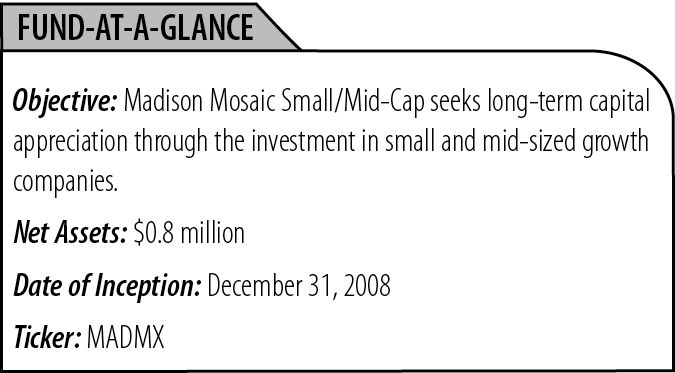
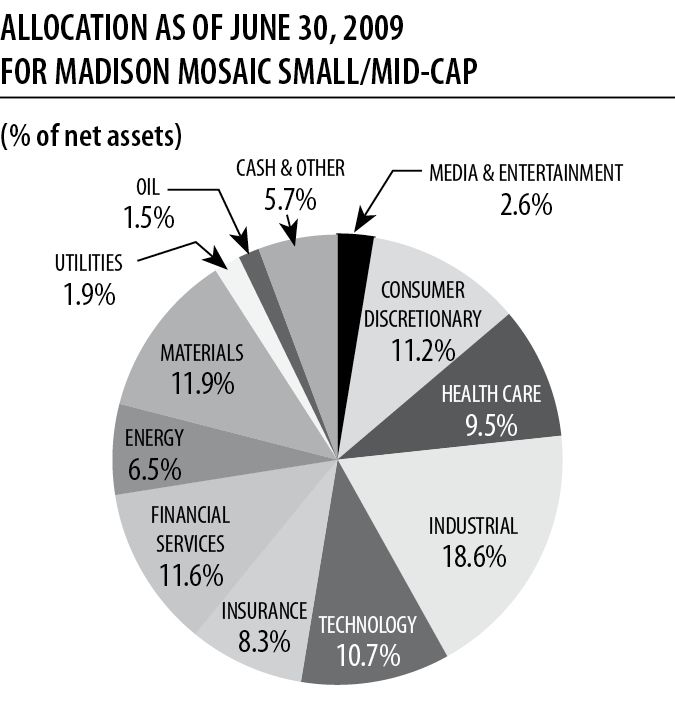
Mosaic Small/Mid-Cap Fund (MADMX) was launched on 12/31/08 with a mandate to find high-quality companies among a universe of stocks with market capitalizations in the general range of $200 million and $12 billion. The fund’s benchmark is the Russell 2500¨ Index. While it is too early to make any broad characterizations
regarding the fund’s performance, its first six months were quite strong, with a return of 10.80%, well ahead of its Russell benchmark, which saw a 6.52% return. There is currently no Small/Mid Lipper peer group, but the fund did compare favorably with the Lipper Mid-Cap Core Index, which returned 10.18% and the Lipper Small-Cap Core Index, which was up 8.23%.
TOP TEN STOCK HOLDINGS AS OF JUNE 30, 2009
FOR MADISON MOSAIC SMALL/MID-CAP
|
Laboratory Corp. of America Holdings |
2.30% |
|
iShares COMEX Gold Trust |
2.24% |
|
Valspar Corp. |
2.22% |
|
Sears Holdings Corp. |
2.10% |
|
Bed Bath & Beyond Inc. |
2.03% |
|
Iron Mountain |
2.00% |
|
IDEXX Labs, Inc. |
1.97% |
|
Kirby Corp. |
1.95% |
|
Ritchie Brothers Auctioneers |
1.95% |
|
Morningstar, Inc. |
1.93% |
Madison Mosaic Equity Trust 9
Madison Mosaic Equity Trust June 30, 2009
Investors Fund - Portfolio of Investments (unaudited)
|
NUMBER |
VALUE |
||||||
|
COMMON STOCKS: |
|||||||
|
CONSUMER DISCRETIONARY: 7.0% |
|||||||
|
Staples Inc. |
25,369 |
$ |
511,693 |
||||
|
Target Corp. |
20,610 |
813,477 |
|||||
|
Walt Disney Co. |
38,750 |
904,037 |
|||||
|
CONSUMER STAPLES: 12.4% |
|||||||
|
Coca-Cola Co. |
12,713 |
610,097 |
|||||
|
Costco Wholesale Corp. |
12,055 |
550,913 |
|||||
|
Diageo PLC - ADR |
18,030 |
1,032,217 |
|||||
|
PepsiCo, Inc. |
17,112 |
940,476 |
|||||
|
Walgreen Co. |
27,232 |
800,621 |
|||||
|
ENERGY: 6.6% |
|||||||
|
Apache Corp. |
7,745 |
558,802 |
|||||
|
Devon Energy Corp. |
11,840 |
645,280 |
|||||
|
Schlumberger Ltd. |
16,645 |
900,661 |
|||||
|
FINANCIAL SERVICES: 7.0% |
|||||||
|
Franklin Resources |
8,220 |
591,922 |
|||||
|
State Street Corp. |
14,400 |
679,680 |
|||||
|
Wells Fargo & Co. |
39,288 |
953,127 |
|||||
|
HEALTH CARE: 21.2% |
|||||||
|
Baxter International |
18,950 |
1,003,592 |
|||||
|
Covance Inc.* |
19,145 |
941,934 |
|||||
|
Dentsply International Inc. |
21,507 |
656,394 |
|||||
|
Johnson & Johnson |
15,639 |
888,295 |
|||||
|
Medtronic Inc. |
24,594 |
858,085 |
|||||
|
Novartis AG - ADR |
20,618 |
841,008 |
|||||
|
Quest Diagnostics Inc. |
11,745 |
662,770 |
|||||
|
Zimmer Holdings Inc.* |
21,041 |
896,347 |
|||||
|
INDUSTRIAL: 10.9% |
|||||||
|
3M Company |
15,796 |
949,340 |
|||||
|
ABB Ltd - ADR |
47,235 |
745,368 |
|||||
|
Jacobs Engineering Group Inc.* |
19,395 |
816,335 |
|||||
|
Waste Management Inc. |
34,210 |
963,354 |
|||||
|
INSURANCE: 5.8% |
|||||||
|
Berkshire Hathaway Inc.- Class B* |
366 |
$ |
1,059,837 |
||||
|
Markel Corp.* |
2,811 |
791,859 |
|||||
|
MEDIA & ENTERTAINMENT: 3.0% |
|||||||
|
Comcast Corp.- Special Class A* |
67,715 |
954,781 |
|||||
|
TECHNOLOGY: 18.2% |
|||||||
|
Check Point Software Technologies Ltd |
19,565 |
459,191 |
|||||
|
Cisco Systems Inc.* |
72,999 |
1,360,701 |
|||||
|
EMC Corp. |
65,700 |
860,670 |
|||||
|
Google Inc.- Class A* |
2,528 |
1,065,779 |
|||||
|
Hewlett-Packard Co. |
21,855 |
844,696 |
|||||
|
Microsoft Corp. |
50,004 |
1,188,595 |
|||||
|
TOTAL COMMON STOCKS |
$ |
29,301,934 |
|||||
|
REPURCHASE AGREEMENT: |
|||||||
|
With U.S. Bank National Association issued 6/30/09 at 0.01%, due 7/1/09, collateralized by $2,595,960 in Fannie Mae MBS #729590 |
2,544,987 |
||||||
|
TOTAL INVESTMENTS: 100.1% of net assets (Cost $35,644,879) |
$ |
31,846,921 |
|||||
|
LIABILITIES LESS CASH AND RECEIVABLES: (0.1%) of net assets |
(22,780) |
|
|||||
|
NET ASSETS: 100% |
$ |
31,824,141 |
|||||
*Non-income producing
The Notes to Financial Statements are an integral part of these statements.
10 Semi-annual Report • June 30, 2009
Madison Mosaic Equity Trust June 30, 2009
Balanced Fund - Portfolio of Investments (unaudited)
|
NUMBER |
VALUE |
||||||
|
COMMON STOCKS: |
|||||||
|
CONSUMER DISCRETIONARY: 4.9% |
|||||||
|
Staples Inc. |
6,055 |
$ |
122,129 |
||||
|
Target Corp. |
4,545 |
179,391 |
|||||
|
Walt Disney Co. |
9,150 |
213,469 |
|||||
|
CONSUMER STAPLES: 8.7% |
|||||||
|
Coca-Cola Co. |
2,885 |
138,451 |
|||||
|
Costco Wholesale Corp. |
2,865 |
130,931 |
|||||
|
Diageo PLC - ADR |
4,160 |
238,160 |
|||||
|
Pepsico, Inc. |
3,897 |
214,179 |
|||||
|
Walgreen Co. |
6,650 |
195,510 |
|||||
|
ENERGY: 4.6% |
|||||||
|
Apache Corp. |
1,840 |
132,756 |
|||||
|
Devon Energy Corp. |
2,630 |
143,335 |
|||||
|
Schlumberger Ltd. |
3,815 |
206,430 |
|||||
|
FINANCIAL SERVICES: 5.0% |
|||||||
|
Franklin Resources |
1,930 |
138,979 |
|||||
|
State Street Corp. |
3,395 |
160,244 |
|||||
|
Wells Fargo & Co. |
9,340 |
226,588 |
|||||
|
HEALTH CARE: 14.6% |
|||||||
|
Baxter International |
4,305 |
227,993 |
|||||
|
Covance Inc.* |
4,290 |
211,068 |
|||||
|
Dentsply International Inc. |
4,797 |
146,404 |
|||||
|
Johnson & Johnson |
3,595 |
204,196 |
|||||
|
Medtronic Inc. |
5,610 |
195,733 |
|||||
|
Novartis AG - ADR |
4,865 |
198,443 |
|||||
|
Quest Diagnostics Inc. |
2,790 |
157,440 |
|||||
|
Zimmer Holdings Inc.* |
4,601 |
196,003 |
|||||
|
INDUSTRIAL: 7.7% |
|||||||
|
3M Company |
3,760 |
225,976 |
|||||
|
ABB Ltd - ADR |
11,270 |
177,841 |
|||||
|
Jacobs Engineering Group Inc.* |
4,515 |
190,036 |
|||||
|
Waste Management Inc. |
7,650 |
215,424 |
|||||
|
INSURANCE: 4.0% |
|||||||
|
Berkshire Hathaway Inc.- Class B* |
85 |
246,137 |
|||||
|
Markel Corp.* |
627 |
176,626 |
|||||
|
NUMBER |
VALUE |
||||||
|
MEDIA & ENTERTAINMENT: 2.1% |
|||||||
|
Comcast Corp.- Special Class A* |
15,597 |
$ |
219,918 |
||||
|
TECHNOLOGY: 12.7% |
|||||||
|
Check Point Software Technologies Ltd |
4,305 |
101,038 |
|||||
|
Cisco Systems, Inc.* |
17,315 |
322,752 |
|||||
|
EMC Corp. |
15,420 |
202,002 |
|||||
|
Google Inc.- Class A* |
603 |
254,219 |
|||||
|
Hewlett-Packard Co. |
5,035 |
194,603 |
|||||
|
Microsoft Corp. |
11,100 |
263,847 |
|||||
|
TOTAL COMMON STOCKS |
$ |
6,768,251 |
|||||
|
PRINCIPAL AMOUNT |
VALUE |
||||||
|
DEBT INSTRUMENTS: |
|||||||
|
CORPORATE OBLIGATIONS: 20.3% |
|||||||
|
BANKS: 1.2% |
|||||||
|
Wachovia Corp., 5.25%, 8/1/14 |
$ |
125,000 |
$ |
122,456 |
|||
|
COMPUTERS & PERIPHERAL: 1.0% |
|||||||
|
Hewlett-Packard Co., 4.5%, 3/1/13 |
100,000 |
104,053 |
|||||
|
CONSUMER GOODS: 2.5% |
|||||||
|
Costco Wholesale Corp., 5.3%, 3/15/12 |
100,000 |
107,540 |
|||||
|
Wal-Mart Stores, Inc., 4.75%, 8/15/10 |
150,000 |
154,836 |
|||||
|
CONSUMER STAPLES: 2.0% |
|||||||
|
Kraft Foods, Inc., 5.625%, 11/1/11 |
100,000 |
106,305 |
|||||
|
Sysco Corp. 5.25%, 2/12/18 |
100,000 |
101,786 |
|||||
|
ENERGY: 1.5% |
|||||||
|
Valero Energy Corp., 6.875%, 4/15/12 |
150,000 |
159,613 |
|||||
|
FINANCIALS: 3.1% |
|||||||
|
American Express Co., 4.875%, 7/15/13 |
150,000 |
146,647 |
|||||
|
International Lease Finance, 4.875%, 9/1/10 |
200,000 |
179,323 |
|||||
Madison Mosaic Equity Trust 11
Balanced Fund • Portfolio of Investments • June 30, 2009 (concluded)
|
PRINCIPAL AMOUNT |
VALUE |
||||
|
HEALTH CARE: 2.9% |
|||||
|
Abbot Laboratories, 5.6%, 11/30/17 |
125,000 |
$ |
134,117 |
||
|
UnitedHealth Group, 5%, 8/15/14 |
175,000 |
170,418 |
|||
|
INDUSTRIAL: 1.0% |
|||||
|
United Parcel, 5.5%, 1/15/18 |
100,000 |
106,686 |
|||
|
TECHNOLOGY: 2.0% |
|||||
|
Cisco Systems, Inc., 5.25%, 2/22/11 |
100,000 |
105,485 |
|||
|
Oracle Corp., 4.95%, 4/15/13 |
100,000 |
104,806 |
|||
|
TELECOMMUNICATIONS: 3.1% |
|||||
|
AT & T Broadband, 8.375%, 3/15/13 |
150,000 |
171,139 |
|||
|
Verizon New England, 6.5%, 9/15/11 |
150,000 |
159,745 |
|||
|
US TREASURY & AGENCY OBLIGATIONS: 12.3% |
|||||
|
Fannie Mae, 6.625%, 11/15/10 |
200,000 |
215,947 |
|||
|
Fannie Mae, 4.875%, 5/18/12 |
150,000 |
163,145 |
|||
|
Federal Home Loan Bank, 4.375% 9/17/10 |
200,000 |
208,963 |
|||
|
Federal Home Loan Bank, 5.5% 8/13/14 |
150,000 |
167,650 |
|||
|
Freddie Mac, 4.875%, 11/15/13 |
150,000 |
163,826 |
|||
|
US Treasury Note, 5.125%, 6/30/11 |
150,000 |
161,848 |
|||
|
US Treasury Note, 3.875%, 5/15/18 |
60,000 |
61,842 |
|||
|
US Treasury Note, 3.75%, 11/15/18 |
150,000 |
152,637 |
|||
|
TOTAL DEBT INSTRUMENTS |
$ |
3,430,813 |
|||
|
PRINCIPAL AMOUNT |
VALUE |
||||
|
REPURCHASE AGREEMENT: |
|||||
|
With U.S. Bank National Association issued 6/30/09 at 0.01%, due 7/1/09, collateralized by $264,412 in Fannie Mae MBS #729590 due 7/1/18. Proceeds at maturity are $259,221 (Cost $259,221) |
$ |
259,221 |
|||
|
TOTAL INVESTMENTS: 99.4% of net assets (Cost $10,780,929) |
$ |
10,458,285 |
|||
|
CASH AND RECEIVABLES LESS LIABILITIES: 0.6% of net assets |
64,493 |
||||
|
NET ASSETS: 100% |
$ |
10,522,778 |
*Non-income producing
The Notes to Financial Statements are an integral part of these statements.
12 Semi-annual Report • June 30, 2009
Madison Mosaic Equity Trust June 30, 2009
Disciplined Equity Fund • Portfolio of Investments (unaudited)
|
NUMBER |
VALUE |
||||||
|
COMMON STOCKS: |
|||||||
|
CONSUMER DISCRETIONARY: 5.7% |
|||||||
|
Nike Inc.- Class B |
945 |
$ |
48,932 |
||||
|
Staples Inc. |
2,300 |
46,391 |
|||||
|
Target Corp. |
1,495 |
59,008 |
|||||
|
Walt Disney Co. |
2,605 |
60,775 |
|||||
|
CONSUMER STAPLES: 11.9% |
|||||||
|
Clorox Co. |
750 |
41,872 |
|||||
|
Coca-Cola Co. |
1,125 |
53,989 |
|||||
|
Costco Wholesale Corp. |
1,225 |
55,983 |
|||||
|
Diageo Ltd - ADR |
1,265 |
72,421 |
|||||
|
Pepsico, Inc. |
1,395 |
76,669 |
|||||
|
Procter & Gamble |
1,965 |
100,412 |
|||||
|
Walgreen Co. |
1,655 |
48,657 |
|||||
|
ENERGY: 11.7% |
|||||||
|
Apache Corp. |
565 |
40,765 |
|||||
|
ConocoPhillips Inc. |
2,245 |
94,425 |
|||||
|
Devon Energy Corp. |
1,230 |
67,035 |
|||||
|
Exxon Mobil Corp. |
1,418 |
99,132 |
|||||
|
Schlumberger Ltd. |
1,590 |
86,035 |
|||||
|
XTO Energy Inc. |
1,450 |
55,303 |
|||||
|
FINANCIAL SERVICES: 6.0% |
|||||||
|
Brookfield Asset Management Inc. |
2,060 |
35,164 |
|||||
|
Franklin Resources |
765 |
55,088 |
|||||
|
State Street Corp. |
1,250 |
59,000 |
|||||
|
Wells Fargo & Co. |
3,095 |
75,085 |
|||||
|
HEALTH CARE: 14.2% |
|||||||
|
Baxter International |
1,355 |
71,761 |
|||||
|
Becton, Dickinson & Co. |
390 |
27,811 |
|||||
|
Covance Inc.* |
1,200 |
59,040 |
|||||
|
Dentsply International Inc. |
1,295 |
39,523 |
|||||
|
Johnson & Johnson |
1,685 |
95,708 |
|||||
|
Medtronic, Inc. |
1,100 |
38,379 |
|||||
|
Novartis AG - ADR |
2,085 |
85,047 |
|||||
|
Quest Diagnostics Inc. |
805 |
45,426 |
|||||
|
Zimmer Holdings Inc.* |
1,657 |
70,588 |
|||||
|
NUMBER |
VALUE |
||||||
|
INDUSTRIAL: 8.2% |
|||||||
|
3M Company |
1,320 |
$ |
79,332 |
||||
|
ABB Ltd - ADR |
3,695 |
58,307 |
|||||
|
Jacobs Engineering Group Inc.* |
1,300 |
54,717 |
|||||
|
United Technologies |
1,165 |
60,533 |
|||||
|
Waste Management Inc. |
2,030 |
57,165 |
|||||
|
INSURANCE: 6.4% |
|||||||
|
Aflac Inc. |
1,505 |
46,790 |
|||||
|
Berkshire Hathaway Inc.- Class B* |
23 |
66,602 |
|||||
|
Markel Corp.* |
239 |
67,326 |
|||||
|
OdysseyRe Holdings Corp. |
1,555 |
62,169 |
|||||
|
MATERIALS: 4.4% |
|||||||
|
ITT Corp. |
1,025 |
45,612 |
|||||
|
Praxair Inc. |
570 |
40,510 |
|||||
|
Sigma-Aldrich |
780 |
38,657 |
|||||
|
Valspar Corp. |
1,785 |
40,216 |
|||||
|
MEDIA & ENTERTAINMENT: 2.2% |
|||||||
|
Comcast Corp.- Special Class A* |
5,987 |
84,417 |
|||||
|
TECHNOLOGY: 17.0% |
|||||||
|
Check Point Software Technologies Ltd |
2,290 |
53,746 |
|||||
|
Cisco Systems, Inc.* |
8,475 |
157,974 |
|||||
|
EMC Corp. |
6,035 |
79,059 |
|||||
|
Fiserv Inc.* |
875 |
39,987 |
|||||
|
Google Inc.- Class A* |
127 |
53,542 |
|||||
|
Hewlett-Packard Co. |
2,665 |
103,002 |
|||||
|
Microsoft Corp. |
6,400 |
152,128 |
|||||
|
TELECOMMUNICATIONS: 3.9% |
|||||||
|
AT & T |
1,985 |
49,308 |
|||||
|
China Mobile Ltd.-ADR |
675 |
33,804 |
|||||
|
Vodafone Group-ADR |
3,280 |
63,927 |
|||||
|
UTILITIES: 3.6% |
|||||||
|
Entergy Corp. |
920 |
71,318 |
|||||
|
FPL Group Inc. |
1,125 |
63,968 |
|||||
|
TOTAL COMMON STOCKS |
$ |
3,589,540 |
|||||
The Notes to Financial Statements are an integral part of these statements.
Madison Mosaic Equity Trust 13
Disciplined Equity Fund • Portfolio of Investments • June 30, 2009 (concluded)
|
NUMBER |
VALUE |
||
|
REPURCHASE AGREEMENT: |
|||
|
With U.S. Bank National Association issued 6/30/09 at 0.01%, due 7/1/09, collateralized by $201,872 in Fannie Mae MBS #729590 due 7/1/18. Proceeds at maturity are $197,908 (Cost $197,908) |
$ |
197,908 |
|
|
TOTAL INVESTMENTS: 100.5% of net assets (Cost $4,048,432) |
$ |
3,787,448 |
|
|
LIABILITIES LESS CASH AND RECEIVABLES: (0.5%) of net assets |
(20,167) |
||
|
NET ASSETS: 100% |
$ |
3,767,281 |
*Non-income producing
The Notes to Financial Statements are an integral part of these statements.
14 Semi-annual Report • June 30, 2009
Madison Mosaic Equity Trust June 30, 2009
Mid-Cap Fund • Portfolio of Investments (unaudited)
|
NUMBER |
VALUE |
||||||
|
COMMON STOCKS: |
|||||||
|
CONSUMER |
|||||||
|
Bed Bath & Beyond Inc.* |
65,935 |
$ 2,027,501 |
|||||
|
Brown-Forman Corp.- Class B |
75,053 |
3,225,778 |
|||||
|
CarMax Inc.* |
166,614 |
2,449,226 |
|||||
|
Mohawk Industries Inc.* |
43,215 |
1,541,911 |
|||||
|
Starbucks Corp.* |
153,060 |
2,126,003 |
|||||
|
Tiffany & Company |
78,478 |
1,990,202 |
|||||
|
YUM! Brands Inc. |
85,525 |
2,851,404 |
|||||
|
ENERGY: 7.0% |
|||||||
|
Apache Corp. |
29,545 |
2,131,672 |
|||||
|
EOG Resources Inc. |
35,880 |
2,436,970 |
|||||
|
Noble Corp. |
70,485 |
2,132,171 |
|||||
|
Unit Corp.* |
50,795 |
1,400,418 |
|||||
|
FINANCIAL SERVICES: 10.9% |
|||||||
|
Brookfield Asset Management Inc. |
236,651 |
4,039,633 |
|||||
|
Glacier Bancorp, Inc. |
163,610 |
2,416,520 |
|||||
|
Leucadia National Corp. |
140,010 |
2,952,811 |
|||||
|
SEI Investments Co. |
175,049 |
3,157,884 |
|||||
|
HEALTH CARE: 13.4% |
|||||||
|
Covance Inc.* |
63,675 |
3,132,810 |
|||||
|
Dentsply International Inc. |
77,824 |
2,375,188 |
|||||
|
Laboratory Corp of America Holdings* |
62,649 |
4,246,976 |
|||||
|
Techne Corp. |
37,079 |
2,366,011 |
|||||
|
Zimmer Holdings Inc.* |
77,685 |
3,309,381 |
|||||
|
INDUSTRIAL: 19.8% |
|||||||
|
Copart, Inc.* |
93,200 |
3,231,244 |
|||||
|
Dun & Bradstreet Corp. |
32,065 |
2,603,998 |
|||||
|
Expeditors Int’l of Washington Inc. |
77,140 |
2,571,848 |
|||||
|
Iron Mountain* |
102,237 |
2,939,314 |
|||||
|
Jacobs Engineering Group Inc.* |
81,140 |
3,415,183 |
|||||
|
Kaydon Corp. |
68,340 |
2,225,150 |
|||||
|
Kirby Corp.* |
95,631 |
3,040,109 |
|||||
|
Waste Management, Inc. |
96,450 |
2,716,032 |
|||||
|
NUMBER |
VALUE |
||||||
|
INSURANCE: 10.1% |
|||||||
|
Brown & Brown, Inc. |
169,662 |
$3,381,364 |
|||||
|
Markel Corp.* |
15,376 |
4,331,419 |
|||||
|
Odyssey Re Holdings Corp. |
96,280 |
3,849,274 |
|||||
|
MATERIALS: 7.0% |
|||||||
|
Ecolab Inc. |
72,485 |
2,826,190 |
|||||
|
IDEX Corp. |
86,944 |
2,136,214 |
|||||
|
Martin Marietta Materials |
39,081 |
3,082,709 |
|||||
|
MEDIA & ENTERTAINMENT: 2.1% |
|||||||
|
Liberty Global Inc.- Series C* |
149,120 |
2,357,587 |
|||||
|
TECHNOLOGY: 6.0% |
|||||||
|
Fiserv Inc.* |
66,901 |
3,057,376 |
|||||
|
Zebra Technologies Corp.- Class A* |
160,400 |
3,795,064 |
|||||
|
UTILITIES: 3.0% |
|||||||
|
Covanta Holding Corp.* |
206,250 |
3,498,000 |
|||||
|
TOTAL COMMON STOCKS |
$ |
107,368,545 |
|||||
|
REPURCHASE AGREEMENT: |
|||||||
|
With U.S. Bank National Association issued 6/30/09 at 0.01%, due 7/1/09, collateralized by $7,246,995 in Fannie Mae MBS #729590 due 7/1/18. Proceeds at maturity are $7,104,696 (Cost $7,104,694) |
7,104,694 |
||||||
|
TOTAL INVESTMENTS: 99.6% of net assets (Cost $119,764,322) |
$ |
114,473,239 |
|||||
|
CASH AND RECEIVABLES LESS LIABILITIES: 0.4% of net assets |
437,919 |
||||||
|
NET ASSETS: 100% |
$ |
114,911,158 |
|||||
*Non-income producing
The Notes to Financial Statements are an integral part of these statements.
Madison Mosaic Equity Trust 15
Madison Mosaic Equity Trust June 30, 2009
Small/Mid-Cap Fund • Portfolio of Investments (unaudited)
|
NUMBER |
VALUE |
||||||
|
COMMON STOCKS: |
|||||||
|
CONSUMER DISCRETIONARY: 11.2% |
|||||||
|
Bed Bath & Beyond Inc.* |
565 |
$ |
17,374 |
||||
|
Brown-Forman Corp.- Class B |
270 |
11,605 |
|||||
|
CarMax Inc.* |
770 |
11,319 |
|||||
|
Jack-in-the-Box Inc.* |
655 |
14,705 |
|||||
|
Mohawk Industries Inc.* |
260 |
9,277 |
|||||
|
Sears Holdings Corp.* |
270 |
17,960 |
|||||
|
YUM! Brands Inc. |
405 |
13,503 |
|||||
|
ENERGY: 6.5% |
|||||||
|
Cimarex Energy Co. |
370 |
10,486 |
|||||
|
ENSCO International Inc. |
440 |
15,343 |
|||||
|
EQT Corp. |
325 |
11,345 |
|||||
|
Rowan Companies, Inc. |
415 |
8,018 |
|||||
|
Unit Corp.* |
390 |
10,752 |
|||||
|
FINANCIAL SERVICES: 10.8% |
|||||||
|
Brookfield Asset Management Inc. |
805 |
13,741 |
|||||
|
Fidelity National Finance |
805 |
10,892 |
|||||
|
Glacier Bancorp, Inc. |
710 |
10,487 |
|||||
|
Jeffries Group Inc. |
575 |
12,265 |
|||||
|
Leucadia National Corp. |
655 |
13,814 |
|||||
|
Morningstar, Inc.* |
400 |
16,492 |
|||||
|
SEI Investments Co. |
845 |
15,244 |
|||||
|
HEALTH CARE: 9.5% |
|||||||
|
Covance Inc.* |
305 |
15,006 |
|||||
|
Dentsply International Inc. |
530 |
16,176 |
|||||
|
IDEXX Labs, Inc.* |
365 |
16,863 |
|||||
|
Laboratory Corp. of America Holdings* |
290 |
19,659 |
|||||
|
Techne Corp. |
210 |
13,400 |
|||||
|
INDUSTRIAL: 18.5% |
|||||||
|
Aecom Technology Corp.* |
495 |
15,840 |
|||||
|
American Ecology Corp. |
650 |
11,648 |
|||||
|
Copart, Inc.* |
460 |
15,948 |
|||||
|
Expeditors Int’l of Washington Inc. |
425 |
14,169 |
|||||
|
Fastenal Co. |
365 |
12,107 |
|||||
|
Iron Mountain* |
595 |
17,106 |
|||||
|
Kaydon Corp. |
385 |
12,536 |
|||||
|
Kirby Corp.* |
525 |
16,690 |
|||||
|
NUMBER |
VALUE |
||||||
|
INDUSTRIAL (continued) |
|||||||
|
Knight Transport Inc. |
730 |
$ |
12,082 |
||||
|
Middleby Corp. |
320 |
14,054 |
|||||
|
Ritchie Brothers Auctioneers |
710 |
16,650 |
|||||
|
INSURANCE: 8.3% |
|||||||
|
Aflac Inc. |
395 |
12,280 |
|||||
|
Brown & Brown, Inc. |
655 |
13,054 |
|||||
|
Markel Corp.* |
36 |
10,141 |
|||||
|
OdysseyRe Holdings Corp. |
365 |
14,593 |
|||||
|
RLI Corp. |
290 |
12,992 |
|||||
|
White Mountains Insurance Group |
35 |
7,981 |
|||||
|
MATERIALS: 11.9% |
|||||||
|
Ball Corp. |
315 |
14,225 |
|||||
|
Bemis Company |
480 |
12,096 |
|||||
|
IDEX Corp. |
615 |
15,111 |
|||||
|
iShares COMEX Gold Trust* |
210 |
19,160 |
|||||
|
Martin Marietta Materials |
111 |
8,756 |
|||||
|
Sigma-Aldrich |
270 |
13,381 |
|||||
|
Valspar Corp. |
845 |
19,038 |
|||||
|
MEDIA & ENTERTAINMENT: 2.6% |
|||||||
|
Discovery Communications Inc.* |
665 |
14,996 |
|||||
|
Liberty Global Inc.- Series C* |
485 |
7,668 |
|||||
|
OIL: 1.5% |
|||||||
|
Contango Oil & Gas* |
305 |
12,959 |
|||||
|
TECHNOLOGY: 10.7% |
|||||||
|
Concur Technologies, Inc.* |
480 |
14,918 |
|||||
|
FactSet Research Systems Inc. |
305 |
15,210 |
|||||
|
FARO Technologies Inc.* |
595 |
9,240 |
|||||
|
FLIR Systems, Inc.* |
460 |
10,378 |
|||||
|
Maxim Integrated Products, Inc. |
810 |
12,709 |
|||||
|
Teradata Corp.* |
670 |
15,698 |
|||||
|
Zebra Technologies Corp.- Class A* |
555 |
13,131 |
|||||
|
UTILITIES: 1.9% |
|||||||
|
Covanta Holding Corp.* |
970 |
16,451 |
|||||
|
TOTAL COMMON STOCKS |
$ |
800,722 |
|||||
The Notes to Financial Statements are an integral part of these statements.
16 Semi-annual Report • June 30, 2009
|
NUMBER |
VALUE |
|||
|
REPURCHASE AGREEMENT: |
||||
|
With U.S. Bank National Association issued 6/30/09 at 0.01%, due 7/1/09, collateralized by $50,381 in Fannie Mae MBS #729590 due 7/1/18. Proceeds at maturity are $49,392 (Cost $49,392) |
$ |
49,392 |
||
|
TOTAL INVESTMENTS: 99.2% of net assets (Cost $761,870) |
$ |
850,114 |
||
|
CASH AND RECEIVABLES LESS LIABILITIES: 0.8% of net assets |
6,764 |
|||
|
NET ASSETS: 100% |
$ |
856,878 |
||
*Non-income producing
The Notes to Financial Statements are an integral part of these statements.
Madison Mosaic Equity Trust 17
Madison Mosaic Equity Trust June 30, 2009
Statements of Assets and Liabilities (unaudited)
|
Investors Fund |
Balanced Fund |
Disciplined Equity Fund |
Mid-Cap Fund |
Small/ Fund |
|
|
ASSETS |
|||||
|
Investments, at value (Notes 1 and 2) |
|||||
|
Investment securities |
$29,301,934 |
$10,199,064 |
$3,589,540 |
$107,368,545 |
$800,722 |
|
Repurchase agreements |
2,544,987 |
259,221 |
197,908 |
7,104,694 |
49,392 |
|
Total investments* |
31,846,921 |
10,458,285 |
3,787,448 |
114,473,239 |
850,114 |
|
Receivables |
|||||
|
Investment securities sold |
196,588 |
67,953 |
-- |
-- |
6,581 |
|
Dividends and interest |
20,422 |
51,134 |
5,368 |
57,824 |
375 |
|
Capital shares sold |
26,856 |
275 |
3,483 |
409,614 |
1,099 |
|
Total assets |
32,090,787 |
10,577,647 |
3,796,299 |
114,940,677 |
858,169 |
|
LIABILITIES |
|||||
|
Payables |
|||||
|
Investment securities purchased |
242,345 |
47,608 |
25,552 |
-- |
-- |
|
Dividends |
-- |
2,599 |
-- |
-- |
-- |
|
Capital shares redeemed |
3,000 |
1,074 |
1,341 |
14,798 |
-- |
|
Service agreement fees |
10,676 |
-- |
-- |
-- |
666 |
|
Auditor fees |
6,750 |
2,713 |
1,750 |
10,846 |
625 |
|
Independent trustee fees |
3,875 |
875 |
375 |
3,875 |
-- |
|
Total liabilities |
266,646 |
54,869 |
29,018 |
29,519 |
1,291 |
|
NET ASSETS |
$31,824,141 |
$10,522,778 |
$3,767,281 |
$114,911,158 |
$856,878 |
|
Net assets consists of: |
|||||
|
Paid in capital |
43,049,758 |
11,878,216 |
4,692,283 |
144,719,405 |
762,880 |
|
Undistributed net investment income (loss) |
96,448 |
-- |
15,372 |
(143,425) |
(1,122) |
|
Accumulated net realized gains (losses) |
(7,524,107) |
(1,032,794) |
(679,390) |
(24,373,739) |
6,876 |
|
Net unrealized appreciation (depreciation) |
(3,797,958) |
(322,644) |
(260,984) |
(5,291,083) |
88,244 |
|
Net assets |
$31,824,141 |
$10,522,778 |
$3,767,281 |
$114,911,158 |
$856,878 |
|
CAPITAL SHARES OUTSTANDING |
|||||
|
An unlimited number of capital shares, |
2,570,903 |
741,023 |
393,312 |
14,247,680 |
77,343 |
|
NET ASSET VALUE PER SHARE |
$12.38 |
$14.20 |
$9.58 |
$8.07 |
$11.08 |
|
*INVESTMENT SECURITIES, AT COST |
$35,644,879 |
$10,780,929 |
$4,048,432 |
$119,764,322 |
$761,870 |
The Notes to Financial Statements are an integral part of these statements.
18 Semi-annual Report • June 30, 2009
Madison Mosaic Equity Trust
Statements of Operations (unaudited)
For the six-months ended June 30, 2009
|
Investors Fund |
Balanced Fund |
Disciplined Equity Fund |
Mid-Cap Fund |
Small/ Fund |
|
|
INVESTMENT INCOME (Note 1) |
|||||
|
Interest income |
$66 |
$82,876 |
$-- |
$327 |
$-- |
|
Dividend income |
216,980 |
50,913 |
30,923 |
464,088 |
3,310 |
|
Total investment income |
217,046 |
133,789 |
30,923 |
464,415 |
3,310 |
|
EXPENSES (Notes 3 and 5) |
|||||
|
Investment advisory fees |
101,310 |
36,542 |
11,781 |
359,295 |
2,659 |
|
Other expenses: |
|||||
|
Service agreement fees |
20,564 |
19,977 |
2,998 |
229,949 |
1,148 |
|
Auditor fees |
6,750 |
2,713 |
1,750 |
10,846 |
625 |
|
Independent trustee fees |
7,750 |
1,750 |
750 |
7,750 |
-- |
|
Line of credit interest and fees |
8 |
-- |
-- |
-- |
-- |
|
Other expenses waived |
-- |
-- |
(1,728) |
-- |
-- |
|
Total other expenses |
35,072 |
24,440 |
3,770 |
248,545 |
1,773 |
|
Total expenses |
136,382 |
60,982 |
15,551 |
607,840 |
4,432 |
|
NET INVESTMENT INCOME (LOSS) |
80,664 |
72,807 |
15,372 |
(143,425) |
(1,122) |
|
REALIZED AND UNREALIZED GAIN (LOSS) ON INVESTMENTS |
|||||
|
Net realized gain (loss) on investments |
(3,703,083) |
(656,939) |
(339,821) |
(7,218,397) |
6,876 |
|
Change in net unrealized appreciation of investments |
6,178,596 |
1,317,997 |
630,284 |
14,735,991 |
88,244 |
|
NET GAIN ON INVESTMENTS |
2,475,513 |
661,058 |
290,463 |
7,517,594 |
95,120 |
|
TOTAL INCREASE IN NET ASSETS |
$2,556,177 |
$733,865 |
$305,835 |
$7,374,169 |
$93,998 |
The Notes to Financial Statements are an integral part of these statements.
Madison Mosaic Equity Trust 19
Madison Mosaic Equity Trust
Statements of Changes in Net Assets
For the period indicated
|
Investors Fund |
Balanced Fund |
|||
|
(unaudited) |
Year Ended Dec. 31, |
(unaudited) |
Year Ended Dec. 31, |
|
|
2009 |
2008 |
2009 |
2008 |
|
|
INCREASE (DECREASE) IN NET ASSETS |
||||
|
Net investment income |
$80,664 |
$197,784 |
$72,807 |
$183,567 |
|
Net realized loss on investments |
(3,703,083) |
(3,690,284) |
(656,939) |
(374,909) |
|
Net unrealized appreciation (depreciation) on investments |
6,178,596 |
(12,030,041) |
1,317,997 |
(2,446,122) |
|
Total increase (decrease) in net assets |
2,556,177 |
(15,522,541) |
733,865 |
(2,637,464) |
|
DISTRIBUTIONS TO SHAREHOLDERS |
||||
|
From net investment income |
-- |
(182,000) |
(72,807) |
(183,567) |
|
From net capital gains |
-- |
(1,977,544) |
-- |
(442,077) |
|
Total distributions |
-- |
(2,159,544) |
(72,807) |
(625,644) |
|
CAPITAL SHARE TRANSACTIONS (Note 7) |
1,237,580 |
(10,278,608) |
(277,202) |
(397,601) |
|
TOTAL INCREASE (DECREASE) IN NET ASSETS |
3,793,757 |
(27,960,693) |
383,856 |
(3,660,709) |
|
NET ASSETS |
||||
|
Beginning of period |
$28,030,384 |
$55,991,077 |
$10,138,922 |
$13,799,631 |
|
End of period |
$31,824,141 |
$28,030,384 |
$10,522,778 |
$10,138,922 |
The Notes to Financial Statements are an integral part of these statements.
20 Semi-annual Report • June 30, 2009
Statements of Changes in Net Assets (concluded)
|
Disciplined Equity Fund |
Mid-Cap Fund |
Small/ |
|||
|
(unaudited) |
Year Ended Dec. 31, |
(unaudited) |
Year Ended Dec. 31, |
(unaudited) |
|
|
2009 |
2008 |
2009 |
2008 |
2009 |
|
|
INCREASE (DECREASE) IN NET ASSETS |
|||||
|
Net investment income (loss) |
$15,372 |
$31,772 |
$(143,425) |
$(396,723) |
$(1,122) |
|
Net realized gain (loss) on investments |
(339,821) |
(339,569) |
(7,218,397) |
(17,155,342) |
6,876 |
|
Net unrealized appreciation (depreciation) on investments |
630,284 |
(1,252,633) |
14,735,991 |
(37,108,476) |
88,244 |
|
Total increase (decrease) in net assets resulting from operations |
305,835 |
(1,560,430) |
7,374,169 |
(54,660,541) |
93,998 |
|
DISTRIBUTIONS TO SHAREHOLDERS |
|||||
|
From net investment income |
-- |
(31,772) |
-- |
- |
-- |
|
From net capital gains |
-- |
(55,612) |
-- |
(5,114,645) |
-- |
|
Total distributions |
-- |
(87,384) |
-- |
(5,114,645) |
-- |
|
CAPITAL SHARE TRANSACTIONS (Note 7) |
389,762 |
220,282 |
18,573,085 |
2,361,460 |
762,880 |
|
TOTAL INCREASE (DECREASE) IN NET ASSETS |
695,597 |
(1,427,532) |
25,947,254 |
(57,413,726) |
856,878 |
|
NET ASSETS |
|||||
|
Beginning of period |
$3,071,684 |
$4,499,216 |
$88,963,904 |
$146,377,630 |
$ -- |
|
End of period |
$3,767,281 |
$3,071,684 |
$114,911,158 |
$88,963,904 |
$856,878 |
* Inception of Fund was December 31, 2008 with effective date of January 1, 2009.
The Notes to Financial Statements are an integral part of these statements.
Madison Mosaic Equity Trust 21
Madison Mosaic Equity Trust
Financial Highlights
Selected data for a share outstanding for the periods indicated.
INVESTORS FUND
|
(unaudited) |
Year Ended December 31, |
||||
|
2009 |
2008 |
2007 |
2006 |
2005 |
|
|
Net asset value, beginning of period |
$11.31 |
$18.44 |
$20.57 |
$18.81 |
$20.82 |
|
Investment operations: |
|||||
|
Net investment income |
0.03 |
0.08 |
0.20 |
0.09 |
0.06 |
|
Net realized and unrealized gain (loss) on investments |
1.04 |
(6.28) |
(0.21) |
3.02 |
(0.62) |
|
Total from investment operations |
1.07 |
(6.20) |
(0.01) |
3.11 |
(0.56) |
|
Less distributions: |
|||||
|
From net investment income |
-- |
(0.08) |
(0.20) |
(0.09) |
(0.06) |
|
From net capital gains |
-- |
(0.85) |
(1.92) |
(1.26) |
(1.39) |
|
Total distributions |
-- |
(0.93) |
(2.12) |
(1.35) |
(1.45) |
|
Net asset value, end of period |
$12.38 |
$11.31 |
$18.44 |
$20.57 |
$18.81 |
|
Total return (%) |
9.46 |
(33.40) |
(0.18) |
16.55 |
(2.81) |
|
Ratios and supplemental data |
|||||
|
Net assets, end of period (in thousands) |
$31,824 |
$28,030 |
$55,991 |
$176,861 |
$130,339 |
|
Ratio of expenses to average net assets (%) |
1.001 |
1.05 |
0.94 |
0.95 |
0.94 |
|
Ratio of net investment income to average net assets (%) |
0.591 |
0.47 |
0.78 |
0.55 |
0.29 |
|
Portfolio turnover (%) |
39 |
47 |
51 |
52 |
41 |
BALANCED FUND
|
(unaudited) |
Year Ended December 31, |
||||
|
2009 |
2008 |
2007 |
2006 |
2005 |
|
|
Net asset value, beginning of period |
$13.29 |
$17.62 |
$18.39 |
$17.40 |
$19.51 |
|
Investment operations: |
|||||
|
Net investment income |
0.10 |
0.25 |
0.28 |
0.23 |
0.18 |
|
Net realized and unrealized gain (loss) on investments |
0.91 |
(3.72) |
0.13 |
1.84 |
(0.60) |
|
Total from investment operations |
1.01 |
(3.47) |
0.41 |
2.07 |
(0.42) |
|
Less distributions: |
|||||
|
From net investment income |
(0.10) |
(0.25) |
(0.28) |
(0.23) |
(0.18) |
|
From net capital gains |
-- |
(0.61) |
(0.90) |
(0.85) |
(1.51) |
|
Total distributions |
(0.10) |
(0.86) |
(1.18) |
(1.08) |
(1.69) |
|
Net asset value, end of period |
$14.20 |
$13.29 |
$17.62 |
$18.39 |
$17.40 |
|
Total return (%) |
7.64 |
(19.92) |
2.24 |
11.96 |
(2.16) |
|
Ratios and supplemental data |
|||||
|
Net assets, end of period (in thousands) |
$10,523 |
$10,139 |
$13,800 |
$16,267 |
$17,514 |
|
Ratio of expenses to average net assets (%) |
1.241 |
1.24 |
1.22 |
1.22 |
1.21 |
|
Ratio of net investment income to average net assets (%) |
1.481 |
1.49 |
1.47 |
1.24 |
0.88 |
|
Portfolio turnover (%) |
27 |
50 |
42 |
35 |
34 |
1Annualized.
The Notes to Financial Statements are an integral part of these statements.
22 Semi-annual Report • June 30, 2009
Financial Highlights (continued)
Selected data for a share outstanding for the periods indicated.
DISCIPLINED EQUITY FUND
|
(unaudited) |
Year Ended December 31, |
||||
|
2009 |
2008 |
2007 |
2006 |
2005 |
|
|
Net asset value, beginning of period |
$8.81 |
$13.78 |
$14.07 |
$12.61 |
$13.38 |
|
Investment operations: |
|||||
|
Net investment income |
0.04 |
0.09 |
0.06 |
0.07 |
0.03 |
|
Net realized and unrealized gain (loss) on investments |
0.73 |
(4.80) |
1.21 |
2.05 |
(0.35) |
|
Total from investment operations |
0.77 |
(4.71) |
1.27 |
2.12 |
(0.32) |
|
Less distributions: |
|||||
|
From net investment income |
-- |
(0.09) |
(0.06) |
(0.07) |
(0.03) |
|
From net capital gains |
-- |
(0.17) |
(1.50) |
(0.59) |
(0.42) |
|
Total distributions |
-- |
(0.26 |
(1.56) |
(0.66) |
(0.45) |
|
Net asset value, end of period |
$9.58 |
$8.81 |
$13.78 |
$14.07 |
$12.61 |
|
Total return (%) |
8.74 |
(34.20) |
9.05 |
16.83 |
(2.34) |
|
Ratios and supplemental data |
|||||
|
Net assets, end of period (in thousands) |
$3,767 |
$3,072 |
$4,499 |
$4,081 |
$3,608 |
|
Ratio of expenses to average net assets before fee waiver (%) |
1.091 |
1.14 |
1.26 |
1.27 |
1.25 |
|
Ratio of expenses to average net assets after fee waiver (%) |
0.981 |
1.06 |
N/A |
N/A |
N/A |
|
Ratio of net investment income to average net assets |
0.861 |
0.72 |
0.41 |
0.54 |
0.24 |
|
Ratio of net investment income to average net assets |
0.971 |
0.80 |
N/A |
N/A |
N/A |
|
Portfolio turnover (%) |
41 |
63 |
70 |
54 |
122 |
MID-CAP FUND
|
(unaudited) |
Year Ended December 31, |
|||||
|
2009 |
2008 |
2007 |
2006 |
2005 |
||
|
Net asset value, beginning of period |
$7.67 |
$12.87 |
$13.04 |
$11.99 |
$12.52 |
|
|
Investment operations: |
||||||
|
Net investment loss |
(0.01) |
(0.03) |
(0.02) |
(0.02) |
(0.05) |
|
|
Net realized and unrealized gain (loss) on investments |
0.41 |
(4.71) |
1.15 |
1.98 |
0.12 |
|
|
Total from investment operations |
0.40 |
(4.74) |
1.13 |
1.96 |
0.07 |
|
|
Less distributions from capital gains |
-- |
(0.46) |
(1.30) |
(0.91) |
(0.60) |
|
|
Net asset value, end of period |
8.07 |
$7.67 |
$12.87 |
$13.04 |
$11.99 |
|
|
Total return (%) |
5.22 |
(36.61) |
8.62 |
16.32 |
0.55 |
|
|
Ratios and supplemental data |
||||||
|
Net assets, end of period (in thousands) |
$114,911 |
$88,964 |
$146,378 |
$147,122 |
$146,266 |
|
|
Ratio of expenses to average net assets (%) |
1.251
|
1.26 |
1.25 |
1.25 |
1.25 |
|
|
Ratio of net investment income to average net assets (%) |
(0.30)1
|
(0.33) |
(0.18) |
(0.18) |
(0.37) |
|
|
Portfolio turnover (%) |
24 |
76 |
43 |
47 |
46 |
|
1Annualized.
The Notes to Financial Statements are an integral part of these statements.
Madison Mosaic Equity Trust 23
Financial Highlights (concluded)
Selected data for a share outstanding for the periods indicated.
SMALL/MID-CAP FUND
|
(unaudited) |
||
|
2009 |
||
|
Net asset value, beginning of period |
$10.00* |
|
|
Investment operations: |
||
|
Net investment loss |
(0.02) |
|
|
Net realized and unrealized gain on investments |
1.10 |
|
|
Total from investment operations |
1.08 |
|
|
Less distributions from capital gains |
-- |
|
|
Net asset value, end of period |
11.08 |
|
|
Total return (%) |
10.80 |
|
|
Ratios and supplemental data |
||
|
Net assets, end of period (in thousands) |
$857 |
|
|
Ratio of expenses to average net assets (%) |
1.221
|
|
|
Ratio of net investment income to average net assets (%) |
(0.311
|
|
|
Portfolio turnover (%) |
24 |
|
1Annualized.
* Inception of Fund was December 31, 2008 with effective date of January 1, 2009.
The Notes to Financial Statements are an integral part of these statements.
24 Semi-annual Report • June 30, 2009
Madison Mosaic Equity Trust
Notes to Financial Statements
1. Summary of Significant Accounting Policies. Madison Mosaic Equity Trust (the "Trust") is registered with the Securities and Exchange Commission under the Investment Company Act of 1940 as an open-end, investment management company. This report contains information about five separate funds (the "Funds"): the Investors Fund, Balanced Fund, Disciplined Equity Fund, Mid-Cap Fund and Small/Mid-Cap Fund whose objectives and strategies are described in the Trust’s prospectus for the Funds. A sixth Trust portfolio, available to certain institutional investors (as defined in the portfolio’s prospectus) presents its financial information in a separate report.
Securities Valuation: Securities traded on a national securities exchange are valued at their closing sale price. Repurchase agreements and other securities having maturities of 60 days or less are valued at amortized cost, which approximates market value. Securities having longer
maturities, for which quotations are readily available, are valued at the mean between their closing bid and ask prices. Securities for which market quotations are not readily available are valued at their fair value as determined in good faith under procedures approved by the Board of Trustees.
The Funds adopted Financial Accounting Standards Board Statement No. 157, Fair Value Measurements (FAS 157) effective January 1, 2008. In accordance with FAS 157, fair value is defined as the price that the Funds would receive to sell an investment or pay to transfer a liability in an orderly transaction with an independent buyer in the principal market, or in the absence of a principal market the most advantageous market for the investment or liability. FAS 157 establishes a
three-tier hierarchy to distinguish between (1) inputs that reflect the assumptions market participants would use in pricing an asset or liability developed based on market data obtained from sources independent of the reporting entity (observable inputs) and (2) inputs that reflect the reporting entity’s own assumptions about the assumptions market participants would use in pricing an asset or liability developed based on the best information available in the circumstances
(unobservable inputs) and to establish classification of fair value measurements for disclosure purposes.
Various inputs as noted above are used in determining the value of the Funds’ investments and other financial instruments. These inputs are summarized in the three broad levels listed below.
Level 1: Quoted prices in active markets for identical securities
Level 2: Other significant observable inputs (including quoted prices for similar securities, interest rates, prepayment speeds, credit risk, etc.)
Level 3: Significant unobservable inputs (including the Funds’ own assumptions in determining the fair value of investments)
The inputs or methodology used for valuing securities are not necessarily an indication of the risk associated with investing in those securities. In April 2009, the FASB issued FSP FAS 157-4, "Determining Fair Value When Volume and Level of Activity for the Asset or Liability Have Significantly Decreased and Identifying Transactions
That Are Not Orderly" (FSP 157-4). FSP 157-4 provides guidance on how to determine the fair value of assets and liabilities when the volume and level of activity for the asset/liability has significantly decreased.
The following table represents the Funds’ investments carried on the Statement of Assets and Liabilities by caption and by level within the fair value hierarchy as of June 30, 2009 (unaudited):
|
Fund |
Level 1 |
Level 2 |
Level 3 |
Value at 6/30/2009 |
|
Investors |
||||
|
Common Stocks |
$29,301,934 |
$-- |
$-- |
$29,301,934 |
|
Repurchase Agreement |
-- |
2,544,987 |
-- |
2,544,987 |
|
Total |
$29,301,934 |
$2,544,987 |
-- |
$31,846,921 |
|
Balanced |
||||
|
Common Stocks |
$6,768,251 |
$-- |
$-- |
$6,768,251 |
|
Corporate Obligations |
-- |
2,134,955 |
-- |
2,134,955 |
|
U.S. Treasury & |
-- |
1,295,858 |
-- |
1,295,858 |
|
Repurchase Agreement |
-- |
259,221 |
-- |
259,221 |
|
Total |
$6,768,251 |
$3,690,034 |
$-- |
$10,458,285 |
Madison Mosaic Equity Trust 25
Notes to Financial Statements (continued)
|
Fund |
Level 1 |
Level 2 |
Level 3 |
Value at 6/30/2009 |
|
Disciplined Equity |
||||
|
Common Stocks |
$3,589,540 |
$-- |
$-- |
$3,589,540 |
|
Repurchase Agreement |
-- |
197,908 |
-- |
197,908 |
|
Total |
$3,589,540 |
$197,908 |
$-- |
$3,787,448 |
|
Mid-Cap |
||||
|
Common Stocks |
$107,368,545 |
$-- |
$-- |
$107,368,545 |
|
Repurchase Agreement |
-- |
7,104,694 |
-- |
7,104,694 |
|
Total |
$107,368,545 |
$7,104,694 |
$-- |
$114,473,239 |
|
Small/Mid-Cap |
||||
|
Common Stocks |
$800,722 |
$-- |
$-- |
$800,722 |
|
Repurchase Agreement |
-- |
49,392 |
-- |
49,392 |
|
Total |
$800,722 |
$49,392 |
$-- |
$850,114 |
|
At June 30, 2009 and for the six-months then ended, the Funds held no Level 3 securities. Please see the Portfolio of Investments for each respective Fund for the common stock sector breakdown and listing of all securities within each caption. |
||||
Investment Transactions: Investment transactions are recorded on a trade date basis. The cost of investments sold is determined on the identified cost basis for financial statement and federal income tax purposes.
Investment Income: Interest income is recorded on an accrual basis. Bond premium is amortized and original issue discount and market discount are accreted over the expected life of each applicable security using the effective interest method. Dividend income is recorded net of applicable withholding taxes on the ex-dividend date. Other income is accrued as earned.
Distribution of Income and Gains: Distributions are recorded on the ex-dividend date. Net investment income, determined as gross investment income less total expenses, is declared as a regular dividend and distributed to shareholders at year-end for the Investors, Disciplined Equity, Mid-Cap and Small/Mid-Cap Funds. The Trust
intends to declare and pay regular dividends quarterly on the Balanced Fund. Capital gain distributions, if any, are declared and paid annually at year-end.
The tax character of distributions paid during 2008 and 2007 were as follows:
|
2008 |
2007 |
|
|
Investors Fund: |
||
|
Distributions paid from: |
||
|
Ordinary income |
$182,000 |
$1,241,405 |
|
Short-term capital gains |
341,483 |
577,431 |
|
Long-term capital gains |
1,636,061 |
11,121,404 |
26 Semi-annual Report • June 30, 2009
Notes to Financial Statements (continued)
|
2008 |
2007 |
|
|
Balanced Fund: |
||
|
Distributions paid from: |
||
|
Ordinary income |
$183,567 |
$220,474 |
|
Short-term capital gains |
32,244 |
109,880 |
|
Long-term capital gains |
409,833 |
561,069 |
|
Disciplined Equity Fund: |
||
|
Distributions paid from: |
||
|
Ordinary income |
$31,772 |
$18,188 |
|
Short-term capital gains |
-- |
193,322 |
|
Long-term capital gains |
55,612 |
245,858 |
|
Mid-Cap Fund: |
||
|
Distributions paid from: |
||
|
Short-term capital gains |
$2,196,654 |
$2,056,124 |
|
Long-term capital gains |
2,917,991 |
11,637,002 |
The Investors Fund, Balanced Fund, Mid-Cap Fund and Disciplined Equity Fund designate 100%, 58%, 25% and 100%, respectively, of dividends declared from net investment income and short-term capital gains during the fiscal year ended December 31, 2008 as qualified income under the Jobs and Growth Tax Relief Reconciliation Act of 2003.
As of June 30, 2009, the components of distributable earnings on a tax basis were as follows (unaudited):
|
Investors Fund: |
|
|
Undistributed net investment income |
$96,448 |
|
Accumulated net realized losses |
(7,429,763) |
|
Net unrealized depreciation on investments |
(3,892,302) |
|
$(11,225,617) |
|
|
Balanced Fund: |
|
|
Accumulated net realized losses |
$(973,039) |
|
Net unrealized depreciation on investments |
(382,399) |
|
$(1,355,438) |
|
|
Disciplined Equity Fund: |
|
|
Undistributed net investment income |
$15,372 |
|
Accumulated net realized losses |
(679,390) |
|
Net unrealized depreciation on investments |
(260,984) |
|
$ (925,002) |
|
|
Mid-Cap Fund: |
|
|
Undistributed net investment loss |
$(143,425) |
|
Accumulated net realized losses |
(22,407,443) |
|
Net unrealized depreciation on investments |
(7,257,379) |
|
$(29,808,247) |
|
|
Small/Mid-Cap Fund: |
|
|
Undistributed net investment loss |
$(1,122) |
|
Accumulated net realized gains |
6,876 |
|
Net unrealized appreciation on investments |
88,244 |
|
$93,998 |
Net realized gains or losses may differ for financial and tax reporting purposes as a result of loss deferrals related to wash sales and post-October transactions.
Income Tax: No provision is made for federal income taxes since it is the intention of the Trust to comply with the provisions of Subchapter M of the Internal Revenue Code available to investment companies and to make the requisite distribution to shareholders of taxable income which will be sufficient to relieve it from all or substantially all federal income taxes.
The Funds adopted the provisions of Financial Accounting Standards Board Interpretation No. 48 ("FIN 48"), "Accounting for Uncertainty in Income Taxes." The implementation of FIN 48 resulted in no material liability for unrecognized tax benefits and no material change to the beginning net asset value of the Funds.
As of and during the year ended December 31, 2008, the Funds did not have a liability for any unrecognized tax benefits. The Funds recognize interest and penalties, if any, related to unrecognized tax benefits as income tax expense in the statement of operations. During the period, the Funds did not incur any interest or penalties.
As of December 31, 2008, capital loss carryovers available to offset future capital gains for federal income tax purposes for the Balanced, Disciplined Equity and Mid-Cap Funds is $235,669. $234,547 and $8,967,149, respectively. These losses expire December 31, 2016. For the Investors Fund, losses of $130,741 and $2,376,096 expire December 31, 2010 and 2016, respectively. A portion of the losses set to expire in 2010 were acquired through its merger with Mosaic Focus Fund on July 1,
2002 and is subject to certain limitations.
Use of Estimates: The preparation of the financial statements in conformity with accounting principles generally accepted in the United States of America requires management to make estimates and assumptions. Such estimates affect the reported amounts of assets and liabilities and reported amounts of increases and decreases in net assets from operations during the reporting period. Actual results could differ from those estimates.
2. Investments in Repurchase Agreements. When the Funds purchase securities under agreements to resell, the securities are held for safekeeping by the custodian bank as collateral. Should the market value of the securities purchased under such an agreement decrease below the principal amount to be received at the termination of the agreement plus accrued interest, the counterparty is required to place an equivalent amount of additional securities in safekeeping with the Trust’s custodian bank. Pursuant to an Exemptive Order issued by the Securities and Exchange Commission, the Funds, along with other registered investment companies having Advisory and Services Agreements with the same advisor, transfers uninvested cash balances into a joint trading account. The aggregate balance in this joint trading account is invested in one or more consolidated repurchase agreements whose underlying securities are U.S. Treasury or federal agency obligations. As of June 30, 2009, the Investors Fund had approximately a 20.9% interest, the Balanced Fund approximately a 2.1% interest, the Disciplined Equity Fund approximately a 1.6% interest, the Mid-Cap Fund approximately a 58.3% interest and the Small/Mid-Cap Fund approximately a 0.4% interest in the consolidated repurchase agreement of $12,184,689 collateralized by $12,428,737 in Fannie Mae Mortgage Backed Security Notes. Proceeds at maturity were $12,184,693.
3. Investment Advisory Fees and Other Transactions with Affiliates. The investment advisor to the Trust, Madison Mosaic, LLC, a wholly owned subsidiary of Madison Investment Advisors, Inc. (collectively "the Advisor"), earns an advisory fee equal to 0.75% per annum of the average net assets of the Balanced, Disciplined Equity, Mid-Cap and Small/Mid-Cap Funds and the first $100 million in the Investors Fund. The advisory fee paid by the Investors Fund is reduced to 0.60% per annum on assets over $100 million. The fees are accrued daily and are paid monthly.
Madison Mosaic Equity Trust 27
Notes to Financial Statements (continued)
4. Investment Transactions. Purchases and sales of securities (excluding short-term securities) for the six-months ended June 30, 2009 were as follows (unaudited):
|
Purchases |
Sales |
|
|
Investors Fund: |
||
|
U. S. Gov’t Securities |
-- |
-- |
|
Other |
$10,128,575 |
$10,759,388 |
|
Balanced Fund: |
||
|
U. S. Gov’t Securities |
$159,212 |
$163,194 |
|
Other |
$2,427,800 |
$2,334,224 |
|
Disciplined Equity Fund: |
||
|
U. S. Gov’t Securities |
-- |
-- |
|
Other |
$1,605,883 |
$1,242,420 |
|
Mid-Cap Fund: |
||
|
U. S. Gov’t Securities |
-- |
-- |
|
Other |
$38,092,905 |
$21,851,282 |
|
Small/Mid-Cap Fund: |
||
|
U. S. Gov’t Securities |
-- |
-- |
|
Other |
$ 846,178 |
$140,576 |
In March 2008, the FASB issued Statement of Financial Accounting Standards No. 161 ("SFAS No. 161"), "Disclosures about Derivative Instructions and Hedging Activities." This standard is intended to enhance financial statement disclosures for derivative instruments and hedging activities and enable investors to understand: a) how and why a fund uses derivative instruments, b) how derivative instruments and related hedge fund items are accounted for, and c) how derivative instruments and related hedge items affect a fund’s financial position, results of operations and cash flows. SFAS No. 161 is effective for financial statements issued for fiscal years and interim periods beginning after November 15, 2008. The Fund adopted SFAS No. 161 effective January 1, 2009. As of June 30, 2009 and for the six-months then ended, the Funds did not hold any derivative instruments nor engage in any hedging activities.
5. Other Expenses. Under a separate Services Agreement, the Advisor will provide or arrange for each Fund to have all other necessary operational and support services for a fee based on a percentage of average net assets. These fees are accrued daily and paid monthly. This
percentage was 0.41% for the Balanced Fund, 0.35% for the Disciplined Equity Fund and 0.50% for the Small/Mid-Cap Fund, respectively. Additionally, the Advisor agreed to waive 0.11% of this fee for the Disciplined Equity Fund. This waiver may end at any time. For the Investors Fund, this fee was 0.24% on the first $100 million and 0.39% on all assets greater than $100 million. For the Mid-Cap Fund, this fee was 0.48% on the first $150 million and 0.45% on all assets greater than
$150 million. The direct expenses paid by the Investors, Disciplined Equity and Small/Mid-Cap Funds and referenced below come out of this fee.
The Funds pay the expenses of the Funds’ Independent Trustees directly. For the six-months ended June 30, 2009, these fees were $7,750, $1,750, $750, $7,750 and $0 for the Investors, Balanced, Disciplined Equity, Mid-Cap and Small/Mid-Cap Funds, respectively.
The Funds also pay the expenses of the Funds’ Independent auditors directly. For the six-months ended June 30, 2009, the amounts expensed for these fees were $6,750, $2,713, $1,750, $10,846 and $625 for the Investors, Balanced, Disciplined Equity, Mid-Cap and Small/Mid-Cap Funds, respectively.
6. Aggregate Cost and Unrealized Appreciation (Depreciation). The aggregate cost for federal income tax purposes and the net unrealized appreciation (depreciation) are as follows as of June 30, 2009 (unaudited):
|
Investors |
Balanced |
|
|
Aggregate Cost |
$35,739,223 |
$10,840,684 |
|
Gross unrealized appreciation |
1,138,904 |
455,986 |
|
Gross unrealized depreciation |
(5,031,206) |
(838,385) |
|
Net unrealized depreciation |
$(3,892,302) |
$(382,399) |
|
Disciplined Equity Fund |
Mid-Cap |
||
|
Aggregate Cost |
$4,048,432 |
$121,730,618 |
|
|
Gross unrealized appreciation |
153,207 |
6,376,657 |
|
|
Gross unrealized depreciation |
(414,191) |
(13,634,036) |
|
|
Net unrealized depreciation |
$(260,984) |
$(75,257,379) |
|
|
Small/ |
|
|
Aggregate Cost |
$761,870 |
|
Gross unrealized appreciation |
110,873 |
|
Gross unrealized depreciation |
(22,629) |
|
Net unrealized appreciation |
$88,244 |
28 Semi-annual Report • June 30, 2009
Notes to Financial Statements (continued)
7. Capital Share Transactions. An unlimited number of capital shares, without par value, are authorized. Transactions in capital shares were as follows:
|
(unaudited) |
Year Ended December 31, |
|
|
Investors Fund |
2009 |
2008 |
|
In Dollars |
||
|
Shares sold |
$3,025,464 |
$2,371,218 |
|
Shares issued in reinvestment |
-- |
2,069,858 |
|
Total shares issued |
3,025,464 |
4,441,076 |
|
Shares redeemed |
(1,787,884) |
(14,719,684) |
|
Net increase (decrease) |
$1,237,580 |
$(10,278,608) |
|
In Shares |
||
|
Shares sold |
269,193 |
154,758 |
|
Shares issued in reinvestment |
-- |
190,420 |
|
Total shares issued |
269,193 |
345,178 |
|
Shares redeemed |
(175,695) |
(903,981) |
|
Net increase (decrease) |
93,498 |
(558,803) |
|
(unaudited) |
Year Ended December 31, |
|
|
Balanced Fund |
2009 |
2008 |
|
In Dollars |
||
|
Shares sold |
$201,382 |
$553,255 |
|
Shares issued in reinvestment |
66,160 |
574,299 |
|
Total shares issued |
267,542 |
1,127,554 |
|
Shares redeemed |
(544,744) |
(1,525,155) |
|
Net decrease |
$(277,202) |
$(397,601) |
|
In Shares |
||
|
Shares sold |
15,209 |
35,053 |
|
Shares issued in reinvestment |
5,043 |
41,331 |
|
Total shares issued |
20,252 |
76,384 |
|
Shares redeemed |
(41,890) |
(96,967) |
|
Net decrease |
(21,638) |
(20,583) |
|
(unaudited) |
Year Ended December 31, |
|
|
Disciplined Equity Fund |
2009 |
2008 |
|
In Dollars |
||
|
Shares sold |
$483,728 |
$343,286 |
|
Shares issued in reinvestment |
-- |
86,250 |
|
Total shares issued |
483,728 |
429,536 |
|
Shares redeemed |
(93,966) |
(209,254) |
|
Net increase |
$389,762 |
$220,282 |
|
In Shares |
||
|
Shares sold |
57,089 |
31,179 |
|
Shares issued in reinvestment |
-- |
9,790 |
|
Total shares issued |
57,089 |
40,969 |
|
Shares redeemed |
(12,397) |
(18,775) |
|
Net increase |
44,692 |
22,194 |
|
(unaudited) |
Year Ended December 31, |
|
|
Mid-Cap Fund |
2009 |
2008 |
|
In Dollars |
||
|
Shares sold |
$29,372,263 |
$45,558,885 |
|
Shares issued in reinvestment of dividends |
-- |
4,664,982 |
|
Total shares issued |
29,372,263 |
50,223,867 |
|
Shares redeemed |
(10,799,178) |
(47,862,407) |
|
Net increase |
$18,573,085 |
$ 2,361,460 |
|
In Shares |
||
|
Shares sold |
4,144,055 |
4,387,485 |
|
Shares issued in reinvestment of dividends |
-- |
641,675 |
|
Total shares issued |
4,144,055 |
5,029,160 |
|
Shares redeemed |
(1,497,494) |
(4,805,004) |
|
Net increase |
2,646,561 |
224,156 |
Madison Mosaic Equity Trust 29
Notes to Financial Statements (concluded)
|
(unaudited) |
|
|
Small/Mid-Cap Fund |
2009 |
|
In Dollars |
|
|
Shares sold |
$916,180 |
|
Shares issued in reinvestment of dividends |
-- |
|
Total shares issued |
916,180 |
|
Shares redeemed |
(153,300) |
|
Net increase |
$762,880 |
|
In Shares |
|
|
Shares sold |
92,343 |
|
Shares issued in reinvestment of dividends |
-- |
|
Total shares issued |
92,343 |
|
Shares redeemed |
(15,000) |
|
Net increase |
77,343 |
8. Line of Credit. The Investors Fund, Balanced Fund, Disciplined Equity Fund and Mid-Cap Fund have lines of credit of $13 million, $4 million, $1 million and $35 million, respectively. Each line is a revolving credit facility with a bank to be used for temporary emergency purposes, including the meeting of redemption requests that otherwise might require the untimely disposition of securities. The interest rate on the outstanding principal amount is equal to the prime rate less 1/2%. During the six-months ended June 30, 2009, the Balanced, Disciplined Equity and Mid-Cap Funds did not borrow on their respective lines of credit. The Investors Fund had total draws during the year of $105,000 with interest paid on those draws of $8. All draws were paid back by the end of the year. The Small/Mid-Cap Fund currently does not have a line of credit in place.
9. Subsequent Events. Management has evaluated subsequent events through August 27, the date the financial statements were issued.
Fund Expenses (unaudited)
Example: As a shareholder of one of the Funds, you incur two types of costs: (1) transaction costs and (2) ongoing costs, including investment advisory fees and other expenses. This Example is intended to help you understand your ongoing costs (in dollars) of investing in any Fund and to compare these costs with the ongoing costs of investing in other mutual funds. See Notes 3 and 5 above for an explanation of the types of costs charged by the Funds. This Example is based on an investment of $1,000 invested on January 1, 2009 and held for the six-months ended June 30, 2009.
Actual Expenses
The table below titled "Based on Actual Total Return" provides information about actual account values and actual expenses. You may use the information provided in this table, together with the amount you invested, to estimate the expenses that you paid over the period. To estimate the expenses you paid on your account, divide your ending account value by $1,000 (for example, an $8,500 ending account valued divided by $1,000 = 8.5), then multiply the result by the number under the heading entitled "Expenses Paid During the Period."
|
Based on Actual Total Return1 |
||||||||||||||||
|
Beginning |
Ending |
Annualized |
Expenses Paid |
|||||||||||||
|
Investors Fund |
$ |
1,000.00 |
$ |
1,094.61 |
1.00 |
% |
$ |
4.83 |
||||||||
|
Balanced Fund |
$ |
1,000.00 |
$ |
1,076.45 |
1.24 |
% |
$ |
6.09 |
||||||||
|
Disciplined Equity Fund |
$ |
1,000.00 |
$ |
1,087.40 |
0.98 |
%* |
$ |
4.74 |
||||||||
|
Mid-Cap Fund |
$ |
1,000.00 |
$ |
1,052.15 |
1.26 |
% |
$ |
6.01 |
||||||||
|
Small/Mid-Cap Fund |
$ |
1,000.00 |
$ |
1,108.00 |
1.22 |
% |
$ |
6.00 |
||||||||
|
*After fee waiver. See Note 5. 1For the six-months ended June 30, 2009. 2Expenses are equal to each Fund’s annualized expense ratio multiplied by the average account value over the period, multiplied by the number of days in the most recent fiscal half-year, then divided by 365. |
||||||||||||||||
30 Semi-annual Report • June 30, 2009
Hypothetical Example for Comparison Purposes
The table below titled "Based on Hypothetical Total Return" provides information about hypothetical account values and hypothetical expenses based on the actual expense ratio and an assumed rate of return of 5.00% per year before expenses, which is not any Fund’s actual return. The hypothetical account values and expenses may not be used to estimate the actual ending account balance or expenses you paid for the period. You may use the information provided in this table to compare the ongoing costs of investing in a fund offered by the Trust and other funds. To do so, compare the 5.00% hypothetical example relating to the applicable Fund with the 5.00% hypothetical examples that appear in the shareholder reports of the other funds.
|
Based on Hypothetical Total Return1 |
||||||||||||||||
|
Beginning |
Ending |
Annualized |
Expenses Paid |
|||||||||||||
|
Investors Fund |
$ |
1,000.00 |
$ |
1,025.05 |
1.00 |
% |
$ |
5.02 |
||||||||
|
Balanced Fund |
$ |
1,000.00 |
$ |
1,025.05 |
1.24 |
% |
$ |
6.22 |
||||||||
|
Disciplined Equity Fund |
$ |
1,000.00 |
$ |
1,025.05 |
0.98 |
%* |
$ |
4.91 |
||||||||
|
Mid-Cap Fund |
$ |
1,000.00 |
$ |
1,025.05 |
1.26 |
% |
$ |
6.30 |
||||||||
|
Small/Mid-Cap Fund |
$ |
1,000.00 |
$ |
1,025.05 |
1.22 |
% |
$ |
6.12 |
||||||||
|
*After fee waiver. See Note 5. 1For the six-months ended June 30, 2009. 2Expenses are equal to each Fund’s annualized expense ratio multiplied by the average account value over the period, multiplied by the number of days in the most recent fiscal half-year, then divided by 365. |
||||||||||||||||
Forward-Looking Statement Disclosure. One of our most important responsibilities as mutual fund managers is to communicate with shareholders in an open and direct manner. Some of our comments in our letters to shareholders are based on current management expectations and are considered "forward-looking statements." Actual future results, however, may prove to be different from our expectations. You can identify forward-looking statements by words such as "estimate," "may," "will," "expect," "believe," "plan" and other similar terms. We cannot promise future returns. Our opinions are a reflection of our best judgment at the time this report is compiled, and we disclaim any obligation to update or alter forward-looking statements as a result of new information, future events, or otherwise.
Proxy Voting Information. The Trust adopted policies that provide guidance and set forth parameters for the voting of proxies relating to securities held in the Trust’s portfolios. Additionally, information regarding how the Trust voted proxies related to portfolio securities for the one-year period ended June 30, 2009 is available. These policies and voting information are available to you upon request and free of charge by writing to Madison Mosaic Funds, 550 Science Drive, Madison, WI 53711 or by calling toll-free at 1-800-368-3195. The Trust’s proxy voting policies and voting information may also be obtained by visiting the Securities and Exchange Commission web site at www.sec.gov. The Trust will respond to shareholder requests for copies of our policies and voting information within two business days of request by first-class mail or other means designed to ensure prompt delivery.
N-Q Disclosure. The Trust files its complete schedule of portfolio holdings with the U.S. Securities and Exchange Commission (the "Commission") for the first and third quarters of each fiscal year on Form N-Q. The Trust’s Forms N-Q are available on the Commission’s website. The Trust’s Forms N-Q may be reviewed and copied at the Commission’s Public Reference Room in Washington, DC. Information about the operation of the Public Reference Room may be obtained by calling the Commission at 1-202-551-8090. Form N-Q and other information about the Trust are available on the EDGAR Database on the Commission’s Internet site at http://www.sec.gov. Copies of this information may also be obtained, upon payment of a duplicating fee, by electronic request at the following email address: publicinfo@sec.gov, or by writing the Commission’s Public Reference Section, Washington, DC 20549-0102. Finally, you may call Madison Mosaic at 800-368-3195 if you would like a copy of Form N-Q and we will mail one to you at no charge.
Discussion of Contract Adoption for Small/Mid-Cap Fund (Unaudited)
The Trustees considered a number of factors when the Board approved the advisory contract between the advisor and the Small/Mid Cap series of the Trust, which series was first publicly offered January 1, 2009. Rather than providing you with a list of factors or conclusory statements that explained the Board’s decision-making process, the following discussion is designed to describe what you would have seen and heard if you had been at
Madison Mosaic Equity Trust 31
the Trust’s Board meeting when it approved the amendment to the Trust’s advisory contract to include this new fund:
With regard to the nature, extent and quality of the services to be provided by the advisor, the Board reviewed the biographies and tenure of the personnel involved in fund management. They recognized the wide array of investment professionals employed by the firm. The officers of the investment advisor discussed the firm’s ongoing investment philosophies and strategies intended to provide superior performance consistent with each funds’ investment objectives under various market scenarios. The Trustees also noted their familiarity with the advisor due to the advisor’s history of providing advisory services to the Madison Mosaic family.
The Board also discussed the quality of services provided by the transfer agent, US Bancorp Fund Services, LLC. The advisor reported that the transfer agent has routinely ranked at or near the top in customer service surveys for third party transfer agents. The Independent Trustees noted that they had completed a satisfactory on-site review of the transfer agent’s facilities and operations, including its main operations in Milwaukee, Wisconsin and its emergency recovery center located in West Allis, Wisconsin.
With regard to the investment performance of the fund and the investment advisor, the Board recognized that the Small/Mid-Cap Funds was new and had no performance history of its own. The Board reviewed other equity performance information provided by the advisor in connection with historic mid-cap performance. The Board
engaged in a comprehensive discussion of performance and market conditions.
With regard to the costs of the services to be provided and the profits to be realized by the investment advisor and its affiliates from the relationship with each Mosaic fund, the Board reviewed the proposed expense ratio for the Small/Mid-Cap Fund and compared it with funds in the Trust.
The Trustees recognized that the fund’s fee structure should be reviewed based on total fund expense ratio rather than simply comparing advisory fees to other advisory fees in light of the simple expense structure (i.e. a single advisory and a single services fee). As such, the Board focused its attention on the total expense ratio to be paid by the fund. The Board
also recognized that investors are often required to pay distribution fees (loads) over and above the amounts identified in the expense ratio comparison reviewed by the Board, whereas no such fees are paid by Madison Mosaic shareholders.
The Trustees sought to ensure that fees were adequate so that the advisor did not neglect its management responsibilities for the fund in favor of more "profitable" accounts. At the same time, the Trustees sought to ensure that compensation paid to the advisor was not unreasonably high. The Board reviewed materials demonstrating that although the advisor is compensated for
a variety of the administrative services it provides or arranges to provide pursuant to its Services Agreements, such compensation generally does not cover all costs due to the relatively small size of the funds in the Madison Mosaic family. Administrative, operational, regulatory and compliance fees and costs in excess of the Services Agreement fees are paid by the advisor from its investment advisory fees earned.
With regard to the extent to which economies of scale would be realized as a fund grows, the Trustees recognized that the Small/Mid-Cap Fund was new and discussion of this matter was premature.
Finally, the Board reviewed the role of Mosaic Funds Distributor, LLC. They noted that the advisor pays all distribution expenses of the Small/Mid-Cap Fund because the fund itself does not pay distribution fees. Such expenses include FINRA regulatory fees and "bluesky" fees charged by state governments in order to permit the funds to be offered in the various United States
jurisdictions.
Based on all of the material factors explained above, plus a number of other matters that the Trustees are generally required to consider under guidelines developed by the Securities and Exchange Commission and applicable law, the Trustees concluded that the advisor’s contract regarding the new Small/Mid-Cap series of the Trust should be approved.
32 Semi-annual Report • June 30, 2009
The Madison Mosaic Family of Mutual Funds
Madison Mosaic Equity Trust
Investors Fund
Balanced Fund
Mid-Cap Fund
Small/Mid Cap Fund
Disciplined Equity Fund
Madison Institutional Equity Option Fund
Madison Mosaic Income Trust
Government Fund
Intermediate Income Fund
Institutional Bond Fund
Corporate Income Shares (COINS)
Madison Mosaic Tax-Free Trust
Virginia Tax-Free Fund
Tax-Free National Fund
Madison Mosaic Government Money Market
For more complete information on any Madison Mosaic fund, including charges and expenses, request a prospectus by calling 1-800-368-3195. Read it carefully before you invest or send money. This document does not constitute an offering by the distributor in any jurisdiction in which such offering may not be lawfully made. Mosaic Funds Distributor, LLC.
TRANSER AGENT
Madison Mosaic Funds
c/o US Bancorp Fund Services, LLC
P.O. Box 701
Milwaukee, WI 53201-0701
TELEPHONE NUMBERS
Shareholder Service
Toll-free nationwide: 888-670-3600
550 Science Drive
Madison, Wisconsin 53711
Madison Mosaic Funds
www.mosaicfunds.com
SEC File Number 811-3615
Semi-Annual Report (unaudited)
June 30, 2009
Madison Institutional Equity Option Fund (MADOX)
Active Equity Management combined with a Covered Call Option Strategy
Madison Investment Advisors, Inc.
www.madisonfunds.com
MADOX | Madison Institutional Equity Option Fund
Table of Contents
|
Portfolio Manager Review |
1 |
|
Portfolio of Investments |
4 |
|
Statement of Assets and Liabilities |
6 |
|
Statement of Operations |
7 |
|
Statement of Changes in Net Assets |
8 |
|
Financial Highlights |
9 |
|
Notes to Financial Statements |
10 |
|
Fund Expenses |
14 |
MADOX | Madison Institutional Equity Option Fund
Portfolio Manager Review
What happened in the market during the first half of 2009?
The wild ride for stock investors during the first half of 2009 can be traced by the path of the S&P 500, which is often used as a proxy for the overall market. The Index began the year with the same downward momentum that characterized 2008, when the market dropped a record-setting -37.0%. The Index fell an additional 25% by March
9, then rallied strongly through May before consolidating gains as the first half of the year came to an end. By June 30, the Index had made up its early losses, finishing with a deceivingly average-looking year-to-date 3.16% return.
Over the past 12 months, the market has been buffeted by unprecedented financial woes, economic recession, unprecedented government stimulus programs and wide swings of investor psychology. In the fall of 2008 the collapse of Lehman Brothers and the subsequent massive interventions from the Federal government raised hopes that the worst was behind. But as we entered the first months of 2009 a new wave of uncertainty gripped the market. The new administration’s announcements of
dramatic and sizable support initiatives were not enough to overcome the continuing negative economic and corporate news. The economy, as measured by GDP, was dropping at an annualized 6% rate, and employment fell at a record-setting pace. The crisis in the housing market showed no sign of abating and the domestic automobile business was in freefall. It was no wonder that consumer sentiment hit a new low while investor sentiment could be summed up in one word: fearful.
From the market lows in early March, the S&P rallied strongly through most of the remaining period, ending the six months in plus territory for the first half of 2009. This rebound was not so much driven by positive news as it was by diminishing worry. In other words, investors who were once worried about the collapse of the global financial system and another great depression were beginning to believe that the economic problems were deep, but not fathomless. By the later part of the period, some of the important economic indicators showed signs of bottoming and other problem areas showed decreasing losses. These signs, however modest, were eagerly noted by investors looking for hints of recovery and as we entered the second half of the period, the market sentiment shifted from fear to hope.
How did the fund perform the first half of 2009 given the marketplace conditions?
We are very pleased to report that Madison Institutional Equity Option Fund ("MADOX" or the "Fund") performed admirably through the very tumultuous first half. For the six-months ended June 30, 2009, the fund provided a total return of 11.80%. This compared favorably to the S&P 500 Index which returned 3.16% and the CBOE S&P BuyWrite Index (BXM) which posted a 7.71% return over the same period. The fund’s strong performance during the period was powered by a combination of very favorable underlying stock performance coupled with an option strategy that allowed the fund to participate in the market rally. Technology and Consumer Discretionary stocks were among the best performing sectors during the first half and the fund was well represented in these areas. The fund had little exposure to the Telecommunications, Utilities and Industrial Sectors which all lagged the market during the first half of the year. The fund entered the year with the vast majority of options "out-of-the-money" and we continued to write calls well "out-of-the-money" at attractive premiums during the early part of the year (out-of-the-money means the stock price is below the strike price at which the shares would be called away). This allowed the fund to capture meaningful upside as the market rallied off the March lows.
Describe the fund’s portfolio equity and option structure.
As of June 30, 2009, the fund held 34 equity securities. Unexpired covered call options had been written against approximately 70% of the fund’s stock holdings as of June 30, 2009. During the first half of 2009, the fund generated premiums of $310,309 from its covered call writing activities. It is the strategy of the fund to write "out-of-the-money" call options and at June 30, 83% of the fund’s call
1 | Semi-annual Report | June 30, 2009
MADOX | Madison Institutional Equity Option Fund / Portfolio Manager Review / continued
options (24 of 29 different options) remained "out-of-the-money." The number of "out-of-the-money" options has slightly declined from the beginning of the year as the strength of the market rally has moved many share prices above their corresponding option strike prices. The fund’s managers have also begun writing options "closer-to-the-money" in order to capture higher premium income and provide the fund added protection from a reversal in the market’s upward surge.
Which sectors are prevalent in the fund?
From a sector perspective, MADOX’s largest exposure as of June 30, 2009 was to the Consumer Discretionary sector, followed by Health Care, Technology, Financials and Energy. The fund was not invested in the Materials, Consumer Staples and Utilities sectors as of June 30, 2009.
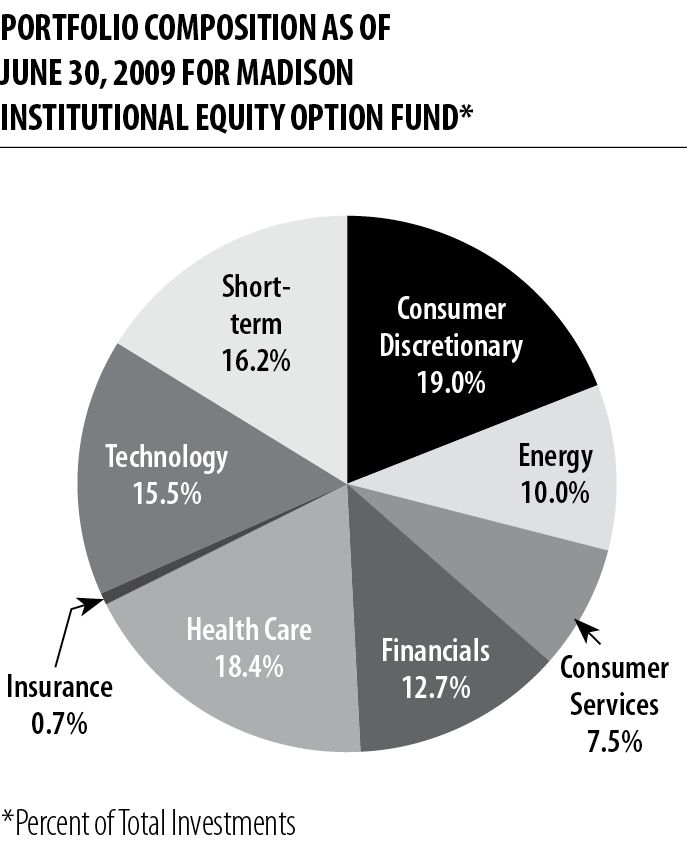
Discuss the fund’s security and option selection process.
The fund is managed by two teams of investment professionals. We like to think of these teams as a "right hand" and "left hand" meaning they work together to make common stock and option decisions. We use fundamental analysis to select solid companies with good growth prospects and attractive valuations. We then seek attractive call
options to write on those stocks. It is our belief that this partnership of active management between the equity and option teams provides investors with an innovative, risk-moderated approach to equity investing. The fund’s portfolio managers seek to invest in a portfolio of common stocks that have favorable "PEG" ratios (Price-Earnings ratio to Growth rate) as well as financial strength and industry leadership. As bottom-up investors, we focus on the fundamental businesses
of our companies. Our stock selection philosophy strays away from the "beat the street" mentality, as we seek companies that have sustainable competitive advantages, predictable cash flows, solid balance sheets and high-quality management teams. By concentrating on long-term prospects and circumventing the "instant gratification" school of thought, we believe we bring elements of consistency, stability and predictability to our shareholders.
Once we have selected attractive and solid names for the fund, we employ our call writing strategy. This procedure entails selling calls that are primarily out-of the-money, meaning that the strike price is higher than the common stock price, so that the fund can participate in some stock appreciation. By receiving option premiums, the fund receives a high level of investment income and adds an element of downside protection. Call options may be written over a number of time periods
and at differing strike prices in an effort to maximize the protective value to the strategy and spread income evenly throughout the year.
What is management’s outlook for the market and fund for the rest of 2009?
After watching the market drop and then rebound during the past six months the question remains: Is this the beginning of a new bull market or a rally within a bear market? The answer may lie in an old market adage which describes rallies following a bear market: "First comes price, then comes optimism and then comes earnings." The price piece of this equation can be seen in the S&P 500’s 37% rally from the March low through period end. Optimism improved markedly since the bleak days of early March, when there was real fear of a total collapse of the global financial system. However, positive earnings news remained sparse, leading us to the conclusion that it is too early to confidently categorize the latest rally. For the market to truly
2 | Semi-annual Report | June 30, 2009
MADOX | Madison Institutional Equity Option Fund / Portfolio Manager Review / concluded
transition into a new bull market phase we need evidence of a return to positive revenue and earnings growth and although earnings are stabilizing mainly through cost cutting efforts, revenue growth will only become sustainable once the economy begins growing again. We do expect overall corporate earnings to improve in 2010, but the rate and the breadth are subject to many variables. As a result, we continue to concentrate our portfolios in shares of high-quality companies with
superior competitive advantages, strong balance sheets and positive free cash flow generation. These kinds of companies can be a source of stability if volatility increases while still providing upside if, in fact, a new bull market is upon us.
On the option writing side, after spiking above 80 last November the VIX Index has steadily declined this year into the upper 20’s as market volatility has calmed along with investor fear (VIX is the ticker symbol for the Chicago Board Options Exchange Volatility Index, a popular measure of the implied volatility of options on the S&P 500 index). Despite this decline, volatility remains above levels seen between 2003 and 2007 and option premiums continue to be relatively
attractive.
TOP TEN STOCK HOLDINGS AS OF
JUNE 30, 2009 FOR MADISON
INSTITUTIONAL EQUITY OPTION FUND
|
% of net assets |
|
|
Wells Fargo & Co. |
4.66% |
|
Biogen Idec |
4.34% |
|
UnitedHealth Group |
4.27% |
|
Apache Corp. |
4.16% |
|
Kohl’s Corp. |
3.70% |
|
Coach Inc. |
3.61% |
|
EMC Corp. |
3.57% |
|
XTO Energy Inc. |
3.30% |
|
Lowe’s Companies Inc. |
3.21% |
|
Gilead Sciences Inc. |
3.06% |
3 | Semi-annual Report | June 30, 2009
MADOX | Madison Institutional Equity Option Fund
Portfolio of Investments | June 30, 2009
|
Number |
||
|
COMMON STOCKS: |
||
|
CONSUMER DISCRETIONARY: 20.0% |
||
|
10,000 |
American Eagle Outfitters, Inc. |
$141,700 |
|
4,000 |
Best Buy Co., Inc. |
133,960 |
|
7,000 |
Coach Inc. |
188,160 |
|
4,500 |
Kohl’s Corp.* |
192,375 |
|
8,600 |
Lowe’s Companies, Inc. |
166,926 |
|
7,000 |
Starbucks Corp.* |
97,230 |
|
3,000 |
Target Corp. |
118,410 |
|
CONSUMER SERVICES: 7.8% |
||
|
9,000 |
eBay Inc. |
154,170 |
|
4,700 |
Garmin, Ltd. |
111,954 |
|
5,000 |
Intuit Inc.* |
140,800 |
|
ENERGY: 10.4% |
||
|
3,000 |
Apache Corp. |
216,450 |
|
2,100 |
Transocean, Ltd. |
156,009 |
|
4,500 |
XTO Energy Inc. |
171,630 |
|
FINANCIALS: 13.3% |
||
|
7,878 |
Bank of America Corp. |
103,990 |
|
6,000 |
Capital One Financial Corp. |
131,280 |
|
14,000 |
Citigroup, Inc. |
41,580 |
|
12,000 |
Marshall & Isley Corp. |
57,600 |
|
4,000 |
Morgan Stanley & Co. |
114,040 |
|
10,000 |
Wells Fargo & Co. |
242,600 |
|
HEALTH CARE: 19.3% |
||
|
5,000 |
Biogen Idec, Inc.* |
225,750 |
|
2,000 |
Genzyme Corp.* |
111,340 |
|
3,400 |
Gilead Sciences Inc. |
159,256 |
|
8,000 |
Mylan Inc.* |
104,400 |
|
5,000 |
Pfizer, Inc. |
75,000 |
|
8,900 |
UnitedHealth Group, Inc. |
222,322 |
|
2,500 |
Zimmer Holdings, Inc.* |
106,500 |
|
INSURANCE: 0.8% |
||
|
9,000 |
MGIC Investment Corp.* |
39,600 |
|
TECHNOLOGY: 16.2% |
||
|
3,000 |
Altera Corp. |
$48,840 |
|
8,500 |
Cisco Systems, Inc.* |
158,440 |
|
14,200 |
EMC Corp. |
186,020 |
|
19,000 |
Flextronics International Ltd.* |
78,090 |
|
6,000 |
Linear Technology Corp. |
140,100 |
|
4,500 |
Xilinx, Inc. |
92,070 |
|
5,900 |
Zebra Technologies Corp. - Class A* |
139,594 |
|
TOTAL COMMON STOCKS |
$4,568,186 |
|
|
SHORT-TERM INVESTMENTS: |
||
|
REPURCHASE AGREEMENT: 16.9% |
||
|
With U.S. Bank National Association issued 6/30/09 at 0.01%, due 7/1/09, collateralized by $899,866 in Fannie Mae MBS #729590 due 7/1/18. Proceeds at maturity are $882,196 (Cost $882,196) |
882,196 |
|
|
TOTAL INVESTMENTS: |
$5,450,382 |
|
|
Liabilities Less Cash |
(3,312) |
|
|
Total Call Options Written: (4.6%) |
(241,408) |
|
|
NET ASSETS: 100% |
$5,205,662 |
|
*Non-income producing.
The Notes to Financial Statements are an integral part of this statement.
4 | Semi-annual Report | June 30, 2009
MADOX | Madison Institutional Equity Option Fund / Portfolio of Investments / concluded
|
Contracts |
CALL OPTIONS WRITTEN |
Expiration |
Exercise |
Market |
|
|
100 |
American Eagle Outfitters, Inc. |
November 2009 |
$17.50 |
$5,500 |
|
|
30 |
Apache Corp. |
July 2009 |
80.00 |
750 |
|
|
40 |
Best Buy Co., Inc. |
December 2009 |
37.00 |
10,000 |
|
|
40 |
Biogen Idec, Inc. |
July 2009 |
55.00 |
200 |
|
|
30 |
Capital One Financial Corp. |
September 2009 |
25.00 |
4,275 |
|
|
30 |
Capital One Financial Corp. |
December 2009 |
28.00 |
5,250 |
|
|
85 |
Cisco Systems, Inc. |
January 2010 |
20.00 |
11,560 |
|
|
70 |
Coach Inc. |
November 2009 |
27.50 |
21,700 |
|
|
40 |
eBay Inc. |
October 2009 |
18.00 |
4,460 |
|
|
50 |
eBay Inc. |
January 2010 |
20.00 |
4,600 |
|
|
100 |
EMC Corp. |
October 2009 |
13.00 |
11,350 |
|
|
17 |
Garmin Ltd |
October 2009 |
30.00 |
1,020 |
|
|
20 |
Genzyme Corp. |
October 2009 |
57.50 |
7,000 |
|
|
34 |
Gilead Sciences Inc. |
November 2009 |
49.00 |
9,520 |
|
|
32 |
Intuit Inc. |
January 2010 |
25.00 |
15,040 |
|
|
18 |
Intuit Inc. |
January 2010 |
27.50 |
5,580 |
|
|
45 |
Kohl’s Corp. |
July 2009 |
45.00 |
2,025 |
|
|
60 |
Linear Technology Corp. |
November 2009 |
24.00 |
9,600 |
|
|
86 |
Lowe’s Companies, Inc. |
October 2009 |
22.50 |
3,870 |
|
|
20 |
Morgan Stanley & Co. |
October 2009 |
27.00 |
7,600 |
|
|
80 |
Mylan Inc. |
January 2010 |
15.00 |
7,200 |
|
|
70 |
Starbucks Corp. |
January 2010 |
15.00 |
9,450 |
|
|
30 |
Target Corp. |
January 2010 |
42.00 |
10,050 |
|
|
21 |
Transocean Ltd. |
November 2009 |
85.00 |
7,770 |
|
|
89 |
UnitedHealth Group, Inc. |
September 2009 |
25.00 |
20,025 |
|
|
45 |
Xilinx, Inc. |
December 2009 |
22.50 |
5,175 |
|
|
45 |
XTO Energy Inc. |
August 2009 |
35.00 |
19,800 |
|
|
49 |
Zebra Technologies Corp. - Class A |
November 2009 |
22.50 |
13,475 |
|
|
25 |
Zimmer Holdings, Inc. |
December 2009 |
45.00 |
7,563 |
|
|
TOTAL CALL OPTIONS WRITTEN |
$241,408 |
The Notes to Financial Statements are an integral part of this statement.
5 | Semi-annual Report | June 30, 2009
MADOX | Madison Institutional Equity Option Fund
Statement of Assets and Liabilities | June 30, 2009
|
ASSETS |
|
|
Investments, at value (Note 1 and 2) |
|
|
Investment securities |
$4,568,186 |
|
Repurchase agreements |
882,196 |
|
Total investments (cost $8,932,498) |
5,450,382 |
|
Dividends and interest receivable |
563 |
|
Total assets |
5,450,945 |
|
LIABILITIES |
|
|
Options written, at value (premiums received of $367,392) |
241,408 |
|
Payables |
|
|
Service agreement fees |
475 |
|
Auditor fees |
2,650 |
|
Independent trustee fees |
750 |
|
Total liabilities |
245,283 |
|
NET ASSETS |
$5,205,662 |
|
Net assets consists of: |
|
|
Paid in capital |
9,763,461 |
|
Undistributed net investment income |
10,876 |
|
Accumulated net realized losses on investments and options transactions |
(1,212,543) |
|
Net unrealized depreciation on investments and options transactions |
(3,356,132) |
|
Net assets |
$5,205,662 |
|
CAPITAL SHARES ISSUED AND OUTSTANDING |
|
|
An unlimited number of capital shares authorized, $.01 par value per share (Note 7) |
406,957 |
|
NET ASSET VALUE PER SHARE |
$12.79 |
The Notes to Financial Statements are an integral part of this statement.
6 | Semi-annual Report | June 30, 2009
MADOX | Madison Institutional Equity Option Fund
Statement of Operations | For the six-months ended June 30, 2009
|
INVESTMENT INCOME (Note 1) |
|
|
Interest income |
$29 |
|
Dividend income |
23,517 |
|
Total investment income |
23,546 |
|
EXPENSES (Notes 3 and 5) |
|
|
Investment advisory fees |
17,345 |
|
Performance fulcrum fee |
(7,467) |
|
Other expenses: |
|
|
Service agreement fees |
475 |
|
Auditor fees |
2,650 |
|
Independent trustee fees |
1,500 |
|
Total other expenses |
4,625 |
|
Total expenses |
14,503 |
|
NET INVESTMENT INCOME |
9,043 |
|
REALIZED AND UNREALIZED GAIN (LOSS) ON INVESTMENTS |
|
|
Net realized gain (loss) on: |
|
|
Investments |
(1,082,139) |
|
Options |
185,828 |
|
Net unrealized appreciation on: |
|
|
Investments |
1,382,740 |
|
Options |
52,033 |
|
NET GAIN ON INVESTMENTS AND OPTIONS TRANSACTIONS |
538,462 |
|
TOTAL INCREASE IN NET ASSETS RESULTING FROM OPERATIONS |
$547,505 |
The Notes to Financial Statements are an integral part of this statement.
7 | Semi-annual Report | June 30, 2009
MADOX | Madison Institutional Equity Option Fund
Statement of Changes in Net Assets
For the period indicated
|
(unaudited)Six-Months Ended |
Year Ended Dec. 31, |
|
|
2009 |
2008 |
|
|
INCREASE (DECREASE) IN NET ASSETS RESULTING FROM OPERATIONS |
||
|
Net investment income |
$9,043 |
$69,833 |
|
Net realized gain (loss) on investments and options transactions |
(896,311) |
69,727 |
|
Net unrealized appreciation (depreciation) on investments and options transactions |
1,434,773 |
(3,245,411) |
|
Total Increase (decrease) in net assets resulting from operations |
547,505 |
(3,105,851) |
|
DISTRIBUTION TO SHAREHOLDERS |
||
|
From net investment income |
-- |
(68,000) |
|
From net capital gains |
-- |
(708,647) |
|
Total distributions |
-- |
(776,647) |
|
CAPITAL SHARE TRANSACTIONS |
16,306 |
(4,628,800) |
|
TOTAL INCREASE (DECREASE) IN NET ASSETS |
563,811 |
(8,511,298) |
|
NET ASSETS |
||
|
Beginning of period |
$4,641,851 |
$13,153,149 |
|
End of period |
$5,205,662 |
$4,641,851 |
The Notes to Financial Statements are an integral part of this statement.
8 | Semi-annual Report | June 30, 2009
MADOX | Madison Institutional Equity Option Fund
Financial Highlights
Per Share Operating Performance for One Share Outstanding Throughout the Period
|
(unaudited) Six-Months Ended |
Year Ended |
For the period March 31, 2006* through |
||
|
2009 |
2008 |
2007 |
December 31, 2006 |
|
|
Net Asset Value, Beginning of Period |
$11.44 |
$18.13 |
$21.18 |
$20.00 |
|
Investment Operations |
||||
|
Net investment income |
0.02 |
0.15 |
0.13 |
0.10 |
|
Net realized and unrealized gain on investments and options transactions |
1.33 |
(5.40) |
(0.84) |
1.44 |
|
Total from investment operations |
1.35 |
(5.25) |
(0.71) |
1.54 |
|
Less distributions from: |
||||
|
Net investment income |
-- |
(0.15) |
(0.13) |
(0.10) |
|
Capital gains |
-- |
(1.29) |
(2.21) |
(0.26) |
|
Total distributions |
-- |
(1.44) |
(2.34) |
(0.36) |
|
Net Asset Value, End of Period |
$12.79 |
$11.44 |
$18.13 |
$21.18 |
|
Total Investment Return (%) |
11.80 |
(29.91) |
(3.98) |
7.74 |
|
Ratios and Supplemental Data |
||||
|
Net assets, end of period (thousands) |
$5,206 |
$4,642 |
$13,153 |
$11,511 |
|
Ratio of expenses to average net assets (%) |
0.62** |
0.79 |
0.95 |
0.94** |
|
Ratio of net investment Income to average net assets (%) |
0.39** |
0.69 |
0.65 |
0.83** |
|
Portfolio turnover (%) |
29 |
40 |
103 |
41 |
* Commencement of operations.
** Annualized.
The Notes to Financial Statements are an integral part of this statement.
9 | Semi-annual Report | June 30, 2009
MADOX | Madison Institutional Equity Option Fund
Notes to Financial Statements | June 30, 2009
Note 1 – Summary of Significant Accounting Policies.
Madison Mosaic Equity Trust (the "Trust") is registered with the Securities and Exchange Commission under the Investment Company Act of 1940 as an open-end, investment management company. The Trust currently offers five portfolios, each of which is a diversified mutual fund. This report contains information about one of these portfolios, the Madison Institutional Equity Option Fund (the "Fund"), which commenced operations March 31, 2006. Its objectives and strategies are detailed in its prospectus. The remaining five Trust portfolios present their financial information in a separate report.
Securities Valuation: Securities traded on a national securities exchange are valued at their closing sale price. Repurchase agreements and other securities having maturities of 60 days or less are valued at amortized cost, which approximates market value. Securities having longer maturities, for which quotations are readily available, are valued at the mean between their closing bid and ask prices. Securities for which market quotations are not readily available are valued at their fair value as determined in good faith under procedures approved by the Board of Trustees. Exchange-traded options are valued at the mean of the best bid and best ask prices across all option exchanges.
The Funds adopted Financial Accounting Standards Board Statement No. 157, Fair Value Measurements (FAS 157) effective January 1, 2008. In accordance with FAS 157, fair value is defined as the price that the Fund would receive to sell an investment or pay to transfer a liability in an orderly transaction with an independent buyer in the principal market, or in the absence of a principal market the most advantageous market for the investment or liability. FAS 157 establishes a three-tier hierarchy to distinguish between (1) inputs that reflect the assumptions market participants would use in pricing an asset or liability developed based on market data obtained from sources independent of the reporting entity (observable inputs) and (2) inputs that reflect the reporting entity’s own assumptions about the assumptions market participants would use in pricing an asset or liability developed based on the best information available in the circumstances (unobservable inputs) and to establish classification of fair value measurements for disclosure purposes.
Various inputs as noted above are used in determining the value of the Fund’s investments and other financial instruments. These inputs are summarized in the three broad levels listed below.
Level 1: Quoted prices in active markets for identical securities
Level 2: Other significant observable inputs (including quoted prices for similar securities, interest rates, prepayment speeds, credit risk, etc.)
Level 3: Significant unobservable inputs (including the Fund’s own assumptions in determining the fair value of investments)
The inputs or methodology used for valuing securities are not necessarily an indication of the risk associated with investing in those securities. In April 2009, the FASB issued FSP FAS 157-4, "Determining Fair Value When Volume and Level of Activity for the Asset or Liability Have Significantly Decreased and Identifying Transactions
That Are Not Orderly" (FSP 157-4). FSP 157-4 provides guidance on how to determine the fair value of assets and liabilities when the volume and level of activity for the asset/liability has significantly decreased.
The following table represents the Funds’ investments carried on the Statement of Assets and Liabilities by caption and by level within the fair value hierarchy as of June 30, 2009 (unaudited):
|
Fund |
Level 1 |
Level 2 |
Level 3 |
Value at 6/30/2009 |
|
Madison Institutional Equity Option |
||||
|
Assets: |
||||
|
Common Stocks |
$4,568,186 |
$-- |
$-- |
$4,568,186 |
|
Repurchase Agreement |
-- |
882,196 |
-- |
882,196 |
|
Total |
$4,568,186 |
$882,196 |
$-- |
$5,450,382 |
|
Liabilities: |
||||
|
Written optons |
||||
|
Total |
$241,408 |
$-- |
$-- |
$241,408 |
|
At June 30, 2009 and for the six-months then ended, the Fund held no Level 3 securities. Please see Portfolio of Investments for common stock sector breakdown and listing of all securities within each caption. |
||||
10 | Semi-annual Report | June 30, 2009
MADOX | Madison Institutional Equity Option Fund / Notes to Financial Statements / continued
Investment Transactions: Investment transactions are recorded on a trade date basis. The cost of investments sold is determined on the identified cost basis for financial statement and federal income tax purposes.
Investment Income: Interest income is recorded on an accrual basis. Bond premium is amortized and original issue discount and market discount are accreted over the expected life of each applicable security using the effective interest method. Dividend income is recorded net of applicable withholding taxes on the ex-dividend date. Other income is accrued as earned.
Distribution of Income and Gains: Distributions are recorded on the ex-dividend date. Net investment income, determined as gross investment income less total expenses, is declared as a regular dividend and distributed to shareholders at year-end for the Fund. Capital gain distributions, if
any, are declared and paid annually at year-end.
The tax character of distributions paid to shareholders was $741,526 of ordinary income and $35, 121 of long-term gains in 2008 and $1,349,660 of ordinary income and $19,107 of long-term gains in 2007, respectively. The Fund designates 7.28% of dividends declared from net investment income and short-term capital gains during the fiscal year ended December 31, 2008 as qualified income under the Jobs and Growth Tax Relief Reconciliation Act of 2003.
As of June 30, 2009, the components of distributable earnings on a tax basis were as follows (unaudited):
|
Undistributed net investment income |
$10,876 |
|
Accumulated net realized losses |
(1,210,477) |
|
Net unrealized depreciation on investments |
(3,358,198) |
|
$(4,557,799) |
Net realized gains or losses may differ for financial and tax reporting purposes as a result of loss deferrals related to wash sales and post-October transactions.
Income Tax: No provision is made for federal income taxes since it is the intention of the Trust to comply with the provisions of Subchapter M of the Internal Revenue Code available to investment companies and to make the requisite distribution to shareholders of taxable income which will be
sufficient to relieve it from all or substantially all federal income taxes.
The Fund adopted the provisions of Financial Accounting Standards Board Interpretation No. 48 ("FIN 48"), "Accounting for Uncertainty in Income Taxes." The implementation of FIN 48 resulted in no material liability for unrecognized tax benefits and no material change to the beginning net asset value of the Fund.
As of and during the year ended December 31, 2008, the Fund did not have a liability for any unrecognized tax benefits. The Fund recognizes interest and penalties, if any, related to unrecognized tax benefits as income tax expense in the statement of operations. During the period, the Fund did not incur any interest or penalties.
Information on the tax components of investments, excluding option contracts, as of June 30, 2009 is as follows:
|
Aggregate Cost |
$8,934,564 |
|
Gross unrealized appreciation |
34,220 |
|
Gross unrealized depreciation |
(3,518,402) |
|
Net unrealized depreciation |
$(3,484,182) |
Use of Estimates: The preparation of the financial statements in conformity with accounting principles generally accepted in the United States of America requires management to make estimates and assumptions. Such estimates affect the reported amounts of assets and liabilities and reported amounts of increases and decreases in net assets from operations during the reporting period. Actual results could differ from those estimates.
Note 2 – Investments in Repurchase Agreements.
When the Fund purchases securities under agreements to resell, the securities are held for safekeeping by the custodian bank as collateral. Should the market value of the securities purchased under such an agreement decrease below the principal amount to be received at the termination of the agreement plus accrued interest, the counterparty is required to place an equivalent amount of additional securities in safekeeping with the Trust’s custodian bank. Pursuant to an Exemptive Order issued by the Securities and Exchange Commission, the Fund, along with other registered investment companies having Advisory and Services Agreements with the same advisor, transfers uninvested cash balances into a joint trading account. The aggregate balance in this joint trading account is invested in one or more consolidated repurchase agreements whose underlying securities are U.S. Treasury or federal agency obligations. As of June 30, 2009, the Fund had approximately a 7.2% interest in the consolidated repurchase agreement of $12,184,689 collateralized by $12,428,737 in Fannie Mae Mortgage Backed Security Notes. Proceeds at maturity were $12,184,693.
Note 3 – Investment Advisory Fees and Other Transactions with Affiliates.
The investment advisor to the Fund, Madison Asset Management, LLC, a wholly owned subsidiary of Madison Investment Advisors, Inc. (collectively "the Advisor"), earns an advisory fee equal to 0.75% per annum of the average net assets of the Fund. As of April 1, 2007, a fulcrum fee was applied to the advisory fee which
11 | Semi-annual Report | June 30, 2009
MADOX | Madison Institutional Equity Option Fund / Notes to Financial Statements / continued
can increase, decrease or have no effect on the advisory fee based on certain performance criteria described in the Fund’s offering materials. The fee is accrued daily and is paid monthly.
Note 4 – Investment Transactions.
Purchases and sales, excluding short-term investments for the year ended June 30, 2009 were $1,252,669 and $1,762,842, respectively. No U.S. Government securities were purchased or sold during the period.
Note 5 – Other Expenses.
Under a separate Services Agreement, the Advisor will provide or arrange for the Fund to have all other necessary operational and support services for a fee based on a percentage of average net assets. These fees are accrued daily and paid monthly. The Fund also pays the expenses of the Fund’s Independent Trustees and auditors directly. For the six-months ended June 30, 2009, these fees amounted to $1,500 and $2,650, respectively. The combined Services Agreement fees paid to the Advisor and Independent Trustees and auditor fees may not exceed 0.20% of average net assets.
Note 6 – Covered Call Options.
The Fund will pursue its primary objective by employing an option strategy of writing (selling) covered call options on common stocks. The number of call options the Fund can write (sell) is limited by the amount of equity securities the Fund holds in its portfolio. The Fund will not write (sell) "naked" or uncovered call options. The Fund seeks to produce a high level of
current income and gains generated from option writing premiums and, to a lesser extent, from dividends.
An option on a security is a contract that gives the holder of the option, in return for a premium, the right to buy from (in the case of a call) or sell to (in the case of a put) the writer of the option the security underlying the option at a specified exercise or "strike" price. The writer of an option on a security has the obligation upon exercise of the option to deliver the underlying security upon payment of the exercise price (in the case of a call) or to pay the exercise
price upon delivery of the underlying security (in the case of a put).
There are several risks associated with transactions in options on securities. As the writer of a covered call option, the Fund forgoes, during the option’s life, the opportunity to profit from increases in the market value of the security covering the call option above the sum of the premium and the strike price of the call but has retained the risk of loss should the price of the underlying security decline. The writer of an option has no control over the time when it may be
required to fulfill its obligation as writer of the option. Once an option writer has received an exercise notice, it cannot effect a closing purchase transaction in order to terminate its obligation under the option and must deliver the underlying security at the exercise price.
Transactions in option contracts during the year ended June 30, 2009 were as follows (unaudited):
|
Number of |
Premiums |
|
|
Options outstanding, |
1,629 |
$420,804 |
|
Options written |
1,373 |
310,309 |
|
Options expired |
(666) |
(135,021) |
|
Options closed |
(200) |
(53,003) |
|
Options assigned |
(735) |
(175,697) |
|
Options outstanding |
1,401 |
$367,392 |
In March 2008, the FASB issued Statement of Financial Accounting Standards No. 161 ("SFAS No. 161"), "Disclosures about Derivative Instructions and Hedging Activities." This standard is intended to enhance financial statement disclosures for derivative instruments and hedging activities and enable investors to understand: a) how and why a fund uses derivative instruments,
b) how derivative instruments and related hedge fund items are accounted for, and c) how derivative instruments and related hedge items affect a fund’s financial position, results of operations and cash flows. SFAS No. 161 is effective for financial statements issued for fiscal years and interim periods beginning after November 15, 2008. The Fund adopted SFAS No. 161 effective January 1, 2009.
The following table presents the types of derivatives in the Fund by location as presented on the Statement of Assets and Liabilities as of June 30, 2009:
12 | Semi-annual Report | June 30, 2009
MADOX | Madison Institutional Equity Option Fund / Notes to Financial Statements / concluded
|
Statement of Asset & Liability Presentation of Fair Values of Derivative Instruments |
||||
|
Asset Derivatives |
Liability Derivatives |
|||
|
Derivatives not accounted |
Statement of Assets and Liabilities Location |
Fair Value |
Statement of Assets |
Fair Value |
|
Equity contracts |
-- |
Options written, at value |
$241,408 |
|
The following table presents the effect of Derivative Instruments on the Statement of Operations for the six-months ended June 30, 2009:
|
Amount of Realized Gain/(Loss) on Derivatives |
|
|
Derivatives not accounted |
Options |
|
Equity contracts |
$185,828 |
|
Change in Unrealized Appreciation on Derivatives |
|
|
Derivatives not accounted |
Options |
|
Equity contracts |
$52,033 |
Note 7 – Capital Share Transactions.
An unlimited number of capital shares, without par value, are authorized. Transactions in capital shares were as follows:
|
(unaudited) |
Year Ended December 31, |
|
|
2009 |
2008 |
|
|
In Dollars |
||
|
Shares sold |
$40,346 |
$-- |
|
Shares issued in reinvestment of dividends |
-- |
758,333 |
|
Total shares issued |
40,346 |
758,333 |
|
Shares redeemed |
(24,040) |
(5,387,133) |
|
Net increase (decrease) |
$16,306 |
$(4,628,800) |
|
(unaudited) |
Year Ended December 31, |
|
|
continued |
2009 |
2008 |
|
In Shares |
||
|
Shares sold |
3,270 |
-- |
|
Shares issued in reinvestment of dividends |
-- |
55,026 |
|
Total shares issued |
3,270 |
55,026 |
|
Shares redeemed |
(1,912) |
(374,854) |
|
Net increase (decrease) |
1,358 |
(319,828) |
Note 8 – Subsequent Events. Management has evaluated subsequent events through August 27, the date the financial statements were issued.
13 | Semi-annual Report | June 30, 2009
MADOX | Madison Institutional Equity Option Fund
Fund Expenses
Example: As a shareholder of the Fund, you incur two types of costs: (1) transaction costs and (2) ongoing costs, including Investment advisory fees and Other expenses. This Example is intended to help you understand your ongoing costs (in dollars) of investing in the Fund and to compare these costs with the ongoing costs of
investing in other mutual funds. See Notes 3
and 5 above for an explanation of the types of costs charged by the Fund. This Example is based on an investment of $1,000 invested on January 1, 2009 and held for the six-months ended June 30, 2009.
Actual Expenses
The table below titled "Based on Actual Total Return" provides information about actual account values and actual expenses. You may use the information provided in this table, together with the amount you invested, to estimate the expenses that you paid over the period. To estimate the expenses you paid on your account, divide your ending account value by $1,000 (for example, an $8,500 ending account valued divided by $1,000 = 8.5), then multiply the result by the number under the heading entitled "Expenses Paid During the Period."
|
Based on Actual Total Return1 |
||||
|
|
Beginning |
Ending |
Annualized |
Expenses Paid |
|
Madison Institutional |
$1,000.00 |
$1,118.00 |
0.62% |
$3.09 |
|
1For the six-months ended June 30, 2009. 2Expenses are equal to the Fund’s annualized expense ratio multiplied by the average account value over the period, multiplied by the number of days in the most recent fiscal half-year, then divided by 365. |
||||
Hypothetical Example for Comparison Purposes
The table below titled "Based on Hypothetical Total Return" provides information about hypothetical account values and hypothetical expenses based on the actual expense ratio and an assumed rate of return of 5.00% per year before expenses, which is not the Fund’s actual return. The hypothetical account values and expenses may not be used to estimate the actual ending account balance or expenses you paid for the period. You may use the information provided in this table to compare the ongoing costs of investing in the Fund and other funds. To do so, compare the 5.00% hypothetical example relating to the Fund with the 5.00% hypothetical examples that appear in the shareholder reports of the other funds.
|
Based on Hypothetical Total Return1 |
||||
|
Beginning |
Ending |
Annualized |
Expenses Paid |
|
|
Madison Institutional |
$1,000.00 |
$1,025.05 |
0.62% |
$3.12 |
|
1For the six-months ended June 30, 2009. 2Expenses are equal to the Fund’s annualized expense ratio multiplied by the average account value over the period, multiplied by the number of days in the most recent fiscal half-year, then divided by 365. |
||||
14 | Semi-annual Report | June 30, 2009
MADOX | Madison Institutional Equity Option Fund
Forward-Looking Statement Disclosure.
One of our most important responsibilities as investment company managers is to communicate with shareholders in an open and direct manner. Some of our comments in our letters to shareholders are based on current management expectations and are considered "forward-looking statements." Actual future results, however, may prove to be different from our expectations. You can identify forward-looking statements by words such as "estimate," "may," "will," "expect," "believe," "plan" and other similar terms. We cannot promise future returns. Our opinions are a reflection of our best judgment at the time this report is compiled, and we disclaim any obligation to update or alter forward-looking statements as a result of new information, future events, or otherwise.
Proxy Voting Information.
The Fund adopted policies that provide guidance and set forth parameters for the voting of proxies relating to securities held in the Fund. Additionally, information regarding how the Fund voted proxies related to portfolio securities, if applicable, during the one-year period ended June 30, 2009 is available to you upon request and free of charge, by writing to Madison Institutional Equity Option Fund, 550 Science Drive, Madison, WI 53711 or by calling toll-free at 1-800-368-3195. The Fund’s proxy voting policies and voting information may also be obtained by visiting the Securities and Exchange Commission web site at www.sec.gov. The Fund will respond to shareholder requests for copies of our policies and voting information within two business days of request by first-class mail or other means designed to ensure prompt delivery.
N-Q Disclosure.
The Fund files its complete schedule of portfolio holdings with the U.S. Securities and Exchange Commission (the "Commission") for the first and third quarters of each fiscal year on Form N-Q. The Fund’s Forms N-Q are available on the Commission’s website. The Fund’s Forms N-Q may be reviewed and copied at the Commission’s Public Reference Room in Washington, DC. Information about the operation of the Public Reference Room may be obtained by calling the Commission at 1-202-551-8090. Form N-Q and other information about the Fund are available on the EDGAR Database on the Commission’s Internet site at http://www.sec.gov. Copies of this information may also be obtained, upon payment of a duplicating fee, by electronic request at the following email address: publicinfo@sec.gov, or by writing the Commission’s Public Reference Section, Washington, DC 20549-0102. Finally, you may call the Fund at 800-368-3195 if you would like a copy of Form N-Q and we will mail one to you at no charge.
Discussion of Contract Renewal (Unaudited)
The Trustees considered a number of factors when the Board approved the renewal of the advisory contract between the advisor and the Fund during its meeting in February 2009. Rather than providing you with a list of factors or conclusory statements that explained the Board’s decision-making process, the following discussion is designed to describe what you would have seen and heard if you had been at the Fund’s Board meeting when it renewed the Fund’s advisory contract:
The Board reviewed a variety of matters in connection with Fund’s investment advisory contract with Madison Asset Management, LLC ("MAM").
With regard to the nature, extent and quality of the services to be provided by the Advisor, the Board reviewed the biographies and tenure of the personnel involved in Fund management and the experience of MAM and its affiliates as investment manager to two closed-end investment companies with similar investment strategies. They recognized the wide array of investment professionals employed by the firm. The Fund’s portfolio manager discussed the firm’s ongoing investment philosophies and strategies intended to provide superior performance consistent with the fund’s investment objectives under various market scenarios. The Trustees also noted their familiarity with MAM and its affiliates due to their history of providing advisory services to the Madison Mosaic organization.
The Board also discussed the quality of services provided to Fund by its transfer agent and custodian as well as the various administrative services provided by directly the Advisor.
With regard to the investment performance of Fund and the investment advisor, the Board reviewed current performance information. They discussed the reasons for both outperformance and underperformance compared with peer groups and applicable indices and benchmarks. In particular, the Board recognized that Fund generated sufficient income in 2008 to return $1.44 per share to its shareholders in dividends. The 2008 dividend distributions did not include any return of capital.
The Board also recognized that during the most recent year, Fund produced a total cumulative return of -29.9%, compared to a loss of -37.0% for the S&P 500 Index and a loss of -28.9% for the CBOE Buy Write ("BXM") Index during the same period. The fund’s performance for the year was comparable to that of the BXM and its outperformance compared with the broader market index reflected the fund’s returns from option writing in accordance with its investment objectives.
MAM’s stock picking strategy involves seeking a portfolio of common stocks that have favorable "PEG" ratios (price-
15 | Semi-annual Report | June 30, 2009
MADOX | Madison Institutional Equity Option Fund
earnings ratio to growth rate) as well as financial strength and industry leadership. As bottom-up investors, it focuses on the fundamental businesses of companies. As such, Fund’s stock selection philosophy stays away from the "beat the street" objective, as MAM looks for companies that have sustainable competitive advantages, predictable cash flows, solid balance sheets and high-quality management teams. By concentrating on long-term prospects and circumventing the "instant gratification" school of thought, the Advisor explained that it believes it seeks to bring elements of consistency, stability and predictability to Fund shareholders under normal market conditions. This approach served Fund shareholders well during the unprecedented turbulent market of 2008.
The Advisor explained that the main source for the slight performance gap with the BXM could be attributed to the fortunes of the underlying stocks. The Fund tends to concentrate its holdings in the Consumer Discretionary, Financial, and Technology Sectors, all of which performed poorly in 2008. Furthermore, two of the best three performing sectors in the S&P 500 were Consumer Staples and Utilities and the Fund did not have any holdings in these sectors in 2008.
The Board engaged in a comprehensive discussion of fund performance and market conditions with the Fund’s portfolio manager in connection with its contract renewal deliberations. The Board recognized that because Fund has a fulcrum fee, MAM is monetarily penalized for underperforming its market index (the BXM) and rewarded for material outperformance. As such, in colloquial terms, the Board recognized that MAM "puts its money where its mouth is."
MAM personnel discussed with the Board the methodology for arriving at the peer groups and indices used for performance comparisons.
With regard to the costs of the services to be provided and the profits to be realized by the investment advisor and its affiliates from the relationship with Fund, the Board reviewed the expense ratios for a variety of other options funds in the Fund peer group with similar investment objectives. Based on peer group comparisons, the Board recognized that Fund’s costs were low for the quality and extent of services provided.
The Trustees recognized that the Fund fee structure should be reviewed based on total fund expense ratio rather than simply comparing advisory fees to other advisory fees in light of the simple expense structure maintained by Fund (i.e. an advisory, adjusted up or down by a fulcrum fee, with a cap on administrative expenses). As such, the Board focused its attention on the total expense ratios paid by other funds with similar investment objectives.
The Trustees sought to ensure that fees were adequate so that MAM (and its affiliates) did not neglect its management responsibilities to Fund in favor of more "profitable" accounts. At the same time, the Trustees sought to ensure that compensation paid to MAM was not unreasonably high. The Board reviewed materials demonstrating that although MAM is compensated for a variety of the administrative services it provides or arranges to provide pursuant to its Services Agreement with Fund, such compensation generally does not cover all costs due to the cap on administrative expenses. Administrative, operational, regulatory and compliance fees and costs in excess of the Services Agreement fees are paid by the Madison Investment Advisors, Inc. ("Madison") organization from investment advisory fees earned. For these reasons, the Trustees recognized that examination of the Fund’s total expense ratio compared to those of other investment companies was more meaningful than a simple comparison of basic "investment management only" fee schedules.
In reviewing costs and profits, the Board recognized that Fund is to a certain extent "subsidized" by the greater Madison organization because the salaries of all portfolio management personnel, trading desk personnel, corporate accounting personnel and employees of Madison who serve as Trust officers, as well as facility costs (rent), could not be supported by fees received from Fund alone. However, the Board recognized that the Fund is profitable to MAM because such salaries and fixed costs are already paid in whole or in part from revenue generated by management of the remaining assets. The Trustees noted that total Madison managed assets, including subsidiaries, approximated $7.5 billion at the time of the meeting. As a result, although the fees paid by Fund at its present size might not be sufficient to profitably support a stand-alone fund, it was reasonably profitable to Madison as part of its larger, diversified organization. In sum, the Trustees recognized that Fund is important to Madison, is managed with the attention given to other firm clients and is not treated as "loss leader."
With regard to the extent to which economies of scale would be realized as Fund grows, the Trustees recognized that at the fund’s current size, it was premature to discuss any economies of scale.
After further discussion and analysis and reviewing the totality of the information presented, including the information set forth above and the other information required by applicable law to be considered by the Board of Trustees, the Trustees concluded that the Fund advisory fee is fair and reasonable for the portfolio and that renewal of its Advisory and Services Agreements without change were in the best interests of the Fund and its shareholders.
16 | Semi-annual Report | June 30, 2009
Madison Investment Advisors, Inc.
550 SCIENCE DRIVE
MADISON, WI 53711
1-800-767-0300
www.madisonfunds.com
SEC File # 811-03615
Item 2. Code of Ethics.
Not applicable in semi-annual report.
Item 3. Audit Committee Financial Expert.
Not applicable in semi-annual report.
Item 4. Principal Accountant Fees and Services.
Not applicable in semi-annual report.
Item 5. Audit Committee of Listed Registrants.
Not applicable.
Item 6. Schedule of Investments
Included in report to shareholders (Item 1) above.
Item 7. Disclosure of Proxy Voting Policies and Procedures for Closed-End Management Investment Companies.
Not applicable.
Item 8. Portfolio Managers of Closed-End Management Investment Companies.
Not applicable.
Item 9. Purchases of Equity Securities by Closed-End Management Investment Company and Affiliated Purchasers
Not applicable.
Item 10. Submission of Matters to a Vote of Security Holders.
No changes. The Trust does not normally hold shareholder meetings.
Item 11. Controls and Procedures.
(a) The Trust’s principal executive officer and principal financial officer determined that the Trust’s disclosure controls and procedures (as defined in Rule 30a-3(c) under the Investment Company Act of 1940 (the "Act")) are effective, based on their evaluation of these controls and procedures required by Rule 30a-3(b) under the Act and Rules 13a-15(b) or 15d-15(b) under the Securities Exchange Act of 1934 within 90 days of the date of this report. There were no significant changes in the Trust’s internal controls or in other factors that could significantly affect these controls subsequent to the date of their evaluation. The officers identified no significant deficiencies or material weaknesses.
(b) There were no changes in the Trust's internal control over financial reporting (as defined in Rule 30a-3(d) under the Act) that occurred during the second fiscal quarter of the period covered by this report that has materially affected, or is reasonably likely to materially affect, the Trust's internal control over financial reporting.
Item 12. Exhibits.
(a)(1) Code of ethics referred to in Item 2 (no change from the previously filed Code).
(a)(2) Certifications of principal executive and principal financial officers as required by Rule 30a-2(a) under the Act.
(b) Certification of principal executive and principal financial officers as required by Rule 30a-2(b) under the Act.
SIGNATURES
Pursuant to the requirements of the Securities Exchange Act of 1934 and the Investment Company Act of 1940, the Registrant has duly caused this Report to be signed on its behalf by the undersigned, thereunto duly authorized.
Madison Mosaic Equity Trust
By: (signature)
W. Richard Mason, Secretary
Date: August 27, 2009
Pursuant to the requirements of the Securities Exchange Act of 1934 and the Investment Company Act of 1940, this Report has been signed below by the following persons on behalf of the Registrant and in the capacities and on the dates indicated.
By: (signature)
Katherine L. Frank, Chief Executive Officer
Date: August 27, 2009
By: (signature)
Greg Hoppe, Chief Financial Officer
Date: August 27, 2009