EX-99.2
Exhibit 99.2 November 2021
Disclosure Statement Cautionary Note Regarding
Forward-LookingStatements This presentation contains forward-looking statements within the meaning of the Private Securities Litigation Reform Act of 1995, including statements about the strategic vision, the financial condition, results of
operations, asset quality trends and profitability of Farmers National Banc Corp. (“Farmers”). Forward-looking statements are not historical facts but instead express only management’s current expectations and forecasts of future
events or long-term-goals, many of which, by their nature, are inherently uncertain and outside of Farmers’ control. Forward-looking statements are preceded by terms such as “expects,” “believes,”
“anticipates,” “intends” and similar expressions, as well as any statements related to future expectations of performance or conditional verbs, such as “will,” “would,” “should,”
“could” or “may.” Farmers’ actual results and financial condition may differ, possibly materially, from those indicated in these forward-looking statements. Factors that could cause Farmers’ actual results to
differ materially from those described in the forward-looking statements include impacts from, among others, the possibility that the anticipated benefits of Farmers recently closed merger with Cortland Bancorp (“Cortland”), including
anticipated cost savings and strategic gains, are not realized when expected or at all, including as a result of the impact of, or problems arising from, the integration of the two companies, or as a result of other factors; the COVID-19 pandemic on
local, national and global economic conditions; higher default rates on loans made to our customers related to the COVID-19 pandemic and its impact on our customers’ operations and financial condition; unexpected changes in interest rates or
disruptions in the mortgage markets related to COVID-19 or other responses to the health crisis; and the other factors contained in Farmers’ periodic reports and registration statements filed with the Securities and Exchange Commission,
including without limitation, under the section entitled “Risk Factors” in its Annual Report on Form 10-K for the year ended December 31, 2020 and its Quarterly Reports on Form 10-Q, which have been filed with the Securities and Exchange
Commission and are available on Farmers’ website (www.farmersbankgroup.com) and on the Securities and Exchange Commission’s website (www.sec.gov). Forward-looking statements are not guarantees of future performance and should not be
relied upon as representing management’s views as of any subsequent date. Farmers undertakes no obligation to update forward-looking statements, whether as a result of new information, future events or otherwise, except as required by
applicable law. Use of Non-GAAP Financial Measures This presentation contains certain financial information determined by methods other than in accordance with accounting principles generally accepted in the United States (“GAAP”). These
non-GAAP financial measures include “Tangible Common Equity to Tangible Common Assets,” “Tangible Book value per Share,” and our “Efficiency Ratio.” Farmers believes that these non-GAAP financial measures provide
both management and investors a more complete understanding of Farmers’ capital. These non-GAAP financial measures are supplemental and are not a substitute for any analysis based on GAAP financial measures. Because not all companies use the
same calculation of “Tangible Common Equity ratio,” this presentation may not be comparable to other similarly titled measures as calculated by other companies. 2
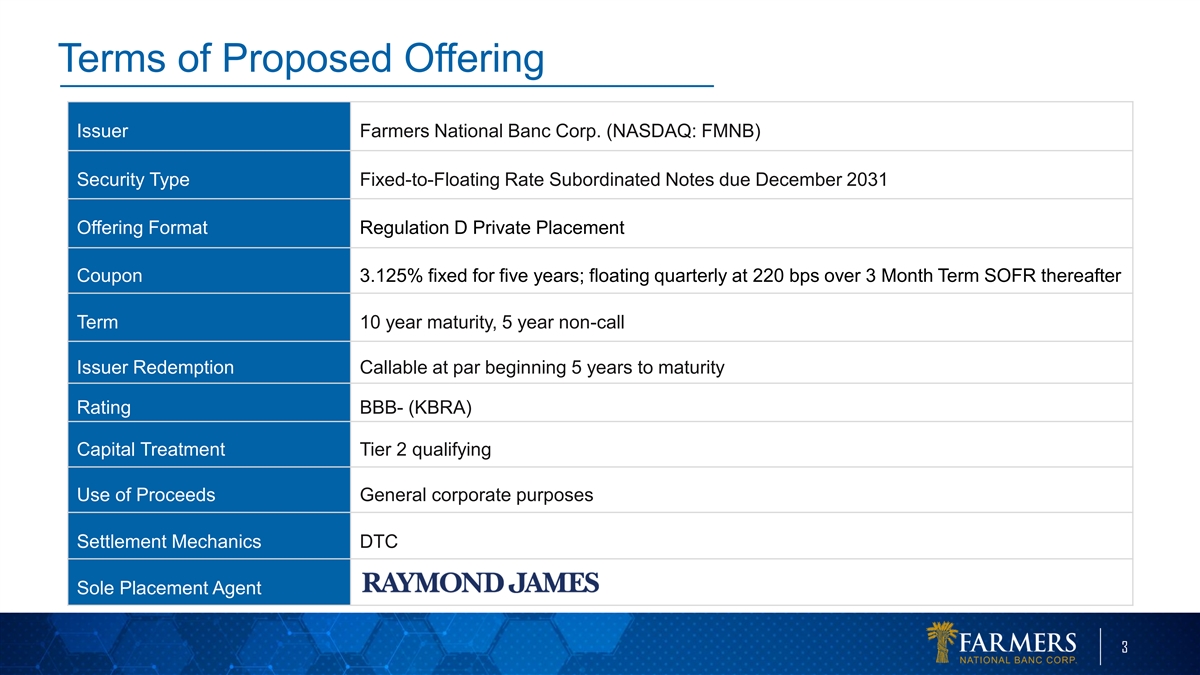
Terms of Proposed Offering Issuer Farmers National Banc Corp. (NASDAQ:
FMNB) Security Type Fixed-to-Floating Rate Subordinated Notes due December 2031 Offering Format Regulation D Private Placement Coupon 3.125% fixed for five years; floating quarterly at 220 bps over 3 Month Term SOFR thereafter Term 10 year maturity,
5 year non-call Issuer Redemption Callable at par beginning 5 years to maturity Rating BBB- (KBRA) Capital Treatment Tier 2 qualifying Use of Proceeds General corporate purposes Settlement Mechanics DTC Sole Placement Agent 3
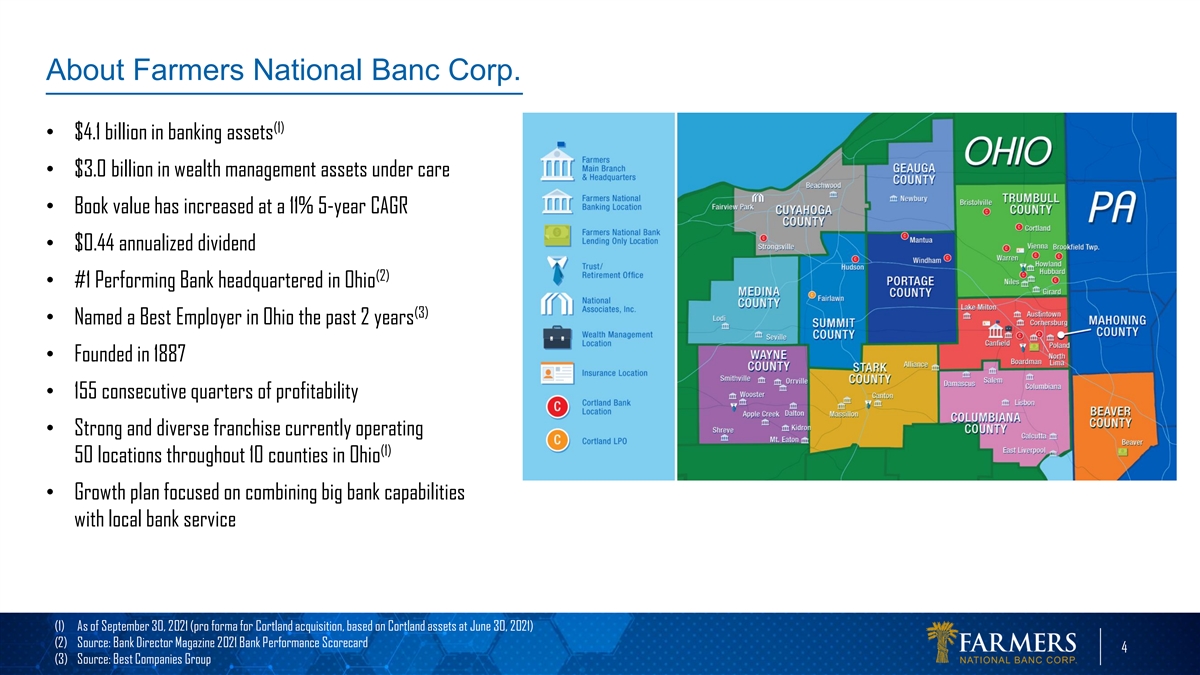
About Farmers National Banc Corp. (1) • $4.1 billion in banking
assets • $3.0 billion in wealth management assets under care • Book value has increased at a 11% 5-year CAGR • $0.44 annualized dividend (2) • #1 Performing Bank headquartered in Ohio (3) • Named a Best Employer in Ohio
the past 2 years • Founded in 1887 • 155 consecutive quarters of profitability • Strong and diverse franchise currently operating (1) 50 locations throughout 10 counties in Ohio • Growth plan focused on combining big bank
capabilities with local bank service (1) As of September 30, 2021 (pro forma for Cortland acquisition, based on Cortland assets at June 30, 2021) (2) Source: Bank Director Magazine 2021 Bank Performance Scorecard 4 (3) Source: Best Companies
Group
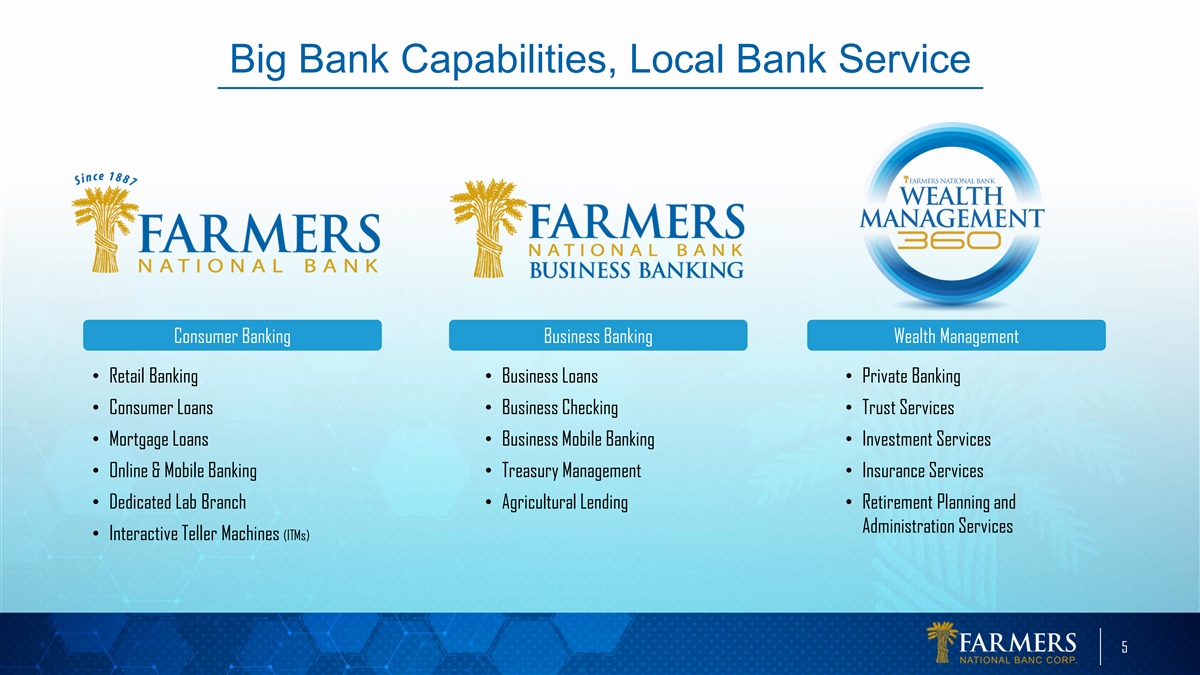
Big Bank Capabilities, Local Bank Service Consumer Banking Business
Banking Wealth Management • Retail Banking• Business Loans• Private Banking • Consumer Loans• Business Checking• Trust Services • Mortgage Loans• Business Mobile Banking• Investment Services
• Online & Mobile Banking• Treasury Management• Insurance Services • Dedicated Lab Branch• Agricultural Lending• Retirement Planning and Administration Services • Interactive Teller Machines (ITMs)
5
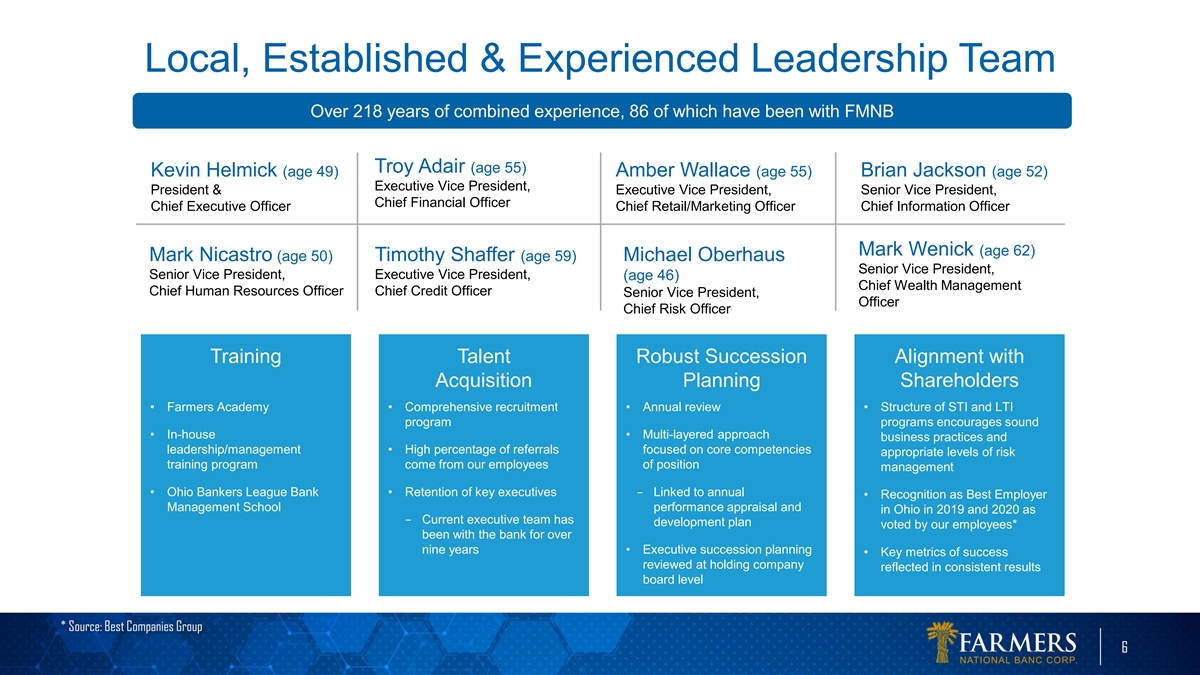
Local, Established & Experienced Leadership Team Over 218 years of
combined experience, 86 of which have been with FMNB Troy Adair (age 55) Kevin Helmick (age 49) Amber Wallace (age 55) Brian Jackson (age 52) Executive Vice President, President & Executive Vice President, Senior Vice President, Chief Financial
Officer Chief Executive Officer Chief Retail/Marketing Officer Chief Information Officer Mark Wenick (age 62) Mark Nicastro (age 50) Timothy Shaffer (age 59) Michael Oberhaus Senior Vice President, Senior Vice President, Executive Vice President,
(age 46) Chief Wealth Management Chief Human Resources Officer Chief Credit Officer Senior Vice President, Officer Chief Risk Officer Training Talent Robust Succession Alignment with Acquisition Planning Shareholders • Farmers Academy•
Comprehensive recruitment • Annual review• Structure of STI and LTI program programs encourages sound • In-house • Multi-layered approach business practices and leadership/management • High percentage of referrals
focused on core competencies appropriate levels of risk training program come from our employees of position management • Ohio Bankers League Bank • Retention of key executives− Linked to annual • Recognition as Best Employer
Management School performance appraisal and in Ohio in 2019 and 2020 as − Current executive team has development plan voted by our employees* been with the bank for over nine years• Executive succession planning • Key metrics of
success reviewed at holding company reflected in consistent results board level * Source: Best Companies Group 6
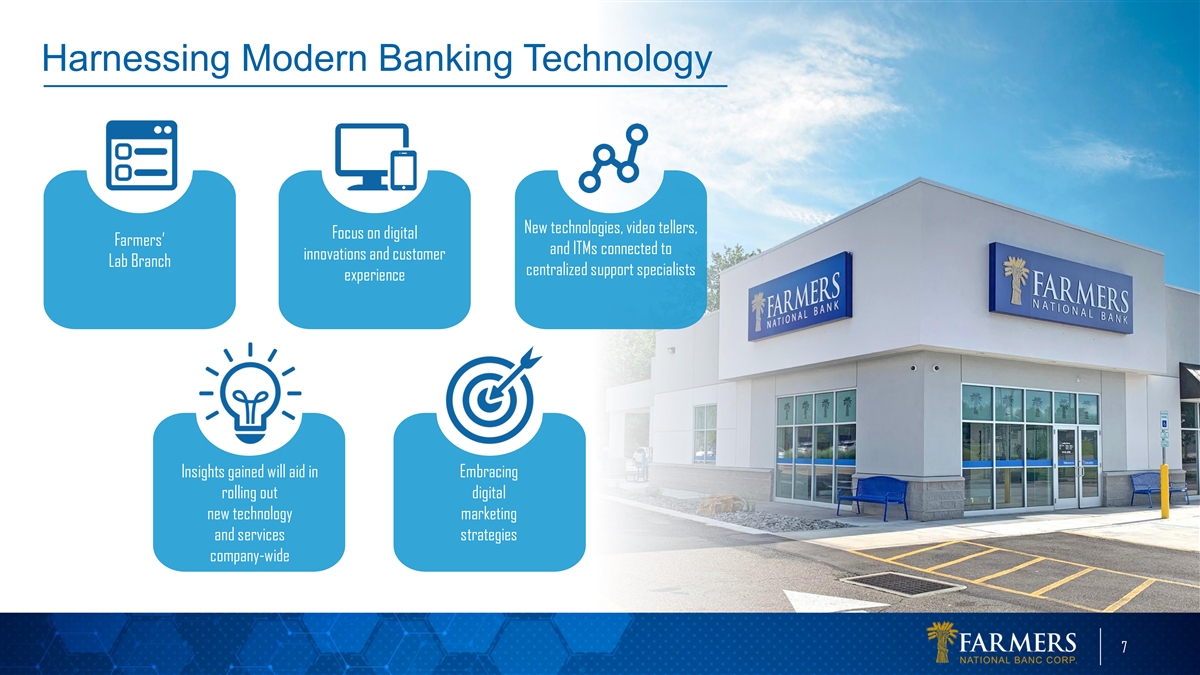
Harnessing Modern Banking Technology New technologies, video tellers,
Focus on digital Farmers’ and ITMs connected to innovations and customer Lab Branch centralized support specialists experience Insights gained will aid in Embracing rolling out digital new technology marketing and services strategies
company-wide 7
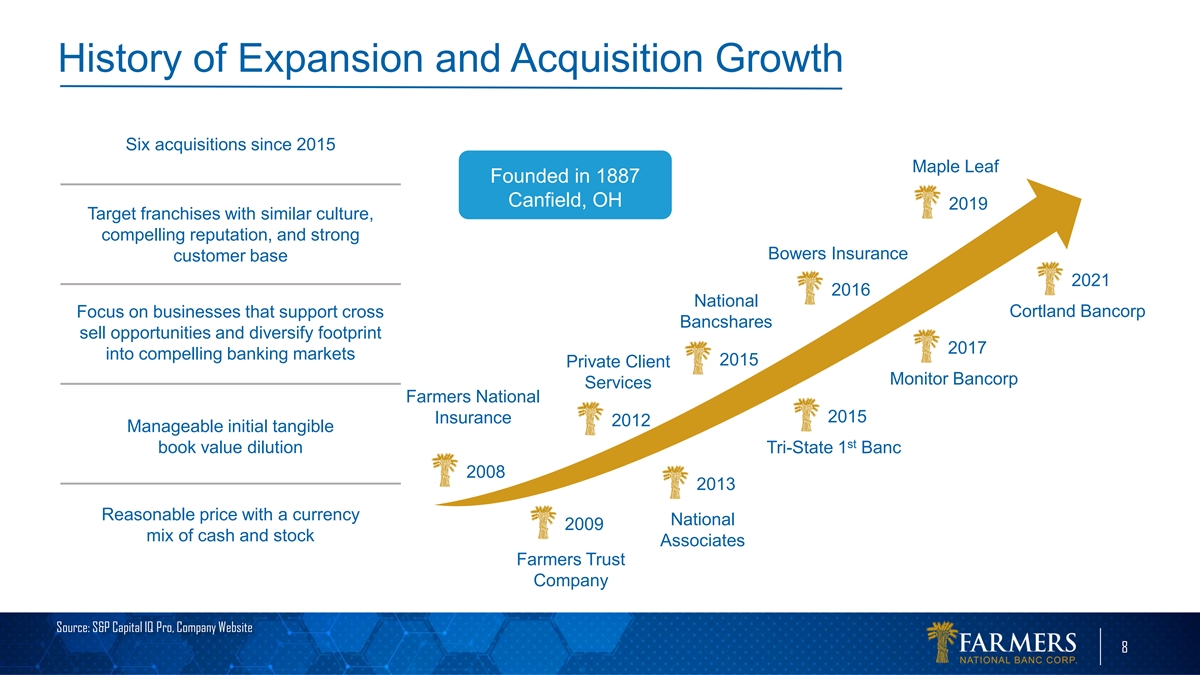
History of Expansion and Acquisition Growth Six acquisitions since 2015
Maple Leaf Founded in 1887 Canfield, OH 2019 Target franchises with similar culture, compelling reputation, and strong Bowers Insurance customer base 2021 2016 National Focus on businesses that support cross Cortland Bancorp Bancshares sell
opportunities and diversify footprint 2017 into compelling banking markets 2015 Private Client Monitor Bancorp Services Farmers National 2015 Insurance 2012 Manageable initial tangible st book value dilution Tri-State 1 Banc 2008 2013 Reasonable
price with a currency National 2009 mix of cash and stock Associates Farmers Trust Company Source: S&P Capital IQ Pro, Company Website 8
Well-Positioned in Strong Markets Compelling Market Opportunities
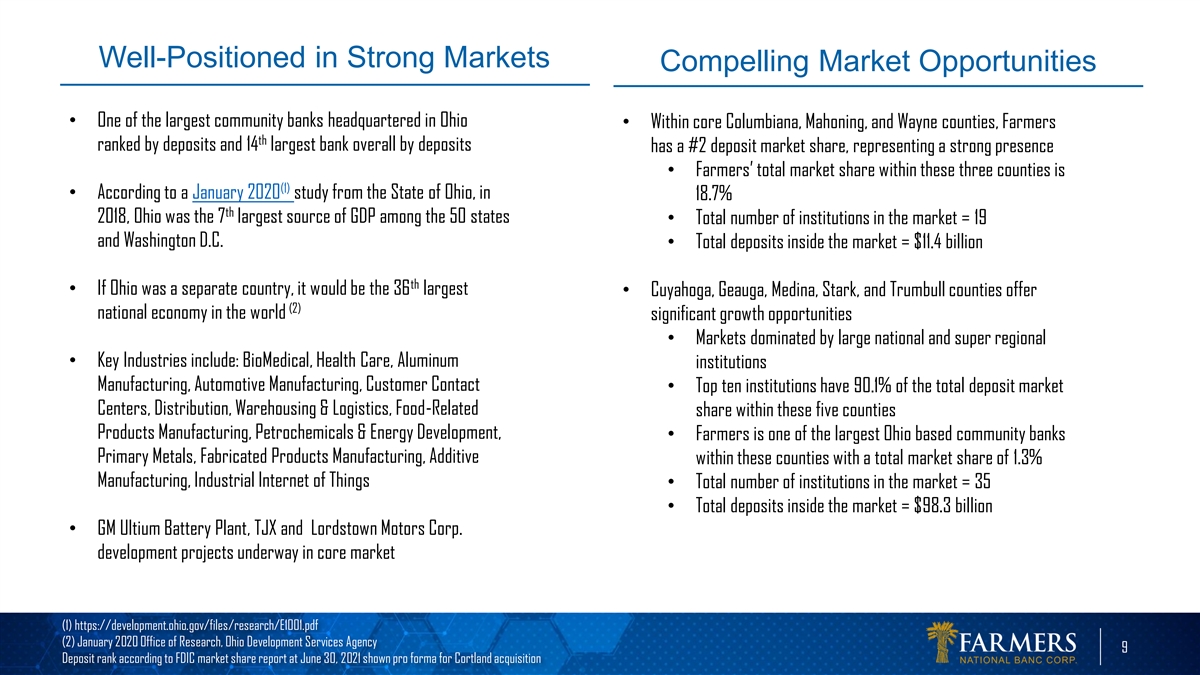
• One of the largest community banks headquartered in Ohio • Within core Columbiana, Mahoning, and Wayne counties, Farmers th ranked by deposits and 14 largest bank overall by deposits has a #2 deposit market share, representing a strong
presence • Farmers’ total market share within these three counties is (1) • According to a January 2020 study from the State of Ohio, in 18.7% th 2018, Ohio was the 7 largest source of GDP among the 50 states • Total number
of institutions in the market = 19 and Washington D.C. • Total deposits inside the market = $11.4 billion th • If Ohio was a separate country, it would be the 36 largest • Cuyahoga, Geauga, Medina, Stark, and Trumbull counties
offer (2) national economy in the world significant growth opportunities • Markets dominated by large national and super regional • Key Industries include: BioMedical, Health Care, Aluminum institutions Manufacturing, Automotive
Manufacturing, Customer Contact • Top ten institutions have 90.1% of the total deposit market Centers, Distribution, Warehousing & Logistics, Food-Related share within these five counties Products Manufacturing, Petrochemicals & Energy
Development, • Farmers is one of the largest Ohio based community banks Primary Metals, Fabricated Products Manufacturing, Additive within these counties with a total market share of 1.3% Manufacturing, Industrial Internet of Things •
Total number of institutions in the market = 35 • Total deposits inside the market = $98.3 billion • GM Ultium Battery Plant, TJX and Lordstown Motors Corp. development projects underway in core market (1)
https://development.ohio.gov/files/research/E1001.pdf (2) January 2020 Office of Research, Ohio Development Services Agency 9 Deposit rank according to FDIC market share report at June 30, 2021 shown pro forma for Cortland acquisition
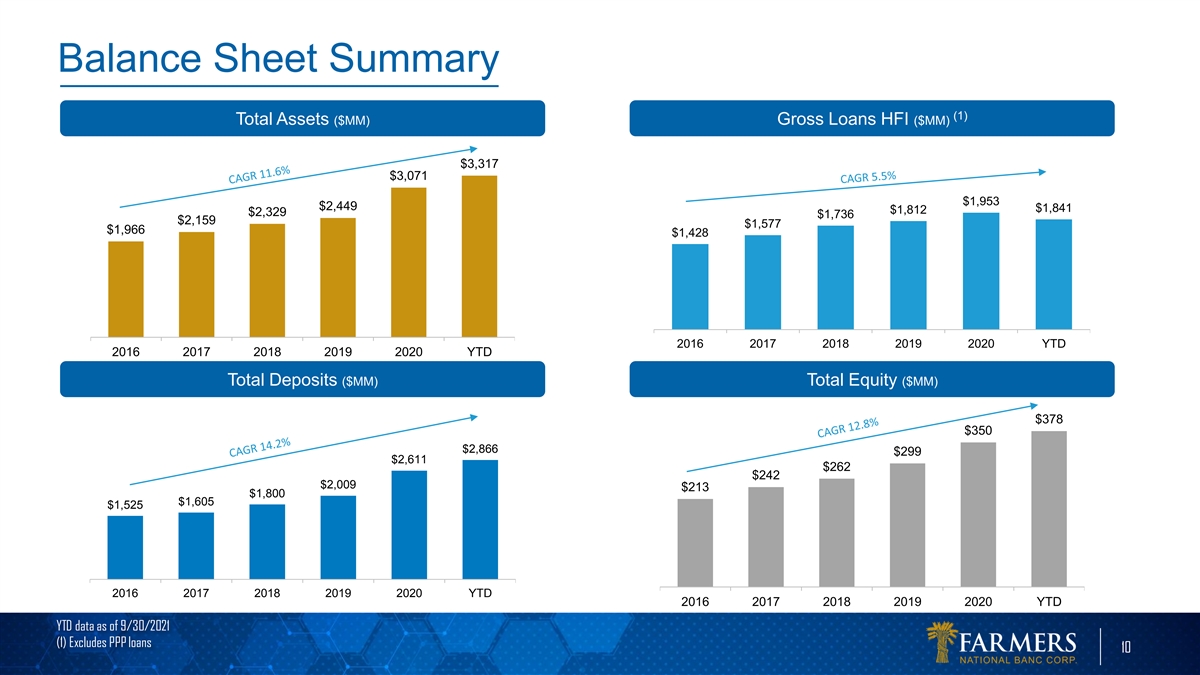
Balance Sheet Summary (1) Total Assets ($MM) Gross Loans HFI ($MM)
$3,317 $3,071 $1,953 $2,449 $1,841 $1,812 $2,329 $1,736 $2,159 $1,577 $1,966 $1,428 2016 2017 2018 2019 2020 YTD 2016 2017 2018 2019 2020 YTD Total Deposits ($MM) Total Equity ($MM) $378 $350 $2,866 $299 $2,611 $262 $242 $2,009 $213 $1,800 $1,605
$1,525 2016 2017 2018 2019 2020 YTD 2016 2017 2018 2019 2020 YTD YTD data as of 9/30/2021 (1) Excludes PPP loans 10
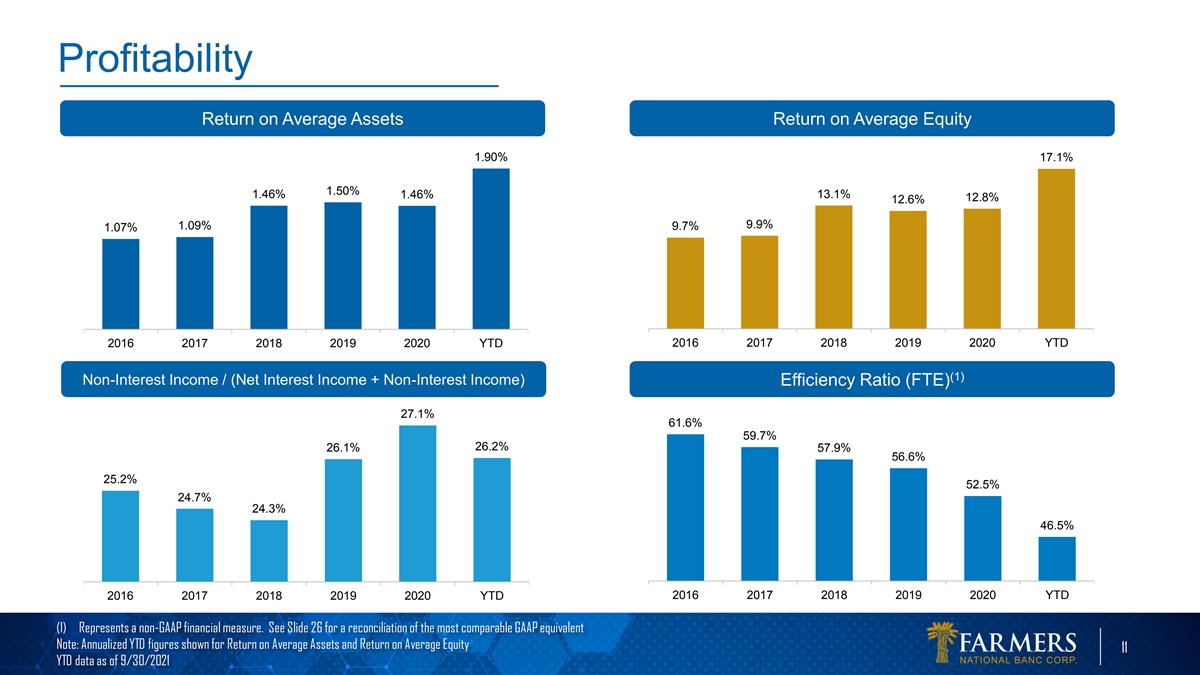
Profitability Return on Average Assets Return on Average Equity 1.90%
17.1% 1.50% 1.46% 1.46% 13.1% 12.8% 12.6% 9.9% 1.09% 9.7% 1.07% 2016 2017 2018 2019 2020 YTD 2016 2017 2018 2019 2020 YTD (1) Non-Interest Income / (Net Interest Income + Non-Interest Income) Efficiency Ratio (FTE) 27.1% 61.6% 59.7% 26.2% 26.1%
57.9% 56.6% 25.2% 52.5% 24.7% 24.3% 46.5% 2016 2017 2018 2019 2020 YTD 2016 2017 2018 2019 2020 YTD (1) Represents a non-GAAP financial measure. See Slide 26 for a reconciliation of the most comparable GAAP equivalent Note: Annualized YTD figures
shown for Return on Average Assets and Return on Average Equity 11 YTD data as of 9/30/2021
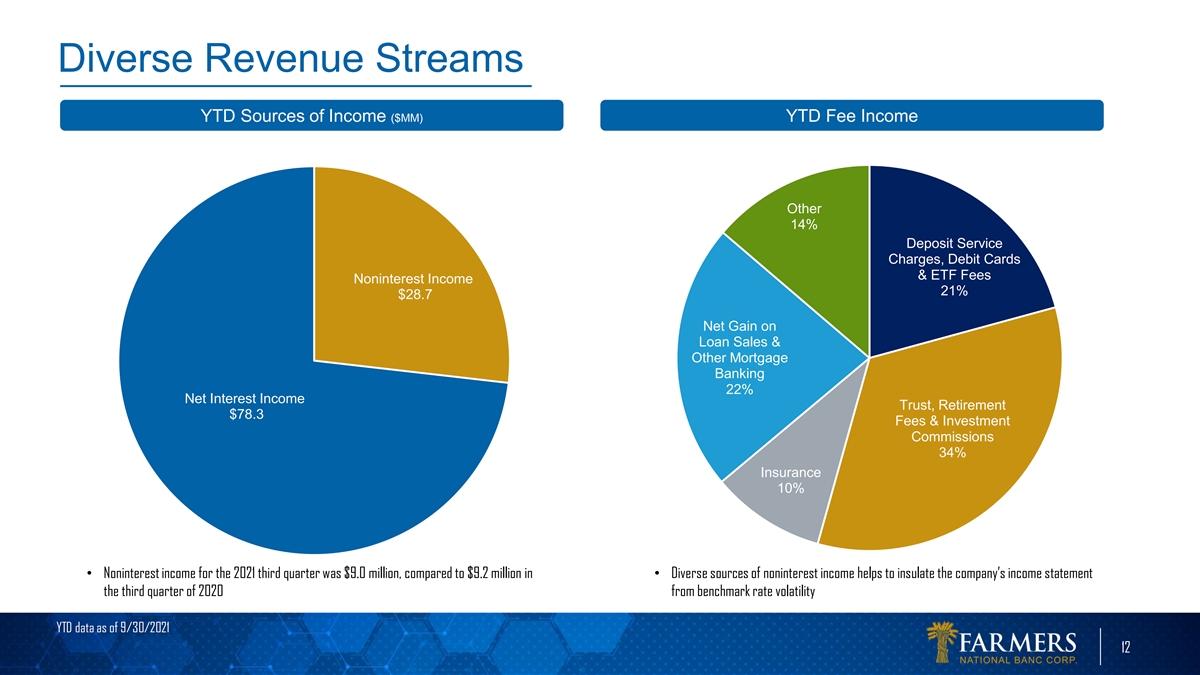
Diverse Revenue Streams YTD Sources of Income ($MM) YTD Fee Income
Other 14% Deposit Service Charges, Debit Cards & ETF Fees Noninterest Income 21% $28.7 Net Gain on Loan Sales & Other Mortgage Banking 22% Net Interest Income Trust, Retirement $78.3 Fees & Investment Commissions 34% Insurance 10%
• Noninterest income for the 2021 third quarter was $9.0 million, compared to $9.2 million in • Diverse sources of noninterest income helps to insulate the company’s income statement the third quarter of 2020 from benchmark rate
volatility YTD data as of 9/30/2021 12
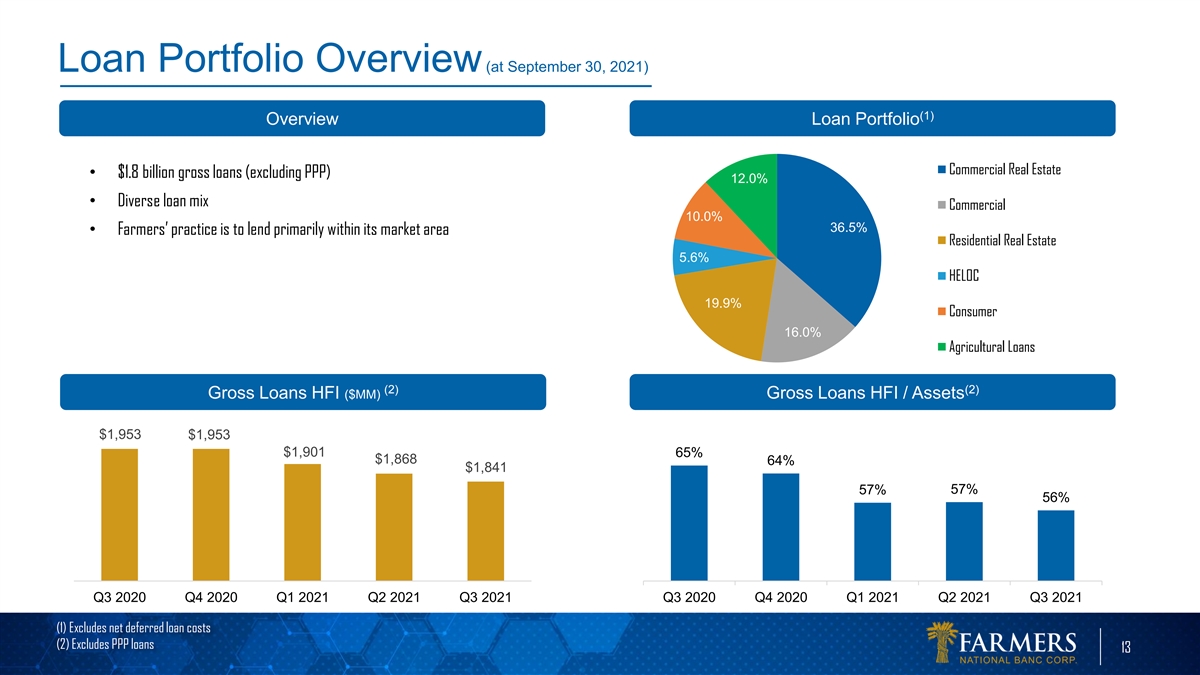
Loan Portfolio Overview (at September 30, 2021) (1) Overview Loan
Portfolio Commercial Real Estate • $1.8 billion gross loans (excluding PPP) 12.0% • Diverse loan mix Commercial 10.0% 36.5% • Farmers’ practice is to lend primarily within its market area Residential Real Estate 5.6% HELOC
19.9% Consumer 16.0% Agricultural Loans (2) (2) Gross Loans HFI ($MM) Gross Loans HFI / Assets $1,953 $1,953 $1,901 65% $1,868 64% $1,841 57% 57% 56% Q3 2020 Q4 2020 Q1 2021 Q2 2021 Q3 2021 Q3 2020 Q4 2020 Q1 2021 Q2 2021 Q3 2021 (1) Excludes net
deferred loan costs (2) Excludes PPP loans 13
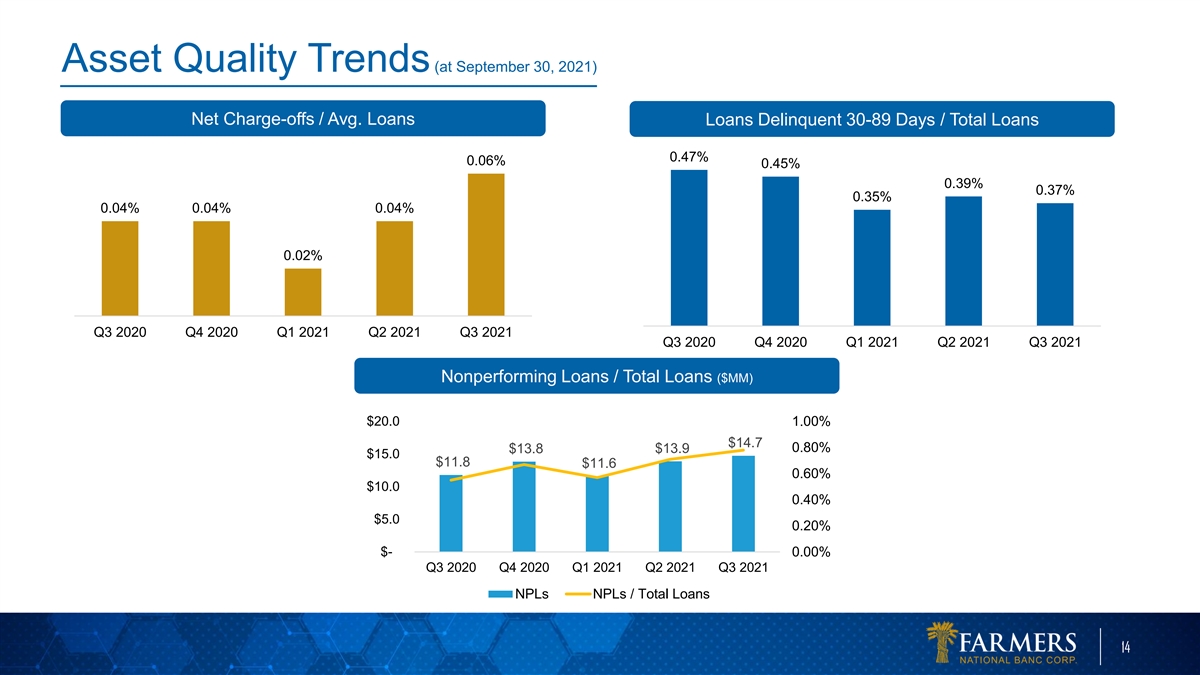
Asset Quality Trends (at September 30, 2021) Net Charge-offs / Avg.
Loans Loans Delinquent 30-89 Days / Total Loans 0.47% 0.06% 0.45% 0.39% 0.37% 0.35% 0.04% 0.04% 0.04% 0.02% Q3 2020 Q4 2020 Q1 2021 Q2 2021 Q3 2021 Q3 2020 Q4 2020 Q1 2021 Q2 2021 Q3 2021 Nonperforming Loans / Total Loans ($MM) $20.0 1.00% $14.7
0.80% $13.8 $13.9 $15.0 $11.8 $11.6 0.60% $10.0 0.40% $5.0 0.20% $- 0.00% Q3 2020 Q4 2020 Q1 2021 Q2 2021 Q3 2021 NPLs NPLs / Total Loans 14
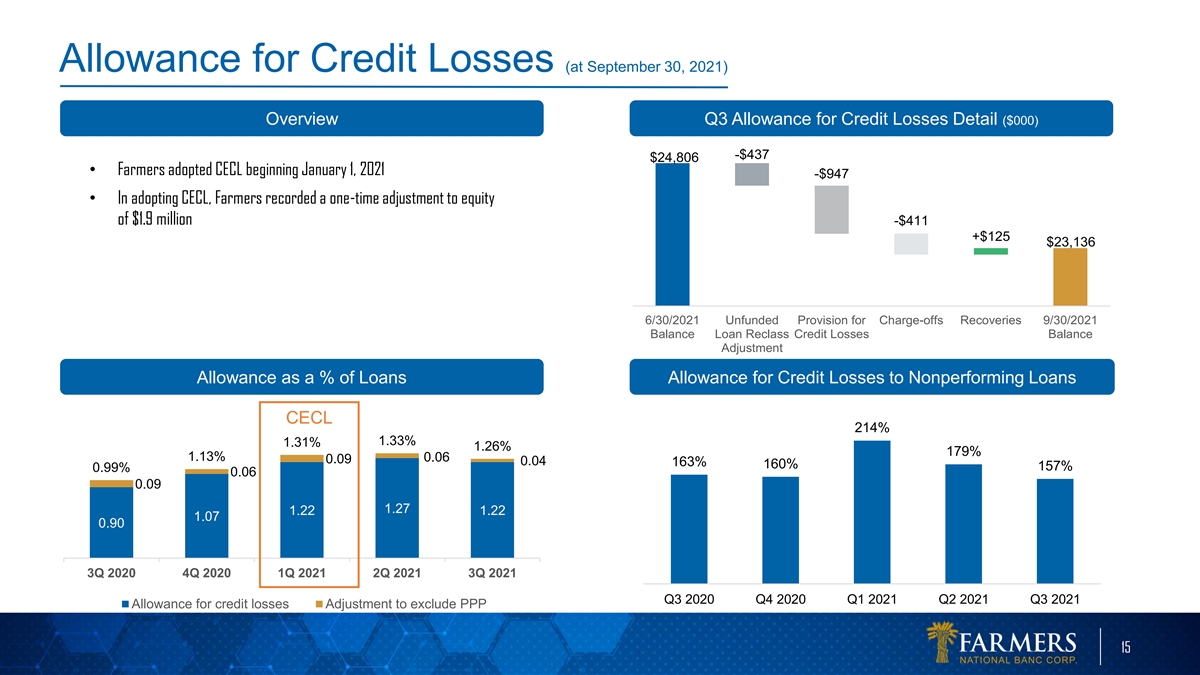
Allowance for Credit Losses (at September 30, 2021) Overview Q3
Allowance for Credit Losses Detail ($000) -$437 $24,806 • Farmers adopted CECL beginning January 1, 2021 -$947 • In adopting CECL, Farmers recorded a one-time adjustment to equity of $1.9 million -$411 +$125 $23,136 6/30/2021 Unfunded
Provision for Charge-offs Recoveries 9/30/2021 Balance Loan Reclass Credit Losses Balance Adjustment Allowance as a % of Loans Allowance for Credit Losses to Nonperforming Loans CECL 214% 1.33% 1.31% 1.26% 179% 1.13% 0.06 0.09 0.04 163% 160% 157%
0.99% 0.06 0.09 1.27 1.22 1.22 1.07 0.90 3Q 2020 4Q 2020 1Q 2021 2Q 2021 3Q 2021 Q3 2020 Q4 2020 Q1 2021 Q2 2021 Q3 2021 Allowance for credit losses Adjustment to exclude PPP 15
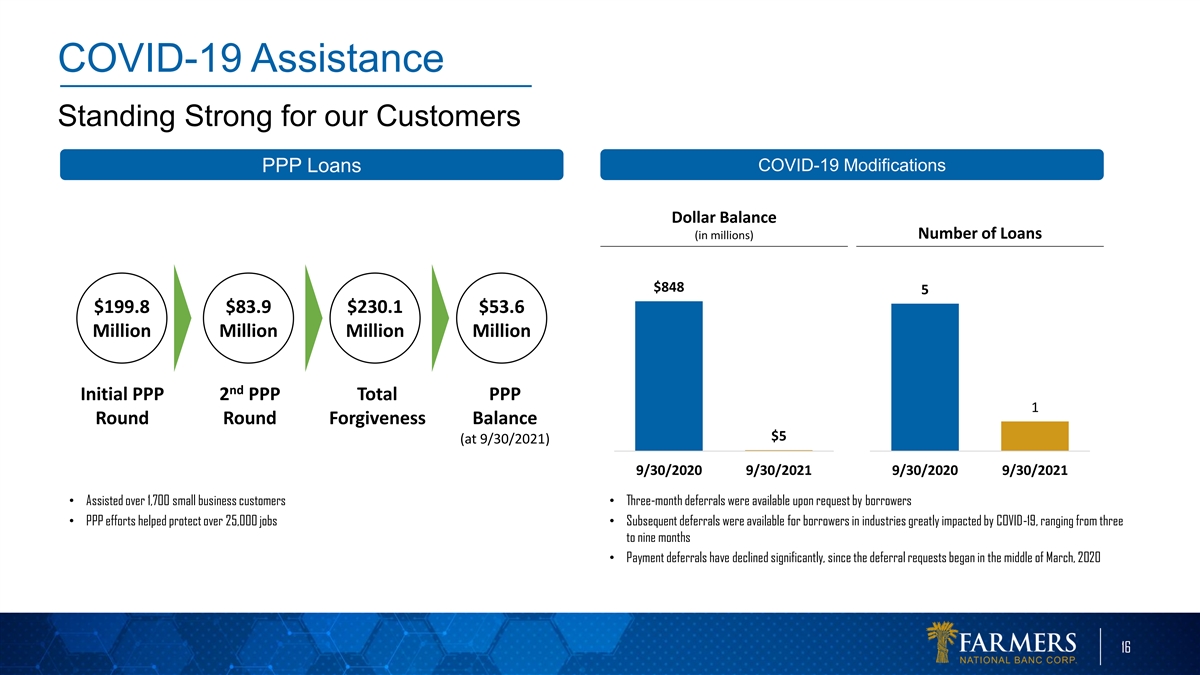
COVID-19 Assistance Standing Strong for our Customers COVID-19
Modifications PPP Loans Dollar Balance (in millions) Number of Loans $848 5 $199.8 $83.9 $230.1 $53.6 Million Million Million Million nd Initial PPP 2 PPP Total PPP 1 Round Round Forgiveness Balance $5 (at 9/30/2021) 9/30/2020 9/30/2021 9/30/2020
9/30/2021 • Assisted over 1,700 small business customers• Three-month deferrals were available upon request by borrowers • PPP efforts helped protect over 25,000 jobs• Subsequent deferrals were available for borrowers in
industries greatly impacted by COVID-19, ranging from three to nine months • Payment deferrals have declined significantly, since the deferral requests began in the middle of March, 2020 16
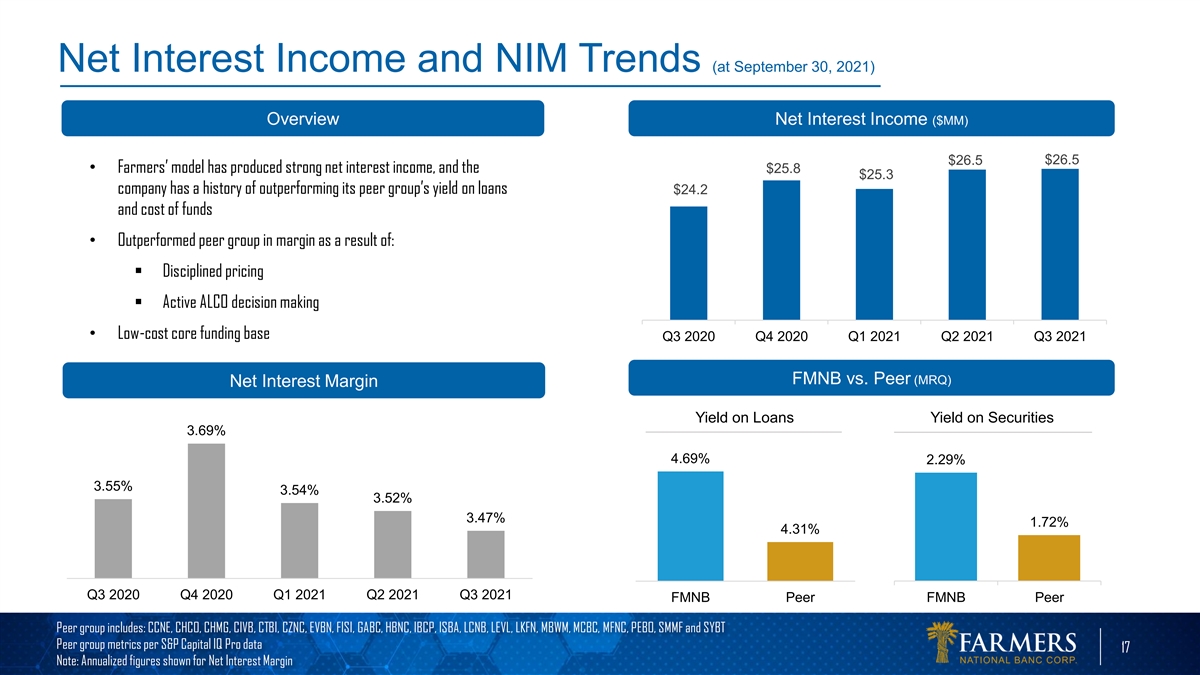
Net Interest Income and NIM Trends (at September 30, 2021) Overview Net
Interest Income ($MM) $26.5 $26.5 • Farmers’ model has produced strong net interest income, and the $25.8 $25.3 company has a history of outperforming its peer group’s yield on loans $24.2 and cost of funds • Outperformed
peer group in margin as a result of: § Disciplined pricing § Active ALCO decision making • Low-cost core funding base Q3 2020 Q4 2020 Q1 2021 Q2 2021 Q3 2021 FMNB vs. Peer (MRQ) Net Interest Margin Yield on Loans Yield on Securities
3.69% 4.69% 2.29% 3.55% 3.54% 3.52% 3.47% 1.72% 4.31% Q3 2020 Q4 2020 Q1 2021 Q2 2021 Q3 2021 FMNB Peer FMNB Peer Peer group includes: CCNE, CHCO, CHMG, CIVB, CTBI, CZNC, EVBN, FISI, GABC, HBNC, IBCP, ISBA, LCNB, LEVL, LKFN, MBWM, MCBC, MFNC, PEBO,
SMMF and SYBT Peer group metrics per S&P Capital IQ Pro data 17 Note: Annualized figures shown for Net Interest Margin
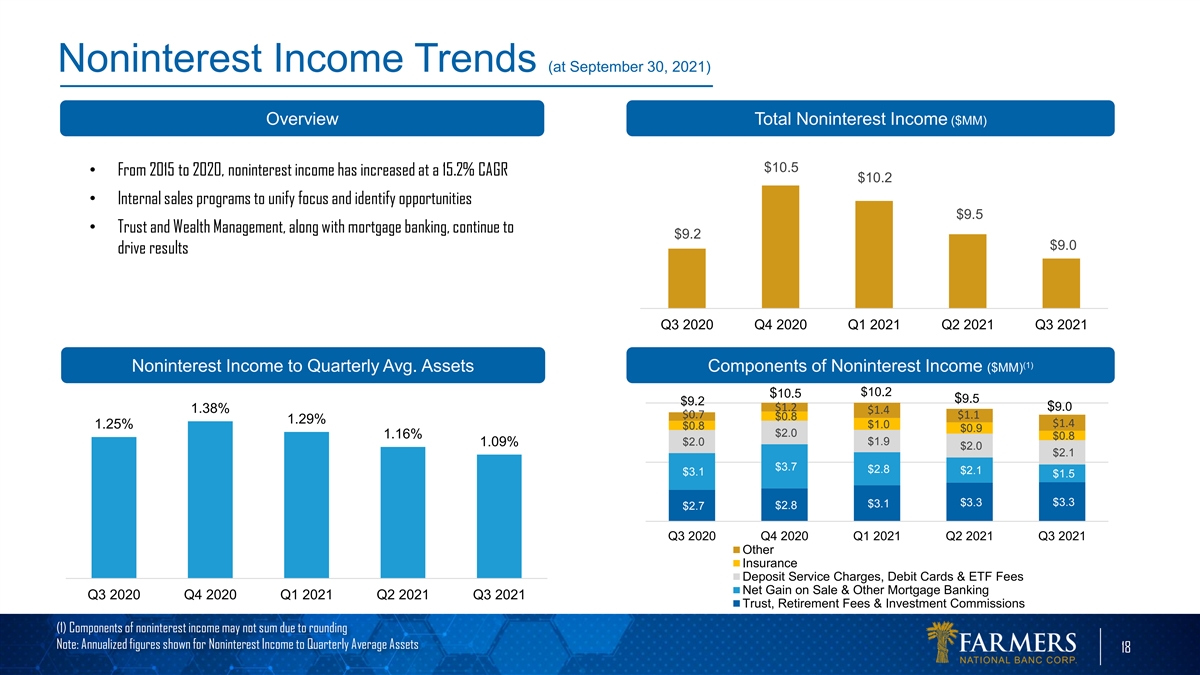
Noninterest Income Trends (at September 30, 2021) Overview Total
Noninterest Income ($MM) $10.5 • From 2015 to 2020, noninterest income has increased at a 15.2% CAGR $10.2 • Internal sales programs to unify focus and identify opportunities $9.5 • Trust and Wealth Management, along with mortgage
banking, continue to $9.2 $9.0 drive results Q3 2020 Q4 2020 Q1 2021 Q2 2021 Q3 2021 (1) Noninterest Income to Quarterly Avg. Assets Components of Noninterest Income ($MM) $10.2 $10.5 $9.5 $9.2 $1.2 $9.0 1.38% $1.4 $0.7 $1.1 $0.8 1.29% $1.4 1.25%
$1.0 $0.8 $0.9 $2.0 1.16% $0.8 $1.9 1.09% $2.0 $2.0 $2.1 $3.7 $2.8 $2.1 $3.1 $1.5 $3.3 $3.3 $3.1 $2.8 $2.7 Q3 2020 Q4 2020 Q1 2021 Q2 2021 Q3 2021 Other Insurance Deposit Service Charges, Debit Cards & ETF Fees Net Gain on Sale & Other
Mortgage Banking Q3 2020 Q4 2020 Q1 2021 Q2 2021 Q3 2021 Trust, Retirement Fees & Investment Commissions (1) Components of noninterest income may not sum due to rounding Note: Annualized figures shown for Noninterest Income to Quarterly Average
Assets 18
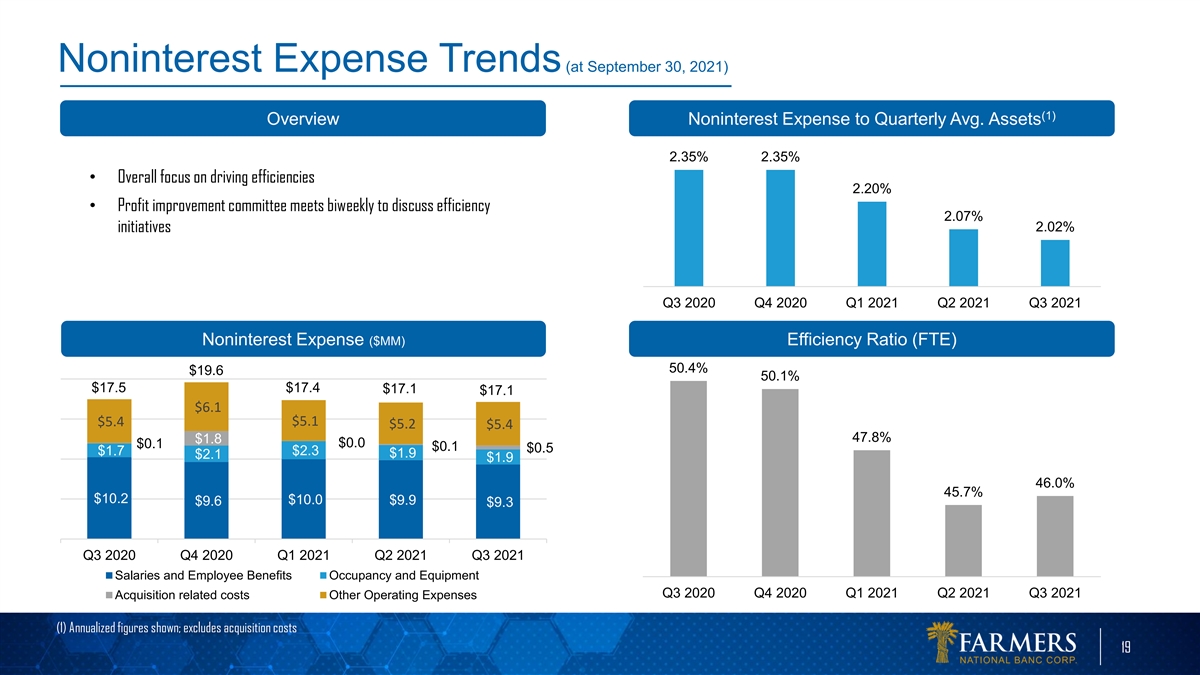
Noninterest Expense Trends (at September 30, 2021) (1) Overview
Noninterest Expense to Quarterly Avg. Assets 2.35% 2.35% • Overall focus on driving efficiencies 2.20% • Profit improvement committee meets biweekly to discuss efficiency 2.07% 2.02% initiatives Q3 2020 Q4 2020 Q1 2021 Q2 2021 Q3 2021
Noninterest Expense ($MM) Efficiency Ratio (FTE) 50.4% $19.6 50.1% $17.5 $17.4 $17.1 $17.1 $6.1 $5.4 $5.1 $5.2 $5.4 47.8% $1.8 $0.0 $0.1 $0.1 $0.5 $1.7 $2.3 $1.9 $2.1 $1.9 46.0% 45.7% $10.2 $10.0 $9.9 $9.6 $9.3 Q3 2020 Q4 2020 Q1 2021 Q2 2021 Q3
2021 Salaries and Employee Benefits Occupancy and Equipment Q3 2020 Q4 2020 Q1 2021 Q2 2021 Q3 2021 Acquisition related costs Other Operating Expenses (1) Annualized figures shown; excludes acquisition costs 19

Investment Securities (at September 30, 2021) Overview Portfolio
Composition Treasury & U.S. Gov. • Farmers recognized $979,000 of realized gains on the income 7.7% State & SBA statement in the nine months ended September 30, 2021 Political 0.4% 41.6% CMO - Res • 3Q 2021 yield on securities
portfolio of 2.29%; YTD yield of 2.52% 1.1% MBS - Res 48.8% Corporate 0.3% Securities Portfolio ($000) Portfolio Detail Amortized Unrealized Fair Security Cost Gains Losses Value U.S. Treasury and U.S. Government Sponsored Entities 89,919 53 (1,502)
88,470 State and Political Subdivisions 485,125 22,776 (618) 507,283 Corporate Bonds 3,604 77 (14) 3,667 Mortgage-backed Securities - Residential 569,235 2,778 (5,909) 566,104 Collateralized Mortgage Obligations - Residential 12,956 290 (5) 13,241
Small Business Administration 4,471 125 0 4,596 Totals 1,165,310 26,099 (8,048) 1,183,361 20
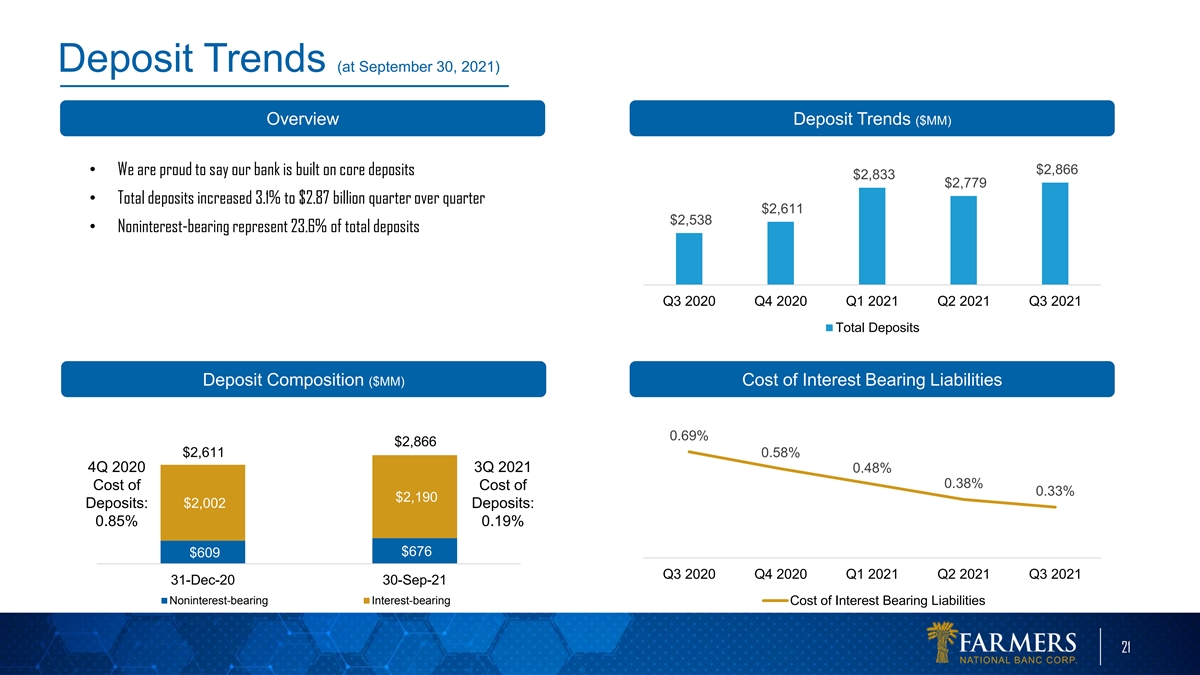
Deposit Trends (at September 30, 2021) Overview Deposit Trends ($MM)
$2,866 • We are proud to say our bank is built on core deposits $2,833 $2,779 • Total deposits increased 3.1% to $2.87 billion quarter over quarter $2,611 $2,538 • Noninterest-bearing represent 23.6% of total deposits Q3 2020 Q4
2020 Q1 2021 Q2 2021 Q3 2021 Total Deposits Deposit Composition ($MM) Cost of Interest Bearing Liabilities 0.69% $2,866 $2,611 0.58% 4Q 2020 3Q 2021 0.48% 0.38% Cost of Cost of 0.33% $2,190 $2,002 Deposits: Deposits: 0.85% 0.19% $676 $609 Q3 2020 Q4
2020 Q1 2021 Q2 2021 Q3 2021 31-Dec-20 30-Sep-21 Noninterest-bearing Interest-bearing Cost of Interest Bearing Liabilities 21
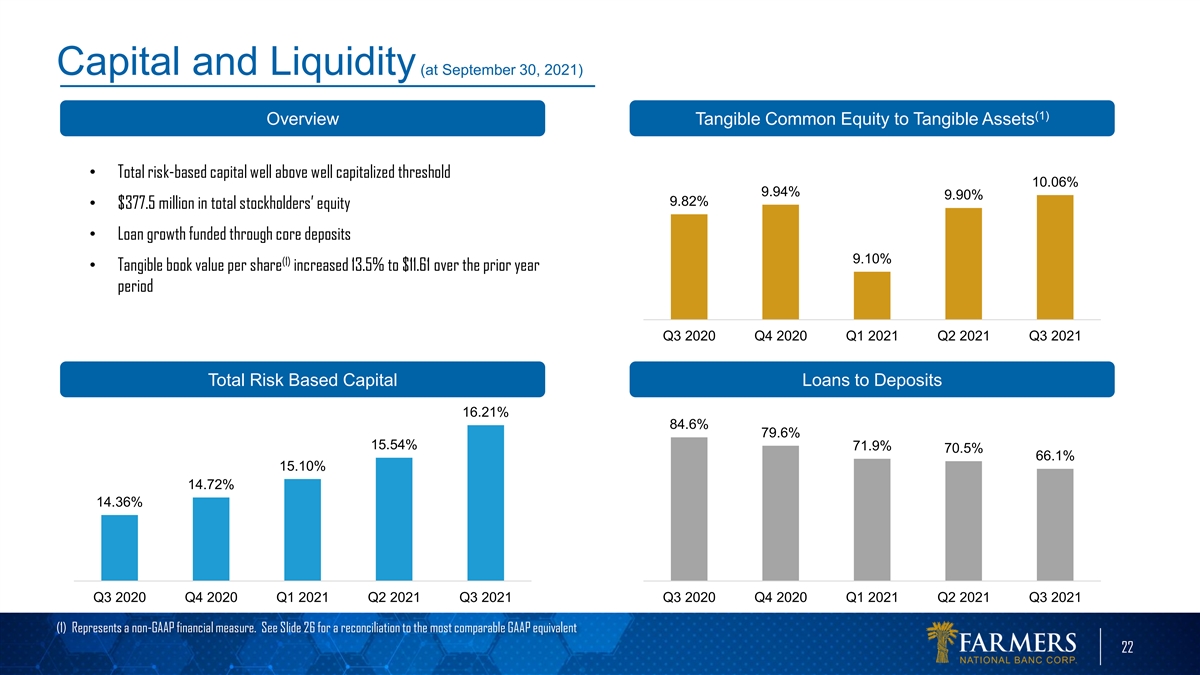
Capital and Liquidity (at September 30, 2021) (1) Overview Tangible
Common Equity to Tangible Assets • Total risk-based capital well above well capitalized threshold 10.06% 9.94% 9.90% 9.82% • $377.5 million in total stockholders’ equity • Loan growth funded through core deposits 9.10% (1)
• Tangible book value per share increased 13.5% to $11.61 over the prior year period Q3 2020 Q4 2020 Q1 2021 Q2 2021 Q3 2021 Total Risk Based Capital Loans to Deposits 16.21% 84.6% 79.6% 15.54% 71.9% 70.5% 66.1% 15.10% 14.72% 14.36% Q3 2020 Q4
2020 Q1 2021 Q2 2021 Q3 2021 Q3 2020 Q4 2020 Q1 2021 Q2 2021 Q3 2021 (1) Represents a non-GAAP financial measure. See Slide 26 for a reconciliation to the most comparable GAAP equivalent 22
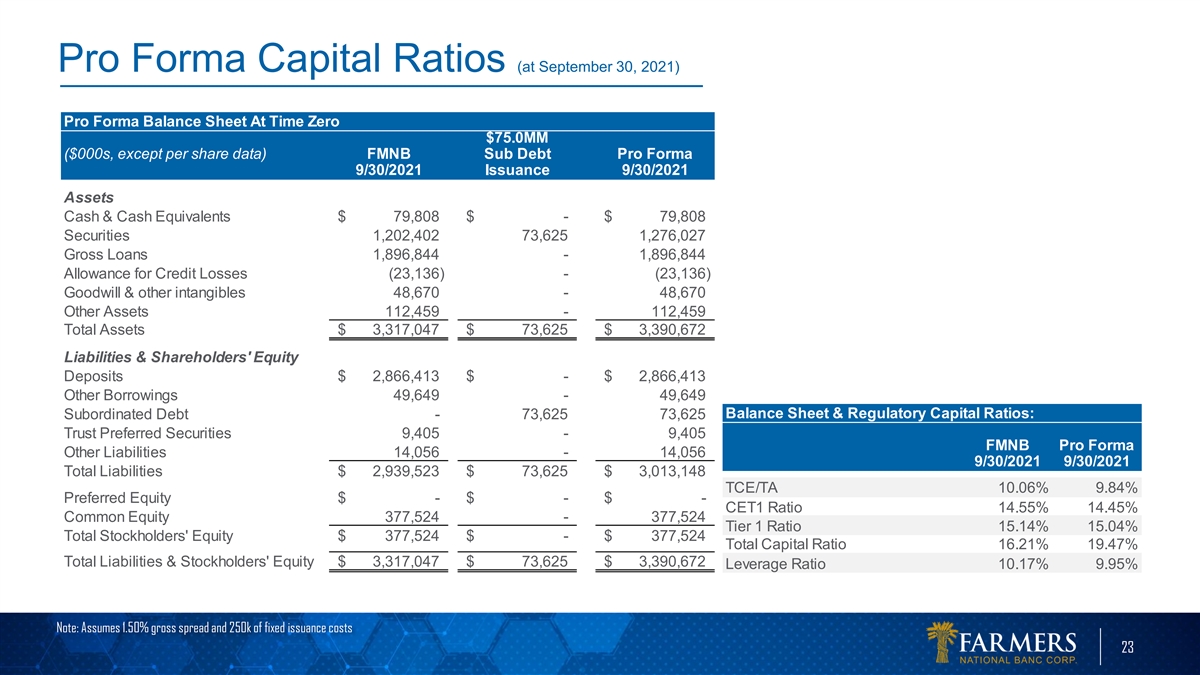
Pro Forma Capital Ratios (at September 30, 2021) Pro Forma Balance
Sheet At Time Zero $75.0MM ($000s, except per share data) FMNB Sub Debt Pro Forma 9/30/2021 Issuance 9/30/2021 Assets Cash & Cash Equivalents $ 79,808 $ - $ 79,808 Securities 1,202,402 73,625 1,276,027 Gross Loans 1,896,844 - 1,896,844 Allowance
for Credit Losses (23,136) - (23,136) Goodwill & other intangibles 48,670 - 48,670 Other Assets 112,459 - 112,459 Total Assets $ 3,317,047 $ 73,625 $ 3 ,390,672 Liabilities & Shareholders' Equity Deposits $ 2 ,866,413 $ - $ 2,866,413 Other
Borrowings 49,649 - 49,649 Balance Sheet & Regulatory Capital Ratios: Subordinated Debt - 73,625 73,625 Trust Preferred Securities 9,405 - 9 ,405 FMNB Pro Forma Other Liabilities 14,056 - 14,056 9/30/2021 9/30/2021 Total Liabilities $ 2 ,939,523
$ 73,625 $ 3,013,148 TCE/TA 10.06% 9.84% Preferred Equity $ - $ - $ - CET1 Ratio 14.55% 14.45% Common Equity 377,524 - 377,524 Tier 1 Ratio 15.14% 15.04% Total Stockholders' Equity $ 377,524 $ - $ 377,524 Total Capital Ratio 16.21% 19.47% Total
Liabilities & Stockholders' Equity $ 3 ,317,047 $ 73,625 $ 3,390,672 Leverage Ratio 10.17% 9.95% Note: Assumes 1.50% gross spread and 250k of fixed issuance costs 23
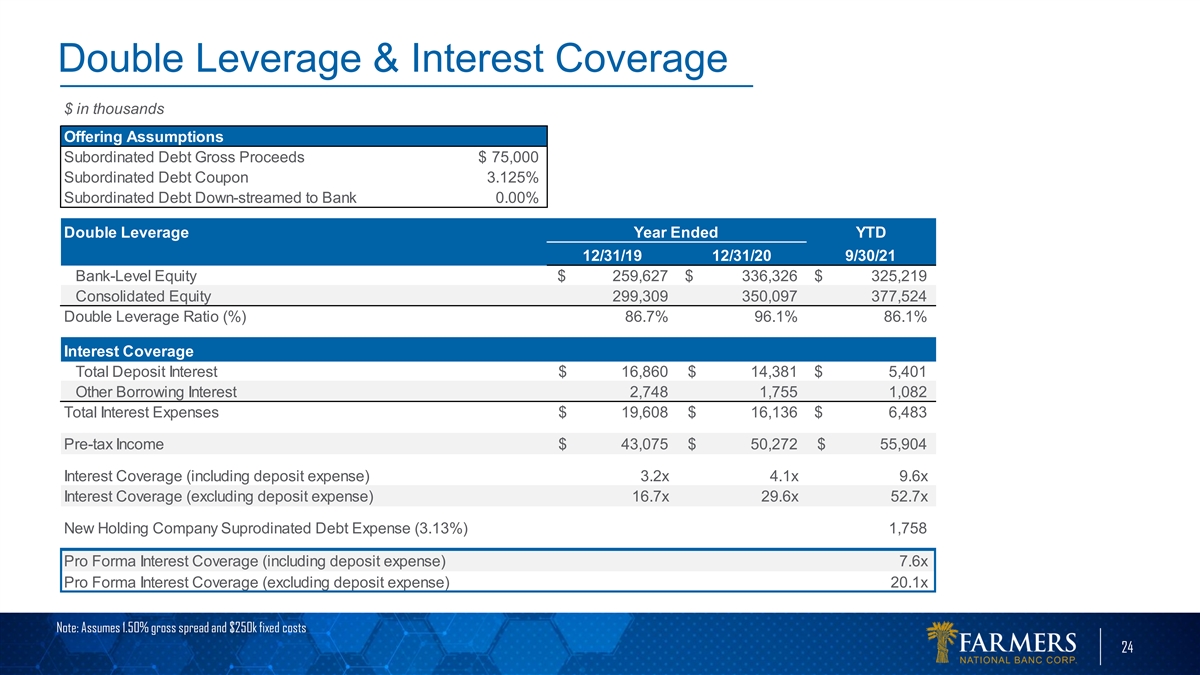
Double Leverage & Interest Coverage $ in thousands Offering
Assumptions Subordinated Debt Gross Proceeds $ 75,000 Subordinated Debt Coupon 3.125% Subordinated Debt Down-streamed to Bank 0.00% Double Leverage Year Ended YTD 12/31/19 12/31/20 9/30/21 Bank-Level Equity $ 259,627 $ 336,326 $ 325,219 Consolidated
Equity 299,309 350,097 377,524 Double Leverage Ratio (%) 86.7% 96.1% 86.1% Interest Coverage Total Deposit Interest $ 16,860 $ 14,381 $ 5 ,401 Other Borrowing Interest 2,748 1,755 1,082 Total Interest Expenses $ 19,608 $ 16,136 $ 6,483 Pre-tax
Income $ 43,075 $ 5 0,272 $ 5 5,904 Interest Coverage (including deposit expense) 3.2x 4.1x 9.6x Interest Coverage (excluding deposit expense) 16.7x 29.6x 52.7x New Holding Company Suprodinated Debt Expense (3.13%) 1,758 Pro Forma Interest Coverage
(including deposit expense) 7.6x Pro Forma Interest Coverage (excluding deposit expense) 20.1x Note: Assumes 1.50% gross spread and $250k fixed costs 24
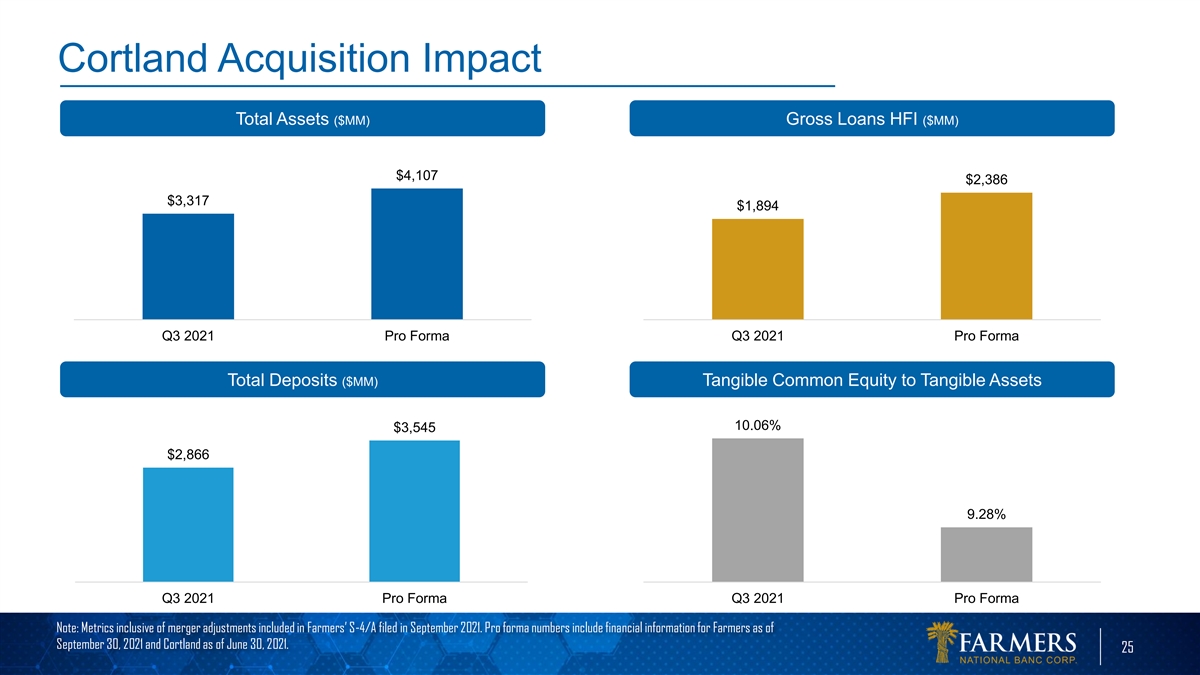
Cortland Acquisition Impact Total Assets ($MM) Gross Loans HFI ($MM)
$4,107 $2,386 $3,317 $1,894 Q3 2021 Pro Forma Q3 2021 Pro Forma Total Deposits ($MM) Tangible Common Equity to Tangible Assets 10.06% $3,545 $2,866 9.28% Q3 2021 Pro Forma Q3 2021 Pro Forma Note: Metrics inclusive of merger adjustments included in
Farmers’ S-4/A filed in September 2021. Pro forma numbers include financial information for Farmers as of September 30, 2021 and Cortland as of June 30, 2021. 25
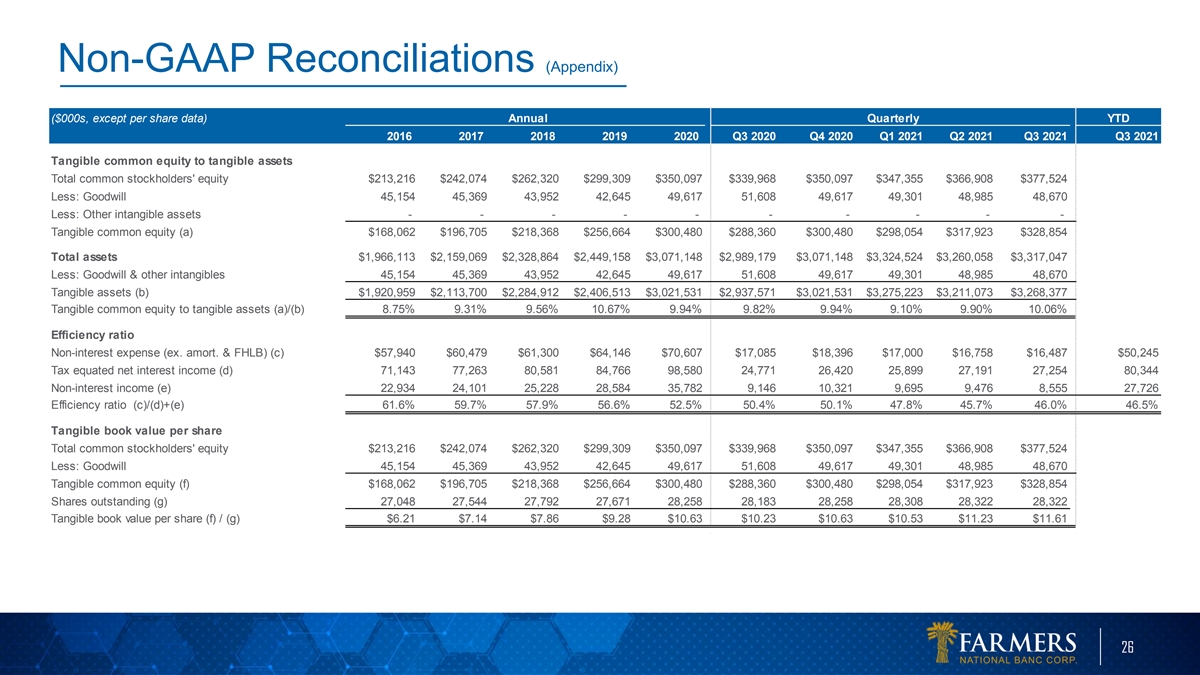
Non-GAAP Reconciliations (Appendix) ($000s, except per share data)
Annual Quarterly YTD 2016 2017 2018 2019 2020 Q3 2020 Q4 2020 Q1 2021 Q2 2021 Q3 2021 Q3 2021 Tangible common equity to tangible assets Total common stockholders' equity $213,216 $242,074 $262,320 $299,309 $350,097 $339,968 $350,097 $347,355
$366,908 $377,524 Less: Goodwill 45,154 45,369 43,952 42,645 49,617 51,608 49,617 49,301 48,985 48,670 Less: Other intangible assets - - - - - - - - - - Tangible common equity (a) $168,062 $196,705 $218,368 $256,664 $300,480 $288,360 $300,480
$298,054 $317,923 $328,854 Total assets $1,966,113 $2,159,069 $2,328,864 $2,449,158 $3,071,148 $2,989,179 $3,071,148 $3,324,524 $3,260,058 $3,317,047 Less: Goodwill & other intangibles 45,154 45,369 43,952 42,645 49,617 51,608 49,617 49,301
48,985 48,670 Tangible assets (b) $1,920,959 $2,113,700 $2,284,912 $2,406,513 $3,021,531 $2,937,571 $3,021,531 $3,275,223 $3,211,073 $3,268,377 Tangible common equity to tangible assets (a)/(b) 8.75% 9.31% 9.56% 10.67% 9.94% 9.82% 9.94% 9.10% 9.90%
10.06% Efficiency ratio Non-interest expense (ex. amort. & FHLB) (c) $57,940 $60,479 $61,300 $64,146 $70,607 $17,085 $18,396 $17,000 $16,758 $16,487 $50,245 Tax equated net interest income (d) 71,143 77,263 80,581 84,766 98,580 24,771 26,420
25,899 27,191 27,254 80,344 Non-interest income (e) 22,934 24,101 25,228 28,584 35,782 9,146 10,321 9,695 9,476 8,555 27,726 Efficiency ratio (c)/(d)+(e) 61.6% 59.7% 57.9% 56.6% 52.5% 50.4% 50.1% 47.8% 45.7% 46.0% 46.5% Tangible book value per share
Total common stockholders' equity $213,216 $242,074 $262,320 $299,309 $350,097 $339,968 $350,097 $347,355 $366,908 $377,524 Less: Goodwill 45,154 45,369 43,952 42,645 49,617 51,608 49,617 49,301 48,985 48,670 Tangible common equity (f) $168,062
$196,705 $218,368 $256,664 $300,480 $288,360 $300,480 $298,054 $317,923 $328,854 Shares outstanding (g) 27,048 27,544 27,792 27,671 28,258 28,183 28,258 28,308 28,322 28,322 Tangible book value per share (f) / (g) $6.21 $7.14 $7.86 $9.28 $10.63
$10.23 $10.63 $10.53 $11.23 $11.61 26
