Exhibit 99.2
|
McDermott International, Inc. Q4 2017 Supplemental Information February 21, 2017 © 2017 McDermott International, Inc. All rights reserved.
|
FORWARD-LOOKING STATEMENTS In accordance with the Safe Harbor provisions of the Private Securities Litigation Reform Act of 1995, McDermott cautions that statements in this presentation which are forward looking, and provide other than historical information, involve risks, contingencies and uncertainties that may impact McDermott’s actual results of operations. These forward-looking statements include, among other things, statements about backlog, bids and change orders outstanding, target projects and revenue pipeline, to the extent these may be viewed as indicators of future revenues or profitability, McDermott’s 2018 focus areas, potential savings related to the “Fit 2 Grow” initiative, the timing of award of target projects and the anticipated range of values and breakdown by project type, McDermott’s earnings and other guidance for 2018 and expectations related to the guidance, estimates relating to the percentage of completion of various ongoing projects and the expected value, scope, execution and timing of the projects discussed, expectations related to debt maturities, expectations regarding free cash flow and working capital, our beliefs about the effect of low oil prices on McDermott, our beliefs relating to the risk of contract cancellations, our beliefs relating to the impact of the Tax Cuts and Jobs Act on McDermott, expectations relating to the MOU with Saudi Aramco, including with respect to the timing of capital expenditures, our expectations with respect to where customers are investing capital and our expectations with respect to the impact to McDermott upon the adoption of the new revenue recognition standards. Although we believe that the expectations reflected in those forward-looking statements are reasonable, we can give no assurance that those expectations will prove to have been correct. Those statements are made by using various underlying assumptions and are subject to numerous risks, contingencies and uncertainties, including, among others: adverse changes in the markets in which we operate or credit markets, our inability to successfully execute on contracts in backlog, changes in project design or schedules, the availability of qualified personnel, changes in the terms, scope or timing of contracts, contract cancellations, change orders and other modifications and actions by our customers and other business counterparties, changes in industry norms and adverse outcomes in legal or other dispute resolution proceedings. If one or more of these risks materialize, or if underlying assumptions prove incorrect, actual results may vary materially from those expected. You should not place undue reliance on forward-looking statements. For a more complete discussion of these and other risk factors, please see McDermott’s annual and quarterly filings with the Securities and Exchange Commission, including its annual report on Form 10-K for the year ended December 31, 2017. This presentation reflects management’s views as of the date hereof. Except to the extent required by applicable law, McDermott undertakes no obligation to update or revise any forward-looking statement. © 2017 McDermott International, Inc. All rights reserved. 2
|
NON-GAAP MEASURES This presentation includes several “non-GAAP” financial measures as defined under Regulation G of the U.S. Securities Exchange Act of 1934, as amended. We report our financial results in accordance with U.S. generally accepted accounting principles (“GAAP”), but believe that certain non-GAAP financial measures provide useful supplemental information to investors regarding the underlying business trends and performance of our ongoing operations and are useful for period-over-period comparisons of those operations. The non-GAAP measures we have presented in this presentation include the total and diluted per share amounts of adjusted net income (loss) attributable to the Company and adjusted operating income and operating margin, EBITDA, adjusted EBITDA and free cash flow, in each case excluding the impact of certain identified items. We believe that these measures are useful for investors to review because they provide consistent measures of the underlying results of our ongoing business. Furthermore, our management uses adjusted net income (loss) and adjusted operating income as measures of the performance of our operations. However, non-GAAP measures should not be considered as substitutes for operating income, net income or other data prepared and reported in accordance with GAAP and should be viewed in addition to McDermott’s reported results prepared in accordance with GAAP. The Forecast non-GAAP measures we have presented in this presentation include forecast free cash flow, adjusted free cash flow and EBITDA, in each case excluding the impact of certain identified items. We believe these forward-looking financial measures are within reasonable measure. We define “free cash flow” as cash flows from operations less capital expenditures. We believe investors consider free cash flow as an important measure because it generally represents funds available to pursue opportunities that may enhance shareholder value, such as making acquisitions or other investments. Our management uses free cash flow for that reason. Additionally, adjusted free cash flow represents free cash flow plus cash received as a result of the sale leaseback arrangement for the Amazon vessel. We define EBITDA as net income plus depreciation and amortization, interest expense, net and provision for income taxes. We have included EBITDA disclosures in this presentation because EBITDA is widely used by investors for valuation and comparing our financial performance with the performance of other companies in our industry. Our management also uses EBITDA to monitor and compare the financial performance of our operations. EBITDA does not give effect to the cash that we must use to service our debt or pay our income taxes, and thus does not reflect the funds actually available for capital expenditures, dividends or various other purposes. In addition, our presentation of EBITDA may not be comparable to similarly titled measures in other companies’ reports. You should not consider EBITDA in isolation from, or as a substitute for, net income or cash flow measures prepared in accordance with U.S. GAAP. Reconciliations of these non-GAAP financial measures and forecast non-GAAP financial measures to the most comparable GAAP measures are provided in the tables set forth at the end of this presentation. © 2017 McDermott International, Inc. All rights reserved. 3
|
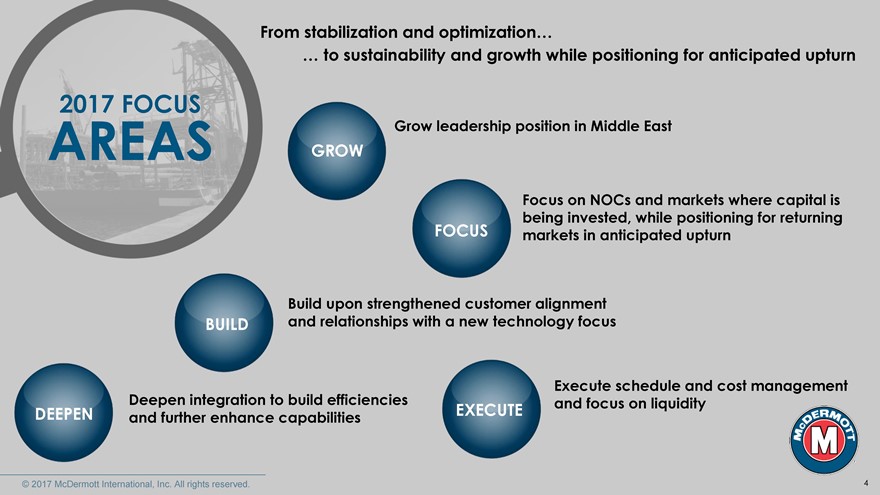
From stabilization and optimization… … to sustainability and growth while positioning for anticipated upturn 2017 FOCUS Grow leadership position in Middle East AREAS GROW Focus on NOCs and markets where capital is being invested, while positioning for returning FOCUS markets in anticipated upturn Build upon strengthened customer alignment BUILD and relationships with a new technology focus efficiencies Execute schedule and cost management EXECUTE and focus on liquidity DEEPEN ilities 4
|
QUARTERLY RESULTS © 2017 McDermott International, Inc. All rights reserved. 5
|
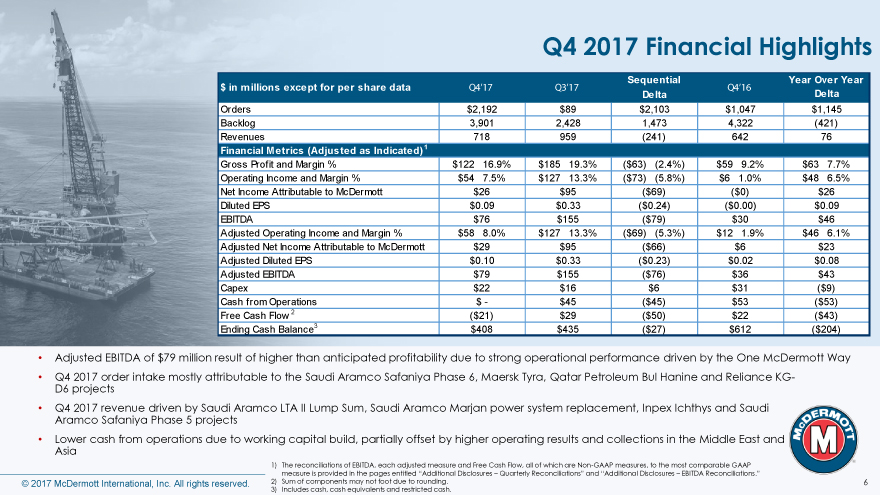
Q4 2017 Financial Highlights Sequential Year Over Year $ in millions except for per share data Q4’17 Q3’17 Q4’16 Delta Delta Orders $2,192 $89 $2,103 $1,047 $1,145 Backlog 3,901 2,428 1,473 4,322 (421) Revenues 718 959 (241) 642 76 Financial Metrics (Adjusted as Indicated)1 Gross Profit and Margin % $122 16.9% $185 19.3% ($63) (2.4%) $59 9.2% $63 7.7% Operating Income and Margin % $54 7.5% $127 13.3% ($73) (5.8%) $6 1.0% $48 6.5% Net Income Attributable to McDermott $26 $95 ($69) ($0) $26 Diluted EPS $0.09 $0.33 ($0.24) ($0.00) $0.09 EBITDA $76 $155 ($79) $30 $46 Adjusted Operating Income and Margin % $58 8.0% $127 13.3% ($69) (5.3%) $12 1.9% $46 6.1% Adjusted Net Income Attributable to McDermott $29 $95 ($66) $6 $23 Adjusted Diluted EPS $0.10 $0.33 ($0.23) $0.02 $0.08 Adjusted EBITDA $79 $155 ($76) $36 $43 Capex $22 $16 $6 $31 ($9) Cash from Operations $—$45 ($45) $53 ($53) Free Cash Flow 2 ($21) $29 ($50) $22 ($43) Ending Cash Balance3 $408 $435 ($27) $612 ($204) • Adjusted EBITDA of $79 million result of higher than anticipated profitability due to strong operational performance driven by the One McDermott Way • Q4 2017 order intake mostly attributable to the Saudi Aramco Safaniya Phase 6, Maersk Tyra, Qatar Petroleum Bul Hanine and Reliance KG-D6 projects • Q4 2017 revenue driven by Saudi Aramco LTA II Lump Sum, Saudi Aramco Marjan power system replacement, Inpex Ichthys and Saudi Aramco Safaniya Phase 5 projects • Lower cash from operations due to working capital build, partially offset by higher operating results and collections in the Middle East and Asia 1) The reconciliations of EBITDA, each adjusted measure and Free Cash Flow, all of which are Non-GAAP measures, to the most comparable GAAP measure is provided in the pages entitled “Additional Disclosures – Quarterly Reconciliations” and “Additional Disclosures – EBITDA Reconciliations.” © 2017 McDermott International, Inc. All rights reserved. 2) Sum of components may not foot due to rounding. 6 3) Includes cash, cash equivalents and restricted cash.
|
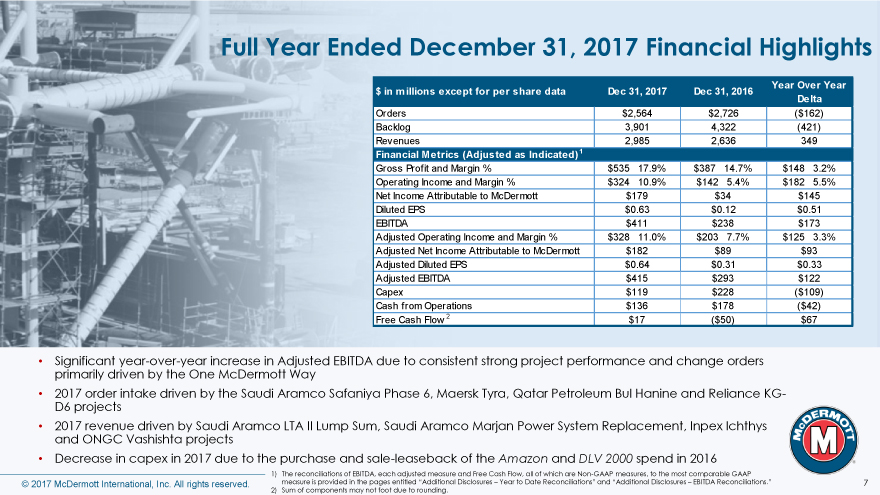
Full Year Ended December 31, 2017 Financial Highlights Year Over Year $ in millions except for per share data Dec 31, 2017 Dec 31, 2016 Delta Orders $2,564 $2,726 ($162) Backlog 3,901 4,322 (421) Revenues 2,985 2,636 349 Financial Metrics (Adjusted as Indicated)1 Gross Profit and Margin % $535 17.9% $387 14.7% $148 3.2% Operating Income and Margin % $324 10.9% $142 5.4% $182 5.5% Net Income Attributable to McDermott $179 $34 $145 Diluted EPS $0.63 $0.12 $0.51 EBITDA $411 $238 $173 Adjusted Operating Income and Margin % $328 11.0% $203 7.7% $125 3.3% Adjusted Net Income Attributable to McDermott $182 $89 $93 Adjusted Diluted EPS $0.64 $0.31 $0.33 Adjusted EBITDA $415 $293 $122 Capex $119 $228 ($109) Cash from Operations $136 $178 ($42) Free Cash Flow 2 $17 ($50) $67 • Significant year-over-year increase in Adjusted EBITDA due to consistent strong project performance and change orders primarily driven by the One McDermott Way • 2017 order intake driven by the Saudi Aramco Safaniya Phase 6, Maersk Tyra, Qatar Petroleum Bul Hanine and Reliance KG-D6 projects • 2017 revenue driven by Saudi Aramco LTA II Lump Sum, Saudi Aramco Marjan Power System Replacement, Inpex Ichthys and ONGC Vashishta projects • Decrease in capex in 2017 due to the purchase and sale-leaseback of the Amazon and DLV 2000 spend in 2016 1) The reconciliations of EBITDA, each adjusted measure and Free Cash Flow, all of which are Non-GAAP measures, to the most comparable GAAP © 2017 McDermott International, Inc. All rights reserved. measure is provided in the pages entitled “Additional Disclosures – Year to Date Reconciliations” and “Additional Disclosures – EBITDA Reconciliations.” 7 2) Sum of components may not foot due to rounding.
|
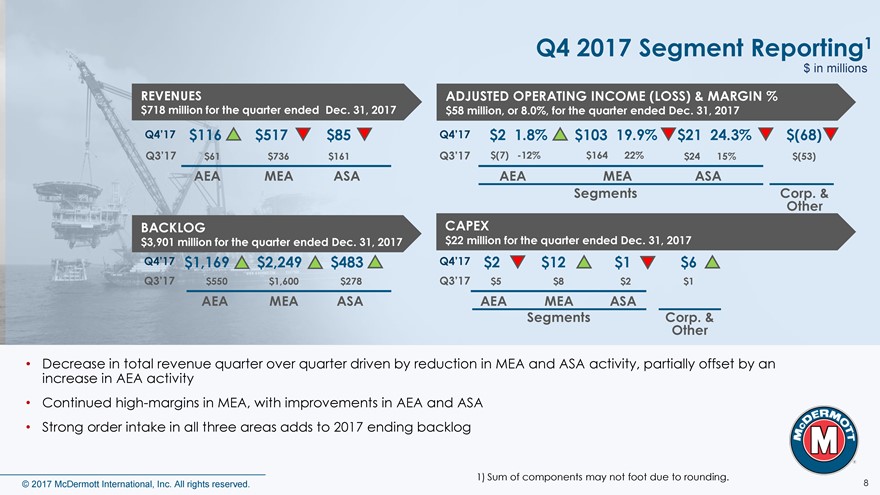
Q4 2017 Segment Reporting1 $ in millions REVENUES ADJUSTED OPERATING INCOME (LOSS) & MARGIN % $718 million for the quarter ended Dec. 31, 2017 $58 million, or 8.0%, for the quarter ended Dec. 31, 2017 Q4’17 $116 $517 $85 Q4’17 $2 1.8% $103 19.9% $21 24.3% $(68) Q3’17 $61 $736 $161 Q3’17 $(7) -12% $164 22% $24 15% $(53) AEA MEA ASA AEA MEA ASA Segments Corp. Other & BACKLOG CAPEX $3,901 million for the quarter ended Dec. 31, 2017 $22 million for the quarter ended Dec. 31, 2017 Q4’17 $1,169 $2,249 $483 Q4’17 $2 $12 $1 $6 Q3’17 $550 $1,600 $278 Q3’17 $5 $8 $2 $1 AEA MEA ASA AEA MEA ASA Segments Corp. Other & • Decrease in total revenue quarter over quarter driven by reduction in MEA and ASA activity, partially offset by an increase in AEA activity • Continued high-margins in MEA, with improvements in AEA and ASA • Strong order intake in all three areas adds to 2017 ending backlog 1) Sum of components may not foot due to rounding. © 2017 McDermott International, Inc. All rights reserved. 8
|
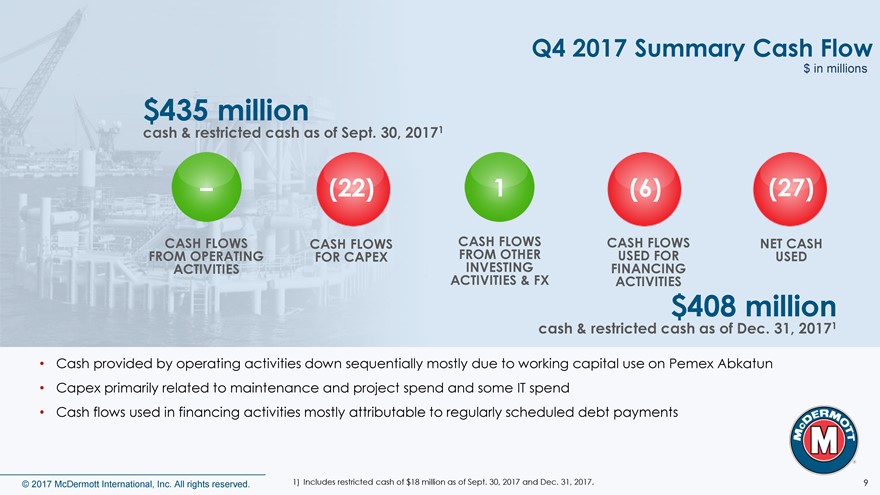
Q4 2017 Summary Cash Flow $ in millions $435 million cash & restricted cash as of Sept. 30, 20171 – (22) 1 (6) (27) CASH FLOWS CASH FLOWS CASH FROM FLOWS OTHER CASH FLOWS NET CASH FROM OPERATING FOR CAPEX USED FOR USED ACTIVITIES ACTIVITIES INVESTING & FX FINANCING ACTIVITIES $408 million cash & restricted cash as of Dec. 31, 20171 • Cash provided by operating activities down sequentially mostly due to working capital use on Pemex Abkatun • Capex primarily related to maintenance and project spend and some IT spend • Cash flows used in financing activities mostly attributable to regularly scheduled debt payments © 2017 McDermott International, Inc. All rights reserved. 1) Includes restricted cash of $18 million as of Sept. 30, 2017 and Dec. 31, 2017. 9
|
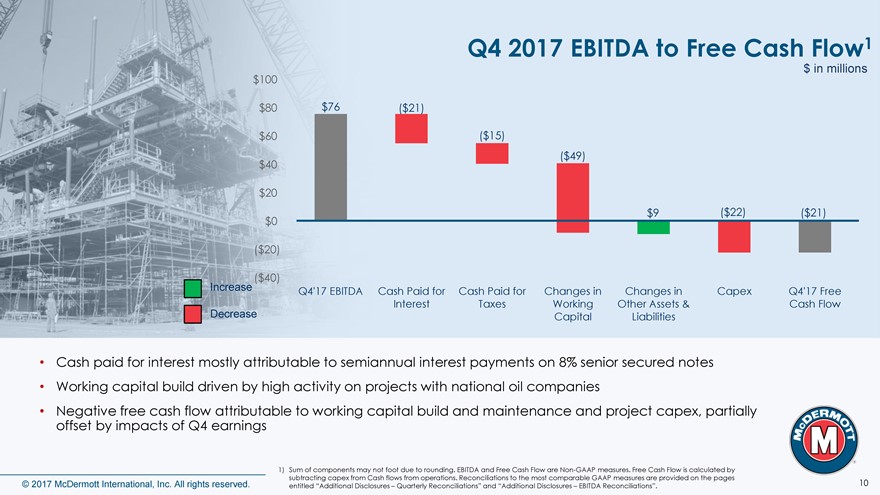
Q4 2017 EBITDA to Free Cash Flow1 $100 $ in millions $80 $76 ($21) $60 ($15) ($49) $40 $20 $9 ($22) ($21) $0 ($20) Increase ($40) Q4’17 EBITDA Cash Paid for Cash Paid for Changes in Changes in Capex Q4’17 Free Decrease Interest Taxes Working Other Assets & Cash Flow Capital Liabilities • Cash paid for interest mostly attributable to semiannual interest payments on 8% senior secured notes • Working capital build driven by high activity on projects with national oil companies • Negative free cash flow attributable to working capital build and maintenance and project capex, partially offset by impacts of Q4 earnings 1) Sum of components may not foot due to rounding. EBITDA and Free Cash Flow are Non-GAAP measures. Free Cash Flow is calculated by subtracting capex from Cash flows from operations. Reconciliations to the most comparable GAAP measures are provided on the pages © 2017 McDermott International, Inc. All rights reserved. entitled “Additional Disclosures – Quarterly Reconciliations” and “Additional Disclosures – EBITDA Reconciliations”. 10
|
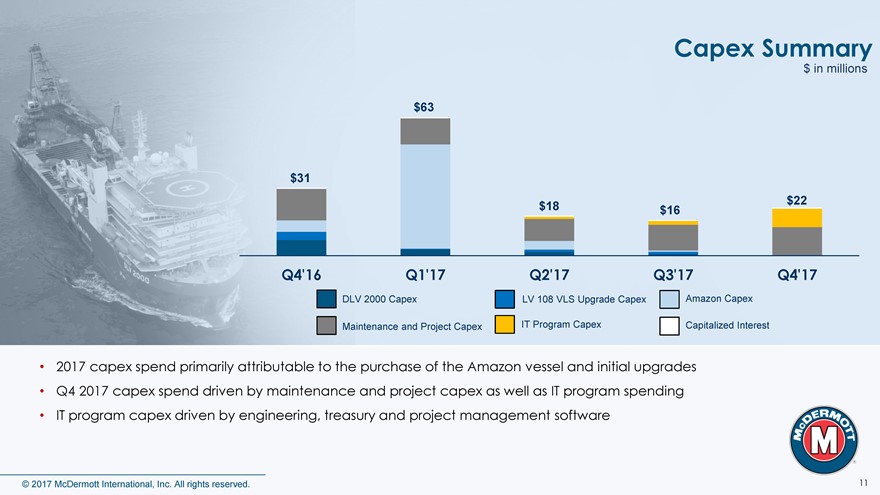
Capex Summary $ in millions $63 $31 $22 $18 $16 Q4’16 Q1’17 Q2’17 Q3’17 Q4’17 DLV 2000 Capex LV 108 VLS Upgrade Capex Amazon Capex Maintenance and Project Capex IT Program Capex Capitalized Interest • 2017 capex spend primarily attributable to the purchase of the Amazon vessel and initial upgrades • Q4 2017 capex spend driven by maintenance and project capex as well as IT program spending • IT program capex driven by engineering, treasury and project management software © 2017 McDermott International, Inc. All rights reserved. 11
|
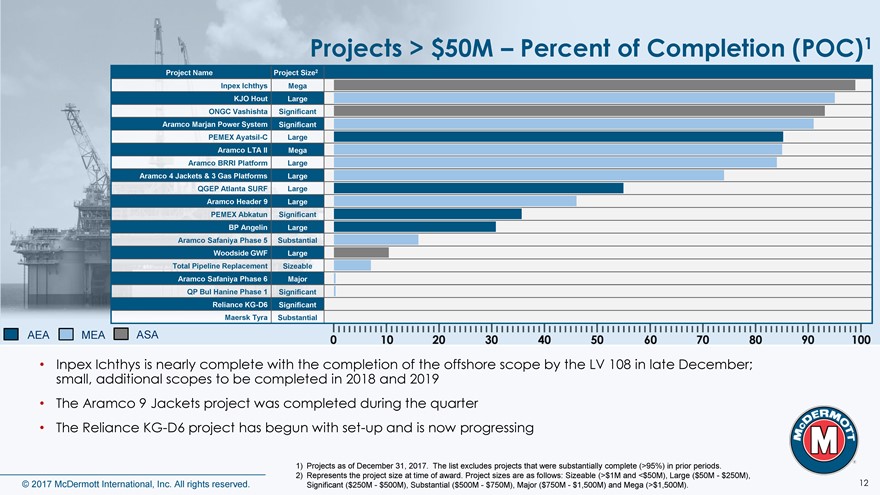
Projects > $50M – Percent of Completion (POC)1 Project Name Project Size2 Inpex Ichthys Mega KJO Hout Large ONGC Vashishta Significant Aramco Marjan Power System Significant PEMEX Ayatsil-C Large Aramco LTA II Mega Aramco BRRI Platform Large Aramco 4 Jackets & 3 Gas Platforms Large QGEP Atlanta SURF Large Aramco Header 9 Large PEMEX Abkatun Significant BP Angelin Large Aramco Safaniya Phase 5 Substantial Woodside GWF Large Total Pipeline Replacement Sizeable Aramco Safaniya Phase 6 Major QP Bul Hanine Phase 1 Significant Reliance KG-D6 Significant Maersk Tyra Substantial AEA MEA ASA • Inpex Ichthys is nearly complete with the completion of the offshore scope by the LV 108 in late December; small, additional scopes to be completed in 2018 and 2019 • The Aramco 9 Jackets project was completed during the quarter • The Reliance KG-D6 project has begun with set-up and is now progressing 1) Projects as of December 31, 2017. The list excludes projects that were substantially complete (>95%) in prior periods. 2) Represents the project size at time of award. Project sizes are as follows: Sizeable (>$1M and <$50M), Large ($50M—$250M), 12 © 2017 McDermott International, Inc. All rights reserved. Significant ($250M—$500M), Substantial ($500M—$750M), Major ($750M—$1,500M) and Mega (>$1,500M).
|
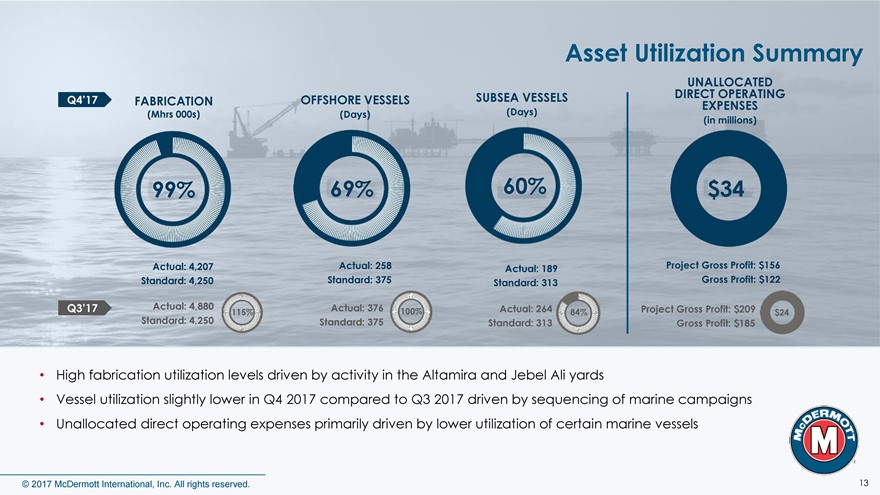
Asset Utilization Summary DIRECT UNALLOCATED OPERATING Q4’17 FABRICATION OFFSHORE VESSELS SUBSEA VESSELS EXPENSES (Mhrs 000s) (Days) (Days) (in millions) 69% 60% $34 Actual: 4,207 Actual: 258 Actual: 189 Project Gross Profit: $156 Standard: 4,250 Standard: 375 Standard: 313 Gross Profit: $122 Q3’17 Actual: 4,880 Actual: 376 Actual: 264 Project Gross Profit: $209 Standard: 4,250 115% 100% 84% $24 Standard: 375 Standard: 313 Gross Profit: $185 • High fabrication utilization levels driven by activity in the Altamira and Jebel Ali yards • Vessel utilization slightly lower in Q4 2017 compared to Q3 2017 driven by sequencing of marine campaigns • Unallocated direct operating expenses primarily driven by lower utilization of certain marine vessels © 2017 McDermott International, Inc. All rights reserved. 13
|
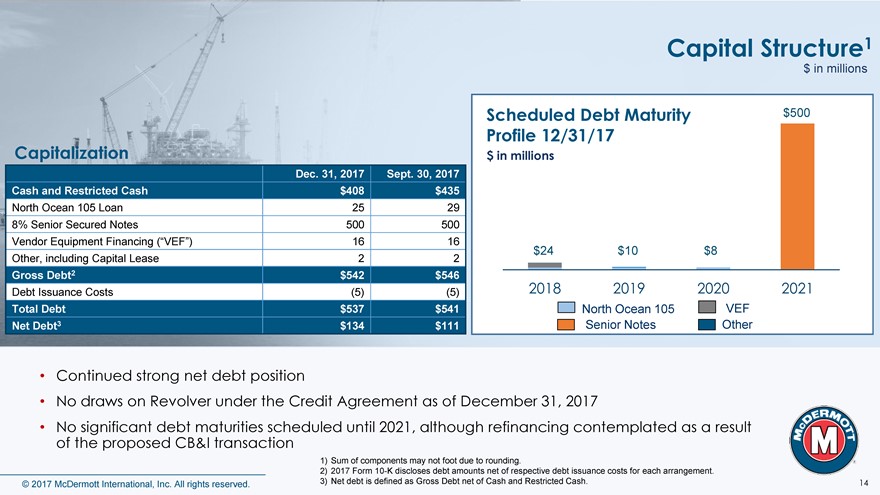
Capital Structure1 $ in millions Scheduled Debt Maturity $500 Capitalization Profile 12/31/17 $ in millions Dec. 31, 2017 Sept. 30, 2017 Cash and Restricted Cash $408 $435 North Ocean 105 Loan 25 29 8% Senior Secured Notes 500 500 Vendor Equipment Financing (“VEF”) 16 16 $24 $10 $8 Other, including Capital Lease 2 2 Gross Debt2 $542 $546 Debt Issuance Costs (5) (5) 2018 2019 2020 2021 Total Debt $537 $541 North Ocean 105 VEF Net Debt3 $134 $111 Senior Notes Other • Continued strong net debt position • No draws on Revolver under the Credit Agreement as of December 31, 2017 • No significant debt maturities scheduled until 2021, although refinancing contemplated as a result of the proposed CB&I transaction 1) Sum of components may not foot due to rounding. 2) 2017 Form 10-K discloses debt amounts net of respective debt issuance costs for each arrangement. © 2017 McDermott International, Inc. All rights reserved. 3) Net debt is defined as Gross Debt net of Cash and Restricted Cash. 14
|
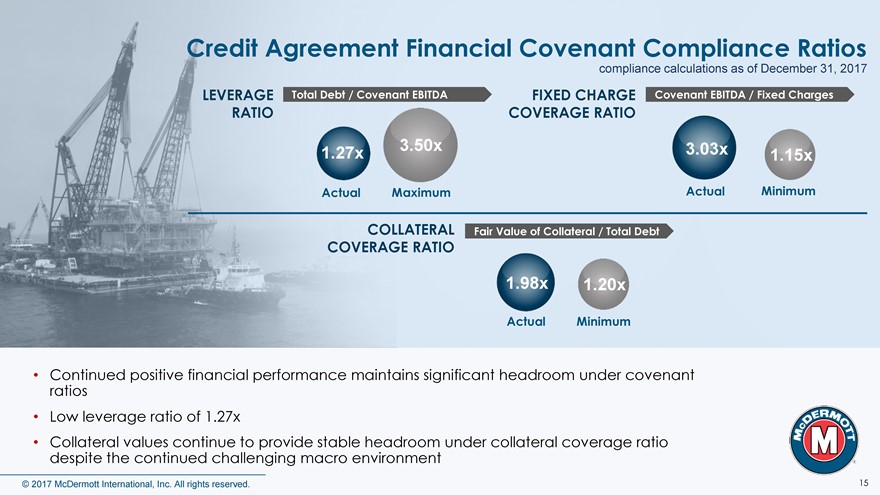
Credit Agreement Financial Covenant Compliance Ratios compliance calculations as of December 31, 2017 LEVERAGE Total Debt / Covenant EBITDA FIXED CHARGE Covenant EBITDA / Fixed Charges RATIO COVERAGE RATIO 3.50x 3.03x 1.27x 1.15x Actual Maximum Actual Minimum COLLATERAL Fair Value of Collateral / Total Debt COVERAGE RATIO 1.98x 1.20x Actual Minimum • Continued positive financial performance maintains significant headroom under covenant ratios • Low leverage ratio of 1.27x • Collateral values continue to provide stable headroom under collateral coverage ratio despite the continued challenging macro environment © 2017 McDermott International, Inc. All rights reserved. 15
|
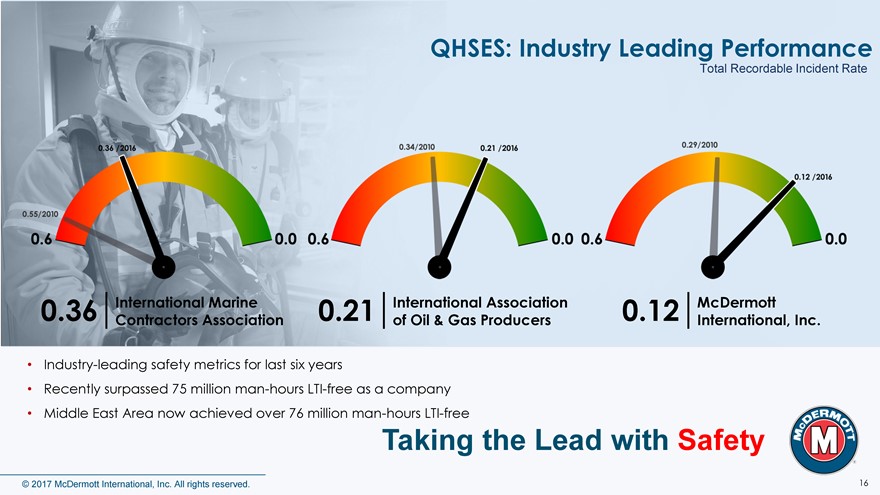
QHSES: Industry Leading Performance Total Recordable Incident Rate 0.36 International Marine 0.21 International Association 0.12 McDermott Contractors Association of Oil & Gas Producers International, Inc. • Industry-leading safety metrics for last six years • Recently surpassed 75 million man-hours LTI-free as a company • Middle East Area now achieved over 76 million man-hours LTI-free Taking the Lead with Safety © 2017 McDermott International, Inc. All rights reserved. 16
|
ORDER INTAKE, BACKLOG & BID PIPELINE © 2017 McDermott International, Inc. All rights reserved. 17
|
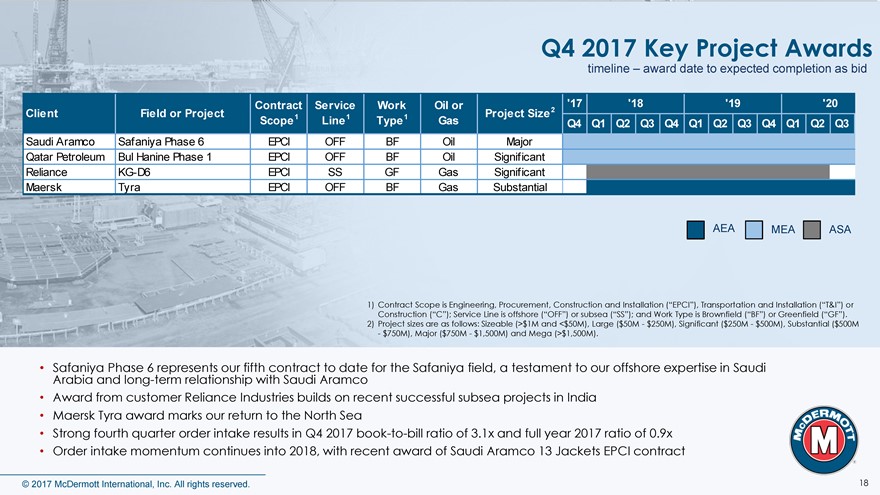
Q4 2017 Key Project Awards timeline – award date to expected completion as bid Contract Service Work Oil or ‘17 ‘18 ‘19 ‘20 Client Field or Project Project Size2 Scope1 Line1 Type1 Gas Q4 Q1 Q2 Q3 Q4 Q1 Q2 Q3 Q4 Q1 Q2 Q3 Saudi Aramco Safaniya Phase 6 EPCI OFF BF Oil Major Qatar Petroleum Bul Hanine Phase 1 EPCI OFF BF Oil Significant Reliance KG-D6 EPCI SS GF Gas Significant Maersk Tyra EPCI OFF BF Gas Substantial AEA MEA ASA 1) Contract Scope is Engineering, Procurement, Construction and Installation (“EPCI”), Transportation and Installation (“T&I”) or Construction (“C”); Service Line is offshore (“OFF”) or subsea (“SS”); and Work Type is Brownfield (“BF”) or Greenfield (“GF”). 2) Project sizes are as follows: Sizeable (>$1M and <$50M), Large ($50M—$250M), Significant ($250M—$500M), Substantial ($500M —$750M), Major ($750M—$1,500M) and Mega (>$1,500M). • Arabia Safaniya and Phase long-term 6 represents relationship our fifth with contract Saudi Aramco to date for the Safaniya field, a testament to our offshore expertise in Saudi • Award from customer Reliance Industries builds on recent successful subsea projects in India • Maersk Tyra award marks our return to the North Sea • Strong fourth quarter order intake results in Q4 2017 book-to-bill ratio of 3.1x and full year 2017 ratio of 0.9x • Order intake momentum continues into 2018, with recent award of Saudi Aramco 13 Jackets EPCI contract © 2017 McDermott International, Inc. All rights reserved. 18
|
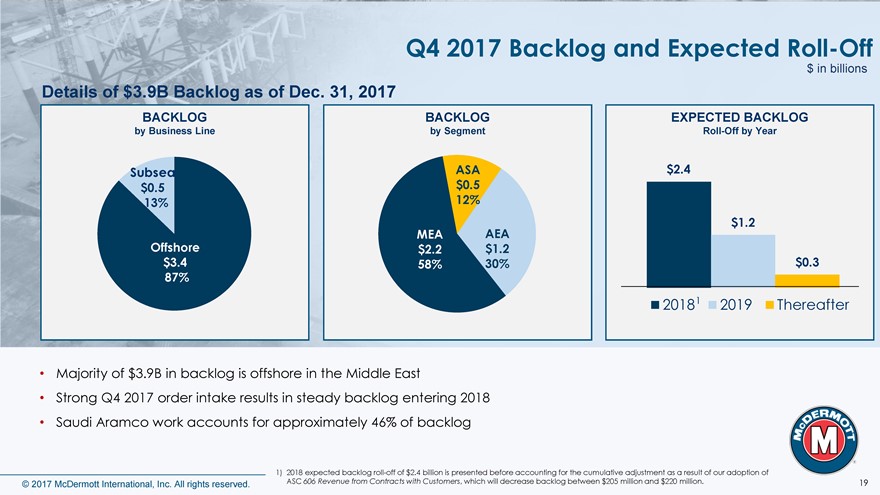
Q4 2017 Backlog and Expected Roll-Off $ in billions Details of $3.9B Backlog as of Dec. 31, 2017 BACKLOG BACKLOG EXPECTED BACKLOG by Business Line by Segment Roll-Off by Year Subsea ASA $2.4 $0.5 $0.5 13% 12% $1.2 MEA AEA Offshore $2.2 $1.2 $3.4 58% 30% $0.3 87% 20181 2019 Thereafter • Majority of $3.9B in backlog is offshore in the Middle East • Strong Q4 2017 order intake results in steady backlog entering 2018 • Saudi Aramco work accounts for approximately 46% of backlog 1) 2018 expected backlog roll-off of $2.4 billion is presented before accounting for the cumulative adjustment as a result of our adoption of © 2017 McDermott International, Inc. All rights reserved. ASC 606 Revenue from Contracts with Customers, which will decrease backlog between $205 million and $220 million. 19
|
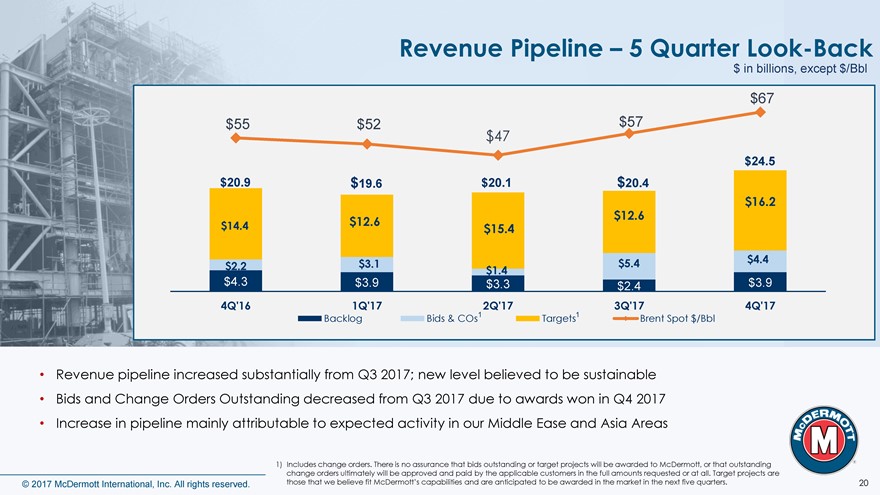
Revenue Pipeline – 5 Quarter Look-Back $ in billions, except $/Bbl 39 40 $67 75 37 38 35 36 34 33 $55 $52 $57 31 32 $47 29 30 27 28 45 25 26 $24.5 23 24 22 21 $20.9 $19.6 $20.1 $20.4 19 20 18 17 $16.2 15 16 $12.6 14 13 $14.4 $12.6 15 12 $15.4 10 11 8 9 6 7 $4.4 5 $2.2 $3.1 $5.4 3 4 $1.4 2 1 $4.3 $3.9 $3.3 $2.4 $3.9 0 -15 4Q’16 1Q’17 2Q’17 3Q’17 4Q’17 Backlog Bids & COs1 Targets1 Brent Spot $/Bbl • Revenue pipeline increased substantially from Q3 2017; new level believed to be sustainable • Bids and Change Orders Outstanding decreased from Q3 2017 due to awards won in Q4 2017 • Increase in pipeline mainly attributable to expected activity in our Middle Ease and Asia Areas 1) Includes change orders. There is no assurance that bids outstanding or target projects will be awarded to McDermott, or that outstanding change orders ultimately will be approved and paid by the applicable customers in the full amounts requested or at all. Target projects are © 2017 McDermott International, Inc. All rights reserved. those that we believe fit McDermott’s capabilities and are anticipated to be awarded in the market in the next five quarters. 20
|
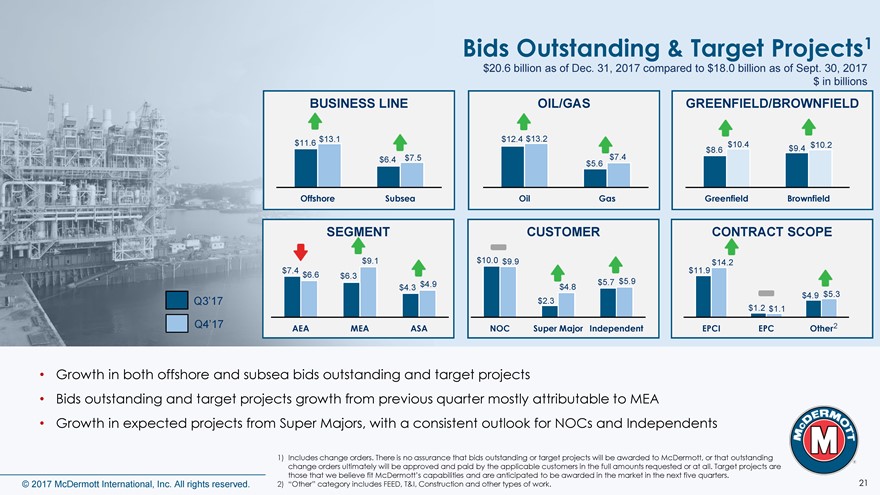
Bids Outstanding & Target Projects1 $20.6 billion as of Dec. 31, 2017 compared to $18.0 billion as of Sept. 30, 2017 $ in billions BUSINESS LINE OIL/GAS GREENFIELD/BROWNFIELD $13.1 $12.4 $13.2 $11.6 $10.4 $10.2 $8.6 $9.4 $6.4 $7.5 $7.4 $5.6 Offshore Subsea Oil Gas Greenfield Brownfield SEGMENT CUSTOMER CONTRACT SCOPE $9.1 $10.0 $9.9 $14.2 $7.4 $11.9 $6.6 $6.3 $4.9 $5.7 $5.9 $4.3 $4.8 $5.3 $4.9 Q3’17 $2.3 $1.2 $1.1 Q4’17 AEA MEA ASA NOC Super Major Independent EPCI EPC Other2 • Growth in both offshore and subsea bids outstanding and target projects • Bids outstanding and target projects growth from previous quarter mostly attributable to MEA • Growth in expected projects from Super Majors, with a consistent outlook for NOCs and Independents 1) Includes change orders. There is no assurance that bids outstanding or target projects will be awarded to McDermott, or that outstanding change orders ultimately will be approved and paid by the applicable customers in the full amounts requested or at all. Target projects are those that we believe fit McDermott’s capabilities and are anticipated to be awarded in the market in the next five quarters. 21 © 2017 McDermott International, Inc. All rights reserved. 2) “Other” category includes FEED, T&I, Construction and other types of work.
|
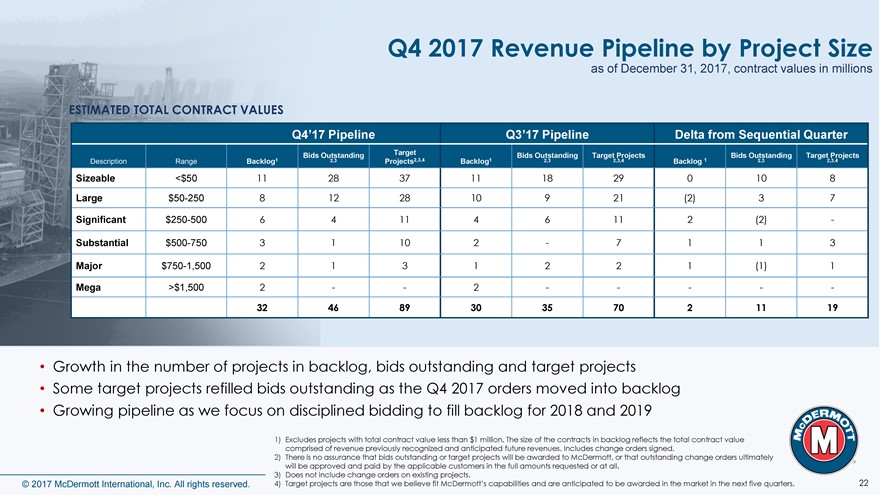
Q4 2017 Revenue Pipeline by Project Size as of December 31, 2017, contract values in millions ESTIMATED TOTAL CONTRACT VALUES Q4’17 Pipeline Q3’17 Pipeline Delta from Sequential Quarter Bids Outstanding Target Bids Outstanding Target Projects Bids Outstanding Target Projects Description Range Backlog1 2,3 Projects2,3,4 Backlog1 2,3 2,3,4 Backlog 1 2,3 2,3,4 Sizeable <$50 11 28 37 11 18 29 0 10 8 Large $50-250 8 12 28 10 9 21 (2) 3 7 Significant $250-500 6 4 11 4 6 11 2 (2)—Substantial $500-750 3 1 10 2—7 1 1 3 Major $750-1,500 2 1 3 1 2 2 1 (1) 1 Mega >$1,500 2 — 2 — ——32 46 89 30 35 70 2 11 19 • Growth in the number of projects in backlog, bids outstanding and target projects • Some target projects refilled bids outstanding as the Q4 2017 orders moved into backlog • Growing pipeline as we focus on disciplined bidding to fill backlog for 2018 and 2019 1) Excludes projects with total contract value less than $1 million. The size of the contracts in backlog reflects the total contract value comprised of revenue previously recognized and anticipated future revenues. Includes change orders signed. 2) There is no assurance that bids outstanding or target projects will be awarded to McDermott, or that outstanding change orders ultimately will be approved and paid by the applicable customers in the full amounts requested or at all. 3) Does not include change orders on existing projects. 22 © 2017 McDermott International, Inc. All rights reserved. 4) Target projects are those that we believe fit McDermott’s capabilities and are anticipated to be awarded in the market in the next five quarters.
|
2018 GUIDANCE © 2017 McDermott International, Inc. All rights reserved. 23
|
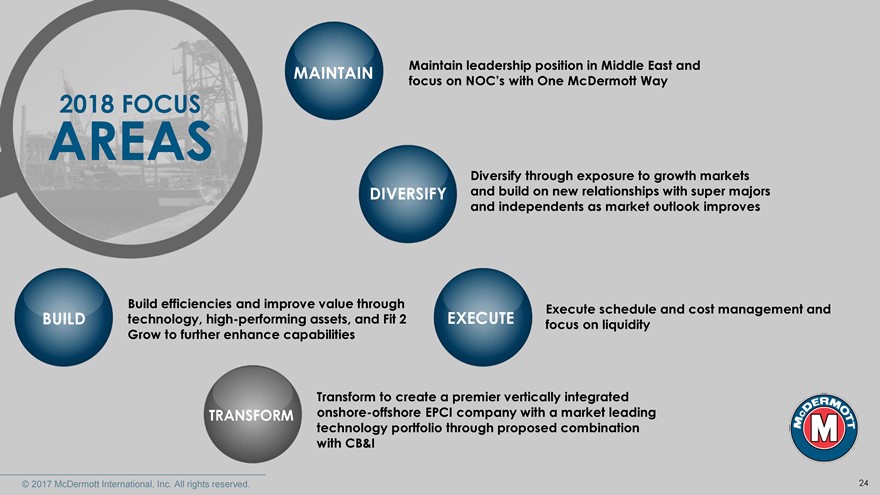
MAINTAIN Maintain leadership position in Middle East and focus on NOC’s with One McDermott Way 2018 FOCUS AREAS Diversify through exposure to growth markets DIVERSIFY and build on new relationships with super majors and independents as market outlook improves value through Execute schedule and cost management and BUILD assets, and Fit 2 EXECUTE focus on liquidity abilities Transform to create a premier vertically integrated TRANSFORM onshore-offshore EPCI company with a market leading technology portfolio through proposed combination with CB&I 24
|
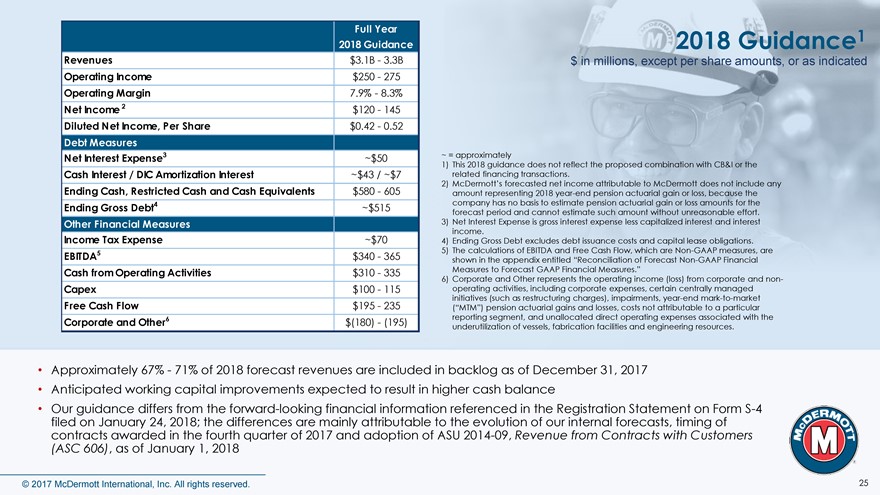
Full Year 1 2018 Guidance 2018 Guidance Revenues $3.1B—3.3B $ in millions, except per share amounts, or as indicated Operating Income $250—275 Operating Margin 7.9%—8.3% Net Income 2 $120—145 Diluted Net Income, Per Share $0.42—0.52 Debt Measures Net Interest Expense3 ~$50 ~ = approximately 1) This 2018 guidance does not reflect the proposed combination with CB&I or the Cash Interest / DIC Amortization Interest ~$43 / ~$7 related financing transactions. 2) McDermott’s forecasted net income attributable to McDermott does not include any Ending Cash, Restricted Cash and Cash Equivalents $580—605 amount representing 2018 year-end pension actuarial gain or loss, because the Ending Gross Debt4 ~$515 company has no basis to estimate pension actuarial gain or loss amounts for the forecast period and cannot estimate such amount without unreasonable effort. Other Financial Measures 3) Net Interest Expense is gross interest expense less capitalized interest and interest income. Income Tax Expense ~$70 4) Ending Gross Debt excludes debt issuance costs and capital lease obligations. 5 5) The calculations of EBITDA and Free Cash Flow, which are Non-GAAP measures, are EBITDA $340—365 shown in the appendix entitled “Reconciliation of Forecast Non-GAAP Financial Cash from Operating Activities $310—335 Measures to Forecast GAAP Financial Measures.” 6) Corporate and Other represents the operating income (loss) from corporate and non- Capex $100—115 operating activities, including corporate expenses, certain centrally managed initiatives (such as restructuring charges), impairments, year-end mark-to-market Free Cash Flow $195—235 (“MTM”) pension actuarial gains and losses, costs not attributable to a particular 6 reporting segment, and unallocated direct operating expenses associated with the Corporate and Other $(180)—(195) underutilization of vessels, fabrication facilities and engineering resources. • Approximately 67%—71% of 2018 forecast revenues are included in backlog as of December 31, 2017 • Anticipated working capital improvements expected to result in higher cash balance • Our guidance differs from the forward-looking financial information referenced in the Registration Statement on Form S-4 filed on January 24, 2018; the differences are mainly attributable to the evolution of our internal forecasts, timing of contracts awarded in the fourth quarter of 2017 and adoption of ASU 2014-09, Revenue from Contracts with Customers (ASC 606), as of January 1, 2018 © 2017 McDermott International, Inc. All rights reserved. 25
|
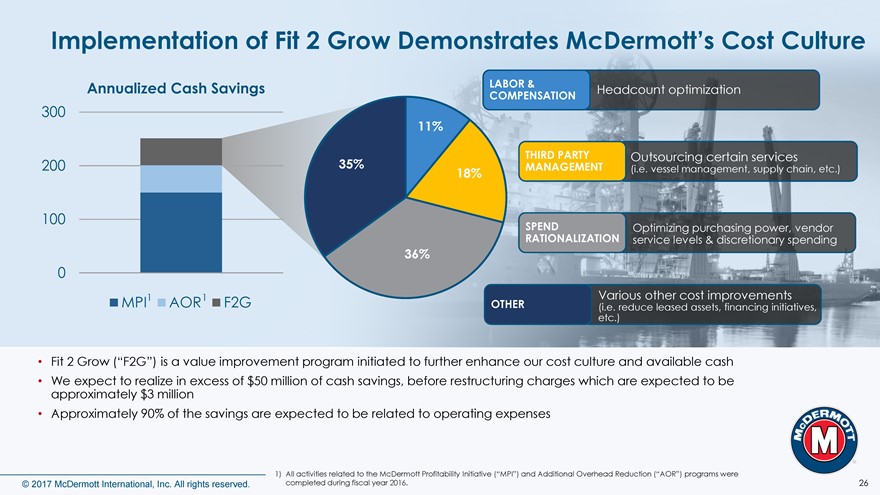
Implementation of Fit 2 Grow Demonstrates McDermott’s Cost Culture Annualized Cash Savings LABOR & Headcount optimization COMPENSATION 300 11% THIRD PARTY Outsourcing certain services 200 35% MANAGEMENT (i.e. vessel management, supply chain, etc.) 18% 100 SPEND Optimizing purchasing power, vendor RATIONALIZATION service levels & discretionary spending 36% 0 MPI1 AOR1 F2G Various other cost improvements OTHER (i.e. reduce leased assets, financing initiatives, etc.) • Fit 2 Grow (“F2G”) is a value improvement program initiated to further enhance our cost culture and available cash • We expect to realize in excess of $50 million of cash savings, before restructuring charges which are expected to be approximately $3 million • Approximately 90% of the savings are expected to be related to operating expenses 1) All activities related to the McDermott Profitability Initiative (“MPI”) and Additional Overhead Reduction (“AOR”) programs were © 2017 McDermott International, Inc. All rights reserved. completed during fiscal year 2016. 26

|
FREQUENTLY ASKED QUESTIONS How… When… If you… The market… © 2017 McDermott International, Inc. All rights reserved. 27
|
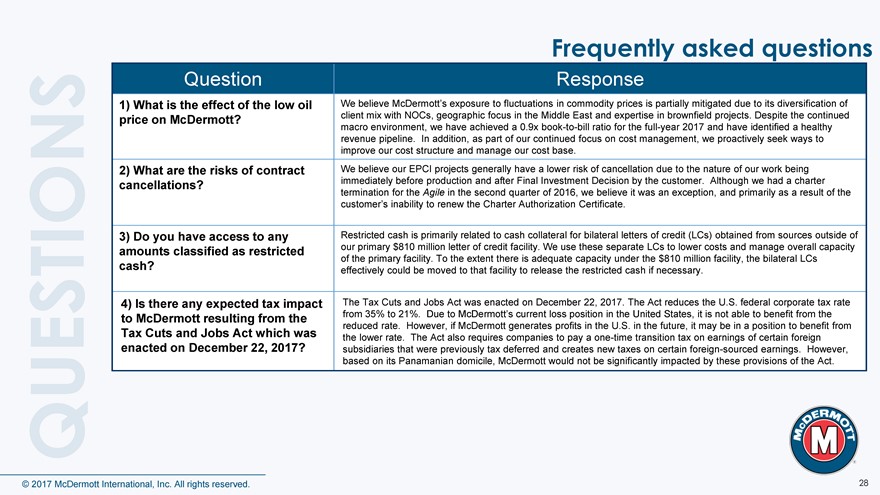
Frequently asked questions Question Response 1) What is the effect of the low oil We believe McDermott’s exposure to fluctuations in commodity prices is partially mitigated due to its diversification of price on McDermott? client mix with NOCs, geographic focus in the Middle East and expertise in brownfield projects. Despite the continued macro environment, we have achieved a 0.9x book-to-bill ratio for the full-year 2017 and have identified a healthy revenue pipeline. In addition, as part of our continued focus on cost management, we proactively seek ways to improve our cost structure and manage our cost base. 2) What are the risks of contract We believe our EPCI projects generally have a lower risk of cancellation due to the nature of our work being cancellations? immediately before production and after Final Investment Decision by the customer. Although we had a charter termination for the Agile in the second quarter of 2016, we believe it was an exception, and primarily as a result of the customer’s inability to renew the Charter Authorization Certificate. 3) Do you have access to any Restricted cash is primarily related to cash collateral for bilateral letters of credit (LCs) obtained from sources outside of amounts classified as restricted our primary $810 million letter of credit facility. We use these separate LCs to lower costs and manage overall capacity of the primary facility. To the extent there is adequate capacity under the $810 million facility, the bilateral LCs cash? effectively could be moved to that facility to release the restricted cash if necessary. 4) Is there any expected tax impact The Tax Cuts and Jobs Act was enacted on December 22, 2017. The Act reduces the U.S. federal corporate tax rate to McDermott resulting from the from 35% to 21%. Due to McDermott’s current loss position in the United States, it is not able to benefit from the reduced rate. However, if McDermott generates profits in the U.S. in the future, it may be in a position to benefit from Tax Cuts and Jobs Act which was the lower rate. The Act also requires companies to pay a one-time transition tax on earnings of certain foreign enacted on December 22, 2017? subsidiaries that were previously tax deferred and creates new taxes on certain foreign-sourced earnings. However, based on its Panamanian domicile, McDermott would not be significantly impacted by these provisions of the Act. © 2017 McDermott International, Inc. All rights reserved. 28
|
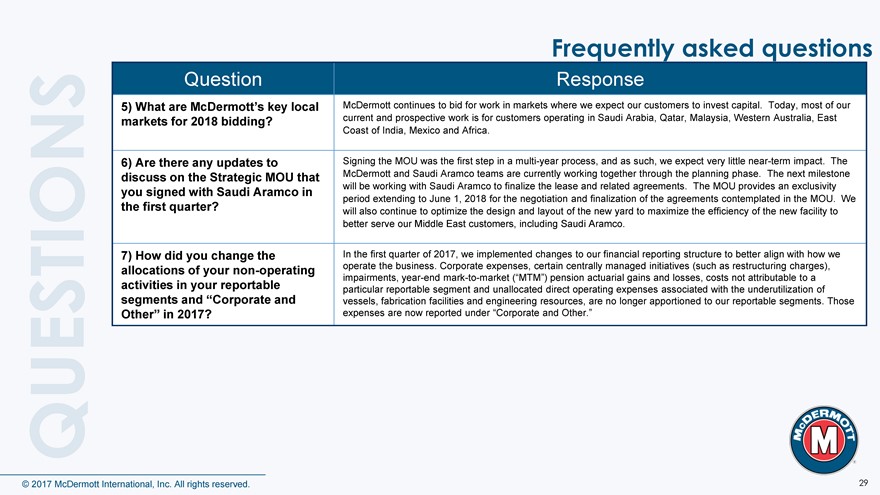
Frequently asked questions Question Response 5) What are McDermott’s key local McDermott continues to bid for work in markets where we expect our customers to invest capital. Today, most of our markets for 2018 bidding? current and prospective work is for customers operating in Saudi Arabia, Qatar, Malaysia, Western Australia, East Coast of India, Mexico and Africa. 6) Are there any updates to Signing the MOU was the first step in a multi-year process, and as such, we expect very little near-term impact. The discuss on the Strategic MOU that McDermott and Saudi Aramco teams are currently working together through the planning phase. The next milestone will be working with Saudi Aramco to finalize the lease and related agreements. The MOU provides an exclusivity you signed with Saudi Aramco in period extending to June 1, 2018 for the negotiation and finalization of the agreements contemplated in the MOU. We the first quarter? will also continue to optimize the design and layout of the new yard to maximize the efficiency of the new facility to better serve our Middle East customers, including Saudi Aramco. 7) How did you change the In the first quarter of 2017, we implemented changes to our financial reporting structure to better align with how we allocations of your non-operating operate the business. Corporate expenses, certain centrally managed initiatives (such as restructuring charges), impairments, year-end mark-to-market (“MTM”) pension actuarial gains and losses, costs not attributable to a activities in your reportable particular reportable segment and unallocated direct operating expenses associated with the underutilization of segments and “Corporate and vessels, fabrication facilities and engineering resources, are no longer apportioned to our reportable segments. Those Other” in 2017? expenses are now reported under “Corporate and Other.” © 2017 McDermott International, Inc. All rights reserved. 29
|
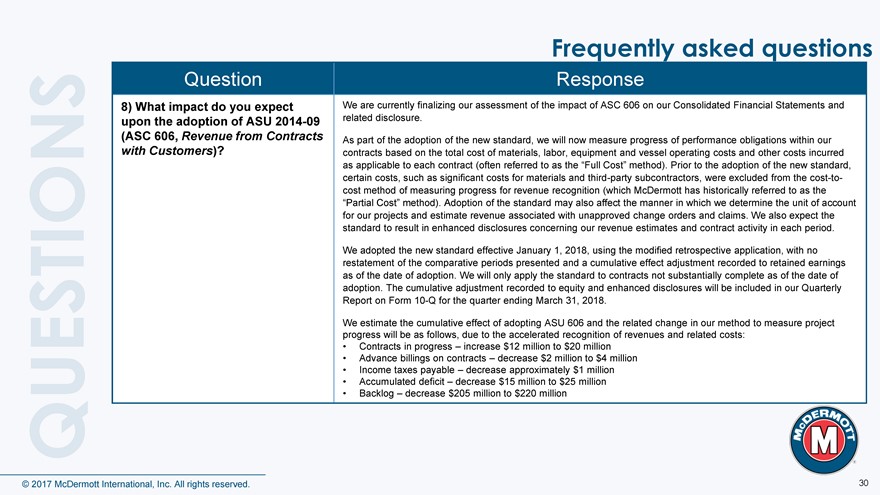
Frequently asked questions Question Response 8) What impact do you expect We are currently finalizing our assessment of the impact of ASC 606 on our Consolidated Financial Statements and upon the adoption of ASU 2014-09 related disclosure. (ASC 606, Revenue from Contracts As part of the adoption of the new standard, we will now measure progress of performance obligations within our with Customers)? contracts based on the total cost of materials, labor, equipment and vessel operating costs and other costs incurred as applicable to each contract (often referred to as the “Full Cost” method). Prior to the adoption of the new standard, certain costs, such as significant costs for materials and third-party subcontractors, were excluded from the cost-to-cost method of measuring progress for revenue recognition (which McDermott has historically referred to as the “Partial Cost” method). Adoption of the standard may also affect the manner in which we determine the unit of account for our projects and estimate revenue associated with unapproved change orders and claims. We also expect the standard to result in enhanced disclosures concerning our revenue estimates and contract activity in each period. We adopted the new standard effective January 1, 2018, using the modified retrospective application, with no restatement of the comparative periods presented and a cumulative effect adjustment recorded to retained earnings as of the date of adoption. We will only apply the standard to contracts not substantially complete as of the date of adoption. The cumulative adjustment recorded to equity and enhanced disclosures will be included in our Quarterly Report on Form 10-Q for the quarter ending March 31, 2018. We estimate the cumulative effect of adopting ASU 606 and the related change in our method to measure project progress will be as follows, due to the accelerated recognition of revenues and related costs: • Contracts in progress – increase $12 million to $20 million • Advance billings on contracts – decrease $2 million to $4 million • Income taxes payable – decrease approximately $1 million • Accumulated deficit – decrease $15 million to $25 million • Backlog – decrease $205 million to $220 million © 2017 McDermott International, Inc. All rights reserved. 30
|
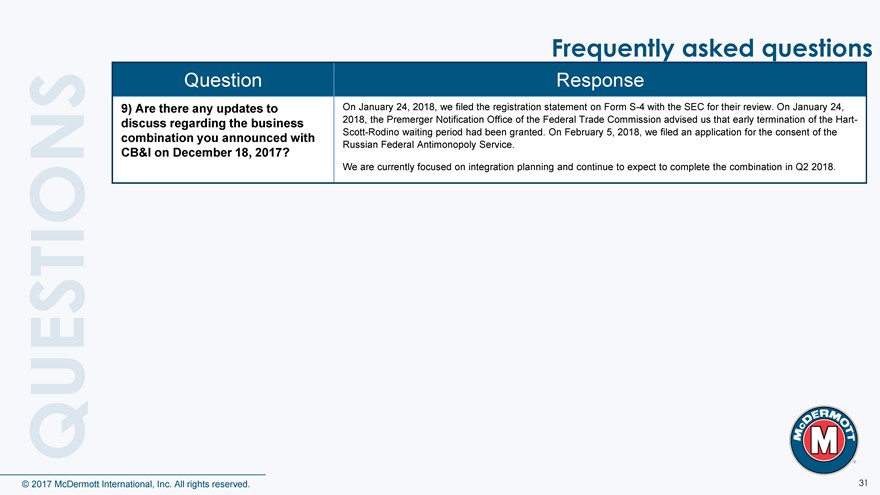
Frequently asked questions Question Response 9) Are there any updates to On January 24, 2018, we filed the registration statement on Form S-4 with the SEC for their review. On January 24, discuss regarding the business 2018, the Premerger Notification Office of the Federal Trade Commission advised us that early termination of the Hart-Scott-Rodino waiting period had been granted. On February 5, 2018, we filed an application for the consent of the combination you announced with Russian Federal Antimonopoly Service. CB&I on December 18, 2017? We are currently focused on integration planning and continue to expect to complete the combination in Q2 2018. © 2017 McDermott International, Inc. All rights reserved. 31

|
FINANCIAL APPENDIX © 2017 McDermott International, Inc. All rights reserved. 32
|
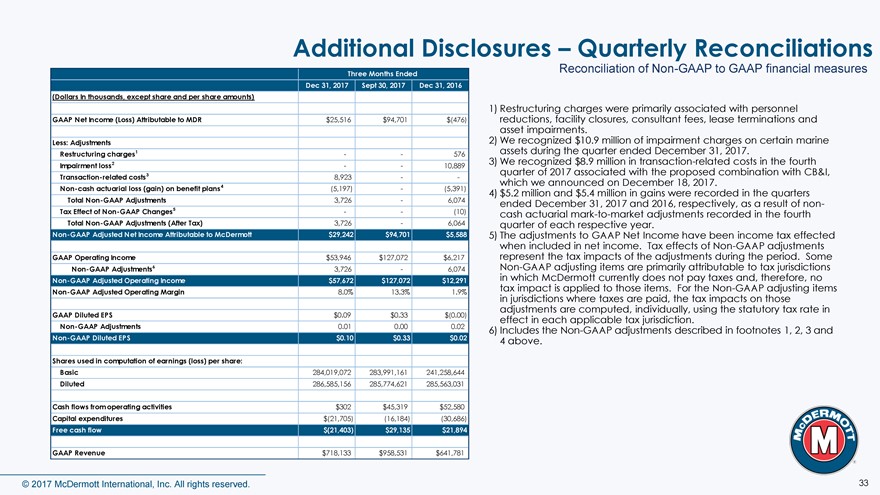
Additional Disclosures – Quarterly Reconciliations Reconciliation of Non-GAAP to GAAP financial measures Three Months Ended Dec 31, 2017 Sept 30, 2017 Dec 31, 2016 (Dollars In thousands, except share and per share amounts) 1) Restructuring charges were primarily associated with personnel GAAP Net Income (Loss) Attributable to MDR $25,516 $94,701 $(476) reductions, facility closures, consultant fees, lease terminations and asset impairments. Less: Adjustments 2) We recognized $10.9 million of impairment charges on certain marine Restructuring charges1 — — 576 assets during the quarter ended December 31, 2017. Impairment loss2 3) We recognized $8.9 million in transaction-related costs in the fourth — — 10,889 3 quarter of 2017 associated with the proposed combination with CB&I, Transaction-related costs 8,923 — — 4 which we announced on December 18, 2017. Non-cash actuarial loss (gain) on benefit plans (5,197) — (5,391) 4) $5.2 million and $5.4 million in gains were recorded in the quarters Total Non-GAAP Adjustments 3,726 — 6,074 ended December 31, 2017 and 2016, respectively, as a result of non-Tax Effect of Non-GAAP Changes5 — — (10) cash actuarial mark-to-market adjustments recorded in the fourth Total Non-GAAP Adjustments (After Tax) 3,726 — 6,064 quarter of each respective year. Non-GAAP Adjusted Net Income Attributable to McDermott $29,242 $94,701 $5,588 5) The adjustments to GAAP Net Income have been income tax effected when included in net income. Tax effects of Non-GAAP adjustments GAAP Operating Income $53,946 $127,072 $6,217 represent the tax impacts of the adjustments during the period. Some Non-GAAP Adjustments6 3,726 — 6,074 Non-GAAP adjusting items are primarily attributable to tax jurisdictions Non-GAAP Adjusted Operating Income $57,672 $127,072 $12,291 in which McDermott currently does not pay taxes and, therefore, no Non-GAAP Adjusted Operating Margin 8.0% 13.3% 1.9% tax impact is applied to those items. For the Non-GAAP adjusting items in jurisdictions where taxes are paid, the tax impacts on those adjustments are computed, individually, using the statutory tax rate in GAAP Diluted EPS $0.09 $0.33 $(0.00) effect in each applicable tax jurisdiction. Non-GAAP Adjustments 0.01 0.00 0.02 6) Includes the Non-GAAP adjustments described in footnotes 1, 2, 3 and Non-GAAP Diluted EPS $0.10 $0.33 $0.02 4 above. Shares used in computation of earnings (loss) per share: Basic 284,019,072 283,991,161 241,258,644 Diluted 286,585,156 285,774,621 285,563,031 Cash flows from operating activities $302 $45,319 $52,580 Capital expenditures $(21,705) (16,184) (30,686) Free cash flow $(21,403) $29,135 $21,894 GAAP Revenue $718,133 $958,531 $641,781 © 2017 McDermott International, Inc. All rights reserved. 33
|
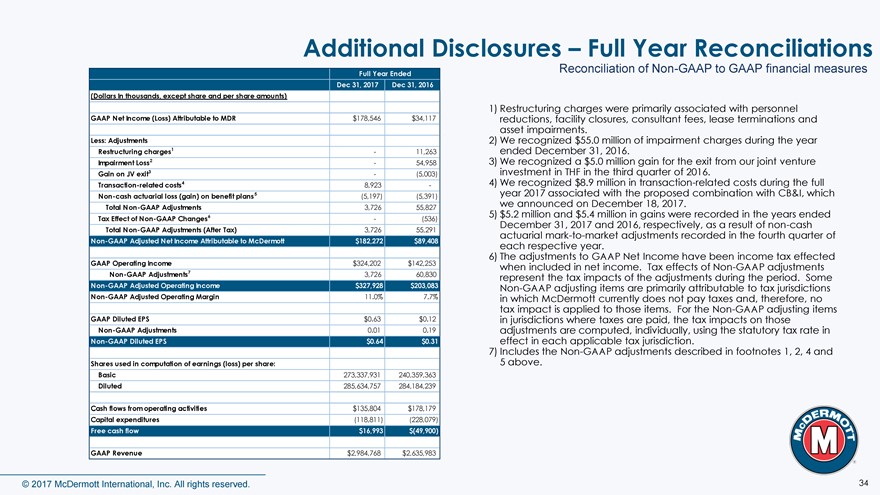
Additional Disclosures – Full Year Reconciliations Reconciliation of Non-GAAP to GAAP financial measures Full Year Ended Dec 31, 2017 Dec 31, 2016 (Dollars In thousands, except share and per share amounts) 1) Restructuring charges were primarily associated with personnel GAAP Net Income (Loss) Attributable to MDR $178,546 $34,117 reductions, facility closures, consultant fees, lease terminations and asset impairments. Less: Adjustments 2) We recognized $55.0 million of impairment charges during the year Restructuring charges1 — 11,263 ended December 31, 2016. Impairment Loss2 — 54,958 3) We recognized a $5.0 million gain for the exit from our joint venture Gain on JV exit3 — (5,003) investment in THF in the third quarter of 2016. Transaction-related costs4 8,923 — 4) We recognized $8.9 million in transaction-related costs during the full Non-cash actuarial loss (gain) on benefit plans5 (5,197) (5,391) year 2017 associated with the proposed combination with CB&I, which Total Non-GAAP Adjustments 3,726 55,827 we announced on December 18, 2017. 6 5) $5.2 million and $5.4 million in gains were recorded in the years ended Tax Effect of Non-GAAP Changes — (536) December 31, 2017 and 2016, respectively, as a result of non-cash Total Non-GAAP Adjustments (After Tax) 3,726 55,291 actuarial mark-to-market adjustments recorded in the fourth quarter of Non-GAAP Adjusted Net Income Attributable to McDermott $182,272 $89,408 each respective year. 6) The adjustments to GAAP Net Income have been income tax effected GAAP Operating Income $324,202 $142,253 when included in net income. Tax effects of Non-GAAP adjustments Non-GAAP Adjustments7 3,726 60,830 represent the tax impacts of the adjustments during the period. Some Non-GAAP Adjusted Operating Income $327,928 $203,083 Non-GAAP adjusting items are primarily attributable to tax jurisdictions Non-GAAP Adjusted Operating Margin 11.0% 7.7% in which McDermott currently does not pay taxes and, therefore, no tax impact is applied to those items. For the Non-GAAP adjusting items GAAP Diluted EPS $0.63 $0.12 in jurisdictions where taxes are paid, the tax impacts on those Non-GAAP Adjustments 0.01 0.19 adjustments are computed, individually, using the statutory tax rate in Non-GAAP Diluted EPS $0.64 $0.31 effect in each applicable tax jurisdiction. 7) Includes the Non-GAAP adjustments described in footnotes 1, 2, 4 and Shares used in computation of earnings (loss) per share: 5 above. Basic 273,337,931 240,359,363 Diluted 285,634,757 284,184,239 Cash flows from operating activities $135,804 $178,179 Capital expenditures (118,811) (228,079) Free cash flow $16,993 $(49,900) GAAP Revenue $2,984,768 $2,635,983 © 2017 McDermott International, Inc. All rights reserved. 34
|
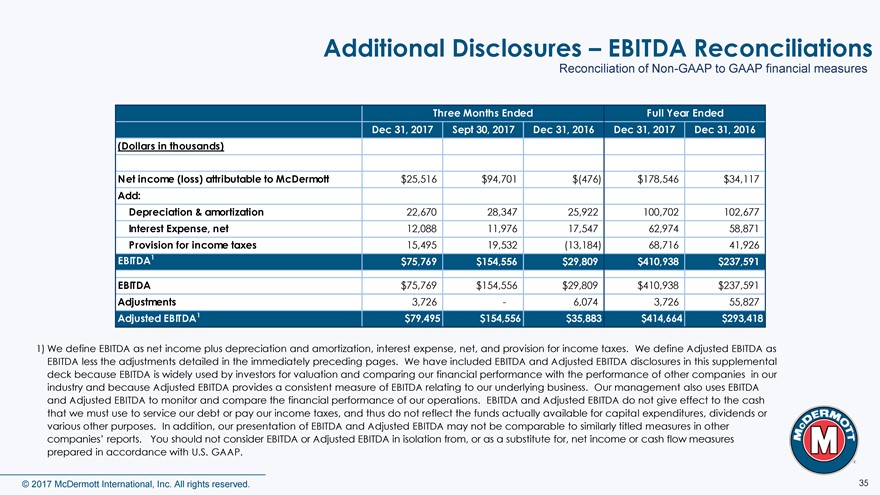
Additional Disclosures – EBITDA Reconciliations Reconciliation of Non-GAAP to GAAP financial measures Three Months Ended Full Year Ended Dec 31, 2017 Sept 30, 2017 Dec 31, 2016 Dec 31, 2017 Dec 31, 2016 (Dollars in thousands) Net income (loss) attributable to McDermott $25,516 $94,701 $(476) $178,546 $34,117 Add: Depreciation & amortization 22,670 28,347 25,922 100,702 102,677 Interest Expense, net 12,088 11,976 17,547 62,974 58,871 Provision for income taxes 15,495 19,532 (13,184) 68,716 41,926 EBITDA1 $75,769 $154,556 $29,809 $410,938 $237,591 EBITDA $75,769 $154,556 $29,809 $410,938 $237,591 Adjustments 3,726 — 6,074 3,726 55,827 Adjusted EBITDA1 $79,495 $154,556 $35,883 $414,664 $293,418 1) We define EBITDA as net income plus depreciation and amortization, interest expense, net, and provision for income taxes. We define Adjusted EBITDA as EBITDA less the adjustments detailed in the immediately preceding pages. We have included EBITDA and Adjusted EBITDA disclosures in this supplemental deck because EBITDA is widely used by investors for valuation and comparing our financial performance with the performance of other companies in our industry and because Adjusted EBITDA provides a consistent measure of EBITDA relating to our underlying business. Our management also uses EBITDA and Adjusted EBITDA to monitor and compare the financial performance of our operations. EBITDA and Adjusted EBITDA do not give effect to the cash that we must use to service our debt or pay our income taxes, and thus do not reflect the funds actually available for capital expenditures, dividends or various other purposes. In addition, our presentation of EBITDA and Adjusted EBITDA may not be comparable to similarly titled measures in other companies’ reports. You should not consider EBITDA or Adjusted EBITDA in isolation from, or as a substitute for, net income or cash flow measures prepared in accordance with U.S. GAAP. © 2017 McDermott International, Inc. All rights reserved. 35
|
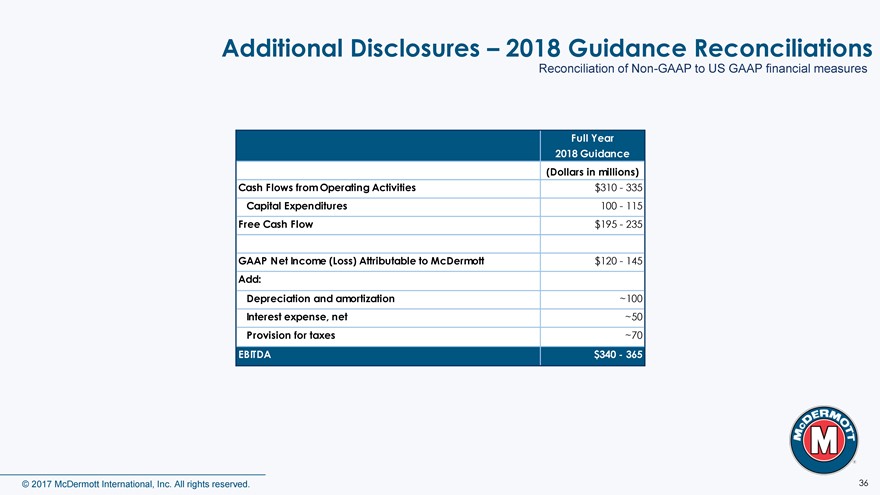
Additional Disclosures – 2018 Guidance Reconciliations Reconciliation of Non-GAAP to US GAAP financial measures Full Year 2018 Guidance (Dollars in millions) Cash Flows from Operating Activities $310—335 Capital Expenditures 100—115 Free Cash Flow $195—235 GAAP Net Income (Loss) Attributable to McDermott $120—145 Add: Depreciation and amortization ~100 Interest expense, net ~50 Provision for taxes ~70 EBITDA $340—365 © 2017 McDermott International, Inc. All rights reserved. 36
|
ADDITIONAL INFORMATION AND WHERE TO FIND IT This communication does not constitute an offer to sell or the solicitation of an offer to buy any securities or a solicitation of any proxy, vote or approval with respect to the proposed transaction or otherwise, nor shall there be any sale of securities in any jurisdiction in which such offer, solicitation or sale would be unlawful prior to registration or qualification under the securities laws of any such jurisdiction. In connection with the proposed transactions, on January 24, 2018, McDermott International, Inc. (“McDermott”) filed a Registration Statement on Form S-4 with the SEC, that included (1) a joint proxy statement of McDermott and Chicago Bridge & Iron Company N.V. (“CB&I”), which also constitutes a prospectus of McDermott and (2) an offering prospectus of McDermott Technology, B.V. to be used in connection with McDermott Technology, B.V.’s offer to acquire CB&I shares. After the registration statement is declared effective by the SEC, McDermott and CB&I intend to mail a definitive joint proxy statement/prospectus to stockholders of McDermott and shareholders of CB&I. Additionally, McDermott Technology, B.V. intends to file a Tender Offer Statement on Schedule TO-T (the “Schedule TO”) with the SEC and soon thereafter CB&I intends to file a Solicitation/Recommendation Statement on Schedule 14D-9 (the “Schedule 14D-9”) with respect to the exchange offer. The exchange offer for the outstanding common stock of CB&I referred to in this document has not yet commenced. The solicitation and offer to purchase shares of CB&I’s common stock will only be made pursuant to the Schedule TO and related offer to purchase. This material is not a substitute for the joint proxy statement/prospectus, the Schedule TO, the Schedule 14D-9 or the Registration Statement or for any other document that McDermott or CB&I may file with the SEC and send to McDermott’s and/or CB&I’s shareholders in connection with the proposed transactions. BEFORE MAKING ANY VOTING OR INVESTMENT DECISION OR DECISION WITH RESPECT TO THE EXCHANGE OFFER, WE URGE INVESTORS OF CB&I AND MCDERMOTT TO READ THE REGISTRATION STATEMENT, JOINT PROXY STATEMENT/PROSPECTUS, SCHEDULE TO (INCLUDING AN OFFER TO PURCHASE, RELATED LETTER OF TRANSMITTAL AND OTHER OFFER DOCUMENTS) AND SCHEDULE 14D-9, AS EACH MAY BE AMENDED OR SUPPLEMENTED FROM TIME TO TIME, AND OTHER RELEVANT DOCUMENTS FILED BY MCDERMOTT AND CB&I WITH THE SEC CAREFULLY WHEN THEY BECOME AVAILABLE BECAUSE THEY WILL CONTAIN IMPORTANT INFORMATION ABOUT MCDERMOTT, CB&I AND THE PROPOSED TRANSACTIONS. Investors will be able to obtain free copies of the Registration Statement, joint proxy statement/prospectus, Schedule TO and Schedule 14D-9, as each may be amended from time to time, and other relevant documents filed by McDermott and CB&I with the SEC (when they become available) at http://www.sec.gov, the SEC’s website, or free of charge from McDermott’s website (http://www.mcdermott.com) under the tab, “Investors” and under the heading “Financial Information” or by contacting McDermott’s Investor Relations Department at (281) 870-5147. These documents are also available free of charge from CB&I’s website (http://www.cbi.com) under the tab “Investors” and under the heading “SEC Filings” or by contacting CB&I’s Investor Relations Department at (832) 513-1068. PARTICIPANTS IN PROXY SOLICITATION McDermott, CB&I and their respective directors and certain of their executive officers and employees may be deemed, under SEC rules, to be participants in the solicitation of proxies from McDermott’s and CB&I’s shareholders in connection with the proposed transactions. Information regarding the officers and directors of McDermott is included in its definitive proxy statement for its 2017 annual meeting filed with SEC on March 24, 2017. Information regarding the officers and directors of CB&I is included in its definitive proxy statement for its 2017 annual meeting filed with the SEC on March 24, 2017. Additional information regarding the persons who may be deemed participants and their interests will be set forth in the Registration Statement and joint proxy statement/prospectus and other materials when they are filed with SEC in connection with the proposed transactions. Free copies of these documents may be obtained as described in the paragraphs above. © 2017 McDermott International, Inc. All rights reserved. 37