Supplemental Package
Exhibit 99.3

Supplemental Information
Second Quarter 2011
This information is preliminary and based on company data available
at the time of the earnings presentation. It speaks only as of the particular date or dates included in the accompanying pages. Bank of America does not undertake an obligation to, and disclaims any duty to, update any of the information provided.
Any forward-looking statements in this information are subject to the forward-looking language contained in Bank of America’s reports filed with the SEC pursuant to the Securities Exchange Act of 1934, which are available at the SEC’s
website (www.sec.gov) or at Bank of America’s website (www.bankofamerica.com). Bank of America’s future financial performance is subject to risks and uncertainties as described in its SEC filings.
|
|
|
|
|
| Bank of America Corporation and Subsidiaries |
|
|
|
|
| Table of Contents |
|
|
Page |
|
| |
|
|
|
| Consolidated Financial Highlights |
|
|
2 |
|
| Supplemental Financial Data |
|
|
3 |
|
| Consolidated Statement of Income |
|
|
4 |
|
| Consolidated Balance Sheet |
|
|
5,6 |
|
| Capital Management |
|
|
7 |
|
| Core Net Interest Income |
|
|
8 |
|
| Quarterly Average Balances and Interest Rates |
|
|
9,10 |
|
| Year-to-Date Average Balances and Interest Rates |
|
|
11,12 |
|
| Debt Securities and Available-for-Sale Marketable Equity Securities |
|
|
13 |
|
| Quarterly Results by Business Segment |
|
|
14 |
|
| Year-to-Date Results by Business Segment |
|
|
15 |
|
| Deposits |
|
|
|
|
| Total Segment Results |
|
|
16 |
|
| Key Indicators |
|
|
17 |
|
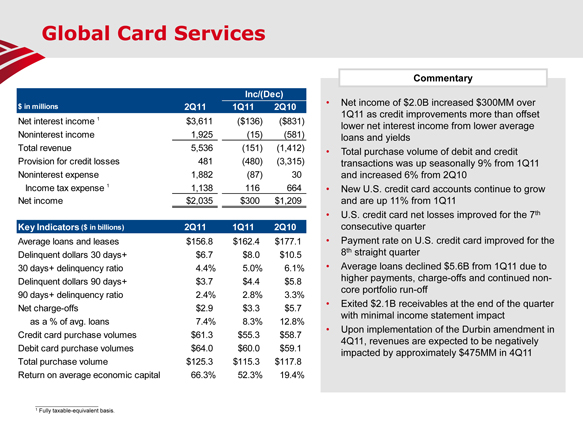
| Global Card Services |
|
|
|
|
| Total Segment Results |
|
|
18 |
|
| Key Indicators |
|
|
19 |
|
| Consumer Real Estate Services |
|
|
|
|
| Total Segment Results |
|
|
20 |
|
| Quarterly and Year-to-Date Results |
|
|
21 |
|
| Key Indicators |
|
|
22 |
|
| Global Commercial Banking |
|
|
|
|
| Total Segment Results |
|
|
23 |
|
| Key Indicators |
|
|
24 |
|
| Global Banking & Markets |
|
|
|
|
| Total Segment Results |
|
|
25 |
|
| Key Indicators |
|
|
26 |
|
| Credit Default Swaps with Monoline Financial Guarantors |
|
|
27 |
|
| Investment Banking Product Rankings |
|
|
28 |
|
| Global Wealth & Investment Management |
|
|
|
|
| Total Segment Results |
|
|
29 |
|
| Key Indicators |
|
|
30 |
|
| All Other |
|
|
|
|
| Total Segment Results |
|
|
31 |
|
| Equity Investments |
|
|
32 |
|
| Outstanding Loans and Leases |
|
|
33 |
|
| Quarterly Average Loans and Leases by Business Segment |
|
|
34 |
|
| Commercial Credit Exposure by Industry |
|
|
35 |
|
| Net Credit Default Protection by Maturity Profile and Credit Exposure Debt Rating |
|
|
36 |
|
| Selected Emerging Markets |
|
|
37 |
|
| Selected European Countries |
|
|
38 |
|
| Nonperforming Loans, Leases and Foreclosed Properties |
|
|
39 |
|
| Nonperforming Loans, Leases and Foreclosed Properties Activity |
|
|
40 |
|
| Quarterly Net Charge-offs and Net Charge-off Ratios |
|
|
41 |
|
| Year-to-Date Net Charge-offs and Net Charge-off Ratios |
|
|
42 |
|
| Allocation of the Allowance for Credit Losses by Product Type |
|
|
43 |
|
|
|
| Exhibit A: Non-GAAP Reconciliations |
|
|
44,45 |
|
|
|
| Appendix: Selected Slides from the Second Quarter 2011 Earnings Release Presentation |
|
|
46 |
|
1
Bank of America Corporation and Subsidiaries
Consolidated Financial Highlights
(Dollars in millions, except per share information; shares in thousands)
|
|
|
|
|
|
|
|
|
|
|
|
|
|
|
|
|
|
|
|
|
|
|
|
|
|
|
|
|
|
|
|
|
| |
|
Six Months Ended
June 30 |
|
|
|
|
|
|
Second
Quarter
2011 |
|
|
First
Quarter
2011 |
|
|
Fourth
Quarter
2010 |
|
|
Third
Quarter
2010 |
|
|
Second
Quarter
2010 |
|
| |
|
2011 |
|
|
2010 |
|
|
|
|
|
|
|
|
|
|
| Income statement |
|
|
|
|
|
|
|
|
|
|
|
|
|
|
|
|
|
|
|
|
|
|
|
|
|
|
|
|
|
|
|
|
| Net interest income |
|
$ |
23,425 |
|
|
$ |
26,649 |
|
|
|
|
|
|
$ |
11,246 |
|
|
$ |
12,179 |
|
|
$ |
12,439 |
|
|
$ |
12,435 |
|
|
$ |
12,900 |
|
| Noninterest income |
|
|
16,688 |
|
|
|
34,473 |
|
|
|
|
|
|
|
1,990 |
|
|
|
14,698 |
|
|
|
9,959 |
|
|
|
14,265 |
|
|
|
16,253 |
|
| Total revenue, net of interest expense |
|
|
40,113 |
|
|
|
61,122 |
|
|
|
|
|
|
|
13,236 |
|
|
|
26,877 |
|
|
|
22,398 |
|
|
|
26,700 |
|
|
|
29,153 |
|
| Provision for credit losses |
|
|
7,069 |
|
|
|
17,910 |
|
|
|
|
|
|
|
3,255 |
|
|
|
3,814 |
|
|
|
5,129 |
|
|
|
5,396 |
|
|
|
8,105 |
|
| Goodwill impairment |
|
|
2,603 |
|
|
|
— |
|
|
|
|
|
|
|
2,603 |
|
|
|
— |
|
|
|
2,000 |
|
|
|
10,400 |
|
|
|
— |
|
| Merger and restructuring charges |
|
|
361 |
|
|
|
1,029 |
|
|
|
|
|
|
|
159 |
|
|
|
202 |
|
|
|
370 |
|
|
|
421 |
|
|
|
508 |
|
| All other noninterest expense (1) |
|
|
40,175 |
|
|
|
33,999 |
|
|
|
|
|
|
|
20,094 |
|
|
|
20,081 |
|
|
|
18,494 |
|
|
|
16,395 |
|
|
|
16,745 |
|
| Income tax expense (benefit) |
|
|
(3,318 |
) |
|
|
1,879 |
|
|
|
|
|
|
|
(4,049 |
) |
|
|
731 |
|
|
|
(2,351 |
) |
|
|
1,387 |
|
|
|
672 |
|
| Net income (loss) |
|
|
(6,777 |
) |
|
|
6,305 |
|
|
|
|
|
|
|
(8,826 |
) |
|
|
2,049 |
|
|
|
(1,244 |
) |
|
|
(7,299 |
) |
|
|
3,123 |
|
| Preferred stock dividends |
|
|
611 |
|
|
|
688 |
|
|
|
|
|
|
|
301 |
|
|
|
310 |
|
|
|
321 |
|
|
|
348 |
|
|
|
340 |
|
| Net income (loss) applicable to common shareholders |
|
|
(7,388 |
) |
|
|
5,617 |
|
|
|
|
|
|
|
(9,127 |
) |
|
|
1,739 |
|
|
|
(1,565 |
) |
|
|
(7,647 |
) |
|
|
2,783 |
|
| Diluted earnings (loss) per common share
(2) |
|
|
(0.73 |
) |
|
|
0.55 |
|
|
|
|
|
|
|
(0.90 |
) |
|
|
0.17 |
|
|
|
(0.16 |
) |
|
|
(0.77 |
) |
|
|
0.27 |
|
| Average diluted common shares issued and outstanding
(2) |
|
|
10,085,479 |
|
|
|
10,020,926 |
|
|
|
|
|
|
|
10,094,928 |
|
|
|
10,181,351 |
|
|
|
10,036,575 |
|
|
|
9,976,351 |
|
|
|
10,029,776 |
|
| Dividends paid per common share |
|
$ |
0.02 |
|
|
$ |
0.02 |
|
|
|
|
|
|
$ |
0.01 |
|
|
$ |
0.01 |
|
|
$ |
0.01 |
|
|
$ |
0.01 |
|
|
$ |
0.01 |
|
|
|
|
|
|
|
|
|
|
|
| Performance ratios |
|
|
|
|
|
|
|
|
|
|
|
|
|
|
|
|
|
|
|
|
|
|
|
|
|
|
|
|
|
|
|
|
| Return on average assets |
|
|
n/m |
|
|
|
0.51 |
% |
|
|
|
|
|
|
n/m |
|
|
|
0.36 |
% |
|
|
n/m |
|
|
|
n/m |
|
|
|
0.50 |
% |
| Return on average common shareholders’ equity |
|
|
n/m |
|
|
|
5.45 |
|
|
|
|
|
|
|
n/m |
|
|
|
3.29 |
|
|
|
n/m |
|
|
|
n/m |
|
|
|
5.18 |
|
| Return on average tangible common shareholders’ equity
(3) |
|
|
n/m |
|
|
|
9.48 |
|
|
|
|
|
|
|
n/m |
|
|
|
5.28 |
|
|
|
n/m |
|
|
|
n/m |
|
|
|
9.19 |
|
| Return on average tangible shareholders’ equity (3) |
|
|
n/m |
|
|
|
9.26 |
|
|
|
|
|
|
|
n/m |
|
|
|
5.54 |
|
|
|
n/m |
|
|
|
n/m |
|
|
|
8.98 |
|
| At period end |
|
|
|
|
|
|
|
|
|
|
|
|
|
|
|
|
|
|
|
|
|
|
|
|
|
|
|
|
|
|
|
|
| Book value per share of common stock |
|
$ |
20.29 |
|
|
$ |
21.45 |
|
|
|
|
|
|
$ |
20.29 |
|
|
$ |
21.15 |
|
|
$ |
20.99 |
|
|
$ |
21.17 |
|
|
$ |
21.45 |
|
| Tangible book value per share of common
stock (3) |
|
|
12.65 |
|
|
|
12.14 |
|
|
|
|
|
|
|
12.65 |
|
|
|
13.21 |
|
|
|
12.98 |
|
|
|
12.91 |
|
|
|
12.14 |
|
| Market price per share of common stock: |
|
|
|
|
|
|
|
|
|
|
|
|
|
|
|
|
|
|
|
|
|
|
|
|
|
|
|
|
|
|
|
|
| Closing price |
|
$ |
10.96 |
|
|
$ |
14.37 |
|
|
|
|
|
|
$ |
10.96 |
|
|
$ |
13.33 |
|
|
$ |
13.34 |
|
|
$ |
13.10 |
|
|
$ |
14.37 |
|
| High closing price for the period |
|
|
15.25 |
|
|
|
19.48 |
|
|
|
|
|
|
|
13.72 |
|
|
|
15.25 |
|
|
|
13.56 |
|
|
|
15.67 |
|
|
|
19.48 |
|
| Low closing price for the period |
|
|
10.50 |
|
|
|
14.37 |
|
|
|
|
|
|
|
10.50 |
|
|
|
13.33 |
|
|
|
10.95 |
|
|
|
12.32 |
|
|
|
14.37 |
|
| Market capitalization |
|
|
111,060 |
|
|
|
144,174 |
|
|
|
|
|
|
|
111,060 |
|
|
|
135,057 |
|
|
|
134,536 |
|
|
|
131,442 |
|
|
|
144,174 |
|
|
|
|
|
|
|
|
|
|
|
| Number of banking centers - U.S. |
|
|
5,742 |
|
|
|
5,900 |
|
|
|
|
|
|
|
5,742 |
|
|
|
5,805 |
|
|
|
5,856 |
|
|
|
5,879 |
|
|
|
5,900 |
|
| Number of branded ATMs - U.S. |
|
|
17,817 |
|
|
|
18,078 |
|
|
|
|
|
|
|
17,817 |
|
|
|
17,886 |
|
|
|
17,926 |
|
|
|
17,929 |
|
|
|
18,078 |
|
| Full-time equivalent employees |
|
|
287,839 |
|
|
|
284,628 |
|
|
|
|
|
|
|
287,839 |
|
|
|
288,062 |
|
|
|
288,471 |
|
|
|
287,293 |
|
|
|
284,628 |
|
| (1) |
Excludes merger and restructuring charges and goodwill impairment charge. |
| (2) |
Due to a net loss applicable to common shareholders for the second quarter of 2011 and the fourth and third quarters of 2010, no dilutive potential common shares
were included in the calculations of diluted earnings per share and average diluted common shares because they were antidilutive. |
| (3) |
Tangible equity ratios and tangible book value per share of common stock are non-GAAP measures. We believe the use of these non-GAAP measures provides additional
clarity in assessing the results of the Corporation. (See Exhibit A: Non-GAAP Reconciliations - Reconciliations to GAAP Financial Measures on pages 44-45.) |
Certain prior period amounts have been reclassified to conform to current period presentation.
|
|
|
| This information is preliminary and based on company data available at the time of the presentation. |
|
2 |
Bank of America Corporation and Subsidiaries
Supplemental Financial Data
(Dollars in millions, except per share information)
Fully taxable-equivalent basis data (1)
|
|
|
|
|
|
|
|
|
|
|
|
|
|
|
|
|
|
|
|
|
|
|
|
|
|
|
|
|
|
|
|
|
|
|
|
|
|
|
|
|
|
|
|
|
|
|
|
|
|
|
|
|
|
|
|
|
|
|
|
|
| |
|
Six Months
Ended
June 30 |
|
|
|
|
|
|
|
|
|
Second
Quarter
2011 |
|
|
|
|
|
First
Quarter
2011 |
|
|
|
|
|
Fourth
Quarter
2010 |
|
|
|
|
|
Third
Quarter
2010 |
|
|
|
|
|
Second
Quarter
2010 |
|
|
|
|
| |
|
2011 |
|
|
|
|
|
2010 |
|
|
|
|
|
|
|
|
|
|
|
|
|
|
|
|
|
|
| Net interest income |
|
$ |
23,890 |
|
|
|
|
|
|
$ |
27,267 |
|
|
|
|
|
|
|
|
|
|
$ |
11,493 |
|
|
|
|
|
|
$ |
12,397 |
|
|
|
|
|
|
$ |
12,709 |
|
|
|
|
|
|
$ |
12,717 |
|
|
|
|
|
|
$ |
13,197 |
|
|
|
|
|
| Total revenue, net of interest expense |
|
|
40,578 |
|
|
|
|
|
|
|
61,740 |
|
|
|
|
|
|
|
|
|
|
|
13,483 |
|
|
|
|
|
|
|
27,095 |
|
|
|
|
|
|
|
22,668 |
|
|
|
|
|
|
|
26,982 |
|
|
|
|
|
|
|
29,450 |
|
|
|
|
|
| Net interest yield (2) |
|
|
2.58 |
|
|
|
% |
|
|
|
2.85 |
|
|
|
% |
|
|
|
|
|
|
|
2.50 |
|
|
|
% |
|
|
|
2.67 |
|
|
|
% |
|
|
|
2.69 |
|
|
|
% |
|
|
|
2.72 |
|
|
|
% |
|
|
|
2.77 |
|
|
|
% |
|
| Efficiency ratio |
|
|
n/m |
|
|
|
|
|
|
|
56.73 |
|
|
|
|
|
|
|
|
|
|
|
n/m |
|
|
|
|
|
|
|
74.86 |
|
|
|
|
|
|
|
92.04 |
|
|
|
|
|
|
|
100.87 |
|
|
|
|
|
|
|
58.58 |
|
|
|
|
|
|
|
|
|
|
|
|
|
|
|
|
|
|
|
|
|
|
| |
|
|
|
|
|
|
|
|
|
|
|
|
|
|
|
|
|
|
|
|
|
|
|
|
|
|
|
|
|
|
|
|
|
|
|
|
|
|
|
|
|
|
|
|
|
|
|
|
|
|
|
|
|
|
|
|
|
|
|
|
|
|
|
|
|
|
|
|
|
|
|
|
| Performance ratios, excluding goodwill impairment charges (3) |
|
|
|
|
|
|
|
|
|
|
|
|
|
|
|
|
|
|
|
|
|
|
|
|
|
|
|
|
|
|
|
|
|
|
|
|
|
|
|
|
|
|
|
|
|
|
|
|
|
|
|
|
|
|
|
|
|
|
|
| |
|
Six Months
Ended
June 30
2011 |
|
|
|
|
|
|
|
|
|
|
|
|
|
|
|
Second
Quarter
2011 |
|
|
|
|
|
|
|
|
|
|
|
Fourth
Quarter
2010 |
|
|
|
|
|
Third
Quarter
2010 |
|
|
|
|
|
|
|
|
|
|
| Per common share information |
|
|
|
|
|
|
|
|
|
|
|
|
|
|
|
|
|
|
|
|
|
|
|
|
|
|
|
|
|
|
|
|
|
|
|
|
|
|
|
|
|
|
|
|
|
|
|
|
|
|
|
|
|
|
|
|
|
|
|
|
| Earnings (loss) |
|
$ |
(0.48 |
) |
|
|
|
|
|
|
|
|
|
|
|
|
|
|
|
|
|
$ |
(0.65 |
) |
|
|
|
|
|
|
|
|
|
|
|
|
|
$ |
0.04 |
|
|
|
|
|
|
$ |
0.27 |
|
|
|
|
|
|
|
|
|
|
|
|
|
| Diluted earnings (loss) |
|
|
(0.48 |
) |
|
|
|
|
|
|
|
|
|
|
|
|
|
|
|
|
|
|
(0.65 |
) |
|
|
|
|
|
|
|
|
|
|
|
|
|
|
0.04 |
|
|
|
|
|
|
|
0.27 |
|
|
|
|
|
|
|
|
|
|
|
|
|
| Efficiency ratio (1) |
|
|
n/m |
|
|
|
|
|
|
|
|
|
|
|
|
|
|
|
|
|
|
|
n/m |
|
|
|
|
|
|
|
|
|
|
|
|
|
|
|
83.22 |
|
|
|
% |
|
|
|
62.33 |
|
|
|
% |
|
|
|
|
|
|
|
|
|
| Return on average assets |
|
|
n/m |
|
|
|
|
|
|
|
|
|
|
|
|
|
|
|
|
|
|
|
n/m |
|
|
|
|
|
|
|
|
|
|
|
|
|
|
|
0.13 |
|
|
|
|
|
|
|
0.52 |
|
|
|
|
|
|
|
|
|
|
|
|
|
| Return on average common shareholders’ equity |
|
|
n/m |
|
|
|
|
|
|
|
|
|
|
|
|
|
|
|
|
|
|
|
n/m |
|
|
|
|
|
|
|
|
|
|
|
|
|
|
|
0.79 |
|
|
|
|
|
|
|
5.06 |
|
|
|
|
|
|
|
|
|
|
|
|
|
| Return on average tangible common shareholders’ equity (3) |
|
|
n/m |
|
|
|
|
|
|
|
|
|
|
|
|
|
|
|
|
|
|
|
n/m |
|
|
|
|
|
|
|
|
|
|
|
|
|
|
|
1.27 |
|
|
|
|
|
|
|
8.67 |
|
|
|
|
|
|
|
|
|
|
|
|
|
| Return on average tangible shareholders’ equity
(3) |
|
|
n/m |
|
|
|
|
|
|
|
|
|
|
|
|
|
|
|
|
|
|
|
n/m |
|
|
|
|
|
|
|
|
|
|
|
|
|
|
|
1.96 |
|
|
|
|
|
|
|
8.54 |
|
|
|
|
|
|
|
|
|
|
|
|
|
| (1) |
Fully taxable-equivalent basis is a non-GAAP measure. Fully taxable-equivalent basis is a performance measure used by management in operating the business that
management believes provides investors with a more accurate picture of the interest margin for comparative purposes. (See Exhibit A: Non-GAAP Reconciliations - Reconciliations to GAAP Financial Measures on pages 44-45). |
| (2) |
Calculation includes fees earned on overnight deposits placed with the Federal Reserve of $112 million and $198 million for the six months ended June 30, 2011
and 2010; $49 million and $63 million for the second and first quarters of 2011, and $63 million, $107 million and $106 million for the fourth, third and second quarters of 2010, respectively. For more information see Quarterly and Year-to-Date
Average Balances and Interest Rates - Fully Taxable-equivalent Basis on pages 9-10 and 11-12. |
| (3) |
Total noninterest expense, excluding goodwill impairment charges, net income, excluding goodwill impairment charges and net income applicable to common shareholders,
excluding goodwill impairment charges and tangible equity ratios are non-GAAP measures. We believe the use of these non-GAAP measures provides additional clarity in assessing the results of the Corporation. (See Exhibit A: Non-GAAP Reconciliations -
Reconciliations to GAAP Financial Measures on pages 44-45). |
| Certain |
prior period amounts have been reclassified to conform to current period presentation. |
|
|
|
| This information is preliminary and based on company data available at the time of the presentation. |
|
3 |
Bank of America Corporation and Subsidiaries
Consolidated Statement of Income
(Dollars in millions, except per share information; shares in thousands)
|
|
|
|
|
|
|
|
|
|
|
|
|
|
|
|
|
|
|
|
|
|
|
|
|
|
|
|
|
|
|
| |
|
Six Months
Ended
June 30 |
|
|
|
|
Second Quarter |
|
|
First Quarter |
|
|
Fourth Quarter |
|
|
Third Quarter |
|
|
Second Quarter |
|
| |
|
2011 |
|
|
2010 |
|
|
|
|
2011 |
|
|
2011 |
|
|
2010 |
|
|
2010 |
|
|
2010 |
|
| Interest income |
|
|
|
|
|
|
|
|
|
|
|
|
|
|
|
|
|
|
|
|
|
|
|
|
|
|
|
|
|
|
| Loans and leases |
|
$ |
23,249 |
|
|
$ |
26,362 |
|
|
|
|
$ |
11,320 |
|
|
$ |
11,929 |
|
|
$ |
12,149 |
|
|
$ |
12,485 |
|
|
$ |
12,887 |
|
| Debt securities |
|
|
5,557 |
|
|
|
6,033 |
|
|
|
|
|
2,675 |
|
|
|
2,882 |
|
|
|
3,029 |
|
|
|
2,605 |
|
|
|
2,917 |
|
| Federal funds sold and securities borrowed or purchased under agreements to resell |
|
|
1,114 |
|
|
|
905 |
|
|
|
|
|
597 |
|
|
|
517 |
|
|
|
486 |
|
|
|
441 |
|
|
|
457 |
|
| Trading account assets |
|
|
3,164 |
|
|
|
3,539 |
|
|
|
|
|
1,538 |
|
|
|
1,626 |
|
|
|
1,661 |
|
|
|
1,641 |
|
|
|
1,796 |
|
| Other interest income |
|
|
1,886 |
|
|
|
2,159 |
|
|
|
|
|
918 |
|
|
|
968 |
|
|
|
965 |
|
|
|
1,037 |
|
|
|
1,062 |
|
|
|
|
|
|
|
|
|
|
|
|
|
|
|
|
|
|
|
|
|
|
|
|
|
|
|
|
|
|
|
|
| Total interest income |
|
|
34,970 |
|
|
|
38,998 |
|
|
|
|
|
17,048 |
|
|
|
17,922 |
|
|
|
18,290 |
|
|
|
18,209 |
|
|
|
19,119 |
|
|
|
|
|
|
|
|
|
|
|
|
|
|
|
|
|
|
|
|
|
|
|
|
|
|
|
|
|
|
|
|
|
|
|
|
|
|
|
|
|
| Interest expense |
|
|
|
|
|
|
|
|
|
|
|
|
|
|
|
|
|
|
|
|
|
|
|
|
|
|
|
|
|
|
| Deposits |
|
|
1,682 |
|
|
|
2,153 |
|
|
|
|
|
843 |
|
|
|
839 |
|
|
|
894 |
|
|
|
950 |
|
|
|
1,031 |
|
| Short-term borrowings |
|
|
2,525 |
|
|
|
1,709 |
|
|
|
|
|
1,341 |
|
|
|
1,184 |
|
|
|
1,142 |
|
|
|
848 |
|
|
|
891 |
|
| Trading account liabilities |
|
|
1,254 |
|
|
|
1,375 |
|
|
|
|
|
627 |
|
|
|
627 |
|
|
|
561 |
|
|
|
635 |
|
|
|
715 |
|
| Long-term debt |
|
|
6,084 |
|
|
|
7,112 |
|
|
|
|
|
2,991 |
|
|
|
3,093 |
|
|
|
3,254 |
|
|
|
3,341 |
|
|
|
3,582 |
|
|
|
|
|
|
|
|
|
|
|
|
|
|
|
|
|
|
|
|
|
|
|
|
|
|
|
|
|
|
|
|
| Total interest expense |
|
|
11,545 |
|
|
|
12,349 |
|
|
|
|
|
5,802 |
|
|
|
5,743 |
|
|
|
5,851 |
|
|
|
5,774 |
|
|
|
6,219 |
|
|
|
|
|
|
|
|
|
|
|
|
|
|
|
|
|
|
|
|
|
|
|
|
|
|
|
|
|
|
|
|
| Net interest income |
|
|
23,425 |
|
|
|
26,649 |
|
|
|
|
|
11,246 |
|
|
|
12,179 |
|
|
|
12,439 |
|
|
|
12,435 |
|
|
|
12,900 |
|
|
|
|
|
|
|
|
|
|
| Noninterest income |
|
|
|
|
|
|
|
|
|
|
|
|
|
|
|
|
|
|
|
|
|
|
|
|
|
|
|
|
|
|
| Card income |
|
|
3,795 |
|
|
|
3,999 |
|
|
|
|
|
1,967 |
|
|
|
1,828 |
|
|
|
2,127 |
|
|
|
1,982 |
|
|
|
2,023 |
|
| Service charges |
|
|
4,044 |
|
|
|
5,142 |
|
|
|
|
|
2,012 |
|
|
|
2,032 |
|
|
|
2,036 |
|
|
|
2,212 |
|
|
|
2,576 |
|
| Investment and brokerage services |
|
|
6,110 |
|
|
|
6,019 |
|
|
|
|
|
3,009 |
|
|
|
3,101 |
|
|
|
2,879 |
|
|
|
2,724 |
|
|
|
2,994 |
|
| Investment banking income |
|
|
3,262 |
|
|
|
2,559 |
|
|
|
|
|
1,684 |
|
|
|
1,578 |
|
|
|
1,590 |
|
|
|
1,371 |
|
|
|
1,319 |
|
| Equity investment income |
|
|
2,687 |
|
|
|
3,391 |
|
|
|
|
|
1,212 |
|
|
|
1,475 |
|
|
|
1,512 |
|
|
|
357 |
|
|
|
2,766 |
|
| Trading account profits |
|
|
4,813 |
|
|
|
6,463 |
|
|
|
|
|
2,091 |
|
|
|
2,722 |
|
|
|
995 |
|
|
|
2,596 |
|
|
|
1,227 |
|
| Mortgage banking income (loss) |
|
|
(12,566 |
) |
|
|
2,398 |
|
|
|
|
|
(13,196 |
) |
|
|
630 |
|
|
|
(1,419 |
) |
|
|
1,755 |
|
|
|
898 |
|
| Insurance income |
|
|
1,013 |
|
|
|
1,393 |
|
|
|
|
|
400 |
|
|
|
613 |
|
|
|
598 |
|
|
|
75 |
|
|
|
678 |
|
| Gains on sales of debt securities |
|
|
1,445 |
|
|
|
771 |
|
|
|
|
|
899 |
|
|
|
546 |
|
|
|
872 |
|
|
|
883 |
|
|
|
37 |
|
| Other income (loss) |
|
|
2,218 |
|
|
|
3,065 |
|
|
|
|
|
1,957 |
|
|
|
261 |
|
|
|
(1,114 |
) |
|
|
433 |
|
|
|
1,861 |
|
| Other-than-temporary impairment losses on available-for-sale debt securities: |
|
|
|
|
|
|
|
|
|
|
|
|
|
|
|
|
|
|
|
|
|
|
|
|
|
|
|
|
|
|
| Total other-than-temporary impairment losses |
|
|
(157 |
) |
|
|
(1,783 |
) |
|
|
|
|
(63 |
) |
|
|
(111 |
) |
|
|
(612 |
) |
|
|
(156 |
) |
|
|
(462 |
) |
| Less: Portion of other-than-temporary impairment losses recognized in other comprehensive income |
|
|
24 |
|
|
|
1,056 |
|
|
|
|
|
18 |
|
|
|
23 |
|
|
|
495 |
|
|
|
33 |
|
|
|
336 |
|
|
|
|
|
|
|
|
|
|
|
|
|
|
|
|
|
|
|
|
|
|
|
|
|
|
|
|
|
|
|
|
| Net impairment losses recognized in earnings on available-for-sale debt securities |
|
|
(133 |
) |
|
|
(727 |
) |
|
|
|
|
(45 |
) |
|
|
(88 |
) |
|
|
(117 |
) |
|
|
(123 |
) |
|
|
(126 |
) |
|
|
|
|
|
|
|
|
|
|
|
|
|
|
|
|
|
|
|
|
|
|
|
|
|
|
|
|
|
|
|
| Total noninterest income |
|
|
16,688 |
|
|
|
34,473 |
|
|
|
|
|
1,990 |
|
|
|
14,698 |
|
|
|
9,959 |
|
|
|
14,265 |
|
|
|
16,253 |
|
|
|
|
|
|
|
|
|
|
|
|
|
|
|
|
|
|
|
|
|
|
|
|
|
|
|
|
|
|
|
|
| Total revenue, net of interest expense |
|
|
40,113 |
|
|
|
61,122 |
|
|
|
|
|
13,236 |
|
|
|
26,877 |
|
|
|
22,398 |
|
|
|
26,700 |
|
|
|
29,153 |
|
|
|
|
|
|
|
|
|
|
| Provision for credit losses |
|
|
7,069 |
|
|
|
17,910 |
|
|
|
|
|
3,255 |
|
|
|
3,814 |
|
|
|
5,129 |
|
|
|
5,396 |
|
|
|
8,105 |
|
|
|
|
|
|
|
|
|
|
| Noninterest expense |
|
|
|
|
|
|
|
|
|
|
|
|
|
|
|
|
|
|
|
|
|
|
|
|
|
|
|
|
|
|
| Personnel |
|
|
19,339 |
|
|
|
17,947 |
|
|
|
|
|
9,171 |
|
|
|
10,168 |
|
|
|
8,800 |
|
|
|
8,402 |
|
|
|
8,789 |
|
| Occupancy |
|
|
2,434 |
|
|
|
2,354 |
|
|
|
|
|
1,245 |
|
|
|
1,189 |
|
|
|
1,212 |
|
|
|
1,150 |
|
|
|
1,182 |
|
| Equipment |
|
|
1,199 |
|
|
|
1,226 |
|
|
|
|
|
593 |
|
|
|
606 |
|
|
|
607 |
|
|
|
619 |
|
|
|
613 |
|
| Marketing |
|
|
1,124 |
|
|
|
982 |
|
|
|
|
|
560 |
|
|
|
564 |
|
|
|
484 |
|
|
|
497 |
|
|
|
495 |
|
| Professional fees |
|
|
1,412 |
|
|
|
1,161 |
|
|
|
|
|
766 |
|
|
|
646 |
|
|
|
883 |
|
|
|
651 |
|
|
|
644 |
|
| Amortization of intangibles |
|
|
767 |
|
|
|
885 |
|
|
|
|
|
382 |
|
|
|
385 |
|
|
|
420 |
|
|
|
426 |
|
|
|
439 |
|
| Data processing |
|
|
1,338 |
|
|
|
1,280 |
|
|
|
|
|
643 |
|
|
|
695 |
|
|
|
662 |
|
|
|
602 |
|
|
|
632 |
|
| Telecommunications |
|
|
762 |
|
|
|
689 |
|
|
|
|
|
391 |
|
|
|
371 |
|
|
|
366 |
|
|
|
361 |
|
|
|
359 |
|
| Other general operating |
|
|
11,800 |
|
|
|
7,475 |
|
|
|
|
|
6,343 |
|
|
|
5,457 |
|
|
|
5,060 |
|
|
|
3,687 |
|
|
|
3,592 |
|
| Goodwill impairment |
|
|
2,603 |
|
|
|
— |
|
|
|
|
|
2,603 |
|
|
|
— |
|
|
|
2,000 |
|
|
|
10,400 |
|
|
|
— |
|
| Merger and restructuring charges |
|
|
361 |
|
|
|
1,029 |
|
|
|
|
|
159 |
|
|
|
202 |
|
|
|
370 |
|
|
|
421 |
|
|
|
508 |
|
|
|
|
|
|
|
|
|
|
|
|
|
|
|
|
|
|
|
|
|
|
|
|
|
|
|
|
|
|
|
|
| Total noninterest expense |
|
|
43,139 |
|
|
|
35,028 |
|
|
|
|
|
22,856 |
|
|
|
20,283 |
|
|
|
20,864 |
|
|
|
27,216 |
|
|
|
17,253 |
|
|
|
|
|
|
|
|
|
|
|
|
|
|
|
|
|
|
|
|
|
|
|
|
|
|
|
|
|
|
|
|
| Income (loss) before income taxes |
|
|
(10,095 |
) |
|
|
8,184 |
|
|
|
|
|
(12,875 |
) |
|
|
2,780 |
|
|
|
(3,595 |
) |
|
|
(5,912 |
) |
|
|
3,795 |
|
| Income tax expense (benefit) |
|
|
(3,318 |
) |
|
|
1,879 |
|
|
|
|
|
(4,049 |
) |
|
|
731 |
|
|
|
(2,351 |
) |
|
|
1,387 |
|
|
|
672 |
|
|
|
|
|
|
|
|
|
|
|
|
|
|
|
|
|
|
|
|
|
|
|
|
|
|
|
|
|
|
|
|
| Net income (loss) |
|
$ |
(6,777 |
) |
|
$ |
6,305 |
|
|
|
|
$ |
(8,826 |
) |
|
$ |
2,049 |
|
|
$ |
(1,244 |
) |
|
$ |
(7,299 |
) |
|
$ |
3,123 |
|
|
|
|
|
|
|
|
|
|
|
|
|
|
|
|
|
|
|
|
|
|
|
|
|
|
|
|
|
|
|
|
| Preferred stock dividends |
|
|
611 |
|
|
|
688 |
|
|
|
|
|
301 |
|
|
|
310 |
|
|
|
321 |
|
|
|
348 |
|
|
|
340 |
|
|
|
|
|
|
|
|
|
|
|
|
|
|
|
|
|
|
|
|
|
|
|
|
|
|
|
|
|
|
|
|
| Net income (loss) applicable to common shareholders |
|
$ |
(7,388 |
) |
|
$ |
5,617 |
|
|
|
|
$ |
(9,127 |
) |
|
$ |
1,739 |
|
|
$ |
(1,565 |
) |
|
$ |
(7,647 |
) |
|
$ |
2,783 |
|
|
|
|
|
|
|
|
|
|
|
|
|
|
|
|
|
|
|
|
|
|
|
|
|
|
|
|
|
|
|
|
|
|
|
|
|
|
|
|
|
| Per common share information |
|
|
|
|
|
|
|
|
|
|
|
|
|
|
|
|
|
|
|
|
|
|
|
|
|
|
|
|
|
|
| Earnings (loss) |
|
$ |
(0.73 |
) |
|
$ |
0.56 |
|
|
|
|
$ |
(0.90 |
) |
|
$ |
0.17 |
|
|
$ |
(0.16 |
) |
|
$ |
(0.77 |
) |
|
$ |
0.28 |
|
| Diluted earnings (loss) (1) |
|
|
(0.73 |
) |
|
|
0.55 |
|
|
|
|
|
(0.90 |
) |
|
|
0.17 |
|
|
|
(0.16 |
) |
|
|
(0.77 |
) |
|
|
0.27 |
|
| Dividends paid |
|
|
0.02 |
|
|
|
0.02 |
|
|
|
|
|
0.01 |
|
|
|
0.01 |
|
|
|
0.01 |
|
|
|
0.01 |
|
|
|
0.01 |
|
|
|
|
|
|
|
|
|
|
|
|
|
|
|
|
|
|
|
|
|
|
|
|
|
|
|
|
|
|
|
|
| Average common shares issued and outstanding |
|
|
10,085,479 |
|
|
|
9,570,166 |
|
|
|
|
|
10,094,928 |
|
|
|
10,075,875 |
|
|
|
10,036,575 |
|
|
|
9,976,351 |
|
|
|
9,956,773 |
|
|
|
|
|
|
|
|
|
|
|
|
|
|
|
|
|
|
|
|
|
|
|
|
|
|
|
|
|
|
|
|
| Average diluted common shares issued and
outstanding (1) |
|
|
10,085,479 |
|
|
|
10,020,926 |
|
|
|
|
|
10,094,928 |
|
|
|
10,181,351 |
|
|
|
10,036,575 |
|
|
|
9,976,351 |
|
|
|
10,029,776 |
|
|
|
|
|
|
|
|
|
|
|
|
|
|
|
|
|
|
|
|
|
|
|
|
|
|
|
|
|
|
|
|
| (1) |
Due to a net loss applicable to common shareholders for the second quarter of 2011 and for the fourth and third quarters of 2010, the impact of antidilutive equity
instruments was excluded from diluted earnings per share and average diluted common shares. |
Certain prior period amounts
have been reclassified to conform to current period presentation.
|
|
|
| This information is preliminary and based on company data available at the time of the presentation. |
|
4 |
Bank of America Corporation and Subsidiaries
Consolidated Balance Sheet
(Dollars in millions)
|
|
|
|
|
|
|
|
|
|
|
|
|
| |
|
June 30
2011 |
|
|
March 31
2011 |
|
|
June 30
2010 |
|
| Assets |
|
|
|
|
|
|
|
|
|
|
|
|
| Cash and cash equivalents |
|
$ |
119,527 |
|
|
$ |
97,542 |
|
|
$ |
151,034 |
|
| Time deposits placed and other short-term investments |
|
|
20,291 |
|
|
|
23,707 |
|
|
|
20,718 |
|
| Federal funds sold and securities borrowed or purchased under agreements to resell |
|
|
235,181 |
|
|
|
234,056 |
|
|
|
247,667 |
|
| Trading account assets |
|
|
196,939 |
|
|
|
208,761 |
|
|
|
197,376 |
|
| Derivative assets |
|
|
66,598 |
|
|
|
65,334 |
|
|
|
87,839 |
|
| Debt securities: |
|
|
|
|
|
|
|
|
|
|
|
|
| Available-for-sale |
|
|
330,871 |
|
|
|
330,345 |
|
|
|
314,765 |
|
| Held-to-maturity, at cost |
|
|
181 |
|
|
|
431 |
|
|
|
435 |
|
| Total debt securities |
|
|
331,052 |
|
|
|
330,776 |
|
|
|
315,200 |
|
| Loans and leases |
|
|
941,257 |
|
|
|
932,425 |
|
|
|
956,177 |
|
| Allowance for loan and lease losses |
|
|
(37,312 |
) |
|
|
(39,843 |
) |
|
|
(45,255 |
) |
| Loans and leases, net of allowance |
|
|
903,945 |
|
|
|
892,582 |
|
|
|
910,922 |
|
| Premises and equipment, net |
|
|
13,793 |
|
|
|
14,151 |
|
|
|
14,536 |
|
| Mortgage servicing rights (includes $12,372, $15,282 and $14,745 measured at fair value) |
|
|
12,642 |
|
|
|
15,560 |
|
|
|
15,041 |
|
| Goodwill |
|
|
71,074 |
|
|
|
73,869 |
|
|
|
85,801 |
|
| Intangible assets |
|
|
9,176 |
|
|
|
9,560 |
|
|
|
10,796 |
|
| Loans held-for-sale |
|
|
20,092 |
|
|
|
25,003 |
|
|
|
38,046 |
|
| Customer and other receivables |
|
|
86,550 |
|
|
|
97,318 |
|
|
|
86,466 |
|
| Other assets |
|
|
174,459 |
|
|
|
186,313 |
|
|
|
186,942 |
|
| Total assets |
|
$ |
2,261,319 |
|
|
$ |
2,274,532 |
|
|
$ |
2,368,384 |
|
|
|
|
|
| Assets of consolidated VIEs included in total assets above (substantially all pledged
as collateral) |
|
|
|
|
|
|
|
|
|
|
|
|
| Trading account assets |
|
$ |
10,746 |
|
|
$ |
12,012 |
|
|
$ |
10,675 |
|
| Derivative assets |
|
|
2,293 |
|
|
|
2,280 |
|
|
|
2,094 |
|
| Available-for-sale debt securities |
|
|
251 |
|
|
|
2,104 |
|
|
|
9,493 |
|
| Loans and leases |
|
|
151,928 |
|
|
|
146,309 |
|
|
|
134,143 |
|
| Allowance for loan and lease losses |
|
|
(7,792 |
) |
|
|
(8,335 |
) |
|
|
(10,585 |
) |
| Loans and leases, net of allowance |
|
|
144,136 |
|
|
|
137,974 |
|
|
|
123,558 |
|
| Loans held-for-sale |
|
|
1,561 |
|
|
|
1,605 |
|
|
|
3,371 |
|
| All other assets |
|
|
7,115 |
|
|
|
4,883 |
|
|
|
9,190 |
|
| Total assets of consolidated VIEs |
|
$ |
166,102 |
|
|
$ |
160,858 |
|
|
$ |
158,381 |
|
Certain prior period amounts have been reclassified to conform to current period presentation.
|
|
|
| This information is preliminary and based on company data available at the time of the presentation. |
|
5 |
Bank of America Corporation and Subsidiaries
Consolidated Balance Sheet (continued)
(Dollars in millions)
|
|
|
|
|
|
|
|
|
|
|
|
|
| |
|
June 30
2011 |
|
|
March 31
2011 |
|
|
June 30
2010 |
|
| Liabilities |
|
|
|
|
|
|
|
|
|
|
|
|
| Deposits in U.S. offices: |
|
|
|
|
|
|
|
|
|
|
|
|
| Noninterest-bearing |
|
$ |
301,558 |
|
|
$ |
286,357 |
|
|
$ |
258,988 |
|
| Interest-bearing |
|
|
647,480 |
|
|
|
652,096 |
|
|
|
640,807 |
|
| Deposits in non-U.S. offices: |
|
|
|
|
|
|
|
|
|
|
|
|
| Noninterest-bearing |
|
|
6,555 |
|
|
|
7,894 |
|
|
|
5,791 |
|
| Interest-bearing |
|
|
82,815 |
|
|
|
73,828 |
|
|
|
68,881 |
|
| Total deposits |
|
|
1,038,408 |
|
|
|
1,020,175 |
|
|
|
974,467 |
|
| Federal funds purchased and securities loaned or sold under agreements to repurchase |
|
|
239,521 |
|
|
|
260,521 |
|
|
|
307,211 |
|
| Trading account liabilities |
|
|
74,989 |
|
|
|
88,478 |
|
|
|
89,982 |
|
| Derivative liabilities |
|
|
54,414 |
|
|
|
53,501 |
|
|
|
67,297 |
|
| Commercial paper and other short-term borrowings |
|
|
50,632 |
|
|
|
58,324 |
|
|
|
73,358 |
|
| Accrued expenses and other liabilities (includes $897, $961 and $1,413 of reserve for unfunded lending
commitments) |
|
|
154,520 |
|
|
|
128,221 |
|
|
|
132,812 |
|
| Long-term debt |
|
|
426,659 |
|
|
|
434,436 |
|
|
|
490,083 |
|
| Total liabilities |
|
|
2,039,143 |
|
|
|
2,043,656 |
|
|
|
2,135,210 |
|
| Shareholders’ equity |
|
|
|
|
|
|
|
|
|
|
|
|
| Preferred stock, $0.01 par value; authorized -100,000,000 shares; issued and outstanding - 3,943,660, 3,943,660 and
3,960,660 shares |
|
|
16,562 |
|
|
|
16,562 |
|
|
|
17,993 |
|
| Common stock and additional paid-in capital, $0.01 par value; authorized - 12,800,000,000, 12,800,000,000 and
12,800,000,000 shares; issued and outstanding - 10,133,189,501, 10,131,803,417 and 10,033,016,719 shares |
|
|
151,567 |
|
|
|
151,379 |
|
|
|
149,175 |
|
| Retained earnings |
|
|
53,254 |
|
|
|
62,483 |
|
|
|
70,497 |
|
| Accumulated other comprehensive income (loss) |
|
|
793 |
|
|
|
463 |
|
|
|
(4,447 |
) |
| Other |
|
|
— |
|
|
|
(11 |
) |
|
|
(44 |
) |
| Total shareholders’ equity |
|
|
222,176 |
|
|
|
230,876 |
|
|
|
233,174 |
|
| Total liabilities and shareholders’ equity |
|
$ |
2,261,319 |
|
|
$ |
2,274,532 |
|
|
$ |
2,368,384 |
|
|
|
|
|
| Liabilities of consolidated VIEs included in total liabilities
above |
|
|
|
|
|
|
|
|
|
|
|
|
| Commercial paper and other short-term borrowings |
|
$ |
5,421 |
|
|
$ |
6,954 |
|
|
$ |
17,848 |
|
| Long-term debt |
|
|
64,745 |
|
|
|
65,197 |
|
|
|
85,186 |
|
| All other liabilities |
|
|
1,127 |
|
|
|
1,240 |
|
|
|
2,535 |
|
| Total liabilities of consolidated
VIEs |
|
$ |
71,293 |
|
|
$ |
73,391 |
|
|
$ |
105,569 |
|
Certain prior period amounts have been reclassified to conform to current period presentation.
|
|
|
| This information is preliminary and based on company data available at the time of the presentation. |
|
6 |
Bank of America Corporation and Subsidiaries
Capital Management
(Dollars in millions)
|
|
|
|
|
|
|
|
|
|
|
|
|
|
|
|
|
|
|
|
|
|
|
|
|
|
|
|
|
|
|
| |
|
Second
Quarter
2011 |
|
|
|
|
First
Quarter
2011 |
|
|
|
|
Fourth
Quarter
2010 |
|
|
|
|
Third
Quarter
2010 |
|
|
|
|
Second
Quarter
2010 |
|
|
|
| Risk-based capital (1): |
|
|
|
|
|
|
|
|
|
|
|
|
|
|
|
|
|
|
|
|
|
|
|
|
|
|
|
|
|
|
| Tier 1 common |
|
$ |
114,684 |
|
|
|
|
$ |
123,882 |
|
|
|
|
$ |
125,139 |
|
|
|
|
$ |
124,756 |
|
|
|
|
$ |
119,716 |
|
|
|
| Tier 1 capital |
|
|
153,133 |
|
|
|
|
|
162,295 |
|
|
|
|
|
163,626 |
|
|
|
|
|
164,763 |
|
|
|
|
|
159,551 |
|
|
|
| Total capital |
|
|
217,986 |
|
|
|
|
|
229,094 |
|
|
|
|
|
229,594 |
|
|
|
|
|
231,120 |
|
|
|
|
|
220,827 |
|
|
|
| Risk-weighted assets |
|
|
1,392,747 |
|
|
|
|
|
1,433,377 |
|
|
|
|
|
1,455,951 |
|
|
|
|
|
1,476,774 |
|
|
|
|
|
1,494,990 |
|
|
|
| Tier 1 common equity ratio (2) |
|
|
8.23 |
|
|
% |
|
|
8.64 |
|
|
% |
|
|
8.60 |
|
|
% |
|
|
8.45 |
|
|
% |
|
|
8.01 |
|
|
% |
| Tier 1 capital ratio |
|
|
11.00 |
|
|
|
|
|
11.32 |
|
|
|
|
|
11.24 |
|
|
|
|
|
11.16 |
|
|
|
|
|
10.67 |
|
|
|
| Total capital ratio |
|
|
15.65 |
|
|
|
|
|
15.98 |
|
|
|
|
|
15.77 |
|
|
|
|
|
15.65 |
|
|
|
|
|
14.77 |
|
|
|
| Tier 1 leverage ratio |
|
|
6.86 |
|
|
|
|
|
7.25 |
|
|
|
|
|
7.21 |
|
|
|
|
|
7.21 |
|
|
|
|
|
6.68 |
|
|
|
| Tangible equity ratio (3) |
|
|
6.63 |
|
|
|
|
|
6.85 |
|
|
|
|
|
6.75 |
|
|
|
|
|
6.54 |
|
|
|
|
|
6.14 |
|
|
|
| Tangible common equity ratio (3) |
|
|
5.87 |
|
|
|
|
|
6.10 |
|
|
|
|
|
5.99 |
|
|
|
|
|
5.74 |
|
|
|
|
|
5.35 |
|
|
|
| (1) |
Reflects preliminary data for current period risk-based capital. |
| (2) |
Tier 1 common equity ratio equals Tier 1 capital excluding preferred stock, trust preferred securities, hybrid securities and minority interest divided by
risk-weighted assets. |
| (3) |
Tangible equity ratio equals period end tangible shareholders’ equity divided by period end tangible assets. Tangible common equity equals period end tangible
common shareholders’ equity divided by period end tangible assets. Tangible shareholders’ equity and tangible assets are non-GAAP measures. We believe the use of these non-GAAP measures provide additional clarity in assessing the results
of the Corporation. (See Exhibit A: Non-GAAP Reconciliations - Reconciliation to GAAP Financial Measures on pages 44-45). |
| * |
Preliminary data on risk-based capital |
Outstanding Common Stock
No common shares were repurchased in the second
quarter of 2011.
There is no existing Board authorized share repurchase program.
Certain prior period amounts have been reclassified to conform to current period presentation.
|
|
|
| This information is preliminary and based on company data available at the time of the presentation. |
|
7 |
Bank of America Corporation and Subsidiaries
Core Net Interest Income
(Dollars in millions)
|
|
|
|
|
|
|
|
|
|
|
|
|
|
|
|
|
|
|
|
|
|
|
|
|
|
|
|
|
|
|
|
|
|
|
|
|
|
|
|
|
|
|
|
|
|
|
|
|
|
|
|
|
|
|
|
|
| |
|
Six Months
Ended
June 30 |
|
|
|
|
|
|
Second
Quarter |
|
|
|
|
|
First Quarter |
|
|
|
|
|
Fourth Quarter |
|
|
|
|
|
Third Quarter |
|
|
|
|
|
Second
Quarter |
|
|
|
|
| |
|
2011 |
|
|
|
|
|
2010 |
|
|
|
|
|
|
2011 |
|
|
|
|
|
2011 |
|
|
|
|
|
2010 |
|
|
|
|
|
2010 |
|
|
|
|
|
2010 |
|
|
|
|
| Net interest income (1) |
|
|
|
|
|
|
|
|
|
|
|
|
|
|
|
|
|
|
|
|
|
|
|
|
|
|
|
|
|
|
|
|
|
|
|
|
|
|
|
|
|
|
|
|
|
|
|
|
|
|
|
|
|
|
|
|
| As reported (2) |
|
$ |
23,890 |
|
|
|
|
|
|
$ |
27,267 |
|
|
|
|
|
|
$ |
11,493 |
|
|
|
|
|
|
$ |
12,397 |
|
|
|
|
|
|
$ |
12,709 |
|
|
|
|
|
|
$ |
12,717 |
|
|
|
|
|
|
$ |
13,197 |
|
|
|
|
|
| Impact of market-based net
interest
income (3) |
|
|
(1,965 |
) |
|
|
|
|
|
|
(2,235 |
) |
|
|
|
|
|
|
(914 |
) |
|
|
|
|
|
|
(1,051 |
) |
|
|
|
|
|
|
(1,150 |
) |
|
|
|
|
|
|
(1,045 |
) |
|
|
|
|
|
|
(1,049 |
) |
|
|
|
|
|
|
|
|
|
|
|
|
|
|
|
|
|
|
|
|
|
|
|
|
|
|
|
|
|
|
|
|
|
|
|
|
|
|
|
|
|
|
|
|
|
|
|
|
|
|
|
|
|
|
|
|
|
|
|
|
|
| Core net interest income |
|
$ |
21,925 |
|
|
|
|
|
|
$ |
25,032 |
|
|
|
|
|
|
$ |
10,579 |
|
|
|
|
|
|
$ |
11,346 |
|
|
|
|
|
|
$ |
11,559 |
|
|
|
|
|
|
$ |
11,672 |
|
|
|
|
|
|
$ |
12,148 |
|
|
|
|
|
|
|
|
|
|
|
|
|
|
|
|
|
|
|
|
|
|
|
|
|
|
|
|
|
|
|
|
|
|
|
|
|
|
|
|
|
|
|
|
|
|
|
|
|
|
|
|
|
|
|
|
|
|
|
|
|
|
|
|
|
|
|
|
|
|
|
|
|
|
|
|
|
|
| Average earning assets (4) |
|
|
|
|
|
|
|
|
|
|
|
|
|
|
|
|
|
|
|
|
|
|
|
|
|
|
|
|
|
|
|
|
|
|
|
|
|
|
|
|
|
|
|
|
|
|
|
|
|
|
|
|
|
|
|
|
| As reported |
|
$ |
1,857,124 |
|
|
|
|
|
|
$ |
1,921,864 |
|
|
|
|
|
|
$ |
1,844,525 |
|
|
|
|
|
|
$ |
1,869,863 |
|
|
|
|
|
|
$ |
1,883,539 |
|
|
|
|
|
|
$ |
1,863,819 |
|
|
|
|
|
|
$ |
1,910,790 |
|
|
|
|
|
| Impact of market-based earning
assets (3) |
|
|
(465,617 |
) |
|
|
|
|
|
|
(533,180 |
) |
|
|
|
|
|
|
(461,775 |
) |
|
|
|
|
|
|
(469,503 |
) |
|
|
|
|
|
|
(481,629 |
) |
|
|
|
|
|
|
(503,890 |
) |
|
|
|
|
|
|
(530,785 |
) |
|
|
|
|
|
|
|
|
|
|
|
|
|
|
|
|
|
|
|
|
|
|
|
|
|
|
|
|
|
|
|
|
|
|
|
|
|
|
|
|
|
|
|
|
|
|
|
|
|
|
|
|
|
|
|
|
|
|
|
|
|
| Core average earning assets |
|
$ |
1,391,507 |
|
|
|
|
|
|
$ |
1,388,684 |
|
|
|
|
|
|
$ |
1,382,750 |
|
|
|
|
|
|
$ |
1,400,360 |
|
|
|
|
|
|
$ |
1,401,910 |
|
|
|
|
|
|
$ |
1,359,929 |
|
|
|
|
|
|
$ |
1,380,005 |
|
|
|
|
|
|
|
|
|
|
|
|
|
|
|
|
|
|
|
|
|
|
|
|
|
|
|
|
|
|
|
|
|
|
|
|
|
|
|
|
|
|
|
|
|
|
|
|
|
|
|
|
|
|
|
|
|
|
|
|
|
|
|
|
|
|
|
|
|
|
|
|
|
|
|
|
|
|
|
Net interest yield
contribution (1,
5) |
|
|
|
|
|
|
|
|
|
|
|
|
|
|
|
|
|
|
|
|
|
|
|
|
|
|
|
|
|
|
|
|
|
|
|
|
|
|
|
|
|
|
|
|
|
|
|
|
|
|
|
|
|
|
|
|
| As reported (2) |
|
|
2.58 |
|
|
|
% |
|
|
|
2.85 |
|
|
% |
|
|
|
|
2.50 |
|
|
|
% |
|
|
|
2.67 |
|
|
|
% |
|
|
|
2.69 |
|
|
|
% |
|
|
|
2.72 |
|
|
|
% |
|
|
|
2.77 |
|
|
|
% |
|
| Impact of market-based
activities (3)
|
|
|
0.58 |
|
|
|
|
|
|
|
0.77 |
|
|
|
|
|
|
|
0.56 |
|
|
|
|
|
|
|
0.59 |
|
|
|
|
|
|
|
0.60 |
|
|
|
|
|
|
|
0.70 |
|
|
|
|
|
|
|
0.76 |
|
|
|
|
|
|
|
|
|
|
|
|
|
|
|
|
|
|
|
|
|
|
|
|
|
|
|
|
|
|
|
|
|
|
|
|
|
|
|
|
|
|
|
|
|
|
|
|
|
|
|
|
|
|
|
|
|
|
|
|
|
|
| Core net interest yield on earning assets |
|
|
3.16 |
|
|
|
% |
|
|
|
3.62 |
|
|
% |
|
|
|
|
3.06 |
|
|
|
% |
|
|
|
3.26 |
|
|
|
% |
|
|
|
3.29 |
|
|
|
% |
|
|
|
3.42 |
|
|
|
% |
|
|
|
3.53 |
|
|
|
% |
|
|
|
|
|
|
|
|
|
|
|
|
|
|
|
|
|
|
|
|
|
|
|
|
|
|
|
|
|
|
|
|
|
|
|
|
|
|
|
|
|
|
|
|
|
|
|
|
|
|
|
|
|
|
|
|
|
|
| (1) |
Fully taxable-equivalent basis |
| (2) |
Balance and calculation include fees earned on overnight deposits placed with the Federal Reserve of $112 million and $198 million for the six months ended
June 30, 2011 and 2010; $49 million and $63 million for the second and first quarters of 2011, and $63 million, $107 million and $106 million for the fourth, third and second quarters of 2010, respectively. |
| (3) |
Represents the impact of market-based amounts included in Global Banking & Markets. |
| (4) |
For the three and six months ended June 30, 2011, $40.4 billion and $20.3 billion of non-interest earning equity securities were reclassified from trading
account assets to other non-earning assets. Prior period amounts are immaterial and have not been restated. |
| (5) |
Calculated on an annualized basis. |
Certain prior period amounts have been reclassified to conform to current period presentation.
|
|
|
| This information is preliminary and based on company data available at the time of the presentation. |
|
8 |
Bank of America Corporation and Subsidiaries
Quarterly Average Balances and Interest Rates - Fully Taxable-equivalent Basis
(Dollars in millions)
|
|
|
|
|
|
|
|
|
|
|
|
|
|
|
|
|
|
|
|
|
|
|
|
|
|
|
|
|
|
|
|
|
|
|
|
|
|
|
|
|
|
|
|
|
|
|
| |
|
Second Quarter 2011 |
|
|
|
|
First Quarter 2011 |
|
|
|
|
|
Second Quarter 2010 |
|
|
|
|
| |
|
|
|
|
Interest |
|
|
|
|
|
|
|
|
|
|
Interest |
|
|
|
|
|
|
|
|
|
|
|
Interest |
|
|
|
|
|
|
|
| |
|
Average |
|
|
Income/ |
|
|
Yield/ |
|
|
|
|
Average |
|
|
Income/ |
|
|
Yield/ |
|
|
|
|
|
Average |
|
|
Income/ |
|
|
Yield/ |
|
|
|
|
| |
|
Balance |
|
|
Expense |
|
|
Rate |
|
|
|
|
Balance |
|
|
Expense |
|
|
Rate |
|
|
|
|
|
Balance |
|
|
Expense |
|
|
Rate |
|
|
|
|
| Earning assets |
|
|
|
|
|
|
|
|
|
|
|
|
|
|
|
|
|
|
|
|
|
|
|
|
|
|
|
|
|
|
|
|
|
|
|
|
|
|
|
|
|
|
|
|
|
|
| Time deposits placed and other short-term investments
(1) |
|
$ |
27,298 |
|
|
$ |
106 |
|
|
|
1.56 |
|
|
% |
|
$ |
31,294 |
|
|
$ |
88 |
|
|
|
1.14 |
|
|
|
% |
|
|
$ |
30,741 |
|
|
$ |
70 |
|
|
|
0.93 |
|
|
|
% |
|
| Federal funds sold and securities borrowed or purchased under agreements to resell |
|
|
259,069 |
|
|
|
597 |
|
|
|
0.92 |
|
|
|
|
|
227,379 |
|
|
|
517 |
|
|
|
0.92 |
|
|
|
|
|
|
|
263,564 |
|
|
|
457 |
|
|
|
0.70 |
|
|
|
|
|
| Trading account assets (2) |
|
|
186,760 |
|
|
|
1,576 |
|
|
|
3.38 |
|
|
|
|
|
221,041 |
|
|
|
1,669 |
|
|
|
3.05 |
|
|
|
|
|
|
|
213,927 |
|
|
|
1,853 |
|
|
|
3.47 |
|
|
|
|
|
| Debt securities (3) |
|
|
335,269 |
|
|
|
2,696 |
|
|
|
3.22 |
|
|
|
|
|
335,847 |
|
|
|
2,917 |
|
|
|
3.49 |
|
|
|
|
|
|
|
314,299 |
|
|
|
2,966 |
|
|
|
3.78 |
|
|
|
|
|
| Loans and leases (4): |
|
|
|
|
|
|
|
|
|
|
|
|
|
|
|
|
|
|
|
|
|
|
|
|
|
|
|
|
|
|
|
|
|
|
|
|
|
|
|
|
|
|
|
|
|
|
| Residential mortgage (5) |
|
|
265,420 |
|
|
|
2,763 |
|
|
|
4.16 |
|
|
|
|
|
262,049 |
|
|
|
2,881 |
|
|
|
4.40 |
|
|
|
|
|
|
|
247,715 |
|
|
|
2,982 |
|
|
|
4.82 |
|
|
|
|
|
| Home equity |
|
|
131,786 |
|
|
|
1,261 |
|
|
|
3.83 |
|
|
|
|
|
136,089 |
|
|
|
1,335 |
|
|
|
3.96 |
|
|
|
|
|
|
|
148,219 |
|
|
|
1,537 |
|
|
|
4.15 |
|
|
|
|
|
| Discontinued real estate |
|
|
15,997 |
|
|
|
129 |
|
|
|
3.22 |
|
|
|
|
|
12,899 |
|
|
|
110 |
|
|
|
3.42 |
|
|
|
|
|
|
|
13,972 |
|
|
|
134 |
|
|
|
3.84 |
|
|
|
|
|
| U.S. credit card |
|
|
106,164 |
|
|
|
2,718 |
|
|
|
10.27 |
|
|
|
|
|
109,941 |
|
|
|
2,837 |
|
|
|
10.47 |
|
|
|
|
|
|
|
118,738 |
|
|
|
3,121 |
|
|
|
10.54 |
|
|
|
|
|
| Non-U.S. credit card |
|
|
27,259 |
|
|
|
760 |
|
|
|
11.18 |
|
|
|
|
|
27,633 |
|
|
|
779 |
|
|
|
11.43 |
|
|
|
|
|
|
|
27,706 |
|
|
|
854 |
|
|
|
12.37 |
|
|
|
|
|
| Direct/Indirect consumer (6) |
|
|
89,403 |
|
|
|
945 |
|
|
|
4.24 |
|
|
|
|
|
90,097 |
|
|
|
993 |
|
|
|
4.47 |
|
|
|
|
|
|
|
98,549 |
|
|
|
1,233 |
|
|
|
5.02 |
|
|
|
|
|
| Other consumer (7) |
|
|
2,745 |
|
|
|
47 |
|
|
|
6.87 |
|
|
|
|
|
2,753 |
|
|
|
45 |
|
|
|
6.58 |
|
|
|
|
|
|
|
2,958 |
|
|
|
46 |
|
|
|
6.32 |
|
|
|
|
|
|
|
|
|
|
|
|
|
|
|
|
|
|
|
|
|
|
|
|
|
|
|
|
|
|
|
|
|
|
|
|
|
|
|
|
| Total consumer |
|
|
638,774 |
|
|
|
8,623 |
|
|
|
5.41 |
|
|
|
|
|
641,461 |
|
|
|
8,980 |
|
|
|
5.65 |
|
|
|
|
|
|
|
657,857 |
|
|
|
9,907 |
|
|
|
6.03 |
|
|
|
|
|
|
|
|
|
|
|
|
|
|
|
|
|
|
|
|
|
|
|
|
|
|
|
|
|
|
|
|
|
|
|
|
|
|
|
|
| U.S. commercial |
|
|
190,479 |
|
|
|
1,827 |
|
|
|
3.85 |
|
|
|
|
|
191,353 |
|
|
|
1,926 |
|
|
|
4.08 |
|
|
|
|
|
|
|
195,144 |
|
|
|
2,005 |
|
|
|
4.12 |
|
|
|
|
|
| Commercial real estate (8) |
|
|
45,762 |
|
|
|
382 |
|
|
|
3.35 |
|
|
|
|
|
48,359 |
|
|
|
437 |
|
|
|
3.66 |
|
|
|
|
|
|
|
64,218 |
|
|
|
541 |
|
|
|
3.38 |
|
|
|
|
|
| Commercial lease financing |
|
|
21,284 |
|
|
|
235 |
|
|
|
4.41 |
|
|
|
|
|
21,634 |
|
|
|
322 |
|
|
|
5.95 |
|
|
|
|
|
|
|
21,271 |
|
|
|
261 |
|
|
|
4.90 |
|
|
|
|
|
| Non-U.S. commercial |
|
|
42,214 |
|
|
|
339 |
|
|
|
3.22 |
|
|
|
|
|
36,159 |
|
|
|
299 |
|
|
|
3.35 |
|
|
|
|
|
|
|
28,564 |
|
|
|
256 |
|
|
|
3.59 |
|
|
|
|
|
|
|
|
|
|
|
|
|
|
|
|
|
|
|
|
|
|
|
|
|
|
|
|
|
|
|
|
|
|
|
|
|
|
|
|
| Total commercial |
|
|
299,739 |
|
|
|
2,783 |
|
|
|
3.72 |
|
|
|
|
|
297,505 |
|
|
|
2,984 |
|
|
|
4.06 |
|
|
|
|
|
|
|
309,197 |
|
|
|
3,063 |
|
|
|
3.97 |
|
|
|
|
|
|
|
|
|
|
|
|
|
|
|
|
|
|
|
|
|
|
|
|
|
|
|
|
|
|
|
|
|
|
|
|
|
|
|
|
| Total loans and leases |
|
|
938,513 |
|
|
|
11,406 |
|
|
|
4.87 |
|
|
|
|
|
938,966 |
|
|
|
11,964 |
|
|
|
5.14 |
|
|
|
|
|
|
|
967,054 |
|
|
|
12,970 |
|
|
|
5.38 |
|
|
|
|
|
|
|
|
|
|
|
|
|
|
|
|
|
|
|
|
|
|
|
|
|
|
|
|
|
|
|
|
|
|
|
|
|
|
|
|
| Other earning assets |
|
|
97,616 |
|
|
|
866 |
|
|
|
3.56 |
|
|
|
|
|
115,336 |
|
|
|
922 |
|
|
|
3.24 |
|
|
|
|
|
|
|
121,205 |
|
|
|
994 |
|
|
|
3.29 |
|
|
|
|
|
|
|
|
|
|
|
|
|
|
|
|
|
|
|
|
|
|
|
|
|
|
|
|
|
|
|
|
|
|
|
|
|
|
|
|
| Total earning assets |
|
|
1,844,525 |
|
|
|
17,247 |
|
|
|
3.75 |
|
|
|
|
|
1,869,863 |
|
|
|
18,077 |
|
|
|
3.92 |
|
|
|
|
|
|
|
1,910,790 |
|
|
|
19,310 |
|
|
|
4.05 |
|
|
|
|
|
|
|
|
|
|
|
|
|
|
|
|
|
|
|
|
|
|
|
|
|
|
|
|
| Cash and cash equivalents (1) |
|
|
115,956 |
|
|
|
49 |
|
|
|
|
|
|
|
|
|
138,241 |
|
|
|
63 |
|
|
|
|
|
|
|
|
|
|
|
209,686 |
|
|
|
106 |
|
|
|
|
|
|
|
|
|
| Other assets, less allowance for loan and lease losses
(2) |
|
|
378,629 |
|
|
|
|
|
|
|
|
|
|
|
|
|
330,434 |
|
|
|
|
|
|
|
|
|
|
|
|
|
|
|
373,956 |
|
|
|
|
|
|
|
|
|
|
|
|
|
|
|
|
|
|
|
|
|
|
|
|
|
|
|
|
|
|
|
|
|
|
|
|
| Total assets |
|
$ |
2,339,110 |
|
|
|
|
|
|
|
|
|
|
|
|
$ |
2,338,538 |
|
|
|
|
|
|
|
|
|
|
|
|
|
|
$ |
2,494,432 |
|
|
|
|
|
|
|
|
|
|
|
|
|
|
|
|
|
|
|
|
|
|
|
|
|
|
|
|
|
|
|
|
|
|
|
|
| (1) |
For this presentation, fees earned on overnight deposits placed with the Federal Reserve are included in the cash and cash equivalents line, consistent with the
Corporation’s Consolidated Balance Sheet presentation of these deposits. Net interest income and net interest yield are calculated excluding these fees. |
| (2) |
For the second quarter of 2011, $40.4 billion of non-interest earning equity securities were reclassified from trading account assets to other non-earning assets.
Prior period amounts are immaterial and have not been restated. |
| (3) |
Yields on available-for-sale debt securities are calculated based on fair value rather than the cost basis. The use of fair value does not have a material impact on
net interest yield. |
| (4) |
Nonperforming loans are included in the respective average loan balances. Income on these nonperforming loans is recognized on a cash basis. Purchased
credit-impaired loans were written down to fair value upon acquisition and accrete interest income over the remaining life of the loan. |
| (5) |
Includes non-U.S. residential mortgages of $94 million and $92 million in the second and first quarters of 2011, and $506 million in the second quarter of 2010.
|
| (6) |
Includes non-U.S. consumer loans of $8.7 billion and $8.2 billion in the second and first quarters of 2011, and $7.7 billion in the second quarter of 2010.
|
| (7) |
Includes consumer finance loans of $1.8 billion and $1.9 billion in the second and first quarters of 2011, and $2.1 billion in the second quarter of 2010; other
non-U.S. consumer loans of $840 million and $777 million in the second and first quarters of 2011, and $679 million in the second quarter of 2010; and consumer overdrafts of $79 million and $76 million in the second and first quarters of 2011, and
$155 million in the second quarter of 2010. |
| (8) |
Includes U.S. commercial real estate loans of $43.4 billion and $45.7 billion in the second and first quarters of 2011, and $61.6 billion in the second quarter of
2010, and non-U.S. commercial real estate loans of $2.4 billion and $2.7 billion in the second and first quarters of 2011, and $2.6 billion in the second quarter of 2010. |
Certain prior period amounts have been reclassified to conform to current period presentation.
|
|
|
| This information is preliminary and based on company data available at the time of the presentation. |
|
9 |
Bank of America Corporation and Subsidiaries
Quarterly Average Balances and Interest Rates - Fully Taxable-equivalent Basis (continued)
(Dollars in millions)
|
|
|
|
|
|
|
|
|
|
|
|
|
|
|
|
|
|
|
|
|
|
|
|
|
|
|
|
|
|
|
|
|
|
|
|
|
|
|
|
|
|
|
|
|
|
|
|
|
| |
|
Second Quarter 2011 |
|
|
|
|
|
First Quarter 2011 |
|
|
|
|
|
Second Quarter 2010 |
|
|
|
|
| |
|
|
|
|
Interest |
|
|
|
|
|
|
|
|
|
|
|
Interest |
|
|
|
|
|
|
|
|
|
|
|
Interest |
|
|
|
|
|
|
|
| |
|
Average |
|
|
Income/ |
|
|
Yield/ |
|
|
|
|
|
Average |
|
|
Income/ |
|
|
Yield/ |
|
|
|
|
|
Average |
|
|
Income/ |
|
|
Yield/ |
|
|
|
|
| |
|
Balance |
|
|
Expense |
|
|
Rate |
|
|
|
|
|
Balance |
|
|
Expense |
|
|
Rate |
|
|
|
|
|
Balance |
|
|
Expense |
|
|
Rate |
|
|
|
|
| Interest-bearing liabilities |
|
|
|
|
|
|
|
|
|
|
|
|
|
|
|
|
|
|
|
|
|
|
|
|
|
|
|
|
|
|
|
|
|
|
|
|
|
|
|
|
|
|
|
|
|
|
|
|
| U.S. interest-bearing deposits: |
|
|
|
|
|
|
|
|
|
|
|
|
|
|
|
|
|
|
|
|
|
|
|
|
|
|
|
|
|
|
|
|
|
|
|
|
|
|
|
|
|
|
|
|
|
|
|
|
| Savings |
|
$ |
41,668 |
|
|
$ |
31 |
|
|
|
0.30 |
|
|
|
% |
|
|
$ |
38,905 |
|
|
$ |
32 |
|
|
|
0.34 |
|
|
|
% |
|
|
$ |
37,290 |
|
|
$ |
43 |
|
|
|
0.46 |
|
|
|
% |
|
| NOW and money market deposit accounts |
|
|
478,690 |
|
|
|
304 |
|
|
|
0.25 |
|
|
|
|
|
|
|
475,954 |
|
|
|
316 |
|
|
|
0.27 |
|
|
|
|
|
|
|
442,262 |
|
|
|
372 |
|
|
|
0.34 |
|
|
|
|
|
| Consumer CDs and IRAs |
|
|
113,728 |
|
|
|
281 |
|
|
|
0.99 |
|
|
|
|
|
|
|
118,306 |
|
|
|
300 |
|
|
|
1.03 |
|
|
|
|
|
|
|
147,425 |
|
|
|
441 |
|
|
|
1.20 |
|
|
|
|
|
| Negotiable CDs, public funds and other time deposits |
|
|
13,842 |
|
|
|
42 |
|
|
|
1.22 |
|
|
|
|
|
|
|
13,995 |
|
|
|
39 |
|
|
|
1.11 |
|
|
|
|
|
|
|
17,355 |
|
|
|
59 |
|
|
|
1.36 |
|
|
|
|
|
|
|
|
|
|
|
|
|
|
|
|
|
|
|
|
|
|
|
|
|
|
|
|
|
|
|
|
|
|
|
|
|
|
|
|
|
|
| Total U.S. interest-bearing deposits |
|
|
647,928 |
|
|
|
658 |
|
|
|
0.41 |
|
|
|
|
|
|
|
647,160 |
|
|
|
687 |
|
|
|
0.43 |
|
|
|
|
|
|
|
644,332 |
|
|
|
915 |
|
|
|
0.57 |
|
|
|
|
|
|
|
|
|
|
|
|
|
|
|
|
|
|
|
|
|
|
|
|
|
|
|
|
|
|
|
|
|
|
|
|
|
|
|
|
|
|
| Non-U.S. interest-bearing deposits: |
|
|
|
|
|
|
|
|
|
|
|
|
|
|
|
|
|
|
|
|
|
|
|
|
|
|
|
|
|
|
|
|
|
|
|
|
|
|
|
|
|
|
|
|
|
|
|
|
| Banks located in non-U.S. countries |
|
|
19,234 |
|
|
|
37 |
|
|
|
0.77 |
|
|
|
|
|
|
|
21,534 |
|
|
|
38 |
|
|
|
0.72 |
|
|
|
|
|
|
|
19,751 |
|
|
|
36 |
|
|
|
0.72 |
|
|
|
|
|
| Governments and official institutions |
|
|
2,131 |
|
|
|
2 |
|
|
|
0.38 |
|
|
|
|
|
|
|
2,307 |
|
|
|
2 |
|
|
|
0.35 |
|
|
|
|
|
|
|
4,214 |
|
|
|
3 |
|
|
|
0.28 |
|
|
|
|
|
| Time, savings and other |
|
|
64,889 |
|
|
|
146 |
|
|
|
0.90 |
|
|
|
|
|
|
|
60,432 |
|
|
|
112 |
|
|
|
0.76 |
|
|
|
|
|
|
|
52,195 |
|
|
|
77 |
|
|
|
0.60 |
|
|
|
|
|
|
|
|
|
|
|
|
|
|
|
|
|
|
|
|
|
|
|
|
|
|
|
|
|
|
|
|
|
|
|
|
|
|
|
|
|
|
| Total non-U.S. interest-bearing deposits |
|
|
86,254 |
|
|
|
185 |
|
|
|
0.86 |
|
|
|
|
|
|
|
84,273 |
|
|
|
152 |
|
|
|
0.73 |
|
|
|
|
|
|
|
76,160 |
|
|
|
116 |
|
|
|
0.61 |
|
|
|
|
|
|
|
|
|
|
|
|
|
|
|
|
|
|
|
|
|
|
|
|
|
|
|
|
|
|
|
|
|
|
|
|
|
|
|
|
|
|
| Total interest-bearing deposits |
|
|
734,182 |
|
|
|
843 |
|
|
|
0.46 |
|
|
|
|
|
|
|
731,433 |
|
|
|
839 |
|
|
|
0.46 |
|
|
|
|
|
|
|
720,492 |
|
|
|
1,031 |
|
|
|
0.57 |
|
|
|
|
|
|
|
|
|
|
|
|
|
|
|
|
|
|
|
|
|
|
|
|
|
|
|
|
|
|
|
|
|
|
|
|
|
|
|
|
|
|
| Federal funds purchased, securities loaned or sold under agreements to repurchase and other short-term borrowings |
|
|
338,692 |
|
|
|
1,342 |
|
|
|
1.59 |
|
|
|
|
|
|
|
371,573 |
|
|
|
1,184 |
|
|
|
1.29 |
|
|
|
|
|
|
|
454,051 |
|
|
|
891 |
|
|
|
0.79 |
|
|
|
|
|
| Trading account liabilities |
|
|
96,108 |
|
|
|
627 |
|
|
|
2.62 |
|
|
|
|
|
|
|
83,914 |
|
|
|
627 |
|
|
|
3.03 |
|
|
|
|
|
|
|
100,021 |
|
|
|
715 |
|
|
|
2.87 |
|
|
|
|
|
| Long-term debt |
|
|
435,144 |
|
|
|
2,991 |
|
|
|
2.75 |
|
|
|
|
|
|
|
440,511 |
|
|
|
3,093 |
|
|
|
2.84 |
|
|
|
|
|
|
|
497,469 |
|
|
|
3,582 |
|
|
|
2.88 |
|
|
|
|
|
|
|
|
|
|
|
|
|
|
|
|
|
|
|
|
|
|
|
|
|
|
|
|
|
|
|
|
|
|
|
|
|
|
|
|
|
|
| Total interest-bearing liabilities |
|
|
1,604,126 |
|
|
|
5,803 |
|
|
|
1.45 |
|
|
|
|
|
|
|
1,627,431 |
|
|
|
5,743 |
|
|
|
1.43 |
|
|
|
|
|
|
|
1,772,033 |
|
|
|
6,219 |
|
|
|
1.41 |
|
|
|
|
|
|
|
|
|
|
|
|
|
|
|
|
|
|
|
|
|
|
|
|
|
|
|
|
|
|
| Noninterest-bearing sources: |
|
|
|
|
|
|
|
|
|
|
|
|
|
|
|
|
|
|
|
|
|
|
|
|
|
|
|
|
|
|
|
|
|
|
|
|
|
|
|
|
|
|
|
|
|
|
|
|
| Noninterest-bearing deposits |
|
|
301,762 |
|
|
|
|
|
|
|
|
|
|
|
|
|
|
|
291,707 |
|
|
|
|
|
|
|
|
|
|
|
|
|
|
|
271,123 |
|
|
|
|
|
|
|
|
|
|
|
|
|
| Other liabilities |
|
|
198,155 |
|
|
|
|
|
|
|
|
|
|
|
|
|
|
|
188,631 |
|
|
|
|
|
|
|
|
|
|
|
|
|
|
|
217,815 |
|
|
|
|
|
|
|
|
|
|
|
|
|
| Shareholders’ equity |
|
|
235,067 |
|
|
|
|
|
|
|
|
|
|
|
|
|
|
|
230,769 |
|
|
|
|
|
|
|
|
|
|
|
|
|
|
|
233,461 |
|
|
|
|
|
|
|
|
|
|
|
|
|
|
|
|
|
|
|
|
|
|
|
|
|
|
|
|
|
|
|
|
|
|
|
|
|
|
| Total liabilities and shareholders’ equity |
|
$ |
2,339,110 |
|
|
|
|
|
|
|
|
|
|
|
|
|
|
$ |
2,338,538 |
|
|
|
|
|
|
|
|
|
|
|
|
|
|
$ |
2,494,432 |
|
|
|
|
|
|
|
|
|
|
|
|
|
|
|
|
|
|
|
|
|
|
|
|
|
|
|
|
|
|
|
|
|
|
|
|
|
|
| Net interest spread |
|
|
|
|
|
|
|
|
|
|
2.30 |
|
|
|
% |
|
|
|
|
|
|
|
|
|
|
|
2.49 |
|
|
|
% |
|
|
|
|
|
|
|
|
|
|
|
2.64 |
|
|
|
% |
|
| Impact of noninterest-bearing sources |
|
|
|
|
|
|
|
|
|
|
0.19 |
|
|
|
|
|
|
|
|
|
|
|
|
|
|
|
0.17 |
|
|
|
|
|
|
|
|
|
|
|
|
|
|
|
0.10 |
|
|
|
|
|
|
|
|
|
|
|
|
|
|
|
|
|
|
|
|
|
|
|
|
|
|
|
|
|
|
| Net interest income/yield on earning assets
(1) |
|
|
|
|
|
$ |
11,444 |
|
|
|
2.49 |
|
|
|
% |
|
|
|
|
|
|
$ |
12,334 |
|
|
|
2.66 |
|
|
|
% |
|
|
|
|
|
|
$ |
13,091 |
|
|
|
2.74 |
|
|
|
% |
|
|
|
|
|
|
|
|
|
|
|
|
|
|
|
|
|
|
|
|
|
|
|
|
|
|
For footnotes see page 9.
Certain prior period amounts have been reclassified to
conform to current period presentation.
|
|
|
| This information is preliminary and based on company data available at the time of the presentation. |
|
10 |
Bank of America Corporation and Subsidiaries
Year-to-Date Average Balances and Interest Rates - Fully Taxable-equivalent Basis
(Dollars in millions)
|
|
|
|
|
|
|
|
|
|
|
|
|
|
|
|
|
|
|
|
|
|
|
|
|
|
|
|
|
|
|
|
|
| |
|
Six Months Ended June 30 |
|
|
|
|
| |
|
2011 |
|
|
|
|
|
2010 |
|
|
|
|
| |
|
Average
Balance |
|
|
Interest
Income/
Expense |
|
|
Yield/
Rate |
|
|
|
|
|
Average
Balance |
|
|
Interest
Income/
Expense |
|
|
Yield/
Rate |
|
|
|
|
| Earning assets |
|
|
|
|
|
|
|
|
|
|
|
|
|
|
|
|
|
|
|
|
|
|
|
|
|
|
|
|
|
|
|
|
| Time deposits placed and other short-term investments
(1) |
|
$ |
29,285 |
|
|
$ |
194 |
|
|
|
1.34 |
|
|
|
% |
|
|
$ |
29,179 |
|
|
$ |
130 |
|
|
|
0.90 |
|
|
|
% |
|
| Federal funds sold and securities borrowed or purchased under agreements to resell |
|
|
243,311 |
|
|
|
1,114 |
|
|
|
0.92 |
|
|
|
|
|
|
|
264,810 |
|
|
|
905 |
|
|
|
0.69 |
|
|
|
|
|
| Trading account assets (2) |
|
|
203,806 |
|
|
|
3,245 |
|
|
|
3.21 |
|
|
|
|
|
|
|
214,233 |
|
|
|
3,648 |
|
|
|
3.42 |
|
|
|
|
|
| Debt securities (3) |
|
|
335,556 |
|
|
|
5,613 |
|
|
|
3.35 |
|
|
|
|
|
|
|
312,727 |
|
|
|
6,139 |
|
|
|
3.93 |
|
|
|
|
|
| Loans and leases (4): |
|
|
|
|
|
|
|
|
|
|
|
|
|
|
|
|
|
|
|
|
|
|
|
|
|
|
|
|
|
|
|
|
| Residential mortgage (5) |
|
|
263,744 |
|
|
|
5,644 |
|
|
|
4.28 |
|
|
|
|
|
|
|
245,785 |
|
|
|
6,082 |
|
|
|
4.95 |
|
|
|
|
|
| Home equity |
|
|
133,926 |
|
|
|
2,596 |
|
|
|
3.90 |
|
|
|
|
|
|
|
150,365 |
|
|
|
3,123 |
|
|
|
4.18 |
|
|
|
|
|
| Discontinued real estate |
|
|
14,457 |
|
|
|
239 |
|
|
|
3.31 |
|
|
|
|
|
|
|
14,201 |
|
|
|
287 |
|
|
|
4.05 |
|
|
|
|
|
| U.S. credit card |
|
|
108,042 |
|
|
|
5,555 |
|
|
|
10.37 |
|
|
|
|
|
|
|
122,027 |
|
|
|
6,491 |
|
|
|
10.73 |
|
|
|
|
|
| Non-U.S. credit card |
|
|
27,445 |
|
|
|
1,539 |
|
|
|
11.31 |
|
|
|
|
|
|
|
28,783 |
|
|
|
1,760 |
|
|
|
12.33 |
|
|
|
|
|
| Direct/Indirect consumer (6) |
|
|
89,748 |
|
|
|
1,938 |
|
|
|
4.36 |
|
|
|
|
|
|
|
99,728 |
|
|
|
2,535 |
|
|
|
5.13 |
|
|
|
|
|
| Other consumer (7) |
|
|
2,748 |
|
|
|
92 |
|
|
|
6.75 |
|
|
|
|
|
|
|
2,981 |
|
|
|
94 |
|
|
|
6.34 |
|
|
|
|
|
|
|
|
|
|
|
|
|
|
|
|
|
|
|
|
|
|
|
|
|
|
|
|
|
|
| Total consumer |
|
|
640,110 |
|
|
|
17,603 |
|
|
|
5.53 |
|
|
|
|
|
|
|
663,870 |
|
|
|
20,372 |
|
|
|
6.17 |
|
|
|
|
|
|
|
|
|
|
|
|
|
|
|
|
|
|
|
|
|
|
|
|
|
|
|
|
|
|
| U.S. commercial |
|
|
190,914 |
|
|
|
3,753 |
|
|
|
3.96 |
|
|
|
|
|
|
|
198,882 |
|
|
|
3,975 |
|
|
|
4.03 |
|
|
|
|
|
| Commercial real estate (8) |
|
|
47,053 |
|
|
|
819 |
|
|
|
3.51 |
|
|
|
|
|
|
|
66,361 |
|
|
|
1,116 |
|
|
|
3.39 |
|
|
|
|
|
| Commercial lease financing |
|
|
21,458 |
|
|
|
557 |
|
|
|
5.18 |
|
|
|
|
|
|
|
21,472 |
|
|
|
565 |
|
|
|
5.26 |
|
|
|
|
|
| Non-U.S. commercial |
|
|
39,203 |
|
|
|
638 |
|
|
|
3.28 |
|
|
|
|
|
|
|
28,682 |
|
|
|
520 |
|
|
|
3.65 |
|
|
|
|
|
|
|
|
|
|
|
|
|
|
|
|
|
|
|
|
|
|
|
|
|
|
|
|
|
|
| Total commercial |
|
|
298,628 |
|
|
|
5,767 |
|
|
|
3.89 |
|
|
|
|
|
|
|
315,397 |
|
|
|
6,176 |
|
|
|
3.94 |
|
|
|
|
|
|
|
|
|
|
|
|
|
|
|
|
|
|
|
|
|
|
|
|
|
|
|
|
|
|
| Total loans and leases |
|
|
938,738 |
|
|
|
23,370 |
|
|
|
5.01 |
|
|
|
|
|
|
|
979,267 |
|
|
|
26,548 |
|
|
|
5.45 |
|
|
|
|
|
|
|
|
|
|
|
|
|
|
|
|
|
|
|
|
|
|
|
|
|
|
|
|
|
|
| Other earning assets |
|
|
106,428 |
|
|
|
1,788 |
|
|
|
3.39 |
|
|
|
|
|
|
|
121,648 |
|
|
|
2,047 |
|
|
|
3.39 |
|
|
|
|
|
|
|
|
|
|
|
|
|
|
|
|
|
|
|
|
|
|
|
|
|
|
|
|
|
|
| Total earning assets |
|
|
1,857,124 |
|
|
|
35,324 |
|
|
|
3.84 |
|
|
|
|
|
|
|
1,921,864 |
|
|
|
39,417 |
|
|
|
4.14 |
|
|
|
|
|
|
|
|
|
|
|
|
|
|
|
|
|
|
|
|
|
|
| Cash and cash equivalents (1) |
|
|
127,037 |
|
|
|
112 |
|
|
|
|
|
|
|
|
|
|
|
203,334 |
|
|
|
198 |
|
|
|
|
|
|
|
|
|
| Other assets, less allowance for loan and lease losses
(2) |
|
|
354,665 |
|
|
|
|
|
|
|
|
|
|
|
|
|
|
|
380,261 |
|
|
|
|
|
|
|
|
|
|
|
|
|
|
|
|
|
|
|
|
|
|
|
|
|
|
|
|
|
|
| Total assets |
|
$ |
2,338,826 |
|
|
|
|
|
|
|
|
|
|
|
|
|
|
$ |
2,505,459 |
|
|
|
|
|
|
|
|
|
|
|
|
|
|
|
|
|
|
|
|
|
|
|
|
|
|
|
|
|
|
| (1) |
Fees earned on overnight deposits placed with the Federal Reserve, which were included in the time deposits placed and other short-term investments line in prior
periods, have been reclassified to cash and cash equivalents, consistent with the balance sheet presentation of these deposits. Net interest income and net interest yield are calculated excluding these fees. |
| (2) |
For the six months ended June 30, 2011, $20.3 billion of non-interest earning equity securities were reclassified from trading account assets to other
non-earning assets. Prior period amounts are immaterial and have not been restated. |
| (3) |
Yields on AFS debt securities are calculated based on fair value rather than the cost basis. The use of fair value does not have a material impact on net interest
yield. |
| (4) |
Nonperforming loans are included in the respective average loan balances. Income on these nonperforming loans is recognized on a cash basis. Purchased
credit-impaired loans were written down to fair value upon acquisition and accrete interest income over the remaining life of the loan. |
| (5) |
Includes non-U.S. residential mortgages of $93 million and $522 million for the six months ended June 30, 2011 and 2010. |
| (6) |
Includes non-U.S. consumer loans of $8.4 billion and $7.9 billion for the six months ended June 30, 2011 and 2010. |
| (7) |
Includes consumer finance loans of $1.9 billion and $2.2 billion, other non-U.S. consumer loans of $809 million and $671 million, and consumer overdrafts of $78
million and $144 million for the six months ended June 30, 2011 and 2010. |
| (8) |
Includes U.S. commercial real estate loans of $44.5 billion and $63.6 billion, and non-U.S. commercial real estate loans of $2.5 billion and $2.8 billion for the six
months ended June 30, 2011 and 2010. |
Certain prior period amounts have been reclassified to conform to current
period presentation.
|
|
|
| This information is preliminary and based on company data available at the time of the presentation. |
|
11 |
Bank of America Corporation and Subsidiaries
Year-to-Date Average Balances and Interest Rates - Fully Taxable-equivalent Basis (continued)
(Dollars in millions)
|
|
|
|
|
|
|
|
|
|
|
|
|
|
|
|
|
|
|
|
|
|
|
|
|
|
|
|
|
|
|
|
|
| |
|
Six Months Ended June 30 |
|
|
|
|
| |
|
2011 |
|
|
|
|
|
2010 |
|
|
|
|
| |
|
Average
Balance |
|
|
Interest
Income/
Expense |
|
|
Yield/
Rate |
|
|
|
|
|
Average
Balance |
|
|
Interest
Income/
Expense |
|
|
Yield/
Rate |
|
|
|
|
| Interest-bearing liabilities |
|
|
|
|
|
|
|
|
|
|
|
|
|
|
|
|
|
|
|
|
|
|
|
|
|
|
|
|
|
|
|
|
| U.S. interest-bearing deposits: |
|
|
|
|
|
|
|
|
|
|
|
|
|
|
|
|
|
|
|
|
|
|
|
|
|
|
|
|
|
|
|
|
| Savings |
|
$ |
40,294 |
|
|
$ |
63 |
|
|
|
0.32 |
|
|
|
% |
|
|
$ |
36,214 |
|
|
$ |
86 |
|
|
|
0.48 |
|
|
|
% |
|
| NOW and money market deposit accounts |
|
|
477,330 |
|
|
|
620 |
|
|
|
0.26 |
|
|
|
|
|
|
|
429,258 |
|
|
|
713 |
|
|
|
0.33 |
|
|
|
|
|
| Consumer CDs and IRAs |
|
|
116,004 |
|
|
|
581 |
|
|
|
1.01 |
|
|
|
|
|
|
|
156,755 |
|
|
|
1,008 |
|
|
|
1.30 |
|
|
|
|
|
| Negotiable CDs, public funds and other time deposits |
|
|
13,918 |
|
|
|
81 |
|
|
|
1.17 |
|
|
|
|
|
|
|
18,552 |
|
|
|
122 |
|
|
|
1.33 |
|
|
|
|
|
|
|
|
|
|
|
|
|
|
|
|
|
|
|
|
|
|
|
|
|
|
|
|
|
|
| Total U.S. interest-bearing deposits |
|
|
647,546 |
|
|
|
1,345 |
|
|
|
0.42 |
|
|
|
|
|
|
|
640,779 |
|
|
|
1,929 |
|
|
|
0.61 |
|
|
|
|
|
|
|
|
|
|
|
|
|
|
|
|
|
|
|
|
|
|
|
|
|
|
|
|
|
|
| Non-U.S. interest-bearing deposits: |
|
|
|
|
|
|
|
|
|
|
|
|
|
|
|
|
|
|
|
|
|
|
|
|
|
|
|
|
|
|
|
|
| Banks located in non-U.S. countries |
|
|
20,378 |
|
|
|
75 |
|
|
|
0.74 |
|
|
|
|
|
|
|
19,091 |
|
|
|
68 |
|
|
|
0.72 |
|
|
|
|
|
| Governments and official institutions |
|
|
2,219 |
|
|
|
4 |
|
|
|
0.36 |
|
|
|
|
|
|
|
4,916 |
|
|
|
6 |
|
|
|
0.25 |
|
|
|
|
|
| Time, savings and other |
|
|
62,673 |
|
|
|
258 |
|
|
|
0.83 |
|
|
|
|
|
|
|
53,534 |
|
|
|
150 |
|
|
|
0.57 |
|
|
|
|
|
|
|
|
|
|
|
|
|
|
|
|
|
|
|
|
|
|
|
|
|
|
|
|
|
|
| Total non-U.S. interest-bearing deposits |
|
|
85,270 |
|
|
|
337 |
|
|
|
0.80 |
|
|
|
|
|
|
|
77,541 |
|
|
|
224 |
|
|
|
0.58 |
|
|
|
|
|
|
|
|
|
|
|
|
|
|
|
|
|
|
|
|
|
|
|
|
|
|
|
|
|
|
| Total interest-bearing deposits |
|
|
732,816 |
|
|
|
1,682 |
|
|
|
0.46 |
|
|
|
|
|
|
|
718,320 |
|
|
|
2,153 |
|
|
|
0.60 |
|
|
|
|
|
|
|
|
|
|
|
|
|
|
|
|
|
|
|
|
|
|
|
|
|
|
|
|
|
|
| Federal funds purchased and securities loaned or sold under agreements to repurchase and other short-term
borrowings |
|
|
355,042 |
|
|
|
2,526 |
|
|
|
1.43 |
|
|
|
|
|
|
|
481,041 |
|
|
|
1,709 |
|
|
|
0.72 |
|
|
|
|
|
| Trading account liabilities |
|
|
90,044 |
|
|
|
1,254 |
|
|
|
2.81 |
|
|
|
|
|
|
|
95,105 |
|
|
|
1,374 |
|
|
|
2.91 |
|
|
|
|
|
| Long-term debt |
|
|
437,812 |
|
|
|
6,084 |
|
|
|
2.80 |
|
|
|
|
|
|
|
505,507 |
|
|
|
7,112 |
|
|
|
2.82 |
|
|
|
|
|
|
|
|
|
|
|
|
|
|
|
|
|
|
|
|
|
|
|
|
|
|
|
|
|
|
| Total interest-bearing liabilities |
|
|
1,615,714 |
|
|
|
11,546 |
|
|
|
1.44 |
|
|
|
|
|
|
|
1,799,973 |
|
|
|
12,348 |
|
|
|
1.38 |
|
|
|
|
|
|
|
|
|
|
|
|
|
|
|
|
|
|
|
|
|
|
| Noninterest-bearing sources: |
|
|
|
|
|
|
|
|
|
|
|
|
|
|
|
|
|
|
|
|
|
|
|
|
|
|
|
|
|
|
|
|
| Noninterest-bearing deposits |
|
|
296,762 |
|
|
|
|
|
|
|
|
|
|
|
|
|
|
|
268,024 |
|
|
|
|
|
|
|
|
|
|
|
|
|
| Other liabilities |
|
|
193,420 |
|
|
|
|
|
|
|
|
|
|
|
|
|
|
|
205,767 |
|
|
|
|
|
|
|
|
|
|
|
|
|
| Shareholders’ equity |
|
|
232,930 |
|
|
|
|
|
|
|
|
|
|
|
|
|
|
|
231,695 |
|
|
|
|
|
|
|
|
|
|
|
|
|
|
|
|
|
|
|
|
|
|
|
|
|
|
|
|
|
|
| Total liabilities and shareholders’ equity |
|
$ |
2,338,826 |
|
|
|
|
|
|
|
|
|
|
|
|
|
|
$ |
2,505,459 |
|
|
|
|
|
|
|
|
|
|
|
|
|
|
|
|
|
|
|
|
|
|
|
|
|
|
|
|
|
|
| Net interest spread |
|
|
|
|
|
|
|
|
|
|
2.40 |
|
|
|
% |
|
|
|
|
|
|
|
|
|
|
|
2.76 |
|
|
|
% |
|
| Impact of noninterest-bearing sources |
|
|
|
|
|
|
|
|
|
|
0.17 |
|
|
|
|
|
|
|
|
|
|
|
|
|
|
|
0.06 |
|
|
|
|
|
|
|
|
|
|
|
|
|
|
|
|
|
|
|
|
|
|
| Net interest income/yield on earning assets
(1) |
|
|
|
|
|
$ |
23,778 |
|
|
|
2.57 |
|
|
|
% |
|
|
|
|
|
|
$ |
27,069 |
|
|
|
2.82 |
|
|
|
% |
|
|
|
|
|
|
|
|
|
|
|
|
|
|
|
|
|
|
For footnotes see page 11.
Certain prior period amounts have been reclassified to
conform to current period presentation.
|
|
|
| This information is preliminary and based on company data available at the time of the presentation. |
|
12 |
Bank of America Corporation and Subsidiaries
Debt Securities and Available-for-Sale Marketable Equity Securities
(Dollars in millions)
|
|
|
|
|
|
|
|
|
|
|
|
|
|
|
|
|
| |
|
June 30, 2011 |
|
| |
|
Amortized
Cost |
|
|
Gross
Unrealized
Gains |
|
|
Gross
Unrealized
Losses |
|
|
Fair
Value |
|
| Available-for-sale debt securities |
|
|
|
|
|
|
|
|
|
|
|
|
|
|
|
|
| U.S. Treasury and agency securities |
|
$ |
49,874 |
|
|
$ |
684 |
|
|
$ |
(1,289 |
) |
|
$ |
49,269 |
|
| Mortgage-backed securities: |
|
|
|
|
|
|
|
|
|
|
|
|
|
|
|
|
| Agency |
|
|
180,151 |
|
|
|
3,128 |
|
|
|
(1,663 |
) |
|
|
181,616 |
|
| Agency collateralized mortgage obligations |
|
|
48,212 |
|
|
|
930 |
|
|
|
(31 |
) |
|
|
49,111 |
|
| Non-agency residential |
|
|
19,564 |
|
|
|
568 |
|
|
|
(557 |
) |
|
|
19,575 |
|
| Non-agency commercial |
|
|
6,018 |
|
|
|
702 |
|
|
|
(2 |
) |
|
|
6,718 |
|
| Non-U.S. securities |
|
|
4,314 |
|
|
|
62 |
|
|
|
(16 |
) |
|
|
4,360 |
|
| Corporate bonds |
|
|
4,388 |
|
|
|
154 |
|
|
|
(4 |
) |
|
|
4,538 |
|
| Other taxable securities (1) |
|
|
12,010 |
|
|
|
79 |
|
|
|
(66 |
) |
|
|
12,023 |
|
|
|
|
|
|
|
|
|
|
|
|
|
|
|
|
|
|
| Total taxable securities |
|
$ |
324,531 |
|
|
$ |
6,307 |
|
|
$ |
(3,628 |
) |
|
$ |
327,210 |
|
| Tax-exempt securities |
|
|
3,808 |
|
|
|
18 |
|
|
|
(165 |
) |
|
|
3,661 |
|
|
|
|
|
|
|
|
|
|
|
|
|
|
|
|
|
|
| Total available-for-sale debt securities |
|
$ |
328,339 |
|
|
$ |
6,325 |
|
|
$ |
(3,793 |
) |
|
$ |
330,871 |
|
|
|
|
|
|
|
|
|
|
|
|
|
|
|
|
|
|
| Held-to-maturity debt securities |
|
|
181 |
|
|
|
— |
|
|
|
— |
|
|
|
181 |
|
|
|
|
|
|
|
|
|
|
|
|
|
|
|
|
|
|
| Total debt securities |
|
$ |
328,520 |
|
|
$ |
6,325 |
|
|
$ |
(3,793 |
) |
|
$ |
331,052 |
|
|
|
|
|
|
|
|
|
|
|
|
|
|
|
|
|
|
| Available-for-sale marketable equity securities
(2) |
|
$ |
8,536 |
|
|
$ |
10,445 |
|
|
$ |
(19 |
) |
|
$ |
18,962 |
|
|
|
|
|
|
|
|
|
|
|
|
|
|
|
|
|
|
|
|
| |
|
March 31, 2011 |
|
| |
|
Amortized
Cost |
|
|
Gross
Unrealized
Gains |
|
|
Gross
Unrealized
Losses |
|
|
Fair
Value |
|
| Available-for-sale debt securities |
|
|
|
|
|
|
|
|
|
|
|
|
|
|
|
|
| U.S. Treasury and agency securities |
|
$ |
49,361 |
|
|
$ |
625 |
|
|
$ |
(887 |
) |
|
$ |
49,099 |
|
| Mortgage-backed securities: |
|
|
|
|
|
|
|
|
|
|
|
|
|
|
|
|
| Agency |
|
|
192,301 |
|
|
|
2,605 |
|
|
|
(3,136 |
) |
|
|
191,770 |
|
| Agency collateralized mortgage obligations |
|
|
34,819 |
|
|
|
237 |
|
|
|
(29 |
) |
|
|
35,027 |
|
| Non-agency residential |
|
|
20,625 |
|
|
|
536 |
|
|
|
(507 |
) |
|
|
20,654 |
|
| Non-agency commercial |
|
|
6,116 |
|
|
|
684 |
|
|
|
(1 |
) |
|
|
6,799 |
|
| Non-U.S. securities |
|
|
4,250 |
|
|
|
63 |
|
|
|
(11 |
) |
|
|
4,302 |
|
| Corporate bonds |
|
|
4,340 |
|
|
|
134 |
|
|
|
(5 |
) |
|
|
4,469 |
|
| Other taxable securities (1) |
|
|
12,883 |
|
|
|
75 |
|
|
|
(90 |
) |
|
|
12,868 |
|
|
|
|
|
|
|
|
|
|
|
|
|
|
|
|
|
|
| Total taxable securities |
|
$ |
324,695 |
|
|
$ |
4,959 |
|
|
$ |
(4,666 |
) |
|
$ |
324,988 |
|
| Tax-exempt securities |
|
|
5,546 |
|
|
|
31 |
|
|
|
(220 |
) |
|
|
5,357 |
|
|
|
|
|
|
|
|
|
|
|
|
|
|
|
|
|
|
| Total available-for-sale debt securities |
|
$ |
330,241 |
|
|
$ |
4,990 |
|
|
$ |
(4,886 |
) |
|
$ |
330,345 |
|
|
|
|
|
|
|
|
|
|
|
|
|
|
|
|
|
|
| Held-to-maturity debt securities |
|
|
431 |
|
|
|
— |
|
|
|
— |
|
|
|
431 |
|
|
|
|
|
|
|
|
|
|
|
|
|
|
|
|
|
|
| Total debt securities |
|
$ |
330,672 |
|
|
$ |
4,990 |
|
|
$ |
(4,886 |
) |
|
$ |
330,776 |
|
|
|
|
|
|
|
|
|
|
|
|
|
|
|
|
|
|
| Available-for-sale marketable equity securities
(2) |
|
$ |
8,535 |
|
|
$ |
11,925 |
|
|
$ |
(15 |
) |
|
$ |
20,445 |
|
|
|
|
|
|
|
|
|
|
|
|
|
|
|
|
|
|
| (1) |
Substantially all asset-backed securities. |
| (2) |
Classified in other assets on the Consolidated Balance Sheet. |
Certain prior period amounts have been reclassified to conform to current period presentation.
|
|
|
| This information is preliminary and based on company data available at the time of the presentation. |
|
13 |
Bank of America Corporation and Subsidiaries
Quarterly Results by Business Segment
(Dollars in millions)
|
|
|
|
|
|
|
|
|
|
|
|
|
|
|
|
|
|
|
|
|
|
|
|
|
|
|
|
|
|
|
|
|
|
|
| |
|
Second Quarter 2011 |
|
| |
|
Total
Corporation |
|
|
|
|
Deposits |
|
|
Global
Card
Services |
|
|
Consumer
Real
Estate
Services |
|
|
Global
Commercial
Banking |
|
|
Global
Banking
&
Markets |
|
|
GWIM |
|
|
All
Other |
|
|
|
|
|
|
|
|
|
|
|
| Net interest income (1) |
|
$ |
11,493 |
|
|
|
|
$ |
2,281 |
|
|
$ |
3,611 |
|
|
$ |
579 |
|
|
$ |
1,827 |
|
|
$ |
1,791 |
|
|
$ |
1,571 |
|
|
$ |
(167 |
) |
| Noninterest income (loss) |
|
|
1,990 |
|
|
|
|
|
1,020 |
|
|
|
1,925 |
|
|
|
(11,894 |
) |
|
|
983 |
|
|
|
5,005 |
|
|
|
2,919 |
|
|
|
2,032 |
|
|
|
|
|
|
|
|
|
|
|
|
|
|
|
|
|
|
|
|
|
|
|
|
|
|
|
|
|
|
|
|
|
|
|
|
| Total revenue, net of interest expense |
|
|
13,483 |
|
|
|
|
|
3,301 |
|
|
|
5,536 |
|
|
|
(11,315 |
) |
|
|
2,810 |
|
|
|
6,796 |
|
|
|
4,490 |
|
|
|
1,865 |
|
|
|
|
|
|
|
|
|
|
|
| Provision for credit losses |
|
|
3,255 |
|
|
|
|
|
31 |
|
|
|
481 |
|
|
|
1,507 |
|
|
|
(417 |
) |
|
|
(82 |
) |
|
|
72 |
|
|
|
1,663 |
|
| Noninterest expense |
|
|
22,856 |
|
|
|
|
|
2,599 |
|
|
|
1,882 |
|
|
|
8,647 |
|
|
|
1,068 |
|
|
|
4,713 |
|
|
|
3,631 |
|
|
|
316 |
|
|
|
|
|
|
|
|
|
|
|
|
|
|
|
|
|
|
|
|
|
|
|
|
|
|
|
|
|
|
|
|
|
|
|
|
| Income (loss) before income taxes |
|
|
(12,628 |
) |
|
|
|
|
671 |
|
|
|
3,173 |
|
|
|
(21,469 |
) |
|
|
2,159 |
|
|
|
2,165 |
|
|
|
787 |
|
|
|
(114 |
) |
| Income tax expense (benefit) (1) |
|
|
(3,802 |
) |
|
|
|
|
241 |
|
|
|
1,138 |
|
|
|
(6,949 |
) |
|
|
778 |
|
|
|
607 |
|
|
|
281 |
|
|
|
102 |
|
|
|
|
|
|
|
|
|
|
|
|
|
|
|
|
|
|
|
|
|
|
|
|
|
|
|
|
|
|
|
|
|
|
|
|
| Net income (loss) |
|
$ |
(8,826 |
) |
|
|
|
$ |
430 |
|
|
$ |
2,035 |
|
|
$ |
(14,520 |
) |
|
$ |
1,381 |
|
|
$ |
1,558 |
|
|
$ |
506 |
|
|
$ |
(216 |
) |
|
|
|
|
|
|
|
|
|
|
|
|
|
|
|
|
|
|
|
|
|
|
|
|
|
|
|
|
|
|
|
|
|
|
|
|
|
|
|
|
|
|
|
|
|
| Average |
|
|
|
|
|
|
|
|
|
|
|
|
|
|
|
|
|
|
|
|
|
|
|
|
|
|
|
|
|
|
|
|
|
|
| Total loans and leases |
|
$ |
938,513 |
|
|
|
|
|
n/m |
|
|
$ |
156,788 |
|
|
$ |
121,683 |
|
|
$ |
189,346 |
|
|
$ |
109,473 |
|
|
$ |
102,200 |
|
|
$ |
258,397 |
|
| Total assets (2) |
|
|
2,339,110 |
|
|
|
|
$ |
451,554 |
|
|
|
161,776 |
|
|
|
198,030 |
|
|
|
320,428 |
|
|
|
750,908 |
|
|
|
289,050 |
|
|
|
167,364 |
|
| Total deposits |
|
|
1,035,944 |
|
|
|
|
|
426,684 |
|
|
|
n/m |
|
|
|
n/m |
|
|
|
166,481 |
|
|
|
118,133 |
|
|
|
255,219 |
|
|
|
46,684 |
|
|
|
|
|
|
|
|
|
|
|
| Period end |
|
|
|
|
|
|
|
|
|
|
|
|
|
|
|
|
|
|
|
|
|
|
|
|
|
|
|
|
|
|
|
|
|
|
| Total loans and leases |
|
$ |
941,257 |
|
|
|
|
|
n/m |
|
|
$ |
153,280 |
|
|
$ |
121,553 |
|
|
$ |
189,434 |
|
|
$ |
114,165 |
|
|
$ |
102,878 |
|
|
$ |
259,285 |
|
| Total assets (2) |
|
|
2,261,319 |
|
|
|
|
$ |
449,123 |
|
|
|
161,756 |
|
|
|
185,398 |
|
|
|
280,289 |
|
|
|
691,249 |
|
|
|
284,294 |
|
|
|
209,210 |
|
| Total deposits |
|
|
1,038,408 |
|
|
|
|
|
424,579 |
|
|
|
n/m |
|
|
|
n/m |
|
|
|
170,156 |
|
|
|
123,618 |
|
|
|
255,580 |
|
|
|
42,355 |
|
| |
|
First Quarter 2011 |
|
| |
|
Total
Corporation |
|
|
|
|
Deposits |
|
|
Global
Card
Services |
|
|
Consumer
Real Estate
Services |
|
|
Global
Commercial
Banking |
|
|
Global
Banking &
Markets |
|
|
GWIM |
|
|
All
Other |
|
| Net interest income (1) |
|
$ |
12,397 |
|
|
|
|
$ |
2,205 |
|
|
$ |
3,747 |
|
|
$ |
896 |
|
|
$ |
1,850 |
|
|
$ |
2,037 |
|
|
$ |
1,569 |
|
|
$ |
93 |
|
| Noninterest income |
|
|
14,698 |
|
|
|
|
|
984 |
|
|
|
1,940 |
|
|
|
1,167 |
|
|
|
801 |
|
|
|
5,849 |
|
|
|
2,923 |
|
|
|
1,034 |
|
|
|
|
|
|
|
|
|
|
|
|
|
|
|
|
|
|
|
|
|
|
|
|
|
|
|
|
|
|
|
|
|
|
|
|
| Total revenue, net of interest expense |
|
|
27,095 |
|
|
|
|
|
3,189 |
|
|
|
5,687 |
|
|
|
2,063 |
|
|
|
2,651 |
|
|
|
7,886 |
|
|
|
4,492 |
|
|
|
1,127 |
|
|
|
|
|
|
|
|
|
|
|
| Provision for credit losses |
|
|
3,814 |
|
|
|
|
|
33 |
|
|
|
961 |
|
|
|
1,098 |
|
|
|
79 |
|
|
|
(202 |
) |
|
|
46 |
|
|
|
1,799 |
|
| Noninterest expense |
|
|
20,283 |
|
|
|
|
|
2,592 |
|
|
|
1,969 |
|
|
|
4,801 |
|
|
|
1,106 |
|
|
|
4,722 |
|
|
|
3,599 |
|
|
|
1,494 |
|
|
|
|
|
|
|
|
|
|
|
|
|
|
|
|
|
|
|
|
|
|
|
|
|
|
|
|
|
|
|
|
|
|
|
|
| Income (loss) before income taxes |
|
|
2,998 |
|
|
|
|
|
564 |
|
|
|
2,757 |
|
|
|
(3,836 |
) |
|
|
1,466 |
|
|
|
3,366 |
|
|
|
847 |
|
|
|
(2,166 |
) |
| Income tax expense (benefit) (1) |
|
|
949 |
|
|
|
|
|
209 |
|
|
|
1,022 |
|
|
|
(1,421 |
) |
|
|
543 |
|
|
|
1,232 |
|
|
|
314 |
|
|
|
(950 |
) |
|
|
|
|
|
|
|
|
|
|
|
|
|
|
|
|
|
|
|
|
|
|
|
|
|
|
|
|
|
|
|
|
|
|
|
| Net income (loss) |
|
$ |
2,049 |
|
|
|
|
$ |
355 |
|
|
$ |
1,735 |
|
|
$ |
(2,415 |
) |
|
$ |
923 |
|
|
$ |
2,134 |
|
|
$ |
533 |
|
|
$ |
(1,216 |
) |
|
|
|
|
|
|
|
|
|
|
|
|
|
|
|
|
|
|
|
|
|
|
|
|
|
|
|
|
|
|
|
|
|
|
|
|
|
|
|
|
|
|
|
|
|
| Average |
|
|
|
|
|
|
|
|
|
|
|
|
|
|
|
|
|
|
|
|
|
|
|
|
|
|
|
|
|
|
|
|
|
|
| Total loans and leases |
|
$ |
938,966 |
|
|
|
|
|
n/m |
|
|
$ |
162,425 |
|
|
$ |
120,560 |
|
|
$ |
192,437 |
|
|
$ |
103,704 |
|
|
$ |
100,851 |
|
|
$ |
258,350 |
|
| Total assets (2) |
|
|
2,338,538 |
|
|
|
|
$ |
443,461 |
|
|
|
165,768 |
|
|
|
209,329 |
|
|
|
312,570 |
|
|
|
710,684 |
|
|
|
297,335 |
|
|
|
199,391 |
|
| Total deposits |
|
|
1,023,140 |
|
|
|
|
|
418,298 |
|
|
|
n/m |
|
|
|
n/m |
|
|
|
160,217 |
|
|
|
112,028 |
|
|
|
258,518 |
|
|
|
48,608 |
|
|
|
|
|
|
|
|
|
|
|
| Period end |
|
|
|
|
|
|
|
|
|
|
|
|
|
|
|
|
|
|
|
|
|
|
|
|
|
|
|
|
|
|
|
|
|
|
| Total loans and leases |
|
$ |
932,425 |
|
|
|
|
|
n/m |
|
|
$ |
158,444 |
|
|
$ |
118,749 |
|
|
$ |
190,749 |
|
|
$ |
105,651 |
|
|
$ |
101,286 |
|
|
$ |
256,931 |
|
| Total assets (2) |
|
|
2,274,532 |
|
|
|
|
$ |
456,248 |
|
|
|
164,084 |
|
|
|
204,485 |
|
|
|
309,930 |
|
|
|
698,458 |
|
|
|
285,472 |
|
|
|
155,855 |
|
| Total deposits |
|
|
1,020,175 |
|
|
|
|
|
431,022 |
|
|
|
n/m |
|
|
|
n/m |
|
|
|
161,584 |
|
|
|
115,212 |
|
|
|
256,526 |
|
|
|
34,818 |
|
| |
|
Second Quarter 2010 |
|
| |
|
Total
Corporation |
|
|
|
|
Deposits |
|
|
Global
Card
Services |
|
|
Consumer
Real Estate
Services |
|
|
Global
Commercial
Banking |
|
|
Global
Banking &
Markets |
|
|
GWIM |
|
|
All
Other |
|
| Net interest income (1) |
|
$ |
13,197 |
|
|
|
|
$ |
2,144 |
|
|
$ |
4,442 |
|
|
$ |
992 |
|
|
$ |
2,097 |
|
|
$ |
2,002 |
|
|
$ |
1,443 |
|
|
$ |
77 |
|
| Noninterest income |
|
|
16,253 |
|
|
|
|
|
1,551 |
|
|
|
2,506 |
|
|
|
1,712 |
|
|
|
786 |
|
|
|
3,902 |
|
|
|
2,746 |
|
|
|
3,050 |
|
|
|
|
|
|
|
|
|
|
|
|
|
|
|
|
|
|
|
|
|
|
|
|
|
|
|
|
|
|
|
|
|
|
|
|
| Total revenue, net of interest expense |
|
|
29,450 |
|
|
|
|
|
3,695 |
|
|
|
6,948 |
|
|
|
2,704 |
|
|
|
2,883 |
|
|
|
5,904 |
|
|
|
4,189 |
|
|
|
3,127 |
|
|
|
|
|
|
|
|
|
|
|
| Provision for credit losses |
|
|
8,105 |
|
|
|
|
|
61 |
|
|
|
3,796 |
|
|
|
2,390 |
|
|
|
623 |
|
|
|
(133 |
) |
|
|
122 |
|
|
|
1,246 |
|
| Noninterest expense |
|
|
17,253 |
|
|
|
|
|
2,572 |
|
|
|
1,852 |
|
|
|
2,738 |
|
|
|
974 |
|
|
|
4,735 |
|
|
|
3,269 |
|
|
|
1,113 |
|
|
|
|
|
|
|
|
|
|
|
|
|
|
|
|
|
|
|
|
|
|
|
|
|
|
|
|
|
|
|
|
|
|
|
|
| Income (loss) before income taxes |
|
|
4,092 |
|
|
|
|
|
1,062 |
|
|
|
1,300 |
|
|
|
(2,424 |
) |
|
|
1,286 |
|
|
|
1,302 |
|
|
|
798 |
|
|
|
768 |
|
| Income tax expense (benefit) (1) |
|
|
969 |
|
|
|
|
|
388 |
|
|
|
474 |
|
|
|
(882 |
) |
|
|
471 |
|
|
|
404 |
|
|
|
469 |
|
|
|
(355 |
) |
|
|
|
|
|
|
|
|
|
|
|
|
|
|
|
|
|
|
|
|
|
|
|
|
|
|
|
|
|
|
|
|
|
|
|
| Net income (loss) |
|
$ |
3,123 |
|
|
|
|
$ |
674 |
|
|
$ |
826 |
|
|
$ |
(1,542 |
) |
|
$ |
815 |
|
|
$ |
898 |
|
|
$ |
329 |
|
|
$ |
1,123 |
|
|
|
|
|
|
|
|
|
|
|
|
|
|
|
|
|
|
|
|
|
|
|
|
|
|
|
|
|
|
|
|
|
|
|
|
|
|
|
|
|
|
|
|
|
|
| Average |
|
|
|
|
|
|
|
|
|
|
|
|
|
|
|
|
|
|
|
|
|
|
|
|
|
|
|
|
|
|
|
|
|
|
| Total loans and leases |
|
$ |
967,054 |
|
|
|
|
|
n/m |
|
|
$ |
177,076 |
|
|
$ |
130,662 |
|
|
$ |
206,603 |
|
|
$ |
95,839 |
|
|
$ |
98,811 |
|
|
$ |
257,322 |
|
| Total assets (2) |
|
|
2,494,432 |
|
|
|
|
$ |
443,520 |
|
|
|
187,138 |
|
|
|
227,595 |
|
|
|
305,788 |
|
|
|
779,060 |
|
|
|
259,801 |
|
|
|
291,530 |
|
| Total deposits |
|
|
991,615 |
|
|
|
|
|
418,480 |
|
|
|
n/m |
|
|
|
n/m |
|
|
|
145,499 |
|
|
|
112,565 |
|
|
|
226,276 |
|
|
|
64,709 |
|
|
|
|
|
|
|
|
|
|
|
| Period end |
|
|
|
|
|
|
|
|
|
|
|
|
|
|
|
|
|
|
|
|
|
|
|
|
|
|
|
|
|
|
|
|
|
|
| Total loans and leases |
|
$ |
956,177 |
|
|
|
|
|
n/m |
|
|
$ |
172,531 |
|
|
$ |
129,797 |
|
|
$ |
203,659 |
|
|
$ |
95,756 |
|
|
$ |
99,157 |
|
|
$ |
254,516 |
|
| Total assets (2) |
|
|
2,368,384 |
|
|
|
|
$ |
439,770 |
|
|
|
184,213 |
|
|
|
223,998 |
|
|
|
306,234 |
|
|
|
718,563 |
|
|
|
252,507 |
|
|
|
243,099 |
|
| Total deposits |
|
|
974,467 |
|
|
|
|
|
414,470 |
|
|
|
n/m |
|
|
|
n/m |
|
|
|
147,414 |
|
|
|
105,678 |
|
|
|
226,572 |
|
|
|
57,424 |
|
| (1) |
Fully taxable-equivalent basis |
| (2) |
Total assets include asset allocations to match liabilities (i.e., deposits). |
Certain prior
period amounts have been reclassified among the segments to conform to current period presentation.
|
|
|
| This information is preliminary and based on company data available at the time of the presentation. |
|
14 |
Bank of America Corporation and Subsidiaries
Year-to-Date Results by Business Segment
(Dollars in millions)
|
|
|
|
|
|
|
|
|
|
|
|
|
|
|
|
|
|
|
|
|
|
|
|
|
|
|
|
|
|
|
|
|
|
|
| |
|
Six Months Ended June 30, 2011 |
|
| |
|
Total
Corporation |
|
|
|
|
Deposits |
|
|
Global
Card
Services |
|
|
Consumer
Real Estate
Services |
|
|
Global
Commercial
Banking |
|
|
Global
Banking &
Markets |
|
|
GWIM |
|
|
All
Other |
|
| Net interest income (1) |
|
$ |
23,890 |
|
|
|
|
$ |
4,486 |
|
|
$ |
7,358 |
|
|
$ |
1,475 |
|
|
$ |
3,677 |
|
|
$ |
3,828 |
|
|
$ |
3,140 |
|
|
$ |
(74 |
) |
| Noninterest income (loss) |
|
|
16,688 |
|
|
|
|
|
2,004 |
|
|
|
3,865 |
|
|
|
(10,727 |
) |
|
|
1,784 |
|
|
|
10,854 |
|
|
|
5,842 |
|
|
|
3,066 |
|
|
|
|
|
|
|
|
|
|
|
|
|
|
|
|
|
|
|
|
|
|
|
|
|
|
|
|
|
|
|
|
|
|
|
|
| Total revenue, net of interest expense |
|
|
40,578 |
|
|
|
|
|
6,490 |
|
|
|
11,223 |
|
|
|
(9,252 |
) |
|
|
5,461 |
|
|
|
14,682 |
|
|
|
8,982 |
|
|
|
2,992 |
|
|
|
|
|
|
|
|
|
|
|
| Provision for credit losses |
|
|
7,069 |
|
|
|
|
|
64 |
|
|
|
1,442 |
|
|
|
2,605 |
|
|
|
(338 |
) |
|
|
(284 |
) |
|
|
118 |
|
|
|
3,462 |
|
| Noninterest expense |
|
|
43,139 |
|
|
|
|
|
5,191 |
|
|
|
3,851 |
|
|
|
13,448 |
|
|
|
2,174 |
|
|
|
9,435 |
|
|
|
7,230 |
|
|
|
1,810 |
|
|
|
|
|
|
|
|
|
|
|
|
|
|
|
|
|
|
|
|
|
|
|
|
|
|
|
|
|
|
|
|
|
|
|
|
| Income (loss) before income taxes |
|
|
(9,630 |
) |
|
|
|
|
1,235 |
|
|
|
5,930 |
|
|
|
(25,305 |
) |
|
|
3,625 |
|
|
|
5,531 |
|
|
|
1,634 |
|
|
|
(2,280 |
) |
| Income tax expense (benefit) (1) |
|
|
(2,853 |
) |
|
|
|
|
450 |
|
|
|
2,160 |
|
|
|
(8,370 |
) |
|
|
1,321 |
|
|
|
1,839 |
|
|
|
595 |
|
|
|
(848 |
) |
|
|
|
|
|
|
|
|
|
|
|
|
|
|
|
|
|
|
|
|
|
|
|
|
|
|
|
|
|
|
|
|
|
|
|
| Net income (loss) |
|
$ |
(6,777 |
) |
|
|
|
$ |
785 |
|
|
$ |
3,770 |
|
|
$ |
(16,935 |
) |
|
$ |
2,304 |
|
|
$ |
3,692 |
|
|
$ |
1,039 |
|
|
$ |
(1,432 |
) |
|
|
|
|
|
|
|
|
|
|
|
|
|
|
|
|
|
|
|
|
|
|
|
|
|
|
|
|
|
|
|
|
|
|
|
|
|
|
|
|
|
|
|
|
|
| Average |
|
|
|
|
|
|
|
|
|
|
|
|
|
|
|
|
|
|
|
|
|
|
|
|
|
|
|
|
|
|
|
|
|
|
| Total loans and leases |
|
$ |
938,738 |
|
|
|
|
|
n/m |
|
|
$ |
159,591 |
|
|
$ |
121,125 |
|
|
$ |
190,883 |
|
|
$ |
106,604 |
|
|
$ |
101,529 |
|
|
$ |
258,374 |
|
| Total assets (2) |
|
|
2,338,826 |
|
|
|
|
$ |
447,530 |
|
|
|
163,761 |
|
|
|
203,648 |
|
|
|
316,521 |
|
|
|
730,907 |
|
|
|
293,170 |
|
|
|
n/m |
|
| Total deposits |
|
|
1,029,578 |
|
|
|
|
|
422,514 |
|
|
|
n/m |
|
|
|
n/m |
|
|
|
163,366 |
|
|
|
115,097 |
|
|
|
256,859 |
|
|
|
47,642 |
|
|
|
|
|
|
|
|
|
|
|
| Period end |
|
|
|
|
|
|
|
|
|
|
|
|
|
|
|
|
|
|
|
|
|
|
|
|
|
|
|
|
|
|
|
|
|
|
| Total loans and leases |
|
$ |
941,257 |
|
|
|
|
|
n/m |
|
|
$ |
153,280 |
|
|
$ |
121,553 |
|
|
$ |
189,434 |
|
|
$ |
114,165 |
|
|
$ |
102,878 |
|
|
$ |
259,285 |
|
| Total assets (2) |
|
|
2,261,319 |
|
|
|
|
$ |
449,123 |
|
|
|
161,756 |
|
|
|
185,398 |
|
|
|
280,289 |
|
|
|
691,249 |
|
|
|
284,294 |
|
|
|
n/m |
|
| Total deposits |
|
|
1,038,408 |
|
|
|
|
|
424,579 |
|
|
|
n/m |
|
|
|
n/m |
|
|
|
170,156 |
|
|
|
123,618 |
|
|
|
255,580 |
|
|
|
42,355 |
|
|
|
| |
|
Six Months Ended June 30, 2010 |
|
| |
|
Total
Corporation |
|
|
|
|
Deposits |
|
|
Global Card
Services |
|
|
Consumer
Real Estate
Services |
|
|
Global
Commercial
Banking |
|
|
Global
Banking &
Markets |
|
|
GWIM |
|
|
All
Other |
|
| Net interest income (1) |
|
$ |
27,267 |
|
|
|
|
$ |
4,319 |
|
|
$ |
9,262 |
|
|
$ |
2,199 |
|
|
$ |
4,290 |
|
|
$ |
4,172 |
|
|
$ |
2,907 |
|
|
$ |
118 |
|
| Noninterest income |
|
|
34,473 |
|
|
|
|
|
3,094 |
|
|
|
4,576 |
|
|
|
4,038 |
|
|
|
1,685 |
|
|
|
11,425 |
|
|
|
5,323 |
|
|
|
4,332 |
|
|
|
|
|
|
|
|
|
|
|
|
|
|
|
|
|
|
|
|
|
|
|
|
|
|
|
|
|
|
|
|
|
|
|
|
| Total revenue, net of interest expense |
|
|
61,740 |
|
|
|
|
|
7,413 |
|
|
|
13,838 |
|
|
|
6,237 |
|
|
|
5,975 |
|
|
|
15,597 |
|
|
|
8,230 |
|
|
|
4,450 |
|
|
|
|
|
|
|
|
|
|
|
| Provision for credit losses |
|
|
17,910 |
|
|
|
|
|
98 |
|
|
|
7,331 |
|
|
|
5,990 |
|
|
|
1,559 |
|
|
|
103 |
|
|
|
363 |
|
|
|
2,466 |
|
| Noninterest expense |
|
|
35,028 |
|
|
|
|
|
5,139 |
|
|
|
3,664 |
|
|
|
5,985 |
|
|
|
2,005 |
|
|
|
9,024 |
|
|
|
6,368 |
|
|
|
2,843 |
|
|
|
|
|
|
|
|
|
|
|
|
|
|
|
|
|
|
|
|
|
|
|
|
|
|
|
|
|
|
|
|
|
|
|
|
| Income (loss) before income taxes |
|
|
8,802 |
|
|
|
|
|
2,176 |
|
|
|
2,843 |
|
|
|
(5,738 |
) |
|
|
2,411 |
|
|
|
6,470 |
|
|
|
1,499 |
|
|
|
(859 |
) |
| Income tax expense (benefit) (1) |
|
|
2,497 |
|
|
|
|
|
804 |
|
|
|
1,049 |
|
|
|
(2,119 |
) |
|
|
891 |
|
|
|
2,333 |
|
|
|
731 |
|
|
|
(1,192 |
) |
|
|
|
|
|
|
|
|
|
|
|
|
|
|
|
|
|
|
|
|
|
|
|
|
|
|
|
|
|
|
|
|
|
|
|
| Net income (loss) |
|
$ |
6,305 |
|
|
|
|
$ |
1,372 |
|
|
$ |
1,794 |
|
|
$ |
(3,619 |
) |
|
$ |
1,520 |
|
|
$ |
4,137 |
|
|
$ |
768 |
|
|
$ |
333 |
|
|
|
|
|
|
|
|
|
|
|
|
|
|
|
|
|
|
|
|
|
|
|
|
|
|
|
|
|
|
|
|
|
|
|
|
|
|
|
|
|
|
|
|
|
|
| Average |
|
|
|
|
|
|
|
|
|
|
|
|
|
|
|
|
|
|
|
|
|
|
|
|
|
|
|
|
|
|
|
|
|
|
| Total loans and leases |
|
$ |
979,267 |
|
|
|
|
|
n/m |
|
|
$ |
182,909 |
|
|
$ |
132,195 |
|
|
$ |
210,450 |
|
|
$ |
97,427 |
|
|
$ |
98,826 |
|
|
$ |
256,742 |
|
| Total assets (2) |
|
|
2,505,459 |
|
|
|
|
$ |
442,691 |
|
|
|
191,913 |
|
|
|
230,076 |
|
|
|
301,925 |
|
|
|
781,949 |
|
|
|
256,510 |
|
|
|
n/m |
|
| Total deposits |
|
|
986,345 |
|
|
|
|
|
417,665 |
|
|
|
n/m |
|
|
|
n/m |
|
|
|
144,572 |
|
|
|
108,124 |
|
|
|
223,956 |
|
|
|
67,770 |
|
|
|
|
|
|
|
|
|
|
|
| Period end |
|
|
|
|
|
|
|
|
|
|
|
|
|
|
|
|
|
|
|
|
|
|
|
|
|
|
|
|
|
|
|
|
|
|
| Total loans and leases |
|
$ |
956,177 |
|
|
|
|
|
n/m |
|
|
$ |
172,531 |
|
|
$ |
129,797 |
|
|
$ |
203,659 |
|
|
$ |
95,756 |
|
|
$ |
99,157 |
|
|
$ |
254,516 |
|
| Total assets (2) |
|
|
2,368,384 |
|
|
|
|
$ |
439,770 |
|
|
|
184,213 |
|
|
|
223,998 |
|
|
|
306,234 |
|
|
|
718,563 |
|
|
|
252,507 |
|
|
|
n/m |
|
| Total deposits |
|
|
974,467 |
|
|
|
|
|
414,470 |
|
|
|
n/m |
|
|
|
n/m |
|
|
|
147,414 |
|
|
|
105,678 |
|
|
|
226,572 |
|
|
|
57,424 |
|
| (1) |
Fully taxable-equivalent basis |
| (2) |
Total assets include asset allocations to match liabilities (i.e., deposits). |
Certain prior
period amounts have been reclassified among the segments to conform to the current period presentation.
|
|
|
| This information is preliminary and based on company data available at the time of the presentation. |
|
15 |
Bank of America Corporation and Subsidiaries
Deposits Segment Results
(Dollars in millions)
|
|
|
|
|
|
|
|
|
|
|
|
|
|
|
|
|
|
|
|
|
|
|
|
|
|
|
|
|
|
|
|
|
|
|
|
|
|
|
|
|
|
|
|
|
|
|
| |
|
Six Months Ended
June 30 |
|
|
|
|
Second
Quarter
2011 |
|
|
First
Quarter
2011 |
|
|
|
|
|
Fourth
Quarter
2010 |
|
|
|
|
|
Third
Quarter
2010 |
|
|
|
|
|
Second
Quarter
2010 |
|
|
|
|
| |
|
2011 |
|
|
2010 |
|
|
|
|
|
|
|
|
|
|
|
| Net interest income (1) |
|
$ |
4,486 |
|
|
$ |
4,319 |
|
|
|
|
$ |
2,281 |
|
|
$ |
2,205 |
|
|
|
|
|
|
$ |
2,006 |
|
|
|
|
|
|
$ |
1,954 |
|
|
|
|
|
|
$ |
2,144 |
|
|
|
|
|
| Noninterest income: |
|
|
|
|
|
|
|
|
|
|
|
|
|
|
|
|
|
|
|
|
|
|
|
|
|
|
|
|
|
|
|
|
|
|
|
|
|
|
|
|
|
|
|
|
|
|
| Service charges |
|
|
1,888 |
|
|
|
2,973 |
|
|
|
|
|
965 |
|
|
|
923 |
|
|
|
|
|
|
|
947 |
|
|
|
|
|
|
|
1,138 |
|
|
|
|
|
|
|
1,494 |
|
|
|
|
|
| All other income |
|
|
116 |
|
|
|
121 |
|
|
|
|
|
55 |
|
|
|
61 |
|
|
|
|
|
|
|
50 |
|
|
|
|
|
|
|
54 |
|
|
|
|
|
|
|
57 |
|
|
|
|
|
|
|
|
|
|
|
|
|
|
|
|
|
|
|
|
|
|
|
|
|
|
|
|
|
|
|
|
|
|
|
|
|
|
|
|
|
|
|
|
|
|
|
|
|
|
|
|
| Total noninterest income |
|
|
2,004 |
|
|
|
3,094 |
|
|
|
|
|
1,020 |
|
|
|
984 |
|
|
|
|
|
|
|
997 |
|
|
|
|
|
|
|
1,192 |
|
|
|
|
|
|
|
1,551 |
|
|
|
|
|
|
|
|
|
|
|
|
|
|
|
|
|
|
|
|
|
|
|
|
|
|
|
|
|
|
|
|
|
|
|
|
|
|
|
|
|
|
|
|
|
|
|
|
|
|
|
|
| Total revenue, net of interest expense |
|
|
6,490 |
|
|
|
7,413 |
|
|
|
|
|
3,301 |
|
|
|
3,189 |
|
|
|
|
|
|
|
3,003 |
|
|
|
|
|
|
|
3,146 |
|
|
|
|
|
|
|
3,695 |
|
|
|
|
|
|
|
|
|
|
|
|
|
|
|
|
|
|
| Provision for credit losses |
|
|
64 |
|
|
|
98 |
|
|
|
|
|
31 |
|
|
|
33 |
|
|
|
|
|
|
|
41 |
|
|
|
|
|
|
|
62 |
|
|
|
|
|
|
|
61 |
|
|
|
|
|
| Noninterest expense |
|
|
5,191 |
|
|
|
5,139 |
|
|
|
|
|
2,599 |
|
|
|
2,592 |
|
|
|
|
|
|
|
3,262 |
|
|
|
|
|
|
|
2,762 |
|
|
|
|
|
|
|
2,572 |
|
|
|
|
|
|
|
|
|
|
|
|
|
|
|
|
|
|
|
|
|
|
|
|
|
|
|
|
|
|
|
|
|
|
|
|
|
|
|
|
|
|
|
|
|
|
|
|
|
|
|
|
| Income (loss) before income taxes |
|
|
1,235 |
|
|
|
2,176 |
|
|
|
|
|
671 |
|
|
|
564 |
|
|
|
|
|
|
|
(300 |
) |
|
|
|
|
|
|
322 |
|
|
|
|
|
|
|
1,062 |
|
|
|
|
|
| Income tax expense (benefit) (1) |
|
|
450 |
|
|
|
804 |
|
|
|
|
|
241 |
|
|
|
209 |
|
|
|
|
|
|
|
(105 |
) |
|
|
|
|
|
|
116 |
|
|
|
|
|
|
|
388 |
|
|
|
|
|
|
|
|
|
|
|
|
|
|
|
|
|
|
|
|
|
|
|
|
|
|
|
|
|
|
|
|
|
|
|
|
|
|
|
|
|
|
|
|
|
|
|
|
|
|
|
|
| Net income (loss) |
|
$ |
785 |
|
|
$ |
1,372 |
|
|
|
|
$ |
430 |
|
|
$ |
355 |
|
|
|
|
|
|
$ |
(195 |
) |
|
|
|
|
|
$ |
206 |
|
|
|
|
|
|
$ |
674 |
|
|
|
|
|
|
|
|
|
|
|
|
|
|
|
|
|
|
|
|
|
|
|
|
|
|
|
|
|
|
|
|
|
|
|
|
|
|
|
|
|
|
|
|
|
|
|
|
|
|
|
|
|
|
|
|
|
|
|
|
|
|
|
|
|
| Net interest yield (1) |
|
|
2.15 |
% |
|
|
2.09 |
% |
|
|
|
|
2.15 |
% |
|
|
2.14 |
|
|
|
% |
|
|
|
1.93 |
|
|
|
% |
|
|
|
1.89 |
|
|
|
% |
|
|
|
2.06 |
|
|
|
% |
|
| Return on average equity |
|
|
6.70 |
|
|
|
11.45 |
|
|
|
|
|
7.30 |
|
|
|
6.09 |
|
|
|
|
|
|
|
n/m |
|
|
|
|
|
|
|
3.34 |
|
|
|
|
|
|
|
11.16 |
|
|
|
|
|
| Return on average economic capital (2) |
|
|
27.93 |
|
|
|
44.82 |
|
|
|
|
|
30.41 |
|
|
|
25.43 |
|
|
|
|
|
|
|
n/m |
|
|
|
|
|
|
|
12.85 |
|
|
|
|
|
|
|
43.52 |
|
|
|
|
|
| Efficiency ratio (1) |
|
|
79.99 |
|
|
|
69.32 |
|
|
|
|
|
78.75 |
|
|
|
81.28 |
|
|
|
|
|
|
|
108.61 |
|
|
|
|
|
|
|
87.81 |
|
|
|
|
|
|
|
69.59 |
|
|
|
|
|
|
|
|
|
|
|
|
|
|
|
|
|
|
| Balance sheet |
|
|
|
|
|
|
|
|
|
|
|
|
|
|
|
|
|
|
|
|
|
|
|
|
|
|
|
|
|
|
|
|
|
|
|
|
|
|
|
|
|
|
|
|
|
|
|
|
|
|
|
|
|
|
|
|
|
|
|
| Average |
|
|
|
|
|
|
|
|
|
|
|
|
|
|
|
|
|
|
|
|
|
|
|
|
|
|
|
|
|
|
|
|
|
|
|
|
|
|
|
|
|
|
|
|
|
|
| Total earning assets (3) |
|
$ |
421,313 |
|
|
$ |
416,185 |
|
|
|
|
$ |
425,363 |
|
|
$ |
417,218 |
|
|
|
|
|
|
$ |
411,765 |
|
|
|
|
|
|
$ |
410,330 |
|
|
|
|
|
|
$ |
417,132 |
|
|
|
|
|
| Total assets (3) |
|
|
447,530 |
|
|
|
442,691 |
|
|
|
|
|
451,554 |
|
|
|
443,461 |
|
|
|
|
|
|
|
438,346 |
|
|
|
|
|
|
|
436,479 |
|
|
|
|
|
|
|
443,520 |
|
|
|
|
|
| Total deposits |
|
|
422,514 |
|
|
|
417,665 |
|
|
|
|
|
426,684 |
|
|
|
418,298 |
|
|
|
|
|
|
|
413,150 |
|
|
|
|
|
|
|
411,117 |
|
|
|
|
|
|
|
418,480 |
|
|
|
|
|
| Allocated equity |
|
|
23,627 |
|
|
|
24,179 |
|
|
|
|
|
23,612 |
|
|
|
23,641 |
|
|
|
|
|
|
|
24,128 |
|
|
|
|
|
|
|
24,402 |
|
|
|
|
|
|
|
24,226 |
|
|
|
|
|
| Economic capital (4) |
|
|
5,672 |
|
|
|
6,202 |
|
|
|
|
|
5,662 |
|
|
|
5,683 |
|
|
|
|
|
|
|
6,161 |
|
|
|
|
|
|
|
6,424 |
|
|
|
|
|
|
|
6,239 |
|
|
|
|
|
|
|
|
|
|
|
|
|
|
|
|
|
|
| Period end |
|
|
|
|
|
|
|
|
|
|
|
|
|
|
|
|
|
|
|
|
|
|
|
|
|
|
|
|
|
|
|
|
|
|
|
|
|
|
|
|
|
|
|
|
|
|
| Total earning assets (3) |
|
$ |
422,646 |
|
|
$ |
413,648 |
|
|
|
|
$ |
422,646 |
|
|
$ |
429,956 |
|
|
|
|
|
|
$ |
414,215 |
|
|
|
|
|
|
$ |
408,734 |
|
|
|
|
|
|
$ |
413,648 |
|
|
|
|
|
| Total assets (3) |
|
|
449,123 |
|
|
|
439,770 |
|
|
|
|
|
449,123 |
|
|
|
456,248 |
|
|
|
|
|
|
|
440,954 |
|
|
|
|
|
|
|
434,854 |
|
|
|
|
|
|
|
439,770 |
|
|
|
|
|
| Total deposits |
|
|
424,579 |
|
|
|
414,470 |
|
|
|
|
|
424,579 |
|
|
|
431,022 |
|
|
|
|
|
|
|
415,189 |
|
|
|
|
|
|
|
409,365 |
|
|
|
|
|
|
|
414,470 |
|
|
|
|
|
| (1) |
Fully taxable-equivalent basis |
| (2) |
Return on average economic capital is calculated as net income, excluding cost of funds and earnings credit on intangibles, divided by average economic capital.
|
| (3) |
Total earning assets and total assets include asset allocations to match liabilities (i.e., deposits). |
| (4) |
Economic capital represents allocated equity less goodwill and a percentage of intangible assets. |
Certain prior
period amounts have been reclassified among the segments to conform to current period presentation.
|
|
|
| This information is preliminary and based on company data available at the time of the presentation. |
|
16 |
Bank of America Corporation and Subsidiaries
Deposits Key Indicators
(Dollars in millions, except as noted)
|
|
|
|
|
|
|
|
|
|
|
|
|
|
|
|
|
|
|
|
|
|
|
|
|
|
|
|
|
|
|
|
|
|
|
|
|
|
|
|
|
|
|
|
|
|
|
|
|
|
|
|
|
|
|
|
|
|
|
|
|
| |
|
Six Months
Ended
June 30 |
|
|
|
|
|
|
Second
Quarter
2011
|
|
|
|
|
|
First
Quarter
2011 |
|
|
|
|
|
Fourth
Quarter
2010 |
|
|
|
|
|
Third
Quarter
2010 |
|
|
|
|
|
Second
Quarter
2010 |
|
|
|
|
| |
|
2011 |
|
|
|
|
|
2010 |
|
|
|
|
|
|
|
|
|
|
|
|
|
|
|
|
|
|
| Average deposit balances |
|
|
|
|
|
|
|
|
|
|
|
|
|
|
|
|
|
|
|
|
|
|
|
|
|
|
|
|
|
|
|
|
|
|
|
|
|
|
|
|
|
|
|
|
|
|
|
|
|
|
|
|
|
|
|
|
|
|
|
|
| Checking |
|
$ |
163,576 |
|
|
|
|
|
|
$ |
149,385 |
|
|
|
|
|
|
|
|
|
|
$ |
166,666 |
|
|
|
|
|
|
$ |
160,452 |
|
|
|
|
|
|
$ |
154,333 |
|
|
|
|
|
|
$ |
150,117 |
|
|
|
|
|
|
$ |
152,130 |
|
|
|
|
|
| Savings |
|
|
37,962 |
|
|
|
|
|
|
|
34,412 |
|
|
|
|
|
|
|
|
|
|
|
39,209 |
|
|
|
|
|
|
|
36,701 |
|
|
|
|
|
|
|
35,120 |
|
|
|
|
|
|
|
35,135 |
|
|
|
|
|
|
|
35,467 |
|
|
|
|
|
| MMS |
|
|
127,251 |
|
|
|
|
|
|
|
119,489 |
|
|
|
|
|
|
|
|
|
|
|
128,546 |
|
|
|
|
|
|
|
125,941 |
|
|
|
|
|
|
|
124,446 |
|
|
|
|
|
|
|
122,996 |
|
|
|
|
|
|
|
122,123 |
|
|
|
|
|
| CDs and IRAs |
|
|
90,425 |
|
|
|
|
|
|
|
111,218 |
|
|
|
|
|
|
|
|
|
|
|
88,912 |
|
|
|
|
|
|
|
91,954 |
|
|
|
|
|
|
|
95,860 |
|
|
|
|
|
|
|
99,702 |
|
|
|
|
|
|
|
105,592 |
|
|
|
|
|
| Non-U.S. and other |
|
|
3,300 |
|
|
|
|
|
|
|
3,161 |
|
|
|
|
|
|
|
|
|
|
|
3,351 |
|
|
|
|
|
|
|
3,250 |
|
|
|
|
|
|
|
3,391 |
|
|
|
|
|
|
|
3,167 |
|
|
|
|
|
|
|
3,168 |
|
|
|
|
|
|
|
|
|
|
|
|
|
|
|
|
|
|
|
|
|
|
|
|
|
|
|
|
|
|
|
|
|
|
|
|
|
|
|
|
|
|
|
|
|
|
|
|
|
|
|
|
|
|
|
|
|
|
|
|
|
|
|
|
|
|
| Total average deposit balances |
|
$ |
422,514 |
|
|
|
|
|
|
$ |
417,665 |
|
|
|
|
|
|
|
|
|
|
$ |
426,684 |
|
|
|
|
|
|
$ |
418,298 |
|
|
|
|
|
|
$ |
413,150 |
|
|
|
|
|
|
$ |
411,117 |
|
|
|
|
|
|
$ |
418,480 |
|
|
|
|
|
|
|
|
|
|
|
|
|
|
|
|
|
|
|
|
|
|
|
|
|
|
|
|
|
|
|
|
|
|
|
|
|
|
|
|
|
|
|
|
|
|
|
|
|
|
|
|
|
|
|
|
|
|
|
|
|
|
|
|
|
|
|
|
|
|
|
|
|
|
|
|
|
|
|
|
|
|
|
| Deposit spreads (excludes noninterest costs) |
|
|
|
|
|
|
|
|
|
|
|
|
|
|
|
|
|
|
|
|
|
|
|
|
|
|
|
|
|
|
|
|
|
|
|
|
|
|
|
|
|
|
|
|
|
|
|
|
|
|
|
|
|
|
|
|
|
|
|
|
| Checking |
|
|
3.43 |
|
|
|
% |
|
|
|
3.82 |
|
|
|
% |
|
|
|
|
|
|
|
3.36 |
|
|
|
% |
|
|
|
3.50 |
|
|
|
% |
|
|
|
3.60 |
|
|
|
% |
|
|
|
3.76 |
|
|
|
% |
|
|
|
3.81 |
|
|
|
% |
|
| Savings |
|
|
3.37 |
|
|
|
|
|
|
|
3.72 |
|
|
|
|
|
|
|
|
|
|
|
3.32 |
|
|
|
|
|
|
|
3.42 |
|
|
|
|
|
|
|
3.51 |
|
|
|
|
|
|
|
3.63 |
|
|
|
|
|
|
|
3.70 |
|
|
|
|
|
| MMS |
|
|
1.50 |
|
|
|
|
|
|
|
0.81 |
|
|
|
|
|
|
|
|
|
|
|
1.46 |
|
|
|
|
|
|
|
1.55 |
|
|
|
|
|
|
|
1.55 |
|
|
|
|
|
|
|
1.53 |
|
|
|
|
|
|
|
0.84 |
|
|
|
|
|
| CDs and IRAs |
|
|
0.35 |
|
|
|
|
|
|
|
0.17 |
|
|
|
|
|
|
|
|
|
|
|
0.36 |
|
|
|
|
|
|
|
0.35 |
|
|
|
|
|
|
|
0.32 |
|
|
|
|
|
|
|
0.28 |
|
|
|
|
|
|
|
0.22 |
|
|
|
|
|
| Non-U.S. and other |
|
|
3.90 |
|
|
|
|
|
|
|
4.37 |
|
|
|
|
|
|
|
|
|
|
|
3.83 |
|
|
|
|
|
|
|
3.97 |
|
|
|
|
|
|
|
4.10 |
|
|
|
|
|
|
|
4.24 |
|
|
|
|
|
|
|
4.34 |
|
|
|
|
|
| Total deposit spreads |
|
|
2.18 |
|
|
|
|
|
|
|
1.96 |
|
|
|
|
|
|
|
|
|
|
|
2.16 |
|
|
|
|
|
|
|
2.20 |
|
|
|
|
|
|
|
2.20 |
|
|
|
|
|
|
|
2.23 |
|
|
|
|
|
|
|
2.02 |
|
|
|
|
|
|
|
|
|
|
|
|
|
|
|
|
|
|
|
|
|
|
| Cost per dollar deposit (1) |
|
|
2.52 |
|
|
|
% |
|
|
|
2.48 |
|
|
|
% |
|
|
|
|
|
|
|
2.44 |
|
|
|
% |
|
|
|
2.60 |
|
|
|
% |
|
|
|
2.65 |
|
|
|
% |
|
|
|
2.67 |
|
|
|
% |
|
|
|
2.46 |
|
|
|
% |
|
|
|
|
|
|
|
|
|
|
|
|
|
|
|
|
|
|
| Client brokerage assets (2) |
|
$ |
69,000 |
|
|
|
|
|
|
$ |
51,102 |
|
|
|
|
|
|
|
|
|
|
$ |
69,000 |
|
|
|
|
|
|
$ |
66,703 |
|
|
|
|
|
|
$ |
63,597 |
|
|
|
|
|
|
$ |
59,984 |
|
|
|
|
|
|
$ |
51,102 |
|
|
|
|
|
|
|
|
|
|
|
|
|
|
|
|
|
|
|
|
|
|
| Online banking (end of period) |
|
|
|
|
|
|
|
|
|
|
|
|
|
|
|
|
|
|
|
|
|
|
|
|
|
|
|
|
|
|
|
|
|
|
|
|
|
|
|
|
|
|
|
|
|
|
|
|
|
|
|
|
|
|
|
|
|
|
|
|
| Active accounts (units in thousands) |
|
|
29,660 |
|
|
|
|
|
|
|
29,195 |
|
|
|
|
|
|
|
|
|
|
|
29,660 |
|
|
|
|
|
|
|
30,065 |
|
|
|
|
|
|
|
29,345 |
|
|
|
|
|
|
|
29,313 |
|
|
|
|
|
|
|
29,195 |
|
|
|
|
|
| Active billpay accounts (units in thousands) |
|
|
15,356 |
|
|
|
|
|
|
|
14,902 |
|
|
|
|
|
|
|
|
|
|
|
15,356 |
|
|
|
|
|
|
|
15,345 |
|
|
|
|
|
|
|
14,986 |
|
|
|
|
|
|
|
14,941 |
|
|
|
|
|
|
|
14,902 |
|
|
|
|
|
| Online Only (units in thousands) |
|
|
14,304 |
|
|
|
|
|
|
|
14,293 |
|
|
|
|
|
|
|
|
|
|
|
14,304 |
|
|
|
|
|
|
|
14,720 |
|
|
|
|
|
|
|
14,359 |
|
|
|
|
|
|
|
14,372 |
|
|
|
|
|
|
|
14,293 |
|
|
|
|
|
| (1) |
Cost per dollar deposit represents annualized noninterest expense, excluding one-time expenses, as a percentage of average deposits. |
| (2) |
During the first quarter of 2011, the Merrill Edge business was moved from GWIM along with historical results. |
Certain prior period amounts have been reclassified to conform to current period presentation.
|
|
|
| This information is preliminary and based on company data available at the time of the presentation. |
|
17 |
Bank of America Corporation and Subsidiaries
Global Card Services Segment Results
(Dollars in millions)
|
|
|
|
|
|
|
|
|
|
|
|
|
|
|
|
|
|
|
|
|
|
|
|
|
|
|
|
|
|
|
|
|
| |
|
Six Months
Ended
June 30 |
|
|
|
|
|
|
Second
Quarter
2011 |
|
|
First
Quarter
2011 |
|
|
Fourth
Quarter
2010 |
|
|
Third
Quarter
2010 |
|
|
Second
Quarter
2010 |
|
| |
|
2011 |
|
|
2010 |
|
|
|
|
|
|
|
|
| Net interest income (1) |
|
$ |
7,358 |
|
|
$ |
9,262 |
|
|
|
|
|
|
$ |
3,611 |
|
|
$ |
3,747 |
|
|
$ |
4,206 |
|
|
$ |
4,364 |
|
|
$ |
4,442 |
|
| Noninterest income: |
|
|
|
|
|
|
|
|
|
|
|
|
|
|
|
|
|
|
|
|
|
|
|
|
|
|
|
|
|
|
|
|
| Card income |
|
|
3,562 |
|
|
|
3,784 |
|
|
|
|
|
|
|
1,833 |
|
|
|
1,729 |
|
|
|
2,000 |
|
|
|
1,879 |
|
|
|
1,901 |
|
| All other income (loss) |
|
|
303 |
|
|
|
792 |
|
|
|
|
|
|
|
92 |
|
|
|
211 |
|
|
|
125 |
|
|
|
(403 |
) |
|
|
605 |
|
|
|
|
|
|
|
|
|
|
|
|
|
|
|
|
|
|
|
|
|
|
|
|
|
|
|
|
|
|
|
|
|
|
| Total noninterest income |
|
|
3,865 |
|
|
|
4,576 |
|
|
|
|
|
|
|
1,925 |
|
|
|
1,940 |
|
|
|
2,125 |
|
|
|
1,476 |
|
|
|
2,506 |
|
|
|
|
|
|
|
|
|
|
|
|
|
|
|
|
|
|
|
|
|
|
|
|
|
|
|
|
|
|
|
|
|
|
| Total revenue, net of interest expense |
|
|
11,223 |
|
|
|
13,838 |
|
|
|
|
|
|
|
5,536 |
|
|
|
5,687 |
|
|
|
6,331 |
|
|
|
5,840 |
|
|
|
6,948 |
|
|
|
|
|
|
|
|
|
|
|
| Provision for credit losses |
|
|
1,442 |
|
|
|
7,331 |
|
|
|
|
|
|
|
481 |
|
|
|
961 |
|
|
|
2,144 |
|
|
|
3,177 |
|
|
|
3,796 |
|
| Goodwill impairment |
|
|
— |
|
|
|
— |
|
|
|
|
|
|
|
— |
|
|
|
— |
|
|
|
— |
|
|
|
10,400 |
|
|
|
— |
|
| All other noninterest expense |
|
|
3,851 |
|
|
|
3,664 |
|
|
|
|
|
|
|
1,882 |
|
|
|
1,969 |
|
|
|
1,807 |
|
|
|
1,750 |
|
|
|
1,852 |
|
|
|
|
|
|
|
|
|
|
|
|
|
|
|
|
|
|
|
|
|
|
|
|
|
|
|
|
|
|
|
|
|
|
| Income (loss) before income taxes |
|
|
5,930 |
|
|
|
2,843 |
|
|
|
|
|
|
|
3,173 |
|
|
|
2,757 |
|
|
|
2,380 |
|
|
|
(9,487 |
) |
|
|
1,300 |
|
| Income tax expense (1) |
|
|
2,160 |
|
|
|
1,049 |
|
|
|
|
|
|
|
1,138 |
|
|
|
1,022 |
|
|
|
882 |
|
|
|
334 |
|
|
|
474 |
|
|
|
|
|
|
|
|
|
|
|
|
|
|
|
|
|
|
|
|
|
|
|
|
|
|
|
|
|
|
|
|
|
|
| Net income (loss) |
|
$ |
3,770 |
|
|
$ |
1,794 |
|
|
|
|
|
|
$ |
2,035 |
|
|
$ |
1,735 |
|
|
$ |
1,498 |
|
|
$ |
(9,821 |
) |
|
$ |
826 |
|
|
|
|
|
|
|
|
|
|
|
|
|
|
|
|
|
|
|
|
|
|
|
|
|
|
|
|
|
|
|
|
|
|
|
|
|
|
|
|
|
|
|
|
| Net interest yield (1) |
|
|
9.19 |
% |
|
|
10.13 |
% |
|
|
|
|
|
|
9.12 |
% |
|
|
9.26 |
% |
|
|
9.92 |
% |
|
|
10.07 |
% |
|
|
9.97 |
% |
| Return on average equity |
|
|
29.73 |
|
|
|
8.61 |
|
|
|
|
|
|
|
32.66 |
|
|
|
26.89 |
|
|
|
21.51 |
|
|
|
n/m |
|
|
|
8.14 |
|
| Return on average economic capital (2) |
|
|
59.01 |
|
|
|
19.74 |
|
|
|
|
|
|
|
66.26 |
|
|
|
52.32 |
|
|
|
40.33 |
|
|
|
15.19 |
|
|
|
19.40 |
|
| Efficiency ratio (1) |
|
|
34.31 |
|
|
|
26.49 |
|
|
|
|
|
|
|
33.99 |
|
|
|
34.62 |
|
|
|
28.54 |
|
|
|
n/m |
|
|
|
26.68 |
|
| Efficiency ratio, excluding goodwill impairment charge
(1) |
|
|
34.31 |
|
|
|
26.49 |
|
|
|
|
|
|
|
33.99 |
|
|
|
34.62 |
|
|
|
28.54 |
|
|
|
29.97 |
|
|
|
26.68 |
|
|
|
|
|
|
|
|
|
|
|
| Balance sheet |
|
|
|
|
|
|
|
|
|
|
|
|
|
|
|
|
|
|
|
|
|
|
|
|
|
|
|
|
|
|
|
|
|
|
|
|
|
|
|
|
|
|
| Average |
|
|
|
|
|
|
|
|
|
|
|
|
|
|
|
|
|
|
|
|
|
|
|
|
|
|
|
|
|
|
|
|
| Total loans and leases |
|
$ |
159,591 |
|
|
$ |
182,909 |
|
|
|
|
|
|
$ |
156,788 |
|
|
$ |
162,425 |
|
|
$ |
166,683 |
|
|
$ |
170,706 |
|
|
$ |
177,076 |
|
| Total earning assets |
|
|
161,462 |
|
|
|
184,326 |
|
|
|
|
|
|
|
158,861 |
|
|
|
164,093 |
|
|
|
168,173 |
|
|
|
171,999 |
|
|
|
178,646 |
|
| Total assets |
|
|
163,761 |
|
|
|
191,913 |
|
|
|
|
|
|
|
161,776 |
|
|
|
165,768 |
|
|
|
168,273 |
|
|
|
178,255 |
|
|
|
187,138 |
|
| Allocated equity |
|
|
25,573 |
|
|
|
41,994 |
|
|
|
|
|
|
|
24,982 |
|
|
|
26,171 |
|
|
|
27,626 |
|
|
|
35,391 |
|
|
|
40,677 |
|
| Economic capital (3) |
|
|
12,915 |
|
|
|
18,767 |
|
|
|
|
|
|
|
12,341 |
|
|
|
13,496 |
|
|
|
14,916 |
|
|
|
15,643 |
|
|
|
17,501 |
|
|
|
|
|
|
|
|
|
|
|
| Period end |
|
|
|
|
|
|
|
|
|
|
|
|
|
|
|
|
|
|
|
|
|
|
|
|
|
|
|
|
|
|
|
|
| Total loans and leases |
|
$ |
153,280 |
|
|
$ |
172,531 |
|
|
|
|
|
|
$ |
153,280 |
|
|
$ |
158,444 |
|
|
$ |
166,899 |
|
|
$ |
168,366 |
|
|
$ |
172,531 |
|
| Total earning assets |
|
|
156,058 |
|
|
|
174,278 |
|
|
|
|
|
|
|
156,058 |
|
|
|
160,529 |
|
|
|
168,706 |
|
|
|
170,037 |
|
|
|
174,278 |
|
| Total assets |
|
|
161,756 |
|
|
|
184,213 |
|
|
|
|
|
|
|
161,756 |
|
|
|
164,084 |
|
|
|
170,311 |
|
|
|
170,317 |
|
|
|
184,213 |
|
| (1) |
Fully taxable-equivalent basis |
| (2) |
Return on average economic capital is calculated as net income, excluding goodwill impairment charge, cost of funds and earnings credit on intangibles, divided by
average economic capital. |
| (3) |
Economic capital represents allocated equity less goodwill and a percentage of intangible assets. |
Certain prior
period amounts have been reclassified among the segments to conform to current period presentation.
|
|
|
| This information is preliminary and based on company data available at the time of the presentation. |
|
18 |
Bank of America Corporation and Subsidiaries
Global Card Services Key Indicators
(Dollars in millions)
|
|
|
|
|
|
|
|
|
|
|
|
|
|
|
|
|
|
|
|
|
|
|
|
|
|
|
|
|
|
|
|
|
|
|
|
|
|
|
|
|
|
|
|
|
|
|
|
|
|
|
|
|
|
|
|
|
|
|
|
|
| |
|
Six Months Ended
June
30 |
|
|
|
|
|
|
|
|
|
Second
Quarter
2011
|
|
|
|
|
|
First
Quarter
2011 |
|
|
|
|
|
Fourth
Quarter
2010 |
|
|
|
|
|
Third
Quarter
2010 |
|
|
|
|
|
Second
Quarter
2010 |
|
|
|
|
| |
2011 |
|
|
|
|
|
2010 |
|
|
|
|
|
|
|
|
|
|
|
|
|
|
| Credit Card Data (1) |
|
|
|
|
|
|
|
|
|
|
|
|
|
|
|
|
|
|
|
|
|
|
|
|
|
|
|
|
|
|
|
|
|
|
|
|
|
|
|
|
|
|
|
|
|
|
|
|
|
|
|
|
|
|
|
|
|
|
|
|
|
|
|
|
|
|
|
|
|
|
|
|
|
|
|
|
|
| Loans |
|
|
|
|
|
|
|
|
|
|
|
|
|
|
|
|
|
|
|
|
|
|
|
|
|
|
|
|
|
|
|
|
|
|
|
|
|
|
|
|
|
|
|
|
|
|
|
|
|
|
|
|
|
|
|
|
|
|
|
|
| Average credit card outstandings |
|
$ |
135,487 |
|
|
|
|
|
|
$ |
150,810 |
|
|
|
|
|
|
|
|
|
|
$ |
133,423 |
|
|
|
|
|
|
$ |
137,574 |
|
|
|
|
|
|
$ |
140,130 |
|
|
|
|
|
|
$ |
142,298 |
|
|
|
|
|
|
$ |
146,444 |
|
|
|
|
|
| Ending credit card outstandings |
|
|
130,696 |
|
|
|
|
|
|
|
143,130 |
|
|
|
|
|
|
|
|
|
|
|
130,696 |
|
|
|
|
|
|
|
134,342 |
|
|
|
|
|
|
|
141,250 |
|
|
|
|
|
|
|
140,871 |
|
|
|
|
|
|
|
143,130 |
|
|
|
|
|
|
|
|
|
|
|
|
|
|
|
|
|
|
|
|
|
|
| Credit quality |
|
|
|
|
|
|
|
|
|
|
|
|
|
|
|
|
|
|
|
|
|
|
|
|
|
|
|
|
|
|
|
|
|
|
|
|
|
|
|
|
|
|
|
|
|
|
|
|
|
|
|
|
|
|
|
|
|
|
|
|
| Net charge-offs |
|
$ |
5,036 |
|
|
|
|
|
|
$ |
9,053 |
|
|
|
|
|
|
|
|
|
|
$ |
2,360 |
|
|
|
|
|
|
$ |
2,676 |
|
|
|
|
|
|
$ |
2,911 |
|
|
|
|
|
|
$ |
3,270 |
|
|
|
|
|
|
$ |
4,459 |
|
|
|
|
|
|
|
|
7.50 |
|
|
|
% |
|
|
|
12.11 |
|
|
|
% |
|
|
|
|
|
|
|
7.09 |
|
|
|
% |
|
|
|
7.89 |
|
|
|
% |
|
|
|
8.24 |
|
|
|
% |
|
|
|
9.12 |
|
|
|
% |
|
|
|
12.21 |
|
|
|
% |
|
| 30+ delinquency |
|
$ |
5,478 |
|
|
|
|
|
|
$ |
8,256 |
|
|
|
|
|
|
|
|
|
|
$ |
5,478 |
|
|
|
|
|
|
$ |
6,478 |
|
|
|
|
|
|
$ |
7,268 |
|
|
|
|
|
|
$ |
7,643 |
|
|
|
|
|
|
$ |
8,256 |
|
|
|
|
|
|
|
|
4.19 |
|
|
|
% |
|
|
|
5.77 |
|
|
|
% |
|
|
|
|
|
|
|
4.19 |
|
|
|
% |
|
|
|
4.82 |
|
|
|
% |
|
|
|
5.15 |
|
|
|
% |
|
|
|
5.43 |
|
|
|
% |
|
|
|
5.77 |
|
|
|
% |
|
| 90+ delinquency |
|
$ |
3,020 |
|
|
|
|
|
|
$ |
4,542 |
|
|
|
|
|
|
|
|
|
|
$ |
3,020 |
|
|
|
|
|
|
$ |
3,570 |
|
|
|
|
|
|
$ |
3,919 |
|
|
|
|
|
|
$ |
4,007 |
|
|
|
|
|
|
$ |
4,542 |
|
|
|
|
|
|
|
|
2.31 |
|
|
|
% |
|
|
|
3.17 |
|
|
|
% |
|
|
|
|
|
|
|
2.31 |
|
|
|
% |
|
|
|
2.65 |
|
|
|
% |
|
|
|
2.77 |
|
|
|
% |
|
|
|
2.84 |
|
|
|
% |
|
|
|
3.17 |
|
|
|
% |
|
|
|
|
|
|
|
|
|
|
|
|
|
|
|
| Other Global Card Services Key Indicators |
|
|
|
|
|
|
|
|
|
|
|
|
|
|
|
|
|
|
|
|
|
|
|
|
|
|
|
|
|
|
|
|
|
|
|
|
|
|
|
|
|
|
|
|
|
|
|
|
|
|
|
|
|
|
|
|
|
|
|
|
|
|
|
|
|
|
| Credit card data |
|
|
|
|
|
|
|
|
|
|
|
|
|
|
|
|
|
|
|
|
|
|
|
|
|
|
|
|
|
|
|
|
|
|
|
|
|
|
|
|
|
|
|
|
|
|
|
|
|
|
|
|
|
|
|
|
|
|
|
|
| Gross interest yield |
|
|
10.57 |
|
|
|
% |
|
|
|
11.04 |
|
|
|
% |
|
|
|
|
|
|
|
10.47 |
|
|
|
% |
|
|
|
10.67 |
|
|
|
% |
|
|
|
10.92 |
|
|
|
% |
|
|
|
11.13 |
|
|
|
% |
|
|
|
10.89 |
|
|
|
% |
|
| Risk adjusted margin |
|
|
5.41 |
|
|
|
|
|
|
|
1.58 |
|
|
|
|
|
|
|
|
|
|
|
5.87 |
|
|
|
|
|
|
|
4.97 |
|
|
|
|
|
|
|
5.40 |
|
|
|
|
|
|
|
3.28 |
|
|
|
|
|
|
|
1.33 |
|
|
|
|
|
| New account growth (in thousands) |
|
|
1,859 |
|
|
|
|
|
|
|
1,403 |
|
|
|
|
|
|
|
|
|
|
|
941 |
|
|
|
|
|
|
|
918 |
|
|
|
|
|
|
|
790 |
|
|
|
|
|
|
|
710 |
|
|
|
|
|
|
|
664 |
|
|
|
|
|
| Purchase volumes |
|
$ |
106,683 |
|
|
|
|
|
|
$ |
102,600 |
|
|
|
|
|
|
|
|
|
|
$ |
56,187 |
|
|
|
|
|
|
$ |
50,496 |
|
|
|
|
|
|
$ |
56,458 |
|
|
|
|
|
|
$ |
54,257 |
|
|
|
|
|
|
$ |
53,924 |
|
|
|
|
|
|
|
|
|
|
|
|
|
|
|
|
|
|
|
|
|
|
| Debit card data |
|
|
|
|
|
|
|
|
|
|
|
|
|
|
|
|
|
|
|
|
|
|
|
|
|
|
|
|
|
|
|
|
|
|
|
|
|
|
|
|
|
|
|
|
|
|
|
|
|
|
|
|
|
|
|
|
|
|
|
|
| Debit purchase volumes |
|
$ |
124,045 |
|
|
|
|
|
|
$ |
115,203 |
|
|
|
|
|
|
|
|
|
|
$ |
64,049 |
|
|
|
|
|
|
$ |
59,996 |
|
|
|
|
|
|
$ |
60,866 |
|
|
|
|
|
|
$ |
58,011 |
|
|
|
|
|
|
$ |
59,136 |
|
|
|
|
|
| (1) |
Credit Card includes U.S., Europe and Canada consumer credit card and does not include business card, debit card and unsecured consumer lending.
|
Certain prior period amounts have been reclassified to conform to current period presentation.
|
|
|
| This information is preliminary and based on company data available at the time of the presentation. |
|
19 |
Bank of America Corporation and Subsidiaries
Consumer Real Estate Services Segment Results
(Dollars in millions; except as noted)
|
|
|
|
|
|
|
|
|
|
|
|
|
|
|
|
|
|
|
|
|
|
|
|
|
|
|
|
|
|
|
|
|
|
|
|
|
|
|
|
|
|
|
|
|
|
|
|
|
|
|
|
|
|
|
|
|
| |
|
Six Months Ended
June
30 |
|
|
|
|
|
Second
Quarter
2011
|
|
|
|
|
|
First
Quarter
2011 |
|
|
|
|
|
Fourth
Quarter
2010 |
|
|
|
|
|
Third
Quarter
2010 |
|
|
|
|
|
Second
Quarter
2010 |
|
|
|
|
| |
|
2011 |
|
|
|
|
|
2010 |
|
|
|
|
|
|
|
|
|
|
|
|
|
|
|
|
|
|
|
|
|
|
|
|
| Net interest income (1) |
|
$ |
1,475 |
|
|
|
|
|
|
$ |
2,199 |
|
|
|
|
|
|
$ |
579 |
|
|
|
|
|
|
$ |
896 |
|
|
|
|
|
|
$ |
1,124 |
|
|
|
|
|
|
$ |
1,339 |
|
|
|
|
|
|
$ |
992 |
|
|
|
|
|
| Noninterest income: |
|
|
|
|
|
|
|
|
|
|
|
|
|
|
|
|
|
|
|
|
|
|
|
|
|
|
|
|
|
|
|
|
|
|
|
|
|
|
|
|
|
|
|
|
|
|
|
|
|
|
|
|
|
|
|
|
| Mortgage banking income (loss) |
|
|
(12,323 |
) |
|
|
|
|
|
|
2,661 |
|
|
|
|
|
|
|
(13,018 |
) |
|
|
|
|
|
|
695 |
|
|
|
|
|
|
|
(1,254 |
) |
|
|
|
|
|
|
1,757 |
|
|
|
|
|
|
|
1,020 |
|
|
|
|
|
| Insurance income |
|
|
730 |
|
|
|
|
|
|
|
1,051 |
|
|
|
|
|
|
|
299 |
|
|
|
|
|
|
|
431 |
|
|
|
|
|
|
|
484 |
|
|
|
|
|
|
|
527 |
|
|
|
|
|
|
|
513 |
|
|
|
|
|
| All other income (loss) |
|
|
866 |
|
|
|
|
|
|
|
326 |
|
|
|
|
|
|
|
825 |
|
|
|
|
|
|
|
41 |
|
|
|
|
|
|
|
126 |
|
|
|
|
|
|
|
(12 |
) |
|
|
|
|
|
|
179 |
|
|
|
|
|
|
|
|
|
|
|
|
|
|
|
|
|
|
|
|
|
|
|
|
|
|
|
|
|
|
|
|
|
|
|
|
|
|
|
|
|
|
|
|
|
|
|
|
|
|
|
|
|
|
|
|
|
|
|
|
|
|
| Total noninterest income (loss) |
|
|
(10,727 |
) |
|
|
|
|
|
|
4,038 |
|
|
|
|
|
|
|
(11,894 |
) |
|
|
|
|
|
|
1,167 |
|
|
|
|
|
|
|
(644 |
) |
|
|
|
|
|
|
2,272 |
|
|
|
|
|
|
|
1,712 |
|
|
|
|
|
|
|
|
|
|
|
|
|
|
|
|
|
|
|
|
|
|
|
|
|
|
|
|
|
|
|
|
|
|
|
|
|
|
|
|
|
|
|
|
|
|
|
|
|
|
|
|
|
|
|
|
|
|
|
|
|
|
| Total revenue, net of interest expense |
|
|
(9,252 |
) |
|
|
|
|
|
|
6,237 |
|
|
|
|
|
|
|
(11,315 |
) |
|
|
|
|
|
|
2,063 |
|
|
|
|
|
|
|
480 |
|
|
|
|
|
|
|
3,611 |
|
|
|
|
|
|
|
2,704 |
|
|
|
|
|
|
|
|
|
|
|
|
|
|
|
|
|
|
|
|
| Provision for credit losses |
|
|
2,605 |
|
|
|
|
|
|
|
5,990 |
|
|
|
|
|
|
|
1,507 |
|
|
|
|
|
|
|
1,098 |
|
|
|
|
|
|
|
1,198 |
|
|
|
|
|
|
|
1,302 |
|
|
|
|
|
|
|
2,390 |
|
|
|
|
|
| Goodwill impairment |
|
|
2,603 |
|
|
|
|
|
|
|
— |
|
|
|
|
|
|
|
2,603 |
|
|
|
|
|
|
|
— |
|
|
|
|
|
|
|
2,000 |
|
|
|
|
|
|
|
— |
|
|
|
|
|
|
|
— |
|
|
|
|
|
| All other noninterest expense |
|
|
10,845 |
|
|
|
|
|
|
|
5,985 |
|
|
|
|
|
|
|
6,044 |
|
|
|
|
|
|
|
4,801 |
|
|
|
|
|
|
|
3,980 |
|
|
|
|
|
|
|
2,924 |
|
|
|
|
|
|
|
2,738 |
|
|
|
|
|
|
|
|
|
|
|
|
|
|
|
|
|
|
|
|
|
|
|
|
|
|
|
|
|
|
|
|
|
|
|
|
|
|
|
|
|
|
|
|
|
|
|
|
|
|
|
|
|
|
|
|
|
|
|
|
|
|
| Loss before income taxes |
|
|
(25,305 |
) |
|
|
|
|
|
|
(5,738 |
) |
|
|
|
|
|
|
(21,469 |
) |
|
|
|
|
|
|
(3,836 |
) |
|
|
|
|
|
|
(6,698 |
) |
|
|
|
|
|
|
(615 |
) |
|
|
|
|
|
|
(2,424 |
) |
|
|
|
|
| Income tax benefit (1) |
|
|
(8,370 |
) |
|
|
|
|
|
|
(2,119 |
) |
|
|
|
|
|
|
(6,949 |
) |
|
|
|
|
|
|
(1,421 |
) |
|
|
|
|
|
|
(1,761 |
) |
|
|
|
|
|
|
(222 |
) |
|
|
|
|
|
|
(882 |
) |
|
|
|
|
|
|
|
|
|
|
|
|
|
|
|
|
|
|
|
|
|
|
|
|
|
|
|
|
|
|
|
|
|
|
|
|
|
|
|
|
|
|
|
|
|
|
|
|
|
|
|
|
|
|
|
|
|
|
|
|
|
| Net loss |
|
$ |
(16,935 |
) |
|
|
|
|
|
$ |
(3,619 |
) |
|
|
|
|
|
$ |
(14,520 |
) |
|
|
|
|
|
$ |
(2,415 |
) |
|
|
|
|
|
$ |
(4,937 |
) |
|
|
|
|
|
$ |
(393 |
) |
|
|
|
|
|
$ |
(1,542 |
) |
|
|
|
|
|
|
|
|
|
|
|
|
|
|
|
|
|
|
|
|
|
|
|
|
|
|
|
|
|
|
|
|
|
|
|
|
|
|
|
|
|
|
|
|
|
|
|
|
|
|
|
|
|
|
|
|
|
|
|
|
|
|
|
|
|
|
|
|
|
|
|
|
|
|
|
|
| Net interest yield (1) |
|
|
1.80 |
|
|
|
% |
|
|
|
2.36 |
|
|
|
% |
|
|
|
1.46 |
|
|
|
% |
|
|
|
2.11 |
|
|
|
% |
|
|
|
2.48 |
|
|
|
% |
|
|
|
2.87 |
|
|
|
% |
|
|
|
2.13 |
|
|
|
% |
|
| Efficiency ratio (1) |
|
|
n/m |
|
|
|
|
|
|
|
95.96 |
|
|
|
|
|
|
|
n/m |
|
|
|
|
|
|
|
n/m |
|
|
|
|
|
|
|
n/m |
|
|
|
|
|
|
|
80.97 |
|
|
|
|
|
|
|
101.27 |
|
|
|
|
|
|
|
|
|
|
|
|
|
|
|
|
|
|
|
|
| Balance sheet |
|
|
|
|
|
|
|
|
|
|
|
|
|
|
|
|
|
|
|
|
|
|
|
|
|
|
|
|
|
|
|
|
|
|
|
|
|
|
|
|
|
|
|
|
|
|
|
|
|
|
|
|
|
|
|
|
|
|
|
|
|
|
|
|
|
|
|
|
|
|
|
| Average |
|
|
|
|
|
|
|
|
|
|
|
|
|
|
|
|
|
|
|
|
|
|
|
|
|
|
|
|
|
|
|
|
|
|
|
|
|
|
|
|
|
|
|
|
|
|
|
|
|
|
|
|
|
|
|
|
| Total loans and leases |
|
$ |
121,125 |
|
|
|
|
|
|
$ |
132,195 |
|
|
|
|
|
|
$ |
121,683 |
|
|
|
|
|
|
$ |
120,560 |
|
|
|
|
|
|
$ |
124,933 |
|
|
|
|
|
|
$ |
127,712 |
|
|
|
|
|
|
$ |
130,662 |
|
|
|
|
|
| Total earning assets |
|
|
165,469 |
|
|
|
|
|
|
|
188,222 |
|
|
|
|
|
|
|
158,674 |
|
|
|
|
|
|
|
172,339 |
|
|
|
|
|
|
|
180,030 |
|
|
|
|
|
|
|
184,994 |
|
|
|
|
|
|
|
186,873 |
|
|
|
|
|
| Total assets |
|
|
203,648 |
|
|
|
|
|
|
|
230,076 |
|
|
|
|
|
|
|
198,030 |
|
|
|
|
|
|
|
209,329 |
|
|
|
|
|
|
|
218,085 |
|
|
|
|
|
|
|
221,909 |
|
|
|
|
|
|
|
227,595 |
|
|
|
|
|
| Allocated equity |
|
|
17,933 |
|
|
|
|
|
|
|
26,641 |
|
|
|
|
|
|
|
17,139 |
|
|
|
|
|
|
|
18,736 |
|
|
|
|
|
|
|
24,310 |
|
|
|
|
|
|
|
26,493 |
|
|
|
|
|
|
|
26,174 |
|
|
|
|
|
| Economic capital (2) |
|
|
15,211 |
|
|
|
|
|
|
|
21,837 |
|
|
|
|
|
|
|
14,437 |
|
|
|
|
|
|
|
15,994 |
|
|
|
|
|
|
|
19,511 |
|
|
|
|
|
|
|
21,692 |
|
|
|
|
|
|
|
21,371 |
|
|
|
|
|
|
|
|
|
|
|
|
|
|
|
|
|
|
|
|
| Period end |
|
|
|
|
|
|
|
|
|
|
|
|
|
|
|
|
|
|
|
|
|
|
|
|
|
|
|
|
|
|
|
|
|
|
|
|
|
|
|
|
|
|
|
|
|
|
|
|
|
|
|
|
|
|
|
|
| Total loans and leases |
|
$ |
121,553 |
|
|
|
|
|
|
$ |
129,797 |
|
|
|
|
|
|
$ |
121,553 |
|
|
|
|
|
|
$ |
118,749 |
|
|
|
|
|
|
$ |
122,933 |
|
|
|
|
|
|
$ |
127,700 |
|
|
|
|
|
|
$ |
129,797 |
|
|
|
|
|
| Total earning assets |
|
|
149,908 |
|
|
|
|
|
|
|
186,819 |
|
|
|
|
|
|
|
149,908 |
|
|
|
|
|
|
|
166,265 |
|
|
|
|
|
|
|
172,082 |
|
|
|
|
|
|
|
178,068 |
|
|
|
|
|
|
|
186,819 |
|
|
|
|
|
| Total assets |
|
|
185,398 |
|
|
|
|
|
|
|
223,998 |
|
|
|
|
|
|
|
185,398 |
|
|
|
|
|
|
|
204,485 |
|
|
|
|
|
|
|
212,413 |
|
|
|
|
|
|
|
214,498 |
|
|
|
|
|
|
|
223,998 |
|
|
|
|
|
|
|
|
|
|
|
|
|
|
|
|
|
|
|
|
| Period end (in billions) |
|
|
|
|
|
|
|
|
|
|
|
|
|
|
|
|
|
|
|
|
|
|
|
|
|
|
|
|
|
|
|
|
|
|
|
|
|
|
|
|
|
|
|
|
|
|
|
|
|
|
|
|
|
|
|
|
| Mortgage servicing portfolio (3) |
|
$ |
1,996.7 |
|
|
|
|
|
|
$ |
2,127.6 |
|
|
|
|
|
|
$ |
1,996.7 |
|
|
|
|
|
|
$ |
2,028.0 |
|
|
|
|
|
|
$ |
2,056.8 |
|
|
|
|
|
|
$ |
2,079.5 |
|
|
|
|
|
|
$ |
2,127.6 |
|
|
|
|
|
| (1) |
Fully taxable-equivalent basis |
| (2) |
Economic capital represents allocated equity less goodwill and a percentage of intangible assets (excluding mortgage servicing rights). |
| (3) |
Servicing of residential mortgage loans, home equity lines of credit, home equity loans and discontinued real estate mortgage loans. |
Certain prior
period amounts have been reclassified among the segments to conform to current period presentation.
|
|
|
| This information is preliminary and based on company data available at the time of the presentation. |
|
20 |
Bank of America Corporation and Subsidiaries
Consumer Real Estate Services Results (1)
(Dollars in millions)
|
|
|
|
|
|
|
|
|
|
|
|
|
|
|
|
|
|
|
|
|
| |
|
Six Months Ended June 30, 2011 |
|
| |
|
Total
Consumer Real
Estate Services |
|
|
|
|
|
|
Home Loans |
|
|
Legacy Asset
Servicing |
|
|
Other |
|
| Net interest income (2) |
|
$ |
1,475 |
|
|
|
|
|
|
$ |
1,056 |
|
|
$ |
460 |
|
|
$ |
(41 |
) |
| Noninterest income: |
|
|
|
|
|
|
|
|
|
|
|
|
|
|
|
|
|
|
|
|
| Mortgage banking income (loss) |
|
|
(12,323 |
) |
|
|
|
|
|
|
1,696 |
|
|
|
(13,149 |
) |
|
|
(870 |
) |
| Insurance income |
|
|
730 |
|
|
|
|
|
|
|
730 |
|
|
|
— |
|
|
|
— |
|
| All other income |
|
|
866 |
|
|
|
|
|
|
|
822 |
|
|
|
44 |
|
|
|
— |
|
|
|
|
|
|
|
|
|
|
|
|
|
|
|
|
|
|
|
|
|
|
| Total noninterest income (loss) |
|
|
(10,727 |
) |
|
|
|
|
|
|
3,248 |
|
|
|
(13,105 |
) |
|
|
(870 |
) |
|
|
|
|
|
|
|
|
|
|
|
|
|
|
|
|
|
|
|
|
|
| Total revenue, net of interest expense |
|
|
(9,252 |
) |
|
|
|
|
|
|
4,304 |
|
|
|
(12,645 |
) |
|
|
(911 |
) |
|
|
|
|
|
|
|
| Provision for credit losses |
|
|
2,605 |
|
|
|
|
|
|
|
121 |
|
|
|
2,484 |
|
|
|
— |
|
| Goodwill impairment |
|
|
2,603 |
|
|
|
|
|
|
|
— |
|
|
|
— |
|
|
|
2,603 |
|
| Noninterest expense |
|
|
10,845 |
|
|
|
|
|
|
|
3,221 |
|
|
|
7,624 |
|
|
|
— |
|
|
|
|
|
|
|
|
|
|
|
|
|
|
|
|
|
|
|
|
|
|
| Income (loss) before income taxes |
|
|
(25,305 |
) |
|
|
|
|
|
|
962 |
|
|
|
(22,753 |
) |
|
|
(3,514 |
) |
| Income tax expense (benefit) (2) |
|
|
(8,370 |
) |
|
|
|
|
|
|
354 |
|
|
|
(8,388 |
) |
|
|
(336 |
) |
|
|
|
|
|
|
|
|
|
|
|
|
|
|
|
|
|
|
|
|
|
| Net income (loss) |
|
$ |
(16,935 |
) |
|
|
|
|
|
$ |
608 |
|
|
$ |
(14,365 |
) |
|
$ |
(3,178 |
) |
|
|
|
|
|
|
|
|
|
|
|
|
|
|
|
|
|
|
|
|
|
|
|
|
|
|
|
|
| Balance sheet |
|
|
|
|
|
|
|
|
|
|
|
|
|
|
|
|
|
|
|
|
|
|
|
|
|
|
|
| Average |
|
|
|
|
|
|
|
|
|
|
|
|
|
|
|
|
|
|
|
|
| Total loans and leases |
|
$ |
121,125 |
|
|
|
|
|
|
$ |
55,632 |
|
|
$ |
65,493 |
|
|
$ |
— |
|
| Total earning assets |
|
|
165,469 |
|
|
|
|
|
|
|
75,695 |
|
|
|
67,565 |
|
|
|
22,209 |
|
| Total assets |
|
|
203,648 |
|
|
|
|
|
|
|
77,052 |
|
|
|
83,531 |
|
|
|
43,065 |
|
| Allocated equity |
|
|
17,933 |
|
|
|
|
|
|
|
n/a |
|
|
|
n/a |
|
|
|
n/a |
|
| Economic capital (3) |
|
|
15,211 |
|
|
|
|
|
|
|
n/a |
|
|
|
n/a |
|
|
|
n/a |
|
|
|
|
|
|
|
|
| Period end |
|
|
|
|
|
|
|
|
|
|
|
|
|
|
|
|
|
|
|
|
| Total loans and leases |
|
$ |
121,553 |
|
|
|
|
|
|
$ |
55,454 |
|
|
$ |
66,099 |
|
|
$ |
— |
|
| Total earning assets |
|
|
149,908 |
|
|
|
|
|
|
|
69,822 |
|
|
|
68,114 |
|
|
|
11,972 |
|
| Total assets |
|
|
185,398 |
|
|
|
|
|
|
|
71,723 |
|
|
|
83,412 |
|
|
|
30,263 |
|
|
|
| |
|
Three Months Ended June 30, 2011 |
|
| |
|
Total
Consumer Real
Estate Services |
|
|
|
|
|
|
Home Loans |
|
|
Legacy Asset
Servicing |
|
|
Other |
|
| Net interest income (2) |
|
$ |
579 |
|
|
|
|
|
|
$ |
481 |
|
|
$ |
129 |
|
|
$ |
(31 |
) |
| Noninterest income: |
|
|
|
|
|
|
|
|
|
|
|
|
|
|
|
|
|
|
|
|
| Mortgage banking income (loss) |
|
|
(13,018 |
) |
|
|
|
|
|
|
938 |
|
|
|
(13,083 |
) |
|
|
(873 |
) |
| Insurance income |
|
|
299 |
|
|
|
|
|
|
|
299 |
|
|
|
— |
|
|
|
— |
|
| All other income |
|
|
825 |
|
|
|
|
|
|
|
795 |
|
|
|
30 |
|
|
|
— |
|
|
|
|
|
|
|
|
|
|
|
|
|
|
|
|
|
|
|
|
|
|
| Total noninterest income (loss) |
|
|
(11,894 |
) |
|
|
|
|
|
|
2,032 |
|
|
|
(13,053 |
) |
|
|
(873 |
) |
|
|
|
|
|
|
|
|
|
|
|
|
|
|
|
|
|
|
|
|
|
| Total revenue, net of interest expense |
|
|
(11,315 |
) |
|
|
|
|
|
|
2,513 |
|
|
|
(12,924 |
) |
|
|
(904 |
) |
|
|
|
|
|
|
|
| Provision for credit losses |
|
|
1,507 |
|
|
|
|
|
|
|
121 |
|
|
|
1,386 |
|
|
|
— |
|
| Goodwill impairment |
|
|
2,603 |
|
|
|
|
|
|
|
— |
|
|
|
— |
|
|
|
2,603 |
|
| Noninterest expense |
|
|
6,044 |
|
|
|
|
|
|
|
1,553 |
|
|
|
4,491 |
|
|
|
— |
|
|
|
|
|
|
|
|
|
|
|
|
|
|
|
|
|
|
|
|
|
|
| Income (loss) before income taxes |
|
|
(21,469 |
) |
|
|
|
|
|
|
839 |
|
|
|
(18,801 |
) |
|
|
(3,507 |
) |
| Income tax expense (benefit) (2) |
|
|
(6,949 |
) |
|
|
|
|
|
|
308 |
|
|
|
(6,924 |
) |
|
|
(333 |
) |
|
|
|
|
|
|
|
|
|
|
|
|
|
|
|
|
|
|
|
|
|
| Net income (loss) |
|
$ |
(14,520 |
) |
|
|
|
|
|
$ |
531 |
|
|
$ |
(11,877 |
) |
|
$ |
(3,174 |
) |
|
|
|
|
|
|
|
|
|
|
|
|
|
|
|
|
|
|
|
|
|
|
|
|
|
|
|
|
| Balance sheet |
|
|
|
|
|
|
|
|
|
|
|
|
|
|
|
|
|
|
|
|
|
|
|
|
|
|
|
| Average |
|
|
|
|
|
|
|
|
|
|
|
|
|
|
|
|
|
|
|
|
| Total loans and leases |
|
$ |
121,683 |
|
|
|
|
|
|
$ |
55,267 |
|
|
$ |
66,416 |
|
|
$ |
— |
|
| Total earning assets |
|
|
158,674 |
|
|
|
|
|
|
|
71,876 |
|
|
|
68,444 |
|
|
|
18,354 |
|
| Total assets |
|
|
198,030 |
|
|
|
|
|
|
|
73,377 |
|
|
|
84,616 |
|
|
|
40,037 |
|
| Allocated equity |
|
|
17,139 |
|
|
|
|
|
|
|
n/a |
|
|
|
n/a |
|
|
|
n/a |
|
| Economic capital (3) |
|
|
14,437 |
|
|
|
|
|
|
|
n/a |
|
|
|
n/a |
|
|
|
n/a |
|
|
|
|
|
|
|
|
| Period end |
|
|
|
|
|
|
|
|
|
|
|
|
|
|
|
|
|
|
|
|
| Total loans and leases |
|
$ |
121,553 |
|
|
|
|
|
|
$ |
55,454 |
|
|
$ |
66,099 |
|
|
$ |
— |
|
| Total earning assets |
|
|
149,908 |
|
|
|
|
|
|
|
69,822 |
|
|
|
68,114 |
|
|
|
11,972 |
|
| Total assets |
|
|
185,398 |
|
|
|
|
|
|
|
71,723 |
|
|
|
83,411 |
|
|
|
30,264 |
|
|
|
| |
|
Three Months Ended March 31, 2011 |
|
| |
|
Total
Consumer Real
Estate Services |
|
|
|
|
|
|
Home Loans |
|
|
Legacy Asset
Servicing |
|
|
Other |
|
| Net interest income (2) |
|
$ |
896 |
|
|
|
|
|
|
$ |
575 |
|
|
$ |
331 |
|
|
$ |
(10 |
) |
| Noninterest income: |
|
|
|
|
|
|
|
|
|
|
|
|
|
|
|
|
|
|
|
|
| Mortgage banking income (loss) |
|
|
695 |
|
|
|
|
|
|
|
758 |
|
|
|
(66 |
) |
|
|
3 |
|
| Insurance income |
|
|
431 |
|
|
|
|
|
|
|
431 |
|
|
|
— |
|
|
|
— |
|
| All other income |
|
|
41 |
|
|
|
|
|
|
|
27 |
|
|
|
14 |
|
|
|
— |
|
|
|
|
|
|
|
|
|
|
|
|
|
|
|
|
|
|
|
|
|
|
| Total noninterest income (loss) |
|
|
1,167 |
|
|
|
|
|
|
|
1,216 |
|
|
|
(52 |
) |
|
|
3 |
|
|
|
|
|
|
|
|
|
|
|
|
|
|
|
|
|
|
|
|
|
|
| Total revenue, net of interest expense |
|
|
2,063 |
|
|
|
|
|
|
|
1,791 |
|
|
|
279 |
|
|
|
(7 |
) |
|
|
|
|
|
|
|
| Provision for credit losses |
|
|
1,098 |
|
|
|
|
|
|
|
— |
|
|
|
1,098 |
|
|
|
— |
|
| Noninterest expense |
|
|
4,801 |
|
|
|
|
|
|
|
1,668 |
|
|
|
3,133 |
|
|
|
— |
|
|
|
|
|
|
|
|
|
|
|
|
|
|
|
|
|
|
|
|
|
|
| Income (loss) before income taxes |
|
|
(3,836 |
) |
|
|
|
|
|
|
123 |
|
|
|
(3,952 |
) |
|
|
(7 |
) |
| Income tax expense (benefit) (2) |
|
|
(1,421 |
) |
|
|
|
|
|
|
46 |
|
|
|
(1,464 |
) |
|
|
(3 |
) |
|
|
|
|
|
|
|
|
|
|
|
|
|
|
|
|
|
|
|
|
|
| Net income (loss) |
|
$ |
(2,415 |
) |
|
|
|
|
|
$ |
77 |
|
|
$ |
(2,488 |
) |
|
$ |
(4 |
) |
|
|
|
|
|
|
|
|
|
|
|
|
|
|
|
|
|
|
|
|
|
|
|
|
|
|
|
|
| Balance sheet |
|
|
|
|
|
|
|
|
|
|
|
|
|
|
|
|
|
|
|
|
|
|
|
|
|
|
|
| Average |
|
|
|
|
|
|
|
|
|
|
|
|
|
|
|
|
|
|
|
|
| Total loans and leases |
|
$ |
120,560 |
|
|
|
|
|
|
$ |
55,990 |
|
|
$ |
64,570 |
|
|
$ |
— |
|
| Total earning assets |
|
|
172,339 |
|
|
|
|
|
|
|
79,469 |
|
|
|
66,763 |
|
|
|
26,107 |
|
| Total assets |
|
|
209,329 |
|
|
|
|
|
|
|
80,686 |
|
|
|
82,517 |
|
|
|
46,126 |
|
| Allocated equity |
|
|
18,736 |
|
|
|
|
|
|
|
n/a |
|
|
|
n/a |
|
|
|
n/a |
|
| Economic capital (3) |
|
|
15,994 |
|
|
|
|
|
|
|
n/a |
|
|
|
n/a |
|
|
|
n/a |
|
|
|
|
|
|
|
|
| Period end |
|
|
|
|
|
|
|
|
|
|
|
|
|
|
|
|
|
|
|
|
| Total loans and leases |
|
$ |
118,749 |
|
|
|
|
|
|
$ |
55,608 |
|
|
$ |
63,141 |
|
|
$ |
— |
|
| Total earning assets |
|
|
166,265 |
|
|
|
|
|
|
|
74,047 |
|
|
|
65,228 |
|
|
|
26,990 |
|
| Total assets |
|
|
204,485 |
|
|
|
|
|
|
|
74,783 |
|
|
|
80,303 |
|
|
|
49,399 |
|
| (1) |
Consumer Real Estate Services includes Home Loans and Legacy Asset Servicing with results related to mortgage servicing rights included in Other.
|
| (2) |
Fully taxable-equivalent basis |
| (3) |
Economic capital represents allocated equity less goodwill and a percentage of intangible assets (excluding mortgage servicing rights). |
Certain
prior period amounts have been reclassified among the segments to conform to current period presentation.
|
|
|
| This information is preliminary and based on company data available at the time of the presentation. |
|
21 |
Bank of America Corporation and Subsidiaries
Consumer Real Estate Services Key Indicators
(Dollars in millions, except as noted)
|
|
|
|
|
|
|
|
|
|
|
|
|
|
|
|
|
|
|
|
|
|
|
|
|
|
|
|
|
|
|
|
|
|
|
|
|
|
|
|
|
|
|
|
|
|
|
|
|
|
|
|
|
|
|
|
|
|
|
|
|
| |
|
Six Months Ended
June
30 |
|
|
|
|
Second
Quarter
2011
|
|
|
|
|
|
First
Quarter
2011 |
|
|
|
|
|
Fourth
Quarter
2010 |
|
|
|
|
|
Third
Quarter
2010 |
|
|
|
|
|
Second
Quarter
2010 |
|
|
|
|
| |
|
2011 |
|
|
|
|
|
2010 |
|
|
|
|
|
|
|
|
|
|
|
|
| Mortgage servicing rights at fair value rollforward: |
|
|
|
|
|
|
|
|
|
|
|
|
|
|
|
|
|
|
|
|
|
|
|
|
|
|
|
|
|
|
|
|
|
|
|
|
|
|
|
|
|
|
|
|
|
|
|
|
|
|
|
|
|
|
|
|
|
|
|
|
| Balance, beginning of period |
|
$ |
14,900 |
|
|
|
|
|
|
$ |
19,465 |
|
|
|
|
|
|
|
|
|
|
$ |
15,282 |
|
|
|
|
|
|
$ |
14,900 |
|
|
|
|
|
|
$ |
12,251 |
|
|
|
|
|
|
$ |
14,745 |
|
|
|
|
|
|
$ |
18,842 |
|
|
|
|
|
| Net additions |
|
|
1,017 |
|
|
|
|
|
|
|
2,014 |
|
|
|
|
|
|
|
|
|
|
|
176 |
|
|
|
|
|
|
|
841 |
|
|
|
|
|
|
|
757 |
|
|
|
|
|
|
|
745 |
|
|
|
|
|
|
|
882 |
|
|
|
|
|
| Impact of customer payments |
|
|
(1,345 |
) |
|
|
|
|
|
|
(2,037 |
) |
|
|
|
|
|
|
|
|
|
|
(639 |
) |
|
|
|
|
|
|
(706 |
) |
|
|
|
|
|
|
(799 |
) |
|
|
|
|
|
|
(923 |
) |
|
|
|
|
|
|
(981 |
) |
|
|
|
|
| Other changes in mortgage servicing rights fair value
(1) |
|
|
(2,200 |
) |
|
|
|
|
|
|
(4,697 |
) |
|
|
|
|
|
|
|
|
|
|
(2,447 |
) |
|
|
|
|
|
|
247 |
|
|
|
|
|
|
|
2,691 |
|
|
|
|
|
|
|
(2,316 |
) |
|
|
|
|
|
|
(3,998 |
) |
|
|
|
|
|
|
|
|
|
|
|
|
|
|
|
|
|
|
|
|
|
|
|
|
|
|
|
|
|
|
|
|
|
|
|
|
|
|
|
|
|
|
|
|
|
|
|
|
|
|
|
|
|
|
|
|
|
|
|
|
|
|
|
|
|
| Balance, end of period |
|
$ |
12,372 |
|
|
|
|
|
|
$ |
14,745 |
|
|
|
|
|
|
|
|
|
|
$ |
12,372 |
|
|
|
|
|
|
$ |
15,282 |
|
|
|
|
|
|
$ |
14,900 |
|
|
|
|
|
|
$ |
12,251 |
|
|
|
|
|
|
$ |
14,745 |
|
|
|
|
|
|
|
|
|
|
|
|
|
|
|
|
|
|
|
|
|
|
|
|
|
|
|
|
|
|
|
|
|
|
|
|
|
|
|
|
|
|
|
|
|
|
|
|
|
|
|
|
|
|
|
|
|
|
|
|
|
|
|
|
|
|
| Capitalized mortgage servicing rights |
|
|
|
|
|
|
|
|
|
|
|
|
|
|
|
|
|
|
|
|
|
|
|
|
|
|
|
|
|
|
|
|
|
|
|
|
|
|
|
|
|
|
|
|
|
|
|
|
|
|
|
|
|
|
|
|
|
|
|
|
| (% of loans serviced for investors) |
|
|
78 |
|
|
|
bps |
|
|
|
86 |
|
|
|
bps |
|
|
|
|
|
|
|
78 |
|
|
|
bps |
|
|
|
95 |
|
|
|
bps |
|
|
|
92 |
|
|
|
bps |
|
|
|
73 |
|
|
|
bps |
|
|
|
86 |
|
|
|
bps |
|
| Mortgage loans serviced for investors (in billions) |
|
$ |
1,578 |
|
|
|
|
|
|
$ |
1,706 |
|
|
|
|
|
|
|
|
|
|
$ |
1,578 |
|
|
|
|
|
|
$ |
1,610 |
|
|
|
|
|
|
$ |
1,628 |
|
|
|
|
|
|
$ |
1,669 |
|
|
|
|
|
|
$ |
1,706 |
|
|
|
|
|
|
|
|
|
|
|
|
|
|
|
|
|
|
|
|
|
|
| Loan production: |
|
|
|
|
|
|
|
|
|
|
|
|
|
|
|
|
|
|
|
|
|
|
|
|
|
|
|
|
|
|
|
|
|
|
|
|
|
|
|
|
|
|
|
|
|
|
|
|
|
|
|
|
|
|
|
|
|
|
|
|
| Consumer Real Estate Services |
|
|
|
|
|
|
|
|
|
|
|
|
|
|
|
|
|
|
|
|
|
|
|
|
|
|
|
|
|
|
|
|
|
|
|
|
|
|
|
|
|
|
|
|
|
|
|
|
|
|
|
|
|
|
|
|
|
|
|
|
| First mortgage |
|
$ |
90,839 |
|
|
|
|
|
|
$ |
136,106 |
|
|
|
|
|
|
|
|
|
|
$ |
38,320 |
|
|
|
|
|
|
$ |
52,519 |
|
|
|
|
|
|
$ |
81,255 |
|
|
|
|
|
|
$ |
69,875 |
|
|
|
|
|
|
$ |
69,141 |
|
|
|
|
|
| Home equity |
|
|
2,454 |
|
|
|
|
|
|
|
3,602 |
|
|
|
|
|
|
|
|
|
|
|
879 |
|
|
|
|
|
|
|
1,575 |
|
|
|
|
|
|
|
2,024 |
|
|
|
|
|
|
|
2,000 |
|
|
|
|
|
|
|
1,831 |
|
|
|
|
|
| Total Corporation (2) |
|
|
|
|
|
|
|
|
|
|
|
|
|
|
|
|
|
|
|
|
|
|
|
|
|
|
|
|
|
|
|
|
|
|
|
|
|
|
|
|
|
|
|
|
|
|
|
|
|
|
|
|
|
|
|
|
|
|
|
|
| First mortgage |
|
|
97,104 |
|
|
|
|
|
|
|
141,440 |
|
|
|
|
|
|
|
|
|
|
|
40,370 |
|
|
|
|
|
|
|
56,734 |
|
|
|
|
|
|
|
84,673 |
|
|
|
|
|
|
|
71,925 |
|
|
|
|
|
|
|
71,938 |
|
|
|
|
|
| Home equity |
|
|
2,782 |
|
|
|
|
|
|
|
4,184 |
|
|
|
|
|
|
|
|
|
|
|
1,054 |
|
|
|
|
|
|
|
1,728 |
|
|
|
|
|
|
|
2,137 |
|
|
|
|
|
|
|
2,136 |
|
|
|
|
|
|
|
2,137 |
|
|
|
|
|
|
|
|
|
|
|
|
|
|
|
|
|
|
|
|
|
|
| Mortgage banking income (loss) |
|
|
|
|
|
|
|
|
|
|
|
|
|
|
|
|
|
|
|
|
|
|
|
|
|
|
|
|
|
|
|
|
|
|
|
|
|
|
|
|
|
|
|
|
|
|
|
|
|
|
|
|
|
|
|
|
|
|
|
|
| Production income (loss): |
|
|
|
|
|
|
|
|
|
|
|
|
|
|
|
|
|
|
|
|
|
|
|
|
|
|
|
|
|
|
|
|
|
|
|
|
|
|
|
|
|
|
|
|
|
|
|
|
|
|
|
|
|
|
|
|
|
|
|
|
| Core production revenue |
|
$ |
1,492 |
|
|
|
|
|
|
$ |
2,711 |
|
|
|
|
|
|
|
|
|
|
$ |
824 |
|
|
|
|
|
|
$ |
668 |
|
|
|
|
|
|
$ |
1,622 |
|
|
|
|
|
|
$ |
1,849 |
|
|
|
|
|
|
$ |
1,428 |
|
|
|
|
|
| Representations and warranties provision |
|
|
(15,050 |
) |
|
|
|
|
|
|
(1,774 |
) |
|
|
|
|
|
|
|
|
|
|
(14,037 |
) |
|
|
|
|
|
|
(1,013 |
) |
|
|
|
|
|
|
(4,140 |
) |
|
|
|
|
|
|
(872 |
) |
|
|
|
|
|
|
(1,248 |
) |
|
|
|
|
|
|
|
|
|
|
|
|
|
|
|
|
|
|
|
|
|
|
|
|
|
|
|
|
|
|
|
|
|
|
|
|
|
|
|
|
|
|
|
|
|
|
|
|
|
|
|
|
|
|
|
|
|
|
|
|
|
|
|
|
|
| Total production income (loss) |
|
|
(13,558 |
) |
|
|
|
|
|
|
937 |
|
|
|
|
|
|
|
|
|
|
|
(13,213 |
) |
|
|
|
|
|
|
(345 |
) |
|
|
|
|
|
|
(2,518 |
) |
|
|
|
|
|
|
977 |
|
|
|
|
|
|
|
180 |
|
|
|
|
|
|
|
|
|
|
|
|
|
|
|
|
|
|
|
|
|
|
|
|
|
|
|
|
|
|
|
|
|
|
|
|
|
|
|
|
|
|
|
|
|
|
|
|
|
|
|
|
|
|
|
|
|
|
|
|
|
|
|
|
|
|
| Servicing income: |
|
|
|
|
|
|
|
|
|
|
|
|
|
|
|
|
|
|
|
|
|
|
|
|
|
|
|
|
|
|
|
|
|
|
|
|
|
|
|
|
|
|
|
|
|
|
|
|
|
|
|
|
|
|
|
|
|
|
|
|
| Servicing fees |
|
|
3,162 |
|
|
|
|
|
|
|
3,218 |
|
|
|
|
|
|
|
|
|
|
|
1,556 |
|
|
|
|
|
|
|
1,606 |
|
|
|
|
|
|
|
1,634 |
|
|
|
|
|
|
|
1,623 |
|
|
|
|
|
|
|
1,649 |
|
|
|
|
|
| Impact of customer payments (3) |
|
|
(1,345 |
) |
|
|
|
|
|
|
(2,037 |
) |
|
|
|
|
|
|
|
|
|
|
(639 |
) |
|
|
|
|
|
|
(706 |
) |
|
|
|
|
|
|
(799 |
) |
|
|
|
|
|
|
(923 |
) |
|
|
|
|
|
|
(981 |
) |
|
|
|
|
| Fair value changes of mortgage servicing rights, net of economic hedge results (4) |
|
|
(870 |
) |
|
|
|
|
|
|
209 |
|
|
|
|
|
|
|
|
|
|
|
(873 |
) |
|
|
|
|
|
|
3 |
|
|
|
|
|
|
|
257 |
|
|
|
|
|
|
|
(89 |
) |
|
|
|
|
|
|
12 |
|
|
|
|
|
| Other servicing-related revenue |
|
|
288 |
|
|
|
|
|
|
|
334 |
|
|
|
|
|
|
|
|
|
|
|
151 |
|
|
|
|
|
|
|
137 |
|
|
|
|
|
|
|
172 |
|
|
|
|
|
|
|
169 |
|
|
|
|
|
|
|
160 |
|
|
|
|
|
|
|
|
|
|
|
|
|
|
|
|
|
|
|
|
|
|
|
|
|
|
|
|
|
|
|
|
|
|
|
|
|
|
|
|
|
|
|
|
|
|
|
|
|
|
|
|
|
|
|
|
|
|
|
|
|
|
|
|
|
|
| Total net servicing income |
|
|
1,235 |
|
|
|
|
|
|
|
1,724 |
|
|
|
|
|
|
|
|
|
|
|
195 |
|
|
|
|
|
|
|
1,040 |
|
|
|
|
|
|
|
1,264 |
|
|
|
|
|
|
|
780 |
|
|
|
|
|
|
|
840 |
|
|
|
|
|
|
|
|
|
|
|
|
|
|
|
|
|
|
|
|
|
|
|
|
|
|
|
|
|
|
|
|
|
|
|
|
|
|
|
|
|
|
|
|
|
|
|
|
|
|
|
|
|
|
|
|
|
|
|
|
|
|
|
|
|
|
| Total Consumer Real Estate Services mortgage banking income (loss) |
|
|
(12,323 |
) |
|
|
|
|
|
|
2,661 |
|
|
|
|
|
|
|
|
|
|
|
(13,018 |
) |
|
|
|
|
|
|
695 |
|
|
|
|
|
|
|
(1,254 |
) |
|
|
|
|
|
|
1,757 |
|
|
|
|
|
|
|
1,020 |
|
|
|
|
|
| Other business segments’ mortgage banking loss (5)
|
|
|
(243 |
) |
|
|
|
|
|
|
(263 |
) |
|
|
|
|
|
|
|
|
|
|
(178 |
) |
|
|
|
|
|
|
(65 |
) |
|
|
|
|
|
|
(165 |
) |
|
|
|
|
|
|
(2 |
) |
|
|
|
|
|
|
(122 |
) |
|
|
|
|
|
|
|
|
|
|
|
|
|
|
|
|
|
|
|
|
|
|
|
|
|
|
|
|
|
|
|
|
|
|
|
|
|
|
|
|
|
|
|
|
|
|
|
|
|
|
|
|
|
|
|
|
|
|
|
|
|
|
|
|
|
| Total consolidated mortgage banking income (loss) |
|
$ |
(12,566 |
) |
|
|
|
|
|
$ |
2,398 |
|
|
|
|
|
|
|
|
|
|
$ |
(13,196 |
) |
|
|
|
|
|
$ |
630 |
|
|
|
|
|
|
$ |
(1,419 |
) |
|
|
|
|
|
$ |
1,755 |
|
|
|
|
|
|
$ |
898 |
|
|
|
|
|
|
|
|
|
|
|
|
|
|
|
|
|
|
|
|
|
|
|
|
|
|
|
|
|
|
|
|
|
|
|
|
|
|
|
|
|
|
|
|
|
|
|
|
|
|
|
|
|
|
|
|
|
|
|
|
|
|
|
|
|
|
| (1) |
These amounts reflect the change in discount rates and prepayment speed assumptions, mostly due to changes in interest rates, as well as the effect of changes in
other assumptions. |
| (2) |
In addition to loan production in Consumer Real Estate Services, the remaining first mortgage and home equity loan production is primarily in GWIM.
|
| (3) |
Represents the change in the market value of the mortgage servicing rights asset due to the impact of customer payments received during the year.
|
| (4) |
Includes sale of mortgage servicing rights. |
| (5) |
Includes the effect of transfers of mortgage loans from Consumer Real Estate Services to the asset and liability management portfolio included in All Other.
|
Certain prior period amounts have been reclassified among the segments to conform to current period presentation.
|
|
|
| This information is preliminary and based on company data available at the time of the presentation. |
|
22 |
Bank of America Corporation and Subsidiaries
Global Commercial Banking Segment Results
(Dollars in millions)
|
|
|
|
|
|
|
|
|
|
|
|
|
|
|
|
|
|
|
|
|
|
|
|
|
|
|
|
|
|
|
|
|
|
|
|
|
|
|
|
|
|
|
|
|
|
|
|
|
|
|
|
|
|
|
|
|
|
|
|
|
| |
|
Six Months Ended
June
30 |
|
|
|
|
|
|
|
|
|
Second
Quarter |
|
|
|
|
|
First
Quarter |
|
|
|
|
|
Fourth
Quarter |
|
|
|
|
|
Third
Quarter |
|
|
|
|
|
Second
Quarter |
|
|
|
|
| |
|
2011 |
|
|
|
|
|
2010 |
|
|
|
|
|
|
|
|
|
2011 |
|
|
|
2011 |
|
|
|
|
|
2010 |
|
|
|
|
|
2010 |
|
|
|
|
|
2010 |
|
|
| Net interest income (1) |
|
$ |
3,677 |
|
|
|
|
|
|
$ |
4,290 |
|
|
|
|
|
|
|
|
|
|
$ |
1,827 |
|
|
|
|
|
|
$ |
1,850 |
|
|
|
|
|
|
$ |
1,865 |
|
|
|
|
|
|
$ |
1,853 |
|
|
|
|
|
|
$ |
2,097 |
|
|
|
|
|
| Noninterest income: |
|
|
|
|
|
|
|
|
|
|
|
|
|
|
|
|
|
|
|
|
|
|
|
|
|
|
|
|
|
|
|
|
|
|
|
|
|
|
|
|
|
|
|
|
|
|
|
|
|
|
|
|
|
|
|
|
|
|
|
|
| Service charges |
|
|
1,182 |
|
|
|
|
|
|
|
1,188 |
|
|
|
|
|
|
|
|
|
|
|
576 |
|
|
|
|
|
|
|
606 |
|
|
|
|
|
|
|
563 |
|
|
|
|
|
|
|
589 |
|
|
|
|
|
|
|
589 |
|
|
|
|
|
| All other income |
|
|
602 |
|
|
|
|
|
|
|
497 |
|
|
|
|
|
|
|
|
|
|
|
407 |
|
|
|
|
|
|
|
195 |
|
|
|
|
|
|
|
186 |
|
|
|
|
|
|
|
191 |
|
|
|
|
|
|
|
197 |
|
|
|
|
|
|
|
|
|
|
|
|
|
|
|
|
|
|
|
|
|
|
|
|
|
|
|
|
|
|
|
|
|
|
|
|
|
|
|
|
|
|
|
|
|
|
|
|
|
|
|
|
|
|
|
|
|
|
|
|
|
|
|
|
|
|
| Total noninterest income |
|
|
1,784 |
|
|
|
|
|
|
|
1,685 |
|
|
|
|
|
|
|
|
|
|
|
983 |
|
|
|
|
|
|
|
801 |
|
|
|
|
|
|
|
749 |
|
|
|
|
|
|
|
780 |
|
|
|
|
|
|
|
786 |
|
|
|
|
|
|
|
|
|
|
|
|
|
|
|
|
|
|
|
|
|
|
|
|
|
|
|
|
|
|
|
|
|
|
|
|
|
|
|
|
|
|
|
|
|
|
|
|
|
|
|
|
|
|
|
|
|
|
|
|
|
|
|
|
|
|
| Total revenue, net of interest expense |
|
|
5,461 |
|
|
|
|
|
|
|
5,975 |
|
|
|
|
|
|
|
|
|
|
|
2,810 |
|
|
|
|
|
|
|
2,651 |
|
|
|
|
|
|
|
2,614 |
|
|
|
|
|
|
|
2,633 |
|
|
|
|
|
|
|
2,883 |
|
|
|
|
|
|
|
|
|
|
|
|
|
|
|
|
|
|
|
|
|
|
| Provision for credit losses |
|
|
(338 |
) |
|
|
|
|
|
|
1,559 |
|
|
|
|
|
|
|
|
|
|
|
(417 |
) |
|
|
|
|
|
|
79 |
|
|
|
|
|
|
|
(136 |
) |
|
|
|
|
|
|
556 |
|
|
|
|
|
|
|
623 |
|
|
|
|
|
| Noninterest expense |
|
|
2,174 |
|
|
|
|
|
|
|
2,005 |
|
|
|
|
|
|
|
|
|
|
|
1,068 |
|
|
|
|
|
|
|
1,106 |
|
|
|
|
|
|
|
1,061 |
|
|
|
|
|
|
|
1,061 |
|
|
|
|
|
|
|
974 |
|
|
|
|
|
|
|
|
|
|
|
|
|
|
|
|
|
|
|
|
|
|
|
|
|
|
|
|
|
|
|
|
|
|
|
|
|
|
|
|
|
|
|
|
|
|
|
|
|
|
|
|
|
|
|
|
|
|
|
|
|
|
|
|
|
|
| Income before income taxes |
|
|
3,625 |
|
|
|
|
|
|
|
2,411 |
|
|
|
|
|
|
|
|
|
|
|
2,159 |
|
|
|
|
|
|
|
1,466 |
|
|
|
|
|
|
|
1,689 |
|
|
|
|
|
|
|
1,016 |
|
|
|
|
|
|
|
1,286 |
|
|
|
|
|
| Income tax expense (1) |
|
|
1,321 |
|
|
|
|
|
|
|
891 |
|
|
|
|
|
|
|
|
|
|
|
778 |
|
|
|
|
|
|
|
543 |
|
|
|
|
|
|
|
636 |
|
|
|
|
|
|
|
372 |
|
|
|
|
|
|
|
471 |
|
|
|
|
|
|
|
|
|
|
|
|
|
|
|
|
|
|
|
|
|
|
|
|
|
|
|
|
|
|
|
|
|
|
|
|
|
|
|
|
|
|
|
|
|
|
|
|
|
|
|
|
|
|
|
|
|
|
|
|
|
|
|
|
|
|
| Net income |
|
$ |
2,304 |
|
|
|
|
|
|
$ |
1,520 |
|
|
|
|
|
|
|
|
|
|
$ |
1,381 |
|
|
|
|
|
|
$ |
923 |
|
|
|
|
|
|
$ |
1,053 |
|
|
|
|
|
|
$ |
644 |
|
|
|
|
|
|
$ |
815 |
|
|
|
|
|
|
|
|
|
|
|
|
|
|
|
|
|
|
|
|
|
|
|
|
|
|
|
|
|
|
|
|
|
|
|
|
|
|
|
|
|
|
|
|
|
|
|
|
|
|
|
|
|
|
|
|
|
|
|
|
|
|
|
|
|
|
|
|
|
|
|
|
|
|
|
|
|
|
|
|
|
|
|
| Net interest yield (1) |
|
|
2.66 |
|
|
|
% |
|
|
|
3.26 |
|
|
|
% |
|
|
|
|
|
|
|
2.60 |
|
|
|
% |
|
|
|
2.73 |
|
|
|
% |
|
|
|
2.67 |
|
|
|
% |
|
|
|
2.61 |
|
|
|
% |
|
|
|
3.13 |
|
|
|
% |
|
| Return on average equity |
|
|
11.33 |
|
|
|
|
|
|
|
6.93 |
|
|
|
|
|
|
|
|
|
|
|
13.67 |
|
|
|
|
|
|
|
9.02 |
|
|
|
|
|
|
|
9.72 |
|
|
|
|
|
|
|
5.96 |
|
|
|
|
|
|
|
7.46 |
|
|
|
|
|
| Return on average economic capital
(2) |
|
|
22.85 |
|
|
|
|
|
|
|
13.04 |
|
|
|
|
|
|
|
|
|
|
|
27.92 |
|
|
|
|
|
|
|
17.96 |
|
|
|
|
|
|
|
18.76 |
|
|
|
|
|
|
|
11.52 |
|
|
|
|
|
|
|
14.14 |
|
|
|
|
|
| Efficiency ratio (1) |
|
|
39.81 |
|
|
|
|
|
|
|
33.56 |
|
|
|
|
|
|
|
|
|
|
|
38.01 |
|
|
|
|
|
|
|
41.72 |
|
|
|
|
|
|
|
40.58 |
|
|
|
|
|
|
|
40.28 |
|
|
|
|
|
|
|
33.80 |
|
|
|
|
|
|
|
|
|
|
|
|
|
|
|
|
|
|
|
|
|
|
| Balance sheet |
|
|
|
|
|
|
|
|
|
|
|
|
|
|
|
|
|
|
|
|
|
|
|
|
|
|
|
|
|
|
|
|
|
|
|
|
|
|
|
|
|
|
|
|
|
|
|
|
|
|
|
|
|
|
|
|
|
|
|
|
|
|
|
|
|
|
|
|
|
|
|
|
|
|
|
|
|
| Average |
|
|
|
|
|
|
|
|
|
|
|
|
|
|
|
|
|
|
|
|
|
|
|
|
|
|
|
|
|
|
|
|
|
|
|
|
|
|
|
|
|
|
|
|
|
|
|
|
|
|
|
|
|
|
|
|
|
|
|
|
| Total loans and leases |
|
$ |
190,883 |
|
|
|
|
|
|
$ |
210,450 |
|
|
|
|
|
|
|
|
|
|
$ |
189,346 |
|
|
|
|
|
|
$ |
192,437 |
|
|
|
|
|
|
$ |
195,293 |
|
|
|
|
|
|
$ |
199,320 |
|
|
|
|
|
|
$ |
206,603 |
|
|
|
|
|
| Total earning assets (3) |
|
|
278,272 |
|
|
|
|
|
|
|
265,125 |
|
|
|
|
|
|
|
|
|
|
|
281,844 |
|
|
|
|
|
|
|
274,662 |
|
|
|
|
|
|
|
277,402 |
|
|
|
|
|
|
|
281,749 |
|
|
|
|
|
|
|
268,552 |
|
|
|
|
|
| Total assets (3) |
|
|
316,521 |
|
|
|
|
|
|
|
301,925 |
|
|
|
|
|
|
|
|
|
|
|
320,428 |
|
|
|
|
|
|
|
312,570 |
|
|
|
|
|
|
|
314,781 |
|
|
|
|
|
|
|
318,395 |
|
|
|
|
|
|
|
305,788 |
|
|
|
|
|
| Total deposits |
|
|
163,366 |
|
|
|
|
|
|
|
144,572 |
|
|
|
|
|
|
|
|
|
|
|
166,481 |
|
|
|
|
|
|
|
160,217 |
|
|
|
|
|
|
|
156,672 |
|
|
|
|
|
|
|
148,605 |
|
|
|
|
|
|
|
145,499 |
|
|
|
|
|
| Allocated equity |
|
|
41,008 |
|
|
|
|
|
|
|
44,222 |
|
|
|
|
|
|
|
|
|
|
|
40,515 |
|
|
|
|
|
|
|
41,506 |
|
|
|
|
|
|
|
42,992 |
|
|
|
|
|
|
|
42,925 |
|
|
|
|
|
|
|
43,869 |
|
|
|
|
|
| Economic capital (4) |
|
|
20,309 |
|
|
|
|
|
|
|
23,558 |
|
|
|
|
|
|
|
|
|
|
|
19,817 |
|
|
|
|
|
|
|
20,806 |
|
|
|
|
|
|
|
22,289 |
|
|
|
|
|
|
|
22,218 |
|
|
|
|
|
|
|
23,159 |
|
|
|
|
|
|
|
|
|
|
|
|
|
|
|
|
|
|
|
|
|
|
| Period end |
|
|
|
|
|
|
|
|
|
|
|
|
|
|
|
|
|
|
|
|
|
|
|
|
|
|
|
|
|
|
|
|
|
|
|
|
|
|
|
|
|
|
|
|
|
|
|
|
|
|
|
|
|
|
|
|
|
|
|
|
| Total loans and leases |
|
$ |
189,434 |
|
|
|
|
|
|
$ |
203,659 |
|
|
|
|
|
|
|
|
|
|
$ |
189,434 |
|
|
|
|
|
|
$ |
190,749 |
|
|
|
|
|
|
$ |
194,038 |
|
|
|
|
|
|
$ |
196,333 |
|
|
|
|
|
|
$ |
203,659 |
|
|
|
|
|
| Total earning assets (3) |
|
|
242,272 |
|
|
|
|
|
|
|
269,508 |
|
|
|
|
|
|
|
|
|
|
|
242,272 |
|
|
|
|
|
|
|
272,424 |
|
|
|
|
|
|
|
274,637 |
|
|
|
|
|
|
|
267,834 |
|
|
|
|
|
|
|
269,508 |
|
|
|
|
|
| Total assets (3) |
|
|
280,289 |
|
|
|
|
|
|
|
306,234 |
|
|
|
|
|
|
|
|
|
|
|
280,289 |
|
|
|
|
|
|
|
309,930 |
|
|
|
|
|
|
|
312,802 |
|
|
|
|
|
|
|
304,534 |
|
|
|
|
|
|
|
306,234 |
|
|
|
|
|
| Total deposits |
|
|
170,156 |
|
|
|
|
|
|
|
147,414 |
|
|
|
|
|
|
|
|
|
|
|
170,156 |
|
|
|
|
|
|
|
161,584 |
|
|
|
|
|
|
|
161,279 |
|
|
|
|
|
|
|
150,994 |
|
|
|
|
|
|
|
147,414 |
|
|
|
|
|
| (1) |
Fully taxable-equivalent basis |
| (2) |
Return on average economic capital is calculated as net income, excluding cost of funds and earnings credit on intangibles, divided by average economic capital.
|
| (3) |
Total earning assets and total assets include asset allocations to match liabilities (i.e., deposits). |
| (4) |
Economic capital represents allocated equity less goodwill and a percentage of intangible assets. |
Certain prior period amounts have been reclassified among the segments to conform to current period presentation.
|
|
|
| This information is preliminary and based on company data available at the time of the presentation. |
|
23 |
Bank of America Corporation and Subsidiaries
Global Commercial Banking Key Indicators
(Dollars in millions)
|
|
|
|
|
|
|
|
|
|
|
|
|
|
|
|
|
|
|
|
|
|
|
|
|
|
|
|
|
|
|
|
|
|
|
|
|
|
|
|
|
|
|
|
|
|
|
|
|
|
|
|
|
|
|
|
|
|
|
| |
|
Six Months Ended
June 30 |
|
|
|
|
|
|
|
Second
Quarter |
|
|
|
|
|
First
Quarter |
|
|
|
|
|
Fourth
Quarter |
|
|
|
|
|
Third
Quarter |
|
|
|
|
|
Second
Quarter |
|
|
|
|
|
|
|
|
|
|
|
|
|
|
|
|
|
|
|
|
|
|
|
|
|
|
|
|
|
|
|
|
|
|
|
|
|
|
|
|
|
|
|
|
|
|
|
|
|
|
|
|
|
|
|
| |
|
2011 |
|
|
|
|
|
2010 |
|
|
|
|
|
|
|
2011 |
|
|
|
|
|
2011 |
|
|
|
|
|
2010 |
|
|
|
|
|
2010 |
|
|
|
|
|
2010 |
|
|
|
|
| Revenue, net of interest expense by service segment |
|
|
|
|
|
|
|
|
|
|
|
|
|
|
|
|
|
|
|
|
|
|
|
|
|
|
|
|
|
|
|
|
|
|
|
|
|
|
|
|
|
|
|
|
|
|
|
|
|
|
|
|
|
|
|
|
|
|
| Business lending |
|
$ |
3,045 |
|
|
|
|
|
|
$ |
3,493 |
|
|
|
|
|
|
|
|
$ |
1,564 |
|
|
|
|
|
|
$ |
1,481 |
|
|
|
|
|
|
$ |
1,491 |
|
|
|
|
|
|
$ |
1,536 |
|
|
|
|
|
|
$ |
1,635 |
|
|
|
|
|
| Treasury services |
|
|
2,416 |
|
|
|
|
|
|
|
2,482 |
|
|
|
|
|
|
|
|
|
1,246 |
|
|
|
|
|
|
|
1,170 |
|
|
|
|
|
|
|
1,123 |
|
|
|
|
|
|
|
1,097 |
|
|
|
|
|
|
|
1,248 |
|
|
|
|
|
|
|
|
|
|
|
|
|
|
|
|
|
|
|
|
|
|
|
|
|
|
|
|
|
|
|
|
|
|
|
|
|
|
|
|
|
|
|
|
|
|
|
|
|
|
|
|
|
|
|
|
|
|
|
|
|
|
|
|
| Total revenue, net of interest expense
(1) |
|
$ |
5,461 |
|
|
|
|
|
|
$ |
5,975 |
|
|
|
|
|
|
|
|
$ |
2,810 |
|
|
|
|
|
|
$ |
2,651 |
|
|
|
|
|
|
$ |
2,614 |
|
|
|
|
|
|
$ |
2,633 |
|
|
|
|
|
|
$ |
2,883 |
|
|
|
|
|
|
|
|
|
|
|
|
|
|
|
|
|
|
|
|
|
|
|
|
|
|
|
|
|
|
|
|
|
|
|
|
|
|
|
|
|
|
|
|
|
|
|
|
|
|
|
|
|
|
|
|
|
|
|
|
|
|
|
|
|
|
|
|
|
|
|
|
|
|
|
|
|
|
|
|
| Average loans and leases by product |
|
|
|
|
|
|
|
|
|
|
|
|
|
|
|
|
|
|
|
|
|
|
|
|
|
|
|
|
|
|
|
|
|
|
|
|
|
|
|
|
|
|
|
|
|
|
|
|
|
|
|
|
|
|
|
|
|
|
| U.S. commercial |
|
$ |
104,766 |
|
|
|
|
|
|
$ |
106,161 |
|
|
|
|
|
|
|
|
$ |
104,829 |
|
|
|
|
|
|
$ |
104,703 |
|
|
|
|
|
|
$ |
102,914 |
|
|
|
|
|
|
$ |
101,447 |
|
|
|
|
|
|
$ |
104,262 |
|
|
|
|
|
| Commercial real estate |
|
|
41,690 |
|
|
|
|
|
|
|
55,808 |
|
|
|
|
|
|
|
|
|
40,597 |
|
|
|
|
|
|
|
42,796 |
|
|
|
|
|
|
|
45,854 |
|
|
|
|
|
|
|
49,747 |
|
|
|
|
|
|
|
53,721 |
|
|
|
|
|
| Direct/Indirect consumer |
|
|
41,752 |
|
|
|
|
|
|
|
46,088 |
|
|
|
|
|
|
|
|
|
41,078 |
|
|
|
|
|
|
|
42,436 |
|
|
|
|
|
|
|
44,185 |
|
|
|
|
|
|
|
45,885 |
|
|
|
|
|
|
|
46,272 |
|
|
|
|
|
| Other |
|
|
2,675 |
|
|
|
|
|
|
|
2,393 |
|
|
|
|
|
|
|
|
|
2,842 |
|
|
|
|
|
|
|
2,502 |
|
|
|
|
|
|
|
2,340 |
|
|
|
|
|
|
|
2,241 |
|
|
|
|
|
|
|
2,348 |
|
|
|
|
|
|
|
|
|
|
|
|
|
|
|
|
|
|
|
|
|
|
|
|
|
|
|
|
|
|
|
|
|
|
|
|
|
|
|
|
|
|
|
|
|
|
|
|
|
|
|
|
|
|
|
|
|
|
|
|
|
|
|
|
| Total average loans and leases |
|
$ |
190,883 |
|
|
|
|
|
|
$ |
210,450 |
|
|
|
|
|
|
|
|
$ |
189,346 |
|
|
|
|
|
|
$ |
192,437 |
|
|
|
|
|
|
$ |
195,293 |
|
|
|
|
|
|
$ |
199,320 |
|
|
|
|
|
|
$ |
206,603 |
|
|
|
|
|
|
|
|
|
|
|
|
|
|
|
|
|
|
|
|
|
|
|
|
|
|
|
|
|
|
|
|
|
|
|
|
|
|
|
|
|
|
|
|
|
|
|
|
|
|
|
|
|
|
|
|
|
|
|
|
|
|
|
|
| Loan spread |
|
|
2.33 |
|
|
|
% |
|
|
|
2.31 |
|
|
|
% |
|
|
|
|
|
2.26 |
|
|
|
% |
|
|
|
2.40 |
|
|
|
% |
|
|
|
2.27 |
|
|
|
% |
|
|
|
2.29 |
|
|
|
% |
|
|
|
2.32 |
|
|
|
% |
|
|
|
|
|
|
|
|
|
|
|
|
|
|
|
|
|
| Credit quality |
|
|
|
|
|
|
|
|
|
|
|
|
|
|
|
|
|
|
|
|
|
|
|
|
|
|
|
|
|
|
|
|
|
|
|
|
|
|
|
|
|
|
|
|
|
|
|
|
|
|
|
|
|
|
|
|
|
|
| Reservable utilized criticized exposure
(2) |
|
$ |
27,041 |
|
|
|
|
|
|
$ |
37,613 |
|
|
|
|
|
|
|
|
$ |
27,041 |
|
|
|
|
|
|
$ |
30,643 |
|
|
|
|
|
|
$ |
32,816 |
|
|
|
|
|
|
$ |
36,332 |
|
|
|
|
|
|
$ |
37,613 |
|
|
|
|
|
|
|
|
14.27 |
|
|
|
% |
|
|
|
18.50 |
|
|
|
% |
|
|
|
|
|
14.27 |
|
|
|
% |
|
|
|
15.83 |
|
|
|
% |
|
|
|
16.74 |
|
|
|
% |
|
|
|
18.45 |
|
|
|
% |
|
|
|
18.50 |
|
|
|
% |
|
| Nonperforming loans, leases and foreclosed properties
(3) |
|
$ |
7,373 |
|
|
|
|
|
|
$ |
10,027 |
|
|
|
|
|
|
|
|
$ |
7,373 |
|
|
|
|
|
|
$ |
8,321 |
|
|
|
|
|
|
$ |
8,681 |
|
|
|
|
|
|
$ |
9,414 |
|
|
|
|
|
|
$ |
10,027 |
|
|
|
|
|
|
|
|
3.88 |
|
|
|
% |
|
|
|
4.92 |
|
|
|
% |
|
|
|
|
|
3.88 |
|
|
|
% |
|
|
|
4.36 |
|
|
|
% |
|
|
|
4.47 |
|
|
|
% |
|
|
|
4.79 |
|
|
|
% |
|
|
|
4.92 |
|
|
|
% |
|
|
|
|
|
|
|
|
|
|
|
|
|
|
|
|
|
| Average deposit balances |
|
|
|
|
|
|
|
|
|
|
|
|
|
|
|
|
|
|
|
|
|
|
|
|
|
|
|
|
|
|
|
|
|
|
|
|
|
|
|
|
|
|
|
|
|
|
|
|
|
|
|
|
|
|
|
|
|
|
| Interest-bearing |
|
$ |
53,655 |
|
|
|
|
|
|
$ |
54,192 |
|
|
|
|
|
|
|
|
$ |
52,643 |
|
|
|
|
|
|
$ |
54,679 |
|
|
|
|
|
|
$ |
55,354 |
|
|
|
|
|
|
$ |
53,565 |
|
|
|
|
|
|
$ |
54,195 |
|
|
|
|
|
| Noninterest-bearing |
|
|
109,711 |
|
|
|
|
|
|
|
90,380 |
|
|
|
|
|
|
|
|
|
113,838 |
|
|
|
|
|
|
|
105,538 |
|
|
|
|
|
|
|
101,318 |
|
|
|
|
|
|
|
95,040 |
|
|
|
|
|
|
|
91,304 |
|
|
|
|
|
|
|
|
|
|
|
|
|
|
|
|
|
|
|
|
|
|
|
|
|
|
|
|
|
|
|
|
|
|
|
|
|
|
|
|
|
|
|
|
|
|
|
|
|
|
|
|
|
|
|
|
|
|
|
|
|
|
|
|
| Total |
|
$ |
163,366 |
|
|
|
|
|
|
$ |
144,572 |
|
|
|
|
|
|
|
|
$ |
166,481 |
|
|
|
|
|
|
$ |
160,217 |
|
|
|
|
|
|
$ |
156,672 |
|
|
|
|
|
|
$ |
148,605 |
|
|
|
|
|
|
$ |
145,499 |
|
|
|
|
|
|
|
|
|
|
|
|
|
|
|
|
|
|
|
|
|
|
|
|
|
|
|
|
|
|
|
|
|
|
|
|
|
|
|
|
|
|
|
|
|
|
|
|
|
|
|
|
|
|
|
|
|
|
|
|
|
|
|
|
| (1) |
Fully taxable-equivalent basis |
| (2) |
Criticized exposure corresponds to the Special Mention, Substandard and Doubtful asset categories defined by regulatory authorities. The reservable criticized
exposure is on an end-of-period basis and is also shown as a percentage of total reservable commercial utilized credit exposure, including loans and leases, standby letters of credit, financial guarantees, commercial letters of credit and bankers
acceptances. |
| (3) |
Nonperforming loans, leases and foreclosed properties are presented on an end-of-period basis. The nonperforming ratio is calculated as nonperforming loans, leases
and foreclosed properties divided by loans, leases and foreclosed properties. |
Certain prior period amounts have been
reclassified among the segments to conform to current period presentation.
|
|
|
| This information is preliminary and based on company data available at the time of the presentation. |
|
24 |
Bank of America Corporation and Subsidiaries
Global Banking & Markets Segment Results
(Dollars in millions)
|
|
|
|
|
|
|
|
|
|
|
|
|
|
|
|
|
|
|
|
|
|
|
|
|
|
|
|
|
|
|
|
|
|
|
|
|
|
|
|
|
|
|
|
|
|
|
|
|
|
|
|
|
|
|
|
|
|
|
| |
|
Six Months Ended
June
30 |
|
|
|
|
|
|
|
Second
Quarter |
|
|
|
|
|
First
Quarter |
|
|
|
|
|
Fourth
Quarter |
|
|
|
|
|
Third
Quarter |
|
|
|
|
|
Second
Quarter |
|
|
|
|
| |
|
2011 |
|
|
|
|
|
2010 |
|
|
|
|
|
|
|
2011 |
|
|
|
|
|
2011 |
|
|
|
|
|
2010 |
|
|
|
|
|
2010 |
|
|
|
|
|
2010 |
|
|
|
|
| Net interest income (1) |
|
$ |
3,828 |
|
|
|
|
|
|
$ |
4,172 |
|
|
|
|
|
|
|
|
$ |
1,791 |
|
|
|
|
|
|
$ |
2,037 |
|
|
|
|
|
|
$ |
2,007 |
|
|
|
|
|
|
$ |
1,901 |
|
|
|
|
|
|
$ |
2,002 |
|
|
|
|
|
| Noninterest income: |
|
|
|
|
|
|
|
|
|
|
|
|
|
|
|
|
|
|
|
|
|
|
|
|
|
|
|
|
|
|
|
|
|
|
|
|
|
|
|
|
|
|
|
|
|
|
|
|
|
|
|
|
|
|
|
|
|
|
| Service charges |
|
|
917 |
|
|
|
|
|
|
|
931 |
|
|
|
|
|
|
|
|
|
442 |
|
|
|
|
|
|
|
475 |
|
|
|
|
|
|
|
501 |
|
|
|
|
|
|
|
459 |
|
|
|
|
|
|
|
468 |
|
|
|
|
|
| Investment and brokerage services |
|
|
1,264 |
|
|
|
|
|
|
|
1,299 |
|
|
|
|
|
|
|
|
|
587 |
|
|
|
|
|
|
|
677 |
|
|
|
|
|
|
|
562 |
|
|
|
|
|
|
|
580 |
|
|
|
|
|
|
|
676 |
|
|
|
|
|
| Investment banking income |
|
|
3,148 |
|
|
|
|
|
|
|
2,517 |
|
|
|
|
|
|
|
|
|
1,637 |
|
|
|
|
|
|
|
1,511 |
|
|
|
|
|
|
|
1,583 |
|
|
|
|
|
|
|
1,306 |
|
|
|
|
|
|
|
1,301 |
|
|
|
|
|
| Trading account profits |
|
|
4,691 |
|
|
|
|
|
|
|
6,273 |
|
|
|
|
|
|
|
|
|
2,071 |
|
|
|
|
|
|
|
2,620 |
|
|
|
|
|
|
|
961 |
|
|
|
|
|
|
|
2,454 |
|
|
|
|
|
|
|
1,202 |
|
|
|
|
|
| All other income (loss) |
|
|
834 |
|
|
|
|
|
|
|
405 |
|
|
|
|
|
|
|
|
|
268 |
|
|
|
|
|
|
|
566 |
|
|
|
|
|
|
|
(210 |
) |
|
|
|
|
|
|
407 |
|
|
|
|
|
|
|
255 |
|
|
|
|
|
|
|
|
|
|
|
|
|
|
|
|
|
|
|
|
|
|
|
|
|
|
|
|
|
|
|
|
|
|
|
|
|
|
|
|
|
|
|
|
|
|
|
|
|
|
|
|
|
|
|
|
|
|
|
|
|
|
|
|
| Total noninterest income |
|
|
10,854 |
|
|
|
|
|
|
|
11,425 |
|
|
|
|
|
|
|
|
|
5,005 |
|
|
|
|
|
|
|
5,849 |
|
|
|
|
|
|
|
3,397 |
|
|
|
|
|
|
|
5,206 |
|
|
|
|
|
|
|
3,902 |
|
|
|
|
|
|
|
|
|
|
|
|
|
|
|
|
|
|
|
|
|
|
|
|
|
|
|
|
|
|
|
|
|
|
|
|
|
|
|
|
|
|
|
|
|
|
|
|
|
|
|
|
|
|
|
|
|
|
|
|
|
|
|
|
| Total revenue, net of interest expense |
|
|
14,682 |
|
|
|
|
|
|
|
15,597 |
|
|
|
|
|
|
|
|
|
6,796 |
|
|
|
|
|
|
|
7,886 |
|
|
|
|
|
|
|
5,404 |
|
|
|
|
|
|
|
7,107 |
|
|
|
|
|
|
|
5,904 |
|
|
|
|
|
|
|
|
|
|
|
|
|
|
|
|
|
|
|
|
|
| Provision for credit losses |
|
|
(284 |
) |
|
|
|
|
|
|
103 |
|
|
|
|
|
|
|
|
|
(82 |
) |
|
|
|
|
|
|
(202 |
) |
|
|
|
|
|
|
(112 |
) |
|
|
|
|
|
|
(157 |
) |
|
|
|
|
|
|
(133 |
) |
|
|
|
|
| Noninterest expense |
|
|
9,435 |
|
|
|
|
|
|
|
9,024 |
|
|
|
|
|
|
|
|
|
4,713 |
|
|
|
|
|
|
|
4,722 |
|
|
|
|
|
|
|
4,383 |
|
|
|
|
|
|
|
4,391 |
|
|
|
|
|
|
|
4,735 |
|
|
|
|
|
|
|
|
|
|
|
|
|
|
|
|
|
|
|
|
|
|
|
|
|
|
|
|
|
|
|
|
|
|
|
|
|
|
|
|
|
|
|
|
|
|
|
|
|
|
|
|
|
|
|
|
|
|
|
|
|
|
|
|
| Income before income taxes |
|
|
5,531 |
|
|
|
|
|
|
|
6,470 |
|
|
|
|
|
|
|
|
|
2,165 |
|
|
|
|
|
|
|
3,366 |
|
|
|
|
|
|
|
1,133 |
|
|
|
|
|
|
|
2,873 |
|
|
|
|
|
|
|
1,302 |
|
|
|
|
|
| Income tax expense (1) |
|
|
1,839 |
|
|
|
|
|
|
|
2,333 |
|
|
|
|
|
|
|
|
|
607 |
|
|
|
|
|
|
|
1,232 |
|
|
|
|
|
|
|
478 |
|
|
|
|
|
|
|
1,434 |
|
|
|
|
|
|
|
404 |
|
|
|
|
|
|
|
|
|
|
|
|
|
|
|
|
|
|
|
|
|
|
|
|
|
|
|
|
|
|
|
|
|
|
|
|
|
|
|
|
|
|
|
|
|
|
|
|
|
|
|
|
|
|
|
|
|
|
|
|
|
|
|
|
| Net income |
|
$ |
3,692 |
|
|
|
|
|
|
$ |
4,137 |
|
|
|
|
|
|
|
|
$ |
1,558 |
|
|
|
|
|
|
$ |
2,134 |
|
|
|
|
|
|
$ |
655 |
|
|
|
|
|
|
$ |
1,439 |
|
|
|
|
|
|
$ |
898 |
|
|
|
|
|
|
|
|
|
|
|
|
|
|
|
|
|
|
|
|
|
|
|
|
|
|
|
|
|
|
|
|
|
|
|
|
|
|
|
|
|
|
|
|
|
|
|
|
|
|
|
|
|
|
|
|
|
|
|
|
|
|
|
|
|
|
|
|
|
|
|
|
|
|
|
|
|
|
|
|
| Return on average equity |
|
|
18.61 |
|
|
|
% |
|
|
|
15.99 |
|
|
|
% |
|
|
|
|
|
16.44 |
|
|
|
% |
|
|
|
20.59 |
|
|
|
% |
|
|
|
5.47 |
|
|
|
% |
|
|
|
11.25 |
|
|
|
% |
|
|
|
7.03 |
|
|
|
% |
|
| Return on average economic capital (2) |
|
|
25.86 |
|
|
|
|
|
|
|
20.28 |
|
|
|
|
|
|
|
|
|
23.40 |
|
|
|
|
|
|
|
28.02 |
|
|
|
|
|
|
|
7.30 |
|
|
|
|
|
|
|
14.42 |
|
|
|
|
|
|
|
9.06 |
|
|
|
|
|
| Efficiency ratio (1) |
|
|
64.26 |
|
|
|
|
|
|
|
57.86 |
|
|
|
|
|
|
|
|
|
69.35 |
|
|
|
|
|
|
|
59.88 |
|
|
|
|
|
|
|
81.12 |
|
|
|
|
|
|
|
61.78 |
|
|
|
|
|
|
|
80.19 |
|
|
|
|
|
|
|
|
|
|
|
|
|
|
|
|
|
|
|
|
|
| Balance sheet |
|
|
|
|
|
|
|
|
|
|
|
|
|
|
|
|
|
|
|
|
|
|
|
|
|
|
|
|
|
|
|
|
|
|
|
|
|
|
|
|
|
|
|
|
|
|
|
|
|
|
|
|
|
|
|
|
|
|
|
|
|
|
|
|
|
|
|
|
|
|
|
|
|
|
| Average |
|
|
|
|
|
|
|
|
|
|
|
|
|
|
|
|
|
|
|
|
|
|
|
|
|
|
|
|
|
|
|
|
|
|
|
|
|
|
|
|
|
|
|
|
|
|
|
|
|
|
|
|
|
|
|
|
|
|
| Total trading-related assets (3, 4) |
|
$ |
459,278 |
|
|
|
|
|
|
$ |
519,767 |
|
|
|
|
|
|
|
|
$ |
460,153 |
|
|
|
|
|
|
$ |
458,394 |
|
|
|
|
|
|
$ |
485,161 |
|
|
|
|
|
|
$ |
507,014 |
|
|
|
|
|
|
$ |
522,304 |
|
|
|
|
|
| Total loans and leases |
|
|
106,604 |
|
|
|
|
|
|
|
97,427 |
|
|
|
|
|
|
|
|
|
109,473 |
|
|
|
|
|
|
|
103,704 |
|
|
|
|
|
|
|
100,606 |
|
|
|
|
|
|
|
98,874 |
|
|
|
|
|
|
|
95,839 |
|
|
|
|
|
| Total earning assets (3,5) |
|
|
572,701 |
|
|
|
|
|
|
|
628,193 |
|
|
|
|
|
|
|
|
|
569,517 |
|
|
|
|
|
|
|
575,920 |
|
|
|
|
|
|
|
591,238 |
|
|
|
|
|
|
|
599,621 |
|
|
|
|
|
|
|
622,820 |
|
|
|
|
|
| Total assets (5) |
|
|
730,907 |
|
|
|
|
|
|
|
781,949 |
|
|
|
|
|
|
|
|
|
750,908 |
|
|
|
|
|
|
|
710,684 |
|
|
|
|
|
|
|
744,643 |
|
|
|
|
|
|
|
752,159 |
|
|
|
|
|
|
|
779,060 |
|
|
|
|
|
| Total deposits |
|
|
115,097 |
|
|
|
|
|
|
|
108,124 |
|
|
|
|
|
|
|
|
|
118,133 |
|
|
|
|
|
|
|
112,028 |
|
|
|
|
|
|
|
114,942 |
|
|
|
|
|
|
|
106,472 |
|
|
|
|
|
|
|
112,565 |
|
|
|
|
|
| Allocated equity |
|
|
40,004 |
|
|
|
|
|
|
|
52,182 |
|
|
|
|
|
|
|
|
|
38,001 |
|
|
|
|
|
|
|
42,029 |
|
|
|
|
|
|
|
47,511 |
|
|
|
|
|
|
|
50,756 |
|
|
|
|
|
|
|
51,245 |
|
|
|
|
|
| Economic capital (6) |
|
|
29,126 |
|
|
|
|
|
|
|
41,582 |
|
|
|
|
|
|
|
|
|
27,078 |
|
|
|
|
|
|
|
31,197 |
|
|
|
|
|
|
|
36,810 |
|
|
|
|
|
|
|
40,237 |
|
|
|
|
|
|
|
40,705 |
|
|
|
|
|
|
|
|
|
|
|
|
|
|
|
|
|
|
|
|
|
| Period end |
|
|
|
|
|
|
|
|
|
|
|
|
|
|
|
|
|
|
|
|
|
|
|
|
|
|
|
|
|
|
|
|
|
|
|
|
|
|
|
|
|
|
|
|
|
|
|
|
|
|
|
|
|
|
|
|
|
|
| Total trading-related assets (4) |
|
$ |
445,220 |
|
|
|
|
|
|
$ |
483,769 |
|
|
|
|
|
|
|
|
$ |
445,220 |
|
|
|
|
|
|
$ |
455,958 |
|
|
|
|
|
|
$ |
417,714 |
|
|
|
|
|
|
$ |
516,875 |
|
|
|
|
|
|
$ |
483,769 |
|
|
|
|
|
| Total loans and leases |
|
|
114,165 |
|
|
|
|
|
|
|
95,756 |
|
|
|
|
|
|
|
|
|
114,165 |
|
|
|
|
|
|
|
105,651 |
|
|
|
|
|
|
|
99,964 |
|
|
|
|
|
|
|
99,525 |
|
|
|
|
|
|
|
95,756 |
|
|
|
|
|
| Total earning assets (5) |
|
|
557,327 |
|
|
|
|
|
|
|
565,208 |
|
|
|
|
|
|
|
|
|
557,327 |
|
|
|
|
|
|
|
563,943 |
|
|
|
|
|
|
|
514,462 |
|
|
|
|
|
|
|
607,436 |
|
|
|
|
|
|
|
565,208 |
|
|
|
|
|
| Total assets (5) |
|
|
691,249 |
|
|
|
|
|
|
|
718,563 |
|
|
|
|
|
|
|
|
|
691,249 |
|
|
|
|
|
|
|
698,458 |
|
|
|
|
|
|
|
655,778 |
|
|
|
|
|
|
|
755,075 |
|
|
|
|
|
|
|
718,563 |
|
|
|
|
|
| Total deposits |
|
|
123,618 |
|
|
|
|
|
|
|
105,678 |
|
|
|
|
|
|
|
|
|
123,618 |
|
|
|
|
|
|
|
115,212 |
|
|
|
|
|
|
|
110,971 |
|
|
|
|
|
|
|
109,601 |
|
|
|
|
|
|
|
105,678 |
|
|
|
|
|
|
|
|
|
|
|
|
|
|
|
|
|
|
|
|
|
| Trading-related assets (average) |
|
|
|
|
|
|
|
|
|
|
|
|
|
|
|
|
|
|
|
|
|
|
|
|
|
|
|
|
|
|
|
|
|
|
|
|
|
|
|
|
|
|
|
|
|
|
|
|
|
|
|
|
|
|
|
|
|
|
| Trading account securities (3) |
|
$ |
190,004 |
|
|
|
|
|
|
$ |
204,068 |
|
|
|
|
|
|
|
|
$ |
174,009 |
|
|
|
|
|
|
$ |
206,177 |
|
|
|
|
|
|
$ |
201,006 |
|
|
|
|
|
|
$ |
201,494 |
|
|
|
|
|
|
$ |
204,139 |
|
|
|
|
|
| Reverse repurchases |
|
|
162,655 |
|
|
|
|
|
|
|
195,590 |
|
|
|
|
|
|
|
|
|
173,403 |
|
|
|
|
|
|
|
151,788 |
|
|
|
|
|
|
|
166,070 |
|
|
|
|
|
|
|
183,246 |
|
|
|
|
|
|
|
193,905 |
|
|
|
|
|
| Securities borrowed |
|
|
49,616 |
|
|
|
|
|
|
|
56,100 |
|
|
|
|
|
|
|
|
|
54,044 |
|
|
|
|
|
|
|
45,140 |
|
|
|
|
|
|
|
51,294 |
|
|
|
|
|
|
|
54,899 |
|
|
|
|
|
|
|
57,292 |
|
|
|
|
|
| Derivative assets |
|
|
57,003 |
|
|
|
|
|
|
|
64,009 |
|
|
|
|
|
|
|
|
|
58,697 |
|
|
|
|
|
|
|
55,289 |
|
|
|
|
|
|
|
66,791 |
|
|
|
|
|
|
|
67,375 |
|
|
|
|
|
|
|
66,968 |
|
|
|
|
|
|
|
|
|
|
|
|
|
|
|
|
|
|
|
|
|
|
|
|
|
|
|
|
|
|
|
|
|
|
|
|
|
|
|
|
|
|
|
|
|
|
|
|
|
|
|
|
|
|
|
|
|
|
|
|
|
|
|
|
| Total trading-related assets (3,
4) |
|
$ |
459,278 |
|
|
|
|
|
|
$ |
519,767 |
|
|
|
|
|
|
|
|
$ |
460,153 |
|
|
|
|
|
|
$ |
458,394 |
|
|
|
|
|
|
$ |
485,161 |
|
|
|
|
|
|
$ |
507,014 |
|
|
|
|
|
|
$ |
522,304 |
|
|
|
|
|
|
|
|
|
|
|
|
|
|
|
|
|
|
|
|
|
|
|
|
|
|
|
|
|
|
|
|
|
|
|
|
|
|
|
|
|
|
|
|
|
|
|
|
|
|
|
|
|
|
|
|
|
|
|
|
|
|
|
|
| (1) |
Fully taxable-equivalent basis |
| (2) |
For the three and six months ended June 30, 2011, $40.4 billion and $20.3 billion of non-interest earning equity securities were reclassified from trading account
assets to other non-earning assets. Prior period amounts are immaterial and have not been restated. |
| (3) |
Return on average economic capital is calculated as net income, excluding cost of funds and earnings credit on intangibles, divided by average economic capital.
|
| (4) |
Includes assets which are not considered earning assets (i.e. derivative assets). |
| (5) |
Total earning assets and total assets include asset allocations to match liabilities (i.e. deposits). |
| (6) |
Economic capital represents allocated equity less goodwill and a percentage of intangible assets. |
Certain prior period amounts have been reclassified among the segments to conform to current period presentation.
|
|
|
| This information is preliminary and based on company data available at the time of the presentation. |
|
25 |
Bank of America Corporation and Subsidiaries
Global Banking & Markets Key Indicators
(Dollars in millions)
|
|
|
|
|
|
|
|
|
|
|
|
|
|
|
|
|
|
|
|
|
|
|
|
|
|
|
|
|
|
|
|
|
|
|
|
|
|
|
|
|
|
|
|
|
|
|
|
|
|
|
|
|
|
|
|
|
|
|
| |
|
Six Months Ended
June
30 |
|
|
|
|
|
|
|
Second
Quarter |
|
|
|
|
|
First
Quarter |
|
|
|
|
|
Fourth
Quarter |
|
|
|
|
|
Third
Quarter |
|
|
|
|
|
Second
Quarter |
|
|
|
|
| |
|
2011 |
|
|
|
|
|
2010 |
|
|
|
|
|
|
|
2011 |
|
|
|
|
|
2011 |
|
|
|
|
|
2010 |
|
|
|
|
|
2010 |
|
|
|
|
|
2010 |
|
|
|
|
| Sales and trading revenue |
|
|
|
|
|
|
|
|
|
|
|
|
|
|
|
|
|
|
|
|
|
|
|
|
|
|
|
|
|
|
|
|
|
|
|
|
|
|
|
|
|
|
|
|
|
|
|
|
|
|
|
|
|
|
|
|
|
|
| Fixed income, currency and commodities |
|
$ |
6,343 |
|
|
|
|
|
|
$ |
7,717 |
|
|
|
|
|
|
|
|
$ |
2,697 |
|
|
|
|
|
|
$ |
3,646 |
|
|
|
|
|
|
$ |
1,673 |
|
|
|
|
|
|
$ |
3,477 |
|
|
|
|
|
|
$ |
2,230 |
|
|
|
|
|
| Equity income |
|
|
2,330 |
|
|
|
|
|
|
|
2,396 |
|
|
|
|
|
|
|
|
|
1,081 |
|
|
|
|
|
|
|
1,249 |
|
|
|
|
|
|
|
781 |
|
|
|
|
|
|
|
967 |
|
|
|
|
|
|
|
882 |
|
|
|
|
|
|
|
|
|
|
|
|
|
|
|
|
|
|
|
|
|
|
|
|
|
|
|
|
|
|
|
|
|
|
|
|
|
|
|
|
|
|
|
|
|
|
|
|
|
|
|
|
|
|
|
|
|
|
|
|
|
|
|
|
| Total sales and trading revenue
(1) |
|
$ |
8,673 |
|
|
|
|
|
|
$ |
10,113 |
|
|
|
|
|
|
|
|
$ |
3,778 |
|
|
|
|
|
|
$ |
4,895 |
|
|
|
|
|
|
$ |
2,454 |
|
|
|
|
|
|
$ |
4,444 |
|
|
|
|
|
|
$ |
3,112 |
|
|
|
|
|
|
|
|
|
|
|
|
|
|
|
|
|
|
|
|
|
|
|
|
|
|
|
|
|
|
|
|
|
|
|
|
|
|
|
|
|
|
|
|
|
|
|
|
|
|
|
|
|
|
|
|
|
|
|
|
|
|
|
|
| Investment banking income |
|
|
|
|
|
|
|
|
|
|
|
|
|
|
|
|
|
|
|
|
|
|
|
|
|
|
|
|
|
|
|
|
|
|
|
|
|
|
|
|
|
|
|
|
|
|
|
|
|
|
|
|
|
|
|
|
|
|
| Advisory (2) |
|
$ |
700 |
|
|
|
|
|
|
$ |
409 |
|
|
|
|
|
|
|
|
$ |
381 |
|
|
|
|
|
|
$ |
319 |
|
|
|
|
|
|
$ |
336 |
|
|
|
|
|
|
$ |
273 |
|
|
|
|
|
|
$ |
242 |
|
|
|
|
|
| Debt issuance |
|
|
1,679 |
|
|
|
|
|
|
|
1,509 |
|
|
|
|
|
|
|
|
|
880 |
|
|
|
|
|
|
|
799 |
|
|
|
|
|
|
|
808 |
|
|
|
|
|
|
|
743 |
|
|
|
|
|
|
|
773 |
|
|
|
|
|
| Equity issuance |
|
|
769 |
|
|
|
|
|
|
|
599 |
|
|
|
|
|
|
|
|
|
376 |
|
|
|
|
|
|
|
393 |
|
|
|
|
|
|
|
439 |
|
|
|
|
|
|
|
290 |
|
|
|
|
|
|
|
286 |
|
|
|
|
|
|
|
|
|
|
|
|
|
|
|
|
|
|
|
|
|
|
|
|
|
|
|
|
|
|
|
|
|
|
|
|
|
|
|
|
|
|
|
|
|
|
|
|
|
|
|
|
|
|
|
|
|
|
|
|
|
|
|
|
| Total investment banking income |
|
$ |
3,148 |
|
|
|
|
|
|
$ |
2,517 |
|
|
|
|
|
|
|
|
$ |
1,637 |
|
|
|
|
|
|
$ |
1,511 |
|
|
|
|
|
|
$ |
1,583 |
|
|
|
|
|
|
$ |
1,306 |
|
|
|
|
|
|
$ |
1,301 |
|
|
|
|
|
|
|
|
|
|
|
|
|
|
|
|
|
|
|
|
|
|
|
|
|
|
|
|
|
|
|
|
|
|
|
|
|
|
|
|
|
|
|
|
|
|
|
|
|
|
|
|
|
|
|
|
|
|
|
|
|
|
|
|
| Corporate Banking |
|
|
|
|
|
|
|
|
|
|
|
|
|
|
|
|
|
|
|
|
|
|
|
|
|
|
|
|
|
|
|
|
|
|
|
|
|
|
|
|
|
|
|
|
|
|
|
|
|
|
|
|
|
|
|
|
|
|
| Business lending |
|
$ |
1,626 |
|
|
|
|
|
|
$ |
1,747 |
|
|
|
|
|
|
|
|
$ |
758 |
|
|
|
|
|
|
$ |
868 |
|
|
|
|
|
|
$ |
750 |
|
|
|
|
|
|
$ |
778 |
|
|
|
|
|
|
$ |
872 |
|
|
|
|
|
| Treasury services |
|
|
1,237 |
|
|
|
|
|
|
|
1,218 |
|
|
|
|
|
|
|
|
|
624 |
|
|
|
|
|
|
|
613 |
|
|
|
|
|
|
|
617 |
|
|
|
|
|
|
|
579 |
|
|
|
|
|
|
|
619 |
|
|
|
|
|
|
|
|
|
|
|
|
|
|
|
|
|
|
|
|
|
|
|
|
|
|
|
|
|
|
|
|
|
|
|
|
|
|
|
|
|
|
|
|
|
|
|
|
|
|
|
|
|
|
|
|
|
|
|
|
|
|
|
|
| Total revenue, net of interest expense |
|
$ |
2,863 |
|
|
|
|
|
|
$ |
2,965 |
|
|
|
|
|
|
|
|
$ |
1,382 |
|
|
|
|
|
|
$ |
1,481 |
|
|
|
|
|
|
$ |
1,367 |
|
|
|
|
|
|
$ |
1,357 |
|
|
|
|
|
|
$ |
1,491 |
|
|
|
|
|
|
|
|
|
|
|
|
|
|
|
|
|
|
|
|
|
|
|
|
|
|
|
|
|
|
|
|
|
|
|
|
|
|
|
|
|
|
|
|
|
|
|
|
|
|
|
|
|
|
|
|
|
|
|
|
|
|
|
|
|
|
|
|
|
|
|
|
|
|
|
|
| Global Corporate & Investment Banking Key Indicators |
|
|
|
|
|
|
|
|
|
|
|
|
|
|
|
|
|
|
|
|
|
|
|
|
|
|
|
|
|
|
|
|
|
|
|
|
|
|
|
|
|
|
|
|
|
|
|
|
|
|
|
|
|
|
|
|
|
|
|
| Average deposit balances |
|
|
|
|
|
|
|
|
|
|
|
|
|
|
|
|
|
|
|
|
|
|
|
|
|
|
|
|
|
|
|
|
|
|
|
|
|
|
|
|
|
|
|
|
|
|
|
|
|
|
|
|
|
|
|
|
|
|
| Interest-bearing |
|
$ |
55,347 |
|
|
|
|
|
|
$ |
52,870 |
|
|
|
|
|
|
|
|
$ |
57,524 |
|
|
|
|
|
|
$ |
53,145 |
|
|
|
|
|
|
$ |
59,068 |
|
|
|
|
|
|
$ |
55,833 |
|
|
|
|
|
|
$ |
55,109 |
|
|
|
|
|
| Noninterest-bearing |
|
|
52,650 |
|
|
|
|
|
|
|
46,730 |
|
|
|
|
|
|
|
|
|
53,081 |
|
|
|
|
|
|
|
52,214 |
|
|
|
|
|
|
|
48,454 |
|
|
|
|
|
|
|
43,981 |
|
|
|
|
|
|
|
49,009 |
|
|
|
|
|
|
|
|
|
|
|
|
|
|
|
|
|
|
|
|
|
|
|
|
|
|
|
|
|
|
|
|
|
|
|
|
|
|
|
|
|
|
|
|
|
|
|
|
|
|
|
|
|
|
|
|
|
|
|
|
|
|
|
|
| Total average deposits |
|
$ |
107,997 |
|
|
|
|
|
|
$ |
99,600 |
|
|
|
|
|
|
|
|
$ |
110,605 |
|
|
|
|
|
|
$ |
105,359 |
|
|
|
|
|
|
$ |
107,522 |
|
|
|
|
|
|
$ |
99,814 |
|
|
|
|
|
|
$ |
104,118 |
|
|
|
|
|
|
|
|
|
|
|
|
|
|
|
|
|
|
|
|
|
|
|
|
|
|
|
|
|
|
|
|
|
|
|
|
|
|
|
|
|
|
|
|
|
|
|
|
|
|
|
|
|
|
|
|
|
|
|
|
|
|
|
|
|
|
|
|
|
|
|
|
|
|
|
|
|
|
|
|
| Loan spread |
|
|
1.92 |
|
|
|
% |
|
|
|
1.94 |
|
|
|
% |
|
|
|
|
|
1.57 |
|
|
|
% |
|
|
|
2.29 |
|
|
|
% |
|
|
|
1.62 |
|
|
|
% |
|
|
|
1.77 |
|
|
|
% |
|
|
|
1.94 |
|
|
|
% |
|
|
|
|
|
|
|
|
|
|
|
|
|
|
|
|
|
| Provision for credit losses |
|
$ |
(238 |
) |
|
|
|
|
|
$ |
10 |
|
|
|
|
|
|
|
|
$ |
(74 |
) |
|
|
|
|
|
$ |
(164 |
) |
|
|
|
|
|
$ |
(110 |
) |
|
|
|
|
|
$ |
(102 |
) |
|
|
|
|
|
$ |
(191 |
) |
|
|
|
|
|
|
|
|
|
|
|
|
|
|
|
|
|
|
|
|
| Credit quality (3, 4) |
|
|
|
|
|
|
|
|
|
|
|
|
|
|
|
|
|
|
|
|
|
|
|
|
|
|
|
|
|
|
|
|
|
|
|
|
|
|
|
|
|
|
|
|
|
|
|
|
|
|
|
|
|
|
|
|
|
|
| Reservable utilized criticized exposure |
|
$ |
4,801 |
|
|
|
|
|
|
$ |
7,290 |
|
|
|
|
|
|
|
|
$ |
4,801 |
|
|
|
|
|
|
$ |
5,298 |
|
|
|
|
|
|
$ |
5,924 |
|
|
|
|
|
|
$ |
7,131 |
|
|
|
|
|
|
$ |
7,290 |
|
|
|
|
|
|
|
|
4.26 |
|
|
|
% |
|
|
|
7.29 |
|
|
|
% |
|
|
|
|
|
4.26 |
|
|
|
% |
|
|
|
4.87 |
|
|
|
% |
|
|
|
5.67 |
|
|
|
% |
|
|
|
6.95 |
|
|
|
% |
|
|
|
7.29 |
|
|
|
% |
|
| Nonperforming loans, leases and foreclosed properties |
|
$ |
327 |
|
|
|
|
|
|
$ |
905 |
|
|
|
|
|
|
|
|
$ |
327 |
|
|
|
|
|
|
$ |
314 |
|
|
|
|
|
|
$ |
645 |
|
|
|
|
|
|
$ |
993 |
|
|
|
|
|
|
$ |
905 |
|
|
|
|
|
|
|
|
0.34 |
|
|
|
% |
|
|
|
1.13 |
|
|
|
% |
|
|
|
|
|
0.34 |
|
|
|
% |
|
|
|
0.35 |
|
|
|
% |
|
|
|
0.76 |
|
|
|
% |
|
|
|
1.19 |
|
|
|
% |
|
|
|
1.13 |
|
|
|
% |
|
| Average loans and leases by product |
|
|
|
|
|
|
|
|
|
|
|
|
|
|
|
|
|
|
|
|
|
|
|
|
|
|
|
|
|
|
|
|
|
|
|
|
|
|
|
|
|
|
|
|
|
|
|
|
|
|
|
|
|
|
|
|
|
|
| U.S. commercial |
|
$ |
34,039 |
|
|
|
|
|
|
$ |
34,878 |
|
|
|
|
|
|
|
|
$ |
34,369 |
|
|
|
|
|
|
$ |
33,704 |
|
|
|
|
|
|
$ |
33,522 |
|
|
|
|
|
|
$ |
32,681 |
|
|
|
|
|
|
$ |
33,593 |
|
|
|
|
|
| Commercial real estate |
|
|
68 |
|
|
|
|
|
|
|
33 |
|
|
|
|
|
|
|
|
|
54 |
|
|
|
|
|
|
|
82 |
|
|
|
|
|
|
|
24 |
|
|
|
|
|
|
|
26 |
|
|
|
|
|
|
|
31 |
|
|
|
|
|
| Commercial lease financing |
|
|
23,259 |
|
|
|
|
|
|
|
23,472 |
|
|
|
|
|
|
|
|
|
23,041 |
|
|
|
|
|
|
|
23,478 |
|
|
|
|
|
|
|
23,271 |
|
|
|
|
|
|
|
23,356 |
|
|
|
|
|
|
|
23,250 |
|
|
|
|
|
| Non-U.S. commercial |
|
|
32,757 |
|
|
|
|
|
|
|
22,309 |
|
|
|
|
|
|
|
|
|
35,267 |
|
|
|
|
|
|
|
30,220 |
|
|
|
|
|
|
|
26,550 |
|
|
|
|
|
|
|
24,650 |
|
|
|
|
|
|
|
22,710 |
|
|
|
|
|
| Other |
|
|
42 |
|
|
|
|
|
|
|
45 |
|
|
|
|
|
|
|
|
|
41 |
|
|
|
|
|
|
|
46 |
|
|
|
|
|
|
|
42 |
|
|
|
|
|
|
|
43 |
|
|
|
|
|
|
|
43 |
|
|
|
|
|
|
|
|
|
|
|
|
|
|
|
|
|
|
|
|
|
|
|
|
|
|
|
|
|
|
|
|
|
|
|
|
|
|
|
|
|
|
|
|
|
|
|
|
|
|
|
|
|
|
|
|
|
|
|
|
|
|
|
|
| Total average loans and leases |
|
$ |
90,165 |
|
|
|
|
|
|
$ |
80,737 |
|
|
|
|
|
|
|
|
$ |
92,772 |
|
|
|
|
|
|
$ |
87,530 |
|
|
|
|
|
|
$ |
83,409 |
|
|
|
|
|
|
$ |
80,756 |
|
|
|
|
|
|
$ |
79,627 |
|
|
|
|
|
|
|
|
|
|
|
|
|
|
|
|
|
|
|
|
|
|
|
|
|
|
|
|
|
|
|
|
|
|
|
|
|
|
|
|
|
|
|
|
|
|
|
|
|
|
|
|
|
|
|
|
|
|
|
|
|
|
|
|
|
| |
|
| (1) Sales and trading revenue breakdown: |
|
|
|
|
|
|
|
|
|
|
|
|
|
|
|
|
|
|
|
|
|
|
|
|
|
|
|
|
|
|
|
|
|
|
|
|
|
|
|
|
|
|
|
|
|
|
|
|
|
|
|
|
|
|
|
|
|
|
| Net Interest Income |
|
$ |
2,037 |
|
|
|
|
|
|
$ |
2,328 |
|
|
|
|
|
|
|
|
$ |
952 |
|
|
|
|
|
|
$ |
1,085 |
|
|
|
|
|
|
$ |
1,183 |
|
|
|
|
|
|
$ |
1,090 |
|
|
|
|
|
|
$ |
1,083 |
|
|
|
|
|
| Commissions |
|
|
1,255 |
|
|
|
|
|
|
|
1,258 |
|
|
|
|
|
|
|
|
|
583 |
|
|
|
|
|
|
|
672 |
|
|
|
|
|
|
|
542 |
|
|
|
|
|
|
|
560 |
|
|
|
|
|
|
|
657 |
|
|
|
|
|
| Trading |
|
|
4,618 |
|
|
|
|
|
|
|
6,244 |
|
|
|
|
|
|
|
|
|
2,031 |
|
|
|
|
|
|
|
2,587 |
|
|
|
|
|
|
|
925 |
|
|
|
|
|
|
|
2,427 |
|
|
|
|
|
|
|
1,189 |
|
|
|
|
|
| Other |
|
|
763 |
|
|
|
|
|
|
|
283 |
|
|
|
|
|
|
|
|
|
212 |
|
|
|
|
|
|
|
551 |
|
|
|
|
|
|
|
(196 |
) |
|
|
|
|
|
|
367 |
|
|
|
|
|
|
|
183 |
|
|
|
|
|
|
|
|
|
|
|
|
|
|
|
|
|
|
|
|
|
|
|
|
|
|
|
|
|
|
|
|
|
|
|
|
|
|
|
|
|
|
|
|
|
|
|
|
|
|
|
|
|
|
|
|
|
|
|
|
|
|
|
|
| Total sales and trading revenue |
|
$ |
8,673 |
|
|
|
|
|
|
$ |
10,113 |
|
|
|
|
|
|
|
|
$ |
3,778 |
|
|
|
|
|
|
$ |
4,895 |
|
|
|
|
|
|
$ |
2,454 |
|
|
|
|
|
|
$ |
4,444 |
|
|
|
|
|
|
$ |
3,112 |
|
|
|
|
|
|
|
|
|
|
|
|
|
|
|
|
|
|
|
|
|
|
|
|
|
|
|
|
|
|
|
|
|
|
|
|
|
|
|
|
|
|
|
|
|
|
|
|
|
|
|
|
|
|
|
|
|
|
|
|
|
|
|
|
| (2) |
Advisory includes fees on debt and equity advisory and mergers and acquisitions. |
| (3) |
Criticized exposure corresponds to the Special Mention, Substandard and Doubtful asset categories defined by regulatory authorities. The reservable criticized
exposure is on an end-of-period basis and is also shown as a percentage of total reservable commercial utilized credit exposure, including loans and leases, standby letters of credit, financial guarantees, commercial letters of credit and
bankers’ acceptances. |
| (4) |
Nonperforming loans, leases and foreclosed properties are on an end-of-period basis and defined as nonperforming loans and leases plus foreclosed properties. The
nonperforming ratio is nonperforming assets divided by commercial loans and leases plus commercial foreclosed properties. |
Certain prior period amounts have been reclassified among the segments to conform to current period presentation.
|
|
|
| This information is preliminary and based on company data available at the time of the presentation. |
|
26 |
Bank of America Corporation and Subsidiaries
Credit Default Swaps with Monoline Financial Guarantors
(Dollars in millions)
|
|
|
|
|
|
|
|
|
|
|
|
|
|
|
|
|
|
|
|
|
|
|
|
|
| |
|
June 30, 2011 |
|
|
|
|
| |
|
Super
Senior
CDOs |
|
|
|
|
|
Other
Guaranteed
Positions |
|
|
|
|
|
Total |
|
|
|
|
| Notional |
|
$ |
2,968 |
|
|
|
|
|
|
$ |
32,656 |
|
|
|
|
|
|
$ |
35,624 |
|
|
|
|
|
| Mark-to-market or guarantor receivable |
|
|
2,578 |
|
|
|
|
|
|
|
6,150 |
|
|
|
|
|
|
|
8,728 |
|
|
|
|
|
| Credit valuation adjustment |
|
|
(2,363 |
) |
|
|
|
|
|
|
(3,314 |
) |
|
|
|
|
|
|
(5,677 |
) |
|
|
|
|
|
|
|
|
|
|
|
|
|
|
|
|
|
|
|
|
|
|
|
|
|
|
|
|
|
| Total |
|
$ |
215 |
|
|
|
|
|
|
$ |
2,836 |
|
|
|
|
|
|
$ |
3,051 |
|
|
|
|
|
|
|
|
|
|
|
|
|
|
|
|
|
|
|
|
|
|
|
|
|
|
|
|
|
|
| Credit valuation adjustment % |
|
|
92 |
|
|
|
% |
|
|
|
54 |
|
|
|
% |
|
|
|
65 |
|
|
|
% |
|
|
|
|
|
|
|
|
| Losses during the three months ended June 30, 2011 |
|
$ |
(38 |
) |
|
|
|
|
|
$ |
(223 |
) |
|
|
|
|
|
$ |
(261 |
) |
|
|
|
|
|
|
|
|
|
|
|
| Losses during the six months ended June 30, 2011 |
|
|
(314 |
) |
|
|
|
|
|
|
(354 |
) |
|
|
|
|
|
|
(668 |
) |
|
|
|
|
|
|
|
| |
|
March 31, 2011 |
|
|
|
|
| |
|
Super
Senior
CDOs |
|
|
|
|
|
Other
Guaranteed
Positions |
|
|
|
|
|
Total |
|
|
|
|
| Notional |
|
$ |
3,225 |
|
|
|
|
|
|
$ |
35,273 |
|
|
|
|
|
|
$ |
38,498 |
|
|
|
|
|
| Mark-to-market or guarantor receivable |
|
|
2,693 |
|
|
|
|
|
|
|
5,623 |
|
|
|
|
|
|
|
8,316 |
|
|
|
|
|
| Credit valuation adjustment |
|
|
(2,444 |
) |
|
|
|
|
|
|
(2,838 |
) |
|
|
|
|
|
|
(5,282 |
) |
|
|
|
|
|
|
|
|
|
|
|
|
|
|
|
|
|
|
|
|
|
|
|
|
|
|
|
|
|
| Total |
|
$ |
249 |
|
|
|
|
|
|
$ |
2,785 |
|
|
|
|
|
|
$ |
3,034 |
|
|
|
|
|
|
|
|
|
|
|
|
|
|
|
|
|
|
|
|
|
|
|
|
|
|
|
|
|
|
| Credit valuation adjustment % |
|
|
91 |
|
|
|
% |
|
|
|
50 |
|
|
|
% |
|
|
|
64 |
|
|
|
% |
|
|
|
|
|
|
|
|
| Losses during the three months ended March 31, 2011 |
|
$ |
(276 |
) |
|
|
|
|
|
$ |
(131 |
) |
|
|
|
|
|
$ |
(407 |
) |
|
|
|
|
Certain prior period amounts have been reclassified to conform to current period presentation.
|
|
|
| This information is preliminary and based on company data available at the time of the presentation. |
|
27 |
Bank of America Corporation and Subsidiaries
Investment Banking Product Rankings
|
|
|
|
|
|
|
|
|
|
|
|
|
|
|
|
|
|
|
|
|
| |
|
Six Months Ended June 30, 2011 |
|
|
|
|
| |
|
Global |
|
|
U.S. |
|
|
|
|
| |
|
Product
Ranking |
|
Market
Share |
|
|
|
|
|
Product
Ranking |
|
Market
Share |
|
|
|
|
| High-yield corporate debt |
|
3 |
|
|
9.7 |
|
|
|
% |
|
|
2 |
|
|
11.4 |
|
|
|
% |
|
| Leveraged loans |
|
2 |
|
|
14.1 |
|
|
|
|
|
|
2 |
|
|
17.8 |
|
|
|
|
|
| Mortgage-backed securities |
|
2 |
|
|
11.1 |
|
|
|
|
|
|
1 |
|
|
14.4 |
|
|
|
|
|
| Asset-backed securities |
|
1 |
|
|
13.0 |
|
|
|
|
|
|
1 |
|
|
20.3 |
|
|
|
|
|
| Convertible debt |
|
5 |
|
|
6.3 |
|
|
|
|
|
|
4 |
|
|
10.3 |
|
|
|
|
|
| Common stock underwriting |
|
2 |
|
|
7.7 |
|
|
|
|
|
|
4 |
|
|
9.9 |
|
|
|
|
|
| Investment grade corporate debt |
|
2 |
|
|
6.8 |
|
|
|
|
|
|
1 |
|
|
14.4 |
|
|
|
|
|
| Syndicated loans |
|
2 |
|
|
10.2 |
|
|
|
|
|
|
2 |
|
|
19.2 |
|
|
|
|
|
| Net investment banking revenue |
|
2 |
|
|
7.9 |
|
|
|
|
|
|
2 |
|
|
11.9 |
|
|
|
|
|
| Announced mergers and acquisitions |
|
6 |
|
|
14.1 |
|
|
|
|
|
|
7 |
|
|
21.1 |
|
|
|
|
|
| Equity capital markets |
|
2 |
|
|
7.5 |
|
|
|
|
|
|
4 |
|
|
10.0 |
|
|
|
|
|
| Debt capital markets |
|
4 |
|
|
5.7 |
|
|
|
|
|
|
2 |
|
|
10.6 |
|
|
|
|
|
Source: Dealogic data as of July 5, 2011. Figures above include self-led transactions.
| • |
|
Rankings based on deal volumes except for investment banking revenue rankings which reflect fees. |
| • |
|
Debt capital markets excludes loans but includes agencies. |
| • |
|
Mergers and acquisitions fees included in investment banking revenues reflect 10 percent fee credit at announcement and 90 percent fee credit
at completion as per Dealogic. |
| • |
|
Mergers and acquisitions volume rankings are for announced transactions and provide credit to all investment banks advising the target or
acquiror. |
| • |
|
Each advisor receives full credit for the deal amount unless advising a minority stakeholder. |
Highlights
|
|
|
| Global top 3 rankings in: |
|
|
|
|
| High-yield corporate debt |
|
Common stock underwriting |
| Leveraged loans |
|
Investment grade corporate debt |
| Mortgage-backed securities |
|
Syndicated loans |
| Asset-backed securities |
|
Equity capital markets |
|
|
| U.S. top 3 rankings in: |
|
|
|
|
| High-yield corporate debt |
|
Investment grade corporate debt |
| Leveraged loans |
|
Syndicated loans |
| Mortgage-backed securities |
|
Debt capital markets |
| Asset-backed securities |
|
|
Excluding self-mandated deals:
Global: #1 - Asset-backed securities, Investment grade corporate debt
Global: #2 - High-yield
corporate debt, Leveraged loans, Mortgage-backed securities, Common stock underwriting, Syndicated loans, Equity capital markets
US: #1 -
Asset-backed securities, Investment grade corporate debt
US: #2 - High-yield corporate debt, Leveraged loans, Mortgage-backed securities,
Syndicated loans, Debt capital markets
|
|
|
| This information is preliminary and based on company data available at the time of the presentation. |
|
28 |
Bank of America Corporation and Subsidiaries
Global Wealth & Investment Management Segment Results
(Dollars in millions, except as noted)
|
|
|
|
|
|
|
|
|
|
|
|
|
|
|
|
|
|
|
|
|
|
|
|
|
|
|
|
|
|
|
|
|
|
|
|
|
|
|
|
|
|
|
|
|
|
|
|
|
|
|
|
|
|
|
|
|
|
|
|
|
| |
|
Six Months Ended
June
30 |
|
|
|
|
|
|
|
|
|
Second
Quarter
2011 |
|
|
|
|
|
First
Quarter
2011 |
|
|
|
|
|
Fourth
Quarter
2010 |
|
|
|
|
|
Third
Quarter
2010 |
|
|
|
|
|
Second
Quarter
2010 |
|
|
|
|
| |
|
2011 |
|
|
|
|
|
2010 |
|
|
|
|
|
|
|
|
|
|
|
|
|
|
|
|
|
|
| Net interest income (1) |
|
$ |
3,140 |
|
|
|
|
|
|
$ |
2,907 |
|
|
|
|
|
|
|
|
|
|
$ |
1,571 |
|
|
|
|
|
|
$ |
1,569 |
|
|
|
|
|
|
$ |
1,425 |
|
|
|
|
|
|
$ |
1,345 |
|
|
|
|
|
|
$ |
1,443 |
|
|
|
|
|
| Noninterest income: |
|
|
|
|
|
|
|
|
|
|
|
|
|
|
|
|
|
|
|
|
|
|
|
|
|
|
|
|
|
|
|
|
|
|
|
|
|
|
|
|
|
|
|
|
|
|
|
|
|
|
|
|
|
|
|
|
|
|
|
|
| Investment and brokerage services |
|
|
4,756 |
|
|
|
|
|
|
|
4,303 |
|
|
|
|
|
|
|
|
|
|
|
2,378 |
|
|
|
|
|
|
|
2,378 |
|
|
|
|
|
|
|
2,266 |
|
|
|
|
|
|
|
2,091 |
|
|
|
|
|
|
|
2,195 |
|
|
|
|
|
| All other income |
|
|
1,086 |
|
|
|
|
|
|
|
1,020 |
|
|
|
|
|
|
|
|
|
|
|
541 |
|
|
|
|
|
|
|
545 |
|
|
|
|
|
|
|
470 |
|
|
|
|
|
|
|
462 |
|
|
|
|
|
|
|
551 |
|
|
|
|
|
|
|
|
|
|
|
|
|
|
|
|
|
|
|
|
|
|
|
|
|
|
|
|
|
|
|
|
|
|
|
|
|
|
|
|
|
|
|
|
|
|
|
|
|
|
|
|
|
|
|
|
|
|
|
|
|
|
|
|
|
|
| Total noninterest income |
|
|
5,842 |
|
|
|
|
|
|
|
5,323 |
|
|
|
|
|
|
|
|
|
|
|
2,919 |
|
|
|
|
|
|
|
2,923 |
|
|
|
|
|
|
|
2,736 |
|
|
|
|
|
|
|
2,553 |
|
|
|
|
|
|
|
2,746 |
|
|
|
|
|
|
|
|
|
|
|
|
|
|
|
|
|
|
|
|
|
|
|
|
|
|
|
|
|
|
|
|
|
|
|
|
|
|
|
|
|
|
|
|
|
|
|
|
|
|
|
|
|
|
|
|
|
|
|
|
|
|
|
|
|
|
| Total revenue, net of interest expense |
|
|
8,982 |
|
|
|
|
|
|
|
8,230 |
|
|
|
|
|
|
|
|
|
|
|
4,490 |
|
|
|
|
|
|
|
4,492 |
|
|
|
|
|
|
|
4,161 |
|
|
|
|
|
|
|
3,898 |
|
|
|
|
|
|
|
4,189 |
|
|
|
|
|
|
|
|
|
|
|
|
|
|
|
|
|
|
|
|
|
|
| Provision for credit losses |
|
|
118 |
|
|
|
|
|
|
|
363 |
|
|
|
|
|
|
|
|
|
|
|
72 |
|
|
|
|
|
|
|
46 |
|
|
|
|
|
|
|
155 |
|
|
|
|
|
|
|
127 |
|
|
|
|
|
|
|
122 |
|
|
|
|
|
| Noninterest expense |
|
|
7,230 |
|
|
|
|
|
|
|
6,368 |
|
|
|
|
|
|
|
|
|
|
|
3,631 |
|
|
|
|
|
|
|
3,599 |
|
|
|
|
|
|
|
3,485 |
|
|
|
|
|
|
|
3,364 |
|
|
|
|
|
|
|
3,269 |
|
|
|
|
|
|
|
|
|
|
|
|
|
|
|
|
|
|
|
|
|
|
|
|
|
|
|
|
|
|
|
|
|
|
|
|
|
|
|
|
|
|
|
|
|
|
|
|
|
|
|
|
|
|
|
|
|
|
|
|
|
|
|
|
|
|
| Income before income taxes |
|
|
1,634 |
|
|
|
|
|
|
|
1,499 |
|
|
|
|
|
|
|
|
|
|
|
787 |
|
|
|
|
|
|
|
847 |
|
|
|
|
|
|
|
521 |
|
|
|
|
|
|
|
407 |
|
|
|
|
|
|
|
798 |
|
|
|
|
|
| Income tax expense (1) |
|
|
595 |
|
|
|
|
|
|
|
731 |
|
|
|
|
|
|
|
|
|
|
|
281 |
|
|
|
|
|
|
|
314 |
|
|
|
|
|
|
|
199 |
|
|
|
|
|
|
|
150 |
|
|
|
|
|
|
|
469 |
|
|
|
|
|
|
|
|
|
|
|
|
|
|
|
|
|
|
|
|
|
|
|
|
|
|
|
|
|
|
|
|
|
|
|
|
|
|
|
|
|
|
|
|
|
|
|
|
|
|
|
|
|
|
|
|
|
|
|
|
|
|
|
|
|
|
| Net income |
|
$ |
1,039 |
|
|
|
|
|
|
$ |
768 |
|
|
|
|
|
|
|
|
|
|
$ |
506 |
|
|
|
|
|
|
$ |
533 |
|
|
|
|
|
|
$ |
322 |
|
|
|
|
|
|
$ |
257 |
|
|
|
|
|
|
$ |
329 |
|
|
|
|
|
|
|
|
|
|
|
|
|
|
|
|
|
|
|
|
|
|
|
|
|
|
|
|
|
|
|
|
|
|
|
|
|
|
|
|
|
|
|
|
|
|
|
|
|
|
|
|
|
|
|
|
|
|
|
|
|
|
|
|
|
|
|
|
|
|
|
|
|
|
|
|
|
|
|
|
|
|
|
| Net interest yield (1) |
|
|
2.32 |
|
|
|
% |
|
|
|
2.49 |
|
|
|
% |
|
|
|
|
|
|
|
2.34 |
|
|
|
% |
|
|
|
2.30 |
|
|
|
% |
|
|
|
2.10 |
|
|
|
% |
|
|
|
2.18 |
|
|
|
% |
|
|
|
2.42 |
|
|
|
% |
|
| Return on average equity |
|
|
11.80 |
|
|
|
|
|
|
|
8.61 |
|
|
|
|
|
|
|
|
|
|
|
11.54 |
|
|
|
|
|
|
|
12.06 |
|
|
|
|
|
|
|
7.00 |
|
|
|
|
|
|
|
5.66 |
|
|
|
|
|
|
|
7.27 |
|
|
|
|
|
| Return on average economic capital (2) |
|
|
30.21 |
|
|
|
|
|
|
|
22.76 |
|
|
|
|
|
|
|
|
|
|
|
29.97 |
|
|
|
|
|
|
|
30.44 |
|
|
|
|
|
|
|
18.12 |
|
|
|
|
|
|
|
15.20 |
|
|
|
|
|
|
|
19.10 |
|
|
|
|
|
| Efficiency ratio (1) |
|
|
80.50 |
|
|
|
|
|
|
|
77.37 |
|
|
|
|
|
|
|
|
|
|
|
80.88 |
|
|
|
|
|
|
|
80.12 |
|
|
|
|
|
|
|
83.76 |
|
|
|
|
|
|
|
86.29 |
|
|
|
|
|
|
|
78.05 |
|
|
|
|
|
|
|
|
|
|
|
|
|
|
|
|
|
|
|
|
|
|
| Balance sheet |
|
|
|
|
|
|
|
|
|
|
|
|
|
|
|
|
|
|
|
|
|
|
|
|
|
|
|
|
|
|
|
|
|
|
|
|
|
|
|
|
|
|
|
|
|
|
|
|
|
|
|
|
|
|
|
|
|
|
|
|
| Average |
|
|
|
|
|
|
|
|
|
|
|
|
|
|
|
|
|
|
|
|
|
|
|
|
|
|
|
|
|
|
|
|
|
|
|
|
|
|
|
|
|
|
|
|
|
|
|
|
|
|
|
|
|
|
|
|
|
|
|
|
| Total loans and leases |
|
$ |
101,529 |
|
|
|
|
|
|
$ |
98,826 |
|
|
|
|
|
|
|
|
|
|
$ |
102,200 |
|
|
|
|
|
|
$ |
100,851 |
|
|
|
|
|
|
$ |
100,306 |
|
|
|
|
|
|
$ |
99,103 |
|
|
|
|
|
|
$ |
98,811 |
|
|
|
|
|
| Total earning assets (3) |
|
|
272,958 |
|
|
|
|
|
|
|
235,284 |
|
|
|
|
|
|
|
|
|
|
|
268,968 |
|
|
|
|
|
|
|
276,992 |
|
|
|
|
|
|
|
268,872 |
|
|
|
|
|
|
|
245,146 |
|
|
|
|
|
|
|
239,186 |
|
|
|
|
|
| Total assets (3) |
|
|
293,170 |
|
|
|
|
|
|
|
256,510 |
|
|
|
|
|
|
|
|
|
|
|
289,050 |
|
|
|
|
|
|
|
297,335 |
|
|
|
|
|
|
|
289,643 |
|
|
|
|
|
|
|
265,641 |
|
|
|
|
|
|
|
259,801 |
|
|
|
|
|
| Total deposits |
|
|
256,859 |
|
|
|
|
|
|
|
223,956 |
|
|
|
|
|
|
|
|
|
|
|
255,219 |
|
|
|
|
|
|
|
258,518 |
|
|
|
|
|
|
|
246,281 |
|
|
|
|
|
|
|
234,807 |
|
|
|
|
|
|
|
226,276 |
|
|
|
|
|
| Allocated equity |
|
|
17,755 |
|
|
|
|
|
|
|
18,002 |
|
|
|
|
|
|
|
|
|
|
|
17,574 |
|
|
|
|
|
|
|
17,938 |
|
|
|
|
|
|
|
18,227 |
|
|
|
|
|
|
|
18,039 |
|
|
|
|
|
|
|
18,179 |
|
|
|
|
|
| Economic capital (4) |
|
|
7,038 |
|
|
|
|
|
|
|
7,209 |
|
|
|
|
|
|
|
|
|
|
|
6,868 |
|
|
|
|
|
|
|
7,210 |
|
|
|
|
|
|
|
7,475 |
|
|
|
|
|
|
|
7,264 |
|
|
|
|
|
|
|
7,380 |
|
|
|
|
|
|
|
|
|
|
|
|
|
|
|
|
|
|
|
|
|
|
| Period end |
|
|
|
|
|
|
|
|
|
|
|
|
|
|
|
|
|
|
|
|
|
|
|
|
|
|
|
|
|
|
|
|
|
|
|
|
|
|
|
|
|
|
|
|
|
|
|
|
|
|
|
|
|
|
|
|
|
|
|
|
| Total loans and leases |
|
$ |
102,878 |
|
|
|
|
|
|
$ |
99,157 |
|
|
|
|
|
|
|
|
|
|
$ |
102,878 |
|
|
|
|
|
|
$ |
101,286 |
|
|
|
|
|
|
$ |
100,724 |
|
|
|
|
|
|
$ |
99,511 |
|
|
|
|
|
|
$ |
99,157 |
|
|
|
|
|
| Total earning assets (3) |
|
|
263,867 |
|
|
|
|
|
|
|
231,375 |
|
|
|
|
|
|
|
|
|
|
|
263,867 |
|
|
|
|
|
|
|
264,753 |
|
|
|
|
|
|
|
275,260 |
|
|
|
|
|
|
|
245,370 |
|
|
|
|
|
|
|
231,375 |
|
|
|
|
|
| Total assets (3) |
|
|
284,294 |
|
|
|
|
|
|
|
252,507 |
|
|
|
|
|
|
|
|
|
|
|
284,294 |
|
|
|
|
|
|
|
285,472 |
|
|
|
|
|
|
|
296,251 |
|
|
|
|
|
|
|
266,489 |
|
|
|
|
|
|
|
252,507 |
|
|
|
|
|
| Total deposits |
|
|
255,580 |
|
|
|
|
|
|
|
226,572 |
|
|
|
|
|
|
|
|
|
|
|
255,580 |
|
|
|
|
|
|
|
256,526 |
|
|
|
|
|
|
|
257,982 |
|
|
|
|
|
|
|
240,381 |
|
|
|
|
|
|
|
226,572 |
|
|
|
|
|
| (1) |
Fully taxable-equivalent basis |
| (2) |
Return on average economic capital is calculated as net income, excluding cost of funds and earnings credit on intangibles, divided by average economic capital.
|
| (3) |
Total earning assets and total assets include asset allocations to match liabilities (i.e., deposits). |
| (4) |
Economic capital represents allocated equity less goodwill and a percentage of intangible assets. |
Certain prior period amounts have been reclassified among the segments to conform to current period presentation.
|
|
|
| This information is preliminary and based on company data available at the time of the presentation. |
|
29 |
Bank of America Corporation and Subsidiaries
Global Wealth & Investment Management - Key Indicators and Metrics
(Dollars in millions, except as noted)
|
|
|
|
|
|
|
|
|
|
|
|
|
|
|
|
|
|
|
|
|
|
|
|
|
|
|
|
|
|
|
|
|
| |
|
Six Months Ended
June 30 |
|
|
|
|
|
|
Second
Quarter
2011
|
|
|
First
Quarter
2011 |
|
|
Fourth
Quarter
2010 |
|
|
Third
Quarter
2010 |
|
|
Second
Quarter
2010 |
|
| |
|
2011 |
|
|
2010 |
|
|
|
|
|
|
|
|
|
|
| Revenues |
|
|
|
|
|
|
|
|
|
|
|
|
|
|
|
|
|
|
|
|
|
|
|
|
|
|
|
|
|
|
|
|
| Merrill Lynch Global Wealth Management |
|
$ |
7,034 |
|
|
$ |
6,126 |
|
|
|
|
|
|
$ |
3,494 |
|
|
$ |
3,540 |
|
|
$ |
3,428 |
|
|
$ |
3,177 |
|
|
$ |
3,138 |
|
| U.S. Trust |
|
|
1,407 |
|
|
|
1,323 |
|
|
|
|
|
|
|
711 |
|
|
|
696 |
|
|
|
708 |
|
|
|
691 |
|
|
|
682 |
|
| Retirement Services |
|
|
545 |
|
|
|
483 |
|
|
|
|
|
|
|
273 |
|
|
|
272 |
|
|
|
226 |
|
|
|
242 |
|
|
|
244 |
|
| Other (1) |
|
|
(4 |
) |
|
|
298 |
|
|
|
|
|
|
|
12 |
|
|
|
(16 |
) |
|
|
(201 |
) |
|
|
(212 |
) |
|
|
125 |
|
|
|
|
|
|
|
|
|
|
|
|
|
|
|
|
|
|
|
|
|
|
|
|
|
|
|
|
|
|
|
|
|
|
| Total revenues |
|
$ |
8,982 |
|
|
$ |
8,230 |
|
|
|
|
|
|
$ |
4,490 |
|
|
$ |
4,492 |
|
|
$ |
4,161 |
|
|
$ |
3,898 |
|
|
$ |
4,189 |
|
|
|
|
|
|
|
|
|
|
|
|
|
|
|
|
|
|
|
|
|
|
|
|
|
|
|
|
|
|
|
|
|
|
|
|
|
|
|
|
|
|
|
|
| Client Balances |
|
|
|
|
|
|
|
|
|
|
|
|
|
|
|
|
|
|
|
|
|
|
|
|
|
|
|
|
|
|
|
|
|
|
|
|
|
|
|
|
|
|
| Client Balances by Business |
|
|
|
|
|
|
|
|
|
|
|
|
|
|
|
|
|
|
|
|
|
|
|
|
|
|
|
|
|
|
|
|
| Merrill Lynch Global Wealth Management |
|
$ |
1,539,798 |
|
|
$ |
1,402,547 |
|
|
|
|
|
|
$ |
1,539,798 |
|
|
$ |
1,554,294 |
|
|
$ |
1,515,896 |
|
|
$ |
1,466,346 |
|
|
$ |
1,402,547 |
|
| U.S. Trust |
|
|
341,911 |
|
|
|
327,342 |
|
|
|
|
|
|
|
341,911 |
|
|
|
345,092 |
|
|
|
340,341 |
|
|
|
334,150 |
|
|
|
327,342 |
|
| Retirement Services |
|
|
252,379 |
|
|
|
224,930 |
|
|
|
|
|
|
|
252,379 |
|
|
|
255,573 |
|
|
|
246,774 |
|
|
|
234,249 |
|
|
|
224,930 |
|
| Other (1, 2) |
|
|
67,875 |
|
|
|
92,227 |
|
|
|
|
|
|
|
67,875 |
|
|
|
71,759 |
|
|
|
78,275 |
|
|
|
86,199 |
|
|
|
92,227 |
|
|
|
|
|
|
|
|
|
|
|
| Client Balances by Type |
|
|
|
|
|
|
|
|
|
|
|
|
|
|
|
|
|
|
|
|
|
|
|
|
|
|
|
|
|
|
|
|
| Assets under management (2) |
|
$ |
660,928 |
|
|
$ |
591,872 |
|
|
|
|
|
|
$ |
660,928 |
|
|
$ |
664,466 |
|
|
$ |
630,498 |
|
|
$ |
611,461 |
|
|
$ |
591,872 |
|
| Client brokerage assets |
|
|
1,066,078 |
|
|
|
1,010,751 |
|
|
|
|
|
|
|
1,066,078 |
|
|
|
1,087,624 |
|
|
|
1,077,049 |
|
|
|
1,055,384 |
|
|
|
1,010,751 |
|
| Assets in custody |
|
|
116,499 |
|
|
|
118,694 |
|
|
|
|
|
|
|
116,499 |
|
|
|
116,816 |
|
|
|
115,033 |
|
|
|
114,207 |
|
|
|
118,694 |
|
| Client deposits |
|
|
255,580 |
|
|
|
226,572 |
|
|
|
|
|
|
|
255,580 |
|
|
|
256,526 |
|
|
|
257,982 |
|
|
|
240,381 |
|
|
|
226,572 |
|
| Loans and leases |
|
|
102,878 |
|
|
|
99,157 |
|
|
|
|
|
|
|
102,878 |
|
|
|
101,286 |
|
|
|
100,724 |
|
|
|
99,511 |
|
|
|
99,157 |
|
|
|
|
|
|
|
|
|
|
|
|
|
|
|
|
|
|
|
|
|
|
|
|
|
|
|
|
|
|
|
|
|
|
| Total client balances |
|
$ |
2,201,963 |
|
|
$ |
2,047,046 |
|
|
|
|
|
|
$ |
2,201,963 |
|
|
$ |
2,226,718 |
|
|
$ |
2,181,286 |
|
|
$ |
2,120,944 |
|
|
$ |
2,047,046 |
|
|
|
|
|
|
|
|
|
|
|
|
|
|
|
|
|
|
|
|
|
|
|
|
|
|
|
|
|
|
|
|
|
|
|
|
|
|
|
|
|
|
|
|
| Assets Under Management Flows
(2) |
|
|
|
|
|
|
|
|
|
|
|
|
|
|
|
|
|
|
|
|
|
|
|
|
|
|
|
|
|
|
|
|
| Liquidity assets under management (3) |
|
$ |
(10,430 |
) |
|
$ |
(27,066 |
) |
|
|
|
|
|
$ |
(3,771 |
) |
|
$ |
(6,659 |
) |
|
$ |
(8,050 |
) |
|
$ |
(6,599 |
) |
|
$ |
(9,788 |
) |
| Long-term assets under management (4) |
|
|
18,694 |
|
|
|
4,401 |
|
|
|
|
|
|
|
4,535 |
|
|
|
14,159 |
|
|
|
5,648 |
|
|
|
4,032 |
|
|
|
1,366 |
|
|
|
|
|
|
|
|
|
|
|
|
|
|
|
|
|
|
|
|
|
|
|
|
|
|
|
|
|
|
|
|
|
|
| Total assets under management flows |
|
$ |
8,264 |
|
|
$ |
(22,665 |
) |
|
|
|
|
|
$ |
764 |
|
|
$ |
7,500 |
|
|
$ |
(2,402 |
) |
|
$ |
(2,567 |
) |
|
$ |
(8,422 |
) |
|
|
|
|
|
|
|
|
|
|
|
|
|
|
|
|
|
|
|
|
|
|
|
|
|
|
|
|
|
|
|
|
|
|
|
|
|
|
|
|
|
|
|
| Associates (5) |
|
|
|
|
|
|
|
|
|
|
|
|
|
|
|
|
|
|
|
|
|
|
|
|
|
|
|
|
|
|
|
|
|
|
|
|
|
|
|
|
|
|
| Number of Financial Advisors |
|
|
16,241 |
|
|
|
15,299 |
|
|
|
|
|
|
|
16,241 |
|
|
|
15,695 |
|
|
|
15,511 |
|
|
|
15,486 |
|
|
|
15,299 |
|
|
|
|
|
|
|
|
|
|
|
| Total Wealth Advisors |
|
|
17,817 |
|
|
|
16,781 |
|
|
|
|
|
|
|
17,817 |
|
|
|
17,201 |
|
|
|
17,025 |
|
|
|
16,983 |
|
|
|
16,781 |
|
|
|
|
|
|
|
|
|
|
|
| Total Client Facing Professionals |
|
|
20,876 |
|
|
|
19,744 |
|
|
|
|
|
|
|
20,876 |
|
|
|
20,273 |
|
|
|
20,068 |
|
|
|
20,013 |
|
|
|
19,744 |
|
|
|
|
|
|
|
|
|
|
|
| Merrill Lynch Global Wealth Management Metrics |
|
|
|
|
|
|
|
|
|
|
|
|
|
|
|
|
|
|
|
|
|
|
|
|
|
|
|
|
|
|
|
|
|
|
|
|
|
|
|
|
|
|
| Financial Advisor Productivity (6) (in
thousands) |
|
$ |
912 |
|
|
$ |
826 |
|
|
|
|
|
|
$ |
894 |
|
|
$ |
931 |
|
|
$ |
913 |
|
|
$ |
846 |
|
|
$ |
843 |
|
|
|
|
|
|
|
|
|
|
|
| U.S. Trust Metrics |
|
|
|
|
|
|
|
|
|
|
|
|
|
|
|
|
|
|
|
|
|
|
|
|
|
|
|
|
|
|
|
|
|
|
|
|
|
|
|
|
|
|
| Client Facing Professionals |
|
|
2,280 |
|
|
|
2,277 |
|
|
|
|
|
|
|
2,280 |
|
|
|
2,313 |
|
|
|
2,311 |
|
|
|
2,302 |
|
|
|
2,277 |
|
| (1) |
Other includes the results of BofA Global Capital Management (the former Columbia cash management business) and residual net interest income.
|
| (2) |
Includes the Columbia Management long-term asset management business through the date of sale on May 1, 2010. |
| (3) |
Assets under advisory and discretion of GWIM in which the investment strategy seeks a high level of income while maintaining liquidity and capital preservation. The
duration of these strategies are less than one year. |
| (4) |
Assets under advisory and discretion of GWIM in which the duration of the investment strategy is longer than one year. |
| (5) |
Includes Merrill Edge ® |
| (6) |
Financial Advisor Productivity is defined as annualized MLGWM total revenue divided by the total number of financial advisors (excluding Merrill Edge Financial
Advisors). |
Certain prior period amounts have been reclassified among the segments to conform to current period
presentation.
|
|
|
| This information is preliminary and based on company data available at the time of the presentation. |
|
30 |
Bank of America Corporation and Subsidiaries
All Other Results
(1)
(Dollars in millions)
|
|
|
|
|
|
|
|
|
|
|
|
|
|
|
|
|
|
|
|
|
|
|
|
|
|
|
|
|
|
|
|
|
| |
|
Six Months Ended
June 30 |
|
|
|
|
|
|
Second
Quarter
2011
|
|
|
First
Quarter
2011 |
|
|
Fourth
Quarter
2010 |
|
|
Third
Quarter
2010 |
|
|
Second
Quarter
2010 |
|
| |
|
2011 |
|
|
2010 |
|
|
|
|
|
|
|
|
|
|
| Net interest income (2) |
|
$ |
(74 |
) |
|
$ |
118 |
|
|
|
|
|
|
$ |
(167 |
) |
|
$ |
93 |
|
|
$ |
76 |
|
|
$ |
(39 |
) |
|
$ |
77 |
|
| Noninterest income: |
|
|
|
|
|
|
|
|
|
|
|
|
|
|
|
|
|
|
|
|
|
|
|
|
|
|
|
|
|
|
|
|
| Equity investment income |
|
|
2,547 |
|
|
|
2,765 |
|
|
|
|
|
|
|
1,139 |
|
|
|
1,408 |
|
|
|
1,501 |
|
|
|
267 |
|
|
|
2,253 |
|
| Gains on sales of debt securities |
|
|
1,299 |
|
|
|
662 |
|
|
|
|
|
|
|
831 |
|
|
|
468 |
|
|
|
858 |
|
|
|
794 |
|
|
|
14 |
|
| All other income (loss) |
|
|
(780 |
) |
|
|
905 |
|
|
|
|
|
|
|
62 |
|
|
|
(842 |
) |
|
|
(1,760 |
) |
|
|
(275 |
) |
|
|
783 |
|
|
|
|
|
|
|
|
|
|
|
|
|
|
|
|
|
|
|
|
|
|
|
|
|
|
|
|
|
|
|
|
|
|
| Total noninterest income |
|
|
3,066 |
|
|
|
4,332 |
|
|
|
|
|
|
|
2,032 |
|
|
|
1,034 |
|
|
|
599 |
|
|
|
786 |
|
|
|
3,050 |
|
|
|
|
|
|
|
|
|
|
|
|
|
|
|
|
|
|
|
|
|
|
|
|
|
|
|
|
|
|
|
|
|
|
| Total revenue, net of interest expense |
|
|
2,992 |
|
|
|
4,450 |
|
|
|
|
|
|
|
1,865 |
|
|
|
1,127 |
|
|
|
675 |
|
|
|
747 |
|
|
|
3,127 |
|
|
|
|
|
|
|
|
|
|
|
| Provision for credit losses |
|
|
3,462 |
|
|
|
2,466 |
|
|
|
|
|
|
|
1,663 |
|
|
|
1,799 |
|
|
|
1,839 |
|
|
|
329 |
|
|
|
1,246 |
|
| Merger and restructuring charges |
|
|
361 |
|
|
|
1,029 |
|
|
|
|
|
|
|
159 |
|
|
|
202 |
|
|
|
370 |
|
|
|
421 |
|
|
|
508 |
|
| All other noninterest expense |
|
|
1,449 |
|
|
|
1,814 |
|
|
|
|
|
|
|
157 |
|
|
|
1,292 |
|
|
|
516 |
|
|
|
143 |
|
|
|
605 |
|
|
|
|
|
|
|
|
|
|
|
|
|
|
|
|
|
|
|
|
|
|
|
|
|
|
|
|
|
|
|
|
|
|
| Income (loss) before income taxes |
|
|
(2,280 |
) |
|
|
(859 |
) |
|
|
|
|
|
|
(114 |
) |
|
|
(2,166 |
) |
|
|
(2,050 |
) |
|
|
(146 |
) |
|
|
768 |
|
| Income tax expense (benefit) (2) |
|
|
(848 |
) |
|
|
(1,192 |
) |
|
|
|
|
|
|
102 |
|
|
|
(950 |
) |
|
|
(2,410 |
) |
|
|
(515 |
) |
|
|
(355 |
) |
|
|
|
|
|
|
|
|
|
|
|
|
|
|
|
|
|
|
|
|
|
|
|
|
|
|
|
|
|
|
|
|
|
| Net income (loss) |
|
$ |
(1,432 |
) |
|
$ |
333 |
|
|
|
|
|
|
$ |
(216 |
) |
|
$ |
(1,216 |
) |
|
$ |
360 |
|
|
$ |
369 |
|
|
$ |
1,123 |
|
|
|
|
|
|
|
|
|
|
|
|
|
|
|
|
|
|
|
|
|
|
|
|
|
|
|
|
|
|
|
|
|
|
|
|
|
|
|
|
|
|
|
|
|
|
|
|
|
|
|
|
|
|
|
|
|
|
|
|
|
|
|
|
|
|
|
|
|
|
|
|
|
|
|
|
|
| Balance sheet |
|
|
|
|
|
|
|
|
|
|
|
|
|
|
|
|
|
|
|
|
|
|
|
|
|
|
|
|
|
|
|
|
|
|
|
|
|
|
|
|
|
|
| Average |
|
|
|
|
|
|
|
|
|
|
|
|
|
|
|
|
|
|
|
|
|
|
|
|
|
|
|
|
|
|
|
|
| Total loans and leases |
|
$ |
258,374 |
|
|
$ |
256,742 |
|
|
|
|
|
|
$ |
258,397 |
|
|
$ |
258,350 |
|
|
$ |
252,180 |
|
|
$ |
238,442 |
|
|
$ |
257,322 |
|
| Total assets (3) |
|
|
183,289 |
|
|
|
300,395 |
|
|
|
|
|
|
|
167,364 |
|
|
|
199,391 |
|
|
|
196,487 |
|
|
|
206,559 |
|
|
|
291,530 |
|
| Total deposits |
|
|
47,642 |
|
|
|
67,770 |
|
|
|
|
|
|
|
46,684 |
|
|
|
48,608 |
|
|
|
44,841 |
|
|
|
44,871 |
|
|
|
64,709 |
|
| Allocated equity (4) |
|
|
67,030 |
|
|
|
24,475 |
|
|
|
|
|
|
|
73,244 |
|
|
|
60,748 |
|
|
|
50,731 |
|
|
|
35,972 |
|
|
|
29,091 |
|
|
|
|
|
|
|
|
|
|
|
| Period end |
|
|
|
|
|
|
|
|
|
|
|
|
|
|
|
|
|
|
|
|
|
|
|
|
|
|
|
|
|
|
|
|
| Total loans and leases |
|
$ |
259,285 |
|
|
$ |
254,516 |
|
|
|
|
|
|
$ |
259,285 |
|
|
$ |
256,931 |
|
|
$ |
255,212 |
|
|
$ |
241,798 |
|
|
$ |
254,516 |
|
| Total assets (5) |
|
|
209,210 |
|
|
|
243,099 |
|
|
|
|
|
|
|
209,210 |
|
|
|
155,855 |
|
|
|
176,400 |
|
|
|
193,893 |
|
|
|
243,099 |
|
| Total deposits |
|
|
42,355 |
|
|
|
57,424 |
|
|
|
|
|
|
|
42,355 |
|
|
|
34,818 |
|
|
|
38,748 |
|
|
|
37,652 |
|
|
|
57,424 |
|
| (1) |
All Other consists of two broad groupings, Equity Investments and Other. Equity Investments includes Global Principal Investments, Strategic and other investments,
and Corporate Investments. BlackRock, Inc., previously included in Strategic and other investments, was sold during 2011. Substantially all of the equity investments in Corporate Investments were sold during 2010. Other includes liquidating
businesses, merger and restructuring charges, ALM functions (i.e., residential mortgage portfolio and investment securities) and related activities (i.e., economic hedges, fair value option on structured liabilities), and the impact of certain
allocation methodologies. Other also includes certain residential mortgage and discontinued real estate products that are managed by Legacy Asset Servicing within Consumer Real Estate Services). |
| (2) |
Fully taxable-equivalent basis |
| (3) |
Includes elimination of segments’ excess asset allocations to match liabilities (i.e., deposits) of $672.3 billion and $600.1 billion for the six months ended
June 30, 2011 and 2010; $676.7 billion, $667.9 billion, $660.7 billion, $633.8 billion and $611.2 billion for the second and first quarters of 2011, and the fourth, third and second quarters of 2010, respectively. |
| (4) |
Represents both the risk-based capital and the portion of goodwill and intangibles assigned to All Other as well as the remaining portion of equity not specifically
allocated to the segments. |
| (5) |
Includes elimination of segments’ excess asset allocations to match liabilities (i.e., deposits) of $629.6 billion, $661.1 billion, $647.3 billion, $621.1
billion and $603.5 billion at June 30, 2011, March 31, 2011, December 31, 2010, September 30, 2010 and June 30, 2010, respectively. |
Certain prior period amounts have been reclassified among the segments to conform to current period presentation.
|
|
|
| This information is preliminary and based on company data available at the time of the presentation. |
|
31 |
Bank of America Corporation and Subsidiaries
Equity Investments
(Dollars in millions)
|
|
|
|
|
|
|
|
|
|
|
|
|
|
|
|
|
|
|
|
|
|
|
|
|
| |
|
Global Principal Investments Exposures |
|
|
Equity
Investment
Income |
|
| |
|
June 30, 2011 |
|
|
March 31,
2011 |
|
|
June 30, 2011 |
|
| |
|
Book
Value |
|
|
Unfunded
Commitments |
|
|
Total |
|
|
Total |
|
|
Three Months
Ended |
|
|
Six Months
Ended |
|
| |
|
|
|
|
|
|
|
|
|
| Global Principal Investments: |
|
|
|
|
|
|
|
|
|
|
|
|
|
|
|
|
|
|
|
|
|
|
|
|
| Private Equity Investments |
|
$ |
5,021 |
|
|
$ |
133 |
|
|
$ |
5,154 |
|
|
$ |
5,194 |
|
|
$ |
210 |
|
|
$ |
1,413 |
|
| Global Real Estate |
|
|
1,505 |
|
|
|
214 |
|
|
|
1,719 |
|
|
|
1,704 |
|
|
|
42 |
|
|
|
116 |
|
| Global Strategic Capital |
|
|
2,522 |
|
|
|
406 |
|
|
|
2,928 |
|
|
|
2,933 |
|
|
|
182 |
|
|
|
275 |
|
| Legacy/Other Investments |
|
|
1,757 |
|
|
|
369 |
|
|
|
2,126 |
|
|
|
2,656 |
|
|
|
(35 |
) |
|
|
(40 |
) |
|
|
|
|
|
|
|
|
|
|
|
|
|
|
|
|
|
|
|
|
|
|
|
|
|
| Total Global Principal Investments |
|
$ |
10,805 |
|
|
$ |
1,122 |
|
|
$ |
11,927 |
|
|
$ |
12,487 |
|
|
$ |
399 |
|
|
$ |
1,764 |
|
|
|
|
|
|
|
|
|
|
|
|
|
|
|
|
|
|
|
|
|
|
|
|
|
|
Components of Equity Investment Income
(Dollars in millions)
|
|
|
|
|
|
|
|
|
|
|
|
|
|
|
|
|
|
|
|
|
|
|
|
|
|
|
|
|
|
|
|
|
| |
|
Six Months Ended
June
30 |
|
|
|
|
|
|
Second Quarter |
|
|
First Quarter |
|
|
Fourth Quarter |
|
|
Third Quarter |
|
|
Second Quarter |
|
| |
|
2011 |
|
|
2010 |
|
|
|
|
|
|
2011 |
|
|
2011 |
|
|
2010 |
|
|
2010 |
|
|
2010 |
|
| Global Principal Investments |
|
$ |
1,764 |
|
|
$ |
1,391 |
|
|
|
|
|
|
$ |
399 |
|
|
$ |
1,365 |
|
|
$ |
867 |
|
|
$ |
46 |
|
|
$ |
814 |
|
| Corporate Investments |
|
|
— |
|
|
|
(305 |
) |
|
|
|
|
|
|
— |
|
|
|
— |
|
|
|
6 |
|
|
|
6 |
|
|
|
6 |
|
| Strategic and other investments (1) |
|
|
783 |
|
|
|
1,679 |
|
|
|
|
|
|
|
740 |
|
|
|
43 |
|
|
|
628 |
|
|
|
215 |
|
|
|
1,433 |
|
|
|
|
|
|
|
|
|
|
|
|
|
|
|
|
|
|
|
|
|
|
|
|
|
|
|
|
|
|
|
|
|
|
| Total equity investment income included in All Other |
|
|
2,547 |
|
|
|
2,765 |
|
|
|
|
|
|
|
1,139 |
|
|
|
1,408 |
|
|
|
1,501 |
|
|
|
267 |
|
|
|
2,253 |
|
| Total equity investment income included in the business segments |
|
|
140 |
|
|
|
626 |
|
|
|
|
|
|
|
73 |
|
|
|
67 |
|
|
|
11 |
|
|
|
90 |
|
|
|
513 |
|
|
|
|
|
|
|
|
|
|
|
|
|
|
|
|
|
|
|
|
|
|
|
|
|
|
|
|
|
|
|
|
|
|
| Total consolidated equity investment income |
|
$ |
2,687 |
|
|
$ |
3,391 |
|
|
|
|
|
|
$ |
1,212 |
|
|
$ |
1,475 |
|
|
$ |
1,512 |
|
|
$ |
357 |
|
|
$ |
2,766 |
|
|
|
|
|
|
|
|
|
|
|
|
|
|
|
|
|
|
|
|
|
|
|
|
|
|
|
|
|
|
|
|
|
|
| (1) |
Includes the Corporation’s equity investment interest in BlackRock prior to its sale in the second quarter of 2011. |
Certain prior period amounts have been reclassified among the segments to conform to current period presentation.
|
|
|
| This information is preliminary and based on company data available at the time of the presentation. |
|
32 |
Bank of America Corporation and Subsidiaries
Outstanding Loans and Leases
(Dollars in millions)
|
|
|
|
|
|
|
|
|
|
|
|
|
| |
|
June 30
2011 |
|
|
March 31
2011 |
|
|
Increase
(Decrease) |
|
| Consumer |
|
|
|
|
|
|
|
|
|
|
|
|
| Residential mortgage (1) |
|
$ |
266,333 |
|
|
$ |
261,934 |
|
|
$ |
4,399 |
|
| Home equity |
|
|
130,654 |
|
|
|
133,629 |
|
|
|
(2,975 |
) |
| Discontinued real estate (2) |
|
|
12,003 |
|
|
|
12,694 |
|
|
|
(691 |
) |
| U.S. credit card |
|
|
104,659 |
|
|
|
107,107 |
|
|
|
(2,448 |
) |
| Non-U.S. credit card |
|
|
26,037 |
|
|
|
27,235 |
|
|
|
(1,198 |
) |
| Direct/Indirect consumer (3) |
|
|
90,258 |
|
|
|
89,444 |
|
|
|
814 |
|
| Other consumer (4) |
|
|
2,762 |
|
|
|
2,754 |
|
|
|
8 |
|
|
|
|
|
|
|
|
|
|
|
|
|
|
| Total consumer loans excluding loans measured at fair value |
|
|
632,706 |
|
|
|
634,797 |
|
|
|
(2,091 |
) |
| Consumer loans measured at fair value
(5) |
|
|
5,194 |
|
|
|
— |
|
|
|
5,194 |
|
|
|
|
|
|
|
|
|
|
|
|
|
|
| Total consumer |
|
|
637,900 |
|
|
|
634,797 |
|
|
|
3,103 |
|
|
|
|
|
|
|
|
|
|
|
|
|
|
|
|
|
|
|
|
|
|
|
|
|
|
|
| Commercial |
|
|
|
|
|
|
|
|
|
|
|
|
| U.S. commercial (6) |
|
|
190,606 |
|
|
|
188,449 |
|
|
|
2,157 |
|
| Commercial real estate (7) |
|
|
44,028 |
|
|
|
47,008 |
|
|
|
(2,980 |
) |
| Commercial lease financing |
|
|
21,391 |
|
|
|
21,563 |
|
|
|
(172 |
) |
| Non-U.S. commercial |
|
|
42,929 |
|
|
|
36,921 |
|
|
|
6,008 |
|
|
|
|
|
|
|
|
|
|
|
|
|
|
| Total commercial loans excluding loans measured at fair value |
|
|
298,954 |
|
|
|
293,941 |
|
|
|
5,013 |
|
| Commercial loans measured at fair value
(5) |
|
|
4,403 |
|
|
|
3,687 |
|
|
|
716 |
|
|
|
|
|
|
|
|
|
|
|
|
|
|
| Total commercial |
|
|
303,357 |
|
|
|
297,628 |
|
|
|
5,729 |
|
|
|
|
|
|
|
|
|
|
|
|
|
|
| Total loans and leases |
|
$ |
941,257 |
|
|
$ |
932,425 |
|
|
$ |
8,832 |
|
|
|
|
|
|
|
|
|
|
|
|
|
|
| (1) |
Includes non-U.S. residential mortgages of $90 million and $92 million at June 30, 2011 and March 31, 2011. |
| (2) |
Includes $10.7 billion and $11.4 billion of pay option loans, and $1.3 billion and $1.3 billion of subprime loans at June 30, 2011 and March 31, 2011. The
Corporation no longer originates these products. |
| (3) |
Includes dealer financial services loans of $42.1 billion and $41.5 billion, consumer lending of $9.9 billion and $11.1 billion, U.S. securities-based lending margin
loans of $21.3 billion and $19.7 billion, student loans of $6.3 billion and $6.6 billion, non-U.S. consumer loans of $8.7 billion and $8.5 billion, and other consumer loans of $2.0 billion and $2.1 billion at June 30, 2011 and March 31,
2011. |
| (4) |
Includes consumer finance loans of $1.8 billion and $1.9 billion, other non-U.S. consumer loans of $866 million and $818 million, and consumer overdrafts of $104
million and $69 million at June 30, 2011 and March 31, 2011. |
| (5) |
Certain consumer loans are accounted for under the fair value option and include residential mortgages of $1.2 billion and discontinued real estate of $4.0 billion
at June 30, 2011. Certain commercial loans are accounted for under the fair value option and include U.S. commercial loans of $1.6 billion and $1.4 billion, non-U.S. commercial loans of $2.8 billion and $2.3 billion, and commercial real estate
loans of $11 million and $68 million at June 30, 2011 and March 31, 2011. |
| (6) |
Includes U.S. small business commercial loans, including card related products, of $13.9 billion and $14.3 billion at June 30, 2011 and March 31, 2011.
|
| (7) |
Includes U.S. commercial real estate loans of $41.7 billion and $44.6 billion, and non-U.S. commercial real estate loans of $2.3 billion and $2.4 billion at
June 30, 2011 and March 31, 2011. |
Certain prior period amounts have been reclassified to conform to current
period presentation.
|
|
|
| This information is preliminary and based on company data available at the time of the presentation. |
|
33 |
Bank of America Corporation and Subsidiaries
Quarterly Average Loans and Leases by Business Segment
(Dollars in millions)
|
|
|
|
|
|
|
|
|
|
|
|
|
|
|
|
|
|
|
|
|
|
|
|
|
|
|
|
|
|
|
|
|
|
|
| |
|
Second Quarter 2011 |
|
| |
|
Total
Corporation |
|
|
|
|
Deposits |
|
|
Global
Card
Services |
|
|
Consumer
Real Estate
Services |
|
|
Global
Commercial
Banking |
|
|
Global
Banking &
Markets |
|
|
GWIM |
|
|
All Other |
|
| Consumer |
|
|
|
|
|
|
|
|
|
|
|
|
|
|
|
|
|
|
|
|
|
|
|
|
|
|
|
|
|
|
|
|
|
|
| Residential mortgage |
|
$ |
265,420 |
|
|
|
|
$ |
— |
|
|
$ |
— |
|
|
$ |
1,167 |
|
|
$ |
263 |
|
|
$ |
101 |
|
|
$ |
36,367 |
|
|
$ |
227,522 |
|
| Home equity |
|
|
131,786 |
|
|
|
|
|
— |
|
|
|
— |
|
|
|
115,250 |
|
|
|
1,033 |
|
|
|
— |
|
|
|
15,248 |
|
|
|
255 |
|
| Discontinued real estate |
|
|
15,997 |
|
|
|
|
|
— |
|
|
|
— |
|
|
|
3,548 |
|
|
|
— |
|
|
|
— |
|
|
|
— |
|
|
|
12,449 |
|
| U.S. credit card |
|
|
106,164 |
|
|
|
|
|
— |
|
|
|
106,164 |
|
|
|
— |
|
|
|
— |
|
|
|
— |
|
|
|
— |
|
|
|
— |
|
| Non-U.S. credit card |
|
|
27,259 |
|
|
|
|
|
— |
|
|
|
27,259 |
|
|
|
— |
|
|
|
— |
|
|
|
— |
|
|
|
— |
|
|
|
— |
|
| Direct/Indirect consumer |
|
|
89,403 |
|
|
|
|
|
52 |
|
|
|
10,932 |
|
|
|
94 |
|
|
|
41,078 |
|
|
|
561 |
|
|
|
30,231 |
|
|
|
6,455 |
|
| Other consumer |
|
|
2,745 |
|
|
|
|
|
414 |
|
|
|
835 |
|
|
|
— |
|
|
|
— |
|
|
|
5 |
|
|
|
17 |
|
|
|
1,474 |
|
|
|
|
|
|
|
|
|
|
|
|
|
|
|
|
|
|
|
|
|
|
|
|
|
|
|
|
|
|
|
|
|
|
|
|
| Total consumer |
|
|
638,774 |
|
|
|
|
|
466 |
|
|
|
145,190 |
|
|
|
120,059 |
|
|
|
42,374 |
|
|
|
667 |
|
|
|
81,863 |
|
|
|
248,155 |
|
|
|
|
|
|
|
|
|
|
|
| Commercial |
|
|
|
|
|
|
|
|
|
|
|
|
|
|
|
|
|
|
|
|
|
|
|
|
|
|
|
|
|
|
|
|
|
|
| U.S. commercial |
|
|
190,479 |
|
|
|
|
|
157 |
|
|
|
10,421 |
|
|
|
1,619 |
|
|
|
104,829 |
|
|
|
45,755 |
|
|
|
18,322 |
|
|
|
9,376 |
|
| Commercial real estate |
|
|
45,762 |
|
|
|
|
|
3 |
|
|
|
277 |
|
|
|
5 |
|
|
|
40,597 |
|
|
|
908 |
|
|
|
1,792 |
|
|
|
2,180 |
|
| Commercial lease financing |
|
|
21,284 |
|
|
|
|
|
— |
|
|
|
— |
|
|
|
— |
|
|
|
— |
|
|
|
23,042 |
|
|
|
34 |
|
|
|
(1,792 |
) |
| Non-U.S. commercial |
|
|
42,214 |
|
|
|
|
|
— |
|
|
|
900 |
|
|
|
— |
|
|
|
1,546 |
|
|
|
39,101 |
|
|
|
189 |
|
|
|
478 |
|
|
|
|
|
|
|
|
|
|
|
|
|
|
|
|
|
|
|
|
|
|
|
|
|
|
|
|
|
|
|
|
|
|
|
|
| Total commercial |
|
|
299,739 |
|
|
|
|
|
160 |
|
|
|
11,598 |
|
|
|
1,624 |
|
|
|
146,972 |
|
|
|
108,806 |
|
|
|
20,337 |
|
|
|
10,242 |
|
|
|
|
|
|
|
|
|
|
|
|
|
|
|
|
|
|
|
|
|
|
|
|
|
|
|
|
|
|
|
|
|
|
|
|
| Total loans and leases |
|
$ |
938,513 |
|
|
|
|
$ |
626 |
|
|
$ |
156,788 |
|
|
$ |
121,683 |
|
|
$ |
189,346 |
|
|
$ |
109,473 |
|
|
$ |
102,200 |
|
|
$ |
258,397 |
|
|
|
|
|
|
|
|
|
|
|
|
|
|
|
|
|
|
|
|
|
|
|
|
|
|
|
|
|
|
|
|
|
|
|
|
|
|
| |
|
First Quarter 2011 |
|
| |
|
Total
Corporation |
|
|
|
|
Deposits |
|
|
Global
Card
Services |
|
|
Consumer
Real Estate
Services |
|
|
Global
Commercial
Banking |
|
|
Global
Banking &
Markets |
|
|
GWIM |
|
|
All Other |
|
| Consumer |
|
|
|
|
|
|
|
|
|
|
|
|
|
|
|
|
|
|
|
|
|
|
|
|
|
|
|
|
|
|
|
|
|
|
| Residential mortgage |
|
$ |
262,049 |
|
|
|
|
$ |
— |
|
|
$ |
— |
|
|
$ |
— |
|
|
$ |
283 |
|
|
$ |
99 |
|
|
$ |
35,752 |
|
|
$ |
225,915 |
|
| Home equity |
|
|
136,089 |
|
|
|
|
|
— |
|
|
|
— |
|
|
|
119,123 |
|
|
|
1,013 |
|
|
|
— |
|
|
|
15,686 |
|
|
|
267 |
|
| Discontinued real estate |
|
|
12,899 |
|
|
|
|
|
— |
|
|
|
— |
|
|
|
— |
|
|
|
— |
|
|
|
— |
|
|
|
— |
|
|
|
12,899 |
|
| U.S. credit card |
|
|
109,941 |
|
|
|
|
|
— |
|
|
|
109,941 |
|
|
|
— |
|
|
|
— |
|
|
|
— |
|
|
|
— |
|
|
|
— |
|
| Non-U.S. credit card |
|
|
27,633 |
|
|
|
|
|
— |
|
|
|
27,633 |
|
|
|
— |
|
|
|
— |
|
|
|
— |
|
|
|
— |
|
|
|
— |
|
| Direct/Indirect consumer |
|
|
90,097 |
|
|
|
|
|
56 |
|
|
|
12,284 |
|
|
|
97 |
|
|
|
42,436 |
|
|
|
371 |
|
|
|
28,110 |
|
|
|
6,743 |
|
| Other consumer |
|
|
2,753 |
|
|
|
|
|
383 |
|
|
|
772 |
|
|
|
(16 |
) |
|
|
2 |
|
|
|
5 |
|
|
|
18 |
|
|
|
1,589 |
|
|
|
|
|
|
|
|
|
|
|
|
|
|
|
|
|
|
|
|
|
|
|
|
|
|
|
|
|
|
|
|
|
|
|
|
| Total consumer |
|
|
641,461 |
|
|
|
|
|
439 |
|
|
|
150,630 |
|
|
|
119,204 |
|
|
|
43,734 |
|
|
|
475 |
|
|
|
79,566 |
|
|
|
247,413 |
|
|
|
|
|
|
|
|
|
|
|
| Commercial |
|
|
|
|
|
|
|
|
|
|
|
|
|
|
|
|
|
|
|
|
|
|
|
|
|
|
|
|
|
|
|
|
|
|
| U.S. commercial |
|
|
191,353 |
|
|
|
|
|
198 |
|
|
|
10,521 |
|
|
|
1,349 |
|
|
|
104,703 |
|
|
|
45,511 |
|
|
|
19,355 |
|
|
|
9,716 |
|
| Commercial real estate |
|
|
48,359 |
|
|
|
|
|
2 |
|
|
|
257 |
|
|
|
5 |
|
|
|
42,796 |
|
|
|
934 |
|
|
|
1,731 |
|
|
|
2,634 |
|
| Commercial lease financing |
|
|
21,634 |
|
|
|
|
|
— |
|
|
|
— |
|
|
|
— |
|
|
|
— |
|
|
|
23,478 |
|
|
|
34 |
|
|
|
(1,878 |
) |
| Non-U.S. commercial |
|
|
36,159 |
|
|
|
|
|
— |
|
|
|
1,017 |
|
|
|
2 |
|
|
|
1,204 |
|
|
|
33,306 |
|
|
|
165 |
|
|
|
465 |
|
|
|
|
|
|
|
|
|
|
|
|
|
|
|
|
|
|
|
|
|
|
|
|
|
|
|
|
|
|
|
|
|
|
|
|
| Total commercial |
|
|
297,505 |
|
|
|
|
|
200 |
|
|
|
11,795 |
|
|
|
1,356 |
|
|
|
148,703 |
|
|
|
103,229 |
|
|
|
21,285 |
|
|
|
10,937 |
|
|
|
|
|
|
|
|
|
|
|
|
|
|
|
|
|
|
|
|
|
|
|
|
|
|
|
|
|
|
|
|
|
|
|
|
| Total loans and leases |
|
$ |
938,966 |
|
|
|
|
$ |
639 |
|
|
$ |
162,425 |
|
|
$ |
120,560 |
|
|
$ |
192,437 |
|
|
$ |
103,704 |
|
|
$ |
100,851 |
|
|
$ |
258,350 |
|
|
|
|
|
|
|
|
|
|
|
|
|
|
|
|
|
|
|
|
|
|
|
|
|
|
|
|
|
|
|
|
|
|
|
|
|
|
| |
|
Second Quarter 2010 |
|
| |
|
Total
Corporation |
|
|
|
|
Deposits |
|
|
Global
Card
Services |
|
|
Consumer
Real Estate
Services |
|
|
Global
Commercial
Banking |
|
|
Global
Banking &
Markets |
|
|
GWIM |
|
|
All Other |
|
| Consumer |
|
|
|
|
|
|
|
|
|
|
|
|
|
|
|
|
|
|
|
|
|
|
|
|
|
|
|
|
|
|
|
|
|
|
| Residential mortgage |
|
$ |
247,715 |
|
|
|
|
$ |
— |
|
|
$ |
— |
|
|
$ |
— |
|
|
$ |
304 |
|
|
$ |
513 |
|
|
$ |
35,204 |
|
|
$ |
211,694 |
|
| Home equity |
|
|
148,219 |
|
|
|
|
|
— |
|
|
|
— |
|
|
|
129,010 |
|
|
|
923 |
|
|
|
— |
|
|
|
16,409 |
|
|
|
1,877 |
|
| Discontinued real estate |
|
|
13,972 |
|
|
|
|
|
— |
|
|
|
— |
|
|
|
— |
|
|
|
— |
|
|
|
— |
|
|
|
— |
|
|
|
13,972 |
|
| U.S. credit card |
|
|
118,738 |
|
|
|
|
|
— |
|
|
|
118,738 |
|
|
|
— |
|
|
|
— |
|
|
|
— |
|
|
|
— |
|
|
|
— |
|
| Non-U.S. credit card |
|
|
27,706 |
|
|
|
|
|
— |
|
|
|
27,706 |
|
|
|
— |
|
|
|
— |
|
|
|
— |
|
|
|
— |
|
|
|
— |
|
| Direct/Indirect consumer |
|
|
98,549 |
|
|
|
|
|
69 |
|
|
|
17,159 |
|
|
|
101 |
|
|
|
46,272 |
|
|
|
82 |
|
|
|
24,112 |
|
|
|
10,754 |
|
| Other consumer |
|
|
2,958 |
|
|
|
|
|
326 |
|
|
|
673 |
|
|
|
(210 |
) |
|
|
— |
|
|
|
7 |
|
|
|
19 |
|
|
|
2,143 |
|
|
|
|
|
|
|
|
|
|
|
|
|
|
|
|
|
|
|
|
|
|
|
|
|
|
|
|
|
|
|
|
|
|
|
|
| Total consumer |
|
|
657,857 |
|
|
|
|
|
395 |
|
|
|
164,276 |
|
|
|
128,901 |
|
|
|
47,499 |
|
|
|
602 |
|
|
|
75,744 |
|
|
|
240,440 |
|
|
|
|
|
|
|
|
|
|
|
| Commercial |
|
|
|
|
|
|
|
|
|
|
|
|
|
|
|
|
|
|
|
|
|
|
|
|
|
|
|
|
|
|
|
|
|
|
| U.S. commercial |
|
|
195,144 |
|
|
|
|
|
341 |
|
|
|
11,562 |
|
|
|
1,754 |
|
|
|
104,262 |
|
|
|
44,952 |
|
|
|
20,872 |
|
|
|
11,401 |
|
| Commercial real estate |
|
|
64,218 |
|
|
|
|
|
5 |
|
|
|
193 |
|
|
|
7 |
|
|
|
53,721 |
|
|
|
1,363 |
|
|
|
2,019 |
|
|
|
6,910 |
|
| Commercial lease financing |
|
|
21,271 |
|
|
|
|
|
— |
|
|
|
— |
|
|
|
— |
|
|
|
1 |
|
|
|
23,250 |
|
|
|
30 |
|
|
|
(2,010 |
) |
| Non-U.S. commercial |
|
|
28,564 |
|
|
|
|
|
— |
|
|
|
1,045 |
|
|
|
— |
|
|
|
1,120 |
|
|
|
25,672 |
|
|
|
146 |
|
|
|
581 |
|
|
|
|
|
|
|
|
|
|
|
|
|
|
|
|
|
|
|
|
|
|
|
|
|
|
|
|
|
|
|
|
|
|
|
|
| Total commercial |
|
|
309,197 |
|
|
|
|
|
346 |
|
|
|
12,800 |
|
|
|
1,761 |
|
|
|
159,104 |
|
|
|
95,237 |
|
|
|
23,067 |
|
|
|
16,882 |
|
|
|
|
|
|
|
|
|
|
|
|
|
|
|
|
|
|
|
|
|
|
|
|
|
|
|
|
|
|
|
|
|
|
|
|
| Total loans and leases |
|
$ |
967,054 |
|
|
|
|
$ |
741 |
|
|
$ |
177,076 |
|
|
$ |
130,662 |
|
|
$ |
206,603 |
|
|
$ |
95,839 |
|
|
$ |
98,811 |
|
|
$ |
257,322 |
|
|
|
|
|
|
|
|
|
|
|
|
|
|
|
|
|
|
|
|
|
|
|
|
|
|
|
|
|
|
|
|
|
|
|
|
Certain prior period amounts have been reclassified among the segments to conform to current period presentation.
|
|
|
| This information is preliminary and based on company data available at the time of the presentation. |
|
34 |
Bank of America Corporation and Subsidiaries
Commercial Credit Exposure by Industry (1, 2, 3)
(Dollars in millions)
|
|
|
|
|
|
|
|
|
|
|
|
|
|
|
|
|
|
|
|
|
|
|
|
|
| |
|
Commercial Utilized |
|
|
Total Commercial Committed |
|
| |
|
June 30
2011 |
|
|
March 31
2011 |
|
|
Increase
(Decrease) |
|
|
June 30
2011 |
|
|
March 31
2011 |
|
|
Increase
(Decrease) |
|
| Diversified financials |
|
$ |
51,889 |
|
|
$ |
54,085 |
|
|
$ |
(2,196 |
) |
|
$ |
79,056 |
|
|
$ |
81,676 |
|
|
$ |
(2,620 |
) |
| Real estate (4) |
|
|
53,597 |
|
|
|
56,084 |
|
|
|
(2,487 |
) |
|
|
67,093 |
|
|
|
69,273 |
|
|
|
(2,180 |
) |
| Government and public education |
|
|
42,153 |
|
|
|
42,292 |
|
|
|
(139 |
) |
|
|
58,027 |
|
|
|
58,174 |
|
|
|
(147 |
) |
| Capital goods |
|
|
23,880 |
|
|
|
22,151 |
|
|
|
1,729 |
|
|
|
46,822 |
|
|
|
45,833 |
|
|
|
989 |
|
| Healthcare equipment and services |
|
|
28,757 |
|
|
|
29,227 |
|
|
|
(470 |
) |
|
|
45,608 |
|
|
|
46,124 |
|
|
|
(516 |
) |
| Retailing |
|
|
25,530 |
|
|
|
24,994 |
|
|
|
536 |
|
|
|
45,604 |
|
|
|
44,506 |
|
|
|
1,098 |
|
| Consumer services |
|
|
23,195 |
|
|
|
23,261 |
|
|
|
(66 |
) |
|
|
37,735 |
|
|
|
38,441 |
|
|
|
(706 |
) |
| Materials |
|
|
17,696 |
|
|
|
16,162 |
|
|
|
1,534 |
|
|
|
35,831 |
|
|
|
34,277 |
|
|
|
1,554 |
|
| Banks |
|
|
32,005 |
|
|
|
29,454 |
|
|
|
2,551 |
|
|
|
35,461 |
|
|
|
32,894 |
|
|
|
2,567 |
|
| Commercial services and supplies |
|
|
20,740 |
|
|
|
21,013 |
|
|
|
(273 |
) |
|
|
31,344 |
|
|
|
31,139 |
|
|
|
205 |
|
| Energy |
|
|
12,661 |
|
|
|
10,426 |
|
|
|
2,235 |
|
|
|
29,817 |
|
|
|
27,471 |
|
|
|
2,346 |
|
| Food, beverage and tobacco |
|
|
14,697 |
|
|
|
14,789 |
|
|
|
(92 |
) |
|
|
28,920 |
|
|
|
28,550 |
|
|
|
370 |
|
| Utilities |
|
|
6,407 |
|
|
|
7,355 |
|
|
|
(948 |
) |
|
|
24,697 |
|
|
|
26,325 |
|
|
|
(1,628 |
) |
| Insurance, including monolines |
|
|
16,306 |
|
|
|
16,673 |
|
|
|
(367 |
) |
|
|
23,059 |
|
|
|
23,483 |
|
|
|
(424 |
) |
| Individuals and trusts |
|
|
16,249 |
|
|
|
16,935 |
|
|
|
(686 |
) |
|
|
20,498 |
|
|
|
21,802 |
|
|
|
(1,304 |
) |
| Media |
|
|
10,730 |
|
|
|
10,517 |
|
|
|
213 |
|
|
|
20,461 |
|
|
|
19,944 |
|
|
|
517 |
|
| Transportation |
|
|
11,778 |
|
|
|
11,721 |
|
|
|
57 |
|
|
|
18,129 |
|
|
|
17,894 |
|
|
|
235 |
|
| Pharmaceuticals and biotechnology |
|
|
4,998 |
|
|
|
4,569 |
|
|
|
429 |
|
|
|
12,152 |
|
|
|
12,063 |
|
|
|
89 |
|
| Technology hardware and equipment |
|
|
4,557 |
|
|
|
4,270 |
|
|
|
287 |
|
|
|
11,005 |
|
|
|
10,798 |
|
|
|
207 |
|
| Religious and social organizations |
|
|
8,087 |
|
|
|
8,013 |
|
|
|
74 |
|
|
|
10,319 |
|
|
|
10,384 |
|
|
|
(65 |
) |
| Telecommunication services |
|
|
3,890 |
|
|
|
3,717 |
|
|
|
173 |
|
|
|
10,096 |
|
|
|
9,527 |
|
|
|
569 |
|
| Software and services |
|
|
3,480 |
|
|
|
3,358 |
|
|
|
122 |
|
|
|
8,995 |
|
|
|
8,882 |
|
|
|
113 |
|
| Consumer durables and apparel |
|
|
4,329 |
|
|
|
4,247 |
|
|
|
82 |
|
|
|
8,938 |
|
|
|
8,599 |
|
|
|
339 |
|
| Food and staples retailing |
|
|
3,123 |
|
|
|
3,824 |
|
|
|
(701 |
) |
|
|
6,521 |
|
|
|
6,940 |
|
|
|
(419 |
) |
| Automobiles and components |
|
|
2,466 |
|
|
|
2,256 |
|
|
|
210 |
|
|
|
6,391 |
|
|
|
5,905 |
|
|
|
486 |
|
| Other |
|
|
3,521 |
|
|
|
7,556 |
|
|
|
(4,035 |
) |
|
|
7,191 |
|
|
|
11,122 |
|
|
|
(3,931 |
) |
| Total commercial credit exposure by industry |
|
$ |
446,721 |
|
|
$ |
448,949 |
|
|
$ |
(2,228 |
) |
|
$ |
729,770 |
|
|
$ |
732,026 |
|
|
$ |
(2,256 |
) |
|
|
|
|
|
|
|
| Net credit default protection purchased on total commitments
(5) |
|
|
|
|
|
|
|
|
|
|
|
|
|
$ |
(19,861 |
) |
|
$ |
(19,179 |
) |
|
|
|
|
| (1) |
Includes loans and leases, standby letters of credit and financial guarantees, derivative assets, assets held-for-sale, commercial letters of credit, bankers’
acceptances, securitized assets, foreclosed properties and other collateral acquired. Derivative assets are reported on a mark-to-market basis and have been reduced by the amount of cash collateral applied of $58.8 billion and $57.7 billion at
June 30, 2011 and March 31, 2011. Not reflected in utilized and committed exposure is additional non-cash derivative collateral held of $14.0 billion and $14.9 billion which consists primarily of other marketable securities at
June 30, 2011 and March 31, 2011. |
| (2) |
Total commercial utilized and total commercial committed exposure includes loans and letters of credit measured at fair value and are comprised of loans outstanding
of $4.0 billion and $3.7 billion and issued letters of credit at notional value of $1.2 billion and $1.4 billion at June 30, 2011 and March 31, 2011. In addition, total commercial committed exposure includes unfunded loan commitments at
notional value of $26.8 billion and $27.0 billion at June 30, 2011 and March 31, 2011. |
| (3) |
Includes U.S. small business commercial exposure. |
| (4) |
Industries are viewed from a variety of perspectives to best isolate the perceived risks. For purposes of this table, the real estate industry is defined based upon
the borrowers’ or counterparties’ primary business activity using operating cash flows and primary source of repayment as key factors. |
| (5) |
Represents net notional credit protection purchased. |
Certain prior period amounts have been reclassified to conform to current period presentation.
|
|
|
| This information is preliminary and based on company data available at the time of the presentation. |
|
35 |
Bank of America Corporation and Subsidiaries
Net Credit Default Protection by Maturity Profile (1)
|
|
|
|
|
|
|
|
|
|
|
|
|
|
|
|
|
| |
|
June 30
2011 |
|
|
|
|
|
March 31
2011 |
|
|
|
|
| Less than or equal to one year |
|
|
14 |
|
|
|
% |
|
|
|
13 |
|
|
|
% |
|
| Greater than one year and less than or equal to five years |
|
|
80 |
|
|
|
|
|
|
|
78 |
|
|
|
|
|
| Greater than five years |
|
|
6 |
|
|
|
|
|
|
|
9 |
|
|
|
|
|
| Total net credit default protection |
|
|
100 |
|
|
|
% |
|
|
|
100 |
|
|
|
% |
|
| (1) |
To mitigate the cost of purchasing credit protection, credit exposure can be added by selling credit protection. The distribution of maturities for net credit
default protection purchased is shown above. |
Net Credit Default Protection by Credit Exposure Debt Rating (1, 2)
(Dollars in millions)
|
|
|
|
|
|
|
|
|
|
|
|
|
|
|
|
|
|
|
|
|
|
|
|
|
| |
|
June 30, 2011 |
|
|
|
|
|
March 31, 2011 |
|
|
|
|
| Ratings (3) |
|
Net Notional |
|
|
Percent |
|
|
|
|
|
Net Notional |
|
|
Percent |
|
|
|
|
| AA |
|
$ |
(313 |
) |
|
|
1.6 |
|
|
|
% |
|
|
$ |
(223 |
) |
|
|
1.2 |
|
|
|
% |
|
| A |
|
|
(7,016 |
) |
|
|
35.3 |
|
|
|
|
|
|
|
(6,967 |
) |
|
|
36.3 |
|
|
|
|
|
| BBB |
|
|
(7,542 |
) |
|
|
38.0 |
|
|
|
|
|
|
|
(7,105 |
) |
|
|
37.0 |
|
|
|
|
|
| BB |
|
|
(1,659 |
) |
|
|
8.4 |
|
|
|
|
|
|
|
(1,871 |
) |
|
|
9.8 |
|
|
|
|
|
| B |
|
|
(1,381 |
) |
|
|
7.0 |
|
|
|
|
|
|
|
(1,231 |
) |
|
|
6.4 |
|
|
|
|
|
| CCC and below |
|
|
(756 |
) |
|
|
3.8 |
|
|
|
|
|
|
|
(756 |
) |
|
|
3.9 |
|
|
|
|
|
| NR
(4) |
|
|
(1,194 |
) |
|
|
5.9 |
|
|
|
|
|
|
|
(1,026 |
) |
|
|
5.4 |
|
|
|
|
|
| Total net credit default protection |
|
$ |
(19,861 |
) |
|
|
100.0 |
|
|
|
% |
|
|
$ |
(19,179 |
) |
|
|
100.0 |
|
|
|
% |
|
| (1) |
To mitigate the cost of purchasing credit protection, credit exposure can be added by selling credit protection. The distribution of debt rating for net notional
credit default protection purchased is shown as a negative and the net notional credit protection sold is shown as a positive amount. |
| (2) |
Ratings are refreshed on a quarterly basis. |
| (3) |
The Corporation considers ratings of BBB- or higher to meet the definition of investment grade. |
| (4) |
In addition to names which have not been rated, “NR” includes $(1.1) billion and $(921) million in net credit default swap index positions at June 30,
2011 and March 31, 2011. While index positions are principally investment grade, credit default swaps indices include names in and across each of the ratings categories. |
Certain prior period amounts have been reclassified to conform to current period presentation.
|
|
|
| This information is preliminary and based on company data available at the time of the presentation. |
|
36 |
Bank of America Corporation and Subsidiaries
Selected Emerging Markets
(1)
(Dollars in millions)
|
|
|
|
|
|
|
|
|
|
|
|
|
|
|
|
|
|
|
|
|
|
|
|
|
|
|
|
|
|
|
|
|
| |
|
Loans and
Leases, and
Loan
Commitments |
|
|
Other
Financing
(2) |
|
|
Derivative
Assets (3) |
|
|
Securities
/
Other
Investments (4) |
|
|
Total
Cross–border
Exposure (5) |
|
|
Local Country
Exposure Net
of Local
Liabilities (6) |
|
|
Total
Emerging
Markets
Exposure
at
June 30,
2011 |
|
|
Increase
(Decrease)
from
March 31,
2011 |
|
| Region/Country |
|
|
|
|
|
|
|
|
|
|
|
|
|
|
|
|
|
|
|
|
|
|
|
|
|
|
|
|
|
|
|
|
| Asia Pacific |
|
|
|
|
|
|
|
|
|
|
|
|
|
|
|
|
|
|
|
|
|
|
|
|
|
|
|
|
|
|
|
|
| China (7) |
|
$ |
2,534 |
|
|
$ |
425 |
|
|
$ |
990 |
|
|
$ |
21,494 |
|
|
$ |
25,443 |
|
|
$ |
99 |
|
|
$ |
25,542 |
|
|
$ |
(612 |
) |
| India |
|
|
4,154 |
|
|
|
1,485 |
|
|
|
551 |
|
|
|
2,381 |
|
|
|
8,571 |
|
|
|
516 |
|
|
|
9,087 |
|
|
|
271 |
|
| South Korea |
|
|
873 |
|
|
|
1,255 |
|
|
|
401 |
|
|
|
2,105 |
|
|
|
4,634 |
|
|
|
1,774 |
|
|
|
6,408 |
|
|
|
(856 |
) |
| Taiwan |
|
|
472 |
|
|
|
78 |
|
|
|
74 |
|
|
|
603 |
|
|
|
1,227 |
|
|
|
1,519 |
|
|
|
2,746 |
|
|
|
400 |
|
| Singapore |
|
|
616 |
|
|
|
43 |
|
|
|
428 |
|
|
|
1,488 |
|
|
|
2,575 |
|
|
|
— |
|
|
|
2,575 |
|
|
|
80 |
|
| Hong Kong |
|
|
518 |
|
|
|
396 |
|
|
|
178 |
|
|
|
1,056 |
|
|
|
2,148 |
|
|
|
287 |
|
|
|
2,435 |
|
|
|
389 |
|
| Thailand |
|
|
20 |
|
|
|
15 |
|
|
|
32 |
|
|
|
878 |
|
|
|
945 |
|
|
|
— |
|
|
|
945 |
|
|
|
313 |
|
| Malaysia |
|
|
85 |
|
|
|
10 |
|
|
|
132 |
|
|
|
476 |
|
|
|
703 |
|
|
|
2 |
|
|
|
705 |
|
|
|
366 |
|
| Indonesia |
|
|
148 |
|
|
|
15 |
|
|
|
5 |
|
|
|
519 |
|
|
|
687 |
|
|
|
7 |
|
|
|
694 |
|
|
|
166 |
|
| Other Asia Pacific (8) |
|
|
226 |
|
|
|
92 |
|
|
|
53 |
|
|
|
381 |
|
|
|
752 |
|
|
|
— |
|
|
|
752 |
|
|
|
246 |
|
| Total Asia Pacific |
|
|
9,646 |
|
|
|
3,814 |
|
|
|
2,844 |
|
|
|
31,381 |
|
|
|
47,685 |
|
|
|
4,204 |
|
|
|
51,889 |
|
|
|
763 |
|
| Latin America |
|
|
|
|
|
|
|
|
|
|
|
|
|
|
|
|
|
|
|
|
|
|
|
|
|
|
|
|
|
|
|
|
| Brazil |
|
|
1,254 |
|
|
|
375 |
|
|
|
407 |
|
|
|
3,213 |
|
|
|
5,249 |
|
|
|
1,848 |
|
|
|
7,097 |
|
|
|
(658 |
) |
| Mexico |
|
|
2,029 |
|
|
|
475 |
|
|
|
257 |
|
|
|
3,032 |
|
|
|
5,793 |
|
|
|
— |
|
|
|
5,793 |
|
|
|
2,496 |
|
| Chile |
|
|
1,069 |
|
|
|
58 |
|
|
|
336 |
|
|
|
27 |
|
|
|
1,490 |
|
|
|
41 |
|
|
|
1,531 |
|
|
|
19 |
|
| Peru |
|
|
373 |
|
|
|
114 |
|
|
|
20 |
|
|
|
92 |
|
|
|
599 |
|
|
|
— |
|
|
|
599 |
|
|
|
107 |
|
| Other Latin America (8) |
|
|
263 |
|
|
|
346 |
|
|
|
39 |
|
|
|
334 |
|
|
|
982 |
|
|
|
152 |
|
|
|
1,134 |
|
|
|
(136 |
) |
| Total Latin America |
|
|
4,988 |
|
|
|
1,368 |
|
|
|
1,059 |
|
|
|
6,698 |
|
|
|
14,113 |
|
|
|
2,041 |
|
|
|
16,154 |
|
|
|
1,828 |
|
| Middle East and Africa |
|
|
|
|
|
|
|
|
|
|
|
|
|
|
|
|
|
|
|
|
|
|
|
|
|
|
|
|
|
|
|
|
| United Arab Emirates |
|
|
1,088 |
|
|
|
30 |
|
|
|
126 |
|
|
|
85 |
|
|
|
1,329 |
|
|
|
— |
|
|
|
1,329 |
|
|
|
203 |
|
| Bahrain |
|
|
79 |
|
|
|
1 |
|
|
|
4 |
|
|
|
1,001 |
|
|
|
1,085 |
|
|
|
2 |
|
|
|
1,087 |
|
|
|
1 |
|
| South Africa |
|
|
361 |
|
|
|
22 |
|
|
|
88 |
|
|
|
48 |
|
|
|
519 |
|
|
|
— |
|
|
|
519 |
|
|
|
109 |
|
| Other Middle East and Africa (8) |
|
|
513 |
|
|
|
103 |
|
|
|
93 |
|
|
|
209 |
|
|
|
918 |
|
|
|
28 |
|
|
|
946 |
|
|
|
20 |
|
| Total Middle East and Africa |
|
|
2,041 |
|
|
|
156 |
|
|
|
311 |
|
|
|
1,343 |
|
|
|
3,851 |
|
|
|
30 |
|
|
|
3,881 |
|
|
|
333 |
|
| Central and Eastern Europe |
|
|
|
|
|
|
|
|
|
|
|
|
|
|
|
|
|
|
|
|
|
|
|
|
|
|
|
|
|
|
|
|
| Russian Federation |
|
|
819 |
|
|
|
117 |
|
|
|
12 |
|
|
|
187 |
|
|
|
1,135 |
|
|
|
11 |
|
|
|
1,146 |
|
|
|
644 |
|
| Turkey |
|
|
321 |
|
|
|
45 |
|
|
|
6 |
|
|
|
217 |
|
|
|
589 |
|
|
|
96 |
|
|
|
685 |
|
|
|
(53 |
) |
| Other Central and Eastern Europe (8) |
|
|
116 |
|
|
|
84 |
|
|
|
221 |
|
|
|
492 |
|
|
|
913 |
|
|
|
— |
|
|
|
913 |
|
|
|
(578 |
) |
| Total Central and Eastern Europe |
|
|
1,256 |
|
|
|
246 |
|
|
|
239 |
|
|
|
896 |
|
|
|
2,637 |
|
|
|
107 |
|
|
|
2,744 |
|
|
|
13 |
|
| Total emerging market exposure |
|
$ |
17,931 |
|
|
$ |
5,584 |
|
|
$ |
4,453 |
|
|
$ |
40,318 |
|
|
$ |
68,286 |
|
|
$ |
6,382 |
|
|
$ |
74,668 |
|
|
$ |
2,937 |
|
| (1) |
There is no generally accepted definition of emerging markets. The definition that we use includes all countries in Asia Pacific excluding Japan, Australia and
New Zealand; all countries in Latin America excluding Cayman Islands and Bermuda; all countries in Middle East and Africa; and all countries in Central and Eastern Europe. At June 30, 2011 and March 31, 2011, there was $474 million
and $368 million in emerging market exposure accounted for under the fair value option. |
| (2) |
Includes acceptances, due froms, standby letters of credit, commercial letters of credit and formal guarantees. |
| (3) |
Derivative assets are carried at fair value and have been reduced by the amount of cash collateral applied of $1.1 billion and $881 million at June 30, 2011 and
March 31, 2011. At June 30, 2011 and March 31, 2011, there were $226 million and $306 million of other marketable securities collateralizing derivative assets. |
| (4) |
Generally, cross-border resale agreements are presented based on the domicile of the counterparty, consistent with Federal Financial Institutions Examination Council
(FFIEC) reporting requirements. Cross-border resale agreements where the underlying securities are U.S. Treasury securities, in which case the domicile is the U.S., are excluded from this presentation. |
| (5) |
Cross-border exposure includes amounts payable to the Corporation by borrowers or counterparties with a country of residence other than the one in which the credit
is booked, regardless of the currency in which the claim is denominated, consistent with FFIEC reporting requirements. |
| (6) |
Local country exposure includes amounts payable to the Corporation by borrowers with a country of residence in which the credit is booked, regardless of the currency
in which the claim is denominated. Local funding or liabilities are subtracted from local exposures consistent with FFIEC reporting requirements. Total amount of available local liabilities funding local country exposure at June 30, 2011 was
$21.4 billion compared to $18.4 billion at March 31, 2011. Local liabilities at June 30, 2011 in Asia Pacific, Latin America, and Middle East and Africa were $19.2 billion, $1.6 billion and $579 million, respectively, of which $8.8
billion was in Singapore, $2.6 billion in Hong Kong, $2.4 billion in China, $2.1 billion in India, $1.5 billion in Mexico, $1.0 billion in Korea, $949 million in Indonesia and $579 million in South Africa. There were no other countries with
available local liabilities funding local country exposure greater than $500 million. |
| (7) |
Securities/Other Investments includes an investment of $19.6 billion in China Construction Bank. |
| (8) |
No country included in Other Asia Pacific, Other Latin America, Other Middle East and Africa, or Other Central and Eastern Europe had total non-U.S. exposure of more
than $500 million. |
Certain prior period amounts have been reclassified to conform to current period presentation.
|
|
|
| This information is preliminary and based on company data available at the time of the presentation. |
|
37 |
Bank of America Corporation and Subsidiaries
Selected European Countries
(Dollars in millions)
|
|
|
|
|
|
|
|
|
|
|
|
|
|
|
|
|
|
|
|
|
|
|
|
|
|
|
|
|
|
|
|
|
| |
|
Loans and
Leases, and
Loan
Commitments |
|
|
Other
Financing
(1) |
|
|
Derivative
Assets (2) |
|
|
Securities/
Other
Investments
(3) |
|
|
Total
Cross–border
Exposure (4) |
|
|
Local Country
Exposure Net
of Local
Liabilities (5) |
|
|
Total
Non-U.S.
Exposure
at
June 30,
2011 |
|
|
Credit Default
Protection
(6) |
|
| Greece |
|
|
|
|
|
|
|
|
|
|
|
|
|
|
|
|
|
|
|
|
|
|
|
|
|
|
|
|
|
|
|
|
| Sovereign |
|
$ |
— |
|
|
$ |
— |
|
|
$ |
— |
|
|
$ |
17 |
|
|
$ |
17 |
|
|
$ |
— |
|
|
$ |
17 |
|
|
$ |
(7 |
) |
| Non-sovereign |
|
|
399 |
|
|
|
5 |
|
|
|
52 |
|
|
|
47 |
|
|
|
503 |
|
|
|
— |
|
|
|
503 |
|
|
|
— |
|
| Total Greece |
|
$ |
399 |
|
|
$ |
5 |
|
|
$ |
52 |
|
|
$ |
64 |
|
|
$ |
520 |
|
|
$ |
— |
|
|
$ |
520 |
|
|
$ |
(7 |
) |
| Ireland |
|
|
|
|
|
|
|
|
|
|
|
|
|
|
|
|
|
|
|
|
|
|
|
|
|
|
|
|
|
|
|
|
| Sovereign |
|
$ |
1 |
|
|
$ |
— |
|
|
$ |
10 |
|
|
$ |
25 |
|
|
$ |
36 |
|
|
$ |
— |
|
|
$ |
36 |
|
|
$ |
— |
|
| Non-sovereign |
|
|
1,625 |
|
|
|
570 |
|
|
|
304 |
|
|
|
298 |
|
|
|
2,797 |
|
|
|
— |
|
|
|
2,797 |
|
|
|
(41 |
) |
| Total Ireland |
|
$ |
1,626 |
|
|
$ |
570 |
|
|
$ |
314 |
|
|
$ |
323 |
|
|
$ |
2,833 |
|
|
$ |
— |
|
|
$ |
2,833 |
|
|
$ |
(41 |
) |
| Italy |
|
|
|
|
|
|
|
|
|
|
|
|
|
|
|
|
|
|
|
|
|
|
|
|
|
|
|
|
|
|
|
|
| Sovereign |
|
$ |
28 |
|
|
$ |
— |
|
|
$ |
1,320 |
|
|
$ |
16 |
|
|
$ |
1,364 |
|
|
$ |
9 |
|
|
$ |
1,373 |
|
|
$ |
(1,361 |
) |
| Non-sovereign |
|
|
1,165 |
|
|
|
18 |
|
|
|
655 |
|
|
|
1,233 |
|
|
|
3,071 |
|
|
|
2,450 |
|
|
|
5,521 |
|
|
|
(252 |
) |
| Total Italy |
|
$ |
1,193 |
|
|
$ |
18 |
|
|
$ |
1,975 |
|
|
$ |
1,249 |
|
|
$ |
4,435 |
|
|
$ |
2,459 |
|
|
$ |
6,894 |
|
|
$ |
(1,613 |
) |
| Portugal |
|
|
|
|
|
|
|
|
|
|
|
|
|
|
|
|
|
|
|
|
|
|
|
|
|
|
|
|
|
|
|
|
| Sovereign |
|
$ |
— |
|
|
$ |
— |
|
|
$ |
32 |
|
|
$ |
— |
|
|
$ |
32 |
|
|
$ |
— |
|
|
$ |
32 |
|
|
$ |
(30 |
) |
| Non-sovereign |
|
|
280 |
|
|
|
22 |
|
|
|
6 |
|
|
|
80 |
|
|
|
388 |
|
|
|
— |
|
|
|
388 |
|
|
|
— |
|
| Total Portugal |
|
$ |
280 |
|
|
$ |
22 |
|
|
$ |
38 |
|
|
$ |
80 |
|
|
$ |
420 |
|
|
$ |
— |
|
|
$ |
420 |
|
|
$ |
(30 |
) |
| Spain |
|
|
|
|
|
|
|
|
|
|
|
|
|
|
|
|
|
|
|
|
|
|
|
|
|
|
|
|
|
|
|
|
| Sovereign |
|
$ |
27 |
|
|
$ |
— |
|
|
$ |
39 |
|
|
$ |
5 |
|
|
$ |
71 |
|
|
$ |
52 |
|
|
$ |
123 |
|
|
$ |
(64 |
) |
| Non-sovereign |
|
|
911 |
|
|
|
102 |
|
|
|
241 |
|
|
|
2,199 |
|
|
|
3,453 |
|
|
|
2,490 |
|
|
|
5,943 |
|
|
|
(14 |
) |
| Total Spain |
|
$ |
938 |
|
|
$ |
102 |
|
|
$ |
280 |
|
|
$ |
2,204 |
|
|
$ |
3,524 |
|
|
$ |
2,542 |
|
|
$ |
6,066 |
|
|
$ |
(78 |
) |
| Total |
|
|
|
|
|
|
|
|
|
|
|
|
|
|
|
|
|
|
|
|
|
|
|
|
|
|
|
|
|
|
|
|
| Sovereign |
|
$ |
56 |
|
|
$ |
— |
|
|
$ |
1,401 |
|
|
$ |
63 |
|
|
$ |
1,520 |
|
|
$ |
61 |
|
|
$ |
1,581 |
|
|
$ |
(1,462 |
) |
| Non-sovereign |
|
|
4,380 |
|
|
|
717 |
|
|
|
1,258 |
|
|
|
3,857 |
|
|
|
10,212 |
|
|
|
4,940 |
|
|
|
15,152 |
|
|
|
(307 |
) |
| Total selected European exposure |
|
$ |
4,436 |
|
|
$ |
717 |
|
|
$ |
2,659 |
|
|
$ |
3,920 |
|
|
$ |
11,732 |
|
|
$ |
5,001 |
|
|
$ |
16,733 |
|
|
$ |
(1,769 |
) |
| (1) |
Includes acceptances, due froms, standby letters of credit, commercial letters of credit and formal guarantees. |
| (2) |
Derivative assets are carried at fair value and have been reduced by the amount of cash collateral applied of $3.1 billion at June 30, 2011. At June 30,
2011, there was $77 million of other marketable securities collateralizing derivative assets. |
| (3) |
Generally, cross-border resale agreements are presented based on the domicile of the counterparty, consistent with FFIEC reporting requirements. Cross-border resale
agreements where the underlying securities are U.S. Treasury securities, in which case the domicile is the U.S., are excluded from this presentation. |
| (4) |
Cross-border exposure includes amounts payable to the Corporation by borrowers or counterparties with a country of residence other than the one in which the credit
is booked, regardless of the currency in which the claim is denominated, consistent with FFIEC reporting requirements. |
| (5) |
Local country exposure includes amounts payable to the Corporation by borrowers with a country of residence in which the credit is booked regardless of the currency
in which the claim is denominated. Local funding or liabilities of $957 million are subtracted from local exposures consistent with FFIEC reporting requirements. Of the $957 million applied for exposure reduction, $389 million was in Italy, $362
million in Ireland, $158 million in Spain and $48 million in Greece. |
| (6) |
Represents net notional credit default protection purchased to hedge counterparty risk. |
Certain prior period amounts have been reclassified to conform to current period presentation.
|
|
|
| This information is preliminary and based on company data available at the time of the presentation. |
|
38 |
Bank of America Corporation and Subsidiaries
Nonperforming Loans, Leases and Foreclosed Properties
(Dollars in millions)
|
|
|
|
|
|
|
|
|
|
|
|
|
|
|
|
|
|
|
|
|
| |
|
June 30
2011 |
|
|
March 31
2011 |
|
|
December 31
2010 |
|
|
September 30
2010 |
|
|
June 30
2010 |
|
| Residential mortgage |
|
$ |
16,726 |
|
|
$ |
17,466 |
|
|
$ |
17,691 |
|
|
$ |
18,291 |
|
|
$ |
18,283 |
|
| Home equity |
|
|
2,345 |
|
|
|
2,559 |
|
|
|
2,694 |
|
|
|
2,702 |
|
|
|
2,951 |
|
| Discontinued real estate |
|
|
324 |
|
|
|
327 |
|
|
|
331 |
|
|
|
297 |
|
|
|
293 |
|
| Direct/Indirect consumer |
|
|
58 |
|
|
|
68 |
|
|
|
90 |
|
|
|
83 |
|
|
|
85 |
|
| Other consumer |
|
|
25 |
|
|
|
36 |
|
|
|
48 |
|
|
|
56 |
|
|
|
72 |
|
|
|
|
|
|
|
|
|
|
|
|
|
|
|
|
|
|
|
|
|
|
| Total consumer |
|
|
19,478 |
|
|
|
20,456 |
|
|
|
20,854 |
|
|
|
21,429 |
|
|
|
21,684 |
|
|
|
|
|
|
|
|
|
|
|
|
|
|
|
|
|
|
|
|
|
|
| U.S. commercial (1) |
|
|
2,767 |
|
|
|
3,056 |
|
|
|
3,453 |
|
|
|
3,894 |
|
|
|
4,217 |
|
| Commercial real estate |
|
|
5,051 |
|
|
|
5,695 |
|
|
|
5,829 |
|
|
|
6,376 |
|
|
|
6,704 |
|
| Commercial lease financing |
|
|
23 |
|
|
|
53 |
|
|
|
117 |
|
|
|
123 |
|
|
|
140 |
|
| Non-U.S. commercial |
|
|
108 |
|
|
|
155 |
|
|
|
233 |
|
|
|
272 |
|
|
|
130 |
|
|
|
|
|
|
|
|
|
|
|
|
|
|
|
|
|
|
|
|
|
|
|
|
|
7,949 |
|
|
|
8,959 |
|
|
|
9,632 |
|
|
|
10,665 |
|
|
|
11,191 |
|
| U.S. small business commercial |
|
|
156 |
|
|
|
172 |
|
|
|
204 |
|
|
|
202 |
|
|
|
222 |
|
|
|
|
|
|
|
|
|
|
|
|
|
|
|
|
|
|
|
|
|
|
| Total commercial |
|
|
8,105 |
|
|
|
9,131 |
|
|
|
9,836 |
|
|
|
10,867 |
|
|
|
11,413 |
|
|
|
|
|
|
|
|
|
|
|
|
|
|
|
|
|
|
|
|
|
|
| Total nonperforming loans and leases |
|
|
27,583 |
|
|
|
29,587 |
|
|
|
30,690 |
|
|
|
32,296 |
|
|
|
33,097 |
|
| Foreclosed properties |
|
|
2,475 |
|
|
|
2,056 |
|
|
|
1,974 |
|
|
|
2,260 |
|
|
|
2,501 |
|
|
|
|
|
|
|
|
|
|
|
|
|
|
|
|
|
|
|
|
|
|
| Total nonperforming loans, leases and foreclosed properties
(2, 3, 4) |
|
$ |
30,058 |
|
|
$ |
31,643 |
|
|
$ |
32,664 |
|
|
$ |
34,556 |
|
|
$ |
35,598 |
|
|
|
|
|
|
|
|
|
|
|
|
|
|
|
|
|
|
|
|
|
|
|
|
|
|
|
|
| Fully insured home loans past due 90 days or more and still accruing |
|
$ |
20,047 |
|
|
$ |
19,754 |
|
|
$ |
16,768 |
|
|
$ |
16,427 |
|
|
$ |
15,338 |
|
| Other loans past due 90 days or more and still accruing |
|
|
4,243 |
|
|
|
5,129 |
|
|
|
5,611 |
|
|
|
5,781 |
|
|
|
6,448 |
|
|
|
|
|
|
|
|
|
|
|
|
|
|
|
|
|
|
|
|
|
|
| Total loans past due 90 days or more and still accruing
(3, 5) |
|
$ |
24,290 |
|
|
$ |
24,883 |
|
|
$ |
22,379 |
|
|
$ |
22,208 |
|
|
$ |
21,786 |
|
|
|
|
|
|
|
|
|
|
|
|
|
|
|
|
|
|
|
|
|
|
|
|
|
|
|
|
| Nonperforming loans, leases and foreclosed properties/Total assets (6) |
|
|
1.33 |
% |
|
|
1.39 |
% |
|
|
1.44 |
% |
|
|
1.48 |
% |
|
|
1.51 |
% |
| Allowance for loan and lease losses (excluding the valuation allowance for purchased credit-impaired loans)/Total loans and
leases (excluding purchased credit-impaired loans) (6) |
|
|
3.24 |
|
|
|
3.58 |
|
|
|
3.94 |
|
|
|
4.25 |
|
|
|
4.37 |
|
| Nonperforming loans, leases and foreclosed properties/Total loans, leases and foreclosed properties (6) |
|
|
3.22 |
|
|
|
3.40 |
|
|
|
3.48 |
|
|
|
3.71 |
|
|
|
3.73 |
|
| Nonperforming loans and leases/Total loans and leases
(6) |
|
|
2.96 |
|
|
|
3.19 |
|
|
|
3.27 |
|
|
|
3.47 |
|
|
|
3.48 |
|
|
|
|
|
|
|
| Allowance for credit losses: |
|
|
|
|
|
|
|
|
|
|
|
|
|
|
|
|
|
|
|
|
| Allowance for loan and lease losses
(7) |
|
$ |
37,312 |
|
|
$ |
39,843 |
|
|
$ |
41,885 |
|
|
$ |
43,581 |
|
|
$ |
45,255 |
|
| Reserve for unfunded lending commitments |
|
|
897 |
|
|
|
961 |
|
|
|
1,188 |
|
|
|
1,294 |
|
|
|
1,413 |
|
|
|
|
|
|
|
|
|
|
|
|
|
|
|
|
|
|
|
|
|
|
| Total allowance for credit losses |
|
$ |
38,209 |
|
|
$ |
40,804 |
|
|
$ |
43,073 |
|
|
$ |
44,875 |
|
|
$ |
46,668 |
|
|
|
|
|
|
|
|
|
|
|
|
|
|
|
|
|
|
|
|
|
|
|
|
|
|
|
|
| Allowance for loan and lease losses/Total loans and leases
(6) |
|
|
4.00 |
% |
|
|
4.29 |
% |
|
|
4.47 |
% |
|
|
4.69 |
% |
|
|
4.75 |
% |
| Allowance for loan and lease losses/Total nonperforming loans and leases (8) |
|
|
135 |
|
|
|
135 |
|
|
|
136 |
|
|
|
135 |
|
|
|
137 |
|
| Allowance for loan and lease losses (excluding the valuation allowance for purchased credit-impaired loans)/Total nonperforming
loans and leases |
|
|
105 |
|
|
|
108 |
|
|
|
116 |
|
|
|
118 |
|
|
|
121 |
|
|
|
|
|
|
|
| Commercial utilized reservable criticized exposure
(9) |
|
$ |
35,110 |
|
|
$ |
39,435 |
|
|
$ |
42,621 |
|
|
$ |
47,698 |
|
|
$ |
50,319 |
|
| Commercial utilized reservable criticized exposure/Commercial utilized reservable exposure (9) |
|
|
9.73 |
% |
|
|
10.94 |
% |
|
|
11.80 |
% |
|
|
13.06 |
% |
|
|
13.48 |
% |
| Total commercial utilized criticized exposure/Commercial utilized exposure (9) |
|
|
10.80 |
|
|
|
11.73 |
|
|
|
12.43 |
|
|
|
13.61 |
|
|
|
14.26 |
|
| (1) |
Excludes U.S. small business commercial loans. |
| (2) |
Balances do not include past due consumer credit card, business card loans, consumer loans secured by real estate where repayments are insured by the Federal Housing
Administration, individually insured long-term credit protection agreements and in general, consumer loans not secured by real estate. |
| (3) |
Balances do not include purchased credit-impaired loans even though the customer may be contractually past due. Purchased credit-impaired loans were written down to
fair value upon acquisition and accrete interest income over the remaining life of the loan. |
|
|
|
|
|
|
|
|
|
|
|
|
|
|
|
|
|
|
|
|
|
| (4) Balances do not include the following: |
|
June 30
2011 |
|
|
March 31
2011 |
|
|
December 31
2010 |
|
|
September 30
2010 |
|
|
June 30
2010 |
|
| Nonperforming loans held-for-sale |
|
$ |
2,119 |
|
|
$ |
2,421 |
|
|
$ |
2,540 |
|
|
$ |
3,654 |
|
|
$ |
4,044 |
|
| Nonperforming loans accounted for under the fair value option |
|
|
2,389 |
|
|
|
15 |
|
|
|
30 |
|
|
|
15 |
|
|
|
15 |
|
|
Nonaccruing troubled debt restructured loans removed from the purchased credit-impaired portfolio
prior to January 1, 2010 |
|
|
465 |
|
|
|
456 |
|
|
|
426 |
|
|
|
378 |
|
|
|
403 |
|
| (5) |
Balances do not include loans held-for-sale past due 90 days or more and still accruing of $19 million, $48 million, $60 million, $79 million and $158 million at
June 30, 2011, March 31, 2011, December 31, 2010, September 30, 2010 and June 30, 2010, respectively. At June 30, 2011, March 31, 2011, December 31, 2010, September 30, 2010
and June 30, 2010 there were no loans accounted for under the fair value option past due 90 days or more and still accruing interest. |
| (6) |
Total assets and total loans and leases do not include loans accounted for under the fair value option of $9.6 billion, $3.7 billion, $3.3 billion, $3.7 billion and
$3.9 billion at June 30, 2011, March 31, 2011, December 31, 2010, September 30, 2010 and June 30, 2010, respectively. |
| (7) |
Balances include the allowance for loan and lease losses on purchased credit-impaired loans of $8.4 billion, $8.0 billion, $6.4 billion, $5.6 billion and $5.3
billion at June 30, 2011, March 31, 2011, December 31, 2010, September 30, 2010 and June 30, 2010, respectively. |
| (8) |
Allowance for loan and lease losses includes $19.9 billion, $22.1 billion, $22.9 billion, $23.7 billion and $24.3 billion allocated to products (primarily Global
Card Services portfolios and purchased credit-impaired loans) that are excluded from nonperforming loans and leases at June 30, 2011, March 31, 2011, December 31, 2010, September 30, 2010 and June 30, 2010,
respectively. Excluding these amounts, allowance for loan and lease losses as a percentage of total nonperforming loans and leases was 63 percent, 60 percent, 62 percent, 62 percent and 63 percent at June 30, 2011, March 31,
2011, December 31, 2010, September 30, 2010 and June 30, 2010, respectively. |
| (9) |
Criticized exposure corresponds to the Special Mention, Substandard and Doubtful asset categories defined by regulatory authorities. The reservable criticized
exposure excludes loans held-for-sale, exposure accounted for under the fair value option and other nonreservable exposure. |
Loans are classified as U.S. or non-U.S. based upon the domicile of the borrower.
Certain prior period amounts have been reclassified to conform to current period presentation.
|
|
|
| This information is preliminary and based on company data available at the time of the presentation. |
|
39 |
Bank of America Corporation and Subsidiaries
Nonperforming Loans, Leases and Foreclosed Properties Activity (1)
(Dollars in millions)
|
|
|
|
|
|
|
|
|
|
|
|
|
|
|
|
|
|
|
|
|
| |
|
Second
Quarter
2011 |
|
|
First
Quarter
2011 |
|
|
Fourth
Quarter
2010 |
|
|
Third
Quarter
2010 |
|
|
Second
Quarter
2010 |
|
| Nonperforming Consumer Loans: |
|
|
|
|
|
|
|
|
|
|
|
|
|
|
|
|
|
|
|
|
| Balance, beginning of period |
|
$ |
20,456 |
|
|
$ |
20,854 |
|
|
$ |
21,429 |
|
|
$ |
21,684 |
|
|
$ |
21,557 |
|
| Additions to nonperforming loans: |
|
|
|
|
|
|
|
|
|
|
|
|
|
|
|
|
|
|
|
|
| New nonaccrual loans |
|
|
4,044 |
|
|
|
4,127 |
|
|
|
4,568 |
|
|
|
4,551 |
|
|
|
5,409 |
|
| Reductions in nonperforming loans: |
|
|
|
|
|
|
|
|
|
|
|
|
|
|
|
|
|
|
|
|
| Paydowns and payoffs |
|
|
(1,003 |
) |
|
|
(779 |
) |
|
|
(739 |
) |
|
|
(917 |
) |
|
|
(528 |
) |
| Returns to performing status (2) |
|
|
(1,311 |
) |
|
|
(1,340 |
) |
|
|
(1,841 |
) |
|
|
(1,469 |
) |
|
|
(1,816 |
) |
| Charge-offs (3) |
|
|
(2,300 |
) |
|
|
(2,020 |
) |
|
|
(2,261 |
) |
|
|
(1,987 |
) |
|
|
(2,607 |
) |
| Transfers to foreclosed properties |
|
|
(408 |
) |
|
|
(386 |
) |
|
|
(302 |
) |
|
|
(433 |
) |
|
|
(331 |
) |
|
|
|
|
|
|
|
|
|
|
|
|
|
|
|
|
|
|
|
|
|
| Total net additions (reductions) to nonperforming loans |
|
|
(978 |
) |
|
|
(398 |
) |
|
|
(575 |
) |
|
|
(255 |
) |
|
|
127 |
|
|
|
|
|
|
|
|
|
|
|
|
|
|
|
|
|
|
|
|
|
|
| Total nonperforming consumer loans, end of period |
|
|
19,478 |
|
|
|
20,456 |
|
|
|
20,854 |
|
|
|
21,429 |
|
|
|
21,684 |
|
| Foreclosed properties |
|
|
1,797 |
|
|
|
1,331 |
|
|
|
1,249 |
|
|
|
1,485 |
|
|
|
1,744 |
|
|
|
|
|
|
|
|
|
|
|
|
|
|
|
|
|
|
|
|
|
|
| Total nonperforming consumer loans and foreclosed properties, end of period |
|
$ |
21,275 |
|
|
$ |
21,787 |
|
|
$ |
22,103 |
|
|
$ |
22,914 |
|
|
$ |
23,428 |
|
|
|
|
|
|
|
|
|
|
|
|
|
|
|
|
|
|
|
|
|
|
| Nonperforming Commercial Loans and Leases
(4): |
|
|
|
|
|
|
|
|
|
|
|
|
|
|
|
|
|
|
|
|
| Balance, beginning of period |
|
$ |
9,131 |
|
|
$ |
9,836 |
|
|
$ |
10,867 |
|
|
$ |
11,413 |
|
|
$ |
12,060 |
|
| Additions to nonperforming loans and leases: |
|
|
|
|
|
|
|
|
|
|
|
|
|
|
|
|
|
|
|
|
| New nonaccrual loans and leases |
|
|
1,042 |
|
|
|
1,299 |
|
|
|
1,820 |
|
|
|
1,852 |
|
|
|
2,256 |
|
| Advances |
|
|
52 |
|
|
|
67 |
|
|
|
102 |
|
|
|
83 |
|
|
|
62 |
|
| Reductions in nonperforming loans and leases: |
|
|
|
|
|
|
|
|
|
|
|
|
|
|
|
|
|
|
|
|
| Paydowns and payoffs |
|
|
(1,023 |
) |
|
|
(764 |
) |
|
|
(1,113 |
) |
|
|
(906 |
) |
|
|
(1,148 |
) |
| Sales |
|
|
(141 |
) |
|
|
(247 |
) |
|
|
(228 |
) |
|
|
(187 |
) |
|
|
(256 |
) |
| Return to performing status (5) |
|
|
(362 |
) |
|
|
(320 |
) |
|
|
(465 |
) |
|
|
(415 |
) |
|
|
(404 |
) |
| Charge-offs (6) |
|
|
(291 |
) |
|
|
(488 |
) |
|
|
(767 |
) |
|
|
(628 |
) |
|
|
(870 |
) |
| Transfers to foreclosed properties |
|
|
(241 |
) |
|
|
(200 |
) |
|
|
(304 |
) |
|
|
(217 |
) |
|
|
(205 |
) |
| Transfers to loans held-for-sale |
|
|
(62 |
) |
|
|
(52 |
) |
|
|
(76 |
) |
|
|
(128 |
) |
|
|
(82 |
) |
|
|
|
|
|
|
|
|
|
|
|
|
|
|
|
|
|
|
|
|
|
| Total net reductions in nonperforming loans and leases |
|
|
(1,026 |
) |
|
|
(705 |
) |
|
|
(1,031 |
) |
|
|
(546 |
) |
|
|
(647 |
) |
|
|
|
|
|
|
|
|
|
|
|
|
|
|
|
|
|
|
|
|
|
| Total nonperforming commercial loans and leases, end of period |
|
|
8,105 |
|
|
|
9,131 |
|
|
|
9,836 |
|
|
|
10,867 |
|
|
|
11,413 |
|
| Foreclosed properties |
|
|
678 |
|
|
|
725 |
|
|
|
725 |
|
|
|
775 |
|
|
|
757 |
|
|
|
|
|
|
|
|
|
|
|
|
|
|
|
|
|
|
|
|
|
|
| Total nonperforming commercial loans, leases and foreclosed properties, end of period |
|
$ |
8,783 |
|
|
$ |
9,856 |
|
|
$ |
10,561 |
|
|
$ |
11,642 |
|
|
$ |
12,170 |
|
|
|
|
|
|
|
|
|
|
|
|
|
|
|
|
|
|
|
|
|
|
| (1) |
For amounts excluded from nonperforming loans, leases and foreclosed properties, see footnotes to Nonperforming Loans, Leases and Foreclosed Properties table on page
39. |
| (2) |
Consumer loans may be returned to performing status when all principal and interest is current and full repayment of the remaining contractual principal and interest
is expected, or when the loan otherwise becomes well-secured and is in the process of collection. Certain troubled debt restructurings are classified as nonperforming at the time of restructure and may only be returned to performing status after
considering the borrower’s sustained repayment performance for a reasonable period, generally six months. |
| (3) |
Our policy is not to classify consumer credit card and consumer loans not secured by real estate as nonperforming; therefore, the charge-offs on these loans have no
impact on nonperforming activity and therefore are excluded from this table. |
| (4) |
Includes U.S. small business commercial activity. |
| (5) |
Commercial loans and leases may be restored to performing status when all principal and interest is current and full repayment of the remaining contractual principal
and interest is expected or when the loan otherwise becomes well-secured and is in the process of collection. Troubled debt restructurings are generally classified as performing after a sustained period of demonstrated payment performance.
|
| (6) |
Business card loans are not classified as nonperforming; therefore, the charge-offs on these loans have no impact on nonperforming activity and accordingly are
excluded from this table. |
Certain prior period amounts have been reclassified to conform to current period presentation.
|
|
|
| This information is preliminary and based on company data available at the time of the presentation. |
|
40 |
Bank of America Corporation and Subsidiaries
Quarterly Net Charge-offs and Net Charge-off Ratios (1)
(Dollars in millions)
|
|
|
|
|
|
|
|
|
|
|
|
|
|
|
|
|
|
|
|
|
|
|
|
|
|
|
|
|
|
|
|
|
|
|
|
|
|
|
|
|
| |
|
Second
Quarter
2011 |
|
|
First
Quarter
2011 |
|
|
Fourth
Quarter
2010 |
|
|
Third
Quarter
2010 |
|
|
Second
Quarter
2010 |
|
| Net Charge-offs |
|
Amount |
|
|
Percent |
|
|
Amount |
|
|
Percent |
|
|
Amount |
|
|
Percent |
|
|
Amount |
|
|
Percent |
|
|
Amount |
|
|
Percent |
|
| Residential mortgage |
|
$ |
1,104 |
|
|
|
1.67 |
% |
|
$ |
905 |
|
|
|
1.40 |
% |
|
$ |
970 |
|
|
|
1.51 |
% |
|
$ |
660 |
|
|
|
1.10 |
% |
|
$ |
971 |
|
|
|
1.57 |
% |
| Home equity |
|
|
1,263 |
|
|
|
3.84 |
|
|
|
1,179 |
|
|
|
3.51 |
|
|
|
1,271 |
|
|
|
3.61 |
|
|
|
1,372 |
|
|
|
3.80 |
|
|
|
1,741 |
|
|
|
4.71 |
|
| Discontinued real estate |
|
|
26 |
|
|
|
0.84 |
|
|
|
20 |
|
|
|
0.61 |
|
|
|
11 |
|
|
|
0.35 |
|
|
|
17 |
|
|
|
0.48 |
|
|
|
19 |
|
|
|
0.54 |
|
| U.S. credit card |
|
|
1,931 |
|
|
|
7.29 |
|
|
|
2,274 |
|
|
|
8.39 |
|
|
|
2,572 |
|
|
|
9.05 |
|
|
|
2,975 |
|
|
|
10.24 |
|
|
|
3,517 |
|
|
|
11.88 |
|
| Non-U.S. credit card |
|
|
429 |
|
|
|
6.31 |
|
|
|
402 |
|
|
|
5.91 |
|
|
|
339 |
|
|
|
4.90 |
|
|
|
295 |
|
|
|
4.32 |
|
|
|
942 |
|
|
|
13.64 |
|
| Direct/Indirect consumer |
|
|
366 |
|
|
|
1.64 |
|
|
|
525 |
|
|
|
2.36 |
|
|
|
641 |
|
|
|
2.78 |
|
|
|
707 |
|
|
|
2.93 |
|
|
|
879 |
|
|
|
3.58 |
|
| Other consumer |
|
|
43 |
|
|
|
6.44 |
|
|
|
40 |
|
|
|
5.93 |
|
|
|
50 |
|
|
|
6.96 |
|
|
|
80 |
|
|
|
10.68 |
|
|
|
73 |
|
|
|
10.01 |
|
|
|
|
|
|
|
|
|
|
|
|
|
|
|
|
|
|
|
|
|
|
|
|
|
|
|
|
|
|
|
|
|
|
|
|
|
|
|
|
|
|
| Total consumer |
|
|
5,162 |
|
|
|
3.27 |
|
|
|
5,345 |
|
|
|
3.38 |
|
|
|
5,854 |
|
|
|
3.62 |
|
|
|
6,106 |
|
|
|
3.81 |
|
|
|
8,142 |
|
|
|
4.96 |
|
|
|
|
|
|
|
|
|
|
|
|
|
|
|
|
|
|
|
|
|
|
|
|
|
|
|
|
|
|
|
|
|
|
|
|
|
|
|
|
|
|
| U.S. commercial (2) |
|
|
60 |
|
|
|
0.14 |
|
|
|
(21 |
) |
|
|
(0.05 |
) |
|
|
210 |
|
|
|
0.47 |
|
|
|
206 |
|
|
|
0.47 |
|
|
|
179 |
|
|
|
0.41 |
|
| Commercial real estate |
|
|
163 |
|
|
|
1.43 |
|
|
|
288 |
|
|
|
2.42 |
|
|
|
347 |
|
|
|
2.67 |
|
|
|
410 |
|
|
|
2.93 |
|
|
|
645 |
|
|
|
4.03 |
|
| Commercial lease financing |
|
|
(8 |
) |
|
|
(0.15 |
) |
|
|
1 |
|
|
|
0.02 |
|
|
|
20 |
|
|
|
0.38 |
|
|
|
19 |
|
|
|
0.34 |
|
|
|
(3 |
) |
|
|
(0.06 |
) |
| Non-U.S. commercial |
|
|
13 |
|
|
|
0.13 |
|
|
|
103 |
|
|
|
1.22 |
|
|
|
8 |
|
|
|
0.10 |
|
|
|
12 |
|
|
|
0.17 |
|
|
|
66 |
|
|
|
0.98 |
|
|
|
|
|
|
|
|
|
|
|
|
|
|
|
|
|
|
|
|
|
|
|
|
|
|
|
|
|
|
|
|
|
|
|
|
|
|
|
|
|
|
|
|
|
228 |
|
|
|
0.32 |
|
|
|
371 |
|
|
|
0.54 |
|
|
|
585 |
|
|
|
0.83 |
|
|
|
647 |
|
|
|
0.91 |
|
|
|
887 |
|
|
|
1.23 |
|
| U.S. small business commercial |
|
|
275 |
|
|
|
7.78 |
|
|
|
312 |
|
|
|
8.68 |
|
|
|
344 |
|
|
|
9.13 |
|
|
|
444 |
|
|
|
11.38 |
|
|
|
528 |
|
|
|
12.94 |
|
|
|
|
|
|
|
|
|
|
|
|
|
|
|
|
|
|
|
|
|
|
|
|
|
|
|
|
|
|
|
|
|
|
|
|
|
|
|
|
|
|
| Total commercial |
|
|
503 |
|
|
|
0.68 |
|
|
|
683 |
|
|
|
0.94 |
|
|
|
929 |
|
|
|
1.25 |
|
|
|
1,091 |
|
|
|
1.46 |
|
|
|
1,415 |
|
|
|
1.86 |
|
|
|
|
|
|
|
|
|
|
|
|
|
|
|
|
|
|
|
|
|
|
|
|
|
|
|
|
|
|
|
|
|
|
|
|
|
|
|
|
|
|
| Total net charge-offs |
|
$ |
5,665 |
|
|
|
2.44 |
|
|
$ |
6,028 |
|
|
|
2.61 |
|
|
$ |
6,783 |
|
|
|
2.87 |
|
|
$ |
7,197 |
|
|
|
3.07 |
|
|
$ |
9,557 |
|
|
|
3.98 |
|
|
|
|
|
|
|
|
|
|
|
|
|
|
|
|
|
|
|
|
|
|
|
|
|
|
|
|
|
|
|
|
|
|
|
|
|
|
|
|
|
|
|
|
|
|
|
|
|
|
|
|
|
| By Business Segment |
|
|
|
|
|
|
|
|
|
|
|
|
|
|
|
|
|
|
|
|
|
|
|
|
|
|
|
|
|
|
|
|
|
|
|
|
|
|
|
|
| Deposits |
|
$ |
36 |
|
|
|
23.58 |
% |
|
$ |
34 |
|
|
|
21.34 |
% |
|
$ |
40 |
|
|
|
25.64 |
% |
|
$ |
70 |
|
|
|
39.43 |
% |
|
$ |
66 |
|
|
|
35.64 |
% |
| Global Card Services |
|
|
2,879 |
|
|
|
7.37 |
|
|
|
3,342 |
|
|
|
8.34 |
|
|
|
3,693 |
|
|
|
8.79 |
|
|
|
4,230 |
|
|
|
9.83 |
|
|
|
5,672 |
|
|
|
12.85 |
|
| Consumer Real Estate Services |
|
|
1,213 |
|
|
|
4.16 |
|
|
|
1,114 |
|
|
|
3.75 |
|
|
|
1,183 |
|
|
|
3.76 |
|
|
|
1,323 |
|
|
|
4.11 |
|
|
|
1,664 |
|
|
|
5.11 |
|
| Global Commercial Banking |
|
|
321 |
|
|
|
0.68 |
|
|
|
514 |
|
|
|
1.08 |
|
|
|
639 |
|
|
|
1.30 |
|
|
|
730 |
|
|
|
1.45 |
|
|
|
960 |
|
|
|
1.86 |
|
| Global Banking & Markets |
|
|
(9 |
) |
|
|
(0.03 |
) |
|
|
(3 |
) |
|
|
(0.01 |
) |
|
|
25 |
|
|
|
0.10 |
|
|
|
52 |
|
|
|
0.22 |
|
|
|
87 |
|
|
|
0.38 |
|
| Global Wealth & Investment Management |
|
|
129 |
|
|
|
0.50 |
|
|
|
88 |
|
|
|
0.36 |
|
|
|
131 |
|
|
|
0.52 |
|
|
|
112 |
|
|
|
0.45 |
|
|
|
115 |
|
|
|
0.47 |
|
| All Other |
|
|
1,096 |
|
|
|
1.70 |
|
|
|
939 |
|
|
|
1.47 |
|
|
|
1,072 |
|
|
|
1.69 |
|
|
|
680 |
|
|
|
1.13 |
|
|
|
993 |
|
|
|
1.55 |
|
|
|
|
|
|
|
|
|
|
|
|
|
|
|
|
|
|
|
|
|
|
|
|
|
|
|
|
|
|
|
|
|
|
|
|
|
|
|
|
|
|
| Total net charge-offs |
|
$ |
5,665 |
|
|
|
2.44 |
|
|
$ |
6,028 |
|
|
|
2.61 |
|
|
$ |
6,783 |
|
|
|
2.87 |
|
|
$ |
7,197 |
|
|
|
3.07 |
|
|
$ |
9,557 |
|
|
|
3.98 |
|
|
|
|
|
|
|
|
|
|
|
|
|
|
|
|
|
|
|
|
|
|
|
|
|
|
|
|
|
|
|
|
|
|
|
|
|
|
|
|
|
|
| (1) |
Net charge-off ratios are calculated as annualized net charge-offs divided by average outstanding loans and leases excluding loans accounted for under the fair value
option during the period for each loan and lease category. |
| (2) |
Excludes U.S. small business commercial loans. |
Loans are classified as U.S. or non-U.S. based upon the domicile of the borrower.
Certain prior period amounts have been reclassified to conform to current period presentation.
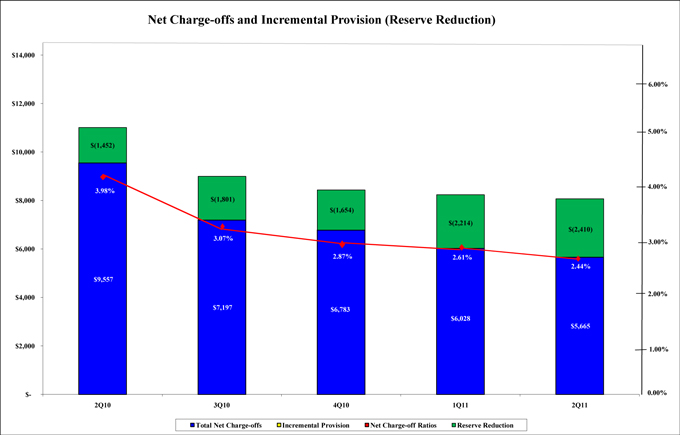
|
|
|
| This information is preliminary and based on company data available at the time of the presentation. |
|
41 |
Bank of America Corporation and Subsidiaries
Year-to-Date Net Charge-offs and Net Charge-off Ratios (1)
(Dollars in millions)
|
|
|
|
|
|
|
|
|
|
|
|
|
|
|
|
|
| |
|
Six Months Ended June 30 |
|
| |
|
2011 |
|
|
2010 |
|
| Net Charge-offs |
|
Amount |
|
|
Percent |
|
|
Amount |
|
|
Percent |
|
| Residential mortgage |
|
$ |
2,009 |
|
|
|
1.54 |
% |
|
$ |
2,040 |
|
|
|
1.67 |
% |
| Home equity |
|
|
2,442 |
|
|
|
3.68 |
|
|
|
4,138 |
|
|
|
5.55 |
|
| Discontinued real estate |
|
|
46 |
|
|
|
0.73 |
|
|
|
40 |
|
|
|
0.57 |
|
| U.S. credit card |
|
|
4,205 |
|
|
|
7.85 |
|
|
|
7,480 |
|
|
|
12.36 |
|
| Non-U.S. credit card |
|
|
831 |
|
|
|
6.11 |
|
|
|
1,573 |
|
|
|
11.02 |
|
| Direct/Indirect consumer |
|
|
891 |
|
|
|
2.00 |
|
|
|
1,988 |
|
|
|
4.02 |
|
| Other consumer |
|
|
83 |
|
|
|
6.19 |
|
|
|
131 |
|
|
|
8.90 |
|
|
|
|
|
|
|
|
|
|
|
|
|
|
|
|
|
|
| Total consumer |
|
|
10,507 |
|
|
|
3.32 |
|
|
|
17,390 |
|
|
|
5.28 |
|
|
|
|
|
|
|
|
|
|
|
|
|
|
|
|
|
|
| U.S. commercial (2) |
|
|
39 |
|
|
|
0.05 |
|
|
|
465 |
|
|
|
0.52 |
|
| Commercial real estate |
|
|
451 |
|
|
|
1.93 |
|
|
|
1,260 |
|
|
|
3.83 |
|
| Commercial lease financing |
|
|
(7 |
) |
|
|
(0.06 |
) |
|
|
18 |
|
|
|
0.17 |
|
| Non-U.S. commercial |
|
|
116 |
|
|
|
0.64 |
|
|
|
91 |
|
|
|
0.68 |
|
|
|
|
|
|
|
|
|
|
|
|
|
|
|
|
|
|
|
|
|
599 |
|
|
|
0.43 |
|
|
|
1,834 |
|
|
|
1.26 |
|
| U.S. small business commercial |
|
|
587 |
|
|
|
8.24 |
|
|
|
1,130 |
|
|
|
13.59 |
|
|
|
|
|
|
|
|
|
|
|
|
|
|
|
|
|
|
| Total commercial |
|
|
1,186 |
|
|
|
0.81 |
|
|
|
2,964 |
|
|
|
1.92 |
|
|
|
|
|
|
|
|
|
|
|
|
|
|
|
|
|
|
| Total net charge-offs |
|
$ |
11,693 |
|
|
|
2.53 |
|
|
$ |
20,354 |
|
|
|
4.21 |
|
|
|
|
|
|
|
|
|
|
|
|
|
|
|
|
|
|
|
|
|
|
|
| By Business Segment |
|
|
|
|
|
|
|
|
|
|
|
|
|
|
|
|
| Deposits |
|
$ |
70 |
|
|
|
22.45 |
% |
|
$ |
109 |
|
|
|
41.53 |
% |
| Global Card Services |
|
|
6,221 |
|
|
|
7.86 |
|
|
|
11,682 |
|
|
|
12.88 |
|
| Consumer Real Estate Services |
|
|
2,327 |
|
|
|
3.95 |
|
|
|
3,981 |
|
|
|
6.07 |
|
| Global Commercial Banking |
|
|
835 |
|
|
|
0.88 |
|
|
|
2,037 |
|
|
|
1.95 |
|
| Global Banking & Markets |
|
|
(12 |
) |
|
|
(0.02 |
) |
|
|
230 |
|
|
|
0.50 |
|
| Global Wealth & Investment Management |
|
|
217 |
|
|
|
0.43 |
|
|
|
234 |
|
|
|
0.48 |
|
| All Other |
|
|
2,035 |
|
|
|
1.59 |
|
|
|
2,081 |
|
|
|
1.64 |
|
|
|
|
|
|
|
|
|
|
|
|
|
|
|
|
|
|
| Total net charge-offs |
|
$ |
11,693 |
|
|
|
2.53 |
|
|
$ |
20,354 |
|
|
|
4.21 |
|
|
|
|
|
|
|
|
|
|
|
|
|
|
|
|
|
|
| (1) |
Net charge-off ratios are calculated as annualized net charge-offs divided by average outstanding loans and leases excluding loans accounted for under the fair value
option during the period for each loan and lease category. |
| (2) |
Excludes U.S. small business commercial loans. |
Loans are classified as U.S. or non-U.S. based upon the domicile of the borrower.
Certain prior period amounts have been reclassified to conform to current period presentation.
|
|
|
| This information is preliminary and based on company data available at the time of the presentation. |
|
42 |
Bank of America Corporation and Subsidiaries
Allocation of the Allowance for Credit Losses by Product Type
(Dollars in millions)
|
|
|
|
|
|
|
|
|
|
|
|
|
|
|
|
|
|
|
|
|
|
|
|
|
|
|
|
|
|
|
|
|
|
|
|
|
|
|
|
|
|
|
|
|
|
|
|
|
| |
|
June 30, 2011 |
|
March 31, 2011 |
|
June 30, 2010 |
|
|
|
| Allowance for loan and lease losses |
|
Amount |
|
|
Percent
of
Total |
|
|
|
|
Percent of
Loans and
Leases
Outstanding (1) |
|
|
|
|
Amount |
|
|
Percent
of
Total |
|
|
|
|
Percent of
Loans and
Leases
Outstanding (1) |
|
|
|
|
Amount |
|
|
Percent
of
Total |
|
|
|
|
Percent of
Loans and
Leases
Outstanding (1) |
|
|
|
| Residential mortgage |
|
$ |
5,845 |
|
|
|
15.66 |
|
|
% |
|
|
2.19 |
|
|
% |
|
$ |
5,369 |
|
|
|
13.48 |
|
|
% |
|
|
2.05 |
|
|
% |
|
$ |
5,086 |
|
|
|
11.24 |
|
|
% |
|
|
2.07 |
|
|
% |
| Home equity |
|
|
13,111 |
|
|
|
35.14 |
|
|
|
|
|
10.03 |
|
|
|
|
|
12,857 |
|
|
|
32.27 |
|
|
|
|
|
9.62 |
|
|
|
|
|
12,840 |
|
|
|
28.37 |
|
|
|
|
|
8.78 |
|
|
|
| Discontinued real estate |
|
|
1,997 |
|
|
|
5.35 |
|
|
|
|
|
16.64 |
|
|
|
|
|
1,871 |
|
|
|
4.69 |
|
|
|
|
|
14.74 |
|
|
|
|
|
912 |
|
|
|
2.02 |
|
|
|
|
|
6.62 |
|
|
|
| U.S. credit card |
|
|
7,540 |
|
|
|
20.21 |
|
|
|
|
|
7.20 |
|
|
|
|
|
9,100 |
|
|
|
22.84 |
|
|
|
|
|
8.50 |
|
|
|
|
|
12,384 |
|
|
|
27.36 |
|
|
|
|
|
10.61 |
|
|
|
| Non-U.S.credit card |
|
|
1,771 |
|
|
|
4.75 |
|
|
|
|
|
6.80 |
|
|
|
|
|
2,069 |
|
|
|
5.19 |
|
|
|
|
|
7.60 |
|
|
|
|
|
2,197 |
|
|
|
4.85 |
|
|
|
|
|
8.32 |
|
|
|
| Direct/Indirect consumer |
|
|
1,475 |
|
|
|
3.95 |
|
|
|
|
|
1.63 |
|
|
|
|
|
1,939 |
|
|
|
4.87 |
|
|
|
|
|
2.17 |
|
|
|
|
|
2,929 |
|
|
|
6.47 |
|
|
|
|
|
2.98 |
|
|
|
| Other consumer |
|
|
145 |
|
|
|
0.39 |
|
|
|
|
|
5.25 |
|
|
|
|
|
163 |
|
|
|
0.41 |
|
|
|
|
|
5.92 |
|
|
|
|
|
182 |
|
|
|
0.41 |
|
|
|
|
|
6.08 |
|
|
|
|
|
|
|
|
|
|
|
|
|
|
|
|
|
|
|
|
|
|
|
|
|
|
|
|
|
|
|
|
|
|
|
|
|
|
|
|
|
|
|
|
|
|
|
|
|
|
|
|
| Total consumer |
|
|
31,884 |
|
|
|
85.45 |
|
|
|
|
|
5.04 |
|
|
|
|
|
33,368 |
|
|
|
83.75 |
|
|
|
|
|
5.26 |
|
|
|
|
|
36,530 |
|
|
|
80.72 |
|
|
|
|
|
5.62 |
|
|
|
|
|
|
|
|
|
|
|
|
|
|
|
|
|
|
|
|
|
|
|
|
|
|
|
|
|
|
|
|
|
|
|
|
|
|
|
|
|
|
|
|
|
|
|
|
|
|
|
|
| U.S. commercial (2) |
|
|
2,792 |
|
|
|
7.48 |
|
|
|
|
|
1.46 |
|
|
|
|
|
3,156 |
|
|
|
7.92 |
|
|
|
|
|
1.67 |
|
|
|
|
|
4,495 |
|
|
|
9.93 |
|
|
|
|
|
2.35 |
|
|
|
| Commercial real estate |
|
|
2,314 |
|
|
|
6.20 |
|
|
|
|
|
5.26 |
|
|
|
|
|
2,904 |
|
|
|
7.29 |
|
|
|
|
|
6.18 |
|
|
|
|
|
3,593 |
|
|
|
7.94 |
|
|
|
|
|
5.83 |
|
|
|
| Commercial lease financing |
|
|
99 |
|
|
|
0.27 |
|
|
|
|
|
0.46 |
|
|
|
|
|
124 |
|
|
|
0.31 |
|
|
|
|
|
0.57 |
|
|
|
|
|
269 |
|
|
|
0.60 |
|
|
|
|
|
1.26 |
|
|
|
| Non-U.S.commercial |
|
|
223 |
|
|
|
0.60 |
|
|
|
|
|
0.52 |
|
|
|
|
|
291 |
|
|
|
0.73 |
|
|
|
|
|
0.79 |
|
|
|
|
|
368 |
|
|
|
0.81 |
|
|
|
|
|
1.32 |
|
|
|
|
|
|
|
|
|
|
|
|
|
|
|
|
|
|
|
|
|
|
|
|
|
|
|
|
|
|
|
|
|
|
|
|
|
|
|
|
|
|
|
|
|
|
|
|
|
|
|
|
| Total commercial (3) |
|
|
5,428 |
|
|
|
14.55 |
|
|
|
|
|
1.82 |
|
|
|
|
|
6,475 |
|
|
|
16.25 |
|
|
|
|
|
2.20 |
|
|
|
|
|
8,725 |
|
|
|
19.28 |
|
|
|
|
|
2.89 |
|
|
|
|
|
|
|
|
|
|
|
|
|
|
|
|
|
|
|
|
|
|
|
|
|
|
|
|
|
|
|
|
|
|
|
|
|
|
|
|
|
|
|
|
|
|
|
|
|
|
|
|
| Allowance for loan and lease
losses |
|
|
37,312 |
|
|
|
100.00 |
|
|
% |
|
|
4.00 |
|
|
|
|
|
39,843 |
|
|
|
100.00 |
|
|
% |
|
|
4.29 |
|
|
|
|
|
45,255 |
|
|
|
100.00 |
|
|
% |
|
|
4.75 |
|
|
|
|
|
|
|
|
|
|
|
|
|
|
|
|
|
|
|
|
|
|
|
|
|
|
|
|
|
|
|
|
|
|
|
|
|
|
|
|
|
|
|
|
|
|
|
|
|
|
|
|
| Reserve for unfunded lending
commitments |
|
|
897 |
|
|
|
|
|
|
|
|
|
|
|
|
|
|
|
961 |
|
|
|
|
|
|
|
|
|
|
|
|
|
|
|
1,413 |
|
|
|
|
|
|
|
|
|
|
|
|
|
|
|
|
|
|
|
|
|
|
|
|
|
|
|
|
|
|
|
|
|
|
|
|
|
|
|
|
|
|
|
|
|
|
|
|
|
|
|
|
|
|
|
|
|
|
|
|
|
|
| Allowance for credit losses
(4) |
|
$ |
38,209 |
|
|
|
|
|
|
|
|
|
|
|
|
|
|
$ |
40,804 |
|
|
|
|
|
|
|
|
|
|
|
|
|
|
$ |
46,668 |
|
|
|
|
|
|
|
|
|
|
|
|
|
|
|
|
|
|
|
|
|
|
|
|
|
|
|
|
|
|
|
|
|
|
|
|
|
|
|
|
|
|
|
|
|
|
|
|
|
|
|
|
|
|
|
|
|
|
|
|
|
|
| (1) |
Ratios are calculated as allowance for loan and lease losses as a percentage of loans and leases outstanding excluding loans accounted for under the fair value
option for each loan and lease category. Loans accounted for under the fair value option include residental mortgage loans of $1.2 billion and discontinued real estate loans of $4.0 billion at June 30, 2011. They also include U.S. commercial
loans of $1.6 billion, $1.4 billion and $2.1 billion, non-U.S. commercial loans of $2.8 billion, $2.3 billion and $1.7 billion, and commercial real estate loans of $11 million, $68 million and $114 million at June 30, 2011, March 31,
2011 and June 30, 2010, respectively. |
| (2) |
Includes allowance for U.S. small business commercial loans of $1.0 billion, $1.3 billion and $2.0 billion at June 30, 2011, March 31, 2011 and
June 30, 2010, respectively. |
| (3) |
Includes allowance for loan and lease losses for impaired commercial loans of $778 million, $996 million and $1.4 billion at June 30, 2011, March 31,
2011 and June 30, 2010, respectively. |
| (4) |
Includes $8.4 billion, $8.0 billion and $5.3 billion of allowance for credit losses related to purchased credit-impaired loans at June 30,
2011, March 31, 2011 and June 30, 2010, respectively. |
Certain prior period amounts have been reclassified
to conform to current period presentation.
|
|
|
| This information is preliminary and based on company data available at the time of the presentation. |
|
43 |
Exhibit A: Non-GAAP Reconciliations
Bank of America Corporation and Subsidiaries
Reconciliations to GAAP Financial
Measures
(Dollars in millions)
The Corporation evaluates its business based on a fully taxable-equivalent basis, a non-GAAP
measure. The Corporation believes managing the business with net interest income on a fully taxable-equivalent basis provides a more accurate picture of the interest margin for comparative purposes. Total revenue, net of interest expense, includes
net interest income on a fully taxable-equivalent basis and noninterest income. The Corporation views related ratios and analyses (i.e., efficiency ratios and net interest yield) on a fully taxable-equivalent basis. To derive the fully
taxable-equivalent basis, net interest income is adjusted to reflect tax exempt income on an equivalent before-tax basis with a corresponding increase in income tax expense. This measure ensures comparability of net interest income arising from
taxable and tax-exempt sources. The efficiency ratio measures the costs expended to generate a dollar of revenue, and net interest yield evaluates the basis points the Corporation earns over the cost of funds.
The Corporation also evaluates its business based on the following ratios that utilize tangible equity, a non-GAAP measure. Return on
average tangible common shareholders’ equity measures the Corporation’s earnings contribution as a percentage of common shareholders’ equity plus any Common Equivalent Securities less goodwill and intangible assets (excluding mortgage
servicing rights), net of related deferred tax liabilities. Return on average tangible shareholders’ equity measures the Corporation’s earnings contribution as a percentage of average shareholders’ equity less goodwill and intangible
assets (excluding mortgage servicing rights), net of related deferred tax liabilities. The tangible common equity ratio represents common shareholders’ equity plus any Common Equivalent Securities less goodwill and intangible assets (excluding
mortgage servicing rights), net of related deferred tax liabilities divided by total assets less goodwill and intangible assets (excluding mortgage servicing rights), net of related deferred tax liabilities. The tangible equity ratio represents
total shareholders’ equity less goodwill and intangible assets (excluding mortgage servicing rights), net of related deferred tax liabilities divided by total assets less goodwill and intangible assets (excluding mortgage servicing rights), net
of related deferred tax liabilities. Tangible book value per common share represents ending common shareholders’ equity less goodwill and intangible assets (excluding mortgage servicing rights), net of related deferred tax liabilities divided
by ending common shares outstanding. These measures are used to evaluate the Corporation’s use of equity (i.e., capital). In addition, profitability, relationship and investment models all use return on average tangible shareholders’
equity as key measures to support our overall growth goals.
In certain presentations, earnings and diluted earnings per common
share, the efficiency ratio, return on average assets, return on common shareholders’ equity, return on average tangible common shareholders’ equity and return on average tangible shareholders’ equity are calculated excluding the
impact of goodwill impairment charges of $2.6 billion recorded in the second quarter of 2011, and $2.0 billion and $10.4 billion recorded in the fourth and third quarters of 2010. Accordingly, these are non-GAAP measures.
See the tables below and on page 45 for reconciliations of these non-GAAP measures with financial measures defined by GAAP for the three
months ended June 30, 2011, March 31, 2011, December 31, 2010, September 30, 2010 and June 30, 2010 and the six months ended June 30, 2011 and 2010. The Corporation believes the use of these non-GAAP
measures provides additional clarity in assessing the results of the Corporation. Other companies may define or calculate supplemental financial data differently.
|
|
|
|
|
|
|
|
|
|
|
|
|
|
|
|
|
|
|
|
|
|
|
|
|
|
|
|
|
| |
|
Six Months Ended
June 30 |
|
|
Second
Quarter
2011
|
|
|
First
Quarter
2011 |
|
|
Fourth
Quarter
2010 |
|
|
Third
Quarter
2010 |
|
|
Second
Quarter
2010 |
|
| |
|
2011 |
|
|
2010 |
|
|
|
|
|
|
|
| Reconciliation of net interest income to net interest income on a fully taxable-equivalent
basis |
|
|
|
|
|
|
|
|
|
|
|
|
|
|
|
|
|
|
|
|
|
|
|
| Net interest income |
|
$ |
23,425 |
|
|
$ |
26,649 |
|
|
$ |
11,246 |
|
|
$ |
12,179 |
|
|
$ |
12,439 |
|
|
$ |
12,435 |
|
|
$ |
12,900 |
|
| Fully taxable-equivalent adjustment |
|
|
465 |
|
|
|
618 |
|
|
|
247 |
|
|
|
218 |
|
|
|
270 |
|
|
|
282 |
|
|
|
297 |
|
|
|
|
|
|
|
|
|
|
|
|
|
|
|
|
|
|
|
|
|
|
|
|
|
|
|
|
|
|
| Net interest income on a fully taxable-equivalent basis |
|
$ |
23,890 |
|
|
$ |
27,267 |
|
|
$ |
11,493 |
|
|
$ |
12,397 |
|
|
$ |
12,709 |
|
|
$ |
12,717 |
|
|
$ |
13,197 |
|
|
|
|
|
|
|
|
|
|
|
|
|
|
|
|
|
|
|
|
|
|
|
|
|
|
|
|
|
|
|
| Reconciliation of total revenue, net of interest expense to total revenue, net of interest expense on a fully
taxable-equivalent basis |
|
|
|
|
|
|
|
|
|
|
|
|
|
|
|
|
|
|
|
|
|
|
|
|
|
|
|
|
|
|
| Total revenue, net of interest expense |
|
$ |
40,113 |
|
|
$ |
61,122 |
|
|
$ |
13,236 |
|
|
$ |
26,877 |
|
|
$ |
22,398 |
|
|
$ |
26,700 |
|
|
$ |
29,153 |
|
| Fully taxable-equivalent adjustment |
|
|
465 |
|
|
|
618 |
|
|
|
247 |
|
|
|
218 |
|
|
|
270 |
|
|
|
282 |
|
|
|
297 |
|
|
|
|
|
|
|
|
|
|
|
|
|
|
|
|
|
|
|
|
|
|
|
|
|
|
|
|
|
|
| Total revenue, net of interest expense on a fully taxable-equivalent basis |
|
$ |
40,578 |
|
|
$ |
61,740 |
|
|
$ |
13,483 |
|
|
$ |
27,095 |
|
|
$ |
22,668 |
|
|
$ |
26,982 |
|
|
$ |
29,450 |
|
|
|
|
|
|
|
|
|
|
|
|
|
|
|
|
|
|
|
|
|
|
|
|
|
|
|
|
|
|
|
| Reconciliation of total noninterest expense to total noninterest expense, excluding goodwill impairment
charges |
|
|
|
|
|
|
|
|
|
|
|
|
|
|
|
|
|
|
|
|
|
|
|
| Total noninterest expense |
|
$ |
43,139 |
|
|
$ |
35,028 |
|
|
$ |
22,856 |
|
|
$ |
20,283 |
|
|
$ |
20,864 |
|
|
$ |
27,216 |
|
|
$ |
17,253 |
|
| Goodwill impairment charges |
|
|
(2,603 |
) |
|
|
— |
|
|
|
(2,603 |
) |
|
|
— |
|
|
|
(2,000 |
) |
|
|
(10,400 |
) |
|
|
— |
|
|
|
|
|
|
|
|
|
|
|
|
|
|
|
|
|
|
|
|
|
|
|
|
|
|
|
|
|
|
| Total noninterest expense, excluding goodwill impairment charges |
|
$ |
40,536 |
|
|
$ |
35,028 |
|
|
$ |
20,253 |
|
|
$ |
20,283 |
|
|
$ |
18,864 |
|
|
$ |
16,816 |
|
|
$ |
17,253 |
|
|
|
|
|
|
|
|
|
|
|
|
|
|
|
|
|
|
|
|
|
|
|
|
|
|
|
|
|
|
|
| Reconciliation of income tax expense (benefit) to income tax expense (benefit) on a fully taxable-equivalent
basis |
|
|
|
|
|
|
|
|
|
|
|
|
|
|
|
|
|
|
|
|
|
|
|
| Income tax expense (benefit) |
|
$ |
(3,318 |
) |
|
$ |
1,879 |
|
|
$ |
(4,049 |
) |
|
$ |
731 |
|
|
$ |
(2,351 |
) |
|
$ |
1,387 |
|
|
$ |
672 |
|
| Fully taxable-equivalent adjustment |
|
|
465 |
|
|
|
618 |
|
|
|
247 |
|
|
|
218 |
|
|
|
270 |
|
|
|
282 |
|
|
|
297 |
|
|
|
|
|
|
|
|
|
|
|
|
|
|
|
|
|
|
|
|
|
|
|
|
|
|
|
|
|
|
| Income tax expense (benefit) on a fully taxable-equivalent basis |
|
$ |
(2,853 |
) |
|
$ |
2,497 |
|
|
$ |
(3,802 |
) |
|
$ |
949 |
|
|
$ |
(2,081 |
) |
|
$ |
1,669 |
|
|
$ |
969 |
|
|
|
|
|
|
|
|
|
|
|
|
|
|
|
|
|
|
|
|
|
|
|
|
|
|
|
|
|
|
|
| Reconciliation of net income (loss) to net income (loss), excluding goodwill impairment
charges |
|
|
|
|
|
|
|
|
|
|
|
|
|
|
|
|
|
|
|
|
|
|
|
| Net income (loss) |
|
$ |
(6,777 |
) |
|
$ |
6,305 |
|
|
$ |
(8,826 |
) |
|
$ |
2,049 |
|
|
$ |
(1,244 |
) |
|
$ |
(7,299 |
) |
|
$ |
3,123 |
|
| Goodwill impairment charges |
|
|
2,603 |
|
|
|
— |
|
|
|
2,603 |
|
|
|
— |
|
|
|
2,000 |
|
|
|
10,400 |
|
|
|
— |
|
|
|
|
|
|
|
|
|
|
|
|
|
|
|
|
|
|
|
|
|
|
|
|
|
|
|
|
|
|
| Net income (loss), excluding goodwill impairment charges |
|
$ |
(4,174 |
) |
|
$ |
6,305 |
|
|
$ |
(6,223 |
) |
|
$ |
2,049 |
|
|
$ |
756 |
|
|
$ |
3,101 |
|
|
$ |
3,123 |
|
|
|
|
|
|
|
|
|
|
|
|
|
|
|
|
|
|
|
|
|
|
|
|
|
|
|
|
|
|
|
| Reconciliation of net income (loss) applicable to common shareholders to net income (loss) applicable to common shareholders, excluding goodwill impairment
charges |
|
|
|
|
|
|
|
|
|
|
|
|
|
|
|
|
|
|
|
|
|
|
|
| Net income (loss) applicable to common shareholders |
|
$ |
(7,388 |
) |
|
$ |
5,617 |
|
|
$ |
(9,127 |
) |
|
$ |
1,739 |
|
|
$ |
(1,565 |
) |
|
$ |
(7,647 |
) |
|
$ |
2,783 |
|
| Goodwill impairment charges |
|
|
2,603 |
|
|
|
— |
|
|
|
2,603 |
|
|
|
— |
|
|
|
2,000 |
|
|
|
10,400 |
|
|
|
— |
|
|
|
|
|
|
|
|
|
|
|
|
|
|
|
|
|
|
|
|
|
|
|
|
|
|
|
|
|
|
| Net income (loss) applicable to common shareholders, excluding goodwill impairment charges |
|
$ |
(4,785 |
) |
|
$ |
5,617 |
|
|
$ |
(6,524 |
) |
|
$ |
1,739 |
|
|
$ |
435 |
|
|
$ |
2,753 |
|
|
$ |
2,783 |
|
|
|
|
|
|
|
|
|
|
|
|
|
|
|
|
|
|
|
|
|
|
|
|
|
|
|
|
|
|
Certain prior
period amounts have been reclassified to conform to current period presentation.
|
|
|
| This information is preliminary and based on company data available at the time of the presentation. |
|
44 |
Exhibit A: Non-GAAP Reconciliations - continued
Bank of America Corporation and Subsidiaries
Reconciliations to GAAP Financial Measures
(Dollars in millions)
|
|
|
|
|
|
|
|
|
|
|
|
|
|
|
|
|
|
|
|
|
|
|
|
|
|
|
|
|
| |
|
Six Months Ended
June 30 |
|
|
Second
Quarter
2011 |
|
|
First
Quarter
2011 |
|
|
Fourth
Quarter
2010 |
|
|
Third
Quarter
2010 |
|
|
Second
Quarter
2010 |
|
| |
|
2011 |
|
|
2010 |
|
|
|
|
|
|
|
| Reconciliation of average common shareholders’ equity to average tangible common shareholders’
equity |
|
|
|
|
|
|
|
|
|
|
|
|
|
|
|
|
|
|
|
|
|
|
|
|
|
|
|
|
|
|
| Common shareholders’ equity |
|
$ |
216,367 |
|
|
$ |
207,975 |
|
|
$ |
218,505 |
|
|
$ |
214,206 |
|
|
$ |
218,728 |
|
|
$ |
215,911 |
|
|
$ |
215,468 |
|
| Common Equivalent Securities |
|
|
— |
|
|
|
5,848 |
|
|
|
— |
|
|
|
— |
|
|
|
— |
|
|
|
— |
|
|
|
— |
|
| Goodwill |
|
|
(73,834 |
) |
|
|
(86,225 |
) |
|
|
(73,748 |
) |
|
|
(73,922 |
) |
|
|
(75,584 |
) |
|
|
(82,484 |
) |
|
|
(86,099 |
) |
| Intangible assets (excluding mortgage servicing rights) |
|
|
(9,580 |
) |
|
|
(11,559 |
) |
|
|
(9,394 |
) |
|
|
(9,769 |
) |
|
|
(10,211 |
) |
|
|
(10,629 |
) |
|
|
(11,216 |
) |
| Related deferred tax liabilities |
|
|
2,983 |
|
|
|
3,446 |
|
|
|
2,932 |
|
|
|
3,035 |
|
|
|
3,121 |
|
|
|
3,214 |
|
|
|
3,395 |
|
|
|
|
|
|
|
|
|
|
|
|
|
|
|
|
|
|
|
|
|
|
|
|
|
|
|
|
|
|
| Tangible common shareholders’ equity |
|
$ |
135,936 |
|
|
$ |
119,485 |
|
|
$ |
138,295 |
|
|
$ |
133,550 |
|
|
$ |
136,054 |
|
|
$ |
126,012 |
|
|
$ |
121,548 |
|
|
|
|
|
|
|
|
|
|
|
|
|
|
|
|
|
|
|
|
|
|
|
|
|
|
|
|
|
|
|
| Reconciliation of average shareholders’ equity to average tangible shareholders’
equity |
|
|
|
|
|
|
|
|
|
|
|
|
|
|
|
|
|
|
|
|
|
|
|
|
|
|
|
|
|
|
| Shareholders’ equity |
|
$ |
232,930 |
|
|
$ |
231,695 |
|
|
$ |
235,067 |
|
|
$ |
230,769 |
|
|
$ |
235,525 |
|
|
$ |
233,978 |
|
|
$ |
233,461 |
|
| Goodwill |
|
|
(73,834 |
) |
|
|
(86,225 |
) |
|
|
(73,748 |
) |
|
|
(73,922 |
) |
|
|
(75,584 |
) |
|
|
(82,484 |
) |
|
|
(86,099 |
) |
| Intangible assets (excluding mortgage servicing rights) |
|
|
(9,580 |
) |
|
|
(11,559 |
) |
|
|
(9,394 |
) |
|
|
(9,769 |
) |
|
|
(10,211 |
) |
|
|
(10,629 |
) |
|
|
(11,216 |
) |
| Related deferred tax liabilities |
|
|
2,983 |
|
|
|
3,446 |
|
|
|
2,932 |
|
|
|
3,035 |
|
|
|
3,121 |
|
|
|
3,214 |
|
|
|
3,395 |
|
|
|
|
|
|
|
|
|
|
|
|
|
|
|
|
|
|
|
|
|
|
|
|
|
|
|
|
|
|
| Tangible shareholders’ equity |
|
$ |
152,499 |
|
|
$ |
137,357 |
|
|
$ |
154,857 |
|
|
$ |
150,113 |
|
|
$ |
152,851 |
|
|
$ |
144,079 |
|
|
$ |
139,541 |
|
|
|
|
|
|
|
|
|
|
|
|
|
|
|
|
|
|
|
|
|
|
|
|
|
|
|
|
|
|
|
| Reconciliation of period end common shareholders’ equity to period end tangible common shareholders’
equity |
|
|
|
|
|
|
|
|
|
|
|
|
|
|
|
|
|
|
|
|
|
|
|
|
|
|
|
|
|
|
| Common shareholders’ equity |
|
$ |
205,614 |
|
|
$ |
215,181 |
|
|
$ |
205,614 |
|
|
$ |
214,314 |
|
|
$ |
211,686 |
|
|
$ |
212,391 |
|
|
$ |
215,181 |
|
| Goodwill |
|
|
(71,074 |
) |
|
|
(85,801 |
) |
|
|
(71,074 |
) |
|
|
(73,869 |
) |
|
|
(73,861 |
) |
|
|
(75,602 |
) |
|
|
(85,801 |
) |
| Intangible assets (excluding mortgage servicing rights) |
|
|
(9,176 |
) |
|
|
(10,796 |
) |
|
|
(9,176 |
) |
|
|
(9,560 |
) |
|
|
(9,923 |
) |
|
|
(10,402 |
) |
|
|
(10,796 |
) |
| Related deferred tax liabilities |
|
|
2,853 |
|
|
|
3,215 |
|
|
|
2,853 |
|
|
|
2,933 |
|
|
|
3,036 |
|
|
|
3,123 |
|
|
|
3,215 |
|
|
|
|
|
|
|
|
|
|
|
|
|
|
|
|
|
|
|
|
|
|
|
|
|
|
|
|
|
|
| Tangible common shareholders’ equity |
|
$ |
128,217 |
|
|
$ |
121,799 |
|
|
$ |
128,217 |
|
|
$ |
133,818 |
|
|
$ |
130,938 |
|
|
$ |
129,510 |
|
|
$ |
121,799 |
|
|
|
|
|
|
|
|
|
|
|
|
|
|
|
|
|
|
|
|
|
|
|
|
|
|
|
|
|
|
|
| Reconciliation of period end shareholders’ equity to period end tangible shareholders’
equity |
|
|
|
|
|
|
|
|
|
|
|
|
|
|
|
|
|
|
|
|
|
|
|
|
|
|
|
|
|
|
| Shareholders’ equity |
|
$ |
222,176 |
|
|
$ |
233,174 |
|
|
$ |
222,176 |
|
|
$ |
230,876 |
|
|
$ |
228,248 |
|
|
$ |
230,495 |
|
|
$ |
233,174 |
|
| Goodwill |
|
|
(71,074 |
) |
|
|
(85,801 |
) |
|
|
(71,074 |
) |
|
|
(73,869 |
) |
|
|
(73,861 |
) |
|
|
(75,602 |
) |
|
|
(85,801 |
) |
| Intangible assets (excluding mortgage servicing rights) |
|
|
(9,176 |
) |
|
|
(10,796 |
) |
|
|
(9,176 |
) |
|
|
(9,560 |
) |
|
|
(9,923 |
) |
|
|
(10,402 |
) |
|
|
(10,796 |
) |
| Related deferred tax liabilities |
|
|
2,853 |
|
|
|
3,215 |
|
|
|
2,853 |
|
|
|
2,933 |
|
|
|
3,036 |
|
|
|
3,123 |
|
|
|
3,215 |
|
|
|
|
|
|
|
|
|
|
|
|
|
|
|
|
|
|
|
|
|
|
|
|
|
|
|
|
|
|
| Tangible shareholders’ equity |
|
$ |
144,779 |
|
|
$ |
139,792 |
|
|
$ |
144,779 |
|
|
$ |
150,380 |
|
|
$ |
147,500 |
|
|
$ |
147,614 |
|
|
$ |
139,792 |
|
|
|
|
|
|
|
|
|
|
|
|
|
|
|
|
|
|
|
|
|
|
|
|
|
|
|
|
|
|
|
| Reconciliation of period end assets to period end tangible assets |
|
|
|
|
|
|
|
|
|
|
|
|
|
|
|
|
|
|
|
|
|
|
|
|
|
|
|
|
|
|
| Assets |
|
$ |
2,261,319 |
|
|
$ |
2,368,384 |
|
|
$ |
2,261,319 |
|
|
$ |
2,274,532 |
|
|
$ |
2,264,909 |
|
|
$ |
2,339,660 |
|
|
$ |
2,368,384 |
|
| Goodwill |
|
|
(71,074 |
) |
|
|
(85,801 |
) |
|
|
(71,074 |
) |
|
|
(73,869 |
) |
|
|
(73,861 |
) |
|
|
(75,602 |
) |
|
|
(85,801 |
) |
| Intangible assets (excluding mortgage servicing rights) |
|
|
(9,176 |
) |
|
|
(10,796 |
) |
|
|
(9,176 |
) |
|
|
(9,560 |
) |
|
|
(9,923 |
) |
|
|
(10,402 |
) |
|
|
(10,796 |
) |
| Related deferred tax liabilities |
|
|
2,853 |
|
|
|
3,215 |
|
|
|
2,853 |
|
|
|
2,933 |
|
|
|
3,036 |
|
|
|
3,123 |
|
|
|
3,215 |
|
|
|
|
|
|
|
|
|
|
|
|
|
|
|
|
|
|
|
|
|
|
|
|
|
|
|
|
|
|
| Tangible assets |
|
$ |
2,183,922 |
|
|
$ |
2,275,002 |
|
|
$ |
2,183,922 |
|
|
$ |
2,194,036 |
|
|
$ |
2,184,161 |
|
|
$ |
2,256,779 |
|
|
$ |
2,275,002 |
|
|
|
|
|
|
|
|
|
|
|
|
|
|
|
|
|
|
|
|
|
|
|
|
|
|
|
|
|
|
Certain prior period amounts have been reclassified to conform to current period presentation.
|
|
|
| This information is preliminary and based on company data available at the time of the presentation. |
|
45 |
Appendix: Selected Slides from the
Second Quarter 2011 Earnings Release Presentation
|
|
|
| This information is preliminary and based on company data available at the time of the presentation. |
|
46 |
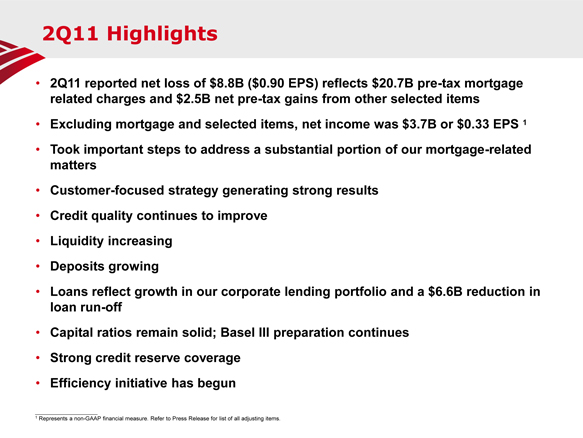
2Q11
Highlights
2Q11 reported net loss of $8.8B ($0.90 EPS) reflects $20.7B pre-tax mortgage related charges and
$2.5B net pre-tax gains from other selected items
Excluding mortgage and selected items, net income was $3.7B
or $0.33 EPS 1
Took important steps to address a substantial portion of our mortgage-related matters
Customer-focused strategy generating strong results
Credit quality continues to improve
Liquidity increasing
Deposits growing
Loans reflect growth in our corporate lending portfolio and a $6.6B reduction in loan run-off
Capital ratios remain solid; Basel III preparation continues
Strong credit reserve coverage
Efficiency initiative has begun
1 Represents a
non-GAAP financial measure. Refer to Press Release for list of all adjusting items.
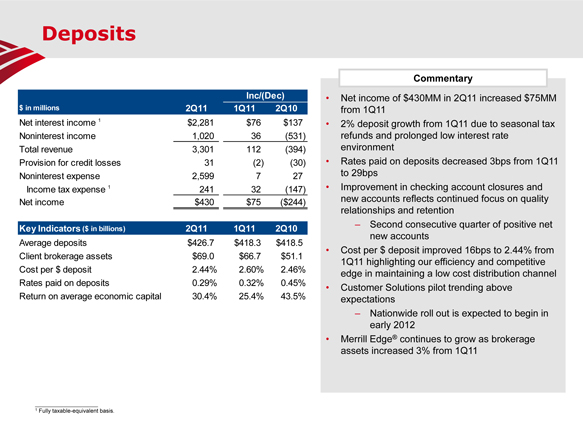
Deposits
Inc/(Dec)
$ in millions 2Q11 1Q11 2Q10
Net interest income
1 $2,281 $76 $137
Noninterest income 1,020 36 (531)
Total revenue 3,301 112 (394)
Provision for credit losses 31 (2) (30)
Noninterest expense 2,599 7 27
Income tax expense 1 241 32 (147)
Net income $430
$75 ($244)
Key Indicators ($ in billions) 2Q11 1Q11 2Q10
Average deposits $426.7 $418.3 $418.5
Client brokerage assets $69.0 $66.7 $51.1
Cost
per $ deposit 2.44% 2.60% 2.46%
Rates paid on deposits 0.29% 0.32% 0.45%
Return on average economic capital 30.4% 25.4% 43.5%
Commentary
Net income of $430MM in 2Q11 increased $75MM from 1Q11
2% deposit growth from 1Q11 due to seasonal tax refunds and prolonged low interest rate environment
Rates paid on deposits decreased 3bps from 1Q11 to 29bps
Improvement in checking account closures and new accounts reflects continued focus on quality relationships and retention
Second consecutive quarter of positive net new accounts
Cost per $ deposit improved 16bps to 2.44% from 1Q11 highlighting our efficiency and competitive edge in maintaining a low
cost distribution channel
Customer Solutions pilot trending above expectations
Nationwide roll out is expected to begin in early 2012
Merrill Edge® continues to grow as brokerage assets increased 3% from 1Q11
1 Fully taxable-equivalent basis.

Global
Wealth & Investment Management
Inc/(Dec)
$ in millions 2Q11 1Q11 2Q10
Net interest income 1 $1,571 $2 $128
Noninterest
income 2,919 (4) 173
Total revenue 4,490 (2) 301
Provision for credit losses 72 26 (50)
Noninterest expense 3,631 32 362
Income tax
expense 1 281 (33) (188)
Net income $506 ($27) $177
Key Indicators ($ in billions) 2Q11 1Q11 2Q10
Total client balances $2,201.9 $2,226.7 $2,047.0
Average loans and leases $102.2 $100.9 $98.8
Average deposits $255.2 $258.5 $226.3
Liquidity
AUM flows ($3.8) ($6.7) ($9.8)
Long-term AUM flows $4.5 $14.2 $1.4
Financial advisors (in thousands) 16.2 15.7 15.3
Pre-tax margin 17.5% 18.9% 19.1%
Return on
average economic capital 30.0% 30.4% 19.1%
Commentary
Net income of $506MM was down $27MM from 1Q11 on higher expenses from increased investment in advisors and higher credit
costs
Revenue nearly flat to 1Q11 record levels
Record Asset Management fees driven by market and long-term AUM flows
Lower brokerage revenue reflecting lower market activity
Client balances fell by 1% driven by lower market valuations and seasonal outflow in deposits and brokerage offset by AUM
inflows
Average loans up $1.3B from 1Q11, the 5th consecutive quarter of loan growth
Provision expense increased from decline in residential mortgage valuations
8th consecutive quarter of increased client facing associates driven by the addition of more than 500 financial advisors
in 2Q11
1 Fully taxable-equivalent basis.
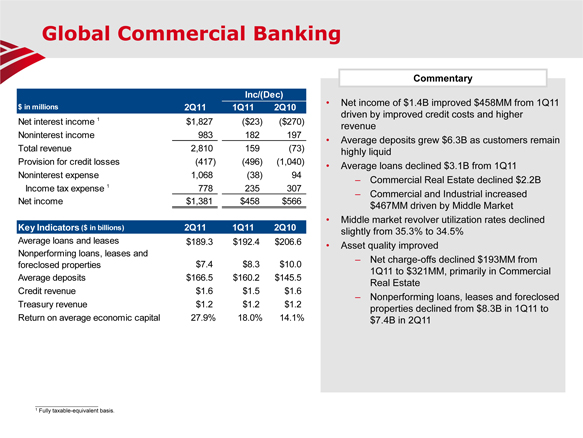
Global
Commercial Banking
Inc/(Dec)
$ in millions 2Q11 1Q11 2Q10
Net interest income
1 $1,827 ($23) ($270)
Noninterest income 983 182 197
Total revenue 2,810 159 (73)
Provision for credit losses (417) (496) (1,040)
Noninterest expense 1,068 (38) 94
Income tax
expense 1 778 235 307
Net income $1,381 $458 $566
Key Indicators ($ in billions) 2Q11 1Q11 2Q10
Average loans and leases $189.3 $192.4 $206.6
Nonperforming loans, leases and
foreclosed properties $7.4 $8.3 $10.0
Average
deposits $166.5 $160.2 $145.5
Credit revenue $1.6 $1.5 $1.6
Treasury revenue $1.2 $1.2 $1.2
Return on average economic capital 27.9% 18.0% 14.1%
Commentary
Net income of $1.4B improved $458MM
from 1Q11 driven by improved credit costs and higher revenue Average deposits grew $6.3B as customers remain highly liquid Average loans declined $3.1B from 1Q11
Commercial Real Estate declined $2.2B
Commercial
and Industrial increased $467MM driven by Middle Market Middle market revolver utilization rates declined slightly from 35.3% to 34.5% Asset quality improved
Net charge-offs declined $193MM from 1Q11 to $321MM, primarily in Commercial Real Estate
Nonperforming loans, leases and foreclosed properties declined from $8.3B in 1Q11 to $7.4B in 2Q11
1 Fully taxable-equivalent basis.
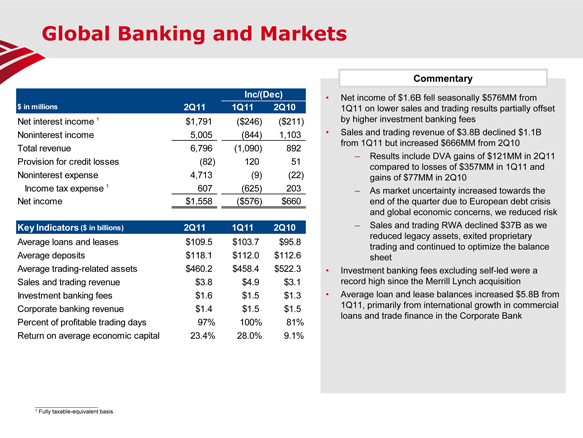
Global
Banking and Markets
IInc/(Dec) $ in millions 2Q11 1Q11 2Q10
Net interest income 1 $1,791 ($246) ($211) Noninterest income 5,005 (844) 1,103 Total revenue 6,796 (1,090) 892 Provision
for credit losses (82) 120 51 Noninterest expense 4,713 (9) (22) Income tax expense 1 607 (625) 203 Net income $1,558 ($576) $660
Key Indicators ($ in billions) 2Q11 1Q11 2Q10
Average loans and leases $109.5 $103.7 $95.8 Average deposits $118.1 $112.0 $112.6 Average trading-related assets $460.2
$458.4 $522.3 Sales and trading revenue $3.8 $4.9 $3.1 Investment banking fees $1.6 $1.5 $1.3 Corporate banking revenue $1.4 $1.5 $1.5 Percent of profitable trading days 97% 100% 81% Return on average economic capital 23.4% 28.0% 9.1% $460.2
1 Fully taxable-equivalent basis.
Commentary
Net income of $1.6B fell seasonally
$576MM from 1Q11 on lower sales and trading results partially offset by higher investment banking fees
Sales
and trading revenue of $3.8B declined $1.1B from 1Q11 but increased $666MM from 2Q10
– Results include
DVA gains of $121MM in 2Q11 compared to losses of $357MM in 1Q11 and gains of $77MM in 2Q10
– As market
uncertainty increased towards the end of the quarter due to European debt crisis and global economic concerns, we reduced risk
– Sales and trading RWA declined $37B as we reduced legacy assets, exited proprietary trading and continued to optimize the balance sheet
Investment banking fees excluding self-led were a record high since the Merrill Lynch acquisition
Average loan and lease balances increased $5.8B from 1Q11, primarily from international growth in commercial loans and
trade finance in the Corporate Bank
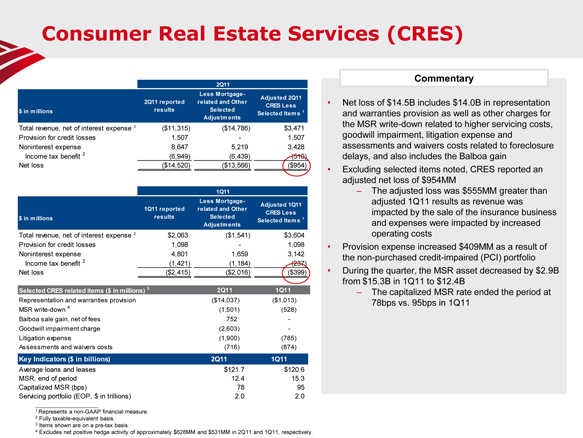
Consumer
Real Estate Services (CRES)
2Q11
Less Mortgage- Adjusted 2Q11
2Q11 reported
related and Other CRES Less
$ in millions results Selected Selected Items 1
Adjustments
Total revenue, net of interest expense 2 ($11,315) ($14,786) $3,471
Provision for credit losses 1,507 - 1,507
Noninterest expense 8,647 5,219 3,428
Income tax benefit 2 (6,949) (6,439) (510)
Net
loss ($14,520) ($13,566) ($954)
1Q11
Less Mortgage- Adjusted 1Q11
1Q11 reported
related and Other CRES Less
$ in millions results Selected Selected Items 1
Adjustments
Total revenue, net of interest expense 2 $2,063 ($1,541) $3,604
Provision for credit losses 1,098 - 1,098
Noninterest expense 4,801 1,659 3,142
Income tax benefit 2 (1,421) (1,184) (237)
Net
loss ($2,415) ($2,016) ($399)
Selected CRES related items ($ in millions) 3 2Q11 1Q11
Representation and warranties provision ($14,037) ($1,013)
MSR write-down 4 (1,501) (528)
Balboa sale gain, net of fees 752 -
Goodwill
impairment charge (2,603) -
Litigation expense (1,900) (785)
Assessments and waivers costs (716) (874)
Key Indicators ($ in billions) 2Q11 1Q11
Average
loans and leases $121.7 $120.6
MSR, end of period 12.4 15.3
Capitalized MSR (bps) 78 95
Servicing portfolio (EOP, $ in trillions) 2.0 2.0
Commentary
Net loss of $14.5B includes $14.0B in representation and warranties provision as well as other charges for the MSR write-down related to higher servicing costs, goodwill impairment,
litigation expense and assessments and waivers costs related to foreclosure delays, and also includes the Balboa gain
Excluding selected items noted, CRES reported an adjusted net loss of $954MM
The adjusted loss was $555MM greater than adjusted 1Q11 results as revenue was impacted by the sale of the insurance business and expenses were impacted by increased operating costs
Provision expense increased $409MM as a result of the non-purchased credit-impaired (PCI) portfolio
During the quarter, the MSR asset decreased by $2.9B from $15.3B in 1Q11 to $12.4B
The capitalized MSR rate ended the period at 78bps vs. 95bps in 1Q11
1 Represents a non-GAAP financial measure.
2 Fully taxable-equivalent basis.
3 Items shown
are on a pre-tax basis.
4 Excludes net positive hedge activity of approximately $628MM and $531MM in 2Q11 and
1Q11, respectively.
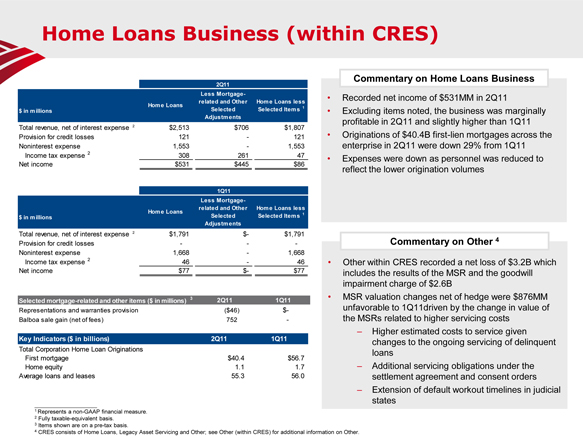
Home Loans
Business (within CRES)
2Q11
Less Mortgage-
related and Other Home Loans less
$ in millions Home Loans Selected Selected Items 1
Adjustments
Total revenue, net of interest expense 2 $2,513 $706 $1,807
Provision for credit losses 121 - 121
Noninterest
expense 1,553 - 1,553
Income tax expense 2 308 261 47
Net income $531 $445 $86
1Q11
Less Mortgage-
related and Other Home Loans less
$ in millions Home Loans Selected Selected Items 1
Adjustments
Total revenue, net of interest expense 2 $1,791 $- $1,791
Provision for credit losses - - -
Noninterest
expense 1,668 - 1,668
Income tax expense 2 46 - 46
Net income $77 $- $77
Selected mortgage-related and other items ($ in millions) 3 2Q11 1Q11
Representations and warranties provision ($46) $-
Balboa sale gain (net of fees) 752 -
Key Indicators ($ in billions) 2Q11 1Q11
Total
Corporation Home Loan Originations
First mortgage $40.4 $56.7
Home equity 1.1 1.7
Average loans and leases 55.3 56.0
Commentary on
Home Loans Business
Recorded net income of $531MM in 2Q11
Excluding items noted, the business was marginally profitable in 2Q11 and slightly higher than 1Q11
Originations of $40.4B first-lien mortgages across the enterprise in 2Q11 were down 29% from 1Q11
Expenses were down as personnel was reduced to reflect the lower origination volumes
Commentary on Other 4
Other within CRES recorded a net loss of $3.2B which includes the results of the MSR and the goodwill impairment charge of $2.6B
MSR valuation changes net of hedge were $876MM unfavorable to 1Q11driven by the change in value of the MSRs related to
higher servicing costs
Higher estimated costs to service given changes to the ongoing servicing of delinquent
loans
Additional servicing obligations under the settlement agreement and consent orders
Extension of default workout timelines in judicial states
1 Represents a non-GAAP financial measure.
2 Fully taxable-equivalent basis.
3 Items shown
are on a pre-tax basis.
4 CRES consists of Home Loans, Legacy Asset Servicing and Other; see Other (within
CRES) for additional information on Other.
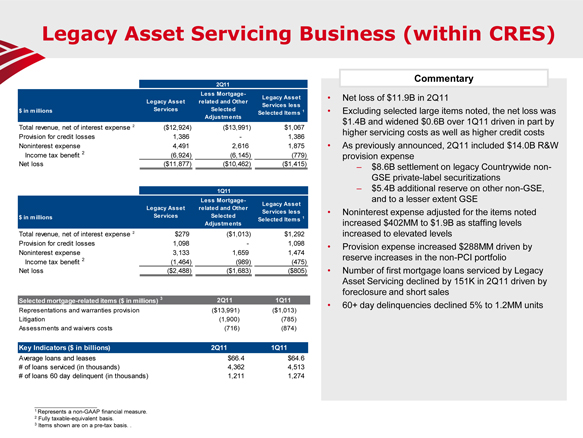
Legacy
Asset Servicing Business (within CRES)
2Q11
Less Mortgage- Legacy Asset
Legacy Asset related and Other Services less
$ in
millions Services Selected Selected Items 1
Adjustments
Total revenue, net of interest expense 2 ($12,924) ($13,991) $1,067
Provision for credit losses 1,386 - 1,386
Noninterest expense 4,491 2,616 1,875
Income tax
benefit 2 (6,924) (6,145) (779)
Net loss ($11,877) ($10,462) ($1,415)
1Q11
Less Mortgage- Legacy Asset
Legacy Asset related
and Other Services less
$ in millions Services Selected Selected Items 1
Adjustments
Total revenue, net of interest expense 2 $279 ($1,013) $1,292
Provision for credit losses 1,098 - 1,098
Noninterest expense 3,133 1,659 1,474
Income tax benefit 2 (1,464) (989) (475)
Net loss
($2,488) ($1,683) ($805)
Selected mortgage-related items ($ in millions) 3 2Q11 1Q11
Representations and warranties provision ($13,991) ($1,013)
Litigation (1,900) (785)
Assessments and waivers costs (716) (874)
Key
Indicators ($ in billions) 2Q11 1Q11
Average loans and leases $66.4 $64.6
# of loans serviced (in thousands) 4,362 4,513
# of loans 60 day delinquent (in thousands) 1,211 1,274
Commentary
Net loss of $11.9B in 2Q11
Excluding selected large items noted, the net loss was $1.4B and widened $0.6B over 1Q11 driven in part by higher
servicing costs as well as higher credit costs
As previously announced, 2Q11 included $14.0B R&W provision
expense
$8.6B settlement on legacy Countrywide non- GSE private-label securitizations
$5.4B additional reserve on other non-GSE, and to a lesser extent GSE
Noninterest expense adjusted for the items noted increased $402MM to $1.9B as staffing levels increased to elevated levels
Provision expense increased $288MM driven by reserve increases in the non-PCI portfolio
Number of first mortgage loans serviced by Legacy Asset Servicing declined by 151K in 2Q11 driven by foreclosure and short
sales
60+ day delinquencies declined 5% to 1.2MM units
1 Represents a non-GAAP financial measure.
2 Fully taxable-equivalent basis.
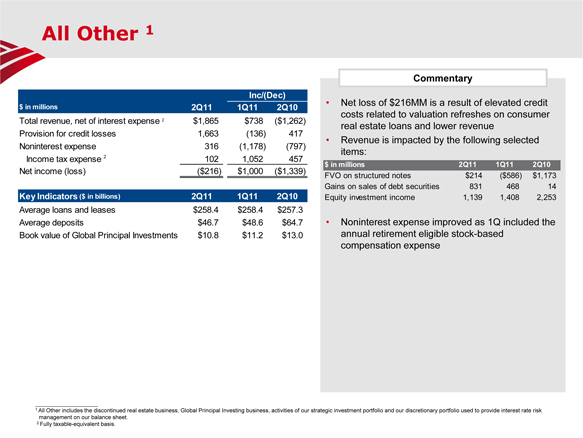
All Other
1
Inc/(Dec)
$ in millions 2Q11 1Q11 2Q10
Total revenue, net
of interest expense 2
Provision for credit losses
Noninterest expense
Income tax expense 2
Net income (loss)
$1,865 $738 ($1,262)
1,663 (136) 417
316 (1,178) (797)
102 1,052 457
($216) $1,000 ($1,339)
Key Indicators ($ in
billions) 2Q11 1Q11 2Q10
Average loans and leases
Average deposits
Book value of Global Principal Investments
$258.4
$258.4 $257.3
$46.7 $48.6 $64.7
$10.8 $11.2 $13.0
Commentary
Net loss of $216MM is a result of elevated credit costs related to valuation refreshes on consumer real estate loans and
lower revenue
Revenue is impacted by the following selected items:
$ in millions 2Q11 1Q11 2Q10
FVO on structured notes $214 ($586) $1,173
Gains
on sales of debt securities 831 468 14
Equity investment income 1,139 1,408 2,253
Noninterest expense improved as 1Q included the annual retirement eligible stock-based compensation expense
1 All Other includes the discontinued real estate business, Global Principal Investing business, activities of our
strategic investment portfolio and our discretionary portfolio used to provide interest rate risk management on our balance sheet.
2 Fully taxable-equivalent basis.

Expenses
2Q11 Noninterest Expense ($B)
2Q11 1Q11 4Q10
Total noninterest expense $22.9
$20.3 $20.9
Selected large mortgage-related items
Litigation expense 1.9 0.8 0.6
Mortgage-related assessments and waivers costs 0.7 0.9 0.2
CRES goodwill impairment charge 2.6 - 2.0
Commentary vs. 1Q11
Expense increased $2.6B from 1Q11
Excluding the
selected mortgage-related items in the quarter, noninterest expense was in line with 1Q11, excluding the $1.0B cost of retirement eligible stock-based compensation expense which only happens in the first quarter
2Q included increased servicing costs in our mortgage business as well as increased costs of adding client-facing
professionals across targeted growth areas offset by reduced personnel in other areas of the company
Among the
many client facing associates added in growth areas during the quarter were more than 500 financial advisors and nearly 100 small business bankers
Average FTE in 2Q11 287,839 vs. 288,062 in 1Q11
Company-wide efficiency initiative launched (“New BAC”)
Team of internal and external experts driving process
Tangible results on expense levels from New BAC are expected in 2012
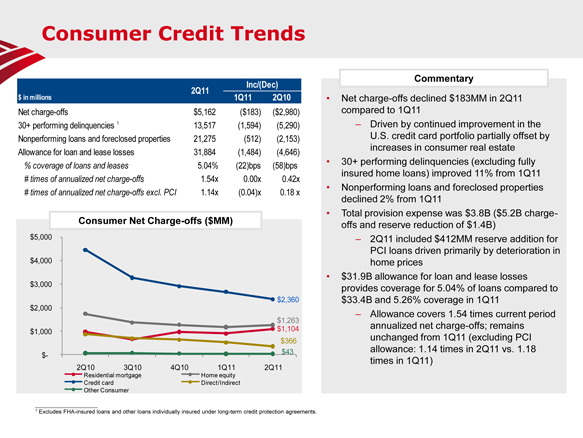
Consumer
Credit Trends
Inc/(Dec)
2Q11
$ in millions 1Q11 2Q10
Net charge-offs $5,162 ($183) ($2,980)
30+ performing delinquencies 1 13,517 (1,594) (5,290)
Nonperforming loans and foreclosed properties 21,275 (512) (2,153)
Allowance for loan and lease losses 31,884 (1,484) (4,646)
% coverage of loans and leases 5.04% (22)bps (58)bps
# times of annualized net charge-offs 1.54x 0.00x 0.42x
# times of annualized net charge-offs excl. PCI 1.14x (0.04)x 0.18 x
Consumer Net Charge-offs ($MM)
$5,000
$4,000
$3,000
$2,360
$2,000
$1,263
$1,000 $1,104
$366
$- $43
2Q10 3Q10 4Q10 1Q11 2Q11
Residential mortgage Home equity
Credit card Direct/Indirect
Other Consumer
Commentary
Net charge-offs declined $183MM in 2Q11 compared to 1Q11
Driven by continued improvement in the U.S. credit card portfolio partially offset by increases in consumer real estate
30+ performing delinquencies (excluding fully insured home loans) improved 11% from 1Q11
Nonperforming loans and foreclosed properties declined 2% from 1Q11
Total provision expense was $3.8B ($5.2B charge- offs and reserve reduction of $1.4B)
2Q11 included $412MM reserve addition for PCI loans driven primarily by deterioration in home prices
$31.9B allowance for loan and lease losses provides coverage for 5.04% of loans compared to $33.4B and 5.26% coverage in
1Q11
Allowance covers 1.54 times current period annualized net charge-offs; remains unchanged from 1Q11
(excluding PCI allowance: 1.14 times in 2Q11 vs. 1.18 times in 1Q11)
1 Excludes FHA-insured loans and other
loans individually insured under long-term credit protection agreements.
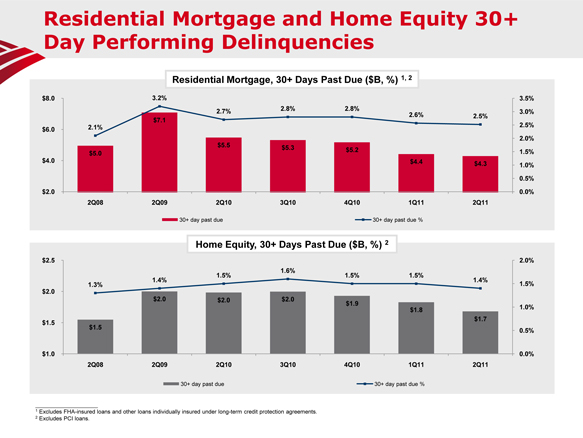
Residential Mortgage and Home Equity 30+ Day Performing Delinquencies
Residential Mortgage, 30+ Days Past Due ($B, %) 1, 2
$8.0 3.2% 3.5%
2.7% 2.8% 2.8% 3.0%
$7.1 2.6% 2.5%
2.5%
$6.0 2.1%
2.0%
$5.5
$5.0 $5.3 $5.2 1.5%
$4.0 $4.4 $4.3 1.0%
0.5%
$2.0 0.0%
2Q08 2Q09 2Q10 3Q10 4Q10 1Q11 2Q11
30+ day past due 30+ day past due %
Home Equity, 30+ Days Past Due ($B, %) 2
$2.5
2.0%
1.6%
1.5% 1.5% 1.5%
1.4% 1.4%
1.3% 1.5%
$2.0
$2.0 $2.0 $2.0 $1.9
$1.8 1.0%
$1.5 $1.7
$1.5 0.5%
$1.0 0.0%
2Q08 2Q09 2Q10 3Q10 4Q10 1Q11 2Q11
30+ day past
due 30+ day past due %
1 Excludes FHA-insured loans and other loans individually insured under long-term
credit protection agreements.
2 Excludes PCI loans.
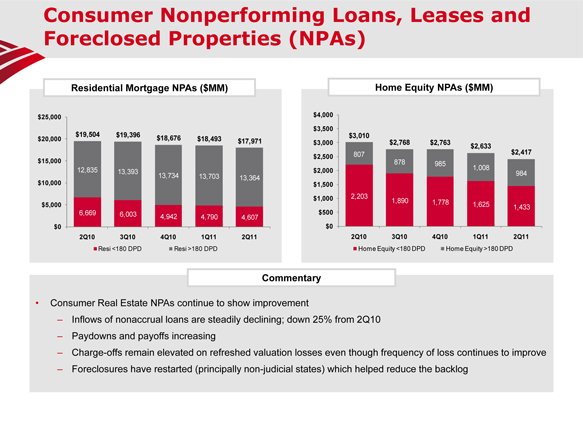
Consumer
Nonperforming Loans, Leases and Foreclosed Properties (NPAs)
Residential Mortgage NPAs ($MM)
$25,000
$19,504 $19,396
$20,000 $18,676 $18,493 $17,971
$15,000
12,835 13,393
13,734 13,703 13,364
$10,000
$5,000
6,669 6,003
4,942 4,790 4,607
$0
2Q10 3Q10 4Q10 1Q11 2Q11
Resi<180 DPD Resi>180 DPD
Home Equity NPAs ($MM)
$4,000
$3,500
$3,010 $2,768
$3,000 $2,763
$2,633
807 $2,417
$2,500
878 985
$2,000 1,008
984
$ 1,500
$1,000 2,203
1,890 1,778
1,625 1,433
$500
$0
2Q10 3Q10 4Q10 1Q11 2Q11
Home Equity<180 DPD Home Equity>180 DPD
Commentary
Consumer Real Estate NPAs continue to show improvement
Inflows of nonaccrual loans are steadily declining; down 25% from 2Q10
Paydowns and payoffs increasing
Charge-offs
remain elevated on refreshed valuation losses even though frequency of loss continues to improve
Foreclosures
have restarted (principally non-judicial states) which helped reduce the backlog
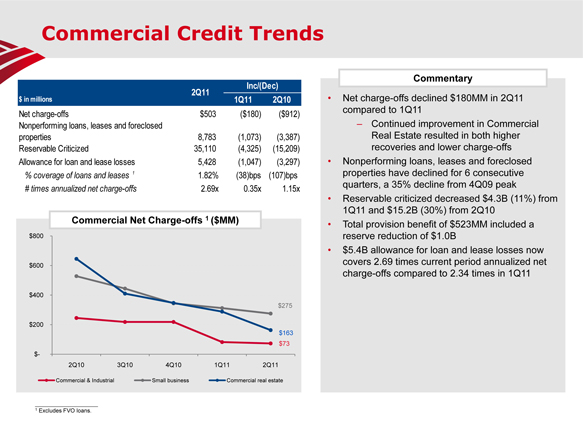
Commercial
Credit Trends
Inc/(Dec)
2Q11
$ in millions 1Q11 2Q10
Net charge-offs $503 ($180) ($912)
Nonperforming loans, leases and foreclosed
properties 8,783 (1,073) (3,387)
Reservable Criticized 35,110 (4,325) (15,209)
Allowance for loan and lease losses 5,428 (1,047) (3,297)
% coverage of loans and leases 1 1.82% (38)bps (107)bps
# times annualized net charge-offs 2.69x 0.35x 1.15x
Commercial Net Charge-offs 1 ($MM)
$800
$600
$400
$275
$200
$163
$73
$-
2Q10 3Q10 4Q10 1Q11 2Q11
Commercial & Industrial Small business Commercial real estate
1 Excludes FVO loans.
Commentary
Net charge-offs declined $180MM in 2Q11 compared to 1Q11
Continued improvement in Commercial Real Estate resulted in both higher recoveries and lower charge-offs Nonperforming
loans, leases and foreclosed properties have declined for 6 consecutive quarters, a 35% decline from 4Q09 peak
Reservable criticized decreased $4.3B (11%) from 1Q11 and $15.2B (30%) from 2Q10 Total provision benefit of
$523MM included a reserve reduction of $1.0B $5.4B allowance for loan and lease losses now covers 2.69 times current period annualized net charge-offs compared to 2.34 times in 1Q11
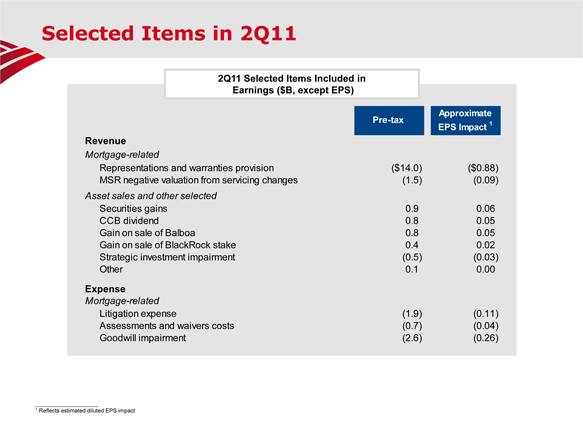
Selected
Items in 2Q11
2Q11 Selected Items Included in Earnings ($B, except EPS)
Approximate
Pre-tax EPS Impact 1
Revenue
Mortgage-related
Representations and warranties provision ($14.0) ($0.88)
MSR negative valuation from servicing changes (1.5) (0.09)
Asset sales and other selected
Securities gains
0.9 0.06
CCB dividend 0.8 0.05
Gain on sale of Balboa 0.8 0.05
Gain on sale of
BlackRock stake 0.4 0.02
Strategic investment impairment (0.5) (0.03)
Other 0.1 0.00
Expense
Mortgage-related
Litigation expense (1.9) (0.11)
Assessments and waivers costs (0.7) (0.04)
Goodwill impairment (2.6) (0.26)
1 Reflects estimated diluted EPS impact
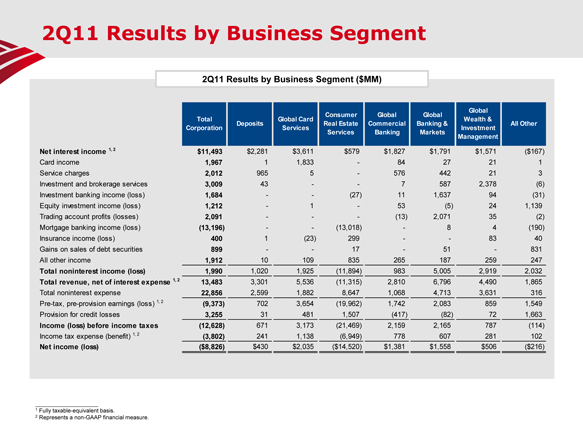
2Q11
Results by Business Segment
2Q11 Results by Business Segment ($MM)
Consumer Global Global Global
Total Global Card Wealth &
Deposits Real
Estate Commercial Banking & All Other
Corporation Services Investment
Services Banking Markets Management
Net interest income 1, 2 $11,493 $2,281 $3,611 $579 $1,827 $1,791 $1,571($167)
Card income 1,967 1 1,833—84 27 21 1
Service
charges 2,012 965 5—576 442 21 3
Investment and brokerage services 3,009 43—- 7 587 2,378(6)
Investment banking income (loss) 1,684—-(27) 11 1,637 94(31)
Equity investment income (loss) 1,212—1—53(5) 24 1,139
Trading account profits (losses) 2,091——(13) 2,071 35(2)
Mortgage banking income (loss)(13,196)—-(13,018)—8 4(190)
Insurance income (loss) 400 1(23) 299—- 83 40
Gains on sales of debt securities 899—- 17—51—831
All other income 1,912 10 109 835 265 187 259 247
Total noninterest income (loss) 1,990 1,020 1,925(11,894) 983 5,005 2,919 2,032
Total revenue, net of interest expense 1, 2 13,483 3,301 5,536(11,315) 2,810 6,796 4,490 1,865
Total noninterest expense 22,856 2,599 1,882 8,647 1,068 4,713 3,631 316
Pre-tax, pre-provision earnings (loss) 1, 2(9,373) 702 3,654(19,962) 1,742 2,083 859 1,549
Provision for credit losses 3,255 31 481 1,507(417)(82) 72 1,663
Income (loss) before income taxes(12,628) 671 3,173(21,469) 2,159 2,165 787(114)
Income tax expense (benefit) 1, 2(3,802) 241 1,138(6,949) 778 607 281 102
Net income (loss)($8,826) $430 $2,035($14,520) $1,381 $1,558 $506($216)
1 Fully taxable-equivalent basis.
2 Represents a
non-GAAP financial measure.
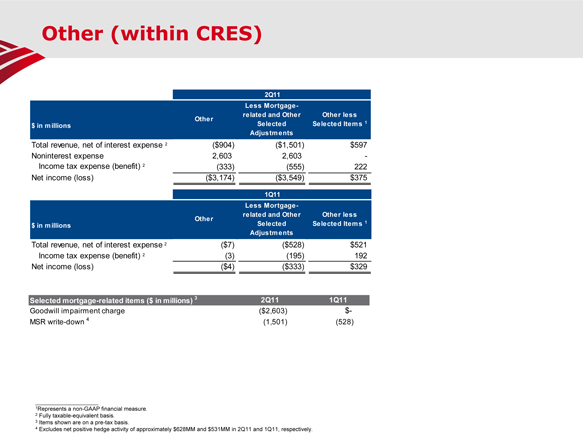
Other
(within CRES)
2Q11
Less Mortgage-
Other related and Other Other less
$ in millions Selected Selected Items 1
Adjustments
Total revenue, net of interest expense 2($904)($1,501) $597
Noninterest expense 2,603 2,603 -
Income tax
expense (benefit) 2(333)(555) 222
Net income (loss)($3,174)($3,549) $375
1Q11
Less Mortgage-
Other related and Other Other less
$ in millions Selected Selected Items 1
Adjustments
Total revenue, net of interest expense 2($7)($528) $521
Income tax expense (benefit) 2(3)(195) 192
Net
income (loss)($4)($333) $329
Selected mortgage-related items ($ in millions) 3 2Q11 1Q11
Goodwill impairment charge($2,603) $-
MSR write-down 4(1,501)(528)
1 Represents a
non-GAAP financial measure.
2 Fully taxable-equivalent basis.
3 Items shown are on a pre-tax basis.
4 Excludes net positive hedge activity of approximately $628MM and $531MM in 2Q11 and 1Q11, respectively.

Impact of
FHA and Other Fully Insured Home Loans on Delinquencies 1
FHA and Other Fully Insured Home Loans ($MM)
2Q10 3Q10 4Q10 1Q11 2Q11
FHA and Other Fully insured Home Loans 30+ Day Performing Delinquencies $17,053 $18,256 $19,150 $22,961 $23,802
Change from prior period 2,066 1,203 894 3,811 841
30+ Day Performing Delinquency Amounts
Total consumer as reported 35,860 36,167 36,254 38,072 37,319
Total consumer excluding FHA and other fully insured home loans 2 18,807 17,911 17,104 15,111 13,517
Residential mortgages as reported 22,536 23,573 24,267 27,381 28,091
Residential mortgages excluding FHA and other fully insured home loans 2 5,483 5,317 5,117 4,420 4,289
30+ Day Performing Delinquency Ratios
Total
consumer as reported 5.52% 5.70% 5.63% 6.00% 5.90%
Total consumer excluding FHA and other fully insured home
loans 2 3.24% 3.23% 3.16% 2.90% 2.63%
Residential mortgages as reported 9.18% 9.69% 9.41% 10.45% 10.55%
Residential mortgages excluding FHA and other fully insured home loans 2 2.72% 2.82% 2.84% 2.57% 2.52%
Commentary vs. 1Q11
During 2Q11 we continued to repurchase delinquent fully-insured home loans which masks the continued improvement in our 30+ day performing delinquency trends
– Total consumer 30+ day performing delinquency excluding fully-insured home loans improved for the 9th consecutive
quarter, down $1.6B
– U.S. credit card of $831MM led the decline while first- and second-lien mortgages
declined as well
1 Includes FHA-insured loans and loans individually insured under long-term credit protection
agreements.
2 Excludes PCI loans.
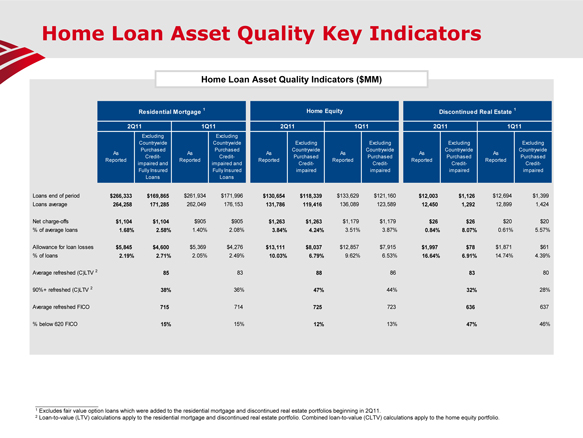
Home Loan
Asset Quality Key Indicators
Home Loan Asset Quality Indicators ($MM)
Residential Mortgage 1 Home Equity Discontinued Real Estate 1
2Q11 1Q11 2Q11 1Q11 2Q11 1Q11
Excluding Excluding
Countrywide Countrywide
Excluding Excluding Excluding Excluding
Purchased Purchased Countrywide Countrywide Countrywide Countrywide
As As As As As As
Credit- Credit- Purchased Purchased Purchased Purchased
Reported Reported Reported Reported Reported Reported
impaired and impaired and Credit- Credit- Credit- Credit-
Fully Insured Fully Insured impaired impaired impaired impaired
Loans Loans
Loans end of period $266,333 $169,865
$261,934 $171,996 $130,654 $118,339 $133,629 $121,160 $12,003 $1,126 $12,694 $1,399
Loans average 264,258
171,285 262,049 176,153 131,786 119,416 136,089 123,589 12,450 1,292 12,899 1,424
Net charge-offs $1,104
$1,104 $905 $905 $1,263 $1,263 $1,179 $1,179 $26 $26 $20 $20
% of average loans 1.68% 2.58% 1.40% 2.08% 3.84%
4.24% 3.51% 3.87% 0.84% 8.07% 0.61% 5.57%
Allowance for loan losses $5,845 $4,600 $5,369 $4,276 $13,111 $8,037
$12,857 $7,915 $1,997 $78 $1,871 $61
% of loans 2.19% 2.71% 2.05% 2.49% 10.03% 6.79% 9.62% 6.53% 16.64% 6.91%
14.74% 4.39%
Average refreshed (C)LTV 2 85 83 88 86 83 80
90%+ refreshed (C)LTV 2 38% 36% 47% 44% 32% 28%
Average refreshed FICO 715 714 725 723 636 637
%
below 620 FICO 15% 15% 12% 13% 47% 46%
1 Excludes fair value option loans which were added to the residential
mortgage and discontinued real estate portfolios beginning in 2Q11.
2 Loan-to-value (LTV) calculations apply
to the residential mortgage and discontinued real estate portfolio. Combined loan-to-value (CLTV) calculations apply to the home equity portfolio.
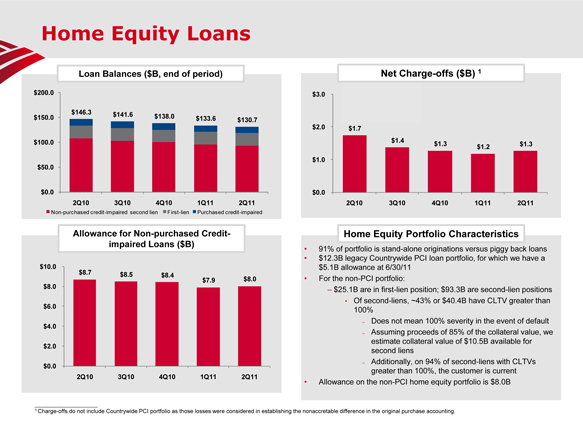
Home
Equity Loans
Loan Balances ($B, end of period)
$200.0
$146.3 $141.6 $150.0 $138.0 $133.6 $130.7
$100.0
$50.0
$0.0
2Q10 3Q10 4Q10 1Q11 2Q11
Non-purchased credit-impaired second lien First-lien Purchased credit-impaired
Net Charge-offs ($B) 1
$3.0 2Q10 includes $128MM
of collateral dependent
modified loans
$2.0 $1.7
$1.4
$1.3 $1.3
$1.2
$1.0
$0.0
2Q10 3Q10 4Q10 1Q11 2Q11
Allowance for
Non-purchased Credit-impaired Loans ($B)
$10.0 $8.7 $8.5 $8.4 $7.9 $8.0 $8.0
$6.0 $4.0 $2.0
$0.0
2Q10 3Q10 4Q10 1Q11 2Q11
Home Equity Portfolio Characteristics
91% of portfolio is stand-alone originations versus piggy back loans $12.3B legacy Countrywide PCI loan portfolio, for which we have a $5.1B allowance at 6/30/11 For the non-PCI portfolio:
– $25.1B are in first-lien position; $93.3B are second-lien positions
• Of second-liens, ~43% or $40.4B have CLTV greater than 100%
– Does not mean 100% severity in the event of default
– Assuming proceeds of 85% of the collateral value, we estimate collateral value of $10.5B available for second liens
– Additionally, on 94% of second-liens with CLTVs greater than 100%, the customer is current Allowance on
the non-PCI home equity portfolio is $8.0B
1 Charge-offs do not include Countrywide PCI portfolio as those
losses were considered in establishing the nonaccretable difference in the original purchase accounting.