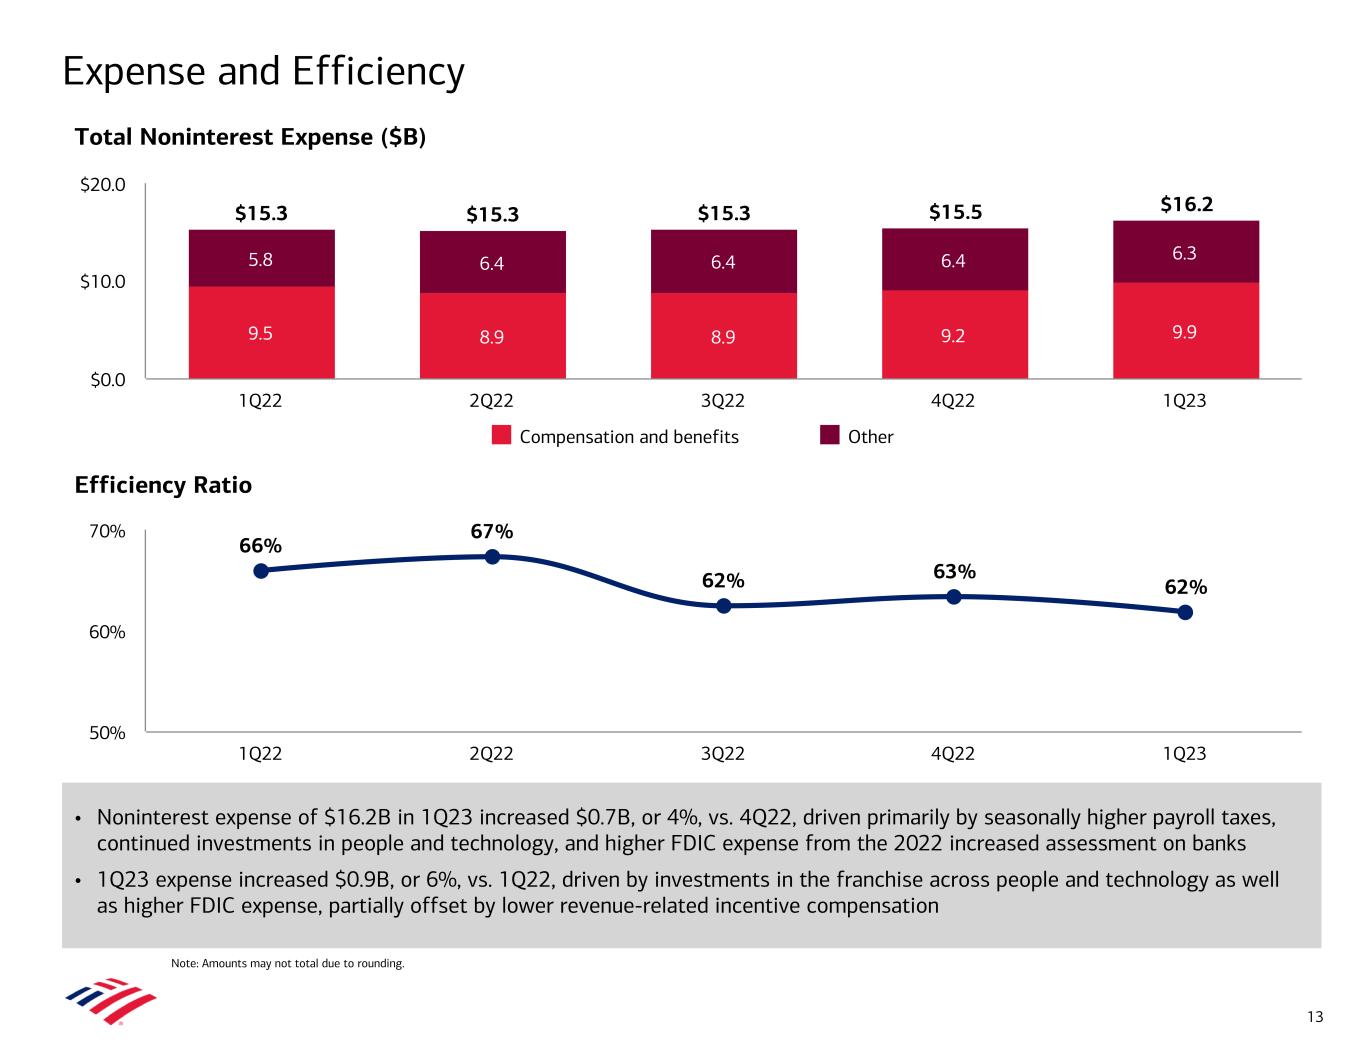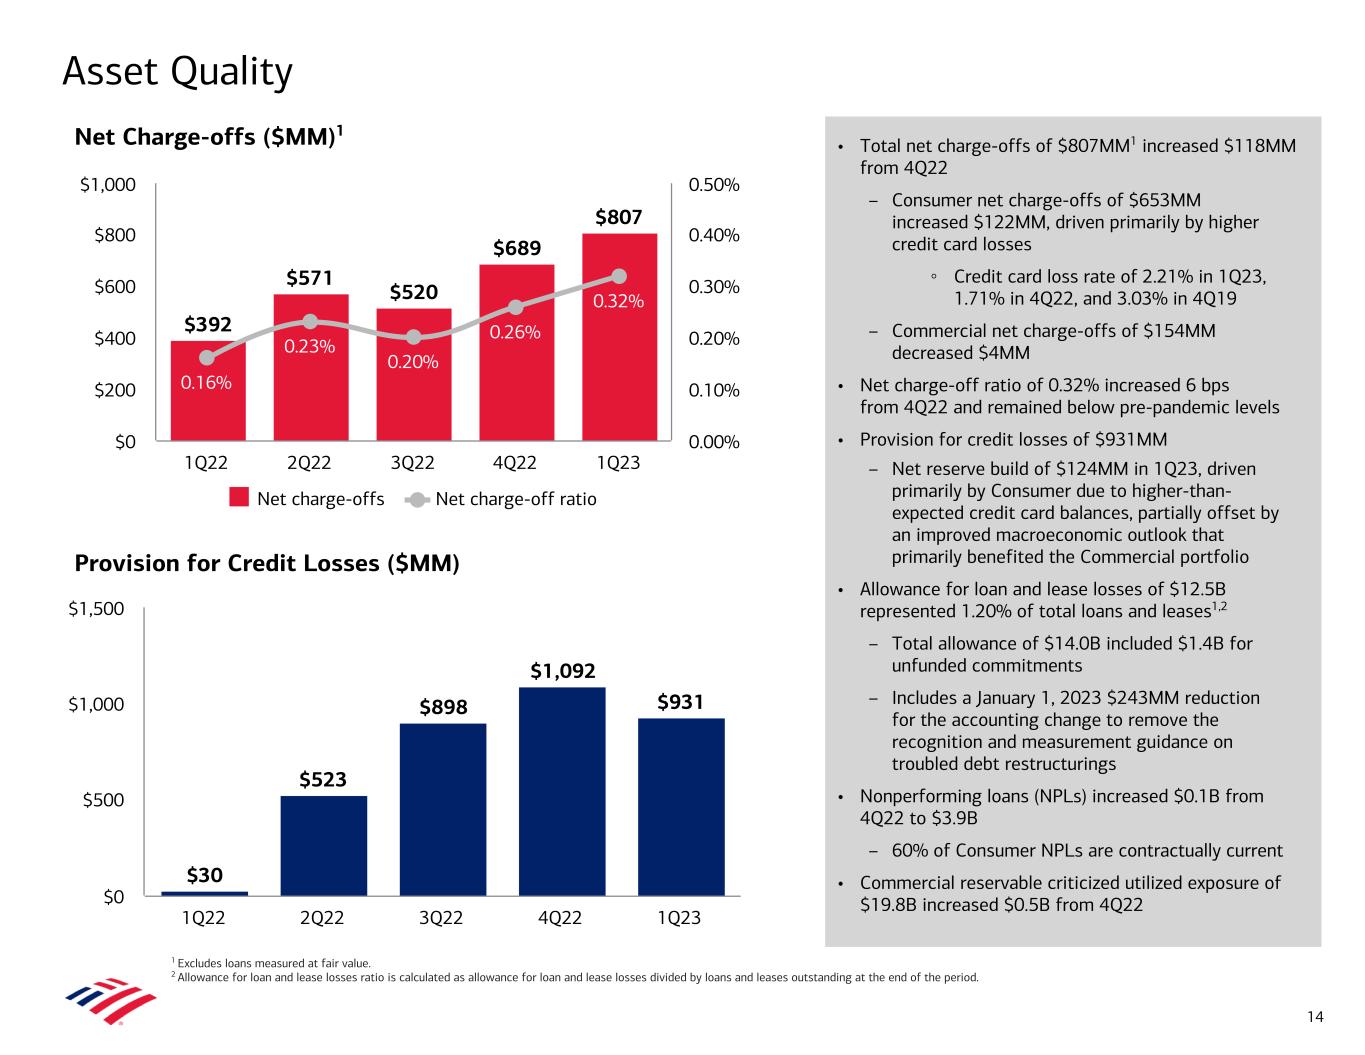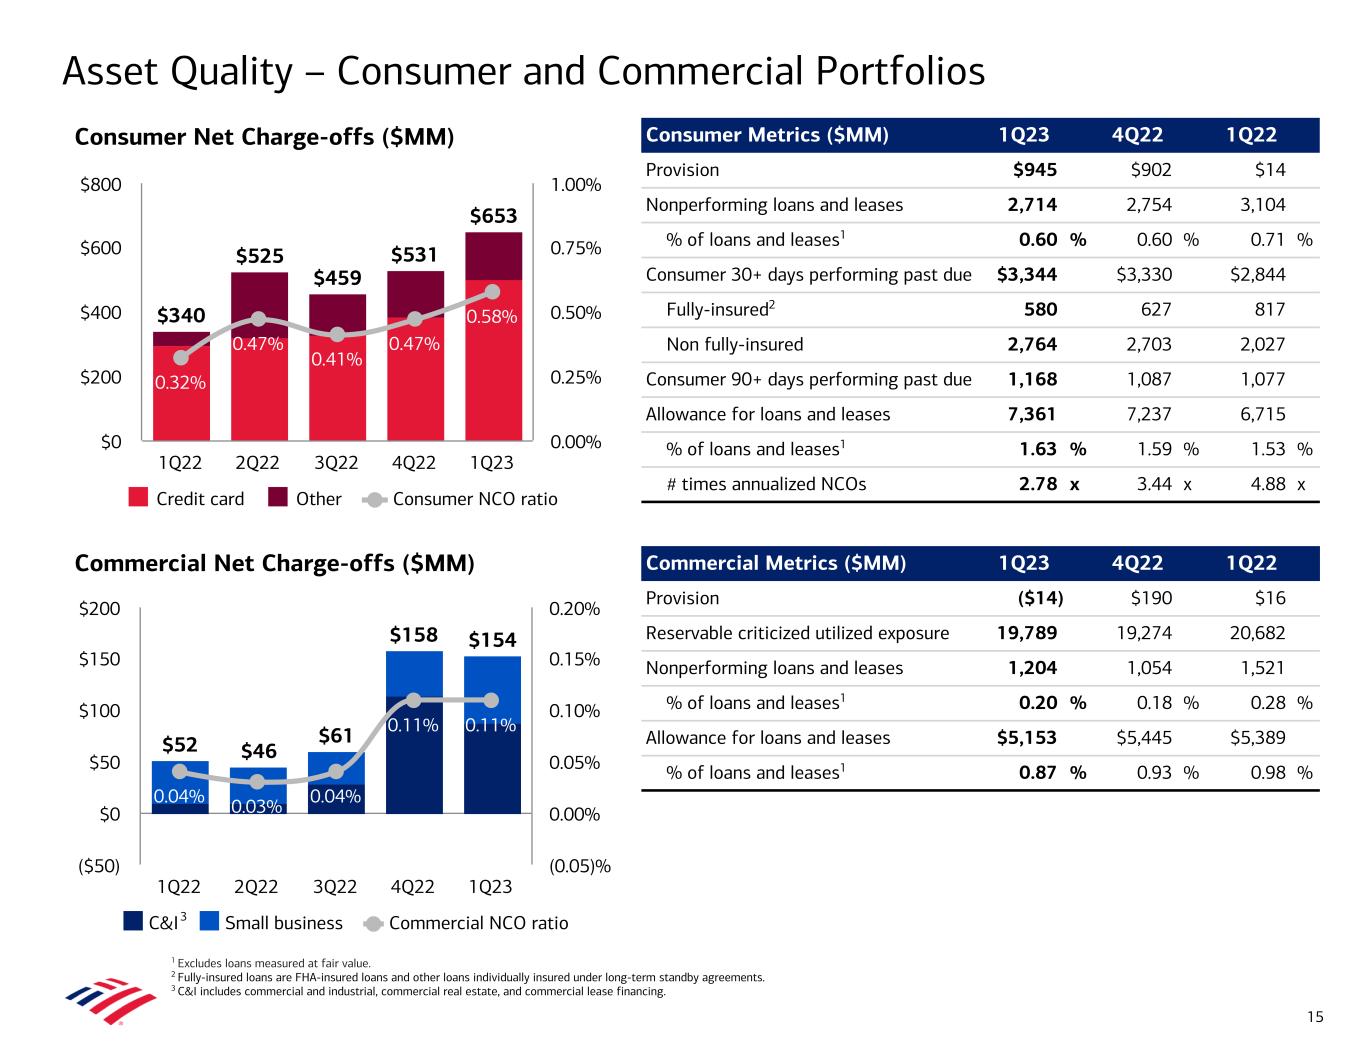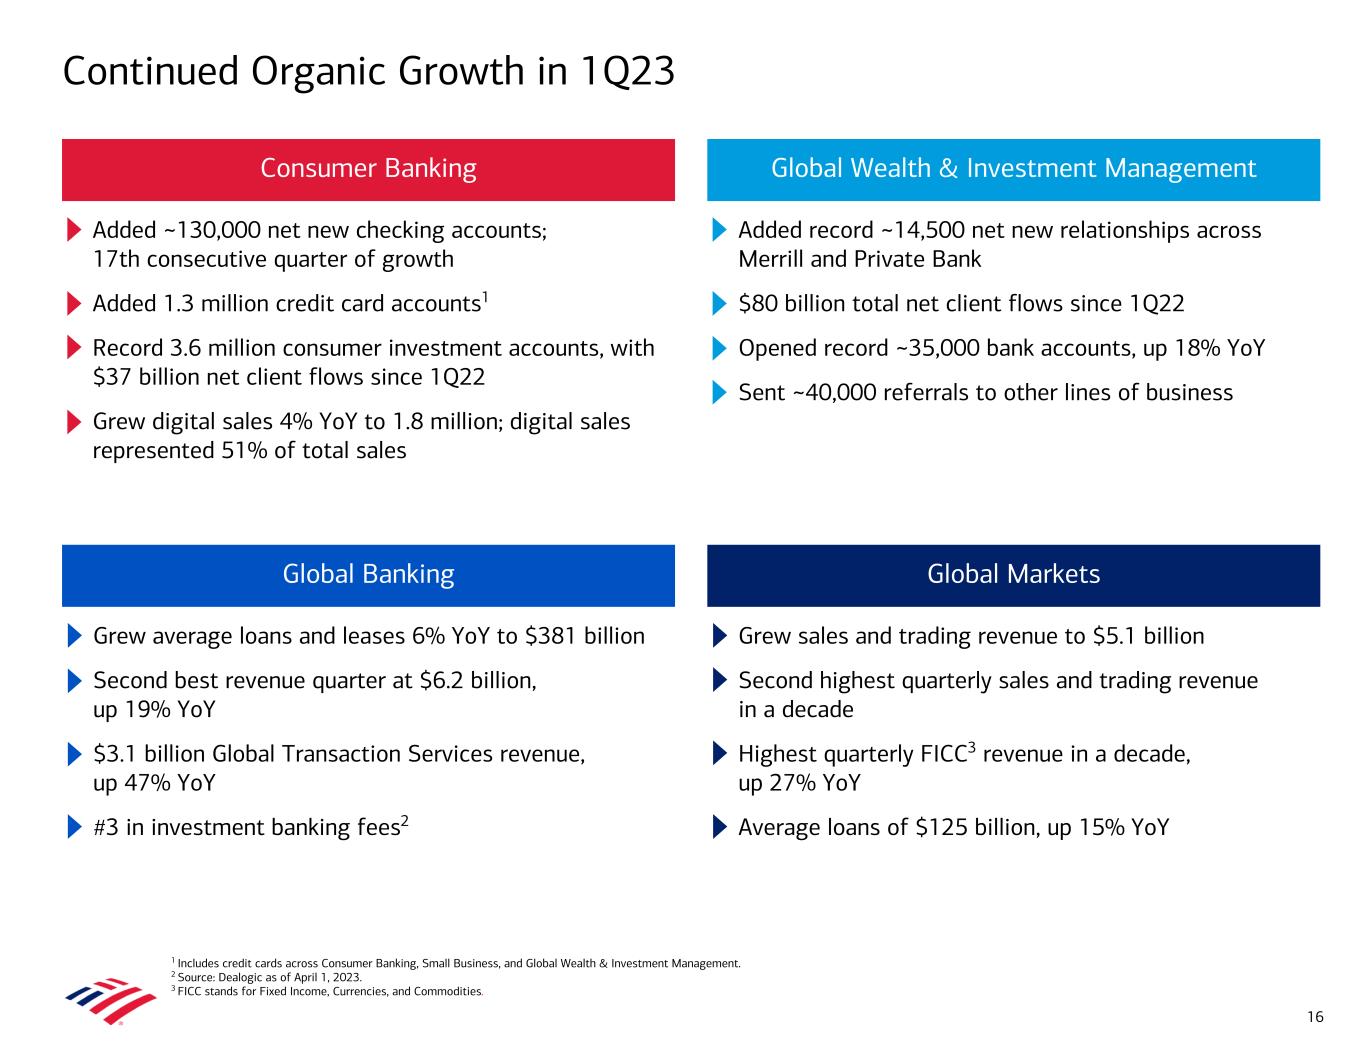
0000070858-23-000131.txt : 20230418 0000070858-23-000131.hdr.sgml : 20230418 20230418064741 ACCESSION NUMBER: 0000070858-23-000131 CONFORMED SUBMISSION TYPE: 8-K PUBLIC DOCUMENT COUNT: 74 CONFORMED PERIOD OF REPORT: 20230418 ITEM INFORMATION: Results of Operations and Financial Condition ITEM INFORMATION: Regulation FD Disclosure ITEM INFORMATION: Financial Statements and Exhibits FILED AS OF DATE: 20230418 DATE AS OF CHANGE: 20230418 FILER: COMPANY DATA: COMPANY CONFORMED NAME: BANK OF AMERICA CORP /DE/ CENTRAL INDEX KEY: 0000070858 STANDARD INDUSTRIAL CLASSIFICATION: NATIONAL COMMERCIAL BANKS [6021] IRS NUMBER: 560906609 STATE OF INCORPORATION: DE FISCAL YEAR END: 1231 FILING VALUES: FORM TYPE: 8-K SEC ACT: 1934 Act SEC FILE NUMBER: 001-06523 FILM NUMBER: 23825446 BUSINESS ADDRESS: STREET 1: BANK OF AMERICA CORPORATE CENTER STREET 2: 100 N TRYON ST CITY: CHARLOTTE STATE: NC ZIP: 28255 BUSINESS PHONE: 7043868486 MAIL ADDRESS: STREET 1: BANK OF AMERICA CORPORATE CENTER STREET 2: 100 N TRYON ST CITY: CHARLOTTE STATE: NC ZIP: 28255 FORMER COMPANY: FORMER CONFORMED NAME: BANKAMERICA CORP/DE/ DATE OF NAME CHANGE: 19981022 FORMER COMPANY: FORMER CONFORMED NAME: NATIONSBANK CORP DATE OF NAME CHANGE: 19920703 FORMER COMPANY: FORMER CONFORMED NAME: NCNB CORP DATE OF NAME CHANGE: 19920107 8-K 1 bac-20230418.htm 8-K bac-20230418
0000070858false00000708582023-04-182023-04-180000070858us-gaap:CommonStockMember2023-04-182023-04-180000070858us-gaap:SeriesEPreferredStockMember2023-04-182023-04-180000070858bac:SeriesGGPreferredStockMember2023-04-182023-04-180000070858bac:SeriesHHPreferredStockMember2023-04-182023-04-180000070858bac:SeriesLPreferredStockMember2023-04-182023-04-180000070858bac:Series1PreferredStockMember2023-04-182023-04-180000070858bac:Series2PreferredStockMember2023-04-182023-04-180000070858bac:Series4PreferredStockMember2023-04-182023-04-180000070858bac:Series5PreferredStockMember2023-04-182023-04-180000070858bac:FloatingRatePreferredHybridIncomeTermSecuritiesMember2023-04-182023-04-180000070858bac:A5.63FixedtoFloatingRatePreferredHybridIncomeTermSecuritiesMember2023-04-182023-04-180000070858bac:IncomeCapitalObligationNotesMember2023-04-182023-04-180000070858bac:SeniorMediumTermNotesSeriesAStepUpCallableNotesMember2023-04-182023-04-180000070858bac:SeriesKKPreferredStockMember2023-04-182023-04-180000070858bac:SeriesLLPreferredStockMember2023-04-182023-04-180000070858bac:SeriesNNPreferredStockMember2023-04-182023-04-180000070858bac:SeriesPPPreferredStockMember2023-04-182023-04-180000070858bac:SeriesQQPreferredStockMember2023-04-182023-04-180000070858bac:DepositarySharesEachRepresentingA11000thInterestInAShareOf4750NonCumulativePreferredStockSeriesSSMember2023-04-182023-04-18

As filed with the Securities and Exchange Commission on April 18, 2023


UNITED STATES
SECURITIES AND EXCHANGE COMMISSION
WASHINGTON, D.C. 20549
FORM 8-K
CURRENT REPORT
PURSUANT TO SECTION 13 OR 15(d) OF THE
SECURITIES EXCHANGE ACT OF 1934
Date of Report (Date of earliest event reported):
April 18, 2023
BANK OF AMERICA CORPORATION
(Exact name of registrant as specified in its charter)
 
Delaware 1-6523 56-0906609
(State or Other Jurisdiction of Incorporation) (Commission File Number) (IRS Employer Identification No.)
100 North Tryon Street
Charlotte, North Carolina 28255
(Address of principal executive offices)
(704) 386-5681
(Registrant’s telephone number, including area code)
Not Applicable
(Former name or former address, if changed since last report)
 
 
Check the appropriate box below if the Form 8-K filing is intended to simultaneously satisfy the filing obligation of the registrant under any of the following provisions:
 
Written communications pursuant to Rule 425 under the Securities Act (17 CFR 230.425)
 
Soliciting material pursuant to Rule 14a-12 under the Exchange Act (17 CFR 240.14a-12)
 
Pre-commencement communications pursuant to Rule 14d-2(b) under the Exchange Act (17 CFR 240.14d-2(b))
 
Pre-commencement communications pursuant to Rule 13e-4(c) under the Exchange Act (17 CFR 240.13e-4(c))


Securities registered pursuant to Section 12(b) of the Act:
Title of each classTrading Symbol(s)Name of each exchange on which registered
Common Stock, par value $0.01 per shareBACNew York Stock Exchange
Depositary Shares, each representing a 1/1,000th interest in a share of Floating Rate Non-Cumulative Preferred Stock, Series EBAC PrENew York Stock Exchange
Depositary Shares, each representing a 1/1,000th interest in a share of 6.000% Non-Cumulative Preferred Stock, Series GGBAC PrBNew York Stock Exchange
Depositary Shares, each representing a 1/1,000th interest in a share of 5.875% Non-Cumulative Preferred Stock, Series HHBAC PrKNew York Stock Exchange
7.25% Non-Cumulative Perpetual Convertible Preferred Stock, Series LBAC PrLNew York Stock Exchange
Depositary Shares, each representing a 1/1,200th interest in a share of BML PrGNew York Stock Exchange
Bank of America Corporation Floating Rate Non-Cumulative
Preferred Stock, Series 1
Depositary Shares, each representing a 1/1,200th interest in a share of BML PrHNew York Stock Exchange
Bank of America Corporation Floating Rate Non-Cumulative
Preferred Stock, Series 2
Depositary Shares, each representing a 1/1,200th interest in a share of BML PrJNew York Stock Exchange
Bank of America Corporation Floating Rate Non-Cumulative
Preferred Stock, Series 4
Depositary Shares, each representing a 1/1,200th interest in a share of BML PrLNew York Stock Exchange
Bank of America Corporation Floating Rate Non-Cumulative
Preferred Stock, Series 5
Floating Rate Preferred Hybrid Income Term Securities of BAC Capital Trust XIII (and the guarantee related thereto)BAC/PFNew York Stock Exchange
5.63% Fixed to Floating Rate Preferred Hybrid Income Term Securities of BAC Capital Trust XIV (and the guarantee related thereto)BAC/PGNew York Stock Exchange
Income Capital Obligation Notes initially due December 15, 2066 of Bank of America CorporationMER PrKNew York Stock Exchange
Senior Medium-Term Notes, Series A, Step Up Callable Notes, due BAC/31BNew York Stock Exchange
November 28, 2031 of BofA Finance LLC (and the guarantee of the
Registrant with respect thereto)
Depositary Shares, each representing a 1/1,000th interest in a share of 5.375% Non-Cumulative Preferred Stock, Series KKBAC PrMNew York Stock Exchange
Depositary Shares, each representing a 1/1,000th interest in a share of 5.000% Non-Cumulative Preferred Stock, Series LLBAC PrN
New York Stock Exchange
Depositary Shares, each representing a 1/1,000th interest in a share of 4.375% Non-Cumulative Preferred Stock, Series NNBAC PrONew York Stock Exchange
Depositary Shares, each representing a 1/1,000th interest in a share of 4.125% Non-Cumulative Preferred Stock, Series PPBAC PrPNew York Stock Exchange
Depositary Shares, each representing a 1/1,000th interest in a share of 4.250% Non-Cumulative Preferred Stock, Series QQBAC PrQNew York Stock Exchange
Depositary Shares, each representing a 1/1,000th interest in a share of 4.750% Non-Cumulative Preferred Stock, Series SSBAC PrSNew York Stock Exchange
Indicate by check mark whether the registrant is an emerging growth company as defined in Rule 405 of the Securities Act of 1933 (17 CFR 230.405) or Rule 12b-2 of the Securities Exchange Act of 1934 (17 CFR 240.12b-2).
Emerging growth company
If an emerging growth company, indicate by check mark if the registrant has elected not to use the extended transition period for complying with any new or revised financial accounting standards provided pursuant to Section 13(a) of the Exchange Act.


ITEM 2.02. RESULTS OF OPERATIONS AND FINANCIAL CONDITION.
On April 18, 2023, Bank of America Corporation (the “Corporation”) announced financial results for the first quarter ended March 31, 2023, reporting first quarter net income of $8.2 billion, or $0.94 per diluted share. A copy of the press release announcing the Corporation’s results for the first quarter ended March 31, 2023 (the “Press Release”) is attached hereto as Exhibit 99.1 and is incorporated by reference in this Item 2.02. The Press Release is available on the Corporation’s website.
The information provided in Item 2.02 of this report, including Exhibit 99.1, shall be deemed to be “filed” for purposes of Section 18 of the Securities Exchange Act of 1934, as amended.
ITEM 7.01. REGULATION FD DISCLOSURE.
On April 18, 2023, the Corporation will hold an investor conference call and webcast to discuss financial results for the first quarter ended March 31, 2023, including the Press Release and other matters relating to the Corporation.
The Corporation has also made available on its website presentation materials containing certain historical and forward-looking information relating to the Corporation (the “Presentation Materials”) and materials that contain additional information about the Corporation’s financial results for the first quarter ended March 31, 2023 (the “Supplemental Information”). The Presentation Materials and the Supplemental Information are furnished herewith as Exhibit 99.2 and Exhibit 99.3, respectively, and are incorporated by reference in this Item 7.01. All information in Exhibits 99.2 and 99.3 is presented as of the particular date or dates referenced therein, and the Corporation does not undertake any obligation to, and disclaims any duty to, update any of the information provided.
The information provided in Item 7.01 of this report, including Exhibits 99.2 and 99.3, shall not be deemed “filed” for purposes of Section 18 of the Securities Exchange Act of 1934, as amended, nor shall the information or Exhibits 99.2 or 99.3 be deemed incorporated by reference in any filings under the Securities Act of 1933, as amended.
ITEM 9.01. FINANCIAL STATEMENTS AND EXHIBITS.
(d) Exhibits.
Exhibit 99.1 is filed herewith. Exhibits 99.2 and 99.3 are furnished herewith.
EXHIBIT NO.  DESCRIPTION OF EXHIBIT


104Cover Page Interactive Data File (embedded in the cover page formatted in Inline XBRL)


SIGNATURES
Pursuant to the requirements of the Securities Exchange Act of 1934, as amended, the Corporation has duly caused this report to be signed on its behalf by the undersigned hereunto duly authorized.
 
BANK OF AMERICA CORPORATION
By: /s/ Rudolf A. Bless
 Rudolf A. Bless
 Chief Accounting Officer

Dated: April 18, 2023


EX-99.1 2 bac-03312023ex991.htm EX-99.1 bac-03312023ex991
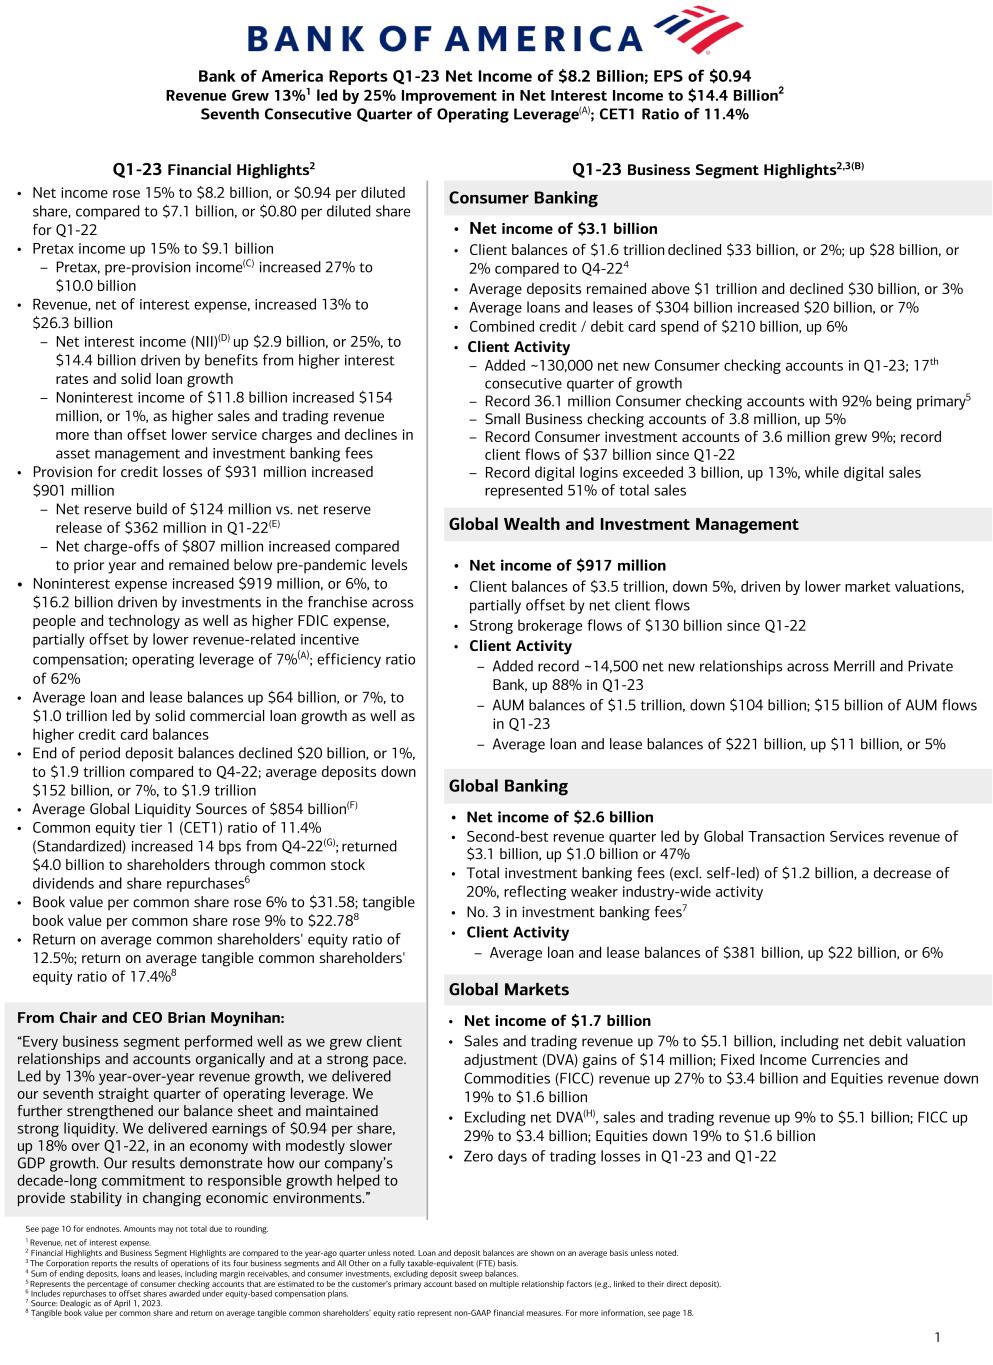
1 Q1-23 Financial Highlights2 Q1-23 Business Segment Highlights2,3(B) Consumer Banking Global Wealth and Investment Management Global Banking Global Markets See page 10 for endnotes. Amounts may not total due to rounding. 1 Revenue, net of interest expense. 2 Financial Highlights and Business Segment Highlights are compared to the year-ago quarter unless noted. Loan and deposit balances are shown on an average basis unless noted. 3 The Corporation reports the results of operations of its four business segments and All Other on a fully taxable-equivalent (FTE) basis. 4 Sum of ending deposits, loans and leases, including margin receivables, and consumer investments, excluding deposit sweep balances. 5 Represents the percentage of consumer checking accounts that are estimated to be the customer’s primary account based on multiple relationship factors (e.g., linked to their direct deposit). 6 Includes repurchases to offset shares awarded under equity-based compensation plans. 7 Source: Dealogic as of April 1, 2023. 8 Tangible book value per common share and return on average tangible common shareholders’ equity ratio represent non-GAAP financial measures. For more information, see page 18. • Net income rose 15% to $8.2 billion, or $0.94 per diluted share, compared to $7.1 billion, or $0.80 per diluted share for Q1-22 • Pretax income up 15% to $9.1 billion – Pretax, pre-provision income(C) increased 27% to $10.0 billion • Revenue, net of interest expense, increased 13% to $26.3 billion – Net interest income (NII)(D) up $2.9 billion, or 25%, to $14.4 billion driven by benefits from higher interest rates and solid loan growth – Noninterest income of $11.8 billion increased $154 million, or 1%, as higher sales and trading revenue more than offset lower service charges and declines in asset management and investment banking fees • Provision for credit losses of $931 million increased $901 million – Net reserve build of $124 million vs. net reserve release of $362 million in Q1-22(E) – Net charge-offs of $807 million increased compared to prior year and remained below pre-pandemic levels • Noninterest expense increased $919 million, or 6%, to $16.2 billion driven by investments in the franchise across people and technology as well as higher FDIC expense, partially offset by lower revenue-related incentive compensation; operating leverage of 7%(A); efficiency ratio of 62% • Average loan and lease balances up $64 billion, or 7%, to $1.0 trillion led by solid commercial loan growth as well as higher credit card balances • End of period deposit balances declined $20 billion, or 1%, to $1.9 trillion compared to Q4-22; average deposits down $152 billion, or 7%, to $1.9 trillion • Average Global Liquidity Sources of $854 billion(F) • Common equity tier 1 (CET1) ratio of 11.4% (Standardized) increased 14 bps from Q4-22(G); returned $4.0 billion to shareholders through common stock dividends and share repurchases6 • Book value per common share rose 6% to $31.58; tangible book value per common share rose 9% to $22.788 • Return on average common shareholders' equity ratio of 12.5%; return on average tangible common shareholders' equity ratio of 17.4%8 • Net income of $1.7 billion • Sales and trading revenue up 7% to $5.1 billion, including net debit valuation adjustment (DVA) gains of $14 million; Fixed Income Currencies and Commodities (FICC) revenue up 27% to $3.4 billion and Equities revenue down 19% to $1.6 billion • Excluding net DVA(H), sales and trading revenue up 9% to $5.1 billion; FICC up 29% to $3.4 billion; Equities down 19% to $1.6 billion • Zero days of trading losses in Q1-23 and Q1-22 From Chair and CEO Brian Moynihan: “Every business segment performed well as we grew client relationships and accounts organically and at a strong pace. Led by 13% year-over-year revenue growth, we delivered our seventh straight quarter of operating leverage. We further strengthened our balance sheet and maintained strong liquidity. We delivered earnings of $0.94 per share, up 18% over Q1-22, in an economy with modestly slower GDP growth. Our results demonstrate how our company’s decade-long commitment to responsible growth helped to provide stability in changing economic environments.” • Net income of $917 million • Client balances of $3.5 trillion, down 5%, driven by lower market valuations, partially offset by net client flows • Strong brokerage flows of $130 billion since Q1-22 • Client Activity – Added record ~14,500 net new relationships across Merrill and Private Bank, up 88% in Q1-23 – AUM balances of $1.5 trillion, down $104 billion; $15 billion of AUM flows in Q1-23 – Average loan and lease balances of $221 billion, up $11 billion, or 5% • Net income of $2.6 billion • Second-best revenue quarter led by Global Transaction Services revenue of $3.1 billion, up $1.0 billion or 47% • Total investment banking fees (excl. self-led) of $1.2 billion, a decrease of 20%, reflecting weaker industry-wide activity • No. 3 in investment banking fees7 • Client Activity – Average loan and lease balances of $381 billion, up $22 billion, or 6% • Net income of $3.1 billion • Client balances of $1.6 trillion declined $33 billion, or 2%; up $28 billion, or 2% compared to Q4-224 • Average deposits remained above $1 trillion and declined $30 billion, or 3% • Average loans and leases of $304 billion increased $20 billion, or 7% • Combined credit / debit card spend of $210 billion, up 6% • Client Activity – Added ~130,000 net new Consumer checking accounts in Q1-23; 17th consecutive quarter of growth – Record 36.1 million Consumer checking accounts with 92% being primary5 – Small Business checking accounts of 3.8 million, up 5% – Record Consumer investment accounts of 3.6 million grew 9%; record client flows of $37 billion since Q1-22 – Record digital logins exceeded 3 billion, up 13%, while digital sales represented 51% of total sales Bank of America Reports Q1-23 Net Income of $8.2 Billion; EPS of $0.94 Revenue Grew 13%1 led by 25% Improvement in Net Interest Income to $14.4 Billion2 Seventh Consecutive Quarter of Operating Leverage(A); CET1 Ratio of 11.4%


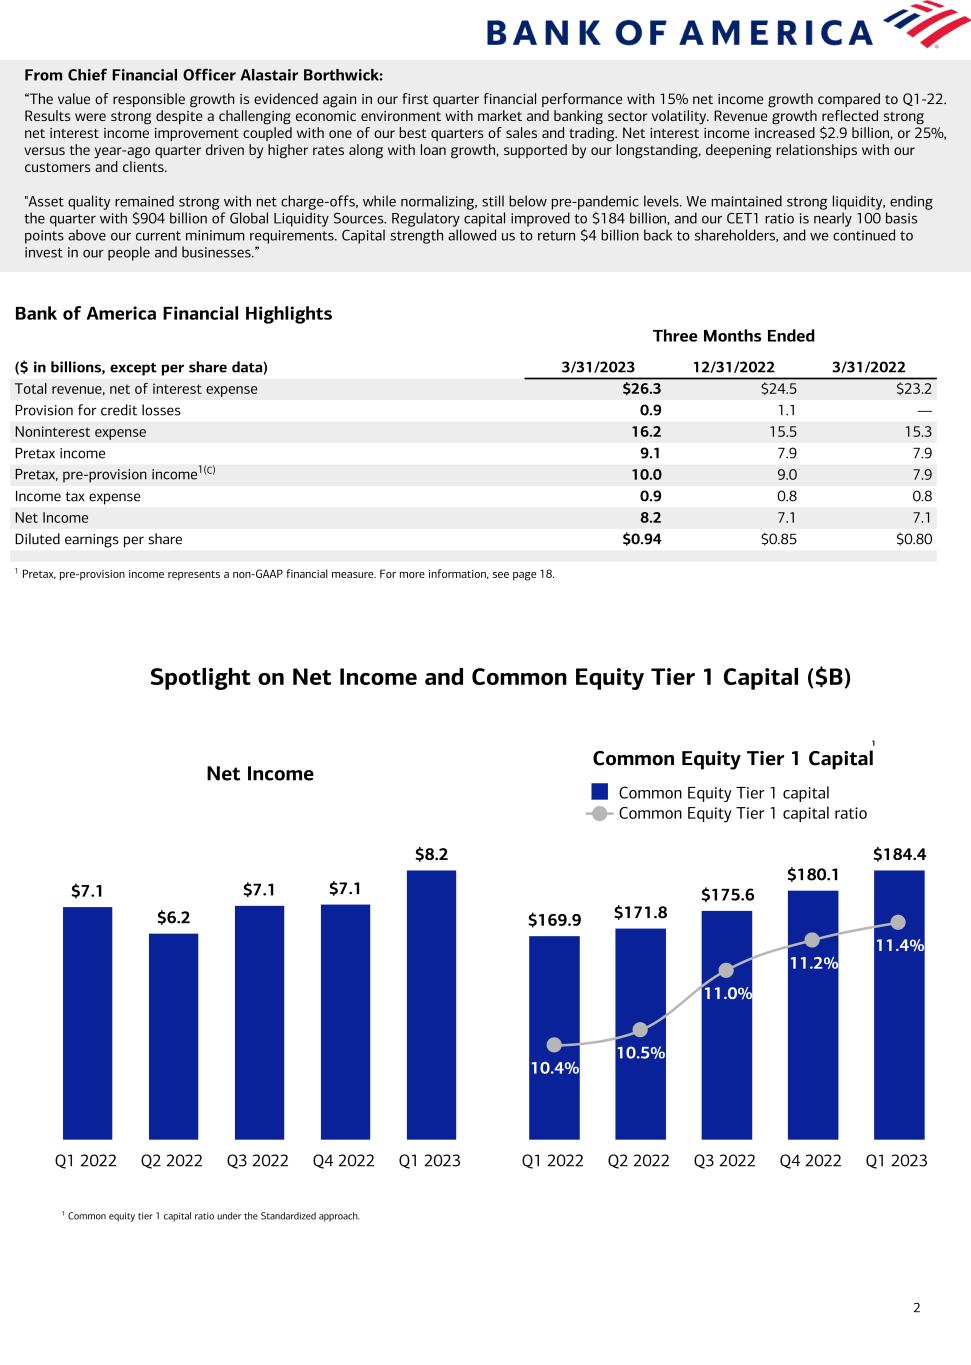
2 Bank of America Financial Highlights Three Months Ended ($ in billions, except per share data) 3/31/2023 12/31/2022 3/31/2022 Total revenue, net of interest expense $26.3 $24.5 $23.2 Provision for credit losses 0.9 1.1 — Noninterest expense 16.2 15.5 15.3 Pretax income 9.1 7.9 7.9 Pretax, pre-provision income1(C) 10.0 9.0 7.9 Income tax expense 0.9 0.8 0.8 Net Income 8.2 7.1 7.1 Diluted earnings per share $0.94 $0.85 $0.80 1 Pretax, pre-provision income represents a non-GAAP financial measure. For more information, see page 18. From Chief Financial Officer Alastair Borthwick: “The value of responsible growth is evidenced again in our first quarter financial performance with 15% net income growth compared to Q1-22. Results were strong despite a challenging economic environment with market and banking sector volatility. Revenue growth reflected strong net interest income improvement coupled with one of our best quarters of sales and trading. Net interest income increased $2.9 billion, or 25%, versus the year-ago quarter driven by higher rates along with loan growth, supported by our longstanding, deepening relationships with our customers and clients. "Asset quality remained strong with net charge-offs, while normalizing, still below pre-pandemic levels. We maintained strong liquidity, ending the quarter with $904 billion of Global Liquidity Sources. Regulatory capital improved to $184 billion, and our CET1 ratio is nearly 100 basis points above our current minimum requirements. Capital strength allowed us to return $4 billion back to shareholders, and we continued to invest in our people and businesses.” Common Equity Tier 1 Capital $169.9 $171.8 $175.6 $180.1 $184.4 10.4% 10.5% 11.0% 11.2% 11.4% Common Equity Tier 1 capital Common Equity Tier 1 capital ratio Q1 2022 Q2 2022 Q3 2022 Q4 2022 Q1 2023 Net Income $7.1 $6.2 $7.1 $7.1 $8.2 Q1 2022 Q2 2022 Q3 2022 Q4 2022 Q1 2023 Spotlight on Net Income and Common Equity Tier 1 Capital ($B) 1 Common equity tier 1 capital ratio under the Standardized approach. 1


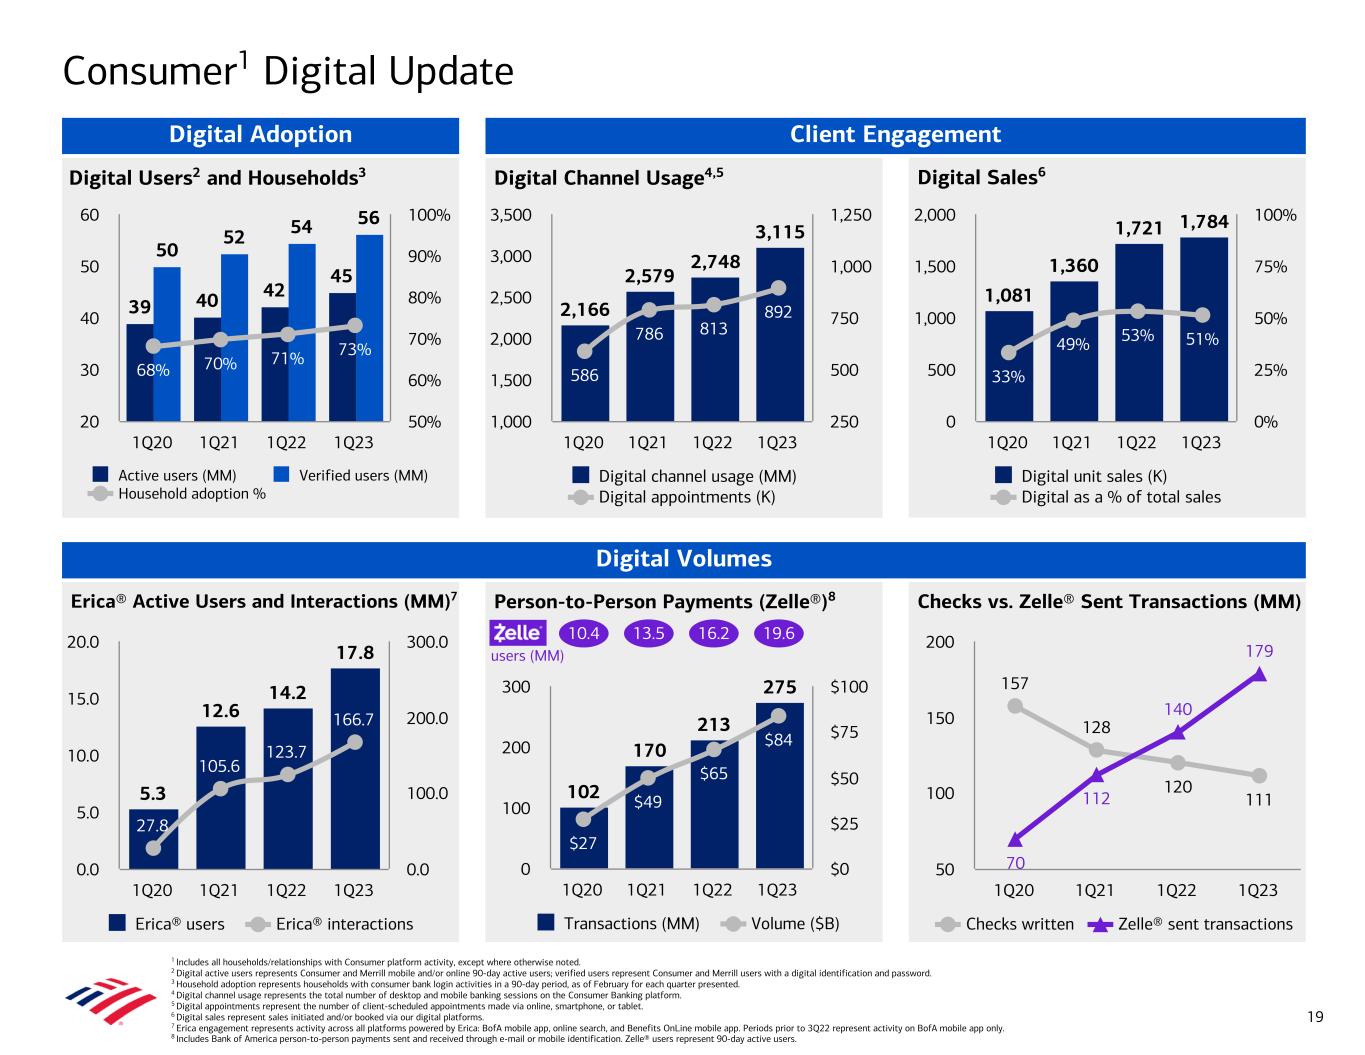
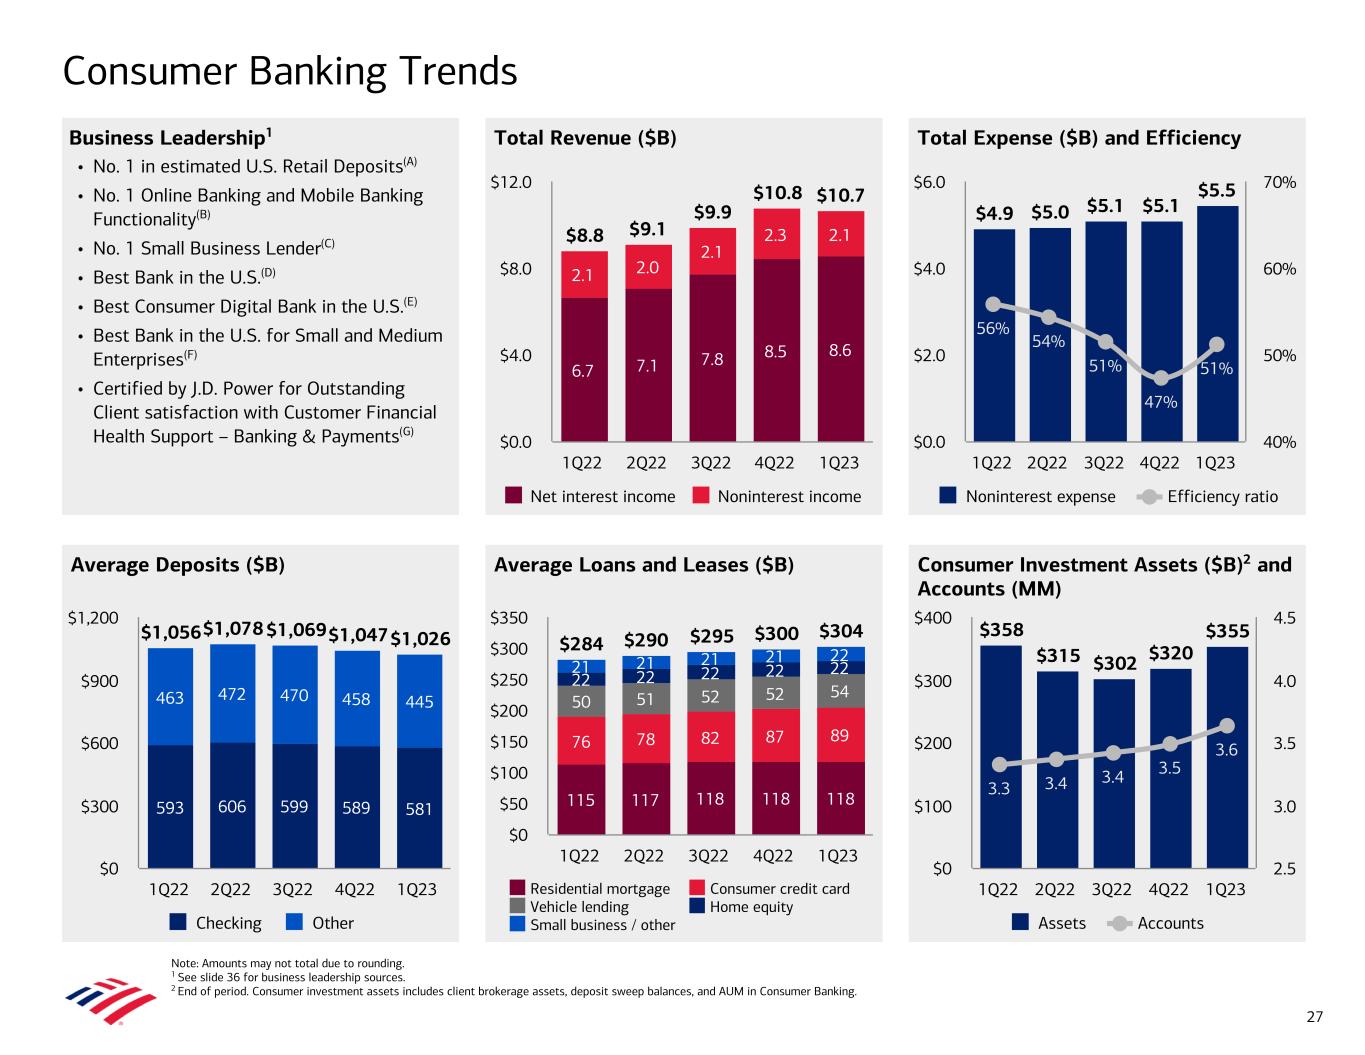
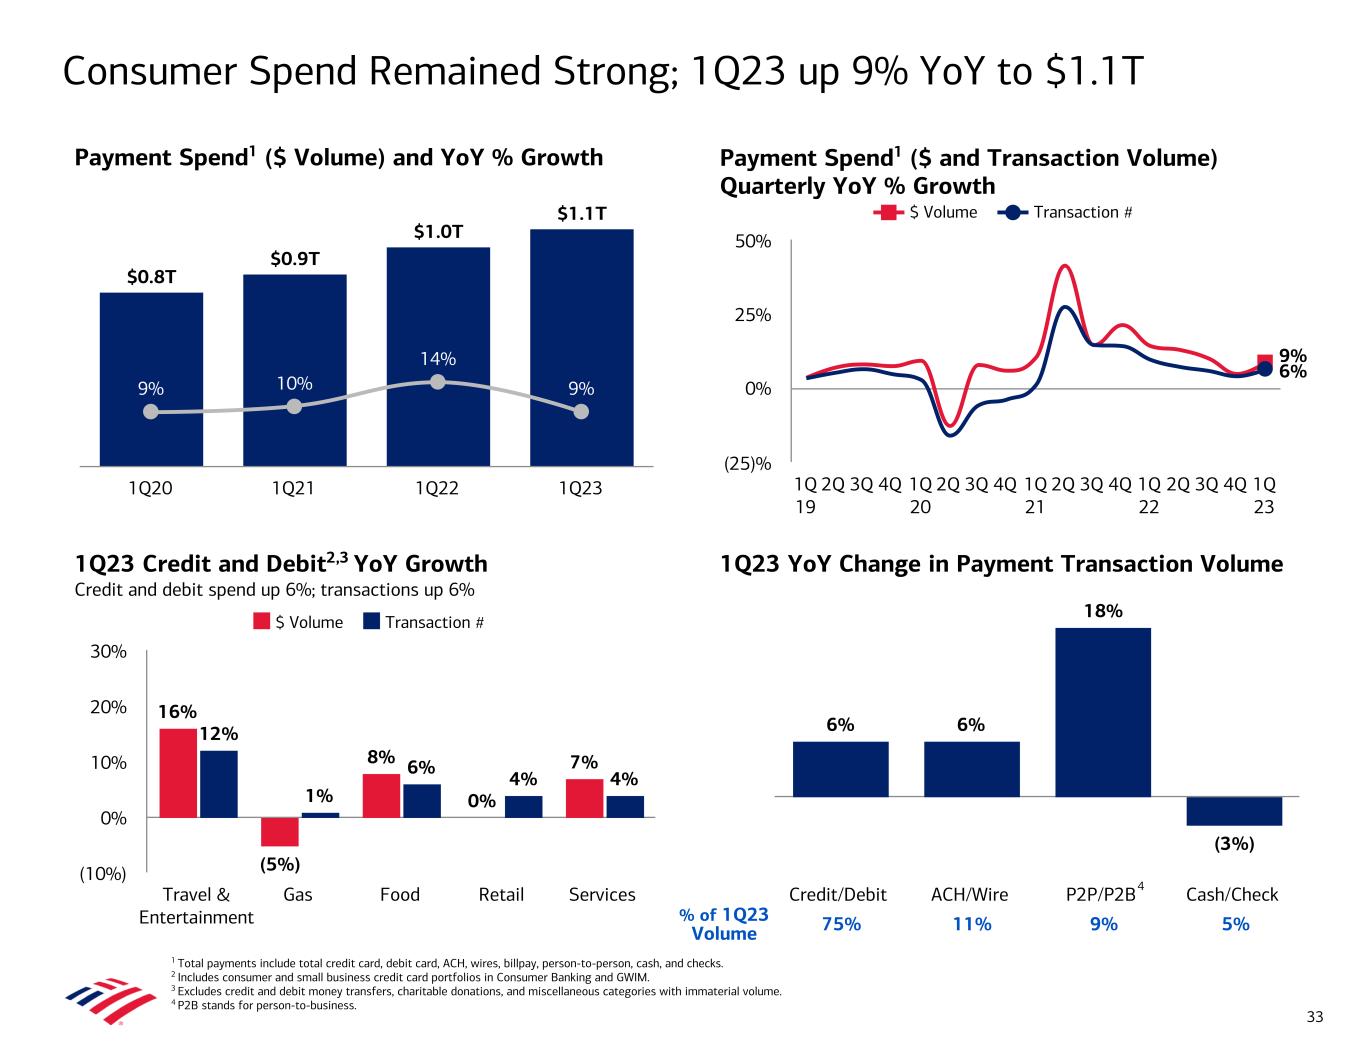
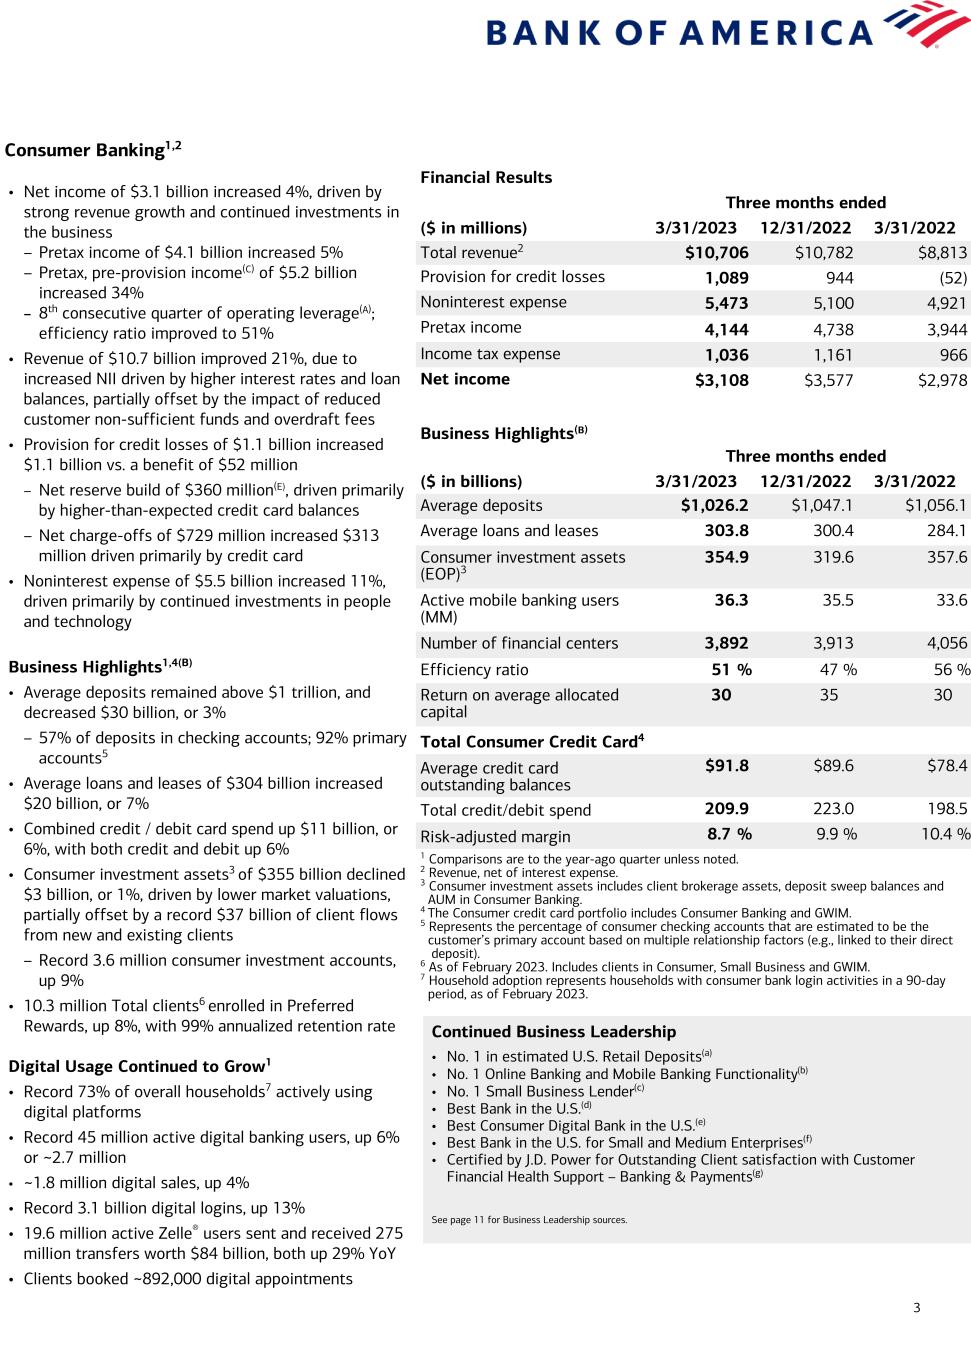
3 Consumer Banking1,2 Financial Results Three months ended ($ in millions) 3/31/2023 12/31/2022 3/31/2022 Total revenue2 $10,706 $10,782 $8,813 Provision for credit losses 1,089 944 (52) Noninterest expense 5,473 5,100 4,921 Pretax income 4,144 4,738 3,944 Income tax expense 1,036 1,161 966 Net income $3,108 $3,577 $2,978 Business Highlights(B) Three months ended ($ in billions) 3/31/2023 12/31/2022 3/31/2022 Average deposits $1,026.2 $1,047.1 $1,056.1 Average loans and leases 303.8 300.4 284.1 Consumer investment assets (EOP)3 354.9 319.6 357.6 Active mobile banking users (MM) 36.3 35.5 33.6 Number of financial centers 3,892 3,913 4,056 Efficiency ratio 51 % 47 % 56 % Return on average allocated capital 30 35 30 Total Consumer Credit Card4 Average credit card outstanding balances $91.8 $89.6 $78.4 Total credit/debit spend 209.9 223.0 198.5 Risk-adjusted margin 8.7 % 9.9 % 10.4 % 1 Comparisons are to the year-ago quarter unless noted. 2 Revenue, net of interest expense. 3 Consumer investment assets includes client brokerage assets, deposit sweep balances and AUM in Consumer Banking. 4 The Consumer credit card portfolio includes Consumer Banking and GWIM. 5 Represents the percentage of consumer checking accounts that are estimated to be the customer’s primary account based on multiple relationship factors (e.g., linked to their direct deposit). 6 As of February 2023. Includes clients in Consumer, Small Business and GWIM. 7 Household adoption represents households with consumer bank login activities in a 90-day period, as of February 2023. • Net income of $3.1 billion increased 4%, driven by strong revenue growth and continued investments in the business – Pretax income of $4.1 billion increased 5% – Pretax, pre-provision income(C) of $5.2 billion increased 34% – 8th consecutive quarter of operating leverage(A); efficiency ratio improved to 51% • Revenue of $10.7 billion improved 21%, due to increased NII driven by higher interest rates and loan balances, partially offset by the impact of reduced customer non-sufficient funds and overdraft fees • Provision for credit losses of $1.1 billion increased $1.1 billion vs. a benefit of $52 million – Net reserve build of $360 million(E), driven primarily by higher-than-expected credit card balances – Net charge-offs of $729 million increased $313 million driven primarily by credit card • Noninterest expense of $5.5 billion increased 11%, driven primarily by continued investments in people and technology Business Highlights1,4(B) • Average deposits remained above $1 trillion, and decreased $30 billion, or 3% – 57% of deposits in checking accounts; 92% primary accounts5 • Average loans and leases of $304 billion increased $20 billion, or 7% • Combined credit / debit card spend up $11 billion, or 6%, with both credit and debit up 6% • Consumer investment assets3 of $355 billion declined $3 billion, or 1%, driven by lower market valuations, partially offset by a record $37 billion of client flows from new and existing clients – Record 3.6 million consumer investment accounts, up 9% • 10.3 million Total clients6 enrolled in Preferred Rewards, up 8%, with 99% annualized retention rate Digital Usage Continued to Grow1 • Record 73% of overall households7 actively using digital platforms • Record 45 million active digital banking users, up 6% or ~2.7 million • ~1.8 million digital sales, up 4% • Record 3.1 billion digital logins, up 13% • 19.6 million active Zelle® users sent and received 275 million transfers worth $84 billion, both up 29% YoY • Clients booked ~892,000 digital appointments Continued Business Leadership • No. 1 in estimated U.S. Retail Deposits(a) • No. 1 Online Banking and Mobile Banking Functionality(b) • No. 1 Small Business Lender(c) • Best Bank in the U.S.(d) • Best Consumer Digital Bank in the U.S.(e) • Best Bank in the U.S. for Small and Medium Enterprises(f) • Certified by J.D. Power for Outstanding Client satisfaction with Customer Financial Health Support – Banking & Payments(g) See page 11 for Business Leadership sources.


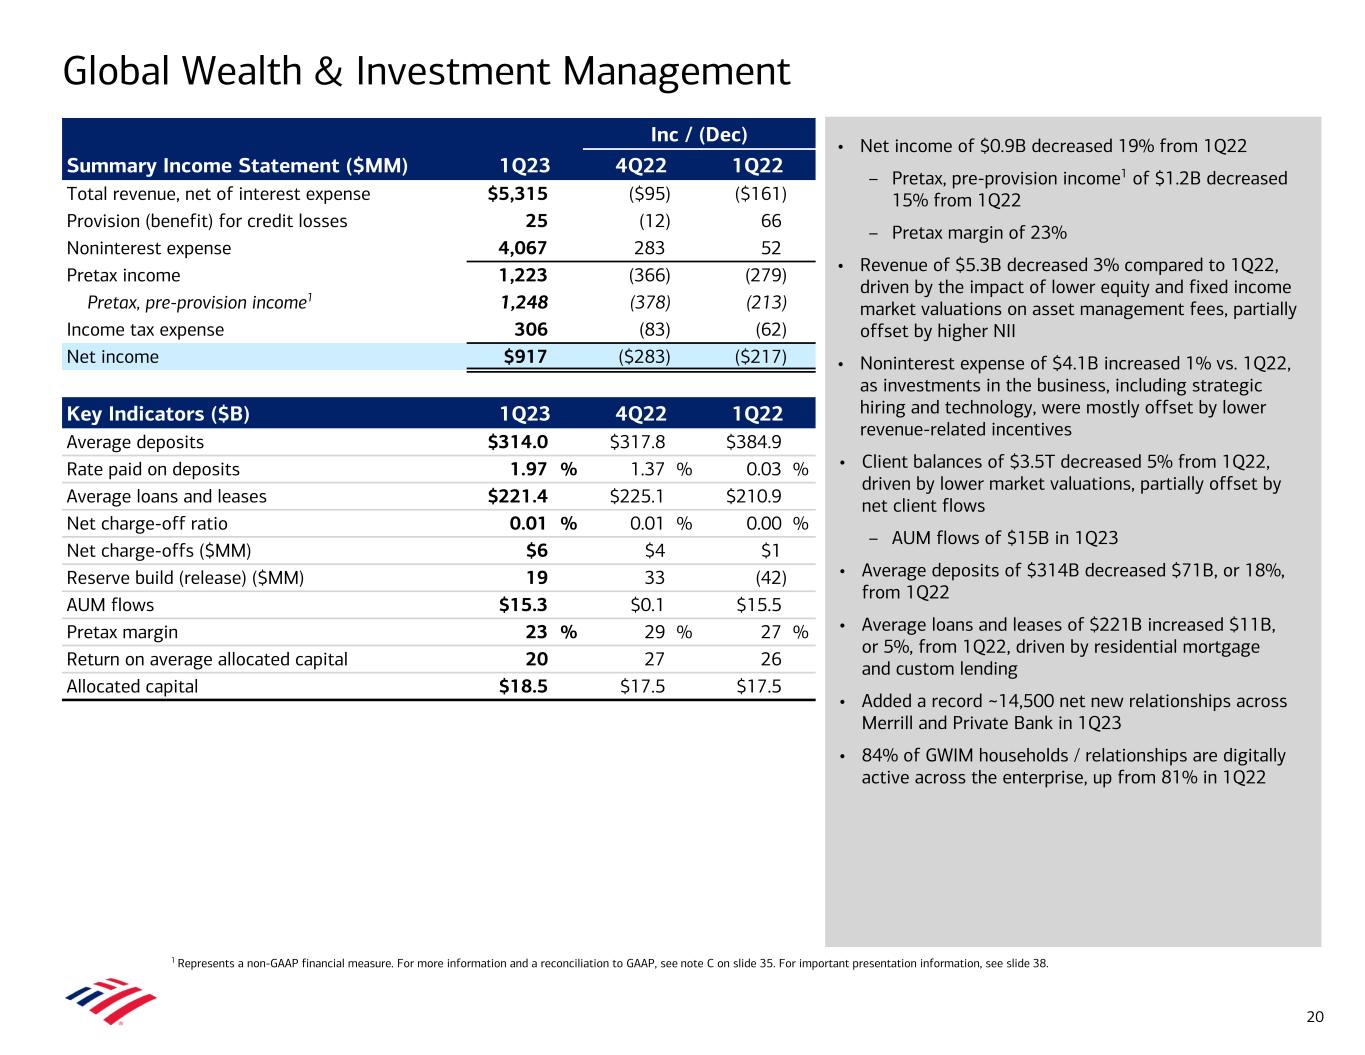
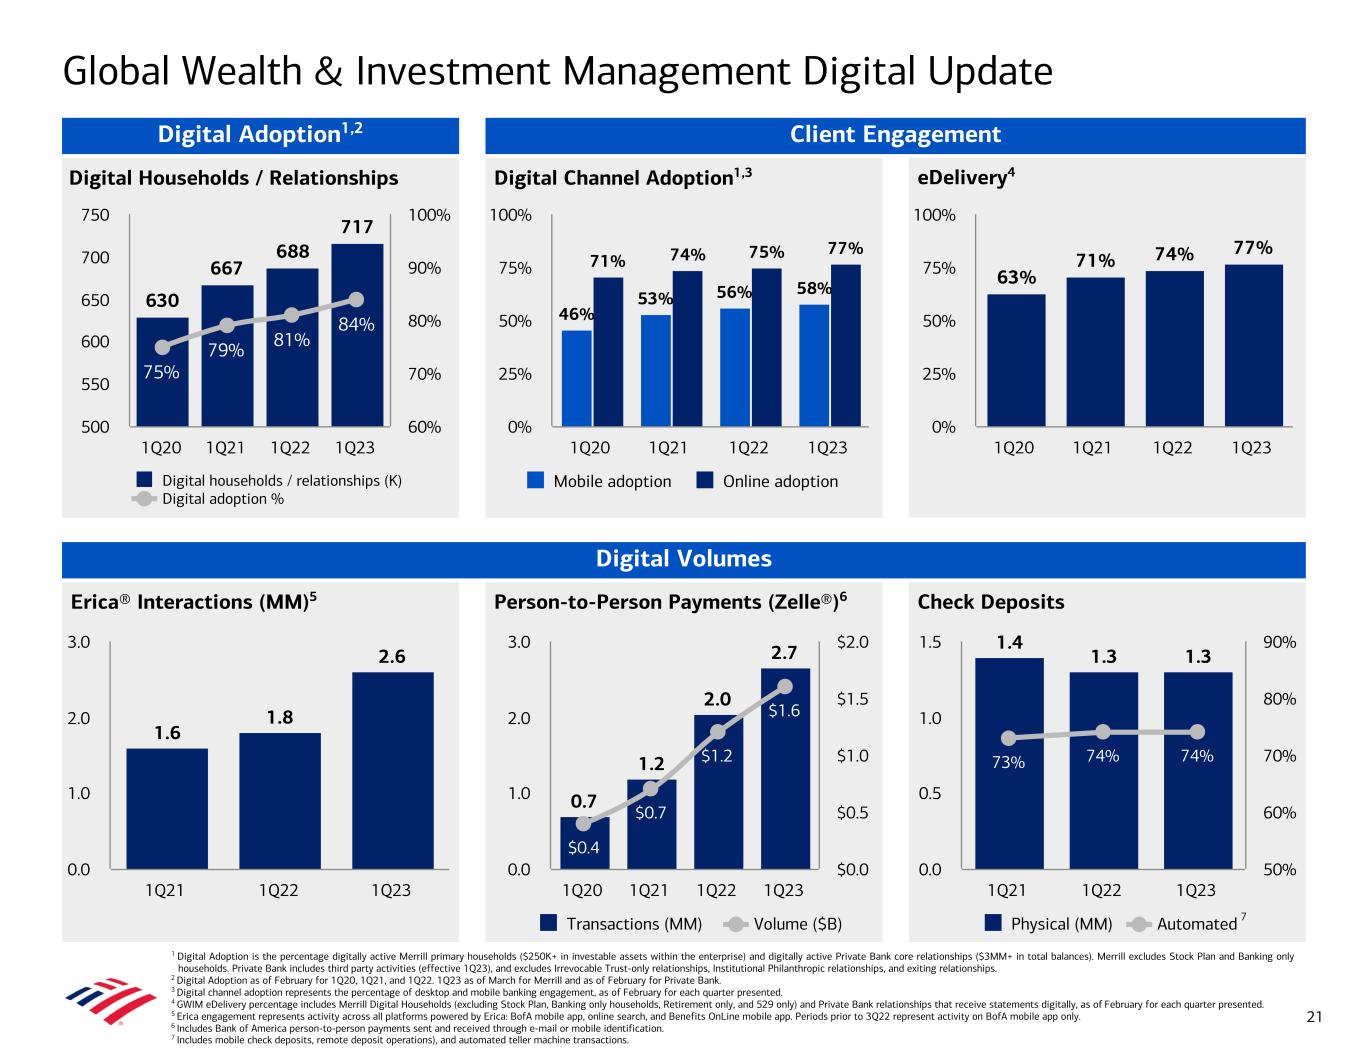
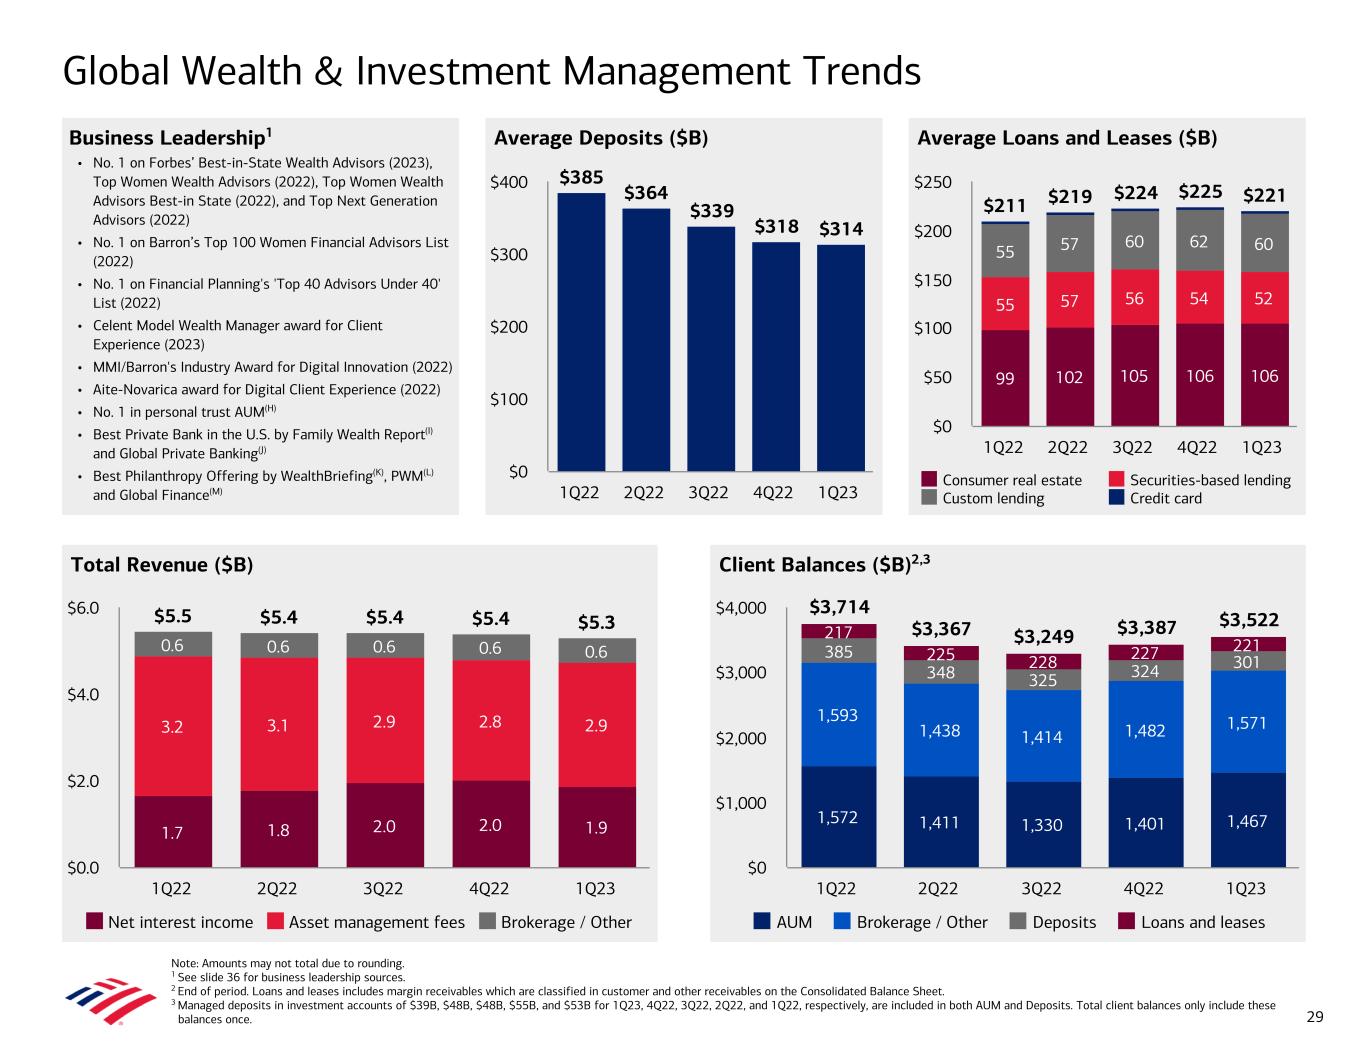
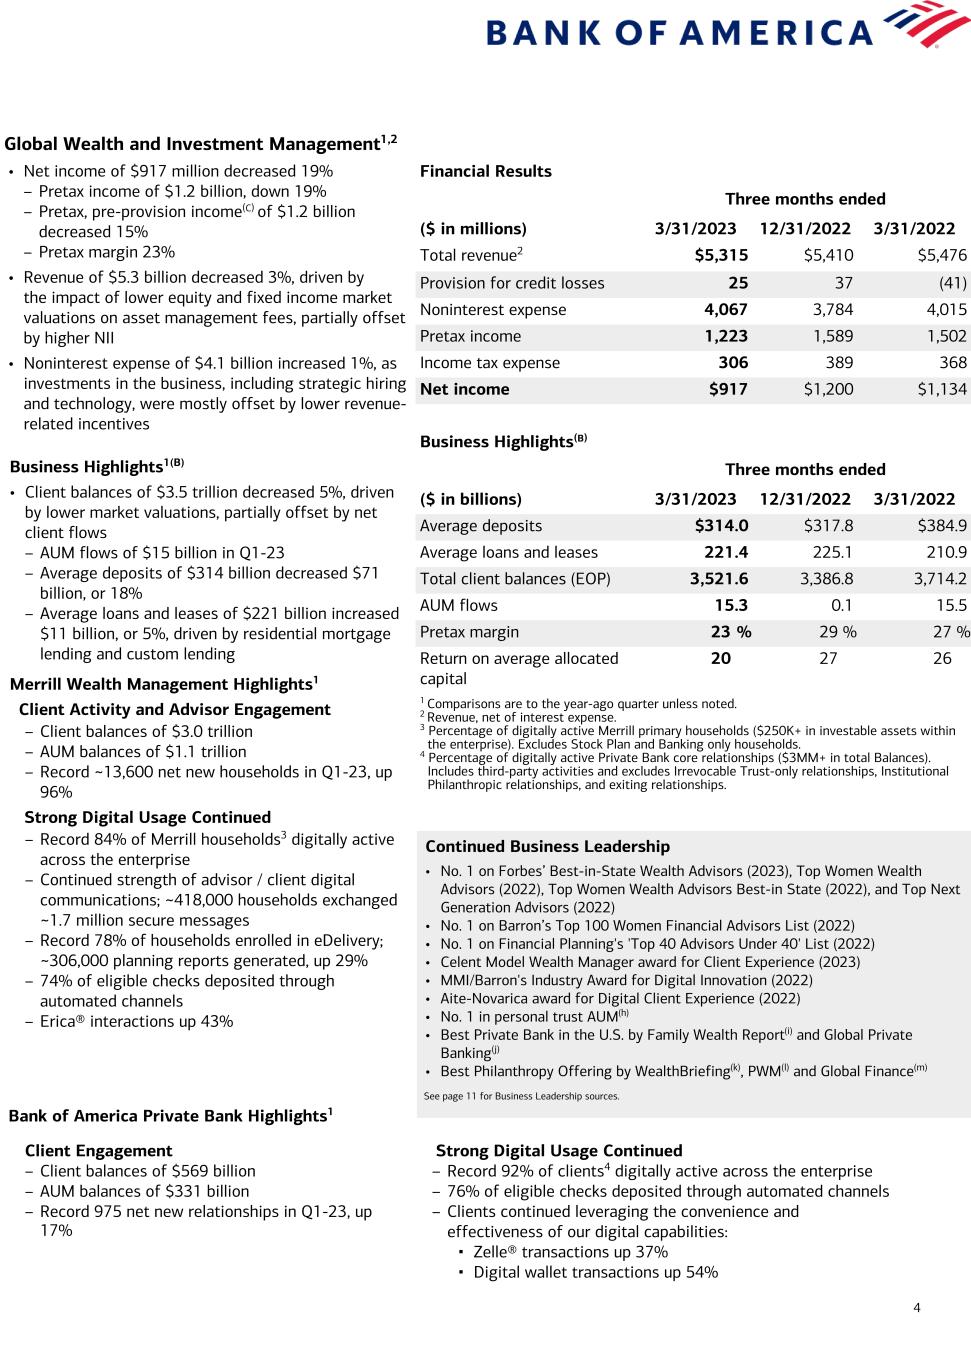
4 Global Wealth and Investment Management1,2 Financial Results Three months ended ($ in millions) 3/31/2023 12/31/2022 3/31/2022 Total revenue2 $5,315 $5,410 $5,476 Provision for credit losses 25 37 (41) Noninterest expense 4,067 3,784 4,015 Pretax income 1,223 1,589 1,502 Income tax expense 306 389 368 Net income $917 $1,200 $1,134 Business Highlights(B) Three months ended ($ in billions) 3/31/2023 12/31/2022 3/31/2022 Average deposits $314.0 $317.8 $384.9 Average loans and leases 221.4 225.1 210.9 Total client balances (EOP) 3,521.6 3,386.8 3,714.2 AUM flows 15.3 0.1 15.5 Pretax margin 23 % 29 % 27 % Return on average allocated capital 20 27 26 1 Comparisons are to the year-ago quarter unless noted. 2 Revenue, net of interest expense. 3 Percentage of digitally active Merrill primary households ($250K+ in investable assets within the enterprise). Excludes Stock Plan and Banking only households. 4 Percentage of digitally active Private Bank core relationships ($3MM+ in total Balances). Includes third-party activities and excludes Irrevocable Trust-only relationships, Institutional Philanthropic relationships, and exiting relationships. Continued Business Leadership • No. 1 on Forbes’ Best-in-State Wealth Advisors (2023), Top Women Wealth Advisors (2022), Top Women Wealth Advisors Best-in State (2022), and Top Next Generation Advisors (2022) • No. 1 on Barron’s Top 100 Women Financial Advisors List (2022) • No. 1 on Financial Planning's 'Top 40 Advisors Under 40' List (2022) • Celent Model Wealth Manager award for Client Experience (2023) • MMI/Barron's Industry Award for Digital Innovation (2022) • Aite-Novarica award for Digital Client Experience (2022) • No. 1 in personal trust AUM(h) • Best Private Bank in the U.S. by Family Wealth Report(i) and Global Private Banking(j) • Best Philanthropy Offering by WealthBriefing(k), PWM(l) and Global Finance(m) See page 11 for Business Leadership sources. • Net income of $917 million decreased 19% – Pretax income of $1.2 billion, down 19% – Pretax, pre-provision income(C) of $1.2 billion decreased 15% – Pretax margin 23% • Revenue of $5.3 billion decreased 3%, driven by the impact of lower equity and fixed income market valuations on asset management fees, partially offset by higher NII • Noninterest expense of $4.1 billion increased 1%, as investments in the business, including strategic hiring and technology, were mostly offset by lower revenue- related incentives Business Highlights1(B) • Client balances of $3.5 trillion decreased 5%, driven by lower market valuations, partially offset by net client flows – AUM flows of $15 billion in Q1-23 – Average deposits of $314 billion decreased $71 billion, or 18% – Average loans and leases of $221 billion increased $11 billion, or 5%, driven by residential mortgage lending and custom lending Merrill Wealth Management Highlights1 Client Activity and Advisor Engagement – Client balances of $3.0 trillion – AUM balances of $1.1 trillion – Record ~13,600 net new households in Q1-23, up 96% Strong Digital Usage Continued – Record 84% of Merrill households3 digitally active across the enterprise – Continued strength of advisor / client digital communications; ~418,000 households exchanged ~1.7 million secure messages – Record 78% of households enrolled in eDelivery; ~306,000 planning reports generated, up 29% – 74% of eligible checks deposited through automated channels – Erica® interactions up 43% Client Engagement – Client balances of $569 billion – AUM balances of $331 billion – Record 975 net new relationships in Q1-23, up 17% Bank of America Private Bank Highlights1 Strong Digital Usage Continued – Record 92% of clients4 digitally active across the enterprise – 76% of eligible checks deposited through automated channels – Clients continued leveraging the convenience and effectiveness of our digital capabilities: ▪ Zelle® transactions up 37% ▪ Digital wallet transactions up 54%


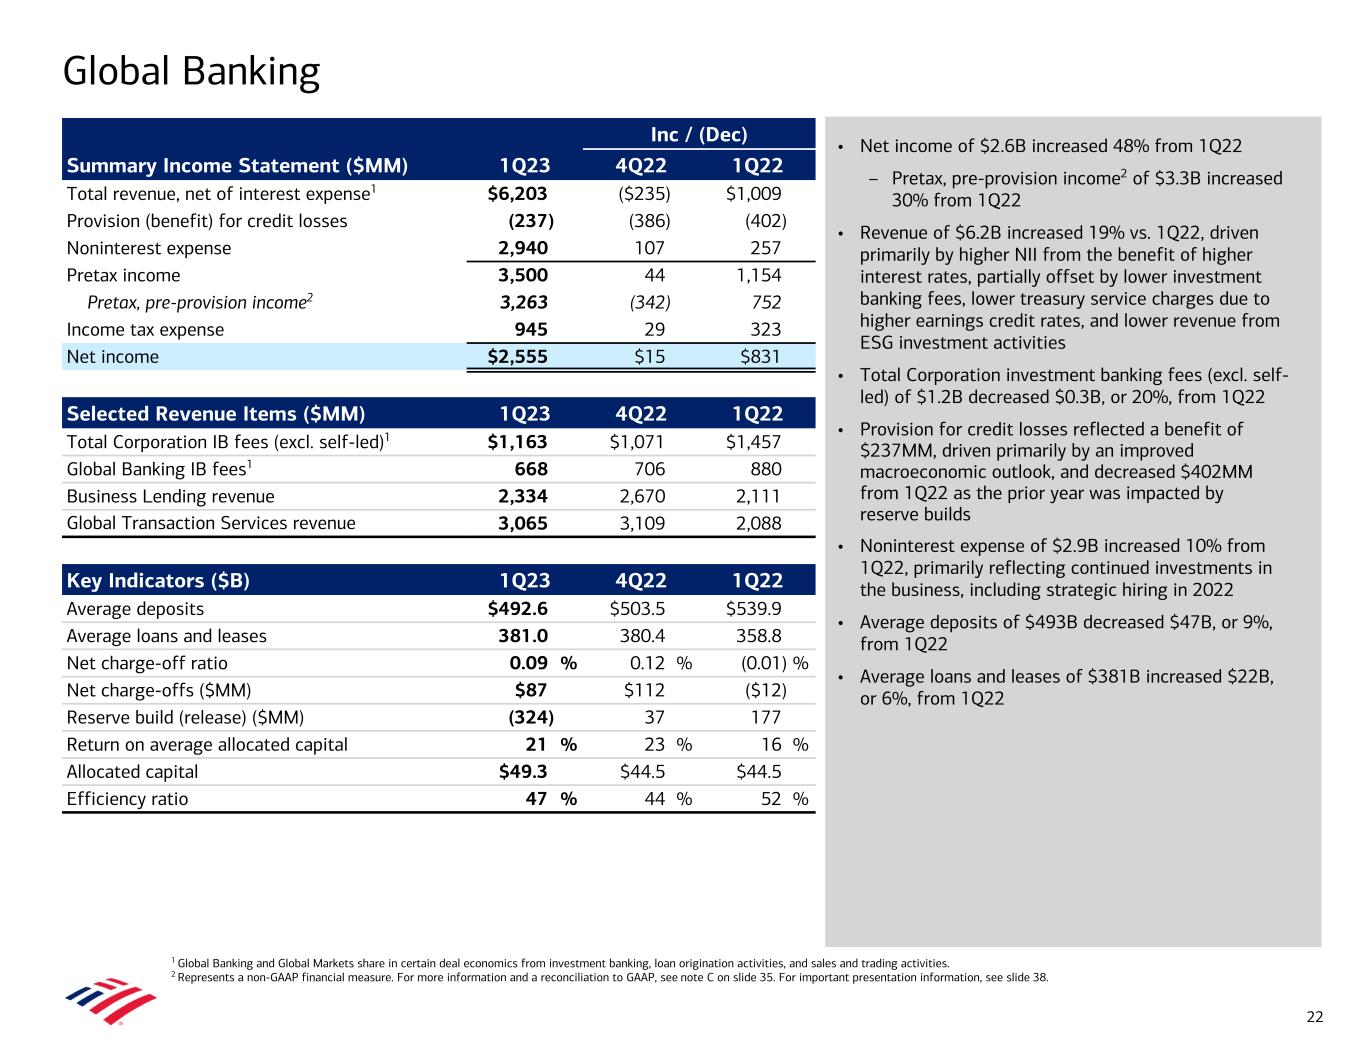
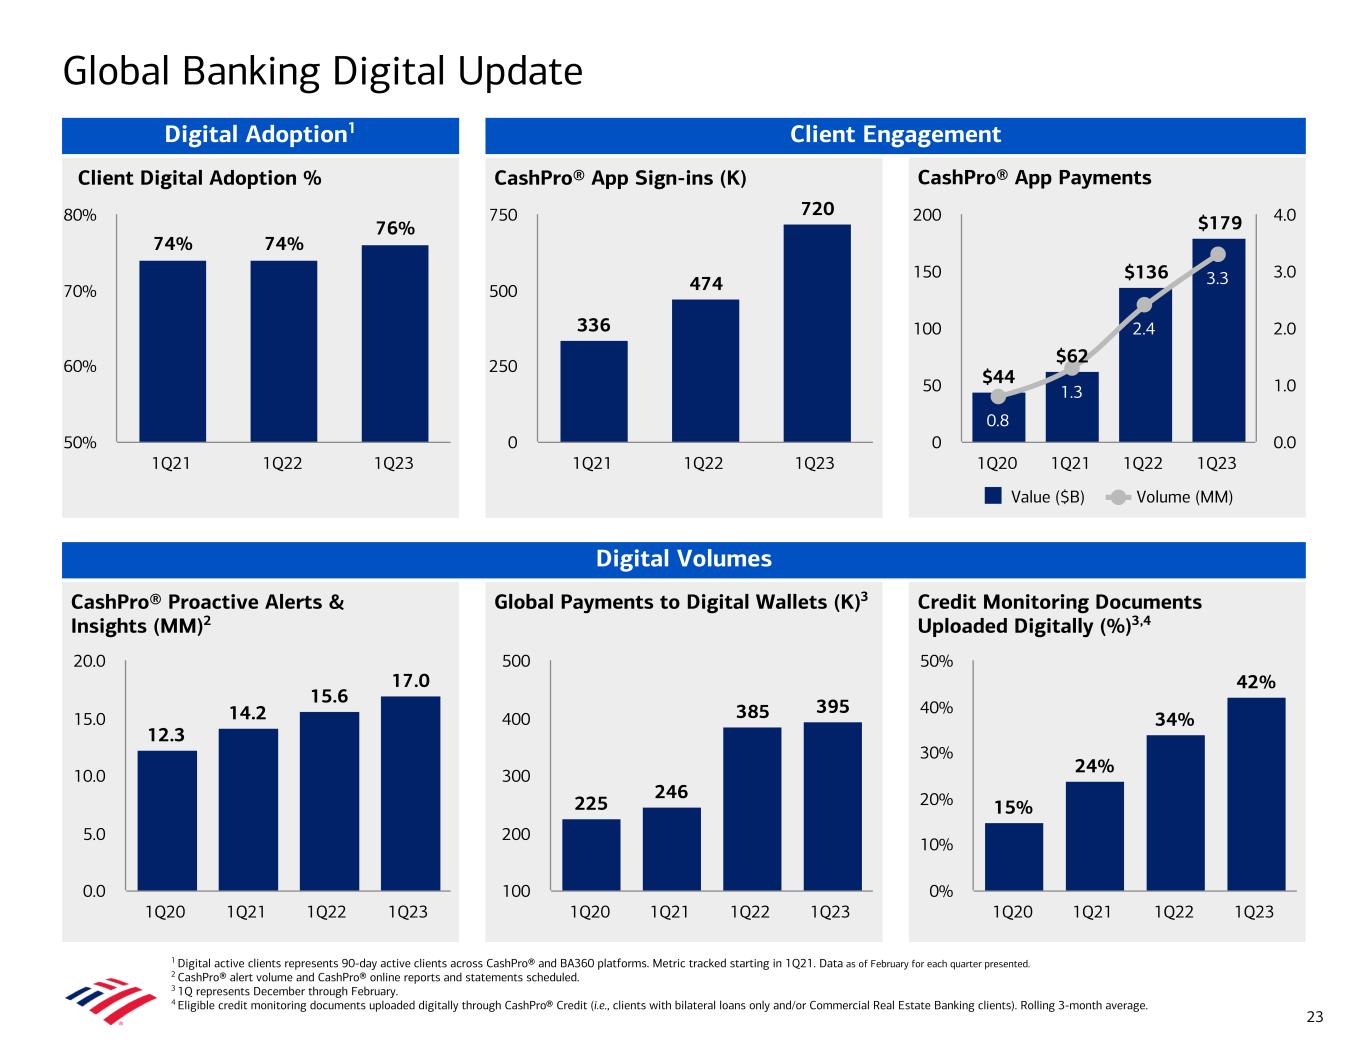
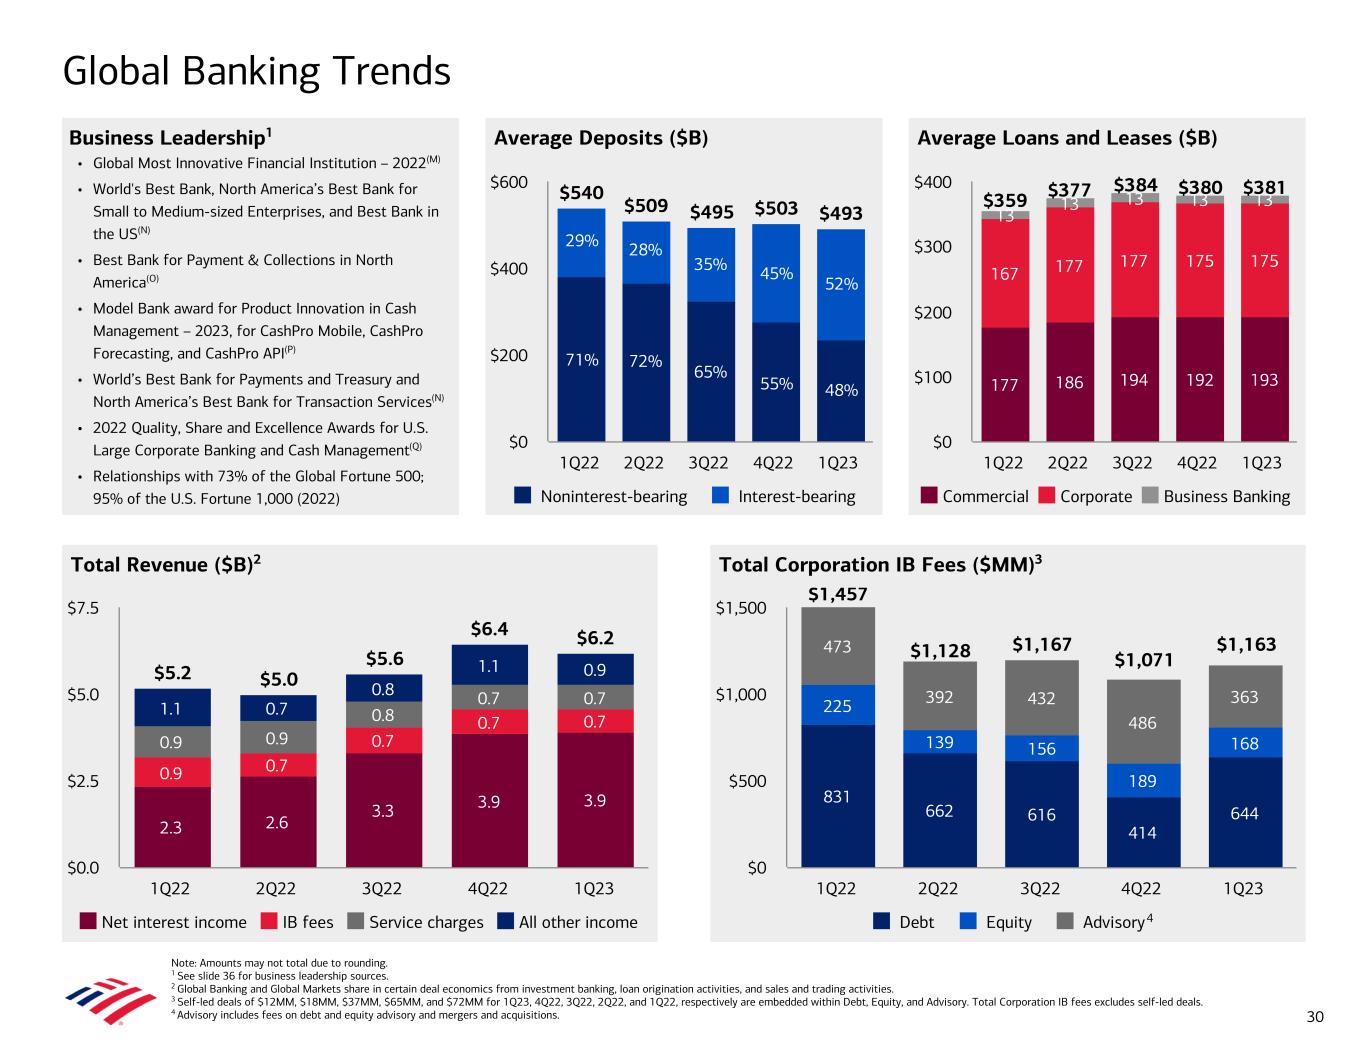
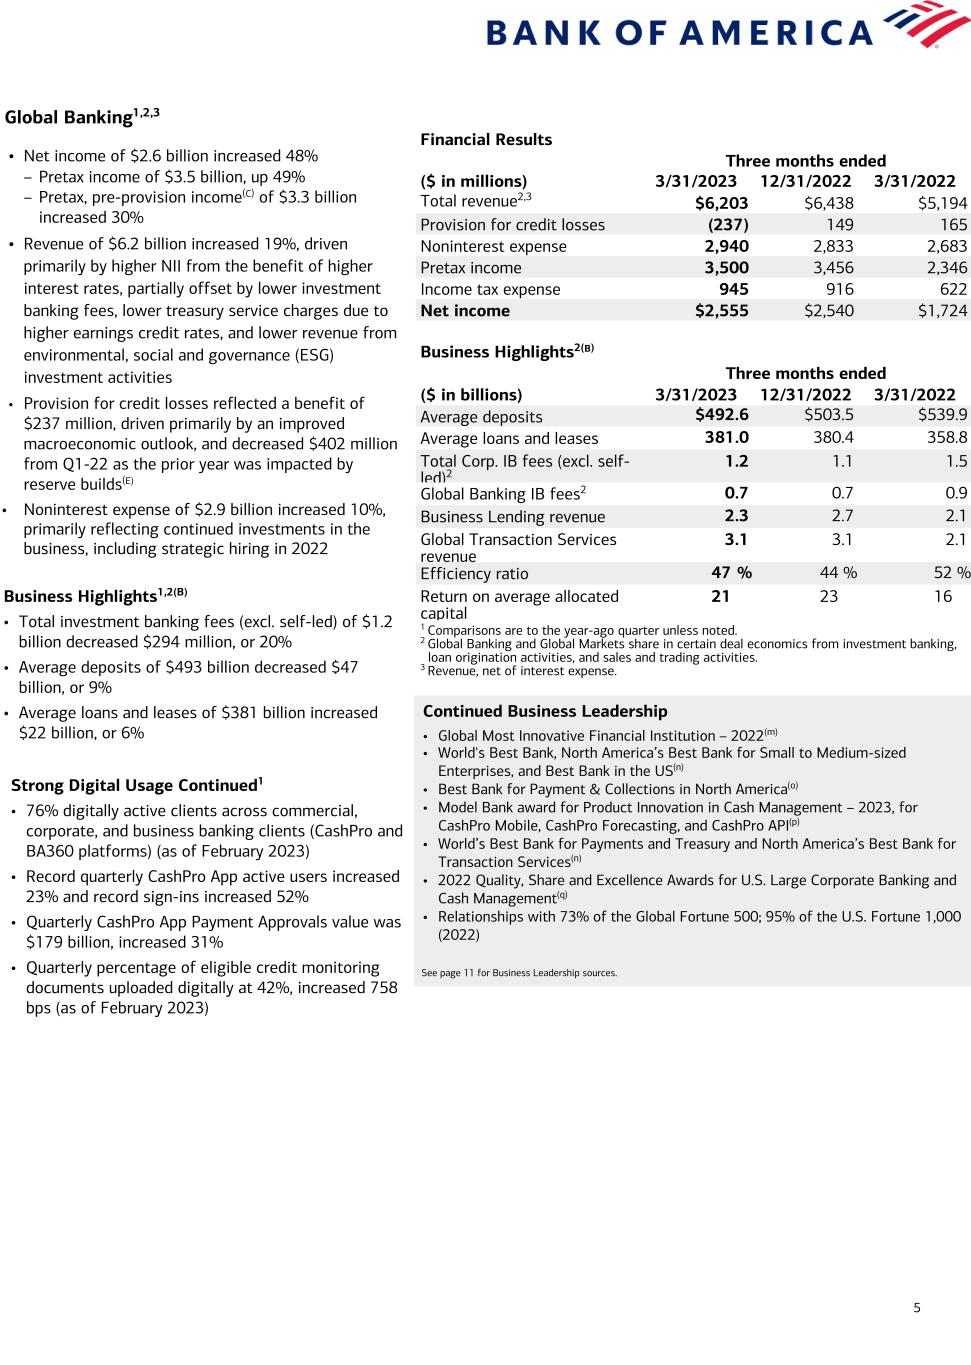
5 Global Banking1,2,3 Financial Results Three months ended ($ in millions) 3/31/2023 12/31/2022 3/31/2022 Total revenue2,3 $6,203 $6,438 $5,194 Provision for credit losses (237) 149 165 Noninterest expense 2,940 2,833 2,683 Pretax income 3,500 3,456 2,346 Income tax expense 945 916 622 Net income $2,555 $2,540 $1,724 Business Highlights2(B) Three months ended ($ in billions) 3/31/2023 12/31/2022 3/31/2022 Average deposits $492.6 $503.5 $539.9 Average loans and leases 381.0 380.4 358.8 Total Corp. IB fees (excl. self- led)2 1.2 1.1 1.5 Global Banking IB fees2 0.7 0.7 0.9 Business Lending revenue 2.3 2.7 2.1 Global Transaction Services revenue 3.1 3.1 2.1 Efficiency ratio 47 % 44 % 52 % Return on average allocated capital 21 23 16 1 Comparisons are to the year-ago quarter unless noted. 2 Global Banking and Global Markets share in certain deal economics from investment banking, loan origination activities, and sales and trading activities. 3 Revenue, net of interest expense. • Net income of $2.6 billion increased 48% – Pretax income of $3.5 billion, up 49% – Pretax, pre-provision income(C) of $3.3 billion increased 30% • Revenue of $6.2 billion increased 19%, driven primarily by higher NII from the benefit of higher interest rates, partially offset by lower investment banking fees, lower treasury service charges due to higher earnings credit rates, and lower revenue from environmental, social and governance (ESG) investment activities • Provision for credit losses reflected a benefit of $237 million, driven primarily by an improved macroeconomic outlook, and decreased $402 million from Q1-22 as the prior year was impacted by reserve builds(E) • Noninterest expense of $2.9 billion increased 10%, primarily reflecting continued investments in the business, including strategic hiring in 2022 Continued Business Leadership • Global Most Innovative Financial Institution – 2022(m) • World's Best Bank, North America’s Best Bank for Small to Medium-sized Enterprises, and Best Bank in the US(n) • Best Bank for Payment & Collections in North America(o) • Model Bank award for Product Innovation in Cash Management – 2023, for CashPro Mobile, CashPro Forecasting, and CashPro API(p) • World’s Best Bank for Payments and Treasury and North America’s Best Bank for Transaction Services(n) • 2022 Quality, Share and Excellence Awards for U.S. Large Corporate Banking and Cash Management(q) • Relationships with 73% of the Global Fortune 500; 95% of the U.S. Fortune 1,000 (2022) See page 11 for Business Leadership sources. Strong Digital Usage Continued1 • 76% digitally active clients across commercial, corporate, and business banking clients (CashPro and BA360 platforms) (as of February 2023) • Record quarterly CashPro App active users increased 23% and record sign-ins increased 52% • Quarterly CashPro App Payment Approvals value was $179 billion, increased 31% • Quarterly percentage of eligible credit monitoring documents uploaded digitally at 42%, increased 758 bps (as of February 2023) Business Highlights1,2(B) • Total investment banking fees (excl. self-led) of $1.2 billion decreased $294 million, or 20% • Average deposits of $493 billion decreased $47 billion, or 9% • Average loans and leases of $381 billion increased $22 billion, or 6%


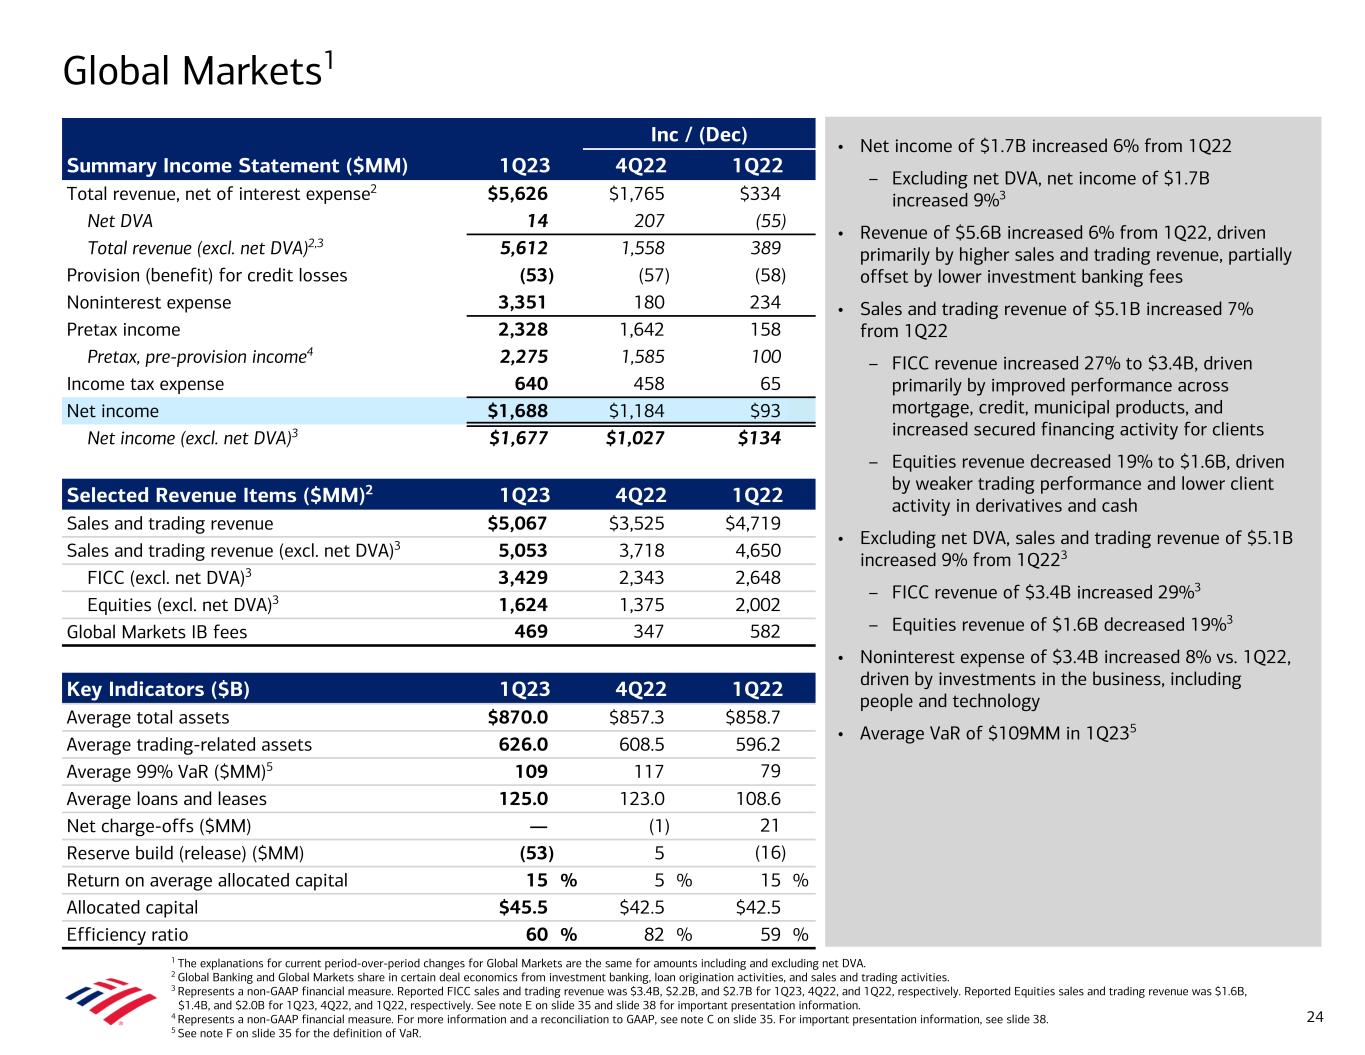
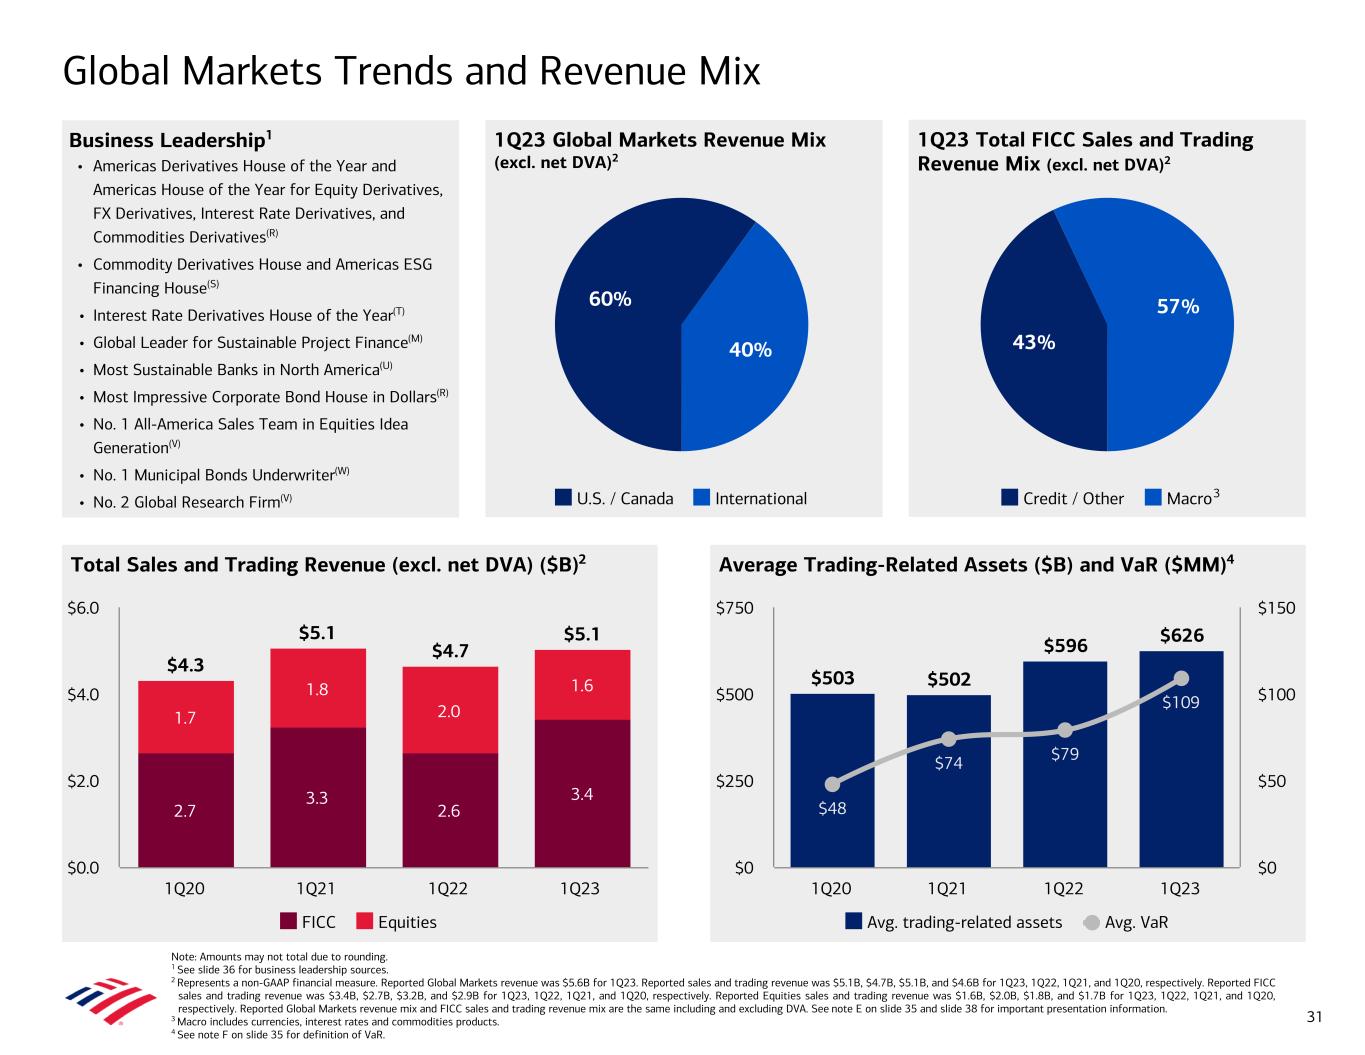
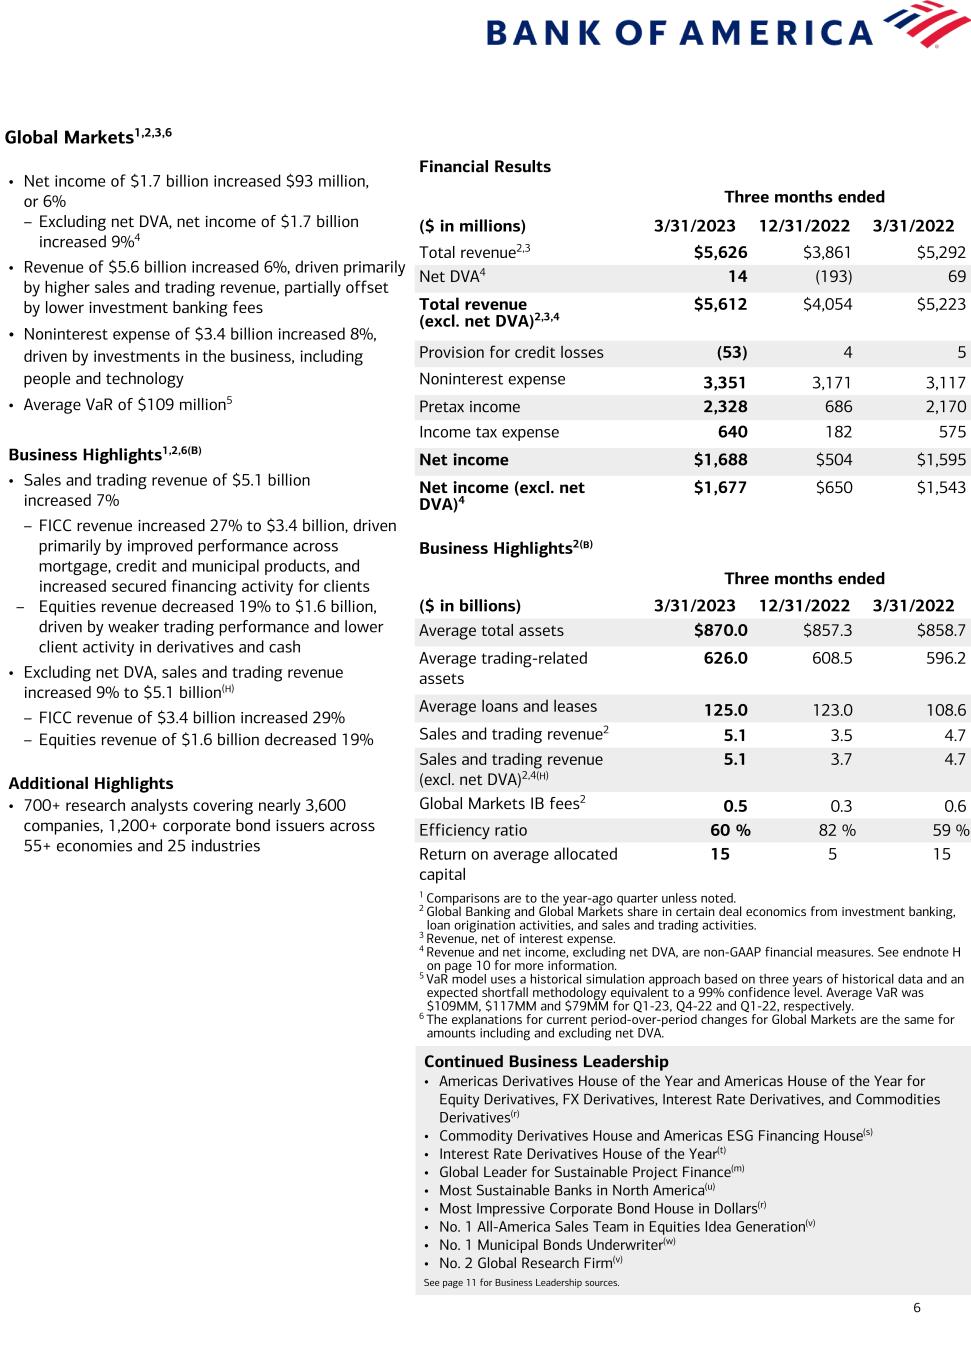
6 Global Markets1,2,3,6 Financial Results Three months ended ($ in millions) 3/31/2023 12/31/2022 3/31/2022 Total revenue2,3 $5,626 $3,861 $5,292 Net DVA4 14 (193) 69 Total revenue (excl. net DVA)2,3,4 $5,612 $4,054 $5,223 Provision for credit losses (53) 4 5 Noninterest expense 3,351 3,171 3,117 Pretax income 2,328 686 2,170 Income tax expense 640 182 575 Net income $1,688 $504 $1,595 Net income (excl. net DVA)4 $1,677 $650 $1,543 Business Highlights2(B) Three months ended ($ in billions) 3/31/2023 12/31/2022 3/31/2022 Average total assets $870.0 $857.3 $858.7 Average trading-related assets 626.0 608.5 596.2 Average loans and leases 125.0 123.0 108.6 Sales and trading revenue2 5.1 3.5 4.7 Sales and trading revenue (excl. net DVA)2,4(H) 5.1 3.7 4.7 Global Markets IB fees2 0.5 0.3 0.6 Efficiency ratio 60 % 82 % 59 % Return on average allocated capital 15 5 15 1 Comparisons are to the year-ago quarter unless noted. 2 Global Banking and Global Markets share in certain deal economics from investment banking, loan origination activities, and sales and trading activities. 3 Revenue, net of interest expense. 4 Revenue and net income, excluding net DVA, are non-GAAP financial measures. See endnote H on page 10 for more information. 5 VaR model uses a historical simulation approach based on three years of historical data and an expected shortfall methodology equivalent to a 99% confidence level. Average VaR was $109MM, $117MM and $79MM for Q1-23, Q4-22 and Q1-22, respectively. 6 The explanations for current period-over-period changes for Global Markets are the same for amounts including and excluding net DVA. • Net income of $1.7 billion increased $93 million, or 6% – Excluding net DVA, net income of $1.7 billion increased 9%4 • Revenue of $5.6 billion increased 6%, driven primarily by higher sales and trading revenue, partially offset by lower investment banking fees • Noninterest expense of $3.4 billion increased 8%, driven by investments in the business, including people and technology • Average VaR of $109 million5 Business Highlights1,2,6(B) • Sales and trading revenue of $5.1 billion increased 7% – FICC revenue increased 27% to $3.4 billion, driven primarily by improved performance across mortgage, credit and municipal products, and increased secured financing activity for clients – Equities revenue decreased 19% to $1.6 billion, driven by weaker trading performance and lower client activity in derivatives and cash • Excluding net DVA, sales and trading revenue increased 9% to $5.1 billion(H) – FICC revenue of $3.4 billion increased 29% – Equities revenue of $1.6 billion decreased 19% Additional Highlights • 700+ research analysts covering nearly 3,600 companies, 1,200+ corporate bond issuers across 55+ economies and 25 industries Continued Business Leadership • Americas Derivatives House of the Year and Americas House of the Year for Equity Derivatives, FX Derivatives, Interest Rate Derivatives, and Commodities Derivatives(r) • Commodity Derivatives House and Americas ESG Financing House(s) • Interest Rate Derivatives House of the Year(t) • Global Leader for Sustainable Project Finance(m) • Most Sustainable Banks in North America(u) • Most Impressive Corporate Bond House in Dollars(r) • No. 1 All-America Sales Team in Equities Idea Generation(v) • No. 1 Municipal Bonds Underwriter(w) • No. 2 Global Research Firm(v) See page 11 for Business Leadership sources.


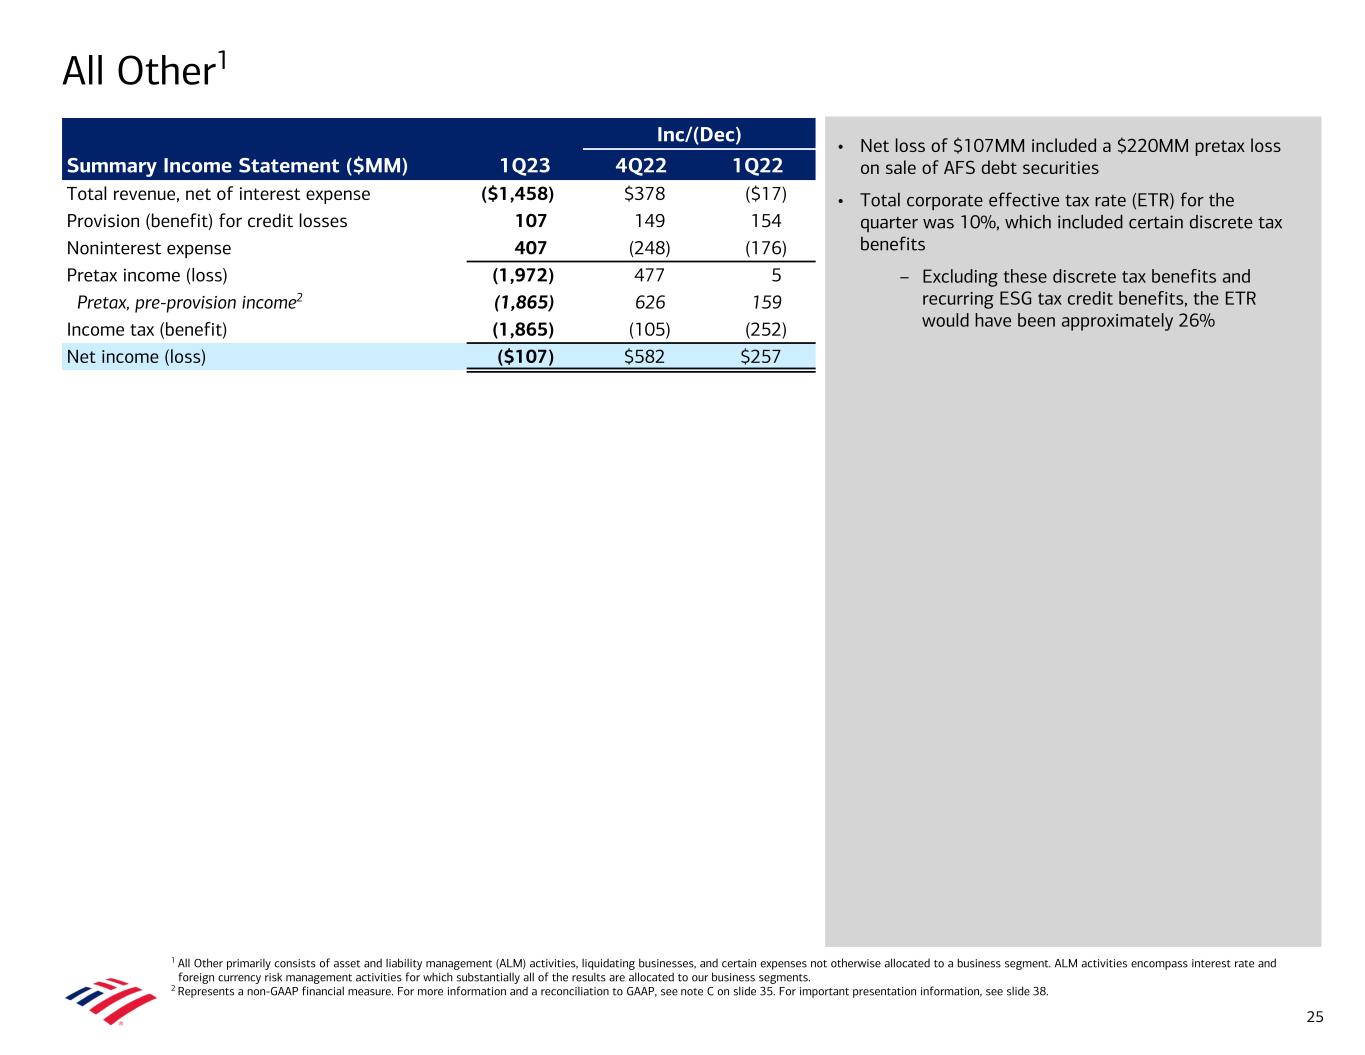
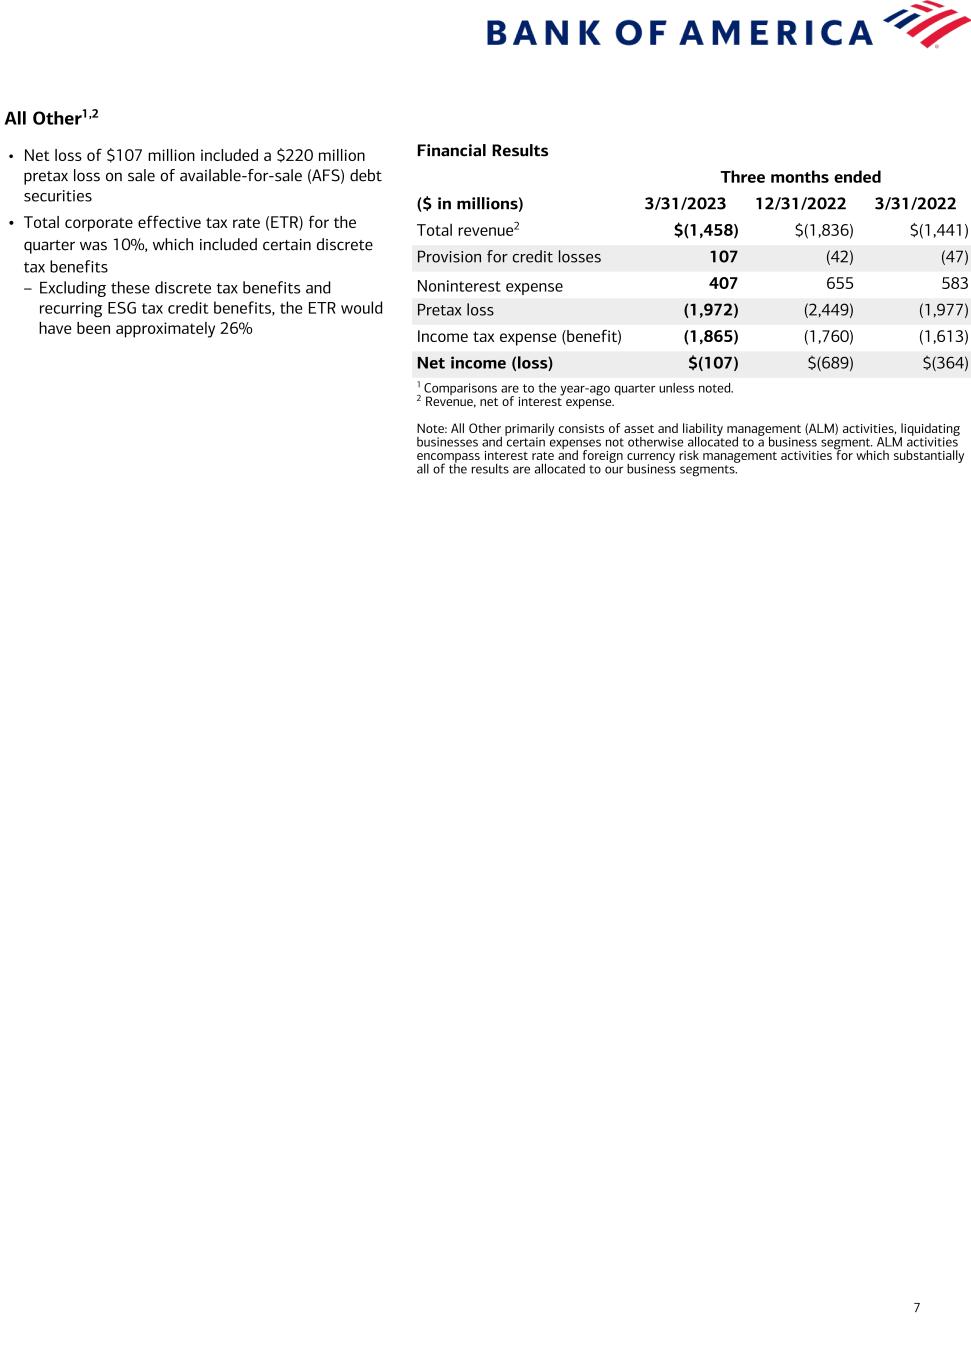
7 All Other1,2 Financial Results Three months ended ($ in millions) 3/31/2023 12/31/2022 3/31/2022 Total revenue2 $(1,458) $(1,836) $(1,441) Provision for credit losses 107 (42) (47) Noninterest expense 407 655 583 Pretax loss (1,972) (2,449) (1,977) Income tax expense (benefit) (1,865) (1,760) (1,613) Net income (loss) $(107) $(689) $(364) 1 Comparisons are to the year-ago quarter unless noted. 2 Revenue, net of interest expense. Note: All Other primarily consists of asset and liability management (ALM) activities, liquidating businesses and certain expenses not otherwise allocated to a business segment. ALM activities encompass interest rate and foreign currency risk management activities for which substantially all of the results are allocated to our business segments. • Net loss of $107 million included a $220 million pretax loss on sale of available-for-sale (AFS) debt securities • Total corporate effective tax rate (ETR) for the quarter was 10%, which included certain discrete tax benefits – Excluding these discrete tax benefits and recurring ESG tax credit benefits, the ETR would have been approximately 26%


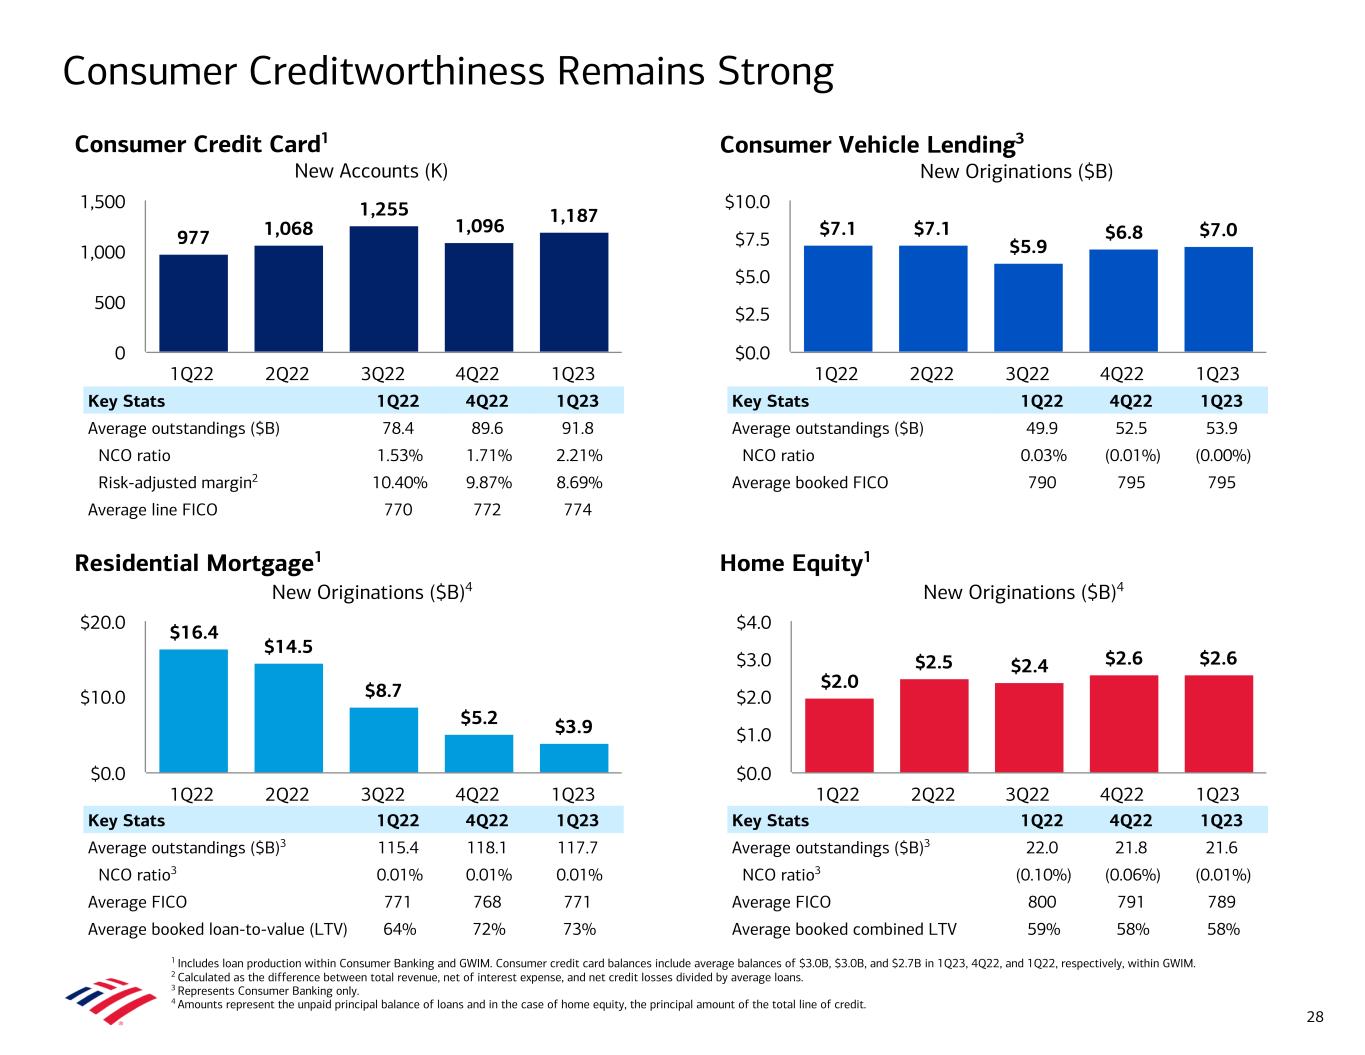
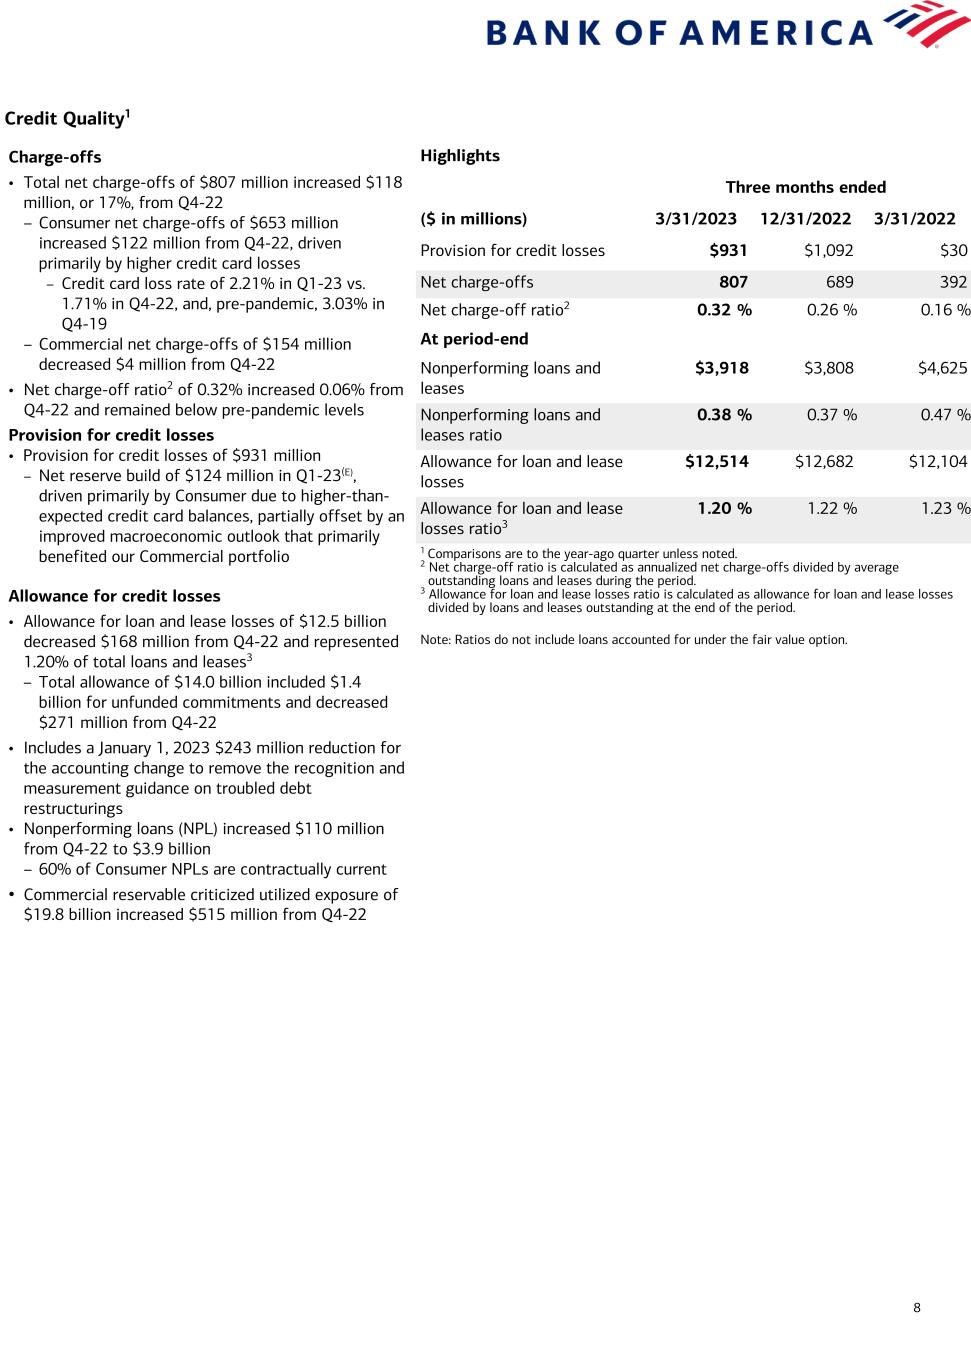
8 Credit Quality1 Highlights Three months ended ($ in millions) 3/31/2023 12/31/2022 3/31/2022 Provision for credit losses $931 $1,092 $30 Net charge-offs 807 689 392 Net charge-off ratio2 0.32 % 0.26 % 0.16 % At period-end Nonperforming loans and leases $3,918 $3,808 $4,625 Nonperforming loans and leases ratio 0.38 % 0.37 % 0.47 % Allowance for loan and lease losses $12,514 $12,682 $12,104 Allowance for loan and lease losses ratio3 1.20 % 1.22 % 1.23 % 1 Comparisons are to the year-ago quarter unless noted. 2 Net charge-off ratio is calculated as annualized net charge-offs divided by average outstanding loans and leases during the period. 3 Allowance for loan and lease losses ratio is calculated as allowance for loan and lease losses divided by loans and leases outstanding at the end of the period. Note: Ratios do not include loans accounted for under the fair value option. Charge-offs • Total net charge-offs of $807 million increased $118 million, or 17%, from Q4-22 – Consumer net charge-offs of $653 million increased $122 million from Q4-22, driven primarily by higher credit card losses – Credit card loss rate of 2.21% in Q1-23 vs. 1.71% in Q4-22, and, pre-pandemic, 3.03% in Q4-19 – Commercial net charge-offs of $154 million decreased $4 million from Q4-22 • Net charge-off ratio2 of 0.32% increased 0.06% from Q4-22 and remained below pre-pandemic levels Provision for credit losses • Provision for credit losses of $931 million – Net reserve build of $124 million in Q1-23(E), driven primarily by Consumer due to higher-than- expected credit card balances, partially offset by an improved macroeconomic outlook that primarily benefited our Commercial portfolio Allowance for credit losses • Allowance for loan and lease losses of $12.5 billion decreased $168 million from Q4-22 and represented 1.20% of total loans and leases3 – Total allowance of $14.0 billion included $1.4 billion for unfunded commitments and decreased $271 million from Q4-22 • Includes a January 1, 2023 $243 million reduction for the accounting change to remove the recognition and measurement guidance on troubled debt restructurings • Nonperforming loans (NPL) increased $110 million from Q4-22 to $3.9 billion – 60% of Consumer NPLs are contractually current • Commercial reservable criticized utilized exposure of $19.8 billion increased $515 million from Q4-22


9 Balance Sheet, Liquidity and Capital Highlights ($ in billions except per share data, end of period, unless otherwise noted)(B) Three months ended 3/31/2023 12/31/2022 3/31/2022 Ending Balance Sheet Total assets $3,194.7 $3,051.4 $3,238.2 Total loans and leases 1,046.4 1,045.7 993.1 Total loans and leases in business segments (excluding All Other) 1,036.6 1,035.5 978.1 Total deposits 1,910.4 1,930.3 2,072.4 Average Balance Sheet Average total assets $3,096.1 $3,074.3 $3,207.7 Average loans and leases 1,041.4 1,039.2 977.8 Average deposits 1,893.6 1,925.5 2,045.8 Funding and Liquidity Long-term debt $283.9 $276.0 $278.7 Global Liquidity Sources, average(F) 854 868 1,109 Equity Common shareholders’ equity $251.8 $244.8 $239.5 Common equity ratio 7.9 % 8.0 % 7.4 % Tangible common shareholders’ equity1 $181.6 $174.6 $169.3 Tangible common equity ratio1 5.8 % 5.9 % 5.3 % Per Share Data Common shares outstanding (in billions) 7.97 8.00 8.06 Book value per common share $31.58 $30.61 $29.70 Tangible book value per common share1 22.78 21.83 20.99 Regulatory Capital(G) CET1 capital $184.4 $180.1 $169.9 Standardized approach Risk-weighted assets $1,623 $1,605 $1,639 CET1 ratio 11.4 % 11.2 % 10.4 % Advanced approaches Risk-weighted assets $1,429 $1,411 $1,416 CET1 ratio 12.9 % 12.8 % 12.0 % Supplementary leverage Supplementary leverage ratio (SLR) 6.0 % 5.9 % 5.4 % 1 Represents a non-GAAP financial measure. For reconciliation, see page 18.


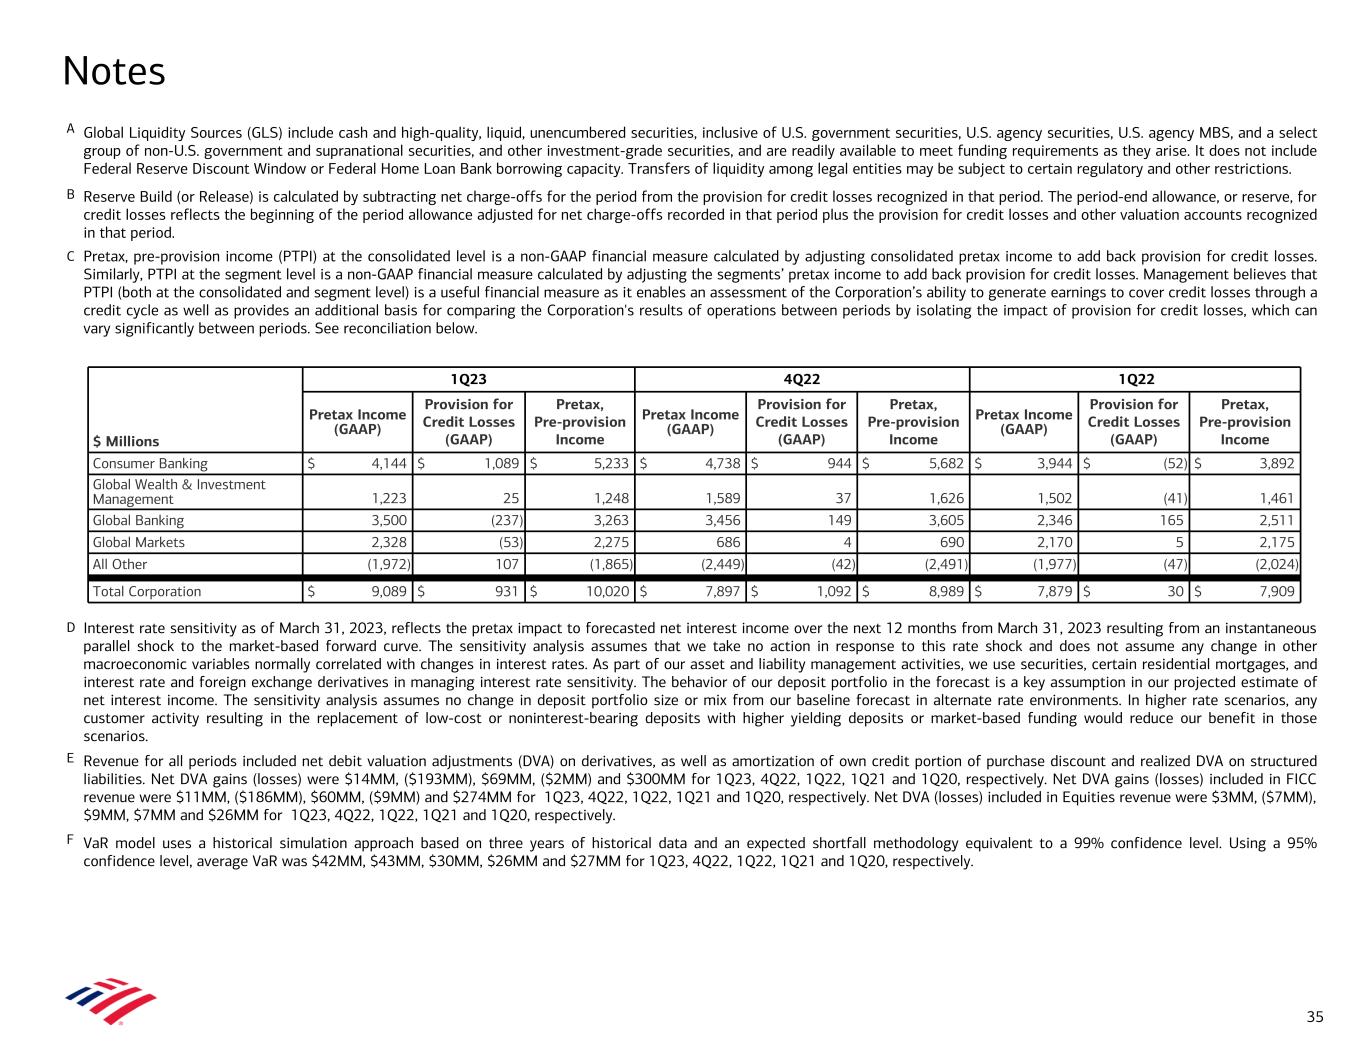
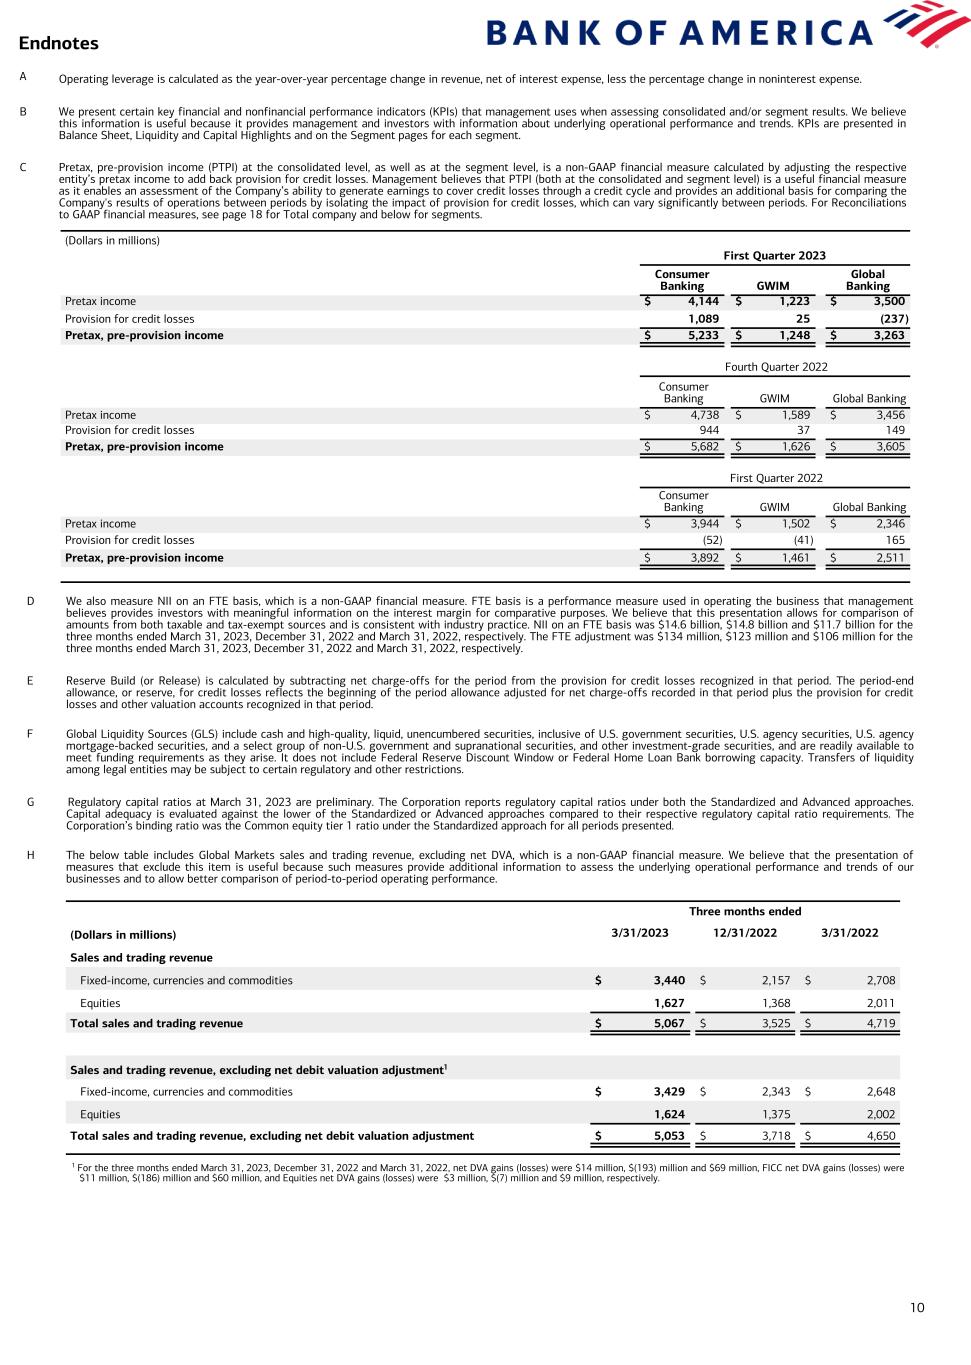
10 Endnotes Three months ended (Dollars in millions) 3/31/2023 12/31/2022 3/31/2022 Sales and trading revenue Fixed-income, currencies and commodities $ 3,440 $ 2,157 $ 2,708 Equities 1,627 1,368 2,011 Total sales and trading revenue $ 5,067 $ 3,525 $ 4,719 Sales and trading revenue, excluding net debit valuation adjustment1 Fixed-income, currencies and commodities $ 3,429 $ 2,343 $ 2,648 Equities 1,624 1,375 2,002 Total sales and trading revenue, excluding net debit valuation adjustment $ 5,053 $ 3,718 $ 4,650 A Operating leverage is calculated as the year-over-year percentage change in revenue, net of interest expense, less the percentage change in noninterest expense. B We present certain key financial and nonfinancial performance indicators (KPIs) that management uses when assessing consolidated and/or segment results. We believe this information is useful because it provides management and investors with information about underlying operational performance and trends. KPIs are presented in Balance Sheet, Liquidity and Capital Highlights and on the Segment pages for each segment. C Pretax, pre-provision income (PTPI) at the consolidated level, as well as at the segment level, is a non-GAAP financial measure calculated by adjusting the respective entity’s pretax income to add back provision for credit losses. Management believes that PTPI (both at the consolidated and segment level) is a useful financial measure as it enables an assessment of the Company’s ability to generate earnings to cover credit losses through a credit cycle and provides an additional basis for comparing the Company's results of operations between periods by isolating the impact of provision for credit losses, which can vary significantly between periods. For Reconciliations to GAAP financial measures, see page 18 for Total company and below for segments. 1 For the three months ended March 31, 2023, December 31, 2022 and March 31, 2022, net DVA gains (losses) were $14 million, $(193) million and $69 million, FICC net DVA gains (losses) were $11 million, $(186) million and $60 million, and Equities net DVA gains (losses) were $3 million, $(7) million and $9 million, respectively. (Dollars in millions) First Quarter 2023 Consumer Banking GWIM Global Banking Pretax income $ 4,144 $ 1,223 $ 3,500 Provision for credit losses 1,089 25 (237) Pretax, pre-provision income $ 5,233 $ 1,248 $ 3,263 Fourth Quarter 2022 Consumer Banking GWIM Global Banking Pretax income $ 4,738 $ 1,589 $ 3,456 Provision for credit losses 944 37 149 Pretax, pre-provision income $ 5,682 $ 1,626 $ 3,605 First Quarter 2022 Consumer Banking GWIM Global Banking Pretax income $ 3,944 $ 1,502 $ 2,346 Provision for credit losses (52) (41) 165 Pretax, pre-provision income $ 3,892 $ 1,461 $ 2,511 D We also measure NII on an FTE basis, which is a non-GAAP financial measure. FTE basis is a performance measure used in operating the business that management believes provides investors with meaningful information on the interest margin for comparative purposes. We believe that this presentation allows for comparison of amounts from both taxable and tax-exempt sources and is consistent with industry practice. NII on an FTE basis was $14.6 billion, $14.8 billion and $11.7 billion for the three months ended March 31, 2023, December 31, 2022 and March 31, 2022, respectively. The FTE adjustment was $134 million, $123 million and $106 million for the three months ended March 31, 2023, December 31, 2022 and March 31, 2022, respectively. E Reserve Build (or Release) is calculated by subtracting net charge-offs for the period from the provision for credit losses recognized in that period. The period-end allowance, or reserve, for credit losses reflects the beginning of the period allowance adjusted for net charge-offs recorded in that period plus the provision for credit losses and other valuation accounts recognized in that period. F Global Liquidity Sources (GLS) include cash and high-quality, liquid, unencumbered securities, inclusive of U.S. government securities, U.S. agency securities, U.S. agency mortgage-backed securities, and a select group of non-U.S. government and supranational securities, and other investment-grade securities, and are readily available to meet funding requirements as they arise. It does not include Federal Reserve Discount Window or Federal Home Loan Bank borrowing capacity. Transfers of liquidity among legal entities may be subject to certain regulatory and other restrictions. GRegulatR Regulatory capital ratios at March 31, 2023 are preliminary. The Corporation reports regulatory capital ratios under both the Standardized and Advanced approaches. Capital adequacy is evaluated against the lower of the Standardized or Advanced approaches compared to their respective regulatory capital ratio requirements. The Corporation’s binding ratio was the Common equity tier 1 ratio under the Standardized approach for all periods presented. H The below table includes Global Markets sales and trading revenue, excluding net DVA, which is a non-GAAP financial measure. We believe that the presentation of measures that exclude this item is useful because such measures provide additional information to assess the underlying operational performance and trends of our businesses and to allow better comparison of period-to-period operating performance.


11 (a) Estimated U.S. retail deposits based on June 30, 2022 FDIC deposit data. (b) Javelin 2022 Online and Mobile Banking Scorecards. (c) FDIC, 4Q22. (d) Global Finance, May 2022. (e) Global Finance, August 2022. (f) Global Finance, December 2022. (g) J.D. Power 2023 Financial Health Support CertificationSM is based on exceeding customer experience benchmarks using client surveys and a best practices verification. For more information, visit jdpower.com/awards. (h) Industry Q4-22 FDIC call reports. (i) Family Wealth Report, 2022. (j) Global Private Banking, The Digital Banker, 2022. (k) WealthBriefing, 2022. (l) PWM, 2022. (m) Global Finance, 2022. (n) Euromoney, 2022. (o) Global Finance Treasury & Cash Management Awards, 2023. (p) Celent, 2023. (q) Greenwich, 2023. (r) GlobalCapital, 2022. (s) IFR, 2022. (t) Risk.net, 2022. (u) Capital Monitor, 2022. (v) Institutional Investor, 2022. (w) Refinitiv, 2023 YTD. Business Leadership Sources


12 Contact Information and Investor Conference Call Invitation Investor Call Information Chief Executive Officer Brian Moynihan and Chief Financial Officer Alastair Borthwick will discuss first-quarter 2023 financial results in a conference call at 8:30 a.m. ET today. The presentation and supporting materials can be accessed on the Bank of America Investor Relations website at https://investor.bankofamerica.com. For a listen-only connection to the conference call, dial 1.877.200.4456 (U.S.) or 1.785.424.1732 (international). The conference ID is 79795. Please dial in 10 minutes prior to the start of the call. Investors can access replays of the conference call by visiting the Investor Relations website or by calling 1.800.934.4850 (U.S.) or 1.402.220.1178 (international) from noon April 18 through 11:59 p.m. ET on April 28. Investors May Contact: Lee McEntire, Bank of America Phone: 1.980.388.6780 lee.mcentire@bofa.com Jonathan G. Blum, Bank of America (Fixed Income) Phone: 1.212.449.3112 jonathan.blum@bofa.com Bank of America Bank of America is one of the world’s leading financial institutions, serving individual consumers, small and middle-market businesses and large corporations with a full range of banking, investing, asset management and other financial and risk management products and services. The company provides unmatched convenience in the United States, serving approximately 68 million consumer and small business clients with approximately 3,900 retail financial centers, approximately 15,000 ATMs and award-winning digital banking with approximately 56 million verified digital users. Bank of America is a global leader in wealth management, corporate and investment banking and trading across a broad range of asset classes, serving corporations, governments, institutions and individuals around the world. Bank of America offers industry-leading support to approximately 3 million small business households through a suite of innovative, easy-to-use online products and services. The company serves clients through operations across the United States, its territories and more than 35 countries. Bank of America Corporation stock (NYSE: BAC) is listed on the New York Stock Exchange. Forward-Looking Statements Bank of America Corporation (the Corporation) and its management may make certain statements that constitute “forward-looking statements” within the meaning of the Private Securities Litigation Reform Act of 1995. These statements can be identified by the fact that they do not relate strictly to historical or current facts. Forward-looking statements often use words such as “anticipates,” “targets,” “expects,” “hopes,” “estimates,” “intends,” “plans,” “goals,” “believes,” “continue” and other similar expressions or future or conditional verbs such as “will,” “may,” “might,” “should,” “would” and “could.” Forward-looking statements represent the Corporation’s current expectations, plans or forecasts of its future results, revenues, liquidity, provision for credit losses, expenses, efficiency ratio, capital measures, strategy, deposits, assets, and future business and economic conditions more generally, and other future matters. These statements are not guarantees of future results or performance and involve certain known and unknown risks, uncertainties and assumptions that are difficult to predict and are often beyond the Corporation’s control. Actual outcomes and results may differ materially from those expressed in, or implied by, any of these forward-looking statements. Reporters May Contact: Bill Halldin, Bank of America Phone: 1.916.724.0093 william.halldin@bofa.com Christopher Feeney, Bank of America Phone: 1.980.386.6794 christopher.feeney@bofa.com


13 You should not place undue reliance on any forward-looking statement and should consider the following uncertainties and risks, as well as the risks and uncertainties more fully discussed under Item 1A. Risk Factors of the Corporation’s 2022 Annual Report on Form 10-K and in any of the Corporation’s subsequent Securities and Exchange Commission filings: the Corporation’s potential judgments, orders, settlements, penalties, fines and reputational damage resulting from pending or future litigation and regulatory investigations, proceedings and enforcement actions, including as a result of our participation in and execution of government programs related to the Coronavirus Disease 2019 (COVID-19) pandemic, such as the processing of unemployment benefits for California and certain other states; the possibility that the Corporation's future liabilities may be in excess of its recorded liability and estimated range of possible loss for litigation, and regulatory and government actions; the possibility that the Corporation could face increased claims from one or more parties involved in mortgage securitizations; the Corporation’s ability to resolve representations and warranties repurchase and related claims; the risks related to the discontinuation of the London Interbank Offered Rate and other reference rates, including increased expenses and litigation and the effectiveness of hedging strategies; uncertainties about the financial stability and growth rates of non-U.S. jurisdictions, the risk that those jurisdictions may face difficulties servicing their sovereign debt, and related stresses on financial markets, currencies and trade, and the Corporation’s exposures to such risks, including direct, indirect and operational; the impact of U.S. and global interest rates, inflation, currency exchange rates, economic conditions, trade policies and tensions, including tariffs, and potential geopolitical instability; the impact of the interest rate, inflationary, macroeconomic, banking and regulatory environment on the Corporation’s assets, business, financial condition and results of operations; the impact of adverse developments affecting the U.S. or global banking industry, including bank failures and liquidity concerns, which could cause continued or worsening economic and market volatility, and regulatory responses thereto; the possibility that future credit losses may be higher than currently expected due to changes in economic assumptions, customer behavior, adverse developments with respect to U.S. or global economic conditions and other uncertainties, including the impact of supply chain disruptions, inflationary pressures and labor shortages on economic conditions and our business; potential losses related to the Corporation’s concentration of credit risk; the Corporation's ability to achieve its expense targets and expectations regarding revenue, net interest income, provision for credit losses, net charge-offs, effective tax rate, loan growth or other projections; adverse changes to the Corporation’s credit ratings from the major credit rating agencies; an inability to access capital markets or maintain deposits or borrowing costs; estimates of the fair value and other accounting values, subject to impairment assessments, of certain of the Corporation’s assets and liabilities; the estimated or actual impact of changes in accounting standards or assumptions in applying those standards; uncertainty regarding the content, timing and impact of regulatory capital and liquidity requirements; the impact of adverse changes to total loss-absorbing capacity requirements, stress capital buffer requirements and/or global systemically important bank surcharges; the potential impact of actions of the Board of Governors of the Federal Reserve System on the Corporation’s capital plans; the effect of changes in or interpretations of income tax laws and regulations; the impact of implementation and compliance with U.S. and international laws, regulations and regulatory interpretations, including, but not limited to, recovery and resolution planning requirements, Federal Deposit Insurance Corporation assessments, the Volcker Rule, fiduciary standards, derivatives regulations and the Coronavirus Aid, Relief, and Economic Security Act and any similar or related rules and regulations; a failure or disruption in or breach of the Corporation’s operational or security systems or infrastructure, or those of third parties, including as a result of cyber-attacks or campaigns; the risks related to the transition and physical impacts of climate change; our ability to achieve environmental, social and governance goals and commitments or the impact of any changes in the Corporation's sustainability strategy or commitments generally; the impact of any future federal government shutdown and uncertainty regarding the federal government’s debt limit or changes in fiscal, monetary or regulatory policy; the emergence or continuation of widespread health emergencies or pandemics, including the magnitude and duration of the COVID-19 pandemic and its impact on U.S. and/or global financial market conditions and our business, results of operations, financial condition and prospects; the impact of natural disasters, extreme weather events, military conflict (including the Russia/Ukraine conflict, the possible expansion of such conflict and potential geopolitical consequences), terrorism or other geopolitical events; and other matters. Forward-looking statements speak only as of the date they are made, and the Corporation undertakes no obligation to update any forward- looking statement to reflect the impact of circumstances or events that arise after the date the forward-looking statement was made. “Bank of America” and “BofA Securities” are the marketing names used by the Global Banking and Global Markets divisions of Bank of America Corporation. Lending, other commercial banking activities, and trading in certain financial instruments are performed globally by banking affiliates of Bank of America Corporation, including Bank of America, N.A., Member FDIC. Trading in securities and financial instruments, and strategic advisory, and other investment banking activities, are performed globally by investment banking affiliates of Bank of America Corporation (“Investment Banking Affiliates”) or other affiliates, including, in the United States, BofA Securities, Inc., Merrill Lynch Professional Clearing Corp. and Merrill Lynch, Pierce, Fenner & Smith Incorporated, each of which are registered broker-dealers and Members of SIPC, and, in other jurisdictions, by locally registered entities. BofA Securities, Inc. and Merrill Lynch Professional Clearing Corp. are registered as futures commission merchants with the CFTC and are members of the NFA. Investment products offered by Investment Banking Affiliates: Are Not FDIC Insured · May Lose Value · Are Not Bank Guaranteed. Bank of America Corporation’s broker-dealers are not banks and are separate legal entities from their bank affiliates. The obligations of the broker-dealers are not obligations of their bank affiliates (unless explicitly stated otherwise), and these bank affiliates are not responsible for securities sold, offered, or recommended by the broker-dealers. The foregoing also applies to other non-bank affiliates. For more Bank of America news, including dividend announcements and other important information, visit the Bank of America newsroom at https://newsroom.bankofamerica.com. www.bankofamerica.com


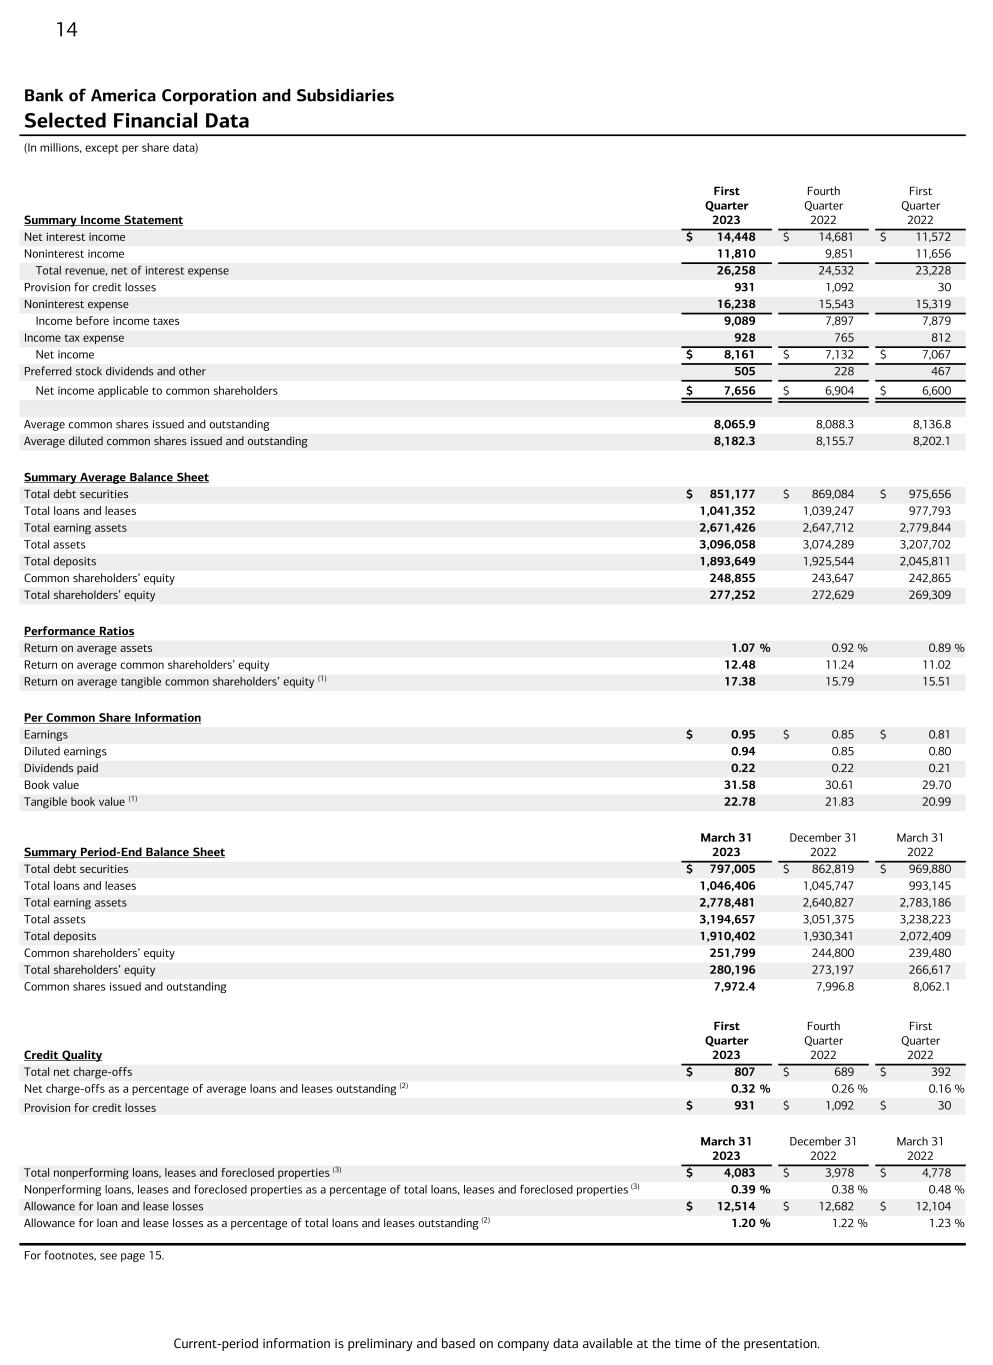
Current-period information is preliminary and based on company data available at the time of the presentation. 14 Bank of America Corporation and Subsidiaries Selected Financial Data (In millions, except per share data) First Quarter 2023 Fourth Quarter 2022 First Quarter 2022Summary Income Statement Net interest income $ 14,448 $ 14,681 $ 11,572 Noninterest income 11,810 9,851 11,656 Total revenue, net of interest expense 26,258 24,532 23,228 Provision for credit losses 931 1,092 30 Noninterest expense 16,238 15,543 15,319 Income before income taxes 9,089 7,897 7,879 Income tax expense 928 765 812 Net income $ 8,161 $ 7,132 $ 7,067 Preferred stock dividends and other 505 228 467 Net income applicable to common shareholders $ 7,656 $ 6,904 $ 6,600 Average common shares issued and outstanding 8,065.9 8,088.3 8,136.8 Average diluted common shares issued and outstanding 8,182.3 8,155.7 8,202.1 Summary Average Balance Sheet Total debt securities $ 851,177 $ 869,084 $ 975,656 Total loans and leases 1,041,352 1,039,247 977,793 Total earning assets 2,671,426 2,647,712 2,779,844 Total assets 3,096,058 3,074,289 3,207,702 Total deposits 1,893,649 1,925,544 2,045,811 Common shareholders’ equity 248,855 243,647 242,865 Total shareholders’ equity 277,252 272,629 269,309 Performance Ratios Return on average assets 1.07 % 0.92 % 0.89 % Return on average common shareholders’ equity 12.48 11.24 11.02 Return on average tangible common shareholders’ equity (1) 17.38 15.79 15.51 Per Common Share Information Earnings $ 0.95 $ 0.85 $ 0.81 Diluted earnings 0.94 0.85 0.80 Dividends paid 0.22 0.22 0.21 Book value 31.58 30.61 29.70 Tangible book value (1) 22.78 21.83 20.99 Summary Period-End Balance Sheet March 31 2023 December 31 2022 March 31 2022 Total debt securities $ 797,005 $ 862,819 $ 969,880 Total loans and leases 1,046,406 1,045,747 993,145 Total earning assets 2,778,481 2,640,827 2,783,186 Total assets 3,194,657 3,051,375 3,238,223 Total deposits 1,910,402 1,930,341 2,072,409 Common shareholders’ equity 251,799 244,800 239,480 Total shareholders’ equity 280,196 273,197 266,617 Common shares issued and outstanding 7,972.4 7,996.8 8,062.1 First Quarter 2023 Fourth Quarter 2022 First Quarter 2022Credit Quality Total net charge-offs $ 807 $ 689 $ 392 Net charge-offs as a percentage of average loans and leases outstanding (2) 0.32 % 0.26 % 0.16 % Provision for credit losses $ 931 $ 1,092 $ 30 March 31 2023 December 31 2022 March 31 2022 Total nonperforming loans, leases and foreclosed properties (3) $ 4,083 $ 3,978 $ 4,778 Nonperforming loans, leases and foreclosed properties as a percentage of total loans, leases and foreclosed properties (3) 0.39 % 0.38 % 0.48 % Allowance for loan and lease losses $ 12,514 $ 12,682 $ 12,104 Allowance for loan and lease losses as a percentage of total loans and leases outstanding (2) 1.20 % 1.22 % 1.23 % For footnotes, see page 15.


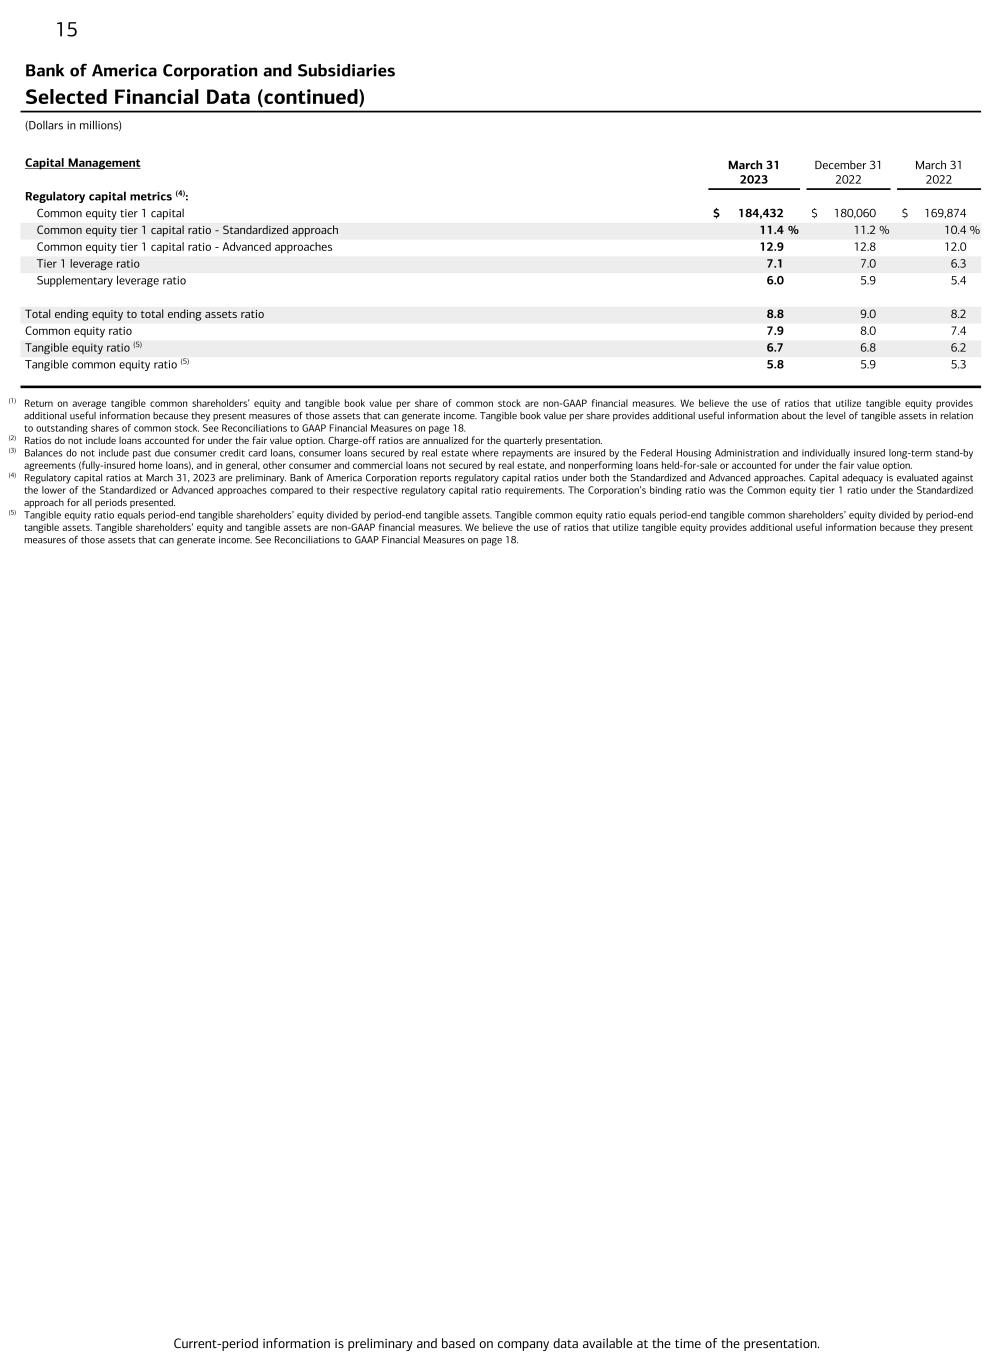
Current-period information is preliminary and based on company data available at the time of the presentation. 15 Bank of America Corporation and Subsidiaries Selected Financial Data (continued) (Dollars in millions) Capital Management March 31 2023 December 31 2022 March 31 2022 Regulatory capital metrics (4): Common equity tier 1 capital $ 184,432 $ 180,060 $ 169,874 Common equity tier 1 capital ratio - Standardized approach 11.4 % 11.2 % 10.4 % Common equity tier 1 capital ratio - Advanced approaches 12.9 12.8 12.0 Tier 1 leverage ratio 7.1 7.0 6.3 Supplementary leverage ratio 6.0 5.9 5.4 Total ending equity to total ending assets ratio 8.8 9.0 8.2 Common equity ratio 7.9 8.0 7.4 Tangible equity ratio (5) 6.7 6.8 6.2 Tangible common equity ratio (5) 5.8 5.9 5.3 (1) Return on average tangible common shareholders’ equity and tangible book value per share of common stock are non-GAAP financial measures. We believe the use of ratios that utilize tangible equity provides additional useful information because they present measures of those assets that can generate income. Tangible book value per share provides additional useful information about the level of tangible assets in relation to outstanding shares of common stock. See Reconciliations to GAAP Financial Measures on page 18. (2) Ratios do not include loans accounted for under the fair value option. Charge-off ratios are annualized for the quarterly presentation. (3) Balances do not include past due consumer credit card loans, consumer loans secured by real estate where repayments are insured by the Federal Housing Administration and individually insured long-term stand-by agreements (fully-insured home loans), and in general, other consumer and commercial loans not secured by real estate, and nonperforming loans held-for-sale or accounted for under the fair value option. (4) Regulatory capital ratios at March 31, 2023 are preliminary. Bank of America Corporation reports regulatory capital ratios under both the Standardized and Advanced approaches. Capital adequacy is evaluated against the lower of the Standardized or Advanced approaches compared to their respective regulatory capital ratio requirements. The Corporation’s binding ratio was the Common equity tier 1 ratio under the Standardized approach for all periods presented. (5) Tangible equity ratio equals period-end tangible shareholders’ equity divided by period-end tangible assets. Tangible common equity ratio equals period-end tangible common shareholders’ equity divided by period-end tangible assets. Tangible shareholders’ equity and tangible assets are non-GAAP financial measures. We believe the use of ratios that utilize tangible equity provides additional useful information because they present measures of those assets that can generate income. See Reconciliations to GAAP Financial Measures on page 18.


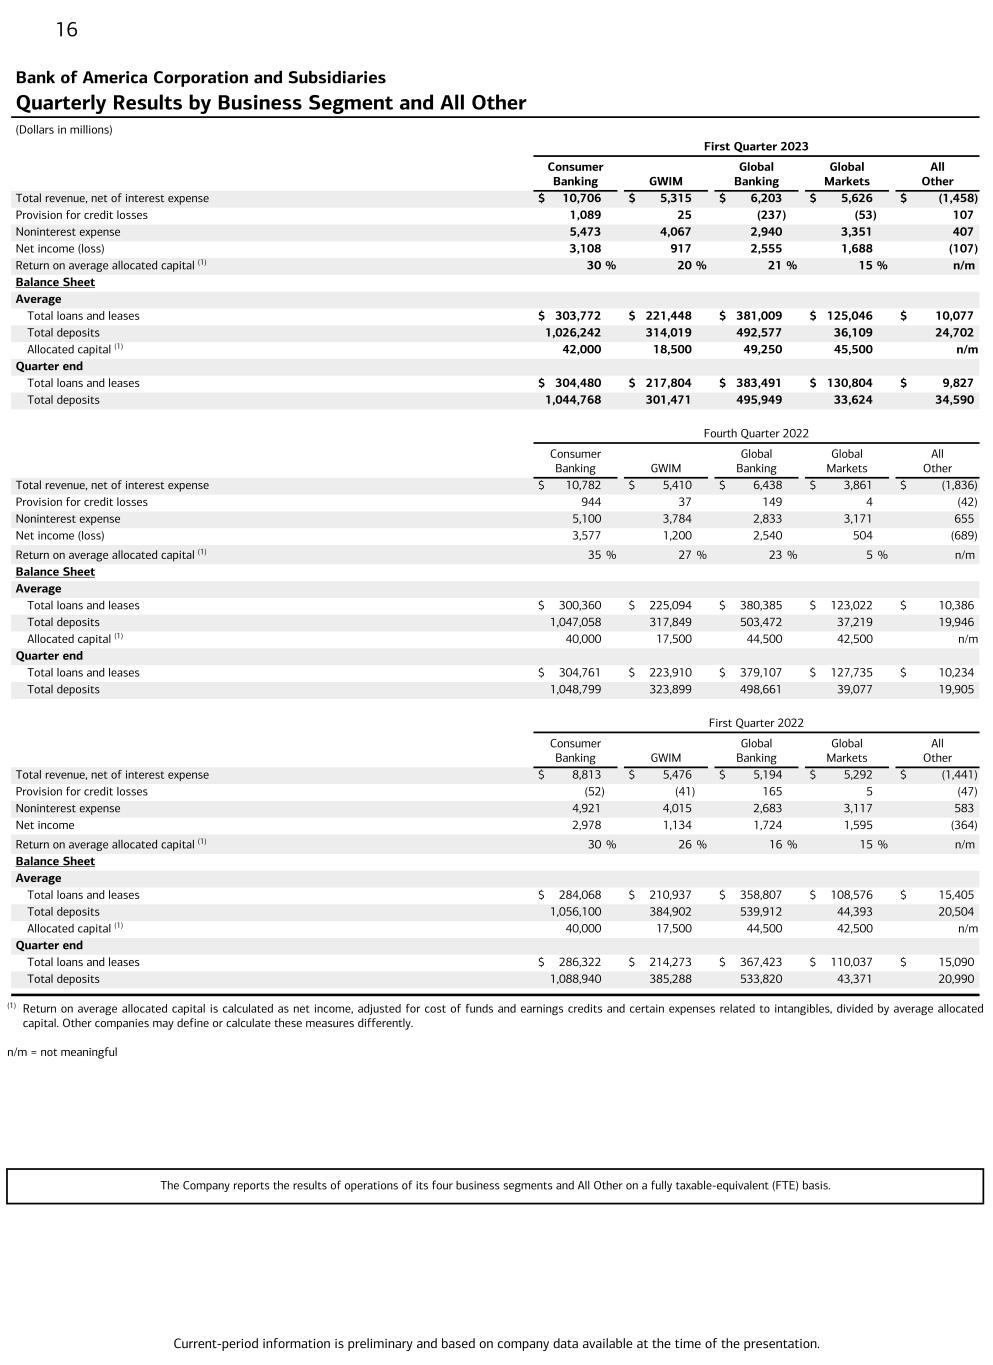
Current-period information is preliminary and based on company data available at the time of the presentation. 16 Bank of America Corporation and Subsidiaries Quarterly Results by Business Segment and All Other (Dollars in millions) First Quarter 2023 Consumer Banking GWIM Global Banking Global Markets All Other Total revenue, net of interest expense $ 10,706 $ 5,315 $ 6,203 $ 5,626 $ (1,458) Provision for credit losses 1,089 25 (237) (53) 107 Noninterest expense 5,473 4,067 2,940 3,351 407 Net income (loss) 3,108 917 2,555 1,688 (107) Return on average allocated capital (1) 30 % 20 % 21 % 15 % n/m Balance Sheet Average Total loans and leases $ 303,772 $ 221,448 $ 381,009 $ 125,046 $ 10,077 Total deposits 1,026,242 314,019 492,577 36,109 24,702 Allocated capital (1) 42,000 18,500 49,250 45,500 n/m Quarter end Total loans and leases $ 304,480 $ 217,804 $ 383,491 $ 130,804 $ 9,827 Total deposits 1,044,768 301,471 495,949 33,624 34,590 Fourth Quarter 2022 Consumer Banking GWIM Global Banking Global Markets All Other Total revenue, net of interest expense $ 10,782 $ 5,410 $ 6,438 $ 3,861 $ (1,836) Provision for credit losses 944 37 149 4 (42) Noninterest expense 5,100 3,784 2,833 3,171 655 Net income (loss) 3,577 1,200 2,540 504 (689) Return on average allocated capital (1) 35 % 27 % 23 % 5 % n/m Balance Sheet Average Total loans and leases $ 300,360 $ 225,094 $ 380,385 $ 123,022 $ 10,386 Total deposits 1,047,058 317,849 503,472 37,219 19,946 Allocated capital (1) 40,000 17,500 44,500 42,500 n/m Quarter end Total loans and leases $ 304,761 $ 223,910 $ 379,107 $ 127,735 $ 10,234 Total deposits 1,048,799 323,899 498,661 39,077 19,905 First Quarter 2022 Consumer Banking GWIM Global Banking Global Markets All Other Total revenue, net of interest expense $ 8,813 $ 5,476 $ 5,194 $ 5,292 $ (1,441) Provision for credit losses (52) (41) 165 5 (47) Noninterest expense 4,921 4,015 2,683 3,117 583 Net income 2,978 1,134 1,724 1,595 (364) Return on average allocated capital (1) 30 % 26 % 16 % 15 % n/m Balance Sheet Average Total loans and leases $ 284,068 $ 210,937 $ 358,807 $ 108,576 $ 15,405 Total deposits 1,056,100 384,902 539,912 44,393 20,504 Allocated capital (1) 40,000 17,500 44,500 42,500 n/m Quarter end Total loans and leases $ 286,322 $ 214,273 $ 367,423 $ 110,037 $ 15,090 Total deposits 1,088,940 385,288 533,820 43,371 20,990 (1) Return on average allocated capital is calculated as net income, adjusted for cost of funds and earnings credits and certain expenses related to intangibles, divided by average allocated capital. Other companies may define or calculate these measures differently. n/m = not meaningful The Company reports the results of operations of its four business segments and All Other on a fully taxable-equivalent (FTE) basis.


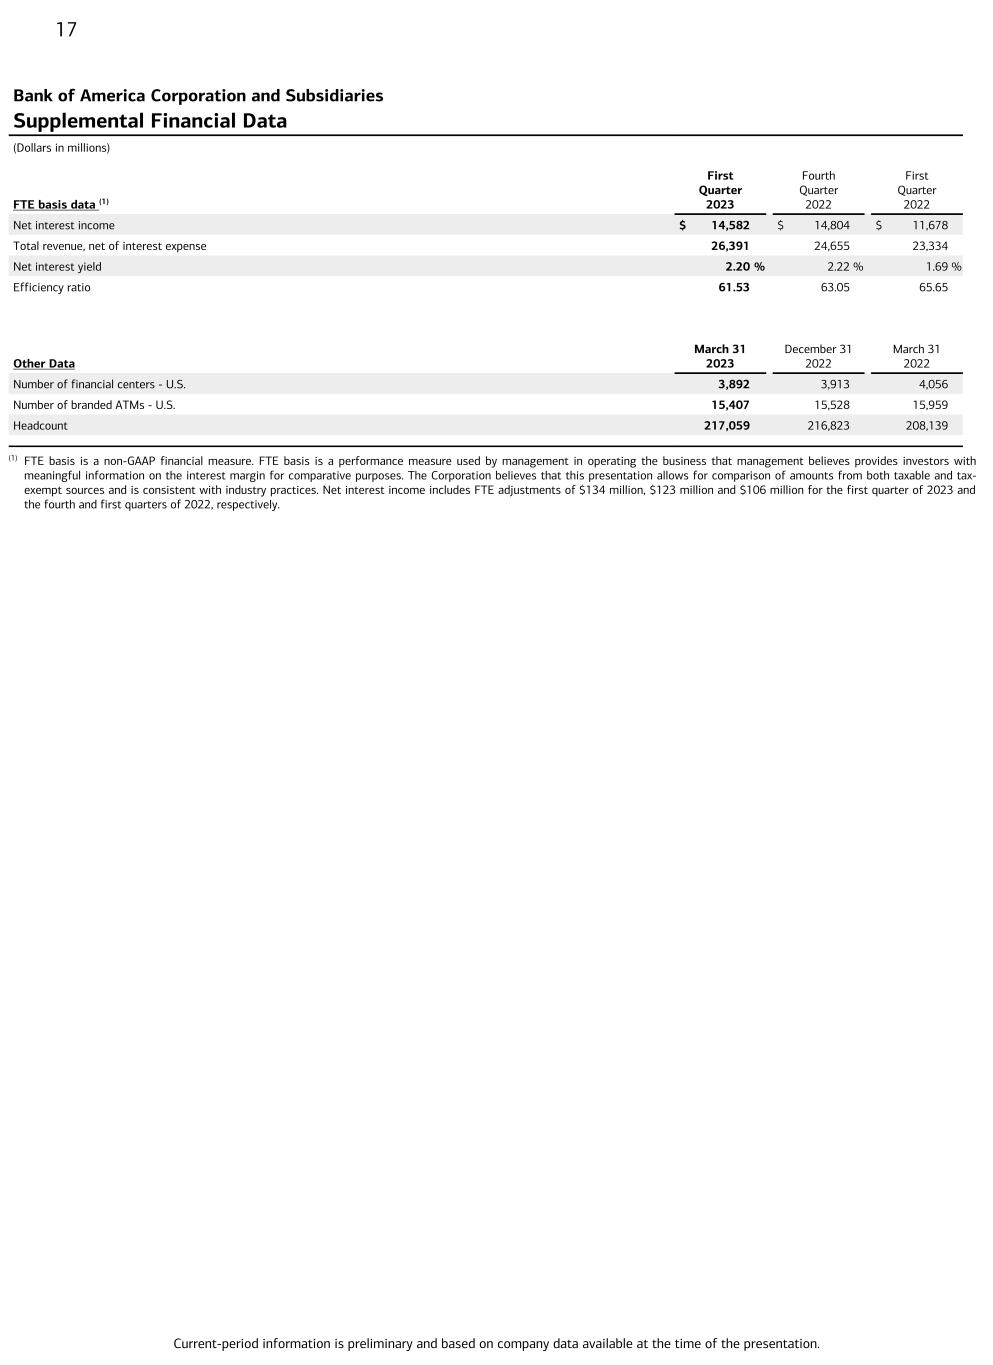
Current-period information is preliminary and based on company data available at the time of the presentation. 17 Bank of America Corporation and Subsidiaries Supplemental Financial Data (Dollars in millions) First Quarter 2023 Fourth Quarter 2022 First Quarter 2022FTE basis data (1) Net interest income $ 14,582 $ 14,804 $ 11,678 Total revenue, net of interest expense 26,391 24,655 23,334 Net interest yield 2.20 % 2.22 % 1.69 % Efficiency ratio 61.53 63.05 65.65 Other Data March 31 2023 December 31 2022 March 31 2022 Number of financial centers - U.S. 3,892 3,913 4,056 Number of branded ATMs - U.S. 15,407 15,528 15,959 Headcount 217,059 216,823 208,139 (1) FTE basis is a non-GAAP financial measure. FTE basis is a performance measure used by management in operating the business that management believes provides investors with meaningful information on the interest margin for comparative purposes. The Corporation believes that this presentation allows for comparison of amounts from both taxable and tax- exempt sources and is consistent with industry practices. Net interest income includes FTE adjustments of $134 million, $123 million and $106 million for the first quarter of 2023 and the fourth and first quarters of 2022, respectively.


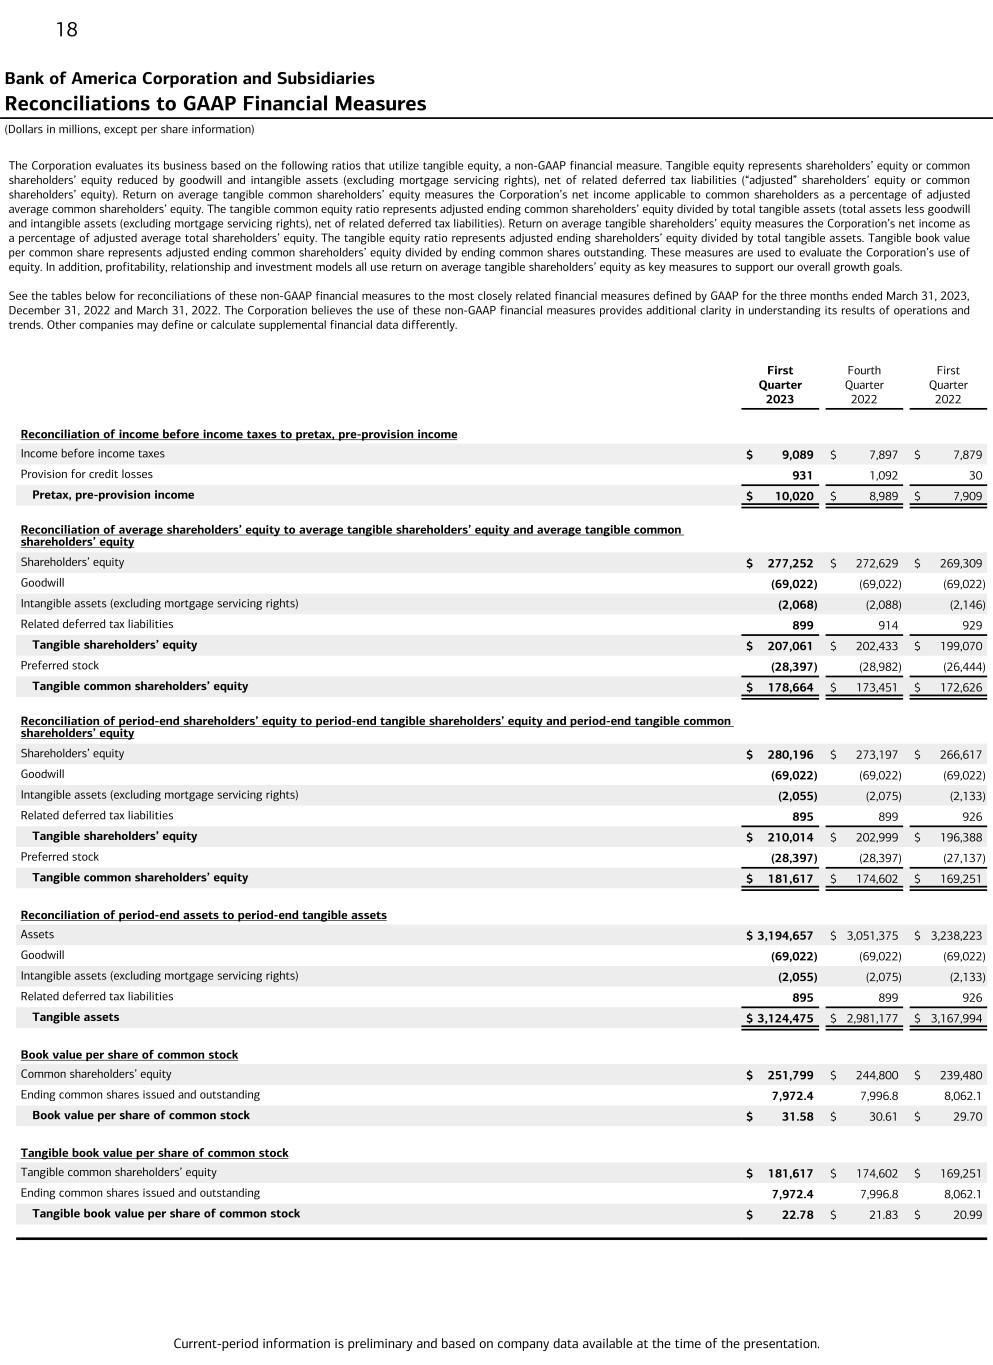
Current-period information is preliminary and based on company data available at the time of the presentation. 18 The Corporation evaluates its business based on the following ratios that utilize tangible equity, a non-GAAP financial measure. Tangible equity represents shareholders’ equity or common shareholders’ equity reduced by goodwill and intangible assets (excluding mortgage servicing rights), net of related deferred tax liabilities (“adjusted” shareholders’ equity or common shareholders’ equity). Return on average tangible common shareholders’ equity measures the Corporation’s net income applicable to common shareholders as a percentage of adjusted average common shareholders’ equity. The tangible common equity ratio represents adjusted ending common shareholders’ equity divided by total tangible assets (total assets less goodwill and intangible assets (excluding mortgage servicing rights), net of related deferred tax liabilities). Return on average tangible shareholders’ equity measures the Corporation’s net income as a percentage of adjusted average total shareholders’ equity. The tangible equity ratio represents adjusted ending shareholders’ equity divided by total tangible assets. Tangible book value per common share represents adjusted ending common shareholders’ equity divided by ending common shares outstanding. These measures are used to evaluate the Corporation’s use of equity. In addition, profitability, relationship and investment models all use return on average tangible shareholders’ equity as key measures to support our overall growth goals. See the tables below for reconciliations of these non-GAAP financial measures to the most closely related financial measures defined by GAAP for the three months ended March 31, 2023, December 31, 2022 and March 31, 2022. The Corporation believes the use of these non-GAAP financial measures provides additional clarity in understanding its results of operations and trends. Other companies may define or calculate supplemental financial data differently. Bank of America Corporation and Subsidiaries Reconciliations to GAAP Financial Measures (Dollars in millions, except per share information) First Quarter 2023 Fourth Quarter 2022 First Quarter 2022 Reconciliation of income before income taxes to pretax, pre-provision income Income before income taxes $ 9,089 $ 7,897 $ 7,879 Provision for credit losses 931 1,092 30 Pretax, pre-provision income $ 10,020 $ 8,989 $ 7,909 Reconciliation of average shareholders’ equity to average tangible shareholders’ equity and average tangible common shareholders’ equity Shareholders’ equity $ 277,252 $ 272,629 $ 269,309 Goodwill (69,022) (69,022) (69,022) Intangible assets (excluding mortgage servicing rights) (2,068) (2,088) (2,146) Related deferred tax liabilities 899 914 929 Tangible shareholders’ equity $ 207,061 $ 202,433 $ 199,070 Preferred stock (28,397) (28,982) (26,444) Tangible common shareholders’ equity $ 178,664 $ 173,451 $ 172,626 Reconciliation of period-end shareholders’ equity to period-end tangible shareholders’ equity and period-end tangible common shareholders’ equity Shareholders’ equity $ 280,196 $ 273,197 $ 266,617 Goodwill (69,022) (69,022) (69,022) Intangible assets (excluding mortgage servicing rights) (2,055) (2,075) (2,133) Related deferred tax liabilities 895 899 926 Tangible shareholders’ equity $ 210,014 $ 202,999 $ 196,388 Preferred stock (28,397) (28,397) (27,137) Tangible common shareholders’ equity $ 181,617 $ 174,602 $ 169,251 Reconciliation of period-end assets to period-end tangible assets Assets $ 3,194,657 $ 3,051,375 $ 3,238,223 Goodwill (69,022) (69,022) (69,022) Intangible assets (excluding mortgage servicing rights) (2,055) (2,075) (2,133) Related deferred tax liabilities 895 899 926 Tangible assets $ 3,124,475 $ 2,981,177 $ 3,167,994 Book value per share of common stock Common shareholders’ equity $ 251,799 $ 244,800 $ 239,480 Ending common shares issued and outstanding 7,972.4 7,996.8 8,062.1 Book value per share of common stock $ 31.58 $ 30.61 $ 29.70 Tangible book value per share of common stock Tangible common shareholders’ equity $ 181,617 $ 174,602 $ 169,251 Ending common shares issued and outstanding 7,972.4 7,996.8 8,062.1 Tangible book value per share of common stock $ 22.78 $ 21.83 $ 20.99


EX-99.2 3 bac-033312023ex992.htm EX-99.2 bac-033312023ex992
Bank of America 1Q23 Financial Results April 18, 2023


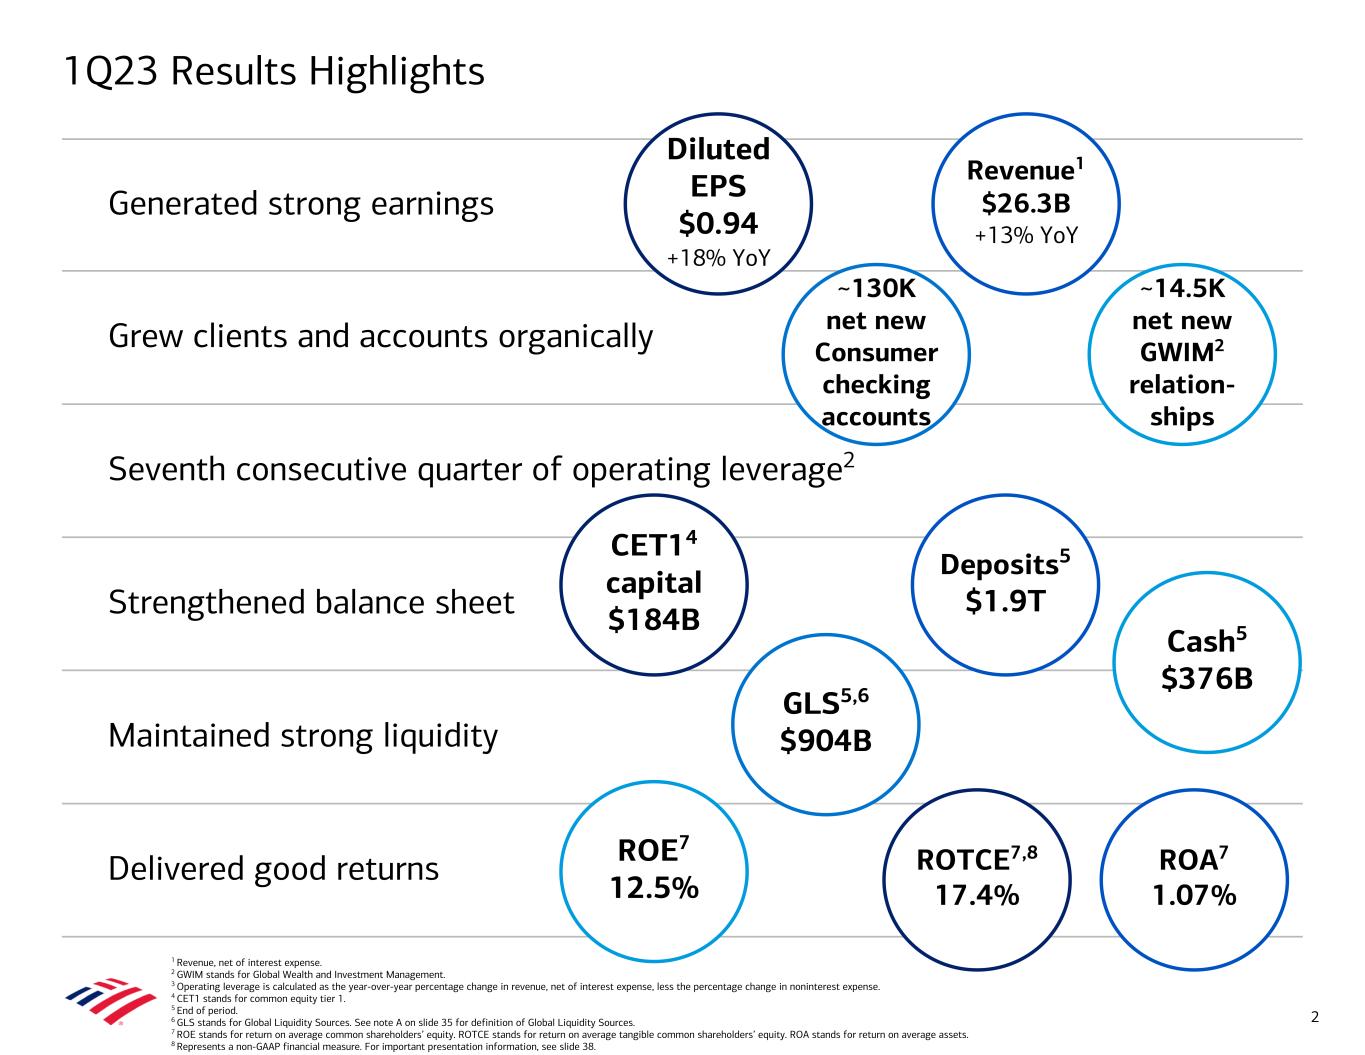
1Q23 Results Highlights 2 Generated strong earnings Grew clients and accounts organically Seventh consecutive quarter of operating leverage2 Strengthened balance sheet Maintained strong liquidity Delivered good returns Diluted EPS $0.94 +18% YoY CET14 capital $184B GLS5,6 $904B ROTCE7,8 17.4% ROE7 12.5% Cash5 $376B ~130K net new Consumer checking accounts ~14.5K net new GWIM2 relation- ships 1 Revenue, net of interest expense. 2 GWIM stands for Global Wealth and Investment Management. 3 Operating leverage is calculated as the year-over-year percentage change in revenue, net of interest expense, less the percentage change in noninterest expense. 4 CET1 stands for common equity tier 1. 5 End of period. 6 GLS stands for Global Liquidity Sources. See note A on slide 35 for definition of Global Liquidity Sources. 7 ROE stands for return on average common shareholders’ equity. ROTCE stands for return on average tangible common shareholders’ equity. ROA stands for return on average assets. 8 Represents a non-GAAP financial measure. For important presentation information, see slide 38. Revenue1 $26.3B +13% YoY Deposits5 $1.9T ROA7 1.07%


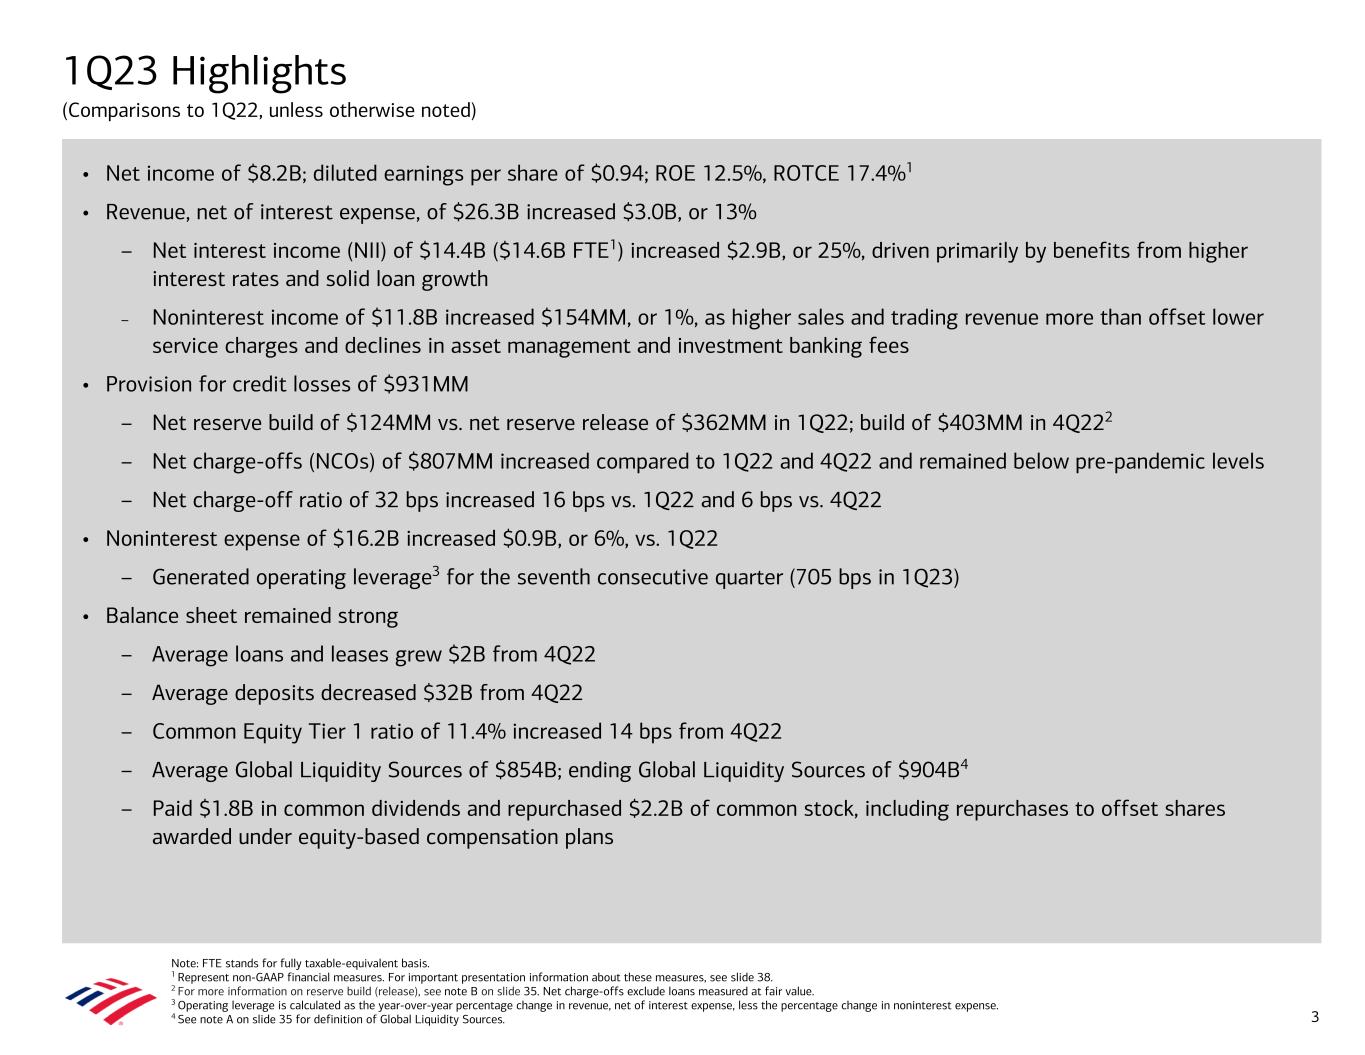
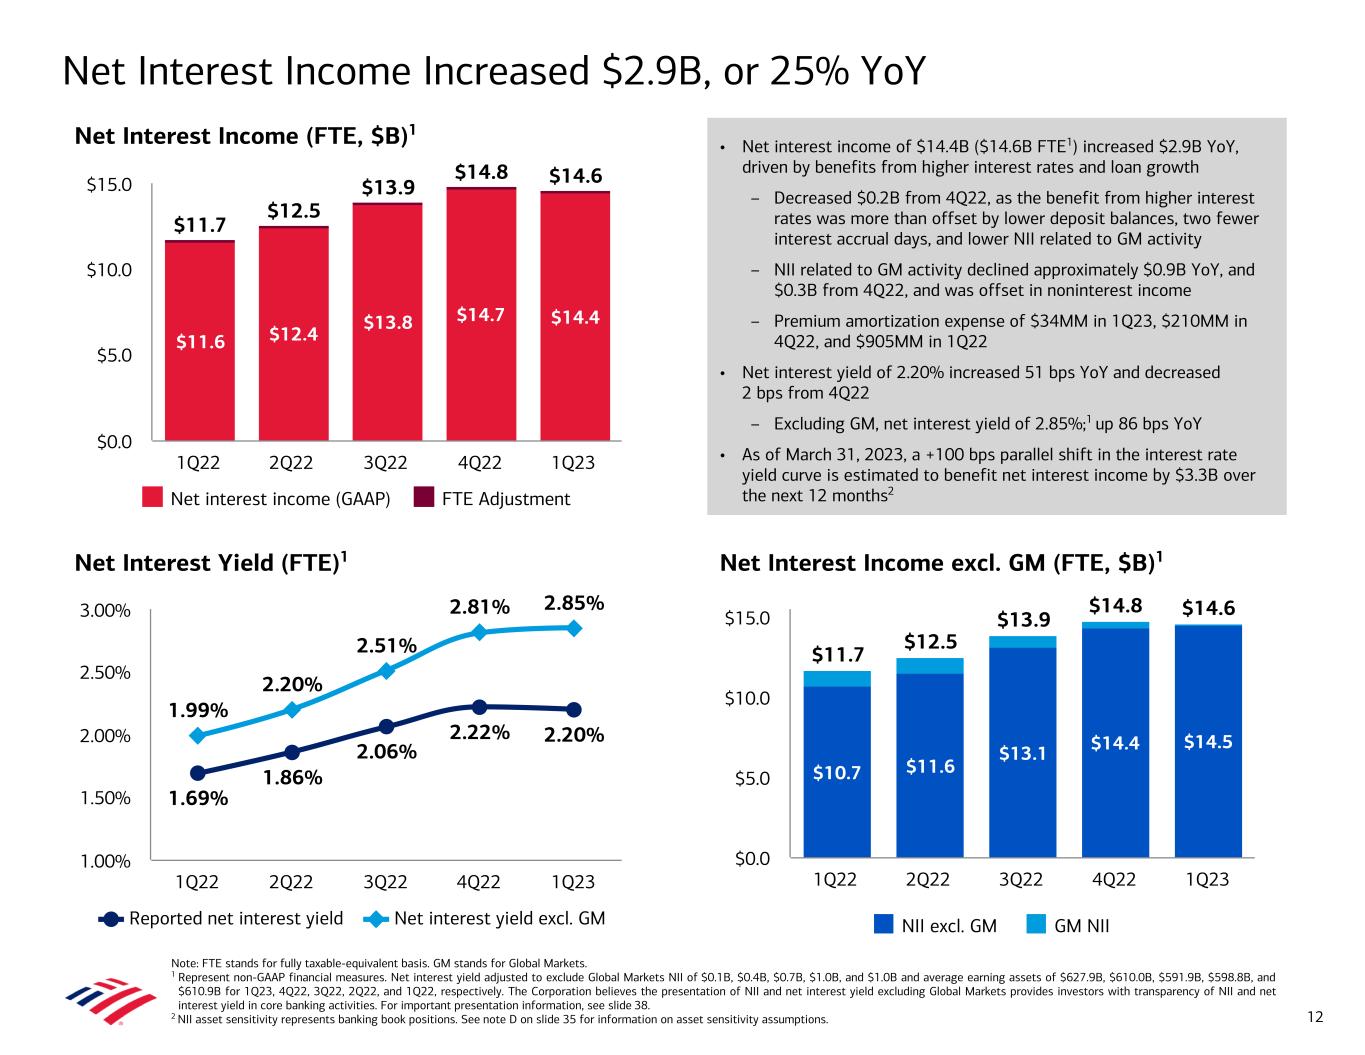
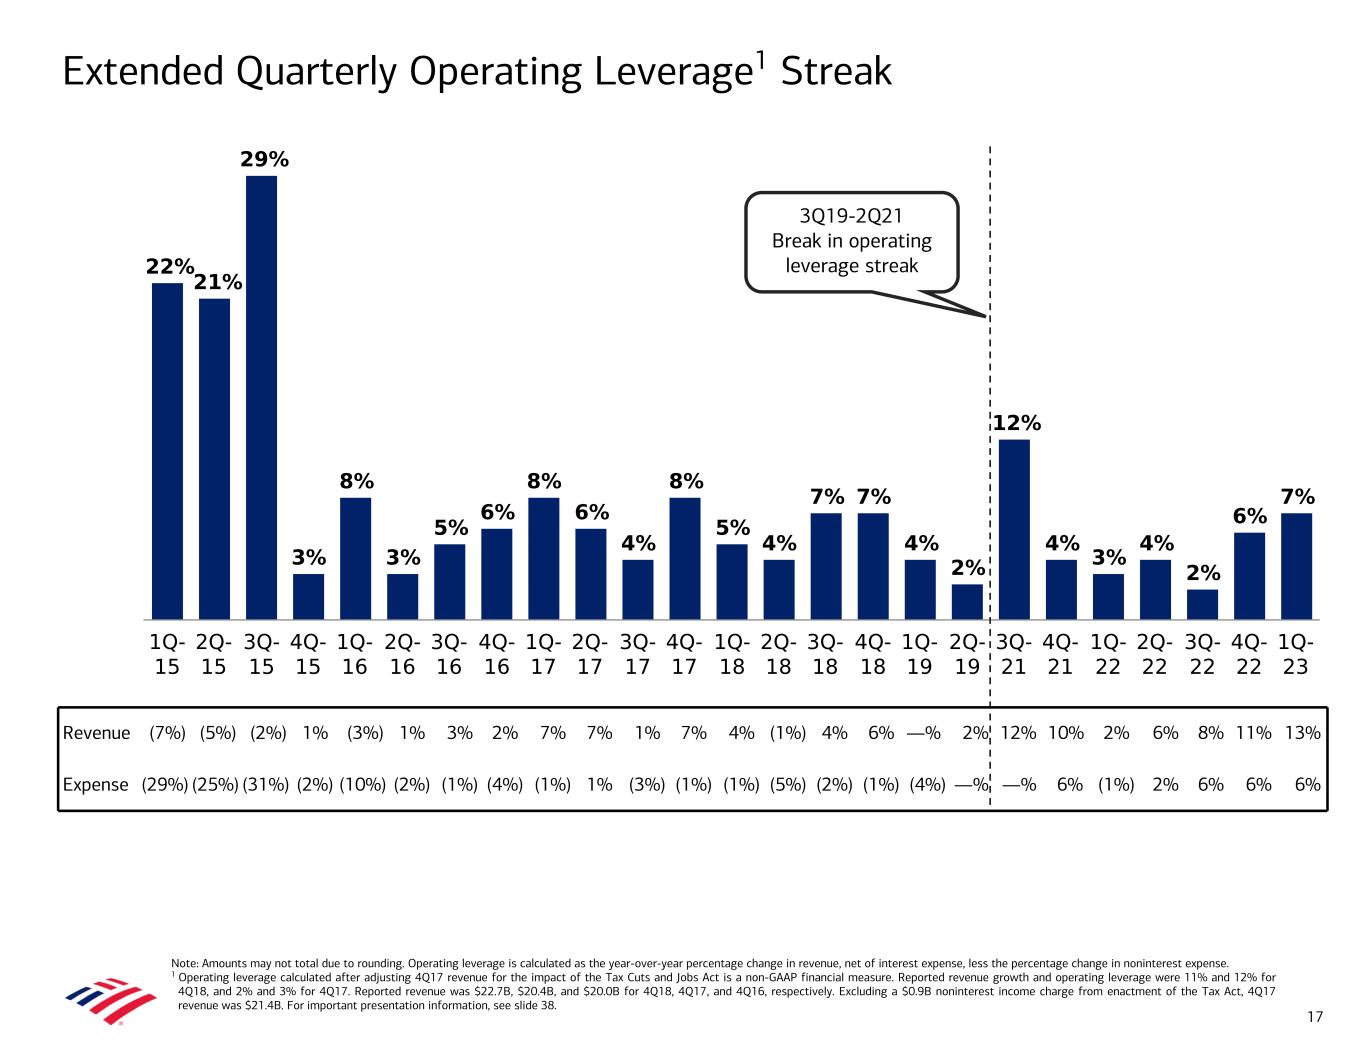
1Q23 Highlights (Comparisons to 1Q22, unless otherwise noted) • Net income of $8.2B; diluted earnings per share of $0.94; ROE 12.5%, ROTCE 17.4%1 • Revenue, net of interest expense, of $26.3B increased $3.0B, or 13% – Net interest income (NII) of $14.4B ($14.6B FTE1) increased $2.9B, or 25%, driven primarily by benefits from higher interest rates and solid loan growth – Noninterest income of $11.8B increased $154MM, or 1%, as higher sales and trading revenue more than offset lower service charges and declines in asset management and investment banking fees • Provision for credit losses of $931MM – Net reserve build of $124MM vs. net reserve release of $362MM in 1Q22; build of $403MM in 4Q222 – Net charge-offs (NCOs) of $807MM increased compared to 1Q22 and 4Q22 and remained below pre-pandemic levels – Net charge-off ratio of 32 bps increased 16 bps vs. 1Q22 and 6 bps vs. 4Q22 • Noninterest expense of $16.2B increased $0.9B, or 6%, vs. 1Q22 – Generated operating leverage3 for the seventh consecutive quarter (705 bps in 1Q23) • Balance sheet remained strong – Average loans and leases grew $2B from 4Q22 – Average deposits decreased $32B from 4Q22 – Common Equity Tier 1 ratio of 11.4% increased 14 bps from 4Q22 – Average Global Liquidity Sources of $854B; ending Global Liquidity Sources of $904B4 – Paid $1.8B in common dividends and repurchased $2.2B of common stock, including repurchases to offset shares awarded under equity-based compensation plans 3 Note: FTE stands for fully taxable-equivalent basis. 1 Represent non-GAAP financial measures. For important presentation information about these measures, see slide 38. 2 For more information on reserve build (release), see note B on slide 35. Net charge-offs exclude loans measured at fair value. 3 Operating leverage is calculated as the year-over-year percentage change in revenue, net of interest expense, less the percentage change in noninterest expense. 4 See note A on slide 35 for definition of Global Liquidity Sources.


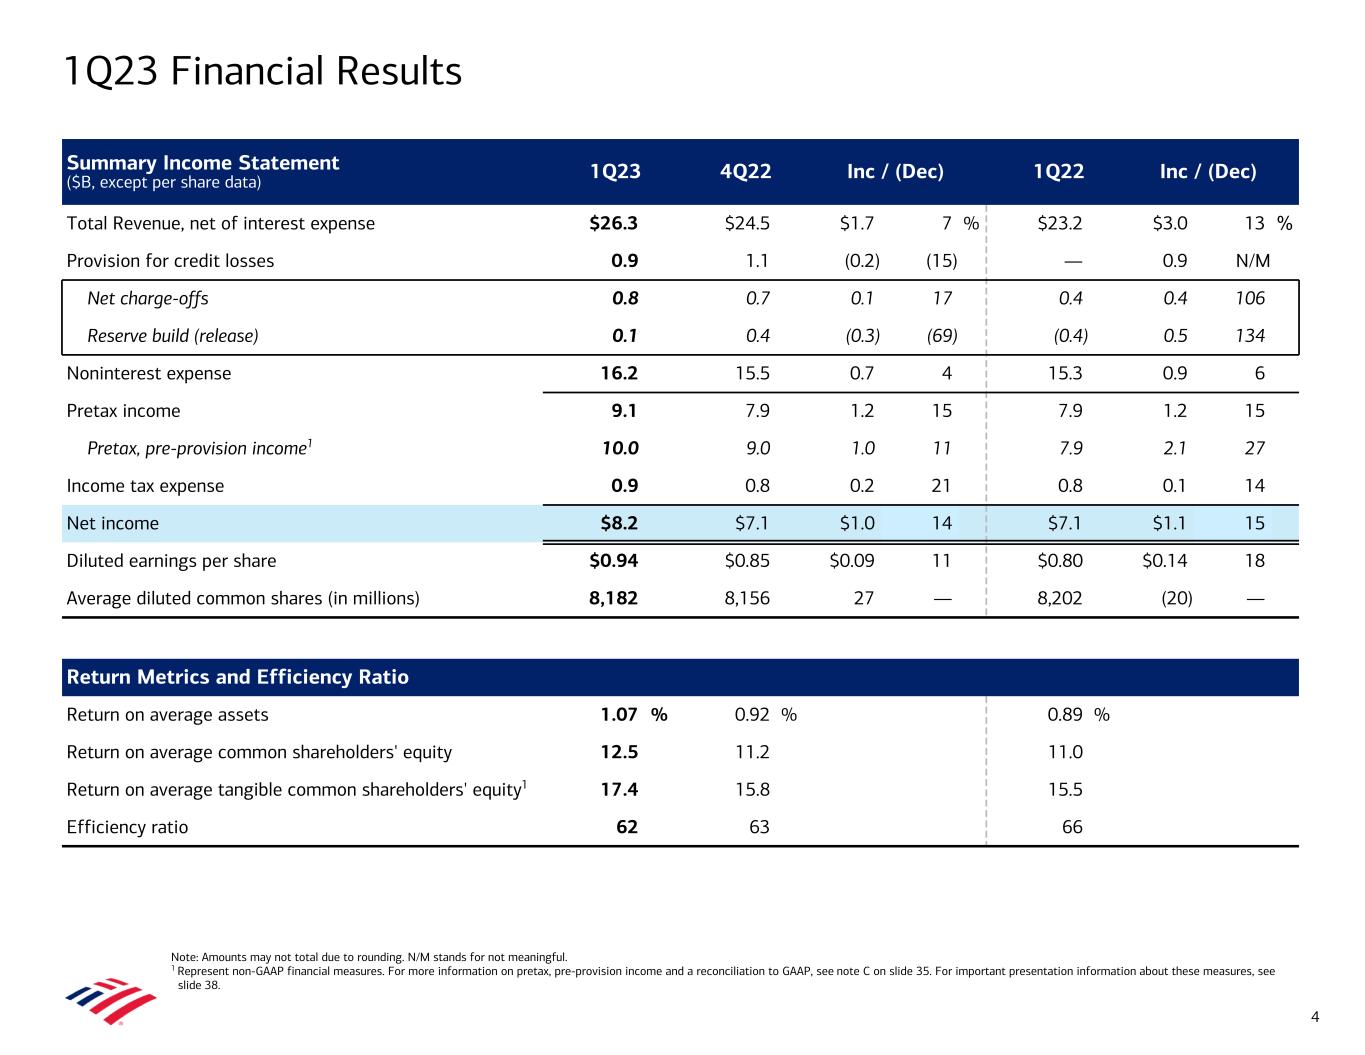
Note: Amounts may not total due to rounding. N/M stands for not meaningful. 1 Represent non-GAAP financial measures. For more information on pretax, pre-provision income and a reconciliation to GAAP, see note C on slide 35. For important presentation information about these measures, see slide 38. Summary Income Statement ($B, except per share data) 1Q23 4Q22 Inc / (Dec) 1Q22 Inc / (Dec) Total Revenue, net of interest expense $26.3 $24.5 $1.7 7 % $23.2 $3.0 13 % Provision for credit losses 0.9 1.1 (0.2) (15) — 0.9 N/M Net charge-offs 0.8 0.7 0.1 17 0.4 0.4 106 Reserve build (release) 0.1 0.4 (0.3) (69) (0.4) 0.5 134 Noninterest expense 16.2 15.5 0.7 4 15.3 0.9 6 Pretax income 9.1 7.9 1.2 15 7.9 1.2 15 Pretax, pre-provision income1 10.0 9.0 1.0 11 7.9 2.1 27 Income tax expense 0.9 0.8 0.2 21 0.8 0.1 14 Net income $8.2 $7.1 $1.0 14 $7.1 $1.1 15 Diluted earnings per share $0.94 $0.85 $0.09 11 $0.80 $0.14 18 Average diluted common shares (in millions) 8,182 8,156 27 — 8,202 (20) — Return Metrics and Efficiency Ratio Return on average assets 1.07 % 0.92 % 0.89 % Return on average common shareholders' equity 12.5 11.2 11.0 Return on average tangible common shareholders' equity1 17.4 15.8 15.5 Efficiency ratio 62 63 66 1Q23 Financial Results 4


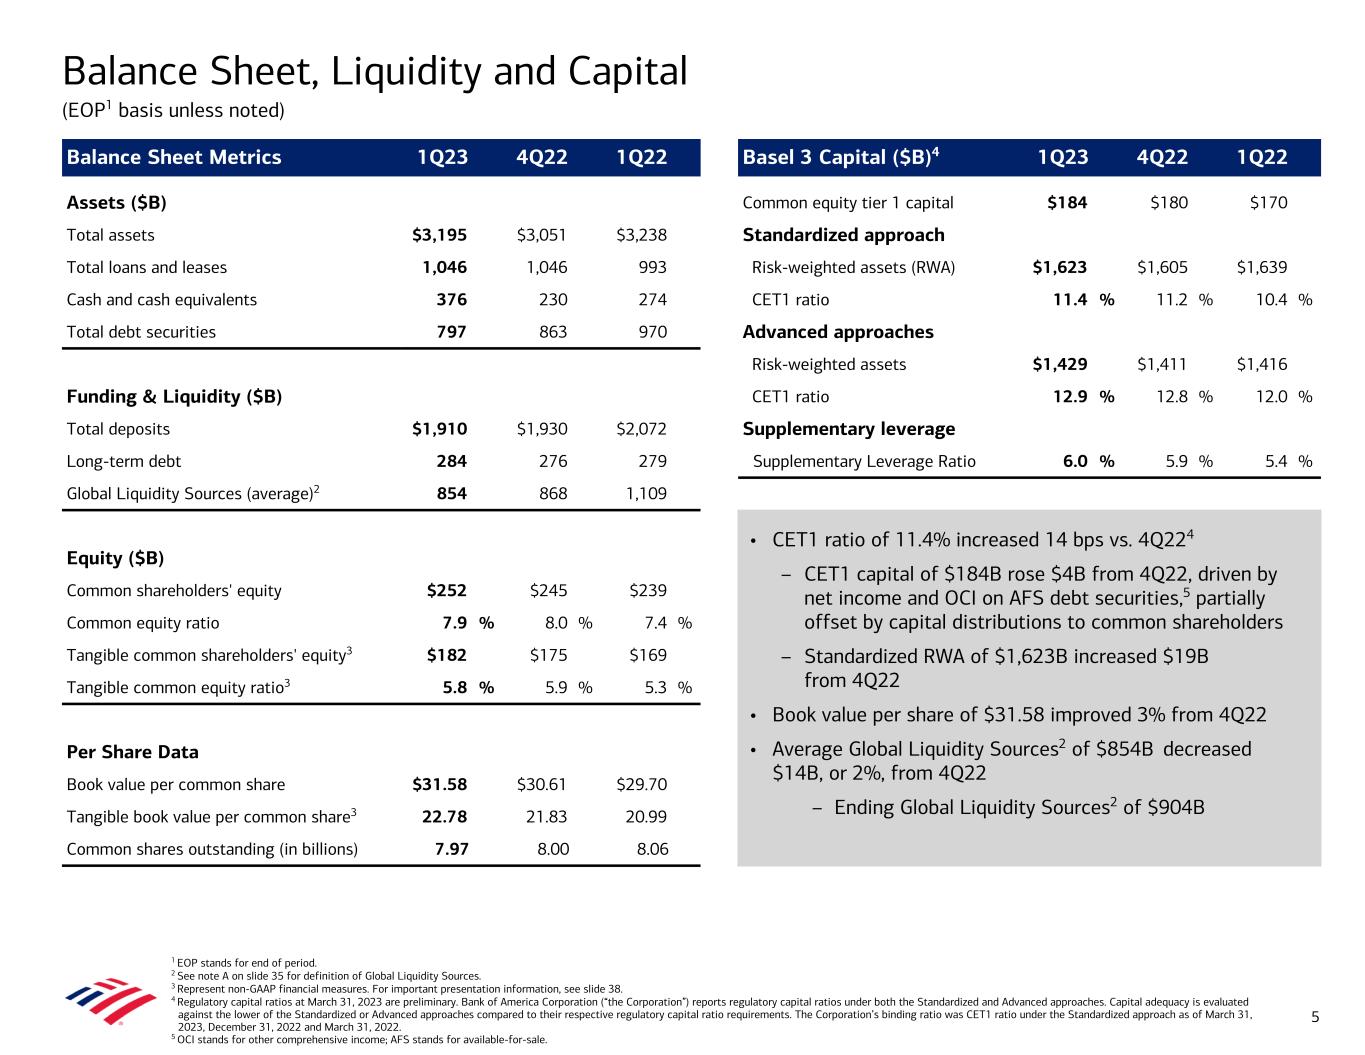
Balance Sheet Metrics 1Q23 4Q22 1Q22 Basel 3 Capital ($B)4 1Q23 4Q22 1Q22 Assets ($B) Common equity tier 1 capital $184 $180 $170 Total assets $3,195 $3,051 $3,238 Standardized approach Total loans and leases 1,046 1,046 993 Risk-weighted assets (RWA) $1,623 $1,605 $1,639 Cash and cash equivalents 376 230 274 CET1 ratio 11.4 % 11.2 % 10.4 % Total debt securities 797 863 970 Advanced approaches Risk-weighted assets $1,429 $1,411 $1,416 Funding & Liquidity ($B) CET1 ratio 12.9 % 12.8 % 12.0 % Total deposits $1,910 $1,930 $2,072 Supplementary leverage Long-term debt 284 276 279 Supplementary Leverage Ratio 6.0 % 5.9 % 5.4 % Global Liquidity Sources (average)2 854 868 1,109 Equity ($B) Common shareholders' equity $252 $245 $239 Common equity ratio 7.9 % 8.0 % 7.4 % Tangible common shareholders' equity3 $182 $175 $169 Tangible common equity ratio3 5.8 % 5.9 % 5.3 % Per Share Data Book value per common share $31.58 $30.61 $29.70 Tangible book value per common share3 22.78 21.83 20.99 Common shares outstanding (in billions) 7.97 8.00 8.06 1 EOP stands for end of period. 2 See note A on slide 35 for definition of Global Liquidity Sources. 3 Represent non-GAAP financial measures. For important presentation information, see slide 38. 4 Regulatory capital ratios at March 31, 2023 are preliminary. Bank of America Corporation (“the Corporation”) reports regulatory capital ratios under both the Standardized and Advanced approaches. Capital adequacy is evaluated against the lower of the Standardized or Advanced approaches compared to their respective regulatory capital ratio requirements. The Corporation’s binding ratio was CET1 ratio under the Standardized approach as of March 31, 2023, December 31, 2022 and March 31, 2022. 5 OCI stands for other comprehensive income; AFS stands for available-for-sale. Balance Sheet, Liquidity and Capital (EOP1 basis unless noted) 5 • CET1 ratio of 11.4% increased 14 bps vs. 4Q224 – CET1 capital of $184B rose $4B from 4Q22, driven by net income and OCI on AFS debt securities,5 partially offset by capital distributions to common shareholders – Standardized RWA of $1,623B increased $19B from 4Q22 • Book value per share of $31.58 improved 3% from 4Q22 • Average Global Liquidity Sources2 of $854B decreased $14B, or 2%, from 4Q22 – Ending Global Liquidity Sources2 of $904B


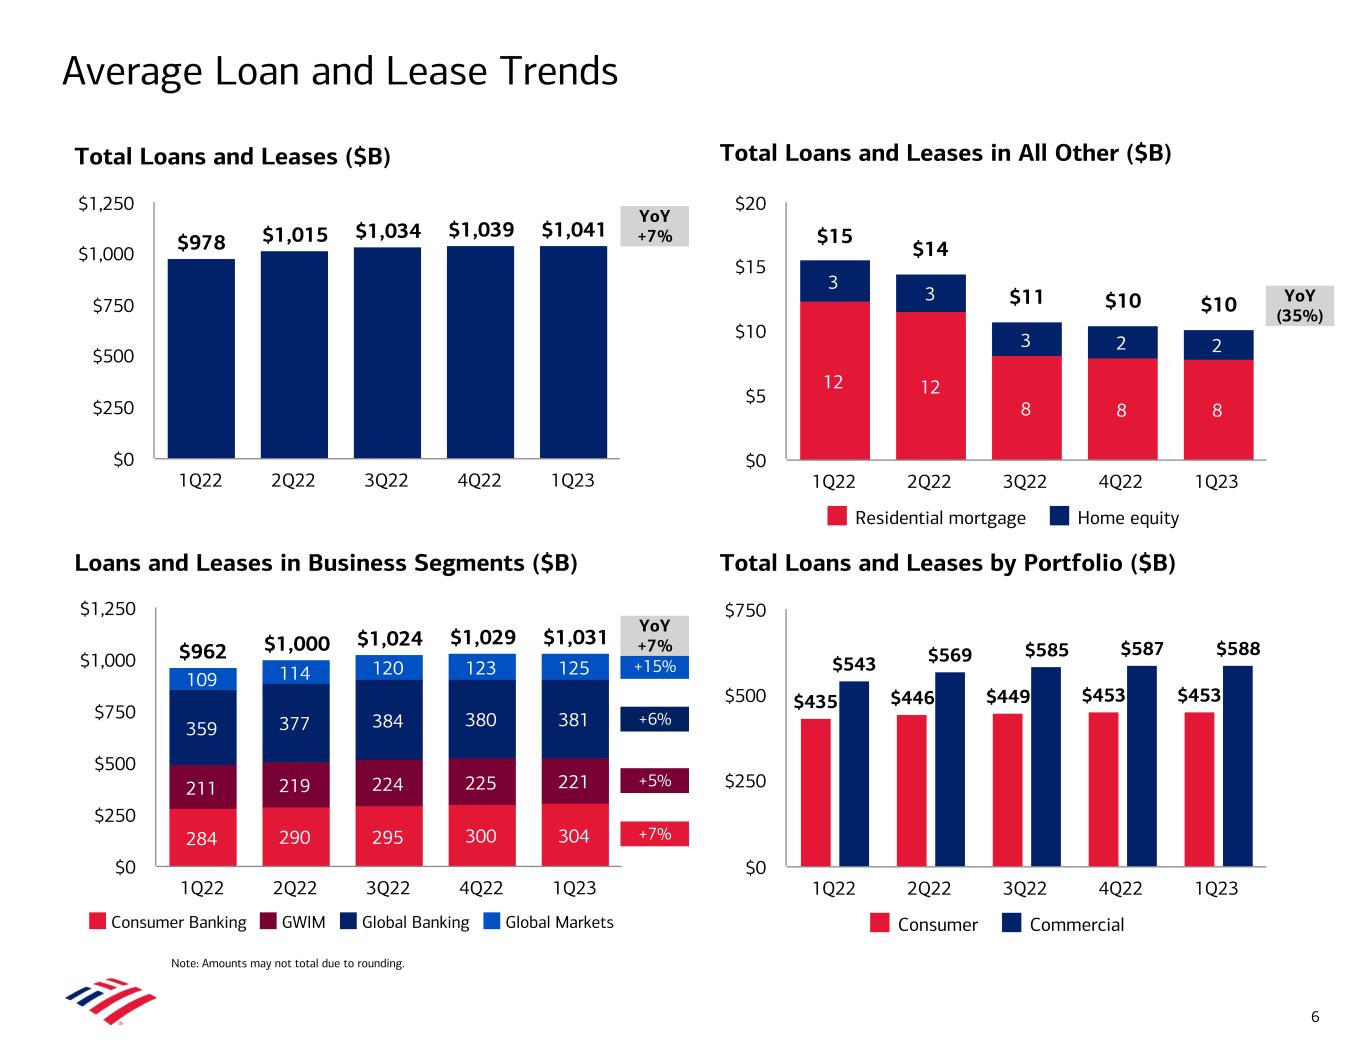
$962 $1,000 $1,024 $1,029 $1,031 284 290 295 300 304 211 219 224 225 221 359 377 384 380 381 109 114 120 123 125 Consumer Banking GWIM Global Banking Global Markets 1Q22 2Q22 3Q22 4Q22 1Q23 $0 $250 $500 $750 $1,000 $1,250 $978 $1,015 $1,034 $1,039 $1,041 1Q22 2Q22 3Q22 4Q22 1Q23 $0 $250 $500 $750 $1,000 $1,250 +7% +5% +6% +15% Average Loan and Lease Trends YoY +7% YoY +7% YoY (35%) Note: Amounts may not total due to rounding. Total Loans and Leases in All Other ($B) Loans and Leases in Business Segments ($B) Total Loans and Leases by Portfolio ($B) Total Loans and Leases ($B) $435 $446 $449 $453 $453 $543 $569 $585 $587 $588 Consumer Commercial 1Q22 2Q22 3Q22 4Q22 1Q23 $0 $250 $500 $750 6 12 12 8 8 8 3 3 3 2 2 $15 $14 $11 $10 $10 Residential mortgage Home equity 1Q22 2Q22 3Q22 4Q22 1Q23 $0 $5 $10 $15 $20


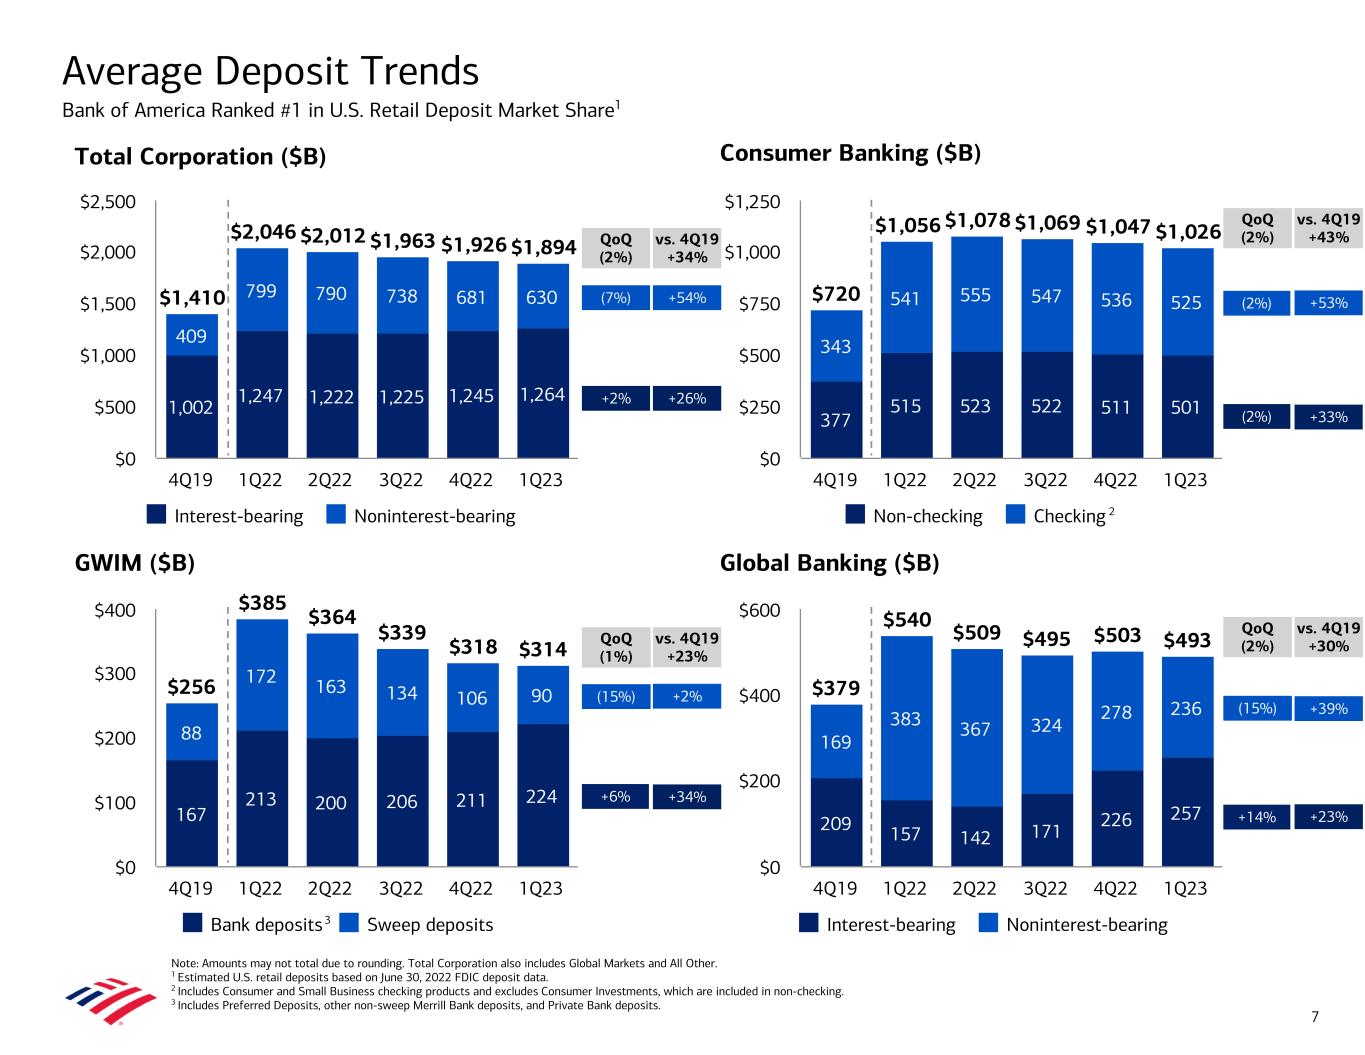
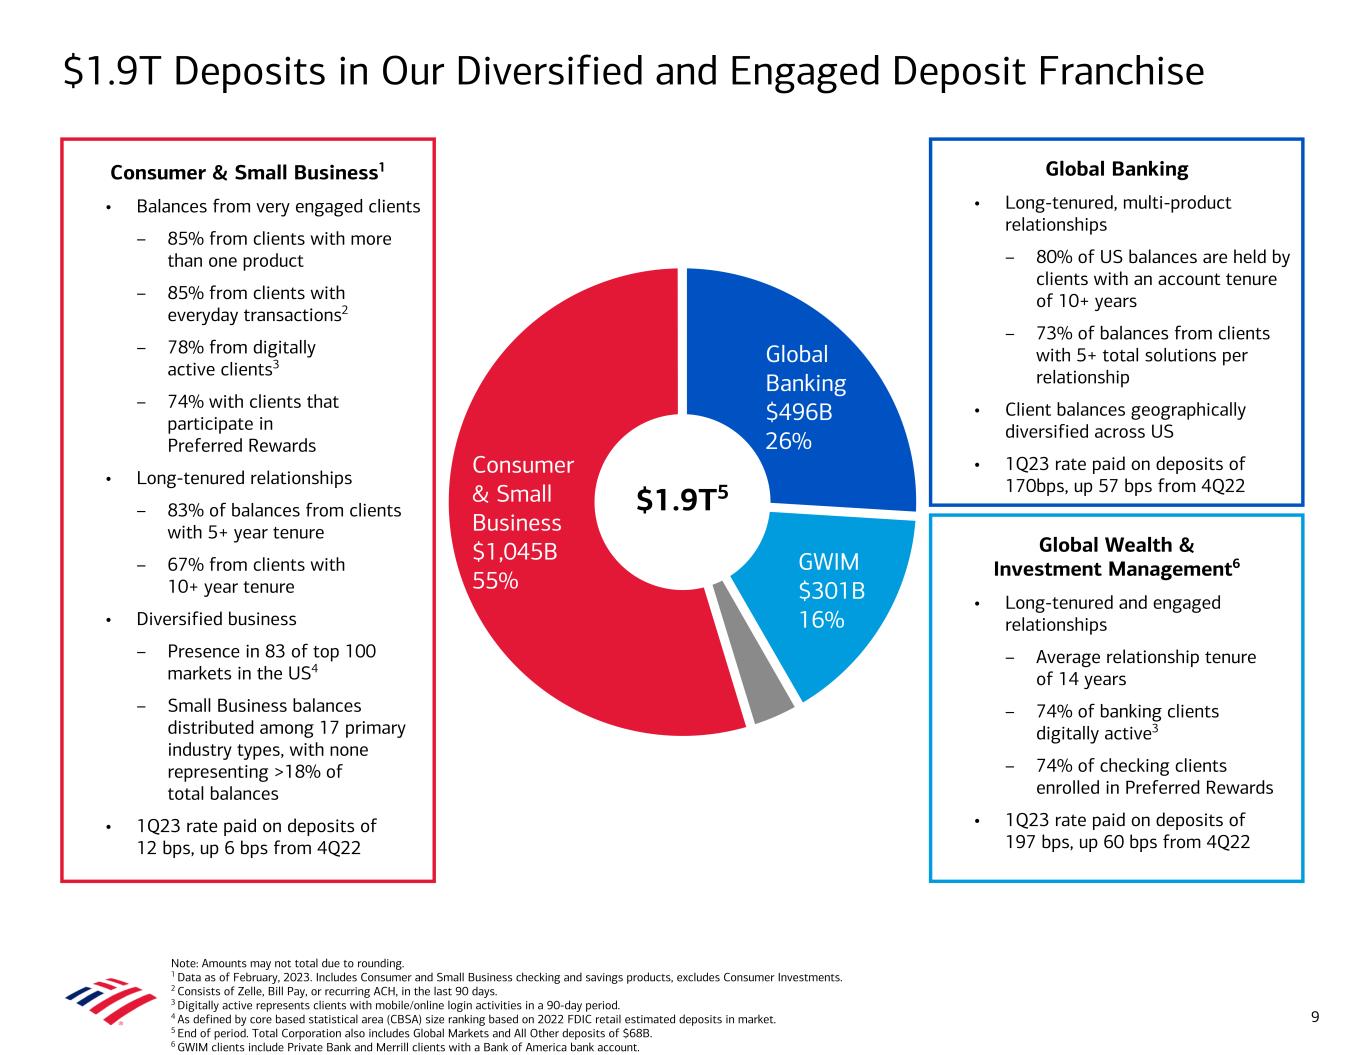
Consumer Banking ($B) GWIM ($B) Global Banking ($B) Total Corporation ($B) Average Deposit Trends Bank of America Ranked #1 in U.S. Retail Deposit Market Share1 Note: Amounts may not total due to rounding. Total Corporation also includes Global Markets and All Other. 1 Estimated U.S. retail deposits based on June 30, 2022 FDIC deposit data. 2 Includes Consumer and Small Business checking products and excludes Consumer Investments, which are included in non-checking. 3 Includes Preferred Deposits, other non-sweep Merrill Bank deposits, and Private Bank deposits. $256 $385 $364 $339 $318 $314 167 213 200 206 211 224 88 172 163 134 106 90 Bank deposits Sweep deposits 4Q19 1Q22 2Q22 3Q22 4Q22 1Q23 $0 $100 $200 $300 $400 $1,410 $2,046 $2,012 $1,963 $1,926 $1,894 1,002 1,247 1,222 1,225 1,245 1,264 409 799 790 738 681 630 Interest-bearing Noninterest-bearing 4Q19 1Q22 2Q22 3Q22 4Q22 1Q23 $0 $500 $1,000 $1,500 $2,000 $2,500 $379 $540 $509 $495 $503 $493 209 157 142 171 226 257 169 383 367 324 278 236 Interest-bearing Noninterest-bearing 4Q19 1Q22 2Q22 3Q22 4Q22 1Q23 $0 $200 $400 $600 +6% (15%) +2% (7%) QoQ (2%) QoQ (1%) QoQ (2%) +14% (15%) (2%) QoQ (2%) 7 $720 $1,056 $1,078 $1,069 $1,047 $1,026 377 515 523 522 511 501 343 541 555 547 536 525 Non-checking Checking 4Q19 1Q22 2Q22 3Q22 4Q22 1Q23 $0 $250 $500 $750 $1,000 $1,250 (2%) 2 +26% +54% vs. 4Q19 +34% +34% +2% vs. 4Q19 +23% +33% +53% vs. 4Q19 +43% +23% +39% vs. 4Q19 +30% 3


$497 $547 Non-checking ($B) Checking ($B) 09/30/22 12/30/22 03/31/23 $475 $500 $525 $550 $575 $271 $225 Interest-bearing ($B) Noninterest-bearing ($B) 09/30/22 12/30/22 03/31/23 $150 $200 $250 $300 $350 $222 $80 Bank deposits ($B) Sweep deposits ($B) 09/30/22 12/30/22 03/31/23 $0 $100 $200 $300 Interest-bearing ($B) Noninterest-bearing ($B) Total ($B) Fed Funds Target Rate 09/30/22 12/30/22 03/31/23 $500 $1,000 $1,500 $2,000 3.00% 4.00% 5.00% Consumer Banking Declined $4B to $1,045B in 1Q23 GWIM Declined $22B to $301B in 1Q23 Global Banking Declined $3B to $496B in 1Q23 Total Deposits of $1,910B Declined $20B in 1Q23 Weekly Ending Deposit Trends 8 $555 $184 $300 $518 Note: Amounts may not total due to rounding. Deposit trends represent weekly end-of-period deposit balances. Total Corporation also includes Global Markets and All Other. 1 Includes Consumer and Small Business checking products and excludes Consumer Investments, which are included in non-checking. 2 Includes Preferred Deposits, other non-sweep Merrill Bank deposits, and Private Bank deposits. $208 $117 $1,938 $1,219 $719 $1,910 $1,275 $636 3/10 3/103/10 1 $1,930 $1,269 $661 $543 $506 $244 $255 $223 $101 2


Global Banking $496B 26% GWIM $301B 16% Consumer & Small Business $1,045B 55% $1.9T Deposits in Our Diversified and Engaged Deposit Franchise 9 Note: Amounts may not total due to rounding. 1 Data as of February, 2023. Includes Consumer and Small Business checking and savings products, excludes Consumer Investments. 2 Consists of Zelle, Bill Pay, or recurring ACH, in the last 90 days. 3 Digitally active represents clients with mobile/online login activities in a 90-day period. 4 As defined by core based statistical area (CBSA) size ranking based on 2022 FDIC retail estimated deposits in market. 5 End of period. Total Corporation also includes Global Markets and All Other deposits of $68B. 6 GWIM clients include Private Bank and Merrill clients with a Bank of America bank account. Consumer & Small Business1 • Balances from very engaged clients – 85% from clients with more than one product – 85% from clients with everyday transactions2 – 78% from digitally active clients3 – 74% with clients that participate in Preferred Rewards • Long-tenured relationships – 83% of balances from clients with 5+ year tenure – 67% from clients with 10+ year tenure • Diversified business – Presence in 83 of top 100 markets in the US4 – Small Business balances distributed among 17 primary industry types, with none representing >18% of total balances • 1Q23 rate paid on deposits of 12 bps, up 6 bps from 4Q22 Global Wealth & Investment Management6 • Long-tenured and engaged relationships – Average relationship tenure of 14 years – 74% of banking clients digitally active3 – 74% of checking clients enrolled in Preferred Rewards • 1Q23 rate paid on deposits of 197 bps, up 60 bps from 4Q22 Global Banking • Long-tenured, multi-product relationships – 80% of US balances are held by clients with an account tenure of 10+ years – 73% of balances from clients with 5+ total solutions per relationship • Client balances geographically diversified across US • 1Q23 rate paid on deposits of 170bps, up 57 bps from 4Q22$1.9T5


Strong Excess Deposits Drove Need to Invest (EOP, $T) 10 $1.4 $1.6 $1.7 $1.7 $1.8 $1.9 $1.9 $2.0 $2.1 $2.1 $2.0 $1.9 $1.9 $1.9 1.4 1.6 1.7 1.7 1.8 1.9 1.9 2.0 2.1 2.1 2.0 1.9 1.9 1.9 1.0 1.1 1.0 1.0 0.9 0.9 0.9 0.9 1.0 1.0 1.0 1.0 1.0 1.0 0.5 0.5 0.7 0.7 0.9 1.0 1.0 1.0 1.1 1.1 1.0 0.9 0.9 0.9 Deposits Loans Deposits in excess of loans 4Q19 1Q20 2Q20 3Q20 4Q20 1Q21 2Q21 3Q21 4Q21 1Q22 2Q22 3Q22 4Q22 1Q23 Note: Amounts may not total due to rounding.


Investments Made to Extract the Value of Deposits 11 $634 $726 $761 $885 $1,065 $1,183 $1,200 $1,248 $1,331 $1,244 $1,131 $1,085 $1,093 $1,173 162 380 348 230 376 256 247 308 230 173 216 438 675 633 624 Cash and cash equivalents ($B) AFS and other securities ($B) HTM securities ($B) 4Q19 1Q20 2Q20 3Q20 4Q20 1Q21 2Q21 3Q21 4Q21 1Q22 2Q22 3Q22 4Q22 1Q23 $0 $500 $1,000 $1,500 • Managed within various interest rate sensitivity, liquidity, and capital limits • Deposits in excess of loans grew from $0.5T in 4Q19 to $1.1T (4Q21-1Q22) and were $0.9T at March 31, 2023 – Stored excess deposits in cash and investment securities – Hedged AFS securities with floating rate swaps, beginning in 2020 – Stopped adding to HTM securities book as deposits appeared to be peaking; book has declined quarterly and is $59B below peak of $683B in 3Q21 – Weighted average life of HTM portfolio currently 8.5 years; AFS 5.5 years – NII excluding Global Markets trough of $9.1B in 3Q20 vs. $14.5B in 1Q233 • Reduced AFS securities and increased cash in 1Q23 Yield2 on: Cash 1.2% 0.8% 0.0% 0.0% 0.1% 0.0% 0.0% 0.1% 0.1% 0.1% 0.6% 1.8% 3.1% 4.0% Securities 2.5% 2.5% 2.1% 1.6% 1.5% 1.4% 1.3% 1.4% 1.5% 1.6% 1.7% 1.9% 2.3% 2.6% Blended 2.2% 2.1% 1.3% 1.1% 1.0% 1.1% 1.0% 1.1% 1.2% 1.3% 1.5% 1.9% 2.4% 2.9% Note: Amounts may not total due to rounding. 1 HTM stands for held-to-maturity. 2 Yields based on average balances. Yield on cash represents yield on interest-bearing deposits with the Federal Reserve, non-U.S. central banks and other banks. 3 Fully taxable-equivalent basis. Represents a non-GAAP financial measure. Reported NII was $10.1B and $14.4B in 3Q20 and 1Q23. FTE NII was $10.2B and $14.6B in 3Q20 and 1Q23. Global Markets NII was $1.1B and $0.1B in 3Q20 and 1Q23. For important presentation information, see slide 38. 1


Net Interest Income (FTE, $B)1 • Net interest income of $14.4B ($14.6B FTE1) increased $2.9B YoY, driven by benefits from higher interest rates and loan growth – Decreased $0.2B from 4Q22, as the benefit from higher interest rates was more than offset by lower deposit balances, two fewer interest accrual days, and lower NII related to GM activity – NII related to GM activity declined approximately $0.9B YoY, and $0.3B from 4Q22, and was offset in noninterest income – Premium amortization expense of $34MM in 1Q23, $210MM in 4Q22, and $905MM in 1Q22 • Net interest yield of 2.20% increased 51 bps YoY and decreased 2 bps from 4Q22 – Excluding GM, net interest yield of 2.85%;1 up 86 bps YoY • As of March 31, 2023, a +100 bps parallel shift in the interest rate yield curve is estimated to benefit net interest income by $3.3B over the next 12 months2 Net Interest Income Increased $2.9B, or 25% YoY Net Interest Yield (FTE)1 Note: FTE stands for fully taxable-equivalent basis. GM stands for Global Markets. 1 Represent non-GAAP financial measures. Net interest yield adjusted to exclude Global Markets NII of $0.1B, $0.4B, $0.7B, $1.0B, and $1.0B and average earning assets of $627.9B, $610.0B, $591.9B, $598.8B, and $610.9B for 1Q23, 4Q22, 3Q22, 2Q22, and 1Q22, respectively. The Corporation believes the presentation of NII and net interest yield excluding Global Markets provides investors with transparency of NII and net interest yield in core banking activities. For important presentation information, see slide 38. 2 NII asset sensitivity represents banking book positions. See note D on slide 35 for information on asset sensitivity assumptions. 1.69% 1.86% 2.06% 2.22% 2.20% 1.99% 2.20% 2.51% 2.81% 2.85% Reported net interest yield Net interest yield excl. GM 1Q22 2Q22 3Q22 4Q22 1Q23 1.00% 1.50% 2.00% 2.50% 3.00% $11.7 $12.5 $13.9 $14.8 $14.6 $11.6 $12.4 $13.8 $14.7 $14.4 Net interest income (GAAP) FTE Adjustment 1Q22 2Q22 3Q22 4Q22 1Q23 $0.0 $5.0 $10.0 $15.0 12 Net Interest Income excl. GM (FTE, $B)1 $11.7 $12.5 $13.9 $14.8 $14.6 $10.7 $11.6 $13.1 $14.4 $14.5 NII excl. GM GM NII 1Q22 2Q22 3Q22 4Q22 1Q23 $0.0 $5.0 $10.0 $15.0


$15.3 $15.3 $15.3 $15.5 $16.2 9.5 8.9 8.9 9.2 9.9 5.8 6.4 6.4 6.4 6.3 Compensation and benefits Other 1Q22 2Q22 3Q22 4Q22 1Q23 $0.0 $10.0 $20.0 66% 67% 62% 63% 62% 1Q22 2Q22 3Q22 4Q22 1Q23 50% 60% 70% • Noninterest expense of $16.2B in 1Q23 increased $0.7B, or 4%, vs. 4Q22, driven primarily by seasonally higher payroll taxes, continued investments in people and technology, and higher FDIC expense from the 2022 increased assessment on banks • 1Q23 expense increased $0.9B, or 6%, vs. 1Q22, driven by investments in the franchise across people and technology as well as higher FDIC expense, partially offset by lower revenue-related incentive compensation Total Noninterest Expense ($B) Efficiency Ratio Expense and Efficiency Note: Amounts may not total due to rounding. 13


• Total net charge-offs of $807MM1 increased $118MM from 4Q22 – Consumer net charge-offs of $653MM increased $122MM, driven primarily by higher credit card losses ◦ Credit card loss rate of 2.21% in 1Q23, 1.71% in 4Q22, and 3.03% in 4Q19 – Commercial net charge-offs of $154MM decreased $4MM • Net charge-off ratio of 0.32% increased 6 bps from 4Q22 and remained below pre-pandemic levels • Provision for credit losses of $931MM – Net reserve build of $124MM in 1Q23, driven primarily by Consumer due to higher-than- expected credit card balances, partially offset by an improved macroeconomic outlook that primarily benefited the Commercial portfolio • Allowance for loan and lease losses of $12.5B represented 1.20% of total loans and leases1,2 – Total allowance of $14.0B included $1.4B for unfunded commitments – Includes a January 1, 2023 $243MM reduction for the accounting change to remove the recognition and measurement guidance on troubled debt restructurings • Nonperforming loans (NPLs) increased $0.1B from 4Q22 to $3.9B – 60% of Consumer NPLs are contractually current • Commercial reservable criticized utilized exposure of $19.8B increased $0.5B from 4Q22 Asset Quality 1 Excludes loans measured at fair value. 2 Allowance for loan and lease losses ratio is calculated as allowance for loan and lease losses divided by loans and leases outstanding at the end of the period. Provision for Credit Losses ($MM) Net Charge-offs ($MM)1 $30 $523 $898 $1,092 $931 1Q22 2Q22 3Q22 4Q22 1Q23 $0 $500 $1,000 $1,500 $392 $571 $520 $689 $807 0.16% 0.23% 0.20% 0.26% 0.32% Net charge-offs Net charge-off ratio 1Q22 2Q22 3Q22 4Q22 1Q23 $0 $200 $400 $600 $800 $1,000 0.00% 0.10% 0.20% 0.30% 0.40% 0.50% 14


Commercial Net Charge-offs ($MM) Consumer Net Charge-offs ($MM) Asset Quality – Consumer and Commercial Portfolios 1 Excludes loans measured at fair value. 2 Fully-insured loans are FHA-insured loans and other loans individually insured under long-term standby agreements. 3 C&I includes commercial and industrial, commercial real estate, and commercial lease financing. $52 $46 $61 $158 $154 0.04% 0.03% 0.04% 0.11% 0.11% C&I Small business Commercial NCO ratio 1Q22 2Q22 3Q22 4Q22 1Q23 ($50) $0 $50 $100 $150 $200 (0.05)% 0.00% 0.05% 0.10% 0.15% 0.20% $340 $525 $459 $531 $653 0.32% 0.47% 0.41% 0.47% 0.58% Credit card Other Consumer NCO ratio 1Q22 2Q22 3Q22 4Q22 1Q23 $0 $200 $400 $600 $800 0.00% 0.25% 0.50% 0.75% 1.00% Commercial Metrics ($MM) 1Q23 4Q22 1Q22 Provision ($14) $190 $16 Reservable criticized utilized exposure 19,789 19,274 20,682 Nonperforming loans and leases 1,204 1,054 1,521 % of loans and leases1 0.20 % 0.18 % 0.28 % Allowance for loans and leases $5,153 $5,445 $5,389 % of loans and leases1 0.87 % 0.93 % 0.98 % Consumer Metrics ($MM) 1Q23 4Q22 1Q22 Provision $945 $902 $14 Nonperforming loans and leases 2,714 2,754 3,104 % of loans and leases1 0.60 % 0.60 % 0.71 % Consumer 30+ days performing past due $3,344 $3,330 $2,844 Fully-insured2 580 627 817 Non fully-insured 2,764 2,703 2,027 Consumer 90+ days performing past due 1,168 1,087 1,077 Allowance for loans and leases 7,361 7,237 6,715 % of loans and leases1 1.63 % 1.59 % 1.53 % # times annualized NCOs 2.78 x 3.44 x 4.88 x 15 3


Added record ~14,500 net new relationships across Merrill and Private Bank $80 billion total net client flows since 1Q22 Opened record ~35,000 bank accounts, up 18% YoY Sent ~40,000 referrals to other lines of business Continued Organic Growth in 1Q23 16 Consumer Banking Global Wealth & Investment Management Global Banking Global Markets Added ~130,000 net new checking accounts; 17th consecutive quarter of growth Added 1.3 million credit card accounts1 Record 3.6 million consumer investment accounts, with $37 billion net client flows since 1Q22 Grew digital sales 4% YoY to 1.8 million; digital sales represented 51% of total sales Grew average loans and leases 6% YoY to $381 billion Second best revenue quarter at $6.2 billion, up 19% YoY $3.1 billion Global Transaction Services revenue, up 47% YoY #3 in investment banking fees2 Grew sales and trading revenue to $5.1 billion Second highest quarterly sales and trading revenue in a decade Highest quarterly FICC3 revenue in a decade, up 27% YoY Average loans of $125 billion, up 15% YoY 1 Includes credit cards across Consumer Banking, Small Business, and Global Wealth & Investment Management. 2 Source: Dealogic as of April 1, 2023. 3 FICC stands for Fixed Income, Currencies, and Commodities.


3Q19-2Q21 Break in operating leverage streak Revenue (7%) (5%) (2%) 1% (3%) 1% 3% 2% 7% 7% 1% 7% 4% (1%) 4% 6% —% 2% 12% 10% 2% 6% 8% 11% 13% Expense (29%) (25%) (31%) (2%) (10%) (2%) (1%) (4%) (1%) 1% (3%) (1%) (1%) (5%) (2%) (1%) (4%) —% —% 6% (1%) 2% 6% 6% 6% Extended Quarterly Operating Leverage1 Streak 17 Note: Amounts may not total due to rounding. Operating leverage is calculated as the year-over-year percentage change in revenue, net of interest expense, less the percentage change in noninterest expense. 1 Operating leverage calculated after adjusting 4Q17 revenue for the impact of the Tax Cuts and Jobs Act is a non-GAAP financial measure. Reported revenue growth and operating leverage were 11% and 12% for 4Q18, and 2% and 3% for 4Q17. Reported revenue was $22.7B, $20.4B, and $20.0B for 4Q18, 4Q17, and 4Q16, respectively. Excluding a $0.9B noninterest income charge from enactment of the Tax Act, 4Q17 revenue was $21.4B. For important presentation information, see slide 38.


• Net income of $3.1B increased 4% from 1Q22, driven by strong revenue growth and continued investments in the business – Pretax, pre-provision income1 of $5.2B increased 34% from 1Q22 – 8th consecutive quarter of operating leverage; efficiency ratio improved YoY to 51% • Revenue of $10.7B improved 21% from 1Q22, due to increased NII driven by higher interest rates and loan balances, partially offset by the impact of reduced customer non-sufficient funds and overdraft fees • Provision for credit losses of $1.1B vs. a benefit of $52MM in 1Q22 – Net reserve build of $360MM, driven primarily by higher- than-expected credit card balances – Net charge-offs of $729MM increased $313MM driven primarily by credit card • Noninterest expense of $5.5B increased 11% from 1Q22, driven primarily by continued investments in people and technology • Average deposits remained above $1T and decreased $30B, or 3%, from 1Q22 – 57% of deposits in checking accounts; 92% primary accounts5 • Average loans and leases of $304B increased $20B, or 7%, from 1Q22 • Combined credit / debit card spend4 of $210B increased 6% from 1Q22, with both credit and debit up 6% • Consumer investment assets3 of $355B declined $3B, or 1%, from 1Q22, driven by lower market valuations, partially offset by record $37B of client flows from new and existing clients – Record 3.6MM consumer investment accounts, up 9% • 10.3MM Total clients6 enrolled in Preferred Rewards, up 8% from 1Q22; 99% annualized retention rate Consumer Banking 1 Represents a non-GAAP financial measure. For more information and a reconciliation to GAAP, see note C on slide 35. For important presentation information, see slide 38. 2 Cost of deposits calculated as annualized noninterest expense as a percentage of total average deposits within the Deposits sub-segment. 3 End of period Consumer investment assets includes client brokerage assets, deposit sweep balances, and assets under management (AUM) in Consumer Banking. 4 Includes consumer credit card portfolios in Consumer Banking and GWIM. 5 Represents the percentage of consumer checking accounts that are estimated to be the customer’s primary account based on multiple relationship factors (e.g., linked to their direct deposit). 6 As of February, 2023. Includes clients in Consumer, Small Business, and GWIM. Inc / (Dec) Summary Income Statement ($MM) 1Q23 4Q22 1Q22 Total revenue, net of interest expense $10,706 ($76) $1,893 Provision (benefit) for credit losses 1,089 145 1,141 Noninterest expense 5,473 373 552 Pretax income 4,144 (594) 200 Pretax, pre-provision income1 5,233 (449) 1,341 Income tax expense 1,036 (125) 70 Net income $3,108 ($469) $130 Key Indicators ($B) 1Q23 4Q22 1Q22 Average deposits $1,026.2 $1,047.1 $1,056.1 Rate paid on deposits 0.12 % 0.06 % 0.02 % Cost of deposits2 1.36 1.21 1.16 Average loans and leases $303.8 $300.4 $284.1 Net charge-off ratio 0.97 % 0.78 % 0.59 % Net charge-offs ($MM) $729 $591 $416 Reserve build (release) ($MM) 360 353 (468) Consumer investment assets3 $354.9 $319.6 $357.6 Active mobile banking users (MM) 36.3 35.5 33.6 % Consumer sales through digital channels 51 % 49 % 53 % Number of financial centers 3,892 3,913 4,056 Combined credit /debit purchase volumes4 $209.9 $223.0 $198.5 Total consumer credit card risk-adjusted margin4 8.69 % 9.87 % 10.40 % Return on average allocated capital 30 35 30 Allocated capital $42.0 $40.0 $40.0 Efficiency ratio 51 % 47 % 56 % 18


Erica® Active Users and Interactions (MM)7 Checks vs. Zelle® Sent Transactions (MM) Digital Sales6Digital Users2 and Households3 Digital Channel Usage4,5 1,081 1,360 1,721 1,784 33% 49% 53% 51% Digital unit sales (K) Digital as a % of total sales 1Q20 1Q21 1Q22 1Q23 0 500 1,000 1,500 2,000 0% 25% 50% 75% 100% 2,166 2,579 2,748 3,115 586 786 813 892 Digital channel usage (MM) Digital appointments (K) 1Q20 1Q21 1Q22 1Q23 1,000 1,500 2,000 2,500 3,000 3,500 250 500 750 1,000 1,250 39 40 42 45 50 52 54 56 68% 70% 71% 73% Active users (MM) Verified users (MM) Household adoption % 1Q20 1Q21 1Q22 1Q23 20 30 40 50 60 50% 60% 70% 80% 90% 100% Client Engagement Person-to-Person Payments (Zelle®)8 Digital Volumes 102 170 213 275 $27 $49 $65 $84 Transactions (MM) Volume ($B) 1Q20 1Q21 1Q22 1Q23 0 100 200 300 $0 $25 $50 $75 $100 Consumer1 Digital Update 1 Includes all households/relationships with Consumer platform activity, except where otherwise noted. 2 Digital active users represents Consumer and Merrill mobile and/or online 90-day active users; verified users represent Consumer and Merrill users with a digital identification and password. 3 Household adoption represents households with consumer bank login activities in a 90-day period, as of February for each quarter presented. 4 Digital channel usage represents the total number of desktop and mobile banking sessions on the Consumer Banking platform. 5 Digital appointments represent the number of client-scheduled appointments made via online, smartphone, or tablet. 6 Digital sales represent sales initiated and/or booked via our digital platforms. 7 Erica engagement represents activity across all platforms powered by Erica: BofA mobile app, online search, and Benefits OnLine mobile app. Periods prior to 3Q22 represent activity on BofA mobile app only. 8 Includes Bank of America person-to-person payments sent and received through e-mail or mobile identification. Zelle® users represent 90-day active users. 10.4 13.5 16.2 19.6 users (MM) 19 Digital Adoption 5.3 12.6 14.2 17.8 27.8 105.6 123.7 166.7 Erica® users Erica® interactions 1Q20 1Q21 1Q22 1Q23 0.0 5.0 10.0 15.0 20.0 0.0 100.0 200.0 300.0 157 128 120 111 70 112 140 179 Checks written Zelle® sent transactions 1Q20 1Q21 1Q22 1Q23 50 100 150 200


• Net income of $0.9B decreased 19% from 1Q22 – Pretax, pre-provision income1 of $1.2B decreased 15% from 1Q22 – Pretax margin of 23% • Revenue of $5.3B decreased 3% compared to 1Q22, driven by the impact of lower equity and fixed income market valuations on asset management fees, partially offset by higher NII • Noninterest expense of $4.1B increased 1% vs. 1Q22, as investments in the business, including strategic hiring and technology, were mostly offset by lower revenue-related incentives • Client balances of $3.5T decreased 5% from 1Q22, driven by lower market valuations, partially offset by net client flows – AUM flows of $15B in 1Q23 • Average deposits of $314B decreased $71B, or 18%, from 1Q22 • Average loans and leases of $221B increased $11B, or 5%, from 1Q22, driven by residential mortgage and custom lending • Added a record ~14,500 net new relationships across Merrill and Private Bank in 1Q23 • 84% of GWIM households / relationships are digitally active across the enterprise, up from 81% in 1Q22 Global Wealth & Investment Management 1 Represents a non-GAAP financial measure. For more information and a reconciliation to GAAP, see note C on slide 35. For important presentation information, see slide 38. Inc / (Dec) Summary Income Statement ($MM) 1Q23 4Q22 1Q22 Total revenue, net of interest expense $5,315 ($95) ($161) Provision (benefit) for credit losses 25 (12) 66 Noninterest expense 4,067 283 52 Pretax income 1,223 (366) (279) Pretax, pre-provision income1 1,248 (378) (213) Income tax expense 306 (83) (62) Net income $917 ($283) ($217) Key Indicators ($B) 1Q23 4Q22 1Q22 Average deposits $314.0 $317.8 $384.9 Rate paid on deposits 1.97 % 1.37 % 0.03 % Average loans and leases $221.4 $225.1 $210.9 Net charge-off ratio 0.01 % 0.01 % 0.00 % Net charge-offs ($MM) $6 $4 $1 Reserve build (release) ($MM) 19 33 (42) AUM flows $15.3 $0.1 $15.5 Pretax margin 23 % 29 % 27 % Return on average allocated capital 20 27 26 Allocated capital $18.5 $17.5 $17.5 20


Erica® Interactions (MM)5 1.6 1.8 2.6 1Q21 1Q22 1Q23 0.0 1.0 2.0 3.0 Person-to-Person Payments (Zelle®)6 Check Deposits eDelivery4Digital Households / Relationships Digital Channel Adoption1,3 63% 71% 74% 77% 1Q20 1Q21 1Q22 1Q23 0% 25% 50% 75% 100% 46% 53% 56% 58% 71% 74% 75% 77% Mobile adoption Online adoption 1Q20 1Q21 1Q22 1Q23 0% 25% 50% 75% 100% 630 667 688 717 75% 79% 81% 84% Digital households / relationships (K) Digital adoption % 1Q20 1Q21 1Q22 1Q23 500 550 600 650 700 750 60% 70% 80% 90% 100% Client Engagement Digital Volumes Global Wealth & Investment Management Digital Update 1 Digital Adoption is the percentage digitally active Merrill primary households ($250K+ in investable assets within the enterprise) and digitally active Private Bank core relationships ($3MM+ in total balances). Merrill excludes Stock Plan and Banking only households. Private Bank includes third party activities (effective 1Q23), and excludes Irrevocable Trust-only relationships, Institutional Philanthropic relationships, and exiting relationships. 2 Digital Adoption as of February for 1Q20, 1Q21, and 1Q22. 1Q23 as of March for Merrill and as of February for Private Bank. 3 Digital channel adoption represents the percentage of desktop and mobile banking engagement, as of February for each quarter presented. 4 GWIM eDelivery percentage includes Merrill Digital Households (excluding Stock Plan, Banking only households, Retirement only, and 529 only) and Private Bank relationships that receive statements digitally, as of February for each quarter presented. 5 Erica engagement represents activity across all platforms powered by Erica: BofA mobile app, online search, and Benefits OnLine mobile app. Periods prior to 3Q22 represent activity on BofA mobile app only. 6 Includes Bank of America person-to-person payments sent and received through e-mail or mobile identification. 7 Includes mobile check deposits, remote deposit operations), and automated teller machine transactions. 21 Digital Adoption1,2 0.7 1.2 2.0 2.7 $0.4 $0.7 $1.2 $1.6 Transactions (MM) Volume ($B) 1Q20 1Q21 1Q22 1Q23 0.0 1.0 2.0 3.0 $0.0 $0.5 $1.0 $1.5 $2.0 1.4 1.3 1.3 73% 74% 74% Physical (MM) Automated 1Q21 1Q22 1Q23 0.0 0.5 1.0 1.5 50% 60% 70% 80% 90% 7


• Net income of $2.6B increased 48% from 1Q22 – Pretax, pre-provision income2 of $3.3B increased 30% from 1Q22 • Revenue of $6.2B increased 19% vs. 1Q22, driven primarily by higher NII from the benefit of higher interest rates, partially offset by lower investment banking fees, lower treasury service charges due to higher earnings credit rates, and lower revenue from ESG investment activities • Total Corporation investment banking fees (excl. self- led) of $1.2B decreased $0.3B, or 20%, from 1Q22 • Provision for credit losses reflected a benefit of $237MM, driven primarily by an improved macroeconomic outlook, and decreased $402MM from 1Q22 as the prior year was impacted by reserve builds • Noninterest expense of $2.9B increased 10% from 1Q22, primarily reflecting continued investments in the business, including strategic hiring in 2022 • Average deposits of $493B decreased $47B, or 9%, from 1Q22 • Average loans and leases of $381B increased $22B, or 6%, from 1Q22 Global Banking 1 Global Banking and Global Markets share in certain deal economics from investment banking, loan origination activities, and sales and trading activities. 2 Represents a non-GAAP financial measure. For more information and a reconciliation to GAAP, see note C on slide 35. For important presentation information, see slide 38. Inc / (Dec) Summary Income Statement ($MM) 1Q23 4Q22 1Q22 Total revenue, net of interest expense1 $6,203 ($235) $1,009 Provision (benefit) for credit losses (237) (386) (402) Noninterest expense 2,940 107 257 Pretax income 3,500 44 1,154 Pretax, pre-provision income2 3,263 (342) 752 Income tax expense 945 29 323 Net income $2,555 $15 $831 Selected Revenue Items ($MM) 1Q23 4Q22 1Q22 Total Corporation IB fees (excl. self-led)1 $1,163 $1,071 $1,457 Global Banking IB fees1 668 706 880 Business Lending revenue 2,334 2,670 2,111 Global Transaction Services revenue 3,065 3,109 2,088 Key Indicators ($B) 1Q23 4Q22 1Q22 Average deposits $492.6 $503.5 $539.9 Average loans and leases 381.0 380.4 358.8 Net charge-off ratio 0.09 % 0.12 % (0.01) % Net charge-offs ($MM) $87 $112 ($12) Reserve build (release) ($MM) (324) 37 177 Return on average allocated capital 21 % 23 % 16 % Allocated capital $49.3 $44.5 $44.5 Efficiency ratio 47 % 44 % 52 % 22


Credit Monitoring Documents Uploaded Digitally (%)3,4 CashPro® Proactive Alerts & Insights (MM)2 Global Payments to Digital Wallets (K)3 15% 24% 34% 42% 1Q20 1Q21 1Q22 1Q23 0% 10% 20% 30% 40% 50% 225 246 385 395 1Q20 1Q21 1Q22 1Q23 100 200 300 400 500 12.3 14.2 15.6 17.0 1Q20 1Q21 1Q22 1Q23 0.0 5.0 10.0 15.0 20.0 CashPro® App PaymentsClient Digital Adoption % CashPro® App Sign-ins (K) $44 $62 $136 $179 0.8 1.3 2.4 3.3 Value ($B) Volume (MM) 1Q20 1Q21 1Q22 1Q23 0 50 100 150 200 0.0 1.0 2.0 3.0 4.0 336 474 720 1Q21 1Q22 1Q23 0 250 500 750 74% 74% 76% 1Q21 1Q22 1Q23 50% 60% 70% 80% Client Engagement Digital Volumes Global Banking Digital Update 23 Digital Adoption1 1 Digital active clients represents 90-day active clients across CashPro® and BA360 platforms. Metric tracked starting in 1Q21. Data as of February for each quarter presented. 2 CashPro® alert volume and CashPro® online reports and statements scheduled. 3 1Q represents December through February. 4 Eligible credit monitoring documents uploaded digitally through CashPro® Credit (i.e., clients with bilateral loans only and/or Commercial Real Estate Banking clients). Rolling 3-month average.


Global Markets1 • Net income of $1.7B increased 6% from 1Q22 – Excluding net DVA, net income of $1.7B increased 9%3 • Revenue of $5.6B increased 6% from 1Q22, driven primarily by higher sales and trading revenue, partially offset by lower investment banking fees • Sales and trading revenue of $5.1B increased 7% from 1Q22 – FICC revenue increased 27% to $3.4B, driven primarily by improved performance across mortgage, credit, municipal products, and increased secured financing activity for clients – Equities revenue decreased 19% to $1.6B, driven by weaker trading performance and lower client activity in derivatives and cash • Excluding net DVA, sales and trading revenue of $5.1B increased 9% from 1Q223 – FICC revenue of $3.4B increased 29%3 – Equities revenue of $1.6B decreased 19%3 • Noninterest expense of $3.4B increased 8% vs. 1Q22, driven by investments in the business, including people and technology • Average VaR of $109MM in 1Q235 1 The explanations for current period-over-period changes for Global Markets are the same for amounts including and excluding net DVA. 2 Global Banking and Global Markets share in certain deal economics from investment banking, loan origination activities, and sales and trading activities. 3 Represents a non-GAAP financial measure. Reported FICC sales and trading revenue was $3.4B, $2.2B, and $2.7B for 1Q23, 4Q22, and 1Q22, respectively. Reported Equities sales and trading revenue was $1.6B, $1.4B, and $2.0B for 1Q23, 4Q22, and 1Q22, respectively. See note E on slide 35 and slide 38 for important presentation information. 4 Represents a non-GAAP financial measure. For more information and a reconciliation to GAAP, see note C on slide 35. For important presentation information, see slide 38. 5 See note F on slide 35 for the definition of VaR. Inc / (Dec) Summary Income Statement ($MM) 1Q23 4Q22 1Q22 Total revenue, net of interest expense2 $5,626 $1,765 $334 Net DVA 14 207 (55) Total revenue (excl. net DVA)2,3 5,612 1,558 389 Provision (benefit) for credit losses (53) (57) (58) Noninterest expense 3,351 180 234 Pretax income 2,328 1,642 158 Pretax, pre-provision income4 2,275 1,585 100 Income tax expense 640 458 65 Net income $1,688 $1,184 $93 Net income (excl. net DVA)3 $1,677 $1,027 $134 Selected Revenue Items ($MM)2 1Q23 4Q22 1Q22 Sales and trading revenue $5,067 $3,525 $4,719 Sales and trading revenue (excl. net DVA)3 5,053 3,718 4,650 FICC (excl. net DVA)3 3,429 2,343 2,648 Equities (excl. net DVA)3 1,624 1,375 2,002 Global Markets IB fees 469 347 582 Key Indicators ($B) 1Q23 4Q22 1Q22 Average total assets $870.0 $857.3 $858.7 Average trading-related assets 626.0 608.5 596.2 Average 99% VaR ($MM)5 109 117 79 Average loans and leases 125.0 123.0 108.6 Net charge-offs ($MM) — (1) 21 Reserve build (release) ($MM) (53) 5 (16) Return on average allocated capital 15 % 5 % 15 % Allocated capital $45.5 $42.5 $42.5 Efficiency ratio 60 % 82 % 59 % 24


All Other1 • Net loss of $107MM included a $220MM pretax loss on sale of AFS debt securities • Total corporate effective tax rate (ETR) for the quarter was 10%, which included certain discrete tax benefits – Excluding these discrete tax benefits and recurring ESG tax credit benefits, the ETR would have been approximately 26% 1 All Other primarily consists of asset and liability management (ALM) activities, liquidating businesses, and certain expenses not otherwise allocated to a business segment. ALM activities encompass interest rate and foreign currency risk management activities for which substantially all of the results are allocated to our business segments. 2 Represents a non-GAAP financial measure. For more information and a reconciliation to GAAP, see note C on slide 35. For important presentation information, see slide 38. Inc/(Dec) Summary Income Statement ($MM) 1Q23 4Q22 1Q22 Total revenue, net of interest expense ($1,458) $378 ($17) Provision (benefit) for credit losses 107 149 154 Noninterest expense 407 (248) (176) Pretax income (loss) (1,972) 477 5 Pretax, pre-provision income2 (1,865) 626 159 Income tax (benefit) (1,865) (105) (252) Net income (loss) ($107) $582 $257 25


Supplemental Business Segment Trends


Total Expense ($B) and Efficiency Business Leadership1 • No. 1 in estimated U.S. Retail Deposits(A) • No. 1 Online Banking and Mobile Banking Functionality(B) • No. 1 Small Business Lender(C) • Best Bank in the U.S.(D) • Best Consumer Digital Bank in the U.S.(E) • Best Bank in the U.S. for Small and Medium Enterprises(F) • Certified by J.D. Power for Outstanding Client satisfaction with Customer Financial Health Support – Banking & Payments(G) Total Revenue ($B) Average Deposits ($B) Consumer Investment Assets ($B)2 and Accounts (MM) Average Loans and Leases ($B) Consumer Banking Trends Note: Amounts may not total due to rounding. 1 See slide 36 for business leadership sources. 2 End of period. Consumer investment assets includes client brokerage assets, deposit sweep balances, and AUM in Consumer Banking. $8.8 $9.1 $9.9 $10.8 $10.7 6.7 7.1 7.8 8.5 8.6 2.1 2.0 2.1 2.3 2.1 Net interest income Noninterest income 1Q22 2Q22 3Q22 4Q22 1Q23 $0.0 $4.0 $8.0 $12.0 $4.9 $5.0 $5.1 $5.1 $5.5 56% 54% 51% 47% 51% Noninterest expense Efficiency ratio 1Q22 2Q22 3Q22 4Q22 1Q23 $0.0 $2.0 $4.0 $6.0 40% 50% 60% 70% $1,056$1,078$1,069$1,047$1,026 593 606 599 589 581 463 472 470 458 445 Checking Other 1Q22 2Q22 3Q22 4Q22 1Q23 $0 $300 $600 $900 $1,200 $284 $290 $295 $300 $304 115 117 118 118 118 76 78 82 87 89 50 51 52 52 54 22 22 22 22 2221 21 21 21 22 Residential mortgage Consumer credit card Vehicle lending Home equity Small business / other 1Q22 2Q22 3Q22 4Q22 1Q23 $0 $50 $100 $150 $200 $250 $300 $350 27 $358 $315 $302 $320 $355 3.3 3.4 3.4 3.5 3.6 Assets Accounts 1Q22 2Q22 3Q22 4Q22 1Q23 $0 $100 $200 $300 $400 2.5 3.0 3.5 4.0 4.5


977 1,068 1,255 1,096 1,187 1Q22 2Q22 3Q22 4Q22 1Q23 0 500 1,000 1,500 Home Equity1 New Originations ($B)4 Consumer Creditworthiness Remains Strong 1 Includes loan production within Consumer Banking and GWIM. Consumer credit card balances include average balances of $3.0B, $3.0B, and $2.7B in 1Q23, 4Q22, and 1Q22, respectively, within GWIM. 2 Calculated as the difference between total revenue, net of interest expense, and net credit losses divided by average loans. 3 Represents Consumer Banking only. 4 Amounts represent the unpaid principal balance of loans and in the case of home equity, the principal amount of the total line of credit. Consumer Vehicle Lending3 New Originations ($B) Consumer Credit Card1 New Accounts (K) 28 Residential Mortgage1 New Originations ($B)4 Key Stats 1Q22 4Q22 1Q23 Average outstandings ($B) 78.4 89.6 91.8 NCO ratio 1.53% 1.71% 2.21% Risk-adjusted margin2 10.40% 9.87% 8.69% Average line FICO 770 772 774 $7.1 $7.1 $5.9 $6.8 $7.0 1Q22 2Q22 3Q22 4Q22 1Q23 $0.0 $2.5 $5.0 $7.5 $10.0 Key Stats 1Q22 4Q22 1Q23 Average outstandings ($B) 49.9 52.5 53.9 NCO ratio 0.03% (0.01%) (0.00%) Average booked FICO 790 795 795 $16.4 $14.5 $8.7 $5.2 $3.9 1Q22 2Q22 3Q22 4Q22 1Q23 $0.0 $10.0 $20.0 Key Stats 1Q22 4Q22 1Q23 Average outstandings ($B)3 115.4 118.1 117.7 NCO ratio3 0.01% 0.01% 0.01% Average FICO 771 768 771 Average booked loan-to-value (LTV) 64% 72% 73% $2.0 $2.5 $2.4 $2.6 $2.6 1Q22 2Q22 3Q22 4Q22 1Q23 $0.0 $1.0 $2.0 $3.0 $4.0 Key Stats 1Q22 4Q22 1Q23 Average outstandings ($B)3 22.0 21.8 21.6 NCO ratio3 (0.10%) (0.06%) (0.01%) Average FICO 800 791 789 Average booked combined LTV 59% 58% 58%


Average Deposits ($B) Global Wealth & Investment Management Trends Business Leadership1 • No. 1 on Forbes’ Best-in-State Wealth Advisors (2023), Top Women Wealth Advisors (2022), Top Women Wealth Advisors Best-in State (2022), and Top Next Generation Advisors (2022) • No. 1 on Barron’s Top 100 Women Financial Advisors List (2022) • No. 1 on Financial Planning's 'Top 40 Advisors Under 40' List (2022) • Celent Model Wealth Manager award for Client Experience (2023) • MMI/Barron's Industry Award for Digital Innovation (2022) • Aite-Novarica award for Digital Client Experience (2022) • No. 1 in personal trust AUM(H) • Best Private Bank in the U.S. by Family Wealth Report(I) and Global Private Banking(J) • Best Philanthropy Offering by WealthBriefing(K), PWM(L) and Global Finance(M) Note: Amounts may not total due to rounding. 1 See slide 36 for business leadership sources. 2 End of period. Loans and leases includes margin receivables which are classified in customer and other receivables on the Consolidated Balance Sheet. 3 Managed deposits in investment accounts of $39B, $48B, $48B, $55B, and $53B for 1Q23, 4Q22, 3Q22, 2Q22, and 1Q22, respectively, are included in both AUM and Deposits. Total client balances only include these balances once. Average Loans and Leases ($B) Total Revenue ($B) Client Balances ($B)2,3 $5.5 $5.4 $5.4 $5.4 $5.3 1.7 1.8 2.0 2.0 1.9 3.2 3.1 2.9 2.8 2.9 0.6 0.6 0.6 0.6 0.6 Net interest income Asset management fees Brokerage / Other 1Q22 2Q22 3Q22 4Q22 1Q23 $0.0 $2.0 $4.0 $6.0 1,572 1,411 1,330 1,401 1,467 1,593 1,438 1,414 1,482 1,571 385 348 325 324 301 217 225 228 227 221 $3,714 $3,367 $3,249 $3,387 $3,522 AUM Brokerage / Other Deposits Loans and leases 1Q22 2Q22 3Q22 4Q22 1Q23 $0 $1,000 $2,000 $3,000 $4,000 $211 $219 $224 $225 $221 99 102 105 106 106 55 57 56 54 52 55 57 60 62 60 Consumer real estate Securities-based lending Custom lending Credit card 1Q22 2Q22 3Q22 4Q22 1Q23 $0 $50 $100 $150 $200 $250$385 $364 $339 $318 $314 1Q22 2Q22 3Q22 4Q22 1Q23 $0 $100 $200 $300 $400 29


Global Banking Trends Note: Amounts may not total due to rounding. 1 See slide 36 for business leadership sources. 2 Global Banking and Global Markets share in certain deal economics from investment banking, loan origination activities, and sales and trading activities. 3 Self-led deals of $12MM, $18MM, $37MM, $65MM, and $72MM for 1Q23, 4Q22, 3Q22, 2Q22, and 1Q22, respectively are embedded within Debt, Equity, and Advisory. Total Corporation IB fees excludes self-led deals. 4 Advisory includes fees on debt and equity advisory and mergers and acquisitions. Average Deposits ($B)Business Leadership1 • Global Most Innovative Financial Institution – 2022(M) • World's Best Bank, North America’s Best Bank for Small to Medium-sized Enterprises, and Best Bank in the US(N) • Best Bank for Payment & Collections in North America(O) • Model Bank award for Product Innovation in Cash Management – 2023, for CashPro Mobile, CashPro Forecasting, and CashPro API(P) • World’s Best Bank for Payments and Treasury and North America’s Best Bank for Transaction Services(N) • 2022 Quality, Share and Excellence Awards for U.S. Large Corporate Banking and Cash Management(Q) • Relationships with 73% of the Global Fortune 500; 95% of the U.S. Fortune 1,000 (2022) Average Loans and Leases ($B) Total Revenue ($B)2 Total Corporation IB Fees ($MM)3 $5.2 $5.0 $5.6 $6.4 $6.2 2.3 2.6 3.3 3.9 3.9 0.9 0.7 0.7 0.7 0.7 0.9 0.9 0.8 0.7 0.7 1.1 0.7 0.8 1.1 0.9 Net interest income IB fees Service charges All other income 1Q22 2Q22 3Q22 4Q22 1Q23 $0.0 $2.5 $5.0 $7.5 831 662 616 414 644 225 139 156 189 168 473 392 432 486 363 $1,457 $1,128 $1,167 $1,071 $1,163 Debt Equity Advisory 1Q22 2Q22 3Q22 4Q22 1Q23 $0 $500 $1,000 $1,500 177 186 194 192 193 167 177 177 175 175 13 13 13 13 13$359 $377 $384 $380 $381 Commercial Corporate Business Banking 1Q22 2Q22 3Q22 4Q22 1Q23 $0 $100 $200 $300 $400 4 $540 $509 $495 $503 $493 Noninterest-bearing Interest-bearing 1Q22 2Q22 3Q22 4Q22 1Q23 $0 $200 $400 $600 30 71% 72% 65% 55% 48% 29% 28% 35% 45% 52%


Global Markets Trends and Revenue Mix Note: Amounts may not total due to rounding. 1 See slide 36 for business leadership sources. 2 Represents a non-GAAP financial measure. Reported Global Markets revenue was $5.6B for 1Q23. Reported sales and trading revenue was $5.1B, $4.7B, $5.1B, and $4.6B for 1Q23, 1Q22, 1Q21, and 1Q20, respectively. Reported FICC sales and trading revenue was $3.4B, $2.7B, $3.2B, and $2.9B for 1Q23, 1Q22, 1Q21, and 1Q20, respectively. Reported Equities sales and trading revenue was $1.6B, $2.0B, $1.8B, and $1.7B for 1Q23, 1Q22, 1Q21, and 1Q20, respectively. Reported Global Markets revenue mix and FICC sales and trading revenue mix are the same including and excluding DVA. See note E on slide 35 and slide 38 for important presentation information. 3 Macro includes currencies, interest rates and commodities products. 4 See note F on slide 35 for definition of VaR. 1Q23 Global Markets Revenue Mix (excl. net DVA)2 Business Leadership1 • Americas Derivatives House of the Year and Americas House of the Year for Equity Derivatives, FX Derivatives, Interest Rate Derivatives, and Commodities Derivatives(R) • Commodity Derivatives House and Americas ESG Financing House(S) • Interest Rate Derivatives House of the Year(T) • Global Leader for Sustainable Project Finance(M) • Most Sustainable Banks in North America(U) • Most Impressive Corporate Bond House in Dollars(R) • No. 1 All-America Sales Team in Equities Idea Generation(V) • No. 1 Municipal Bonds Underwriter(W) • No. 2 Global Research Firm(V) 1Q23 Total FICC Sales and Trading Revenue Mix (excl. net DVA)2 Total Sales and Trading Revenue (excl. net DVA) ($B)2 Average Trading-Related Assets ($B) and VaR ($MM)4 $4.3 $5.1 $4.7 $5.1 2.7 3.3 2.6 3.4 1.7 1.8 2.0 1.6 FICC Equities 1Q20 1Q21 1Q22 1Q23 $0.0 $2.0 $4.0 $6.0 $503 $502 $596 $626 $48 $74 $79 $109 Avg. trading-related assets Avg. VaR 1Q20 1Q21 1Q22 1Q23 $0 $250 $500 $750 $0 $50 $100 $150 60% 40% U.S. / Canada International 43% 57% Credit / Other Macro3 31


Additional Presentation Information


Consumer Spend Remained Strong; 1Q23 up 9% YoY to $1.1T 1 Total payments include total credit card, debit card, ACH, wires, billpay, person-to-person, cash, and checks. 2 Includes consumer and small business credit card portfolios in Consumer Banking and GWIM. 3 Excludes credit and debit money transfers, charitable donations, and miscellaneous categories with immaterial volume. 4 P2B stands for person-to-business. Payment Spend1 ($ and Transaction Volume) Quarterly YoY % Growth 33 1Q23 Credit and Debit2,3 YoY Growth Credit and debit spend up 6%; transactions up 6% $ Volume Transaction # 1Q 19 2Q 3Q 4Q 1Q 20 2Q 3Q 4Q 1Q 21 2Q 3Q 4Q 1Q 22 2Q 3Q 4Q 1Q 23 (25)% 0% 25% 50% 16% (5%) 8% 0% 7% 12% 1% 6% 4% 4% $ Volume Transaction # Travel & Entertainment Gas Food Retail Services (10%) 0% 10% 20% 30% Payment Spend1 ($ Volume) and YoY % Growth $0.8T $0.9T $1.0T $1.1T 9% 10% 14% 9% 1Q20 1Q21 1Q22 1Q23 9% 6% 1Q23 YoY Change in Payment Transaction Volume 6% 6% 18% (3%) Credit/Debit ACH/Wire P2P/P2B Cash/Check % of 1Q23 Volume 75% 11% 9% 5% 4


Commercial Real Estate Loans 34 21.2% 6.9% 12.3% 7.0% 4Q09 1Q23 Total Commercial loans Total loans and leases Commercial Real Estate as a Percent of: Geographic Distribution ($B) $16.3 22% $13.8 19% $13.8 19% $9.1 12% $7.0 10% $5.8 8% Northeast California Southeast Southwest Midwest Midsouth Northwest Other Non-US Office Portfolio Scheduled Maturities ($B) $18.7 26% $14.2 19% $10.9 15% $6.0 8% $5.7 8% $13.5 18% Office Industrial/ Warehouse Multi-family rental Shopping centers/Retail Hotel/Motels Multi-use Residential Other ~$73B Distribution by Property Type ($B) $2.6 3%$2.0 3% $2.8 4% $1.3 2% $2.7 4% $4.0 $5.8 $2.9 $5.9 2023 2024 2025 2026 and beyond • ~75% Class A property type • ~55% origination LTV • ~2% NPL to loans • $3.7B reservable criticized exposure ◦ ~75% LTV1 • NCOs $15MM in 1Q23 ~$73B Note: Amounts may not total due to rounding. 1 Based on recently appraised properties.


A Global Liquidity Sources (GLS) include cash and high-quality, liquid, unencumbered securities, inclusive of U.S. government securities, U.S. agency securities, U.S. agency MBS, and a select group of non-U.S. government and supranational securities, and other investment-grade securities, and are readily available to meet funding requirements as they arise. It does not include Federal Reserve Discount Window or Federal Home Loan Bank borrowing capacity. Transfers of liquidity among legal entities may be subject to certain regulatory and other restrictions. B Reserve Build (or Release) is calculated by subtracting net charge-offs for the period from the provision for credit losses recognized in that period. The period-end allowance, or reserve, for credit losses reflects the beginning of the period allowance adjusted for net charge-offs recorded in that period plus the provision for credit losses and other valuation accounts recognized in that period. C Pretax, pre-provision income (PTPI) at the consolidated level is a non-GAAP financial measure calculated by adjusting consolidated pretax income to add back provision for credit losses. Similarly, PTPI at the segment level is a non-GAAP financial measure calculated by adjusting the segments’ pretax income to add back provision for credit losses. Management believes that PTPI (both at the consolidated and segment level) is a useful financial measure as it enables an assessment of the Corporation’s ability to generate earnings to cover credit losses through a credit cycle as well as provides an additional basis for comparing the Corporation's results of operations between periods by isolating the impact of provision for credit losses, which can vary significantly between periods. See reconciliation below. D Interest rate sensitivity as of March 31, 2023, reflects the pretax impact to forecasted net interest income over the next 12 months from March 31, 2023 resulting from an instantaneous parallel shock to the market-based forward curve. The sensitivity analysis assumes that we take no action in response to this rate shock and does not assume any change in other macroeconomic variables normally correlated with changes in interest rates. As part of our asset and liability management activities, we use securities, certain residential mortgages, and interest rate and foreign exchange derivatives in managing interest rate sensitivity. The behavior of our deposit portfolio in the forecast is a key assumption in our projected estimate of net interest income. The sensitivity analysis assumes no change in deposit portfolio size or mix from our baseline forecast in alternate rate environments. In higher rate scenarios, any customer activity resulting in the replacement of low-cost or noninterest-bearing deposits with higher yielding deposits or market-based funding would reduce our benefit in those scenarios. E Revenue for all periods included net debit valuation adjustments (DVA) on derivatives, as well as amortization of own credit portion of purchase discount and realized DVA on structured liabilities. Net DVA gains (losses) were $14MM, ($193MM), $69MM, ($2MM) and $300MM for 1Q23, 4Q22, 1Q22, 1Q21 and 1Q20, respectively. Net DVA gains (losses) included in FICC revenue were $11MM, ($186MM), $60MM, ($9MM) and $274MM for 1Q23, 4Q22, 1Q22, 1Q21 and 1Q20, respectively. Net DVA (losses) included in Equities revenue were $3MM, ($7MM), $9MM, $7MM and $26MM for 1Q23, 4Q22, 1Q22, 1Q21 and 1Q20, respectively. F VaR model uses a historical simulation approach based on three years of historical data and an expected shortfall methodology equivalent to a 99% confidence level. Using a 95% confidence level, average VaR was $42MM, $43MM, $30MM, $26MM and $27MM for 1Q23, 4Q22, 1Q22, 1Q21 and 1Q20, respectively. Notes $ Millions 1Q23 4Q22 1Q22 Pretax Income (GAAP) Provision for Credit Losses (GAAP) Pretax, Pre-provision Income Pretax Income (GAAP) Provision for Credit Losses (GAAP) Pretax, Pre-provision Income Pretax Income (GAAP) Provision for Credit Losses (GAAP) Pretax, Pre-provision Income Consumer Banking $ 4,144 $ 1,089 $ 5,233 $ 4,738 $ 944 $ 5,682 $ 3,944 $ (52) $ 3,892 Global Wealth & Investment Management 1,223 25 1,248 1,589 37 1,626 1,502 (41) 1,461 Global Banking 3,500 (237) 3,263 3,456 149 3,605 2,346 165 2,511 Global Markets 2,328 (53) 2,275 686 4 690 2,170 5 2,175 All Other (1,972) 107 (1,865) (2,449) (42) (2,491) (1,977) (47) (2,024) Total Corporation $ 9,089 $ 931 $ 10,020 $ 7,897 $ 1,092 $ 8,989 $ 7,879 $ 30 $ 7,909 35


Business Leadership Sources (A) Estimated U.S. retail deposits based on June 30, 2022 FDIC deposit data. (B) Javelin 2022 Online and Mobile Banking Scorecards. (C) FDIC, 4Q22. (D) Global Finance, May 2022. (E) Global Finance, August 2022. (F) Global Finance, December 2022. (G) J.D. Power 2023 Financial Health Support CertificationSM is based on exceeding customer experience benchmarks using client surveys and a best practices verification. For more information, visit jdpower.com/awards. (H) Industry Q4-22 FDIC call reports. (I) Family Wealth Report, 2022. (J) Global Private Banking, The Digital Banker, 2022. (K) WealthBriefing, 2022. (L) PWM, 2022. (M) Global Finance, 2022. (N) Euromoney, 2022. (O) Global Finance Treasury & Cash Management Awards, 2023. (P) Celent, 2023. (Q) Greenwich, 2023. (R) GlobalCapital, 2022. (S) IFR, 2022. (T) Risk.net, 2022. (U) Capital Monitor, 2022. (V) Institutional Investor, 2022. (W) Refinitiv, 2023 YTD. 36


Forward-Looking Statements Bank of America Corporation (the Corporation) and its management may make certain statements that constitute “forward-looking statements” within the meaning of the Private Securities Litigation Reform Act of 1995. These statements can be identified by the fact that they do not relate strictly to historical or current facts. Forward-looking statements often use words such as “anticipates,” “targets,” “expects,” “hopes,” “estimates,” “intends,” “plans,” “goals,” “believes,” “continue” and other similar expressions or future or conditional verbs such as “will,” “may,” “might,” “should,” “would” and “could.” Forward-looking statements represent the Corporation’s current expectations, plans or forecasts of its future results, revenues, liquidity, provision for credit losses, expenses, efficiency ratio, capital measures, strategy, deposits, assets, and future business and economic conditions more generally, and other future matters. These statements are not guarantees of future results or performance and involve certain known and unknown risks, uncertainties and assumptions that are difficult to predict and are often beyond the Corporation’s control. Actual outcomes and results may differ materially from those expressed in, or implied by, any of these forward-looking statements. You should not place undue reliance on any forward-looking statement and should consider the following uncertainties and risks, as well as the risks and uncertainties more fully discussed under Item 1A. Risk Factors of the Corporation’s 2022 Annual Report on Form 10-K and in any of the Corporation’s subsequent Securities and Exchange Commission filings: the Corporation’s potential judgments, orders, settlements, penalties, fines and reputational damage resulting from pending or future litigation and regulatory investigations, proceedings and enforcement actions, including as a result of our participation in and execution of government programs related to the Coronavirus Disease 2019 (COVID-19) pandemic, such as the processing of unemployment benefits for California and certain other states; the possibility that the Corporation's future liabilities may be in excess of its recorded liability and estimated range of possible loss for litigation, and regulatory and government actions; the possibility that the Corporation could face increased claims from one or more parties involved in mortgage securitizations; the Corporation’s ability to resolve representations and warranties repurchase and related claims; the risks related to the discontinuation of the London Interbank Offered Rate and other reference rates, including increased expenses and litigation and the effectiveness of hedging strategies; uncertainties about the financial stability and growth rates of non-U.S. jurisdictions, the risk that those jurisdictions may face difficulties servicing their sovereign debt, and related stresses on financial markets, currencies and trade, and the Corporation’s exposures to such risks, including direct, indirect and operational; the impact of U.S. and global interest rates, inflation, currency exchange rates, economic conditions, trade policies and tensions, including tariffs, and potential geopolitical instability; the impact of the interest rate, inflationary, macroeconomic, banking and regulatory environment on the Corporation’s assets, business, financial condition and results of operations; the impact of adverse developments affecting the U.S. or global banking industry, including bank failures and liquidity concerns, which could cause continued or worsening economic and market volatility, and regulatory responses thereto; the possibility that future credit losses may be higher than currently expected due to changes in economic assumptions, customer behavior, adverse developments with respect to U.S. or global economic conditions and other uncertainties, including the impact of supply chain disruptions, inflationary pressures and labor shortages on economic conditions and our business; potential losses related to the Corporation’s concentration of credit risk; the Corporation's ability to achieve its expense targets and expectations regarding revenue, net interest income, provision for credit losses, net charge-offs, effective tax rate, loan growth or other projections; adverse changes to the Corporation’s credit ratings from the major credit rating agencies; an inability to access capital markets or maintain deposits or borrowing costs; estimates of the fair value and other accounting values, subject to impairment assessments, of certain of the Corporation’s assets and liabilities; the estimated or actual impact of changes in accounting standards or assumptions in applying those standards; uncertainty regarding the content, timing and impact of regulatory capital and liquidity requirements; the impact of adverse changes to total loss-absorbing capacity requirements, stress capital buffer requirements and/or global systemically important bank surcharges; the potential impact of actions of the Board of Governors of the Federal Reserve System on the Corporation’s capital plans; the effect of changes in or interpretations of income tax laws and regulations; the impact of implementation and compliance with U.S. and international laws, regulations and regulatory interpretations, including, but not limited to, recovery and resolution planning requirements, Federal Deposit Insurance Corporation assessments, the Volcker Rule, fiduciary standards, derivatives regulations and the Coronavirus Aid, Relief, and Economic Security Act and any similar or related rules and regulations; a failure or disruption in or breach of the Corporation’s operational or security systems or infrastructure, or those of third parties, including as a result of cyber- attacks or campaigns; the risks related to the transition and physical impacts of climate change; our ability to achieve environmental, social and governance goals and commitments or the impact of any changes in the Corporation's sustainability strategy or commitments generally; the impact of any future federal government shutdown and uncertainty regarding the federal government’s debt limit or changes in fiscal, monetary or regulatory policy; the emergence or continuation of widespread health emergencies or pandemics, including the magnitude and duration of the COVID-19 pandemic and its impact on U.S. and/or global financial market conditions and our business, results of operations, financial condition and prospects; the impact of natural disasters, extreme weather events, military conflict (including the Russia/Ukraine conflict, the possible expansion of such conflict and potential geopolitical consequences), terrorism or other geopolitical events; and other matters. Forward-looking statements speak only as of the date they are made, and the Corporation undertakes no obligation to update any forward-looking statement to reflect the impact of circumstances or events that arise after the date the forward-looking statement was made. 37


Important Presentation Information 38 • The information contained herein is preliminary and based on Corporation data available at the time of the earnings presentation. It speaks only as of the particular date or dates included in the accompanying slides. Bank of America does not undertake an obligation to, and disclaims any duty to, update any of the information provided. • The Corporation may present certain metrics and ratios, including year-over-year comparisons of revenue, noninterest expense and pretax income, excluding certain items (e.g., DVA) that are non-GAAP financial measures. The Corporation believes the use of these non-GAAP financial measures provides additional clarity in understanding its results of operations and trends. For more information about the non-GAAP financial measures contained herein, please see the presentation of the most directly comparable financial measures calculated in accordance with GAAP and accompanying reconciliations in the earnings press release for the quarter ended March 31, 2023, and other earnings-related information available through the Bank of America Investor Relations website at: https://investor.bankofamerica.com/quarterly-earnings. • The Corporation presents certain key financial and nonfinancial performance indicators that management uses when assessing consolidated and/or segment results. The Corporation believes this information is useful because it provides management with information about underlying operational performance and trends. KPIs are presented in 1Q23 Financial Results on slide 4 and on the Summary Income Statement for each segment. • The Corporation also views net interest income and related ratios and analyses on a fully taxable-equivalent (FTE) basis, which when presented on a consolidated basis are non-GAAP financial measures. The Corporation believes managing the business with net interest income on an FTE basis provides investors with meaningful information on the interest margin for comparative purposes. The Corporation believes that the presentation allows for comparison of amounts from both taxable and tax-exempt sources and is consistent with industry practices. The FTE adjustment was $134MM, $123MM, $106MM, $103MM and $106MM for 1Q23, 4Q22, 3Q22, 2Q22 and 1Q22, respectively. • The Corporation allocates capital to its business segments using a methodology that considers the effect of regulatory capital requirements in addition to internal risk-based capital models. Allocated capital is reviewed periodically and refinements are made based on multiple considerations that include, but are not limited to, risk-weighted assets measured under Basel 3 Standardized and Advanced approaches, business segment exposures and risk profile, and strategic plans. As a result of this process, in the first quarter of 2023, the Corporation adjusted the amount of capital being allocated to its business segments.


EX-99.3 4 bac-03312023ex993.htm EX-99.3 Document


baclogo2020a.jpg


Supplemental Information
First Quarter 2023


Current-period information is preliminary and based on company data available at the time of the earnings presentation. It speaks only as of the particular date or dates included in the accompanying pages. Bank of America Corporation (the Corporation) does not undertake an obligation to, and disclaims any duty to, update any of the information provided. Any forward-looking statements in this information are subject to the forward-looking language contained in the Corporation’s reports filed with the SEC pursuant to the Securities Exchange Act of 1934, which are available at the SEC’s website (www.sec.gov) or at the Corporation’s website (www.bankofamerica.com). The Corporation’s future financial performance is subject to risks and uncertainties as described in its SEC filings.


Bank of America Corporation and Subsidiaries
Table of ContentsPage
 
Consumer Banking
Global Wealth & Investment Management
Global Banking
Global Markets
All Other
Key Performance Indicators
The Corporation presents certain key financial and nonfinancial performance indicators that management uses when assessing consolidated and/or segment results. The Corporation believes this information is useful because it provides management with information about underlying operational performance and trends. Key performance indicators are presented in Consolidated Financial Highlights on page 2 and on the Key Indicators pages for each segment.
Business Segment Operations
The Corporation reports the results of operations of its four business segments and All Other on a fully taxable-equivalent (FTE) basis. Additionally, the results for the total Corporation as presented on pages 11 - 12 are reported on an FTE basis.


Bank of America Corporation and Subsidiaries
Consolidated Financial Highlights
(In millions, except per share information)
 First
Quarter
2023
Fourth
Quarter
2022
Third
Quarter
2022
Second
Quarter
2022
First
Quarter
2022
 
Income statement
Net interest income$14,448 $14,681 $13,765 $12,444 $11,572 
Noninterest income11,810 9,851 10,737 10,244 11,656 
Total revenue, net of interest expense26,258 24,532 24,502 22,688 23,228 
Provision for credit losses931 1,092 898 523 30 
Noninterest expense16,238 15,543 15,303 15,273 15,319 
Income before income taxes9,089 7,897 8,301 6,892 7,879 
Pretax, pre-provision income (1)
10,020 8,989 9,199 7,415 7,909 
Income tax expense928 765 1,219 645 812 
Net income 8,161 7,132 7,082 6,247 7,067 
Preferred stock dividends and other505 228 503 315 467 
Net income applicable to common shareholders7,656 6,904 6,579 5,932 6,600 
Diluted earnings per common share0.94 0.85 0.81 0.73 0.80 
Average diluted common shares issued and outstanding8,182.3 8,155.7 8,160.8 8,163.1 8,202.1 
Dividends paid per common share$0.22 $0.22 $0.22 $0.21 $0.21 
Performance ratios
Return on average assets1.07 %0.92 %0.90 %0.79 %0.89 %
Return on average common shareholders’ equity12.48 11.24 10.79 9.93 11.02 
Return on average shareholders’ equity11.94 10.38 10.37 9.34 10.64 
Return on average tangible common shareholders’ equity (2)
17.38 15.79 15.21 14.05 15.51 
Return on average tangible shareholders’ equity (2)
15.98 13.98 13.99 12.66 14.40 
Efficiency ratio 61.84 63.36 62.45 67.32 65.95 
At period end
Book value per share of common stock$31.58 $30.61 $29.96 $29.87 $29.70 
Tangible book value per share of common stock (2)
22.78 21.83 21.21 21.13 20.99 
Market capitalization228,012 264,853 242,338 250,136 332,320 
Number of financial centers - U.S.3,892 3,913 3,932 3,984 4,056 
Number of branded ATMs - U.S.15,407 15,528 15,572 15,730 15,959 
Headcount217,059 216,823 213,270 209,824 208,139 
(1)    Pretax, pre-provision income (PTPI) is a non-GAAP financial measure calculated by adjusting pretax income to add back provision for credit losses. Management believes that PTPI is a useful financial measure because it enables an assessment of the Corporation's ability to generate earnings to cover credit losses through a credit cycle. (See Exhibit A: Non-GAAP Reconciliations - Reconciliations to GAAP Financial Measures on page 30.)
(2)    Tangible equity ratios and tangible book value per share of common stock are non-GAAP financial measures. We believe the use of ratios that utilize tangible equity provides additional useful information because they present measures of those assets that can generate income. Tangible book value per share provides additional useful information about the level of tangible assets in relation to outstanding shares of common stock. (See Exhibit A: Non-GAAP Reconciliations - Reconciliations to GAAP Financial Measures on page 30.)


Current-period information is preliminary and based on company data available at the time of the presentation.
2


Bank of America Corporation and Subsidiaries
Consolidated Statement of Income
(In millions, except per share information)
 First
Quarter
2023
Fourth
Quarter
2022
Third
Quarter
2022
Second
Quarter
2022
First
Quarter
2022
 
Net interest income
Interest income$28,655 $25,075 $19,621 $14,975 $12,894 
Interest expense14,207 10,394 5,856 2,531 1,322 
Net interest income14,448 14,681 13,765 12,444 11,572 
Noninterest income
Fees and commissions7,894 7,735 8,001 8,491 8,985 
Market making and similar activities4,712 3,052 3,068 2,717 3,238 
Other income (loss)(796)(936)(332)(964)(567)
Total noninterest income11,810 9,851 10,737 10,244 11,656 
Total revenue, net of interest expense26,258 24,532 24,502 22,688 23,228 
Provision for credit losses931 1,092 898 523 30 
Noninterest expense
Compensation and benefits9,918 9,161 8,887 8,917 9,482 
Occupancy and equipment1,799 1,786 1,777 1,748 1,760 
Information processing and communications1,697 1,658 1,546 1,535 1,540 
Product delivery and transaction related890 904 892 924 933 
Professional fees537 649 525 518 450 
Marketing458 460 505 463 397 
Other general operating939 925 1,171 1,168 757 
Total noninterest expense16,238 15,543 15,303 15,273 15,319 
Income before income taxes9,089 7,897 8,301 6,892 7,879 
Income tax expense928 765 1,219 645 812 
Net income$8,161 $7,132 $7,082 $6,247 $7,067 
Preferred stock dividends and other505 228 503 315 467 
Net income applicable to common shareholders$7,656 $6,904 $6,579 $5,932 $6,600 
Per common share information
Earnings$0.95 $0.85 $0.81 $0.73 $0.81 
Diluted earnings0.94 0.85 0.81 0.73 0.80 
Average common shares issued and outstanding8,065.9 8,088.3 8,107.7 8,121.6 8,136.8 
Average diluted common shares issued and outstanding8,182.3 8,155.7 8,160.8 8,163.1 8,202.1 

Consolidated Statement of Comprehensive Income
(Dollars in millions)
First
Quarter
2023
Fourth
Quarter
2022
Third
Quarter
2022
Second
Quarter
2022
First
Quarter
2022
Net income $8,161 $7,132 $7,082 $6,247 $7,067 
Other comprehensive income (loss), net-of-tax:
Net change in debt securities555 353 (1,112)(1,822)(3,447)
Net change in debit valuation adjustments10 (543)462 575 261 
Net change in derivatives2,042 835 (3,703)(2,008)(5,179)
Employee benefit plan adjustments10 (764)37 36 24 
Net change in foreign currency translation adjustments12 (10)(37)(38)28 
Other comprehensive income (loss)2,629 (129)(4,353)(3,257)(8,313)
Comprehensive income (loss)$10,790 $7,003 $2,729 $2,990 $(1,246)


Current-period information is preliminary and based on company data available at the time of the presentation.
3


Bank of America Corporation and Subsidiaries
Net Interest Income and Noninterest Income
(Dollars in millions) 
 First
Quarter
2023
Fourth
Quarter
2022
Third
Quarter
2022
Second
Quarter
2022
First
Quarter
2022
 
Net interest income
Interest income
Loans and leases$13,097 $12,114 $10,231 $8,222 $7,352 
Debt securities5,460 5,016 4,239 4,049 3,823 
Federal funds sold and securities borrowed or purchased under agreements to resell3,712 2,725 1,446 396 (7)
Trading account assets2,028 1,768 1,449 1,223 1,081 
Other interest income4,358 3,452 2,256 1,085 645 
Total interest income28,655 25,075 19,621 14,975 12,894 
Interest expense
Deposits4,314 2,999 1,235 320 164 
Short-term borrowings6,180 4,273 2,264 553 (112)
Trading account liabilities504 421 383 370 364 
Long-term debt3,209 2,701 1,974 1,288 906 
Total interest expense14,207 10,394 5,856 2,531 1,322 
Net interest income$14,448 $14,681 $13,765 $12,444 $11,572 
Noninterest income
Fees and commissions
Card income
Interchange fees (1)
$956 $1,029 $1,060 $1,072 $935 
Other card income513 523 513 483 468 
Total card income1,469 1,552 1,573 1,555 1,403 
Service charges
Deposit-related fees1,097 1,081 1,162 1,417 1,530 
Lending-related fees313 308 304 300 303 
Total service charges1,410 1,389 1,466 1,717 1,833 
Investment and brokerage services
Asset management fees2,918 2,844 2,920 3,102 3,286 
Brokerage fees934 879 875 989 1,006 
Total investment and brokerage services 3,852 3,723 3,795 4,091 4,292 
Investment banking fees
Underwriting income569 411 452 435 672 
Syndication fees231 174 283 301 312 
Financial advisory services363 486 432 392 473 
Total investment banking fees1,163 1,071 1,167 1,128 1,457 
Total fees and commissions7,894 7,735 8,001 8,491 8,985 
Market making and similar activities4,712 3,052 3,068 2,717 3,238 
Other income (loss)(796)(936)(332)(964)(567)
Total noninterest income$11,810 $9,851 $10,737 $10,244 $11,656 
(1)Gross interchange fees and merchant income were $3.2 billion, $3.3 billion, $3.3 billion, $3.3 billion and $2.9 billion and are presented net of $2.2 billion, $2.3 billion, $2.2 billion, $2.2 billion and $2.0 billion of expenses for rewards and partner payments as well as certain other card costs for the first quarter of 2023 and the fourth, third, second, and first quarters of 2022, respectively.


Current-period information is preliminary and based on company data available at the time of the presentation.
4


Bank of America Corporation and Subsidiaries
Consolidated Balance Sheet
(Dollars in millions)
March 31
2023
December 31
2022
March 31
2022
Assets
Cash and due from banks$29,327 $30,334 $29,769 
Interest-bearing deposits with the Federal Reserve, non-U.S. central banks and other banks346,891 199,869 244,165 
Cash and cash equivalents376,218 230,203 273,934 
Time deposits placed and other short-term investments11,637 7,259 5,645 
Federal funds sold and securities borrowed or purchased under agreements to resell298,078 267,574 302,108 
Trading account assets314,978 296,108 313,400 
Derivative assets40,947 48,642 48,231 
Debt securities:  
Carried at fair value172,510 229,994 297,700 
Held-to-maturity, at cost624,495 632,825 672,180 
Total debt securities797,005 862,819 969,880 
Loans and leases1,046,406 1,045,747 993,145 
Allowance for loan and lease losses(12,514)(12,682)(12,104)
Loans and leases, net of allowance1,033,892 1,033,065 981,041 
Premises and equipment, net11,708 11,510 10,820 
Goodwill69,022 69,022 69,022 
Loans held-for-sale6,809 6,871 10,270 
Customer and other receivables79,902 67,543 83,622 
Other assets154,461 150,759 170,250 
Total assets$3,194,657 $3,051,375 $3,238,223 
Liabilities
Deposits in U.S. offices:
Noninterest-bearing$617,922 $640,745 $787,045 
Interest-bearing1,183,106 1,182,590 1,178,451 
Deposits in non-U.S. offices:
Noninterest-bearing17,686 20,480 27,589 
Interest-bearing91,688 86,526 79,324 
Total deposits1,910,402 1,930,341 2,072,409 
Federal funds purchased and securities loaned or sold under agreements to repurchase314,380 195,635 214,685 
Trading account liabilities92,452 80,399 117,122 
Derivative liabilities40,169 44,816 44,266 
Short-term borrowings56,564 26,932 24,789 
Accrued expenses and other liabilities216,621 224,073 219,625 
Long-term debt283,873 275,982 278,710 
Total liabilities2,914,461 2,778,178 2,971,606 
Shareholders’ equity
Preferred stock, $0.01 par value; authorized – 100,000,000 shares; issued and outstanding – 4,088,099, 4,088,101 and 4,037,686 shares
28,397 28,397 27,137 
Common stock and additional paid-in capital, $0.01 par value; authorized – 12,800,000,000 shares; issued and outstanding – 7,972,438,148, 7,996,777,943 and 8,062,102,236 shares
57,264 58,953 59,968 
Retained earnings213,062 207,003 192,929 
Accumulated other comprehensive income (loss)(18,527)(21,156)(13,417)
Total shareholders’ equity280,196 273,197 266,617 
Total liabilities and shareholders’ equity$3,194,657 $3,051,375 $3,238,223 
Assets of consolidated variable interest entities included in total assets above (isolated to settle the liabilities of the variable interest entities)
Trading account assets$4,276 $2,816 $2,160 
Loans and leases15,754 16,738 15,946 
Allowance for loan and lease losses(797)(797)(880)
Loans and leases, net of allowance14,957 15,941 15,066 
All other assets129 116 417 
Total assets of consolidated variable interest entities$19,362 $18,873 $17,643 
Liabilities of consolidated variable interest entities included in total liabilities above
Short-term borrowings$1,339 $42 $228 
Long-term debt4,883 4,581 3,557 
All other liabilities7 13 
Total liabilities of consolidated variable interest entities$6,229 $4,636 $3,791 


Current-period information is preliminary and based on company data available at the time of the presentation.
5


Bank of America Corporation and Subsidiaries
Capital Management
(Dollars in millions)
March 31
2023
December 31
2022
March 31
2022
Risk-based capital metrics (1):
Standardized Approach
Common equity tier 1 capital$184,432 $180,060 $169,874 
Tier 1 capital212,825 208,446 197,007 
Total capital242,604 238,773 229,186 
Risk-weighted assets1,623,377 1,604,870 1,638,958 
Common equity tier 1 capital ratio11.4 %11.2 %10.4 %
Tier 1 capital ratio13.1 13.0 12.0 
Total capital ratio14.9 14.9 14.0 
Advanced Approaches
Common equity tier 1 capital$184,432 $180,060 $169,874 
Tier 1 capital212,825 208,446 197,007 
Total capital233,736 230,916 222,481 
Risk-weighted assets1,428,647 1,411,005 1,415,505 
Common equity tier 1 capital ratio12.9 %12.8 %12.0 %
Tier 1 capital ratio14.9 14.8 13.9 
Total capital ratio16.4 16.4 15.7 
Leverage-based metrics (1):
Adjusted average assets$3,018,318 $2,997,118 $3,129,996 
Tier 1 leverage ratio7.1 %7.0 %6.3 %
Supplementary leverage exposure$3,554,920 $3,523,484 $3,661,948 
Supplementary leverage ratio6.0 %5.9 %5.4 %
Total ending equity to total ending assets ratio8.8 9.0 8.2 
Common equity ratio7.9 8.0 7.4 
Tangible equity ratio (2)
6.7 6.8 6.2 
Tangible common equity ratio (2)
5.8 5.9 5.3 
(1)Regulatory capital ratios at March 31, 2023 are preliminary. We report regulatory capital ratios under both the Standardized and Advanced approaches. Capital adequacy is evaluated against the lower of the Standardized or Advanced approaches compared to their respective regulatory capital ratio requirements. The Corporation's binding ratio was the Common equity tier 1 ratio under the Standardized approach for all periods presented.
(2)Tangible equity ratio equals period-end tangible shareholders’ equity divided by period-end tangible assets. Tangible common equity ratio equals period-end tangible common shareholders’ equity divided by period-end tangible assets. Tangible shareholders’ equity and tangible assets are non-GAAP financial measures. We believe the use of ratios that utilize tangible equity provides additional useful information because they present measures of those assets that can generate income. (See Exhibit A: Non-GAAP Reconciliations - Reconciliation to GAAP Financial Measures on page 30.)


Current-period information is preliminary and based on company data available at the time of the presentation.
6


Bank of America Corporation and Subsidiaries
Capital Composition under Basel 3
(Dollars in millions)
March 31
2023
December 31
2022
March 31
2022
Total common shareholders' equity$251,799 $244,800 $239,480 
CECL transitional amount (1)
1,254 1,881 1,881 
Goodwill, net of related deferred tax liabilities(68,644)(68,644)(68,641)
Deferred tax assets arising from net operating loss and tax credit carryforwards(7,835)(7,776)(7,843)
Intangibles, other than mortgage servicing rights, net of related deferred tax liabilities(1,538)(1,554)(1,589)
Defined benefit pension plan net assets, net-of-tax(882)(867)(1,248)
Cumulative unrealized net (gain) loss related to changes in fair value of financial liabilities attributable to own creditworthiness, net-of-tax485 496 1,047 
Accumulated net (gain) loss on certain cash flow hedges (2)
9,886 11,925 7,049 
Other(93)(201)(262)
Common equity tier 1 capital184,432 180,060 169,874 
Qualifying preferred stock, net of issuance cost28,396 28,396 27,136 
Other(3)(10)(3)
Tier 1 capital212,825 208,446 197,007 
Tier 2 capital instruments17,840 18,751 21,737 
Qualifying allowance for credit losses (3)
12,315 11,739 11,000 
Other(376)(163)(558)
Total capital under the Standardized approach242,604 238,773 229,186 
Adjustment in qualifying allowance for credit losses under the Advanced approaches (3)
(8,868)(7,857)(6,705)
Total capital under the Advanced approaches$233,736 $230,916 $222,481 
(1)March 31, 2022 and December 31, 2022 include 75 percent of the current expected credit losses (CECL) transition provision’s impact as of December 31, 2021. March 31, 2023 includes 50 percent of the transition provision’s impact as of December 31, 2021.
(2)Includes amounts in accumulated other comprehensive income related to the hedging of items that are not recognized at fair value on the Consolidated Balance Sheet.
(3)Includes the impact of transition provisions related to the CECL accounting standard.


Current-period information is preliminary and based on company data available at the time of the presentation.
7


Bank of America Corporation and Subsidiaries
Quarterly Average Balances and Interest Rates – Fully Taxable-equivalent Basis
(Dollars in millions)
 First Quarter 2023Fourth Quarter 2022First Quarter 2022
Average
Balance
Interest
Income/
Expense (1)
Yield/
Rate
Average
Balance
Interest
Income/
Expense (1)
Yield/
Rate
Average
Balance
Interest
Income/
Expense (1)
Yield/
Rate
Earning assets
Interest-bearing deposits with the Federal Reserve,
   non-U.S. central banks and other banks
$202,700 $1,999 4.00 %$175,595 $1,375 3.11 %$244,971 $86 0.14 %
Time deposits placed and other short-term
    investments
10,581 108 4.16 9,558 74 3.07 9,253 12 0.52 
Federal funds sold and securities borrowed or
   purchased under agreements to resell
287,532 3,712 5.24 289,321 2,725 3.74 299,404 (7)(0.01)
Trading account assets183,657 2,040 4.50 169,003 1,784 4.19 151,969 1,096 2.92 
Debt securities851,177 5,485 2.58 869,084 5,043 2.30 975,656 3,838 1.58 
Loans and leases (2)
   
Residential mortgage 229,275 1,684 2.94 229,364 1,663 2.90 223,979 1,525 2.73 
Home equity26,513 317 4.84 26,983 275 4.05 27,784 220 3.21 
Credit card91,775 2,426 10.72 89,575 2,327 10.31 78,409 1,940 10.03 
Direct/Indirect and other consumer105,657 1,186 4.55 106,598 1,119 4.16 104,632 579 2.25 
Total consumer453,220 5,613 5.00 452,520 5,384 4.73 434,804 4,264 3.96 
U.S. commercial376,852 4,471 4.81 378,850 4,172 4.37 346,510 2,127 2.49 
Non-U.S. commercial127,003 1,778 5.68 125,983 1,474 4.64 118,767 504 1.72 
Commercial real estate70,591 1,144 6.57 68,764 994 5.74 63,065 387 2.49 
Commercial lease financing13,686 147 4.33 13,130 139 4.21 14,647 106 2.92 
Total commercial588,132 7,540 5.20 586,727 6,779 4.58 542,989 3,124 2.33 
Total loans and leases 1,041,352 13,153 5.11 1,039,247 12,163 4.65 977,793 7,388 3.06 
Other earning assets94,427 2,292 9.82 95,904 2,034 8.42 120,798 587 1.97 
Total earning assets2,671,426 28,789 4.36 2,647,712 25,198 3.78 2,779,844 13,000 1.89 
Cash and due from banks27,784 27,771  28,082 
Other assets, less allowance for loan and lease losses396,848 398,806   399,776 
Total assets$3,096,058 $3,074,289   $3,207,702 
Interest-bearing liabilities
U.S. interest-bearing deposits
Demand and money market deposits$975,085 $2,790 1.16 %$980,964 $2,044 0.83 %$1,001,184 $80 0.03 %
Time and savings deposits196,984 919 1.89 180,684 543 1.19 163,981 40 0.10 
Total U.S. interest-bearing deposits1,172,069 3,709 1.28 1,161,648 2,587 0.88 1,165,165 120 0.04 
Non-U.S. interest-bearing deposits91,603 605 2.68 83,073 412 1.97 81,879 44 0.22 
Total interest-bearing deposits1,263,672 4,314 1.38 1,244,721 2,999 0.96 1,247,044 164 0.05 
Federal funds purchased and securities loaned or sold
   under agreements to repurchase
256,015 3,551 5.63 214,267 2,246 4.16 217,152 79 0.15 
Short-term borrowings and other interest-bearing
    liabilities
156,887 2,629 6.79 150,351 2,027 5.35 126,454 (191)(0.61)
Trading account liabilities43,953 504 4.65 40,393 421 4.13 64,240 364 2.30 
Long-term debt244,759 3,209 5.28 243,871 2,701 4.41 246,042 906 1.50 
Total interest-bearing liabilities1,965,286 14,207 2.93 1,893,603 10,394 2.18 1,900,932 1,322 0.28 
Noninterest-bearing sources   
Noninterest-bearing deposits629,977 680,823   798,767 
Other liabilities (3)
223,543 227,234   238,694 
Shareholders’ equity277,252 272,629   269,309 
Total liabilities and shareholders’ equity$3,096,058 $3,074,289   $3,207,702 
Net interest spread1.43 %  1.60 %1.61 %
Impact of noninterest-bearing sources0.77   0.62 0.08 
Net interest income/yield on earning assets (4)
$14,582 2.20 % $14,804 2.22 %$11,678 1.69 %
(1)Includes the impact of interest rate risk management contracts.
(2)Nonperforming loans are included in the respective average loan balances. Income on these nonperforming loans is generally recognized on a cost recovery basis.
(3)Includes $37.3 billion, $31.9 billion and $30.2 billion of structured notes and liabilities for the first quarter of 2023 and the fourth and first quarters of 2022, respectively.
(4)Net interest income includes FTE adjustments of $134 million, $123 million and $106 million for the first quarter of 2023 and the fourth and first quarters of 2022, respectively.


Current-period information is preliminary and based on company data available at the time of the presentation.
8


Bank of America Corporation and Subsidiaries
Debt Securities
(Dollars in millions)
 March 31, 2023
 Amortized
Cost
Gross
Unrealized
Gains
Gross
Unrealized
Losses
Fair
Value
Available-for-sale debt securities
Mortgage-backed securities:
Agency$24,726 $5 $(1,479)$23,252 
Agency-collateralized mortgage obligations2,235  (200)2,035 
Commercial6,890 31 (481)6,440 
Non-agency residential459 3 (55)407 
Total mortgage-backed securities34,310 39 (2,215)32,134 
U.S. Treasury and government agencies102,943 2 (1,438)101,507 
Non-U.S. securities13,161 2 (43)13,120 
Other taxable securities4,830 1 (85)4,746 
Tax-exempt securities11,105 25 (227)10,903 
Total available-for-sale debt securities166,349 69 (4,008)162,410 
Other debt securities carried at fair value (1)
10,081 63 (44)10,100 
Total debt securities carried at fair value176,430 132 (4,052)172,510 
Held-to-maturity debt securities
Agency mortgage-backed securities494,998  (80,664)414,334 
U.S. Treasury and government agencies121,609  (17,511)104,098 
Other taxable securities7,921  (901)7,020 
Total held-to-maturity debt securities624,528  (99,076)525,452 
Total debt securities$800,958 $132 $(103,128)$697,962 
 December 31, 2022
Available-for-sale debt securities
Mortgage-backed securities:   
Agency$25,204 $$(1,767)$23,442 
Agency-collateralized mortgage obligations2,452 — (231)2,221 
Commercial6,894 28 (515)6,407 
Non-agency residential461 15 (90)386 
Total mortgage-backed securities35,011 48 (2,603)32,456 
U.S. Treasury and government agencies160,773 18 (1,769)159,022 
Non-U.S. securities13,455 (52)13,407 
Other taxable securities4,728 (84)4,645 
Tax-exempt securities11,518 19 (279)11,258 
Total available-for-sale debt securities225,485 90 (4,787)220,788 
Other debt securities carried at fair value (1)
8,986 376 (156)9,206 
Total debt securities carried at fair value234,471 466 (4,943)229,994 
Held-to-maturity debt securities
Agency mortgage-backed securities503,233 — (87,319)415,914 
U.S. Treasury and government agencies121,597 — (20,259)101,338 
Other taxable securities8,033 — (1,018)7,015 
Total held-to-maturity debt securities632,863 — (108,596)524,267 
Total debt securities$867,334 $466 $(113,539)$754,261 
(1)    Primarily includes non-U.S. securities used to satisfy certain international regulatory requirements.


Current-period information is preliminary and based on company data available at the time of the presentation.
9


Bank of America Corporation and Subsidiaries
Supplemental Financial Data
(Dollars in millions)
First
Quarter
2023
Fourth
Quarter
2022
Third
Quarter
2022
Second
Quarter
2022
First
Quarter
2022
 
FTE basis data (1)
Net interest income$14,582 $14,804 $13,871 $12,547 $11,678 
Total revenue, net of interest expense 26,391 24,655 24,608 22,791 23,334 
Net interest yield2.20 %2.22 %2.06 %1.86 %1.69 %
Efficiency ratio 61.53 63.05 62.18 67.01 65.65 
(1)FTE basis is a non-GAAP financial measure. FTE basis is a performance measure used by management in operating the business that management believes provides investors with meaningful information on the interest margin for comparative purposes. The Corporation believes that this presentation allows for comparison of amounts from both taxable and tax-exempt sources and is consistent with industry practices. Net interest income includes FTE adjustments of $134 million, $123 million, $106 million, $103 million and $106 million for the first quarter of 2023 and the fourth, third, second and first quarters of 2022, respectively.


Current-period information is preliminary and based on company data available at the time of the presentation.
10


Bank of America Corporation and Subsidiaries
Quarterly Results by Business Segment and All Other
(Dollars in millions)
 First Quarter 2023
 Total
Corporation
Consumer BankingGWIMGlobal BankingGlobal MarketsAll
Other
Net interest income$14,582 $8,593 $1,876 $3,907 $109 $97 
Noninterest income
Fees and commissions:
Card income1,469 1,274 12 190 16 (23)
Service charges1,410 599 19 714 78  
Investment and brokerage services3,852 74 3,238 9 533 (2)
Investment banking fees1,163  39 668 469 (13)
Total fees and commissions7,894 1,947 3,308 1,581 1,096 (38)
Market making and similar activities4,712 5 34 45 4,398 230 
Other income (loss)
(796)161 97 670 23 (1,747)
Total noninterest income (loss)11,810 2,113 3,439 2,296 5,517 (1,555)
Total revenue, net of interest expense 26,392 10,706 5,315 6,203 5,626 (1,458)
Provision for credit losses931 1,089 25 (237)(53)107 
Noninterest expense16,238 5,473 4,067 2,940 3,351 407 
Income (loss) before income taxes9,223 4,144 1,223 3,500 2,328 (1,972)
Income tax expense (benefit)1,062 1,036 306 945 640 (1,865)
Net income (loss)$8,161 $3,108 $917 $2,555 $1,688 $(107)
Average
Total loans and leases$1,041,352 $303,772 $221,448 $381,009 $125,046 $10,077 
Total assets (1)
3,096,058 1,105,245 359,164 588,886 870,038 172,725 
Total deposits1,893,649 1,026,242 314,019 492,577 36,109 24,702 
Quarter end
Total loans and leases$1,046,406 $304,480 $217,804 $383,491 $130,804 $9,827 
Total assets (1)
3,194,657 1,124,438 349,888 591,231 861,477 267,623 
Total deposits1,910,402 1,044,768 301,471 495,949 33,624 34,590 
 Fourth Quarter 2022
 Total
Corporation
Consumer BankingGWIMGlobal BankingGlobal MarketsAll
Other
Net interest income$14,804 $8,494 $2,015 $3,880 $371 $44 
Noninterest income
Fees and commissions:
Card income1,552 1,333 19 196 17 (13)
Service charges1,389 586 17 703 79 
Investment and brokerage services3,723 71 3,166 482 (2)
Investment banking fees1,071 — 35 706 347 (17)
Total fees and commissions7,735 1,990 3,237 1,611 925 (28)
Market making and similar activities3,052 36 34 2,685 292 
Other income (loss)(936)293 122 913 (120)(2,144)
Total noninterest income (loss)9,851 2,288 3,395 2,558 3,490 (1,880)
Total revenue, net of interest expense24,655 10,782 5,410 6,438 3,861 (1,836)
Provision for credit losses1,092 944 37 149 (42)
Noninterest expense15,543 5,100 3,784 2,833 3,171 655 
Income (loss) before income taxes8,020 4,738 1,589 3,456 686 (2,449)
Income tax expense (benefit)888 1,161 389 916 182 (1,760)
Net income (loss)$7,132 $3,577 $1,200 $2,540 $504 $(689)
Average
Total loans and leases$1,039,247 $300,360 $225,094 $380,385 $123,022 $10,386 
Total assets (1)
3,074,289 1,123,813 361,592 595,525 857,319 136,040 
Total deposits1,925,544 1,047,058 317,849 503,472 37,219 19,946 
Quarter end
Total loans and leases$1,045,747 $304,761 $223,910 $379,107 $127,735 $10,234 
Total assets (1)
3,051,375 1,126,453 368,893 588,466 812,489 155,074 
Total deposits1,930,341 1,048,799 323,899 498,661 39,077 19,905 
(1)Total assets include asset allocations to match liabilities (i.e., deposits).


Current-period information is preliminary and based on company data available at the time of the presentation.
11


Bank of America Corporation and Subsidiaries
Quarterly Results by Business Segment and All Other (continued)
(Dollars in millions)
 First Quarter 2022
 Total
Corporation
Consumer BankingGWIMGlobal BankingGlobal MarketsAll
Other
Net interest income$11,678 $6,680 $1,668 $2,344 $993 $(7)
Noninterest income
Fees and commissions:
Card income1,403 1,185 18 176 14 10 
Service charges1,833 844 19 886 82 
Investment and brokerage services4,292 83 3,654 12 545 (2)
Investment banking fees1,457 — 66 880 582 (71)
Total fees and commissions8,985 2,112 3,757 1,954 1,223 (61)
Market making and similar activities3,238 — 13 49 3,190 (14)
Other income (loss)(567)21 38 847 (114)(1,359)
Total noninterest income (loss)11,656 2,133 3,808 2,850 4,299 (1,434)
Total revenue, net of interest expense23,334 8,813 5,476 5,194 5,292 (1,441)
Provision for credit losses30 (52)(41)165 (47)
Noninterest expense15,319 4,921 4,015 2,683 3,117 583 
Income (loss) before income taxes7,985 3,944 1,502 2,346 2,170 (1,977)
Income tax expense (benefit)918 966 368 622 575 (1,613)
Net income (loss)$7,067 $2,978 $1,134 $1,724 $1,595 $(364)
Average
Total loans and leases$977,793 $284,068 $210,937 $358,807 $108,576 $15,405 
Total assets (1)
3,207,702 1,133,001 431,040 630,517 858,719 154,425 
Total deposits2,045,811 1,056,100 384,902 539,912 44,393 20,504 
Quarter end
Total loans and leases$993,145 $286,322 $214,273 $367,423 $110,037 $15,090 
Total assets (1)
3,238,223 1,166,443 433,122 623,168 883,304 132,186 
Total deposits2,072,409 1,088,940 385,288 533,820 43,371 20,990 
(1)Total assets include asset allocations to match liabilities (i.e., deposits).


Current-period information is preliminary and based on company data available at the time of the presentation.
12


Bank of America Corporation and Subsidiaries
Consumer Banking Segment Results
(Dollars in millions)
First
Quarter
2023
Fourth
Quarter
2022
Third
Quarter
2022
Second
Quarter
2022
First
Quarter
2022
Net interest income$8,593 $8,494 $7,784 $7,087 $6,680 
Noninterest income:
Card income1,274 1,333 1,331 1,320 1,185 
Service charges599 586 597 679 844 
All other income240 369 192 50 104 
Total noninterest income2,113 2,288 2,120 2,049 2,133 
Total revenue, net of interest expense10,706 10,782 9,904 9,136 8,813 
Provision for credit losses1,089 944 738 350 (52)
Noninterest expense5,473 5,100 5,097 4,959 4,921 
Income before income taxes4,144 4,738 4,069 3,827 3,944 
Income tax expense1,036 1,161 997 938 966 
Net income$3,108 $3,577 $3,072 $2,889 $2,978 
Net interest yield3.27 %3.11 %2.79 %2.55 %2.48 %
Return on average allocated capital (1)
30 35 30 29 30 
Efficiency ratio51.12 47.29 51.47 54.28 55.84 
Balance Sheet
Average
Total loans and leases$303,772 $300,360 $295,231 $289,595 $284,068 
Total earning assets (2)
1,065,202 1,083,850 1,106,513 1,114,552 1,092,742 
Total assets (2)
1,105,245 1,123,813 1,145,846 1,154,773 1,133,001 
Total deposits1,026,242 1,047,058 1,069,093 1,078,020 1,056,100 
Allocated capital (1)
42,000 40,000 40,000 40,000 40,000 
Period end
Total loans and leases$304,480 $304,761 $297,825 $294,570 $286,322 
Total earning assets (2)
1,081,780 1,085,079 1,110,524 1,114,524 1,125,963 
Total assets (2)
1,124,438 1,126,453 1,149,918 1,154,366 1,166,443 
Total deposits1,044,768 1,048,799 1,072,580 1,077,215 1,088,940 
(1)    Return on average allocated capital is calculated as net income, adjusted for cost of funds and earnings credits and certain expenses related to intangibles, divided by average allocated capital. Other companies may define or calculate these measures differently.
(2)    Total earning assets and total assets include asset allocations to match liabilities (i.e., deposits) and allocated shareholders’ equity.


Current-period information is preliminary and based on company data available at the time of the presentation.
13


Bank of America Corporation and Subsidiaries
Consumer Banking Key Indicators
(Dollars in millions)
 First
Quarter
2023
Fourth
Quarter
2022
Third
Quarter
2022
Second
Quarter
2022
First
Quarter
2022
Average deposit balances
Checking$580,910 $588,668 $599,099 $606,331 $593,428 
Savings68,327 69,790 71,933 73,295 72,413 
MMS339,823 356,015 365,271 362,798 354,850 
CDs and IRAs33,098 28,619 28,731 29,796 30,685 
Other4,084 3,966 4,059 5,800 4,724 
Total average deposit balances$1,026,242 $1,047,058 $1,069,093 $1,078,020 $1,056,100 
Deposit spreads (excludes noninterest costs)
Checking2.22 %2.09 %1.98 %1.93 %1.91 %
Savings2.53 2.33 2.19 2.19 2.19 
MMS2.99 2.25 1.64 1.29 1.23 
CDs and IRAs3.27 2.91 1.85 0.98 0.46 
Other4.37 3.35 2.04 1.04 0.41 
Total deposit spreads2.54 2.19 1.88 1.70 1.65 
Consumer investment assets$354,892 $319,648 $302,413 $315,243 $357,593 
Active digital banking users (in thousands) (1)
44,962 44,054 43,496 42,690 42,269 
Active mobile banking users (in thousands) (2)
36,322 35,452 34,922 34,167 33,589 
Financial centers3,892 3,913 3,932 3,984 4,056 
ATMs15,407 15,528 15,572 15,730 15,959 
Total credit card (3)
Loans
Average credit card outstandings$91,775 $89,575 $85,009 $81,024 $78,409 
Ending credit card outstandings92,469 93,421 87,296 84,010 79,356 
Credit quality
Net charge-offs$501 $386 $328 $323 $297 
2.21 %1.71 %1.53 %1.60 %1.53 %
30+ delinquency$1,674 $1,505 $1,202 $1,008 $1,003 
1.81 %1.61 %1.38 %1.20 %1.26 %
90+ delinquency$828 $717 $547 $493 $492 
0.90 %0.77 %0.63 %0.59 %0.62 %
Other total credit card indicators (3)
Gross interest yield11.85 %11.18 %10.71 %9.76 %9.90 %
Risk-adjusted margin8.69 9.87 10.07 9.95 10.40 
New accounts (in thousands)1,187 1,096 1,256 1,068 977 
Purchase volumes$85,544 $92,800 $91,064 $91,810 $80,914 
Debit card data
Purchase volumes$124,376 $130,157 $127,135 $128,707 $117,584 
Loan production (4)
Consumer Banking:
First mortgage$1,956 $2,286 $4,028 $6,551 $8,116 
Home equity2,183 2,113 1,999 2,151 1,725 
Total (5):
First mortgage$3,937 $5,217 $8,724 $14,471 $16,353 
Home equity2,596 2,596 2,420 2,535 2,040 
(1)    Represents mobile and/or online active users over the past 90 days.
(2)    Represents mobile active users over the past 90 days.
(3)    In addition to the credit card portfolio in Consumer Banking, the remaining credit card portfolio is in GWIM.
(4)    Loan production amounts represent the unpaid principal balance of loans and, in the case of home equity, the principal amount of the total line of credit.
(5)    In addition to loan production in Consumer Banking, there is also first mortgage and home equity loan production in GWIM.


Current-period information is preliminary and based on company data available at the time of the presentation.
14


Bank of America Corporation and Subsidiaries
Consumer Banking Quarterly Results
(Dollars in millions)
First Quarter 2023Fourth Quarter 2022
Total Consumer BankingDepositsConsumer
Lending
Total Consumer BankingDepositsConsumer
Lending
Net interest income$8,593 $5,816 $2,777 $8,494 $5,719 $2,775 
Noninterest income:
Card income1,274 (10)1,284 1,333 (9)1,342 
Service charges599 598 1 586 585 
All other income 240 197 43 369 214 155 
Total noninterest income2,113 785 1,328 2,288 790 1,498 
Total revenue, net of interest expense10,706 6,601 4,105 10,782 6,509 4,273 
Provision for credit losses1,089 183 906 944 176 768 
Noninterest expense5,473 3,415 2,058 5,100 3,189 1,911 
Income before income taxes4,144 3,003 1,141 4,738 3,144 1,594 
Income tax expense1,036 751 285 1,161 771 390 
Net income $3,108 $2,252 $856 $3,577 $2,373 $1,204 
Net interest yield3.27 %2.31 %3.76 %3.11 %2.18 %3.71 %
Return on average allocated capital (1)
30 67 12 35 72 18 
Efficiency ratio51.12 51.76 50.10 47.29 49.00 44.70 
Balance Sheet
Average
Total loans and leases$303,772 $4,119 $299,653 $300,360 $4,132 $296,228 
Total earning assets (2)
1,065,202 1,022,445 299,794 1,083,850 1,042,289 296,535 
Total assets (2)
1,105,245 1,056,007 306,275 1,123,813 1,075,446 303,340 
Total deposits1,026,242 1,021,374 4,868 1,047,058 1,041,669 5,389 
Allocated capital (1)
42,000 13,700 28,300 40,000 13,000 27,000 
Period end
Total loans and leases$304,480 $4,065 $300,415 $304,761 $4,148 $300,613 
Total earning assets (2)
1,081,780 1,038,545 300,595 1,085,079 1,043,049 300,787 
Total assets (2)
1,124,438 1,074,571 307,227 1,126,453 1,077,203 308,007 
Total deposits1,044,768 1,039,744 5,024 1,048,799 1,043,194 5,605 
First Quarter 2022
Total Consumer BankingDepositsConsumer
Lending
Net interest income$6,680 $4,052 $2,628 
Noninterest income:
Card income1,185 (8)1,193 
Service charges844 843 
All other income104 68 36 
Total noninterest income2,133 903 1,230 
Total revenue, net of interest expense8,813 4,955 3,858 
Provision for credit losses(52)73 (125)
Noninterest expense4,921 3,008 1,913 
Income before income taxes3,944 1,874 2,070 
Income tax expense966 459 507 
Net income$2,978 $1,415 $1,563 
Net interest yield2.48 %1.56 %3.79 %
Return on average allocated capital (1)
30 44 23 
Efficiency ratio55.84 60.71 49.58 
Balance Sheet
Average
Total loans and leases$284,068 $4,215 $279,853 
Total earning assets (2)
1,092,742 1,050,490 281,255 
Total assets (2)
1,133,001 1,084,343 287,660 
Total deposits1,056,100 1,050,247 5,853 
Allocated capital (1)
40,000 13,000 27,000 
Period end
Total loans and leases$286,322 $4,165 $282,157 
Total earning assets (2)
1,125,963 1,083,664 284,069 
Total assets (2)
1,166,443 1,117,241 290,972 
Total deposits1,088,940 1,082,885 6,055 
(1)    Return on average allocated capital is calculated as net income, adjusted for cost of funds and earnings credits and certain expenses related to intangibles, divided by average allocated capital. Other companies may define or calculate these measures differently.
(2)    For presentation purposes, in segments or businesses where the total of liabilities and equity exceeds assets, the Corporation allocates assets from All Other to match the segments’ and businesses’ liabilities and allocated shareholders’ equity. As a result, total earning assets and total assets of the businesses may not equal total Consumer Banking.


Current-period information is preliminary and based on company data available at the time of the presentation.
15


Bank of America Corporation and Subsidiaries
Global Wealth & Investment Management Segment Results
(Dollars in millions)
 First
Quarter
2023
Fourth
Quarter
2022
Third
Quarter
2022
Second
Quarter
2022
First
Quarter
2022
 
Net interest income $1,876 $2,015 $1,981 $1,802 $1,668 
Noninterest income:
Investment and brokerage services3,238 3,166 3,255 3,486 3,654 
All other income201 229 193 145 154 
Total noninterest income3,439 3,395 3,448 3,631 3,808 
Total revenue, net of interest expense 5,315 5,410 5,429 5,433 5,476 
Provision for credit losses25 37 37 33 (41)
Noninterest expense4,067 3,784 3,816 3,875 4,015 
Income before income taxes 1,223 1,589 1,576 1,525 1,502 
Income tax expense 306 389 386 374 368 
Net income$917 $1,200 $1,190 $1,151 $1,134 
Net interest yield 2.20 %2.29 %2.12 %1.82 %1.62 %
Return on average allocated capital (1)
20 27 27 26 26 
Efficiency ratio76.53 69.96 70.28 71.34 73.31 
Balance Sheet
Average
Total loans and leases$221,448 $225,094 $223,734 $219,277 $210,937 
Total earning assets (2)
346,384 348,718 370,733 396,611 418,248 
Total assets (2)
359,164 361,592 383,468 409,472 431,040 
Total deposits314,019 317,849 339,487 363,943 384,902 
Allocated capital (1)
18,500 17,500 17,500 17,500 17,500 
Period end
Total loans and leases$217,804 $223,910 $224,858 $221,705 $214,273 
Total earning assets (2)
336,560 355,461 357,434 380,771 419,903 
Total assets (2)
349,888 368,893 370,790 393,948 433,122 
Total deposits301,471 323,899 324,859 347,991 385,288 
(1)Return on average allocated capital is calculated as net income, adjusted for cost of funds and earnings credits and certain expenses related to intangibles, divided by average allocated capital. Other companies may define or calculate these measures differently.
(2)Total earning assets and total assets include asset allocations to match liabilities (i.e., deposits) and allocated shareholders’ equity.


Current-period information is preliminary and based on company data available at the time of the presentation.
16


Bank of America Corporation and Subsidiaries
Global Wealth & Investment Management Key Indicators
(Dollars in millions)
 First
Quarter
2023
Fourth
Quarter
2022
Third
Quarter
2022
Second
Quarter
2022
First
Quarter
2022
 
Revenue by Business
Merrill Wealth Management$4,397 $4,486 $4,524 $4,536 $4,589 
Bank of America Private Bank918 924 905 897 887 
Total revenue, net of interest expense $5,315 $5,410 $5,429 $5,433 $5,476 
Client Balances by Business, at period end
Merrill Wealth Management$2,952,681 $2,822,910 $2,710,985 $2,819,998 $3,116,052 
Bank of America Private Bank568,925 563,931 537,771 547,116 598,100 
Total client balances$3,521,606 $3,386,841 $3,248,756 $3,367,114 $3,714,152 
Client Balances by Type, at period end
Assets under management (1)
$1,467,242 $1,401,474 $1,329,557 $1,411,344 $1,571,605 
Brokerage and other assets1,571,409 1,482,025 1,413,946 1,437,562 1,592,802 
Deposits301,471 323,899 324,859 347,991 385,288 
Loans and leases (2)
220,633 226,973 228,129 224,847 217,461 
Less: Managed deposits in assets under management(39,149)(47,530)(47,735)(54,630)(53,004)
Total client balances$3,521,606 $3,386,841 $3,248,756 $3,367,114 $3,714,152 
Assets Under Management Rollforward
Assets under management, beginning balance$1,401,474 $1,329,557 $1,411,344 $1,571,605 $1,638,782 
Net client flows15,262 105 4,110 1,033 15,537 
Market valuation/other50,506 71,812 (85,897)(161,294)(82,714)
Total assets under management, ending balance$1,467,242 $1,401,474 $1,329,557 $1,411,344 $1,571,605 
Advisors, at period end
Total wealth advisors (3)
19,243 19,273 18,841 18,449 18,571 
(1)Defined as managed assets under advisory and/or discretion of GWIM.
(2)Includes margin receivables which are classified in customer and other receivables on the Consolidated Balance Sheet.
(3)Includes advisors across all wealth management businesses in GWIM and Consumer Banking.


Current-period information is preliminary and based on company data available at the time of the presentation.
17


Bank of America Corporation and Subsidiaries
Global Banking Segment Results
(Dollars in millions)
 First
Quarter
2023
Fourth
Quarter
2022
Third
Quarter
2022
Second
Quarter
2022
First
Quarter
2022
 
Net interest income $3,907 $3,880 $3,326 $2,634 $2,344 
Noninterest income:
Service charges714 703 771 933 886 
Investment banking fees668 706 726 692 880 
All other income914 1,149 768 747 1,084 
Total noninterest income2,296 2,558 2,265 2,372 2,850 
Total revenue, net of interest expense 6,203 6,438 5,591 5,006 5,194 
Provision for credit losses(237)149 170 157 165 
Noninterest expense2,940 2,833 2,651 2,799 2,683 
Income before income taxes 3,500 3,456 2,770 2,050 2,346 
Income tax expense 945 916 734 543 622 
Net income$2,555 $2,540 $2,036 $1,507 $1,724 
Net interest yield 3.03 %2.90 %2.53 %1.97 %1.68 %
Return on average allocated capital (1)
21 23 18 14 16 
Efficiency ratio 47.41 44.03 47.41 55.90 51.65 
Balance Sheet
Average
Total loans and leases$381,009 $380,385 $384,305 $377,248 $358,807 
Total earning assets (2)
522,374 531,206 521,555 537,660 566,277 
Total assets (2)
588,886 595,525 585,683 601,945 630,517 
Total deposits492,577 503,472 495,154 509,261 539,912 
Allocated capital (1)
49,250 44,500 44,500 44,500 44,500 
Period end
Total loans and leases$383,491 $379,107 $377,711 $385,376 $367,423 
Total earning assets (2)
524,299 522,539 511,494 526,879 558,639 
Total assets (2)
591,231 588,466 575,442 591,490 623,168 
Total deposits495,949 498,661 484,309 499,714 533,820 
(1)Return on average allocated capital is calculated as net income, adjusted for cost of funds and earnings credits and certain expenses related to intangibles, divided by average allocated capital. Other companies may define or calculate these measures differently.
(2)Total earning assets and total assets include asset allocations to match liabilities (i.e., deposits) and allocated shareholders’ equity.


Current-period information is preliminary and based on company data available at the time of the presentation.
18


Bank of America Corporation and Subsidiaries
Global Banking Key Indicators
(Dollars in millions)
 First
Quarter
2023
Fourth
Quarter
2022
Third
Quarter
2022
Second
Quarter
2022
First
Quarter
2022
 
Investment Banking fees (1)
Advisory (2)
$313 $446 $397 $361 $439 
Debt issuance290 184 273 283 359 
Equity issuance65 76 56 48 82 
Total Investment Banking fees (3)
$668 $706 $726 $692 $880 
Business Lending
Corporate$1,034 $1,417 $902 $946 $1,060 
Commercial1,233 1,188 1,111 1,024 993 
Business Banking67 65 66 62 58 
Total Business Lending revenue$2,334 $2,670 $2,079 $2,032 $2,111 
Global Transaction Services
Corporate$1,549 $1,546 $1,369 $1,138 $949 
Commercial1,129 1,185 1,112 973 896 
Business Banking387 378 322 270 243 
Total Global Transaction Services revenue$3,065 $3,109 $2,803 $2,381 $2,088 
Average deposit balances
Interest-bearing$257,012 $225,671 $171,203 $142,366 $157,126 
Noninterest-bearing235,565 277,801 323,951 366,895 382,786 
Total average deposits$492,577 $503,472 $495,154 $509,261 $539,912 
Loan spread1.55 %1.52 %1.51 %1.49 %1.53 %
Provision for credit losses$(237)$149 $170 $157 $165 
Credit quality (4, 5)
Reservable criticized utilized exposure$18,104 $17,519 $15,809 $15,999 $18,304 
4.46 %4.37 %3.95 %3.92 %4.72 %
Nonperforming loans, leases and foreclosed properties$1,023 $923 $1,057 $1,126 $1,329 
0.27 %0.25 %0.28 %0.29 %0.37 %
Average loans and leases by product
U.S. commercial$229,558 $230,591 $233,027 $225,820 $211,568 
Non-U.S. commercial82,412 82,222 84,287 86,092 80,783 
Commercial real estate55,019 54,104 53,042 50,973 51,400 
Commercial lease financing14,019 13,467 13,948 14,362 15,055 
Other1 
Total average loans and leases$381,009 $380,385 $384,305 $377,248 $358,807 
Total Corporation Investment Banking fees
Advisory (2)
$363 $486 $432 $392 $473 
Debt issuance644 414 616 662 831 
Equity issuance168 189 156 139 225 
Total investment banking fees including self-led deals1,175 1,089 1,204 1,193 1,529 
Self-led deals(12)(18)(37)(65)(72)
Total Investment Banking fees$1,163 $1,071 $1,167 $1,128 $1,457 
(1)Investment banking fees represent total investment banking fees for Global Banking inclusive of self-led deals and fees included within Business Lending.
(2)Advisory includes fees on debt and equity advisory and mergers and acquisitions.
(3)Investment banking fees represent only the fee component in Global Banking and do not include certain other items shared with the Investment Banking Group under internal revenue sharing agreements.
(4)Criticized exposure corresponds to the Special Mention, Substandard and Doubtful asset categories defined by regulatory authorities. The reservable criticized exposure is on an end-of-period basis and is also shown as a percentage of total commercial reservable utilized exposure, including loans and leases, standby letters of credit, financial guarantees, commercial letters of credit and bankers’ acceptances.
(5)Nonperforming loans, leases and foreclosed properties are on an end-of-period basis. The nonperforming ratio is nonperforming assets divided by loans, leases and foreclosed properties.

Current-period information is preliminary and based on company data available at the time of the presentation.
19


Bank of America Corporation and Subsidiaries
Global Markets Segment Results
(Dollars in millions)
 First
Quarter
2023
Fourth
Quarter
2022
Third
Quarter
2022
Second
Quarter
2022
First
Quarter
2022
 
Net interest income$109 $371 $743 $981 $993 
Noninterest income:
Investment and brokerage services533 482 457 518 545 
Investment banking fees469 347 430 461 582 
Market making and similar activities4,398 2,685 2,874 2,657 3,190 
All other income117 (24)(21)(115)(18)
Total noninterest income5,517 3,490 3,740 3,521 4,299 
Total revenue, net of interest expense (1)
5,626 3,861 4,483 4,502 5,292 
Provision for credit losses(53)11 
Noninterest expense3,351 3,171 3,023 3,109 3,117 
Income before income taxes2,328 686 1,449 1,385 2,170 
Income tax expense640 182 384 367 575 
Net income$1,688 $504 $1,065 $1,018 $1,595 
Return on average allocated capital (2)
15 %%10 %10 %15 %
Efficiency ratio59.56 82.14 67.42 69.07 58.90 
Balance Sheet
Average
Total trading-related assets$626,035 $608,493 $592,391 $606,135 $596,154 
Total loans and leases125,046 123,022 120,435 114,375 108,576 
Total earning assets627,935 610,045 591,883 598,832 610,926 
Total assets870,038 857,319 847,899 866,742 858,719 
Total deposits36,109 37,219 38,820 41,192 44,393 
Allocated capital (2)
45,500 42,500 42,500 42,500 42,500 
Period end
Total trading-related assets$599,841 $564,769 $592,938 $577,309 $616,811 
Total loans and leases130,804 127,735 121,721 118,290 110,037 
Total earning assets632,873 587,772 595,988 571,921 609,290 
Total assets 861,477 812,489 848,752 835,129 883,304 
Total deposits33,624 39,077 37,318 40,055 43,371 
Trading-related assets (average)
Trading account securities$339,248 $309,217 $308,514 $295,190 $301,285 
Reverse repurchases126,760 122,753 112,828 131,456 138,581 
Securities borrowed116,280 119,334 114,032 119,200 114,468 
Derivative assets43,747 57,189 57,017 60,289 41,820 
Total trading-related assets$626,035 $608,493 $592,391 $606,135 $596,154 
(1)Substantially all of Global Markets total revenue is sales and trading revenue and investment banking fees, with a small portion related to certain revenue sharing agreements with other business segments. For additional sales and trading revenue information, see page 21.
(2)Return on average allocated capital is calculated as net income, adjusted for cost of funds and earnings credits and certain expenses related to intangibles, divided by average allocated capital. Other companies may define or calculate these measures differently.


Current-period information is preliminary and based on company data available at the time of the presentation.
20


Bank of America Corporation and Subsidiaries
Global Markets Key Indicators
(Dollars in millions)
First
Quarter
2023
Fourth
Quarter
2022
Third
Quarter
2022
Second
Quarter
2022
First
Quarter
2022
Sales and trading revenue (1)
Fixed-income, currencies and commodities$3,440 $2,157 $2,552 $2,500 $2,708 
Equities1,627 1,368 1,540 1,653 2,011 
Total sales and trading revenue$5,067 $3,525 $4,092 $4,153 $4,719 
Sales and trading revenue, excluding net debit valuation adjustment (2,3)
Fixed-income, currencies and commodities$3,429 $2,343 $2,567 $2,340 $2,648 
Equities1,624 1,375 1,539 1,655 2,002 
Total sales and trading revenue, excluding net debit valuation adjustment$5,053 $3,718 $4,106 $3,995 $4,650 
Sales and trading revenue breakdown
Net interest income$(74)$188 $586 $851 $911 
Commissions529 476 444 504 531 
Trading4,398 2,684 2,873 2,656 3,190 
Other214 177 189 142 87 
Total sales and trading revenue$5,067 $3,525 $4,092 $4,153 $4,719 
(1)    Includes Global Banking sales and trading revenue of $177 million, $262 million, $287 million, $319 million and $179 million for the first quarter of 2023 and the fourth, third, second and first quarters of 2022, respectively.
(2)    For this presentation, sales and trading revenue excludes net debit valuation adjustment (DVA) gains (losses) which include net DVA on derivatives, as well as amortization of own credit portion of purchase discount and realized DVA on structured liabilities. Sales and trading revenue excluding net DVA gains (losses) represents a non-GAAP financial measure. We believe the use of this non-GAAP financial measure provides additional useful information to assess the underlying performance of these businesses and to allow better comparison of period-to-period operating performance.
(3)Net DVA gains (losses) were $14 million, $(193) million, $(14) million, $158 million and $69 million for the first quarter of 2023 and the fourth, third, second and first quarters of 2022, respectively. FICC net DVA gains (losses) were $11 million, $(186) million, $(15) million, $160 million and $60 million for the first quarter of 2023 and the fourth, third, second and first quarters of 2022, respectively. Equities net DVA gains (losses) were $3 million, $(7) million, $1 million, $(2) million and $9 million for the first quarter of 2023 and the fourth, third, second and first quarters of 2022, respectively.


Current-period information is preliminary and based on company data available at the time of the presentation.
21


Bank of America Corporation and Subsidiaries
All Other Results (1)
(Dollars in millions)
 First
Quarter
2023
Fourth
Quarter
2022
Third
Quarter
2022
Second
Quarter
2022
First
Quarter
2022
 
Net interest income$97 $44 $37 $43 $(7)
Noninterest income (loss)(1,555)(1,880)(836)(1,329)(1,434)
Total revenue, net of interest expense(1,458)(1,836)(799)(1,286)(1,441)
Provision for credit losses107 (42)(58)(25)(47)
Noninterest expense407 655 716 531 583 
Loss before income taxes(1,972)(2,449)(1,457)(1,792)(1,977)
Income tax expense (benefit)(1,865)(1,760)(1,176)(1,474)(1,613)
Net income (loss)$(107)$(689)$(281)$(318)$(364)
Balance Sheet
Average
Total loans and leases$10,077 $10,386 $10,629 $14,391 $15,405 
Total assets (2)
172,725 136,040 142,650 124,923 154,425 
Total deposits24,702 19,946 20,221 19,663 20,504 
Period end
Total loans and leases$9,827 $10,234 $10,351 $10,825 $15,090 
Total assets (3)
267,623 155,074 128,051 136,673 132,186 
Total deposits34,590 19,905 19,031 19,374 20,990 
(1)All Other primarily consists of asset and liability management (ALM) activities, liquidating businesses and certain expenses not otherwise allocated to a business segment. ALM activities encompass interest rate and foreign currency risk management activities for which substantially all of the results are allocated to our business segments.
(2)Includes elimination of segments’ excess asset allocations to match liabilities (i.e., deposits) and allocated shareholders’ equity of $1.0 trillion, $1.0 trillion, $1.1 trillion, $1.1 trillion and $1.2 trillion for the first quarter of 2023 and the fourth, third, second and first quarters of 2022, respectively.
(3)Includes elimination of segments’ excess asset allocations to match liabilities (i.e., deposits) and allocated shareholders’ equity of $1.0 trillion, $1.0 trillion, $1.1 trillion, $1.1 trillion and $1.2 trillion at March 31, 2023, December 31, 2022, September 30, 2022, June 30, 2022 and March 31, 2022, respectively.


Current-period information is preliminary and based on company data available at the time of the presentation.
22


Bank of America Corporation and Subsidiaries
Outstanding Loans and Leases
(Dollars in millions)
March 31
2023
December 31
2022
March 31
2022
Consumer
Residential mortgage$228,827 $229,670 $226,030 
Home equity25,868 26,563 26,936 
Credit card92,469 93,421 79,356 
Direct/Indirect consumer (1) 
104,540 106,236 105,754 
Other consumer (2) 
120 156 205 
Total consumer loans excluding loans accounted for under the fair value option451,824 456,046 438,281 
Consumer loans accounted for under the fair value option (3) 
334 339 568 
Total consumer452,158 456,385 438,849 
Commercial
U.S. commercial360,655 358,481 330,973 
Non-U.S. commercial124,827 124,479 122,267 
Commercial real estate (4) 
73,051 69,766 62,533 
Commercial lease financing13,448 13,644 14,008 
571,981 566,370 529,781 
U.S. small business commercial (5)
18,204 17,560 17,972 
Total commercial loans excluding loans accounted for under the fair value option590,185 583,930 547,753 
Commercial loans accounted for under the fair value option (3) 
4,063 5,432 6,543 
Total commercial594,248 589,362 554,296 
Total loans and leases $1,046,406 $1,045,747 $993,145 
(1)Includes primarily auto and specialty lending loans and leases of $52.7 billion, $51.8 billion and $49.7 billion, U.S. securities-based lending loans of $48.1 billion, $50.4 billion and $51.9 billion and non-U.S. consumer loans of $2.8 billion, $3.0 billion and $3.2 billion at March 31, 2023, December 31, 2022 and March 31, 2022, respectively.
(2)Substantially all of other consumer is consumer overdrafts.
(3)Consumer loans accounted for under the fair value option includes residential mortgage loans of $72 million, $71 million and $248 million and home equity loans of $262 million, $268 million and $320 million at March 31, 2023, December 31, 2022 and March 31, 2022, respectively. Commercial loans accounted for under the fair value option includes U.S. commercial loans of $2.2 billion, $2.9 billion and $4.0 billion and non-U.S. commercial loans of $1.9 billion, $2.5 billion and $2.6 billion at March 31, 2023, December 31, 2022 and March 31, 2022, respectively.
(4)Includes U.S. commercial real estate loans of $67.2 billion, $64.9 billion and $58.3 billion and non-U.S. commercial real estate loans of $5.8 billion, $4.8 billion and $4.3 billion at March 31, 2023, December 31, 2022 and March 31, 2022, respectively.
(5)Includes card-related products and Paycheck Protection Program (PPP) loans.


Current-period information is preliminary and based on company data available at the time of the presentation.
23


Bank of America Corporation and Subsidiaries
Quarterly Average Loans and Leases by Business Segment and All Other
(Dollars in millions)
 First Quarter 2023
 Total
Corporation
Consumer BankingGWIMGlobal
Banking
Global
Markets
All 
Other
Consumer
Residential mortgage$229,275 $117,747 $103,700 $1 $ $7,827 
Home equity26,513 21,571 2,444  200 2,298 
Credit card91,775 88,731 3,045   (1)
Direct/Indirect and other consumer105,657 52,728 52,927   2 
Total consumer453,220 280,777 162,116 1 200 10,126 
Commercial
U.S. commercial376,852 22,985 52,067 229,558 72,074 168 
Non-U.S. commercial127,003  999 82,412 43,478 114 
Commercial real estate70,591 10 6,266 55,019 9,294 2 
Commercial lease financing13,686   14,019  (333)
Total commercial588,132 22,995 59,332 381,008 124,846 (49)
Total loans and leases$1,041,352 $303,772 $221,448 $381,009 $125,046 $10,077 
 Fourth Quarter 2022
 Total
Corporation
Consumer BankingGWIMGlobal
Banking
Global
Markets
All 
Other
Consumer
Residential mortgage$229,364 $118,051 $103,331 $$— $7,981 
Home equity26,983 21,834 2,485 — 207 2,457 
Credit card89,575 86,540 3,036 — — (1)
Direct/Indirect and other consumer106,598 51,501 55,093 — — 
Total consumer452,520 277,926 163,945 207 10,441 
Commercial
U.S. commercial378,850 22,423 54,306 230,591 71,330 200 
Non-U.S. commercial125,983 1,090 82,222 42,590 80 
Commercial real estate68,764 10 5,753 54,104 8,895 
Commercial lease financing13,130 — — 13,467 — (337)
Total commercial586,727 22,434 61,149 380,384 122,815 (55)
Total loans and leases $1,039,247 $300,360 $225,094 $380,385 $123,022 $10,386 
 First Quarter 2022
 Total
Corporation
Consumer BankingGWIMGlobal
Banking
Global
Markets
All 
Other
Consumer
Residential mortgage$223,979 $115,388 $96,221 $$— $12,369 
Home equity27,784 21,963 2,400 — 241 3,180 
Credit card78,409 75,730 2,679 — — — 
Direct/Indirect and other consumer104,632 49,292 55,338 — — 
Total consumer434,804 262,373 156,638 241 15,551 
Commercial
U.S. commercial346,510 21,683 48,496 211,568 64,566 197 
Non-U.S. commercial118,767 — 1,237 80,783 36,684 63 
Commercial real estate63,065 12 4,566 51,400 7,085 
Commercial lease financing14,647 — — 15,055 — (408)
Total commercial542,989 21,695 54,299 358,806 108,335 (146)
Total loans and leases$977,793 $284,068 $210,937 $358,807 $108,576 $15,405 


Current-period information is preliminary and based on company data available at the time of the presentation.
24


Bank of America Corporation and Subsidiaries
Commercial Credit Exposure by Industry (1, 2, 3, 4, 6)
(Dollars in millions)
Commercial UtilizedTotal Commercial Committed
March 31
2023
December 31
2022
March 31
2022
March 31
2023
December 31
2022
March 31
2022
Asset managers & funds$102,345 $106,842 $102,558 $164,480 $165,087 $158,973 
Real estate (5)
73,515 72,180 67,211 101,072 99,722 93,888 
Capital goods48,146 45,580 44,545 88,060 87,314 85,942 
Finance companies58,226 55,248 50,559 81,811 79,546 76,101 
Healthcare equipment and services34,245 33,554 33,164 59,280 58,761 58,264 
Materials27,224 26,304 27,570 56,244 55,589 60,017 
Retailing26,021 24,785 26,678 54,127 53,714 51,557 
Consumer services27,475 26,980 27,045 48,491 47,372 47,344 
Government & public education33,443 34,861 35,212 46,931 48,134 49,213 
Food, beverage and tobacco24,307 23,232 23,332 46,838 47,486 46,566 
Individuals and trusts31,874 34,897 29,340 43,488 45,572 38,961 
Commercial services and supplies24,136 23,628 20,818 41,711 41,596 42,809 
Utilities19,118 20,292 18,908 39,209 40,164 38,178 
Energy13,667 15,132 16,770 34,923 36,043 36,001 
Transportation22,051 22,273 21,268 33,846 33,858 32,034 
Technology hardware and equipment10,500 11,441 10,551 29,807 29,825 26,479 
Global commercial banks26,910 27,217 25,092 29,047 29,293 26,234 
Media15,102 14,781 11,693 29,006 28,216 27,525 
Software and services11,678 12,961 12,075 25,300 25,633 30,195 
Consumer durables and apparel10,167 10,009 10,989 21,784 21,389 22,089 
Pharmaceuticals and biotechnology6,581 7,547 6,175 21,419 26,208 19,093 
Vehicle dealers13,281 12,909 11,438 21,237 20,638 20,381 
Insurance10,007 10,224 6,784 19,109 19,444 18,120 
Telecommunication services9,646 9,679 10,500 17,666 17,349 18,453 
Automobiles and components8,163 8,774 9,195 15,910 16,911 17,782 
Food and staples retailing7,331 7,157 7,304 12,507 11,908 12,772 
Financial markets infrastructure (clearinghouses)3,013 3,913 4,359 8,526 8,752 6,966 
Religious and social organizations2,542 2,467 2,906 4,557 4,689 5,345 
Total commercial credit exposure by industry$700,714 $704,867 $674,039 $1,196,386 $1,200,213 $1,167,282 
(1)Includes loans and leases, standby letters of credit and financial guarantees, derivative assets, assets held-for-sale, commercial letters of credit, bankers’ acceptances, securitized assets, foreclosed properties and other collateral acquired. Derivative assets are carried at fair value, reflect the effects of legally enforceable master netting agreements and have been reduced by cash collateral of $29.1 billion, $33.8 billion and $34.1 billion at March 31, 2023, December 31, 2022 and March 31, 2022, respectively. Not reflected in utilized and committed exposure is additional non-cash derivative collateral held of $51.0 billion, $51.1 billion and $45.6 billion, which consists primarily of other marketable securities, at March 31, 2023, December 31, 2022 and March 31, 2022, respectively.
(2)Total utilized and total committed exposure includes loans of $4.1 billion, $5.4 billion and $6.5 billion and issued letters of credit with a notional amount of $15 million, $28 million and $48 million accounted for under the fair value option at March 31, 2023, December 31, 2022 and March 31, 2022, respectively. In addition, total committed exposure includes unfunded loan commitments accounted for under the fair value option with a notional amount of $3.1 billion, $3.0 billion and $4.0 billion at March 31, 2023, December 31, 2022 and March 31, 2022, respectively.
(3)Includes U.S. small business commercial exposure.
(4)Includes the notional amount of unfunded legally binding lending commitments net of amounts distributed (e.g., syndicated or participated) to other financial institutions.
(5)Industries are viewed from a variety of perspectives to best isolate the perceived risks. For purposes of this table, the real estate industry is defined based on the primary business activity of the borrowers or the counterparties using operating cash flows and primary source of repayment as key factors.
(6)Includes $749 million, $1.0 billion and $3.0 billion of PPP loan exposure across impacted industries at March 31, 2023, December 31, 2022 and March 31, 2022, respectively.


Current-period information is preliminary and based on company data available at the time of the presentation.
25


Bank of America Corporation and Subsidiaries
Nonperforming Loans, Leases and Foreclosed Properties
(Dollars in millions)
March 31
2023
December 31
2022
September 30
2022
June 30
2022
March 31
2022
Residential mortgage$2,125 $2,167 $2,187 $2,245 $2,422 
Home equity488 510 532 563 615 
Direct/Indirect consumer101 77 41 58 67 
Total consumer2,714 2,754 2,760 2,866 3,104 
U.S. commercial559 553 640 742 818 
Non-U.S. commercial125 212 274 279 268 
Commercial real estate502 271 282 218 361 
Commercial lease financing4 11 44 54 
1,190 1,040 1,207 1,283 1,501 
U.S. small business commercial14 14 16 15 20 
Total commercial1,204 1,054 1,223 1,298 1,521 
Total nonperforming loans and leases3,918 3,808 3,983 4,164 4,625 
Foreclosed properties165 170 173 162 153 
Total nonperforming loans, leases and foreclosed properties (1, 2)
$4,083 $3,978 $4,156 $4,326 $4,778 
Fully-insured home loans past due 30 days or more and still accruing$580 $627 $672 $734 $817 
Consumer credit card past due 30 days or more and still accruing 1,674 1,505 1,202 1,008 1,003 
Other loans past due 30 days or more and still accruing3,146 4,008 3,281 3,494 3,736 
Total loans past due 30 days or more and still accruing (3, 4)
$5,400 $6,140 $5,155 $5,236 $5,556 
Fully-insured home loans past due 90 days or more and still accruing$338 $368 $427 $492 $574 
Consumer credit card past due 90 days or more and still accruing
828 717 547 493 492 
Other loans past due 90 days or more and still accruing508 626 647 720 607 
Total loans past due 90 days or more and still accruing (4)
$1,674 $1,711 $1,621 $1,705 $1,673 
Nonperforming loans, leases and foreclosed properties/Total assets (5)
0.13 %0.13 %0.14 %0.14 %0.15 %
Nonperforming loans, leases and foreclosed properties/Total loans, leases and foreclosed properties (5)
0.39 0.38 0.40 0.42 0.48 
Nonperforming loans and leases/Total loans and leases (5)
0.38 0.37 0.39 0.41 0.47 
Commercial reservable criticized utilized exposure (6)
$19,789 $19,274 $17,659 $18,114 $20,682 
Commercial reservable criticized utilized exposure/Commercial reservable utilized exposure (6)
3.17 %3.12 %2.88 %2.95 %3.54 %
Total commercial criticized utilized exposure/Commercial utilized exposure (6)
3.67 3.70 2.82 2.99 3.47 
(1)Balances do not include past due consumer credit card, consumer loans secured by real estate where repayments are insured by the FHA and individually insured long-term stand-by agreements (fully-insured home loans), and in general, other consumer and commercial loans not secured by real estate.
(2)Balances do not include nonperforming loans held-for-sale of $250 million, $219 million, $222 million, $270 million and $336 million at March 31, 2023, December 31, 2022, September 30, 2022, June 30, 2022 and March 31, 2022, respectively.
(3)Balances do not include loans held-for-sale past due 30 days or more and still accruing of $36 million, $58 million, $81 million, $179 million and $654 million at March 31, 2023, December 31, 2022, September 30, 2022, June 30, 2022 and March 31, 2022, respectively.
(4)These balances are excluded from total nonperforming loans, leases and foreclosed properties.
(5)Total assets and total loans and leases do not include loans accounted for under the fair value option of $4.4 billion, $5.8 billion, $4.9 billion, $5.5 billion and $7.1 billion at March 31, 2023, December 31, 2022, September 30, 2022, June 30, 2022 and March 31, 2022, respectively.
(6)Criticized exposure corresponds to the Special Mention, Substandard and Doubtful asset categories defined by regulatory authorities. The reservable criticized exposure excludes loans held-for-sale, exposure accounted for under the fair value option and other nonreservable exposure.


Current-period information is preliminary and based on company data available at the time of the presentation.
26


Bank of America Corporation and Subsidiaries
Nonperforming Loans, Leases and Foreclosed Properties Activity (1)
 (Dollars in millions)
First
Quarter
2023
Fourth
Quarter
2022
Third
Quarter
2022
Second
Quarter
2022
First
Quarter
2022
Nonperforming Consumer Loans and Leases:
Balance, beginning of period$2,754 $2,760 $2,866 $3,104 $2,989 
Additions253 208 236 365 644 
Reductions:
Paydowns and payoffs(103)(89)(124)(147)(175)
Sales(2)(1)(1)(269)(131)
Returns to performing status (2)
(170)(109)(193)(157)(202)
Charge-offs (3)
(12)(6)(12)(23)(15)
Transfers to foreclosed properties(6)(9)(12)(7)(6)
Total net additions (reductions) to nonperforming loans and leases(40)(6)(106)(238)115 
Total nonperforming consumer loans and leases, end of period2,714 2,754 2,760 2,866 3,104 
Foreclosed properties117 121 125 115 118 
Nonperforming consumer loans, leases and foreclosed properties, end of period$2,831 $2,875 $2,885 $2,981 $3,222 
Nonperforming Commercial Loans and Leases (4):
Balance, beginning of period$1,054 $1,223 $1,298 $1,521 $1,578 
Additions419 141 307 321 183 
Reductions:
Paydowns(72)(144)(180)(342)(159)
Sales (4)(12)(16)(25)
Returns to performing status (5)
(52)(35)(148)(146)(5)
Charge-offs(88)(127)(42)(40)(12)
Transfers to loans held-for-sale(57)— — — (39)
Total net additions (reductions) to nonperforming loans and leases150 (169)(75)(223)(57)
Total nonperforming commercial loans and leases, end of period1,204 1,054 1,223 1,298 1,521 
Foreclosed properties48 49 48 47 35 
Nonperforming commercial loans, leases and foreclosed properties, end of period$1,252 $1,103 $1,271 $1,345 $1,556 
(1)For amounts excluded from nonperforming loans, leases and foreclosed properties, see footnotes to Nonperforming Loans, Leases and Foreclosed Properties table on page 26.
(2)Consumer loans and leases may be returned to performing status when all principal and interest is current and full repayment of the remaining contractual principal and interest is expected, or when the loan otherwise becomes well-secured and is in the process of collection. Prior to January 1, 2023, certain troubled debt restructurings were classified as nonperforming at the time of restructuring and were only returned to performing status after considering the borrower’s sustained repayment performance for a reasonable period, generally six months.
(3)Our policy is not to classify consumer credit card and non-bankruptcy related consumer loans not secured by real estate as nonperforming; therefore, the charge-offs on these loans have no impact on nonperforming activity and, accordingly, are excluded from this table.
(4)Includes U.S. small business commercial activity. Small business card loans are excluded as they are not classified as nonperforming.
(5)Commercial loans and leases may be returned to performing status when all principal and interest is current and full repayment of the remaining contractual principal and interest is expected, or when the loan otherwise becomes well-secured and is in the process of collection. Prior to January 1, 2023, troubled debt restructurings were generally classified as performing after a sustained period of demonstrated payment performance.


Current-period information is preliminary and based on company data available at the time of the presentation.
27


Bank of America Corporation and Subsidiaries
Quarterly Net Charge-offs and Net Charge-off Ratios (1) 
(Dollars in millions)
 First
Quarter
2023
Fourth
Quarter
2022
Third
Quarter
2022
Second
Quarter
2022
First
Quarter
2022
AmountPercentAmountPercentAmountPercentAmountPercentAmountPercent
Net Charge-offs
Residential mortgage (2)
$1  %$(1)— %$(3)(0.01)%$86 0.15 %$(10)(0.02)%
Home equity (3)
(12)(0.18)(18)(0.27)(18)(0.25)(24)(0.37)(30)(0.44)
Credit card501 2.21 386 1.71 328 1.53 323 1.60 297 1.53 
Direct/Indirect consumer1  — 0.03 0.02 0.02 
Other consumer162 n/m163 n/m143 n/m136 n/m79 n/m
Total consumer653 0.58 531 0.47 459 0.41 525 0.47 340 0.32 
U.S. commercial 47 0.05 47 0.05 23 0.03 15 0.02 (14)(0.02)
Non-U.S. commercial20 0.07 31 0.10 (6)(0.02)(5)(0.01)— 
Total commercial and industrial67 0.06 78 0.06 17 0.01 10 0.01 (13)(0.01)
Commercial real estate22 0.12 34 0.20 13 0.08 (4)(0.03)23 0.15 
Commercial lease financing(1)(0.01)0.05 (1)(0.05)0.13 — — 
88 0.06 114 0.08 29 0.02 10 0.01 10 0.01 
U.S. small business commercial66 1.48 44 0.99 32 0.72 36 0.79 42 0.94 
Total commercial154 0.11 158 0.11 61 0.04 46 0.03 52 0.04 
Total net charge-offs$807 0.32 $689 0.26 $520 0.20 $571 0.23 $392 0.16 
By Business Segment and All Other
Consumer Banking$729 0.97 %$591 0.78 %$512 0.69 %$502 0.70 %$416 0.59 %
Global Wealth & Investment Management6 0.01 0.01 0.01 0.02 — 
Global Banking87 0.09 112 0.12 26 0.03 14 0.01 (12)(0.01)
Global Markets  (1)(0.01)(1)— (4)(0.01)21 0.08 
All Other (15)(0.59)(17)(0.66)(22)(0.80)50 1.40 (34)(0.91)
Total net charge-offs$807 0.32 $689 0.26 $520 0.20 $571 0.23 $392 0.16 
(1)Net charge-off ratios are calculated as annualized net charge-offs divided by average outstanding loans and leases excluding loans accounted for under the fair value option during the period for each loan and lease category.
(2)Includes loan sale net charge-offs (recoveries) of $90 million and $(6) million for the second and first quarters of 2022 and $0 for the remaining quarters.
(3)Includes loan sale net recoveries of $6 million and $2 million for the second and first quarters of 2022 and $0 for the remaining quarters.
n/m = not meaningful


Current-period information is preliminary and based on company data available at the time of the presentation.
28


Bank of America Corporation and Subsidiaries
Allocation of the Allowance for Credit Losses by Product Type
(Dollars in millions)
March 31, 2023December 31, 2022March 31, 2022
Amount
Percent of
Loans and
Leases
Outstanding (1, 2)
Amount
Percent of
Loans and
Leases
Outstanding 
(1, 2)
Amount
Percent of
Loans and
Leases
Outstanding (1, 2)
Allowance for loan and lease losses
Residential mortgage$305 0.13%$328 0.14%$301 0.13%
Home equity98 0.3892 0.35172 0.64
Credit card6,220 6.736,136 6.575,684 7.16
Direct/Indirect consumer628 0.60585 0.55512 0.48
Other consumer110 n/m96 n/m46 n/m
Total consumer7,361 1.637,237 1.596,715 1.53
U.S. commercial (3)
2,835 0.753,007 0.802,966 0.85
Non-U.S. commercial1,019 0.821,194 0.961,155 0.94
Commercial real estate1,253 1.721,192 1.711,218 1.95
Commercial lease financing46 0.3452 0.3850 0.36
Total commercial 5,153 0.875,445 0.935,389 0.98
Allowance for loan and lease losses12,514 1.2012,682 1.2212,104 1.23
Reserve for unfunded lending commitments1,437 1,540 1,379  
Allowance for credit losses$13,951 $14,222 $13,483  
Asset Quality Indicators
Allowance for loan and lease losses/Total loans and leases (2)
1.20%1.22%1.23%
Allowance for loan and lease losses/Total nonperforming loans and leases (4)
319333262
Ratio of the allowance for loan and lease losses/Annualized net charge-offs3.834.647.62
(1)Ratios are calculated as allowance for loan and lease losses as a percentage of loans and leases outstanding excluding loans accounted for under the fair value option. Consumer loans accounted for under the fair value option include residential mortgage loans of $72 million, $71 million and $248 million, and home equity loans of $262 million, $268 million and $320 million at March 31, 2023, December 31, 2022 and March 31, 2022, respectively. Commercial loans accounted for under the fair value option include U.S. commercial loans of $2.2 billion, $2.9 billion and $4.0 billion and non-U.S. commercial loans of $1.9 billion, $2.5 billion and $2.6 billion at March 31, 2023, December 31, 2022 and March 31, 2022, respectively.
(2)Total loans and leases do not include loans accounted for under the fair value option of $4.4 billion, $5.8 billion and $7.1 billion at March 31, 2023, December 31, 2022 and March 31, 2022, respectively.
(3)Includes allowance for loan and lease losses for U.S. small business commercial loans of $864 million, $844 million and $1.0 billion at March 31, 2023, December 31, 2022 and March 31, 2022, respectively.
(4)Allowance for loan and lease losses includes $7.1 billion, $7.0 billion and $6.6 billion allocated to products (primarily the Consumer Lending portfolios within Consumer Banking) that are excluded from nonperforming loans and leases at March 31, 2023, December 31, 2022 and March 31, 2022, respectively. Excluding these amounts, allowance for loan and lease losses as a percentage of total nonperforming loans and leases was 138 percent, 149 percent and 118 percent at March 31, 2023, December 31, 2022 and March 31, 2022, respectively.
n/m = not meaningful


Current-period information is preliminary and based on company data available at the time of the presentation.
29


Exhibit A: Non-GAAP Reconciliations
Bank of America Corporation and Subsidiaries
Reconciliations to GAAP Financial Measures
(Dollars in millions, except per share information)

The Corporation evaluates its business based on the following ratios that utilize tangible equity, a non-GAAP financial measure. Tangible equity represents shareholders’ equity or common shareholders’ equity reduced by goodwill and intangible assets (excluding mortgage servicing rights), net of related deferred tax liabilities ("adjusted" shareholders' equity or common shareholders’ equity). Return on average tangible common shareholders’ equity measures the Corporation’s net income applicable to common shareholders as a percentage of adjusted average common shareholders’ equity. The tangible common equity ratio represents adjusted ending common shareholders’ equity divided by total tangible assets (total assets less goodwill and intangible assets (excluding mortgage servicing rights), net of related deferred tax liabilities). Return on average tangible shareholders’ equity measures the Corporation’s net income as a percentage of adjusted average total shareholders’ equity. The tangible equity ratio represents adjusted ending shareholders’ equity divided by total tangible assets. Tangible book value per common share represents adjusted ending common shareholders’ equity divided by ending common shares outstanding. These measures are used to evaluate the Corporation’s use of equity. In addition, profitability, relationship and investment models all use return on average tangible shareholders’ equity as key measures to support our overall growth goals.

See the tables below for reconciliations of these non-GAAP financial measures to the most closely related financial measures defined by GAAP for the three months ended March 31, 2023, December 31, 2022, September 30, 2022, June 30, 2022 and March 31, 2022. The Corporation believes the use of these non-GAAP financial measures provides additional clarity in understanding its results of operations and trends. Other companies may define or calculate supplemental financial data differently.
 First
Quarter
2023
Fourth
Quarter
2022
Third
Quarter
2022
Second
Quarter
2022
First
Quarter
2022
 
Reconciliation of income before income taxes to pretax, pre-provision income
Income before income taxes$9,089 $7,897 $8,301 $6,892 $7,879 
Provision for credit losses931 1,092 898 523 30 
Pretax, pre-provision income$10,020 $8,989 $9,199 $7,415 $7,909 
Reconciliation of average shareholders’ equity to average tangible shareholders’ equity and average tangible common shareholders’ equity
Shareholders’ equity$277,252 $272,629 $271,017 $268,197 $269,309 
Goodwill(69,022)(69,022)(69,022)(69,022)(69,022)
Intangible assets (excluding mortgage servicing rights)(2,068)(2,088)(2,107)(2,127)(2,146)
Related deferred tax liabilities899 914 920 926 929 
Tangible shareholders’ equity$207,061 $202,433 $200,808 $197,974 $199,070 
Preferred stock(28,397)(28,982)(29,134)(28,674)(26,444)
Tangible common shareholders’ equity$178,664 $173,451 $171,674 $169,300 $172,626 
Reconciliation of period-end shareholders’ equity to period-end tangible shareholders’ equity and period-end tangible common shareholders’ equity
Shareholders’ equity$280,196 $273,197 $269,524 $269,118 $266,617 
Goodwill(69,022)(69,022)(69,022)(69,022)(69,022)
Intangible assets (excluding mortgage servicing rights)(2,055)(2,075)(2,094)(2,114)(2,133)
Related deferred tax liabilities895 899 915 920 926 
Tangible shareholders’ equity$210,014 $202,999 $199,323 $198,902 $196,388 
Preferred stock(28,397)(28,397)(29,134)(29,134)(27,137)
Tangible common shareholders’ equity$181,617 $174,602 $170,189 $169,768 $169,251 
Reconciliation of period-end assets to period-end tangible assets
Assets$3,194,657 $3,051,375 $3,072,953 $3,111,606 $3,238,223 
Goodwill(69,022)(69,022)(69,022)(69,022)(69,022)
Intangible assets (excluding mortgage servicing rights)(2,055)(2,075)(2,094)(2,114)(2,133)
Related deferred tax liabilities895 899 915 920 926 
Tangible assets$3,124,475 $2,981,177 $3,002,752 $3,041,390 $3,167,994 
Book value per share of common stock
Common shareholders’ equity$251,799 $244,800 $240,390 $239,984 $239,480 
Ending common shares issued and outstanding7,972.4 7,996.8 8,024.5 8,035.2 8,062.1 
Book value per share of common stock$31.58 $30.61 $29.96 $29.87 $29.70 
Tangible book value per share of common stock
Tangible common shareholders’ equity$181,617 $174,602 $170,189 $169,768 $169,251 
Ending common shares issued and outstanding7,972.4 7,996.8 8,024.5 8,035.2 8,062.1 
Tangible book value per share of common stock$22.78 $21.83 $21.21 $21.13 $20.99 
Current-period information is preliminary and based on company data available at the time of the presentation.
30
EX-101.SCH 5 bac-20230418.xsd XBRL TAXONOMY EXTENSION SCHEMA DOCUMENT 0000001 - Document - Cover Page link:presentationLink link:calculationLink link:definitionLink EX-101.DEF 6 bac-20230418_def.xml XBRL TAXONOMY EXTENSION DEFINITION LINKBASE DOCUMENT EX-101.LAB 7 bac-20230418_lab.xml XBRL TAXONOMY EXTENSION LABEL LINKBASE DOCUMENT Depositary Shares, each representing a 1/1,000th interest in a share of Floating Rate Non-Cumulative Preferred Stock, Series E Series E Preferred Stock [Member] Depositary Shares, each representing 1/1,000th interest in a share of 5.375% Non-Cumulative Preferred Stock, Series KK Series KK Preferred Stock [Member] Series KK Preferred Stock [Member] Pre-commencement Issuer Tender Offer Pre-commencement Issuer Tender Offer Depositary Shares, each representing a 1/1,000th interest in a share of 5.000% Non-Cumulative Preferred Stock, Series LL Series LL Preferred Stock [Member] Series LL Preferred Stock [Member] Entity Address, Postal Zip Code Entity Address, Postal Zip Code Depositary Shares, each representing a 1/1,200th interest in a share of Bank of America Corporation Floating Rate Non-Cumulative Preferred Stock, Series 1 Series 1 Preferred Stock [Member] Series 1 Preferred Stock [Member] Depositary Shares, each representing a 1/1,000th interest in a share of 6.000% Non-Cumulative Preferred Stock, Series GG Series GG Preferred Stock [Member] Series GG Preferred Stock [Member] Depositary Shares, each representing a 1/1,000th interest in a share of 5.875% Non-Cumulative Preferred Stock, HH Series HH Preferred Stock [Member] Series HH Preferred Stock [Member] Floating Rate Preferred Hybrid Income Term Securities of BAC Capital Trust XIII (and the guarantee related thereto) Floating Rate Preferred Hybrid Income Term Securities [Member] Floating Rate Preferred Hybrid Income Term Securities [Member] Document Period End Date Document Period End Date Entity Central Index Key Entity Central Index Key Depositary Shares, each representing a 1/1,200th interest in a share of Bank of America Corporation Floating Rate Non-Cumulative Preferred Stock, Series 4 Series 4 Preferred Stock [Member] Series Four Preferred Stock member. 7.25% Non-Cumulative Perpetual Convertible Preferred Stock, Series L Series L Preferred Stock [Member] Series L Preferred Stock Member. 5.63% Fixed to Floating Rate Preferred Hybrid Income Term Securities of BAC Capital Trust XIV (and the guarantee related thereto) 5.63% Fixed to Floating Rate Preferred Hybrid Income Term Securities [Member] 5.63% Fixed to Floating Rate Preferred Hybrid Income Term Securities [Member] Document Information [Table] Document Information [Table] Entity Emerging Growth Company Entity Emerging Growth Company Security Exchange Name Security Exchange Name Title of 12(b) Security Title of 12(b) Security Entity Incorporation, State or Country Code Entity Incorporation, State or Country Code Entity Address, Address Line One Entity Address, Address Line One Common Stock, par value $0.01 per share Common Stock [Member] Income Capital Obligation Notes initially due December 15, 2066 of Bank of America Corporation Income Capital Obligation Notes [Member] Income Capital Obligation Notes [Member] Depositary Shares, each representing a 1/1,200th interest in a share of Bank of America Corporation Floating Rate Non-Cumulative Preferred Stock, Series 5 Series 5 Preferred Stock [Member] Series Five Preferred Stock member. Entity Registrant Name Entity Registrant Name Written Communications Written Communications Local Phone Number Local Phone Number Depositary Shares, each representing a 1/1,200th interest in a share of Bank of America Corporation Floating Rate Non-Cumulative Preferred Stock, Series 2 Series 2 Preferred Stock [Member] Series Two Preferred Stock member. Soliciting Material Soliciting Material Entity Address, State or Province Entity Address, State or Province City Area Code City Area Code Document Type Document Type Document Information [Line Items] Document Information [Line Items] Class of Stock [Domain] Class of Stock [Domain] Cover [Abstract] Cover [Abstract] Entity Address, City or Town Entity Address, City or Town Class of Stock [Axis] Class of Stock [Axis] Pre-commencement Tender Offer Pre-commencement Tender Offer Entity File Number Entity File Number Amendment Flag Amendment Flag Depositary Shares, each representing a 1/1,000th interest in a share of 4.750% Non-Cumulative Preferred Stock, Series SS Depositary Shares, each representing a 1/1,000th interest in a share of 4.750% Non-Cumulative Preferred Stock, Series SS [Member] Depositary Shares, each representing a 1/1,000th interest in a share of 4.750% Non-Cumulative Preferred Stock, Series SS Trading Symbol Trading Symbol Depositary Shares, each representing a 1/1,000th interest in a share of 4.125% Non-Cumulative Preferred Stock, Series PP Series PP Preferred Stock [Member] Series PP Preferred Stock Depositary Shares, each representing a 1/1,000th interest in a share of 4.250% Non-Cumulative Preferred Stock, Series QQ Series QQ Preferred Stock [Member] Series QQ Preferred Stock Entity Tax Identification Number Entity Tax Identification Number Senior Medium-Term Notes, Series A, Step Up Callable Notes, due November 28, 2031 of BofA Finance LLC (and the guarantee of the Registrant with respect thereto) Senior Medium-Term Notes, Series A, Step Up Callable Notes [Member] Senior Medium-Term Notes, Series A, Step Up Callable Notes [Member] Depositary Shares, each representing a 1/1,000th interest in a share of 4.375% Non-Cumulative Preferred Stock, Series NN Series NN Preferred Stock [Member] Series NN Preferred Stock EX-101.PRE 8 bac-20230418_pre.xml XBRL TAXONOMY EXTENSION PRESENTATION LINKBASE DOCUMENT GRAPHIC 9 bac-03312023ex991001.jpg GRAPHIC begin 644 bac-03312023ex991001.jpg M_]C_X 02D9)1@ ! @ 0 ! #_VP!# @&!@<&!0@'!P<)"0@*#!0-# L+ M#!D2$P\4'1H?'AT:'!P@)"XG("(L(QP<*#7J#A(6&AXB)BI*3E)66EYB9FJ*CI*6FIZBIJK*SM+6VM[BYNL+#Q,7& MQ\C)RM+3U-76U]C9VN'BX^3EYN?HZ>KQ\O/T]?;W^/GZ_\0 'P$ P$! 0$! M 0$! 0 $" P0%!@<("0H+_\0 M1$ @$"! 0#! <%! 0 0)W $" M Q$$!2$Q!A)!40=A<1,B,H$(%$*1H;'!"2,S4O 58G+1"A8D-.$E\1<8&1HF M)R@I*C4V-S@Y.D-$149'2$E*4U155E=865IC9&5F9VAI:G-T=79W>'EZ@H.$ MA8:'B(F*DI.4E9:7F)F:HJ.DI::GJ*FJLK.TM;:WN+FZPL/$Q<;'R,G*TM/4 MU=;7V-G:XN/DY>;GZ.GJ\O/T]?;W^/GZ_]H # ,! (1 Q$ /P#W^BBB@ HH MHH **** "BBB@ HHHH **** "BBB@ HHHH **** "BBB@ HHHH **** "BBB M@ HHHH **** "BBB@ HHHH **** "BBB@ HHHH **** "BBB@ HHHH **** M"BBB@ HHHH **** "BBB@ HHHH **** "BBB@ HHHH **** "BBB@ HHHH * M*** "BBB@ HHHH **** "BBB@ HHHH ***1F5%+.P50,DDX H 6BLRR\1Z)J M-P]O9:M97$R-M:..=6;/TS6'XHTWQA=DMH^IV\4*\B) 8W/_ (YS^E$KQW1 MK0IQJSY7)1\WL=/>WUMIULUS=RB*%>K$$X_*L&V^('ABYF:)=36-@<9E1D!_ M$C%<.?&OC/PTXBUFP$T8X+S1D9^CKQ5Z'Q'X)\5D0ZKIPL[I_E$A7&2?1U_K M67M+[?B>O'*73BY58N4>\&G^%KGID,\-S$)8)4EC89#(P8'\14E>;S?#C4-, MF%QX7UN6W).=DSD#'U4<_B*[324U.SL,:U?6T\B_\M(TV#\23S^0JTV]T>?7 MP]&$5*E44D^EFG]W_!-2BJ-KK6EWMR]O:ZA;33)U2.4,?TJ]5'+*,HNTE8** M**"0HHHH **** "BBB@ HHHH **** "BBB@ HHHH **** "BBB@ HHHH *** M* "BBB@ HHHH **** "BBB@ HHHH **** "BBB@ HHHH **** "BBB@ HHHH M **** "BBB@ HHHH **** "BBB@ HHHH **** "BBB@ HHHH ***^;3\3_B! M>^()=,TV^$TQG>.&)+2(DX)X^[Z"MJ5&56]NA$YJ&Y])45\ZWGQ*^)7AF[A. MN1;5?E8[FT1 X'7!4#^=>V^#_$]OXN\.6^K01F(OE)(B<[''49[_ /UZ=7#S MIKF>J\A1J*3L;M%%>(_%#XH:YH?BUM*T*[2".WB7SB8D?6?&'QGKOA-](&C7:VXN!+YN8D?.W;C[P..IIOPG^)-UXGEN-)U MN='U%JT5P/Q:\3:KX6\,VU[I M%P()WNEC9C&KY7:QQA@?05:^%OB#4O$O@U-1U6<371N)$+A%3@8QP !4^RE[ M/VG0KG7-RG:45B^+]0N=*\(ZK?V<@CN;>W9XV*@X(]CQ7FOPE\>^(O%/B.ZL M]7O5G@CMC(JB%$PV0.J@41HRE!S6R$YI243V2BO%OB=\5-3TCQ"NC^&[E(VM MQBYE\M9-TA_@ (/3^9]J]*\&IKP\.6\WB.[$^HS#S&41J@B!'"84#)'?W-$J M,H04WU!33DTC?HHK.UW6['P[H]QJFH2;+>%I)'\L5%<>/OB9X4N(I-9$PC<\)=VR[7]@P M _0UU?4JG5J_8Q]O$^CZ*Y+P'X[LO&^EM+$GD7L&!<6Y.=I/\0/=36OXHOKC M3/"NJWUJX2XM[622-B <,%)!P>*YW"2ERO%KH]#\1?%B\UZPM[V&[BM)+A%F=]/10$R-V3MXXS71+!SC MNU]YDJR>R9[I1117(;!17 ?%CQG=^$/#]O\ V;*L>H7@_ M&N1^%WQ/UK7/%?\ 96O7B3)<1'[.1"B8D'./E ZC/Y5O'#SE3=1;&;J14N4] MMHHK'\5W]QI?A/5;ZT<)<6]L\D;%0<,!QP>*Q2N[&C=M38HKYLT+XT>)XM^2?3_ #0+A!;QJ=AX)! !R.OX5](QR++&LB,&1P&4CN#6M:A*DTI$0J*> MPZBOGWQO\8->M_%=Y:Z!?)#86[>2,PH^]EX9LD'O_*O5OAMK=_XA\"V.IZG, M)KN5I0[A N<2,!P !T IU,/.$%.744:BE+E1UE%(Z9\2/B;K)D&F32W9CQO\FQC;;GIG"T4L/*I'F35@G447 M9GTI17AWAWQ#\5KWQ'IUMJ$5U%923H)W>P10(\_-SMXXS7N-35I.F[-I^A49 M\P45\^^,?B;XQTSQQJ6E:;J"K#%<^5#$+:-CVP,E*]7U&WUB\6>.&!70"%$P2V/X0*]<)"J68@ #))[4ZM-TY%^,_C=="^DL/"R(L:-M-Y(H)PB;/NG'([&NM MKGE%QDXOH:)W5PHKP;XA_%?7M,\8W>G:%?)#:6H$39A1]T@^\'G""F]F1&I%RY4=A116=KFD+K MFDSZ>]W1 PVH?]MN@ M^@R:\WBC^(/Q9F+M*VGZ.3CJT<./8=9#^GTKL_#GP1T;2=1>\U2Z;5L/"?@CX7V*:CJDT4MXHRMQ<@,Y;_IFG;KV_.N2U?X\:A/JT47A_ M2T-L'QBX4M)-[ *?E_6N*T?P_P"*?B=KCW$DTLPW?OKR?_5Q#T _H*][\)_# MS0/!=MY\<:S7BKF2]GQD>N!T4?3\Z=14Z>M5\TA1YIZ0T1K:#?77B'0DFUC0 MWL'E'S6UP5<$>N.WT(!JO+I_A3PMYE_+;65FQ.X.RC=]$'7\!7,>)_BG#;&2 MTT-1-*.#??73GDD\*/Y**\JI5C?W4?4X') MZ\J?/7GR0Z]W^B^?W'>:[\6S\T.AVN.WGW _DH_K^524M9LW^O83"OV> I\TN[U_X/Y'"Z%\)Y()([C4]2:.13D)9G!'_ S_ M $%=[:V&D;^B_K M7&V]KJOB+4-D*3WMTYR226/U)/05/M(QT@C9Y9B\9^]Q\^5+III^B_$^A-(U M[3-=@,NG7:3!>&4<,OU!Y%:5>:>%/AG=:=<17]_J,D,ZG(BM6Q^!;O\ 3%>E M]JW@VUJCY[&TJ%*KRX>?,OZ^\****HXPHHHH **** "BBB@ HHHH **** "B MBB@ HHHH **** "BBB@ HHHH **** "BBB@ HHHH **** "BBB@ HHHH *** M* "BBB@ HHHH **** "BBB@ HHHH **** "BBB@ HHHH **** "BBB@ HHHH M **** "BBB@ KY&T?7$\-_$(:O) TZ6UW*QC0X+9W#K^-?7-?*?A*>RMOBK; MS:B\*6BWDID:?&P##=<\=<5W8.W+._8YZ^\35\?_ !&7Q^EAIL%BMA!'-O,M MQ*#\Q&.2!P!D^M>U_#?P_#X<\&6MI%>17AE)G>:$Y1F;^Z?3 %>)L3:A)EQG_EFG)_,[?R->;>%/"/Q$.E M+J'APSVUI>#=NBNUB\S!(!(+ ^M&'ART7*]F] J2O-*U[%[X4ZC)X5^)<^BW M9*I@=22I_0C_@5?2%?(_B;1?%'AC6H+[75D2_F;STG:42%F4CDL">> ME?4OAW6(O$'AZQU6'&VYA5R <[6_B'X'(J<;&]JBZE4'O%GD/[0O^LT#Z3_^ MR5P%UHFH^$K#PYXMT^1A'#]W/:8##JC;CAA[@UK"K[.A!O;K^)$H);7Q9\ M*=)U6UP"]ZJRQYYCD"-N7_/:NI^!_P#R3J/_ *^I?Z5X!K-MJGAV>^\.7I9$ MCN [H?NLR@A77V()KW_X'_\ ).H_^OJ7^E+$4U"A9;7"G)RJ7?8Z/X@?\B!K MG_7H_P#*OG#P3XEF\*C6-0MHF>X:T\J)@,A&9@-Q^G\\5]'_ ! _Y$#7/^O1 M_P"5>'_!C3+76-=U;3KV(26]Q8,CJ?0L.?KWJ<,TJ,G+8JJFYJQ;^#'AFW\0 M>([G6]1F29[%Q(L+'+/*QR'/L,?G7T37RR3JOPE^(C!-SI$W0\"YMR?\!^!% M?3.DZI::WI5MJ-C*)+>X0.C#^1]QT-1C$W)3W3V'0:MR]2[7B?[05_,D&B6" ML1%(997']XC:%_F:]LKRSXX>&;G6?#MKJ=I&TDNFLY=%&28VQDX]MH/TS66% M:5:+9=5-P=BU\$]%M;'P+#J4: W-^[M(YZX5RH'TXS^-=IXET>UUWP[?:=>1 MAXI8FQG^%@,AA[@X->-?"3XEZ?HNFG0-;F^SPHY:VG(^49.2K>G/.?>NM\<_ M%G0]/T&XM]&OHK[4)T,>"Q/3CTK2K2JNN[+J3"<.0\J^$5[+IWQ,L M8%8[;@26\@'0C:3_ #45]!^-_P#D1=<_Z\I?_037BOP/\,W%]XH.O2QL+2R5 M@DA'#RL,8'T!)/X5[5XW_P"1%US_ *\I?_035XIIUU;R)HI^S9\X?#GQE;>" MMVS>8\ZSB-E+YY#$CD\UK^+O"7Q" M32SJ7B7S[BUM/XY;M93'N(!P Q/)Q7LI1A*,.962M;U.%MM.5CZ6TV_@U33+ M:_MFW0W$:R(?8C-9'CO_ )$/7/\ KRD_E7&_ SQ =1\*3:3+(#+ITF$!Z^6W M(_([OTKLO'?_ "(>N?\ 7E)_*O+<.2KR^9UJ7-"Y\OZ-X'I;7P;:Z_.6'VR[:&%3W55R6_$\?A7T-\'/^28 M:7_OS?\ HUJX_P"-NFV^C^"_#VG6B;(+:8QH/8)U/O78?!S_ ))AI?\ OS?^ MC6KGQ%3VE!2\_P#,TIQY:EO(L_%C_DF>L_[B?^C%KPKX>?$%? CW['3#>_:@ M@XG\O;MS_LG/6O=?BQ_R3/6?]Q/_ $8M>/?"35?"^F2ZH?$ALP'$?D_:80_3 M=G'!QVHP]OJ\KJ^NWW!4O[16=CU#P%\4U\<:Y/IHTB5P^E>,?A]%?QQZ7E1>187)$D(C' MRPRKC*CT'0CZGTKU$H-P4M[:'+>24K;'>_ K0+W3-#OM1O(7A6]=?)5Q@LB@ M_-CT)/'TKK_B7_R3C7?^O8_S%3^!_%,/B[PO;:BA47 'EW,8/W)!U_ ]1[&H M/B7_ ,DXUW_KV/\ ,5YTI2E7O+>YTI)4[(\J_9^_Y/^O5?_0Z]0^*-_+I MWPXUB:$D2-&L0([!W"G]":\O_9^_Y/^O5?_0Z]C\8Z(WB/PCJ>DICS+B' M]WGIO!#+^H%:XAI8F[VT(I7=+0\0^!>B6FI>*;N^NHUD-A"&B5N@=CC=^ !_ M.OHNOE7P%XJG^'OBV4W]M((7!@NX2N'7!R"!Z@_IFO?8_B=X-DL_M(UZV5<9 MV-D/]-N,YIXRG-U.9*Z%0E%1L=8J*N=J@9.3@=367XEUJ/P]X%#XRU#7;R^._%M(@D<9S-*&& M[\.3^-7/@GK,FC>,[O0KIMBWBE-I[3(3C]-PJAX;\'?$N#2(KC06N;6SNU$R MB*]2+?D<$C<#T]:YW5M.\1>"O%%K>:M&8M2$@NT=I!)O.[.203GD_2Q1S1-%*BO&PPRL,@CWKE M[?X=^'K;63J*6I/.5MV;,:MZ@?T/%8U(RELSVYKV'3M+T[0;#R+.&.WMT&6.>ONQ/6FZSKFG MZ!8FYOYUC0#Y4'WG/H!WKQ/Q7XZU#Q([0*3;:>#\L"G[WNQ[_3I4>[27F=<8 MXW.9W?NTU]W_ 7_ %H=EXI^*4-OOM-! FEZ&Z8?(O\ N@]?KT^M>67-U>:K M>F:XDEN;F4]3RS&M#P]X8U+Q)=B*SB(B!_>3N,(@^OK[5[5X9\%:7X:C5XD\ M^\Q\US(.?^ C^$5"4ZNKV/2G7P63PY*:YI_C\WT]/P.$\,_"RYN]EUKC&WA/ M(MT/SM]3V_G]*]4T[2[+2;5;:PMD@A'\*CK[D]35NBMXP4=CYC&9A7QJ!I7+D!H\ DY_N5ZI15PJ3A\+L3**EN>76OP'\+P2AYKK4;A0 M?N/(H!_[Y4&O1M,TNRT;3XK'3K:.WMHAA8T''_US[U;HISJSG\3N$81CLCAO M%_POTSQGK"ZCJ&HW\;I$(DCA9 J@$GC*GN378:=80:7IMK86PQ!;1+$@/7"C M'/O5FBDYRDE%O1#44G=',^,_ ^F^-[.VM]0EGA^SR%TD@*AN1@CD'CI^56?" M?A>W\(:*-*M+JYN(%D9U-P02N>H& .,\_C6[11[27+R7T#E5[]3DO&GP_P!- M\<-9F_NKN#[('"?9RHSNQG.0?2MS0=&@\/Z'::3;2220VJ;$>3&XC.>< #O6 MC10YR<5%O1!RJ]SC?&7PUT7QK>07=[)<6]Q$A0R6Y4%U[!L@].:$2-)NF(+9/T %;E%#J2<>1O07*KW*.LZ7#K>C7>F3NZ1749C= MH\;@#Z9KE_!WPRTKP7JJG(/'>I/!W@VW\%V4UG9ZA>W-M(^\1W)4 MA&[E< 8S72T4>TER\E]!H-+14%'G6O_!CPQK5R]S )M.E< MY86Q&PG_ '2,#\,5GZ=\!O#UK<++>7M[>*/^61(13]<<_K7JM%;+$54K*1'L MX7O8K6%A::7916=C;QV]M$NU(XQ@ 4S5M.BUC2+O3IW=(KJ)HG9,;@",<9JY M165W>Y=NAQ/@[X9:5X+U.6_L;R]FDEB\HK.5( R#V4>E=M113G.4W>3$HJ*L M@KG_ !?X3MO&.D)IMY=W5O )1(WV"_AYIG@>:\EL+N[G M-TJJXN"IQM)QC 'K70R:18RZU#J[P*;V&%H$D[A6()'Z?J:O44I3E)\S>H** M2LCF?&?@BP\;V=M:W]S%= M]'LY9I8("Q5Y MB"QW,6.< #J:V**.>7+RWT#E5[F7XCT*W\2Z#=:1=2RQPW 9XB-PP0>,@CM M7G?_ H'PY_T%-5_[ZC_ /B*]8HJH5IP5HNPI0C+='F&G? [0--U*UOHM2U- MI+>5955FCP2IR,_+[5Z?112G4E/XG<(Q4=CSW4OA#HNI^*)=?EO[];F2X%P8 MT9-FX$''WP*$5? MS./\&?#RQ\$7%Q)I^HW\T=PH5X9V0ID'AN%'/4?C6_KNCP>(-#N])N9)(X;J M/8[1XW >V016C12E.4IHU%)61QO@SX;Z7X(O;FZL+N\G>XC$;"\7-YU];&*[Q@7,!VN?KV;\17&K^S_ *-Y MF6UF_*>@1 ?SQ_2O7J*TC7J15DR73BW=HQO#/AG3_">CKIFFB3R0Q*+0>8?*NXQB*<=O8CN*\_T+X6:A-JCC5RL M-G"^#Y;9,W^[Z#WKV.BHE3C)W9Z.'S7$X>DZ5.6C_#T,BT@?3;J.PLK*.'3T M "[%P,8ZY]#M5OXK&R\06ZN=,DT*&_A:.*T#)>G MENK-D'OD#';Z@ ^F**\3^(/BO4?MGB&Y\.ZOKXDT7RUF$*6ZV<#\ AMWSOD@ M] >?:IUU7Q)XG\:7^G1>([O3+5-"@O\ 9:HA_>,BDX+ D#+=N: /4KSQ#IEA MKNGZ+X\7>()X?A[XB2$ZIK26FH[5(Y MD*[T#$#KA1DCOCWKW#X>79U'P3IVH/K$VJRW2>;+<2@*0Y^\@4<*%((Q[4 = M16!XB\9Z%X5EM8=5NG2>ZSY,,4+RNX'4[4!.!7F.K^(/$6J3>/-4B\27.ECP MU+Y=G9PJFQ]N>9 P);?CCZ_A4-S'?^*/B3X&OI=4OM/N-2T1K@FVV P'RR6" M;E/#'KG/6@#V^"9+FWBGB),GYYK5C\0^)/#OC&U6XUNYU:&]\/2ZF] MO/&BJLJHS (% P/E _$T >S5#=W4%C9SWEU((K>"-I99&Z*JC)/X 5XOX'UO MQSJESX>UC?JEW:7TS#4#<2VWV4QDD PHIWJ5QTZG%/\ "E_XLUOPKK_B"^\2 M2&UTX7\4-H(5)D81MAG;T7(P,=J /7]*U2RUO3+?4M.N%N+.X7=%*H(##..A MY'2KE>'V/B+7-4T_X>>'HM8ETQ-7MI9;J]@1%D;8"51.,+TQP.X_'HO$M]-I MT>A^&(/$7B"^U><3,K::MN)IU4GEW?"J%P1QR<'- 'IU\&RRZOS6WFR!0[*N,;MO!/., MCT[UYEKNI:SI7B/XI7.FZ=97EK_H\=Y]HR6C5D90R*.&QDDY/&![T ?0EM

\-^,K#1SXCN=9MM3T66\=K@(3!(J,P="H&%)7 !SU[T >O.ZQHSNP5 M%!+,QP /4T1R)+&LD;JZ, RLIR"#T(->!I_PE6N_!*_\3:KXJN7BDL)8TLX8 MU4.HD*DR-C))P1QCCOUKHVTWQ9;_ MT >&=6O;V69;>>X3S8EG6W,0S' Q7 M QVSD^YZ4 >MU@:_XV\-^%YHX-9U>"UFD&Y8CEGQZ[5!('O6;\.-;AUGP_.J MWNJ7-Q:73V]PNJ*@GA<8RC% <>MV M/+S^% 'H,7B/19]"_MN/5+1M+"[C=^:!&!G')['/&/7BET3Q!I7B2Q:]T>]C MO+99#$9(\X# D<_4?G7G7PDM[>ZO/',4,,4N@OK+_94VAHFY.[:.F,;/TJS M\'"T'A/Q"T$'F-'K=V8X5(7<0$PHSP/2@#T'5M8T[0M/>_U2\AM+5,!I96P, MGH!ZGV%9VB^-?#?B*UNKG2M8MKB*T7=<-DIY2X)W,& ('!YZ<55BU]I=(OKW MQ;H(T6RL]LFZ]GBG5^O(V$X((&.Y)&*YCP)9G6?$VO>/+RU2PT[4;<6]I;S M*9+=<9ED'0;MHQGMGM@D ZK1_B!X4U_5/[-TO7+:YO,$B)<@MCD[20 W'/&: MV=5U6QT339M1U*Y2VLX0#)*^<+D@#I[D5Y/KPGTSXO>$;O4)+"]TV6:6WTNW ML0(GMM^ '<#.\ $=P..@[]1\9_\ DDFO?[D/_HY* .FN_$VBV.AQ:U_TF8Y/E\@RPD^Q;5%DDSL0L 6QUP.^*COKZVTRPGOKR98;:W0R2R-T50,DUXO>VNM:Q\3O M!JZKJ][IU_C*1D&K%>'Z1>:W=ZAX"\.:?KMUIEG=^'$EF M-NB,Q*J>1N!P> ,U2M?&WB;_ (12UTM];D6XN/%#Z.VJR(IDC@&SGGC=\QY/ M8?C0![[17E7BV[UOPKI>B:':>)[NXDU76$M)=3N%C:6VC8#* @8SSG)Y_2N= MUWQ5XD\.67CW18==NKW^R([.6TOY0IFB,CQAD8@8/#$=.QH ]WHKQB,>*W^( M.G^'F\:ZCY&J:.+Z6588@T;9/$8VX4%[/[;=RW6H:G<6 ML]U;^6MP\<97"*SX4,=^,G^[^8!]!T5Q?P[E\2FWU2V\0QW0CAN?]"DO)(GG M,1&=LAC)!(]?>N6UO5ML4GMX[<(/.A^(_%FC>%+>";5[HP_:)/+A1(VD>1O0*H)-:-A?0:EI\%];%S!.@D0NA M0X/J& (_&O";^ZU/QC2!'M&@DNG(#@%"I0,%4 M"9")_EW'R\'YMO.?3!HOOB!X3TW63I-YKMI#>A@C1LQPC'LS8VJ?8D5Y]X>E MO_AWK'AOP_J5GH6I6%Y*UM8ZC8IMN4)_B<'KG=@D'H>2>_&ZB-0O/!_C/5[" M:T3PQ=:V7N[*9A]K.'0LR.1A2QQA2#@=,]P#Z.U#4;+2K"6^U"ZBMK6(9DFE M8*JCIU/OQ63X?\;>&_%,\T&BZM!=S0C<\:Y5@.F<, 2/<<(-)\-V*WNL7L=G;-((EDDS@L02!P/0'\JJZ)XS\.>)'FC MTC6+6[DA7?(B-AE7UP<''O7&?'3S#X5T7R2@E_MNWV>8,KNVOC..U9>DC4;3 MX\1_\)"=/EU&XT=A;MI0*1(H))\Q6RV3@X.?3\ #T"/Q]X9GL]-O(=366WU* MZ^QVKI$Y$DV<;>G'/)@"P4+TD/8 "EU'4;K2O"7Q.N[*7RYU\28#%0W64= MB"* /H=&5T5U(*L,@CN*6O)]8U36]>^(&N:)%XAN=%L]'TM+J+[,$!F=E#%W M+ Y49P0/2L+2?%WBGQ7=> ;7^VI]-?5K:\%W+;Q(3(8M^' 8$ D)^!.10![K M574M2L]'TZ?4-0G6"T@7=)*V<*,X[5YCX+U?Q3=Z=K.GC7K:2?3/$+68NM37 M)E@!P4&,?.3T^I'ICI?BS_R2SQ!_U[C_ -"6@"WI?Q%\(ZWJ4.G:;KEO<7H] :CA^)O@J>]%FGB*S$Y?RPKDJ-V<8R0!5#X>1^)%T31FU&YT M5],.G1>2EM#(LX^1=NYBQ!XZX'6O+?"GAOQ#XR^'VI:!96VEQ:9/J\C27]Q( MQEB*LI.U O7@\>>%_#%VEIK.LP6MPZ[A$0SL!V)"@X'UK9L+ M^TU2PAOK&=)[6==\HKS+5_">L:'XMU'Q-X6U?29[AK6.*]LM4&+_ 99:NED+,ONC:!?NJ5)!V^W']* .GKG?$'C MC0/#%];V6IW*/$MYH7B[Q;'XDN+"71 M-4-I;::BIY.Q75<2 C+$[CSGJ#^&@;*[UOXXZ9QS7$-O;/1T:+S%+LJMM\P $Y0\8/N*/'.AQ>)?!FI:/-?K8I9TY^]U]\>U>E?$70+CQ;X?@AT MFXLY+O3M0BNO)G?]W*R9S$^,XSNZ'^M &YX?\6:#XJBEET34X;Q82!($R&3/ M3*D C//..U3?\)%I!\0?V"+^(ZKY?FFU!)8+ZGL*\@T_5=?A^*WB/5(M%M7U M"UT())8:=*95:8R+Y:NV!EL%);G2_BWHDM[HNM'5;RSD:_DN(%5 MY)9'P9 -W$2C ]@O2@#Z%HHHH **** "BBB@ HHHH **** "BBB@ HHHH ** M** "BBB@ HHHH **** "BBB@ HHHH **** "BBB@ HHHH **** "BBB@ HHH MH **** "BBB@ HHHH **** "BBB@ HHHH **** "BL#QQJ-WI'@?6M1L9?*N M[:TDDBDVAMK <'!R#^->:^%/'&N7'B3PI:1^*(?$*ZK;F34;1;6-6L#L#$ED M Q@DC!]/>@#VFBN(M?BCHUW?V\<=GJ(L+F]^P0:FT2_9Y9^0%!W;L$@@';BG M_P#"SM%_X1J76OLU_B+4/[-:T\M//^T9 V ;L=\]>E '775K#?6<]I M-HY$/1E88(_(US6G_#3P9I=]%>V?AZSCN(6#1N06VL.A )(R/6J>H_%#1]-O MKZ)K+4IK/3IUM[[4(8E,%M(Q VL2P8X) . <5!JOQ8TK2[K5X!H^M78TAU6\ MEMK=6CC!&=VXN./KS0!L7_P]\):IJ-SJ%[H=M-PCCN9+9;1Y 3DQ* G7H !67!\0-'N;W4+:&.Z)#*D()!=\N%'((')R: M-FR\&^'M.DTV2TTN&)M,$@LRI;]SYF=^.>^3U]:N:1H6F:!!-!I5FEK#-*9G MCC)VESU(&<#IVI- UVQ\2Z':ZQIKL]KN&&"001V(((_"O*[/Q9K7B2P MO/$]SXU@\+Z/]N>TTZ$VLA:KX \*:WJO]IZEH=K<7 MAQND8$;\=-P!PWX@UJ2:'IDNK6FJO9QF^M(VB@F&08T(P0!TQ7,ZA\3='TW6 MH]%2VU+4;Y[:*>$65N)//5^A7!]/F)( I)/BAHT>H2Q"SU%["&]&GRZFL2_ M9DG)QM)W;L9(&0N* .IU?1]/U[39-.U2V6YLY2"\3$@-@@C.#Z@&F:MH&E:Y MIJZ?J5E'<6B,K+$V0%*]",8QBN7OOBKH.G:3?:A<6]^HLM2?3)8!$ID\Q06+ M ;L;, G.>@/%;VG^*+#4_$NH:':I,\]A#%+--@>5B094 YSDCGI0 /X0T"2T MU.U?3(C!JDOG7J$MB9\YR>?7TJP/#ND#4[74?L,?VRTM_LT$O.4B_N]<8YKC M_B1JOB/0;[0;[3-82#3[G4K:QFLQ:HS/O9BS>8V<# P /7-6_B/=W^E:;_: MB>*IM$L(4*E+?3UN'EEY*\D' X] /4B@#2T_X>>$=*U==5L="M(+U6+)(@/R M$]U7.!^ K2LO#>CZ=I5UI=I8QQ65T7::%2<.7&&SSW%>>VGC+7[GPEX,>]U6 MQT^?6&F%WJ@6-XXPBLR#D[ S8 ([$$8!I?#OQ*74#I=[KFI0Z?;PV.;E0N!< MW#\C P3M6-1(<<#S5S0!VE]X'\,:CHUIHUYI%M+8VF?LT+9S'Z[3GN1 M+N4J5C,8+#C!RV/QJM\4]8U#1=!TN?3;J2VEEU:WA=DZLC%LK]#B@#J='T+2 M_#]F]II-E%:6[R-*8XAA=QQDX[=!42>&M&2?5)ET^+S-54+?$Y/G@ KAA]"1 M^-<]JGQ/T?2[_4(&LM2N+7394BO[Z"%6AMG8@88E@QQGG:#BLWQM\2(K.R\0 MZ7HMIJ=S?V%D7EO;2)6BM'9"4+,3^/ /Z&@#IKOP)X7OM%M='NM&MY;"T)-O M$Q;,63D[6SN'YUS?B?X76.H0>'-.TBQL;?2;#4?M-Y;.6'FQG 8# )+$#N1] M:UK75+Y_@Y%JS7+F_.@BY,_\7F^1NW?7/-8'@GXF)/I7AW3]8LM7^W:A;8AO MIX%$5W*HR0K;NIZ D &@#LM,\&>'-'TNZTRQT>VBL[O/VB(KO$O^\6R3^-1Z M-X%\,>'VN&TO1[>W>XC,4KC@?V%!80KI>QH_LI&Y"K$EASZDFL5?AEX,33OL"Z# +;S?.V!WR' MQC(.[(XXZUQEAXR\3-\*?%6I+??;KS3;R2VL-2BMU!N45U ?8 5/4\XQ^6:L MZ9XPN8/#_B+4+;Q=+K]_I]BTPL+G31:M$P&0Y7:K,OZ4 >C:+H.E>';#[#I% MC%9VVXN4C'WF/4DGDG@F>X]CDS2[M2X?RW) W#H>#61IWPY\(:5+-)9:#:Q--"T M$GWF#QMPRD$D8-9:_%?1IX=&:QTW5KZ35X))[6&V@5G^0E65@6&""#[<=:1_ MB[X)H1YEO,HR5==WICID\B@#8T7X?^%/#VH?;]*T.V MM[O! E&69<]=NXG;^&*V=5TJQUO3)M.U*V6YLY@!)$^<-@@CI[@5R5Q\3[&$ MVL$>A:[/J$]LUVUA':@3P0JQ7?(I8!1ZBKFF?$70]6U#0[2T%RPUJ" M2:TG9 $)CSOC/.0XP>,8]Z -?5O#&BZ[IT%AJ>G0W5K;LK11OGY"!@8(YZ53 MUSP)X7\27J7FKZ-;75RJA1*V58@= 2",CZUE?\+1T:2P2YMK/4;AY[^2PM(( MHE+W3I]YD^;&P9ZDCZ4R7XJZ)#86UP]CJAFFU!M-:T2W#317"C)1E#<]L;2< MYH V=6\#>&-*Q01VRX*^4@ &T8(XX''2M>[TZTOM,ETVY@62S MEB,+Q'.&0C&/RK@9/C+I$-I>W$N@>(4&GS"*]#6B_P"C9( +G?@9ST!S6KJ_ MQ*TK2[ZXM8;'4=1-G;+=WDEE$K+;1,-P+[F'\/.!DXH W+;POHEI>6%Y!I\4 M=Q86_P!EM7!.8HL8VCGIS5>3P3X:ETFZTN31[=[*ZN#=31,"0TIQE\YR#QU& M*Q+[XIZ1;7TEI::9J^IR)91WX:RMPZF%UW!LEAC@CKC\:S;WXL;]6\*II&BW MU[9:S#-.VV)?-8*I^2,%P-RL/FSQCIF@#J8O /A6'09-#30[4:;))YKP$$Y? M&-V2GBPTQK#6M7U%])AU M:VB$R(P M&6(#84YY(Z#. 3Q0!UHT#2UU:WU46:"^M[?[-%-DY2+^Z.<8YK/D\">%Y=#_ M +%DT6V?3O-,PA8$A7/5@O,/!?Q(UNXNM8LM>F#+-)=#2;ORU4;X0=T1P "0"K#/7GK0!ZCH7AO1 M_#-F]IHUA%9P.V]UCS\S=,DG)-4M<\#>&?$EZEYJ^CV]UG\Z-9^+*166@W. MC:3>7/\ :&I"SGCDA >(J2'BQO'[WICG;[T =Q+X=TB:;3)7T^'?I>?L6T;1 M!D ?*!QT 'X5>N;>&\M9;:YB2:"9#')&XRKJ1@@CN"*HWE_-_P (Q<:A'%+: MS_8VF6.91OB;82 PY&0>O45P7AOXG&#PKX7&L6^I:GK&L032)]BMD8N8V.1M M!7'&.@QP2<4 ='H7PW\,>'-=N=7T_388YY2OE KD6^%P=F>F>I^OI4MS\.?! M]YJ[:K<>'[*2\9_,9RIPS>I7.TGZBN7U?XOHOARSU+1]'OGEEU4:;-#0Y\N5&;*Y!!ZGT)%95W\6_#MM'I3QPZC=_VK;-<6BVUOO9R#M\O;G. M_((QC'!YI]]\4M*L)KI&TO5IH[".)]1FB@4K9>8 0KY8$L,\A0<6RR"58W) # $ \$=B?SJIH7@OPWX:FEFT?1[:TEE78\B EBO MIDY./:LRY^(NGIXDDT.PTS4]4N88XY9GLHD98UD *GYF!/!!X!JKI_CZ\O?B M5JOAG^Q+S[+9B)!.L:Y1FR2[G?PA&-N!GUH W8/!?ARVL]/LX=*A2WT^X^U6 MJ MB*7.=PYZY]:)_!?AVYL]0M)M*A>#4;C[3=H2V)90<9P.1S534OB[I&FR:J#H^MSQ:5=&VO)X; M93'$0<;MV_H3^/M0!T.N>!_#7B6XBN-7TB"ZFB78LC95MO\ =)4C(]C5M?#6 MBI>Z;>1Z= D^FQM%9L@VB!&&TA0.,8.*P]1^(VGVFL_V58:7JVKW*0)<3C3K M<2"%' *ELL.2"#@=JBUKXG:5HVI7]F-.U2^&FJCZA/9P*\=J&Y&\EASCDXSW M]#0!:U?X>Z)J<"P1VZ6L;ZHFIW.Q26FE7)/)/RDD\D=LCOD=%J6FV>L:=/I^ MH0+/:3KMDB;.&&<]JY#4OBGH]C>R6EMIVK:DZ6*:ANL;<.I@89#9+# QSSBC M2?BGH^K:KI-E'IVK6\>K*QL[JYMPD4I4990=V>.F<8SW[T 7]-^&_@_1]1@U M#3]"MX+N!MTFZ!:/:Z7:):P22M,R(3@NW4\_05S%A\4- M&U"_M(XK/45L+V[-E::D\2BWGF&1M4[MW)! )7!Q4_Q'\8W/@OPZE]9V#74\ MLZ0H2N8TRPSN^8')&0,=\9XH L:Q\.?".OZB^H:GH5M/=N07ERRE\#'.TC/ M[UT%C8VFF645E8VT5M:PKMCBB4*JCV KE]0^(-KIYTZV;1=8EU6_1Y(],CA0 MW"(I(+.-^T#CCYN:V?#/B33_ !9HD6JZ:TGDNS(R2KM>-U."K#L10!1O?A]X M3U'63JUWH5I->LP=I&4X=AW9<[6/N0:UCHNG'7%UHVB?VDL'V87&3N$><[?3 M&>:\KL/%&IZI\2;Q+_Q3:Z#%? 6@>#WNI-+LHTFN)'8RE075&;(C!Z[1P,>PS6/\2O%V MHZ/I\^F^'2IUD6DM[)*5#+:V\8+,[ @C+$;5!')/M72>$K^XU+P7HFH7LOF7 M-S803328"[G:,%C@<#DF@"M8> ?"FEZR=7L="LX+_)82JOW2>I4=%/T J:7P M9X=FL=3LI-+A-MJ<_P!HO(\L!-)D'<>?4 \5PJ^.]:U7XGZ!%I\JQ>%KV:YM MHSL4F\:&,EI 2,A-Q &#SM-=)\5==U'PW\.]1U32;C[/>PM$$DV*V-TBJ>&! M'0F@#>T'PSHOABT>UT73H;*)VW.(QRY]23R?Q-32:-ITNMPZR]JC:C#"8(Y\ MGO,O!OC/4[_XAV^C6_BA/$>F2V+3W$C6:0-;..@!4#=DX'?K52U\ M8:KBO&+;QAJJ^']4N+O M7;V!X_$4D5M',WE<8BPQ4!>O/)'H:[#6?BAI&C:EJ%I_9^J7L>F;/[0NK M2 /%:[N@8E@3[X!Q0!V]9>H>)-&TK4;?3[[48(+NXQY<3M@G)VC/H">!GJ>* MYK4OBEI-CJ-S96NF:MJ4L%HEZ6L;=70PNNX-DL,#!'7'MFL_4+C4/&\NB:CI M6CBX\-W*17-PYFCAFF9'RD;YR=B,-Q ZGC..H!Z31110 4444 %%%% !1110 M 4444 %%%% !1110 4444 %%%% !1110 4444 %%%% !1110 4444 %%%% ! M1110 4444 %%%% !1110 4444 %%%% !1110 4444 %%%% &/XKT>7Q!X3U3 M2()$BEO+9X4=\[5)&,G%)M5O;:'P]>V MFI7373'5+622: LO;^.HDO+91XBV?9^&_<[5(^;CW[5 MZ)7#7OQ$E/B'4='T/PWJ&LOIA5;V6!XT6-F&0HW'YCP?RH PW^&WB.UOY)=+ MU73$BO-#BTJ[-Q"[LNR,(6C ('.._3/0U3N/@]>B'0)XI-&O;O3]/^P3V^HP MN\$@#,P==I# C<:]7-_!%9PW%VZV8D4';<.JE21G:><9^AJ83PF7RA*AD*[M M@89V^N/2@#,\,:0="\/6NG-%91/$&+)91&.$$L6.U220.>YKSVX^&7B6RTO6 M/#NB:MI?_"/:G*\FR]@9[J!8HVVNYD 53Z$]C2_ M:[;9&_VB+;+S&=XP_P!/6@#D- \$7&B^-/[9:[AEMUT:'354*0Y:/;\WH =O M3-Z?/?&Z$U_:R-=1*6!**0P4X[$_7VKT35_%&CZ)H< MVL7E]%]BB(5I(F#Y8D# QU.3TJC=^,[6V\9:9H"Q))'?6LMS]L$PV1A,Y&,< M].N: .]]X^U'5YKN'^Q[V-V:SVG<)G@,);TQAF/U-:GPX\%WOA#3[[^ MU+V&]U"[E0O-$"!Y<<:H@YYR,'\Z[*&:*XB66&5)8VY5T8,#]"*XW4/B"PUZ M^TC0O#]_K[*C')"5+89P.!U/TH YKP=X*M_"_ M@V'0KEHM1VNTLIEB&QG8YX4YP!6"WP_UB&.RO[2[T_\ M@&^LQ:"[-U +8])O,&S_OKI2M>VJVOVIKF$6^,^:9!L_/ MI0!4\/Z2N@^'=-TE93,+*VC@\PC&_:H&<=NG2LCQWX7N?%FDV%I;7$4+6VH0 MW;-+G!5,Y QWYKI#=6ZVWVDSQ"WQN\TN-N/7/3%-2\M91$8[F%Q-GRRL@._' M7'K0!Y9J/PENF\4:MJ%I%X>O;74K@W+?VK:R22V[-RP3:P!&G&ZMPD;F>()(0$;>,,3T ]:07ELUT;47$)N ,F(.- MX'KCK0!X_P##_2K/5OBKK>MZ7<&Y\/V,DDMB^PJ@N;A4\W9D=@I'XBNY^(.@ M^(?$NAKIFA:G;V"3,1=M*&W21_W 5Y /.?;\:U_$GB+3_"F@W&KZD[+;0 ?* M@RSL3@*H[DFN?L/B&S:UI^F:YX>U#1'U/(L9;ED=)6'.T[3\C;R54'YPX9LDGU![DG-1^'/".LQ^,;KQ7XEOK&: M_DLQ8Q06$3+$D>[<22QR3D?YXQV)O+41M(;F$(C;&;>,!O0GUI)+VTAG2"2Y MA29_NQM( S?0=30!Q7B#X?-KC:N$:SLXY+>*'3EBC^6,B199&=0!R[H@.,_* M@^E;/A?0;[2[K6-1U.:W>^U2Y6:1+4-Y486-44#=R3AWD X.Y" Q'JN3UZ&@#B==^&FH: MM)XY:*^M4'B(6@@W!OW7DXSNX[XXQ6P/!=V/'$6O?:H/)30?[+,>#NW[]V[T MQ^M=9%?6%V_AC7 MO"?BWP'HFGSZ?+J=I8WV)9U\(ZZ/&C^*/#5]8175Q8?8;B&_CZ[ MKMCX;T*YUC5)#%:VR;GVC)))P%'J22 /K7,6?Q(_XF6F6VM>'=1T>#56"6-S M<,C+(Q^ZK!22A.1@&@#'U7X1_:/"?A?3K*6Q>[T+<2EY$SV]R9,&3GPR1QNB@#:-Q)+<=3BO13?V:N$-W '9S&%,@R M6_N_7VITUY;6SQI/<0Q/(<(KN%+'VSUH \[U'X;7][IGCBU2^ME;Q#<1S0$A ML1!2"0W'MVK/U;X37DOB*75K1-!OOM5M!%/#JUO(XB>- FZ,H1U"C@UZI)=V MT)<2W$2%!N8,X&T>I]!2?;;3[4+7[3#]H/\ RR\P;_RZT <38> ;FQ\1ZCJ* MSV:6]SHD>F1PPHRB-E4#('.%XX&2:R(/AKK^E:?X-ETO4=-.J>'EN$/VE',, MHFR"?EPW -=W;>*-*O=3U/3;2Y6:]T[:)HE(&6*[@%)X)P.?3O2Z#KZZOHEI MJ%W;'39;@.?LUQ(I=0I(/(Z\#/XT 0^*=$NO$7@O4-&$T,=W=VWE&0@[ QQD M^N*PM&\"WFF>*[;5Y+N!XHO#T>DE%!W&12"6Z?=X^M=HEY:R6INDN86MP"3* ML@*<=>>E);W]G=L5MKN"8@9(CD#8'KQ0!@_#_P ,W'@_P38:'=3Q3S6QDW21 M9VG=(S#&>>C5S4/PL:3P)JF@WEY%]LFU&74+.ZA!'V>1L%#Z]B#CL3766GBJ MWO/&VH^&%MY5N+*V2X>8D;P!WSS6S<7=M:('N;B*%"?#C4V\.:+%IS:)8:IIFI MC45CM[>1+5V'8C);TY[X[5Z0)X3*(A*AD*[P@89V^N/2F->VB0O,UU"L4;;7 MQH J/:7][X;EL[Z2W^WSVK12O"&$6]E(R .V[G->BBZMRL3">+;+_ *L[QA_IZU$^I6,4:227 MMLB.<(S2J QSC@YYH \UN/A;JC^'M0M(-2LUO7\1MKELSJQC]D?OZ]*7Q%\- MM9U[6K+Q!(KB\CTY)[FWN9& MNI[&X>W V-(JF1''7 *+G'^W[4 :UH?">O:;\1KOQ#IU_826.HQV\=['=1OYH$:A:^@:-5+@\[%9@7 SUH T?&_A:Y\4QZ&M MM<10_P!G:M#?OYF?F5-V5&._-<_=?#;4+C0?&VGK?6PD\07QN8&(;$2[@<-Q MUX[5I77Q!N/^$IU70-+\,:AJ<^F>7Y[PS1(HWJ&7[[#W_*H_$GQ&O/"VGC4- M0\):FMF(XVDF$T)$;/@;#\V203CCB@"I'X(\3:'XDNM7\.:EI:G4+2W@NX[Z M&1MC1($#IM(SP.AJ#5_AYXA>_P#$HT;5-.CL/$B*+T74+F2$[2K&/!P<@GKT MS[5O7'C:^L/#ESJ]_P"$M7A,+X^SH8Y'*[2QD)5L*@QR3[<5N^'=:B\1^'K' M6((GBBO(A*L;D;E!['% ''V/PWFTS6+V>VO(C:2^'TT>%7!WAE =NV..U16 M?PWOH+?P-%)>VS#P]YWVC ;]Z' 'R\?SK2UCX@R:=XJN] L?#NH:I+_"SZ9:74=M.PE>WDL_M0OUD4QYW8V8SG/?- '+7WA/Q9/KNE>*8+W15U^VMI+2XB:*7[ M+)&S$KMYW C/X^U;G@3PHW@_PX;":Z%U=33R75Q*J[5:1SSM'8# %=!'>6LT M\D$5S"\T?WXU<%E^H[5))(D,;22.J(HRS,< #W- 'F/BGPAXO\7WZZ)JESI! MT1I#XU[7?#-_!<11II-X;B57SEQ MC&!CO]:OZ_XFL="\+WNO,ZW-M;1EP(7!\P] H/3DU'X2UV_\1:.-0OM+BT_> M08DCO%N-RE0.HI?'@\*R M:1J%O,TF:%-I&H-]OG2".]VJ(-S'3H77?O4J2[.2> 3 MQ_DYNE_"[4;#1_"]D]_:L^CZNVH2LH;#H6SM7CK]:W+3XG:1._6O:Z* / M?$MCXCN-;\.ZAXIMF:%M$$4K-I)OXXKDL=X:)2-KE.?:O<:* /GW5O">JZ-X8\#&>WEEM M$>>[U7-B;P)<2@,K2P@C?C)7VQ^!?#X3\^+PA:&"\U'2Y==N)I$FTR2U2&)U M3*B,D[8\YQG Y(KW^B@#YWUSPA.OAKQ_:6.@RF*WU>&>QACMB<)G#F(8Z;># MM[5T4FBZ+XE^(7A0VGAR1/#JV5R&@FL&AB5LDC*D #+<\]:]FHH \]^#MA<: M9X4U"TGMIK98]5N1#'*A7$>1C /;K6)H&IR_#WQ5XLM=8TG59HM2U%[ZSN;. MT:=9E?)V97HPXX/O^/KM% 'C'BI+>Y\>G6/$V@:C>Z+=:&$L(6LGE,$[')1D M .R3KSV]>.,OP[X0U"ZU;X?6/BC2IKF&'3KH7"7$19(QN9HD?L"!MX/ICM7O M=% 'SU;^'(!X'-IJ2ZCIZVGB&ZFLU_LJ2[@V@+@218.4.3@_7KS1J=OKM_X9 M\(75UX?73M+L[RZ^TV]OI32P\X\N9K7(.TDOP>F<]P*^A:* /G^?0)[7PIHK MF'4M4\.IK[W=]:#3)+?9$P7 6 DDQ [CZ?-TK8U>73;'7? NN:+X>U&UT.RN MKT2QQ:=(K*TB* WEXSACG''8^E>T44 ?.-WH5S>^#]5U&X\/7CM'XR>\,4MF M3,+9@N_Y<9(.%!QQQ[5VRV%IJWQ*\-S:?H\\&A2:+

6UFT*(I9QM*D#;GG M [@Y[UZQ10!X9X-T;6;KQ+H7AC4K.Z6P\*7%W.+B6)A'<'=B JQX.-Q(QV%8 MWA3P]?\ ]N:=!JQO;/7;;6?M,LB:$\DDIW\EKH-@Q,#SG@>_?Z,HH X3XN:% MJ.N^"0NEV[7-U9W<5X+=>LH0G*CU.#G'?%C17,4FEZ@M M_?M=Q^2;<(1^[PW)8G(P/;WQ[/6'JW@[PYKM[%>ZEH]K<7<3*R3E-L@(.1\P MP2!Z&@#PS54OXO!_BWPY_8NK/?S>)'O%,=D[1^273#;P,<[>,?7I4_Q)BOM; MU#Q0H\/+;W]M/$+1X-'EEN+E%*CS?M .U!@#C'M[U]$44 >2:5X/M=<^+WBB M]US39I[:*.RDMO.#"&200@%L='*X([XR:YK1M'FL_"'C70M.T"ZM?$S2W/DS M)8E-]KO3]VDN,$$ X4'GM7T!10!\]Z)H9DTC6[BR%W'./#5Q:RV<6@26:.VS M@,Q8B27)ZX)/->G?"_PQ9:!X.TZY2TDAU*]LX&O'F+&1F"\*0>@7. .,"NVH MH \#\7:4#KWCF/6]!OM0U/4$B&A7$=H\P "D (X!"$'&>G0_CN6GA)Y_B7X8 M?7-(CNY$\/)]NGEMQ(C7*8&6;&"XQP>O%>P44 <1\6?#]_XE^'E]8Z9&9;M& M29(1UDVL"5'OC./<5R_B74Y_B3<>&=)TK1]4MGMM1BOK^6[M'A6U5 E>OT4 ?,VH6NG7\'CVRCT.ZOO$4^ORKI\T%H[F/]Z"<2 83')(R."*U M?%>@ZE)XSUA/$*SM%=V%O#:70T9]0Z1@.(RK#RWWY.>_7CO[=HGAS3] EU*2 MQ60-J-V]Y<;WW9D;KCT'M6M0!XUIW@N/5_B?$FNVUY>V5MH%KB6XC>)9YDVC M+C/WN2=I)P?I7,:O%J&KZ_'?KX>&GZG!XBC9X[71Y1*(P_\ K7N&=3T46% MQ;6L_C)_LL1@=HVB5_P"7'KVWB3PIIOBF&U2_^T1RVDOG6UQ;3-%+"_JK"F^'O"6E M^&GNYK,7$UY>,&N;N[G:::; P-S-V'I0!PDNJ#PU\:]>U*^L-3>SN-/@BBEM MK*2968!21E0?2L3QR\^N^,M*UR2TNCX?DTUX8C=:+)=K%-YC!MT&5*L0!ACV MQCU'N=% 'ALVE:CX-T?P9XETV+4=4EL(;BQG5[)XYGA?>T0:+)90IX_*L_5? M">K:1X6\#M/;RRVJRSWFK9L3>!+B4!E:6$$;L9*^V/P/T%10!\_R>$Y+G1?# M%C$=2NM/N/$CROC3Y+/[/"X&X*N24C^]@Y'4U>\>Z5##JLOART\,6T.GVVDL M+"Y&DRWLDKDL?+C<'$>"2=QZ'GN*]RHH ^;-4BN[N3PAIUW92RS6OAW+PW=A M+> %R4SY2?,K+@?,>X7TJQ=:9;#0_!4NBS/J7ARR%PEU<'26N56Y/\4MOD$] M< G.,#KW]DUOP+I6N:RNKM<:C8Z@(?L[7%A=M TD><[6QU&?\\"M70M!TWPW MI,6F:5;""UBR0N2Q))R22>22>YH Y'X<^&+6W\,6YEEN;F-)Y7A6YLFM=JF1 M9% C8DA5= R\]ZZK4M+L0+K4)(Y@PAD:06^=[DH%W#'.\*NT$<\_2M:F30QW M$$D,JAXY%*.I[@C!% &'X-FT^\\%:9)I4EXUC)!^Y>[8F;;DCYB>_P#D<5YY M\/M>E\ ^'F\*ZSH.M-J-K=2"/[)8O*ERK-D.K#C'/<]J]>M[>&UMX[>WB2*& M)0D<:+A54# '85)0!X9?V]M;?%GQ;=:NGB>WMKC[-]FETA+A1+B(;LF,8^Q<$ M *1P<>E>O44 ?/WA32,ZKX&ATC0;^QUG3Y9&URYEM'B^3^(/(0 ^[G')ZUWW MQ 9SE1RP'TL8;,-!&\L M<40CS(4&XD ?>XYK:HH X#5+.Y?XX:#=K;3-;)I4Z/,$)16+' += :/B'9W- MSXD\#26]O-*D.L!Y6C0L(UQU8CH/W>H/>^&=*>ZLM3FL3-%J# M6Y:",%MI&_\ O]2!^-><^'/"7B'0_BGI]C(+!K&WT#[/)-#9R+$\1F)9,EC^ M]))8DGH>E>TT4 >/ZSX#>RU.TT[1[J_O9;/3I985N=A2"*,[H(!A1NW3!#\V M3MBQTK9^'$VJ2:I,'GUF;3_[-MC<-JHEW+?9;S53S!G&,9"_*#C%>CT4 %%% M% !1110 4444 %%%% !1110 4444 %%%% !1110 4444 %%%% !1110 4444 M %%%% !1110 4444 %%%% !1110 4444 %%%% !1110 4444 %%%% !1110 M4444 %%%% !1110 4444 %%%% !1110 4444 %%%% !1110 4444 %%%% !1 M110 4444 %%%% !1110 4444 %%%% !1110 4444 %%%% !1110 4444 %%% M% !1110 4444 %%%% !1110 4444 %%%% !1110 4444 %%%% !1110 4444 M %%%% !1110 4444 %%%% !1110 4444 %%%% !1110 4444 %%%% !1110 M4444 %%%% !1110 4444 %%%% !1110 4444 %%%% !1110 4444 %%%% !1 M110 4444 %%%% !1110 4444 %%%% !1110 4444 %%%% !1110 4444 %%% M% !1110 4444 %%%% !1110 4444 %%%% !1110 4444 %%%% !1110 4444 M %%%% !1110 4444 %%%% !1110 4444 %%%% !1110 4444 %%%% !1110 M4444 %%%% !1110 4444 %%%% !1110 4444 %%%% !1110 4444 %%%% !1 M110 4444 %%%% !1110 4444 %%%% !1110 4444 %%%% !1110 4444 %%% M% !1110 4444 %%%% !1110 4444 %%%% !1110 4444 %%%% !1110 4444 M %%%% !1110!Y[J/C'Q%JWC6^\,>$+732^FQJ][>ZB7,:LW(153G/O['TYL> M$O&VIZZFO:5>Z;;Q>)-&)1[>.4B&6D8D\B1<_*XR-HRS<_3WQ:^% .N>)/$WC1FBBCU>1%M;8 M2JTBQ)QN<*3M)^7CV/M0!N> /%^M^(M8\1Z9KEE96MQI,T46VT9F!+!R,O&F@>+-"T_Q18:*;/6IC!%_9SR&2%N/O;N"/F&<#UYI?''B_QKX4 M2]U1;?PY'I-O(%B@N)Y#MZ==-?:9:7;P/ \\*2M"_WHRR@[3[C.*X;1?B)K?B)9I] M)\%SW%G%)1HK7U;0KSPWXW\37 M7ASPJDMF_AP1QVT=H1;SR&10RD ,VW)*]3CWH ]8M]:TJZCFDM]3LIHX!F9 MHYU81CU8@\?C3H-6TVZNOLMOJ%I+<;!)Y4RN1IEPNH M7$=J4*3-; *9B!P=Y/WN^: /7FUG3S-<6T%[:SWL",S6J3IY@P.A&>/QJAH_ MB>"]\,VFL:J+?2?M&[,F?QKSCX=65MINAII-[X.U&#Q+'%= M+<:E)I_RL3O.?/\ XMPP!C/]:RK*UUJQ\!^"-(N_#;M;G[2;N:?1C>RVK;V* M 1$?+NR.2.A]J /4M?\ &46D7_AR"V@CO8=:O!;+.DPVH/[PP"&_,5-XS\5Q M^#M%CU*6T>Z5[F.WV(X4@N>N<>U>1^'?#VMV^G>#(9=)U",6GB6:5U>V9?)B M.,,1T5>O/2N\^,FEWFK^"H+6RL[BZD.H0,R6Z,S!03D_+R /6@#H-7\5QZ3X MOT'P^UH\CZOYVV8. (_+7=R,AZ5PU_X*71OBOX,N]*M=3FM$^U&ZGFGFN$B_=X7+.2$SD^F:XG4;"_ ML_ -GI5YIUW#-=^*Y9HXWMR[. "5_ ML>.X-$T":&QN=&@2WCM+4B.60.F0@48+=HZ7XGN-1URUL#IGEP3Z8 ME_\ :?M*':S$?N]GWN_WNE79_$VC1"5$U6PDN(\@0"Z3>6'\.,YS[5YA-::C MI?BBYU:73[L6MOX&\II2#$HE4@E/,(PKE-;+Q5X?TS4)6MK*\OE=DL3OS$ $E>>5&<9]0:\"[S5;_P ,PW6KEFFDDD,4CQ")Y(=Y\MG0<*Q7!('K7G?P\T,O MJ=[H-WH O/#8LDQ>:CH@LYF=7!6)\C][C[VXCJ/S]8TW2K#1[4VVFV<%I 6+ M^7"@5,_!YTS4/%^GZ,=(O9U@E.GM();1F&1NW$A@ #G'H>>F;_P 0/&7B/PE? MZ:]GINGR:5=74-JT\TC&0N^<@(,8 /))^EG6<]VT>M6TKK!&7*H ^6..@ M&1S0!Z)7)>*+KQU'=./#5GH?V2*'S&FU&63=(W.555QCH.2<(-#NM;2! M;;7=1THQ%BQLB@,FW*>F/UKS_ .)&K^(H+>T\(Z9I^NW%I+ B:CK-O9M/ M(T>,,$V@ NV.3QUH VM$\9>(?%OP\L=F:3X M M[.T\&>(Y-)4M8R636!\[RRF6=DSEE8M@GN2:ROA?I=Y;^,MQO@R,T_RY=4))48#?F/3 .M\7>,YO#6K:+I=IH\NIWFK-*L,:3K%@H%) MR6XZ-^E'AKQY::X-6BO[5]'O-)F6&\ANY4*H6SM(<'!!P:Y;XL:;+>>*?!UT MVG:O=V%L]T;IM+CD:6,%4"X*S MBT/4-0TJ6UU22SC+F""[C&3Z%LX7\:\QGBE\3>-M:U*[T#Q#;:1<^&3:%OL3 M+,[>:N0@Y^;KP>2 >,=+=&LM#GFT_^RU2UO7T7[%TP:_8_P!GV]Q?75K8RR6R7$D,MRF8@P'4YP1DXST-69M5TZWL M4OIK^UBM'QMG>95C;/3#$X->2:7X1.H^.M/;6=!:XLHO",$0-U:EHTN 0-OS M# < GCJ*Y:U\.^(K7PQX$N+S3-1%I8K>)<0_V;]J>W=I'VLT#8R",8/;KZ4 M?0D^JZ=;627MQ?VL5J^-L\DRJC9Z88G!ILVLZ7;V<=Y/J5G%:R<).\ZJC_1B M<&O%KGPI:1>#=$1U\1B6VO+FYM"V@^SAC\M8P"0,)_#D8..V<5Y'JUF5O4N/ /AOQ=H?B"6Z5GB:!HK M-N?F,F24V_3CVH ]SN-4T^TNHK6YO[6&XE_U<4DRJ[_0$Y-)>ZOINFNB7VH6 MEJTGW%GF5"WTR>:\*\3^&M2F\9>*8]6L]5DAU-XS:W%EHPO=T8'"K(2#$5.! MVZ53\7V/]H^,_$<5TMX]O:V%M:W5T-,^W-&@0.9 0P\EN#P<]S0![X=?T80F M8ZM8"(+O+FY3&W.,YSTSQFI8]5TZ:Z6UBO[5[ET\Q85F4N5QGF^(/$]U>VNDOJ.A_\ "**FGW$]H65I1P,9&/,Z].7(\-S_ -N?\)"9$D%FWVCR=XY!QNV= M3Z4 >V67B[1;_P 17^A6][&;ZR\L2(77#%@3M7GYB IR!TJ'Q)XKC\.:EH5E M):/.=7O1:*RN%\LG'S'CGK7%Z%IT6A_&7Q(]UX:N6349+>33KV&PWQ1$1L)& M\P#"9+<^O>K_ ,4M#N-=U7P=#':7<]LFJ W+VP<&*,X!8LO*?7(H Z&[\8); M>.&\,+8O),-,;41-Y@4$!BNS!Z'CKG%6M'\217OA>UUK5%@TD3 [HYKI&5#N M( \P?*< ?+G\.:X^X ML[^W\-_#C2+C3+E;VW6[N#;2V1N22'/#VV0QX.=Q(QF@#V#6O'UAINJ:':6; M6M_'J5W]FDFBNEQ;\9W' .>.V13O%GCFT\/^&AK-@+?5(_M4=L1#HV'A/2],M;K5(;+7I!K"SZ>8_)8XRLD?.U!TP21U^E2:UX4 MU*WL_&5GIVA74=K)KMG+:0P6K!&C&=S( ,;1W(X% 'L]AKLUWXBUC3);$00: M>(BMR;A&\WW MH<5YGXN@O=,N/BOJ$]EGZ396\.N6 MDD-XOB"Z\/26MC8C16M!*BKRX&6+R'')X[T >XZ'XGT_6-)LKIKJU@N;BRCO M)+7[0K/"K(&.>AP,]<"DT+Q?HGB*QGO-/OHFBA=UDWNH*A&(+$9X7C@GM7F6 ME^#%L?$'PUE@\.^2ATV=-79;3 +-;@8GXZDEAAO4BL_PSH=HGPVUGPQK7AK7 M+6^WO]HNK/3"7D3SE*!'Q^\ X..?E!Q0!ZGK^NV3^'9[_3_$L%K% PWW%J([ MEF."!&H.06)Q@8)/3O3K=_$%SX&M'NI6M==:V229;>.,N7QDJHD.P,>G/ -< M;\/=%_M6'5=-UWPY:S:5;RQ/97=SHZV3W#!2"6BQU7. V.Y]>.W?P5X1KE!J$6E:E>7,GD@?O+=O M+5",8R"X+$<$IQP:KZ5XU\116>HR:A/(7M;.QOTCN8(EDECD#[@^QJ32?&5M+X;TW4=4/EW-Z9 D%K!)*S[&(.U% M#,0 2>V: .IHKF[CQQI$.H:5;1F>X34H7FBFM[>210JD#^%3SDX([=\5I:U MJ+Z;:02H]NADNH(,W!8*=\BI@;03N.<#/&<9(% &E16!)XU\/Q7CVK7S;X[C M[+(PMY"DB3ZH-.CO"9VE:!6\IQ&\BYW(LA&QF&#E0<\'TJJ?'OAH.@ M_M!R'D:)'%M*4:1<@H&VX+_*?ESDXX% '245B1^+M$ETV>_%XRPP3"WD62"1 M)5E.,)Y94/N.X8&,G/%7M,U:RUBW>:RE9UC+M#NH+N9;TQ):0^?-] MHA>$K%SA\.H)7@\C(H VZ*QX_%&DOID^HM--!:P$!VN+66$Y. H"NH+9) & M*+ZWU2=1;VS6-I?VVG3DLPD:281G>O8*#,G!R3AN1CG M6T/5AJMIYSR0AI2TL,2'YA 3^[8C.?F7#=OO8H U:*PM3\566E>(;'1YXKII MKN)Y5:*WDD"A2H_A4]2WX8YQD9?)XKT2/5/[.>\(G$PMRWE.8A*>D9DQL#G( M^4G//2@#:HK%\4:XWA_1Q=QQQ/))/%;H9GV1(9'"AG;!PHSD_EWJA(M!@FU8'2Y-.AFC3[)Y5!Z<4 =)6+XB\*Z3XH@MX]3AD+6TG MFV\T,K121/ZJRD$5A:SXLU*PGUQ(A;XL4TXQ94GF>4H^>>>!QTK;'B*VMCK$ MNH75K';6%RD&8]Y8%D1@K KRY+C 7..1L;59&4,I.1C([U;TG7 MM.ULW"V,TC/;,%FCEA>)T)&1E7 .".0<8- %J_L;74["XL;V%9K6XC,J66CV?VJ^F\J M+<$7"EF9BP )K/;QCH":;_:$NHI#;"?[,S3(T;)+C.QE8!E..<$# MMZB@#J:;X\C-BY8@ ;O+!QAAV#=3Z4 =917)V^LZ_I^I:1'KL>GF#57,*K M:HZM:S>6T@1BS$2 A&&X!>0..:FOM5UN\\17FD:(=/A-C;13RR7L;R>:TA?: MJA67:/D.6YZ].* .FHKEE\7FX\(6&J6UH&U'4%V6]F6S^^YW D?P+M8EO1?7 M K5\-:G+K7A;2=5G1$FO;.*X=8\[59T#$#/;F@#4HK T[QIH&JW5M;V=\SO= M _9V:"1$E(&2%=E"E@ 20#G@U/;>*=&O-26P@NRTS.\:,87$"Z$:AF9$;:,]MQ&,^W4=Q6)XP\<6FA:7J MBV4QDU.SC!VBVDDCCU M=Y94F>(-O! ;$A(P2,8SSD5M'7]+%H]T;M?)2[^Q,^UN)O,$>SI_?(&>E & ME17.Z;XSTO49-5!,]O'ILDBS37$$D<>U I9M[*%'+=,YP,]*L6_BS1+BVN[C M[888[2(33_:87@*1G.'PZ@E3@X(&#B@#:HKE]+\6)K'C%]-M/,^QIIXN#Y]K M)#)O,FWHX!VX]OQKJ* "H([I9+R:V"D-$JDGLLVU_Y#VH?]7<%LLKB.,S2! [GHHSU/M4LLT5O"\TTB1Q(-S.[ !1ZDGI0!2U MWPUX<\3!?[9T:VO&4861TPX'H&&& _&M>&6&W@CABC*QQJ$11V & *K1R)+& MLD;JZ. RLIR"#T(-.H M?:E_NFC[4O\ =-5:* +7VI?[IH^U+_=-5:* +7VI M?[IH^U+_ '356B@"U]J7^Z:/M2_W356B@"U]J7^Z:/M2_P!TU5HH M?:E_NF MC[4O]TU5HH M?:E_NFC[4O\ =-5:* +7VI?[IKD]4\!>&M7U2[U"XM[R.6] M%VEO>21)<@# WJK 'BNBHH ?9+::=90V=G;K!;0((XHD& JCH!4_VI?[IJK1 M0!:^U+_=-'VI?[IJK10!:^U+_=-'VI?[IJK10!:^U+_=-8'B#PQHOB6ZM;N^ MBN8[RU#+#HW*1P:U:* *N@Z/I/AFP:RTJS,$3R&60ER[R.>K,S$ MEB?4FM3[4O\ =-5:* (=;T[3/$6D3Z7JMI]HLYP \98CH<@@CD$$ UF:'X0T M'0-1.HVT-U/?^7Y*W-YU%-HH DHHHH YW3O!MAIGC+5/$\-Q=M>:C&LOJSZAIMQD-Y;!$"L<=CAE([J2.]85AX3URP MLO#EW<6=S+/:6ES;75M87JQ2(9)5<,K%@K#Y<$;AU'7%>H52TC5;;6](M=3M M-_V>YC$D>\8.#ZB@#DUT2]TBZ\.WNFZ-<2PVB7BSVINT:5&G97W%G8!OF!S@ M\9XS6YXKTVZU73K*&T0.\6I6=PX+ 82.='8\^BJ:W:* .%N?#6J2>%M>L5@4 MW%WK)NX5\P?-'Y\;YSGCY5/%7=$M]8T+4M1LCI+7-K>:E+=I?)/&%5)"&(=2 M=VY>1P"" .176T4 >>6/A[6TT[1O#TVGB.#3-26[;4?.0I+&DC2+M4'?O;(! MR !EN35FT\-:I%X=\/V;PJ)K/66NYAY@^6,R2MG.>>'7CWKNJ* //-;\)ZM= M:IJ5_!"[J-9MK^*.*X$3S1I:B%@K9^5@22,XSM]ZZ;PSIHLHKVX:QO+2>[F# MRB\NA/(^$50Q(9@. !@'M6[10!PTWA34+GPGXITT+%%<:AJ$]S;[F&UU+*R[ MB.@.W!] :?-IFH:WJ]SJFIZ T=LNEO8_8)+B-GN2[JS(M0TNYB"7R6EM>6EU8V=[>JUP?+8F1?.4M@$;=NYB01R0*ZCPSIO MV66^O'T^_M+BY*!S?7:SR.$!Q]UF QD]ZZ&J5CJMMJ%YJ%K!O\RPG$$VX8&X MHK\>HPXH S]5TVZNO%/A^^B0&WLVN#,Q8#;OCVKQWYK.\56][J5OJ.F0>%$O M#=0F%+R6:$1\K@%\G>-I)Z*>G%=5'/%*\J1RH[0MLD56!*-@-@^APP/T(J2@ M#D=1\(Q2Z1;0B$W&HLD-M/=[RO 1YB,X+A-VTX)!(JKIGAJ\M-?M#_9\<*6 MNI7=V]\K)^^AD60)$ #N^4.@(( B&">*W];\36.ARP03+<3W,Q!%O:P/-(( M]P#2%4!(5OVUI';R?9=1G2>,2(;>REDP#TW87Y3ST.#0!G:Y:Z MC'XKT;5[+3WOH;>WN;>:..5$9?,,15OG(!'[LYP<\C@UA2^'M;;3+WPV-/!M M[G5S>C4_.38L37 G.5SO\P?='&.AS7:Z3JUIK6E0ZE9-(UM,"4+QE&."0>", M]0:AT?Q#I^NR7:6+3[[1PDRSV\D+*2-PX< X(.WO+6UE9A-=%A$ M C$$J-QR0,#CUQ0!R6FZ?J5CK6HZU8^'18026R1G35GB5KF;?_K3L)1<+D9S MD]^@I-1CUV^\4B>]\/W-SI>GR![&&"X@"RR#_EM)N<'(_A7''4Y.,;-EXOTN M_6T:(SA;JSEO8RT?2*-E5L@9.N:)K?B5=?O#I;6+S:'+IMM M;S3QL\LCDMDE&*JHX R>YZ5Z%10!P>M>&-5O9]>:"!6%XFF"',BC<89BTG?C M /XT:AX:U9[K5;V"W25QKUMJ=O"90OVB..&)&&>BG*MC/=1VYKO** //KCP] MK.J:K/K#V/V5KC4M.D%J\J,Z16[DL[%25R=QX!/"CZ5JN+[1?%6IZE]@>Y@U M.:QMHA&XW #>KN1Z*#D^P-;&NZ[::!8&XN!))*^5M[:%"\MQ(%)"(J@DDX/T MZGBHY_$^F6^DPZC(UP(IY/)AB-K()I),D;!&5WYX/;H">E %;Q5IU[=MH]]8 M0"ZETR^%TUMO"&5?+>,A2>-PWY&2!QU%8#>&M7O]2.K362V[7.NVUZUJTJLT M4,47E[F(.TL2,X!/;DUV&DZU9ZU#*]HTH>"3RIH9HFCDB? .&5@".""/4'(J MA_PF6C_;OLWF7&S[3]D^T_9G\CSMVWR_,QMSN^7KC/&<\4 ;5T\R6LKV\*SS M!"4B9]H<]AG!Q7G#>%)O$4VJK::*/#=K<6-S97*;E'VF9MNQ]B?*0N&._J=V M*ZV?QEHUM?R6LDEQLBF%O-H:/ M)J.CBR32I&NY?])1Q<3B)HU6/!R%^=CEMIX''6C7K"74A:W;^$7N=1>U"EA> MI&L+'GRI6#@N@/H&'7 KL:* .)T_X?G3M-T](-:OK>[L[#[)_HPA\LDGA^#=(TZ_FDDNK>TB217*'RV" % 5 !4$8!Y/N:WJS M[W6;2PU&TL9S();J.62/:N1MC +9[_Q"@#S[PA:ZIK7A?P9;_P!FO;6>GRK> M27DDL9$@57"JB@ELDL,[@, 'K5[POX4NM-_LO3]2T[4)?[-F:2.[_M &V)&X M*ZQ[MV2&Y!7 R>375:7JVDM/::7IL7E1R6(O($2'RT$)( ^4@%3STP*UY98X M8GEE=4C12S.QP% ZDGL* ,/P5I=SHO@[3=.O(UCN8(RLBJ00#N)ZCCO7+ZQH M.O?V3XKT:STK[4NK7+W,%V+A$0!U0%7!.[<"I P"",&M4N;[698H5*7.MZ=>1'S ,Q0^1YAZ\8\MN.^*IS:)X@^S76DQZ2 M&A?Q FHB\-R@0P_:DF.%SNW @@@#C@G@5W.EZK;:O;2SVN_9%<2V[;Q@[XW M*-^&5-2:C?0Z7IEWJ%QN\BUA>>3:,G:JEC@>N!0!P][X=UF\TGQ9H8LBBZC< MR7=M>&9!&^=A"$ [U)*D$[<>YIE[X7O-8TG4732[^VU)H(DC.HZ@LPEV2K+Y M8VLV%)7&3CKTKT""9+FWBGCSLD0.N>N",U)0!RNF6^JW?C9]9O-+>PMO[-%J MJRSQNY?S-QR$) &#Z_E75444 %9MK_R'M0_ZYQ?R-:59MK_R'M0_ZYQ?R- & ME5:[Z)^-6:K7?1/QH \%=-M8[K5;PPVR3%O*B)(+.V#D\L.,_RQ5S7/A_'J/B(^ M(-+UB]T;5)(Q%/+;;6691C&Y3U/ _(4V^^'D6HZ)96EUKFJ3:A97)N[;4I'5 MIHY/0<8V\#CVZT <[=_$;Q!HMOXJT[4[?3I-8T6"*XAF@5_)F1V0A':MM_AU+?:KIUWK/B74-2ATZX%Q; M02Q1*0X.1N=5!(X%9US\'[>>VU:Q3Q%J<.FZC<&Z:S0)L60L#D\98<# XZ#K MB@"O<>-_%UYXCU72='@T=19:;%>F2Z63/S1JS !3SRW'3'O5"U^)7BUM+\-: M]=6FCC2M5O5LGBB\PS9W%2V2<#E6('/:NVL_ MK9Z[J6JK>3-)?6"6+H5&%5 M45=P]_EJB/AG8CPMH6@_VA<>5I%Z+R.7:NZ1@S-@^WSG\J .5UOXMZC!K&MQ MZ>^F0PZ5.8$MKF&5Y;QE.'PR_*G0XS6I=>/O$]_XLM]%\.Z98R?;-)BOHFNR MR^07P27(/*@'& ,Y(K8G^';Q:UJ&H:+XCU+2$U&3SKN"W",K/W92P.TG)K4M MO",%OXS_ .$F-Y/+#K\>'7T0+=P-+X@$@82#!_A7)YZ\XZ>]?16MZ7'K>A7VE2 MR-''>0/ SJ,E0PQD?G7$1?":*2TL-/U+Q'J=]I-BZO%8.$2,[>@.!DCK0!'X M\\KZY>6VNWUE!K<>R]MXDC8/\I PS D M#D\#U/-6]*^']GI6MZ-JD=[.\FEZ<-/C1E&'7YOF/O\ -0!Y?XH\8WNM^#;" MZUR.WCN-*\4K;SM:JVQA&C$L 23Z_E76R^++WQ1\,O$NOW5GISZ28Y$M+)MS M.54X/G%6&">N!@C@YK3?X4Z>]F]L=1N=KZS_ &N3L7[^,;/]WFK;_#BR">([ M>VO[BWLM=7,UJJ@I%(>KIZ$\Y'O["@#G;7Q;K\5UX1\.^'[+2(5U#1([H"X$ MFR$[2<##$D #@')]Z8OQ0UVT\!Z[J5Y86.E M=;9> [2RUW0M56\G:31].%A&A48D4*1N/OS7%>-_ LVCZ*TFEQZC?"ZU]=3N M6MXP\ENISDK'_'C/&: -KP+XP\0>(_%>H6%Q=Z1=Z;81JS7>GP/LF9AD*'9\ M CZ'H:](KR_P'+XC?Q9,D&%MLE]5LTMW,V?X %!(]^G7VKU"@ HHHH M**** "BBB@ HHHH **** "BBB@ HHHH **** "BBB@ HHHH **** "BBB@ H MHHH **** "BBB@ HHHH **** "BBB@ HHHH **** "BBB@ HHHH **** "BB MB@"]1110!)1110 4444 >>Q3Q:5XY22YNX]3:^OWA@D@U)_,MB5;]T]OG847 M:1D=#R1GFL;PU:II?A[P!J5O/>B>YN!#.#0[*A<9\M2^U'K#4+M[71[EYS<,LYA6214!CC9P00#ESC/)4=:Z-])L'>S8VL8 M%G(9;=5&U4@+'&3Z<9_AM+CQ%?Z);:O=W\L#:-/+@74 MD1F47 6.1]A!8F/!R>NG49JMX8NH1I MW@F]LM6NKK6;N;9>QF_DF+P^5(9-Z%B %(7L,''K7K0@A"HHB0+&'-(M+&!4DDMX1";CRPKR >I% 'G^EZU'>^)O#E_IQ%M%JC7 M)DA.KRW$SQ^3(X\R)OE0AE'0G!XJ"$7=G\.O"E\;^ZF?5I+1=2N+S498U\OR MG*J7&?+4OM4E1ELX).;>%K?[.88S#M MV^65&W'ICIB@#S&1I[>&PL[W5H%T.ZUORY39ZG),+>/[.6$#3D*P#2@''HP7 MH:W? *V2:CXL33I_/M%U11')YYFS_HT.1O)).#D=>,8[5UPLK06OV46L(M^G ME>6-GY=*DCABA!$4:(#C(50.@P/T % 'EA>/2+3X@W.F7,BZY%(RQR1R0<=L=.*V]"DLK?QK:VN@:E+?:?-I;S7F;QKA0X>,1.2S'#,#) MZ9Q[5VPMK<7)N1!%YY&TR[!N(],]<406MO:AA;P10ACN81H%R?4XH Y?Q''8 MVVNIJ,/B>UT;5EM/+9;EHVCEA#$C M-DC06VKZWM MM8!'G"%L[I5SSM$:M(,]@*ZR]TVSU)(TO+:.98Y%E0./NLI# _F!5@QHS*Q1 M2R_=)'(^E %.T&GZ3'8Z/!)#"4AV6UN7 9HXP <#J0,C/UK%\/?\CIXO_P"O MBV_])TKIC'&TBR%%,B@A6(Y /4 _@/RH5$5F944,WWB!R?K0!P_BZ'3KCQYX MYQGM[5G>';^[DO/#$8O;B:R;4-2BMY'E9O M/MTW^46)/SC &"1^'W:.QT-T8JZ^%]1*LIP0?-BY%:%M!0 L,8 4J,*. >H^E,EL[6=(TFMH9$C(**Z M A<=,9Z4 >:^&H;KQ+J.F0Z]<7[[O#T,SQK#]%BN;Y9]1:PCFD5Y TK+]T.1U()&,]S73^6GF>9L7?C;NQSCTS5:+3+.&_ M-]' JW!A6#<.T8)8*!T')/3KQZ"@#A_$$]G/XGUV'7=5FL8+33HI=/"WC6XY M\S?*NUAN8,%'?&!Z\L\.1W^N>)K1]:NKY)8=!TZ[EM4G:)#<%IBS.JD9.5Y7 MH>X.!CT&:UM[AHVG@BE:,[D+H&*GU&>E/$:"0R!%WD %L\56V MGR2:=P)-;S(4DC;H01@_2I# M;PM;_9VB0P[=OEE05QZ8H Y'0]1L9/&/B'44O(/L5R]I902^8-D]PJ.65#T8 MX91QW4CM7&P3(VG6M\FK(PFUX2R>&M 'E\M[9Q?"W7M FFB. MMO/>VOV,L/.DGEFC ^G/:NI\>S-:^&+/S+V2V0ZC91SSQS&(A#.@ M?YP00,$\YKJ#:V[7*W)@B,ZC E*#<:M?2Z9'XEM] OY7TF-M.$DS7KNMNTDI$^V4EF0>7L+$9V[MU M27J7UMI=VEKJT$%K/J.F1Q1:=JCW3VY:X"R'>Z@J&4KA>1PWJ:]0AM;>W@,$ M-O%%"<_NT0*O/7@4D5E:01>5#:PQQ[@VQ(P!GKG [T 9.J02Z%X)U)-'\][B MVLYY+?S9&FD:3:S#+.26.[U/M7"6XT>/7/#DVDZH]Y<2:3>2S2-?/.Q)CC(< M@L=I)ST Z>W'K%01V5K"28K:%"22=L8&2>OYT >0WUW=CPZEZEQ/]K_X099? M/#GS-V5);=USWS6MXOU.VUF?7K6RU(75NGA:YE9+6Y)42!@5)VGK_,'!X->E MB"$8Q%&,)L&%'W?3Z>U-AL[6W4+!;0Q* 5 1 H /4<4 >::C<6\8\+V&G7<$ MND3I,TYFU:6*-YPD91&E&]NC.P3@''M2PEOMOA_3=>UJ-])>.^E26WU%S'*Z MR+Y433?*7*(SCGJ5R4NPGUQC%/>SM98%@DMH M7A3!6-D!48Z8% '+?#;R/^$6G^S2^;;_ -IWWE2&0R;U^TR8.XDELCN2J75[H]_)'J-MJ3S"10A)\R$DK&>0 5R.PQG%>N)&D8(1%4$ MDX48Y/4U#'86<)E,=I AEXD*Q@;_ *^M 'G4\EOX3O=*ODDU&2VET&\N+R+[ M7+(9?*6!E*AF^5AN8 C&,^E8>H:E-:1:^NGW*6Z/X9N+KR[76);PI(K+LG7UX%>S&*,E28T)4%5.WH#U _(5%'86<49CCM($C(*E5C &#U&/>@#S M[7[:32]5T'31,@<5UOA%+F/PW M;I=7T%ZZO*$F@N#.OE^8VQ?,(!U#_KG%_(UI5FVO_(>U#_KG%_(T :55[H$A<#U MJQ10!G;6]#^5&UO0_E6C10!G;6]#^5&UO0_E4FK:M9:'I5QJ>I3^19VZ[I9- MK-M&<=%!)Z]A5%_%VA)X5_X2A_*KEKWB&Z269PB(/4D\"I(Y(YHDEB=7C=0RNIR&!Z$'N* *&UO0_E1M; MT/Y5HT4 9VUO0_E1M;T/Y5HT4 9VUO0_E1M;T/Y5HT4 9VUO0_E1M;T/Y5HU MDZ?XGT+5M3GTW3]6M+J\MP3+##*&9 " A_*C:WH?RI=4UO3M% M%L=1NX[<7,RP1;S]YST_#WZ"EU#7-(TE(WU+5+*S23[C7%PD8;Z;B,T -VMZ M'\J-K>A_*KT4L<\*30R))$X#(Z,"&!Z$$=15==4T][\V"WULUZ!N-N)E,@'K MMSF@"':WH?RHVMZ'\JL:AJ-GI-C+?:A(6_GF M1!#MWF0G"A<9SGTQ0!2VMZ'\J-K>A_*DC\0:--)81Q:I:2-J 8V8296\\*,M MLP?FQWQ3;?Q)HEW;VT\&K63Q74IAMW$ZXED'55Y^8^PH ?M;T/Y4;6]#^5:- M% &=M;T/Y4;6]#^5:-% &=M;T/Y4;6]#^5:-% &=M;T/Y4;6]#^5:-% &=M; MT/Y4;6]#^5:-% &=M;T/Y4;6]#^5:-% &=M;T/Y4;6]#^5:-% &=M;T/Y4;6 M]#^5:-% &=M;T/Y4;6]#^5:-% &=M;T/Y4;6]#^5:-% &=M;T/Y4;6]#^5:- M% &=M;T/Y4;6]#^5:-% &=M;T/Y4;6]#^5:-% &=M;T/Y4;6]#^5:-% &=M; MT/Y4;6]#^5:-% &=M;T/Y4;6]#^5:-% &=M;T/Y4;6]#^5:-% &=M;T/Y4;6 M]#^5:-% &=M;T/Y4;6]#^5:-% &=M;T/Y4;6]#^5:-% &=M;T/Y4;6]#^5:- M% &=M;T/Y4;6]#^5:-% $=%244 %%%% !1110!YK!<-I7B/QOXFU&UL+A=+E MRCB(FX55M8V5$<_=!#'(]6;UK4N_%6MZ+YL>KVEBTLFEW-_;?9F?"O"JEHGS MU^^/F&.AX%;[>&]/DCUN*99)HM9;==1NW'^J6(A< $#:@]\YK/7P3;21SB_U M34=0>2QDL(Y+AH]T$,@ ;;M0 L<+EF!/RB@#1\/W>J:AIB7FIP6L!G59(HH' M9RJ%0?F) RWTX'OUKE?#^A6/BW1+O6-7$DM_=75RJ3^:P>T5)7C18B#\FT(# MQU.2UN;3X;R5I;NQ?'DS M%OO[7 +Q%N22I[G@$YH Q-0GDU[X.:5KE^\K:A'#;N)4E9 S&5%+%00#D#/( M.,G'6N^U+7-/TB2%+V9XVFSL"PN^<8_N@XZCK5/^P4U+PC#HM_;QV*!(T,-C M+O6,1L"H5F49'RKU7V]ZW: ."\9:/IZW5J-.CD'B:^NXWM9EF*5O$E^XBTUTG?S$EXPR\_(B ;FQ@8!SR>=3_A M#G36[[5K?Q%J\%S>$;]JVSA$'1%+PL0@],]&+*_UG3&TR_E#&6U8$%,,0#@\C( .#R,UMT4 <9\6O^25^(/\ MKW'_ *&M>-Z^+GP5\-Y=)822:'XCTVWNK1N3]GN\1M(A] P!8?\ ZS7T7JNE M66MZ9/INHP">SN%VRQEBNX9SU!![53U+PKH>K^'XM"O]/CGTV%46.!F;Y @P MN&!SP.,Y_G0!Y?>>,/$2:AH_AO1#>0I!H$%VS65DES+*Y4 AR $'&2.%]6L=/L[S2D>#3U*VH61T,2GJ RL#C M@=30!6^)ERUG\-=@#S#1_'7BGQ5!X-TJUU*#3;W5 M;6XN+J_^RK(3Y3NH54/RY.S)^O&*W=2U;Q3-XTTSP79Z]#:7"Z4;ZZU/[$C- M.X8IM6,G:HR,G\:Z*X^'/A.ZTBQTJ71T-I8%C:JLLBM%N.6PX;=@D],TM[\/ M/"NH6-C9W&DH8K%#';%)9$>-3U7>K!B#D\$]Z /.M-^(/BOQ"G@NUMKZVL;K M5)KZVNY_LHE1S"%VNJDCL3T(&?;BJ;>-O'-IX9O=;EU^VF72=<.F2P?V>B_: ME# %F;/R_>QA0.G6O78?"&@6TFD/!ID43:0'%CL+*(=XP_ .#GOG-0R>!_#< MNF7>G/IBFTN[PWT\?FO\\Y()?.[(Z#@<>U 'G.K>.?&=[XE\10Z!#=LND7*V M\%I!8)-',1]XS2$AES@XVUZ)XO\ $5SX=\!ZAKL5L#=06PD6&3D*YP!N]@3S M]*CU7X>>%-:U634[_2(Y+N0 2NLKIYF.FX*P#?B#70W-I;WMG+9W4*36TJ&. M2)QE64C!!% 'E^E:_P"*[;Q/HFBZAKL-^-?TJ2YCF2S1#92A"P( X=>WS=:7 MX#Z?!XKZ2\62&:254@^SJI0B1@27'S-G'0]*[/0? OAKPU=M=Z3IBP7#1 M^5YC2/(RIUVJ7)VCV&*TM%T33O#VF1Z;I5L+:TC+,L89FP6))Y8D]2: /._' MGA6_/BR;Q4FE:5XBL8;#RI=-OY-K0A26+1Y!4$C/7GK5JYLK/QC\/[#5O#6A M:&;Q[(0P1ZM%N%O RE5P#@AAP>!6[XE^'/ASQ5?Q7]_9_Z4KIYLB.P,T:_\ MLVP0"#^=2:K\.?"6M?9OMNC1,+:$6\(BD>(+$,D)A&'')X]Z ,SX/7=G-\,- M'2U$R)%YD+"=PQ,@=BV".",DX]OI67)I=CIO[0>GM96D-NUUI,\\YC4 R2&0 MY9O4FNV_X1+0?(TJ!=-B2+291-9)&2HA?U !YZ]\\\U:DT/39=>AUM[8'4H8 M#;QS[FRL9.2N,XZ^U ')_&;_ )))KW^Y%_Z.2N?AUWQ'HVO)H&IZI;ZK9WV@ M2WD:_8TC^SLJ'"X&=RD#'S9S_/U#5-+L=:TV?3M2MDN;.< 21/T8 @C]0#6/ MI/@'PQH;7+Z?I:QO:O\(+AHH8F>'4" M4@B6-!\AZ*H %9_A&\:U\)?#Z-8;:03^(94)F@60J-YY4D?*?</?%G]B^(O%UKJ=M!8Z/JWV%-(>U4^GW3V)Y[5W]U\._"=YK+:M< M:-"]V\HF<[W".XZ,T>=A/N15U_">AR-K+-8*3K*A=0_>/^_ !49YXX)Z8H F M\-ZA+J_A?2=2G"B:[LX9Y HP S(&./;)K4J"RL[?3K"WL;2/R[:WC6*) 2=J M*, 9//05/0 4444 %%%% !1110 4444 %%%% !1110 4444 %%%% !1110 4 M444 %%%% !1110 4444 %%%% !1110 4444 %%%% !1110 4444 %%%% !11 M10 4444 -#H79 REEP2H/(S3JY[3O!NF:9XPU/Q/!)3,8 Q]T8 M_P!D=2?;%=#0!Y_?>*?$5O9>)M8BETK[#HEU)%]DDMI!),B(CG$OF8#'=@?( M><>M=)'XNT634Y--^U,+V'F>(Q/^X'EB3,C8VJ-I').">,YXK+T?P78KJVLZ MCJVE6<]Q/J;7-M+(BN1'L0*>>A#*WTITGAB[NX?&]M(RPKK9*V\H.<*;5(LD M#IA@W% %Q?&VBR6ES<1273"&V:["-9RHTT0_CC!4;UY'*Y R#T-/LO%ME=Z! M:ZL;7442<*/*73YW<,5#8"A,E>?O@;3ZUA:;X:N9[61+O2KFVO4TZ6TCN+C5 M'N(PSJH(12QPIV@Y(!X'%(MIXH;2- M6T^Y@M[./R+VVMKY(Y)ML:A'60$84 M,&R,@GCZ4 =';^+-$N8K>5+Y52XCFEC:5&C&(CB0'7[3M+]H/ MF-(YA3+1CFK%SXNT6V%H1<37!NH! MF)?F31;*QGC2Y5&@E@# \MP4.\\CG(Z'- '2ZAXNT72[I[>[ MN9%:)5>=DMY'2!6^Z9652(\_[1'KTJ/4?&N@Z7S*_:3':RR) &4 M,&=E4A1@@Y)Q^1K"U+1-> \46=KI\$\?B%01<-< +;,T"PL'!&6 V[AM!SG' M%+=^$]1_L3QI8PJLC:G:I!9LS@;RMJL7S>GS#O0!T-KXMT6ZFN8A M*O"5_K]U<)"T<<J'4+O2+RTNDMC ); MG5&NL@LI95!8X&5!R<'CI0!MOK-A'/?P-/B2PA6>Y78W[M&#$'IS]QNF>E95 MSXZ\/VIOW0:V-6^R&?3;U M[<-:HR(RB)'SAF)S\Y'7M6OHUA_96AZ?IQD\S[);1P;_ .]L4+G]*S-%TZ]T MR7Q',\*.UWJ#W-LGF ;U\F-0">V60B@##\/>+[V^\/G6[K6]"O1%IWVVXTZP M@(FB/E[]A8S-C!XY4?A5D>*=4ADDT^[6R%_+#;2VSPAO+43&0,&!/.Q8G?.1 MN Z"E72]1UCQ-I%]JCBJ^L>"4N/M<6 MF6$$$,=L@A5FXG?>"RGJ0H1-@[ 2OQB@#M;:ZM[R!9[6>*>%NDD3AE/XBN?T MSQMI>HP:G<2+,DH3QGMWS7.7'AS6KC1O$6BBSC47-_)?VMTTX\N4^\RQN0S.OEHH(X&W+$'(RO%3Z79:G>>+9=>U"Q&G MHMB+.. S+([G?O9B5X ' '.>O2F>+4ENA'9S>$X-;M9<)&SRK^[6V6)/4<5H>'= M8EU[PU;:CY20W$BNCQYRJRHQ1AGN-RG\*YV?P[=0Z'H]I=Z''KVI6MF(&O'N MA$ V!D,Q^9D)]CG'3-;7A?2;GPWI6G:&+>-[>&W9Y;J-@JB8ON*K'C.TEF(/ M8#% ">%]5U/49=:MM5^R&?3[_P"S*UK&R*RF*.09#,3G]X1^'2H-7\4_V-XQ MM=/N%F>SFT^6?9;VLD\AD61 ,! 3C!;MBKF@:9X50E]J(N("&SE/ M(B3)]/F1JIZO::K;>,+36['3OM\*Z?+:/$DZQNK-(C@_-@$?(>^: +(\207E MSI3:==VLMI?VT\Z$J^]]FW[O&!@MA@V#TQT-<]I?C+4KC3K2ZN9+5-_A@:K( M[QML$W&2=N3M]AD^E2Z/X4U.PFT!YEA)MH=1:YV/E4DN)%D"KGJ!\PS[>]4; M;P=K$>@):-#'YP\)'2B/,&/M&,8^GOTH ZN[\6Z7ID<"WT[M.]L+F1;:VEF" M1G_EHVU243.>6QT/H:+WQGH=C.87N9II!;I=%;6UEG_J'?GC)X/'-.\.>$[W0Y;B%V26 M(:'9Z?'*&^_)$)@W'8?.N/K0!U]K=07UG#=VTBRV\\:R1R+T96&01]0:FK)\ M+6$^E>$M&TZZ4+<6MC##* <@,J 'GOR*UJ "BBB@ HHHH **** "BBB@ HHH MH **** "BBB@ HHHH *S;7_D/:A_USB_D:TJS;7_ )#VH?\ 7.+^1H TJ*** M "BL_7+&[U+0KVRL;Y["ZGA9(KI!DQ,1P13/#VGWFE>'[*QU#47U&[@C"2W4 M@PTI]3U^G//% $^K:I:Z+I-UJ5ZY6WMHS(Y49)QV [DG@#U-9"Z]K,5A=7U] MX>%K;Q6LEPN;Q7?*KD(ZA?E)]BP%/\;Z9=ZOX0OK2QC$ET#'-%&3CS#'(LFW M/OMQ^-5+WQ!%KF@ZE9VNG:NES)8S?)<:=-$%;8?EW,H4G/ "DYH U=+UHZDU MN#:-$LMC%>;_ #5(&_/R8SNXQUP :M0:OIMS!+/;ZA:2Q1';))',K*A]"0>* M\YO]$UFYT[48+2TN$GE\)VMLGRE=T@:3=&">-V#C'N*AU32!J>@ZO/9QZA-. MVG):?9#HSVJE?-5@,%1O*X8<9 !- 'HESXCT>UT^^OGU*U:"Q0O!G M! /7C@=ZNV=[:ZA;+<6=Q%/"W1XW##Z9%(0P M81Y=S;$&!C=SP*[/0;JVN])B>TMI[>, *8YK5[=@V!GY74'\<8H J>&?%-EX MCTNSN%EMX;RXA\UK-9U>2,>XX./?%:<&JZ=U3Z6VJZGXC M\+WUUITUM<174[7<$>E/!':[H)1M,I'SY.WD'!.#QD4 =EI'BRPOO#6F:Q?S MVNG?;X5E6.>X48)[ G&?RK3NM6TVQ&;O4+2W& ';.U@Q827!@D4- MYL;(JDH3E.H .W&>*75]*EN=<\20:@+^"VU5(1;/!I+W)\KR57:'4'RV5PQP M<8)S0!Z3)J=A#>QV4M];)=R#*0-*H=OHN7=U=V_VNWN=+=HV "(98[C: FU!GEB,J0 ":V/&UM++ M'HMP;66[L;34DGO((HC*S1A' ;8 2P5RC8 )XSCB@"UK_BJST?PY_:]O+;7: M22QPP8N%6.1W<(/G&< $Y) . #5Z#4MF@G4]0:U18XFFE:UE,T85V9&*I) )9?+(RH.UB<@< D]:](G2&*P ME0V_F0K&P,"(#N7'W0O?/3% &1X?UK4]7=Y;O19K.RF436DSR1DF,JN ZAB0 MQ)8\<8QGGJ[1=?FU35M4TZXTR6QFL1$V))5)[:V M\-#6(M)A62/4;6]CE6&W.P&-8Q*,JV2/E7Y=IZ=*W=*MIXO'/B2XDAD6"6&S M$^,C/UH LZQKTMCJ-KI>GV#7^HW"-*(O-$:1QJ0"[N0<#+ # M))^AK3MIIGLTENX5MI=N9(_,#A/^!<9^M<)J\%E?^)K+7]2TK5)])NM-,&Q; M:8O#(LA8>9"@WE %W3/$>CZQ;-<66H6\D:RF(XD7(8.4'&>Y4X]>U4]5\416%CJ-W; M0+=PV>G2WRRQW";)"F[,?!+ Y4\XQ^/%<1%I@N/!4&A-HUV+F'6XC=QM8R*K M1?;2V=^W:Z[#G()P/2M7Q1HTPNO$$6GZ] 'H=QJVFVLHBN-0M(9"X M0)),JDL0"!@GK@CCW%375Y;6-NUQ=W$-O"OWI)G"*/J3Q7G&I^'9Y])^(CS: M8;B^N(%2WE^S[GG(LXQ\AQD_.#C'?WK<\3PNNH>%[ZZL[B[T^TFD:YCB@:WM+&\:V^T-.#&X"H0^[@#._'? MIUK3?4K".P%^][;+9D9%P95$>/7=G%>6'3;T2K?Q:?>6NFQ^(I[IH_[.9V5& MMU6.7R,98!L]!D$YQP<7QI:6,NC:BUO?ZAI"ZE+# MM)#A2I (+88@$9/)J+P]H)DUF"74-*W*GAFRMU>>WSMD!EWH"1P>5R/IF@#N M+K4]/LHXI+N^MK=)3B-I950.?8D\TV_U6QTV-6N[RV@+Y\M9I53S".PR>:\K MTO3-0L8M$DU2"\BMF\.6UF!_93WACD&[S(V0 LA(*=1SMQVK6M--BT352FH6 M&H:E;/H=K9V$[6+S-\GF;T$+/Q#<1_9H9[) M;R1-V_RU*;B,X&<#VJOH.N:IJWFSW&ASVME*@FLY6EC+/&57"NHEZIHWV)KY)'MW2Z6; M[@!8. !MX/4%AVSTI%\2ZA;ZSI]EJ>B&TBU"5X;>1;I96#JC/\Z <#:IY!89 MQGK6+ (;SQU8:KH5EJL4LF]=5EO+6>*,P[#M4"4#YO,V$!.V*);;:=ZGS0%R<+C9R3STS0!T^N:_'H=SI,5Y @A BDDW'/7_5X[=:GFUB#[-9W%GLO8;FX2$203)M )(+9) (&.@R?05A M^-[=9+CPYI7S1Z?$S%3]HGCPI#$#Y@Q7G&>M<9INF7\>O M:5(]E<*B>(]3F=C$0%C>.8*Y..%)(P>AR*J:597&F0>%;S5=,O);&UBODDB6 MT>9H)GE!C'YSK7A^2[TEUL5FU6X@AF@R+6.21& MB5@1A"1D@=1R.QK<\(W$>C Z-<6T]O+>:GJ,EJGDD)Y:SLP.<8 (8$=CVH Z MJ\O[/3H1->W<%M$3MWSR!%SZ9-)-J%E;QB2>\MXHRAD#/*%!08RV2>G(Y]Q7 M,>($6U\:Z=JFH6-Q>:8EC- GDVKW/DSLZ')1 2-R@C=CMCC-8&@>&)7U+PLN MJ:0S6MO;:E(D4\6Y;8/<1M"C=@P3@ ]-I]* /0M2NKRUM5>PT\WT[,%$?G+& MJC!^9F/;CL">1Q6%!XS+17$-SI4T6JP7J6)LDE5PTCH)%*OP-NP[LG!&#QGK MH>)];GT'1S0*Q_B?8"0@QDD GL.2*Q=!T>QU'2'B^T:F M-1%V+Z>_ELI+61K@C&Y%E3!4*-@7! 7 - &QIWB6/4YK2"&UD2:5IQ/'(PS; M^2WEOG&0?GP!SR"3VQ6Y7F::+]CO8[N>/59-*FN;A)O($IF?:6*NXB ;#2M. M_ ^:/@8%=%X.D(7[-?&\_MV.PM#?^>SE>5;;C)V[N&W%>I'.: .D:[MD29G MN(E6 XE)< 1\ _-Z<$'GUJ&35M-BN5MI-0M4N'?RUB:90S-P=H&I3W.INLMIY%G)(DB_9HD)W@;1AD88)SQP#FJ>IQ6U[%X\TR M'2I[K6+S4/*M9([)V"N8(=A,P7:FQOFY88Z]Z /3M9U:WT/2+C4KI9&BA ^2 M,99R2%50/4D@?C5+3]4UN33KJ6_\/RQ7<9)BA2>(B92QV@'?P0NW=GC.<9Z5 M;UF*UDT*XBU&SDOK9HPLT$<1D:0' .%')]>.>.*XW1=6?3IM3OM*BUZ_\/6] MI\L%Q#+),;E9"ICA$@\PC (.<@$=1S0!OVGBJ5;^^L=9TQM/N+6S^W?NYA.D MD.2"00 <@CICN,9IFE>+)[Z\TR*[TEK2'586FLI1<+*2 H?#@#Y3M.>"P[9K M$TRXO[O3]=U*"&[;Q5>63F%)[">&& *#Y4*-*BJ<,V3_ 'B2<8'%7PSI-I9^ M(]$DT#3M6@CBMI(M1_M"WE1(U*Y^7S!@.9 N?+X(SGM0!V.H^)+;2_$-IIMX MT,$$]I-35-H MG!*[65?+R0!SN^\2!Q70'6+*"RM;B^N8++[2JE$N)D7D@':#G!//8FO-=(T? M4XM#T^.33[I73PA*T(;==-U*.XUO1[R]MIM!MK6W M6.R>XV.N_P V(JJG86W)R< XZ\4 =]=ZII]AG[9?VMM@ GSIE3 .0#R>^#^5 M6E97171@RL,@@Y!%><>%/#5U!JEJNMZ>)I8/#=I;&6:(2!9 \NZ,,002 5!P M?2MOP'>"V\.:)H%U# MW:4[8UFE5"Y]!D\TZ6^M()1%+=01R$JH1Y "2Q(48]200/7%<+KD"6_B/Q%) MJ>CW>H1ZAI\4-B8;-[@$ .&BRH(0EF!RV <@YXX=X6\.3P^*$N-9L1/=6FAZ M?"MU+'O F4R^9M8\;@=N2.>1ZT =_1110 4444 %%%% !1110 4444 %%%8P ME\3?:0#9:1Y&_P"]]KDW;<]<>7C..V: -FN9B\=Z/))\R7T5O]J:T^UR6KB# MS0YCQOQ@?.-N3QFNFKS3PSX?OM?\/SVUSJ<2:.=8NY'M8[7$K[+QVVF4N1@L MHSA0<<9[T >EU'<7$-I;2W-Q*D4$2%Y)'.%10,DD]@!7EUQ'>1>%_&&MVUU? M/J,&H7<$+?:'VV\/F@/L4< A=QW8)&..@%5-8LXIO!_BIK2^T^2Q_LH.;.PU M.2ZVR+N(E.0",C@^NWF@#V"BO.M8U'PZTNGZ/9_8;BU\B:X6XN-8DB@ #*&4 M,I;>^6!P?NCN,US?]J7\OAG09K>_OGE;2Q_;;Q.6:.R$@'F@DY$N X!ZE=YY M*B@#VFBJ=A?:?=!X+&Z@F^S!%=8Y Q0%0RY^JD$>H->5ZG<6?V?Q/<)JG ![!17F4\-Z;7Q[K%I/>RZG87,\ M=A&)W*0G[+$IW#/2@#T2HTMX8YY)TAC667 DD50&?'3)[XK@_$\>**3"*5#,2I//8\5BZ>C:G=:)IRZA?'1Y=9OXK9XKIP9K98F*J) = MQ3<& .>@X- 'K5%>2ZY-;00^*_/U":WUVPD6+1;=;IU=4$4?D^6F?GWN6!X. M>0>E:FHS7T>O77A0S3*^L7=O=Q.KG,VUI)YGFW._P O;&S+\HR/4C/:O/; ME6O]/UF.?6;>T$?B.3;'>W+117"B-?W!8$$#G=QG[O0C-2:7J_VV\\*G3X7M MX@VHP^2+IIHY&C&,K(?OID$J?3TH ]'HKRCP[=PN?!]S9:C-<>(+N4C68C;&3A D@4#@8X ZT>'+86VD?#[54N+MKV^N!%KT5YCX;O+-_"\FH1WXF\:26MRSP27;&7[0 Q,?DENBD ;< 52 MM[JSCCTI] U2:ZFN-(N9-4(NVE/$(*R2 D['\S@=#RP[< 'K=%>7V&B6DE]X M,226^==2TN1[T-?3'SV6.)EW?/S@L>.G-9JW=RL>CZ=C:SK[:9-)%% LSQPHVUFVYDEE$<2Y[ MNR<<8 MJ=+R^M+RRMM0-NYNFD17@1E 8+N P2>RR727MLMAI&BZG< M:??N+:>Y2^GU>2*W,0EVJJN!F5U7:,D9&"<\UFB\#^$M!UG4]4M;UH-(#RZ= M=ZD]M*^"?WR,IRSG;M^8!M,DU#4I+5K96B#>8B $,1(6#<_P[3Q47BN2P MN+/QT/$%^%U*WM?+L(6NFC'EFV4@QH&&[=(9 >#G&#TQ0!ZI1HHM M(+E)#:6R$[%;:3\Q+LS'IEL#ID@&A#XRTQKJ>WN8;ZR:"U>\D:[MFC58E(!; M)^O\ZLP^)M-N+=Y8VGW)/';M#) \0C;\C@'!W YZ8SZ&L+3=+7Q;I&N:G M/(T:ZV##:2 9,=JF1$P!_O$M)COO%8^L0ZA9:[<7\VHP^;%-:"YNHH-D=N9& M$08!BPRD;2L2Q('FH<8% 'IM1P7$-S&9()4E0.R%D.1N5BK#Z@@@^XK$\+WL M^I:;>K/=&\BBNY8(;OY09XQCYLH ,@EERH'W:\^T^2PT[P%+'9WI@F.K&+53 M'=-YL%M]M978C=E!M/+<<$G/>@#V"BN,\)26R^*-6UA:R75Y<16]O&,O+,X15'N3P*JV.NZ1JEE+> M6&IV=S;19$DT4RLJ8Y.X@\<>M6+V2TALY)[YH5MH1YCO-C:@7G<<\#&,YKA5 MT:\\21ZWKD%L(%U&2S^RVTX\LW$-O+YFZ08X,F649'"[<]Q0!W$>IV,UM#

!W0[3UP2A(^M &]17!G4=8 MTGX>S^*IM8EO[J731IVR:U-?N M="N;^.:>&(-!-$4&0%4#:V_H0?N]: /2**X;R-<;Q>FC-XIU 03Z<;QG6"W# MHZR*N%_=D!2&Z$$\=>M9WA_5M>\3SZ7:RZY<60DT?[3-):P0[I)1,8]WSHP& M0,D ?E0!Z517G-EXCO\ 7-#TJ--0U0:N]H\TJZ7#;X=5D,:RL9AM )4D $9R M>PI?#NM:]XEU'1D;53:02Z%:ZA%([?4[JR$FILC& 1G/\ H\S _.K5$5N"L"S,TN5SAMVWY2N,9ZT >@]*R['Q)H>IWC6=CK M%C%I;-6D"YW)&VWS/R0M4/C6&UM] M&T#[!'$D\.JV2V B & 9%#!ZL[%H_M$\$#7,HCCWL%,LA' M"C/5B!TZ\5,[I%&TDC*B*"69C@ #N37E/B34GNM:L=3U'3=41[;6((;*(V4A M5(A)\S@XP7D(!X_A"CKG/HB:A-=7\MC/H=ZEH5(-U,83"XQTV^87YZX5R@]3@]/>C3_$>B:M=R6FG:O8W=Q&,O%!<*[*. MF< ],UA:>L7B3QBFM6D2C2M.M9;*&<+Q=N[+OV^L:;, ]"2<<#EJ1P^(_&-E M<6$:KIFAK-$;F,;1+,Z[#%&1_"@R6(XW;0.0< '06&M6VI:C?6=NLF;/;ND( M&Q\EA\ISS@HP/N*TJQM)\-VFBW\]Q9O.(Y((H%ADGDD$:H6QC\G^T3DL3N?:J9YZ<(O ]*MT4 %( MJ*@PJA1DG &.3R:6B@ HHHH **** "BBB@ I@BC65I0BB1@%9P.2!G )]LG\ MS3Z* "BBB@ HHHH **** "BBB@ HHHH **** "BBB@ J))(%F-NCQB4+YAC! M&0"3SCT)!Y^M2UYY8V\>@Z]]J\2:;>->SWS)#K27!>%Q)(1%&RALQ@!E3:5V MY[\T >A*JKG:H&3DX'4TR."&%66**-%8Y(50 :Y.YL;>U^*NE7$*,LMUIMZ9 MB78[BKV^W@G QD]/6L232[76]#\6:[? G5+:ZO$M+K<0]F(,K'Y9_A^[N..I M8YS0!Z,+6W54401!8SE $&%/J/2G+%&N=L:#(P<#J*XS6[F;5]+\(6=T62'6 M+F,7JJ2N]1;O*8SCL60 CN,CO5C0[6#1/'6J:/IT8ATY["WO!;)Q'#*7D1MH MZ*&"+P.ZY[F@#I+6QL[6XNI;:)$EG=6F(.22%"CZ *!QT_.J>F:'::3-?7&Y M9'NKM[HO(HS&7"@J#ZD:QX\U33EL'MK*XCN)H;A7WRA;.%F56! M 7@<$AN>U1^)K^.^L_%'EQ%0!I<@0$?*3M7'L!GOF@#TM-F7V;9YGBZUC'[QTVDP0<_*1G' MH<@]P:T)_%^JI;7>MQP67]BVNHFQ>$JWGNJS"%I V=HPV2%V\@=030!TFH:) M!J.KZ=?SMG[$)0(BH*OYB@'.?3%:0C0! $4!/NX'W?IZ5PD_BW7H[:_U-8=- M_L^RU?[ T160RR)YZQ;@V["D;L]#G':N]H 8T,3RK*T:&1?NL5&1]#2E%+AR MHW 8!QR*=10!&\$,B,DD4;(QRRLH()]Z<(T7;A%&P87 Z?2G44 ,6&))'D6- M%=_O,% +?4THCC 4!% 3[HQT^E.HH 0JI()4$KT)'2D$<855"* IRHQT^E.H MH 8L,2RM*L2"1AAG"C)^II%@A0N4B13(.@]J M:\$,D9C>)&C8Y*E003UZ5)10 BJ%4*H 4# [4M%% #2B,.GTIU% $0MH 9"(8QYGW\*/F^OK3I88YT*2QI(A_A=013Z* &-#$ M^S=$AV'*94?+]/2FM;0.4+01DQ\IE =OT]*EHH C>"*5T>2)'9#E2R@E?IZ4 MKPQ2.'>)&8 J"5!.#U%/HH :\:2)L=%9/[K#(ID=M!$28X8T)&#M4#(J6B@! M%4*H50 , #M31%&/,Q&H\PY?C[QP!SZ\ #\*?10 BJJ*%50J@8 P!3!!$K M.RQ(&D^^0HRWU]:DHH 9'%'#&(XHU1!T51@"GT44 %%%% !1110 5FVO_(>U M#_KG%_(UI5FVO_(>U#_KG%_(T :5%%% !1110!2U72;#7-/>PU*W6XM7(+1L M2 2#D=#Z@5%IN@Z=I$KR64+QLZ[6+3._'_ B:OS31V\$D\SA(HU+NQZ 9)K MD?#/C4ZCI%_>ZY#%IQM1'.0,D"WE0/&[=P>6!]"IH Z&?0]-N8)H9K4.LT_V MAR6;=YF P;.00 ,$8 Q5FTL[:QLX[2UA2*WC&U8U' %07FLZ=83/%=WD4+ MI;M=/O. L2D L3T R15./Q;HG1027%^I2>#[1&88WES%_ST.P'"<_>/% &E]@M?[06_\E?M2PF 2]PA()7Z M9 -9 (#)Q]TY'M5BQT33=,>)[*TCA:*V2T M0KGY8E)*I] 2:PH_&]GJ'B;2-/TN=)K6ZBN))97A=M $UMX9T>SU$W]O9+%.7:3Y7 M8(';.Y@F=H)RQW<6F1+-',9XR"V(W.1R,CFDT_P 5Z'JDS16FH([+&9@65D#Q MC@NA8 .HX^9PUJW2#4+<3)'()4^8J4< @,K @@X)'![FJ=SX2T M&\N$GN--BDD5$C.2V'5/NAQG#X[;LU6F\7Z?/H6HZAI=S%)]D@,V^YCEBA(P M<-NVGR>)I] /FB[AABD9A$Y3+[^-V,# 3.3QSZ@T ;;HDL;1R M(KHP*LK#((/4$5R(^'UE9:U#JNBW5&2/2@"Q9>$-#TXK]DLVB"QF-5%Q(5"D;< %L=* M-.\'Z%I$D+V%DT!@_P!6JSR;5_X"6Q^E/7Q5HTFEIJ,=T\EL\K0CRX)'?>,Y M4H%W C!R"*;'XCMKRXTAM/N;6:TOS,-[.RN=BG(5=O4$$,&(Q@]^* -NBL+3 M_&7A_5;JVMK'44FDNE+0$1N%EP,D*Q&TD $D9R,'BIK/Q/HVH7_V*UO5DG)< M)\C!9"OW@CD;7QWVDXH UZ*Y&;QQ97.OZ'I^DW$=PE[=R0S.87VE$AD?,;D! M6^9 ,@D=:Z#4M7L](C22\>4!R0HB@>5C^" F@"]17(7'CJP@U_3XQ: M=+=1RQ1/([NLB* H)QAFR,9&.V*UYO%6B0Z?9WQOTD@O!FV,*-*TH R=JJ" MQQWXX[T ;%%9]EKFF:E)#'9WL4[3P?:8MASOCW;2P^AX/<54G\7:%;P0S-?A MDF#M'Y43R$JC;6;"@D*#QNZ>] &W15.YU.W@T6;58S]HMH[=KE3"=WF(%W#; MZY'2LCPM?:YJ@- &U16'<^*](CNI["*_@;48D8_9VW J1&)/GP"57:0< M^^.O%<_JWC34;*ROIX$LG,/AT:JA4,Z&4D\ \$IP.P- '>45C+KL4-[JJWMQ M9PVMA#%*\GF'<@8,27! ''&"<\]*;'XOT%[&[O#J"QP6FS[09HWC:(,<*65 M@" >QQ@T ;=%9FE^(=+UF>>"PNO,F@"M(C1LC!6SM8!@,J<'!''%,U/Q-I.C M3B+4+IH3@,SF%RB G +.%*J/./2[735O)9IXGA9& MWL#G>!\NT ]/QH ZVBLBW\4Z+++"V@>35+RTA M+7TUI (6=]YC)^7&T'?@'(&>>A-3KXLT1]+&HK? VYF-N/W;^89?^>?EXW[O M]G&: -JBL:3Q5HD>F1:@U\OV>64P1[8V+M(,Y01@;MPP(&\11: MI/\ (8;?4)+:$JC*2BJI&X-SG+'T^E '045RFD:UK6N:UD\7Z9/I>JSZ=> M0/<6%LUPR7*R1*% )#'*[MG!^90>E96L>+]1L)-<6*.U(L;;3Y8LAB"9Y71\ MG(R,*,<#WH [:BL4>(+>VDUE]0N;2&UT^9(RZR,67+]!_L^6^?44BMX9E@E,R-&T;MC:K*P#+G(QD=Z -NBL[2M>TW6S<"PN#(]N MP65&C:-D)&1E6 .".AZ&IM1U*STFS:[OIUA@!"[CDDL3@ V>,@?A0!=HKB/^$OU+39]9BU!;#4%T^Q-V9=/W(J/D@0ON+88]0<],Y'2 MKB^);^.]ETJZ@M$U)+B! T;LT1C=2[MS@@JB2?B%]<4 =7134=)$#HRLC#(9 M3D&G4 %%%% !1110 4444 %%,6:)I7B61#(@!9 PRH/3([4^@ HKSV^\4>(+ M>Q\3:O'>Z6MKHUW+$EG-;-NG5$5L>8).&;=@?*><<5TE[XOTK39#'=M<*\<* MSW/EVSR"V1NAE900G0]>P)ZYQ#ITGEW)V,2K;58 #&6R'7&,YR,5#-XM MTB#46LWEFW),EO),+=S#'*V-J-(!M#'M73XCTL6;7?V@^2M[ M]@+>6W^O\T1;<8_OG&>G?I0!%?\ AJVU*.9)[N\^:>.XMRD@4VCHH4&+CCH< M@Y!W'L<5+I&A0Z1+=7'VFYO+RZ*^?=73*9'"C"K\H50!DX ZD]34/\ PEND M?VG]A\Z;=]H^RF86[^3YW_//S,;=V>,9Z\=>*VZ .:U#P59ZC=ZC(VHZC#;Z MF5-]:0R(([C"*F"2A< JH!VL,U/>>$M-OCJ/F&=1J MQ*$8 *(3E-O''O_2H M[#QQH>I7%E%;2W16]8I;S26+;12W#>8\D M<,OV:3RIG0$LL;[<.1M;@$YVG&<4 +)X4T^2::4O/NFU*/4VPP_UJ*B@#C[N M$''UYJO)X*L)+N5S=WPLI;L7LFG"1?(>8,&W'Y=_W@&*[MI/:K'A?Q-!XHT] MKN"UNK<*[KB>!T! =E!#,H!^[D@9QG!I-0\7Z-IE[-:W,TP-OL^TRI;R/%;[ MON^8X!5,Y!Y/ ()P* %D\*:?)I=YIS//Y-W>_;I"'&X2>:LN!QTW*./2MRN/ M&O7=[\1;C1H[BZM[2RA@E;N)I;:1K&95G"K MO(0E?F.WG Y..*BTKQSINH^'%UF:&[M(6945)+:3,C,Q55C^7]X3CHN>M '4 M45S\GC70H+$W=S19$E*[@I0C<"1R..U4&8WJX M@%Q,!92DV\1SAI1MS&.#][!P">@H Z&BL>3Q-IRZJ--C^U7$XV;VMK626.+? M]W>ZJ57(YY/ Y.!4.B>*;?6]4U.QBM+R)K&X:#S)+>14?"(2=Q4 '+D;AH WJ*R-5\2Z;H]R+:Y-Q)/Y1G:.VMI)F2,'!=@@.%SGKUP<9P:CF\6Z) L MK/>C$<,,XVHQ\Q)3MC*8'S[CQ\N>>* -NBN=E\;Z'#=RP/+= 0W/V6:;[)+Y M,4I( 5I-NT5+20PI(!DJ9-NT$#WZ\=>* ->BL2U\6Z1>:A'9PS3$RRO##,UNZ MPS2)G.M &_16)_PEFD'6/[)6:9K[",T2VTA,:LNX,YVX1<=V MQ@\=:33O%ND:K.M5= \22ZUXJUFS"3Q6EI;6KQQW%LT,BNYEW9# $CY%QVH Z>BN:"(9)-P?=C&4 QM[]:J>,M7U30[>2]M]8TR MW 3_ $2QFM6DENY0/]6") 22< ;5R,YYH ZZBN.O_%&J6UW\MO-ED=[6V$B^9Y ^57VYR0V M"X/HPH VZ*P=;\4V^AZOIFGRVEY,]]YAW6]O))L"J3T53DYQQV'-+=^+]&LK M^2TFGFS#(D,\RV\C0PNV-JO(!M4GT6'P[X?LM'MYIIHK2,1K).VYV'N?\XK3HH P?&6GW^K^&;C2 MM/!#WS);32!@#%"S 2MSU(3=@>I%8W_"(7L/B,/->3ZIINH:;)IU]YRPQ^4@ MYCP$5>>F1GI4^H^&[S5]'U) MTTG5$OYUM8<:E=PR>9&DXD8#8[ #<><9S7HM% ')>(X-?GUM8[:*]ETEK/: MJV4\41%QN.3(7(;9MVXVY_BR#Q7&6&EZS#>6NF1Q7L=S8>'+.SOEL);?=R'R MC&7*Y!#;2GJNW)ZCVZ4 <-:V#7 M5QI&OZ#9:K+H\FCQ644%G<1Q30^6[$;O,9ISVL2RR;S"60J 6&BBCAB2*)%CC0!511@*!T '84RZN8[.TFN MIB1%#&TCX&3@#)_E0!Y_<:-KNN_V3;2Z/+I:6NF75G++)/$P5Y(E12@1B2N1 MU(!]A5&YT6YA\'WSZEI>JP7.GZ%=0K+<7D4D )AVL(PC%L':,;E'05Z997<5 M_86]Y 28;B)98R1@[6&1^AI\\$5U;RV]Q&DL,J%)(W&592,$$=P10!Y\VD:M MXKAL VGS:7!;Z-<6JSSRQL9))HT0;1&S': NXDX/3BK-KIFK:C=Z(U]H+VD& MD64T4L;S1,+EGC$?EQ[6/R'!.6V_P\=<=TB+%&L:*%10%50, =J=0!YI<:# MX@N?#VO:18V.H6^F3:6T%I9:E=0R.L_0"-U=B$V\?.WIC S70BUU&Q\<7UX- M*FN[*_L;:#SHI(@(FC:4L'#,#@B08V@UU5% '&^%[#5-/UA8+>QU'3]!2V9? MLE_<13;)=R[!"4=V"!=X(8X^[@"M*#2KE?'VHZJ\(%K-IEO;QS9&=ZR3,PQU M'#(?3\JZ"J5IJEM>W]_90EC-8ND]-T'PSK%I<:))_U.>;?. MKLJ3,YC)(/S$[AT_'%>AT4 <'IWAK58?#_@2TEM_+FTMA]LQ(I\H?998\@YY M^9E'&>M4_#?A2]M['2M+U*QU5)M,B=([PWD36H;RVC#HH;?R&/!48S[5Z110 M!Y[I.E:ZJ^"["XT-[:/0GVW-P9XC&X6VDB#( Q8@E@>0",].I&YXE37'U/3O ML$=[+IFR7[4EA+%'-YGR^629"/D^_G:XA+HTET)4)+NH(*CJ#GGI4VD:!K7AVXTC5&TQKYT@O8[BSMIHPU MN9[@3#87958#&P\CL1FNHM/%FEWVN2:7;O+(Z?*LZPN87D!;>@DQMW+LYY[^ MH. >+=*_M..Q?[9$\LQ@BEFLIHXI).?D61E"D\''/..,T M$T^YBBE0QLQ!;S&4$,&YP06+NQP 3_ (=: &:59+I'ANUL M[.T=1;6P2*VDE!8$+PA;D>V>E73[+>" M-I)'VD[5 R3@B623_0XK>64B M,_=F8JF/Q!SZ5I6]_;75S=6\,FZ6U<1S+M(VL5# 9(YX(/% '-6>C7XD\8SR M6?E/JKJUN"Z%F'V6-,$@G&'##GZ]#FL&_P#"6M3Z'J MSZ%X]MH[8--JH/V-?,7]Y_HDFVFCR7O]N1LU MO:KX+ET^T1'NP()%B=L"0QR M(Y0GH-VPKZM M>D52U#5+;3#:"Y+#[7<+;1;5SEVSC/H.#0!P]]X:O=6TO4)XM,U.'4B+;8NJ M7D3B=8IA+Y8\MF !P1DX^]Z5L:HFK>((M+;^Q+FQ^RZI;SNES-"6*+G-'*_EI M$EG*\I?&2OEA=V1@]L4 \$-K<)'+)#);K'O0L0H8'/#$<9KK8O%NBRZ+/ MJWVIDM;>3R9A)"Z21R9 \LQD;M^2 %QDY&,YJQI.O6&M-/':M,D]N5$T%Q \ M,L>[E24< X.#@]#@^E ')KH5[8WFDZU9:/?RO#>W$UU9W%S"UPQEB">8#OV9 M&T<;NA/>MSPA8W]I'K$VH6AM7O-3DN8XC(KD(RH!DJ2,\'BM:UU2VN]1OK"( ML9[$H)@5P 77<,'OQ5?4O$6FZ5'?-A[4 )K'4-?E^SV_AF6 MVOXYT%OK4DL $"*^=ZE7,G(S\NT YP>,UT;>(M-CN+R"25D:SN8K64F,D>9* M%* 8SUWKSVK5H X>2RU_24\0:;I^D&\CU.XEGM;L3QI'"95 82AF#?*V3\H; M((Z&KVN^';AOAM)X>TX":>*SBMX0S!=^S:.IX&0M=510!Y]K>D:UXD;7;T:1 M-8M)H%QIMO!<31&2>63G/R.RA1@ $M_$>E&L^&=7NVU\P6H;[7::9%#^\4;F MAE=I!R>,!AUZ]LUZ#10!P.I^&]6DO-9O8+42G^V[/4;>$RJ/M,<442LH).%. M5;&['*CMS45YH&LZMJ=WJYTU[3[1?Z8RVLLL9D$5O*7>1MK%J^);'1I72[AU$A$\QI(-.GFC5?4NB%>WKQ2?\)7HNZT4WA!NHXI8\Q/A5E. M(RYQA-QX ;&3Q0!ERF\T3Q9JNJ-827%OJ#6%K#Y3KN)W2*[8SG"AP3[9]#BW MXLT^]NTTB\L;?[5)INH)=M;!U4S*$="%+$+N&_<,D#Y>M;5M>PW>3>'-6U+49-5ETXV_VK6[.Z-I))&SQPPH%+N0 MQ7<2,X4G@"N\O)IH+266WMFN95&5A1E4N?0%B /Q-3T4 <3I^A/J'B::]?P[ M_8^F364MO>VTS1$WSNRX+)$S+\H#C<3D[\=*KZKX/:2XNI+.P>6&"2VVPS3E MWO%$D;S M(QR"B(@#$#Y6' -=]10!A>%=.GT^RO?-M19I<7DD\-IE3Y"-CY? ME)4$D%L D?-6[110 4444 %%%% !1110!S^G^#M*TSQ=J7B:W\_^T-1C6.;= M)E !CH.WW1^7&*Z"BB@#SN[\ R2C5]3BLK$ZX-8_M'3YW4$LJA,1NV,A6PXQ MVR#VJ;4_"UY+XAU>\;3IK^TU:.+=%'JTMJ(RL?ELCJAPRD _96$$9) &6/)&2/F (]Z ,N_\)74GB>U:U6)-%G^S27T9EK>WUYY8F>&SAWF-"2 S$D 9(.!G)P<#BK]W?+9Z>UVT%S* ?* MAA+R$D@ ;1SW_#OQ0!R4OA?4G\,7]@!%Y\^N_;T^?CROMBS=?7:#QZU3D\/> M(?)FTM+&V-J=?74Q=FZQNB^U+,0$VYW 9') XX)KK='\06VL7%W:K;W5K=VF MPS6]U'L=5?.UN"00=K<@]C4]OJT%SK=]I*)()[.*&:1B!M(D+A<'.<_NSGCT MH X[3?!]Q9W[VMWITMY:_P!IO>QW/]K3)$ 9C,I:#.W>K'IC!(!)Y-=AH]_< MZC8M<75BUF_G2QK&S;MRJY57Z#A@ PXZ&HM6U^TT>"_EN([EA9637LFR$D&- M65HKA)@PF#RNX.W&5X8= M>]8VJ^'=<:'Q3I-G:VTUIX@D9Q>23[3;[XDB<,F,M@)E<=B@#AAX6N)387,.FM:3+J\-WZD>-(V7)9B>1D $\"FZOX6O'\3:K>K8S:A::G%$K)%JLMIY;*I0JZJ0& M4C'/)'/%=W10!P^J^']1&HPMH6F_8+F/R(UU"*_(1HDVY66+'[S"[E&03TY' M;4T*QU/2]>UM);2-K&^O3>1W2S#(S%&NPIC.>F*Z2B@#BM<\.7K^+9]7@ MM9[VWNK..W>.#4Y+-HV1G()VD!E(D[\@C@/,5W89VA5"J>N[YCVKOZ* /+X;'5M=L?%.B6MC&MM>:U(LMX\X' ME+F,O\F,EL#C'&3U%:#^#[A=7U:*XTZ74+#4;W[4'75IH(U#!XL3975U;-FV=\E"00 3@>QZ#K6M10!R'ACPY?Z3J&GS70C"0:!:Z>^U\_O8 MRQ;\.1S67H'AW7_"YTNZBL8+Z1=(BT^XA%R(S&\;LP921@J=Y![\#K7H=% ' M+VN@WLVI^))[P1P)JUM!$OE/O*$1,K\X'0MP>,^U8NC>%M4L]/@A-@T&J6%B M\-K?RZM+<0K-Y>Q72)B0%/7! P.!FO0J* //-/\ #.KG5;>^OM.,Z)I-Q:7$ M-[JCW'VB5S$<88%41MC=!WY P*BG\(ZW?:5?VD226=DKVL]E87&H/*1)%+O< M"49:-& 50 3@C(QTKTBB@#@+CPK>7-E+>6VEM;:E'=6EPJWFJ27)N!!(7"%F M+;!\S8QGD\@5M:%8:I_PE.L:QJ%G%:QWEM:Q0QK/YC#RS+NW8 /SCIGZUTM M% &)KFEW-_JWAZY@">787S3S;C@[3!*G'JJZC;W>F1>';*^MIHRD MI M7+..O/3K52U\*WEIJT,,-K;QV4.J?;TNED^81B'RQ%MQG(X7KC:/PKMJ* .< M\16.I/K6B:KIUK'=FQ>820M,(R1(FT$$C'!Q6#?^&=T&*VMVL]9O&N/ MMQGP8$DV[P4QDL-IVXX/&<8KT&B@ HHHH **** "BBB@ K-M?^0]J'_7.+^1 MK2K-M?\ D/:A_P!G\Q M3/#TFKR^'[)]>AAAU4Q@W,AL[O1%U/1E2QD,Z%A67_ (GU M36/#NK^(;">:V2TL;>T9%D*K%/(R-N#&C*-V#MPU+J?\ :FGZ#K$MGJD= MO;,ED(TMM7DO989#< &0-(H*AE(&.0=I]37J$=O!$CI'#&B.2S*J@!B>I/KF MH8=+T^VA>&"PM8HG(9D2%55B#D$@#DYH X?Q +&RN1H*27DDUO9->O.:]?GLK2YEBEN+6&62(YC>2,,4/L3TKG[[PI,^KS7^G7MI;K-;1VS MP7-B)T14W8\OYEV?>.1R/:@#E;B+4+?5M)T&[O%GAAT1)O,?6)K03W!7TMK%I_B+4[U[ZU6QM&DMH-3DMYK=R 681*0LNXL#AL M'C SG%>E+:VZ!@L$2AU", @&Y0, 'V [5$VEZ<]Q%<-86K31 ".0PJ60#I@X MR* ,OQ?J-OI^CQ)/'-)]LN8K6,1736WSL>-TJD%%XY(^F#FN MKJ[GN_[)&H MW$=HOB6&WQ::I+-MC:S+M&)CAR-^3CL<@=*]9N+>"[@:"YACFA;[TO '7TIT%K;VJE;>"*%3C(C0*. M!@=/:@#RV_O+NVEU&""016UWXK:&Z^TR65 MC'I5]*MV+[4G2Q2#6Y0L"+"'9);D .>0Y"X/WE';CT)[.UEBEBDMH7CF.949 M 0Y]6'?H.OI49TK3C9K9FPM3:J=PA,*[ ?7;C% 'F>GM?:IX>C U6*2*SU2[ M3[(^L2Q_:8E.%5;D8=@F>,C!XSCBGOK#Z[J6CPP&6+2I-(,\$5UK$MJSRB0H MQ,J!C*5 7&3CY]W.:](FTK3KF(13Z?:RQAMP1X58!O7!'6GW&G6-Y"D-S9V\ M\4>-B2Q*RKCT!'% 'G&J?;['2]/U/5]6BU**RTQ6NH+35Y+9V()/VB-D*B4L M!C#;1D<'DBNK\9:G<6W@6\U"PED@$ 1L\*L4QTP2./PJT0&4JP!!&"#WH \OUA;>.+Q3I>FZA=7>E?\(Z]S M+F^DG\J?Y]N'+$CPR:OHFH6VLVU_$FH0QQ MZ2K*P=V;89%*G<60$MALJ-IX!P1V$.D:?;ZG-J4-G$EY/&LT@:Y0869HP74>S=14LD42WM[&VB@ESYD< M<2JKYZY �!YEXD8M+XH9B2QL-'))[_ +^2KNLZI>Q7?B.%K^X@L_[=L;6: M992OV:W>& OM;^ $M@D8QO)Z\UZ(UI;/OWV\3;PH;* [@O*@^N.WI2M;6[+, M&@C(F_UH*#]YQCYO7@ 7:AJWK:6NJ:5$DJ7CNT;2RXFC64 MDMC;L.,\;_>NJ\-1&P\7^(M,BN+J2SABM)HDN+F28HSB3=AG)/.P<9KHXK&R MMX([>*UMXX58,D:QJ%# Y! Z9R,U,L4:RO*L:B1P S ^,F@#SCQ!>W MS:IKMLE_=PQ_VSI,">5,R&-)&B#A2#QG)SCKFJVL3W&@WVOZ=:ZC?0:=YNE^ M;-+=R2/;1S2NDSJ[DEFRW>M36_DJ8@1*5VMYV7W ER<[ M<>N?3(-.L;6-([>RMXHXWWHL<2J%;&,@ <'!/-%QIUE>2QRW-G;SR1?ZMY8E M8I]"1Q0!YEXPUMBNJW5J[V]_I4T$+SMJ\L(,N$;$=N,JZD-CY@-W/7%:]Q-_ M9/C47=]=-?PWE^EO;&WU.16M690HC>V!V,H.23R>G M495O%EU>0LR!W5H/LQ78I QC!S\H.>3FC:26U[8>$M3NM3GFUNYUM#F]%G;B[(P9Q$N\_P# L9H&FV*W#W"V5N)W M8,T@B7VUP9+.X=DP7*,K*5?A@59LCKW!% M9%EX[CM-&U&XU>>UN9+2]^Q6\UB,)?N45@(P6.&RQ4_,0"I.0 <=??6%KJ=E M+9WL"3V\JE71QD$$8_#ZU&VE:<]I%:R6-L]O",1QO$&5?H#0!Y]<6ZV.FZ;J MU]=VLDDWB&*_U5X) \5ON0QHN?[J$1#<>XSQ706-Q#J'Q+O+FQE2:"WTJ."> M6)@R^89695R.X7)QV##UKI(--L;:&2&WLK>**3[Z1Q*JM]0!S3[6TMK*$0VE MO%!$#D)$@5<_04 >8ZW'IXUOQW=W.JW%E=6T$,EL8;YX<.+?*ML5@'.0!@@^ MG>F>(+[4+K2/%,=])(&&A:=*T#$[8Y7:7?A>@)(&?H/2O3I].L;FXCN)[*WE MGCY222)69?H2,BI'M;>4R&2")S(H5]R [@.@/J!D_G0!YSJ-S/:ZQXC>WFDB M9O$6E1LT;%259;8,IQV()!'<&JNJZA+]E\0ZFVJW,>OV6K"WL;1;ME&T.@CC M$(.UA(IR25).X\\#'J#6MNQ8M!$2[J[$H.67&"?<8&#[4QK"S>\6\>T@:Z08 M68Q@N!Z!NM 'F>IK<-H_BO6?[1U(7FGZQLM=M[*L<2@Q?+L#;2#N.00>M>GP M75O=&46\\4IBD,4GEN&V..JG'0C(X]Z#:V[1R1F"(I(VYU*##'U([G@?E45E MIUKIYN3;1!&N9VN)CW=VP"3^ ^@% 'FCZA*;.75?[5N1XC77_LJ60NVV^7] MI$8B\G.TJ8?FSMSSNS72>#K:6ZO]:U*ZO[Z>2+5+NVABDN&\J*,2= F<'ZG. M.@P*ZG[!9_;?MOV2#[5C;Y_EC?CTW=:ECBCB#".-4W,6;:,9)ZD^] '.>+F. MH?8?#41.[59"+G'\-JF#*?\ @65C_P"VE4/%.BS01:K?1SPBRN4MVGA\L^:6 MB;*I&0:M]BGLA&N9"\?FR39^]DNS/Z;>,=Z]% MJ'[+;_:OM7D1?:-NWS=@W[?3/7%34 %%%% !1110 4444 %%%% !1110 444 M4 %%%% 'G&MZG9^';[4;GP]XBB.I27(>70)"DGVB8D!@B_ZQ&8=P2O?'6IO$ M_B71=:U:3PO+K&GVEE;R(VJ2W-RD9;!#"! Q!)) W'H!D=3QWC6L#W<=VT2F M>-&C23NJL5+#\2J_E3RB$Y*C\J /-=0DLK'QCXEFU3Q)<:,+B.WGLFCE2,3( ML6W*Y4F0APWR@G[PXYKI](\3VZ>&[.7Q!?6UCJ2V5O+?)*XC\EI!@%@>%RP/ M!]*Z0JK8RH.#D9'2@JISE1R,'CJ* .&\&20CQ5K<=AJ9UJSDBAEDU-F61A+E MAY.]0%8!0" H&W<<]:R]?3P[_P )OXD;Q#=16X_LNU-MYER8F8@SY* $;F'R MXQDC(QUY]-5%10J*%4= !@4C(K$%E!(.1D=* /)-0GU*3P]J:ZH\OVL^!E>X M20G/FD2;B1_>]:L:Q))"/%;Q.R.(M'PRG!^_@UZI@'J!1@>@H \H\27%J9?% M[W]X\7B*"0#1(A.5DV^4AA\E ?FW2%@V <\@\"DUVR6YTWXB:E=&;[?8;7MG M6=P('6SA?* ' .[G('->L%5+!BH+#H<L6-^T:V\Q9G#X5D9&!0@,"" 006'!P>:O4 M%%%% !14<,\5S'YD$J2)N9=R'(RI((_ @C\*D!!Z'- !11D#OUI'=8T9W8*J MC)8G H 6B@$$9'(J-YXHRP>5%VKN;U#_KG%_(UI5FVO\ R'M0 M_P"N<7\C0!I4444 4]5U2ST72KG4K^7R;2VC,DKX)P![#DTW1]7LM>TBVU33 MIO.L[E-\;[2,CIT/(Y!%6KBWANK>2WN(HYH9%*/'(H964]00>"*2VMK>RMH[ M:U@C@@B4+'%$H54 [ #@"@#%\::K=:-X2O;RR94NOW<,+L,A'DD6,-CO@MG\ M*9'I6G^%;.YUB6^U286ML\EP]Q?2S!PHW,Q1FV@\'& .M:FLZ3:Z[H]UIEX& M-OV@BN_,+>6@%(E>*>*-CO"'=@JP3VZ7 V))""K*WR_.,@[3QZ^U21>"9K&6SN=-U2R263W,LCNHS/)/DNQQTY)( ^E %#2 M/&]]?)X?NKW1H+33];0F&1;TR21L(FE^9=@&"J-R&)Z9 J+2?B3:ZC<#C( /'.: ,(:]J^ ML:WX+O9;".QTZ^N9)8=MX7D=#:RLHD38 ,C#8#-@UTVM:Y-]I964D9Y12"",$4 M4Y/$FJCQ#;Z''HD4ETUI'=W$GVS$4*L[(PSLRQ&WC YSSMZUG:;\1[;4=0L5 M6.R%E?7+6T#)?![@$;MKO#M^56V_WB1EXOGN;EK%;-R8P M@;:[/NP.GWL8]JJZ+X9N=#:.VM]45M*B=VBMGM5\Q58D[/,SRH)XXS@#F@#G M;KQ'JFN-X6U".QCM-)O-73R)1=L9I8]DN-\>P !@,XW'M^#[;Q+K/D^'$TN! M)UO]0O89?M]X=[>69_EW"(X7Y 00,C:%YY-:5GX'EM$TFU_MF1].TFZ%Q:6Y MMU# , C/G) #$ @#WS4O_"&/!8:7%8ZFT%UIUY/=PS/ '!\XR;E*Y'&)2 < M]A0!T-_?1Z;I=S?7 ^2WA:5PO/09('K5&UE?0O"AN]5D9I+:W>ZNVSN^;!>3 M'L#G ],"K.H:,CO4]_90ZEIUU87*E MH+F)X9 #C*L"#^AH X.?Q#JA\0^'=2U:RBTZP:SO+HI#=M*Q01*V)%V* P'H M6'7FH;WQ_P#VIH%_;F.S@DO-'NKFU:TU 3R1%8L[95"C8V&SP6&01GCGHH HZ;XDU&"&PT_5M.2W%YISS6MQ!>&5F,:*6#Y0 M;6(;((W#@U!H_B+6KG4?#%I9V\4ME>:&+V1KN\)F/,(W,PC.YE#GT#;B3MP* MT[3PC<"XMYM2U8WAL[22TM%2W$0C#@*S-R=S84#L.O'-$'A":Q;0I-/U0PRZ M7I_]G,SP!Q-%^[SQD;6S&.>>IXH T=?UN32!8P6MH+N_O[C[/;0M)Y:D[6=F M9L'"A58G )Z<57U#6=5T[2H)[FUT:WN&9ED%SJACA7'3:YBRQ/IM&*LZ]H9U M@64T-V]G>V,_VBVG5 X5MK(0RGJI5F!&1]:SKCPM?W.HV&IR:TK:A:QRPF1[ M-3&4D*D[4S\K#8,')ZG.: *-EX\NM6.DQ:7H@GGU&SEN?GNPL" 2>..21GZ]XDU35M-@N;.QC@TD:Y;6JW7VMA-)LNTC8^6$QL+!E^_G'.* MZ#0O!T6AW=A<+>RSM9VD]J-Z %Q+,LI8X[@KC@=ZJMX'E\H64>LR)I::BNH1 MVOV=2RN)A,4WYY3=G' (SU(&* -7Q1KY\.:9%=+!%(9;A(-\\WDPQ;L_/(^U MMJC&,X/) [U0N/$VJ)ZE!/,"FH'R$$109$@C)8$2 \+_C6]J= MO>W-L$L;V.UE#9+20"567!RI7(_GVKB!X1U'2?$.@Q:5=E/+CU&:>Z-H&A1Y M7A;9L! 4'#8 /\)Z\T 7)/B&BVMC&UK:VVI7-QB*&%H&VR$R[3D9* M[<+D[ATYIUIX[N=5DTVWTO2K>>ZO%N]^^]VQ1-;R(C8=4;>I+Y! Z8XYXG3P M.+:&PEL]3=-3M);B5KN:%9!.T[;I=Z9'!8*1@C&T5IPZ!(-7TW4[J^,US96\ M\!VPA%D\UD;.!TQY8 Z]>30!D6GC:]U)-.MK'2(6U6Z:Z$L$MV5B@%O)Y4C& M0(206( ^7G/.,59\ 7%S.XE\UT9/: %8KQ MAB1D9'I6\"QWMWJ>MZGJ%K")_M]S )UO9)6 63:(PA4*% 48(Z^@S5RQ\$FT M;3[5]4DETG3KC[3:69A52K#=M#/G+*NXX&!T&2<5MZ-I":/#=QI*TOVF\FNR M2,;3(Y8C\,T H3^79:W] MFL+C,=S$;=&>-"C F-L?>)V_>SC)/8"J,W@NY74["YL=8$-OIULMO96LUJ)E M@PNTN/F&7(XW'D#@8R<@$'BZ+4(?!=C?3W]W!J5L]H)OLL[1H[M+$K[@N-PY M;CIS5K5DDUGQM;Z'+,E<=>]1ZMH,UYJEMJNGZ@UAJ$,30&0Q"5)( MF()5E)'0@$$$8Y]: *W@VYN'M=4L+FXEN?[-U&6TCFF;<[Q@*Z[CW(#A<]3M MYYKG?"?B75+#0=&-_8))IUW>O9K>?;"\P=I7"%HRF-N<+]\GIQ7::'H\>B6# M6ZS27$TLKSSSR8#2RN2ZD$L<-P"+6SBTN*2Y>>*QL;FR*LF/-68H6)YXQLQ^- M $%IXSO&;3I-0T=+6UU6"2:Q9+KS'RL9E"R+L 0E 3P6Q@BC1_&.H7]QH!O- M&AM;36X#);.EX970B/S,.NP KG!!/3D"GV?@N6(V"7NL2WD&FP/#8H850IN M3R]SD??8(2 < ;M_U7E_)T M/7S.O;'2M1M*N-2\(MI&LW EN;FQ-M=SPJ%#,R;791VY)(XKD?$?@[4SXWBM50-O"D8 R2Q,8'4YSP!W .AT_Q#?OK\&E:KI<-F]W: MO=6KPW7G!E0J'5LHNUAO4\9')YXK'\37US>^,X]%%OJ]S9V]@+N2#2YA \KN M[*N^3>F%4(WRAADMWQ6UI?AZZBU>'5M4U(WMQ!:FVMT6 1+$K%2Y(RK:;J1L+X0&VD8PB5)8]VX J2.0++1]0NY[@W+)71K2]E1Y%EW7;@&0O(Q9Y.,#<69 MCZ#\*JR^#X6O&\BZ,&GRS6\\MHL8^9X-GE[6_A7]W'D8.=O49- '2T444 %% M%% !1110 4444 %%%% !1110 4444 %%%% !1110 4444 %%%% !1110 5C# MQ3I9N1;_ .G>9OV?\@^XQG./O;,8]\XK9HH *\G\/74^A:7J$EQ*[Z7K%[J, M89CD6UT)YE4>RR*H'LR_[=>L5BGPKI;^'+O098WEL;IYGD5VRV >:TM,U MCQ!J_B[3#YL5A:S:.EY-83VSET9G4.N=ZX88(#%>!V-;/_"'642V!LKV_L9K M.S2Q6:WD7=)"GW5?1G(P>3S0!!XGN%@O_#:F%)/.U58P69AL_IF\BSO/ML67Y\SS&DY..1ECQ0!RMGXFUS M2?"VN:QJ%U:WQAU.:SMXDMG0A_M/DKD[V)0$CY0,XXR34ESXTUNQTW4G^SP7 MDMNUG]GN#93VD4OG3B)HR')(9+4[=[B]>SU"1YGM3* MD,GU MH P]0\3:W9:M#HLD]A'?+:&\GG33[BXC(9V5(U1&R/NG+$]N!SQ'<>,-8$>E MW$\<&AV=Q9)/-<7]E+,BS$D-$Q5D\K .Y^N?8UTNI^'8-1U&+48[R\L;U(C M 9[1U!>,G.U@P8$9Y'&1DX/-1:EX835+;[+-JNJ+:O;_ &>:%)EQ.F"#N)4M MD@D$@@F@"AI-UK5SX^UR"34+5M-MEM]L'V=MV&1R-K>9@'.,G:<@GCC'-:$7ANUMM<.JVMS=6[/'''+;Q MN/*E" A-P()X![$=JGO]$M-1O[>\G\SS8()H$VM@;90H;/O\@Q0!RECXMUN& M+0+_ %;^SWLM6LGN6BM8'5X"L'G?>9R&R 1C QQR:LQ^(];LO!T_BK5/L#VI ML/M<5C;PNLB%@&1&E+D-P<$[1S6VGAC3DAT>$K(T>DPF&W5F!!4Q^60W'/RU M5M/!EA;:?+ICW>H76F/;M:K8W$^Z*.(C&T8 ;@< DDCM0!C:OXIU_P -17T> MI#3;FX_L>YU&V:WA>-%>';NC<%R6'SKA@5Z'@58&I^+'\11:/]JT9&N;%KU) MOLZLGL#-7JIM+B_24G"R7#)'(P?_9< MLP/LWM3=9UB+7(_%M]"KQ%O"#K+"_P!Z&16N0Z-[JP(_"NYT?PTMG;Z/]J:Y=&.2.76K3[)>>6^ R[2NX#'#8 M;K["@#"2R34O%M[92DA)_#%NA(."N9)N1Z$=<^U+I<.J>(-'TW6(XXFGN[?3 M[XF9RBLZ ETR%8CJ"./XC707WA_'VN\TYRFHRZ>NGQO(WR(H+%6P!U!BJ !^@H PK'1KR'68;JXV>9)//>3F(DHC%$B6 M,$X)^49S@9*DX&0*IZEXMO;/2O&%U'#;E]$E"6X8-AQY$4GS\\\R$<8X KL: MYC5/ VG:M/J;2WFHQ0ZGM-U;P3[(Y&"A W3.=JJ,9P<<@T 9.I>*O$%O;^)= M3MQIGV#0;DH\#PN99XUBCD;#[P%;#G'RG/' KI?$UG?:KX8O+72YO*NYD'EL M9#'D9!*[ARNY(#JMQ>1V%[J0F%I',GE7,8BB +@ L,LI M!&1D#GBNNO;1;ZSDMC-/"'Q^\@D*.N#G@CZ4 SD?

XCQOH[[5=1N;R]B-O)?>=LE2'>6$:8X48."0.>OIBU8^% MET^QDLH=8U3[.;E '*^)-+MVU?Q#<:YH5WJ(EB5 MM-NXHP_V9%B&0K$CR6$@9MV1G(YXXTM3NKF^^!UW=WA)NI_#KR2D]2YMR2?S M-;>I^&(=7'E7>I:D;-HQ'-:+,%CF4=0V!NY[X(S6C?Z;:ZEI-SI=Q'_HES U MO(B';\C+M(&.G!H X]]8UC31'INK?8+F"]TFXN(#;121&-HE3*.2YW AQ\PV MG@\5R^OR";0=3E6-8P_@>-@BDD+DOP"22?Q)->A6W@^SADDEN+V_OI3:O9QO M=2J3#$V-RH%4 9PN203P.:;<>"M)N;*6TD-QYYC&GPQ%G?$DDS%$WO%,U;Q9KN@#4[*Z&G7= M]!;VUS;31PO%&ZR3^4RNA=B"#R"&YSTXYZ.\\*Z9?MJAN%E;^TDB6;#XV^5D MHRD<@@G.?4"JI\%:?-!=I>75[>3W8A66YGE!DV1/O1!A0 H;)X'.3F@ TC5- M7'BF\T35I+*E6O$^L3Z-IL+VD4LB/$VUXW5@RNI[$$ T *PN]1LY; M'RI$1X8IH[F;R\%2S%6!#[GTDV^L-!+/*K+-]E#1H0<\#)+# M@@9SUYXZ5ECP;I[6]PES/>74]S/!/-=+#YL;)YD+;73(QE3V/H: .+T72M,B^(,DGARR@L["QM9+?4'MD"1SSL MR%4('#,@#$GJ-X'K6=HFF+X5ETJ+4_#&FP:A=2/;PZO RR2?:&5V&_Y P##< M,@MZ'&:ZO1/"<6@0PV]IJNI-:PH42WD>/9SGGA W> MI:EJ+VC%[:.\F#)$Q!7< JC+8) +9(R: . E:?1=-5+BSOK6*;3!#JWF9+3R M)\\[KS\Q**Z[QP3*G/''I&CZP]_<7=CXC1&58C@ ;1 MI'?11SA5O J[W [8 M[=: (_$GB;3/"FE_VAJDK)&SB*-(T+O*YZ(JCJ36#/\ $JPM/#FJ:S=Z+KEG M'IPC,L%W9^5(X=MJE*_A3XECT2^^V?9TMS(R1.%&Z9, $@ GCMTH ]#L_$,-[K MDFE)97R.EJEU]H>'$+*V,*'SRW/3Z^E:]>+W]QJ\7C/Q4-)>%8VMUC)) M#X7E1_>]/>N8\+N)-/NKBPUNR68>'[H7]G ]RTTS^43OEWC:'5^X([XXH ^C MZIZ?JECJJW#6-PDZV\[V\I7/RR+PR_A7A>C:3#97/PPOX9+S[3JT:GE@;<%L*!DX Q6[\%HM!L+[6;#F+Q#%>7*- [2;A;AUQP?EZXYZT >D^*/ M%.G>$-)74=3\XQ-*L*)"F]W=LX '?H3^%7M)U2UUK2+34[)R]M=Q+-&2,'!& M>1V->;>-[G4M9^*&B:3I6F1ZFFC0/J-S;RW A1G?Y$!8@\C.[&.BSO)H-QHM MW&FR1RK+EU/+OU@6OC#39M*N=2NTN].MX+LV9-]"8R[[@H*CDE26 M !^OI7DW@^;4]8\0^'O!=Y),3X8N[J>_ MK-*MGXMDWN6<^7"2H;(!Z=/IVH ^DJ*\.\6:G9^$DTOQ7X2DDFT>^T^YTI1& M[LHF^9HF^;DG>",^BUZKX.T5_#W@_2]+E9GF@MU$S,NZ[=7 U73H(H9Y+: M71VB9IXUC=@'9MXPS<'[I&"/K7:5Q&K:9J^O:Y:0S:+86C6=S#=+JZ7!=Q&L MF2B?NP0S!=K G #=Z -.34=6MO'UGIDUQ:R:=>6=Q/'&EN5DC,;1 9H5?E],*.U '6:EJ-OI.G37UTQ$,2Y(499CT"J.[$D #N2!6-X.UC5=7 MAU;^UX88;BUU!H%BBY$:>7&X4G^)AO()'!Q4U[H9UK;;:@)X8+&=)+.>"[;S M)"$QN?@8();UZ9XJOX4\-SZ#>:W+/=W$RWEZ98O-G,GR>6BY.?XLJ1] * * M\;QZ;KWB.WU479L["YB5)HK-WCMXF@C7DJF';-XBM]27Y_^6*1Q*W;[V4;CZ56F\+:T M]A>^'UBM/[-NM4-Z;XSG>L;3B9D\O;R^+[:&]EEN9&@L4LHK@Q36DB3Q[YFC#MGHO'3&1R3Q63+X8US4-7 MN=1N8+2W,^IZ?=")+@R;8X#\V3M'S>W3WK9OO#9U/Q'JD]T$;3K[2$T]AGYL M[Y2W'IAQS0!?U'Q+I>E3W,-W.R/;0)<2A8V;"NY1!P.69@0%')JF_C72(;6: M:X^UP/#-%!)!):OYJM*<1_( 20W8C/0CJ*YW_A"M:O?"MT-2G@?79KFUG++, MZHXM]FU=ZC.(M/UCQ# M!JWVHVMC?)&D\5H[101&&)LNZC ^9F//('7 K:T_2KBV\6:WJ4FS[/>16R18 M/S9C#[LCM]X5SNJ>'=?F7Q5IMK;63VOB"3(NWN"# C01Q-E-O)&PD8/.1TH MZ:7Q+I<-KJ%Q),X2PN%MIQL.X2-LV@#OGS$QCKFJ?B_6Y]"ATB:$R;)]2B@F M6.$RNZ%7)"J 3G('3FN?O-.CN?B786-E<12V;11WFHQJVXJ]J2L1;T+,Z?\ M?FND\5Z9?ZC!IDNG1PRS6-_'=F*64QB15# @-@X/S>E !'XRTAM/N;MVN86M MIUMI;:6W=9Q*V-B"/&26W#&,YS]:8_C71XK833?:XW^U+9M;FUD,RRLF]5* M$\KR",@USVH>#]8U?[;JL\<$-]+J%M=QV<=VZCRX4*;3,H!5F#.<@,]):QN+E_M M43V]PMJ]M);.)O-8 J@3&22&!&.WT-97B/QF(_#WG:4;J*[;4(+"4&T9I;9G M=-V4(^]L;*YR"2.M5M:\&ZC?:CJ-]#Y;$ZK;W\$0N7A,JI;B%E+IRAY8@CT' MK5EO"]S/I:"+3TL[E]5M+R827\ERTB12(26=QG=M4@ 9' Y] "6?Q/)HMO?/ M5Y MNPQ,),8SC9C=N]L9S7$>&?&BIX7LM;\07]Z3J3HD<36.U$D9&<)$%7?.2^'EP+<7(6SD/V6-LD&7 ^3@$X/ M( )QBC4/&^C:;-=QR?;)OL<:S7#V]I)*D4;+N#EE!&,<]:SM4T/7(]0\1_V9 M;V=Q!KL2+YL\Y0VSB+RB2NT[EP PP0QA>-UO],BLK1F;! M+);M'EO3DCUH W=-\4Z=JFI_V?"MW%.T)N(OM%L\0FC! +)N R 67\Q6=J'B MB33/&TVG2QW4]J-,CN$AM;5I7WF1U8Y4<#"CJ0/QJQ%HEVGB71+\F/R;+2YK M27YN=[M"1@=Q^[;]*L)I5ROCB?6#L^ROIL=J.?FWK(['CTPPH AMO%%I>:A: MRP7UN=-GTMM0!:)@^P,OS[CP% /*D9S]*H7?CRRFL[F*QAOX[M]/FO;5Y[-D M1D1,AQN'3)7_ +Z''-<_)X>U+PUX2^UW/VE '7:%XRLK^#3X+ MHW,-U/9"X\VXM7ACEVJID*LP .-P/T.1Q4]MXUT>Y1Y,W44?V5[R)YK9T$\* M %GCR/F !!QUP0<8K-O_ E>:A;:%:O)''':Z7<65PX;)5I(40%?7D'TJA9> M$;\Z1):76F1I>1:;+:0W3:O/.I=H]F4C<853WZ8X�!V&C:[9Z_:M=6 G:W MXV2R0-&L@(SE"P&X>XXK)A\86EO%_ITS3RRZA-V#AOFS^%0WGA/4)=9U:ZETU+VWU=8FEA&KS6Z1,(EC=&"# M#H0HYQGDC% '2'Q;I(UJXTD2S-=6Q'V@K"Q2%3&) SOC:J[2.2>3QV-1VOC3 M1KE'D9[BVB%J]XDES;O$LL"XW2)D<@ @^N"..:J+X5FE'B^V=TAM]958H&0D ME%^S+"21[$&J6B^&[NWB7[?H<$MS;V3P(\^L33QRLP *A'4A$;'/&1P,&@"_ MJ/C>VLO#5[K*:;J16W52LI[<9ZBNBLKI;VT2X6*>(/GY)X MS&XP<17!/X2UNXT37+""-+&SN;:-+.PEOGN%256+$AB/W:$;1M&1QG KN M["6[GM%DOK5+6JNZ6R7BE!D_:+*: ?@9%4'\* -&D 7DKCGT[UA^,]:_X1_PAJ6H MJZI,D6R L<#S7(1,^VYA7#>'/$.G>$M!\2:=I%U!J4&EQQ7-ELERK^:H4J2/ M^FJL3[.* /4_,C\T1;U\S;N"9YQZX]*-\8F\O<@E*[MN>2!WQZ&?%,NK:Q-9WTM MKX=NID2TMVA!830_*9'YOE;U\PKNV9Y(]<>E\VA,G&>65@.!U MQ7!:)!;W\7A7P[>(TEG'-?M>V4ZC8LT3#;"5R0R)YAVC)!"*>U '7:SX,A\0 MZW97]]JM[)86LT=S'IJE! 9$^ZQ^7&(H]+U_Q/ MI5E&(]/MI89H+=!A(FDBRZJ/X1D!L#C+'UKEH+"UA^&VC^+(X8_^$@EEM+M[ MX#]]))+,@="W4J0Y3;TQCC@4 >K;EW[-PW8SC/-!90P4L QZ#/)KR>:QM9?A MEJ'BYX$/B%99[Q+XK^^21)F"1ANH4!0FWIC(QR:LRZ78ZKX1\6>(+Z%#J\-Q M?M!>,/WMK]G9UB"-U0 (IP.N3GJ: /4**YK7==O],\$1:M;QPF^<6HV3 [ T MLD:-D @\;S6-JGB_6?#DFLVVH_8KV>WMK2:U>WMY(QNGF:$*R[G+ ,H/')&1 MC- '?45YIK/B7Q"?#FNQQ3A)+:&"2'4!ID]L&WN5= LC9#+@'<">&Z9YKO3) M>6>C2RW4T$]W%$[EXHC&C$9(^4LQ'&/XC0!>HK@=/\5ZY%%X=O\ 57T^2SU> MR>X:&VMW1X2L'G<,7.[(!&,#M5?3O&7B/4;6VGMK6*>2_LI9XHO[-N(TM9!' MOC5Y6.V13]TD;>2,<&@#T:BN$A^(:R:E!.T42Z(^G"9I^=ZW!A-QLZXQY0)] M../54TI[HQQJ=L!DKGD4ZN M9T#POH.F:=87\>GVTE['")6OVC#3R,5^9S)]XDY/?O69IGBK6IH?#NK7BV)T MW7IA'';Q1,);8.C/&2Y8A^%PWRK@GCI0!W-%)$T;[=HZ&>Q-ZDWV&1O*VNJE,>:-WWA\V1T/% ':45YQ;^/=2U M&'2((Q#:75Q8-=W,JV$]VH(D,854C((!(8Y)X Y)S5ZP\3>(]7U33+""TM+ M!Y].%Y=?:XI"\;"78P5,J>>V<8SDYZ4 =S33(@D$9=1(P+!<\D#JV5SI6FZ8(%O=3N&B26X0ND2K&TC,5!!8X7 &1R>O%8-_#KG_ G>A1+? M:?\ VA_9=Z'N#:/Y>WS;?&(_,SGI_'CK]* .\HKSF'QUJES!I-H?(@OK@7AN M;B.PFN4 MYO)^6)#N^8X/)P/?(J]9>)M>UF;3--MH;?3K^:VGN;J6[M9"JK' M*(EV1%E;YR=PW'A?7- ';"1#(T8=2Z@%E!Y /3(_ _E3J\TN-S%V=3TZT\R4 M.0_FK&I9ANXQNXQCISF@#OZ*X'4/%VM:'!XABOFL+B?3OL;QW,<#Q1JD[E"S MIO8D)@MP>1Z=:TO".M:IK&I:HL]]87VG6QC2WO+.V:-)V9QO[.7[!$LLUC_9\TS^I#RHVV/*\C MU)+":QMM.TV[6T=9K=I99V"([D$.H08< <-R,^U '3T5R^AZMK.MR3:HL]C! MH\=U/ EN;=GF=(G:,N9-X )92<;3Q[UFZ9XJUJ:#P]JUX+(Z9KLPBCMHHF$M MN'1GC)I6[O, MDDBJ(FD._&\$L=O(R!SQBNE\*ZI?:E:ZA'J)@>YL;Z6T:2!"B2!<$-M))'## MC)Z4 ;AD17"%U#-T!/)IV<5YWX=T#2?$OA"ZU?6;6&?4;Z6Y:6\D4&6#;*ZJ M$?J@0* ,$8(S534U&N?"+0=:U.%9M25+"19G'S!FFB#,/=A_.@#T^F[UWA-P MW$9QGFJ&HZU::7/#%<1WKM-]TV]C-.HYQ\QC0A?QQ7)>+-$TB75;*TTO3[=? M$EW>1W?VR-!YUO$D@:25GZA< H!G!+8 ZX .\+H&"EE#-T!/)IU>?_$;1;?^ MS;C48=!MI)#B6[U6,+]JM$3!+Q@X+$*#@!ACT/0]I:7JXXZ]//".H+;H+R2\FB:;'S%/LLQV MY].!3/'FBZ1J%O%;'2=/FU?5I5LXKF2U1Y(UP2\@8C/R1AB/?'K0!T]WJUE9 ML4EG7>'A0HIRP\UQ&A(]"QZU<5E=0R,&4]"#D&N2OO!XFOI!;VUB+*1;%3YF M=ZK;S!RF-IW!E ')[#BMW1-,.DV$EK^["FYGF18QA55Y6<#'L&H T:*** "B MBB@ HHHH **** "BBB@ HHHH **** "BBO*M/6QTKP$^KWEG]LGO;Z6TFDO+ MAQ%%&;ME!8\[(UP"<#GOUS0!Z?)S MP6$NDZVD@LGTFTUO39E^S;OLT49>+S67/ 7&[)''6M36WTRX\1^5+>:-'H1T MN,:7)=S$6^[?()&B92%\P8CYSD#&.] 'K%%>4:V;32)+#4=0U+3-=O[?3[9# M87,A6>5ER?-MADG>Y/3;S@?,*[;QIJ,.F^&WDN+2.XAFFB@<3N4BC#N!OD8 MX1>IH Z&BO&((XI[JXT^!X#IK:]8;4T]W6##1G?L.>A(YP<$YJ[JEM!I5]K. MGQJUKX?35[ WD:,5CCA:++YQ]U"X3=VP3GO0!Z5::O!>:QJ.FHD@EL/*\QF MVMO4L,<^U:%<+X'32E\4>*/[$$/]GDVOEFW.8S^[;.T],9].*H7,NG:9\01< M"?3=7N[N_CB\DRG[=8Y4(=H!.8EQN(PN 2=V$EN[:6Z2D^-#K>+U Y\\0^(M8W =",W.,T =[JFKP:5)IZ3)(QO;M;2/8!\K,K, M"*)E PI6-I#NY]%/3O7E.E?V1+#X1E=XW\4' M5E.I[F)G63;+O$@Z@!L 9XQC%=[XE#_\)9X0*#+"[N<9Z9^RR]: .IHKR/P] M+:D^%9+&5I/%+7)_MM Y,VWRW\X3CL ^W;N[[=M5]/U.UO\ 7]#U'3X+"REO M?M8NK>UD9YU'V>1@EP>!N#*#@C((XZ4 >R45Y=X;TRWL%^'%];Q.EW>VNV[F M+L6F!LR^')/(W $#MCC%:/Q"NX4UW0+>ZCMKBU*W$LMK>S&*WEP$"DL V74M MD+M/!)XP* .ZAL[6VEEE@MH8I)FW2NB!2Y]6(ZGZU-7D^F:#8./!^F+=07=G M/)?R7+6$[>5*2-P0NI!8+\J<\D)SW%0ZU]DC3Q(DLFSQ7%>JFBQ;R)A& GDB M%>Z'G=CC[VZ@#UZH;BZ@M!&9Y5C$DBQ)N/WG8X 'N:\QUBUU2;7=3\-V+S++ M!/)KULP) /[L;(R?0W!8X]%JK?FPUW2;7Q5J<:_8+WQ!"ZM<\)#:HOE#=GA5 M+*6R?[U 'IUIJ\-YJ^HZ:B2"6P\OS&8#:V]=PQSZ5H5Y7>Z3I&J/XWNHX8YX M(-.@>R>-R40"V8JR8.,C PPYKT;19'ET+3Y)6+2/;1LS-U)*C)- %ZBBB@ H MHHH **** "BBB@ (!!!&0>U5K33K&P+FSL[>W+\OY,2IN^N!S5FB@ HHHH * M*** "BBB@ HHHH **** "BBB@ K-M?\ D/:A_P!&- M+UNY:>^B=R]I)92*'(#Q.5)!QW!4$'J.:GUO68-#T[[7/'+*6D2&*&$ O+([ M!514A2Y8,'VA0H8DDC&#Q MTR 1?\(1IDKSO?3WVH-/9O8R&[N"V86() QC!RHY'/O2IX)TQI99+Z>^U%I; M*2P?[9.7!A27"[2 MH!!!Z$>]-/CJ$6OSZ5>)?_VB=-^QL\0/G>7YOW]VS&P@YSWQC- %Y?"EJ^FW M6GWM[J&H6MS"8&CNY]P5/; !S_M')]Z?IOABVT[55U,WE_=WBVYMA)=3[_W9 M96QC &^* MR^-;>ZCL%TW3KR]O+R.206J;$:%8VV2&0LP48?Y>",%1*6Y(WYP-N, $Y![8) -K5-(.IM$RZ MEJ%DT8(S:3!0P..H((/3KC-46\':4--MK.'[3 ]M,UQ%=QSMYXE;.]RYR6+; MCG.0<].E5_#?B>*^CT^UGEN9IKN&XGCN9XDC#B.78RX4X!&Y?J.>N:;#XWBO MH[7^S-*OKV:XMVNQ$AC0K '*JY+,!\^,J,Y(ZXH M1>%ULQ:+8WUU$RWWVR\ MF:4M)=G85VN>X^YQT 4 <4V#P5I=O=12))>&U@G^TPV+3DV\4N2=RK[$D@9 MP#R ,"M*UUNQN_#\>N)*5L'M_M.]Q@JFW<21V('45A)X[C58I+S1=0M(;BTF MO+9Y#$3)'&H"M+:[>0R7@M7N/M3V G/V=I=V[<4_WO MFQG:3SBB[\%Z7>75S(\EXEM=R"6ZLHYRL$[\XYH W=5TJVUG3VL;L-Y+21R'8<'*.KK^JBJ>I>%],U:XO9KR.1 MVO+:.VDPY7"QNSH5QR&#,3GV%8]UXSU%=1TB"V\-WYBOY90HF:)'=$C+!E!D M&W)QPV#@'C)JW>>,[>TN;O&GWPW:!':>?YE Z;=H !SSG&3@9S5^WTX0Z8UC+=7-TK*RM M+.X+L#UY [^E9^F^)EU76;S3[73;TI9SO!<7;A5B5U . =V6SD= <=\4:IX ME^PZF^G6>EWFI745N+F=+8H/*C)(7)=AEF*MA1S\IZ4 2Q^&M.BAT>(([)I$ M1BM@S9^4Q^7AO7Y:;H_AJ#1#&EK?:@UK"FR"UEGW11+V &,D <#).*YJ_P!< MFU_Q3X>@TY=2DTF\TZ2^#V=PD!?YX@K,2P;:H8=V\\8S_ M '=OR8_N\5TLL4#+"X>1M0NK_4 UM+:JMU/N$<<@ <# M') R:;!981Y;B8C* ,0^ =+EBE2ZN]2NS+82Z<7GN2Q$$FW( Q@ M'Y!SC/KFMS^R;;^V8M5P_P!ICMFM5^;C865CQZY45>HH YM/!6G6\-DME<7M MG-9QO#'/;S .8V; MISWK2HH S=9T.UUN*W$[S136THFM[BW?9)$^",J?<$@@Y!!Z5%:>'K:UO[6_ M:XN[F[MH98%EN)=Y*R,C-G\47&, 5KT4 UDGDBN()<2# MSG+R*<@@J6.<$'H/2I;OPK:W1LYOMNH17MHCQQWD<_[YD8@LK$@A@2 <$<8& M,5NT4 8$O@_2[B.]2X^T3&]MH;>6228E\1%BC!NH<%R=WJ!Z4^7PIIT\T\TI MG>2>YMKJ1B_62#;L/3_8&?6MRB@#C_%OA=[U);[3H99;V6YM))UCG\IS'"S$ M>6QP%?YSU.#[=:L^&;768=2O9;O[=#ICQQK!;:A<)/,L@+;VW(6 4@J,;CR" M>*Z>B@#F]3\$:9JDNIM+<7T46I@?;((9]B2L%"!CQD': .#@XY!JQ)X6M#J\ MVHV]W?VCW#K)XPYQG)'8U:*W>:1YYFGFFF?<\LA !8GIT ' P!6A10! MBV_A?3;:[M[F,2^9;W=Q>)E^/,GW;\^WSG [5=T_2[;3&O#;A\W=RUS+N.?G M8 ''H.!5VB@#C->\!O>QW T?59]/CNI6EN[%F9K:Y+?>#!65DW=]C#.3D'-; MCZ,NI>'8=,U2*&,+Y19+,E8U,;JRA<\@?*O%:]% !7-+X+MHM3OM0@U75H;B M]E\R8I.O..B\J3M X S@5TM% &!J7A2WU:6<7>HZHUIL].FM=5O[IKN1[>=8DAM<_) $4@E1V+$\X]!6C10!2O-+MKZ^T^\F M#^;82M+#@X&YD9#GU^5S1)I=M+K,.J2;VN((7AB!/RH'(+$#U.U1GT%7:* " MBBB@ HHHH **** "BBB@ HHHH **** "BBB@ HHK&'BC3S7C'OG% &S29!!Y!%+7DWA^XET#2M0GFD9M*UB]U&)BQR+>Z$\JI]% MD4!?9E']Z@#U@8(XP0:,#TKS[PWJ>L76E:#H>CS6=JUOX?L[N:>Z@:7<77:B M!0RX'R,2$#E MB1L(SQT.: .OQSGO17)^!I]:N[?4IM4U&"Z1-1NH45+=D9=DS+U+M\N!PN./ M4UG:YKMSHVK^*+FQM;3[7;V^FA))0YW^9+(F& ;H!G&,=>*TMI[5H8&@4/-,T(5P7;*A@IR"#C-:.IZCK^B6%K#/=Z?=W^ MH7L5I;2K:/%'$6!+,R^8Q; 5B "N>![T =7@9S1BN!N_%6O6-S<:0S:?+J$. MHV=LMSY#K&\4X."4WY# JW\6#QTS4-]XA\66-KXGD-[I$AT!!,3]AD'VE3$) M=O\ K?D[C/S=C]0#T2L;5- -_JEMJ=MJ-U87L$+P"2%4<-&Q4E2KJ1U4'(P: MY;5/&VK?VCJZ:5;,XTQ8PMLNF7%RUW(T:RE?,C^6/AE49!YY/%=1XEUN71?# M.&SWY!QSU_ANRDL-"MH93:%MBG-K;>0F,#'R[FYQWS M0!HK<0OK*ZAE8,I MZ$'(--26.4OY+-9DM+'7F^Q?V3>:FMBMH(6$R(TQA63S-V"V[!*[>AQ MG(R8[;Q1XB>SL=6EETW[%/K)TYK9+9P^S[2T(?S#)C(P#C;CK^ !Z!17.^*Y MU@E\/AH(I?,U>%!YF[Y#M<[A@CGCOD<]*P8/%'B)[.SU:633?L4NM'36MDMG M#E/M+0!_,,F PP#C;CKZ\ 'H%%U/6M>9M5%Q90Z2;F>&.U^S,TK)&[1[ MC)O !++G&TX''7FN?MO&?B'_ (1#1M9O!8+-K4D$%M';6DTWD;D=W=E5BS_* MAPB@8[D]: /2**XF#Q/J)TRZ6\N$LKA+Q;>UNI](N%^UJ4#_ "6Y(Q:\EO[;3)[I'PP0!8HV)7)W9+-QC'4\2V/B/Q#KEY8: M?;Q6^E79T_[;>&\M)'(8R&-56,LA4$HS9)SC'UH [2.6.:,212+(AZ,IR#^- M-CN(99I8HY%:2$@2*#RI(R,_@0:YCX=K(WPZTQ0X64QR#>!P#O;G%97A>T@\ M,ZAIUEK&A"WU>X!MUUB.02I>RA2S%FR'#,%9L,,<$ T >@9&<9Y]*3S$W;=Z MY],UR&D:=9Z=\4-:6SMHX!-I=K-+L7&]S-/ECZG@?E62--3POJ,FJ:QX8TBY MBGU=W&IQLKW,7G3XB8JT8.!N0<.2.H% 'HY('4XHKR7Q+XDT[5-L^]T77=0.GZA+=:='JFG7+30*D3F%D:,HR-E MLY(8G<,8P.#WO>*M9N-"T3[9:P133OTMYHK,7JW%O.6B,6XJ=VX J01[@CZ4 4K7P==+J5IJ=U>PO>#57U* MZ\N,A#FW:!43)S@ KR>N#TS4LOAF[6/6E1-,O(M3U#[4]O?PETV>3''M^N8\ MYP>M:]CXCT;4HIY;/4K:5+=/,E8. $0Y(8Y_AX/S=.#3+;Q3H5W8W-[#JMJU MK; --*7PJ ]"2>QQP>_:@#EA\/)HH=+E9]-U"YLDN(F@O[7+('"IDEEV M8"J3GY" M>,#KTJ;3_#6I:5K%A=VMU:/$FF6^GW22HVXB(L=R$'OO(P>G%:'AG6+G7?!V MG:PT,0NKNU6;RE8JFXC.,\D#WYJG8Z]JL?B>/1M5M]/W36LESOLIF?R I48D M#*.#NX;C.T\4 9]QX&NW\)6&F6NHI;ZA9RS,EV$) 27S%<8S_=DX_P!I0:EU M;P/%-J]K?V-II,ZPV*V/V74;;S$5$)*,A_A(R01CD8Z8JWX?U_4]?DAO8[>P MATF<&2%'G8W+1<[)"H& &X.,]#USQ5CQ?K>H>'M#EU.QLK:YC@&Z833M&57( M'R@*=QY[D4 6Y=%BN?"\NB2+##%-:-;.+6+RT4,I4[%R<#DX&:XN[T36Y]=T M'2]6N;22(Z=>VBS6L+@\Q(N]LD@$^@]^:](K _X3CPMO"?V_I^2#C]\,$CJ, M],^W7VH PCX-U^\AM$O-7M+=K32[C3X9+.%PZF1442Y+=1L!P,8]?2JWPXN9 MH+Y0=(LFNM>S;96S*"SE#YCL3EONGWYZFNJ/B:RN;:RN=+N+2[AGO5M'8S M[-AP<@#!RXP/E.,YZUEV'BZ\N]3T^U>W@"W.J7]BQ&C7VFSVR7.FNYVW"L4D5XRA^Z<@C(-9 \#&+6[VZ%GH-W#>W(NG>]L M?,FB8A0ZJ<\C(R,D8SWK:@\46$>A6FI:I*=!M;:UN)]7LTANT9[9_-!$P&,[/[WWAT]: #0M'?2)-59YED^W7\EV MNT8VAE48/O\ +5+4-#U:/Q!O' M(K;L-0L]5L8KVPN8[BVE!*2QMD'!P?R((_"N?T_7=Z396 TI9WBC>ZG M=9+A48JSJ%4A1D'&U='/XDT6VU1=,G MU.VCO695\EG&0S?=4^A/8'D]JAG\7>'K:]-E-K%FERLHA:(RC*.< !O[N20! MGK0!RV@Z>^M6L=M;16D-II>KQ7<=Y;QR".^PI+D;R6+9;!;'=6 M_M;5+O2+VTA358$AN!0 O)_VC6T/'/A8L%&OZ?E@2#YPP<=@>A/MU]JM)XGT232CJBZG;&R M$GE&7?QOSC9CKNSVZT 5K'1]0'B1=:U":U,QL/LC1VZL%SYA<$$^V!]:L^&= M(?0?#EEI>[;4"8SN)/08YH LT5R>I>.M,@M]/NK*^LY;6;4$ MM;F61]HB5D=MW.,?=&">*UH?$^ASZ9/J,>J6QLX'\N64O@(_'RG/0G(P.^1Z MT :U%98\2:*=*DU3^T[864;;'F+@!7SC:<\ALD<=>15#_A*[>XUS2+:QFMY[ M&]ANI))\G*&'R^/;[YSGTH Z.BL7_A)+0W:,L]H=.:P>^-U]HYV*P&X+CE,' M.[/IZU)8>)]#U6Y>WL-5M+B5(_-*QR _(#@L#T(!."1TH UJ*Q;'Q;H&IWZ6 M5CJEO<7+J61(R3N4?Q ]"OOTJUJFNZ7HHC.I7L5OY@)0.>6 QDX'.!D9/;- M&A165>^)M$T^WMI[K5+:.*Z7? V\'S5P#N7'5<$<].11>>)M$L)X(+K5+:*6 M=!)&I<9*'@-QT4^IXH U:*RY_$FBVNJ+ID^IVT=ZS*ODLX!#-]U3Z$]@>3VJ M=]7TZ.WN9WO(5BMI?)F+O#T-]]ADUBS6Z$WD&+ MS1E9,X"GT)/ SUIEEXPT6^U'4[*.]C673G*3EV 7"HKLV?0;L$GN#0!NT5GZ M7K>F:W'(^FWD5RL9 F>GX'L:676]+@@EGEO[=(HIQ;2.S@!920 A]\L./ M>@"_163J6N0VC^() MM+EBFO=(#@QR?= P]1GN.*SK_6]8FUV[TO0[*SF>Q@CFG>[F9 Q?=M1=JGLARQX&1P>: .DH MKF(=: .VHK-TS5#J=U>&)5^R0,D<E4?$GB2/P[>:*+B2"*TO;MX)YICC8!#(XQ[ED4>^?6@#H**RD\2Z M*^DG55U.V-B'\LS;^-^<;?7=GC'6HW\0VLT.G3Z=-:74%W=BV+F?9M.UB0!@ MY<;?N\'KZ4 ;-%8L/B[P]<7T=E#K%G).M)/XO\/VU^ M;&75;<70D\KRP>?2F'QUX642'^WK$^7]X"4$X]0.I'N.* .AHK M(O?%&A:=%#+=ZI;1QSQB:-R^0T9Z/D?P^_2EN_$^AV$X@NM5M(IB$(C:4;B& MR5('<$*?RH UJ*Q=9OXY]*BBL=1MXKB^4/:NT^P2*"I8JP!Q\IZ@'J*?X:8W#[H9Y(7+3F8%E;!*N0-P_ 8Z8XH UZ*** "BBB@ HHHH **** "BBB@ MK'/AC2V\/7>AR0&2PNFF:5';))E=G8@]OF8D>G'I6Q7*+\0=(9;>1;;5&AN9 M6@AF6QD*R2C=\BX')^5N>G'6@"S)X,T[RK);:>^LWM+-;%);:X*.\"CA&/?' M4'J"3@C-7=/\.Z;I=W#<64!A,-FEC&BL=JQ*Q8#'KD]:S'\6P7<,#6KO:2KJ MD5A<0W=JV]68!MF 1@E64AN1SWK,L?$>JS:SI]O)<@Q3:_?63CRUYACCE9%Z M=BJ\]3CF@#9B\%:/%9):*DWE)ITNF#]YSY,A!8?7@+H%T73Y[AWOKR]>988K*U8-+L9@2$). H R2<9^H%2 MGQOI)BL&A6\N)+[SA###;.T@:(@2*RX^4@G!S@>] #8O!.GQ:7:V"W>HE;)U M>SE-P?,MMJE $;'3:2,'.0>C\/6JS:?/-/=W,]A*\T4L\Q9BSH4.>V,,> M!@"K&C:Q:ZYIXO+02JGF/$Z2H4>-T8JRL#T(((J'5M?M=)N+>U:*YN;NX5GC MMK6(R.47&YB.@ R!DGJ0!0!#-X7M'U2>_@N[^T>Y97N8[:X*),R@*&([' R MN,@#-+<^&;:]U&.ZNKR_FCCG6Y2U>?\ V=WDV,JNNT#(8%N0<8P/?\^E %+3/#]MI%]=W%K/=!+J1YFMWEW1*[MN9E'8DY/7N:9?>%]-U M&:_EN%E+7RVZS;7QD0N73'IR3GUK#T_Q)JEWX+\.7>^W&H:K,D#SO$2D9(=B MVT$=DP!GJ11I_C+S)8%U.^LK1+:2X2\G9A''*4E>*,+N)QN\N1\ DC9CI0!N MZEX8TO5Y[N:]A>0W=JEI* Y V*[.I&.0P9BR7$TI:226/A-Q] !C %6 M+GPWIUW%K4S&&7R9;B. F&. M3:&VEO7!'MSC-4O$VNSZ-K/AY$\YK>[N98YXH8#*\@$#LH )'S!3D8Z<\9H M L3>%+-]0DO+>[O[.2946X%K<%!-L&%+>X'&1@X YXK2U33+36--GT^]C,EO M,N& 8J>#D$$<@@@$$="*PQXL@OAISVDC6QEU0V$\-U;-Y@<1NY3@C:<*#NY& M/K2R^.=,2[CACMM0FCENS91W$=O^Z>8$@H&)'0JPSTR" 30!.GA#3OLFI0W$ MUW=R:C;&TN+BXFW2&'##8#T4#@^-U:W$>J MI>-))JMQ8K="T(A4_:'CB0L > JY&>>ISFM@>+],.H?90MR8S=?8_M?DGR/ M/SCR]_KGY<],\9SQ0!';^#[>+5TO+C4-0O((&62UM;JY>1()!N!?D_,<,,;L MXQQUXUCI=L=:&K8;[4+PUV[G@L$NG$#2)+,T#+&KH M^PIO/!;(S@9XYI9/$EJNMOI45M>W$T3(L\D$!:.$N,J&;Z$'C. ><4 6YM+M MI]8M-4<-]IM8I88R&XVR%"V1_P!LUJC>^%[._P#FFN;[SUNC=03K<,'MW*[2 M(SV7&1MY')XI;GQ-:6>J0V5S:WT2S3BWCN7MR(6D/W5W>YX!QC/>LK1_%I32 M1)J)FNKV?4KVVMH+>$&1UBGD4 8&%11DG'N_9[JX%S<68N#Y,L@QRR],],-O9O;Q7ES-=M*L=M#;DRJ8CMEW*<;=K$ Y[D8S6XDX>T6X\N559 M ^QD(<<9P5ZY]J ,N?POIMQ/=32++ONKV"^DP_\ RUA"!,>W[M*IR>-],MDO6O;>_LVM+5KQDN+>"1P0#R.* "'P9I<-\D MZM=&".Y-W%9M.3!',227"?[Q)QG )R *L)X7TU--@L LOD07OVY!OY\WS3-U M]-Y/'I658>*;C5/&]G816][:V4FF37+17=MY9=A)$%8$\]&;C/?D=*O77B<6 MWC"WT :?=RF6V,[3QQY5?G51^'S')[<4 :>H:7;:FUFUR&)M+A;F+:V,.H(& M?4?,:IKX7TU--AL LOD17WV]1OY\WSC-U]-Y/'I4%EXQT[4DN7L;?4+A+8NL MC1VCD%U?84!QAFSS@=!R<4W_ (332ULKJ>:.\@FMIX[=[22 ^<9'QL55&=V[ M(QCCKZ&@":T\+6=AJ#W-I=7\,3S/.UHEP1!YC$ECM]R2<9QDYQ0?">F?\([8 MZ(HG2VL=AM9$E*RQ,GW6##OU^N2#UKGT\7WLNI:UN>2R@M[K3X(8KRT)9/.8 M*PP""=Q(PF0Q62V$V_VB*Y822QDY*NW? MD9SU'8BHG\862K JV6IR7$T;3"V6T83+$K;=[*<%03T!Y/8=:L6OBK2+V*YF MANO(5(4P.K,KC/4?*WT(H M:5H]IHVCPZ79B1;:%2J;I"6P23][KW M/-9EAX1@M-66^N+^_O\ [.VZRCN[AI!;$KM8C)^9B"WS'D D4V?QOI5NAD,= MZ\<=O'=7+I;LPM8W&Y3)Z'&20,D#DC%-U#QUI.G3:@DD5_*FG%?MN7:LQO"-G->Q3W=] MJ5Y'#,)XK:XNBT2N#E3CJ<'D!B0,#TJ>Y\4:9:VFLW4DDGE:1_Q]D(3C]VLG M'K\K"H;_ ,7Z9IUY<6\JW+I:%!=W$4):*V+ $;V[<$$XS@$$X% &GJ.F6VJ+ M;+\M3#'>7%HQ(/FV^W>/;YE(_2H-.TR:P=VE MU:_O0PP%N3'A?<;$6M"B@#F_'.E7&M>'%LK>%YF:^M'=4?:?+6=&#+V*T\8:3I]NSQZI:K):7K:M::) MISWUZ[+$K*@"(79V8A555'))) ]ZCTK5CJ@ESIU_9-'C*W<.S=G/0@D'IZ\ M4 <-J'AV^UW2-4>.VUK^T7L!;HNIFW2-U\Q7,0\K&<[<9/&&/-:^N/J/B#2( M'M]!OX387UK=M;7)B4W"H^YD3#D9& 1G ) P:[.B@#S;5="U/7IM7U#^R98H M+VZTM%M;C9OD2"?=+(R@D ;6Q@G)"=.E;MW%?:7XZGU6/2KF_MKK3HK6,VQ3 M,+I)(Q4AF7"L'!ST^7GM5_4_%EAI4^I13QW#-I\,$TNQ005F=D7;SR#K2]T3X?:5:W5G(;VTLE5[9 M67<7 ^Z"2%SVY./>LBVTR34/%L5_I^@W6BP21S#4Y9A'']K+KA1L1CN8,=V\ M],$9.:Z+3?$MIJ.I-IQM[RSO1%YZPWWF#C:1_$<]*ZCQ1#?>(/A_J$-OI M\\5Y<1%4M92H<$/WP2.0,]:W[^]BTZQENYUE:*(9811-(W7'"J"3^ JS0 5P M&FZ!J<'A[P9;R6;+-8:F9KE6WB MB&^4[AS"+9$+]?[P(]:-+T'5(-9TJ:6T98X=;U.YD;;Z-I&K:"OAG4)]*N+H6=E=6L]O"4,D+R2(RN 6 ((0@X.1D>]6/#WAW5+ M/7-$O+FS,,8_M6>2/.,X.,X#9QD9!KL8]6MY->N-'59/M,%M'S*I(.4>XD93QZJ0?QK(\ M-R:IX7TQ- GT"_N_LTLBV]U:M$8I8F>1AQZ275-3-S#J 9/)6- MG1MS$MN#(%QC&?E7'M9OM U.7PMXMM4LV-Q>ZH9[=,C,B9BPW7_9/7TKM[2] MBO?/\I91Y$S0OYD3)EEZXR!D<]1P:LT <3);:E9^*P^AV>J6Z7-\'OTG\IK2 M5, /*IW%U; & N,GJO4UE:9IVM+8^&M(DT2[C.EZLTUQET4 >?P>&Y9-2T.[6RU!T M_MB6^NSJ/D[U)MFC5]J< ;@F!C.>:Z#QKIEWJ_A6YM;*(33B2&40%@HF$.>:Z"B@#C]4:_\ $,FB21Z+?6J6FK0SR?:O+4[ D@+ *YX!*C\> M,UCZ]XZEBUB.]N[>], M"RSJL#1!T5"%RN5.#@G9],N\5:#J/C:^TB2.VO=,AB@O%N^)--L5N;75--OI-/ $=U<-:%K=58 '<3]Y> M>2 0.<]#0!SWA:-[#7](BUI=56_^P/9Z>;J""-"BA&*T34!I;6S$MIRP&1I]PPKF7A5V]".^$+:35OLBP^6 MHB5P&EDPS!5C0')Y8J-HZG%7=*U^VU6ZN+0075K>6ZH\EO=1;'"-G:PZ@@E6 M&03R#F@#B?#&F:QX7;1[NZT6[NP-#AL'CMC&TEO*CLQ!!8##!AR#U3GM6Q;- MJ6C^*=8OGT&^NH]56WDA:W:(F(K&$:)\N ,')R"1\QYKLZBN9TM;6:XD#E(D M+L$0LQ &3@#DGV% 'G>HZ-J[Z;XB\/II4\LNJZD;F'4 R>2J,R'WECJDQF5H3'LEB-M'&4R74ALHP[=CGO7;44 M8^L^$+S5O%=_9/"5T*^C^VR3!A@7/DM;[<=< MX,;@^J>M>@T4 ><6FAZ[>:1;ZAJ5D4U>ZUNSNKJ(.I\N*$HF<@XQA"__ .D MU;2]6DT?QMHT6D74DFI3R7%K.I3RI%:*)0,ELALJPQBO2*PKCQ3;PZIQQD' MN,&@#@;C3=9TCPYH_A*WT^^FL1:@:E?6)3>4+!KJ\: M2SDMM378%MRLF^X.2=R[F,C$ ?-O ^G2>*[>\.H^'=1M;&>\CT^^>:>. KO" M-!+&" Q&?F=>G-=-10!YA=>']:N)'UN.SO;97U[^T/L4+1?:%B^S>1O ;*;] MPW[3GCWK2CT&X;^S+JWM=3+OKZWUV;\Q"3:+=H]^(^ .$&,9SDXKO:* //[; M0-3C\):/:-9L+B#7_MO5C0^$M!@O5NXM,@6593,HYV+(3G>$SM#9YR M!F@#)\>3-;OX9F6WEN"FM1GRHL;V_M+G M[+/LW+#%$$,CC) R1TZX KT&YLK:\>W:XA61K>431%OX' (W#WPQ'XU/0!P' MBS0-3U"^\2/:VC2I=Z7900D,/G=)Y6866VG^*[?PO8Z)+:ZC';IH4,"167V<[KC8RR+*TF< M ?)C;UR>2>*W?!^@W=AJ\]S?V03.C:?:K(^TG
:GX$KGL>*[:HYX([JWE MMYEW12H4=DO+K.HVE]"DUEH*-I-GOPZLK/YIX]H_LZ_537 MH,44<$2Q11K'&HPJH, #V%5]-TNRTBS%I86Z00ABVU>[$Y))/))]35N@ HHH MH **** "BBB@ HHHH **** "N,L_"FH0:%X=LGDMS+IVJ&[F(8X*$RG"\H3:M>72R6_ES:[:ZBH+'/E1PQHP/'WLH<#]:6S\*:A;ZK M8W3R6YC@UN]U!P&.?+ECD50./O9<9'UYKLZ* .$L/"VLZ+'H5Y:I9W5YI\=W M!- \[1H\WU_>2W".?W*M+OC'W<$G?@C/8XR :EU;3-4B\3VNO:5#;73K9O9S6]Q.8 M?E+JZLK!6Z%2",=#[5HRZU;QZSINFA'=K^":>.0?="Q[,Y[\^8,?0UIT <9H M/A&^TG4]&NIIH)/LUO??:=A(_>W$Z2X0$?=!##)P>G'-=G110!SWA[PZMEX+ ML-#U>"VNO)B"2H5\R-B#D?>'/;M69'X8OK&^MM4L;.Q,\ I' 7"XP3U]017/\ B3PCK^LS M:S$6@N(KJ1&LYI;^6-;>,!,IY*J5)W*QW9YW<],5W%A<7-S:++=V;6,;>.>6'IQ6FEY;R7LUFDJM<0HDDD8ZJ MK%@I/UVM^55KG5XK;7;#26C(FU0_,<^4;W'ITQWKC= O(;;[!J-U%;WRS:N[1VL>JL)(YI)F7S% MM-FT$;BQ7<=HR>M>RU"MG:I\BNGU&92@:4RKF' M:5+JQXY . >#7>T4 8OA72;C1=&>TNFC:1KRZG!C)(VR3O(O4#G##/O61K^@ MZG?ZXMUIME:V5P)(L:K'?.DAC4@LLD03$G&Y0K$CG.178T4 >>S>$=?N]2AD MNV@G,.L)>B[DOY3F!9=RQK#MV*0N%Z]L]\A)? ^HQKI]R$M[F:SOM0E:W^UR M0!XKF8N,2*,AAA.,8/(ST->ATV1_+C=RK,%!.%&2?H.YH XRZ\,R'1[6WB\- MV#2K)+,VW594D@D8_>2;R]Y)_B/'/K6Q'IVM+X(_LUM34ZW]A,(OL9 FV8#] M,G![XSWQ6M9W(O+*"Z$4T0FC5Q',A1UR,X93T/J*GH \QN_ FM7\-\3%;6\E MQHLVGCS-1FN6:5VC(9F=>!\IZ?\ ZMWQ5X0NO$-Y<-'/%%%+HT]B&;)(E:2- MU)&.5^0YYKL:S]6U>+2%LVEC=_M5W%:+LQPSG )]J ,:PT[7;KQ=::UJEK8V ML<&GS6ICM[EI69W>)L\HN!\A_3\)]0T[5$\96>LV$%K<0_8WLYDFG,3(#(K[ MQA6W< \<=JZ*B@#BU\-:W:^"%TJTN8TO%OY+B01SO$)86N6D,8D4;D)1L9 X M/YUFKX*UB.>[OX8K.*X&H6M];6S7DDJMY2%&1Y&7()#'!P<'%>C44 <'<>%M M2\O=.G2*.=I J6\JLX+%!R0..,9X]ZL77A/4)O#GB#3UDM_. MU#4S=PDL=H3?&V&XX.$/KVKM** /&[F\AM[[Q#J=W%;WEO#J[-)8?VJT#S/& MRJF+8(0[?*N,M\^ >X%>D^*M)N-<*<>]:I ML[5KD7)MH3< 8$I0;A^/6IJ ..\0>&;RY\5)K=K;17B/9+:20/?2VI0J[,K! MD!R/G8$'V(JOJW@FXNH=*ATZ.TLK?[*+#4;=9693;%T=E0D98C:ZC..)"?:N MHL=7BO\ 5=4L$C=9-.DCCD9L88O&KC'X,!1K>KQ:%I;7\\;R1K+%'M3&F>*[.B@#SS6?"OB*>T\4Z=81:<] MOK<:%;B:Y=6B80)$5*!#G[F0L.=.M=2L=4G$S";49K?R\Q MJCJR*I5Q\F0>O.#TS72:/XC@UFUT^>&TNU2]21U8QY6/8VTAV' )[#O@^E;- M !1110 4566\5]1DLO(G#1Q+)YIC(C;)(P&Z%ACD=LCUJS0 5FVO_(>U#_KG M%_(UI5FVO_(>U#_KG%_(T :5%%% !1110!6OC>BU)T];=KC(P+AF5,=^0":@ MTYM9+O\ VG'8(F/D^S2.QS[[@*T** ,7Q5!H]QH3IKEV+.T$D;BY\WRC#(K MHP?^$A@#D\5P&LZ[>2:-XATVU\0#6["&RBE348=BO!(90OE-)%A22OS< $=^ MHKU.[NK:RMFGO)X8(%P&DF<*HSQR3Q45C=Z??6Y;3[BVN(5.";=U=0?3CB@# MB&\,:4WCJ_TUHIS9-I,=P83=2E3*9)%WGYN6P!R>>*YEM:M]2\):7:ZBML;Z M/P]!>..O M-=9M7^Z/3I00&&" 1Z&@#RN>X2XU^^DTSQ WB1VT&[0W"-$QLC\I4!H0JYD/ M8C=\@P<5-'KUCJUSX<@M/$$:*-!N_M5S#.&^SMY<&'8YP&7YCSR*](L[BUN[ M2.YLY8I;>50\H?VY_P"/83().>?NYS0!Y>]] M;V7A+Q%IMBUG)/!9P2MJ.F7CRQRY?:-V2=DG!)&3D'.:N>([&*Y@^)&H2O<& MYT\![-A<.H@9;.)PRJ#@'=SG%>I+%&BE5154\D 8%+M!SP.>O'6@#R3699KW MQ!K\-]JFGZ?>(L(TR>]O7@:!3$I$D2CAOWA?/J1M/&*U-1N+/2_' O)[RPU: MXN+VWA%LMXRW=DS!$PD8)#)GYR,*<%B6GF>9L7? MC&['./K0!YUHEQ8Z=XX2W6[L=8GO[FYVWEO>,UQ /F?9-'DKL7&P,,8.T;1F MM'Q?+9'Q5HMMKURMOH3V]PQ,LQBADN 8]BNV0/NF0@$\D>U=H(T5V<(H9NI MY-#HLBE74,I[$9% 'G<>DZ)K7C*]2,FYTY- M?(,=RY1AYMP 68M9/#EK+;R:E?/ CS'=YKJP^]( (^2<@'(ZFO9\#.<#/2F M2B%542B,+N 7=C&>V/>@#S.-]/\ [:AM?&FL02P0Z-:M9SRW1BAN7._SI5.1 MN?B/W (QUJ!)YH?'&KW-U)_Q37]L0B8Q.5(F:U@\II3WBS@8S]Y@3P*]59$? M&Y5;!R,C.#2[5((('/7CK0!Y<0VH:G9V=Q/<&"7Q9=Q.J3NFY!;RD+E2#MR! MQTJAJ5Q'I5O?:8DFW3XO$PC%O/=&*%H?LJ2-$TA/RJ68L!W(QC!->P;5]!US MTK)UK0O[5FL;F&\EL[NQE:6&6-5899"A#*P((*D^A'K0!C?#VRM;?3-0N;6X MLIENKQY EG=?:%MTP L6_N1R<=MV!P!7*:YK-K=:^MU:I:6=_;Z_;VA+7SF[ M=1.B.?*QA8V4GC.""#U->BZ+H2:1+?7+W4MW>WTBR7$\BJNXJH50%4 >_ MJ36IL3<6VKN.,G')Q0!Y]X:N-'EU.[GU6]B_X2D:ETC P'[NP/@R:\LKU9O'#Z=.TL3W!:X^TA"64QD\;7& ,8 QBO4-B; M]^U=^,;L;0[MM2\JX:5BWEKY;2';A-7\16VH:7IPTW5EN'B\+Z@\QMY]VU_)AQN(/# YZ\BO6U1$) M*J%W')P,9- CC485% YX ]>M 'FD^D6UIJ6DP6RW!&I:#>&Z5IY',[*("I;) M))!9L'KSBJEE%H-S\/?#B66N:1!Y20R7-K=7I6*XE\C#1R$-E2,[L6%I]GS$ZPPF4R+E691AS]Y M21D'N"#7$>')[.6;P@^G7TD^N7.[^W(_M#-)M\ES+YRY^4K+L R!@\#BO5Z: M$569@H#-U(')H X_X:Z;:67AEIK>+9)+>7:N=Q.0MS*%ZGTJC\0M2TJYTRYB MC\10C4+([ET=94<7DPPR121#YVR<# (ZY.:] & ,4TQH9!(44N!@-CD?C0 M!Q7CG4[6Z\-26$LL<3_:+1+]P^6TY78,)21]TKC(8\ X/04SP?)&?%^M"VU4 MZY;M;6Y_M(LKF,@N!;EDPC8'S\ 'YSNSD&NYVKDG R>O'6A$5%"HH51T &!0 M!YCXDL8KR;X@W4[W!ET^R26T*W#J(7%N6#* < Y .<9HU&U32+^3["\\7VOP MM>SSYG=C)(GE;7)8GYAO;GKS7H#ZOI::LNE/?6PU"1=PMC(/,(P3G;UZ _D: M=?ZKI>F%!J%_9VADX3[1,L>[V&3S0!Y9X@9GTS6F9BS-X2L223DD^9+6KXBO M+N*Z\7!;B>.U2[TU;AXW8&&V;9YS*1RORELD=!DUZ2 C*" I4C@CN*JP:IIM MU>S6=O?VDUU'_K88YE9TQQ\R@Y'XT >7:O):K%KMOX>O';0]VE O:W+&-+AK ML"01N#P3'LW;3W'F_8+*4B:9B@E>6:/.6)P6P@]\" MNV6-%0(J*%'8#BH;NQMK^'R;J)98]R.5/0E6#+GUY ..E '/>.;L6%AI-T\_ MV>WBU:U,\I?:JIOP2Q[+R,YXKB]9UFQO]9OYCJH.DMKMA&\\=T4C\LVYW ." M/E)ZX.*]4>\LB\4#W$!:?<(T+@^9M^\ .^._I6?>6>G>(HM+FBNXWBBGCOH& M@96$H4$#ZK\W4>U &-X(:V&J^(HM*F\W1([B(6I64R1B3RQYHC8D\9QP#@$F MLOQ5>:7I,FMZAI/BIX-?8AUTZ*>.3S;A8U1(S#@L=P51CWR,5Z*J*BA44*HZ M # %(8T,@D*+O P&QR/QH X37-"OHH5>*_6(WVH)<0VPAS(ETZ;21)NP43#2 M8VY^0\XIGA74[E=5T_3H]0\U1]J@N--VIBQCA;;%T&XIH 6BBB@ HHJI'JNG2W[V$=_:O>(,O;K,ID4>ZY MR* +=%1I/#)))&DL;/']]0P)7ZCM2Q2QSPI-#(DD4BAD=&!5@>001U% #Z** M* "BBB@ HHJ$W5NMVMH9XQ%+N6P5KNXUEXKB8@[WB)GRC'K ML.%^7I[5Z]10!Y+=6<&FW&I6!M_(\-0^(X?M<"*1"D#6B-@@<",S%2PZ^VTU9%\.3>([1;06S-''M,6)?**XQ&6S]WC.[%>NT4 >2Z_I=C!XE MU'3KY]+L+%;&&/2C>PL1$,/O,!# "0-@G'S?=[5V7BFP>[^&.JV^;'"@\HR8M\A@ M."?4'^E9]O-8VVFVFA7VG:;]B_M#4Q!-JL9>"%8[@JD2KW8AOE&1PIQFO7:* M /(_".E0:S>Z#;:O:_:[:/2;P"*X1MGRW:J@*-Z+P V[=N[OC;Q33X>TV/X1:J4TJW6:2]GW$0 ,P6]<+GCG"\#VKURB@#S;QMINAZ M7-:R_P#$FVVEHXAT:_BQ%*"V[,./NR$@C(5CST%96N*FIZ_JO]LS6.F-<6=O M_9AU&%S+;AH\L8"&&)%D+9V_-D+VQ7KU% 'G^E6ND6'Q.U%M0CM!J<]K:-:S M/$%>9]LJR,A]>F<>V:N^+%O3XKTIM/4F[&E:GY! Z28@V?K79T4 >2Z3IVC: MI/H=CHJD2W.GSPZ\R*1)AH?,\PC&[YOO8XS5:'6-8MK0>+I8KA[C3X1 MHLT 4GS'$1+.!WSQT4 >/W^C0Z;J::1K=SIR6L&CV\-E-J<;.AE^ M?SGB(8 2[MI)^]C;BN@T#1([KQK4>=F783C=D \Y( MS[UZ!3)9HH$#S2I&A8+N=@!DG '/KF'[3@>9G/'F;=F,\]<=Z;K\%I>>(M4BO[O3K.VDLK=='FOH'+1H M4.6MSN&UP^2+QJ,?P]O5M99Y;Q;9 \D (D9(QSC.>_K7IM% 'EE\+#PY?>( M["/2;/\ LJ>\L4,4R;;2 NA+2N ,;DS7D),8&'W-;E6"K M)G:?E^;&W'%=M=>&H+K5=3>TUR^LWO0C7UM;/$0WR; WSHS)E5QD$=/7FMZQ MLK?3;"VL;2,1VUM$L,2 YVJHP!^0H \SUI++2M8M-0N;G3M=U.."UC-C=Q'[ M267'[RV/)4MNW%=O)'+"NO\ &]_#8Z HN;*WNK>XN8H)?M7^HB5F_P!9)Q]T M8'XD@8$KGD9':@#QVSLH;FZ73TC@?2SXG@V16<3Q6 M^PV;%MBY^X6ZX."2?6K5_8VNFWNIZ>UN+?PU%XBMC=P(A$*0M9JQR!P(S+L+ M=N>>]>MT4 <1X$CTV/6_%)T>&*/3FNX# (4VQD>0F2@QC&<]./2N1U:+29+' M5_[0AC?Q3_;R%3)&6G6$7:>7M.,B+RMO^SU[U[+5:;4;&WO(;.:\MX[J;_50 MO*H=_P#=4G)_"@#RV.U^U^);];[4-.LM<&M;[>2>!S=^2)%,:QMN&8VC 4@# M;RV>