July 16, 2014
Investors May Contact:
Lee McEntire, Bank of America, 1.980.388.6780
Jonathan Blum, Bank of America (Fixed Income), 1.212.449.3112
Reporters May Contact:
Jerry Dubrowski, Bank of America, 1.980.388.2840
jerome.f.dubrowski@bankofamerica.com
Bank of America Reports Second-quarter 2014 Net Income of $2.3 Billion, or $0.19 per Diluted Share, on Revenue of $22.0 Billion(A)
Results Include Litigation Expense of $4.0 Billion (Pretax) or Approximately $0.22 per Share (After Tax)
Company Reaches Settlement With AIG to Resolve Residential Mortgage-backed Securities Claims for $650 Million
Business Metrics Reflect Progress on Customer-focused Strategy
• | Total Period-end Deposit Balances up $54 Billion, or 5 Percent, From Q2-13 to a Record $1.13 Trillion |
• | Funding of $13.7 Billion in Residential Home Loans and Home Equity Loans in Q2-14 Helped Nearly 43,000 Homeowners Purchase a Home or Refinance a Mortgage |
• | More Than 1.1 Million New Credit Cards Issued in Q2-14, With 65 Percent Going to Existing Customers |
• | Global Wealth and Investment Management Reports Record Revenue of $4.6 Billion and Record Total Client Balances of $2.47 Trillion |
• | Global Banking Average Loan Balances up 6 Percent From Q2-13 to $271 Billion |
• | Bank of America Merrill Lynch Maintained a Leadership Position in Investment Banking with Total Firmwide Fees of $1.6 Billion and Record Equity Issuance Fees in Q2-14, Excluding Self-led Deals |
• | FICC Sales and Trading Revenue, Excluding Net DVA, up 5 Percent From Q2-13(B) |
• | Noninterest Expense, Excluding Litigation, Down 6 Percent From Q2-13 to $14.6 Billion(C) |
• | Credit Quality Continued to Improve With Net Charge-offs Down 49 Percent From Q2-13 to $1.1 Billion; Net Charge-off Ratio of 0.48 Percent Is Lowest in a Decade |
Capital and Liquidity Measures Remain Strong
• | Estimated Common Equity Tier 1 Ratio Under Basel 3 (Standardized Approach, Fully Phased-in) Increased to 9.5 Percent in Q2-14; Advanced Approaches Increased to 9.9 Percent in Q2-14(D) |
• | Estimated Supplementary Leverage Ratios Above 2018 Required Minimums(E) |
• | Long-term Debt Down $5 Billion From Year-ago Quarter |
• | Record Global Excess Liquidity Sources of $431 Billion, up $89 Billion From Q2-13; Time-to-required Funding at 38 Months |
• | Tangible Book Value per Share Increased 7 Percent From Q2-13 to $14.24 per Share(F) |
Page 2
CHARLOTTE — Bank of America Corporation today reported net income of $2.3 billion, or $0.19 per diluted share, for the second quarter of 2014, compared to net income of $4.0 billion, or $0.32 per diluted share, in the year-ago period. Revenue, net of interest expense, on an FTE basis(A) declined 4 percent from the second quarter of 2013 to $22.0 billion.
"The economy continues to strengthen, and our customers and clients are doing more business with us," said Chief Executive Officer Brian Moynihan. "Among other positive indicators, consumers are spending more, brokerage assets are up by double digits and our corporate clients are increasingly turning to us to help finance business expansion and merger activity. We are well positioned for further progress."
"During the quarter, our Basel 3 capital ratios improved and credit losses remained near historical lows," said Chief Financial Officer Bruce Thompson. "In addition, we did a good job managing expenses. Although litigation expenses were higher than the year-ago quarter, total noninterest expense, excluding litigation, declined 6 percent from the second quarter of 2013."(C)
Selected Financial Highlights
Three Months Ended | |||||||||||
(Dollars in millions, except per share data) | June 30 2014 | March 31 2014 | June 30 2013 | ||||||||
Net interest income, FTE basis1 | $ | 10,226 | $ | 10,286 | $ | 10,771 | |||||
Noninterest income | 11,734 | 12,481 | 12,178 | ||||||||
Total revenue, net of interest expense, FTE basis1 | 21,960 | 22,767 | 22,949 | ||||||||
Provision for credit losses | 411 | 1,009 | 1,211 | ||||||||
Noninterest expense2 | 18,541 | 22,238 | 16,018 | ||||||||
Net income (loss) | $ | 2,291 | $ | (276 | ) | $ | 4,012 | ||||
Diluted earnings (loss) per common share | $ | 0.19 | $ | (0.05 | ) | $ | 0.32 | ||||
1 | Fully taxable-equivalent (FTE) basis is a non-GAAP financial measure. For reconciliations to GAAP financial measures, refer to pages 22-24 of this press release. Net interest income on a GAAP basis was $10.0 billion, $10.1 billion and $10.5 billion for the three months ended June 30, 2014, March 31, 2014 and June 30, 2013, respectively. Total revenue, net of interest expense, on a GAAP basis was $21.7 billion, $22.6 billion and $22.7 billion for the three months ended June 30, 2014, March 31, 2014 and June 30, 2013, respectively. |
2 | Noninterest expense includes litigation expense of $4.0 billion, $6.0 billion and $0.5 billion for the three months ended June 30, 2014, March 31, 2014 and June 30, 2013, respectively. |
Net interest income, on an FTE basis, declined 5 percent from the year-ago quarter to $10.2 billion(A). The decline was driven by lower yields on debt securities due to a $528 million change in market-related premium amortization expense. Excluding these market-related adjustments, net interest income was relatively stable at $10.4 billion for both periods and the net interest margin was 2.26 percent in the second quarter of 2014, compared to 2.28 percent in the second quarter of 2013(A).
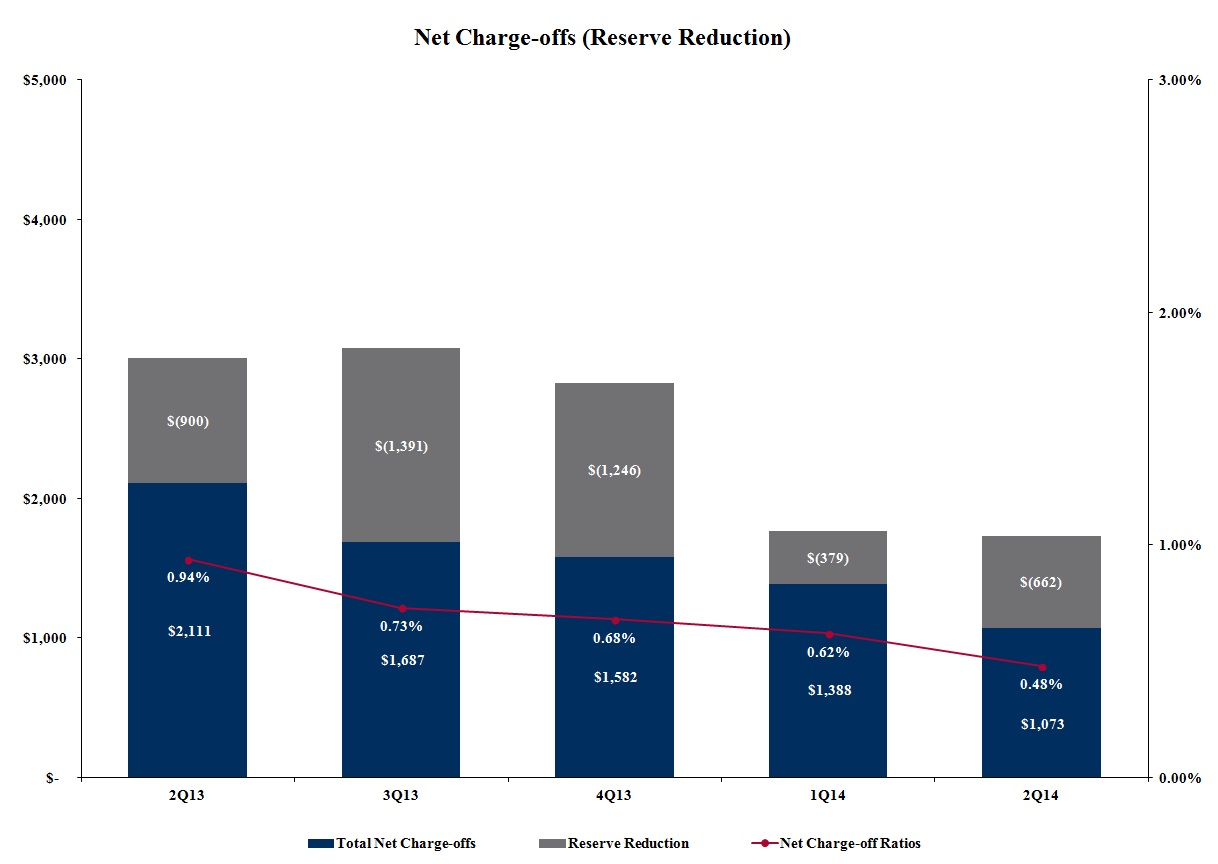
Noninterest income was down 4 percent from the year-ago quarter, driven primarily by year-over-year declines in mortgage banking income and equity investment income. The provision for credit losses declined 66 percent from the second quarter of 2013 to $411 million, driven by improved credit quality. Net charge-offs declined 49 percent from the second quarter of 2013 to $1.1 billion, with the net charge-off ratio falling to 0.48 percent in the second quarter of 2014 from 0.94 percent in the year-ago quarter. During the second
Page 3
quarter of 2014, the reserve release was $662 million, compared to a reserve release of $900 million in the second quarter of 2013.
Noninterest expense was $18.5 billion, compared to $16.0 billion in the year-ago quarter, driven by higher mortgage-related litigation expense, partially offset by reduced personnel expense. Substantially all litigation expense incurred in the second quarter of 2014 related to previously disclosed legacy mortgage-related matters. Excluding litigation expense, noninterest expense declined 6 percent from the year-ago quarter to $14.6 billion, reflecting continued progress by the company to realize cost savings in its Legacy Assets and Servicing business as well as Project New BAC(C).
The effective tax rate of 18.0 percent for the second quarter of 2014 was driven by the impact of recurring tax preference benefits on the lower level of pretax income. The effective tax rate for the second quarter of 2013 of 27.0 percent was primarily driven by recurring tax preference benefits and an increase in tax benefits from the 2012 non-U.S. restructurings.
At June 30, 2014, the company had 233,201 full-time employees, down 9 percent from the year-ago quarter and 2 percent below the first quarter of 2014.
AIG Settlement
On July 15, 2014, Bank of America executed a definitive settlement agreement with AIG to resolve all outstanding residential mortgage-backed securities (RMBS) litigation between the parties. Under the terms of the settlement, AIG will file notices of dismissal in its securities lawsuits against Bank of America and its affiliates pending in California and New York federal courts. Also, AIG has agreed to withdraw its objection to the Bank of New York Mellon private-label securities settlement (Article 77 Proceeding).
The AIG settlement amount of $650 million was covered by litigation reserves as of June 30, 2014. Bank of America has now resolved approximately 95 percent of the unpaid principal balance of all RMBS as to which RMBS securities litigation has been filed or threatened for all Bank of America-related entities.
In addition, the parties agreed to settle three actions brought by Bank of America seeking to collect mortgage insurance proceeds due from AIG’s United Guaranty mortgage insurance subsidiaries on legacy Bank of America originated and serviced loans.
Business Segment Results
The company reports results through five business segments: Consumer and Business Banking (CBB), Consumer Real Estate Services (CRES), Global Wealth and Investment Management (GWIM), Global Banking, and Global Markets, with the remaining operations recorded in All Other.
Page 4
Consumer and Business Banking (CBB)
Three Months Ended | |||||||||||
(Dollars in millions) | June 30 2014 | March 31 2014 | June 30 2013 | ||||||||
Total revenue, net of interest expense, FTE basis | $ | 7,373 | $ | 7,438 | $ | 7,434 | |||||
Provision for credit losses | 534 | 812 | 967 | ||||||||
Noninterest expense | 4,000 | 3,963 | 4,184 | ||||||||
Net income | $ | 1,788 | $ | 1,666 | $ | 1,391 | |||||
Return on average allocated capital1 | 24.3 | % | 22.9 | % | 18.6 | % | |||||
Average loans | $ | 160,240 | $ | 162,061 | $ | 163,593 | |||||
Average deposits | 543,566 | 534,557 | 522,244 | ||||||||
At period-end | |||||||||||
Brokerage assets | $ | 105,926 | $ | 100,206 | $ | 84,182 | |||||
1 | Return on average allocated capital is a non-GAAP financial measure. The company believes the use of this non-GAAP financial measure provides additional clarity in assessing the results of the segments. Other companies may define or calculate this measure differently. For reconciliation to GAAP financial measures, refer to pages 22-24 of this press release. |
Business Highlights
• | Average deposit balances increased $21.3 billion, or 4 percent, from the year-ago quarter to $543.6 billion. The increase was primarily driven by growth in liquid products in the current low-rate environment. |
• | Client brokerage assets increased $21.7 billion, or 26 percent, from the year-ago quarter to $105.9 billion, driven by increased market valuation and account flows. |
• | Credit card issuance remained strong with the company issuing 1.1 million new credit cards in the second quarter of 2014, up 18 percent from the year-ago quarter. Approximately 65 percent of these cards went to existing customers. |
• | The number of mobile banking customers increased 17 percent from the year-ago quarter to 15.5 million users, with 10 percent of customer deposit transactions using mobile devices. |
• | Return on average allocated capital was 24.3 percent in the second quarter of 2014, compared to 18.6 percent in the second quarter of 2013. |
Page 5
Financial Overview
Consumer and Business Banking reported net income of $1.8 billion, up $397 million, or 29 percent, from the year-ago quarter, reflecting lower provision for credit losses and continued progress on the company's strategy of deepening relationships and reducing costs by optimizing the delivery network. Revenue was relatively stable compared to the year-ago quarter as higher service charge income was offset by lower net interest income and slightly lower card income.
The provision for credit losses decreased $433 million from the year-ago quarter to $534 million, reflecting continued improvement in credit quality. Noninterest expense decreased 4 percent, or $184 million, from the year-ago quarter to $4.0 billion, driven by lower operating, litigation and personnel expenses. Network optimization continued with the reduction of another 72 banking centers through sales and closures during the second quarter of 2014.
Consumer Real Estate Services (CRES)
Three Months Ended | |||||||||||
(Dollars in millions) | June 30 2014 | March 31 2014 | June 30 2013 | ||||||||
Total revenue, net of interest expense, FTE basis | $ | 1,390 | $ | 1,192 | $ | 2,115 | |||||
Provision for credit losses | (20 | ) | 25 | 291 | |||||||
Noninterest expense1 | 5,902 | 8,129 | 3,383 | ||||||||
Net loss | $ | (2,802 | ) | $ | (5,027 | ) | $ | (930 | ) | ||
Average loans and leases | 88,257 | 88,914 | 90,114 | ||||||||
At period-end | |||||||||||
Loans and leases | $ | 88,156 | $ | 88,355 | $ | 89,257 | |||||
1 Noninterest expense includes litigation expense of $3.8 billion, $5.8 billion and $219 million for the three months ended June 30, 2014, March 31, 2014 and June 30, 2013.
Business Highlights
• | Bank of America funded $13.7 billion in residential home loans and home equity loans during the second quarter of 2014, helping nearly 43,000 homeowners either refinance an existing mortgage or purchase a home. This included more than 5,500 first-time homebuyer mortgages and more than 13,800 mortgages to low- and moderate-income borrowers. |
• | The number of 60+ days delinquent first mortgage loans serviced by Legacy Assets and Servicing (LAS) declined 5 percent during the second quarter of 2014 to 263,000 loans from 277,000 loans at the end of the first quarter of 2014, and declined 47 percent from 492,000 loans at the end of the second quarter of 2013. |
• | Noninterest expense in LAS, excluding litigation, declined to $1.4 billion in the second quarter of 2014 from $1.6 billion in the first quarter of 2014 and $2.3 billion in the year-ago quarter as the company continued to focus on reducing the number of delinquent mortgage loans in its portfolio(G). |
Page 6
Financial Overview
Consumer Real Estate Services reported a net loss of $2.8 billion for the second quarter of 2014, compared to a net loss of $930 million for the same period in 2013, driven largely by a $3.6 billion increase in litigation expense. Revenue declined $725 million from the second quarter of 2013 to $1.4 billion, driven primarily by lower core production revenue due to fewer loan originations as well as lower servicing income, primarily due to a smaller servicing portfolio.
CRES first-mortgage originations declined 59 percent in the second quarter of 2014 compared to the same period in 2013, reflecting a decline in overall market demand for refinance mortgages. Core production revenue decreased $542 million from the year-ago quarter to $318 million due primarily to lower volume and a reduction in revenues from sales of loans that had returned to performing status.
The provision for credit losses decreased $311 million from the year-ago quarter to a provision benefit of $20 million due to the continued improvement in portfolio trends.
Noninterest expense increased $2.5 billion from the year-ago quarter to $5.9 billion, due to a $3.6 billion increase in litigation expense, partially offset by lower LAS default-related staffing and other default-related servicing expenses, and lower Home Loans expenses as refinance demand slowed.
Global Wealth and Investment Management (GWIM)
Three Months Ended | |||||||||||
(Dollars in millions) | June 30 2014 | March 31 2014 | June 30 2013 | ||||||||
Total revenue, net of interest expense, FTE basis | $ | 4,589 | $ | 4,547 | $ | 4,499 | |||||
Provision for credit losses | (8 | ) | 23 | (15 | ) | ||||||
Noninterest expense | 3,447 | 3,359 | 3,270 | ||||||||
Net income | $ | 724 | $ | 729 | $ | 759 | |||||
Return on average allocated capital1 | 24.3 | % | 24.7 | % | 30.6 | % | |||||
Average loans and leases | $ | 118,512 | $ | 115,945 | $ | 109,589 | |||||
Average deposits | 240,042 | 242,792 | 235,344 | ||||||||
At period-end (dollars in billions) | |||||||||||
Assets under management | $ | 878.7 | $ | 841.8 | $ | 743.6 | |||||
Total client balances2 | 2,468.2 | 2,395.8 | 2,215.1 | ||||||||
1 | Return on average allocated capital is a non-GAAP financial measure. The company believes the use of this non-GAAP financial measure provides additional clarity in assessing the results of the segments. Other companies may define or calculate this measure differently. For reconciliation to GAAP financial measures, refer to pages 22-24 of this press release. |
2 | Total client balances are defined as assets under management, client brokerage assets, assets in custody, client deposits and loans (including margin receivables). |
Business Highlights
• | Client balances increased 11 percent from the year-ago quarter to a record $2.47 trillion, driven by higher market levels and net inflows. Second-quarter 2014 long-term assets under management (AUM) flows of $11.9 billion were the 20th consecutive quarter of positive flows. |
Page 7
• | Asset management fees grew to a record $1.95 billion, up 15 percent from the year-ago quarter. |
• | Average loan balances increased 8 percent from the year-ago quarter to $118.5 billion. |
• | Pretax margin was 25.1 percent in the second quarter of 2014, compared to the record year-ago margin of 27.6 percent, marking the sixth straight quarter over 25 percent. |
Financial Overview
Global Wealth and Investment Management reported net income of $724 million, compared to $759 million in the second quarter of 2013. Revenue increased 2 percent from the year-ago quarter to a record $4.6 billion, driven by higher noninterest income related to improved market valuation and long-term AUM flows.
Credit quality remained strong in the second quarter with the provision for credit losses relatively stable compared to the year-ago quarter. Noninterest expense increased 5 percent to $3.4 billion, driven in part by higher revenue-related incentive compensation and other volume-related expenses and additional investments in technology and other areas to support business growth.
Return on average allocated capital was 24.3 percent in the second quarter of 2014, down from 30.6 percent in the year-ago quarter, as relatively stable earnings were more than offset by increased capital allocations.
Client balances rose 11 percent from the year-ago quarter to $2.47 trillion, driven largely by higher market levels, long-term AUM flows of $49.0 billion and period-end client loan growth of $8.5 billion. Assets under management rose $135.1 billion, or 18 percent, from the second quarter of 2013 to $878.7 billion, driven by increased market valuation and long-term AUM flows. Average deposit balances increased $4.7 billion from the second quarter of 2013 to $240.0 billion.
Page 8
Global Banking
Three Months Ended | |||||||||||
(Dollars in millions) | June 30 2014 | March 31 2014 | June 30 2013 | ||||||||
Total revenue, net of interest expense, FTE basis | $ | 4,179 | $ | 4,269 | $ | 4,138 | |||||
Provision for credit losses | 132 | 265 | 163 | ||||||||
Noninterest expense | 1,899 | 2,028 | 1,849 | ||||||||
Net income | $ | 1,353 | $ | 1,236 | $ | 1,297 | |||||
Return on average allocated capital1 | 17.5 | % | 16.2 | % | 22.6 | % | |||||
Average loans and leases | $ | 271,417 | $ | 271,475 | $ | 255,674 | |||||
Average deposits | 258,937 | 256,433 | 226,912 | ||||||||
1 | Return on average allocated capital is a non-GAAP financial measure. The company believes the use of this non-GAAP financial measure provides additional clarity in assessing the results of the segments. Other companies may define or calculate this measure differently. For reconciliation to GAAP financial measures, refer to pages 22-24 of this press release. |
Business Highlights
• | Bank of America Merrill Lynch (BAML) was ranked No. 2 in global net investment banking fees in the second quarter of 2014 with firmwide investment banking fees of $1.6 billion, excluding self-led deals(H). Global Banking achieved record equity underwriting fees, excluding self-led deals. |
• | BAML ranked among the top three financial institutions globally in leveraged loans, convertible debt, asset-backed securities, common stock underwriting, investment grade corporate debt and syndicated loans during the second quarter of 2014(H). |
• | BAML was recently awarded two of Euromoney magazine’s most prestigious accolades: Best Global Investment Bank and Best Global Transaction Services House, marking the first time Euromoney awarded one firm both awards in the same year. |
• | Average loan and lease balances increased $15.7 billion, or 6 percent, from the year-ago quarter, to $271.4 billion, with growth in the commercial and industrial loan portfolio and the commercial real estate and leasing portfolios. |
• | Average deposits increased $32.0 billion, or 14 percent, from the year-ago quarter to $258.9 billion primarily due to increased client liquidity and international growth. |
Financial Overview
Global Banking reported net income of $1.4 billion in the second quarter of 2014, compared to $1.3 billion in the year-ago quarter as a decline in the provision for credit losses was partially offset by higher noninterest expense. Revenue of $4.2 billion was relatively stable compared to the second quarter of 2013.
Global Corporate Banking revenue increased to $1.6 billion in the second quarter of 2014, up $29 million from the year-ago quarter, and Global Commercial Banking revenue decreased $59 million to $1.7 billion. Included in these results are Business Lending revenue of $1.8 billion, down $80 million from the year-ago quarter, and Global Transaction
Page 9
Services revenue of $1.5 billion, up $50 million from the year-ago period. Global Banking investment banking fees, excluding self-led deals, increased $33 million versus the year-ago quarter.
The provision for credit losses decreased $31 million from the year-ago quarter to $132 million. Noninterest expense increased $50 million, or 3 percent, from the year-ago quarter to $1.9 billion, primarily from higher litigation expense.
Return on average allocated capital was 17.5 percent in the second quarter of 2014, down from 22.6 percent in the year-ago quarter, as modest earnings improvement was more than offset by increased capital allocations.
Global Markets1
Three Months Ended | |||||||||||
(Dollars in millions) | June 30 2014 | March 31 2014 | June 30 2013 | ||||||||
Total revenue, net of interest expense, FTE basis | $ | 4,583 | $ | 5,012 | $ | 4,194 | |||||
Provision for credit losses | 19 | 19 | (16 | ) | |||||||
Noninterest expense | 2,862 | 3,077 | 2,770 | ||||||||
Net income | $ | 1,101 | $ | 1,308 | $ | 962 | |||||
Return on average allocated capital2 | 13.0 | % | 15.6 | % | 12.9 | % | |||||
Total average assets | $ | 617,103 | $ | 601,439 | $ | 656,109 | |||||
1 | During 2014, the management of structured liabilities and the associated DVA were moved into Global Markets from All Other to better align the performance risk of these instruments. As such, net DVA represents the combined total of net DVA on derivatives and structured liabilities. Prior periods have been reclassified to conform to current period presentation. Net DVA gains were $69 million, $112 million and $49 million for the three months ended June 30, 2014, March 31, 2014 and June 30, 2013, respectively. |
2 | Return on average allocated capital is a non-GAAP financial measure. The company believes the use of this non-GAAP financial measure provides additional clarity in assessing the results of the segments. Other companies may define or calculate this measure differently. For reconciliation to GAAP financial measures, refer to pages 22-24 of this press release. |
Business Highlights
• | Fixed Income, Currency and Commodities (FICC) sales and trading revenue, excluding net DVA(B), increased 5 percent from the second quarter of 2013 to $2.4 billion. |
• | Return on average allocated capital was 13.0 percent in the second quarter of 2014, compared to 12.9 percent in the second quarter of 2013, reflecting increased net income which was largely offset by an increase in allocated capital compared to the year-ago quarter. |
Financial Overview
Global Markets reported net income of $1.1 billion in the second quarter of 2014, up 14 percent from the year-ago quarter. Revenue increased $389 million, or 9 percent, from the year-ago quarter to $4.6 billion, reflecting higher equity investment gains (not included in sales and trading) and increased investment banking fees.
Total sales and trading revenue was comparable to the year-ago quarter at $3.5 billion. Excluding net DVA, sales and trading revenue was $3.4 billion in both periods(I). FICC sales
Page 10
and trading revenue, excluding net DVA(B), was $2.4 billion in the second quarter of 2014, an increase of $117 million, or 5 percent, from the year-ago quarter, reflecting improved performance in mortgage and municipal products, partially offset by declines in foreign exchange and commodities. Equities sales and trading revenue, excluding net DVA(J), was $1.0 billion, a decrease of $162 million, or 14 percent, from the year-ago quarter as low volatility depressed secondary market volumes and reduced client activity. In addition to sales and trading, there was an equity investment gain of $240 million in the second quarter of 2014.
Noninterest expense was $2.9 billion compared to $2.8 billion in the year-ago quarter.
All Other1
Three Months Ended | |||||||||||
(Dollars in millions) | June 30 2014 | March 31 2014 | June 30 2013 | ||||||||
Total revenue, net of interest expense, FTE basis2, 3 | $ | (154 | ) | $ | 309 | $ | 569 | ||||
Provision for credit losses | (246 | ) | (135 | ) | (179 | ) | |||||
Noninterest expense4 | 431 | 1,682 | 562 | ||||||||
Net income (loss) | $ | 127 | $ | (188 | ) | $ | 533 | ||||
Total average loans | 210,575 | 217,391 | 238,910 | ||||||||
1 | All Other consists of ALM activities, equity investments, the international consumer card business, liquidating businesses and other. ALM activities encompass the whole-loan residential mortgage portfolio and investment securities, interest rate and foreign currency risk management activities including the residual net interest income allocation, the impact of certain allocation methodologies and accounting hedge ineffectiveness. |
2 | Revenue includes equity investment income of $56 million, $674 million and $576 million for the three months ended June 30, 2014, March 31, 2014 and June 30, 2013, respectively, and gains on sales of debt securities of $382 million, $357 million and $452 million for the three months ended June 30, 2014, March 31, 2014 and June 30, 2013, respectively. |
3 | During 2014, the management of structured liabilities and the associated DVA were moved into Global Markets from All Other to better align the performance risk of these instruments. Prior periods have been reclassified to conform to current period presentation. |
4 | The three months ended March 31, 2014 included $717 million of expense related to annual retirement-eligible incentive compensation. |
All Other reported net income of $127 million in the second quarter of 2014, compared to net income of $533 million for the same period a year ago. The decline was primarily driven by lower equity investment income and the negative quarterly impact of market-related net interest income adjustments compared to the year-ago quarter. This was partially offset by an improvement in the provision for credit losses driven primarily by recoveries on bulk sales of nonperforming loans, and lower noninterest expense.
Page 11
Credit Quality
Three Months Ended | |||||||||||
(Dollars in millions) | June 30 2014 | March 31 2014 | June 30 2013 | ||||||||
Provision for credit losses | $ | 411 | $ | 1,009 | $ | 1,211 | |||||
Net charge-offs1 | 1,073 | 1,388 | 2,111 | ||||||||
Net charge-off ratio1, 2 | 0.48 | % | 0.62 | % | 0.94 | % | |||||
Net charge-off ratio, excluding the PCI loan portfolio2 | 0.49 | 0.64 | 0.97 | ||||||||
Net charge-off ratio, including PCI write-offs2 | 0.55 | 0.79 | 1.07 | ||||||||
At period-end | |||||||||||
Nonperforming loans, leases and foreclosed properties | $ | 15,300 | $ | 17,732 | $ | 21,280 | |||||
Nonperforming loans, leases and foreclosed properties ratio3 | 1.70 | % | 1.96 | % | 2.33 | % | |||||
Allowance for loan and lease losses | $ | 15,811 | $ | 16,618 | $ | 21,235 | |||||
Allowance for loan and lease losses ratio4 | 1.75 | % | 1.84 | % | 2.33 | % | |||||
1 | Excludes write-offs of PCI loans of $160 million, $391 million and $313 million for the three months ended June 30, 2014, March 31, 2014 and June 30, 2013, respectively. |
2 | Net charge-off ratios are calculated as annualized net charge-offs divided by average outstanding loans and leases during the period; quarterly results are annualized. |
3 | Nonperforming loans, leases and foreclosed properties ratios are calculated as nonperforming loans, leases and foreclosed properties divided by outstanding loans, leases and foreclosed properties at the end of the period. |
4 | Allowance for loan and lease losses ratios are calculated as allowance for loan and lease losses divided by loans and leases outstanding at the end of the period. |
Note: Ratios do not include loans accounted for under the fair value option.
Credit quality continued to improve in the second quarter of 2014. Compared with the second quarter a year ago, net charge-offs declined across all major portfolios and the provision for credit losses decreased. The number of 30+ days performing delinquent loans, excluding fully-insured loans, declined across all consumer portfolios from the year-ago quarter, reaching record low levels in the U.S. credit card portfolio. Additionally, reservable criticized balances and nonperforming loans, leases and foreclosed properties continued to decline, down 17 percent and 28 percent respectively, from the year-ago period.
Net charge-offs were $1.1 billion in the second quarter of 2014, down from $1.4 billion in the first quarter of 2014 and $2.1 billion in the second quarter of 2013. The second quarter of 2014 included $185 million of recoveries associated with the $2.1 billion bulk sale of nonperforming loans.
The provision for credit losses declined to $411 million in the second quarter of 2014 from $1.2 billion in the second quarter of 2013, driven by lower levels of delinquencies across the consumer lending portfolio, as well as improvement in the consumer real estate portfolios, primarily due to increased home prices. During the second quarter of 2014, the reserve release was $662 million compared to a reserve release of $900 million in the second quarter of 2013.
Page 12
The allowance for loan and lease losses to annualized net charge-off coverage ratio was 3.67 times in the second quarter of 2014, compared with 2.95 times in the first quarter of 2014 and 2.51 times in the second quarter of 2013. The increase was due to the improvement in net charge-offs discussed above. The allowance to annualized net charge-off coverage ratio, excluding the purchased credit-impaired (PCI) portfolio, was 3.25 times, 2.58 times and 2.04 times for the same periods, respectively.
Nonperforming loans, leases and foreclosed properties were $15.3 billion at June 30, 2014, a decrease from $17.7 billion at March 31, 2014 and $21.3 billion at June 30, 2013.
Capital and Liquidity Management1,2,3
(Dollars in billions) | At June 30 2014 | At March 31 2014 | |||||
Basel 3 Transition (under standardized approach) | |||||||
Common equity tier 1 capital - Basel 3 | $ | 153.6 | $ | 150.9 | |||
Risk-weighted assets | 1,282.7 | 1,282.1 | |||||
Common equity tier 1 capital ratio - Basel 3 | 12.0 | % | 11.8 | % | |||
Basel 3 Fully Phased-in (under standardized approach)3 | |||||||
Common equity tier 1 capital - Basel 3 | $ | 137.2 | 130.1 | ||||
Risk-weighted assets | 1,437.0 | 1,447.4 | |||||
Common equity tier 1 capital ratio - Basel 3 | 9.5 | % | 9.0 | % | |||
(Dollars in millions, except per share information) | At June 30 2014 | At March 31 2014 | At June 30 2013 | ||||||||
Tangible common equity ratio4 | 7.14 | % | 7.00 | % | 6.98 | % | |||||
Total shareholders’ equity | $ | 237,411 | $ | 231,888 | $ | 231,032 | |||||
Common equity ratio | 10.25 | % | 10.17 | % | 10.21 | % | |||||
Tangible book value per share4 | $ | 14.24 | $ | 13.81 | $ | 13.32 | |||||
Book value per share | 21.16 | 20.75 | 20.18 | ||||||||
1 | Regulatory capital ratios are preliminary. |
2 | On January 1, 2014, the Basel 3 rules became effective, subject to transition provisions primarily related to regulatory deductions and adjustments impacting common equity tier 1 capital and tier 1 capital. |
3 | Basel 3 common equity tier 1 capital and risk-weighted assets on a fully phased-in basis are non-GAAP financial measures. For reconciliations to GAAP financial measures, refer to page 18 of this press release. The company's fully phased-in Basel 3 estimates are based on its current understanding of the Standardized and Advanced approaches under the Basel 3 rules, assuming all relevant regulatory model approvals, except for the potential reduction to risk-weighted assets resulting from removal of the Comprehensive Risk Measure surcharge. The Basel 3 rules require approval by banking regulators of certain models used as part of risk-weighted asset calculations. If these models are not approved, the company's capital ratio would likely be adversely impacted, which in some cases could be significant. |
4 | Tangible common equity ratio and tangible book value per share are non-GAAP financial measures. For reconciliations to GAAP financial measures, refer to pages 22-24 of this press release. |
The common equity tier 1 capital ratio under the Basel 3 Standardized approach for measuring risk-weighted assets was 12.0 percent at June 30, 2014, up from 11.8 percent at March 31, 2014.
While the Basel 3 fully phased-in Standardized and fully phased-in Advanced approaches do not go into effect until 2018, the company is providing the following estimates for comparative purposes.
Page 13
The estimated common equity tier 1 capital ratio under the Basel 3 Standardized approach on a fully phased-in basis was 9.5 percent at June 30, 2014, up from 9.0 percent at March 31, 2014 (D).
The estimated common equity tier 1 capital ratio under the Basel 3 Advanced approaches on a fully phased-in basis increased to 9.9 percent from 9.6 percent at March 31, 2014(D).
In connection with the final U.S. rule and Notice of Proposed Rulemaking (NPR) issued on April 8 and effective in 2018(E), the company's estimated supplementary leverage ratios were above the 5 percent supplementary leverage ratio minimum for bank holding companies, and both of the company's primary bank subsidiaries were above the 6 percent supplementary leverage ratio minimum for primary bank subsidiaries.
At June 30, 2014, the company's Global Excess Liquidity Sources totaled $431 billion, compared to $427 billion at March 31, 2014 and $342 billion at June 30, 2013. Time-to-required funding was 38 months at June 30, 2014, compared to 35 months at March 31, 2014 and 32 months at June 30, 2013.
Period-end common shares issued and outstanding were 10.52 billion at June 30, 2014, 10.53 billion at March 31, 2014 and 10.74 billion at June 30, 2013. During the second quarter of 2014, approximately 14 million common shares were repurchased for approximately $233 million at an average price of $16.16 per share.
Tangible book value per share(F) was $14.24 at June 30, 2014, compared to $13.81 at March 31, 2014 and $13.32 at June 30, 2013. Book value per share was $21.16 at June 30, 2014, compared to $20.75 at March 31, 2014 and $20.18 at June 30, 2013.
------------------------------
End Notes
(A) | Fully taxable-equivalent (FTE) basis is a non-GAAP financial measure. For reconciliation to GAAP financial measures, refer to pages 22-24 of this press release. Net interest income on a GAAP basis was $10.0 billion, $10.1 billion and $10.5 billion for the three months ended June 30, 2014, March 31, 2014 and June 30, 2013, respectively. Net interest income on an FTE basis excluding market-related adjustments represents a non-GAAP financial measure. Market-related adjustments of premium amortization expense and hedge ineffectiveness were ($0.2) billion, ($0.3) billion, and $0.4 billion for the three months ended June 30, 2014, March 31, 2014 and June 30, 2013, respectively. Total revenue, net of interest expense, on a GAAP basis was $21.7 billion, $22.6 billion and $22.7 billion for the three months ended June 30, 2014, March 31, 2014 and June 30, 2013, respectively. |
(B) | FICC sales and trading revenue, excluding net DVA is a non-GAAP financial measure. Net DVA included in FICC revenue was gains (losses) of $56 million, $80 million and $(37) million for the three months ended June 30, 2014, March 31, 2014 and June 30, 2013, respectively. |
(C) | Noninterest expense excluding litigation is a non-GAAP financial measure. Noninterest expense including litigation was $18.5 billion, $22.2 billion and $16.0 billion for the three months ended June 30, 2014, March 31, 2014 and June 30, 2013, respectively. Noninterest expense excluding litigation was $14.6 billion, $16.2 billion and $15.5 billion or the three months ended June 30, 2014, March 31, 2014 and June 30, 2013, respectively. Litigation expense was $4.0 billion, $6.0 billion and $0.5 billion for the three months ended June 30, 2014, March 31, 2014 and June 30, 2013, respectively. |
(D) | Basel 3 common equity tier 1 capital and risk-weighted assets on a fully phased-in basis are non-GAAP financial measures. For reconciliation to GAAP financial measures, refer to page 18 of this press release. The company's fully phased-in Basel 3 estimates are based on its current understanding of the Standardized and Advanced approaches under the Basel 3 rules, assuming all relevant regulatory model approvals, except for the potential reduction to risk-weighted assets resulting from removal of the Comprehensive Risk Measure surcharge. These estimates will evolve over time as the company’s businesses change and as a result of further rulemaking or clarification by U.S. regulatory agencies. The Basel 3 rules require approval by banking regulators of certain models used as part of risk-weighted asset calculations. If these models are not approved, the company's capital ratio would likely be adversely impacted, which in some cases could be significant. The company continues to evaluate the potential impact of proposed rules and anticipates it will be in compliance with any final rules by the proposed effective dates. |
(E) | The supplementary leverage ratio includes the estimated increase to the supplementary leverage exposure in accordance with the U.S. Notice of Proposed Rulemaking approved on April 8, 2014. The supplementary leverage ratio is measured using the quarter-end |
Page 14
tier 1 capital calculated under Basel 3 on a fully phased-in basis, divided by the simple average of the sum of on-balance sheet assets and certain off-balance sheet exposures, including, among other items, derivatives and securities financing transactions, at the end of each month in the quarter.
(F) | Tangible book value per share of common stock is a non-GAAP financial measure. Other companies may define or calculate this measure differently. Book value per share was $21.16 at June 30, 2014, compared to $20.75 at March 31, 2014 and $20.18 at June 30, 2013. For more information, refer to pages 22-24 of this press release. |
(G) | Legacy Assets and Servicing (LAS) noninterest expense, excluding litigation, is a non-GAAP financial measure. LAS noninterest expense was $5.2 billion, $7.4 billion and $2.5 billion for the three months ended June 30, 2014, March 31, 2014 and June 30, 2013, respectively. LAS litigation expense was $3.8 billion, $5.8 billion and $0.2 billion in the three months ended June 30, 2014, March 31, 2014 and June 30, 2013. |
(H) | Rankings per Dealogic as of July 1, 2014. |
(I) | Sales and trading revenue excluding the impact of net DVA is a non-GAAP financial measure. Net DVA gains were $69 million, $112 million and $49 million for the three months ended June 30, 2014, March 31, 2014 and June 30, 2013, respectively. In the first quarter of 2014, the management of structured liabilities and the associated DVA were moved into Global Markets from All Other to better align the performance risk of these instruments. As such, net DVA represents the combined total of net DVA on derivatives and structured liabilities. Prior periods have been reclassified to conform to current period presentation. |
(J) | Equity sales and trading revenue, excluding net DVA is a non-GAAP financial measure. Equities net DVA gains were $13 million, $32 million and $86 million for the three months ended June 30, 2014, March 31, 2014 and June 30, 2013, respectively. |
Note: Chief Executive Officer Brian Moynihan and Chief Financial Officer Bruce Thompson will discuss second-quarter 2014 results in a conference call at 8:30 a.m. ET today.
The presentation and supporting materials can be accessed on the Bank of America Investor Relations website at http://investor.bankofamerica.com. For a listen-only connection to the conference call, dial 1.877.200.4456 (U.S.) or 1.785.424.1732 (international), and the conference ID is: 79795. Please dial in 10 minutes prior to the start of the call.
A replay will be available via webcast through the Bank of America Investor Relations website. A replay will also be available beginning at noon on July 16 through midnight, July 24 by telephone at 800.753.8546 (U.S.) or 1.402.220.0685 (international).
Bank of America
Bank of America is one of the world's largest financial institutions, serving individual consumers, small businesses, middle-market businesses and large corporations with a full range of banking, investing, asset management and other financial and risk management products and services. The company provides unmatched convenience in the United States, serving approximately 49 million consumer and small business relationships with approximately 5,000 retail banking offices and approximately 16,000 ATMs and award-winning online banking with 30 million active users and more than 15 million mobile users. Bank of America is among the world's leading wealth management companies and is a global leader in corporate and investment banking and trading across a broad range of asset classes, serving corporations, governments, institutions and individuals around the world. Bank of America offers industry-leading support to approximately 3 million small business owners through a suite of innovative, easy-to-use online products and services. The company serves clients through operations in more than 40 countries. Bank of America Corporation stock (NYSE: BAC) is listed on the New York Stock Exchange.
Page 15
Forward-looking Statements
Bank of America and its management may make certain statements that constitute “forward-looking statements” within the meaning of the Private Securities Litigation Reform Act of 1995. These statements can be identified by the fact that they do not relate strictly to historical or current facts. Forward-looking statements often use words such as “anticipates,” “targets,” “expects,” “hopes,” “estimates,” “intends,” “plans,” “goals,” “believes,” “continue” and other similar expressions or future or conditional verbs such as “will,” “may,” “might,” “should,” “would” and “could.” The forward-looking statements made represent Bank of America's current expectations, plans or forecasts of its future results and revenues, and future business and economic conditions more generally, and other matters. These statements are not guarantees of future results or performance and involve certain risks, uncertainties and assumptions that are difficult to predict and are often beyond Bank of America's control. Actual outcomes and results may differ materially from those expressed in, or implied by, any of these forward-looking statements.
You should not place undue reliance on any forward-looking statement and should consider the following uncertainties and risks, as well as the risks and uncertainties more fully discussed under Item 1A. Risk Factors of Bank of America's 2013 Annual Report on Form 10-K, and in any of Bank of America's subsequent Securities and Exchange Commission filings: the potential negative impacts of the Company’s prior adjustment to its regulatory capital ratios, including without limitation the results of the Federal Reserve's review of the resubmitted Comprehensive Capital Analysis and Review, or the revised capital actions that have been resubmitted to the Federal Reserve, the Company's ability to resolve representations and warranties repurchase claims made by monolines and private-label and other investors, including as a result of any adverse court rulings, and the chance that the Company could face related servicing, securities, fraud, indemnity or other claims from one or more counterparties, including monolines or private-label and other investors; the possibility that final court approval of negotiated settlements is not obtained; the possibility that the court decision with respect to the BNY Mellon Settlement is overturned on appeal in whole or in part; potential claims, damages, penalties and fines resulting from pending or future litigation and regulatory proceedings, including proceedings instituted by the U.S. Department of Justice, state Attorneys General and other members of the RMBS Working Group of the Financial Fraud Enforcement Task Force concerning mortgage-related matters; the possibility that the European Commission will impose remedial measures in relation to its investigation of the Company's competitive practices; the possible outcome of LIBOR, other reference rate and foreign exchange inquiries and investigations; the possibility that future representations and warranties losses may occur in excess of the Company's recorded liability and estimated range of possible loss for its representations and warranties exposures; the possibility that the Company may not collect mortgage insurance claims; the possibility that future claims, damages, penalties and fines may occur in excess of the Company’s recorded liability and estimated range of possible losses for litigation exposures; uncertainties about the financial stability and growth rates of non-U.S. jurisdictions, the risk that those jurisdictions may face difficulties servicing their sovereign debt, and related stresses on financial markets, currencies and trade, and the Company's exposures to such risks, including direct, indirect and operational; uncertainties related to the timing and pace of Federal Reserve tapering of quantitative easing, and the impact on global interest rates, currency exchange rates, and economic conditions in a number of countries; the possibility of future inquiries or investigations regarding pending or completed foreclosure activities; the possibility that unexpected foreclosure delays could impact the rate of decline of default-
Page 16
related servicing costs; uncertainty regarding timing and the potential impact of regulatory capital and liquidity requirements (including Basel 3); the negative impact of the Dodd-Frank Wall Street Reform and Consumer Protection Act on the Company's businesses and earnings, including as a result of additional regulatory interpretation and rulemaking and the success of the Company's actions to mitigate such impacts; the potential impact of implementing and conforming to the Volcker Rule; the potential impact of future derivative regulations; adverse changes to the Company's credit ratings from the major credit rating agencies; estimates of the fair value of certain of the Company's assets and liabilities; reputational damage that may result from negative publicity, fines and penalties from regulatory violations and judicial proceedings; the Company's ability to fully realize the anticipated cost savings in Legacy Assets and Servicing and the anticipated cost savings and other benefits from Project New BAC, including in accordance with currently anticipated timeframes; a failure in or breach of the Company’s operational or security systems or infrastructure, or those of third parties with which we do business, including as a result of cyber attacks; the impact on the Company's business, financial condition and results of operations of a potential higher interest rate environment; and other similar matters.
Forward-looking statements speak only as of the date they are made, and Bank of America undertakes no obligation to update any forward-looking statement to reflect the impact of circumstances or events that arise after the date the forward-looking statement was made.
BofA Global Capital Management Group, LLC (BofA Global Capital Management) is an asset management division of Bank of America Corporation. BofA Global Capital Management entities furnish investment management services and products for institutional and individual investors.
Bank of America Merrill Lynch is the marketing name for the global banking and global markets businesses of Bank of America Corporation. Lending, derivatives and other commercial banking activities are performed by banking affiliates of Bank of America Corporation, including Bank of America, N.A., member FDIC. Securities, financial advisory and other investment banking activities are performed by investment banking affiliates of Bank of America Corporation (Investment Banking Affiliates), including Merrill Lynch, Pierce, Fenner & Smith Incorporated, which are registered broker-dealers and members of FINRA and SIPC. Investment products offered by Investment Banking Affiliates: Are Not FDIC Insured * May Lose Value * Are Not Bank Guaranteed. Bank of America Corporation's broker-dealers are not banks and are separate legal entities from their bank affiliates. The obligations of the broker-dealers are not obligations of their bank affiliates (unless explicitly stated otherwise), and these bank affiliates are not responsible for securities sold, offered or recommended by the broker-dealers. The foregoing also applies to other non-bank affiliates.
For more Bank of America news, visit the Bank of America newsroom at http://newsroom.bankofamerica.com.
www.bankofamerica.com
Page 17
Bank of America Corporation and Subsidiaries | |||||||||||||||||||
Selected Financial Data | |||||||||||||||||||
(Dollars in millions, except per share data; shares in thousands) | |||||||||||||||||||
Summary Income Statement | Six Months Ended June 30 | Second Quarter 2014 | First Quarter 2014 | Second Quarter 2013 | |||||||||||||||
2014 | 2013 | ||||||||||||||||||
Net interest income | $ | 20,098 | $ | 21,213 | $ | 10,013 | $ | 10,085 | $ | 10,549 | |||||||||
Noninterest income | 24,215 | 24,711 | 11,734 | 12,481 | 12,178 | ||||||||||||||
Total revenue, net of interest expense | 44,313 | 45,924 | 21,747 | 22,566 | 22,727 | ||||||||||||||
Provision for credit losses | 1,420 | 2,924 | 411 | 1,009 | 1,211 | ||||||||||||||
Noninterest expense | 40,779 | 35,518 | 18,541 | 22,238 | 16,018 | ||||||||||||||
Income (loss) before income taxes | 2,114 | 7,482 | 2,795 | (681 | ) | 5,498 | |||||||||||||
Income tax expense (benefit) | 99 | 1,987 | 504 | (405 | ) | 1,486 | |||||||||||||
Net income (loss) | $ | 2,015 | $ | 5,495 | $ | 2,291 | $ | (276 | ) | $ | 4,012 | ||||||||
Preferred stock dividends | 494 | 814 | 256 | 238 | 441 | ||||||||||||||
Net income (loss) applicable to common shareholders | $ | 1,521 | $ | 4,681 | $ | 2,035 | $ | (514 | ) | $ | 3,571 | ||||||||
Common shares issued | 25,149 | 44,480 | 224 | 24,925 | 364 | ||||||||||||||
Average common shares issued and outstanding | 10,539,769 | 10,787,357 | 10,519,359 | 10,560,518 | 10,775,867 | ||||||||||||||
Average diluted common shares issued and outstanding (1) | 10,599,641 | 11,549,693 | 11,265,123 | 10,560,518 | 11,524,510 | ||||||||||||||
Summary Average Balance Sheet | |||||||||||||||||||
Total loans and leases | $ | 916,012 | $ | 910,269 | $ | 912,580 | $ | 919,482 | $ | 914,234 | |||||||||
Total debt securities | 337,845 | 349,794 | 345,889 | 329,711 | 343,260 | ||||||||||||||
Total earning assets | 1,822,177 | 1,845,651 | 1,840,850 | 1,803,298 | 1,833,541 | ||||||||||||||
Total assets | 2,154,494 | 2,198,443 | 2,169,555 | 2,139,266 | 2,184,610 | ||||||||||||||
Total deposits | 1,123,399 | 1,077,631 | 1,128,563 | 1,118,178 | 1,079,956 | ||||||||||||||
Common shareholders' equity | 222,705 | 218,509 | 222,215 | 223,201 | 218,790 | ||||||||||||||
Total shareholders' equity | 236,173 | 236,024 | 235,797 | 236,553 | 235,063 | ||||||||||||||
Performance Ratios | |||||||||||||||||||
Return on average assets | 0.19 | % | 0.50 | % | 0.42 | % | n/m | 0.74 | % | ||||||||||
Return on average tangible common shareholders' equity (2) | 2.05 | 6.53 | 5.47 | n/m | 9.88 | ||||||||||||||
Per common share information | |||||||||||||||||||
Earnings (loss) | $ | 0.14 | $ | 0.43 | $ | 0.19 | $ | (0.05 | ) | $ | 0.33 | ||||||||
Diluted earnings (loss) (1) | 0.14 | 0.42 | 0.19 | (0.05 | ) | 0.32 | |||||||||||||
Dividends paid | 0.02 | 0.02 | 0.01 | 0.01 | 0.01 | ||||||||||||||
Book value | 21.16 | 20.18 | 21.16 | 20.75 | 20.18 | ||||||||||||||
Tangible book value (2) | 14.24 | 13.32 | 14.24 | 13.81 | 13.32 | ||||||||||||||
June 30 2014 | March 31 2014 | June 30 2013 | |||||||||||||||||
Summary Period-End Balance Sheet | |||||||||||||||||||
Total loans and leases | $ | 911,899 | $ | 916,217 | $ | 921,570 | |||||||||||||
Total debt securities | 352,883 | 340,696 | 336,403 | ||||||||||||||||
Total earning assets | 1,830,546 | 1,812,832 | 1,779,883 | ||||||||||||||||
Total assets | 2,170,557 | 2,149,851 | 2,123,320 | ||||||||||||||||
Total deposits | 1,134,329 | 1,133,650 | 1,080,783 | ||||||||||||||||
Common shareholders' equity | 222,565 | 218,536 | 216,791 | ||||||||||||||||
Total shareholders' equity | 237,411 | 231,888 | 231,032 | ||||||||||||||||
Period-end common shares issued and outstanding | 10,515,825 | 10,530,045 | 10,743,098 | ||||||||||||||||
Credit Quality | Six Months Ended June 30 | Second Quarter 2014 | First Quarter 2014 | Second Quarter 2013 | |||||||||||||||
2014 | 2013 | ||||||||||||||||||
Total net charge-offs | $ | 2,461 | $ | 4,628 | $ | 1,073 | $ | 1,388 | $ | 2,111 | |||||||||
Net charge-offs as a percentage of average loans and leases outstanding (3) | 0.55 | % | 1.04 | % | 0.48 | % | 0.62 | % | 0.94 | % | |||||||||
Provision for credit losses | $ | 1,420 | $ | 2,924 | $ | 411 | $ | 1,009 | $ | 1,211 | |||||||||
June 30 2014 | March 31 2014 | June 30 2013 | |||||||||||||||||
Total nonperforming loans, leases and foreclosed properties (4) | $ | 15,300 | $ | 17,732 | $ | 21,280 | |||||||||||||
Nonperforming loans, leases and foreclosed properties as a percentage of total loans, leases and foreclosed properties (3) | 1.70 | % | 1.96 | % | 2.33 | % | |||||||||||||
Allowance for loan and lease losses | $ | 15,811 | $ | 16,618 | $ | 21,235 | |||||||||||||
Allowance for loan and lease losses as a percentage of total loans and leases outstanding (3) | 1.75 | % | 1.84 | % | 2.33 | % | |||||||||||||
For footnotes see page 18. | |||||||||||||||||||
More | This information is preliminary and based on company data available at the time of the presentation. |
Page 18
Bank of America Corporation and Subsidiaries | |||||||||||||||||||
Selected Financial Data (continued) | |||||||||||||||||||
(Dollars in millions) | |||||||||||||||||||
Basel 3 Transition | Basel 1 | ||||||||||||||||||
Capital Management | June 30 2014 | March 31 2014 | June 30 2013 | ||||||||||||||||
Risk-based capital metrics (5, 6): | |||||||||||||||||||
Common equity tier 1 capital | $ | 153,582 | $ | 150,922 | n/a | ||||||||||||||
Tier 1 common capital | n/a | n/a | $ | 136,546 | |||||||||||||||
Common equity tier 1 capital ratio | 12.0 | % | 11.8 | % | n/a | ||||||||||||||
Tier 1 common capital ratio (7) | n/a | n/a | 10.6 | % | |||||||||||||||
Tier 1 leverage ratio | 7.7 | 7.4 | 7.4 | ||||||||||||||||
Tangible equity ratio (8) | 7.85 | 7.65 | 7.67 | ||||||||||||||||
Tangible common equity ratio (8) | 7.14 | 7.00 | 6.98 | ||||||||||||||||
Regulatory Capital Reconciliations (5, 6) | June 30 2014 | March 31 2014 | |||||||||||||||||
Regulatory capital – Basel 3 transition to fully phased-in | |||||||||||||||||||
Common equity tier 1 capital (transition) | $ | 153,582 | $ | 150,922 | |||||||||||||||
Adjustments and deductions recognized in Tier 1 capital during transition | (10,547 | ) | (11,302 | ) | |||||||||||||||
Other adjustments and deductions phased in during transition | (5,852 | ) | (9,474 | ) | |||||||||||||||
Common equity tier 1 capital (fully phased-in) | $ | 137,183 | $ | 130,146 | |||||||||||||||
June 30 2014 | March 31 2014 | ||||||||||||||||||
Risk-weighted assets – As reported to Basel 3 (fully phased-in) | |||||||||||||||||||
As reported risk-weighted assets | $ | 1,282,720 | $ | 1,282,117 | |||||||||||||||
Change in risk-weighted assets from reported to fully phased-in | 154,240 | 165,332 | |||||||||||||||||
Basel 3 Standardized approach risk-weighted assets (fully phased-in) | 1,436,960 | 1,447,449 | |||||||||||||||||
Change in risk-weighted assets for advanced models | (49,464 | ) | (86,234 | ) | |||||||||||||||
Basel 3 Advanced approaches risk-weighted assets (fully phased-in) | $ | 1,387,496 | $ | 1,361,215 | |||||||||||||||
Regulatory capital ratios | |||||||||||||||||||
Basel 3 Standardized approach common equity tier 1 (transition) | 12.0 | % | 11.8 | % | |||||||||||||||
Basel 3 Standardized approach common equity tier 1 (fully phased-in) | 9.5 | 9.0 | |||||||||||||||||
Basel 3 Advanced approaches common equity tier 1 (fully phased-in) | 9.9 | 9.6 | |||||||||||||||||
(1) | The diluted earnings (loss) per common share excludes the effect of any equity instruments that are antidilutive to earnings per share. There were no potential common shares that were dilutive in the first quarter of 2014 because of the net loss. |
(2) | Return on average tangible shareholders' equity and tangible book value per share of common stock are non-GAAP financial measures. We believe the use of these non-GAAP financial measures provides additional clarity in assessing the results of the Corporation. Other companies may define or calculate non-GAAP financial measures differently. See Reconciliations to GAAP Financial Measures on pages 22-24. |
(3) | Ratios do not include loans accounted for under the fair value option during the period. Charge-off ratios are annualized for the quarterly presentation. |
(4) | Balances do not include past due consumer credit card, consumer loans secured by real estate where repayments are insured by the Federal Housing Administration and individually insured long-term stand-by agreements (fully-insured home loans), and in general, other consumer and commercial loans not secured by real estate; purchased credit-impaired loans even though the customer may be contractually past due; nonperforming loans held-for-sale; nonperforming loans accounted for under the fair value option; and nonaccruing troubled debt restructured loans removed from the purchased credit-impaired portfolio prior to January 1, 2010. |
(5) | Regulatory capital ratios are preliminary. |
(6) | On January 1, 2014, the Basel 3 rules became effective, subject to transition provisions primarily related to regulatory deductions and adjustments impacting common equity tier 1 capital and Tier 1 capital. We reported under Basel 1 (which included the Market Risk Final Rules) at June 30, 2013. Basel 3 common equity tier 1 capital and risk-weighted assets on a fully phased-in basis are non-GAAP financial measures. For reconciliations to GAAP financial measures, see above. The company's fully phased-in Basel 3 estimates are based on its current understanding of the Standardized and Advanced approaches under the Basel 3 rules, assuming all relevant regulatory model approvals, except for the potential reduction to risk-weighted assets resulting from removal of the Comprehensive Risk Measure surcharge. The Basel 3 rules require approval by banking regulators of certain models used as part of risk-weighted asset calculations. If these models are not approved, the company's capital ratio would likely be adversely impacted, which in some cases could be significant. |
(7) | Tier 1 common capital ratio equals Tier 1 capital excluding preferred stock, trust preferred securities, hybrid securities and minority interest divided by risk-weighted assets. |
(8) | Tangible equity ratio equals period-end tangible shareholders' equity divided by period-end tangible assets. Tangible common equity ratio equals period-end tangible common shareholders' equity divided by period-end tangible assets. Tangible shareholders' equity and tangible assets are non-GAAP financial measures. We believe the use of these non-GAAP financial measures provides additional clarity in assessing the results of the Corporation. Other companies may define or calculate non-GAAP financial measures differently. See Reconciliations to GAAP Financial Measures on pages 22-24. |
n/a = not applicable
n/m = not meaningful
Certain prior period amounts have been reclassified to conform to current period presentation.
More | This information is preliminary and based on company data available at the time of the presentation. |
Page 19
Bank of America Corporation and Subsidiaries | ||||||||||||||||||||||||
Quarterly Results by Business Segment | ||||||||||||||||||||||||
(Dollars in millions) | ||||||||||||||||||||||||
Second Quarter 2014 | ||||||||||||||||||||||||
Consumer & Business Banking | Consumer Real Estate Services | GWIM | Global Banking | Global Markets | All Other | |||||||||||||||||||
Total revenue, net of interest expense (FTE basis) (1) | $ | 7,373 | $ | 1,390 | $ | 4,589 | $ | 4,179 | $ | 4,583 | $ | (154 | ) | |||||||||||
Provision for credit losses | 534 | (20 | ) | (8 | ) | 132 | 19 | (246 | ) | |||||||||||||||
Noninterest expense | 4,000 | 5,902 | 3,447 | 1,899 | 2,862 | 431 | ||||||||||||||||||
Net income (loss) | 1,788 | (2,802 | ) | 724 | 1,353 | 1,101 | 127 | |||||||||||||||||
Return on average allocated capital (2) | 24.33 | % | n/m | 24.33 | % | 17.51 | % | 13.01 | % | n/m | ||||||||||||||
Balance Sheet | ||||||||||||||||||||||||
Average | ||||||||||||||||||||||||
Total loans and leases | $ | 160,240 | $ | 88,257 | $ | 118,512 | $ | 271,417 | $ | 63,579 | $ | 210,575 | ||||||||||||
Total deposits | 543,566 | n/m | 240,042 | 258,937 | n/m | 35,851 | ||||||||||||||||||
Allocated capital (2) | 29,500 | 23,000 | 12,000 | 31,000 | 34,000 | n/m | ||||||||||||||||||
Period end | ||||||||||||||||||||||||
Total loans and leases | $ | 161,142 | $ | 88,156 | $ | 120,187 | $ | 270,683 | $ | 66,260 | $ | 205,471 | ||||||||||||
Total deposits | 545,530 | n/m | 237,046 | 270,268 | n/m | 31,999 | ||||||||||||||||||
First Quarter 2014 | ||||||||||||||||||||||||
Consumer & Business Banking | Consumer Real Estate Services | GWIM | Global Banking | Global Markets | All Other | |||||||||||||||||||
Total revenue, net of interest expense (FTE basis) (1) | $ | 7,438 | $ | 1,192 | $ | 4,547 | $ | 4,269 | $ | 5,012 | $ | 309 | ||||||||||||
Provision for credit losses | 812 | 25 | 23 | 265 | 19 | (135 | ) | |||||||||||||||||
Noninterest expense | 3,963 | 8,129 | 3,359 | 2,028 | 3,077 | 1,682 | ||||||||||||||||||
Net income (loss) | 1,666 | (5,027 | ) | 729 | 1,236 | 1,308 | (188 | ) | ||||||||||||||||
Return on average allocated capital (2) | 22.92 | % | n/m | 24.74 | % | 16.18 | % | 15.64 | % | n/m | ||||||||||||||
Balance Sheet | ||||||||||||||||||||||||
Average | ||||||||||||||||||||||||
Total loans and leases | $ | 162,061 | $ | 88,914 | $ | 115,945 | $ | 271,475 | $ | 63,696 | $ | 217,391 | ||||||||||||
Total deposits | 534,557 | n/m | 242,792 | 256,433 | n/m | 34,381 | ||||||||||||||||||
Allocated capital (2) | 29,500 | 23,000 | 12,000 | 31,000 | 34,000 | n/m | ||||||||||||||||||
Period end | ||||||||||||||||||||||||
Total loans and leases | $ | 160,127 | $ | 88,355 | $ | 116,482 | $ | 273,239 | $ | 64,598 | $ | 213,416 | ||||||||||||
Total deposits | 552,211 | n/m | 244,051 | 257,502 | n/m | 32,818 | ||||||||||||||||||
Second Quarter 2013 | ||||||||||||||||||||||||
Consumer & Business Banking | Consumer Real Estate Services | GWIM | Global Banking | Global Markets | All Other | |||||||||||||||||||
Total revenue, net of interest expense (FTE basis) (1) | $ | 7,434 | $ | 2,115 | $ | 4,499 | $ | 4,138 | $ | 4,194 | $ | 569 | ||||||||||||
Provision for credit losses | 967 | 291 | (15 | ) | 163 | (16 | ) | (179 | ) | |||||||||||||||
Noninterest expense | 4,184 | 3,383 | 3,270 | 1,849 | 2,770 | 562 | ||||||||||||||||||
Net income (loss) | 1,391 | (930 | ) | 759 | 1,297 | 962 | 533 | |||||||||||||||||
Return on average allocated capital (2) | 18.62 | % | n/m | 30.59 | % | 22.62 | % | 12.89 | % | n/m | ||||||||||||||
Balance Sheet | ||||||||||||||||||||||||
Average | ||||||||||||||||||||||||
Total loans and leases | $ | 163,593 | $ | 90,114 | $ | 109,589 | $ | 255,674 | $ | 56,354 | $ | 238,910 | ||||||||||||
Total deposits | 522,244 | n/m | 235,344 | 226,912 | n/m | 34,017 | ||||||||||||||||||
Allocated capital (2) | 30,000 | 24,000 | 10,000 | 23,000 | 30,000 | n/m | ||||||||||||||||||
Period end | ||||||||||||||||||||||||
Total loans and leases | $ | 164,851 | $ | 89,257 | $ | 111,785 | $ | 258,503 | $ | 63,127 | $ | 234,047 | ||||||||||||
Total deposits | 525,085 | n/m | 235,012 | 228,934 | n/m | 34,858 | ||||||||||||||||||
(1) | Fully taxable-equivalent basis is a performance measure used by management in operating the business that management believes provides investors with a more accurate picture of the interest margin for comparative purposes. |
(2) Return on average allocated capital is calculated as net income, adjusted for cost of funds and earnings credits and certain expenses related to intangibles, divided by average allocated capital. Allocated capital and the related return are non-GAAP financial measures. The Corporation believes the use of these non-GAAP financial measures provides additional clarity in assessing the results of the segments. Other companies may define or calculate these measures differently. (See Exhibit A: Non-GAAP Reconciliations - Reconciliations to GAAP Financial Measures on pages 22-24.)
n/m = not meaningful
Certain prior period amounts have been reclassified among the segments to conform to current period presentation.
More | This information is preliminary and based on company data available at the time of the presentation. |
Page 20
Bank of America Corporation and Subsidiaries | ||||||||||||||||||||||||
Year-to-Date Results by Business Segment | ||||||||||||||||||||||||
(Dollars in millions) | ||||||||||||||||||||||||
Six Months Ended June 30, 2014 | ||||||||||||||||||||||||
Consumer & Business Banking | Consumer Real Estate Services | GWIM | Global Banking | Global Markets | All Other | |||||||||||||||||||
Total revenue, net of interest expense (FTE basis) (1) | $ | 14,811 | $ | 2,582 | $ | 9,136 | $ | 8,448 | $ | 9,595 | $ | 155 | ||||||||||||
Provision for credit losses | 1,346 | 5 | 15 | 397 | 38 | (381 | ) | |||||||||||||||||
Noninterest expense | 7,963 | 14,031 | 6,806 | 3,927 | 5,939 | 2,113 | ||||||||||||||||||
Net income (loss) | 3,454 | (7,829 | ) | 1,453 | 2,589 | 2,409 | (61 | ) | ||||||||||||||||
Return on average allocated capital (2) | 23.63 | % | n/m | 24.53 | % | 16.85 | % | 14.32 | % | n/m | ||||||||||||||
Balance Sheet | ||||||||||||||||||||||||
Average | ||||||||||||||||||||||||
Total loans and leases | $ | 161,145 | $ | 88,584 | $ | 117,235 | $ | 271,446 | $ | 63,637 | $ | 213,965 | ||||||||||||
Total deposits | 539,087 | n/m | 241,409 | 257,692 | n/m | 35,119 | ||||||||||||||||||
Allocated capital (2) | 29,500 | 23,000 | 12,000 | 31,000 | 34,000 | n/m | ||||||||||||||||||
Period end | ||||||||||||||||||||||||
Total loans and leases | $ | 161,142 | $ | 88,156 | $ | 120,187 | $ | 270,683 | $ | 66,260 | $ | 205,471 | ||||||||||||
Total deposits | 545,530 | n/m | 237,046 | 270,268 | n/m | 31,999 | ||||||||||||||||||
Six Months Ended June 30, 2013 | ||||||||||||||||||||||||
Consumer & Business Banking | Consumer Real Estate Services | GWIM | Global Banking | Global Markets | All Other | |||||||||||||||||||
Total revenue, net of interest expense (FTE basis) (1) | $ | 14,846 | $ | 4,427 | $ | 8,920 | $ | 8,168 | $ | 8,973 | $ | 1,023 | ||||||||||||
Provision for credit losses | 1,919 | 626 | 7 | 312 | (11 | ) | 71 | |||||||||||||||||
Noninterest expense | 8,349 | 8,788 | 6,523 | 3,685 | 5,843 | 2,330 | ||||||||||||||||||
Net income (loss) | 2,833 | (3,086 | ) | 1,479 | 2,581 | 2,074 | (386 | ) | ||||||||||||||||
Return on average allocated capital (2) | 19.08 | % | n/m | 30.00 | % | 22.64 | % | 13.97 | % | n/m | ||||||||||||||
Balance Sheet | ||||||||||||||||||||||||
Average | ||||||||||||||||||||||||
Total loans and leases | $ | 164,713 | $ | 91,531 | $ | 107,845 | $ | 249,903 | $ | 54,529 | $ | 241,748 | ||||||||||||
Total deposits | 512,424 | n/m | 244,329 | 224,132 | n/m | 34,883 | ||||||||||||||||||
Allocated capital (2) | 30,000 | 24,000 | 10,000 | 23,000 | 30,000 | n/m | ||||||||||||||||||
Period end | ||||||||||||||||||||||||
Total loans and leases | $ | 164,851 | $ | 89,257 | $ | 111,785 | $ | 258,503 | $ | 63,127 | $ | 234,047 | ||||||||||||
Total deposits | 525,085 | n/m | 235,012 | 228,934 | n/m | 34,858 | ||||||||||||||||||
(1) | Fully taxable-equivalent basis is a performance measure used by management in operating the business that management believes provides investors with a more accurate picture of the interest margin for comparative purposes. |
(2) Return on average allocated capital is calculated as net income, adjusted for cost of funds and earnings credits and certain expenses related to intangibles, divided by average allocated capital. Allocated capital and the related return are non-GAAP financial measures. The Corporation believes the use of these non-GAAP financial measures provides additional clarity in assessing the results of the segments. Other companies may define or calculate these measures differently. (See Exhibit A: Non-GAAP Reconciliations - Reconciliations to GAAP Financial Measures on pages 22-24.)
n/m = not meaningful
Certain prior period amounts have been reclassified among the segments to conform to current period presentation.
More | This information is preliminary and based on company data available at the time of the presentation. |
Page 21
Bank of America Corporation and Subsidiaries | ||||||||||||||||||||
Supplemental Financial Data | ||||||||||||||||||||
(Dollars in millions) | ||||||||||||||||||||
Fully taxable-equivalent (FTE) basis data (1) | Six Months Ended June 30 | Second Quarter 2014 | First Quarter 2014 | Second Quarter 2013 | ||||||||||||||||
2014 | 2013 | |||||||||||||||||||
Net interest income | $ | 20,512 | $ | 21,646 | $ | 10,226 | $ | 10,286 | $ | 10,771 | ||||||||||
Total revenue, net of interest expense | 44,727 | 46,357 | 21,960 | 22,767 | 22,949 | |||||||||||||||
Net interest yield (2) | 2.26 | % | 2.36 | % | 2.22 | % | 2.29 | % | 2.35 | % | ||||||||||
Efficiency ratio | 91.17 | 76.62 | 84.43 | 97.68 | 69.80 | |||||||||||||||
Other Data | June 30 2014 | March 31 2014 | June 30 2013 | |||||||||||||||||
Number of banking centers - U.S. | 5,023 | 5,095 | 5,328 | |||||||||||||||||
Number of branded ATMs - U.S. | 15,976 | 16,214 | 16,354 | |||||||||||||||||
Ending full-time equivalent employees | 233,201 | 238,560 | 257,158 | |||||||||||||||||
(1) | FTE basis is a non-GAAP financial measure. FTE basis is a performance measure used by management in operating the business that management believes provides investors with a more accurate picture of the interest margin for comparative purposes. See Reconciliations to GAAP Financial Measures on pages 22-24. |
(2) | Beginning in the first quarter of 2014, interest-bearing deposits placed with the Federal Reserve and certain non-U.S. central banks are included in earning assets. Prior period yields have been reclassified to conform to current period presentation. |
Certain prior period amounts have been reclassified to conform to current period presentation.
More | This information is preliminary and based on company data available at the time of the presentation. |
Page 22
Bank of America Corporation and Subsidiaries | ||||
Reconciliations to GAAP Financial Measures | ||||
(Dollars in millions) | ||||
The Corporation evaluates its business based on a fully taxable-equivalent basis, a non-GAAP financial measure. The Corporation believes managing the business with net interest income on a fully taxable-equivalent basis provides a more accurate picture of the interest margin for comparative purposes. Total revenue, net of interest expense, includes net interest income on a fully taxable-equivalent basis and noninterest income. The Corporation views related ratios and analyses (i.e., efficiency ratios and net interest yield) on a fully taxable-equivalent basis. To derive the fully taxable-equivalent basis, net interest income is adjusted to reflect tax-exempt income on an equivalent before-tax basis with a corresponding increase in income tax expense. For purposes of this calculation, the Corporation uses the federal statutory tax rate of 35 percent. This measure ensures comparability of net interest income arising from taxable and tax-exempt sources. The efficiency ratio measures the costs expended to generate a dollar of revenue, and net interest yield measures the basis points the Corporation earns over the cost of funds.
The Corporation also evaluates its business based on the following ratios that utilize tangible equity, a non-GAAP financial measure. Tangible equity represents an adjusted shareholders' equity or common shareholders' equity amount which has been reduced by goodwill and intangible assets (excluding mortgage servicing rights), net of related deferred tax liabilities. Return on average tangible common shareholders' equity measures the Corporation's earnings contribution as a percentage of adjusted average common shareholders' equity. The tangible common equity ratio represents adjusted ending common shareholders' equity divided by total assets less goodwill and intangible assets (excluding mortgage servicing rights), net of related deferred tax liabilities. Return on average tangible shareholders' equity measures the Corporation's earnings contribution as a percentage of adjusted average total shareholders' equity. The tangible equity ratio represents adjusted ending shareholders' equity divided by total assets less goodwill and intangible assets (excluding mortgage servicing rights), net of related deferred tax liabilities. Tangible book value per common share represents adjusted ending common shareholders' equity divided by ending common shares outstanding. These measures are used to evaluate the Corporation's use of equity. In addition, profitability, relationship and investment models all use return on average tangible shareholders' equity as key measures to support our overall growth goals.
In addition, the Corporation evaluates its business segment results based on measures that utilize average allocated capital. The Corporation allocates capital to its business segments using a methodology that considers the effect of regulatory capital requirements in addition to internal risk-based capital models. The Corporation's internal risk-based capital models use a risk-adjusted methodology incorporating each segment's credit, market, interest rate, business and operational risk components. Return on average allocated capital is calculated as net income, adjusted for cost of funds and earnings credits and certain expenses related to intangibles, divided by average allocated capital. Allocated capital and the related return both represent non-GAAP financial measures. Allocated capital is reviewed periodically and refinements are made based on multiple considerations that include, but are not limited to, business segment exposures and risk profile, regulatory constraints and strategic plans. As part of this process, in the first quarter of 2014, the Corporation adjusted the amount of capital being allocated to its business segments. This change resulted in a reduction of the unallocated capital, which is reflected in All Other, and an aggregate increase to the amount of capital being allocated to the business segments. Prior periods were not restated.
See the tables below and on pages 23-24 for reconciliations of these non-GAAP financial measures to financial measures defined by GAAP for the six months ended June 30, 2014 and 2013, and the three months ended June 30, 2014, March 31, 2014 and June 30, 2013. The Corporation believes the use of these non-GAAP financial measures provides additional clarity in assessing the results of the Corporation. Other companies may define or calculate supplemental financial data differently.
Six Months Ended June 30 | Second Quarter 2014 | First Quarter 2014 | Second Quarter 2013 | ||||||||||||||||||
2014 | 2013 | ||||||||||||||||||||
Reconciliation of net interest income to net interest income on a fully taxable-equivalent basis | |||||||||||||||||||||
Net interest income | $ | 20,098 | $ | 21,213 | $ | 10,013 | $ | 10,085 | $ | 10,549 | |||||||||||
Fully taxable-equivalent adjustment | 414 | 433 | 213 | 201 | 222 | ||||||||||||||||
Net interest income on a fully taxable-equivalent basis | $ | 20,512 | $ | 21,646 | $ | 10,226 | $ | 10,286 | $ | 10,771 | |||||||||||
Reconciliation of total revenue, net of interest expense to total revenue, net of interest expense on a fully taxable-equivalent basis | |||||||||||||||||||||
Total revenue, net of interest expense | $ | 44,313 | $ | 45,924 | $ | 21,747 | $ | 22,566 | $ | 22,727 | |||||||||||
Fully taxable-equivalent adjustment | 414 | 433 | 213 | 201 | 222 | ||||||||||||||||
Total revenue, net of interest expense on a fully taxable-equivalent basis | $ | 44,727 | $ | 46,357 | $ | 21,960 | $ | 22,767 | $ | 22,949 | |||||||||||
Reconciliation of income tax expense (benefit) to income tax expense (benefit) on a fully taxable-equivalent basis | |||||||||||||||||||||
Income tax expense (benefit) | $ | 99 | $ | 1,987 | $ | 504 | $ | (405 | ) | $ | 1,486 | ||||||||||
Fully taxable-equivalent adjustment | 414 | 433 | 213 | 201 | 222 | ||||||||||||||||
Income tax expense (benefit) on a fully taxable-equivalent basis | $ | 513 | $ | 2,420 | $ | 717 | $ | (204 | ) | $ | 1,708 | ||||||||||
Reconciliation of average common shareholders' equity to average tangible common shareholders' equity | |||||||||||||||||||||
Common shareholders' equity | $ | 222,705 | $ | 218,509 | $ | 222,215 | $ | 223,201 | $ | 218,790 | |||||||||||
Goodwill | (69,832 | ) | (69,937 | ) | (69,822 | ) | (69,842 | ) | (69,930 | ) | |||||||||||
Intangible assets (excluding mortgage servicing rights) | (5,354 | ) | (6,409 | ) | (5,235 | ) | (5,474 | ) | (6,270 | ) | |||||||||||
Related deferred tax liabilities | 2,132 | 2,393 | 2,100 | 2,165 | 2,360 | ||||||||||||||||
Tangible common shareholders' equity | $ | 149,651 | $ | 144,556 | $ | 149,258 | $ | 150,050 | $ | 144,950 | |||||||||||
Reconciliation of average shareholders' equity to average tangible shareholders' equity | |||||||||||||||||||||
Shareholders' equity | $ | 236,173 | $ | 236,024 | $ | 235,797 | $ | 236,553 | $ | 235,063 | |||||||||||
Goodwill | (69,832 | ) | (69,937 | ) | (69,822 | ) | (69,842 | ) | (69,930 | ) | |||||||||||
Intangible assets (excluding mortgage servicing rights) | (5,354 | ) | (6,409 | ) | (5,235 | ) | (5,474 | ) | (6,270 | ) | |||||||||||
Related deferred tax liabilities | 2,132 | 2,393 | 2,100 | 2,165 | 2,360 | ||||||||||||||||
Tangible shareholders' equity | $ | 163,119 | $ | 162,071 | $ | 162,840 | $ | 163,402 | $ | 161,223 | |||||||||||
Certain prior period amounts have been reclassified to conform to current period presentation.
More | This information is preliminary and based on company data available at the time of the presentation. |
Page 23
Bank of America Corporation and Subsidiaries | |||||||||||||||||||||
Reconciliations to GAAP Financial Measures (continued) | |||||||||||||||||||||
(Dollars in millions) | |||||||||||||||||||||
Six Months Ended June 30 | Second Quarter 2014 | First Quarter 2014 | Second Quarter 2013 | ||||||||||||||||||
2014 | 2013 | ||||||||||||||||||||
Reconciliation of period-end common shareholders' equity to period-end tangible common shareholders' equity | |||||||||||||||||||||
Common shareholders' equity | $ | 222,565 | $ | 216,791 | $ | 222,565 | $ | 218,536 | $ | 216,791 | |||||||||||
Goodwill | (69,810 | ) | (69,930 | ) | (69,810 | ) | (69,842 | ) | (69,930 | ) | |||||||||||
Intangible assets (excluding mortgage servicing rights) | (5,099 | ) | (6,104 | ) | (5,099 | ) | (5,337 | ) | (6,104 | ) | |||||||||||
Related deferred tax liabilities | 2,078 | 2,297 | 2,078 | 2,100 | 2,297 | ||||||||||||||||
Tangible common shareholders' equity | $ | 149,734 | $ | 143,054 | $ | 149,734 | $ | 145,457 | $ | 143,054 | |||||||||||
Reconciliation of period-end shareholders' equity to period-end tangible shareholders' equity | |||||||||||||||||||||
Shareholders' equity | $ | 237,411 | $ | 231,032 | $ | 237,411 | $ | 231,888 | $ | 231,032 | |||||||||||
Goodwill | (69,810 | ) | (69,930 | ) | (69,810 | ) | (69,842 | ) | (69,930 | ) | |||||||||||
Intangible assets (excluding mortgage servicing rights) | (5,099 | ) | (6,104 | ) | (5,099 | ) | (5,337 | ) | (6,104 | ) | |||||||||||
Related deferred tax liabilities | 2,078 | 2,297 | 2,078 | 2,100 | 2,297 | ||||||||||||||||
Tangible shareholders' equity | $ | 164,580 | $ | 157,295 | $ | 164,580 | $ | 158,809 | $ | 157,295 | |||||||||||
Reconciliation of period-end assets to period-end tangible assets | |||||||||||||||||||||
Assets | $ | 2,170,557 | $ | 2,123,320 | $ | 2,170,557 | $ | 2,149,851 | $ | 2,123,320 | |||||||||||
Goodwill | (69,810 | ) | (69,930 | ) | (69,810 | ) | (69,842 | ) | (69,930 | ) | |||||||||||
Intangible assets (excluding mortgage servicing rights) | (5,099 | ) | (6,104 | ) | (5,099 | ) | (5,337 | ) | (6,104 | ) | |||||||||||
Related deferred tax liabilities | 2,078 | 2,297 | 2,078 | 2,100 | 2,297 | ||||||||||||||||
Tangible assets | $ | 2,097,726 | $ | 2,049,583 | $ | 2,097,726 | $ | 2,076,772 | $ | 2,049,583 | |||||||||||
Book value per share of common stock | |||||||||||||||||||||
Common shareholders' equity | $ | 222,565 | $ | 216,791 | $ | 222,565 | $ | 218,536 | $ | 216,791 | |||||||||||
Ending common shares issued and outstanding | 10,515,825 | 10,743,098 | 10,515,825 | 10,530,045 | 10,743,098 | ||||||||||||||||
Book value per share of common stock | $ | 21.16 | $ | 20.18 | $ | 21.16 | $ | 20.75 | $ | 20.18 | |||||||||||
Tangible book value per share of common stock | |||||||||||||||||||||
Tangible common shareholders' equity | $ | 149,734 | $ | 143,054 | $ | 149,734 | $ | 145,457 | $ | 143,054 | |||||||||||
Ending common shares issued and outstanding | 10,515,825 | 10,743,098 | 10,515,825 | 10,530,045 | 10,743,098 | ||||||||||||||||
Tangible book value per share of common stock | $ | 14.24 | $ | 13.32 | $ | 14.24 | $ | 13.81 | $ | 13.32 | |||||||||||
Certain prior period amounts have been reclassified to conform to current period presentation.
More | This information is preliminary and based on company data available at the time of the presentation. |
Page 24
Bank of America Corporation and Subsidiaries | |||||||||||||||||||||
Reconciliations to GAAP Financial Measures (continued) | |||||||||||||||||||||
(Dollars in millions) | |||||||||||||||||||||
Six Months Ended June 30 | Second Quarter 2014 | First Quarter 2014 | Second Quarter 2013 | ||||||||||||||||||
2014 | 2013 | ||||||||||||||||||||
Reconciliation of return on average allocated capital (1) | |||||||||||||||||||||
Consumer & Business Banking | |||||||||||||||||||||
Reported net income | $ | 3,454 | $ | 2,833 | $ | 1,788 | $ | 1,666 | $ | 1,391 | |||||||||||
Adjustment related to intangibles (2) | 2 | 4 | 1 | 1 | 2 | ||||||||||||||||
Adjusted net income | $ | 3,456 | $ | 2,837 | $ | 1,789 | $ | 1,667 | $ | 1,393 | |||||||||||
Average allocated equity (3) | $ | 61,468 | $ | 62,063 | $ | 61,460 | $ | 61,475 | $ | 62,050 | |||||||||||
Adjustment related to goodwill and a percentage of intangibles | (31,968 | ) | (32,063 | ) | (31,960 | ) | (31,975 | ) | (32,050 | ) | |||||||||||
Average allocated capital | $ | 29,500 | $ | 30,000 | $ | 29,500 | $ | 29,500 | $ | 30,000 | |||||||||||
Global Wealth & Investment Management | |||||||||||||||||||||
Reported net income | $ | 1,453 | $ | 1,479 | $ | 724 | $ | 729 | $ | 759 | |||||||||||
Adjustment related to intangibles (2) | 7 | 9 | 4 | 3 | 4 | ||||||||||||||||
Adjusted net income | $ | 1,460 | $ | 1,488 | $ | 728 | $ | 732 | $ | 763 | |||||||||||
Average allocated equity (3) | $ | 22,233 | $ | 20,311 | $ | 22,222 | $ | 22,243 | $ | 20,300 | |||||||||||
Adjustment related to goodwill and a percentage of intangibles | (10,233 | ) | (10,311 | ) | (10,222 | ) | (10,243 | ) | (10,300 | ) | |||||||||||
Average allocated capital | $ | 12,000 | $ | 10,000 | $ | 12,000 | $ | 12,000 | $ | 10,000 | |||||||||||
Global Banking | |||||||||||||||||||||
Reported net income | $ | 2,589 | $ | 2,581 | $ | 1,353 | $ | 1,236 | $ | 1,297 | |||||||||||
Adjustment related to intangibles (2) | 1 | 1 | 1 | — | 1 | ||||||||||||||||
Adjusted net income | $ | 2,590 | $ | 2,582 | $ | 1,354 | $ | 1,236 | $ | 1,298 | |||||||||||
Average allocated equity (3) | $ | 53,406 | $ | 45,411 | $ | 53,405 | $ | 53,407 | $ | 45,416 | |||||||||||
Adjustment related to goodwill and a percentage of intangibles | (22,406 | ) | (22,411 | ) | (22,405 | ) | (22,407 | ) | (22,416 | ) | |||||||||||
Average allocated capital | $ | 31,000 | $ | 23,000 | $ | 31,000 | $ | 31,000 | $ | 23,000 | |||||||||||
Global Markets | |||||||||||||||||||||
Reported net income | $ | 2,409 | $ | 2,074 | $ | 1,101 | $ | 1,308 | $ | 962 | |||||||||||
Adjustment related to intangibles (2) | 5 | 4 | 3 | 2 | 2 | ||||||||||||||||
Adjusted net income | $ | 2,414 | $ | 2,078 | $ | 1,104 | $ | 1,310 | $ | 964 | |||||||||||
Average allocated equity (3) | $ | 39,374 | $ | 35,364 | $ | 39,373 | $ | 39,375 | $ | 35,357 | |||||||||||
Adjustment related to goodwill and a percentage of intangibles | (5,374 | ) | (5,364 | ) | (5,373 | ) | (5,375 | ) | (5,357 | ) | |||||||||||
Average allocated capital | $ | 34,000 | $ | 30,000 | $ | 34,000 | $ | 34,000 | $ | 30,000 | |||||||||||
(1) | There are no adjustments to reported net income (loss) or average allocated equity for Consumer Real Estate Services. |
(2) | Represents cost of funds, earnings credits and certain expenses related to intangibles. |
(3) | Average allocated equity is comprised of average allocated capital plus capital for the portion of goodwill and intangibles specifically assigned to the business segment. |
Certain prior period amounts have been reclassified to conform to current period presentation.
This information is preliminary and based on company data available at the time of the presentation. | |