January 15, 2014
Investors May Contact:
Anne Walker, Bank of America, 1.646.855.3644
Lee McEntire, Bank of America, 1.980.388.6780
Jonathan Blum, Bank of America (Fixed Income), 1.212.449.3112
Reporters May Contact:
Jerry Dubrowski, Bank of America, 1.980.388.2840
jerome.f.dubrowski@bankofamerica.com
Bank of America Reports Fourth-quarter 2013 Net Income of $3.4 Billion, or $0.29 per Diluted Share, on Revenue of $21.7 BillionA
Fourth-quarter 2013 Results Included
• | Pretax Negative DVA/FVO Adjustments of $0.6 Billion due to Tightening of the Company's Credit Spreads |
• | Pretax Litigation Expense of $2.3 Billion |
• | Effective Tax Rate of 10.6 Percent |
Fourth-quarter 2013 Highlights Compared to Year-ago Quarter
• | Period-end Consolidated Deposit Balances Increased $14 Billion to Record $1.12 Trillion |
• | Period-end Loan Balances Increased $20 Billion to $928 Billion |
• | Combined Debit and Consumer Credit Card Spending Rose 4.0 Percent to $123 Billion |
• | Period-end Commercial Loan Balances Increased $42 Billion to $396 Billion |
• | Global Wealth and Investment Management Pretax Margin Increased to 26.6 Percent From 21.1 Percent |
• | Record Global Banking Revenue of $4.3 Billion, up 9 Percent |
• | Achieved New BAC and Legacy Assets and Servicing 2013 Cost Savings Targets |
• | Credit Quality Continued to Improve With Net Charge-offs Down 49 Percent; Ratio at 0.68 Percent |
• | Basel 1 Tier 1 Common Capital of $145 Billion, Ratio of 11.19 Percent |
• | Basel 3 Tier 1 Common Capital Ratio of 9.96 Percent, up From 9.25 PercentD |
Full-year 2013 Highlights Compared to Full-year 2012
• | Nearly $90 Billion in Residential Home Loans and Home Equity Loans Funded in 2013 |
• | More Than 3.9 Million New Consumer Credit Cards Issued in 2013 |
• | Record Earnings of $3 Billion in Global Wealth and Investment Management |
• | Bank of America Merrill Lynch Gained Market Share and Maintained No. 2 Ranking in Global Investment Banking FeesC |
• | Liquidity Remained Strong at $376 Billion; Parent Company Time-to-required Funding Improved to 38 Months From 33 Months |
• | Initiated Capital Return to Shareholders Through Repurchase of $3.2 Billion of Common Stock at an Average Price of $13.90 per Share |
More
Page 2
CHARLOTTE — Bank of America Corporation today reported net income of $3.4 billion, or $0.29 per diluted share, for the fourth quarter of 2013, compared to $732 million, or $0.03 per diluted share in the year-ago period. Revenue, net of interest expense, on an FTE basisA rose 15 percent from the fourth quarter of 2012 to $21.7 billion.
For the year ended December 31, 2013, net income increased to $11.4 billion, or $0.90 per diluted share, from $4.2 billion, or $0.25 per diluted share, in 2012. Revenue, net of interest expense, on an FTE basisA rose 7 percent to $89.8 billion.
"We are pleased to see the core businesses continue to perform well, serving our customers and clients," said Chief Executive Officer Brian Moynihan. "While work remains on past issues, our two hundred forty thousand teammates continue to do a great job winning in the marketplace."
“We enter this year with one of the strongest balance sheets in our company’s history,” said Chief Financial Officer Bruce Thompson. “Capital and liquidity are at record levels, credit losses are at historic lows, our cost savings initiatives are on track and yielding significant savings, and our businesses are seeing good momentum.”
Selected Financial Highlights
Three Months Ended | Year Ended | ||||||||||||||
(Dollars in millions, except per share data) | December 31 2013 | December 31 2012 | December 31 2013 | December 31 2012 | |||||||||||
Net interest income, FTE basis1 | $ | 10,999 | $ | 10,555 | $ | 43,124 | $ | 41,557 | |||||||
Noninterest income | 10,702 | 8,336 | 46,677 | 42,678 | |||||||||||
Total revenue, net of interest expense, FTE basis | 21,701 | 18,891 | 89,801 | 84,235 | |||||||||||
Total revenue, net of interest expense, FTE basis, excluding DVA and FVO2 | 22,319 | 19,610 | 90,958 | 91,819 | |||||||||||
Provision for credit losses | 336 | 2,204 | 3,556 | 8,169 | |||||||||||
Noninterest expense | 17,307 | 18,360 | 69,214 | 72,093 | |||||||||||
Net income | $ | 3,439 | $ | 732 | $ | 11,431 | $ | 4,188 | |||||||
Diluted earnings per common share | $ | 0.29 | $ | 0.03 | $ | 0.90 | $ | 0.25 | |||||||
1 | Fully taxable-equivalent (FTE) basis is a non-GAAP financial measure. For reconciliation to GAAP financial measures, refer to pages 23-25 of this press release. Net interest income on a GAAP basis was $10.8 billion and $10.3 billion for the three months ended December 31, 2013 and 2012, and $42.3 billion and $40.7 billion for the years ended December 31, 2013 and 2012. Total revenue, net of interest expense, on a GAAP basis was $21.5 billion and $18.7 billion for the three months ended December 31, 2013 and 2012, and $88.9 billion and $83.3 billion for the years ended December 31, 2013 and 2012. |
2 | Total revenue, net of interest expense, on an FTE basis excluding DVA and FVO adjustments is a non-GAAP financial measure. DVA losses were $201 million and $277 million for the three months ended December 31, 2013 and 2012, and $508 million and $2.5 billion for the years ended December 31, 2013 and 2012. Valuation losses related to FVO were $417 million and $442 million for the three months ended December 31, 2013 and 2012, and $649 million and $5.1 billion for the years ended December 31, 2013 and 2012. |
Revenue, net of interest expense, on an FTE basisA rose $2.8 billion from the fourth quarter of 2012 to $21.7 billion. Excluding the impact of debit valuation adjustments (DVA) and fair value option (FVO) adjustmentsB, revenue was $22.3 billion in the fourth quarter of 2013, compared to $19.6 billion in the fourth quarter of 2012.
More
Page 3
Net interest income, on an FTE basis, rose 4 percent from the year-ago quarter to $11.0 billionA. The improvement was driven by reductions in long-term debt balances and yields, favorable market-related adjustments from lower premium amortization, lower rates paid on deposits, and higher commercial loan balances. These factors were partially offset by lower consumer loan balances and lower asset yields. Net interest margin was 2.56 percent in the fourth quarter of 2013, compared to 2.35 percent in the fourth quarter of 2012.
Noninterest income increased 28 percent from the year-ago quarter, to $10.7 billion, driven by lower representations and warranties provision and year-over-year improvement in both investment banking fees and investment and brokerage income. This was partially offset by lower equity investment income compared to the fourth quarter of 2012.
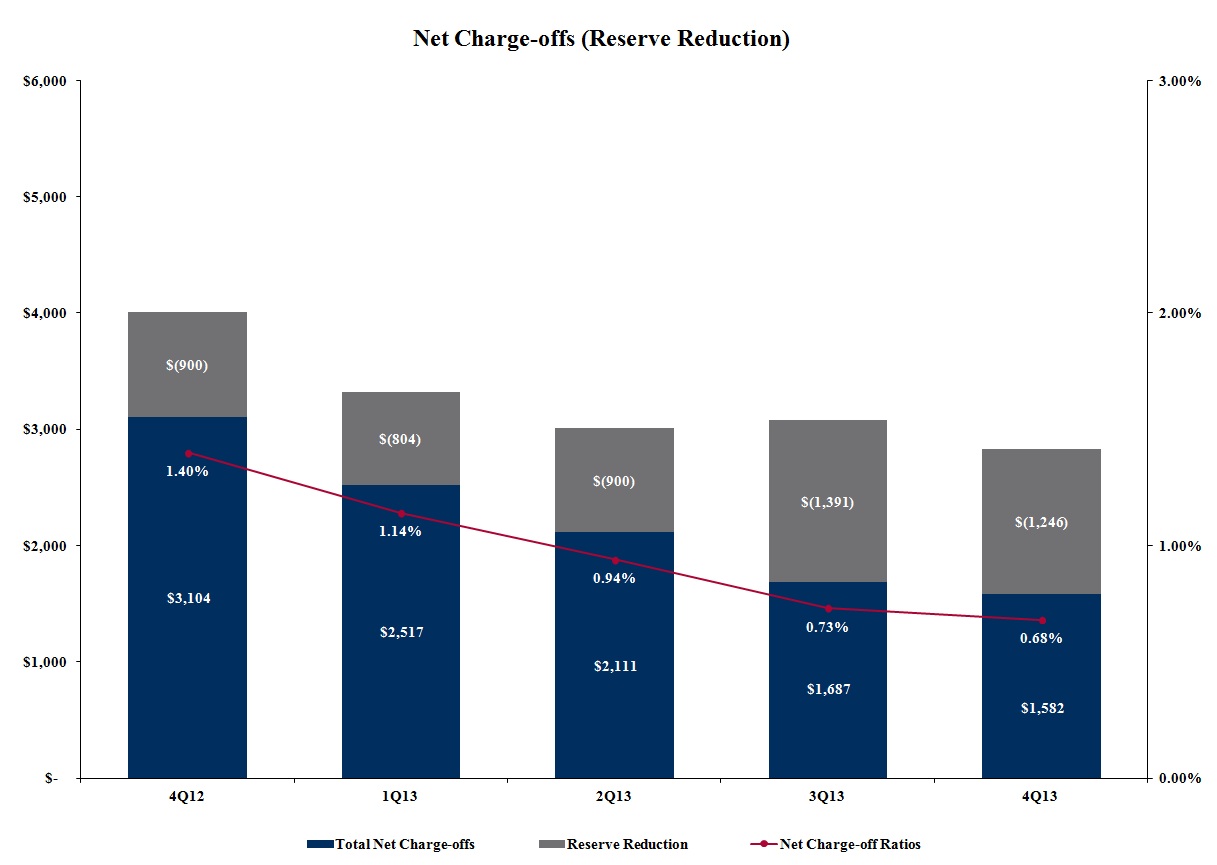
The provision for credit losses declined $1.9 billion from the fourth quarter of 2012 to $336 million, driven by improved credit quality. Net charge-offs declined significantly to $1.6 billion in the fourth quarter of 2013 from $3.1 billion in the fourth quarter of 2012, with the net charge-off ratio falling to 0.68 percent in the fourth quarter of 2013 from 1.40 percent in the year-ago quarter. The provision for credit losses in the fourth quarter of 2013 included a $1.2 billion reduction in the allowance for credit losses, compared to a $900 million reduction in the allowance in the fourth quarter of 2012.
Noninterest expense was $17.3 billion, compared to $18.4 billion in the year-ago quarter, driven primarily by reduced expenses in Legacy Assets and Servicing (LAS) and lower personnel expense as the company continued to streamline processes and achieve cost savings. This was partially offset by higher litigation expense reflecting continued evaluation of legacy exposures largely related to residential mortgage-backed securities (RMBS) litigation. Litigation expense rose to $2.3 billion in the fourth quarter of 2013 from $1.1 billion in the third quarter of 2013 and $916 million in the fourth quarter of 2012. In addition, the year-ago quarter included a $1.1 billion expense related to the Independent Foreclosure Review (IFR) acceleration agreement.
Income tax expense for the fourth quarter of 2013 was $406 million on $3.8 billion of pretax income, compared to an income tax benefit of $2.6 billion on $1.9 billion of pretax loss in the year-ago quarter. The effective tax rate for the quarter of 10.6 percent was driven by recurring tax preference items and certain discrete tax benefits. At December 31, 2013, the company had 242,117 full-time employees, down 9 percent from the year-ago quarter.
Business Segment Results
The company reports results through five business segments: Consumer and Business Banking (CBB), Consumer Real Estate Services (CRES), Global Wealth and Investment Management (GWIM), Global Banking, and Global Markets, with the remaining operations recorded in All Other.
Unless otherwise noted, business segment revenue, net of interest expense, is on an FTE basis.
More
Page 4
Consumer and Business Banking (CBB)
Three Months Ended | Year Ended | ||||||||||||||
(Dollars in millions) | December 31 2013 | December 31 2012 | December 31 2013 | December 31 2012 | |||||||||||
Total revenue, net of interest expense, FTE basis | $ | 7,497 | $ | 7,401 | $ | 29,867 | $ | 29,790 | |||||||
Provision for credit losses | 427 | 1,078 | 3,107 | 4,148 | |||||||||||
Noninterest expense | 4,042 | 4,174 | 16,357 | 16,995 | |||||||||||
Net income | $ | 1,967 | $ | 1,446 | $ | 6,588 | $ | 5,546 | |||||||
Return on average allocated capital1, 2 | 26.03 | % | — | % | 21.98 | % | — | % | |||||||
Return on average economic capital1, 2 | — | 23.46 | — | 23.12 | |||||||||||
Average loans | $ | 163,152 | $ | 167,219 | $ | 164,570 | $ | 173,036 | |||||||
Average deposits | 528,808 | 484,086 | 518,980 | 475,180 | |||||||||||
At period-end | |||||||||||||||
Brokerage assets | $ | 96,048 | $ | 75,946 | |||||||||||
1 | Effective January 1, 2013, the company revised, on a prospective basis, its methodology for allocating capital to the business segments. In connection with this change in methodology, the company updated the applicable terminology to allocated capital from economic capital as reported in prior periods. For reconciliation of allocated capital, refer to pages 23-25 of this press release. |
2 | Return on average allocated capital and return on average economic capital are non-GAAP financial measures. The company believes the use of these non-GAAP financial measures provides additional clarity in assessing the results of the segments. Other companies may define or calculate these measures differently. For reconciliation to GAAP financial measures, refer to pages 23-25 of this press release. |
Business Highlights
• | Average deposit balances for the quarter of $528.8 billion increased $44.7 billion, or 9 percent, from the year-ago quarter. The increase was driven by growth in liquid products in the current low-rate environment and the $20 billion average impact of deposit transfers primarily from Global Wealth and Investment Management (GWIM). The average rate paid on deposits declined to 8 basis points in the fourth quarter of 2013 from 16 basis points in the year-ago quarter, due to pricing discipline and a shift in the mix of deposits. |
• | The number of active mobile banking customers increased 20 percent from the year-ago quarter to 14.4 million. |
• | Total Corporate U.S. Consumer Credit Card (including balances in GWIM) retail spending per average active account increased 6 percent from the fourth quarter of 2012. |
• | Total Corporate U.S. Consumer Credit Card net credit loss rate for the fourth quarter of 2013 was 3.19 percent, the lowest since the first quarter of 2006. |
• | Return on average allocated capital increased to 26.03 percent in the fourth quarter of 2013 from 23.55 percent in the third quarter of 2013. |
More
Page 5
Financial Overview
Consumer and Business Banking reported net income of $2.0 billion, up $521 million, or 36 percent, from the year-ago quarter, driven by lower provision for credit losses, lower noninterest expense and higher revenue.
Revenue of $7.5 billion increased $96 million from the year-ago quarter, driven by higher net interest income. The provision for credit losses decreased $651 million from the year-ago quarter to $427 million, reflecting continued improvement in credit quality. Noninterest expense decreased $132 million from the year-ago quarter to $4.0 billion, primarily due to lower personnel expense and lower FDIC expense, partially offset by higher litigation expense.
Consumer Real Estate Services (CRES)
Three Months Ended | Year Ended | ||||||||||||||
(Dollars in millions) | December 31 2013 | December 31 2012 | December 31 2013 | December 31 2012 | |||||||||||
Total revenue, net of interest expense, FTE basis | $ | 1,712 | $ | 475 | $ | 7,716 | $ | 8,751 | |||||||
Provision for credit losses | (474 | ) | 485 | (156 | ) | 1,442 | |||||||||
Noninterest expense | 3,794 | 5,607 | 16,013 | 17,190 | |||||||||||
Net loss | $ | (1,061 | ) | $ | (3,704 | ) | $ | (5,155 | ) | $ | (6,439 | ) | |||
Average loans and leases | 89,687 | 96,605 | 90,278 | 103,524 | |||||||||||
At period-end | |||||||||||||||
Loans and leases | $ | 89,753 | $ | 94,660 | |||||||||||
Business Highlights
• | Bank of America funded $13.5 billion in residential home loans and home equity loans during the fourth quarter of 2013, helping nearly 50,000 homeowners either refinance an existing mortgage or purchase a home through our retail channels. This included nearly 4,200 first-time homebuyer mortgages and more than 17,000 mortgages to low- and moderate-income borrowers. |
• | Approximately 68 percent of funded first mortgages were refinances and 32 percent were for home purchases. |
• | The number of 60+ days delinquent first-mortgage loans serviced by LAS declined 18 percent during the fourth quarter of 2013 to 325,000 loans from 398,000 loans at the end of the third quarter of 2013, and declined 58 percent from 773,000 loans at the end of the fourth quarter of 2012. |
More
Page 6
Financial Overview
Consumer Real Estate Services reported a net loss of $1.1 billion for the fourth quarter of 2013, compared to a net loss of $3.7 billion for the same period in 2012. The year-ago quarter included the settlements with the Federal National Mortgage Association (Fannie Mae) to resolve outstanding and potential repurchase and certain other claims and $1.1 billion of expense related to the IFR acceleration agreement.
Revenue increased $1.2 billion from the fourth quarter of 2012 to $1.7 billion due to a $2.9 billion reduction in representations and warranties provision, partially offset by a $1.1 billion decline in servicing revenue reflecting lower Mortgage Servicing Rights (MSR) net-of-hedge performance and a smaller servicing portfolio, as well as a decline in core production revenue.
CRES first-mortgage originations declined 46 percent in the fourth quarter of 2013 compared to the same period in 2012, reflecting a corresponding decline in the overall market demand for mortgages. Core production revenue declined in the fourth quarter of 2013 to $403 million from $986 million in the year-ago quarter due to lower volume as well as a reduction in margins resulting from the continued industrywide margin compression over the past year. The provision for representations and warranties declined to $70 million in the fourth quarter of 2013 from $3.0 billion in the fourth quarter of 2012, which included the Fannie Mae settlements mentioned above.
The provision for credit losses decreased $959 million from the year-ago quarter to a benefit of $474 million, driven primarily by increased home prices and improved portfolio trends.
Noninterest expense decreased $1.8 billion from the year-ago quarter to $3.8 billion, due to the IFR expense in the year-ago quarter mentioned above, as well as lower LAS default-related servicing expenses as a result of continued staff reductions and lower assessments, waivers and similar costs related to foreclosure delays. These improvements were partially offset by a $522 million increase in litigation expense in LAS from the fourth quarter of 2012 to the fourth quarter of 2013.
A significant contributor to the year-over-year expense reduction was the improvement in the number of 60+ days delinquent first-mortgage loans serviced by LAS, which fell 58 percent to 325,000 loans from 773,000 loans at the end of the fourth quarter of 2012.
More
Page 7
Global Wealth and Investment Management (GWIM)
Three Months Ended | Year Ended | ||||||||||||||
(Dollars in millions) | December 31 2013 | December 31 2012 | December 31 2013 | December 31 2012 | |||||||||||
Total revenue, net of interest expense, FTE basis | $ | 4,480 | $ | 4,193 | $ | 17,790 | $ | 16,518 | |||||||
Provision for credit losses | 26 | 112 | 56 | 266 | |||||||||||
Noninterest expense | 3,264 | 3,196 | 13,038 | 12,721 | |||||||||||
Net income | $ | 777 | $ | 576 | $ | 2,974 | $ | 2,245 | |||||||
Return on average allocated capital1, 2 | 30.97 | % | — | % | 29.90 | % | — | % | |||||||
Return on average economic capital1, 2 | — | 28.36 | — | 30.80 | |||||||||||
Average loans and leases | $ | 115,546 | $ | 103,785 | $ | 111,023 | $ | 100,456 | |||||||
Average deposits | 240,395 | 249,658 | 242,161 | 242,384 | |||||||||||
At period-end (dollars in billions) | |||||||||||||||
Assets under management | $ | 821.4 | $ | 698.1 | |||||||||||
Total client balances3 | 2,366.4 | 2,151.6 | |||||||||||||
1 | Effective January 1, 2013, the company revised, on a prospective basis, its methodology for allocating capital to the business segments. In connection with this change in methodology, the company updated the applicable terminology to allocated capital from economic capital as reported in prior periods. For reconciliation of allocated capital, refer to pages 23-25 of this press release. |
2 | Return on average allocated capital and return on average economic capital are non-GAAP financial measures. The company believes the use of these non-GAAP financial measures provides additional clarity in assessing the results of the segments. Other companies may define or calculate these measures differently. For reconciliation to GAAP financial measures, refer to pages 23-25 of this press release. |
3 | Total client balances are defined as assets under management, assets in custody, client brokerage assets, client deposits and loans (including margin receivables). |
Business Highlights
• | Pretax margin increased to 26.6 percent from 21.1 percent in the year-ago quarter. |
• | Asset management fees grew to $1.8 billion, up 15 percent from the year-ago quarter. |
• | Client balances increased 10 percent to a record $2.37 trillion, driven by higher market levels and net inflows. |
• | Period-end loan balances increased to a record $115.8 billion, up 9 percent from the year-ago quarter. |
• | Fourth-quarter 2013 long-term AUM flows of $9.4 billion were the 18th consecutive quarter of positive flows. For the full year, long-term AUM flows were a record $47.8 billion, up $21.4 billion or 81 percent from a year ago. |
• | Return on average allocated capital increased to 30.97 percent in the fourth quarter of 2013 from 28.68 percent in the third quarter of 2013. |
Financial Overview
Global Wealth and Investment Management reported strong results across many measures in the fourth quarter of 2013 with record net income, record asset management fees and
More
Page 8
strong client flows. Net income rose 35 percent from the fourth quarter of 2012 to a record $777 million, reflecting strong revenue performance and low credit costs.
Revenue increased 7 percent from the year-ago quarter to $4.5 billion, driven by higher noninterest income related to long-term AUM flows and higher market levels.
The provision for credit losses decreased $86 million from the year-ago quarter to $26 million due to improvement in the home loans portfolio. Noninterest expense of $3.3 billion increased 2 percent, driven by higher volume-related expenses, partially offset by lower support and other personnel costs.
Client balances rose 10 percent from a year ago to $2.37 trillion, driven largely by higher market levels, long-term AUM flows of $47.8 billion and period-end client loan growth of $9.5 billion. Assets under management rose $123.4 billion, or 18 percent, from the fourth quarter of 2012 to $821.4 billion, driven by market appreciation and long-term AUM flows. Average deposit balances declined $9.3 billion from the fourth quarter of 2012 to $240.4 billion as the impact of transfers to CBB was partially offset by organic growth.
Global Banking
Three Months Ended | Year Ended | ||||||||||||||
(Dollars in millions) | December 31 2013 | December 31 2012 | December 31 2013 | December 31 2012 | |||||||||||
Total revenue, net of interest expense, FTE basis | $ | 4,305 | $ | 3,951 | $ | 16,481 | $ | 15,674 | |||||||
Provision for credit losses | 441 | 62 | 1,075 | (342 | ) | ||||||||||
Noninterest expense | 1,927 | 1,753 | 7,552 | 7,619 | |||||||||||
Net income | $ | 1,267 | $ | 1,392 | $ | 4,974 | $ | 5,344 | |||||||
Return on average allocated capital1, 2 | 21.86 | % | — | % | 21.64 | % | — | % | |||||||
Return on average economic capital1, 2 | — | 28.97 | — | 27.69 | |||||||||||
Average loans and leases | $ | 268,849 | $ | 232,396 | $ | 257,245 | $ | 224,336 | |||||||
Average deposits | 259,762 | 242,817 | 237,457 | 223,940 | |||||||||||
1 | Effective January 1, 2013, the company revised, on a prospective basis, its methodology for allocating capital to the business segments. In connection with this change in methodology, the company updated the applicable terminology to allocated capital from economic capital as reported in prior periods. For reconciliation of allocated capital, refer to pages 23-25 of this press release. |
2 | Return on average allocated capital and return on average economic capital are non-GAAP financial measures. The company believes the use of these non-GAAP financial measures provides additional clarity in assessing the results of the segments. Other companies may define or calculate these measures differently. For reconciliation to GAAP financial measures, refer to pages 23-25 of this press release. |
Business Highlights
• | Global Banking achieved record revenues and firmwide Investment Banking fees. |
• | Firmwide investment banking fees of $1.7 billion, excluding self-led deals, increased $441 million, or 34 percent, from the prior quarter and $138 million, or 9 percent, from the year-ago quarter. |
More
Page 9
• | Bank of America Merrill Lynch (BAML) maintained its No. 2 ranking in global net investment banking fees in the fourth quarter of 2013, with an increase in market share to 8.0 percent from 7.3 percent in the third quarter of 2013, and was No. 1 in investment banking fees in the Americas with 10.7 percent market share in the fourth quarter of 2013C. BAML was also ranked among the top three global financial institutions in announced mergers and acquisitions, leveraged loans, investment-grade corporate debt, mortgage-backed securities, asset-backed securities and syndicated loans during the fourth quarter of 2013C. |
• | Average loan and lease balances increased $36.5 billion, or 16 percent, from the year-ago quarter, to $268.8 billion with growth primarily in the commercial and industrial loan portfolio and the commercial real estate portfolio. |
• | Average deposits rose $16.9 billion, or 7 percent, from the year-ago quarter to $259.8 billion due to client liquidity and international growth. |
Financial Overview
Global Banking reported net income of $1.3 billion in the fourth quarter of 2013, down $125 million from the year-ago quarter, as an increase in revenue was more than offset by higher provision for credit losses as the company built reserves associated with loan growth. Net charge-offs declined to $7 million in the fourth quarter of 2013 from $132 million in the fourth quarter of 2012.
Revenue of $4.3 billion was up 9 percent from the year-ago quarter, reflecting higher net interest income, driven by loan growth and higher Investment Banking fees.
Global Corporate Banking revenue increased to $1.6 billion in the fourth quarter, up $125 million from the year-ago quarter, and Global Commercial Banking revenue increased $117 million to $1.8 billion. Included in these results are Business Lending revenue of $1.8 billion, up $180 million from the year-ago quarter, and Treasury Services revenue of $1.5 billion, up $62 million from the year-ago period. Global Banking investment banking fees, excluding self-led deals, increased $101 million from the year-ago quarter.
Noninterest expense increased $174 million, or 10 percent, from the year-ago quarter to $1.9 billion, primarily from higher incentive compensation associated with the strong performance in investment banking.
More
Page 10
Global Markets
Three Months Ended | Year Ended | ||||||||||||||
(Dollars in millions) | December 31 2013 | December 31 2012 | December 31 2013 | December 31 2012 | |||||||||||
Total revenue, net of interest expense, FTE basis | $ | 3,624 | $ | 3,020 | $ | 16,058 | $ | 14,284 | |||||||
Total revenue, net of interest expense, FTE basis, excluding DVA1 | 3,824 | 3,296 | 16,566 | 16,732 | |||||||||||
Provision for credit losses | 104 | 17 | 140 | 34 | |||||||||||
Noninterest expense | 3,284 | 2,627 | 12,013 | 11,295 | |||||||||||
Net income | $ | 215 | $ | 181 | $ | 1,563 | $ | 1,229 | |||||||
Net income, excluding DVA and U.K. tax1 | 341 | 355 | 3,009 | 3,552 | |||||||||||
Return on average allocated capital, excluding DVA and U.K. tax2, 3, 4 | 4.54 | % | — | 10.06 | % | — | |||||||||
Return on average economic capital, excluding DVA and U.K. tax2, 3, 4 | — | 9.98 | % | — | 25.76 | % | |||||||||
Total average assets | $ | 603,110 | $ | 645,808 | $ | 632,804 | $ | 606,249 | |||||||
1 | Total revenue, net of interest expense, on an FTE basis excluding DVA and net income excluding DVA and the U.K. corporate tax rate adjustments are non-GAAP financial measures. DVA losses were $200 million and $276 million for the three months ended December 31, 2013 and 2012, and $508 million and $2.4 billion for the years ended December 31, 2013 and 2012. U.K. corporate tax rate adjustments were $1.1 billion and $0.8 billion for the years ended December 31, 2013 and 2012. |
2 | Effective January 1, 2013, the company revised, on a prospective basis, its methodology for allocating capital to the business segments. In connection with this change in methodology, the company updated the applicable terminology to allocated capital from economic capital as reported in prior periods. For reconciliation of allocated capital, refer to pages 23-25 of this press release. |
3 | Return on average allocated capital and return on average economic capital, excluding DVA and U.K. corporate tax rate adjustments, are non-GAAP financial measures. Return on average allocated capital was 5.24 percent for 2013 and return on average economic capital was 8.95 percent for 2012. |
4 | Return on average allocated capital and return on average economic capital are non-GAAP financial measures. The company believes the use of these non-GAAP financial measures provides additional clarity in assessing the results of the segments. Other companies may define or calculate these measures differently. For reconciliation to GAAP financial measures, refer to pages 23-25 of this press release. |
Business Highlights
• | Sales and trading revenue, excluding DVAF, rose 19 percent from the fourth quarter of 2012 to $3.0 billion. |
• | Equities sales and trading revenue, excluding DVAG, rose 27 percent from the fourth quarter of 2012, due to continued gains in market share and increased market volumes. |
• | Bank of America Merrill Lynch was named "No. 1 Global Research" firm for the third consecutive year by Institutional Investor. |
Financial Overview
Global Markets reported net income of $215 million in the fourth quarter of 2013, compared to $181 million in the year-ago quarter. Excluding DVAF losses, net income was $341 million in the fourth quarter of 2013, compared to $355 million in the year-ago quarter.
Global Markets revenue increased $604 million, or 20 percent, from the year-ago quarter to $3.6 billion. Excluding DVAF, revenue increased $528 million, or 16 percent, to $3.8 billion
More
Page 11
driven by strong performance in Equities in both primary and secondary markets. DVA losses were $200 million, compared to losses of $276 million in the year-ago quarter.
Fixed Income, Currency and Commodities sales and trading revenue, excluding DVAG, was $2.1 billion in the fourth quarter of 2013, an increase of $292 million, or 16 percent, from the year-ago quarter, as stronger results in credit and mortgage products more than offset weakness in rates and commodities.
Equities sales and trading revenue, excluding DVAG, was $904 million, an increase of $191 million, or 27 percent, from the year-ago quarter due to gains in market share, higher market volumes, and increased client financing balances.
Noninterest expense increased to $3.3 billion from $2.6 billion in the year-ago quarter, primarily driven by expense associated with RMBS litigation.
Total average assets declined 7 percent from the fourth quarter of 2012 to $603.1 billion from $645.8 billion.
All Other1
Three Months Ended | Year Ended | ||||||||||||||
(Dollars in millions) | December 31 2013 | December 31 2012 | December 31 2013 | December 31 2012 | |||||||||||
Total revenue, net of interest expense, FTE basis2 | $ | 83 | $ | (149 | ) | $ | 1,889 | $ | (782 | ) | |||||
Provision for credit losses | (188 | ) | 450 | (666 | ) | 2,621 | |||||||||
Noninterest expense | 996 | 1,003 | 4,241 | 6,273 | |||||||||||
Net income (loss) | $ | 274 | $ | 841 | $ | 487 | $ | (3,737 | ) | ||||||
Total average loans | 226,049 | 247,128 | 235,454 | 259,241 | |||||||||||
1 | All Other consists of ALM activities, equity investments, the international consumer card business, liquidating businesses and other. ALM activities encompass the whole-loan residential mortgage portfolio and investment securities, interest rate and foreign currency risk management activities including the residual net interest income allocation, gains/losses on structured liabilities, the impact of certain allocation methodologies and accounting hedge ineffectiveness. Equity Investments include Global Principal Investments (GPI), strategic and certain other investments. Other includes certain residential mortgage loans that are managed by Legacy Assets and Servicing within CRES. |
2 | Revenue includes equity investment income of $392 million and $569 million for the three months ended December 31, 2013 and 2012 and $2.6 billion and $1.1 billion for the years ended December 31, 2013 and 2012, and gains on sales of debt securities of $364 million and $117 million for the three months ended December 31, 2013 and 2012, and $1.2 billion and $1.5 billion for the years ended December 31, 2013 and 2012. |
All Other reported net income of $274 million in the fourth quarter of 2013, compared to $841 million for the same period a year ago. The decline was primarily driven by lower income tax benefits, as the year-ago period included the recognition of certain foreign tax credits, as well as lower equity investment income compared to the year-ago quarter. This was partially offset by a $638 million decrease in the provision for credit losses from the year-ago quarter, primarily reflecting the continued improvement in portfolio trends, including increased home prices in the residential mortgage portfolio. Negative FVO adjustments were $417 million in the fourth quarter of 2013, flat from the year-ago quarter.
More
Page 12
Credit Quality
Three Months Ended | Year Ended | ||||||||||||||
(Dollars in millions) | December 31 2013 | December 31 2012 | December 31 2013 | December 31 2012 | |||||||||||
Provision for credit losses | $ | 336 | $ | 2,204 | $ | 3,556 | $ | 8,169 | |||||||
Net charge-offs1 | 1,582 | 3,104 | 7,897 | 14,908 | |||||||||||
Net charge-off ratio1, 2 | 0.68 | % | 1.40 | % | 0.87 | % | 1.67 | % | |||||||
Net charge-off ratio, excluding the PCI loan portfolio2 | 0.70 | % | 1.44 | % | 0.90 | % | 1.73 | % | |||||||
Net charge-off ratio, including PCI write-offs2 | 1.00 | 1.90 | 1.13 | 1.99 | |||||||||||
December 31 2013 | December 31 2012 | ||||||||||||||
Nonperforming loans, leases and foreclosed properties | $ | 17,772 | $ | 23,555 | |||||||||||
Nonperforming loans, leases and foreclosed properties ratio3 | 1.93 | % | 2.62 | % | |||||||||||
Allowance for loan and lease losses | $ | 17,428 | $ | 24,179 | |||||||||||
Allowance for loan and lease losses ratio4 | 1.90 | % | 2.69 | % | |||||||||||
1 | Excludes write-offs of PCI loans of $741 million and $1.1 billion for the three months ended December 31, 2013 and 2012, and $2.3 billion and $2.8 billion for the years ended December 31, 2013 and 2012. |
2 | Net charge-off ratios are calculated as net charge-offs divided by average outstanding loans and leases during the period; quarterly results are annualized. |
3 | Nonperforming loans, leases and foreclosed properties ratios are calculated as nonperforming loans, leases and foreclosed properties divided by outstanding loans, leases and foreclosed properties at the end of the period. |
4 | Allowance for loan and lease losses ratios are calculated as allowance for loan and lease losses divided by loans and leases outstanding at the end of the period. |
Note: Ratios do not include loans measured under the fair value option.
Credit quality continued to improve in the fourth quarter of 2013, with net charge-offs declining across all major portfolios and the provision for credit losses decreasing from the year-ago quarter. The number of 30+ days performing delinquent loans, excluding fully-insured loans, declined across all consumer portfolios from the year-ago quarter, again reaching record low levels in the U.S. credit card portfolio. Additionally, reservable criticized balances and nonperforming loans, leases and foreclosed properties also continued to decline, down 19 percent and 25 percent from the year-ago period.
Net charge-offs were $1.6 billion in the fourth quarter of 2013, down from $3.1 billion in the fourth quarter of 2012. The most recent quarter included $144 million in accelerated charge-offs related to the impact associated with a clarification of regulatory guidance on the accounting for troubled debt restructurings in the home loans portfolios.
The provision for credit losses was $336 million, down $1.9 billion from the fourth quarter of 2012. The provision included a $1.2 billion reduction in the allowance for credit losses in the fourth quarter of 2013, compared to a $900 million reduction in the allowance in the fourth quarter of 2012. The reduction in provision was driven by improvement in the consumer real estate portfolios, primarily due to increased home prices and continued portfolio improvement, as well as lower levels of delinquencies across the Consumer Lending portfolio. This was partially offset by higher provision for credit losses in the commercial portfolio associated with loan growth.
More
Page 13
The allowance for loan and lease losses to annualized net charge-off coverage ratio was 2.78 times in the fourth quarter of 2013, compared to 1.96 times in the fourth quarter of 2012. The allowance to annualized net charge-off coverage ratio, excluding PCI, was 2.38 times in the fourth quarter of 2013 and 1.51 times in the fourth quarter of 2012.
Nonperforming loans, leases and foreclosed properties were $17.8 billion at December 31, 2013, a decrease from $20.0 billion at September 30, 2013 and $23.6 billion at December 31, 2012.
Capital and Liquidity Management
(Dollars in millions, except per share information) | At December 31 2013 | At September 30 2013 | At December 31 2012 | ||||||||
Total shareholders’ equity | $ | 232,685 | $ | 232,282 | $ | 236,956 | |||||
Tier 1 common capital | 145,235 | 142,825 | 133,403 | ||||||||
Tier 1 common capital ratio including Market Risk Final Rule2 | 11.19 | % | 11.08 | % | n/a | ||||||
Tangible common equity ratio1 | 7.20 | 7.08 | 6.74 | ||||||||
Common equity ratio | 10.43 | 10.30 | 9.87 | ||||||||
Tangible book value per share1 | $ | 13.79 | $ | 13.62 | $ | 13.36 | |||||
Book value per share | 20.71 | 20.50 | 20.24 | ||||||||
1 | Tangible common equity ratio and tangible book value per share are non-GAAP financial measures. For reconciliation to GAAP financial measures, refer to pages 23-25 of this press release. |
2 | As of January 1, 2013, the Market Risk Final Rule became effective under Basel 1. The Market Risk Final Rule introduces new measures of market risk including a charge related to stressed Value-at-Risk (sVaR), an incremental risk charge and a comprehensive risk measure, as well as other technical modifications. The Basel 1 Tier 1 common capital ratio for December 31, 2012 is not presented as the Market Risk Final Rule did not apply during that period. |
n/a = not applicable
The Tier 1 common capital ratio, including the Market Risk Final Rule, was 11.19 percent at December 31, 2013, up from 11.08 percent at September 30, 2013.
As of December 31, 2013, the company's Tier 1 common capital ratio on a Basel 3 fully phased-in basis under the Advanced approach is estimated at 9.96 percent, up from 9.94 percent at September 30, 2013 and 9.25 percent at December 31, 2012D.
The estimated Basel 3 Tier 1 common capital ratio at year-end 2013 increased modestly from the third quarter of 2013 as earnings were offset by negative other comprehensive income for the quarter and common share repurchases. Estimated Basel 3 risk-weighted assets at year-end 2013 increased modestly compared to the third quarter of 2013.
Based on the proposed increases to the U.S. supplementary leverage ratio minimum requirements, the company expects that as of December 31, 2013, the supplementary leverage ratio for Bank of America Corporation would be above the proposed required 5 percent minimum and the supplementary leverage ratios for the company’s two primary bank subsidiaries, Bank of America, National Association and FIA Card Services, National Association, would be above the proposed 6 percent minimum. The U.S. supplementary leverage ratio requirements are expected to take effect in 2018E.
More
Page 14
At December 31, 2013, the company's total Global Excess Liquidity Sources totaled $376 billion, up from $359 billion at September 30, 2013 and $372 billion at December 31, 2012. Long-term debt was $250 billion as of December 31, 2013, down from $255 billion at September 30, 2013 and $276 billion at December 31, 2012, reflecting the company's continued focus on liability management. Time-to-required funding was 38 months at December 31, 2013, compared to 35 months at September 30, 2013 and 33 months at December 31, 2012.
During the fourth quarter of 2013, a cash dividend of $0.01 per common share was paid, and the company recorded $256 million in preferred dividends.
Period-end common shares issued and outstanding were 10.59 billion and 10.78 billion at December 31, 2013 and 2012. The company previously announced that it was authorized to repurchase up to $5.0 billion of common stock. As of December 31, 2013, approximately 232 million common shares had been repurchased for approximately $3.2 billion at an average price of $13.90 per share.
Tangible book value per share of common stockH was $13.79 at December 31, 2013 compared to $13.36 at December 31, 2012. Book value per share was $20.71 at December 31, 2013 compared to $20.24 at December 31, 2012.
------------------------------
A | Fully taxable-equivalent (FTE) basis is a non-GAAP financial measure. For reconciliation to GAAP financial measures, refer to pages 23-25 of this press release. Net interest income on a GAAP basis was $10.8 billion and $10.3 billion for the three months ended December 31, 2013 and 2012, and $42.3 billion and $40.7 billion for the years ended December 31, 2013 and 2012. Total revenue, net of interest expense, on a GAAP basis was $21.5 billion and $18.7 billion for the three months ended December 31, 2013 and 2012, and $88.9 billion and $83.3 billion for the years ended December 31, 2013 and 2012. |
B | Total revenue, net of interest expense, on an FTE basis excluding DVA and FVO adjustments is a non-GAAP financial measure. DVA losses were $201 million and $277 million for the three months ended December 31, 2013 and 2012, and $508 million and $2.5 billion for the years ended December 31, 2013 and 2012. Valuation losses related to FVO were $417 million and $442 million for the three months ended December 31, 2013 and 2012, and $649 million and $5.1 billion for the years ended December 31, 2013 and 2012. |
C | Rankings per Dealogic as of January 2, 2014. |
D | Basel 3 Tier 1 common capital ratio is a non-GAAP financial measure. For reconciliation to GAAP financial measures, refer to page 19 of this press release. Fully phased-in Basel 3 estimates for December 31, 2013 were calculated under the final Advanced approach of the Basel 3 rules released by the Federal Reserve, assuming all regulatory model approvals, except for the potential reduction to risk-weighted assets resulting from the Comprehensive Risk Measure after one year. |
E | The supplementary leverage ratio is calculated in accordance with the U.S. Notice of Proposed Rulemaking issued in July 2013 and represents an average of the monthly ratios for the quarter of Tier 1 capital to the sum of on-balance sheet assets and certain off-balance sheet exposures, including, among other items, derivative and securities financing transactions. |
F | Revenue, sales and trading revenue, international revenue and net income (loss) excluding the impact of DVA or the U.K. corporate tax rate adjustments (or both) are non-GAAP financial measures. DVA losses were $200 million and $276 million for the three months ended December 31, 2013 and 2012, and $508 million and $2.4 billion for the years ended December 31, 2013 and 2012. The impacts of the U.K. corporate tax rate adjustments were $1.1 billion and $0.8 billion for the years ended December 31, 2013 and 2012. |
G | Fixed Income, Currency and Commodities (FICC) sales and trading revenue, excluding DVA, and Equity sales and trading revenue, excluding DVA, are non-GAAP financial measures. FICC DVA losses were $193 million and $237 million for the three months ended December 31, 2013 and 2012, and $491 million and $2.2 billion for the years ended December 31, 2013 and 2012. Equities DVA losses were $7 million and $39 million for the three months ended December 31, 2013 and 2012, and $17 million and $253 million for the years ended December 31, 2013 and 2012. |
H | Tangible book value per share of common stock is a non-GAAP measure. Other companies may define or calculate this measure differently. For reconciliation to GAAP measures, refer to pages 23-25 of this press release. |
More
Page 15
Note: Chief Executive Officer Brian Moynihan and Chief Financial Officer Bruce Thompson will discuss fourth-quarter 2013 results in a conference call at 8:30 a.m. ET today. The presentation and supporting materials can be accessed on the Bank of America Investor Relations Web site at http://investor.bankofamerica.com. For a listen-only connection to the conference call, dial 1.877.200.4456 (U.S.) or 1.785.424.1734 (international) and the conference ID: 79795.
A replay will be available via webcast through the Bank of America Investor Relations website. A replay of the conference call will also be available beginning at noon on January 15 through midnight, January 23 by telephone at 800.753.8546 (U.S.) or 1.402.220.0685 (international).
Bank of America
Bank of America is one of the world's largest financial institutions, serving individual consumers, small- and middle-market businesses and large corporations with a full range of banking, investing, asset management and other financial and risk management products and services. The company provides unmatched convenience in the United States, serving approximately 50 million consumer and small business relationships with approximately 5,100 retail banking offices and approximately 16,300 ATMs and award-winning online banking with 30 million active users and more than 14 million mobile users. Bank of America is among the world's leading wealth management companies and is a global leader in corporate and investment banking and trading across a broad range of asset classes, serving corporations, governments, institutions and individuals around the world. Bank of America offers industry-leading support to approximately 3 million small business owners through a suite of innovative, easy-to-use online products and services. The company serves clients through operations in more than 40 countries. Bank of America Corporation stock (NYSE: BAC) is listed on the New York Stock Exchange.
Bank of America and its management may make certain statements that constitute “forward-looking statements” within the meaning of the Private Securities Litigation Reform Act of 1995. These statements can be identified by the fact that they do not relate strictly to historical or current facts. Forward-looking statements often use words such as “anticipates,” “targets,” “expects,” “estimates,” “intends,” “plans,” “goals,” “believes” and other similar expressions or future or conditional verbs such as “will,” “should,” “would” and “could.” The forward-looking statements made represent Bank of America's current expectations, plans or forecasts of its future results and revenues, and other similar matters. These statements are not guarantees of future results or performance and involve certain risks, uncertainties and assumptions that are difficult to predict and are often beyond Bank of America's control. Actual outcomes and results may differ materially from those expressed in, or implied by, any of these forward-looking statements.
You should not place undue reliance on any forward-looking statement and should consider all of the following uncertainties and risks, as well as those more fully discussed under Item 1A. Risk Factors of Bank of America's 2012 Annual Report on Form 10-K, and in any of Bank of America's subsequent filings: the Company's ability to resolve representations and warranties repurchase claims made by monolines and private-label and other investors, including as a result of any adverse court rulings, and the chance that the Company could face related servicing, securities, fraud, indemnity or other claims from one or more of the government-sponsored enterprises, monolines or private-label and other investors; the
More
Page 16
possibility that final court approval of negotiated settlements is not obtained; the possibility that future representations and warranties losses may occur in excess of the Company's recorded liability and estimated range of possible loss for its representations and warranties exposures; the possibility that the Company may not collect mortgage insurance claims; the possible impact of a future FASB standard on accounting for credit losses; uncertainties about the financial stability of several countries in the eurozone, the risk that those countries may default on their sovereign debt and related stresses on financial markets, the euro and the eurozone and the Company's exposures to such risks, including direct, indirect and operational; uncertainties related to the timing and pace of Federal Reserve tapering of quantitative easing, and the impact on global interest rates, currency exchange rates, and economic conditions in a number of countries; the potential impact of any future federal debt ceiling impasse; the possibility of future inquiries or investigations regarding pending or completed foreclosure activities; the potential impact of regulatory capital and liquidity requirements; the negative impact of the Dodd-Frank Wall Street Reform and Consumer Protection Act on the Company's businesses and earnings, including as a result of additional regulatory interpretation and rulemaking and the success of the Company's actions to mitigate such impacts; the potential impact on debit card interchange fee revenue in connection with the U.S. District Court for the District of Columbia's ruling on July 31, 2013 regarding the Federal Reserve's rules implementing the Financial Reform Act's Durbin Amendment; adverse changes to the Company's credit ratings from the major credit rating agencies; estimates of the fair value of certain of the Company's assets and liabilities; the possibility that the European Commission will impose remedial measures in relation to its investigation of the Company's competitive practices; the impact of potential regulatory enforcement action relating to optional identity theft protection services and certain optional credit card debt cancellation products; unexpected claims, damages, penalties and fines resulting from pending or future litigation and regulatory proceedings including proceedings instituted by members of the Financial Fraud Enforcement Task Force; the Company's ability to fully realize the cost savings and other anticipated benefits from Project New BAC, including in accordance with currently anticipated timeframes; the impact on the Company's business, financial condition and results of operations of a potential higher interest rate environment; and other similar matters.
Forward-looking statements speak only as of the date they are made, and Bank of America undertakes no obligation to update any forward-looking statement to reflect the impact of circumstances or events that arise after the date the forward-looking statement was made.
BofA Global Capital Management Group, LLC (BofA Global Capital Management) is an asset management division of Bank of America Corporation. BofA Global Capital Management entities furnish investment management services and products for institutional and individual investors.
Bank of America Merrill Lynch is the marketing name for the global banking and global markets businesses of Bank of America Corporation. Lending, derivatives and other commercial banking activities are performed by banking affiliates of Bank of America Corporation, including Bank of America, N.A., member FDIC. Securities, financial advisory and other investment banking activities are performed by investment banking affiliates of Bank of America Corporation (Investment Banking Affiliates), including Merrill Lynch, Pierce, Fenner & Smith Incorporated, which are registered broker-dealers and members of FINRA and SIPC. Investment products offered by Investment Banking Affiliates: Are Not FDIC Insured * May Lose Value * Are Not Bank Guaranteed. Bank of America Corporation's
More
Page 17
broker-dealers are not banks and are separate legal entities from their bank affiliates. The obligations of the broker-dealers are not obligations of their bank affiliates (unless explicitly stated otherwise), and these bank affiliates are not responsible for securities sold, offered or recommended by the broker-dealers. The foregoing also applies to other non-bank affiliates.
For more Bank of America news, visit the Bank of America newsroom at http://newsroom.bankofamerica.com.
www.bankofamerica.com
More
Page 18
Bank of America Corporation and Subsidiaries | ||||||||||||||||||||
Selected Financial Data | ||||||||||||||||||||
(Dollars in millions, except per share data) | ||||||||||||||||||||
Summary Income Statement | Year Ended December 31 | Fourth Quarter 2013 | Third Quarter 2013 | Fourth Quarter 2012 | ||||||||||||||||
2013 | 2012 | |||||||||||||||||||
Net interest income | $ | 42,265 | $ | 40,656 | $ | 10,786 | $ | 10,266 | $ | 10,324 | ||||||||||
Noninterest income | 46,677 | 42,678 | 10,702 | 11,264 | 8,336 | |||||||||||||||
Total revenue, net of interest expense | 88,942 | 83,334 | 21,488 | 21,530 | 18,660 | |||||||||||||||
Provision for credit losses | 3,556 | 8,169 | 336 | 296 | 2,204 | |||||||||||||||
Noninterest expense | 69,214 | 72,093 | 17,307 | 16,389 | 18,360 | |||||||||||||||
Income (loss) before income taxes | 16,172 | 3,072 | 3,845 | 4,845 | (1,904 | ) | ||||||||||||||
Income tax expense (benefit) | 4,741 | (1,116 | ) | 406 | 2,348 | (2,636 | ) | |||||||||||||
Net income | $ | 11,431 | $ | 4,188 | $ | 3,439 | $ | 2,497 | $ | 732 | ||||||||||
Preferred stock dividends | 1,349 | 1,428 | 256 | 279 | 365 | |||||||||||||||
Net income applicable to common shareholders | $ | 10,082 | $ | 2,760 | $ | 3,183 | $ | 2,218 | $ | 367 | ||||||||||
Earnings per common share | $ | 0.94 | $ | 0.26 | $ | 0.30 | $ | 0.21 | $ | 0.03 | ||||||||||
Diluted earnings per common share | 0.90 | 0.25 | 0.29 | 0.20 | 0.03 | |||||||||||||||
Summary Average Balance Sheet | Year Ended December 31 | Fourth Quarter 2013 | Third Quarter 2013 | Fourth Quarter 2012 | ||||||||||||||||
2013 | 2012 | |||||||||||||||||||
Total loans and leases | $ | 918,641 | $ | 898,768 | $ | 929,777 | $ | 923,978 | $ | 893,166 | ||||||||||
Debt securities | 337,953 | 353,577 | 325,119 | 327,493 | 360,213 | |||||||||||||||
Total earning assets | 1,746,974 | 1,769,969 | 1,708,501 | 1,710,685 | 1,788,936 | |||||||||||||||
Total assets | 2,163,513 | 2,191,356 | 2,134,875 | 2,123,430 | 2,210,365 | |||||||||||||||
Total deposits | 1,089,735 | 1,047,782 | 1,112,674 | 1,090,611 | 1,078,076 | |||||||||||||||
Common shareholders’ equity | 218,468 | 216,996 | 220,088 | 216,766 | 219,744 | |||||||||||||||
Total shareholders’ equity | 233,947 | 235,677 | 233,415 | 230,392 | 238,512 | |||||||||||||||
Performance Ratios | Year Ended December 31 | Fourth Quarter 2013 | Third Quarter 2013 | Fourth Quarter 2012 | ||||||||||||||||
2013 | 2012 | |||||||||||||||||||
Return on average assets | 0.53 | % | 0.19 | % | 0.64 | % | 0.47 | % | 0.13 | % | ||||||||||
Return on average tangible shareholders’ equity (1) | 7.13 | 2.60 | 8.53 | 6.32 | 1.77 | |||||||||||||||
Credit Quality | Year Ended December 31 | Fourth Quarter 2013 | Third Quarter 2013 | Fourth Quarter 2012 | ||||||||||||||||
2013 | 2012 | |||||||||||||||||||
Total net charge-offs | $ | 7,897 | $ | 14,908 | $ | 1,582 | $ | 1,687 | $ | 3,104 | ||||||||||
Net charge-offs as a % of average loans and leases outstanding (2) | 0.87 | % | 1.67 | % | 0.68 | % | 0.73 | % | 1.40 | % | ||||||||||
Provision for credit losses | $ | 3,556 | $ | 8,169 | $ | 336 | $ | 296 | $ | 2,204 | ||||||||||
December 31 2013 | September 30 2013 | December 31 2012 | ||||||||||||||||||
Total nonperforming loans, leases and foreclosed properties (3) | $ | 17,772 | $ | 20,028 | $ | 23,555 | ||||||||||||||
Nonperforming loans, leases and foreclosed properties as a % of total loans, leases and foreclosed properties (2) | 1.93 | % | 2.17 | % | 2.62 | % | ||||||||||||||
Allowance for loan and lease losses | $ | 17,428 | $ | 19,432 | $ | 24,179 | ||||||||||||||
Allowance for loan and lease losses as a % of total loans and leases outstanding (2) | 1.90 | % | 2.10 | % | 2.69 | % | ||||||||||||||
For footnotes see page 19. | ||||||||||||||||||||
More | This information is preliminary and based on company data available at the time of the presentation. |
Page 19
Bank of America Corporation and Subsidiaries | ||||||||||||||||||||
Selected Financial Data (continued) | ||||||||||||||||||||
(Dollars in millions, except per share data; shares in thousands) | ||||||||||||||||||||
Capital Management | December 31 2013 | September 30 2013 | December 31 2012 | |||||||||||||||||
Risk-based capital (4, 5): | ||||||||||||||||||||
Tier 1 common capital | $ | 145,235 | $ | 142,825 | $ | 133,403 | ||||||||||||||
Tier 1 common capital ratio (6) | 11.19 | % | 11.08 | % | 11.06 | % | ||||||||||||||
Tier 1 leverage ratio | 7.87 | 7.79 | 7.37 | |||||||||||||||||
Tangible equity ratio (7) | 7.86 | 7.73 | 7.62 | |||||||||||||||||
Tangible common equity ratio (7) | 7.20 | 7.08 | 6.74 | |||||||||||||||||
Period-end common shares issued and outstanding | 10,591,808 | 10,683,282 | 10,778,264 | |||||||||||||||||
Basel 1 to Basel 3 (fully phased-in) Reconciliation (5, 8) | December 31 2013 | September 30 2013 | December 31 2012 | |||||||||||||||||
Regulatory capital – Basel 1 to Basel 3 (fully phased-in) | ||||||||||||||||||||
Basel 1 Tier 1 capital | $ | 161,456 | $ | 159,008 | $ | 155,461 | ||||||||||||||
Deduction of qualifying preferred stock and trust preferred securities | (16,221 | ) | (16,183 | ) | (22,058 | ) | ||||||||||||||
Basel 1 Tier 1 common capital | 145,235 | 142,825 | 133,403 | |||||||||||||||||
Deduction of defined benefit pension assets | (829 | ) | (935 | ) | (737 | ) | ||||||||||||||
Deferred tax assets and threshold deductions (deferred tax asset temporary differences, MSRs and significant investments) | (4,803 | ) | (4,758 | ) | (3,020 | ) | ||||||||||||||
Other deductions, net | (7,288 | ) | (5,319 | ) | (1,020 | ) | ||||||||||||||
Basel 3 Advanced approach (fully phased-in) Tier 1 common capital | $ | 132,315 | $ | 131,813 | $ | 128,626 | ||||||||||||||
Risk-weighted assets – Basel 1 to Basel 3 (fully phased-in) | ||||||||||||||||||||
Basel 1 risk-weighted assets | $ | 1,297,529 | $ | 1,289,444 | $ | 1,205,976 | ||||||||||||||
Credit and other risk-weighted assets | 31,515 | 37,140 | 103,085 | |||||||||||||||||
Increase due to Market Risk Final Rule | — | — | 81,811 | |||||||||||||||||
Basel 3 Advanced approach (fully phased-in) risk-weighted assets | $ | 1,329,044 | $ | 1,326,584 | $ | 1,390,872 | ||||||||||||||
Tier 1 common capital ratios | ||||||||||||||||||||
Basel 1 | 11.19 | % | 11.08 | % | 11.06 | % | ||||||||||||||
Basel 3 Advanced approach (fully phased-in) | 9.96 | 9.94 | 9.25 | |||||||||||||||||
Year Ended December 31 | Fourth Quarter 2013 | Third Quarter 2013 | Fourth Quarter 2012 | |||||||||||||||||
2013 | 2012 | |||||||||||||||||||
Common shares issued | 45,288 | 242,326 | 624 | 184 | 997 | |||||||||||||||
Average common shares issued and outstanding | 10,731,165 | 10,746,028 | 10,633,030 | 10,718,918 | 10,777,204 | |||||||||||||||
Average diluted common shares issued and outstanding | 11,491,418 | 10,840,854 | 11,404,438 | 11,482,226 | 10,884,921 | |||||||||||||||
Dividends paid per common share | $ | 0.04 | $ | 0.04 | $ | 0.01 | $ | 0.01 | $ | 0.01 | ||||||||||
Summary Period-End Balance Sheet | December 31 2013 | September 30 2013 | December 31 2012 | |||||||||||||||||
Total loans and leases | $ | 928,233 | $ | 934,392 | $ | 907,819 | ||||||||||||||
Total debt securities | 323,945 | 320,998 | 360,331 | |||||||||||||||||
Total earning assets | 1,668,680 | 1,712,648 | 1,788,305 | |||||||||||||||||
Total assets | 2,102,273 | 2,126,653 | 2,209,974 | |||||||||||||||||
Total deposits | 1,119,271 | 1,110,118 | 1,105,261 | |||||||||||||||||
Total shareholders’ equity | 232,685 | 232,282 | 236,956 | |||||||||||||||||
Common shareholders’ equity | 219,333 | 218,967 | 218,188 | |||||||||||||||||
Book value per share of common stock | $ | 20.71 | $ | 20.50 | $ | 20.24 | ||||||||||||||
Tangible book value per share of common stock (1) | 13.79 | 13.62 | 13.36 | |||||||||||||||||
(1) | Return on average tangible shareholders’ equity and tangible book value per share of common stock are non-GAAP financial measures. We believe the use of these non-GAAP financial measures provides additional clarity in assessing the results of the Corporation. Other companies may define or calculate non-GAAP financial measures differently. See Reconciliations to GAAP Financial Measures on pages 23-25. |
(2) | Ratios do not include loans accounted for under the fair value option during the period. Charge-off ratios are annualized for the quarterly presentation. |
(3) | Balances do not include past due consumer credit card, consumer loans secured by real estate where repayments are insured by the Federal Housing Administration and individually insured long-term stand-by agreements (fully-insured home loans), and in general, other consumer and commercial loans not secured by real estate; purchased credit-impaired loans even though the customer may be contractually past due; nonperforming loans held-for-sale; nonperforming loans accounted for under the fair value option; and nonaccruing troubled debt restructured loans removed from the purchased credit-impaired portfolio prior to January 1, 2010. |
(4) | Regulatory capital ratios are preliminary until filed with the Federal Reserve on Form Y-9C. |
(5) | Basel 1 includes the Market Risk Final Rule at December 31, 2013 and September 30, 2013. Basel 1 did not include the Market Risk Final Rule at December 31, 2012. |
(6) | Tier 1 common capital ratio equals Tier 1 capital excluding preferred stock, trust preferred securities, hybrid securities and minority interest divided by risk-weighted assets. |
(7) | Tangible equity ratio equals period-end tangible shareholders’ equity divided by period-end tangible assets. Tangible common equity equals period-end tangible common shareholders’ equity divided by period-end tangible assets. Tangible shareholders’ equity and tangible assets are non-GAAP financial measures. We believe the use of these non-GAAP financial measures provides additional clarity in assessing the results of the Corporation. Other companies may define or calculate non-GAAP financial measures differently. See Reconciliations to GAAP Financial Measures on pages 23-25. |
(8) | Basel 3 (fully phased-in) estimates are based on the Advanced approach under the final Basel 3 rules issued on July 2, 2013, assuming all regulatory model approvals, except for the potential reduction to risk-weighted assets resulting from the Comprehensive Risk Measure after one year. |
Certain prior period amounts have been reclassified to conform to current period presentation.
More | This information is preliminary and based on company data available at the time of the presentation. |
Page 20
Bank of America Corporation and Subsidiaries | ||||||||||||||||||||||||
Quarterly Results by Business Segment | ||||||||||||||||||||||||
(Dollars in millions) | ||||||||||||||||||||||||
Fourth Quarter 2013 | ||||||||||||||||||||||||
Consumer & Business Banking | Consumer Real Estate Services | Global Banking | Global Markets | GWIM | All Other | |||||||||||||||||||
Total revenue, net of interest expense (FTE basis) (1) | $ | 7,497 | $ | 1,712 | $ | 4,305 | $ | 3,624 | $ | 4,480 | $ | 83 | ||||||||||||
Provision for credit losses | 427 | (474 | ) | 441 | 104 | 26 | (188 | ) | ||||||||||||||||
Noninterest expense | 4,042 | 3,794 | 1,927 | 3,284 | 3,264 | 996 | ||||||||||||||||||
Net income (loss) | 1,967 | (1,061 | ) | 1,267 | 215 | 777 | 274 | |||||||||||||||||
Return on average allocated capital (2, 3) | 26.03 | % | n/m | 21.86 | % | 2.87 | % | 30.97 | % | n/m | ||||||||||||||
Balance Sheet | ||||||||||||||||||||||||
Average | ||||||||||||||||||||||||
Total loans and leases | $ | 163,152 | $ | 89,687 | $ | 268,849 | n/m | $ | 115,546 | $ | 226,049 | |||||||||||||
Total deposits | 528,808 | n/m | 259,762 | n/m | 240,395 | 34,030 | ||||||||||||||||||
Allocated capital (2, 3) | 30,000 | 24,000 | 23,000 | $ | 30,000 | 10,000 | n/m | |||||||||||||||||
Period end | ||||||||||||||||||||||||
Total loans and leases | $ | 165,090 | $ | 89,753 | $ | 269,469 | n/m | $ | 115,846 | $ | 220,694 | |||||||||||||
Total deposits | 531,707 | n/m | 265,718 | n/m | 244,901 | 27,702 | ||||||||||||||||||
Third Quarter 2013 | ||||||||||||||||||||||||
Consumer & Business Banking | Consumer Real Estate Services | Global Banking | Global Markets | GWIM | All Other | |||||||||||||||||||
Total revenue, net of interest expense (FTE basis) (1) | $ | 7,524 | $ | 1,577 | $ | 4,008 | $ | 3,376 | $ | 4,390 | $ | 868 | ||||||||||||
Provision for credit losses | 761 | (308 | ) | 322 | 47 | 23 | (549 | ) | ||||||||||||||||
Noninterest expense | 3,980 | 3,419 | 1,927 | 2,884 | 3,249 | 930 | ||||||||||||||||||
Net income (loss) | 1,779 | (1,000 | ) | 1,134 | (778 | ) | 719 | 643 | ||||||||||||||||
Return on average allocated capital (2, 3) | 23.55 | % | n/m | 19.57 | % | n/m | 28.68 | % | n/m | |||||||||||||||
Balance Sheet | ||||||||||||||||||||||||
Average | ||||||||||||||||||||||||
Total loans and leases | $ | 165,707 | $ | 88,406 | $ | 260,085 | n/m | $ | 112,752 | $ | 232,538 | |||||||||||||
Total deposits | 522,023 | n/m | 239,839 | n/m | 239,663 | 35,126 | ||||||||||||||||||
Allocated capital (2, 3) | 30,000 | 24,000 | 23,000 | $ | 30,000 | 10,000 | n/m | |||||||||||||||||
Period end | ||||||||||||||||||||||||
Total loans and leases | $ | 167,254 | $ | 87,586 | $ | 267,165 | n/m | $ | 114,175 | $ | 229,550 | |||||||||||||
Total deposits | 526,876 | n/m | 263,121 | n/m | 241,553 | 30,705 | ||||||||||||||||||
Fourth Quarter 2012 | ||||||||||||||||||||||||
Consumer & Business Banking | Consumer Real Estate Services | Global Banking | Global Markets | GWIM | All Other | |||||||||||||||||||
Total revenue, net of interest expense (FTE basis) (1) | $ | 7,401 | $ | 475 | $ | 3,951 | $ | 3,020 | $ | 4,193 | $ | (149 | ) | |||||||||||
Provision for credit losses | 1,078 | 485 | 62 | 17 | 112 | 450 | ||||||||||||||||||
Noninterest expense | 4,174 | 5,607 | 1,753 | 2,627 | 3,196 | 1,003 | ||||||||||||||||||
Net income (loss) | 1,446 | (3,704 | ) | 1,392 | 181 | 576 | 841 | |||||||||||||||||
Return on average economic capital (2, 3) | 23.46 | % | n/m | 28.97 | % | 5.12 | % | 28.36 | % | n/m | ||||||||||||||
Balance Sheet | ||||||||||||||||||||||||
Average | ||||||||||||||||||||||||
Total loans and leases | $ | 167,219 | $ | 96,605 | $ | 232,396 | n/m | $ | 103,785 | $ | 247,128 | |||||||||||||
Total deposits | 484,086 | n/m | 242,817 | n/m | 249,658 | 36,939 | ||||||||||||||||||
Economic capital (2, 3) | 24,561 | 12,474 | 19,123 | $ | 14,184 | 8,149 | n/m | |||||||||||||||||
Period end | ||||||||||||||||||||||||
Total loans and leases | $ | 169,266 | $ | 94,660 | $ | 242,340 | n/m | $ | 105,928 | $ | 241,981 | |||||||||||||
Total deposits | 496,159 | n/m | 243,306 | n/m | 266,188 | 36,061 | ||||||||||||||||||
(1) | Fully taxable-equivalent basis is a performance measure used by management in operating the business that management believes provides investors with a more accurate picture of the interest margin for comparative purposes. |
(2) | Effective January 1, 2013, the Corporation revised, on a prospective basis, its methodology for allocating capital to the business segments. In connection with the change in methodology, the Corporation updated the applicable terminology in the above table to allocated capital from economic capital as reported in prior periods. For more information, see Exhibit A: Non-GAAP Reconciliations - Reconciliations to GAAP Financial Measures on pages 23-25. |
(3) | Return on average allocated capital and return on average economic capital are calculated as net income, adjusted for cost of funds and earnings credits and certain expenses related to intangibles, divided by average allocated capital or average economic capital, as applicable. Allocated capital, economic capital and the related returns are non-GAAP financial measures. The Corporation believes the use of these non-GAAP financial measures provides additional clarity in assessing the results of the segments. Other companies may define or calculate these measures differently. (See Exhibit A: Non-GAAP Reconciliations - Reconciliations to GAAP Financial Measures on pages 23-25.) |
n/m = not meaningful
Certain prior period amounts have been reclassified among the segments to conform to current period presentation.
More | This information is preliminary and based on company data available at the time of the presentation. |
Page 21
Bank of America Corporation and Subsidiaries | ||||||||||||||||||||||||
Annual Results by Business Segment | ||||||||||||||||||||||||
(Dollars in millions) | ||||||||||||||||||||||||
Year Ended December 31, 2013 | ||||||||||||||||||||||||
Consumer & Business Banking | Consumer Real Estate Services | Global Banking | Global Markets | GWIM | All Other | |||||||||||||||||||
Total revenue, net of interest expense (FTE basis) (1) | $ | 29,867 | $ | 7,716 | $ | 16,481 | $ | 16,058 | $ | 17,790 | $ | 1,889 | ||||||||||||
Provision for credit losses | 3,107 | (156 | ) | 1,075 | 140 | 56 | (666 | ) | ||||||||||||||||
Noninterest expense | 16,357 | 16,013 | 7,552 | 12,013 | 13,038 | 4,241 | ||||||||||||||||||
Net income (loss) | 6,588 | (5,155 | ) | 4,974 | 1,563 | 2,974 | 487 | |||||||||||||||||
Return on average allocated capital (2, 3) | 21.98 | % | n/m | 21.64 | % | 5.24 | % | 29.90 | % | n/m | ||||||||||||||
Balance Sheet | ||||||||||||||||||||||||
Average | ||||||||||||||||||||||||
Total loans and leases | $ | 164,570 | $ | 90,278 | $ | 257,245 | n/m | $ | 111,023 | $ | 235,454 | |||||||||||||
Total deposits | 518,980 | n/m | 237,457 | n/m | 242,161 | 34,617 | ||||||||||||||||||
Allocated capital (2, 3) | 30,000 | 24,000 | 23,000 | $ | 30,000 | 10,000 | n/m | |||||||||||||||||
Period end | ||||||||||||||||||||||||
Total loans and leases | $ | 165,090 | $ | 89,753 | $ | 269,469 | n/m | $ | 115,846 | $ | 220,694 | |||||||||||||
Total deposits | 531,707 | n/m | 265,718 | n/m | 244,901 | 27,702 | ||||||||||||||||||
Year Ended December 31, 2012 | ||||||||||||||||||||||||
Consumer & Business Banking | Consumer Real Estate Services | Global Banking | Global Markets | GWIM | All Other | |||||||||||||||||||
Total revenue, net of interest expense (FTE basis) (1) | $ | 29,790 | $ | 8,751 | $ | 15,674 | $ | 14,284 | $ | 16,518 | $ | (782 | ) | |||||||||||
Provision for credit losses | 4,148 | 1,442 | (342 | ) | 34 | 266 | 2,621 | |||||||||||||||||
Noninterest expense | 16,995 | 17,190 | 7,619 | 11,295 | 12,721 | 6,273 | ||||||||||||||||||
Net income (loss) | 5,546 | (6,439 | ) | 5,344 | 1,229 | 2,245 | (3,737 | ) | ||||||||||||||||
Return on average economic capital (2, 3) | 23.12 | % | n/m | 27.69 | % | 8.95 | % | 30.80 | % | n/m | ||||||||||||||
Balance Sheet | ||||||||||||||||||||||||
Average | ||||||||||||||||||||||||
Total loans and leases | $ | 173,036 | $ | 103,524 | $ | 224,336 | n/m | $ | 100,456 | $ | 259,241 | |||||||||||||
Total deposits | 475,180 | n/m | 223,940 | n/m | 242,384 | 43,087 | ||||||||||||||||||
Economic capital (2, 3) | 24,051 | 13,676 | 19,312 | $ | 13,824 | 7,359 | n/m | |||||||||||||||||
Period end | ||||||||||||||||||||||||
Total loans and leases | $ | 169,266 | $ | 94,660 | $ | 242,340 | n/m | $ | 105,928 | $ | 241,981 | |||||||||||||
Total deposits | 496,159 | n/m | 243,306 | n/m | 266,188 | 36,061 | ||||||||||||||||||
(1) | Fully taxable-equivalent basis is a performance measure used by management in operating the business that management believes provides investors with a more accurate picture of the interest margin for comparative purposes. |
(2) | Effective January 1, 2013, the Corporation revised, on a prospective basis, its methodology for allocating capital to the business segments. In connection with the change in methodology, the Corporation updated the applicable terminology in the above table to allocated capital from economic capital as reported in prior periods. For more information, see Exhibit A: Non-GAAP Reconciliations - Reconciliations to GAAP Financial Measures on pages 23-25. |
(3) | Return on average allocated capital and return on average economic capital are calculated as net income, adjusted for cost of funds and earnings credits and certain expenses related to intangibles, divided by average allocated capital or average economic capital, as applicable. Allocated capital, economic capital and the related returns are non-GAAP financial measures. The Corporation believes the use of these non-GAAP financial measures provides additional clarity in assessing the results of the segments. Other companies may define or calculate these measures differently. (See Exhibit A: Non-GAAP Reconciliations - Reconciliations to GAAP Financial Measures on pages 23-25.) |
n/m = not meaningful
Certain prior period amounts have been reclassified among the segments to conform to current period presentation.
More | This information is preliminary and based on company data available at the time of the presentation. |
Page 22
Bank of America Corporation and Subsidiaries | ||||||||||||||||||||
Supplemental Financial Data | ||||||||||||||||||||
(Dollars in millions) | ||||||||||||||||||||
Fully taxable-equivalent (FTE) basis data (1) | Year Ended December 31 | Fourth Quarter 2013 | Third Quarter 2013 | Fourth Quarter 2012 | ||||||||||||||||
2013 | 2012 | |||||||||||||||||||
Net interest income | $ | 43,124 | $ | 41,557 | $ | 10,999 | $ | 10,479 | $ | 10,555 | ||||||||||
Total revenue, net of interest expense | 89,801 | 84,235 | 21,701 | 21,743 | 18,891 | |||||||||||||||
Net interest yield (2) | 2.47 | % | 2.35 | % | 2.56 | % | 2.44 | % | 2.35 | % | ||||||||||
Efficiency ratio | 77.07 | 85.59 | 79.75 | 75.38 | 97.19 | |||||||||||||||
Other Data | December 31 2013 | September 30 2013 | December 31 2012 | |||||||||||||||||
Number of banking centers - U.S. | 5,151 | 5,243 | 5,478 | |||||||||||||||||
Number of branded ATMs - U.S. | 16,259 | 16,201 | 16,347 | |||||||||||||||||
Ending full-time equivalent employees | 242,117 | 247,943 | 267,190 | |||||||||||||||||
(1) | FTE basis is a non-GAAP financial measure. FTE basis is a performance measure used by management in operating the business that management believes provides investors with a more accurate picture of the interest margin for comparative purposes. See Reconciliations to GAAP Financial Measures on pages 23-25. |
(2) | Calculation includes fees earned on overnight deposits placed with the Federal Reserve and, beginning in the third quarter of 2012, fees earned on deposits, primarily overnight, placed with certain non-U.S. central banks of $182 million and $189 million for the years ended December 31, 2013 and 2012; $59 million and $50 million for the fourth and third quarters of 2013, respectively and $42 million for the fourth quarter of 2012. |
Certain prior period amounts have been reclassified to conform to current period presentation.
More | This information is preliminary and based on company data available at the time of the presentation. |
Page 23
Bank of America Corporation and Subsidiaries | ||||
Reconciliations to GAAP Financial Measures | ||||
(Dollars in millions) | ||||
The Corporation evaluates its business based on a fully taxable-equivalent basis, a non-GAAP financial measure. The Corporation believes managing the business with net interest income on a fully taxable-equivalent basis provides a more accurate picture of the interest margin for comparative purposes. Total revenue, net of interest expense, includes net interest income on a fully taxable-equivalent basis and noninterest income. The Corporation views related ratios and analyses (i.e., efficiency ratios and net interest yield) on a fully taxable-equivalent basis. To derive the fully taxable-equivalent basis, net interest income is adjusted to reflect tax-exempt income on an equivalent before-tax basis with a corresponding increase in income tax expense. For purposes of this calculation, the Corporation uses the federal statutory tax rate of 35 percent. This measure ensures comparability of net interest income arising from taxable and tax-exempt sources. The efficiency ratio measures the costs expended to generate a dollar of revenue, and net interest yield measures the basis points the Corporation earns over the cost of funds.
The Corporation also evaluates its business based on the following ratios that utilize tangible equity, a non-GAAP financial measure. Tangible equity represents an adjusted shareholders’ equity or common shareholders’ equity amount which has been reduced by goodwill and intangible assets (excluding mortgage servicing rights), net of related deferred tax liabilities. Return on average tangible common shareholders’ equity measures the Corporation’s earnings contribution as a percentage of adjusted average common shareholders’ equity. Return on average tangible shareholders’ equity measures the Corporation’s earnings contribution as a percentage of adjusted average total shareholders’ equity. The tangible common equity ratio represents adjusted ending common shareholders’ equity divided by total assets less goodwill and intangible assets (excluding mortgage servicing rights), net of related deferred tax liabilities. The tangible equity ratio represents adjusted ending shareholders’ equity divided by total assets less goodwill and intangible assets (excluding mortgage servicing rights), net of related deferred tax liabilities. Tangible book value per common share represents adjusted ending common shareholders’ equity divided by ending common shares outstanding. These measures are used to evaluate the Corporation’s use of equity. In addition, profitability, relationship and investment models all use return on average tangible shareholders’ equity as key measures to support our overall growth goals.
Effective January 1, 2013, on a prospective basis, the Corporation adjusted the amount of capital being allocated to its business segments. The adjustment reflects a refinement to the prior-year methodology (economic capital) which focused solely on internal risk-based economic capital models. The refined methodology (allocated capital) now also considers the effect of regulatory capital requirements in addition to internal risk-based economic capital models. The Corporation’s internal risk-based capital models use a risk-adjusted methodology incorporating each segment’s credit, market, interest rate, business and operational risk components. The capital allocated to the Corporation’s business segments is currently referred to as allocated capital and, prior to January 1, 2013, was referred to as economic capital, both of which represent non-GAAP financial measures. The Corporation plans to further refine, in the first quarter of 2014, the capital being allocated to the Corporation’s business segments with the result being additional capital allocated to the business segments. Allocated capital is subject to change over time.
See the tables below and on pages 24-25 for reconciliations of these non-GAAP financial measures with financial measures defined by GAAP for the years ended December 31, 2013 and 2012, and the three months ended December 31, 2013, September 30, 2013 and December 31, 2012. The Corporation believes the use of these non-GAAP financial measures provides additional clarity in assessing the results of the Corporation. Other companies may define or calculate supplemental financial data differently.
Year Ended December 31 | Fourth Quarter 2013 | Third Quarter 2013 | Fourth Quarter 2012 | ||||||||||||||||||
2013 | 2012 | ||||||||||||||||||||
Reconciliation of net interest income to net interest income on a fully taxable-equivalent basis | |||||||||||||||||||||
Net interest income | $ | 42,265 | $ | 40,656 | $ | 10,786 | $ | 10,266 | $ | 10,324 | |||||||||||
Fully taxable-equivalent adjustment | 859 | 901 | 213 | 213 | 231 | ||||||||||||||||
Net interest income on a fully taxable-equivalent basis | $ | 43,124 | $ | 41,557 | $ | 10,999 | $ | 10,479 | $ | 10,555 | |||||||||||
Reconciliation of total revenue, net of interest expense to total revenue, net of interest expense on a fully taxable-equivalent basis | |||||||||||||||||||||
Total revenue, net of interest expense | $ | 88,942 | $ | 83,334 | $ | 21,488 | $ | 21,530 | $ | 18,660 | |||||||||||
Fully taxable-equivalent adjustment | 859 | 901 | 213 | 213 | 231 | ||||||||||||||||
Total revenue, net of interest expense on a fully taxable-equivalent basis | $ | 89,801 | $ | 84,235 | $ | 21,701 | $ | 21,743 | $ | 18,891 | |||||||||||
Reconciliation of income tax expense (benefit) to income tax expense (benefit) on a fully taxable-equivalent basis | |||||||||||||||||||||
Income tax expense (benefit) | $ | 4,741 | $ | (1,116 | ) | $ | 406 | $ | 2,348 | $ | (2,636 | ) | |||||||||
Fully taxable-equivalent adjustment | 859 | 901 | 213 | 213 | 231 | ||||||||||||||||
Income tax expense (benefit) on a fully taxable-equivalent basis | $ | 5,600 | $ | (215 | ) | $ | 619 | $ | 2,561 | $ | (2,405 | ) | |||||||||
Reconciliation of average common shareholders’ equity to average tangible common shareholders’ equity | |||||||||||||||||||||
Common shareholders’ equity | $ | 218,468 | $ | 216,996 | $ | 220,088 | $ | 216,766 | $ | 219,744 | |||||||||||
Goodwill | (69,910 | ) | (69,974 | ) | (69,864 | ) | (69,903 | ) | (69,976 | ) | |||||||||||
Intangible assets (excluding mortgage servicing rights) | (6,132 | ) | (7,366 | ) | (5,725 | ) | (5,993 | ) | (6,874 | ) | |||||||||||
Related deferred tax liabilities | 2,328 | 2,593 | 2,231 | 2,296 | 2,490 | ||||||||||||||||
Tangible common shareholders’ equity | $ | 144,754 | $ | 142,249 | $ | 146,730 | $ | 143,166 | $ | 145,384 | |||||||||||
Reconciliation of average shareholders’ equity to average tangible shareholders’ equity | |||||||||||||||||||||
Shareholders’ equity | $ | 233,947 | $ | 235,677 | $ | 233,415 | $ | 230,392 | $ | 238,512 | |||||||||||
Goodwill | (69,910 | ) | (69,974 | ) | (69,864 | ) | (69,903 | ) | (69,976 | ) | |||||||||||
Intangible assets (excluding mortgage servicing rights) | (6,132 | ) | (7,366 | ) | (5,725 | ) | (5,993 | ) | (6,874 | ) | |||||||||||
Related deferred tax liabilities | 2,328 | 2,593 | 2,231 | 2,296 | 2,490 | ||||||||||||||||
Tangible shareholders’ equity | $ | 160,233 | $ | 160,930 | $ | 160,057 | $ | 156,792 | $ | 164,152 | |||||||||||
Certain prior period amounts have been reclassified to conform to current period presentation.
More | This information is preliminary and based on company data available at the time of the presentation. |
Page 24
Bank of America Corporation and Subsidiaries | |||||||||||||||||||||
Reconciliations to GAAP Financial Measures (continued) | |||||||||||||||||||||
(Dollars in millions) | |||||||||||||||||||||
Year Ended December 31 | Fourth Quarter 2013 | Third Quarter 2013 | Fourth Quarter 2012 | ||||||||||||||||||
2013 | 2012 | ||||||||||||||||||||
Reconciliation of period-end common shareholders’ equity to period-end tangible common shareholders’ equity | |||||||||||||||||||||
Common shareholders’ equity | $ | 219,333 | $ | 218,188 | $ | 219,333 | $ | 218,967 | $ | 218,188 | |||||||||||
Goodwill | (69,844 | ) | (69,976 | ) | (69,844 | ) | (69,891 | ) | (69,976 | ) | |||||||||||
Intangible assets (excluding mortgage servicing rights) | (5,574 | ) | (6,684 | ) | (5,574 | ) | (5,843 | ) | (6,684 | ) | |||||||||||
Related deferred tax liabilities | 2,166 | 2,428 | 2,166 | 2,231 | 2,428 | ||||||||||||||||
Tangible common shareholders’ equity | $ | 146,081 | $ | 143,956 | $ | 146,081 | $ | 145,464 | $ | 143,956 | |||||||||||
Reconciliation of period-end shareholders’ equity to period-end tangible shareholders’ equity | |||||||||||||||||||||
Shareholders’ equity | $ | 232,685 | $ | 236,956 | $ | 232,685 | $ | 232,282 | $ | 236,956 | |||||||||||
Goodwill | (69,844 | ) | (69,976 | ) | (69,844 | ) | (69,891 | ) | (69,976 | ) | |||||||||||
Intangible assets (excluding mortgage servicing rights) | (5,574 | ) | (6,684 | ) | (5,574 | ) | (5,843 | ) | (6,684 | ) | |||||||||||
Related deferred tax liabilities | 2,166 | 2,428 | 2,166 | 2,231 | 2,428 | ||||||||||||||||
Tangible shareholders’ equity | $ | 159,433 | $ | 162,724 | $ | 159,433 | $ | 158,779 | $ | 162,724 | |||||||||||
Reconciliation of period-end assets to period-end tangible assets | |||||||||||||||||||||
Assets | $ | 2,102,273 | $ | 2,209,974 | $ | 2,102,273 | $ | 2,126,653 | $ | 2,209,974 | |||||||||||
Goodwill | (69,844 | ) | (69,976 | ) | (69,844 | ) | (69,891 | ) | (69,976 | ) | |||||||||||
Intangible assets (excluding mortgage servicing rights) | (5,574 | ) | (6,684 | ) | (5,574 | ) | (5,843 | ) | (6,684 | ) | |||||||||||
Related deferred tax liabilities | 2,166 | 2,428 | 2,166 | 2,231 | 2,428 | ||||||||||||||||
Tangible assets | $ | 2,029,021 | $ | 2,135,742 | $ | 2,029,021 | $ | 2,053,150 | $ | 2,135,742 | |||||||||||
Book value per share of common stock | |||||||||||||||||||||
Common shareholders’ equity | $ | 219,333 | $ | 218,188 | $ | 219,333 | $ | 218,967 | $ | 218,188 | |||||||||||
Ending common shares issued and outstanding | 10,591,808 | 10,778,264 | 10,591,808 | 10,683,282 | 10,778,264 | ||||||||||||||||
Book value per share of common stock | $ | 20.71 | $ | 20.24 | $ | 20.71 | $ | 20.50 | $ | 20.24 | |||||||||||
Tangible book value per share of common stock | |||||||||||||||||||||
Tangible common shareholders’ equity | $ | 146,081 | $ | 143,956 | $ | 146,081 | $ | 145,464 | $ | 143,956 | |||||||||||
Ending common shares issued and outstanding | 10,591,808 | 10,778,264 | 10,591,808 | 10,683,282 | 10,778,264 | ||||||||||||||||
Tangible book value per share of common stock | $ | 13.79 | $ | 13.36 | $ | 13.79 | $ | 13.62 | $ | 13.36 | |||||||||||
Certain prior period amounts have been reclassified to conform to current period presentation.
More | This information is preliminary and based on company data available at the time of the presentation. |
Page 25
Bank of America Corporation and Subsidiaries | |||||||||||||||||||||
Reconciliations to GAAP Financial Measures (continued) | |||||||||||||||||||||
(Dollars in millions) | |||||||||||||||||||||
Year Ended December 31 | Fourth Quarter 2013 | Third Quarter 2013 | Fourth Quarter 2012 | ||||||||||||||||||
2013 | 2012 | ||||||||||||||||||||
Reconciliation of return on average allocated capital/economic capital (1) | |||||||||||||||||||||
Consumer & Business Banking | |||||||||||||||||||||
Reported net income | $ | 6,588 | $ | 5,546 | $ | 1,967 | $ | 1,779 | $ | 1,446 | |||||||||||
Adjustment related to intangibles (2) | 7 | 13 | 1 | 2 | 3 | ||||||||||||||||
Adjusted net income | $ | 6,595 | $ | 5,559 | $ | 1,968 | $ | 1,781 | $ | 1,449 | |||||||||||
Average allocated equity (3) | $ | 62,045 | $ | 56,214 | $ | 62,007 | $ | 62,032 | $ | 56,673 | |||||||||||
Adjustment related to goodwill and a percentage of intangibles | (32,045 | ) | (32,163 | ) | (32,007 | ) | (32,032 | ) | (32,112 | ) | |||||||||||
Average allocated capital/economic capital | $ | 30,000 | $ | 24,051 | $ | 30,000 | $ | 30,000 | $ | 24,561 | |||||||||||
Global Banking | |||||||||||||||||||||
Reported net income | $ | 4,974 | $ | 5,344 | $ | 1,267 | $ | 1,134 | $ | 1,392 | |||||||||||
Adjustment related to intangibles (2) | 2 | 4 | — | 1 | 1 | ||||||||||||||||
Adjusted net income | $ | 4,976 | $ | 5,348 | $ | 1,267 | $ | 1,135 | $ | 1,393 | |||||||||||
Average allocated equity (3) | $ | 45,412 | $ | 41,742 | $ | 45,410 | $ | 45,413 | $ | 41,546 | |||||||||||
Adjustment related to goodwill and a percentage of intangibles | (22,412 | ) | (22,430 | ) | (22,410 | ) | (22,413 | ) | (22,423 | ) | |||||||||||
Average allocated capital/economic capital | $ | 23,000 | $ | 19,312 | $ | 23,000 | $ | 23,000 | $ | 19,123 | |||||||||||
Global Markets | |||||||||||||||||||||
Reported net income (loss) | $ | 1,563 | $ | 1,229 | $ | 215 | $ | (778 | ) | $ | 181 | ||||||||||
Adjustment related to intangibles (2) | 8 | 9 | 2 | 2 | 2 | ||||||||||||||||
Adjusted net income (loss) | $ | 1,571 | $ | 1,238 | $ | 217 | $ | (776 | ) | $ | 183 | ||||||||||
Average allocated equity (3) | $ | 35,373 | $ | 19,193 | $ | 35,381 | $ | 35,369 | $ | 19,562 | |||||||||||
Adjustment related to goodwill and a percentage of intangibles | (5,373 | ) | (5,369 | ) | (5,381 | ) | (5,369 | ) | (5,378 | ) | |||||||||||
Average allocated capital/economic capital | $ | 30,000 | $ | 13,824 | $ | 30,000 | $ | 30,000 | $ | 14,184 | |||||||||||
Global Wealth & Investment Management | |||||||||||||||||||||
Reported net income | $ | 2,974 | $ | 2,245 | $ | 777 | $ | 719 | $ | 576 | |||||||||||
Adjustment related to intangibles (2) | 16 | 22 | 4 | 4 | 5 | ||||||||||||||||
Adjusted net income | $ | 2,990 | $ | 2,267 | $ | 781 | $ | 723 | $ | 581 | |||||||||||
Average allocated equity (3) | $ | 20,292 | $ | 17,729 | $ | 20,265 | $ | 20,283 | $ | 18,489 | |||||||||||
Adjustment related to goodwill and a percentage of intangibles | (10,292 | ) | (10,370 | ) | (10,265 | ) | (10,283 | ) | (10,340 | ) | |||||||||||
Average allocated capital/economic capital | $ | 10,000 | $ | 7,359 | $ | 10,000 | $ | 10,000 | $ | 8,149 | |||||||||||
(1) | There are no adjustments to reported net income (loss) or average allocated equity for Consumer Real Estate Services. |
(2) | Represents cost of funds, earnings credits and certain expenses related to intangibles. |
(3) | Average allocated equity is comprised of average allocated capital (or economic capital prior to 2013) plus capital for the portion of goodwill and intangibles specifically assigned to the business segment. |
Certain prior period amounts have been reclassified to conform to current period presentation.
More | This information is preliminary and based on company data available at the time of the presentation. |