Corporate Governance and Staggered Boards: Trends and Analysis

P A G E 1 THIS PRESENTATION (THE “PRESENTATION”) IS PROVIDED FOR INFORMATION AND REFERENCE ONLY AND IS NOT INTENDED TO BE, AND MUST NOT BE TAKEN AS, THE BASIS FOR ANY INVESTMENT DECISION TO INVEST IN STAR EQUITY FUND, LP (the “FUND”) OR ANY OTHER PRODUCT SPONSORED BY STAR INVESMENT MANAGEMENT LLC (the “MANAGER”). THIS PRESENTATION DOES NOT CONSTITUTE AN OFFER TO SELL OR A SOLICITATION OF AN OFFER TO BUY ANY SECURITIES AND MAY NOT BE USED OR RELIED UPON IN EVALUATING THE MERITS OF ANY INVESTMENT. THE INFORMATION SET FORTH HEREIN DOES NOT PURPORT TO BE COMPLETE. AN OFFER OR SOLICITATION OF AN INVESTMENT IN THE FUND WILL ONLY BE MADE AT THE TIME A QUALIFIED OFFEREE RECEIVES A CONFIDENTIAL PRIVATE OFFERING MEMORANDUM (“CPOM”), WHICH CONTAINS IMPORTANT INFORMATION (INCLUDING INVESTMENT OBJECTIVE, POLICIES, RISK FACTORS, FEES, TAX IMPLICATIONS AND RELEVANT QUALIFICATIONS), AND ONLY IN THOSE JURISDICTIONS WHERE PERMITTED BY LAW. IN THE CASE OF ANY INCONSISTENCY BETWEEN THE DESCRIPTIONS OR TERMS IN THIS PRESENTATION AND THE CPOM, THE CPOM SHALL CONTROL. THESE SECURITIES SHALL NOT BE OFFERED OR SOLD IN ANY JURISDICTION IN WHICH SUCH OFFER, SOLICITATION OR SALE WOULD BE UNLAWFUL UNTIL THE REQUIREMENTS OF THE LAWS OF SUCH JURISDICTION HAVE BEEN SATISFIED. WHILE ALL THE INFORMATION PREPARED IN THIS DOCUMENT IS BELIEVED TO BE ACCURATE, THE MANAGER MAKES NO EXPRESS WARRANTY AS TO THE COMPLETENESS OR ACCURACY OF SUCH INFORMATION, NOR CAN IT ACCEPT RESPONSIBILITY FOR ERRORS APPEARING IN THE PRESENTATION. BY ACCEPTING THIS PRESENTATION, YOU AGREE THAT: (I) THE INFORMATION CONTAINED HEREIN MAY NOT BE USED, REPRODUCED, OR DISTRIBUTED TO OTHERS, IN WHOLE OR IN PART, WITHOUT THE PRIOR WRITTEN CONSENT OF THE MANAGER; AND (II) YOU WILL KEEP CONFIDENTIAL ALL INFORMATION CONTAINED IN THIS PRESENTATION. THE CONTENTS OF THIS PRESENTATION SHOULD NOT BE CONSTRUED AS INVESTMENT, LEGAL, TAX, OR OTHER ADVICE. YOU SHOULD CONSULT YOUR OWN ADVISORS AS TO LEGAL, BUSINESS, TAX, AND OTHER RELATED MATTERS. AN INVESTMENT IN THE FUND IS SPECULATIVE AND INVOLVES A HIGH DEGREE OF RISK. INVESTORS SHOULD UNDERSTAND THE RISK OF INVESTING IN THE FUND AND HAVE THE FINANCIAL ABILITY AND WILLINGNESS TO ACCEPT THEM IF THEY ARE TO CONSIDER AN INVESTMENT IN THE FUND. INVESTORS COULD LOSE ALL OR SUBSTANTIALLY ALL OF THEIR INVESTMENT. OPPORTUNITIES FOR WITHDRAWAL AND TRANSFERABILITY OF INTERESTS IN THE FUND ARE RESTRICTED, SO INVESTORS MAY NOT HAVE ACCESS TO CAPITAL WHEN IT IS NEEDED. THERE IS NO SECONDARY MARKET FOR THE INTERESTS IN THE FUND AND NONE IS EXPECTED TO DEVELOP. THE MANAGER APPLIES AN ‘ACTIVIST’ STRATEGY TO THE PORTFOLIO, WHICH IS UNDER THE SOLE AUTHORITY OF THE MANAGER, AND, THUS, IS PRIMARILY INVESTED IN A RELATIVELY LIMITED NUMBER OF LONG/SHORT EQUITY POSITIONS. THIS LACK OF DIVERSIFICATION MAY RESULT IN HIGHER RISK. LEVERAGE MAY BE EMPLOYED IN THE PORTFOLIO, WHICH CAN MAKE INVESTMENT PERFORMANCE VOLATILE AND MAGNIFY LOSSES. AN INVESTOR SHOULD NOT MAKE AN INVESTMENT, UNLESS IT IS PREPARED TO LOSE ALL OR A SUBSTANTIAL PORTION OF ITS INVESTMENT. THIS PRESENTATION CONSIDERS CERTAIN ACTUAL TRANSACTIONS THAT ARE PRESENTED FOR ILLUSTRATIVE PURPOSES ONLY. ANY MARKET ANALYSIS, ESTIMATES, AND SIMILAR INFORMATION, INCLUDING ALL STATEMENTS OF OPINION AND/OR BELIEF, CONTAINED IN THIS PRESENTATION ARE SUBJECT TO INHERENT UNCERTAINTIES AND QUALIFICATIONS AND ARE BASED ON A NUMBER OF ASSUMPTIONS. ALL STATEMENTS IN THIS PRESENTATION OTHER THAN HISTORICAL FACTS ARE FORWARD-LOOKING STATEMENTS, WHICH RELY ON A NUMBER OF ASSUMPTIONS CONCERNING FUTURE EVENTS AND ARE SUBJECT TO NUMEROUS AND MATERIAL FACTORS OVER WHICH THE MANAGER HAS NO CONTROL. THERE IS NO GUARANTEE THAT THE FUND’S INVESTMENT OBJECTIVE WILL BE ACHIEVED. MOREOVER, THE PAST PERFORMANCE (IF ANY) OF THE MEMBERS OF THE MANAGER IS NOT INDICATIVE OF FUTURE RESULTS. NO INFORMATION CONTAINED HEREIN SHOULD BE RELIED UPON AS ANY INDICATION AS TO THE FUTURE PERFORMANCE OF ANY INVESTMENT. Disclaimer
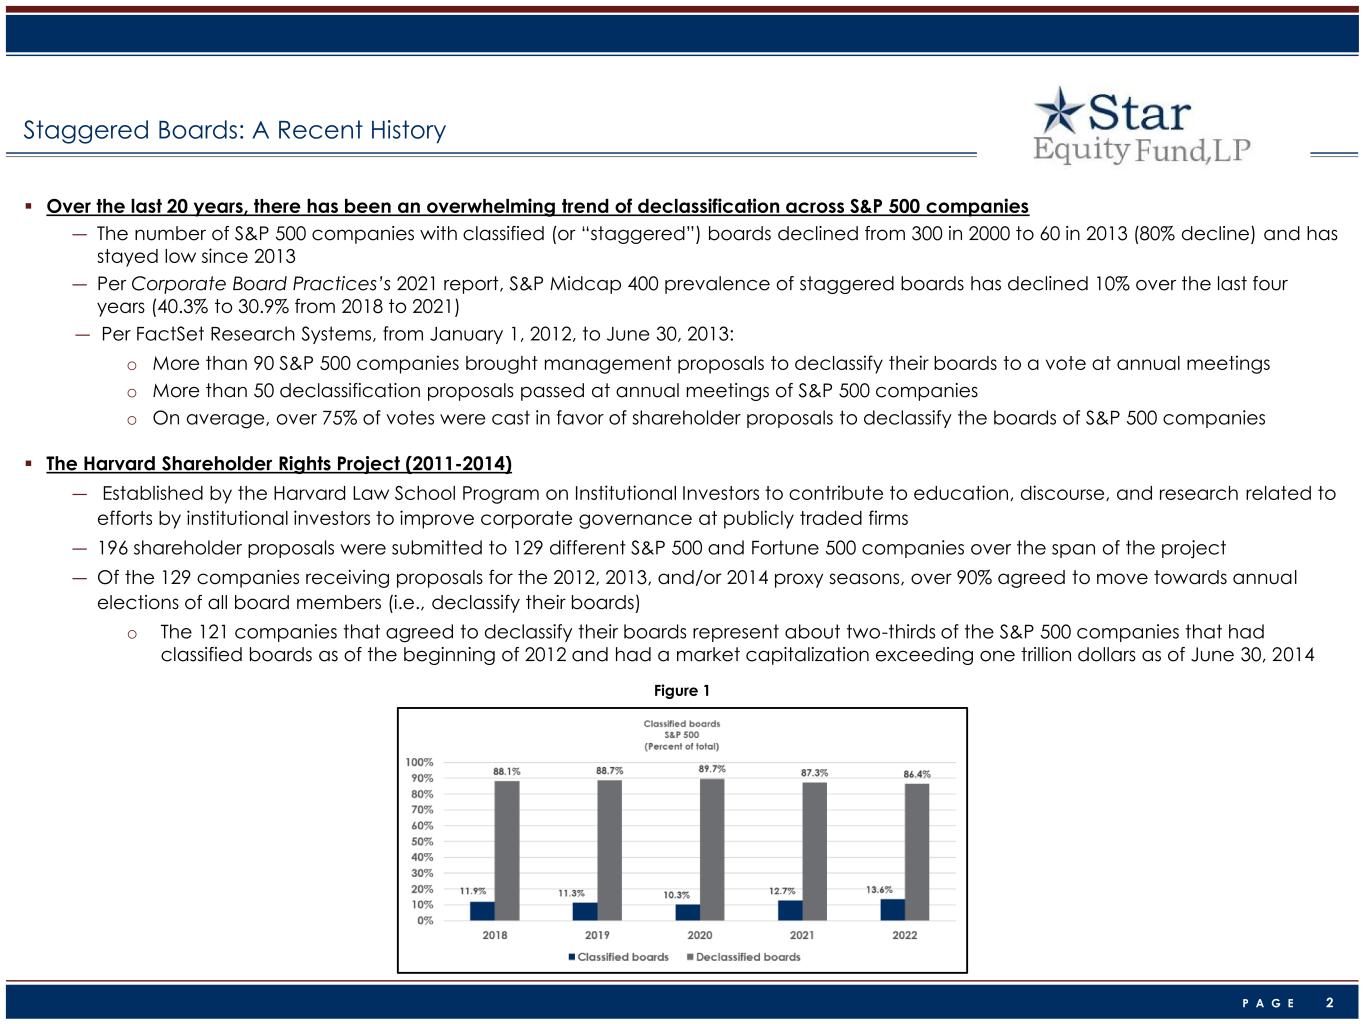
P A G E 2 ▪ Over the last 20 years, there has been an overwhelming trend of declassification across S&P 500 companies ― The number of S&P 500 companies with classified (or “staggered”) boards declined from 300 in 2000 to 60 in 2013 (80% decline) and has stayed low since 2013 ― Per Corporate Board Practices’s 2021 report, S&P Midcap 400 prevalence of staggered boards has declined 10% over the last four years (40.3% to 30.9% from 2018 to 2021) ― Per FactSet Research Systems, from January 1, 2012, to June 30, 2013: o More than 90 S&P 500 companies brought management proposals to declassify their boards to a vote at annual meetings o More than 50 declassification proposals passed at annual meetings of S&P 500 companies o On average, over 75% of votes were cast in favor of shareholder proposals to declassify the boards of S&P 500 companies ▪ The Harvard Shareholder Rights Project (2011-2014) ― Established by the Harvard Law School Program on Institutional Investors to contribute to education, discourse, and research related to efforts by institutional investors to improve corporate governance at publicly traded firms ― 196 shareholder proposals were submitted to 129 different S&P 500 and Fortune 500 companies over the span of the project ― Of the 129 companies receiving proposals for the 2012, 2013, and/or 2014 proxy seasons, over 90% agreed to move towards annual elections of all board members (i.e., declassify their boards) o The 121 companies that agreed to declassify their boards represent about two-thirds of the S&P 500 companies that had classified boards as of the beginning of 2012 and had a market capitalization exceeding one trillion dollars as of June 30, 2014 Staggered Boards: A Recent History Figure 1
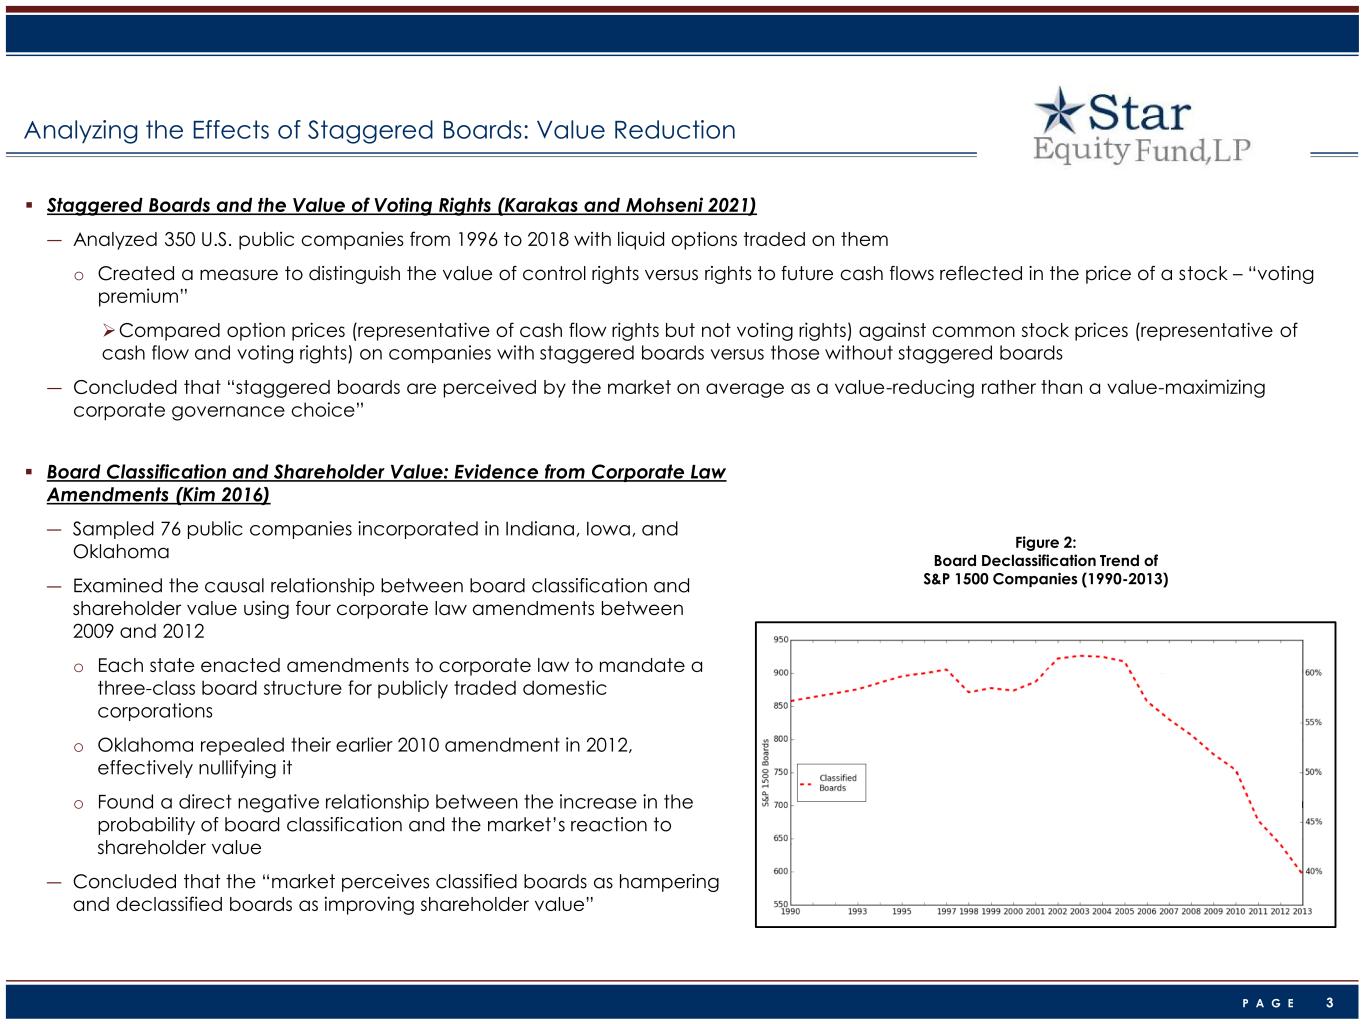
P A G E 3 Analyzing the Effects of Staggered Boards: Value Reduction ▪ Staggered Boards and the Value of Voting Rights (Karakas and Mohseni 2021) ― Analyzed 350 U.S. public companies from 1996 to 2018 with liquid options traded on them o Created a measure to distinguish the value of control rights versus rights to future cash flows reflected in the price of a stock – “voting premium” ➢Compared option prices (representative of cash flow rights but not voting rights) against common stock prices (representative of cash flow and voting rights) on companies with staggered boards versus those without staggered boards ― Concluded that “staggered boards are perceived by the market on average as a value-reducing rather than a value-maximizing corporate governance choice” Figure 2: Board Declassification Trend of S&P 1500 Companies (1990-2013) ▪ Board Classification and Shareholder Value: Evidence from Corporate Law Amendments (Kim 2016) ― Sampled 76 public companies incorporated in Indiana, Iowa, and Oklahoma ― Examined the causal relationship between board classification and shareholder value using four corporate law amendments between 2009 and 2012 o Each state enacted amendments to corporate law to mandate a three-class board structure for publicly traded domestic corporations o Oklahoma repealed their earlier 2010 amendment in 2012, effectively nullifying it o Found a direct negative relationship between the increase in the probability of board classification and the market’s reaction to shareholder value ― Concluded that the “market perceives classified boards as hampering and declassified boards as improving shareholder value”
P A G E 4 Analyzing the Effects of Staggered Boards: Value Reduction Continued ▪ Classified Boards, Firm Value, and Managerial Entrenchment (Faleye 2006) ― Sampled 2,021 firms from 1995 to 2002 o Excluded mutual funds, real estate investment trusts, and limited partnerships o Each firm either maintained a staggered board or annual election of all directors throughout all years of the study ― Found an average of $795 million reduction in the market value of companies with a staggered board using Fama-McBeth framework o Ran regressions over eight-year period, found correlation to be negative and significant (p value < .01) in each year ― Concluded that “classified boards are associated with a significant depression in firm value each year during the entire eight-year period” ― Found that “classified boards significantly insulate top management from market discipline” ▪ The Costs of Entrenched Boards (Bebchuk and Cohen 2005) ― Conducted study from 1995 to 2002 ― Found firms with staggered boards established in the firm’s corporate charter to be more negatively correlated with firm value than firms with staggered boards established in the company’s by-laws o Supports the notion that companies with staggered boards enumerated in the company’s by-laws are more attractive to shareholders because of the relative ease with which company by-laws can be amended compared to corporate charters ― Found that staggered boards are associated with lower firm value ▪ Corporate Governance and Equity Prices (Gompers, Ishii, and Metrick 2003) ― Sampled approximately 1,500 firms per year during the 1990s ― Found that “corporate governance [was] strongly correlated with stock returns during the 1990s” ― Observed decline in firm value as the balance of power shifted away from shareholders across companies in study o Reduction in firm value increased over 500% from the beginning to the end of the decade for each “one-point increase in the Governance Index” (a metric used to indicate increasing management power and decreasing shareholder power) ― Concluded that an investment strategy that purchased shares of firms with the lowest Governance Index and selling shares of firms with the highest Governance Index would have yielded annual returns of 8.5%

P A G E 5 Analyzing the Effects of Staggered Boards: Accountability to Shareholders ▪ Staggered Boards, Unequal Voting Rights, Poison Pills and Innovation Intensity: New Evidence from the Asian Markets (Mbanyele 2021) ― Studied a sample of 625 listed firms from six Asian countries (China, India, Indonesia, Japan, South Korea, and Thailand) ― Questioned the pro-staggered board opinion that classification facilitates better long-term R&D outcomes by evaluating innovation intensity and spending o Employed three proxy measures of takeover protection as independent variables: staggered board provision, unequal voting rights provision, and poison pill provision ― Found that the adoption of classified boards was associated with a 7.7% decrease in R&D intensity, defined as R&D expenditure scaled by total assets ― Determined that all three proxy measures had “no incremental effect on long term innovation activities” individually or combined Figure 3: Distribution of Sample Firms by Year of the Decision to Declassify ▪ Activism and the Shift to Annual Director Elections (Guo, Kruse, Nohel 2014) ― Sampled 465 firms that switched from staggered boards to annual director elections between 2003 and 2010 ― Found that the market responds favorably to a switch to annual director elections (significant at the 5% level) ― Movements to declassify director boards prompted by an aggressive 13D filing from an activist hedge fund causes a “highly significant” jump in share prices of around 1.4% o Declassifying announcements prompted by a shareholder proposal shows no significant action in share price ― Concluded that hedge funds are far more able to create change in board staggering compared to individual shareholders o Observed that companies prodded by hedge funds to declassify completed the transition to annual elections significantly faster than firms encouraged by non-binding shareholder proposals o Hedge funds in the sample had a stake in the target firm of at least 5%
P A G E 6 1. Since the mid-2000s, there has been a significant shift in corporate governance favoring the declassification of boards 2. Insulation of incumbent board members via board-staggering has been shown to associate with reduction in firm value 3. Shifting the balance of power away from shareholders has been observed to cause reduction in firm value 4. Leading corporations across all major industries have exhibited movement towards board declassification 5. Activist hedge funds are significantly more successful than individual shareholders in motivating companies to declassify their boards Conclusions
PAGE 7 A P P E N D I X Sources Contact Information
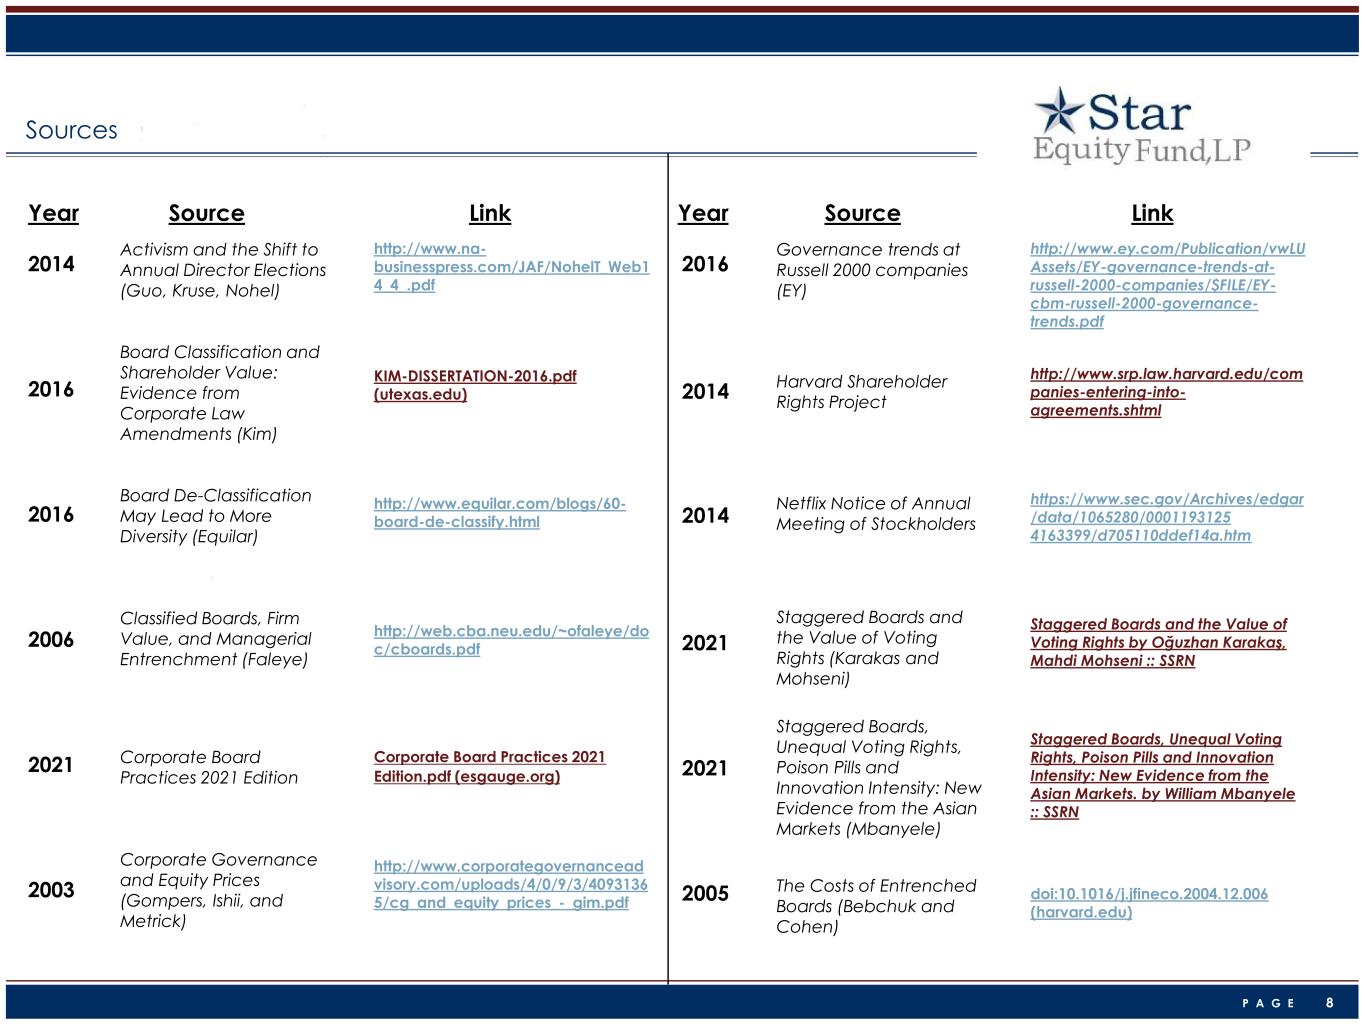
P A G E 8 Year Source Link Year Source Link Sources 2014 2016 2016 2006 2021 2003 Activism and the Shift to Annual Director Elections (Guo, Kruse, Nohel) Board Classification and Shareholder Value: Evidence from Corporate Law Amendments (Kim) Board De-Classification May Lead to More Diversity (Equilar) Classified Boards, Firm Value, and Managerial Entrenchment (Faleye) Corporate Board Practices 2021 Edition Corporate Governance and Equity Prices (Gompers, Ishii, and Metrick) http://www.na- businesspress.com/JAF/NohelT_Web1 4_4_.pdf KIM-DISSERTATION-2016.pdf (utexas.edu) http://www.equilar.com/blogs/60- board-de-classify.html http://web.cba.neu.edu/~ofaleye/do c/cboards.pdf Corporate Board Practices 2021 Edition.pdf (esgauge.org) http://www.corporategovernancead visory.com/uploads/4/0/9/3/4093136 5/cg_and_equity_prices_-_gim.pdf 2016 2014 2014 2021 2021 2005 Governance trends at Russell 2000 companies (EY) Harvard Shareholder Rights Project Netflix Notice of Annual Meeting of Stockholders Staggered Boards and the Value of Voting Rights (Karakas and Mohseni) Staggered Boards, Unequal Voting Rights, Poison Pills and Innovation Intensity: New Evidence from the Asian Markets (Mbanyele) The Costs of Entrenched Boards (Bebchuk and Cohen) http://www.ey.com/Publication/vwLU Assets/EY-governance-trends-at- russell-2000-companies/$FILE/EY- cbm-russell-2000-governance- trends.pdf http://www.srp.law.harvard.edu/com panies-entering-into- agreements.shtml https://www.sec.gov/Archives/edgar /data/1065280/0001193125 4163399/d705110ddef14a.htm Staggered Boards and the Value of Voting Rights by Oğuzhan Karakaş, Mahdi Mohseni :: SSRN Staggered Boards, Unequal Voting Rights, Poison Pills and Innovation Intensity: New Evidence from the Asian Markets. by William Mbanyele :: SSRN doi:10.1016/j.jfineco.2004.12.006 (harvard.edu)
P A G E 9 Contact Information Jeff Eberwein Portfolio Manager Email: jeff.Eberwein@starequity.com Office: +1.203.489.9501 Shawn Miles Director of Research Email: shawn.miles@starequity.com Office: +1.203.489.9506 Jack Smith Analyst Email: jack.smith@starequity.com Office: +1.203.489.9507 Star Equity Fund, LP 53 Forest Avenue Suite 101 Old Greenwich, CT 06870