Horizon Bancorp, Inc.
ITEM 2. PROPERTIES
The main office and full service branch of Horizon and the Bank is located at 515 Franklin Street, Michigan City, Indiana. The building located across the street from the main office of Horizon and the Bank, at 502 Franklin Street, houses the credit administration, operations, facilities and purchasing, and information technology departments of the Bank. In addition to these principal facilities, the Bank has 73 sales offices and one loan production office located in various cities and towns in northern and central Indiana and southern and central Michigan. Horizon maintains such branches and offices as it believes are necessary for the convenience of its customers and the community, and Horizon frequently assesses the suitability of all its business locations.
Horizon owns all of its facilities except for leased offices in East Lansing, Michigan and Grand Rapids, Michigan . The Bank also leases one loan production office in Troy, Michigan.
ITEM 3. LEGAL PROCEEDINGS
Horizon and its subsidiaries are involved in various legal proceedings incidental to the conduct of their business. Management does not expect that the outcome of any such proceedings will have a material adverse effect on our consolidated financial position or results of operations.
ITEM 4. MINE SAFETY DISCLOSURES
Not applicable.
SPECIAL ITEM: INFORMATION ABOUT OUR EXECUTIVE OFFICERS
| Craig M. Dwight |
63 |
Chairman of Horizon since July 2014; Chairman and Chief Executive Officer of the Bank since January 2003; Chief Executive Officer of Horizon and the Bank since July 2001; President of the Bank from 1998 to January 2003. | ||||
| James D. Neff |
60 |
President of Horizon and the Bank since January 2018; Executive Vice President – Consumer and Mortgage Banking of the Bank from 2016 to January 2018; Executive Vice President – Mortgage Banking of the Bank from January 2004 to 2016; Senior Vice President of the Bank from October 1999 to January 2004; Corporate Secretary of Horizon from 2007 to 2017. | ||||
| Mark E. Secor |
53 |
Executive Vice President of Horizon since January 2014 ; | ||||
| Kathie A. DeRuiter |
58 |
Executive Vice President of Horizon and Senior Bank Operations Officer since January 2014; Senior Vice President, Senior Bank Operations Officer from January 2003 to January 2014; Vice President, Senior Bank Operations Officer from January 2000 to January 2003. | ||||
| Dennis J. Kuhn |
60 |
Executive Vice President and Chief Commercial Banking Officer since October 2017; Regional Market President for Michigan and Northeast Indiana from February 2014 to October 2017; Chair of the Regional Loan Committee; Market President for Kalamazoo, Michigan from May 2010 to October 2017. | ||||
| Todd A. Etzler |
53 |
Senior Vice President and General Counsel since July 2018; Vice President and General Counsel since March 2017; Corporate Secretary since January 2018. General Counsel of Family Express Corporation from July 2011 to March 2017. |
All officers are appointed annually by the Board of Directors of Horizon and the Bank, as applicable.
35
Horizon Bancorp, Inc.
PART II
ITEM 5. MARKET FOR REGISTRANT’S COMMON EQUITY, RELATED STOCKHOLDER MATTERS AND ISSUER PURCHASES OF EQUITY SECURITIES
Common Stock and Related Stockholder Matters
Horizon common stock is traded on the NASDAQ Global Select Market under the symbol “HBNC.”
The approximate number of holders of record of Horizon’s outstanding common stock as of February 27, 2020 was 1,509.
The Equity Compensation Plan Information table appears under the caption “Equity Compensation Plan Information” in Item 12 below and is incorporated herein by reference.
Repurchases of Securities
There were no purchases by the Company of its common stock during the fourth quarter of 2019.
36
Horizon Bancorp, Inc.
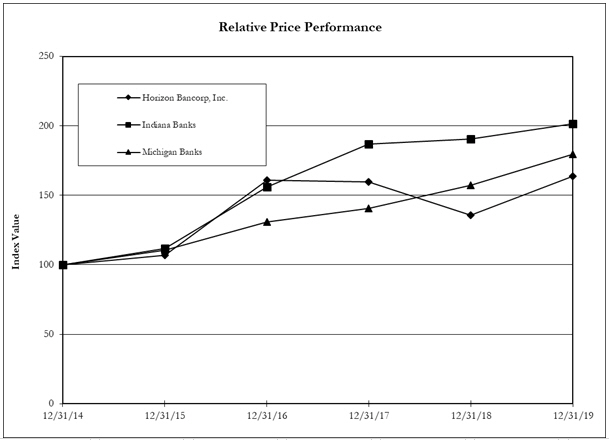
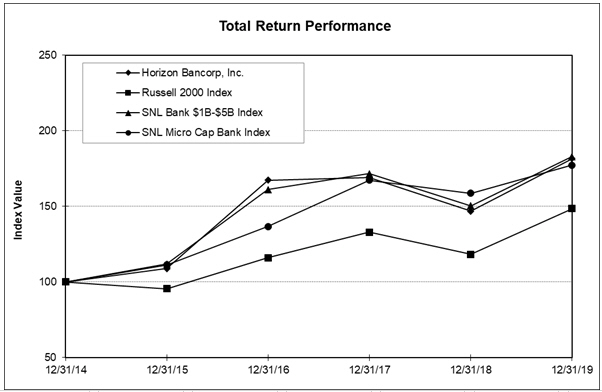
Performance Graph
The SEC requires Horizon to include a line graph comparing Horizon’s cumulative five-year total shareholder returns on the common shares with market and industry returns over the past five years. S&P Global Market Intelligence prepared the following graph. The return represented in the graph assumes the investment of $100 on December 31, 2014, and further assumes reinvestment of all dividends. The Company’s common stock began trading on the NASDAQ Global Market on February 1, 2007, and on the NASDAQ Global Select Market on January 2, 2014. Prior to that date, the common stock was traded on the NASDAQ Capital Market.
| Index |
December 31 2014 |
December 31 2015 |
December 31 2016 |
December 31 2017 |
December 31 2018 |
December 31 2019 |
||||||||||||||||||
| Horizon Bancorp, Inc. |
100.00 |
108.88 |
167.30 |
169.07 |
146.83 |
181.60 |
||||||||||||||||||
| Russell 2000 Index |
100.00 |
95.59 |
115.95 |
132.94 |
118.30 |
148.49 |
||||||||||||||||||
| SNL Bank $1B-$5B Index |
100.00 |
111.94 |
161.04 |
171.69 |
150.42 |
182.85 |
||||||||||||||||||
| SNL Micro Cap Bank Index |
100.00 |
111.20 |
136.72 |
167.25 |
158.70 |
177.22 |
||||||||||||||||||
Source: S&P Global Market Intelligence
©
202037