Exhibit 99.1
News Release

| Contact: |
||||
| William L. Prater | Will Fisackerly | |||
| Senior Executive Vice President and | Senior Vice President and | |||
| Chief Financial Officer | Director of Corporate Finance | |||
| 662/680-2536 | 662/680-2475 |
BancorpSouth Announces Third Quarter 2014 Earnings
TUPELO, MS, October 20, 2014/PRNewswire — BancorpSouth, Inc. (NYSE: BXS) today announced financial results for the quarter and nine months ended September 30, 2014.
Highlights for the third quarter of 2014 included:
| • | Net income of $28.8 million or $0.30 per diluted share. |
| • | Net operating income of $30.8 million or $0.32 per diluted share. |
| • | Progress toward remediating Bank Secrecy Act (“BSA”) and anti-money-laundering (“AML”) compliance weaknesses, which resulted in one-time pre-tax costs during the quarter of $3.1 million. |
| • | Generated net loan growth of $198.9 million, or 8.5 percent annualized, which represents the sixth consecutive quarter of net loan growth. |
| • | Net interest margin increased to 3.62 percent from 3.59 percent for the second quarter of 2014. |
| • | Meaningful growth in several non-interest revenue sources, including insurance commission revenue. |
| • | Non-performing loans and leases (“NPLs”) declined $4.7 million, or 6.4 percent, compared to the second quarter of 2014, while non-performing assets (“NPAs”) decreased $17.3 million, or 13.4 percent, over the same period. |
The Company reported net income of $28.8 million, or $0.30 per diluted share, for the third quarter of 2014 compared with net income of $24.9 million, or $0.26 per diluted share, for the third quarter of 2013 and net income of $30.9 million, or $0.32 per diluted share, for the second quarter of 2014. Additionally, the Company reported net income of $88.1 million, or $0.92 per
- MORE -
BancorpSouth, Inc.
Box 789 • Tupelo, MS 38802-0789 • (662) 680-2000
BXS Announces Third Quarter Results
Page 2
October 20, 2014
diluted share, for the first nine months of 2014 compared to $66.4 million, or $0.70 per diluted share, for the first nine months of 2013.
The Company reported net operating income (excluding merger related and other non-operating expenses) of $30.8 million, or $0.32 per diluted share, for the third quarter of 2014 compared to $27.7 million, or $0.29 per diluted share, for the third quarter of 2013 and $31.5 million, or $0.33 per diluted share, for the second quarter of 2014.
The Company incurred pre-tax costs totaling $3.1 million during the quarter related to BSA and AML compliance remediation that are considered to be one-time in nature. This reflects the Company’s estimate of total one-time costs necessary to complete its enhancements to these programs. Annual ongoing costs associated with these programs are expected to total approximately $3 million pre-tax, $0.5 million of which is reflected in the third quarter results.
“Our results for the third quarter reflect continued positive momentum in several core fundamental areas of our company performance,” remarked Dan Rollins, Chairman and Chief Executive Officer. “Our lending team continues to win new business, which resulted in net quarterly loan growth of over eight percent on an annualized basis. We are also pleased with our ability to continue to maintain our net interest margin despite continued pressure on loan yields. Additionally, we benefitted from continued growth in several of our noninterest revenue line items, including insurance commission revenue. With that said, the primary focus of our efforts during the quarter has been on remediating the regulatory concerns identified regarding our BSA and AML processes. We are pleased with the progress that we have made on these efforts and our people continue to work diligently to make the necessary improvements.”
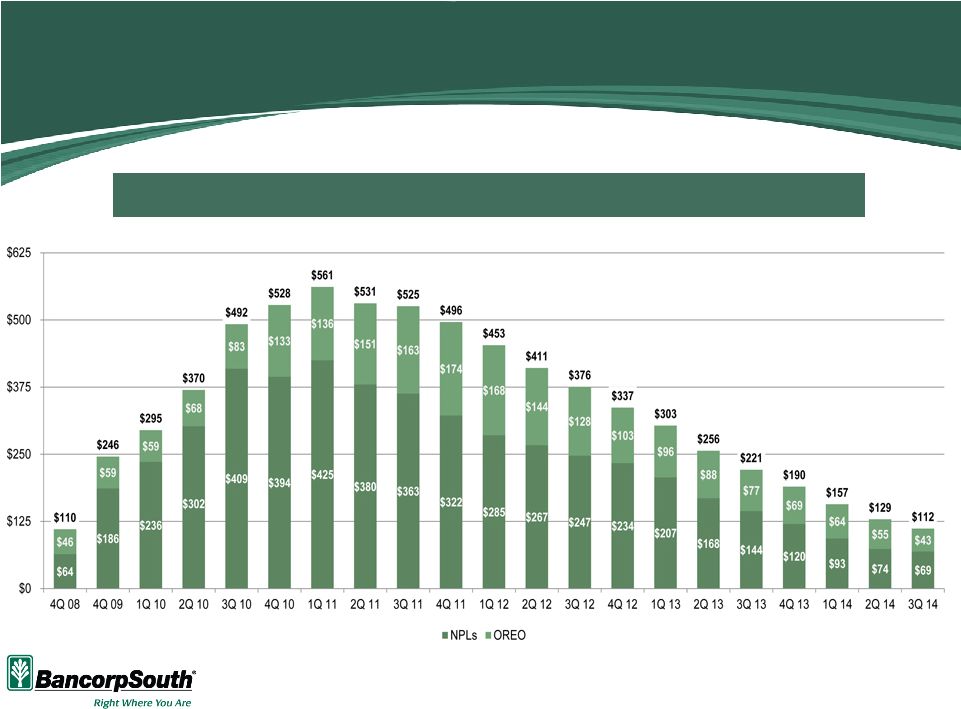
Earnings for the quarter reflect no recorded provision for credit losses, which is consistent with no recorded provision for the second quarter of 2014 and a decline from $0.5 million for the third quarter of 2013. NPLs declined $4.7 million, or 6.4 percent, during the third quarter of 2014 to $68.9 million at September 30, 2014 compared with $73.7 million at June 30, 2014 and declined $75.4 million, or 52.2 percent, from $144.3 million at September 30, 2013. In addition, total NPAs declined $17.3 million, or 13.4 percent, to $111.6 million at September 30, 2014 compared with $128.9 million at June 30, 2014 and declined $109.6 million, or 49.5 percent, from $221.2 million at September 30, 2013. Net charge-offs were $3.2 million for the third quarter of 2014 compared with $2.6 million for the second quarter of 2014 and $7.6 million for the third quarter of 2013.
Net Interest Revenue
Net interest revenue was $105.6 million for the third quarter of 2014, an increase of 5.4 percent from $100.2 million for the third quarter of 2013 and an increase of 2.5 percent from $103.1 million for the second quarter of 2014. The fully taxable equivalent net interest margin was 3.62 percent for the third quarter of 2014 compared to 3.45 percent for the third quarter of 2013 and 3.59 percent for the second quarter of 2014. Yields on loans and leases declined to 4.36 percent for the third quarter of 2014 compared with 4.55 percent for the third quarter of 2013 and 4.38 percent for the second quarter of 2014, while yields on total interest earning assets were relatively flat at 3.89 percent for the third quarter of 2014 compared with 3.85 percent for the
- MORE -
BXS Announces Third Quarter Results
Page 3
October 20, 2014
third quarter of 2013 and 3.88 percent for the second quarter of 2014. The average cost of deposits was 0.28 percent for the third quarter of 2014 compared to 0.36 percent for the third quarter of 2013 and 0.28 percent for the second quarter of 2014.
Asset, Deposit and Loan Activity
Total assets were $13.1 billion at September 30, 2014 compared with $12.9 billion at September 30, 2013. Loans and leases, net of unearned income, were $9.5 billion at September 30, 2014 compared with $8.8 billion at September 30, 2013.
Total deposits were $10.7 billion at both September 30, 2014 and September 30, 2013. The decrease in time deposits of $326.4 million, or 13.6 percent, at September 30, 2014 compared to September 30, 2013 was partially offset by growth in noninterest bearing demand deposits, which increased $213.4 million, or 8.2 percent, over the same period. Additionally, savings deposits increased $91.6 million, or 7.5 percent, while interest bearing demand deposits remained relatively flat, over the same period. As of September 30, 2014, $804.3 million of time deposits were scheduled to mature during the following two quarters at a weighted average rate of 0.89 percent.
Provision for Credit Losses and Allowance for Credit Losses
For the third quarter of 2014, no provision for credit losses was recorded, compared with $0.5 million for the third quarter of 2013 and no recorded provision for the second quarter of 2014. Net charge-offs for the third quarter of 2014 were $3.2 million, compared with $7.6 million for the third quarter of 2013 and $2.6 million for the second quarter of 2014. Recoveries of previously charged-off loans were $3.3 million for the third quarter of 2014, compared with $4.3 million for the third quarter of 2013 and $3.0 million for the second quarter of 2014. Annualized net charge-offs were 0.13 percent of average loans and leases for the third quarter of 2014, compared with 0.35 percent for the third quarter of 2013 and 0.11 percent for the second quarter of 2014.
NPLs were $68.9 million, or 0.72 percent of net loans and leases, at September 30, 2014, compared with $144.3 million, or 1.65 percent of net loans and leases, at September 30, 2013, and $73.7 million, or 0.79 percent of net loans and leases, at June 30, 2014. The allowance for credit losses was $144.0 million, or 1.51 percent of net loans and leases, at September 30, 2014 compared with $154.0 million, or 1.76 percent of net loans and leases, at September 30, 2013 and $147.1 million, or 1.58 percent of net loans and leases, at June 30, 2014.
NPLs at September 30, 2014 consisted primarily of $54.6 million of nonaccrual loans, compared with $64.5 million of nonaccrual loans at June 30, 2014. Payments received on nonaccrual loans during the third quarter of 2014 totaled $11.9 million, compared with payments received on such loans of $12.9 million during the second quarter of 2014. NPLs at September 30, 2014 also included $1.9 million of loans 90 days or more past due and still accruing, compared with $2.4 million of such loans at June 30, 2014, and included restructured loans still accruing of $12.4 million at September 30, 2014, compared with $6.7 million of such loans at June 30, 2014. Early
- MORE -
BXS Announces Third Quarter Results
Page 4
October 20, 2014
stage past due loans, representing loans 30-89 days past due, totaled $24.4 million at September 30, 2014 compared to $28.8 million at June 30, 2014.
Included in nonaccrual loans at September 30, 2014 were $31.7 million of loans, or 58.1 percent of total nonaccrual loans, that were paying as agreed, compared with $36.6 million, or 56.7 percent of total nonaccrual loans, that were paying as agreed at June 30, 2014. These loans were generally placed on nonaccrual status because the collateral values were less than the outstanding balances, and because of uncertainty as to whether the borrowers possessed adequate liquidity or would be able to generate sufficient cash flow to satisfy the debt given the short-fall in collateral values. Such loans are generally deemed to be impaired, with a specific reserve established for the difference in the balance owed and the disposition value of the collateral.
Other real estate owned (“OREO”) decreased $12.6 million to $42.7 million during the third quarter of 2014 from $55.3 million at June 30, 2014. This net decrease reflected $3.5 million of OREO added through foreclosure, offset by sales of OREO of $14.4 million. Write-downs in the value of existing properties were $1.6 million for the third quarter of 2014 compared to $2.2 million for the second quarter of 2014. Sales of OREO during the third quarter of 2014 resulted in a net loss of $3.3 million compared to a net loss of $1.1 million for the second quarter of 2014. At September 30, 2014, OREO was carried at 39.8 percent of the aggregate loan balances at the time of foreclosure, compared with 44.2 percent at June 30, 2014.
Noninterest Revenue
Noninterest revenue was $69.3 million for the third quarter of 2014, compared with $62.5 million for the third quarter of 2013 and $69.8 million for the second quarter of 2014. These results included a positive mortgage servicing rights (“MSR”) valuation adjustment of $0.6 million for the third quarter of 2014 compared with a negative MSR valuation adjustment of $0.2 million for the third quarter of 2013 and a negative MSR valuation adjustment of $2.1 million for the second quarter of 2014.
Excluding the MSR valuation adjustments, net mortgage lending revenue was $6.3 million for the third quarter of 2014, compared with $5.4 million for the third quarter of 2013 and $11.2 million for the second quarter of 2014. Mortgage origination volume for the third quarter of 2014 was $305.7 million, compared with $341.9 million for the third quarter of 2013 and $291.0 million for the second quarter of 2014.
Credit and debit card fee revenue was $9.0 million for the third quarter of 2014, compared with $8.8 million for the third quarter of 2013 and $8.6 million for the second quarter of 2014. Deposit service charge revenue was $13.1 million for the third quarter of 2014, compared with $13.7 million for the third quarter of 2013 and $12.4 million for the second quarter of 2014. Insurance commission revenue was $29.2 million for the third quarter of 2014, compared with $23.8 million for the third quarter of 2013 and $28.6 million for the second quarter of 2014.
- MORE -
BXS Announces Third Quarter Results
Page 5
October 20, 2014
Noninterest Expense
Noninterest expense for the third quarter of 2014 was $133.7 million, compared with $129.4 million for the third quarter of 2013 and $128.0 million for the second quarter of 2014. Salaries and employee benefits expense was $77.5 million for the third quarter of 2014 compared to $73.5 million for the third quarter of 2013 and $74.7 million for the second quarter of 2014. Foreclosed property expense was $5.7 million for the third quarter of 2014 compared with $3.3 million for the third quarter of 2013 and $4.2 million for the second quarter of 2014. Deposit insurance assessments were $2.1 million for the third quarter of 2014 compared to $3.3 million for the third quarter of 2013 and $2.0 million for the second quarter of 2014. Noninterest expense for the third quarter of 2014 includes pre-tax costs totaling $3.1 million related to BSA and AML compliance remediation that are considered to be one-time in nature. This reflects the Company’s estimate of total one-time costs necessary to complete its enhancements to its BSA and AML compliance programs. Noninterest expense for the third quarter of 2013 included pre-tax charges of $2.9 million related to the write-off of unamortized issuance costs associated with the redemption of trust preferred securities and $2.8 million to increase the litigation accrual related to probable losses associated with various legal proceedings.
Capital Management
BancorpSouth is a “well capitalized” financial holding company, as defined by federal regulations, with Tier 1 risk-based capital of 13.18 percent at September 30, 2014 and total risk based capital of 14.43 percent, compared with required minimum levels of 6 percent and 10 percent, respectively, for “well capitalized” classification. The Company’s equity capitalization consists of 100 percent common stock. BancorpSouth’s ratio of shareholders’ equity to assets was 12.32 percent at September 30, 2014, compared with 11.46 percent at September 30, 2013 and 12.24 percent at June 30, 2014. The ratio of tangible shareholders’ equity to tangible assets was 10.14 percent at September 30, 2014, compared with 9.43 percent at September 30, 2013 and 10.03 percent at June 30, 2014.
Transaction Closings and Announcements
On December 18, 2013, BancorpSouth Insurance Services, Inc. acquired the assets of Houston, Texas based GEM Insurance Agencies, LP (“GEM”). GEM was formed in 1954 and produces annual commission revenues of approximately $9 million. As a part of the transaction, the Company’s existing Houston office re-located into GEM’s current office located at 3355 West Alabama Street in Houston. The combined operations are expected to produce annual revenues of approximately $11 million.
On January 8, 2014, the Company announced the signing of a definitive merger agreement with Ouachita Bancshares Corp., parent company of Ouachita Independent Bank (collectively referred to as “OIB”), headquartered in Monroe, Louisiana, pursuant to which Ouachita Bancshares Corp. will be merged with and into the Company. OIB operates 12 full-service banking offices along the I-20 corridor and has loan production offices in Madison, Mississippi and Natchitoches, Louisiana. As of September 30, 2014, OIB, on a consolidated basis, reported total assets of $640.2 million, total loans of $483.0 million and total deposits of $537.6 million. Under the
- MORE -
BXS Announces Third Quarter Results
Page 6
October 20, 2014
terms of the definitive agreement, the Company will issue approximately 3,675,000 shares of the Company’s common stock plus $22.875 million in cash for all outstanding shares of Ouachita Bancshares Corp.’s capital stock, subject to certain conditions and potential adjustments. The terms of the amended agreement provide for a minimum total deal value of $107.5 million but also allow Ouachita Bancshares Corp. to terminate the agreement if the average closing price of the Company’s common stock declines below a certain threshold prior to closing. The merger has been unanimously approved by the Board of Directors of each company and was approved by OIB shareholders on April 8, 2014. On July 21, 2014, the Company announced the merger agreement was extended to allow for additional time to obtain the necessary regulatory approvals and to satisfy all closing conditions. The transaction is expected to close shortly after receiving all required regulatory approvals, although the Company can provide no assurance that the merger will close timely or at all.
On January 21, 2014, the Company announced the signing of a definitive merger agreement with Central Community Corporation, headquartered in Temple, Texas, pursuant to which Central Community Corporation will be merged with and into the Company. Central Community Corporation is the parent company of First State Bank Central Texas (“First State Bank”), which is headquartered in Austin, Texas. First State Bank operates 31 full-service banking offices in central Texas. As of September 30, 2014, Central Community Corporation, on a consolidated basis, reported total assets of $1.4 billion, total loans of $570.7 million and total deposits of $1.1 billion. Under the terms of the definitive agreement, the Company will issue approximately 7,250,000 shares of the Company’s common stock plus $28.5 million in cash for all outstanding shares of Central Community Corporation’s capital stock, subject to certain conditions and potential adjustments. The terms of the amended agreement provide for a minimum total deal value of $191.0 million but also allow Central Community Corporation to terminate the agreement if the average closing price of the Company’s common stock declines below a certain threshold prior to closing. The merger has been unanimously approved by the Board of Directors of each company and was approved by Central Community Corporation shareholders on April 24, 2014. On July 21, 2014, the Company announced the merger agreement was extended to allow for additional time to obtain the necessary regulatory approvals and to satisfy all closing conditions. The transaction is expected to close shortly after receiving all required regulatory approvals, although the Company can provide no assurance that the merger will close timely or at all.
For additional information regarding the status of the merger with Ouachita Bancshares Corp. and the status of the merger with Central Community Corporation, please refer to the Current Report on Form 8-K that was previously filed with the Securities and Exchange Commission (the “SEC”) on July 24, 2014, Part II, Item 5 of the Quarterly Report on Form 10-Q that was previously filed with the SEC on August 6, 2014 and the Current Report on Form 8-K that was previously filed with the SEC on September 4, 2014.
On April 9, 2014, BancorpSouth Insurance Services, Inc. acquired assets of Lafayette, Louisiana based Knox Insurance Group, LLC. Knox was formed in 1972 and currently produces annual revenues of approximately $3 million. Knox will continue to operate under current leadership in Lafayette.
- MORE -
BXS Announces Third Quarter Results
Page 7
October 20, 2014
Summary
Rollins concluded, “Our teammates are working daily to enhance core operating performance. We are seeing the benefits of our sales efforts, as we continue to report meaningful quarter to quarter loan growth as well as growth in several of our noninterest lines of business. We also are working on projects daily that will improve efficiency in quarters and years to come. We are hopeful that our efforts in working through the necessary improvements to our compliance programs will result in a timely resolution to the BSA and AML concerns and ultimately allow us to close our two pending bank transactions.”
Conference Call
BancorpSouth will conduct a conference call to discuss its third quarter 2014 results on October 21, 2014, at 10:00 a.m. (Central Time). Investors may listen via the Internet by accessing BancorpSouth’s website at http://www.bancorpsouth.com. A replay of the conference call will be available at BancorpSouth’s website for at least two weeks following the call.
About BancorpSouth, Inc.
BancorpSouth, Inc. is a financial holding company headquartered in Tupelo, Mississippi, with $13.1 billion in assets. BancorpSouth Bank, a wholly-owned subsidiary of BancorpSouth, Inc., operates approximately 300 commercial banking, mortgage, and insurance locations in Alabama, Arkansas, Florida, Louisiana, Mississippi, Missouri, Tennessee and Texas, including an insurance location in Illinois.
Forward-Looking Statements
Certain statements contained in this news release may not be based upon historical facts and are “forward-looking statements” within the meaning of Section 27A of the Securities Act of 1933, as amended, and Section 21E of the Securities Exchange Act of 1934, as amended. These forward-looking statements may be identified by their reference to a future period or periods or by the use of forward-looking terminology such as “anticipate,” “believe,” “could,” “estimate,” “expect,” “foresee,” “hope,” “intend,” “may,” “might,” “plan,” “will,” or “would” or future or conditional verb tenses and variations or negatives of such terms. These forward-looking statements include, without limitation, those relating to the terms, timing and closings of the proposed mergers with Ouachita Bancshares Corp. and Central Community Corporation, the Company’s ability to satisfy the requirements of the consent order issued by the FDIC and the Mississippi Department of Banking and Consumer Finance (“Mississippi Banking Department”), the Company’s undertaking and performance of the necessary actions to remediate and fully resolve those concerns regarding the Company’s procedures, systems and processes related to certain of its compliance programs, including its Bank Secrecy Act and anti-money-laundering programs, that have been identified by its federal bank regulators, the findings and results of the investigation by the Consumer Financial Protection Bureau (the “CFPB”) of the Company’s fair lending practices, the acceptance by customers of Ouachita Bancshares Corp. and Central Community Corporation of the Company’s products and services if the proposed mergers close, the outcome of any instituted, pending or threatened material litigation, amortization expense for intangible assets, goodwill impairments, loan impairment, utilization of appraisals and inspections for real estate loans, maturity, renewal or extension of construction, acquisition and development loans, net interest revenue, fair value determinations, the amount of the Company’s non-performing loans and leases, additions to OREO, credit quality, credit losses, liquidity, off-balance sheet commitments and arrangements, valuation of mortgage servicing rights, allowance and provision for credit losses, continued weakness in the economic environment, early identification and resolution of credit issues, utilization of non-GAAP financial measures, the ability of the Company to collect all amounts due according to the contractual terms of loan agreements, the Company’s reserve for losses from representation and warranty obligations, the Company’s foreclosure process related to mortgage loans, the resolution of non-performing loans that are collaterally dependent, real estate values, fully-indexed interest rates, interest rate risk, interest rate sensitivity, calculation of economic value of equity, impaired loan charge-offs, troubled debt restructurings, diversification of the Company’s revenue stream, liquidity needs and strategies, sources of funding, net interest margin, declaration and payment of dividends, cost saving initiatives, improvement in the Company’s efficiencies, operating expense trends, future acquisitions and consideration to be used therefor, the impact of litigation regarding debit card fees and the impact of certain claims and ongoing, pending or threatened litigation, administrative and investigatory matters.
The Company cautions readers not to place undue reliance on the forward-looking statements contained in this news release, in that actual results could differ materially from those indicated in such forward-looking statements as a result of a variety of factors. These factors may include, but
- MORE -
BXS Announces Third Quarter Results
Page 8
October 20, 2014
are not limited to, the ability of the Company to resolve to the satisfaction of its federal bank regulators those identified concerns regarding the Company’s procedures, systems and processes related to certain of its compliance programs, including its Bank Secrecy Act and anti-money laundering programs, the Company’s ability to comply with the consent order issued by the FDIC and the Mississippi Banking Department, the findings and results of the CFPB in its review of the Company’s fair lending practices, the ability of the Company, Ouachita Bancshares Corp. and Central Community Corporation to obtain regulatory approval of and close the proposed mergers, the potential impact upon the Company of the delay in the closings of these proposed mergers, the impact of any ongoing, pending or threatened litigation, administrative and investigatory matters involving the Company, conditions in the financial markets and economic conditions generally, the adequacy of the Company’s provision and allowance for credit losses to cover actual credit losses, the credit risk associated with real estate construction, acquisition and development loans, losses resulting from the significant amount of the Company’s OREO, limitations on the Company’s ability to declare and pay dividends, the availability of capital on favorable terms if and when needed, liquidity risk, governmental regulation, including the Dodd-Frank Act, and supervision of the Company’s operations, the short-term and long-term impact of changes to banking capital standards on the Company’s regulatory capital and liquidity, the impact of regulations on service charges on the Company’s core deposit accounts, the susceptibility of the Company’s business to local economic and environmental conditions, the soundness of other financial institutions, changes in interest rates, the impact of monetary policies and economic factors on the Company’s ability to attract deposits or make loans, volatility in capital and credit markets, reputational risk, the impact of the loss of any key Company personnel, the impact of hurricanes or other adverse weather events, any requirement that the Company write down goodwill or other intangible assets, diversification in the types of financial services the Company offers, the Company’s ability to adapt its products and services to evolving industry standards and consumer preferences, competition with other financial services companies, risks in connection with completed or potential acquisitions, the Company’s growth strategy, interruptions or breaches in the Company’s information system security, the failure of certain third-party vendors to perform, unfavorable ratings by rating agencies, dilution caused by the Company’s issuance of any additional shares of its common stock to raise capital or acquire other banks, bank holding companies, financial holding companies and insurance agencies, other factors generally understood to affect the assets, business, cash flows, financial condition, liquidity, prospects and/or results of operations of financial services companies and other factors detailed from time to time in the Company’s press and news releases, reports and other filings with the SEC. Forward-looking statements speak only as of the date that they were made, and, except as required by law, the Company does not undertake any obligation to update or revise forward-looking statements to reflect events or circumstances that occur after the date of this news release.
- MORE -
BXS Announces Third Quarter Results
Page 9
October 20, 2014
BancorpSouth, Inc.
Selected Financial Information
(Dollars in thousands, except per share data)
(Unaudited)
| Quarter Ended 9/30/2014 |
Quarter Ended 6/30/2014 |
Quarter Ended 3/31/2014 |
Quarter Ended 12/31/2013 |
Quarter Ended 9/30/2013 |
||||||||||||||||
| Earnings Summary: |
||||||||||||||||||||
| Interest revenue |
$ | 113,922 | $ | 111,499 | $ | 110,599 | $ | 112,510 | $ | 111,961 | ||||||||||
| Interest expense |
8,309 | 8,418 | 9,076 | 10,093 | 11,720 | |||||||||||||||
|
|
|
|
|
|
|
|
|
|
|
|||||||||||
| Net interest revenue |
105,613 | 103,081 | 101,523 | 102,417 | 100,241 | |||||||||||||||
| Provision for credit losses |
— | — | — | — | 500 | |||||||||||||||
|
|
|
|
|
|
|
|
|
|
|
|||||||||||
| Net interest revenue, after provision for credit losses |
105,613 | 103,081 | 101,523 | 102,417 | 99,741 | |||||||||||||||
| Noninterest revenue |
69,278 | 69,838 | 66,517 | 65,125 | 62,514 | |||||||||||||||
| Noninterest expense |
133,699 | 127,954 | 126,707 | 127,830 | 129,397 | |||||||||||||||
|
|
|
|
|
|
|
|
|
|
|
|||||||||||
| Income before income taxes |
41,192 | 44,965 | 41,333 | 39,712 | 32,858 | |||||||||||||||
| Income tax expense |
12,414 | 14,097 | 12,889 | 12,014 | 8,001 | |||||||||||||||
|
|
|
|
|
|
|
|
|
|
|
|||||||||||
| Net income |
$ | 28,778 | $ | 30,868 | $ | 28,444 | $ | 27,698 | $ | 24,857 | ||||||||||
|
|
|
|
|
|
|
|
|
|
|
|||||||||||
| Balance Sheet - Period End Balances |
||||||||||||||||||||
| Total assets |
$ | 13,071,557 | $ | 12,985,887 | $ | 13,143,555 | $ | 13,029,733 | $ | 12,916,153 | ||||||||||
| Total earning assets |
11,929,416 | 11,794,445 | 11,948,897 | 11,814,060 | 11,765,785 | |||||||||||||||
| Total securities |
2,211,462 | 2,332,192 | 2,426,758 | 2,466,989 | 2,554,156 | |||||||||||||||
| Loans and leases, net of unearned income |
9,510,542 | 9,311,661 | 9,068,376 | 8,958,015 | 8,773,115 | |||||||||||||||
| Allowance for credit losses |
143,950 | 147,132 | 149,704 | 153,236 | 153,974 | |||||||||||||||
| Total deposits |
10,701,537 | 10,670,414 | 10,811,790 | 10,773,836 | 10,717,946 | |||||||||||||||
| Long-term debt |
81,742 | 83,835 | 85,835 | 81,714 | 83,500 | |||||||||||||||
| Total shareholders’ equity |
1,610,543 | 1,588,850 | 1,554,676 | 1,513,130 | 1,480,611 | |||||||||||||||
| Balance Sheet - Average Balances |
||||||||||||||||||||
| Total assets |
$ | 12,987,103 | $ | 12,933,879 | $ | 13,087,128 | $ | 12,955,127 | $ | 12,928,505 | ||||||||||
| Total earning assets |
11,892,493 | 11,825,994 | 11,958,836 | 11,869,072 | 11,846,790 | |||||||||||||||
| Total securities |
2,272,114 | 2,394,045 | 2,452,178 | 2,511,888 | 2,598,786 | |||||||||||||||
| Loans and leases, net of unearned income |
9,393,709 | 9,232,743 | 9,022,155 | 8,830,917 | 8,682,966 | |||||||||||||||
| Total deposits |
10,662,841 | 10,650,077 | 10,825,308 | 10,739,352 | 10,745,945 | |||||||||||||||
| Long-term debt |
81,742 | 83,967 | 87,767 | 81,714 | 62,848 | |||||||||||||||
| Total shareholders’ equity |
1,600,721 | 1,574,588 | 1,537,897 | 1,501,928 | 1,474,047 | |||||||||||||||
| Nonperforming Assets: |
||||||||||||||||||||
| Non-accrual loans and leases |
$ | 54,612 | $ | 64,533 | $ | 77,531 | $ | 92,173 | $ | 121,353 | ||||||||||
| Loans and leases 90+ days past due, still accruing |
1,925 | 2,406 | 1,949 | 1,226 | 1,479 | |||||||||||||||
| Restructured loans and leases, still accruing |
12,398 | 6,712 | 13,776 | 27,007 | 21,502 | |||||||||||||||
|
|
|
|
|
|
|
|
|
|
|
|||||||||||
| Non-performing loans (NPLs) |
68,935 | 73,651 | 93,256 | 120,406 | 144,334 | |||||||||||||||
|
|
|
|
|
|
|
|
|
|
|
|||||||||||
| Other real estate owned |
42,691 | 55,253 | 63,595 | 69,338 | 76,853 | |||||||||||||||
|
|
|
|
|
|
|
|
|
|
|
|||||||||||
| Non-performing assets (NPAs) |
$ | 111,626 | $ | 128,904 | $ | 156,851 | $ | 189,744 | $ | 221,187 | ||||||||||
| Financial Ratios and Other Data: |
||||||||||||||||||||
| Return on average assets |
0.88 | % | 0.96 | % | 0.88 | % | 0.85 | % | 0.76 | % | ||||||||||
| Return on average shareholders’ equity |
7.13 | % | 7.86 | % | 7.50 | % | 7.32 | % | 6.69 | % | ||||||||||
| Return on tangible equity |
8.83 | % | 9.74 | % | 9.28 | % | 9.16 | % | 8.29 | % | ||||||||||
| Pre-tax pre-provision return on average assets |
1.26 | % | 1.39 | % | 1.28 | % | 1.22 | % | 1.02 | % | ||||||||||
| Non-interest income to average assets |
2.12 | % | 2.17 | % | 2.06 | % | 1.99 | % | 1.92 | % | ||||||||||
| Non-interest expense to average assets |
4.08 | % | 3.97 | % | 3.93 | % | 3.91 | % | 3.97 | % | ||||||||||
| Net interest margin-fully taxable equivalent |
3.62 | % | 3.59 | % | 3.54 | % | 3.52 | % | 3.45 | % | ||||||||||
| Net interest rate spread |
3.50 | % | 3.48 | % | 3.43 | % | 3.39 | % | 3.32 | % | ||||||||||
| Efficiency ratio (tax equivalent) |
75.19 | % | 72.76 | % | 74.16 | % | 75.00 | % | 78.11 | % | ||||||||||
| Loan/deposit ratio |
88.87 | % | 87.27 | % | 83.87 | % | 83.15 | % | 81.85 | % | ||||||||||
| Price to earnings mult (avg) |
16.64 | 21.00 | 23.33 | 25.68 | 22.66 | |||||||||||||||
| Market value to book value |
120.13 | % | 148.53 | % | 154.13 | % | 160.04 | % | 128.22 | % | ||||||||||
| Market value to book value (avg) |
129.54 | % | 143.72 | % | 150.43 | % | 143.60 | % | 126.22 | % | ||||||||||
| Market value to tangible book value |
149.58 | % | 185.73 | % | 192.80 | % | 201.69 | % | 159.50 | % | ||||||||||
| Market value to tangible book value (avg) |
161.30 | % | 179.75 | % | 188.17 | % | 180.98 | % | 157.02 | % | ||||||||||
| Headcount FTE |
3,938 | 3,981 | 3,981 | 4,005 | 3,994 | |||||||||||||||
- MORE -
BXS Announces Third Quarter Results
Page 10
October 20, 2014
BancorpSouth, Inc.
Selected Financial Information
(Dollars in thousands, except per share data)
(Unaudited)
| Quarter Ended 9/30/2014 |
Quarter Ended 6/30/2014 |
Quarter Ended 3/31/2014 |
Quarter Ended 12/31/2013 |
Quarter Ended 9/30/2013 |
||||||||||||||||
| Credit Quality Ratios: |
||||||||||||||||||||
| Net charge-offs to average loans and leases (annualized) |
0.13 | % | 0.11 | % | 0.16 | % | 0.03 | % | 0.35 | % | ||||||||||
| Provision for credit losses to average loans and leases (annualized) |
0.00 | % | 0.00 | % | 0.00 | % | 0.00 | % | 0.02 | % | ||||||||||
| Allowance for credit losses to net loans and leases |
1.51 | % | 1.58 | % | 1.65 | % | 1.71 | % | 1.76 | % | ||||||||||
| Allowance for credit losses to non-performing loans and leases |
208.82 | % | 199.77 | % | 160.53 | % | 127.27 | % | 106.68 | % | ||||||||||
| Allowance for credit losses to non-performing assets |
128.96 | % | 114.14 | % | 95.44 | % | 80.76 | % | 69.61 | % | ||||||||||
| Non-performing loans and leases to net loans and leases |
0.72 | % | 0.79 | % | 1.03 | % | 1.34 | % | 1.65 | % | ||||||||||
| Non-performing assets to net loans and leases |
1.17 | % | 1.38 | % | 1.73 | % | 2.12 | % | 2.52 | % | ||||||||||
| Equity Ratios: |
||||||||||||||||||||
| Total shareholders’ equity to total assets |
12.32 | % | 12.24 | % | 11.83 | % | 11.61 | % | 11.46 | % | ||||||||||
| Tangible shareholders’ equity to tangible assets |
10.14 | % | 10.03 | % | 9.69 | % | 9.44 | % | 9.43 | % | ||||||||||
| Capital Adequacy: |
||||||||||||||||||||
| Tier 1 capital |
13.18 | % | 13.09 | % | 13.18 | % | 12.99 | % | 13.25 | % | ||||||||||
| Total capital |
14.43 | % | 14.35 | % | 14.44 | % | 14.25 | % | 14.50 | % | ||||||||||
| Tier 1 leverage capital |
10.47 | % | 10.33 | % | 10.04 | % | 9.93 | % | 9.93 | % | ||||||||||
| Estimated for current quarter |
||||||||||||||||||||
| Common Share Data: |
||||||||||||||||||||
| Basic earnings per share |
$ | 0.30 | $ | 0.32 | $ | 0.30 | $ | 0.29 | $ | 0.26 | ||||||||||
| Diluted earnings per share |
0.30 | 0.32 | 0.30 | 0.29 | 0.26 | |||||||||||||||
| Cash dividends per share |
0.08 | 0.05 | 0.05 | 0.05 | 0.05 | |||||||||||||||
| Book value per share |
16.77 | 16.54 | 16.19 | 15.89 | 15.55 | |||||||||||||||
| Tangible book value per share |
13.46 | 13.23 | 12.95 | 12.60 | 12.50 | |||||||||||||||
| Market value per share (last) |
20.14 | 24.57 | 24.96 | 25.42 | 19.94 | |||||||||||||||
| Market value per share (high) |
25.43 | 25.55 | 26.24 | 25.54 | 20.77 | |||||||||||||||
| Market value per share (low) |
20.11 | 22.16 | 22.46 | 19.64 | 17.76 | |||||||||||||||
| Market value per share (avg) |
21.72 | 23.78 | 24.36 | 22.81 | 19.63 | |||||||||||||||
| Dividend payout ratio |
25.03 | % | 15.56 | % | 16.80 | % | 17.19 | % | 19.15 | % | ||||||||||
| Total shares outstanding |
96,065,021 | 96,046,057 | 96,004,679 | 95,231,691 | 95,211,602 | |||||||||||||||
| Average shares outstanding - basic |
96,052,260 | 96,034,475 | 95,629,890 | 95,217,203 | 95,201,238 | |||||||||||||||
| Average shares outstanding - diluted |
96,373,950 | 96,373,121 | 95,952,611 | 95,644,383 | 95,519,318 | |||||||||||||||
| Yield/Rate: |
||||||||||||||||||||
| (Taxable equivalent basis) |
||||||||||||||||||||
| Loans, loans held for sale, and leases net of unearned income |
4.36 | % | 4.38 | % | 4.48 | % | 4.52 | % | 4.55 | % | ||||||||||
| Available-for-sale securities: |
||||||||||||||||||||
| Taxable |
1.42 | % | 1.45 | % | 1.50 | % | 1.51 | % | 1.50 | % | ||||||||||
| Tax-exempt |
5.37 | % | 5.44 | % | 5.58 | % | 5.52 | % | 5.61 | % | ||||||||||
| Short-term investments |
0.22 | % | 0.24 | % | 0.25 | % | 0.25 | % | 0.25 | % | ||||||||||
| Total interest earning assets and revenue |
3.89 | % | 3.88 | % | 3.85 | % | 3.86 | % | 3.85 | % | ||||||||||
| Deposits: |
0.28 | % | 0.28 | % | 0.31 | % | 0.34 | % | 0.36 | % | ||||||||||
| Demand - interest bearing |
0.17 | % | 0.17 | % | 0.17 | % | 0.18 | % | 0.18 | % | ||||||||||
| Savings |
0.12 | % | 0.12 | % | 0.13 | % | 0.13 | % | 0.12 | % | ||||||||||
| Other time |
0.96 | % | 0.97 | % | 1.06 | % | 1.13 | % | 1.18 | % | ||||||||||
| Short-term borrowings |
0.10 | % | 0.09 | % | 0.07 | % | 0.07 | % | 0.07 | % | ||||||||||
| Total int bearing dep & s/t borrowings |
0.36 | % | 0.37 | % | 0.39 | % | 0.43 | % | 0.45 | % | ||||||||||
| Junior subordinated debt |
2.81 | % | 2.81 | % | 2.86 | % | 2.96 | % | 6.57 | % | ||||||||||
| Long-term debt |
2.85 | % | 2.84 | % | 2.91 | % | 2.94 | % | 3.19 | % | ||||||||||
| Total interest bearing liabilities and expense |
0.39 | % | 0.40 | % | 0.42 | % | 0.46 | % | 0.53 | % | ||||||||||
| Interest bearing liabilities to interest earning assets |
71.07 | % | 71.98 | % | 73.51 | % | 72.91 | % | 74.15 | % | ||||||||||
| Net interest tax equivalent adjustment |
$ | 2,810 | $ | 2,860 | $ | 2,823 | $ | 2,893 | $ | 2,905 | ||||||||||
- MORE -
BXS Announces Third Quarter Results
Page 11
October 20, 2014
BancorpSouth, Inc.
Consolidated Balance Sheets
(Unaudited)
| Sep-14 | Jun-14 | Mar-14 | Dec-13 | Sep-13 | ||||||||||||||||
| (Dollars in thousands) | ||||||||||||||||||||
| Assets |
||||||||||||||||||||
| Cash and due from banks |
$ | 169,226 | $ | 201,196 | $ | 199,214 | $ | 208,961 | $ | 199,464 | ||||||||||
| Interest bearing deposits with other banks |
70,408 | 44,949 | 390,896 | 319,462 | 361,401 | |||||||||||||||
| Available-for-sale securities, at fair value |
2,211,462 | 2,332,192 | 2,426,758 | 2,466,989 | 2,554,156 | |||||||||||||||
| Loans and leases |
9,546,250 | 9,347,429 | 9,103,850 | 8,993,888 | 8,806,392 | |||||||||||||||
| Less: Unearned income |
35,708 | 35,768 | 35,474 | 35,873 | 33,277 | |||||||||||||||
| Allowance for credit losses |
143,950 | 147,132 | 149,704 | 153,236 | 153,974 | |||||||||||||||
|
|
|
|
|
|
|
|
|
|
|
|||||||||||
| Net loans and leases |
9,366,592 | 9,164,529 | 8,918,672 | 8,804,779 | 8,619,141 | |||||||||||||||
| Loans held for sale |
137,005 | 105,643 | 62,867 | 69,593 | 77,114 | |||||||||||||||
| Premises and equipment, net |
307,497 | 310,515 | 314,367 | 315,260 | 314,441 | |||||||||||||||
| Accrued interest receivable |
42,311 | 40,697 | 42,666 | 42,150 | 43,034 | |||||||||||||||
| Goodwill |
291,498 | 291,498 | 286,800 | 286,800 | 275,173 | |||||||||||||||
| Other identifiable intangibles |
25,619 | 26,745 | 25,021 | 26,079 | 15,179 | |||||||||||||||
| Bank owned life insurance |
243,827 | 241,962 | 240,077 | 239,434 | 236,969 | |||||||||||||||
| Other real estate owned |
42,691 | 55,253 | 63,595 | 69,338 | 76,853 | |||||||||||||||
| Other assets |
163,421 | 170,708 | 172,622 | 180,888 | 143,228 | |||||||||||||||
|
|
|
|
|
|
|
|
|
|
|
|||||||||||
| Total Assets |
$ | 13,071,557 | $ | 12,985,887 | $ | 13,143,555 | $ | 13,029,733 | $ | 12,916,153 | ||||||||||
|
|
|
|
|
|
|
|
|
|
|
|||||||||||
| Liabilities |
||||||||||||||||||||
| Deposits: |
||||||||||||||||||||
| Demand: Noninterest bearing |
$ | 2,811,156 | $ | 2,718,242 | $ | 2,725,042 | $ | 2,644,592 | $ | 2,597,762 | ||||||||||
| Interest bearing |
4,498,275 | 4,511,760 | 4,583,481 | 4,582,450 | 4,493,359 | |||||||||||||||
| Savings |
1,311,874 | 1,299,203 | 1,297,344 | 1,234,130 | 1,220,227 | |||||||||||||||
| Other time |
2,080,232 | 2,141,209 | 2,205,923 | 2,312,664 | 2,406,598 | |||||||||||||||
|
|
|
|
|
|
|
|
|
|
|
|||||||||||
| Total deposits |
10,701,537 | 10,670,414 | 10,811,790 | 10,773,836 | 10,717,946 | |||||||||||||||
| Federal funds purchased and securities sold under agreement to repurchase |
431,428 | 394,446 | 456,303 | 421,028 | 418,623 | |||||||||||||||
| Short-term Federal Home Loan Bank borrowings and other short-term borrowing |
2,000 | 2,000 | — | — | — | |||||||||||||||
| Accrued interest payable |
3,894 | 3,926 | 4,050 | 4,836 | 5,156 | |||||||||||||||
| Junior subordinated debt securities |
23,198 | 23,198 | 23,198 | 31,446 | 31,446 | |||||||||||||||
| Long-term debt |
81,742 | 83,835 | 85,835 | 81,714 | 83,500 | |||||||||||||||
| Other liabilities |
217,215 | 219,218 | 207,703 | 203,743 | 178,871 | |||||||||||||||
|
|
|
|
|
|
|
|
|
|
|
|||||||||||
| Total Liabilities |
11,461,014 | 11,397,037 | 11,588,879 | 11,516,603 | 11,435,542 | |||||||||||||||
| Shareholders’ Equity |
||||||||||||||||||||
| Common stock |
240,165 | 240,118 | 240,012 | 238,079 | 238,029 | |||||||||||||||
| Capital surplus |
322,488 | 321,952 | 320,969 | 312,900 | 312,798 | |||||||||||||||
| Accumulated other comprehensive loss |
(15,513 | ) | (15,040 | ) | (22,060 | ) | (29,959 | ) | (39,389 | ) | ||||||||||
| Retained earnings |
1,063,403 | 1,041,820 | 1,015,755 | 992,110 | 969,173 | |||||||||||||||
|
|
|
|
|
|
|
|
|
|
|
|||||||||||
| Total Shareholders’ Equity |
1,610,543 | 1,588,850 | 1,554,676 | 1,513,130 | 1,480,611 | |||||||||||||||
|
|
|
|
|
|
|
|
|
|
|
|||||||||||
| Total Liabilities & Shareholders’ Equity |
$ | 13,071,557 | $ | 12,985,887 | $ | 13,143,555 | $ | 13,029,733 | $ | 12,916,153 | ||||||||||
|
|
|
|
|
|
|
|
|
|
|
|||||||||||
- MORE -
BXS Announces Third Quarter Results
Page 12
October 20, 2014
BancorpSouth, Inc.
Consolidated Average Balance Sheets
(Unaudited)
| Sep-14 | Jun-14 | Mar-14 | Dec-13 | Sep-13 | ||||||||||||||||
| (Dollars in thousands) | ||||||||||||||||||||
| Assets |
||||||||||||||||||||
| Cash and due from banks |
$ | 155,876 | $ | 157,813 | $ | 168,056 | $ | 163,948 | $ | 163,322 | ||||||||||
| Interest bearing deposits with other banks |
120,707 | 145,530 | 449,207 | 471,695 | 487,075 | |||||||||||||||
| Available-for-sale securities, at fair value |
2,272,114 | 2,394,045 | 2,452,178 | 2,511,888 | 2,598,786 | |||||||||||||||
| Loans and leases |
9,430,043 | 9,269,469 | 9,058,081 | 8,864,983 | 8,715,894 | |||||||||||||||
| Less: Unearned income |
36,334 | 36,726 | 35,926 | 34,066 | 32,928 | |||||||||||||||
| Allowance for credit losses |
146,592 | 149,676 | 153,615 | 153,443 | 160,609 | |||||||||||||||
|
|
|
|
|
|
|
|
|
|
|
|||||||||||
| Net loans and leases |
9,247,117 | 9,083,067 | 8,868,540 | 8,677,474 | 8,522,357 | |||||||||||||||
| Loans held for sale |
105,964 | 53,676 | 35,297 | 54,572 | 77,964 | |||||||||||||||
| Premises and equipment, net |
309,373 | 313,012 | 315,804 | 315,174 | 312,724 | |||||||||||||||
| Accrued interest receivable |
38,758 | 38,291 | 39,336 | 39,665 | 39,354 | |||||||||||||||
| Goodwill |
291,498 | 293,082 | 286,800 | 279,091 | 275,173 | |||||||||||||||
| Other identifiable intangibles |
26,031 | 25,271 | 25,420 | 18,658 | 15,446 | |||||||||||||||
| Bank owned life insurance |
242,718 | 240,736 | 239,969 | 237,657 | 235,708 | |||||||||||||||
| Other real estate owned |
49,123 | 60,822 | 69,086 | 77,211 | 86,545 | |||||||||||||||
| Other assets |
127,824 | 128,534 | 137,435 | 108,094 | 114,051 | |||||||||||||||
|
|
|
|
|
|
|
|
|
|
|
|||||||||||
| Total Assets |
$ | 12,987,103 | $ | 12,933,879 | $ | 13,087,128 | $ | 12,955,127 | $ | 12,928,505 | ||||||||||
|
|
|
|
|
|
|
|
|
|
|
|||||||||||
| Liabilities |
||||||||||||||||||||
| Deposits: |
||||||||||||||||||||
| Demand: Noninterest bearing |
$ | 2,766,626 | $ | 2,683,939 | $ | 2,647,376 | $ | 2,667,667 | $ | 2,551,812 | ||||||||||
| Interest bearing |
4,480,008 | 4,492,495 | 4,657,785 | 4,484,269 | 4,530,219 | |||||||||||||||
| Savings |
1,308,184 | 1,298,829 | 1,260,838 | 1,224,588 | 1,216,599 | |||||||||||||||
| Other time |
2,108,023 | 2,174,814 | 2,259,309 | 2,362,828 | 2,447,315 | |||||||||||||||
|
|
|
|
|
|
|
|
|
|
|
|||||||||||
| Total deposits |
10,662,841 | 10,650,077 | 10,825,308 | 10,739,352 | 10,745,945 | |||||||||||||||
| Federal funds purchased and securities sold under agreement to repurchase |
444,017 | 435,505 | 458,436 | 469,245 | 441,807 | |||||||||||||||
| Short-term Federal Home Loan Bank borrowings and other short-term borrowing |
6,489 | 3,621 | — | — | — | |||||||||||||||
| Accrued interest payable |
3,940 | 3,926 | 4,400 | 5,051 | 5,391 | |||||||||||||||
| Junior subordinated debt securities |
23,198 | 23,198 | 23,748 | 31,446 | 86,074 | |||||||||||||||
| Long-term debt |
81,742 | 83,967 | 87,767 | 81,714 | 62,848 | |||||||||||||||
| Other liabilities |
164,155 | 158,997 | 149,572 | 126,391 | 112,393 | |||||||||||||||
|
|
|
|
|
|
|
|
|
|
|
|||||||||||
| Total Liabilities |
11,386,382 | 11,359,291 | 11,549,231 | 11,453,199 | 11,454,458 | |||||||||||||||
| Shareholders’ Equity |
||||||||||||||||||||
| Common stock |
240,123 | 240,071 | 238,853 | 238,038 | 237,997 | |||||||||||||||
| Capital surplus |
322,219 | 321,628 | 314,117 | 312,835 | 312,349 | |||||||||||||||
| Accumulated other comprehensive loss |
(14,827 | ) | (16,663 | ) | (23,644 | ) | (32,267 | ) | (43,695 | ) | ||||||||||
| Retained earnings |
1,053,206 | 1,029,552 | 1,008,571 | 983,322 | 967,396 | |||||||||||||||
|
|
|
|
|
|
|
|
|
|
|
|||||||||||
| Total Shareholders’ Equity |
1,600,721 | 1,574,588 | 1,537,897 | 1,501,928 | 1,474,047 | |||||||||||||||
|
|
|
|
|
|
|
|
|
|
|
|||||||||||
| Total Liabilities & Shareholders’ Equity |
$ | 12,987,103 | $ | 12,933,879 | $ | 13,087,128 | $ | 12,955,127 | $ | 12,928,505 | ||||||||||
|
|
|
|
|
|
|
|
|
|
|
|||||||||||
- MORE -
BXS Announces Third Quarter Results
Page 13
October 20, 2014
BancorpSouth, Inc.
Consolidated Condensed Statements of Income
(Dollars in thousands, except per share data)
(Unaudited)
| Quarter Ended | Year Ended | |||||||||||||||||||||||||||
| Sep-14 | Jun-14 | Mar-14 | Dec-13 | Sep-13 | Sep-14 | Sep-13 | ||||||||||||||||||||||
| INTEREST REVENUE: |
||||||||||||||||||||||||||||
| Loans and leases |
$ | 102,681 | $ | 99,962 | $ | 98,744 | $ | 99,989 | $ | 98,836 | $ | 301,387 | $ | 296,452 | ||||||||||||||
| Deposits with other banks |
68 | 87 | 276 | 299 | 310 | 431 | 1,395 | |||||||||||||||||||||
| Available-for-sale securities: |
||||||||||||||||||||||||||||
| Taxable |
6,646 | 7,133 | 7,547 | 7,963 | 8,218 | 21,326 | 25,323 | |||||||||||||||||||||
| Tax-exempt |
3,607 | 3,669 | 3,715 | 3,810 | 3,866 | 10,991 | 11,737 | |||||||||||||||||||||
| Loans held for sale |
920 | 648 | 317 | 449 | 731 | 1,885 | 2,090 | |||||||||||||||||||||
|
|
|
|
|
|
|
|
|
|
|
|
|
|
|
|||||||||||||||
| Total interest revenue |
113,922 | 111,499 | 110,599 | 112,510 | 111,961 | 336,020 | 336,997 | |||||||||||||||||||||
|
|
|
|
|
|
|
|
|
|
|
|
|
|
|
|||||||||||||||
| INTEREST EXPENSE: |
||||||||||||||||||||||||||||
| Interest bearing demand |
1,956 | 1,905 | 1,920 | 2,036 | 2,061 | 5,781 | 7,609 | |||||||||||||||||||||
| Savings |
410 | 402 | 391 | 387 | 383 | 1,203 | 1,318 | |||||||||||||||||||||
| Other time |
5,083 | 5,249 | 5,890 | 6,746 | 7,271 | 16,222 | 22,983 | |||||||||||||||||||||
| Federal funds purchased and securities sold under agreement to repurchase |
84 | 80 | 78 | 84 | 80 | 242 | 213 | |||||||||||||||||||||
| Long-term debt |
612 | 619 | 629 | 605 | 501 | 1,860 | 1,204 | |||||||||||||||||||||
| Junior subordinated debt |
164 | 162 | 168 | 235 | 1,424 | 494 | 7,141 | |||||||||||||||||||||
| Other |
— | 1 | — | — | — | 1 | (3 | ) | ||||||||||||||||||||
|
|
|
|
|
|
|
|
|
|
|
|
|
|
|
|||||||||||||||
| Total interest expense |
8,309 | 8,418 | 9,076 | 10,093 | 11,720 | 25,803 | 40,465 | |||||||||||||||||||||
|
|
|
|
|
|
|
|
|
|
|
|
|
|
|
|||||||||||||||
| Net interest revenue |
105,613 | 103,081 | 101,523 | 102,417 | 100,241 | 310,217 | 296,532 | |||||||||||||||||||||
| Provision for credit losses |
— | — | — | — | 500 | — | 7,500 | |||||||||||||||||||||
|
|
|
|
|
|
|
|
|
|
|
|
|
|
|
|||||||||||||||
| Net interest revenue, after provision for credit losses |
105,613 | 103,081 | 101,523 | 102,417 | 99,741 | 310,217 | 289,032 | |||||||||||||||||||||
|
|
|
|
|
|
|
|
|
|
|
|
|
|
|
|||||||||||||||
| NONINTEREST REVENUE: |
||||||||||||||||||||||||||||
| Mortgage lending |
6,938 | 9,089 | 3,394 | 9,605 | 5,134 | 19,421 | 35,372 | |||||||||||||||||||||
| Credit card, debit card and merchant fees |
8,972 | 8,567 | 7,843 | 8,324 | 8,834 | 25,382 | 24,681 | |||||||||||||||||||||
| Deposit service charges |
13,111 | 12,437 | 12,536 | 13,570 | 13,679 | 38,084 | 39,335 | |||||||||||||||||||||
| Security gains (losses), net |
18 | 5 | (4 | ) | 29 | (5 | ) | 19 | 17 | |||||||||||||||||||
| Insurance commissions |
29,246 | 28,621 | 31,599 | 21,397 | 23,800 | 89,466 | 76,303 | |||||||||||||||||||||
| Wealth Management |
5,961 | 5,828 | 5,916 | 5,320 | 6,057 | 17,705 | 17,646 | |||||||||||||||||||||
| Other |
5,032 | 5,291 | 5,233 | 6,880 | 5,015 | 15,556 | 16,587 | |||||||||||||||||||||
|
|
|
|
|
|
|
|
|
|
|
|
|
|
|
|||||||||||||||
| Total noninterest revenue |
69,278 | 69,838 | 66,517 | 65,125 | 62,514 | 205,633 | 209,941 | |||||||||||||||||||||
|
|
|
|
|
|
|
|
|
|
|
|
|
|
|
|||||||||||||||
| NONINTEREST EXPENSE: |
||||||||||||||||||||||||||||
| Salaries and employee benefits |
77,453 | 74,741 | 78,883 | 75,466 | 73,532 | 231,077 | 242,080 | |||||||||||||||||||||
| Occupancy, net of rental income |
10,313 | 10,245 | 10,287 | 9,935 | 10,360 | 30,845 | 31,174 | |||||||||||||||||||||
| Equipment |
4,205 | 4,169 | 4,499 | 4,298 | 4,555 | 12,873 | 14,088 | |||||||||||||||||||||
| Deposit insurance assessments |
2,125 | 2,035 | 1,600 | 2,687 | 3,325 | 5,760 | 9,068 | |||||||||||||||||||||
| Write-off and amortization of bond issue cost |
12 | 12 | 12 | 12 | 2,907 | 36 | 2,983 | |||||||||||||||||||||
| Other |
39,591 | 36,752 | 31,426 | 35,432 | 34,718 | 107,769 | 107,626 | |||||||||||||||||||||
|
|
|
|
|
|
|
|
|
|
|
|
|
|
|
|||||||||||||||
| Total noninterest expenses |
133,699 | 127,954 | 126,707 | 127,830 | 129,397 | 388,360 | 407,019 | |||||||||||||||||||||
|
|
|
|
|
|
|
|
|
|
|
|
|
|
|
|||||||||||||||
| Income before income taxes |
41,192 | 44,965 | 41,333 | 39,712 | 32,858 | 127,490 | 91,954 | |||||||||||||||||||||
| Income tax expense |
12,414 | 14,097 | 12,889 | 12,014 | 8,001 | 39,400 | 25,537 | |||||||||||||||||||||
|
|
|
|
|
|
|
|
|
|
|
|
|
|
|
|||||||||||||||
| Net income |
$ | 28,778 | $ | 30,868 | $ | 28,444 | $ | 27,698 | $ | 24,857 | $ | 88,090 | $ | 66,417 | ||||||||||||||
|
|
|
|
|
|
|
|
|
|
|
|
|
|
|
|||||||||||||||
| Net income per share: Basic |
$ | 0.30 | $ | 0.32 | $ | 0.30 | $ | 0.29 | $ | 0.26 | $ | 0.92 | $ | 0.70 | ||||||||||||||
|
|
|
|
|
|
|
|
|
|
|
|
|
|
|
|||||||||||||||
| Diluted |
$ | 0.30 | $ | 0.32 | $ | 0.30 | $ | 0.29 | $ | 0.26 | $ | 0.92 | $ | 0.70 | ||||||||||||||
|
|
|
|
|
|
|
|
|
|
|
|
|
|
|
|||||||||||||||
- MORE -
BXS Announces Third Quarter Results
Page 14
October 20, 2014
BancorpSouth, Inc.
Selected Loan Data
(Dollars in thousands)
(Unaudited)
| Quarter Ended | ||||||||||||||||||||
| Sep-14 | Jun-14 | Mar-14 | Dec-13 | Sep-13 | ||||||||||||||||
| LOAN AND LEASE PORTFOLIO: |
||||||||||||||||||||
| Commercial and industrial |
$ | 1,714,012 | $ | 1,699,803 | $ | 1,581,251 | $ | 1,529,249 | $ | 1,503,809 | ||||||||||
| Real estate |
||||||||||||||||||||
| Consumer mortgages |
2,191,265 | 2,071,503 | 2,047,001 | 1,976,073 | 1,931,171 | |||||||||||||||
| Home equity |
518,263 | 506,988 | 498,283 | 494,339 | 490,361 | |||||||||||||||
| Agricultural |
242,023 | 238,003 | 229,602 | 234,576 | 234,547 | |||||||||||||||
| Commercial and industrial-owner occupied |
1,508,679 | 1,505,679 | 1,488,380 | 1,473,320 | 1,422,077 | |||||||||||||||
| Construction, acquisition and development |
819,636 | 772,162 | 748,027 | 741,458 | 723,609 | |||||||||||||||
| Commercial real estate |
1,916,577 | 1,901,759 | 1,847,983 | 1,846,039 | 1,795,352 | |||||||||||||||
| Credit cards |
109,464 | 109,186 | 105,988 | 111,328 | 105,112 | |||||||||||||||
| All other |
490,623 | 506,578 | 521,861 | 551,633 | 567,077 | |||||||||||||||
|
|
|
|
|
|
|
|
|
|
|
|||||||||||
| Total loans |
$ | 9,510,542 | $ | 9,311,661 | $ | 9,068,376 | $ | 8,958,015 | $ | 8,773,115 | ||||||||||
|
|
|
|
|
|
|
|
|
|
|
|||||||||||
| ALLOWANCE FOR CREDIT LOSSES: |
||||||||||||||||||||
| Balance, beginning of period |
$ | 147,132 | $ | 149,704 | $ | 153,236 | $ | 153,974 | $ | 161,047 | ||||||||||
| Loans and leases charged off: |
||||||||||||||||||||
| Commercial and industrial |
(306 | ) | (860 | ) | (201 | ) | (837 | ) | (889 | ) | ||||||||||
| Real estate |
||||||||||||||||||||
| Consumer mortgages |
(1,510 | ) | (1,682 | ) | (1,945 | ) | (1,435 | ) | (2,996 | ) | ||||||||||
| Home equity |
(510 | ) | (438 | ) | (318 | ) | (287 | ) | (379 | ) | ||||||||||
| Agricultural |
(47 | ) | (18 | ) | (696 | ) | (238 | ) | (169 | ) | ||||||||||
| Commercial and industrial-owner occupied |
(1,229 | ) | (936 | ) | (1,206 | ) | (1,041 | ) | (1,684 | ) | ||||||||||
| Construction, acquisition and development |
(1,458 | ) | (41 | ) | (1,666 | ) | (1,784 | ) | (1,727 | ) | ||||||||||
| Commercial real estate |
(70 | ) | (361 | ) | (901 | ) | (1,039 | ) | (2,441 | ) | ||||||||||
| Credit cards |
(612 | ) | (608 | ) | (559 | ) | (559 | ) | (750 | ) | ||||||||||
| All other |
(743 | ) | (671 | ) | (583 | ) | (1,108 | ) | (837 | ) | ||||||||||
|
|
|
|
|
|
|
|
|
|
|
|||||||||||
| Total loans charged off |
(6,485 | ) | (5,615 | ) | (8,075 | ) | (8,328 | ) | (11,872 | ) | ||||||||||
|
|
|
|
|
|
|
|
|
|
|
|||||||||||
| Recoveries: |
||||||||||||||||||||
| Commercial and industrial |
565 | 359 | 1,076 | 1,361 | 820 | |||||||||||||||
| Real estate |
||||||||||||||||||||
| Consumer mortgages |
952 | 956 | 538 | 1,735 | 1,516 | |||||||||||||||
| Home equity |
157 | 182 | 184 | 97 | 66 | |||||||||||||||
| Agricultural |
45 | 26 | 9 | 34 | 48 | |||||||||||||||
| Commercial and industrial-owner occupied |
460 | 78 | 358 | 734 | 297 | |||||||||||||||
| Construction, acquisition and development |
392 | 808 | 1,637 | 2,483 | 953 | |||||||||||||||
| Commercial real estate |
286 | 226 | 323 | 784 | 221 | |||||||||||||||
| Credit cards |
116 | 135 | 131 | 133 | 164 | |||||||||||||||
| All other |
330 | 273 | 287 | 229 | 214 | |||||||||||||||
|
|
|
|
|
|
|
|
|
|
|
|||||||||||
| Total recoveries |
3,303 | 3,043 | 4,543 | 7,590 | 4,299 | |||||||||||||||
|
|
|
|
|
|
|
|
|
|
|
|||||||||||
| Net charge-offs |
(3,182 | ) | (2,572 | ) | (3,532 | ) | (738 | ) | (7,573 | ) | ||||||||||
| Provision charged to operating expense |
— | — | — | — | 500 | |||||||||||||||
|
|
|
|
|
|
|
|
|
|
|
|||||||||||
| Balance, end of period |
$ | 143,950 | $ | 147,132 | $ | 149,704 | $ | 153,236 | $ | 153,974 | ||||||||||
|
|
|
|
|
|
|
|
|
|
|
|||||||||||
| Average loans for period |
$ | 9,393,709 | $ | 9,232,743 | $ | 9,022,155 | $ | 8,830,917 | $ | 8,682,966 | ||||||||||
|
|
|
|
|
|
|
|
|
|
|
|||||||||||
| Ratio: |
||||||||||||||||||||
| Net charge-offs to average loans (annualized) |
0.13 | % | 0.11 | % | 0.16 | % | 0.03 | % | 0.35 | % | ||||||||||
|
|
|
|
|
|
|
|
|
|
|
|||||||||||
- MORE -
BXS Announces Third Quarter Results
Page 15
October 20, 2014
BancorpSouth, Inc.
Selected Loan Data
(Dollars in thousands)
(Unaudited)
| Quarter Ended | ||||||||||||||||||||
| Sep-14 | Jun-14 | Mar-14 | Dec-13 | Sep-13 | ||||||||||||||||
| NON-PERFORMING ASSETS |
||||||||||||||||||||
| NON-PERFORMING LOANS AND LEASES: |
||||||||||||||||||||
| Nonaccrual Loans and Leases |
||||||||||||||||||||
| Commercial and industrial |
$ | 2,786 | $ | 2,917 | $ | 3,023 | $ | 3,079 | $ | 5,498 | ||||||||||
| Real estate |
||||||||||||||||||||
| Consumer mortgages |
23,408 | 24,355 | 24,353 | 25,645 | 30,569 | |||||||||||||||
| Home equity |
2,073 | 2,116 | 2,740 | 3,695 | 3,287 | |||||||||||||||
| Agricultural |
638 | 595 | 651 | 1,260 | 4,086 | |||||||||||||||
| Commercial and industrial-owner occupied |
7,495 | 11,094 | 14,122 | 18,568 | 18,138 | |||||||||||||||
| Construction, acquisition and development |
6,070 | 9,202 | 9,968 | 17,567 | 26,127 | |||||||||||||||
| Commercial real estate |
11,102 | 13,406 | 21,496 | 20,972 | 31,468 | |||||||||||||||
| Credit cards |
168 | 132 | 168 | 119 | 196 | |||||||||||||||
| All other |
872 | 716 | 1,010 | 1,268 | 1,984 | |||||||||||||||
|
|
|
|
|
|
|
|
|
|
|
|||||||||||
| Total nonaccrual loans and leases |
$ | 54,612 | $ | 64,533 | $ | 77,531 | $ | 92,173 | $ | 121,353 | ||||||||||
|
|
|
|
|
|
|
|
|
|
|
|||||||||||
| Loans and Leases 90+ Days Past Due, Still Accruing: |
||||||||||||||||||||
| Commercial and industrial |
$ | 60 | $ | 302 | $ | 287 | $ | 27 | $ | 15 | ||||||||||
| Real estate |
||||||||||||||||||||
| Consumer mortgages |
1,590 | 1,607 | 1,307 | 888 | 1,178 | |||||||||||||||
| Home equity |
20 | 116 | 12 | — | — | |||||||||||||||
| Agricultural |
— | 100 | — | — | — | |||||||||||||||
| Commercial and industrial-owner occupied |
— | — | — | — | — | |||||||||||||||
| Construction, acquisition and development |
— | — | — | — | — | |||||||||||||||
| Commercial real estate |
— | — | — | 311 | — | |||||||||||||||
| Credit cards |
255 | 281 | 297 | — | 263 | |||||||||||||||
| All other |
— | — | 46 | — | 23 | |||||||||||||||
|
|
|
|
|
|
|
|
|
|
|
|||||||||||
| Total loans and leases 90+ days past due, still accruing |
1,925 | 2,406 | 1,949 | 1,226 | 1,479 | |||||||||||||||
|
|
|
|
|
|
|
|
|
|
|
|||||||||||
| Restructured Loans and Leases, Still Accruing |
12,398 | 6,712 | 13,776 | 27,007 | 21,502 | |||||||||||||||
|
|
|
|
|
|
|
|
|
|
|
|||||||||||
| Total non-performing loans and leases |
68,935 | 73,651 | 93,256 | 120,406 | 144,334 | |||||||||||||||
|
|
|
|
|
|
|
|
|
|
|
|||||||||||
| OTHER REAL ESTATE OWNED: |
42,691 | 55,253 | 63,595 | 69,338 | 76,853 | |||||||||||||||
|
|
|
|
|
|
|
|
|
|
|
|||||||||||
| Total Non-performing Assets |
$ | 111,626 | $ | 128,904 | $ | 156,851 | $ | 189,744 | $ | 221,187 | ||||||||||
|
|
|
|
|
|
|
|
|
|
|
|||||||||||
| Additions to Nonaccrual Loans and Leases During the Quarter |
$ | 16,707 | $ | 13,748 | $ | 22,479 | $ | 18,556 | $ | 21,182 | ||||||||||
|
|
|
|
|
|
|
|
|
|
|
|||||||||||
| Loans and Leases 30-89 Days Past Due, Still Accruing: |
||||||||||||||||||||
| Commercial and industrial |
$ | 3,753 | $ | 3,605 | $ | 2,616 | $ | 2,817 | $ | 1,909 | ||||||||||
| Real estate |
||||||||||||||||||||
| Consumer mortgages |
13,013 | 11,448 | 12,236 | 14,150 | 10,914 | |||||||||||||||
| Home equity |
1,315 | 960 | 1,587 | 1,828 | 1,278 | |||||||||||||||
| Agricultural |
190 | 1,122 | 302 | 495 | 761 | |||||||||||||||
| Commercial and industrial-owner occupied |
2,364 | 6,340 | 3,248 | 4,081 | 1,995 | |||||||||||||||
| Construction, acquisition and development |
1,036 | 1,616 | 2,848 | 1,993 | 3,920 | |||||||||||||||
| Commercial real estate |
926 | 1,658 | 3,953 | 5,574 | 5,818 | |||||||||||||||
| Credit cards |
602 | 556 | 592 | 655 | 688 | |||||||||||||||
| All other |
1,196 | 1,490 | 963 | 2,189 | 1,634 | |||||||||||||||
|
|
|
|
|
|
|
|
|
|
|
|||||||||||
| Total Loans and Leases 30-89 days past due, still accruing |
$ | 24,395 | $ | 28,795 | $ | 28,345 | $ | 33,782 | $ | 28,917 | ||||||||||
|
|
|
|
|
|
|
|
|
|
|
|||||||||||
| Credit Quality Ratios: |
||||||||||||||||||||
| Provision for credit losses to average loans and leases (annualized) |
0.00 | % | 0.00 | % | 0.00 | % | 0.00 | % | 0.02 | % | ||||||||||
| Allowance for credit losses to net loans and leases |
1.51 | % | 1.58 | % | 1.65 | % | 1.71 | % | 1.76 | % | ||||||||||
| Allowance for credit losses to non-performing loans and leases |
208.82 | % | 199.77 | % | 160.53 | % | 127.27 | % | 106.68 | % | ||||||||||
| Allowance for credit losses to non-performing assets |
128.96 | % | 114.14 | % | 95.44 | % | 80.76 | % | 69.61 | % | ||||||||||
| Non-performing loans and leases to net loans and leases |
0.72 | % | 0.79 | % | 1.03 | % | 1.34 | % | 1.65 | % | ||||||||||
| Non-performing assets to net loans and leases |
1.17 | % | 1.38 | % | 1.73 | % | 2.12 | % | 2.52 | % | ||||||||||
- MORE -
BXS Announces Third Quarter Results
Page 16
October 20, 2014
BancorpSouth, Inc.
Selected Loan Data
(Dollars in thousands)
(Unaudited)
| Quarter Ended | ||||||||||||||||||||
| Sep-14 | Jun-14 | Mar-14 | Dec-13 | Sep-13 | ||||||||||||||||
| REAL ESTATE CONSTRUCTION, ACQUISITION AND DEVELOPMENT (“CAD”) PORTFOLIO: |
||||||||||||||||||||
| Outstanding Balance |
||||||||||||||||||||
| Multi-family construction |
$ | 24,076 | $ | 15,874 | $ | 11,339 | $ | 7,702 | $ | 7,974 | ||||||||||
| One-to-four family construction |
220,066 | 226,252 | 221,790 | 224,286 | 203,988 | |||||||||||||||
| Recreation and all other loans |
33,015 | 35,364 | 36,897 | 36,868 | 41,762 | |||||||||||||||
| Commercial construction |
245,734 | 192,605 | 177,264 | 150,847 | 139,041 | |||||||||||||||
| Commercial acquisition and development |
121,439 | 122,380 | 122,051 | 128,157 | 136,206 | |||||||||||||||
| Residential acquisition and development |
175,306 | 179,687 | 178,686 | 193,598 | 194,638 | |||||||||||||||
|
|
|
|
|
|
|
|
|
|
|
|||||||||||
| Total outstanding balance |
$ | 819,636 | $ | 772,162 | $ | 748,027 | $ | 741,458 | $ | 723,609 | ||||||||||
|
|
|
|
|
|
|
|
|
|
|
|||||||||||
| Nonaccrual CAD Loans |
||||||||||||||||||||
| Multi-family construction |
$ | — | $ | — | $ | — | $ | — | $ | — | ||||||||||
| One-to-four family construction |
1,239 | 2,603 | 2,824 | 2,937 | 3,249 | |||||||||||||||
| Recreation and all other loans |
1,060 | 981 | 919 | 728 | 782 | |||||||||||||||
| Commercial construction |
— | — | — | 865 | 1,686 | |||||||||||||||
| Commercial acquisition and development |
2,033 | 1,835 | 2,224 | 6,890 | 11,150 | |||||||||||||||
| Residential acquisition and development |
3,086 | 3,783 | 4,001 | 6,147 | 9,260 | |||||||||||||||
|
|
|
|
|
|
|
|
|
|
|
|||||||||||
| Total nonaccrual CAD loans |
$ | 7,418 | $ | 9,202 | $ | 9,968 | $ | 17,567 | $ | 26,127 | ||||||||||
|
|
|
|
|
|
|
|
|
|
|
|||||||||||
| CAD Loans 90+ Days Past Due, Still Accruing: |
||||||||||||||||||||
| Multi-family construction |
$ | — | $ | — | $ | — | $ | — | $ | — | ||||||||||
| One-to-four family construction |
— | — | — | — | — | |||||||||||||||
| Recreation and all other loans |
— | — | — | — | — | |||||||||||||||
| Commercial construction |
— | — | — | — | — | |||||||||||||||
| Commercial acquisition and development |
— | — | — | — | — | |||||||||||||||
| Residential acquisition and development |
— | — | — | — | — | |||||||||||||||
|
|
|
|
|
|
|
|
|
|
|
|||||||||||
| Total CAD loans 90+ days past due, still accruing |
$ | — | $ | — | $ | — | $ | — | $ | — | ||||||||||
|
|
|
|
|
|
|
|
|
|
|
|||||||||||
| Restructured CAD Loans, Still Accruing |
||||||||||||||||||||
| Multi-family construction |
$ | — | $ | — | $ | — | $ | — | $ | — | ||||||||||
| One-to-four family construction |
— | — | — | 1,274 | 1,028 | |||||||||||||||
| Recreation and all other loans |
10 | 11 | 13 | 13 | 15 | |||||||||||||||
| Commercial construction |
— | — | — | 346 | 348 | |||||||||||||||
| Commercial acquisition and development |
391 | 395 | 402 | 1,990 | 2,010 | |||||||||||||||
| Residential acquisition and development |
947 | 700 | 1,192 | 3,111 | 3,162 | |||||||||||||||
|
|
|
|
|
|
|
|
|
|
|
|||||||||||
| Total restructured CAD loans, still accruing |
$ | 1,348 | $ | 1,106 | $ | 1,607 | $ | 6,734 | $ | 6,563 | ||||||||||
|
|
|
|
|
|
|
|
|
|
|
|||||||||||
| Total Non-performing CAD loans |
$ | 8,766 | $ | 10,308 | $ | 11,575 | $ | 24,301 | $ | 32,690 | ||||||||||
|
|
|
|
|
|
|
|
|
|
|
|||||||||||
| CAD NPL as a % of Outstanding CAD Balance |
||||||||||||||||||||
| Multi-family construction |
— | — | — | — | — | |||||||||||||||
| One-to-four family construction |
0.6 | % | 1.2 | % | 1.3 | % | 1.9 | % | 2.1 | % | ||||||||||
| Recreation and all other loans |
3.2 | % | 2.8 | % | 2.5 | % | 2.0 | % | 1.9 | % | ||||||||||
| Commercial construction |
0.0 | % | 0.0 | % | 0.0 | % | 0.8 | % | 1.5 | % | ||||||||||
| Commercial acquisition and development |
2.0 | % | 1.8 | % | 2.2 | % | 6.9 | % | 9.7 | % | ||||||||||
| Residential acquisition and development |
2.3 | % | 2.5 | % | 2.9 | % | 4.8 | % | 6.4 | % | ||||||||||
| Total CAD NPL as a % of outstanding CAD balance |
1.1 | % | 1.3 | % | 1.5 | % | 3.3 | % | 4.5 | % | ||||||||||
- MORE -
BXS Announces Third Quarter Results
Page 17
October 20, 2014
BancorpSouth, Inc.
Selected Loan Data
(Dollars in thousands)
(Unaudited)
| September 30, 2014 | ||||||||||||||||||||||||||||
| Pass | Special Mention |
Substandard | Doubtful | Loss | Impaired | Total | ||||||||||||||||||||||
| LOAN PORTFOLIO BY INTERNALLY ASSIGNED GRADE: |
||||||||||||||||||||||||||||
| Commercial and industrial |
$ | 1,685,887 | $ | 994 | $ | 25,536 | $ | 341 | $ | — | $ | 1,254 | $ | 1,714,012 | ||||||||||||||
| Real estate |
||||||||||||||||||||||||||||
| Consumer mortgages |
2,098,275 | — | 88,742 | — | — | 4,248 | 2,191,265 | |||||||||||||||||||||
| Home equity |
507,884 | — | 9,752 | — | — | 627 | 518,263 | |||||||||||||||||||||
| Agricultural |
227,546 | 500 | 13,711 | — | — | 266 | 242,023 | |||||||||||||||||||||
| Commercial and industrial-owner occupied |
1,443,345 | 3,685 | 57,572 | 142 | — | 3,935 | 1,508,679 | |||||||||||||||||||||
| Construction, acquisition and development |
776,197 | 255 | 39,310 | 342 | — | 3,532 | 819,636 | |||||||||||||||||||||
| Commercial real estate |
1,850,212 | — | 57,393 | 189 | — | 8,783 | 1,916,577 | |||||||||||||||||||||
| Credit cards |
109,464 | — | — | — | — | — | 109,464 | |||||||||||||||||||||
| All other |
471,065 | — | 19,382 | — | — | 176 | 490,623 | |||||||||||||||||||||
|
|
|
|
|
|
|
|
|
|
|
|
|
|
|
|||||||||||||||
| Total loans |
$ | 9,169,875 | $ | 5,434 | $ | 311,398 | $ | 1,014 | $ | — | $ | 22,821 | $ | 9,510,542 | ||||||||||||||
|
|
|
|
|
|
|
|
|
|
|
|
|
|
|
|||||||||||||||
| June 30, 2014 | ||||||||||||||||||||||||||||
| Pass | Special Mention |
Substandard | Doubtful | Loss | Impaired | Total | ||||||||||||||||||||||
| LOAN PORTFOLIO BY INTERNALLY ASSIGNED GRADE: |
||||||||||||||||||||||||||||
| Commercial and industrial |
$ | 1,650,893 | $ | 16,307 | $ | 31,157 | $ | — | $ | — | $ | 1,446 | $ | 1,699,803 | ||||||||||||||
| Real estate |
||||||||||||||||||||||||||||
| Consumer mortgages |
1,983,165 | — | 82,769 | — | — | 5,569 | 2,071,503 | |||||||||||||||||||||
| Home equity |
496,451 | — | 9,903 | — | — | 634 | 506,988 | |||||||||||||||||||||
| Agricultural |
224,337 | 509 | 12,724 | — | — | 433 | 238,003 | |||||||||||||||||||||
| Commercial and industrial-owner occupied |
1,435,618 | 3,782 | 61,508 | 342 | — | 4,429 | 1,505,679 | |||||||||||||||||||||
| Construction, acquisition and development |
721,572 | 255 | 43,238 | 576 | — | 6,521 | 772,162 | |||||||||||||||||||||
| Commercial real estate |
1,814,209 | — | 76,286 | 350 | — | 10,914 | 1,901,759 | |||||||||||||||||||||
| Credit cards |
109,186 | — | — | — | — | — | 109,186 | |||||||||||||||||||||
| All other |
495,292 | — | 11,104 | — | — | 182 | 506,578 | |||||||||||||||||||||
|
|
|
|
|
|
|
|
|
|
|
|
|
|
|
|||||||||||||||
| Total loans |
$ | 8,930,723 | $ | 20,853 | $ | 328,689 | $ | 1,268 | $ | — | $ | 30,128 | $ | 9,311,661 | ||||||||||||||
|
|
|
|
|
|
|
|
|
|
|
|
|
|
|
|||||||||||||||
- MORE -
BXS Announces Third Quarter Results
Page 18
October 20, 2014
BancorpSouth, Inc.
Geographical Information
(Dollars in thousands)
(Unaudited)
| September 30, 2014 | ||||||||||||||||||||||||||||||||||||
| Alabama and Florida Panhandle |
Arkansas* | Mississippi* | Missouri | Greater Memphis Area |
Tennessee* | Texas and Louisiana |
Corporate Banking and Other |
Total | ||||||||||||||||||||||||||||
| LOAN AND LEASE PORTFOLIO: |
||||||||||||||||||||||||||||||||||||
| Commercial and industrial |
$ | 78,447 | $ | 184,004 | $ | 295,398 | $ | 21,656 | $ | 22,151 | $ | 87,812 | $ | 301,052 | $ | 723,492 | $ | 1,714,012 | ||||||||||||||||||
| Real estate |
||||||||||||||||||||||||||||||||||||
| Consumer mortgages |
179,069 | 276,898 | 709,536 | 68,573 | 111,936 | 166,424 | 541,041 | 137,788 | 2,191,265 | |||||||||||||||||||||||||||
| Home equity |
70,133 | 40,706 | 168,679 | 21,146 | 70,006 | 80,539 | 64,831 | 2,223 | 518,263 | |||||||||||||||||||||||||||
| Agricultural |
7,204 | 73,145 | 55,899 | 3,065 | 13,757 | 11,895 | 72,511 | 4,547 | 242,023 | |||||||||||||||||||||||||||
| Commercial and industrial-owner occupied |
177,765 | 169,198 | 463,012 | 66,224 | 91,349 | 90,381 | 319,516 | 131,234 | 1,508,679 | |||||||||||||||||||||||||||
| Construction, acquisition and development |
120,547 | 71,224 | 214,651 | 21,009 | 74,120 | 116,058 | 173,894 | 28,133 | 819,636 | |||||||||||||||||||||||||||
| Commercial real estate |
273,560 | 329,167 | 281,569 | 198,130 | 108,243 | 110,457 | 427,991 | 187,460 | 1,916,577 | |||||||||||||||||||||||||||
| Credit cards |
— | — | — | — | — | — | — | 109,464 | 109,464 | |||||||||||||||||||||||||||
| All other |
27,508 | 41,794 | 127,743 | 3,453 | 35,378 | 34,717 | 72,335 | 147,695 | 490,623 | |||||||||||||||||||||||||||
|
|
|
|
|
|
|
|
|
|
|
|
|
|
|
|
|
|
|
|||||||||||||||||||
| Total loans |
$ | 934,233 | $ | 1,186,136 | $ | 2,316,487 | $ | 403,256 | $ | 526,940 | $ | 698,283 | $ | 1,973,171 | $ | 1,472,036 | $ | 9,510,542 | ||||||||||||||||||
|
|
|
|
|
|
|
|
|
|
|
|
|
|
|
|
|
|
|
|||||||||||||||||||
| CAD PORTFOLIO: |
||||||||||||||||||||||||||||||||||||
| Multi-family construction |
$ | 11,151 | $ | 1,122 | $ | 5 | $ | — | $ | — | $ | 8,725 | $ | 3,073 | $ | — | $ | 24,076 | ||||||||||||||||||
| One-to-four family construction |
39,432 | 14,450 | 50,009 | 3,883 | 11,238 | 58,286 | 42,309 | 459 | 220,066 | |||||||||||||||||||||||||||
| Recreation and all other loans |
887 | 6,221 | 11,813 | 564 | 4,186 | 1,680 | 7,664 | — | 33,015 | |||||||||||||||||||||||||||
| Commercial construction |
34,593 | 19,576 | 68,862 | 5,764 | 20,493 | 23,762 | 50,426 | 22,258 | 245,734 | |||||||||||||||||||||||||||
| Commercial acquisition and development |
10,514 | 15,986 | 35,132 | 5,450 | 17,617 | 7,906 | 27,227 | 1,607 | 121,439 | |||||||||||||||||||||||||||
| Residential acquisition and development |
23,970 | 13,869 | 48,830 | 5,348 | 20,586 | 15,699 | 43,195 | 3,809 | 175,306 | |||||||||||||||||||||||||||
|
|
|
|
|
|
|
|
|
|
|
|
|
|
|
|
|
|
|
|||||||||||||||||||
| Total CAD loans |
$ | 120,547 | $ | 71,224 | $ | 214,651 | $ | 21,009 | $ | 74,120 | $ | 116,058 | $ | 173,894 | $ | 28,133 | $ | 819,636 | ||||||||||||||||||
|
|
|
|
|
|
|
|
|
|
|
|
|
|
|
|
|
|
|
|||||||||||||||||||
| NON-PERFORMING LOANS AND LEASES: |
||||||||||||||||||||||||||||||||||||
| Commercial and industrial |
$ | 1,306 | $ | 1,104 | $ | 365 | $ | — | $ | 25 | $ | 164 | $ | 557 | $ | 214 | $ | 3,735 | ||||||||||||||||||
| Real estate |
||||||||||||||||||||||||||||||||||||
| Consumer mortgages |
1,871 | 1,301 | 6,573 | 1,126 | 2,940 | 2,183 | 2,375 | 8,951 | 27,320 | |||||||||||||||||||||||||||
| Home equity |
515 | 1 | 373 | — | 283 | 408 | 529 | 2 | 2,111 | |||||||||||||||||||||||||||
| Agricultural |
100 | 18 | 210 | 266 | — | 37 | 16 | — | 647 | |||||||||||||||||||||||||||
| Commercial and industrial-owner occupied |
816 | 3,569 | 5,574 | 102 | 663 | 763 | 453 | 4 | 11,944 | |||||||||||||||||||||||||||
| Construction, acquisition and development |
1,514 | 64 | 2,466 | — | 1,459 | 355 | 1,558 | 2 | 7,418 | |||||||||||||||||||||||||||
| Commercial real estate |
2,053 | 119 | 1,692 | 635 | 3,285 | 3,665 | 943 | 867 | 13,259 | |||||||||||||||||||||||||||
| Credit cards |
— | — | — | — | — | — | — | 1,418 | 1,418 | |||||||||||||||||||||||||||
| All other |
— | 46 | 382 | — | 10 | 334 | 296 | 15 | 1,083 | |||||||||||||||||||||||||||
|
|
|
|
|
|
|
|
|
|
|
|
|
|
|
|
|
|
|
|||||||||||||||||||
| Total loans |
$ | 8,175 | $ | 6,222 | $ | 17,635 | $ | 2,129 | $ | 8,665 | $ | 7,909 | $ | 6,727 | $ | 11,473 | $ | 68,935 | ||||||||||||||||||
|
|
|
|
|
|
|
|
|
|
|
|
|
|
|
|
|
|
|
|||||||||||||||||||
| NON-PERFORMING LOANS AND LEASES AS A PERCENTAGE OF OUTSTANDING: |
||||||||||||||||||||||||||||||||||||
| Commercial and industrial |
1.66 | % | 0.60 | % | 0.12 | % | 0.00 | % | 0.11 | % | 0.19 | % | 0.19 | % | 0.03 | % | 0.22 | % | ||||||||||||||||||
| Real estate |
||||||||||||||||||||||||||||||||||||
| Consumer mortgages |
1.04 | % | 0.47 | % | 0.93 | % | 1.64 | % | 2.63 | % | 1.31 | % | 0.44 | % | 6.50 | % | 1.25 | % | ||||||||||||||||||
| Home equity |
0.73 | % | 0.00 | % | 0.22 | % | 0.00 | % | 0.40 | % | 0.51 | % | 0.82 | % | 0.09 | % | 0.41 | % | ||||||||||||||||||
| Agricultural |
1.39 | % | 0.02 | % | 0.38 | % | 8.68 | % | 0.00 | % | 0.31 | % | 0.02 | % | 0.00 | % | 0.27 | % | ||||||||||||||||||
| Commercial and industrial-owner occupied |
0.46 | % | 2.11 | % | 1.20 | % | 0.15 | % | 0.73 | % | 0.84 | % | 0.14 | % | 0.00 | % | 0.79 | % | ||||||||||||||||||
| Construction, acquisition and development |
1.26 | % | 0.09 | % | 1.15 | % | 0.00 | % | 1.97 | % | 0.31 | % | 0.90 | % | 0.01 | % | 0.91 | % | ||||||||||||||||||
| Commercial real estate |
0.75 | % | 0.04 | % | 0.60 | % | 0.32 | % | 3.03 | % | 3.32 | % | 0.22 | % | 0.46 | % | 0.69 | % | ||||||||||||||||||
| Credit cards |
— | — | — | — | — | — | — | 1.30 | % | 1.30 | % | |||||||||||||||||||||||||
| All other |
0.00 | % | 0.11 | % | 0.30 | % | 0.00 | % | 0.03 | % | 0.96 | % | 0.41 | % | 0.01 | % | 0.22 | % | ||||||||||||||||||
|
|
|
|
|
|
|
|
|
|
|
|
|
|
|
|
|
|
|
|||||||||||||||||||
| Total loans |
0.88 | % | 0.52 | % | 0.76 | % | 0.53 | % | 1.64 | % | 1.13 | % | 0.34 | % | 0.78 | % | 0.72 | % | ||||||||||||||||||
|
|
|
|
|
|
|
|
|
|
|
|
|
|
|
|
|
|
|
|||||||||||||||||||
| * | Excludes the Greater Memphis Area. |
- MORE -
BXS Announces Third Quarter Results
Page 19
October 20, 2014
BancorpSouth, Inc.
Selected Additional Information
(Dollars in thousands)
(Unaudited)
| September 30, 2014 | ||||||||||||||||||||||||||||||||||||
| Alabama and Florida Panhandle |
Arkansas* | Mississippi* | Missouri | Greater Memphis Area |
Tennessee* | Texas and Louisiana |
Other | Total | ||||||||||||||||||||||||||||
| OTHER REAL ESTATE OWNED: |
||||||||||||||||||||||||||||||||||||
| Commercial and industrial |
$ | 84 | $ | — | $ | — | $ | — | $ | — | $ | — | $ | — | $ | — | $ | 84 | ||||||||||||||||||
| Real estate |
||||||||||||||||||||||||||||||||||||
| Consumer mortgages |
809 | 97 | 1,777 | — | — | 173 | 29 | — | 2,885 | |||||||||||||||||||||||||||
| Home equity |
— | — | 188 | — | — | — | — | — | 188 | |||||||||||||||||||||||||||
| Agricultural |
— | — | 216 | — | 462 | — | — | 678 | ||||||||||||||||||||||||||||
| Commercial and industrial-owner occupied |
— | — | 2,456 | — | 601 | 238 | 60 | — | 3,355 | |||||||||||||||||||||||||||
| Construction, acquisition and development |
8,318 | 83 | 9,957 | 37 | 12,156 | 2,817 | 140 | — | 33,508 | |||||||||||||||||||||||||||
| Commercial real estate |
796 | 288 | 646 | — | — | 121 | — | — | 1,851 | |||||||||||||||||||||||||||
| All other |
— | — | 142 | — | — | — | — | — | 142 | |||||||||||||||||||||||||||
|
|
|
|
|
|
|
|
|
|
|
|
|
|
|
|
|
|
|
|||||||||||||||||||
| Total loans |
$ | 10,007 | $ | 468 | $ | 15,382 | $ | 37 | $ | 13,219 | $ | 3,349 | $ | 229 | $ | — | $ | 42,691 | ||||||||||||||||||
|
|
|
|
|
|
|
|
|
|
|
|
|
|
|
|
|
|
|
|||||||||||||||||||
| Quarter Ended | ||||||||||||||||||||
| Sep-14 | Jun-14 | Mar-14 | Dec-13 | Sep-13 | ||||||||||||||||
| OTHER REAL ESTATE OWNED: |
||||||||||||||||||||
| Balance, beginning of period |
$ | 55,253 | $ | 63,595 | $ | 69,338 | $ | 76,853 | $ | 88,438 | ||||||||||
| Additions to foreclosed properties |
||||||||||||||||||||
| New foreclosed property |
3,476 | 4,144 | 4,855 | 7,868 | 9,536 | |||||||||||||||
| Reductions in foreclosed properties |
||||||||||||||||||||
| Sales |
(14,429 | ) | (10,269 | ) | (8,767 | ) | (14,272 | ) | (19,333 | ) | ||||||||||
| Writedowns |
(1,609 | ) | (2,217 | ) | (1,831 | ) | (1,111 | ) | (1,788 | ) | ||||||||||
|
|
|
|
|
|
|
|
|
|
|
|||||||||||
| Balance, end of period |
$ | 42,691 | $ | 55,253 | $ | 63,595 | $ | 69,338 | $ | 76,853 | ||||||||||
|
|
|
|
|
|
|
|
|
|
|
|||||||||||
| FORECLOSED PROPERTY EXPENSE |
||||||||||||||||||||
| Loss on sale of other real estate owned |
$ | 3,289 | $ | 1,073 | $ | 466 | $ | 949 | $ | 352 | ||||||||||
| Writedown of other real estate owned |
1,609 | 2,217 | 1,831 | 1,111 | 1,788 | |||||||||||||||
| Other foreclosed property expense |
823 | 912 | 258 | 771 | 1,158 | |||||||||||||||
|
|
|
|
|
|
|
|
|
|
|
|||||||||||
| Total foreclosed property expense |
$ | 5,721 | $ | 4,202 | $ | 2,555 | $ | 2,831 | $ | 3,298 | ||||||||||
|
|
|
|
|
|
|
|
|
|
|
|||||||||||
| * | Excludes the Greater Memphis Area. |
- MORE -
BXS Announces Third Quarter Results
Page 20
October 20, 2014
BancorpSouth, Inc.
Noninterest Revenue and Expense
(Dollars in thousands)
(Unaudited)
| Quarter Ended | ||||||||||||||||||||
| Sep-14 | Jun-14 | Mar-14 | Dec-13 | Sep-13 | ||||||||||||||||
| NONINTEREST REVENUE: |
||||||||||||||||||||
| Mortgage lending |
$ | 6,938 | $ | 9,089 | $ | 3,394 | $ | 9,605 | $ | 5,134 | ||||||||||
| Credit card, debit card and merchant fees |
8,972 | 8,567 | 7,843 | 8,324 | 8,834 | |||||||||||||||
| Service charges |
13,111 | 12,437 | 12,536 | 13,570 | 13,679 | |||||||||||||||
| Securities gains, net |
18 | 5 | (4 | ) | 29 | (5 | ) | |||||||||||||
| Insurance commissions |
29,246 | 28,621 | 31,599 | 21,397 | 23,800 | |||||||||||||||
| Trust income |
3,537 | 3,624 | 3,568 | 3,717 | 3,332 | |||||||||||||||
| Annuity fees |
461 | 695 | 772 | 566 | 719 | |||||||||||||||
| Brokerage commissions and fees |
1,963 | 1,509 | 1,576 | 1,037 | 2,005 | |||||||||||||||
| Bank-owned life insurance |
1,865 | 1,885 | 1,849 | 2,466 | 1,954 | |||||||||||||||
| Other miscellaneous income |
3,167 | 3,406 | 3,384 | 4,414 | 3,062 | |||||||||||||||
|
|
|
|
|
|
|
|
|
|
|
|||||||||||
| Total noninterest revenue |
$ | 69,278 | $ | 69,838 | $ | 66,517 | $ | 65,125 | $ | 62,514 | ||||||||||
|
|
|
|
|
|
|
|
|
|
|
|||||||||||
| NONINTEREST EXPENSE: |
||||||||||||||||||||
| Salaries and employee benefits |
$ | 77,453 | $ | 74,741 | $ | 78,883 | $ | 75,466 | $ | 73,532 | ||||||||||
| Occupancy, net of rental income |
10,313 | 10,245 | 10,287 | 9,935 | 10,360 | |||||||||||||||
| Equipment |
4,205 | 4,169 | 4,499 | 4,298 | 4,555 | |||||||||||||||
| Deposit insurance assessments |
2,125 | 2,035 | 1,600 | 2,687 | 3,325 | |||||||||||||||
| Amortization of bond issue cost |
12 | 12 | 12 | 12 | 2,907 | |||||||||||||||
| Advertising |
1,192 | 1,331 | 632 | 1,436 | 1,210 | |||||||||||||||
| Foreclosed property expense |
5,721 | 4,202 | 2,555 | 2,831 | 3,298 | |||||||||||||||
| Telecommunications |
2,254 | 2,258 | 2,248 | 1,971 | 2,227 | |||||||||||||||
| Public relations |
950 | 857 | 822 | 972 | 1,105 | |||||||||||||||
| Data processing |
2,734 | 2,863 | 2,741 | 2,939 | 2,772 | |||||||||||||||
| Computer software |
2,488 | 2,851 | 2,423 | 2,197 | 2,190 | |||||||||||||||
| Amortization of intangibles |
1,126 | 1,148 | 1,058 | 819 | 686 | |||||||||||||||
| Legal |
2,620 | 3,002 | 1,878 | 2,537 | 4,626 | |||||||||||||||
| Merger expense |
188 | 1,009 | 560 | — | — | |||||||||||||||
| Postage and shipping |
1,103 | 1,116 | 1,287 | 1,133 | 1,027 | |||||||||||||||
| Other miscellaneous expense |
19,215 | 16,115 | 15,222 | 18,597 | 15,577 | |||||||||||||||
|
|
|
|
|
|
|
|
|
|
|
|||||||||||
| Total noninterest expense |
$ | 133,699 | $ | 127,954 | $ | 126,707 | $ | 127,830 | $ | 129,397 | ||||||||||
|
|
|
|
|
|
|
|
|
|
|
|||||||||||
| INSURANCE COMMISSIONS: |
||||||||||||||||||||
| Property and casualty commissions |
$ | 22,746 | $ | 21,576 | $ | 19,987 | $ | 15,588 | $ | 18,372 | ||||||||||
| Life and health commissions |
5,128 | 5,549 | 5,010 | 4,525 | 4,061 | |||||||||||||||
| Risk management income |
708 | 617 | 705 | 648 | 628 | |||||||||||||||
| Other |
664 | 879 | 5,897 | 636 | 739 | |||||||||||||||
|
|
|
|
|
|
|
|
|
|
|
|||||||||||
| Total insurance commissions |
$ | 29,246 | $ | 28,621 | $ | 31,599 | $ | 21,397 | $ | 23,800 | ||||||||||
|
|
|
|
|
|
|
|
|
|
|
|||||||||||
- MORE -
BXS Announces Third Quarter Results
Page 21
October 20, 2014
BancorpSouth, Inc.
Selected Additional Information
(Dollars in thousands)
(Unaudited)
| Quarter Ended | ||||||||||||||||||||
| Sep-14 | Jun-14 | Mar-14 | Dec-13 | Sep-13 | ||||||||||||||||
| MORTGAGE SERVICING RIGHTS: |
||||||||||||||||||||
| Fair value, beginning of period |
$ | 52,272 | $ | 53,436 | $ | 54,662 | $ | 51,025 | $ | 49,001 | ||||||||||
| Additions to mortgage servicing rights: |
||||||||||||||||||||
| Originations of servicing assets |
2,400 | 2,565 | 1,460 | 1,984 | 3,826 | |||||||||||||||
| Changes in fair value: |
||||||||||||||||||||
| Due to payoffs/paydowns |
(1,559 | ) | (1,616 | ) | (1,138 | ) | (1,240 | ) | (1,560 | ) | ||||||||||
| Due to change in valuation inputs or assumptions used in the valuation model |
648 | (2,111 | ) | (1,547 | ) | 2,894 | (240 | ) | ||||||||||||
| Other changes in fair value |
(2 | ) | (2 | ) | (1 | ) | (1 | ) | (2 | ) | ||||||||||
|
|
|
|
|
|
|
|
|
|
|
|||||||||||
| Fair value, end of period |
$ | 53,759 | $ | 52,272 | $ | 53,436 | $ | 54,662 | $ | 51,025 | ||||||||||
|
|
|
|
|
|
|
|
|
|
|
|||||||||||
| MORTGAGE LENDING REVENUE: |
||||||||||||||||||||
| Origination |
$ | 3,736 | $ | 8,758 | $ | 1,964 | $ | 3,590 | $ | 2,862 | ||||||||||
| Servicing |
4,113 | 4,058 | 4,115 | 4,361 | 4,072 | |||||||||||||||
| MSR payoffs/paydowns |
(1,559 | ) | (1,616 | ) | (1,138 | ) | (1,240 | ) | (1,560 | ) | ||||||||||
| MSR valuation adjustment |
648 | (2,111 | ) | (1,547 | ) | 2,894 | (240 | ) | ||||||||||||
|
|
|
|
|
|
|
|
|
|
|
|||||||||||
| Total mortgage lending revenue |
$ | 6,938 | $ | 9,089 | $ | 3,394 | $ | 9,605 | $ | 5,134 | ||||||||||
|
|
|
|
|
|
|
|
|
|
|
|||||||||||
| Mortgage loans serviced |
$ | 5,649,897 | $ | 5,630,192 | $ | 5,568,828 | $ | 5,577,325 | $ | 5,543,619 | ||||||||||
| MSR/mtg loans serviced |
0.95 | % | 0.93 | % | 0.96 | % | 0.98 | % | 0.92 | % | ||||||||||
| AVAILABLE-FOR-SALE SECURITIES, at fair value |
||||||||||||||||||||
| U.S. Government agencies |
$ | 1,238,088 | $ | 1,333,368 | $ | 1,419,269 | $ | 1,458,349 | $ | 1,519,459 | ||||||||||
| Government agency issued residential mortgage-back securities |
218,748 | 229,414 | 241,596 | 250,234 | 268,367 | |||||||||||||||
| Government agency issued commercial mortgage-back securities |
237,325 | 237,321 | 234,059 | 230,912 | 229,412 | |||||||||||||||
| Obligations of states and political subdivisions |
509,304 | 520,897 | 523,811 | 519,405 | 528,889 | |||||||||||||||
| Other |
7,997 | 11,192 | 8,023 | 8,089 | 8,029 | |||||||||||||||
|
|
|
|
|
|
|
|
|
|
|
|||||||||||
| Total available-for-sale securities |
$ | 2,211,462 | $ | 2,332,192 | $ | 2,426,758 | $ | 2,466,989 | $ | 2,554,156 | ||||||||||
|
|
|
|
|
|
|
|
|
|
|
|||||||||||
- MORE -
BXS Announces Third Quarter Results
Page 22
October 20, 2014
BancorpSouth, Inc.
Reconciliation of Non-GAAP Measures
(Dollars in thousands, except per share amounts)
(Unaudited)
Management evaluates the Company’s capital position and operating performance by utilizing certain financial measures not calculated in accordance with U.S. Generally Accepted Accounting Principles (GAAP), including tangible shareholders’ equity to tangible assets, return on tangible equity, pre-tax pre-provision return on average assets, tangible book value per share, and operating earnings per share. The Company has included these non-GAAP financial measures in this news release for the applicable periods presented. Management believes that the presentation of these non-GAAP financial measures (i) provides important supplemental information that contributes to a proper understanding of the Company’s operating performance, (ii) enables a more complete understanding of factors and trends affecting the Company’s business and (iii) allows investors to evaluate the Company’s performance in a manner similar to Management, the financial services industry, bank stock analysts and bank regulators. Reconciliations of these non-GAAP financial measures to the most directly comparable GAAP financial measures are presented in the tables below. These non-GAAP financial measures should not be considered as substitutes for GAAP financial measures, and the Company strongly encourages investors to review the GAAP financial measures included in this news release and not to place undue reliance upon any single financial measure. In addition, because non-GAAP financial measures are not standardized, it may not be possible to compare the non-GAAP financial measures presented in this news release with other companies’ non-GAAP financial measures having the same or similar names.
Reconciliation of Pre-tax, Pre-provision Earnings and Net Operating Income:
| Quarter ended | ||||||||||||||||||||
| 9/30/2014 | 6/30/2014 | 3/31/2014 | 12/31/2013 | 9/30/2013 | ||||||||||||||||
| Net income |
$ | 28,778 | $ | 30,868 | $ | 28,444 | $ | 27,698 | $ | 24,857 | ||||||||||
| Plus: Provision for credit losses |
— | — | — | — | 500 | |||||||||||||||
| Income tax expense |
12,414 | 14,097 | 12,889 | 12,014 | 8,001 | |||||||||||||||
|
|
|
|
|
|
|
|
|
|
|
|||||||||||
| Pre-tax, pre-provision earnings |
$ | 41,192 | $ | 44,965 | $ | 41,333 | $ | 39,712 | $ | 33,358 | ||||||||||
|
|
|
|
|
|
|
|
|
|
|
|||||||||||
| Net income |
$ | 28,778 | $ | 30,868 | $ | 28,444 | $ | 27,698 | $ | 24,857 | ||||||||||
| Plus: Merger expense, net of tax |
117 | 626 | 347 | — | — | |||||||||||||||
| One time charge for BSA, net of tax |
1,903 | — | — | — | — | |||||||||||||||
| Legal charge, net of tax |
— | — | — | — | 1,085 | |||||||||||||||
| Write off unamortized TRUPS issue cost, net of tax |
— | — | — | — | 1,789 | |||||||||||||||
|
|
|
|
|
|
|
|
|
|
|
|||||||||||
| Net operating income |
$ | 30,798 | $ | 31,494 | $ | 28,791 | $ | 27,698 | $ | 27,731 | ||||||||||
|
|
|
|
|
|
|
|
|
|
|
|||||||||||
- MORE -
BXS Announces Third Quarter Results
Page 23
October 20, 2014
BancorpSouth, Inc.
Reconciliation of Non-GAAP Measures
(Dollars in thousands, except per share amounts)
(Unaudited)
Reconciliation of Tangible Assets and Tangible Shareholders’ Equity to
Total Assets and Total Shareholders’ Equity:
| Quarter ended | ||||||||||||||||||||
| 9/30/2014 | 6/30/2014 | 3/31/2014 | 12/31/2013 | 9/30/2013 | ||||||||||||||||
| Tangible assets |
||||||||||||||||||||
| Total assets |
$ | 13,071,557 | $ | 12,985,887 | $ | 13,143,555 | $ | 13,029,733 | $ | 12,916,153 | ||||||||||
| Less: Goodwill |
291,498 | 291,498 | 286,800 | 286,800 | 275,173 | |||||||||||||||
| Other identifiable intangible assets |
25,619 | 26,745 | 25,021 | 26,079 | 15,179 | |||||||||||||||
|
|
|
|
|
|
|
|
|
|
|
|||||||||||
| Total tangible assets |
$ | 12,754,440 | $ | 12,667,644 | $ | 12,831,734 | $ | 12,716,854 | $ | 12,625,801 | ||||||||||
| Tangible shareholders’ equity |
||||||||||||||||||||
| Total shareholders’ equity |
$ | 1,610,543 | $ | 1,588,850 | $ | 1,554,676 | $ | 1,513,130 | $ | 1,480,611 | ||||||||||
| Less: Goodwill |
291,498 | 291,498 | 286,800 | 286,800 | 275,173 | |||||||||||||||
| Other identifiable intangible assets |
25,619 | 26,745 | 25,021 | 26,079 | 15,179 | |||||||||||||||
|
|
|
|
|
|
|
|
|
|
|
|||||||||||
| Total tangible shareholders’ equity |
$ | 1,293,426 | $ | 1,270,607 | $ | 1,242,855 | $ | 1,200,251 | $ | 1,190,259 | ||||||||||
| Total average assets |
$ | 12,987,103 | $ | 12,933,879 | $ | 13,087,128 | $ | 12,955,127 | $ | 12,928,505 | ||||||||||
| Total common shares outstanding |
96,065,021 | 96,046,057 | 96,004,679 | 95,231,691 | 95,211,602 | |||||||||||||||
| Average shares outstanding-diluted |
96,373,950 | 96,373,121 | 95,952,611 | 96,644,383 | 95,519,318 | |||||||||||||||
| Tangible shareholders’ equity to tangible assets* |
10.14 | % | 10.03 | % | 9.69 | % | 9.44 | % | 9.43 | % | ||||||||||
| Return on tangible equity ** |
8.83 | % | 9.74 | % | 9.28 | % | 9.16 | % | 8.29 | % | ||||||||||
| Pre-tax pre-provision return on average assets *** |
1.26 | % | 1.39 | % | 1.28 | % | 1.22 | % | 1.02 | % | ||||||||||
| Tangible book value per share**** |
$ | 13.46 | $ | 13.23 | $ | 12.95 | $ | 12.60 | $ | 12.50 | ||||||||||
| Operating earnings per share***** |
$ | 0.32 | $ | 0.33 | $ | 0.30 | $ | 0.29 | $ | 0.29 | ||||||||||
| * | Tangible shareholders’ equity to tangible assets is defined by the Company as total shareholders’ equity less goodwill and other identifiable intangible assets, divided by the difference of total assets less goodwill and other identifiable intangible assets. |
| ** | Return on tangible equity is defined by the Company as annualized net income divided by tangible shareholders’ equity. |
| *** | Pre-tax pre-provision return on average assets is defined by the Company as annualized pre-tax pre-provision earnings divided by total average assets. |
| **** | Tangible book value per share is defined by the Company as tangible shareholders’ equity divided by total common shares outstanding. |
| ***** | Operating earnings per share is defined by the Company as net operating income divided by average shares outstanding-diluted. |
- END -