EXHIBIT 99.1
News Release

| Contact: | ||
| William L. Prater | Will Fisackerly | |
| Treasurer and |
First Vice President and | |
| 662/680-2000 | 662/680-2475 | |
BancorpSouth Announces First Quarter 2012 Earnings of
$22.9 Million or $0.25 per Diluted Share
TUPELO, Miss., April 23, 2012/PRNewswire-FirstCall via COMTEX/ — BancorpSouth, Inc. (NYSE: BXS) today announced financial results for the quarter ended March 31, 2012. The Company reported net income of $22.9 million, or $0.25 per diluted share, for the first quarter of 2012 compared with a net loss of $0.5 million, or $0.01 per diluted share, for the first quarter of 2011 and net income of $13.3 million, or $0.16 per diluted share, for the fourth quarter of 2011.
“Our results for the first quarter reflect our highest level of quarterly earnings in over two years,” remarked Aubrey Patterson, Chairman and Chief Executive Officer of BancorpSouth. “We are also pleased to report additional meaningful improvement in asset quality. Earnings for the quarter reflect decreases in credit costs as a result of asset quality improvement as well as another exceptional quarter for our noninterest revenue lines of business, particularly our mortgage operation.”
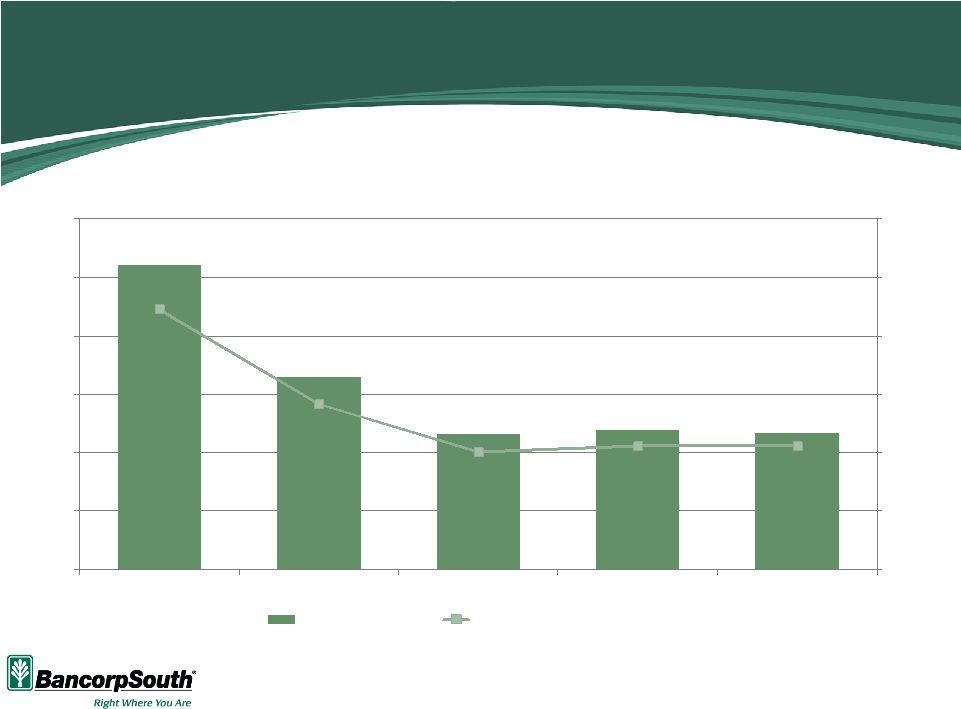
Earnings for the quarter benefited from a reduction in the provision for credit losses to $10.0 million compared to $53.5 million for the first quarter of 2011 and $19.3 million for the fourth quarter of 2011. Non-performing loans (“NPLs”) declined $37.0 million, or 11.5 percent, during the first quarter of 2012 to $285.2 million at March 31, 2012 compared with $322.3 million at December 31, 2011. NPLs have declined $139.8 million, or 32.9 percent, from $425.0 million at March 31, 2011. In addition, gross nonaccrual loan formation was $40.4 million for the first quarter of 2012 compared to $111.2 million for the first quarter of 2011 and $39.5 million for the fourth quarter of 2011. Total loans 30 – 89 days past due decreased during the first quarter of 2012 to $29.0 million at March 31, 2012 from $37.5 million at December 31, 2011. Net charge-offs decreased $0.5 million, or 2.0 percent, to $23.3 million for the first quarter of 2012 compared with $23.8 million for the fourth quarter of 2011. Net charge-offs during the first quarter of 2012 included $15.4 million of charge-offs of loans which had been impaired and reserved for in prior quarters.
Patterson added, “We continue to benefit from solid results produced by our noninterest revenue lines of business. Our mortgage business generated $395.1 million of new loans during the first quarter and contributed $15.1 million of revenue including a positive mortgage servicing rights (“MSR”) valuation adjustment of $3.7 million. Also, our insurance group produced organic growth on both a comparable and sequential quarter basis.”
- MORE -
Box 789 Tupelo, MS 38802-0789 (662) 680-2000
 is a financial holding company.
BXS Announces First Quarter Results
Page 2
April 23, 2012
Net Interest Revenue
Net interest revenue was $105.6 million for the first quarter of 2012, a decrease of 3.5 percent from $109.4 million for the first quarter of 2011 and a decrease of 1.8 percent from $107.5 million for the fourth quarter of 2011. The fully taxable equivalent net interest margin was 3.66 percent for the first quarter of 2012 compared with 3.69 percent for both the first and fourth quarters of 2011.
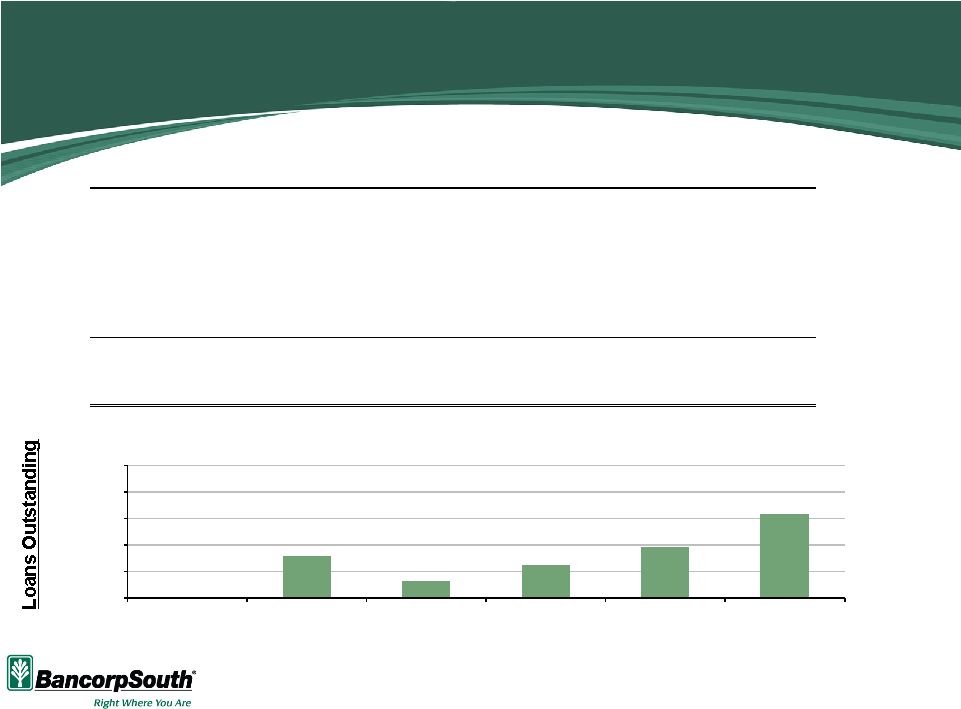
Asset, Deposit and Loan Activity
Total assets were $13.3 billion at March 31, 2012 compared with $13.5 billion at March 31, 2011. Total deposits were $11.1 billion at March 31, 2012, a decrease of 3.3 percent from $11.5 billion at March 31, 2011. Loans and leases, net of unearned income, were $8.7 billion at March 31, 2012, a decrease of 5.5 percent from $9.2 billion at March 31, 2011.
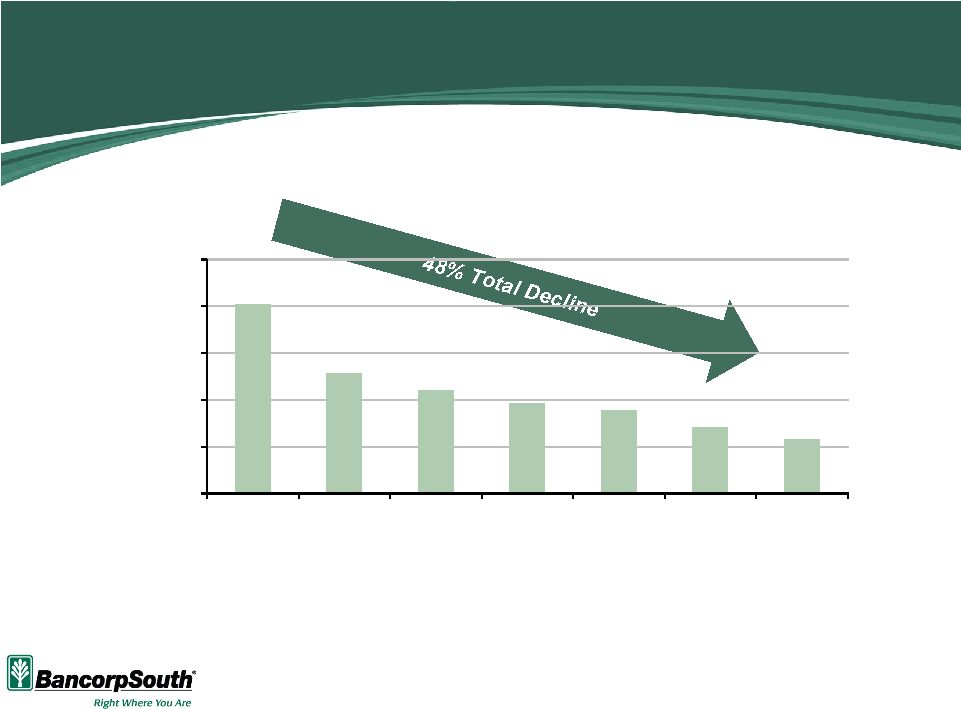
The construction, acquisition, and development (“CAD”) loan portfolio, which decreased $259.2 million, or 23.2 percent, from March 31, 2011 to March 31, 2012, accounted for 54.5 percent of the decline in net loans and leases over the same time period. Excluding the impact of the CAD loan portfolio, net loans and leases declined $216.7 million, or 2.7 percent, during this period.
Patterson added, “Deposit balances at the end of the first quarter of 2012 compared to the end of the first quarter of 2011 reflect a shift from time deposits and interest bearing demand deposits to savings and noninterest bearing demand deposits.” Time deposits, which decreased $623.0 million, or 17.9 percent, during this period, were offset partially by significant growth in noninterest bearing demand deposits, which increased $232.0 million, or 11.4 percent, over the period. Additionally, savings deposits increased $134.7 million, or 14.4 percent, while interest bearing demand deposits decreased $125.5 million, or 2.5 percent, over the period. As of March 31, 2012, approximately $1.1 billion of time deposits were scheduled to mature during the following two quarters at a weighted average rate of 1.02 percent.
Provision for Credit Losses and Allowance for Credit Losses
For the first quarter of 2012, the provision for credit losses was $10.0 million, compared with $53.5 million for the first quarter of 2011 and $19.3 million for the fourth quarter of 2011. The decrease in the provision for credit losses reflects a decline in the formation of new non-accrual loans, including fewer loans being identified for impairment, continued stabilization in values of previously impaired loans, decreased past due balances and lower net charge-offs.
Net charge-offs for the first quarter of 2012 were $23.3 million, compared with $52.1 million for the first quarter of 2011 and $23.8 million for the fourth quarter of 2011. Recoveries increased to $5.5 million for the first quarter of 2012, compared with $1.7 million for the first quarter of
- MORE -
BXS Announces First Quarter Results
Page 3
April 23, 2012
2011 and $2.6 million for the fourth quarter of 2011. Annualized net charge-offs were 1.06 percent of average loans and leases for the first quarter of 2012, compared with 2.24 percent for the first quarter of 2011 and 1.06 percent for the fourth quarter of 2011.
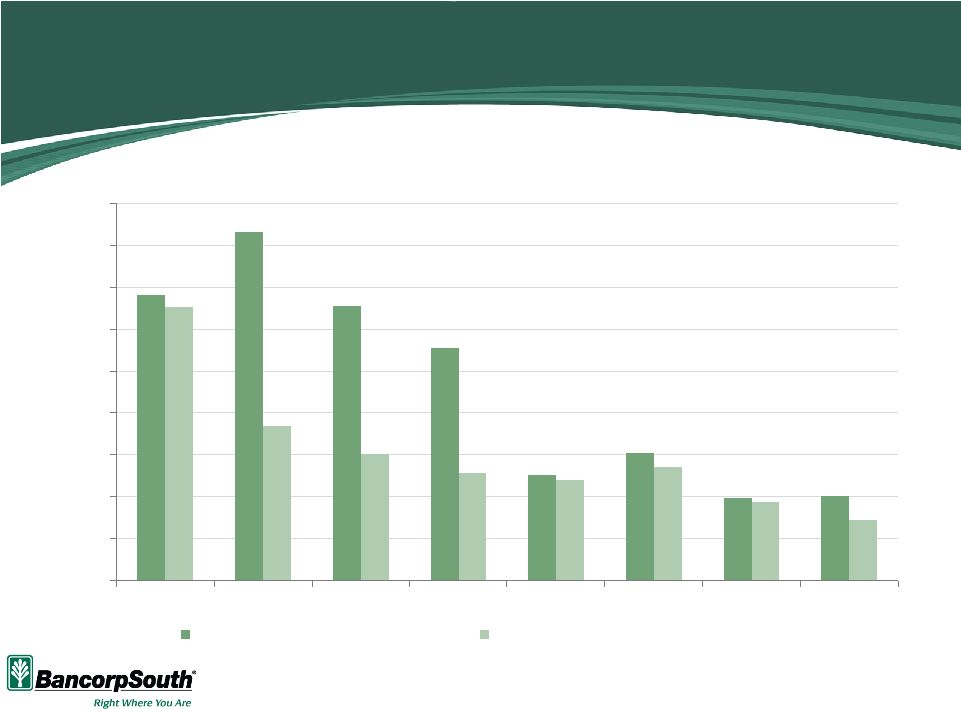
NPLs were $285.2 million, or 3.26 percent of net loans and leases, at March 31, 2012 compared with $425.0 million, or 4.61 percent of net loans and leases, at March 31, 2011 and $322.3 million, or 3.63 percent of net loans and leases, at December 31, 2011. The allowance for credit losses was $181.8 million, or 2.08 percent of net loans and leases, at March 31, 2012 compared with $198.3 million, or 2.15 percent of net loans and leases, at March 31, 2011 and $195.1 million, or 2.20 percent of net loans and leases, at December 31, 2011. Patterson added, “The first quarter reduction in the allowance for credit losses was driven primarily by charge-offs of $15.4 million associated with loans that had been identified and reported as impaired and were reserved for in previous quarters.”
NPLs at March 31, 2012 consisted primarily of $253.2 million of nonaccrual loans, compared with $276.8 million of nonaccrual loans at December 31, 2011. Included in the reduction of nonaccrual loans during the first quarter of 2012 were payments received on nonaccrual loans of $20.6 million. NPLs at March 31, 2012 also included $1.7 million of loans 90 days or more past due and still accruing, compared with $3.4 million at December 31, 2011, and included restructured loans still accruing of $30.3 million at March 31, 2012, compared with $42.0 million at December 31, 2011. Loans and leases 30 to 89 days past due were $29.0 million at March 31, 2012 compared with $37.5 million at December 31, 2011.
At March 31, 2012, $76.3 million of NPLs were residential CAD loans, $45.1 million were other CAD loans, $46.8 million were commercial real estate loans and $52.2 million were consumer mortgages. NPLs from all other loan types totaled $64.8 million at March 31, 2012. Included in nonaccrual loans at March 31, 2012 were $137.5 million of loans, or 54.3 percent of total nonaccrual loans, that were paying as agreed, compared with $141.2 million, or 51.0 percent, at the end of the fourth quarter of 2011. These loans were generally placed on nonaccrual status because the collateral values were less than the outstanding balances, and because of uncertainty as to whether the borrowers possessed adequate liquidity or will be able to generate sufficient cash flow to satisfy the debt given the short-fall in collateral values. Such loans are generally deemed to be impaired, with a specific reserve established for the difference in the balance owed and the disposition value of the collateral.
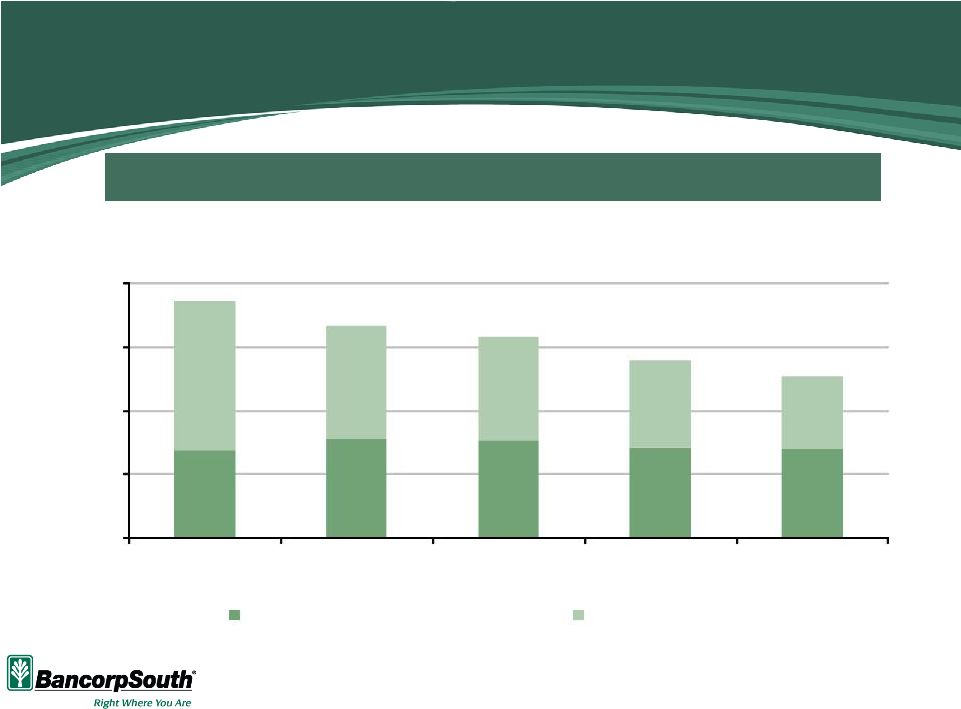
At the end of the first quarter, 83.4 percent of nonaccrual loans were determined to be collateral dependent, and after write-downs and specific reserves, the remaining book balance of these loans was 69.6 percent of the unpaid principal balance. At March 31, 2012, coverage of unimpaired nonaccrual loans by the nonspecified allowance for credit losses was 371 percent and coverage of unimpaired NPLs by the nonspecified allowance for credit losses was 211 percent.
Other real estate owned (“OREO”) decreased $6.0 million to $167.8 million during the first quarter of 2012. This decrease reflected $10.8 million added through foreclosure, offset by sales of other real estate owned of $11.8 million. OREO sales were $16.7 million for the fourth quarter of 2011. Write-downs in the value of existing properties were $5.0 million for the first quarter of 2012, representing a decrease of $3.7 million from $8.7 million for the fourth quarter
- MORE -
BXS Announces First Quarter Results
Page 4
April 23, 2012
of 2011. Sales of OREO during the first quarter of 2012 resulted in no material net gain or loss, consistent with the fourth quarter of 2011. At March 31, 2012, OREO was carried at 52.4 percent of the aggregate loan balances at the time of foreclosure, compared with 54.5 percent at December 31, 2011.
Noninterest Revenue
Noninterest revenue was $72.4 million for the first quarter of 2012, compared with $68.3 million for the first quarter of 2011 and $65.3 million for the fourth quarter of 2011. These results included positive MSR valuation adjustments of $3.7 million and $2.5 million for the first quarters of 2012 and 2011, respectively, and a negative MSR valuation adjustment of $1.0 million for the fourth quarter of 2011.
Excluding the MSR valuation adjustments, net mortgage lending revenue was $11.4 million for the first quarter of 2012, compared with $5.0 million for the first quarter of 2011 and $9.9 million for the fourth quarter of 2011. Mortgage origination volume for the first quarter of 2012 was $395.1 million, compared with $202.8 million for the first quarter of 2011 and $389.6 million for the fourth quarter of 2011.
Credit and debit card fees decreased $2.8 million, or 27.3 percent, for the first quarter of 2012 from the first quarter of 2011 and decreased $0.3 million, or 3.3 percent, from the fourth quarter of 2011. Service charges were essentially flat for the comparable quarters and declined $2.3 million, or 13.2 percent, on a sequential quarter basis. Insurance commissions rose $0.6 million, or 2.7 percent, for the comparable quarters and increased $3.7 million, or 19.3 percent, on a sequential quarter basis.
Noninterest Expense
Noninterest expense for the first quarter of 2012 was $135.7 million, compared with $130.0 million for the first quarter of 2011 and $135.9 million for the fourth quarter of 2011. Salaries and employee benefits expense increased to $74.9 million for the first quarter of 2012 from $70.4 million for the first quarter of 2011 and $70.5 million for the fourth quarter of 2011. This is attributable primarily to increases in FICA taxes, employee benefits and incentive compensation. Foreclosed property expense increased to $8.4 million for the first quarter of 2012 from $7.1 million for the first quarter of 2011 and declined from $10.8 million for the fourth quarter of 2011. Deposit insurance assessments were flat at $5.4 million on a comparable quarter basis and decreased on a sequential quarter basis from $5.7 million for the fourth quarter of 2011.
Capital Management
BancorpSouth remains a “well capitalized” financial holding company, as defined by federal regulations, with Tier 1 risk-based capital of 13.13 percent at March 31, 2012 and total risk based capital of 14.39 percent, compared with required minimum levels of 6 percent and 10 percent, respectively, for “well capitalized” classification. The Company’s equity capitalization is 100 percent common stock. BancorpSouth’s ratio of shareholders’ equity to assets increased
- MORE -
BXS Announces First Quarter Results
Page 5
April 23, 2012
to 10.46 percent at March 31, 2012, compared with 8.94 percent at March 31, 2011 and 9.72 percent at December 31, 2011. The ratio of tangible shareholders’ equity to tangible assets increased to 8.49 percent at March 31, 2012, compared with 6.95 percent at March 31, 2011 and 7.67 percent at December 31, 2011.
On January 24, 2012, the Company completed an underwritten public offering of 10,952,381 shares of Company common stock at a public offering price of $10.50 per share. The gross proceeds from the offering, before expenses, were $109.3 million. Offering expenses were approximately $575,000. The proceeds from the offering have been and will be used by the Company for general corporate purposes, including to maintain certain capital levels and liquidity at the Company, potentially provide equity capital to BancorpSouth Bank, fund growth either organically or through acquisition of other financial institutions, insurance agencies, or other businesses that are closely aligned to the operations of the Company, and fund investments in its subsidiaries. The impact of this offering is reflected in the financial statements as of and for the quarter ended March 31, 2012.
Summary
Patterson concluded, “Our first quarter results are reflective of the significant improvement in asset quality achieved over the past several quarters as well as a continued focus on organic growth in our noninterest revenue lines of business. The results reported for these lines of business continue to support our belief that they differentiate our Company from many of our peers. Over the past several quarters, significant efforts have been focused on asset quality improvement. Although continuing to improve asset quality is certainly still the top priority, we recognize the importance of focusing on quality loan production and improving efficiency. While we are encouraged by recent economic trends, we remain cautious about the prospects of significant near-term growth given the competitive landscape and subdued loan demand.
“BancorpSouth is focused on customer service and relationships. Our Company has been built on providing a comprehensive range of financial products including a wide array of deposit and loan offerings, mortgage lending, insurance, trust, and many other products and services. We have continued to work to strengthen relationships with existing clients and to develop relationships with new customers. We believe that our company is positioned to achieve long-term growth and increased shareholder value as the economic cycle improves.”
Conference Call
BancorpSouth will conduct a conference call to discuss its first quarter 2012 results on April 24, 2012, at 10:00 a.m. (Central Time). Investors may listen via the Internet by accessing BancorpSouth’s website at http://www.bancorpsouth.com. A replay of the conference call will be available at BancorpSouth’s website for at least two weeks following the call.
Forward-Looking Statements
Certain statements contained in this news release may not be based on historical facts and are “forward-looking statements” within the meaning of Section 27A of the Securities Act of 1933,
- MORE -
BXS Announces First Quarter Results
Page 6
April 23, 2012
as amended, and Section 21E of the Securities Exchange Act of 1934, as amended. These forward-looking statements may be identified by their reference to a future period or periods or by the use of forward-looking terminology such as “anticipate,” “believe,” “estimate,” “expect,” “may,” “might,” “will,” “would,” “could” or “intend.” These forward-looking statements include, without limitation, statements relating to our use of proceeds from the public offering of our common stock, our differentiation from many of our peers because of our noninterest revenue lines of business, our ability to achieve long-term growth and increased shareholder value, and our use of non-GAAP financial measures.
We caution you not to place undue reliance on the forward-looking statements contained in this news release in that actual results could differ materially from those indicated in such forward-looking statements because of a variety of factors. These factors may include, but are not limited to, conditions in the financial markets and economic conditions generally, the ongoing debt crisis and the downgrade of the sovereign credit ratings for various nations, the adequacy of the Company’s provision and allowance for credit losses to cover actual credit losses, the credit risk associated with real estate construction, acquisition and development loans, losses resulting from the significant amount of the Company’s other real estate owned, limitations on the Company’s ability to declare and pay dividends, the impact of legal or administrative proceedings, the availability of capital on favorable terms if and when needed, liquidity risk, governmental regulation, including the Dodd Frank Act, and supervision of the Company’s operations, the impact of regulations on service charges on the Company’s core deposit accounts, the susceptibility of the Company’s business to local economic conditions, the soundness of other financial institutions, changes in interest rates, the impact of monetary policies and economic factors on the Company’s ability to attract deposits or make loans, volatility in capital and credit markets, reputational risk, the impact of hurricanes or other adverse weather events, any requirement that the Company write down goodwill or other intangible assets, diversification in the types of financial services the Company offers, competition with other financial services companies, risks in connection with completed or potential acquisitions, the Company’s growth strategy, interruptions or breaches in the Company’s information system security, the failure of certain third party vendors to perform, dilution caused by the Company’s issuance of any additional shares of its common stock to raise capital or acquire other banks, bank holding companies, financial holding companies and insurance agencies, the effectiveness of the Company’s internal controls, other factors generally understood to affect the financial results of financial services companies and other factors detailed from time to time in the Company’s press releases and filings with the Securities and Exchange Commission.
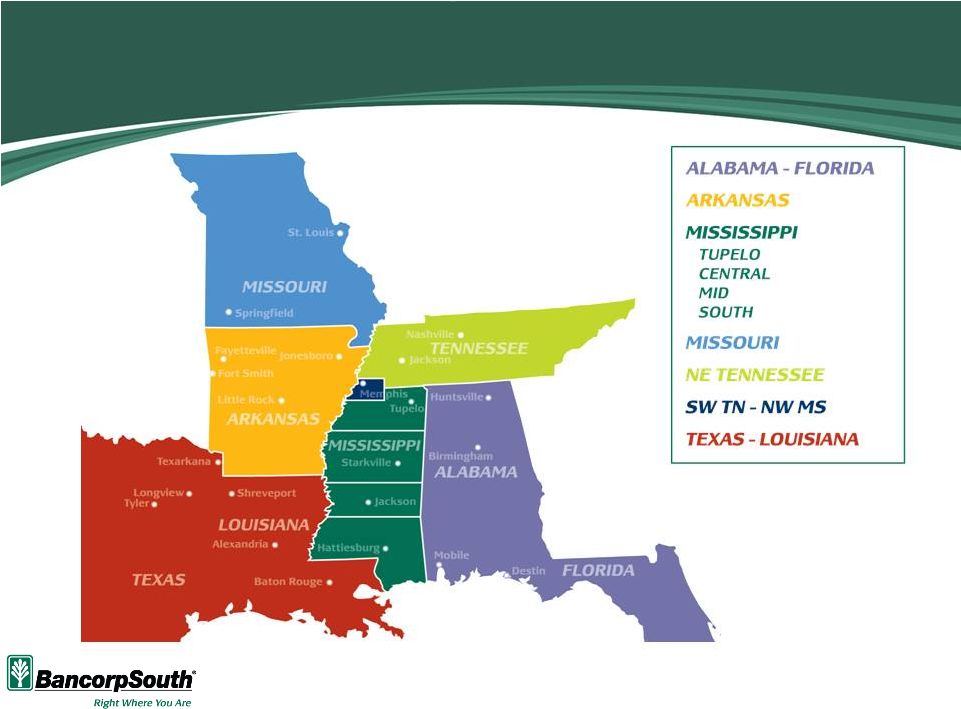
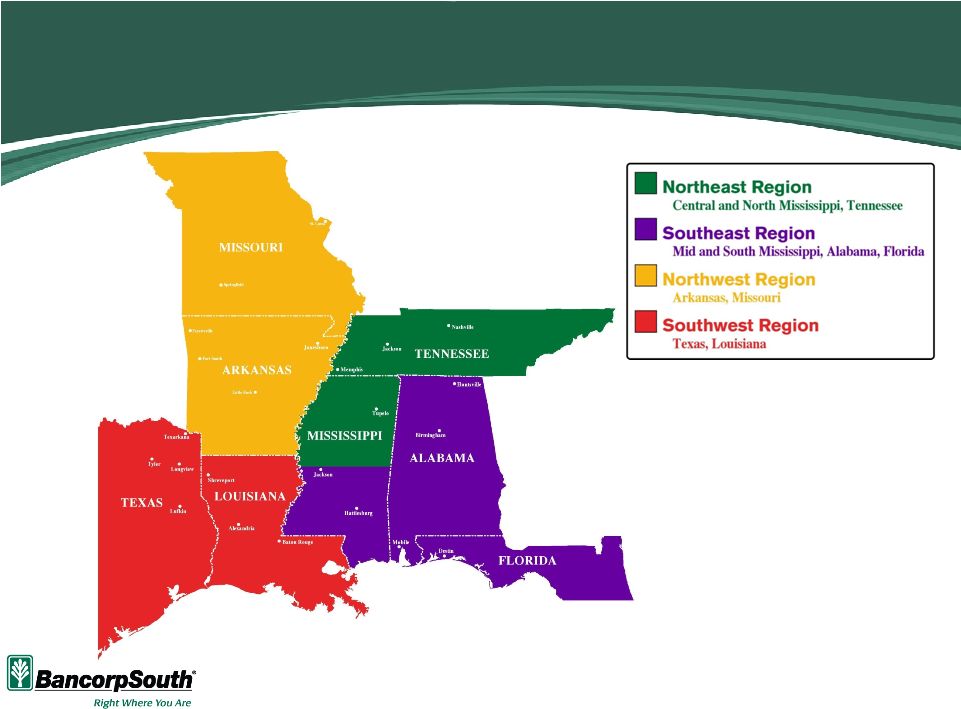
BancorpSouth, Inc. is a financial holding company headquartered in Tupelo, Mississippi, with $13.3 billion in assets. BancorpSouth Bank, a wholly-owned subsidiary of BancorpSouth, Inc., operates 290 commercial banking, mortgage, insurance, trust and broker/dealer locations in Alabama, Arkansas, Florida, Louisiana, Mississippi, Missouri and Tennessee, including an insurance location in Illinois.
- MORE -
BXS Announces First Quarter Results
Page 7
April 23, 2012
BancorpSouth, Inc.
Selected Financial Data
| Three Months Ended March 31, |
||||||||
| 2012 | 2011 | |||||||
| (Dollars in thousands, except per share amounts) |
||||||||
| Earnings Summary: |
||||||||
| Net interest revenue |
$ | 105,610 | $ | 109,437 | ||||
| Provision for credit losses |
10,000 | 53,479 | ||||||
| Noninterest revenue |
72,360 | 68,311 | ||||||
| Noninterest expense |
135,680 | 130,010 | ||||||
|
|
|
|
|
|||||
| Income (loss) before income taxes |
32,290 | (5,741 | ) | |||||
| Income tax provision (benefit) |
9,424 | (5,247 | ) | |||||
|
|
|
|
|
|||||
| Net income (loss) |
$ | 22,866 | $ | (494 | ) | |||
|
|
|
|
|
|||||
| Earnings (loss) per share: Basic |
$ | 0.25 | $ | (0.01 | ) | |||
|
|
|
|
|
|||||
| Diluted |
$ | 0.25 | $ | (0.01 | ) | |||
|
|
|
|
|
|||||
| Balance sheet data at March 31: |
||||||||
| Total assets |
$ | 13,307,572 | $ | 13,547,238 | ||||
| Total earning assets |
12,087,427 | 12,335,690 | ||||||
| Loans and leases, net of unearned income |
8,737,923 | 9,213,836 | ||||||
| Allowance for credit losses |
181,777 | 198,333 | ||||||
| Total deposits |
11,082,322 | 11,464,114 | ||||||
| Common shareholders’ equity |
1,392,199 | 1,211,061 | ||||||
| Book value per share |
14.74 | 14.51 | ||||||
| Average balance sheet data: |
||||||||
| Total assets |
$ | 13,088,358 | $ | 13,539,763 | ||||
| Total earning assets |
11,964,721 | 12,394,769 | ||||||
| Loans and leases, net of unearned interest |
8,791,542 | 9,299,984 | ||||||
| Total deposits |
11,043,952 | 11,497,638 | ||||||
| Common shareholders’ equity |
1,363,709 | 1,219,399 | ||||||
| Non-performing assets at March 31: |
||||||||
| Non-accrual loans and leases |
$ | 253,227 | $ | 370,726 | ||||
| Loans and leases 90+ days past due, still accruing |
1,698 | 4,829 | ||||||
| Restructured loans and leases, still accruing |
30,311 | 49,472 | ||||||
| Other real estate owned |
167,808 | 136,412 | ||||||
|
|
|
|
|
|||||
| Total non-performing assets |
453,044 | 561,439 | ||||||
| Net charge-offs as a percentage of average loans (annualized) |
1.06 | % | 2.24 | % | ||||
| Performance ratios (annualized): |
||||||||
| Return on average assets |
0.70 | % | (0.01 | %) | ||||
| Return on common equity |
6.74 | % | (0.16 | %) | ||||
| Total shareholders’ equity to total assets |
10.46 | % | 8.94 | % | ||||
| Tangible shareholders’ equity to tangible assets |
8.49 | % | 6.95 | % | ||||
| Net interest margin |
3.66 | % | 3.69 | % | ||||
| Average shares outstanding - basic |
91,727,524 | 83,448,935 | ||||||
| Average shares outstanding - diluted |
91,769,863 | 83,448,935 | ||||||
| Cash dividends per share |
$ | 0.01 | $ | 0.11 | ||||
| Tier I capital |
13.13 | % | 10.65 | % | ||||
| Total capital |
14.39 | % | 11.92 | % | ||||
| Tier I leverage capital |
9.85 | % | 8.01 | % | ||||
- MORE -
BXS Announces First Quarter Results
Page 8
April 23, 2012
BancorpSouth, Inc.
Consolidated Balance Sheets
(Unaudited)
| Mar-12 | Dec-11 | Sep-11 | Jun-11 | Mar-11 | ||||||||||||||||
| (Dollars in thousands) | ||||||||||||||||||||
| Assets |
||||||||||||||||||||
| Cash and due from banks |
$ | 184,441 | $ | 195,681 | $ | 161,876 | $ | 166,761 | $ | 146,989 | ||||||||||
| Interest bearing deposits with other banks |
665,675 | 303,663 | 338,250 | 304,344 | 102,312 | |||||||||||||||
| Held-to-maturity securities, at amortized cost |
— | — | — | — | 1,667,203 | |||||||||||||||
| Available-for-sale securities, at fair value |
2,573,535 | 2,513,518 | 2,481,555 | 2,560,824 | 1,145,463 | |||||||||||||||
| Federal funds sold and securities purchased under agreement to resell |
— | — | — | — | 150,000 | |||||||||||||||
| Loans and leases |
8,777,538 | 8,911,258 | 9,096,928 | 9,255,879 | 9,255,609 | |||||||||||||||
| Less: Unearned income |
39,615 | 40,947 | 41,023 | 41,326 | 41,773 | |||||||||||||||
| Allowance for credit losses |
181,777 | 195,118 | 199,686 | 197,627 | 198,333 | |||||||||||||||
|
|
|
|
|
|
|
|
|
|
|
|||||||||||
| Net loans and leases |
8,556,146 | 8,675,193 | 8,856,219 | 9,016,926 | 9,015,503 | |||||||||||||||
| Loans held for sale |
110,294 | 83,458 | 100,687 | 70,519 | 56,876 | |||||||||||||||
| Premises and equipment, net |
321,720 | 323,383 | 323,285 | 328,075 | 329,862 | |||||||||||||||
| Accrued interest receivable |
50,008 | 51,266 | 53,338 | 55,525 | 61,105 | |||||||||||||||
| Goodwill |
271,297 | 271,297 | 271,297 | 271,297 | 271,297 | |||||||||||||||
| Bank owned life insurance |
202,698 | 200,085 | 197,945 | 197,028 | 194,988 | |||||||||||||||
| Other real estate owned |
167,808 | 173,805 | 162,686 | 151,204 | 136,412 | |||||||||||||||
| Other assets |
203,950 | 204,502 | 251,380 | 244,547 | 269,228 | |||||||||||||||
|
|
|
|
|
|
|
|
|
|
|
|||||||||||
| Total Assets |
$ | 13,307,572 | $ | 12,995,851 | $ | 13,198,518 | $ | 13,367,050 | $ | 13,547,238 | ||||||||||
|
|
|
|
|
|
|
|
|
|
|
|||||||||||
| Liabilities |
||||||||||||||||||||
| Deposits: |
||||||||||||||||||||
| Demand: Noninterest bearing |
$ | 2,260,012 | $ | 2,269,799 | $ | 2,198,535 | $ | 2,096,655 | $ | 2,027,990 | ||||||||||
| Interest bearing |
4,897,585 | 4,706,825 | 4,736,858 | 4,939,553 | 5,023,073 | |||||||||||||||
| Savings |
1,067,256 | 991,702 | 968,277 | 944,993 | 932,574 | |||||||||||||||
| Other time |
2,857,469 | 2,986,863 | 3,159,563 | 3,327,262 | 3,480,477 | |||||||||||||||
|
|
|
|
|
|
|
|
|
|
|
|||||||||||
| Total deposits |
11,082,322 | 10,955,189 | 11,063,233 | 11,308,463 | 11,464,114 | |||||||||||||||
| Federal funds purchased and securities sold under agreement to repurchase |
401,089 | 373,933 | 449,501 | 426,097 | 421,782 | |||||||||||||||
| Short-term Federal Home Loan Bank borrowings and other short-term borrowing |
1,500 | 1,500 | 1,500 | 703 | 2,715 | |||||||||||||||
| Accrued interest payable |
7,652 | 8,644 | 10,017 | 11,348 | 13,238 | |||||||||||||||
| Junior subordinated debt securities |
160,312 | 160,312 | 160,312 | 160,312 | 160,312 | |||||||||||||||
| Long-term Federal Home Loan Bank borrowings |
33,500 | 33,500 | 33,500 | 35,000 | 110,000 | |||||||||||||||
| Other liabilities |
228,998 | 199,861 | 213,702 | 178,424 | 164,016 | |||||||||||||||
|
|
|
|
|
|
|
|
|
|
|
|||||||||||
| Total Liabilities |
11,915,373 | 11,732,939 | 11,931,765 | 12,120,347 | 12,336,177 | |||||||||||||||
| Shareholders’ Equity |
||||||||||||||||||||
| Common stock |
236,090 | 208,709 | 208,722 | 208,722 | 208,704 | |||||||||||||||
| Capital surplus |
309,426 | 227,567 | 227,006 | 226,362 | 225,597 | |||||||||||||||
| Accumulated other comprehensive income (loss) |
(4,136 | ) | (2,261 | ) | 14,595 | 6,289 | (16,579 | ) | ||||||||||||
| Retained earnings |
850,819 | 828,897 | 816,430 | 805,330 | 793,339 | |||||||||||||||
|
|
|
|
|
|
|
|
|
|
|
|||||||||||
| Total Shareholders’ Equity |
1,392,199 | 1,262,912 | 1,266,753 | 1,246,703 | 1,211,061 | |||||||||||||||
|
|
|
|
|
|
|
|
|
|
|
|||||||||||
| Total Liabilities & Shareholders’ Equity |
$ | 13,307,572 | $ | 12,995,851 | $ | 13,198,518 | $ | 13,367,050 | $ | 13,547,238 | ||||||||||
|
|
|
|
|
|
|
|
|
|
|
|||||||||||
- MORE -
BXS Announces First Quarter Results
Page 9
April 23, 2012
BancorpSouth, Inc.
Consolidated Average Balance Sheets
(Unaudited)
| Mar-12 | Dec-11 | Sep-11 | Jun-11 | Mar-11 | ||||||||||||||||
| (Dollars in thousands) | ||||||||||||||||||||
| Assets |
||||||||||||||||||||
| Cash and due from banks |
$ | 160,827 | $ | 151,004 | $ | 148,409 | $ | 151,194 | $ | 156,329 | ||||||||||
| Interest bearing deposits with other banks |
603,714 | 384,231 | 309,146 | 187,901 | 167,271 | |||||||||||||||
| Held-to-maturity securities, at amortized cost |
— | — | — | 1,097,562 | 1,653,284 | |||||||||||||||
| Available-for-sale securities, at fair value |
2,507,941 | 2,509,943 | 2,529,482 | 1,609,720 | 1,085,131 | |||||||||||||||
| Federal funds sold and securities purchased under agreement to resell |
274 | 2,174 | — | 38,736 | 150,000 | |||||||||||||||
| Loans and leases |
8,832,104 | 8,995,035 | 9,179,730 | 9,291,434 | 9,342,939 | |||||||||||||||
| Less: Unearned income |
40,562 | 40,806 | 41,316 | 42,307 | 42,954 | |||||||||||||||
| Allowance for credit losses |
202,158 | 208,005 | 205,209 | 212,968 | 218,107 | |||||||||||||||
|
|
|
|
|
|
|
|
|
|
|
|||||||||||
| Net loans and leases |
8,589,384 | 8,746,224 | 8,933,205 | 9,036,159 | 9,081,878 | |||||||||||||||
| Loans held for sale |
61,250 | 67,781 | 62,025 | 44,704 | 39,098 | |||||||||||||||
| Premises and equipment, net |
322,641 | 322,544 | 326,800 | 328,829 | 330,920 | |||||||||||||||
| Accrued interest receivable |
47,512 | 49,256 | 53,122 | 54,570 | 58,450 | |||||||||||||||
| Goodwill |
271,297 | 271,297 | 271,297 | 271,297 | 270,510 | |||||||||||||||
| Bank owned life insurance |
11,204 | 14,558 | 14,642 | 14,189 | 13,217 | |||||||||||||||
| Other real estate owned |
170,924 | 164,841 | 152,052 | 138,827 | 129,781 | |||||||||||||||
| Other assets |
341,390 | 362,926 | 374,475 | 391,872 | 403,894 | |||||||||||||||
|
|
|
|
|
|
|
|
|
|
|
|||||||||||
| Total Assets |
$ | 13,088,358 | $ | 13,046,779 | $ | 13,174,655 | $ | 13,365,560 | $ | 13,539,763 | ||||||||||
|
|
|
|
|
|
|
|
|
|
|
|||||||||||
| Liabilities |
||||||||||||||||||||
| Deposits: |
||||||||||||||||||||
| Demand: Noninterest bearing |
$ | 2,139,371 | $ | 2,248,904 | $ | 2,147,707 | $ | 2,018,197 | $ | 1,893,720 | ||||||||||
| Interest bearing |
4,960,060 | 4,714,059 | 4,789,462 | 4,977,764 | 5,153,063 | |||||||||||||||
| Savings |
1,027,611 | 975,892 | 957,871 | 941,169 | 897,312 | |||||||||||||||
| Other time |
2,916,910 | 3,078,376 | 3,246,332 | 3,418,741 | 3,553,543 | |||||||||||||||
|
|
|
|
|
|
|
|
|
|
|
|||||||||||
| Total deposits |
11,043,952 | 11,017,231 | 11,141,372 | 11,355,871 | 11,497,638 | |||||||||||||||
| Federal funds purchased and securities sold under agreement to repurchase |
358,124 | 430,968 | 457,640 | 423,949 | 430,930 | |||||||||||||||
| Short-term Federal Home Loan Bank borrowings and other short-term borrowing |
1,500 | 1,500 | 486 | 1,641 | 2,719 | |||||||||||||||
| Accrued interest payable |
9,392 | 10,617 | 12,108 | 13,558 | 14,873 | |||||||||||||||
| Junior subordinated debt securities |
160,312 | 160,312 | 160,312 | 160,312 | 160,312 | |||||||||||||||
| Long-term Federal Home Loan Bank borrowings |
33,500 | 33,500 | 34,984 | 89,395 | 110,000 | |||||||||||||||
| Other liabilities |
117,869 | 123,746 | 115,938 | 98,553 | 103,892 | |||||||||||||||
|
|
|
|
|
|
|
|
|
|
|
|||||||||||
| Total Liabilities |
11,724,649 | 11,777,874 | 11,922,840 | 12,143,279 | 12,320,364 | |||||||||||||||
| Shareholders’ Equity |
||||||||||||||||||||
| Common stock |
231,276 | 208,722 | 208,722 | 208,715 | 208,704 | |||||||||||||||
| Capital surplus |
294,973 | 227,201 | 226,582 | 225,912 | 225,162 | |||||||||||||||
| Accumulated other comprehensive income (loss) |
(2,269 | ) | 8,927 | 6,379 | (10,040 | ) | (14,346 | ) | ||||||||||||
| Retained earnings |
839,729 | 824,055 | 810,132 | 797,694 | 799,879 | |||||||||||||||
|
|
|
|
|
|
|
|
|
|
|
|||||||||||
| Total Shareholders’ Equity |
1,363,709 | 1,268,905 | 1,251,815 | 1,222,281 | 1,219,399 | |||||||||||||||
|
|
|
|
|
|
|
|
|
|
|
|||||||||||
| Total Liabilities & Shareholders’ Equity |
$ | 13,088,358 | $ | 13,046,779 | $ | 13,174,655 | $ | 13,365,560 | $ | 13,539,763 | ||||||||||
|
|
|
|
|
|
|
|
|
|
|
|||||||||||
- MORE -
BXS Announces First Quarter Results
Page 10
April 23, 2012
BancorpSouth, Inc.
Consolidated Condensed Statements of Income
(Dollars in thousands, except per share data)
(Unaudited)
| Quarter Ended | ||||||||||||||||||||
| Mar-12 | Dec-11 | Sep-11 | Jun-11 | Mar-11 | ||||||||||||||||
| INTEREST REVENUE: |
||||||||||||||||||||
| Loans and leases |
$ | 109,012 | $ | 112,566 | $ | 114,260 | $ | 116,892 | $ | 117,358 | ||||||||||
| Deposits with other banks |
401 | 252 | 203 | 124 | 122 | |||||||||||||||
| Federal funds sold and securities purchased under agreement to resell |
— | 1 | — | 35 | 131 | |||||||||||||||
| Held-to-maturity securities: |
||||||||||||||||||||
| Taxable |
— | — | — | 5,066 | 8,014 | |||||||||||||||
| Tax-exempt |
— | — | — | 2,291 | 3,347 | |||||||||||||||
| Available-for-sale securities: |
||||||||||||||||||||
| Taxable |
11,162 | 11,781 | 13,172 | 10,451 | 8,585 | |||||||||||||||
| Tax-exempt |
4,256 | 4,158 | 4,130 | 1,871 | 824 | |||||||||||||||
| Loans held for sale |
544 | 635 | 632 | 505 | 447 | |||||||||||||||
|
|
|
|
|
|
|
|
|
|
|
|||||||||||
| Total interest revenue |
125,375 | 129,393 | 132,397 | 137,235 | 138,828 | |||||||||||||||
|
|
|
|
|
|
|
|
|
|
|
|||||||||||
| INTEREST EXPENSE: |
||||||||||||||||||||
| Interest bearing demand |
4,449 | 4,737 | 5,324 | 6,039 | 6,546 | |||||||||||||||
| Savings |
714 | 747 | 828 | 810 | 826 | |||||||||||||||
| Other time |
11,291 | 13,104 | 14,837 | 16,285 | 17,483 | |||||||||||||||
| Federal funds purchased and securities sold under agreement to repurchase |
63 | 76 | 95 | 135 | 152 | |||||||||||||||
| FHLB borrowings |
367 | 367 | 375 | 1,194 | 1,523 | |||||||||||||||
| Junior subordinated debt |
2,879 | 2,871 | 2,861 | 2,860 | 2,859 | |||||||||||||||
| Other |
2 | 2 | 2 | — | 2 | |||||||||||||||
|
|
|
|
|
|
|
|
|
|
|
|||||||||||
| Total interest expense |
19,765 | 21,904 | 24,322 | 27,323 | 29,391 | |||||||||||||||
|
|
|
|
|
|
|
|
|
|
|
|||||||||||
| Net interest revenue |
105,610 | 107,489 | 108,075 | 109,912 | 109,437 | |||||||||||||||
| Provision for credit losses |
10,000 | 19,250 | 25,112 | 32,240 | 53,479 | |||||||||||||||
|
|
|
|
|
|
|
|
|
|
|
|||||||||||
| Net interest revenue, after provision for credit losses |
95,610 | 88,239 | 82,963 | 77,672 | 55,958 | |||||||||||||||
|
|
|
|
|
|
|
|
|
|
|
|||||||||||
| NONINTEREST REVENUE: |
||||||||||||||||||||
| Mortgage lending |
15,142 | 8,928 | (1,443 | ) | 2,003 | 7,581 | ||||||||||||||
| Credit card, debit card and merchant fees |
7,523 | 7,783 | 12,981 | 11,263 | 10,346 | |||||||||||||||
| Service charges |
15,116 | 17,412 | 17,334 | 16,556 | 15,368 | |||||||||||||||
| Trust income |
2,282 | 3,348 | 2,854 | 2,850 | 3,134 | |||||||||||||||
| Security gains, net |
74 | 18 | 2,047 | 10,045 | 17 | |||||||||||||||
| Insurance commissions |
23,153 | 19,416 | 22,012 | 22,941 | 22,549 | |||||||||||||||
| Other |
9,070 | 8,430 | 6,270 | 9,486 | 9,316 | |||||||||||||||
|
|
|
|
|
|
|
|
|
|
|
|||||||||||
| Total noninterest revenue |
72,360 | 65,335 | 62,055 | 75,144 | 68,311 | |||||||||||||||
|
|
|
|
|
|
|
|
|
|
|
|||||||||||
| NONINTEREST EXPENSE: |
||||||||||||||||||||
| Salaries and employee benefits |
74,931 | 70,512 | 71,851 | 70,142 | 70,375 | |||||||||||||||
| Occupancy, net of rental income |
10,066 | 10,315 | 11,144 | 10,232 | 10,671 | |||||||||||||||
| Equipment |
5,333 | 5,108 | 5,346 | 5,595 | 5,658 | |||||||||||||||
| Deposit insurance assessments |
5,383 | 5,674 | 3,781 | 6,436 | 5,425 | |||||||||||||||
| Prepayment penalty on FHLB borrowings |
— | — | — | 9,778 | — | |||||||||||||||
| Other |
39,967 | 44,247 | 38,576 | 34,886 | 37,881 | |||||||||||||||
|
|
|
|
|
|
|
|
|
|
|
|||||||||||
| Total noninterest expenses |
135,680 | 135,856 | 130,698 | 137,069 | 130,010 | |||||||||||||||
|
|
|
|
|
|
|
|
|
|
|
|||||||||||
| Income (loss) before income taxes |
32,290 | 17,718 | 14,320 | 15,747 | (5,741 | ) | ||||||||||||||
| Income tax expense (benefit) |
9,424 | 4,415 | 2,386 | 2,921 | (5,247 | ) | ||||||||||||||
|
|
|
|
|
|
|
|
|
|
|
|||||||||||
| Net income (loss) |
$ | 22,866 | $ | 13,303 | $ | 11,934 | $ | 12,826 | $ | (494 | ) | |||||||||
|
|
|
|
|
|
|
|
|
|
|
|||||||||||
| Net income (loss) per share: Basic |
$ | 0.25 | $ | 0.16 | $ | 0.14 | $ | 0.15 | $ | (0.01 | ) | |||||||||
|
|
|
|
|
|
|
|
|
|
|
|||||||||||
| Diluted |
$ | 0.25 | $ | 0.16 | $ | 0.14 | $ | 0.15 | $ | (0.01 | ) | |||||||||
|
|
|
|
|
|
|
|
|
|
|
|||||||||||
- MORE -
BXS Announces First Quarter Results
Page 11
April 23, 2012
BancorpSouth, Inc.
Selected Loan Data
(Dollars in thousands)
(Unaudited)
| Quarter Ended | ||||||||||||||||||||
| Mar-12 | Dec-11 | Sep-11 | Jun-11 | Mar-11 | ||||||||||||||||
| LOAN AND LEASE PORTFOLIO: |
||||||||||||||||||||
| Commercial and industrial |
$ | 1,441,727 | $ | 1,473,728 | $ | 1,503,391 | $ | 1,526,686 | $ | 1,484,223 | ||||||||||
| Real estate |
||||||||||||||||||||
| Consumer mortgages |
1,937,997 | 1,945,190 | 1,966,124 | 1,971,499 | 1,958,367 | |||||||||||||||
| Home equity |
501,331 | 514,362 | 523,030 | 531,787 | 531,406 | |||||||||||||||
| Agricultural |
256,683 | 239,487 | 249,715 | 255,310 | 250,393 | |||||||||||||||
| Commercial and industrial-owner occupied |
1,287,542 | 1,301,575 | 1,329,644 | 1,366,734 | 1,316,824 | |||||||||||||||
| Construction, acquisition and development |
858,110 | 908,362 | 976,694 | 1,060,675 | 1,117,335 | |||||||||||||||
| Commercial real estate |
1,742,001 | 1,754,022 | 1,772,003 | 1,764,648 | 1,831,226 | |||||||||||||||
| Credit cards |
100,527 | 106,281 | 103,232 | 101,955 | 100,732 | |||||||||||||||
| All other |
612,005 | 627,304 | 632,072 | 635,259 | 623,330 | |||||||||||||||
|
|
|
|
|
|
|
|
|
|
|
|||||||||||
| Total loans |
$ | 8,737,923 | $ | 8,870,311 | $ | 9,055,905 | $ | 9,214,553 | $ | 9,213,836 | ||||||||||
|
|
|
|
|
|
|
|
|
|
|
|||||||||||
| ALLOWANCE FOR CREDIT LOSSES: |
||||||||||||||||||||
| Balance, beginning of period |
$ | 195,118 | $ | 199,686 | $ | 197,627 | $ | 198,333 | $ | 196,913 | ||||||||||
| Loans and leases charged off: |
||||||||||||||||||||
| Commercial and industrial |
(4,272 | ) | (1,677 | ) | (1,295 | ) | (5,556 | ) | (8,809 | ) | ||||||||||
| Real estate |
||||||||||||||||||||
| Consumer mortgages |
(4,216 | ) | (2,953 | ) | (2,344 | ) | (1,629 | ) | (3,260 | ) | ||||||||||
| Home equity |
(851 | ) | (1,667 | ) | (1,712 | ) | (1,391 | ) | (1,082 | ) | ||||||||||
| Agricultural |
(96 | ) | (110 | ) | (2,345 | ) | (373 | ) | (592 | ) | ||||||||||
| Commercial and industrial-owner occupied |
(3,868 | ) | (1,136 | ) | (4,222 | ) | (3,228 | ) | (1,716 | ) | ||||||||||
| Construction, acquisition and development |
(11,394 | ) | (10,539 | ) | (7,697 | ) | (16,783 | ) | (32,343 | ) | ||||||||||
| Commercial real estate |
(2,809 | ) | (6,858 | ) | (4,467 | ) | (1,597 | ) | (4,514 | ) | ||||||||||
| Credit cards |
(562 | ) | (706 | ) | (760 | ) | (725 | ) | (881 | ) | ||||||||||
| All other |
(758 | ) | (794 | ) | (770 | ) | (4,971 | ) | (553 | ) | ||||||||||
|
|
|
|
|
|
|
|
|
|
|
|||||||||||
| Total loans charged off |
(28,826 | ) | (26,440 | ) | (25,612 | ) | (36,253 | ) | (53,750 | ) | ||||||||||
|
|
|
|
|
|
|
|
|
|
|
|||||||||||
| Recoveries: |
||||||||||||||||||||
| Commercial and industrial |
1,542 | 446 | 348 | 589 | 184 | |||||||||||||||
| Real estate |
||||||||||||||||||||
| Consumer mortgages |
323 | 263 | 485 | 220 | 143 | |||||||||||||||
| Home equity |
315 | 43 | 51 | 46 | 45 | |||||||||||||||
| Agricultural |
10 | 76 | — | 45 | 2 | |||||||||||||||
| Commercial and industrial-owner occupied |
351 | 100 | 99 | 21 | 173 | |||||||||||||||
| Construction, acquisition and development |
2,155 | 971 | 923 | 1,493 | 564 | |||||||||||||||
| Commercial real estate |
383 | 340 | 300 | 392 | 13 | |||||||||||||||
| Credit cards |
118 | 168 | 141 | 239 | 255 | |||||||||||||||
| All other |
288 | 215 | 212 | 262 | 312 | |||||||||||||||
|
|
|
|
|
|
|
|
|
|
|
|||||||||||
| Total recoveries |
5,485 | 2,622 | 2,559 | 3,307 | 1,691 | |||||||||||||||
|
|
|
|
|
|
|
|
|
|
|
|||||||||||
| Net charge-offs |
(23,341 | ) | (23,818 | ) | (23,053 | ) | (32,946 | ) | (52,059 | ) | ||||||||||
| Provision charged to operating expense |
10,000 | 19,250 | 25,112 | 32,240 | 53,479 | |||||||||||||||
|
|
|
|
|
|
|
|
|
|
|
|||||||||||
| Balance, end of period |
$ | 181,777 | $ | 195,118 | $ | 199,686 | $ | 197,627 | $ | 198,333 | ||||||||||
|
|
|
|
|
|
|
|
|
|
|
|||||||||||
| Average loans for period |
$ | 8,791,542 | $ | 8,954,229 | $ | 9,138,414 | $ | 9,249,127 | $ | 9,300,029 | ||||||||||
|
|
|
|
|
|
|
|
|
|
|
|||||||||||
| Ratio: |
||||||||||||||||||||
| Net charge-offs to average loans (annualized) |
1.06 | % | 1.06 | % | 1.01 | % | 1.42 | % | 2.24 | % | ||||||||||
|
|
|
|
|
|
|
|
|
|
|
|||||||||||
- MORE -
BXS Announces First Quarter Results
Page 12
April 23, 2012
BancorpSouth, Inc.
Selected Loan Data
(Dollars in thousands)
(Unaudited)
| Quarter Ended | ||||||||||||||||||||
| Mar-12 | Dec-11 | Sep-11 | Jun-11 | Mar-11 | ||||||||||||||||
| NON-PERFORMING ASSETS |
||||||||||||||||||||
| NON-PERFORMING LOANS AND LEASES: |
||||||||||||||||||||
| Nonaccrual Loans and Leases |
||||||||||||||||||||
| Commercial and industrial |
$ | 11,025 | $ | 12,260 | $ | 11,122 | $ | 9,337 | $ | 14,655 | ||||||||||
| Real estate |
||||||||||||||||||||
| Consumer mortgages |
46,562 | 47,878 | 44,100 | 34,174 | 36,025 | |||||||||||||||
| Home equity |
2,687 | 2,036 | 2,634 | 1,232 | 1,543 | |||||||||||||||
| Agricultural |
4,254 | 4,179 | 6,254 | 8,526 | 7,597 | |||||||||||||||
| Commercial and industrial-owner occupied |
32,842 | 33,112 | 26,977 | 26,387 | 24,638 | |||||||||||||||
| Construction, acquisition and development |
115,649 | 133,110 | 171,566 | 200,434 | 224,847 | |||||||||||||||
| Commercial real estate |
35,715 | 40,616 | 49,500 | 48,571 | 58,945 | |||||||||||||||
| Credit cards |
509 | 594 | 551 | 546 | 617 | |||||||||||||||
| All other |
3,984 | 3,013 | 1,775 | 1,869 | 1,859 | |||||||||||||||
|
|
|
|
|
|
|
|
|
|
|
|||||||||||
| Total nonaccrual loans and leases |
$ | 253,227 | $ | 276,798 | $ | 314,479 | $ | 331,076 | $ | 370,726 | ||||||||||
|
|
|
|
|
|
|
|
|
|
|
|||||||||||
| Loans and Leases 90+ Days Past Due, Still Accruing: |
||||||||||||||||||||
| Commercial and industrial |
$ | 10 | $ | 12 | $ | 1,846 | $ | 118 | $ | 501 | ||||||||||
| Real estate |
||||||||||||||||||||
| Consumer mortgages |
1,314 | 2,974 | 4,136 | 2,482 | 3,152 | |||||||||||||||
| Home equity |
— | — | 134 | 242 | 139 | |||||||||||||||
| Agricultural |
— | — | 131 | — | 7 | |||||||||||||||
| Commercial and industrial-owner occupied |
— | — | 42 | — | 255 | |||||||||||||||
| Construction, acquisition and development |
— | — | 290 | 432 | 19 | |||||||||||||||
| Commercial real estate |
— | — | 106 | 19 | 7 | |||||||||||||||
| Credit cards |
228 | 299 | 257 | 299 | 240 | |||||||||||||||
| All other |
146 | 149 | 412 | 388 | 509 | |||||||||||||||
|
|
|
|
|
|
|
|
|
|
|
|||||||||||
| Total loans and leases 90+ days past due, still accruing |
1,698 | 3,434 | 7,354 | 3,980 | 4,829 | |||||||||||||||
|
|
|
|
|
|
|
|
|
|
|
|||||||||||
| Restructured Loans and Leases, Still Accruing |
30,311 | 42,018 | 40,966 | 44,786 | 49,472 | |||||||||||||||
|
|
|
|
|
|
|
|
|
|
|
|||||||||||
| Total non-performing loans and leases |
285,236 | 322,250 | 362,799 | 379,842 | 425,027 | |||||||||||||||
|
|
|
|
|
|
|
|
|
|
|
|||||||||||
| OTHER REAL ESTATE OWNED: |
167,808 | 173,805 | 162,686 | 151,204 | 136,412 | |||||||||||||||
|
|
|
|
|
|
|
|
|
|
|
|||||||||||
| Total Non-performing Assets |
$ | 453,044 | $ | 496,055 | $ | 525,485 | $ | 531,046 | $ | 561,439 | ||||||||||
|
|
|
|
|
|
|
|
|
|
|
|||||||||||
| Additions to Nonaccrual Loans and Leases During the Quarter |
$ | 40,392 | $ | 39,474 | $ | 60,799 | $ | 50,427 | $ | 111,241 | ||||||||||
|
|
|
|
|
|
|
|
|
|
|
|||||||||||
| Loans and Leases 30-89 Days Past Due, Still Accruing: |
||||||||||||||||||||
| Commercial and industrial |
$ | 4,809 | $ | 8,065 | $ | 9,759 | $ | 7,903 | $ | 8,407 | ||||||||||
| Real estate |
||||||||||||||||||||
| Consumer mortgages |
10,736 | 15,864 | 20,144 | 18,621 | 17,136 | |||||||||||||||
| Home equity |
2,248 | 2,037 | 2,066 | 2,916 | 2,492 | |||||||||||||||
| Agricultural |
663 | 339 | 1,485 | 2,901 | 818 | |||||||||||||||
| Commercial and industrial-owner occupied |
3,332 | 2,154 | 7,348 | 2,786 | 4,369 | |||||||||||||||
| Construction, acquisition and development |
2,431 | 2,714 | 4,469 | 4,939 | 8,047 | |||||||||||||||
| Commercial real estate |
2,104 | 3,292 | 5,136 | 4,091 | 7,090 | |||||||||||||||
| Credit cards |
686 | 802 | 851 | 785 | 969 | |||||||||||||||
| All other |
1,983 | 2,280 | 2,832 | 3,005 | 2,192 | |||||||||||||||
|
|
|
|
|
|
|
|
|
|
|
|||||||||||
| Total Loans and Leases 30-89 days past due, still accruing |
$ | 28,992 | $ | 37,547 | $ | 54,090 | $ | 47,947 | $ | 51,520 | ||||||||||
|
|
|
|
|
|
|
|
|
|
|
|||||||||||
| Credit Quality Ratios: |
||||||||||||||||||||
| Provision for credit losses to average loans and leases (annualized) |
0.45 | % | 0.86 | % | 1.10 | % | 1.39 | % | 2.30 | % | ||||||||||
| Allowance for credit losses to net loans and leases |
2.08 | % | 2.20 | % | 2.21 | % | 2.14 | % | 2.15 | % | ||||||||||
| Allowance for credit losses to non-performing assets |
40.12 | % | 39.33 | % | 38.00 | % | 37.21 | % | 35.33 | % | ||||||||||
| Allowance for credit losses to non-performing loans and leases |
63.73 | % | 60.55 | % | 55.04 | % | 52.03 | % | 46.66 | % | ||||||||||
| Non-performing loans and leases to net loans and leases |
3.26 | % | 3.63 | % | 4.01 | % | 4.12 | % | 4.61 | % | ||||||||||
| Non-performing assets to net loans and leases |
5.18 | % | 5.59 | % | 5.80 | % | 5.76 | % | 6.09 | % | ||||||||||
- MORE -
BXS Announces First Quarter Results
Page 13
April 23, 2012
BancorpSouth, Inc.
Selected Loan Data
(Dollars in thousands)
(Unaudited)
| Quarter Ended | ||||||||||||||||||||
| Mar-12 | Dec-11 | Sep-11 | Jun-11 | Mar-11 | ||||||||||||||||
| REAL ESTATE CONSTRUCTION, ACQUISITION AND DEVELOPMENT (“CAD”) PORTFOLIO: |
||||||||||||||||||||
| Outstanding Balance |
||||||||||||||||||||
| Multi-family construction |
$ | 4,683 | $ | 2,138 | $ | 10,349 | $ | 19,116 | $ | 21,051 | ||||||||||
| One-to-four family construction |
159,281 | 169,827 | 181,445 | 198,809 | 212,435 | |||||||||||||||
| Recreation and all other loans |
63,407 | 67,235 | 61,084 | 66,366 | 63,686 | |||||||||||||||
| Commercial construction |
122,173 | 130,124 | 140,570 | 160,834 | 155,402 | |||||||||||||||
| Commercial acquisition and development |
191,783 | 197,044 | 206,516 | 222,460 | 244,950 | |||||||||||||||
| Residential acquisition and development |
316,783 | 341,994 | 376,730 | 393,090 | 419,811 | |||||||||||||||
|
|
|
|
|
|
|
|
|
|
|
|||||||||||
| Total outstanding balance |
$ | 858,110 | $ | 908,362 | $ | 976,694 | $ | 1,060,675 | $ | 1,117,335 | ||||||||||
|
|
|
|
|
|
|
|
|
|
|
|||||||||||
| Nonaccrual CAD Loans |
||||||||||||||||||||
| Multi-family construction |
$ | — | $ | 1,067 | $ | — | $ | 9,174 | $ | 8,352 | ||||||||||
| One-to-four family construction |
11,953 | 14,690 | 17,937 | 24,537 | 33,570 | |||||||||||||||
| Recreation and all other loans |
386 | 436 | 712 | 774 | 708 | |||||||||||||||
| Commercial construction |
3,702 | 5,235 | 10,159 | 16,618 | 20,889 | |||||||||||||||
| Commercial acquisition and development |
23,464 | 23,968 | 31,862 | 37,207 | 47,200 | |||||||||||||||
| Residential acquisition and development |
76,144 | 87,714 | 110,896 | 112,124 | 114,128 | |||||||||||||||
|
|
|
|
|
|
|
|
|
|
|
|||||||||||
| Total nonaccrual CAD loans |
115,649 | 133,110 | 171,566 | 200,434 | 224,847 | |||||||||||||||
|
|
|
|
|
|
|
|
|
|
|
|||||||||||
| CAD Loans 90+ Days Past Due, Still Accruing: |
||||||||||||||||||||
| Multi-family construction |
— | — | — | — | — | |||||||||||||||
| One-to-four family construction |
— | — | 211 | — | — | |||||||||||||||
| Recreation and all other loans |
— | — | — | 2 | 2 | |||||||||||||||
| Commercial construction |
— | — | — | — | — | |||||||||||||||
| Commercial acquisition and development |
— | — | — | — | — | |||||||||||||||
| Residential acquisition and development |
— | — | 79 | 430 | 17 | |||||||||||||||
|
|
|
|
|
|
|
|
|
|
|
|||||||||||
| Total CAD loans 90+ days past due, still accruing |
— | — | 290 | 432 | 19 | |||||||||||||||
|
|
|
|
|
|
|
|
|
|
|
|||||||||||
| Restructured CAD Loans, Still Accruing |
||||||||||||||||||||
| Multi-family construction |
— | — | — | — | — | |||||||||||||||
| One-to-four family construction |
799 | 318 | 321 | 1,697 | 113 | |||||||||||||||
| Recreation and all other loans |
847 | 852 | 24 | 24 | — | |||||||||||||||
| Commercial construction |
977 | — | — | — | — | |||||||||||||||
| Commercial acquisition and development |
2,975 | 433 | 1,415 | 1,415 | 834 | |||||||||||||||
| Residential acquisition and development |
106 | 446 | 410 | 2,274 | 3,408 | |||||||||||||||
|
|
|
|
|
|
|
|
|
|
|
|||||||||||
| Total restructured CAD loans, still accruing |
5,704 | 2,049 | 2,170 | 5,410 | 4,355 | |||||||||||||||
|
|
|
|
|
|
|
|
|
|
|
|||||||||||
| Total Non-performing CAD loans |
$ | 121,353 | $ | 135,159 | $ | 174,026 | $ | 206,276 | $ | 229,221 | ||||||||||
|
|
|
|
|
|
|
|
|
|
|
|||||||||||
| CAD NPL as a % of Outstanding CAD Balance |
||||||||||||||||||||
| Multi-family construction |
— | 49.9 | % | — | 48.0 | % | 39.7 | % | ||||||||||||
| One-to-four family construction |
8.0 | % | 8.8 | % | 10.2 | % | 13.2 | % | 15.9 | % | ||||||||||
| Recreation and all other loans |
1.9 | % | 1.9 | % | 1.2 | % | 1.2 | % | 1.1 | % | ||||||||||
| Commercial construction |
3.8 | % | 4.0 | % | 7.2 | % | 10.3 | % | 13.4 | % | ||||||||||
| Commercial acquisition and development |
13.8 | % | 12.4 | % | 16.1 | % | 17.4 | % | 19.6 | % | ||||||||||
| Residential acquisition and development |
24.1 | % | 25.8 | % | 29.6 | % | 29.2 | % | 28.0 | % | ||||||||||
| Total CAD NPL as a % of outstanding CAD balance |
14.1 | % | 14.9 | % | 17.8 | % | 19.4 | % | 20.5 | % | ||||||||||
- MORE -
BXS Announces First Quarter Results
Page 14
April 23, 2012
BancorpSouth, Inc.
Selected Loan Data
(Dollars in thousands)
(Unaudited)
| March 31, 2012 | ||||||||||||||||||||||||||||
| Pass | Special Mention |
Substandard | Doubtful | Loss | Impaired | Total | ||||||||||||||||||||||
| LOAN PORTFOLIO BY INTERNALLY ASSIGNED GRADE: |
||||||||||||||||||||||||||||
| Commercial and industrial |
$ | 1,376,983 | $ | 6,449 | $ | 47,783 | $ | 4,159 | $ | 247 | $ | 6,106 | $ | 1,441,727 | ||||||||||||||
| Real estate |
||||||||||||||||||||||||||||
| Consumer mortgages |
1,729,187 | 23,918 | 151,679 | 4,351 | 446 | 28,416 | 1,937,997 | |||||||||||||||||||||
| Home equity |
476,300 | 2,793 | 19,626 | 754 | 275 | 1,583 | 501,331 | |||||||||||||||||||||
| Agricultural |
229,865 | 1,936 | 21,763 | 20 | — | 3,099 | 256,683 | |||||||||||||||||||||
| Commercial and industrial-owner occupied |
1,151,368 | 24,662 | 83,041 | 230 | 89 | 28,152 | 1,287,542 | |||||||||||||||||||||
| Construction, acquisition and development |
601,396 | 22,939 | 121,556 | 956 | — | 111,263 | 858,110 | |||||||||||||||||||||
| Commercial real estate |
1,491,021 | 47,535 | 171,891 | 72 | — | 31,482 | 1,742,001 | |||||||||||||||||||||
| Credit cards |
100,527 | — | — | — | — | — | 100,527 | |||||||||||||||||||||
| All other |
575,399 | 16,685 | 18,222 | 678 | 10 | 1,011 | 612,005 | |||||||||||||||||||||
|
|
|
|
|
|
|
|
|
|
|
|
|
|
|
|||||||||||||||
| Total loans |
$ | 7,732,046 | $ | 146,917 | $ | 635,561 | $ | 11,220 | $ | 1,067 | $ | 211,112 | $ | 8,737,923 | ||||||||||||||
|
|
|
|
|
|
|
|
|
|
|
|
|
|
|
|||||||||||||||
- MORE -
BXS Announces First Quarter Results
Page 15
April 23, 2012
BancorpSouth, Inc.
Selected Loan Data
(Dollars in thousands)
(Unaudited)
| As of | ||||||||||||||||||||
| Mar-12 | Dec-11 | Sep-11 | Jun-11 | Mar-11 | ||||||||||||||||
| Unpaid principal balance of impaired loans |
$ | 266,483 | $ | 287,099 | $ | 342,839 | $ | 374,760 | $ | 423,497 | ||||||||||
| Cumulative charge-offs on impaired loans |
55,371 | 52,176 | 62,950 | 71,103 | 84,676 | |||||||||||||||
|
|
|
|
|
|
|
|
|
|
|
|||||||||||
| Impaired nonaccrual loan and lease outstanding balance |
211,112 | 234,923 | 279,889 | 303,657 | 338,821 | |||||||||||||||
| Other non-accrual loans and leases not impaired |
42,115 | 41,875 | 34,590 | 27,419 | 31,905 | |||||||||||||||
|
|
|
|
|
|
|
|
|
|
|
|||||||||||
| Total non-accrual loans and leases |
$ | 253,227 | $ | 276,798 | $ | 314,479 | $ | 331,076 | $ | 370,726 | ||||||||||
|
|
|
|
|
|
|
|
|
|
|
|||||||||||
| Allowance for impaired loans |
25,546 | 39,708 | 38,657 | 46,810 | 49,419 | |||||||||||||||
|
|
|
|
|
|
|
|
|
|
|
|||||||||||
| Nonaccrual loans and leases, net of specific reserves |
$ | 227,681 | $ | 237,090 | $ | 275,822 | $ | 284,266 | $ | 321,307 | ||||||||||
|
|
|
|
|
|
|
|
|
|
|
|||||||||||
| Loans and leases 90+ days past due, still accruing |
$ | 1,698 | $ | 3,434 | $ | 7,354 | $ | 3,980 | $ | 4,829 | ||||||||||
| Restructured loans and leases, still accruing |
30,311 | 42,018 | 40,966 | 44,786 | 49,472 | |||||||||||||||
|
|
|
|
|
|
|
|
|
|
|
|||||||||||
| Total non-performing loans and leases |
$ | 285,236 | $ | 322,250 | $ | 362,799 | $ | 379,842 | $ | 425,027 | ||||||||||
|
|
|
|
|
|
|
|
|
|
|
|||||||||||
| Allowance for impaired loans |
$ | 25,546 | $ | 39,708 | $ | 38,657 | $ | 46,810 | $ | 49,419 | ||||||||||
| Allowance for all other loans and leases |
156,231 | 155,410 | 161,029 | 150,817 | 148,914 | |||||||||||||||
|
|
|
|
|
|
|
|
|
|
|
|||||||||||
| Total allowance for credit losses |
$ | 181,777 | $ | 195,118 | $ | 199,686 | $ | 197,627 | $ | 198,333 | ||||||||||
|
|
|
|
|
|
|
|
|
|
|
|||||||||||
| Outstanding balance of impaired loans |
$ | 211,112 | $ | 234,923 | $ | 279,889 | $ | 303,657 | $ | 338,821 | ||||||||||
| Allowance for impaired loans |
25,546 | 39,708 | 38,657 | 46,810 | 49,419 | |||||||||||||||
|
|
|
|
|
|
|
|
|
|
|
|||||||||||
| Net book value of impaired loans |
$ | 185,566 | $ | 195,215 | $ | 241,232 | $ | 256,847 | $ | 289,402 | ||||||||||
|
|
|
|
|
|
|
|
|
|
|
|||||||||||
| Net book value of impaired loans as a % of unpaid principal balance |
70 | % | 68 | % | 70 | % | 69 | % | 68 | % | ||||||||||
| Coverage of other non-accrual loans and leases not impaired by the allowance for all other loans and leases |
371 | % | 371 | % | 466 | % | 550 | % | 467 | % | ||||||||||
| Coverage of non-performing loans and leases not impaired by the allowance for all other loans and leases |
211 | % | 178 | % | 194 | % | 198 | % | 173 | % | ||||||||||
- MORE -
BXS Announces First Quarter Results
Page 16
April 23, 2012
BancorpSouth, Inc.
Geographical Information
(Dollars in thousands)
(Unaudited)
| March 31, 2012 | ||||||||||||||||||||||||||||||||||||
| Alabama and Florida Panhandle |
Arkansas | Mississippi | Missouri | Greater Memphis Area |
Tennessee | Texas and Louisiana |
Other | Total | ||||||||||||||||||||||||||||
| LOAN AND LEASE PORTFOLIO: |
||||||||||||||||||||||||||||||||||||
| Commercial and industrial |
$ | 56,958 | $ | 165,503 | $ | 333,153 | $ | 51,881 | $ | 16,991 | $ | 78,288 | $ | 249,569 | $ | 489,384 | $ | 1,441,727 | ||||||||||||||||||
| Real estate |
||||||||||||||||||||||||||||||||||||
| Consumer mortgages |
108,285 | 270,476 | 757,160 | 55,566 | 82,585 | 166,615 | 444,094 | 53,216 | 1,937,997 | |||||||||||||||||||||||||||
| Home equity |
57,995 | 39,922 | 170,628 | 24,849 | 67,484 | 75,894 | 62,253 | 2,306 | 501,331 | |||||||||||||||||||||||||||
| Agricultural |
5,775 | 83,839 | 72,900 | 3,937 | 9,262 | 13,199 | 62,470 | 5,301 | 256,683 | |||||||||||||||||||||||||||
| Commercial and industrial-owner occupied |
114,985 | 166,065 | 453,201 | 68,002 | 95,874 | 95,133 | 244,967 | 49,315 | 1,287,542 | |||||||||||||||||||||||||||
| Construction, acquisition and development |
104,362 | 69,566 | 244,459 | 48,115 | 95,198 | 92,608 | 185,781 | 18,021 | 858,110 | |||||||||||||||||||||||||||
| Commercial real estate |
203,365 | 342,591 | 342,816 | 219,999 | 115,186 | 101,142 | 362,700 | 54,202 | 1,742,001 | |||||||||||||||||||||||||||
| Credit cards |
— | — | — | — | — | — | — | 100,527 | 100,527 | |||||||||||||||||||||||||||
| All other |
31,347 | 88,646 | 195,309 | 5,662 | 57,105 | 47,204 | 95,521 | 91,211 | 612,005 | |||||||||||||||||||||||||||
|
|
|
|
|
|
|
|
|
|
|
|
|
|
|
|
|
|
|
|||||||||||||||||||
| Total loans |
$ | 683,072 | $ | 1,226,608 | $ | 2,569,626 | $ | 478,011 | $ | 539,685 | $ | 670,083 | $ | 1,707,355 | $ | 863,483 | $ | 8,737,923 | ||||||||||||||||||
|
|
|
|
|
|
|
|
|
|
|
|
|
|
|
|
|
|
|
|||||||||||||||||||
| CAD PORTFOLIO: |
||||||||||||||||||||||||||||||||||||
| Multi-family construction |
$ | 2,634 | $ | — | $ | 11 | $ | — | $ | — | $ | 675 | $ | 1,363 | $ | — | $ | 4,683 | ||||||||||||||||||
| One-to-four family construction |
26,983 | 12,703 | 41,728 | 6,787 | 9,580 | 28,030 | 32,890 | 580 | 159,281 | |||||||||||||||||||||||||||
| Recreation and all other loans |
1,735 | 8,937 | 31,632 | 562 | 3,174 | 845 | 16,522 | — | 63,407 | |||||||||||||||||||||||||||
| Commercial construction |
14,363 | 5,930 | 36,794 | 2,619 | 9,093 | 19,605 | 30,253 | 3,516 | 122,173 | |||||||||||||||||||||||||||
| Commercial acquisition and development |
13,905 | 16,392 | 52,641 | 15,018 | 32,228 | 16,719 | 38,903 | 5,977 | 191,783 | |||||||||||||||||||||||||||
| Residential acquisition and development |
44,742 | 25,604 | 81,653 | 23,129 | 41,123 | 26,734 | 65,850 | 7,948 | 316,783 | |||||||||||||||||||||||||||
|
|
|
|
|
|
|
|
|
|
|
|
|
|
|
|
|
|
|
|||||||||||||||||||
| Total CAD loans |
$ | 104,362 | $ | 69,566 | $ | 244,459 | $ | 48,115 | $ | 95,198 | $ | 92,608 | $ | 185,781 | $ | 18,021 | $ | 858,110 | ||||||||||||||||||
|
|
|
|
|
|
|
|
|
|
|
|
|
|
|
|
|
|
|
|||||||||||||||||||
| NON-PERFORMING LOANS AND LEASES: |
||||||||||||||||||||||||||||||||||||
| Commercial and industrial |
$ | 2,455 | $ | 2,175 | $ | 789 | $ | 3,414 | $ | 7 | $ | 215 | $ | 2,756 | $ | 669 | $ | 12,480 | ||||||||||||||||||
| Real estate |
||||||||||||||||||||||||||||||||||||
| Consumer mortgages |
5,655 | 4,716 | 12,654 | 5,172 | 3,074 | 5,820 | 7,171 | 7,963 | 52,225 | |||||||||||||||||||||||||||
| Home equity |
952 | 26 | 406 | — | 487 | 501 | 313 | 2 | 2,687 | |||||||||||||||||||||||||||
| Agricultural |
96 | 214 | 1,007 | 1,388 | 1,296 | 252 | — | 1 | 4,254 | |||||||||||||||||||||||||||
| Commercial and industrial-owner occupied |
8,923 | 6,164 | 7,344 | 1,567 | 4,402 | 5,508 | 3,183 | 2 | 37,093 | |||||||||||||||||||||||||||
| Construction, acquisition and development |
20,596 | 5,702 | 7,932 | 13,813 | 24,274 | 15,866 | 31,272 | 1,898 | 121,353 | |||||||||||||||||||||||||||
| Commercial real estate |
10,500 | 1,813 | 8,113 | 12,649 | 3,190 | 5,116 | 3,500 | 1,963 | 46,844 | |||||||||||||||||||||||||||
| Credit cards |
— | — | — | — | — | — | — | 3,060 | 3,060 | |||||||||||||||||||||||||||
| All other |
325 | 2,204 | 1,053 | 118 | 31 | 1,157 | 198 | 154 | 5,240 | |||||||||||||||||||||||||||
|
|
|
|
|
|
|
|
|
|
|
|
|
|
|
|
|
|
|
|||||||||||||||||||
| Total loans |
$ | 49,502 | $ | 23,014 | $ | 39,298 | $ | 38,121 | $ | 36,761 | $ | 34,435 | $ | 48,393 | $ | 15,712 | $ | 285,236 | ||||||||||||||||||
|
|
|
|
|
|
|
|
|
|
|
|
|
|
|
|
|
|
|
|||||||||||||||||||
- MORE -
BXS Announces First Quarter Results
Page 17
April 23, 2012
BancorpSouth, Inc.
Selected Additional Information
(Dollars in thousands)
(Unaudited)
| March 31, 2012 | ||||||||||||||||||||||||||||||||||||
| Alabama and Florida Panhandle |
Arkansas | Mississippi | Missouri | Greater Memphis Area |
Tennessee | Texas and Louisiana |
Other | Total | ||||||||||||||||||||||||||||
| OTHER REAL ESTATE OWNED: |
||||||||||||||||||||||||||||||||||||
| Commercial and industrial |
$ | 423 | $ | 16 | $ | — | $ | — | $ | 821 | $ | — | $ | — | $ | — | $ | 1,260 | ||||||||||||||||||
| Real estate |
— | |||||||||||||||||||||||||||||||||||
| Consumer mortgages |
3,505 | 615 | 2,970 | — | 4,713 | 3,523 | 111 | 3,377 | 18,814 | |||||||||||||||||||||||||||
| Home equity |
— | 26 | 22 | — | 586 | 141 | — | — | 775 | |||||||||||||||||||||||||||
| Agricultural |
902 | — | 730 | — | 1,164 | 2,371 | — | — | 5,167 | |||||||||||||||||||||||||||
| Commercial and industrial-owner occupied |
1,564 | 656 | 2,583 | 2,113 | 1,829 | 164 | 174 | 291 | 9,374 | |||||||||||||||||||||||||||
| Construction, acquisition and development |
16,179 | 1,766 | 25,510 | 1,965 | 46,007 | 19,458 | 2,630 | — | 113,515 | |||||||||||||||||||||||||||
| Commercial real estate |
3,557 | 1,744 | 3,241 | 307 | 7,318 | — | 233 | 579 | 16,979 | |||||||||||||||||||||||||||
| All other |
209 | 83 | 990 | 117 | 437 | — | 55 | 33 | 1,924 | |||||||||||||||||||||||||||
| Total loans |
$ | 26,339 | $ | 4,906 | $ | 36,046 | $ | 4,502 | $ | 62,875 | $ | 25,657 | $ | 3,203 | $ | 4,280 | $ | 167,808 | ||||||||||||||||||
| Quarter Ended | ||||||||||||||||||||||||||||||||||||
| Mar-12 | Dec-11 | Sep-11 | Jun-11 | Mar-11 | ||||||||||||||||||||||||||||||||
| OTHER REAL ESTATE OWNED: |
||||||||||||||||||||||||||||||||||||
| Balance, beginning of period |
$ | 173,805 | $ | 162,686 | $ | 151,204 | $ | 136,412 | $ | 133,412 | ||||||||||||||||||||||||||
| Additions to foreclosed properties |
||||||||||||||||||||||||||||||||||||
| New foreclosed property |
10,766 | 36,507 | 29,063 | 38,199 | 21,464 | |||||||||||||||||||||||||||||||
| Reductions in foreclosed properties |
||||||||||||||||||||||||||||||||||||
| Sales |
(11,771 | ) | (16,688 | ) | (13,136 | ) | (21,135 | ) | (13,528 | ) | ||||||||||||||||||||||||||
| Writedowns |
(4,992 | ) | (8,700 | ) | (4,445 | ) | (2,272 | ) | (4,936 | ) | ||||||||||||||||||||||||||
|
|
|
|
|
|
|
|
|
|
|
|||||||||||||||||||||||||||
| Balance, end of period |
$ | 167,808 | $ | 173,805 | $ | 162,686 | $ | 151,204 | $ | 136,412 | ||||||||||||||||||||||||||
|
|
|
|
|
|
|
|
|
|
|
|||||||||||||||||||||||||||
| FORECLOSED PROPERTY EXPENSE |
||||||||||||||||||||||||||||||||||||
| Loss (gain) on sale of other real estate owned |
$ | 770 | $ | 711 | $ | 16 | $ | (140 | ) | $ | 492 | |||||||||||||||||||||||||
| Writedown of other real estate owned |
4,992 | 8,700 | 4,445 | 2,272 | 4,936 | |||||||||||||||||||||||||||||||
| Other foreclosed property expense |
2,648 | 1,422 | 1,655 | 1,633 | 1,654 | |||||||||||||||||||||||||||||||
|
|
|
|
|
|
|
|
|
|
|
|||||||||||||||||||||||||||
| Total foreclosed property expense |
$ | 8,410 | $ | 10,833 | $ | 6,116 | $ | 3,765 | $ | 7,082 | ||||||||||||||||||||||||||
|
|
|
|
|
|
|
|
|
|
|
|||||||||||||||||||||||||||
- MORE -
BXS Announces First Quarter Results
Page 18
April 23, 2012
BancorpSouth, Inc.
Noninterest Revenue and Expense
(Dollars in thousands)
(Unaudited)
| Quarter Ended | ||||||||||||||||||||
| Mar-12 | Dec-11 | Sep-11 | Jun-11 | Mar-11 | ||||||||||||||||
| NONINTEREST REVENUE: |
||||||||||||||||||||
|
Mortgage lending |
$ | 15,142 | $ | 8,928 | $ | (1,443 | ) | $ | 2,003 | $ | 7,581 | |||||||||
| Credit card, debit card and merchant fees |
7,523 | 7,783 | 12,981 | 11,263 | 10,346 | |||||||||||||||
| Service charges |
15,116 | 17,412 | 17,334 | 16,556 | 15,368 | |||||||||||||||
| Trust income |
2,282 | 3,348 | 2,854 | 2,850 | 3,134 | |||||||||||||||
| Securities gains, net |
74 | 18 | 2,047 | 10,045 | 17 | |||||||||||||||
| Insurance commissions |
23,153 | 19,416 | 22,012 | 22,941 | 22,549 | |||||||||||||||
| Annuity fees |
642 | 382 | 552 | 1,094 | 1,296 | |||||||||||||||
| Brokerage commissions and fees |
1,438 | 1,215 | 1,627 | 1,437 | 1,638 | |||||||||||||||
| Bank-owned life insurance |
2,613 | 2,007 | 1,734 | 2,223 | 1,699 | |||||||||||||||
| Other miscellaneous income |
4,377 | 4,826 | 2,357 | 4,732 | 4,683 | |||||||||||||||
|
|
|
|
|
|
|
|
|
|
|
|||||||||||
| Total noninterest revenue |
$ | 72,360 | $ | 65,335 | $ | 62,055 | $ | 75,144 | $ | 68,311 | ||||||||||
|
|
|
|
|
|
|
|
|
|
|
|||||||||||
| NONINTEREST EXPENSE: |
||||||||||||||||||||
|
Salaries and employee benefits |
$ | 74,931 | $ | 70,512 | $ | 71,851 | $ | 70,142 | $ | 70,375 | ||||||||||
| Occupancy, net of rental income |
10,066 | 10,315 | 11,144 | 10,232 | 10,671 | |||||||||||||||
| Equipment |
5,333 | 5,108 | 5,346 | 5,595 | 5,658 | |||||||||||||||
| Deposit insurance assessments |
5,383 | 5,674 | 3,781 | 6,436 | 5,425 | |||||||||||||||
| Prepayment penalty on FHLB borrowings |
— | — | — | 9,778 | — | |||||||||||||||
| Advertising |
841 | 1,778 | 1,140 | 1,291 | 889 | |||||||||||||||
| Foreclosed property expense |
8,409 | 10,833 | 6,116 | 3,765 | 7,082 | |||||||||||||||
| Telecommunications |
2,206 | 2,110 | 2,097 | 2,036 | 2,143 | |||||||||||||||
| Public relations |
1,466 | 1,244 | 1,415 | 1,554 | 1,514 | |||||||||||||||
| Data processing |
2,764 | 2,398 | 2,614 | 2,365 | 2,301 | |||||||||||||||
| Computer software |
1,803 | 1,892 | 1,863 | 1,899 | 1,848 | |||||||||||||||
| Amortization of intangibles |
763 | 813 | 823 | 833 | 854 | |||||||||||||||
| Legal |
2,216 | 3,947 | 1,467 | 1,158 | 2,598 | |||||||||||||||
| Postage and shipping |
1,255 | 1,163 | 1,182 | 1,171 | 1,297 | |||||||||||||||
| Other miscellaneous expense |
18,244 | 18,069 | 19,859 | 18,814 | 17,355 | |||||||||||||||
|
|
|
|
|
|
|
|
|
|
|
|||||||||||
| Total noninterest expense |
$ | 135,680 | $ | 135,856 | $ | 130,698 | $ | 137,069 | $ | 130,010 | ||||||||||
|
|
|
|
|
|
|
|
|
|
|
|||||||||||
| INSURANCE COMMISSIONS: |
||||||||||||||||||||
|
Property and casualty commissions |
$ | 14,430 | $ | 14,033 | $ | 16,226 | $ | 16,527 | $ | 13,683 | ||||||||||
| Life and health commissions |
4,724 | 4,024 | 4,359 | 4,301 | 4,477 | |||||||||||||||
| Risk management income |
655 | 597 | 703 | 596 | 713 | |||||||||||||||
| Other |
3,344 | 762 | 724 | 1,517 | 3,676 | |||||||||||||||
|
|
|
|
|
|
|
|
|
|
|
|||||||||||
| Total insurance commissions |
$ | 23,153 | $ | 19,416 | $ | 22,012 | $ | 22,941 | $ | 22,549 | ||||||||||
|
|
|
|
|
|
|
|
|
|
|
|||||||||||
- MORE -
BXS Announces First Quarter Results
Page 19
April 23, 2012
BancorpSouth, Inc.
Selected Additional Information
(Dollars in thousands)
(Unaudited)
| Quarter Ended | ||||||||||||||||||||
| Mar-12 | Dec-11 | Sep-11 | Jun-11 | Mar-11 | ||||||||||||||||
| MORTGAGE SERVICING RIGHTS: |
||||||||||||||||||||
| Fair value, beginning of period |
$ | 30,174 | $ | 29,159 | $ | 39,455 | $ | 42,306 | $ | 38,642 | ||||||||||
| Additions to mortgage servicing rights: |
||||||||||||||||||||
| Originations of servicing assets |
3,525 | 3,754 | 3,127 | 2,380 | 2,431 | |||||||||||||||
| Changes in fair value: |
||||||||||||||||||||
| Due to payoffs/paydowns |
(1,726 | ) | (1,745 | ) | (1,745 | ) | (1,390 | ) | (1,300 | ) | ||||||||||
| Due to change in valuation inputs or assumptions used in the valuation model |
3,697 | (991 | ) | (11,676 | ) | (3,839 | ) | 2,540 | ||||||||||||
| Other changes in fair value |
(2 | ) | (3 | ) | (2 | ) | (2 | ) | (7 | ) | ||||||||||
|
|
|
|
|
|
|
|
|
|
|
|||||||||||
| Fair value, end of period |
$ | 35,668 | $ | 30,174 | $ | 29,159 | $ | 39,455 | $ | 42,306 | ||||||||||
|
|
|
|
|
|
|
|
|
|
|
|||||||||||
| MORTGAGE LENDING REVENUE: |
||||||||||||||||||||
|
Production revenue: |
||||||||||||||||||||
| Origination |
$ | 9,720 | $ | 8,308 | $ | 8,688 | $ | 4,066 | $ | 3,224 | ||||||||||
| Servicing |
3,451 | 3,356 | 3,290 | 3,166 | 3,117 | |||||||||||||||
| Payoffs/Paydowns |
(1,726 | ) | (1,745 | ) | (1,745 | ) | (1,390 | ) | (1,300 | ) | ||||||||||
|
|
|
|
|
|
|
|
|
|
|
|||||||||||
| Total production revenue |
11,445 | 9,919 | 10,233 | 5,842 | 5,041 | |||||||||||||||
| Market value adjustment |
3,697 | (991 | ) | (11,676 | ) | (3,839 | ) | 2,540 | ||||||||||||
|
|
|
|
|
|
|
|
|
|
|
|||||||||||
| Total mortgage lending revenue (loss) |
$ | 15,142 | $ | 8,928 | $ | (1,443 | ) | $ | 2,003 | $ | 7,581 | |||||||||
|
|
|
|
|
|
|
|
|
|
|
|||||||||||
| HELD-TO-MATURITY SECURITIES, at amortized cost |
||||||||||||||||||||
|
U.S. Government agencies |
$ | — | $ | — | $ | — | $ | — | $ | 1,278,185 | ||||||||||
| Obligations of states and political subdivisions |
— | — | — | — | 389,018 | |||||||||||||||
|
|
|
|
|
|
|
|
|
|
|
|||||||||||
| Total held-to-maturity securities |
$ | — | $ | — | $ | — | $ | — | $ | 1,667,203 | ||||||||||
|
|
|
|
|
|
|
|
|
|
|
|||||||||||
| AVAILABLE-FOR-SALE SECURITIES, at fair value |
||||||||||||||||||||
|
U.S. Government agencies |
$ | 1,578,441 | $ | 1,501,243 | $ | 1,497,456 | $ | 1,599,231 | $ | 459,763 | ||||||||||
| Government agency issued residential mortgage-back securities |
385,146 | 404,610 | 420,689 | 430,402 | 529,302 | |||||||||||||||
| Government agency issued commercial mortgage-back securities |
31,647 | 34,599 | 34,475 | 31,627 | 30,938 | |||||||||||||||
| Obligations of states and political subdivisions |
568,642 | 563,520 | 519,431 | 486,653 | 111,380 | |||||||||||||||
| Other |
9,659 | 9,546 | 9,504 | 12,911 | 14,080 | |||||||||||||||
|
|
|
|
|
|
|
|
|
|
|
|||||||||||
| Total available-for-sale securities |
$ | 2,573,535 | $ | 2,513,518 | $ | 2,481,555 | $ | 2,560,824 | $ | 1,145,463 | ||||||||||
|
|
|
|
|
|
|
|
|
|
|
|||||||||||
- MORE -
BXS Announces First Quarter Results
Page 20
April 23, 2012
BancorpSouth, Inc.
Average Balances, Interest Income and Expense,
and Average Yields and Rates
(Dollars in thousands)
(Unaudited)
| Quarter Ended March 31, 2012 |
||||||||||||
| (Taxable equivalent basis) | Average Balance |
Interest | Yield/ Rate |
|||||||||
| ASSETS |
||||||||||||
| Loans, loans held for sale, and leases net of unearned income |
$ | 8,852,792 | $ | 110,407 | 5.02 | % | ||||||
| Available-for-sale securities: |
||||||||||||
| Taxable |
2,058,859 | 11,272 | 2.20 | % | ||||||||
| Tax-exempt |
449,082 | 6,547 | 5.86 | % | ||||||||
| Short-term investments |
603,988 | 401 | 0.27 | % | ||||||||
|
|
|
|
|
|||||||||
| Total interest earning assets and revenue |
11,964,721 | 128,627 | 4.32 | % | ||||||||
| Other assets |
1,325,795 | |||||||||||
| Less: allowance for credit losses |
(202,158 | ) | ||||||||||
|
|
|
|||||||||||
| Total |
$ | 13,088,358 | ||||||||||
|
|
|
|||||||||||
| LIABILITIES AND SHAREHOLDERS’ EQUITY |
||||||||||||
| Deposits: |
||||||||||||
| Demand - interest bearing |
$ | 4,960,060 | $ | 4,449 | 0.36 | % | ||||||
| Savings |
1,027,611 | 714 | 0.28 | % | ||||||||
| Other time |
2,916,910 | 11,291 | 1.56 | % | ||||||||
| Short-term borrowings |
359,690 | 83 | 0.09 | % | ||||||||
| Junior subordinated debt |
160,312 | 2,879 | 7.22 | % | ||||||||
| Long-term debt |
33,500 | 349 | 4.19 | % | ||||||||
|
|
|
|
|
|||||||||
| Total interest bearing liabilities and expense |
9,458,083 | 19,765 | 0.84 | % | ||||||||
| Demand deposits - noninterest bearing |
2,139,371 | |||||||||||
| Other liabilities |
127,195 | |||||||||||
|
|
|
|||||||||||
| Total liabilities |
11,724,649 | |||||||||||
| Shareholders’ equity |
1,363,709 | |||||||||||
|
|
|
|||||||||||
| Total |
$ | 13,088,358 | ||||||||||
|
|
|
|
|
|||||||||
| Net interest revenue |
$ | 108,862 | ||||||||||
|
|
|
|||||||||||
| Net interest margin |
3.66 | % | ||||||||||
| Net interest rate spread |
3.48 | % | ||||||||||
| Interest bearing liabilities to interest earning assets |
79.05 | % | ||||||||||
| Net interest tax equivalent adjustment |
$ | 3,252 | ||||||||||
- MORE -
BXS Announces First Quarter Results
Page 21
April 23, 2012
BancorpSouth, Inc.
Average Balances, Interest Income and Expense,
and Average Yields and Rates
(Dollars in thousands)
(Unaudited)
| Quarter Ended December 31, 2011 |
||||||||||||
| (Taxable equivalent basis) | Average Balance |
Interest | Yield/ Rate |
|||||||||
| ASSETS |
||||||||||||
| Loans, loans held for sale, and leases net of unearned income |
$ | 9,022,010 | $ | 114,094 | 5.02 | % | ||||||
| Available-for-sale securities: |
||||||||||||
| Taxable |
2,083,983 | 11,891 | 2.26 | % | ||||||||
| Tax-exempt |
425,960 | 6,396 | 5.96 | % | ||||||||
| Short-term investments |
386,405 | 253 | 0.26 | % | ||||||||
|
|
|
|
|
|||||||||
| Total interest earning assets and revenue |
11,918,358 | 132,634 | 4.42 | % | ||||||||
| Other assets |
1,336,426 | |||||||||||
| Less: allowance for credit losses |
(208,005 | ) | ||||||||||
|
|
|
|||||||||||
| Total |
$ | 13,046,779 | ||||||||||
|
|
|
|||||||||||
| LIABILITIES AND SHAREHOLDERS’ EQUITY |
||||||||||||
| Deposits: |
||||||||||||
| Demand - interest bearing |
$ | 4,714,059 | $ | 4,737 | 0.40 | % | ||||||
| Savings |
975,892 | 746 | 0.30 | % | ||||||||
| Other time |
3,078,376 | 13,104 | 1.69 | % | ||||||||
| Short-term borrowings |
432,539 | 95 | 0.09 | % | ||||||||
| Junior subordinated debt |
160,312 | 2,871 | 7.11 | % | ||||||||
| Long-term debt |
33,500 | 350 | 4.15 | % | ||||||||
|
|
|
|
|
|||||||||
| Total interest bearing liabilities and expense |
9,394,678 | 21,903 | 0.92 | % | ||||||||
| Demand deposits - noninterest bearing |
2,248,904 | |||||||||||
| Other liabilities |
134,292 | |||||||||||
|
|
|
|||||||||||
| Total liabilities |
11,777,874 | |||||||||||
| Shareholders’ equity |
1,268,905 | |||||||||||
|
|
|
|||||||||||
| Total |
$ | 13,046,779 | ||||||||||
|
|
|
|
|
|||||||||
| Net interest revenue |
$ | 110,731 | ||||||||||
|
|
|
|||||||||||
| Net interest margin |
3.69 | % | ||||||||||
| Net interest rate spread |
3.49 | % | ||||||||||
| Interest bearing liabilities to interest earning assets |
78.83 | % | ||||||||||
| Net interest tax equivalent adjustment |
$ | 3,241 | ||||||||||
- MORE -
BXS Announces First Quarter Results
Page 22
April 23, 2012
BancorpSouth, Inc.
Average Balances, Interest Income and Expense,
and Average Yields and Rates
(Dollars in thousands)
(Unaudited)
| Quarter Ended September 30, 2011 |
||||||||||||
| (Taxable equivalent basis) | Average Balance |
Interest | Yield/ Rate |
|||||||||
| ASSETS |
||||||||||||
| Loans, loans held for sale, and leases net of unearned income |
$ | 9,200,439 | $ | 115,605 | 4.99 | % | ||||||
| Available-for-sale securities: |
||||||||||||
| Taxable |
2,123,772 | 13,283 | 2.48 | % | ||||||||
| Tax-exempt |
405,710 | 6,354 | 6.21 | % | ||||||||
| Short-term investments |
309,146 | 203 | 0.26 | % | ||||||||
|
|
|
|
|
|||||||||
| Total interest earning assets and revenue |
12,039,067 | 135,445 | 4.46 | % | ||||||||
| Other assets |
1,340,797 | |||||||||||
| Less: allowance for credit losses |
(205,209 | ) | ||||||||||
|
|
|
|||||||||||
| Total |
$ | 13,174,655 | ||||||||||
|
|
|
|||||||||||
| LIABILITIES AND SHAREHOLDERS’ EQUITY |
||||||||||||
| Deposits: |
||||||||||||
| Demand - interest bearing |
$ | 4,789,462 | $ | 5,323 | 0.44 | % | ||||||
| Savings |
957,871 | 828 | 0.34 | % | ||||||||
| Other time |
3,246,332 | 14,837 | 1.81 | % | ||||||||
| Short-term borrowings |
458,199 | 112 | 0.10 | % | ||||||||
| Junior subordinated debt |
160,312 | 2,861 | 7.08 | % | ||||||||
| Long-term debt |
34,984 | 361 | 4.09 | % | ||||||||
|
|
|
|
|
|||||||||
| Total interest bearing liabilities and expense |
9,647,160 | 24,322 | 1.00 | % | ||||||||
| Demand deposits - noninterest bearing |
2,147,707 | |||||||||||
| Other liabilities |
127,973 | |||||||||||
|
|
|
|||||||||||
| Total liabilities |
11,922,840 | |||||||||||
| Shareholders’ equity |
1,251,815 | |||||||||||
|
|
|
|||||||||||
| Total |
$ | 13,174,655 | ||||||||||
|
|
|
|
|
|||||||||
| Net interest revenue |
$ | 111,123 | ||||||||||
|
|
|
|||||||||||
| Net interest margin |
3.66 | % | ||||||||||
| Net interest rate spread |
3.46 | % | ||||||||||
| Interest bearing liabilities to interest earning assets |
80.13 | % | ||||||||||
| Net interest tax equivalent adjustment |
$ | 3,048 | ||||||||||
- MORE -
BXS Announces First Quarter Results
Page 23
April 23, 2012
BancorpSouth, Inc.
Average Balances, Interest Income and Expense,
and Average Yields and Rates
(Dollars in thousands)
(Unaudited)
| Quarter Ended June 30, 2011 |
||||||||||||
| (Taxable equivalent basis) | Average Balance |
Interest | Yield/ Rate |
|||||||||
| ASSETS |
||||||||||||
| Loans, loans held for sale, and leases net of unearned income |
$ | 9,293,831 | $ | 118,284 | 5.10 | % | ||||||
| Held-to-maturity securities: |
||||||||||||
| Taxable |
887,767 | 5,143 | 2.32 | % | ||||||||
| Tax-exempt |
209,795 | 3,523 | 6.74 | % | ||||||||
| Available-for-sale securities: |
||||||||||||
| Taxable |
1,432,822 | 10,485 | 2.94 | % | ||||||||
| Tax-exempt |
176,898 | 2,879 | 6.53 | % | ||||||||
| Short-term investments |
226,638 | 160 | 0.28 | % | ||||||||
|
|
|
|
|
|||||||||
| Total interest earning assets and revenue |
12,227,751 | 140,474 | 4.61 | % | ||||||||
| Other assets |
1,350,777 | |||||||||||
| Less: allowance for credit losses |
(212,968 | ) | ||||||||||
|
|
|
|||||||||||
| Total |
$ | 13,365,560 | ||||||||||
|
|
|
|||||||||||
| LIABILITIES AND SHAREHOLDERS’ EQUITY |
||||||||||||
| Deposits: |
||||||||||||
| Demand - interest bearing |
$ | 4,977,764 | $ | 6,040 | 0.49 | % | ||||||
| Savings |
941,169 | 810 | 0.35 | % | ||||||||
| Other time |
3,418,741 | 16,284 | 1.91 | % | ||||||||
| Short-term borrowings |
425,666 | 155 | 0.15 | % | ||||||||
| Junior subordinated debt |
160,312 | 2,860 | 7.16 | % | ||||||||
| Long-term debt |
89,395 | 1,174 | 5.27 | % | ||||||||
|
|
|
|
|
|||||||||
| Total interest bearing liabilities and expense |
10,013,047 | 27,323 | 1.09 | % | ||||||||
| Demand deposits - noninterest bearing |
2,018,197 | |||||||||||
| Other liabilities |
112,035 | |||||||||||
|
|
|
|||||||||||
| Total liabilities |
12,143,279 | |||||||||||
| Shareholders’ equity |
1,222,281 | |||||||||||
|
|
|
|||||||||||
| Total |
$ | 13,365,560 | ||||||||||
|
|
|
|
|
|||||||||
| Net interest revenue |
$ | 113,151 | ||||||||||
|
|
|
|||||||||||
| Net interest margin |
3.71 | % | ||||||||||
| Net interest rate spread |
3.51 | % | ||||||||||
| Interest bearing liabilities to interest earning assets |
81.89 | % | ||||||||||
| Net interest tax equivalent adjustment |
$ | 3,239 | ||||||||||
- MORE -
BXS Announces First Quarter Results
Page 24
April 23, 2012
BancorpSouth, Inc.
Average Balances, Interest Income and Expense,
and Average Yields and Rates
(Dollars in thousands)
(Unaudited)
| Quarter Ended March 31, 2011 | ||||||||||||
| (Taxable equivalent basis) | Average Balance |
Interest | Yield/ Rate |
|||||||||
| ASSETS |
||||||||||||
| Loans, loans held for sale, and leases net of unearned income |
$ | 9,339,083 | $ | 118,648 | 5.15 | % | ||||||
| Held-to-maturity securities: |
||||||||||||
| Taxable |
1,322,668 | 8,124 | 2.49 | % | ||||||||
| Tax-exempt |
330,616 | 5,150 | 6.32 | % | ||||||||
| Available-for-sale securities: |
||||||||||||
| Taxable |
1,014,404 | 8,585 | 3.43 | % | ||||||||
| Tax-exempt |
70,727 | 1,267 | 7.27 | % | ||||||||
| Short-term investments |
317,271 | 253 | 0.32 | % | ||||||||
|
|
|
|
|
|||||||||
| Total interest earning assets and revenue |
12,394,769 | 142,026 | 4.65 | % | ||||||||
| Other assets |
1,363,101 | |||||||||||
| Less: allowance for credit losses |
(218,107 | ) | ||||||||||
|
|
|
|||||||||||
| Total |
$ | 13,539,763 | ||||||||||
|
|
|
|||||||||||
| LIABILITIES AND SHAREHOLDERS’ EQUITY |
||||||||||||
| Deposits: |
||||||||||||
| Demand - interest bearing |
$ | 5,153,063 | $ | 6,546 | 0.52 | % | ||||||
| Savings |
897,312 | 826 | 0.37 | % | ||||||||
| Other time |
3,553,543 | 17,483 | 2.00 | % | ||||||||
| Short-term borrowings |
433,743 | 193 | 0.18 | % | ||||||||
| Junior subordinated debt |
160,312 | 2,859 | 7.23 | % | ||||||||
| Long-term debt |
110,000 | 1,484 | 5.47 | % | ||||||||
|
|
|
|
|
|||||||||
| Total interest bearing liabilities and expense |
10,307,973 | 29,391 | 1.16 | % | ||||||||
| Demand deposits - noninterest bearing |
1,893,720 | |||||||||||
| Other liabilities |
118,671 | |||||||||||
|
|
|
|||||||||||
| Total liabilities |
12,320,364 | |||||||||||
| Shareholders’ equity |
1,219,399 | |||||||||||
|
|
|
|||||||||||
| Total |
$ | 13,539,763 | ||||||||||
|
|
|
|
|
|||||||||
| Net interest revenue |
$ | 112,635 | ||||||||||
|
|
|
|||||||||||
| Net interest margin |
3.69 | % | ||||||||||
| Net interest rate spread |
3.49 | % | ||||||||||
| Interest bearing liabilities to interest earning assets |
83.16 | % | ||||||||||
| Net interest tax equivalent adjustment |
$ | 3,199 | ||||||||||
- MORE -
BXS Announces First Quarter Results
Page 25
April 23, 2012
BancorpSouth, Inc.
Reconciliation of Non-GAAP Measures
(Dollars in thousands)
(Unaudited)
Reconciliation of Tangible Assets and Tangible Shareholders’ Equity to
Total Assets and Total Shareholders’ Equity (a):
| March 31, | December 31, | |||||||||||
| 2012 | 2011 | 2011 | ||||||||||
| Tangible assets |
||||||||||||
| Total assets |
$ | 13,307,572 | $ | 13,547,238 | $ | 12,995,851 | ||||||
| Less: Goodwill |
271,297 | 271,297 | 271,297 | |||||||||
| Other identifiable intangible assets |
15,850 | 18,844 | 16,613 | |||||||||
|
|
|
|
|
|
|
|||||||
| Total tangible assets |
$ | 13,020,425 | $ | 13,257,097 | $ | 12,707,941 | ||||||
| Tangible shareholders’ equity |
||||||||||||
| Total shareholders’ equity |
$ | 1,392,199 | $ | 1,211,061 | $ | 1,262,912 | ||||||
| Less: Goodwill |
271,297 | 271,297 | 271,297 | |||||||||
| Other identifiable intangible assets |
15,850 | 18,844 | 16,613 | |||||||||
|
|
|
|
|
|
|
|||||||
| Total tangible shareholders’ equity |
$ | 1,105,052 | $ | 920,920 | $ | 975,002 | ||||||
| Tangible shareholders’ equity to tangible assets |
8.49 | % | 6.95 | % | 7.67 | % | ||||||
| (a) | BancorpSouth, Inc. utilizes the ratio of tangible shareholders’ equity to tangible assets when evaluating the performance of the Company. Tangible shareholders’ equity is defined by the Company as total shareholders’ equity less goodwill and other identifiable intangible assets. Tangible assets are defined by the Company as total assets less goodwill and other identifiable intangible assets. Management believes the ratio of tangible shareholders’ equity to tangible assets is important to investors who are interested in evaluating the adequacy of the Company’s capital levels. |
- END -