Date of Report (date of earliest event reported): | April 18, 2017 |
Pennsylvania | 0-10587 | 23-2195389 |
(State or other jurisdiction of incorporation) | (Commission File Number) | (IRS Employer Identification Number) |
One Penn Square Lancaster, Pennsylvania | 17604 | |
(Address of principal executive offices) | (Zip Code) |
Exhibit No. | Description |
99.1 | Press Release dated April 18, 2017. |
99.2 | Supplementary financial information for the quarter ended March 31, 2017. |
99.3 | Presentation materials to be discussed during the conference call and webcast on April 19, 2017. |
Date: April 18, 2017 | FULTON FINANCIAL CORPORATION |
By: /s/ Philmer H. Rohrbaugh | |
Philmer H. Rohrbaugh | |
Senior Executive Vice President, | |
Chief Operating Officer and | |
Chief Financial Officer |
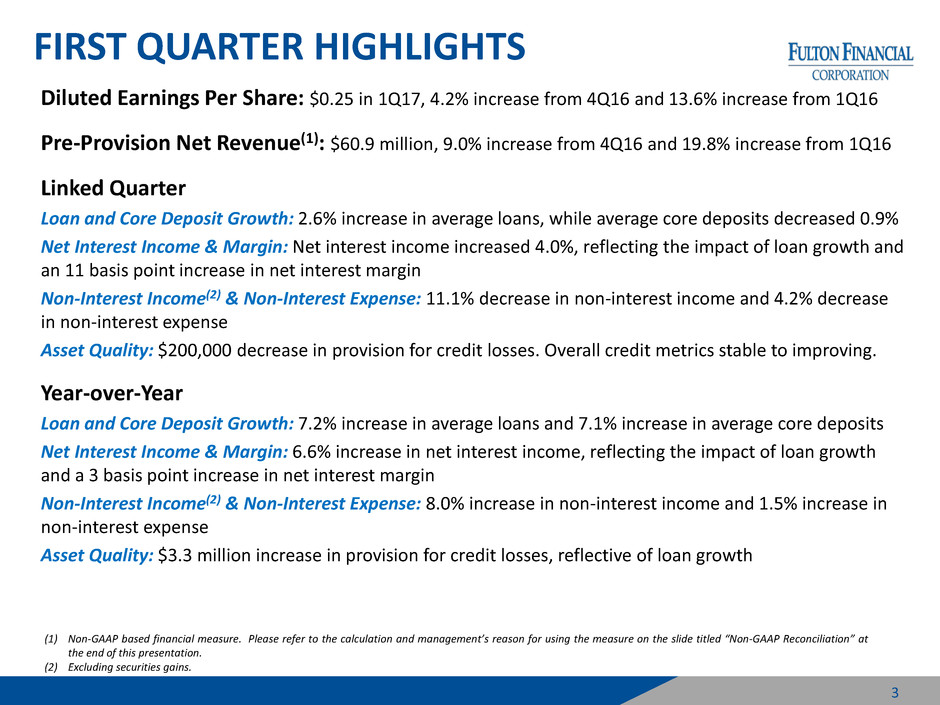
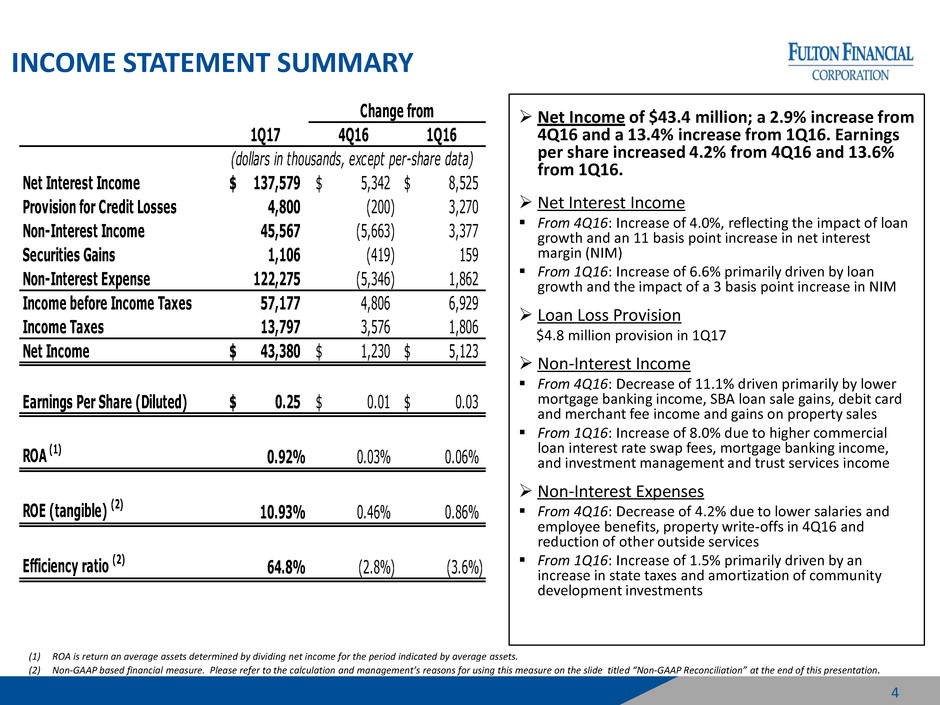
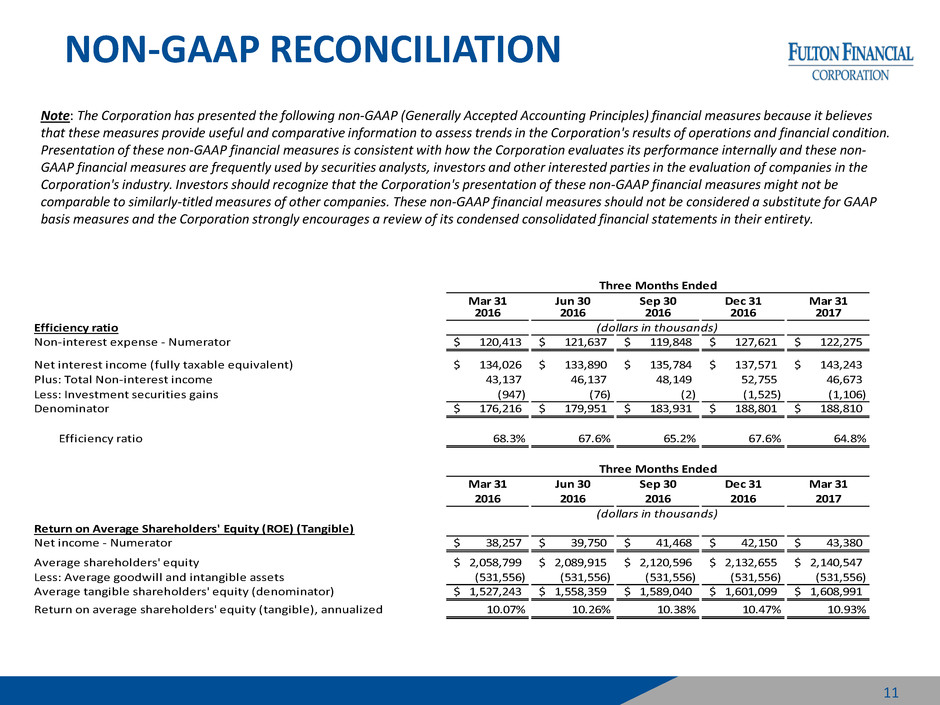
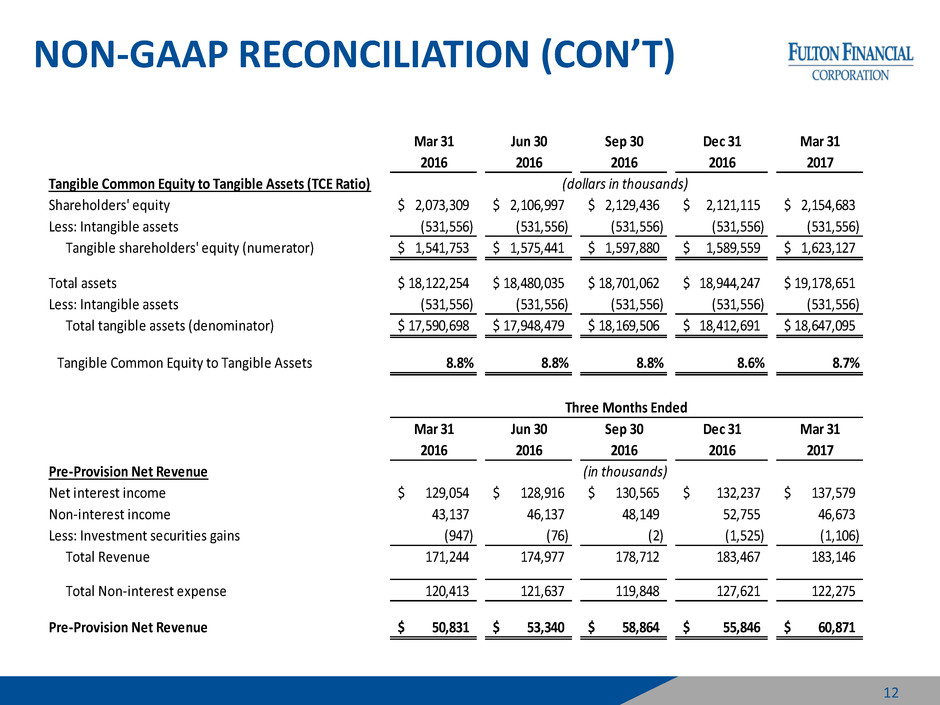
• | Diluted earnings per share for the first quarter of 2017 were 25 cents, a 4.2 percent increase from the fourth quarter of 2016 and a 13.6 percent increase from the first quarter of 2016. Pre-provision net revenue of $60.9 million was 9.0% higher than the fourth quarter of 2016 and 19.8% higher than the first quarter of 2016. |
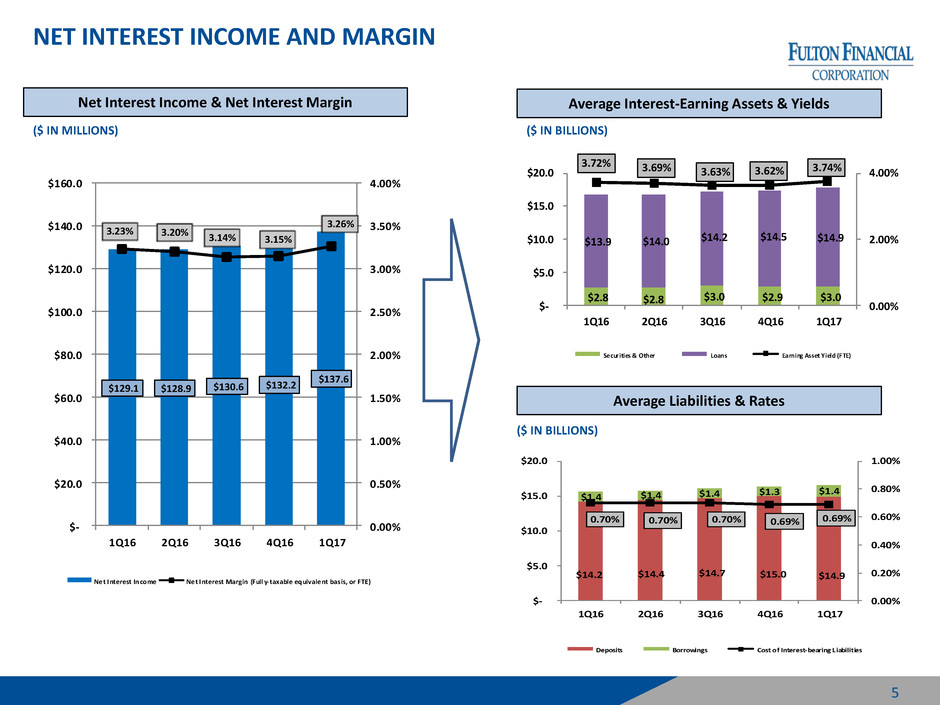
• | Net interest income for the first quarter of 2017 increased $5.3 million, or 4.0 percent, compared to the fourth quarter of 2016 and $8.5 million, or 6.6 percent, compared to first quarter of 2016. |
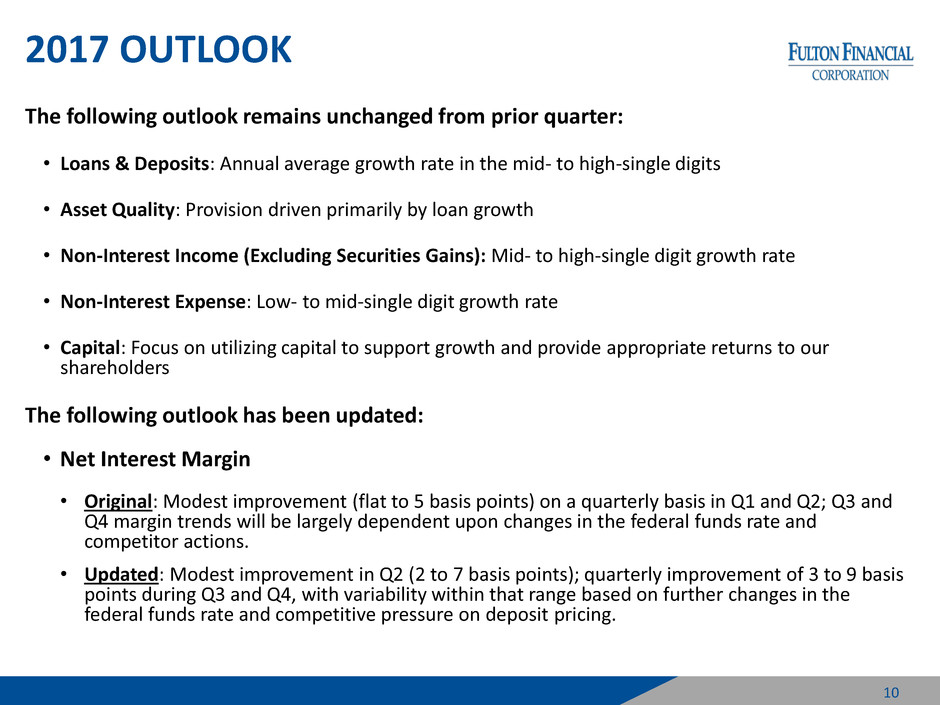
• | Net interest margin increased eleven basis points, to 3.26 percent, compared to the fourth quarter of 2016, and increased three basis points compared to the first quarter of 2016. |
• | Loans at March 31, 2017 increased $263.9 million, or 1.8 percent, compared to December 31, 2016 and $1.1 billion, or 7.9 percent, compared to March 31, 2016. Average loans for the first quarter of 2017 increased 2.6 percent and 7.2 percent, compared to the fourth quarter of 2016 and the first quarter of 2016, respectively. |
• | Deposits at March 31, 2017 increased $77.5 million, or 0.5 percent, compared to |
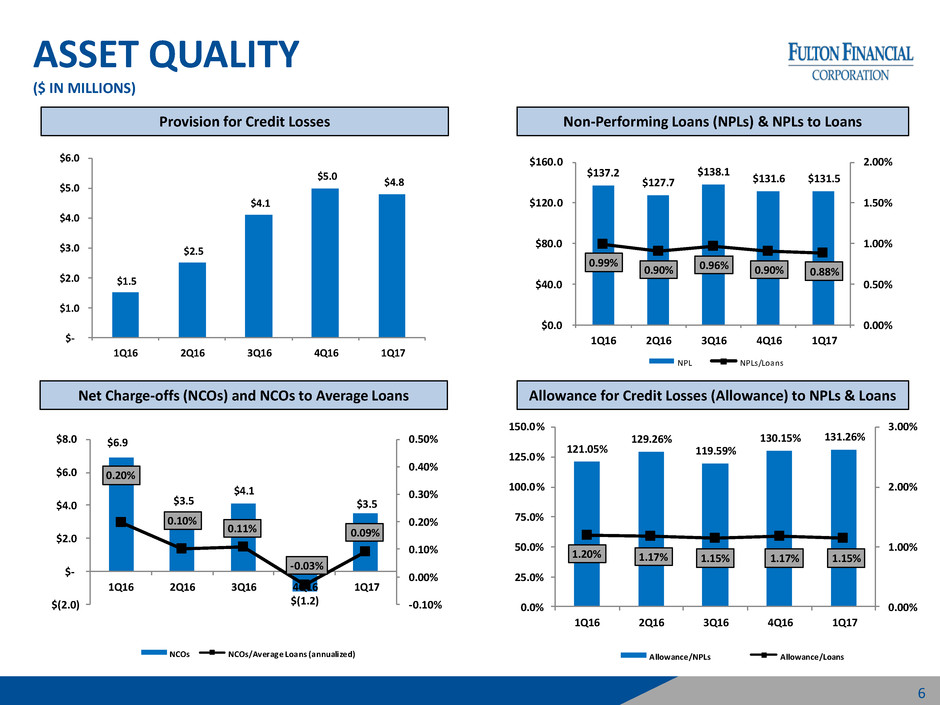
• | The provision for credit losses in the first quarter of 2017 was $4.8 million, compared to a $5.0 million provision in the fourth quarter of 2016, and a $1.5 million provision in the first quarter of 2016. |
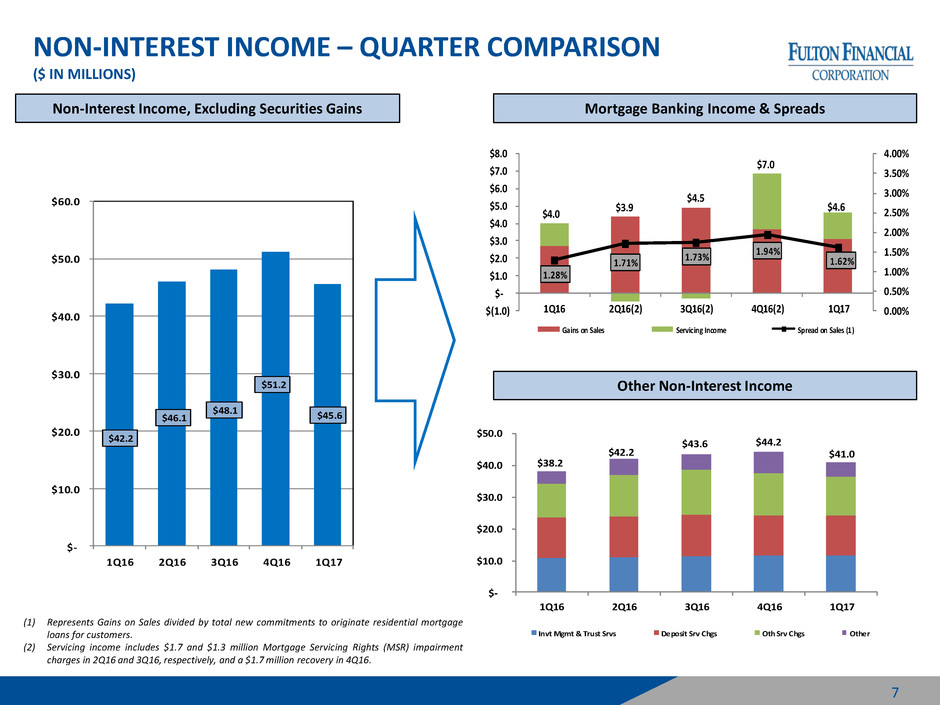
• | Non-interest income, excluding investment securities gains, decreased $5.7 million, or 11.1 percent, in comparison to the fourth quarter of 2016, and increased $3.4 million, or 8.0 percent, in comparison to the first quarter of 2016. |
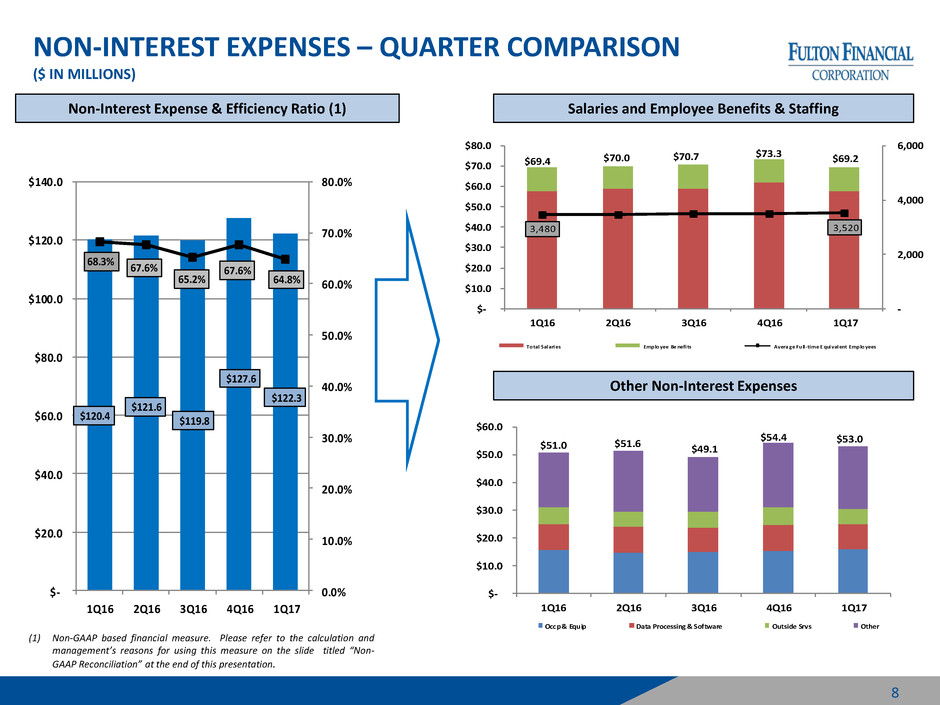
• | Non-interest expense decreased $5.3 million, or 4.2 percent, compared to the fourth quarter of 2016 and increased $1.9 million, or 1.5 percent, compared to the first quarter of 2016. |
Three Months Ended | Increase (decrease) | |||||||||||||||||||
March 31, 2017 | December 31, 2016 | in Balance | ||||||||||||||||||
Balance | Yield (1) | Balance | Yield (1) | $ | % | |||||||||||||||
(dollars in thousands) | ||||||||||||||||||||
Average Loans, net of unearned income, by type: | ||||||||||||||||||||
Real estate - commercial mortgage | $ | 6,039,140 | 3.98 | % | $ | 5,828,313 | 3.90 | % | $ | 210,827 | 3.6 | % | ||||||||
Commercial - industrial, financial, and agricultural | 4,205,070 | 3.89 | % | 4,081,498 | 3.74 | % | 123,572 | 3.0 | % | |||||||||||
Real estate - residential mortgage | 1,637,669 | 3.76 | % | 1,572,895 | 3.75 | % | 64,774 | 4.1 | % | |||||||||||
Real estate - home equity | 1,613,249 | 4.18 | % | 1,633,668 | 4.05 | % | (20,419 | ) | (1.2 | )% | ||||||||||
Real estate - construction | 840,968 | 3.97 | % | 845,528 | 3.78 | % | (4,560 | ) | (0.5 | )% | ||||||||||
Consumer | 284,352 | 5.26 | % | 289,864 | 5.25 | % | (5,512 | ) | (1.9 | )% | ||||||||||
Leasing and other | 237,114 | 5.08 | % | 224,050 | 5.41 | % | 13,064 | 5.8 | % | |||||||||||
Total Average Loans, net of unearned income | $ | 14,857,562 | 4.00 | % | $ | 14,475,816 | 3.90 | % | $ | 381,746 | 2.6 | % | ||||||||
(1) Presented on a tax-equivalent basis using a 35% Federal tax rate and statutory interest expense disallowances. |
Three Months Ended | Increase (decrease) | |||||||||||||||||||
March 31, 2017 | December 31, 2016 | in Balance | ||||||||||||||||||
Balance | Rate | Balance | Rate | $ | % | |||||||||||||||
(dollars in thousands) | ||||||||||||||||||||
Average Deposits, by type: | ||||||||||||||||||||
Noninterest-bearing demand | $ | 4,301,727 | — | % | 4,331,894 | — | % | $ | (30,167 | ) | (0.7 | )% | ||||||||
Interest-bearing demand | 3,650,931 | 0.25 | % | 3,714,391 | 0.21 | % | (63,460 | ) | (1.7 | )% | ||||||||||
Savings deposits | 4,194,216 | 0.21 | % | 4,216,090 | 0.21 | % | (21,874 | ) | (0.5 | )% | ||||||||||
Total average demand and savings | 12,146,874 | 0.15 | % | 12,262,375 | 0.14 | % | (115,501 | ) | (0.9 | )% | ||||||||||
Time deposits | 2,739,453 | 1.09 | % | 2,777,203 | 1.09 | % | (37,750 | ) | (1.4 | )% | ||||||||||
Total Average Deposits | $ | 14,886,327 | 0.32 | % | $ | 15,039,578 | 0.31 | % | $ | (153,251 | ) | (1.0 | )% |
Exhibit 99.2 | ||||||||||||||||||||||||||
FULTON FINANCIAL CORPORATION | ||||||||||||||||||||||||||
CONDENSED CONSOLIDATED ENDING BALANCE SHEETS (UNAUDITED) | ||||||||||||||||||||||||||
dollars in thousands | ||||||||||||||||||||||||||
% Change from | ||||||||||||||||||||||||||
Mar 31 | Dec 31 | Sep 30 | Jun 30 | Mar 31 | Dec 31 | Mar 31 | ||||||||||||||||||||
2017 | 2016 | 2016 | 2016 | 2016 | 2016 | 2016 | ||||||||||||||||||||
ASSETS | ||||||||||||||||||||||||||
Cash and due from banks | $ | 93,844 | $ | 118,763 | $ | 86,497 | $ | 84,647 | $ | 83,479 | (21.0 | )% | 12.4 | % | ||||||||||||
Other interest-earning assets | 350,387 | 291,252 | 428,966 | 408,086 | 408,060 | 20.3 | % | (14.1 | )% | |||||||||||||||||
Loans held for sale | 24,783 | 28,697 | 27,836 | 34,330 | 19,719 | (13.6 | )% | 25.7 | % | |||||||||||||||||
Investment securities | 2,506,017 | 2,559,227 | 2,508,068 | 2,529,724 | 2,516,205 | (2.1 | )% | (0.4 | )% | |||||||||||||||||
Loans, net of unearned income | 14,963,177 | 14,699,272 | 14,391,238 | 14,155,159 | 13,870,701 | 1.8 | % | 7.9 | % | |||||||||||||||||
Allowance for loan losses | (170,076 | ) | (168,679 | ) | (162,526 | ) | (162,546 | ) | (163,841 | ) | 0.8 | % | 3.8 | % | ||||||||||||
Net loans | 14,793,101 | 14,530,593 | 14,228,712 | 13,992,613 | 13,706,860 | 1.8 | % | 7.9 | % | |||||||||||||||||
Premises and equipment | 216,171 | 217,806 | 228,009 | 228,861 | 228,057 | (0.8 | )% | (5.2 | )% | |||||||||||||||||
Accrued interest receivable | 46,355 | 46,294 | 43,600 | 43,316 | 44,379 | 0.1 | % | 4.5 | % | |||||||||||||||||
Goodwill and intangible assets | 531,556 | 531,556 | 531,556 | 531,556 | 531,556 | — | % | — | % | |||||||||||||||||
Other assets | 616,362 | 620,059 | 617,818 | 626,902 | 583,939 | (0.6 | )% | 5.6 | % | |||||||||||||||||
Total Assets | $ | 19,178,576 | $ | 18,944,247 | $ | 18,701,062 | $ | 18,480,035 | $ | 18,122,254 | 1.2 | % | 5.8 | % | ||||||||||||
LIABILITIES AND SHAREHOLDERS' EQUITY | ||||||||||||||||||||||||||
Deposits | $ | 15,090,344 | $ | 15,012,864 | $ | 14,952,479 | $ | 14,292,564 | $ | 14,404,280 | 0.5 | % | 4.8 | % | ||||||||||||
Short-term borrowings | 453,317 | 541,317 | 264,042 | 722,214 | 352,883 | (16.3 | )% | 28.5 | % | |||||||||||||||||
Other liabilities | 342,323 | 339,548 | 389,819 | 392,708 | 326,128 | 0.8 | % | 5.0 | % | |||||||||||||||||
FHLB advances and long-term debt | 1,137,909 | 929,403 | 965,286 | 965,552 | 965,654 | 22.4 | % | 17.8 | % | |||||||||||||||||
Total Liabilities | 17,023,893 | 16,823,132 | 16,571,626 | 16,373,038 | 16,048,945 | 1.2 | % | 6.1 | % | |||||||||||||||||
Shareholders' equity | 2,154,683 | 2,121,115 | 2,129,436 | 2,106,997 | 2,073,309 | 1.6 | % | 3.9 | % | |||||||||||||||||
Total Liabilities and Shareholders' Equity | $ | 19,178,576 | $ | 18,944,247 | $ | 18,701,062 | $ | 18,480,035 | $ | 18,122,254 | 1.2 | % | 5.8 | % | ||||||||||||
LOANS, DEPOSITS AND SHORT-TERM BORROWINGS DETAIL: | ||||||||||||||||||||||||||
Loans, by type: | ||||||||||||||||||||||||||
Real estate - commercial mortgage | $ | 6,118,533 | $ | 6,018,582 | $ | 5,818,915 | $ | 5,635,347 | $ | 5,558,108 | 1.7 | % | 10.1 | % | ||||||||||||
Commercial - industrial, financial and agricultural | 4,167,809 | 4,087,486 | 4,024,119 | 4,099,177 | 4,035,333 | 2.0 | % | 3.3 | % | |||||||||||||||||
Real estate - residential mortgage | 1,665,142 | 1,601,994 | 1,542,696 | 1,447,292 | 1,377,459 | 3.9 | % | 20.9 | % | |||||||||||||||||
Real estate - home equity | 1,595,901 | 1,625,115 | 1,640,421 | 1,647,319 | 1,659,481 | (1.8 | )% | (3.8 | )% | |||||||||||||||||
Real estate - construction | 882,983 | 843,649 | 861,634 | 853,699 | 810,872 | 4.7 | % | 8.9 | % | |||||||||||||||||
Consumer | 288,826 | 291,470 | 283,673 | 278,071 | 263,221 | (0.9 | )% | 9.7 | % | |||||||||||||||||
Leasing and other | 243,983 | 230,976 | 219,780 | 194,254 | 166,227 | 5.6 | % | 46.8 | % | |||||||||||||||||
Total Loans, net of unearned income | $ | 14,963,177 | $ | 14,699,272 | $ | 14,391,238 | $ | 14,155,159 | $ | 13,870,701 | 1.8 | % | 7.9 | % | ||||||||||||
Deposits, by type: | ||||||||||||||||||||||||||
Noninterest-bearing demand | $ | 4,417,733 | $ | 4,376,137 | $ | 4,210,099 | $ | 4,125,375 | $ | 4,134,861 | 1.0 | % | 6.8 | % | ||||||||||||
Interest-bearing demand | 3,702,663 | 3,703,712 | 3,703,048 | 3,358,536 | 3,430,206 | — | % | 7.9 | % | |||||||||||||||||
Savings and money market accounts | 4,251,574 | 4,179,773 | 4,235,015 | 3,986,008 | 3,972,199 | 1.7 | % | 7.0 | % | |||||||||||||||||
Time deposits | 2,718,374 | 2,753,242 | 2,804,317 | 2,822,645 | 2,867,014 | (1.3 | )% | (5.2 | )% | |||||||||||||||||
Total Deposits | $ | 15,090,344 | $ | 15,012,864 | $ | 14,952,479 | $ | 14,292,564 | $ | 14,404,280 | 0.5 | % | 4.8 | % | ||||||||||||
Short-term borrowings, by type: | ||||||||||||||||||||||||||
Customer repurchase agreements | $ | 181,170 | $ | 195,734 | $ | 189,727 | $ | 168,521 | $ | 162,431 | (7.4 | )% | 11.5 | % | ||||||||||||
Customer short-term promissory notes | 87,726 | 67,013 | 65,871 | 69,509 | 76,807 | 30.9 | % | 14.2 | % | |||||||||||||||||
Short-term FHLB advances | 130,000 | — | — | 35,000 | 81,000 | N/M | 60.5 | % | ||||||||||||||||||
Federal funds purchased | 54,421 | 278,570 | 8,444 | 449,184 | 32,645 | (80.5 | )% | 66.7 | % | |||||||||||||||||
Total Short-term Borrowings | $ | 453,317 | $ | 541,317 | $ | 264,042 | $ | 722,214 | $ | 352,883 | (16.3 | )% | 28.5 | % | ||||||||||||
N/M - Not meaningful |
FULTON FINANCIAL CORPORATION | ||||||||||||||||||||||||||||||
CONDENSED CONSOLIDATED STATEMENTS OF INCOME (UNAUDITED) | ||||||||||||||||||||||||||||||
in thousands, except per-share data and percentages | ||||||||||||||||||||||||||||||
Three Months Ended | % Change from | |||||||||||||||||||||||||||||
Mar 31 | Dec 31 | Sep 30 | Jun 30 | Mar 31 | Dec 31 | Mar 31 | ||||||||||||||||||||||||
2017 | 2016 | 2016 | 2016 | 2016 | 2016 | 2016 | ||||||||||||||||||||||||
Interest Income: | ||||||||||||||||||||||||||||||
Interest income | $ | 158,487 | $ | 153,012 | $ | 151,468 | $ | 149,309 | $ | 149,311 | 3.6 | % | 6.1 | % | ||||||||||||||||
Interest expense | 20,908 | 20,775 | 20,903 | 20,393 | 20,257 | 0.6 | % | 3.2 | % | |||||||||||||||||||||
Net Interest Income | 137,579 | 132,237 | 130,565 | 128,916 | 129,054 | 4.0 | % | 6.6 | % | |||||||||||||||||||||
Provision for credit losses | 4,800 | 5,000 | 4,141 | 2,511 | 1,530 | (4.0 | )% | 213.7 | % | |||||||||||||||||||||
Net Interest Income after Provision | 132,779 | 127,237 | 126,424 | 126,405 | 127,524 | 4.4 | % | 4.1 | % | |||||||||||||||||||||
Non-Interest Income: | ||||||||||||||||||||||||||||||
Other service charges and fees | 12,437 | 13,333 | 14,407 | 12,983 | 10,750 | (6.7 | )% | 15.7 | % | |||||||||||||||||||||
Service charges on deposit accounts | 12,400 | 12,814 | 13,078 | 12,896 | 12,558 | (3.2 | )% | (1.3 | )% | |||||||||||||||||||||
Investment management and trust services | 11,808 | 11,610 | 11,425 | 11,247 | 10,988 | 1.7 | % | 7.5 | % | |||||||||||||||||||||
Mortgage banking income | 4,596 | 6,959 | 4,529 | 3,897 | 4,030 | (34.0 | )% | 14.0 | % | |||||||||||||||||||||
Other | 4,326 | 6,514 | 4,708 | 5,038 | 3,864 | (33.6 | )% | 12.0 | % | |||||||||||||||||||||
Non-Interest Income before Investment Securities Gains | 45,567 | 51,230 | 48,147 | 46,061 | 42,190 | (11.1 | )% | 8.0 | % | |||||||||||||||||||||
Investment securities gains | 1,106 | 1,525 | 2 | 76 | 947 | (27.5 | )% | 16.8 | % | |||||||||||||||||||||
Total Non-Interest Income | 46,673 | 52,755 | 48,149 | 46,137 | 43,137 | (11.5 | )% | 8.2 | % | |||||||||||||||||||||
Non-Interest Expense: | ||||||||||||||||||||||||||||||
Salaries and employee benefits | 69,236 | 73,256 | 70,696 | 70,029 | 69,372 | (5.5 | )% | (0.2 | )% | |||||||||||||||||||||
Net occupancy expense | 12,663 | 11,798 | 11,782 | 11,811 | 12,220 | 7.3 | % | 3.6 | % | |||||||||||||||||||||
Other outside services | 5,546 | 6,536 | 5,783 | 5,508 | 6,056 | (15.1 | )% | (8.4 | )% | |||||||||||||||||||||
Software | 4,693 | 4,912 | 4,117 | 3,953 | 3,921 | (4.5 | )% | 19.7 | % | |||||||||||||||||||||
Data processing | 4,286 | 4,530 | 4,610 | 5,476 | 5,400 | (5.4 | )% | (20.6 | )% | |||||||||||||||||||||
Equipment expense | 3,359 | 3,408 | 3,137 | 2,872 | 3,371 | (1.4 | )% | (0.4 | )% | |||||||||||||||||||||
Professional fees | 2,737 | 2,783 | 2,535 | 3,353 | 2,333 | (1.7 | )% | 17.3 | % | |||||||||||||||||||||
FDIC insurance expense | 2,058 | 2,067 | 1,791 | 2,960 | 2,949 | (0.4 | )% | (30.2 | )% | |||||||||||||||||||||
Marketing | 1,986 | 1,730 | 1,774 | 1,916 | 1,624 | 14.8 | % | 22.3 | % | |||||||||||||||||||||
Other | 15,711 | 16,601 | 13,623 | 13,759 | 13,167 | (5.4 | )% | 19.3 | % | |||||||||||||||||||||
Total Non-Interest Expense | 122,275 | 127,621 | 119,848 | 121,637 | 120,413 | (4.2 | )% | 1.5 | % | |||||||||||||||||||||
Income Before Income Taxes | 57,177 | 52,371 | 54,725 | 50,905 | 50,248 | 9.2 | % | 13.8 | % | |||||||||||||||||||||
Income tax expense | 13,797 | 10,221 | 13,257 | 11,155 | 11,991 | 35.0 | % | 15.1 | % | |||||||||||||||||||||
Net Income | $ | 43,380 | $ | 42,150 | $ | 41,468 | $ | 39,750 | $ | 38,257 | 2.9 | % | 13.4 | % | ||||||||||||||||
PER SHARE: | ||||||||||||||||||||||||||||||
Net income: | ||||||||||||||||||||||||||||||
Basic | $ | 0.25 | $ | 0.24 | $ | 0.24 | $ | 0.23 | $ | 0.22 | 4.2 | % | 13.6 | % | ||||||||||||||||
Diluted | 0.25 | 0.24 | 0.24 | 0.23 | 0.22 | 4.2 | % | 13.6 | % | |||||||||||||||||||||
Cash dividends | $ | 0.11 | $ | 0.12 | $ | 0.10 | $ | 0.10 | $ | 0.09 | (8.3 | )% | 22.2 | % | ||||||||||||||||
Shareholders' equity | 12.36 | 12.19 | 12.30 | 12.17 | 11.96 | 1.4 | % | 3.3 | % | |||||||||||||||||||||
Shareholders' equity (tangible) | 9.31 | 9.13 | 9.23 | 9.10 | 8.89 | 2.0 | % | 4.7 | % | |||||||||||||||||||||
Weighted average shares (basic) | 174,150 | 173,554 | 173,020 | 173,394 | 173,331 | 0.3 | % | 0.5 | % | |||||||||||||||||||||
Weighted average shares (diluted) | 175,577 | 174,874 | 174,064 | 174,318 | 174,416 | 0.4 | % | 0.7 | % | |||||||||||||||||||||
Shares outstanding, end of period | 174,343 | 174,040 | 173,144 | 173,139 | 173,393 | 0.2 | % | 0.5 | % | |||||||||||||||||||||
SELECTED FINANCIAL RATIOS: | ||||||||||||||||||||||||||||||
Return on average assets | 0.92 | % | 0.89 | % | 0.89 | % | 0.88 | % | 0.86 | % | ||||||||||||||||||||
Return on average shareholders' equity | 8.22 | % | 7.86 | % | 7.78 | % | 7.65 | % | 7.47 | % | ||||||||||||||||||||
Return on average shareholders' equity (tangible) | 10.93 | % | 10.47 | % | 10.38 | % | 10.26 | % | 10.07 | % | ||||||||||||||||||||
Net interest margin | 3.26 | % | 3.15 | % | 3.14 | % | 3.20 | % | 3.23 | % | ||||||||||||||||||||
Efficiency ratio | 64.76 | % | 67.60 | % | 65.16 | % | 67.59 | % | 68.33 | % | ||||||||||||||||||||
N/M - Not meaningful |
FULTON FINANCIAL CORPORATION | ||||||||||||||||||||||||||||||||||
CONDENSED CONSOLIDATED AVERAGE BALANCE SHEET ANALYSIS (UNAUDITED) | ||||||||||||||||||||||||||||||||||
dollars in thousands | ||||||||||||||||||||||||||||||||||
Three Months Ended | ||||||||||||||||||||||||||||||||||
March 31, 2017 | December 31, 2016 | March 31, 2016 | ||||||||||||||||||||||||||||||||
Average | Yield/ | Average | Yield/ | Average | Yield/ | |||||||||||||||||||||||||||||
Balance | Interest (1) | Rate | Balance | Interest (1) | Rate | Balance | Interest (1) | Rate | ||||||||||||||||||||||||||
ASSETS | ||||||||||||||||||||||||||||||||||
Interest-earning assets: | ||||||||||||||||||||||||||||||||||
Loans, net of unearned income | $ | 14,857,562 | $ | 146,650 | 4.00% | $ | 14,475,816 | $ | 141,826 | 3.90% | $ | 13,853,420 | $ | 137,895 | 4.00% | |||||||||||||||||||
Taxable investment securities | 2,145,656 | 11,914 | 2.19% | 2,096,086 | 10,941 | 2.07% | 2,180,593 | 12,003 | 2.20% | |||||||||||||||||||||||||
Tax-exempt investment securities | 403,856 | 4,383 | 4.34% | 389,047 | 4,234 | 4.35% | 259,396 | 3,138 | 4.84% | |||||||||||||||||||||||||
Equity securities | 11,740 | 176 | 6.08% | 13,068 | 181 | 5.52% | 14,386 | 218 | 6.10% | |||||||||||||||||||||||||
Total Investment Securities | 2,561,252 | 16,473 | 2.57% | 2,498,201 | 15,356 | 2.45% | 2,454,375 | 15,359 | 2.50% | |||||||||||||||||||||||||
Loans held for sale | 15,857 | 187 | 4.72% | 24,411 | 199 | 3.26% | 12,252 | 131 | 4.28% | |||||||||||||||||||||||||
Other interest-earning assets | 312,295 | 842 | 1.08% | 411,369 | 966 | 0.94% | 358,562 | 898 | 1.00% | |||||||||||||||||||||||||
Total Interest-earning Assets | 17,746,966 | 164,152 | 3.74% | 17,409,797 | 158,347 | 3.62% | 16,678,609 | 154,283 | 3.72% | |||||||||||||||||||||||||
Noninterest-earning assets: | ||||||||||||||||||||||||||||||||||
Cash and due from banks | 116,529 | 117,741 | 98,449 | |||||||||||||||||||||||||||||||
Premises and equipment | 217,875 | 226,482 | 226,284 | |||||||||||||||||||||||||||||||
Other assets | 1,149,621 | 1,171,031 | 1,137,292 | |||||||||||||||||||||||||||||||
Less: allowance for loan losses | (170,134 | ) | (164,523 | ) | (167,372 | ) | ||||||||||||||||||||||||||||
Total Assets | $ | 19,060,857 | $ | 18,760,528 | $ | 17,973,262 | ||||||||||||||||||||||||||||
LIABILITIES AND SHAREHOLDERS' EQUITY | ||||||||||||||||||||||||||||||||||
Interest-bearing liabilities: | ||||||||||||||||||||||||||||||||||
Demand deposits | $ | 3,650,931 | $ | 2,239 | 0.25% | $ | 3,714,391 | $ | 1,927 | 0.21% | $ | 3,438,355 | $ | 1,494 | 0.17% | |||||||||||||||||||
Savings deposits | 4,194,216 | 2,211 | 0.21% | 4,216,090 | 2,249 | 0.21% | 3,932,824 | 1,804 | 0.18% | |||||||||||||||||||||||||
Time deposits | 2,739,453 | 7,352 | 1.09% | 2,777,203 | 7,593 | 1.09% | 2,867,651 | 7,429 | 1.04% | |||||||||||||||||||||||||
Total Interest-bearing Deposits | 10,584,600 | 11,802 | 0.45% | 10,707,684 | 11,769 | 0.44% | 10,238,830 | 10,727 | 0.42% | |||||||||||||||||||||||||
Short-term borrowings | 712,497 | 855 | 0.48% | 308,094 | 116 | 0.15% | 445,402 | 268 | 0.24% | |||||||||||||||||||||||||
FHLB advances and long-term debt | 990,044 | 8,252 | 3.35% | 947,661 | 8,891 | 3.74% | 958,213 | 9,262 | 3.88% | |||||||||||||||||||||||||
Total Interest-bearing Liabilities | 12,287,141 | 20,909 | 0.69% | 11,963,439 | 20,776 | 0.69% | 11,642,445 | 20,257 | 0.70% | |||||||||||||||||||||||||
Noninterest-bearing liabilities: | ||||||||||||||||||||||||||||||||||
Demand deposits | 4,301,727 | 4,331,894 | 3,967,887 | |||||||||||||||||||||||||||||||
Other | 331,442 | 332,540 | 304,131 | |||||||||||||||||||||||||||||||
Total Liabilities | 16,920,310 | 16,627,873 | 15,914,463 | |||||||||||||||||||||||||||||||
Shareholders' equity | 2,140,547 | 2,132,655 | 2,058,799 | |||||||||||||||||||||||||||||||
Total Liabilities and Shareholders' Equity | $ | 19,060,857 | $ | 18,760,528 | $ | 17,973,262 | ||||||||||||||||||||||||||||
Net interest income/net interest margin (fully taxable equivalent) | 143,243 | 3.26% | 137,571 | 3.15% | 134,026 | 3.23% | ||||||||||||||||||||||||||||
Tax equivalent adjustment | (5,664 | ) | (5,334 | ) | (4,972 | ) | ||||||||||||||||||||||||||||
Net interest income | $ | 137,579 | $ | 132,237 | $ | 129,054 | ||||||||||||||||||||||||||||
(1) Presented on a tax-equivalent basis using a 35% Federal tax rate and statutory interest expense disallowances. | ||||||||||||||||||||||||||||||||||
AVERAGE LOANS, DEPOSITS AND SHORT-TERM BORROWINGS DETAIL: | ||||||||||||||||||||||||||||||||||
Three Months Ended | % Change from | |||||||||||||||||||||||||||||||||
Mar 31 | Dec 31 | Sep 30 | Jun 30 | Mar 31 | Dec 31 | Mar 31 | ||||||||||||||||||||||||||||
2017 | 2016 | 2016 | 2016 | 2016 | 2016 | 2016 | ||||||||||||||||||||||||||||
Loans, by type: | ||||||||||||||||||||||||||||||||||
Real estate - commercial mortgage | $ | 6,039,140 | $ | 5,828,313 | $ | 5,670,888 | $ | 5,557,680 | $ | 5,487,421 | 3.6 | % | 10.1 | % | ||||||||||||||||||||
Commercial - industrial, financial and agricultural | 4,205,070 | 4,081,498 | 4,066,275 | 4,080,524 | 4,095,268 | 3.0 | % | 2.7 | % | |||||||||||||||||||||||||
Real estate - residential mortgage | 1,637,669 | 1,572,895 | 1,503,209 | 1,399,851 | 1,381,409 | 4.1 | % | 18.6 | % | |||||||||||||||||||||||||
Real estate - home equity | 1,613,249 | 1,633,668 | 1,640,913 | 1,656,140 | 1,674,032 | (1.2 | )% | (3.6 | )% | |||||||||||||||||||||||||
Real estate - construction | 840,968 | 845,528 | 837,920 | 820,881 | 792,014 | (0.5 | )% | 6.2 | % | |||||||||||||||||||||||||
Consumer | 284,352 | 289,864 | 281,517 | 272,293 | 263,295 | (1.9 | )% | 8.0 | % | |||||||||||||||||||||||||
Leasing and other | 237,114 | 224,050 | 211,528 | 178,655 | 159,981 | 5.8 | % | 48.2 | % | |||||||||||||||||||||||||
Total Loans, net of unearned income | $ | 14,857,562 | $ | 14,475,816 | $ | 14,212,250 | $ | 13,966,024 | $ | 13,853,420 | 2.6 | % | 7.2 | % | ||||||||||||||||||||
Deposits, by type: | ||||||||||||||||||||||||||||||||||
Noninterest-bearing demand | $ | 4,301,727 | $ | 4,331,894 | $ | 4,227,639 | $ | 4,077,642 | $ | 3,967,887 | (0.7 | )% | 8.4 | % | ||||||||||||||||||||
Interest-bearing demand | 3,650,931 | 3,714,391 | 3,602,448 | 3,454,031 | 3,438,355 | (1.7 | )% | 6.2 | % | |||||||||||||||||||||||||
Savings deposits | 4,194,216 | 4,216,090 | 4,078,942 | 3,989,988 | 3,932,824 | (0.5 | )% | 6.6 | % | |||||||||||||||||||||||||
Time deposits | 2,739,453 | 2,777,203 | 2,814,258 | 2,844,434 | 2,867,651 | (1.4 | )% | (4.5 | )% | |||||||||||||||||||||||||
Total Deposits | $ | 14,886,327 | $ | 15,039,578 | $ | 14,723,287 | $ | 14,366,095 | $ | 14,206,717 | (1.0 | )% | 4.8 | % | ||||||||||||||||||||
Short-term borrowings, by type: | ||||||||||||||||||||||||||||||||||
Customer repurchase agreements | $ | 199,403 | $ | 200,126 | $ | 187,588 | $ | 180,595 | $ | 171,408 | (0.4 | )% | 16.3 | % | ||||||||||||||||||||
Customer short-term promissory notes | 79,985 | 67,355 | 70,072 | 77,535 | 74,013 | 18.8 | % | 8.1 | % | |||||||||||||||||||||||||
Federal funds purchased | 308,220 | 40,613 | 148,546 | 138,012 | 183,970 | 658.9 | % | 67.5 | % | |||||||||||||||||||||||||
Short-term FHLB advances and other borrowings | 124,889 | — | 20,163 | 7,527 | 16,011 | N/M | 680.0 | % | ||||||||||||||||||||||||||
Total Short-term Borrowings | $ | 712,497 | $ | 308,094 | $ | 426,369 | $ | 403,669 | $ | 445,402 | 131.3 | % | 60.0 | % | ||||||||||||||||||||
N/M - Not meaningful |
FULTON FINANCIAL CORPORATION | |||||||||||||||||||||
ASSET QUALITY INFORMATION (UNAUDITED) | |||||||||||||||||||||
dollars in thousands | |||||||||||||||||||||
Three Months Ended | |||||||||||||||||||||
Mar 31 | Dec 31 | Sep 30 | Jun 30 | Mar 31 | |||||||||||||||||
2017 | 2016 | 2016 | 2016 | 2016 | |||||||||||||||||
ALLOWANCE FOR CREDIT LOSSES: | |||||||||||||||||||||
Balance at beginning of period | $ | 171,325 | $ | 165,169 | $ | 165,108 | $ | 166,065 | $ | 171,412 | |||||||||||
Loans charged off: | |||||||||||||||||||||
Commercial - industrial, financial and agricultural | (5,527 | ) | (1,319 | ) | (3,144 | ) | (4,625 | ) | (6,188 | ) | |||||||||||
Consumer and home equity | (1,554 | ) | (2,156 | ) | (1,394 | ) | (1,614 | ) | (2,548 | ) | |||||||||||
Real estate - commercial mortgage | (1,224 | ) | (174 | ) | (1,350 | ) | (1,474 | ) | (582 | ) | |||||||||||
Real estate - construction | (247 | ) | — | (150 | ) | (742 | ) | (326 | ) | ||||||||||||
Real estate - residential mortgage | (216 | ) | (116 | ) | (802 | ) | (340 | ) | (1,068 | ) | |||||||||||
Leasing and other | (639 | ) | (589 | ) | (832 | ) | (1,951 | ) | (443 | ) | |||||||||||
Total loans charged off | (9,407 | ) | (4,354 | ) | (7,672 | ) | (10,746 | ) | (11,155 | ) | |||||||||||
Recoveries of loans previously charged off: | |||||||||||||||||||||
Commercial - industrial, financial and agricultural | 4,191 | 2,192 | 1,539 | 2,931 | 2,319 | ||||||||||||||||
Consumer and home equity | 373 | 580 | 463 | 889 | 534 | ||||||||||||||||
Real estate - commercial mortgage | 450 | 885 | 296 | 1,367 | 825 | ||||||||||||||||
Real estate - construction | 548 | 1,080 | 898 | 1,563 | 383 | ||||||||||||||||
Real estate - residential mortgage | 230 | 288 | 228 | 420 | 136 | ||||||||||||||||
Leasing and other | 137 | 485 | 168 | 108 | 81 | ||||||||||||||||
Recoveries of loans previously charged off | 5,929 | 5,510 | 3,592 | 7,278 | 4,278 | ||||||||||||||||
Net loans charged off | (3,478 | ) | 1,156 | (4,080 | ) | (3,468 | ) | (6,877 | ) | ||||||||||||
Provision for credit losses | 4,800 | 5,000 | 4,141 | 2,511 | 1,530 | ||||||||||||||||
Balance at end of period | $ | 172,647 | $ | 171,325 | $ | 165,169 | $ | 165,108 | $ | 166,065 | |||||||||||
Net charge-offs to average loans (annualized) | 0.09 | % | (0.03 | )% | 0.11 | % | 0.10 | % | 0.20 | % | |||||||||||
NON-PERFORMING ASSETS: | |||||||||||||||||||||
Non-accrual loans | $ | 117,264 | $ | 120,133 | $ | 124,017 | $ | 111,742 | $ | 122,170 | |||||||||||
Loans 90 days past due and accruing | 14,268 | 11,505 | 14,095 | 15,992 | 15,013 | ||||||||||||||||
Total non-performing loans | 131,532 | 131,638 | 138,112 | 127,734 | 137,183 | ||||||||||||||||
Other real estate owned | 11,906 | 12,815 | 11,981 | 11,918 | 10,946 | ||||||||||||||||
Total non-performing assets | $ | 143,438 | $ | 144,453 | $ | 150,093 | $ | 139,652 | $ | 148,129 | |||||||||||
NON-PERFORMING LOANS, BY TYPE: | |||||||||||||||||||||
Commercial - industrial, financial and agricultural | $ | 43,826 | $ | 43,460 | $ | 47,330 | $ | 38,902 | $ | 39,140 | |||||||||||
Real estate - commercial mortgage | 36,713 | 39,319 | 39,631 | 35,704 | 43,132 | ||||||||||||||||
Real estate - residential mortgage | 23,597 | 23,655 | 23,451 | 25,030 | 25,182 | ||||||||||||||||
Real estate - construction | 13,550 | 9,842 | 11,223 | 11,879 | 12,005 | ||||||||||||||||
Consumer and home equity | 13,408 | 15,045 | 16,426 | 16,061 | 16,210 | ||||||||||||||||
Leasing | 438 | 317 | 51 | 158 | 1,514 | ||||||||||||||||
Total non-performing loans | $ | 131,532 | $ | 131,638 | $ | 138,112 | $ | 127,734 | $ | 137,183 | |||||||||||
TROUBLED DEBT RESTRUCTURINGS (TDRs), BY TYPE: | |||||||||||||||||||||
Real-estate - residential mortgage | $ | 27,033 | $ | 27,617 | $ | 26,854 | $ | 27,324 | $ | 27,565 | |||||||||||
Real-estate - commercial mortgage | 15,237 | 15,957 | 16,085 | 17,808 | 17,427 | ||||||||||||||||
Consumer and home equity | 9,638 | 8,633 | 7,707 | 7,191 | 6,562 | ||||||||||||||||
Commercial - industrial, financial and agricultural | 7,441 | 6,627 | 7,488 | 5,756 | 5,650 | ||||||||||||||||
Real estate - construction | 273 | 726 | 843 | 3,086 | 3,092 | ||||||||||||||||
Total accruing TDRs | $ | 59,622 | $ | 59,560 | $ | 58,977 | $ | 61,165 | $ | 60,296 | |||||||||||
Non-accrual TDRs (1) | 27,220 | 27,850 | 27,904 | 24,887 | 27,277 | ||||||||||||||||
Total TDRs | $ | 86,842 | $ | 87,410 | $ | 86,881 | $ | 86,052 | $ | 87,573 | |||||||||||
(1) Included within non-accrual loans above. | |||||||||||||||||||||
DELINQUENCY RATES, BY TYPE: | Total Delinquency % | ||||||||||||||||||||
Mar 31 | Dec 31 | Sep 30 | Jun 30 | Mar 31 | |||||||||||||||||
2017 | 2016 | 2016 | 2016 | 2016 | |||||||||||||||||
Real estate - commercial mortgage | 0.78 | % | 0.78 | % | 0.87 | % | 0.81 | % | 0.93 | % | |||||||||||
Commercial - industrial, financial and agricultural | 1.25 | % | 1.31 | % | 1.48 | % | 1.25 | % | 1.46 | % | |||||||||||
Real estate - construction | 1.99 | % | 1.29 | % | 1.61 | % | 1.93 | % | 2.00 | % | |||||||||||
Real estate - residential mortgage | 2.44 | % | 2.74 | % | 2.67 | % | 2.70 | % | 3.10 | % | |||||||||||
Consumer, home equity, leasing and other | 1.22 | % | 1.45 | % | 1.53 | % | 1.47 | % | 1.48 | % | |||||||||||
Total | 1.23 | % | 1.27 | % | 1.38 | % | 1.30 | % | 1.44 | % | |||||||||||
ASSET QUALITY RATIOS: | |||||||||||||||||||||
Mar 31 | Dec 31 | Sep 30 | Jun 30 | Mar 31 | |||||||||||||||||
2017 | 2016 | 2016 | 2016 | 2016 | |||||||||||||||||
Non-accrual loans to total loans | 0.78 | % | 0.82 | % | 0.86 | % | 0.79 | % | 0.88 | % | |||||||||||
Non-performing loans to total loans | 0.88 | % | 0.90 | % | 0.96 | % | 0.90 | % | 0.99 | % | |||||||||||
Non-performing assets to total loans and OREO | 0.96 | % | 0.98 | % | 1.04 | % | 0.99 | % | 1.07 | % | |||||||||||
Non-performing assets to total assets | 0.75 | % | 0.76 | % | 0.80 | % | 0.76 | % | 0.82 | % | |||||||||||
Allowance for credit losses to loans outstanding | 1.15 | % | 1.17 | % | 1.15 | % | 1.17 | % | 1.20 | % | |||||||||||
Allowance for credit losses to non-performing loans | 131.26 | % | 130.15 | % | 119.59 | % | 129.26 | % | 121.05 | % | |||||||||||
Non-performing assets to tangible common shareholders' equity and allowance for credit losses | 7.99 | % | 8.20 | % | 8.51 | % | 8.02 | % | 8.67 | % |
FULTON FINANCIAL CORPORATION | ||||||||||||||||||||||||||
RECONCILIATION OF GAAP TO NON-GAAP MEASURES (UNAUDITED) | ||||||||||||||||||||||||||
in thousands, except per share data and percentages | ||||||||||||||||||||||||||
Explanatory note: | This press release contains supplemental financial information, as detailed below, which has been derived by methods other than Generally Accepted Accounting Principles ("GAAP"). The Corporation has presented these non-GAAP financial measures because it believes that these measures provide useful and comparative information to assess trends in the Corporation's results of operations. Presentation of these non-GAAP financial measures is consistent with how the Corporation evaluates its performance internally and these non-GAAP financial measures are frequently used by securities analysts, investors and other interested parties in the evaluation of companies in the Corporation's industry. Management believes that these non-GAAP financial measures, in addition to GAAP measures, are also useful to investors to evaluate the Corporation's results. Investors should recognize that the Corporation's presentation of these non-GAAP financial measures might not be comparable to similarly-titled measures of other companies. These non-GAAP financial measures should not be considered a substitute for GAAP basis measures, and the Corporation strongly encourages a review of its condensed consolidated financial statements in their entirety. Reconciliations of these non-GAAP financial measures to the most directly comparable GAAP measure follow: | |||||||||||||||||||||||||
Three Months Ended | ||||||||||||||||||||||||||
Mar 31 | Dec 31 | Sep 30 | Jun 30 | Mar 31 | ||||||||||||||||||||||
2017 | 2016 | 2016 | 2016 | 2016 | ||||||||||||||||||||||
Shareholders' equity (tangible), per share | ||||||||||||||||||||||||||
Shareholders' equity | $ | 2,154,683 | $ | 2,121,115 | $ | 2,129,436 | $ | 2,106,997 | $ | 2,073,309 | ||||||||||||||||
Less: Goodwill and intangible assets | (531,556 | ) | (531,556 | ) | (531,556 | ) | (531,556 | ) | (531,556 | ) | ||||||||||||||||
Tangible shareholders' equity (numerator) | $ | 1,623,127 | $ | 1,589,559 | $ | 1,597,880 | $ | 1,575,441 | $ | 1,541,753 | ||||||||||||||||
Shares outstanding, end of period (denominator) | 174,343 | 174,040 | 173,144 | 173,139 | 173,393 | |||||||||||||||||||||
Shareholders' equity (tangible), per share | $ | 9.31 | $ | 9.13 | $ | 9.23 | $ | 9.10 | $ | 8.89 | ||||||||||||||||
Return on average shareholders' equity (tangible) | ||||||||||||||||||||||||||
Net income - Numerator | $ | 43,380 | $ | 42,150 | $ | 41,468 | $ | 39,750 | $ | 38,257 | ||||||||||||||||
Average shareholders' equity | $ | 2,140,547 | $ | 2,132,655 | $ | 2,120,596 | $ | 2,089,915 | $ | 2,058,799 | ||||||||||||||||
Less: Average goodwill and intangible assets | (531,556 | ) | (531,556 | ) | (531,556 | ) | (531,556 | ) | (531,556 | ) | ||||||||||||||||
Average tangible shareholders' equity (denominator) | $ | 1,608,991 | $ | 1,601,099 | $ | 1,589,040 | $ | 1,558,359 | $ | 1,527,243 | ||||||||||||||||
Return on average shareholders' equity (tangible), annualized | 10.93 | % | 10.47 | % | 10.38 | % | 10.26 | % | 10.07 | % | ||||||||||||||||
Efficiency ratio | ||||||||||||||||||||||||||
Non-interest expense - Numerator | $ | 122,275 | $ | 127,621 | $ | 119,848 | $ | 121,637 | $ | 120,413 | ||||||||||||||||
Net interest income (fully taxable equivalent) | $ | 143,243 | $ | 137,571 | $ | 135,784 | $ | 133,890 | $ | 134,026 | ||||||||||||||||
Plus: Total Non-interest income | 46,673 | 52,755 | 48,149 | 46,137 | 43,137 | |||||||||||||||||||||
Less: Investment securities gains | (1,106 | ) | (1,525 | ) | (2 | ) | (76 | ) | (947 | ) | ||||||||||||||||
Denominator | $ | 188,810 | $ | 188,801 | $ | 183,931 | $ | 179,951 | $ | 176,216 | ||||||||||||||||
Efficiency ratio | 64.76 | % | 67.60 | % | 65.16 | % | 67.59 | % | 68.33 | % | ||||||||||||||||
Non-performing assets to tangible shareholders' equity and allowance for credit losses | ||||||||||||||||||||||||||
Non-performing assets (numerator) | $ | 143,438 | $ | 144,453 | $ | 150,093 | $ | 139,652 | $ | 148,129 | ||||||||||||||||
Tangible shareholders' equity | $ | 1,623,127 | $ | 1,589,559 | 1,597,880 | 1,575,441 | $ | 1,541,753 | ||||||||||||||||||
Plus: Allowance for credit losses | 172,647 | 171,325 | 165,169 | 165,108 | 166,065 | |||||||||||||||||||||
Tangible shareholders' equity and allowance for credit losses (denominator) | $ | 1,795,774 | $ | 1,760,884 | $ | 1,763,049 | $ | 1,740,549 | $ | 1,707,818 | ||||||||||||||||
Non-performing assets to tangible shareholders' equity and allowance for credit losses | 7.99 | % | 8.20 | % | 8.51 | % | 8.02 | % | 8.67 | % | ||||||||||||||||
Pre-provision net revenue | ||||||||||||||||||||||||||
Net interest income | $ | 137,579 | $ | 132,237 | $ | 130,565 | $ | 128,916 | $ | 129,054 | ||||||||||||||||
Non-interest income | 46,673 | 52,755 | 48,149 | 46,137 | 43,137 | |||||||||||||||||||||
Less: Investment securities gains | (1,106 | ) | (1,525 | ) | (2 | ) | (76 | ) | (947 | ) | ||||||||||||||||
Total revenue | $ | 183,146 | $ | 183,467 | $ | 178,712 | $ | 174,977 | $ | 171,244 | ||||||||||||||||
Total non-interest expense | $ | 122,275 | $ | 127,621 | $ | 119,848 | $ | 121,637 | $ | 120,413 | ||||||||||||||||
Pre-provision net revenue | $ | 60,871 | $ | 55,846 | $ | 58,864 | $ | 53,340 | $ | 50,831 |
ZP);+=!Y]0FV_/)RIU1O*JHJ
M]W7U'CR=UM95635NMT1/.GH]D?'H>W*+2[C1C4QK77, F_;Z>/LGIA8>%QB1Z14S6ILB72YHG_Y
MZ8]MJ3,Y54SU4_\ &'ELN(C$IB.NK_E+;9%)4
M
M :FXKK#5Y+P[9W044:RU*V]9FL:FZN2-[9'(B
M>G9BDQL>]38S[-RKAKW[OJA]L6JK^!=HIXZ:_#?]%HX+ Q<6C%L
M4V*=\1\^M%+B1\GED..7BNOFFT#;U8)GNE^XJ/1M51[KOR1\R[2L3PZHY$Z;
M+MN7S9W*2U51%O,^S5U]$]O5W*3M#D_C77
MXS+;!%)4
M !
M0"H !0"H
M
M
M
M
M
M
M
M
M
M
M
M
M
M
M
M
M
M
M
M
M
M
M IN@%0 %-P&X%0 %-T7Q *NW> YD]* .9/2@!%1>[J!4"G,GI0!S)Z4
M
C7]GV,KWMZH
MJ*B\K2M\G\6UEY55-ZGG1%,S\X6';F3=QL:*K,Z3,_27/OXWFLG_ (CWK_BQ
M_H&A_L? _)A0_P!KYWYDGQN]95_^T:]K_P"9'^@/V/@?DP^?M?._,E.OR?>M
M&3ZF8;>:;*[G67RX15[Y(JZL5%9I%->E75.Z?"?