Exhibit 99.1

CONTACT:
Steve Martens, VP Investor Relations
Molex Incorporated
630-527-4344
For Immediate Release
MOLEX REPORTS FOURTH QUARTER AND FULL FISCAL YEAR RESULTS
Lisle, Illinois – August 7, 2013 — Molex Incorporated (NASDAQ: MOLX and MOLXA), a global electronic components company, today reported results for its fourth quarter and full fiscal year ended June 30, 2013.
Fourth Quarter Results
| Three Months Ended | ||||||||||||
| Jun 30, | Mar 31, | Jun 30, | ||||||||||
| USD millions, except per share data | 2013 | 2013 | 2012 | |||||||||
| Net revenue |
$ | 882.9 | $ | 852.9 | $ | 858.5 | ||||||
| Net income |
57.1 | 44.8 | 72.0 | |||||||||
| Earnings per share |
0.32 | 0.25 | 0.40 | |||||||||
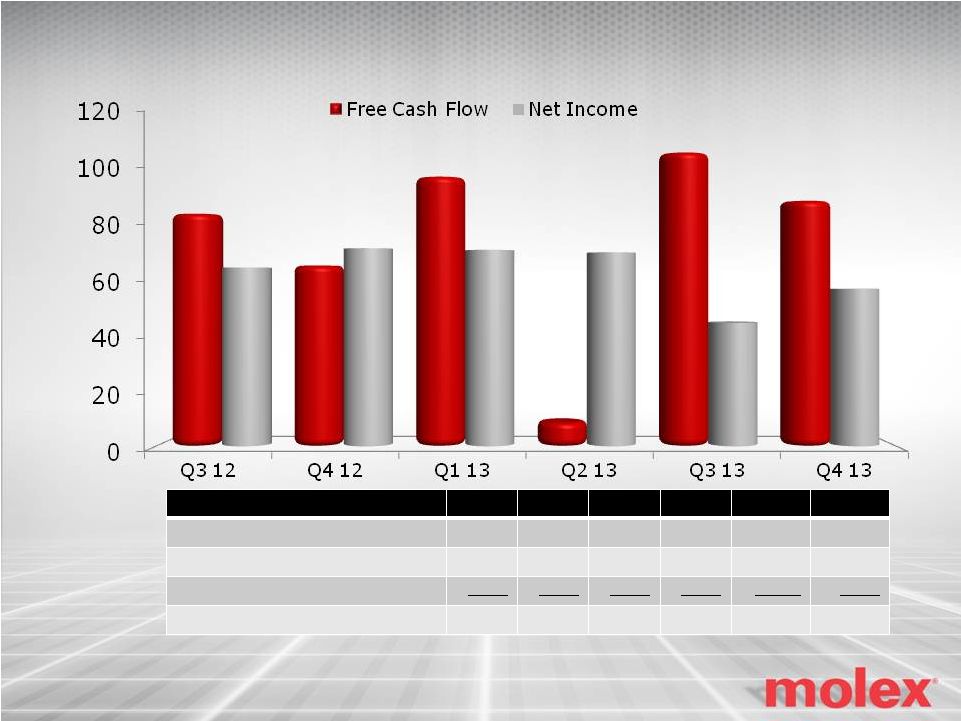
Net revenue for the June 2013 quarter was $882.9 million, an increase of 3.5% from the March 2013 quarter and an increase of 2.8% from the June 2012 quarter. In local currencies, net revenue increased 5.1% compared with the March 2013 quarter and 4.7% compared with the June 2012 quarter. Orders for the June 2013 quarter were $880.0 million, a decrease of 3.2% and 2.3% from the March 2013 quarter and the June 2012 quarter, respectively.
Net income for the June 2013 quarter was $57.1 million or $0.32 per share, compared with $44.8 million, or $0.25 per share, for the March 2013 quarter and $72.0 million, or $0.40 per share, for the June 2012 quarter. Net income for the June 2013 quarter was impacted by additional tax expense of $1.7 million ($0.01 per share) reflecting a reduction in the future tax benefit of deferred tax assets in Korea due to a tax incentive granted to one of our plants. Net income for the March 2013 and June 2012 quarters also was impacted by costs related to unauthorized activities in Japan as outlined below.
“Revenue in all end markets grew sequentially, except for the mobile devices market which remained weak throughout the quarter. We expect tablet and mobile phone production to increase during the September quarter as our customers roll-out new products in time for the holidays,” stated Martin P. Slark, Chief Executive Officer. “We are also encouraged by an improving order rate in most end markets, signaling better growth in the second half of the year.”
1
Other financial highlights for the quarter ended June 30, 2013:
| • | Gross profit margin was 29.1%, compared with 29.1% in the March 2013 quarter and 30.0% in the June 2012 quarter. |
| • | SG&A expense was $174.0 million, compared with $167.4 million in the March 2013 quarter and $161.6 million in the June 2012 quarter. |
| • | Backlog was $452.8 million, a decrease of 2.2% from the March 2013 quarter and an increase of 8.8% from the June 2012 quarter. |
| • | The book-to-bill ratio for the June quarter was 1 to 1 compared with 1.07 to 1 for the March 2013 quarter and 1.05 to 1 for the June 2012 quarter. |
| • | Capital expenditures were $58.9 million or 6.7% of revenue. |
| • | Inventory days outstanding was 84 days compared with 89 days in the March 2013 quarter and 87 days in the June 2012 quarter. |
| • | Accounts receivable days outstanding was 69 days compared with 70 days in the March 2013 quarter and 70 days in the June 2012 quarter. |
| • | The effective tax rate was 32.4%. Excluding the one-time expense previously mentioned, the effective tax rate was 30.4%. |
Outlook
Based upon current order rates and customer backlog, the Company estimates net revenue in the range of $890 to $930 million for the September 2013 quarter. At this level of net revenue, the Company expects earnings per share in the range of $0.35 to $0.39, assuming constant foreign currency rates, unchanged commodity prices and an effective tax rate in the range of 30% to 32%.
Full Fiscal Year Results
| Twelve Months Ended | ||||||||
| Jun 30, | Jun 30, | |||||||
| USD millions, except per share data | 2013 | 2012 | ||||||
| Net revenue |
$ | 3,620.4 | $ | 3,489.2 | ||||
| Net income |
243.6 | 281.4 | ||||||
| Earnings per share |
1.36 | 1.59 | ||||||
Net revenue for the full fiscal year ended June 30, 2013 was $3.6 billion, a 3.8% increase from the prior fiscal year. Net revenue in local currencies increased 5.4% from the prior fiscal year. Net income for the year ended June 30, 2013 was $243.6 million or $1.36 per share, compared with net income of $281.4 million or $1.59 per share in the prior fiscal year. These periods also include costs related to unauthorized activities in Japan as outlined below. The effective tax rate for the fiscal year ended June 30, 2013 was 30.1%.
“Revenue for fiscal 2013 increased 3.8% despite a difficult economic environment, due to our diverse end-market and customer exposure, technology leadership and global reach,” commented Martin P. Slark. “Going forward, we expect these attributes to drive above market growth and earnings expansion. Cash flow was also very strong for the year, which allowed us to increase our dividend again.”
2
Japan Litigation Settlement
As previously announced on February 15, 2013, Molex and Mizuho Bank settled litigation regarding previously reported unauthorized loans. Net income in the March 2013 quarter was impacted by a pretax charge of $21.2 million ($13.5 million after-tax, or $0.08 per share) largely for interest expense and legal fees. Net income for the June 2012 quarter was impacted by a pretax charge of $3.1 million ($2.0 million after-tax, or $0.01 per share) largely for legal fees. For the full years ended June 30, 2013 and 2012, net income was impacted by pretax charges of $25.4 million ($16.2 million after-tax, or $0.09 per share) and $11.3 million ($7.2 million after-tax, or $0.04 per share), respectively.
Earnings Conference Call Information
A conference call will be held on Wednesday, August 7, 2013 at 8:30 a.m. central time. Please dial (888) 679-8034 to participate in the call. International callers should dial (617) 213-4847. Please dial in at least five minutes prior to the start of the call and refer to participant pass code 89187280. Internet users will be able to access the webcast, including slide materials, live and in replay in the “Investors” section of the Company’s website at www.molex.com. A 48-hour telephone replay will be available at approximately 10:30 a.m. central time at (888) 286-8010 or (617) 801-6888 / pass code 24614663.
Other Investor Events
September 4, 2013 / 2013 Citi Global Technology Conference in New York
September 10, 2013 / Deutsche Bank’s dbAccess Technology Conference in Las Vegas
Forward-Looking Statements
Statements in this release that are not historical are forward-looking and are subject to various risks and uncertainties that could cause actual results to vary materially from those stated. Words such as “expect,” “anticipate,” “outlook,” “forecast,” “could,” “project,” “intend,” “plan,” “continue,” “believe,” “seek,” “estimate,” “should,” “may,” “assume,” “potential,” variations of such words and similar expressions are intended to identify such forward-looking statements. Forward-looking statements are based on currently available information and include, among others, the discussion under “Outlook.” These statements are not guarantees of future performance and involve certain risks, uncertainties and assumptions that are difficult to predict. Respective risks, uncertainties and assumptions that could affect the outcome or results of operations are described in Part 1, Item 1A of our Annual Report on Form 10-K for the year ended June 30, 2012, and the Form 10-Q for the quarters ended September 30, 2012, December 31, 2012 and March 31, 2013, which are incorporated by reference and in other reports that Molex files or furnishes with the Securities and Exchange Commission.
We have based our forward-looking statements on our management’s beliefs and assumptions based on information available to management at the time the statements are made. We caution you that actual outcomes and results may differ materially from what is expressed, implied, or forecast by our forward-looking statements. Reference is made in particular to forward-looking statements regarding growth strategies, industry trends, global economic conditions, success of customers, cost of raw materials, value of inventory, currency exchange rates, labor costs, protection of intellectual property, cost reduction initiatives, acquisition synergies, manufacturing strategies, product development introduction and sales, regulatory changes, competitive strengths, natural disasters, unauthorized access to data, government investigations and outcomes of legal proceedings. Except as required under the federal securities laws, we do not have any intention or obligation to update publicly any forward-looking statements after the distribution of this report, whether as a result of new information, future events, changes in assumptions, or otherwise.
3
Molex Incorporated is a 74-year-old global manufacturer of electronic, electrical and fiber optic interconnection systems. Based in Lisle, Illinois, USA, the Company operates 41 manufacturing locations in 15 countries. The Molex website is www.molex.com.
# # #
Editor’s note: Molex is traded on the NASDAQ Global Select Market (MOLX and MOLXA) in the United States and on the London Stock Exchange. The Company’s voting common stock (MOLX) is included in the S&P 500 Index.
4
Molex Incorporated
Condensed Consolidated Balance Sheets
(in thousands)
| June
30, 2013 |
June
30, 2012 |
|||||||
| (Unaudited) | ||||||||
| ASSETS | ||||||||
| Current assets: |
||||||||
| Cash and cash equivalents |
$ | 711,561 | $ | 637,417 | ||||
| Marketable securities |
10,378 | 14,830 | ||||||
| Accounts receivable, less allowances of $40,855 and $37,876, respectively |
703,434 | 751,279 | ||||||
| Inventories |
531,810 | 531,825 | ||||||
| Deferred income taxes |
54,163 | 110,789 | ||||||
| Other current assets |
32,538 | 33,098 | ||||||
|
|
|
|
|
|||||
| Total current assets |
2,043,884 | 2,079,238 | ||||||
| Property, plant and equipment, net |
1,114,092 | 1,150,549 | ||||||
| Goodwill |
191,053 | 160,986 | ||||||
| Non-current deferred income taxes |
52,543 | 50,038 | ||||||
| Other assets |
185,282 | 170,692 | ||||||
|
|
|
|
|
|||||
| Total assets |
$ | 3,586,854 | $ | 3,611,503 | ||||
|
|
|
|
|
|||||
| LIABILITIES AND STOCKHOLDERS’ EQUITY | ||||||||
| Current liabilities: |
||||||||
| Current portion of long-term debt and short-term borrowings |
$ | 54,283 | $ | 104,933 | ||||
| Accounts payable |
347,700 | 355,491 | ||||||
| Accrued expenses: |
||||||||
| Salaries, commissions and bonuses |
113,433 | 89,404 | ||||||
| Accrued liability for unauthorized activities in Japan |
— | 184,177 | ||||||
| Other |
127,652 | 122,631 | ||||||
| Income taxes payable |
15,966 | 35,360 | ||||||
|
|
|
|
|
|||||
| Total current liabilities |
659,034 | 891,996 | ||||||
| Other non-current liabilities |
18,382 | 18,174 | ||||||
| Accrued pension and other postretirement benefits |
76,275 | 115,176 | ||||||
| Long-term debt |
310,000 | 150,032 | ||||||
|
|
|
|
|
|||||
| Total liabilities |
1,063,691 | 1,175,378 | ||||||
|
|
|
|
|
|||||
| Commitments and contingencies |
||||||||
| Total stockholders’ equity |
2,523,163 | 2,436,125 | ||||||
|
|
|
|
|
|||||
| Total liabilities and stockholders’ equity |
$ | 3,586,854 | $ | 3,611,503 | ||||
|
|
|
|
|
|||||
5
Molex Incorporated
Condensed Consolidated Statements of Income
(Unaudited)
(in thousands, except per share data)
| Three Months Ended June 30, |
Years Ended June 30, |
|||||||||||||||
| 2013 | 2012 | 2013 | 2012 | |||||||||||||
| Net revenue |
$ | 882,933 | $ | 858,526 | $ | 3,620,447 | $ | 3,489,189 | ||||||||
| Cost of sales |
625,938 | 600,904 | 2,557,333 | 2,420,726 | ||||||||||||
|
|
|
|
|
|
|
|
|
|||||||||
| Gross profit |
256,995 | 257,622 | 1,063,114 | 1,068,463 | ||||||||||||
|
|
|
|
|
|
|
|
|
|||||||||
| Selling, general and administrative |
174,049 | 161,581 | 685,582 | 657,732 | ||||||||||||
| Unauthorized activities in Japan |
— | 3,093 | 25,398 | 11,259 | ||||||||||||
|
|
|
|
|
|
|
|
|
|||||||||
| Total operating expenses |
174,049 | 164,674 | 710,980 | 668,991 | ||||||||||||
|
|
|
|
|
|
|
|
|
|||||||||
| Income from operations |
82,946 | 92,948 | 352,134 | 399,472 | ||||||||||||
| Interest expense, net |
(1,035 | ) | (663 | ) | (4,560 | ) | (5,360 | ) | ||||||||
| Other income, net |
2,591 | 2,836 | 901 | 6,155 | ||||||||||||
|
|
|
|
|
|
|
|
|
|||||||||
| Total other income (expense), net |
1,556 | 2,173 | (3,659 | ) | 795 | |||||||||||
|
|
|
|
|
|
|
|
|
|||||||||
| Income before income taxes |
84,502 | 95,121 | 348,475 | 400,267 | ||||||||||||
| Income taxes |
27,354 | 23,160 | 104,852 | 118,890 | ||||||||||||
|
|
|
|
|
|
|
|
|
|||||||||
| Net income |
$ | 57,148 | $ | 71,961 | $ | 243,623 | $ | 281,377 | ||||||||
|
|
|
|
|
|
|
|
|
|||||||||
| Earnings per share: |
||||||||||||||||
| Basic |
$ | 0.32 | $ | 0.41 | $ | 1.37 | $ | 1.60 | ||||||||
| Diluted |
$ | 0.32 | $ | 0.40 | $ | 1.36 | $ | 1.59 | ||||||||
| Dividends declared per share |
$ | 0.24 | $ | 0.22 | $ | 0.90 | $ | 0.82 | ||||||||
| Average common shares outstanding: |
||||||||||||||||
| Basic |
177,852 | 176,437 | 177,290 | 175,980 | ||||||||||||
| Diluted |
180,262 | 178,231 | 179,328 | 177,382 | ||||||||||||
6
Molex Incorporated
Condensed Consolidated Statements of Cash Flows
(Unaudited)
(in thousands)
| Years Ended June 30, |
||||||||
| 2013 | 2012 | |||||||
| Operating activities: |
||||||||
| Net income |
$ | 243,623 | $ | 281,377 | ||||
| Add (deduct) non-cash items included in net income: |
||||||||
| Depreciation and amortization |
234,885 | 236,974 | ||||||
| Deferred income taxes |
40,818 | 10,236 | ||||||
| (Gain) loss on sale of property, plant and equipment |
(5,292 | ) | 2,580 | |||||
| Share-based compensation |
29,237 | 23,335 | ||||||
| Other non-cash items |
(10,342 | ) | (20,561 | ) | ||||
| Changes in assets and liabilities: |
||||||||
| Accounts receivable |
23,690 | 44,161 | ||||||
| Inventories |
(10,874 | ) | (5,338 | ) | ||||
| Accounts payable |
9,684 | 312 | ||||||
| Other current assets and liabilities |
6,305 | (10,246 | ) | |||||
| Unauthorized activities in Japan |
(165,813 | ) | — | |||||
| Other assets and liabilities |
(13,369 | ) | 10,889 | |||||
|
|
|
|
|
|||||
| Cash provided from operating activities |
382,552 | 573,719 | ||||||
|
|
|
|
|
|||||
| Investing activities: |
||||||||
| Capital expenditures |
(262,933 | ) | (227,101 | ) | ||||
| Acquisitions |
(55,299 | ) | (24,000 | ) | ||||
| Proceeds from sales of property, plant and equipment |
15,358 | 3,444 | ||||||
| Proceeds from sales or maturities of marketable securities |
12,727 | 12,496 | ||||||
| Purchase of marketable securities |
(8,713 | ) | (14,934 | ) | ||||
| Insurance proceeds and other investing activities |
11,694 | 22,400 | ||||||
|
|
|
|
|
|||||
| Cash used for investing activities |
(287,166 | ) | (227,695 | ) | ||||
| Financing activities: |
||||||||
| Proceeds from revolving credit facility |
247,000 | 75,000 | ||||||
| Payments on revolving credit facility |
(87,000 | ) | (260,000 | ) | ||||
| Proceeds from short-term loans and current portion of long-term debt |
232,312 | — | ||||||
| Payments on short-term loans and current portion of long-term debt |
(271,163 | ) | (53,748 | ) | ||||
| Proceeds from issuance of (payments on) long-term debt |
— | 149,425 | ||||||
| Cash dividends paid |
(155,791 | ) | (140,638 | ) | ||||
| Exercise of stock options |
14,482 | 7,873 | ||||||
| Other financing activities |
(4,332 | ) | (4,194 | ) | ||||
|
|
|
|
|
|||||
| Cash used for financing activities |
(24,492 | ) | (226,282 | ) | ||||
| Effect of exchange rate changes on cash |
3,250 | (14,924 | ) | |||||
|
|
|
|
|
|||||
| Net increase in cash and cash equivalents |
74,144 | 104,818 | ||||||
| Cash and cash equivalents, beginning of year |
637,417 | 532,599 | ||||||
|
|
|
|
|
|||||
| Cash and cash equivalents, end of year |
$ | 711,561 | $ | 637,417 | ||||
|
|
|
|
|
|||||
7