MODINE MANUFACTURING COMPANY
|
PART I
|
|||
|
ITEM 1.
|
1
|
||
|
ITEM 1A.
|
10
|
||
|
ITEM 1B.
|
19
|
||
|
ITEM 2.
|
19
|
||
|
ITEM 3.
|
19
|
||
|
ITEM 4.
|
19
|
||
|
20
|
|||
|
PART II
|
|||
|
ITEM 5.
|
21
|
||
|
ITEM 7.
|
23
|
||
|
ITEM 7A.
|
41
|
||
|
ITEM 8.
|
44
|
||
|
ITEM 9.
|
87
|
||
|
ITEM 9A.
|
87
|
||
|
ITEM 9B.
|
87 | ||
|
ITEM 9C.
|
87 | ||
|
PART III
|
|||
|
ITEM 10.
|
88 | ||
|
ITEM 11.
|
88
|
||
|
ITEM 12.
|
89 | ||
|
ITEM 13.
|
89 | ||
|
ITEM 14.
|
89 | ||
|
PART IV
|
|||
|
ITEM 15.
|
89 | ||
|
ITEM 16.
|
89 | ||
| 90 | |||
| 91 | |||
| 95 | |||
(This page intentionally left blank.)
PART I
Modine Manufacturing Company specializes in providing innovative and environmentally responsible thermal management solutions to diversified global markets and customers. Our broad portfolio of systems and solutions support our purpose of engineering a cleaner, healthier world ™.
We sell thermal management products and solutions into a wide array of commercial, industrial, and building heating, ventilating, air conditioning, and refrigeration (“HVAC&R”) markets. In addition, we are a leading provider of engineered
heat transfer systems and high-quality heat transfer components for use in on- and off-highway original equipment manufacturer (“OEM”) vehicular applications. Our primary product groups include i) heating, ventilation and air conditioning; ii)
coils, coolers, and coatings; and iii) powertrain cooling and engine cooling. Our primary customers across the globe include:
| − |
Heating, ventilation and cooling OEMs;
|
| − |
Construction architects and contractors;
|
| − |
Wholesalers of heating equipment;
|
| − |
Agricultural, industrial and construction equipment OEMs;
|
| − |
Commercial and industrial equipment OEMs; and
|
| − |
Automobile, truck, bus, and specialty vehicle OEMs.
|
We develop sustainable solutions to meet the ever-increasing heat transfer needs of our customers. Our products and systems solve complex heat transfer challenges requiring effective thermal management. Typical customer and market demands
include products and systems that are more efficient, lighter weight, more compact, and more durable as our customers ensure compliance with increasingly stringent energy efficiency, emissions and fuel economy requirements. Our heritage provides
a depth and breadth of expertise in thermal management, which, when combined with our global manufacturing presence, standardized processes, and state-of-the-art technical resources, enables us to rapidly bring highly-valued, customized solutions
to our customers.
History
Modine was incorporated under the laws of the State of Wisconsin on June 23, 1916 by its founder, Arthur B. Modine. Mr. Modine’s “Turbotube” radiators became standard equipment on the famous Ford Motor Company Model T. When he died at the
age of 95, A.B. Modine had personally been granted more than 120 U.S. patents for his heat transfer innovations. The standard of innovation exemplified by A.B. Modine remains the cornerstone of Modine today.
Terms and Year References
When we use the terms “Modine,” “we,” “us,” the “Company,” or “our” in this report, unless the context otherwise requires, we are referring to Modine Manufacturing Company. Our fiscal year ends on March 31 and, accordingly, all references to
a particular year mean the fiscal year ended March 31 of that year, unless indicated otherwise.
Business Strategy and Results
Building on over 100 years of excellence in thermal management, we provide trusted systems and solutions that enable our customers to succeed in the ever-changing global marketplace, all while improving air quality and conserving natural
resources. Our air purification systems improve air quality in schools and businesses. Our data center cooling solutions reduce water and energy consumption by data centers. Our thermal components lower harmful emissions for internal
combustion engines and our battery thermal management systems enable cleaner running electric vehicles. Our cooler and coatings products also encourage the transition to environmentally-friendly refrigerants.
Fiscal 2022 was a year of significant change for Modine — a year of significant progress. We have onboarded seasoned
leaders with the requisite experience to drive transformative change, including two new segment presidents as well as general managers focused on market-based verticals within our business. Our new leadership teams are driving change by
applying 80/20 principles to our business. We are analyzing our business to better focus resources on products and markets with the highest growth opportunities and best return profiles. With our teams in place, we are focused on growing the
areas of our business with the strongest market drivers and best returns, including HVAC&R, data centers, and electric vehicles.
During fiscal 2022, our consolidated net sales were $2.1 billion, a 13 percent increase from $1.8 billion in fiscal 2021. This increase was primarily due to higher sales in our Heavy-Duty Equipment (“HDE”), Commercial and Industrial Solutions
(“CIS”), and Building HVAC Systems (“BHVAC”) segments, partially offset by lower sales in our Automotive segment. Our operating income of $119 million in fiscal 2022 represents a $217 million improvement from the prior year operating loss of
$98 million. The operating income and operating loss during fiscal 2022 and 2021 include $56 million of impairment reversals and $167 million of impairment charges, respectively, primarily related to assets within the Automotive segment that
were held for sale during portions of fiscal 2021 and 2022.
Our top five customers are in the commercial vehicle, off-highway and automotive and light vehicle markets and our ten largest customers accounted for 39 percent of our fiscal 2022 sales. In fiscal 2022, 60 percent of our total sales were
generated from customers outside of the U.S., with 53 percent of total sales generated by foreign operations and 7 percent generated by exports from the U.S. In fiscal 2021, 63 percent of our total sales were generated from customers outside of
the U.S., with 56 percent of total sales generated by foreign operations and 7 percent generated by exports from the U.S. In fiscal 2020, 59 percent of our total sales were generated from customers outside of the U.S., with 52 percent of total
sales generated by foreign operations and 7 percent generated by exports from the U.S.
Markets
We sell products to multiple end markets. The following is a summary of our primary end markets, categorized as a percentage of our net sales:
|
Fiscal 2022
|
Fiscal 2021
|
|||||||
|
Commercial HVAC&R
|
38
|
%
|
34
|
%
|
||||
|
Automotive and light vehicle
|
18
|
%
|
25
|
%
|
||||
|
Off-highway
|
16
|
%
|
15
|
%
|
||||
|
Commercial vehicle
|
16
|
%
|
15
|
%
|
||||
|
Data center cooling
|
5
|
%
|
4
|
%
|
||||
|
Industrial cooling
|
3
|
%
|
4
|
%
|
||||
|
Other
|
4
|
%
|
3
|
%
|
||||
Competitive Position
We compete with many manufacturers of heat transfer and HVAC&R products, some of which are divisions of larger companies. The markets for our products continue to be very dynamic. Our traditional OEM customers are faced with dramatically
increased international competition and have expanded their global manufacturing footprints to compete in local markets. In addition, consolidation within the supply base and vertical integration have introduced new or restructured competitors
to our markets. Some of these market changes have caused us to experience competition from suppliers in other parts of the world that enjoy economic advantages such as lower labor costs, lower healthcare costs, and lower tax rates. Many of our
customers also continue to ask us, as well as their other primary suppliers, to provide research and development (“R&D”), design, and validation support for new potential projects. This combined work effort often results in stronger customer
relationships and more partnership opportunities for us.
Business Segments
Our chief operating decision maker reviews the separate financial results for each of our operating segments. These results are used to evaluate the performance of each business segment and for making decisions on the allocation of
resources. Financial information for our operating segments is included in Note 22 of the Notes to Consolidated Financial Statements.
Effective July 1, 2021, we aligned the data center businesses previously managed by and reported within the CIS segment under the BHVAC segment. The BHVAC segment assumed management of our business in Guadalajara, Spain and a portion of our
business in Grenada, Mississippi. Through this segment change, we aligned our data center businesses under the same leadership team to accelerate commercial excellence, operational improvements, and organizational efficiencies.
Effective April 1, 2022, we began managing our company under two operating segments, Climate Solutions and Performance Technologies. The Climate
Solutions segment includes the BHVAC and CIS segment businesses with the exception of CIS Coatings. The Performance Technologies segment includes the HDE and Automotive segment businesses and the CIS Coatings business. Our new structure
aligns businesses serving similar or complimentary end markets, products and technologies under common segment management. We expect this simplified segment structure will allow us to better focus our resources on targeted growth opportunities
and more efficiently apply the 80/20 principles across all product lines to optimize profit margins and cash flow.
Building HVAC Systems Segment
Market Overview
Our BHVAC businesses in North America serve heating, indoor air quality, and data center markets. Our businesses in the United Kingdom (“U.K.”) and in Spain serve data center, air conditioning, and indoor air quality markets in the U.K.,
mainland Europe, the Middle East, Far East and Africa (“EMEA”).
The heating market in North America experienced moderate growth in fiscal 2022. We expect increasing demands for energy efficiency and decarbonization initiatives will drive additional modest growth in the North American heating markets in
fiscal 2023.
The North American indoor air quality market experienced strong growth during fiscal 2022, largely driven by an increased focus on and available federal and local funding for ventilation improvements by school and healthcare systems as a
result of the COVID-19 pandemic. We expect the federal COVID recovery funds for schools to upgrade facilities, including their HVAC systems, will drive continued strong growth in the North American indoor air quality market in fiscal 2023.
In fiscal 2022, the data center markets in North America and EMEA experienced strong growth. We expect continued strong growth in the data center markets in fiscal 2023, driven by the ever-increasing reliance on digital technologies,
specifically colocation and cloud usage. Market demand for data usage and storage continues to rise, driven by the increased use of the IoT (Internet of Things) technology, which connects various devices through the internet, artificial
intelligence, smart phones, and digital transformation trends. Digital transformation trends driving market demand include employers offering remote work arrangements and an increased focus on the digital customer experience, as more
transactions and customer interactions are taking place virtually through websites and mobile applications.
The indoor air quality and air conditioning markets served by our U.K. business experienced moderate growth in fiscal 2022. We expect these markets will continue to exhibit moderate growth in fiscal 2023. Looking forward, we expect that
European legislation, designed to increase equipment efficiency and reduce the use of high global warming potential refrigerants, will result in customer buying pattern shifts over the next few years, as HVAC equipment providers shift products
towards more efficient and environmentally-friendly alternatives. We expect commercial investment, construction market activity, and energy efficiency legislation will drive increased demand in the air conditioning and indoor air quality markets
in the years to come.
Products
Unit heaters (gas-fired, hydronic, electric and oil-fired); duct furnaces (indoor and outdoor); infrared units (high- and low-intensity); perimeter heating products (commercial fin-tube radiation, cabinet unit heaters, and convectors);
roof-mounted direct- and indirect-fired makeup air units; unit ventilators; single packaged vertical units; ceiling cassettes; IT cooling solutions including precision air conditioning units for data center applications; computer room air
conditioning (CRAC) and computer room air handler (CRAH) units; hybrid fan coils; fan walls; chillers; condensers and condensing units. Aftersales includes spare parts, maintenance service and control solutions for existing plant equipment and
new building management controls and systems.
Customers
Mechanical contractors; HVAC wholesalers; installers; and end users in a variety of residential, commercial and industrial applications, including data center management (including large colocation, cloud service providers and hyperscalers),
education, hospitality, telecommunications, hotels, restaurants, hospitals, residential garages, warehousing, manufacturing, and greenhouses.
Commercial and Industrial Solutions Segment
Market Overview
Our CIS businesses provide a broad offering of thermal management products to the HVAC&R markets in North America, EMEA, and China. In fiscal 2022, the primary HVAC&R and industrial cooling markets served by our CIS segment
experienced modest to moderate growth. We expect continued moderate growth in these markets in fiscal 2023. Trends influencing the primary CIS markets include refrigerant substitution and energy efficiency requirements, both of which are
expected to benefit the commercial HVAC&R markets. We also expect that global population growth will drive changes in food consumption and food chain cooling demand trends and general increases in global trade will drive investments in
refrigeration infrastructure. Demand for more efficient HVAC&R systems in buildings and processes is driven by more stringent energy efficiency regulations.
Products
Coils (microchannel, heat recovery, round tube plate fin, and motor and generator cooling coils); coolers (evaporator unit coolers, remote condensers, fluid coolers, transformer oil coolers, gas coolers, dry and brine coolers, and air blast
coolers); and coatings to protect against corrosion.
Customers
Commercial and industrial equipment manufacturers; distributors, contractors, and end users in a variety of commercial and industrial applications, including commercial and residential HVAC, mobile air conditioning, refrigeration, food and
beverage processing, precision and industrial cooling, and industrial power conversion, production, and transmission.
Heavy Duty Equipment and Automotive Segments
Geographically, we have a strong presence in the vehicular markets within the U.S., Mexico, Brazil, Europe, China, India and South Korea. We leverage our global organizational structure and expertise to solve our customers’ technical
challenges. Our customers value our technical support presence in all regions, our extensive product portfolio, and our ability to provide them with global standard designs.
Vehicular OEMs consistently apply pricing pressure on suppliers while requiring a consistent level of quality. In addition, OEMs often seek new technology solutions at low prices for their thermal management needs. In general, this creates
challenges for us and the entire supply base, but also provides an opportunity for suppliers, like Modine, who develop innovative solutions at a competitive cost.
The following summarizes the primary vehicular markets we serve:
Commercial Vehicle
Market Overview
During fiscal 2022, the North American and European commercial vehicle markets, particularly for heavy- and medium-duty trucks, experienced strong growth as these markets continued to recover from the negative impacts of the COVID-19 pandemic,
which were most severe during the first half of fiscal 2021. The commercial vehicle markets in Asia experienced modest declines resulting from cyclical market weakness in fiscal 2022. Global supply chain challenges and rising inflation
pressures began in fiscal 2022 and we expect these challenges will continue in fiscal 2023.
In fiscal 2023, we expect overall moderate growth in the global commercial vehicle markets, with the strongest growth expected in North America, as customers work through backlog orders, and Brazil, where we expect strong growth trends
influenced by upcoming emission standards. We expect that the commercial vehicle market in China, however, will moderately decline in fiscal 2023 due to cyclical market weakness and the negative impacts of recent government-required lock-downs
and supply chain challenges associated with COVID-19.
Trends influencing the commercial and specialty vehicle markets include the continued need by commercial vehicle manufacturers to meet increasingly stringent emissions and fuel consumption requirements in all regions of the world. For
example, Modine has realized incremental business in Asia as China 6 and Bharat Stage 6 regulations have been implemented in China and India, respectively. Additionally, truck and bus manufacturers are developing and bringing to market
alternative powertrains, including battery electric, waste heat recovery, fuel cells, and other hydrogen-based technologies aimed at improving vehicle efficiency and reducing carbon footprint. These trends are driving the advancement of product
development worldwide and are creating demand for incremental improvements to thermal transfer products and systems. We recently announced availability of our suite of EVantage™ Thermal Management Systems for commercial electric vehicle
chassis. These complete battery thermal management systems regulate battery, traction motor, and power electronics temperatures within optimal ranges under all operating conditions and are customizable for all chassis sizes. We are producing
these systems for several customers, with additional programs launching in fiscal 2023. We are also engaged in development with prospective customers – both traditional OEMs and start-up companies – on vehicles that cover the full range of
commercial vehicle applications from last-mile to Class 8 trucks to transit-, coach and school buses. We are well positioned to support these exciting changes.
Products
Powertrain cooling (engine cooling modules, radiators, charge air coolers, condensers, oil coolers, fan shrouds, and surge tanks); on-engine cooling (exhaust gas recirculation (“EGR”) coolers, engine oil coolers, fuel coolers, charge air
coolers and intake air coolers); auxiliary cooling (transmission and retarder oil coolers and power steering coolers); and complete battery thermal management systems and electronics cooling packages.
Customers
Commercial, medium- and heavy-duty truck and engine manufacturers; and bus and specialty vehicle manufacturers.
Off-Highway
Market Overview
Overall, global off-highway markets experienced strong growth in fiscal 2022. The strongest growth was seen within the North and South American and European off-highway markets, including agricultural, construction, and mining markets.
Growth was particularly strong for larger tractor and vehicle applications. Global supply chain challenges and rising inflation pressures began in fiscal 2022 and we expect these challenges will continue in fiscal 2023.
In fiscal 2023, we expect overall moderate growth in the global off-highway markets, with the strongest growth expected in North America, as customers work through backlog orders with limited inventory currently in the supply chain. We expect
that the off-highway market in China, however, will moderately decline in fiscal 2023 due to cyclical market weakness and the negative impacts of recent government-required lock-downs and supply chain challenges associated with COVID-19.
We expect wide-scale adoption of alternative powertrains will happen more gradually in the off-highway markets compared with commercial vehicle markets. However, there are several off-highway customers and applications that are currently
active in developing and bringing this technology to market. We are actively engaged with them and see additional opportunities in the future.
Products
Powertrain cooling (engine cooling modules, radiators, condensers, charge air coolers, fuel coolers and oil coolers); auxiliary cooling (power steering coolers and transmission oil coolers); on-engine cooling (EGR coolers, engine oil coolers,
fuel coolers, charge air coolers and intake air coolers); and complete battery thermal management systems and electronics cooling packages.
Customers
Construction, agricultural, and mining equipment and engine manufacturers, and industrial manufacturers of material handling equipment, generator sets and compressors.
Automotive and Light Vehicle
Market Overview
The European, North American and Chinese automotive and light vehicle markets declined during fiscal 2022. Semiconductor chip shortages and other supply chain challenges resulted in significantly lower global automotive production and
contributed to the market declines. In fiscal 2023, we expect that the limitations associated with semiconductor chip shortages will ease and, as a result, we expect growth in the North American and Chinese automotive and light vehicle markets.
With regard to the European automotive and light vehicle market, we are monitoring the impacts of the military conflict in Ukraine. We believe the conflict could result in lower automotive production in Europe if supply parts and raw materials
for OEMs become less available or if there continues to be a significant impact on energy and fuel availability and prices.
Overall, we expect that longer-term growth of the global automotive market will be supported by the technology transformation to electric vehicles, tightening of emissions standards for internal combustion engines, in-vehicle technology
enhancements and growth in emerging markets.
Products
Powertrain cooling (engine cooling assemblies, radiators, condensers and charge air coolers); auxiliary cooling (power steering coolers and transmission oil coolers); component assemblies; radiators for special applications; on-engine cooling
(EGR coolers, engine oil coolers, transmission oil coolers, fuel coolers, charge air coolers and intake air coolers); liquid-cooled condensers, chillers (including valves) and cooling plates for battery thermal management; coolers and casings for
electronics cooling and coolers for electric axles (“e-axles”).
Customers
Automobile and light truck OEMs, as well as Tier-1 filter module customers, front-end module assemblers, e-axle producers, power electronics providers, and electric vehicle startup companies.
Geographical Areas
We maintain administrative organizations in all key geographical regions to facilitate customer support, development and testing, and
other administrative functions. We operate in four continents and within the following countries:
|
North America
|
South America
|
Europe
|
Asia
|
|
United States
|
Brazil
|
Germany |
China
|
|
Mexico
|
|
Hungary
|
India
|
|
Italy
|
South Korea
|
||
|
Netherlands
|
United Arab Emirates
|
||
|
Serbia
|
|||
|
Spain
|
|||
|
Sweden
|
|||
|
United Kingdom
|
Our non-U.S. subsidiaries and affiliates manufacture and sell a number of commercial, industrial and building HVAC&R and vehicular products similar to those produced in the U.S.
Exports
Export sales from the U.S. to foreign countries, as a percentage of consolidated net sales, were 7 percent in fiscal 2022, 2021, and 2020.
Export sales from the U.S. to foreign countries, as a percentage of consolidated net sales, were 7 percent in fiscal 2022, 2021, and 2020.
We believe our international presence positions us to benefit from the anticipated long-term growth of the global commercial, industrial and building HVAC&R and vehicular markets. We are committed to increasing our involvement and
investment in international markets in the years ahead.
Customer Dependence
Our ten largest customers, some of which are conglomerates or otherwise affiliated with one another, accounted for 39 percent of our consolidated net sales in fiscal 2022. In fiscal 2022, our largest customer accounted for less than 10
percent of our sales. In fiscal 2021 and 2020, Daimler AG, which included Mercedes-Benz Group AG and Daimler Truck AG prior to the spin-off of Daimler Truck AG in fiscal 2022, accounted for 10 percent or more of our sales.
Our top customers operate primarily in the commercial vehicle, off-highway, automotive and light vehicle, commercial air conditioning and refrigeration markets. Our top customers, listed alphabetically, include: Carrier; Caterpillar; Daimler
Truck AG (including Detroit Diesel, Freightliner, Thomas Built Buses, and Western Star Trucks); Deere & Company; Denso Corporation; Mercedes-Benz Group AG (including AMG, Athlon, and Maybach); Trane Technologies; Volkswagen AG (including
Audi, MAN, Porsche, Scania, and Navistar); Volvo Group (including Mack Trucks and Renault Trucks); and ZF Friedrichshafen AG. Generally, we supply products to our customers on the basis of individual purchase orders received from them. When it
is in the mutual interest of Modine and our customers, we utilize long-term sales agreements to minimize investment risks and provide the customer with a proven source of competitively-priced products. These contracts are typically three to five
years in duration.
Backlog of Orders
Our operating segments maintain their own inventories and production schedules. We believe that our current production capacity is capable of handling our expected sales volume in fiscal 2023 and beyond.
Our operating segments maintain their own inventories and production schedules. We believe that our current production capacity is capable of handling our expected sales volume in fiscal 2023 and beyond.
Raw Materials
We purchase aluminum, nickel and steel from several domestic and foreign suppliers. In general, we do not rely on any one supplier for these materials, which are, for the most part, available from numerous sources in quantities required by us. The supply of copper and brass material is concentrated between two global suppliers, with other suppliers qualified and supplying lesser amounts to mitigate risk. While our suppliers may become constrained due to global demand, we typically do not experience raw material shortages and believe that our suppliers’ production of these metals will be adequate throughout the next fiscal year. We typically adjust metals pricing with our raw material suppliers on a monthly basis and our major fabricated component suppliers on a quarterly basis. When possible, we have included provisions within our long-term customer contracts which provide for adjustments to customer prices, on a prospective basis, based upon increases and decreases in the cost of key raw materials. When applicable, however, these contract provisions are typically limited to the underlying cost of the material based upon the London Metal Exchange, and do not include related premiums or fabrication costs. In addition, there can often be a three-month to one-year lag until the time that the price adjustments take effect.
Patents and other Intellectual Property
We protect our intellectual property through patents, trademarks, trade secrets and copyrights. As a part of our ongoing R&D activities, we routinely seek patents on new products and processes. Our Patent Review Committee manages our intellectual property strategy and portfolio. We own or license numerous patents related to our products and operations. Also, because we have many product lines, we believe that our business as a whole is not materially dependent upon any particular patent or license, or any particular group of patents or licenses. We consider each of our patents, trademarks, and licenses to be of value and aggressively defend our rights throughout the world against infringement. We have over 500 active patents and pending patent applications worldwide.
We protect our intellectual property through patents, trademarks, trade secrets and copyrights. As a part of our ongoing R&D activities, we routinely seek patents on new products and processes. Our Patent Review Committee manages our intellectual property strategy and portfolio. We own or license numerous patents related to our products and operations. Also, because we have many product lines, we believe that our business as a whole is not materially dependent upon any particular patent or license, or any particular group of patents or licenses. We consider each of our patents, trademarks, and licenses to be of value and aggressively defend our rights throughout the world against infringement. We have over 500 active patents and pending patent applications worldwide.
Research and Development
We are committed to creating value through technology and innovation. We focus our engineering and R&D efforts on solutions that meet challenging heat transfer needs of OEMs and other customers within the commercial, industrial, and building HVAC&R and commercial vehicle, construction, agricultural, powersports and automotive and light vehicle markets. Our products and systems are often aimed at solving difficult and complex heat transfer challenges requiring advanced thermal management. Typical market demands are for products and systems that are more efficient, lighter weight, more compact, and more durable to meet customer standards as customers work to ensure compliance with increasingly stringent energy efficiency and emissions requirements. Our heritage includes a depth and breadth of expertise in thermal management that, combined with our global manufacturing presence, standardized processes, and state-of-the-art technical resources, enables us to rapidly bring customized solutions to our customers.
We are committed to creating value through technology and innovation. We focus our engineering and R&D efforts on solutions that meet challenging heat transfer needs of OEMs and other customers within the commercial, industrial, and building HVAC&R and commercial vehicle, construction, agricultural, powersports and automotive and light vehicle markets. Our products and systems are often aimed at solving difficult and complex heat transfer challenges requiring advanced thermal management. Typical market demands are for products and systems that are more efficient, lighter weight, more compact, and more durable to meet customer standards as customers work to ensure compliance with increasingly stringent energy efficiency and emissions requirements. Our heritage includes a depth and breadth of expertise in thermal management that, combined with our global manufacturing presence, standardized processes, and state-of-the-art technical resources, enables us to rapidly bring customized solutions to our customers.
R&D expenditures, including certain application engineering costs for specific customer solutions, totaled $50 million, $46 million, and $60 million in fiscal 2022, 2021, and 2020, respectively. As a percentage of our consolidated net
sales, we spent approximately 2 percent on R&D in fiscal 2022 and approximately 3 percent in both fiscal 2021 and 2020. As our key markets continue to change, we are committed to meaningful R&D investment in the years to come. To
achieve efficiencies and lower development costs, our R&D groups work closely with our customers on special projects and system designs. These development projects focus on advancements in refrigerant heat exchangers, chillers, adiabatic gas
coolers, remote condensers, unit coolers, fluid coolers, corrosion resistant coatings, and within our data center business, CRAH units and fan walls. Vehicular-related projects include EGR technology, oil coolers, charge air coolers, and battery
thermal management systems for commercial vehicle, agriculture, construction, and automotive and light vehicle markets. Our continuous focus on development enables our customers to meet more stringent emission and energy efficiency standards.
Most of our current R&D activities are focused on internal development in the areas of building HVAC, commercial and industrial thermal management products, data center cooling, and vehicular and equipment cooling including electric vehicle,
powertrain and engine cooling. We also collaborate with industry, university, and government-sponsored research organizations that conduct research and provide data on practical applications in the markets we serve. We continue to identify,
evaluate and engage in external research projects that complement our strategic internal research initiatives in order to further leverage our significant thermal technology expertise and capabilities.
Quality Improvement
Globally, we drive quality improvement by maintaining the Global Modine Management System and executing the Modine Quality Strategy.
Through our integrated and process-oriented Global Modine Management System, the majority of our manufacturing facilities and administrative offices are registered to ISO 9001:20015 or IATF 16949:2016 standards, helping to ensure that our
customers receive high quality products and services. We regularly monitor our process performance to meet rising customer expectations for performance, quality and service.
Our Global Modine Management System focuses on well-defined improvement principles and leadership behaviors to engage our teams in facilitating rapid improvements. We drive sustainable and systematic continuous improvement throughout our
company by utilizing the principles, processes and behaviors of the Global Modine Management System.
To ensure future quality, we continue to execute the Modine Quality Strategy, which focuses on people, process, performance, quality engineering and the Global Modine Management System.
Environmental Matters
We are committed to engineering a cleaner, healthier world by preventing pollution, eliminating waste and reducing environmental risks and employ waste management programs to advance our environmental stewardship and minimize our environmental
footprint. The majority of our facilities maintain Environmental Management System (“EMS”) certification to the international ISO14001 standard through independent third-party audits.
We are focused on reducing both our energy and water usage and have empowered each of our global facilities to create and carry out action plans that contribute to our company-wide reduction goals. Examples of steps we are taking to meet
these goals include the installation of more efficient LED lighting systems, the replacement of inefficient boilers and air compressors, improved building HVAC management systems, increased industrial water recycling, and the installation of
water-saving faucets.
We are committed to continuously driving energy efficiency across our product portfolio, reflecting our sense of environmental responsibility. For our data center customers, we are focused on designing and providing cooling solutions that
reduce both electrical and water usage. We are also shifting our product portfolios in our industrial businesses toward lower-emission propellants and refrigerants that greatly reduce the environmental impact and enhance energy efficiency for
our customers’ heating and cooling systems. In addition, we are focusing on reducing energy use by recycling waste heat produced from air conditioning systems. Lastly, products in our vehicular businesses include oil, charge-air, and EGR
coolers, radiators, air conditioning condensers, and battery thermal management systems for cars, trucks, buses, specialty vehicles, and off-highway equipment. These products allow both internal combustion and electric vehicle systems to run at
optimal temperatures, which promotes better fuel efficiency, lower emissions, and improved vehicle lifespans. We continue to focus on product design and development to improve fuel efficiency and reduce overall energy consumption, while still
providing the vehicle performance that our customers expect.
Obligations for remedial activities may arise at our facilities due to past practices, or as a result of a property purchase or sale. These obligations most often relate to sites where past operations followed practices that were considered
acceptable under then-existing regulations, but now require investigative and/or remedial work to ensure appropriate environmental protection or where we are a successor to the obligations of prior owners and current laws and regulations require
investigative and/or remedial work to ensure sufficient environmental compliance. Liabilities for environmental investigative work and remediation at sites in the U.S. and abroad totaled $18 million at March 31, 2022.
Seasonal Nature of Business
Our overall operating performance is generally not subject to a significant degree of seasonality. Both our BHVAC and CIS segments experience some seasonality, as demand for HVAC&R products can be affected by heating and cooling seasons, weather patterns, construction, and other factors. Sales volume within the BHVAC segment is generally stronger in our second and third fiscal quarters, corresponding with demand for heating products. We generally expect sales volume within our CIS segment to be higher during our first and second fiscal quarters due to the construction seasons in the northern hemisphere. Sales to vehicular OEM customers are dependent upon market demand for new vehicles. However, our second fiscal quarter production schedules are typically impacted by customer summer shutdowns and our third fiscal quarter is affected by holiday schedules.
Our overall operating performance is generally not subject to a significant degree of seasonality. Both our BHVAC and CIS segments experience some seasonality, as demand for HVAC&R products can be affected by heating and cooling seasons, weather patterns, construction, and other factors. Sales volume within the BHVAC segment is generally stronger in our second and third fiscal quarters, corresponding with demand for heating products. We generally expect sales volume within our CIS segment to be higher during our first and second fiscal quarters due to the construction seasons in the northern hemisphere. Sales to vehicular OEM customers are dependent upon market demand for new vehicles. However, our second fiscal quarter production schedules are typically impacted by customer summer shutdowns and our third fiscal quarter is affected by holiday schedules.
Working Capital
We manufacture products for the majority of customers in our CIS, HDE, and Automotive segments on an as-ordered basis, which makes large inventories of finished products unnecessary. In Brazil, within our HDE segment, we maintain aftermarket product inventory in order to timely meet customer needs in the Brazilian automotive and commercial vehicle aftermarkets. In our BHVAC segment, we maintain varying levels of finished goods inventory due to seasonal demand and the timing of sales programs. We have not experienced a significant number of returned products within any of our operating segments.
We manufacture products for the majority of customers in our CIS, HDE, and Automotive segments on an as-ordered basis, which makes large inventories of finished products unnecessary. In Brazil, within our HDE segment, we maintain aftermarket product inventory in order to timely meet customer needs in the Brazilian automotive and commercial vehicle aftermarkets. In our BHVAC segment, we maintain varying levels of finished goods inventory due to seasonal demand and the timing of sales programs. We have not experienced a significant number of returned products within any of our operating segments.
Human Capital Resource Management
As of March 31, 2022, we employed approximately 11,100 persons worldwide.
We recognize that our continued success is a direct result of the quality of our people. As such, we strive to be an employer of choice in every community in which we operate. We do this by fostering a fair, respectful, and safe work
environment for our people in alignment with our core values.
We have identified priorities that we believe are essential to attract, develop and retain highly-qualified talent. These include, among others, i) providing career development programs; ii) promoting health and safety; iii) fostering
diversity and inclusion in the workplace; and iv) providing competitive compensation and benefits.
Workforce Development
Our operations require expertise across a wide range of disciplines, from engineering and manufacturing to accounting and finance to information technology. Both our human resources team at our corporate headquarters and our local facility
managers work to hire talented individuals who align with our values.
All of our new employees go through a comprehensive onboarding program with their managers to ensure proper training is provided to succeed in their respective roles. We encourage our employees to grow their skills through both internal and
external training programs.
We are committed to growing our employees’ capabilities. Through our annual Performance and Development Process (“PDP”), we provide all salaried employees with a consistent, structured development and performance review experience. The PDP
provides employees with a development pathway that focuses on both annual performance goals and longer-term career development. In addition, we perform strategic talent reviews and succession planning on a regular cadence.
Health and Safety
The health and safety of our employees is paramount to us. We are committed to conducting our business operations in a safe and healthy manner. We employ a behavior-based safety program which proactively seeks to correct at-risk behaviors
while positively reinforcing safe behaviors. We educate and train employees on safe practices and promote personal accountability and responsibility for safety at all levels of our organization.
We have consistently out-performed the private-industry Recordable Incident Rate (“RIR” as defined by the Occupational Safety and Health Administration) average for the manufacturing sector, which was 3.1 in 2020. During fiscal 2022, we
recorded an RIR of 1.18, well below the manufacturing sector average.
We have also taken steps to protect our global employees from the impacts of the COVID-19 pandemic since its onset, including enhanced cleaning and sanitation procedures. In addition, we have encouraged our employees to protect themselves
with vaccinations and have held numerous vaccination events across our locations to make vaccinations more accessible for interested employees.
Diversity and Inclusion
We are committed to a diverse workforce, founded on respect and value for people of different backgrounds, experiences, and perspectives. Incorporating diverse talent and fostering an inclusive workforce is a key focus of our talent
management strategy. We track and focus on indicators of diversity and inclusion across our global operations, including the number of women in supervisory roles and minority new hires in the U.S.
Competitive Compensation and Benefits
We offer our employees competitive compensation and comprehensive benefit packages. We regularly benchmark our compensation practices and benefits programs against those of comparable industries and in the geographic areas where our
facilities are located. We believe that our compensation and employee benefits are competitive and allow us to attract and retain talent throughout our organization.
Available Information
Through our website, www.modine.com (Investors link), we make available, free of charge, our annual reports on Form 10-K, quarterly reports on Form 10-Q, current reports on Form 8-K, proxy statements, other Securities Exchange Act reports and all amendments to those reports as soon as reasonably practicable after such material is electronically filed with, or furnished to, the Securities and Exchange Commission (“SEC”). Our reports are also available free of charge on the SEC’s website, www.sec.gov. Also available free of charge on our website are the following corporate governance documents, among others:
Through our website, www.modine.com (Investors link), we make available, free of charge, our annual reports on Form 10-K, quarterly reports on Form 10-Q, current reports on Form 8-K, proxy statements, other Securities Exchange Act reports and all amendments to those reports as soon as reasonably practicable after such material is electronically filed with, or furnished to, the Securities and Exchange Commission (“SEC”). Our reports are also available free of charge on the SEC’s website, www.sec.gov. Also available free of charge on our website are the following corporate governance documents, among others:
| − |
Code of Conduct, which is applicable to all Modine directors and employees, including our executive officers;
|
| − |
Corporate Governance Guidelines;
|
| − |
Audit Committee Charter;
|
| − |
Human Capital and Compensation Committee Charter;
|
| − |
Corporate Governance and Nominating Committee Charter; and
|
| − |
Technology Committee Charter.
|
All of the reports and corporate governance documents referenced above and other materials relating to corporate governance may also be obtained without charge by contacting Corporate Secretary, Modine Manufacturing Company, 1500 DeKoven
Avenue, Racine, Wisconsin 53403-2552. We do not intend to incorporate our internet website and the information contained therein or incorporated therein into this Annual Report on Form 10-K.
In the ordinary course of our business, we face various market, operational, strategic, financial and general risks. These risks could have a material impact on our business, financial condition, and results of
operations. Please consider each of the risks described below, along with other information contained in this Annual Report on Form 10-K, when making any investment decisions with respect to our securities.
Our Enterprise Risk Management process seeks to identify and address material risks. We believe that risk-taking is an inherent aspect of operating a global business and, in particular, one focused on growth and
cost-competitiveness. Our goal is to proactively manage risks in a structured approach in conjunction with strategic planning, while preserving and enhancing shareholder value. However, the risks set forth below and elsewhere in this report, as
well as other risks currently unknown or deemed immaterial at the date of this report, could adversely affect us and cause our financial results to vary materially from recent or anticipated future results.
| A. |
MARKET RISKS
|
Economic Uncertainties
The military conflict between Russia and Ukraine has resulted in geopolitical instability. Our business,
financial position, results of operations and cash flows could be adversely affected by the negative impacts on the global economy resulting from the conflict in Ukraine.
In February 2022, Russian troops invaded Ukraine and the military conflict is ongoing. While the length and total impact of the military conflict is unpredictable, it has led to market disruptions, including volatility in raw material prices
and credit and capital markets, and supply chain challenges. In response to the military conflict, governments in the U.S. and abroad have imposed sanctions against Russia and proposed or threatened additional potential sanctions. These
sanctions could adversely affect the global economy and financial markets in which we operate.
We do not have manufacturing operations in Ukraine or Russia nor any significant business relationships with Ukraine- or Russian-based customers or suppliers. To date, we have not experienced any material impacts of the ongoing military
conflict. We are monitoring the situation and its impact on the global markets, which may, in turn, impact our business. For example, it is possible that the conflict could result in lower automotive production in Europe if supply parts and raw
materials for OEMs become less available or if there are continued significant increases in energy and fuel prices. In addition, the threat of cyberattacks on the global supply chain may increase, which could directly or indirectly impact our
operations.
At this time, we cannot reasonably estimate the full impact of the military conflict between Russia and Ukraine. It is not possible to predict the extent and duration of the military conflict, sanctions, and any associated market disruptions,
which could have a material adverse effect on our business, financial position, results of operations and cash flows.
The COVID-19 pandemic and associated supply chain challenges could adversely affect our business, financial position, results of operations and cash flows.
Since its onset, the COVID-19 pandemic has broadly impacted the global economy and our key end markets. During fiscal 2022, the direct effects on our company from the COVID-19 pandemic generally lessened, particularly compared with the
significant impacts during the first half of fiscal 2021.
The COVID-19 pandemic and other market and economic dynamics have contributed to global supply chain challenges, labor shortages and inflationary market
conditions. Raw material and logistic prices have increased and we, like many companies, have experienced delays and shortages in certain purchased commodities and components. In addition, our Automotive segment has been impacted by lower order volume associated with semiconductor shortages, which have caused lower global automotive production. While we are focused on mitigating the
negative impacts of the labor shortages and supply chain challenges, there can be no assurance that our efforts will be successful, and the pandemic and related market dynamics could have a material adverse effect on our business, financial
position, results of operations and cash flow.
Since February 2022, COVID-19 cases have increased in many areas in China. As a result of government-required lock-downs,
we suspended production at manufacturing facilities in China for portions of March and April 2022. While these plants have since reopened, they are currently manufacturing at reduced levels and customer demand has been negatively impacted by
the lock-downs and supply chain challenges, including component shortages. While we are actively working to address the supply chain challenges and expect to increase production levels at our plants in China in the second quarter of fiscal
2023, there can be no assurance that our efforts will be successful. All of our other manufacturing locations are open and operating, although production has been negatively affected at times by employee absences due to COVID-19. Our business
operations could be further affected if any of our key management or leadership personnel are incapacitated or if a significant portion of our workforce is unable to work effectively due to illness, quarantines, government actions or similar
pandemic-related impediments.
At this time, we cannot reasonably estimate the full impact of the COVID-19 pandemic or the ongoing supply chain challenges, the full extent of which will depend largely on future developments which are
unpredictable and outside of our control. If we, our suppliers, or our customers experience prolonged shutdowns or other significant business disruptions, it is possible that our ability to conduct business in the manner and on the timelines
presently planned could be materially and negatively impacted, which could have a material adverse effect on our business, financial position, results of operations and cash flows.
A future widespread outbreak of an illness or other public health threat could adversely affect our business, financial position, results of operations and cash flows.
An outbreak of a disease or public health threat in the future could create economic and financial disruptions and adversely affect our businesses around the world. Potential impacts of epidemics, pandemics, or
other health crises include, but are not limited to, (i) staffing shortages if portions of our workforce are unable to work effectively due to illness, quarantines, government actions, facility closures, or other restrictions; (ii) short- or
long-term disruptions in our supply chain and our ability to deliver products to our customers; (iii) deterioration in the markets that we or our customers operate in, which may result in lower sales or a lack in the ability of our customers to
pay us; and (iv) significant volatility or negative pressure in the financial markets, which could adversely affect our access to capital and/or financing.
Customer and Supplier Matters
Increases in costs of materials, including aluminum, copper, steel and stainless steel (nickel), other raw materials and purchased components, could place significant pressure on our results of
operations.
Increases in the costs of raw materials and other purchased components, which may be impacted by a variety of factors, including changes in trade laws, tariffs, sanctions, inflation, the behavior of our suppliers and significant fluctuations
in demand, could have a significant adverse effect on our results of operations. In the shorter-term, our ability to adjust for cost increases is limited when prices are fixed for current orders. In these cases, if we are not able to recover
such cost increases through price increases to our customers, such cost increases will have an adverse effect on our results of operations. With regard to our longer-term sales programs, we have sought to reduce the risk of cost increases by
including provisions within our customer contracts, where possible, which provide for prospective price adjustments based upon increases and decreases in the cost of key raw materials. However, where these contract provisions are applicable,
there can often be a three-month to one-year lag until the time of the price adjustment. To further mitigate our exposure, from time to time we enter into forward contracts to hedge a portion of our forecasted aluminum and copper purchases.
However, these hedges may only partially offset increases in material costs, and significant increases could have an adverse effect on our results of operations.
We could be adversely affected if we experience shortages of components or materials from our suppliers.
In an effort to manage and reduce our costs while balancing supply risk, we have added key suppliers to our supply base during the last year. We are, however, still dependent upon limited sources of supply for certain components used in the
manufacture of our products, including aluminum, copper, steel and stainless steel (nickel). We select our suppliers based upon total value (including price, delivery and quality), taking into consideration their production capacities, financial
condition and willingness and ability to meet our demand. In some cases, it can take several months or longer to find a supplier due to qualification requirements.
Strong demand, the potential effects of trade laws and tariffs, capacity constraints, financial instability, public health crises, such as pandemics and epidemics, or other circumstances experienced by our suppliers could result in shortages
or delays in their supply of product to us, or a significant price increase resulting in our need to resource. If we experience significant or prolonged shortages of any critical components or materials
from our suppliers and could not procure the components or materials from other sources, we may be unable to meet our production schedules and could miss product delivery dates, which would adversely affect our sales, results of operations and
customer relationships.
Our results of operations could be adversely affected by price reduction pressures from OEMs.
Although we have been successful in negotiating price increases in many of our contracts in response to the current inflationary market conditions, we have historically faced price-reduction pressure from our vehicular OEM customers.
Virtually all of these OEMs have imposed aggressive price-reduction initiatives upon their suppliers. We have taken, and will continue to take, steps to reduce our operating costs to offset both inflationary pressures and contractual price
reductions in order to achieve profit margins that are acceptable to us. For existing contractual price reductions, if we are unable to offset price reductions through improved operating efficiencies and manufacturing processes, sourcing
alternatives, technology enhancements and other cost reduction initiatives, or through price negotiations, our results of operations could be adversely affected.
We expect vehicular OEM customers will continue to apply pricing pressure and many will require contractual price reductions for new sales programs. As
part of our application of the 80/20 principles, we have improved our pricing discipline and have clear strategic targets in terms of profit margins for new sales programs. If contractual price downs are unavoidable, we contemplate them in our
overall strategy and adjust pricing as necessary to provide satisfactory profit margins throughout the duration of the sales programs. While we believe that this pricing strategy will strengthen our business and
allow us to focus our resources on higher margin sales programs, it is possible that it may result in a lower overall win rate for new business in the short-term. If our pricing strategy results in winning less
new business, our results of operations could be adversely affected.
Our net sales and profitability could be adversely affected from business losses or declines with major customers.
Deterioration of a business relationship with a major customer could cause our sales and profitability to suffer. In certain areas of our businesses, a large portion of sales are attributable to a relatively small number of customers. In our
vehicular businesses, the failure to obtain new business on new models or to retain or increase business on redesigned existing models could adversely affect our business and financial results. In addition, as a result of the relatively long
lead times required for many of our complex components, it may be difficult in the short term for us to obtain new sales to replace any unexpected decline in sales of existing products. The loss of a major customer in any of our businesses, the
loss of business with respect to one or more of the vehicle models that use our vehicular products, or a significant decline in the production levels of such vehicles could have an adverse effect on our business, results of operations and
financial condition.
Continual customer pressure to absorb costs adversely affects our profitability.
Vehicular customers often request that we pay for design, engineering and tooling costs that are incurred prior to the start of production and recover these costs through amortization in the piece price of the product. Some of these costs
cannot be capitalized, which adversely affects our profitability until the programs for which they have been incurred are launched. If a given program is not launched, or is launched with significantly lower volumes than planned, we may not be
able to recover the design, engineering and tooling costs from our customers, further adversely affecting our results of operations.
Climate Change and ESG-Related Risks
Global climate change and related emphasis on ESG matters by various stakeholders could negatively affect our business.
Increased public awareness and concern regarding global climate change may result in more regional and/or federal requirements to reduce or mitigate the effects of greenhouse gas emissions. There continues to be a lack of consistent climate
legislation, which creates economic and regulatory uncertainty. Such regulatory uncertainty extends to our product portfolio and overall costs of compliance, which may impact the demand for our products and/ or require us to make increased
capital expenditures to meet new standards and regulations. Further, our customers and the markets we serve may impose emissions or other environmental standards upon us through regulation, market-based emissions policies or consumer preference
that we may not be able to timely meet, or which may not be economically feasible for us, due to the required level of capital investment or technological advancement.
There is a growing consensus that greenhouse gas emissions are linked to global climate changes. Climate changes, such as extreme weather conditions, create financial risk to our business. For example, the demand for our products and services
may be affected by unseasonable weather conditions. Climate changes could also disrupt our operations by impacting the availability and cost of materials needed for manufacturing and could increase insurance and other operating costs. We could
also face indirect financial risks passed through the supply chain, and process disruptions due to climate changes could result in price modifications for our products and the resources needed to produce them.
Furthermore, customer, investor, and employee expectations in areas such as the environment, social matters and corporate governance (ESG) have been rapidly evolving and increasing. Specifically, certain customers are requiring information on
our environmental sustainability plans and commitments, which we have not yet released publicly as of the date of this filing. There can be no assurance of the extent to which any of our future plans or commitments will be achieved, or that any
investments we make in furtherance of achieving any such plans, targets, goals or other commitments will meet customer, investor, employee or other stakeholder expectations and desires or any legal standards regarding sustainability performance.
Additionally, the enhanced stakeholder focus on ESG issues requires the continuous monitoring of various and evolving standards and the associated reporting requirements. A failure to adequately meet stakeholder expectations may result in the
loss of business, diluted market valuation, an inability to attract and retain customers or an inability to attract and retain top talent.
Competitive Environment
Continued and increased strong competition could adversely affect our business and our results of operations.
The global competitive environment continues to be dynamic as many of our customers, faced with intense international competition, have expanded their sourcing of components. As a result, we experience competition from suppliers in other
parts of the world that enjoy economic advantages, such as lower labor costs, lower health care costs, lower tax rates, lower costs associated with legal compliance, and, in some cases, export or raw materials subsidies. In addition,
consolidation and vertical integration within the supply base have introduced new or restructured competitors to our markets. Increased competition could adversely affect our business and our results of operations.
| B. |
OPERATIONAL RISKS
|
Complexities of Global Presence
We are subject to risks related to our international operations and global customer base.
We have manufacturing and technical facilities located in North America, South America, Europe, and Asia. In fiscal 2022, 60 percent of our sales were generated from customers outside the U.S., with 53 percent of these sales generated by our
non-U.S. operations. Consequently, our global operations are subject to complex international laws and regulations and numerous risks and uncertainties, including changes in monetary and fiscal policies, including those related to tax and trade,
cross-border trade restrictions or prohibitions, import or other charges or taxes, fluctuations in foreign currency exchange and interest rates, inflation, changing economic conditions, public health crises, including the ongoing COVID-19
pandemic, unreliable intellectual property protection and legal systems, insufficient infrastructures, social unrest, political instability and disputes (including, for example, impacts of the military conflict in Ukraine), incompatible business
practices, and international terrorism. Changes in policies or laws governing the terms of foreign trade, and in particular increased trade restrictions, tariffs or taxes on imports from countries where we either manufacture products, such as
Mexico, or buy raw materials, such as China, could have a material adverse effect on our results of operations. In addition, compliance with multiple and often conflicting laws and regulations of various countries can be challenging and
expensive.
Embargoes or sanctions imposed by the U.S. government or those abroad that restrict or prohibit sales to or purchases from specific persons or countries or based upon product classification may expose us to potential criminal and civil
sanctions to the extent that we are alleged or found to be in violation, whether intentional or unintentional. Governments in the U.S. and abroad have imposed sanctions on Russia in connection with the military conflict in Ukraine. While we do
not have manufacturing operations in Ukraine or Russia nor any significant business relationships with Russian-based customers or suppliers, we are actively monitoring the sanctions requirements and reacting as necessary to ensure compliance. We
cannot predict future regulatory requirements to which our business operations may be subject or the manner in which existing laws might be administered or interpreted.
In addition, the U.S. Foreign Corrupt Practices Act, the U.K. Bribery Act and other similar anti-corruption laws generally prohibit companies and their intermediaries from making payments to improperly influence foreign government officials or
other persons for the purpose of obtaining or retaining business. In recent years, there has been a substantial increase in the global enforcement of anti-corruption laws. In the event that we believe our employees or agents may have violated
applicable anti-corruption laws, or if we are subject to allegations of any such violations, we may have to expend significant time and financial resources towards the investigation and remediation of the matter, which could disrupt our business
and result in a material adverse effect on our financial condition, results of operations and reputation.
Challenges of Maintaining a Competitive Cost Structure
We may be unable to maintain competitive cost structures within our business.
In recent years, we have engaged in various restructuring activities in order to optimize our manufacturing footprint and cost structure. These restructuring activities have included targeted headcount reductions that support our objective of
reducing operational and SG&A cost structures and the consolidation and/or closure of manufacturing facilities in North America, Europe and Asia. In addition, we continue to focus on reducing costs for materials and services through targeted
adjustments and negotiations with our supply base. Our successful execution of these initiatives, and our ability to identify and execute future opportunities to optimize our cost structures, is critical to enable us to establish a cost
structure that will improve and sustain our long-term competitiveness. Any failure to do so could, in turn, adversely affect our results of operations and financial condition.
Challenges of Program Launches
We launch a significant number of new programs at our facilities across the world. The success of these launches is critical to our business.
We design technologically advanced products, and the processes required to produce these products can be difficult and complex. We spend significant time and financial resources to ensure the successful launch of new products and programs.
Due to our high level of launch activity, particularly within our HDE segment, we must appropriately manage these launches and deploy our operational and administrative resources to take advantage of the resulting increase in our business. If we
do not successfully launch new products and programs, we may lose market share or damage relationships with our customers, which could negatively affect our business. In addition, any failure in our manufacturing strategy for these new products
or programs could result in operating inefficiencies or asset impairment charges, which could adversely affect our results of operations.
Information Technology (IT) Systems
We may be adversely affected by a substantial disruption in, or material breach of, our IT systems.
We are dependent upon our IT infrastructure, including network, hardware, and software systems, to conduct our business. Despite network and other cybersecurity measures we have in place, our IT systems could be compromised or we could
experience a cybersecurity breach from computer viruses, ransomware, phishing, break-ins or similar disruptions. A substantial disruption in our IT systems for a prolonged time period, or a material breach of our IT systems, could result in
delays in receiving inventory and supplies or filling customer orders, and/or the release of otherwise confidential information, including personal information that is protected by the General Data Protection Regulation, adversely affecting our
customer service and relationships as well as our reputation, and could lead to significant remediation expenses and litigation risks. Our systems, and the systems of our service providers or others, could be breached, damaged or interrupted by
cyber-attacks or other man-made intentional or unintentional events, or by natural disasters or occurrences, many of which may, despite our best efforts, be beyond our ability to effectively detect, anticipate or control. This impact may be
heightened by the increased disbursement of our workforce resulting from our own and from government efforts to mitigate the spread of the COVID-19 pandemic. Further, the military conflict in Ukraine and the associated political uncertainty may
increase the threat of cyberattacks on the global supply chain, which could directly or indirectly impact our operations. Any such events and the related delays, problems or costs could have a material adverse effect on our business, financial
condition, results of operations and reputation.
Environmental, Health and Safety Regulations
We could be adversely impacted by the costs of environmental, health and safety regulations.
Our operations are subject to various federal, state, local and foreign laws and regulations governing, among other things, emissions to air, discharge to waters and the generation, handling, storage, transportation, treatment and disposal of
waste and other materials. The operation of our manufacturing facilities entails risks in these areas and there can be no assurance we will avoid material costs or liabilities relating to such matters. Our financial responsibility to clean up
contaminated property may extend to previously-owned or used property, properties owned by unrelated companies, as well as properties we currently own and use, regardless of whether the contamination is attributable to prior owners. In addition,
potentially material expenditures could be required in order for our products and operations to comply with evolving environmental, health and safety laws, regulations (including those developed as a concern to climate control), or other
requirements that may be adopted or imposed in the future. Future costs to remediate contamination or to comply with environmental, health and safety laws and regulations could adversely affect our business, results of operations, and financial
condition.
Claims and Litigation
We may incur material losses and costs as a result of warranty and product liability claims and litigation or other legal proceedings.
In the event our products fail to perform as expected, we are exposed to warranty and product liability claims and may be required to participate in a recall or other field campaign of such products. Many of our vehicular customers offer
extended warranty protection for their vehicles and require their supply base to extend warranty coverage as well. If our customers demand higher warranty-related cost recoveries, or if our products fail to perform as expected, it could have a
material adverse impact on our results of operations and financial condition. We are also involved in various legal proceedings from time to time incidental to our business. If any such proceeding has a negative result, it could adversely
affect our business, results of operations, financial condition and reputation.
| C. |
STRATEGIC RISKS
|
Business Optimization and Growth Strategies
Inability to execute on our strategic initiatives may adversely impact our business and operating results.
We are well on our way in our strategic transformation. We have onboarded seasoned leaders with the requisite experience to drive transformative
change, including two new segment presidents as well as general managers focused on market-based verticals within our business. Our leadership teams are driving change by applying 80/20 principles to our business. We are analyzing our
business to better focus resources on products and markets with the highest growth opportunities and best return profiles. We plan to continue to employ an 80/20 mindset to optimize profit margins and cash flow. If we are unable to
successfully apply the 80/20 principles to our businesses and execute on our strategic initiatives, we may not achieve the financial or operational successes anticipated.
In addition, we will continue to review our business portfolio and pursue acquisitions to accelerate growth. There can be no assurance we will be able to identify attractive acquisition targets. If we are unable to successfully execute on
organic growth opportunities or complete acquisitions in the future, our growth may be limited. In addition, future acquisitions will require integration of operations, sales and marketing, information technology, finance, and administrative
functions. If we are unable to successfully integrate future acquisitions and operate these businesses profitably, we may not achieve the financial or operational success expected from the acquisitions.
| D. |
FINANCIAL RISKS
|
Liquidity and Access to Cash
Our indebtedness may limit our use of cash flow to support operating, development and investment activities, and failure to comply with our debt covenants could adversely affect our liquidity and
financial results.
As of March 31, 2022, we had total outstanding indebtedness of $378 million. Our indebtedness and related debt service obligations (i) require that significant cash flow from operations be used for principal and interest payments, which
reduces the funds we have available for other business purposes; (ii) limit our flexibility in planning for or reacting to changes in our business and market conditions; and (iii) expose us to interest rate risk, since the majority of our debt
obligations carry variable interest rates.
Our credit and Senior Note agreements contain financial covenants that, among other things, require us to maintain a minimum interest coverage ratio and impose a maximum leverage ratio. Failure to comply with debt covenants could result in an
event of default, which, if not cured or waived, could result in us being required to repay these borrowings before their due date. If we are forced to refinance these borrowings on less favorable terms, our results of operations and financial
condition could be adversely affected by increased costs and interest rates.
Market trends and regulatory requirements may require additional funding for our pension plans.
Our defined benefit pension plans in the U.S. are frozen to new participants. Our funding policy is to contribute annually, at a minimum, the amount necessary on an actuarial basis to provide for benefits in accordance with applicable laws
and regulations. Our domestic plans have an unfunded liability totaling $22 million as of March 31, 2022. As a result of funding relief provisions within the American Rescue Plan Act of 2021, we do not expect to make cash contributions to our
U.S. plans during fiscal 2023. Funding requirements for our defined benefit plans are dependent upon, among other things, interest rates, underlying asset returns, mortality rate assumptions, and the impact of legislative or regulatory changes.
Should changes in actuarial assumptions or other factors result in the requirement of significant additional funding contributions, our financial condition could be adversely affected.
Goodwill and Intangible Assets
Our balance sheet includes significant amounts of goodwill and intangible assets. An impairment of a significant portion of these assets would adversely affect our financial results.
Our balance sheet includes goodwill and intangible assets totaling $258 million at March 31, 2022. We perform goodwill impairment tests annually, as of March 31, or more frequently if business events or other conditions exist that require a
more frequent evaluation. In addition, we review intangible assets for impairment whenever business conditions or other events indicate that the assets may be impaired. If we determine the carrying value of an asset is impaired, we write down
the asset to fair value and record an impairment charge to current operations.
We use judgment in determining if an indication of impairment exists. For our annual goodwill impairment tests, we use significant
estimates and assumptions, including revenue growth rates and operating profit margins to calculate estimated future cash flows and risk-adjusted discount rates. We cannot predict the
occurrence of future events or circumstances, including lower than forecasted revenues, market trends that fall below our current expectations, actions of key customers, increases in discount rates, and the continued general economic
uncertainties and impacts associated with the COVID-19 pandemic and the military conflict in Ukraine, which could adversely affect the carrying value of goodwill and intangible assets. An impairment of a significant portion of goodwill or
intangible assets could have a material adverse effect on our financial results.
Income Taxes
We may be subject to additional income tax expense or become subject to additional tax exposure.
The subjectivity of or changes in tax laws and regulations in jurisdictions where we have significant operations could materially affect our results of operations and financial condition. We are also subject to tax audits in each jurisdiction
in which we operate. Unfavorable or unexpected outcomes from one or more tax audits could adversely affect our results of operations and financial condition.
In addition, as of March 31, 2022, our net deferred tax assets totaled $21 million. Each quarter, we evaluate the probability that our deferred tax assets will be realized and determine whether valuation allowances or adjustments thereto are
needed. This determination involves judgement and the use of significant estimates and assumptions, including expectations of future taxable income and tax planning strategies. Future events or circumstances, such as lower taxable income or
unfavorable changes in the financial outlook of our operations in certain jurisdictions, could require us to establish further valuation allowances, which could have a material adverse effect on our results of operations and financial condition.
| E. |
GENERAL RISKS
|
Customers and Markets
We are dependent upon the health of the customers and markets we serve.
We are highly susceptible to unfavorable trends or disruptions in the markets we serve, as our customers’ sales and production levels are affected by general economic conditions, including supply chain challenges, access to credit, the price
of fuel and electricity, employment levels and trends, interest rates, labor relations issues, regulatory requirements, government-imposed restrictions relating to health crises or other unusual events, trade agreements and other market factors,
as well as by customer-specific issues. Any significant decline in production levels for current and future customers could result in asset impairment charges and a reduction in our sales, thereby adversely impacting our results of operations
and financial condition.
Exposure to Foreign Currencies
As a global company, we are subject to foreign currency rate fluctuations, which affect our financial results.
Although our financial results are reported in U.S. dollars, a significant portion of our sales and operating costs are realized in foreign currencies. Our sales and profitability are affected by movements of the U.S. dollar against foreign
currencies in which we generate sales and incur expenses. To the extent that we are unable to match sales in foreign currencies with costs paid in the same currency, exchange rate fluctuations in any such currency could have an adverse effect on
our financial results. During times of a strengthening U.S. dollar, our reported sales and earnings from our international operations will be lower because the applicable local currency will be translated into fewer U.S. dollars. In certain
instances, currency rate fluctuations may create pricing pressure relative to competitors quoting in different currencies, which could result in our products becoming less competitive. Significant long-term fluctuations in relative currency
values could have an adverse effect on our results of operations and financial condition.
Reliance upon Technology Advantage
If we cannot differentiate ourselves from our competitors with our technology, our existing and potential customers may seek lower prices and our sales and earnings may be adversely affected.
Price, quality, delivery, technological innovation, and application engineering development are the primary elements of competition in our markets. If we fail to keep pace with technological changes and cannot differentiate ourselves from our
competitors with our technology or fail to provide high quality, innovative products and services that both meet or exceed customer expectations and address their ever-evolving needs, we may experience price erosion, lower sales, and lower profit
margins. Significant technological developments by our competitors or others also could adversely affect our business and results of operations.
Developments or assertions by or against us relating to intellectual property rights could adversely affect our business.
We own and license significant intellectual property, including a large number of patents, trademarks, copyrights and trade secrets. Our intellectual property plays an important role in maintaining our competitive position in a number of the
markets we serve. As we maintain or expand our operations in jurisdictions where the enforcement of intellectual property rights is less robust, the risk of others duplicating our proprietary technologies increases, despite our efforts to
protect them. Developments or assertions by or against us relating to intellectual property rights could adversely affect our business and results of operations.
Attracting and Retaining Talent
Our continued success is dependent on being able to attract, develop and retain qualified personnel.
Our ability to sustain and grow our business requires us to hire, develop, and retain skilled and diverse personnel throughout our organization. We depend significantly on the engagement of our employees and their skills, experience and
industry knowledge to support our objectives and initiatives. We have recently observed tightening and increased competitiveness in the labor markets and have experienced labor shortages at certain of our manufacturing locations. Any prolonged
labor shortages or significant employee turnover could negatively impact productivity and result in increased labor costs, such as increased overtime to meet demand or increased wage rates necessary to attract and retain employees. Overall,
difficulty in attracting, developing, and retaining qualified personnel could adversely affect our business and results of operations.
None.
We operate manufacturing facilities located in the U.S. and in multiple foreign countries. Our world headquarters, including general offices and laboratory, experimental and tooling facilities, is located in Racine, Wisconsin. We have
additional technical support functions located in Grenada, Mississippi; Leeds, United Kingdom; Pocenia, Italy; Guadalajara, Spain; Söderköping, Sweden; Bonlanden, Germany; Sao Paulo, Brazil; Changzhou, China; and Chennai, India.
The following table summarizes the number of manufacturing facilities within each of our operating segments as of March 31, 2022.
|
Americas
|
Europe
|
Asia
|
Total
|
|||||||||||||
|
BHVAC
|
2
|
4
|
-
|
6
|
||||||||||||
|
CIS
|
9
|
6
|
1
|
16
|
||||||||||||
|
HDE
|
6
|
2
|
4
|
12
|
||||||||||||
|
Automotive
|
1
|
5
|
2
|
8
|
||||||||||||
|
Total manufacturing facilities
|
18
|
17
|
7
|
42
|
||||||||||||
Of the facilities summarized in the table above, 22 include leased manufacturing space. We consider our plants and equipment to be well maintained and suitable for their purposes. We review our manufacturing capacity regularly and make the
determination as to our need to expand or, conversely, rationalize our facilities as necessary to meet changing market conditions and our needs.
The information required hereunder is incorporated by reference from Note 20 of the Notes to Consolidated Financial Statements.
Not applicable.
The following sets forth the name, age (as of March 31, 2022), business experience during at least the last five years, and certain other information relative to each executive officer of the Company.
|
Name
|
Age
|
Position
|
||
|
Brian J. Agen
|
53
|
Vice President, Human Resources (October 2012 – Present).
|
||
|
Neil D. Brinker
|
46
|
President and Chief Executive Officer (December 2020 – Present). Prior to joining Modine, Mr. Brinker served as President and Chief Operating Officer of Advanced Energy Industries, Inc. after serving as its Executive Vice President
and Chief Operating Officer. Prior to joining Advanced Energy Industries, Inc, Mr. Brinker served as a Group President at IDEX Corporation.
|
||
|
Michael B. Lucareli
|
53
|
Executive Vice President, Chief Financial Officer (May 2021 – Present); previously Vice President, Finance and Chief Financial Officer for the Company.
|
||
|
Eric S. McGinnis
|
51
|
President, Climate Solutions (April 2022 – Present); previously Vice President, Building HVAC upon joining Modine in August 2021. Prior to joining Modine, Mr. McGinnis served as President, Industrial Systems at Regal Beloit.
|
||
|
Adrian I. Peace
|
54
|
President, Performance Technologies (April 2022 – Present); previously Vice President, Commercial & Industrial Solutions upon joining Modine in August 2021. Prior to joining Modine, Mr. Peace served as a Strategy Advisor for AIP
LLC. Prior to AIP LLC, Mr. Peace served as Senior Vice President, Emerging Business Operations for Republic Services. Prior to Republic Services, Mr. Peace served as the Vice President of the International Business and Specialty Brands
at W.W. Grainger, Inc.
|
||
|
Sylvia A. Stein
|
55
|
Vice President, General Counsel, Corporate Secretary and Chief Compliance Officer (February 2020 – Present); previously Vice President, General Counsel and Corporate Secretary for the Company. Prior to joining Modine, Ms. Stein served
as the Associate General Counsel, Marketing & Regulatory at the Kraft Heinz Foods Company.
|
Executive Officer positions are designated in our Bylaws and the persons holding these positions are elected annually by the Board, generally at its first meeting after the annual meeting of shareholders in July of each year. In addition, the
Human Capital and Compensation Committee of the Board may recommend and the Board of Directors may approve promotions and other actions with regard to executive officers at any time during the fiscal year.
There are no family relationships among the executive officers and directors. There are no arrangements or understandings between any of the executive officers and any other person pursuant to which he or she was elected an officer of Modine.
PART II
|
ITEM 5.
|
MARKET FOR REGISTRANT’S COMMON EQUITY, RELATED STOCKHOLDER MATTERS AND ISSUER PURCHASES OF EQUITY SECURITIES.
|
Our common stock is listed on the New York Stock Exchange. Our trading symbol is MOD. As of March 31, 2022, shareholders of record numbered 2,164.
We did not pay dividends during fiscal 2022 or 2021. Under our credit agreements, we are permitted to pay dividends on our common stock, subject to certain restrictions based upon the calculation of debt covenants, as further described under
“Liquidity and Capital Resources” under Item 7. Management’s Discussion and Analysis of Financial Condition and Results of Operations. We currently do not intend to pay dividends in fiscal 2023.
The following describes the Company’s purchases of common stock during the fourth quarter of fiscal 2022:
|
Period
|
Total Number of
Shares Purchased
|
Average
Price Paid
Per Share
|
Total Number of
Shares Purchased
as Part of Publicly
Announced Plans
or Programs
|
Maximum
Number (or
Approximate Dollar
Value) of Shares
that May Yet Be
Purchased Under the
Plans or Programs (a)
|
|
January 1 – January 31, 2022
|
_______
|
_______
|
_______
|
$50,000,000
|
|
February 1 – February 28, 2022
|
17,169 (b)
|
$10.12
|
_______
|
$50,000,000
|
|
March 1 – March 31, 2022
|
10,630 (b)
|
$9.70
|
_______
|
$50,000,000
|
|
Total
|
27,799 (b)
|
$9.96
|
_______
|
|
(a)
|
Effective November 5, 2020, the Board of Directors approved a two-year, $50.0 million share repurchase program. This program allows the Company to repurchase Modine common stock at such times and prices deemed appropriate by the
authorized officers of the Company.
|
|
(b)
|
Consists of shares delivered back to the Company by employees and/or directors to satisfy tax withholding obligations that arise upon the vesting of stock awards. The Company, pursuant to its equity compensation plans, gives
participants the opportunity to turn back to the Company the number of shares from the award sufficient to satisfy tax withholding obligations that arise upon the termination of restrictions. These shares are held as treasury shares.
|
PERFORMANCE GRAPH
The following graph compares the cumulative five-year total return on our common stock with similar returns on the Russell 2000 Index, the Standard & Poor’s (S&P) MidCap 400 Industrials Index, and the S&P SmallCap 600 Industrials
Index. During fiscal 2022 the Company determined that the S&P SmallCap 600 Industrials Index was more representative of its business and will replace the S&P MidCap 400 Industrials Index for purposes of this performance graph beginning
in fiscal 2023. The graph assumes a $100 investment and reinvestment of dividends. The return shown on the graph is not necessarily indicative of future performance.
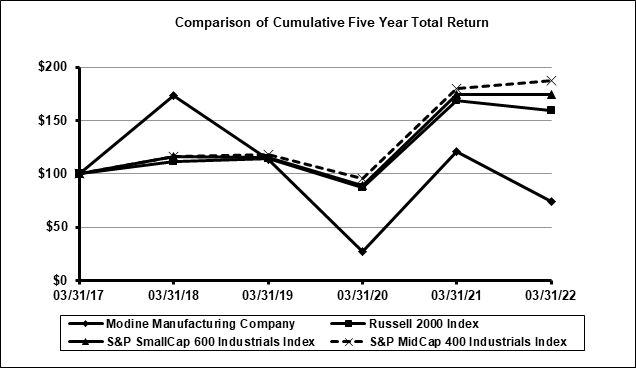
|
Indexed Returns
|
||||||||||||||||||||||||
|
Initial Investment
|
Years ended March 31,
|
|||||||||||||||||||||||
|
Company / Index
|
March 31, 2017
|
2018
|
2019
|
2020
|
2021
|
2022
|
||||||||||||||||||
|
Modine Manufacturing Company
|
$
|
100
|
$
|
173.36
|
$
|
113.69
|
$
|
26.64
|
$
|
121.07
|
$
|
73.85
|
||||||||||||
|
Russell 2000 Index
|
100
|
111.79
|
114.09
|
86.72
|
168.96
|
159.19
|
||||||||||||||||||
|
S&P SmallCap 600 Industrials Index
|
100
|
116.52
|
115.17
|
89.24
|
174.33
|
174.34
|
||||||||||||||||||
|
S&P MidCap 400 Industrials Index
|
100
|
116.46
|
117.90
|
95.87
|
179.84
|
187.64
|
||||||||||||||||||
Overview
Founded in 1916, Modine Manufacturing Company is a global leader in thermal management systems and components, bringing heating and
cooling technology and solutions to diversified global markets. Our product systems and solutions support our purpose of engineering a cleaner, healthier world. We operate in four continents, in 15 countries, and
employ approximately 11,100 persons worldwide.
Our primary product groups include i) heating, ventilation and air conditioning; ii) coils, coolers, and coatings; and iii) powertrain cooling and engine cooling. We provide our thermal management technology and solutions to a wide array of
commercial, industrial, and building heating, ventilating, air conditioning, refrigeration, and data center markets. In addition, our products are used in on- and off-highway original-equipment vehicular
applications.
Company Strategy
Fiscal 2022 was a year of significant change for Modine — a year of significant progress. We onboarded seasoned leaders with the requisite experience to drive transformative change, including two new segment presidents as well as general
managers focused on market-based verticals within our business. Effective April 1, 2022, we began managing our company under two operating segments, Climate Solutions and Performance Technologies. The Climate Solutions segment includes the
BHVAC and CIS segment businesses with the exception of CIS Coatings. The Performance Technologies segment includes the HDE and Automotive segment businesses and the CIS Coatings business. Our new structure aligns businesses serving similar or
complimentary end markets, products and technologies under common segment management.
Our new leadership teams are driving change by applying 80/20 principles to our business. We are analyzing our business to better focus resources on
products and markets with the highest growth opportunities and best return profiles. The results of our data analytics are changing how we serve our customers and are allowing us to significantly reduce the complexity of our business, including
reducing the number of SKUs, eliminating unprofitable product lines, and changing how we operate on the factory floor. The data has also highlighted opportunities for us to improve our pricing practices and develop strategies to target new
customers.
With our teams in place, we are focused on growing the areas of our business with the strongest market drivers and best returns, including HVAC&R,
data centers, and electric vehicles. We are also focused on addressing and simplifying the underperforming areas of our business. We are utilizing an 80/20 mindset to reduce complexity in our product offerings, improve our pricing discipline,
and increase our operational efficiency in both our manufacturing processes and in our supply chain. In addition, we are executing restructuring actions that were approved in the fourth quarter of fiscal 2022, which we expect to reduce
administrative and overhead costs, primarily in the Performance Technologies segment.
Our ultimate objective is to accelerate growth, allowing us to complete our transformation. We expect to change our mix of
business, as we grow certain areas and strategically deemphasize others. We expect these changes will fuel improvements in both earnings and cash flow, all while supporting our customers with innovative and environmentally responsible thermal
management solutions to succeed in the ever-changing global marketplace.
Development of New Products and Technology
Our ability to develop new products and technologies based upon our building block methodology for new and emerging markets is one of our competitive strengths. Under this methodology, we focus on creating core
technologies that form the basis for multiple products and product lines. Each of our business segments has a strong heritage of new product development and our technology team benefits from mutual strengths. We own four global,
state-of-the-art technology centers, dedicated to the development and testing of products and technologies. The centers are located in Racine, Wisconsin, Grenada, Mississippi, Pocenia, Italy and Bonlanden, Germany. Our reputation for providing
high quality products and technologies has been a strength valued by our customers.
We continue to benefit from relationships with customers that recognize the value of having us participate directly in product design, development and validation processes. This has resulted, and we expect it to
continue to result, in strong, long-term customer relationships with companies that value partnerships with their suppliers.
Strategic Planning and Corporate Development
We employ both short-term (one-to-three year) and longer-term (five-to-seven year) strategic planning processes, which enable us to continually assess our opportunities, competitive threats, and economic market
challenges.
We devote significant resources to global strategic planning and development activities to strengthen our competitive position. We will continue to pursue organic- and external-growth opportunities, particularly to grow our global, market leading positions in the HVAC&R and data center markets. In addition, we have a
dedicated team focused on products and solutions for electric vehicles, supporting demands for climate-friendly alternative powertrains. We have provided our general managers with the tools that they need to be successful, including dedicated
resources to create an entrepreneurial environment and to challenge the status quo.
Operational and Financial Discipline
We are using 80/20 principles to guide our path forward towards commercial excellence. Through closely analyzing our customer and product data with our 80/20 mindset, we have gained a valuable
understanding of what drives our profitability and have also identified areas requiring improvement. Beginning in fiscal 2023, we began managing our company under two operating segments, Climate Solutions and Performance Technologies.
These segment teams, led by segment presidents and general managers focused on the underlying market verticals, are driving transformative change with our 80/20 mindset. Each general manager has developed a strategic plan designed to meet the
objective of his or her market- based vertical - venture, grow, or improve. We expect these strategies to fuel earnings and cash flow improvements.
While executing on our strategic initiatives, we have faced obstacles including supply chain challenges associated with the COVID-19
pandemic and other market and economic dynamics and cost inflation. We have and will continue to address these challenges head-on. We’ve implemented selling price
increases for our products in response to raw material and other price increases and are engaged with suppliers to ensure availability of purchased commodities and components.
Our executive management incentive compensation (annual cash incentive) plan for fiscal 2022 was based upon two performance goals:
growth in consolidated net earnings before interest, taxes, depreciation, amortization, and certain other adjustments (“Adjusted EBITDA”); and a cash flow
margin metric. These performance goals drive alignment of management and shareholders’ interests in both our earnings growth and cash flow targets. In addition, we provide a long-term incentive compensation plan for officers and certain key
leaders throughout our organization to attract, retain, and motivate these employees who are responsible for driving the long-term success of our company. The plan is comprised of stock awards, stock options, and performance-based
stock or cash awards. The performance-based awards for the fiscal 2022 through 2024 performance period are based upon a target three-year average growth in Adjusted EBITDA and a target three-year average
consolidated cash flow return on invested capital.
Segment Information – Strategy, Market Conditions and Trends
Each of our operating segments is managed by a vice president and has separate strategic and financial plans, and financial results, all of which are reviewed by our chief operating decision maker. These plans and results are used by
management to evaluate the performance of each segment and to make decisions on the allocation of resources.
Effective July 1, 2021, we aligned the data center businesses previously managed by and reported within the CIS segment under the BHVAC segment. The BHVAC segment assumed management of our business in Guadalajara, Spain and a portion of our
business in Grenada, Mississippi. Through this segment change, we aligned our data center businesses under the BHVAC leadership team in order to accelerate commercial excellence, operational improvements, and organizational efficiencies.
Effective April 1, 2022, we began managing our company under two operating segments, Climate Solutions and Performance Technologies. The Climate
Solutions segment includes the BHVAC and CIS segment businesses with the exception of CIS Coatings. The Performance Technologies segment includes the HDE and Automotive segment businesses and the CIS Coatings business. Our new structure
aligns businesses serving similar or complimentary end markets, products and technologies under common segment management. We expect this simplified segment structure will allow us to better focus our resources on targeted growth opportunities
and more efficiently apply the 80/20 principles across all product lines to optimize profit margins and cash flow.
Building HVAC Systems (16
percent of fiscal 2022 net sales)
Our BHVAC segment manufactures and sells a variety of heating, ventilating, and
air conditioning products, primarily for commercial buildings and data centers in North America and Europe, as well as in the Middle East. We sell and distribute our heating, ventilation and cooling products
through wholesalers, distributors, consulting engineers, contractors and data center operators for applications such as data centers, schools, greenhouses, hotels, restaurants, hospitals, warehouses, residential garages, and manufacturing
facilities. Our heating products include gas (natural and propane), electric, oil and hydronic unit heaters, low- and high-intensity infrared and duct furnace units. Our indoor air quality products include roof-mounted direct- and
indirect-fired makeup air units, single-packaged vertical units and unit ventilators used in school room applications, and ceiling cassettes. Our data center products include IT cooling solutions including precision air conditioning units,
CRAC and CRAH units, fan walls, chillers, and condensers and condensing units. We also provide other cooling products including precision air conditioning units and air- and water-cooled chillers used in a variety of commercial building
applications. In addition, we provide control solutions for existing plant equipment and new building management controls and systems.
Economic conditions, such as demand for new commercial construction, building renovations, including HVAC replacement, growth in data centers and school renovations, and higher efficiency requirements, are growth
drivers for our HVAC products. During fiscal 2022, our sales increased in both North America and Europe, primarily driven by increased sales of heating, ventilation, and data center products.
We expect growth in each of the HVAC and data center markets we serve during fiscal 2023. These markets are heavily impacted by construction activity, building regulations, owner/occupant comfort requirements, and
the ever-increasing reliance on digital technologies. Growth rates in these markets have shown increasing strength as the need for digital infrastructure expands and manufacturing, housing, and business investments increase. In addition, we
expect sales growth in the indoor air quality markets in North America during fiscal 2023 to be driven by available federal and local funding for ventilation improvements by school and healthcare systems in connection with the COVID-19 pandemic.
Commercial and Industrial Solutions (30 percent of fiscal 2022 net sales)
Our CIS segment provides a broad offering of thermal management products to the HVAC&R markets in North America, EMEA, and China, including solutions tailored to indoor, outdoor, and mobile climates, food storage and
transport-refrigeration, and industrial processes. Our primary product groups in the CIS segment include coils, coolers, and coatings. Our coils products include microchannel, heat recovery, and round tube plate fin coils for a variety of
commercial and industrial applications. Our coolers include commercial refrigeration units, which are used across the food supply chain, carbon dioxide and ammonia unit coolers, remote condensers, transformer oil coolers, and brine coolers. In
addition, we offer proprietary coating solutions for corrosion protection, prolonging the life of heat-transfer equipment.
During fiscal 2022, CIS segment sales increased driven by both increased sales volume, as the primary HVAC&R and industrial cooling markets were negatively impacted in the prior year from the COVID-19 pandemic, and favorable product
pricing adjustments in response to raw material price increases. In addition, we also implemented targeted headcount reductions to reduce operational and SG&A cost structures.
Looking ahead, we anticipate continued market growth in the HVAC&R markets. We are utilizing an 80/20 mindset to simplify our product offerings for
coils and improve our pricing discipline to ensure our pricing is reflective of the service and support that we proudly offer with our products. We are also focused on growing our cooler sales and believe we can become a market leader in more
environmentally friendly carbon dioxide gas coolers and adiabatic solutions in North America and Europe. In addition, we are targeting sales growth for coatings, both in coatings applied by us and expanding our market share in aftermarket
coating solutions, which allow customers to apply protective coating solutions themselves.
Heavy Duty Equipment (39 percent of fiscal 2022 net sales)
Our HDE segment provides powertrain and engine cooling products, including, but not limited to, radiators, charge air coolers, condensers, oil coolers, EGR coolers, fuel coolers, electronics cooling packages, and battery thermal management
systems to OEMs in the commercial vehicle, off-highway, and automotive and light vehicle markets in North America, South America, Europe, and Asia. In addition, our HDE segment serves Brazil’s commercial vehicle and automotive aftermarkets.
Sales in the HDE segment increased during fiscal 2022, primarily due to higher sales volume to commercial vehicle and off-highway customers and favorable product pricing adjustments in response to raw material price increases. The key markets
served by our HDE segment, particularly in the Americas and in Europe, were negatively impacted in the prior year by the COVID-19 pandemic.
In fiscal 2023, we expect to benefit from anticipated market growth in the commercial vehicle and off-highway markets, particularly in the Americas and in Europe, partially offset by market weakness expected in China. In addition, we recently
announced availability of our suite of EVantage™ Thermal Management Systems for commercial electric vehicle chassis. These complete battery thermal management systems regulate battery, traction motor, and power electronics temperatures. We are
producing these systems for several customers, with additional programs launching in fiscal 2023. We are also engaged in development with prospective customers for solutions related to electric trucks and buses. Finally, we are applying our
80/20 mindset across our business portfolio to reduce complexity, improve our pricing discipline, and improve the HDE segment’s profitability and cash flow generation.
Automotive (15 percent of fiscal 2022 net sales)
Our Automotive segment provides powertrain and engine cooling products, including, but not limited to, radiators, charge air coolers, condensers, oil coolers, and EGR coolers, to OEMs primarily in the automotive and light vehicle markets in
North America, Europe, and Asia.
We completed the sale of our air-cooled automotive business in Austria during the first quarter of fiscal 2022. Sales in fiscal 2022 decreased, primarily due to lower sales from the air-cooled automotive business and lower sales volume. Our
fiscal 2022 sales were negatively impacted by the global semiconductor chip shortage and its impact on the global automotive market. During fiscal 2022, we recorded $20 million of restructuring expenses within the Automotive segment, primarily
related to targeted headcount reductions in Europe to reduce administrative and overhead costs.
We expect that the semiconductor chip shortages will begin to ease in fiscal 2023, which we anticipate will drive sales volume growth particularly in North America and in China. We are monitoring the automotive and light vehicle markets in
Europe in light of potential impacts from the military conflict between Russia and Ukraine, which may further aggravate supply chain challenges and increase energy and fuel prices. We expect such impacts could negatively impact automotive
production levels in Europe. We are focused on targeted growth opportunities with electric vehicle customers, as the demand and investment in electric vehicles continues to grow in light of increasingly stringent global emissions and energy
efficiency requirements.
Consolidated Results of Operations
COVID-19 Pandemic and Supply Chain Disruptions
During fiscal 2022, the effects on our company from the COVID-19 pandemic lessened, particularly compared with the significant impacts during the first half of fiscal 2021.
The COVID-19 pandemic and other market and economic dynamics have contributed to global supply chain challenges and inflationary market conditions. Since the fourth quarter of fiscal 2022, the military conflict between Russia and Ukraine and
the related sanctions imposed by governments in the U.S. and abroad have further aggravated these market conditions, particularly driving higher oil and gas prices. We, like many companies, have experienced labor shortages and negative impacts
from supply chain challenges, including rising prices for raw materials and logistics, as well as delays and shortages in certain commodities and components we purchase from suppliers. We are focused on mitigating the negative impacts of these
supply chain challenges. We have implemented selling price increases for our products in response to raw material and other price increases and are engaged with suppliers to ensure availability of key raw materials. In addition, our Automotive
segment has been impacted by lower order volume associated with semiconductor shortages, which have caused lower global automotive production.
Since February 2022, COVID-19 cases have increased in many areas in China. As a result of government-required lock-downs, we suspended production at manufacturing facilities in China for portions of March and April 2022. While these plants
have since reopened, they are currently manufacturing at reduced levels and customer demand has been negatively impacted by the lock-downs and supply chain challenges, including component shortages. We are actively working to address the supply
chain challenges and expect to increase production levels at our plants in China in the second quarter of fiscal 2023. All of our other manufacturing locations are open and operating, although production has been negatively affected at times by
employee absences due to COVID-19.
We expect temporary disruptions due to illness-related employee absences and the pressures associated with supply chain challenges will continue, at least in the near term. We cannot reasonably estimate the full impact that the COVID-19
pandemic or the ongoing supply chain challenges will have on our business, results of operations, or cash flows in the future.
Liquid-cooled Automotive Business
On October 25, 2021, we announced that we agreed with Dana Incorporated (“Dana”) to terminate an agreement for the sale of our liquid-cooled automotive business. In connection with the termination of the sale agreement, we determined that the
liquid-cooled automotive business no longer met the requirements to be classified as held for sale during the third quarter of fiscal 2022. While held for sale, we had fully impaired the long-lived assets within the liquid-cooled automotive
business, which primarily consisted of property, plant and equipment assets. Upon reverting back to held and used classification, we adjusted the long-lived assets to the lower of their (i) carrying value, as if held for sale classification had
not been met; or (ii) fair value. As a result, we reversed $57 million of previous impairment charges during the third quarter of fiscal 2022 within the Automotive segment. In addition, we resumed depreciating the property, plant and equipment
assets based upon the remeasured asset values.
In total, we recorded $56 million of net impairment reversals during fiscal 2022 within the Automotive segment related to assets that are no longer held for sale, primarily driven by the $57 million impairment reversal in the third quarter
discussed above. See Note 2 of the Notes to Consolidated Financial Statements for additional information.
Air-cooled Automotive Business
On April 30, 2021, we sold our air-cooled automotive business to Schmid Metall GmbH. As a result of this transaction, we recorded a loss of $7 million during the first quarter of fiscal 2022.
Fiscal 2022 Highlights
Fiscal 2022 net sales increased $242 million, or 13 percent, from the prior year, primarily due to higher sales in our HDE, CIS, and BHVAC segments, partially offset by lower sales in our Automotive segment. Cost of sales increased $226
million, or 15 percent, from the prior year primarily due to higher raw material prices and higher sales volume. Gross profit increased $16 million and gross margin declined 110 basis points to 15.1 percent. SG&A expenses increased $4
million, primarily due to higher compensation-related expenses, as the prior-year benefitted from cost-saving actions implemented in response to COVID-19. We withdrew most of these cost-savings actions in the third quarter of fiscal 2021 as
production returned to more normal levels. Operating income of $119 million during fiscal 2022 represents a $217 million improvement from the prior-year operating loss of $98 million. The operating income and operating loss during fiscal 2022
and 2021 include $56 million of impairment reversals and $167 million of impairment charges, respectively, primarily related to the automotive businesses that were held for sale.
Fiscal 2021 Highlights
Fiscal 2021 net sales decreased $167 million, or 8 percent, from the prior year, primarily due to lower sales across our business segments, largely driven by the negative impacts of the COVID-19 pandemic. Foreign currency exchange rate
changes favorably impacted sales in fiscal 2021 by $28 million. Cost of sales decreased $153 million, or 9 percent, from the prior year, primarily due to lower sales volume. Gross profit decreased $14 million and gross margin improved 60 basis
points to 16.2 percent. SG&A expenses decreased $39 million, primarily due to lower costs associated with our review of strategic alternatives for our Automotive segment businesses. In addition, SG&A expenses decreased due to
cost-reduction initiatives implemented early in the fiscal year in response to the negative impacts of COVID-19. The operating loss of $98 million during fiscal 2021 represents a $136 million decline from the prior-year operating income of $38
million and was primarily due to the $167 million of impairment charges recorded, partially offset by lower SG&A expenses.
The following table presents our consolidated financial results on a comparative basis for fiscal years 2022, 2021 and 2020.
|
Years ended March 31,
|
||||||||||||||||||||||||
|
2022
|
2021
|
2020
|
||||||||||||||||||||||
|
(in millions)
|
$’s
|
% of sales
|
$’s
|
% of sales
|
$’s
|
% of sales
|
||||||||||||||||||
|
Net sales
|
$
|
2,050
|
100.0
|
%
|
$
|
1,808
|
100.0
|
%
|
$
|
1,976
|
100.0
|
%
|
||||||||||||
|
Cost of sales
|
1,741
|
84.9
|
%
|
1,515
|
83.8
|
%
|
1,668
|
84.4
|
%
|
|||||||||||||||
|
Gross profit
|
309
|
15.1
|
%
|
293
|
16.2
|
%
|
308
|
15.6
|
%
|
|||||||||||||||
|
Selling, general and administrative expenses
|
215
|
10.5
|
%
|
211
|
11.7
|
%
|
250
|
12.6
|
%
|
|||||||||||||||
|
Restructuring expenses
|
24
|
1.2
|
%
|
13
|
0.7
|
%
|
12
|
0.6
|
%
|
|||||||||||||||
|
Impairment charges (reversals) - net
|
(56
|
)
|
-2.7
|
%
|
167
|
9.2
|
%
|
9
|
0.4
|
%
|
||||||||||||||
|
Loss (gain) on sale of assets
|
7
|
0.3
|
%
|
-
|
-
|
(1
|
)
|
-
|
||||||||||||||||
|
Operating income (loss)
|
119
|
5.8
|
%
|
(98
|
)
|
-5.4
|
%
|
38
|
1.9
|
%
|
||||||||||||||
|
Interest expense
|
(16
|
)
|
-0.8
|
%
|
(19
|
)
|
-1.1
|
%
|
(23
|
)
|
-1.1
|
%
|
||||||||||||
|
Other expense – net
|
(2
|
)
|
-0.1
|
%
|
(2
|
)
|
-0.1
|
%
|
(5
|
)
|
-0.2
|
%
|
||||||||||||
|
Earnings (loss) before income taxes
|
101
|
5.0
|
%
|
(119
|
)
|
-6.6
|
%
|
10
|
0.5
|
%
|
||||||||||||||
|
Provision for income taxes
|
(15
|
)
|
-0.7
|
%
|
(90
|
)
|
-5.0
|
%
|
(12
|
)
|
-0.6
|
%
|
||||||||||||
|
Net earnings (loss)
|
$
|
86
|
4.2
|
%
|
$
|
(209
|
)
|
-11.6
|
%
|
$
|
(2
|
)
|
-0.1
|
%
|
||||||||||
Year Ended March 31, 2022 Compared with Year Ended March 31, 2021
Fiscal 2022 net sales of $2,050 million were $242 million, or 13 percent, higher than the prior year, primarily due to higher sales volume and favorable pricing adjustments in response to raw material price increases in our HDE, CIS, and BHVAC
segments. Sales in these segments increased $142 million, $115 million, and $74 million, respectively. Automotive segment sales decreased $85 million.
Fiscal 2022 cost of sales of $1,741 million increased $226 million, or 15 percent, primarily due to higher raw material prices, which increased $148 million, and higher sales volume. In addition, cost of sales in fiscal 2021 was favorably
impacted by cost-saving actions taken in response to the COVID-19 pandemic. These factors, which caused an increase in cost of sales compared with the prior year, were partially offset by lower depreciation expense in the Automotive segment and
improved operating efficiencies. As a percentage of sales, cost of sales increased 110 basis points to 84.9 percent.
As a result of higher sales and higher cost of sales as a percentage of sales, fiscal 2022 gross profit increased $16 million and gross margin declined 110 basis points to 15.1 percent.
Fiscal 2022 SG&A expenses increased $4 million. The increase in SG&A expenses was primarily due to higher compensation-related expenses, as the prior year was favorably impacted by cost-saving actions implemented to mitigate the
negative impacts of COVID-19. In addition, environmental charges related to a previously-owned manufacturing facility in the U.S. increased $3 million. These increases were partially offset by lower costs related to our review of strategic
alternatives for the Automotive segment businesses and lower strategic reorganization costs, which decreased $4 million and $3 million, respectively. The lower strategic reorganization costs primarily resulted from lower severance expenses for
executive management positions.
Restructuring expenses of $24 million in fiscal 2022 increased $11 million compared with last year, primarily due to higher severance-related expenses in the Automotive segment, partially offset by lower severance-related expenses in the CIS
and HDE segments. We are targeting approximately $20 million of annual cost savings on a consolidated basis from the restructuring actions approved in fiscal 2022.
The net impairment reversals of $56 million during fiscal 2022 primarily related to assets that were held for sale in the Automotive segment. In fiscal 2021, we recorded $167 million of impairment charges to write down the long-lived assets
in the liquid- and air-cooled automotive businesses when they were classified as held for sale. In fiscal 2022, we adjusted the long-lived assets in the liquid-cooled automotive business to the lower of carrying or fair value when they no longer
met the held for sale classification criteria.
We sold our air-cooled automotive business on April 30, 2021. As a result of the sale, we recorded a $7 million loss on sale at Corporate during fiscal 2022.
Operating income of $119 million during fiscal 2022 represents an improvement of $217 million from the prior-year operating loss of $98 million. The operating income and operating loss during fiscal 2022 and 2021 included the significant
impairment reversal and impairment charges within the Automotive segment. In addition, as compared with the prior year, the fiscal 2022 operating income was favorably impacted by higher gross profit. Operating income was negatively impacted by
higher restructuring expenses, the loss on sale of the air-cooled automotive business, and higher SG&A expenses.
The provision for income taxes was $15 million and $90 million in fiscal 2022 and 2021, respectively. The $75 million decrease was primarily due to the absence of $117 million of income tax charges recorded in fiscal 2021 to increase the
valuation allowances on deferred tax assets in the U.S. and in certain foreign jurisdictions and a net $11 million income tax benefit recorded in fiscal 2022 related to valuation allowances on deferred tax assets in foreign jurisdictions. These
drivers, which decreased the provision for income taxes, were partially offset by the absence of income tax benefits totaling $47 million recorded in the prior year, including $38 million related to the Automotive segment impairment charges and
$9 million resulting from the allocation of the income tax provision between net earnings and other comprehensive income. See Note 8 of the Notes to Consolidated Financial Statements for additional information.
Year Ended March 31, 2021 Compared with Year Ended March 31, 2020
Fiscal 2021 net sales of $1,808 million were $167 million, or 8 percent, lower than the prior year, primarily due to lower sales volume across our business segments, partially offset by a $28 million favorable impact of foreign currency
exchange rate changes. Sales in the HDE, Automotive, BHVAC, and CIS segments decreased $64 million, $47 million, $44 million, and $29 million, respectively. Fiscal 2021 sales were significantly impacted by market-driven volume declines and
temporary plant closures early in fiscal 2021 due to the COVID-19 pandemic.
Fiscal 2021 cost of sales of $1,515 million decreased $153 million, or 9 percent, primarily due to lower sales volume. Fiscal 2021 cost of sales was negatively impacted by $24 million from foreign currency exchange rate changes. As a
percentage of sales, cost of sales decreased 60 basis points to 83.8 percent. The unfavorable impacts of lower sales volume and, to a lesser extent, higher material costs, which negatively impacted cost of sales as a percentage of sales by
approximately 50 basis points, were more than offset by benefits from procurement and other cost-reduction initiatives and an $8 million decrease in depreciation expense in the Automotive segment. We ceased depreciating the long-lived assets
within the liquid- and air-cooled automotive businesses once they were classified as held for sale during fiscal 2021. In addition, program and equipment transfer costs to prepare the liquid-cooled automotive business for sale decreased $3
million compared with the prior year.
As a result of lower sales and lower cost of sales as a percentage of sales, fiscal 2021 gross profit decreased $14 million and gross margin improved 60 basis points to 16.2 percent.
Fiscal 2021 SG&A expenses decreased $39 million. The decrease in SG&A expenses was primarily due to lower costs recorded at Corporate associated with our review of strategic alternatives for the Automotive segment businesses, which
decreased $30 million, and lower compensation-related expenses, which decreased $13 million, largely resulting from cost-saving actions taken in response to COVID-19. These favorable drivers were partially offset by $7 million of CEO transition
costs recorded at Corporate and a $3 million unfavorable impact of foreign currency exchange rate changes.
Restructuring expenses totaled $13 million during fiscal 2021 and increased $1 million compared with the prior year, primarily due to higher severance expenses. The fiscal 2021 restructuring expenses primarily consisted of severance expenses
related to headcount reductions within the CIS, Automotive and HDE segments.
During fiscal 2021, we recorded impairment charges totaling $167 million within the Automotive segment, an increase of $158 million compared with the prior year. The impairment charges during fiscal 2021 primarily related to writing down the
long-lived assets in the liquid- and air-cooled automotive businesses when they were classified as held for sale. The $9 million of impairment charges recorded in fiscal 2020 primarily related to two manufacturing facilities in the Automotive
segment.
The operating loss of $98 million during fiscal 2021 represents a $136 million decline from the prior-year operating income of $38 million. The decline was primarily due to higher impairment charges, which increased $158 million, and lower
earnings in our BHVAC segment, which decreased $13 million. These negative drivers were partially offset by lower costs associated with our review of strategic alternatives for the Automotive segment businesses, which decreased $33 million.
The provision for income taxes was $90 million and $12 million in fiscal 2021 and 2020, respectively. The $78 million increase was primarily due to an increase in income tax charges related to valuation allowances, partially offset by income
tax benefits totaling $38 million related to the impairment charges recorded during fiscal 2021. In fiscal 2021, we recorded income tax charges totaling $117 million to increase the valuation allowances on deferred tax assets in the U.S. and in
certain foreign jurisdictions, compared with $7 million of income tax charges for valuation allowances in fiscal 2020.
Segment Results of Operations
Effective July 1, 2021, we aligned the data center businesses previously managed by and reported within the CIS segment under the BHVAC segment. The BHVAC segment assumed management of our business in Guadalajara, Spain and a portion of our
business in Grenada, Mississippi. Through this segment change, we aligned our data center businesses under the same leadership team to accelerate commercial excellence, operational improvements, and organizational efficiencies. As a result, we
revised our reporting segments and are reporting the financial results of the transferred businesses within the BHVAC segment. The segment realignment had no impact on the HDE and Automotive segments or on our consolidated financial position,
results of operations, and cash flows. We have recast the segment financial information for fiscal 2021 and 2020 to conform to the fiscal 2022 presentation.
Effective April 1, 2022, we began managing our company under two operating segments, Climate Solutions and Performance Technologies. The Climate Solutions segment includes the BHVAC and CIS segment businesses with the exception of CIS
Coatings. The Performance Technologies segment includes the HDE and Automotive segment businesses and the CIS Coatings business. Beginning for fiscal 2023, we will report the financial results under the new segment structure.
BHVAC
|
Years ended March 31,
|
||||||||||||||||||||||||
|
2022
|
2021
|
2020
|
||||||||||||||||||||||
|
(in millions)
|
$’s
|
% of sales
|
$’s
|
% of sales
|
$’s
|
% of sales
|
||||||||||||||||||
|
Net sales
|
$
|
337
|
100.0
|
%
|
$
|
263
|
100.0
|
%
|
$
|
307
|
100.0
|
%
|
||||||||||||
|
Cost of sales
|
243
|
72.2
|
%
|
178
|
67.6
|
%
|
206
|
67.3
|
%
|
|||||||||||||||
|
Gross profit
|
94
|
27.8
|
%
|
85
|
32.4
|
%
|
100
|
32.7
|
%
|
|||||||||||||||
|
Selling, general and administrative expenses
|
48
|
14.1
|
%
|
40
|
15.2
|
%
|
42
|
13.7
|
%
|
|||||||||||||||
|
Operating income
|
$
|
46
|
13.6
|
%
|
$
|
45
|
17.2
|
%
|
$
|
58
|
19.0
|
%
|
||||||||||||
Year Ended March 31, 2022 Compared with Year Ended March 31, 2021
BHVAC net sales increased $74 million, or 28 percent, in fiscal 2022 compared with the prior year, primarily due to higher sales volume and, to a lesser extent, favorable pricing adjustments in response to raw material price increases. Sales
to commercial HVAC customers increased $41 million, primarily due to higher sales of heating and ventilation products in North America. In addition, sales to data center customers increased $32 million.
BHVAC cost of sales increased $65 million, or 37 percent, in fiscal 2022, primarily due to higher sales volume and higher raw material prices, which increased by $16 million. As a percentage of sales, cost of sales increased 460 basis points
to 72.2 percent, primarily due to the higher material costs.
As a result of higher sales and higher cost of sales as a percentage of sales, gross profit increased $9 million and gross margin declined 460 basis points to 27.8 percent.
BHVAC SG&A expenses increased $8 million compared with the prior year, yet decreased 110 basis points as a percentage of sales. The increase in SG&A expenses was primarily due to higher compensation-related expenses, which increased
$6 million and included higher commission expenses.
Operating income in fiscal 2022 of $46 million increased $1 million, primarily due to higher gross profit, partially offset by higher SG&A expenses.
Year Ended March 31, 2021 Compared with Year Ended March 31, 2020
BHVAC net sales decreased $44 million, or 14 percent, in fiscal 2021 compared with the prior year, primarily due to lower sales to a significant data center customer. Sales to data center customers decreased $42 million compared with the
prior year. Sales to commercial HVAC customers were consistent with the prior year, as higher sales of ventilation and heating products in the U.S. were largely offset by lower sales in Europe.
BHVAC cost of sales decreased $28 million, or 14 percent, in fiscal 2021, primarily due to lower sales volume. As a percentage of sales, cost of sales increased 30 basis points to 67.6 percent and was negatively impacted by unfavorable sales
mix.
As a result of the lower sales and higher cost of sales as a percentage of sales, gross profit decreased $15 million and gross margin declined 30 basis points to 32.4 percent.
BHVAC SG&A expenses decreased $2 million from the prior year. The decrease in SG&A expenses was primarily due to lower compensation-related expenses.
Operating income in fiscal 2021 of $45 million decreased $13 million, primarily due to lower gross profit.
CIS
|
Years ended March 31,
|
||||||||||||||||||||||||
|
2022
|
2021
|
2020
|
||||||||||||||||||||||
|
(in millions)
|
$’s
|
% of sales
|
$’s
|
% of sales
|
$’s
|
% of sales
|
||||||||||||||||||
|
Net sales
|
$
|
627
|
100.0
|
%
|
$
|
512
|
100.0
|
%
|
$
|
541
|
100.0
|
%
|
||||||||||||
|
Cost of sales
|
539
|
85.9
|
%
|
448
|
87.5
|
%
|
477
|
88.1
|
%
|
|||||||||||||||
|
Gross profit
|
88
|
14.1
|
%
|
64
|
12.5
|
%
|
64
|
11.9
|
%
|
|||||||||||||||
|
Selling, general and administrative expenses
|
51
|
8.1
|
%
|
49
|
9.5
|
%
|
51
|
9.3
|
%
|
|||||||||||||||
|
Restructuring expenses
|
2
|
0.4
|
%
|
5
|
1.0
|
%
|
2
|
0.4
|
%
|
|||||||||||||||
|
Impairment charge
|
-
|
-
|
-
|
-
|
1
|
0.1
|
%
|
|||||||||||||||||
|
Operating income
|
$
|
35
|
5.6
|
%
|
$
|
10
|
2.0
|
%
|
$
|
11
|
2.1
|
%
|
||||||||||||
Year Ended March 31, 2022 Compared with Year Ended March 31, 2021
CIS net sales increased $115 million, or 22 percent, in fiscal 2022 compared with the prior year, primarily due to higher sales volume and favorable product pricing adjustments in response to raw material price increases. CIS sales in fiscal
2021 were negatively impacted by the COVID-19 pandemic, primarily in the first half of the fiscal year. Sales to commercial HVAC&R customers increased $117 million.
CIS cost of sales increased $91 million, or 20 percent, primarily due to higher sales volume and higher raw material prices, which increased by $51 million. As a percentage of sales, cost of sales decreased 160 basis points to 85.9 percent,
primarily due to the favorable impacts of the higher sales volume and improved operating efficiencies, partially offset by higher material costs.
As a result of the higher sales and lower cost of sales as a percentage of sales, gross profit increased $24 million and gross margin improved 160 basis points to 14.1 percent.
CIS SG&A expenses increased $2 million compared with the prior year, yet decreased 140 basis points as a percentage of sales. The increase in SG&A expenses was primarily due to higher compensation-related expenses.
Restructuring expenses during fiscal 2022 decreased $3 million, primarily due to lower severance expenses. The fiscal 2022 severance expenses primarily related to targeted headcount reductions in Europe and China. The fiscal 2021 severance
expenses primarily related to plant consolidation activities in China and targeted headcount reductions in North America.
Operating income in fiscal 2022 increased $25 million to $35 million, primarily due to higher gross profit.
Year Ended March 31, 2021 Compared with Year Ended March 31, 2020
CIS net sales decreased $29 million, or 5 percent, in fiscal 2021 compared with the prior year, primarily due to lower sales volume resulting from the impacts of the COVID-19 pandemic, partially offset by a $12 million favorable impact of
foreign currency exchange rate changes. Sales to commercial HVAC&R customers decreased $33 million and were partially offset by higher industrial cooling sales, which increased $5 million.
CIS cost of sales decreased $29 million, or 6 percent, primarily due to lower sales volume, partially offset by an $11 million unfavorable impact of foreign currency exchange rate changes. As a percentage of sales, cost of sales decreased 60
basis points to 87.5 percent, as the favorable impact of cost-reduction and procurement initiatives more than offset the impact of the lower sales volume.
As a result of both the lower sales and lower cost of sales as a percentage of sales, gross profit remained consistent at $64 million and gross margin improved 60 basis points to 12.5 percent.
CIS SG&A expenses decreased $2 million compared with the prior year. The decrease in SG&A expenses was primarily due to lower compensation-related expenses.
Restructuring expenses during fiscal 2021 increased $3 million, primarily due to higher severance expenses. The fiscal 2021 restructuring expenses primarily consisted of severance expenses and equipment transfer costs related to plant
consolidation activities in China and targeted headcount reductions in North America.
Operating income in fiscal 2021 decreased $1 million to $10 million, primarily due to higher restructuring expenses, partially offset by lower SG&A expenses.
HDE
|
Years ended March 31,
|
||||||||||||||||||||||||
|
2022
|
2021
|
2020
|
||||||||||||||||||||||
|
(in millions)
|
$’s
|
% of sales
|
$’s
|
% of sales
|
$’s
|
% of sales
|
||||||||||||||||||
|
Net sales
|
$
|
824
|
100.0
|
%
|
$
|
682
|
100.0
|
%
|
$
|
746
|
100.0
|
%
|
||||||||||||
|
Cost of sales
|
737
|
89.4
|
%
|
594
|
87.0
|
%
|
649
|
87.0
|
%
|
|||||||||||||||
|
Gross profit
|
87
|
10.6
|
%
|
88
|
13.0
|
%
|
97
|
13.0
|
%
|
|||||||||||||||
|
Selling, general and administrative expenses
|
51
|
6.2
|
%
|
49
|
7.1
|
%
|
56
|
7.4
|
%
|
|||||||||||||||
|
Restructuring expenses
|
1
|
0.2
|
%
|
3
|
0.4
|
%
|
3
|
0.4
|
%
|
|||||||||||||||
|
Operating income
|
$
|
35
|
4.2
|
%
|
$
|
37
|
5.4
|
%
|
$
|
38
|
5.1
|
%
|
||||||||||||
Year Ended March 31, 2022 Compared with Year Ended March 31, 2021
HDE net sales increased $142 million, or 21 percent, in fiscal 2022 compared with the prior year, primarily due to higher sales volume and, to a lesser extent, favorable product pricing adjustments in response to raw material price increases.
HDE sales in fiscal 2021 were negatively impacted by the COVID-19 pandemic. Sales to off-highway and commercial vehicle customers increased $71 million and $69 million, respectively.
HDE cost of sales increased $143 million, or 24 percent, primarily due to higher sales volume and higher raw material prices, which increased approximately $67 million. As a percentage of sales, cost of sales increased 240 basis points to
89.4 percent, primarily due to the higher material prices.
As a result of higher sales and higher cost of sales as a percentage of sales, gross profit decreased $1 million and gross margin declined 240 basis points to 10.6 percent.
HDE SG&A expenses increased $2 million compared with the prior year, yet decreased 90 basis points as a percentage of sales. The increase in SG&A expenses was primarily related to higher compensation-related expenses, which increased
$6 million, partially offset by lower development and other administrative costs.
Restructuring expenses during fiscal 2022 decreased $2 million, primarily due to lower severance expenses.
Operating income in fiscal 2022 decreased $2 million to $35 million, primarily due to lower gross profit and higher SG&A expenses, partially offset by lower restructuring expenses.
Year Ended March 31, 2021 Compared with Year Ended March 31, 2020
HDE net sales decreased $64 million, or 9 percent, in fiscal 2021 compared with the prior year, primarily due to lower sales volume resulting from the impacts of the COVID-19 pandemic, which were most severe in the Americas and Europe during
the first half of the fiscal year. Sales to off-highway customers increased $20 million and were offset by lower sales to commercial vehicle and automotive and light vehicle customers, which decreased $52 million and $11 million, respectively.
HDE cost of sales decreased $55 million, or 8 percent, primarily due to lower sales volume. As a percentage of sales, cost of sales was consistent at 87.0 percent. Beyond the unfavorable impacts of the lower sales volume, higher material
costs impacted cost of sales as a percentage of sales by approximately 100 basis points. The unfavorable materials costs primarily resulted from higher commodity pricing and tariffs on imported materials. These negative impacts were largely
offset by favorable impacts from improved operating efficiencies and cost savings from procurement and other cost-reduction initiatives.
As a result of the lower sales, gross profit decreased $9 million. Gross margin of 13.0 percent was consistent with the prior year.
HDE SG&A expenses decreased $7 million compared with the prior year. The decrease in SG&A expenses was primarily due to lower compensation-related expenses, which decreased $6 million, and cost-reduction initiatives, including lower
travel expenses.
Restructuring expenses during fiscal 2021 totaled $3 million, consistent with the prior year. Fiscal 2021 restructuring expenses primarily consisted of severance expenses resulting from targeted headcount reductions in North America.
Operating income in fiscal 2021 decreased $1 million to $37 million, primarily due to lower gross profit, partially offset by lower SG&A expenses.
AUTOMOTIVE
|
Years ended March 31,
|
||||||||||||||||||||||||
|
2022
|
2021
|
2020
|
||||||||||||||||||||||
|
(in millions)
|
$’s
|
% of sales
|
$’s
|
% of sales
|
$’s
|
% of sales
|
||||||||||||||||||
|
Net sales
|
$
|
313
|
100.0
|
%
|
$
|
398
|
100.0
|
%
|
$
|
445
|
100.0
|
%
|
||||||||||||
|
Cost of sales
|
274
|
87.5
|
%
|
342
|
85.9
|
%
|
396
|
89.1
|
%
|
|||||||||||||||
|
Gross profit
|
39
|
12.5
|
%
|
56
|
14.1
|
%
|
48
|
10.9
|
%
|
|||||||||||||||
|
Selling, general and administrative expenses
|
40
|
12.6
|
%
|
36
|
9.1
|
%
|
45
|
10.1
|
%
|
|||||||||||||||
|
Restructuring expenses
|
20
|
6.5
|
%
|
4
|
1.0
|
%
|
6
|
1.5
|
%
|
|||||||||||||||
|
Impairment charges (reversals) - net
|
(56
|
)
|
-17.9
|
%
|
167
|
41.9
|
%
|
8
|
1.8
|
%
|
||||||||||||||
|
Gain on sale of assets
|
-
|
-
|
-
|
-
|
(1
|
)
|
-0.2
|
%
|
||||||||||||||||
|
Operating income (loss)
|
$
|
35
|
11.3
|
%
|
$
|
(151
|
)
|
-37.9
|
%
|
$
|
(10
|
)
|
-2.3
|
%
|
||||||||||
Year Ended March 31, 2022 Compared with Year Ended March 31, 2021
Automotive net sales decreased $85 million, or 21 percent, in fiscal 2022 compared with the prior year, primarily due to $58 million of lower sales from the air-cooled automotive business, which we sold in the first quarter of fiscal 2022, and
lower sales volume, largely associated with the negative impacts of the global semiconductor chip shortage on the global automotive market. These drivers, which decreased sales, were partially offset by favorable product pricing adjustments in
response to raw material price increases. Sales in Europe, North America, and Asia decreased $62 million, $13 million, and $11 million, respectively.
Automotive cost of sales decreased $68 million, or 20 percent, compared with the prior year, primarily due to lower sales volume and lower depreciation expenses, which decreased $9 million. We ceased depreciating the property, plant and
equipment assets within the liquid- and air-cooled automotive businesses when they were classified as held for sale during the second half of fiscal 2021. Upon reverting back to held and used classification during the third quarter of fiscal
2022, we resumed depreciating the property, plant and equipment assets in the liquid-cooled automotive business. These decreases were partially offset by higher raw material prices, which increased $14 million. As a percentage of sales, cost of
sales increased 160 basis points to 87.5 percent.
As a result of the lower sales and higher cost of sales as a percentage of sales, gross profit decreased $17 million and gross margin declined 160 basis points to 12.5 percent.
Automotive SG&A expenses increased $4 million compared with the prior year. The increase in SG&A expenses was primarily related to higher compensation-related expenses and, to a lesser extent, higher development and administrative
expenses.
Restructuring expenses during fiscal 2022 totaled $20 million, an increase of $16 million compared with the prior year. The increase was primarily driven by higher severance expenses in Europe related to targeted headcount reductions.
The fiscal 2022 net impairment reversal of $56 million primarily related to assets in our liquid-cooled automotive business. We remeasured the previously impaired long-lived assets within the liquid-cooled automotive business to the lower of
their carrying or fair value once they were no longer held for sale. The fiscal 2021 impairment charges totaling $167 million related to assets in the liquid- and air-cooled automotive businesses, which were first classified as held for sale in
fiscal 2021.
Operating income of $35 million during fiscal 2022 represents a $186 million improvement from the prior-year operating loss of $151 million. The operating income and operating loss during fiscal 2022 and 2021 were driven by the significant
net impairment reversal and impairment charges, respectively. In addition, as compared with the prior year, operating income was unfavorably impacted by lower gross profit and higher restructuring expenses.
Year Ended March 31, 2021 Compared with Year Ended March 31, 2020
Automotive net sales decreased $47 million, or 11 percent, in fiscal 2021 compared with the prior year, primarily due to lower sales volume largely resulting from the impacts of the COVID-19 pandemic, partially offset by an $18 million
favorable impact of foreign currency exchange rate changes. Sales in Europe and North America decreased $39 million and $19 million, respectively. Sales in Asia increased $12 million.
Automotive cost of sales decreased $54 million, or 14 percent, compared with the prior year, primarily due to lower sales volume, partially offset by a $15 million unfavorable impact of foreign currency exchange rate changes. As a percentage
of sales, cost of sales decreased 320 basis points to 85.9 percent and was favorably impacted by lower depreciation expenses of $8 million, cost savings from procurement initiatives and improved operating efficiencies, partially offset by the
unfavorable impact of lower sales volume. We ceased depreciating the long-lived assets within the liquid- and air-cooled automotive businesses when they were classified as held for sale in November 2020 and February 2021, respectively.
As a result of the lower sales and lower cost of sales as a percentage of sales, gross profit increased $8 million and gross margin improved 320 basis points to 14.1 percent.
Automotive SG&A expenses decreased $9 million compared with the prior year. The decrease in SG&A expenses was primarily due to lower compensation-related expenses, which decreased $8 million.
Restructuring expenses during fiscal 2021 totaled $4 million, a decrease of $2 million compared with the prior year. The decrease was primarily driven by lower severance expenses in Europe resulting from fewer targeted headcount reductions.
Impairment charges during fiscal 2021 totaled $167 million and primarily related to assets in the liquid- and air-cooled automotive businesses. Upon classifying these businesses as held for sale, we recorded impairment charges to write down
the long-lived assets of these businesses based upon the selling prices in the agreements. During fiscal 2020, we recorded asset impairment charges totaling $8 million, primarily related to manufacturing facilities in Austria and Germany.
The Automotive operating loss in fiscal 2021 of $151 million, as compared with an operating loss of $10 million in the prior year, was significantly impacted by the large impairment charges, which were partially offset by higher gross profit
and lower SG&A and restructuring expenses.
Liquidity and Capital Resources
Our primary sources of liquidity are cash flow from operating activities, our cash and cash equivalents as of March 31, 2022 of $45 million, and an available borrowing capacity of $173 million under our revolving credit facility. Given our
extensive international operations, approximately $42 million of our cash and cash equivalents are held by our non-U.S. subsidiaries. Amounts held by non-U.S. subsidiaries are available for general corporate use; however, these funds may be
subject to foreign withholding taxes if repatriated. We believe our sources of liquidity will provide sufficient cash flow to adequately cover our funding needs on both a short-term and long-term basis.
Our primary contractual obligations include pension obligations, debt and related interest payments, lease obligations, and obligations for capital expenditures. Our pension liabilities totaled $49 million as of March 31, 2022. As a result
of funding relief provisions within the American Rescue Plan Act of 2021, we do not expect to make cash contributions to our U.S. plans during fiscal 2023.
Net Cash Provided by Operating Activities
Net cash provided by operating activities in fiscal 2022 was $12 million, a decrease of $138 million from $150 million in the prior year. This decrease in operating cash flow was primarily due to unfavorable net changes in working capital,
including higher inventory and accounts receivable levels and higher payments for incentive compensation and employee benefits as compared with the same period in the prior year. Inventory, including amounts that were held for sale, increased
$61 million from March 31, 2021 to March 31, 2022. The higher inventory levels in fiscal 2022 have largely resulted from both increased raw material prices and strategic safety stock builds in connection with global supply chain constraints and
challenges.
Net cash provided by operating activities in fiscal 2021 was $150 million, an increase of $92 million from $58 million in the prior year. This increase in operating cash flow was primarily due to favorable net changes in working capital,
including impacts from the timing of payments to vendors and receipts from customers, as compared with the prior year. The favorable changes in working capital also included lower payments for incentive compensation, employee benefits, and
payroll taxes. During fiscal 2021, we deferred payments of U.S. payroll taxes totaling $7 million, as permitted by the Coronavirus Aid, Relief, and Economic Security Act. We resumed payment of these payroll taxes during the fourth quarter of
fiscal 2021. We paid half of the deferred amount in fiscal 2022 and expect to pay the other half in fiscal 2023. Also during fiscal 2021, payments for separation and project costs associated with our review of strategic alternatives for the
Automotive segment businesses and restructuring activities decreased $31 million and $5 million, respectively, compared with fiscal 2020.
Capital Expenditures
Capital expenditures of $40 million during fiscal 2022 increased $8 million compared with fiscal 2021. Our capital spending in fiscal 2022 primarily occurred in the HDE and Automotive segments, which totaled $15 million and $13 million,
respectively, and included tooling and equipment purchases in conjunction with new and renewal programs with customers. In fiscal 2021, we delayed certain projects and the purchase of certain program-related equipment and tooling to preserve our
available liquidity during the first year of the COVID-19 pandemic.
Debt
Our total debt outstanding increased $38 million to $378 million at March 31, 2022 compared with the prior year, primarily due to borrowings during fiscal 2022. As of March 31, 2021, $5 million of debt was classified within liabilities held
for sale on our consolidated balance sheet.
Our credit agreements require us to maintain compliance with various covenants, including a leverage ratio covenant and an interest expense coverage ratio covenant discussed further below. Also, as specified in the credit agreement, the term
loans require prepayments in the event of certain asset sales. In addition, at the time of each incremental borrowing under the revolving credit facility, we must represent to the lenders that there has been no material adverse effect, as
defined in the credit agreement, on our business, property, or results of operations.
The leverage ratio covenant within our primary credit agreements requires us to limit our consolidated indebtedness, less a portion of our cash balance, both as defined by the credit agreements, to no more than three and one-quarter times
consolidated net earnings before interest, taxes, depreciation, amortization, and certain other adjustments (“Adjusted EBITDA”). We are also subject to an interest expense coverage ratio covenant, which requires us to maintain Adjusted EBITDA of
at least three times consolidated interest expense. As of March 31, 2022, our leverage ratio and interest coverage ratio were 2.3 and 11.4, respectively. We expect to remain in compliance with our debt covenants during fiscal 2023 and beyond.
See Note 17 of the Notes to Consolidated Financial Statements for additional information regarding our credit agreements.
Critical Accounting Policies
The following critical accounting policies reflect the more significant judgments and estimates used in preparing our consolidated financial statements. Application of these policies results in accounting estimates that have the greatest
potential for a significant impact on our financial statements. The following discussion of these judgments and estimates is intended to supplement the significant accounting policies presented in Note 1 of the Notes to Consolidated Financial
Statements. In addition, recently issued accounting pronouncements that either have or could materially impact our financial statement are disclosed in Note 1 of the Notes to Consolidated Financial Statements.
Revenue Recognition
We recognize revenue based upon consideration specified in a contract and as we satisfy performance obligations by transferring control over our products to our customers, which may be at a point in time or over time. The majority of our
revenue is recognized at a point in time, based upon shipment terms. A limited number of our customer contracts provide an enforceable right to payment for performance completed to date. For these contracts, we recognize revenue over time based
upon our estimated progress towards the satisfaction of the contract’s performance obligations. We record an allowance for credit losses and we accrue for estimated warranty costs at the time of sale. We base these estimates upon historical
experience, current business trends and economic conditions, and risks specific to the underlying accounts receivable or warranty claims.
Impairment of Long-Lived Assets
We perform impairment evaluations of long-lived assets, including property, plant and equipment and intangible assets, whenever business conditions or events indicate that those assets may be impaired. We consider factors such as operating
losses, declining financial outlooks and market conditions when evaluating the necessity for an impairment analysis. In the event the net asset values exceed undiscounted cash flows expected to be generated by the assets, we write down the
assets to fair value and record an impairment charge. We estimate fair value in various ways depending on the nature of the underlying assets. Fair value is generally based upon appraised value, estimated salvage value, or selling prices under
negotiation, as applicable.
The most significant long-lived assets we evaluated for impairment indicators were property, plant and equipment and intangible assets, which totaled $315 million and $90 million, respectively, at March 31, 2022. Within property, plant and
equipment, the most significant assets evaluated are buildings and improvements and machinery and equipment. Our most significant intangible assets evaluated are customer relationships, trade names, and acquired technology, the majority of which
are related to our CIS and BHVAC segments. We evaluate impairment at the lowest level of separately identifiable cash flows, which is generally at the manufacturing plant level. We monitor manufacturing plant financial performance to determine
whether indicators exist that would require an impairment evaluation for the facility. This includes significant adverse changes in plant profitability metrics; substantial changes in the mix of customer products manufactured in the plant;
changes in manufacturing strategy; and the shifting of programs to other facilities under a manufacturing realignment strategy. When such indicators are present, we perform an impairment evaluation.
During fiscal 2022, we recorded net impairment reversals of $56 million, primarily related to assets that were held for sale in the Automotive segment. In fiscal 2021, we recorded $167 million of impairment charges to write down the
long-lived assets in the liquid- and air-cooled automotive businesses when they were classified as held for sale. In fiscal 2022, we adjusted the long-lived assets in the liquid-cooled automotive business to the lower of carrying or fair value
when they no longer met the held for sale classification criteria. See Note 2 of the Notes to the Consolidated Financial Statements for additional information.
Impairment of Goodwill
We perform goodwill impairment tests annually, as of March 31, unless business events or other conditions exist that require a more frequent evaluation. We consider factors such as operating losses, declining financial and market outlooks,
and market capitalization when evaluating the necessity for an interim impairment analysis. We test goodwill for impairment at a reporting unit level. Goodwill resulting from recent acquisitions generally represents the highest risk of
impairment, which typically decreases as the businesses are integrated into the Company and positioned for future operating and financial performance. We test goodwill for impairment by comparing the fair value of each reporting unit with its
carrying value. We determine the fair value of a reporting unit based upon the present value of estimated future cash flows. If the fair value of a reporting unit exceeds the carrying value of the reporting unit’s net assets, goodwill is not
impaired. However, if the carrying value of the reporting unit’s net assets exceeds its fair value, we would conclude goodwill is impaired and would record an impairment charge equal to the amount that the reporting unit’s carrying value exceeds
its fair value.
Determining the fair value of a reporting unit involves judgment and the use of significant estimates and assumptions, which include assumptions regarding the revenue growth rates and operating profit margins used to calculate estimated future
cash flows and risk-adjusted discount rates. We determine the expected future revenue growth rates and operating profit margins after consideration of our historical revenue growth rates and earnings levels, our assessment of future market
potential and our expectations of future business performance. The discount rates used in determining discounted cash flows are rates corresponding to our cost of capital, adjusted for country- and business-specific risks where appropriate.
While we believe the assumptions used in our goodwill impairment tests are appropriate and result in a reasonable estimate of the fair value of each reporting unit, future events or circumstances could have a potential negative effect on the
estimated fair value of our reporting units. These events or circumstances include lower than forecasted revenues, market trends that fall below our current expectations, actions of key customers, increases in discount rates, and the continued
general economic uncertainties and impacts associated with the COVID-19 pandemic and the military conflict in Ukraine. We cannot predict the occurrence of certain events or changes in circumstances that might adversely affect the carrying value
of goodwill.
At March 31, 2022, our goodwill totaled $168 million related to our CIS and BHVAC segments. Each of these segments is comprised of two reporting units. We conducted annual goodwill impairment tests as of March 31, 2022 by applying a fair
value-based test and determined the fair value of each of our reporting units exceeded the respective book value. A 10 percent decrease in the estimated fair value of our reporting units would not have resulted in a different conclusion.
Acquisitions
From time to time, we make strategic acquisitions that have a material impact on our consolidated results of operations or financial position. We allocate the purchase price of acquired businesses to the identifiable tangible and intangible
assets acquired and liabilities assumed in the transaction based upon their estimated fair values as of the acquisition date. We determine the estimated fair values using information available to us and engage third-party valuation specialists
when necessary. The estimates we use to determine the fair value of long-lived assets, such as intangible assets, can be complex and require significant judgments. While we use our best estimates and assumptions, our estimates are inherently
uncertain and subject to refinement. As a result, during the measurement period, which may be up to one year from the acquisition date, we record adjustments to the assets acquired and liabilities assumed, with the corresponding offset to
goodwill. Upon conclusion of the measurement period or final determination of the values of assets acquired or liabilities assumed, whichever comes first, any subsequent adjustments are recorded to our consolidated statement of operations. We
also estimate the useful lives of intangible assets to determine the amount of amortization expense to record in future periods. We periodically review the estimated useful lives assigned to our intangible assets to determine whether such
estimated useful lives continue to be appropriate.
Pension Obligations
Our calculation of the expense and liabilities of our pension plans is dependent upon various assumptions. At March 31, 2022, our pension liabilities totaled $49 million. The most significant assumptions include the discount rate, long-term
expected return on plan assets, and mortality rates. We base our selection of assumptions on historical trends and economic and market conditions at the time of valuation. In accordance with U.S. GAAP, actual results that differ from these
assumptions are accumulated and amortized over future periods. These differences impact future benefit cost. Our domestic pension plans are closed to new participants; therefore, participants in these plans are not accruing benefits based upon
their current service as the plans do not include increases in annual earnings or for future service in calculating the average annual earnings and years of credited service under the pension plan formula.
For the following discussion regarding sensitivity of assumptions, all amounts presented are in reference to our domestic pension plans, since our domestic plans comprise all of our pension plan assets and the large majority of our pension
plan expense.
To determine the expected rate of return on pension plan assets, we consider such factors as (a) the actual return earned on plan assets, (b) historical rates of return on the various asset classes in the plan portfolio, (c) projections of
returns on those asset classes, (d) the amount of active management of the assets, (e) capital market conditions and economic forecasts, and (f) administrative expenses paid with the plan assets. The long-term rate of return utilized in both
fiscal 2022 and 2021 was 7.5 percent. For fiscal 2023, we have assumed a rate of 7.0 percent. A change of 25 basis points in the expected rate of return on assets would impact our fiscal 2023 pension expense by less than $1 million.
The discount rate reflects rates available on long-term, high-quality fixed-income corporate bonds on the measurement date of March 31. For fiscal 2022 and 2021, for purposes of determining pension expense, we used a discount rate of 3.2 and
3.4 percent, respectively. We determined these rates based upon a yield curve that was created following an analysis of the projected cash flows from our plans. See Note 18 of the Notes to Consolidated Financial Statements for additional
information. A change in the assumed discount rate of 25 basis points would impact our fiscal 2023 pension expense by less than $1 million.
Income Taxes
We operate in numerous taxing jurisdictions; therefore, we are subject to regular examinations by federal, state and non-U.S. taxing authorities. Due to the application of complex and sometimes ambiguous tax laws and rulings in the
jurisdictions in which we do business, there is an inherent level of uncertainty within our worldwide tax provisions. Despite our belief that our tax return positions are consistent with applicable tax laws, it is possible that taxing
authorities could challenge certain positions.
Our deferred tax assets and liabilities reflect temporary differences between the amount of assets and liabilities for financial and tax reporting purposes. We adjust these amounts to reflect changes in tax rates expected to be in effect when
the temporary differences reverse. We record a valuation allowance if we determine it is more likely than not that the net deferred tax assets in a particular jurisdiction will not be realized. This determination, which is made on a
jurisdiction-by-jurisdiction basis, involves judgment and the use of significant estimates and assumptions, including expectations of future taxable income and tax planning strategies. We believe the assumptions that we used are appropriate and
result in a reasonable determination regarding the future realizability of deferred tax assets. However, future events or circumstances, such as lower-than-expected taxable income or unfavorable changes in the financial outlook of our operations
in certain jurisdictions, could cause us to record additional valuation allowances.
See Note 8 of the Notes to Consolidated Financial Statements for additional information regarding income taxes.
We maintain liabilities and reserves for a number of loss exposures, including environmental remediation costs, product warranties, self-insurance costs,
estimated credit losses associated with trade receivables, regulatory compliance matters, and litigation. Establishing loss reserves for these exposures requires the use of estimates and judgment to determine the risk exposure and ultimate
potential liability. We estimate these reserve requirements by using consistent and suitable methodologies for the particular type of loss reserve being calculated. See Notes 15 and 20 of the Notes to Consolidated Financial Statements for
additional information regarding product warranties and contingencies and litigation, respectively.
Forward-Looking Statements
This report, including, but not limited to, the discussion under Item 7. Management’s Discussion and Analysis of Financial Condition and Results of Operations, contains statements, including information about future financial performance,
accompanied by phrases such as “believes,” “estimates,” “expects,” “plans,” “anticipates,” “intends,” and other similar “forward-looking” statements, as defined in the Private Securities Litigation Reform Act of 1995. Modine’s actual results,
performance or achievements may differ materially from those expressed or implied in these statements, because of certain risks and uncertainties, including, but not limited to, those described under “Risk Factors” in Item 1A. in Part I. of this
report and identified in our other public filings with the U.S. Securities and Exchange Commission. Other risks and uncertainties include, but are not limited to, the following:
Market Risks:
| • |
The impact of potential adverse developments or disruptions in the global economy and financial markets, including impacts related to tariffs, sanctions and other trade issues or cross-border trade restrictions (and any potential
resulting trade war), inflation and supply chain challenges, and including impacts associated with the military conflict between Russia and Ukraine;
|
| • |
The impact of the COVID-19 pandemic on the national and global economy, our business, suppliers, customers, and employees;
|
| • |
The impact of other economic, social and political conditions, changes, challenges and unrest, particularly in the geographic, product and financial markets where we and our customers operate and compete, including foreign currency
exchange rate fluctuations; changes in interest rates; recession and recovery therefrom; and the general uncertainties about the impact of regulatory and/or policy changes, including those related to tax and trade that have been or may be
implemented in the U.S. or abroad;
|
| • |
The impact of potential price increases associated with raw materials, including aluminum, copper, steel and stainless steel (nickel), and other purchased component inventory including, but not limited to, increases in the underlying
material cost based upon the London Metal Exchange and related premiums or fabrication costs. These prices may be impacted by a variety of factors, including changes in trade laws and tariffs, the behavior of our suppliers and
significant fluctuations in demand. This risk includes our ability to successfully manage our exposure and our ability to adjust product pricing in response to price increases, including through our quotation process or through contract
provisions for prospective price adjustments, as well as the inherent lag in timing of such contract provisions;
|
| • |
Our ability to mitigate increased labor costs and labor shortages; and
|
| • |
The impact of current and future environmental laws and regulations on our business and the businesses of our customers, including our ability to take advantage of opportunities to supply alternative new technologies to meet
environmental and/or energy standards and objectives.
|
Operational Risks:
| • |
The impact of problems, including logistic and transportation challenges, associated with suppliers meeting our quantity, quality, price and timing demands, and the overall health of our suppliers, including their ability and
willingness to supply our volume demands if their production capacity becomes constrained;
|
| • |
The overall health of and price-reduction pressure from our vehicular customers in light of economic and market-specific factors, and the potential impact on us from any deterioration in the stability or performance of any of our major
customers;
|
| • |
Our ability to maintain current customer relationships and compete effectively for new business, including our ability to achieve profit margins acceptable to us by offsetting or otherwise addressing any cost increases associated with
supply chain challenges and inflationary market conditions;
|
| • |
The impact of product or manufacturing difficulties or operating inefficiencies, including any program launch and product transfer challenges and warranty claims;
|
| • |
The impact of delays or modifications initiated by major customers with respect to program launches, product applications or requirements;
|
| • |
Our ability to consistently structure our operations in order to develop and maintain a competitive cost base with appropriately skilled and stable labor, while also positioning ourselves geographically, so that we can continue to
support our customers with the technical expertise and market-leading products they demand and expect from Modine;
|
| • |
Our ability to effectively and efficiently manage our cost structure in response to sales volume increases or decreases and to complete restructuring activities and realize the anticipated benefits of those activities;
|
| • |
Costs and other effects of the investigation and remediation of environmental contamination; particularly when related to the actions or inactions of others and/or facilities over which we have no control;
|
| • |
Our ability to recruit and maintain talent, including personnel in managerial, leadership, operational and administrative functions, in light of tight global labor markets;
|
| • |
Our ability to protect our proprietary information and intellectual property from theft or attack by internal or external sources;
|
| • |
The impact of a substantial disruption or material breach of our information technology systems, and any related delays, problems or costs;
|
| • |
Increasingly complex and restrictive laws and regulations, including those associated with being a U.S. public company and others present in various jurisdictions in which we operate, and the costs associated with compliance therewith;
|
| • |
Work stoppages or interference at our facilities or those of our major customers and/or suppliers;
|
| • |
The constant and increasing pressures associated with healthcare and associated insurance costs; and
|
| • |
Costs and other effects of litigation, claims, or other obligations.
|
Strategic Risks:
| • |
Our ability to successfully realize anticipated benefits from strategic initiatives and our application of 80/20 principles to our business,
through which we are focused on reducing complexity and growing businesses with strong market drivers;
|
| • |
Our ability to successfully execute strategies to reduce costs and improve operating margins; and
|
| • |
The potential impacts from actions by activist shareholders, including disruption of our business and related costs.
|
Financial Risks:
| • |
Our ability to fund our global liquidity requirements efficiently for our current operations and meet our long-term commitments in the event of disruption in or tightening of the credit markets or
extended recessionary conditions in the global economy;
|
| • |
The impact of increases in interest rates in relation to our variable-rate debt obligations;
|
| • |
The impact of changes in federal, state or local taxes that could have the effect of increasing our income tax expense;
|
| • |
Our ability to comply with the financial covenants in our credit agreements, including our leverage ratio (net debt divided by Adjusted EBITDA, as defined in our credit agreements) and our interest coverage ratio (Adjusted EBITDA
divided by interest expense, as defined in our credit agreements);
|
| • |
The potential unfavorable impact of foreign currency exchange rate fluctuations on our financial results; and
|
| • |
Our ability to effectively realize the benefits of deferred tax assets in various jurisdictions in which we operate.
|
Forward-looking statements are as of the date of this report; we do not assume any obligation to update any forward-looking statements.
In the normal course of business, we are subject to market exposure from changes in foreign currency exchange rates, interest rates, commodity prices, credit risk and other market changes.
Foreign Currency Risk
We are subject to the risk of changes in foreign currency exchange rates due to our operations in foreign countries. We have manufacturing facilities in Brazil, China, India, Mexico, and throughout Europe. We also have joint ventures in
China and South Korea. We sell and distribute products throughout the world and also purchase raw materials from suppliers in foreign countries. As a result, our financial results are affected by changes in foreign currency exchange rates and
economic conditions in the foreign markets in which we do business. Whenever possible, we attempt to mitigate foreign currency risks on transactions with customers and suppliers in foreign countries by entering into contracts that are
denominated in the functional currency of the entity engaging in the transaction. In addition, for certain transactions that are denominated in a currency other than the engaging entity’s functional currency, we may
enter into foreign currency derivative contracts to further manage our foreign currency risk. In fiscal 2022, we recorded a net loss of less than $1 million within our statement of operations related to foreign currency derivative
contracts. In addition, our consolidated financial results are impacted by the translation of revenue and expenses in foreign currencies into U.S. dollars. These translation impacts are primarily affected by changes in exchange rates between
the U.S. dollar and European currencies, primarily the euro, and changes between the U.S. dollar and the Brazilian real. In fiscal 2022, more than 50 percent of our sales were generated in countries outside the U.S. A change in foreign currency
exchange rates will positively or negatively affect our sales; however, this impact will be offset, usually to a large degree, with a corresponding effect on our cost of sales and other expenses. In fiscal 2022, changes in foreign currency
exchange rates favorably impacted our sales by $10 million; however, the impact on our operating income was only $1 million. Foreign currency exchange rate risk can be estimated by measuring the impact of a near-term adverse movement of 10
percent in foreign currency exchange rates. If these rates were 10 percent higher or lower during fiscal 2022, there would not have been a material impact on our fiscal 2022 earnings.
We maintain foreign currency-denominated debt obligations and intercompany loans that are subject to foreign currency exchange risk. We seek to mitigate this risk through maintaining offsetting positions between external and intercompany
loans; however, from time to time, we also enter into foreign currency derivative contracts to manage the currency exchange rate exposure. These derivative instruments are typically not accounted for as hedges, and
accordingly, gains or losses on the derivatives are recorded in other income and expense in the consolidated statements of operations and typically offset the foreign currency changes on the outstanding loans.
Interest Rate Risk
We seek to reduce the potential volatility of earnings that could arise from changes in interest rates. We generally utilize a mixture of debt maturities and both fixed-rate and variable-rate debt to manage exposure to changes in interest
rates. Interest on both our term loans and borrowings under our primary multi-currency revolving credit facility, including swingline borrowings, is variable and is currently based primarily on either LIBOR or EURIBOR, plus 137.5 to 250 basis
points, depending on our leverage ratio. As a result, we are subject to risk of fluctuations in LIBOR and EURIBOR and changes in our leverage ratio, which would affect the variable interest rate on our term loans and revolving credit facility
and could create variability in interest expense.
As of March 31, 2022, our outstanding borrowings on variable-rate term loans and the revolving credit facility totaled $164 million and $72 million, respectively. Based upon our outstanding debt with variable interest rates at March 31, 2022,
a 100-basis point increase in interest rates would increase our annual interest expense in fiscal 2023 by approximately $2 million.
Commodity Price and Supply Risk
To produce the products we sell, we purchase raw materials and supplies including aluminum, copper, steel and stainless steel (nickel), and natural gas. In addition, we also purchase components and parts that are integrated into our end
products.
We seek to mitigate commodity price risk primarily by adjusting product pricing in response to applicable price increases. Our contracts with certain vehicular customers contain provisions that provide for prospective price adjustments based
upon changes in raw material prices. These prospective price adjustments generally lag behind the actual raw material price fluctuations by three months or longer, and typically the contract provisions are limited to the underlying material cost
based upon the London Metal Exchange and exclude additional cost elements, such as related premiums and fabrication. In instances where the risk is not covered contractually, we seek to adjust product pricing in
response to price increases, including through our quotation process and through price list increases.
In fiscal 2022, we experienced a significant increase in raw material prices and price increases on other goods and services in connection with global supply chain challenges. In response, we implemented selling
price increases for our products. The full impact of these selling price increases, however, are not expected to be realized until fiscal 2023 as the higher pricing works through our existing orders. Nevertheless, we are still subject to the
risk of further price increases on commodities, components, and other goods and services that we purchase.
Regarding supply risk in light of recent supply chain challenges, we are engaged with our suppliers to ensure availability of purchased
commodities and components and we have added key suppliers to our supply base during the last year. However, we are still dependent upon limited sources of supply for certain components
used in the manufacture of our products, including aluminum, copper, steel and stainless steel (nickel). Even with this expanded supply base, we are exposed to the risk of suppliers of certain raw materials not being able or willing to meet
strong customer demand, as they may not increase their output capacity as quickly as customers increase their orders, the impact of trade laws and tariffs, and increased prices being charged by raw material suppliers.
We also purchase parts from suppliers that use our tooling to create the parts. In most instances, and for financial reasons, we do not have duplicate tooling for the manufacture of the purchased parts. As a result, we are exposed to the
risk of a supplier being unable to provide the quantity or quality of parts that we require. Even in situations where suppliers are manufacturing parts without the use of our tooling, we face the challenge of obtaining consistently high-quality
parts from suppliers that are financially stable. We utilize a supplier risk management program that leverages internal and third-party tools to identify and mitigate higher-risk supplier situations.
Credit Risk
Credit risk represents the possibility of loss from a customer failing to make payment according to contract terms. Our principal credit risk consists of outstanding trade accounts receivable. At March 31, 2022, 29 percent of our trade
accounts receivable was concentrated with our top ten customers. These customers operate primarily in the commercial vehicle, off-highway, automotive and light vehicle, commercial air conditioning, and refrigeration markets and are influenced by
similar market and general economic factors. In the past, credit losses from our customers have not been significant, nor have we experienced a significant increase in credit losses in connection with the COVID-19 pandemic.
We manage credit risk through a focus on the following:
| • |
Cash and investments – We review cash deposits and short-term investments to
ensure banks have acceptable credit ratings, and short-term investments are maintained in secured or guaranteed instruments. We consider our holdings in cash and investments to be stable and secure at March 31, 2022;
|
| • |
Trade accounts receivable – Prior to granting credit, we evaluate each
customer, taking into consideration the customer’s financial condition, payment experience and credit information. After credit is granted, we actively monitor the customer’s financial condition and applicable business news;
|
| • |
Pension assets – We have retained outside advisors to assist in the
management of the assets in our pension plans. In making investment decisions, we utilize an established risk management protocol that focuses on protection of the plan assets against downside risk. We ensure that investments within
these plans provide appropriate diversification, the investments are monitored by investment teams, and portfolio managers adhere to the established investment policies. We believe the plan assets are subject to appropriate investment
policies and controls; and
|
| • |
Insurance – We monitor our insurance providers to ensure they maintain
financial ratings that are acceptable to us. We have not identified any concerns in this regard based upon our reviews.
|
In addition, we are exposed to risks associated with price reduction pressure applied by OEM customers. If contractual price downs are unavoidable, we contemplate them in our overall strategy and adjust pricing as necessary to provide profit
margins that are acceptable to us.
Economic and Market Risk
Economic risk represents the possibility of loss resulting from economic instability in certain areas of the world, such as that caused by geopolitical uncertainly or pandemics, or downturns in markets in which we operate. We sell a broad
range of products that provide thermal solutions to customers operating in diverse markets, including the commercial, industrial, and building HVAC&R and commercial vehicle, off-highway, and automotive and light vehicle markets.
Considering our global presence, we also encounter risks imposed by potential trade restrictions, including tariffs, embargoes, sanctions, and the like. We continue to pursue non-speculative opportunities to mitigate these economic risks, and
capitalize, when possible, on changing market conditions. We pursue new market opportunities after careful consideration of the potential associated risks and benefits. Successes in new markets are dependent upon our ability to commercialize
our investments. Current examples of new and emerging markets for us include those related to electric vehicles, data centers, indoor air quality, and aftermarket coatings. Our investments in these areas are subject to the risks associated with
technological success, customer and market acceptance, and our ability to meet the demands of our customers as these markets grow.
Hedging and Foreign Currency Forward Contracts
We use derivative financial instruments as a tool to manage certain financial risks. We prohibit the use of leveraged derivatives.
Commodity Derivatives
From time to time, we enter into over-the-counter forward contracts related to forecasted purchases of aluminum and copper. Our strategy is to reduce our exposure to changing market prices of these commodities. In fiscal 2022 and 2021, we
designated certain commodity forward contracts as cash flow hedges for accounting purposes. Accordingly, for these designated hedges, we record unrealized gains and losses related to the change in the fair value of the contracts in other
comprehensive income (loss) within shareholders’ equity and subsequently recognize the gains and losses within cost of sales as the underlying inventory is sold. In fiscal 2022, 2021, and 2020, net gains and losses recognized in cost of sales
related to commodity forward contracts were approximately $1 million or less in each year.
Foreign Currency Forward Contracts
We use derivative financial instruments in a limited way to mitigate foreign currency exchange risk. We periodically enter into foreign currency forward contracts to hedge specific foreign currency-denominated assets and liabilities as well
as forecasted transactions. We have designated certain hedges of forecasted transactions as cash flow hedges for accounting purposes. Accordingly, for these designated hedges, we record unrealized gains and losses related to the change in the
fair value of the contracts in other comprehensive income (loss) within shareholders’ equity and subsequently recognize the gains and losses as a component of earnings at the same time and in the same financial statement line that the underlying
transactions impact earnings. In fiscal 2022, 2021, and 2020, net gains and losses recognized in sales and cost of sales related to foreign currency forward contracts were less than $1 million in each year. We have not designated forward
contracts related to foreign currency-denominated assets and liabilities as hedges. Accordingly, for these non-designated contracts, we record unrealized gains and losses related to the change in the fair value of the contracts in other income
and expense. Gains and losses on these non-designated foreign currency forward contracts are offset by foreign currency gains and losses associated with the related assets and liabilities.
Counterparty Risks
We manage counterparty risks by ensuring that counterparties to derivative instruments maintain credit ratings acceptable to us. At March 31, 2022, all counterparties had a sufficient long-term credit rating.