Pay vs Performance Disclosure
|
12 Months Ended |
|
Jan. 27, 2024
USD ($)
|
Jan. 28, 2023
USD ($)
|
Jan. 29, 2022
USD ($)
|
Jan. 30, 2021
USD ($)
|
| Pay vs Performance Disclosure [Table] |
|
|
|
|
| Pay vs Performance [Table Text Block] |
2024 PAY VERSUS PERFORMANCE TABLE AND SUPPORTING NARRATIVE
As required by Section 953(a) of the Dodd-Frank Wall Street Reform and Consumer Protection Act, and Item 402(v) of Regulation S-K, we are providing the following information about the relationship between executive compensation actually paid (as defined by SEC rules) and certain financial performance of the company. For further information about how we align executive compensation with the company’s performance, see “Compensation Discussion & Analysis” on page 33 above.
Pay Versus Performance Table
| |
|
|
|
|
|
|
|
|
|
|
|
|
|
|
|
|
| Year |
|
Summary
Compensation
Table Total
for PEO(1) |
|
Compensation
Actually Paid
to PEO(1)(2)(7) |
|
Average
Summary
Compensation
Table Total for
Non-PEO
Named
Executive
Officers(3) |
|
Average
Compensation
Actually Paid to
Non-PEO Named
Executive
Officers(2)(3)(7) |
|
Value of Initial Fixed $100
Investment Based On: |
|
Net
Income(5) |
|
Operating
Cash
Flow to
Qualifying
Net Income
Ratio(6) |
Total
Shareholder
Return |
|
Peer Group
Total
Shareholder
Return(4) |
| 2024 |
|
$ |
7,207,277 |
|
$ |
9,482,848 |
|
$ |
2,436,368 |
|
$ |
2,868,769 |
|
$ |
258 |
|
$ |
115 |
|
$ |
219 |
|
1.15x |
| 2023 |
|
$ |
7,131,438 |
|
$ |
8,610,554 |
|
$ |
1,888,781 |
|
$ |
1,797,502 |
|
$ |
208 |
|
$ |
203 |
|
$ |
142 |
|
1.14x |
| 2022 |
|
$ |
4,801,952 |
|
$ |
3,630,008 |
|
$ |
1,715,928 |
|
$ |
1,430,384 |
|
$ |
190 |
|
$ |
150 |
|
$ |
49 |
|
6.55x |
| 2021 |
|
$ |
5,235,281 |
|
$ |
12,824,898 |
|
$ |
2,131,607 |
|
$ |
3,951,356 |
|
$ |
182 |
|
$ |
119 |
|
$ |
34 |
|
4.40x |
|
|
|
|
| Company Selected Measure Name |
operating cash flow to qualifying net income
|
|
|
|
| Named Executive Officers, Footnote [Text Block] |
| (1) |
Reflects compensation for our Chief Executive Officer, Mr. Nielsen, who served as our Principal Executive Officer (PEO) for each of the last four years. |
|
|
|
|
| Peer Group Issuers, Footnote [Text Block] |
| (4) |
The Peer Group selected for Total Shareholder Return (TSR) comparisons is the S&P Composite 1500 Construction & Engineering index. |
|
|
|
|
| PEO Total Compensation Amount |
$ 7,207,277
|
$ 7,131,438
|
$ 4,801,952
|
$ 5,235,281
|
| PEO Actually Paid Compensation Amount |
$ 9,482,848
|
8,610,554
|
3,630,008
|
12,824,898
|
| Adjustment To PEO Compensation, Footnote [Text Block] |
| (7) |
The following adjustments were made to SCT total compensation to determine “compensation actually paid” for our NEOs. No adjustments were required in respect of pension plans, modifications to prior option grants, or dividend payments as none of these items are applicable to Dycom during the reported timeframe. |
|
|
PEO |
|
Other NEO Average |
| Adjustments |
|
2024 |
|
2023 |
|
2022 |
|
2021 |
|
2024 |
|
2023 |
|
2022 |
|
2021 |
Summary
Compensation
Table Total |
|
$ |
7,207,277 |
|
$ |
7,131,438 |
|
$ |
4,801,952 |
|
$ |
5,235,281 |
|
$ |
2,436,368 |
|
$ |
1,888,781 |
|
$ |
1,715,928 |
|
$ |
2,131,607 |
Deduction for
amount reported
in “Stock Awards”
column of
the Summary
Compensation
Table |
|
$ |
2,171,092 |
|
$ |
1,993,378 |
|
$ |
1,760,679 |
|
$ |
1,231,419 |
|
$ |
1,013,187 |
|
$ |
768,571 |
|
$ |
734,251 |
|
$ |
983,267 |
Deduction for
amounts reported
in “Option
Awards” column
of the Summary
Compensation
Table |
|
$ |
1,477,438 |
|
$ |
1,369,392 |
|
$ |
1,193,495 |
|
$ |
926,138 |
|
$ |
211,074 |
|
$ |
130,093 |
|
$ |
90,611 |
|
$ |
— |
Addition of fair
value at fiscal
year (FY) end, of
equity awards
granted during the
FY that remained
outstanding(a) |
|
$ |
3,812,099 |
|
$ |
3,198,813 |
|
$ |
2,388,460 |
|
$ |
7,914,808 |
|
$ |
1,398,545 |
|
$ |
760,357 |
|
$ |
601,547 |
|
$ |
2,378,984 |
Addition of change
in fair value at FY
end versus prior
FY end for awards
granted in prior
FY that remained
outstanding(a) |
|
$ |
937,718 |
|
$ |
958,486 |
|
$ |
(876,896) |
|
$ |
1,848,158 |
|
$ |
297,844 |
|
$ |
137,144 |
|
$ |
(121,022) |
|
$ |
413,974 |
Addition of fair
value at vesting
date, of equity
awards granted
during the FY that
vested during
the FY(a) |
|
$ |
— |
|
$ |
— |
|
$ |
— |
|
$ |
— |
|
$ |
— |
|
$ |
— |
|
$ |
— |
|
$ |
— |
Addition of change
in fair value at
vesting date versus
prior FY end for
awards granted
in prior FY that
vested during
the FY(a) |
|
$ |
1,174,284 |
|
$ |
684,586 |
|
$ |
270,666 |
|
$ |
(15,793) |
|
$ |
(39,728) |
|
$ |
61,747 |
|
$ |
58,793 |
|
$ |
10,058 |
Deduction of the
fair value at the
prior FY end for
awards granted
in prior FY that
failed to meet
their vesting
conditions(a) |
|
$ |
— |
|
$ |
— |
|
$ |
— |
|
$ |
— |
|
$ |
— |
|
$ |
151,863 |
|
$ |
— |
|
$ |
— |
Compensation
Actually Paid |
|
$ |
9,482,848 |
|
$ |
8,610,554 |
|
$ |
3,630,008 |
|
$ |
12,824,898 |
|
$ |
2,868,769 |
|
$ |
1,797,502 |
|
$ |
1,430,384 |
|
$ |
3,951,356 |
| (a) |
Measurement date equity fair values are calculated with assumptions derived on a basis consistent with those used for grant date fair value purposes.
Restricted stock units are valued based on the last sale price on the relevant measurement date. Options are valued using a Black Scholes model with assumptions established as at the relevant measurement date. Performance stock units are valued by applying the probable or actual outcome based on performance through the measurement date, multiplied by the last sale price on the relevant measurement date. |
| |
|
|
|
|
|
|
|
|
|
|
|
|
|
|
|
|
|
|
|
|
|
|
|
|
|
|
Fair Values
Per Share |
|
Grant Year |
| |
2024 |
|
2023 |
|
2022 |
|
2021 |
|
2020 |
|
2019 |
|
2018 |
|
2017 |
| RSUs |
|
$ |
115.18 |
|
$ |
92.73 |
|
$ |
84.53 - $94.71 |
|
$ |
81.14 - $94.71 |
|
$ |
26.34 - $94.71 |
|
$ |
26.34 - $120.43 |
|
$ |
44.51 - $82.95 |
|
$ |
44.51 - $109.11 |
| Stock Options |
|
$ |
48.34 |
|
$ |
58.67 |
|
$ |
50.49 - $59.27 |
|
$ |
58.21 - $73.64 |
|
$ |
9.61 - $53.22 |
|
$ |
4.91 - $41.57 |
|
$ |
12.18 - $34.71 |
|
$ |
10.94 - $28.77 |
|
|
Grant Year |
| Assumed Payout Factors |
|
2024 |
|
2023 |
|
2022 |
|
2021 |
|
2020 |
|
2019 |
|
2018 |
| PSUs |
|
100% - 101% |
|
98% - 100% |
|
0% - 100% |
|
42% - 117% |
|
0% - 100% |
|
8% - 40% |
|
0% - 17% | |
|
|
|
| Non-PEO NEO Average Total Compensation Amount |
$ 2,436,368
|
1,888,781
|
1,715,928
|
2,131,607
|
| Non-PEO NEO Average Compensation Actually Paid Amount |
$ 2,868,769
|
1,797,502
|
1,430,384
|
3,951,356
|
| Adjustment to Non-PEO NEO Compensation Footnote [Text Block] |
| (7) |
The following adjustments were made to SCT total compensation to determine “compensation actually paid” for our NEOs. No adjustments were required in respect of pension plans, modifications to prior option grants, or dividend payments as none of these items are applicable to Dycom during the reported timeframe. |
|
|
PEO |
|
Other NEO Average |
| Adjustments |
|
2024 |
|
2023 |
|
2022 |
|
2021 |
|
2024 |
|
2023 |
|
2022 |
|
2021 |
Summary
Compensation
Table Total |
|
$ |
7,207,277 |
|
$ |
7,131,438 |
|
$ |
4,801,952 |
|
$ |
5,235,281 |
|
$ |
2,436,368 |
|
$ |
1,888,781 |
|
$ |
1,715,928 |
|
$ |
2,131,607 |
Deduction for
amount reported
in “Stock Awards”
column of
the Summary
Compensation
Table |
|
$ |
2,171,092 |
|
$ |
1,993,378 |
|
$ |
1,760,679 |
|
$ |
1,231,419 |
|
$ |
1,013,187 |
|
$ |
768,571 |
|
$ |
734,251 |
|
$ |
983,267 |
Deduction for
amounts reported
in “Option
Awards” column
of the Summary
Compensation
Table |
|
$ |
1,477,438 |
|
$ |
1,369,392 |
|
$ |
1,193,495 |
|
$ |
926,138 |
|
$ |
211,074 |
|
$ |
130,093 |
|
$ |
90,611 |
|
$ |
— |
Addition of fair
value at fiscal
year (FY) end, of
equity awards
granted during the
FY that remained
outstanding(a) |
|
$ |
3,812,099 |
|
$ |
3,198,813 |
|
$ |
2,388,460 |
|
$ |
7,914,808 |
|
$ |
1,398,545 |
|
$ |
760,357 |
|
$ |
601,547 |
|
$ |
2,378,984 |
Addition of change
in fair value at FY
end versus prior
FY end for awards
granted in prior
FY that remained
outstanding(a) |
|
$ |
937,718 |
|
$ |
958,486 |
|
$ |
(876,896) |
|
$ |
1,848,158 |
|
$ |
297,844 |
|
$ |
137,144 |
|
$ |
(121,022) |
|
$ |
413,974 |
Addition of fair
value at vesting
date, of equity
awards granted
during the FY that
vested during
the FY(a) |
|
$ |
— |
|
$ |
— |
|
$ |
— |
|
$ |
— |
|
$ |
— |
|
$ |
— |
|
$ |
— |
|
$ |
— |
Addition of change
in fair value at
vesting date versus
prior FY end for
awards granted
in prior FY that
vested during
the FY(a) |
|
$ |
1,174,284 |
|
$ |
684,586 |
|
$ |
270,666 |
|
$ |
(15,793) |
|
$ |
(39,728) |
|
$ |
61,747 |
|
$ |
58,793 |
|
$ |
10,058 |
Deduction of the
fair value at the
prior FY end for
awards granted
in prior FY that
failed to meet
their vesting
conditions(a) |
|
$ |
— |
|
$ |
— |
|
$ |
— |
|
$ |
— |
|
$ |
— |
|
$ |
151,863 |
|
$ |
— |
|
$ |
— |
Compensation
Actually Paid |
|
$ |
9,482,848 |
|
$ |
8,610,554 |
|
$ |
3,630,008 |
|
$ |
12,824,898 |
|
$ |
2,868,769 |
|
$ |
1,797,502 |
|
$ |
1,430,384 |
|
$ |
3,951,356 |
| (a) |
Measurement date equity fair values are calculated with assumptions derived on a basis consistent with those used for grant date fair value purposes.
Restricted stock units are valued based on the last sale price on the relevant measurement date. Options are valued using a Black Scholes model with assumptions established as at the relevant measurement date. Performance stock units are valued by applying the probable or actual outcome based on performance through the measurement date, multiplied by the last sale price on the relevant measurement date. |
| |
|
|
|
|
|
|
|
|
|
|
|
|
|
|
|
|
|
|
|
|
|
|
|
|
|
|
Fair Values
Per Share |
|
Grant Year |
| |
2024 |
|
2023 |
|
2022 |
|
2021 |
|
2020 |
|
2019 |
|
2018 |
|
2017 |
| RSUs |
|
$ |
115.18 |
|
$ |
92.73 |
|
$ |
84.53 - $94.71 |
|
$ |
81.14 - $94.71 |
|
$ |
26.34 - $94.71 |
|
$ |
26.34 - $120.43 |
|
$ |
44.51 - $82.95 |
|
$ |
44.51 - $109.11 |
| Stock Options |
|
$ |
48.34 |
|
$ |
58.67 |
|
$ |
50.49 - $59.27 |
|
$ |
58.21 - $73.64 |
|
$ |
9.61 - $53.22 |
|
$ |
4.91 - $41.57 |
|
$ |
12.18 - $34.71 |
|
$ |
10.94 - $28.77 |
|
|
Grant Year |
| Assumed Payout Factors |
|
2024 |
|
2023 |
|
2022 |
|
2021 |
|
2020 |
|
2019 |
|
2018 |
| PSUs |
|
100% - 101% |
|
98% - 100% |
|
0% - 100% |
|
42% - 117% |
|
0% - 100% |
|
8% - 40% |
|
0% - 17% |
|
|
|
|
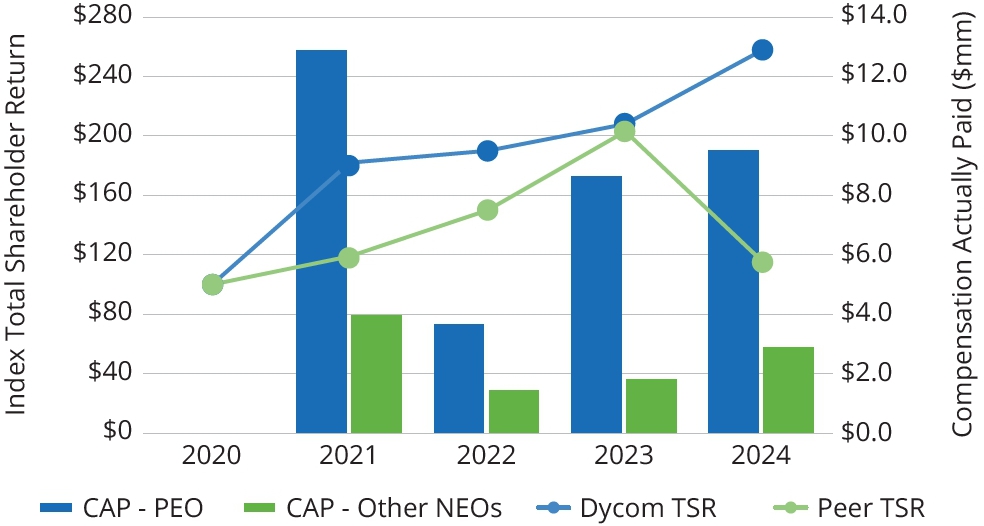
| Compensation Actually Paid vs. Total Shareholder Return [Text Block] |
Compensation Actually Paid vs Total
Shareholder Return
|
|
|
|
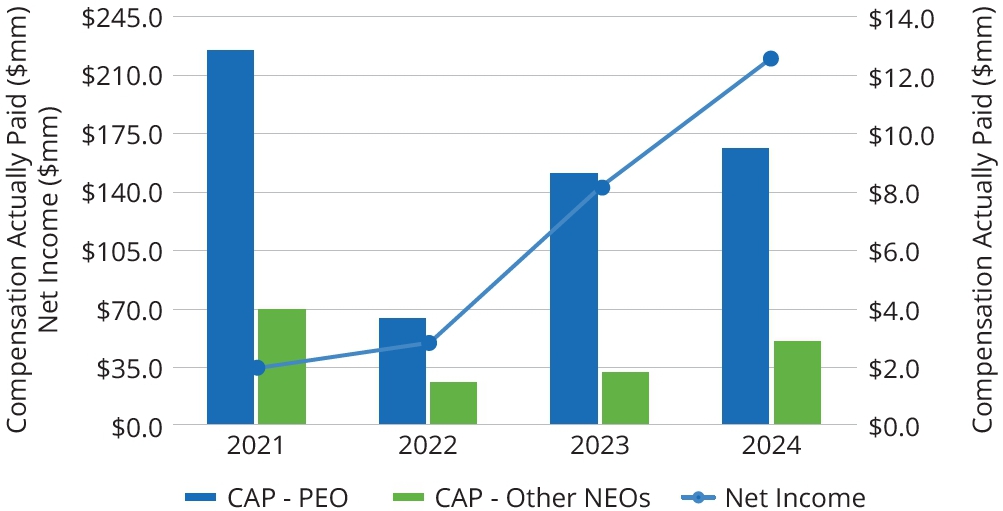
| Compensation Actually Paid vs. Net Income [Text Block] |
Compensation Actually Paid vs Net Income
|
|
|
|
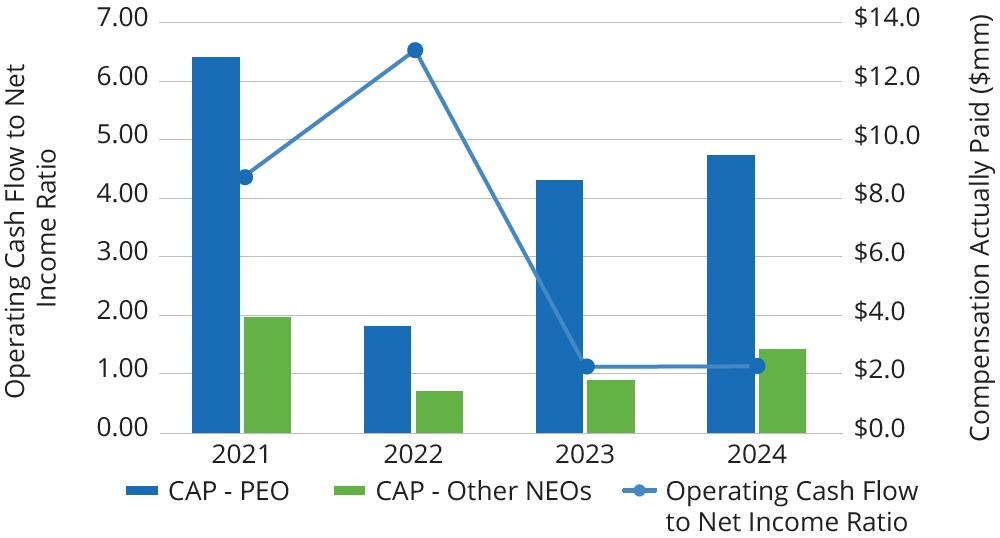
| Compensation Actually Paid vs. Company Selected Measure [Text Block] |
Compensation Actually Paid versus Operating
Cash Flow to Net Income Ratio
|
|
|
|
| Tabular List [Table Text Block] |
Tabular List of Company Performance Measures
For the fiscal year ending ended January 27, 2024, operating cash flow to qualifying net income ratio is identified as the most important financial performance measure in linking “compensation actually paid” to Dycom performance and is included in the pay versus performance table. The other most important measures for pay versus performance purposes comprise contract revenue and pre-tax income. The following table lists the collective ‘most important’ measures alphabetically.
| Tabular List of Most Important Measures |
| (1) Contract Revenue |
| (2) Operating Cash Flow to Qualifying Net Income Ratio |
| (3) Pre-Tax Income |
Further details on how these measures feature in our executive compensation program can be found in the Compensation Discussion & Analysis.
|
|
|
|
| Total Shareholder Return Amount |
$ 258
|
208
|
190
|
182
|
| Peer Group Total Shareholder Return Amount |
115
|
203
|
150
|
119
|
| Net Income (Loss) Attributable to Parent |
$ 219,000,000
|
$ 142,000,000
|
$ 49,000,000
|
$ 34,000,000
|
| Company Selected Measure Amount |
1,150,000
|
1,140,000
|
6,550,000
|
4,400,000
|
| PEO Name |
Mr. Nielsen
|
Mr. Nielsen
|
Mr. Nielsen
|
Mr. Nielsen
|
| Measure [Axis]: 1 |
|
|
|
|
| Pay vs Performance Disclosure [Table] |
|
|
|
|
| Measure Name |
(1) Contract Revenue
|
|
|
|
| Measure [Axis]: 2 |
|
|
|
|
| Pay vs Performance Disclosure [Table] |
|
|
|
|
| Measure Name |
(2) Operating Cash Flow to Qualifying Net Income Ratio
|
|
|
|
| Non-GAAP Measure Description [Text Block] |
| (6) |
The company-selected measure is the ratio of operating cash flow to qualifying net income attained. Qualifying net income is tax affected adjusted operating income. Adjusted operating income is income before income taxes excluding (a) asset impairments, (b) amounts for performance share compensation, (c) amounts recorded for changes to the Company’s capital structure, and (d) amounts for amortization of debt discount. Adjusted operating income is reduced by (a) income taxes using the Company’s effective tax rate and (b) amounts included in the provision for income taxes due to the application of FASB Accounting Standards Update No. 2016-09, Compensation – Stock Compensation (Topic 718): Improvements to Employee Share-Based Payment Accounting to arrive at Qualifying Net Income. |
|
|
|
|
| Measure [Axis]: 3 |
|
|
|
|
| Pay vs Performance Disclosure [Table] |
|
|
|
|
| Measure Name |
(3) Pre-Tax Incom
|
|
|
|
| P E O Deductionforamountreportedin Stock Awardscolumnofthe Summary Compensation Table [Member] |
|
|
|
|
| Pay vs Performance Disclosure [Table] |
|
|
|
|
| Adjustment to Compensation Amount |
$ 2,171,092
|
$ 1,993,378
|
$ 1,760,679
|
$ 1,231,419
|
| Non P E O Deductionforamountreportedin Stock Awardscolumnofthe Summary Compensation Table [Member] |
|
|
|
|
| Pay vs Performance Disclosure [Table] |
|
|
|
|
| Adjustment to Compensation Amount |
1,013,187
|
768,571
|
734,251
|
983,267
|
| P E O Deductionforamountsreportedin Option Awardscolumnofthe Summary Compensation Table [Member] |
|
|
|
|
| Pay vs Performance Disclosure [Table] |
|
|
|
|
| Adjustment to Compensation Amount |
1,477,438
|
1,369,392
|
1,193,495
|
926,138
|
| Non P E O Deductionforamountsreportedin Option Awardscolumnofthe Summary Compensation Table [Member] |
|
|
|
|
| Pay vs Performance Disclosure [Table] |
|
|
|
|
| Adjustment to Compensation Amount |
211,074
|
130,093
|
90,611
|
0
|
| P E O Addition Of Fair Value At Fiscal Year End Of Equity Awards Granted During The F Y That Remained Outstanding [Member] |
|
|
|
|
| Pay vs Performance Disclosure [Table] |
|
|
|
|
| Adjustment to Compensation Amount |
3,812,099
|
3,198,813
|
2,388,460
|
7,914,808
|
| Non P E O Addition Of Fair Value At Fiscal Year End Of Equity Awards Granted During The F Y That Remained Outstanding [Member] |
|
|
|
|
| Pay vs Performance Disclosure [Table] |
|
|
|
|
| Adjustment to Compensation Amount |
1,398,545
|
760,357
|
601,547
|
2,378,984
|
| P E O Addition Of Change In Fair Value At F Y End Versus Prior F Y End For Awards Granted In Prior F Y That Remained Outstanding [Member] |
|
|
|
|
| Pay vs Performance Disclosure [Table] |
|
|
|
|
| Adjustment to Compensation Amount |
937,718
|
958,486
|
(876,896)
|
1,848,158
|
| Non P E O Addition Of Change In Fair Value At F Y End Versus Prior F Y End For Awards Granted In Prior F Y That Remained Outstanding [Member] |
|
|
|
|
| Pay vs Performance Disclosure [Table] |
|
|
|
|
| Adjustment to Compensation Amount |
297,844
|
137,144
|
(121,022)
|
413,974
|
| P E O Addition Of Fair Value At Vesting Date Of Equity Awards Granted During The F Y That Vested During The F Y [Member] |
|
|
|
|
| Pay vs Performance Disclosure [Table] |
|
|
|
|
| Adjustment to Compensation Amount |
0
|
0
|
0
|
0
|
| Non P E O Addition Of Fair Value At Vesting Date Of Equity Awards Granted During The F Y That Vested During The F Y [Member] |
|
|
|
|
| Pay vs Performance Disclosure [Table] |
|
|
|
|
| Adjustment to Compensation Amount |
0
|
0
|
0
|
0
|
| P E O Addition Of Change In Fair Value At Vesting Date Versus Prior F Y End For Awards Granted In Prior F Y That Vested During The F Y [Member] |
|
|
|
|
| Pay vs Performance Disclosure [Table] |
|
|
|
|
| Adjustment to Compensation Amount |
1,174,284
|
684,586
|
270,666
|
(15,793)
|
| Non P E O Addition Of Change In Fair Value At Vesting Date Versus Prior F Y End For Awards Granted In Prior F Y That Vested During The F Y [Member] |
|
|
|
|
| Pay vs Performance Disclosure [Table] |
|
|
|
|
| Adjustment to Compensation Amount |
(39,728)
|
61,747
|
58,793
|
10,058
|
| P E O Deduction Of The Fair Value At The Prior F Y End For Awards Granted In Prior F Y That Failed To Meet Their Vesting Conditions [Member] |
|
|
|
|
| Pay vs Performance Disclosure [Table] |
|
|
|
|
| Adjustment to Compensation Amount |
0
|
0
|
0
|
0
|
| Non P E O Deduction Of The Fair Value At The Prior F Y End For Awards Granted In Prior F Y That Failed To Meet Their Vesting Conditions [Member] |
|
|
|
|
| Pay vs Performance Disclosure [Table] |
|
|
|
|
| Adjustment to Compensation Amount |
$ 0
|
$ 151,863
|
$ 0
|
$ 0
|