Document | | | | | |
| NEWS RELEASE |
February 28, 2024 |
DYCOM INDUSTRIES, INC. ANNOUNCES FISCAL 2024 FOURTH QUARTER AND ANNUAL RESULTS
Fourth Quarter Highlights
•Contract revenues of $952.5 million
•Non-GAAP Adjusted EBITDA of $93.7 million, or 9.8% of contract revenues
•Net Income of $23.4 million, or $0.79 per common share diluted
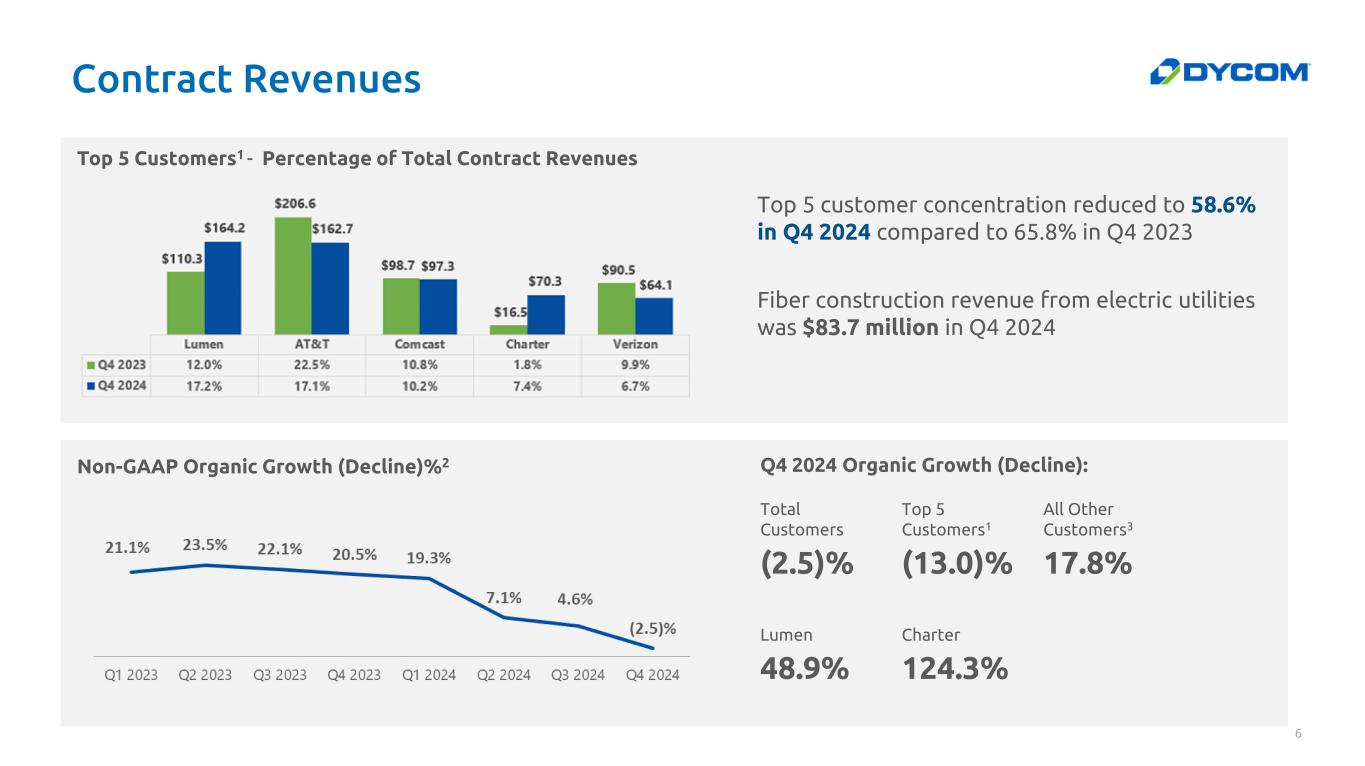
Palm Beach Gardens, Florida, February 28, 2024 - Dycom Industries, Inc. (NYSE: DY) announced today its results for the fourth quarter ended January 27, 2024. Contract revenues increased 3.8% to $952.5 million for the quarter ended January 27, 2024, compared to $917.5 million in the year ago quarter. Contract revenues decreased 2.5% on an organic basis after excluding $57.5 million of contract revenues from an acquired business that was not owned during the year ago quarter.
Non-GAAP Adjusted EBITDA increased to $93.7 million, or 9.8% of contract revenues, for the quarter ended January 27, 2024, compared to $83.1 million, or 9.1% of contract revenues, in the year ago quarter. Net income was $23.4 million, or $0.79 per common share diluted, for the quarter ended January 27, 2024, compared to $24.8 million, or $0.83 per common share diluted, in the year ago quarter.
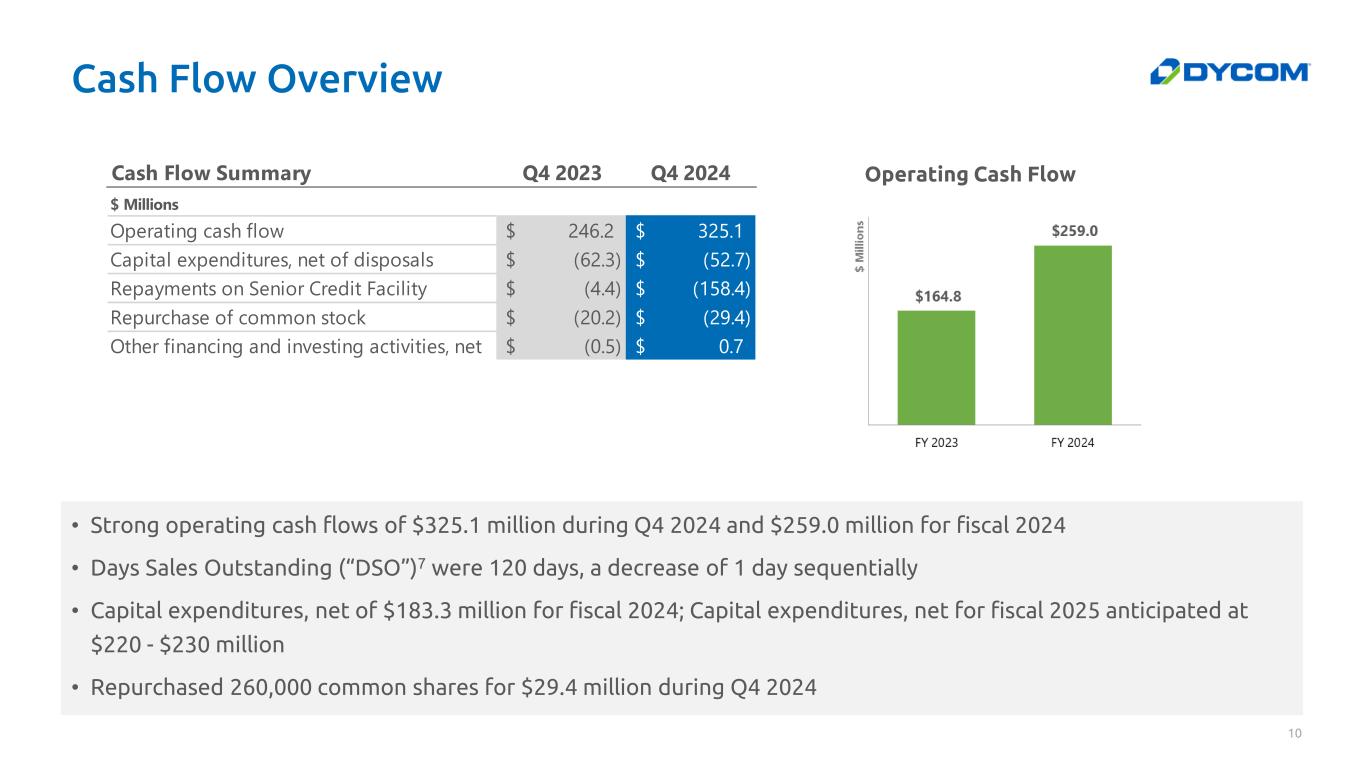
During the quarter ended January 27, 2024, the Company repurchased 260,000 shares of its own common stock in open market transactions for $29.4 million at an average price of $112.93 per share.
Annual Highlights
Contract revenues increased 9.6% to $4.176 billion for the fiscal year ended January 27, 2024, compared to $3.808 billion for the prior year. Contract revenues increased 6.9% on an organic basis after excluding $102.7 million of contract revenues from an acquired business that was not owned during the prior year.
Non-GAAP Adjusted EBITDA increased to $504.8 million, or 12.1% of contract revenues, for the fiscal year ended January 27, 2024, compared to $366.1 million, or 9.6% of contract revenues, for the prior year. Net income increased to $218.9 million, or $7.37 per common share diluted, for the fiscal year ended January 27, 2024, compared to $142.2 million, or $4.74 per common share diluted, for the prior year.
During the fiscal year ended January 27, 2024, the Company purchased 485,000 shares of its own common stock in open market
transactions for $49.7 million at an average price of $102.39 per share.
Outlook
The Company expects organic contract revenues for the quarter ending April 27, 2024 to range from in-line to slightly lower as a percentage of contract revenues compared to the quarter ended April 29, 2023. In addition, the Company expects approximately $60 million of acquired contract revenues for the quarter ending April 27, 2024. Non-GAAP Adjusted EBITDA as a percentage of contract revenues for the quarter ending April 27, 2024 is expected to increase 25 to 75 basis points compared to the quarter ended April 29, 2023. Looking ahead to the quarter ending July 27, 2024, the Company expects organic revenue growth to resume. For additional information regarding the Company’s outlook, please see the presentation materials available on the Company’s website posted in connection with the conference call discussed below.
Use of Non-GAAP Financial Measures
The Company reports its financial results in accordance with U.S. generally accepted accounting principles (GAAP). In quarterly results releases, trend schedules, conference calls, slide presentations, and webcasts, the Company may use or discuss Non-GAAP financial measures, as defined by Regulation G of the Securities and Exchange Commission. See Reconciliation of Non-GAAP Financial Measures to Comparable GAAP Financial Measures in the press release tables that follow.
Conference Call Information and Other Selected Data
The Company will host a conference call to discuss fiscal 2024 fourth quarter results on Wednesday, February 28, 2024 at 9:00 a.m. Eastern time. Interested parties may participate in the question and answer session of the conference call by registering at https://register.vevent.com/register/BI04716039406d48de96d1eaa577c7a3ee. Upon registration, participants will receive a dial-in number and unique PIN to access the call. Participants are encouraged to join approximately ten minutes prior to the scheduled start time.
For all other attendees, a live listen-only audio webcast of the call, including an accompanying slide presentation, can be accessed directly at https://edge.media-server.com/mmc/p/7zpg8iau. A replay of the live webcast and the related materials will be available on the Company's Investor Center website at https://dycomind.com/investors for approximately 120 days following the event.
About Dycom Industries, Inc.
Dycom is a leading provider of specialty contracting services to the telecommunications infrastructure and utility industries throughout the United States. These services include program management; planning; engineering and design; aerial, underground, and wireless construction; maintenance; and fulfillment services. Additionally, Dycom provides underground facility locating services for various utilities, including telecommunications providers, and other construction and maintenance services for electric and gas utilities.
Forward Looking Information
This press release contains forward-looking statements within the meaning of the 1995 Private Securities Litigation Reform Act. These forward-looking statements include those related to the outlook for the quarters ending April 27, 2024 and July 27, 2024, including, but not limited to, those statements found under the “Outlook” section of this press release. Forward-looking statements are based on management’s expectations, estimates and projections, are made solely as of the date these statements are made, and are subject to both known and unknown risks and uncertainties that may cause the actual results and occurrences discussed in these forward-looking statements to differ materially from those referenced or implied in the forward-looking statements contained in this press release. The most significant of these known risks and uncertainties are described in the Company’s Form 10-K, Form 10-Q, and Form 8-K reports (including all amendments to those reports) and include future economic conditions and trends including the potential impacts of an inflationary economic environment, changes to customer capital budgets and spending priorities, the availability and cost of materials, equipment and labor necessary to perform our work, the adequacy of the Company’s insurance and other reserves and allowances for doubtful accounts, whether the carrying value of the Company’s assets may be impaired, the future impact of any acquisitions or dispositions, adjustments and cancellations of the Company’s projects, the impact to the Company’s backlog from project cancellations or postponements, the impacts of pandemics and public health emergencies, the impact of varying climate and weather conditions, the anticipated outcome of other contingent events, including litigation or regulatory actions involving the Company, the adequacy of our liquidity, the availability of financing to address our financials needs, the Company’s ability to generate sufficient cash to service its indebtedness, the impact of restrictions imposed by the Company’s credit agreement, and other risks and uncertainties detailed from time to time in the Company’s filings with the Securities and Exchange Commission. The Company does not undertake any obligation to update its forward-looking statements.
For more information, contact:
Callie Tomasso, Vice President Investor Relations
Email: investorrelations@dycomind.com
Phone: (561) 627-7171
---Tables Follow---
| | | | | | | | | | | |
| DYCOM INDUSTRIES, INC. AND SUBSIDIARIES |
| CONDENSED CONSOLIDATED BALANCE SHEETS |
| (Dollars in thousands) |
| Unaudited |
| | | |
| January 27, 2024 | | January 28, 2023 |
| ASSETS | | | |
| Current assets: | | | |
| Cash and equivalents | $ | 101,086 | | | $ | 224,186 | |
| Accounts receivable, net | 1,243,256 | | | 1,067,013 | |
| Contract assets | 52,211 | | | 43,932 | |
| Inventories | 108,565 | | | 114,972 | |
| Income tax receivable | 2,665 | | | 3,929 | |
| Other current assets | 42,253 | | | 38,648 | |
| Total current assets | 1,550,036 | | | 1,492,680 | |
| | | |
| Property and equipment, net | 444,909 | | | 367,852 | |
| Operating lease right-of-use assets | 76,348 | | | 67,240 | |
| Goodwill and other intangible assets, net | 420,945 | | | 359,111 | |
| Other assets | 24,647 | | | 26,371 | |
| Total assets | $ | 2,516,885 | | | $ | 2,313,254 | |
| | | |
| LIABILITIES AND STOCKHOLDERS’ EQUITY | | | |
| Current liabilities: | | | |
| Accounts payable | $ | 222,121 | | | $ | 207,739 | |
| Current portion of debt | 17,500 | | | 17,500 | |
| Contract liabilities | 39,122 | | | 19,512 | |
| Accrued insurance claims | 44,466 | | | 41,043 | |
| Operating lease liabilities | 32,015 | | | 27,527 | |
| Income taxes payable | 3,861 | | | 14,896 | |
| Other accrued liabilities | 147,219 | | | 141,334 | |
| Total current liabilities | 506,304 | | | 469,551 | |
| | | |
| Long-term debt | 791,415 | | | 807,367 | |
| Accrued insurance claims - non-current | 49,447 | | | 49,347 | |
| Operating lease liabilities - non-current | 44,110 | | | 39,628 | |
| Deferred tax liabilities, net - non-current | 49,562 | | | 60,205 | |
| Other liabilities | 21,391 | | | 18,401 | |
| Total liabilities | 1,462,229 | | | 1,444,499 | |
| | | |
| Total stockholders’ equity | 1,054,656 | | | 868,755 | |
| Total liabilities and stockholders’ equity | $ | 2,516,885 | | | $ | 2,313,254 | |
| | | |
| | | | | | | | | | | | | | | | | | | | | | | |
| DYCOM INDUSTRIES, INC. AND SUBSIDIARIES |
| CONDENSED CONSOLIDATED STATEMENTS OF OPERATIONS |
| (Dollars in thousands, except share amounts) |
| Unaudited |
| | | | | | | |
| Quarter | | Quarter | | Fiscal Year | | Fiscal Year |
| Ended | | Ended | | Ended | | Ended |
| January 27, 2024 | | January 28, 2023 | | January 27, 2024 | | January 28, 2023 |
| Contract revenues | $ | 952,455 | | | $ | 917,466 | | | $ | 4,175,574 | | | $ | 3,808,462 | |
| | | | | | | |
| Costs of earned revenues, excluding depreciation and amortization | 791,378 | | | 765,658 | | | 3,361,815 | | | 3,160,264 | |
General and administrative1 | 72,975 | | | 71,964 | | | 327,674 | | | 293,478 | |
| Depreciation and amortization | 45,306 | | | 36,745 | | | 163,092 | | | 144,181 | |
| Total | 909,659 | | | 874,367 | | | 3,852,581 | | | 3,597,923 | |
| | | | | | | |
| Interest expense, net | (15,002) | | | (11,561) | | | (52,603) | | | (40,618) | |
| | | | | | | |
| Other income, net | 3,981 | | | 345 | | | 21,609 | | | 10,201 | |
| Income before income taxes | 31,775 | | | 31,883 | | | 291,999 | | | 180,122 | |
| | | | | | | |
Provision for income taxes2 | 8,357 | | | 7,074 | | | 73,076 | | | 37,909 | |
| | | | | | | |
| Net income | $ | 23,418 | | | $ | 24,809 | | | $ | 218,923 | | | $ | 142,213 | |
| | | | | | | |
| Earnings per common share: | | | | | | | |
| | | | | | | |
| Basic earnings per common share | $ | 0.80 | | | $ | 0.84 | | | $ | 7.46 | | | $ | 4.81 | |
| | | | | | | |
| Diluted earnings per common share | $ | 0.79 | | | $ | 0.83 | | | $ | 7.37 | | | $ | 4.74 | |
| | | | | | | |
| Shares used in computing earnings per common share: | | | | |
| | | | | | | |
| Basic | 29,300,031 | | | 29,516,443 | | | 29,333,054 | | | 29,549,990 | |
| | | | | | | |
| Diluted | 29,713,204 | | | 29,964,593 | | | 29,698,926 | | | 29,996,591 | |
| | | | | | | |
| | | | | | | | | | | | | | | | | | | | | | | |
| DYCOM INDUSTRIES, INC. AND SUBSIDIARIES |
RECONCILIATION OF NON-GAAP FINANCIAL MEASURES
TO COMPARABLE GAAP FINANCIAL MEASURES |
| (Dollars in thousands) |
| Unaudited |
| | | | | | | |
| CONTRACT REVENUES, NON-GAAP ORGANIC CONTRACT REVENUES, AND GROWTH (DECLINE) % |
| | | | | | | |
| Quarter | | Quarter | | Fiscal Year | | Fiscal Year |
| Ended | | Ended | | Ended | | Ended |
| January 27, 2024 | | January 28, 2023 | | January 27, 2024 | | January 28, 2023 |
| Contract Revenues - GAAP | $ | 952,455 | | $ | 917,466 | | | $ | 4,175,574 | | $ | 3,808,462 | |
| Contract Revenues - GAAP Growth % | 3.8 | % | | | | 9.6 | % | | |
| | | | | | | |
| Contract Revenues - GAAP | $ | 952,455 | | $ | 917,466 | | | $ | 4,175,574 | | $ | 3,808,462 | |
Revenues from an acquired business3 | (57,468) | | — | | | (102,692) | | — | |
| Non-GAAP Organic Contract Revenues | $ | 894,987 | | $ | 917,466 | | | $ | 4,072,882 | | $ | 3,808,462 | |
| Non-GAAP Organic Contract Revenues (Decline) Growth % | (2.5) | % | | | | 6.9 | % | | |
| | | | | | | |
| | | | | | | | | | | | | | | | | | | | | | | |
| NET INCOME AND NON-GAAP ADJUSTED EBITDA |
| | | | | | | |
| Quarter | | Quarter | | Fiscal Year | | Fiscal Year |
| Ended | | Ended | | Ended | | Ended |
| January 27, 2024 | | January 28, 2023 | | January 27, 2024 | | January 28, 2023 |
| Reconciliation of net income to Non-GAAP Adjusted EBITDA: | | | | | | | |
| Net income | $ | 23,418 | | | $ | 24,809 | | | $ | 218,923 | | | $ | 142,213 | |
| Interest expense, net | 15,002 | | | 11,561 | | | 52,603 | | | 40,618 | |
| Provision for income taxes | 8,357 | | | 7,074 | | | 73,076 | | | 37,909 | |
| Depreciation and amortization | 45,306 | | | 36,745 | | | 163,092 | | | 144,181 | |
| Earnings Before Interest, Taxes, Depreciation & Amortization ("EBITDA") | 92,083 | | | 80,189 | | | 507,694 | | | 364,921 | |
| Gain on sale of fixed assets | (4,618) | | | (2,768) | | | (28,348) | | | (16,759) | |
| Stock-based compensation expense | 6,217 | | | 5,654 | | | 25,457 | | | 17,927 | |
| Non-GAAP Adjusted EBITDA | $ | 93,682 | | | $ | 83,075 | | | $ | 504,803 | | | $ | 366,089 | |
| Non-GAAP Adjusted EBITDA % of contract revenues | 9.8 | % | | 9.1 | % | | 12.1 | % | | 9.6 | % |
| | | | | | | |
DYCOM INDUSTRIES, INC. AND SUBSIDIARIES
RECONCILIATION OF NON-GAAP FINANCIAL MEASURES
TO COMPARABLE GAAP FINANCIAL MEASURES (CONTINUED)
Explanation of Non-GAAP Financial Measures
The Company reports its financial results in accordance with U.S. generally accepted accounting principles (GAAP). In the Company’s quarterly results releases, trend schedules, conference calls, slide presentations, and webcasts, it may use or discuss Non-GAAP financial measures, as defined by Regulation G of the Securities and Exchange Commission. The Company believes that the presentation of certain Non-GAAP financial measures in these materials provides information that is useful to investors because it allows for a more direct comparison of the Company’s performance for the period reported with the Company’s performance in prior periods. The Company cautions that Non-GAAP financial measures should be considered in addition to, but not as a substitute for, the Company’s reported GAAP results. Management defines the Non-GAAP financial measures used as follows:
•Non-GAAP Organic Contract Revenues - contract revenues from businesses that are included for the entire period in both the current and prior year periods, excluding contract revenues from storm restoration services. Non-GAAP Organic Contract Revenue change percentage is calculated as the change in Non-GAAP Organic Contract Revenues from the comparable prior year period divided by the comparable prior year period Non-GAAP Organic Contract Revenues. Management believes Non-GAAP Organic Contract Revenues is a helpful measure for comparing the Company’s revenue performance with prior periods.
•Non-GAAP Adjusted EBITDA - net income before interest, taxes, depreciation and amortization, gain on sale of fixed assets, stock-based compensation expense, and certain non-recurring items. Management believes Non-GAAP Adjusted EBITDA is a helpful measure for comparing the Company’s operating performance with prior periods as well as with the performance of other companies with different capital structures or tax rates.
Notes
1 Includes stock-based compensation expense of $6.2 million and $5.7 million for the quarters ended January 27, 2024 and January 28, 2023, respectively, and $25.5 million and $17.9 million for the fiscal years ended January 27, 2024 and January 28, 2023, respectively.
2 Net income for the fiscal year ended January 27, 2024 includes income tax benefits of $2.9 million related to the vesting and exercise of share-based awards. Net income for the fiscal year ended January 28, 2023 includes income tax benefits of $7.6 million related to the vesting and exercise of share-based awards, credits related to tax filings for prior years, and other incremental tax benefits.
3 Amounts represent contract revenues from an acquired business that was not owned for the full period in both the current and comparable prior periods.


