0000066382false2024Q2June 100000663822023-06-042023-12-0200000663822024-01-05xbrli:shares00000663822023-09-032023-12-02iso4217:USD00000663822022-09-042022-12-0300000663822022-05-292022-12-03iso4217:USDxbrli:shares00000663822023-12-0200000663822023-06-030000066382us-gaap:CommonStockMember2023-06-0300000663822022-05-2800000663822022-12-030000066382us-gaap:AdditionalPaidInCapitalMember2023-06-030000066382us-gaap:RetainedEarningsMember2023-06-030000066382us-gaap:AccumulatedOtherComprehensiveIncomeMember2023-06-030000066382us-gaap:DeferredCompensationShareBasedPaymentsMember2023-06-030000066382us-gaap:RetainedEarningsMember2023-06-042023-09-0200000663822023-06-042023-09-020000066382us-gaap:AccumulatedOtherComprehensiveIncomeMember2023-06-042023-09-020000066382us-gaap:CommonStockMember2023-06-042023-09-020000066382us-gaap:AdditionalPaidInCapitalMember2023-06-042023-09-020000066382us-gaap:CommonStockMember2023-09-020000066382us-gaap:AdditionalPaidInCapitalMember2023-09-020000066382us-gaap:RetainedEarningsMember2023-09-020000066382us-gaap:AccumulatedOtherComprehensiveIncomeMember2023-09-020000066382us-gaap:DeferredCompensationShareBasedPaymentsMember2023-09-0200000663822023-09-020000066382us-gaap:RetainedEarningsMember2023-09-032023-12-020000066382us-gaap:AccumulatedOtherComprehensiveIncomeMember2023-09-032023-12-020000066382us-gaap:AdditionalPaidInCapitalMember2023-09-032023-12-020000066382us-gaap:CommonStockMember2023-09-032023-12-020000066382us-gaap:CommonStockMember2023-12-020000066382us-gaap:AdditionalPaidInCapitalMember2023-12-020000066382us-gaap:RetainedEarningsMember2023-12-020000066382us-gaap:AccumulatedOtherComprehensiveIncomeMember2023-12-020000066382us-gaap:DeferredCompensationShareBasedPaymentsMember2023-12-020000066382us-gaap:CommonStockMember2022-05-280000066382us-gaap:AdditionalPaidInCapitalMember2022-05-280000066382us-gaap:RetainedEarningsMember2022-05-280000066382us-gaap:AccumulatedOtherComprehensiveIncomeMember2022-05-280000066382us-gaap:DeferredCompensationShareBasedPaymentsMember2022-05-280000066382us-gaap:RetainedEarningsMember2022-05-292022-09-0300000663822022-05-292022-09-030000066382us-gaap:AccumulatedOtherComprehensiveIncomeMember2022-05-292022-09-030000066382us-gaap:CommonStockMember2022-05-292022-09-030000066382us-gaap:AdditionalPaidInCapitalMember2022-05-292022-09-030000066382us-gaap:CommonStockMember2022-09-030000066382us-gaap:AdditionalPaidInCapitalMember2022-09-030000066382us-gaap:RetainedEarningsMember2022-09-030000066382us-gaap:AccumulatedOtherComprehensiveIncomeMember2022-09-030000066382us-gaap:DeferredCompensationShareBasedPaymentsMember2022-09-0300000663822022-09-030000066382us-gaap:RetainedEarningsMember2022-09-042022-12-030000066382us-gaap:AccumulatedOtherComprehensiveIncomeMember2022-09-042022-12-030000066382us-gaap:CommonStockMember2022-09-042022-12-030000066382us-gaap:AdditionalPaidInCapitalMember2022-09-042022-12-030000066382us-gaap:CommonStockMember2022-12-030000066382us-gaap:AdditionalPaidInCapitalMember2022-12-030000066382us-gaap:RetainedEarningsMember2022-12-030000066382us-gaap:AccumulatedOtherComprehensiveIncomeMember2022-12-030000066382us-gaap:DeferredCompensationShareBasedPaymentsMember2022-12-030000066382mlkn:GlobalHoldingsNetherlandsBVMember2023-10-29xbrli:pure0000066382mlkn:MaarsHoldingBVMembermlkn:GlobalHoldingsNetherlandsBVMember2023-10-300000066382mlkn:GlobalHoldingsNetherlandsBVMember2023-10-302023-10-300000066382mlkn:GlobalHoldingsNetherlandsBVMember2023-10-300000066382mlkn:SinglePerformanceObligationMemberus-gaap:ProductMember2023-09-032023-12-020000066382mlkn:SinglePerformanceObligationMemberus-gaap:ProductMember2022-09-042022-12-030000066382mlkn:SinglePerformanceObligationMemberus-gaap:ProductMember2023-06-042023-12-020000066382mlkn:SinglePerformanceObligationMemberus-gaap:ProductMember2022-05-292022-12-030000066382us-gaap:ProductMembermlkn:MultiplePerformanceObligationsMember2023-09-032023-12-020000066382us-gaap:ProductMembermlkn:MultiplePerformanceObligationsMember2022-09-042022-12-030000066382us-gaap:ProductMembermlkn:MultiplePerformanceObligationsMember2023-06-042023-12-020000066382us-gaap:ProductMembermlkn:MultiplePerformanceObligationsMember2022-05-292022-12-030000066382us-gaap:ServiceMembermlkn:MultiplePerformanceObligationsMember2023-09-032023-12-020000066382us-gaap:ServiceMembermlkn:MultiplePerformanceObligationsMember2022-09-042022-12-030000066382us-gaap:ServiceMembermlkn:MultiplePerformanceObligationsMember2023-06-042023-12-020000066382us-gaap:ServiceMembermlkn:MultiplePerformanceObligationsMember2022-05-292022-12-030000066382mlkn:OtherMember2023-09-032023-12-020000066382mlkn:OtherMember2022-09-042022-12-030000066382mlkn:OtherMember2023-06-042023-12-020000066382mlkn:OtherMember2022-05-292022-12-030000066382mlkn:WorkplaceMemberus-gaap:OperatingSegmentsMembermlkn:AmericasContractMember2023-09-032023-12-020000066382mlkn:WorkplaceMemberus-gaap:OperatingSegmentsMembermlkn:AmericasContractMember2022-09-042022-12-030000066382mlkn:WorkplaceMemberus-gaap:OperatingSegmentsMembermlkn:AmericasContractMember2023-06-042023-12-020000066382mlkn:WorkplaceMemberus-gaap:OperatingSegmentsMembermlkn:AmericasContractMember2022-05-292022-12-030000066382us-gaap:OperatingSegmentsMembermlkn:AmericasContractMembermlkn:PerformanceSeatingMember2023-09-032023-12-020000066382us-gaap:OperatingSegmentsMembermlkn:AmericasContractMembermlkn:PerformanceSeatingMember2022-09-042022-12-030000066382us-gaap:OperatingSegmentsMembermlkn:AmericasContractMembermlkn:PerformanceSeatingMember2023-06-042023-12-020000066382us-gaap:OperatingSegmentsMembermlkn:AmericasContractMembermlkn:PerformanceSeatingMember2022-05-292022-12-030000066382us-gaap:OperatingSegmentsMembermlkn:AmericasContractMembermlkn:LifestyleMember2023-09-032023-12-020000066382us-gaap:OperatingSegmentsMembermlkn:AmericasContractMembermlkn:LifestyleMember2022-09-042022-12-030000066382us-gaap:OperatingSegmentsMembermlkn:AmericasContractMembermlkn:LifestyleMember2023-06-042023-12-020000066382us-gaap:OperatingSegmentsMembermlkn:AmericasContractMembermlkn:LifestyleMember2022-05-292022-12-030000066382us-gaap:OperatingSegmentsMembermlkn:AmericasContractMembermlkn:OtherProductsMember2023-09-032023-12-020000066382us-gaap:OperatingSegmentsMembermlkn:AmericasContractMembermlkn:OtherProductsMember2022-09-042022-12-030000066382us-gaap:OperatingSegmentsMembermlkn:AmericasContractMembermlkn:OtherProductsMember2023-06-042023-12-020000066382us-gaap:OperatingSegmentsMembermlkn:AmericasContractMembermlkn:OtherProductsMember2022-05-292022-12-030000066382us-gaap:OperatingSegmentsMembermlkn:AmericasContractMember2023-09-032023-12-020000066382us-gaap:OperatingSegmentsMembermlkn:AmericasContractMember2022-09-042022-12-030000066382us-gaap:OperatingSegmentsMembermlkn:AmericasContractMember2023-06-042023-12-020000066382us-gaap:OperatingSegmentsMembermlkn:AmericasContractMember2022-05-292022-12-030000066382mlkn:WorkplaceMemberus-gaap:OperatingSegmentsMembermlkn:InternationalContractSpecialtyMember2023-09-032023-12-020000066382mlkn:WorkplaceMemberus-gaap:OperatingSegmentsMembermlkn:InternationalContractSpecialtyMember2022-09-042022-12-030000066382mlkn:WorkplaceMemberus-gaap:OperatingSegmentsMembermlkn:InternationalContractSpecialtyMember2023-06-042023-12-020000066382mlkn:WorkplaceMemberus-gaap:OperatingSegmentsMembermlkn:InternationalContractSpecialtyMember2022-05-292022-12-030000066382us-gaap:OperatingSegmentsMembermlkn:InternationalContractSpecialtyMembermlkn:PerformanceSeatingMember2023-09-032023-12-020000066382us-gaap:OperatingSegmentsMembermlkn:InternationalContractSpecialtyMembermlkn:PerformanceSeatingMember2022-09-042022-12-030000066382us-gaap:OperatingSegmentsMembermlkn:InternationalContractSpecialtyMembermlkn:PerformanceSeatingMember2023-06-042023-12-020000066382us-gaap:OperatingSegmentsMembermlkn:InternationalContractSpecialtyMembermlkn:PerformanceSeatingMember2022-05-292022-12-030000066382us-gaap:OperatingSegmentsMembermlkn:InternationalContractSpecialtyMembermlkn:LifestyleMember2023-09-032023-12-020000066382us-gaap:OperatingSegmentsMembermlkn:InternationalContractSpecialtyMembermlkn:LifestyleMember2022-09-042022-12-030000066382us-gaap:OperatingSegmentsMembermlkn:InternationalContractSpecialtyMembermlkn:LifestyleMember2023-06-042023-12-020000066382us-gaap:OperatingSegmentsMembermlkn:InternationalContractSpecialtyMembermlkn:LifestyleMember2022-05-292022-12-030000066382us-gaap:OperatingSegmentsMembermlkn:InternationalContractSpecialtyMembermlkn:OtherProductsMember2023-09-032023-12-020000066382us-gaap:OperatingSegmentsMembermlkn:InternationalContractSpecialtyMembermlkn:OtherProductsMember2022-09-042022-12-030000066382us-gaap:OperatingSegmentsMembermlkn:InternationalContractSpecialtyMembermlkn:OtherProductsMember2023-06-042023-12-020000066382us-gaap:OperatingSegmentsMembermlkn:InternationalContractSpecialtyMembermlkn:OtherProductsMember2022-05-292022-12-030000066382us-gaap:OperatingSegmentsMembermlkn:InternationalContractSpecialtyMember2023-09-032023-12-020000066382us-gaap:OperatingSegmentsMembermlkn:InternationalContractSpecialtyMember2022-09-042022-12-030000066382us-gaap:OperatingSegmentsMembermlkn:InternationalContractSpecialtyMember2023-06-042023-12-020000066382us-gaap:OperatingSegmentsMembermlkn:InternationalContractSpecialtyMember2022-05-292022-12-030000066382mlkn:WorkplaceMemberus-gaap:OperatingSegmentsMembermlkn:RetailSegmentMember2023-09-032023-12-020000066382mlkn:WorkplaceMemberus-gaap:OperatingSegmentsMembermlkn:RetailSegmentMember2022-09-042022-12-030000066382mlkn:WorkplaceMemberus-gaap:OperatingSegmentsMembermlkn:RetailSegmentMember2023-06-042023-12-020000066382mlkn:WorkplaceMemberus-gaap:OperatingSegmentsMembermlkn:RetailSegmentMember2022-05-292022-12-030000066382us-gaap:OperatingSegmentsMembermlkn:RetailSegmentMembermlkn:PerformanceSeatingMember2023-09-032023-12-020000066382us-gaap:OperatingSegmentsMembermlkn:RetailSegmentMembermlkn:PerformanceSeatingMember2022-09-042022-12-030000066382us-gaap:OperatingSegmentsMembermlkn:RetailSegmentMembermlkn:PerformanceSeatingMember2023-06-042023-12-020000066382us-gaap:OperatingSegmentsMembermlkn:RetailSegmentMembermlkn:PerformanceSeatingMember2022-05-292022-12-030000066382us-gaap:OperatingSegmentsMembermlkn:RetailSegmentMembermlkn:LifestyleMember2023-09-032023-12-020000066382us-gaap:OperatingSegmentsMembermlkn:RetailSegmentMembermlkn:LifestyleMember2022-09-042022-12-030000066382us-gaap:OperatingSegmentsMembermlkn:RetailSegmentMembermlkn:LifestyleMember2023-06-042023-12-020000066382us-gaap:OperatingSegmentsMembermlkn:RetailSegmentMembermlkn:LifestyleMember2022-05-292022-12-030000066382us-gaap:OperatingSegmentsMembermlkn:RetailSegmentMembermlkn:OtherProductsMember2023-09-032023-12-020000066382us-gaap:OperatingSegmentsMembermlkn:RetailSegmentMembermlkn:OtherProductsMember2022-09-042022-12-030000066382us-gaap:OperatingSegmentsMembermlkn:RetailSegmentMembermlkn:OtherProductsMember2023-06-042023-12-020000066382us-gaap:OperatingSegmentsMembermlkn:RetailSegmentMembermlkn:OtherProductsMember2022-05-292022-12-030000066382us-gaap:OperatingSegmentsMembermlkn:RetailSegmentMember2023-09-032023-12-020000066382us-gaap:OperatingSegmentsMembermlkn:RetailSegmentMember2022-09-042022-12-030000066382us-gaap:OperatingSegmentsMembermlkn:RetailSegmentMember2023-06-042023-12-020000066382us-gaap:OperatingSegmentsMembermlkn:RetailSegmentMember2022-05-292022-12-030000066382mlkn:KnollIncMember2021-05-302022-05-280000066382mlkn:KnollIncMember2021-07-190000066382mlkn:KnollIncMember2021-07-192021-07-190000066382mlkn:KnollIncMember2021-07-190000066382us-gaap:RestrictedStockMembermlkn:KnollIncMember2021-07-190000066382mlkn:KnollIncMembermlkn:KnollIncMember2021-07-190000066382mlkn:KnollIncMembermlkn:KnollIncMember2021-05-302022-05-280000066382mlkn:KnollIncMemberus-gaap:OrderOrProductionBacklogMember2021-07-192021-07-190000066382mlkn:KnollIncMemberus-gaap:OrderOrProductionBacklogMember2021-07-190000066382mlkn:KnollIncMemberus-gaap:TradeNamesMember2021-07-190000066382srt:MinimumMembermlkn:KnollIncMemberus-gaap:TradeNamesMember2021-07-192021-07-190000066382mlkn:KnollIncMemberus-gaap:TradeNamesMembersrt:MaximumMember2021-07-192021-07-190000066382mlkn:KnollIncMemberus-gaap:TradeNamesMember2021-07-190000066382srt:MinimumMembermlkn:KnollIncMembermlkn:DesignsMember2021-07-192021-07-190000066382mlkn:KnollIncMembersrt:MaximumMembermlkn:DesignsMember2021-07-192021-07-190000066382mlkn:KnollIncMembermlkn:DesignsMember2021-07-190000066382srt:MinimumMembermlkn:KnollIncMemberus-gaap:CustomerRelationshipsMember2021-07-192021-07-190000066382mlkn:KnollIncMemberus-gaap:CustomerRelationshipsMembersrt:MaximumMember2021-07-192021-07-190000066382mlkn:KnollIncMemberus-gaap:CustomerRelationshipsMember2021-07-190000066382mlkn:AmericasContractMember2023-06-030000066382mlkn:InternationalContractSpecialtyMember2023-06-030000066382mlkn:RetailSegmentMember2023-06-030000066382mlkn:AmericasContractMember2023-06-042023-12-020000066382mlkn:InternationalContractSpecialtyMember2023-06-042023-12-020000066382mlkn:RetailSegmentMember2023-06-042023-12-020000066382mlkn:AmericasContractMember2023-12-020000066382mlkn:InternationalContractSpecialtyMember2023-12-020000066382mlkn:RetailSegmentMember2023-12-020000066382mlkn:GlobalRetailMember2023-03-040000066382country:US2023-09-032023-12-020000066382us-gaap:ForeignPlanMember2023-09-032023-12-020000066382country:US2022-09-042022-12-030000066382us-gaap:ForeignPlanMember2022-09-042022-12-030000066382country:US2023-06-042023-12-020000066382us-gaap:ForeignPlanMember2023-06-042023-12-020000066382country:US2022-05-292022-12-030000066382us-gaap:ForeignPlanMember2022-05-292022-12-030000066382us-gaap:CarryingReportedAmountFairValueDisclosureMember2023-12-020000066382us-gaap:CarryingReportedAmountFairValueDisclosureMember2023-06-030000066382us-gaap:EstimateOfFairValueFairValueDisclosureMember2023-12-020000066382us-gaap:EstimateOfFairValueFairValueDisclosureMember2023-06-030000066382us-gaap:FairValueMeasuredAtNetAssetValuePerShareMemberus-gaap:MoneyMarketFundsMemberus-gaap:FairValueMeasurementsRecurringMember2023-12-020000066382us-gaap:FairValueInputsLevel2Memberus-gaap:MoneyMarketFundsMemberus-gaap:FairValueMeasurementsRecurringMember2023-12-020000066382us-gaap:FairValueMeasuredAtNetAssetValuePerShareMemberus-gaap:MoneyMarketFundsMemberus-gaap:FairValueMeasurementsRecurringMember2023-06-030000066382us-gaap:FairValueInputsLevel2Memberus-gaap:MoneyMarketFundsMemberus-gaap:FairValueMeasurementsRecurringMember2023-06-030000066382us-gaap:ForeignExchangeForwardMemberus-gaap:FairValueMeasuredAtNetAssetValuePerShareMemberus-gaap:FairValueMeasurementsRecurringMember2023-12-020000066382us-gaap:ForeignExchangeForwardMemberus-gaap:FairValueInputsLevel2Memberus-gaap:FairValueMeasurementsRecurringMember2023-12-020000066382us-gaap:ForeignExchangeForwardMemberus-gaap:FairValueMeasuredAtNetAssetValuePerShareMemberus-gaap:FairValueMeasurementsRecurringMember2023-06-030000066382us-gaap:ForeignExchangeForwardMemberus-gaap:FairValueInputsLevel2Memberus-gaap:FairValueMeasurementsRecurringMember2023-06-030000066382us-gaap:FairValueMeasuredAtNetAssetValuePerShareMemberus-gaap:FairValueMeasurementsRecurringMember2023-12-020000066382us-gaap:FairValueInputsLevel2Memberus-gaap:FairValueMeasurementsRecurringMember2023-12-020000066382us-gaap:FairValueMeasuredAtNetAssetValuePerShareMemberus-gaap:FairValueMeasurementsRecurringMember2023-06-030000066382us-gaap:FairValueInputsLevel2Memberus-gaap:FairValueMeasurementsRecurringMember2023-06-030000066382us-gaap:FairValueInputsLevel2Memberus-gaap:FairValueMeasurementsRecurringMemberus-gaap:OtherComprehensiveIncomeMemberus-gaap:InterestRateSwapMember2023-12-020000066382us-gaap:FairValueInputsLevel2Memberus-gaap:FairValueMeasurementsRecurringMemberus-gaap:OtherComprehensiveIncomeMemberus-gaap:InterestRateSwapMember2023-06-030000066382us-gaap:FairValueInputsLevel2Memberus-gaap:FairValueMeasurementsRecurringMemberus-gaap:OtherComprehensiveIncomeMember2023-12-020000066382us-gaap:FairValueInputsLevel2Memberus-gaap:FairValueMeasurementsRecurringMemberus-gaap:OtherComprehensiveIncomeMember2023-06-030000066382mlkn:September2016InterestRateSwapMember2023-12-020000066382mlkn:September2016InterestRateSwapMember2023-06-042023-12-020000066382mlkn:June2017InterestRateSwapMember2023-12-020000066382mlkn:June2017InterestRateSwapMember2023-06-042023-12-020000066382mlkn:January2022InterestRateSwapMember2023-12-020000066382mlkn:January2022InterestRateSwapMember2023-06-042023-12-020000066382mlkn:March2023InterestRateSwapMember2023-12-020000066382mlkn:March2023InterestRateSwapMember2023-06-042023-12-020000066382us-gaap:SecuredOvernightFinancingRateSofrOvernightIndexSwapRateMembermlkn:March2023InterestRateSwapMember2023-06-042023-12-020000066382mlkn:HAYASMember2023-06-030000066382mlkn:HAYASMember2022-05-280000066382mlkn:HAYASMember2023-06-042023-12-020000066382mlkn:HAYASMember2022-05-292022-12-030000066382mlkn:HAYASMember2023-12-020000066382mlkn:HAYASMember2022-12-030000066382srt:MinimumMemberus-gaap:PerformanceGuaranteeMember2023-06-042023-12-020000066382srt:MaximumMemberus-gaap:PerformanceGuaranteeMember2023-06-042023-12-020000066382us-gaap:PerformanceGuaranteeMember2023-12-020000066382us-gaap:PerformanceGuaranteeMember2023-06-030000066382us-gaap:FinancialStandbyLetterOfCreditMember2023-12-020000066382us-gaap:FinancialStandbyLetterOfCreditMember2023-06-030000066382mlkn:SyndicatedRevolvingLineOfCreditDueJuly2026Memberus-gaap:DomesticLineOfCreditMember2023-12-020000066382mlkn:SyndicatedRevolvingLineOfCreditDueJuly2026Memberus-gaap:DomesticLineOfCreditMember2023-06-030000066382mlkn:TermLoanADueJuly2026Member2023-12-020000066382mlkn:TermLoanADueJuly2026Member2023-06-030000066382mlkn:TermLoanBDueJuly2028Member2023-12-020000066382mlkn:TermLoanBDueJuly2028Member2023-06-030000066382us-gaap:NotesPayableOtherPayablesMembermlkn:PrivatePlacementNotesMember2021-07-31mlkn:loan0000066382us-gaap:DomesticLineOfCreditMember2021-07-310000066382us-gaap:DomesticLineOfCreditMember2021-06-300000066382mlkn:TermLoanADueJuly2026Memberus-gaap:SecuredDebtMember2021-07-012021-07-310000066382mlkn:TermLoanADueJuly2026Memberus-gaap:SecuredDebtMember2021-07-310000066382mlkn:TermLoanBDueJuly2028Memberus-gaap:SecuredDebtMember2021-07-012021-07-310000066382mlkn:TermLoanBDueJuly2028Memberus-gaap:SecuredDebtMember2021-07-310000066382mlkn:TermLoanADueJuly2026AndTermLoanBDueJuly2028Member2023-06-042023-12-020000066382mlkn:TermLoanADueJuly2026AndTermLoanBDueJuly2028Member2022-05-292022-12-030000066382us-gaap:AccumulatedTranslationAdjustmentMember2023-06-030000066382us-gaap:AccumulatedDefinedBenefitPlansAdjustmentMember2023-06-030000066382us-gaap:AccumulatedGainLossNetCashFlowHedgeParentMember2023-06-030000066382us-gaap:AccumulatedTranslationAdjustmentMember2023-06-042023-12-020000066382us-gaap:AccumulatedDefinedBenefitPlansAdjustmentMember2023-06-042023-12-020000066382us-gaap:AccumulatedGainLossNetCashFlowHedgeParentMember2023-06-042023-12-020000066382us-gaap:AccumulatedTranslationAdjustmentMember2023-12-020000066382us-gaap:AccumulatedDefinedBenefitPlansAdjustmentMember2023-12-020000066382us-gaap:AccumulatedGainLossNetCashFlowHedgeParentMember2023-12-020000066382us-gaap:AccumulatedTranslationAdjustmentMember2022-05-280000066382us-gaap:AccumulatedDefinedBenefitPlansAdjustmentMember2022-05-280000066382us-gaap:AccumulatedGainLossNetCashFlowHedgeParentMember2022-05-280000066382us-gaap:AccumulatedTranslationAdjustmentMember2022-05-292022-12-030000066382us-gaap:AccumulatedDefinedBenefitPlansAdjustmentMember2022-05-292022-12-030000066382us-gaap:AccumulatedGainLossNetCashFlowHedgeParentMember2022-05-292022-12-030000066382us-gaap:AccumulatedTranslationAdjustmentMember2022-12-030000066382us-gaap:AccumulatedDefinedBenefitPlansAdjustmentMember2022-12-030000066382us-gaap:AccumulatedGainLossNetCashFlowHedgeParentMember2022-12-03mlkn:segment0000066382us-gaap:OperatingSegmentsMember2023-09-032023-12-020000066382us-gaap:OperatingSegmentsMember2022-09-042022-12-030000066382us-gaap:OperatingSegmentsMember2023-06-042023-12-020000066382us-gaap:OperatingSegmentsMember2022-05-292022-12-030000066382us-gaap:CorporateNonSegmentMember2023-09-032023-12-020000066382us-gaap:CorporateNonSegmentMember2022-09-042022-12-030000066382us-gaap:CorporateNonSegmentMember2023-06-042023-12-020000066382us-gaap:CorporateNonSegmentMember2022-05-292022-12-030000066382mlkn:KnollIntegrationMembermlkn:KnollIncMember2023-12-020000066382mlkn:KnollIntegrationMember2023-06-042023-12-020000066382mlkn:KnollIntegrationMemberus-gaap:FacilityClosingMember2023-06-042023-12-020000066382mlkn:KnollIntegrationMemberus-gaap:OtherRestructuringMember2023-06-042023-12-020000066382mlkn:KnollIntegrationMember2022-05-292022-12-030000066382mlkn:KnollIntegrationMemberus-gaap:EmployeeSeveranceMember2022-05-292022-12-030000066382mlkn:KnollIntegrationMembermlkn:LeaseTerminationCostsMember2022-05-292022-12-030000066382mlkn:KnollIntegrationMemberus-gaap:OtherRestructuringMember2022-05-292022-12-030000066382mlkn:KnollIntegrationMemberus-gaap:EmployeeSeveranceMember2023-06-030000066382mlkn:KnollIntegrationMemberus-gaap:FacilityClosingMember2023-06-030000066382mlkn:KnollIntegrationMembermlkn:SeveranceAndEmployeeBenefitsAndExitAndDisposalActivitiesMember2023-06-030000066382mlkn:KnollIntegrationMemberus-gaap:EmployeeSeveranceMember2023-06-042023-12-020000066382mlkn:KnollIntegrationMembermlkn:SeveranceAndEmployeeBenefitsAndExitAndDisposalActivitiesMember2023-06-042023-12-020000066382mlkn:KnollIntegrationMemberus-gaap:EmployeeSeveranceMember2023-12-020000066382mlkn:KnollIntegrationMemberus-gaap:FacilityClosingMember2023-12-020000066382mlkn:KnollIntegrationMembermlkn:SeveranceAndEmployeeBenefitsAndExitAndDisposalActivitiesMember2023-12-020000066382mlkn:KnollIntegrationMemberus-gaap:OperatingSegmentsMembermlkn:AmericasContractMember2023-09-032023-12-020000066382mlkn:KnollIntegrationMemberus-gaap:OperatingSegmentsMembermlkn:AmericasContractMember2022-09-042022-12-030000066382mlkn:KnollIntegrationMemberus-gaap:OperatingSegmentsMembermlkn:AmericasContractMember2023-06-042023-12-020000066382mlkn:KnollIntegrationMemberus-gaap:OperatingSegmentsMembermlkn:AmericasContractMember2022-05-292022-12-030000066382mlkn:KnollIntegrationMemberus-gaap:OperatingSegmentsMembermlkn:InternationalContractSpecialtyMember2023-09-032023-12-020000066382mlkn:KnollIntegrationMemberus-gaap:OperatingSegmentsMembermlkn:InternationalContractSpecialtyMember2022-09-042022-12-030000066382mlkn:KnollIntegrationMemberus-gaap:OperatingSegmentsMembermlkn:InternationalContractSpecialtyMember2023-06-042023-12-020000066382mlkn:KnollIntegrationMemberus-gaap:OperatingSegmentsMembermlkn:InternationalContractSpecialtyMember2022-05-292022-12-030000066382mlkn:KnollIntegrationMemberus-gaap:OperatingSegmentsMembermlkn:RetailSegmentMember2023-09-032023-12-020000066382mlkn:KnollIntegrationMemberus-gaap:OperatingSegmentsMembermlkn:RetailSegmentMember2022-09-042022-12-030000066382mlkn:KnollIntegrationMemberus-gaap:OperatingSegmentsMembermlkn:RetailSegmentMember2023-06-042023-12-020000066382mlkn:KnollIntegrationMemberus-gaap:OperatingSegmentsMembermlkn:RetailSegmentMember2022-05-292022-12-030000066382mlkn:KnollIntegrationMemberus-gaap:CorporateNonSegmentMember2023-09-032023-12-020000066382mlkn:KnollIntegrationMemberus-gaap:CorporateNonSegmentMember2022-09-042022-12-030000066382mlkn:KnollIntegrationMemberus-gaap:CorporateNonSegmentMember2023-06-042023-12-020000066382mlkn:KnollIntegrationMemberus-gaap:CorporateNonSegmentMember2022-05-292022-12-030000066382mlkn:KnollIntegrationMember2023-09-032023-12-020000066382mlkn:KnollIntegrationMember2022-09-042022-12-030000066382srt:MinimumMembermlkn:A2023RestructuringPlanMemberus-gaap:EmployeeSeveranceMember2022-05-292023-06-030000066382mlkn:A2023RestructuringPlanMemberus-gaap:EmployeeSeveranceMembersrt:MaximumMember2022-05-292023-06-030000066382mlkn:A2023RestructuringPlanMember2022-05-292023-06-030000066382mlkn:A2023RestructuringPlanMemberus-gaap:EmployeeSeveranceMember2022-05-292023-06-030000066382mlkn:A2023RestructuringPlanMembermlkn:NonCashAssetImpairmentsMember2022-05-292023-06-030000066382mlkn:A2023RestructuringPlanMember2023-12-020000066382srt:MinimumMembermlkn:A2024RestructuringPlanMember2023-06-042023-12-020000066382mlkn:A2024RestructuringPlanMembersrt:MaximumMember2023-06-042023-12-020000066382mlkn:A2024RestructuringPlanMemberus-gaap:EmployeeSeveranceMember2023-06-042023-12-020000066382mlkn:A2024RestructuringPlanMemberus-gaap:EmployeeSeveranceMember2023-06-030000066382mlkn:A2023RestructuringPlanMemberus-gaap:EmployeeSeveranceMember2023-06-030000066382mlkn:A2023RestructuringPlanMemberus-gaap:EmployeeSeveranceMember2023-06-042023-12-020000066382mlkn:A2024RestructuringPlanMemberus-gaap:EmployeeSeveranceMember2023-12-020000066382mlkn:A2023RestructuringPlanMemberus-gaap:EmployeeSeveranceMember2023-12-020000066382mlkn:AmericasContractMember2023-09-032023-12-020000066382mlkn:AmericasContractMember2022-09-042022-12-030000066382mlkn:AmericasContractMember2022-05-292022-12-030000066382mlkn:InternationalContractSpecialtyMember2023-09-032023-12-020000066382mlkn:InternationalContractSpecialtyMember2022-09-042022-12-030000066382mlkn:InternationalContractSpecialtyMember2022-05-292022-12-030000066382mlkn:RetailSegmentMember2023-09-032023-12-020000066382mlkn:RetailSegmentMember2022-09-042022-12-030000066382mlkn:RetailSegmentMember2022-05-292022-12-030000066382us-gaap:VariableInterestEntityNotPrimaryBeneficiaryMember2023-12-020000066382us-gaap:VariableInterestEntityNotPrimaryBeneficiaryMember2023-06-03
UNITED STATES
SECURITIES AND EXCHANGE COMMISSION
Washington, D.C. 20549
__________________________________________
FORM 10-Q
(Mark One)
| | | | | |
| ☒ | QUARTERLY REPORT PURSUANT TO SECTION 13 OR 15(d) OF THE SECURITIES EXCHANGE ACT OF 1934 |
For the quarterly period ended December 2, 2023
or
| | | | | |
| ☐ | TRANSITION REPORT PURSUANT TO SECTION 13 OR 15(d) OF THE SECURITIES EXCHANGE ACT OF 1934 |
For the transition period from to
Commission file number: 001-15141
__________________________________________
MillerKnoll, Inc.
(Exact name of registrant as specified in its charter)
__________________________________________
| | | | | | | | |
| Michigan | | 38-0837640 |
(State or other jurisdiction of
incorporation or organization) | | (I.R.S. Employer Identification No.) |
855 East Main Avenue
Zeeland, MI 49464
(Address of principal executive offices and zip code)
(616) 654-3000
(Registrant's telephone number, including area code)
Securities registered pursuant to Section 12(b) of the Act:
| | | | | | | | |
| Title of each class | Trading Symbol(s) | Name of each exchange on which registered |
| Common Stock, par value $0.20 per share | MLKN | Nasdaq Global Select Market |
Indicate by check mark whether the registrant: (1) has filed all reports required to be filed by Section 13 or 15(d) of the Securities Exchange Act of 1934 during the preceding 12 months (or for such shorter period that the registrant was required to file such reports); and (2) has been subject to such filing requirements for the past 90 days. Yes x No o
Indicate by check mark whether the registrant has submitted electronically every Interactive Data File required to be submitted
pursuant to Rule 405 of Regulation S-T (§232.405 of this chapter) during the preceding 12 months (or for such shorter period that the
registrant was required to submit such files). Yes x No o
Indicate by check mark whether the registrant is a large accelerated filer, an accelerated filer, a non-accelerated filer, a smaller reporting company, or an emerging growth company. See the definitions of “large accelerated filer,” “accelerated filer,” “smaller reporting company,” and "emerging growth company" in Rule 12b-2 of the Exchange Act.
| | | | | | | | | | | | | | | | | | | | | | | | | | | | | |
| Large accelerated filer | x | Accelerated filer | o | Non-accelerated filer | o | Smaller reporting company | ☐ | Emerging growth company | ☐ |
If an emerging growth company, indicate by check mark if the registrant has elected not to use the extended transition period for complying with any new or revised financial accounting standards provided pursuant to Section 13(a) of the Exchange Act. ☐
Indicate by check mark whether the registrant is a shell company (as defined in Rule 12b-2 of the Act). Yes ☐ No ☒
As of January 5, 2024, MillerKnoll, Inc. had 72,818,258 shares of common stock outstanding.
MillerKnoll, Inc.
Form 10-Q
Table of Contents
| | | | | |
| | Page No. |
| Part I — Financial Information | |
| Item 1 Financial Statements (Unaudited) | |
| Condensed Consolidated Statements of Comprehensive Income — Three and Six Months Ended December 2, 2023 and December 3, 2022 | |
| Condensed Consolidated Balance Sheets — December 2, 2023 and June 3, 2023 | |
| Condensed Consolidated Statements of Cash Flows — Six Months Ended December 2, 2023 and December 3, 2022 | |
| |
| Condensed Consolidated Statements of Stockholders' Equity — Six Months Ended December 2, 2023 and December 3, 2022 | |
| Notes to Condensed Consolidated Financial Statements | |
| |
| |
| |
| |
| |
| |
| |
| |
| |
| |
| |
| |
| |
| |
| |
| |
| |
| |
| |
| Item 2 Management's Discussion and Analysis of Financial Condition and Results of Operations | |
| Item 3 Quantitative and Qualitative Disclosures about Market Risk | |
| Item 4 Controls and Procedures | |
| Part II — Other Information | |
| Item 1 Legal Proceedings | |
| Item 1A Risk Factors | |
| Item 2 Unregistered Sales of Equity Securities and Use of Proceeds | |
| Item 5 Other Information | |
| Item 6 Exhibits | |
| Signatures | |
PART I - FINANCIAL INFORMATION
Item 1: Financial Statements
MillerKnoll, Inc.
Condensed Consolidated Statements of Comprehensive Income
| | | | | | | | | | | | | | | | | | | | | | | |
| (Dollars in millions, except share data) | Three Months Ended | | Six Months Ended |
| (Unaudited) | December 2, 2023 | | December 3, 2022 | | December 2, 2023 | | December 3, 2022 |
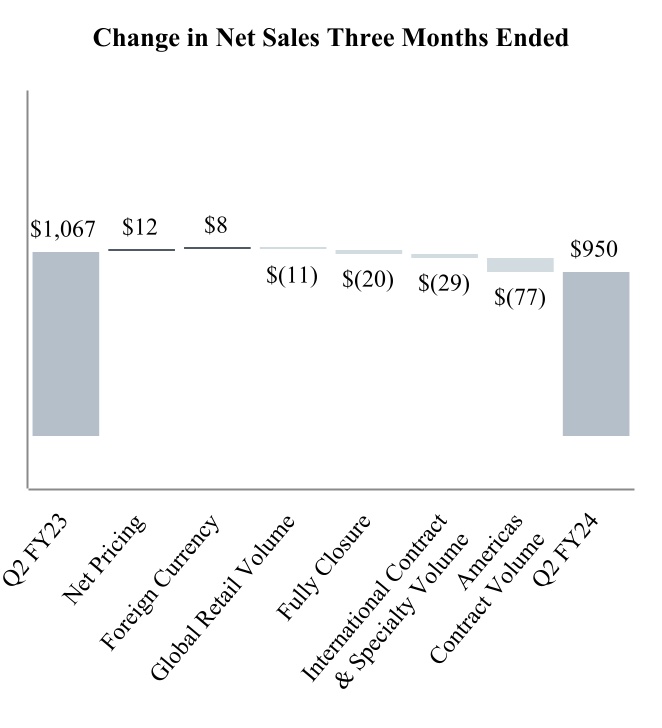
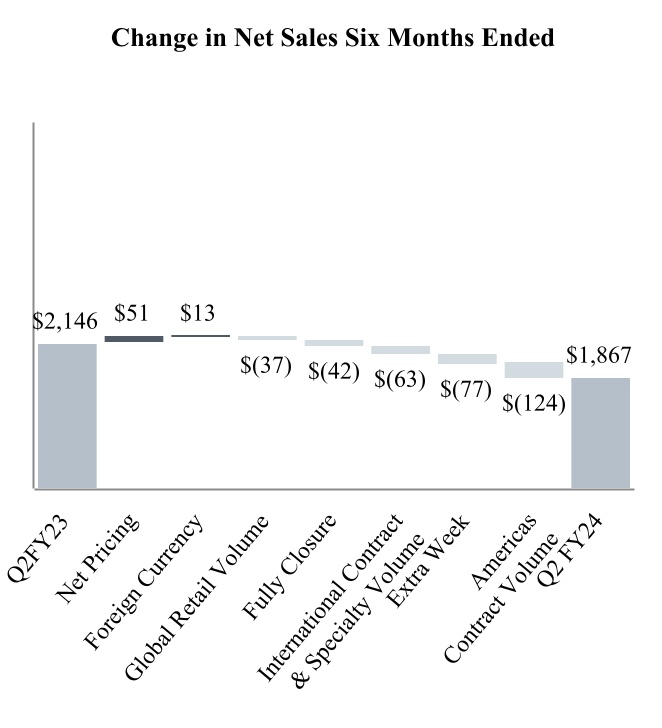
| Net sales | $ | 949.5 | | | $ | 1,066.9 | | | $ | 1,867.2 | | | $ | 2,145.7 | |
| Cost of sales | 577.5 | | | 699.3 | | | 1,137.1 | | | 1,406.0 | |
| Gross margin | 372.0 | | | 367.6 | | | 730.1 | | | 739.7 | |
| Operating expenses: | | | | | | | |
| Selling, general and administrative | 287.6 | | | 290.8 | | | 578.1 | | | 587.7 | |
| | | | | | | |
| Restructuring expense | 1.8 | | | 14.7 | | | 7.0 | | | 15.2 | |
| Design and research | 22.2 | | | 23.4 | | | 44.3 | | | 47.3 | |
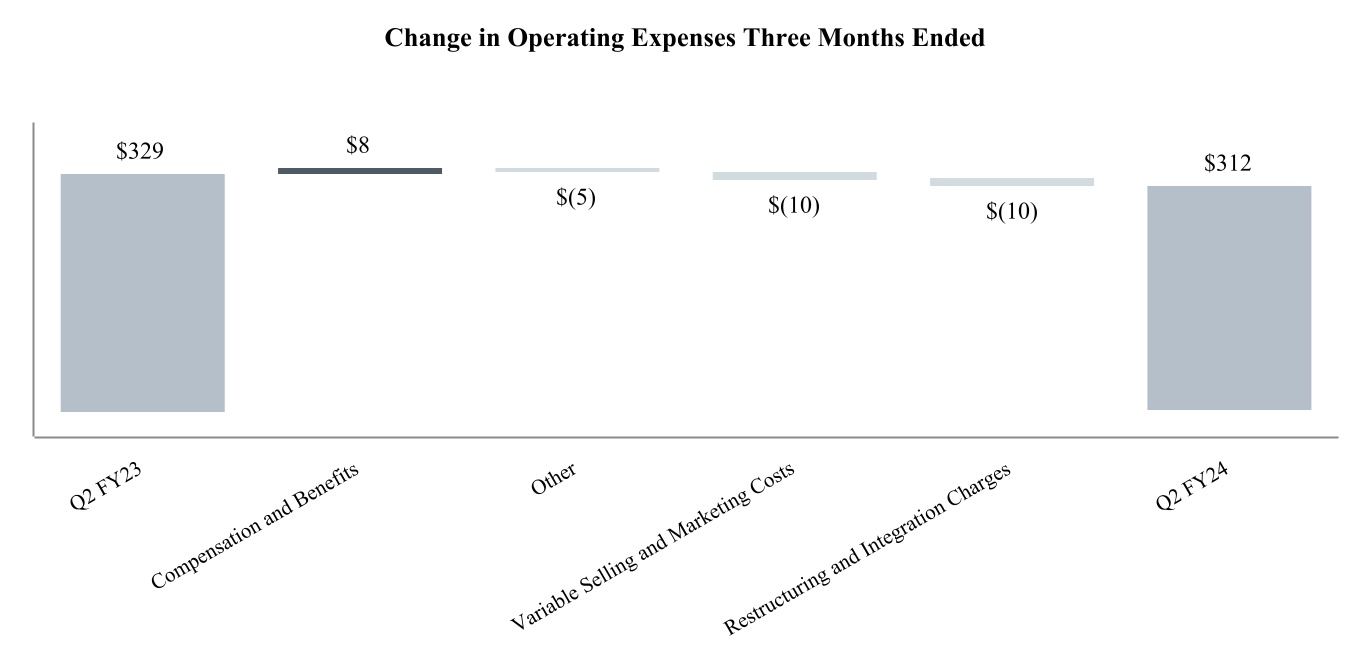
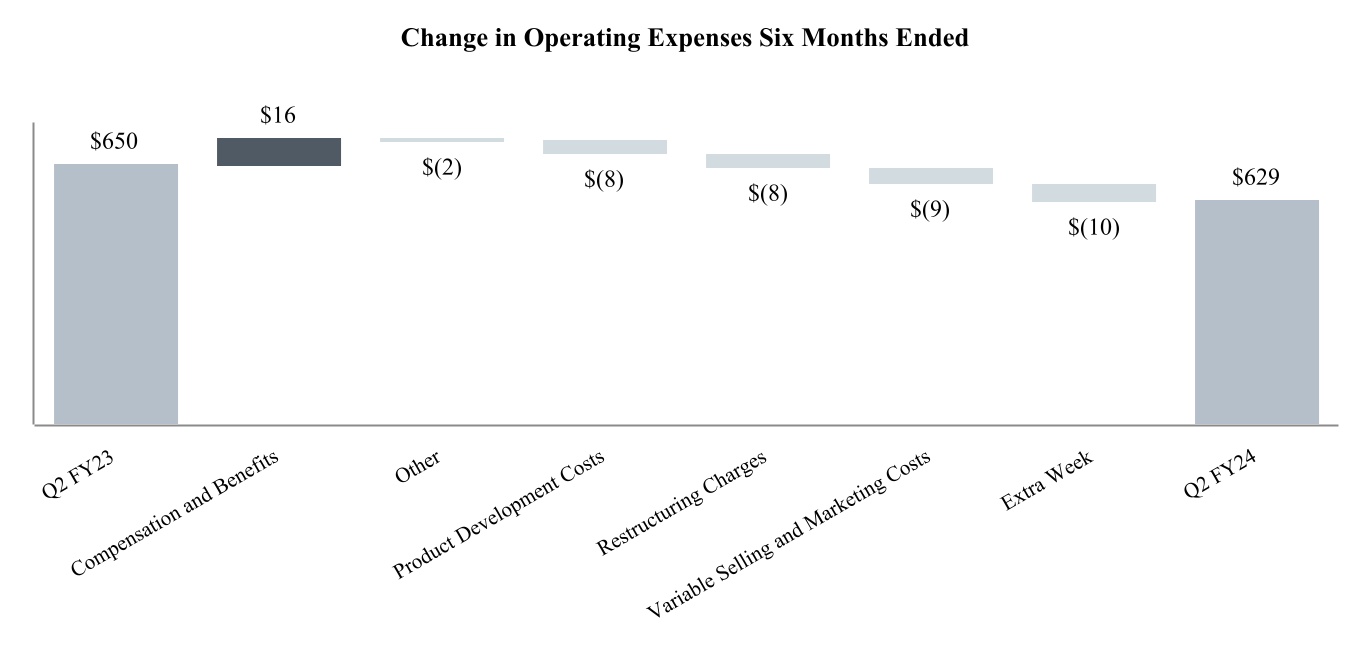
| Total operating expenses | 311.6 | | | 328.9 | | | 629.4 | | | 650.2 | |
| Operating earnings | 60.4 | | | 38.7 | | | 100.7 | | | 89.5 | |
| | | | | | | |
| Interest expense | 19.8 | | | 18.3 | | | 39.0 | | | 35.0 | |
| Interest and other investment (income) expense | (1.3) | | | (0.7) | | | (3.5) | | | (1.1) | |
| Other (income) expense, net | (2.4) | | | (0.5) | | | (0.2) | | | 0.3 | |
| Earnings before income taxes and equity income | 44.3 | | | 21.6 | | | 65.4 | | | 55.3 | |
| Income tax expense | 9.5 | | | 4.3 | | | 14.6 | | | 10.6 | |
| Equity (loss) income from nonconsolidated affiliates, net of tax | (0.4) | | | 0.2 | | | (0.3) | | | 0.2 | |
| Net earnings | 34.4 | | | 17.5 | | | 50.5 | | | 44.9 | |
| Net earnings attributable to redeemable noncontrolling interests | 0.9 | | | 1.5 | | | 0.3 | | | 3.1 | |
| Net earnings attributable to MillerKnoll, Inc. | $ | 33.5 | | | $ | 16.0 | | | $ | 50.2 | | | $ | 41.8 | |
| | | | | | | |
| Earnings per share - basic | $ | 0.45 | | | $ | 0.21 | | | $ | 0.67 | | | $ | 0.55 | |
| Earnings per share - diluted | $ | 0.45 | | | $ | 0.21 | | | $ | 0.67 | | | $ | 0.55 | |
| | | | | | | |
| Other comprehensive (loss) income, net of tax | | | | | | | |
| Foreign currency translation adjustments | $ | 7.3 | | | $ | 44.2 | | | $ | 11.2 | | | $ | (28.3) | |
| Pension and post-retirement liability adjustments | — | | | 0.4 | | | (0.1) | | | 0.8 | |
| Unrealized (loss) gain on interest rate swap agreement | (7.9) | | | 7.2 | | | (0.1) | | | 21.5 | |
| | | | | | | |
| Other comprehensive (loss) income, net of tax | $ | (0.6) | | | $ | 51.8 | | | $ | 11.0 | | | $ | (6.0) | |
| Comprehensive income | 33.8 | | | 69.3 | | | 61.5 | | | 38.9 | |
| Comprehensive income attributable to redeemable noncontrolling interests | 0.9 | | | 1.4 | | | 0.3 | | | 3.1 | |
| Comprehensive income attributable to MillerKnoll, Inc. | $ | 32.9 | | | $ | 67.9 | | | $ | 61.2 | | | $ | 35.8 | |
See accompanying notes to Condensed Consolidated Financial Statements.
MillerKnoll, Inc.
Condensed Consolidated Balance Sheets
| | | | | | | | | | | |
| (Dollars in millions, except share data) | | | |
| (Unaudited) | December 2, 2023 | | June 3, 2023 |
| ASSETS | | | |
| Current Assets: | | | |
| Cash and cash equivalents | $ | 225.8 | | | $ | 223.5 | |
| | | |
Accounts receivable, net of allowance of $9.5 and $6.4 | 319.9 | | | 334.1 | |
| Unbilled accounts receivable | 24.9 | | | 29.4 | |
| Inventories, net | 448.2 | | | 487.4 | |
| Prepaid expenses | 82.0 | | | 92.7 | |
| Assets held for sale | 4.6 | | | — | |
| Other current assets | 8.9 | | | 9.1 | |
| Total current assets | 1,114.3 | | | 1,176.2 | |
| Property and equipment, at cost | 1,578.6 | | | 1,570.7 | |
| Less — accumulated depreciation | (1,060.7) | | | (1,034.4) | |
| Net property and equipment | 517.9 | | | 536.3 | |
| Right of use assets | 382.5 | | | 415.9 | |
| Goodwill | 1,227.6 | | | 1,221.7 | |
| Indefinite-lived intangibles | 482.7 | | | 480.7 | |
Other amortizable intangibles, net of accumulated amortization of $205.0 and $185.2 | 297.0 | | | 313.1 | |
| Other noncurrent assets | 133.5 | | | 130.9 | |
| Total Assets | $ | 4,155.5 | | | $ | 4,274.8 | |
| | | |
| LIABILITIES, REDEEMABLE NONCONTROLLING INTERESTS & STOCKHOLDERS' EQUITY |
| Current Liabilities: | | | |
| Accounts payable | $ | 250.7 | | | $ | 269.5 | |
| Short-term borrowings and current portion of long-term debt | 38.8 | | | 33.4 | |
| Accrued compensation and benefits | 95.8 | | | 61.7 | |
| Short-term lease liability | 76.1 | | | 77.1 | |
| Accrued warranty | 18.8 | | | 20.8 | |
| Customer deposits | 92.9 | | | 93.8 | |
| Other accrued liabilities | 140.7 | | | 146.5 | |
| Total current liabilities | 713.8 | | | 702.8 | |
| Long-term debt | 1,278.2 | | | 1,365.1 | |
| Pension and post-retirement benefits | 7.7 | | | 7.5 | |
| Lease liabilities | 360.7 | | | 393.7 | |
| Other liabilities | 264.9 | | | 265.5 | |
| Total Liabilities | 2,625.3 | | | 2,734.6 | |
| Redeemable noncontrolling interests | 109.6 | | | 107.6 | |
| Stockholders' Equity: | | | |
Preferred stock, no par value (10,000,000 shares authorized, none issued) | — | | | — | |
Common stock, $0.20 par value (240,000,000 shares authorized, 73,077,659 and 75,698,670 shares issued and outstanding in fiscal 2024 and 2023, respectively) | 14.6 | | | 15.1 | |
| Additional paid-in capital | 791.5 | | | 836.5 | |
| Retained earnings | 698.6 | | | 676.1 | |
| Accumulated other comprehensive loss | (84.1) | | | (95.1) | |
| | | |
| | | |
| | | |
| Total Stockholders' Equity | 1,420.6 | | | 1,432.6 | |
| Total Liabilities, Redeemable Noncontrolling Interests, and Stockholders' Equity | $ | 4,155.5 | | | $ | 4,274.8 | |
See accompanying notes to Condensed Consolidated Financial Statements.
MillerKnoll, Inc.
Condensed Consolidated Statements of Cash Flows
| | | | | | | | | | | |
| (Dollars in millions) | Six Months Ended |
| (Unaudited) | December 2, 2023 | | December 3, 2022 |
| Cash Flows from Operating Activities: | | | |
| Net earnings | $ | 50.5 | | | $ | 44.9 | |
| Adjustments to reconcile net earnings to net cash provided by (used in) operating activities: | | | |
| Depreciation and amortization | 74.6 | | | 77.7 | |
| Stock-based compensation | 11.7 | | | 10.9 | |
| Amortization of deferred financing costs | 2.3 | | | 2.3 | |
| | | |
| | | |
| Loss on sale of equity method investment | 0.4 | | | — | |
| | | |
| | | |
| Deferred taxes | (0.3) | | | (0.3) | |
| | | |
| | | |
| | | |
| Restructuring expense | 7.0 | | | 15.2 | |
| | | |
| | | |
| | | |
| | | |
| Decrease (increase) in current assets | 71.0 | | | (34.7) | |
| | | |
| (Decrease) in current liabilities | (1.7) | | | (111.9) | |
| | | |
| Other, net | (2.1) | | | (9.4) | |
| Net Cash Provided by (Used in) Operating Activities | 213.4 | | | (5.3) | |
| | | |
| Cash Flows from Investing Activities: | | | |
| | | |
| | | |
| Notes receivables issued | (7.1) | | | (4.5) | |
| | | |
| | | |
| | | |
| | | |
| Proceeds from the sale of equity method investment | 3.5 | | | — | |
| Capital expenditures | (39.9) | | | (40.3) | |
| | | |
| | | |
| | | |
| | | |
| | | |
| | | |
| Proceeds from loan on cash surrender value of life insurance | — | | | 13.5 | |
| Other, net | 2.2 | | | (0.7) | |
| Net Cash (Used in) Investing Activities | (41.3) | | | (32.0) | |
| | | |
| Cash Flows from Financing Activities: | | | |
| | | |
| Repayments of long-term debt | (13.1) | | | (13.1) | |
| | | |
| | | |
| Proceeds from credit facility | 386.1 | | | 559.3 | |
| Repayments of credit facility | (457.8) | | | (492.3) | |
| | | |
| Dividends paid | (28.1) | | | (28.4) | |
| Common stock issued | 1.9 | | | 2.5 | |
| Common stock repurchased and retired | (60.0) | | | (14.3) | |
| Other, net | 0.2 | | | (2.1) | |
| Net Cash (Used in) Provided by Financing Activities | (170.8) | | | 11.6 | |
| | | |
| Effect of Exchange Rate Changes on Cash and Cash Equivalents | 1.0 | | | (7.1) | |
| Net Increase (Decrease) in Cash and Cash Equivalents | 2.3 | | | (32.8) | |
| | | |
| Cash and Cash Equivalents, Beginning of Period | 223.5 | | | 230.3 | |
| Cash and Cash Equivalents, End of Period | $ | 225.8 | | | $ | 197.5 | |
See accompanying notes to Condensed Consolidated Financial Statements.
MillerKnoll, Inc.
Condensed Consolidated Statements of Stockholders' Equity
| | | | | | | | | | | | | | | | | | | | | | | | | | | | | | | | | | | | | | | | | | | | | | | | | |
| | | Six Months Ended December 2, 2023 | | |
| (Dollars in millions, except share data) | | | Common Stock | | Additional Paid-in Capital | | Retained Earnings | | Accumulated Other Comprehensive Loss | | Deferred Compensation Plan | | MillerKnoll, Inc. Stockholders' Equity | | | | | | |
| (Unaudited) | | Shares | | Amount | | | | | | | | | |
| June 3, 2023 | | | 75,698,670 | | | $ | 15.1 | | | $ | 836.5 | | | $ | 676.1 | | | $ | (95.1) | | | $ | — | | | $ | 1,432.6 | | | | | | | |
| Net earnings | | | — | | | — | | | — | | | 16.7 | | | — | | | — | | | 16.7 | | | | | | | |
| Other comprehensive income, net of tax | | | — | | | — | | | — | | | — | | | 11.6 | | | — | | | 11.6 | | | | | | | |
| Stock-based compensation expense | | | (983) | | | — | | | 6.4 | | | — | | | — | | | — | | | 6.4 | | | | | | | |
| | | | | | | | | | | | | | | | | | | | | |
| Restricted and performance stock units released | | | 332,566 | | | 0.1 | | | 0.1 | | | — | | | — | | | — | | | 0.2 | | | | | | | |
| Employee stock purchase plan issuances | | | 45,107 | | | — | | | 0.9 | | | — | | | — | | | — | | | 0.9 | | | | | | | |
| Repurchase and retirement of common stock | | | (1,670,135) | | | (0.3) | | | (31.7) | | | — | | | — | | | — | | | (32.0) | | | | | | | |
Dividends declared ($0.1875 per share) | | | — | | | — | | | — | | | (14.1) | | | — | | | — | | | (14.1) | | | | | | | |
| September 2, 2023 | | | 74,405,225 | | | $ | 14.9 | | | $ | 812.2 | | | $ | 678.7 | | | $ | (83.5) | | | $ | — | | | $ | 1,422.3 | | | | | | | |
| Net earnings | | | — | | | — | | | — | | | 33.5 | | | — | | | — | | | 33.5 | | | | | | | |
| Other comprehensive income, net of tax | | | — | | | — | | | — | | | — | | | (0.6) | | | — | | | (0.6) | | | | | | | |
| Stock-based compensation expense | | | — | | | — | | | 5.3 | | | — | | | — | | | — | | | 5.3 | | | | | | | |
| Exercise of stock options | | | 19,429 | | | — | | | 0.4 | | | — | | | — | | | — | | | 0.4 | | | | | | | |
| Restricted and performance stock units released | | | 11,887 | | | — | | | — | | | — | | | — | | | — | | | — | | | | | | | |
| Employee stock purchase plan issuances | | | 31,669 | | | — | | | 1.3 | | | — | | | — | | | — | | | 1.3 | | | | | | | |
| Repurchase and retirement of common stock | | | (1,390,551) | | | (0.3) | | | (27.7) | | | — | | | — | | | — | | | (28.0) | | | | | | | |
Dividends declared ($0.1875 per share) | | | — | | | — | | | — | | | (13.7) | | | — | | | — | | | (13.7) | | | | | | | |
| Other | | | — | | | — | | | — | | | 0.1 | | | — | | | — | | | 0.1 | | | | | | | |
| December 2, 2023 | | | 73,077,659 | | | $ | 14.6 | | | $ | 791.5 | | | $ | 698.6 | | | $ | (84.1) | | | $ | — | | | $ | 1,420.6 | | | | | | | |
| | | | | | | | | | | | | | | | | | | | | |
| | | | | | | | | | | | | | | | | | | | | |
| | | | | | | | | | | | | | | | | | | | | |
| | | | | | | | | | | | | | | | | | | | | |
| | | | | | | | | | | | | | | | | | | | | |
| | | | | | | | | | | | | | | | | | | | | |
| | | | | | | | | | | | | | | | | | | | | |
| | | | | | | | | | | | | | | | | | | | | |
| | | | | | | | | | | | | | | | | | | | | |
| | | | | | | | | | | | | | | | | | | | | |
| | | | | | | | | | | | | | | | | | | | | |
| | | | | | | | | | | | | | | | | | | | | |
| | | | | | | | | | | | | | | | | | | | | |
| | | | | | | | | | | | | | | | | | | | | |
| | | | | | | | | | | | | | | | | | | | | |
| | | | | | | | | | | | | | | | | | | | | |
| | | | | | | | | | | | | | | | | | | | | |
| | | | | | | | | | | | | | | | | | | | | |
| | | | | | | | | | | | | | | | | | | | | |
| | | | | | | | | | | | | | | | | | | | | |
| | | | | | | | | | | | | | | | | | | | | |
| | | | | | | | | | | | | | | | | | | | | |
| | | | | | | | | | | | | | | | | | | | | |
| | | | | | | | | | | | | | | | | | | | | |
| | | | | | | | | | | | | | | | | | | | | |
| | | | | | | | | | | | | | | | | | | | | |
| | | | | | | | | | | | | | | | | | | | | | | | | | | | | | | | | | | | | | | | | | | | | | | | | |
| | | | | | | | | | | | | | | | | | | | | |
| | | Six Months Ended December 3, 2022 | | |
| (Dollars in millions, except share data) | | | Common Stock | | Additional Paid-in Capital | | Retained Earnings | | Accumulated Other Comprehensive Loss | | Deferred Compensation Plan | | MillerKnoll, Inc. Stockholders' Equity | | | | | | |
| (Unaudited) | | Shares | | Amount | | | | | | | | | |
| May 28, 2022 | | | 75,824,241 | | | $ | 15.2 | | | $ | 825.7 | | | $ | 693.3 | | | $ | (107.1) | | | $ | — | | | $ | 1,427.1 | | | | | | | |
| Net earnings | | | — | | | — | | | — | | | 25.8 | | | — | | | — | | | 25.8 | | | | | | | |
| Other comprehensive loss, net of tax | | | — | | | — | | | — | | | — | | | (57.8) | | | — | | | (57.8) | | | | | | | |
| Stock-based compensation expense | | | (13,474) | | | — | | | 5.4 | | | — | | | — | | | — | | | 5.4 | | | | | | | |
| Exercise of stock options | | | 43,469 | | | — | | | 1.0 | | | — | | | — | | | — | | | 1.0 | | | | | | | |
| Restricted and performance stock units released | | | 160,551 | | | — | | | 0.1 | | | — | | | — | | | — | | | 0.1 | | | | | | | |
| Employee stock purchase plan issuances | | | 35,753 | | | — | | | 0.8 | | | — | | | — | | | — | | | 0.8 | | | | | | | |
| Repurchase and retirement of common stock | | | (494,509) | | | (0.1) | | | (14.2) | | | — | | | — | | | — | | | (14.3) | | | | | | | |
Dividends declared ($0.1875 per share) | | | — | | | — | | | — | | | (14.3) | | | — | | | — | | | (14.3) | | | | | | | |
| Other | | | — | | | — | | | 0.5 | | | 0.5 | | | — | | | — | | | 1.0 | | | | | | | |
| September 3, 2022 | | | 75,556,031 | | | $ | 15.1 | | | $ | 819.3 | | | $ | 705.3 | | | $ | (164.9) | | | $ | — | | | $ | 1,374.8 | | | | | | | |
| Net earnings | | | — | | | — | | | — | | | 16.0 | | | — | | | — | | | 16.0 | | | | | | | |
| Other comprehensive income, net of tax | | | — | | | — | | | — | | | — | | | 51.8 | | | — | | | 51.8 | | | | | | | |
| Stock-base compensation expense | | | (2,476) | | | — | | | 5.5 | | | — | | | — | | | — | | | 5.5 | | | | | | | |
| | | | | | | | | | | | | | | | | | | | | |
| Restricted and performance stock units released | | | 8,763 | | | — | | | 0.1 | | | — | | | — | | | — | | | 0.1 | | | | | | | |
| Employee stock purchase plan issuances | | | 44,010 | | | — | | | 0.7 | | | — | | | — | | | — | | | 0.7 | | | | | | | |
| Repurchase and retirement of common stock | | | (3,222) | | | — | | | (0.1) | | | — | | | — | | | — | | | (0.1) | | | | | | | |
Dividends declared ($0.1875 per share) | | | — | | | — | | | — | | | (14.3) | | | — | | | — | | | (14.3) | | | | | | | |
| Other | | | — | | | | | $ | 0.2 | | | $ | (0.4) | | | $ | — | | | $ | — | | | (0.2) | | | | | | | |
| December 3, 2022 | | | 75,603,106 | | | $ | 15.1 | | | $ | 825.7 | | | $ | 706.6 | | | $ | (113.1) | | | $ | — | | | $ | 1,434.3 | | | | | | | |
| | | | | | | | | | | | | | | | | | | | | |
| | | | | | | | | | | | | | | | | | | | | |
| | | | | | | | | | | | | | | | | | | | | |
| | | | | | | | | | | | | | | | | | | | | |
| | | | | | | | | | | | | | | | | | | | | |
| | | | | | | | | | | | | | | | | | | | | |
| | | | | | | | | | | | | | | | | | | | | |
| | | | | | | | | | | | | | | | | | | | | |
| | | | | | | | | | | | | | | | | | | | | |
| | | | | | | | | | | | | | | | | | | | | |
| | | | | | | | | | | | | | | | | | | | | |
| | | | | | | | | | | | | | | | | | | | | |
See accompanying notes to Condensed Consolidated Financial Statements.
Notes to Condensed Consolidated Financial Statements
(Dollars in millions, except share data)
(unaudited)
1. Description of Business
MillerKnoll, Inc. (the "Company") researches, designs, manufactures, sells, and distributes interior furnishings for use in various environments including residential, office, healthcare, and educational settings and provides related services that support organizations and individuals all over the world. The Company's products are sold primarily through the following channels: independent contract office furniture dealers, direct customer sales, owned and independent retailers, direct-mail catalogs, and the Company's eCommerce platforms.
MillerKnoll is a collective of dynamic brands that comes together to design the world we live in. A global leader in design, MillerKnoll includes Herman Miller® and Knoll®, as well as Colebrook Bosson Saunders®, DatesWeiser®, Design Within Reach®, Edelman®, Geiger®, HAY®, Holly Hunt®, Knoll Textiles®, Maharam®, Muuto®, NaughtOne®, and Spinneybeck®|FilzFelt®. MillerKnoll represents over 100 years of design research and exploration in service of humanity. The Company is united by a belief in design as a tool to create positive impact and shape a more sustainable, caring, and beautiful future for all people and the planet.
Basis of Presentation
The Condensed Consolidated Financial Statements have been prepared by MillerKnoll, Inc. in accordance with accounting principles generally accepted in the United States of America ("U.S. GAAP") for interim financial information and with the instructions to Form 10-Q and Article 10 of Regulation S-X. Accordingly, they do not include all of the information and footnotes required by U.S. GAAP for complete financial statements. Management believes the disclosures made in this document are adequate with respect to interim reporting requirements. Unless otherwise noted or indicated by the context, all references to "MillerKnoll," "we," "our," "Company" and similar references are to MillerKnoll, Inc., its predecessors, and controlled subsidiaries.
The accompanying unaudited Condensed Consolidated Financial Statements, taken as a whole, contain all adjustments that are of a normal recurring nature necessary to present fairly the financial position of the Company as of December 2, 2023. Operating results for the three and six months ended December 2, 2023 are not necessarily indicative of the results that may be expected for the year ending June 1, 2024 ("fiscal 2024"). These Condensed Consolidated Financial Statements should be read in conjunction with the financial statements and notes thereto included in the Company's Annual Report on Form 10-K for the year ended June 3, 2023 ("fiscal 2023"). All intercompany transactions have been eliminated in the Condensed Consolidated Financial Statements. The financial statements of equity method investments are not consolidated.
The Company's fiscal year is the 52 or 53 week period ending on the Saturday closest to May 31. The fiscal year ending June 1, 2024 contains 52 weeks, while fiscal year ended June 3, 2023 ("fiscal 2023") contained 53 weeks. The first quarter of fiscal 2024 contained 13 weeks and the first quarter of fiscal 2023 contained 14 weeks.
Investments in Nonconsolidated Affiliates
On October 30, 2023, the Company sold its 48.2% investment in Global Holdings Netherlands B.V., which owns 100% of Maars Holding B.V. ("Maars") for total purchase consideration of $5.9 million. As part of this transaction, we received cash proceeds of $3.5 million at closing, a $1.4 million receivable under a vendor loan, and $1.0 million of cash held in an escrow account to secure the representations and warranties made to the purchaser. As a result of the sale, a loss of $0.4 million was recorded in Equity (loss) income from nonconsolidated affiliates, net of tax during the second quarter of fiscal 2024.
2. Recently Issued Accounting Standards
The Company evaluates all Accounting Standards Updates ("ASUs") issued by the Financial Accounting Standards Board ("FASB") for consideration of their applicability to our consolidated financial statements.
Recently Issued Accounting Standards Not Yet Adopted
ASU 2023-07, Segment Reporting (Topic 280): Improvements to Reportable Segment Disclosures. In November 2023, the FASB issued this ASU to update reportable segment disclosure requirements, primarily through enhanced disclosures about significant segment expenses and information used to assess segment performance. This ASU is effective for fiscal years beginning after December 15, 2023, and interim periods within fiscal years beginning after December 15, 2024, with early adoption permitted. The Company is currently evaluating the impact of adopting this ASU on its consolidated financial statements and disclosures.
ASU 2023-09, Income Taxes (Topic 740): Improvements to Tax Disclosures. In December 2023, the FASB issued this ASU which expands disclosures in an entity’s income tax rate reconciliation table and regarding cash taxes paid both in the U.S. and foreign jurisdictions. The update will be effective for annual periods beginning after December 15, 2024. We are assessing the effect of this update on our consolidated financial statements and related disclosures.
We have assessed all other ASUs issued but not yet adopted and concluded that those not disclosed are not relevant to the Company or are not expected to have a material impact.
3. Revenue from Contracts with Customers
Disaggregated Revenue
Revenue disaggregated by contract type is provided in the table below:
| | | | | | | | | | | | | | | | | | | | | | | |
| Three Months Ended | | Six Months Ended |
| (In millions) | December 2, 2023 | | December 3, 2022 | | December 2, 2023 | | December 3, 2022 |
| Net Sales: | | | | | | | |
| Single performance obligation | | | | | | | |
| Product revenue | $ | 871.3 | | | $ | 996.6 | | | $ | 1,716.8 | | | $ | 2,004.3 | |
| Multiple performance obligations | | | | | | | |
| Product revenue | 74.9 | | | 66.3 | | | 143.6 | | | 132.8 | |
| Service revenue | 1.0 | | | 0.6 | | | 2.0 | | | 1.8 | |
| Other | 2.3 | | | 3.4 | | | 4.8 | | | 6.8 | |
| Total | $ | 949.5 | | | $ | 1,066.9 | | | $ | 1,867.2 | | | $ | 2,145.7 | |
The Company internally reports and evaluates products based on the categories Workplace, Performance Seating, Lifestyle and Other. A description of these categories is included below.
The Workplace category includes products centered on creating highly functional and productive settings for both groups and individuals. This category focuses on the development of products, beyond seating, that define boundaries, support work and enable productivity.
The Performance Seating category includes products centered on seating ergonomics, productivity and function across an evolving and diverse range of settings. This category focuses on the development of ergonomic seating solutions for specific use cases requiring more than basic utility.
The Lifestyle category includes products focused on bringing spaces to life through beautiful yet functional products. This category focuses on the development of products that support a way of living, in thoughtful yet elevated ways. The products in this category help create emotive and visually appealing spaces via a portfolio that offers diversity in aesthetics, price and performance.
The Other category primarily consists of textiles, uncategorized product sales, and service sales.
Revenue disaggregated by product type and reportable segment is provided in the table below:
| | | | | | | | | | | | | | | | | | | | | | | |
| Three Months Ended | | Six Months Ended |
| (In millions) | December 2, 2023 | | December 3, 2022 | | December 2, 2023 | | December 3, 2022 |
| Americas Contract: | | | | | | | |
| Workplace | $ | 311.3 | | | $ | 342.1 | | | $ | 635.5 | | | $ | 680.8 | |
| Performance Seating | 103.8 | | | 115.0 | | | 207.1 | | | 233.9 | |
| Lifestyle | 56.0 | | | 68.4 | | | 116.6 | | | 139.5 | |
| Other | 5.0 | | | 4.2 | | | 7.3 | | | 12.9 | |
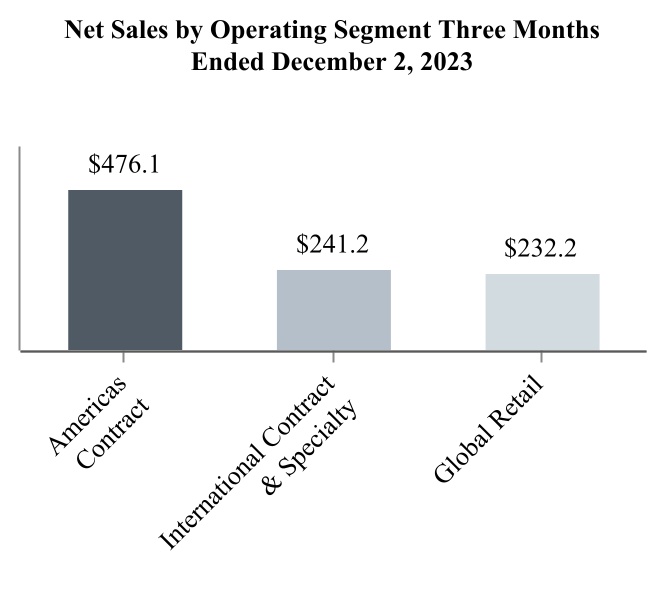
| Total Americas Contract | $ | 476.1 | | | $ | 529.7 | | | $ | 966.5 | | | $ | 1,067.1 | |
| | | | | | | |
| International Contract & Specialty: | | | | | | | |
| Workplace | $ | 36.5 | | | $ | 49.5 | | | $ | 75.2 | | | $ | 93.8 | |
| Performance Seating | 64.3 | | | 65.7 | | | 116.9 | | | 134.7 | |
| Lifestyle | 88.9 | | | 99.6 | | | 177.3 | | | 206.6 | |
| Other | 51.5 | | | 50.1 | | | 100.1 | | | 102.3 | |
| Total International Contract & Specialty | $ | 241.2 | | | $ | 264.9 | | | $ | 469.5 | | | $ | 537.4 | |
| | | | | | | |
| Global Retail: | | | | | | | |
| Workplace | $ | 3.3 | | | $ | 21.9 | | | $ | 7.5 | | | $ | 49.4 | |
| Performance Seating | 55.6 | | | 50.9 | | | 97.7 | | | 102.1 | |
| Lifestyle | 172.9 | | | 198.8 | | | 325.4 | | | 388.6 | |
| Other | 0.4 | | | 0.7 | | | 0.6 | | | 1.1 | |
| Total Global Retail | $ | 232.2 | | | $ | 272.3 | | | $ | 431.2 | | | $ | 541.2 | |
| | | | | | | |
| Total | $ | 949.5 | | | $ | 1,066.9 | | | $ | 1,867.2 | | | $ | 2,145.7 | |
In the current year, certain products were reclassified within the Performance Seating, Lifestyle, and Other categories based on management's internal reporting of the performance of these product lines. The prior year has been restated to reflect these changes.
Refer to Note 15 of the Condensed Consolidated Financial Statements for further information related to our reportable segments.
Contract Balances
Customers may make payments before the satisfaction of the Company's performance obligation and recognition of revenue. These payments represent contract liabilities and are included within the caption “Customer deposits” in the Condensed Consolidated Balance Sheets. During the three and six months ended December 2, 2023, the Company recognized Net sales of $24.4 million and $71.9 million respectively, related to customer deposits that were included in the balance sheet as of June 3, 2023.
4. Acquisitions
Knoll, Inc.
On July 19, 2021, the Company completed the acquisition of Knoll, a leader in the design, manufacture, marketing and sale of high-end furniture products and accessories for workplace and residential markets. The Company has included the financial results of Knoll in the condensed consolidated financial statements from the date of acquisition. The transaction costs associated with the acquisition, which included financial advisory, legal, proxy filing, regulatory and financing fees, were approximately $30.0 million for the twelve months ended May 28, 2022 and were recorded in general and administrative expenses.
Under the terms of the Agreement and Plan of Merger, each issued and outstanding share of Knoll common stock (excluding shares exercising dissenters rights, shares owned by Knoll as treasury stock, shares owned by the deal parties or their subsidiaries, or shares subject to Knoll restricted stock awards) was converted into a right to receive 0.32 shares of Herman Miller, Inc. (now MillerKnoll, Inc.) common stock and $11.00 in cash, without interest. The acquisition date fair value of the consideration transferred for Knoll was $1,887.3 million, which consisted of the following (in millions, except share amounts):
| | | | | | | | | | | | | | | | | |
| Knoll Shares | | Herman Miller, Inc (now MillerKnoll, Inc.) Shares Exchanged | | Fair Value |
| Cash Consideration: | | | | | |
| Shares of Knoll Common Stock issued and outstanding at July 19, 2021 | 49,444,825 | | | | | $ | 543.9 | |
| Knoll equivalent shares for outstanding option awards, outstanding awards of restricted common stock held by non-employee directors and outstanding awards of performance units held by individuals who are former employees of Knoll and remain eligible to vest at July 19, 2021 | 184,857 | | | | | 1.4 | |
| Total number of Knoll shares for cash consideration | 49,629,682 | | | | | |
| | | | | |
| Shares of Knoll Preferred Stock issued and outstanding at July 19, 2021 | 169,165 | | | | | 254.4 | |
| | | | | |
| Consideration for payment to settle Knoll's outstanding debt | | | | | 376.9 | |
| | | | | |
| Share Consideration: | | | | | |
| Shares of Knoll Common Stock issued and outstanding at July 19, 2021 | 49,444,825 | | | | | |
| Knoll equivalent shares for outstanding awards of restricted common stock held by non-employee directors and outstanding awards of performance units held by individuals who are former employees of Knoll and remain eligible to vest at July 19, 2021 | 74,857 | | | | | |
| Total number of Knoll shares for share consideration | 49,519,682 | | | 15,843,921 | | | 688.3 | |
| | | | | |
| Replacement Share-Based Awards: | | | | | |
| Outstanding awards of Knoll Restricted Stock and Performance units relating to Knoll Common Stock at July 19, 2021 | | | | | 22.4 | |
| | | | | |
| | | | | |
| Total acquisition date fair value of consideration transferred | | | | | $ | 1,887.3 | |
| | | | | |
The aggregate cash paid in connection with the Knoll acquisition was $1,176.6 million. MillerKnoll funded the acquisition through cash on-hand and debt proceeds, as described in "Note 13. Short-Term Borrowings and Long-Term Debt."
Outstanding unvested restricted stock awards, performance stock awards, performance stock units and restricted stock units with a fair value of $53.4 million converted into Company awards. Of the total fair value, $22.4 million was allocated to purchase consideration and $31.0 million was allocated to future services and is being expensed over the remaining service periods on a straight-line basis. Per the terms of the converted awards any qualifying termination within the twelve months subsequent to the acquisition resulted in accelerated vesting and related recognition of expense.
The transaction was accounted for as a business combination which requires that assets and liabilities assumed be recognized at their fair value as of the acquisition date. The following table summarizes the fair value of assets acquired and liabilities assumed as of the date of acquisition:
| | | | | |
| (In millions) | Fair Value |
| Cash | $ | 88.0 | |
| Accounts receivable | 82.3 | |
| Inventories | 219.9 | |
| Other current assets | 29.2 | |
| Property and equipment | 296.5 | |
| Right-of-use assets | 202.7 | |
| Intangible assets | 756.6 | |
| Goodwill | 903.5 | |
| Other noncurrent assets | 25.1 | |
| Total assets acquired | 2,603.8 | |
| |
| Accounts payable | 144.0 | |
| Other current liabilities | 153.1 | |
| Lease liabilities | 177.8 | |
| Other liabilities | 241.6 | |
| Total liabilities assumed | 716.5 | |
| Net Assets Acquired | $ | 1,887.3 | |
The excess of purchase consideration over the fair value of net tangible and identifiable intangible assets acquired was recorded as goodwill. Goodwill is attributed to the assembled workforce of Knoll and anticipated operational synergies. Goodwill related to the acquisition was allocated to each of the reporting segments with a total value as of the opening balance sheet date of $903.5 million. Goodwill arising from the acquisition is not deductible for tax reporting purposes.
Certain measurement period adjustments were made during the twelve months ended May 28, 2022 to the preliminary fair values resulting in a net decrease to goodwill of $22.4 million primarily related to adjustments to the value of certain liabilities acquired and the fair value of intangible assets acquired. The allocation of purchase price was completed in the fourth quarter of fiscal year 2022.
The following table summarizes the acquired identified intangible assets, valuation method employed, useful lives and fair value, as determined by the Company as of the acquisition date:
| | | | | | | | | | | | | | | | | |
| (In millions) | Valuation Method | | Useful Life (years) | | Fair Value |
| Backlog | Multi-Period Excess Earnings | | Less than 1 Year | | $ | 27.6 | |
| Trade name - indefinite lived | Relief from Royalty | | Indefinite | | 418.0 | |
| Trade name - amortizing | Relief from Royalty | | 5-10 Years | | 14.0 | |
| Designs | Relief from Royalty | | 9-15 years | | 40.0 | |
| Customer Relationships | Multi-Period Excess Earnings | | 2-15 years | | 257.0 | |
| Total | | | | | $ | 756.6 | |
5. Inventories, net
| | | | | | | | | | | |
| (In millions) | December 2, 2023 | | June 3, 2023 |
| Finished goods and work in process | $ | 330.3 | | | $ | 357.2 | |
| Raw materials | 117.9 | | | 130.2 | |
| Total | $ | 448.2 | | | $ | 487.4 | |
Inventories are primarily valued using the first-in first-out method.
6. Goodwill and Indefinite-Lived Intangibles
Goodwill and other indefinite-lived intangible assets included in the Condensed Consolidated Balance Sheets consisted of the following as of December 2, 2023 and June 3, 2023:
| | | | | | | | | | | | | | | | | | | | | | | | | |
| (In millions) | Americas Contract | | International Contract & Specialty | | Global Retail | | Total | | |
| June 3, 2023 | | | | | | | | | |
| Goodwill | $ | 565.1 | | | $ | 303.0 | | | $ | 479.1 | | | $ | 1,347.2 | | | |
| Foreign currency translation adjustments | 2.0 | | | 1.9 | | | 2.0 | | | 5.9 | | | |
| Accumulated impairment losses | (36.7) | | | — | | | (88.8) | | | (125.5) | | | |
| December 2, 2023 | $ | 530.4 | | | $ | 304.9 | | | $ | 392.3 | | | $ | 1,227.6 | | | |
Other indefinite-lived assets included in the Consolidated Balance Sheets consist of the following:
| | | | | | | | |
| (In millions) | | Indefinite-lived Intangible Assets |
| June 3, 2023 | | $ | 480.7 | |
| Foreign currency translation adjustments | | 2.0 | |
| December 2, 2023 | | $ | 482.7 | |
Goodwill is tested for impairment at the reporting unit level annually, or more frequently when events or changes in circumstances indicate that the fair value of a reporting unit has more likely than not declined below its carrying value. When testing goodwill for impairment, the Company may first assess qualitative factors. If an initial qualitative assessment identifies that it is more likely than not that the carrying value of a reporting unit exceeds its estimated fair value, additional quantitative testing is performed. The Company may also elect to bypass the qualitative testing and proceed directly to the quantitative testing. If the quantitative testing indicates that goodwill is impaired, the carrying value of goodwill is written down to fair value.
During the third quarter of fiscal year 2023, the Company assessed changes in circumstances that occurred during the quarter to determine if it was more likely than not that the fair values of any reporting units were below their carrying amounts. Although our annual impairment test is performed during the fourth quarter, we perform this qualitative assessment each interim reporting period.
While there was no single determinate event, the consideration in totality of several factors that developed during the third quarter of fiscal year 2023 led us to conclude that it was more likely than not that the fair value of the Global Retail reporting unit was below its carrying amount. These factors included: (i) the decision to discontinue stand-alone operations of the Fully brand and (ii) the assessment of our third quarter results, for which the performance of the Global Retail reporting unit was below management's expectations.
Accordingly, the Company performed an interim quantitative impairment analysis as of March 4, 2023 to determine the fair value of the Global Retail reporting unit as compared to the carrying value. In performing the quantitative impairment test, the Company determined that the fair value of the Global Retail reporting unit exceeded the carrying amount and, as such, the reporting unit was not impaired. The Company determined that the Global Retail reporting unit exceeded its carrying value by 1% and therefore has a heightened risk of future impairments if any assumptions, estimates or market factors change in the future.
Each of the reporting units was reviewed for impairment using a qualitative assessment as of March 31, 2023, our annual testing date. In performing the qualitative impairment test for fiscal year 2023, the Company determined that the fair value of its reporting units exceeded the carrying amount and, as such, these reporting units were not impaired.
During the second quarter of fiscal year 2024, the Company performed an assessment to determine whether there were indicators of a triggering event which could indicate the carrying amount of the reporting units may not be supported by the fair value. No indicators of a triggering event for potential impairment were noted in the second quarter of fiscal 2024.
The Company generally uses the discounted cash flow method under a weighting of the income and market approach to estimate the fair value of our reporting units. These approaches are based on a discounted cash flow analysis and observable comparable company information that use several inputs, including:
•actual and forecasted revenue growth rates and operating margins,
•discount rates based on the reporting unit's weighted average cost of capital, and
•revenue and EBITDA of comparable companies
The Company selected the assumptions used in the financial forecasts using historical data, supplemented by current and anticipated market conditions, management’s long-term strategic plans, and guideline companies.
Intangible assets with indefinite useful lives are not subject to amortization and are evaluated annually for impairment, or more frequently when events or changes in circumstances indicate that the fair value of an intangible asset may not be recoverable. Management has not identified any events or changes in circumstances that may indicate an indefinite-lived intangible is more likely than not to be impaired as of the second quarter of fiscal year 2024.
7. Employee Benefit Plans
The following table summarizes the components of net periodic benefit cost for the Company's defined benefit pension plans:
| | | | | | | | | | | | | | | | | | | | | | | |
| Pension Benefits |
| Three Months Ended December 2, 2023 | | Three Months Ended December 3, 2022 |
| (In millions) | Domestic | | International | | Domestic | | International |
| Service cost | $ | — | | | $ | — | | | $ | — | | | $ | — | |
| Interest cost | 1.5 | | | 1.0 | | | 1.5 | | | 0.8 | |
| Expected return on plan assets(1) | (2.3) | | | (1.2) | | | (2.0) | | | (1.1) | |
| Expected administrative expenses | 0.2 | | | — | | | 0.1 | | | — | |
| Net amortization loss | — | | | — | | | — | | | 0.6 | |
| | | | | | | |
| Net periodic benefit (income) cost | $ | (0.6) | | | $ | (0.2) | | | $ | (0.4) | | | $ | 0.3 | |
| | | | | | | |
| Six Months Ended December 2, 2023 | | Six Months Ended December 3, 2022 |
| (In millions) | Domestic | | International | | Domestic | | International |
| Service cost | $ | — | | | $ | — | | | $ | — | | | $ | — | |
| Interest cost | 3.0 | | | 2.0 | | | 3.0 | | | 1.6 | |
| Expected return on plan assets(1) | (4.6) | | | (2.5) | | | (4.0) | | | (2.3) | |
| Expected administrative expenses | 0.4 | | | — | | | 0.2 | | | — | |
| Net amortization loss | — | | | — | | | — | | | 1.2 | |
| | | | | | | |
| Net periodic benefit (income) cost | $ | (1.2) | | | $ | (0.5) | | | $ | (0.8) | | | $ | 0.5 | |
(1)The weighted-average expected long-term rate of return on plan assets is 6.0%.
8. Earnings Per Share
The following table reconciles the numerators and denominators used in the calculations of basic and diluted earnings per share ("EPS") for the three and six months ended:
| | | | | | | | | | | | | | | | | | | | | | | |
| Three Months Ended | | Six Months Ended |
| December 2, 2023 | | December 3, 2022 | | December 2, 2023 | | December 3, 2022 |
Numerators: | | | | | | | |
| Numerator for both basic and diluted EPS, Net earnings attributable to MillerKnoll, Inc. - in millions | $ | 33.5 | | | $ | 16.0 | | | $ | 50.2 | | | $ | 41.8 | |
| | | | | | | |
Denominators: | | | | | | | |
| Denominator for basic EPS, weighted-average common shares outstanding | 73,655,409 | | | 75,370,514 | | | 74,573,958 | | | 75,458,089 | |
| Potentially dilutive shares resulting from stock plans | 584,884 | | | 507,564 | | | 503,754 | | | 584,551 | |
| Denominator for diluted EPS | 74,240,293 | | | 75,878,078 | | | 75,077,712 | | | 76,042,640 | |
| Antidilutive equity awards not included in weighted-average common shares - diluted | 4,277,783 | | | 2,654,297 | | | 4,079,832 | | | 1,171,951 | |
9. Stock-Based Compensation
The following table summarizes the stock-based compensation expense and related income tax effect for the three and six months ended:
| | | | | | | | | | | | | | | | | | | | | | | |
| Three Months Ended | | Six Months Ended |
| (In millions) | December 2, 2023 | | December 3, 2022 | | December 2, 2023 | | December 3, 2022 |
| Stock-based compensation expense | $ | 5.3 | | | $ | 5.5 | | | $ | 11.7 | | | $ | 10.9 | |
| Related income tax effect | $ | 1.2 | | | $ | 1.3 | | | $ | 2.8 | | | $ | 2.6 | |
Certain Company equity-based compensation awards contain provisions that allow for continued vesting into retirement. Stock-based awards are considered fully vested for expense attribution purposes when the employee's retention of the award is no longer contingent on providing subsequent service.
10. Income Taxes
The Company's process for determining the provision for income taxes for the three and six months ended December 2, 2023 involved using an estimated annual effective tax rate which was based on expected annual income and statutory tax rates across the various jurisdictions in which it operates. The effective tax rates were 21.4% and 19.8%, respectively, for the three month periods ended December 2, 2023 and December 3, 2022. The year over year change in the effective tax rate for the three months ended December 2, 2023 resulted from the same quarter of the prior year having more favorable tax credit impacts in the United States than the current year quarter. For the three months ended December 2, 2023, the effective tax rate is slightly higher than the United States federal statutory rate due to United States state income taxes and the mix of earnings in tax jurisdictions that had rates that were higher than the United States federal statutory rate coupled with less favorable foreign tax credit impacts from the recapture of an overall domestic loss carryover. For the three months ended December 3, 2022, the effective tax rate was lower than the United States federal statutory rate due to the favorable impact of increased foreign tax credits in the United States resulting from the recapture of prior year overall domestic loss.
The effective tax rates were 22.4% and 19.2%, respectively, for the six months ended December 2, 2023 and December 3, 2022. The year over year increase in the effective rate for the six months ended December 2, 2023 resulted from the same six months in the prior year having more favorable foreign tax credit impacts in the United States than the current six months. For the six months ended December 2, 2023, the effective tax rate is higher than the United States federal statutory rate due to United States state income taxes and the mix of earnings in tax jurisdictions that had rates that were higher than the United States federal statutory rate coupled with less favorable foreign tax credit impacts from the recapture of an overall domestic loss carryover. For the six months ended December 3, 2022, the effective tax rate was lower than the United States federal statutory rate due to the favorable impact of increased foreign tax credits in the United States resulting from the recapture of prior year overall domestic loss.
The Company recognizes interest and penalties related to uncertain tax benefits through Income tax expense in its Condensed Consolidated Statements of Comprehensive Income. Interest and penalties recognized in the Company's Condensed Consolidated Statements of Comprehensive Income were negligible for the three and six months ended December 2, 2023 and December 3, 2022.
The Company's recorded liability for potential interest and penalties related to uncertain tax benefits was:
| | | | | | | | | | | |
| (In millions) | December 2, 2023 | | June 3, 2023 |
| Liability for interest and penalties | $ | 0.9 | | | $ | 0.7 | |
| Liability for uncertain tax positions, current | $ | 1.6 | | | $ | 1.6 | |
| | | |
The Company is subject to periodic audits by domestic and foreign tax authorities. Currently, the Company is undergoing routine periodic audits in both domestic and foreign tax jurisdictions. It is reasonably possible that the amounts of unrecognized tax benefits could change in the next twelve months because of the audits. Tax payments related to these audits, if any, are not expected to be material to the Company's Condensed Consolidated Statements of Comprehensive Income.
For the majority of tax jurisdictions, the Company is no longer subject to state, local, or non-United States income tax examinations by tax authorities for fiscal years before 2020.
11. Fair Value Measurements
The Company's financial instruments consist of cash equivalents, marketable securities, accounts and notes receivable, deferred compensation plan, accounts payable, debt, interest rate swaps, foreign currency exchange contracts, redeemable noncontrolling interests, indefinite-lived intangible assets and right-of-use assets. The Company's financial instruments, other than long-term debt, are recorded at fair value.
The carrying value and fair value of the Company's long-term debt, including current maturities, is as follows for the periods indicated:
| | | | | | | | | | | |
| (In millions) | December 2, 2023 | | June 3, 2023 |
| Carrying value | $ | 1,331.1 | | | $ | 1,414.4 | |
| Fair value | $ | 1,369.4 | | | $ | 1,378.2 | |
The following describes the methods the Company uses to estimate the fair value of financial assets and liabilities recorded in net earnings, which have not significantly changed in the current period:
Cash and cash equivalents — The Company invests excess cash in short term investments in the form of money market funds, which are valued using net asset value ("NAV").
Mutual Funds-equity — The Company's equity securities primarily include equity mutual funds. The equity mutual fund investments are recorded at fair value using quoted prices for similar securities.
Deferred compensation plan — The Company's deferred compensation plan primarily includes various domestic and international mutual funds that are recorded at fair value using quoted prices for similar securities.
Foreign currency exchange contracts — The Company's foreign currency exchange contracts are valued using an approach based on foreign currency exchange rates obtained from active markets. The estimated fair value of forward currency exchange contracts is based on month-end spot rates as adjusted by market-based current activity. These forward contracts are not designated as hedging instruments.
The following table sets forth financial assets and liabilities measured at fair value through net income and the respective pricing levels to which the fair value measurements are classified within the fair value hierarchy as of December 2, 2023 and June 3, 2023.
| | | | | | | | | | | | | | | | | | | | | | | | | | | |
| (In millions) | December 2, 2023 | | | | June 3, 2023 |
| Financial Assets | NAV | | Quoted Prices with Other
Observable Inputs (Level 2) | | | | NAV | | Quoted Prices with Other
Observable Inputs (Level 2) | | |
| Cash equivalents: | | | | | | | | | | | |
| Money market funds | $ | 7.3 | | | $ | — | | | | | $ | 17.3 | | | $ | — | | | |
| | | | | | | | | | | |
| Foreign currency forward contracts | — | | | 1.6 | | | | | — | | | 1.3 | | | |
| Deferred compensation plan | — | | | 18.6 | | | | | — | | | 16.3 | | | |
| Total | $ | 7.3 | | | $ | 20.2 | | | | | $ | 17.3 | | | $ | 17.6 | | | |
| | | | | | | | | | | |
| Financial Liabilities | | | | | | | | | | | |
| Foreign currency forward contracts | — | | | 0.5 | | | | | — | | | 1.8 | | | |
| | | | | | | | | | | |
| Total | $ | — | | | $ | 0.5 | | | | | $ | — | | | $ | 1.8 | | | |
The following describes the methods the Company uses to estimate the fair value of financial assets and liabilities recorded in other comprehensive income, which have not significantly changed in the current period:
Interest rate swap agreements — The value of the Company's interest rate swap agreements are determined using a market approach based on rates obtained from active markets. The interest rate swap agreements are designated as cash flow hedging instruments.
The following table sets forth financial assets and liabilities measured at fair value through other comprehensive income and the respective pricing levels to which the fair value measurements are classified within the fair value hierarchy as of December 2, 2023 and June 3, 2023.
| | | | | | | | | | | | | | |
| (In millions) | | December 2, 2023 | | June 3, 2023 |
| Financial Assets | Balance Sheet Location | Quoted Prices with Other Observable Inputs (Level 2) | | Quoted Prices with Other Observable Inputs (Level 2) |
| | | | |
| Interest rate swap agreement | Other noncurrent assets | $ | 57.5 | | | $ | 59.9 | |
| Total | | $ | 57.5 | | | $ | 59.9 | |
| | | | |
| Financial Liabilities | | | | |
| Interest rate swap agreement | Other liabilities | $ | 0.8 | | | $ | 3.0 | |
| | | | |
| Total | | $ | 0.8 | | | $ | 3.0 | |
Derivative Instruments and Hedging Activities
Foreign Currency Forward Contracts
The Company transacts business in various foreign currencies and has established a program that primarily utilizes foreign currency forward contracts to reduce the risks associated with the effects of certain foreign currency exposures. Under this program, the Company's strategy is to have increases or decreases in our foreign currency exposures offset by gains or losses on the foreign currency forward contracts to mitigate the risks and volatility associated with foreign currency transaction gains or losses. These foreign currency exposures typically arise from net liability or asset exposures in non-functional currencies on the balance sheets of our foreign subsidiaries. These foreign currency forward contracts generally settle within 30 days and are not used for trading purposes.
These forward contracts are not designated as hedging instruments. Accordingly, we record the fair value of these contracts as of the end of the reporting period in the Consolidated Balance Sheets with changes in fair value recorded within the Consolidated Statements of Comprehensive Income. The balance sheet classification for the fair values of these forward contracts is to Other current assets for unrealized gains and to Other accrued liabilities for unrealized losses. The Consolidated Statements of Comprehensive Income classification for the fair values of these forward contracts is to Other (income) expense, net, for both realized and unrealized gains and losses.
Interest Rate Swaps
The Company enters into interest rate swap agreements to manage its exposure to interest rate changes and its overall cost of borrowing. The Company's interest rate swap agreements exchange variable rate interest payments for fixed rate payments over the life of the agreement without the exchange of the underlying notional amounts. The notional amount of the interest rate swap agreements is used to measure interest to be paid or received. The differential paid or received on the interest rate swap agreements is recognized as an adjustment to interest expense.
The interest rate swaps were designated as cash flow hedges at inception and the facts and circumstances of the hedged relationships remain consistent with the initial quantitative effectiveness assessment in that the hedged instruments remain an effective accounting hedge as of December 2, 2023. Since a designated derivative meets hedge accounting criteria, the fair value of the hedge is recorded in the Consolidated Statements of Stockholders’ Equity as a component of Accumulated other comprehensive loss, net of tax. The ineffective portion of the change in fair value of the derivatives is immediately recognized in earnings. The interest rate swap agreements are assessed for hedge effectiveness on a quarterly basis.
| | | | | | | | | | | | | | | | | | | | | | | | | | | | | |
| (In millions) | Notional Amount | | Forward Start Date | | Amendment Effective Date | | Termination Date | | Effective Fixed Interest Rate |
| September 2016 Interest Rate Swap | $ | 150.0 | | | January 3, 2018 | | February 3, 2023 | | January 3, 2028 | | 1.910 | % |
| June 2017 Interest Rate Swap | $ | 75.0 | | | January 3, 2018 | | February 3, 2023 | | January 3, 2028 | | 2.348 | % |
| January 2022 Interest Rate Swap | $ | 575.0 | | | January 31, 2022 | | January 31, 2023 | | January 29, 2027 | | 1.650 | % |
| March 2023 Interest Rate Swap | $ | 150.0 | | | March 3, 2023 | | none | | January 3, 2029 | | 3.950 | % |
The swaps above effectively converted indebtedness up to the notional amounts from a SOFR-based floating interest rate plus 0.11448% plus applicable margin to an effective fixed interest rate plus 0.11448% plus applicable margin under the terms of our Credit Agreement, as amended. Effective Fixed Interest Rates include the rates amended effective January 31, 2023, or February 3, 2023, for the first three swaps included in the chart above.
The following table summarizes the effects of the interest rate swap agreements for the three and six months ended:
| | | | | | | | | | | | | | | | | | | | | | | |
| Three Months Ended | | Six Months Ended |
| (In millions) | December 2, 2023 | | December 3, 2022 | | December 2, 2023 | | December 3, 2022 |
| (Loss) Gain recognized in Other comprehensive loss (effective portion) | $ | (7.9) | | | $ | 7.2 | | | $ | (0.1) | | | $ | 21.5 | |
| Gain reclassified from Accumulated other comprehensive loss into earnings | $ | 7.7 | | | $ | 2.4 | | | $ | 15.1 | | | $ | 2.0 | |
There were no gains or losses recognized in earnings for hedge ineffectiveness for the three and six month periods ended December 2, 2023 and December 3, 2022. The amount of gain expected to be reclassified from Accumulated other comprehensive income into earnings during the next twelve months is $27.1 million, net of tax is $20.3 million.
Redeemable Noncontrolling Interests
Changes in the Company's redeemable noncontrolling interest in HAY for the six months ended December 2, 2023 and December 3, 2022 are as follows:
| | | | | | | | | | | |
| (In millions) | December 2, 2023 | | December 3, 2022 |
| Beginning Balance | $ | 107.6 | | | $ | 106.9 | |
| | | |
| Net income attributable to redeemable noncontrolling interests | 0.4 | | | 3.1 | |
| | | |
| Dividend attributable to redeemable noncontrolling interests | — | | | (1.6) | |
| | | |
| Foreign currency translation adjustments | 1.6 | | | (1.8) | |
| Ending Balance | $ | 109.6 | | | $ | 106.6 | |
12. Commitments and Contingencies
Product Warranties
The Company provides coverage to the end-user for parts and labor on products sold under its warranty policy and for other product-related matters. The specific terms, conditions and length of those warranties vary depending upon the product sold. The Company does not sell or otherwise issue warranties or warranty extensions as stand-alone products. Reserves have been established for various costs associated with the Company's warranty programs. General warranty reserves are based on historical claims experience and other currently available information and are periodically adjusted for business levels and other factors. Specific reserves are established once an issue is identified with the amounts for such reserves based on the estimated cost of correction. The Company provides an assurance-type warranty that ensures that products will function as intended. As such, the Company's estimated warranty obligation is accounted for as a liability and is recorded within current and long-term liabilities within the Condensed Consolidated Balance Sheets.
Changes in the warranty reserve for the stated periods were as follows:
| | | | | | | | | | | | | | | | | | | | | | | |
| Three Months Ended | | Six Months Ended |
| (In millions) | December 2, 2023 | | December 3, 2022 | | December 2, 2023 | | December 3, 2022 |
| Accrual Balance — beginning | $ | 73.2 | | | $ | 72.3 | | | $ | 73.9 | | | $ | 73.2 | |
| Accrual for warranty matters | 4.9 | | | 7.4 | | | 10.1 | | | 11.7 | |
| Settlements and adjustments | (6.8) | | | (5.6) | | | (12.7) | | | (10.8) | |
| | | | | | | |
| | | | | | | |
| Accrual Balance — ending | $ | 71.3 | | | $ | 74.1 | | | $ | 71.3 | | | $ | 74.1 | |
Guarantees
The Company is periodically required to provide performance bonds to do business with certain customers. These arrangements are common in the industry and generally have terms ranging between one year and three years. The bonds are required to provide assurance to customers that the products and services they have purchased will be installed and/or provided properly and without damage to their facilities. The bonds are provided by various bonding agencies. However, the Company is ultimately liable for claims that may occur against them. As of December 2, 2023, the Company had a maximum financial exposure related to performance bonds totaling approximately $9.1 million. The Company has no history of claims, nor is it aware of circumstances that would require it to pay, under any of these arrangements. The Company also believes that the resolution of any claims that might arise in the future, either individually or in the aggregate, would not materially affect the Company's Consolidated Financial Statements. Accordingly, no liability has been recorded in respect to these bonds as of either December 2, 2023 or June 3, 2023.
The Company has entered into standby letter of credit arrangements for purposes of protecting various insurance companies and lessors against default on insurance premium and lease payments. As of December 2, 2023, the Company had a maximum financial exposure from these standby letters of credit totaling approximately $12.7 million, all of which is considered usage against the Company's revolving line of credit. The Company has no history of claims, nor is it aware of circumstances that would require it to perform under any of these arrangements and believes that the resolution of any claims that might arise in the future, either individually or in the aggregate, would not materially affect the Company's Consolidated Financial Statements. Accordingly, no liability has been recorded with respect to these arrangements as of December 2, 2023 or June 3, 2023.
Contingencies
The Company is also involved in legal proceedings and litigation arising in the ordinary course of business. In the opinion of management, the outcome of such proceedings and litigation currently pending will not have a material adverse effect, if any, on the Company's Consolidated Financial Statements.
13. Short-Term Borrowings and Long-Term Debt
Short-term borrowings and long-term debt as of December 2, 2023 and June 3, 2023 consisted of the following:
| | | | | | | | | | | |
| (In millions) | December 2, 2023 | | June 3, 2023 |
| | | |
| | | |
| | | |
| | | |
| Syndicated revolving line of credit, due July 2026 | $ | 355.0 | | | $ | 426.7 | |
Term Loan A, 7.2128%, due July 2026 | 360.0 | | | 370.0 | |
Term Loan B, 7.4628%, due July 2028 | 612.5 | | | 615.6 | |
| Supplier financing program | 2.3 | | | 2.1 | |
| Finance lease liability | 1.5 | | | — | |
| Total debt | $ | 1,331.3 | | | $ | 1,414.4 | |
| Less: Unamortized discount and issuance costs | (14.3) | | | (15.9) | |
| Less: Current debt | (38.8) | | | (33.4) | |
| Long-term debt | $ | 1,278.2 | | | $ | 1,365.1 | |
In connection with the acquisition of Knoll, in July, 2021, the Company entered into a credit agreement that provided for a syndicated revolving line of credit and two term loans. The revolving line of credit provides the Company with up to $725 million in revolving variable rate interest borrowing capacity that matures in July 2026, replacing the previous $500 million syndicated revolving line of credit. The term loans consist of a five-year senior secured term loan "A" facility with an aggregate principal amount of $400 million and a seven-year senior secured term loan "B" facility with an aggregate principal amount of $625 million, the proceeds of which were used to finance a portion of the cash consideration for the acquisition of Knoll, and to pay fees, costs, and expenses related thereto. In January 2023, the company entered into an Amendment to the credit agreement which transitioned the benchmark rate from LIBOR to the Secured Overnight Financing Rate ("SOFR") for U.S. dollar borrowings. SOFR is the recommended risk-free reference rate of the Federal Reserve Board and Alternative Reference Rates Committee, as defined within the credit agreement. The indebtedness incurred under the revolving line of credit and term loans is secured by substantially all of the Company’s tangible and intangible assets, including, without limitation, the Company’s intellectual property. The Company’s direct and indirect wholly-owned domestic subsidiaries have also guaranteed the obligations of the Company and the foreign borrowers under the revolving line of credit and term loans and pledged substantially all of their tangible and intangible assets as security for their obligations under such guarantee.
During the six months ended December 2, 2023 and the six months ended December 3, 2022, the Company made total principal payments on term loans "A" and "B" in the amounts of $10.0 million and $3.1 million, respectively.
Available borrowings under the syndicated revolving line of credit were as follows for the periods indicated:
| | | | | | | | | | | | |
| (In millions) | | December 2, 2023 | | June 3, 2023 |
| Syndicated revolving line of credit borrowing capacity | | $ | 725.0 | | | $ | 725.0 | |
| Less: Borrowings under the syndicated revolving line of credit | | 355.0 | | | 426.7 | |
| Less: Outstanding letters of credit | | 12.7 | | | 14.1 | |
Available borrowings under the syndicated revolving line of credit | | $ | 357.3 | | | $ | 284.2 | |
Supplier Financing Program
The Company has an agreement with a third-party financial institution that allows certain participating suppliers the ability to finance payment obligations of the Company. Under this program, participating suppliers may finance payment obligations of the Company, prior to their scheduled due dates, at a discounted price to the third-party financial institution.
The Company has lengthened the payment terms for certain suppliers that have chosen to participate in the program. As a result, certain amounts due to suppliers have payment terms that are longer than standard industry practice and as such, these amounts have been excluded from “Accounts payable” in the Condensed Consolidated Balance Sheets as the amounts have been accounted for by the Company as current debt, within “Short-term borrowings and current portion of long-term debt”. As of December 2, 2023 and June 3, 2023, the liability related to the supplier financing program was $2.3 million and $2.1 million, respectively.
14. Accumulated Other Comprehensive Loss
The following table provides an analysis of the changes in accumulated other comprehensive loss for the six months ended December 2, 2023 and December 3, 2022:
| | | | | | | | | | | | | | | | | | | | | | | | | |
| (In millions) | Cumulative Translation Adjustments | | Pension and Other Post-retirement Benefit Plans | | | | Interest Rate Swap Agreement | | Accumulated Other Comprehensive Loss |
| Balance at June 3, 2023 | $ | (114.0) | | | $ | (23.8) | | | | | $ | 42.7 | | | $ | (95.1) | |
| | | | | | | | | |
| Other comprehensive income (loss), net of tax before reclassifications | 11.2 | | | — | | | | | (15.2) | | | (4.0) | |
| Reclassification from accumulated other comprehensive loss - Other, net | — | | | (0.1) | | | | | 15.1 | | | 15.0 | |
| Tax benefit | — | | | — | | | | | — | | | — | |
| Net reclassifications | — | | | (0.1) | | | | | 15.1 | | | 15.0 | |
| Net current period other comprehensive income (loss) | 11.2 | | | (0.1) | | | | | (0.1) | | | 11.0 | |
| Balance at December 2, 2023 | $ | (102.8) | | | $ | (23.9) | | | | | $ | 42.6 | | | $ | (84.1) | |
| | | | | | | | | |
| Balance at May 28, 2022 | $ | (93.9) | | | $ | (36.9) | | | | | $ | 23.7 | | | $ | (107.1) | |
| | | | | | | | | |
| Other comprehensive (loss) income, net of tax before reclassifications | (28.3) | | | — | | | | | 19.5 | | | (8.8) | |
| Reclassification from accumulated other comprehensive loss - Other, net | — | | | 1.1 | | | | | 2.0 | | | 3.1 | |
| Tax benefit | — | | | (0.3) | | | | | — | | | (0.3) | |
| Net reclassifications | — | | | 0.8 | | | | | 2.0 | | | 2.8 | |
| Net current period other comprehensive (loss) income | (28.3) | | | 0.8 | | | | | 21.5 | | | (6.0) | |
| Balance at December 3, 2022 | $ | (122.2) | | | $ | (36.1) | | | | | $ | 45.2 | | | $ | (113.1) | |
15. Operating Segments
The Company's reportable segments consist of three segments: Americas Contract, International Contract & Specialty, and Global Retail.
The Americas Contract segment includes the operations associated with the design, manufacture and sale of furniture products directly or indirectly through an independent dealership network for office, healthcare, and educational environments throughout North and South America.
The International Contract & Specialty segment includes the operations associated with the design, manufacture and sale of furniture products, indirectly or directly through an independent dealership network in Europe, the Middle East, Africa and Asia-Pacific as well as the global activities of the Specialty brands, which include Holly Hunt, Spinneybeck, Maharam, Edelman, and Knoll Textiles.
The Global Retail segment includes global operations associated with the sale of modern design furnishings and accessories to third-party retailers, as well as direct to consumer sales through eCommerce, direct-mail catalogs, and physical retail stores.
The Company also reports a “Corporate” category consisting primarily of unallocated expenses related to general corporate functions, including, but not limited to, certain legal, executive, corporate finance, information technology, administrative and acquisition-related costs. Management regularly reviews corporate costs and believes disclosing such information provides more visibility and transparency regarding how the chief operating decision maker reviews results of the Company. The accounting policies of the operating segments are the same as those of the Company.
The following is a summary of certain key financial measures for the respective periods indicated:
| | | | | | | | | | | | | | | | | | | | | | | |
| Three Months Ended | | Six Months Ended |
| (In millions) | December 2, 2023 | | December 3, 2022 | | December 2, 2023 | | December 3, 2022 |
| Net Sales: | | | | | | | |
| Americas Contract | $ | 476.1 | | | $ | 529.7 | | | $ | 966.5 | | | $ | 1,067.1 | |
| International Contract & Specialty | 241.2 | | | 264.9 | | | 469.5 | | | 537.4 | |
| Global Retail | 232.2 | | | 272.3 | | | 431.2 | | | 541.2 | |
| Total | $ | 949.5 | | | $ | 1,066.9 | | | $ | 1,867.2 | | | $ | 2,145.7 | |
| | | | | | | |
| Operating Earnings: | | | | | | | |
| Americas Contract | $ | 35.1 | | | $ | 25.3 | | | $ | 76.5 | | | $ | 45.7 | |
| International Contract & Specialty | 23.8 | | | 28.3 | | | 35.2 | | | 56.2 | |
| Global Retail | 14.7 | | | 2.0 | | | 16.9 | | | 19.8 | |
| Total reportable segments | $ | 73.6 | | | $ | 55.6 | | | $ | 128.6 | | | $ | 121.7 | |
| Corporate | (13.2) | | | (16.9) | | | (27.9) | | | (32.2) | |
| Total | $ | 60.4 | | | $ | 38.7 | | | $ | 100.7 | | | $ | 89.5 | |
| | | | | | | |
| | | | | | | |
| | | | | | | |
| | | | | | | |
| | | | | | | |
| | | | | | | |
| | | | | | | |
Many of the Company's assets, including manufacturing, office and showroom facilities, support multiple segments. For that reason, it is impractical to disclose asset information on a segment basis.
16. Restructuring and Integration Expense
As part of restructuring and integration activities the Company has incurred expenses that qualify as exit and disposal costs under U.S. GAAP. These include severance and employee benefit costs as well as other direct separation benefit costs. Severance and employee benefit costs primarily relate to cash severance, as well as non-cash severance, including accelerated equity award compensation expense. The Company also incurs expenses that are an integral component of, and directly attributable to, our restructuring and integration activities, which do not qualify as exit and disposal costs under U.S. GAAP. These include integration implementation costs that relate primarily to professional fees and non-cash losses incurred on debt extinguishment.
The expenses associated with integration initiatives are included in Selling, general and administrative and the expenses associated with restructuring activities are included in Restructuring expense in the Condensed Consolidated Statements of Comprehensive Income.
Knoll Integration:
Following the Knoll acquisition, the Company announced a multi-year program (the "Knoll Integration") designed to reduce costs and integrate and optimize operations of the combined organization. The Company currently expects that the Knoll Integration will result in pre-tax cash costs that are expected to be approximately $150 million, comprised of the following categories:
•Severance and employee benefit costs associated with plans to integrate our operating structure, resulting in workforce reductions. These costs will primarily include: severance and employee benefits (cash severance, non-cash severance, including accelerated stock-compensation award expense and other termination benefits).
•Exit and disposal activities include those incurred as a direct result of integration activities, primarily including the reorganization and consolidation of facilities as well as asset impairment charges.
•Other integration costs include professional fees and other incremental third-party expenses, including a loss on extinguishment of debt associated with financing of the Knoll acquisition.
For the six months ended December 2, 2023, we incurred $10.8 million of costs related to the Knoll Integration which was comprised of $8.7 million of exit and disposal costs related to the consolidation of facilities and $2.1 million of other integration costs.
For the six months ended December 3, 2022, we incurred $8.7 million of costs related to the Knoll Integration including: $1.4 million of severance and employee benefit costs, $2.8 million of lease termination fees, and $4.5 million of other integration costs.
The following table provides an analysis of the changes in liability balance for Knoll Integration costs that qualify as exit and disposal costs under U.S. GAAP (i.e., severance and employee benefit costs and exit and disposal activities) for the six months ended December 2, 2023:
| | | | | | | | | | | | | | | | | |
| (In millions) | Severance and Employee Benefit | | Exit and Disposal Activities | | Total |
| June 3, 2023 | $ | 2.9 | | | $ | — | | | $ | 2.9 | |
| Integration Costs | — | | | 8.7 | | | 8.7 | |
| Amounts Paid | (1.6) | | | (4.7) | | | (6.3) | |
| Non-cash costs | — | | | (2.6) | | | (2.6) | |
| December 2, 2023 | $ | 1.3 | | | $ | 1.4 | | | $ | 2.7 | |
The Company expects that a substantial portion of the liability for the Knoll Integration as of December 2, 2023 will be paid in the balance of fiscal year 2024.
The following is a summary of integration expenses by segment for the periods indicated:
| | | | | | | | | | | | | | | | | | | | | | | |
| Three Months Ended | | Six Months Ended |
| (In millions) | December 2, 2023 | | December 3, 2022 | | December 2, 2023 | | December 3, 2022 |
| Americas Contract | $ | 6.4 | | | $ | 1.1 | | | $ | 9.5 | | | $ | 4.0 | |
| International Contract & Specialty | 0.5 | | | 1.0 | | | 1.2 | | | 1.5 | |
| Global Retail | — | | | — | | | — | | | 0.2 | |
| Corporate | — | | | 2.0 | | | 0.1 | | | 3.0 | |
| Total | $ | 6.9 | | | $ | 4.1 | | | $ | 10.8 | | | $ | 8.7 | |
In the second quarter of fiscal 2024 a manufacturing facility located in Wisconsin met the criteria to be classified as an asset held for sale. The decision to sell this facility was made as a result of facility integration activities performed in connection with the integration of Knoll. The carrying amount of these assets held for sale was $4.6 million and is classified as current assets within "Assets held for sale" in the Condensed Consolidated Balance Sheets as of December 2, 2023. No impairment has been recorded on the carrying value of the asset.
Restructuring Activities
During fiscal year 2023, the Company announced a series of actions that relate to the 2023 restructuring plan ("2023 restructuring plan") to reduce expenses. These restructuring activities included voluntary and involuntary reductions in workforces and charges incurred in connection with the decision to cease operating Fully as a stand-alone brand. As the result of these actions, the Company projected an annualized expense reduction of approximately $30 million to $35 million. The Company incurred $34.0 million of costs related to the 2023 restructuring plan comprised of $27.9 million of severance and employee benefit costs and $6.1 million of non-impairment charges related to the closure of the Fully business. The restructuring plan was complete in fiscal 2023 and no future costs related to this plan are expected.
During fiscal year 2024, the Company announced an action related to the 2024 restructuring plan ("2024 restructuring plan") to reduce expenses. This restructuring activity included involuntary reductions in workforces. As the result of the action, the Company projects an annualized expense reduction of approximately $5.0 million to $8.0 million. During the six months ended December 2, 2023 the Company incurred $7.0 million of severance and employee benefit costs related to the 2024 restructuring plan.
The following table provides an analysis of the changes in the restructuring cost reserve for the six months ended December 2, 2023:
| | | | | | | | | | | | | |
| Severance and Employee-Related | | |
| (In millions) | 2024 Restructuring Plan | | 2023 Restructuring Plan | | |
| June 3, 2023 | $ | — | | | $ | 7.3 | | | |
| Restructuring Costs | 7.0 | | | — | | | |
| Amounts Paid | (4.6) | | | (6.6) | | | |
| December 2, 2023 | $ | 2.4 | | | $ | 0.7 | | | |
The Company expects that remaining liability for the 2023 and 2024 restructuring plans as of December 2, 2023, will be paid in fiscal year 2024.
The following is a summary of restructuring costs by segment for the periods indicated:
| | | | | | | | | | | | | | | | | | | | | | | |
| Three Months Ended | | Six Months Ended |
| (In millions) | December 2, 2023 | | December 3, 2022 | | December 2, 2023 | | December 3, 2022 |
| Americas Contract | $ | — | | | $ | 13.2 | | | $ | 4.3 | | | $ | 13.2 | |
| International Contract & Specialty | 0.8 | | | 0.7 | | | 1.5 | | | 0.7 | |
| Global Retail | 1.0 | | | 0.8 | | | 1.2 | | | 1.3 | |
| | | | | | | |
| Total | $ | 1.8 | | | $ | 14.7 | | | $ | 7.0 | | | $ | 15.2 | |
17. Variable Interest Entities
The Company entered into long-term notes receivable with certain independently owned dealers that are deemed to be variable interests in variable interest entities. The carrying value of these long-term notes receivable was $12.6 million and $6.3 million as of December 2, 2023 and June 3, 2023 respectively and represents the Company’s maximum exposure to loss. The Company is not deemed to be the primary beneficiary for any of these variable interest entities as each independently owned dealer controls the activities that most significantly impact the entity’s economic performance, including sales, marketing, and operations.
Item 2: Management's Discussion and Analysis of Financial Condition and Results of Operations
(Dollars in millions, except share data)
The following is management's discussion and analysis of certain significant factors that affected the Company's financial condition, earnings and cash flows during the periods included in the accompanying Condensed Consolidated Financial Statements and should be read in conjunction with the Company's Annual Report on Form 10-K for the fiscal year ended June 3, 2023. References to “Notes” are to the footnotes included in the accompanying Condensed Consolidated Financial Statements.
Business Overview
The Company researches, designs, manufactures, sells, and distributes interior furnishings for use in various environments including residential, office, healthcare, and educational settings and provides related services that support organizations and individuals all over the world. The Company's products are sold primarily through independent contract office furniture dealers, direct customer sales, owned and independent retailers, direct-mail catalogs, and the Company’s eCommerce platforms. The following is a summary of results for the three months ended December 2, 2023:
•Net sales were $949.5 million and orders were $944.0 million, representing a decrease of 11.0% and 6.8%, respectively, when compared to the same quarter of the prior year. On an organic basis, which excludes the impact of foreign currency translation and the impact of the closure of the Fully business, Net sales were $941.6 million(*) and orders were $934.0 million(*), representing an organic decrease of 10.1% and 6.0%, respectively, when compared to the same quarter of the prior year.
•Gross margin in the second quarter was 39.2% as compared to 34.5% for the same quarter of the prior year. The increase in Gross margin was driven primarily by the impact of price increase actions, reduced costs associated with commodities, inventory handling and freight, as well as the continued realization of synergies associated with the Knoll integration.
•Operating expenses decreased by $17.3 million or 5.3% as compared to the same quarter of the prior year. The decrease was driven primarily by the realization of cost synergies as a result of optimization of our organizational structure, a reduction in restructuring costs as compared to the same prior of the prior year as well as lower variable costs due to decreased sales.
•As of the end of the second quarter, the Company has captured $147 million in annualized run rate synergies following the close of the Knoll acquisition in the first quarter of Fiscal 2022. The Company continues to make further progress on integration plans and expects total run-rate cost synergies to equal $160 million per year by July 2024 (three years following the acquisition closing date).
•The effective tax rate was 21.4% compared to 19.8% for the same quarter of the prior year. The prior year tax rate benefited from favorable tax credit benefits which outpaced the current year benefit.
•Diluted earnings per share was $0.45 as compared to earnings per share of $0.21 in the prior year. Excluding integration related costs, restructuring costs, and the amortization of intangible assets purchased as part of the Knoll acquisition, adjusted diluted earnings per share was $0.59(*), a 28.3%(*) increase as compared to prior year adjusted diluted earnings per share.
(*) Non-GAAP measurements; see accompanying reconciliations and explanations under the heading "Reconciliation of Non-GAAP Financial Measures."
The following summary includes the Company's view of the economic environment in which it operates:
•During the second quarter, demand levels for the Company's products continued to be impacted by general economic uncertainty around the world driven by geopolitical concerns, persistent inflationary affects, and elevated market interest rates. The Company believes that our second quarter financial results reflect how our diversified business model, with brands across multiple channels, customer segments and geographies, provides risk diversification, and opportunities for long-term future growth.
•The Americas Contract segment in the second quarter reported Net sales totaling $476.1 million, down 10.1% compared to the prior year period on a reported basis and down 10.3%(*) organically. Americas Contract had new orders of $437.4 million, which was a decrease of 7.7% from the prior year, and down 8.1%(*) on an organic basis.
•The International Contract & Specialty segment delivered Net sales in the second quarter of $241.2 million, a decrease of 8.9% from the year-ago period on a reported basis and a decrease of 10.4%(*) organically. New orders in this segment totaled $233.9 million, representing a year-over-year decrease of 3.2% on a reported basis and a decrease of 5.1%(*) organically.
•Net sales in the second quarter for the Global Retail segment totaled $232.2 million, a decrease of 14.7% over the same quarter last year on a reported basis and a decrease of 9.4%(*) organically. Orders in the quarter totaled $272.7 million, down 8.4% compared to the same period last year on a reported basis and down 3.0%(*) organically.
(*) Non-GAAP measurements; see accompanying reconciliations and explanations under the heading "Reconciliation of Non-GAAP Financial Measures."
The Company's fiscal year is the 52 or 53 week period ending on the Saturday closest to May 31. The fiscal year ending June 1, 2024 contains 52 weeks, while fiscal year ended June 3, 2023 ("fiscal 2023") contained 53 weeks. The first quarter of fiscal 2024 contained 13 weeks and the first quarter of fiscal 2023 contained 14 weeks. This is a factor that should be considered when comparing the Company's year to date financial results to the prior year period.
The remaining sections within Item 2 include additional analysis of the three and six months ended December 2, 2023, including discussion of significant variances compared to the prior year periods.
Reconciliation of Non-GAAP Financial Measures
This report contains non-GAAP financial measures that are not in accordance with, nor an alternative to, generally accepted accounting principles (GAAP) and may be different from non-GAAP measures presented by other companies. These non-GAAP financial measures are not measurements of our financial performance under GAAP and should not be considered an alternative to the related GAAP measurement. These non-GAAP measures have limitations as analytical tools and should not be considered in isolation or as a substitute for analysis of our results as reported under GAAP. Our presentation of non-GAAP measures should not be construed as an indication that our future results will be unaffected by unusual or infrequent items. We compensate for these limitations by providing equal prominence of our GAAP results. Reconciliations of these non-GAAP measures to the most directly comparable financial measures calculated and presented in accordance with GAAP are provided in the financial tables included within this report. The Company believes these non-GAAP measures are useful for investors as they provide financial information on a more comparative basis for the periods presented.
The non-GAAP financial measures referenced within this report include: Adjusted Earnings per Share and Organic Growth (Decline).
Adjusted Earnings per Share represents reported diluted earnings per share excluding the impact from amortization of Knoll purchased intangibles, integration charges, restructuring expenses, and the related tax effect of these adjustments. These adjustments are described further below.
Organic Growth (Decline) represents the change in sales and orders, excluding currency translation effects, the impact of an additional week in the fiscal 2023 and the impact of the closure of the Fully business.
The adjustments made to arrive at these non-GAAP financial measures are as follows:
•Amortization of Knoll Purchased Intangibles: Includes expenses associated with the amortization of acquisition related intangibles acquired as part of the Knoll acquisition. The revenue generated by the associated intangible assets has not been excluded from the related non-GAAP financial measure. We exclude the impact of the amortization of Knoll purchased intangibles as such non-cash amounts were significantly impacted by the size of the Knoll acquisition. Furthermore, we believe that this adjustment enables better comparison of our results as Amortization of Knoll Purchased Intangibles will not recur in future periods once such intangible assets have been fully amortized. Any future acquisitions may result in the amortization of additional intangible assets. Although we exclude the Amortization of Knoll Purchased Intangibles in these non-GAAP measures, we believe that it is important for investors to understand that such intangible assets were recorded as part of purchase accounting and contribute to revenue generation.
•Integration Charges: Knoll integration-related costs include severance, accelerated stock-based compensation expenses, asset impairment charges, and expenses related to synergy realization efforts and reorganization initiatives.
•Restructuring charges: Includes actions involving targeted workforce reductions.
•Tax related items: We excluded the income tax benefit/provision effect of the tax related items from our non-GAAP measures because they are not associated with the tax expense on our ongoing operating results.
The following tables reconciles Net sales to Net sales, organic for the periods ended as indicated below:
| | | | | | | | | | | | | | |
| |
| | | | |
| Three Months Ended |
| December 2, 2023 |
| Americas Contract | International Contract & Specialty | Global Retail | Total |
| Net sales, as reported | $ | 476.1 | | $ | 241.2 | | $ | 232.2 | | $ | 949.5 | |
| % change from PY | (10.1) | % | (8.9) | % | (14.7) | % | (11.0) | % |
| | | | |
| Adjustments | | | | |
| | | | |
| | | | |
Currency translation effects (1) | (0.8) | | (3.9) | | (3.2) | | (7.9) | |
| | | | |
| Net sales, organic | $ | 475.3 | | $ | 237.3 | | $ | 229.0 | | $ | 941.6 | |
| % change from PY | (10.3) | % | (10.4) | % | (9.4) | % | (10.1) | % |
| | | | |
| Three Months Ended |
| December 3, 2022 |
| Americas Contract | International Contract & Specialty | Global Retail | Total |
| Net sales, as reported | $ | 529.7 | | $ | 264.9 | | $ | 272.3 | | $ | 1,066.9 | |
| | | | |
| Adjustments | | | | |
| | | | |
| Fully closure | — | | — | | (19.5) | | (19.5) | |
| | | | |
| Net sales, organic | $ | 529.7 | | $ | 264.9 | | $ | 252.8 | | $ | 1,047.4 | |
| (1) Currency translation effects represent the estimated net impact of translating current period sales and orders using the average exchange rates applicable to the comparable prior year period |
| | | | | | | | | | | | | | |
| |
| | | | |
| Six Months Ended |
| December 2, 2023 |
| Americas Contract | International Contract & Specialty | Global Retail | Total |
| Net sales, as reported | $ | 966.5 | | $ | 469.5 | | $ | 431.2 | | $ | 1,867.2 | |
| % change from PY | (9.4) | % | (12.6) | % | (20.3) | % | (13.0) | % |
| | | | |
| Adjustments | | | | |
| | | | |
| | | | |
Currency translation effects (1) | (1.2) | | (6.9) | | (5.2) | | (13.3) | |
| | | | |
| Net sales, organic | $ | 965.3 | | $ | 462.6 | | $ | 426.0 | | $ | 1,853.9 | |
| % change from PY | (6.1) | % | (10.7) | % | (11.4) | % | (8.5) | % |
| | | | |
| Six Months Ended |
| December 3, 2022 |
| Americas Contract | International Contract & Specialty | Global Retail | Total |
| Net sales, as reported | $ | 1,067.1 | | $ | 537.4 | | $ | 541.2 | | $ | 2,145.7 | |
| | | | |
| Adjustments | | | | |
| | | | |
| Fully closure | — | | — | | (42.3) | | (42.3) | |
| Impact of extra week in FY23 | (38.7) | | (19.6) | | (18.2) | | (76.5) | |
| Net sales, organic | $ | 1,028.4 | | $ | 517.8 | | $ | 480.7 | | $ | 2,026.9 | |
| (1) Currency translation effects represent the estimated net impact of translating current period sales and orders using the average exchange rates applicable to the comparable prior year period |
| | | | |
The following tables reconcile orders as reported to organic orders for the periods ended as indicated below:
| | | | | | | | | | | | | | |
| |
| Three Months Ended |
| December 2, 2023 |
| Americas Contract | International Contract & Specialty | Global Retail | Total |
| Orders, as reported | $ | 437.4 | | $ | 233.9 | | $ | 272.7 | | $ | 944.0 | |
| % change from PY | (7.7) | % | (3.2) | % | (8.4) | % | (6.8) | % |
| | | | |
| Adjustments | | | | |
| | | | |
Currency translation effects (1) | (1.9) | | (4.5) | | (3.6) | | (10.0) | |
| | | | |
| Orders, organic | $ | 435.5 | | $ | 229.4 | | $ | 269.1 | | $ | 934.0 | |
| % change from PY | (8.1) | % | (5.1) | % | (3.0) | % | (6.0) | % |
| | | | |
| Three Months Ended |
| December 3, 2022 |
| Americas Contract | International Contract & Specialty | Global Retail | Total |
| Orders, as reported | $ | 474.1 | | $ | 241.7 | | $ | 297.6 | | $ | 1,013.4 | |
| | | | |
| Adjustments | | | | |
| Fully closure | — | | — | | (20.3) | | (20.3) | |
| | | | |
| | | | |
| Orders, organic | $ | 474.1 | | $ | 241.7 | | $ | 277.3 | | $ | 993.1 | |
| (1) Currency translation effects represent the estimated net impact of translating current period sales and orders using the average exchange rates applicable to the comparable prior year period. |
| | | | | | | | | | | | | | |
| Six Months Ended |
| December 2, 2023 |
| Americas Contract | International Contract & Specialty | Global Retail | Total |
| Orders, as reported | $ | 924.7 | | $ | 461.8 | | $ | 471.2 | | $ | 1,857.7 | |
| % change from PY | (6.2) | % | (6.5) | % | (13.9) | % | (8.3) | % |
| | | | |
| Adjustments | | | | |
| | | | |
Currency translation effects (1) | (4.2) | | (7.4) | | (5.7) | | (17.3) | |
| | | | |
| Orders, organic | $ | 920.5 | | $ | 454.4 | | $ | 465.5 | | $ | 1,840.4 | |
| % change from PY | (3.0) | % | (4.4) | % | (4.4) | % | (3.7) | % |
| | | | |
| Six Months Ended |
| December 3, 2022 |
| Americas Contract | International Contract & Specialty | Global Retail | Total |
| Orders, as reported | $ | 985.4 | | $ | 494.1 | | $ | 547.0 | | $ | 2,026.5 | |
| | | | |
| Adjustments | | | | |
| | | | |
| | | | |
| Impact of extra week in FY23 | (36.2) | | (18.9) | | (16.6) | | (71.7) | |
| Fully closure | — | | — | | (43.3) | | (43.3) | |
| Orders, organic | $ | 949.2 | | $ | 475.2 | | $ | 487.1 | | $ | 1,911.5 | |
| (1) Currency translation effects represent the estimated net impact of translating current period sales and orders using the average exchange rates applicable to the comparable prior year period. |
| | | | |
The following table reconciles earnings per share - diluted to adjusted earnings per share - diluted for the periods ended as indicated below:
| | | | | | | | | | | | | | |
| Three Months Ended | Six Months Ended |
| December 2, 2023 | December 3, 2022 | December 2, 2023 | December 3, 2022 |
| Earnings per share - diluted | $ | 0.45 | | $ | 0.21 | | $ | 0.67 | | $ | 0.55 | |
| | | | |
| | | | |
| | | | |
| | | | |
| | | | |
| | | | |
| Add: Amortization of Knoll purchased intangibles | 0.08 | | 0.08 | | 0.16 | | 0.16 | |
| | | | |
| Add: Integration charges | 0.09 | | 0.06 | | 0.16 | | 0.12 | |
| Add: Restructuring charges | 0.02 | | 0.19 | | 0.08 | | 0.20 | |
| | | | |
| | | | |
| | | | |
| | | | |
| Tax impact on adjustments | (0.05) | | (0.08) | | (0.11) | | (0.13) | |
| Adjusted earnings per share - diluted | $ | 0.59 | | $ | 0.46 | | $ | 0.96 | | $ | 0.90 | |
| Weighted average shares outstanding (used for calculating adjusted earnings per share) – diluted | 74,240,293 | | 75,878,078 | | 75,077,712 | | 76,042,640 | |
Key Highlights
The following table presents certain key highlights from the results of operations for the three and six months ended:
| | | | | | | | | | | | | | | | | | | | | | | | | | | | | | | | | | | |
| Three Months Ended | | Six Months Ended |
| (In millions, except share data) | December 2, 2023 | | December 3, 2022 | | % Change | | December 2, 2023 | | December 3, 2022 | | % Change |
| | | | | | | | | | | |
| Net sales | $ | 949.5 | | | $ | 1,066.9 | | | (11.0) | % | | $ | 1,867.2 | | | $ | 2,145.7 | | | (13.0) | % |
| Cost of sales | 577.5 | | | 699.3 | | | (17.4) | % | | 1,137.1 | | | 1,406.0 | | | (19.1) | % |
| Gross margin | 372.0 | | | 367.6 | | | 1.2 | % | | 730.1 | | | 739.7 | | | (1.3) | % |
| Operating expenses | 311.6 | | | 328.9 | | | (5.3) | % | | 629.4 | | | 650.2 | | | (3.2) | % |
| Operating earnings | 60.4 | | | 38.7 | | | 56.1 | % | | 100.7 | | | 89.5 | | | 12.5 | % |
| | | | | | | | | | | |
| Other expenses, net | 16.1 | | | 17.1 | | | (5.8) | % | | 35.3 | | | 34.2 | | | 3.2 | % |
| Earnings before income taxes and equity income | 44.3 | | | 21.6 | | | 105.1 | % | | 65.4 | | | 55.3 | | | 18.3 | % |
| Income tax expense | 9.5 | | | 4.3 | | | 120.9 | % | | 14.6 | | | 10.6 | | | 37.7 | % |
| Equity (loss) income from nonconsolidated affiliates, net of tax | (0.4) | | | 0.2 | | | (300.0) | % | | (0.3) | | | 0.2 | | | (250.0) | % |
| Net earnings | 34.4 | | | 17.5 | | | 96.6 | % | | 50.5 | | | 44.9 | | | 12.5 | % |
| Net earnings attributable to redeemable noncontrolling interests | 0.9 | | | 1.5 | | | n/a | | 0.3 | | | 3.1 | | | n/a |
| Net earnings attributable to MillerKnoll, Inc. | $ | 33.5 | | | $ | 16.0 | | | 109.4 | % | | $ | 50.2 | | | $ | 41.8 | | | 20.1 | % |
| Earnings per share - basic | $ | 0.45 | | | $ | 0.21 | | | 114.3 | % | | $ | 0.67 | | | $ | 0.55 | | | 21.8 | % |
| Orders | $ | 944.0 | | | $ | 1,013.4 | | | (6.8) | % | | $ | 1,857.7 | | | $ | 2,026.5 | | | (8.3) | % |
| Backlog | $ | 688.5 | | | $ | 815.4 | | | (15.6) | % | | | | | | |
The following table presents select components of the Company's Condensed Consolidated Statements of Comprehensive (Loss) Income as a percentage of Net sales, for the three and six months ended:
| | | | | | | | | | | | | | | | | | | | | | | |
| Three Months Ended | | Six Months Ended |
| December 2, 2023 | | December 3, 2022 | | December 2, 2023 | | December 3, 2022 |
| Net sales | 100.0 | % | | 100.0 | % | | 100.0 | % | | 100.0 | % |
| Cost of sales | 60.8 | | | 65.5 | | | 60.9 | | | 65.5 | |
| Gross margin | 39.2 | | | 34.5 | | | 39.1 | | | 34.5 | |
| Operating expenses | 32.8 | | | 30.8 | | | 33.7 | | | 30.3 | |
| Operating earnings | 6.4 | | | 3.6 | | | 5.4 | | | 4.2 | |
| | | | | | | |
| Other expenses, net | 1.7 | | | 1.6 | | | 1.9 | | | 1.6 | |
| Earnings before income taxes and equity income | 4.7 | | | 2.0 | | | 3.5 | | | 2.6 | |
| Income tax expense | 1.0 | | | 0.4 | | | 0.8 | | | 0.5 | |
| Equity (loss) income from nonconsolidated affiliates, net of tax | — | | | — | | | — | | | — | |
| Net earnings | 3.6 | | | 1.6 | | | 2.7 | | | 2.1 | |
| Net earnings attributable to redeemable noncontrolling interests | 0.1 | | | 0.1 | | | — | | | 0.1 | |
| Net earnings attributable to MillerKnoll, Inc. | 3.5 | | | 1.5 | | | 2.7 | | | 1.9 | |
Net Sales
The following chart presents graphically the primary drivers of the year-over-year change in Net sales for the three and six months ended December 2, 2023. The amounts presented in the graph are expressed in millions and have been rounded.
Net sales decreased $117 million or 11.0% in the second quarter of fiscal 2024 compared to the second quarter of fiscal 2023. The following items contributed to the change:
•Decreased sales volume within the Global Retail, International Contract & Specialty, and Americas Contract segments of approximately $11 million, $29 million and $77 million, respectively.
•Decrease of $20 million related to the closure of the Fully business that occurred in the prior year. Offset in part by:
•Price increases, net of incremental discounting, which drove an increase in Net sales of approximately $12 million.
•Foreign currency translation increased Net sales by approximately $8 million.
Net sales decreased $279 million or 13.0% in the first six months of fiscal 2024 compared to the first six months of fiscal 2023. The following items contributed to the change:
•The additional week during the first quarter of the prior year contributed to approximately $77 million of the net sales decrease.
•Decrease of $42 million related to the closure of the Fully business that occurred in the prior year.
•Decreased sales volume within the Global Retail, International Contract & Specialty, and Americas Contract segments of approximately $37 million, $63 million and $124 million, respectively. Offset in part by:
•Price increases, net of incremental discounting, which drove an increase in Net sales of approximately $51 million.
•Foreign currency translation increased Net sales by approximately $13 million.
Gross Margin
Gross margin was 39.2% in the second quarter of fiscal 2024 as compared to 34.5% in the second quarter of fiscal 2023. The following factors summarize the major drivers of the year-over-year change in gross margin percentage:
•Price increases, net of incremental discounting, contributed to margin improvement of approximately 90 basis points.
•Reduction in costs from commodities, storage and handling costs, freight and product distribution costs, as compared to the same period of the prior year which increased gross margin by approximately 460 basis points.
•Savings from the realization of incremental synergies associated with the Knoll acquisition as compared to the same period in the prior year. These factors were offset in part by;
•Loss of leverage on lower sales volumes, which negatively impacted margin by approximately 120 basis points.
Gross margin was 39.1% in the six months ended December 2, 2023 as compared to 34.5% for the same period in the prior fiscal year. The following factors summarize the major drivers of the year-over-year change in gross margin percentage:
•Price increases, net of incremental discounting, contributed to margin improvement of approximately 180 basis points.
•Reduction in costs from commodities, storage and handling costs, freight and product distribution costs, as compared to the same period of the prior year which increased gross margin by approximately 370 basis points.
•Savings from the realization of incremental synergies associated with the Knoll acquisition as compared to the same period in the prior year. These factors were offset in part by;
•Loss of leverage on lower sales volumes and unfavorable channel and product mix, which negatively impacted gross margin by approximately 110 basis points.
Operating Expenses
The following chart presents graphically the primary drivers of the year-over-year change in Operating expenses for the three and six months ended December 2, 2023. The amounts presented in the graphs are expressed in millions and have been rounded.
Operating expenses decreased by $17 million or 5.3% in the second quarter of fiscal 2024 compared to the prior year period. The following factors contributed to the change:
•Variable selling and marketing costs decreased by approximately $10 million, due in part to the closure of the Fully business that occurred in the prior year; and
•Restructuring charges related to reductions in the Company's workforce as well as acquisition related integration costs contributed to a decrease in Operating expenses as compared to the same period of the prior year of approximately $10 million; and
•Other costs, primarily product development costs decreased approximately $5 million, primarily in the Americas Contract and Global Retail segments. These decreases were offset in part by:
•Compensation and benefit costs, which increased approximately $8 million, driven by changes in variable-based compensation and incentives;
Operating expenses decreased by $21 million or 3.2% in the first six months of fiscal 2024 compared to the first six months of fiscal 2023. The following factors contributed to the change:
•The impact of an extra week in the first quarter of fiscal 2023 decreased operating expenses by approximately $10 million in the current period; and
•Variable selling and marketing costs decreased by approximately $9 million, due in part to the closure of the Fully business that occurred in the prior year; and
•Restructuring charges related to reductions in the Company's workforce contributed to a decrease in Operating expenses of approximately $8 million; and
•Product development costs decreased approximately $8 million, primarily in the Americas Contract and Global Retail segments; and
•Savings from the realization of incremental synergies associated with the Knoll acquisition as compared to the same period in the prior year. These decreases were offset in part by:
•Compensation and benefit costs, which increased approximately $16 million, driven by changes in variable-based compensation and incentives.
Other Income/Expense
During the three months ended December 2, 2023, net Other expense was $16.1 million, representing a decrease of $1.0 million compared to the same period in the prior year, driven primarily by increased interest income as well as higher foreign currency gains recorded in the current fiscal year, offset in part by increased interest expense as compared to the same period of the prior year.
During the six months ended December 2, 2023, net Other expense was $35.3 million, representing an increase of $1.1 million compared to the same period in the prior year. This change is driven primarily by increased interest expense as compared to the same period of the prior year, offset in part by increased interest income in the current year.
Income Taxes
See Note 10 of the Condensed Consolidated Financial Statements for additional information.
Operating Segment Results
The business is comprised of various operating segments as defined by generally accepted accounting principles in the United States. These operating segments are determined on the basis of how the Company internally reports and evaluates financial information used to make operating decisions. The segments identified by the Company are Americas Contract, International Contract & Specialty, and Global Retail. Unallocated expenses are reported within the Corporate category. For descriptions of each segment, refer to Note 15 of the Condensed Consolidated Financial Statements.
The charts below present the relative mix of Net sales and Operating earnings across each of the Company's segments during the three and six month periods ended December 2, 2023. This is followed by a discussion of the Company's results, by reportable segment. The amounts presented in the charts are in millions and have been rounded.
Americas Contract
| | | | | | | | | | | | | | | | | | | | | | | | | | | | | | | | | | | |
| Three Months Ended | | Six Months Ended |
| (Dollars in millions) | December 2, 2023 | | December 3, 2022 | | Change | | December 2, 2023 | | December 3, 2022 | | Change |
| Net sales | $ | 476.1 | | | $ | 529.7 | | | $ | (53.6) | | | $ | 966.5 | | | $ | 1,067.1 | | | $ | (100.6) | |
| Gross margin | 161.0 | | | 158.7 | | | 2.3 | | | 335.8 | | | 302.9 | | | 32.9 | |
| Gross margin % | 33.8 | % | | 30.0 | % | | 3.8 | % | | 34.7 | % | | 28.4 | % | | 6.3 | % |
| | | | | | | | | | | |
| | | | | | | | | | | |
| Operating earnings | 35.1 | | | 25.3 | | | 9.8 | | | 76.5 | | | 45.7 | | | 30.8 | |
| Operating earnings % | 7.4 | % | | 4.8 | % | | 2.6 | % | | 7.9 | % | | 4.3 | % | | 3.6 | % |
For the three month comparative period, Net sales decreased 10.1%, or 10.3%(*) on an organic basis, over the prior year period due to:
•Decreased sales volumes within the segment of approximately $77 million, driven by the impact of a challenging macro-economic environment; offset by
•Price increases, net of incremental discounting of $23 million.
For the six month comparative period, Net sales decreased 9.4%, or 6.1%(*) on an organic basis, over the prior year period due to:
•Decreased volumes within the segment of approximately $124 million, which was driven by the impact of a challenging macro-economic environment compounded by pandemic-driven pent-up demand last year; and
•The impact of an additional week in the same period of the prior year, which reduced sales approximately $39 million; offset by
•Price increases, net of incremental discounting of $61 million; and
•Favorable foreign currency translation of approximately $1 million.
(*) Non-GAAP measurements; see accompanying reconciliations and explanations under the heading "Reconciliation of Non-GAAP Financial Measures."
For the three month comparative period, operating earnings increased $9.8 million, or 38.7%, over the prior year period due to:
•Increased Gross margin of $2 million due to the increased gross margin percentage of 380 basis points, which more than offset the decrease in net sales discussed above. The increase in gross margin percentage was due primarily to:
◦The impact of incremental list price increases, net of contract price discounting which provided an approximately 330 basis point improvement over the prior year; and
◦Decreased commodity costs which provided an improvement of approximately 300 basis points. These increases were offset in part by increased labor costs as well as loss of labor and overhead leverage due to reduced production volumes which had a negative impact on margin of 250 basis points.; as well as
◦The favorable impact of realization of synergies associated with the Knoll acquisition.
•Decreased Operating expenses of $8 million driven primarily by decreased restructuring charges related to reductions in the Company's workforce of approximately $13 million offset in part by an increase in variable compensation costs of approximately $4 million.
For the six month comparative period, operating earnings increased $30.8 million, or 67.4%, over the prior year period due to:
•Increased Gross margin of $32.9 million due to the increased gross margin percentage of 630 basis points. The increase in gross margin percentage was due primarily to:
◦The impact of incremental list price increases, net of contract price discounting, that increased gross margin percentage by 430 basis points; and
◦Decreased commodity and product distribution costs that increased gross margin percentage by 380 basis points. These increases were offset in part by increased labor costs as well as loss of labor and overhead leverage due to reduced production volumes as well as unfavorable product mix which had a negative impact on margin of 180 basis points. Partially offset by;
•Increased Operating expenses of $2 million. The following factors contributed to the change:
◦An increase in variable based compensation of approximately $10 million and increased acquisition related costs costs of $6 million; offset by
◦A decrease of approximately $5 million due to the additional week in the prior year as well as decreased restructuring charges related to reductions in the Company's workforce of approximately $9 million compared to the prior year.
International Contract & Specialty
| | | | | | | | | | | | | | | | | | | | | | | | | | | | | | | | | | | |
| Three Months Ended | | Six Months Ended |
| (Dollars in millions) | December 2, 2023 | | December 3, 2022 | | Change | | December 2, 2023 | | December 3, 2022 | | Change |
| Net sales | $ | 241.2 | | | $ | 264.9 | | | $ | (23.7) | | | $ | 469.5 | | | $ | 537.4 | | | $ | (67.9) | |
| Gross margin | 106.0 | | | 109.0 | | | (3.0) | | | 202.9 | | | 222.4 | | | (19.5) | |
| Gross margin % | 43.9 | % | | 41.1 | % | | 2.8 | % | | 43.2 | % | | 41.4 | % | | 1.8 | % |
| | | | | | | | | | | |
| | | | | | | | | | | |
| Operating earnings | 23.8 | | | 28.3 | | | (4.5) | | | 35.2 | | | 56.2 | | | (21.0) | |
| Operating earnings % | 9.9 | % | | 10.7 | % | | (0.8) | % | | 7.5 | % | | 10.5 | % | | (3.0) | % |
For the three month comparative period, Net sales decreased 8.9%, or 10.4%(*) on an organic basis, over the prior year period due to:
•Decline in sales volume of approximately $29 million driven mainly by challenging macroeconomic conditions in Europe and China; offset in part by
•Favorable foreign currency translation of approximately $4 million; and
•Price increases, net of incremental discounting of $1 million.
For the six month comparative period, Net sales decreased 12.6%, or 10.7%(*) on an organic basis, over the prior year period due to:
•Impact of the extra week in the prior year period, which drove a decrease of $20 million; and
•Decreased sales volume of approximately $63 million; offset in part by
•Price increases, net of incremental discounting of $8 million; and
•Favorable foreign currency translation of approximately $7 million.
(*) Non-GAAP measurements; see accompanying reconciliations and explanations under the heading "Reconciliation of Non-GAAP Financial Measures."
For the three month comparative period, operating earnings decreased $4.5 million, or 15.9%, over the prior year period due to:
•Decreased Gross margin of $3 million due to the decrease in net sales discussed above, which more than offset an increase in gross margin percentage of 280 basis points due primarily to favorable product mix.
•Operating expenses increased approximately $2 million which was largely due to an increase in variable compensation costs in the current year.
For the six month comparative period, operating earnings decreased $21.0 million, or 37.4%, over the prior year period due to:
•Decreased Gross margin of $20 million due to the decrease in sales explained above, which more than offset an increase in gross margin percentage of 180 basis points due primarily to favorable product mix and the impact of incremental list price increases, net of contract price discounting
•Increased Operating expenses of $2 million which was largely due to an increase in variable compensation costs in the current year of $8 million offset by a decrease of $4 million due to the additional week in the prior year and a decrease of $2 million of variable selling costs.
Global Retail
| | | | | | | | | | | | | | | | | | | | | | | | | | | | | | | | | | | |
| Three Months Ended | | Six Months Ended |
| (Dollars in millions) | December 2, 2023 | | December 3, 2022 | | Change | | December 2, 2023 | | December 3, 2022 | | Change |
| Net sales | $ | 232.2 | | | $ | 272.3 | | | $ | (40.1) | | | $ | 431.2 | | | $ | 541.2 | | | $ | (110.0) | |
| Gross margin | 105.0 | | | 99.9 | | | 5.1 | | | 191.4 | | | 214.4 | | | (23.0) | |
| Gross margin % | 45.2 | % | | 36.7 | % | | 8.5 | % | | 44.4 | % | | 39.6 | % | | 4.8 | % |
| | | | | | | | | | | |
| | | | | | | | | | | |
| Operating earnings | 14.7 | | | 2.0 | | | 12.7 | | | 16.9 | | | 19.8 | | | (2.9) | |
| Operating earnings % | 6.3 | % | | 0.7 | % | | 5.6 | % | | 3.9 | % | | 3.7 | % | | 0.2 | % |
For the three month comparative period, Net sales decreased 14.7%, and decreased 9.4%(*) on an organic basis, over the prior year period due to:
•Decrease of $20 million related to the closure of the Fully business that occurred in the prior year; and
•Incremental discounting, net of price increases which decreased sales by $12 million; and
•A decrease in sales volume of approximately $11 million, driven by a slowdown in our wholesale sales internationally due to high rates impacting customer demand and the continued softness in the North American housing market; offset by
•Favorable foreign currency translation of approximately $3 million.
For the six month comparative period, Net sales decreased 20.3%, and decreased 11.4%(*) on an organic basis, over the prior year period due to:
•Decrease of $42 million related to the closure of the Fully business that occurred in the prior year; and
•A decrease in sales volume of approximately $37 million, driven by a slowdown in the North American housing market and a continuation of general economic uncertainty; and
•The additional week during the first quarter of the prior year contributed to approximately $18 million of the net sales decrease; and
•Incremental discounting, net of price increases, which decreased sales by $18 million; offset by
•Favorable foreign currency translation of approximately $5 million.
(*) Non-GAAP measurements; see accompanying reconciliations and explanations under the heading "Reconciliation of Non-GAAP Financial Measures."
For the three month comparative period, Operating earnings increased $13 million or 635.0% over the prior year period due to:
•Increased Gross margin of $5 million due to the gross margin percentage increase of 850 basis points attributable to the favorable impact of reduced costs as compared to the prior year associated with product distribution and inventory handling; and
•Decreased Operating expenses of $8 million driven primarily by decreased variable selling costs, decreased product development costs, as well as a decrease due to to the closure of the Fully business that occurred in the prior year.
For the six month comparative period, Operating earnings decreased $2.9 million, or 14.6%, over the prior year period due to:
•Decreased Gross margin of $23 million primarily due to decreased sales explained above, offset by an increase in gross margin percentage of 480 basis points attributable to the favorable impact of reduced costs as compared to the prior year associated with product distribution and inventory handling; and
•Decreased Operating expenses of $20 million driven primarily by decreased variable selling and marketing costs of $11 million, a decrease of $4 million due to the additional week in the prior year, decreased product development of $3 million, as well as a decrease due to to the closure of the Fully business that occurred in the prior year.
Corporate
Corporate unallocated expenses totaled $13.2 million for the second quarter of fiscal 2024, a decrease of $3.7 million from the second quarter of fiscal 2023. The decrease was driven primarily by a reduction in integration costs as compared to the same period of the prior year.
Corporate unallocated expenses totaled $27.9 million for the first six months of fiscal 2024, a decrease of $4.3 million from the same period of fiscal 2023. The decrease was driven primarily by a reduction in integration costs as compared to the same period of the prior year.
Liquidity and Capital Resources
The table below summarizes the net change in Cash and cash equivalents for the six months ended as indicated.
| | | | | | | | | | | |
| (In millions) | December 2, 2023 | | December 3, 2022 |
| | | |
| Cash provided by (used in): | | | |
| Operating activities | $ | 213.4 | | | $ | (5.3) | |
| Investing activities | (41.3) | | | (32.0) | |
| Financing activities | (170.8) | | | 11.6 | |
| Effect of exchange rate changes | 1.0 | | | (7.1) | |
| Net change in Cash and cash equivalents | $ | 2.3 | | | $ | (32.8) | |
Cash Flows - Operating Activities
The principal source of our operating cash flow is net earnings. Net cash provided by operating activities for the six months ended December 2, 2023 totaled $213.4 million, as compared to cash used of $5.3 million in the same period of the prior year. The increase in cash inflow is due primarily to higher net income and a reduction in working capital. Our working capital consists primarily of receivables from customers, inventory, prepaid expenses, accounts payable, accrued compensation, and accrued other expenses. The following all affected these account balances:
•The timing of collection of our receivables;
•Effective inventory management resulting in reduced inventory levels; and
•Increased variable compensation in the current quarter.
Cash Flows - Investing Activities
Cash used in investing activities for the six months ended December 2, 2023 was $41.3 million, as compared to $32.0 million in the same period of the prior year. The increase in cash outflow in the current year, compared to the prior year, was primarily due to the advancement of $13.5 million of cash against the value of company owned life insurance policies received in the six months ended December 3, 2022. This is reflected as cash proceeds from investing activities in the Consolidated Statement of Cash Flows. In the six months ended December 2, 2023 the Company received $3.5 million of proceeds related to the sale of its investment in Maars.
At the end of the second quarter of fiscal 2024, there were outstanding commitments for capital purchases of $14.4 million. The Company plans to fund these commitments through a combination of cash on hand and cash flows from operations. The Company expects full-year capital purchases to be between $80 million and $100 million, which will be primarily related to investments in the Company's facilities and equipment. This compares to full-year capital spending of $83.3 million in fiscal 2023. Capital expenditures for the first six months of fiscal 2024 of $39.9 million were comparable to the same period of the prior year.
Cash Flows - Financing Activities
Cash used in financing activities for the six months ended December 2, 2023 was $170.8 million, as compared to cash provided by financing activities of $11.6 million in the same period of the prior year. The increase in cash used in the current year, compared to the prior year, was primarily due to net payments on the credit agreement of $71.7 million in the current year compared to net borrowings of $67.0 million in the same period of the prior year.
During the six months ended December 2, 2023 we repurchased 3.1 million shares at a cost of 60.0 million, compared to share repurchases totaling $14.3 million in the same period of the prior year.
Sources of Liquidity
The Company has taken actions to safeguard its cash flow and liquidity position in the current environment. The Company is closely managing spending levels, capital investments, and working capital.
The Company maintains an open market share repurchase program under our existing share repurchase authorization and may repurchase shares from time to time based on management’s evaluation of market conditions, share price and other factors.
At the end of the second quarter of fiscal 2024, the Company had a well-positioned balance sheet and liquidity profile. The Company has access to liquidity through credit facilities as well as cash and cash equivalents. These sources have been summarized below. For additional information, refer to Note 13 to the Condensed Consolidated Financial Statements.
| | | | | | | | | | | |
| (In millions) | December 2, 2023 | | June 3, 2023 |
| Cash and cash equivalents | $ | 225.8 | | | $ | 223.5 | |
| | | |
| Availability under syndicated revolving line of credit | 357.3 | | | 284.2 | |
| Total liquidity | $ | 583.1 | | | $ | 507.7 | |
Of the Cash and cash equivalents noted above at the end of the second quarter of fiscal 2024, the Company had $211.9 million of Cash and cash equivalents held outside the United States.
The Company’s syndicated revolving line of credit, which matures in July, 2026, provides the Company with up to $725 million in revolving variable interest borrowing capacity and allows the Company to borrow incremental amounts, at its option, subject to negotiated terms as outlined in the agreement. Outstanding borrowings bear interest at rates based on the prime rate, federal funds rate, SOFR or negotiated terms as outlined in the agreement.
As of December 2, 2023, the total debt outstanding related to borrowings under the syndicated revolving line of credit was $355.0 million with available borrowings against this facility of $357.3 million.
The Company intends to repatriate $106.5 million of undistributed foreign earnings all of which is held in cash in certain foreign jurisdictions with the remainder of undistributed earnings outside the U.S. recorded in working capital. The Company has recorded a $5.8 million deferred tax liability related to foreign withholding taxes on these future dividends received in the U.S. from foreign subsidiaries. A significant portion of the $106.5 million of undistributed foreign earnings was previously taxed under the U.S. Tax Cut and Jobs Act (TCJA). The Company intends to remain indefinitely reinvested in the remaining undistributed earnings outside the U.S. which is estimated to be approximately $282.2 million on December 2, 2023.
The Company believes cash on hand, cash generated from operations, and borrowing capacity will provide adequate liquidity to fund near term and foreseeable future business operations, capital needs, future dividends and share repurchases, subject to financing availability in the marketplace.
Contractual Obligations
Contractual obligations associated with ongoing business and financing activities will require cash payments in future periods. A table summarizing the amounts and estimated timing of these future cash payments as of June 3, 2023 was provided in the Company's Annual Report on Form 10-K for the year ended June 3, 2023. There have been no material changes in such obligations since that date.
Guarantees
See Note 12 to the Condensed Consolidated Financial Statements.
Variable Interest Entities
See Note 17 to the Condensed Consolidated Financial Statements.
Contingencies
See Note 12 to the Condensed Consolidated Financial Statements.
Critical Accounting Policies
The Company strives to report financial results clearly and understandably. The Company follows accounting principles generally accepted in the United States in preparing its consolidated financial statements, which require certain estimates and judgments that affect the financial position and results of operations for the Company. The Company continually reviews the accounting policies and financial information disclosures. A summary of the more significant accounting policies that require the use of estimates and judgments in preparing the financial statements is provided in the Company's Annual Report on Form 10-K for the year ended June 3, 2023.
New Accounting Standards
See Note 2 to the Condensed Consolidated Financial Statements.
Cautionary Note Regarding Forward-Looking Statements
This report includes forward-looking statements within the meaning of Section 27A of the Securities Act of 1933 and Section 21E of the Securities Exchange Act of 1934. Forward-looking statements relate to future events and anticipated results of operations, business strategies, the anticipated benefits of our acquisition of Knoll, the anticipated impact of the Knoll acquisition on the combined Company’s business and future financial and operating results, the expected amount and timing of synergies from the Knoll acquisition, and other aspects of our operations or operating results. These forward-looking statements generally can be identified by phrases such as “will,” “expects,” “anticipates,” “foresees,” “forecasts,” “estimates” or other words or phrases of similar import. It is uncertain whether any of the events anticipated by the forward-looking statements will transpire or occur, or if any of them do, what impact they will have on the results of operations and financial condition of MillerKnoll or the price of MillerKnoll’s stock. These forward-looking statements involve certain risks and uncertainties, many of which are beyond MillerKnoll’s control, that could cause actual results to differ materially from those indicated in such forward-looking statements, including but not limited to: general economic conditions; the impact of any government policies and actions to protect the health and safety of individuals or to maintain the functioning of national or global economies, and the Company's response to any such policies and actions; the impact of public health crises, such as pandemics and epidemics; risks related to the additional debt incurred in connection with the Knoll acquisition; MillerKnoll’s ability to comply with its debt covenants and obligations; the risk that the anticipated benefits of the Knoll acquisition will be more costly to realize than expected; the effect of the announcement of the Knoll acquisition on the ability of MillerKnoll to retain and hire key personnel and maintain relationships with customers, suppliers and others with whom MillerKnoll does business, or on MillerKnoll’s operating results and business generally; the ability to successfully integrate Knoll’s operations; the ability of MillerKnoll to implement its plans, forecasts and other expectations with respect to MillerKnoll’s business after the completion of the Knoll acquisition and realize expected synergies; business disruption following the Knoll acquisition; the availability and pricing of raw materials; the financial strength of our dealers and the financial strength of our customers; the success of newly-introduced products; the pace and level of government procurement; regional and global geopolitical events; foreign currency exchange fluctuations; and the outcome of pending litigation or governmental audits or investigations. For additional information about other factors that could cause actual results to differ materially from those described in the forward-looking statements, please refer to MillerKnoll’s periodic reports and other filings with the SEC, including the risk factors identified in our Annual Report on Form 10-K for the year ended June 3, 2023. The forward-looking statements included in this report are made only as of the date hereof. MillerKnoll does not undertake any obligation to update any forward-looking statements to reflect subsequent events or circumstances, except as required by law.
Item 3: Quantitative and Qualitative Disclosures About Market Risk
The information concerning quantitative and qualitative disclosures about market risk contained in the Company’s Annual Report on Form 10-K for the year ended June 3, 2023 has not changed materially. The nature of market risks from interest rates and commodity prices has not changed materially during the first six months of fiscal 2024.
Foreign Exchange Risk
The Company primarily manufactures its products in the United States, United Kingdom, Canada, China, Italy, India, Mexico and Brazil. It also sources completed products and product components from outside the United States. The Company's completed products are sold in numerous countries around the world. Sales in foreign countries as well as certain expenses related to those sales are transacted in currencies other than the Company's reporting currency, the U.S. dollar. Accordingly, production costs and profit margins related to these sales are affected by the currency exchange relationship between the countries where the sales take place and the countries where the products are sourced or manufactured. These currency exchange relationships can also impact the Company's competitive positions within these markets.
In the normal course of business, the Company enters into contracts denominated in foreign currencies. The principal foreign currencies in which the Company conducts its business are the British pound sterling, euro, Canadian dollar, Japanese yen, Mexican peso, Hong Kong dollar, Chinese renminbi, and the Danish krone. Changes in the fair value of such contracts are reported in earnings in the period the value of the contract changes. The net gain or loss upon settlement and the change in fair value of outstanding contracts is recorded as a component of Other (income) expense.
Item 4: Controls and Procedures
Evaluation of Disclosure Controls and Procedures
Under the supervision and with the participation of management, including the Company's Chief Executive Officer and Chief Financial Officer, management has evaluated the effectiveness of the Company's disclosure controls and procedures (as defined in Exchange Act Rules 13a-15(e) and 15d-15(e)) as of December 2, 2023, and the Company's Chief Executive Officer and Chief Financial Officer have concluded that, as of that date, the Company's disclosure controls and procedures are effective.
Changes in Internal Control Over Financial Reporting
There were no changes in the Company's internal control over financial reporting (as defined in Exchange Act Rules 13a-15(f) and 15d-15(f)) during the quarterly period ended December 2, 2023, that have materially affected, or are reasonably likely to materially affect, the Company's internal control over financial reporting.
PART II - OTHER INFORMATION
Item 1: Legal Proceedings
There have been no material changes in the Company's legal proceedings from those set forth in the Company's Annual Report on Form 10-K for the year ended June 3, 2023.
Item 1A: Risk Factors
There have been no material changes in the Company's risk factors from those set forth in the Company's Annual Report on Form 10-K for the year ended June 3, 2023.
Item 2: Unregistered Sales of Equity Securities and Use of Proceeds
Issuer Purchases of Equity Securities
The Company has one share repurchase plan authorized by the Board of Directors on January 16, 2019, which provides a share repurchase authorization of $250.0 million with no specified expiration date. The approximate dollar value of shares available for purchase under the plan at December 2, 2023 was $160.6 million.
The following is a summary of share repurchase activity during the fiscal quarter ended December 2, 2023.
| | | | | | | | | | | | | | | | | | | | | | | |
| Period | (a) Total Number of Shares Purchased | | (b) Average Price Paid per Share | | (c) Total Number of Shares Purchased as Part of Publicly Announced Plans or Programs | | (d) Approximate Dollar Value of Shares that may yet be Purchased Under the Plans or Programs (in millions) (1) |
| 9/3/2023 - 9/30/2023 | 924,662 | | | $ | 18.28 | | | 924,662 | | | $ | 171.6 | |
| 10/1/2023 - 10/28/2023 | 323,590 | | | $ | 24.04 | | | 323,590 | | | $ | 163.8 | |
| 10/29/2023 - 12/2/2023 | 142,299 | | | $ | 22.92 | | | 142,299 | | | $ | 160.6 | |
| Total | 1,390,551 | | | | | 1,390,551 | | | |
(1) Amounts are as of the end of the period indicated
The Company may repurchase shares from time to time for cash in open market transactions, privately negotiated transactions, pursuant to accelerated share repurchase programs or otherwise in accordance with applicable federal securities laws. The timing and amount of the repurchases will be determined by the Company's management based on their evaluation of market conditions, share price and other factors. The share repurchase program may be suspended or discontinued at any time.
During the period covered by this report, the Company did not sell any shares of common stock that were not registered under the Securities Act of 1933.
Item 5: Other Information
During the period covered by this Quarterly Report on Form 10-Q, no director or officer of the Company adopted or terminated a "Rule 10b5-1 Trading Arrangement" or "Non-Rule 10b5-1 Trading Arrangement," as each term is defined in Item 408(a) of Regulation S-K.
Item 6: Exhibits
The following exhibits (listed by number corresponding to the Exhibit table as Item 601 in Regulation S-K) are filed with this Report:
Exhibit Number Document
101.INS The instance document does not appear in the interactive data file because its XBRL tags are embedded within the Inline XBRL Document.
101.SCH XBRL Taxonomy Extension Schema Document
101.CAL XBRL Taxonomy Extension Calculation Linkbase Document
101.LAB XBRL Taxonomy Extension Label Linkbase Document
101.PRE XBRL Taxonomy Extension Presentation Linkbase Document
101.DEF XBRL Taxonomy Extension Definition Linkbase Document
104 Cover Page Interactive Data File (embedded within the Inline XBRL Document)
* Denotes compensatory plan or arrangement.
Signatures
Pursuant to the requirements of the Securities Exchange Act of 1934, the registrant has duly caused this report to be signed on its behalf by the undersigned thereunto duly authorized.
MillerKnoll, Inc.
| | | | | | | | | | | | | | |
| January 10, 2024 | | /s/ Andrea R. Owen | |
| | | Andrea R. Owen | |
| | | President and Chief Executive Officer | |
| | | (Duly Authorized Signatory for Registrant) |
| | | | |
| January 10, 2024 | | /s/ Jeffrey M. Stutz | |
| | | Jeffrey M. Stutz | |
| | | Chief Financial Officer | |
| | | (Duly Authorized Signatory for Registrant) |