
ENTERGY STATISTICAL REPORT
AND INVESTOR GUIDE
2011
Entergy is a point-of-view-driven company with a sustainable approach to business. We use sophisticated analyses to develop informed points of view on key issues that affect our business. Our points of view are dynamic, changing with market conditions, and they determine our strategies. We also consider sustainability when setting our strategies by evaluating and optimizing their safety, economic, environmental and societal impact. We believe we must make progress simultaneously along multiple dimensions to truly succeed for all our stakeholders. We have assembled the statistics and facts in this report to support your review and analysis of Entergy’s results over the last five years. This information is available in two electronic files, Excel and PDF in order to facilitate easier access and analysis.
Entergy Investor Relations
Entergy Corporation is an integrated energy company engaged primarily in electric power production and retail distribution operations. Entergy owns and operates power plants with approximately 30,000 megawatts of electric generating capacity, and it is the second-largest nuclear generator in the United States. Entergy delivers electricity to 2.8 million utility customers in Arkansas, Louisiana, Mississippi and Texas. Entergy has annual revenues of more than $11 billion and approximately 15,000 employees.
2
CORPORATE STRUCTURE
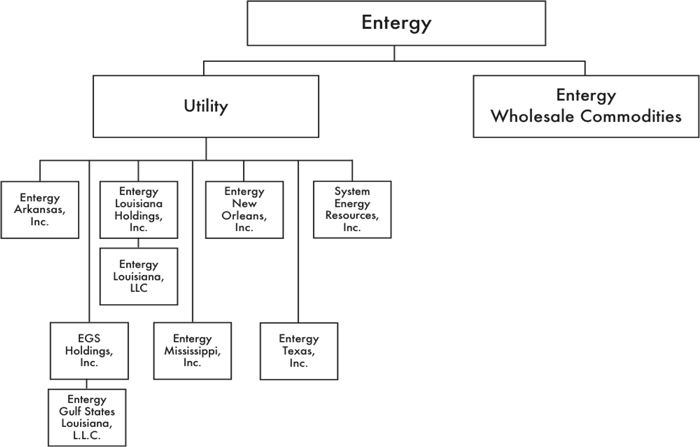
On December 5, 2011, Entergy Corporation and ITC Holdings Corp. announced that the Boards of Directors of both companies had approved a definitive agreement under which Entergy will spin off and then merge its electric transmission business with ITC. Completion of the transaction is expected in 2013, subject to the satisfaction of certain closing conditions. Primary filings and approvals required include: Entergy’s Retail Regulators, Federal Energy Regulatory Commission, Hart-Scott-Rodino Act, Internal Revenue Service, Securities and Exchange Commission, and ITC Shareholders.
3
(a) Effective December 31, 2007, Entergy Gulf States, Inc. completed a jurisdictional separation into two vertically integrated utility companies, one operating under the sole retail jurisdiction of the PUCT, Entergy Texas, Inc., and the other operating under the sole retail jurisdiction of the LPSC, Entergy Gulf States Louisiana, L.L.C., Entergy Gulf States Louisiana, L.L.C. is the successor for financial reporting purposes to Entergy Gulf States, Inc.
4
5
ENTERGY CORPORATION AND SUBSIDIARIES EXECUTIVE PROFILES (CONTINUED)
ENTERGY CORPORATION AND SUBSIDIARIES UTILITY OPERATING COMPANY PRESIDENTS
6
SELECTED FINANCIAL AND OPERATING DATA
| (In millions, except percentages, per share amounts, and ratios) | 2011 | 2010 | 2009 | 2008 | 2007 | |||||||||||||||
| GAAP MEASURES |
||||||||||||||||||||
| Operating Revenues |
$ | 11,229 | $ | 11,488 | $ | 10,746 | $ | 13,094 | $ | 11,484 | ||||||||||
| As-Reported Net Income |
$ | 1,346 | $ | 1,250 | $ | 1,231 | $ | 1,221 | $ | 1,135 | ||||||||||
| As-Reported Earnings Per Share |
$ | 7.55 | $ | 6.66 | $ | 6.30 | $ | 6.20 | $ | 5.60 | ||||||||||
| Shares of Common Stock Outstanding: |
||||||||||||||||||||
| End of Year |
176.4 | 178.7 | 189.1 | 189.4 | 193.1 | |||||||||||||||
| Weighted Average – Diluted |
178.4 | 187.8 | 195.8 | 201.0 | 202.8 | |||||||||||||||
| Return on Average Invested Capital – As-Reported |
8.0 | % | 7.8 | % | 7.7 | % | 8.1 | % | 8.3 | % | ||||||||||
| Return on Average Common Equity – As-Reported |
15.4 | % | 14.6 | % | 14.9 | % | 15.4 | % | 14.1 | % | ||||||||||
| Net Cash Flow Provided by Operating Activities |
$ | 3,129 | $ | 3,926 | $ | 2,933 | $ | 3,324 | $ | 2,560 | ||||||||||
| Year-End Closing Market Price Per Share of Common Stock |
$ | 73.05 | $ | 70.83 | $ | 81.84 | $ | 83.13 | $ | 119.52 | ||||||||||
| Book Value Per Share at End of Year |
$ | 50.81 | $ | 47.53 | $ | 45.54 | $ | 42.07 | $ | 40.71 | ||||||||||
| Market Value of Equity at End of Year |
$ | 12,883 | $ | 12,661 | $ | 15,477 | $ | 15,741 | $ | 23,082 | ||||||||||
| Price to Earnings Ratio – As-Reported |
9.68 | 10.64 | 12.99 | 13.41 | 21.34 | |||||||||||||||
| Common Dividend Paid Per Share |
$ | 3.32 | $ | 3.24 | $ | 3.00 | $ | 3.00 | $ | 2.58 | ||||||||||
| Common Dividend Payout Ratio – As-Reported |
44 | % | 49 | % | 48 | % | 48 | % | 46 | % | ||||||||||
| NON-GAAP MEASURES |
||||||||||||||||||||
| Operational Earnings |
$ | 1,359 | $ | 1,332 | $ | 1,302 | $ | 1,276 | $ | 1,167 | ||||||||||
| Operational Earnings Per Share |
$ | 7.62 | $ | 7.10 | $ | 6.67 | $ | 6.51 | $ | 5.76 | ||||||||||
| Special Items Per Share |
$ | (0.07 | ) | $ | (0.44 | ) | $ | (0.37 | ) | $ | (0.31 | ) | $ | (0.16 | ) | |||||
| Return on Average Invested Capital – Operational |
8.0 | % | 8.2 | % | 8.1 | % | 8.4 | % | 8.5 | % | ||||||||||
| Return on Average Common Equity – Operational |
15.6 | % | 15.6 | % | 15.7 | % | 16.1 | % | 14.5 | % | ||||||||||
| Price to Earnings Ratio – Operational |
9.59 | 9.98 | 12.27 | 12.77 | 20.75 | |||||||||||||||
| Common Dividend Payout Ratio – Operational |
44 | % | 46 | % | 45 | % | 46 | % | 45 | % | ||||||||||
| 2011 | 2010 | 2009 | 2008 | 2007 | ||||||||||||||||
| Retail Kilowatt-Hour Sales (millions) |
108,688 | 107,510 | 99,148 | 100,609 | 102,013 | |||||||||||||||
| Peak Demand (megawatts) |
22,387 | 21,799 | 21,009 | 21,241 | 22,001 | |||||||||||||||
| Retail Customers – Year End (thousands) |
2,757 | 2,743 | 2,719 | 2,689 | 2,668 | |||||||||||||||
| 2011 | 2010 | 2009 | 2008 | 2007 | ||||||||||||||||
| Operating Revenues (millions)(a) |
$ | 2,414 | $ | 2,566 | $ | 2,711 | $ | 2,794 | $ | 2,247 | ||||||||||
| Billed Electric Energy Sales (gigawatt hours) |
43,520 | 42,682 | 43,969 | 44,747 | 40,916 | |||||||||||||||
| (a) Includes revenue associated with below-market PPA for Palisades of $42,996,197 for 2011, $46,296,187 for 2010, $52,520,249 for 2009, $76,223,175 for 2008, and $50,215,623 for 2007. |
| |||||||||||||||||||
| 2011 | 2010 | 2009 | 2008 | 2007 | ||||||||||||||||
| Total Employees – Year End |
14,682 | 14,958 | 15,181 | 14,669 | 14,322 | |||||||||||||||
OWNED AND LEASED CAPABILITY (MW)(a)
As of December 31, 2011
| Entergy Arkansas |
Entergy Gulf States Louisiana |
Entergy Louisiana |
Entergy Mississippi |
Entergy New Orleans |
Entergy Texas |
System Energy |
Entergy Wholesale Commodities (c)(d)(e) |
Total | ||||||||||||||||||||||||||||
| Gas/Oil |
1,534 | 1,980 | 4,843 | 2,632 | 764 | 2,269 | - | 1,340 | 15,362 | |||||||||||||||||||||||||||
| Coal |
1,209 | 363 | - | 420 | - | 269 | - | 181 | 2,442 | |||||||||||||||||||||||||||
|
|
||||||||||||||||||||||||||||||||||||
| Total Fossil |
2,743 | 2,343 | 4,843 | 3,052 | 764 | 2,538 | - | 1,521 | 17,804 | |||||||||||||||||||||||||||
|
|
||||||||||||||||||||||||||||||||||||
| Nuclear |
1,823 | 974 | 1,159 | - | - | - | 1,071 | 5,011 | 10,038 | |||||||||||||||||||||||||||
| Other(b) |
74 | - | - | - | - | - | - | 80 | 154 | |||||||||||||||||||||||||||
|
|
||||||||||||||||||||||||||||||||||||
| Total |
4,640 | 3,317 | 6,002 | 3,052 | 764 | 2,538 | 1,071 | 6,612 | 27,996 | |||||||||||||||||||||||||||
| (a) | Owned and Leased Capability is the dependable load carrying capability as demonstrated under actual operating conditions based on the primary fuel (assuming no curtailments) that each station was designed to utilize. |
| (b) | Other includes Hydro (EAI) and Wind (EWC). |
| (c) | Reflects Net MW in Operation. Net MW in Operation is the installed capacity owned and operated. Excludes management services contract for Cooper Nuclear Station. |
| (d) | Reflects the final testing and confirmation of a small incremental increase in output associated with equipment replacements installed at Palisades. |
| (e) | Reflects nameplate rating of generating unit and excludes capacity under contract. |
7
CONSOLIDATED ENTERGY CORPORATION AND SUBSIDIARIES DATA
CONSOLIDATED QUARTERLY FINANCIAL METRICS
| 2011 | 2010 | YTD % | ||||||||||||||||||||||||||||||||||||||||||
| 1Q | 2Q | 3Q | 4Q | YTD | 1Q | 2Q | 3Q | 4Q | YTD | CHANGE | ||||||||||||||||||||||||||||||||||
| GAAP MEASURES |
||||||||||||||||||||||||||||||||||||||||||||
| As-Reported Net Income ($ millions) |
248.7 | 315.6 | 628.1 | 154.1 | 1,346.4 | 213.8 | 315.3 | 492.9 | 228.3 | 1,250.2 | 7.7 | |||||||||||||||||||||||||||||||||
| Return on Average Invested Capital – As-Reported (%)(a) |
7.7 | 7.7 | 8.2 | 8.0 | 8.0 | 7.6 | 8.1 | 8.2 | 7.8 | 7.8 | 2.6 | |||||||||||||||||||||||||||||||||
| Return on Average Common Equity – As-Reported (%)(a) |
14.8 | 14.8 | 16.1 | 15.4 | 15.4 | 13.8 | 14.8 | 15.5 | 14.6 | 14.6 | 5.5 | |||||||||||||||||||||||||||||||||
| Net Margin – As-Reported (%)(a) |
11.4 | 11.5 | 12.6 | 12.0 | 12.0 | 11.3 | 11.7 | 11.7 | 10.9 | 10.9 | 10.1 | |||||||||||||||||||||||||||||||||
| Cash Flow Interest Coverage (# times)(a) |
7.8 | 7.6 | 6.6 | 7.1 | 7.1 | 6.3 | 6.6 | 8.0 | 7.8 | 7.8 | (9.0 | ) | ||||||||||||||||||||||||||||||||
| Revolver Capacity ($ millions) |
2,258 | 1,993 | 2,116 | 2,001 | 2,001 | 1,417 | 1,338 | 2,216 | 2,354 | 2,354 | (15.0 | ) | ||||||||||||||||||||||||||||||||
| Total Debt ($ millions) |
12,018 | 12,360 | 12,452 | 12,387 | 12,387 | 12,152 | 11,853 | 12,247 | 11,816 | 11,816 | 4.8 | |||||||||||||||||||||||||||||||||
| Debt to Capital Ratio (%) |
57.6 | 58.1 | 57.3 | 57.3 | 57.3 | 57.0 | 56.6 | 57.5 | 57.3 | 57.3 | - | |||||||||||||||||||||||||||||||||
| Off-Balance Sheet Liabilities ($ millions) |
650 | 647 | 645 | 604 | 604 | 644 | 641 | 638 | 653 | 653 | (7.5 | ) | ||||||||||||||||||||||||||||||||
| NON-GAAP MEASURES |
||||||||||||||||||||||||||||||||||||||||||||
| Operational Earnings ($ millions) |
248.7 | 315.6 | 628.1 | 167.2 | 1,359.5 | 253.7 | 325.7 | 518.1 | 235.0 | 1,332.5 | 2.0 | |||||||||||||||||||||||||||||||||
| Return on Average Invested Capital – Operational (%)(a) |
7.9 | 7.9 | 8.2 | 8.0 | 8.0 | 8.0 | 8.5 | 8.7 | 8.2 | 8.2 | (2.4 | ) | ||||||||||||||||||||||||||||||||
| Return on Average Common Equity – Operational (%)(a) |
15.3 | 15.2 | 16.1 | 15.6 | 15.6 | 14.9 | 15.8 | 16.6 | 15.6 | 15.6 | - | |||||||||||||||||||||||||||||||||
| Net Margin – Operational (%)(a) |
11.8 | 11.8 | 12.7 | 12.1 | 12.1 | 12.2 | 12.5 | 12.5 | 11.6 | 11.6 | 4.3 | |||||||||||||||||||||||||||||||||
| Total Gross Liquidity ($ millions) |
2,984 | 2,523 | 3,103 | 2,695 | 2,695 | 3,074 | 2,674 | 4,147 | 3,648 | 3,648 | (26.1 | ) | ||||||||||||||||||||||||||||||||
| Debt to Capital Ratio, Excluding Securitization Debt (%) |
55.7 | 56.3 | 55.1 | 55.0 | 55.0 | 55.2 | 54.8 | 55.6 | 55.3 | 55.3 | (0.5 | ) | ||||||||||||||||||||||||||||||||
| Net Debt to Net Capital Ratio, Excluding Securitization Debt (%) |
54.0 | 55.1 | 52.8 | 53.5 | 53.5 | 51.3 | 51.6 | 50.9 | 52.1 | 52.1 | 2.7 | |||||||||||||||||||||||||||||||||
| Net Debt to Net Capital Ratio Including Off-Balance Sheet Liabilities, Excluding Securitization Debt (%) |
55.5 | 56.5 | 54.3 | 54.8 | 54.8 | 52.9 | 53.2 | 52.5 | 53.8 | 53.8 | 1.9 | |||||||||||||||||||||||||||||||||
| (a) | Rolling twelve months. Totals may not foot due to rounding. |
CONSOLIDATED ANNUAL FINANCIAL METRICS
|
|
2011 | 2010 | 2009 | 2008 | 2007 | |||||||||||||||
| GAAP MEASURES |
||||||||||||||||||||
| As-Reported Net Income ($ millions) |
1,346 | 1,250 | 1,231 | 1,221 | 1,135 | |||||||||||||||
| Return on Average Invested Capital – As-Reported (%) |
8.0 | 7.8 | 7.7 | 8.1 | 8.3 | |||||||||||||||
| Return on Average Common Equity – As-Reported (%) |
15.4 | 14.6 | 14.9 | 15.4 | 14.1 | |||||||||||||||
| Net Margin – As-Reported (%) |
12.0 | 10.9 | 11.5 | 9.3 | 9.9 | |||||||||||||||
| Cash Flow Interest Coverage (# times) |
7.1 | 7.8 | 6.1 | 6.5 | 5.0 | |||||||||||||||
| Revolver Capacity ($ millions) |
2,001 | 2,354 | 1,464 | 645 | 1,730 | |||||||||||||||
| Total Debt ($ millions) |
12,387 | 11,816 | 12,014 | 12,279 | 11,123 | |||||||||||||||
| Debt to Capital Ratio (%) |
57.3 | 57.3 | 57.4 | 59.7 | 57.6 | |||||||||||||||
| Off-Balance Sheet Liabilities ($ millions) |
||||||||||||||||||||
| Debt of Joint Ventures – Entergy’s Share |
96 | 107 | 116 | 125 | 135 | |||||||||||||||
| Leases – Entergy’s Share |
508 | 546 | 530 | 449 | 523 | |||||||||||||||
| Total |
604 | 653 | 646 | 574 | 658 | |||||||||||||||
| NON-GAAP MEASURES |
||||||||||||||||||||
| Operational Earnings ($ millions) |
1,359 | 1,332 | 1,302 | 1,276 | 1,167 | |||||||||||||||
| Return on Average Invested Capital – Operational (%) |
8.0 | 8.2 | 8.1 | 8.4 | 8.5 | |||||||||||||||
| Return on Average Common Equity – Operational (%) |
15.6 | 15.6 | 15.7 | 16.1 | 14.5 | |||||||||||||||
| Net Margin – Operational (%) |
12.1 | 11.6 | 12.1 | 9.7 | 10.2 | |||||||||||||||
| Total Gross Liquidity ($ millions) |
2,695 | 3,648 | 3,174 | 2,565 | 2,984 | |||||||||||||||
| Debt to Capital Ratio, Excluding Securitization Debt (%) |
55.0 | 55.3 | 55.6 | 59.1 | 56.9 | |||||||||||||||
| Net Debt to Net Capital Ratio, Excluding Securitization Debt (%) |
53.5 | 52.1 | 51.5 | 54.8 | 53.9 | |||||||||||||||
| Net Debt to Net Capital Ratio Including Off-Balance Sheet Liabilities, Excluding Securitization Debt (%) |
54.8 | 53.8 | 53.1 | 56.2 | 55.5 | |||||||||||||||
8
ENTERGY CORPORATION CONSOLIDATED QUARTERLY RESULTS – GAAP TO NON-GAAP RECONCILIATION
| 2011 | 2010 | YTD | ||||||||||||||||||||||||||||||||||||||||||
| ($/share) | 1Q | 2Q | 3Q | 4Q | YTD | 1Q | 2Q | 3Q | 4Q | YTD | CHANGE | |||||||||||||||||||||||||||||||||
| AS-REPORTED |
||||||||||||||||||||||||||||||||||||||||||||
| Utility |
0.91 | 1.39 | 2.95 | 0.96 | 6.20 | 0.73 | 1.18 | 1.78 | 0.63 | 4.33 | 1.87 | |||||||||||||||||||||||||||||||||
| Entergy Wholesale Commodities |
0.68 | 0.36 | 0.73 | 0.97 | 2.74 | 0.47 | 0.55 | 0.76 | 0.83 | 2.59 | 0.15 | |||||||||||||||||||||||||||||||||
| Parent & Other |
(0.21 | ) | 0.01 | (0.15 | ) | (1.06 | ) | (1.39 | ) | (0.08 | ) | (0.08 | ) | 0.08 | (0.20 | ) | (0.26 | ) | (1.13 | ) | ||||||||||||||||||||||||
| CONSOLIDATED AS-REPORTED EARNINGS |
1.38 | 1.76 | 3.53 | 0.87 | 7.55 | 1.12 | 1.65 | 2.62 | 1.26 | 6.66 | 0.89 | |||||||||||||||||||||||||||||||||
| LESS SPECIAL ITEMS |
||||||||||||||||||||||||||||||||||||||||||||
| Utility |
- | - | - | - | - | - | - | - | - | - | - | |||||||||||||||||||||||||||||||||
| Entergy Wholesale Commodities |
- | - | - | - | - | (0.29 | ) | (0.08 | ) | (0.14 | ) | (0.04 | ) | (0.54 | ) | 0.54 | ||||||||||||||||||||||||||||
| Parent & Other |
- | - | - | (0.07 | ) | (0.07 | ) | 0.08 | 0.02 | - | - | 0.10 | (0.17 | ) | ||||||||||||||||||||||||||||||
| TOTAL SPECIAL ITEMS |
- | - | - | (0.07 | ) | (0.07 | ) | (0.21 | ) | (0.06 | ) | (0.14 | ) | (0.04 | ) | (0.44 | ) | 0.37 | ||||||||||||||||||||||||||
| OPERATIONAL |
||||||||||||||||||||||||||||||||||||||||||||
| Utility |
0.91 | 1.39 | 2.95 | 0.96 | 6.20 | 0.73 | 1.18 | 1.78 | 0.63 | 4.33 | 1.87 | |||||||||||||||||||||||||||||||||
| Entergy Wholesale Commodities |
0.68 | 0.36 | 0.73 | 0.97 | 2.74 | 0.76 | 0.63 | 0.90 | 0.87 | 3.13 | (0.39 | ) | ||||||||||||||||||||||||||||||||
| Parent & Other |
(0.21 | ) | 0.01 | (0.15 | ) | (0.99 | ) | (1.32 | ) | (0.16 | ) | (0.10 | ) | 0.08 | (0.20 | ) | (0.36 | ) | (0.96 | ) | ||||||||||||||||||||||||
| CONSOLIDATED OPERATIONAL EARNINGS |
1.38 | 1.76 | 3.53 | 0.94 | 7.62 | 1.33 | 1.71 | 2.76 | 1.30 | 7.10 | 0.52 | |||||||||||||||||||||||||||||||||
| Weather Impact |
0.10 | 0.18 | 0.29 | (0.05 | ) | 0.52 | 0.17 | 0.09 | 0.29 | 0.06 | 0.62 | (0.10 | ) | |||||||||||||||||||||||||||||||
| SHARES OF COMMON STOCK |
||||||||||||||||||||||||||||||||||||||||||||
| OUTSTANDING (in millions) |
||||||||||||||||||||||||||||||||||||||||||||
| End of Period |
178.3 | 176.8 | 176.1 | 176.4 | 176.4 | 189.3 | 187.5 | 181.5 | 178.7 | 178.7 | (2.3 | ) | ||||||||||||||||||||||||||||||||
| Weighted Average - Diluted |
180.1 | 178.9 | 177.7 | 177.1 | 178.4 | 191.3 | 190.7 | 187.8 | 181.6 | 187.8 | (9.4 | ) | ||||||||||||||||||||||||||||||||
Totals may not foot due to rounding.
9
FINANCIAL RESULTS
ENTERGY CORPORATION CONSOLIDATED QUARTERLY SPECIAL ITEMS (Shown as Positive/(Negative) Impact on Earnings)
| 2011 | 2010 | YTD | ||||||||||||||||||||||||||||||||||||||||||
| ($/share) | 1Q | 2Q | 3Q | 4Q | YTD | 1Q | 2Q | 3Q | 4Q | YTD | CHANGE | |||||||||||||||||||||||||||||||||
| UTILITY |
||||||||||||||||||||||||||||||||||||||||||||
| SPECIAL ITEMS |
||||||||||||||||||||||||||||||||||||||||||||
| None |
- | - | - | - | - | - | - | - | - | - | - | |||||||||||||||||||||||||||||||||
| Total |
- | - | - | - | - | - | - | - | - | - | - | |||||||||||||||||||||||||||||||||
| ENTERGY WHOLESALE COMMODITIES |
||||||||||||||||||||||||||||||||||||||||||||
| SPECIAL ITEMS |
||||||||||||||||||||||||||||||||||||||||||||
| Non-utility nuclear spin-off expenses |
- | - | - | - | - | (0.29 | ) | (0.08 | ) | (0.14 | ) | (0.04 | ) | (0.54 | ) | 0.54 | ||||||||||||||||||||||||||||
| Total |
- | - | - | - | - | (0.29 | ) | (0.08 | ) | (0.14 | ) | (0.04 | ) | (0.54 | ) | 0.54 | ||||||||||||||||||||||||||||
| PARENT & OTHER |
||||||||||||||||||||||||||||||||||||||||||||
| SPECIAL ITEMS |
||||||||||||||||||||||||||||||||||||||||||||
| Non-utility nuclear spin-off expenses |
- | - | - | - | - | 0.08 | 0.02 | - | - | 0.10 | (0.10 | ) | ||||||||||||||||||||||||||||||||
| Transmission business spin-merge expenses |
- | - | - | (0.07 | ) | (0.07 | ) | - | - | - | - | - | (0.07 | ) | ||||||||||||||||||||||||||||||
| Total |
- | - | - | (0.07 | ) | (0.07 | ) | 0.08 | 0.02 | - | - | 0.10 | (0.17 | ) | ||||||||||||||||||||||||||||||
| TOTAL SPECIAL ITEMS |
- | - | - | (0.07 | ) | (0.07 | ) | (0.21 | ) | (0.06 | ) | (0.14 | ) | (0.04 | ) | (0.44 | ) | 0.37 | ||||||||||||||||||||||||||
| 2011 | 2010 | YTD | ||||||||||||||||||||||||||||||||||||||||||
| ($ millions) | 1Q | 2Q | 3Q | 4Q | YTD | 1Q | 2Q | 3Q | 4Q | YTD | CHANGE | |||||||||||||||||||||||||||||||||
| UTILITY |
||||||||||||||||||||||||||||||||||||||||||||
| SPECIAL ITEMS |
||||||||||||||||||||||||||||||||||||||||||||
| None |
- | - | - | - | - | - | - | - | - | - | - | |||||||||||||||||||||||||||||||||
| Total |
- | - | - | - | - | - | - | - | - | - | - | |||||||||||||||||||||||||||||||||
| ENTERGY WHOLESALE COMMODITIES |
||||||||||||||||||||||||||||||||||||||||||||
| SPECIAL ITEMS |
||||||||||||||||||||||||||||||||||||||||||||
| Non-utility nuclear spin-off expenses |
- | - | - | - | - | (54.3 | ) | (14.5 | ) | (25.2 | ) | (6.7 | ) | (100.7 | ) | 100.7 | ||||||||||||||||||||||||||||
| Total |
- | - | - | - | - | (54.3 | ) | (14.5 | ) | (25.2 | ) | (6.7 | ) | (100.7 | ) | 100.7 | ||||||||||||||||||||||||||||
| PARENT & OTHER |
||||||||||||||||||||||||||||||||||||||||||||
| SPECIAL ITEMS |
||||||||||||||||||||||||||||||||||||||||||||
| Non-utility nuclear spin-off expenses |
- | - | - | - | - | 14.4 | 4.0 | - | - | 18.5 | (18.5 | ) | ||||||||||||||||||||||||||||||||
| Transmission business spin-merge expenses |
- | - | - | (13.0 | ) | (13.0 | ) | - | - | - | - | - | (13.0 | ) | ||||||||||||||||||||||||||||||
| Total |
- | - | - | (13.0 | ) | (13.0 | ) | 14.4 | 4.0 | - | - | 18.5 | (31.5 | ) | ||||||||||||||||||||||||||||||
| TOTAL SPECIAL ITEMS |
- | - | - | (13.0 | ) | (13.0 | ) | (39.9 | ) | (10.5 | ) | (25.2 | ) | (6.7 | ) | (82.2 | ) | 69.2 | ||||||||||||||||||||||||||
| Totals may not foot due to rounding. | ||||||||||||||||||||||||||||||||||||||||||||
10
FINANCIAL RESULTS
ENTERGY CORPORATION CONSOLIDATED ANNUAL RESULTS – GAAP TO NON-GAAP RECONCILIATION
| ($/share) | 2011 | 2010 | 2009 | 2008 | 2007 | |||||||||||||||
| AS-REPORTED |
||||||||||||||||||||
| Utility |
6.20 | 4.33 | 3.53 | 2.92 | 3.37 | |||||||||||||||
| Entergy Wholesale Commodities |
2.74 | 2.59 | 3.26 | 3.96 | 2.88 | |||||||||||||||
| Parent & Other |
(1.39 | ) | (0.26 | ) | (0.49 | ) | (0.68 | ) | (0.65 | ) | ||||||||||
| CONSOLIDATED AS-REPORTED EARNINGS |
7.55 | 6.66 | 6.30 | 6.20 | 5.60 | |||||||||||||||
| LESS SPECIAL ITEMS |
||||||||||||||||||||
| Utility |
- | - | - | (0.08 | ) | (0.07 | ) | |||||||||||||
| Entergy Wholesale Commodities |
- | (0.54 | ) | (0.23 | ) | (0.10 | ) | (0.09 | ) | |||||||||||
| Parent & Other |
(0.07 | ) | 0.10 | (0.14 | ) | (0.13 | ) | - | ||||||||||||
| TOTAL SPECIAL ITEMS |
(0.07 | ) | (0.44 | ) | (0.37 | ) | (0.31 | ) | (0.16 | ) | ||||||||||
| OPERATIONAL |
||||||||||||||||||||
| Utility |
6.20 | 4.33 | 3.53 | 3.00 | 3.44 | |||||||||||||||
| Entergy Wholesale Commodities |
2.74 | 3.13 | 3.49 | 4.06 | 2.97 | |||||||||||||||
| Parent & Other |
(1.32 | ) | (0.36 | ) | (0.35 | ) | (0.55 | ) | (0.65 | ) | ||||||||||
| CONSOLIDATED OPERATIONAL EARNINGS |
7.62 | 7.10 | 6.67 | 6.51 | 5.76 | |||||||||||||||
| Weather Impact |
0.52 | 0.62 | (0.01 | ) | (0.02 | ) | 0.11 | |||||||||||||
11
FINANCIAL RESULTS
ENTERGY CORPORATION CONSOLIDATED ANNUAL SPECIAL ITEMS (Shown as Positive/(Negative) Impact on Earnings)
| ($/share) | 2011 | 2010 | 2009 | 2008 | 2007 | |||||||||||||||
| UTILITY SPECIAL ITEMS |
||||||||||||||||||||
| Dilution effect - unsuccessful remarketing |
- | - | - | (0.08 | ) | - | ||||||||||||||
| Nuclear alignment |
- | - | - | - | (0.07 | ) | ||||||||||||||
| Total |
- | - | - | (0.08 | ) | (0.07 | ) | |||||||||||||
| ENTERGY WHOLESALE COMMODITIES SPECIAL ITEMS |
||||||||||||||||||||
| Non-utility nuclear spin-off expenses |
- | (0.54 | ) | (0.23 | ) | - | - | |||||||||||||
| Dilution effect - unsuccessful remarketing |
- | - | - | (0.10 | ) | - | ||||||||||||||
| Nuclear alignment |
- | - | - | - | (0.09 | ) | ||||||||||||||
| Total |
- | (0.54 | ) | (0.23 | ) | (0.10 | ) | (0.09 | ) | |||||||||||
| PARENT & OTHER SPECIAL ITEMS |
||||||||||||||||||||
| Transmission business spin-merge expenses |
(0.07 | ) | - | - | - | - | ||||||||||||||
| Non-utility nuclear spin-off expenses |
- | 0.10 | (0.14 | ) | (0.28 | ) | - | |||||||||||||
| Dilution effect - unsuccessful remarketing |
- | - | - | 0.15 | - | |||||||||||||||
| Total |
(0.07 | ) | 0.10 | (0.14 | ) | (0.13 | ) | - | ||||||||||||
| TOTAL SPECIAL ITEMS |
(0.07 | ) | (0.44 | ) | (0.37 | ) | (0.31 | ) | (0.16 | ) | ||||||||||
| ($ millions) |
2011 | 2010 | 2009 | 2008 | 2007 | |||||||||||||||
| UTILITY SPECIAL ITEMS |
||||||||||||||||||||
| Nuclear alignment |
- | - | - | - | (13.6 | ) | ||||||||||||||
| Total |
- | - | - | - | (13.6 | ) | ||||||||||||||
| ENTERGY WHOLESALE COMMODITIES SPECIAL ITEMS |
||||||||||||||||||||
| Non-utility nuclear spin-off expenses |
- | (100.7 | ) | (44.0 | ) | - | - | |||||||||||||
| Nuclear alignment |
- | - | - | - | (18.4 | ) | ||||||||||||||
| Total |
- | (100.7 | ) | (44.0 | ) | - | (18.4 | ) | ||||||||||||
| PARENT & OTHER SPECIAL ITEMS |
||||||||||||||||||||
| Transmission business spin-merge expenses |
(13.0 | ) | - | - | - | - | ||||||||||||||
| Non-utility nuclear spin-off expenses |
- | 18.5 | (27.0 | ) | (55.4 | ) | - | |||||||||||||
| Total |
(13.0 | ) | 18.5 | (27.0 | ) | (55.4 | ) | - | ||||||||||||
| TOTAL SPECIAL ITEMS |
(13.0 | ) | (82.2 | ) | (71.0 | ) | (55.4 | ) | (32.0 | ) | ||||||||||
12
FINANCIAL RESULTS
DESCRIPTION OF ENTERGY CORPORATION CONSOLIDATED SPECIAL ITEMS
| MAIN EARNINGS CATEGORY | ||
|
| ||
| UTILITY SPECIAL ITEMS |
||
| Dilution effect – unsuccessful remarketing(a) |
Diluted earnings per share | |
| Nuclear alignment |
Operating expenses: Other operation and maintenance | |
|
| ||
| ENTERGY WHOLESALE COMMODITIES SPECIAL ITEMS |
||
| Non-utility nuclear spin-off expenses |
Operating expenses: Other operation and maintenance Operating expenses: Taxes other than income taxes Operating expenses: Depreciation Interest and Other Charges: Other interest | |
| Dilution effect – unsuccessful remarketing(a) |
Diluted earnings per share | |
| Nuclear alignment |
Operating expenses: Other operation and maintenance | |
|
| ||
| PARENT & OTHER SPECIAL ITEMS |
||
| Transmission business spin-merge expenses |
Operating expenses: Other operation and maintenance Income taxes | |
| Non-utility nuclear spin-off expenses |
Operating expenses: Other operation and maintenance Income taxes | |
| Dilution effect – unsuccessful remarketing(a) |
Diluted earnings per share | |
|
| ||
| (a) | Entergy had 10,000,000 equity units outstanding as of December 31, 2008, that obligated the holders to purchase a certain number of shares of Entergy common stock for a stated price no later than February 17, 2009. Under the terms of the purchase contracts, Entergy attempted to remarket the notes payable associated with the equity units in February 2009 but was unsuccessful, the note holders put the notes to Entergy, Entergy retired the notes, and Entergy issued 6,598,000 shares of common stock in the settlement of the purchase contracts. |
13
FINANCIAL RESULTS
CONSOLIDATED STATEMENTS OF INCOME (unaudited)
| In thousands, except share data, for the years ended December 31, | 2011 | 2010 | 2009 | 2008 | 2007 | |||||||||||||||
| OPERATING REVENUES: |
||||||||||||||||||||
| Electric |
$8,673,517 | $8,740,637 | $7,880,016 | $10,073,160 | $9,046,301 | |||||||||||||||
| Natural gas |
165,819 | 197,658 | 172,213 | 241,856 | 206,073 | |||||||||||||||
| Competitive businesses |
2,389,737 | 2,549,282 | 2,693,421 | 2,778,740 | 2,232,024 | |||||||||||||||
| Total |
11,229,073 | 11,487,577 | 10,745,650 | 13,093,756 | 11,484,398 | |||||||||||||||
| OPERATING EXPENSES: |
||||||||||||||||||||
| Operating and maintenance: |
||||||||||||||||||||
| Fuel, fuel-related expenses, and gas purchased for resale |
2,492,714 | 2,518,582 | 2,309,831 | 3,577,764 | 2,934,833 | |||||||||||||||
| Purchased power |
1,564,967 | 1,659,416 | 1,395,203 | 2,491,200 | 1,986,950 | |||||||||||||||
| Nuclear refueling outage expenses |
255,618 | 256,123 | 241,310 | 221,759 | 180,971 | |||||||||||||||
| Other operation and maintenance |
2,867,758 | 2,969,402 | 2,750,810 | 2,742,762 | 2,649,654 | |||||||||||||||
| Decommissioning |
190,595 | 211,736 | 199,063 | 189,409 | 167,898 | |||||||||||||||
| Taxes other than income taxes |
536,026 | 534,299 | 503,859 | 496,952 | 489,058 | |||||||||||||||
| Depreciation and amortization |
1,102,202 | 1,069,894 | 1,082,775 | 1,030,860 | 963,712 | |||||||||||||||
| Other regulatory charges (credits) – net |
205,959 | 44,921 | (21,727 | ) | 59,883 | 54,954 | ||||||||||||||
| Total |
9,215,839 | 9,264,373 | 8,461,124 | 10,810,589 | 9,428,030 | |||||||||||||||
| Gain on sale of business |
- | 44,173 | - | - | - | |||||||||||||||
| OPERATING INCOME |
2,013,234 | 2,267,377 | 2,284,526 | 2,283,167 | 2,056,368 | |||||||||||||||
| OTHER INCOME: |
||||||||||||||||||||
| Allowance for equity funds used during construction |
84,305 | 59,381 | 59,545 | 44,523 | 42,742 | |||||||||||||||
| Interest and investment income |
129,134 | 185,455 | 236,628 | 197,872 | 238,911 | |||||||||||||||
| Other than temporary impairment losses |
(140 | ) | (1,378 | ) | (86,069 | ) | (49,656 | ) | (4,914 | ) | ||||||||||
| Miscellaneous – net |
(59,271 | ) | (48,124 | ) | (40,396 | ) | (23,452 | ) | (21,684 | ) | ||||||||||
| Total |
154,028 | 195,334 | 169,708 | 169,287 | 255,055 | |||||||||||||||
| INTEREST EXPENSE: |
||||||||||||||||||||
| Interest expense |
551,521 | 610,146 | 603,679 | 634,188 | 662,084 | |||||||||||||||
| Allowance for borrowed funds used during construction |
(37,894 | ) | (34,979 | ) | (33,235 | ) | (25,267 | ) | (25,032 | ) | ||||||||||
| Total |
513,627 | 575,167 | 570,444 | 608,921 | 637,052 | |||||||||||||||
| INCOME BEFORE INCOME TAXES |
1,653,635 | 1,887,544 | 1,883,790 | 1,843,533 | 1,674,371 | |||||||||||||||
| Income taxes |
286,263 | 617,239 | 632,740 | 602,998 | 514,417 | |||||||||||||||
| CONSOLIDATED NET INCOME |
1,367,372 | 1,270,305 | 1,251,050 | 1,240,535 | 1,159,954 | |||||||||||||||
| Preferred dividend requirements of subsidiaries |
20,933 | 20,063 | 19,958 | 19,969 | 25,105 | |||||||||||||||
| NET INCOME ATTRIBUTABLE TO ENTERGY CORPORATION |
$1,346,439 | $1,250,242 | $1,231,092 | $1,220,566 | $1,134,849 | |||||||||||||||
| Basic earnings per average common share |
$7.59 | $6.72 | $6.39 | $6.39 | $5.77 | |||||||||||||||
| Diluted earnings per average common share |
$7.55 | $6.66 | $6.30 | $6.20 | $5.60 | |||||||||||||||
| Dividends declared per common share |
$3.32 | $3.24 | $3.00 | $3.00 | $2.58 | |||||||||||||||
| Average number of common shares outstanding: |
||||||||||||||||||||
| Basic |
177,430,208 | 186,010,452 | 192,772,032 | 190,925,613 | 196,572,945 | |||||||||||||||
| Diluted |
178,370,695 | 187,814,235 | 195,838,068 | 201,011,588 | 202,780,283 | |||||||||||||||
Certain prior year data has been reclassified to conform with current year presentation.
14
FINANCIAL RESULTS
2011 CONSOLIDATING INCOME STATEMENT (unaudited)
| In thousands, except share data, for the year ended December 31, 2011. | UTILITY | ENTERGY WHOLESALE COMMODITIES |
PARENT & OTHER | CONSOLIDATED | ||||||||||||
| OPERATING REVENUES: |
||||||||||||||||
| Electric |
$ | 8,676,009 | $ | - | $ | (2,492 | ) | $ | 8,673,517 | |||||||
| Natural gas |
165,819 | - | - | 165,819 | ||||||||||||
| Competitive businesses |
- | 2,413,773 | (24,036 | ) | 2,389,737 | |||||||||||
| Total |
8,841,828 | 2,413,773 | (26,528 | ) | 11,229,073 | |||||||||||
| OPERATING EXPENSES: |
||||||||||||||||
| Operating and maintenance: |
||||||||||||||||
| Fuel, fuel-related expenses, and gas purchased for resale |
2,183,559 | 309,917 | (762 | ) | 2,492,714 | |||||||||||
| Purchased power |
1,548,276 | 58,971 | (42,280 | ) | 1,564,967 | |||||||||||
| Nuclear refueling outage expenses |
105,000 | 150,617 | - | 255,618 | ||||||||||||
| Other operation and maintenance |
1,950,567 | 905,453 | 11,739 | 2,867,758 | ||||||||||||
| Decommissioning |
109,144 | 81,450 | - | 190,595 | ||||||||||||
| Taxes other than income taxes |
431,619 | 102,961 | 1,446 | 536,026 | ||||||||||||
| Depreciation and amortization |
918,453 | 179,188 | 4,561 | 1,102,202 | ||||||||||||
| Other regulatory charges (credits) - net |
205,959 | - | - | 205,959 | ||||||||||||
| Total |
7,452,577 | 1,788,557 | (25,296 | ) | 9,215,839 | |||||||||||
| Gain on sale of investment |
- | - | - | - | ||||||||||||
| OPERATING INCOME |
1,389,251 | 625,216 | (1,232 | ) | 2,013,234 | |||||||||||
| OTHER INCOME (DEDUCTIONS): |
||||||||||||||||
| Allowance for equity funds used during construction |
84,305 | - | - | 84,305 | ||||||||||||
| Interest and investment income |
158,737 | 136,492 | (166,095 | ) | 129,134 | |||||||||||
| Other than temporary impairment losses |
- | (140 | ) | - | (140 | ) | ||||||||||
| Miscellaneous – net |
(25,377 | ) | (23,637 | ) | (10,257 | ) | (59,271 | ) | ||||||||
| Total |
217,665 | 112,715 | (176,352 | ) | 154,028 | |||||||||||
| INTEREST EXPENSE: |
||||||||||||||||
| Interest expense |
493,632 | 20,634 | 37,255 | 551,521 | ||||||||||||
| Allowance for borrowed funds used during construction |
(37,893 | ) | - | - | (37,894 | ) | ||||||||||
| Total |
455,739 | 20,634 | 37,255 | 513,627 | ||||||||||||
| INCOME BEFORE INCOME TAXES |
1,151,177 | 717,297 | (214,839 | ) | 1,653,635 | |||||||||||
| Income taxes |
27,311 | 225,456 | 33,496 | 286,263 | ||||||||||||
| CONSOLIDATED NET INCOME |
1,123,866 | 491,841 | (248,335 | ) | 1,367,372 | |||||||||||
| Preferred dividend requirements of subsidiaries |
17,329 | 3,245 | 359 | 20,933 | ||||||||||||
| NET INCOME ATTRIBUTABLE TO ENTERGY CORPORATION |
$ | 1,106,537 | $ | 488,596 | $ | (248,694 | ) | $ | 1,346,439 | |||||||
| Earnings Per Average Common Share: |
||||||||||||||||
| Basic |
$6.24 | $2.75 | $(1.40) | $7.59 | ||||||||||||
| Diluted |
$6.20 | $2.74 | $(1.39) | $7.55 | ||||||||||||
Totals may not foot due to rounding.
15
FINANCIAL RESULTS
CONSOLIDATED BALANCE SHEETS (unaudited)
| In thousands, as of December 31, | 2011 | 2010 | 2009 | 2008 | 2007 | |||||||||||||||
| ASSETS |
||||||||||||||||||||
| CURRENT ASSETS: |
||||||||||||||||||||
| Cash and cash equivalents: |
||||||||||||||||||||
| Cash |
$ | 81,468 | $ | 76,290 | $ | 85,861 | $ | 115,876 | $ | 126,652 | ||||||||||
| Temporary cash investments |
612,970 | 1,218,182 | 1,623,690 | 1,804,615 | 1,127,076 | |||||||||||||||
| Total cash and cash equivalents |
694,438 | 1,294,472 | 1,709,551 | 1,920,491 | 1,253,728 | |||||||||||||||
| Securitization recovery trust account |
50,304 | 43,044 | 13,098 | 12,062 | 19,273 | |||||||||||||||
| Accounts receivable: |
||||||||||||||||||||
| Customer |
568,558 | 602,796 | 553,692 | 734,204 | 610,724 | |||||||||||||||
| Allowance for doubtful accounts |
(31,159 | ) | (31,777 | ) | (27,631 | ) | (25,610 | ) | (25,789 | ) | ||||||||||
| Other |
166,186 | 161,662 | 152,303 | 206,627 | 303,060 | |||||||||||||||
| Accrued unbilled revenues |
298,283 | 302,901 | 302,463 | 282,914 | 288,076 | |||||||||||||||
| Total accounts receivable |
1,001,868 | 1,035,582 | 980,827 | 1,198,135 | 1,176,071 | |||||||||||||||
| Deferred fuel costs |
209,776 | 64,659 | 126,798 | 167,092 | - | |||||||||||||||
| Accumulated deferred income taxes |
9,856 | 8,472 | - | 7,307 | 38,117 | |||||||||||||||
| Fuel inventory – at average cost |
202,132 | 207,520 | 196,855 | 216,145 | 208,584 | |||||||||||||||
| Materials and supplies – at average cost |
894,756 | 866,908 | 825,702 | 776,170 | 692,376 | |||||||||||||||
| Deferred nuclear refueling outage costs |
231,031 | 218,423 | 225,290 | 221,803 | 172,936 | |||||||||||||||
| System agreement cost equalization |
36,800 | 52,160 | 70,000 | 394,000 | 268,000 | |||||||||||||||
| Prepaid taxes |
- | 301,807 | 184,819 | - | 46,924 | |||||||||||||||
| Prepayments and other |
291,742 | 246,036 | 201,221 | 247,184 | 82,238 | |||||||||||||||
| Total |
3,622,703 | 4,339,083 | 4,534,161 | 5,160,389 | 3,958,247 | |||||||||||||||
| OTHER PROPERTY AND INVESTMENTS: |
||||||||||||||||||||
| Investment in affiliates – at equity |
44,876 | 40,697 | 39,580 | 66,247 | 78,992 | |||||||||||||||
| Decommissioning trust funds |
3,788,031 | 3,595,716 | 3,211,183 | 2,832,243 | 3,307,636 | |||||||||||||||
| Non-utility property – at cost (less accumulated depreciation) |
260,436 | 257,847 | 247,664 | 231,115 | 220,204 | |||||||||||||||
| Other |
416,423 | 405,946 | 120,273 | 107,939 | 82,563 | |||||||||||||||
| Total |
4,509,766 | 4,300,206 | 3,618,700 | 3,237,544 | 3,689,395 | |||||||||||||||
| PROPERTY, PLANT AND EQUIPMENT: |
||||||||||||||||||||
| Electric |
39,385,524 | 37,153,061 | 36,343,772 | 34,495,406 | 32,959,022 | |||||||||||||||
| Property under capital lease |
809,449 | 800,078 | 783,096 | 745,504 | 740,095 | |||||||||||||||
| Natural gas |
343,550 | 330,608 | 314,256 | 303,769 | 300,767 | |||||||||||||||
| Construction work in progress |
1,779,723 | 1,661,560 | 1,547,319 | 1,712,761 | 1,054,833 | |||||||||||||||
| Nuclear fuel under capital lease |
- | - | 527,521 | 465,374 | 361,502 | |||||||||||||||
| Nuclear fuel |
1,546,167 | 1,377,962 | 739,827 | 636,813 | 665,620 | |||||||||||||||
| Total property, plant and equipment |
43,864,413 | 41,323,269 | 40,255,791 | 38,359,627 | 36,081,839 | |||||||||||||||
| Less – accumulated depreciation and amortization |
18,255,128 | 17,474,914 | 16,866,389 | 15,930,513 | 15,107,569 | |||||||||||||||
| Property, plant and equipment – net |
25,609,285 | 23,848,355 | 23,389,402 | 22,429,114 | 20,974,270 | |||||||||||||||
| DEFERRED DEBITS AND OTHER ASSETS: |
||||||||||||||||||||
| Regulatory assets: |
||||||||||||||||||||
| Regulatory asset for income taxes - net |
799,006 | 845,725 | 816,856 | 581,719 | 595,743 | |||||||||||||||
| Other regulatory assets (includes securitization property of $1,009,103 as of December 31, 2011, $882,346 as of December 31, 2010, $818,047 as of December 31, 2009 $296,083 as of December 31, 2008, and $313,404 as of December 31, 2007) |
4,636,871 | 3,838,237 | 3,647,154 | 3,615,104 | 2,971,399 | |||||||||||||||
| Deferred fuel costs |
172,202 | 172,202 | 172,202 | 168,122 | 168,122 | |||||||||||||||
| Goodwill |
377,172 | 377,172 | 377,172 | 377,172 | 377,172 | |||||||||||||||
| Accumulated deferred income taxes |
19,003 | 54,523 | - | - | - | |||||||||||||||
| Other |
955,691 | 909,773 | 1,006,306 | 1,047,654 | 908,654 | |||||||||||||||
| Total |
6,959,945 | 6,197,632 | 6,019,690 | 5,789,771 | 5,021,090 | |||||||||||||||
| TOTAL ASSETS |
$ | 40,701,699 | $ | 38,685,276 | $ | 37,561,953 | $ | 36,616,818 | $ | 33,643,002 | ||||||||||
Certain prior year data has been reclassified to conform with current year presentation.
16
FINANCIAL RESULTS
CONSOLIDATED BALANCE SHEETS (unaudited)
| In thousands, as of December 31, |
2011 | 2010 | 2009 | 2008 | 2007 | |||||||||||||||
| LIABILITIES AND EQUITY |
||||||||||||||||||||
| CURRENT LIABILITIES: |
||||||||||||||||||||
| Currently maturing long-term debt |
$ | 2,192,733 | $ | 299,548 | $ | 711,957 | $ | 544,460 | $ | 996,757 | ||||||||||
| Notes payable and commercial paper |
108,331 | 154,135 | 30,031 | 55,034 | 25,037 | |||||||||||||||
| Accounts payable |
1,069,096 | 1,181,099 | 998,228 | 1,475,745 | 1,031,300 | |||||||||||||||
| Customer deposits |
351,741 | 335,058 | 323,342 | 302,303 | 291,171 | |||||||||||||||
| Taxes accrued |
278,235 | - | - | 75,210 | - | |||||||||||||||
| Accumulated deferred income taxes |
99,929 | 49,307 | 48,584 | - | - | |||||||||||||||
| Interest accrued |
183,512 | 217,685 | 192,283 | 187,310 | 187,968 | |||||||||||||||
| Deferred fuel costs |
255,839 | 166,409 | 219,639 | 183,539 | 54,947 | |||||||||||||||
| Obligations under capital leases |
3,631 | 3,388 | 212,496 | 162,393 | 152,615 | |||||||||||||||
| Pension and other postretirement liabilities |
44,031 | 39,862 | 55,031 | 46,288 | 34,795 | |||||||||||||||
| System agreement cost equalization |
80,090 | 52,160 | 187,204 | 460,315 | 268,000 | |||||||||||||||
| Other |
283,531 | 277,598 | 215,202 | 273,297 | 214,164 | |||||||||||||||
| Total |
4,950,699 | 2,776,249 | 3,193,997 | 3,765,894 | 3,256,754 | |||||||||||||||
| NON-CURRENT LIABILITIES: |
||||||||||||||||||||
| Accumulated deferred income taxes and taxes accrued |
8,096,452 | 8,573,646 | 7,662,798 | 6,565,770 | 6,379,679 | |||||||||||||||
| Accumulated deferred investment tax credits |
284,747 | 292,330 | 308,395 | 325,570 | 343,539 | |||||||||||||||
| Obligations under capital leases |
38,421 | 42,078 | 354,233 | 343,093 | 220,438 | |||||||||||||||
| Other regulatory liabilities |
728,193 | 539,026 | 378,862 | 280,643 | 490,323 | |||||||||||||||
| Decommissioning and asset retirement cost liabilities |
3,296,570 | 3,148,479 | 2,939,539 | 2,677,495 | 2,489,061 | |||||||||||||||
| Accumulated provisions |
385,512 | 395,250 | 141,315 | 147,452 | 133,406 | |||||||||||||||
| Pension and other postretirement liabilities |
3,133,657 | 2,175,364 | 2,241,039 | 2,177,993 | 1,361,326 | |||||||||||||||
| Long-term debt (includes securitization bonds of $1,070,556 as of December 31, 2011, $931,131 as of December 31, 2010, $838,349 as of December 31, 2009 $310,373 as of December 31, 2008, and $329,421 as of December 31, 2007) |
10,043,713 | 11,317,157 | 10,705,738 | 11,174,289 | 9,728,135 | |||||||||||||||
| Other |
501,954 | 618,559 | 711,334 | 880,998 | 1,066,508 | |||||||||||||||
| Total |
26,509,219 | 27,101,889 | 25,443,253 | 24,573,303 | 22,212,415 | |||||||||||||||
| Commitments and Contingencies |
||||||||||||||||||||
| Subsidiaries preferred stock without sinking fund |
186,511 | 216,738 | 217,343 | 217,029 | 217,162 | |||||||||||||||
| EQUITY: |
||||||||||||||||||||
| Common shareholders’ equity: |
||||||||||||||||||||
| Common stock, $.01 par value, authorized 500,000,000 shares; issued 254,752,788 shares in 2011, 2010, and 2009, 248,174,087 shares in 2008 and 2007 |
2,548 | 2,548 | 2,548 | 2,482 | 2,482 | |||||||||||||||
| Paid-in capital |
5,360,682 | 5,367,474 | 5,370,042 | 4,869,303 | 4,850,769 | |||||||||||||||
| Retained earnings |
9,446,960 | 8,689,401 | 8,043,122 | 7,382,719 | 6,735,965 | |||||||||||||||
| Accumulated other comprehensive income (loss) |
(168,452 | ) | (38,212 | ) | (75,185 | ) | (112,698 | ) | 8,320 | |||||||||||
| Less – treasury stock, at cost (78,396,988 shares in 2011; |
||||||||||||||||||||
| 76,006,920 shares in 2010; 65,634,580 shares in 2009; |
||||||||||||||||||||
| 58,815,518 shares in 2008; 55,053,847 shares in 2007;) |
5,680,468 | 5,524,811 | 4,727,167 | 4,175,214 | 3,734,865 | |||||||||||||||
| Total common shareholders’ equity |
8,961,270 | 8,496,400 | 8,613,360 | 7,966,592 | 7,862,671 | |||||||||||||||
| Subsidiaries preferred stock without sinking fund |
94,000 | 94,000 | 94,000 | 94,000 | 94,000 | |||||||||||||||
| Total |
9,055,270 | 8,590,400 | 8,707,360 | 8,060,592 | 7,956,671 | |||||||||||||||
| TOTAL LIABILITIES AND EQUITY |
$ | 40,701,699 | $ | 38,685,276 | $ | 37,561,953 | $ | 36,616,818 | $ | 33,643,002 | ||||||||||
Certain prior year data has been reclassified to conform with current year presentation.
17
FINANCIAL RESULTS
2011 CONSOLIDATING BALANCE SHEET (unaudited)
| In thousands, as of December 31, 2011. | UTILITY | ENTERGY WHOLESALE COMMODITIES |
PARENT & OTHER | CONSOLIDATED | ||||||||||||
| ASSETS |
||||||||||||||||
| CURRENT ASSETS: |
||||||||||||||||
| Cash and cash equivalents: |
||||||||||||||||
| Cash |
$ | 77,711 | $ | 3,754 | $ | 3 | $ | 81,468 | ||||||||
| Temporary cash investments |
281,921 | 318,633 | 12,416 | 612,970 | ||||||||||||
| Total cash and cash equivalents |
359,632 | 322,387 | 12,419 | 694,438 | ||||||||||||
| Securitization recovery trust account |
50,304 | - | - | 50,304 | ||||||||||||
| Notes receivable |
- | 1,083,918 | (1,083,918 | ) | - | |||||||||||
| Accounts receivable: |
||||||||||||||||
| Customer |
403,321 | 165,237 | - | 568,558 | ||||||||||||
| Allowance for doubtful accounts |
(30,827 | ) | (332 | ) | - | (31,159 | ) | |||||||||
| Associated companies |
42,847 | 99,162 | (142,009 | ) | - | |||||||||||
| Other |
151,956 | 13,376 | 854 | 166,186 | ||||||||||||
| Accrued unbilled revenues |
297,265 | 1,018 | - | 298,283 | ||||||||||||
| Total accounts receivable |
864,562 | 278,461 | (141,155 | ) | 1,001,868 | |||||||||||
| Deferred fuel costs |
209,776 | - | - | 209,776 | ||||||||||||
| Accumulated deferred income taxes |
141,804 | 4,655 | (136,603 | ) | 9,856 | |||||||||||
| Fuel inventory – at average cost |
196,246 | 5,886 | - | 202,132 | ||||||||||||
| Materials and supplies – at average cost |
559,230 | 335,526 | - | 894,756 | ||||||||||||
| Deferred nuclear refueling outage costs |
103,788 | 127,243 | - | 231,031 | ||||||||||||
| System agreement cost equalization |
36,800 | - | - | 36,800 | ||||||||||||
| Prepaid taxes |
- | 79,165 | (79,165 | ) | - | |||||||||||
| Prepayments and other |
67,285 | 222,049 | 2,408 | 291,742 | ||||||||||||
| Total |
2,589,427 | 2,459,290 | (1,426,014 | ) | 3,622,703 | |||||||||||
| OTHER PROPERTY AND INVESTMENTS: |
||||||||||||||||
| Investment in affiliates – at equity |
1,147,271 | 44,764 | (1,147,159 | ) | 44,876 | |||||||||||
| Decommissioning trust funds |
1,639,951 | 2,148,080 | - | 3,788,031 | ||||||||||||
| Non-utility property – at cost (less accumulated depreciation) |
174,029 | 71,888 | 14,519 | 260,436 | ||||||||||||
| Other |
374,379 | 12,044 | 30,000 | 416,423 | ||||||||||||
| Total |
3,335,630 | 2,276,776 | (1,102,640 | ) | 4,509,766 | |||||||||||
| PROPERTY, PLANT AND EQUIPMENT: |
||||||||||||||||
| Electric |
34,487,985 | 4,894,128 | 3,411 | 39,385,524 | ||||||||||||
| Property under capital lease |
809,449 | - | - | 809,449 | ||||||||||||
| Natural gas |
343,111 | 439 | - | 343,550 | ||||||||||||
| Construction work in progress |
1,420,163 | 358,902 | 658 | 1,779,723 | ||||||||||||
| Nuclear fuel |
801,972 | 744,195 | - | 1,546,167 | ||||||||||||
| Total property, plant and equipment |
37,862,680 | 5,997,664 | 4,069 | 43,864,413 | ||||||||||||
| Less – accumulated depreciation and amortization |
17,238,272 | 1,016,507 | 349 | 18,255,128 | ||||||||||||
| Property, plant and equipment – net |
20,624,408 | 4,981,157 | 3,720 | 25,609,285 | ||||||||||||
| DEFERRED DEBITS AND OTHER ASSETS: |
||||||||||||||||
| Regulatory assets: |
||||||||||||||||
| Regulatory asset for income taxes - net |
799,006 | - | - | 799,006 | ||||||||||||
| Other regulatory assets (includes securitization property of |
||||||||||||||||
| $1,009,103 as of December 31, 2011) |
4,636,871 | - | - | 4,636,871 | ||||||||||||
| Deferred fuel costs |
172,202 | - | - | 172,202 | ||||||||||||
| Goodwill |
374,099 | 3,073 | - | 377,172 | ||||||||||||
| Accumulated deferred income taxes |
4,313 | 9,232 | 5,458 | 19,003 | ||||||||||||
| Other |
198,593 | 803,552 | (46,454 | ) | 955,691 | |||||||||||
| Total |
6,185,084 | 815,857 | (40,996 | ) | 6,959,945 | |||||||||||
| TOTAL ASSETS |
$ | 32,734,549 | $10,533,080 | $(2,565,930) | $40,701,699 | |||||||||||
Totals may not foot due to rounding.
18
FINANCIAL RESULTS
2011 CONSOLIDATING BALANCE SHEET (unaudited)
| In thousands, as of December 31, 2011. |
UTILITY | |
ENTERGY WHOLESALE COMMODITIES |
|
PARENT & OTHER | CONSOLIDATED | ||||||||||
| LIABILITIES AND EQUITY |
||||||||||||||||
| CURRENT LIABILITIES: |
||||||||||||||||
| Currently maturing long-term debt |
$ | 245,472 | $ | 27,261 | $ | 1,920,000 | $ | 2,192,733 | ||||||||
| Notes payable and commercial paper: |
||||||||||||||||
| Associated companies |
- | 138,862 | (138,862 | ) | - | |||||||||||
| Other |
108,331 | - | - | 108,331 | ||||||||||||
| Accounts payable: |
||||||||||||||||
| Associated companies |
14,839 | 36,878 | (51,717 | ) | - | |||||||||||
| Other |
787,516 | 280,663 | 917 | 1,069,096 | ||||||||||||
| Customer deposits |
351,741 | - | - | 351,741 | ||||||||||||
| Taxes accrued |
569,641 | - | (291,406 | ) | 278,235 | |||||||||||
| Accumulated deferred income taxes |
54,592 | 42,613 | 2,724 | 99,929 | ||||||||||||
| Interest accrued |
169,710 | 490 | 13,312 | 183,512 | ||||||||||||
| Deferred fuel costs |
255,839 | - | - | 255,839 | ||||||||||||
| Obligations under capital leases |
3,631 | - | - | 3,631 | ||||||||||||
| Pension and other postretirement liabilities |
37,858 | 6,173 | - | 44,031 | ||||||||||||
| System agreement cost equalization |
80,090 | - | - | 80,090 | ||||||||||||
| Other |
114,083 | 158,277 | 11,171 | 283,531 | ||||||||||||
|
|
||||||||||||||||
| Total |
2,793,343 | 691,217 | 1,466,139 | 4,950,699 | ||||||||||||
|
|
||||||||||||||||
| NON-CURRENT LIABILITIES: |
||||||||||||||||
| Accumulated deferred income taxes and taxes accrued |
6,680,438 | 824,393 | 591,621 | 8,096,452 | ||||||||||||
| Accumulated deferred investment tax credits |
284,747 | - | - | 284,747 | ||||||||||||
| Obligations under capital leases |
38,421 | - | - | 38,421 | ||||||||||||
| Other regulatory liabilities |
737,403 | - | (9,210 | ) | 728,193 | |||||||||||
| Decommissioning and asset retirement cost liabilities |
1,803,665 | 1,492,905 | - | 3,296,570 | ||||||||||||
| Accumulated provisions |
379,331 | 1,849 | 4,332 | 385,512 | ||||||||||||
| Pension and other postretirement liabilities |
2,463,493 | 670,164 | - | 3,133,657 | ||||||||||||
| Long-term debt (includes securitization bonds of $1,070,556 as of December 31, 2011) |
8,936,342 | 107,744 | 999,627 | 10,043,713 | ||||||||||||
| Other |
651,919 | 639,552 | (789,517 | ) | 501,954 | |||||||||||
|
|
||||||||||||||||
| Total |
21,975,759 | 3,736,607 | 796,853 | 26,509,219 | ||||||||||||
|
|
||||||||||||||||
| Commitments and Contingencies |
||||||||||||||||
| Subsidiaries preferred stock without sinking fund |
186,510 | 55,399 | (55,398 | ) | 186,511 | |||||||||||
| EQUITY: |
||||||||||||||||
| Common shareholders’ equity: |
||||||||||||||||
| Common stock, $.01 par value, authorized 500,000,000 shares; issued 254,752,788 shares in 2011 |
2,161,268 | 327,937 | (2,486,657 | ) | 2,548 | |||||||||||
| Paid-in capital |
2,416,634 | 1,499,406 | 1,444,642 | 5,360,682 | ||||||||||||
| Retained earnings |
3,417,829 | 4,118,292 | 1,910,839 | 9,446,960 | ||||||||||||
| Accumulated other comprehensive income (loss) |
(190,794 | ) | 104,222 | (81,880 | ) | (168,452 | ) | |||||||||
| Less – treasury stock, at cost (78,396,988 shares in 2011) |
120,000 | - | 5,560,468 | 5,680,468 | ||||||||||||
|
|
||||||||||||||||
| Total common shareholders’ equity |
7,684,937 | 6,049,857 | (4,773,524 | ) | 8,961,270 | |||||||||||
|
|
||||||||||||||||
| Subsidiaries preferred stock without sinking fund |
94,000 | - | - | 94,000 | ||||||||||||
|
|
||||||||||||||||
| Total |
7,778,937 | 6,049,857 | (4,773,524 | ) | 9,055,270 | |||||||||||
|
|
||||||||||||||||
| TOTAL LIABILITIES AND EQUITY |
$ | 32,734,549 | $10,533,080 | $(2,565,930) | $40,701,699 | |||||||||||
Totals may not foot due to rounding.
19
FINANCIAL RESULTS
CONSOLIDATED STATEMENTS OF CASH FLOW (unaudited)
| In thousands, for the years ended December 31, |
2011 | 2010 | 2009 | 2008 | 2007 | |||||||||||||||
|
|
||||||||||||||||||||
| OPERATING ACTIVITIES: |
||||||||||||||||||||
| Consolidated net income |
$ | 1,367,372 | $ | 1,270,305 | $ | 1,251,050 | $ | 1,240,535 | $ | 1,159,954 | ||||||||||
| Adjustments to reconcile consolidated net income to net cash flow provided by operating activities: |
||||||||||||||||||||
| Depreciation, amortization, and decommissioning, including nuclear fuel amortization |
1,745,455 | 1,705,331 | 1,458,861 | 1,391,689 | 1,264,727 | |||||||||||||||
| Deferred income taxes, investment tax credits, and non-current taxes accrued |
(280,029 | ) | 718,987 | 864,684 | 333,948 | 476,241 | ||||||||||||||
| Gain on sale of business |
- | (44,173 | ) | - | - | - | ||||||||||||||
| Changes in working capital: |
||||||||||||||||||||
| Receivables |
28,091 | (99,640 | ) | 116,444 | 78,653 | (62,646 | ) | |||||||||||||
| Fuel inventory |
5,393 | (10,665 | ) | 19,291 | (7,561 | ) | (10,445 | ) | ||||||||||||
| Accounts payable |
(131,970 | ) | 216,635 | (14,251 | ) | (23,225 | ) | (103,048 | ) | |||||||||||
| Prepaid taxes and taxes accrued |
580,042 | (116,988 | ) | (260,029 | ) | 122,134 | (187,324 | ) | ||||||||||||
| Interest accrued |
(34,172 | ) | 17,651 | 4,974 | (652 | ) | 11,785 | |||||||||||||
| Deferred fuel |
(55,686 | ) | 8,909 | 72,314 | (38,500 | ) | 912 | |||||||||||||
| Other working capital accounts |
41,875 | (160,326 | ) | (43,391 | ) | (119,296 | ) | (73,269 | ) | |||||||||||
| Changes in provisions for estimated losses |
(11,086 | ) | 265,284 | (12,030 | ) | 12,462 | (59,292 | ) | ||||||||||||
| Changes in other regulatory assets |
(673,244 | ) | 339,408 | (415,157 | ) | (324,211 | ) | 254,736 | ||||||||||||
| Changes in pensions and other postretirement liabilities |
962,461 | (80,844 | ) | 71,789 | 828,160 | (56,224 | ) | |||||||||||||
| Other |
(415,685 | ) | (103,793 | ) | (181,391 | ) | (169,808 | ) | (56,337 | ) | ||||||||||
| Net cash flow provided by operating activities |
3,128,817 | 3,926,081 | 2,933,158 | 3,324,328 | 2,559,770 | |||||||||||||||
| INVESTING ACTIVITIES: |
||||||||||||||||||||
| Construction / capital expenditures |
(2,040,027 | ) | (1,974,286 | ) | (1,931,245 | ) | (2,212,255 | ) | (1,578,030 | ) | ||||||||||
| Allowance for equity funds used during construction |
86,252 | 59,381 | 59,545 | 44,523 | 42,742 | |||||||||||||||
| Nuclear fuel purchases |
(641,493 | ) | (407,711 | ) | (525,474 | ) | (423,951 | ) | (408,732 | ) | ||||||||||
| Proceeds from sale / leaseback of nuclear fuel |
- | - | 284,997 | 297,097 | 169,066 | |||||||||||||||
| Proceeds from sale of assets and businesses |
6,531 | 228,171 | 39,554 | 30,725 | 13,063 | |||||||||||||||
| Payment for purchase of plant |
(646,137 | ) | - | - | (266,823 | ) | (336,211 | ) | ||||||||||||
| Insurance proceeds received for property damages |
- | 7,894 | 53,760 | 130,114 | 83,104 | |||||||||||||||
| Changes in transition charge account |
(7,260 | ) | (29,945 | ) | (1,036 | ) | 7,211 | (19,273 | ) | |||||||||||
| NYPA value sharing payment |
(72,000 | ) | (72,000 | ) | (72,000 | ) | (72,000 | ) | - | |||||||||||
| Payments to storm reserve escrow account |
(6,425 | ) | (296,614 | ) | (6,802 | ) | (248,863 | ) | - | |||||||||||
| Receipts from storm reserve escrow account |
- | 9,925 | - | 249,461 | - | |||||||||||||||
| Decrease (increase) in other investments |
(11,623 | ) | 24,956 | 100,956 | (73,431 | ) | 41,720 | |||||||||||||
| Proceeds from nuclear decommissioning trust fund sales |
1,360,346 | 2,606,383 | 2,570,523 | 1,652,277 | 1,583,584 | |||||||||||||||
| Investment in nuclear decommissioning trust funds |
(1,475,017 | ) | (2,730,377 | ) | (2,667,172 | ) | (1,704,181 | ) | (1,708,764 | ) | ||||||||||
| Net cash flow used in investing activities |
(3,446,853 | ) | (2,574,223 | ) | (2,094,394 | ) | (2,590,096 | ) | (2,117,731 | ) | ||||||||||
| FINANCING ACTIVITIES: |
||||||||||||||||||||
| Proceeds from the issuance of: |
||||||||||||||||||||
| Long-term debt |
2,990,881 | 3,870,694 | 2,003,469 | 3,456,695 | 2,866,136 | |||||||||||||||
| Preferred equity |
- | - | - | - | 10,000 | |||||||||||||||
| Common stock and treasury stock |
46,185 | 51,163 | 28,198 | 34,775 | 78,830 | |||||||||||||||
| Retirement of long-term debt |
(2,437,372 | ) | (4,178,127 | ) | (1,843,169 | ) | (2,486,806 | ) | (1,369,945 | ) | ||||||||||
| Repurchase of common stock |
(234,632 | ) | (878,576 | ) | (613,125 | ) | (512,351 | ) | (1,215,578 | ) | ||||||||||
| Redemption of subsidiary common and preferred stock |
(30,308 | ) | - | (1,847 | ) | - | (57,827 | ) | ||||||||||||
| Changes in credit borrowings – net |
(6,501 | ) | (8,512 | ) | (25,000 | ) | 30,000 | - | ||||||||||||
| Dividends paid: |
||||||||||||||||||||
| Common stock |
(589,605 | ) | (603,854 | ) | (576,956 | ) | (573,045 | ) | (507,327 | ) | ||||||||||
| Preferred equity |
(20,933 | ) | (20,063 | ) | (19,958 | ) | (20,025 | ) | (25,875 | ) | ||||||||||
| Net cash flow provided by (used in) financing activities |
(282,285 | ) | (1,767,275 | ) | (1,048,388 | ) | (70,757 | ) | (221,586 | ) | ||||||||||
| Effect of exchange rates on cash and cash equivalents |
287 | 338 | (1,316 | ) | 3,288 | 30 | ||||||||||||||
| Net increase (decrease) in cash and cash equivalents |
(600,034 | ) | (415,079 | ) | (210,940 | ) | 666,763 | 220,483 | ||||||||||||
| Cash and cash equivalents at beginning of period |
1,294,472 | 1,709,551 | 1,920,491 | 1,253,728 | 1,016,152 | |||||||||||||||
| Effect of the reconsolidation of Entergy New Orleans on cash and cash equivalents |
- | - | - | - | 17,093 | |||||||||||||||
| Cash and cash equivalents at end of period |
$ | 694,438 | $ | 1,294,472 | $ | 1,709,551 | $ | 1,920,491 | $ | 1,253,728 | ||||||||||
Certain prior year data has been reclassified to conform with current year presentation.
20
FINANCIAL RESULTS
CONSOLIDATED STATEMENTS OF CASH FLOW (unaudited)
| $ thousands, for the years ended December 31, |
2011 | 2010 | 2009 | 2008 | 2007 | |||||||||||||||
| SUPPLEMENTAL DISCLOSURE OF |
||||||||||||||||||||
| CASH FLOW INFORMATION: |
||||||||||||||||||||
| Cash paid (received) during the period for: |
||||||||||||||||||||
| Interest – net of amount capitalized |
532,271 | 534,004 | 576,811 | 612,288 | 611,197 | |||||||||||||||
| Income taxes |
(2,042 | ) | 32,144 | 43,057 | 137,234 | 376,808 | ||||||||||||||
| Noncash financing activities: |
||||||||||||||||||||
| Long-tern debt retired (equity unit notes) |
- | - | (500,000 | ) | - | - | ||||||||||||||
| Common stock issued in settlement of equity unit purchase contracts |
- | - | 500,000 | - | - |
CASH FLOW INFORMATION BY BUSINESS
| For the years ended December 31, 2011, 2010, 2009, 2008, and 2007. | UTILITY | |
ENTERGY WHOLESALE COMMODITIES |
|
PARENT & OTHER | CONSOLIDATED | ||||||||||
| ($ thousands) |
||||||||||||||||
| 2011 |
||||||||||||||||
| Net cash flow provided by operating activities |
2,099,569 | 756,499 | 272,749 | 3,128,817 | ||||||||||||
| Net cash flow provided by (used in) investing activities |
(2,346,218 | ) | (1,262,664 | ) | 162,029 | (3,446,853 | ) | |||||||||
| Net cash flow provided by (used in) financing activities |
(215,304 | ) | 374,484 | (441,465 | ) | (282,285 | ) | |||||||||
| 2010 |
||||||||||||||||
| Net cash flow provided by operating activities |
2,941,596 | 629,787 | 354,698 | 3,926,081 | ||||||||||||
| Net cash flow provided by (used in) investing activities |
(2,500,139 | ) | (399,439 | ) | 325,355 | (2,574,223 | ) | |||||||||
| Net cash flow provided by (used in) financing activities |
(859,141 | ) | (230,203 | ) | (677,930 | ) | (1,767,275 | ) | ||||||||
| 2009 |
||||||||||||||||
| Net cash flow provided by (used in) operating activities |
1,586,020 | 2,626,034 | (1,278,896 | ) | 2,933,158 | |||||||||||
| Net cash flow provided by (used in) investing activities |
(1,465,824 | ) | (1,927,120 | ) | 1,298,550 | (2,094,394 | ) | |||||||||
| Net cash flow provided by (used in) financing activities |
553,107 | (701,801 | ) | (899,694 | ) | (1,048,388 | ) | |||||||||
| 2008 |
||||||||||||||||
| Net cash flow provided by (used in) operating activities |
2,379,258 | 1,258,581 | (313,511 | ) | 3,324,328 | |||||||||||
| Net cash flow provided by (used in) investing activities |
(2,845,157 | ) | (429,859 | ) | 684,920 | (2,590,096 | ) | |||||||||
| Net cash flow provided by (used in) financing activities |
250,309 | (832,619 | ) | 511,553 | (70,757 | ) | ||||||||||
| 2007 |
||||||||||||||||
| Net cash flow provided by (used in) operating activities |
1,807,769 | 821,201 | (69,200 | ) | 2,559,770 | |||||||||||
| Net cash flow provided by (used in) investing activities |
(1,238,487 | ) | (846,926 | ) | (32,318 | ) | (2,117,731 | ) | ||||||||
| Net cash flow provided by (used in) financing activities |
(368,909 | ) | 57,766 | 89,557 | (221,586 | ) | ||||||||||
Certain prior year data has been reclassified to conform with current year presentation.
21
FINANCIAL RESULTS
CONSOLIDATED STATEMENTS OF CHANGES IN EQUITY AND COMPREHENSIVE INCOME (unaudited)
| Common Shareholders’ Equity | ||||||||||||||||||||||||||||
| Subsidiaries’ Preferred Stock |
Common Stock |
Treasury Stock | Paid-in Capital | Retained Earnings |
Accumulated Other Comprehensive Income (Loss) |
Total | ||||||||||||||||||||||
| (In Thousands) | ||||||||||||||||||||||||||||
| Balance at December 31, 2006 |
100,000 | 2,482 | (2,644,390 | ) | 4,827,265 | 6,113,042 | (100,512 | ) | 8,297,887 | |||||||||||||||||||
| Consolidated net income (a) |
25,105 | - | - | - | 1,134,849 | - | 1,159,954 | |||||||||||||||||||||
| Other comprehensive income |
- | - | - | - | - | 108,832 | 108,832 | |||||||||||||||||||||
| Common stock repurchases |
- | - | (1,215,578 | ) | - | - | - | (1,215,578 | ) | |||||||||||||||||||
| Common stock issuances related to stock plans |
- | - | 125,103 | 23,504 | - | - | 148,607 | |||||||||||||||||||||
| Common stock dividends declared |
- | - | - | - | (507,326 | ) | - | (507,326 | ) | |||||||||||||||||||
| Preferred stock issued |
10,000 | - | - | - | - | - | 10,000 | |||||||||||||||||||||
| Preferred stock repurchased |
(16,000 | ) | - | - | - | - | - | (16,000 | ) | |||||||||||||||||||
| Preferred dividend requirements of subsidiaries (a) |
(25,105 | ) | - | - | - | - | - | (25,105 | ) | |||||||||||||||||||
| Adjustment related to FIN 48 implementation |
- | - | - | - | (4,600 | ) | - | (4,600 | ) | |||||||||||||||||||
| Balance at December 31, 2007 |
94,000 | 2,482 | (3,734,865 | ) | 4,850,769 | 6,735,965 | 8,320 | 7,956,671 | ||||||||||||||||||||
| Consolidated net income (a) |
19,969 | - | - | - | 1,220,566 | - | 1,240,535 | |||||||||||||||||||||
| Other comprehensive loss |
- | - | - | - | - | (121,018 | ) | (121,018 | ) | |||||||||||||||||||
| Common stock repurchases |
- | - | (512,351 | ) | - | - | - | (512,351 | ) | |||||||||||||||||||
| Common stock issuances related to stock plans |
- | - | 72,002 | 18,534 | - | - | 90,536 | |||||||||||||||||||||
| Common stock dividends declared |
- | - | - | - | (573,924 | ) | - | (573,924 | ) | |||||||||||||||||||
| Preferred dividend requirements of subsidiaries (a) |
(19,969 | ) | - | - | - | - | - | (19,969 | ) | |||||||||||||||||||
| Capital stock and other expenses |
- | - | - | - | 112 | - | 112 | |||||||||||||||||||||
| Balance at December 31, 2008 |
94,000 | 2,482 | (4,175,214 | ) | 4,869,303 | 7,382,719 | (112,698 | ) | 8,060,592 | |||||||||||||||||||
| Consolidated net income (a) |
19,958 | - | - | - | 1,231,092 | - | 1,251,050 | |||||||||||||||||||||
| Other comprehensive income |
- | - | - | - | - | 43,878 | 43,878 | |||||||||||||||||||||
| Common stock repurchases |
- | - | (613,125 | ) | - | - | - | (613,125 | ) | |||||||||||||||||||
| Common stock issuances in settlement of equity unit purchase contracts |
- | 66 | - | 499,934 | - | - | 500,000 | |||||||||||||||||||||
| Common stock issuances related to stock plans |
- | - | 61,172 | 805 | - | - | 61,977 | |||||||||||||||||||||
| Common stock dividends declared |
- | - | - | - | (576,913 | ) | - | (576,913 | ) | |||||||||||||||||||
| Preferred dividend requirements of subsidiaries (a) |
(19,958 | ) | - | - | - | - | - | (19,958 | ) | |||||||||||||||||||
| Capital stock and other expenses |
- | - | - | - | (141 | ) | - | (141 | ) | |||||||||||||||||||
| Adjustment for implementation of new accounting pronouncement |
- | - | - | - | 6,365 | (6,365 | ) | - | ||||||||||||||||||||
| Balance at December 31, 2009 |
94,000 | 2,548 | (4,727,167 | ) | 5,370,042 | 8,043,122 | (75,185 | ) | 8,707,360 | |||||||||||||||||||
| Consolidated net income (a) |
20,063 | - | - | - | 1,250,242 | - | 1,270,305 | |||||||||||||||||||||
| Other comprehensive income |
- | - | - | - | - | 36,973 | 36,973 | |||||||||||||||||||||
| Common stock repurchases |
- | - | (878,576 | ) | - | - | - | (878,576 | ) | |||||||||||||||||||
| Common stock issuances related to stock plans |
- | - | 80,932 | (2,568 | ) | - | - | 78,364 | ||||||||||||||||||||
| Common stock dividends declared |
- | - | - | - | (603,963 | ) | - | (603,963 | ) | |||||||||||||||||||
| Preferred dividend requirements of subsidiaries (a) |
(20,063 | ) | - | - | - | - | - | (20,063 | ) | |||||||||||||||||||
| Balance at December 31, 2010 |
94,000 | 2,548 | (5,524,811 | ) | 5,367,474 | 8,689,401 | (38,212 | ) | 8,590,400 | |||||||||||||||||||
| Consolidated net income (a) |
20,933 | - | - | - | 1,346,439 | - | 1,367,372 | |||||||||||||||||||||
| Other comprehensive loss |
- | - | - | - | - | (130,240 | ) | (130,240 | ) | |||||||||||||||||||
| Common stock repurchases |
- | - | (234,632 | ) | - | - | - | (234,632 | ) | |||||||||||||||||||
| Common stock issuances related to stock plans |
- | - | 78,975 | (6,792 | ) | - | - | 72,183 | ||||||||||||||||||||
| Common stock dividends declared |
- | - | - | - | (588,880 | ) | - | (588,880 | ) | |||||||||||||||||||
| Preferred dividend requirements of subsidiaries (a) |
(20,933 | ) | - | - | - | - | - | (20,933 | ) | |||||||||||||||||||
| Balance at December 31, 2011 |
94,000 | 2,548 | (5,680,468 | ) | 5,360,682 | 9,446,960 | (168,452 | ) | 9,055,270 | |||||||||||||||||||
Certain prior year data has been reclassified to conform with current year presentation.
(a) Consolidated net income and preferred dividend requirements of subsidiaries for 2011, 2010, 2009, 2008, and 2007 include $13.3 million, $13.3 million, $13.3 million, $13.3 million, and $14.2 million, respectively, of preferred dividends on subsidiaries’ preferred stock without sinking fund that is not presented as equity.
22
FINANCIAL RESULTS
CONSOLIDATED STATEMENTS OF COMPREHENSIVE INCOME
| $ thousands, for the years ended December 31, |
2011 | 2010 | 2009 | 2008 | 2007 | |||||||||||||||
| NET INCOME |
$ | 1,367,372 | $ | 1,270,305 | $ | 1,251,050 | $ | 1,240,535 | $ | 1,159,954 | ||||||||||
| Other comprehensive income (loss) |
||||||||||||||||||||
| Cash flow hedges net unrealized gain (loss) (net of tax expense (benefit) of $34,411, ($7,088), $333, $78,837, and $57,185 for 2011 to 2007, respectively) |
71,239 | (11,685 | ) | (2,887 | ) | 133,370 | 93,038 | |||||||||||||
| Pension and other postretirement liabilities (net of tax benefit (expense) of $131,198, $14,387, $34,415, $68,076, and ($29,994) for 2011 to 2007, respectively) |
(223,090 | ) | (8,527 | ) | (35,707 | ) | (125,087 | ) | (1,236 | ) | ||||||||||
| Net unrealized investment gains (net of tax expense (benefit) of $19,368, $51,130, $102,845, ($108,049), and $23,562 for 2011 to 2007, respectively) |
21,254 | 57,523 | 82,929 | (126,013 | ) | 17,060 | ||||||||||||||
| Foreign currency translation (net of tax expense (benefit) of $192, ($182), ($246), ($1,770), and ($16) for 2011 to 2007, respectively) |
357 | (338 | ) | (457 | ) | (3,288 | ) | (30 | ) | |||||||||||
| Other comprehensive income (loss) |
(130,240 | ) | 36,973 | 43,878 | (121,018 | ) | 108,832 | |||||||||||||
| COMPREHENSIVE INCOME |
1,237,132 | 1,307,278 | 1,294,928 | 1,119,517 | 1,268,786 | |||||||||||||||
| Preferred dividend requirements of subsidiaries |
20,933 | 20,063 | 19,958 | 19,969 | 25,105 | |||||||||||||||
| COMPREHENSIVE INCOME ATTRIBUTABLE TO ENTERGY CORPORATION |
$ | 1,216,199 | $ | 1,287,215 | $ | 1,274,970 | $ | 1,099,548 | $ | 1,243,681 | ||||||||||
23
CONSOLIDATED CAPITAL EXPENDITURES
HISTORICAL CAPITAL EXPENDITURES
| ($ millions) | 2011 | 2010 | 2009 | 2008 | 2007 | |||||||||||||||
| Utility |
||||||||||||||||||||
| Maintenance |
925 | 798 | 805 | 855 | 789 | |||||||||||||||
| Other |
1,121 | 777 | 767 | 1,333 | 527 | |||||||||||||||
| Entergy Wholesale Commodities |
712 | 471 | 437 | 357 | 597 | |||||||||||||||
| Parent & Other |
- | - | (6 | ) | 6 | 1 | ||||||||||||||
| Total Historical Capital Expenditures |
2,758 | 2,046 | 2,003 | 2,551 | 1,914 | |||||||||||||||
PLANNED CAPITAL EXPENDITURES
| ($ millions) | 2012 | 2013 | 2014 | |||||||||
| Maintenance Capital: |
||||||||||||
| Utility: |
||||||||||||
| Generation |
128 | 129 | 131 | |||||||||
| Transmission |
282 | 273 | 255 | |||||||||
| Distribution |
433 | 485 | 496 | |||||||||
| Other |
91 | 89 | 103 | |||||||||
| Total |
934 | 976 | 985 | |||||||||
| Entergy Wholesale Commodities |
90 | 120 | 107 | |||||||||
| Total Maintenance Capital |
1,024 | 1,096 | 1,092 | |||||||||
| Capital Commitments: |
||||||||||||
| Utility: |
||||||||||||
| Generation |
1,428 | 583 | 358 | |||||||||
| Transmission |
170 | 128 | 264 | |||||||||
| Distribution |
17 | 11 | 11 | |||||||||
| Other |
45 | 47 | 35 | |||||||||
| Total |
1,660 | 769 | 668 | |||||||||
| Entergy Wholesale Commodities |
259 | 241 | 291 | |||||||||
| Total Capital Commitments |
1,919 | 1,010 | 959 | |||||||||
| Total Planned Capital Expenditures |
2,943 | 2,106 | 2,051 | |||||||||
ENTERGY CORPORATION SECURITIES DETAIL
ENTERGY CORPORATION LONG-TERM DEBT
| CURRENT OR FIRST CALL PRICE |
||||||||||||||||||||||||||
| MATURITY DATE |
FIRST
CALL DATE |
AS OF DECEMBER 31, | ||||||||||||||||||||||||
| CUSIP | RATE | 2011 | 2010 | 2009 | ||||||||||||||||||||||
| ($ | millions | ) | ||||||||||||||||||||||||
| $3.5B Bank Credit Facility |
0.75 | % | 08/12 | $ | 1,920 | $ | 1,632 | $ | 2,566 | |||||||||||||||||
| Bank Term Loan |
06/10 | - | - | 60 | ||||||||||||||||||||||
| 29364GAB9 |
6.58% Notes |
6.58 | % | 05/10 | Now | MW | (T+.50%) | - | - | 75 | ||||||||||||||||
| 29364GB@1 |
6.9% Notes | 6.9 | % | 11/10 | Now | MW | (T+.50%) | - | - | 140 | ||||||||||||||||
| 29364GA@2 |
7.06% Notes | 7.06 | % | 03/11 | Now | MW | (T+.50%) | - | 86 | 86 | ||||||||||||||||
| 29364GAE3 |
3.625% Notes | 3.625 | % | 09/15 | Now | MW | (T+.35%) | 550 | 550 | - | ||||||||||||||||
| 29364GAF0 |
5.125% Notes | 5.125 | % | 09/20 | Now | MW | (T+.40%) | 450 | 450 | - | ||||||||||||||||
| Total |
$ | 2,920 | $ | 2,718 | $ | 2,927 | ||||||||||||||||||||
| (a) | In December 2005, Entergy Corporation sold 10 million equity units with a stated amount of $50 each. An equity unit consisted of (1) a note, initially due February 2011 and initially bearing interest at an annual rate of 5.75%, and (2) a purchase contract that obligated the holder of the equity unit to purchase for $50 between 0.5705 and 0.7074 shares of Entergy Corporation common stock on or before February 17, 2009. Entergy paid the holders quarterly contract adjustment payments of 1.875% per year on the stated amount of $50 per equity unit. Under the terms of the purchase contracts, Entergy attempted to remarket the notes in February 2009 but was unsuccessful, the note holders put the notes to Entergy, Entergy retired the notes, and Entergy issued 6,598,000 shares of common stock in the settlement of the purchase contracts. |
| (b) | On February 16, 2012, Entergy Gulf States Louisiana, L.L.C. sold 500,000 units ($51 million) of Class A preferred, non-voting, membership interest units of Entergy Holdings Company LLC that carry a 10% annual distribution rate. Distributions are payable quarterly commencing on September 15, 2008 and have a liquidation price of $100 per unit. The preferred membership interests are callable at the option of Entergy Holdings Company LLC after ten years under the terms of the LLC agreement. This preferred membership interest is reflected in the Parent & Other disclosure segment in ‘Other Non-Current Liabilities’ on the balance sheet. |
| CORPORATE CREDIT | ||||||
| As of June 2012. | MOODY’S | S&P | ||||
| Entergy Corporation | Baa3 (stable) | BBB (outlook negative) | ||||
24
UTILITY SELECTED DATA
UTILITY QUARTERLY FINANCIAL METRICS
| 2011 | 2010 | YTD % | ||||||||||||||||||||||||||||||||||||||||||
| 1Q | 2Q | 3Q | 4Q | YTD | 1Q | 2Q | 3Q | 4Q | YTD | CHANGE | ||||||||||||||||||||||||||||||||||
| GAAP MEASURES |
||||||||||||||||||||||||||||||||||||||||||||
| As-Reported Net Income ($ millions) |
164.3 | 248.4 | 524.1 | 169.7 | 1,106.5 | 138.6 | 225.8 | 333.6 | 114.3 | 812.4 | 36.2 | |||||||||||||||||||||||||||||||||
| Return on Average Invested Capital – |
||||||||||||||||||||||||||||||||||||||||||||
| As-Reported (%)(a) |
7.0 | 7.0 | 8.0 | 8.3 | 8.3 | 6.5 | 7.1 | 7.2 | 6.9 | 6.9 | 20.3 | |||||||||||||||||||||||||||||||||
| Return on Average Common Equity – |
||||||||||||||||||||||||||||||||||||||||||||
| As-Reported (%)(a) |
11.7 | 11.9 | 14.2 | 14.8 | 14.8 | 10.4 | 11.4 | 11.8 | 11.4 | 11.4 | 29.8 | |||||||||||||||||||||||||||||||||
| Debt to Capital Ratio (%) |
54.7 | 54.7 | 54.3 | 54.0 | 54.0 | 55.8 | 54.9 | 55.0 | 54.3 | 54.3 | (0.6 | ) | ||||||||||||||||||||||||||||||||
| NON-GAAP MEASURES |
||||||||||||||||||||||||||||||||||||||||||||
| Operational Earnings ($ millions) |
164.3 | 248.4 | 524.1 | 169.7 | 1,106.5 | 138.6 | 225.8 | 333.6 | 114.3 | 812.4 | 36.2 | |||||||||||||||||||||||||||||||||
| Return on Average Invested Capital |
||||||||||||||||||||||||||||||||||||||||||||
| – Operational (%)(a) |
7.0 | 7.0 | 8.0 | 8.3 | 8.3 | 6.5 | 7.1 | 7.2 | 6.9 | 6.9 | 20.3 | |||||||||||||||||||||||||||||||||
| Return on Average Common Equity – |
||||||||||||||||||||||||||||||||||||||||||||
| Operational (%)(a) |
11.7 | 11.9 | 14.2 | 14.8 | 14.8 | 10.4 | 11.4 | 11.8 | 11.4 | 11.4 | 29.8 | |||||||||||||||||||||||||||||||||
| Debt to Capital Ratio, excluding securitization debt (%) |
52.1 | 52.2 | 51.3 | 50.9 | 50.9 | 53.4 | 52.5 | 52.3 | 51.6 | 51.6 | (1.4 | ) | ||||||||||||||||||||||||||||||||
| Net Debt to Net Capital Ratio, excluding securitization debt (%) |
50.7 | 51.5 | 49.8 | 49.8 | 49.8 | 50.1 | 49.3 | 48.8 | 48.9 | 48.9 | 1.8 | |||||||||||||||||||||||||||||||||
| (a) | Rolling twelve months. Totals may not foot due to rounding. |
UTILITY ANNUAL FINANCIAL METRICS
| 2011 | 2010 | 2009 | 2008 | 2007 | ||||||||||||||||
| GAAP MEASURES |
||||||||||||||||||||
| As-Reported Net Income ($ millions) |
1,106.5 | 812.4 | 691.6 | 587.8 | 682.7 | |||||||||||||||
| Return on Average Invested Capital – As-Reported (%) |
8.3 | 6.9 | 6.4 | 6.0 | 6.9 | |||||||||||||||
| Return on Average Common Equity – As-Reported (%) |
14.8 | 11.4 | 10.1 | 8.9 | 10.6 | |||||||||||||||
| Debt to Capital Ratio (%) |
54.0 | 54.3 | 55.6 | 53.0 | 51.5 | |||||||||||||||
| NON-GAAP MEASURES |
||||||||||||||||||||
| Operational Earnings ($ millions) |
1,106.5 | 812.4 | 691.6 | 587.8 | 696.4 | |||||||||||||||
| Return on Average Invested Capital – Operational (%) |
8.3 | 6.9 | 6.4 | 6.0 | 7.0 | |||||||||||||||
| Return on Average Common Equity – Operational (%) |
14.8 | 11.4 | 10.1 | 8.9 | 10.8 | |||||||||||||||
| Debt to Capital Ratio, excluding securitization debt (%) |
50.9 | 51.6 | 53.2 | 52.0 | 50.3 | |||||||||||||||
| Net Debt to Net Capital Ratio, excluding securitization debt (%) |
49.8 | 48.9 | 49.2 | 50.0 | 47.2 | |||||||||||||||
UTILITY SECURITIES RATINGS (OUTLOOK)
| MORTGAGE BONDS | PREFERRED STOCK | |||||||||
| As of June 2012. | MOODY’S | S&P | MOODY’S | S&P | ||||||
| Entergy Arkansas, Inc. |
A3 (stable) | A– (outlook negative) | Ba1 | BB+ | ||||||
| Entergy Gulf States Louisiana, L.L.C. |
A3 (stable) | BBB+ (outlook negative) | Ba1 | BB+ | ||||||
| Entergy Louisiana, LLC |
A3 (stable) | A– (outlook negative) | Ba1 | BB+ | ||||||
| Entergy Mississippi, Inc. |
Baa1 (stable) | A– (outlook negative) | Ba2 | BB+ | ||||||
| Entergy New Orleans, Inc. |
Baa3 (stable) | BBB+ (outlook negative) | B1 | BB+ | ||||||
| Entergy Texas, Inc. |
Baa2 (stable) | BBB+ (outlook negative) | – | – | ||||||
| System Energy Resources, Inc. |
Baa2 (stable) | BBB+ (outlook negative) | – | – | ||||||
UTILITY HISTORICAL CAPITAL EXPENDITURES(a)
| ($ millions) | 2011 | 2010 | 2009 | 2008 | 2007 | |||||||||||||||
| Entergy Arkansas |
383 | 291 | 264 | 584 | 305 | |||||||||||||||
| Entergy Gulf States Louisiana |
219 | 237 | 274 | 360 | 168 | |||||||||||||||
| Entergy Louisiana |
734 | 428 | 468 | 584 | 322 | |||||||||||||||
| Entergy Mississippi |
166 | 224 | 131 | 156 | 157 | |||||||||||||||
| Entergy New Orleans |
57 | 80 | 62 | 103 | 94 | |||||||||||||||
| Entergy Texas |
173 | 163 | 188 | 284 | 167 | |||||||||||||||
| System Energy Resources |
235 | 56 | 91 | 86 | 84 | |||||||||||||||
| Other(b) |
79 | 96 | 94 | 31 | 19 | |||||||||||||||
| Total |
2,046 | 1,575 | 1,572 | 2,188 | 1,316 | |||||||||||||||
| (a) | Historical capital expenditures include storm capital spending. |
| (b) | Corresponds to Entergy Services, Inc., Entergy Operations, Inc., and System Fuels, Inc. |
Certain prior year data has been reclassified to conform with current year presentation.
25
UTILITY SELECTED DATA
UTILITY PLANNED CAPITAL EXPENDITURES
| 2012 | ||||||||||||||||||||||||||||||||||||
| ($ millions) | Entergy Arkansas |
Entergy Gulf States Louisiana |
Entergy Louisiana |
Entergy Mississippi |
Entergy New Orleans |
Entergy Texas |
System Energy Resources |
Other(a) | Utility | |||||||||||||||||||||||||||
| Maintenance Capital: |
||||||||||||||||||||||||||||||||||||
| Generation |
34 | 19 | 27 | 10 | 2 | 15 | 19 | 1 | 128 | |||||||||||||||||||||||||||
| Transmission |
73 | 56 | 61 | 37 | 7 | 42 | - | 6 | 282 | |||||||||||||||||||||||||||
| Distribution |
113 | 59 | 98 | 72 | 27 | 64 | - | - | 433 | |||||||||||||||||||||||||||
| Other |
10 | 16 | 9 | 5 | 9 | 5 | 2 | 34 | 91 | |||||||||||||||||||||||||||
| Total Maintenance Capital |
230 | 150 | 195 | 124 | 45 | 126 | 21 | 41 | 934 | |||||||||||||||||||||||||||
| Capital Commitments: |
||||||||||||||||||||||||||||||||||||
| Generation |
325 | 48 | 460 | 223 | 6 | 69 | 297 | - | 1,428 | |||||||||||||||||||||||||||
| Transmission |
44 | 39 | 47 | 37 | - | 3 | - | - | 170 | |||||||||||||||||||||||||||
| Distribution |
9 | - | 7 | - | 1 | - | - | - | 17 | |||||||||||||||||||||||||||
| Other |
16 | 2 | 3 | 2 | 12 | 4 | - | 6 | 45 | |||||||||||||||||||||||||||
| Total Other Capital Commitments |
394 | 89 | 517 | 262 | 19 | 76 | 297 | 6 | 1,660 | |||||||||||||||||||||||||||
| Total Planned Capital Expenditures |
624 | 239 | 712 | 386 | 64 | 202 | 318 | 47 | 2,594 | |||||||||||||||||||||||||||
Totals may not foot due to rounding.
| (a) | Corresponds to Entergy Services, Inc. |
| 2013 | ||||||||||||||||||||||||||||||||||||
| ($ millions) | Entergy Arkansas |
Entergy Gulf States Louisiana |
Entergy Louisiana |
Entergy Mississippi |
Entergy New Orleans |
Entergy Texas |
System Energy Resources |
Other(a) | Utility | |||||||||||||||||||||||||||
| Maintenance Capital: |
||||||||||||||||||||||||||||||||||||
| Generation |
35 | 28 | 27 | 11 | 3 | 11 | 14 | 1 | 129 | |||||||||||||||||||||||||||
| Transmission |
72 | 47 | 54 | 33 | 4 | 58 | - | 4 | 273 | |||||||||||||||||||||||||||
| Distribution |
123 | 64 | 124 | 75 | 28 | 70 | - | - | 485 | |||||||||||||||||||||||||||
| Other |
11 | 15 | 9 | 5 | 10 | 5 | 2 | 35 | 89 | |||||||||||||||||||||||||||
| Total Maintenance Capital |
241 | 154 | 214 | 124 | 45 | 144 | 16 | 40 | 976 | |||||||||||||||||||||||||||
| Capital Commitments: |
||||||||||||||||||||||||||||||||||||
| Generation |
60 | 29 | 410 | 7 | 12 | 46 | 18 | - | 583 | |||||||||||||||||||||||||||
| Transmission |
32 | 26 | 31 | 25 | - | 15 | - | - | 128 | |||||||||||||||||||||||||||
| Distribution |
8 | - | 3 | - | - | - | - | - | 11 | |||||||||||||||||||||||||||
| Other |
11 | 1 | 4 | 1 | 13 | 3 | - | 14 | 47 | |||||||||||||||||||||||||||
| Total Other Capital Commitments |
111 | 56 | 448 | 33 | 25 | 64 | 18 | 14 | 769 | |||||||||||||||||||||||||||
| Total Planned Capital Expenditures |
352 | 210 | 662 | 157 | 70 | 208 | 34 | 54 | 1,745 | |||||||||||||||||||||||||||
Totals may not foot due to rounding.
| (a) | Corresponds to Entergy Services, Inc. |
| 2014 | ||||||||||||||||||||||||||||||||||||
| ($ millions) | Entergy Arkansas |
Entergy Gulf States Louisiana |
Entergy Louisiana |
Entergy Mississippi |
Entergy New Orleans |
Entergy Texas |
System Energy Resources |
Other(a) | Utility | |||||||||||||||||||||||||||
| Maintenance Capital: |
||||||||||||||||||||||||||||||||||||
| Generation |
37 | 23 | 32 | 6 | 1 | 13 | 18 | 1 | 131 | |||||||||||||||||||||||||||
| Transmission |
67 | 43 | 64 | 41 | 4 | 34 | - | 2 | 255 | |||||||||||||||||||||||||||
| Distribution |
115 | 68 | 135 | 84 | 24 | 71 | - | - | 496 | |||||||||||||||||||||||||||
| Other |
11 | 18 | 11 | 6 | 10 | 5 | 2 | 40 | 103 | |||||||||||||||||||||||||||
| Total Maintenance Capital |
230 | 152 | 242 | 137 | 39 | 123 | 20 | 43 | 985 | |||||||||||||||||||||||||||
| Capital Commitments: |
||||||||||||||||||||||||||||||||||||
| Generation |
75 | 22 | 190 | 7 | 17 | 22 | 24 | - | 358 | |||||||||||||||||||||||||||
| Transmission |
71 | 23 | 36 | 26 | 2 | 106 | - | - | 264 | |||||||||||||||||||||||||||
| Distribution |
8 | - | 3 | - | - | - | - | - | 11 | |||||||||||||||||||||||||||
| Other |
4 | - | 7 | 1 | 12 | 3 | - | 8 | 35 | |||||||||||||||||||||||||||
| Total Other Capital Commitments |
158 | 45 | 236 | 34 | 31 | 131 | 24 | 8 | 668 | |||||||||||||||||||||||||||
| Total Planned Capital Expenditures |
388 | 197 | 478 | 171 | 70 | 254 | 44 | 51 | 1,653 | |||||||||||||||||||||||||||
Totals may not foot due to rounding.
| (a) | Corresponds to Entergy Services, Inc. |
2011 UTILITY CONSOLIDATING INCOME STATEMENT (unaudited)
| In thousands, for the year ending December 31, 2011. |
EAI | EGSL | ELL | EMI | ENOI | ETI | SERI | OTHER/ ELIMINATIONS |
UTILITY | |||||||||||||||||||||||||||
| OPERATING REVENUES: |
||||||||||||||||||||||||||||||||||||
| Electric |
$ | 2,084,310 | $ | 2,069,548 | $ | 2,508,915 | $ | 1,266,470 | $ | 529,228 | $ | 1,757,199 | $ | 563,411 | $ | (2,103,072 | ) | $ | 8,676,009 | |||||||||||||||||
| Natural gas |
- | 64,861 | - | - | 100,957 | - | - | 1 | 165,819 | |||||||||||||||||||||||||||
| Total |
2,084,310 | 2,134,409 | 2,508,915 | 1,266,470 | 630,185 | 1,757,199 | 563,411 | (2,103,071 | ) | 8,841,828 | ||||||||||||||||||||||||||
| OPERATING EXPENSES: |
||||||||||||||||||||||||||||||||||||
| Operation and maintenance: |
||||||||||||||||||||||||||||||||||||
| Fuel, fuel-related expenses, and gas purchased for resale |
186,036 | 437,301 | 596,808 | 363,025 | 173,668 | 352,022 | 76,353 | (1,654 | ) | 2,183,559 | ||||||||||||||||||||||||||
| Purchased power |
659,464 | 780,711 | 843,099 | 339,061 | 207,604 | 775,067 | - | (2,056,730 | ) | 1,548,276 | ||||||||||||||||||||||||||
| Nuclear refueling outage expenses |
42,557 | 18,227 | 27,903 | - | - | - | 16,314 | (1 | ) | 105,000 | ||||||||||||||||||||||||||
| Other operation and maintenance |
511,592 | 351,070 | 470,783 | 210,657 | 106,817 | 214,191 | 136,495 | (51,038 | ) | 1,950,567 | ||||||||||||||||||||||||||
| Decommissioning |
38,064 | 14,189 | 24,658 | - | - | - | 31,460 | 773 | 109,144 | |||||||||||||||||||||||||||
| Taxes other than income taxes |
82,847 | 75,858 | 69,769 | 69,759 | 42,032 | 69,329 | 21,425 | 600 | 431,619 | |||||||||||||||||||||||||||
| Depreciation and amortization |
218,902 | 143,387 | 206,986 | 93,119 | 35,026 | 79,263 | 142,543 | (773 | ) | 918,453 | ||||||||||||||||||||||||||
| Other regulatory charges (credits) – net |
(13,506 | ) | (17,045 | ) | 182,800 | 9,460 | 1,910 | 52,307 | (11,781 | ) | 1,814 | 205,959 | ||||||||||||||||||||||||
| Total |
1,725,956 | 1,803,698 | 2,422,806 | 1,085,081 | 567,057 | 1,542,179 | 412,809 | (2,107,009 | ) | 7,452,577 | ||||||||||||||||||||||||||
| OPERATING INCOME |
358,354 | 330,711 | 86,109 | 181,389 | 63,128 | 215,020 | 150,602 | 3,938 | 1,389,251 | |||||||||||||||||||||||||||
| OTHER INCOME: |
||||||||||||||||||||||||||||||||||||
| Allowance for equity funds used during construction |
7,660 | 9,094 | 33,033 | 7,755 | 622 | 3,781 | 22,359 | 1 | 84,305 | |||||||||||||||||||||||||||
| Interest and investment income |
16,533 | 40,945 | 87,487 | 249 | 154 | 5,528 | 8,294 | (453 | ) | 158,737 | ||||||||||||||||||||||||||
| Miscellaneous – net |
(4,172 | ) | (8,799 | ) | (3,520 | ) | (3,904 | ) | (1,234 | ) | (3,047 | ) | (699 | ) | (2 | ) | (25,377 | ) | ||||||||||||||||||
| Total |
20,021 | 41,240 | 117,000 | 4,100 | (458 | ) | 6,262 | 29,954 | (454 | ) | 217,665 | |||||||||||||||||||||||||
| INTEREST AND OTHER CHARGES: |
||||||||||||||||||||||||||||||||||||
| Interest expense |
83,545 | 84,356 | 116,803 | 52,273 | 11,114 | 93,554 | 48,117 | 3,870 | 493,632 | |||||||||||||||||||||||||||
| Allowance for borrowed funds used during construction |
(2,826 | ) | (3,745 | ) | (17,406 | ) | (4,314 | ) | (282 | ) | (2,609 | ) | (6,711 | ) | - | (37,893 | ) | |||||||||||||||||||
| Total |
80,719 | 80,611 | 99,397 | 47,959 | 10,832 | 90,945 | 41,406 | 3,870 | 455,739 | |||||||||||||||||||||||||||
| INCOME BEFORE INCOME TAXES |
297,656 | 291,340 | 103,712 | 137,530 | 51,838 | 130,337 | 139,150 | (386 | ) | 1,151,177 | ||||||||||||||||||||||||||
| Income taxes |
132,765 | 89,737 | (370,211 | ) | 28,801 | 15,862 | 49,492 | 74,953 | 5,912 | 27,311 | ||||||||||||||||||||||||||
| CONSOLIDATED NET INCOME |
164,891 | 201,603 | 473,923 | 108,729 | 35,976 | 80,845 | 64,197 | (6,298 | ) | 1,123,866 | ||||||||||||||||||||||||||
| Preferred dividend requirements and other |
6,873 | 825 | 6,950 | 2,828 | 965 | - | - | (1,112 | ) | 17,329 | ||||||||||||||||||||||||||
| EARNINGS APPLICABLE TO COMMON STOCK/EQUITY |
$ | 158,018 | $ | 200,778 | $ | 466,973 | $ | 105,901 | $ | 35,011 | $ | 80,845 | $ | 64,197 | $ | (5,186 | ) | $ | 1,106,537 | |||||||||||||||||
Totals may not foot due to rounding.
26
UTILITY FINANCIAL RESULTS
2011 UTILITY CONSOLIDATING BALANCE SHEET (unaudited)
| OTHER/ | ||||||||||||||||||||||||||||||||||||
| In thousands, as of December 31, 2011. | EAI | EGSL | ELL | EMI | ENOI | ETI | SERI | ELIMINATIONS | UTILITY | |||||||||||||||||||||||||||
| ASSETS |
||||||||||||||||||||||||||||||||||||
| CURRENT ASSETS: |
||||||||||||||||||||||||||||||||||||
| Cash and cash equivalents: |
||||||||||||||||||||||||||||||||||||
| Cash |
$ | 4,712 | $ | 217 | $ | 878 | $ | 7 | $ | 486 | $ | 150 | $ | 30,961 | $ | 40,300 | $ | 77,711 | ||||||||||||||||||
| Temporary cash investments |
17,887 | 24,628 | - | 9 | 9,348 | 65,139 | 154,196 | 10,714 | 281,921 | |||||||||||||||||||||||||||
| Total cash and cash equivalents |
22,599 | 24,845 | 878 | 16 | 9,834 | 65,289 | 185,157 | 51,014 | 359,632 | |||||||||||||||||||||||||||
| Securitization recovery trust account |
3,890 | - | 5,200 | - | - | 41,215 | - | (1 | ) | 50,304 | ||||||||||||||||||||||||||
| Accounts receivable: |
||||||||||||||||||||||||||||||||||||
| Customer |
90,940 | 61,648 | 102,379 | 51,026 | 29,038 | 68,290 | - | - | 403,321 | |||||||||||||||||||||||||||
| Allowance for doubtful accounts |
(26,155 | ) | (843 | ) | (1,147 | ) | (756 | ) | (465 | ) | (1,461 | ) | - | - | (30,827 | ) | ||||||||||||||||||||
| Associated companies |
58,030 | 171,431 | 60,661 | 51,329 | 12,167 | 129,561 | 172,943 | (613,275 | ) | 42,847 | ||||||||||||||||||||||||||
| Other |
66,838 | 22,082 | 10,945 | 13,924 | 2,603 | 9,573 | 7,294 | 18,697 | 151,956 | |||||||||||||||||||||||||||
| Accrued unbilled revenues |
70,715 | 51,155 | 78,430 | 38,368 | 17,023 | 41,573 | - | 1 | 297,265 | |||||||||||||||||||||||||||
| Total account receivable |
260,368 | 305,473 | 251,268 | 153,891 | 60,366 | 247,536 | 180,237 | (594,577 | ) | 864,562 | ||||||||||||||||||||||||||
| Deferred fuel costs |
209,776 | - | - | - | - | - | - | - | 209,776 | |||||||||||||||||||||||||||
| Accumulated deferred income taxes |
- | - | - | 11,694 | 6,419 | 88,436 | - | 35,255 | 141,804 | |||||||||||||||||||||||||||
| Fuel inventory - at average cost |
48,889 | 23,249 | 23,919 | 42,499 | 3,806 | 53,884 | - | - | 196,246 | |||||||||||||||||||||||||||
| Materials and supplies - at average cost |
143,343 | 114,075 | 140,561 | 35,716 | 9,392 | 29,810 | 86,333 | - | 559,230 | |||||||||||||||||||||||||||
| Deferred nuclear refueling outage costs |
49,047 | 21,066 | 24,197 | - | - | - | 9,479 | (1 | ) | 103,788 | ||||||||||||||||||||||||||
| System agreement cost equalization |
36,800 | - | - | - | - | - | - | - | 36,800 | |||||||||||||||||||||||||||
| Prepayments and other |
8,562 | 5,180 | 13,171 | 4,666 | 2,679 | 15,203 | 1,111 | 16,713 | 67,285 | |||||||||||||||||||||||||||
| Total |
783,274 | 493,888 | 459,194 | 248,482 | 92,496 | 541,373 | 462,317 | (491,597 | ) | 2,589,427 | ||||||||||||||||||||||||||
| OTHER PROPERTY AND INVESTMENTS: |
||||||||||||||||||||||||||||||||||||
| Investment in affiliates - at equity |
- | 339,664 | 807,424 | - | - | 783 | - | (600 | ) | 1,147,271 | ||||||||||||||||||||||||||
| Decommissioning trust funds |
541,657 | 420,917 | 253,968 | - | - | - | 423,409 | - | 1,639,951 | |||||||||||||||||||||||||||
| Non-utility property - at cost |
1,677 | 164,712 | 760 | 4,725 | 1,016 | 930 | - | 209 | 174,029 | |||||||||||||||||||||||||||
| Storm reserve escrow account |
- | 90,249 | 201,249 | 31,844 | 11,996 | - | - | - | 335,338 | |||||||||||||||||||||||||||
| Other |
3,182 | 12,701 | - | - | - | 17,969 | - | 5,189 | 39,041 | |||||||||||||||||||||||||||
| Total |
546,516 | 1,028,243 | 1,263,401 | 36,569 | 13,012 | 19,682 | 423,409 | 4,798 | 3,335,630 | |||||||||||||||||||||||||||
| PROPERTY, PLANT AND EQUIPMENT |
||||||||||||||||||||||||||||||||||||
| Electric |
8,079,732 | 7,068,657 | 7,859,136 | 3,274,031 | 812,329 | 3,338,608 | 3,438,424 | 617,068 | 34,487,985 | |||||||||||||||||||||||||||
| Property under capital lease |
1,234 | - | 274,334 | 10,721 | - | - | 491,023 | 32,137 | 809,449 | |||||||||||||||||||||||||||
| Natural gas |
- | 129,950 | - | - | 213,160 | - | - | 1 | 343,111 | |||||||||||||||||||||||||||
| Construction work in progress |
120,211 | 122,051 | 559,437 | 105,083 | 13,610 | 90,856 | 357,826 | 51,089 | 1,420,163 | |||||||||||||||||||||||||||
| Nuclear fuel |
272,593 | 206,031 | 165,380 | - | - | - | 157,967 | 1 | 801,972 | |||||||||||||||||||||||||||
| Total property, plant and equipment |
8,473,770 | 7,526,689 | 8,858,287 | 3,389,835 | 1,039,099 | 3,429,464 | 4,445,240 | 700,296 | 37,862,680 | |||||||||||||||||||||||||||
| Less - accumulated depreciation and amortization |
3,833,596 | 3,906,353 | 3,606,706 | 1,210,092 | 525,621 | 1,289,166 | 2,518,190 | 348,548 | 17,238,272 | |||||||||||||||||||||||||||
| Property, plant and equipment – net |
4,640,174 | 3,620,336 | 5,251,581 | 2,179,743 | 513,478 | 2,140,298 | 1,927,050 | 351,748 | 20,624,408 | |||||||||||||||||||||||||||
| DEFERRED DEBITS AND OTHER ASSETS: |
||||||||||||||||||||||||||||||||||||
| Regulatory assets: |
||||||||||||||||||||||||||||||||||||
| Regulatory asset for income taxes - net |
87,357 | 173,724 | 175,952 | 65,196 | - | 129,924 | 124,777 | 42,076 | 799,006 | |||||||||||||||||||||||||||
| Other regulatory assets |
1,126,911 | 333,898 | 814,472 | 393,387 | 178,815 | 1,178,067 | 287,796 | 323,525 | 4,636,871 | |||||||||||||||||||||||||||
| Deferred fuel costs |
- | 100,124 | 67,998 | - | 4,080 | - | - | - | 172,202 | |||||||||||||||||||||||||||
| Long-term receivables - associated companies |
- | - | - | - | - | 31,254 | - | (31,254 | ) | - | ||||||||||||||||||||||||||
| Goodwill |
- | - | - | - | - | - | - | 374,099 | 374,099 | |||||||||||||||||||||||||||
| Accumulated deferred income taxes |
- | - | - | - | - | - | - | 4,313 | 4,313 | |||||||||||||||||||||||||||
| Other |
27,980 | 13,506 | 31,269 | 20,017 | 4,154 | 18,408 | 20,016 | 63,243 | 198,593 | |||||||||||||||||||||||||||
| Total |
1,242,248 | 621,252 | 1,089,691 | 478,600 | 187,049 | 1,357,653 | 432,589 | 776,002 | 6,185,084 | |||||||||||||||||||||||||||
| TOTAL ASSETS |
$ | 7,212,212 | $ | 5,763,719 | $ | 8,063,867 | $ | 2,943,394 | $ | 806,035 | $ | 4,059,006 | $ | 3,245,365 | $ | 640,951 | $ | 32,734,549 | ||||||||||||||||||
Totals may not foot due to rounding.
27
UTILITY FINANCIAL RESULTS
2011 UTILITY CONSOLIDATING BALANCE SHEET (unaudited)
| OTHER/ | ||||||||||||||||||||||||||||||||||||
| In thousands, as of December 31, 2011. | EAI | EGSL | ELL | EMI | ENOI | ETI | SERI | ELIMINATIONS | UTILITY | |||||||||||||||||||||||||||
| LIABILITIES AND EQUITY |
||||||||||||||||||||||||||||||||||||
| CURRENT LIABILITIES: |
||||||||||||||||||||||||||||||||||||
| Currently maturing long-term debt |
$ | - | $ | 60,000 | $ | 75,309 | $ | - | $ | - | $ | - | $ | 110,163 | $ | - | $ | 245,472 | ||||||||||||||||||
| Notes payable and commercial paper: |
||||||||||||||||||||||||||||||||||||
| Other |
33,914 | - | 44,392 | - | - | - | - | 30,025 | 108,331 | |||||||||||||||||||||||||||
| Accounts payable: |
||||||||||||||||||||||||||||||||||||
| Associated companies |
228,163 | 73,305 | 218,001 | 46,311 | 27,042 | 60,583 | 8,032 | (646,598 | ) | 14,839 | ||||||||||||||||||||||||||
| Other |
138,054 | 101,009 | 130,295 | 41,489 | 28,098 | 69,160 | 63,331 | 216,080 | 787,516 | |||||||||||||||||||||||||||
| Customer deposits |
81,074 | 49,734 | 86,099 | 68,610 | 21,878 | 38,294 | - | 6,052 | 351,741 | |||||||||||||||||||||||||||
| Taxes accrued |
36,281 | 107,367 | 31,338 | 45,536 | - | 40,311 | 92,455 | 216,353 | 569,641 | |||||||||||||||||||||||||||
| Accumulated deferred income taxes |
124,267 | 5,107 | 4,690 | - | - | - | 3,428 | (82,900 | ) | 54,592 | ||||||||||||||||||||||||||
| Interest accrued |
29,881 | 26,084 | 36,535 | 21,550 | 2,840 | 33,095 | 17,776 | 1,949 | 169,710 | |||||||||||||||||||||||||||
| Deferred fuel costs |
- | 97,178 | 66,535 | 15,841 | 11,621 | 64,664 | - | - | 255,839 | |||||||||||||||||||||||||||
| Obligations under capital leases |
- | - | - | - | - | - | - | 3,631 | 3,631 | |||||||||||||||||||||||||||
| Pension and other postretirement liabilities |
- | 7,911 | 9,161 | - | - | 1,029 | - | 19,757 | 37,858 | |||||||||||||||||||||||||||
| System agreement cost equalization |
- | - | 36,800 | - | - | 43,290 | - | - | 80,090 | |||||||||||||||||||||||||||
| Other |
23,305 | 23,866 | 31,675 | 17,474 | 4,197 | 4,847 | 2,591 | 6,128 | 114,083 | |||||||||||||||||||||||||||
| Total |
694,939 | 551,561 | 770,830 | 256,811 | 95,676 | 355,273 | 297,776 | (229,523 | ) | 2,793,343 | ||||||||||||||||||||||||||
| NON-CURRENT LIABILITIES: |
||||||||||||||||||||||||||||||||||||
| Accumulated deferred income taxes and taxes accrued |
1,708,760 | 1,368,563 | 1,098,690 | 672,129 | 144,405 | 934,990 | 652,418 | 100,483 | 6,680,438 | |||||||||||||||||||||||||||
| Accumulated deferred investment tax credits |
42,939 | 81,520 | 73,283 | 6,372 | 1,539 | 19,339 | 57,865 | 1,890 | 284,747 | |||||||||||||||||||||||||||
| Obligations under capital leases |
- | - | - | 8,112 | - | - | - | 30,309 | 38,421 | |||||||||||||||||||||||||||
| Regulatory liability for income taxes - net |
- | - | - | - | 33,258 | - | - | (33,258 | ) | - | ||||||||||||||||||||||||||
| Other regulatory liabilities |
133,960 | 75,721 | 295,542 | - | 5,726 | 11,710 | 214,745 | (1 | ) | 737,403 | ||||||||||||||||||||||||||
| Decommissioning and asset retirement cost liabilities |
640,228 | 359,792 | 345,834 | 5,697 | 2,893 | 3,870 | 445,352 | (1 | ) | 1,803,665 | ||||||||||||||||||||||||||
| Accumulated provisions |
5,640 | 99,033 | 213,060 | 38,289 | 15,843 | 5,024 | - | 2,442 | 379,331 | |||||||||||||||||||||||||||
| Pension and other postretirement liabilities |
539,016 | 332,672 | 459,685 | 144,088 | 74,017 | 137,735 | 139,719 | 636,561 | 2,463,493 | |||||||||||||||||||||||||||
| Long-term debt |
1,875,921 | 1,482,430 | 2,177,003 | 920,439 | 166,537 | 1,677,127 | 636,885 | - | 8,936,342 | |||||||||||||||||||||||||||
| Long-term payables - associated companies |
- | 31,254 | - | - | - | - | - | (31,254 | ) | - | ||||||||||||||||||||||||||
| Gas system rebuild insurance proceeds |
- | - | - | - | 55,707 | - | - | (55,707 | ) | - | ||||||||||||||||||||||||||
| Other |
10,335 | 47,397 | 65,011 | 5,370 | 9,489 | 14,583 | 42 | 499,692 | 651,919 | |||||||||||||||||||||||||||
| Total |
4,956,799 | 3,878,382 | 4,728,108 | 1,800,496 | 509,414 | 2,804,378 | 2,147,026 | 1,151,156 | 21,975,759 | |||||||||||||||||||||||||||
| Commitments and Contingencies |
||||||||||||||||||||||||||||||||||||
| Subsidiaries preferred stock without sinking fund |
116,350 | - | - | 50,381 | 19,780 | - | - | (1 | ) | 186,510 | ||||||||||||||||||||||||||
| EQUITY: |
||||||||||||||||||||||||||||||||||||
| Common stock or members’ equity |
470 | 1,393,386 | 2,504,436 | 199,326 | 33,744 | 49,452 | 789,350 | (2,808,896 | ) | 2,161,268 | ||||||||||||||||||||||||||
| Paid-in capital/capital stock expense and other |
588,444 | - | - | (690 | ) | 36,294 | 481,994 | - | 1,310,592 | 2,416,634 | ||||||||||||||||||||||||||
| Retained earnings |
855,210 | - | - | 637,070 | 111,127 | 367,909 | 11,213 | 1,435,300 | 3,417,829 | |||||||||||||||||||||||||||
| Accumulated other comprehensive income (loss) |
- | (69,610 | ) | (39,507 | ) | - | - | - | - | (81,677 | ) | (190,794 | ) | |||||||||||||||||||||||
| Less – treasury stock, at cost |
- | - | - | - | - | - | - | 120,000 | 120,000 | |||||||||||||||||||||||||||
| Total |
1,444,124 | 1,323,776 | 2,464,929 | 835,706 | 181,165 | 899,355 | 800,563 | (264,681 | ) | 7,684,937 | ||||||||||||||||||||||||||
| Subsidiaries preferred stock without sinking fund |
- | 10,000 | 100,000 | - | - | - | - | (16,000 | ) | 94,000 | ||||||||||||||||||||||||||
| Total |
1,444,124 | 1,333,776 | 2,564,929 | 835,706 | 181,165 | 899,355 | 800,563 | (280,681 | ) | 7,778,937 | ||||||||||||||||||||||||||
| TOTAL LIABILITIES AND EQUITY |
$ | 7,212,212 | $ | 5,763,719 | $ | 8,063,867 | $ | 2,943,394 | $ | 806,035 | $ | 4,059,006 | $ | 3,245,365 | $ | 640,951 | $ | 32,734,549 | ||||||||||||||||||
Totals may not foot due to rounding.
28
UTILITY FINANCIAL RESULTS
UTILITY SELECTED ANNUAL FINANCIAL METRICS
| 2011 | 2010 | 2009 | 2008 | 2007 | ||||||||||||||||
| ENTERGY ARKANSAS, INC. |
||||||||||||||||||||
| As-Reported Earnings ($ millions) |
158.0 | 165.7 | 60.0 | 40.3 | 132.2 | |||||||||||||||
| Less Special Items ($ millions) |
- | - | - | - | (5.9 | ) | ||||||||||||||
| Operational Earnings ($ millions) |
158.0 | 165.7 | 60.0 | 40.3 | 138.1 | |||||||||||||||
| GAAP MEASURES |
||||||||||||||||||||
| Return on Average Common Equity – As-Reported (%) |
11.1 | 11.8 | 4.3 | 2.9 | 9.4 | |||||||||||||||
| Return on Average Invested Capital – As-Reported (%) |
6.2 | 6.7 | 3.7 | 3.2 | 6.5 | |||||||||||||||
| Cash Flow Interest Coverage (# times) |
7.9 | 6.7 | 5.3 | 6.3 | 5.2 | |||||||||||||||
| Debt to Capital Ratio (%) |
55.0 | 55.9 | 54.0 | 53.5 | 49.0 | |||||||||||||||
| Total Debt ($ millions) |
1,911 | 1,928 | 1,793 | 1,745 | 1,442 | |||||||||||||||
| Total Preferred ($ millions) |
116 | 116 | 116 | 116 | 116 | |||||||||||||||
| Total Equity ($ millions) |
1,444 | 1,404 | 1,412 | 1,400 | 1,385 | |||||||||||||||
| NON-GAAP MEASURES |
||||||||||||||||||||
| Return on Average Common Equity – Operational (%) |
11.1 | 11.8 | 4.3 | 2.9 | 9.8 | |||||||||||||||
| Return on Average Invested Capital – Operational (%) |
6.4 | 6.8 | 3.7 | 3.2 | 6.7 | |||||||||||||||
| Total Debt, excluding securitization debt ($ millions) |
1,797 | 1,804 | 1,793 | 1,745 | 1,442 | |||||||||||||||
| Debt to Capital Ratio, excluding securitization debt (%) |
53.5 | 54.3 | 54.0 | 53.5 | 49.0 | |||||||||||||||
| Net Debt to Net Capital Ratio, excluding securitization debt (%) |
53.2 | 52.8 | 52.8 | 52.9 | 49.0 | |||||||||||||||
| 2007 PRO FORMA(a) | ||||||||||||||||||||
| ENTERGY GULF STATES LOUISIANA, L.L.C. |
||||||||||||||||||||
| As-Reported Earnings ($ millions) |
200.8 | 173.5 | 152.5 | 131.1 | 119.5 | |||||||||||||||
| Less Special Items ($ millions) |
- | - | - | - | (3.6 | ) | ||||||||||||||
| Operational Earnings ($ millions) |
200.8 | 173.5 | 152.5 | 131.1 | 123.1 | |||||||||||||||
| GAAP MEASURES |
||||||||||||||||||||
| Return on Average Common Equity – As-Reported (%) |
14.5 | 12.1 | 11.3 | 10.2 | 9.6 | |||||||||||||||
| Return on Average Invested Capital – As-Reported (%) |
8.5 | 7.5 | 6.7 | 5.8 | 6.5 | |||||||||||||||
| Cash Flow Interest Coverage (# times) |
7.0 | 8.4 | 3.1 | 5.4 | 3.9 | (b) | ||||||||||||||
| Debt to Capital Ratio (%) |
53.6 | 52.0 | 55.8 | 62.7 | 65.7 | |||||||||||||||
| Total Debt ($ millions) |
1,542 | 1,584 | 1,783 | 2,188 | 2,460 | |||||||||||||||
| Total Preferred ($ millions) |
10 | 10 | 10 | 10 | 10 | |||||||||||||||
| Total Equity ($ millions) |
1,324 | 1,454 | 1,403 | 1,293 | 1,274 | |||||||||||||||
| NON-GAAP MEASURES |
||||||||||||||||||||
| Return on Average Common Equity – Operational (%) |
14.5 | 12.1 | 11.3 | 10.2 | 9.9 | |||||||||||||||
| Return on Average Invested Capital – Operational (%) |
8.5 | 7.7 | 7.8 | 7.8 | 7.9 | |||||||||||||||
| Total Debt, excluding assumption debt ($ millions) |
1,542 | 1,584 | 1,615 | 1,418 | 1,381 | |||||||||||||||
| Debt to Capital Ratio, excluding assumption debt (%) |
53.6 | 52.0 | 53.3 | 52.1 | 51.8 | |||||||||||||||
| Net Debt to Net Capital Ratio, excluding assumption debt (%) |
53.2 | 49.4 | 51.0 | 51.2 | 49.8 | |||||||||||||||
| (a) Effective December 31, 2007, Entergy Gulf States, Inc. completed a jurisdictional separation into two vertically integrated utility companies: Entergy Texas and Entergy Gulf States Louisiana. The above pro forma metrics for 2007 reflect the results as if the separation had occurred on January 1, 2007. (b) See page 66 for Pro Forma calculation. |
| |||||||||||||||||||
| ENTERGY LOUISIANA, LLC |
||||||||||||||||||||
| As-Reported Earnings ($ millions) |
467.0 | 224.5 | 225.9 | 150.6 | 136.4 | |||||||||||||||
| Less Special Items ($ millions) |
- | - | - | - | (2.2 | ) | ||||||||||||||
| Operational Earnings ($ millions) |
467.0 | 224.5 | 225.9 | 150.6 | 138.6 | |||||||||||||||
| GAAP MEASURES |
||||||||||||||||||||
| Return on Average Members’ Equity – As-Reported (%) |
20.7 | 11.7 | 13.2 | 9.8 | 9.8 | |||||||||||||||
| Return on Average Invested Capital – As-Reported (%) |
12.1 | 7.6 | 8.2 | 7.1 | 7.1 | |||||||||||||||
| Cash Flow Interest Coverage (# times) |
5.9 | 10.4 | 2.3 | 14.0 | 5.6 | |||||||||||||||
| Debt to Capital Ratio (%) |
47.2 | 46.1 | 49.9 | 46.1 | 43.4 | |||||||||||||||
| Total Debt ($ millions) |
2,297 | 1,830 | 1,902 | 1,462 | 1,192 | |||||||||||||||
| Total Preferred ($ millions) |
100 | 100 | 100 | 100 | 100 | |||||||||||||||
| Total Equity ($ millions) |
2,465 | 2,037 | 1,812 | 1,608 | 1,454 | |||||||||||||||
| NON-GAAP MEASURES |
||||||||||||||||||||
| Return on Average Members’ Equity – Operational (%) |
20.7 | 11.7 | 13.2 | 9.8 | 10.0 | |||||||||||||||
| Return on Average Invested Capital – Operational (%) |
12.4 | 7.6 | 8.2 | 7.1 | 7.2 | |||||||||||||||
| Total Debt, excluding securitization debt ($ millions) |
2,090 | 1,830 | 1,902 | 1,462 | 1,192 | |||||||||||||||
| Debt to Capital Ratio, excluding securitization debt (%) |
44.9 | 46.1 | 49.9 | 46.1 | 43.4 | |||||||||||||||
| Net Debt to Net Capital Ratio, excluding securitization debt (%) |
44.9 | 44.4 | 47.8 | 43.6 | 43.4 | |||||||||||||||
29
UTILITY FINANCIAL RESULTS
UTILITY SELECTED ANNUAL FINANCIAL METRICS (CONTINUED)
| 2011 | 2010 | 2009 | 2008 | 2007 | ||||||||||||||||
| ENTERGY MISSISSIPPI, INC. |
||||||||||||||||||||
| As-Reported Earnings ($ millions) |
105.9 | 82.5 | 76.5 | 58.4 | 70.1 | |||||||||||||||
| Less Special Items ($ millions) |
- | - | - | - | - | |||||||||||||||
| Operational Earnings ($ millions) |
105.9 | 82.5 | 76.5 | 58.4 | 70.1 | |||||||||||||||
| GAAP MEASURES |
||||||||||||||||||||
| Return on Average Common Equity – As-Reported (%) |
13.5 | 11.6 | 11.2 | 8.8 | 11.0 | |||||||||||||||
| Return on Average Invested Capital – As-Reported (%) |
8.0 | 7.3 | 7.3 | 6.3 | 7.0 | |||||||||||||||
| Cash Flow Interest Coverage (# times) |
3.1 | 3.3 | 5.4 | 2.7 | 4.8 | |||||||||||||||
| Debt to Capital Ratio (%) |
51.2 | 51.7 | 53.4 | 49.4 | 49.8 | |||||||||||||||
| Total Debt ($ millions) |
931 | 839 | 852 | 703 | 704 | |||||||||||||||
| Total Preferred ($ millions) |
50 | 50 | 50 | 50 | 50 | |||||||||||||||
| Total Equity ($ millions) |
836 | 733 | 694 | 669 | 659 | |||||||||||||||
| NON-GAAP MEASURES |
||||||||||||||||||||
| Return on Average Common Equity – Operational (%) |
13.5 | 11.6 | 11.2 | 8.8 | 11.0 | |||||||||||||||
| Return on Average Invested Capital – Operational (%) |
8.0 | 7.3 | 7.3 | 6.3 | 7.0 | |||||||||||||||
| Net Debt to Net Capital Ratio (%) |
51.2 | 51.7 | 50.5 | 49.4 | 48.4 | |||||||||||||||
| ENTERGY NEW ORLEANS, INC. |
||||||||||||||||||||
| As-Reported Earnings ($ millions) |
35.0 | 30.1 | 29.5 | 33.4 | 23.0 | |||||||||||||||
| Less Special Items ($ millions) |
- | - | - | - | - | |||||||||||||||
| Operational Earnings ($ millions) |
35.0 | 30.1 | 29.5 | 33.4 | 23.0 | |||||||||||||||
| GAAP MEASURES |
||||||||||||||||||||
| Return on Average Common Equity – As-Reported (%) |
19.0 | 15.3 | 14.3 | 17.4 | 14.1 | |||||||||||||||
| Return on Average Invested Capital – As-Reported (%) |
11.5 | 8.9 | 8.2 | 9.4 | 7.7 | |||||||||||||||
| Cash Flow Interest Coverage (# times) |
5.1 | 4.9 | 9.8 | 5.3 | 11.5 | |||||||||||||||
| Debt to Capital Ratio (%) |
45.3 | 44.6 | 54.8 | 54.5 | 60.9 | |||||||||||||||
| Total Debt ($ millions) |
167 | 167 | 272 | 273 | 304 | |||||||||||||||
| Total Preferred ($ millions) |
20 | 20 | 20 | 20 | 20 | |||||||||||||||
| Total Equity ($ millions) |
181 | 188 | 205 | 208 | 175 | |||||||||||||||
| NON-GAAP MEASURES |
||||||||||||||||||||
| Return on Average Common Equity – Operational (%) |
19.0 | 15.3 | 14.3 | 17.4 | 14.1 | |||||||||||||||
| Return on Average Invested Capital – Operational (%) |
11.5 | 8.9 | 8.2 | 9.4 | 7.7 | |||||||||||||||
| Net Debt to Net Capital Ratio (%) |
43.8 | 35.1 | 26.5 | 37.3 | 52.1 | |||||||||||||||
| 2007 PRO FORMA(a) | ||||||||||||||||||||
| ENTERGY TEXAS, INC. |
||||||||||||||||||||
| As-Reported Net Income ($ millions) |
80.8 | 66.2 | 63.8 | 57.9 | 58.9 | |||||||||||||||
| Less Special Items ($ millions) |
- | - | - | - | - | |||||||||||||||
| Operational Net Income ($ millions) |
80.8 | 66.2 | 63.8 | 57.9 | 58.9 | |||||||||||||||
| GAAP MEASURES |
||||||||||||||||||||
| Return on Average Common Equity – As-Reported (%) |
9.4 | 7.9 | 7.3 | 6.1 | 5.9 | |||||||||||||||
| Return on Average Invested Capital – As-Reported (%) |
5.4 | 4.9 | 5.4 | 4.5 | 4.9 | |||||||||||||||
| Cash Flow Interest Coverage (# times) |
3.6 | 1.4 | 3.7 | 1.1 | 3.0 | |||||||||||||||
| Debt to Capital Ratio (%) |
65.1 | 66.8 | 66.3 | 59.9 | 58.5 | |||||||||||||||
| Total Debt ($ millions) |
1,677 | 1,659 | 1,658 | 1,345 | 1,413 | |||||||||||||||
| Total Preferred ($ millions) |
- | - | - | - | - | |||||||||||||||
| Total Equity ($ millions) |
899 | 824 | 844 | 900 | 1,004 | |||||||||||||||
| NON-GAAP MEASURES |
||||||||||||||||||||
| Return on Average Common Equity – Operational (%) |
9.4 | 7.9 | 7.3 | 6.6 | 7.0 | |||||||||||||||
| Return on Average Invested Capital – Operational (%) |
7.8 | 7.3 | 7.1 | 5.5 | 5.7 | |||||||||||||||
| Total Debt, excluding securitization debt ($ millions) |
927 | 852 | 820 | 1,035 | 1,083 | |||||||||||||||
| Total Equity, excluding equity infusion from parent returned |
899 | 824 | 844 | 900 | 854 | |||||||||||||||
| Debt to Capital Ratio, excluding securitization debt and equity |
50.8 | 50.8 | 49.3 | 53.5 | 55.9 | |||||||||||||||
| Net Debt to Net Capital Ratio, excluding securitization debt and |
48.9 | 49.8 | 42.3 | 53.4 | 47.9 | |||||||||||||||
| (a) | Effective December 31, 2007, Entergy Gulf States, Inc. completed a jurisdictional separation into two vertically integrated utility companies: Entergy Texas and Entergy Gulf States Louisiana. The above pro forma metrics for 2007 reflect the results as if the separation had occurred on January 1, 2007. |
Certain prior year data has been reclassified to conform with current year presentation.
30
UTILITY FINANCIAL RESULTS
UTILITY SELECTED ANNUAL FINANCIAL METRICS (CONTINUED)
| 2011 | 2010 | 2009 | 2008 | 2007 | ||||||||||||||||
| SYSTEM ENERGY RESOURCES, INC. |
||||||||||||||||||||
| As-Reported Net Income ($ millions) |
64.2 | 82.6 | 48.9 | 91.1 | 136.1 | |||||||||||||||
| Less Special Items ($ millions) |
- | - | - | - | (1.9 | ) | ||||||||||||||
| Operational Net Income ($ millions) |
64.2 | 82.6 | 48.9 | 91.1 | 138.0 | |||||||||||||||
| GAAP MEASURES |
||||||||||||||||||||
| Return on Average Common Equity – As-Reported (%) |
8.0 | 10.1 | 5.8 | 10.6 | 15.8 | |||||||||||||||
| Return on Average Invested Capital – As-Reported (%) |
5.6 | 6.8 | 4.4 | 7.1 | 9.8 | |||||||||||||||
| Cash Flow Interest Coverage (# times) |
11.4 | 5.9 | 10.7 | 4.9 | 4.9 | |||||||||||||||
| Debt to Capital Ratio (%) |
48.3 | 51.7 | 49.7 | 51.2 | 50.6 | |||||||||||||||
| Total Debt ($ millions) |
747 | 869 | 820 | 899 | 882 | |||||||||||||||
| Total Preferred ($ millions) |
- | - | - | - | - | |||||||||||||||
| Total Equity ($ millions) |
801 | 812 | 830 | 856 | 862 | |||||||||||||||
| NON-GAAP MEASURES |
||||||||||||||||||||
| Return on Average Common Equity – Operational (%) |
8.0 | 10.1 | 5.8 | 10.6 | 16.0 | |||||||||||||||
| Return on Average Invested Capital – Operational (%) |
5.6 | 6.8 | 4.4 | 7.1 | 9.9 | |||||||||||||||
| Net Debt to Net Capital Ratio (%) |
41.2 | 42.7 | 40.1 | 48.2 | 47.4 | |||||||||||||||
31
UTILITY LONG-TERM DEBT AND PREFERRED STOCK
| BONDS: CUSIP |
TYPE* | RATE | MATURITY DATE |
FIRST CALL DATE |
CURRENT OR FIRST CALL PRICE |
AS OF DECEMBER 31, | ||||||||||||||||||
| 2011 | 2010 | 2009 | ||||||||||||||||||||||
| (in millions | ) | |||||||||||||||||||||||
| 29364DAM2 |
4.50% Series | M | 4.50% | 06/10 | Now | MW (T + .25%) | $ | - | $ | - | $ | 100 | ||||||||||||
| 29364DAN0 |
5.40% Series | M | 5.40% | 08/13 | Now | MW (T + .35%) | 300 | 300 | 300 | |||||||||||||||
| 732835AW3 |
6.3% Series – Pope County(c) | G(b) |
6.3% | 2016 | Now | 100% | - | - | 20 | |||||||||||||||
| 472712ER5 |
4.6% Series – Jefferson County(c) |
G(b) |
4.6% | 2017 | 6/13/11 | 100% | 55 | 55 | 55 | |||||||||||||||
| 29364DAE0 |
5.4% Series | M | 5.4% | 05/18 | Now | 100% | - | - | 150 | |||||||||||||||
| 29364DAH3 |
5.0% Series | M | 5.0% | 07/18 | Now | 100% | 115 | 115 | 115 | |||||||||||||||
| 732835BA0 |
6.3% Series – Pope County | G(b) |
6.3% | 2020 | Now | 100% | - | - | 120 | |||||||||||||||
| 29364DAQ3 |
3.75% Series | M | 3.75% | 02/21 | Now | MW (T + .20%) | 350 | 350 | - | |||||||||||||||
| 453424BP |
5.0% Series – Independence County(c) | G(b) |
5.0% | 2021 | 7/1/10 | 100% | 45 | 45 | 45 | |||||||||||||||
| 29364DAL4 |
5.66% Series | M | 5.66% | 02/25 | Now | MW (T + .20%) | 175 | 175 | 175 | |||||||||||||||
| 29364D811 |
6.7% Series | M | 6.7% | 04/32 | Now | 100% | - | - | 100 | |||||||||||||||
| 29364D795 |
6.0% Series | M | 6.0% | 11/32 | Now | 100% | - | - | 100 | |||||||||||||||
| 29364DAJ9 |
5.9% Series | M | 5.9% | 06/33 | Now | MW (T + .25%) | 100 | 100 | 100 | |||||||||||||||
| 29364DAK6 |
6.38% Series | M | 6.38% | 11/34 | Now | 100% | 60 | 60 | 60 | |||||||||||||||
| 29364D779 |
5.75% Series | M | 5.75% | 11/40 | 11/1/15 | 100% | 225 | 225 | - | |||||||||||||||
| Total bonds |
1,425 | 1,425 | 1,439 | |||||||||||||||||||||
| OTHER LONG-TERM DEBT: |
||||||||||||||||||||||||
| 5.60% Series G – Variable Interest Entity Note Payable |
5.60% | 09/11 | - | 35 | - | |||||||||||||||||||
| 9% Series H – Variable Interest Entity Note Payable |
9.00% | 06/13 | 30 | 30 | - | |||||||||||||||||||
| 5.69% Series I – Variable Interest Entity Note Payable |
5.69% | 07/14 | 70 | 70 | - | |||||||||||||||||||
| 3.23% Series J – Variable Interest Entity Note Payable |
3.23% | 07/16 | 55 | - | - | |||||||||||||||||||
| 2.30% Series Senior Secured – Securitization Bond |
2.30% | 08/21 | 114 | 124 | - | |||||||||||||||||||
| Long-Term United States Department of Energy Obligation(d) |
181 | 181 | 181 | |||||||||||||||||||||
| Unamortized Premium and Discount – Net |
(1 | ) | (1 | ) | (1 | ) | ||||||||||||||||||
| Other |
2 | - | - | |||||||||||||||||||||
| TOTAL LONG-TERM DEBT(e) |
1,876 | 1,864 | 1,619 | |||||||||||||||||||||
| Less Amount Due Within One Year |
- | 35 | 100 | |||||||||||||||||||||
| Long-Term Debt Excluding Amount Due Within One Year |
$ | 1,876 | $ | 1,829 | $ | 1,519 | ||||||||||||||||||
| Fair Value of Long-Term Debt(a) |
$ | 1,756 | $ | 1,713 | $ | 1,463 | ||||||||||||||||||
| *M = Mortgage Bond; G = Governmental Bond |
||||||||||||||||||||||||
| Weighted-average annualized coupon rate |
5.0 | % | 5.1 | % | 5.6 | % | ||||||||||||||||||
| (a) | The fair value excludes long-term DOE obligations of $181 million at Entergy Arkansas and includes debt due within one year. Fair values are based on prices derived by independent third parties that use inputs such as benchmark yields, reported trades, broker / dealer quotes, and issuer spreads. |
| (b) | Consists of pollution control revenue bonds and environmental revenue bonds. |
| (c) | The bonds are secured by a series of collateral first mortgage bonds. |
| (d) | Pursuant to the Nuclear Waste Policy Act of 1982, Entergy’s nuclear owner / licensee subsidiaries have contracts with the DOE for spent nuclear fuel disposal service. The contracts include a one-time fee for generation prior to April 7, 1983. Entergy Arkansas is the only Entergy company that generated electric power with nuclear fuel prior to that date and includes the one-time fee, plus accrued interest, in long-term debt. |
| (e) | Pursuant to the planned spin-off and merger of Entergy’s transmission business with ITC Holdings Corp., Entergy will issue approximately $1.775 billion of debt, with the proceeds being used for prepayment or redemption of outstanding preferred and debt securities at each Utility operating company. Although the aggregate amount and particular series of preferred and debt securities of each Utility operating company to be redeemed as well as the redemption dates are uncertain at this time and are expected to remain subject to change, each Utility operating company currently anticipates that debt securities in the following approximate aggregate amounts will be reedemed prior to or following the spin off and merger: $0.51 billion for Entergy Arkansas, $0.27 billion for Entergy Gulf States Louisiana, $0.38 billion for Entergy Louisiana, $0.29 billion for Entergy Mississippi, $0.01 billion for Entergy New Orleans, and $0.30 billion for Entergy Texas. See pgs. 12 - 14 of 2011 10-K for further detail. |
Totals may not foot due to rounding.
| PREFERRED STOCK: | SHARES AUTHORIZED AND OUTSTANDING |
AS OF DECEMBER 31, | CALL PRICE PER SHARE AS OF DECEMBER 31, |
|||||||||||||||||||||||||||||||
| CUSIP | RATE | 2011 | 2010 | 2009 | 2011 | 2010 | 2009 | 2011 | ||||||||||||||||||||||||||
| Without sinking fund: | (in millions | ) | ||||||||||||||||||||||||||||||||
| Cumulative, $100 par value: |
||||||||||||||||||||||||||||||||||
| 29364D209 |
4.32% Series |
4.32 | % | 70,000 | 70,000 | 70,000 | $ | 7 | $ | 7 | $ | 7 | $103.65 | |||||||||||||||||||||
| 29364D506 |
4.72% Series |
4.72 | % | 93,500 | 93,500 | 93,500 | 9 | 9 | 9 | 107.00 | ||||||||||||||||||||||||
| 29364D308 |
4.56% Series |
4.56 | % | 75,000 | 75,000 | 75,000 | 8 | 8 | 8 | 102.83 | ||||||||||||||||||||||||
| 29364D407 |
4.56% 1965 Series |
4.56 | % | 75,000 | 75,000 | 75,000 | 8 | 8 | 8 | 102.50 | ||||||||||||||||||||||||
| 29364D605 |
6.08% Series |
6.08 | % | 100,000 | 100,000 | 100,000 | 10 | 10 | 10 | 102.83 | ||||||||||||||||||||||||
| Cumulative, $25 par value: |
||||||||||||||||||||||||||||||||||
| 29364D787 |
6.45% Series(a) |
6.45 | % | 3,000,000 | 3,000,000 | 3,000,000 | 75 | 75 | 75 | - | ||||||||||||||||||||||||
| Total without sinking fund (b) | 3,413,500 | 3,413,500 | 3,413,500 | $ | 116 | $ | 116 | $ | 116 | |||||||||||||||||||||||||
| (a) | Series is callable at par. |
| (b) | Pursuant to the planned spin-off and merger of Entergy’s transmission business with ITC Holdings Corp., Entergy will issue approximately $1.775 billion of debt, with the proceeds being used for prepayment or redemption of outstanding preferred and debt securities at each Utility operating company. Although the aggregate amount and particular series of preferred and debt securities of each Utility operating company to be redeemed as well as the redemption dates are uncertain at this time and are expected to remain subject to change, each Utility operating company currently anticipates that all of its outstanding preferred securities, if any, will be redeemed or otherwise retired prior to the spin off and merger. See pgs. 12 - 14 of 2011 10-K for further detail. |
Totals may not foot due to rounding.
32
UTILITY LONG-TERM DEBT AND PREFERRED STOCK
ENTERGY GULF STATES LOUISIANA, L.L.C.
| BONDS: CUSIP |
TYPE* | RATE | MATURITY DATE |
FIRST CALL DATE |
CURRENT OR FIRST CALL PRICE |
AS OF DECEMBER 31, | ||||||||||||||||||
| 2011 | 2010 | 2009 | ||||||||||||||||||||||
| (in millions | ) | |||||||||||||||||||||||
| 128318BL5 |
5.45% Series – Calcasieu Parish | G(b,c) | 5.45% | 2010 | Now | 100% | - | - | 12 | |||||||||||||||
| 29364LAQ5 |
4.875% Series | M(b) | 4.875% | 11/11 | Now | 100% | - | - | 200 | |||||||||||||||
| 29364LAF9 |
6.0% Series | M(b) | 6.0% | 12/12 | Now | 100% | - | - | - | |||||||||||||||
| 128318BH4 |
6.75% Series – Calcasieu Parish | G(b,c) | 6.75% | 2012 | Now | 100% | - | 26 | 26 | |||||||||||||||
| 730816AF9 |
6.7% Series – Pointe Coupee Parish | G(b,c) | 6.7% | 2013 | Now | 100% | - | 9 | 9 | |||||||||||||||
| 29364LAS1 |
5.6% Series | M(b) | 5.6% | 12/14 | Now | 100% | - | - | - | |||||||||||||||
| 450877AJ |
5.7% Series – Iberville Parish | G(b,c) | 5.7% | 2014 | Now | 100% | - | 12 | 12 | |||||||||||||||
| 29364LAU6 |
5.70% Series | M(b) | 5.70% | 06/15 | Now | MW (T +. 30%) | - | - | 200 | |||||||||||||||
| 29364LAN2 |
5.25% Series | M(b) | 5.25% | 08/15 | Now | 100% | - | - | 92 | |||||||||||||||
| 952789AQ8 |
5.8% Series – West Feliciana Parish | G(b,c) | 5.8% | 2015 | Now | 100% | - | - | 15 | |||||||||||||||
| 952789AW5 |
7.0% Series – West Feliciana Parish | G(b,c) | 7.0% | 2015 | Now | 100% | - | - | 17 | |||||||||||||||
| 546398K23 |
2.875% Series – Louisiana Public Facilities Authority | G(c,d) | 2.875% | 2015 | Non-Call Life | 32 | 32 | - | ||||||||||||||||
| 952789AR6 |
5.8% Series – West Feliciana Parish | G(b,c) | 5.8% | 2016 | Now | 100% | 11 | 11 | 20 | |||||||||||||||
| 29365PAM4 |
6.00% Series | M | 6.00% | 05/18 | Now | MW (T + .40%) | 375 | 375 | 375 | |||||||||||||||
| 29365PAQ5 |
3.95% Series | M | 3.95% | 10/20 | Now | MW (T +. 25%) | 250 | 250 | - | |||||||||||||||
| 29365PAP7 |
5.59% Series | M | 5.59% | 10/24 | Now | MW (T + .40%) | 300 | 300 | 300 | |||||||||||||||
| 952789BB0 |
6.6% Series – West Feliciana Parish | G(b,c) | 6.6% | 2028 | Now | 100% | - | - | 22 | |||||||||||||||
| 546398J90 |
5.0% Series – Louisiana Public Facilities Authority | G(c,d) | 5.0% | 2028 | 9/1/15 | 100% | 84 | 84 | - | |||||||||||||||
| 29364LAL6 |
6.2% Series | M(b) | 6.2% | 07/33 | Now | MW (T + .15%) | 240 | 240 | 240 | |||||||||||||||
| 29364LAT9 |
6.18% Series | M(b) | 6.18% | 03/35 | Now | MW (T + .30%) | 85 | 85 | 85 | |||||||||||||||
| Total bonds | 1,377 | 1,424 | 1,625 | |||||||||||||||||||||
| OTHER LONG-TERM DEBT: |
||||||||||||||||||||||||
| 5.41% Series O – Variable Interest Entity Note Payable | 5.41% | 07/12 | 60 | 60 | - | |||||||||||||||||||
| 5.56% Series N – Variable Interest Entity Note Payable | 5.56% | 05/13 | 75 | 75 | - | |||||||||||||||||||
| Credit Facility – weighted average rate 2.25% | 2.25% | 07/13 | 29 | 24 | - | |||||||||||||||||||
| Unamortized Premium and Discount – Net | (2 | ) | (2 | ) | (2 | ) | ||||||||||||||||||
| Other | 4 | 4 | 4 | |||||||||||||||||||||
| TOTAL LONG-TERM DEBT(e) |
1,542 | 1,584 | 1,626 | |||||||||||||||||||||
| Less Amount Due Within One Year |
60 | - | 12 | |||||||||||||||||||||
| Long-Term Debt Excluding Amount Due Within One Year |
$ | 1,482 | $ | 1,584 | $ | 1,614 | ||||||||||||||||||
| Fair Value of Long-Term Debt(a) |
$ | 1,642 | $ | 1,644 | $ | 1,638 | ||||||||||||||||||
| *M = Mortgage Bond; G = Governmental Bond |
||||||||||||||||||||||||
| Weighted-average annualized coupon rate |
5.4 | % | 5.5 | % | 5.8 | % | ||||||||||||||||||
| (a) | The fair value includes debt due within one year. Fair values are based on prices derived by independent third parties that use inputs such as benchmark yields, reported trades, broker / dealer quotes, and issuer spreads. |
| (b) | Entergy Gulf States Louisiana was primarily liable for all of the long-term debt issued by Entergy Gulf States, Inc. that was outstanding on December 31, 2007. Under a debt assumption agreement with Entergy Gulf States Louisiana, Entergy Texas assumed approximately 46% of this long-term debt. Entergy Gulf States Louisiana recorded an assumption asset on its balance sheet to reflect the long-term debt assumed by Entergy Texas. By June 2010, Entergy Texas had repaid the outstanding assumed debt and the debt assumption agreement was terminated. |
| (c) | Consists of pollution control revenue bonds and environmental revenue bonds. |
| (d) | The bonds are secured by a series of collateral first mortgage bonds. |
| (e) | Pursuant to the planned spin-off and merger of Entergy’s transmission business with ITC Holdings Corp., Entergy will issue approximately $1.775 billion of debt, with the proceeds being used for prepayment or redemption of outstanding preferred and debt securities at each Utility operating company. Although the aggregate amount and particular series of preferred and debt securities of each Utility operating company to be redeemed as well as the redemption dates are uncertain at this time and are expected to remain subject to change, each Utility operating company currently anticipates that debt securities in the following approximate aggregate amounts will be reedemed prior to or following the spin off and merger: $0.51 billion for Entergy Arkansas, $0.27 billion for Entergy Gulf States Louisiana, $0.38 billion for Entergy Louisiana, $0.29 billion for Entergy Mississippi, $0.01 billion for Entergy New Orleans, and $0.30 billion for Entergy Texas. See pgs. 12 - 14 of 2011 10-K for further detail. |
Totals may not foot due to rounding.
| PREFERRED MEMBERSHIP INTERESTS: | SHARES / UNITS AUTHORIZED AND OUTSTANDING |
AS OF DECEMBER 31, | CALL PRICE PER SHARE / UNIT AS OF DECEMBER 31, |
|||||||||||||||||||||||||||||||
| CUSIP | RATE | 2011 | 2010 | 2009 | 2011 | 2010 | 2009 | 2011 | ||||||||||||||||||||||||||
| Without sinking fund: | (in millions) | |||||||||||||||||||||||||||||||||
| Cumulative, $100 liquidation value: |
||||||||||||||||||||||||||||||||||
| 29364L763 |
8.25% Series(a) |
8.25 | % | 100,000 | 100,000 | 100,000 | $ | 10 | $ | 10 | $ | 10 | - | |||||||||||||||||||||
| Authorized 6,000,000 shares, $100 par value, cumulative |
||||||||||||||||||||||||||||||||||
| Total without sinking fund (b) | 100,000 | 100,000 | 100,000 | $ | 10 | $ | 10 | $ | 10 | |||||||||||||||||||||||||
| (a) | Series is callable at par on and after December 15, 2015. |
| (b) | Pursuant to the planned spin-off and merger of Entergy’s transmission business with ITC Holdings Corp., Entergy will issue approximately $1.775 billion of debt, with the proceeds being used for prepayment or redemption of outstanding preferred and debt securities at each Utility operating company. Although the aggregate amount and particular series of preferred and debt securities of each Utility operating company to be redeemed as well as the redemption dates are uncertain at this time and are expected to remain subject to change, each Utility operating company currently anticipates that all of its outstanding preferred securities, if any, will be redeemed or otherwise retired prior to the spin off and merger. See pgs. 12 - 14 of 2011 10-K for further detail. |
Totals may not foot due to rounding.
33
UTILITY LONG-TERM DEBT AND PREFERRED STOCK
| BONDS: CUSIP |
TYPE* | RATE |
MATURITY DATE |
FIRST CALL DATE |
CURRENT OR FIRST CALL PRICE |
AS OF DECEMBER 31, | ||||||||||||||||||
| 2011 | 2010 | 2009 | ||||||||||||||||||||||
| (in millions | ) | |||||||||||||||||||||||
| 29364WAD0 |
4.67% Series | M | 4.67% | 06/10 | Now | MW (T + .20%) | $ | - | $ | - | $ | 55 | ||||||||||||
| 29364WAG3 |
5.83% Series | M | 5.83% | 11/10 | Now | 100% | - | - | 150 | |||||||||||||||
| 29364WAC2 |
5.09% Series | M | 5.09% | 11/14 | Now | 100% | - | - | 115 | |||||||||||||||
| 29364WAE8 |
5.56% Series | M | 5.56% | 09/15 | Now | MW (T + .25%) | - | - | 100 | |||||||||||||||
| 29364WAJ7 |
6.50% Series | M | 6.50% | 09/18 | Now | MW (T + .40%) | 300 | 300 | 300 | |||||||||||||||
| 29364WAA6 |
5.5% Series | M | 5.5% | 04/19 | Now | 100% | - | - | 100 | |||||||||||||||
| 29364WAN8 |
4.8% Series | M | 4.8% | 05/21 | Now | MW (T + .25%) | 200 | - | - | |||||||||||||||
| 29364WAK4 |
5.40% Series | M | 5.40% | 11/24 | Now | MW (T + .35%) | 400 | 400 | 400 | |||||||||||||||
| 29364WAM0 |
4.44% Series | M | 4.44% | 01/26 | Now | MW (T + .30%) | 250 | 250 | - | |||||||||||||||
| 546398J82 |
5.0% Series – Louisiana Public Facilities Authority | G(b,c) | 5.0% | 2030 | 12/1/15 | 100% | 115 | 115 | - | |||||||||||||||
| 29364W207 |
7.6% Series | M | 7.6% | 04/32 | Now | 100% | - | - | 150 | |||||||||||||||
| 29364WAB4 |
6.4% Series | M | 6.4% | 10/34 | Now | 100% | 70 | 70 | 70 | |||||||||||||||
| 29364WAF5 |
6.3% Series | M | 6.3% | 09/35 | Now | MW (T + .35%) | 100 | 100 | 100 | |||||||||||||||
| 29364W306 |
6.0% Series | M | 6.0% | 03/40 | 3/15/15 | 100% | 150 | 150 | - | |||||||||||||||
| 29364W405 |
5.875% Series | M | 5.875% | 06/41 | 11/23/15 | 100% | 150 | 150 | - | |||||||||||||||
| Total bonds |
1,735 | 1,535 | 1,540 | |||||||||||||||||||||
| OTHER LONG-TERM DEBT: |
||||||||||||||||||||||||
| Waterford 3 Lease Obligation 7.45% | 7.45% | 188 | 224 | 241 | ||||||||||||||||||||
| Bank Credit Facility – weighted average rate 0.67% | 0.67% | 50 | - | - | ||||||||||||||||||||
| 5.69% Series E – Variable Interest Entity Note Payable | 5.69% | 07/14 | 50 | 50 | - | |||||||||||||||||||
| 3.30% Series F – Variable Interest Entity Note Payable | 3.30% | 03/16 | 20 | - | - | |||||||||||||||||||
| 2.04% Series Senior Secured - Securitization Bond | 2.04% | 06/21 | 207 | - | - | |||||||||||||||||||
| Unamortized Premium and Discount – Net | (2 | ) | (2 | ) | (2 | ) | ||||||||||||||||||
| Other |
4 | - | - | |||||||||||||||||||||
| TOTAL LONG-TERM DEBT(d) |
2,252 | 1,807 | 1,780 | |||||||||||||||||||||
| Less Amount Due Within One Year |
75 | 36 | 222 | |||||||||||||||||||||
| Long-Term Debt Excluding Amount Due Within One Year |
$ | 2,177 | $ | 1,772 | $ | 1,557 | ||||||||||||||||||
| Fair Value of Long-Term Debt(a) |
$ | 2,211 | $ | 1,515 | $ | 1,566 | ||||||||||||||||||
| *M = Mortgage Bond; G = Governmental Bond |
||||||||||||||||||||||||
| Weighted-average annualized coupon rate |
4.9 | % | 5.9 | % | 6.1 | % | ||||||||||||||||||
| (a) | The fair value excludes lease obligations of $188 million at Entergy Louisiana and includes debt due within one year. Fair values are based on prices derived by independent third parties that use inputs such as benchmark yields, reported trades, broker / dealer quotes, and issuer spreads. |
| (b) | Consists of pollution control revenue bonds and environmental revenue bonds. |
| (c) | The bonds are secured by a series of collateral first mortgage bonds. |
| (d) | Pursuant to the planned spin-off and merger of Entergy’s transmission business with ITC Holdings Corp., Entergy will issue approximately $1.775 billion of debt, with the proceeds being used for prepayment or redemption of outstanding preferred and debt securities at each Utility operating company. Although the aggregate amount and particular series of preferred and debt securities of each Utility operating company to be redeemed as well as the redemption dates are uncertain at this time and are expected to remain subject to change, each Utility operating company currently anticipates that debt securities in the following approximate aggregate amounts will be reedemed prior to or following the spin off and merger: $0.51 billion for Entergy Arkansas, $0.27 billion for Entergy Gulf States Louisiana, $0.38 billion for Entergy Louisiana, $0.29 billion for Entergy Mississippi, $0.01 billion for Entergy New Orleans, and $0.30 billion for Entergy Texas. See pgs. 12 - 14 of 2011 10-K for further detail. |
Totals may not foot due to rounding.
| PREFERRED MEMBERSHIP INTERESTS: | UNITS AUTHORIZED AND OUTSTANDING |
AS OF DECEMBER 31, | CALL PRICE PER UNIT AS OF DECEMBER 31, |
|||||||||||||||||||||||||||||||
| CUSIP | RATE | 2011 | 2010 | 2009 | 2011 | 2010 | 2009 | 2011 | ||||||||||||||||||||||||||
| Without sinking fund: | (in millions) | |||||||||||||||||||||||||||||||||
| Cumulative, $100 liquidation value: |
||||||||||||||||||||||||||||||||||
| 293649208 |
6.95% Series(a) |
6.95 | % | 1,000,000 | 1,000,000 | 1,000,000 | $ | 100 | $ | 100 | $ | 100 | - | |||||||||||||||||||||
| Total without sinking fund (b) | 1,000,000 | 1,000,000 | 1,000,000 | $ | 100 | $ | 100 | $ | 100 | |||||||||||||||||||||||||
| (a) | Series is callable at par. |
| (b) | Pursuant to the planned spin-off and merger of Entergy’s transmission business with ITC Holdings Corp., Entergy will issue approximately $1.775 billion of debt, with the proceeds being used for prepayment or redemption of outstanding preferred and debt securities at each Utility operating company. Although the aggregate amount and particular series of preferred and debt securities of each Utility operating company to be redeemed as well as the redemption dates are uncertain at this time and are expected to remain subject to change, each Utility operating company currently anticipates that all of its outstanding preferred securities, if any, will be redeemed or otherwise retired prior to the spin off and merger. See pgs. 12 - 14 of 2011 10-K for further detail. |
34
UTILITY LONG-TERM DEBT AND PREFERRED STOCK
| BONDS: CUSIP |
TYPE* | RATE | MATURITY DATE |
FIRST CALL DATE |
CURRENT OR FIRST CALL PRICE |
AS OF DECEMBER 31, | ||||||||||||||||||
| 2011 | 2010 | 2009 | ||||||||||||||||||||||
| (in millions | ) | |||||||||||||||||||||||
| 29364NAM0 |
4.65% Series | M | 4.65% | 05/11 | Now | MW (T + .30%) | $ | - | $ | 80 | $ | 80 | ||||||||||||
| 29364NAH1 |
5.15% Series | M | 5.15% | 02/13 | Now | MW (T + .20%) | 100 | 100 | 100 | |||||||||||||||
| 29364NAN8 |
5.92% Series | M | 5.92% | 02/16 | Now | MW (T + .30%) | - | 100 | 100 | |||||||||||||||
| 29364NAQ1 |
3.25% Series | M | 3.25% | 06/16 | Now | MW (T + .25%) | 125 | - | - | |||||||||||||||
| 29364NAK4 |
4.95% Series | M | 4.95% | 06/18 | Now | 100% | 95 | 95 | 95 | |||||||||||||||
| 29364NAP3 |
6.64% Series | M | 6.64% | 07/19 | Now | MW (T + .50%) | 150 | 150 | 150 | |||||||||||||||
| 605277AF9 |
4.60% Series – Mississippi Business Finance Corp. | G(b,c) | 4.60% | 2022 | 10/1/09 | 100% | 16 | 16 | 16 | |||||||||||||||
| 453424BN2 |
4.90% Series – Independence County(d) | G(b,c) | 4.90% | 2022 | Now | 100% | 30 | 30 | 30 | |||||||||||||||
| 29364N876 |
6.0% Series | M | 6.0% | 11/32 | Now | 100% | 75 | 75 | 75 | |||||||||||||||
| 29364N868 |
7.25% Series | M | 7.25% | 12/32 | Now | 100% | - | - | 100 | |||||||||||||||
| 29364NAL2 |
6.25% Series | M | 6.25% | 04/34 | Now | MW (T + .25%) | 100 | 100 | 100 | |||||||||||||||
| 29364N843 |
6.20% Series | M | 6.20% | 04/40 | 4/15/15 | 100% | 80 | 80 | - | |||||||||||||||
| 29364N835 |
6.00% Series | M | 6.00% | 05/51 | 5/1/16 | 100% | 150 | - | - | |||||||||||||||
| Total bonds |
921 | 826 | 846 | |||||||||||||||||||||
| OTHER LONG-TERM DEBT: |
||||||||||||||||||||||||
| Unamortized Premium and Discount – Net |
(1 | ) | (1 | ) | (1 | ) | ||||||||||||||||||
| TOTAL LONG-TERM DEBT(e) |
920 | 825 | 845 | |||||||||||||||||||||
| Less Amount Due Within One Year |
- | 80 | - | |||||||||||||||||||||
| Long-Term Debt Excluding Amount Due Within One Year |
$ | 920 | $ | 745 | $ | 845 | ||||||||||||||||||
| Fair Value of Long-Term Debt(a) |
$ | 986 | $ | 802 | $ | 874 | ||||||||||||||||||
| *M = Mortgage Bond; G = Governmental Bond |
||||||||||||||||||||||||
| Weighted-average annualized coupon rate |
5.5 | % | 5.7 | % | 5.9 | % | ||||||||||||||||||
| (a) | The fair value includes debt due within one year. Fair values are based on prices derived by independent third parties that use inputs such as benchmark yields, reported trades, broker / dealer quotes, and issuer spreads. |
| (b) | Consists of pollution control revenue bonds and environmental revenue bonds. |
| (c) | The bonds are secured by a series of collateral first mortgage bonds. |
| (d) | In April 2008, Entergy Mississippi repurchased its $30 million of Auction Rate Independence County Pollution Control Revenue Bonds due July 2022. In June 2008, Entergy Mississippi remarketed the series and fixed the interest rate to maturity at 4.90%. |
| (e) | Pursuant to the planned spin-off and merger of Entergy’s transmission business with ITC Holdings Corp., Entergy will issue approximately $1.775 billion of debt, with the proceeds being used for prepayment or redemption of outstanding preferred and debt securities at each Utility operating company. Although the aggregate amount and particular series of preferred and debt securities of each Utility operating company to be redeemed as well as the redemption dates are uncertain at this time and are expected to remain subject to change, each Utility operating company currently anticipates that debt securities in the following approximate aggregate amounts will be reedemed prior to or following the spin off and merger: $0.51 billion for Entergy Arkansas, $0.27 billion for Entergy Gulf States Louisiana, $0.38 billion for Entergy Louisiana, $0.29 billion for Entergy Mississippi, $0.01 billion for Entergy New Orleans, and $0.30 billion for Entergy Texas. See pgs. 12 - 14 of 2011 10-K for further detail. |
Totals may not foot due to rounding.
| PREFERRED STOCK: | SHARES AUTHORIZED AND OUTSTANDING AS OF DECEMBER 31, |
AS OF DECEMBER 31, | CALL PRICE PER SHARE AS OF DECEMBER 31, |
|||||||||||||||||||||||||||||
| CUSIP | RATE | 2011 | 2010 | 2009 | 2011 | 2010 | 2009 | 2011 | ||||||||||||||||||||||||
| (in millions | ) | |||||||||||||||||||||||||||||||
| Without sinking fund: | ||||||||||||||||||||||||||||||||
| Cumulative, $100 par value: |
||||||||||||||||||||||||||||||||
| 29364N207 |
4.36% Series |
4.36% | 59,920 | 59,920 | 59,920 | $ | 6 | $ | 6 | $ | 6 | $ 103.88 | ||||||||||||||||||||
| 29364N306 |
4.56% Series |
4.56% | 43,887 | 43,887 | 43,887 | 4 | 4 | 4 | 107.00 | |||||||||||||||||||||||
| 29364N405 |
4.92% Series |
4.92% | 100,000 | 100,000 | 100,000 | 10 | 10 | 10 | 102.88 | |||||||||||||||||||||||
| Cumulative, $25 par value: |
||||||||||||||||||||||||||||||||
| 29364N850 |
6.25% Series(a) |
6.25% | 1,200,000 | 1,200,000 | 1,200,000 | 30 | 30 | 30 | - | |||||||||||||||||||||||
| Total without sinking fund (b) | 1,403,807 | 1,403,807 | 1,403,807 | $ | 50 | $ | 50 | $ | 50 | |||||||||||||||||||||||
| (a) | Series is callable at par. |
| (b) | Pursuant to the planned spin-off and merger of Entergy’s transmission business with ITC Holdings Corp., Entergy will issue approximately $1.775 billion of debt, with the proceeds being used for prepayment or redemption of outstanding preferred and debt securities at each Utility operating company. Although the aggregate amount and particular series of preferred and debt securities of each Utility operating company to be redeemed as well as the redemption dates are uncertain at this time and are expected to remain subject to change, each Utility operating company currently anticipates that all of its outstanding preferred securities, if any, will be redeemed or otherwise retired prior to the spin off and merger. See pgs. 12 - 14 of 2011 10-K for further detail. |
Totals may not foot due to rounding.
| BONDS: CUSIP |
TYPE* |
RATE |
MATURITY DATE |
FIRST CALL DATE |
CURRENT OR FIRST CALL PRICE |
AS OF DECEMBER 31, | ||||||||||||||||||
| 2011 | 2010 | 2009 | ||||||||||||||||||||||
| (in millions | ) | |||||||||||||||||||||||
| 29364PAL7 |
4.98% Series | M | 4.98% | 07/10 | Now | 101% | $ | - | $ | - | $ | 30 | ||||||||||||
| 29364PAF0 |
5.25% Series | M | 5.25% | 08/13 | Now | MW (T + .25%) | 70 | 70 | 70 | |||||||||||||||
| 29364PAD5 |
6.75% Series | M | 6.75% | 10/17 | Now | 100% | - | - | 25 | |||||||||||||||
| 29364PAM5 |
5.10% Series | M | 5.10% | 12/20 | Now | MW (T + .35%) | 25 | 25 | - | |||||||||||||||
| 29364PAK9 |
5.6% Series | M | 5.60% | 09/24 | 9/1/08 | 100% | 33 | 34 | 34 | |||||||||||||||
| 29364PAJ2 |
5.65% Series | M | 5.65% | 09/29 | 9/1/09 | 100% | 38 | 39 | 39 | |||||||||||||||
| Total bonds |
167 | 167 | 198 | |||||||||||||||||||||
| OTHER LONG-TERM DEBT: |
||||||||||||||||||||||||
| Affiliated Notes Payable(b) |
- | - | 74 | |||||||||||||||||||||
| Unamortized Premium and Discount – Net |
- | - | - | |||||||||||||||||||||
| TOTAL LONG-TERM DEBT(c) |
167 | 167 | 272 | |||||||||||||||||||||
| Less Amount Due Within One Year |
- | - | 104 | |||||||||||||||||||||
| Long-Term Debt Excluding Amount Due Within One Year |
$ | 167 | $ | 167 | $ | 168 | ||||||||||||||||||
| Fair Value of Long-Term Debt(a) |
$ | 169 | $ | 171 | $ | 198 | ||||||||||||||||||
| *M = Mortgage; G = Governmental |
||||||||||||||||||||||||
| Weighted-average annualized coupon rate |
5.4 | % | 5.4 | % | 5.5 | % | ||||||||||||||||||
| (a) | The fair value includes debt due within one year. Fair values are based on prices derived by independent third parties that use inputs such as benchmark yields, reported trades, broker / dealer quotes, and issuer spreads. |
| (b) | The affiliate note payable at Entergy New Orleans that was due May 2010 was classified as current notes payable - associated companies in 2009. |
| (c) | Pursuant to the planned spin-off and merger of Entergy’s transmission business with ITC Holdings Corp., Entergy will issue approximately $1.775 billion of debt, with the proceeds being used for prepayment or redemption of outstanding preferred and debt securities at each Utility operating company. Although the aggregate amount and particular series of preferred and debt securities of each Utility operating company to be redeemed as well as the redemption dates are uncertain at this time and are expected to remain subject to change, each Utility operating company currently anticipates that debt securities in the following approximate aggregate amounts will be reedemed prior to or following the spin off and merger: $0.51 billion for Entergy Arkansas, $0.27 billion for Entergy Gulf States Louisiana, $0.38 billion for Entergy Louisiana, $0.29 billion for Entergy Mississippi, $0.01 billion for Entergy New Orleans, and $0.30 billion for Entergy Texas. See pgs. 12 - 14 of 2011 10-K for further detail. |
Totals may not foot due to rounding.
| PREFERRED STOCK: | SHARES AUTHORIZED AND OUTSTANDING |
AS OF DECEMBER 31, | CALL PRICE PER SHARE AS OF DECEMBER 31, |
|||||||||||||||||||||||||||||||
| CUSIP | RATE | 2011 | 2010 | 2009 | 2011 | 2010 | 2009 | 2011 | ||||||||||||||||||||||||||
| Without sinking fund: | (in millions | ) | ||||||||||||||||||||||||||||||||
| Cumulative, $100 par value: |
||||||||||||||||||||||||||||||||||
| 29364P301 |
4.75% Series |
4.75 | % | 77,798 | 77,798 | 77,798 | $ | 8 | $ | 8 | $ | 8 | $ 105.00 | |||||||||||||||||||||
| 29364P202 |
4.36% Series |
4.36 | % | 60,000 | 60,000 | 60,000 | 6 | 6 | 6 | 104.58 | ||||||||||||||||||||||||
| 29364P400 |
5.56% Series |
5.56 | % | 60,000 | 60,000 | 60,000 | 6 | 6 | 6 | 102.59 | ||||||||||||||||||||||||
| Total without sinking fund (a) | 197,798 | 197,798 | 197,798 | $ | 20 | $ | 20 | $ | 20 | |||||||||||||||||||||||||
| (a) | Pursuant to the planned spin-off and merger of Entergy’s transmission business with ITC Holdings Corp., Entergy will issue approximately $1.775 billion of debt, with the proceeds being used for prepayment or redemption of outstanding preferred and debt securities at each Utility operating company. Although the aggregate amount and particular series of preferred and debt securities of each Utility operating company to be redeemed as well as the redemption dates are uncertain at this time and are expected to remain subject to change, each Utility operating company currently anticipates that all of its outstanding preferred securities, if any, will be redeemed or otherwise retired prior to the spin off and merger. See pgs. 12 - 14 of 2011 10-K for further detail. |
Totals may not foot due to rounding.
35
UTILITY LONG-TERM DEBT AND PREFERRED STOCK
| BONDS: CUSIP |
MATURITY DATE |
FIRST CALL DATE |
CURRENT OR FIRST CALL PRICE |
AS OF DECEMBER 31, | ||||||||||||||||||||
| TYPE* | RATE | 2011 | 2010 | 2009 | ||||||||||||||||||||
| (in millions | ) | |||||||||||||||||||||||
| 29364LAQ5 |
4.875% Series | M(c) | 4.875% | 11/11 | Now | 100% | - | - | 28 | |||||||||||||||
| 29364LAU6 |
5.70% Series | M(c) | 5.70% | 06/15 | Now | MW (T +. 30%) | - | - | 92 | |||||||||||||||
| 29365TAB0 |
3.60% Series | M | 3.60% | 06/15 | Now | MW (T +. 25%) | 200 | 200 | - | |||||||||||||||
| 952789AR6 |
5.8% Series – West Feliciana Parish | G(b,c) | 5.8% | 2016 | Now | 100% | - | - | 9 | |||||||||||||||
| 29365TAA2 |
7.125% Series | M | 7.125% | 02/19 | Now | MW (T + .50%) | 500 | 500 | 500 | |||||||||||||||
| 29365TAC8 |
4.1% Series | M | 4.100% | 09/21 | Now | MW (T + .30%) | 75 | - | - | |||||||||||||||
| 2936LAT9 |
6.18% Series | M(c) | 6.18% | 03/35 | Now | MW (T + .30%) | - | - | 39 | |||||||||||||||
| 29365T203 |
7.875% Series | M | 7.875% | 06/39 | 06/14 | 100% | 150 | 150 | 150 | |||||||||||||||
| Total bonds | 925 | 850 | 818 | |||||||||||||||||||||
| OTHER LONG-TERM DEBT: |
||||||||||||||||||||||||
| 29365QAA8 |
5.51% Series Senior Secured, Series A - Securitization Bond | 5.51% | 10/13 | 18 | 38 | 57 | ||||||||||||||||||
| 29365QAB6 |
5.79% Series Senior Secured, Series A - Securitization Bond | 5.79% | 10/18 | 122 | 122 | 122 | ||||||||||||||||||
| 29365QAC4 |
5.93% Series Senior Secured, Series A - Securitization Bond | 5.93% | 6/22 | 114 | 114 | 114 | ||||||||||||||||||
| 29365KAA1 |
2.12% Series Senior Secured - Securitization Bond | 2.12% | 02/16 | 132 | 170 | 183 | ||||||||||||||||||
| 29365KAB9 |
3.65% Series Senior Secured - Securitization Bond | 3.65% | 08/19 | 145 | 145 | 145 | ||||||||||||||||||
| 29365KAC7 |
4.38% Series Senior Secured - Securitization Bond | 4.38% | 11/23 | 219 | 219 | 219 | ||||||||||||||||||
| Unamortized Premium and Discount – Net | (3 | ) | (3 | ) | (4 | ) | ||||||||||||||||||
| Other | 5 | 5 | 5 | |||||||||||||||||||||
| TOTAL LONG-TERM DEBT(d) |
1,677 | 1,659 | 1,658 | |||||||||||||||||||||
| Less Amount Due Within One Year |
- | - | 168 | |||||||||||||||||||||
| Long-Term Debt Excluding Amount Due Within One Year |
$ | 1,677 | $ | 1,659 | $ | 1,490 | ||||||||||||||||||
| Fair Value of Long-Term Debt(a) |
$ | 1,906 | $ | 1,822 | $ | 1,747 | ||||||||||||||||||
| *M = Mortgage Bond; G = Governmental Bond |
||||||||||||||||||||||||
| Weighted-average annualized coupon rate |
5.4 | % | 5.4 | % | 5.6 | % | ||||||||||||||||||
| (a) | The fair value includes debt due within one year. Fair values are based on prices derived by independent third parties that use inputs such as benchmark yields, reported trades, broker / dealer quotes, and issuer spreads. |
| (b) | Consists of pollution control revenue bonds and environmental revenue bonds. |
| (c) | Entergy Gulf States Louisiana was primarily liable for all of the long-term debt issued by Entergy Gulf States, Inc. that was outstanding on December 31, 2007. Under a debt assumption agreement with Entergy Gulf States Louisiana, Entergy Texas assumed approximately 46% of this long-term debt. Entergy Gulf States Louisiana recorded an assumption asset on its balance sheet to reflect the long-term debt assumed by Entergy Texas. By June 2010, Entergy Texas had repaid the outstanding assumed debt and the debt assumption agreement was terminated. |
| (d) | Pursuant to the planned spin-off and merger of Entergy’s transmission business with ITC Holdings Corp., Entergy will issue approximately $1.775 billion of debt, with the proceeds being used for prepayment or redemption of outstanding preferred and debt securities at each Utility operating company. Although the aggregate amount and particular series of preferred and debt securities of each Utility operating company to be redeemed as well as the redemption dates are uncertain at this time and are expected to remain subject to change, each Utility operating company currently anticipates that debt securities in the following approximate aggregate amounts will be reedemed prior to or following the spin off and merger: $0.51 billion for Entergy Arkansas, $0.27 billion for Entergy Gulf States Louisiana, $0.38 billion for Entergy Louisiana, $0.29 billion for Entergy Mississippi, $0.01 billion for Entergy New Orleans, and $0.30 billion for Entergy Texas. See pgs. 12 - 14 of 2011 10-K for further detail. |
Totals may not foot due to rounding.
| BONDS: | MATURITY | FIRST CALL | CURRENT OR | AS OF DECEMBER 31, |
||||||||||||||||||||
| CUSIP | TYPE* | RATE | DATE | DATE | FIRST CALL PRICE | 2011 | 2010 | 2009 | ||||||||||||||||
| (in millions | ) | |||||||||||||||||||||||
| 871911AR4 |
6.2% Series | M | 6.2% | 10/12 | Now | MW (T + .35%) | $ | 70 | $ | 70 | $ | 70 | ||||||||||||
| 179423AC2 |
5.875% Series – Mississippi Business Finance Corp. | G(b) |
5.875% | 2022 | Now | 100% | 216 | 216 | 216 | |||||||||||||||
| 605277AC6 |
5.9% Series – Mississippi Business Finance Corp. | G(b) |
5.9% | 2022 | Now | 100% | 103 | 103 | 103 | |||||||||||||||
| 179423AK4 |
6.2% Series – Claiborne County | G(b) |
6.2% | 2026 | Now | 100% | 50 | 90 | 90 | |||||||||||||||
| Total bonds | 439 | 479 | 479 | |||||||||||||||||||||
| OTHER LONG-TERM DEBT: |
||||||||||||||||||||||||
| Grand Gulf Lease Obligation 5.13% |
5.13% | 179 | 222 | 267 | ||||||||||||||||||||
| 6.29% Series F – Variable Interest Entity Note Payable |
6.29% | 09/13 | 70 | 70 | - | |||||||||||||||||||
| 5.33% Series G – Variable Interest Entity Note Payable |
5.33% | 04/15 | 60 | 60 | - | |||||||||||||||||||
| Unamortized Premium and Discount – Net | (1 | ) | (1 | ) | (1 | ) | ||||||||||||||||||
| TOTAL LONG-TERM DEBT |
747 | 830 | 745 | |||||||||||||||||||||
| Less Amount Due Within One Year |
110 | 34 | 42 | |||||||||||||||||||||
| Long-Term Debt Excluding Amount Due Within One Year |
$ | 637 | $ | 797 | $ | 703 | ||||||||||||||||||
| Fair Value of Long-Term Debt(a) |
$ | 583 | $ | 612 | $ | 480 | ||||||||||||||||||
| *M = Mortgage Bond; G = Governmental Bond |
||||||||||||||||||||||||
| Weighted-average annualized coupon rate |
5.8 | % | 5.7 | % | 5.7 | % | ||||||||||||||||||
| (a) | The fair value excludes lease obligations of $179 million at System Energy and includes debt due within one year. Fair values are based on prices derived by independent third parties that use inputs such as benchmark yields, reported trades, broker / dealer quotes, and issuer spreads. |
| (b) | Consists of pollution control revenue bonds and environmental revenue bonds. |
Totals may not foot due to rounding.
36
UTILITY STATISTICAL INFORMATION
| OPERATED | OWNED & LEASED |
OPERATED | ||||||||||||||
| As of December 31, 2011. | PLANTS | UNITS | (MW)(a) | (MW) | ||||||||||||
| Plants that use fuel type: |
||||||||||||||||
| Gas/Oil |
27 | 69 | 14,022 | 14,360 | ||||||||||||
| Coal |
3 | 5 | 2,261 | 3,887 | ||||||||||||
| Petroleum Coke |
1 | 2 | - | 200 | ||||||||||||
| Total Fossil |
31 | 76 | 16,283 | 18,447 | ||||||||||||
| Hydro |
3 | 7 | 74 | 154 | ||||||||||||
| Nuclear |
4 | 5 | 5,027 | 5,146 | ||||||||||||
| Total Capability |
38 | 88 | 21,384 | 23,747 | ||||||||||||
All plants that have units with multiple fuel types are in the Gas & Oil plant count.
| (a) | Owned and Leased Capability is the dependable load carrying capability as demonstrated under actual operating conditions based on the primary fuel (assuming no curtailments) that each station was designed to utilize. |
UTILITY SELECTED OPERATING DATA
| 2011 | 2010 | 2009 | 2008 | 2007 | ||||||||||||||||
| SOURCES OF ENERGY (GWh) |
||||||||||||||||||||
| Net Generation: |
||||||||||||||||||||
| Gas & Oil |
30,042 | 26,637 | 21,767 | 24,552 | 24,131 | |||||||||||||||
| Coal |
14,915 | 15,616 | 15,101 | 15,648 | 15,035 | |||||||||||||||
| Nuclear |
40,102 | 42,339 | 41,851 | 37,994 | 40,988 | |||||||||||||||
| Hydro |
160 | 139 | 233 | 197 | 135 | |||||||||||||||
| Total Net Generation |
85,219 | 84,731 | 78,952 | 78,391 | 80,289 | |||||||||||||||
| Purchased Power: |
||||||||||||||||||||
| Affiliated Companies |
803 | 738 | 741 | 817 | 729 | |||||||||||||||
| Non- affiliated Companies |
32,896 | 33,155 | 30,708 | 32,582 | 33,978 | |||||||||||||||
| Total Purchased Power |
33,699 | 33,893 | 31,449 | 33,399 | 34,707 | |||||||||||||||
| Total Sources of Energy |
118,918 | 118,625 | 110,401 | 111,790 | 114,996 | |||||||||||||||
| USES OF ENERGY (GWh) |
||||||||||||||||||||
| Electric Energy Sales: |
||||||||||||||||||||
| Residential |
36,684 | 37,465 | 33,626 | 33,047 | 33,281 | |||||||||||||||
| Commercial |
28,720 | 28,831 | 27,476 | 27,340 | 27,408 | |||||||||||||||
| Industrial |
40,810 | 38,751 | 35,638 | 37,843 | 38,985 | |||||||||||||||
| Governmental |
2,474 | 2,463 | 2,408 | 2,379 | 2,339 | |||||||||||||||
| Total Retail |
108,688 | 107,510 | 99,148 | 100,609 | 102,013 | |||||||||||||||
| Sales for Resale |
4,111 | 4,372 | 4,862 | 5,401 | 6,145 | |||||||||||||||
| Unbilled Energy |
(131 | ) | (173 | ) | 631 | (264 | ) | 277 | ||||||||||||
| Total Electric Energy Sales |
112,668 | 111,709 | 104,641 | 105,746 | 108,435 | |||||||||||||||
| Line Losses and Company Usage |
6,250 | 6,916 | 5,760 | 6,044 | 6,561 | |||||||||||||||
| Total Uses of Energy |
118,918 | 118,625 | 110,401 | 111,790 | 114,996 | |||||||||||||||
| Peak Demand (MW) |
22,387 | 21,799 | 21,009 | 21,241 | 22,001 | |||||||||||||||
| Operational Summer Capacity at Peak (MW) |
23,979 | 24,310 | 23,578 | 24,844 | 23,996 | |||||||||||||||
| Annual System Load Factor (%) |
60 | 62 | 60 | 59 | 59 | |||||||||||||||
| Retail Electric Sales Growth Rate (%) |
1.1 | 8.4 | (1.5 | ) | (1.4 | ) | 5.5 | |||||||||||||
| Retail Electric Sales Weather-Adjusted Growth Rate (%) |
2.0 | 4.3 | (1.5 | ) | (0.5 | ) | 6.0 | |||||||||||||
| Regional Gross Domestic Product Rate (%) |
2.7 | 3.5 | (2.4 | ) | (0.2 | ) | 3.1 | |||||||||||||
| National Gross Domestic Product Rate (%) |
1.7 | 3.0 | (3.5 | ) | (0.3 | ) | 1.9 | |||||||||||||
| Average Fuel Cost (cents/KWh) |
||||||||||||||||||||
| Natural Gas |
4.85 | 5.39 | 5.64 | 10.28 | 8.05 | |||||||||||||||
| Nuclear Fuel |
0.81 | 0.78 | 0.66 | 0.60 | 0.57 | |||||||||||||||
| Coal |
2.31 | 2.00 | 2.04 | 2.06 | 1.86 | |||||||||||||||
| Fuel Oil |
- | - | - | 19.45 | 14.13 | |||||||||||||||
| Purchased Power |
4.59 | 5.28 | 5.29 | 7.92 | 6.27 | |||||||||||||||
Totals may not foot due to rounding.
37
UTILITY STATISTICAL INFORMATION
2011 CONSOLIDATING UTILITY ELECTRIC STATISTICAL INFORMATION
| EAI | EGSL | ELL | EMI | ENOI | ETI | SERI | ELIMINATIONS | TOTAL | % | |||||||||||||||||||||||||||||||
| ELECTRIC OPERATING REVENUES ($ thousands) |
|
|||||||||||||||||||||||||||||||||||||||
| Residential |
755,807 | 479,060 | 829,663 | 490,088 | 175,994 | 638,161 | - | - | 3,368,773 | 39 | % | |||||||||||||||||||||||||||||
| Commercial |
449,756 | 416,321 | 549,142 | 401,276 | 153,824 | 368,614 | - | (5,905 | ) | 2,333,028 | 27 | % | ||||||||||||||||||||||||||||
| Industrial |
421,384 | 490,378 | 867,491 | 145,792 | 29,800 | 351,731 | - | - | 2,306,576 | 27 | % | |||||||||||||||||||||||||||||
| Governmental |
19,711 | 20,925 | 41,900 | 37,302 | 59,840 | 25,955 | - | - | 205,633 | 2 | % | |||||||||||||||||||||||||||||
| Total Retail |
1,646,658 | 1,406,684 | 2,288,196 | 1,074,458 | 419,458 | 1,384,461 | - | (5,905 | ) | 8,214,010 | 95 | % | ||||||||||||||||||||||||||||
| Sales for Resale |
375,127 | 614,429 | 145,009 | 131,334 | 95,704 | 336,555 | 563,390 | (2,046,019 | ) | 215,529 | 2 | % | ||||||||||||||||||||||||||||
| Other |
62,525 | 48,435 | 75,710 | 60,678 | 14,066 | 36,183 | 21 | (53,642 | ) | 243,978 | 3 | % | ||||||||||||||||||||||||||||
| Total |
2,084,310 | 2,069,548 | 2,508,915 | 1,266,470 | 529,228 | 1,757,199 | 563,411 | (2,105,566 | ) | 8,673,517 | 100 | % | ||||||||||||||||||||||||||||
| FUEL REVENUES (included in above revenues) |
|
|||||||||||||||||||||||||||||||||||||||
| Residential |
147,763 | 186,547 | 332,827 | 181,581 | 59,406 | 231,058 | - | - | 1,139,182 | 34 | % | |||||||||||||||||||||||||||||
| Commercial |
110,070 | 178,013 | 218,649 | 154,748 | 60,829 | 166,223 | - | - | 888,532 | 27 | % | |||||||||||||||||||||||||||||
| Industrial |
126,854 | 292,036 | 535,592 | 69,808 | 15,310 | 214,474 | - | - | 1,254,074 | 37 | % | |||||||||||||||||||||||||||||
| Governmental |
4,965 | 7,453 | 16,595 | 12,861 | 24,790 | 10,836 | - | - | 77,500 | 2 | % | |||||||||||||||||||||||||||||
| Total Retail |
389,652 | 664,049 | 1,103,663 | 418,998 | 160,335 | 622,591 | - | - | 3,359,288 | 100 | % | |||||||||||||||||||||||||||||
| SOURCES OF ENERGY (GWh) |
|
|||||||||||||||||||||||||||||||||||||||
| Net Generation: |
||||||||||||||||||||||||||||||||||||||||
| Gas & Oil |
1,078 | 3,547 | 10,506 | 5,978 | 2,412 | 6,521 | - | - | 30,042 | 25 | % | |||||||||||||||||||||||||||||
| Coal |
7,636 | 2,605 | - | 2,749 | - | 1,925 | - | - | 14,915 | 13 | % | |||||||||||||||||||||||||||||
| Nuclear |
14,194 | 7,686 | 8,929 | - | - | - | 9,293 | - | 40,102 | 34 | % | |||||||||||||||||||||||||||||
| Hydro |
160 | - | - | - | - | - | - | - | 160 | 0 | % | |||||||||||||||||||||||||||||
| Total Net Generation |
23,068 | 13,838 | 19,435 | 8,727 | 2,412 | 8,446 | 9,293 | - | 85,219 | 72 | % | |||||||||||||||||||||||||||||
| Purchased Power: |
||||||||||||||||||||||||||||||||||||||||
| Affiliated Companies |
4,280 | 6,446 | 7,484 | 5,080 | 3,650 | 6,546 | - | (32,683 | ) | 803 | 0 | % | ||||||||||||||||||||||||||||
| Non-affiliated Companies |
4,035 | 10,007 | 8,682 | 1,524 | 489 | 8,159 | - | - | 32,896 | 28 | % | |||||||||||||||||||||||||||||
| Total Purchased Power |
8,315 | 16,453 | 16,166 | 6,604 | 4,139 | 14,705 | - | (32,683 | ) | 33,699 | 28 | % | ||||||||||||||||||||||||||||
| Total Sources of Energy |
31,383 | 30,291 | 35,601 | 15,331 | 6,551 | 23,151 | 9,293 | (32,683 | ) | 118,918 | 100 | % | ||||||||||||||||||||||||||||
| USES OF ENERGY (GWh) |
|
|||||||||||||||||||||||||||||||||||||||
| Electric Energy Sales: |
||||||||||||||||||||||||||||||||||||||||
| Residential |
8,229 | 5,383 | 9,303 | 5,848 | 1,888 | 6,034 | - | - | 36,684 | 34 | % | |||||||||||||||||||||||||||||
| Commercial |
6,051 | 5,239 | 6,155 | 4,985 | 1,939 | 4,433 | - | (81 | ) | 28,720 | 26 | % | ||||||||||||||||||||||||||||
| Industrial |
7,029 | 9,041 | 15,813 | 2,326 | 498 | 6,102 | - | - | 40,810 | 38 | % | |||||||||||||||||||||||||||||
| Governmental |
275 | 222 | 473 | 415 | 795 | 294 | - | - | 2,474 | 2 | % | |||||||||||||||||||||||||||||
| Total Retail |
21,584 | 19,885 | 31,744 | 13,574 | 5,120 | 16,863 | - | (81 | ) | 108,688 | 100 | % | ||||||||||||||||||||||||||||
| Sales for Resale |
8,197 | 9,608 | 2,330 | 763 | 1,186 | 5,416 | 9,293 | (32,683 | ) | 4,111 | - | |||||||||||||||||||||||||||||
| Unbilled Energy |
(49 | ) | (39 | ) | 38 | (69 | ) | (1 | ) | (11 | ) | - | - | (131 | ) | - | ||||||||||||||||||||||||
| Total Electric Energy Sales |
29,732 | 29,454 | 34,112 | 14,268 | 6,305 | 22,268 | 9,293 | (32,764 | ) | 112,668 | - | |||||||||||||||||||||||||||||
| Line Losses and Company Usage |
1,651 | 837 | 1,489 | 1,063 | 246 | 883 | - | 81 | 6,250 | - | ||||||||||||||||||||||||||||||
| Total Uses of Energy |
31,383 | 30,291 | 35,601 | 15,331 | 6,551 | 23,151 | 9,293 | (32,683 | ) | 118,918 | - | |||||||||||||||||||||||||||||
| AVERAGE ELECTRIC REVENUE (cents/KWh) |
|
|||||||||||||||||||||||||||||||||||||||
| Residential |
9.18 | 8.90 | 8.92 | 8.38 | 9.32 | 10.58 | - | - | 9.18 | - | ||||||||||||||||||||||||||||||
| Commercial |
7.43 | 7.95 | 8.92 | 8.05 | 7.93 | 8.32 | - | - | 8.12 | - | ||||||||||||||||||||||||||||||
| Industrial |
5.99 | 5.42 | 5.49 | 6.27 | 5.98 | 5.76 | - | - | 5.65 | - | ||||||||||||||||||||||||||||||
| Governmental |
7.17 | 9.43 | 8.86 | 8.99 | 7.53 | 8.83 | - | - | 8.31 | - | ||||||||||||||||||||||||||||||
| NUMBER OF RETAIL ELECTRIC CUSTOMERS |
|
|||||||||||||||||||||||||||||||||||||||
| (as of December 31, 2011) |
||||||||||||||||||||||||||||||||||||||||
| Residential |
582,813 | 328,718 | 580,627 | 366,697 | 142,680 | 360,909 | - | - | 2,362,444 | 86 | % | |||||||||||||||||||||||||||||
| Commercial |
88,895 | 50,277 | 76,130 | 62,762 | 13,920 | 44,760 | - | - | 336,744 | 12 | % | |||||||||||||||||||||||||||||
| Industrial |
20,402 | 3,278 | 6,908 | 3,488 | 2,288 | 4,809 | - | - | 41,173 | 1 | % | |||||||||||||||||||||||||||||
| Governmental |
693 | 1,615 | 5,767 | 4,358 | 1,738 | 2,248 | - | - | 16,419 | 1 | % | |||||||||||||||||||||||||||||
| Total Retail Customers |
692,803 | 383,888 | 669,432 | 437,305 | 160,626 | 412,726 | - | - | 2,756,780 | 100 | % | |||||||||||||||||||||||||||||
Totals may not foot due to rounding.
38
UTILITY STATISTICAL INFORMATION
| 2011 | 2010 | 2009 | 2008 | 2007 | ||||||||||||||||
| ELECTRIC OPERATING REVENUES ($ thousands) |
||||||||||||||||||||
| Residential |
755,807 | 773,012 | 768,500 | 755,780 | 689,885 | |||||||||||||||
| Commercial |
449,756 | 441,387 | 474,543 | 462,599 | 408,561 | |||||||||||||||
| Industrial |
421,384 | 414,791 | 433,321 | 461,486 | 406,984 | |||||||||||||||
| Governmental |
19,711 | 19,524 | 21,731 | 21,043 | 18,972 | |||||||||||||||
| Total Retail |
1,646,658 | 1,648,714 | 1,698,095 | 1,700,908 | 1,524,402 | |||||||||||||||
| Sales for Resale |
375,127 | 379,894 | 452,424 | 572,350 | 458,372 | |||||||||||||||
| Other |
62,525 | 53,839 | 60,743 | 55,091 | 50,191 | |||||||||||||||
| Total Electric Operating Revenues |
2,084,310 | 2,082,447 | 2,211,263 | 2,328,349 | 2,032,965 | |||||||||||||||
| FUEL REVENUES (included in above revenues) |
||||||||||||||||||||
| Residential |
147,763 | 91,412 | 127,137 | 142,415 | 124,582 | |||||||||||||||
| Commercial |
110,070 | 65,809 | 95,959 | 111,657 | 92,056 | |||||||||||||||
| Industrial |
126,854 | 75,939 | 104,226 | 135,772 | 115,077 | |||||||||||||||
| Governmental |
4,965 | 2,976 | 4,416 | 5,129 | 4,308 | |||||||||||||||
| Total Retail Fuel Revenues |
389,652 | 236,136 | 331,738 | 394,973 | 336,023 | |||||||||||||||
| SOURCES OF ENERGY (GWh) |
||||||||||||||||||||
| Net Generation: |
||||||||||||||||||||
| Gas & Oil |
1,078 | 984 | 1,003 | 300 | 89 | |||||||||||||||
| Coal |
7,636 | 8,233 | 7,955 | 8,273 | 7,935 | |||||||||||||||
| Nuclear |
14,194 | 15,023 | 15,168 | 14,168 | 15,486 | |||||||||||||||
| Hydro |
160 | 139 | 233 | 197 | 135 | |||||||||||||||
| Total Net Generation |
23,068 | 24,379 | 24,359 | 22,938 | 23,645 | |||||||||||||||
| Purchased Power: |
||||||||||||||||||||
| Affiliated Companies |
4,280 | 3,887 | 3,776 | 3,480 | 3,636 | |||||||||||||||
| Non-affiliated Companies |
4,035 | 4,508 | 4,968 | 6,164 | 5,790 | |||||||||||||||
| Total Purchased Power |
8,315 | 8,395 | 8,744 | 9,644 | 9,426 | |||||||||||||||
| Total Sources of Energy |
31,383 | 32,774 | 33,103 | 32,582 | 33,071 | |||||||||||||||
| USES OF ENERGY (GWh) |
||||||||||||||||||||
| Electric Energy Sales: |
||||||||||||||||||||
| Residential |
8,229 | 8,501 | 7,464 | 7,678 | 7,725 | |||||||||||||||
| Commercial |
6,051 | 6,144 | 5,817 | 5,875 | 5,945 | |||||||||||||||
| Industrial |
7,029 | 7,082 | 6,376 | 7,211 | 7,424 | |||||||||||||||
| Governmental |
275 | 277 | 269 | 274 | 277 | |||||||||||||||
| Total Retail |
21,584 | 22,004 | 19,926 | 21,038 | 21,371 | |||||||||||||||
| Sales for Resale |
8,197 | 8,703 | 11,611 | 10,049 | 9,836 | |||||||||||||||
| Unbilled Energy |
(49 | ) | (123 | ) | 111 | 13 | 35 | |||||||||||||
| Total Electric Energy Sales |
29,732 | 30,584 | 31,648 | 31,100 | 31,242 | |||||||||||||||
| Line Losses and Company Usage |
1,651 | 2,190 | 1,455 | 1,482 | 1,829 | |||||||||||||||
| Total Uses of Energy |
31,383 | 32,774 | 33,103 | 32,582 | 33,071 | |||||||||||||||
| AVERAGE ELECTRIC REVENUE (cents/KWh) |
||||||||||||||||||||
| Residential |
9.18 | 9.09 | 10.30 | 9.84 | 8.93 | |||||||||||||||
| Commercial |
7.43 | 7.18 | 8.16 | 7.87 | 6.87 | |||||||||||||||
| Industrial |
5.99 | 5.86 | 6.80 | 6.40 | 5.48 | |||||||||||||||
| Governmental |
7.17 | 7.05 | 8.08 | 7.68 | 6.85 | |||||||||||||||
| NUMBER OF RETAIL ELECTRIC CUSTOMERS |
||||||||||||||||||||
| (as of December 31) |
||||||||||||||||||||
| Residential |
582,813 | 582,557 | 580,672 | 578,664 | 576,975 | |||||||||||||||
| Commercial |
88,895 | 88,725 | 87,929 | 87,322 | 86,532 | |||||||||||||||
| Industrial |
20,402 | 20,605 | 20,118 | 20,922 | 20,040 | |||||||||||||||
| Governmental |
693 | 674 | 661 | 640 | 618 | |||||||||||||||
| Total Retail Customers |
692,803 | 692,561 | 689,380 | 687,548 | 684,165 | |||||||||||||||
Totals may not foot due to rounding.
39
UTILITY STATISTICAL INFORMATION
ENTERGY ARKANSAS, INC.
GENERATION PORTFOLIO
| OWNED & (MW)(a) |
PLANT AVG BTU PER KWH |
TOTAL PLANT – 2011 | ||||||||||||||||||||||||||||||||||||||||||||
| COMMER- CIAL OPER- ATION |
Emissions | NET | EXPEN- SES MWH |
TOTAL ($000) |
||||||||||||||||||||||||||||||||||||||||||
| PLANT | UNIT | OWNER- SHIP |
FUEL TYPE | PURPOSE | NET GENER- ATION |
SO2 (tons) |
NOx (tons) |
CO2 (tons) |
Hg(b) (lbs) |
TECHNOLOGY(c) | GENER- ATION (MWH) |
|||||||||||||||||||||||||||||||||||
| Cecil Lynch |
2 | 100% | 1949 | - | Gas/Oil | Reserve | 14,090 | - | - | - | - | - | 112,605 | 92.9 | 10,457 | |||||||||||||||||||||||||||||||
| 3 | 100% | 1954 | 110 | Gas/Oil | Peaking | 1 | 226 | 94,139 | - | - | ||||||||||||||||||||||||||||||||||||
| Harvey Couch |
1 | 100% | 1943 | - | Gas/Oil | Retired(e) | 15,150 | - | - | - | - | - | 21,365 | 178.6 | 3,816 | |||||||||||||||||||||||||||||||
| 2 | 100% | 1954 | 123 | Gas/Oil | Peaking | - | 23 | 18,035 | - | - | ||||||||||||||||||||||||||||||||||||
| Lake Catherine |
1 | 100% | 1950 | 47 | Gas/Oil | Peaking | 14,310 | - | 1.5 | 406 | - | - | 105,589 | 227.0 | 23,969 | |||||||||||||||||||||||||||||||
| 2 | 100% | 1950 | 45 | Gas/Oil | Peaking | - | 0.6 | 67 | - | - | ||||||||||||||||||||||||||||||||||||
| 3 | 100% | 1953 | 96 | Gas/Oil | Peaking | - | 1.9 | 461 | - | - | ||||||||||||||||||||||||||||||||||||
| 4 | 100% | 1970 | 524 | Gas/Oil | Peaking | 1 | 145 | 89,074 | - | - | ||||||||||||||||||||||||||||||||||||
| Hamilton Moses |
1 | 100% | 1951 | - | Gas/Oil | Reserve | - | - | - | - | - | - | - | - | 381 | |||||||||||||||||||||||||||||||
| 2 | 100% | 1951 | - | Gas/Oil | Reserve | - | - | - | - | - | ||||||||||||||||||||||||||||||||||||
| Mabelvale |
1 | 100% | 1970 | 14 | Gas/Oil | Peaking | 15,020 | - | - | - | - | - | 35,453 | 99.9 | 3,541 | |||||||||||||||||||||||||||||||
| 2 | 100% | 1970 | 14 | Gas/Oil | Peaking | - | - | - | - | - | ||||||||||||||||||||||||||||||||||||
| 3 | 100% | 1970 | 14 | Gas/Oil | Peaking | - | - | - | - | - | ||||||||||||||||||||||||||||||||||||
| 4 | 100% | 1970 | 14 | Gas/Oil | Peaking | - | - | - | - | - | ||||||||||||||||||||||||||||||||||||
| Robert Ritchie |
1 | 100% | 1961 | - | Gas/Oil | Reserve | - | - | - | - | - | - | (90 | ) | (9,416.5 | ) | 847 | |||||||||||||||||||||||||||||
| 3 | 100% | 1970 | 16 | Gas/Oil | Peaking | - | - | - | - | - | - | - | - | |||||||||||||||||||||||||||||||||
| Ouachita |
1 | 100% | 2002 | 255 | Gas | Intermediate | 7,950 | 1 | 27 | 164,640 | - | Dry LNB, SCR | 802,662 | 45.2 | 36,250 | |||||||||||||||||||||||||||||||
| 2 | 100% | 2002 | 257 | Gas | Intermediate | 1 | 27 | 183,652 | - | Dry LNB, SCR | ||||||||||||||||||||||||||||||||||||
| Independence |
1 | 31.5% | 1983 | 263 | Coal | Base | 10,430 | 4,822 | 2,209 | 1,888,632 | 71 | OFA, ESP | 1,739,125 | 25.4 | 44,240 | |||||||||||||||||||||||||||||||
| White Bluff |
1 | 57% | 1980 | 465 | Coal | Base | 10,280 | 8,560 | 4,144 | 3,133,348 | 117 | OFA, ESP | 5,896,903 | 25.9 | 152,457 | |||||||||||||||||||||||||||||||
| 2 | 57% | 1981 | 481 | Coal | Base | 9,500 | 4,984 | 3,503,552 | 131 | OFA, ESP | ||||||||||||||||||||||||||||||||||||
| Cecil Lynch |
Diesel | 100% | 1967 | 5 | Oil | Peaking | - | - | - | - | - | - | - | 36 | ||||||||||||||||||||||||||||||||
| Carpenter |
1 | 100% | 1932 | 31 | Hydro | Peaking | - | - | - | - | - | - | 125,724 | 8.4 | 1,055 | |||||||||||||||||||||||||||||||
| 2 | 100% | 1932 | 31 | Hydro | Peaking | - | - | - | - | - | ||||||||||||||||||||||||||||||||||||
| Remmel |
1 | 100% | 1925 | 4 | Hydro | Peaking | - | - | - | - | - | - | 33,944 | 27.6 | 936 | |||||||||||||||||||||||||||||||
| 2 | 100% | 1925 | 4 | Hydro | Peaking | - | - | - | - | - | ||||||||||||||||||||||||||||||||||||
| 3 | 100% | 1925 | 4 | Hydro | Peaking | - | - | - | - | - | ||||||||||||||||||||||||||||||||||||
| Arkansas |
||||||||||||||||||||||||||||||||||||||||||||||
| Nuclear One |
1 | 100% | 1974 | 834 | Nuclear PWR(d) | Base | 10,328 | - | - | - | - | - | 14,194,445 | 21.1 | 299,399 | |||||||||||||||||||||||||||||||
| 2 | 100% | 1980 | 989 | Nuclear PWR(d) | Base | - | - | - | - | - | ||||||||||||||||||||||||||||||||||||
| Total |
4,640 | 23,067,725 | 25.0 | 577,386 | ||||||||||||||||||||||||||||||||||||||||||
| (a) | Owned and Leased Capability is the dependable load carrying capability as demonstrated under actual operating conditions based on the primary fuel |
(assuming no curtailments) that each station was designed to utilize.
| (b) | Mercury emissions calculated using 2011 unit heat input and 3.92 x 10⁻⁶ lb hg/MMBtu emissiom rate for coal plants and 8.0 x 10⁻¹⁰ lb hg/MMBtu emission rate for natural gas plants. |
| (c) | Installed NOx and particulate matter emission control devices: Combustion Modification/ Fuel Reburning (Combus Mod / Fuel Reburn), Dry Low NOx Burners (Dry LNB), Electrostatic Precipitator (ESP), Low Nox Burners with Closed-coupled Overfire Air (LNB w/ Closed-coupled OFA), Low NOx Burners with Separated Overfire Air (LNB w/ Sep OFA), Low NOx Burner with Overfire Air (LNB w/ OFA), Overfire Air (OFA), Selective Catalytic Reduction (SCR) or Steam Injection. Currently have no SO2, CO2 or Mercury Control equipment operating on any unit. |
| (d) | PWR = Pressurized Water Reactor. |
| (e) | Harvey Couch Unit 1 was officially retired on March 18, 2011. |
Calculations may differ due to rounding.
ENTERGY GULF STATES, INC.
HISTORICAL DATA PRIOR TO SEPARATION(a)
| 2007 | ||||
| SOURCES OF ENERGY (GWh) |
||||
| Net Generation: |
||||
| Gas & Oil |
7,669 | |||
| Coal |
4,074 | |||
| Nuclear |
7,188 | |||
| Hydro |
- | |||
| Total Net Generation |
18,931 | |||
| Purchased Power: |
||||
| Affiliated Companies |
5,514 | |||
| Non-affiliated Companies |
17,658 | |||
| Total Purchased Power |
23,172 | |||
| Total Sources of Energy |
42,103 | |||
| USES OF ENERGY (GWh) |
||||
| Electric Energy Sales: |
||||
| Louisiana |
||||
| Residential |
4,934 | |||
| Commercial |
4,895 | |||
| Industrial |
9,101 | |||
| Governmental |
204 | |||
| Texas |
||||
| Residential |
5,281 | |||
| Commercial |
4,085 | |||
| Industrial |
5,911 | |||
| Governmental |
244 | |||
| Total Retail |
34,655 | |||
| Sales for Resale |
5,388 | |||
| Unbilled Energy |
125 | |||
| Total Electric Energy Sales |
40,168 | |||
| Line Losses and Company Usage |
1,935 | |||
| Total Uses of Energy |
42,103 | |||
| (a) | Effective December 31, 2007, Entergy Gulf States, Inc. completed a jurisdictional separation into two vertically integrated utility companies, one operating under the sole retail jurisdiction of the PUCT, Entergy Texas, Inc., and the other operating under the sole retail jurisdiction of the LPSC, Entergy Gulf States Louisiana, L.L.C., Entergy Gulf States Louisiana, L.L.C. is the successor for financial reporting purposes to Entergy Gulf States, Inc. Certain historical data by separate company is unavailable. |
Totals may not foot due to rounding.
40
UTILITY STATISTICAL INFORMATION
ENTERGY GULF STATES LOUISIANA, L.L.C.(a)
| 2011 | 2010 | 2009 | 2008 | 2007 | ||||||||||||||||
| ELECTRIC OPERATING REVENUES ($ thousands) |
||||||||||||||||||||
| Residential |
479,060 | 498,319 | 393,490 | 553,527 | 497,782 | |||||||||||||||
| Commercial |
416,321 | 426,342 | 354,038 | 520,214 | 452,930 | |||||||||||||||
| Industrial |
490,378 | 488,974 | 383,272 | 672,213 | 620,472 | |||||||||||||||
| Governmental |
20,925 | 20,350 | 17,625 | 24,964 | 21,710 | |||||||||||||||
| Total Retail |
1,406,684 | 1,433,985 | 1,148,425 | 1,770,918 | 1,592,894 | |||||||||||||||
| Sales for Resale |
614,429 | 541,219 | 579,358 | 824,404 | REFER TO PAGE 40 | |||||||||||||||
| Other |
48,435 | 40,506 | 48,827 | 37,630 | ||||||||||||||||
| Total Electric Operating Revenues |
2,069,548 | 2,015,710 | 1,776,610 | 2,632,952 | ||||||||||||||||
| FUEL REVENUES (included in above revenues) |
||||||||||||||||||||
| Residential |
186,547 | 193,863 | 177,483 | 345,071 | 277,105 | |||||||||||||||
| Commercial |
178,013 | 182,546 | 175,960 | 343,938 | 271,015 | |||||||||||||||
| Industrial |
292,036 | 292,789 | 251,212 | 546,603 | 476,015 | |||||||||||||||
| Governmental |
7,453 | 7,251 | 7,341 | 14,572 | 11,120 | |||||||||||||||
| Total Retail Fuel Revenues |
664,049 | 676,449 | 611,996 | 1,250,184 | 1,035,255 | |||||||||||||||
| SOURCES OF ENERGY (GWh) |
||||||||||||||||||||
| Net Generation: |
||||||||||||||||||||
| Gas & Oil |
3,547 | 2,533 | 1,705 | 1,951 | REFER TO PAGE 40 | |||||||||||||||
| Coal |
2,605 | 2,535 | 2,472 | 2,615 | ||||||||||||||||
| Nuclear |
7,686 | 8,363 | 7,836 | 6,334 | ||||||||||||||||
| Hydro |
- | - | - | - | ||||||||||||||||
| Total Net Generation |
13,838 | 13,431 | 12,013 | 10,900 | ||||||||||||||||
| Purchased Power: |
||||||||||||||||||||
| Affiliated Companies |
6,446 | 7,021 | 6,768 | 7,725 | ||||||||||||||||
| Non-affiliated Companies |
10,007 | 10,437 | 9,720 | 9,607 | ||||||||||||||||
| Total Purchased Power |
16,453 | 17,458 | 16,488 | 17,332 | ||||||||||||||||
| Total Sources of Energy |
30,291 | 30,889 | 28,501 | 28,232 | ||||||||||||||||
| USES OF ENERGY (GWh) |
||||||||||||||||||||
| Electric Energy Sales: |
||||||||||||||||||||
| Residential |
5,383 | 5,538 | 5,090 | 4,888 | 4,934 | |||||||||||||||
| Commercial |
5,239 | 5,274 | 5,058 | 4,973 | 4,895 | |||||||||||||||
| Industrial |
9,041 | 8,801 | 7,601 | 8,416 | 9,101 | |||||||||||||||
| Governmental |
222 | 210 | 213 | 215 | 204 | |||||||||||||||
| Total Retail |
19,885 | 19,823 | 17,962 | 18,492 | 19,134 | |||||||||||||||
| Sales for Resale |
9,608 | 10,221 | 9,630 | 9,014 | REFER TO PAGE 40 | |||||||||||||||
| Unbilled Energy |
(39 | ) | (51 | ) | 149 | (138 | ) | |||||||||||||
| Total Electric Energy Sales |
29,454 | 29,993 | 27,741 | 27,368 | ||||||||||||||||
| Line Losses and Company Usage |
837 | 896 | 760 | 864 | ||||||||||||||||
| Total Uses of Energy |
30,291 | 30,889 | 28,501 | 28,232 | ||||||||||||||||
| AVERAGE ELECTRIC REVENUE (cents/KWh) |
||||||||||||||||||||
| Residential |
8.90 | 9.00 | 7.73 | 11.32 | 10.09 | |||||||||||||||
| Commercial |
7.95 | 8.08 | 7.00 | 10.46 | 9.25 | |||||||||||||||
| Industrial |
5.42 | 5.56 | 5.04 | 7.99 | 6.82 | |||||||||||||||
| Governmental |
9.43 | 9.69 | 8.27 | 11.61 | 10.64 | |||||||||||||||
| NUMBER OF RETAIL ELECTRIC CUSTOMERS |
||||||||||||||||||||
| (as of December 31) |
||||||||||||||||||||
| Residential |
328,718 | 326,497 | 324,285 | 320,745 | 317,001 | |||||||||||||||
| Commercial |
50,277 | 49,886 | 49,319 | 48,636 | 47,749 | |||||||||||||||
| Industrial |
3,278 | 3,265 | 3,436 | 3,761 | 4,320 | |||||||||||||||
| Governmental |
1,615 | 1,627 | 1,652 | 1,666 | 1,642 | |||||||||||||||
| Total Retail Customers |
383,888 | 381,275 | 378,692 | 374,808 | 370,712 | |||||||||||||||
| (a) | Effective December 31, 2007, Entergy Gulf States, Inc. completed a jurisdictional separation into two vertically integrated utility companies, one operating under the sole retail jurisdiction of the PUCT, Entergy Texas, Inc., and the other operating under the sole retail jurisdiction of the LPSC, Entergy Gulf States Louisiana, L.L.C., Entergy Gulf States Louisiana, L.L.C. is the successor for financial reporting purposes to Entergy Gulf States, Inc. Certain historical data by separate company is unavailable. Page 40 reflects historical data prior to the separation. |
Totals may not foot due to rounding.
41
UTILITY STATISTICAL INFORMATION
| 2011 | 2010 | 2009 | 2008 | 2007 | ||||||||||||||||
|
|
||||||||||||||||||||
| ELECTRIC OPERATING REVENUES ($ thousands) |
||||||||||||||||||||
| Residential |
638,161 | 558,733 | 533,146 | 606,133 | 544,254 | |||||||||||||||
| Commercial |
368,614 | 320,935 | 336,876 | 416,798 | 364,322 | |||||||||||||||
| Industrial |
351,731 | 305,455 | 332,303 | 489,165 | 414,036 | |||||||||||||||
| Governmental |
25,955 | 22,527 | 22,797 | 26,872 | 23,583 | |||||||||||||||
|
|
||||||||||||||||||||
| Total Retail |
1,384,461 | 1,207,650 | 1,225,122 | 1,538,968 | 1,346,195 | |||||||||||||||
|
|
||||||||||||||||||||
| Sales for Resale |
336,555 | 449,233 | 303,682 | 441,314 | REFER TO PAGE 40 | |||||||||||||||
| Other |
36,183 | 33,548 | 35,019 | 31,976 | ||||||||||||||||
|
|
||||||||||||||||||||
| Total Electric Operating Revenues |
1,757,199 | 1,690,431 | 1,563,823 | 2,012,258 | ||||||||||||||||
|
|
||||||||||||||||||||
| FUEL REVENUES (included in above revenues) |
||||||||||||||||||||
| Residential |
231,058 | 228,693 | 250,230 | 328,397 | 281,118 | |||||||||||||||
| Commercial |
166,223 | 164,098 | 186,662 | 255,759 | 213,574 | |||||||||||||||
| Industrial |
214,474 | 210,357 | 229,164 | 363,208 | 298,219 | |||||||||||||||
| Governmental |
10,836 | 10,333 | 11,479 | 15,446 | 12,946 | |||||||||||||||
|
|
||||||||||||||||||||
| Total Retail Fuel Revenues |
622,591 | 613,481 | 677,535 | 962,810 | 805,857 | |||||||||||||||
|
|
||||||||||||||||||||
| SOURCES OF ENERGY (GWh) |
||||||||||||||||||||
| Net Generation: |
||||||||||||||||||||
| Gas & Oil |
6,521 | 6,355 | 6,184 | 6,046 | REFER TO PAGE 40 | |||||||||||||||
| Coal |
1,925 | 1,874 | 1,827 | 1,933 | ||||||||||||||||
| Nuclear |
- | - | - | - | ||||||||||||||||
| Hydro |
- | - | - | - | ||||||||||||||||
|
|
||||||||||||||||||||
| Total Net Generation |
8,446 | 8,229 | 8,011 | 7,979 | ||||||||||||||||
|
|
||||||||||||||||||||
| Purchased Power: |
||||||||||||||||||||
| Affiliated Companies |
6,546 | 7,537 | 6,349 | 5,696 | ||||||||||||||||
| Non-affiliated Companies |
8,159 | 6,478 | 6,034 | 6,530 | ||||||||||||||||
|
|
||||||||||||||||||||
| Total Purchased Power |
14,705 | 14,016 | 12,383 | 12,226 | ||||||||||||||||
|
|
||||||||||||||||||||
| Total Sources of Energy |
23,151 | 22,245 | 20,394 | 20,205 | ||||||||||||||||
|
|
||||||||||||||||||||
| USES OF ENERGY (GWh) |
||||||||||||||||||||
| Electric Energy Sales: |
||||||||||||||||||||
| Residential |
6,034 | 5,958 | 5,453 | 5,245 | 5,280 | |||||||||||||||
| Commercial |
4,433 | 4,271 | 4,165 | 4,092 | 4,085 | |||||||||||||||
| Industrial |
6,102 | 5,642 | 5,570 | 5,948 | 5,911 | |||||||||||||||
| Governmental |
294 | 271 | 258 | 248 | 246 | |||||||||||||||
|
|
||||||||||||||||||||
| Total Retail |
16,863 | 16,142 | 15,446 | 15,533 | 15,522 | |||||||||||||||
|
|
||||||||||||||||||||
| Sales for Resale |
5,416 | 5,058 | 3,861 | 3,858 | REFER TO PAGE 40 | |||||||||||||||
|
|
||||||||||||||||||||
| Unbilled Energy |
(11 | ) | 10 | 104 | (64 | ) | ||||||||||||||
|
|
||||||||||||||||||||
| Total Electric Energy Sales |
22,268 | 21,210 | 19,411 | 19,327 | ||||||||||||||||
|
|
||||||||||||||||||||
| Line Losses and Company Usage |
883 | 1,035 | 983 | 878 | ||||||||||||||||
|
|
||||||||||||||||||||
| Total Uses of Energy |
23,151 | 22,245 | 20,394 | 20,205 | ||||||||||||||||
|
|
||||||||||||||||||||
| AVERAGE ELECTRIC REVENUE (cents/KWh) |
||||||||||||||||||||
| Residential |
10.58 | 9.38 | 9.78 | 11.56 | 10.31 | |||||||||||||||
| Commercial |
8.32 | 7.51 | 8.09 | 10.19 | 8.92 | |||||||||||||||
| Industrial |
5.76 | 5.41 | 5.97 | 8.22 | 7.00 | |||||||||||||||
| Governmental |
8.83 | 8.31 | 8.84 | 10.84 | 9.63 | |||||||||||||||
|
|
||||||||||||||||||||
| NUMBER OF RETAIL ELECTRIC CUSTOMERS |
||||||||||||||||||||
| (as of December 31) |
||||||||||||||||||||
| Residential |
360,909 | 356,999 | 352,682 | 346,533 | 344,704 | |||||||||||||||
| Commercial |
44,760 | 44,080 | 43,375 | 42,005 | 41,963 | |||||||||||||||
| Industrial |
4,809 | 4,815 | 4,896 | 4,532 | 4,934 | |||||||||||||||
| Governmental |
2,248 | 2,213 | 2,159 | 2,112 | 2,085 | |||||||||||||||
|
|
||||||||||||||||||||
| Total Retail Customers |
412,726 | 408,107 | 403,112 | 395,182 | 393,686 | |||||||||||||||
| (a) | Effective December 31, 2007, Entergy Gulf States, Inc. completed a jurisdictional separation into two vertically integrated utility companies, one operating under the sole retail jurisdiction of the PUCT, Entergy Texas, Inc., and the other operating under the sole retail jurisdiction of the LPSC, Entergy Gulf States Louisiana, L.L.C., Entergy Gulf States Louisiana, L.L.C. is the successor for financial reporting purposes to Entergy Gulf States, Inc. Certain historical data by separate company is unavailable. Page 40 reflects historical data prior to the separation. |
Totals may not foot due to rounding.
42
UTILITY STATISTICAL INFORMATION
ENTERGY GULF STATES LOUISIANA, L.L.C.
GENERATION PORTFOLIO
| PLANT AVG BTU PER KWH |
TOTAL PLANT – 2011 | |||||||||||||||||||||||||||||||||||||||||||||
| COMMER- | OWNED & | Emissions | NET | EXPEN- | TOTAL |
|||||||||||||||||||||||||||||||||||||||||
| PLANT | UNIT | OWNER- SHIP |
CIAL OPER- ATION |
LEASED CAPABILITY (MW)(a) |
FUEL TYPE |
PURPOSE | NET GENER- ATION |
SO2 (tons) |
NOx (tons) |
CO2 (tons) |
Hg(b) (lbs) |
TECHNOLOGY(c) | GENER- ATION (MWH) |
SES PER NET MWH |
PRODUCTION EXPENSE ($000) |
|||||||||||||||||||||||||||||||
| LA Station 2 (d) |
10 | 100% | 1950 | - | Gas | Reserve | - | - | - | - | - | - | - | - | 427 | |||||||||||||||||||||||||||||||
| 11 | 100% | 1950 | - | Gas | Reserve | - | - | - | - | - | ||||||||||||||||||||||||||||||||||||
| 12 | 100% | 1953 | - | Gas | Reserve | - | - | - | - | - | ||||||||||||||||||||||||||||||||||||
| Willow Glen |
1 | 100% | 1960 | 152 | Gas/Oil | Peaking | 11,500 | 1 | 218 | 172,451 | - | - | 1,419,842 | 58.4 | 82,961 | |||||||||||||||||||||||||||||||
| 2 | 100% | 1964 | 195 | Gas/Oil | Peaking | - | 25 | 20,233 | - | - | ||||||||||||||||||||||||||||||||||||
| 3 | 100% | 1968 | - | Gas | Reserve | - | - | - | - | ESP | ||||||||||||||||||||||||||||||||||||
| 4 | 100% | 1973 | 470 | Gas/Oil | Peaking | 3 | 1,376 | 626,649 | - | - | ||||||||||||||||||||||||||||||||||||
| 5 | 100% | 1976 | - | Gas/Oil | Reserve | - | - | - | - | - | ||||||||||||||||||||||||||||||||||||
| Roy S. Nelson |
3 | 100% | 1960 | 145 | Gas/Oil | Intermediate | 12,910 | 1 | 281 | 213,883 | - | - | 1,334,041 | 61.9 | 82,612 | |||||||||||||||||||||||||||||||
| 4 | 100% | 1970 | 450 | Gas/Oil | Intermediate | 4 | 832 | 787,838 | - | - | ||||||||||||||||||||||||||||||||||||
| Calcasieu |
1 | 100% | 2000 | 150 | Gas | Peaking | 11,150 | 1 | 67 | 91,225 | - | |
Dry LNB |
|
314,614 | 58.5 | 18,393 | |||||||||||||||||||||||||||||
| 2 | 100% | 2001 | 160 | Gas | Peaking | 1 | 90 | 120,146 | - | |
Dry LNB |
|
||||||||||||||||||||||||||||||||||
| Ouachita |
3 | 100% | 2002 | 258 | Gas | Intermediate | 7,430 | 1 | 32 | 197,403 | - | |
Dry LNB, SCR |
|
478,674 | 41.2 | 19,726 | |||||||||||||||||||||||||||||
| Roy S. Nelson |
6 | 40% | 1982 | 221 | Coal | Base | 10,910 | 5,796 | 1,460 | 1,788,627 | 65 | |
LNB w/ Sep OFA, ESP |
|
1,511,046 | 38.2 | 57,650 | |||||||||||||||||||||||||||||
| Big Cajun 2 |
3 | 24% | 1983 | 142 | Coal | Base | 10,330 | 3,172 | 802 | 1,115,364 | 42 | |
LNB w/ OFA, ESP |
|
1,093,775 | 25.4 | 27,803 | |||||||||||||||||||||||||||||
| River Bend |
1 | 100%(e) |
1986 | 974 | Nuclear BWR(f) |
Base | 10,769 | - | - | - | - | - | 7,686,445 | 24.5 | 188,286 | |||||||||||||||||||||||||||||||
| Total |
3,317 | 13,838,437 | 34.5 | 477,857 | ||||||||||||||||||||||||||||||||||||||||||
| (a) | Owned and Leased Capability is the dependable load carrying capability as demonstrated under actual operating conditions based on the primary fuel (assuming no curtailments) that each station was designed to utilize. |
| (b) | Mercury emissions calculated using 2011 unit heat input and 3.92 x 10⁻⁶ lb hg/MMBtu emissiom rate for coal plants and 8.0 x 10⁻¹⁰ lb hg/MMBtu emission rate for natural gas plants. |
| (c) | Installed NOx and particulate matter emission control devices: Combustion Modification/ Fuel Reburning (Combus Mod / Fuel Reburn), Dry Low NOx Burners (Dry LNB), Electrostatic Precipitator (ESP), Low Nox Burners with Closed-coupled Overfire Air (LNB w/ Closed-coupled OFA), Low NOx Burners with Separated Overfire Air (LNB w/ Sep OFA), Low NOx Burner with Overfire Air (LNB w/ OFA), Overfire Air (OFA), Selective Catalytic Reduction (SCR) or Steam Injection. Currently have no SO2, CO2 or Mercury Control equipment operating on any unit. |
| (d) | EGSL also owns and operates LA Station 1 units 1a, 2a, 3a and 4a; these units are under a long-term contract with an external 3rd party, which owns all of the output of these units. |
| (e) | 30% of River Bend is not subject to rate regulation by the Public Utility Commission of Texas, the Louisiana Public Service Commission, nor various municipal authorities. |
| (f) | BWR = Boiling Water Reactor. |
Calculations may differ due to rounding.
ENTERGY TEXAS, INC.
GENERATION PORTFOLIO
| PLANT AVG BTU PER KWH |
TOTAL PLANT – 2011 | |||||||||||||||||||||||||||||||||||||||||||
| COMMER- | OWNED & | Emissions | NET | EXPEN- | TOTAL |
|||||||||||||||||||||||||||||||||||||||
| PLANT | UNIT | OWNER- SHIP |
CIAL OPER- ATION |
LEASED CAPABILITY (MW)(a) |
FUEL TYPE |
PURPOSE | NET GENER- ATION |
SO2 (tons) |
NOx (tons) |
CO2 (tons) |
Hg(b) (lbs) |
TECHNOLOGY(c) | GENER- ATION (MWH) |
SES PER NET MWH |
PRODUCTION EXPENSE ($000) |
|||||||||||||||||||||||||||||
| Roy S. Nelson |
6 | 30% | 1982 | 164 | Coal | Base | 10,910 | 4,283 | 1,079 | 1,322,028 | 48 | LNB w/ Sep OFA, ESP |
1,116,859 | 38.9 | 43,403 | |||||||||||||||||||||||||||||
| Big Cajun 2 |
3 | 18% | 1983 | 105 | Coal | Base | 10,320 | 2,345 | 593 | 824,399 | 31 | LNB w/ OFA, ESP |
808,443 | 25.3 | 20,491 | |||||||||||||||||||||||||||||
| Lewis Creek |
1 | 100% | 1970 | 230 | Gas/Oil | Intermediate | 11,360 | 4 | 92 | 689,325 | - | SCR | 1,719,362 | 54.4 | 93,556 | |||||||||||||||||||||||||||||
| 2 | 100% | 1971 | 230 | Gas/Oil | Intermediate | 3 | 85 | 509,486 | - | SCR | ||||||||||||||||||||||||||||||||||
| Sabine |
1 | 100% | 1962 | 212 | Gas/Oil | Intermediate | 11,370 | 2 | 661 | 451,190 | - | - | 4,801,434 | 53.2 | 255,630 | |||||||||||||||||||||||||||||
| 2 | 100% | 1962 | 212 | Gas/Oil | Intermediate | 2 | 518 | 347,665 | - | - | ||||||||||||||||||||||||||||||||||
| 3 | 100% | 1966 | 390 | Gas/Oil | Intermediate | 3 | 679 | 569,384 | - | LNB w/ Sep OFA |
||||||||||||||||||||||||||||||||||
| 4 | 100% | 1974 | 525 | Gas | Intermediate | 7 | 1,406 | 1,310,391 | - | Combus Mod / Fuel Reburn |
||||||||||||||||||||||||||||||||||
| 5 | 100% | 1979 | 470 | Gas/Oil | Intermediate | 2 | 309 | 453,663 | - | LNB w/ Closed- coupled OFA |
||||||||||||||||||||||||||||||||||
| Total |
2,538 | 8,446,097 | 48.9 | 413,080 | ||||||||||||||||||||||||||||||||||||||||
| (a) | Owned and Leased Capability is the dependable load carrying capability as demonstrated under actual operating conditions based on the primary fuel (assuming no curtailments) that each station was designed to utilize. |
| (b) | Mercury emissions calculated using 2011 unit heat input and 3.92 x 10⁻⁶ lb hg/MMBtu emissiom rate for coal plants and 8.0 x 10⁻¹⁰ lb hg/MMBtu emission rate for natural gas plants. |
| (c) | Installed NOx and particulate matter emission control devices: Combustion Modification/ Fuel Reburning (Combus Mod / Fuel Reburn), Dry Low NOx Burners (Dry LNB), Electrostatic Precipitator (ESP), Low Nox Burners with Closed-coupled Overfire Air (LNB w/ Closed-coupled OFA), Low NOx Burners with Separated Overfire Air (LNB w/ Sep OFA), Low NOx Burner with Overfire Air (LNB w/ OFA), Overfire Air (OFA), Selective Catalytic Reduction (SCR) or Steam Injection. Currently have no SO2, CO2 or Mercury Control equipment operating on any unit. |
Calculations may differ due to rounding.
43
UTILITY STATISTICAL INFORMATION
| 2011 | 2010 | 2009 | 2008 | 2007 | ||||||||||||||||
|
|
||||||||||||||||||||
| ELECTRIC OPERATING REVENUES ($ thousands) |
||||||||||||||||||||
| Residential |
829,663 | 840,011 | 669,084 | 967,445 | 853,780 | |||||||||||||||
| Commercial |
549,142 | 543,308 | 456,274 | 659,880 | 578,025 | |||||||||||||||
| Industrial |
867,491 | 817,454 | 664,377 | 1,061,887 | 871,853 | |||||||||||||||
| Governmental |
41,900 | 42,124 | 35,760 | 51,064 | 43,550 | |||||||||||||||
| Total Retail |
2,288,196 | 2,242,897 | 1,825,495 | 2,740,276 | 2,347,208 | |||||||||||||||
| Sales for Resale |
145,009 | 225,011 | 256,596 | 261,218 | 318,001 | |||||||||||||||
| Other |
75,710 | 70,858 | 101,495 | 49,800 | 72,343 | |||||||||||||||
| Total Electric Operating Revenues |
2,508,915 | 2,538,766 | 2,183,586 | 3,051,294 | 2,737,552 | |||||||||||||||
| FUEL REVENUES (included in above revenues) |
||||||||||||||||||||
| Residential |
332,827 | 360,847 | 287,909 | 530,363 | 415,883 | |||||||||||||||
| Commercial |
218,649 | 231,104 | 194,759 | 358,257 | 280,200 | |||||||||||||||
| Industrial |
535,592 | 523,895 | 435,112 | 780,147 | 614,448 | |||||||||||||||
| Governmental |
16,595 | 18,067 | 15,388 | 27,782 | 21,305 | |||||||||||||||
| Total Retail Fuel Revenues |
1,103,663 | 1,133,913 | 933,168 | 1,696,549 | 1,331,836 | |||||||||||||||
| SOURCES OF ENERGY (GWh) |
||||||||||||||||||||
| Net Generation: |
||||||||||||||||||||
| Gas & Oil |
10,506 | 9,429 | 7,090 | 8,930 | 8,784 | |||||||||||||||
| Coal |
- | - | - | - | - | |||||||||||||||
| Nuclear |
8,929 | 10,276 | 8,949 | 9,037 | 9,893 | |||||||||||||||
| Hydro |
- | - | - | - | - | |||||||||||||||
| Total Net Generation |
19,435 | 19,705 | 16,039 | 17,967 | 18,677 | |||||||||||||||
| Purchased Power: |
||||||||||||||||||||
| Affiliated Companies |
7,484 | 5,783 | 7,818 | 5,996 | 6,025 | |||||||||||||||
| Non-affiliated Companies |
8,682 | 9,614 | 7,644 | 7,511 | 7,484 | |||||||||||||||
| Total Purchased Power |
16,166 | 15,397 | 15,462 | 13,507 | 13,509 | |||||||||||||||
| Total Sources of Energy |
35,601 | 35,102 | 31,501 | 31,474 | 32,186 | |||||||||||||||
| USES OF ENERGY (GWh) |
||||||||||||||||||||
| Electric Energy Sales: |
||||||||||||||||||||
| Residential |
9,303 | 9,533 | 8,684 | 8,487 | 8,646 | |||||||||||||||
| Commercial |
6,155 | 6,164 | 5,867 | 5,784 | 5,848 | |||||||||||||||
| Industrial |
15,813 | 14,473 | 13,386 | 13,162 | 13,209 | |||||||||||||||
| Governmental |
473 | 479 | 459 | 459 | 446 | |||||||||||||||
| Total Retail |
31,744 | 30,649 | 28,396 | 27,892 | 28,149 | |||||||||||||||
| Sales for Resale |
2,330 | 2,961 | 1,621 | 2,233 | 2,411 | |||||||||||||||
| Unbilled Energy |
38 | 27 | 164 | (118 | ) | 124 | ||||||||||||||
| Total Electric Energy Sales |
34,112 | 33,637 | 30,181 | 30,007 | 30,684 | |||||||||||||||
| Line Losses and Company Usage |
1,489 | 1,465 | 1,320 | 1,467 | 1,502 | |||||||||||||||
| Total Uses of Energy |
35,601 | 35,102 | 31,501 | 31,474 | 32,186 | |||||||||||||||
| AVERAGE ELECTRIC REVENUE (cents/KWh) |
||||||||||||||||||||
| Residential |
8.92 | 8.81 | 7.70 | 11.40 | 9.87 | |||||||||||||||
| Commercial |
8.92 | 8.81 | 7.78 | 11.41 | 9.88 | |||||||||||||||
| Industrial |
5.49 | 5.65 | 4.96 | 8.07 | 6.60 | |||||||||||||||
| Governmental |
8.86 | 8.79 | 7.79 | 11.13 | 9.76 | |||||||||||||||
| NUMBER OF RETAIL ELECTRIC CUSTOMERS |
||||||||||||||||||||
| (as of December 31) |
||||||||||||||||||||
| Residential |
580,627 | 578,466 | 575,388 | 571,301 | 568,893 | |||||||||||||||
| Commercial |
76,130 | 75,493 | 74,608 | 73,617 | 73,012 | |||||||||||||||
| Industrial |
6,908 | 6,971 | 7,247 | 7,592 | 8,374 | |||||||||||||||
| Governmental |
5,767 | 5,704 | 5,539 | 5,387 | 5,229 | |||||||||||||||
| Total Retail Customers |
669,432 | 666,634 | 662,782 | 657,897 | 655,508 | |||||||||||||||
Totals may not foot due to rounding.
44
UTILITY STATISTICAL INFORMATION
ENTERGY LOUISIANA, LLC
GENERATION PORTFOLIO
| COMMER- CIAL OPER- ATION |
OWNED & LEASED CAPABILITY (MW)(a) |
PLANT AVG BTU PER KWH NET GENER- ATION |
TOTAL PLANT – 2011 | |||||||||||||||||||||||||||||||||||
| Emissions | NET GENER- ATION (MWH) |
EXPEN- SES PER MWH |
TOTAL PRODUCTION EXPENSE ($000) |
|||||||||||||||||||||||||||||||||||
| PLANT | UNIT | OWNER- SHIP |
FUEL TYPE |
PURPOSE |
SO2 (tons) |
NOx (tons) |
CO2 (tons) |
Hg(b) (lbs) |
TECHNOLOGY(c) |
|||||||||||||||||||||||||||||
| Acadia |
2 | 100% | 2002 | 578 | Gas | Intermediate | 7,540 | 2 | 37 | 417,816 | - | SCR | 1,243,351 | 41.9 | 52,034 | |||||||||||||||||||||||
| Buras |
8 | 100% | 1971 | 12 | Gas/Oil | Peaking | 35,980 | - | - | - | - | - | 9,813 | 336.2 | 3,299 | |||||||||||||||||||||||
| Little Gypsy |
1 | 100% | 1961 | 238 | Gas/Oil | Intermediate | 12,620 | 1 | 378 | 217,713 | - | - | 1,797,288 | 71.8 | 128,961 | |||||||||||||||||||||||
| 2 | 100% | 1966 | 410 | Gas/Oil | Intermediate | 2 | 365 | 404,604 | - | - | ||||||||||||||||||||||||||||
| 3 | 100% | 1969 | 522 | Gas/Oil | Intermediate | 3 | 2,086 | 636,336 | - | - | ||||||||||||||||||||||||||||
| Monroe |
10 | 100% | 1961 | - | Gas | Retired(e) | - | - | - | - | - | - | - | - | - | |||||||||||||||||||||||
| 11 | 100% | 1965 | - | Gas | Retired(e) | - | - | - | - | - | ||||||||||||||||||||||||||||
| 12 | 100% | 1968 | - | Gas | Retired(e) | - | - | - | - | - | ||||||||||||||||||||||||||||
| Ninemile Point |
1 | 100% | 1951 | - | Gas/Oil | Retired(f) | 10,930 | - | 1 | 1,906 | - | - | 4,439,683 | 53.9 | 239,394 | |||||||||||||||||||||||
| 2 | 100% | 1953 | - | Gas/Oil | Retired(f) | - | - | - | - | - | ||||||||||||||||||||||||||||
| 3 | 100% | 1955 | 125 | Gas/Oil | Intermediate | 1 | 212 | 154,719 | - | - | ||||||||||||||||||||||||||||
| 4 | 100% | 1971 | 500 | Gas/Oil | Intermediate | 6 | 2,531 | 1,104,973 | - | - | ||||||||||||||||||||||||||||
| 5 | 100% | 1973 | 740 | Gas/Oil | Intermediate | 8 | 3,731 | 1,606,035 | - | - | ||||||||||||||||||||||||||||
| Perryville |
1 | 100% | 2002 | 535 | Gas | Intermediate | 7,360 | 4 | 113 | 882,309 | - | Dry LNB, SCR | 1,948,323 | 41.3 | 80,532 | |||||||||||||||||||||||
| 2 | 100% | 2001 | 156 | Gas | Peaking | - | 1 | 1,876 | - | Dry LNB | ||||||||||||||||||||||||||||
| Sterlington |
6 | 100% | 1958 | - | Gas/Oil | Reserve | 13,160 | - | - | - | - | - | 23,109 | 167.4 | 3,868 | |||||||||||||||||||||||
| 7 | 100% | 1974 | 174 | Gas/Oil | Peaking | 1 | 53 | 17,247 | - | - | ||||||||||||||||||||||||||||
| Waterford |
1 | 100% | 1975 | 411 | Gas/Oil | Intermediate | 13,450 | 69 | 333 | 354,835 | - | - | 1,044,471 | 79.7 | 83,271 | |||||||||||||||||||||||
| 2 | 100% | 1975 | 411 | Gas/Oil | Intermediate | 45 | 453 | 488,524 | - | - | ||||||||||||||||||||||||||||
| 4 | 100% | 2009 | 31 | Oil | Peaking | - | - | 1 | 1,139 | - | Steam Injection | - | - | - | ||||||||||||||||||||||||
| Waterford |
3 | 100% | 1985 | 1,159 | Nuclear PWR(d) |
Base | 10,898 | - | - | - | - | - | 8,928,530 | 22.5 | 201,083 | |||||||||||||||||||||||
| Total |
6,002 | 19,434,568 | 40.8 | 792,442 | ||||||||||||||||||||||||||||||||||
| (a) | Owned and Leased Capability is the dependable load carrying capability as demonstrated under actual operating conditions based on the primary fuel (assuming no curtailments) that each station was designed to utilize. |
| (b) | Mercury emissions calculated using 2011 unit heat input and 3.92 x 10⁻⁶ lb hg/MMBtu emissiom rate for coal plants and 8.0 x 10⁻¹⁰ lb hg/MMBtu emission rate for natural gas plants. |
| (c) | Installed NOx and particulate matter emission control devices: Combustion Modification/ Fuel Reburning (Combus Mod / Fuel Reburn), Dry Low NOx Burners (Dry LNB), Electrostatic Precipitator (ESP), Low Nox Burners with Closed-coupled Overfire Air (LNB w/ Closed-coupled OFA), Low NOx Burners with Separated Overfire Air (LNB w/ Sep OFA), Low NOx Burner with Overfire Air (LNB w/ OFA), Overfire Air (OFA), Selective Catalytic Reduction (SCR) or Steam Injection. Currently have no SO2, CO2 or Mercury Control equipment operating on any unit. |
| (d) | PWR = Pressurized Water Reactor. |
| (e) | Monroe Units 10, 11 & 12 were officially retired on October 14, 2011. |
| (f) | Ninemile Point Units 1 & 2 were officially retired on September 23, 2011. |
Calculations may differ due to rounding.
45
UTILITY STATISTICAL INFORMATION
| 2011 | 2010 | 2009 | 2008 | 2007 | ||||||||||||||||
| ELECTRIC OPERATING REVENUES ($ thousands) |
||||||||||||||||||||
| Residential |
490,088 | 508,571 | 466,632 | 555,913 | 500,097 | |||||||||||||||
| Commercial |
401,276 | 405,577 | 395,444 | 481,878 | 427,545 | |||||||||||||||
| Industrial |
145,792 | 144,581 | 146,608 | 199,453 | 185,119 | |||||||||||||||
| Governmental |
37,302 | 37,754 | 37,740 | 44,336 | 40,417 | |||||||||||||||
| Total Retail |
1,074,458 | 1,096,483 | 1,046,424 | 1,281,580 | 1,153,178 | |||||||||||||||
| Sales for Resale |
131,334 | 87,670 | 79,408 | 131,270 | 172,919 | |||||||||||||||
| Other |
60,678 | 48,769 | 54,275 | 51,849 | 47,914 | |||||||||||||||
| Total Electric Operating Revenues |
1,266,470 | 1,232,922 | 1,180,107 | 1,464,699 | 1,374,011 | |||||||||||||||
| FUEL REVENUES (included in above revenues) |
||||||||||||||||||||
| Residential |
181,581 | 177,354 | 179,338 | 281,916 | 215,446 | |||||||||||||||
| Commercial |
154,748 | 145,950 | 158,937 | 252,867 | 192,289 | |||||||||||||||
| Industrial |
69,808 | 63,696 | 70,679 | 121,026 | 100,293 | |||||||||||||||
| Governmental |
12,861 | 12,031 | 13,614 | 21,352 | 16,605 | |||||||||||||||
| Total Retail Fuel Revenues |
418,998 | 399,031 | 422,568 | 677,161 | 524,633 | |||||||||||||||
| SOURCES OF ENERGY (GWh) |
||||||||||||||||||||
| Net Generation: |
||||||||||||||||||||
| Gas & Oil |
5,978 | 5,469 | 3,583 | 5,257 | 5,734 | |||||||||||||||
| Coal |
2,749 | 2,974 | 2,847 | 2,827 | 3,026 | |||||||||||||||
| Nuclear |
- | - | - | - | - | |||||||||||||||
| Hydro |
- | - | - | - | - | |||||||||||||||
| Total Net Generation |
8,727 | 8,443 | 6,430 | 8,084 | 8,760 | |||||||||||||||
| Purchased Power: |
||||||||||||||||||||
| Affiliated Companies |
5,080 | 5,467 | 6,127 | 4,903 | 4,602 | |||||||||||||||
| Non-affiliated Companies |
1,524 | 1,607 | 1,752 | 2,083 | 2,706 | |||||||||||||||
| Total Purchased Power |
6,604 | 7,074 | 7,879 | 6,986 | 7,308 | |||||||||||||||
| Total Sources of Energy |
15,331 | 15,517 | 14,309 | 15,070 | 16,068 | |||||||||||||||
| USES OF ENERGY (GWh) |
||||||||||||||||||||
| Electric Energy Sales: |
||||||||||||||||||||
| Residential |
5,848 | 6,077 | 5,358 | 5,354 | 5,474 | |||||||||||||||
| Commercial |
4,985 | 5,000 | 4,756 | 4,841 | 4,872 | |||||||||||||||
| Industrial |
2,326 | 2,250 | 2,178 | 2,565 | 2,771 | |||||||||||||||
| Governmental |
415 | 416 | 405 | 411 | 421 | |||||||||||||||
| Total Retail |
13,574 | 13,743 | 12,697 | 13,171 | 13,538 | |||||||||||||||
| Sales for Resale |
763 | 670 | 528 | 935 | 1,493 | |||||||||||||||
| Unbilled Energy |
(69 | ) | (18 | ) | 74 | 23 | (22 | ) | ||||||||||||
| Total Electric Energy Sales |
14,268 | 14,395 | 13,299 | 14,129 | 15,009 | |||||||||||||||
| Line Losses and Company Usage |
1,063 | 1,122 | 1,010 | 941 | 1,059 | |||||||||||||||
| Total Uses of Energy |
15,331 | 15,517 | 14,309 | 15,070 | 16,068 | |||||||||||||||
| AVERAGE ELECTRIC REVENUE (cents/KWh) |
||||||||||||||||||||
| Residential |
8.38 | 8.37 | 8.71 | 10.38 | 9.14 | |||||||||||||||
| Commercial |
8.05 | 8.11 | 8.31 | 9.95 | 8.78 | |||||||||||||||
| Industrial |
6.27 | 6.43 | 6.73 | 7.78 | 6.68 | |||||||||||||||
| Governmental |
8.99 | 9.08 | 9.32 | 10.79 | 9.60 | |||||||||||||||
| NUMBER OF RETAIL ELECTRIC CUSTOMERS |
||||||||||||||||||||
| (as of December 31) |
||||||||||||||||||||
| Residential |
366,697 | 366,722 | 365,804 | 362,649 | 361,725 | |||||||||||||||
| Commercial |
62,762 | 62,858 | 62,613 | 62,556 | 63,642 | |||||||||||||||
| Industrial |
3,488 | 3,450 | 2,749 | 2,827 | 3,109 | |||||||||||||||
| Governmental |
4,358 | 4,322 | 4,259 | 4,208 | 4,096 | |||||||||||||||
| Total Retail Customers |
437,305 | 437,352 | 435,425 | 432,240 | 432,572 | |||||||||||||||
Totals may not foot due to rounding.
46
UTILITY STATISTICAL INFORMATION
ENTERGY MISSISSIPPI, INC.
GENERATION PORTFOLIO
| OWNED & LEASED CAPABILITY (MW)(a) |
PLANT AVG BTU PER KWH |
TOTAL PLANT – 2011 | ||||||||||||||||||||||||||||||||||
| COMMER- CIAL OPER- ATION |
Emissions | NET GENER- ATION (MWH) |
EXPEN- SES PER NET MWH |
TOTAL PRODUCTION EXPENSE ($000) |
||||||||||||||||||||||||||||||||
| PLANT | UNIT | OWNER- SHIP |
FUEL TYPE | PURPOSE | NET GENER- ATION |
SO2 (tons) |
NOx (tons) |
CO2 (tons) |
Hg(b) (lbs) |
TECHNOLOGY(c) | ||||||||||||||||||||||||||
| Attala |
1 | 100% | 2001 | 455 | Gas | Intermediate | 7,310 | 3 | 38 | 547,196 | - | Dry LNB, SCR |
1,526,769 | 43.1 | 65,787 | |||||||||||||||||||||
|
|
||||||||||||||||||||||||||||||||||||
| Baxter Wilson |
1 | 100% | 1967 | 500 | Gas/Oil | Intermediate | 11,860 | 136 | 2,976 | 1,276,005 | - | - | 2,806,390 | 54.9 | 154,070 | |||||||||||||||||||||
| 2 | 100% | 1971 | 676 | Gas/Oil | Intermediate | 5 | 2,676 | 919,365 | - | Combus Mod / Fuel Reburn |
||||||||||||||||||||||||||
|
|
||||||||||||||||||||||||||||||||||||
| Delta |
1 | 100% | 1953 | - | Gas/Oil | Reserve | - | - | - | - | - | - | (416 | ) | (3,047.0 | ) | 1,268 | |||||||||||||||||||
| 2 | 100% | 1953 | - | Gas/Oil | Reserve | - | - | - | - | - | ||||||||||||||||||||||||||
|
|
||||||||||||||||||||||||||||||||||||
| Gerald Andrus |
1 | 100% | 1975 | 712 | Gas/Oil | Intermediate | 11,400 | 5 | 1,599 | 976,255 | - | OFA | 1,468,591 | 56.5 | 83,001 | |||||||||||||||||||||
|
|
||||||||||||||||||||||||||||||||||||
| Natchez |
1 | 100% | 1951 | - | Gas/Oil | Retired(d) | - | - | - | - | - | - | - | - | 2 | |||||||||||||||||||||
|
|
||||||||||||||||||||||||||||||||||||
| Rex Brown |
1 | 100% | 1948 | - | Gas | Retired(e) | 15,670 | - | - | - | - | - | 177,262 | 96.4 | 17,091 | |||||||||||||||||||||
| 3 | 100% | 1951 | 70 | Gas/Oil | Peaking | - | 37 | 32,154 | - | - | ||||||||||||||||||||||||||
| 4 | 100% | 1959 | 209 | Gas/Oil | Intermediate | 1 | 431 | 172,055 | - | - | ||||||||||||||||||||||||||
| 5 | 100% | 1968 | 10 | Oil | Peaking | - | - | - | - | - | ||||||||||||||||||||||||||
|
|
||||||||||||||||||||||||||||||||||||
| Independence |
1 | 25% | 1983 | 209 | Coal | Base | 10,350 | 3,827 | 1,753 | 1,498,915 | 56 | OFA, ESP |
2,748,766 | 24.6 | 67,678 | |||||||||||||||||||||
| 2 | 25% | 1984 | 211 | Coal | Base | 3,773 | 1,599 | 1,475,285 | 55 | OFA, ESP |
||||||||||||||||||||||||||
|
|
||||||||||||||||||||||||||||||||||||
| Total |
3,052 | 8,727,362 | 44.6 | 388,896 | ||||||||||||||||||||||||||||||||
| (a) | Owned and Leased Capability is the dependable load carrying capability as demonstrated under actual operating conditions based on the primary fuel (assuming no curtailments) that each station was designed to utilize. |
| (b) | Mercury emissions calculated using 2011 unit heat input and 3.92 x 10⁻⁶ lb hg/MMBtu emissiom rate for coal plants and 8.0 x 10⁻¹⁰ lb hg/MMBtu emission rate for natural gas plants. |
| (c) | Installed NOx and particulate matter emission control devices: Combustion Modification/ Fuel Reburning (Combus Mod / Fuel Reburn), Dry Low NOx Burners (Dry LNB), Electrostatic Precipitator (ESP), Low Nox Burners with Closed-coupled Overfire Air (LNB w/ Closed-coupled OFA), Low NOx Burners with Separated Overfire Air (LNB w/ Sep OFA), Low NOx Burner with Overfire Air (LNB w/ OFA), Overfire Air (OFA), Selective Catalytic Reduction (SCR) or Steam Injection. Currently have no SO2, CO2 or Mercury Control equipment operating on any unit. |
| (d) | Natchez Unit 1 was officially retired on June 10, 2011. |
| (e) | Rex Brown Unit 1 was officially retired on June 10, 2011. |
Calculations may differ due to rounding.
47
UTILITY STATISTICAL INFORMATION
| 2011 | 2010 | 2009 | 2008 | 2007 | ||||||||||||||||
|
|
||||||||||||||||||||
| ELECTRIC OPERATING REVENUES ($ thousands) |
||||||||||||||||||||
| Residential |
175,994 | 196,391 | 167,794 | 171,584 | 142,497 | |||||||||||||||
| Commercial |
153,824 | 173,536 | 166,454 | 193,552 | 181,438 | |||||||||||||||
| Industrial |
29,800 | 35,826 | 37,225 | 48,378 | 46,697 | |||||||||||||||
| Governmental |
59,840 | 70,146 | 69,306 | 79,973 | 72,467 | |||||||||||||||
|
|
||||||||||||||||||||
| Total Retail |
419,458 | 475,899 | 440,779 | 493,487 | 443,099 | |||||||||||||||
|
|
||||||||||||||||||||
| Sales for Resale |
95,704 | 56,500 | 88,010 | 162,769 | 103,843 | |||||||||||||||
| Other |
14,066 | 10,703 | 7,196 | 16,684 | 10,516 | |||||||||||||||
|
|
||||||||||||||||||||
| Total Electric Operating Revenues |
529,228 | 543,102 | 535,985 | 672,940 | 557,458 | |||||||||||||||
|
|
||||||||||||||||||||
| FUEL REVENUES (included in above revenues) |
||||||||||||||||||||
| Residential |
59,406 | 65,146 | 62,017 | 92,401 | 71,496 | |||||||||||||||
| Commercial |
60,829 | 66,088 | 72,121 | 117,282 | 101,932 | |||||||||||||||
| Industrial |
15,310 | 17,253 | 19,103 | 32,171 | 28,745 | |||||||||||||||
| Governmental |
24,790 | 28,073 | 31,866 | 50,803 | 42,750 | |||||||||||||||
|
|
||||||||||||||||||||
| Total Retail Fuel Revenues |
160,335 | 176,560 | 185,107 | 292,657 | 244,923 | |||||||||||||||
|
|
||||||||||||||||||||
| SOURCES OF ENERGY (GWh) |
||||||||||||||||||||
| Net Generation: |
||||||||||||||||||||
| Gas & Oil |
2,412 | 1,867 | 2,202 | 2,068 | 1,855 | |||||||||||||||
| Coal |
- | - | - | - | - | |||||||||||||||
| Nuclear |
- | - | - | - | - | |||||||||||||||
| Hydro |
- | - | - | - | - | |||||||||||||||
|
|
||||||||||||||||||||
| Total Net Generation |
2,412 | 1,867 | 2,202 | 2,068 | 1,855 | |||||||||||||||
|
|
||||||||||||||||||||
| Purchased Power: |
||||||||||||||||||||
| Affiliated Companies |
3,650 | 3,839 | 3,760 | 3,391 | 3,428 | |||||||||||||||
| Non-affiliated Companies |
489 | 511 | 590 | 687 | 340 | |||||||||||||||
|
|
||||||||||||||||||||
| Total Purchased Power |
4,139 | 4,350 | 4,350 | 4,078 | 3,768 | |||||||||||||||
|
|
||||||||||||||||||||
| Total Sources of Energy |
6,551 | 6,217 | 6,552 | 6,146 | 5,623 | |||||||||||||||
|
|
||||||||||||||||||||
| USES OF ENERGY (GWh) |
||||||||||||||||||||
| Electric Energy Sales: |
||||||||||||||||||||
| Residential |
1,888 | 1,858 | 1,577 | 1,394 | 1,221 | |||||||||||||||
| Commercial |
1,939 | 1,899 | 1,813 | 1,774 | 1,763 | |||||||||||||||
| Industrial |
498 | 503 | 526 | 541 | 568 | |||||||||||||||
| Governmental |
795 | 809 | 805 | 774 | 747 | |||||||||||||||
|
|
||||||||||||||||||||
| Total Retail |
5,120 | 5,069 | 4,721 | 4,483 | 4,299 | |||||||||||||||
|
|
||||||||||||||||||||
| Sales for Resale |
1,186 | 919 | 1,543 | 1,361 | 1,010 | |||||||||||||||
|
|
||||||||||||||||||||
| Unbilled Energy |
(1 | ) | (18 | ) | 29 | 20 | 15 | |||||||||||||
|
|
||||||||||||||||||||
| Total Electric Energy Sales |
6,305 | 5,970 | 6,293 | 5,864 | 5,324 | |||||||||||||||
|
|
||||||||||||||||||||
| Line Losses and Company Usage |
246 | 247 | 259 | 282 | 299 | |||||||||||||||
|
|
||||||||||||||||||||
| Total Uses of Energy |
6,551 | 6,217 | 6,552 | 6,146 | 5,623 | |||||||||||||||
|
|
||||||||||||||||||||
| AVERAGE ELECTRIC REVENUE (cents/KWh) |
||||||||||||||||||||
| Residential |
9.32 | 10.57 | 10.64 | 12.31 | 11.67 | |||||||||||||||
| Commercial |
7.93 | 9.14 | 9.18 | 10.91 | 10.29 | |||||||||||||||
| Industrial |
5.98 | 7.12 | 7.08 | 8.94 | 8.22 | |||||||||||||||
| Governmental |
7.53 | 8.67 | 8.61 | 10.33 | 9.70 | |||||||||||||||
|
|
||||||||||||||||||||
| NUMBER OF RETAIL ELECTRIC CUSTOMERS |
||||||||||||||||||||
| (as of December 31) |
||||||||||||||||||||
| Residential |
142,680 | 138,659 | 132,602 | 124,432 | 115,523 | |||||||||||||||
| Commercial |
13,920 | 14,079 | 13,064 | 12,622 | 12,211 | |||||||||||||||
| Industrial |
2,288 | 2,277 | 2,311 | 2,514 | 2,765 | |||||||||||||||
| Governmental |
1,738 | 2,079 | 1,747 | 1,381 | 1,308 | |||||||||||||||
|
|
||||||||||||||||||||
| Total Retail Customers |
160,626 | 157,094 | 149,724 | 140,949 | 131,807 | |||||||||||||||
Totals may not foot due to rounding.
48
UTILITY STATISTICAL INFORMATION
ENTERGY NEW ORLEANS, INC.
GENERATION PORTFOLIO
| OWNED & LEASED CAPABILITY |
PLANT AVG PER NET ATION |
Emissions | TOTAL PLANT – 2011 | |||||||||||||||||||||||||||||||||||||||||||||||||||||
| NET GENER- ATION |
EXPEN- SES PER NET |
TOTAL PRODUCTION EXPENSE |
||||||||||||||||||||||||||||||||||||||||||||||||||||||
| PLANT | UNIT | OWNER- SHIP |
COMMER- CIAL ATION |
FUEL TYPE |
PURPOSE | SO2 (tons) |
NOx (tons) |
CO2 (tons) |
Hg(b) (lbs) |
TECHNOLOGY(c) | ||||||||||||||||||||||||||||||||||||||||||||||
| A. B. Paterson |
3 | 100 | % | 1950 | - | Gas/Oil | Retired | - | - | - | - | - | - | - | - | 9 | ||||||||||||||||||||||||||||||||||||||||
| 4 | 100 | % | 1954 | - | Gas/Oil | Retired | - | - | - | - | - | |||||||||||||||||||||||||||||||||||||||||||||
| Michoud |
1 | 100 | % | 1957 | - | Gas/Oil | Retired(d) | 11,180 | - | - | 151 | - | - | 2,411,581 | 49.0 | 118,218 | ||||||||||||||||||||||||||||||||||||||||
| 2 | 100 | % | 1963 | 235 | Gas/Oil | Intermediate | 2 | 706 | 409,867 | - | - | |||||||||||||||||||||||||||||||||||||||||||||
| 3 | 100 | % | 1967 | 529 | Gas/Oil | Intermediate | 6 | 1,696 | 1,225,404 | - | |
Combus Mod / Fuel Reburn |
|
|||||||||||||||||||||||||||||||||||||||||||
| A. B. Paterson |
5 | 100 | % | 1967 | - | Oil | Retired | - | - | - | - | - | - | - | - | 3 | ||||||||||||||||||||||||||||||||||||||||
| Total |
764 | 2,411,581 | 49.0 | 118,231 | ||||||||||||||||||||||||||||||||||||||||||||||||||||
| (a) | Owned and Leased Capability is the dependable load carrying capability as demonstrated under actual operating conditions based on the primary fuel (assuming no curtailments) that each station was designed to utilize. |
| (b) | Mercury emissions calculated using 2011 unit heat input and 3.92 x 10⁻⁶ lb hg/MMBtu emissiom rate for coal plants and 8.0 x 10⁻¹⁰ lb hg/MMBtu emission rate for natural gas plants. |
| (c) | Installed NOx and particulate matter emission control devices: Combustion Modification/ Fuel Reburning (Combus Mod / Fuel Reburn), Dry Low NOx Burners (Dry LNB), Electrostatic Precipitator (ESP), Low Nox Burners with Closed-coupled Overfire Air (LNB w/ Closed-coupled OFA), Low NOx Burners with Separated Overfire Air (LNB w/ Sep OFA), Low NOx Burner with Overfire Air (LNB w/ OFA), Overfire Air (OFA), Selective Catalytic Reduction (SCR) or Steam Injection. Currently have no SO2, CO2 or Mercury Control equipment operating on any unit. |
| (d) | Michoud Unit 1 was officially retired on September 23, 2011. |
Calculations may differ due to rounding.
| 2011 | 2010 | 2009 | 2008 | 2007 | ||||||||||||||||
| ELECTRIC OPERATING REVENUES ($ thousands) |
563,411 | 558,584 | 554,007 | 528,998 | 553,193 | |||||||||||||||
| SOURCES OF ENERGY (GWh) |
||||||||||||||||||||
| Net Generation: |
||||||||||||||||||||
| Gas & Oil |
- | - | - | - | - | |||||||||||||||
| Coal |
- | - | - | - | - | |||||||||||||||
| Nuclear |
9,293 | 8,677 | 9,898 | 8,455 | 8,421 | |||||||||||||||
| Hydro |
- | - | - | - | - | |||||||||||||||
| Total Net Generation |
9,293 | 8,677 | 9,898 | 8,455 | 8,421 | |||||||||||||||
| Purchased Power |
- | - | - | - | - | |||||||||||||||
| Total Sources of Energy |
9,293 | 8,677 | 9,898 | 8,455 | 8,421 | |||||||||||||||
| USES OF ENERGY (GWh) |
||||||||||||||||||||
| Electric Energy Sales |
9,293 | 8,692 | 9,898 | 8,475 | 8,440 | |||||||||||||||
| Unbilled Energy |
- | - | - | - | - | |||||||||||||||
| Line Losses and Company Usage |
- | (15 | ) | - | (20 | ) | (19 | ) | ||||||||||||
| Total Uses of Energy |
9,293 | 8,677 | 9,898 | 8,455 | 8,421 | |||||||||||||||
Totals may not foot due to rounding.
SYSTEM ENERGY RESOURCES, INC.
GENERATION PORTFOLIO
| COMMER- CIAL ATION |
OWNED & LEASED CAPABILITY |
PLANT AVG PER NET ATION |
Emissions | TOTAL PLANT – 2011 | ||||||||||||||||||||||||||||||||||||||||||||||||||||||||
| NET GENER- ATION |
EXPEN- SES PER NET |
TOTAL PRODUCTION EXPENSE |
||||||||||||||||||||||||||||||||||||||||||||||||||||||||||
| PLANT | UNIT | OWNER- SHIP |
FUEL TYPE | PURPOSE | SO2 (tons) |
NOx (tons) |
CO2 (tons) |
Hg(b)
(lbs) |
TECHNOLOGY(c) | |||||||||||||||||||||||||||||||||||||||||||||||||||
| Grand Gulf |
1 | 90 | % | 1985 | 1,071 | Nuclear BWR | (d) | Base | 10,415 | - | - | - | - | - | 9,293,410 | 21.1 | 196,375 | |||||||||||||||||||||||||||||||||||||||||||
| Total |
1,071 | 9,293,410 | 21.1 | 196,375 | ||||||||||||||||||||||||||||||||||||||||||||||||||||||||
| (a) | Owned and Leased Capability is the dependable load carrying capability as demonstrated under actual operating conditions based on the primary fuel (assuming no curtailments) that each station was designed to utilize. |
| (b) | Mercury emissions calculated using 2010 unit heat input and 3.92 x 10⁻⁶ lb hg/MMBtu emissiom rate for coal plants and 8.0 x 10⁻¹⁰ lb hg/MMBtu emission rate for natural gas plants. |
| (c) | Installed NOx and particulate matter emission control devices: Combustion Modification/ Fuel Reburning (Combus Mod / Fuel Reburn), Dry Low NOx Burners (Dry LNB), Electrostatic Precipitator (ESP), Low Nox Burners with Closed-coupled Overfire Air (LNB w/ Closed-coupled OFA), Low NOx Burners with Separated Overfire Air (LNB w/ Sep OFA), Low NOx Burner with Overfire Air (LNB w/ OFA), Overfire Air (OFA), Selective Catalytic Reduction (SCR) or Steam Injection. Currently have no SO2, CO2 or Mercury Control equipment operating on any unit. |
| (d) | BWR = Boiling Water Reactor. |
Calculations may differ due to rounding.
49
UTILITY STATISTICAL INFORMATION
UTILITY NUCLEAR PLANT STATISTICS
The following table shows plant performance for 2007 – 2011 based on 18/24 month operating cycle.
| CAPABILITY FACTOR (%) | 2011 | 2010 | 2009 | 2008 | 2007 | |||||
| ANO |
92.1 | 92.3 | 90.9 | 92.6 | 92.8 | |||||
| Grand Gulf |
90.7 | 92.4 | 92.1 | 85.4 | 89.5 | |||||
| River Bend |
93.4 | 92.7 | 94.2 | 81.8 | 88.1 | |||||
| Waterford 3 |
91.4 | 91.4 | 91.4 | 90.6 | 91.5 | |||||
| Entergy Southeast Average |
91.9 | 92.2 | 91.9 | 88.6 | 90.9 | |||||
| Industry Average |
89.3 | 89.3 | 90.2 | 90.7 | 91.1 |
The following table shows plant performance for 2011 and averages for four three-year periods.
| PRODUCTION COST ($/MWh)(a) | 2011 | 2008–2010 | 2007–2009 | 2006–2008 | 2005–2007 | |||||||||||||||
| ANO |
21.1 | 18.5 | 17.2 | 16.3 | 16.0 | |||||||||||||||
| Grand Gulf |
21.1 | 18.8 | 17.7 | 16.6 | 15.3 | |||||||||||||||
| River Bend |
24.5 | 23.4 | 22.9 | 22.4 | 20.1 | |||||||||||||||
| Waterford 3 |
22.5 | 19.3 | 18.1 | 16.9 | 16.7 | |||||||||||||||
| Entergy Southeast Average |
22.0 | 19.6 | 18.5 | 17.5 | 16.7 | |||||||||||||||
| Industry Average |
23.5 | 20.4 | 19.4 | 18.5 | 17.6 | |||||||||||||||
| (a) | Fuel and non-fuel operation and maintenance expenses according to accounting standards that directly relate to the production of electricity per MWh. |
INDIVIDUAL PLANT INFORMATION
| ANO UNIT 1 |
UNIT 2 | GRAND GULF | RIVER BEND | WATERFORD 3 | ||||||||||||||||
| Owner |
Entergy | Entergy | System Energy-90 | % | Entergy | Entergy | ||||||||||||||
| Arkansas | Arkansas | South Mississippi | Gulf States | Louisiana | ||||||||||||||||
| Electric Power | Louisiana | |||||||||||||||||||
| Association-10 | % | |||||||||||||||||||
| Commercial Operation Date |
December 74 | March 80 | July 85 | June 86 | September 85 | |||||||||||||||
| License Expiration Date |
5/20/34 | 7/17/38 | 11/1/24 | 8/29/25 | 12/18/24 | |||||||||||||||
| Architect/Engineer |
Bechtel Power | Bechtel Power | Bechtel Power | Stone & Webster | Ebasco | |||||||||||||||
| Reactor Manufacturer |
Babcox & | Combustion | General | General | Combustion | |||||||||||||||
| Wilcox | Engineering | Electric | Electric | Engineering | ||||||||||||||||
| Reactor Type |
PWR | PWR | BWR | BWR | PWR | |||||||||||||||
| Turbine Generator Manufacturer |
Westinghouse | General Electric | Kraftwerk Union | General Electric | Westinghouse | |||||||||||||||
| Owned and Leased Capability (MW)(a) |
834 | 989 | 1,071 | 974 | 1,159 | |||||||||||||||
| Refueling Data: |
||||||||||||||||||||
| Last Date |
10/17/11 - | 2/21/11 - | 2/19/12 - | 1/15/11 - | 4/5/11 - | |||||||||||||||
| 11/23/11 | 3/26/11 | 6/16/12 | 2/12/11 | 5/12/11 | ||||||||||||||||
| Number of Days |
37 | 34 | 117 | (d) | 28 | 36 | ||||||||||||||
| Next Scheduled Refueling |
Spring 13 | Fall 12 | Spring 14 | Spring 13 | Fall 12 | |||||||||||||||
| 2011 Capability Factor (%) |
92.9 | 91.2 | 90.7 | 93.4 | 91.4 | |||||||||||||||
| ($ millions as of December 31, 2011) |
||||||||||||||||||||
| Net Book Value |
1,171 | (b) | 1,314 | 1,479 | (c) | 1,427 | ||||||||||||||
| Decommissioning Trust Fair Values |
542 | (b) | 423 | 421 | (c) | 254 | ||||||||||||||
| Decommissioning Liability |
633 | (b) | 445 | 350 | (c) | 333 | ||||||||||||||
| (a) | Owned and Leased Capability is the dependable load carrying capability as demonstrated under actual operating conditions based on the primary fuel (assuming no curtailments) that each station was designed to utilize. |
| (b) | ANO Units 1 and 2 are reported together. |
| (c) | 30% of River Bend is not subject to rate regulation by the Public Utility Commission of Texas, the Louisiana Public Service Commission, nor various municipal authorities, and is included in non-utility property on the balance sheet. The decommissioning trust fund balance and decommissioning liability include amounts for the 30% not subject to rate regulation. |
| (d) | Scope included installation of approximately 178 MW uprate; final uprated capacity amount to be determined after final testing and upon completion of NRC review. |
50
UTILITY REGULATORY INFORMATION
| ARKANSAS | LOUISIANA | MISSISSIPPI | NEW ORLEANS | TEXAS | ||||||
| Commission |
Arkansas Public | Louisiana | Mississippi | New Orleans | Public Utility | |||||
| Service | Public Service | Public Service | City Council | Commission | ||||||
| Commission | Commission | Commission | of Texas | |||||||
| Number of Commissioners |
3 | 5 | 3 | 7 | 3 | |||||
| Method of Selection |
Appointed by | Elected | Elected | Elected | Appointed by | |||||
| Governor |
Governor | |||||||||
| Term of Office |
6 years – | 6 years – | 4 years – | 4 years – | 6 years – | |||||
| staggered | staggered | concurrent | concurrent | staggered | ||||||
| (2 term limit) |
||||||||||
| Chair / President |
Appointed by | Selected by | Rotates every | Rotates annually | Appointed by | |||||
| Governor | peers – 1 year | 1 - 2 years, as | from the | Governor | ||||||
| term | determined by members | at-large positions |
| PARTY | SERVICE BEGAN | CURRENT TERM ENDS | ||||
| ARKANSAS |
||||||
| Colette Honorable – Chair |
Democrat | 10/07 | 1/17 | |||
| Olan W. Reeves |
unknown | 1/09 | 1/15 | |||
| Elana C. Wills |
unknown | 1/11 | 1/13 | |||
| LOUISIANA |
||||||
| Foster L. Campbell, Jr. – Chairman |
Democrat | 1/03 | 12/14 | |||
| James M. Field – Vice Chairman |
Republican | 12/96 | 12/12 | |||
| Lambert C. Boissiere, III |
Democrat | 1/05 | 12/16 | |||
| Eric Skrmetta |
Republican | 1/09 | 12/14 | |||
| Clyde C. Holloway |
Republican | 4/09 | 12/16 | |||
| MISSISSIPPI |
||||||
| Leonard Bentz – Chairman (2012) |
Republican | 4/06 | 12/15 | |||
| Lynn Posey – Vice-Chairman (2012) |
Republican | 1/08 | 12/15 | |||
| Brandon Presley |
Democrat | 1/08 | 12/15 | |||
| NEW ORLEANS |
||||||
| Cynthia Hedge-Morrell – Chair of Utility Committee |
Democrat | 4/05 | 5/14 | |||
| Jacquelyn Brechtel Clarkson – President of City Council |
Democrat | 11/07 | 5/14 | |||
| Stacy S. Head – Vice-President of City Council |
Democrat | 5/06 | 5/14 | |||
| Susan Guidry |
Democrat | 5/10 | 5/14 | |||
| Jon Johnson |
Democrat | 5/10 | 5/14 | |||
| Kristen Palmer |
Democrat | 5/10 | 5/14 | |||
| Diana Bajoie(a) |
Democrat | 6/12 | 12/12 | |||
| TEXAS |
||||||
| Donna L. Nelson – Chair |
Republican | 8/08 | 8/15 | |||
| Kenneth W. Anderson Jr. |
Republican | 9/08 | 8/17 | |||
| Rolando Pablos |
Republican | 9/11 | 9/13 |
| (a) | Interim appointment until November 2012 election. |
51
SELECT UTILITY REGULATORY MECHANISMS
| LAST FILED | ALLOWED | |||||||
| RATE BASE | ROE | |||||||
| COMPANY | ($ billions) | (%) | JURISDICTIONAL REGULATORY MECHANISMS | |||||
| EAI | 4.0 | 10.2 | Rate Case | • No fixed schedule for rate filings. EAI filed its last rate case on September 4, 2009. | ||||
| 6/30/09 with known and measurable changes through 6/30/10 | • In June 2010, the APSC approved a settlement in the EAI rate case. Key elements of the settlement include: an approximate $63.7 million base rate increase and a 10.2% allowed return on equity. New base rates became effective with the first billing cycle of July 2010. • Next rate case filing expected to be tied to EAI’s exit from the System Agreement effective in December 2013. | |||||||
| EGSL | 2.4 Electric | 9.9 – 11.4 Electric | FRP | • Annual filing in May; any change in rates typically effective in September. | ||||
| 12/31/11 | 10.65 midpoint +/- 75 bps
60/40 customer/ company sharing |
• In October 2009, the LPSC approved an uncontested settlement extending the FRP regulatory process for an additional three years. The new FRP was adopted for the 2008-2010 test years and retains the 10.65% electric ROE midpoint with a +/- 75 bp bandwidth and a recovery mechanism for Commission-approved capacity additions. Earnings outside the bandwidth are allocated prospectively, 60% to customers and 40% to the company. In November 2011, the LPSC approved a one-year extension of EGSL’s FRP. EGSL is required to file a full rate case by January 2013. | ||||||
| 0.05 Gas 9/30/11 | 10.0 - 11.0 Gas 10.5 midpoint +/- 50 bps |
RSP | • In July 2005, the LPSC approved the EGSL Gas Rate Stabilization Plan (RSP) which specified a 10.5% gas ROE midpoint with a +/- 50 bp bandwidth. Outside the bandwidth, rate changes are determined as follows: +/- 200 bps, rates changed by 50% of difference necessary to bring earned return to end point of band; if more than +/- 200 bps, rates changed 100% to eliminate differential in excess of 200 bps and then same as if within +/- 200 bps. | |||||
| ELL | 3.6 | 9.45 – 11.05 | FRP | • Annual filing in May; any change in rates typically effective in September. | ||||
| 12/31/2011 | 10.25 midpoint +/- 80 bps
60/40 customer/ company sharing |
• In October 2009, the LPSC approved an uncontested settlement extending the FRP regulatory process for an additional three years. The new FRP was adopted for the 2008-2010 test years and retains the 10.25% ROE midpoint with a +/- 80 bp bandwidth and a recovery mechanism for Commission-approved capacity additions. Earnings outside of the bandwidth are allocated prospectively, 60% to customers and 40% to the company. In November 2011, the LPSC approved a one-year extension of ELL’s FRP. ELL is required to file a full rate case by January 2013. | ||||||
| EMI | 1.7 12/31/11 |
10.06 – 12.19 11.12 midpoint (subject to review / approval)
Formulaic ROE reset
Up to ~200 bps on ROE (depends on capital ratios) for price, satisfaction and reliability |
FRP | • Annual filing in March; any change in rates typically effective the first billing cycle of June. • On March 4, 2010, the MPSC approved modifications to EMI’s FRP that (1) aligned EMI’s FRP more closely with the FRPs of the other regulated gas and electric utilities in Mississippi; (2) provided the opportunity to reset the ROE and bandwidth based upon performance ratings; (3) rescored the performance adjustment factors; (4) eliminated the $14.5 million revenue adjustment limit and changed the 2% of revenues limit to a 4% limit, with any adjustment over 2% requiring a hearing; and (5) directed EMI to phase-out the summer / winter rate differential in residential rates over two years. Returns inside the bandwidth result in no change in rates while returns outside the bandwidth reset rates prospectively to or within the bandwidth depending on performance. | ||||
| ENOI | 0.3 Electric 12/31/11
0.09 Gas 12/31/11 |
10.7 – 11.5 Electric 11.1 midpoint +/- 40 bps
10.25 – 11.25 Gas 10.75 midpoint +/- 50 bps
Earnings outside bandwidth reset to midpoint ROE |
FRP
FRP |
• Annual filing in May; any change in rates typically effective in first billing cycle of October. • On April 2, 2009, the City Council of New Orleans (CCNO) approved a comprehensive settlement. A new three-year formula rate plan was adopted, with terms including an 11.1% electric ROE midpoint with a +/- 40 bp bandwidth and a 10.75% gas ROE midpoint with a +/- 50 bp bandwidth. Earnings outside the bandwidth reset to the midpoint ROE, with rates changing on a prospective basis depending on whether ENOI is over or under-earning. The FRP also includes a recovery mechanism for Council-approved capacity additions, plus provisions for extraordinary cost changes and force majeure. The FRP may be extended by the mutual agreement of ENOI and the CCNO. The settlement also implemented energy conservation and demand programs. • ENOI anticipates that it will discuss possible renewal or extension of the FRP with the CCNO Advisors during the course of the 2011 test year FRP proceeding, which was filed May 31, 2012. The CCNO would be required to approve any such renewal or extension. | ||||
| ETI | 1.7 | 10.125 | Rate Case | • No fixed schedule for rate filings. | ||||
| 6/30/11 adjusted test year | • ETI filed its last rate case on November 28, 2011 requesting a $111.8 million increase and a 10.6% return on equity based on an adjusted twelve-month test year ending June 30, 2011. In April 2012, ETI revised its request to a $104.8 million base rate increase. The parties have agreed to a procedural schedule that contemplates a final decision by July 30, 2012, with ultimate rates relating back to June 30, 2012. • As a result of its December 30, 2009 rate case filing, ETI implemented a $17.5 million interim rate increase beginning on May 1, 2010, pursuant to a February 2010 unanimous settlement on interim rates and a $59 million base rate increase for usage on and after August 15, 2010, pursuant to its August 2010 stipulation and settlement agreement approved by the PUCT in December 2010. Other key elements of the stipulation and settlement agreement included an additional $9 million rate increase for bills rendered on and after May 2, 2011 (the first billing cycle of the month) and a 10.125% allowed return on equity. | |||||||
| SERI | 1.0 | 10.94 | • Real-time recovery mechanism. | |||||
| monthly filing as of 5/31/12 | ||||||||
| TOTAL | 14.7 | |||||||
52
UTILITY ELECTRIC AND GAS FUEL RECOVERY MECHANISMS
| DEFERRED FUEL BALANCE AS OF DECEMBER 31, | ||||||||||||||||||||||
| COMPANY | 2011 | 2010 | 2009 | 2008 | 2007 | FUEL RECOVERY MECHANISM | ||||||||||||||||
| ($ millions) | ||||||||||||||||||||||
| EAI | 209.8 | 61.5 | 122.8 | 119.1 | 114.8 | Annual reset in April based on prior calendar year fuel and purchased power costs adjusted for nuclear refueling outages and projected sales plus any under- or over-recovered fuel balance for the prior calendar year. | ||||||||||||||||
| EGSL(a) | 2.9 | 77.8 | 57.8 | 8.1 | 105.8 | Electric: Monthly reset based on fuel and purchased power costs from two months prior plus surcharge or credit for 1/12 of under- or over-recovered fuel balance. | ||||||||||||||||
| Gas: Monthly reset based on estimated gas costs plus a surcharge with an annual reset calculated by taking the over- or under- recovered balance at the end of June and dividing by the projected sales for the next 12 months. | ||||||||||||||||||||||
| ELL(a) | 1.5 | 8.8 | 66.4 | (23.6 | ) | 19.2 | Monthly reset based on fuel and purchased power costs from two months prior plus surcharge or credit for 1/12 of under- or over-recovered fuel balance. | |||||||||||||||
| EMI | (15.8 | ) | 3.2 | (72.9 | ) | 5.0 | (76.6 | ) | Quarterly reset based on projected fuel and purchased power costs and projected sales plus any under- or over-recovered fuel balance from the second prior quarter. | |||||||||||||
| ENOI(b) | (7.5 | ) | (2.8 | ) | 8.1 | 21.8 | 17.3 | Electric: On April 2, 2009 the New Orleans City Council approved a new Fuel Adjustment Clause tariff that calculates a monthly rate based on fuel and purchased power costs from two months prior. A surcharge or credit will be calculated on any under- or over-recovered fuel balance based on the most recent 12 months actual kWh sales. Under the new tariff Grand Gulf non-fuel costs are recovered through base rates. Any incremental monthly Grand Gulf non-fuel costs are included in the Fuel Adjustment Clause. Resource Plan non-fuel costs are collected through the Fuel Adjustment Clause. The new tariff became effective on June 1, 2009. | ||||||||||||||
| Gas: Monthly reset based on estimated gas costs plus a surcharge or credit for the under- or over-recovered fuel balance based on the most recent 12 months Mcf sales. | ||||||||||||||||||||||
| ETI | (64.7 | ) | (77.4 | ) | (102.7 | ) | 21.2 | (67.3 | ) | Semi-annual reset of fuel factor in March and September based on the market price of natural gas plus surcharge or refund for material under- or over-recoveries based on actual costs. | ||||||||||||
| Total | 126.2 | 71.1 | 79.5 | 151.6 | 113.2 | |||||||||||||||||
| Totals may not foot due to rounding. | ||||||||||||||||||||||
| (a) | All years include $100.1 million for Entergy Gulf States Louisiana and $68 million for Entergy Louisiana of fuel, purchased power, and capacity costs, which do not currently earn a return on investment and whose recovery periods are indeterminate but are expected to be over a period greater than twelve months. |
| (b) | 2011, 2010 and 2009 include $4.1 million for Entergy New Orleans of fuel, purchased power, and capacity costs, which do not currently earn a return on investment and whose recovery periods are indeterminate but are expected to be over a period greater than twelve months. |
53
ENTERGY WHOLESALE COMMODITIES
EWC QUARTERLY FINANCIAL METRICS
| 2011 | 2010 | |||||||||||||||||||||||||||||||||||||||||||
| 1Q | 2Q | 3Q | 4Q | YTD | 1Q | 2Q | 3Q | 4Q | YTD | % CHANGE | ||||||||||||||||||||||||||||||||||
| GAAP MEASURES |
||||||||||||||||||||||||||||||||||||||||||||
| As-Reported Net Income ($ millions) |
122.6 | 64.9 | 130.2 | 171.0 | 488.6 | 89.9 | 103.9 | 143.0 | 149.9 | 486.7 | 0 | |||||||||||||||||||||||||||||||||
| Return on Average Invested Capital – As-Reported (%)* |
9.0 | 8.3 | 7.8 | 8.1 | 8.1 | 11.5 | 11.7 | 10.3 | 9.3 | 9.3 | (13) | |||||||||||||||||||||||||||||||||
| Return on Average Common Equity – As-Reported (%)* |
9.5 | 8.7 | 8.0 | 8.4 | 8.4 | 11.8 | 12.1 | 10.4 | 9.4 | 9.4 | (11) | |||||||||||||||||||||||||||||||||
| Debt to Capital Ratio (%) |
4.2 | 4.1 | 3.5 | 4.3 | 4.3 | 10.0 | 8.5 | 4.9 | 5.1 | 5.1 | (16) | |||||||||||||||||||||||||||||||||
| NON-GAAP MEASURES |
||||||||||||||||||||||||||||||||||||||||||||
| Operational Adjusted EBITDA ($ millions) |
253.4 | 174.3 | 241.0 | 193.5 | 862.2 | 290.9 | 229.3 | 246.6 | 280.7 | 1,047.5 | (18) | |||||||||||||||||||||||||||||||||
| Operational Earnings ($ millions) |
122.6 | 64.9 | 130.2 | 171.0 | 488.6 | 144.2 | 118.4 | 168.2 | 156.6 | 587.4 | (17) | |||||||||||||||||||||||||||||||||
| Return on Average Invested Capital – Operational (%)* |
9.8 | 8.9 | 7.9 | 8.1 | 8.1 | 13.2 | 13.4 | 12.2 | 11.1 | 11.1 | (27) | |||||||||||||||||||||||||||||||||
| Return on Average Common Equity – Operational (%)* |
10.4 | 9.3 | 8.2 | 8.4 | 8.4 | 13.7 | 14.0 | 12.4 | 11.3 | 11.3 | (26) | |||||||||||||||||||||||||||||||||
| Net Debt to Net Capital Ratio (%) |
(0.1) | (0.7) | (4.9) | (0.8) | (0.8) | (0.4) | 3.0 | (1.2) | (2.7) | (2.7) | (70) | |||||||||||||||||||||||||||||||||
*Rolling twelve months.
Totals may not foot due to rounding.
| 2011 | 2010 | 2009 | 2008 | 2007 | ||||||||||||||||
| GAAP MEASURES |
||||||||||||||||||||
| As-Reported Net Income ($ millions) |
488.6 | 486.7 | 638.5 | 795.6 | 583.2 | |||||||||||||||
| Return on Average Invested Capital – As-Reported (%) |
8.1 | 9.3 | 13.3 | 17.1 | 13.4 | |||||||||||||||
| Return on Average Common Equity – As-Reported (%) |
8.4 | 9.4 | 14.2 | 19.2 | 16.4 | |||||||||||||||
| Debt to Capital Ratio (%) |
4.3 | 5.1 | 10.5 | 13.0 | 18.3 | |||||||||||||||
| NON-GAAP MEASURES |
||||||||||||||||||||
| Operational Adjusted EBITDA ($ millions) |
862.2 | 1,047.5 | 1,230.4 | 1,305.5 | 883.9 | |||||||||||||||
| Operational Earnings ($ millions) |
488.6 | 587.4 | 682.5 | 795.6 | 601.6 | |||||||||||||||
| Return on Average Invested Capital – Operational (%) |
8.1 | 11.1 | 14.1 | 17.1 | 13.7 | |||||||||||||||
| Return on Average Common Equity – Operational (%) |
8.4 | 11.3 | 15.1 | 19.2 | 17.0 | |||||||||||||||
| Net Debt to Net Capital Ratio (%) |
(0.8) | (2.7) | 2.3 | 4.2 | 10.1 | |||||||||||||||
EWC QUARTERLY OPERATIONAL METRICS
| 2011 | 2010 | YTD | ||||||||||||||||||||||||||||||||||||||||||
| 1Q | 2Q | 3Q | 4Q | YTD | 1Q | 2Q | 3Q | 4Q | YTD | % CHANGE | ||||||||||||||||||||||||||||||||||
| Owned Capacity (MW)(a) |
6,016 | 6,016 | 6,016 | 6,599 | 6,599 | 6,351 | 6,351 | 6,351 | 6,351 | 6,351 | 4 | |||||||||||||||||||||||||||||||||
| Average Realized Revenue/MWh |
$ | 56.98 | $ | 52.32 | $ | 55.87 | $ | 52.74 | $ | 54.48 | $ | 58.31 | $ | 58.15 | $ | 61.51 | $ | 58.16 | $ | 59.04 | (8) | |||||||||||||||||||||||
| Non-Fuel O&M Expense/Purchased Power per MWh(b) |
$ | 24.95 | $ | 26.87 | $ | 25.32 | $ | 25.37 | $ | 25.62 | $ | 23.90 | $ | 26.93 | $ | 29.59 | $ | 26.74 | $ | 26.76 | (4 | ) | ||||||||||||||||||||||
| Billed GWh |
10,519 | 10,652 | 11,284 | 11,065 | 43,520 | 11,128 | 10,498 | 10,736 | 10,320 | 42,682 | 2 | |||||||||||||||||||||||||||||||||
| EWC Nuclear |
||||||||||||||||||||||||||||||||||||||||||||
| Average Realized Revenue/MWh |
$ | 57.46 | $ | 52.38 | $ | 56.07 | $ | 53.00 | $ | 54.73 | $ | 58.72 | $ | 57.69 | $ | 61.41 | $ | 58.80 | $ | 59.16 | (7) | |||||||||||||||||||||||
| Production Cost/MWh(b) |
$ | 24.01 | $ | 25.96 | $ | 24.92 | $ | 25.92 | $ | 25.21 | $ | 23.70 | $ | 24.40 | $ | 27.79 | $ | 25.23 | $ | 25.27 | (0 | ) | ||||||||||||||||||||||
| Non-Fuel O&M Expense/Purchased Power per MWh(b) |
$ | 24.74 | $ | 26.57 | $ | 24.90 | $ | 26.00 | $ | 25.55 | $ | 23.63 | $ | 25.49 | $ | 28.77 | $ | 26.06 | $ | 25.97 | (2 | ) | ||||||||||||||||||||||
| Billed GWh |
9,913 | 9,993 | 10,645 | 10,367 | 40,918 | 10,255 | 9,868 | 9,888 | 9,644 | 39,655 | 3 | |||||||||||||||||||||||||||||||||
| Capacity Factor |
91% | 91% | 98% | 93% | 93% | 94% | 90% | 91% | 86% | 90% | 3 | |||||||||||||||||||||||||||||||||
(a) Fourth quarter and year-to-date 2010 owned capacity includes the 335 MW ownership position in the Harrison County power plant, which was sold on December 31, 2010.
(b) 2010 and 2009 exclude the effects of the non-utility nuclear spin-off expenses special items at EWC Nuclear.
Totals may not foot due to rounding.
EWC ANNUAL OPERATIONAL METRICS
| 2011 | 2010 | 2009 | 2008 | 2007 | ||||||||||||||||
| Owned Capacity (MW)(a) |
6,599 | 6,351 | 6,351 | 6,351 | 6,576 | |||||||||||||||
| Average Realized Revenue/MWh |
$ | 54.48 | $ | 59.04 | $ | 60.46 | $ | 60.73 | $ | 53.69 | ||||||||||
| Non-Fuel O&M Expense/Purchased Power per MWh(b)(c) |
$ | 25.62 | $ | 26.76 | $ | 24.45 | $ | 22.86 | $ | 24.76 | ||||||||||
| Billed GWh |
43,520 | 42,682 | 43,969 | 44,747 | 40,916 | |||||||||||||||
| EWC Nuclear |
||||||||||||||||||||
| Net MW in Operation |
4,998 | 4,998 | 4,998 | 4,998 | 4,998 | |||||||||||||||
| Average Realized Price/MWh |
$ | 54.73 | $ | 59.16 | $ | 61.07 | $ | 59.51 | $ | 52.69 | ||||||||||
| Production Cost/MWh(b)(c) |
$ | 25.21 | $ | 25.27 | $ | 23.26 | $ | 21.88 | $ | 21.19 | ||||||||||
| Non-Fuel O&M Expense/Purchased Power per MWh(b)(c) |
$ | 25.55 | $ | 25.49 | $ | 23.30 | $ | 21.95 | $ | 22.86 | ||||||||||
| Billed GWh |
40,918 | 39,655 | 40,981 | 41,710 | 37,570 | |||||||||||||||
| Capacity Factor |
93% | 90% | 93% | 95% | 89% | |||||||||||||||
(a) Fourth quarter and year-to-date 2010 owned capacity includes the 335 MW ownership position in the Harrison County power plant, which was sold on December 31, 2010.
(b) 2010 and 2009 exclude the effects of the non-utility nuclear spin-off expenses special items at EWC Nuclear.
(c) 2007 excludes the effect of the non-utility nuclear alignment special item at EWC Nuclear.
Totals may not foot due to rounding.
| OPERATED | OWNED CAPACITY(c) | |||||||||||||||||||||||
| As of June 2012. | PLANTS | UNITS | MW | MW | % | |||||||||||||||||||
| Gas/Oil |
1 | 1 | 544(b) | 1,340 | 20 | |||||||||||||||||||
| Coal |
- | - | - (b) | 181 | 3 | |||||||||||||||||||
| Total Fossil |
1 | 1 | 544 | 1,521 | 23 | |||||||||||||||||||
| Wind |
- | - | - | 80 | 1 | |||||||||||||||||||
| Nuclear |
6 | 7 | 5,811(a) | 5,011(d) | 76 | |||||||||||||||||||
| Total Capacity |
7 | 8 | 6,355 | 6,612 | 100 | |||||||||||||||||||
| (a) | Operated capacity includes management services contracts. |
| (b) | Excludes units operated by Entergy’s utility companies. |
| (c) | Includes capacity under power purchase agreements. |
| (d) | Reflects the final testing and confirmation of a small incremental increase in output associated with equipment replacements installed at Palisades. |
54
ENTERGY WHOLESALE COMMODITIES
| JAMES A. | INDIAN POINT | PALISADES | PILGRIM | VERMONT | ||||||||||||||||||||
| FITZPATRICK | UNIT 2 | UNIT 3 | NUCLEAR PLANT | NUCLEAR STATION | YANKEE | |||||||||||||||||||
| Entergy Purchase Date |
11/21/00 | 9/6/01 | 11/21/00 | 4/11/07 | 7/13/99 | 7/31/02 | ||||||||||||||||||
| Commercial Operation Date |
July 75 | August 74 | August 76 | December 71 | December 72 | November 72 | ||||||||||||||||||
| License Expiration Date |
10/17/34 | 9/28/13 | 12/12/15 | 3/24/31 | 6/8/32 | 3/21/32 | ||||||||||||||||||
| Architect/Engineer |
Stone & | United | United | Combustion | Bechtel | Ebasco | ||||||||||||||||||
| Webster | Engineers & | Engineers & | Engineering | Power | ||||||||||||||||||||
| Constructors | Constructors | |||||||||||||||||||||||
| Reactor Manufacturer |
General | Westinghouse | Westinghouse | Combustion | General | General | ||||||||||||||||||
| Electric | Engineering | Electric | Electric | |||||||||||||||||||||
| Reactor Type |
BWR | PWR | PWR | PWR | BWR | BWR | ||||||||||||||||||
| Turbine Generator Manufacturer |
General Electric | Westinghouse | Westinghouse | Westinghouse | General Electric | |
General Electric |
| ||||||||||||||||
| Net MWs in Operation (MW) |
838 | 1,028 | 1,041 | 811(e) | 688 | 605 | ||||||||||||||||||
| (as of December 31, 2011) |
||||||||||||||||||||||||
| Refueling Data: |
||||||||||||||||||||||||
| Last Date |
9/12/10 – | 3/5/12 – | 3/9/11 – | 4/8/12 – | 4/18/11 – | 10/8/11 – | ||||||||||||||||||
| 10/17/10 | 4/1/12 | 4/8/11 | 4/30/12 | 5/12/11 | 11/2/11 | |||||||||||||||||||
| Number of Days |
35 | 28 | 30 | 23 | 25 | 25 | ||||||||||||||||||
| Next Scheduled Refueling |
Fall 12 | Spring 14 | Spring 13 | Fall 13 | Spring 13 | Spring 13 | ||||||||||||||||||
| 2011 Capacity Factor |
97% | 98% | 91% | 94% | 85% | 92% | ||||||||||||||||||
| ($ millions as of December 31, 2011) |
||||||||||||||||||||||||
| Net Book Value |
509 | 1,023 | 804 | 784 | 309 | 386(f) | ||||||||||||||||||
| Decommissioning Trust Fund Balance |
(a) | 693(b) | (a) | 282 | 677 | 496 | ||||||||||||||||||
| Decommissioning Liability |
(a) | 491(b) | (a) | 306 | 362 | 332 | ||||||||||||||||||
| Nearest Market Hub |
NYISO | NYISO | NYISO | MISO | NEPOOL | NEPOOL | ||||||||||||||||||
| Zone A(c) | Zone G(d) | Zone G(d) | Cinergy | Mass Hub | Mass Hub | |||||||||||||||||||
| Capacity Zone (ICAP/UCAP) |
NYISO | NYISO | NYISO | n/a | NEPOOL | NEPOOL | ||||||||||||||||||
| Rest of State | Rest of State | Rest of State | ||||||||||||||||||||||
| (a) | NYPA retained the decommissioning trusts and decommissioning liability. NYPA and Entergy executed decommissioning agreements, specifying their decommissioning obligations. NYPA has the right to require Entergy to assume the decommissioning liability provided that it assigns the corresponding decommissioning trust, up to a specified level, to Entergy. If the decommissioning liability is retained by NYPA, Entergy will perform the decommissioning of the plants at a price equal to the lesser of a pre-specified level or the amount in the decommissioning trusts. Entergy believes that the amounts available to it under either scenario are sufficient to cover the future decommissioning costs without any additional contributions to the trusts. |
| (b) | Includes amount for Indian Point 1. Indian Point 1 has been shut down and in safe storage since the 1970s. |
| (c) | James A. FitzPatrick physically located in NYISO Zone C. |
| (d) | Indian Point physically located in NYISO Zone H. |
| (e) | Reflects the final testing and confirmation of a small incremental increase in output assoicated with equipment replacements. |
| (f) | Under generally accepted accounting principles (GAAP), power plants and other long-lived assets are generally required to be accounted for on a historical cost basis, unless a triggering event occurs which requires an impairment evaluation. In the case of Vermont Yankee, as described in our prior financial statement filings with the U.S. Securities and Exchange Commission, Entergy has performed quarterly impairment evaluations since early 2010, triggered by state actions to shut down the plant early. A number of factors and inputs are used in the Vermont Yankee impairment evaluation, including the status of pending legal and state regulatory matters, as well as assumptions about future revenues and costs of the plant. Under the accounting rules, these inputs are required to be estimated as of the end of each quarterly period. The decline in the overall energy market and forward price of energy at March 31, 2012, which is used as an input in the current accounting analysis, yielded a different impairment result in the first quarter of 2012 as compared to earlier quarters, resulting in a pre-tax impairment charge of $(356) million of plant and related assets. As a result, net book value was $103 million as of March 31, 2012. |
EWC NON-NUCLEAR WHOLESALE ASSETS PLANT STATISTICS
| NERC | COMMERCIAL | OWNERSHIP | NET | TOTAL | FUEL TYPE | |||||||||||||||||||||
| PLANT | LOCATION | REGION | OPERATION | INTEREST | MW | MW | TECHNOLOGY | |||||||||||||||||||
| Independence – Unit 2 |
Newark, AR | SERC | 1983 | 14% | 121 | 842 | Coal | |||||||||||||||||||
| Nelson 6 |
Westlake, LA | SERC | 1982 | 11% | 60 | 550 | Coal | |||||||||||||||||||
| RS Cogen |
Lake Charles, LA | SERC | 2002 | 50% | 213 | 425 | CCGT Cogen | |||||||||||||||||||
| Ritchie – Unit 2 |
Helena, AR | SERC | 1968 | 100% | 544 | 544 | Gas/Oil | |||||||||||||||||||
| Top of Iowa |
Worth County, IA | MRO | 2001 | 50% | 40 | 80 | Wind | |||||||||||||||||||
| White Deer |
Amarillo, TX | SPP | 2001 | 50% | 40 | 80 | Wind | |||||||||||||||||||
| Rhode Island State Energy Center (a) |
Johnston, RI | NPCC | 2002 | 100% | 583 | 583 | CCGT | |||||||||||||||||||
| Total |
1,601 | 3,104 | ||||||||||||||||||||||||
| (a) | Acquired December 21, 2011. |
EWC NON-NUCLEAR WHOLESALE ASSETS PLANT EMISSIONS
| Emissions | ||||||||||||||||||||||||||||
| FUEL TYPE | SO2 | NOx | CO2 | Hg(a) | ||||||||||||||||||||||||
| PLANT | TECHNOLOGY | PURPOSE | (tons) | (tons) | (tons) | (lbs) | TECHNOLOGY(b) | |||||||||||||||||||||
| Independence – Unit 2 |
Coal | Base | 2,173 | 921 | 849,764 | 32 | OFA | |||||||||||||||||||||
| Nelson 6 |
Coal | Base | 1,584 | 399 | 488,817 | 18 | LNB w Sep OFA | |||||||||||||||||||||
| RS Cogen |
CCGT Cogen | Base QF | 4 | 377 | 805,403 | 0 | Dry LNB / SCR | |||||||||||||||||||||
| Ritchie – Unit 2 |
Gas/Oil | Peaking | - | - | - | - | - | |||||||||||||||||||||
| Top of Iowa |
Wind | Renewable | - | - | - | - | - | |||||||||||||||||||||
| White Deer |
Wind | Renewable | - | - | - | - | - | |||||||||||||||||||||
| Rhode Island State Energy Center (c) |
CCGT | Intermediate | 7 | 66 | 1,291,509 | 0 | Dry LNB / SCR | |||||||||||||||||||||
| Total |
3,768 | 1,763 | 3,435,493 | 50 | ||||||||||||||||||||||||
| (a) | Mercury emissions calculated using 2011 unit heat input and 3.92 x 10⁻⁶ lb hg/MMBtu emissiom rate for coal plants and 8.0 x 10⁻¹⁰ lb hg/MMBtu emission rate for natural gas plants. |
| (b) | Installed NOx and particulate matter emission control devices: Combustion Modification/ Fuel Reburning (Combus Mod / Fuel Reburn), Dry Low NOx Burners (Dry LNB), Electrostatic Precipitator (ESP), Low Nox Burners with Closed-coupled Overfire Air (LNB w/ Closed-coupled OFA), Low NOx Burners with Separated Overfire Air (LNB w/ Sep OFA), Low NOx Burner with Overfire Air (LNB w/ OFA), Overfire Air (OFA), Selective Catalytic Reduction (SCR) or Steam Injection. Currently have no SO2, CO2 or Mercury Control equipment operating on any unit. |
| (c) | Acquired December 21, 2011. |
| Totals | may not foot due to rounding. |
55
ENTERGY WHOLESALE COMMODITIES
LONG-TERM DEBT:
NOTE TO NEW YORK POWER AUTHORITY (NYPA) RELATING TO THE PURCHASE OF FITZPATRICK AND INDIAN POINT 3
| ADDITIONAL LTD | TOTAL ENDING | TOTAL | ||||||||||||||||||||||
| INTEREST | RELATED TO | INTEREST | LONG-TERM | INTEREST | ||||||||||||||||||||
| ($ thousands) | LONG-TERM DEBT(a) | EXPENSE | PURCHASE OF IP2 | EXPENSE | DEBT | EXPENSE | ||||||||||||||||||
| 2000 |
744,405 | 3,869 | - | - | 744,405 | 3,869 | ||||||||||||||||||
| 2001 |
682,512 | 35,392 | 74,402 | 1,190 | 756,914 | 36,582 | ||||||||||||||||||
| 2002 |
604,420 | 32,540 | 79,220 | 3,628 | 683,640 | 36,168 | ||||||||||||||||||
| 2003 |
441,845 | 27,387 | 72,863 | 3,643 | 514,708 | 31,030 | ||||||||||||||||||
| 2004 |
379,405 | 21,275 | 66,200 | 3,337 | 445,605 | 24,612 | ||||||||||||||||||
| 2005 |
313,968 | 18,277 | 59,218 | 3,018 | 373,186 | 21,295 | ||||||||||||||||||
| 2006 |
245,390 | 15,137 | 51,900 | 2,682 | 297,289 | 17,819 | ||||||||||||||||||
| 2007 |
173,445 | 11,845 | 44,231 | 2,331 | 217,676 | 14,176 | ||||||||||||||||||
| 2008 |
161,932 | 8,412 | 36,194 | 1,963 | 198,127 | 10,375 | ||||||||||||||||||
| 2009 |
149,771 | 7,839 | 27,772 | 1,577 | 177,543 | 9,416 | ||||||||||||||||||
| 2010 |
137,026 | 7,255 | 18,945 | 1,173 | 155,971 | 8,428 | ||||||||||||||||||
| 2011 |
123,669 | 6,643 | 9,694 | 750 | 133,363 | 7,393 | ||||||||||||||||||
| 2012 |
109,681 | 6,012 | - | 305 | 109,681 | 6,317 | ||||||||||||||||||
| 2013 |
95,011 | 5,331 | - | - | 95,011 | 5,331 | ||||||||||||||||||
| 2014 |
79,638 | 4,627 | - | - | 79,638 | 4,627 | ||||||||||||||||||
| 2015 |
61,027 | 3,889 | - | - | 61,027 | 3,889 | ||||||||||||||||||
| 2016 |
59,022 | 2,995 | - | - | 59,022 | 2,995 | ||||||||||||||||||
| 2017 |
56,921 | 2,899 | - | - | 56,921 | 2,899 | ||||||||||||||||||
| 2018 |
54,719 | 2,798 | - | - | 54,719 | 2,798 | ||||||||||||||||||
| 2019 |
52,412 | 2,693 | - | - | 52,412 | 2,693 | ||||||||||||||||||
| 2020 |
49,994 | 2,582 | - | - | 49,994 | 2,582 | ||||||||||||||||||
| 2021 – 2035 Average |
- | 1,400 | - | - | - | 1,400 | ||||||||||||||||||
| (a) | Includes plant, fuel, and license extension payments. Payments for plant and fuel are made annually on 11/21 (anniversary of close). As of 9/30/03, the entire fuel note has been paid off. Life extension payments made on anniversary of license expiration. Entergy will pay NYPA $2.5 million annually per plant, for up to twenty years if FitzPatrick and/or Indian Point 3 operate beyond their original license date. |
Totals may not foot due to rounding.
EWC NON-NUCLEAR WHOLESALE ASSETS
EWC NON-NUCLEAR WHOLESALE ASSETS SECURITIES DETAIL
DEBT:
OUTSTANDING AS OF DECEMBER 31,
| (ENTERGY’S SHARE) |
2011 | 2010 | 2009 | MATURITY | RATE | |||||
| (in millions) | ||||||||||
| RS Cogen Senior Project Debt |
||||||||||
| Bank Portion(a) |
$40 | $46 | $51 | 10/17/18 | LIBOR + 1.625% | |||||
| Institutional Portion |
$38 | $38 | $38 | 10/15/22 | Fixed 8.73% | |||||
| Debt Service Reserve Letter of Credit(b) |
$ - | $ - | $ 1 | 1 month to 6 months | LIBOR + 1.625% | |||||
| RS Cogen Subordinated Debt |
$13 | $13 | $13 | 10/17/17 | LIBOR + 4.50% | |||||
| Top Deer Senior Project Debt(c) |
$ - | $ 8 | $13 | 06/30/13 | Fixed 5.68% |
| (a) | RS Cogen spread on bank portion increases over time from 1.375% to 2.375%. |
| (b) | RS Cogen spread on Debt Service Reserve Letter of Credit Loan increases over time from 1.375% to 3.250%. The DSR LC fee was 1.375% in the first term and 1.625% in the second term, including 2009. The DSR LC is borrowed for interest periods of 1 month to 6 months as needed. The DSR LC was repaid on January 29, 2010. |
| (c) | In December 2011, at the Company’s election and with the banks’ consent the outstanding balance on the credit facility was paid in full. |
| SHARES OUTSTANDING | ||||||||||||||||||||||||||||
| PREFERRED STOCK: | AS OF DECEMBER 31, | AS OF DECEMBER 31, | ||||||||||||||||||||||||||
| RATE(a) | 2011 | 2010 | 2009 | 2011 | 2010 | 2009 | ||||||||||||||||||||||
| (in millions) | ||||||||||||||||||||||||||||
| Authorized 1,000,000 shares, $1 par value, cumulative |
||||||||||||||||||||||||||||
| Without Sinking Fund: |
||||||||||||||||||||||||||||
| Entergy Asset Management, |
8.95 | % | - | 305,240 | 305,240 | $ | - | $ | 29.4 | $ | 29.4 | |||||||||||||||||
| 8.95% rate(a) |
||||||||||||||||||||||||||||
| Other |
- | - | - | - | - | 0.9 | 1.5 | |||||||||||||||||||||
| Total without sinking fund |
- | 305,240 | 305,240 | $ | - | $ | 30.2 | $ | 30.9 | |||||||||||||||||||
| (a) | Entergy Asset Management’s stockholders’ agreement provides that each December 31 either Entergy Asset Management or the preferred shareholders may request that the preferred dividend rate be reset. |
Totals may not foot due to rounding.
56
DEFINITIONS OF OPERATIONAL MEASURES AND GAAP AND NON-GAAP FINANCIAL MEASURES
ENTERGY WHOLESALE COMMODITIES OPERATIONAL MEASURES
| Owned capacity (MW) |
Installed capacity owned and operated by Entergy Wholesale Commodities, including investments in wind generation accounted for under the equity method of accounting | |
| Average realized revenue per MWh |
As-reported revenue per MWh billed for Entergy Wholesale Commodities plants, excluding revenue from the amortization of the Palisades below-market PPA and investments in wind generation accounted for under the equity method of accounting | |
| Non-fuel O&M expense/purchased power per MWh |
Operation, maintenance and refueling expenses and purchased power per MWh billed, excluding fuel and investments in wind generation accounted for under the equity method of accounting | |
| GWh billed |
Total number of GWh billed to customers, excluding investments in wind generation accounted for under the equity method of accounting | |
| NUCLEAR OPERATIONAL MEASURES | ||
| Net MW in operation |
Installed capacity owned or operated by Entergy Wholesale Commodities - Nuclear | |
| Average realized revenue per MWh |
As-reported revenue per MWh billed for Entergy Wholesale Commodities nuclear plants, excluding revenue from the amortization of the Palisades below-market PPA | |
| Production cost per MWh |
Fuel and non-fuel operation and maintenance expenses according to accounting standards that directly relate to the production of electricity per MWh (based on net generation) | |
| Non-fuel O&M expense/purchased power per MWh |
Operation, maintenance and refueling expenses and purchased power per MWh billed, excluding fuel | |
| GWh billed |
Total number of GWh billed to all customers | |
| Capability factor |
The percentage of the maximum energy generation a plant is capable of supplying to the grid, limited only by factors within control of plant management; a high capability factor indicates effective plant programs and practices to minimize unplanned energy losses and to optimize planned outages | |
| Capacity factor |
Normalized percentage of the period that the nuclear plants generate power | |
| Refueling outage duration |
Number of days lost for scheduled refueling outage during the period | |
Financial measures defined in the below table include measures prepared in accordance with generally accepted accounting principles (GAAP), as well as non- GAAP measures. Non-GAAP measures are included in this report in order to provide metrics that remove the effect of less routine financial impacts from commonly used financial metrics.
| FINANCIAL MEASURES – GAAP | ||
| Return on average invested capital – as-reported |
12-months rolling net income attributable to Entergy Corporation (Net Income) adjusted to include preferred dividends and tax-effected interest expense divided by average invested capital | |
| Return on average common equity – as-reported |
12-months rolling Net Income divided by average common equity | |
| Net margin – as-reported |
12-months rolling Net Income divided by 12-months rolling revenue | |
| Cash flow interest coverage |
12-months cash flow from operating activities plus 12-months rolling interest paid, divided by interest expense | |
| Book value per share |
Common equity divided by end of period shares outstanding | |
| Revolver capacity |
Amount of undrawn capacity remaining on corporate and subsidiary revolvers | |
| Total debt |
Sum of short-term and long-term debt, notes payable, capital leases, and preferred stock with sinking fund on the balance sheet, less non-recourse debt, if any | |
| Debt of joint ventures (Entergy’s share) |
Debt issued by business joint ventures at Entergy Wholesale Commodities assets | |
| Leases (Entergy’s share) |
Operating leases held by subsidiaries capitalized at implicit interest rate | |
| Debt to capital ratio |
Gross debt divided by total capitalization | |
| Securitization debt |
Debt associated with securitization bonds issued to recover storm costs from hurricanes Rita, Ike and Gustav at Entergy Texas; the 2009 ice storm at Entergy Arkansas; and investment recovery of costs associated with the cancelled Little Gypsy repowering project at Entergy Louisiana | |
| FINANCIAL MEASURES – NON-GAAP | ||
| Operational earnings |
As-reported Net Income adjusted to exclude the impact of special items | |
| Operational adjusted EBITDA |
Earnings before interest, income taxes, depreciation and amortization, and interest and investment income excluding decommissioning expense, and other than temporary impairment losses on decommissioning trust fund assets, excluding effects of special items | |
| Return on average invested capital – operational |
12-months rolling operational Net Income adjusted to include preferred dividends and tax-effected interest expense divided by average invested capital | |
| Return on average common equity – operational |
12-months rolling operational Net Income divided by average common equity | |
| Net margin – operational |
12-months rolling operational Net Income divided by 12-months rolling revenue | |
| Total gross liquidity |
Sum of cash and revolver capacity | |
| Debt to capital ratio, excluding securitization debt |
Gross debt divided by total capitalization, excluding securitization debt | |
| Net debt to net capital ratio, excluding securitization debt |
Gross debt less cash and cash equivalents divided by total capitalization less cash and cash equivalents, excluding securitization debt | |
| Net debt to net capital ratio, including off-balance sheet liabilities, excluding securitization debt | Sum of gross debt and off-balance sheet debt less cash and cash equivalents divided by sum of total capitalization and off-balance sheet debt less cash and cash equivalents, excluding securitization debt | |
57
REG G RECONCILIATIONS
PRO FORMA FINANCIAL RESULTS (Reflects Jurisdictional Split of Entergy Gulf States, Inc.) (unaudited)
| RECONCILIATION OF GAAP TO NON-GAAP 2007 PRO FORMA INCOME STATEMENT
In thousands, for the year ended December 31, 2007. |
ENTERGY GULF STATES GAAP |
ADJUSTMENT* | ENTERGY GULF STATES PRO FORMA |
|||||||||
| OPERATING REVENUES: |
||||||||||||
| Electric |
$3,448,008 | $(1,238,442) | $2,209,566 | |||||||||
| Natural gas |
86,604 | - | 86,604 | |||||||||
| Total |
3,534,612 | (1,238,442 | ) | 2,296,170 | ||||||||
| OPERATING EXPENSES: |
||||||||||||
| Operating and maintenance: |
||||||||||||
| Fuel, fuel-related expenses, and gas purchased for resale |
867,081 | (546,413 | ) | 320,668 | ||||||||
| Purchased power |
1,339,986 | (232,938 | ) | 1,107,048 | ||||||||
| Nuclear refueling outage expenses |
12,212 | - | 12,212 | |||||||||
| Other operation and maintenance |
548,999 | (179,119 | ) | 369,880 | ||||||||
| Decommissioning |
11,728 | (173 | ) | 11,555 | ||||||||
| Taxes other than income taxes |
132,489 | (50,615 | ) | 81,874 | ||||||||
| Depreciation and amortization |
208,648 | (68,172 | ) | 140,476 | ||||||||
| Other regulatory charges (credits) – net |
29,923 | (16,808 | ) | 13,115 | ||||||||
| Total |
3,151,066 | (1,094,238 | ) | 2,056,828 | ||||||||
| OPERATING INCOME |
383,546 | (144,204 | ) | 239,342 | ||||||||
| OTHER INCOME: |
||||||||||||
| Allowance for equity funds used during construction |
11,666 | (3,295 | ) | 8,371 | ||||||||
| Interest and dividend income |
75,425 | 28,715 | 104,140 | |||||||||
| Miscellaneous – net |
1,724 | 600 | 2,324 | |||||||||
| Total |
88,815 | 26,020 | 114,835 | |||||||||
| INTEREST AND OTHER CHARGES: |
||||||||||||
| Interest on long-term debt |
149,464 | (14,231 | ) | 135,233 | ||||||||
| Other interest – net |
13,945 | (10,907 | ) | 3,038 | ||||||||
| Allowance for borrowed funds used during construction |
(7,528 | ) | 2,126 | (5,402 | ) | |||||||
| Total |
155,881 | (23,012 | ) | 132,869 | ||||||||
| INCOME BEFORE INCOME TAXES |
316,480 | (95,172 | ) | 221,308 | ||||||||
| Income taxes |
134,098 | (36,249 | ) | 97,849 | ||||||||
| NET INCOME |
182,382 | (58,923 | ) | 123,459 | ||||||||
| Preferred distribution requirements and other |
3,968 | - | 3,968 | |||||||||
| EARNINGS APPLICABLE TO COMMON EQUITY |
$ 178,414 | $ (58,923) | $ 119,491 | |||||||||
*Adjustment to reflect as if the transactions implementing the Entergy Gulf States, Inc. jurisdictional split had occurred as of January 1, 2007.
58
REG G RECONCILIATIONS
CONSOLIDATED FINANCIAL MEASURES – RECONCILIATION OF GAAP TO NON-GAAP MEASURES
2007-2011
| ($ millions) | 2011 | 2010 | 2009 | 2008 | 2007 | |||||||||||||||
| As-Reported Net Income (A) |
1,346 | 1,250 | 1,231 | 1,221 | 1,135 | |||||||||||||||
| Preferred dividends |
21 | 20 | 20 | 20 | 25 | |||||||||||||||
| Tax-effected interest expense |
316 | 354 | 351 | 374 | 392 | |||||||||||||||
| As-Reported Net Income including preferred dividends and tax-effected interest expense (B) |
1,683 | 1,624 | 1,602 | 1,615 | 1,552 | |||||||||||||||
| Special items (C) |
(13 | ) | (82 | ) | (71 | ) | (55 | ) | (32 | ) | ||||||||||
| Operational earnings including preferred dividends and tax-effected interest expense (B-C) |
1,696 | 1,706 | 1,673 | 1,670 | 1,584 | |||||||||||||||
| Operational earnings (A-C) |
1,359 | 1,332 | 1,302 | 1,276 | 1,167 | |||||||||||||||
| Average invested capital (D) |
21,126 | 20,781 | 20,748 | 19,927 | 18,721 | |||||||||||||||
| Average common equity (E) |
8,729 | 8,555 | 8,290 | 7,915 | 8,030 | |||||||||||||||
| Operating revenues (F) |
11,229 | 11,488 | 10,746 | 13,094 | 11,484 | |||||||||||||||
| Gross debt (G) |
12,387 | 11,816 | 12,014 | 12,279 | 11,123 | |||||||||||||||
| Less securitization debt (H) |
1,071 | 931 | 838 | 310 | 330 | |||||||||||||||
| Gross debt, excluding securitization debt (G-H) |
11,316 | 10,885 | 11,176 | 11,969 | 10,793 | |||||||||||||||
| Less cash and cash equivalents (I) |
694 | 1,294 | 1,710 | 1,920 | 1,254 | |||||||||||||||
| Net debt, excluding securitization debt (G-H-I) |
10,622 | 9,591 | 9,466 | 10,049 | 9,539 | |||||||||||||||
| Total capitalization (J) |
21,629 | 20,623 | 20,939 | 20,557 | 19,297 | |||||||||||||||
| Less securitization debt (K) |
1,071 | 931 | 838 | 310 | 330 | |||||||||||||||
| Total capitalization, excluding securitization debt (J-K) |
20,558 | 19,692 | 20,101 | 20,247 | 18,967 | |||||||||||||||
| Less cash and cash equivalents (L) |
694 | 1,294 | 1,710 | 1,920 | 1,254 | |||||||||||||||
| Net capitalization, excluding securitization debt (J-K-L) |
19,864 | 18,398 | 18,391 | 18,327 | 17,713 | |||||||||||||||
| Off-balance sheet liabilities (M) |
604 | 653 | 646 | 574 | 658 | |||||||||||||||
| Revolver capacity (N) |
2,001 | 2,354 | 1,464 | 645 | 1,730 | |||||||||||||||
| Gross liquidity (I+N) |
2,695 | 3,648 | 3,174 | 2,565 | 2,984 | |||||||||||||||
| ($ per share) |
||||||||||||||||||||
| As-Reported earnings per share (O) |
7.55 | 6.66 | 6.30 | 6.20 | 5.60 | |||||||||||||||
| Operational earnings per share (P) |
7.62 | 7.10 | 6.67 | 6.51 | 5.76 | |||||||||||||||
| Common dividend paid per share (Q) |
3.32 | 3.24 | 3.00 | 3.00 | 2.58 | |||||||||||||||
| Year-end closing market price per share of common stock (R) |
73.05 | 70.83 | 81.84 | 83.13 | 119.52 | |||||||||||||||
| (%) |
||||||||||||||||||||
| Return on average invested capital – As-Reported (B/D) |
8.0 | 7.8 | 7.7 | 8.1 | 8.3 | |||||||||||||||
| Return on average invested capital – Operational ((B-C)/D) |
8.0 | 8.2 | 8.1 | 8.4 | 8.5 | |||||||||||||||
| Return on average common equity – As-Reported (A/E) |
15.4 | 14.6 | 14.9 | 15.4 | 14.1 | |||||||||||||||
| Return on average common equity – Operational ((A-C)/E) |
15.6 | 15.6 | 15.7 | 16.1 | 14.5 | |||||||||||||||
| Net margin – As-Reported (A/F) |
12.0 | 10.9 | 11.5 | 9.3 | 9.9 | |||||||||||||||
| Net margin – Operational ((A-C)/F) |
12.1 | 11.6 | 12.1 | 9.7 | 10.2 | |||||||||||||||
| Debt to capital ratio (G/J) |
57.3 | 57.3 | 57.4 | 59.7 | 57.6 | |||||||||||||||
| Debt to capital ratio, excluding securitization debt ((G-H)/(J-K)) |
55.0 | 55.3 | 55.6 | 59.1 | 56.9 | |||||||||||||||
| Net debt to net capital ratio, excluding securitization debt ((G-H-I)/(J-K-L)) |
53.5 | 52.1 | 51.5 | 54.8 | 53.9 | |||||||||||||||
| Net debt to net capital ratio including off-balance sheet liabilities, excluding securitization debt ((G-H-I+M)/(J-K-L+M)) |
54.8 | 53.8 | 53.1 | 56.2 | 55.5 | |||||||||||||||
| Common dividend payout ratio – As-Reported (Q/O) |
44 | 49 | 48 | 48 | 46 | |||||||||||||||
| Common dividend payout ratio – Operational (Q/P) |
44 | 46 | 45 | 46 | 45 | |||||||||||||||
| (ratio) |
||||||||||||||||||||
| Price to earnings ratio – As-Reported (R/O) |
9.68 | 10.64 | 12.99 | 13.41 | 21.34 | |||||||||||||||
| Price to earnings ratio – Operational (R/P) |
9.59 | 9.98 | 12.27 | 12.77 | 20.75 | |||||||||||||||
Calculations may differ due to rounding.
59
REG G RECONCILIATIONS
CONSOLIDATED FINANCIAL MEASURES – RECONCILIATION OF GAAP TO NON-GAAP MEASURES
1Q10-4Q11
| ($ millions) | 1Q11 | 2Q11 | 3Q11 | 4Q11 | 1Q10 | 2Q10 | 3Q10 | 4Q10 | ||||||||||||||||||||||||
| For the quarter: |
||||||||||||||||||||||||||||||||
| As-Reported Net Income (A) |
248.7 | 315.6 | 628.1 | 154.1 | 213.8 | 315.3 | 492.9 | 228.3 | ||||||||||||||||||||||||
| Less special items (B) |
- | - | - | (13.0 | ) | (39.9 | ) | (10.5 | ) | (25.2 | ) | (6.7 | ) | |||||||||||||||||||
| Operational earnings (A-B) |
248.7 | 315.6 | 628.1 | 167.2 | 253.7 | 325.7 | 518.1 | 235.0 | ||||||||||||||||||||||||
| As-Reported Net Income rolling 12 months (C) |
1,285 | 1,285 | 1,421 | 1,346 | 1,210 | 1,298 | 1,336 | 1,250 | ||||||||||||||||||||||||
| Preferred dividends |
20 | 20 | 20 | 21 | 20 | 20 | 20 | 20 | ||||||||||||||||||||||||
| Tax-effected interest expense |
327 | 320 | 320 | 316 | 372 | 368 | 358 | 354 | ||||||||||||||||||||||||
| As-Reported Net Income, rolling 12 months including preferred dividends and tax-effected interest expense (D) |
1,632 | 1,625 | 1,761 | 1,683 | 1,602 | 1,686 | 1,714 | 1,624 | ||||||||||||||||||||||||
| Special items in prior quarters |
(42 | ) | (32 | ) | (7 | ) | - | (53 | ) | (76 | ) | (71 | ) | (75 | ) | |||||||||||||||||
| Special items in current quarter |
||||||||||||||||||||||||||||||||
| Parent & Other |
||||||||||||||||||||||||||||||||
| Transmission business spin-merge expenses |
- | - | - | (13 | ) | - | - | - | - | |||||||||||||||||||||||
| Non-utility nuclear spin-off expenses |
- | - | - | - | 14 | 4 | - | - | ||||||||||||||||||||||||
| Entergy Wholesale Commodities |
||||||||||||||||||||||||||||||||
| Non-utility nuclear spin-off expenses |
- | - | - | - | (54 | ) | (15 | ) | (25 | ) | (7 | ) | ||||||||||||||||||||
| Total special items (E) |
(42 | ) | (32 | ) | (7 | ) | (13 | ) | (94 | ) | (87 | ) | (96 | ) | (82 | ) | ||||||||||||||||
| Operational earnings, rolling 12 months including preferred dividends and tax-effected interest expense (D-E) |
1,674 | 1,657 | 1,768 | 1,696 | 1,696 | 1,773 | 1,810 | 1,706 | ||||||||||||||||||||||||
| Operational earnings, rolling 12 months (C-E) |
1,327 | 1,317 | 1,428 | 1,359 | 1,304 | 1,385 | 1,432 | 1,332 | ||||||||||||||||||||||||
| Average invested capital (F) |
21,093 | 21,101 | 21,509 | 21,126 | 21,149 | 20,761 | 20,802 | 20,781 | ||||||||||||||||||||||||
| Average common equity (G) |
8,698 | 8,684 | 8,849 | 8,729 | 8,745 | 8,769 | 8,608 | 8,555 | ||||||||||||||||||||||||
| Operating revenues, rolling 12 months (H) |
11,269 | 11,210 | 11,273 | 11,229 | 10,716 | 11,058 | 11,453 | 11,488 | ||||||||||||||||||||||||
| Gross debt (I) |
12,018 | 12,360 | 12,452 | 12,387 | 12,152 | 11,853 | 12,247 | 11,816 | ||||||||||||||||||||||||
| Less securitization debt (J) |
910 | 896 | 1,086 | 1,071 | 838 | 829 | 940 | 931 | ||||||||||||||||||||||||
| Gross debt, excluding securitization debt (I-J) |
11,108 | 11,464 | 11,366 | 11,316 | 11,314 | 11,024 | 11,307 | 10,885 | ||||||||||||||||||||||||
| Less cash and cash equivalents (K) |
726 | 530 | 987 | 694 | 1,657 | 1,336 | 1,931 | 1,294 | ||||||||||||||||||||||||
| Net debt, excluding securitization debt (I-J-K) |
10,382 | 10,934 | 10,379 | 10,622 | 9,657 | 9,688 | 9,376 | 9,591 | ||||||||||||||||||||||||
| Total capitalization (L) |
20,864 | 21,268 | 21,728 | 21,629 | 21,322 | 20,935 | 21,290 | 20,623 | ||||||||||||||||||||||||
| Less securitization debt (M) |
910 | 896 | 1,086 | 1,071 | 838 | 829 | 940 | 931 | ||||||||||||||||||||||||
| Total capitalization, excluding securitization debt (L-M) |
19,954 | 20,372 | 20,642 | 20,558 | 20,484 | 20,106 | 20,350 | 19,692 | ||||||||||||||||||||||||
| Less cash and cash equivalents (N) |
726 | 530 | 987 | 694 | 1,657 | 1,336 | 1,931 | 1,294 | ||||||||||||||||||||||||
| Net capitalization, excluding securitization debt (L-M-N) |
19,228 | 19,842 | 19,655 | 19,864 | 18,827 | 18,770 | 18,419 | 18,398 | ||||||||||||||||||||||||
| Off-balance sheet liabilities (O) |
650 | 647 | 645 | 604 | 644 | 641 | 638 | 653 | ||||||||||||||||||||||||
| Revolver capacity (P) |
2,258 | 1,993 | 2,116 | 2,001 | 1,417 | 1,338 | 2,216 | 2,354 | ||||||||||||||||||||||||
| Gross liquidity (K+P) |
2,984 | 2,523 | 3,103 | 2,695 | 3,074 | 2,674 | 4,147 | 3,648 | ||||||||||||||||||||||||
| (%) |
||||||||||||||||||||||||||||||||
| Return on average invested capital – As-Reported (D/F) |
7.7 | 7.7 | 8.2 | 8.0 | 7.6 | 8.1 | 8.2 | 7.8 | ||||||||||||||||||||||||
| Return on average invested capital – Operational ((D-E)/F) |
7.9 | 7.9 | 8.2 | 8.0 | 8.0 | 8.5 | 8.7 | 8.2 | ||||||||||||||||||||||||
| Return on average common equity – As-Reported (C/G) |
14.8 | 14.8 | 16.1 | 15.4 | 13.8 | 14.8 | 15.5 | 14.6 | ||||||||||||||||||||||||
| Return on average common equity – Operational ((C-E)/G) |
15.3 | 15.2 | 16.1 | 15.6 | 14.9 | 15.8 | 16.6 | 15.6 | ||||||||||||||||||||||||
| Net margin – As-Reported (C/H) |
11.4 | 11.5 | 12.6 | 12.0 | 11.3 | 11.7 | 11.7 | 10.9 | ||||||||||||||||||||||||
| Net margin – Operational ((C-E)/H) |
11.8 | 11.8 | 12.7 | 12.1 | 12.2 | 12.5 | 12.5 | 11.6 | ||||||||||||||||||||||||
| Debt to capital ratio (I/L) |
57.6 | 58.1 | 57.3 | 57.3 | 57.0 | 56.6 | 57.5 | 57.3 | ||||||||||||||||||||||||
| Debt to capital ratio, excluding securitization debt ((I-J)/(L-M)) |
55.7 | 56.3 | 55.1 | 55.0 | 55.2 | 54.8 | 55.6 | 55.3 | ||||||||||||||||||||||||
| Net debt to net capital ratio, |
54.0 | 55.1 | 52.8 | 53.5 | 51.3 | 51.6 | 50.9 | 52.1 | ||||||||||||||||||||||||
| Net debt to net capital including off-balance |
55.5 | 56.5 | 54.3 | 54.8 | 52.9 | 53.2 | 52.5 | 53.8 | ||||||||||||||||||||||||
Calculations may differ due to rounding.
60
REG G RECONCILIATIONS
UTILITY FINANCIAL MEASURES – RECONCILIATION OF GAAP TO NON-GAAP MEASURES
2007-2011
| ($ millions) |
2011 | 2010 | 2009 | 2008 | 2007 | |||||||||||||||
| As-Reported Net Income (A) |
1,106.5 | 812.4 | 691.6 | 587.8 | 682.7 | |||||||||||||||
| Preferred dividends |
17.3 | 17.3 | 17.3 | 17.3 | 21.7 | |||||||||||||||
| Tax-effected interest expense |
280.4 | 303.4 | 284.3 | 261.6 | 259.8 | |||||||||||||||
| As-Reported Net Income including preferred dividends and tax-effected interest expense (B) |
1,404.2 | 1,133.2 | 993.3 | 866.7 | 964.2 | |||||||||||||||
| Utility special items |
||||||||||||||||||||
| Nuclear alignment |
- | - | - | - | (13.7 | ) | ||||||||||||||
| Total special items (C) |
- | - | - | - | (13.7 | ) | ||||||||||||||
| Operational earnings including preferred dividends and tax-effected interest expense (B-C) |
1,404.2 | 1,133.2 | 993.3 | 866.7 | 977.9 | |||||||||||||||
| Operational earnings (A-C) |
1,106.5 | 812.4 | 691.6 | 587.8 | 696.4 | |||||||||||||||
| Average invested capital (D) |
16,877 | 16,412 | 15,580 | 14,441 | 13,903 | |||||||||||||||
| Average common equity (E) |
7,462 | 7,109 | 6,828 | 6,618 | 6,440 | |||||||||||||||
| Gross debt (F) |
9,332 | 8,937 | 9,107 | 7,836 | 7,249 | |||||||||||||||
| Less securitization debt (G) |
1,071 | 931 | 838 | 310 | 330 | |||||||||||||||
| Gross debt, excluding securitization debt (F-G) |
8,262 | 8,006 | 8,269 | 7,526 | 6,919 | |||||||||||||||
| Less cash and cash equivalents (H) |
360 | 822 | 1,239 | 566 | 801 | |||||||||||||||
| Net debt, excluding securitization debt (F-G-H) |
7,902 | 7,185 | 7,030 | 6,960 | 6,118 | |||||||||||||||
| Total capitalization (I) |
17,298 | 16,457 | 16,367 | 14,794 | 14,088 | |||||||||||||||
| Less securitization debt (J) |
1,071 | 931 | 838 | 310 | 330 | |||||||||||||||
| Total capitalization, excluding securitization debt (I-J) |
16,227 | 15,526 | 15,529 | 14,484 | 13,758 | |||||||||||||||
| Less cash and cash equivalents (K) |
360 | 822 | 1,239 | 566 | 801 | |||||||||||||||
| Net capitalization, excluding securitization debt (I-J-K) |
15,867 | 14,704 | 14,290 | 13,918 | 12,957 | |||||||||||||||
| (%) |
||||||||||||||||||||
| Return on average invested capital – As-Reported (B/D) |
8.3 | 6.9 | 6.4 | 6.0 | 6.9 | |||||||||||||||
| Return on average invested capital – Operational ((B-C)/D) |
8.3 | 6.9 | 6.4 | 6.0 | 7.0 | |||||||||||||||
| Return on average common equity – As-Reported (A/E) |
14.8 | 11.4 | 10.1 | 8.9 | 10.6 | |||||||||||||||
| Return on average common equity – Operational ((A-C)/E) |
14.8 | 11.4 | 10.1 | 8.9 | 10.8 | |||||||||||||||
| Debt to capital ratio (F/I) |
54.0 | 54.3 | 55.6 | 53.0 | 51.5 | |||||||||||||||
| Debt to capital ratio, excluding securitization debt ((F-G)/(I-J)) |
50.9 | 51.6 | 53.2 | 52.0 | 50.3 | |||||||||||||||
| Net debt to net capital ratio, excluding securitization debt ((F-G-H)/(I-J-K)) |
49.8 | 48.9 | 49.2 | 50.0 | 47.2 | |||||||||||||||
Calculations may differ due to rounding.
61
REG G RECONCILIATIONS
UTILITY FINANCIAL MEASURES – RECONCILIATION OF GAAP TO NON-GAAP MEASURES
1Q10-4Q11
| ($ millions) |
1Q11 | 2Q11 | 3Q11 | 4Q11 | 1Q10 | 2Q10 | 3Q10 | 4Q10 | ||||||||||||||||||||||||
| As-Reported Net Income (A) |
164.3 | 248.4 | 524.1 | 169.7 | 138.6 | 225.8 | 333.6 | 114.3 | ||||||||||||||||||||||||
| Less special items (B) |
- | - | - | - | - | - | - | - | ||||||||||||||||||||||||
| Operational earnings (A-B) |
164.3 | 248.4 | 524.1 | 169.7 | 138.6 | 225.8 | 333.6 | 114.3 | ||||||||||||||||||||||||
| As-Reported Net Income-rolling 12 months (C) |
838.1 | 860.6 | 1,051.2 | 1,106.5 | 718.6 | 797.2 | 836.0 | 812.4 | ||||||||||||||||||||||||
| Preferred dividends |
17.3 | 17.3 | 17.3 | 17.3 | 17.3 | 17.3 | 17.3 | 17.3 | ||||||||||||||||||||||||
| Tax-effected interest expense |
298.0 | 287.2 | 283.3 | 280.4 | 294.2 | 304.0 | 303.6 | 303.4 | ||||||||||||||||||||||||
| As-Reported Net Income, rolling 12 months including preferred dividends and tax-effected interest expense (D) |
1,153.4 | 1,165.1 | 1,351.8 | 1,404.2 | 1,030.1 | 1,118.5 | 1,157.0 | 1,133.2 | ||||||||||||||||||||||||
| Special items in prior quarters |
- | - | - | - | - | - | - | - | ||||||||||||||||||||||||
| Special items in current quarter |
- | - | - | - | - | - | - | - | ||||||||||||||||||||||||
| Total special items (E) |
- | - | - | - | - | - | - | - | ||||||||||||||||||||||||
| Operational earnings, rolling 12 months including preferred dividends and tax-effected interest expense (D-E) |
1,153.4 | 1,165.1 | 1,351.8 | 1,404.2 | 1,030.1 | 1,118.5 | 1,157.0 | 1,133.2 | ||||||||||||||||||||||||
| Operational earnings, rolling 12 months (C-E) |
838.1 | 860.6 | 1,051.2 | 1,106.5 | 718.6 | 797.2 | 836.0 | 812.4 | ||||||||||||||||||||||||
| Average invested capital (F) |
16,583 | 16,682 | 16,923 | 16,877 | 15,730 | 15,858 | 16,040 | 16,412 | ||||||||||||||||||||||||
| Average common equity (G) |
7,139 | 7,257 | 7,391 | 7,462 | 6,880 | 6,977 | 7,080 | 7,109 | ||||||||||||||||||||||||
| Gross debt (H) |
9,131 | 9,305 | 9,432 | 9,332 | 9,197 | 8,984 | 9,071 | 8,937 | ||||||||||||||||||||||||
| Less securitization debt (I) |
911 | 896 | 1,086 | 1,071 | 838 | 829 | 940 | 931 | ||||||||||||||||||||||||
| Gross debt, excluding securitization debt (H-I) |
8,221 | 8,409 | 8,346 | 8,262 | 8,358 | 8,155 | 8,131 | 8,006 | ||||||||||||||||||||||||
| Less cash and cash equivalents (J) |
439 | 226 | 467 | 360 | 1,039 | 990 | 1,055 | 822 | ||||||||||||||||||||||||
| Net debt, excluding securitization debt (H-I-J) |
7,782 | 8,183 | 7,879 | 7,902 | 7,320 | 7,166 | 7,075 | 7,185 | ||||||||||||||||||||||||
| Total capitalization (K) |
16,686 | 17,003 | 17,364 | 17,298 | 16,481 | 16,360 | 16,481 | 16,457 | ||||||||||||||||||||||||
| Less securitization debt (L) |
911 | 896 | 1,086 | 1,071 | 838 | 829 | 940 | 931 | ||||||||||||||||||||||||
| Total capitalization, excluding securitization debt (K-L) |
15,776 | 16,108 | 16,278 | 16,227 | 15,642 | 15,531 | 15,541 | 15,526 | ||||||||||||||||||||||||
| Less cash and cash equivalents (M) |
439 | 226 | 467 | 360 | 1,039 | 990 | 1,055 | 822 | ||||||||||||||||||||||||
| Net capitalization, excluding securitization debt (K-L-M) (%) |
15,337 | 15,882 | 15,811 | 15,867 | 14,603 | 14,542 | 14,486 | 14,704 | ||||||||||||||||||||||||
| Return on average invested capital – |
||||||||||||||||||||||||||||||||
| As-Reported (D/F) |
7.0 | 7.0 | 8.0 | 8.3 | 6.5 | 7.1 | 7.2 | 6.9 | ||||||||||||||||||||||||
| Return on average invested capital – |
||||||||||||||||||||||||||||||||
| Operational ((D-E)/F) |
7.0 | 7.0 | 8.0 | 8.3 | 6.5 | 7.1 | 7.2 | 6.9 | ||||||||||||||||||||||||
| Return on average common equity – |
||||||||||||||||||||||||||||||||
| As-Reported (C/G) |
11.7 | 11.9 | 14.2 | 14.8 | 10.4 | 11.4 | 11.8 | 11.4 | ||||||||||||||||||||||||
| Return on average common equity – |
||||||||||||||||||||||||||||||||
| Operational ((C-E)/G) |
11.7 | 11.9 | 14.2 | 14.8 | 10.4 | 11.4 | 11.8 | 11.4 | ||||||||||||||||||||||||
| Debt to capital ratio (H/K) |
54.7 | 54.7 | 54.3 | 54.0 | 55.8 | 54.9 | 55.0 | 54.3 | ||||||||||||||||||||||||
| Debt to capital ratio, excluding securitization debt ((H-I)/(K-L)) |
52.1 | 52.2 | 51.3 | 50.9 | 53.4 | 52.5 | 52.3 | 51.6 | ||||||||||||||||||||||||
| Net debt to net capital ratio, excluding securitization debt |
50.7 | 51.5 | 49.8 | 49.8 | 50.1 | 49.3 | 48.8 | 48.9 | ||||||||||||||||||||||||
Calculations may differ due to rounding.
62
REG G RECONCILIATIONS
ENTERGY ARKANSAS FINANCIAL MEASURES – RECONCILIATION OF GAAP TO NON-GAAP MEASURES
2007-2011
| ($ millions) | 2011 | 2010 | 2009 | 2008 | 2007 | |||||||||||||||
| As-Reported Earnings (A) |
158.0 | 165.7 | 60.0 | 40.3 | 132.2 | |||||||||||||||
| Preferred dividends |
6.9 | 6.9 | 6.9 | 6.9 | 6.9 | |||||||||||||||
| Tax-effected interest expense |
49.7 | 54.9 | 54.9 | 52.0 | 53.4 | |||||||||||||||
| As-Reported Earnings including preferred dividends and tax-effected interest expense (B) |
214.6 | 227.6 | 121.8 | 99.2 | 192.5 | |||||||||||||||
| Special items |
||||||||||||||||||||
| Nuclear Alignment |
- | - | - | - | (5.9 | ) | ||||||||||||||
| Total special items (C) |
- | - | - | - | (5.9 | ) | ||||||||||||||
| Operational earnings including preferred dividends and tax-effected interest expense (B-C) |
214.6 | 227.6 | 121.8 | 99.2 | 198.4 | |||||||||||||||
| Operational earnings (A-C) |
158.0 | 165.7 | 60.0 | 40.3 | 138.1 | |||||||||||||||
| Average invested capital (D) |
3,460 | 3,385 | 3,291 | 3,102 | 2,965 | |||||||||||||||
| Average invested capital, excluding securitization (E) |
3,341 | 3,323 | 3,291 | 3,102 | 2,965 | |||||||||||||||
| Average common equity (F) |
1,424 | 1,408 | 1,406 | 1,392 | 1,409 | |||||||||||||||
| Gross debt (G) |
1,911 | 1,928 | 1,793 | 1,745 | 1,442 | |||||||||||||||
| Less securitization debt (H) |
114 | 124 | - | - | - | |||||||||||||||
| Gross debt, excluding securitization debt (G-H) |
1,797 | 1,804 | 1,793 | 1,745 | 1,442 | |||||||||||||||
| Less cash and cash equivalents (I) |
23 | 106 | 86 | 40 | 0.2 | |||||||||||||||
| Net debt, excluding securitization debt (G-H-I) |
1,775 | 1,698 | 1,707 | 1,705 | 1,441 | |||||||||||||||
| Total capitalization (J) |
3,472 | 3,448 | 3,321 | 3,261 | 2,942 | |||||||||||||||
| Less securitization debt (K) |
114 | 124 | - | - | - | |||||||||||||||
| Total capitalization, excluding securitization debt (J-K) |
3,358 | 3,324 | 3,321 | 3,261 | 2,942 | |||||||||||||||
| Less cash and cash equivalents (L) |
23 | 106 | 86 | 40 | 0.2 | |||||||||||||||
| Net capitalization, excluding securitization debt (J-K-L) |
3,335 | 3,218 | 3,235 | 3,221 | 2,942 | |||||||||||||||
| (%) |
||||||||||||||||||||
| Return on average invested capital – As-Reported (B/D) |
6.2 | 6.7 | 3.7 | 3.2 | 6.5 | |||||||||||||||
| Return on average invested capital – Operational ((B-C)/E) |
6.4 | 6.8 | 3.7 | 3.2 | 6.7 | |||||||||||||||
| Return on average common equity – As-Reported (A/F) |
11.1 | 11.8 | 4.3 | 2.9 | 9.4 | |||||||||||||||
| Return on average common equity – Operational ((A-C)/F) |
11.1 | 11.8 | 4.3 | 2.9 | 9.8 | |||||||||||||||
| Debt to capital ratio (G/J) |
55.0 | 55.9 | 54.0 | 53.5 | 49.0 | |||||||||||||||
| Debt to capital ratio, excluding securitization debt ((G-H)/(J-K)) |
53.5 | 54.3 | 54.0 | 53.5 | 49.0 | |||||||||||||||
| Net debt to net capital ratio, excluding securitization debt ((G-H-I)/(J-K-L)) |
53.2 | 52.8 | 52.8 | 52.9 | 49.0 | |||||||||||||||
Calculations may differ due to rounding.
63
REG G RECONCILIATIONS
ENTERGY GULF STATES LOUISIANA FINANCIAL MEASURES – RECONCILIATION OF GAAP TO NON-GAAP MEASURES
2007-2011
| ($ millions) | 2011 | 2010 | 2009 | 2008 | 2007 | |||||||||||||||
| As-Reported Earnings (A) |
200.8 | 173.5 | 152.5 | 131.1 | 119.5 | |||||||||||||||
| Preferred dividends |
0.8 | 0.8 | 0.8 | 0.8 | 4.0(a) | |||||||||||||||
| Tax-effected interest expense |
49.7 | 60.2 | 70.7 | 78.1 | 81.8(a) | |||||||||||||||
| As-Reported Earnings including preferred dividends and tax-effected interest expense (B) |
251.3 | 234.6 | 224.0 | 210.0 | 205.3 | |||||||||||||||
| Special items |
||||||||||||||||||||
| Nuclear Alignment |
- | - | - | - | (3.6 | ) | ||||||||||||||
| Total special items (C) |
- | - | - | - | (3.6 | ) | ||||||||||||||
| Operational earnings including preferred dividends and tax-effected interest expense (B-C) |
251.3 | 234.6 | 224.0 | 210.0 | 208.9 | |||||||||||||||
| Operational earnings (A-C) |
200.8 | 173.5 | 152.5 | 131.1 | 123.1 | |||||||||||||||
| Average invested capital (D) |
2,962 | 3,122 | 3,344 | 3,618 | 3,175 | |||||||||||||||
| Average invested capital, excluding assumption debt (E) |
2,962 | 3,039 | 2,875 | 2,693 | 2,636 | |||||||||||||||
| Average common equity (F) |
1,389 | 1,429 | 1,348 | 1,284 | 1,243(b) | |||||||||||||||
| Gross debt (G) |
1,542 | 1,584 | 1,783 | 2,188 | 2,460 | |||||||||||||||
| Less assumption debt (H) |
- | - | 168 | 770 | 1,079 | |||||||||||||||
| Gross debt, excluding assumption debt (G-H) |
1,542 | 1,584 | 1,615 | 1,418 | 1,381 | |||||||||||||||
| Less cash and cash equivalents (I) |
25 | 155 | 144 | 49 | 108 | |||||||||||||||
| Net debt, excluding assumption debt (G-H-I) |
1,517 | 1,429 | 1,471 | 1,369 | 1,273 | |||||||||||||||
| Total capitalization (J) |
2,876 | 3,049 | 3,196 | 3,491 | 3,744 | |||||||||||||||
| Less assumption debt (K) |
- | - | 168 | 770 | 1,079 | |||||||||||||||
| Total capitalization, excluding assumption debt (J-K) |
2,876 | 3,049 | 3,028 | 2,721 | 2,665 | |||||||||||||||
| Less cash and cash equivalents (L) |
25 | 155 | 144 | 49 | 108 | |||||||||||||||
| Net capitalization, excluding assumption debt (J-K-L) |
2,851 | 2,893 | 2,884 | 2,672 | 2,557 | |||||||||||||||
| (%) |
||||||||||||||||||||
| Return on average invested capital – As-Reported (B/D) |
8.5 | 7.5 | 6.7 | 5.8 | 6.5 | |||||||||||||||
| Return on average invested capital – Operational ((B-C)/E) |
8.5 | 7.7 | 7.8 | 7.8 | 7.9 | |||||||||||||||
| Return on average common equity – As-Reported (A/F) |
14.5 | 12.1 | 11.3 | 10.2 | 9.6 | |||||||||||||||
| Return on average common equity – Operational ((A-C)/F) |
14.5 | 12.1 | 11.3 | 10.2 | 9.9 | |||||||||||||||
| Debt to capital ratio (G/J) |
53.6 | 52.0 | 55.8 | 62.7 | 65.7 | |||||||||||||||
| Debt to capital ratio, excluding assumption debt ((G-H)/(J-K)) |
53.6 | 52.0 | 53.3 | 52.1 | 51.8 | |||||||||||||||
| Net debt to net capital ratio, excluding assumption debt ((G-H-I)/(J-K-L)) |
53.2 | 49.4 | 51.0 | 51.2 | 49.8 | |||||||||||||||
ENTERGY TEXAS – RECONCILIATION OF GAAP TO NON-GAAP MEASURES
2007-2011
| ($ millions) | 2011 | 2010 | 2009 | 2008 | 2007 | |||||||||||||||
| As-Reported Net Income (A) |
80.8 | 66.2 | 63.8 | 57.9 | 58.9 | |||||||||||||||
| Preferred dividends |
- | - | - | - | - | |||||||||||||||
| Tax-effected interest expense |
56.0 | 56.5 | 63.9 | 48.0 | 51.2 | |||||||||||||||
| As-Reported Net Income including preferred dividends and tax-effected interest expense (B) |
136.8 | 122.7 | 127.7 | 105.9 | 110.1 | |||||||||||||||
|
Special items |
- | - | - | - | - | |||||||||||||||
|
Total special items (C) |
- | - | - | - | - | |||||||||||||||
|
Operational earnings including preferred dividends and tax-effected interest expense (B-C) |
136.8 | 122.7 | 127.7 | 105.9 | 110.1 | |||||||||||||||
| Operational earnings (A-C) |
80.8 | 66.2 | 63.8 | 57.9 | 58.9 | |||||||||||||||
| Average invested capital (D) |
2,530 | 2,493 | 2,374 | 2,331 | 2,245 | |||||||||||||||
| Average invested capital, excluding securitization and equity infusion from parent (E) |
1,752 | 1,670 | 1,799 | 1,936 | 1,931 | |||||||||||||||
| Average common equity (F) |
862 | 834 | 872 | 952 | 996 | |||||||||||||||
| Average common equity, excluding equity infusion from parent returned beginning of 08 (G) |
862 | 834 | 872 | 877 | 846 | |||||||||||||||
|
Gross debt (H) |
1,677 | 1,659 | 1,658 | 1,345 | 1,413 | |||||||||||||||
| Less securitization debt (I) |
750 | 807 | 838 | 310 | 330 | |||||||||||||||
| Gross debt, excluding securitization debt (H-I) |
927 | 852 | 820 | 1,035 | 1,083 | |||||||||||||||
| Less cash and cash equivalents (J) |
65 | 35 | 201 | 2 | 297 | |||||||||||||||
| Net debt, excluding securitization debt (H-I-J) |
862 | 817 | 619 | 1,033 | 786 | |||||||||||||||
|
Total capitalization (K) |
2,576 | 2,484 | 2,503 | 2,245 | 2,417 | |||||||||||||||
| Less securitization debt (L) |
750 | 807 | 838 | 310 | 330 | |||||||||||||||
| Less equity infusion from parent returned beginning of 08 (M) |
- | - | - | - | 150 | |||||||||||||||
| Total capitalization, excluding securitization and equity infusion from parent (K-L-M) |
1,827 | 1,676 | 1,664 | 1,935 | 1,937 | |||||||||||||||
| Less cash and cash equivalents (N) |
65 | 35 | 201 | 2 | 297 | |||||||||||||||
| Net capitalization, excluding securitization and equity infusion from parent (K-L-M-N) |
1,762 | 1,641 | 1,463 | 1,933 | 1,640 | |||||||||||||||
|
(%) |
||||||||||||||||||||
| Return on average invested capital – As-Reported (B/D) |
5.4 | 4.9 | 5.4 | 4.5 | 4.9 | |||||||||||||||
| Return on average invested capital – Operational ((B-C)/E) |
7.8 | 7.3 | 7.1 | 5.5 | 5.7 | |||||||||||||||
| Return on average common equity – As-Reported (A/F) |
9.4 | 7.9 | 7.3 | 6.1 | 5.9 | |||||||||||||||
| Return on average common equity – Operational ((A-C)/G) |
9.4 | 7.9 | 7.3 | 6.6 | 7.0 | |||||||||||||||
| Debt to capital ratio (H/K) |
65.1 | 66.8 | 66.3 | 59.9 | 58.5 | |||||||||||||||
| Debt to capital ratio, excluding securitization and equity infusion from parent ((H-I)/(K-L-M)) |
50.8 | 50.8 | 49.3 | 53.5 | 55.9 | |||||||||||||||
| Net debt to net capital ratio, excluding securitization and equity infusion from parent ((H-I-J)/(K-L-M-N)) |
48.9 | 49.8 | 42.3 | 53.4 | 47.9 | |||||||||||||||
(a) See page 58 for the Pro Forma EGSL Income Statement.
(b) See page 65 for the Pro Forma EGSL Average Common Equity.
Calculations may differ due to rounding.
64
REG G RECONCILIATIONS
ENTERGY GULF STATES AND ENTERGY TEXAS FINANCIAL MEASURES – RECONCILIATION OF GAAP TO NON-GAAP MEASURES
| EGSL PRO FORMA AVERAGE COMMON EQUITY 2007 ($ millions) |
(D) EGSI |
(E)
ADJUSTMENTS |
(D-E) EGSL 2006 |
|||||||||
| Shareholders Equity: |
||||||||||||
| Preferred membership interests without sinking fund (A) |
47 | (1 | ) | 48 | ||||||||
| Members’ equity |
2,220 | 988 | 1,233 | |||||||||
| Accumulated other comprehensive loss |
(20 | ) | - | (20 | ) | |||||||
| Total Equity (B) |
2,248 | 987 | 1,261 | |||||||||
| 2006 Pro Forma Total Common Equity (B–A) |
1,213 | |||||||||||
| 2007 Total Common Equity (C) |
1,274 | |||||||||||
| 2007 Average Common Equity ((C)+(B–A))/2 |
1,243 | |||||||||||
| EGSL / ETI AVERAGE INVESTED CAPITAL AND RETURN ON AVERAGE INVESTED CAPITAL | 2007 PRO FORMA | |||||||||
| ($ millions) | ETI | EGSL | ||||||||
| As-Reported Net Income (A) |
58.9 | 119.5 | (a) | |||||||
| Preferred dividends |
- | 4.0 | (a) | |||||||
| Tax-effected interest expense |
51.2 | 81.8 | (a) | |||||||
| As-Reported Net Income including preferred dividends and tax-effected interest expense (B) |
110.1 | 205.3 | ||||||||
| Total Special Items (C) |
- | (3.6 | ) | |||||||
| Operational earnings including preferred dividends and tax-effected interest expense (B-C) |
110.1 | 208.9 | ||||||||
| Average Invested Capital (D) |
2,245 | 3,175 | ||||||||
| Less Average Securitization Debt (E) |
165 | - | ||||||||
| Less Average Equity Infusion from Parent (F) |
150 | - | ||||||||
| Less Average Assumption Debt (G) |
- | 540 | ||||||||
| Adjusted Average Invested Capital (D-E-F-G) |
1,931 | 2,636 | ||||||||
| ROIC – As-Reported (B/D) |
4.9% | 6.5% | ||||||||
| ROIC – Operational ((B-C)/(D-E-F-G) |
5.7% | 7.9% | ||||||||
| ETI AVERAGE COMMON EQUITY AND RETURN ON AVERAGE COMMON EQUITY | ||||||||||
| ($ millions) | 2008 | 2007 PRO FORMA | ||||||||
| As-Reported Net Income (A) |
57.9 | 58.9 | ||||||||
| Total Special Items (B) |
- | - | ||||||||
| Operational Earnings (A–B) |
57.9 | 58.9 | ||||||||
| Average Common Equity (C) |
952.2 | 996.1 | ||||||||
| Less Average Equity Infusion from Parent |
75.0 | 150.0 | ||||||||
| Adjusted Average Common Equity (D) |
877.2 | 846.1 | ||||||||
| ROE – As-Reported (A/C) |
6.1 | % | 5.9% | |||||||
| ROE – Operational ((A–B)/D) |
6.6 | % | 7.0% | |||||||
| EGSL / ETI DEBT TO CAPITAL RATIO | 2007 PRO FORMA | |||||||||
| ($ millions) | ETI | EGSL | ||||||||
| Currently maturing long-term debt |
309 | 675 | ||||||||
| Notes Payable |
- | - | ||||||||
| Obligations under capital leases – current |
- | 29 | ||||||||
| Obligations under capital leases – non-current |
- | 82 | ||||||||
| Long-term debt |
1,104 | 1,674 | ||||||||
| Total debt before adjustments (A) |
1,413 | 2,460 | ||||||||
| Less debt assumption by ETI (EGSL) (B) |
- | 1,079 | ||||||||
| Less securitization debt (ETI) (C) |
330 | - | ||||||||
| Adjusted total debt (A-B-C) |
1,083 | 1,381 | ||||||||
| Shareholders’ equity (D) |
1,004 | 1,274 | ||||||||
| Less return of parent equity infusion in beginning of 08 |
150 | - | ||||||||
| Adjusted Common Equity (E) |
854 | 1,274 | ||||||||
| Preferred membership interests without sinking fund (F) |
- | 10 | ||||||||
| Adjusted total capital (A-B-C)+(E+F) |
1,937 | 2,665 | ||||||||
| Adjusted Debt / Capital Ratio (A-B-C)/((A-B-C)+(E+F)) |
55.9% | 51.8% | ||||||||
| EGSL / ETI NET DEBT TO NET CAPITAL RATIO | 2007 PRO FORMA | |||||||||
| ($ millions) | ETI | EGSL | ||||||||
| Currently maturing long-term debt |
309 | 675 | ||||||||
| Notes Payable |
- | - | ||||||||
| Obligations under capital leases – current |
- | 29 | ||||||||
| Obligations under capital leases – non-current |
- | 82 | ||||||||
| Long-term debt |
1,104 | 1,674 | ||||||||
| Total debt before adjustments (A) |
1,413 | 2,460 | ||||||||
| Less debt assumption by ETI (EGSL) (B) |
- | 1,079 | ||||||||
| Less securitization debt (ETI) (C) |
330 | - | ||||||||
| Adjusted total debt (A-B-C) |
1,083 | 1,381 | ||||||||
| Less cash and cash equivalents (D) |
297 | 108 | ||||||||
| Net Debt (A-B-C-D) |
786 | 1,273 | ||||||||
| Shareholders’ equity (E) |
1,004 | 1,274 | ||||||||
| Less return of parent equity infusion in beginning of 08 |
150 | - | ||||||||
| Adjusted Common Equity (F) |
854 | 1,274 | ||||||||
| Preferred membership interests without sinking fund (G) |
- | 10 | ||||||||
| Adjusted total capital (A-B-C)+(F+G) |
1,937 | 2,665 | ||||||||
| Less cash and cash equivalents (D) |
297 | 108 | ||||||||
| Net Capitalization (A-B-C)+(F+G)-(D) |
1,640 | 2,557 | ||||||||
| Adjusted Net Debt / Net Capital Ratio (A-B-C-D)/((A-B-C)+(F+G)-(D)) |
47.9% | 49.8% | ||||||||
(a) See page 58 for the Pro Forma EGSL Income Statement.
Calculations may differ due to rounding.
65
REG G RECONCILIATIONS
ENTERGY GULF STATES AND ENTERGY TEXAS FINANCIAL MEASURES – RECONCILIATION OF GAAP TO NON-GAAP MEASURES (continued)
EGSL PRO FORMA CASH FLOW INTEREST COVERAGE
2007
| (A) | (B) | (A-B) | ||||||||||
| EGSL(a) | ETI | EGSL | ||||||||||
| ($ thousands) | PER 2007 10-K | PER FORM 10 | PRO FORMA | |||||||||
| Net Income |
182,382 | 58,921 | 123,461 | |||||||||
| Adjustments to reconcile net income to net cash flow provided by operating activities: |
||||||||||||
| Reserve for regulatory adjustments |
363 | (363 | ) | 726 | ||||||||
| Other regulatory charges (credits) – net |
29,923 | 16,808 | 13,115 | |||||||||
| Depreciation, amortization, and decommissioning |
220,376 | 68,345 | 152,031 | |||||||||
| Deferred income taxes, investment tax credits, and non-current taxes accrued |
109,131 | 218,873 | (109,742 | ) | ||||||||
| Changes in working capital: |
||||||||||||
| Receivables |
(261,538 | ) | (230,481 | ) | (31,057 | ) | ||||||
| Fuel inventory |
(18,377 | ) | (10,939 | ) | (7,438 | ) | ||||||
| Accounts payable |
38,685 | (1,328 | ) | 40,013 | ||||||||
| Taxes accrued |
(27,781 | ) | 4,936 | (32,717 | ) | |||||||
| Interest accrued |
22,963 | 10,030 | 12,933 | |||||||||
| Deferred fuel costs |
35,363 | 21,619 | 13,744 | |||||||||
| Other working capital accounts |
197,802 | 86,598 | 111,204 | |||||||||
| Provision for estimated losses and reserves |
(91,241 | ) | (568 | ) | (90,673 | ) | ||||||
| Changes in other regulatory assets |
116,317 | (21,038 | ) | 137,355 | ||||||||
| Other |
6,372 | (45,422 | ) | 51,794 | ||||||||
| Net Cash Flow from Operating Activities |
560,740 | 175,991 | 384,749 | |||||||||
| EGSL Pro Forma Net Cash Flow from Operating Activities |
(C | ) | 384,749 | |||||||||
| Cash Paid During Period for Interest – net of amount capitalized |
(D | ) | 131,280 | |||||||||
| Operating Cash Flow before Interest Payments |
(C+D | ) | 516,029 | |||||||||
| Interest and Other Charges |
(E | ) | 132,869 | (a) | ||||||||
| Pro Forma Cash Flow Interest Coverage |
((C+D)/E) | 3.9 | ||||||||||
| (a) | Entergy Gulf States Louisiana, L.L.C. (EGSL) is the successor for financial reporting purposes to Entergy Gulf States, Inc. EGSL’s Cash Flow Statement for the year ended 2007 includes the operations of Entergy Texas, Inc. |
ENTERGY LOUISIANA FINANCIAL MEASURES – RECONCILIATION OF GAAP TO NON-GAAP MEASURES
2007-2011
| ($ millions) | 2011 | 2010 | 2009 | 2008 | 2007 | |||||||||||||||
| As-Reported Earnings (A) |
467.0 | 224.5 | 225.9 | 150.6 | 136.4 | |||||||||||||||
| Preferred dividends |
7.0 | 7.0 | 7.0 | 7.0 | 7.0 | |||||||||||||||
| Tax-effected interest expense |
61.2 | 62.5 | 52.7 | 51.1 | 48.2 | |||||||||||||||
| As-Reported Earnings including preferred dividends and tax-effected interest expense (B) |
535.2 | 294.0 | 285.6 | 208.7 | 191.5 | |||||||||||||||
| Special items |
||||||||||||||||||||
| Nuclear alignment |
- | - | - | - | (2.2 | ) | ||||||||||||||
| Total special items (C) |
- | - | - | - | (2.2 | ) | ||||||||||||||
| Operational earnings including preferred dividends and tax-effected interest expense (B-C) |
535.2 | 294.0 | 285.6 | 208.7 | 193.7 | |||||||||||||||
| Operational earnings (A-C) |
467.0 | 224.5 | 225.9 | 150.6 | 138.6 | |||||||||||||||
| Average invested capital (D) |
4,414 | 3,890 | 3,491 | 2,958 | 2,697 | |||||||||||||||
| Average invested capital, excluding securitization (E) |
4,311 | 3,890 | 3,491 | 2,958 | 2,697 | |||||||||||||||
| Average members’ equity (F) |
2,251 | 1,924 | 1,710 | 1,531 | 1,386 | |||||||||||||||
| Gross debt (G) |
2,297 | 1,830 | 1,902 | 1,462 | 1,192 | |||||||||||||||
| Less securitization debt (H) |
207 | - | - | - | - | |||||||||||||||
| Gross debt, excluding securitization debt (G-H) |
2,090 | 1,830 | 1,902 | 1,462 | 1,192 | |||||||||||||||
| Less cash and cash equivalents (I) |
1 | 123 | 152 | 139 | 0.3 | |||||||||||||||
| Net debt, excluding securitization debt (G-H-I) |
2,089 | 1,707 | 1,750 | 1,323 | 1,192 | |||||||||||||||
| Total capitalization (J) |
4,862 | 3,967 | 3,813 | 3,170 | 2,746 | |||||||||||||||
| Less securitization debt (K) |
207 | - | - | - | - | |||||||||||||||
| Total capitalization, excluding securitization debt (J-K) |
4,655 | 3,967 | 3,813 | 3,170 | 2,746 | |||||||||||||||
| Less cash and cash equivalents (L) |
1 | 123 | 152 | 139 | 0.3 | |||||||||||||||
| Net capitalization, excluding securitization debt (J-K-L) |
4,654 | 3,844 | 3,662 | 3,031 | 2,745 | |||||||||||||||
| (%) |
||||||||||||||||||||
| Return on average invested capital – As-Reported (B/D) |
12.1 | 7.6 | 8.2 | 7.1 | 7.1 | |||||||||||||||
| Return on average invested capital – Operational ((B-C)/E) |
12.4 | 7.6 | 8.2 | 7.1 | 7.2 | |||||||||||||||
| Return on average members’ equity – As-Reported (A/F) |
20.7 | 11.7 | 13.2 | 9.8 | 9.8 | |||||||||||||||
| Return on average members’ equity – Operational ((A-C)/F) |
20.7 | 11.7 | 13.2 | 9.8 | 10.0 | |||||||||||||||
| Debt to capital ratio (G/J) |
47.2 | 46.1 | 49.9 | 46.1 | 43.4 | |||||||||||||||
| Debt to capital ratio, excluding securitization debt ((G-H)/(J-K)) |
44.9 | 46.1 | 49.9 | 46.1 | 43.4 | |||||||||||||||
| Net debt to net capital ratio, excluding securitization debt ((G-H-I)/(J-K-L)) |
44.9 | 44.4 | 47.8 | 43.6 | 43.4 | |||||||||||||||
| Calculations | may differ due to rounding. |
66
REG G RECONCILIATIONS
ENTERGY MISSISSIPPI FINANCIAL MEASURES – RECONCILIATION OF GAAP TO NON-GAAP MEASURES
2007-2011
| ($ millions) | 2011 | 2010 | 2009 | 2008 | 2007 | |||||||||||||||
| As-Reported Earnings (A) |
105.9 | 82.5 | 76.5 | 58.4 | 70.1 | |||||||||||||||
| Preferred dividends |
2.8 | 2.8 | 2.8 | 2.8 | 2.8 | |||||||||||||||
| Tax-effected interest expense |
29.5 | 32.1 | 30.5 | 27.7 | 27.4 | |||||||||||||||
| As-Reported Earnings including preferred dividends and tax-effected interest expense (B) |
138.3 | 117.4 | 109.9 | 88.9 | 100.2 | |||||||||||||||
| Special items |
||||||||||||||||||||
| - | - | - | - | - | ||||||||||||||||
| Total special items (C) |
- | - | - | - | - | |||||||||||||||
| Operational earnings including preferred dividends and tax-effected interest expense (B-C) |
138.3 | 117.4 | 109.9 | 88.9 | 100.2 | |||||||||||||||
| Operational earnings (A-C) |
105.9 | 82.5 | 76.5 | 58.4 | 70.1 | |||||||||||||||
| Average invested capital (D) |
1,720 | 1,609 | 1,509 | 1,418 | 1,439 | |||||||||||||||
| Average common equity (E) |
784 | 714 | 681 | 664 | 639 | |||||||||||||||
| Gross debt (F) |
931 | 839 | 852 | 703 | 704 | |||||||||||||||
| Less cash and cash equivalents (G) |
- | 1 | 91 | 1 | 41 | |||||||||||||||
| Net debt (F-G) |
931 | 837 | 760 | 702 | 664 | |||||||||||||||
| Total capitalization (H) |
1,817 | 1,622 | 1,596 | 1,422 | 1,413 | |||||||||||||||
| Less cash and cash equivalents (I) |
- | 1 | 91 | 1 | 41 | |||||||||||||||
| Net capitalization (H-I) |
1,817 | 1,621 | 1,505 | 1,421 | 1,373 | |||||||||||||||
| (%) |
||||||||||||||||||||
| Return on average invested capital – As-Reported (B/D) |
8.0 | 7.3 | 7.3 | 6.3 | 7.0 | |||||||||||||||
| Return on average invested capital – Operational ((B-C)/D) |
8.0 | 7.3 | 7.3 | 6.3 | 7.0 | |||||||||||||||
| Return on average common equity – As-Reported (A/E) |
13.5 | 11.6 | 11.2 | 8.8 | 11.0 | |||||||||||||||
| Return on average common equity – Operational ((A-C)/E) |
13.5 | 11.6 | 11.2 | 8.8 | 11.0 | |||||||||||||||
| Debt to capital ratio (F/H) |
51.2 | 51.7 | 53.4 | 49.4 | 49.8 | |||||||||||||||
| Net debt to net capital ratio ((F-G)/(H-I)) |
51.2 | 51.7 | 50.5 | 49.4 | 48.4 | |||||||||||||||
ENTERGY NEW ORLEANS FINANCIAL MEASURES – RECONCILIATION OF GAAP TO NON-GAAP MEASURES
2007-2011
| ($ millions) | 2011 | 2010 | 2009 | 2008 | 2007 | |||||||||||||||
| As-Reported Earnings (A) |
35.0 | 30.1 | 29.5 | 33.4 | 23.0 | |||||||||||||||
| Preferred dividends |
1.0 | 1.0 | 1.0 | 1.0 | 1.1 | |||||||||||||||
| Tax-effected interest expense |
6.7 | 7.9 | 10.4 | 12.7 | 12.4 | |||||||||||||||
| As-Reported Earnings including preferred dividends and tax-effected interest expense (B) |
42.7 | 39.0 | 40.9 | 47.0 | 36.5 | |||||||||||||||
| Special items |
||||||||||||||||||||
| - | - | - | - | - | ||||||||||||||||
| Total special items (C) |
- | - | - | - | - | |||||||||||||||
| Operational earnings including preferred dividends and tax-effected interest expense (B-C) |
42.7 | 39.0 | 40.9 | 47.0 | 36.5 | |||||||||||||||
| Operational earnings (A-C) |
35.0 | 30.1 | 29.5 | 33.4 | 23.0 | |||||||||||||||
| Average invested capital (D) |
371 | 436 | 499 | 500 | 476 | |||||||||||||||
| Average common equity (E) |
185 | 197 | 207 | 192 | 164 | |||||||||||||||
| Gross debt (F) |
167 | 167 | 272 | 273 | 304 | |||||||||||||||
| Less cash and cash equivalents (G) |
10 | 55 | 191 | 137 | 92 | |||||||||||||||
| Net debt (F-G) |
157 | 112 | 81 | 136 | 212 | |||||||||||||||
| Total capitalization (H) |
367 | 375 | 497 | 501 | 499 | |||||||||||||||
| Less cash and cash equivalents (I) |
10 | 55 | 191 | 137 | 92 | |||||||||||||||
| Net capitalization (H-I) |
358 | 320 | 306 | 364 | 407 | |||||||||||||||
| (%) |
||||||||||||||||||||
| Return on average invested capital – As-Reported (B/D) |
11.5 | 8.9 | 8.2 | 9.4 | 7.7 | |||||||||||||||
| Return on average invested capital – Operational ((B-C)/D) |
11.5 | 8.9 | 8.2 | 9.4 | 7.7 | |||||||||||||||
| Return on average common equity – As-Reported (A/E) |
19.0 | 15.3 | 14.3 | 17.4 | 14.1 | |||||||||||||||
| Return on average common equity – Operational ((A-C)/E) |
19.0 | 15.3 | 14.3 | 17.4 | 14.1 | |||||||||||||||
| Debt to capital ratio (F/H) |
45.3 | 44.6 | 54.8 | 54.5 | 60.9 | |||||||||||||||
| Net debt to net capital ratio ((F-G)/(H-I)) |
43.8 | 35.1 | 26.5 | 37.3 | 52.1 | |||||||||||||||
Calculations may differ due to rounding.
67
REG G RECONCILIATIONS
SYSTEM ENERGY RESOURCES FINANCIAL MEASURES – RECONCILIATION OF GAAP TO NON-GAAP MEASURES
2007-2011
| ($ millions) | 2011 | 2010 | 2009 | 2008 | 2007 | |||||||||||||||
| As-Reported Net Income (A) |
64.2 | 82.6 | 48.9 | 91.1 | 136.1 | |||||||||||||||
| Preferred dividends |
- | - | - | - | - | |||||||||||||||
| Tax-effected interest expense |
25.5 | 29.9 | 26.7 | 33.9 | 34.5 | |||||||||||||||
| As-Reported Net Income including preferred dividends and tax-effected interest expense (B) |
89.7 | 112.5 | 75.6 | 125.0 | 170.6 | |||||||||||||||
| Special items |
||||||||||||||||||||
| Nuclear Alignment |
- | - | - | - | (1.9 | ) | ||||||||||||||
| Total special items (C) |
- | - | - | - | (1.9 | ) | ||||||||||||||
| Operational earnings including preferred dividends and tax-effected interest expense (B-C) |
89.7 | 112.5 | 75.6 | 125.0 | 172.5 | |||||||||||||||
| Operational earnings (A-C) |
64.2 | 82.6 | 48.9 | 91.1 | 138.0 | |||||||||||||||
| Average invested capital (D) |
1,614 | 1,666 | 1,703 | 1,750 | 1,740 | |||||||||||||||
| Average common equity (E) |
806 | 821 | 843 | 859 | 860 | |||||||||||||||
| Gross debt (F) |
747 | 869 | 820 | 899 | 882 | |||||||||||||||
| Less cash and cash equivalents (G) |
185 | 264 | 264 | 103 | 105 | |||||||||||||||
| Net debt (F-G) |
562 | 605 | 556 | 796 | 777 | |||||||||||||||
| Total capitalization (H) |
1,548 | 1,681 | 1,650 | 1,755 | 1,744 | |||||||||||||||
| Less cash and cash equivalents (I) |
185 | 264 | 264 | 103 | 105 | |||||||||||||||
| Net capitalization (H-I) |
1,362 | 1,417 | 1,386 | 1,652 | 1,639 | |||||||||||||||
| (%) |
||||||||||||||||||||
| Return on average invested capital – As-Reported (B/D) |
5.6 | 6.8 | 4.4 | 7.1 | 9.8 | |||||||||||||||
| Return on average invested capital – Operational ((B-C)/D) |
5.6 | 6.8 | 4.4 | 7.1 | 9.9 | |||||||||||||||
| Return on average common equity – As-Reported (A/E) |
8.0 | 10.1 | 5.8 | 10.6 | 15.8 | |||||||||||||||
| Return on average common equity – Operational ((A-C)/E) |
8.0 | 10.1 | 5.8 | 10.6 | 16.0 | |||||||||||||||
| Debt to capital ratio (F/H) |
48.3 | 51.7 | 49.7 | 51.2 | 50.6 | |||||||||||||||
| Net debt to net capital ratio ((F-G)/(H-I)) |
41.2 | 42.7 | 40.1 | 48.2 | 47.4 | |||||||||||||||
ENTERGY WHOLESALE COMMODITIES FINANCIAL MEASURES – RECONCILIATION OF GAAP TO NON-GAAP MEASURES
2007-2011
| ($ millions) | 2011 | 2010 | 2009 | 2008 | 2007 | |||||||||||||||
| As-Reported Net Income (A) |
488.6 | 486.7 | 638.5 | 795.6 | 583.2 | |||||||||||||||
| Preferred dividends |
3.2 | 2.7 | 2.6 | 2.7 | 3.4 | |||||||||||||||
| Tax-effected interest expense |
12.7 | 44.2 | 48.2 | 62.0 | 48.6 | |||||||||||||||
| As-Reported Net Income including preferred dividends and tax-effected interest expense (B) |
504.5 | 533.6 | 689.3 | 860.2 | 635.2 | |||||||||||||||
| Special items |
||||||||||||||||||||
| Nuclear alignment |
- | - | - | - | (18.4 | ) | ||||||||||||||
| Non-utility nuclear spin-off expenses |
- | (100.7 | ) | (44.0 | ) | - | - | |||||||||||||
| Total special items (C) |
- | (100.7 | ) | (44.0 | ) | - | (18.4 | ) | ||||||||||||
| Operational earnings including preferred dividends and tax-effected interest expense (B-C) |
504.5 | 634.3 | 733.3 | 860.2 | 653.6 | |||||||||||||||
| Operational earnings (A-C) |
488.6 | 587.4 | 682.5 | 795.6 | 601.6 | |||||||||||||||
| Average invested capital (D) |
6,200 | 5,720 | 5,201 | 5,023 | 4,754 | |||||||||||||||
| Average common equity (E) |
5,840 | 5,197 | 4,506 | 4,150 | 3,549 | |||||||||||||||
| Gross debt (F) |
274 | 306 | 568 | 650 | 924 | |||||||||||||||
| Less cash and cash equivalents (G) |
322 | 454 | 453 | 459 | 458 | |||||||||||||||
| Net debt (F-G) |
(49 | ) | (148 | ) | 115 | 191 | 466 | |||||||||||||
| Total capitalization (H) |
6,379 | 6,022 | 5,419 | 4,983 | 5,062 | |||||||||||||||
| Less cash and cash equivalents (I) |
322 | 454 | 453 | 459 | 458 | |||||||||||||||
| Net capitalization (H-I) |
6,057 | 5,568 | 4,965 | 4,524 | 4,604 | |||||||||||||||
| (%) |
||||||||||||||||||||
| Return on average invested capital – As-Reported (B/D) |
8.1 | 9.3 | 13.3 | 17.1 | 13.4 | |||||||||||||||
| Return on average invested capital – Operational ((B-C)/D) |
8.1 | 11.1 | 14.1 | 17.1 | 13.7 | |||||||||||||||
| Return on average common equity – As-Reported (A/E) |
8.4 | 9.4 | 14.2 | 19.2 | 16.4 | |||||||||||||||
| Return on average common equity – Operational ((A-C)/E) |
8.4 | 11.3 | 15.1 | 19.2 | 17.0 | |||||||||||||||
| Debt to capital ratio (F/H) |
4.3 | 5.1 | 10.5 | 13.0 | 18.3 | |||||||||||||||
| Net debt to net capital ratio ((F-G)/(H-I)) |
(0.8 | ) | (2.7 | ) | 2.3 | 4.2 | 10.1 | |||||||||||||
Calculations may differ due to rounding.
68
REG G RECONCILIATIONS
ENTERGY WHOLESALE COMMODITIES FINANCIAL MEASURES – RECONCILIATION OF GAAP TO NON-GAAP MEASURES
1Q10-4Q11
| ($ millions) | 1Q11 | 2Q11 | 3Q11 | 4Q11 | 1Q10 | 2Q10 | 3Q10 | 4Q10 | ||||||||||||||||||||||||
| For the quarter: |
||||||||||||||||||||||||||||||||
| As-Reported Net Income (A) |
122.6 | 64.9 | 130.2 | 171.0 | 89.9 | 103.9 | 143.0 | 149.9 | ||||||||||||||||||||||||
| Less special items (B) |
- | - | - | - | (54.3 | ) | (14.5 | ) | (25.2 | ) | (6.7 | ) | ||||||||||||||||||||
| Operational earnings (A-B)
|
122.6 | 64.9 | 130.2 | 171.0 | 144.2 | 118.4 | 168.2 | 156.6 | ||||||||||||||||||||||||
| As-Reported Net Income, rolling 12 months (C) |
519.4 | 480.4 | 467.5 | 488.6 | 558.0 | 577.3 | 534.7 | 486.7 | ||||||||||||||||||||||||
| Preferred dividends |
2.7 | 2.7 | 2.7 | 3.2 | 2.6 | 2.7 | 2.7 | 2.7 | ||||||||||||||||||||||||
| Tax-effected interest expense |
15.1 | 12.3 | 11.9 | 12.7 | 67.7 | 57.6 | 51.7 | 44.2 | ||||||||||||||||||||||||
| As-Reported Net Income, rolling 12 months including preferred dividends and tax-effected interest expense (D) |
537.3 | 495.4 | 482.2 | 504.5 | 628.3 | 637.5 | 589.0 | 533.6 | ||||||||||||||||||||||||
|
Special items in prior quarters |
(46.4 | ) | (31.9 | ) | (6.7 | ) | - | (37.4 | ) | (76.6 | ) | (80.8 | ) | (94.0 | ) | |||||||||||||||||
| Special items in current quarter |
- | - | - | - | (54.3 | ) | (14.5 | ) | (25.2 | ) | (6.7 | ) | ||||||||||||||||||||
| Total special items (E)
|
(46.4 | ) | (31.9 | ) | (6.7 | ) | - | (91.7 | ) | (91.1 | ) | (106.0 | ) | (100.7 | ) | |||||||||||||||||
| Operational earnings, rolling 12 months including preferred dividends and tax-effected interest expense (D-E) |
583.7 | 527.4 | 488.9 | 504.5 | 720.0 | 728.6 | 695.0 | 634.3 | ||||||||||||||||||||||||
| Operational earnings, rolling |
||||||||||||||||||||||||||||||||
| 12 months (C-E) |
565.8 | 512.3 | 474.2 | 488.6 | 649.7 | 668.4 | 640.7 | 587.4 | ||||||||||||||||||||||||
| Average invested capital (F) |
5,946 | 5,946 | 6,162 | 6,200 | 5,440 | 5,433 | 5,703 | 5,720 | ||||||||||||||||||||||||
| Average common equity (G)
|
5,445 | 5,494 | 5,817 | 5,840 | 4,743 | 4,789 | 5,148 | 5,197 | ||||||||||||||||||||||||
| Gross debt (H) |
259 | 257 | 221 | 274 | 570 | 475 | 298 | 306 | ||||||||||||||||||||||||
| Less cash and cash equivalents (I) |
265 | 299 | 507 | 322 | 588 | 317 | 363 | 454 | ||||||||||||||||||||||||
| Net debt (H-I)
|
(6 | ) | (41 | ) | (286 | ) | (49 | ) | (18 | ) | 158 | (65 | ) | (148 | ) | |||||||||||||||||
| Total capitalization (J) |
6,211 | 6,288 | 6,297 | 6,379 | 5,680 | 5,603 | 6,028 | 6,022 | ||||||||||||||||||||||||
| Less cash and cash equivalents (K) |
265 | 299 | 507 | 322 | 588 | 317 | 363 | 454 | ||||||||||||||||||||||||
| Net capital (J-K)
|
5,946 | 5,989 | 5,789 | 6,057 | 5,092 | 5,286 | 5,665 | 5,568 | ||||||||||||||||||||||||
| (%) |
||||||||||||||||||||||||||||||||
| Return on average invested capital – |
||||||||||||||||||||||||||||||||
| As-Reported (D/F) |
9.0 | 8.3 | 7.8 | 8.1 | 11.5 | 11.7 | 10.3 | 9.3 | ||||||||||||||||||||||||
| Return on average invested capital – |
||||||||||||||||||||||||||||||||
| Operational ((D-E)/F) |
9.8 | 8.9 | 7.9 | 8.1 | 13.2 | 13.4 | 12.2 | 11.1 | ||||||||||||||||||||||||
| Return on average common equity – |
||||||||||||||||||||||||||||||||
| As-Reported (C/G) |
9.5 | 8.7 | 8.0 | 8.4 | 11.8 | 12.1 | 10.4 | 9.4 | ||||||||||||||||||||||||
| Return on average common equity – |
||||||||||||||||||||||||||||||||
| Operational ((C-E)/G) |
10.4 | 9.3 | 8.2 | 8.4 | 13.7 | 14.0 | 12.4 | 11.3 | ||||||||||||||||||||||||
| Debt to capital ratio (H/J) |
4.2 | 4.1 | 3.5 | 4.3 | 10.0 | 8.5 | 4.9 | 5.1 | ||||||||||||||||||||||||
| Net debt to net capital ratio ((H-I)/(J-K)) |
(0.1 | ) | (0.7 | ) | (4.9 | ) | (0.8 | ) | (0.4 | ) | 3.0 | (1.2 | ) | (2.7 | ) | |||||||||||||||||
Calculations may differ due to rounding.
69
REG G RECONCILIATIONS
ENTERGY WHOLESALE COMMODITIES OPERATIONAL ADJUSTED EBITDA – RECONCILIATION OF GAAP TO NON-GAAP MEASURES
1Q10-4Q11
| ($ millions) | 1Q11 | 2Q11 | 3Q11 | 4Q11 | 1Q10 | 2Q10 | 3Q10 | 4Q10 | ||||||||||||||||||||||||
| Net Income (A) |
123.2 | 65.6 | 130.9 | 172.2 | 90.5 | 104.6 | 143.7 | 150.6 | ||||||||||||||||||||||||
| Add back: interest expense (B) |
4.8 | 4.6 | 5.3 | 5.9 | 51.9 | 9.2 | 5.9 | 4.7 | ||||||||||||||||||||||||
| Add back: income tax expense (C) |
85.0 | 64.3 | 64.1 | 12.1 | 87.6 | 67.4 | 30.7 | 83.0 | ||||||||||||||||||||||||
| Add back: depreciation and amortization (D) |
43.2 | 44.2 | 45.2 | 46.6 | 40.5 | 38.2 | 41.8 | 42.7 | ||||||||||||||||||||||||
| Subtract: interest and investment income (E) |
30.9 | 33.1 | 33.6 | 38.9 | 49.5 | 39.9 | 43.2 | 38.6 | ||||||||||||||||||||||||
| Add back: decommissioning expense (F) |
28.1 | 28.6 | 29.1 | (4.4 | ) | 26.2 | 26.6 | 27.1 | 27.6 | |||||||||||||||||||||||
| Subtract: other than temporary impairments (G) |
- | (0.1 | ) | (0.0 | ) | - | (0.2 | ) | (0.8 | ) | (0.2 | ) | (0.1 | ) | ||||||||||||||||||
| Adjusted EBITDA (A+B+C+D-E+F-G) |
253.4 | 174.3 | 241.0 | 193.5 | 247.4 | 206.9 | 206.2 | 270.1 | ||||||||||||||||||||||||
| Add back: special items (H) |
- | - | - | - | 43.5 | 22.4 | 40.4 | 10.6 | ||||||||||||||||||||||||
| Operational adjusted EBITDA (A+B+C+D-E+F-G+H) |
253.4 | 174.3 | 241.0 | 193.5 | 290.9 | 229.3 | 246.6 | 280.7 | ||||||||||||||||||||||||
Totals may not foot due to rounding.
ENTERGY WHOLESALE COMMODITIES OPERATIONAL ADJUSTED EBITDA – RECONCILIATION OF GAAP TO NON-GAAP MEASURES
2007-2011
| ($ millions) | 2011 | 2010 | 2009 | 2008 | 2007 | |||||||||||||||
| Net Income (A) |
491.8 | 489.4 | 641.1 | 798.2 | 586.6 | |||||||||||||||
| Add back: interest expense (B) |
20.6 | 71.8 | 78.3 | 100.8 | 80.8 | |||||||||||||||
| Add back: income tax expense (C) |
225.5 | 268.7 | 322.2 | 289.6 | 143.5 | |||||||||||||||
| Add back: depreciation and amortization (D) |
179.2 | 163.2 | 151.8 | 136.9 | 109.5 | |||||||||||||||
| Subtract: interest and investment income (E) |
136.5 | 171.2 | 196.5 | 163.2 | 150.0 | |||||||||||||||
| Add back: decommissioning expense (F) |
81.5 | 107.5 | 99.4 | 93.6 | 78.7 | |||||||||||||||
| Subtract: other than temporary impairments (G) |
(0.1 | ) | (1.4 | ) | (86.1 | ) | (49.6 | ) | (4.9 | ) | ||||||||||
| Adjusted EBITDA (A+B+C+D-E+F-G) |
862.2 | 930.8 | 1,182.4 | 1,305.5 | 854.0 | |||||||||||||||
| Add back: special items (H) |
- | 116.7 | 48.0 | - | 29.9 | |||||||||||||||
| Operational adjusted EBITDA (A+B+C+D-E+F-G+H) |
862.2 | 1,047.5 | 1,230.4 | 1,305.5 | 883.9 | |||||||||||||||
Totals may not foot due to rounding.
70
71