Exhibit 99.1
THE MARCUS CORPORATION REPORTS SECOND QUARTER RESULTS
Record operating income for Marcus® Hotels & Resorts helps to offset impact of weaker film slate for Marcus Theatres®
Milwaukee, Wis., Dec. 17, 2015….. The Marcus Corporation (NYSE: MCS) today reported results for the second quarter ended November 26, 2015.
Second Quarter Highlights
| · | Total revenues for the second quarter of the transition period ending December 31, 2015 were $115,676,000, a slight decrease from revenues of $116,061,000 for the second quarter of fiscal 2015. |
| · | Operating income was $10,554,000 for the second quarter of the transition period, a 9.2% decrease from operating income of $11,620,000 for the second quarter of fiscal 2015. |
| · | Net earnings attributable to The Marcus Corporation were $4,945,000 for the second quarter of the transition period, a 5.3% decrease from net earnings attributable to The Marcus Corporation of $5,223,000 for the second quarter of fiscal 2015. |
| · | Net earnings per diluted common share attributable to The Marcus Corporation were $0.18 for the second quarter of the transition period, a 5.3% decrease from net earnings per diluted common share attributable to The Marcus Corporation of $0.19 for the second quarter of fiscal 2015. |
First 26 Weeks Highlights
| · | Total revenues for the first 26 weeks of the transition period ending December 31, 2015 were $264,866,000, a 6.9% increase from revenues of $247,830,000 for the first 26 weeks of fiscal 2015. |
| · | Operating income was $36,410,000 for the first 26 weeks of the transition period, a 6.1% increase from operating income of $34,309,000 for the same period in the prior year. |
-more-
Page 2
| · | Net earnings attributable to The Marcus Corporation were $19,596,000 for the first 26 weeks of the transition period, an 11.0% increase from net earnings attributable to The Marcus Corporation of $17,655,000 for the first 26 weeks of fiscal 2015. |
| · | Net earnings per diluted common share attributable to The Marcus Corporation were $0.70 for the first 26 weeks of the transition period, a 9.4% increase from net earnings per diluted common share attributable to The Marcus Corporation of $0.64 for the first 26 weeks of fiscal 2015. |
“Although the theatre division had a challenging second quarter, both divisions still achieved record operating income for the first 26 weeks of the transition period. Second quarter results for Marcus Hotels & Resorts benefited from a higher average daily rate and strong cost controls, which helped to offset the impact of a weaker film slate and a significant number of screens out of service for upgrades for Marcus Theatres,” said Gregory S. Marcus, president and chief executive officer of The Marcus Corporation.
| Marcus Theatres® |
“Marcus Theatres reported record second quarter revenues, as well as record revenues and operating income for the first 26 weeks of the transition period. Our second quarter box-office results generally matched the industry, in spite of an unprecedented number of screens out of service as we prepared for the major opening today of Star Wars: The Force Awakens. Over the past three weeks, we have returned to our nearly two-year record of outperforming the industry as newly renovated screens have come on line,” said Marcus.
“Our successful food and beverage concepts continued to generate significant revenues, with concession revenues per person up 6.6% for the second quarter and 10.1% for the first 26 weeks,” said Rolando B. Rodriguez, president and chief executive officer of Marcus Theatres.
“We recently added 17 newly renovated premium large format screens with DreamLoungerSM recliner seating to our circuit. We now offer premium large format screens in more than 61% of our company-owned, first run theatres, which we believe is the highest percentage among the top chains in the industry. This positions us very well to capitalize on what is expected to be a record-breaking performance for the highly anticipated sequel to the epic Star Wars series,” said Rodriguez.
-more-
Page 3
Rodriguez said the five top-performing films for Marcus Theatres in the second quarter were The Martian, The Hunger Games: Mockingjay – Part 2, Hotel Transylvania 2, Spectre and The Peanuts Movie.
“Looking ahead, potential hits in the pipeline include two other films opening tomorrow, Sisters and Alvin and the Chipmunks – The Road Chip. Five additional pictures, The Big Short, Daddy’s Home, Point Break, Joy and Concussion all open next week, followed by films such as The Revenant, The Hateful Eight and Ride Along 2 in early January,” said Rodriguez.
“We are in the process of renovating five additional theatres, each with DreamLounger recliner seating and selected food and beverage outlets. These renovations, plus two new UltraScreen® auditoriums also under construction, are scheduled to be completed during the first half of 2016. In November, we opened the Midwest’s first 4-D movie theatre at our Gurnee Mills Cinema in Gurnee Mills, Ill. This new technology immerses movie-goers into the action like never before, with special effects including motion, wind, lightning flashes and scents. All of these investments are designed to create the ultimate movie-going experience for our guests,” said Rodriguez.
| Marcus® Hotels & Resorts |
“Marcus Hotels & Resorts achieved record operating income for both the second quarter and first 26 weeks as a result of increased revenues at comparable hotels and a strong focus on operational improvements. Revenue per available room (RevPAR) for comparable company-owned hotels increased 2.4% in the second quarter,” said Marcus.
“The hotel division achieved a 33.1% increase in operating income in the second quarter and a 14.4% increase in operating income for the first 26 weeks, compared to the same periods last year. Our team is focused on delivering exceptional guest experiences, managing costs and increasing profitability in all areas of our properties,” said Joseph Khairallah, chief operating officer of Marcus Hotels & Resorts.
-more-
Page 4
“As part of our strategy to increase our number of rooms under management, we recently expanded our hotel development team with the addition of a senior executive experienced in operations, business development, marketing, feasibility and valuation. The team is aggressively pursuing our strategy to add high-quality management contracts and sourcing potential hotel investment opportunities. We have a number of good potential opportunities in the pipeline, and are continuing to move forward with our growth strategy,” said Khairallah.
Marcus noted that during the second quarter, the company completed the previously announced sale of its former company-owned and operated Hotel Phillips in Kansas City, Mo.
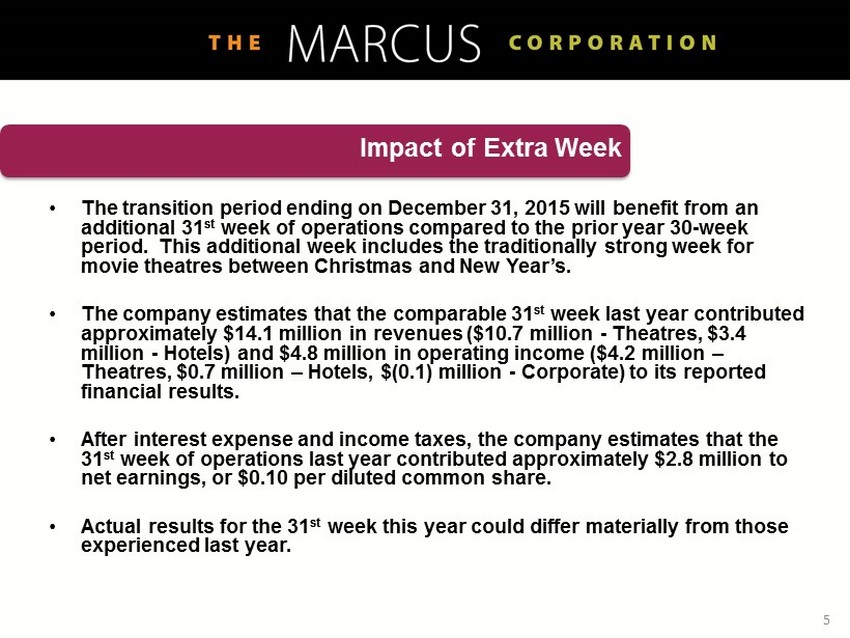
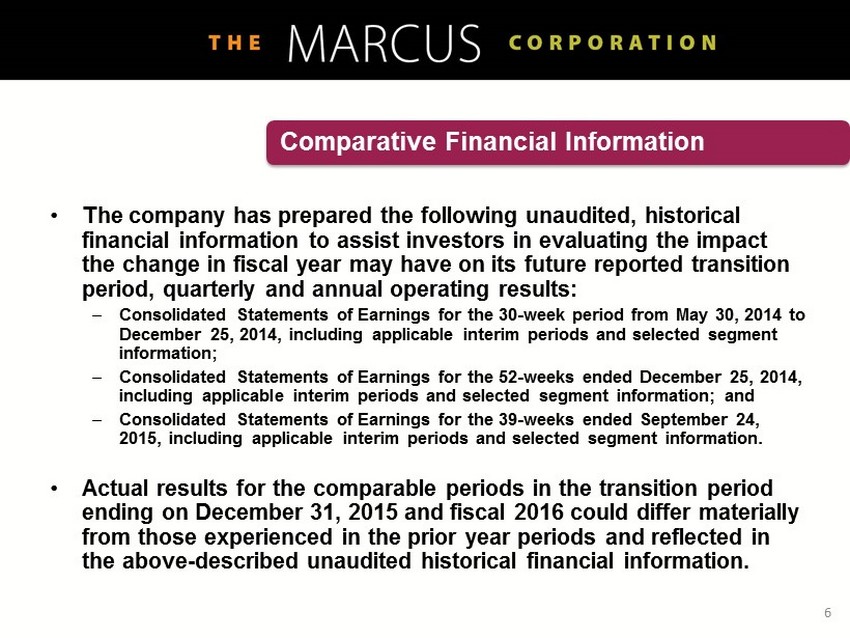
Change in Fiscal Year End
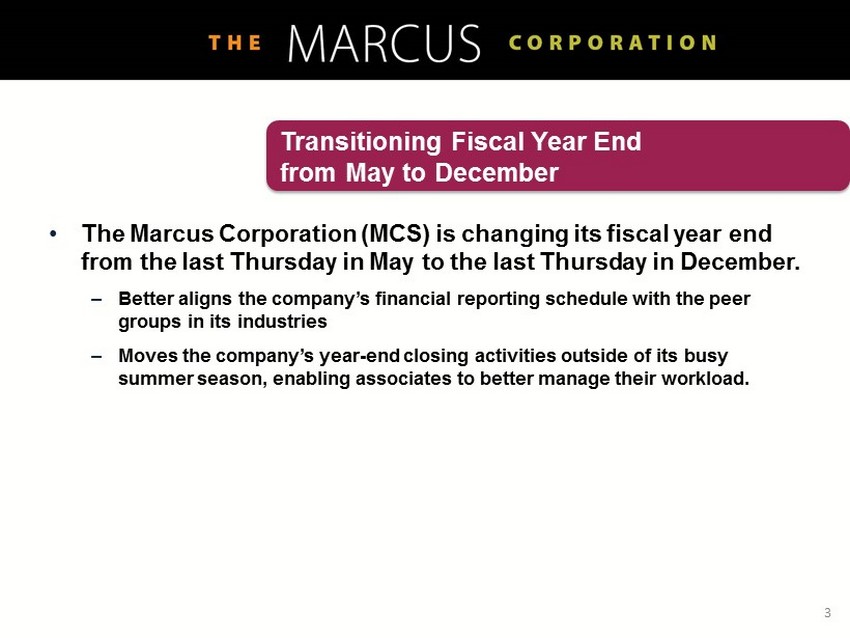
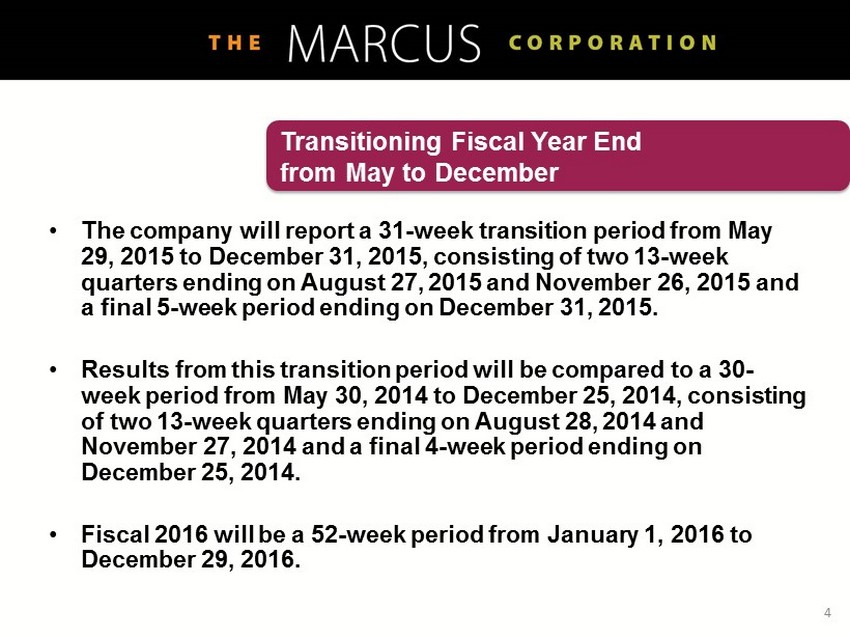
As previously announced, the company has changed its fiscal year end from the last Thursday in May to the last Thursday in December. As a result, the company plans to report its financial results for the 31-week period from May 29, 2015 to December 31, 2015 on a transition report on Form 10-K and thereafter file reports for periods based on the new fiscal year. More specific information on the company’s change in fiscal year, including comparative historical financial information, will be available today on the “presentations” page in the investor relations section of the company’s website: www.marcuscorp.com.
Conference Call and Webcast
Marcus Corporation management will hold a conference call today, Dec. 17, 2015 at
10:00 a.m. Central/11:00 a.m. Eastern time to discuss the second quarter results. Interested parties may listen to the call live on the Internet through the investor relations section of the company's website: www.marcuscorp.com, or by dialing 1-857-244-7327 and entering the passcode 66817673. Listeners should dial in to the call at least 5-10 minutes prior to the start of the call or should go to the website at least 15 minutes prior to the call to download and install any necessary audio software.
A telephone replay of the conference call will be available through Thursday, December 24, 2015, by dialing 1-888-286-8010 and entering the passcode 37995807. The webcast will be archived on the company’s website until its next earnings release.
-more-
Page 5
About The Marcus Corporation
Celebrating its 80th anniversary in 2015, The Marcus Corporation is a leader in the lodging and entertainment industries, with significant company-owned real estate assets. The Marcus Corporation’s theatre division, Marcus Theatres®, currently owns or manages 668 screens at 53 locations in Wisconsin, Illinois, Iowa, Minnesota, Nebraska, North Dakota and Ohio. The company’s lodging division, Marcus® Hotels & Resorts, owns and/or manages 19 hotels, resorts and other properties in 10 states. The company is headquartered in Milwaukee, Wis. For more information, please visit the company’s website at www.marcuscorp.com.
Certain matters discussed in this press release are “forward-looking statements” intended to qualify for the safe harbors from liability established by the Private Securities Litigation Reform Act of 1995. These forward-looking statements may generally be identified as such because the context of such statements include words such as we “believe,” “anticipate,” “expect” or words of similar import. Similarly, statements that describe our future plans, objectives or goals are also forward-looking statements. Such forward-looking statements are subject to certain risks and uncertainties which may cause results to differ materially from those expected, including, but not limited to, the following: (1) the availability, in terms of both quantity and audience appeal, of motion pictures for our theatre division, as well as other industry dynamics such as the maintenance of a suitable window between the date such motion pictures are released in theatres and the date they are released to other distribution channels; (2) the effects of adverse economic conditions in our markets, particularly with respect to our hotels and resorts division; (3) the effects on our occupancy and room rates of the relative industry supply of available rooms at comparable lodging facilities in our markets; (4) the effects of competitive conditions in our markets; (5) our ability to achieve expected benefits and performance from our strategic initiatives and acquisitions; (6) the effects of increasing depreciation expenses, reduced operating profits during major property renovations, impairment losses, and preopening and start-up costs due to the capital intensive nature of our businesses; (7) the effects of adverse weather conditions, particularly during the winter in the Midwest and in our other markets; (8) our ability to identify properties to acquire, develop and/or manage and the continuing availability of funds for such development; and (9) the adverse impact on business and consumer spending on travel, leisure and entertainment resulting from terrorist attacks in the United States or other incidents of violence in public venues such as hotels and movie theatres. Shareholders, potential investors and other readers are urged to consider these factors carefully in evaluating the forward-looking statements and are cautioned not to place undue reliance on such forward-looking statements. The forward-looking statements made herein are made only as of the date of this press release and we undertake no obligation to publicly update such forward-looking statements to reflect subsequent events or circumstances.
-more-
Page 6
THE MARCUS CORPORATION
Consolidated Statements of Earnings
(Unaudited)
(In thousands, except per share data)
| 13 Weeks Ended | 26 Weeks Ended | |||||||||||||||
| November 26, | November 27, | November 26, | November 27, | |||||||||||||
| 2015 | 2014 | 2015 | 2014 | |||||||||||||
| Revenues: | ||||||||||||||||
| Theatre admissions | $ | 31,741 | $ | 32,794 | $ | 79,963 | $ | 74,139 | ||||||||
| Rooms | 29,464 | 29,678 | 63,650 | 64,359 | ||||||||||||
| Theatre concessions | 21,006 | 20,484 | 52,786 | 45,406 | ||||||||||||
| Food and beverage | 19,216 | 20,134 | 38,025 | 36,289 | ||||||||||||
| Other revenues | 14,249 | 12,971 | 30,442 | 27,637 | ||||||||||||
| Total revenues | 115,676 | 116,061 | 264,866 | 247,830 | ||||||||||||
| Costs and expenses: | ||||||||||||||||
| Theatre operations | 29,217 | 27,953 | 70,896 | 62,816 | ||||||||||||
| Rooms | 10,298 | 10,725 | 21,485 | 22,127 | ||||||||||||
| Theatre concessions | 6,517 | 5,841 | 15,555 | 12,562 | ||||||||||||
| Food and beverage | 14,519 | 15,924 | 29,281 | 27,987 | ||||||||||||
| Advertising and marketing | 5,822 | 6,710 | 12,311 | 14,098 | ||||||||||||
| Administrative | 14,787 | 12,955 | 29,353 | 25,347 | ||||||||||||
| Depreciation and amortization | 10,242 | 10,156 | 20,668 | 19,234 | ||||||||||||
| Rent | 2,159 | 2,160 | 4,352 | 4,314 | ||||||||||||
| Property taxes | 4,003 | 3,719 | 7,824 | 7,625 | ||||||||||||
| Other operating expenses | 7,558 | 8,298 | 16,731 | 17,411 | ||||||||||||
| Total costs and expenses | 105,122 | 104,441 | 228,456 | 213,521 | ||||||||||||
| Operating income | 10,554 | 11,620 | 36,410 | 34,309 | ||||||||||||
| Other income (expense): | ||||||||||||||||
| Investment income | 20 | 25 | 25 | 50 | ||||||||||||
| Interest expense | (2,382 | ) | (2,388 | ) | (4,783 | ) | (4,792 | ) | ||||||||
| Loss on disposition of property, equipment and other assets | (226 | ) | (495 | ) | (31 | ) | (501 | ) | ||||||||
| Equity earnings (losses) from unconsolidated joint ventures, net | 39 | 27 | 20 | (14 | ) | |||||||||||
| (2,549 | ) | (2,831 | ) | (4,769 | ) | (5,257 | ) | |||||||||
| Earnings before income taxes | 8,005 | 8,789 | 31,641 | 29,052 | ||||||||||||
| Income taxes | 2,897 | 3,398 | 12,080 | 11,385 | ||||||||||||
| Net earnings | 5,108 | 5,391 | 19,561 | 17,667 | ||||||||||||
| Net earnings (loss) attributable to noncontrolling interests | 163 | 168 | (35 | ) | 12 | |||||||||||
| Net earnings attributable to The Marcus Corporation | $ | 4,945 | $ | 5,223 | $ | 19,596 | $ | 17,655 | ||||||||
| Net earnings per common share attributable to | ||||||||||||||||
| The Marcus Corporation - diluted | $ | 0.18 | $ | 0.19 | $ | 0.70 | $ | 0.64 | ||||||||
| Weighted ave. shares outstanding - diluted | 27,945 | 27,568 | 27,913 | 27,589 | ||||||||||||
-more-
Page 7
THE MARCUS CORPORATION
Condensed Consolidated Balance Sheets
(In thousands)
| (Unaudited) | (Audited) | |||||||
| November 26, | May 28, | |||||||
| 2015 | 2015 | |||||||
| Assets: | ||||||||
| Cash and cash equivalents | $ | 24,273 | $ | 15,483 | ||||
| Accounts and notes receivable | 12,873 | 16,339 | ||||||
| Refundable income taxes | - | 4,022 | ||||||
| Deferred income taxes | 3,187 | 2,997 | ||||||
| Other current assets | 6,507 | 6,732 | ||||||
| Property and equipment, net | 662,698 | 680,117 | ||||||
| Other assets | 90,049 | 83,352 | ||||||
| Total Assets | $ | 799,587 | $ | 809,042 | ||||
| Liabilities and Shareholders' Equity: | ||||||||
| Accounts payable | $ | 21,701 | $ | 36,776 | ||||
| Income taxes | 1,172 | - | ||||||
| Taxes other than income taxes | 16,075 | 15,099 | ||||||
| Other current liabilities | 50,693 | 50,574 | ||||||
| Current portion of capital lease obligation | 5,146 | 5,053 | ||||||
| Current maturities of long-term debt | 19,672 | 17,742 | ||||||
| Capital lease obligation | 15,714 | 18,317 | ||||||
| Long-term debt | 217,457 | 229,669 | ||||||
| Deferred income taxes | 46,149 | 47,502 | ||||||
| Deferred compensation and other | 44,283 | 42,075 | ||||||
| Equity | 361,525 | 346,235 | ||||||
| Total Liabilities and Shareholders' Equity | $ | 799,587 | $ | 809,042 | ||||
-more-
Page 8
THE MARCUS CORPORATION
Business Segment Information
(Unaudited)
(In thousands)
| Theatres | Hotels/ Resorts | Corporate Items | Total | |||||||||||||
| 13 Weeks Ended November 26, 2015 | ||||||||||||||||
| Revenues | $ | 56,463 | $ | 59,089 | $ | 124 | $ | 115,676 | ||||||||
| Operating income (loss) | 7,329 | 7,628 | (4,403 | ) | 10,554 | |||||||||||
| Depreciation and amortization | 5,594 | 4,501 | 147 | 10,242 | ||||||||||||
| 13 Weeks Ended November 27, 2014 | ||||||||||||||||
| Revenues | $ | 56,275 | $ | 59,626 | $ | 160 | $ | 116,061 | ||||||||
| Operating income (loss) | 9,783 | 5,729 | (3,892 | ) | 11,620 | |||||||||||
| Depreciation and amortization | 5,005 | 5,035 | 116 | 10,156 | ||||||||||||
| 26 Weeks Ended November 26, 2015 | ||||||||||||||||
| Revenues | $ | 139,787 | $ | 124,830 | $ | 249 | $ | 264,866 | ||||||||
| Operating income (loss) | 25,389 | 19,140 | (8,119 | ) | 36,410 | |||||||||||
| Depreciation and amortization | 11,280 | 9,101 | 287 | 20,668 | ||||||||||||
| 26 Weeks Ended November 27, 2014 | ||||||||||||||||
| Revenues | $ | 125,662 | $ | 121,873 | $ | 295 | $ | 247,830 | ||||||||
| Operating income (loss) | 24,637 | 16,733 | (7,061 | ) | 34,309 | |||||||||||
| Depreciation and amortization | 9,735 | 9,282 | 217 | 19,234 | ||||||||||||
Corporate items include amounts not allocable to the business segments. Corporate revenues consist principally of rent and the corporate operating loss includes general corporate expenses. Corporate information technology costs and accounting shared services costs are allocated to the business segments based upon several factors, including actual usage and segment revenues.
# # #