UNITED STATES
SECURITIES AND EXCHANGE COMMISSION
Washington, D.C. 20549
FORM N-CSR
CERTIFIED SHAREHOLDER REPORT OF REGISTERED
MANAGEMENT INVESTMENT COMPANIES
|
Investment Company Act file number |
811-00802 | |||||||
|
| ||||||||
|
Mairs and Power Growth Fund, Inc. | ||||||||
|
(Exact name of registrant as specified in charter) | ||||||||
|
| ||||||||
|
332 Minnesota Street, Suite W1520, St. Paul, MN |
|
55101 | ||||||
|
(Address of principal executive offices) |
|
(Zip code) | ||||||
|
| ||||||||
|
William B. Frels, President, 332 Minnesota Street, Suite W1520, St. Paul, MN 55101 | ||||||||
|
(Name and address of agent for service) | ||||||||
|
| ||||||||
|
Registrant’s telephone number, including area code: |
651-222-8478 |
| ||||||
|
| ||||||||
|
Date of fiscal year end: |
December 31, 2011 |
| ||||||
|
| ||||||||
|
Date of reporting period: |
June 30, 2011 |
| ||||||
Mairs and Power
Growth Fund, Inc.
Semi-Annual Report
June 30, 2011
W1520 First National Bank Building
332 Minnesota Street
St. Paul, Minnesota 55101
TO OUR SHAREHOLDERS
August 12, 2011
Second Quarter Results
Reflecting continuing economic weakness in the second quarter, the Growth Fund produced a disappointing investment return of only 0.5% during the period. By comparison, the benchmark Standard & Poor's 500 Index and Dow Jones Industrial Average showed roughly similar respective returns of 0.1% and 1.4%. The Fund performed slightly better than a peer group universe of other multi-cap core funds reported by Lipper in the Wall Street Journal, which turned in an average return of -0.1%. For the entire first half, the Fund achieved a return of 5.8% compared to somewhat better returns of 6.0% and 8.6% for the S&P 500 and DJIA. A peer group universe of comparable multi-cap core funds showed an average return of 6.0% for the same period.
Economic growth during the second quarter continued to be relatively weak with recently reported real Gross Domestic Product showing only a slight 1.3% increase (preliminary basis) compared to an even weaker 0.4% gain in the first quarter. The disappointing performance results primarily from a negligible improvement in consumer spending due largely to continuing high unemployment as well as a declining level of confidence. Business spending continued to show reasonable growth with non-residential fixed investment rising at a 6.3% rate. Government spending slipped a slight 1.1% with all of the decline occurring at the state and local levels. Although down somewhat from recent periods, exports continued to be an area of strength, rising 6.0%.
Interest rates remained relatively stable during the quarter with Federal Reserve policy continuing to be highly stimulative. Longer term rates slipped modestly as most economists pushed out their forecasts for higher rates due to the continuing economic weakness.
The disappointing stock market performance mirrored the overall economy despite the fact that most corporations reported better than expected earnings growth. Reflecting the growing concerns over economic growth, the more defensive sectors of the market such as consumer staples, health care and utilities performed the best, while the more cyclically sensitive areas such as basic industries, capital goods, energy and technology performed the worst. A notable exception was the financial sector where loan losses and increased government regulation have reduced the growth potential for most companies. Among individual holdings in the Fund, the best performers included Techne (+16.4%), H. B. Fuller (+13.7%), Johnson & Johnson (+12.3%), Graco (+11.4%) and Baxter Int'l (+11.0%), while the poorest performers included Stratasys (-28.3%), TCF Financial (-13.0%), Corning (-12.0%), Wells Fargo (-11.5%) and SurModics (-11.2%).
1
TO OUR SHAREHOLDERS (continued)
Recent Events
The stock market has recently experienced significant weakness (-14% over the first part of August) along with a heightened level of volatility primarily in response to growing fears of a "double dip" recession. These concerns developed rather quickly in response to weaker than expected economic reports, together with the sharply divided debate over raising the debt ceiling and implementing budget cuts. The lack of substantive progress toward reducing the Federal budget deficit also led Standard & Poor's to reduce the U. S. Treasury's AAA credit rating to AA+. At the same time, European debt problems resurfaced with respect to Italy and Spain after an even worse situation in Greece seemed to have been resolved, at least for the time being.
Future Outlook
Although the U. S. economy most certainly has experienced a recent slowdown, such an occurrence is not without precedent in past recoveries following recessions, especially those brought on by a crisis of one kind or another. The case can also be made that while the current recovery coming out of the 2007-2008 recession has been slower than past recoveries, it may also be of longer duration than past recoveries. In any event, indicators such as recent employment trends, home sales, retail sales and strong corporate balance sheets all seem to suggest continued slow but, nevertheless, steady growth. While sluggish European growth remains a problem, we believe the question of sustainability of a faster rate of growth in such countries as China, Indonesia, India and Brazil is the more important issue when assessing the prospects for future economic growth in the U.S.
Given the recent commitment of the Federal Reserve to keep interest rates low, it seems that monetary policy will remain highly stimulative over the foreseeable future. Because of the apparent ineffectiveness of quantitative easing, the Fed seems unlikely to undertake any new initiatives unless the economy does, in fact, slip into a recession.
Considering such factors as 1) the continuing strength of corporate earnings growth, 2) an historically low level of interest rates and 3) reasonable valuation levels (12x estimated 2011 S&P 500 earnings), the stock market appears to be quite attractive. However, volatility may remain at elevated levels for some time to come in light of continuing economic uncertainties both here and abroad.
William B. Frels
President and Lead Manager
Mark L. Henneman
Vice President and Co-Manager
Past performance is no guarantee of future results.
The Fund's investment objectives, risks and expenses must be considered carefully before investing. The prospectus contains this and other important information about the Fund, and it may be obtained by calling Shareholder Services at (800) 304-7404, or visiting www.mairsandpower.com. Read it carefully before investing.
2
PERFORMANCE INFORMATION (unaudited) June 30, 2011
Ten years of investment performance (through June 30, 2011)
This chart illustrates the performance of a hypothetical $10,000 investment made in the Fund 10 years ago.
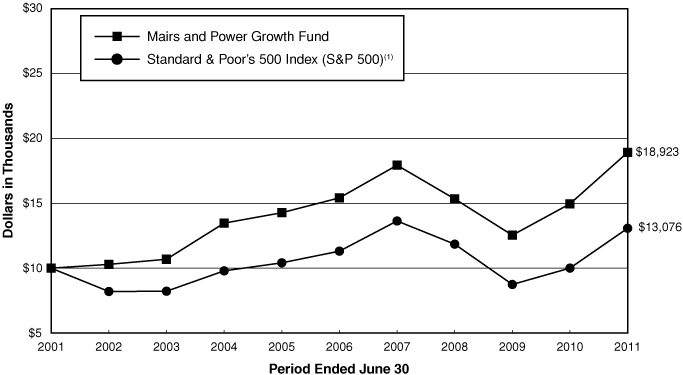
Average annual total returns for periods ended June 30, 2011
| 1 year | 5 years | 10 years | 20 years | ||||||||||||||||
| Mairs and Power Growth Fund | 26.48 | % | 4.18 | % | 6.59 | % | 12.28 | % | |||||||||||
| S&P 500(1) | 30.69 | % | 2.94 | % | 2.72 | % | 8.73 | % | |||||||||||
Performance data quoted represents past performance and does not guarantee future results. All performance information shown includes the reinvestment of dividend and capital gain distributions, but does not reflect the deduction of taxes that a shareholder would pay on Fund distributions or the redemption of Fund shares. The investment return and principal value of an investment will fluctuate so that an investor's shares, when redeemed, may be worth more or less than their original cost. Current performance of the Fund may be lower or higher than the performance quoted. For the most recent month-end performance figures, visit the Fund's website at www.mairsandpower.com or call Shareholder Services at (800) 304-7404.
(1) The S&P 500 is an unmanaged index of 500 common stocks that is generally considered representative of the U.S. stock market. It is not possible to invest directly in an index.
3
FUND INFORMATION (unaudited) June 30, 2011
Portfolio Managers
William B. Frels, lead manager since 2004
Co-manager since 1999
University of Wisconsin, BBA Finance 1962
Mark L. Henneman, co-manager since 2006
University of Minnesota, MBA Finance 1990
General Information
| Fund Symbol | MPGFX | ||||||
| Net Asset Value (NAV) Per Share | $ | 75.87 | |||||
| Expense Ratio | 0.70 | %1 | |||||
| Portfolio Turnover Rate | 1.74 | % | |||||
| Sales Charge | None2 | ||||||
| Fund Inception Year | 1958 | ||||||
Portfolio Composition
Top Ten Portfolio Holdings
(Percent of Total Net Assets) 3
| 3M Co. | 5.0 | % | |||||
| Graco, Inc. | 4.6 | ||||||
| Ecolab, Inc. | 4.6 | ||||||
| Honeywell International Inc. | 4.3 | ||||||
| Emerson Electric Co. | 4.3 | ||||||
| Pentair, Inc. | 4.1 | ||||||
| Donaldson Co., Inc. | 4.1 | ||||||
| Medtronic, Inc. | 4.0 | ||||||
| Valspar Corp. | 3.9 | ||||||
| Target Corp. | 3.7 | ||||||
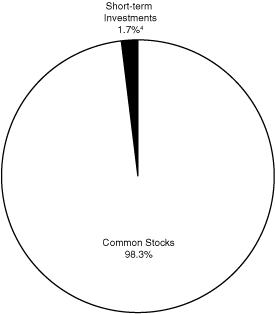
Portfolio Diversification
(Percent of Total Net Assets)
| Common Stocks 98.3% | |||||||
| Health Care | 18.7 | % | |||||
| Capital Goods | 16.9 | ||||||
| Basic Industries | 15.6 | ||||||
| Technology | 12.4 | ||||||
| Financial | 11.5 | ||||||
| Consumer Cyclical | 8.2 | ||||||
| Diversified | 7.4 | ||||||
| Consumer Staple | 6.1 | ||||||
| Transportation | 1.5 | ||||||
| Short-term Investments 1.7%4 | 1.7 | ||||||
| 100.0 | % | ||||||
1 Ratio has been annualized for the six month period ended June 30, 2011.
2 Although the Fund is no-load, investment management fees and other expenses still apply.
3 All holdings in the portfolio are subject to change without notice and may or may not represent current or future portfolio composition. The mention of specific securities is not intended as a recommendation or offer for a particular security, nor is it intended to be a solicitation for the purchase or sale of any security.
4 Represents short-term investments and other assets and liabilities (net).
4
SCHEDULE OF INVESTMENTS (unaudited) June 30, 2011
| Shares | Security Description | Fair Value | |||||||||
| COMMON STOCKS 98.3% | |||||||||||
| BASIC INDUSTRIES 15.6% | |||||||||||
| 2,185,000 | Bemis Co., Inc. | $ | 73,809,300 | ||||||||
| 1,730,000 | Ecolab, Inc. | 97,537,400 | |||||||||
| 2,980,000 | H.B. Fuller Co. (a) | 72,771,600 | |||||||||
| 220,000 | Nalco Holding Co. | 6,118,200 | |||||||||
| 2,340,000 | Valspar Corp. | 84,380,400 | |||||||||
| 334,616,900 | |||||||||||
| CAPITAL GOODS 16.9% | |||||||||||
| 290,000 | Badger Meter, Inc. | 10,727,100 | |||||||||
| 1,440,000 | Donaldson Co., Inc. | 87,379,200 | |||||||||
| 740,000 | Fastenal Co. | 26,632,600 | |||||||||
| 1,930,000 | Graco, Inc. | 97,773,800 | |||||||||
| 1,200,000 | MTS Systems Corp. (a) | 50,196,000 | |||||||||
| 2,190,000 | Pentair, Inc. | 88,388,400 | |||||||||
| 361,097,100 | |||||||||||
| CONSUMER CYCLICAL 8.2% | |||||||||||
| 500,000 | G&K Services, Inc., Class A | 16,930,000 | |||||||||
| 1,700,000 | Target Corp. | 79,747,000 | |||||||||
| 1,220,000 | Toro Co. | 73,810,000 | |||||||||
| 130,000 | The Walt Disney Company | 5,075,200 | |||||||||
| 175,562,200 | |||||||||||
| CONSUMER STAPLE 6.1% | |||||||||||
| 1,580,000 | General Mills, Inc. | 58,807,600 | |||||||||
| 2,400,000 | Hormel Foods Corp. | 71,544,000 | |||||||||
| 130,351,600 | |||||||||||
5
SCHEDULE OF INVESTMENTS (unaudited) (continued) June 30, 2011
| Shares | Security Description | Fair Value | |||||||||
| COMMON STOCKS (continued) | |||||||||||
| DIVERSIFIED 7.4% | |||||||||||
| 1,140,000 | 3M Co. | $ | 108,129,000 | ||||||||
| 2,630,000 | General Electric Co. | 49,601,800 | |||||||||
| 157,730,800 | |||||||||||
| FINANCIAL 11.5% | |||||||||||
| 980,000 | Associated Banc-Corp. | 13,622,000 | |||||||||
| 1,190,000 | Principal Financial Group | 36,199,800 | |||||||||
| 3,040,000 | TCF Financial Corp. | 41,952,000 | |||||||||
| 300,000 | The Travelers Cos., Inc. | 17,514,000 | |||||||||
| 2,910,000 | U.S. Bancorp | 74,234,100 | |||||||||
| 1,910,000 | Wells Fargo & Co. | 53,594,600 | |||||||||
| 500,000 | Western Union Co. | 10,015,000 | |||||||||
| 247,131,500 | |||||||||||
| HEALTH CARE 18.7% | |||||||||||
| 1,000,000 | Baxter International Inc. | 59,690,000 | |||||||||
| 1,130,000 | Johnson & Johnson | 75,167,600 | |||||||||
| 522,500 | MEDTOX Scientific, Inc. (a) | 9,128,075 | |||||||||
| 2,230,000 | Medtronic, Inc. | 85,921,900 | |||||||||
| 950,000 | Patterson Cos., Inc. | 31,245,500 | |||||||||
| 1,610,000 | Pfizer Inc. | 33,166,000 | |||||||||
| 1,200,000 | St. Jude Medical, Inc. | 57,216,000 | |||||||||
| 685,000 | SurModics, Inc. (b) | 7,603,500 | |||||||||
| 160,000 | Techne Corp. | 13,339,200 | |||||||||
| 430,000 | Zimmer Holdings, Inc. (b) | 27,176,000 | |||||||||
| 399,653,775 | |||||||||||
6
SCHEDULE OF INVESTMENTS (unaudited) (continued) June 30, 2011
| Shares | Security Description | Fair Value | |||||||||
| COMMON STOCKS (continued) | |||||||||||
| TECHNOLOGY 12.4% | |||||||||||
| 1,880,000 | Corning Inc. | $ | 34,122,000 | ||||||||
| 1,370,000 | Daktronics, Inc. | 14,782,300 | |||||||||
| 1,625,000 | Emerson Electric Co. | 91,406,250 | |||||||||
| 170,000 | Fiserv, Inc. (b) | 10,647,100 | |||||||||
| 1,540,000 | Honeywell International Inc. | 91,768,600 | |||||||||
| 860,000 | Intel Corp. | 19,057,600 | |||||||||
| 66,534 | NVE Corporation (b) | 3,888,912 | |||||||||
| 20,000 | Stratasys, Inc. (b) | 674,000 | |||||||||
| 266,346,762 | |||||||||||
| TRANSPORTATION 1.5% | |||||||||||
| 120,000 | C.H. Robinson Worldwide, Inc. | 9,460,800 | |||||||||
| 310,000 | United Parcel Service, Inc., Class B | 22,608,300 | |||||||||
| 32,069,100 | |||||||||||
|
TOTAL COMMON STOCKS (cost $1,355,596,293) |
$ | 2,104,559,737 | |||||||||
| SHORT-TERM INVESTMENTS 1.7% | |||||||||||
| 36,610,921 |
First American Prime Obligations Fund, Class Z, 0.04% (c) (cost $36,610,921) |
$ | 36,610,921 | ||||||||
|
TOTAL INVESTMENTS 100.0% (cost $1,392,207,214) |
$ | 2,141,170,658 | |||||||||
| OTHER ASSETS AND LIABILITIES (NET) 0.0% | 456,185 | ||||||||||
| TOTAL NET ASSETS 100.0% | $ | 2,141,626,843 | |||||||||
(a) Affiliated company (Note 5).
(b) Non-income producing.
(c) The rate quoted is the annualized seven-day effective yield as of June 30, 2011.
See accompanying Notes to Financial Statements.
7
STATEMENT OF ASSETS AND LIABILITIES (unaudited) June 30, 2011
| ASSETS | |||||||
| Investments, at fair value (Note 1): | |||||||
| Unaffiliated securities (cost $1,330,921,239) | $ | 2,009,074,983 | |||||
| Affiliated securities (cost $61,285,975) (Note 5) | 132,095,675 | ||||||
| 2,141,170,658 | |||||||
| Receivable for Fund shares sold | 326,713 | ||||||
| Dividends receivable | 2,571,020 | ||||||
| 2,144,068,391 | |||||||
| LIABILITIES | |||||||
| Payable for Fund shares redeemed | 467,557 | ||||||
| Payable for securities purchased | 767,648 | ||||||
| Accrued investment management fees (Note 2) | 1,026,537 | ||||||
| Accrued Fund administration fees (Note 2) | 31,135 | ||||||
| Accrued expenses and other liabilities | 148,671 | ||||||
| 2,441,548 | |||||||
| NET ASSETS | $ | 2,141,626,843 | |||||
| NET ASSETS CONSIST OF | |||||||
| Portfolio capital | $ | 1,377,517,193 | |||||
| Undistributed net investment income | 365,104 | ||||||
| Undistributed net realized gain on investments | 14,781,102 | ||||||
| Net unrealized appreciation of investments | 748,963,444 | ||||||
| TOTAL NET ASSETS | $ | 2,141,626,843 | |||||
|
Fund shares issued and outstanding (par value $0.01 per share; 100,000,000 authorized) |
28,229,025 | ||||||
| Net asset value per share | $ | 75.87 | |||||
See accompanying Notes to Financial Statements.
8
STATEMENT OF OPERATIONS (unaudited) Six Months Ended June 30, 2011
| INVESTMENT INCOME | |||||||||||
| Income: | |||||||||||
| Dividends from unaffiliated securities | $ | 19,330,026 | |||||||||
| Dividends from affiliated securities (Note 5) | 912,100 | ||||||||||
| TOTAL INCOME | $ | 20,242,126 | |||||||||
| Expenses: | |||||||||||
| Investment management fees (Note 2) | 6,297,162 | ||||||||||
| Fund administration fees (Note 2) | 135,145 | ||||||||||
| Fund accounting | 114,796 | ||||||||||
| Directors' compensation (Note 2) | 88,566 | ||||||||||
| Transfer agent fees | 475,222 | ||||||||||
| Custodian fees | 74,171 | ||||||||||
| Legal and audit fees | 38,966 | ||||||||||
| Other expenses | 111,142 | ||||||||||
| TOTAL EXPENSES | 7,335,170 | ||||||||||
| NET INVESTMENT INCOME | 12,906,956 | ||||||||||
|
NET REALIZED GAIN AND NET CHANGE IN UNREALIZED APPRECIATION/DEPRECIATION OF INVESTMENTS (Note 4) |
|||||||||||
| Net realized gain on: | |||||||||||
| Unaffiliated investments sold | 15,393,037 | ||||||||||
| Affiliated investments sold (Note 5) | - | ||||||||||
| 15,393,037 | |||||||||||
|
Net change in unrealized appreciation/depreciation of investments |
89,158,155 | ||||||||||
|
NET REALIZED GAIN AND NET CHANGE IN UNREALIZED APPRECIATION/DEPRECIATION OF INVESTMENTS |
104,551,192 | ||||||||||
| NET INCREASE IN NET ASSETS FROM OPERATIONS | $ | 117,458,148 | |||||||||
See accompanying Notes to Financial Statements.
9
STATEMENTS OF CHANGES IN NET ASSETS
|
Six Months Ended June 30, 2011 (Unaudited) |
Year Ended December 31, 2010 |
||||||||||
| OPERATIONS | |||||||||||
| Net investment income | $ | 12,906,956 | $ | 24,053,553 | |||||||
| Net realized gain on investments sold | 15,393,037 | 26,676,299 | |||||||||
| Net change in unrealized appreciation of investments | 89,158,155 | 265,798,244 | |||||||||
| NET INCREASE IN NET ASSETS FROM OPERATIONS | 117,458,148 | 316,528,096 | |||||||||
| DISTRIBUTIONS TO SHAREHOLDERS FROM | |||||||||||
| Net investment income | (12,638,999 | ) | (23,956,406 | ) | |||||||
| Net realized gain on investments sold | - | (26,917,941 | ) | ||||||||
| Contribution from adviser (Note 2) | - | (1,201,007 | ) | ||||||||
| TOTAL DISTRIBUTIONS TO SHAREHOLDERS | (12,638,999 | ) | (52,075,354 | ) | |||||||
| CAPITAL TRANSACTIONS | |||||||||||
| Proceeds from shares sold | 83,711,987 | 125,571,015 | |||||||||
| Contribution from adviser (Note 2) | - | 1,201,007 | |||||||||
|
Reinvestment of distributions from net investment income and net realized gains |
11,520,830 | 48,072,038 | |||||||||
| Cost of shares redeemed | (99,134,431 | ) | (333,904,916 | ) | |||||||
|
DECREASE IN NET ASSETS FROM CAPITAL TRANSACTIONS |
(3,901,614 | ) | (159,060,856 | ) | |||||||
| TOTAL INCREASE IN NET ASSETS | 100,917,535 | 105,391,886 | |||||||||
| NET ASSETS | |||||||||||
| Beginning of period | 2,040,709,308 | 1,935,317,422 | |||||||||
|
End of period (including undistributed net investment income of $365,104, and $97,147, respectively) |
$ | 2,141,626,843 | $ | 2,040,709,308 | |||||||
| FUND SHARE TRANSACTIONS | |||||||||||
| Shares sold | 1,119,177 | 1,870,148 | |||||||||
| Shares issued for reinvested distributions | 153,366 | 688,287 | |||||||||
| Shares redeemed | (1,325,057 | ) | (4,939,071 | ) | |||||||
| NET DECREASE IN FUND SHARES | (52,514 | ) | (2,380,636 | ) | |||||||
See accompanying Notes to Financial Statements.
10
NOTES TO FINANCIAL STATEMENTS (unaudited) June 30, 2011
Note 1 – Organization and Significant Accounting Policies
The Mairs and Power Growth Fund, Inc. (the Fund) is registered under the Investment Company Act of 1940 (as amended) as a diversified, no-load, open-end management investment company. The objective of the Fund is to provide shareholders with a diversified portfolio of common stocks, which have the potential for above-average, long-term appreciation.
Significant accounting policies of the Fund are as follows:
Security Valuations
Security valuations for Fund investments are furnished by independent pricing services that have been approved by the Fund's Board of Directors (the Board). Investments in equity securities are valued at the NASDAQ Official Closing Price if readily available for such securities on each business day. Other equity securities traded in the over-the-counter market and listed equity securities for which no sale was reported on that date are stated at the last quoted bid price. Debt obligations with 60 days or less remaining until maturity may be valued at their amortized cost, which approximates fair value.
Securities for which prices are not available from an independent pricing service, but where an active market exists, are valued using market quotations obtained from one or more dealers that make markets in the securities or from a widely used quotation system. When market quotations are not readily available, or where the last quoted sale price is not considered representative of the value of the security if it were to be sold on that day, the security will be valued at fair value as determined in good faith by the Fair Value Committee appointed by the Board, pursuant to procedures approved by the Board. Factors that may be considered in determining the fair value of a security are fundamental analytical data relating to the security, the nature and duration of any restrictions on the disposition of the security, and the forces influencing the market in which the security is purchased or sold. As of June 30, 2011, no securities in the Fund were valued using this method.
Fair Valuation Measurements
The Fund has adopted authoritative fair valuation accounting standards which establish a definition of fair value and set out a hierarchy for measuring fair value. These standards require additional disclosures about the various inputs and valuation techniques used to develop the measurements of fair value and changes in valuation techniques and related inputs during the period. These inputs are summarized in the three broad levels listed below:
• Level 1 – Quoted prices in active markets for identical securities.
11
NOTES TO FINANCIAL STATEMENTS (unaudited) (continued) June 30, 2011
Note 1 – Organization and Significant Accounting Policies (continued)
• Level 2 – Other significant observable inputs (including quoted prices for similar securities, interest rates, prepayment speeds, credit risk, etc.).
• Level 3 – Significant unobservable inputs (including the Fund's own assumptions in determining the fair value of investments).
The inputs or methodologies used for valuing securities are not necessarily an indication of the risk associated with investing in those securities. All of the inputs used to value the Fund's investments as of June 30, 2011 were classified as Level 1. For detail of investments by major industry classification, please refer to the Schedule of Investments. There were no transfers between levels during the period. The Fund did not hold any Level 3 investments at either June 30, 2011 or December 30, 2010.
On May 12, 2011, the Financial Accounting Standards Board (FASB) issued an Accounting Standard Update (ASU) modifying Topic 820, Fair Value Measurements and Disclosures. At the same time, the International Accounting Standards Board (IASB) issued International Financial Reporting Standard (IFRS) 13, Fair Value Measurement. The objective by the FASB and IASB is convergence of their guidance on fair value measurements and disclosures. Specifically, the ASU requires reporting entities to disclose i) the amounts of any transfers between Level 1 and Level 2, and the reasons for the transfers, ii) for Level 3 fair value measurements, a) quantitative information about significant unobservable inputs used, b) a description of the valuation processes used by the reporting entity and c) a narrative description of the sensitivity of the fair value measurement to changes in unobservable inputs if a change in those inputs might result in a significantly higher or lower fair value measurement. The effective date of the ASU is for interim and annual periods beginning after December 15, 2011. At this time, management is evaluating the implications of this guidance and the impact it will have on the financial statement amounts and footnote disclosures, if any.
Security Transactions and Investment Income
Security transactions are recorded on the date on which securities are purchased or sold. Dividend income and corporate action transactions are recorded on the ex-dividend date and interest income is recorded on an accrual basis. Realized gains and losses are reported on an identified cost basis.
Income Taxes
The Fund is a "regulated investment company" as defined in Subtitle A, Chapter 1, Subchapter M of the Internal Revenue Code (the Code), as amended. No provision has been made for federal
12
NOTES TO FINANCIAL STATEMENTS (unaudited) (continued) June 30, 2011
Note 1 – Organization and Significant Accounting Policies (continued)
income taxes as it is the intention of the Fund to comply with the provisions of the Code applicable to regulated investment companies and to make distributions of income and realized gains sufficient to relieve it from all or substantially all excise and income taxes.
As of June 30, 2011, the Fund did not have any tax positions that did not meet the "more-likely-than-not" threshold of being sustained by the applicable tax authority. Generally, tax authorities can examine all tax returns filed for the last three years.
Basis of Presentation
The preparation of financial statements in conformity with U.S. generally accepted accounting principles requires management to make estimates and assumptions that affect the reported amount of net assets and liabilities and disclosure of contingent assets and liabilities at the date of the financial statements and the reported results of operations during the reporting period. Actual results could differ from those estimates.
In preparing these financial statements, the Fund has evaluated events and transactions for potential recognition or disclosure through the date the financial statements were available to be issued. This evaluation did not result in any subsequent events that necessitated recognition or disclosures.
Note 2 – Related-Party Transactions
Investment Management and Fund Administration Fees
Mairs and Power, Inc. (the Adviser) provides investment management and fund administration services to the Fund under written agreements approved by the Board. The Fund is charged an investment management fee paid to the Adviser computed at an annual rate of 0.60% of daily net assets up to $2.5 billion, and 0.50% of daily net assets in excess of $2.5 billion. The fund administration fee paid to the Adviser is computed at an annual rate of 0.00375% of daily net assets. For the six months ended June 30, 2011 the Fund incurred $39,357 in administration fees from the Adviser, and as of June 30, 2011, had an accrued liability of $6,416 for administration fees payable to the Adviser.
Pursuant to a sub-administration agreement between the Fund and U.S. Bancorp Fund Services, LLC (USBFS), the Fund is charged a sub-administration fee paid to USBFS. For the six months ended June 30, 2011 the Fund incurred $95,788, in sub-administration fees from USBFS, and as of June 30, 2011, had an accrued liability of $24,719 for sub-administration fees payable to USBFS.
13
NOTES TO FINANCIAL STATEMENTS (unaudited) (continued) June 30, 2011
Note 2 – Related-Party Transactions (continued)
Directors' Compensation
Directors' compensation is paid to individuals who are disinterested directors of the Fund. No compensation is paid to the owners of the Adviser, including principal officers who are not directors of the Fund and William B. Frels, who is an interested director and officer of the Fund.
Contributions from Adviser
During the year ended December 31, 2010, the Fund received two contributions from the Adviser related to prospect services and other expenses paid by the Fund from 1980-2009, which were in violation of the Investment Company Act of 1940. The contribution amounts, which included imputed interest, as disclosed in the Statement of Changes in Net Assets, were $1,192,736 or $0.04 per share based upon shares outstanding as of May 21, 2010 and $8,271 or $0.0003 per share based upon shares outstanding as of September 24, 2010.
Note 3 – Indemnifications
In the normal course of business, the Fund enters into contracts that contain general indemnifications to other parties. The Fund's maximum exposure under these contracts is unknown as this would involve future claims that may be made against the Fund that have not yet occurred. However, based on experience, the Fund expects the risk of loss to be remote.
Note 4 – Distributions Paid, Distributable Earnings and Investment Transactions
Net investment income and net realized gains (losses) may differ for financial reporting and tax purposes because of temporary or permanent book/tax differences. To the extent these differences are permanent, reclassifications are made to the appropriate equity accounts in the period that the difference arises. The Fund's tax basis net realized gains (losses) are determined only at the end of each fiscal year. As a result, no reclassifications were made as of June 30, 2011.
Income and capital gain distributions are determined in accordance with income tax regulations, which may differ from U.S. generally accepted accounting principles. In addition, due to the timing of dividend distributions, the fiscal year in which the amounts are distributed may differ from the year that the income or realized gains (losses) were recorded by the Fund.
14
NOTES TO FINANCIAL STATEMENTS (unaudited) (continued) June 30, 2011
Note 4 – Distributions Paid, Distributable Earnings and Investment Transactions (continued)
The tax character of distributions paid during the six months ended June 30, 2011 and the fiscal year ended December 31, 2010, were as follows:
| 2011 | 2010 | ||||||||||
| Distributions paid from: | |||||||||||
| Ordinary income | $ | 12,638,999 | $ | 25,157,413 | |||||||
| Long-term capital gains | - | 26,917,941 | |||||||||
| $ | 12,638,999 | $ | 52,075,354 | ||||||||
The Fund designated as long-term capital gain dividend, pursuant to Internal Revenue Code Section 852(b)(3), the amount necessary to reduce the earnings and profits of the Fund related to net capital gain to zero for the tax year ended December 31, 2010.
At December 31, 2010, the components of accumulated earnings (losses) on a tax basis were as follows:
| Cost of investments | $ | 1,373,689,523 | |||||
| Gross unrealized appreciation | $ | 790,391,297 | |||||
| Gross unrealized depreciation | (131,296,272 | ) | |||||
| Net unrealized appreciation | $ | 659,095,025 | |||||
| Undistributed ordinary income | $ | 97,147 | |||||
| Undistributed long-term capital gains | 98,329 | ||||||
| Total distributable earnings | $ | 195,476 | |||||
| Total accumulated earnings | $ | 659,290,501 | |||||
The difference between book basis and tax basis unrealized appreciation is attributable primarily to the tax deferral of losses on wash sales.
Purchases and sales of investment securities, excluding government securities, short-term securities and temporary cash investments, during the six months ended June 30, 2011, aggregated $36,458,363 and $39,561,527, respectively. No purchases and sales of government securities occurred during the period.
Note 5 – Transactions With Affiliated Companies
The Fund owned 5% or more of the voting securities of the following companies during the six months ended June 30, 2011. As a result, these companies are deemed to be affiliates of the Fund
15
NOTES TO FINANCIAL STATEMENTS (unaudited) (continued) June 30, 2011
Note 5 – Transactions With Affiliated Companies (continued)
as defined by the Investment Company Act of 1940. Transactions during the period in these securities of affiliated companies were as follows:
| Share Activity | |||||||||||||||||||||||||||
| Security Name |
Balance 12/31/10 |
Purchases | Sales |
Balance 06/30/11 |
Dividend Income |
Fair Value at 06/30/11 |
|||||||||||||||||||||
| H.B. Fuller Co. | 2,980,000 | - | - | 2,980,000 | $ | 432,100 | $ | 72,771,600 | |||||||||||||||||||
| MEDTOX Scientific, Inc. | 522,500 | - | - | 522,500 | - | 9,128,075 | |||||||||||||||||||||
| MTS Systems Corp. | 1,200,000 | - | - | 1,200,000 | 480,000 | 50,196,000 | |||||||||||||||||||||
| $ | 912,100 | $ | 132,095,675 | ||||||||||||||||||||||||
16
FINANCIAL HIGHLIGHTS
SELECTED DATA AND RATIOS
(for a share outstanding throughout each period)
|
Six Months Ended |
Year Ended December 31, | ||||||||||||||||||||||||||
| 06/30/11 (1) | 2010 | 2009 | 2008 | 2007 | 2006 | ||||||||||||||||||||||
| (unaudited) | |||||||||||||||||||||||||||
| Per Share | |||||||||||||||||||||||||||
|
Net asset value, beginning of period |
$ | 72.16 | $ | 63.12 | $ | 52.51 | $ | 76.30 | $ | 77.10 | $ | 71.69 | |||||||||||||||
| Income from investment operations: | |||||||||||||||||||||||||||
| Net investment income | 0.46 | 0.86 | 0.89 | 1.22 | 1.04 | 0.93 | |||||||||||||||||||||
|
Net realized and unrealized gain (loss) |
3.70 | 10.01 | 10.85 | (22.93 | ) | 2.79 | 6.40 | ||||||||||||||||||||
| Total from investment operations | 4.16 | 10.87 | 11.74 | (21.71 | ) | 3.83 | 7.33 | ||||||||||||||||||||
| Distributions to shareholders from: | |||||||||||||||||||||||||||
| Net investment income | (0.45 | ) | (0.86 | ) | (0.89 | ) | (1.22 | ) | (1.04 | ) | (0.91 | ) | |||||||||||||||
|
Net realized gains on unaffiliated investments sold |
- | (0.97 | ) | (0.24 | ) | (0.86 | ) | (3.59 | ) | (0.99 | ) | ||||||||||||||||
| Contributions from Adviser (Note 2) | - | (0.04 | ) | - | - | - | - | ||||||||||||||||||||
| Return of capital | - | - | - | - | - | (0.02 | ) | ||||||||||||||||||||
| Total Distributions | (0.45 | ) | (1.87 | ) | (1.13 | ) | (2.08 | ) | (4.63 | ) | (1.92 | ) | |||||||||||||||
| Contributions from Adviser (Note 2) | - | 0.04 | - | - | - | - | |||||||||||||||||||||
| Net asset value, end of period | $ | 75.87 | $ | 72.16 | $ | 63.12 | $ | 52.51 | $ | 76.30 | $ | 77.10 | |||||||||||||||
| Total investment return | 5.77 | % | 17.40 | %(2) | 22.52 | % | -28.51 | % | 4.90 | % | 10.24 | % | |||||||||||||||
|
Net assets, end of period, in thousands |
$ | 2,141,627 | $ | 2,040,709 | $ | 1,935,317 | $ | 1,681,717 | $ | 2,612,139 | $ | 2,694,315 | |||||||||||||||
| Ratios/supplemental data: | |||||||||||||||||||||||||||
|
Ratio of expenses to average net assets |
0.70 | % | 0.71 | % | 0.71 | % | 0.70 | % | 0.68 | % | 0.69 | % | |||||||||||||||
|
Ratio of net investment income to average net assets |
1.23 | 1.26 | 1.61 | 1.75 | 1.26 | 1.21 | |||||||||||||||||||||
| Portfolio turnover rate | 1.74 | 1.81 | 3.21 | 2.42 | 4.44 | 4.39 | |||||||||||||||||||||
(1) For the six months ended June 30, 2011, all ratios have been annualized except total investment return and portfolio turnover.
(2) For the year ended December 31, 2010, 0.08% of the Fund's total return was a result of contributions as described in Note 2 to the financial statements by the Adviser related to prospect services and other expenses paid by the Fund. Excluding the contributions, total investment return would have been 17.32%.
See accompanying Notes to Financial Statements.
17
FUND EXPENSES (unaudited)
As a shareholder of the Fund, you incur ongoing expenses for the operation of the Fund (e.g., asset-based charges, such as investment management fees). The Fund is a "no-load" mutual fund. As a result, shareholders pay no commissions, fees, or expenses associated with sales representatives or sales charges.
This example is intended to help you understand your ongoing costs (in dollars) of investing in the Fund and to compare these costs with the ongoing costs of investing in other mutual funds. The table below reports the Fund's expenses during the period January 1, 2011 through June 30, 2011 and includes the costs associated with a $1,000 investment.
Actual Expenses
The first line in the table below may be used to estimate the actual expenses you paid over the reporting period. You can do this by dividing your account value by $1,000 and multiplying the result by the expense shown in the table below. For example, if your account value is $8,600, divided by $1,000 = $8.60. Multiply the result by the number in the first line under the heading entitled "Expenses Paid During Period." By doing this you can estimate the expenses you paid on your account during this period.
Hypothetical Example
The second line of the table below provides information about hypothetical account values and hypothetical expenses based on the Fund's actual expenses and an assumed return of 5% per year before expenses, which is not the Fund's actual return. The results may be used to provide you with a basis for comparing the ongoing costs of investing in the Fund with the costs of investing in other funds. To do so, compare this 5% hypothetical example with the 5% hypothetical examples that appear in the shareholder reports of other funds. Please note that this hypothetical example may not be used to estimate the actual ending account balance or expenses you paid during the period.
|
Beginning Account Value 01/01/2011 |
Ending Account Value 06/30/2011 |
Expenses Paid During Period * |
|||||||||||||
| Actual return | $ | 1,000.00 | $ | 1,057.70 | $ | 3.57 | |||||||||
| Hypothetical assumed 5% return | $ | 1,000.00 | $ | 1,021.32 | $ | 3.51 | |||||||||
* The Fund's expenses are equal to the Fund's annualized expense ratio for the most recent six-month period of 0.70%, multiplied by the average account value over the Fund's first fiscal half-year, multiplied by the number of days in the Fund's first fiscal half-year (181 days), divided by 365 days.
18
PROXY VOTING (unaudited)
Proxy Voting Policies and Procedures that the Fund uses to determine how to vote proxies relating to portfolio securities is available (i) without charge, upon request, by calling Shareholder Services at (800) 304-7404 and requesting a copy of the Statement of Additional Information (SAI) and (ii) on the Securities and Exchange Commission's (SEC's) website at www.sec.gov (access Form N-1A).
Information on how the Fund voted proxies relating to portfolio securities during the most recent 12-month period ended June 30 is available at www.mairsandpower.com and on the SEC's website at www.sec.gov.
DISCLOSURE OF PORTFOLIO HOLDINGS (unaudited)
The Fund files a complete schedule of portfolio holdings on Form N-Q for the first and third quarter-ends and on Form N-CSR for the second and fourth quarter-ends with the SEC. The Fund's Forms N-Q and N-CSR are available on the SEC's website at www.sec.gov. Forms N-Q and N-CSR may also be reviewed and copied at the SEC's Public Reference Room in Washington, D.C. Information on the operation of the Public Reference Room may be obtained by calling (800) SEC-0330.
The schedule of portfolio holdings is also printed in the Fund's semi-annual and annual reports to shareholders, which are available without charge by calling Shareholder Services at (800) 304-7404 or by visiting www.mairsandpower.com.
A complete copy of the Fund's portfolio holdings will also be available on or about 15 days following each quarter-end on the Fund's website at www.mairsandpower.com.
RE-APPROVAL OF INVESTMENT ADVISORY CONTRACT (unaudited)
The Fund's Board of Directors (the Directors) unanimously approved the renewal of the Advisory Contract between the Fund and Mairs and Power, Inc. (the Manager) at a Fund Board Meeting held on May 17, 2011.
In preparation for the May 17, 2011 Board Meeting, the Manager provided the Directors with extensive materials, including investment performance data, fee and expense comparisons with other mutual funds having similar investment objectives, and profitability information concerning
19
RE-APPROVAL OF INVESTMENT ADVISORY
CONTRACT (unaudited) (continued)
the Manager. The independent Directors discussed the materials and the proposed renewal of the Advisory Contract in a private session with legal counsel present, but with no representatives of the Manager being present. In reaching their decision to renew the Fund's Advisory contract with the Manager, the Directors considered all factors they believed to be relevant. Each of these factors and the conclusions reached by the Directors with respect to these factors that helped form the basis for the decision to renew the Advisory Contract with the Manager will be discussed below.
Investment Performance
The Directors considered the investment results for the Fund compared to those for mutual funds with similar investment objectives as determined by Morningstar and with two securities indices – the Dow Jones Industrial Average and the S&P 500. In addition to the materials received by the Directors before the May 17, 2011 Board Meeting, the Directors receive detailed performance information at each regular Board Meeting during the year. At the May 17, 2011 Meeting, the Directors reviewed the comparative performance information over 1, 3, 5 and 10 year periods ending with the quarter preceding the meeting. Based upon their review, the Directors concluded that the Fund's investment performance has been even with the average of Morningstar's peer group of mutual funds with similar investment objectives over one year and has been in the upper tier of the peer group over 3, 5 and 10 years, has exceeded index performance over most of those time periods, and has been satisfactory.
Management Fee
In evaluating the level of the management fee paid to the Manager, the Directors considered both the level of the Fund's management fees and overall expenses compared to those of other similar mutual funds, as well as the quality and quantity of advisory and other services provided by the Manager. The management fee paid to the Fund Manager of 60 basis points (0.6 of 1%) on the first $2.5 billion of assets and 50 basis points (0.5 of 1%) on assets above $2.5 billion is below the average for mutual fund managers generally, and is also below the average for actively managed mutual funds in Morningstar's peer group and for a group of competitive funds identified by the Manager. Additionally, the Directors noted that the Growth Fund's total expense ratio of 0.71% at December 31, 2010 is well below the average total expense ratio of actively-managed funds in its Morningstar peer group and for the group of competitive funds identified by the Manager.
The Directors also considered the fees the Manager charges its non-mutual fund advisory clients (Advisory Clients) with investment objectives similar to those of the Fund. The fee rates payable by the Manager's Advisory Clients range from being exactly the same as the fee paid by the Fund to being lower than the fee paid by the Fund (the Manager's larger Advisory Clients, many of
20
RE-APPROVAL OF INVESTMENT ADVISORY
CONTRACT (unaudited) (continued)
which are institutional clients, fall into this latter category). The Manager provided the Directors with information about the differences in the scope of services provided to its Advisory Clients compared with those it provides to the Fund. The level of investment decision-making is considerably higher with respect to the Fund, as cash flows result in purchase and sale decisions being made by the Manager for the Fund virtually every trading day of the year. Other differences include the fact that the Manager provides the Fund with office facilities and Fund Officers. Having considered all of these factors, the Directors concluded that the nature and extent of services provided to the Fund merit higher management fees than those paid by the Manager's Advisory Clients.
With respect to the quality and extent of the Manager's services provided to the Fund, the solid performance record over the most recent 1, 3, 5 and 10 year periods stands out, along with the Fund's "B" Morningstar rating for stewardship (most recent available rating). The Directors also took into account the Manager's ongoing response to regulatory compliance requirements under Rule 38a-1, along with a satisfactory annual review of the Fund's Compliance Program which was completed on October 31, 2010 and presented to the Directors at the December 16, 2010 Board Meeting. The Directors concluded that overall they were satisfied with the nature, extent and quality of services provided by the Manager under the existing Advisory Contract. They further concluded that the Fund's management fee is fair and reasonable for the services provided and the risks assumed by the Manager.
Costs of Services Provided and Profitability to the Manager
At the request of the Directors, the Manager provided profitability information for the most recent three calendar years. The information addressed the Manager's overall profitability and also broke it down between the Manager's advisory business and the Manager's mutual fund business. The profitability of the mutual fund business was further broken down between the two funds advised by the Manager – the Mairs and Power Growth Fund and the Mairs and Power Balanced Fund. The Directors reviewed the Manager's assumptions and methods of allocation used. The Manager stated its belief that the methods of allocation used are reasonable, while acknowledging that there do not appear to be commonly accepted standards for making these kinds of profitability determinations. The Directors believe that the Manager should be entitled to earn a reasonable level of profit for the services it provides to the Fund. Based on their overall review, the Directors concluded that the Manager's level of profitability from its relationship with the Fund is reasonable.
21
RE-APPROVAL OF INVESTMENT ADVISORY
CONTRACT (unaudited) (continued)
Other Benefits to Fund Manager
The Directors considered that the Manager's advisory business benefits from informal soft dollar arrangements whereby the Manager receives proprietary investment research services from broker/dealers that execute the Fund's purchases and sales of securities. The Directors received and reviewed information concerning the Fund's Brokerage Committee and the method by which Fund brokerage is allocated based upon the internally rated quality of brokerage and research services. The Directors reviewed the Fund data for the one-year period ending March 31, 2011 showing the dollar amount of commissions allocated among the broker/dealers used by the Manager for Fund brokerage services and proprietary research. Similar data showing the dollar amount of commissions allocated is provided to the Directors at each regular Board Meeting during the year. The Directors recognized that the profitability of the Manager's advisory business would be lower if it did not receive proprietary research for soft dollars in connection with the Fund's brokerage activity. While difficult to measure, it was concluded by the Directors that the benefit the Manager receives in this way is fairly modest, particularly given the Fund's very low portfolio turnover rate. The Directors noted that the Manager derives reputational benefits from its association with the Fund as well.
Economies of Scale
The management fee of 60 basis points (0.6 of 1%) which the Manager has been paid for more than twenty-five years has always been towards the low end of the mutual fund advisory management fee range. The Manager's approach has been to keep costs to the Fund as low as reasonably possible, including the cost of management fees. At the same time, the Manager believes, and the Directors concur, that it is entitled to earn reasonable returns on its mutual fund business. The Manager acknowledges that while it is difficult to pinpoint the economies of scale to be realized in a Fund the size of Mairs and Power Growth at any particular asset level, there is no question that such economies exist. Accordingly, the Manager, under the terms of the advisory contract renewed by the Directors on May 19, 2005, established a breakpoint at the $2.5 billion asset level which became effective on July 1, 2005. The breakpoint reduces the management fee applicable to assets managed in excess of $2.5 billion from 60 basis points (0.6 of 1%) to 50 basis points (0.5 of 1%). The Directors reaffirmed their conclusion that establishing this breakpoint at $2.5 billion formed a reasonable basis for having management fee levels reflect economies of scale for the benefit of Fund shareholders. The total assets of the Growth Fund exceeded $2.5 billion for the first time in December of 2005 and for the most part stayed above the breakpoint throughout 2007. The Fund's assets dropped below the breakpoint early in 2008 and have remained below it as of the printing of this Semi-Annual Report.
22
HOUSEHOLDING (unaudited)
In an effort to decrease costs, the Fund intends to reduce the number of duplicate Summary Prospectuses and Annual and Semi-Annual Reports you receive by sending only one copy of each to those addresses shared by two or more accounts and to shareholders reasonably believed to be from the same family or household. Once implemented, if you would like to discontinue householding for your accounts, please call Shareholder Services at (800) 304-7404 to request individual copies of these documents. Once notification to stop householding is received, the Fund will begin sending individual copies thirty days after receiving your request. This policy does not apply to account statements
PRIVACY POLICY (unaudited)
Your right to privacy is important to us. We understand that the privacy and security of your nonpublic personal information is important to you; therefore, we maintain various safeguards designed to protect your information from unauthorized access.
Information we collect is either required or necessary to provide the following services for you:
• Service your account;
• Complete transactions or account changes;
• Prevent unauthorized access of your account;
• Improve customer service; and
• Comply with legal and regulatory requirements.
The types of personal information we collect and share with third parties that perform everyday services for the Funds may include:
• Personal information the Funds receive from you on or in applications or other forms, correspondence, or conversations, including, but not limited to, your name, and address, phone number, social security number, net work, assets, income and date of birth; and
• Information about your transactions with the Funds, their affiliates or others, such as your account number and balance, payment history, parties to transactions, cost basis information, and other financial information.
We do not sell information about current or former shareholders to third parties, nor is it our practice to disclose such information to third parties unless requested or permitted to do so by you or your representative or, if necessary, in order to process a transaction, service an account or as permitted by law. We may, however, share information about you with our affiliates.
23
PRIVACY POLICY (unaudited) (continued)
Additionally, we may share information with outside companies that perform administrative services for us. However, our arrangements with these service providers require them to treat your information as confidential.
We maintain physical, electronic, and procedural safeguards that comply with federal standards to guard your nonpublic personal information. Our compliance policies and procedures restrict the use of shareholder information and require that it be held in strict confidence. We do not disclose any information, public or nonpublic, about our present or former shareholders to third parties for the purpose of marketing.
In the event that you hold shares of the Fund(s) through a financial intermediary, including, but not limited to, a broker-dealer, bank, or trust company, the privacy policy of such financial intermediary governs how nonpublic personal information may be shared with nonaffiliated third parties.
We are required by law to annually provide a notice describing our privacy policy. In addition, we will inform you promptly if there are changes to our policy. Please do not hesitate to contact us with questions about this notice or to correct, update or confirm your personal information. The accuracy of your personal information is important. You may contact us anytime by calling (800) 304-7404.
24
This page is intentionally left blank.
This page is intentionally left blank.
MAIRS AND POWER GROWTH FUND, INC.
Established 1958
A No-Load Fund
For Shareholder Services
Call (800) 304-7404
Or write to:
|
(via Regular Mail) c/o U.S. Bancorp Fund Services, LLC 615 East Michigan Street P. O. Box 701 Milwaukee, WI 53201-0701 |
(via Overnight or Express Mail) c/o U.S. Bancorp Fund Services, LLC 3rd Floor 615 East Michigan Street Milwaukee, WI 53202-0701 |
||||||
For Fund literature and information, visit the Fund's website at:
www.mairsandpower.com
Investment Manager
Mairs and Power, Inc.
W1520 First National Bank Building
332 Minnesota Street
Saint Paul, MN 55101
Custodian
U.S. Bank, N.A.
Custody Operations
1555 North River Center Drive, Suite 302
Milwaukee, WI 53212
Officers and Directors
William B. Frels, President & Director
Jon A. Theobald, Chief Compliance
Officer & Secretary
Mark L. Henneman, Vice President
Andrea C. Stimmel, Treasurer
Norbert J. Conzemius, Chair & Director
Bert J. McKasy, Director
Charles M. Osborne, Audit Committee
Chair & Director
Mary Schmid Daugherty, Director
Item 2. Code of Ethics.
Not applicable for semi-annual reports.
Item 3. Audit Committee Financial Expert.
Not applicable for semi-annual reports.
Item 4. Principal Accountant Fees and Services.
Not applicable for semi-annual reports.
Item 5. Audit Committee of Listed Registrants.
Not applicable to registrant.
Item 6. Investments.
(a) Schedule of Investments is included as part of the report to shareholders filed under Item 1 of this Form
(b) Not Applicable.
Item 7. Disclosure of Proxy Voting Policies and Procedures for Closed-End Management Investment Companies.
Not applicable to open-end investment companies.
Item 8. Portfolio Managers of Closed-End Management Investment Companies.
Not applicable to open-end investment companies.
Item 9. Purchases of Equity Securities by Closed-End Management Investment Company and Affiliated Purchasers.
Not applicable to open-end investment companies.
Item 10. Submission of Matters to a Vote of Security Holders.
There has been no material change to the procedures by which shareholders may recommend nominees to the registrant’s board of directors.
Item 11. Controls and Procedures.
(a) The Registrant’s Principal Executive Officer and Principal Financial Officer have reviewed the Registrant’s disclosure controls and procedures (as defined in Rule 30a-3(c) under the
Investment Company Act of 1940 (the “Act”)) as of a date within 90 days of the filing of this report, as required by Rule 30a-3(b) under the Act and Rules 13a-15(b) or 15d-15(b) under the Securities Exchange Act of 1934. Based on their review, such officers have concluded that the disclosure controls and procedures are effective in ensuring that information required to be disclosed in this report is appropriately recorded, processed, summarized and reported and made known to them by others within the Registrant and by the Registrant’s service provider.
(b) There were no changes in the Registrant’s internal control over financial reporting (as defined in Rule 30a-3(d) under the Act) that occurred during the second fiscal quarter of the period covered by this report that has materially affected, or is reasonably likely to materially affect, the Registrant’s internal control over financial reporting.
Item 12. Exhibits.
(a) (1) Any code of ethics or amendment thereto, that is the subject of the disclosure required by Item 2, to the extent that the registrant intends to satisfy Item 2 requirements through filing an exhibit.
Not applicable to semi-annual report.
(2) A separate certification for each principal executive and principal financial officer pursuant to Section 302 of the Sarbanes-Oxley Act of 2002.
Filed herewith.
(3) Any written solicitation to purchase securities under Rule 23c-1 under the Act sent or given during the period covered by the report by or on behalf of the registrant to 10 or more persons.
Not applicable to registrant.
(b) Certifications pursuant to Section 906 of the Sarbanes-Oxley Act of 2002.
Filed herewith.
SIGNATURES
Pursuant to the requirements of the Securities Exchange Act of 1934 and the Investment Company Act of 1940, the registrant has duly caused this report to be signed on its behalf by the undersigned, thereunto duly authorized.
|
(Registrant) |
Mairs and Power Growth Fund, Inc. |
| |||
|
|
| ||||
|
By (Signature and Title)* |
/s/ William B. Frels |
| |||
|
|
William B. Frels, President | ||||
|
|
Principal Executive Officer | ||||
|
|
| ||||
|
Date |
9/1/2011 |
| |||
Pursuant to the requirements of the Securities Exchange Act of 1934 and the Investment Company Act of 1940, this report has been signed below by the following persons on behalf of the registrant and in the capacities and on the dates indicated.
|
By (Signature and Title)* |
/s/ William B. Frels |
| ||
|
|
William B. Frels, President | |||
|
|
Principal Executive Officer | |||
|
|
| |||
|
Date |
9/1/2011 |
| ||
|
By (Signature and Title)* |
/s/ Andrea C. Stimmel |
| ||
|
|
Andrea C. Stimmel, Treasurer | |||
|
|
Principal Financial Officer | |||
|
|
| |||
|
Date |
9/1/2011 |
| ||
* Print the name and title of each signing officer under his or her signature.