Mairs and Power
Growth Fund, Inc.
Ticker Symbol: MPGFX
Summary Prospectus April 29, 2011
The Fund's investment objective, risks and expenses must be considered carefully before investing. The Fund's Prospectus and Statement of Additional Information, both dated April 29, 2011, are incorporated by reference into this Summary Prospectus. For free paper or electronic copies of the Fund's Prospectus and other information about the Fund, go to www.mairsandpower.com or call 800-304-7404.
Fund Summary
Investment Objective
The objective of the Mairs and Power Growth Fund (the Fund) is to provide shareholders with a diversified portfolio of common stocks, which have the potential for above-average long-term appreciation.
Fees and Expenses of the Fund
This table describes the fees and expenses that you may pay if you buy and hold shares of the Fund.
Shareholder Fees
| (fees paid directly from your investment) | None | ||||||
Annual Fund Operating Expenses (expenses that
you pay each year as a percentage of the value of
your investment)
| Management Fees | 0.60 | % | |||||
|
Other Expenses (Transfer Agent, Custodian, Accounting, Legal, Audit, etc.) |
0.11 | % | |||||
| Total Annual Fund Operating Expenses | 0.71 | % | |||||
Expense Example
This example is intended to help you compare the cost of investing in the Fund with the cost of investing in other mutual funds. The example assumes that you invest $10,000 in the Fund for the time periods indicated and you then redeem all of your shares at the end of those periods. The example also assumes that your investment has a 5% return each year and that the Fund's operating expenses remain the same. Although your actual costs may be higher or lower, based on these assumptions, your costs would be:
| 1 year | 3 years | 5 years | 10 years | ||||||||||||
| $ | 73 | $ | 228 | $ | 396 | $ | 885 | ||||||||
Portfolio Turnover
The Fund pays transaction costs, such as commissions, when it buys and sells securities (or "turns over" its portfolio). A higher portfolio turnover rate may indicate higher transaction costs and may result in higher taxes when Fund shares are held in a taxable account. These costs, which are not reflected in annual fund operating expenses or in the example, affect the Fund's performance. During the most recent fiscal year, the Fund's portfolio turnover rate was 1.81% of the average value of its portfolio.
Principal Investment Strategies
Common stocks are the primary emphasis in the portfolio. The Fund may also invest in foreign securities and convertible debt securities rated less than investment grade. Preference is given to holdings in high quality companies, which are characterized by earnings that are reasonably predictable, have a return on equity that is above average, hold market dominance and have financial strength. Because the Fund recognizes that smaller capitalization companies provide somewhat higher returns over longer time frames, some emphasis is placed on small companies (companies with a market capitalization of less than two billion dollars) to medium sized companies (companies with a market capitalization between two and ten billion dollars), generally located in the Upper Midwest region. These companies may be underowned by institutional investors. The Fund seeks to keep its assets reasonably fully invested at all times, to maintain modest portfolio turnover rates and to moderate risk by investing in a diversified portfolio of equity securities.
Principal Risks of Investing in the Fund
All investments have risks. The Fund is designed for long-term investors. You should be prepared to accept fluctuations in portfolio value as the Fund seeks to achieve its investment objective. The Fund cannot provide assurance that it will achieve its objective. Loss of money is a risk of investing in the Fund. The main risks of investing in the Fund are:
Market Conditions
Equity securities are generally subject to greater risk than fixed income securities in adverse market conditions. Equity security prices may fluctuate markedly over the short-term due to changing market conditions, interest rate fluctuations and various economic and political factors.
Fund Management
Active management by the investment adviser in selecting and maintaining a portfolio of securities that will achieve the Fund's investment objective could cause the Fund to underperform compared to other funds having similar investment objectives.
Common Stock
Common stocks represent an ownership interest in a corporation. The Fund could lose money if a company in which it invests becomes financially distressed.
Small and Midcap Securities
These companies, in which the Fund places some emphasis on, have a shorter history of operations and may be less diversified with respect to their product line. Stocks of these companies tend to be more volatile and less liquid than large company stocks.
Convertible Debt Securities Rated Less than Investment-Grade
These securities have a higher degree of credit risk. Companies that issue these lower rated securities are often highly leveraged and traditional methods of financing may not be available to them. Also, market values of lower rated securities may be more sensitive to developments which affect the individual issuer and to general economic conditions.
Securities of Foreign Issuers and ADRs
There are certain risks in securities of foreign issuers which are not associated with domestic securities. These risks among others include political, social or economic instability, difficulty in predicting international trade patterns, taxation and foreign trading practices, and greater fluctuations in price than United States corporations. In addition, there may be less publicly available information about a foreign company than about a United States domiciled company.
Performance
Risk/Return Bar Chart and Table
The following bar chart and table illustrate the risks of investing in the Fund. The bar chart shows changes in the Fund's performance from year to year over a 10-year period. Both the chart and the table assume that all distributions have been reinvested. Visit the Fund's website at www.mairsandpower.com, or call 800-304-7404 for current performance figures.
Past performance of the Fund, before and after taxes, is not necessarily an indication of how the Fund will perform in the future.
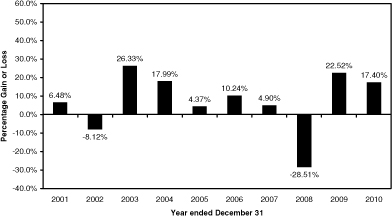
Highest and Lowest Calendar Quarters (for the past 10 years)
| Highest Quarter | 2nd Quarter, 2009: | + 17.71% | |||||||||
| Lowest Quarter | 4th Quarter, 2008: | - 22.23% | |||||||||
Average Annual Total Returns
The following table shows how the Fund's average annual returns before and after taxes for one, five and ten years compare to those of the S&P 500 Index.
The unaudited after-tax returns shown in the table are calculated using the historical highest individual federal marginal income tax rates and do not reflect the impact of state and local taxes. Actual after-tax returns depend on an investor's tax situation and may differ from those shown. After-tax returns shown are not relevant to investors who hold their Fund shares through tax-deferred arrangements, such as 401(k) plans or individual retirement accounts (IRAs).
(For the periods ended December 31, 2010)
| 1 year | 5 years | 10 years | |||||||||||||
| Return Before Taxes | +17.40% | +3.53% | +6.11% | ||||||||||||
|
Return After Taxes on Distributions |
+16.93% | +3.02% | +5.58% | ||||||||||||
|
Return After Taxes on Distributions and Sale of Fund Shares |
+11.89% | +2.98% | +5.22% | ||||||||||||
|
S&P 500 Index (reflects no deduction for fees, expenses or taxes) |
+15.06% | +2.29% | +1.41% | ||||||||||||
2
Portfolio Management
The Fund employs Mairs and Power, Inc. (the Adviser) to manage the Fund's investment portfolio. William B. Frels, the lead portfolio manager of the Fund since 2004, is Chairman, CEO and Director of the Adviser. Mark L. Henneman, co-manager of the Fund since 2006, is Vice President and Director of the Adviser.
Purchase and Sale of Fund Shares
The minimum initial and subsequent investment amounts offered by the Fund are:
| Type of Account |
Minimum Investment |
Subsequent Investment |
|||||||||
| Regular | $ | 2,500 | $ | 100 | |||||||
| IRA | $ | 1,000 | $ | 100 | |||||||
You may purchase or redeem Fund shares directly through the Fund's transfer agent by writing or calling:
Mairs and Power Growth Fund, Inc.
c/o U.S. Bancorp Fund Services, LLC
P.O. Box 701
Milwaukee, WI 53201-0701
Telephone: 800-304-7404
Fund transactions may be made on any day the New York Stock Exchange is open for business. When you buy shares, you can pay for your shares by check or wire. When you sell shares, you will receive a check via mail. If you request a redemption via wire, you will be charged a fee. In certain cases, you may ask your authorized financial professional for more information about buying or selling shares.
Tax Information
The Fund intends to make distributions that may be taxed as ordinary income or capital gains. Such distributions to individual retirement accounts and qualified retirement plans are generally tax-free.
Payments to Broker-Dealers and Other Financial Intermediaries
If you purchase the Fund through a broker-dealer, bank or other financial intermediary (such as a financial adviser), the Fund and/or the Fund's investment adviser may pay a fee to the intermediary for certain services including sub-accounting services, delivering Fund documents to shareholders and providing information about the Fund. These payments may create a conflict of interest by influencing the financial intermediary and your salesperson to recommend the Fund over another investment. Ask your salesperson or visit your financial intermediary's website for more information.
3