| MEDIA CONTACT: | ANALYST CONTACT: | ||||||||||
| Jane Stehney | James Polehna | ||||||||||
| (248) 765-6864 | (248) 244-4586 | ||||||||||
| stehnja@kellyservices.com | james.polehna@kellyservices.com | ||||||||||
| KELLY SERVICES, INC. AND SUBSIDIARIES | |||||||||||||||||||||||||||||||||||
| CONSOLIDATED STATEMENTS OF EARNINGS | |||||||||||||||||||||||||||||||||||
| FOR THE 13 WEEKS ENDED OCTOBER 2, 2022 AND OCTOBER 3, 2021 | |||||||||||||||||||||||||||||||||||
| (UNAUDITED) | |||||||||||||||||||||||||||||||||||
| (In millions of dollars except per share data) | |||||||||||||||||||||||||||||||||||
| % | CC % | ||||||||||||||||||||||||||||||||||
| 2022 | 2021 | Change | Change | Change | |||||||||||||||||||||||||||||||
| Revenue from services | $ | 1,167.9 | $ | 1,195.4 | $ | (27.5) | (2.3) | % | 0.3 | % | |||||||||||||||||||||||||
| Cost of services | 927.3 | 966.5 | (39.2) | (4.0) | |||||||||||||||||||||||||||||||
| Gross profit | 240.6 | 228.9 | 11.7 | 5.1 | 7.6 | ||||||||||||||||||||||||||||||
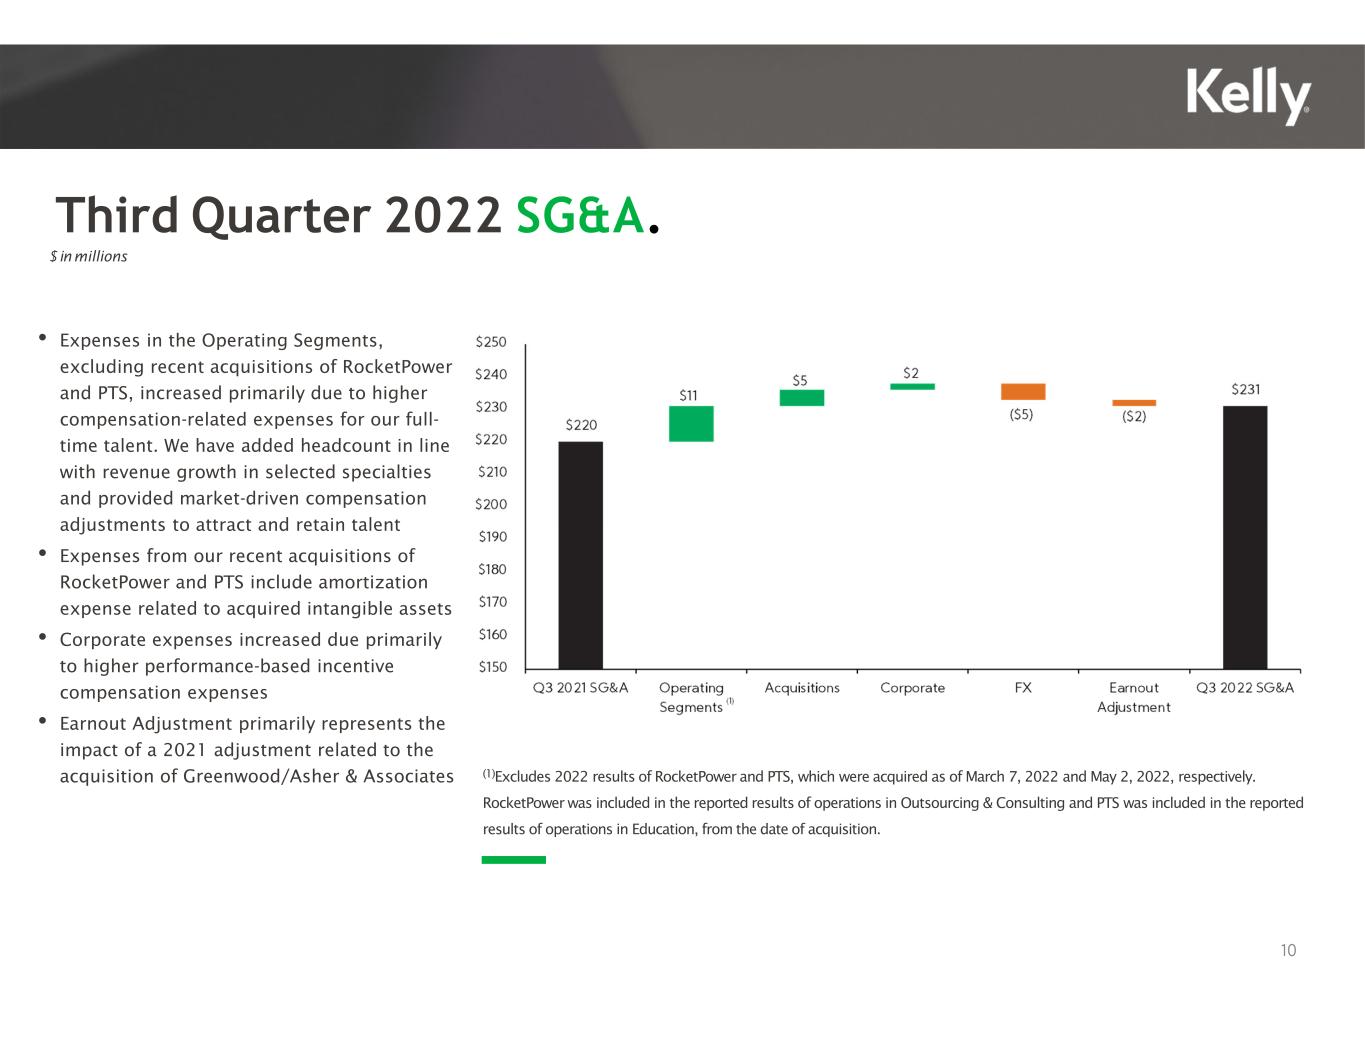
| Selling, general and administrative expenses | 231.1 | 219.9 | 11.2 | 5.1 | 7.1 | ||||||||||||||||||||||||||||||
| Goodwill impairment charge | 30.7 | — | 30.7 | NM | |||||||||||||||||||||||||||||||
| Loss on disposal | 0.2 | — | 0.2 | NM | |||||||||||||||||||||||||||||||
| Earnings (loss) from operations | (21.4) | 9.0 | (30.4) | NM | |||||||||||||||||||||||||||||||
| Gain on investment in Persol Holdings | — | 35.5 | (35.5) | NM | |||||||||||||||||||||||||||||||
| Other income (expense), net | 0.2 | (0.3) | 0.5 | 156.6 | |||||||||||||||||||||||||||||||
| Earnings (loss) before taxes and equity in net earnings (loss) of affiliate | (21.2) | 44.2 | (65.4) | NM | |||||||||||||||||||||||||||||||
| Income tax expense (benefit) | (5.0) | 11.1 | (16.1) | (144.6) | |||||||||||||||||||||||||||||||
| Net earnings (loss) before equity in net earnings (loss) of affiliate | (16.2) | 33.1 | (49.3) | NM | |||||||||||||||||||||||||||||||
| Equity in net earnings (loss) of affiliate | — | 1.7 | (1.7) | NM | |||||||||||||||||||||||||||||||
| Net earnings (loss) | $ | (16.2) | $ | 34.8 | $ | (51.0) | NM | ||||||||||||||||||||||||||||
| Basic earnings (loss) per share | $ | (0.43) | $ | 0.87 | $ | (1.30) | NM | ||||||||||||||||||||||||||||
| Diluted earnings (loss) per share | $ | (0.43) | $ | 0.87 | $ | (1.30) | NM | ||||||||||||||||||||||||||||
| STATISTICS: | |||||||||||||||||||||||||||||||||||
| Permanent placement revenue (included in revenue from services) | $ | 19.8 | $ | 19.7 | $ | 0.1 | 0.7 | % | 4.4 | % | |||||||||||||||||||||||||
| Gross profit rate | 20.6 | % | 19.2 | % | 1.4 | pts. | |||||||||||||||||||||||||||||
| Conversion rate | (8.9) | % | 3.9 | % | (12.8) | pts. | |||||||||||||||||||||||||||||
| Adjusted EBITDA | $ | 19.1 | $ | 17.3 | $ | 1.8 | |||||||||||||||||||||||||||||
| Adjusted EBITDA margin | 1.6 | % | 1.4 | % | 0.2 | pts. | |||||||||||||||||||||||||||||
| Effective income tax rate | 23.4 | % | 25.2 | % | (1.8) | pts. | |||||||||||||||||||||||||||||
| Average number of shares outstanding (millions): | |||||||||||||||||||||||||||||||||||
| Basic | 37.9 | 39.4 | |||||||||||||||||||||||||||||||||
| Diluted | 37.9 | 39.5 | |||||||||||||||||||||||||||||||||
| KELLY SERVICES, INC. AND SUBSIDIARIES | |||||||||||||||||||||||||||||||||||
| CONSOLIDATED STATEMENTS OF EARNINGS | |||||||||||||||||||||||||||||||||||
| FOR THE 39 WEEKS ENDED OCTOBER 2, 2022 AND OCTOBER 3, 2021 | |||||||||||||||||||||||||||||||||||
| (UNAUDITED) | |||||||||||||||||||||||||||||||||||
| (In millions of dollars except per share data) | |||||||||||||||||||||||||||||||||||
| % | CC % | ||||||||||||||||||||||||||||||||||
| 2022 | 2021 | Change | Change | Change | |||||||||||||||||||||||||||||||
| Revenue from services | $ | 3,731.6 | $ | 3,659.4 | $ | 72.2 | 2.0 | % | 4.0 | % | |||||||||||||||||||||||||
| Cost of services | 2,970.0 | 2,986.2 | (16.2) | (0.5) | |||||||||||||||||||||||||||||||
| Gross profit | 761.6 | 673.2 | 88.4 | 13.1 | 15.1 | ||||||||||||||||||||||||||||||
| Selling, general and administrative expenses | 707.3 | 639.9 | 67.4 | 10.5 | 12.2 | ||||||||||||||||||||||||||||||
| Goodwill impairment charge | 30.7 | — | 30.7 | NM | |||||||||||||||||||||||||||||||
| Loss on disposal | 18.7 | — | 18.7 | NM | |||||||||||||||||||||||||||||||
| Gain on sale of assets | (5.3) | — | (5.3) | NM | |||||||||||||||||||||||||||||||
| Earnings from operations | 10.2 | 33.3 | (23.1) | (69.4) | |||||||||||||||||||||||||||||||
| Gain (loss) on investment in Persol Holdings | (67.2) | 71.8 | (139.0) | NM | |||||||||||||||||||||||||||||||
Loss on currency translation from liquidation of subsidiary(1) | (20.4) | — | (20.4) | NM | |||||||||||||||||||||||||||||||
| Other income (expense), net | 1.9 | (4.0) | 5.9 | 148.0 | |||||||||||||||||||||||||||||||
| Earnings (loss) before taxes and equity in net earnings (loss) of affiliate | (75.5) | 101.1 | (176.6) | NM | |||||||||||||||||||||||||||||||
| Income tax expense (benefit) | (13.1) | 19.0 | (32.1) | (169.1) | |||||||||||||||||||||||||||||||
| Net earnings (loss) before equity in net earnings (loss) of affiliate | (62.4) | 82.1 | (144.5) | NM | |||||||||||||||||||||||||||||||
| Equity in net earnings (loss) of affiliate | 0.8 | 2.3 | (1.5) | (66.8) | |||||||||||||||||||||||||||||||
| Net earnings (loss) | $ | (61.6) | $ | 84.4 | $ | (146.0) | NM | ||||||||||||||||||||||||||||
| Basic earnings (loss) per share | $ | (1.62) | $ | 2.12 | $ | (3.74) | NM | ||||||||||||||||||||||||||||
| Diluted earnings (loss) per share | $ | (1.62) | $ | 2.12 | $ | (3.74) | NM | ||||||||||||||||||||||||||||
| STATISTICS: | |||||||||||||||||||||||||||||||||||
| Permanent placement revenue (included in revenue from services) | $ | 71.2 | $ | 54.3 | $ | 16.9 | 31.2 | % | 34.4 | % | |||||||||||||||||||||||||
| Gross profit rate | 20.4 | % | 18.4 | % | 2.0 | pts. | |||||||||||||||||||||||||||||
| Conversion rate | 1.3 | % | 4.9 | % | (3.6) | pts. | |||||||||||||||||||||||||||||
| Adjusted EBITDA | $ | 81.5 | $ | 56.4 | $ | 25.1 | |||||||||||||||||||||||||||||
| Adjusted EBITDA margin | 2.2 | % | 1.5 | % | 0.7 | pts. | |||||||||||||||||||||||||||||
| Effective income tax rate | 17.4 | % | 18.8 | % | (1.4) | pts. | |||||||||||||||||||||||||||||
| Average number of shares outstanding (millions): | |||||||||||||||||||||||||||||||||||
| Basic | 38.2 | 39.4 | |||||||||||||||||||||||||||||||||
| Diluted | 38.2 | 39.5 | |||||||||||||||||||||||||||||||||
| KELLY SERVICES, INC. AND SUBSIDIARIES | ||||||||||||||||||||||||||||||||
| RESULTS OF OPERATIONS BY SEGMENT | ||||||||||||||||||||||||||||||||
| (UNAUDITED) | ||||||||||||||||||||||||||||||||
| (In millions of dollars) | ||||||||||||||||||||||||||||||||
| Third Quarter | ||||||||||||||||||||||||||||||||
| % | CC % | |||||||||||||||||||||||||||||||
| 2022 | 2021 | Change | Change | |||||||||||||||||||||||||||||
| Professional & Industrial | ||||||||||||||||||||||||||||||||
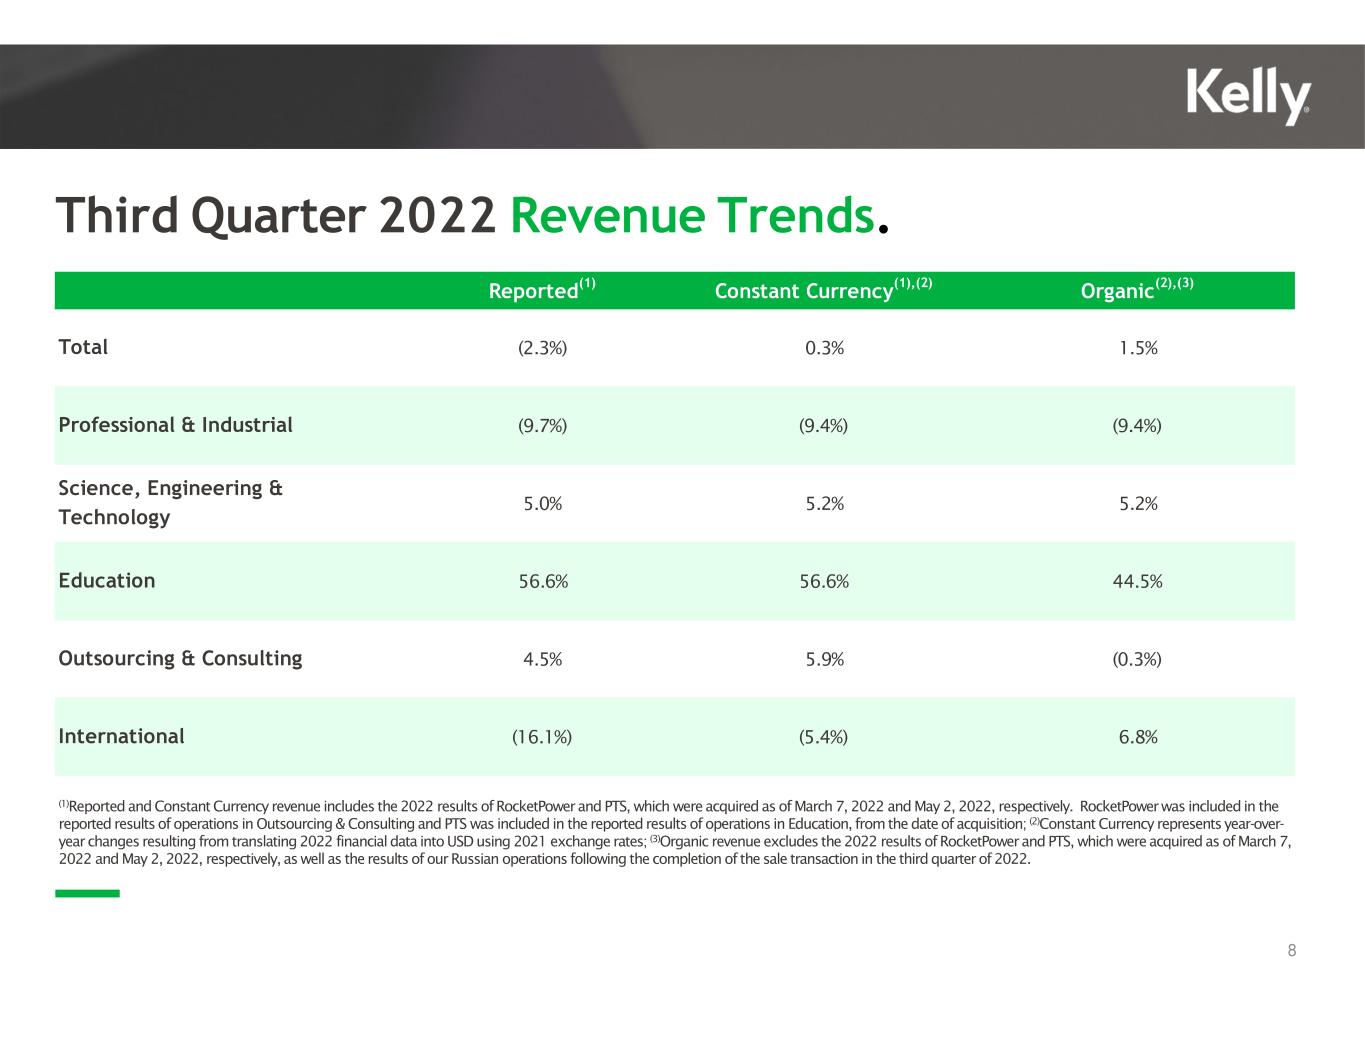
| Revenue from services | $ | 408.6 | $ | 452.6 | (9.7) | % | (9.4) | % | ||||||||||||||||||||||||
| Gross profit | 70.3 | 76.6 | (8.3) | (8.0) | ||||||||||||||||||||||||||||
| Total SG&A expenses | 65.3 | 69.4 | (6.0) | (5.8) | ||||||||||||||||||||||||||||
| Earnings (loss) from operations | 5.0 | 7.2 | (30.7) | |||||||||||||||||||||||||||||
| Gross profit rate | 17.2 | % | 16.9 | % | 0.3 | pts. | ||||||||||||||||||||||||||
| Science, Engineering & Technology | ||||||||||||||||||||||||||||||||
| Revenue from services | $ | 321.3 | $ | 306.2 | 5.0 | % | 5.2 | % | ||||||||||||||||||||||||
| Gross profit | 76.3 | 68.1 | 11.9 | 12.3 | ||||||||||||||||||||||||||||
| Total SG&A expenses | 53.4 | 48.4 | 10.2 | 10.4 | ||||||||||||||||||||||||||||
| Earnings (loss) from operations | 22.9 | 19.7 | 16.2 | |||||||||||||||||||||||||||||
| Gross profit rate | 23.7 | % | 22.3 | % | 1.4 | pts. | ||||||||||||||||||||||||||
| Education | ||||||||||||||||||||||||||||||||
| Revenue from services | $ | 104.3 | $ | 66.6 | 56.6 | % | 56.6 | % | ||||||||||||||||||||||||
| Gross profit | 16.6 | 10.0 | 65.4 | 65.4 | ||||||||||||||||||||||||||||
| Total SG&A expenses | 21.4 | 17.0 | 25.6 | 25.6 | ||||||||||||||||||||||||||||
| Earnings (loss) from operations | (4.8) | (7.0) | 31.8 | |||||||||||||||||||||||||||||
| Gross profit rate | 15.9 | % | 15.1 | % | 0.8 | pts. | ||||||||||||||||||||||||||
| Outsourcing & Consulting | ||||||||||||||||||||||||||||||||
| Revenue from services | $ | 118.5 | $ | 113.4 | 4.5 | % | 5.9 | % | ||||||||||||||||||||||||
| Gross profit | 44.1 | 37.3 | 18.6 | 21.2 | ||||||||||||||||||||||||||||
| Total SG&A expenses | 37.7 | 30.7 | 23.4 | 25.6 | ||||||||||||||||||||||||||||
| Goodwill impairment charge | 30.7 | — | NM | |||||||||||||||||||||||||||||
| Earnings (loss) from operations | (24.3) | 6.6 | NM | |||||||||||||||||||||||||||||
| Gross profit rate | 37.2 | % | 32.8 | % | 4.4 | pts. | ||||||||||||||||||||||||||
| International | ||||||||||||||||||||||||||||||||
| Revenue from services | $ | 215.5 | $ | 256.8 | (16.1) | % | (5.4) | % | ||||||||||||||||||||||||
| Gross profit | 33.3 | 36.9 | (9.6) | 2.0 | ||||||||||||||||||||||||||||
| Total SG&A expenses | 31.4 | 34.5 | (9.1) | 1.5 | ||||||||||||||||||||||||||||
| Earnings (loss) from operations | 1.9 | 2.4 | (16.9) | |||||||||||||||||||||||||||||
| Gross profit rate | 15.5 | % | 14.4 | % | 1.1 | pts. | ||||||||||||||||||||||||||
| KELLY SERVICES, INC. AND SUBSIDIARIES | ||||||||||||||||||||||||||||||||
| RESULTS OF OPERATIONS BY SEGMENT | ||||||||||||||||||||||||||||||||
| (UNAUDITED) | ||||||||||||||||||||||||||||||||
| (In millions of dollars) | ||||||||||||||||||||||||||||||||
| September Year to Date | ||||||||||||||||||||||||||||||||
| % | CC % | |||||||||||||||||||||||||||||||
| 2022 | 2021 | Change | Change | |||||||||||||||||||||||||||||
| Professional & Industrial | ||||||||||||||||||||||||||||||||
| Revenue from services | $ | 1,268.7 | $ | 1,386.7 | (8.5) | % | (8.3) | % | ||||||||||||||||||||||||
| Gross profit | 231.2 | 227.7 | 1.5 | 1.7 | ||||||||||||||||||||||||||||
| Total SG&A expenses | 204.1 | 207.8 | (1.8) | (1.7) | ||||||||||||||||||||||||||||
| Earnings (loss) from operations | 27.1 | 19.9 | 36.1 | |||||||||||||||||||||||||||||
| Gross profit rate | 18.2 | % | 16.4 | % | 1.8 | pts. | ||||||||||||||||||||||||||
| Science, Engineering & Technology | ||||||||||||||||||||||||||||||||
| Revenue from services | $ | 962.7 | $ | 859.1 | 12.1 | % | 12.3 | % | ||||||||||||||||||||||||
| Gross profit | 225.3 | 187.8 | 19.9 | 20.2 | ||||||||||||||||||||||||||||
| Total SG&A expenses | 161.4 | 131.0 | 23.2 | 23.3 | ||||||||||||||||||||||||||||
| Earnings (loss) from operations | 63.9 | 56.8 | 12.5 | |||||||||||||||||||||||||||||
| Gross profit rate | 23.4 | % | 21.9 | % | 1.5 | pts. | ||||||||||||||||||||||||||
| Education | ||||||||||||||||||||||||||||||||
| Revenue from services | $ | 433.2 | $ | 284.1 | 52.5 | % | 52.5 | % | ||||||||||||||||||||||||
| Gross profit | 69.2 | 44.0 | 57.3 | 57.3 | ||||||||||||||||||||||||||||
| Total SG&A expenses | 60.4 | 46.5 | 29.9 | 29.9 | ||||||||||||||||||||||||||||
| Earnings (loss) from operations | 8.8 | (2.5) | NM | |||||||||||||||||||||||||||||
| Gross profit rate | 16.0 | % | 15.5 | % | 0.5 | pts. | ||||||||||||||||||||||||||
| Outsourcing & Consulting | ||||||||||||||||||||||||||||||||
| Revenue from services | $ | 352.0 | $ | 320.0 | 10.0 | % | 11.2 | % | ||||||||||||||||||||||||
| Gross profit | 127.6 | 103.4 | 23.5 | 25.7 | ||||||||||||||||||||||||||||
| Total SG&A expenses | 111.8 | 89.2 | 25.6 | 27.3 | ||||||||||||||||||||||||||||
| Goodwill impairment charge | 30.7 | — | NM | |||||||||||||||||||||||||||||
| Earnings (loss) from operations | (14.9) | 14.2 | NM | |||||||||||||||||||||||||||||
| Gross profit rate | 36.3 | % | 32.3 | % | 4.0 | pts. | ||||||||||||||||||||||||||
| International | ||||||||||||||||||||||||||||||||
| Revenue from services | $ | 715.9 | $ | 810.1 | (11.6) | % | (3.5) | % | ||||||||||||||||||||||||
| Gross profit | 108.3 | 110.3 | (1.8) | 7.4 | ||||||||||||||||||||||||||||
| Total SG&A expenses | 99.2 | 102.2 | (3.0) | 5.4 | ||||||||||||||||||||||||||||
| Earnings (loss) from operations | 9.1 | 8.1 | 13.4 | |||||||||||||||||||||||||||||
| Gross profit rate | 15.1 | % | 13.6 | % | 1.5 | pts. | ||||||||||||||||||||||||||
| KELLY SERVICES, INC. AND SUBSIDIARIES | |||||||||||||||||||||||
| CONSOLIDATED BALANCE SHEETS | |||||||||||||||||||||||
| (UNAUDITED) | |||||||||||||||||||||||
| (In millions of dollars) | |||||||||||||||||||||||
| October 2, 2022 | January 2, 2022 | October 3, 2021 | |||||||||||||||||||||
| Current Assets | |||||||||||||||||||||||
| Cash and equivalents | $ | 122.4 | $ | 112.7 | $ | 43.5 | |||||||||||||||||
| Trade accounts receivable, less allowances of | |||||||||||||||||||||||
| $12.1, $12.6, and $12.3, respectively | 1,519.9 | 1,423.2 | 1,423.9 | ||||||||||||||||||||
| Prepaid expenses and other current assets | 83.1 | 52.8 | 71.0 | ||||||||||||||||||||
| Assets held for sale | 4.7 | — | — | ||||||||||||||||||||
| Total current assets | 1,730.1 | 1,588.7 | 1,538.4 | ||||||||||||||||||||
| Noncurrent Assets | |||||||||||||||||||||||
| Property and equipment, net | 24.9 | 35.3 | 36.1 | ||||||||||||||||||||
| Operating lease right-of-use assets | 67.3 | 75.8 | 79.3 | ||||||||||||||||||||
| Deferred taxes | 300.7 | 302.8 | 304.0 | ||||||||||||||||||||
| Goodwill, net | 161.4 | 114.8 | 114.8 | ||||||||||||||||||||
| Investment in Persol Holdings | — | 264.3 | 222.6 | ||||||||||||||||||||
| Investment in equity affiliate | — | 123.4 | 122.0 | ||||||||||||||||||||
| Other assets | 397.5 | 389.1 | 386.3 | ||||||||||||||||||||
| Total noncurrent assets | 951.8 | 1,305.5 | 1,265.1 | ||||||||||||||||||||
| Total Assets | $ | 2,681.9 | $ | 2,894.2 | $ | 2,803.5 | |||||||||||||||||
| Current Liabilities | |||||||||||||||||||||||
| Short-term borrowings | $ | 0.1 | $ | — | $ | — | |||||||||||||||||
| Accounts payable and accrued liabilities | 735.2 | 687.2 | 645.2 | ||||||||||||||||||||
| Operating lease liabilities | 14.4 | 17.5 | 18.4 | ||||||||||||||||||||
| Accrued payroll and related taxes | 321.4 | 318.4 | 334.9 | ||||||||||||||||||||
| Accrued workers' compensation and other claims | 24.4 | 20.8 | 21.1 | ||||||||||||||||||||
| Income and other taxes | 47.5 | 51.3 | 58.4 | ||||||||||||||||||||
| Total current liabilities | 1,143.0 | 1,095.2 | 1,078.0 | ||||||||||||||||||||
| Noncurrent Liabilities | |||||||||||||||||||||||
| Operating lease liabilities | 55.6 | 61.4 | 64.1 | ||||||||||||||||||||
| Accrued payroll and related taxes | — | 57.6 | 58.2 | ||||||||||||||||||||
| Accrued workers' compensation and other claims | 43.4 | 37.0 | 39.1 | ||||||||||||||||||||
| Accrued retirement benefits | 172.7 | 220.0 | 213.5 | ||||||||||||||||||||
| Other long-term liabilities | 14.5 | 86.8 | 76.5 | ||||||||||||||||||||
| Total noncurrent liabilities | 286.2 | 462.8 | 451.4 | ||||||||||||||||||||
| Stockholders' Equity | |||||||||||||||||||||||
| Common stock | 38.5 | 40.1 | 40.1 | ||||||||||||||||||||
| Treasury stock | (12.4) | (15.1) | (15.2) | ||||||||||||||||||||
| Paid-in capital | 26.6 | 23.9 | 23.2 | ||||||||||||||||||||
| Earnings invested in the business | 1,220.1 | 1,315.0 | 1,245.3 | ||||||||||||||||||||
| Accumulated other comprehensive income (loss) | (20.1) | (27.7) | (19.3) | ||||||||||||||||||||
| Total stockholders' equity | 1,252.7 | 1,336.2 | 1,274.1 | ||||||||||||||||||||
| Total Liabilities and Stockholders' Equity | $ | 2,681.9 | $ | 2,894.2 | $ | 2,803.5 | |||||||||||||||||
| STATISTICS: | |||||||||||||||||||||||
| Working Capital | $ | 587.1 | $ | 493.5 | $ | 460.4 | |||||||||||||||||
| Current Ratio | 1.5 | 1.5 | 1.4 | ||||||||||||||||||||
| Debt-to-capital % | 0.0 | % | 0.0 | % | 0.0 | % | |||||||||||||||||
| Global Days Sales Outstanding | 64 | 60 | 63 | ||||||||||||||||||||
| Year-to-Date Free Cash Flow | $ | (117.3) | $ | 73.8 | $ | 23.5 | |||||||||||||||||
| KELLY SERVICES, INC. AND SUBSIDIARIES | ||||||||||||||
| CONSOLIDATED STATEMENTS OF CASH FLOWS | ||||||||||||||
| FOR THE 39 WEEKS ENDED OCTOBER 2, 2022 AND OCTOBER 3, 2021 | ||||||||||||||
| (UNAUDITED) | ||||||||||||||
| (In millions of dollars) | ||||||||||||||
| 2022 | 2021 | |||||||||||||
| Cash flows from operating activities: | ||||||||||||||
| Net earnings (loss) | $ | (61.6) | $ | 84.4 | ||||||||||
| Adjustments to reconcile net earnings (loss) to net cash from operating activities: | ||||||||||||||
| Goodwill impairment charge | 30.7 | — | ||||||||||||
| Deferred income taxes on goodwill impairment charge | (5.3) | — | ||||||||||||
| Loss on disposal | 18.7 | — | ||||||||||||
| Depreciation and amortization | 24.7 | 22.0 | ||||||||||||
| Operating lease asset amortization | 14.2 | 16.0 | ||||||||||||
| Provision for credit losses and sales allowances | 1.7 | 0.8 | ||||||||||||
| Stock-based compensation | 5.9 | 4.0 | ||||||||||||
| (Gain) loss on investment in Persol Holdings | 67.2 | (71.8) | ||||||||||||
| Loss on currency translation from liquidation of subsidiary | 20.4 | — | ||||||||||||
| Gain on foreign currency remeasurement | (5.5) | — | ||||||||||||
| Gain on sale of assets | (5.3) | — | ||||||||||||
| Equity in net (earnings) loss of PersolKelly Pte. Ltd. | (0.8) | (2.3) | ||||||||||||
| Other, net | 3.5 | 4.6 | ||||||||||||
| Changes in operating assets and liabilities, net of acquisitions | (220.2) | (26.7) | ||||||||||||
| Net cash (used in) from operating activities | (111.7) | 31.0 | ||||||||||||
| Cash flows from investing activities: | ||||||||||||||
| Capital expenditures | (5.6) | (7.5) | ||||||||||||
| Proceeds from sale of assets | 4.5 | — | ||||||||||||
| Acquisition of companies, net of cash received | (143.1) | (213.0) | ||||||||||||
| Cash disposed from sale of Russia, net of proceeds | (6.0) | — | ||||||||||||
| Proceeds from company-owned life insurance | 1.5 | 10.4 | ||||||||||||
| Proceeds from sale of Persol Holdings investment | 196.9 | — | ||||||||||||
| Proceeds from sale of equity method investment | 119.5 | — | ||||||||||||
| Proceeds related to loans with equity affiliate | — | 5.8 | ||||||||||||
| Proceeds from equity securities | — | 5.0 | ||||||||||||
| Other investing activities | — | 0.9 | ||||||||||||
| Net cash from (used in) investing activities | 167.7 | (198.4) | ||||||||||||
| Cash flows from financing activities: | ||||||||||||||
| Net change in short-term borrowings | 0.2 | (0.2) | ||||||||||||
| Financing lease payments | (1.2) | (1.3) | ||||||||||||
| Dividend payments | (7.7) | (2.0) | ||||||||||||
| Payments of tax withholding for stock awards | (0.9) | (0.6) | ||||||||||||
| Buyback of common shares | (27.2) | — | ||||||||||||
| Contingent consideration payments | (0.7) | (1.6) | ||||||||||||
| Other financing activities | 0.1 | — | ||||||||||||
| Net cash used in financing activities | (37.4) | (5.7) | ||||||||||||
| Effect of exchange rates on cash, cash equivalents and restricted cash | (7.4) | (3.9) | ||||||||||||
| Net change in cash, cash equivalents and restricted cash | 11.2 | (177.0) | ||||||||||||
| Cash, cash equivalents and restricted cash at beginning of period | 119.5 | 228.1 | ||||||||||||
| Cash, cash equivalents and restricted cash at end of period | $ | 130.7 | $ | 51.1 | ||||||||||
| KELLY SERVICES, INC. AND SUBSIDIARIES | |||||||||||||||||||||||||||||
| REVENUE FROM SERVICES BY GEOGRAPHY | |||||||||||||||||||||||||||||
| (UNAUDITED) | |||||||||||||||||||||||||||||
| (In millions of dollars) | |||||||||||||||||||||||||||||
| Third Quarter | |||||||||||||||||||||||||||||
| % | CC % | ||||||||||||||||||||||||||||
| 2022 | 2021 | Change | Change | ||||||||||||||||||||||||||
| Americas | |||||||||||||||||||||||||||||
| United States | $ | 861.0 | $ | 851.7 | 1.1 | % | 1.1 | % | |||||||||||||||||||||
| Canada | 43.3 | 43.3 | 0.1 | 3.8 | |||||||||||||||||||||||||
| Puerto Rico | 28.3 | 25.5 | 10.8 | 10.8 | |||||||||||||||||||||||||
| Mexico | 10.9 | 14.4 | (24.0) | (23.3) | |||||||||||||||||||||||||
| Total Americas Region | 943.5 | 934.9 | 0.9 | 1.1 | |||||||||||||||||||||||||
| Europe | |||||||||||||||||||||||||||||
| Switzerland | 55.2 | 54.5 | 1.2 | 6.5 | |||||||||||||||||||||||||
| France | 45.8 | 56.3 | (18.7) | (4.8) | |||||||||||||||||||||||||
| Portugal | 41.9 | 36.6 | 14.2 | 33.8 | |||||||||||||||||||||||||
| Italy | 16.4 | 18.5 | (10.8) | 4.5 | |||||||||||||||||||||||||
| United Kingdom | 14.2 | 17.2 | (17.1) | (3.1) | |||||||||||||||||||||||||
| Russia | 5.0 | 33.0 | (85.0) | (87.9) | |||||||||||||||||||||||||
| Other | 35.6 | 33.7 | 6.0 | 25.3 | |||||||||||||||||||||||||
| Total Europe Region | 214.1 | 249.8 | (14.3) | (2.8) | |||||||||||||||||||||||||
| Total Asia-Pacific Region | 10.3 | 10.7 | (3.8) | 2.9 | |||||||||||||||||||||||||
| Total Kelly Services, Inc. | $ | 1,167.9 | $ | 1,195.4 | (2.3) | % | 0.3 | % | |||||||||||||||||||||
| KELLY SERVICES, INC. AND SUBSIDIARIES | |||||||||||||||||||||||||||||
| REVENUE FROM SERVICES BY GEOGRAPHY | |||||||||||||||||||||||||||||
| (UNAUDITED) | |||||||||||||||||||||||||||||
| (In millions of dollars) | |||||||||||||||||||||||||||||
| September Year to Date | |||||||||||||||||||||||||||||
| % | CC % | ||||||||||||||||||||||||||||
| 2022 | 2021 | Change | Change | ||||||||||||||||||||||||||
| Americas | |||||||||||||||||||||||||||||
| United States | $ | 2,746.5 | $ | 2,604.8 | 5.4 | % | 5.4 | % | |||||||||||||||||||||
| Canada | 122.7 | 116.9 | 5.0 | 7.8 | |||||||||||||||||||||||||
| Puerto Rico | 84.8 | 76.6 | 10.7 | 10.7 | |||||||||||||||||||||||||
| Mexico | 32.4 | 82.1 | (60.5) | (60.3) | |||||||||||||||||||||||||
| Total Americas Region | 2,986.4 | 2,880.4 | 3.7 | 3.8 | |||||||||||||||||||||||||
| Europe | |||||||||||||||||||||||||||||
| Switzerland | 165.5 | 161.2 | 2.6 | 7.2 | |||||||||||||||||||||||||
| France | 150.8 | 168.1 | (10.3) | 0.8 | |||||||||||||||||||||||||
| Portugal | 125.8 | 120.9 | 4.0 | 17.1 | |||||||||||||||||||||||||
| Russia | 63.4 | 99.3 | (36.2) | (35.5) | |||||||||||||||||||||||||
| Italy | 54.3 | 56.0 | (3.0) | 9.1 | |||||||||||||||||||||||||
| United Kingdom | 45.2 | 51.9 | (12.8) | (3.7) | |||||||||||||||||||||||||
| Other | 107.6 | 93.3 | 15.4 | 30.8 | |||||||||||||||||||||||||
| Total Europe Region | 712.6 | 750.7 | (5.1) | 4.0 | |||||||||||||||||||||||||
| Total Asia-Pacific Region | 32.6 | 28.3 | 15.2 | 22.0 | |||||||||||||||||||||||||
| Total Kelly Services, Inc. | $ | 3,731.6 | $ | 3,659.4 | 2.0 | % | 4.0 | % | |||||||||||||||||||||
| KELLY SERVICES, INC. AND SUBSIDIARIES | |||||||||||
| RECONCILIATION OF NON-GAAP MEASURES | |||||||||||
| THIRD QUARTER | |||||||||||
| (UNAUDITED) | |||||||||||
| (In millions of dollars) | |||||||||||
| 2022 | 2021 | ||||||||||
| SG&A Expenses: | As Reported | Adjusted | |||||||||
| Professional & Industrial | $ | 65.3 | $ | 69.4 | |||||||
| Science, Engineering & Technology | 53.4 | 48.4 | |||||||||
| Education | 21.4 | 17.0 | |||||||||
| Outsourcing & Consulting | 37.7 | 30.7 | |||||||||
| International | 31.4 | 34.5 | |||||||||
| Corporate | 21.9 | 20.0 | |||||||||
| Total Company | $ | 231.1 | $ | 220.0 | |||||||
| 2022 | 2021 | ||||||||||||||||||||||||||||
| Earnings (loss) from Operations: | As Reported | Loss on disposal(4) | Goodwill impairment charge(5) | Adjusted | Adjusted | ||||||||||||||||||||||||
| Professional & Industrial | $ | 5.0 | $ | — | $ | — | $ | 5.0 | $ | 7.2 | |||||||||||||||||||
| Science, Engineering & Technology | 22.9 | — | — | 22.9 | 19.7 | ||||||||||||||||||||||||
| Education | (4.8) | — | — | (4.8) | (7.0) | ||||||||||||||||||||||||
| Outsourcing & Consulting | (24.3) | — | 30.7 | 6.4 | 6.6 | ||||||||||||||||||||||||
| International | 1.9 | — | — | 1.9 | 2.4 | ||||||||||||||||||||||||
| Corporate | (21.9) | — | — | (21.9) | (20.0) | ||||||||||||||||||||||||
| Loss on disposal | (0.2) | 0.2 | — | — | — | ||||||||||||||||||||||||
| Total Company | $ | (21.4) | $ | 0.2 | $ | 30.7 | $ | 9.5 | $ | 8.9 | |||||||||||||||||||
| KELLY SERVICES, INC. AND SUBSIDIARIES | |||||||||||||||||
| RECONCILIATION OF NON-GAAP MEASURES | |||||||||||||||||
| THIRD QUARTER | |||||||||||||||||
| (UNAUDITED) | |||||||||||||||||
| (In millions of dollars) | |||||||||||||||||
| 2021 | |||||||||||||||||
| SG&A Expenses: | As Reported | Restructuring(6) | Adjusted | ||||||||||||||
| Professional & Industrial | $ | 69.4 | $ | — | $ | 69.4 | |||||||||||
| Science, Engineering & Technology | 48.4 | — | 48.4 | ||||||||||||||
| Education | 17.0 | — | 17.0 | ||||||||||||||
| Outsourcing & Consulting | 30.7 | — | 30.7 | ||||||||||||||
| International | 34.5 | — | 34.5 | ||||||||||||||
| Corporate | 19.9 | 0.1 | 20.0 | ||||||||||||||
| Total Company | $ | 219.9 | $ | 0.1 | $ | 220.0 | |||||||||||
| 2021 | |||||||||||||||||
| Earnings (loss) from Operations: | As Reported | Restructuring(6) | Adjusted | ||||||||||||||
| Professional & Industrial | $ | 7.2 | $ | — | $ | 7.2 | |||||||||||
| Science, Engineering & Technology | 19.7 | — | 19.7 | ||||||||||||||
| Education | (7.0) | — | (7.0) | ||||||||||||||
| Outsourcing & Consulting | 6.6 | — | 6.6 | ||||||||||||||
| International | 2.4 | — | 2.4 | ||||||||||||||
| Corporate | (19.9) | (0.1) | (20.0) | ||||||||||||||
| Total Company | $ | 9.0 | $ | (0.1) | $ | 8.9 | |||||||||||
| KELLY SERVICES, INC. AND SUBSIDIARIES | |||||||||||
| RECONCILIATION OF NON-GAAP MEASURES | |||||||||||
| SEPTEMBER YEAR TO DATE | |||||||||||
| (UNAUDITED) | |||||||||||
| (In millions of dollars) | |||||||||||
| 2022 | 2021 | ||||||||||
| SG&A Expenses: | As Reported | Adjusted | |||||||||
| Professional & Industrial | $ | 204.1 | $ | 207.8 | |||||||
| Science, Engineering & Technology | 161.4 | 131.0 | |||||||||
| Education | 60.4 | 46.5 | |||||||||
| Outsourcing & Consulting | 111.8 | 89.2 | |||||||||
| International | 99.2 | 102.2 | |||||||||
| Corporate | 70.4 | 63.3 | |||||||||
| Intersegment | — | ||||||||||
| Total Company | $ | 707.3 | $ | 640.0 | |||||||
| 2022 | 2021 | ||||||||||||||||||||||||||||||||||
| Earnings (loss) from Operations: | As Reported | Gain on sale of assets(3) | Loss on disposal(4) | Goodwill impairment charge(5) | Adjusted | Adjusted | |||||||||||||||||||||||||||||
| Professional & Industrial | $ | 27.1 | $ | — | $ | — | $ | — | $ | 27.1 | $ | 19.9 | |||||||||||||||||||||||
| Science, Engineering & Technology | 63.9 | — | — | — | 63.9 | 56.8 | |||||||||||||||||||||||||||||
| Education | 8.8 | — | — | — | 8.8 | (2.5) | |||||||||||||||||||||||||||||
| Outsourcing & Consulting | (14.9) | — | — | 30.7 | 15.8 | 14.2 | |||||||||||||||||||||||||||||
| International | 9.1 | — | — | — | 9.1 | 8.1 | |||||||||||||||||||||||||||||
| Corporate | (70.4) | — | — | — | (70.4) | (63.3) | |||||||||||||||||||||||||||||
| Loss on disposal | (18.7) | — | 18.7 | — | — | — | |||||||||||||||||||||||||||||
| Gain on sale of assets | 5.3 | (5.3) | — | — | — | — | |||||||||||||||||||||||||||||
| Total Company | $ | 10.2 | $ | (5.3) | $ | 18.7 | $ | 30.7 | $ | 54.3 | $ | 33.2 | |||||||||||||||||||||||
| KELLY SERVICES, INC. AND SUBSIDIARIES | |||||||||||||||||
| RECONCILIATION OF NON-GAAP MEASURES | |||||||||||||||||
| SEPTEMBER YEAR TO DATE | |||||||||||||||||
| (UNAUDITED) | |||||||||||||||||
| (In millions of dollars) | |||||||||||||||||
| 2021 | |||||||||||||||||
| SG&A Expenses: | As Reported | Restructuring(6) | Adjusted | ||||||||||||||
| Professional & Industrial | $ | 207.8 | $ | — | $ | 207.8 | |||||||||||
| Science, Engineering & Technology | 131.0 | — | 131.0 | ||||||||||||||
| Education | 46.5 | — | 46.5 | ||||||||||||||
| Outsourcing & Consulting | 89.2 | — | 89.2 | ||||||||||||||
| International | 102.2 | — | 102.2 | ||||||||||||||
| Corporate | 63.2 | 0.1 | 63.3 | ||||||||||||||
| Total Company | $ | 639.9 | $ | 0.1 | $ | 640.0 | |||||||||||
| 2021 | |||||||||||||||||
| Earnings (loss) from Operations: | As Reported | Restructuring(6) | Adjusted | ||||||||||||||
| Professional & Industrial | $ | 19.9 | $ | — | $ | 19.9 | |||||||||||
| Science, Engineering & Technology | 56.8 | — | 56.8 | ||||||||||||||
| Education | (2.5) | — | (2.5) | ||||||||||||||
| Outsourcing & Consulting | 14.2 | — | 14.2 | ||||||||||||||
| International | 8.1 | — | 8.1 | ||||||||||||||
| Corporate | (63.2) | (0.1) | (63.3) | ||||||||||||||
| Total Company | $ | 33.3 | $ | (0.1) | $ | 33.2 | |||||||||||
| KELLY SERVICES, INC. AND SUBSIDIARIES | ||||||||||||||||||||||||||
| RECONCILIATION OF NON-GAAP MEASURES | ||||||||||||||||||||||||||
| (UNAUDITED) | ||||||||||||||||||||||||||
| (In millions of dollars except per share data) | ||||||||||||||||||||||||||
| Third Quarter | September Year to Date | |||||||||||||||||||||||||
| 2022 | 2021 | 2022 | 2021 | |||||||||||||||||||||||
| Income tax expense (benefit) | $ | (5.0) | $ | 11.1 | $ | (13.1) | $ | 19.0 | ||||||||||||||||||
Taxes on investment in Persol Holdings(1) | — | (10.9) | 18.4 | (22.0) | ||||||||||||||||||||||
Taxes on foreign currency matters(2) | — | — | (1.5) | — | ||||||||||||||||||||||
Taxes on gain on sale of assets(3) | — | — | (1.3) | — | ||||||||||||||||||||||
Taxes on loss on disposal(4) | — | — | — | — | ||||||||||||||||||||||
Taxes on goodwill impairment charge(5) | 5.3 | — | 5.3 | — | ||||||||||||||||||||||
Taxes on restructuring charges(6) | — | — | — | — | ||||||||||||||||||||||
| Adjusted income tax expense (benefit) | $ | 0.3 | $ | 0.2 | $ | 7.8 | $ | (3.0) | ||||||||||||||||||
| Third Quarter | September Year to Date | |||||||||||||||||||||||||
| 2022 | 2021 | 2022 | 2021 | |||||||||||||||||||||||
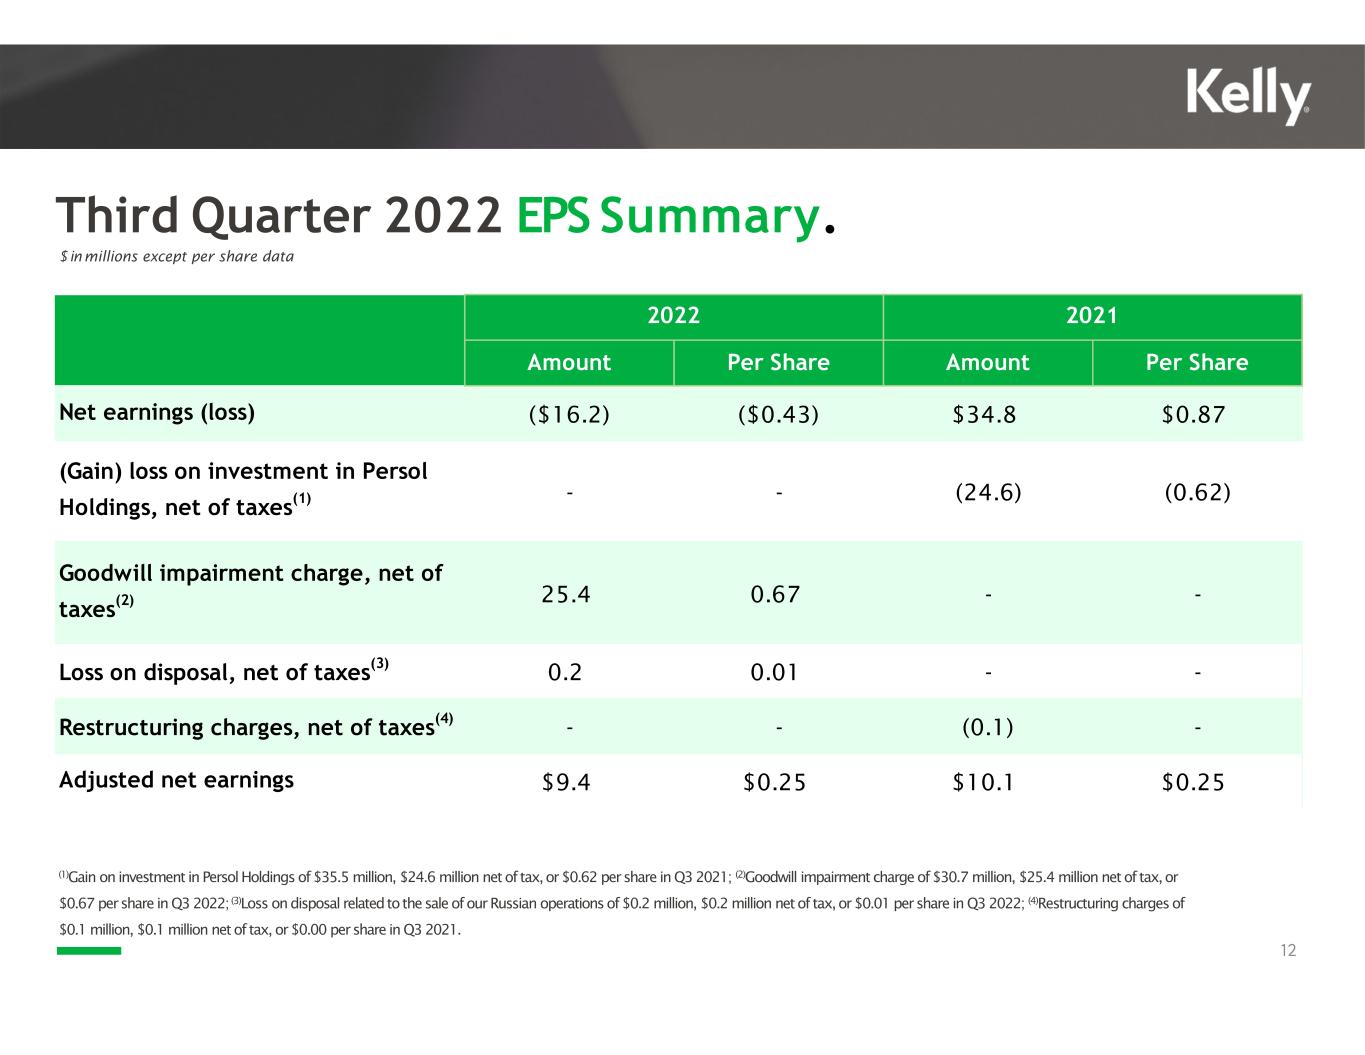
| Net earnings (loss) | $ | (16.2) | $ | 34.8 | $ | (61.6) | $ | 84.4 | ||||||||||||||||||
(Gain) loss on investment in Persol Holdings, net of taxes(1) | — | (24.6) | 48.8 | (49.8) | ||||||||||||||||||||||
Loss on foreign currency matters, net of taxes(2) | — | — | 16.4 | — | ||||||||||||||||||||||
Gain on sale of assets, net of taxes(3) | — | — | (4.0) | — | ||||||||||||||||||||||
Loss on disposal, net of taxes(4) | 0.2 | — | 18.7 | — | ||||||||||||||||||||||
Goodwill impairment charge, net of taxes(5) | 25.4 | — | 25.4 | — | ||||||||||||||||||||||
Restructuring charges, net of taxes(6) | — | (0.1) | — | (0.1) | ||||||||||||||||||||||
| Adjusted net earnings | $ | 9.4 | $ | 10.1 | $ | 43.7 | $ | 34.5 | ||||||||||||||||||
| Third Quarter | September Year to Date | |||||||||||||||||||||||||
| 2022 | 2021 | 2022 | 2021 | |||||||||||||||||||||||
| Per Share | Per Share | |||||||||||||||||||||||||
| Net earnings (loss) | $ | (0.43) | $ | 0.87 | $ | (1.62) | $ | 2.12 | ||||||||||||||||||
(Gain) loss on investment in Persol Holdings, net of taxes(1) | — | (0.62) | 1.28 | (1.25) | ||||||||||||||||||||||
Loss on foreign currency matters, net of taxes(2) | — | — | 0.43 | — | ||||||||||||||||||||||
Gain on sale of assets, net of taxes(3) | — | — | (0.10) | — | ||||||||||||||||||||||
Loss on disposal, net of taxes(4) | 0.01 | — | 0.49 | — | ||||||||||||||||||||||
Goodwill impairment charge, net of taxes(5) | 0.67 | — | 0.67 | — | ||||||||||||||||||||||
Restructuring charges, net of taxes(6) | — | — | — | — | ||||||||||||||||||||||
| Adjusted net earnings | $ | 0.25 | $ | 0.25 | $ | 1.15 | $ | 0.86 | ||||||||||||||||||
| KELLY SERVICES, INC. AND SUBSIDIARIES | |||||||||||||||||||||||
| RECONCILIATION OF NON-GAAP MEASURES | |||||||||||||||||||||||
| (UNAUDITED) | |||||||||||||||||||||||
| (In millions of dollars) | |||||||||||||||||||||||
| Third Quarter | September Year to Date | ||||||||||||||||||||||
| 2022 | 2021 | 2022 | 2021 | ||||||||||||||||||||
| Net earnings (loss) | $ | (16.2) | $ | 34.8 | $ | (61.6) | $ | 84.4 | |||||||||||||||
Other (income) expense, net(2) | (0.2) | 0.3 | (1.9) | 4.0 | |||||||||||||||||||
| Income tax expense (benefit) | (5.0) | 11.1 | (13.1) | 19.0 | |||||||||||||||||||
| Depreciation and amortization | 9.6 | 8.4 | 27.2 | 23.2 | |||||||||||||||||||
| EBITDA | (11.8) | 54.6 | (49.4) | 130.6 | |||||||||||||||||||
| Equity in net (earnings) loss of affiliate | — | (1.7) | (0.8) | (2.3) | |||||||||||||||||||
(Gain) loss on investment in Persol Holdings(1) | — | (35.5) | 67.2 | (71.8) | |||||||||||||||||||
Loss on foreign currency matters(2) | — | — | 20.4 | — | |||||||||||||||||||
Gain on sale of assets(3) | — | — | (5.3) | — | |||||||||||||||||||
Loss on disposal(4) | 0.2 | — | 18.7 | — | |||||||||||||||||||
Goodwill impairment charge(5) | 30.7 | — | 30.7 | — | |||||||||||||||||||
Restructuring(6) | — | (0.1) | — | (0.1) | |||||||||||||||||||
| Adjusted EBITDA | $ | 19.1 | $ | 17.3 | $ | 81.5 | $ | 56.4 | |||||||||||||||
| Adjusted EBITDA margin | 1.6 | % | 1.4 | % | 2.2 | % | 1.5 | % | |||||||||||||||


