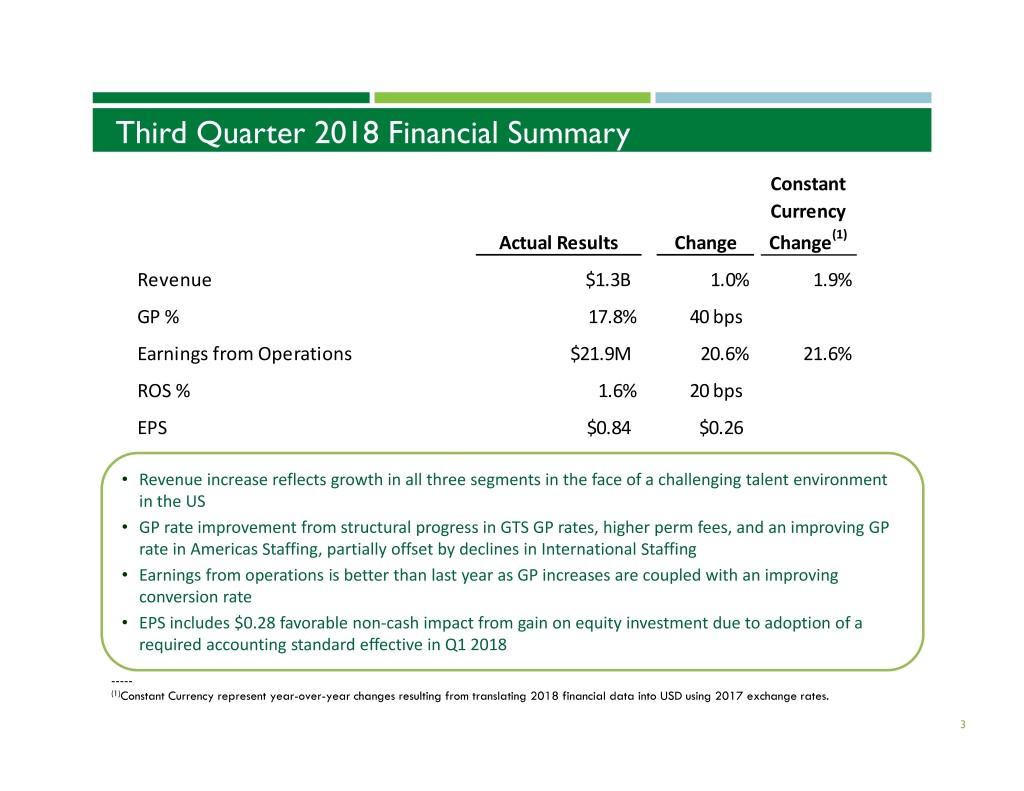
• | Q3 revenue up 1.0%; up 1.9% in constant currency |
• | Q3 operating earnings up 21% from last year |
• | Q3 earnings per share of $0.84, or $0.56 on an adjusted basis, compared to $0.58 last year |
U.S. | 1 800 288-9626 |
International | 1 651 291-5254 |
KELLY SERVICES, INC. AND SUBSIDIARIES | ||||||||||||||||
CONSOLIDATED STATEMENTS OF EARNINGS | ||||||||||||||||
FOR THE 13 WEEKS ENDED SEPTEMBER 30, 2018 AND OCTOBER 1, 2017 | ||||||||||||||||
(UNAUDITED) | ||||||||||||||||
(In millions of dollars except per share data) | ||||||||||||||||
% | CC % | |||||||||||||||
2018 | 2017 | Change | Change | Change | ||||||||||||
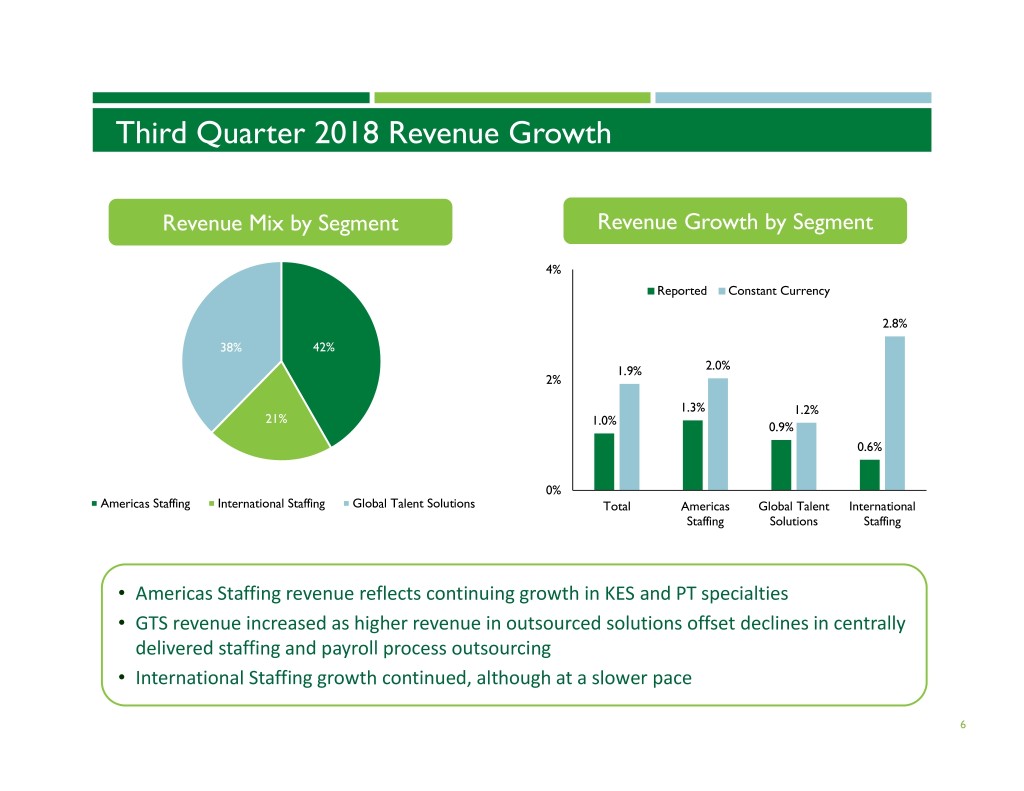
Revenue from services | $ | 1,342.4 | $ | 1,328.8 | $ | 13.6 | 1.0 | % | 1.9 | % | ||||||
Cost of services | 1,103.3 | 1,098.1 | 5.2 | 0.5 | ||||||||||||
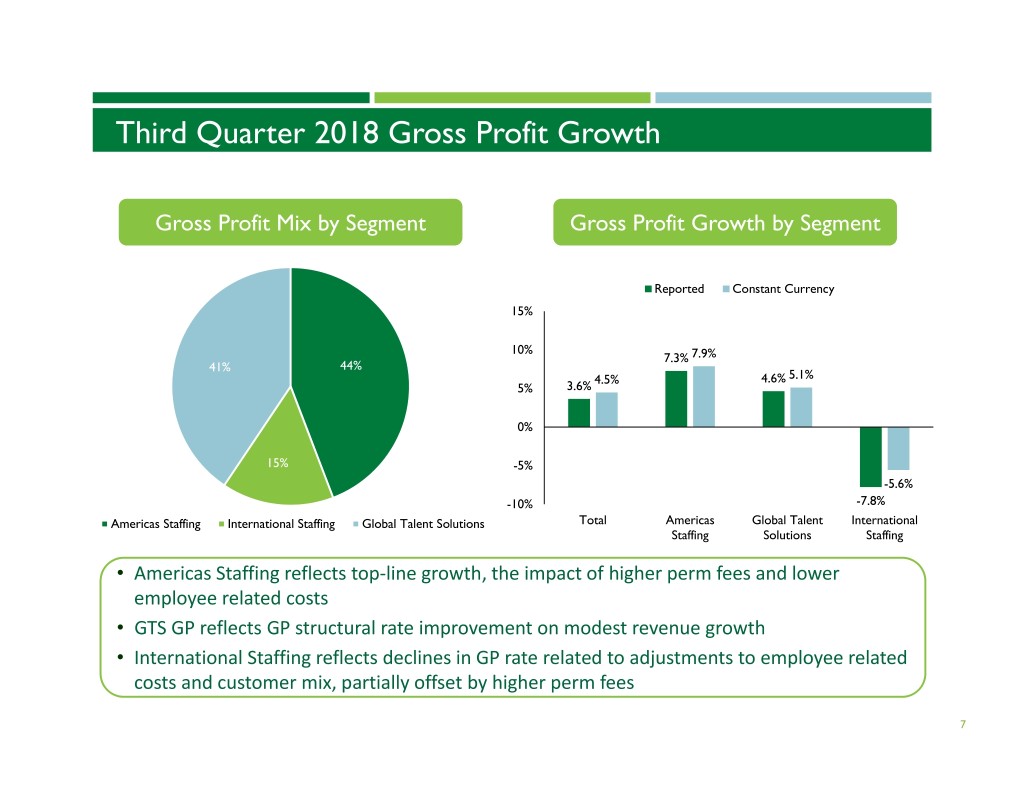
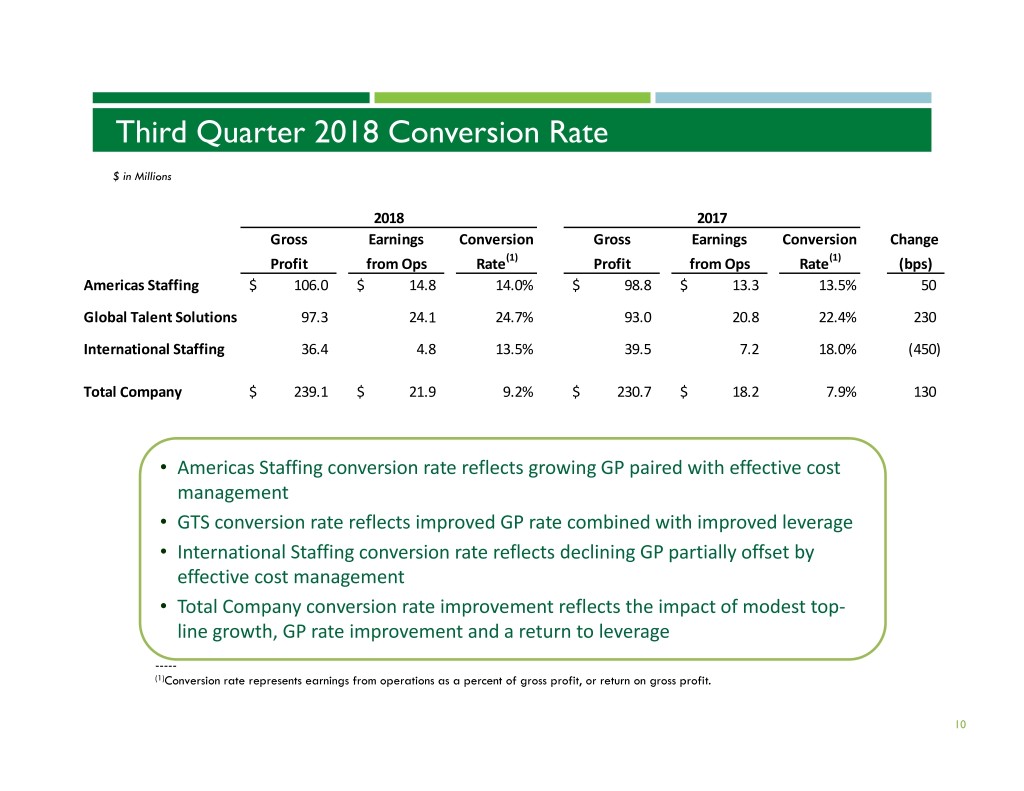
Gross profit | 239.1 | 230.7 | 8.4 | 3.6 | 4.5 | |||||||||||
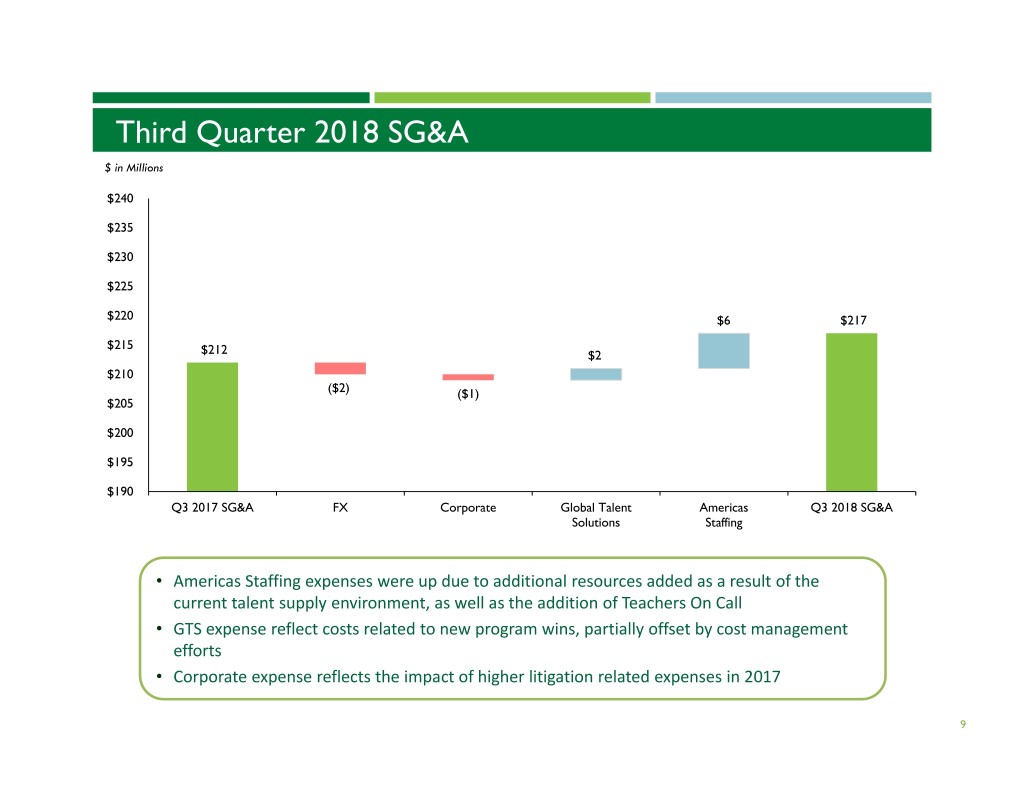
Selling, general and administrative expenses | 217.2 | 212.5 | 4.7 | 2.2 | 3.0 | |||||||||||
Earnings from operations | 21.9 | 18.2 | 3.7 | 20.6 | ||||||||||||
Gain on investment in Persol Holdings | 15.8 | — | 15.8 | 100.0 | ||||||||||||
Other expense, net | (0.7 | ) | (0.4 | ) | (0.3 | ) | (74.3 | ) | ||||||||
Earnings before taxes and equity in net earnings (loss) of affiliate | 37.0 | 17.8 | 19.2 | 108.2 | ||||||||||||
Income tax expense (benefit) | 5.9 | (4.1 | ) | 10.0 | 246.4 | |||||||||||
Net earnings before equity in net earnings (loss) of affiliate | 31.1 | 21.9 | 9.2 | 42.0 | ||||||||||||
Equity in net earnings (loss) of affiliate | 2.0 | 1.1 | 0.9 | 80.5 | ||||||||||||
Net earnings | $ | 33.1 | $ | 23.0 | $ | 10.1 | 43.9 | % | ||||||||
Basic earnings per share | $ | 0.84 | $ | 0.59 | $ | 0.25 | 42.4 | % | ||||||||
Diluted earnings per share | $ | 0.84 | $ | 0.58 | $ | 0.26 | 44.8 | % | ||||||||
STATISTICS: | ||||||||||||||||
Permanent placement income (included in revenue from services) | $ | 18.4 | $ | 14.2 | $ | 4.2 | 30.2 | % | 32.4 | % | ||||||
Gross profit rate | 17.8 | % | 17.4 | % | 0.4 | pts. | ||||||||||
Conversion rate | 9.2 | 7.9 | 1.3 | |||||||||||||
% Return: | ||||||||||||||||
Earnings from operations | 1.6 | 1.4 | 0.2 | |||||||||||||
Net earnings | 2.5 | 1.7 | 0.8 | |||||||||||||
Effective income tax rate | 16.1 | % | (22.9 | ) | % | 39.0 | pts. | |||||||||
Average number of shares outstanding (millions): | ||||||||||||||||
Basic | 38.8 | 38.3 | ||||||||||||||
Diluted | 38.9 | 38.8 | ||||||||||||||
KELLY SERVICES, INC. AND SUBSIDIARIES | ||||||||||||||||
CONSOLIDATED STATEMENTS OF EARNINGS | ||||||||||||||||
FOR THE 39 WEEKS ENDED SEPTEMBER 30, 2018 AND OCTOBER 1, 2017 | ||||||||||||||||
(UNAUDITED) | ||||||||||||||||
(In millions of dollars except per share data) | ||||||||||||||||
% | CC % | |||||||||||||||
2018 | 2017 | Change | Change | Change | ||||||||||||
Revenue from services | $ | 4,099.2 | $ | 3,952.1 | $ | 147.1 | 3.7 | % | 2.8 | % | ||||||
Cost of services | 3,381.4 | 3,261.0 | 120.4 | 3.7 | ||||||||||||
Gross profit | 717.8 | 691.1 | 26.7 | 3.9 | 3.1 | |||||||||||
Selling, general and administrative expenses | 663.5 | 636.2 | 27.3 | 4.3 | 3.6 | |||||||||||
Earnings from operations | 54.3 | 54.9 | (0.6 | ) | (1.0 | ) | ||||||||||
Loss on investment in Persol Holdings | (13.0 | ) | — | (13.0 | ) | (100.0 | ) | |||||||||
Other expense, net | (1.8 | ) | (2.5 | ) | 0.7 | 29.3 | ||||||||||
Earnings before taxes and equity in net earnings (loss) of affiliate | 39.5 | 52.4 | (12.9 | ) | (24.4 | ) | ||||||||||
Income tax (benefit) expense | (3.3 | ) | 0.1 | (3.4 | ) | NM | ||||||||||
Net earnings before equity in net earnings (loss) of affiliate | 42.8 | 52.3 | (9.5 | ) | (18.0 | ) | ||||||||||
Equity in net earnings (loss) of affiliate | 4.0 | 1.6 | 2.4 | 143.5 | ||||||||||||
Net earnings | $ | 46.8 | $ | 53.9 | $ | (7.1 | ) | (13.0 | ) | % | ||||||
Basic earnings per share | $ | 1.20 | $ | 1.38 | $ | (0.18 | ) | (13.0 | ) | % | ||||||
Diluted earnings per share | $ | 1.19 | $ | 1.37 | $ | (0.18 | ) | (13.1 | ) | % | ||||||
STATISTICS: | ||||||||||||||||
Permanent placement income (included in revenue from services) | $ | 52.3 | $ | 41.4 | $ | 10.9 | 26.4 | % | 24.6 | % | ||||||
Gross profit rate | 17.5 | % | 17.5 | % | — | pts. | ||||||||||
Conversion rate | 7.6 | 7.9 | (0.3 | ) | ||||||||||||
% Return: | ||||||||||||||||
Earnings from operations | 1.3 | 1.4 | (0.1 | ) | ||||||||||||
Net earnings | 1.1 | 1.4 | (0.3 | ) | ||||||||||||
Effective income tax rate | (8.2 | ) | % | 0.2 | % | (8.4 | ) | pts. | ||||||||
Average number of shares outstanding (millions): | ||||||||||||||||
Basic | 38.7 | 38.3 | ||||||||||||||
Diluted | 38.8 | 38.8 | ||||||||||||||
KELLY SERVICES, INC. AND SUBSIDIARIES | ||||||||||||||
RESULTS OF OPERATIONS BY SEGMENT | ||||||||||||||
(UNAUDITED) | ||||||||||||||
(In millions of dollars) | ||||||||||||||
Third Quarter | ||||||||||||||
% | CC % | |||||||||||||
2018 | 2017 | Change | Change | |||||||||||
AMERICAS STAFFING | ||||||||||||||
Revenue from services | $ | 561.8 | $ | 554.8 | 1.3 | % | 2.0 | % | ||||||
Gross profit | 106.0 | 98.8 | 7.3 | 7.9 | ||||||||||
Total SG&A expenses | 91.2 | 85.5 | 6.6 | 7.3 | ||||||||||
Earnings from operations | 14.8 | 13.3 | 11.3 | |||||||||||
Gross profit rate | 18.9 | % | 17.8 | % | 1.1 | pts. | ||||||||
Conversion rate | 14.0 | 13.5 | 0.5 | |||||||||||
Return on sales | 2.6 | 2.4 | 0.2 | |||||||||||
GLOBAL TALENT SOLUTIONS | ||||||||||||||
Revenue from services | $ | 507.6 | $ | 503.0 | 0.9 | % | 1.2 | % | ||||||
Gross profit | 97.3 | 93.0 | 4.6 | 5.1 | ||||||||||
Total SG&A expenses | 73.2 | 72.2 | 1.5 | 1.9 | ||||||||||
Earnings from operations | 24.1 | 20.8 | 15.7 | |||||||||||
Gross profit rate | 19.2 | % | 18.5 | % | 0.7 | pts. | ||||||||
Conversion rate | 24.7 | 22.4 | 2.3 | |||||||||||
Return on sales | 4.7 | 4.1 | 0.6 | |||||||||||
INTERNATIONAL STAFFING | ||||||||||||||
Revenue from services | $ | 277.2 | $ | 275.6 | 0.6 | % | 2.8 | % | ||||||
Gross profit | 36.4 | 39.5 | (7.8 | ) | (5.6 | ) | ||||||||
Total SG&A expenses | 31.6 | 32.3 | (2.7 | ) | (0.3 | ) | ||||||||
Earnings from operations | 4.8 | 7.2 | (31.1 | ) | ||||||||||
Gross profit rate | 13.2 | % | 14.3 | % | (1.1 | ) | pts. | |||||||
Conversion rate | 13.5 | 18.0 | (4.5 | ) | ||||||||||
Return on sales | 1.8 | 2.6 | (0.8 | ) | ||||||||||
KELLY SERVICES, INC. AND SUBSIDIARIES | ||||||||||||||
RESULTS OF OPERATIONS BY SEGMENT | ||||||||||||||
(UNAUDITED) | ||||||||||||||
(In millions of dollars) | ||||||||||||||
September Year to Date | ||||||||||||||
% | CC % | |||||||||||||
2018 | 2017 | Change | Change | |||||||||||
AMERICAS STAFFING | ||||||||||||||
Revenue from services | $ | 1,770.1 | $ | 1,703.5 | 3.9 | % | 4.1 | % | ||||||
Gross profit | 322.5 | 307.9 | 4.7 | 4.9 | ||||||||||
SG&A expenses excluding restructuring charges | 273.8 | 252.6 | 8.4 | 8.6 | ||||||||||
Restructuring charges | — | 0.4 | (100.0 | ) | (100.0 | ) | ||||||||
Total SG&A expenses | 273.8 | 253.0 | 8.2 | 8.4 | ||||||||||
Earnings from operations | 48.7 | 54.9 | (11.4 | ) | ||||||||||
Earnings from operations excluding restructuring charges | 48.7 | 55.3 | (12.0 | ) | ||||||||||
Gross profit rate | 18.2 | % | 18.1 | % | 0.1 | pts. | ||||||||
Conversion rate | 15.1 | 17.8 | (2.7 | ) | ||||||||||
Conversion rate excluding restructuring charges | 15.1 | 18.0 | (2.9 | ) | ||||||||||
Return on sales | 2.8 | 3.2 | (0.4 | ) | ||||||||||
Return on sales excluding restructuring charges | 2.8 | 3.2 | (0.4 | ) | ||||||||||
GLOBAL TALENT SOLUTIONS | ||||||||||||||
Revenue from services | $ | 1,494.1 | $ | 1,495.8 | (0.1 | ) | % | (0.3 | ) | % | ||||
Gross profit | 281.8 | 272.2 | 3.6 | 3.2 | ||||||||||
SG&A expenses excluding restructuring charges | 224.0 | 218.8 | 2.4 | 2.0 | ||||||||||
Restructuring charges | — | 2.0 | (100.0 | ) | (100.0 | ) | ||||||||
Total SG&A expenses | 224.0 | 220.8 | 1.5 | 1.0 | ||||||||||
Earnings from operations | 57.8 | 51.4 | 12.5 | |||||||||||
Earnings from operations excluding restructuring charges | 57.8 | 53.4 | 8.3 | |||||||||||
Gross profit rate | 18.9 | % | 18.2 | % | 0.7 | pts. | ||||||||
Conversion rate | 20.5 | 18.9 | 1.6 | |||||||||||
Conversion rate excluding restructuring charges | 20.5 | 19.6 | 0.9 | |||||||||||
Return on sales | 3.9 | 3.4 | 0.5 | |||||||||||
Return on sales excluding restructuring charges | 3.9 | 3.6 | 0.3 | |||||||||||
INTERNATIONAL STAFFING | ||||||||||||||
Revenue from services | $ | 848.5 | $ | 766.0 | 10.8 | % | 5.9 | % | ||||||
Gross profit | 115.4 | 112.7 | 2.3 | (2.1 | ) | |||||||||
Total SG&A expenses | 99.2 | 96.2 | 3.0 | (1.0 | ) | |||||||||
Earnings from operations | 16.2 | 16.5 | (1.4 | ) | ||||||||||
Gross profit rate | 13.6 | % | 14.7 | % | (1.1 | ) | pts. | |||||||
Conversion rate | 14.1 | 14.6 | (0.5 | ) | ||||||||||
Return on sales | 1.9 | 2.2 | (0.3 | ) | ||||||||||
KELLY SERVICES, INC. AND SUBSIDIARIES | ||||||||||
CONSOLIDATED BALANCE SHEETS | ||||||||||
(UNAUDITED) | ||||||||||
(In millions of dollars) | ||||||||||
September 30, 2018 | Dec. 31, 2017 | October 1, 2017 | ||||||||
Current Assets | ||||||||||
Cash and equivalents | $ | 20.8 | $ | 32.5 | $ | 22.2 | ||||
Trade accounts receivable, less allowances of | ||||||||||
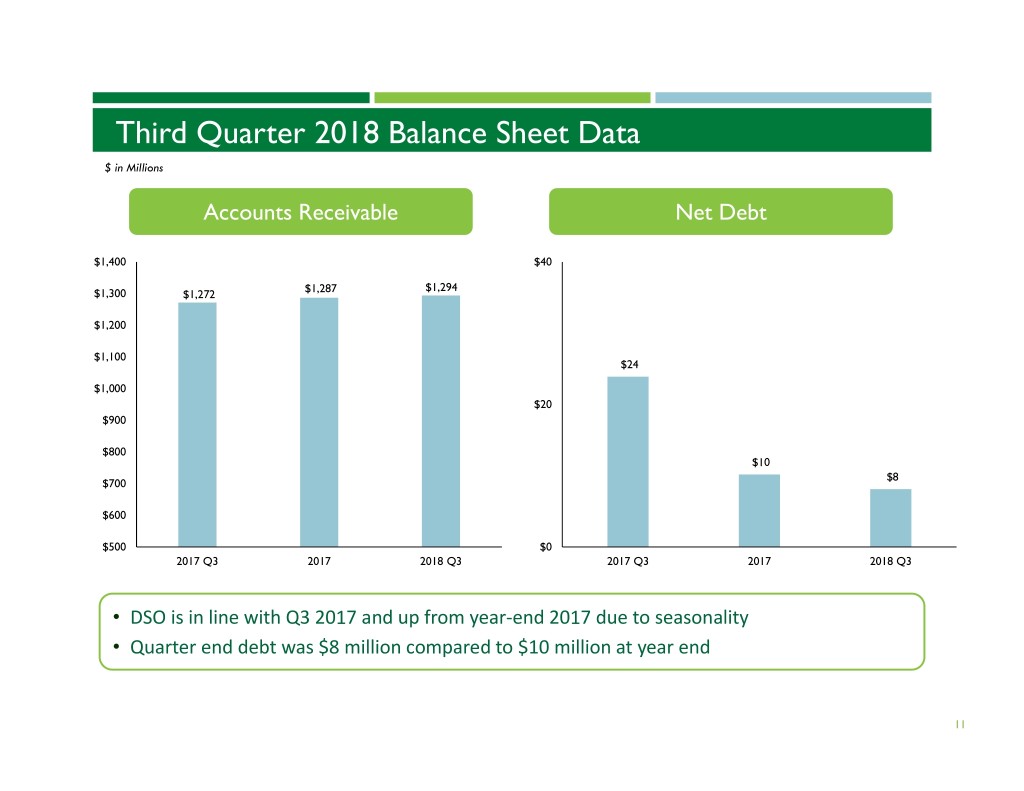
$12.4, $12.9, and $13.1 respectively | 1,294.0 | 1,286.7 | 1,271.7 | |||||||
Prepaid expenses and other current assets | 68.0 | 65.1 | 70.0 | |||||||
Total current assets | 1,382.8 | 1,384.3 | 1,363.9 | |||||||
Noncurrent Assets | ||||||||||
Property and equipment, net | 85.0 | 86.1 | 81.4 | |||||||
Deferred taxes | 196.5 | 183.4 | 192.0 | |||||||
Goodwill | 107.3 | 107.1 | 107.1 | |||||||
Investment in Persol Holdings | 213.6 | 228.1 | 212.4 | |||||||
Investment in equity affiliate | 120.3 | 117.4 | 116.4 | |||||||
Other assets | 287.6 | 271.8 | 263.5 | |||||||
Total noncurrent assets | 1,010.3 | 993.9 | 972.8 | |||||||
Total Assets | $ | 2,393.1 | $ | 2,378.2 | $ | 2,336.7 | ||||
Current Liabilities | ||||||||||
Short-term borrowings | $ | 8.1 | $ | 10.2 | $ | 23.9 | ||||
Accounts payable and accrued liabilities | 497.0 | 537.7 | 496.1 | |||||||
Accrued payroll and related taxes | 304.7 | 287.4 | 312.6 | |||||||
Accrued insurance | 25.9 | 25.7 | 25.6 | |||||||
Income and other taxes | 66.5 | 65.2 | 60.0 | |||||||
Total current liabilities | 902.2 | 926.2 | 918.2 | |||||||
Noncurrent Liabilities | ||||||||||
Accrued insurance | 50.2 | 49.9 | 49.7 | |||||||
Accrued retirement benefits | 186.9 | 178.1 | 175.0 | |||||||
Other long-term liabilities | 68.0 | 72.5 | 66.8 | |||||||
Total noncurrent liabilities | 305.1 | 300.5 | 291.5 | |||||||
Stockholders' Equity | ||||||||||
Common stock | 40.1 | 40.1 | 40.1 | |||||||
Treasury stock | (27.3 | ) | (35.2 | ) | (35.2 | ) | ||||
Paid-in capital | 25.0 | 32.2 | 30.0 | |||||||
Earnings invested in the business | 1,165.0 | 983.6 | 968.8 | |||||||
Accumulated other comprehensive income | (17.0 | ) | 130.8 | 123.3 | ||||||
Total stockholders' equity | 1,185.8 | 1,151.5 | 1,127.0 | |||||||
Total Liabilities and Stockholders' Equity | $ | 2,393.1 | $ | 2,378.2 | $ | 2,336.7 | ||||
STATISTICS: | ||||||||||
Working Capital | $ | 480.6 | $ | 458.1 | $ | 445.7 | ||||
Current Ratio | 1.5 | 1.5 | 1.5 | |||||||
Debt-to-capital % | 0.7 | % | 0.9 | % | 2.1 | % | ||||
Global Days Sales Outstanding | 58 | 55 | 58 | |||||||
Year-to-Date Free Cash Flow | $ | 15.4 | $ | 46.2 | $ | 18.3 | ||||
KELLY SERVICES, INC. AND SUBSIDIARIES | ||||||
CONSOLIDATED STATEMENTS OF CASH FLOWS | ||||||
FOR THE 39 WEEKS ENDED SEPTEMBER 30, 2018 AND OCTOBER 1, 2017 | ||||||
(UNAUDITED) | ||||||
(In millions of dollars) | ||||||
2018 | 2017 | |||||
Cash flows from operating activities: | ||||||
Net earnings | $ | 46.8 | $ | 53.9 | ||
Noncash adjustments: | ||||||
Depreciation and amortization | 19.5 | 16.5 | ||||
Provision for bad debts | 1.3 | 3.6 | ||||
Stock-based compensation | 6.7 | 6.8 | ||||
Loss on investment in Persol Holdings | 13.0 | — | ||||
Other, net | (5.0 | ) | (2.3 | ) | ||
Changes in operating assets and liabilities, net of acquisition | (49.0 | ) | (45.5 | ) | ||
Net cash from operating activities | 33.3 | 33.0 | ||||
Cash flows from investing activities: | ||||||
Capital expenditures | (17.9 | ) | (14.7 | ) | ||
Acquisition of company, net of cash received | — | (37.2 | ) | |||
Investment in equity securities | (5.0 | ) | — | |||
(Loan to) proceeds from repayment of loan to equity affiliate | (2.9 | ) | 0.6 | |||
Other investing activities | (0.8 | ) | — | |||
Net cash used in investing activities | (26.6 | ) | (51.3 | ) | ||
Cash flows from financing activities: | ||||||
Net change in short-term borrowings | (1.9 | ) | 23.9 | |||
Dividend payments | (8.8 | ) | (8.7 | ) | ||
Payments of tax withholding for stock awards | (6.3 | ) | (1.7 | ) | ||
Other financing activities | — | (0.1 | ) | |||
Net cash (used in) from financing activities | (17.0 | ) | 13.4 | |||
Effect of exchange rates on cash, cash equivalents and restricted cash | (0.7 | ) | (2.3 | ) | ||
Net change in cash, cash equivalents and restricted cash | (11.0 | ) | (7.2 | ) | ||
Cash, cash equivalents and restricted cash at beginning of period | 36.9 | 34.3 | ||||
Cash, cash equivalents and restricted cash at end of period | $ | 25.9 | $ | 27.1 | ||
KELLY SERVICES, INC. AND SUBSIDIARIES | |||||||||||||
REVENUE FROM SERVICES | |||||||||||||
(UNAUDITED) | |||||||||||||
(In millions of dollars) | |||||||||||||
Third Quarter (Americas, International and GTS) | |||||||||||||
% | CC % | ||||||||||||
2018 | 2017 | Change | Change | ||||||||||
Americas | |||||||||||||
United States | $ | 942.5 | $ | 941.1 | 0.1 | % | 0.1 | % | |||||
Canada | 37.0 | 37.1 | (0.2 | ) | 4.0 | ||||||||
Mexico | 32.3 | 32.9 | (1.9 | ) | 4.3 | ||||||||
Puerto Rico | 28.2 | 15.9 | 77.0 | 77.0 | |||||||||
Brazil | 8.1 | 12.3 | (33.9 | ) | (20.8 | ) | |||||||
Total Americas | 1,048.1 | 1,039.3 | 0.8 | 1.3 | |||||||||
EMEA | |||||||||||||
France | 68.8 | 73.0 | (5.6 | ) | (4.7 | ) | |||||||
Switzerland | 53.8 | 59.1 | (9.0 | ) | (7.0 | ) | |||||||
Portugal | 48.2 | 46.0 | 4.5 | 5.5 | |||||||||
United Kingdom | 28.1 | 23.3 | 20.4 | 20.9 | |||||||||
Russia | 24.0 | 22.5 | 7.0 | 19.3 | |||||||||
Italy | 18.3 | 15.9 | 15.3 | 16.5 | |||||||||
Germany | 13.8 | 15.5 | (10.3 | ) | (9.4 | ) | |||||||
Ireland | 11.3 | 8.3 | 36.7 | 38.2 | |||||||||
Norway | 8.8 | 8.9 | (1.7 | ) | 1.8 | ||||||||
Other | 13.0 | 12.1 | 7.0 | 9.3 | |||||||||
Total EMEA | 288.1 | 284.6 | 1.3 | 3.5 | |||||||||
Total APAC | 6.2 | 4.9 | 28.9 | 37.5 | |||||||||
Total Kelly Services, Inc. | $ | 1,342.4 | $ | 1,328.8 | 1.0 | % | 1.9 | % | |||||
KELLY SERVICES, INC. AND SUBSIDIARIES | |||||||||||||
REVENUE FROM SERVICES | |||||||||||||
(UNAUDITED) | |||||||||||||
(In millions of dollars) | |||||||||||||
September Year to Date (Americas, International and GTS) | |||||||||||||
% | CC % | ||||||||||||
2018 | 2017 | Change | Change | ||||||||||
Americas | |||||||||||||
United States | $ | 2,898.4 | $ | 2,866.8 | 1.1 | % | 1.1 | % | |||||
Canada | 107.6 | 105.8 | 1.7 | 0.3 | |||||||||
Mexico | 92.7 | 85.0 | 9.1 | 10.5 | |||||||||
Puerto Rico | 74.2 | 51.2 | 45.0 | 45.0 | |||||||||
Brazil | 26.6 | 38.3 | (30.6 | ) | (23.9 | ) | |||||||
Total Americas | 3,199.5 | 3,147.1 | 1.7 | 1.7 | |||||||||
EMEA | |||||||||||||
France | 212.7 | 202.1 | 5.3 | (1.8 | ) | ||||||||
Switzerland | 156.3 | 161.3 | (3.1 | ) | (4.0 | ) | |||||||
Portugal | 150.5 | 124.0 | 21.3 | 13.1 | |||||||||
United Kingdom | 85.6 | 64.3 | 33.1 | 25.7 | |||||||||
Russia | 75.7 | 69.3 | 9.3 | 15.4 | |||||||||
Italy | 58.1 | 45.3 | 28.4 | 19.8 | |||||||||
Germany | 45.0 | 43.3 | 4.0 | (3.3 | ) | ||||||||
Ireland | 34.3 | 23.4 | 46.4 | 36.8 | |||||||||
Norway | 26.4 | 24.9 | 5.8 | 2.6 | |||||||||
Other | 38.2 | 33.5 | 13.9 | 7.2 | |||||||||
Total EMEA | 882.8 | 791.4 | 11.6 | 6.6 | |||||||||
Total APAC | 16.9 | 13.6 | 24.5 | 25.6 | |||||||||
Total Kelly Services, Inc. | $ | 4,099.2 | $ | 3,952.1 | 3.7 | % | 2.8 | % | |||||
KELLY SERVICES, INC. AND SUBSIDIARIES | ||||||||||||||||
RECONCILIATION OF NON-GAAP MEASURES | ||||||||||||||||
(UNAUDITED) | ||||||||||||||||
(In millions of dollars except per share data) | ||||||||||||||||
Third Quarter | September Year to Date | |||||||||||||||
2018 | 2017 | 2018 | 2017 | |||||||||||||
Earnings from operations | $ | 21.9 | $ | 18.2 | $ | 54.3 | $ | 54.9 | ||||||||
Restructuring charges (Note 1) | — | — | — | 2.4 | ||||||||||||
Adjusted earnings from operations | $ | 21.9 | $ | 18.2 | $ | 54.3 | $ | 57.3 | ||||||||
Third Quarter | September Year to Date | |||||||||||||||
2018 | 2017 | 2018 | 2017 | |||||||||||||
Income tax expense (benefit) | $ | 5.9 | $ | (4.1 | ) | $ | (3.3 | ) | $ | 0.1 | ||||||
Tax (expense) benefit on investment in Persol Holdings (Note 2) | (4.9 | ) | — | 4.0 | — | |||||||||||
Tax expense on restructuring charges (Note 1) | — | — | — | 0.7 | ||||||||||||
Adjusted income tax expense (benefit) | $ | 1.0 | $ | (4.1 | ) | $ | 0.7 | $ | 0.8 | |||||||
Third Quarter | September Year to Date | |||||||||||||||
2018 | 2017 | 2018 | 2017 | |||||||||||||
Net earnings | $ | 33.1 | $ | 23.0 | $ | 46.8 | $ | 53.9 | ||||||||
(Gain) loss on investment in Persol Holdings, net of taxes (Note 2) | (10.9 | ) | — | 9.0 | — | |||||||||||
Restructuring charges, net of taxes (Note 1) | — | — | — | 1.7 | ||||||||||||
Adjusted net earnings | $ | 22.2 | $ | 23.0 | $ | 55.8 | $ | 55.6 | ||||||||
Third Quarter | September Year to Date | |||||||||||||||
2018 | 2017 | 2018 | 2017 | |||||||||||||
Per Share | Per Share | |||||||||||||||
Net earnings | $ | 0.84 | $ | 0.58 | $ | 1.19 | $ | 1.37 | ||||||||
(Gain) loss on investment in Persol Holdings, net of taxes (Note 2) | (0.28 | ) | — | 0.23 | — | |||||||||||
Restructuring charges, net of taxes (Note 1) | — | — | — | 0.04 | ||||||||||||
Adjusted net earnings | $ | 0.56 | $ | 0.58 | $ | 1.42 | $ | 1.41 | ||||||||


