UNITED STATES
SECURITIES AND EXCHANGE COMMISSION
Washington, D.C. 20549
FORM N-CSR
CERTIFIED SHAREHOLDER REPORT
OF
REGISTERED MANAGEMENT INVESTMENT COMPANIES
Investment Company Act file number: 811-01027
| Name of Registrant: | Vanguard World Fund |
| Address of Registrant: | P.O. Box 2600 |
| Valley Forge, PA 19482 |
| Name and address of agent for service: | Anne E. Robinson, Esquire |
| P.O. Box 876 | |
| Valley Forge, PA 19482 |
Registrant’s telephone number, including area code: (610) 669-1000
Date of fiscal year end: August 31
Date of reporting period: September 1, 2020—August 31, 2021
Item 1: Reports to Shareholders

Your Fund’s Performance at a Glance | 1 |
Advisors’ Report | 2 |
About Your Fund’s Expenses | 7 |
Performance Summary | 9 |
Financial Statements | 11 |
Trustees Approve Advisory Arrangement | 29 |
Liquidity Risk Management | 31 |
| • | Vanguard U.S. Growth Fund returned 27.52% for Investor Shares and 27.64% for Admiral Shares for the 12 months ended August 31, 2021. The fund’s benchmark returned 28.53%. |
| • | Stocks finished the fiscal year significantly higher as the global economy rebounded faster than many had expected after the sharp pandemic-induced contraction in the spring of 2020. Countries that were more successful in containing the virus generally fared better economically. Swift and extensive fiscal and monetary support from policymakers has also been key to the rebound. |
| • | Value stocks generally outperformed growth stocks and small-capitalization stocks outperformed mid- and large-cap stocks. The U.S. stock market rebounded more strongly than both developed markets outside the United States and emerging markets. |
| • | Nine of the fund’s 11 sectors produced strong double-digit returns. Compared with the benchmark, industrials, consumer staples, and health care stocks contributed positively to relative performance. Communications services, information technology, and real estate were the fund’s biggest detractors. |
| Average Annual Total Returns Periods Ended August 31, 2021 | |||
| One Year | Three Years | Five Years | |
| Stocks | |||
| Russell 1000 Index (Large-caps) | 32.25% | 18.42% | 18.24% |
| Russell 2000 Index (Small-caps) | 47.08 | 10.75 | 14.38 |
| Russell 3000 Index (Broad U.S. market) | 33.04 | 17.85 | 17.97 |
| FTSE All-World ex US Index (International) | 25.74 | 9.82 | 10.23 |
| Bonds | |||
| Bloomberg U.S. Aggregate Bond Index (Broad taxable market) | -0.08% | 5.43% | 3.11% |
| Bloomberg Municipal Bond Index (Broad tax-exempt market) | 3.40 | 5.09 | 3.30 |
| FTSE Three-Month U.S. Treasury Bill Index | 0.06 | 1.20 | 1.13 |
| CPI | |||
| Consumer Price Index | 5.25% | 2.76% | 2.58% |
| Fund Assets Managed | |||
| Investment Advisor | % | $ Million | Investment Strategy |
| Wellington Management Company LLP | 29 | 15,977 | Employs proprietary fundamental research and a rigorous valuation discipline in an effort to invest in high-quality, large-cap, sustainable-growth companies. The investment approach is based on the belief that stock prices often overreact to short-term trends and that bottom-up, intensive research focused on longer-term fundamentals can be used to identify stocks that will outperform the market over time. |
| Jennison Associates LLC | 28 | 15,377 | Uses a research-driven, fundamental investment approach that relies on in-depth company knowledge gleaned through meetings with management, customers, and suppliers. |
| Baillie Gifford Overseas Ltd. | 27 | 14,724 | Uses an active, bottom-up approach to identify exceptional growth companies and own them for long periods. Such companies have special cultures, address large market opportunities, and enjoy sustainable competitive advantages. This approach is based on the belief that these factors drive long-term returns, and a long investment horizon enables the inherent asymmetry of equity market returns to be captured. |
| Vanguard Quantitative Equity Group | 15 | 8,361 | Employs a quantitative fundamental management approach, using models that assess valuation, market sentiment, earnings quality and growth, and management decisions of companies versus their peers. |
| Cash Investments | 1 | 506 | These short-term reserves are invested by Vanguard in equity index products to simulate investment in stocks. Each advisor may also maintain a modest cash position. |
| • | Based on actual fund return. This section helps you to estimate the actual expenses that you paid over the period. The ”Ending Account Value“ shown is derived from the fund‘s actual return, and the third column shows the dollar amount that would have been paid by an investor who started with $1,000 in the fund. You may use the information here, together with the amount you invested, to estimate the expenses that you paid over the period. |
| • | Based on hypothetical 5% yearly return. This section is intended to help you compare your fund‘s costs with those of other mutual funds. It assumes that the fund had a yearly return of 5% before expenses, but that the expense ratio is unchanged. In this case—because the return used is not the fund’s actual return—the results do not apply to your investment. The example is useful in making comparisons because the Securities and Exchange Commission requires all mutual funds to calculate expenses based on a 5% return. You can assess your fund’s costs by comparing this hypothetical example with the hypothetical examples that appear in shareholder reports of other funds. |
| Six Months Ended August 31, 2021 | |||
| Beginning Account Value 2/28/2021 | Ending Account Value 8/31/2021 | Expenses Paid During Period | |
| Based on Actual Fund Return | |||
| U.S. Growth Fund | |||
| Investor Shares | $1,000.00 | $1,144.70 | $2.05 |
| Admiral™ Shares | 1,000.00 | 1,145.30 | 1.51 |
| Based on Hypothetical 5% Yearly Return | |||
| U.S. Growth Fund | |||
| Investor Shares | $1,000.00 | $1,023.29 | $1.94 |
| Admiral Shares | 1,000.00 | 1,023.79 | 1.43 |

| Average Annual Total Returns Periods Ended August 31, 2021 | |||||
| One Year | Five Years | Ten Years | Final Value of a $10,000 Investment | ||

| U.S. Growth Fund Investor Shares | 27.52% | 26.03% | 20.34% | $63,713 |

| Russell 1000 Growth Index | 28.53 | 24.35 | 19.45 | 59,135 |

| Dow Jones U.S. Total Stock Market Float Adjusted Index | 33.32 | 17.95 | 16.16 | 44,721 |
| One Year | Five Years | Ten Years | Final Value of a $50,000 Investment | ||
| U.S. Growth Fund Admiral Shares | 27.64% | 26.17% | 20.50% | $322,601 | |
| Russell 1000 Growth Index | 28.53 | 24.35 | 19.45 | 295,674 | |
| Dow Jones U.S. Total Stock Market Float Adjusted Index | 33.32 | 17.95 | 16.16 | 223,607 | |
| Communication Services | 15.2% |
| Consumer Discretionary | 20.9 |
| Consumer Staples | 2.3 |
| Energy | 0.1 |
| Financials | 3.3 |
| Health Care | 10.9 |
| Industrials | 3.9 |
| Information Technology | 42.4 |
| Materials | 0.2 |
| Real Estate | 0.8 |
| Utilities | 0.0 |
| Other | 0.0 |
| Futures Contracts | ||||
| ($000) | ||||
| Expiration | Number of Long (Short) Contracts | Notional Amount | Value and Unrealized Appreciation (Depreciation) | |
| Long Futures Contracts | ||||
| E-mini S&P 500 Index | September 2021 | 1,981 | 447,756 | 21,476 |
| E-mini S&P Mid-Cap 400 Index | September 2021 | 262 | 72,102 | 158 |
| 21,634 | ||||
| ($000s, except shares and per-share amounts) | Amount |
| Assets | |
| Investments in Securities, at Value | |
| Unaffiliated Issuers (Cost $27,952,527) | 54,179,770 |
| Affiliated Issuers (Cost $879,362) | 879,534 |
| Total Investments in Securities | 55,059,304 |
| Investment in Vanguard | 1,801 |
| Cash | 3,099 |
| Cash Collateral Pledged—Futures Contracts | 26,285 |
| Receivables for Investment Securities Sold | 38,990 |
| Receivables for Accrued Income | 15,957 |
| Receivables for Capital Shares Issued | 47,237 |
| Total Assets | 55,192,673 |
| Liabilities | |
| Payables for Investment Securities Purchased | 6,202 |
| Collateral for Securities on Loan | 176,686 |
| Payables to Investment Advisor | 20,601 |
| Payables for Capital Shares Redeemed | 40,352 |
| Payables to Vanguard | 3,648 |
| Variation Margin Payable—Futures Contracts | 648 |
| Total Liabilities | 248,137 |
| Net Assets | 54,944,536 |
| At August 31, 2021, net assets consisted of: | |
| Paid-in Capital | 22,913,322 |
| Total Distributable Earnings (Loss) | 32,031,214 |
| Net Assets | 54,944,536 |
| Investor Shares—Net Assets | |
| Applicable to 175,436,785 outstanding $.001 par value shares of beneficial interest (unlimited authorization) | 13,405,380 |
| Net Asset Value Per Share—Investor Shares | $76.41 |
| Admiral Shares—Net Assets | |
| Applicable to 209,766,262 outstanding $.001 par value shares of beneficial interest (unlimited authorization) | 41,539,156 |
| Net Asset Value Per Share—Admiral Shares | $198.03 |
| Year Ended August 31, 2021 | |
| ($000) | |
| Investment Income | |
| Income | |
| Dividends1 | 156,777 |
| Interest2 | 898 |
| Securities Lending—Net | 10,888 |
| Total Income | 168,563 |
| Expenses | |
| Investment Advisory Fees—Note B | |
| Basic Fee | 61,059 |
| Performance Adjustment | 12,424 |
| The Vanguard Group—Note C | |
| Management and Administrative—Investor Shares | 25,694 |
| Management and Administrative—Admiral Shares | 41,932 |
| Marketing and Distribution—Investor Shares | 696 |
| Marketing and Distribution—Admiral Shares | 1,096 |
| Custodian Fees | 196 |
| Auditing Fees | 17 |
| Shareholders’ Reports and Proxy—Investor Shares | 429 |
| Shareholders’ Reports and Proxy—Admiral Shares | 426 |
| Trustees’ Fees and Expenses | 43 |
| Total Expenses | 144,012 |
| Expenses Paid Indirectly | (444) |
| Net Expenses | 143,568 |
| Net Investment Income | 24,995 |
| Realized Net Gain (Loss) | |
| Investment Securities Sold2 | 6,584,719 |
| Futures Contracts | 214,368 |
| Foreign Currencies | (858) |
| Realized Net Gain (Loss) | 6,798,229 |
| Change in Unrealized Appreciation (Depreciation) | |
| Investment Securities2 | 4,785,226 |
| Futures Contracts | (25,791) |
| Foreign Currencies | (9) |
| Change in Unrealized Appreciation (Depreciation) | 4,759,426 |
| Net Increase (Decrease) in Net Assets Resulting from Operations | 11,582,650 |
| 1 | Dividends are net of foreign withholding taxes of $614,000. |
| 2 | Interest income, realized net gain (loss), and change in unrealized appreciation (depreciation) from an affiliated company of the fund were $754,000, $21,000, and ($21,000), respectively. Purchases and sales are for temporary cash investment purposes. |
| Year Ended August 31, | ||
| 2021 ($000) | 2020 ($000) | |
| Increase (Decrease) in Net Assets | ||
| Operations | ||
| Net Investment Income | 24,995 | 90,247 |
| Realized Net Gain (Loss) | 6,798,229 | 1,427,385 |
| Change in Unrealized Appreciation (Depreciation) | 4,759,426 | 13,015,813 |
| Net Increase (Decrease) in Net Assets Resulting from Operations | 11,582,650 | 14,533,445 |
| Distributions | ||
| Investor Shares | (441,153) | (357,080) |
| Admiral Shares | (1,285,189) | (704,493) |
| Total Distributions | (1,726,342) | (1,061,573) |
| Capital Share Transactions | ||
| Investor Shares | (1,442,718) | (747,873) |
| Admiral Shares | 6,260,774 | 1,666,649 |
| Net Increase (Decrease) from Capital Share Transactions | 4,818,056 | 918,776 |
| Total Increase (Decrease) | 14,674,364 | 14,390,648 |
| Net Assets | ||
| Beginning of Period | 40,270,172 | 25,879,524 |
| End of Period | 54,944,536 | 40,270,172 |
| Investor Shares | |||||
| For a Share Outstanding Throughout Each Period | Year Ended August 31, | ||||
| 2021 | 2020 | 2019 | 2018 | 2017 | |
| Net Asset Value, Beginning of Period | $62.28 | $41.02 | $43.31 | $35.62 | $30.32 |
| Investment Operations | |||||
| Net Investment Income (Loss)1 | (.013) | .113 | .176 | .134 | .151 |
| Net Realized and Unrealized Gain (Loss) on Investments | 16.700 | 22.856 | .771 | 9.394 | 5.590 |
| Total from Investment Operations | 16.687 | 22.969 | .947 | 9.528 | 5.741 |
| Distributions | |||||
| Dividends from Net Investment Income | (.019) | (.119) | (.132) | (.146) | (.121) |
| Distributions from Realized Capital Gains | (2.538) | (1.590) | (3.105) | (1.692) | (.320) |
| Total Distributions | (2.557) | (1.709) | (3.237) | (1.838) | (.441) |
| Net Asset Value, End of Period | $76.41 | $62.28 | $41.02 | $43.31 | $35.62 |
| Total Return2 | 27.52% | 58.01% | 3.70% | 27.64% | 19.24% |
| Ratios/Supplemental Data | |||||
| Net Assets, End of Period (Millions) | $13,405 | $12,410 | $8,819 | $4,582 | $4,113 |
| Ratio of Total Expenses to Average Net Assets3 | 0.38% | 0.38% | 0.39% | 0.42% | 0.43% |
| Ratio of Net Investment Income (Loss) to Average Net Assets | (0.02%) | 0.25% | 0.44% | 0.35% | 0.47% |
| Portfolio Turnover Rate | 41% | 38% | 41% | 33% | 27% |
| 1 | Calculated based on average shares outstanding. |
| 2 | Total returns do not include account service fees that may have applied in the periods shown. Fund prospectuses provide information about any applicable account service fees. |
| 3 | Includes performance-based investment advisory fee increases (decreases) of 0.03%, 0.02%, 0.01%, 0.01%, and (0.01%). |
| Admiral Shares | |||||
| For a Share Outstanding Throughout Each Period | Year Ended August 31, | ||||
| 2021 | 2020 | 2019 | 2018 | 2017 | |
| Net Asset Value, Beginning of Period | $161.42 | $106.30 | $112.28 | $92.24 | $78.52 |
| Investment Operations | |||||
| Net Investment Income1 | .138 | .410 | .572 | .476 | .502 |
| Net Realized and Unrealized Gain (Loss) on Investments | 43.277 | 59.231 | 1.963 | 24.323 | 14.480 |
| Total from Investment Operations | 43.415 | 59.641 | 2.535 | 24.799 | 14.982 |
| Distributions | |||||
| Dividends from Net Investment Income | (.224) | (.401) | (.464) | (.375) | (.433) |
| Distributions from Realized Capital Gains | (6.581) | (4.120) | (8.051) | (4.384) | (.829) |
| Total Distributions | (6.805) | (4.521) | (8.515) | (4.759) | (1.262) |
| Net Asset Value, End of Period | $198.03 | $161.42 | $106.30 | $112.28 | $92.24 |
| Total Return2 | 27.64% | 58.17% | 3.80% | 27.78% | 19.42% |
| Ratios/Supplemental Data | |||||
| Net Assets, End of Period (Millions) | $41,539 | $27,860 | $17,060 | $6,249 | $3,791 |
| Ratio of Total Expenses to Average Net Assets3 | 0.28% | 0.28% | 0.28% | 0.30% | 0.30% |
| Ratio of Net Investment Income to Average Net Assets | 0.08% | 0.35% | 0.55% | 0.47% | 0.60% |
| Portfolio Turnover Rate | 41% | 38% | 41% | 33% | 27% |
| 1 | Calculated based on average shares outstanding. |
| 2 | Total returns do not include account service fees that may have applied in the periods shown. Fund prospectuses provide information about any applicable account service fees. |
| 3 | Includes performance-based investment advisory fee increases (decreases) of 0.03%, 0.02%, 0.01%, 0.01%, and (0.01%). |
| A. | The following significant accounting policies conform to generally accepted accounting principles for U.S. investment companies. The fund consistently follows such policies in preparing its financial statements. |
| B. | The investment advisory firms Wellington Management Company llp, Jennison Associates LLC, and Baillie Gifford Overseas Ltd., each provide investment advisory services to a portion of the fund for a fee calculated at an annual percentage rate of average net assets managed by the advisor. The basic fees of Wellington Management Company llp and Jennison Associates LLC are subject to quarterly adjustments based on performance relative to the Russell 1000 Growth Index for the preceding three years. The basic fee of Baillie Gifford Overseas Ltd. is subject to quarterly adjustments based on performance relative to the S&P 500 Index for the preceding three years. Pursuant to board approval, a portion of the fund was managed by Jackson Square Partners, LLC through February 2021. The basic fee paid to Jackson Square Partners, LLC, was subject to quarterly adjustments based on performance relative to the Russell 1000 Growth Index for the preceding three years. |
| C. | In accordance with the terms of a Funds' Service Agreement (the “FSA”) between Vanguard and the fund, Vanguard furnishes to the fund investment advisory, corporate management, administrative, marketing, and distribution services at Vanguard’s cost of operations (as defined by the FSA). These costs of operations are allocated to the fund based on methods and guidelines approved by the board of trustees and are generally settled twice a month. |
| D. | The fund has asked its investment advisors to direct certain security trades, subject to obtaining the best price and execution, to brokers who have agreed to rebate to the fund part of |
| E. | Various inputs may be used to determine the value of the fund’s investments and derivatives. These inputs are summarized in three broad levels for financial statement purposes. The inputs or methodologies used to value securities are not necessarily an indication of the risk associated with investing in those securities. |
| Level 1 ($000) | Level 2 ($000) | Level 3 ($000) | Total ($000) | |
| Investments | ||||
| Assets | ||||
| Common Stocks | 53,118,819 | 941,562 | — | 54,060,381 |
| Preferred Stocks | 297 | 2,592 | — | 2,889 |
| Temporary Cash Investments | 879,534 | 116,500 | — | 996,034 |
| Total | 53,998,650 | 1,060,654 | — | 55,059,304 |
| Derivative Financial Instruments | ||||
| Assets | ||||
| Futures Contracts1 | 21,634 | — | — | 21,634 |
| 1 | Includes cumulative appreciation (depreciation) on futures contracts and centrally cleared swaps, if any, as reported in the Schedule of Investments. Only current day’s variation margin is reported within the Statement of Assets and Liabilities. |
| F. | Permanent differences between book-basis and tax-basis components of net assets are reclassified among capital accounts in the financial statements to reflect their tax character. These reclassifications have no effect on net assets or net asset value per share. As of period end, permanent differences primarily attributable to the accounting for foreign currency transactions and distributions in connection with fund share redemptions were reclassified between the following accounts: |
| Amount ($000) | |
| Paid-in Capital | 518,140 |
| Total Distributable Earnings (Loss) | (518,140) |
| Amount ($000) | |
| Undistributed Ordinary Income | 1,117,606 |
| Undistributed Long-Term Gains | 4,871,239 |
| Capital Loss Carryforwards | — |
| Qualified Late-Year Losses | — |
| Net Unrealized Gains (Losses) | 26,042,369 |
| Year Ended August 31, | ||
| 2021 Amount ($000) | 2020 Amount ($000) | |
| Ordinary Income* | 131,261 | 146,931 |
| Long-Term Capital Gains | 1,595,081 | 914,642 |
| Total | 1,726,342 | 1,061,573 |
| * | Includes short-term capital gains, if any. |
| Amount ($000) | |
| Tax Cost | 29,016,932 |
| Gross Unrealized Appreciation | 27,226,225 |
| Gross Unrealized Depreciation | (1,183,854) |
| Net Unrealized Appreciation (Depreciation) | 26,042,371 |
| G. | During the year ended August 31, 2021, the fund purchased $22,029,599,000 of investment securities and sold $18,545,135,000 of investment securities, other than temporary cash investments. |
| H. | Capital share transactions for each class of shares were: |
| Year Ended August 31, | |||||
| 2021 | 2020 | ||||
| Amount ($000) | Shares (000) | Amount ($000) | Shares (000) | ||
| Investor Shares | |||||
| Issued | 2,627,798 | 40,047 | 2,060,722 | 44,973 | |
| Issued in Lieu of Cash Distributions | 426,494 | 6,567 | 347,590 | 8,288 | |
| Redeemed | (4,497,010) | (70,422) | (3,156,185) | (69,011) | |
| Net Increase (Decrease)—Investor Shares | (1,442,718) | (23,808) | (747,873) | (15,750) | |
| Admiral Shares | |||||
| Issued | 11,750,262 | 69,089 | 5,160,714 | 42,335 | |
| Issued in Lieu of Cash Distributions | 1,197,208 | 7,119 | 662,481 | 6,099 | |
| Redeemed | (6,686,696) | (39,036) | (4,156,546) | (36,332) | |
| Net Increase (Decrease)—Admiral Shares | 6,260,774 | 37,172 | 1,666,649 | 12,102 | |
| I. | Management has determined that no events or transactions occurred subsequent to August 31, 2021, that would require recognition or disclosure in these financial statements. |
Philadelphia, Pennsylvania
October 20, 2021


Your Fund’s Performance at a Glance | 1 |
Advisors’ Report | 2 |
About Your Fund’s Expenses | 6 |
Performance Summary | 8 |
Financial Statements | 10 |
Liquidity Risk Management | 28 |
| • | For the 12 months ended August 31, 2021, Vanguard International Growth Fund returned 29.89% for Investor Shares and 30.01% for Admiral Shares, outperforming the 24.87% return of its benchmark. |
| • | The global economy rebounded faster than many had expected after the sharp pandemic-induced contraction in the spring of 2020. Countries that were more successful in containing the virus generally fared better economically. |
| • | Swift and extensive fiscal and monetary support from policymakers was also key to the rebound. As the 12 months under review reflect the recovery in stocks following the sharp downturn at the start of the pandemic, results were excellent. |
| • | The fund outperformed its benchmark in three of the four major global economic regions in which it was invested. Stock selection was strong in Europe, North America, and the Pacific region, while selection in emerging markets detracted. |
| • | The fund also outpaced its benchmark in most industry sectors. Stock selection in health care—particularly biotechnology—and information technology provided the biggest boosts to relative performance. Communication services and financials were the biggest detractors. |
| Average Annual Total Returns Periods Ended August 31, 2021 | |||
| One Year | Three Years | Five Years | |
| Stocks | |||
| Russell 1000 Index (Large-caps) | 32.25% | 18.42% | 18.24% |
| Russell 2000 Index (Small-caps) | 47.08 | 10.75 | 14.38 |
| Russell 3000 Index (Broad U.S. market) | 33.04 | 17.85 | 17.97 |
| FTSE All-World ex US Index (International) | 25.74 | 9.82 | 10.23 |
| Bonds | |||
| Bloomberg U.S. Aggregate Bond Index (Broad taxable market) | -0.08% | 5.43% | 3.11% |
| Bloomberg Municipal Bond Index (Broad tax-exempt market) | 3.40 | 5.09 | 3.30 |
| FTSE Three-Month U.S. Treasury Bill Index | 0.06 | 1.20 | 1.13 |
| CPI | |||
| Consumer Price Index | 5.25% | 2.76% | 2.58% |
| Fund Assets Managed | |||
| Investment Advisor | % | $ Million | Investment Strategy |
| Baillie Gifford Overseas Ltd. | 69 | 50,644 | The advisor seeks stocks that can generate above-average growth in earnings and cash flow, producing a bottom-up, stock-driven approach to country and asset allocation. An in-depth view on each company is measured against the consensus view, leading to discrepancies and potential opportunities to add value. |
| Schroder Investment Management North America Inc. | 30 | 22,215 | Equity analysts located around the world and an international team of global sector specialists help to identify reasonably priced companies with strong growth prospects and a sustainable competitive advantage. |
| Cash Investments | 1 | 730 | These short-term reserves are invested by Vanguard in equity index products to simulate investment in stocks. Each advisor may also maintain a modest cash position. |
| • | Based on actual fund return. This section helps you to estimate the actual expenses that you paid over the period. The ”Ending Account Value“ shown is derived from the fund‘s actual return, and the third column shows the dollar amount that would have been paid by an investor who started with $1,000 in the fund. You may use the information here, together with the amount you invested, to estimate the expenses that you paid over the period. |
| • | Based on hypothetical 5% yearly return. This section is intended to help you compare your fund‘s costs with those of other mutual funds. It assumes that the fund had a yearly return of 5% before expenses, but that the expense ratio is unchanged. In this case—because the return used is not the fund’s actual return—the results do not apply to your investment. The example is useful in making comparisons because the Securities and Exchange Commission requires all mutual funds to calculate expenses based on a 5% return. You can assess your fund’s costs by comparing this hypothetical example with the hypothetical examples that appear in shareholder reports of other funds. |
| Six Months Ended August 31, 2021 | |||
| Beginning Account Value 2/28/2021 | Ending Account Value 8/31/2021 | Expenses Paid During Period | |
| Based on Actual Fund Return | |||
| International Growth Fund | |||
| Investor Shares | $1,000.00 | $1,057.20 | $2.23 |
| Admiral™ Shares | 1,000.00 | 1,057.80 | 1.66 |
| Based on Hypothetical 5% Yearly Return | |||
| International Growth Fund | |||
| Investor Shares | $1,000.00 | $1,023.04 | $2.19 |
| Admiral Shares | 1,000.00 | 1,023.59 | 1.63 |

| Average Annual Total Returns Periods Ended August 31, 2021 | |||||
| One Year | Five Years | Ten Years | Final Value of a $10,000 Investment | ||

| International Growth Fund Investor Shares | 29.89% | 22.09% | 13.78% | $36,369 |

| MSCI All Country World Index ex USA | 24.87 | 9.92 | 6.57 | 18,889 |
| One Year | Five Years | Ten Years | Final Value of a $50,000 Investment | ||
| International Growth Fund Admiral Shares | 30.01% | 22.24% | 13.92% | $184,103 | |
| MSCI All Country World Index ex USA | 24.87 | 9.92 | 6.57 | 94,446 | |
| United States | 17.6% |
| China | 14.0 |
| Netherlands | 10.6 |
| Germany | 8.6 |
| Japan | 7.8 |
| France | 6.5 |
| United Kingdom | 5.5 |
| Switzerland | 4.3 |
| Denmark | 4.1 |
| Italy | 3.4 |
| Taiwan | 3.1 |
| Belgium | 2.5 |
| Sweden | 2.3 |
| Hong Kong | 2.3 |
| India | 1.3 |
| Canada | 1.0 |
| Other | 5.1 |
| Futures Contracts | ||||
| ($000) | ||||
| Expiration | Number of Long (Short) Contracts | Notional Amount | Value and Unrealized Appreciation (Depreciation) | |
| Long Futures Contracts | ||||
| MSCI EAFE Index | September 2021 | 4,526 | 532,145 | 3,492 |
| MSCI Emerging Markets Index | September 2021 | 3,542 | 230,088 | 2,122 |
| 5,614 | ||||
| ($000s, except shares and per-share amounts) | Amount |
| Assets | |
| Investments in Securities, at Value | |
| Unaffiliated Issuers (Cost $34,473,076) | 68,079,465 |
| Affiliated Issuers (Cost $3,359,990) | 5,616,119 |
| Total Investments in Securities | 73,695,584 |
| Investment in Vanguard | 2,401 |
| Cash Collateral Pledged—Futures Contracts | 40,349 |
| Foreign Currency, at Value (Cost $9,305) | 9,278 |
| Receivables for Investment Securities Sold | 1,462 |
| Receivables for Accrued Income | 90,432 |
| Receivables for Capital Shares Issued | 31,908 |
| Variation Margin Receivable—Futures Contracts | 2,867 |
| Other Assets | 421 |
| Total Assets | 73,874,702 |
| Liabilities | |
| Due to Custodian | 6,791 |
| Payables for Investment Securities Purchased | 46,080 |
| Collateral for Securities on Loan | 135,295 |
| Payables to Investment Advisor | 30,569 |
| Payables for Capital Shares Redeemed | 38,836 |
| Payables to Vanguard | 5,283 |
| Deferred Foreign Capital Gains Taxes | 23,082 |
| Total Liabilities | 285,936 |
| Net Assets | 73,588,766 |
| At August 31, 2021, net assets consisted of: | |
| Paid-in Capital | 30,227,231 |
| Total Distributable Earnings (Loss) | 43,361,535 |
| Net Assets | 73,588,766 |
| Investor Shares—Net Assets | |
| Applicable to 206,361,724 outstanding $.001 par value shares of beneficial interest (unlimited authorization) | 11,246,536 |
| Net Asset Value Per Share—Investor Shares | $54.50 |
| Admiral Shares—Net Assets | |
| Applicable to 359,379,126 outstanding $.001 par value shares of beneficial interest (unlimited authorization) | 62,342,230 |
| Net Asset Value Per Share—Admiral Shares | $173.47 |
| Year Ended August 31, 2021 | |
| ($000) | |
| Investment Income | |
| Income | |
| Dividends—Unaffiliated Issuers1 | 765,157 |
| Dividends—Affiliated Issuers | 7,821 |
| Interest—Unaffiliated Issuers | 189 |
| Interest—Affiliated Issuers | 792 |
| Securities Lending—Net | 21,232 |
| Total Income | 795,191 |
| Expenses | |
| Investment Advisory Fees—Note B | |
| Basic Fee | 94,660 |
| Performance Adjustment | 19,710 |
| The Vanguard Group—Note C | |
| Management and Administrative—Investor Shares | 25,856 |
| Management and Administrative—Admiral Shares | 80,862 |
| Marketing and Distribution—Investor Shares | 682 |
| Marketing and Distribution—Admiral Shares | 1,997 |
| Custodian Fees | 2,616 |
| Auditing Fees | 20 |
| Shareholders’ Reports—Investor Shares | 147 |
| Shareholders’ Reports—Admiral Shares | 312 |
| Trustees’ Fees and Expenses | 60 |
| Total Expenses | 226,922 |
| Net Investment Income | 568,269 |
| Realized Net Gain (Loss) | |
| Investment Securities Sold—Unaffiliated Issuers | 7,603,649 |
| Investment Securities Sold—Affiliated Issuers | 28,205 |
| Futures Contracts | 165,740 |
| Forward Currency Contracts | (520) |
| Foreign Currencies | (4,209) |
| Realized Net Gain (Loss) | 7,792,865 |
| Change in Unrealized Appreciation (Depreciation) | |
| Investment Securities—Unaffiliated Issuers2 | 7,348,098 |
| Investment Securities—Affiliated Issuers | 1,193,528 |
| Futures Contracts | (6,821) |
| Forward Currency Contracts | 519 |
| Foreign Currencies | (587) |
| Change in Unrealized Appreciation (Depreciation) | 8,534,737 |
| Net Increase (Decrease) in Net Assets Resulting from Operations | 16,895,871 |
| 1 | Dividends are net of foreign withholding taxes of $74,162,000. |
| 2 | The change in unrealized appreciation (depreciation) is net of the change in deferred foreign capital gains taxes of $23,082,000. |
| Year Ended August 31, | ||
| 2021 ($000) | 2020 ($000) | |
| Increase (Decrease) in Net Assets | ||
| Operations | ||
| Net Investment Income | 568,269 | 338,623 |
| Realized Net Gain (Loss) | 7,792,865 | 1,295,635 |
| Change in Unrealized Appreciation (Depreciation) | 8,534,737 | 17,702,794 |
| Net Increase (Decrease) in Net Assets Resulting from Operations | 16,895,871 | 19,337,052 |
| Distributions | ||
| Investor Shares | (233,496) | (94,219) |
| Admiral Shares | (1,364,844) | (424,749) |
| Total Distributions | (1,598,340) | (518,968) |
| Capital Share Transactions | ||
| Investor Shares | (756,373) | (760,869) |
| Admiral Shares | 2,483,624 | 2,901,570 |
| Net Increase (Decrease) from Capital Share Transactions | 1,727,251 | 2,140,701 |
| Total Increase (Decrease) | 17,024,782 | 20,958,785 |
| Net Assets | ||
| Beginning of Period | 56,563,984 | 35,605,199 |
| End of Period | 73,588,766 | 56,563,984 |
| Investor Shares | |||||
| For a Share Outstanding Throughout Each Period | Year Ended August 31, | ||||
| 2021 | 2020 | 2019 | 2018 | 2017 | |
| Net Asset Value, Beginning of Period | $42.94 | $28.30 | $31.23 | $28.38 | $22.38 |
| Investment Operations | |||||
| Net Investment Income1 | .374 | .238 | .342 | .381 | .240 |
| Net Realized and Unrealized Gain (Loss) on Investments | 12.336 | 14.791 | (1.941) | 2.722 | 6.028 |
| Total from Investment Operations | 12.710 | 15.029 | (1.599) | 3.103 | 6.268 |
| Distributions | |||||
| Dividends from Net Investment Income | (.106) | (.389) | (.403) | (.253) | (.268) |
| Distributions from Realized Capital Gains | (1.044) | — | (.928) | — | — |
| Total Distributions | (1.150) | (.389) | (1.331) | (.253) | (.268) |
| Net Asset Value, End of Period | $54.50 | $42.94 | $28.30 | $31.23 | $28.38 |
| Total Return2 | 29.89% | 53.60% | -4.58% | 10.97% | 28.43% |
| Ratios/Supplemental Data | |||||
| Net Assets, End of Period (Millions) | $11,247 | $9,658 | $7,056 | $8,074 | $7,731 |
| Ratio of Total Expenses to Average Net Assets3 | 0.43% | 0.44% | 0.43% | 0.45% | 0.45% |
| Ratio of Net Investment Income to Average Net Assets | 0.75% | 0.74% | 1.23% | 1.25% | 1.01% |
| Portfolio Turnover Rate | 25% | 20% | 13% | 16% | 15% |
| 1 | Calculated based on average shares outstanding. |
| 2 | Total returns do not include account service fees that may have applied in the periods shown. Fund prospectuses provide information about any applicable account service fees. |
| 3 | Includes performance-based investment advisory fee increases (decreases) of 0.03%, 0.04%, 0.03%, 0.03%, and 0.03%. |
| Admiral Shares | |||||
| For a Share Outstanding Throughout Each Period | Year Ended August 31, | ||||
| 2021 | 2020 | 2019 | 2018 | 2017 | |
| Net Asset Value, Beginning of Period | $136.68 | $90.05 | $99.45 | $90.24 | $71.19 |
| Investment Operations | |||||
| Net Investment Income1 | 1.367 | .863 | 1.203 | 1.365 | .879 |
| Net Realized and Unrealized Gain (Loss) on Investments | 39.246 | 47.105 | (6.230) | 8.652 | 19.127 |
| Total from Investment Operations | 40.613 | 47.968 | (5.027) | 10.017 | 20.006 |
| Distributions | |||||
| Dividends from Net Investment Income | (.497) | (1.338) | (1.418) | (.807) | (.956) |
| Distributions from Realized Capital Gains | (3.326) | — | (2.955) | — | — |
| Total Distributions | (3.823) | (1.338) | (4.373) | (.807) | (.956) |
| Net Asset Value, End of Period | $173.47 | $136.68 | $90.05 | $99.45 | $90.24 |
| Total Return2 | 30.01% | 53.81% | -4.50% | 11.14% | 28.57% |
| Ratios/Supplemental Data | |||||
| Net Assets, End of Period (Millions) | $62,342 | $46,906 | $28,549 | $29,170 | $23,101 |
| Ratio of Total Expenses to Average Net Assets3 | 0.32% | 0.33% | 0.32% | 0.32% | 0.32% |
| Ratio of Net Investment Income to Average Net Assets | 0.86% | 0.83% | 1.34% | 1.38% | 1.14% |
| Portfolio Turnover Rate | 25% | 20% | 13% | 16% | 15% |
| 1 | Calculated based on average shares outstanding. |
| 2 | Total returns do not include account service fees that may have applied in the periods shown. Fund prospectuses provide information about any applicable account service fees. |
| 3 | Includes performance-based investment advisory fee increases (decreases) of 0.03%, 0.04%, 0.03%, 0.03%, and 0.03%. |
| A. | The following significant accounting policies conform to generally accepted accounting principles for U.S. investment companies. The fund consistently follows such policies in preparing its financial statements. |
| B. | The investment advisory firms Baillie Gifford Overseas Ltd. and Schroder Investment Management North America Inc. each provide investment advisory services to a portion of the fund for a fee calculated at an annual percentage rate of average net assets managed by the advisor. The basic fees of Baillie Gifford Overseas Ltd. and Schroder Investment Management North America Inc. are subject to quarterly adjustments based on performance relative to the MSCI All Country World Index ex USA for the preceding three years. |
| C. | In accordance with the terms of a Funds' Service Agreement (the “FSA”) between Vanguard and the fund, Vanguard furnishes to the fund investment advisory, corporate management, administrative, marketing, and distribution services at Vanguard’s cost of operations (as defined by the FSA). These costs of operations are allocated to the fund based on methods and guidelines approved by the board of trustees and are generally settled twice a month. |
| D. | Various inputs may be used to determine the value of the fund’s investments and derivatives. These inputs are summarized in three broad levels for financial statement purposes. The inputs or methodologies used to value securities are not necessarily an indication of the risk associated with investing in those securities. |
| Level 1 ($000) | Level 2 ($000) | Level 3 ($000) | Total ($000) | |
| Investments | ||||
| Assets | ||||
| Common Stocks—North and South America | 13,657,607 | — | — | 13,657,607 |
| Common Stocks—Other | 3,576,767 | 54,594,059 | 23,969 | 58,194,795 |
| Preferred Stock | — | — | 200,032 | 200,032 |
| Temporary Cash Investments | 1,643,150 | — | — | 1,643,150 |
| Total | 18,877,524 | 54,594,059 | 224,001 | 73,695,584 |
| Derivative Financial Instruments | ||||
| Assets | ||||
| Futures Contracts1 | 5,614 | — | — | 5,614 |
| 1 | Includes cumulative appreciation (depreciation) on futures contracts and centrally cleared swaps, if any, as reported in the Schedule of Investments. Only current day’s variation margin is reported within the Statement of Assets and Liabilities. |
| E. | At August 31, 2021, the fair values of derivatives were reflected in the Statement of Assets and Liabilities as follows: |
| Statement of Assets and Liabilities | Equity Contracts ($000) | Total ($000) |
| Unrealized Appreciation—Futures Contracts1 | 5,614 | 5,614 |
| 1 | Includes cumulative appreciation (depreciation) on futures contracts and centrally cleared swaps, if any, as reported in the Schedule of Investments. Only current day’s variation margin is reported within the Statement of Assets and Liabilities. |
| Realized Net Gain (Loss) on Derivatives | Equity Contracts ($000) | Foreign Exchange Contracts ($000) | Total ($000) |
| Futures Contracts | 165,740 | — | 165,740 |
| Forward Currency Contracts | — | (520) | (520) |
| Realized Net Gain (Loss) on Derivatives | 165,740 | (520) | 165,220 |
| Change in Unrealized Appreciation (Depreciation) on Derivatives | |||
| Futures Contracts | (6,821) | — | (6,821) |
| Forward Currency Contracts | — | 519 | 519 |
| Change in Unrealized Appreciation (Depreciation) on Derivatives | (6,821) | 519 | (6,302) |
| F. | Permanent differences between book-basis and tax-basis components of net assets are reclassified among capital accounts in the financial statements to reflect their tax character. These reclassifications have no effect on net assets or net asset value per share. As of period end, permanent differences primarily attributable to the accounting for foreign currency transactions, passive foreign investment companies, distributions in connection with fund share redemptions, and tax expense on capital gains were reclassified between the following accounts: |
| Amount ($000) | |
| Paid-in Capital | 490,319 |
| Total Distributable Earnings (Loss) | (490,319) |
| Amount ($000) | |
| Undistributed Ordinary Income | 966,699 |
| Undistributed Long-Term Gains | 6,575,184 |
| Capital Loss Carryforwards | — |
| Qualified Late-Year Losses | — |
| Net Unrealized Gains (Losses) | 35,819,652 |
| Year Ended August 31, | ||
| 2021 Amount ($000) | 2020 Amount ($000) | |
| Ordinary Income* | 393,403 | 518,968 |
| Long-Term Capital Gains | 1,204,937 | — |
| Total | 1,598,340 | 518,968 |
| * | Includes short-term capital gains, if any. |
| Amount ($000) | |
| Tax Cost | 37,854,541 |
| Gross Unrealized Appreciation | 37,250,196 |
| Gross Unrealized Depreciation | (1,409,153) |
| Net Unrealized Appreciation (Depreciation) | 35,841,043 |
| G. | During the year ended August 31, 2021, the fund purchased $17,215,707,000 of investment securities and sold $16,487,652,000 of investment securities, other than temporary cash investments. |
| H. | Capital share transactions for each class of shares were: |
| Year Ended August 31, | |||||
| 2021 | 2020 | ||||
| Amount ($000) | Shares (000) | Amount ($000) | Shares (000) | ||
| Investor Shares | |||||
| Issued | 2,455,419 | 48,845 | 1,336,137 | 39,787 | |
| Issued in Lieu of Cash Distributions | 223,098 | 4,530 | 90,043 | 2,857 | |
| Redeemed | (3,434,890) | (71,899) | (2,187,049) | (67,132) | |
| Net Increase (Decrease)—Investor Shares | (756,373) | (18,524) | (760,869) | (24,488) | |
| Year Ended August 31, | |||||
| 2021 | 2020 | ||||
| Amount ($000) | Shares (000) | Amount ($000) | Shares (000) | ||
| Admiral Shares | |||||
| Issued | 13,212,176 | 83,917 | 7,810,043 | 74,363 | |
| Issued in Lieu of Cash Distributions | 1,227,487 | 7,836 | 382,469 | 3,816 | |
| Redeemed | (11,956,039) | (75,557) | (5,290,942) | (52,026) | |
| Net Increase (Decrease)—Admiral Shares | 2,483,624 | 16,196 | 2,901,570 | 26,153 | |
| I. | Certain of the fund’s investments are in companies that are considered to be affiliated companies of the fund because the fund owns more than 5% of the outstanding voting securities of the company or the issuer is another member of The Vanguard Group. Transactions during the period in securities of these companies were as follows: |
| Current Period Transactions | ||||||||
| Aug. 31, 2020 Market Value ($000) | Purchases at Cost ($000) | Proceeds from Securities Sold ($000) | Realized Net Gain (Loss) ($000) | Change in Unrealized App. (Dep.) ($000) | Income ($000) | Capital Gain Distributions Received ($000) | Aug. 31, 2021 Market Value ($000) | |
| HelloFresh SE | 543,702 | — | — | — | 595,677 | — | — | 1,139,379 |
| Home24 SE | 23,358 | 4,336 | — | — | 13,381 | — | — | 41,075 |
| Jumia Technologies AG ADR | 61,801 | — | — | — | 72,763 | — | — | 134,564 |
| Umicore SA | NA1 | 192,880 | 45,274 | 12,501 | 222,773 | 7,821 | — | 922,770 |
| Vanguard Market Liquidity Fund | 1,795,364 | NA2 | NA2 | 90 | (89) | 792 | — | 1,643,150 |
| You & Mr. Jones PP | 143,808 | — | — | — | 56,224 | — | — | 200,032 |
| Zalando SE | NA1 | 392,317 | 22,573 | 15,614 | 232,799 | — | — | 1,535,149 |
| Total | 2,568,033 | 28,205 | 1,193,528 | 8,613 | — | 5,616,119 | ||
| 1 | Not applicable—at August 31, 2020, the issuer was not an affiliated company of the fund. |
| 2 | Not applicable—purchases and sales are for temporary cash investment purposes. |
| J. | Management has determined that no events or transactions occurred subsequent to August 31, 2021, that would require recognition or disclosure in these financial statements. |
Philadelphia, Pennsylvania
October 20, 2021


Your Fund’s Performance at a Glance | 1 |
About Your Fund’s Expenses | 2 |
Performance Summary | 4 |
Financial Statements | 6 |
Trustees Approve Advisory Arrangement | 25 |
Liquidity Risk Management | 27 |
| • | For the 12 months ended August 31, 2021, Vanguard FTSE Social Index Fund returned 31.04% for Admiral Shares and 31.09% for Institutional Shares. Those results were roughly in line with the expense-free 31.21% return of its benchmark. |
| • | The global economy rebounded faster than many had expected after the sharp pandemic-induced contraction in the spring of 2020. Countries that were more successful in containing the virus generally fared better economically. Swift and extensive fiscal and monetary support from policymakers was also key to the rebound. |
| • | As the 12 months under review reflect the recovery in stocks following the sharp downturn at the start of the pandemic, results were excellent. |
| • | For the fund’s benchmark index, industry sector performances varied greatly over the period. Financials turned in an outstanding performance. Technology, which accounts for by far the largest slice of the index, also performed very well. Consumer staples was among the laggards. |
| Average Annual Total Returns Periods Ended August 31, 2021 | |||
| One Year | Three Years | Five Years | |
| Stocks | |||
| Russell 1000 Index (Large-caps) | 32.25% | 18.42% | 18.24% |
| Russell 2000 Index (Small-caps) | 47.08 | 10.75 | 14.38 |
| Russell 3000 Index (Broad U.S. market) | 33.04 | 17.85 | 17.97 |
| FTSE All-World ex US Index (International) | 25.74 | 9.82 | 10.23 |
| Bonds | |||
| Bloomberg U.S. Aggregate Bond Index (Broad taxable market) | -0.08% | 5.43% | 3.11% |
| Bloomberg Municipal Bond Index (Broad tax-exempt market) | 3.40 | 5.09 | 3.30 |
| FTSE Three-Month U.S. Treasury Bill Index | 0.06 | 1.20 | 1.13 |
| CPI | |||
| Consumer Price Index | 5.25% | 2.76% | 2.58% |
| • | Based on actual fund return. This section helps you to estimate the actual expenses that you paid over the period. The ”Ending Account Value“ shown is derived from the fund‘s actual return, and the third column shows the dollar amount that would have been paid by an investor who started with $1,000 in the fund. You may use the information here, together with the amount you invested, to estimate the expenses that you paid over the period. |
| • | Based on hypothetical 5% yearly return. This section is intended to help you compare your fund‘s costs with those of other mutual funds. It assumes that the fund had a yearly return of 5% before expenses, but that the expense ratio is unchanged. In this case—because the return used is not the fund’s actual return—the results do not apply to your investment. The example is useful in making comparisons because the Securities and Exchange Commission requires all mutual funds to calculate expenses based on a 5% return. You can assess your fund’s costs by comparing this hypothetical example with the hypothetical examples that appear in shareholder reports of other funds. |
| Six Months Ended August 31, 2021 | |||
| Beginning Account Value 2/28/2021 | Ending Account Value 8/31/2021 | Expenses Paid During Period | |
| Based on Actual Fund Return | |||
| FTSE Social Index Fund | |||
| Admiral™ Shares | $1,000.00 | $1,200.60 | $0.78 |
| Institutional Shares | 1,000.00 | 1,201.10 | 0.67 |
| Based on Hypothetical 5% Yearly Return | |||
| FTSE Social Index Fund | |||
| Admiral Shares | $1,000.00 | $1,024.50 | $0.71 |
| Institutional Shares | 1,000.00 | 1,024.60 | 0.61 |

| Average Annual Total Returns Periods Ended August 31, 2021 | |||||
| One Year | Five Years | Ten Years | Final Value of a $5,000,000 Investment | ||

| FTSE Social Index Fund Institutional Shares | 31.09% | 19.92% | 17.79% | $25,715,711 |

| FTSE4Good US Select Index | 31.21 | 20.03 | 17.93 | 26,009,780 |

| Dow Jones U.S. Total Stock Market Float Adjusted Index | 33.32 | 17.95 | 16.16 | 22,360,680 |
| One Year | Since Inception (2/7/2019) | Final Value of a $10,000 Investment | ||
| FTSE Social Index Fund Admiral Shares | 31.04% | 26.88% | $18,400 | |
| FTSE4Good US Select Index | 31.21 | 27.03 | 18,457 | |
| Dow Jones U.S. Total Stock Market Float Adjusted Index | 33.32 | 24.46 | 17,516 | |
| Basic Materials | 1.7% |
| Consumer Discretionary | 16.8 |
| Consumer Staples | 4.7 |
| Energy | 0.2 |
| Financials | 10.2 |
| Health Care | 13.6 |
| Industrials | 10.7 |
| Real Estate | 3.1 |
| Technology | 34.4 |
| Telecommunications | 3.7 |
| Utilities | 0.9 |
| Futures Contracts | ||||
| ($000) | ||||
| Expiration | Number of Long (Short) Contracts | Notional Amount | Value and Unrealized Appreciation (Depreciation) | |
| Long Futures Contracts | ||||
| E-mini S&P 500 Index | September 2021 | 143 | 32,322 | 123 |
| ($000s, except shares and per-share amounts) | Amount |
| Assets | |
| Investments in Securities, at Value | |
| Unaffiliated Issuers (Cost $8,277,026) | 15,165,791 |
| Affiliated Issuers (Cost $58,580) | 58,580 |
| Total Investments in Securities | 15,224,371 |
| Investment in Vanguard | 487 |
| Cash | 37 |
| Cash Collateral Pledged—Futures Contracts | 635 |
| Receivables for Investment Securities Sold | 27 |
| Receivables for Accrued Income | 11,178 |
| Receivables for Capital Shares Issued | 29,254 |
| Total Assets | 15,265,989 |
| Liabilities | |
| Payables for Investment Securities Purchased | 52,733 |
| Collateral for Securities on Loan | 5,806 |
| Payables for Capital Shares Redeemed | 3,592 |
| Payables to Vanguard | 859 |
| Variation Margin Payable—Futures Contracts | 13 |
| Total Liabilities | 63,003 |
| Net Assets | 15,202,986 |
| At August 31, 2021, net assets consisted of: | |
| Paid-in Capital | 8,769,009 |
| Total Distributable Earnings (Loss) | 6,433,977 |
| Net Assets | 15,202,986 |
| Admiral Shares—Net Assets | |
| Applicable to 193,111,712 outstanding $.001 par value shares of beneficial interest (unlimited authorization) | 8,573,127 |
| Net Asset Value Per Share—Admiral Shares | $44.39 |
| Institutional Shares—Net Assets | |
| Applicable to 207,453,855 outstanding $.001 par value shares of beneficial interest (unlimited authorization) | 6,629,859 |
| Net Asset Value Per Share—Institutional Shares | $31.96 |
| Year Ended August 31, 2021 | |
| ($000) | |
| Investment Income | |
| Income | |
| Dividends1 | 148,506 |
| Interest2 | 24 |
| Securities Lending—Net | 101 |
| Total Income | 148,631 |
| Expenses | |
| The Vanguard Group—Note B | |
| Investment Advisory Services | 1,747 |
| Management and Administrative—Admiral Shares | 7,922 |
| Management and Administrative—Institutional Shares | 5,045 |
| Marketing and Distribution—Admiral Shares | 282 |
| Marketing and Distribution—Institutional Shares | 157 |
| Custodian Fees | 70 |
| Auditing Fees | 29 |
| Shareholders’ Reports—Admiral Shares | 66 |
| Shareholders’ Reports—Institutional Shares | 77 |
| Trustees’ Fees and Expenses | 5 |
| Total Expenses | 15,400 |
| Net Investment Income | 133,231 |
| Realized Net Gain (Loss) | |
| Investment Securities Sold2,3 | 23,991 |
| Futures Contracts | 8,897 |
| Realized Net Gain (Loss) | 32,888 |
| Change in Unrealized Appreciation (Depreciation) | |
| Investment Securities2 | 3,136,291 |
| Futures Contracts | (148) |
| Change in Unrealized Appreciation (Depreciation) | 3,136,143 |
| Net Increase (Decrease) in Net Assets Resulting from Operations | 3,302,262 |
| 1 | Dividends are net of foreign withholding taxes of $31,000. |
| 2 | Interest income, realized net gain (loss), and change in unrealized appreciation (depreciation) from an affiliated company of the fund were $23,000, $0, and less than $1,000, respectively. Purchases and sales are for temporary cash investment purposes. |
| 3 | Includes $50,057,000 of net gain (loss) resulting from in-kind redemptions. |
| Year Ended August 31, | ||
| 2021 ($000) | 2020 ($000) | |
| Increase (Decrease) in Net Assets | ||
| Operations | ||
| Net Investment Income | 133,231 | 118,476 |
| Realized Net Gain (Loss) | 32,888 | (431,510) |
| Change in Unrealized Appreciation (Depreciation) | 3,136,143 | 2,226,427 |
| Net Increase (Decrease) in Net Assets Resulting from Operations | 3,302,262 | 1,913,393 |
| Distributions | ||
| Investor Shares | — | (124) |
| Admiral Shares | (71,878) | (65,035) |
| Institutional Shares | (55,315) | (50,308) |
| Total Distributions | (127,193) | (115,467) |
| Capital Share Transactions | ||
| Investor Shares | — | (59,575) |
| Admiral Shares | 1,467,446 | 804,650 |
| Institutional Shares | 1,251,775 | 528,553 |
| Net Increase (Decrease) from Capital Share Transactions | 2,719,221 | 1,273,628 |
| Total Increase (Decrease) | 5,894,290 | 3,071,554 |
| Net Assets | ||
| Beginning of Period | 9,308,696 | 6,237,142 |
| End of Period | 15,202,986 | 9,308,696 |
| Admiral Shares | |||
| For a Share Outstanding Throughout Each Period | Year Ended August 31, | February 7, 20191 to August 31, 2019 | |
| 2021 | 2020 | ||
| Net Asset Value, Beginning of Period | $34.27 | $27.27 | $25.00 |
| Investment Operations | |||
| Net Investment Income2 | .432 | .465 | .273 |
| Net Realized and Unrealized Gain (Loss) on Investments | 10.110 | 6.996 | 2.183 |
| Total from Investment Operations | 10.542 | 7.461 | 2.456 |
| Distributions | |||
| Dividends from Net Investment Income | (.422) | (.461) | (.186) |
| Distributions from Realized Capital Gains | — | — | — |
| Total Distributions | (.422) | (.461) | (.186) |
| Net Asset Value, End of Period | $44.39 | $34.27 | $27.27 |
| Total Return3 | 31.04% | 27.83% | 9.85% |
| Ratios/Supplemental Data | |||
| Net Assets, End of Period (Millions) | $8,573 | $5,305 | $3,478 |
| Ratio of Total Expenses to Average Net Assets | 0.14% | 0.14% | 0.14%4 |
| Ratio of Net Investment Income to Average Net Assets | 1.13% | 1.60% | 1.79%4 |
| Portfolio Turnover Rate | 4%5 | 18% | 11%5,6 |
| 1 | Inception. |
| 2 | Calculated based on average shares outstanding. |
| 3 | Total returns do not include account service fees that may have applied in the periods shown. Fund prospectuses provide information about any applicable account service fees. |
| 4 | Annualized. |
| 5 | Excludes the value of portfolio securities received or delivered as a result of in-kind purchases or redemptions of the fund’s capital shares. |
| 6 | Reflects the fund’s portfolio turnover for the fiscal year ended August 31, 2019. |
| Institutional Shares | |||||
| For a Share Outstanding Throughout Each Period | Year Ended August 31, | ||||
| 2021 | 2020 | 2019 | 2018 | 2017 | |
| Net Asset Value, Beginning of Period | $24.67 | $19.63 | $19.28 | $16.15 | $13.96 |
| Investment Operations | |||||
| Net Investment Income1 | .317 | .339 | .314 | .305 | .271 |
| Net Realized and Unrealized Gain (Loss) on Investments | 7.282 | 5.037 | .351 | 3.105 | 2.175 |
| Total from Investment Operations | 7.599 | 5.376 | .665 | 3.410 | 2.446 |
| Distributions | |||||
| Dividends from Net Investment Income | (.309) | (.336) | (.315) | (.280) | (.256) |
| Distributions from Realized Capital Gains | — | — | — | — | — |
| Total Distributions | (.309) | (.336) | (.315) | (.280) | (.256) |
| Net Asset Value, End of Period | $31.96 | $24.67 | $19.63 | $19.28 | $16.15 |
| Total Return | 31.09% | 27.86% | 3.58% | 21.34% | 17.72% |
| Ratios/Supplemental Data | |||||
| Net Assets, End of Period (Millions) | $6,630 | $4,003 | $2,701 | $2,349 | $1,443 |
| Ratio of Total Expenses to Average Net Assets | 0.12% | 0.12% | 0.12% | 0.12% | 0.12% |
| Ratio of Net Investment Income to Average Net Assets | 1.15% | 1.62% | 1.49% | 1.71% | 1.79% |
| Portfolio Turnover Rate | 4%2 | 18% | 11%2 | 8%2 | 11%2 |
| 1 | Calculated based on average shares outstanding. |
| 2 | Excludes the value of portfolio securities received or delivered as a result of in-kind purchases or redemptions of the fund’s capital shares. |
| A. | The following significant accounting policies conform to generally accepted accounting principles for U.S. investment companies. The fund consistently follows such policies in preparing its financial statements. |
| B. | In accordance with the terms of a Funds' Service Agreement (the “FSA”) between Vanguard and the fund, Vanguard furnishes to the fund investment advisory, corporate management, administrative, marketing, and distribution services at Vanguard’s cost of operations (as defined by the FSA). These costs of operations are allocated to the fund based on methods and guidelines approved by the board of trustees and are generally settled twice a month. |
| C. | Various inputs may be used to determine the value of the fund’s investments and derivatives. These inputs are summarized in three broad levels for financial statement purposes. The inputs or methodologies used to value securities are not necessarily an indication of the risk associated with investing in those securities. |
| D. | Permanent differences between book-basis and tax-basis components of net assets are reclassified among capital accounts in the financial statements to reflect their tax character. These reclassifications have no effect on net assets or net asset value per share. As of period end, permanent differences primarily attributable to the accounting for in-kind redemptions were reclassified between the following accounts: |
| Amount ($000) | |
| Paid-in Capital | 50,045 |
| Total Distributable Earnings (Loss) | (50,045) |
| Amount ($000) | |
| Undistributed Ordinary Income | 31,685 |
| Undistributed Long-Term Gains | — |
| Capital Loss Carryforwards | (466,746) |
| Qualified Late-Year Losses | — |
| Net Unrealized Gains (Losses) | 6,869,038 |
| Year Ended August 31, | ||
| 2021 Amount ($000) | 2020 Amount ($000) | |
| Ordinary Income* | 127,193 | 115,467 |
| Long-Term Capital Gains | — | — |
| Total | 127,193 | 115,467 |
| * | Includes short-term capital gains, if any. |
| Amount ($000) | |
| Tax Cost | 8,355,333 |
| Gross Unrealized Appreciation | 6,971,956 |
| Gross Unrealized Depreciation | (102,918) |
| Net Unrealized Appreciation (Depreciation) | 6,869,038 |
| E. | During the year ended August 31, 2021, the fund purchased $3,282,987,000 of investment securities and sold $565,810,000 of investment securities, other than temporary cash investments. Purchases and sales include $0 and $110,254,000, respectively, in connection with in-kind purchases and redemptions of the fund's capital shares. |
| F. | Capital share transactions for each class of shares were: |
| Year Ended August 31, | |||||
| 2021 | 2020 | ||||
| Amount ($000) | Shares (000) | Amount ($000) | Shares (000) | ||
| Investor Shares | |||||
| Issued | — | — | 922 | 45 | |
| Issued in Lieu of Cash Distributions | — | — | 124 | 6 | |
| Redeemed1 | — | — | (60,621) | (3,047) | |
| Net Increase (Decrease)—Investor Shares | — | — | (59,575) | (2,996) | |
| Admiral Shares | |||||
| Issued1 | 2,693,123 | 70,662 | 1,697,269 | 58,728 | |
| Issued in Lieu of Cash Distributions | 62,679 | 1,718 | 56,851 | 2,114 | |
| Redeemed | (1,288,356) | (34,072) | (949,470) | (33,560) | |
| Net Increase (Decrease)—Admiral Shares | 1,467,446 | 38,308 | 804,650 | 27,282 | |
| Year Ended August 31, | |||||
| 2021 | 2020 | ||||
| Amount ($000) | Shares (000) | Amount ($000) | Shares (000) | ||
| Institutional Shares | |||||
| Issued | 1,839,997 | 67,229 | 1,143,683 | 54,448 | |
| Issued in Lieu of Cash Distributions | 54,024 | 2,056 | 48,991 | 2,528 | |
| Redeemed | (642,246) | (24,102) | (664,121) | (32,286) | |
| Net Increase (Decrease)—Institutional Shares | 1,251,775 | 45,183 | 528,553 | 24,690 | |
| 1 | In November 2018, the fund announced changes to the availability and minimum investment criteria of the Investor and Admiral share classes. As a result, all of the outstanding Investor Shares automatically converted to Admiral Shares beginning in April 2019. Investor Shares—Redeemed and Admiral Shares—Issued include 68,000 and 49,000 shares, respectively, in the amount of $1,355,000 from the conversion during the year ended August 31, 2020. |
| G. | Management has determined that no events or transactions occurred subsequent to August 31, 2021, that would require recognition or disclosure in these financial statements. |
Index Fund
Philadelphia, Pennsylvania
October 18, 2021


| Vanguard Communication Services Index Fund |
| Vanguard Consumer Discretionary Index Fund |
| Vanguard Consumer Staples Index Fund |
| Vanguard Energy Index Fund |
| Vanguard Financials Index Fund |
| Vanguard Health Care Index Fund |
| Vanguard Industrials Index Fund |
| Vanguard Information Technology Index Fund |
| Vanguard Materials Index Fund |
| Vanguard Utilities Index Fund |
Your Fund’s Performance at a Glance | 1 |
About Your Fund’s Expenses | 2 |
Communication Services Index Fund | 5 |
Consumer Discretionary Index Fund | 18 |
Consumer Staples Index Fund | 31 |
Energy Index Fund | 42 |
Financials Index Fund | 54 |
Health Care Index Fund | 69 |
Industrials Index Fund | 84 |
Information Technology Index Fund | 98 |
Materials Index Fund | 112 |
Utilities Index Fund | 123 |
Trustees Approve Advisory Arrangements | 135 |
Liquidity Risk Management | 136 |

| • | All ten Vanguard U.S. Sector Index Funds had double-digit returns—ranging from about 15% to about 58%—for the 12 months ended August 31, 2021. Each fund closely tracked its target index. |
| • | The global economy rebounded more quickly than many had expected after the sharp pandemic-induced contraction in the spring of 2020. Countries that were more successful in containing the virus generally fared better economically. Swift and extensive fiscal and monetary support from policymakers was also key to the rebound. Stocks rose broadly during the 12 months under review following the sharp contraction. |
| • | Returns were strongest for Vanguard Financials Index, Energy Index, and Materials Index Funds. At the low end were Vanguard Consumer Staples Index and Utilities Index Funds. |
| Average Annual Total Returns Periods Ended August 31, 2021 | |||
| One Year | Three Years | Five Years | |
| Stocks | |||
| Russell 1000 Index (Large-caps) | 32.25% | 18.42% | 18.24% |
| Russell 2000 Index (Small-caps) | 47.08 | 10.75 | 14.38 |
| Russell 3000 Index (Broad U.S. market) | 33.04 | 17.85 | 17.97 |
| FTSE All-World ex US Index (International) | 25.74 | 9.82 | 10.23 |
| Bonds | |||
| Bloomberg U.S. Aggregate Bond Index (Broad taxable market) | -0.08% | 5.43% | 3.11% |
| Bloomberg Municipal Bond Index (Broad tax-exempt market) | 3.40 | 5.09 | 3.30 |
| FTSE Three-Month U.S. Treasury Bill Index | 0.06 | 1.20 | 1.13 |
| CPI | |||
| Consumer Price Index | 5.25% | 2.76% | 2.58% |
| • | Based on actual fund return. This section helps you to estimate the actual expenses that you paid over the period. The ”Ending Account Value“ shown is derived from the fund‘s actual return, and the third column shows the dollar amount that would have been paid by an investor who started with $1,000 in the fund. You may use the information here, together with the amount you invested, to estimate the expenses that you paid over the period. |
| • | Based on hypothetical 5% yearly return. This section is intended to help you compare your fund‘s costs with those of other mutual funds. It assumes that the fund had a yearly return of 5% before expenses, but that the expense ratio is unchanged. In this case—because the return used is not the fund’s actual return—the results do not apply to your investment. The example is useful in making comparisons because the Securities and Exchange Commission requires all mutual funds to calculate expenses based on a 5% return. You can assess your fund’s costs by comparing this hypothetical example with the hypothetical examples that appear in shareholder reports of other funds. |
| Six Months Ended August 31, 2021 | |||
| Beginning Account Value 2/28/2021 | Ending Account Value 8/31/2021 | Expenses Paid During Period | |
| Based on Actual Fund Return | |||
| Communication Services Index Fund | |||
| ETF Shares | $1,000.00 | $1,170.20 | $0.55 |
| Admiral™ Shares | 1,000.00 | 1,170.20 | 0.55 |
| Consumer Discretionary Index Fund | |||
| ETF Shares | $1,000.00 | $1,132.30 | $0.54 |
| Admiral Shares | 1,000.00 | 1,132.40 | 0.54 |
| Consumer Staples Index Fund | |||
| ETF Shares | $1,000.00 | $1,145.40 | $0.54 |
| Admiral Shares | 1,000.00 | 1,145.60 | 0.54 |
| Energy Index Fund | |||
| ETF Shares | $1,000.00 | $1,039.40 | $0.51 |
| Admiral Shares | 1,000.00 | 1,040.00 | 0.51 |
| Financials Index Fund | |||
| ETF Shares | $1,000.00 | $1,192.70 | $0.55 |
| Admiral Shares | 1,000.00 | 1,192.90 | 0.55 |
| Health Care Index Fund | |||
| ETF Shares | $1,000.00 | $1,173.80 | $0.55 |
| Admiral Shares | 1,000.00 | 1,173.90 | 0.55 |
| Industrials Index Fund | |||
| ETF Shares | $1,000.00 | $1,136.70 | $0.54 |
| Admiral Shares | 1,000.00 | 1,136.70 | 0.54 |
| Information Technology Index Fund | |||
| ETF Shares | $1,000.00 | $1,200.00 | $0.55 |
| Admiral Shares | 1,000.00 | 1,200.00 | 0.55 |
| Materials Index Fund | |||
| ETF Shares | $1,000.00 | $1,175.50 | $0.55 |
| Admiral Shares | 1,000.00 | 1,175.70 | 0.55 |
| Utilities Index Fund | |||
| ETF Shares | $1,000.00 | $1,182.40 | $0.55 |
| Admiral Shares | 1,000.00 | 1,182.40 | 0.55 |
| Six Months Ended August 31, 2021 | |||
| Beginning Account Value 2/28/2021 | Ending Account Value 8/31/2021 | Expenses Paid During Period | |
| Based on Hypothetical 5% Yearly Return | |||
| Communication Services Index Fund | |||
| ETF Shares | $1,000.00 | $1,024.70 | $0.51 |
| Admiral Shares | 1,000.00 | 1,024.70 | 0.51 |
| Consumer Discretionary Index Fund | |||
| ETF Shares | $1,000.00 | $1,024.70 | $0.51 |
| Admiral Shares | 1,000.00 | 1,024.70 | 0.51 |
| Consumer Staples Index Fund | |||
| ETF Shares | $1,000.00 | $1,024.70 | $0.51 |
| Admiral Shares | 1,000.00 | 1,024.70 | 0.51 |
| Energy Index Fund | |||
| ETF Shares | $1,000.00 | $1,024.70 | $0.51 |
| Admiral Shares | 1,000.00 | 1,024.70 | 0.51 |
| Financials Index Fund | |||
| ETF Shares | $1,000.00 | $1,024.70 | $0.51 |
| Admiral Shares | 1,000.00 | 1,024.70 | 0.51 |
| Health Care Index Fund | |||
| ETF Shares | $1,000.00 | $1,024.70 | $0.51 |
| Admiral Shares | 1,000.00 | 1,024.70 | 0.51 |
| Industrials Index Fund | |||
| ETF Shares | $1,000.00 | $1,024.70 | $0.51 |
| Admiral Shares | 1,000.00 | 1,024.70 | 0.51 |
| Information Technology Index Fund | |||
| ETF Shares | $1,000.00 | $1,024.70 | $0.51 |
| Admiral Shares | 1,000.00 | 1,024.70 | 0.51 |
| Materials Index Fund | |||
| ETF Shares | $1,000.00 | $1,024.70 | $0.51 |
| Admiral Shares | 1,000.00 | 1,024.70 | 0.51 |
| Utilities Index Fund | |||
| ETF Shares | $1,000.00 | $1,024.70 | $0.51 |
| Admiral Shares | 1,000.00 | 1,024.70 | 0.51 |

| Average Annual Total Returns Periods Ended August 31, 2021 | |||||
| One Year | Five Year | Ten Years | Final Value of a $10,000 Investment | ||

| Communication Services Index Fund ETF Shares Net Asset Value | 39.75% | 11.72% | 11.78% | $30,447 |
| Communication Services Index Fund ETF Shares Market Price | 39.69 | 11.74 | 11.77 | 30,425 | |

| Communication Services Spliced Index | 39.84 | 11.67 | 11.77 | 30,417 |

| MSCI US Investable Market 2500 Index | 33.59 | 18.08 | 16.28 | 45,188 |
| One Year | Five Years | Ten Years | Final Value of a $100,000 Investment | ||
| Communication Services Index Fund Admiral Shares | 39.76% | 11.72% | 11.79% | $304,873 | |
| Communication Services Spliced Index | 39.84 | 11.67 | 11.77 | 304,173 | |
| MSCI US Investable Market 2500 Index | 33.59 | 18.08 | 16.28 | 451,882 | |
| One Year | Five Years | Ten Years | |
| Communication Services Index Fund ETF Shares Market Price | 39.69% | 74.19% | 204.25% |
| Communication Services Index Fund ETF Shares Net Asset Value | 39.75 | 74.02 | 204.47 |
| Communication Services Spliced Index | 39.84 | 73.67 | 204.17 |
| Diversified Telecommunication Services | 11.4% |
| Entertainment | 18.5 |
| Interactive Media & Services | 49.1 |
| Media | 18.6 |
| Wireless Telecommunication Services | 2.4 |
| Shares | Market Value• ($000) | ||
| Temporary Cash Investments (1.1%) | |||
| Money Market Fund (1.1%) | |||
| 2,3 | Vanguard Market Liquidity Fund, 0.068% (Cost $53,930) | 539,312 | 53,931 |
| Total Investments (100.9%) (Cost $3,713,384) | 4,955,188 | ||
| Other Assets and Liabilities—Net (-0.9%) | (43,519) | ||
| Net Assets (100.0%) | 4,911,669 | ||
| Cost is in $000. | |||
| • | See Note A in Notes to Financial Statements. |
| * | Non-income-producing security. |
| 1 | Includes partial security positions on loan to broker-dealers. The total value of securities on loan is $45,517,000. |
| 2 | Affiliated money market fund available only to Vanguard funds and certain trusts and accounts managed by Vanguard. Rate shown is the 7-day yield. |
| 3 | Collateral of $44,707,000 was received for securities on loan. |
| Over-the-Counter Total Return Swaps | ||||||
| Reference Entity | Termination Date | Counterparty | Notional Amount ($000) | Floating Interest Rate Received (Paid) (%) | Value and Unrealized Appreciation ($000) | Value and Unrealized (Depreciation) ($000) |
| Pinterest Inc. | 8/31/22 | BOANA | 5,946 | (0.080)1 | — | — |
| Sirius XM Holdings Inc. | 1/31/22 | GSI | 3,945 | (0.089)2 | 139 | — |
| 139 | — | |||||
| 1 | Based on 1M USD Overnight Bank Funding Rate as of the most recent payment date. Floating interest payment received/paid monthly. |
| 2 | Based on 1M USD London Interbank Offered Rate (LIBOR) as of the most recent payment date. Floating interest payment received/paid monthly. |
| 1M—1-month. | |
| BOANA—Bank of America, N.A. | |
| GSI—Goldman Sachs International. |
| ($000s, except shares and per-share amounts) | Amount |
| Assets | |
| Investments in Securities, at Value | |
| Unaffiliated Issuers (Cost $3,659,454) | 4,901,257 |
| Affiliated Issuers (Cost $53,930) | 53,931 |
| Total Investments in Securities | 4,955,188 |
| Investment in Vanguard | 158 |
| Receivables for Investment Securities Sold | 134,855 |
| Receivables for Accrued Income | 1,294 |
| Receivables for Capital Shares Issued | 136 |
| Unrealized Appreciation—Over-the-Counter Swap Contracts | 139 |
| Total Assets | 5,091,770 |
| Liabilities | |
| Due to Custodian | 3,662 |
| Payables for Investment Securities Purchased | 129,673 |
| Collateral for Securities on Loan | 44,707 |
| Payables for Capital Shares Redeemed | 1,848 |
| Payables to Vanguard | 211 |
| Unrealized Depreciation—Over-the-Counter Swap Contracts | — |
| Total Liabilities | 180,101 |
| Net Assets | 4,911,669 |
| At August 31, 2021, net assets consisted of: | |
| Paid-in Capital | 4,028,240 |
| Total Distributable Earnings (Loss) | 883,429 |
| Net Assets | 4,911,669 |
| ETF Shares—Net Assets | |
| Applicable to 31,943,227 outstanding $.001 par value shares of beneficial interest (unlimited authorization) | 4,787,448 |
| Net Asset Value Per Share—ETF Shares | $149.87 |
| Admiral Shares—Net Assets | |
| Applicable to 1,626,426 outstanding $.001 par value shares of beneficial interest (unlimited authorization) | 124,221 |
| Net Asset Value Per Share—Admiral Shares | $76.38 |
| ETF Shares | |||||
| For a Share Outstanding Throughout Each Period | Year Ended August 31, | ||||
| 2021 | 2020 | 2019 | 2018 | 2017 | |
| Net Asset Value, Beginning of Period | $108.04 | $87.24 | $86.83 | $93.54 | $95.16 |
| Investment Operations | |||||
| Net Investment Income1 | 1.018 | 1.005 | .917 | 3.067 | 3.108 |
| Net Realized and Unrealized Gain (Loss) on Investments | 41.708 | 20.743 | .316 | (6.297) | (1.587) |
| Total from Investment Operations | 42.726 | 21.748 | 1.233 | (3.230) | 1.521 |
| Distributions | |||||
| Dividends from Net Investment Income | (.896) | (.948) | (.823) | (3.480) | (3.141) |
| Distributions from Realized Capital Gains | — | — | — | — | — |
| Total Distributions | (.896) | (.948) | (.823) | (3.480) | (3.141) |
| Net Asset Value, End of Period | $149.87 | $108.04 | $87.24 | $86.83 | $93.54 |
| Total Return | 39.75% | 25.15% | 1.47% | -3.50% | 1.62% |
| Ratios/Supplemental Data | |||||
| Net Assets, End of Period (Millions) | $4,787 | $2,914 | $2,016 | $1,015 | $1,388 |
| Ratio of Total Expenses to Average Net Assets | 0.10% | 0.10% | 0.10% | 0.10% | 0.10% |
| Ratio of Net Investment Income to Average Net Assets | 0.80% | 1.09% | 1.09% | 3.48% | 3.26% |
| Portfolio Turnover Rate2 | 15% | 15% | 33% | 84% | 18% |
| 1 | Calculated based on average shares outstanding. |
| 2 | Excludes the value of portfolio securities received or delivered as a result of in-kind purchases or redemptions of the fund’s capital shares, including ETF Creation Units. |
| Admiral Shares | |||||
| For a Share Outstanding Throughout Each Period | Year Ended August 31, | ||||
| 2021 | 2020 | 2019 | 2018 | 2017 | |
| Net Asset Value, Beginning of Period | $55.06 | $44.46 | $44.25 | $47.67 | $48.50 |
| Investment Operations | |||||
| Net Investment Income1 | .519 | .512 | .470 | 1.554 | 1.601 |
| Net Realized and Unrealized Gain (Loss) on Investments | 21.259 | 10.571 | .157 | (3.199) | (.829) |
| Total from Investment Operations | 21.778 | 11.083 | .627 | (1.645) | .772 |
| Distributions | |||||
| Dividends from Net Investment Income | (.458) | (.483) | (.417) | (1.775) | (1.602) |
| Distributions from Realized Capital Gains | — | — | — | — | — |
| Total Distributions | (.458) | (.483) | (.417) | (1.775) | (1.602) |
| Net Asset Value, End of Period | $76.38 | $55.06 | $44.46 | $44.25 | $47.67 |
| Total Return2 | 39.76% | 25.16% | 1.46% | -3.48% | 1.61% |
| Ratios/Supplemental Data | |||||
| Net Assets, End of Period (Millions) | $124 | $67 | $50 | $46 | $50 |
| Ratio of Total Expenses to Average Net Assets | 0.10% | 0.10% | 0.10% | 0.10% | 0.10% |
| Ratio of Net Investment Income to Average Net Assets | 0.79% | 1.10% | 1.09% | 3.48% | 3.26% |
| Portfolio Turnover Rate3 | 15% | 15% | 33% | 84% | 18% |
| 1 | Calculated based on average shares outstanding. |
| 2 | Total returns do not include account service fees that may have applied in the periods shown. Fund prospectuses provide information about any applicable account service fees. |
| 3 | Excludes the value of portfolio securities received or delivered as a result of in-kind purchases or redemptions of the fund’s capital shares, including ETF Creation Units. |
| A. | The following significant accounting policies conform to generally accepted accounting principles for U.S. investment companies. The fund consistently follows such policies in preparing its financial statements. |
| B. | In accordance with the terms of a Funds' Service Agreement (the “FSA”) between Vanguard and the fund, Vanguard furnishes to the fund investment advisory, corporate management, administrative, marketing, and distribution services at Vanguard’s cost of operations (as defined by the FSA). These costs of operations are allocated to the fund based on methods and guidelines approved by the board of trustees and are generally settled twice a month. |
| C. | Various inputs may be used to determine the value of the fund’s investments and derivatives. These inputs are summarized in three broad levels for financial statement purposes. The inputs or methodologies used to value securities are not necessarily an indication of the risk associated with investing in those securities. |
| Level 1 ($000) | Level 2 ($000) | Level 3 ($000) | Total ($000) | |
| Investments | ||||
| Assets | ||||
| Common Stocks | 4,901,257 | — | — | 4,901,257 |
| Temporary Cash Investments | 53,931 | — | — | 53,931 |
| Total | 4,955,188 | — | — | 4,955,188 |
| Derivative Financial Instruments | ||||
| Assets | ||||
| Swap Contracts | — | 139 | — | 139 |
| Liabilities | ||||
| Swap Contracts | — | — | — | — |
| D. | Permanent differences between book-basis and tax-basis components of net assets are reclassified among capital accounts in the financial statements to reflect their tax character. These reclassifications have no effect on net assets or net asset value per share. As of period end, permanent differences primarily attributable to the accounting for in-kind redemptions and swap agreements were reclassified between the following accounts: |
| Amount ($000) | |
| Paid-in Capital | 370,966 |
| Total Distributable Earnings (Loss) | (370,966) |
| Amount ($000) | |
| Undistributed Ordinary Income | 11,792 |
| Undistributed Long-Term Gains | — |
| Capital Loss Carryforwards | (364,946) |
| Qualified Late-Year Losses | — |
| Net Unrealized Gains (Losses) | 1,236,583 |
| Year Ended August 31, | ||
| 2021 Amount ($000) | 2020 Amount ($000) | |
| Ordinary Income* | 25,168 | 23,046 |
| Long-Term Capital Gains | — | — |
| Total | 25,168 | 23,046 |
| * | Includes short-term capital gains, if any. |
| Amount ($000) | |
| Tax Cost | 3,718,606 |
| Gross Unrealized Appreciation | 1,360,440 |
| Gross Unrealized Depreciation | (123,857) |
| Net Unrealized Appreciation (Depreciation) | 1,236,583 |
| E. | During the year ended August 31, 2021, the fund purchased $2,272,488,000 of investment securities and sold $1,526,320,000 of investment securities, other than temporary cash investments. Purchases and sales include $1,651,055,000 and $976,726,000, respectively, in connection with in-kind purchases and redemptions of the fund's capital shares. |
| F. | Capital share transactions for each class of shares were: |
| Year Ended August 31, | |||||
| 2021 | 2020 | ||||
| Amount ($000) | Shares (000) | Amount ($000) | Shares (000) | ||
| ETF Shares | |||||
| Issued | 1,693,617 | 12,776 | 1,330,015 | 14,802 | |
| Issued in Lieu of Cash Distributions | — | — | — | — | |
| Redeemed | (973,652) | (7,800) | (965,210) | (10,950) | |
| Net Increase (Decrease)—ETF Shares | 719,965 | 4,976 | 364,805 | 3,852 | |
| Admiral Shares | |||||
| Issued | 58,573 | 900 | 39,541 | 862 | |
| Issued in Lieu of Cash Distributions | 544 | 9 | 448 | 10 | |
| Redeemed | (32,266) | (504) | (35,280) | (771) | |
| Net Increase (Decrease)—Admiral Shares | 26,851 | 405 | 4,709 | 101 | |
| G. | Management has determined that no events or transactions occurred subsequent to August 31, 2021, that would require recognition or disclosure in these financial statements. |

| Average Annual Total Returns Periods Ended August 31, 2021 | |||||
| One Year | Five Year | Ten Years | Final Value of a $10,000 Investment | ||
|
| Consumer Discretionary Index Fund ETF Shares Net Asset Value | 32.39% | 22.17% | 19.87% | $61,240 |
| Consumer Discretionary Index Fund ETF Shares Market Price | 32.32 | 22.17 | 19.87 | 61,237 | |
|
| Consumer Discretionary Spliced Index | 32.47 | 22.25 | 19.97 | 61,785 |
|
| MSCI US Investable Market 2500 Index | 33.59 | 18.08 | 16.28 | 45,188 |
| One Year | Five Years | Ten Years | Final Value of a $100,000 Investment | ||
| Consumer Discretionary Index Fund Admiral Shares | 32.39% | 22.18% | 19.87% | $612,572 | |
| Consumer Discretionary Spliced Index | 32.47 | 22.25 | 19.97 | 617,855 | |
| MSCI US Investable Market 2500 Index | 33.59 | 18.08 | 16.28 | 451,882 | |
| One Year | Five Years | Ten Years | |
| Consumer Discretionary Index Fund ETF Shares Market Price | 32.32% | 172.18% | 512.37% |
| Consumer Discretionary Index Fund ETF Shares Net Asset Value | 32.39 | 172.18 | 512.40 |
| Consumer Discretionary Spliced Index | 32.47 | 173.10 | 517.85 |
| Auto Components | 2.5% |
| Automobiles | 12.4 |
| Distributors | 1.0 |
| Diversified Consumer Services | 1.5 |
| Hotels, Restaurants & Leisure | 17.0 |
| Household Durables | 5.1 |
| Internet & Direct Marketing Retail | 27.6 |
| Leisure Products | 1.7 |
| Multiline Retail | 4.2 |
| Other | 0.0 |
| Specialty Retail | 19.7 |
| Textiles, Apparel & Luxury Goods | 7.3 |
| Shares | Market Value• ($000) | ||
| * | Fossil Group Inc. | 160,542 | 2,151 |
| * | Unifi Inc. | 72,926 | 1,695 |
| 543,065 | |||
| Total Common Stocks (Cost $4,999,135) | 7,417,781 | ||
| Temporary Cash Investments (0.0%) | |||
| Money Market Fund (0.0%) | |||
| 4,5 | Vanguard Market Liquidity Fund, 0.068% (Cost $915) | 9,149 | 915 |
| Total Investments (100.1%) (Cost $5,000,050) | 7,418,696 | ||
| Other Assets and Liabilities—Net (-0.1%) | (7,878) | ||
| Net Assets (100.0%) | 7,410,818 | ||
| Cost is in $000. | |||
| • | See Note A in Notes to Financial Statements. |
| * | Non-income-producing security. |
| 1 | Includes partial security positions on loan to broker-dealers. The total value of securities on loan is $843,000. |
| 2 | “Other” represents securities that are not classified by the fund’s benchmark index. |
| 3 | Security value determined using significant unobservable inputs. |
| 4 | Affiliated money market fund available only to Vanguard funds and certain trusts and accounts managed by Vanguard. Rate shown is the 7-day yield. |
| 5 | Collateral of $902,000 was received for securities on loan. |
| CVR—Contingent Value Rights. |
| ($000s, except shares and per-share amounts) | Amount |
| Assets | |
| Investments in Securities, at Value | |
| Unaffiliated Issuers (Cost $4,999,135) | 7,417,781 |
| Affiliated Issuers (Cost $915) | 915 |
| Total Investments in Securities | 7,418,696 |
| Investment in Vanguard | 245 |
| Receivables for Investment Securities Sold | 58,778 |
| Receivables for Accrued Income | 4,026 |
| Receivables for Capital Shares Issued | 1,003 |
| Total Assets | 7,482,748 |
| Liabilities | |
| Due to Custodian | 3,284 |
| Payables for Investment Securities Purchased | 61,811 |
| Collateral for Securities on Loan | 902 |
| Payables for Capital Shares Redeemed | 5,614 |
| Payables to Vanguard | 319 |
| Total Liabilities | 71,930 |
| Net Assets | 7,410,818 |
| At August 31, 2021, net assets consisted of: | |
| Paid-in Capital | 5,150,136 |
| Total Distributable Earnings (Loss) | 2,260,682 |
| Net Assets | 7,410,818 |
| ETF Shares—Net Assets | |
| Applicable to 20,742,318 outstanding $.001 par value shares of beneficial interest (unlimited authorization) | 6,658,089 |
| Net Asset Value Per Share—ETF Shares | $320.99 |
| Admiral Shares—Net Assets | |
| Applicable to 4,530,499 outstanding $.001 par value shares of beneficial interest (unlimited authorization) | 752,729 |
| Net Asset Value Per Share—Admiral Shares | $166.15 |
| ETF Shares | |||||
| For a Share Outstanding Throughout Each Period | Year Ended August 31, | ||||
| 2021 | 2020 | 2019 | 2018 | 2017 | |
| Net Asset Value, Beginning of Period | $246.86 | $178.51 | $180.85 | $141.74 | $126.45 |
| Investment Operations | |||||
| Net Investment Income1 | 1.724 | 1.998 | 2.052 | 2.066 | 2.068 |
| Net Realized and Unrealized Gain (Loss) on Investments | 76.697 | 68.603 | (2.391) | 39.031 | 15.248 |
| Total from Investment Operations | 78.421 | 70.601 | (.339) | 41.097 | 17.316 |
| Distributions | |||||
| Dividends from Net Investment Income | (4.291) | (2.251) | (2.001) | (1.987) | (2.026) |
| Distributions from Realized Capital Gains | — | — | — | — | — |
| Total Distributions | (4.291) | (2.251) | (2.001) | (1.987) | (2.026) |
| Net Asset Value, End of Period | $320.99 | $246.86 | $178.51 | $180.85 | $141.74 |
| Total Return | 32.39% | 39.98% | -0.14% | 29.22% | 13.81% |
| Ratios/Supplemental Data | |||||
| Net Assets, End of Period (Millions) | $6,658 | $4,026 | $3,049 | $3,199 | $2,198 |
| Ratio of Total Expenses to Average Net Assets | 0.10% | 0.10% | 0.10% | 0.10% | 0.10% |
| Ratio of Net Investment Income to Average Net Assets | 0.60% | 1.06% | 1.20% | 1.28% | 1.53% |
| Portfolio Turnover Rate2 | 8% | 10% | 9% | 28% | 6% |
| 1 | Calculated based on average shares outstanding. |
| 2 | Excludes the value of portfolio securities received or delivered as a result of in-kind purchases or redemptions of the fund’s capital shares, including ETF Creation Units. |
| Admiral Shares | |||||
| For a Share Outstanding Throughout Each Period | Year Ended August 31, | ||||
| 2021 | 2020 | 2019 | 2018 | 2017 | |
| Net Asset Value, Beginning of Period | $127.78 | $92.40 | $93.61 | $73.36 | $65.45 |
| Investment Operations | |||||
| Net Investment Income1 | .889 | 1.033 | 1.058 | 1.073 | 1.071 |
| Net Realized and Unrealized Gain (Loss) on Investments | 39.704 | 35.512 | (1.232) | 20.205 | 7.890 |
| Total from Investment Operations | 40.593 | 36.545 | (.174) | 21.278 | 8.961 |
| Distributions | |||||
| Dividends from Net Investment Income | (2.223) | (1.165) | (1.036) | (1.028) | (1.051) |
| Distributions from Realized Capital Gains | — | — | — | — | — |
| Total Distributions | (2.223) | (1.165) | (1.036) | (1.028) | (1.051) |
| Net Asset Value, End of Period | $166.15 | $127.78 | $92.40 | $93.61 | $73.36 |
| Total Return2 | 32.39% | 40.01% | -0.14% | 29.24% | 13.81% |
| Ratios/Supplemental Data | |||||
| Net Assets, End of Period (Millions) | $753 | $437 | $321 | $328 | $204 |
| Ratio of Total Expenses to Average Net Assets | 0.10% | 0.10% | 0.10% | 0.10% | 0.10% |
| Ratio of Net Investment Income to Average Net Assets | 0.60% | 1.06% | 1.20% | 1.28% | 1.53% |
| Portfolio Turnover Rate3 | 8% | 10% | 9% | 28% | 6% |
| 1 | Calculated based on average shares outstanding. |
| 2 | Total returns do not include account service fees that may have applied in the periods shown. Fund prospectuses provide information about any applicable account service fees. |
| 3 | Excludes the value of portfolio securities received or delivered as a result of in-kind purchases or redemptions of the fund’s capital shares, including ETF Creation Units. |
| A. | The following significant accounting policies conform to generally accepted accounting principles for U.S. investment companies. The fund consistently follows such policies in preparing its financial statements. |
| B. | In accordance with the terms of a Funds' Service Agreement (the “FSA”) between Vanguard and the fund, Vanguard furnishes to the fund investment advisory, corporate management, administrative, marketing, and distribution services at Vanguard’s cost of operations (as defined by the FSA). These costs of operations are allocated to the fund based on methods and guidelines approved by the board of trustees and are generally settled twice a month. |
| C. | Various inputs may be used to determine the value of the fund’s investments. These inputs are summarized in three broad levels for financial statement purposes. The inputs or methodologies used to value securities are not necessarily an indication of the risk associated with investing in those securities. |
| Level 1 ($000) | Level 2 ($000) | Level 3 ($000) | Total ($000) | |
| Investments | ||||
| Assets | ||||
| Common Stocks | 7,417,778 | — | 3 | 7,417,781 |
| Temporary Cash Investments | 915 | — | — | 915 |
| Total | 7,418,693 | — | 3 | 7,418,696 |
| D. | Permanent differences between book-basis and tax-basis components of net assets are reclassified among capital accounts in the financial statements to reflect their tax character. These reclassifications have no effect on net assets or net asset value per share. As of period end, permanent differences primarily attributable to the accounting for in-kind redemptions and swap agreements were reclassified between the following accounts: |
| Amount ($000) | |
| Paid-in Capital | 306,232 |
| Total Distributable Earnings (Loss) | (306,232) |
| Amount ($000) | |
| Undistributed Ordinary Income | 31,443 |
| Undistributed Long-Term Gains | — |
| Capital Loss Carryforwards | (182,279) |
| Qualified Late-Year Losses | — |
| Net Unrealized Gains (Losses) | 2,411,518 |
| Year Ended August 31, | ||
| 2021 Amount ($000) | 2020 Amount ($000) | |
| Ordinary Income* | 81,514 | 40,029 |
| Long-Term Capital Gains | — | — |
| Total | 81,514 | 40,029 |
| * | Includes short-term capital gains, if any. |
| Amount ($000) | |
| Tax Cost | 5,007,179 |
| Gross Unrealized Appreciation | 2,542,817 |
| Gross Unrealized Depreciation | (131,299) |
| Net Unrealized Appreciation (Depreciation) | 2,411,518 |
| E. | During the year ended August 31, 2021, the fund purchased $2,568,135,000 of investment securities and sold $1,038,125,000 of investment securities, other than temporary cash investments. Purchases and sales include $1,832,917,000 and $572,858,000, respectively, in connection with in-kind purchases and redemptions of the fund's capital shares. |
| F. | Capital share transactions for each class of shares were: |
| Year Ended August 31, | |||||
| 2021 | 2020 | ||||
| Amount ($000) | Shares (000) | Amount ($000) | Shares (000) | ||
| ETF Shares | |||||
| Issued | 1,907,066 | 6,682 | 928,490 | 4,882 | |
| Issued in Lieu of Cash Distributions | — | — | — | — | |
| Redeemed | (586,506) | (2,250) | (1,003,299) | (5,650) | |
| Net Increase (Decrease)—ETF Shares | 1,320,560 | 4,432 | (74,809) | (768) | |
| Admiral Shares | |||||
| Issued | 361,180 | 2,448 | 134,048 | 1,375 | |
| Issued in Lieu of Cash Distributions | 7,024 | 57 | 3,403 | 36 | |
| Redeemed | (205,345) | (1,392) | (134,606) | (1,465) | |
| Net Increase (Decrease)—Admiral Shares | 162,859 | 1,113 | 2,845 | (54) | |
| G. | Management has determined that no events or transactions occurred subsequent to August 31, 2021, that would require recognition or disclosure in these financial statements. |

| Average Annual Total Returns Periods Ended August 31, 2021 | |||||
| One Year | Five Year | Ten Years | Final Value of a $10,000 Investment | ||
|
| Consumer Staples Index Fund ETF Shares Net Asset Value | 15.01% | 8.81% | 11.90% | $30,773 |
| Consumer Staples Index Fund ETF Shares Market Price | 14.95 | 8.81 | 11.90 | 30,780 | |
|
| MSCI US Investable Market Consumer Staples 25/50 Index | 15.15 | 8.91 | 12.02 | 31,108 |
|
| MSCI US Investable Market 2500 Index | 33.59 | 18.08 | 16.28 | 45,188 |
| One Year | Five Years | Ten Years | Final Value of a $100,000 Investment | ||
| Consumer Staples Index Fund Admiral Shares | 15.04% | 8.82% | 11.91% | $308,089 | |
| MSCI US Investable Market Consumer Staples 25/50 Index | 15.15 | 8.91 | 12.02 | 311,081 | |
| MSCI US Investable Market 2500 Index | 33.59 | 18.08 | 16.28 | 451,882 | |
| One Year | Five Years | Ten Years | |
| Consumer Staples Index Fund ETF Shares Market Price | 14.95% | 52.55% | 207.80% |
| Consumer Staples Index Fund ETF Shares Net Asset Value | 15.01 | 52.53 | 207.73 |
| MSCI US Investable Market Consumer Staples 25/50 Index | 15.15 | 53.24 | 211.08 |
| Beverages | 22.6% |
| Food & Staples Retailing | 23.2 |
| Food Products | 19.6 |
| Household Products | 20.8 |
| Personal Products | 4.9 |
| Tobacco | 8.9 |
| Over-the-Counter Total Return Swaps | ||||||
| Reference Entity | Termination Date | Counterparty | Notional Amount ($000) | Floating Interest Rate Received (Paid)1 (%) | Value and Unrealized Appreciation ($000) | Value and Unrealized (Depreciation) ($000) |
| Campbell Soup Co. | 1/31/22 | GSI | 7,602 | (0.089) | — | (300) |
| 1 | Based on 1M USD London Interbank Offered Rate (LIBOR) as of the most recent payment date. Floating interest payment received/paid monthly. |
| 1M—1-month. | |
| GSI—Goldman Sachs International. |
| ($000s, except shares and per-share amounts) | Amount |
| Assets | |
| Investments in Securities, at Value | |
| Unaffiliated Issuers (Cost $5,570,326) | 6,751,737 |
| Affiliated Issuers (Cost $10,168) | 10,169 |
| Total Investments in Securities | 6,761,906 |
| Investment in Vanguard | 223 |
| Cash | 3 |
| Cash Collateral Pledged—Over-the-Counter Swap Contracts | 530 |
| Receivables for Investment Securities Sold | 176,672 |
| Receivables for Accrued Income | 8,503 |
| Receivables for Capital Shares Issued | 619 |
| Total Assets | 6,948,456 |
| Liabilities | |
| Due to Custodian | 1,378 |
| Payables for Investment Securities Purchased | 177,918 |
| Collateral for Securities on Loan | 10,172 |
| Payables for Capital Shares Redeemed | 4,389 |
| Payables to Vanguard | 298 |
| Unrealized Depreciation—Over-the-Counter Swap Contracts | 300 |
| Total Liabilities | 194,455 |
| Net Assets | 6,754,001 |
| At August 31, 2021, net assets consisted of: | |
| Paid-in Capital | 5,720,183 |
| Total Distributable Earnings (Loss) | 1,033,818 |
| Net Assets | 6,754,001 |
| ETF Shares—Net Assets | |
| Applicable to 31,490,135 outstanding $.001 par value shares of beneficial interest (unlimited authorization) | 5,907,922 |
| Net Asset Value Per Share—ETF Shares | $187.61 |
| Admiral Shares—Net Assets | |
| Applicable to 9,146,074 outstanding $.001 par value shares of beneficial interest (unlimited authorization) | 846,079 |
| Net Asset Value Per Share—Admiral Shares | $92.51 |
| ETF Shares | |||||
| For a Share Outstanding Throughout Each Period | Year Ended August 31, | ||||
| 2021 | 2020 | 2019 | 2018 | 2017 | |
| Net Asset Value, Beginning of Period | $167.31 | $154.72 | $140.13 | $140.15 | $139.97 |
| Investment Operations | |||||
| Net Investment Income1 | 4.385 | 3.992 | 3.896 | 3.603 | 3.651 |
| Net Realized and Unrealized Gain (Loss) on Investments | 20.341 | 12.658 | 14.346 | (.033) | .212 |
| Total from Investment Operations | 24.726 | 16.650 | 18.242 | 3.570 | 3.863 |
| Distributions | |||||
| Dividends from Net Investment Income | (4.427) | (4.060) | (3.652) | (3.590) | (3.683) |
| Distributions from Realized Capital Gains | — | — | — | — | — |
| Total Distributions | (4.427) | (4.060) | (3.652) | (3.590) | (3.683) |
| Net Asset Value, End of Period | $187.61 | $167.31 | $154.72 | $140.13 | $140.15 |
| Total Return | 15.01% | 11.01% | 13.24% | 2.60% | 2.83% |
| Ratios/Supplemental Data | |||||
| Net Assets, End of Period (Millions) | $5,908 | $5,712 | $5,296 | $3,983 | $3,780 |
| Ratio of Total Expenses to Average Net Assets | 0.10% | 0.10% | 0.10% | 0.10% | 0.10% |
| Ratio of Net Investment Income to Average Net Assets | 2.50% | 2.58% | 2.71% | 2.60% | 2.63% |
| Portfolio Turnover Rate2 | 8% | 3% | 6% | 8% | 5% |
| 1 | Calculated based on average shares outstanding. |
| 2 | Excludes the value of portfolio securities received or delivered as a result of in-kind purchases or redemptions of the fund’s capital shares, including ETF Creation Units. |
| Admiral Shares | |||||
| For a Share Outstanding Throughout Each Period | Year Ended August 31, | ||||
| 2021 | 2020 | 2019 | 2018 | 2017 | |
| Net Asset Value, Beginning of Period | $82.50 | $76.29 | $69.09 | $69.10 | $69.02 |
| Investment Operations | |||||
| Net Investment Income1 | 2.160 | 1.973 | 1.923 | 1.776 | 1.797 |
| Net Realized and Unrealized Gain (Loss) on Investments | 10.032 | 6.239 | 7.076 | (.018) | .101 |
| Total from Investment Operations | 12.192 | 8.212 | 8.999 | 1.758 | 1.898 |
| Distributions | |||||
| Dividends from Net Investment Income | (2.183) | (2.002) | (1.799) | (1.768) | (1.818) |
| Distributions from Realized Capital Gains | — | — | — | — | — |
| Total Distributions | (2.183) | (2.002) | (1.799) | (1.768) | (1.818) |
| Net Asset Value, End of Period | $92.51 | $82.50 | $76.29 | $69.09 | $69.10 |
| Total Return2 | 15.04% | 11.03% | 13.24% | 2.59% | 2.81% |
| Ratios/Supplemental Data | |||||
| Net Assets, End of Period (Millions) | $846 | $791 | $710 | $587 | $742 |
| Ratio of Total Expenses to Average Net Assets | 0.10% | 0.10% | 0.10% | 0.10% | 0.10% |
| Ratio of Net Investment Income to Average Net Assets | 2.50% | 2.59% | 2.71% | 2.60% | 2.63% |
| Portfolio Turnover Rate3 | 8% | 3% | 6% | 8% | 5% |
| 1 | Calculated based on average shares outstanding. |
| 2 | Total returns do not include account service fees that may have applied in the periods shown. Fund prospectuses provide information about any applicable account service fees. |
| 3 | Excludes the value of portfolio securities received or delivered as a result of in-kind purchases or redemptions of the fund’s capital shares, including ETF Creation Units. |
| A. | The following significant accounting policies conform to generally accepted accounting principles for U.S. investment companies. The fund consistently follows such policies in preparing its financial statements. |
| B. | In accordance with the terms of a Funds' Service Agreement (the “FSA”) between Vanguard and the fund, Vanguard furnishes to the fund investment advisory, corporate management, administrative, marketing, and distribution services at Vanguard’s cost of operations (as defined by the FSA). These costs of operations are allocated to the fund based on methods and guidelines approved by the board of trustees and are generally settled twice a month. |
| C. | Various inputs may be used to determine the value of the fund’s investments and derivatives. These inputs are summarized in three broad levels for financial statement purposes. The inputs or methodologies used to value securities are not necessarily an indication of the risk associated with investing in those securities. |
| Level 1 ($000) | Level 2 ($000) | Level 3 ($000) | Total ($000) | |
| Investments | ||||
| Assets | ||||
| Common Stocks | 6,751,737 | — | — | 6,751,737 |
| Temporary Cash Investments | 10,169 | — | — | 10,169 |
| Total | 6,761,906 | — | — | 6,761,906 |
| Derivative Financial Instruments | ||||
| Liabilities | ||||
| Swap Contracts | — | 300 | — | 300 |
| D. | Permanent differences between book-basis and tax-basis components of net assets are reclassified among capital accounts in the financial statements to reflect their tax character. These reclassifications have no effect on net assets or net asset value per share. As of period end, permanent differences primarily attributable to the accounting for in-kind redemptions and swap agreements were reclassified between the following accounts: |
| Amount ($000) | |
| Paid-in Capital | 428,613 |
| Total Distributable Earnings (Loss) | (428,613) |
| Amount ($000) | |
| Undistributed Ordinary Income | 23,842 |
| Undistributed Long-Term Gains | — |
| Capital Loss Carryforwards | (168,707) |
| Qualified Late-Year Losses | — |
| Net Unrealized Gains (Losses) | 1,178,683 |
| Year Ended August 31, | ||
| 2021 Amount ($000) | 2020 Amount ($000) | |
| Ordinary Income* | 163,911 | 159,148 |
| Long-Term Capital Gains | — | — |
| Total | 163,911 | 159,148 |
| * | Includes short-term capital gains, if any. |
| Amount ($000) | |
| Tax Cost | 5,583,223 |
| Gross Unrealized Appreciation | 1,442,847 |
| Gross Unrealized Depreciation | (264,164) |
| Net Unrealized Appreciation (Depreciation) | 1,178,683 |
| E. | During the year ended August 31, 2021, the fund purchased $1,324,378,000 of investment securities and sold $1,779,304,000 of investment securities, other than temporary cash investments. Purchases and sales include $768,932,000 and $1,298,044,000, respectively, in connection with in-kind purchases and redemptions of the fund's capital shares. |
| F. | Capital share transactions for each class of shares were: |
| Year Ended August 31, | |||||
| 2021 | 2020 | ||||
| Amount ($000) | Shares (000) | Amount ($000) | Shares (000) | ||
| ETF Shares | |||||
| Issued | 871,879 | 4,824 | 1,146,786 | 7,587 | |
| Issued in Lieu of Cash Distributions | — | — | — | — | |
| Redeemed | (1,304,630) | (7,475) | (1,152,447) | (7,675) | |
| Net Increase (Decrease)—ETF Shares | (432,751) | (2,651) | (5,661) | (88) | |
| Admiral Shares | |||||
| Issued | 211,742 | 2,456 | 294,479 | 3,969 | |
| Issued in Lieu of Cash Distributions | 16,733 | 197 | 15,970 | 211 | |
| Redeemed | (265,847) | (3,092) | (287,989) | (3,896) | |
| Net Increase (Decrease)—Admiral Shares | (37,372) | (439) | 22,460 | 284 | |
| G. | Management has determined that no events or transactions occurred subsequent to August 31, 2021, that would require recognition or disclosure in these financial statements. |

| Average Annual Total Returns Periods Ended August 31, 2021 | |||||
| One Year | Five Year | Ten Years | Final Value of a $10,000 Investment | ||
|
| Energy Index Fund ETF Shares Net Asset Value | 48.07% | -3.21% | -1.01% | $9,036 |
| Energy Index Fund ETF Shares Market Price | 47.91 | -3.21 | -1.01 | 9,034 | |
|
| MSCI US Investable Market Energy 25/50 Index | 48.27 | -3.12 | -0.88 | 9,154 |
|
| MSCI US Investable Market 2500 Index | 33.59 | 18.08 | 16.28 | 45,188 |
| One Year | Five Years | Ten Years | Final Value of a $100,000 Investment | ||
| Energy Index Fund Admiral Shares | 48.18% | -3.18% | -0.98% | $90,583 | |
| MSCI US Investable Market Energy 25/50 Index | 48.27 | -3.12 | -0.88 | 91,542 | |
| MSCI US Investable Market 2500 Index | 33.59 | 18.08 | 16.28 | 451,882 | |
| One Year | Five Years | Ten Years | |
| Energy Index Fund ETF Shares Market Price | 47.91% | -15.07% | -9.66% |
| Energy Index Fund ETF Shares Net Asset Value | 48.07 | -15.04 | -9.64 |
| MSCI US Investable Market Energy 25/50 Index | 48.27 | -14.65 | -8.46 |
| Coal & Consumable Fuels | 0.1% |
| Integrated Oil & Gas | 39.7 |
| Oil & Gas Drilling | 0.8 |
| Oil & Gas Equipment & Services | 9.2 |
| Oil & Gas Exploration & Production | 27.1 |
| Oil & Gas Refining & Marketing | 10.9 |
| Oil & Gas Storage & Transportation | 12.2 |
| Over-the-Counter Total Return Swaps | ||||||
| Reference Entity | Termination Date | Counterparty | Notional Amount ($000) | Floating Interest Rate Received (Paid) (%) | Value and Unrealized Appreciation ($000) | Value and Unrealized (Depreciation) ($000) |
| Cheniere Energy Inc. | 8/31/22 | BOANA | 6,122 | (0.080)1 | — | — |
| Hess Corp. | 1/31/22 | GSI | 20,238 | (0.089)2 | 386 | — |
| 386 | — | |||||
| 1 | Based on 1M USD Overnight Bank Funding Rate as of the most recent payment date. Floating interest payment received/paid monthly. |
| 2 | Based on 1M USD London Interbank Offered Rate (LIBOR) as of the most recent payment date. Floating interest payment received/paid monthly. |
| 1M—1-month. | |
| BOANA—Bank of America, N.A. | |
| GSI—Goldman Sachs International. |
| ($000s, except shares and per-share amounts) | Amount |
| Assets | |
| Investments in Securities, at Value | |
| Unaffiliated Issuers (Cost $7,063,427) | 5,879,179 |
| Affiliated Issuers (Cost $8) | 8 |
| Total Investments in Securities | 5,879,187 |
| Investment in Vanguard | 206 |
| Cash Collateral Pledged—Over-the-Counter Swap Contracts | 20 |
| Receivables for Investment Securities Sold | 65,592 |
| Receivables for Accrued Income | 45,511 |
| Receivables for Capital Shares Issued | 933 |
| Unrealized Appreciation—Over-the-Counter Swap Contracts | 386 |
| Total Assets | 5,991,835 |
| Liabilities | |
| Due to Custodian | 19,122 |
| Payables for Investment Securities Purchased | 66,054 |
| Payables for Capital Shares Redeemed | 491 |
| Payables to Vanguard | 255 |
| Total Liabilities | 85,922 |
| Net Assets | 5,905,913 |
| At August 31, 2021, net assets consisted of: | |
| Paid-in Capital | 8,173,012 |
| Total Distributable Earnings (Loss) | (2,267,099) |
| Net Assets | 5,905,913 |
| ETF Shares—Net Assets | |
| Applicable to 70,676,629 outstanding $.001 par value shares of beneficial interest (unlimited authorization) | 4,805,573 |
| Net Asset Value Per Share—ETF Shares | $67.99 |
| Admiral Shares—Net Assets | |
| Applicable to 32,394,551 outstanding $.001 par value shares of beneficial interest (unlimited authorization) | 1,100,340 |
| Net Asset Value Per Share—Admiral Shares | $33.97 |
| ETF Shares | |||||
| For a Share Outstanding Throughout Each Period | Year Ended August 31, | ||||
| 2021 | 2020 | 2019 | 2018 | 2017 | |
| Net Asset Value, Beginning of Period | $47.90 | $75.75 | $103.13 | $85.71 | $95.06 |
| Investment Operations | |||||
| Net Investment Income1 | 2.802 | 2.957 | 2.769 | 2.519 | 2.8192 |
| Net Realized and Unrealized Gain (Loss) on Investments | 19.789 | (28.064) | (27.449) | 17.837 | (9.801) |
| Total from Investment Operations | 22.591 | (25.107) | (24.680) | 20.356 | (6.982) |
| Distributions | |||||
| Dividends from Net Investment Income | (2.501) | (2.743) | (2.700) | (2.936) | (2.368) |
| Distributions from Realized Capital Gains | — | — | — | — | — |
| Total Distributions | (2.501) | (2.743) | (2.700) | (2.936) | (2.368) |
| Net Asset Value, End of Period | $67.99 | $47.90 | $75.75 | $103.13 | $85.71 |
| Total Return | 48.07% | -33.87% | -24.34% | 24.06% | -7.55% |
| Ratios/Supplemental Data | |||||
| Net Assets, End of Period (Millions) | $4,806 | $2,720 | $3,029 | $4,288 | $3,656 |
| Ratio of Total Expenses to Average Net Assets | 0.10% | 0.10% | 0.10% | 0.10% | 0.10% |
| Ratio of Net Investment Income to Average Net Assets | 4.54% | 4.91% | 3.15% | 2.56% | 2.93%2 |
| Portfolio Turnover Rate3 | 5% | 8% | 7% | 5% | 11% |
| 1 | Calculated based on average shares outstanding. |
| 2 | Net investment income per share and the ratio of net investment income to average net assets include $.453 and 0.47%, respectively, from income received as a result of General Electric Co. and Baker Hughes Inc. merger in July 2017. |
| 3 | Excludes the value of portfolio securities received or delivered as a result of in-kind purchases or redemptions of the fund’s capital shares, including ETF Creation Units. |
| Admiral Shares | |||||
| For a Share Outstanding Throughout Each Period | Year Ended August 31, | ||||
| 2021 | 2020 | 2019 | 2018 | 2017 | |
| Net Asset Value, Beginning of Period | $23.93 | $37.84 | $51.52 | $42.82 | $47.49 |
| Investment Operations | |||||
| Net Investment Income1 | 1.435 | 1.461 | 1.388 | 1.249 | 1.3752 |
| Net Realized and Unrealized Gain (Loss) on Investments | 9.855 | (14.001) | (13.720) | 8.916 | (4.863) |
| Total from Investment Operations | 11.290 | (12.540) | (12.332) | 10.165 | (3.488) |
| Distributions | |||||
| Dividends from Net Investment Income | (1.250) | (1.370) | (1.348) | (1.465) | (1.182) |
| Distributions from Realized Capital Gains | — | — | — | — | — |
| Total Distributions | (1.250) | (1.370) | (1.348) | (1.465) | (1.182) |
| Net Asset Value, End of Period | $33.97 | $23.93 | $37.84 | $51.52 | $42.82 |
| Total Return3 | 48.18% | -33.82% | -24.33% | 24.06% | -7.56% |
| Ratios/Supplemental Data | |||||
| Net Assets, End of Period (Millions) | $1,100 | $407 | $468 | $642 | $523 |
| Ratio of Total Expenses to Average Net Assets | 0.10% | 0.10% | 0.10% | 0.10% | 0.10% |
| Ratio of Net Investment Income to Average Net Assets | 4.52% | 4.84% | 3.15% | 2.56% | 2.93%2 |
| Portfolio Turnover Rate4 | 5% | 8% | 7% | 5% | 11% |
| 1 | Calculated based on average shares outstanding. |
| 2 | Net investment income per share and the ratio of net investment income to average net assets include $.228 and 0.47%, respectively, from income received as a result of General Electric Co. and Baker Hughes Inc. merger in July 2017. |
| 3 | Total returns do not include account service fees that may have applied in the periods shown. Fund prospectuses provide information about any applicable account service fees. |
| 4 | Excludes the value of portfolio securities received or delivered as a result of in-kind purchases or redemptions of the fund’s capital shares, including ETF Creation Units. |
| A. | The following significant accounting policies conform to generally accepted accounting principles for U.S. investment companies. The fund consistently follows such policies in preparing its financial statements. |
| B. | In accordance with the terms of a Funds' Service Agreement (the “FSA”) between Vanguard and the fund, Vanguard furnishes to the fund investment advisory, corporate management, administrative, marketing, and distribution services at Vanguard’s cost of operations (as defined by the FSA). These costs of operations are allocated to the fund based on methods and guidelines approved by the board of trustees and are generally settled twice a month. |
| C. | Various inputs may be used to determine the value of the fund’s investments and derivatives. These inputs are summarized in three broad levels for financial statement purposes. The inputs or methodologies used to value securities are not necessarily an indication of the risk associated with investing in those securities. |
| Level 1 ($000) | Level 2 ($000) | Level 3 ($000) | Total ($000) | |
| Investments | ||||
| Assets | ||||
| Common Stocks | 5,866,811 | 12,368 | — | 5,879,179 |
| Temporary Cash Investments | 8 | — | — | 8 |
| Total | 5,866,819 | 12,368 | — | 5,879,187 |
| Derivative Financial Instruments | ||||
| Assets | ||||
| Swap Contracts | — | 386 | — | 386 |
| Liabilities | ||||
| Swap Contracts | — | — | — | — |
| D. | Permanent differences between book-basis and tax-basis components of net assets are reclassified among capital accounts in the financial statements to reflect their tax character. These reclassifications have no effect on net assets or net asset value per share. As of period end, permanent differences primarily attributable to the accounting for in-kind redemptions, foreign currency transactions, and swap agreements were reclassified between the following accounts: |
| Amount ($000) | |
| Paid-in Capital | 274,387 |
| Total Distributable Earnings (Loss) | (274,387) |
| Amount ($000) | |
| Undistributed Ordinary Income | 72,459 |
| Undistributed Long-Term Gains | — |
| Capital Loss Carryforwards | (1,086,540) |
| Qualified Late-Year Losses | — |
| Net Unrealized Gains (Losses) | (1,253,018) |
| Year Ended August 31, | ||
| 2021 Amount ($000) | 2020 Amount ($000) | |
| Ordinary Income* | 198,557 | 143,456 |
| Long-Term Capital Gains | — | — |
| Total | 198,557 | 143,456 |
| * | Includes short-term capital gains, if any. |
| Amount ($000) | |
| Tax Cost | 7,132,206 |
| Gross Unrealized Appreciation | 576,590 |
| Gross Unrealized Depreciation | (1,829,608) |
| Net Unrealized Appreciation (Depreciation) | (1,253,018) |
| E. | During the year ended August 31, 2021, the fund purchased $2,353,846,000 of investment securities and sold $1,087,860,000 of investment securities, other than temporary cash investments. Purchases and sales include $1,450,064,000 and $862,019,000, respectively, in connection with in-kind purchases and redemptions of the fund's capital shares. |
| F. | Capital share transactions for each class of shares were: |
| Year Ended August 31, | |||||
| 2021 | 2020 | ||||
| Amount ($000) | Shares (000) | Amount ($000) | Shares (000) | ||
| ETF Shares | |||||
| Issued | 1,677,226 | 28,056 | 1,802,367 | 36,134 | |
| Issued in Lieu of Cash Distributions | — | — | — | — | |
| Redeemed | (864,387) | (14,150) | (1,108,388) | (19,350) | |
| Net Increase (Decrease)—ETF Shares | 812,839 | 13,906 | 693,979 | 16,784 | |
| Admiral Shares | |||||
| Issued | 770,533 | 26,470 | 415,739 | 16,420 | |
| Issued in Lieu of Cash Distributions | 30,065 | 981 | 16,719 | 566 | |
| Redeemed | (376,284) | (12,066) | (350,766) | (12,349) | |
| Net Increase (Decrease)—Admiral Shares | 424,314 | 15,385 | 81,692 | 4,637 | |
| G. | Management has determined that no events or transactions occurred subsequent to August 31, 2021, that would require recognition or disclosure in these financial statements. |

| Average Annual Total Returns Periods Ended August 31, 2021 | |||||
| One Year | Five Year | Ten Years | Final Value of a $10,000 Investment | ||
|
| Financials Index Fund ETF Shares Net Asset Value | 58.26% | 15.69% | 15.25% | $41,356 |
| Financials Index Fund ETF Shares Market Price | 58.22 | 15.69 | 15.25 | 41,340 | |
|
| MSCI US Investable Market Financials 25/50 Index | 58.41 | 15.80 | 15.36 | 41,747 |
|
| MSCI US Investable Market 2500 Index | 33.59 | 18.08 | 16.28 | 45,188 |
| One Year | Five Years | Ten Years | Final Value of a $100,000 Investment | ||
| Financials Index Fund Admiral Shares | 58.32% | 15.70% | 15.26% | $413,815 | |
| MSCI US Investable Market Financials 25/50 Index | 58.41 | 15.80 | 15.36 | 417,472 | |
| MSCI US Investable Market 2500 Index | 33.59 | 18.08 | 16.28 | 451,882 | |
| One Year | Five Years | Ten Years | |
| Financials Index Fund ETF Shares Market Price | 58.22% | 107.27% | 313.40% |
| Financials Index Fund ETF Shares Net Asset Value | 58.26 | 107.25 | 313.56 |
| MSCI US Investable Market Financials 25/50 Index | 58.41 | 108.25 | 317.47 |
| Banks | 37.5% |
| Capital Markets | 27.9 |
| Consumer Finance | 6.2 |
| Diversified Financial Services | 7.7 |
| Insurance | 18.1 |
| IT Services | 0.0 |
| Mortgage Real Estate Investment Trusts (REITs) | 1.4 |
| Other | 0.0 |
| Thrifts & Mortgage Finance | 1.2 |
| Shares | Market Value• ($000) | ||
| Temporary Cash Investments (0.2%) | |||
| Money Market Fund (0.2%) | |||
| 4,5 | Vanguard Market Liquidity Fund, 0.068% (Cost $19,582) | 195,835 | 19,584 |
| Total Investments (100.0%) (Cost $9,110,197) | 11,764,231 | ||
| Other Assets and Liabilities—Net (0.0%) | 3,641 | ||
| Net Assets (100.0%) | 11,767,872 | ||
| Cost is in $000. | |||
| • | See Note A in Notes to Financial Statements. |
| * | Non-income-producing security. |
| 1 | Includes partial security positions on loan to broker-dealers. The total value of securities on loan is $8,167,000. |
| 2 | “Other” represents securities that are not classified by the fund’s benchmark index. |
| 3 | Security value determined using significant unobservable inputs. |
| 4 | Affiliated money market fund available only to Vanguard funds and certain trusts and accounts managed by Vanguard. Rate shown is the 7-day yield. |
| 5 | Collateral of $8,398,000 was received for securities on loan. |
| CVR—Contingent Value Rights. |
| REIT—Real Estate Investment Trust. |
| Over-the-Counter Total Return Swaps | ||||||
| Reference Entity | Termination Date | Counterparty | Notional Amount ($000) | Floating Interest Rate Received (Paid)1 (%) | Value and Unrealized Appreciation ($000) | Value and Unrealized (Depreciation) ($000) |
| T Rowe Price Group Inc. | 8/31/22 | BOANA | 22,387 | 0.020 | — | — |
| 1 | Based on 1M USD Overnight Bank Funding Rate as of the most recent payment date. Floating interest payment received/paid monthly. |
| 1M—1-month. | |
| BOANA—Bank of America, N.A. |
| ($000s, except shares and per-share amounts) | Amount |
| Assets | |
| Investments in Securities, at Value | |
| Unaffiliated Issuers (Cost $9,090,615) | 11,744,647 |
| Affiliated Issuers (Cost $19,582) | 19,584 |
| Total Investments in Securities | 11,764,231 |
| Investment in Vanguard | 378 |
| Receivables for Investment Securities Sold | 52,228 |
| Receivables for Accrued Income | 12,610 |
| Receivables for Capital Shares Issued | 734 |
| Unrealized Appreciation—Over-the-Counter Swap Contracts | — |
| Total Assets | 11,830,181 |
| Liabilities | |
| Due to Custodian | 1,168 |
| Payables for Investment Securities Purchased | 50,270 |
| Collateral for Securities on Loan | 8,398 |
| Payables for Capital Shares Redeemed | 1,958 |
| Payables to Vanguard | 515 |
| Total Liabilities | 62,309 |
| Net Assets | 11,767,872 |
| At August 31, 2021, net assets consisted of: | |
| Paid-in Capital | 9,212,074 |
| Total Distributable Earnings (Loss) | 2,555,798 |
| Net Assets | 11,767,872 |
| ETF Shares—Net Assets | |
| Applicable to 115,476,377 outstanding $.001 par value shares of beneficial interest (unlimited authorization) | 10,945,972 |
| Net Asset Value Per Share—ETF Shares | $94.79 |
| Admiral Shares—Net Assets | |
| Applicable to 17,301,118 outstanding $.001 par value shares of beneficial interest (unlimited authorization) | 821,900 |
| Net Asset Value Per Share—Admiral Shares | $47.51 |
| ETF Shares | |||||
| For a Share Outstanding Throughout Each Period | Year Ended August 31, | ||||
| 2021 | 2020 | 2019 | 2018 | 2017 | |
| Net Asset Value, Beginning of Period | $61.18 | $67.31 | $71.60 | $62.26 | $50.81 |
| Investment Operations | |||||
| Net Investment Income1 | 1.676 | 1.652 | 1.539 | 1.298 | 1.035 |
| Net Realized and Unrealized Gain (Loss) on Investments | 33.519 | (6.081) | (4.338) | 9.307 | 11.387 |
| Total from Investment Operations | 35.195 | (4.429) | (2.799) | 10.605 | 12.422 |
| Distributions | |||||
| Dividends from Net Investment Income | (1.585) | (1.701) | (1.491) | (1.265) | (.972) |
| Distributions from Realized Capital Gains | — | — | — | — | — |
| Total Distributions | (1.585) | (1.701) | (1.491) | (1.265) | (.972) |
| Net Asset Value, End of Period | $94.79 | $61.18 | $67.31 | $71.60 | $62.26 |
| Total Return | 58.26% | -6.73% | -3.85% | 17.15% | 24.65% |
| Ratios/Supplemental Data | |||||
| Net Assets, End of Period (Millions) | $10,946 | $6,140 | $7,222 | $8,512 | $6,127 |
| Ratio of Total Expenses to Average Net Assets | 0.10% | 0.10% | 0.10% | 0.10% | 0.10% |
| Ratio of Net Investment Income to Average Net Assets | 2.09% | 2.53% | 2.30% | 1.87% | 1.75% |
| Portfolio Turnover Rate2 | 4% | 5% | 5% | 3% | 5% |
| 1 | Calculated based on average shares outstanding. |
| 2 | Excludes the value of portfolio securities received or delivered as a result of in-kind purchases or redemptions of the fund’s capital shares, including ETF Creation Units. |
| Admiral Shares | |||||
| For a Share Outstanding Throughout Each Period | Year Ended August 31, | ||||
| 2021 | 2020 | 2019 | 2018 | 2017 | |
| Net Asset Value, Beginning of Period | $30.66 | $33.73 | $35.88 | $31.20 | $25.47 |
| Investment Operations | |||||
| Net Investment Income1 | .841 | .828 | .771 | .651 | .514 |
| Net Realized and Unrealized Gain (Loss) on Investments | 16.803 | (3.046) | (2.174) | 4.663 | 5.704 |
| Total from Investment Operations | 17.644 | (2.218) | (1.403) | 5.314 | 6.218 |
| Distributions | |||||
| Dividends from Net Investment Income | (.794) | (.852) | (.747) | (.634) | (.488) |
| Distributions from Realized Capital Gains | — | — | — | — | — |
| Total Distributions | (.794) | (.852) | (.747) | (.634) | (.488) |
| Net Asset Value, End of Period | $47.51 | $30.66 | $33.73 | $35.88 | $31.20 |
| Total Return2 | 58.32% | -6.70% | -3.87% | 17.16% | 24.62% |
| Ratios/Supplemental Data | |||||
| Net Assets, End of Period (Millions) | $822 | $432 | $490 | $690 | $518 |
| Ratio of Total Expenses to Average Net Assets | 0.10% | 0.10% | 0.10% | 0.10% | 0.10% |
| Ratio of Net Investment Income to Average Net Assets | 2.09% | 2.53% | 2.30% | 1.87% | 1.75% |
| Portfolio Turnover Rate3 | 4% | 5% | 5% | 3% | 5% |
| 1 | Calculated based on average shares outstanding. |
| 2 | Total returns do not include account service fees that may have applied in the periods shown. Fund prospectuses provide information about any applicable account service fees. |
| 3 | Excludes the value of portfolio securities received or delivered as a result of in-kind purchases or redemptions of the fund’s capital shares, including ETF Creation Units. |
| A. | The following significant accounting policies conform to generally accepted accounting principles for U.S. investment companies. The fund consistently follows such policies in preparing its financial statements. |
| B. | In accordance with the terms of a Funds' Service Agreement (the “FSA”) between Vanguard and the fund, Vanguard furnishes to the fund investment advisory, corporate management, administrative, marketing, and distribution services at Vanguard’s cost of operations (as defined by the FSA). These costs of operations are allocated to the fund based on methods and guidelines approved by the board of trustees and are generally settled twice a month. |
| C. | Various inputs may be used to determine the value of the fund’s investments and derivatives. These inputs are summarized in three broad levels for financial statement purposes. The inputs or methodologies used to value securities are not necessarily an indication of the risk associated with investing in those securities. |
| Level 1 ($000) | Level 2 ($000) | Level 3 ($000) | Total ($000) | |
| Investments | ||||
| Assets | ||||
| Common Stocks | 11,744,618 | — | 4 | 11,744,622 |
| Corporate Bonds | — | 25 | — | 25 |
| Temporary Cash Investments | 19,584 | — | — | 19,584 |
| Total | 11,764,202 | 25 | 4 | 11,764,231 |
| Derivative Financial Instruments | ||||
| Assets | ||||
| Swap Contracts | — | — | — | — |
| D. | Permanent differences between book-basis and tax-basis components of net assets are reclassified among capital accounts in the financial statements to reflect their tax character. These reclassifications have no effect on net assets or net asset value per share. As of period end, permanent differences primarily attributable to the accounting for in-kind redemptions and swap agreements were reclassified between the following accounts: |
| Amount ($000) | |
| Paid-in Capital | 453,162 |
| Total Distributable Earnings (Loss) | (453,162) |
| Amount ($000) | |
| Undistributed Ordinary Income | 55,567 |
| Undistributed Long-Term Gains | — |
| Capital Loss Carryforwards | (143,547) |
| Qualified Late-Year Losses | — |
| Net Unrealized Gains (Losses) | 2,643,778 |
| Year Ended August 31, | ||
| 2021 Amount ($000) | 2020 Amount ($000) | |
| Ordinary Income* | 181,790 | 187,892 |
| Long-Term Capital Gains | — | — |
| Total | 181,790 | 187,892 |
| * | Includes short-term capital gains, if any. |
| Amount ($000) | |
| Tax Cost | 9,120,453 |
| Gross Unrealized Appreciation | 2,888,847 |
| Gross Unrealized Depreciation | (245,069) |
| Net Unrealized Appreciation (Depreciation) | 2,643,778 |
| E. | During the year ended August 31, 2021, the fund purchased $3,370,489,000 of investment securities and sold $1,913,762,000 of investment securities, other than temporary cash investments. Purchases and sales include $2,686,917,000 and $1,547,082,000, respectively, in connection with in-kind purchases and redemptions of the fund's capital shares. |
| F. | Capital share transactions for each class of shares were: |
| Year Ended August 31, | |||||
| 2021 | 2020 | ||||
| Amount ($000) | Shares (000) | Amount ($000) | Shares (000) | ||
| ETF Shares | |||||
| Issued | 2,863,520 | 35,814 | 1,881,744 | 30,583 | |
| Issued in Lieu of Cash Distributions | — | — | — | — | |
| Redeemed | (1,560,037) | (20,700) | (2,335,793) | (37,525) | |
| Net Increase (Decrease)—ETF Shares | 1,303,483 | 15,114 | (454,049) | (6,942) | |
| Admiral Shares | |||||
| Issued | 407,353 | 10,001 | 245,111 | 8,139 | |
| Issued in Lieu of Cash Distributions | 10,077 | 270 | 10,126 | 310 | |
| Redeemed | (283,504) | (7,060) | (269,610) | (8,886) | |
| Net Increase (Decrease)—Admiral Shares | 133,926 | 3,211 | (14,373) | (437) | |
| G. | Management has determined that no events or transactions occurred subsequent to August 31, 2021, that would require recognition or disclosure in these financial statements. |

| Average Annual Total Returns Periods Ended August 31, 2021 | |||||
| One Year | Five Year | Ten Years | Final Value of a $10,000 Investment | ||
|
| Health Care Index Fund ETF Shares Net Asset Value | 27.99% | 16.23% | 17.71% | $51,071 |
| Health Care Index Fund ETF Shares Market Price | 27.93 | 16.23 | 17.71 | 51,075 | |
|
| MSCI US Investable Market Health Care 25/50 Index | 28.11 | 16.31 | 17.80 | 51,444 |
|
| MSCI US Investable Market 2500 Index | 33.59 | 18.08 | 16.28 | 45,188 |
| One Year | Five Years | Ten Years | Final Value of a $100,000 Investment | ||
| Health Care Index Fund Admiral Shares | 28.01% | 16.24% | 17.72% | $511,046 | |
| MSCI US Investable Market Health Care 25/50 Index | 28.11 | 16.31 | 17.80 | 514,441 | |
| MSCI US Investable Market 2500 Index | 33.59 | 18.08 | 16.28 | 451,882 | |
| One Year | Five Years | Ten Years | |
| Health Care Index Fund ETF Shares Market Price | 27.93% | 112.15% | 410.75% |
| Health Care Index Fund ETF Shares Net Asset Value | 27.99 | 112.13 | 410.71 |
| MSCI US Investable Market Health Care 25/50 Index | 28.11 | 112.82 | 414.44 |
| Biotechnology | 19.0% |
| Health Care Equipment & Supplies | 26.6 |
| Health Care Providers & Services | 18.0 |
| Health Care Technology | 2.2 |
| Life Sciences Tools & Services | 10.3 |
| Pharmaceuticals | 23.9 |
| Shares | Market Value• ($000) | ||
| * | NGM Biopharmaceuticals Inc. | 99,286 | 2,167 |
| * | Aerie Pharmaceuticals Inc. | 143,824 | 2,144 |
| * | Collegium Pharmaceutical Inc. | 101,084 | 2,075 |
| * | Antares Pharma Inc. | 513,163 | 2,022 |
| * | Cara Therapeutics Inc. | 126,092 | 1,990 |
| *,1 | Axsome Therapeutics Inc. | 77,467 | 1,989 |
| * | Harmony Biosciences Holdings Inc. | 54,029 | 1,831 |
| * | Amneal Pharmaceuticals Inc. | 309,448 | 1,745 |
| * | Endo International plc | 736,956 | 1,688 |
| Phibro Animal Health Corp. Class A | 65,935 | 1,602 | |
| * | Phathom Pharmaceuticals Inc. | 44,402 | 1,580 |
| * | Atea Pharmaceuticals Inc. | 52,348 | 1,556 |
| * | Theravance Biopharma Inc. | 175,102 | 1,453 |
| * | Evolus Inc. | 103,653 | 1,099 |
| * | Provention Bio Inc. | 150,173 | 1,008 |
| *,1 | Esperion Therapeutics Inc. | 75,154 | 978 |
| * | SIGA Technologies Inc. | 145,497 | 950 |
| * | Athira Pharma Inc. | 89,082 | 943 |
| *,1 | TherapeuticsMD Inc. | 1,181,452 | 939 |
| * | Relmada Therapeutics Inc. | 37,969 | 908 |
| * | Pliant Therapeutics Inc. | 40,958 | 747 |
| 4,747,149 | |||
| Total Common Stocks (Cost $13,287,610) | 19,850,945 | ||
| Temporary Cash Investments (0.3%) | |||
| Money Market Fund (0.3%) | |||
| 3,4 | Vanguard Market Liquidity Fund, 0.068% (Cost $45,193) | 452,030 | 45,203 |
| Total Investments (100.2%) (Cost $13,332,803) | 19,896,148 | ||
| Other Assets and Liabilities—Net (-0.2%) | (30,468) | ||
| Net Assets (100.0%) | 19,865,680 | ||
| Cost is in $000. | |||
| • | See Note A in Notes to Financial Statements. |
| * | Non-income-producing security. |
| 1 | Includes partial security positions on loan to broker-dealers. The total value of securities on loan is $43,844,000. |
| 2 | Security value determined using significant unobservable inputs. |
| 3 | Affiliated money market fund available only to Vanguard funds and certain trusts and accounts managed by Vanguard. Rate shown is the 7-day yield. |
| 4 | Collateral of $45,177,000 was received for securities on loan. |
| CVR—Contingent Value Rights. |
| Over-the-Counter Total Return Swaps | ||||||
| Reference Entity | Termination Date | Counterparty | Notional Amount ($000) | Floating Interest Rate Received (Paid)1 (%) | Value and Unrealized Appreciation ($000) | Value and Unrealized (Depreciation) ($000) |
| Gilead Sciences Inc. | 8/31/22 | BOANA | 14,556 | (0.080) | — | — |
| 1 | Based on 1M USD London Interbank Offered Rate (LIBOR) as of the most recent payment date. Floating interest payment received/paid monthly. |
| 1M—1-month. | |
| BOANA—Bank of America, N.A. |
| ($000s, except shares and per-share amounts) | Amount |
| Assets | |
| Investments in Securities, at Value | |
| Unaffiliated Issuers (Cost $13,287,610) | 19,850,945 |
| Affiliated Issuers (Cost $45,193) | 45,203 |
| Total Investments in Securities | 19,896,148 |
| Investment in Vanguard | 643 |
| Cash | 287 |
| Receivables for Investment Securities Sold | 66,445 |
| Receivables for Accrued Income | 23,120 |
| Receivables for Capital Shares Issued | 3,581 |
| Total Assets | 19,990,224 |
| Liabilities | |
| Payables for Investment Securities Purchased | 73,906 |
| Collateral for Securities on Loan | 45,177 |
| Payables for Capital Shares Redeemed | 4,598 |
| Payables to Vanguard | 863 |
| Unrealized Depreciation—Over-the-Counter Swap Contracts | — |
| Total Liabilities | 124,544 |
| Net Assets | 19,865,680 |
| At August 31, 2021, net assets consisted of: | |
| Paid-in Capital | 13,627,191 |
| Total Distributable Earnings (Loss) | 6,238,489 |
| Net Assets | 19,865,680 |
| ETF Shares—Net Assets | |
| Applicable to 64,378,176 outstanding $.001 par value shares of beneficial interest (unlimited authorization) | 16,893,520 |
| Net Asset Value Per Share—ETF Shares | $262.41 |
| Admiral Shares—Net Assets | |
| Applicable to 22,642,633 outstanding $.001 par value shares of beneficial interest (unlimited authorization) | 2,972,160 |
| Net Asset Value Per Share—Admiral Shares | $131.26 |
| ETF Shares | |||||
| For a Share Outstanding Throughout Each Period | Year Ended August 31, | ||||
| 2021 | 2020 | 2019 | 2018 | 2017 | |
| Net Asset Value, Beginning of Period | $207.65 | $169.74 | $177.07 | $151.13 | $133.25 |
| Investment Operations | |||||
| Net Investment Income1 | 2.893 | 2.702 | 3.6002 | 2.194 | 1.994 |
| Net Realized and Unrealized Gain (Loss) on Investments | 54.714 | 37.758 | (7.457) | 25.846 | 17.846 |
| Total from Investment Operations | 57.607 | 40.460 | (3.857) | 28.040 | 19.840 |
| Distributions | |||||
| Dividends from Net Investment Income | (2.846) | (2.550) | (3.473) | (2.100) | (1.960) |
| Distributions from Realized Capital Gains | — | — | — | — | — |
| Total Distributions | (2.846) | (2.550) | (3.473) | (2.100) | (1.960) |
| Net Asset Value, End of Period | $262.41 | $207.65 | $169.74 | $177.07 | $151.13 |
| Total Return | 27.99% | 24.05% | -2.22% | 18.75% | 15.06% |
| Ratios/Supplemental Data | |||||
| Net Assets, End of Period (Millions) | $16,894 | $11,724 | $8,899 | $8,594 | $7,002 |
| Ratio of Total Expenses to Average Net Assets | 0.10% | 0.10% | 0.10% | 0.10% | 0.10% |
| Ratio of Net Investment Income to Average Net Assets | 1.25% | 1.45% | 2.12%2 | 1.38% | 1.46% |
| Portfolio Turnover Rate3 | 5% | 7% | 5% | 6% | 4% |
| 1 | Calculated based on average shares outstanding. |
| 2 | Net investment income per share and the ratio of net investment income to average net assets include $1.132 and 0.67%, respectively, resulting from a cash payment received in connection with the merger of Cigna Corp. and Express Scripts Holding Co. in December 2018. |
| 3 | Excludes the value of portfolio securities received or delivered as a result of in-kind purchases or redemptions of the fund’s capital shares, including ETF Creation Units. |
| Admiral Shares | |||||
| For a Share Outstanding Throughout Each Period | Year Ended August 31, | ||||
| 2021 | 2020 | 2019 | 2018 | 2017 | |
| Net Asset Value, Beginning of Period | $103.87 | $84.91 | $88.57 | $75.60 | $66.65 |
| Investment Operations | |||||
| Net Investment Income1 | 1.450 | 1.351 | 1.8042 | 1.101 | .996 |
| Net Realized and Unrealized Gain (Loss) on Investments | 27.365 | 18.884 | (3.727) | 12.920 | 8.934 |
| Total from Investment Operations | 28.815 | 20.235 | (1.923) | 14.021 | 9.930 |
| Distributions | |||||
| Dividends from Net Investment Income | (1.425) | (1.275) | (1.737) | (1.051) | (.980) |
| Distributions from Realized Capital Gains | — | — | — | — | — |
| Total Distributions | (1.425) | (1.275) | (1.737) | (1.051) | (.980) |
| Net Asset Value, End of Period | $131.26 | $103.87 | $84.91 | $88.57 | $75.60 |
| Total Return3 | 28.01% | 24.06% | -2.21% | 18.74% | 15.07% |
| Ratios/Supplemental Data | |||||
| Net Assets, End of Period (Millions) | $2,972 | $1,676 | $1,316 | $1,248 | $924 |
| Ratio of Total Expenses to Average Net Assets | 0.10% | 0.10% | 0.10% | 0.10% | 0.10% |
| Ratio of Net Investment Income to Average Net Assets | 1.25% | 1.45% | 2.12%2 | 1.38% | 1.46% |
| Portfolio Turnover Rate4 | 5% | 7% | 5% | 6% | 4% |
| 1 | Calculated based on average shares outstanding. |
| 2 | Net investment income per share and the ratio of net investment income to average net assets include $.566 and 0.67%, respectively, resulting from a cash payment received in connection with the merger of Cigna Corp. and Express Scripts Holding Co. in December 2018. |
| 3 | Total returns do not include account service fees that may have applied in the periods shown. Fund prospectuses provide information about any applicable account service fees. |
| 4 | Excludes the value of portfolio securities received or delivered as a result of in-kind purchases or redemptions of the fund’s capital shares, including ETF Creation Units. |
| A. | The following significant accounting policies conform to generally accepted accounting principles for U.S. investment companies. The fund consistently follows such policies in preparing its financial statements. |
| B. | In accordance with the terms of a Funds' Service Agreement (the “FSA”) between Vanguard and the fund, Vanguard furnishes to the fund investment advisory, corporate management, administrative, marketing, and distribution services at Vanguard’s cost of operations (as defined by the FSA). These costs of operations are allocated to the fund based on methods and guidelines approved by the board of trustees and are generally settled twice a month. |
| C. | Various inputs may be used to determine the value of the fund’s investments and derivatives. These inputs are summarized in three broad levels for financial statement purposes. The inputs or methodologies used to value securities are not necessarily an indication of the risk associated with investing in those securities. |
| Level 1 ($000) | Level 2 ($000) | Level 3 ($000) | Total ($000) | |
| Investments | ||||
| Assets | ||||
| Common Stocks | 19,850,026 | 11 | 908 | 19,850,945 |
| Temporary Cash Investments | 45,203 | — | — | 45,203 |
| Total | 19,895,229 | 11 | 908 | 19,896,148 |
| Derivative Financial Instruments | ||||
| Liabilities | ||||
| Swap Contracts | — | — | — | — |
| D. | Permanent differences between book-basis and tax-basis components of net assets are reclassified among capital accounts in the financial statements to reflect their tax character. These reclassifications have no effect on net assets or net asset value per share. As of period end, permanent differences primarily attributable to the accounting for in-kind redemptions, passive foreign investment companies, and swap agreements were reclassified between the following accounts: |
| Amount ($000) | |
| Paid-in Capital | 745,708 |
| Total Distributable Earnings (Loss) | (745,708) |
| Amount ($000) | |
| Undistributed Ordinary Income | 59,953 |
| Undistributed Long-Term Gains | — |
| Capital Loss Carryforwards | (361,010) |
| Qualified Late-Year Losses | — |
| Net Unrealized Gains (Losses) | 6,539,546 |
| Year Ended August 31, | ||
| 2021 Amount ($000) | 2020 Amount ($000) | |
| Ordinary Income* | 196,001 | 156,341 |
| Long-Term Capital Gains | — | — |
| Total | 196,001 | 156,341 |
| * | Includes short-term capital gains, if any. |
| Amount ($000) | |
| Tax Cost | 13,356,603 |
| Gross Unrealized Appreciation | 6,993,769 |
| Gross Unrealized Depreciation | (454,223) |
| Net Unrealized Appreciation (Depreciation) | 6,539,546 |
| E. | During the year ended August 31, 2021, the fund purchased $4,924,342,000 of investment securities and sold $2,276,150,000 of investment securities, other than temporary cash investments. Purchases and sales include $3,204,158,000 and $1,506,361,000, respectively, in connection with in-kind purchases and redemptions of the fund's capital shares. |
| F. | Capital share transactions for each class of shares were: |
| Year Ended August 31, | |||||
| 2021 | 2020 | ||||
| Amount ($000) | Shares (000) | Amount ($000) | Shares (000) | ||
| ETF Shares | |||||
| Issued | 3,403,429 | 14,615 | 2,267,426 | 12,263 | |
| Issued in Lieu of Cash Distributions | — | — | — | — | |
| Redeemed | (1,524,366) | (6,700) | (1,477,005) | (8,225) | |
| Net Increase (Decrease)—ETF Shares | 1,879,063 | 7,915 | 790,421 | 4,038 | |
| Admiral Shares | |||||
| Issued | 1,140,545 | 9,947 | 453,890 | 4,915 | |
| Issued in Lieu of Cash Distributions | 23,652 | 212 | 17,644 | 194 | |
| Redeemed | (417,596) | (3,652) | (407,797) | (4,469) | |
| Net Increase (Decrease)—Admiral Shares | 746,601 | 6,507 | 63,737 | 640 | |
| G. | Management has determined that no events or transactions occurred subsequent to August 31, 2021, that would require recognition or disclosure in these financial statements. |

| Average Annual Total Returns Periods Ended August 31, 2021 | |||||
| One Year | Five Year | Ten Years | Final Value of a $10,000 Investment | ||
|
| Industrials Index Fund ETF Shares Net Asset Value | 37.41% | 14.20% | 14.77% | $39,668 |
| Industrials Index Fund ETF Shares Market Price | 37.29 | 14.19 | 14.77 | 39,660 | |
|
| MSCI US Investable Market Industrials 25/50 Index | 37.55 | 14.31 | 14.89 | 40,065 |
|
| MSCI US Investable Market 2500 Index | 33.59 | 18.08 | 16.28 | 45,188 |
| One Year | Five Years | Ten Years | Final Value of a $100,000 Investment | ||
| Industrials Index Fund Admiral Shares | 37.43% | 14.20% | 14.78% | $396,979 | |
| MSCI US Investable Market Industrials 25/50 Index | 37.55 | 14.31 | 14.89 | 400,651 | |
| MSCI US Investable Market 2500 Index | 33.59 | 18.08 | 16.28 | 451,882 | |
| One Year | Five Years | Ten Years | |
| Industrials Index Fund ETF Shares Market Price | 37.29% | 94.17% | 296.60% |
| Industrials Index Fund ETF Shares Net Asset Value | 37.41 | 94.21 | 296.68 |
| MSCI US Investable Market Industrials 25/50 Index | 37.55 | 95.15 | 300.65 |
| Aerospace & Defense | 14.9% |
| Air Freight & Logistics | 6.1 |
| Airlines | 2.5 |
| Building Products | 7.2 |
| Commercial Services & Supplies | 6.8 |
| Construction & Engineering | 1.7 |
| Electrical Equipment | 7.7 |
| Industrial Conglomerates | 10.5 |
| Machinery | 20.5 |
| Marine | 0.2 |
| Professional Services | 7.3 |
| Road & Rail | 11.1 |
| Trading Companies & Distributors | 3.4 |
| Transportation Infrastructure | 0.1 |
| Futures Contracts | ||||
| ($000) | ||||
| Expiration | Number of Long (Short) Contracts | Notional Amount | Value and Unrealized Appreciation (Depreciation) | |
| Long Futures Contracts | ||||
| E-mini S&P 500 Index | September 2021 | 13 | 2,938 | 37 |
| Over-the-Counter Total Return Swaps | ||||||
| Reference Entity | Termination Date | Counterparty | Notional Amount ($000) | Floating Interest Rate Received (Paid)1 (%) | Value and Unrealized Appreciation ($000) | Value and Unrealized (Depreciation) ($000) |
| L3Harris Technologies Inc. | 8/31/22 | BOANA | 5,592 | (0.080) | — | — |
| 1 | Based on 1M USD London Interbank Offered Rate (LIBOR) as of the most recent payment date. Floating interest payment received/paid monthly. |
| 1M—1-month. | |
| BOANA—Bank of America, N.A. |
| ($000s, except shares and per-share amounts) | Amount |
| Assets | |
| Investments in Securities, at Value | |
| Unaffiliated Issuers (Cost $4,725,312) | 5,800,536 |
| Affiliated Issuers (Cost $5,732) | 5,732 |
| Total Investments in Securities | 5,806,268 |
| Investment in Vanguard | 193 |
| Cash | 1 |
| Cash Collateral Pledged—Futures Contracts | 150 |
| Receivables for Investment Securities Sold | 19,970 |
| Receivables for Accrued Income | 9,533 |
| Receivables for Capital Shares Issued | 321 |
| Total Assets | 5,836,436 |
| Liabilities | |
| Due to Custodian | 2,631 |
| Payables for Investment Securities Purchased | 17,294 |
| Collateral for Securities on Loan | 5,017 |
| Payables for Capital Shares Redeemed | 1,000 |
| Payables to Vanguard | 254 |
| Variation Margin Payable—Futures Contracts | 3 |
| Unrealized Depreciation—Over-the-Counter Swap Contracts | — |
| Other Liabilities | 101 |
| Total Liabilities | 26,300 |
| Net Assets | 5,810,136 |
| At August 31, 2021, net assets consisted of: | |
| Paid-in Capital | 4,801,175 |
| Total Distributable Earnings (Loss) | 1,008,961 |
| Net Assets | 5,810,136 |
| ETF Shares—Net Assets | |
| Applicable to 27,288,562 outstanding $.001 par value shares of beneficial interest (unlimited authorization) | 5,437,680 |
| Net Asset Value Per Share—ETF Shares | $199.27 |
| Admiral Shares—Net Assets | |
| Applicable to 3,638,358 outstanding $.001 par value shares of beneficial interest (unlimited authorization) | 372,456 |
| Net Asset Value Per Share—Admiral Shares | $102.37 |
| ETF Shares | |||||
| For a Share Outstanding Throughout Each Period | Year Ended August 31, | ||||
| 2021 | 2020 | 2019 | 2018 | 2017 | |
| Net Asset Value, Beginning of Period | $146.89 | $142.53 | $146.12 | $128.70 | $111.57 |
| Investment Operations | |||||
| Net Investment Income1 | 2.264 | 2.366 | 2.597 | 2.263 | 2.383 |
| Net Realized and Unrealized Gain (Loss) on Investments | 52.318 | 4.554 | (3.754) | 17.412 | 16.998 |
| Total from Investment Operations | 54.582 | 6.920 | (1.157) | 19.675 | 19.381 |
| Distributions | |||||
| Dividends from Net Investment Income | (2.202) | (2.560) | (2.433) | (2.255) | (2.251) |
| Distributions from Realized Capital Gains | — | — | — | — | — |
| Total Distributions | (2.202) | (2.560) | (2.433) | (2.255) | (2.251) |
| Net Asset Value, End of Period | $199.27 | $146.89 | $142.53 | $146.12 | $128.70 |
| Total Return | 37.41% | 4.96% | -0.73% | 15.41% | 17.55% |
| Ratios/Supplemental Data | |||||
| Net Assets, End of Period (Millions) | $5,438 | $3,090 | $3,457 | $3,957 | $3,202 |
| Ratio of Total Expenses to Average Net Assets | 0.10% | 0.10% | 0.10% | 0.10% | 0.10% |
| Ratio of Net Investment Income to Average Net Assets | 1.25% | 1.69% | 1.87% | 1.62% | 1.95% |
| Portfolio Turnover Rate2 | 5% | 4% | 4% | 4% | 5% |
| 1 | Calculated based on average shares outstanding. |
| 2 | Excludes the value of portfolio securities received or delivered as a result of in-kind purchases or redemptions of the fund’s capital shares, including ETF Creation Units. |
| Admiral Shares | |||||
| For a Share Outstanding Throughout Each Period | Year Ended August 31, | ||||
| 2021 | 2020 | 2019 | 2018 | 2017 | |
| Net Asset Value, Beginning of Period | $75.46 | $73.22 | $75.07 | $66.12 | $57.32 |
| Investment Operations | |||||
| Net Investment Income1 | 1.162 | 1.221 | 1.340 | 1.154 | 1.237 |
| Net Realized and Unrealized Gain (Loss) on Investments | 26.880 | 2.336 | (1.941) | 8.955 | 8.721 |
| Total from Investment Operations | 28.042 | 3.557 | (.601) | 10.109 | 9.958 |
| Distributions | |||||
| Dividends from Net Investment Income | (1.132) | (1.317) | (1.249) | (1.159) | (1.158) |
| Distributions from Realized Capital Gains | — | — | — | — | — |
| Total Distributions | (1.132) | (1.317) | (1.249) | (1.159) | (1.158) |
| Net Asset Value, End of Period | $102.37 | $75.46 | $73.22 | $75.07 | $66.12 |
| Total Return2 | 37.43% | 4.98% | -0.75% | 15.41% | 17.55% |
| Ratios/Supplemental Data | |||||
| Net Assets, End of Period (Millions) | $372 | $210 | $202 | $213 | $176 |
| Ratio of Total Expenses to Average Net Assets | 0.10% | 0.10% | 0.10% | 0.10% | 0.10% |
| Ratio of Net Investment Income to Average Net Assets | 1.25% | 1.71% | 1.87% | 1.62% | 1.95% |
| Portfolio Turnover Rate3 | 5% | 4% | 4% | 4% | 5% |
| 1 | Calculated based on average shares outstanding. |
| 2 | Total returns do not include account service fees that may have applied in the periods shown. Fund prospectuses provide information about any applicable account service fees. |
| 3 | Excludes the value of portfolio securities received or delivered as a result of in-kind purchases or redemptions of the fund’s capital shares. |
| A. | The following significant accounting policies conform to generally accepted accounting principles for U.S. investment companies. The fund consistently follows such policies in preparing its financial statements. |
| B. | In accordance with the terms of a Funds' Service Agreement (the “FSA”) between Vanguard and the fund, Vanguard furnishes to the fund investment advisory, corporate management, administrative, marketing, and distribution services at Vanguard’s cost of operations (as defined by the FSA). These costs of operations are allocated to the fund based on methods and guidelines approved by the board of trustees and are generally settled twice a month. |
| C. | Various inputs may be used to determine the value of the fund’s investments and derivatives. These inputs are summarized in three broad levels for financial statement purposes. The inputs or methodologies used to value securities are not necessarily an indication of the risk associated with investing in those securities. |
| Level 1 ($000) | Level 2 ($000) | Level 3 ($000) | Total ($000) | |
| Investments | ||||
| Assets | ||||
| Common Stocks | 5,800,536 | — | — | 5,800,536 |
| Temporary Cash Investments | 5,732 | — | — | 5,732 |
| Total | 5,806,268 | — | — | 5,806,268 |
| Derivative Financial Instruments | ||||
| Assets | ||||
| Futures Contracts1 | 37 | — | — | 37 |
| Liabilities | ||||
| Swap Contracts | — | — | — | — |
| 1 | Includes cumulative appreciation (depreciation) on futures contracts and centrally cleared swaps, if any, as reported in the Schedule of Investments. Only current day’s variation margin is reported within the Statement of Assets and Liabilities. |
| D. | Permanent differences between book-basis and tax-basis components of net assets are reclassified among capital accounts in the financial statements to reflect their tax character. These reclassifications have no effect on net assets or net asset value per share. As of period end, permanent differences primarily attributable to the accounting for in-kind redemptions and swap agreements were reclassified between the following accounts: |
| Amount ($000) | |
| Paid-in Capital | 361,801 |
| Total Distributable Earnings (Loss) | (361,801) |
| Amount ($000) | |
| Undistributed Ordinary Income | 16,617 |
| Undistributed Long-Term Gains | — |
| Capital Loss Carryforwards | (76,579) |
| Qualified Late-Year Losses | — |
| Net Unrealized Gains (Losses) | 1,068,923 |
| Year Ended August 31, | ||
| 2021 Amount ($000) | 2020 Amount ($000) | |
| Ordinary Income* | 56,464 | 61,969 |
| Long-Term Capital Gains | — | — |
| Total | 56,464 | 61,969 |
| * | Includes short-term capital gains, if any. |
| Amount ($000) | |
| Tax Cost | 4,737,346 |
| Gross Unrealized Appreciation | 1,411,233 |
| Gross Unrealized Depreciation | (342,310) |
| Net Unrealized Appreciation (Depreciation) | 1,068,923 |
| E. | During the year ended August 31, 2021, the fund purchased $2,305,160,000 of investment securities and sold $1,093,963,000 of investment securities, other than temporary cash investments. Purchases and sales include $1,949,884,000 and $849,510,000, respectively, in connection with in-kind purchases and redemptions of the fund's capital shares. |
| F. | Capital share transactions for each class of shares were: |
| Year Ended August 31, | |||||
| 2021 | 2020 | ||||
| Amount ($000) | Shares (000) | Amount ($000) | Shares (000) | ||
| ETF Shares | |||||
| Issued | 2,002,840 | 10,975 | 651,928 | 5,081 | |
| Issued in Lieu of Cash Distributions | — | — | — | — | |
| Redeemed | (886,520) | (4,725) | (1,109,156) | (8,300) | |
| Net Increase (Decrease)—ETF Shares | 1,116,320 | 6,250 | (457,228) | (3,219) | |
| Admiral Shares | |||||
| Issued | 203,805 | 2,209 | 99,484 | 1,405 | |
| Issued in Lieu of Cash Distributions | 3,138 | 36 | 3,135 | 44 | |
| Redeemed | (128,438) | (1,384) | (100,525) | (1,432) | |
| Net Increase (Decrease)—Admiral Shares | 78,505 | 861 | 2,094 | 17 | |
| G. | Management has determined that no events or transactions occurred subsequent to August 31, 2021, that would require recognition or disclosure in these financial statements. |

| Average Annual Total Returns Periods Ended August 31, 2021 | |||||
| One Year | Five Year | Ten Years | Final Value of a $10,000 Investment | ||
|
| Information Technology Index Fund ETF Shares Net Asset Value | 30.80% | 30.79% | 23.28% | $81,075 |
| Information Technology Index Fund ETF Shares Market Price | 30.68 | 30.78 | 23.27 | 81,049 | |
|
| Information Technology Spliced Index | 30.94 | 30.94 | 23.43 | 82,054 |
|
| MSCI US Investable Market 2500 Index | 33.59 | 18.08 | 16.28 | 45,188 |
| One Year | Five Years | Ten Years | Final Value of a $100,000 Investment | ||
| Information Technology Index Fund Admiral Shares | 30.81% | 30.80% | 23.29% | $811,544 | |
| Information Technology Spliced Index | 30.94 | 30.94 | 23.43 | 820,538 | |
| MSCI US Investable Market 2500 Index | 33.59 | 18.08 | 16.28 | 451,882 | |
| One Year | Five Years | Ten Years | |
| Information Technology Index Fund ETF Shares Market Price | 30.68% | 282.58% | 710.49% |
| Information Technology Index Fund ETF Shares Net Asset Value | 30.80 | 282.67 | 710.75 |
| Information Technology Spliced Index | 30.94 | 284.85 | 720.54 |
| Communications Equipment | 3.0% |
| Electronic Equipment, Instruments & Components | 3.3 |
| IT Services | 17.9 |
| Semiconductors & Semiconductor Equipment | 18.9 |
| Software | 35.6 |
| Technology Hardware, Storage & Peripherals | 21.3 |
| Futures Contracts | ||||
| ($000) | ||||
| Expiration | Number of Long (Short) Contracts | Notional Amount | Value and Unrealized Appreciation (Depreciation) | |
| Long Futures Contracts | ||||
| E-mini NASDAQ 100 Index | September 2021 | 252 | 78,536 | 2,796 |
| Over-the-Counter Total Return Swaps | ||||||
| Reference Entity | Termination Date | Counterparty | Notional Amount ($000) | Floating Interest Rate Received (Paid)1 (%) | Value and Unrealized Appreciation ($000) | Value and Unrealized (Depreciation) ($000) |
| Visa Inc. Class A | 8/31/22 | BOANA | 114,550 | 0.020 | 160 | — |
| 1 | Based on 1M USD London Interbank Offered Rate (LIBOR) as of the most recent payment date. Floating interest payment received/paid monthly. |
| 1M—1-month. | |
| BOANA—Bank of America, N.A. |
| ($000s, except shares and per-share amounts) | Amount |
| Assets | |
| Investments in Securities, at Value | |
| Unaffiliated Issuers (Cost $30,113,906) | 58,357,224 |
| Affiliated Issuers (Cost $245,185) | 245,229 |
| Total Investments in Securities | 58,602,453 |
| Investment in Vanguard | 1,892 |
| Cash | 324 |
| Cash Collateral Pledged—Futures Contracts | 3,850 |
| Cash Collateral Pledged—Over-the-Counter Swap Contracts | 1,300 |
| Receivables for Investment Securities Sold | 558,477 |
| Receivables for Accrued Income | 41,850 |
| Receivables for Capital Shares Issued | 28,426 |
| Unrealized Appreciation—Over-the-Counter Swap Contracts | 160 |
| Total Assets | 59,238,732 |
| Liabilities | |
| Due to Custodian | 3,140 |
| Payables for Investment Securities Purchased | 565,787 |
| Collateral for Securities on Loan | 116,748 |
| Payables for Capital Shares Redeemed | 11,381 |
| Payables to Vanguard | 2,506 |
| Variation Margin Payable—Futures Contracts | 68 |
| Total Liabilities | 699,630 |
| Net Assets | 58,539,102 |
| At August 31, 2021, net assets consisted of: | |
| Paid-in Capital | 30,526,286 |
| Total Distributable Earnings (Loss) | 28,012,816 |
| Net Assets | 58,539,102 |
| ETF Shares—Net Assets | |
| Applicable to 120,141,710 outstanding $.001 par value shares of beneficial interest (unlimited authorization) | 51,237,926 |
| Net Asset Value Per Share—ETF Shares | $426.48 |
| Admiral Shares—Net Assets | |
| Applicable to 33,433,861 outstanding $.001 par value shares of beneficial interest (unlimited authorization) | 7,301,176 |
| Net Asset Value Per Share—Admiral Shares | $218.38 |
| ETF Shares | |||||
| For a Share Outstanding Throughout Each Period | Year Ended August 31, | ||||
| 2021 | 2020 | 2019 | 2018 | 2017 | |
| Net Asset Value, Beginning of Period | $328.54 | $213.66 | $202.82 | $151.19 | $117.82 |
| Investment Operations | |||||
| Net Investment Income1 | 2.634 | 2.926 | 2.572 | 1.921 | 1.646 |
| Net Realized and Unrealized Gain (Loss) on Investments | 97.919 | 114.955 | 10.792 | 51.430 | 33.329 |
| Total from Investment Operations | 100.553 | 117.881 | 13.364 | 53.351 | 34.975 |
| Distributions | |||||
| Dividends from Net Investment Income | (2.613) | (3.001) | (2.524) | (1.721) | (1.605) |
| Distributions from Realized Capital Gains | — | — | — | — | — |
| Total Distributions | (2.613) | (3.001) | (2.524) | (1.721) | (1.605) |
| Net Asset Value, End of Period | $426.48 | $328.54 | $213.66 | $202.82 | $151.19 |
| Total Return | 30.80% | 55.72% | 6.70% | 35.52% | 29.93% |
| Ratios/Supplemental Data | |||||
| Net Assets, End of Period (Millions) | $51,238 | $38,711 | $20,738 | $22,595 | $14,638 |
| Ratio of Total Expenses to Average Net Assets | 0.10% | 0.10% | 0.10% | 0.10% | 0.10% |
| Ratio of Net Investment Income to Average Net Assets | 0.73% | 1.17% | 1.32% | 1.10% | 1.24% |
| Portfolio Turnover Rate2 | 4% | 5% | 5% | 7% | 6% |
| 1 | Calculated based on average shares outstanding. |
| 2 | Excludes the value of portfolio securities received or delivered as a result of in-kind purchases or redemptions of the fund’s capital shares, including ETF Creation Units. |
| Admiral Shares | |||||
| For a Share Outstanding Throughout Each Period | Year Ended August 31, | ||||
| 2021 | 2020 | 2019 | 2018 | 2017 | |
| Net Asset Value, Beginning of Period | $168.23 | $109.40 | $103.86 | $77.42 | $60.33 |
| Investment Operations | |||||
| Net Investment Income1 | 1.353 | 1.504 | 1.326 | 1.001 | .850 |
| Net Realized and Unrealized Gain (Loss) on Investments | 50.136 | 58.864 | 5.509 | 26.324 | 17.062 |
| Total from Investment Operations | 51.489 | 60.368 | 6.835 | 27.325 | 17.912 |
| Distributions | |||||
| Dividends from Net Investment Income | (1.339) | (1.538) | (1.295) | (.885) | (.822) |
| Distributions from Realized Capital Gains | — | — | — | — | — |
| Total Distributions | (1.339) | (1.538) | (1.295) | (.885) | (.822) |
| Net Asset Value, End of Period | $218.38 | $168.23 | $109.40 | $103.86 | $77.42 |
| Total Return2 | 30.81% | 55.78% | 6.70% | 35.54% | 29.94% |
| Ratios/Supplemental Data | |||||
| Net Assets, End of Period (Millions) | $7,301 | $5,149 | $2,470 | $2,033 | $933 |
| Ratio of Total Expenses to Average Net Assets | 0.10% | 0.10% | 0.10% | 0.10% | 0.10% |
| Ratio of Net Investment Income to Average Net Assets | 0.73% | 1.17% | 1.32% | 1.10% | 1.24% |
| Portfolio Turnover Rate3 | 4% | 5% | 5% | 7% | 6% |
| 1 | Calculated based on average shares outstanding. |
| 2 | Total returns do not include account service fees that may have applied in the periods shown. Fund prospectuses provide information about any applicable account service fees. |
| 3 | Excludes the value of portfolio securities received or delivered as a result of in-kind purchases or redemptions of the fund’s capital shares, including ETF Creation Units. |
| A. | The following significant accounting policies conform to generally accepted accounting principles for U.S. investment companies. The fund consistently follows such policies in preparing its financial statements. |
| B. | In accordance with the terms of a Funds' Service Agreement (the “FSA”) between Vanguard and the fund, Vanguard furnishes to the fund investment advisory, corporate management, administrative, marketing, and distribution services at Vanguard’s cost of operations (as defined by the FSA). These costs of operations are allocated to the fund based on methods and guidelines approved by the board of trustees and are generally settled twice a month. |
| C. | Various inputs may be used to determine the value of the fund’s investments and derivatives. These inputs are summarized in three broad levels for financial statement purposes. The inputs or methodologies used to value securities are not necessarily an indication of the risk associated with investing in those securities. |
| Level 1 ($000) | Level 2 ($000) | Level 3 ($000) | Total ($000) | |
| Investments | ||||
| Assets | ||||
| Common Stocks | 58,345,193 | — | 12,031 | 58,357,224 |
| Temporary Cash Investments | 245,229 | — | — | 245,229 |
| Total | 58,590,422 | — | 12,031 | 58,602,453 |
| Derivative Financial Instruments | ||||
| Assets | ||||
| Futures Contracts1 | 2,796 | — | — | 2,796 |
| Swap Contracts | — | 160 | — | 160 |
| Total | 2,796 | 160 | — | 2,956 |
| 1 | Includes cumulative appreciation (depreciation) on futures contracts and centrally cleared swaps, if any, as reported in the Schedule of Investments. Only current day’s variation margin is reported within the Statement of Assets and Liabilities. |
| D. | Permanent differences between book-basis and tax-basis components of net assets are reclassified among capital accounts in the financial statements to reflect their tax character. These reclassifications have no effect on net assets or net asset value per share. As of period end, permanent differences primarily attributable to the accounting for in-kind redemptions and swap agreements were reclassified between the following accounts: |
| Amount ($000) | |
| Paid-in Capital | 3,420,643 |
| Total Distributable Earnings (Loss) | (3,420,643) |
| Amount ($000) | |
| Undistributed Ordinary Income | 126,375 |
| Undistributed Long-Term Gains | — |
| Capital Loss Carryforwards | (339,928) |
| Qualified Late-Year Losses | — |
| Net Unrealized Gains (Losses) | 28,226,369 |
| Year Ended August 31, | ||
| 2021 Amount ($000) | 2020 Amount ($000) | |
| Ordinary Income* | 348,921 | 356,662 |
| Long-Term Capital Gains | — | — |
| Total | 348,921 | 356,662 |
| * | Includes short-term capital gains, if any. |
| Amount ($000) | |
| Tax Cost | 30,376,083 |
| Gross Unrealized Appreciation | 28,558,677 |
| Gross Unrealized Depreciation | (332,308) |
| Net Unrealized Appreciation (Depreciation) | 28,226,369 |
| E. | During the year ended August 31, 2021, the fund purchased $8,895,071,000 of investment securities and sold $7,281,173,000 of investment securities, other than temporary cash investments. Purchases and sales include $5,932,242,000 and $5,203,447,000, respectively, in connection with in-kind purchases and redemptions of the fund's capital shares. |
| F. | Capital share transactions for each class of shares were: |
| Year Ended August 31, | |||||
| 2021 | 2020 | ||||
| Amount ($000) | Shares (000) | Amount ($000) | Shares (000) | ||
| ETF Shares | |||||
| Issued | 6,291,821 | 16,864 | 7,928,607 | 32,065 | |
| Issued in Lieu of Cash Distributions | — | — | — | — | |
| Redeemed | (5,224,714) | (14,550) | (2,787,898) | (11,300) | |
| Net Increase (Decrease)—ETF Shares | 1,067,107 | 2,314 | 5,140,709 | 20,765 | |
| Admiral Shares | |||||
| Issued | 2,226,601 | 12,124 | 2,339,727 | 18,276 | |
| Issued in Lieu of Cash Distributions | 38,227 | 218 | 35,023 | 293 | |
| Redeemed | (1,715,775) | (9,519) | (1,313,625) | (10,540) | |
| Net Increase (Decrease)—Admiral Shares | 549,053 | 2,823 | 1,061,125 | 8,029 | |
| G. | Management has determined that no events or transactions occurred subsequent to August 31, 2021, that would require recognition or disclosure in these financial statements. |

| Average Annual Total Returns Periods Ended August 31, 2021 | |||||
| One Year | Five Year | Ten Years | Final Value of a $10,000 Investment | ||
|
| Materials Index Fund ETF Shares Net Asset Value | 41.00% | 13.66% | 11.41% | $29,463 |
| Materials Index Fund ETF Shares Market Price | 40.89 | 13.66 | 11.41 | 29,454 | |
|
| MSCI US Investable Market Materials 25/50 Index | 41.15 | 13.74 | 11.51 | 29,738 |
|
| MSCI US Investable Market 2500 Index | 33.59 | 18.08 | 16.28 | 45,188 |
| One Year | Five Years | Ten Years | Final Value of a $100,000 Investment | ||
| Materials Index Fund Admiral Shares | 41.04% | 13.67% | 11.42% | $294,886 | |
| MSCI US Investable Market Materials 25/50 Index | 41.15 | 13.74 | 11.51 | 297,380 | |
| MSCI US Investable Market 2500 Index | 33.59 | 18.08 | 16.28 | 451,882 | |
| One Year | Five Years | Ten Years | |
| Materials Index Fund ETF Shares Market Price | 40.89% | 89.67% | 194.54% |
| Materials Index Fund ETF Shares Net Asset Value | 41.00 | 89.70 | 194.63 |
| MSCI US Investable Market Materials 25/50 Index | 41.15 | 90.39 | 197.38 |
| Chemicals | 62.4% |
| Construction Materials | 4.6 |
| Containers & Packaging | 14.5 |
| Metals & Mining | 17.4 |
| Paper & Forest Products | 1.1 |
| Over-the-Counter Total Return Swaps | ||||||
| Reference Entity | Termination Date | Counterparty | Notional Amount ($000) | Floating Interest Rate Received (Paid)1 (%) | Value and Unrealized Appreciation ($000) | Value and Unrealized (Depreciation) ($000) |
| United States Steel Corp. | 8/31/22 | BOANA | 5,671 | (0.080) | — | — |
| 1 | Based on 1M USD Overnight Bank Funding Rate as of the most recent payment date. Floating interest payment received/paid monthly. |
| 1M—1-month. | |
| BOANA—Bank of America, N.A. |
| ($000s, except shares and per-share amounts) | Amount |
| Assets | |
| Investments in Securities, at Value | |
| Unaffiliated Issuers (Cost $4,185,155) | 4,996,532 |
| Affiliated Issuers (Cost $1,168) | 1,168 |
| Total Investments in Securities | 4,997,700 |
| Investment in Vanguard | 164 |
| Cash Collateral Pledged—Over-the-Counter Swap Contracts | 520 |
| Receivables for Investment Securities Sold | 14,180 |
| Receivables for Accrued Income | 8,233 |
| Receivables for Capital Shares Issued | 592 |
| Total Assets | 5,021,389 |
| Liabilities | |
| Payables for Investment Securities Purchased | 17,474 |
| Payables for Capital Shares Redeemed | 1,415 |
| Payables to Vanguard | 218 |
| Unrealized Depreciation—Over-the-Counter Swap Contracts | — |
| Total Liabilities | 19,107 |
| Net Assets | 5,002,282 |
| At August 31, 2021, net assets consisted of: | |
| Paid-in Capital | 4,291,554 |
| Total Distributable Earnings (Loss) | 710,728 |
| Net Assets | 5,002,282 |
| ETF Shares—Net Assets | |
| Applicable to 20,984,278 outstanding $.001 par value shares of beneficial interest (unlimited authorization) | 3,924,413 |
| Net Asset Value Per Share—ETF Shares | $187.02 |
| Admiral Shares—Net Assets | |
| Applicable to 11,311,795 outstanding $.001 par value shares of beneficial interest (unlimited authorization) | 1,077,869 |
| Net Asset Value Per Share—Admiral Shares | $95.29 |
| ETF Shares | |||||
| For a Share Outstanding Throughout Each Period | Year Ended August 31, | ||||
| 2021 | 2020 | 2019 | 2018 | 2017 | |
| Net Asset Value, Beginning of Period | $134.84 | $122.80 | $134.33 | $124.29 | $108.16 |
| Investment Operations | |||||
| Net Investment Income1 | 2.801 | 2.522 | 2.501 | 2.285 | 2.175 |
| Net Realized and Unrealized Gain (Loss) on Investments | 52.014 | 12.053 | (11.541) | 9.961 | 16.072 |
| Total from Investment Operations | 54.815 | 14.575 | (9.040) | 12.246 | 18.247 |
| Distributions | |||||
| Dividends from Net Investment Income | (2.635) | (2.535) | (2.490) | (2.206) | (2.117) |
| Distributions from Realized Capital Gains | — | — | — | — | — |
| Total Distributions | (2.635) | (2.535) | (2.490) | (2.206) | (2.117) |
| Net Asset Value, End of Period | $187.02 | $134.84 | $122.80 | $134.33 | $124.29 |
| Total Return | 41.00% | 12.12% | -6.73% | 9.91% | 17.06% |
| Ratios/Supplemental Data | |||||
| Net Assets, End of Period (Millions) | $3,924 | $1,676 | $1,921 | $2,749 | $1,913 |
| Ratio of Total Expenses to Average Net Assets | 0.10% | 0.10% | 0.10% | 0.10% | 0.10% |
| Ratio of Net Investment Income to Average Net Assets | 1.66% | 2.05% | 2.04% | 1.71% | 1.87% |
| Portfolio Turnover Rate2 | 5% | 4% | 4% | 5% | 5% |
| 1 | Calculated based on average shares outstanding. |
| 2 | Excludes the value of portfolio securities received or delivered as a result of in-kind purchases or redemptions of the fund’s capital shares, including ETF Creation Units. |
| Admiral Shares | |||||
| For a Share Outstanding Throughout Each Period | Year Ended August 31, | ||||
| 2021 | 2020 | 2019 | 2018 | 2017 | |
| Net Asset Value, Beginning of Period | $68.70 | $62.57 | $68.45 | $63.33 | $55.11 |
| Investment Operations | |||||
| Net Investment Income1 | 1.424 | 1.294 | 1.282 | 1.159 | 1.104 |
| Net Realized and Unrealized Gain (Loss) on Investments | 26.507 | 6.130 | (5.892) | 5.084 | 8.195 |
| Total from Investment Operations | 27.931 | 7.424 | (4.610) | 6.243 | 9.299 |
| Distributions | |||||
| Dividends from Net Investment Income | (1.341) | (1.294) | (1.270) | (1.123) | (1.079) |
| Distributions from Realized Capital Gains | — | — | — | — | — |
| Total Distributions | (1.341) | (1.294) | (1.270) | (1.123) | (1.079) |
| Net Asset Value, End of Period | $95.29 | $68.70 | $62.57 | $68.45 | $63.33 |
| Total Return2 | 41.04% | 12.14% | -6.74% | 9.91% | 17.06% |
| Ratios/Supplemental Data | |||||
| Net Assets, End of Period (Millions) | $1,078 | $583 | $482 | $452 | $372 |
| Ratio of Total Expenses to Average Net Assets | 0.10% | 0.10% | 0.10% | 0.10% | 0.10% |
| Ratio of Net Investment Income to Average Net Assets | 1.67% | 2.08% | 2.04% | 1.71% | 1.87% |
| Portfolio Turnover Rate3 | 5% | 4% | 4% | 5% | 5% |
| 1 | Calculated based on average shares outstanding. |
| 2 | Total returns do not include account service fees that may have applied in the periods shown. Fund prospectuses provide information about any applicable account service fees. |
| 3 | Excludes the value of portfolio securities received or delivered as a result of in-kind purchases or redemptions of the fund’s capital shares, including ETF Creation Units. |
| A. | The following significant accounting policies conform to generally accepted accounting principles for U.S. investment companies. The fund consistently follows such policies in preparing its financial statements. |
| B. | In accordance with the terms of a Funds' Service Agreement (the “FSA”) between Vanguard and the fund, Vanguard furnishes to the fund investment advisory, corporate management, administrative, marketing, and distribution services at Vanguard’s cost of operations (as defined by the FSA). These costs of operations are allocated to the fund based on methods and guidelines approved by the board of trustees and are generally settled twice a month. |
| C. | Various inputs may be used to determine the value of the fund’s investments and derivatives. These inputs are summarized in three broad levels for financial statement purposes. The inputs or methodologies used to value securities are not necessarily an indication of the risk associated with investing in those securities. |
| Level 1 ($000) | Level 2 ($000) | Level 3 ($000) | Total ($000) | |
| Investments | ||||
| Assets | ||||
| Common Stocks | 4,996,532 | — | — | 4,996,532 |
| Temporary Cash Investments | 1,168 | — | — | 1,168 |
| Total | 4,997,700 | — | — | 4,997,700 |
| Derivative Financial Instruments | ||||
| Liabilities | ||||
| Swap Contracts | — | — | — | — |
| D. | Permanent differences between book-basis and tax-basis components of net assets are reclassified among capital accounts in the financial statements to reflect their tax character. These reclassifications have no effect on net assets or net asset value per share. As of period end, permanent differences primarily attributable to the accounting for in-kind redemptions and swap agreements were reclassified between the following accounts: |
| Amount ($000) | |
| Paid-in Capital | 136,377 |
| Total Distributable Earnings (Loss) | (136,377) |
| Amount ($000) | |
| Undistributed Ordinary Income | 15,008 |
| Undistributed Long-Term Gains | — |
| Capital Loss Carryforwards | (103,739) |
| Qualified Late-Year Losses | — |
| Net Unrealized Gains (Losses) | 799,459 |
| Year Ended August 31, | ||
| 2021 Amount ($000) | 2020 Amount ($000) | |
| Ordinary Income* | 54,911 | 46,602 |
| Long-Term Capital Gains | — | — |
| Total | 54,911 | 46,602 |
| * | Includes short-term capital gains, if any. |
| Amount ($000) | |
| Tax Cost | 4,198,241 |
| Gross Unrealized Appreciation | 970,233 |
| Gross Unrealized Depreciation | (170,774) |
| Net Unrealized Appreciation (Depreciation) | 799,459 |
| E. | During the year ended August 31, 2021, the fund purchased $2,293,060,000 of investment securities and sold $584,718,000 of investment securities, other than temporary cash investments. Purchases and sales include $1,831,282,000 and $402,167,000, respectively, in connection with in-kind purchases and redemptions of the fund's capital shares. |
| F. | Capital share transactions for each class of shares were: |
| Year Ended August 31, | |||||
| 2021 | 2020 | ||||
| Amount ($000) | Shares (000) | Amount ($000) | Shares (000) | ||
| ETF Shares | |||||
| Issued | 1,856,866 | 11,008 | 449,882 | 3,931 | |
| Issued in Lieu of Cash Distributions | — | — | — | — | |
| Redeemed | (406,172) | (2,450) | (820,892) | (7,150) | |
| Net Increase (Decrease)—ETF Shares | 1,450,694 | 8,558 | (371,010) | (3,219) | |
| Admiral Shares | |||||
| Issued | 454,856 | 5,232 | 170,584 | 2,794 | |
| Issued in Lieu of Cash Distributions | 11,777 | 146 | 9,703 | 159 | |
| Redeemed | (219,223) | (2,551) | (129,903) | (2,174) | |
| Net Increase (Decrease)—Admiral Shares | 247,410 | 2,827 | 50,384 | 779 | |
| G. | Management has determined that no events or transactions occurred subsequent to August 31, 2021, that would require recognition or disclosure in these financial statements. |

| Average Annual Total Returns Periods Ended August 31, 2021 | |||||
| One Year | Five Year | Ten Years | Final Value of a $10,000 Investment | ||
|
| Utilities Index Fund ETF Shares Net Asset Value | 19.19% | 10.27% | 11.18% | $28,867 |
| Utilities Index Fund ETF Shares Market Price | 19.14 | 10.27 | 11.18 | 28,868 | |
|
| MSCI US Investable Market Utilities 25/50 Index | 19.33 | 10.36 | 11.30 | 29,169 |
|
| MSCI US Investable Market 2500 Index | 33.59 | 18.08 | 16.28 | 45,188 |
| One Year | Five Years | Ten Years | Final Value of a $100,000 Investment | ||
| Utilities Index Fund Admiral Shares | 19.22% | 10.27% | 11.19% | $288,957 | |
| MSCI US Investable Market Utilities 25/50 Index | 19.33 | 10.36 | 11.30 | 291,693 | |
| MSCI US Investable Market 2500 Index | 33.59 | 18.08 | 16.28 | 451,882 | |
| One Year | Five Years | Ten Years | |
| Utilities Index Fund ETF Shares Market Price | 19.14% | 63.05% | 188.68% |
| Utilities Index Fund ETF Shares Net Asset Value | 19.19 | 63.03 | 188.67 |
| MSCI US Investable Market Utilities 25/50 Index | 19.33 | 63.73 | 191.69 |
| Electric Utilities | 60.2% |
| Gas Utilities | 4.4 |
| Independent Power and Renewable Electricity Producers | 3.6 |
| Multi-Utilities | 26.7 |
| Water Utilities | 5.1 |
| Over-the-Counter Total Return Swaps | ||||||
| Reference Entity | Termination Date | Counterparty | Notional Amount ($000) | Floating Interest Rate Received (Paid) (%) | Value and Unrealized Appreciation ($000) | Value and Unrealized (Depreciation) ($000) |
| Ameren Corp. | 1/31/22 | GSI | 8,961 | (0.089)1 | — | (189) |
| Sempra Energy | 8/31/22 | BOANA | 10,589 | (0.080)2 | — | — |
| — | (189) | |||||
| 1 | Based on 1M USD London Interbank Offered Rate (LIBOR) as of the most recent payment date. Floating interest payment received/paid monthly. |
| 2 | Based on 1M USD Overnight Bank Funding Rate as of the most recent payment date. Floating interest payment received/paid monthly. |
| 1M—1-month. | |
| BOANA—Bank of America, N.A. | |
| GSI—Goldman Sachs International. |
| ($000s, except shares and per-share amounts) | Amount |
| Assets | |
| Investments in Securities, at Value | |
| Unaffiliated Issuers (Cost $5,825,802) | 6,685,806 |
| Affiliated Issuers (Cost $1) | 1 |
| Total Investments in Securities | 6,685,807 |
| Investment in Vanguard | 215 |
| Receivables for Investment Securities Sold | 11,327 |
| Receivables for Accrued Income | 28,286 |
| Receivables for Capital Shares Issued | 1,165 |
| Total Assets | 6,726,800 |
| Liabilities | |
| Due to Custodian | 6,376 |
| Payables for Investment Securities Purchased | 11,331 |
| Payables for Capital Shares Redeemed | 1,122 |
| Payables to Vanguard | 296 |
| Unrealized Depreciation—Over-the-Counter Swap Contracts | 189 |
| Total Liabilities | 19,314 |
| Net Assets | 6,707,486 |
| At August 31, 2021, net assets consisted of: | |
| Paid-in Capital | 5,993,379 |
| Total Distributable Earnings (Loss) | 714,107 |
| Net Assets | 6,707,486 |
| ETF Shares—Net Assets | |
| Applicable to 34,281,480 outstanding $.001 par value shares of beneficial interest (unlimited authorization) | 5,125,729 |
| Net Asset Value Per Share—ETF Shares | $149.52 |
| Admiral Shares—Net Assets | |
| Applicable to 21,085,956 outstanding $.001 par value shares of beneficial interest (unlimited authorization) | 1,581,757 |
| Net Asset Value Per Share—Admiral Shares | $75.01 |
| ETF Shares | |||||
| For a Share Outstanding Throughout Each Period | Year Ended August 31, | ||||
| 2021 | 2020 | 2019 | 2018 | 2017 | |
| Net Asset Value, Beginning of Period | $129.35 | $139.09 | $119.32 | $120.75 | $107.35 |
| Investment Operations | |||||
| Net Investment Income1 | 4.310 | 4.306 | 4.087 | 3.757 | 3.697 |
| Net Realized and Unrealized Gain (Loss) on Investments | 20.048 | (9.802) | 19.562 | (1.434) | 13.374 |
| Total from Investment Operations | 24.358 | (5.496) | 23.649 | 2.323 | 17.071 |
| Distributions | |||||
| Dividends from Net Investment Income | (4.188) | (4.244) | (3.879) | (3.753) | (3.671) |
| Distributions from Realized Capital Gains | — | — | — | — | — |
| Total Distributions | (4.188) | (4.244) | (3.879) | (3.753) | (3.671) |
| Net Asset Value, End of Period | $149.52 | $129.35 | $139.09 | $119.32 | $120.75 |
| Total Return | 19.19% | -4.08% | 20.17% | 2.05% | 16.27% |
| Ratios/Supplemental Data | |||||
| Net Assets, End of Period (Millions) | $5,126 | $4,014 | $4,107 | $2,809 | $2,689 |
| Ratio of Total Expenses to Average Net Assets | 0.10% | 0.10% | 0.10% | 0.10% | 0.10% |
| Ratio of Net Investment Income to Average Net Assets | 3.09% | 3.18% | 3.22% | 3.25% | 3.33% |
| Portfolio Turnover Rate2 | 6% | 5% | 4% | 4% | 4% |
| 1 | Calculated based on average shares outstanding. |
| 2 | Excludes the value of portfolio securities received or delivered as a result of in-kind purchases or redemptions of the fund’s capital shares, including ETF Creation Units. |
| Admiral Shares | |||||
| For a Share Outstanding Throughout Each Period | Year Ended August 31, | ||||
| 2021 | 2020 | 2019 | 2018 | 2017 | |
| Net Asset Value, Beginning of Period | $64.89 | $69.78 | $59.86 | $60.58 | $53.86 |
| Investment Operations | |||||
| Net Investment Income1 | 2.166 | 2.163 | 2.038 | 1.883 | 1.863 |
| Net Realized and Unrealized Gain (Loss) on Investments | 10.055 | (4.924) | 9.828 | (.719) | 6.698 |
| Total from Investment Operations | 12.221 | (2.761) | 11.866 | 1.164 | 8.561 |
| Distributions | |||||
| Dividends from Net Investment Income | (2.101) | (2.129) | (1.946) | (1.884) | (1.841) |
| Distributions from Realized Capital Gains | — | — | — | — | — |
| Total Distributions | (2.101) | (2.129) | (1.946) | (1.884) | (1.841) |
| Net Asset Value, End of Period | $75.01 | $64.89 | $69.78 | $59.86 | $60.58 |
| Total Return2 | 19.22% | -4.05% | 20.19% | 2.04% | 16.24% |
| Ratios/Supplemental Data | |||||
| Net Assets, End of Period (Millions) | $1,582 | $1,281 | $1,266 | $868 | $845 |
| Ratio of Total Expenses to Average Net Assets | 0.10% | 0.10% | 0.10% | 0.10% | 0.10% |
| Ratio of Net Investment Income to Average Net Assets | 3.10% | 3.18% | 3.22% | 3.25% | 3.33% |
| Portfolio Turnover Rate3 | 6% | 5% | 4% | 4% | 4% |
| 1 | Calculated based on average shares outstanding. |
| 2 | Total returns do not include account service fees that may have applied in the periods shown. Fund prospectuses provide information about any applicable account service fees. |
| 3 | Excludes the value of portfolio securities received or delivered as a result of in-kind purchases or redemptions of the fund’s capital shares, including ETF Creation Units. |
| A. | The following significant accounting policies conform to generally accepted accounting principles for U.S. investment companies. The fund consistently follows such policies in preparing its financial statements. |
| B. | In accordance with the terms of a Funds' Service Agreement (the “FSA”) between Vanguard and the fund, Vanguard furnishes to the fund investment advisory, corporate management, administrative, marketing, and distribution services at Vanguard’s cost of operations (as defined by the FSA). These costs of operations are allocated to the fund based on methods and guidelines approved by the board of trustees and are generally settled twice a month. |
| C. | Various inputs may be used to determine the value of the fund’s investments and derivatives. These inputs are summarized in three broad levels for financial statement purposes. The inputs or methodologies used to value securities are not necessarily an indication of the risk associated with investing in those securities. |
| Level 1 ($000) | Level 2 ($000) | Level 3 ($000) | Total ($000) | |
| Investments | ||||
| Assets | ||||
| Common Stocks | 6,685,806 | — | — | 6,685,806 |
| Temporary Cash Investments | 1 | — | — | 1 |
| Total | 6,685,807 | — | — | 6,685,807 |
| Derivative Financial Instruments | ||||
| Liabilities | ||||
| Swap Contracts | — | 189 | — | 189 |
| D. | Permanent differences between book-basis and tax-basis components of net assets are reclassified among capital accounts in the financial statements to reflect their tax character. These reclassifications have no effect on net assets or net asset value per share. As of period end, permanent differences primarily attributable to the accounting for in-kind redemptions and swap agreements were reclassified between the following accounts: |
| Amount ($000) | |
| Paid-in Capital | 180,247 |
| Total Distributable Earnings (Loss) | (180,247) |
| Amount ($000) | |
| Undistributed Ordinary Income | 39,131 |
| Undistributed Long-Term Gains | — |
| Capital Loss Carryforwards | (174,481) |
| Qualified Late-Year Losses | — |
| Net Unrealized Gains (Losses) | 849,457 |
| Year Ended August 31, | ||
| 2021 Amount ($000) | 2020 Amount ($000) | |
| Ordinary Income* | 177,658 | 172,428 |
| Long-Term Capital Gains | — | — |
| Total | 177,658 | 172,428 |
| * | Includes short-term capital gains, if any. |
| Amount ($000) | |
| Tax Cost | 5,836,350 |
| Gross Unrealized Appreciation | 1,044,367 |
| Gross Unrealized Depreciation | (194,910) |
| Net Unrealized Appreciation (Depreciation) | 849,457 |
| E. | During the year ended August 31, 2021, the fund purchased $1,605,684,000 of investment securities and sold $1,070,813,000 of investment securities, other than temporary cash investments. Purchases and sales include $1,063,422,000 and $717,121,000, respectively, in connection with in-kind purchases and redemptions of the fund's capital shares. |
| F. | Capital share transactions for each class of shares were: |
| Year Ended August 31, | |||||
| 2021 | 2020 | ||||
| Amount ($000) | Shares (000) | Amount ($000) | Shares (000) | ||
| ETF Shares | |||||
| Issued | 1,157,689 | 8,423 | 1,271,911 | 9,330 | |
| Issued in Lieu of Cash Distributions | — | — | — | — | |
| Redeemed | (718,917) | (5,175) | (1,030,181) | (7,825) | |
| Net Increase (Decrease)—ETF Shares | 438,772 | 3,248 | 241,730 | 1,505 | |
| Admiral Shares | |||||
| Issued | 472,916 | 6,793 | 569,278 | 8,372 | |
| Issued in Lieu of Cash Distributions | 33,142 | 489 | 33,444 | 493 | |
| Redeemed | (413,171) | (5,940) | (478,371) | (7,268) | |
| Net Increase (Decrease)—Admiral Shares | 92,887 | 1,342 | 124,351 | 1,597 | |
| G. | Management has determined that no events or transactions occurred subsequent to August 31, 2021, that would require recognition or disclosure in these financial statements. |
Philadelphia, Pennsylvania
October 20, 2021
| Fund | ($000) |
| Communication Services Index Fund | 25,167 |
| Consumer Discretionary Index Fund | 38,890 |
| Consumer Staples Index Fund | 163,911 |
| Energy Index Fund | 196,797 |
| Financials Index Fund | 176,949 |
| Health Care Index Fund | 196,001 |
| Industrials Index Fund | 56,032 |
| Information Technology Index Fund | 348,921 |
| Materials Index Fund | 54,911 |
| Utilities Index Fund | 177,658 |
| Fund | ($000) |
| Communication Services Index Fund | — |
| Consumer Discretionary Index Fund | — |
| Consumer Staples Index Fund | — |
| Energy Index Fund | — |
| Financials Index Fund | 4,841 |
| Health Care Index Fund | — |
| Industrials Index Fund | — |
| Information Technology Index Fund | — |
| Materials Index Fund | — |
| Utilities Index Fund | — |
| Fund | Percentage |
| Communication Services Index Fund | 100.0% |
| Consumer Discretionary Index Fund | 91.9 |
| Consumer Staples Index Fund | 98.5 |
| Energy Index Fund | 92.9 |
| Financials Index Fund | 90.7 |
| Health Care Index Fund | 93.6 |
| Industrials Index Fund | 97.0 |
| Information Technology Index Fund | 100.0 |
| Materials Index Fund | 79.9 |
| Utilities Index Fund | 99.8 |


| 1 | |
| 2 | |
| 4 | |
| 7 | |
| 24 | |
| 26 |
| • | Vanguard Extended Duration Treasury Index Fund returned –9.40% for Institutional and Institutional Plus Shares and –8.94% for ETF Shares for the 12 months ended August 31, 2021. The fund’s benchmark index returned –9.83%. |
| • | Bond returns were dampened as yields rose amid unprecedented actions from policymakers and a faster-than-expected rebound of the global economy after the sharp pandemic-induced contraction in the spring of 2020. |
| • | The yield of the 30-year U.S. Treasury bond rose from 1.47% to 1.93% as inflation picked up. Long-term corporates outperformed both short- and long-term Treasuries. |
| • | Because the fund invests in zero-coupon U.S. Treasuries with maturities ranging from 20 to 30 years and the prices of such securities are very sensitive to interest rate changes, its interest rate risk is extremely high. As a result, the fund may exhibit substantial short-term volatility and is best used by long-term investors. |
| Average Annual Total Returns Periods Ended August 31, 2021 | |||
| One Year | Three Years | Five Years | |
| Stocks | |||
| Russell 1000 Index (Large-caps) | 32.25% | 18.42% | 18.24% |
| Russell 2000 Index (Small-caps) | 47.08 | 10.75 | 14.38 |
| Russell 3000 Index (Broad U.S. market) | 33.04 | 17.85 | 17.97 |
| FTSE All-World ex US Index (International) | 25.74 | 9.82 | 10.23 |
| Bonds | |||
| Bloomberg U.S. Aggregate Bond Index (Broad taxable market) | -0.08% | 5.43% | 3.11% |
| Bloomberg Municipal Bond Index (Broad tax-exempt market) | 3.40 | 5.09 | 3.30 |
| FTSE Three-Month U.S. Treasury Bill Index | 0.06 | 1.20 | 1.13 |
| CPI | |||
| Consumer Price Index | 5.25% | 2.76% | 2.58% |
| • | Based on actual fund return. This section helps you to estimate the actual expenses that you paid over the period. The ”Ending Account Value“ shown is derived from the fund’s actual return, and the third column shows the dollar amount that would have been paid by an investor who started with $1,000 in the fund. You may use the information here, together with the amount you invested, to estimate the expenses that you paid over the period. |
| • | Based on hypothetical 5% yearly return. This section is intended to help you compare your fund‘s costs with those of other mutual funds. It assumes that the fund had a yearly return of 5% before expenses, but that the expense ratio is unchanged. In this case—because the return used is not the fund’s actual return—the results do not apply to your investment. The example is useful in making comparisons because the Securities and Exchange Commission requires all mutual funds to calculate expenses based on a 5% return. You can assess your fund’s costs by comparing this hypothetical example with the hypothetical examples that appear in shareholder reports of other funds. |
| Six Months Ended August 31, 2021 | |||
| Beginning Account Value 2/28/2021 | Ending Account Value 8/31/2021 | Expenses Paid During Period | |
| Based on Actual Fund Return | |||
| Extended Duration Treasury Index Fund | |||
| ETF Shares | $1,000.00 | $1,062.70 | $0.26 |
| Institutional Shares | 1,000.00 | 1,062.80 | 0.31 |
| Institutional Plus Shares | 1,000.00 | 1,062.80 | 0.21 |
| Based on Hypothetical 5% Yearly Return | |||
| Extended Duration Treasury Index Fund | |||
| ETF Shares | $1,000.00 | $1,024.95 | $0.26 |
| Institutional Shares | 1,000.00 | 1,024.90 | 0.31 |
| Institutional Plus Shares | 1,000.00 | 1,025.00 | 0.20 |
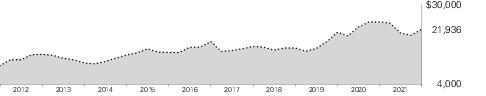
| Average Annual Total Returns Periods Ended August 31, 2021 | |||||
| One Year | Five Years | Ten Years | Final Value of a $10,000 Investment | ||

| Extended Duration Treasury Index Fund ETF Shares Net Asset Value | -8.94% | 4.18% | 8.17% | $21,936 |
| Extended Duration Treasury Index Fund ETF Shares Market Price | -9.14 | 4.07 | 8.15 | 21,900 | |

| Bloomberg U.S. Treasury STRIPS 20–30 Year Equal Par Bond Index | -9.83 | 4.13 | 8.16 | 21,902 |
| One Year | Five Years | Ten Years | Final Value of a $5,000,000 Investment | ||
| Extended Duration Treasury Index Fund Institutional Shares | -9.40% | 4.08% | 8.14% | $10,932,150 | |
| Bloomberg U.S. Treasury STRIPS 20–30 Year Equal Par Bond Index | -9.83 | 4.13 | 8.16 | 10,951,211 | |
| Average Annual Total Returns Periods Ended August 31, 2021 | |||||
| One Year | Five Years | Since Inception (8/28/2013) | Final Value of a $100,000,000 Investment | ||
| Extended Duration Treasury Index Fund Institutional Plus Shares | -9.40% | 4.10% | 9.34% | $204,495,050 | |
| Bloomberg U.S. Treasury STRIPS 20–30 Year Equal Par Bond Index | -9.83 | 4.13 | 9.45 | 206,099,390 | |
| Cumulative Returns of ETF Shares: August 31, 2011, Through August 31, 2021 | |||
| One Year | Five Years | Ten Years | |
| Extended Duration Treasury Index Fund ETF Shares Market Price | -9.14% | 22.10% | 119.00% |
| Extended Duration Treasury Index Fund ETF Shares Net Asset Value | -8.94 | 22.74 | 119.36 |
| Bloomberg U.S. Treasury STRIPS 20–30 Year Equal Par Bond Index | -9.83 | 22.43 | 119.02 |
| 20 - 25 Years | 52.0% |
| 25 - 30 Years | 48.0 |
| Coupon | Maturity Date | Face Amount ($000) | Market Value• ($000) | |||
| U.S. Government and Agency Obligations (100.0%) | ||||||
| U.S. Government Securities (100.0%) | ||||||
| United States Treasury Strip Coupon | 0.000% | 11/15/41 | 59,798 | 39,817 | ||
| United States Treasury Strip Coupon | 0.000% | 2/15/42 | 70,423 | 46,661 | ||
| United States Treasury Strip Coupon | 0.000% | 5/15/42 | 54,485 | 35,786 | ||
| United States Treasury Strip Coupon | 0.000% | 8/15/42 | 78,164 | 50,965 | ||
| United States Treasury Strip Coupon | 0.000% | 11/15/42 | 54,820 | 35,552 | ||
| United States Treasury Strip Coupon | 0.000% | 2/15/43 | 56,400 | 36,290 | ||
| United States Treasury Strip Coupon | 0.000% | 5/15/43 | 78,265 | 50,194 | ||
| United States Treasury Strip Coupon | 0.000% | 8/15/43 | 56,956 | 36,301 | ||
| United States Treasury Strip Coupon | 0.000% | 11/15/43 | 52,238 | 33,134 | ||
| United States Treasury Strip Coupon | 0.000% | 2/15/44 | 66,562 | 42,043 | ||
| United States Treasury Strip Coupon | 0.000% | 5/15/44 | 48,827 | 30,727 | ||
| United States Treasury Strip Coupon | 0.000% | 8/15/44 | 46,796 | 29,280 | ||
| United States Treasury Strip Coupon | 0.000% | 11/15/44 | 51,860 | 32,263 | ||
| United States Treasury Strip Coupon | 0.000% | 2/15/45 | 51,467 | 31,861 | ||
| United States Treasury Strip Coupon | 0.000% | 5/15/45 | 57,687 | 35,572 | ||
| United States Treasury Strip Coupon | 0.000% | 8/15/45 | 54,264 | 33,245 | ||
| United States Treasury Strip Coupon | 0.000% | 11/15/45 | 49,927 | 30,475 | ||
| United States Treasury Strip Coupon | 0.000% | 2/15/46 | 51,373 | 31,181 | ||
| United States Treasury Strip Coupon | 0.000% | 5/15/46 | 53,320 | 32,196 | ||
| United States Treasury Strip Coupon | 0.000% | 8/15/46 | 56,098 | 33,650 | ||
| United States Treasury Strip Coupon | 0.000% | 11/15/46 | 51,435 | 30,744 | ||
| United States Treasury Strip Coupon | 0.000% | 2/15/47 | 50,080 | 29,747 | ||
| United States Treasury Strip Coupon | 0.000% | 5/15/47 | 50,432 | 29,822 | ||
| United States Treasury Strip Coupon | 0.000% | 8/15/47 | 57,370 | 33,696 | ||
| United States Treasury Strip Coupon | 0.000% | 11/15/47 | 61,678 | 36,072 | ||
| United States Treasury Strip Coupon | 0.000% | 2/15/48 | 55,516 | 32,299 | ||
| United States Treasury Strip Coupon | 0.000% | 5/15/48 | 50,080 | 28,976 | ||
| United States Treasury Strip Coupon | 0.000% | 8/15/48 | 57,936 | 33,336 | ||
| United States Treasury Strip Coupon | 0.000% | 11/15/48 | 52,460 | 30,107 | ||
| United States Treasury Strip Coupon | 0.000% | 2/15/49 | 48,623 | 27,734 | ||
| United States Treasury Strip Coupon | 0.000% | 5/15/49 | 53,549 | 30,372 | ||
| United States Treasury Strip Coupon | 0.000% | 8/15/49 | 49,550 | 27,969 | ||
| United States Treasury Strip Coupon | 0.000% | 11/15/49 | 54,272 | 30,676 | ||
| United States Treasury Strip Coupon | 0.000% | 2/15/50 | 56,319 | 31,662 | ||
| United States Treasury Strip Coupon | 0.000% | 5/15/50 | 54,122 | 30,321 | ||
| United States Treasury Strip Coupon | 0.000% | 8/15/50 | 51,269 | 28,610 | ||
| United States Treasury Strip Coupon | 0.000% | 11/15/50 | 31,994 | 17,794 | ||
| United States Treasury Strip Coupon | 0.000% | 2/15/51 | 29,061 | 16,081 | ||
| United States Treasury Strip Coupon | 0.000% | 5/15/51 | 3,146 | 1,733 | ||
| Coupon | Maturity Date | Face Amount ($000) | Market Value• ($000) | |||
| United States Treasury Strip Coupon | 0.000% | 8/15/51 | 976 | 539 | ||
| United States Treasury Strip Principal | 0.000% | 11/15/41 | 47,961 | 32,842 | ||
| United States Treasury Strip Principal | 0.000% | 2/15/42 | 48,877 | 33,336 | ||
| United States Treasury Strip Principal | 0.000% | 5/15/42 | 52,613 | 35,526 | ||
| United States Treasury Strip Principal | 0.000% | 8/15/42 | 37,923 | 25,400 | ||
| United States Treasury Strip Principal | 0.000% | 11/15/42 | 47,002 | 31,282 | ||
| United States Treasury Strip Principal | 0.000% | 2/15/43 | 49,172 | 32,527 | ||
| United States Treasury Strip Principal | 0.000% | 5/15/43 | 34,736 | 22,823 | ||
| United States Treasury Strip Principal | 0.000% | 8/15/43 | 41,015 | 26,823 | ||
| United States Treasury Strip Principal | 0.000% | 11/15/43 | 49,528 | 32,243 | ||
| United States Treasury Strip Principal | 0.000% | 2/15/44 | 40,502 | 26,228 | ||
| United States Treasury Strip Principal | 0.000% | 5/15/44 | 35,930 | 23,116 | ||
| United States Treasury Strip Principal | 0.000% | 8/15/44 | 53,497 | 34,184 | ||
| United States Treasury Strip Principal | 0.000% | 11/15/44 | 45,868 | 29,119 | ||
| United States Treasury Strip Principal | 0.000% | 2/15/45 | 38,827 | 24,519 | ||
| United States Treasury Strip Principal | 0.000% | 5/15/45 | 49,122 | 30,924 | ||
| United States Treasury Strip Principal | 0.000% | 8/15/45 | 54,470 | 34,086 | ||
| United States Treasury Strip Principal | 0.000% | 11/15/45 | 54,791 | 34,159 | ||
| United States Treasury Strip Principal | 0.000% | 2/15/46 | 57,965 | 35,879 | ||
| United States Treasury Strip Principal | 0.000% | 5/15/46 | 51,384 | 31,649 | ||
| United States Treasury Strip Principal | 0.000% | 8/15/46 | 52,864 | 32,371 | ||
| United States Treasury Strip Principal | 0.000% | 11/15/46 | 57,584 | 35,153 | ||
| United States Treasury Strip Principal | 0.000% | 2/15/47 | 57,080 | 34,689 | ||
| United States Treasury Strip Principal | 0.000% | 5/15/47 | 48,940 | 29,616 | ||
| United States Treasury Strip Principal | 0.000% | 8/15/47 | 53,571 | 32,172 | ||
| United States Treasury Strip Principal | 0.000% | 11/15/47 | 64,294 | 38,406 | ||
| United States Treasury Strip Principal | 0.000% | 2/15/48 | 55,198 | 32,847 | ||
| United States Treasury Strip Principal | 0.000% | 5/15/48 | 53,298 | 31,592 | ||
| United States Treasury Strip Principal | 0.000% | 8/15/48 | 40,947 | 24,104 | ||
| United States Treasury Strip Principal | 0.000% | 11/15/48 | 42,111 | 24,770 | ||
| United States Treasury Strip Principal | 0.000% | 2/15/49 | 55,858 | 32,620 | ||
| United States Treasury Strip Principal | 0.000% | 5/15/49 | 51,592 | 29,952 | ||
| United States Treasury Strip Principal | 0.000% | 8/15/49 | 59,222 | 34,150 | ||
| United States Treasury Strip Principal | 0.000% | 11/15/49 | 53,386 | 30,705 | ||
| United States Treasury Strip Principal | 0.000% | 2/15/50 | 64,127 | 36,638 | ||
| United States Treasury Strip Principal | 0.000% | 5/15/50 | 68,121 | 38,707 | ||
| United States Treasury Strip Principal | 0.000% | 8/15/50 | 88,221 | 49,859 | ||
| United States Treasury Strip Principal | 0.000% | 11/15/50 | 52,350 | 29,447 | ||
| United States Treasury Strip Principal | 0.000% | 2/15/51 | 79,276 | 44,388 | ||
| United States Treasury Strip Principal | 0.000% | 5/15/51 | 81,076 | 45,270 | ||
| United States Treasury Strip Principal | 0.000% | 8/15/51 | 92,688 | 51,420 | ||
| Total U.S. Government and Agency Obligations (Cost $2,502,555) | 2,571,024 | |||||
| Coupon | Shares | Market Value• ($000) | ||||
| Temporary Cash Investments (0.0%) | ||||||
| Money Market Fund (0.0%) | ||||||
| 1 | Vanguard Market Liquidity Fund (Cost $551) | 0.068% | 5,514 | 551 | ||
| Total Investments (100.0%) (Cost $2,503,106) | 2,571,575 | |||||
| Other Assets and Liabilities—Net (0.0%) | (900) | |||||
| Net Assets (100%) | 2,570,675 | |||||
| Cost is in $000. |
| • | See Note A in Notes to Financial Statements. |
| 1 | Affiliated money market fund available only to Vanguard funds and certain trusts and accounts managed by Vanguard. Rate shown is the 7-day yield. |
| ($000s, except shares and per-share amounts) | Amount |
| Assets | |
| Investments in Securities, at Value | |
| Unaffiliated Issuers (Cost $2,502,555) | 2,571,024 |
| Affiliated Issuers (Cost $551) | 551 |
| Total Investments in Securities | 2,571,575 |
| Investment in Vanguard | 88 |
| Receivables for Investment Securities Sold | 71,722 |
| Total Assets | 2,643,385 |
| Liabilities | |
| Due to Custodian | 159 |
| Payables for Investment Securities Purchased | 68,236 |
| Payables for Capital Shares Redeemed | 4,284 |
| Payables to Vanguard | 31 |
| Total Liabilities | 72,710 |
| Net Assets | 2,570,675 |
| Statement of Assets and Liabilities (continued) | |
| At August 31, 2021, net assets consisted of: | |
| ($000s, except shares and per-share amounts) | Amount |
| Paid-in Capital | 2,521,257 |
| Total Distributable Earnings (Loss) | 49,418 |
| Net Assets | 2,570,675 |
| ETF Shares—Net Assets | |
| Applicable to 9,075,000 outstanding $.001 par value shares of beneficial interest (unlimited authorization) | 1,276,736 |
| Net Asset Value Per Share—ETF Shares | $140.69 |
| Institutional Shares—Net Assets | |
| Applicable to 18,558,563 outstanding $.001 par value shares of beneficial interest (unlimited authorization) | 788,658 |
| Net Asset Value Per Share—Institutional Shares | $42.50 |
| Institutional Plus Shares—Net Assets | |
| Applicable to 4,736,388 outstanding $.001 par value shares of beneficial interest (unlimited authorization) | 505,281 |
| Net Asset Value Per Share—Institutional Plus Shares | $106.68 |
| Year Ended August 31, 2021 | |
| ($000) | |
| Investment Income | |
| Income | |
| Interest1 | 52,148 |
| Total Income | 52,148 |
| Expenses | |
| The Vanguard Group—Note B | |
| Investment Advisory Services | 60 |
| Management and Administrative—ETF Shares | 622 |
| Management and Administrative—Institutional Shares | 438 |
| Management and Administrative—Institutional Plus Shares | 159 |
| Marketing and Distribution—ETF Shares | 60 |
| Marketing and Distribution—Institutional Shares | 22 |
| Marketing and Distribution—Institutional Plus Shares | 5 |
| Custodian Fees | 5 |
| Auditing Fees | 32 |
| Shareholders’ Reports—ETF Shares | 64 |
| Shareholders’ Reports—Institutional Shares | — |
| Shareholders’ Reports—Institutional Plus Shares | — |
| Trustees’ Fees and Expenses | 1 |
| Total Expenses | 1,468 |
| Net Investment Income | 50,680 |
| Realized Net Gain (Loss) on Investment Securities Sold1,2 | 193,938 |
| Change in Unrealized Appreciation (Depreciation) of Investment Securities1 | (490,660) |
| Net Increase (Decrease) in Net Assets Resulting from Operations | (246,042) |
| 1 | Interest income, realized net gain (loss), and change in unrealized appreciation (depreciation) from an affiliated company of the fund were $1,000, less than $1,000, and less than $1,000, respectively. Purchases and sales are for temporary cash investment purposes. |
| 2 | Includes $220,752,000 of net gain (loss) resulting from in-kind redemptions. |
| Year Ended August 31, | ||
| 2021 ($000) | 2020 ($000) | |
| Increase (Decrease) in Net Assets | ||
| Operations | ||
| Net Investment Income | 50,680 | 63,819 |
| Realized Net Gain (Loss) | 193,938 | 405,593 |
| Change in Unrealized Appreciation (Depreciation) | (490,660) | (49,993) |
| Net Increase (Decrease) in Net Assets Resulting from Operations | (246,042) | 419,419 |
| Distributions | ||
| ETF Shares | (73,445) | (39,381) |
| Institutional Shares | (44,948) | (26,547) |
| Institutional Plus Shares | (26,453) | (23,883) |
| Total Distributions | (144,846) | (89,811) |
| Capital Share Transactions | ||
| ETF Shares | (318,357) | 343,500 |
| Institutional Shares | 19,832 | (76,455) |
| Institutional Plus Shares | (128,823) | (182,509) |
| Net Increase (Decrease) from Capital Share Transactions | (427,348) | 84,536 |
| Total Increase (Decrease) | (818,236) | 414,144 |
| Net Assets | ||
| Beginning of Period | 3,388,911 | 2,974,767 |
| End of Period | 2,570,675 | 3,388,911 |
| ETF Shares | |||||
| For a Share Outstanding Throughout Each Period | Year Ended August 31, | ||||
| 2021 | 2020 | 2019 | 2018 | 2017 | |
| Net Asset Value, Beginning of Period | $163.11 | $146.43 | $113.39 | $120.92 | $139.77 |
| Investment Operations | |||||
| Net Investment Income1 | 2.795 | 3.146 | 3.347 | 3.353 | 3.383 |
| Net Realized and Unrealized Gain (Loss) on Investments2 | (17.061) | 18.113 | 32.972 | (7.272) | (16.377) |
| Total from Investment Operations | (14.266) | 21.259 | 36.319 | (3.919) | (12.994) |
| Distributions | |||||
| Dividends from Net Investment Income | (2.820) | (3.329) | (3.279) | (3.314) | (3.402) |
| Distributions from Realized Capital Gains | (5.334) | (1.250) | — | (.297) | (2.454) |
| Total Distributions | (8.154) | (4.579) | (3.279) | (3.611) | (5.856) |
| Net Asset Value, End of Period | $140.69 | $163.11 | $146.43 | $113.39 | $120.92 |
| Total Return | -8.94% | 14.98% | 32.92% | -3.24% | -8.86% |
| Ratios/Supplemental Data | |||||
| Net Assets, End of Period (Millions) | $1,277 | $1,810 | $1,333 | $658 | $623 |
| Ratio of Total Expenses to Average Net Assets | 0.06% | 0.07% | 0.07% | 0.07% | 0.07% |
| Ratio of Net Investment Income to Average Net Assets | 1.93% | 2.06% | 2.87% | 2.93% | 2.90% |
| Portfolio Turnover Rate3 | 23% | 17% | 20% | 18% | 18% |
| 1 | Calculated based on average shares outstanding. |
| 2 | Includes increases from purchase fees of $.07, $.07, $.04, $.07, and $.16. |
| 3 | Excludes the value of portfolio securities received or delivered as a result of in-kind purchases or redemptions of the fund’s capital shares, including ETF Creation Units. |
| Institutional Shares | |||||
| For a Share Outstanding Throughout Each Period | Year Ended August 31, | ||||
| 2021 | 2020 | 2019 | 2018 | 2017 | |
| Net Asset Value, Beginning of Period | $49.27 | $44.24 | $34.25 | $36.52 | $42.20 |
| Investment Operations | |||||
| Net Investment Income1 | .842 | .959 | 1.015 | 1.016 | 1.024 |
| Net Realized and Unrealized Gain (Loss) on Investments2 | (5.143) | 5.459 | 9.967 | (2.191) | (4.934) |
| Total from Investment Operations | (4.301) | 6.418 | 10.982 | (1.175) | (3.910) |
| Distributions | |||||
| Dividends from Net Investment Income | (.857) | (1.010) | (.992) | (1.005) | (1.030) |
| Distributions from Realized Capital Gains | (1.612) | (.378) | — | (.090) | (.740) |
| Total Distributions | (2.469) | (1.388) | (.992) | (1.095) | (1.770) |
| Net Asset Value, End of Period | $42.50 | $49.27 | $44.24 | $34.25 | $36.52 |
| Total Return3 | -8.95% | 14.98% | 32.94% | -3.23% | -8.86% |
| Ratios/Supplemental Data | |||||
| Net Assets, End of Period (Millions) | $789 | $889 | $862 | $787 | $682 |
| Ratio of Total Expenses to Average Net Assets | 0.06% | 0.06% | 0.06% | 0.06% | 0.06% |
| Ratio of Net Investment Income to Average Net Assets | 1.96% | 2.10% | 2.88% | 2.94% | 2.91% |
| Portfolio Turnover Rate4 | 23% | 17% | 20% | 18% | 18% |
| 1 | Calculated based on average shares outstanding. |
| 2 | Includes increases from purchase fees of $.02, $.02, $.01, $.02, and $.05. |
| 3 | Total returns do not include transaction fees that may have applied in the periods shown. Fund prospectuses provide information about any applicable transaction fees. |
| 4 | Excludes the value of portfolio securities received or delivered as a result of in-kind purchases or redemptions of the fund’s capital shares, including ETF Creation Units. |
| Institutional Plus Shares | |||||
| For a Share Outstanding Throughout Each Period | Year Ended August 31, | ||||
| 2021 | 2020 | 2019 | 2018 | 2017 | |
| Net Asset Value, Beginning of Period | $123.70 | $111.06 | $85.99 | $91.68 | $105.93 |
| Investment Operations | |||||
| Net Investment Income1 | 2.140 | 2.432 | 2.564 | 2.568 | 2.588 |
| Net Realized and Unrealized Gain (Loss) on Investments2 | (12.941) | 13.716 | 25.015 | (5.492) | (12.375) |
| Total from Investment Operations | (10.801) | 16.148 | 27.579 | (2.924) | (9.787) |
| Distributions | |||||
| Dividends from Net Investment Income | (2.173) | (2.560) | (2.509) | (2.541) | (2.603) |
| Distributions from Realized Capital Gains | (4.046) | (.948) | — | (.225) | (1.860) |
| Total Distributions | (6.219) | (3.508) | (2.509) | (2.766) | (4.463) |
| Net Asset Value, End of Period | $106.68 | $123.70 | $111.06 | $85.99 | $91.68 |
| Total Return3 | -8.95% | 15.02% | 32.95% | -3.20% | -8.84% |
| Ratios/Supplemental Data | |||||
| Net Assets, End of Period (Millions) | $505 | $689 | $780 | $533 | $367 |
| Ratio of Total Expenses to Average Net Assets | 0.04% | 0.04% | 0.04% | 0.04% | 0.04% |
| Ratio of Net Investment Income to Average Net Assets | 1.96% | 2.12% | 2.90% | 2.96% | 2.93% |
| Portfolio Turnover Rate4 | 23% | 17% | 20% | 18% | 18% |
| 1 | Calculated based on average shares outstanding. |
| 2 | Includes increases from purchase fees of $.05, $.05, $.03, $.06, and $.12. |
| 3 | Total returns do not include transaction fees that may have applied in the periods shown. Fund prospectuses provide information about any applicable transaction fees. |
| 4 | Excludes the value of portfolio securities received or delivered as a result of in-kind purchases or redemptions of the fund’s capital shares, including ETF Creation Units. |
| Level 1 ($000) | Level 2 ($000) | Level 3 ($000) | Total ($000) | |
| Investments | ||||
| Assets | ||||
| U.S. Government and Agency Obligations | — | 2,571,024 | — | 2,571,024 |
| Temporary Cash Investments | 551 | — | — | 551 |
| Total | 551 | 2,571,024 | — | 2,571,575 |
| Amount ($000) | |
| Paid-in Capital | 219,983 |
| Total Distributable Earnings (Loss) | (219,983) |
| Amount ($000) | |
| Undistributed Ordinary Income | 8,619 |
| Undistributed Long-Term Gains | — |
| Capital Loss Carryforwards | — |
| Qualified Late-Year Losses | (26,472) |
| Net Unrealized Gains (Losses) | 67,271 |
| Year Ended August 31, | ||
| 2021 Amount ($000) | 2020 Amount ($000) | |
| Ordinary Income* | 75,404 | 75,429 |
| Long-Term Capital Gains | 69,442 | 14,382 |
| Total | 144,846 | 89,811 |
| * | Includes short-term capital gains, if any. |
| Amount ($000) | |
| Tax Cost | 2,504,304 |
| Gross Unrealized Appreciation | 185,163 |
| Gross Unrealized Depreciation | (117,892) |
| Net Unrealized Appreciation (Depreciation) | 67,271 |
| Year Ended August 31, | |||||
| 2021 | 2020 | ||||
| Amount ($000) | Shares (000) | Amount ($000) | Shares (000) | ||
| ETF Shares | |||||
| Issued1 | 1,362,442 | 9,725 | 1,411,503 | 8,875 | |
| Issued in Lieu of Cash Distributions | — | — | — | — | |
| Redeemed | (1,680,799) | (11,750) | (1,068,003) | (6,875) | |
| Net Increase (Decrease)—ETF Shares | (318,357) | (2,025) | 343,500 | 2,000 | |
| Institutional Shares | |||||
| Issued1 | 267,929 | 6,594 | 166,646 | 3,592 | |
| Issued in Lieu of Cash Distributions | 44,716 | 998 | 26,362 | 611 | |
| Redeemed | (292,813) | (7,084) | (269,463) | (5,642) | |
| Net Increase (Decrease)—Institutional Shares | 19,832 | 508 | (76,455) | (1,439) | |
| Institutional Plus Shares | |||||
| Issued1 | 125,438 | 1,272 | 332 | — | |
| Issued in Lieu of Cash Distributions | 26,453 | 234 | 23,883 | 221 | |
| Redeemed | (280,714) | (2,340) | (206,724) | (1,674) | |
| Net Increase (Decrease)—Institutional Plus Shares | (128,823) | (834) | (182,509) | (1,453) | |
| 1 | Includes purchase fees for fiscal 2021 and 2020 of $1,200,000 and $1,324,000, respectively (fund totals). |
Philadelphia, Pennsylvania
October 18, 2021
Index Fund


| Vanguard Mega Cap Index Fund |
| Vanguard Mega Cap Growth Index Fund |
| Vanguard Mega Cap Value Index Fund |
Your Fund’s Performance at a Glance | 1 |
About Your Fund’s Expenses | 2 |
Mega Cap Index Fund | 4 |
Mega Cap Growth Index Fund | 21 |
Mega Cap Value Index Fund | 36 |
Trustees Approve Advisory Arrangements | 54 |
Liquidity Risk Management | 56 |
| • | For the 12 months ended August 31, 2021, returns for the three Vanguard Mega Cap Index Funds (based on net asset value) ranged from 27.41% for ETF Shares of the Growth Index Fund to 33.22% for Institutional Shares of the Value Index Fund. Each fund closely tracked its target index. |
| • | The global economy rebounded faster than many had expected after the sharp pandemic-induced contraction in the spring of 2020. Countries that have been more successful in containing the virus have generally fared better economically. Swift and extensive fiscal and monetary support from policymakers has also been key to the rebound. |
| • | As the 12 months under review reflect the recovery in stocks following the sharp downturn at the start of the pandemic, results were excellent. |
| • | Large-capitalization stocks trailed their mid- and small-cap counterparts for the period, and value stocks surpassed growth. |
| • | All 11 sectors for the three funds generated positive returns. Technology stocks contributed the most to the Mega Cap Index Fund and the Growth Index Fund, while financial stocks led the Value Index Fund. All three funds also benefited significantly from exposure to health care and industrials. |
| Average Annual Total Returns Periods Ended August 31, 2021 | |||
| One Year | Three Years | Five Years | |
| Stocks | |||
| Russell 1000 Index (Large-caps) | 32.25% | 18.42% | 18.24% |
| Russell 2000 Index (Small-caps) | 47.08 | 10.75 | 14.38 |
| Russell 3000 Index (Broad U.S. market) | 33.04 | 17.85 | 17.97 |
| FTSE All-World ex US Index (International) | 25.74 | 9.82 | 10.23 |
| Bonds | |||
| Bloomberg U.S. Aggregate Bond Index (Broad taxable market) | -0.08% | 5.43% | 3.11% |
| Bloomberg Municipal Bond Index (Broad tax-exempt market) | 3.40 | 5.09 | 3.30 |
| FTSE Three-Month U.S. Treasury Bill Index | 0.06 | 1.20 | 1.13 |
| CPI | |||
| Consumer Price Index | 5.25% | 2.76% | 2.58% |
| • | Based on actual fund return. This section helps you to estimate the actual expenses that you paid over the period. The ”Ending Account Value“ shown is derived from the fund‘s actual return, and the third column shows the dollar amount that would have been paid by an investor who started with $1,000 in the fund. You may use the information here, together with the amount you invested, to estimate the expenses that you paid over the period. |
| • | Based on hypothetical 5% yearly return. This section is intended to help you compare your fund‘s costs with those of other mutual funds. It assumes that the fund had a yearly return of 5% before expenses, but that the expense ratio is unchanged. In this case—because the return used is not the fund’s actual return—the results do not apply to your investment. The example is useful in making comparisons because the Securities and Exchange Commission requires all mutual funds to calculate expenses based on a 5% return. You can assess your fund’s costs by comparing this hypothetical example with the hypothetical examples that appear in shareholder reports of other funds. |
| Six Months Ended August 31, 2021 | |||
| Beginning Account Value 2/28/2021 | Ending Account Value 8/31/2021 | Expenses Paid During Period | |
| Based on Actual Fund Return | |||
| Mega Cap Index Fund | |||
| ETF Shares | $1,000.00 | $1,198.60 | $0.39 |
| Institutional Shares | 1,000.00 | 1,198.70 | 0.33 |
| Mega Cap Growth Index Fund | |||
| ETF Shares | $1,000.00 | $1,231.00 | $0.39 |
| Institutional Shares | 1,000.00 | 1,231.10 | 0.34 |
| Mega Cap Value Index Fund | |||
| ETF Shares | $1,000.00 | $1,155.30 | $0.38 |
| Institutional Shares | 1,000.00 | 1,155.60 | 0.33 |
| Based on Hypothetical 5% Yearly Return | |||
| Mega Cap Index Fund | |||
| ETF Shares | $1,000.00 | $1,024.85 | $0.36 |
| Institutional Shares | 1,000.00 | 1,024.90 | 0.31 |
| Mega Cap Growth Index Fund | |||
| ETF Shares | $1,000.00 | $1,024.85 | $0.36 |
| Institutional Shares | 1,000.00 | 1,024.90 | 0.31 |
| Mega Cap Value Index Fund | |||
| ETF Shares | $1,000.00 | $1,024.85 | $0.36 |
| Institutional Shares | 1,000.00 | 1,024.90 | 0.31 |

| Average Annual Total Returns Periods Ended August 31, 2021 | |||||
| One Year | Five Year | Ten Years | Final Value of a $10,000 Investment | ||

| Mega Cap Index Fund ETF Shares Net Asset Value | 29.94% | 18.95% | 16.73% | $46,973 |
| Mega Cap Index Fund ETF Shares Market Price | 29.83 | 18.95 | 16.73 | 46,989 | |

| Spliced Mega Cap Index | 30.01 | 19.01 | 16.81 | 47,292 |

| Dow Jones U.S. Total Stock Market Float Adjusted Index | 33.32 | 17.95 | 16.16 | 44,721 |
| One Year | Five Years | Ten Years | Final Value of a $5,000,000 Investment | ||
| Mega Cap Index Fund Institutional Shares | 29.97% | 18.97% | 16.76% | $23,536,259 | |
| Spliced Mega Cap Index | 30.01 | 19.01 | 16.81 | 23,646,020 | |
| Dow Jones U.S. Total Stock Market Float Adjusted Index | 33.32 | 17.95 | 16.16 | 22,360,680 | |
| One Year | Five Years | Ten Years | |
| Mega Cap Index Fund ETF Shares Market Price | 29.83% | 138.14% | 369.89% |
| Mega Cap Index Fund ETF Shares Net Asset Value | 29.94 | 138.14 | 369.73 |
| Spliced Mega Cap Index | 30.01 | 138.72 | 372.92 |
| Basic Materials | 1.4% |
| Consumer Discretionary | 15.7 |
| Consumer Staples | 5.1 |
| Energy | 2.0 |
| Financials | 10.5 |
| Health Care | 12.9 |
| Industrials | 12.3 |
| Real Estate | 1.4 |
| Technology | 33.3 |
| Telecommunications | 3.4 |
| Utilities | 2.0 |
| Futures Contracts | ||||
| ($000) | ||||
| Expiration | Number of Long (Short) Contracts | Notional Amount | Value and Unrealized Appreciation (Depreciation) | |
| Long Futures Contracts | ||||
| E-mini S&P 500 Index | September 2021 | 26 | 5,877 | 131 |
| ($000s, except shares and per-share amounts) | Amount |
| Assets | |
| Investments in Securities, at Value | |
| Unaffiliated Issuers (Cost $2,505,534) | 4,471,474 |
| Affiliated Issuers (Cost $2,249) | 2,250 |
| Total Investments in Securities | 4,473,724 |
| Investment in Vanguard | 145 |
| Cash | 6 |
| Cash Collateral Pledged—Futures Contracts | 300 |
| Receivables for Accrued Income | 5,483 |
| Receivables for Capital Shares Issued | 1 |
| Total Assets | 4,479,659 |
| Liabilities | |
| Payables for Investment Securities Purchased | 9 |
| Collateral for Securities on Loan | 1,377 |
| Payables for Capital Shares Redeemed | 2 |
| Payables to Vanguard | 135 |
| Variation Margin Payable—Futures Contracts | 6 |
| Total Liabilities | 1,529 |
| Net Assets | 4,478,130 |
| At August 31, 2021, net assets consisted of: | |
| Paid-in Capital | 2,553,522 |
| Total Distributable Earnings (Loss) | 1,924,608 |
| Net Assets | 4,478,130 |
| ETF Shares—Net Assets | |
| Applicable to 26,675,000 outstanding $.001 par value shares of beneficial interest (unlimited authorization) | 4,287,839 |
| Net Asset Value Per Share—ETF Shares | $160.74 |
| Institutional Shares—Net Assets | |
| Applicable to 600,400 outstanding $.001 par value shares of beneficial interest (unlimited authorization) | 190,291 |
| Net Asset Value Per Share—Institutional Shares | $316.94 |
| Year Ended August 31, 2021 | |
| ($000) | |
| Investment Income | |
| Income | |
| Dividends | 54,844 |
| Interest1 | 4 |
| Securities Lending—Net | 36 |
| Total Income | 54,884 |
| Expenses | |
| The Vanguard Group—Note B | |
| Investment Advisory Services | 557 |
| Management and Administrative—ETF Shares | 1,658 |
| Management and Administrative—Institutional Shares | 76 |
| Marketing and Distribution—ETF Shares | 122 |
| Marketing and Distribution—Institutional Shares | 4 |
| Custodian Fees | 26 |
| Auditing Fees | 40 |
| Shareholders’ Reports—ETF Shares | 93 |
| Shareholders’ Reports—Institutional Shares | — |
| Trustees’ Fees and Expenses | 1 |
| Total Expenses | 2,577 |
| Net Investment Income | 52,307 |
| Realized Net Gain (Loss) | |
| Investment Securities Sold1,2 | 131,115 |
| Futures Contracts | 1,581 |
| Realized Net Gain (Loss) | 132,696 |
| Change in Unrealized Appreciation (Depreciation) | |
| Investment Securities1 | 814,065 |
| Futures Contracts | (325) |
| Change in Unrealized Appreciation (Depreciation) | 813,740 |
| Net Increase (Decrease) in Net Assets Resulting from Operations | 998,743 |
| 1 | Interest income, realized net gain (loss), and change in unrealized appreciation (depreciation) from an affiliated company of the fund were $4,000, $0, and $1,000, respectively. Purchases and sales are for temporary cash investment purposes. |
| 2 | Includes $154,067,000 of net gain (loss) resulting from in-kind redemptions. |
| Year Ended August 31, | ||
| 2021 ($000) | 2020 ($000) | |
| Increase (Decrease) in Net Assets | ||
| Operations | ||
| Net Investment Income | 52,307 | 46,077 |
| Realized Net Gain (Loss) | 132,696 | 121,553 |
| Change in Unrealized Appreciation (Depreciation) | 813,740 | 472,864 |
| Net Increase (Decrease) in Net Assets Resulting from Operations | 998,743 | 640,494 |
| Distributions | ||
| ETF Shares | (48,029) | (41,365) |
| Institutional Shares | (2,599) | (2,886) |
| Total Distributions | (50,628) | (44,251) |
| Capital Share Transactions | ||
| ETF Shares | 349,653 | 532,703 |
| Institutional Shares | (36,024) | (5,958) |
| Net Increase (Decrease) from Capital Share Transactions | 313,629 | 526,745 |
| Total Increase (Decrease) | 1,261,744 | 1,122,988 |
| Net Assets | ||
| Beginning of Period | 3,216,386 | 2,093,398 |
| End of Period | 4,478,130 | 3,216,386 |
| ETF Shares | |||||
| For a Share Outstanding Throughout Each Period | Year Ended August 31, | ||||
| 2021 | 2020 | 2019 | 2018 | 2017 | |
| Net Asset Value, Beginning of Period | $125.47 | $101.36 | $100.26 | $85.02 | $74.19 |
| Investment Operations | |||||
| Net Investment Income1 | 1.961 | 1.992 | 2.045 | 1.790 | 1.676 |
| Net Realized and Unrealized Gain (Loss) on Investments | 35.218 | 24.065 | 1.052 | 15.214 | 10.788 |
| Total from Investment Operations | 37.179 | 26.057 | 3.097 | 17.004 | 12.464 |
| Distributions | |||||
| Dividends from Net Investment Income | (1.908) | (1.947) | (1.997) | (1.764) | (1.634) |
| Distributions from Realized Capital Gains | — | — | — | — | — |
| Total Distributions | (1.908) | (1.947) | (1.997) | (1.764) | (1.634) |
| Net Asset Value, End of Period | $160.74 | $125.47 | $101.36 | $100.26 | $85.02 |
| Total Return | 29.94% | 26.14% | 3.26% | 20.25% | 17.01% |
| Ratios/Supplemental Data | |||||
| Net Assets, End of Period (Millions) | $4,288 | $3,036 | $1,944 | $1,542 | $1,233 |
| Ratio of Total Expenses to Average Net Assets | 0.07% | 0.07% | 0.07% | 0.07% | 0.07% |
| Ratio of Net Investment Income to Average Net Assets | 1.41% | 1.85% | 2.10% | 1.93% | 2.12% |
| Portfolio Turnover Rate2 | 5% | 4% | 4% | 4% | 6% |
| 1 | Calculated based on average shares outstanding. |
| 2 | Excludes the value of portfolio securities received or delivered as a result of in-kind purchases or redemptions of the fund’s capital shares, including ETF Creation Units. |
| Institutional Shares | |||||
| For a Share Outstanding Throughout Each Period | Year Ended August 31, | ||||
| 2021 | 2020 | 2019 | 2018 | 2017 | |
| Net Asset Value, Beginning of Period | $247.38 | $199.84 | $197.68 | $167.62 | $146.25 |
| Investment Operations | |||||
| Net Investment Income1 | 3.882 | 3.943 | 4.053 | 3.513 | 3.362 |
| Net Realized and Unrealized Gain (Loss) on Investments | 69.463 | 47.454 | 2.062 | 30.038 | 21.220 |
| Total from Investment Operations | 73.345 | 51.397 | 6.115 | 33.551 | 24.582 |
| Distributions | |||||
| Dividends from Net Investment Income | (3.785) | (3.857) | (3.955) | (3.491) | (3.212) |
| Distributions from Realized Capital Gains | — | — | — | — | — |
| Total Distributions | (3.785) | (3.857) | (3.955) | (3.491) | (3.212) |
| Net Asset Value, End of Period | $316.94 | $247.38 | $199.84 | $197.68 | $167.62 |
| Total Return | 29.97% | 26.19% | 3.25% | 20.26% | 17.02% |
| Ratios/Supplemental Data | |||||
| Net Assets, End of Period (Millions) | $190 | $180 | $150 | $122 | $132 |
| Ratio of Total Expenses to Average Net Assets | 0.06% | 0.06% | 0.06% | 0.06% | 0.06% |
| Ratio of Net Investment Income to Average Net Assets | 1.42% | 1.86% | 2.11% | 1.94% | 2.13% |
| Portfolio Turnover Rate2 | 5% | 4% | 4% | 4% | 6% |
| 1 | Calculated based on average shares outstanding. |
| 2 | Excludes the value of portfolio securities received or delivered as a result of in-kind purchases or redemptions of the fund’s capital shares, including ETF Creation Units. |
| A. | The following significant accounting policies conform to generally accepted accounting principles for U.S. investment companies. The fund consistently follows such policies in preparing its financial statements. |
| B. | In accordance with the terms of a Funds' Service Agreement (the “FSA”) between Vanguard and the fund, Vanguard furnishes to the fund investment advisory, corporate management, administrative, marketing, and distribution services at Vanguard’s cost of operations (as defined by the FSA). These costs of operations are allocated to the fund based on methods and guidelines approved by the board of trustees and are generally settled twice a month. |
| C. | Various inputs may be used to determine the value of the fund’s investments and derivatives. These inputs are summarized in three broad levels for financial statement purposes. The inputs or methodologies used to value securities are not necessarily an indication of the risk associated with investing in those securities. |
| D. | Permanent differences between book-basis and tax-basis components of net assets are reclassified among capital accounts in the financial statements to reflect their tax character. These reclassifications have no effect on net assets or net asset value per share. As of period end, permanent differences primarily attributable to the accounting for in-kind redemptions were reclassified between the following accounts: |
| Amount ($000) | |
| Paid-in Capital | 154,071 |
| Total Distributable Earnings (Loss) | (154,071) |
| Amount ($000) | |
| Undistributed Ordinary Income | 11,102 |
| Undistributed Long-Term Gains | — |
| Capital Loss Carryforwards | (52,352) |
| Qualified Late-Year Losses | — |
| Net Unrealized Gains (Losses) | 1,965,858 |
| Year Ended August 31, | ||
| 2021 Amount ($000) | 2020 Amount ($000) | |
| Ordinary Income* | 50,628 | 44,251 |
| Long-Term Capital Gains | — | — |
| Total | 50,628 | 44,251 |
| * | Includes short-term capital gains, if any. |
| Amount ($000) | |
| Tax Cost | 2,507,866 |
| Gross Unrealized Appreciation | 2,016,574 |
| Gross Unrealized Depreciation | (50,716) |
| Net Unrealized Appreciation (Depreciation) | 1,965,858 |
| E. | During the year ended August 31, 2021, the fund purchased $722,000,000 of investment securities and sold $401,695,000 of investment securities, other than temporary cash investments. Purchases and sales include $552,923,000 and $235,014,000, respectively, in connection with in-kind purchases and redemptions of the fund's capital shares. |
| F. | Capital share transactions for each class of shares were: |
| Year Ended August 31, | |||||
| 2021 | 2020 | ||||
| Amount ($000) | Shares (000) | Amount ($000) | Shares (000) | ||
| ETF Shares | |||||
| Issued | 598,960 | 4,325 | 767,900 | 7,475 | |
| Issued in Lieu of Cash Distributions | — | — | — | — | |
| Redeemed | (249,307) | (1,850) | (235,197) | (2,450) | |
| Net Increase (Decrease)—ETF Shares | 349,653 | 2,475 | 532,703 | 5,025 | |
| Institutional Shares | |||||
| Issued | 8,330 | 31 | 14,779 | 73 | |
| Issued in Lieu of Cash Distributions | 1,860 | 7 | 1,311 | 7 | |
| Redeemed | (46,214) | (166) | (22,048) | (102) | |
| Net Increase (Decrease)—Institutional Shares | (36,024) | (128) | (5,958) | (22) | |
| G. | Management has determined that no events or transactions occurred subsequent to August 31, 2021, that would require recognition or disclosure in these financial statements. |

| Average Annual Total Returns Periods Ended August 31, 2021 | |||||
| One Year | Five Year | Ten Years | Final Value of a $10,000 Investment | ||
|
| Mega Cap Growth Index Fund ETF Shares Net Asset Value | 27.41% | 24.59% | 19.63% | $60,057 |
| Mega Cap Growth Index Fund ETF Shares Market Price | 27.32 | 24.58 | 19.63 | 60,027 | |
|
| Spliced Mega Cap Growth Index | 27.49 | 24.66 | 19.73 | 60,516 |
|
| Dow Jones U.S. Total Stock Market Float Adjusted Index | 33.32 | 17.95 | 16.16 | 44,721 |
| One Year | Five Years | Ten Years | Final Value of a $5,000,000 Investment | ||
| Mega Cap Growth Index Fund Institutional Shares | 27.43% | 24.60% | 19.65% | $30,064,937 | |
| Spliced Mega Cap Growth Index | 27.49 | 24.66 | 19.73 | 30,257,871 | |
| Dow Jones U.S. Total Stock Market Float Adjusted Index | 33.32 | 17.95 | 16.16 | 22,360,680 | |
| One Year | Five Years | Ten Years | |
| Mega Cap Growth Index Fund ETF Shares Market Price | 27.32% | 200.12% | 500.27% |
| Mega Cap Growth Index Fund ETF Shares Net Asset Value | 27.41 | 200.15 | 500.57 |
| Spliced Mega Cap Growth Index | 27.49 | 201.00 | 505.16 |
| Basic Materials | 1.7% |
| Consumer Discretionary | 24.0 |
| Consumer Staples | 0.8 |
| Financials | 1.5 |
| Health Care | 6.4 |
| Industrials | 11.3 |
| Real Estate | 1.8 |
| Technology | 51.9 |
| Telecommunications | 0.6 |
| Futures Contracts | ||||
| ($000) | ||||
| Expiration | Number of Long (Short) Contracts | Notional Amount | Value and Unrealized Appreciation (Depreciation) | |
| Long Futures Contracts | ||||
| E-mini NASDAQ 100 Index | September 2021 | 106 | 33,035 | 1,375 |
| E-mini S&P 500 Index | September 2021 | 20 | 4,520 | 153 |
| 1,528 | ||||
| ($000s, except shares and per-share amounts) | Amount |
| Assets | |
| Investments in Securities, at Value | |
| Unaffiliated Issuers (Cost $7,285,888) | 12,722,865 |
| Affiliated Issuers (Cost $33,411) | 33,411 |
| Total Investments in Securities | 12,756,276 |
| Investment in Vanguard | 410 |
| Cash | 48 |
| Cash Collateral Pledged—Futures Contracts | 1,730 |
| Receivables for Accrued Income | 6,141 |
| Receivables for Capital Shares Issued | 3,802 |
| Total Assets | 12,768,407 |
| Liabilities | |
| Payables for Investment Securities Purchased | 50 |
| Collateral for Securities on Loan | 7,436 |
| Payables for Capital Shares Redeemed | 30 |
| Payables to Vanguard | 383 |
| Variation Margin Payable—Futures Contracts | 31 |
| Total Liabilities | 7,930 |
| Net Assets | 12,760,477 |
| At August 31, 2021, net assets consisted of: | |
| Paid-in Capital | 7,532,441 |
| Total Distributable Earnings (Loss) | 5,228,036 |
| Net Assets | 12,760,477 |
| ETF Shares—Net Assets | |
| Applicable to 51,164,192 outstanding $.001 par value shares of beneficial interest (unlimited authorization) | 12,714,331 |
| Net Asset Value Per Share—ETF Shares | $248.50 |
| Institutional Shares—Net Assets | |
| Applicable to 93,487 outstanding $.001 par value shares of beneficial interest (unlimited authorization) | 46,146 |
| Net Asset Value Per Share—Institutional Shares | $493.61 |
| Year Ended August 31, 2021 | |
| ($000) | |
| Investment Income | |
| Income | |
| Dividends | 67,815 |
| Interest1 | 6 |
| Securities Lending—Net | 45 |
| Total Income | 67,866 |
| Expenses | |
| The Vanguard Group—Note B | |
| Investment Advisory Services | 1,566 |
| Management and Administrative—ETF Shares | 5,066 |
| Management and Administrative—Institutional Shares | 21 |
| Marketing and Distribution—ETF Shares | 382 |
| Marketing and Distribution—Institutional Shares | 1 |
| Custodian Fees | 1 |
| Auditing Fees | 30 |
| Shareholders’ Reports—ETF Shares | 218 |
| Shareholders’ Reports—Institutional Shares | — |
| Trustees’ Fees and Expenses | 4 |
| Total Expenses | 7,289 |
| Net Investment Income | 60,577 |
| Realized Net Gain (Loss) | |
| Investment Securities Sold1,2 | 1,326,673 |
| Futures Contracts | 2,402 |
| Realized Net Gain (Loss) | 1,329,075 |
| Change in Unrealized Appreciation (Depreciation) | |
| Investment Securities1 | 1,199,591 |
| Futures Contracts | 1,507 |
| Change in Unrealized Appreciation (Depreciation) | 1,201,098 |
| Net Increase (Decrease) in Net Assets Resulting from Operations | 2,590,750 |
| 1 | Interest income, realized net gain (loss), and change in unrealized appreciation (depreciation) from an affiliated company of the fund were $6,000, less than ($1,000), and less than ($1,000), respectively. Purchases and sales are for temporary cash investment purposes. |
| 2 | Includes $1,352,226,000 of net gain (loss) resulting from in-kind redemptions. |
| Year Ended August 31, | ||
| 2021 ($000) | 2020 ($000) | |
| Increase (Decrease) in Net Assets | ||
| Operations | ||
| Net Investment Income | 60,577 | 55,154 |
| Realized Net Gain (Loss) | 1,329,075 | 263,771 |
| Change in Unrealized Appreciation (Depreciation) | 1,201,098 | 2,767,434 |
| Net Increase (Decrease) in Net Assets Resulting from Operations | 2,590,750 | 3,086,359 |
| Distributions | ||
| ETF Shares | (61,584) | (51,457) |
| Institutional Shares | (342) | (515) |
| Total Distributions | (61,926) | (51,972) |
| Capital Share Transactions | ||
| ETF Shares | 2,252 | 2,801,123 |
| Institutional Shares | (44,428) | 6,716 |
| Net Increase (Decrease) from Capital Share Transactions | (42,176) | 2,807,839 |
| Total Increase (Decrease) | 2,486,648 | 5,842,226 |
| Net Assets | ||
| Beginning of Period | 10,273,829 | 4,431,603 |
| End of Period | 12,760,477 | 10,273,829 |
| ETF Shares | |||||
| For a Share Outstanding Throughout Each Period | Year Ended August 31, | ||||
| 2021 | 2020 | 2019 | 2018 | 2017 | |
| Net Asset Value, Beginning of Period | $196.25 | $132.22 | $127.79 | $104.09 | $87.15 |
| Investment Operations | |||||
| Net Investment Income1 | 1.220 | 1.358 | 1.588 | 1.485 | 1.351 |
| Net Realized and Unrealized Gain (Loss) on Investments | 52.279 | 64.007 | 3.860 | 23.677 | 16.920 |
| Total from Investment Operations | 53.499 | 65.365 | 5.448 | 25.162 | 18.271 |
| Distributions | |||||
| Dividends from Net Investment Income | (1.249) | (1.335) | (1.018) | (1.462) | (1.331) |
| Distributions from Realized Capital Gains | — | — | — | — | — |
| Total Distributions | (1.249) | (1.335) | (1.018) | (1.462) | (1.331) |
| Net Asset Value, End of Period | $248.50 | $196.25 | $132.22 | $127.79 | $104.09 |
| Total Return | 27.41% | 49.84% | 4.32% | 24.38% | 21.17% |
| Ratios/Supplemental Data | |||||
| Net Assets, End of Period (Millions) | $12,714 | $10,193 | $4,388 | $4,152 | $3,135 |
| Ratio of Total Expenses to Average Net Assets | 0.07% | 0.07% | 0.07% | 0.07% | 0.07% |
| Ratio of Net Investment Income to Average Net Assets | 0.58% | 0.90% | 1.30% | 1.29% | 1.43% |
| Portfolio Turnover Rate2 | 8% | 6% | 14% | 9% | 8% |
| 1 | Calculated based on average shares outstanding. |
| 2 | Excludes the value of portfolio securities received or delivered as a result of in-kind purchases or redemptions of the fund’s capital shares, including ETF Creation Units. |
| Institutional Shares | |||||
| For a Share Outstanding Throughout Each Period | Year Ended August 31, | ||||
| 2021 | 2020 | 2019 | 2018 | 2017 | |
| Net Asset Value, Beginning of Period | $389.78 | $262.63 | $253.80 | $206.74 | $173.07 |
| Investment Operations | |||||
| Net Investment Income1 | 2.498 | 2.707 | 3.184 | 2.963 | 2.699 |
| Net Realized and Unrealized Gain (Loss) on Investments | 103.822 | 127.126 | 7.684 | 47.023 | 33.622 |
| Total from Investment Operations | 106.320 | 129.833 | 10.868 | 49.986 | 36.321 |
| Distributions | |||||
| Dividends from Net Investment Income | (2.489) | (2.683) | (2.038) | (2.926) | (2.651) |
| Distributions from Realized Capital Gains | — | — | — | — | — |
| Total Distributions | (2.489) | (2.683) | (2.038) | (2.926) | (2.651) |
| Net Asset Value, End of Period | $493.61 | $389.78 | $262.63 | $253.80 | $206.74 |
| Total Return | 27.43% | 49.87% | 4.34% | 24.39% | 21.20% |
| Ratios/Supplemental Data | |||||
| Net Assets, End of Period (Millions) | $46 | $81 | $43 | $43 | $35 |
| Ratio of Total Expenses to Average Net Assets | 0.06% | 0.06% | 0.06% | 0.06% | 0.06% |
| Ratio of Net Investment Income to Average Net Assets | 0.62% | 0.91% | 1.31% | 1.30% | 1.44% |
| Portfolio Turnover Rate2 | 8% | 6% | 14% | 9% | 8% |
| 1 | Calculated based on average shares outstanding. |
| 2 | Excludes the value of portfolio securities received or delivered as a result of in-kind purchases or redemptions of the fund’s capital shares, including ETF Creation Units. |
| A. | The following significant accounting policies conform to generally accepted accounting principles for U.S. investment companies. The fund consistently follows such policies in preparing its financial statements. |
| B. | In accordance with the terms of a Funds' Service Agreement (the “FSA”) between Vanguard and the fund, Vanguard furnishes to the fund investment advisory, corporate management, administrative, marketing, and distribution services at Vanguard’s cost of operations (as defined by the FSA). These costs of operations are allocated to the fund based on methods and guidelines approved by the board of trustees and are generally settled twice a month. |
| C. | Various inputs may be used to determine the value of the fund’s investments and derivatives. These inputs are summarized in three broad levels for financial statement purposes. The inputs or methodologies used to value securities are not necessarily an indication of the risk associated with investing in those securities. |
| D. | Permanent differences between book-basis and tax-basis components of net assets are reclassified among capital accounts in the financial statements to reflect their tax character. These reclassifications have no effect on net assets or net asset value per share. As of period end, permanent differences primarily attributable to the accounting for in-kind redemptions were reclassified between the following accounts: |
| Amount ($000) | |
| Paid-in Capital | 1,352,246 |
| Total Distributable Earnings (Loss) | (1,352,246) |
| Amount ($000) | |
| Undistributed Ordinary Income | 11,284 |
| Undistributed Long-Term Gains | — |
| Capital Loss Carryforwards | (220,110) |
| Qualified Late-Year Losses | — |
| Net Unrealized Gains (Losses) | 5,436,862 |
| Year Ended August 31, | ||
| 2021 Amount ($000) | 2020 Amount ($000) | |
| Ordinary Income* | 61,926 | 51,972 |
| Long-Term Capital Gains | — | — |
| Total | 61,926 | 51,972 |
| * | Includes short-term capital gains, if any. |
| Amount ($000) | |
| Tax Cost | 7,319,414 |
| Gross Unrealized Appreciation | 5,499,931 |
| Gross Unrealized Depreciation | (63,069) |
| Net Unrealized Appreciation (Depreciation) | 5,436,862 |
| E. | During the year ended August 31, 2021, the fund purchased $2,994,853,000 of investment securities and sold $3,068,961,000 of investment securities, other than temporary cash investments. Purchases and sales include $2,156,587,000 and $2,267,357,000, respectively, in connection with in-kind purchases and redemptions of the fund's capital shares. |
| F. | Capital share transactions for each class of shares were: |
| Year Ended August 31, | |||||
| 2021 | 2020 | ||||
| Amount ($000) | Shares (000) | Amount ($000) | Shares (000) | ||
| ETF Shares | |||||
| Issued | 2,269,215 | 10,750 | 3,379,154 | 22,750 | |
| Issued in Lieu of Cash Distributions | — | — | — | — | |
| Redeemed | (2,266,963) | (11,525) | (578,031) | (4,000) | |
| Net Increase (Decrease)—ETF Shares | 2,252 | (775) | 2,801,123 | 18,750 | |
| Institutional Shares | |||||
| Issued | 13,626 | 29 | 41,327 | 157 | |
| Issued in Lieu of Cash Distributions | 341 | 1 | 515 | 2 | |
| Redeemed | (58,395) | (145) | (35,126) | (116) | |
| Net Increase (Decrease)—Institutional Shares | (44,428) | (115) | 6,716 | 43 | |
| G. | Management has determined that no events or transactions occurred subsequent to August 31, 2021, that would require recognition or disclosure in these financial statements. |

| Average Annual Total Returns Periods Ended August 31, 2021 | |||||
| One Year | Five Year | Ten Years | Final Value of a $10,000 Investment | ||
|
| Mega Cap Value Index Fund ETF Shares Net Asset Value | 33.17% | 13.03% | 13.68% | $36,049 |
| Mega Cap Value Index Fund ETF Shares Market Price | 33.09 | 13.03 | 13.68 | 36,051 | |
|
| Spliced Mega Cap Value Index | 33.27 | 13.08 | 13.76 | 36,286 |
|
| Dow Jones U.S. Total Stock Market Float Adjusted Index | 33.32 | 17.95 | 16.16 | 44,721 |
| One Year | Five Years | Ten Years | Final Value of a $5,000,000 Investment | ||
| Mega Cap Value Index Fund Institutional Shares | 33.22% | 13.05% | 13.71% | $18,068,437 | |
| Spliced Mega Cap Value Index | 33.27 | 13.08 | 13.76 | 18,142,969 | |
| Dow Jones U.S. Total Stock Market Float Adjusted Index | 33.32 | 17.95 | 16.16 | 22,360,680 | |
| One Year | Five Years | Ten Years | |
| Mega Cap Value Index Fund ETF Shares Market Price | 33.09% | 84.45% | 260.51% |
| Mega Cap Value Index Fund ETF Shares Net Asset Value | 33.17 | 84.49 | 260.49 |
| Spliced Mega Cap Value Index | 33.27 | 84.93 | 262.86 |
| Basic Materials | 0.9% |
| Consumer Discretionary | 4.1 |
| Consumer Staples | 11.1 |
| Energy | 4.7 |
| Financials | 22.9 |
| Health Care | 22.0 |
| Industrials | 13.7 |
| Real Estate | 0.9 |
| Technology | 7.6 |
| Telecommunications | 7.2 |
| Utilities | 4.9 |
| Futures Contracts | ||||
| ($000) | ||||
| Expiration | Number of Long (Short) Contracts | Notional Amount | Value and Unrealized Appreciation (Depreciation) | |
| Long Futures Contracts | ||||
| E-mini S&P 500 Index | September 2021 | 48 | 10,849 | 207 |
| ($000s, except shares and per-share amounts) | Amount |
| Assets | |
| Investments in Securities, at Value | |
| Unaffiliated Issuers (Cost $3,424,427) | 4,703,866 |
| Affiliated Issuers (Cost $1,690) | 1,690 |
| Total Investments in Securities | 4,705,556 |
| Investment in Vanguard | 154 |
| Cash Collateral Pledged—Futures Contracts | 480 |
| Receivables for Accrued Income | 10,707 |
| Receivables for Capital Shares Issued | 43 |
| Total Assets | 4,716,940 |
| Liabilities | |
| Payables for Investment Securities Purchased | 2,029 |
| Payables for Capital Shares Redeemed | 22 |
| Payables to Vanguard | 144 |
| Variation Margin Payable—Futures Contracts | 10 |
| Total Liabilities | 2,205 |
| Net Assets | 4,714,735 |
| At August 31, 2021, net assets consisted of: | |
| Paid-in Capital | 3,518,519 |
| Total Distributable Earnings (Loss) | 1,196,216 |
| Net Assets | 4,714,735 |
| ETF Shares—Net Assets | |
| Applicable to 44,685,539 outstanding $.001 par value shares of beneficial interest (unlimited authorization) | 4,586,603 |
| Net Asset Value Per Share—ETF Shares | $102.64 |
| Institutional Shares—Net Assets | |
| Applicable to 629,530 outstanding $.001 par value shares of beneficial interest (unlimited authorization) | 128,132 |
| Net Asset Value Per Share—Institutional Shares | $203.54 |
| Year Ended August 31, 2021 | |
| ($000) | |
| Investment Income | |
| Income | |
| Dividends | 100,564 |
| Interest1 | 2 |
| Securities Lending—Net | 61 |
| Total Income | 100,627 |
| Expenses | |
| The Vanguard Group—Note B | |
| Investment Advisory Services | 593 |
| Management and Administrative—ETF Shares | 1,826 |
| Management and Administrative—Institutional Shares | 51 |
| Marketing and Distribution—ETF Shares | 140 |
| Marketing and Distribution—Institutional Shares | 3 |
| Custodian Fees | 10 |
| Auditing Fees | 40 |
| Shareholders’ Reports—ETF Shares | 88 |
| Shareholders’ Reports—Institutional Shares | 1 |
| Trustees’ Fees and Expenses | 1 |
| Total Expenses | 2,753 |
| Net Investment Income | 97,874 |
| Realized Net Gain (Loss) | |
| Investment Securities Sold1,2 | 125,514 |
| Futures Contracts | 1,299 |
| Realized Net Gain (Loss) | 126,813 |
| Change in Unrealized Appreciation (Depreciation) | |
| Investment Securities1 | 878,741 |
| Futures Contracts | (17) |
| Change in Unrealized Appreciation (Depreciation) | 878,724 |
| Net Increase (Decrease) in Net Assets Resulting from Operations | 1,103,411 |
| 1 | Interest income, realized net gain (loss), and change in unrealized appreciation (depreciation) from an affiliated company of the fund were $2,000, less than ($1000), and less than $1,000, respectively. Purchases and sales are for temporary cash investment purposes. |
| 2 | Includes $165,982,000 of net gain (loss) resulting from in-kind redemptions. |
| Year Ended August 31, | ||
| 2021 ($000) | 2020 ($000) | |
| Increase (Decrease) in Net Assets | ||
| Operations | ||
| Net Investment Income | 97,874 | 80,365 |
| Realized Net Gain (Loss) | 126,813 | 21,714 |
| Change in Unrealized Appreciation (Depreciation) | 878,724 | 18,262 |
| Net Increase (Decrease) in Net Assets Resulting from Operations | 1,103,411 | 120,341 |
| Distributions | ||
| ETF Shares | (89,173) | (74,008) |
| Institutional Shares | (3,020) | (3,648) |
| Total Distributions | (92,193) | (77,656) |
| Capital Share Transactions | ||
| ETF Shares | 592,269 | 526,191 |
| Institutional Shares | (22,744) | (17,219) |
| Net Increase (Decrease) from Capital Share Transactions | 569,525 | 508,972 |
| Total Increase (Decrease) | 1,580,743 | 551,657 |
| Net Assets | ||
| Beginning of Period | 3,133,992 | 2,582,335 |
| End of Period | 4,714,735 | 3,133,992 |
| ETF Shares | |||||
| For a Share Outstanding Throughout Each Period | Year Ended August 31, | ||||
| 2021 | 2020 | 2019 | 2018 | 2017 | |
| Net Asset Value, Beginning of Period | $78.96 | $78.94 | $79.89 | $70.19 | $63.52 |
| Investment Operations | |||||
| Net Investment Income1 | 2.271 | 2.271 | 2.261 | 1.893 | 1.843 |
| Net Realized and Unrealized Gain (Loss) on Investments | 23.557 | (.044) | (1.027) | 9.668 | 6.557 |
| Total from Investment Operations | 25.828 | 2.227 | 1.234 | 11.561 | 8.400 |
| Distributions | |||||
| Dividends from Net Investment Income | (2.148) | (2.207) | (2.184) | (1.861) | (1.730) |
| Distributions from Realized Capital Gains | — | — | — | — | — |
| Total Distributions | (2.148) | (2.207) | (2.184) | (1.861) | (1.730) |
| Net Asset Value, End of Period | $102.64 | $78.96 | $78.94 | $79.89 | $70.19 |
| Total Return | 33.17% | 2.94% | 1.69% | 16.71% | 13.40% |
| Ratios/Supplemental Data | |||||
| Net Assets, End of Period (Millions) | $4,587 | $3,017 | $2,448 | $2,120 | $1,717 |
| Ratio of Total Expenses to Average Net Assets | 0.07% | 0.07% | 0.07% | 0.07% | 0.07% |
| Ratio of Net Investment Income to Average Net Assets | 2.47% | 2.90% | 2.90% | 2.50% | 2.73% |
| Portfolio Turnover Rate2 | 11% | 9% | 10% | 8% | 8% |
| 1 | Calculated based on average shares outstanding. |
| 2 | Excludes the value of portfolio securities received or delivered as a result of in-kind purchases or redemptions of the fund’s capital shares, including ETF Creation Units. |
| Institutional Shares | |||||
| For a Share Outstanding Throughout Each Period | Year Ended August 31, | ||||
| 2021 | 2020 | 2019 | 2018 | 2017 | |
| Net Asset Value, Beginning of Period | $156.56 | $156.53 | $158.41 | $139.18 | $125.94 |
| Investment Operations | |||||
| Net Investment Income1 | 4.492 | 4.522 | 4.467 | 3.743 | 3.596 |
| Net Realized and Unrealized Gain (Loss) on Investments | 46.761 | (.102) | (2.002) | 19.188 | 13.077 |
| Total from Investment Operations | 51.253 | 4.420 | 2.465 | 22.931 | 16.673 |
| Distributions | |||||
| Dividends from Net Investment Income | (4.274) | (4.390) | (4.345) | (3.701) | (3.433) |
| Distributions from Realized Capital Gains | — | — | — | — | — |
| Total Distributions | (4.274) | (4.390) | (4.345) | (3.701) | (3.433) |
| Net Asset Value, End of Period | $203.54 | $156.56 | $156.53 | $158.41 | $139.18 |
| Total Return | 33.22% | 3.00% | 1.68% | 16.71% | 13.41% |
| Ratios/Supplemental Data | |||||
| Net Assets, End of Period (Millions) | $128 | $117 | $134 | $131 | $125 |
| Ratio of Total Expenses to Average Net Assets | 0.06% | 0.06% | 0.06% | 0.06% | 0.06% |
| Ratio of Net Investment Income to Average Net Assets | 2.49% | 2.89% | 2.91% | 2.51% | 2.74% |
| Portfolio Turnover Rate2 | 11% | 9% | 10% | 8% | 8% |
| 1 | Calculated based on average shares outstanding. |
| 2 | Excludes the value of portfolio securities received or delivered as a result of in-kind purchases or redemptions of the fund’s capital shares, including ETF Creation Units. |
| A. | The following significant accounting policies conform to generally accepted accounting principles for U.S. investment companies. The fund consistently follows such policies in preparing its financial statements. |
| B. | In accordance with the terms of a Funds' Service Agreement (the “FSA”) between Vanguard and the fund, Vanguard furnishes to the fund investment advisory, corporate management, administrative, marketing, and distribution services at Vanguard’s cost of operations (as defined by the FSA). These costs of operations are allocated to the fund based on methods and guidelines approved by the board of trustees and are generally settled twice a month. |
| C. | Various inputs may be used to determine the value of the fund’s investments and derivatives. These inputs are summarized in three broad levels for financial statement purposes. The inputs or methodologies used to value securities are not necessarily an indication of the risk associated with investing in those securities. |
| D. | Permanent differences between book-basis and tax-basis components of net assets are reclassified among capital accounts in the financial statements to reflect their tax character. These reclassifications have no effect on net assets or net asset value per share. As of period end, permanent differences primarily attributable to the accounting for in-kind redemptions were reclassified between the following accounts: |
| Amount ($000) | |
| Paid-in Capital | 165,979 |
| Total Distributable Earnings (Loss) | (165,979) |
| Amount ($000) | |
| Undistributed Ordinary Income | 22,126 |
| Undistributed Long-Term Gains | — |
| Capital Loss Carryforwards | (104,115) |
| Qualified Late-Year Losses | — |
| Net Unrealized Gains (Losses) | 1,278,205 |
| Year Ended August 31, | ||
| 2021 Amount ($000) | 2020 Amount ($000) | |
| Ordinary Income* | 92,193 | 77,656 |
| Long-Term Capital Gains | — | — |
| Total | 92,193 | 77,656 |
| * | Includes short-term capital gains, if any. |
| Amount ($000) | |
| Tax Cost | 3,427,351 |
| Gross Unrealized Appreciation | 1,356,596 |
| Gross Unrealized Depreciation | (78,391) |
| Net Unrealized Appreciation (Depreciation) | 1,278,205 |
| E. | During the year ended August 31, 2021, the fund purchased $1,396,298,000 of investment securities and sold $824,326,000 of investment securities, other than temporary cash investments. Purchases and sales include $915,418,000 and $404,209,000, respectively, in connection with in-kind purchases and redemptions of the fund's capital shares. |
| F. | Capital share transactions for each class of shares were: |
| Year Ended August 31, | |||||
| 2021 | 2020 | ||||
| Amount ($000) | Shares (000) | Amount ($000) | Shares (000) | ||
| ETF Shares | |||||
| Issued | 985,809 | 10,826 | 673,200 | 9,075 | |
| Issued in Lieu of Cash Distributions | — | — | — | — | |
| Redeemed | (393,540) | (4,350) | (147,009) | (1,875) | |
| Net Increase (Decrease)—ETF Shares | 592,269 | 6,476 | 526,191 | 7,200 | |
| Institutional Shares | |||||
| Issued | 9,063 | 52 | 7,676 | 51 | |
| Issued in Lieu of Cash Distributions | 1,668 | 10 | 2,292 | 15 | |
| Redeemed | (33,475) | (180) | (27,187) | (177) | |
| Net Increase (Decrease)—Institutional Shares | (22,744) | (118) | (17,219) | (111) | |
| G. | Management has determined that no events or transactions occurred subsequent to August 31, 2021, that would require recognition or disclosure in these financial statements. |
Philadelphia, Pennsylvania
October 18, 2021
| Fund | ($000) |
| Mega Cap Index Fund | 50,628 |
| Mega Cap Growth Index Fund | 61,926 |
| Mega Cap Value Index Fund | 92,193 |
| Fund | Percentage |
| Mega Cap Index Fund | 97.6% |
| Mega Cap Growth Index Fund | 99.1 |
| Mega Cap Value Index Fund | 97.2 |


| 1 | |
| 2 | |
| 7 | |
| 9 | |
| 11 | |
| 46 |
| • | For the 12 months ended August 31, 2021, Vanguard Global Wellington Fund returned 19.36% for Investor Shares and 19.53% for Admiral Shares. Its benchmark returned 19.73%. |
| • | The global economy rebounded faster than many had expected after the sharp pandemic-induced contraction in the spring of 2020. Countries that were more successful in containing the virus generally fared better economically. |
| • | Swift and extensive fiscal and monetary support from policymakers has also been key to the rebound. As the 12 months under review reflect the recovery in stocks following the sharp downturn at the start of the pandemic, results were excellent. Bond returns were dampened by rising bond yields across much of the developed world, notably in the United States. |
| • | The fund’s performance relative to the stock benchmark was hampered by selection in health care and industrials. Information technology was a bright spot. By region, the fund benefited from selection in North America, by far the largest weighting in the fund and the index, and emerging markets. |
| • | In fixed income, the fund’s relative performance was helped by an overweighting and security selection in industrial sectors, particularly consumer noncyclical and consumer cyclical. Security selection in financials, especially within banking, detracted. |
| Average Annual Total Returns Periods Ended August 31, 2021 | |||
| One Year | Three Years | Five Years | |
| Stocks | |||
| Russell 1000 Index (Large-caps) | 32.25% | 18.42% | 18.24% |
| Russell 2000 Index (Small-caps) | 47.08 | 10.75 | 14.38 |
| Russell 3000 Index (Broad U.S. market) | 33.04 | 17.85 | 17.97 |
| FTSE All-World ex US Index (International) | 25.74 | 9.82 | 10.23 |
| Bonds | |||
| Bloomberg U.S. Aggregate Bond Index (Broad taxable market) | -0.08% | 5.43% | 3.11% |
| Bloomberg Municipal Bond Index (Broad tax-exempt market) | 3.40 | 5.09 | 3.30 |
| FTSE Three-Month U.S. Treasury Bill Index | 0.06 | 1.20 | 1.13 |
| CPI | |||
| Consumer Price Index | 5.25% | 2.76% | 2.58% |
Equity Portfolio Manager
Fixed Income Portfolio Manager
| • | Based on actual fund return. This section helps you to estimate the actual expenses that you paid over the period. The ”Ending Account Value“ shown is derived from the fund’s actual return, and the third column shows the dollar amount that would have been paid by an investor who started with $1,000 in the fund. You may use the information here, together with the amount you invested, to estimate the expenses that you paid over the period. |
| • | Based on hypothetical 5% yearly return. This section is intended to help you compare your fund‘s costs with those of other mutual funds. It assumes that the fund had a yearly return of 5% before expenses, but that the expense ratio is unchanged. In this case—because the return used is not the fund’s actual return—the results do not apply to your investment. The example is useful in making comparisons because the Securities and Exchange Commission requires all mutual funds to calculate expenses based on a 5% return. You can assess your fund’s costs by comparing this hypothetical example with the hypothetical examples that appear in shareholder reports of other funds. |
| Six Months Ended August 31, 2021 | |||
| Beginning Account Value 2/28/2021 | Ending Account Value 8/31/2021 | Expenses Paid During Period | |
| Based on Actual Fund Return | |||
| Global Wellington Fund | |||
| Investor Shares | $1,000.00 | $1,092.30 | $2.27 |
| AdmiralTM Shares | 1,000.00 | 1,093.20 | 1.42 |
| Based on Hypothetical 5% Yearly Return | |||
| Global Wellington Fund | |||
| Investor Shares | $1,000.00 | $1,023.04 | $2.19 |
| Admiral Shares | 1,000.00 | 1,023.84 | 1.38 |
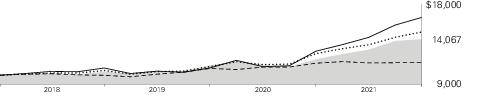
| Average Annual Total Returns Periods Ended August 31, 2021 | ||||
| One Year | Since Inception (11/2/2017) | Final Value of a $10,000 Investment | ||

| Global Wellington Fund Investor Shares | 19.36% | 9.32% | $14,067 |

| Global Wellington Composite Index | 19.73 | 10.95 | 14,885 |

| Bloomberg Global Aggregate Bond Index | 0.52 | 3.51 | 11,412 |

| FTSE Developed Net Tax Index | 30.06 | 14.03 | 16,526 |
| One Year | Since Inception (11/2/2017) | Final Value of a $50,000 Investment | ||
| Global Wellington Fund Admiral Shares | 19.53% | 9.45% | $70,639 | |
| Global Wellington Composite Index | 19.73 | 10.95 | 74,427 | |
| Bloomberg Global Aggregate Bond Index | 0.52 | 3.51 | 57,060 | |
| FTSE Developed Net Tax Index | 30.06 | 14.03 | 82,630 | |
| United States | 57.6% |
| United Kingdom | 7.7 |
| Japan | 7.3 |
| France | 5.9 |
| Switzerland | 4.1 |
| Sweden | 2.1 |
| Canada | 1.7 |
| Spain | 1.6 |
| Taiwan | 1.4 |
| Germany | 1.2 |
| South Korea | 1.0 |
| Other | 8.4 |
| Shares | Market Value• ($000) | |||||
| Common Stocks (65.1%) | ||||||
| Austria (0.7%) | ||||||
| Erste Group Bank AG | 339,395 | 13,552 | ||||
| Canada (0.8%) | ||||||
| Dollarama Inc. | 273,742 | 12,482 | ||||
| Suncor Energy Inc. | 124,865 | 2,332 | ||||
| 14,814 | ||||||
| Finland (0.8%) | ||||||
| * | Nokia OYJ | 2,285,379 | 13,729 | |||
| France (4.3%) | ||||||
| Safran SA | 109,637 | 13,754 | ||||
| Arkema SA | 93,689 | 12,452 | ||||
| BNP Paribas SA | 156,232 | 9,897 | ||||
| Engie SA | 689,698 | 9,883 | ||||
| TotalEnergies SE | 218,017 | 9,643 | ||||
| Vinci SA | 79,230 | 8,501 | ||||
| 1 | Amundi SA | 82,141 | 7,774 | |||
| Schneider Electric SE | 33,673 | 6,016 | ||||
| 77,920 | ||||||
| Germany (0.2%) | ||||||
| Bayerische Motoren Werke AG | 40,079 | 3,804 | ||||
| Japan (5.7%) | ||||||
| Tokio Marine Holdings Inc. | 348,297 | 17,042 | ||||
| Astellas Pharma Inc. | 945,100 | 15,925 | ||||
| Nippon Telegraph & Telephone Corp. | 565,244 | 15,060 | ||||
| Isuzu Motors Ltd. | 904,314 | 11,432 | ||||
| Marui Group Co. Ltd. | 523,265 | 9,309 | ||||
| Honda Motor Co. Ltd. | 307,100 | 9,295 | ||||
| Mitsubishi UFJ Financial Group Inc. | 1,466,522 | 7,956 | ||||
| Nihon Unisys Ltd. | 265,700 | 7,220 | ||||
| Sumitomo Mitsui Financial Group Inc. | 182,101 | 6,285 | ||||
| Mitsubishi Estate Co. Ltd. | 333,500 | 5,221 | ||||
| 104,745 | ||||||
| Netherlands (0.1%) | ||||||
| ING Groep NV | 109,779 | 1,514 | ||||
| South Korea (1.0%) | ||||||
| Samsung Electronics Co. Ltd. | 268,886 | 17,751 | ||||
| Shares | Market Value• ($000) | |||||
| Spain (1.3%) | ||||||
| Iberdrola SA | 1,201,381 | 14,887 | ||||
| CaixaBank SA | 3,149,198 | 9,783 | ||||
| 24,670 | ||||||
| Sweden (2.1%) | ||||||
| Autoliv Inc. | 221,634 | 19,590 | ||||
| Lundin Energy AB | 405,397 | 12,389 | ||||
| Alfa Laval AB | 137,706 | 5,592 | ||||
| 37,571 | ||||||
| Switzerland (3.4%) | ||||||
| Novartis AG (Registered) | 284,059 | 26,273 | ||||
| Nestle SA (Registered) | 142,298 | 17,970 | ||||
| Zurich Insurance Group AG | 22,013 | 9,659 | ||||
| Julius Baer Group Ltd. | 124,048 | 8,467 | ||||
| 62,369 | ||||||
| Taiwan (1.4%) | ||||||
| Taiwan Semiconductor Manufacturing Co. Ltd. | 1,133,175 | 24,857 | ||||
| United Kingdom (5.0%) | ||||||
| AstraZeneca plc ADR | 577,760 | 33,672 | ||||
| WPP plc | 905,730 | 12,281 | ||||
| Linde plc | 32,121 | 10,125 | ||||
| Prudential plc | 440,313 | 9,174 | ||||
| Diageo plc | 169,138 | 8,131 | ||||
| Rotork plc | 1,482,518 | 6,805 | ||||
| BAE Systems plc | 756,809 | 5,913 | ||||
| Derwent London plc | 88,584 | 4,620 | ||||
| 90,721 | ||||||
| United States (38.3%) | ||||||
| Microsoft Corp. | 118,115 | 35,657 | ||||
| Johnson & Johnson | 188,525 | 32,639 | ||||
| Cisco Systems Inc. | 527,167 | 31,113 | ||||
| United Parcel Service Inc. Class B | 152,160 | 29,767 | ||||
| Bank of America Corp. | 712,979 | 29,767 | ||||
| Comcast Corp. Class A | 438,976 | 26,637 | ||||
| Chubb Ltd. | 143,021 | 26,304 | ||||
| Northrop Grumman Corp. | 62,506 | 22,983 | ||||
| Medtronic plc | 163,283 | 21,795 | ||||
| Merck & Co. Inc. | 275,256 | 20,999 | ||||
| TJX Cos. Inc. | 285,894 | 20,790 | ||||
| Eli Lilly & Co. | 77,972 | 20,139 | ||||
| JPMorgan Chase & Co. | 120,765 | 19,316 | ||||
| Mondelez International Inc. Class A | 310,860 | 19,295 | ||||
| Sempra Energy | 144,804 | 19,166 | ||||
| Deere & Co. | 47,508 | 17,959 | ||||
| Baxter International Inc. | 212,825 | 16,222 | ||||
| Texas Instruments Inc. | 84,507 | 16,133 | ||||
| Raytheon Technologies Corp. | 189,237 | 16,040 | ||||
| UnitedHealth Group Inc. | 36,761 | 15,303 | ||||
| PepsiCo Inc. | 95,575 | 14,947 | ||||
| Duke Energy Corp. | 142,261 | 14,889 | ||||
| * | General Motors Co. | 295,282 | 14,472 | |||
| American Express Co. | 87,042 | 14,446 | ||||
| Colgate-Palmolive Co. | 183,927 | 14,337 | ||||
| Shares | Market Value• ($000) | |||||
| McDonald's Corp. | 58,477 | 13,886 | ||||
| PNC Financial Services Group Inc. | 71,489 | 13,662 | ||||
| Lockheed Martin Corp. | 37,555 | 13,512 | ||||
| Broadcom Inc. | 26,924 | 13,387 | ||||
| American Tower Corp. | 39,076 | 11,417 | ||||
| Pioneer Natural Resources Co. | 74,906 | 11,211 | ||||
| General Dynamics Corp. | 52,258 | 10,468 | ||||
| KLA Corp. | 29,395 | 9,993 | ||||
| * | Alphabet Inc. Class A | 3,271 | 9,466 | |||
| Union Pacific Corp. | 43,150 | 9,357 | ||||
| Caterpillar Inc. | 34,927 | 7,365 | ||||
| RenaissanceRe Holdings Ltd. | 39,987 | 6,267 | ||||
| Marsh & McLennan Cos. Inc. | 39,171 | 6,158 | ||||
| Gilead Sciences Inc. | 81,681 | 5,945 | ||||
| Verizon Communications Inc. | 107,380 | 5,906 | ||||
| Accenture plc Class A | 14,592 | 4,911 | ||||
| Intel Corp. | 87,491 | 4,730 | ||||
| BlackRock Inc. | 4,689 | 4,423 | ||||
| Honeywell International Inc. | 15,054 | 3,491 | ||||
| Abbott Laboratories | 21,236 | 2,684 | ||||
| 699,354 | ||||||
| Total Common Stocks (Cost $887,787) | 1,187,371 | |||||
| Coupon | Maturity Date | Face Amount ($000) | ||||
| U.S. Government and Agency Obligations (5.1%) | ||||||
| 2,3 | Fannie Mae Pool | 3.070% | 2/1/25 | 150 | 161 | |
| 2,3 | Fannie Mae REMICS | 2.000% | 9/25/40 | 72 | 73 | |
| 2,3 | Fannie Mae REMICS | 2.500% | 5/25/45–3/25/53 | 678 | 701 | |
| 2,3 | Fannie Mae REMICS | 3.000% | 2/25/49 | 152 | 159 | |
| 2,3 | Fannie Mae REMICS | 3.500% | 6/25/44–2/25/48 | 583 | 617 | |
| 2,3 | Freddie Mac REMICS | 1.750% | 9/15/42 | 785 | 799 | |
| 2,3 | Freddie Mac REMICS | 3.500% | 9/15/40–11/15/40 | 69 | 70 | |
| 2,3 | Freddie Mac REMICS | 4.000% | 12/15/39–8/15/40 | 711 | 772 | |
| 2,4 | Ginnie Mae II Pool | 2.000% | 9/15/51–10/15/51 | 2,000 | 2,040 | |
| 2,4 | Ginnie Mae II Pool | 2.500% | 9/15/51–10/15/51 | 2,100 | 2,176 | |
| 2 | Ginnie Mae REMICS | 2.750% | 9/20/44 | 118 | 121 | |
| 2,3,4 | UMBS Pool | 1.500% | 9/25/36–10/25/36 | 1,700 | 1,725 | |
| 2,3,4 | UMBS Pool | 2.000% | 9/25/36–10/25/51 | 4,400 | 4,469 | |
| 2,3,4 | UMBS Pool | 2.500% | 9/25/36–10/25/51 | 14,725 | 15,277 | |
| 2,3,4 | UMBS Pool | 3.000% | 9/25/51–10/25/51 | 7,100 | 7,425 | |
| United States Treasury Note/Bond | 0.125% | 3/31/23–2/15/24 | 15,450 | 15,412 | ||
| 5 | United States Treasury Note/Bond | 0.250% | 3/15/24–5/31/25 | 18,255 | 18,197 | |
| United States Treasury Note/Bond | 0.375% | 4/15/24–1/31/26 | 2,135 | 2,131 | ||
| United States Treasury Note/Bond | 0.500% | 2/28/26 | 775 | 768 | ||
| United States Treasury Note/Bond | 0.625% | 7/31/26 | 1,630 | 1,619 | ||
| United States Treasury Note/Bond | 0.750% | 4/30/26 | 1,070 | 1,071 | ||
| United States Treasury Note/Bond | 0.875% | 6/30/26 | 585 | 588 | ||
| United States Treasury Note/Bond | 1.125% | 2/15/31 | 315 | 311 | ||
| United States Treasury Note/Bond | 1.625% | 5/15/31 | 245 | 253 | ||
| United States Treasury Note/Bond | 1.875% | 2/15/41 | 1,275 | 1,285 | ||
| United States Treasury Note/Bond | 2.000% | 8/15/51 | 1,200 | 1,222 | ||
| Coupon | Maturity Date | Face Amount ($000) | Market Value• ($000) | |||
| United States Treasury Note/Bond | 2.250% | 5/15/41 | 9,195 | 9,840 | ||
| United States Treasury Note/Bond | 2.375% | 5/15/51 | 2,555 | 2,822 | ||
| Total U.S. Government and Agency Obligations (Cost $91,397) | 92,104 | |||||
| Asset-Backed/Commercial Mortgage-Backed Securities (1.2%) | ||||||
| Bermuda (0.0%) | ||||||
| 1,2 | START Ireland Series 2019-1 | 4.089% | 3/15/44 | 151 | 152 | |
| Canada (0.1%) | ||||||
| 1,2 | Chesapeake Funding II LLC Series 2018-2A | 3.230% | 8/15/30 | 214 | 216 | |
| 1,2,6 | Ford Auto Securitization Trust Series 2019-AA | 2.354% | 6/15/23 | 421 | 335 | |
| 1,2,7 | Master Credit Card Trust II Series 2018-1A, 1M USD LIBOR + 0.490% | 0.578% | 7/21/24 | 765 | 768 | |
| 1,319 | ||||||
| Cayman Islands (0.6%) | ||||||
| 1,2,4,7,8 | BlueMountain CLO XXXII Ltd. Series 2021-32A, 3M USD LIBOR + 1.170% | 1.290% | 10/15/34 | 1,900 | 1,900 | |
| 1,2,7 | Columbia Cent CLO 31 Ltd. Series 2021-31A, 3M USD LIBOR + 1.550% | 1.684% | 4/20/34 | 575 | 571 | |
| 1,2 | Horizon Aircraft Finance II Ltd. Series 2019-1 | 3.721% | 7/15/39 | 220 | 220 | |
| 1,2,7 | KKR CLO 16 Ltd., 3M USD LIBOR + 1.250% | 1.384% | 1/20/29 | 271 | 271 | |
| 1,2,4,7 | KKR CLO 16 Ltd., 3M USD LIBOR + 1.210% | 1.330% | 10/20/34 | 360 | 360 | |
| 1,2,7 | Madison Park Funding XI Ltd. Series 2013-11A, 3M USD LIBOR + 1.450% | 1.588% | 7/23/29 | 300 | 300 | |
| 1,2,7 | Madison Park Funding XVIII Ltd. Series 2015-18A, 3M USD LIBOR + 1.190% | 1.324% | 10/21/30 | 730 | 730 | |
| 1,2,7 | Madison Park Funding XXX Ltd. Series 2018-30A, 3M USD LIBOR + 0.750% | 0.876% | 4/15/29 | 1,396 | 1,395 | |
| 1,2,7 | Magnetite VII Ltd. Series 2012-7A, 3M USD LIBOR + 0.800% | 0.926% | 1/15/28 | 1,358 | 1,358 | |
| 1,2,7 | OHA Credit Funding 3 Ltd. Series 2019-3A, 3M USD LIBOR + 1.140% | 1.286% | 7/2/35 | 1,335 | 1,334 | |
| 1,2,7 | Rockland Park CLO Ltd. Series 2021-1A, 3M USD LIBOR + 1.120% | 1.251% | 4/20/34 | 1,600 | 1,599 | |
| 1,2,7 | Rockland Park CLO Ltd. Series 2021-1A, 3M USD LIBOR + 1.650% | 1.781% | 4/20/34 | 800 | 801 | |
| 1,2,4,7,8 | RR 18 Ltd. Series 2021-18A, 3M USD LIBOR + 1.600% | 1.720% | 10/15/34 | 600 | 600 | |
| 1,2,4,7 | Sound Point CLO XXXI Ltd. Series 2021-3A, 3M USD LIBOR + 1.650% | 1.770% | 10/25/34 | 395 | 394 | |
| 1,2,4,7,8 | Symphony CLO XXVIII Ltd. Series 2021-28A, 3M USD LIBOR + 1.650% | 1.770% | 10/23/34 | 350 | 350 | |
| 12,183 | ||||||
| United States (0.5%) | ||||||
| 1,2 | Aaset Trust Series 2019-1 | 3.844% | 5/15/39 | 194 | 194 | |
| 1,2 | Aligned Data Centers Issuer LLC Series 2021-1A | 1.937% | 8/15/46 | 1,260 | 1,266 | |
| 1,2 | Angel Oak Mortgage Trust I LLC Series 2018-3 | 3.649% | 9/25/48 | 115 | 116 | |
| 1,2 | Castlelake Aircraft Structured Trust Series 2019-1A | 3.967% | 4/15/39 | 205 | 205 | |
| 1,2 | CF Hippolyta LLC Series 2020-1 | 1.690% | 7/15/60 | 778 | 793 | |
| 1,2 | DB Master Finance LLC Series 2019-1A | 3.787% | 5/20/49 | 142 | 143 | |
| 1,2 | DB Master Finance LLC Series 2019-1A | 4.021% | 5/20/49 | 123 | 129 | |
| 1,2 | Domino's Pizza Master Issuer LLC Series 2021-1A | 2.662% | 4/25/51 | 524 | 544 | |
| 1,2 | Domino's Pizza Master Issuer LLC Series 2021-1A | 3.151% | 4/25/51 | 733 | 781 | |
| 2 | Ford Credit Auto Lease Trust Series 2021-A | 0.780% | 9/15/25 | 280 | 280 | |
| Coupon | Maturity Date | Face Amount ($000) | Market Value• ($000) | |||
| 1,2,3 | Freddie Mac STACR REMIC Trust Series 2021-DNA1 | 0.700% | 1/25/51 | 352 | 352 | |
| 2,3,7 | Freddie Mac Structured Agency Credit Risk Debt Notes, 1M USD LIBOR + 5.000% | 5.084% | 12/25/28 | 389 | 406 | |
| 2,3,7 | Freddie Mac Structured Agency Credit Risk Debt Notes, 1M USD LIBOR + 2.500% | 2.584% | 3/25/30 | 945 | 966 | |
| 1,2 | GreatAmerica Leasing Receivables Funding LLC Series 2018-1 | 2.830% | 6/17/24 | 54 | 54 | |
| 2 | Seasoned Credit Risk Transfer Trust Series 2019-3 | 3.500% | 10/25/58 | 194 | 210 | |
| 1,2 | SoFi Consumer Loan Program Trust Series 2019-3 | 2.900% | 5/25/28 | 75 | 75 | |
| 1,2 | Taco Bell Funding LLC Series 2021-1A | 1.946% | 8/25/51 | 590 | 591 | |
| 1,2 | Taco Bell Funding LLC Series 2021-1A | 2.294% | 8/25/51 | 540 | 543 | |
| 1,2 | Towd Point Mortgage Trust Series 2018-1 | 3.000% | 1/25/58 | 141 | 143 | |
| 1,2 | Vantage Data Centers Issuer LLC Series 2019-1A | 3.188% | 7/15/44 | 191 | 198 | |
| 1,2 | Vantage Data Centers LLC Series 2020-1A | 1.645% | 9/15/45 | 810 | 809 | |
| 8,798 | ||||||
| Total Asset-Backed/Commercial Mortgage-Backed Securities (Cost $22,302) | 22,452 | |||||
| Corporate Bonds (20.2%) | ||||||
| Australia (0.5%) | ||||||
| 1 | Commonwealth Bank of Australia | 2.688% | 3/11/31 | 3,150 | 3,181 | |
| 1 | National Australia Bank Ltd. | 2.400% | 12/7/21 | 575 | 578 | |
| 1 | National Australia Bank Ltd. | 2.332% | 8/21/30 | 2,020 | 1,976 | |
| 1 | National Australia Bank Ltd. | 2.990% | 5/21/31 | 795 | 817 | |
| 1 | National Australia Bank Ltd. | 3.933% | 8/2/34 | 1,050 | 1,146 | |
| 1 | Scentre Group Trust 1 | 3.625% | 1/28/26 | 809 | 884 | |
| 1 | Scentre Group Trust 1 | 4.375% | 5/28/30 | 1,230 | 1,444 | |
| 10,026 | ||||||
| Austria (0.1%) | ||||||
| 1 | JAB Holdings BV | 2.200% | 11/23/30 | 430 | 426 | |
| 1 | JAB Holdings BV | 3.750% | 5/28/51 | 805 | 890 | |
| 1,316 | ||||||
| Belgium (0.2%) | ||||||
| 2 | Anheuser-Busch Cos. LLC | 4.900% | 2/1/46 | 925 | 1,182 | |
| 2,9 | Anheuser-Busch InBev SA/NV | 2.000% | 3/17/28 | 217 | 287 | |
| 2,9 | Anheuser-Busch InBev SA/NV | 2.875% | 4/2/32 | 800 | 1,155 | |
| Anheuser-Busch InBev Worldwide Inc. | 4.375% | 4/15/38 | 670 | 801 | ||
| Anheuser-Busch InBev Worldwide Inc. | 4.600% | 4/15/48 | 170 | 210 | ||
| 3,635 | ||||||
| Canada (0.3%) | ||||||
| 6 | Bank of Montreal | 2.850% | 3/6/24 | 3,185 | 2,636 | |
| 2,6 | Bell Telephone Co. of Canada or Bell Canada | 3.350% | 3/22/23 | 975 | 798 | |
| Fortis Inc. | 3.055% | 10/4/26 | 775 | 836 | ||
| Nutrien Ltd. | 4.125% | 3/15/35 | 650 | 751 | ||
| TransCanada PipeLines Ltd. | 4.875% | 1/15/26 | 400 | 459 | ||
| 5,480 | ||||||
| Denmark (0.4%) | ||||||
| 2,9 | Danfoss Finance I BV | 0.375% | 10/28/28 | 1,325 | 1,570 | |
| 9 | Danske Bank A/S | 0.500% | 8/27/25 | 2,450 | 2,928 | |
| Coupon | Maturity Date | Face Amount ($000) | Market Value• ($000) | |||
| 1 | Danske Bank A/S | 1.621% | 9/11/26 | 1,320 | 1,327 | |
| 2,10 | Danske Bank A/S | 2.250% | 1/14/28 | 1,440 | 2,040 | |
| 7,865 | ||||||
| France (1.4%) | ||||||
| 2,9 | Airbus SE | 2.375% | 4/7/32 | 600 | 829 | |
| 2,9 | Airbus SE | 2.375% | 6/9/40 | 700 | 976 | |
| 2,9 | AXA SA | 5.125% | 7/4/43 | 600 | 774 | |
| 1 | BNP Paribas SA | 2.819% | 11/19/25 | 470 | 494 | |
| 1 | BNP Paribas SA | 2.219% | 6/9/26 | 1,095 | 1,128 | |
| 2,9 | BNP Paribas SA | 0.125% | 9/4/26 | 600 | 708 | |
| 2,9 | BNP Paribas SA | 2.125% | 1/23/27 | 1,800 | 2,297 | |
| 2,9 | BPCE SA | 1.125% | 1/18/23 | 700 | 842 | |
| 2,9 | BPCE SA | 0.500% | 9/15/27 | 3,600 | 4,289 | |
| 1 | BPCE SA | 3.250% | 1/11/28 | 525 | 574 | |
| 9 | Cie de Saint-Gobain | 2.375% | 10/4/27 | 1,000 | 1,348 | |
| 2,9 | Credit Mutuel Arkea SA | 1.625% | 4/15/26 | 1,500 | 1,886 | |
| 1 | Danone SA | 2.947% | 11/2/26 | 555 | 597 | |
| 2,9 | Engie SA | 0.000% | 3/4/27 | 1,300 | 1,534 | |
| 2,9 | Orange SA | 1.000% | 5/12/25 | 1,300 | 1,598 | |
| 2,9 | RCI Banque SA | 0.750% | 9/26/22 | 500 | 595 | |
| 2,9 | RCI Banque SA | 1.375% | 3/8/24 | 1,400 | 1,706 | |
| 2,9 | RCI Banque SA | 1.625% | 4/11/25 | 2,325 | 2,874 | |
| 25,049 | ||||||
| Germany (1.0%) | ||||||
| 1 | Bayer US Finance II LLC | 4.250% | 12/15/25 | 1,000 | 1,113 | |
| 1 | Bayer US Finance LLC | 3.375% | 10/8/24 | 770 | 824 | |
| 2,10 | E.ON International Finance BV | 4.750% | 1/31/34 | 200 | 355 | |
| 2,10 | E.ON International Finance BV | 5.875% | 10/30/37 | 250 | 513 | |
| 2,9 | Vantage Towers AG | 0.375% | 3/31/27 | 300 | 357 | |
| 2,9 | Vantage Towers AG | 0.750% | 3/31/30 | 1,800 | 2,157 | |
| 2,10 | Volkswagen Financial Services NV | 0.875% | 2/20/25 | 700 | 959 | |
| 2,9 | Volkswagen International Finance NV | 1.500% | 1/21/41 | 700 | 830 | |
| 2,9 | Volkswagen Leasing GmbH | 2.625% | 1/15/24 | 425 | 534 | |
| 2,9 | Volkswagen Leasing GmbH | 1.375% | 1/20/25 | 3,100 | 3,823 | |
| 2,9 | Volkswagen Leasing GmbH | 0.625% | 7/19/29 | 825 | 979 | |
| 2,9 | Vonovia Finance BV | 1.000% | 7/9/30 | 400 | 490 | |
| 2,9 | Vonovia Finance BV | 1.625% | 10/7/39 | 600 | 736 | |
| 9 | Wintershall Dea Finance BV | 0.840% | 9/25/25 | 1,300 | 1,569 | |
| 9 | Wintershall Dea Finance BV | 1.823% | 9/25/31 | 1,900 | 2,378 | |
| 17,617 | ||||||
| Ireland (0.7%) | ||||||
| AerCap Ireland Capital DAC | 4.625% | 10/15/27 | 1,410 | 1,572 | ||
| AerCap Ireland Capital DAC | 3.875% | 1/23/28 | 2,665 | 2,857 | ||
| 1 | Avolon Holdings Funding Ltd. | 2.125% | 2/21/26 | 939 | 936 | |
| 1 | Avolon Holdings Funding Ltd. | 4.375% | 5/1/26 | 646 | 703 | |
| 9 | CRH Finance DAC | 3.125% | 4/3/23 | 1,634 | 2,032 | |
| 2,9 | CRH SMW Finance DAC | 1.250% | 11/5/26 | 1,200 | 1,506 | |
| 1 | Park Aerospace Holdings Ltd. | 5.500% | 2/15/24 | 2,991 | 3,281 | |
| 12,887 | ||||||
| Italy (0.3%) | ||||||
| 1 | Enel Finance International NV | 3.625% | 5/25/27 | 880 | 978 | |
| 2,9 | Enel Finance International NV | 0.500% | 6/17/30 | 675 | 805 | |
| 1 | Enel Finance International NV | 4.750% | 5/25/47 | 1,030 | 1,307 | |
| Coupon | Maturity Date | Face Amount ($000) | Market Value• ($000) | |||
| 1 | UniCredit SpA | 1.982% | 6/3/27 | 1,505 | 1,508 | |
| 1 | UniCredit SpA | 3.127% | 6/3/32 | 1,130 | 1,153 | |
| 5,751 | ||||||
| Japan (0.1%) | ||||||
| 1 | NTT Finance Corp. | 1.162% | 4/3/26 | 1,180 | 1,179 | |
| Takeda Pharmaceutical Co. Ltd. | 3.025% | 7/9/40 | 200 | 206 | ||
| 1,385 | ||||||
| Mexico (0.0%) | ||||||
| America Movil SAB de CV | 3.625% | 4/22/29 | 275 | 303 | ||
| America Movil SAB de CV | 6.375% | 3/1/35 | 350 | 503 | ||
| 806 | ||||||
| Netherlands (0.3%) | ||||||
| 1 | Cooperatieve Rabobank UA | 1.106% | 2/24/27 | 1,090 | 1,081 | |
| 2,10 | Cooperatieve Rabobank UA | 4.625% | 5/23/29 | 100 | 164 | |
| 9 | Euronext NV | 1.125% | 6/12/29 | 1,125 | 1,408 | |
| 9 | ING Groep NV | 0.250% | 2/18/29 | 2,600 | 3,035 | |
| Shell International Finance BV | 4.000% | 5/10/46 | 300 | 358 | ||
| 6,046 | ||||||
| Norway (0.2%) | ||||||
| 2,9 | Aker BP ASA | 1.125% | 5/12/29 | 1,950 | 2,369 | |
| 1 | Aker BP ASA | 4.000% | 1/15/31 | 1,090 | 1,200 | |
| 3,569 | ||||||
| South Korea (0.0%) | ||||||
| 1 | SK Telecom Co. Ltd. | 3.750% | 4/16/23 | 200 | 210 | |
| Spain (0.2%) | ||||||
| 2,9 | Iberdrola Finanzas SA | 1.250% | 10/28/26 | 1,300 | 1,638 | |
| Telefonica Emisiones SA | 4.665% | 3/6/38 | 1,055 | 1,253 | ||
| 2,891 | ||||||
| Switzerland (0.6%) | ||||||
| 1 | Alcon Finance Corp. | 3.000% | 9/23/29 | 1,280 | 1,364 | |
| 1 | Alcon Finance Corp. | 2.600% | 5/27/30 | 625 | 645 | |
| 2,9 | Credit Suisse Group AG | 1.250% | 7/17/25 | 675 | 821 | |
| 1 | Credit Suisse Group AG | 3.091% | 5/14/32 | 3,730 | 3,890 | |
| 1 | UBS Group AG | 1.494% | 8/10/27 | 1,495 | 1,493 | |
| 9 | UBS Group AG | 0.250% | 2/24/28 | 1,600 | 1,890 | |
| 10,103 | ||||||
| United Arab Emirates (0.4%) | ||||||
| 1 | DAE Funding LLC | 1.550% | 8/1/24 | 1,915 | 1,911 | |
| 1 | Galaxy Pipeline Assets Bidco Ltd. | 2.160% | 3/31/34 | 5,155 | 5,136 | |
| 7,047 | ||||||
| United Kingdom (2.3%) | ||||||
| 1 | Ashtead Capital Inc. | 2.450% | 8/12/31 | 1,995 | 1,983 | |
| AstraZeneca plc | 4.000% | 1/17/29 | 755 | 872 | ||
| 1 | BAE Systems plc | 3.400% | 4/15/30 | 200 | 219 | |
| 2,9 | Barclays plc | 1.375% | 1/24/26 | 1,675 | 2,060 | |
| 2 | Barclays plc | 4.972% | 5/16/29 | 1,875 | 2,204 | |
| Barclays plc | 2.645% | 6/24/31 | 815 | 831 | ||
| BAT Capital Corp. | 3.557% | 8/15/27 | 1,240 | 1,342 | ||
| 2,6 | BP Capital Markets plc | 3.470% | 5/15/25 | 1,350 | 1,149 | |
| 1 | CK Hutchison International 17 II Ltd. | 2.750% | 3/29/23 | 1,275 | 1,319 | |
| 2,10 | CPUK Finance Ltd. | 3.588% | 8/28/25 | 1,400 | 2,082 | |
| 2,9 | FCE Bank plc | 0.869% | 9/13/21 | 1,800 | 2,124 | |
| Coupon | Maturity Date | Face Amount ($000) | Market Value• ($000) | |||
| 2,10 | Heathrow Funding Ltd. | 2.750% | 10/13/29 | 1,700 | 2,441 | |
| 2,10 | Heathrow Funding Ltd. | 2.750% | 8/9/49 | 250 | 347 | |
| 7 | HSBC Holdings plc, 3M USD LIBOR + 1.000% | 1.124% | 5/18/24 | 245 | 248 | |
| 2,10 | HSBC Holdings plc | 2.256% | 11/13/26 | 600 | 854 | |
| HSBC Holdings plc | 1.589% | 5/24/27 | 580 | 582 | ||
| 10 | HSBC Holdings plc | 1.750% | 7/24/27 | 2,000 | 2,773 | |
| 2 | HSBC Holdings plc | 4.041% | 3/13/28 | 1,160 | 1,294 | |
| HSBC Holdings plc | 2.206% | 8/17/29 | 1,565 | 1,579 | ||
| HSBC Holdings plc | 2.804% | 5/24/32 | 935 | 965 | ||
| 2,9 | Natwest Group plc | 1.750% | 3/2/26 | 3,125 | 3,891 | |
| 10 | Natwest Group plc | 3.622% | 8/14/30 | 2,500 | 3,669 | |
| Prudential plc | 3.125% | 4/14/30 | 540 | 589 | ||
| 1 | Sky Ltd. | 3.125% | 11/26/22 | 725 | 750 | |
| 1 | Standard Chartered plc | 2.744% | 9/10/22 | 1,095 | 1,095 | |
| 1 | Standard Chartered plc | 0.991% | 1/12/25 | 815 | 814 | |
| 2,9 | Vodafone Group plc | 1.625% | 11/24/30 | 2,675 | 3,473 | |
| Vodafone Group plc | 5.250% | 5/30/48 | 400 | 533 | ||
| 42,082 | ||||||
| United States (11.2%) | ||||||
| AbbVie Inc. | 3.800% | 3/15/25 | 1,060 | 1,156 | ||
| AbbVie Inc. | 4.050% | 11/21/39 | 275 | 323 | ||
| 2 | Alabama Power Co. | 4.300% | 7/15/48 | 255 | 322 | |
| Altria Group Inc. | 3.875% | 9/16/46 | 400 | 404 | ||
| Amazon.com Inc. | 4.800% | 12/5/34 | 300 | 389 | ||
| American Electric Power Co. Inc. | 3.200% | 11/13/27 | 950 | 1,035 | ||
| 9 | American Express Credit Corp. | 0.625% | 11/22/21 | 1,900 | 2,247 | |
| 10 | American Honda Finance Corp. | 0.750% | 11/25/26 | 1,855 | 2,513 | |
| 9 | American International Group Inc. | 1.500% | 6/8/23 | 975 | 1,180 | |
| American International Group Inc. | 4.250% | 3/15/29 | 1,072 | 1,240 | ||
| American International Group Inc. | 3.400% | 6/30/30 | 785 | 864 | ||
| American International Group Inc. | 4.500% | 7/16/44 | 73 | 90 | ||
| American International Group Inc. | 4.750% | 4/1/48 | 45 | 59 | ||
| American International Group Inc. | 4.375% | 6/30/50 | 570 | 716 | ||
| American Tower Corp. | 5.000% | 2/15/24 | 380 | 419 | ||
| American Tower Corp. | 4.400% | 2/15/26 | 300 | 338 | ||
| 9 | American Tower Corp. | 0.450% | 1/15/27 | 3,120 | 3,711 | |
| Amgen Inc. | 4.663% | 6/15/51 | 350 | 454 | ||
| Amgen Inc. | 2.770% | 9/1/53 | 590 | 565 | ||
| Anthem Inc. | 2.250% | 5/15/30 | 1,010 | 1,028 | ||
| 9 | AT&T Inc. | 2.050% | 5/19/32 | 475 | 628 | |
| 9 | AT&T Inc. | 3.150% | 9/4/36 | 575 | 836 | |
| 9 | AT&T Inc. | 2.600% | 5/19/38 | 425 | 581 | |
| AT&T Inc. | 3.300% | 2/1/52 | 155 | 154 | ||
| 1 | AT&T Inc. | 3.500% | 9/15/53 | 2,620 | 2,689 | |
| 1 | Athene Global Funding | 2.500% | 3/24/28 | 2,555 | 2,643 | |
| 2 | Bank of America Corp. | 3.300% | 1/11/23 | 570 | 594 | |
| Bank of America Corp. | 1.734% | 7/22/27 | 1,325 | 1,343 | ||
| 2 | Bank of America Corp. | 3.593% | 7/21/28 | 1,885 | 2,084 | |
| 2 | Bank of America Corp. | 4.271% | 7/23/29 | 1,640 | 1,884 | |
| 2 | Bank of America Corp. | 2.496% | 2/13/31 | 770 | 792 | |
| Bank of America Corp. | 2.687% | 4/22/32 | 1,165 | 1,212 | ||
| Bank of America Corp. | 2.299% | 7/21/32 | 990 | 996 | ||
| Bank of America Corp. | 3.311% | 4/22/42 | 635 | 685 | ||
| 2,7 | Bank of New York Mellon Corp., 3M USD LIBOR + 1.050% | 1.178% | 10/30/23 | 415 | 420 | |
| Coupon | Maturity Date | Face Amount ($000) | Market Value• ($000) | |||
| 9 | Becton Dickinson Euro Finance Sarl | 0.334% | 8/13/28 | 705 | 832 | |
| Boeing Co. | 1.433% | 2/4/24 | 805 | 807 | ||
| Boeing Co. | 2.196% | 2/4/26 | 1,145 | 1,154 | ||
| Boeing Co. | 3.250% | 3/1/28 | 632 | 666 | ||
| Boeing Co. | 3.450% | 11/1/28 | 230 | 246 | ||
| 2 | Bon Secours Mercy Health Inc. | 2.095% | 6/1/31 | 415 | 417 | |
| 9 | Booking Holdings Inc. | 0.100% | 3/8/25 | 110 | 131 | |
| 9 | Booking Holdings Inc. | 0.500% | 3/8/28 | 445 | 535 | |
| 9 | BorgWarner Inc. | 1.000% | 5/19/31 | 875 | 1,052 | |
| 1 | Boston Gas Co. | 3.001% | 8/1/29 | 130 | 137 | |
| Boston Scientific Corp. | 4.000% | 3/1/29 | 60 | 69 | ||
| Boston Scientific Corp. | 4.550% | 3/1/39 | 600 | 739 | ||
| BP Capital Markets America Inc. | 3.379% | 2/8/61 | 1,090 | 1,130 | ||
| Brandywine Operating Partnership LP | 3.950% | 11/15/27 | 890 | 975 | ||
| Brixmor Operating Partnership LP | 2.500% | 8/16/31 | 805 | 809 | ||
| Broadcom Inc. | 4.700% | 4/15/25 | 1,510 | 1,690 | ||
| 1 | Brooklyn Union Gas Co. | 4.273% | 3/15/48 | 965 | 1,119 | |
| 1 | Cargill Inc. | 4.760% | 11/23/45 | 340 | 457 | |
| Carrier Global Corp. | 2.722% | 2/15/30 | 648 | 680 | ||
| Carrier Global Corp. | 3.377% | 4/5/40 | 250 | 267 | ||
| Charter Communications Operating LLC | 5.050% | 3/30/29 | 595 | 705 | ||
| Charter Communications Operating LLC | 2.300% | 2/1/32 | 1,325 | 1,292 | ||
| Charter Communications Operating LLC | 6.384% | 10/23/35 | 355 | 474 | ||
| Charter Communications Operating LLC | 5.375% | 5/1/47 | 110 | 135 | ||
| Charter Communications Operating LLC | 5.125% | 7/1/49 | 90 | 108 | ||
| Charter Communications Operating LLC | 4.800% | 3/1/50 | 118 | 138 | ||
| Charter Communications Operating LLC | 3.700% | 4/1/51 | 610 | 613 | ||
| Cigna Corp. | 4.375% | 10/15/28 | 420 | 490 | ||
| Cigna Corp. | 2.400% | 3/15/30 | 310 | 320 | ||
| Citigroup Inc. | 4.600% | 3/9/26 | 535 | 610 | ||
| Cleco Corporate Holdings LLC | 3.743% | 5/1/26 | 475 | 519 | ||
| Cleco Corporate Holdings LLC | 3.375% | 9/15/29 | 325 | 340 | ||
| Comcast Corp. | 3.950% | 10/15/25 | 250 | 279 | ||
| Comcast Corp. | 6.500% | 11/15/35 | 178 | 260 | ||
| Comcast Corp. | 4.000% | 3/1/48 | 40 | 47 | ||
| Comcast Corp. | 3.999% | 11/1/49 | 120 | 143 | ||
| 1 | Comcast Corp. | 2.887% | 11/1/51 | 1,852 | 1,844 | |
| Comcast Corp. | 4.049% | 11/1/52 | 11 | 13 | ||
| 1 | Comcast Corp. | 2.937% | 11/1/56 | 190 | 188 | |
| Comcast Corp. | 2.650% | 8/15/62 | 25 | 23 | ||
| 1 | Comcast Corp. | 2.987% | 11/1/63 | 11 | 11 | |
| CommonSpirit Health | 4.200% | 8/1/23 | 770 | 821 | ||
| CommonSpirit Health | 3.347% | 10/1/29 | 355 | 386 | ||
| CommonSpirit Health | 4.187% | 10/1/49 | 435 | 507 | ||
| Commonwealth Edison Co. | 3.650% | 6/15/46 | 35 | 40 | ||
| Commonwealth Edison Co. | 4.000% | 3/1/48 | 245 | 295 | ||
| Conagra Brands Inc. | 4.600% | 11/1/25 | 200 | 226 | ||
| Conagra Brands Inc. | 1.375% | 11/1/27 | 640 | 628 | ||
| Conagra Brands Inc. | 5.300% | 11/1/38 | 990 | 1,281 | ||
| 2 | Consolidated Edison Co. of New York Inc. | 6.300% | 8/15/37 | 75 | 107 | |
| Consolidated Edison Co. of New York Inc. | 4.625% | 12/1/54 | 290 | 371 | ||
| Constellation Brands Inc. | 2.875% | 5/1/30 | 115 | 121 | ||
| 1 | Cox Communications Inc. | 3.500% | 8/15/27 | 2,665 | 2,940 | |
| 1 | Cox Communications Inc. | 4.800% | 2/1/35 | 100 | 121 | |
| Crown Castle International Corp. | 2.100% | 4/1/31 | 2,475 | 2,426 | ||
| Coupon | Maturity Date | Face Amount ($000) | Market Value• ($000) | |||
| Crown Castle International Corp. | 2.900% | 4/1/41 | 420 | 413 | ||
| CSX Corp. | 4.300% | 3/1/48 | 495 | 610 | ||
| CVS Health Corp. | 2.875% | 6/1/26 | 1,455 | 1,562 | ||
| CVS Health Corp. | 4.300% | 3/25/28 | 113 | 130 | ||
| CVS Health Corp. | 4.125% | 4/1/40 | 235 | 275 | ||
| CVS Health Corp. | 5.050% | 3/25/48 | 125 | 165 | ||
| Dignity Health | 3.812% | 11/1/24 | 594 | 641 | ||
| Dignity Health | 4.500% | 11/1/42 | 166 | 201 | ||
| Discovery Communications LLC | 3.950% | 3/20/28 | 424 | 474 | ||
| Discovery Communications LLC | 4.125% | 5/15/29 | 186 | 210 | ||
| Discovery Communications LLC | 3.625% | 5/15/30 | 995 | 1,092 | ||
| Discovery Communications LLC | 4.650% | 5/15/50 | 588 | 696 | ||
| Discovery Communications LLC | 4.000% | 9/15/55 | 497 | 533 | ||
| Dominion Energy South Carolina Inc. | 6.625% | 2/1/32 | 156 | 219 | ||
| Dominion Energy South Carolina Inc. | 5.300% | 5/15/33 | 113 | 149 | ||
| Dominion Energy South Carolina Inc. | 5.450% | 2/1/41 | 300 | 418 | ||
| Dominion Energy South Carolina Inc. | 4.600% | 6/15/43 | 230 | 297 | ||
| Duke Energy Corp. | 2.550% | 6/15/31 | 900 | 926 | ||
| 1 | Eastern Gas Transmission & Storage Inc. | 4.600% | 12/15/44 | 660 | 804 | |
| Energy Transfer LP | 4.900% | 3/15/35 | 1,075 | 1,238 | ||
| 1 | Equitable Financial Life Global Funding | 1.400% | 7/7/25 | 150 | 152 | |
| 1 | Equitable Financial Life Global Funding | 1.300% | 7/12/26 | 1,020 | 1,020 | |
| 1 | Equitable Financial Life Global Funding | 1.400% | 8/27/27 | 825 | 822 | |
| 1 | ERAC USA Finance LLC | 3.300% | 12/1/26 | 300 | 328 | |
| 1 | ERAC USA Finance LLC | 4.500% | 2/15/45 | 455 | 565 | |
| Evergy Kansas Central Inc. | 3.250% | 9/1/49 | 235 | 252 | ||
| 2 | Evergy Metro Inc. | 2.250% | 6/1/30 | 245 | 251 | |
| Exxon Mobil Corp. | 2.275% | 8/16/26 | 1,075 | 1,133 | ||
| Exxon Mobil Corp. | 2.610% | 10/15/30 | 190 | 201 | ||
| FedEx Corp. | 4.100% | 2/1/45 | 85 | 99 | ||
| FedEx Corp. | 4.750% | 11/15/45 | 227 | 286 | ||
| FedEx Corp. | 4.550% | 4/1/46 | 117 | 144 | ||
| FedEx Corp. | 4.050% | 2/15/48 | 33 | 38 | ||
| 9 | Fidelity National Information Services Inc. | 1.500% | 5/21/27 | 1,820 | 2,296 | |
| Fifth Third Bancorp | 2.550% | 5/5/27 | 555 | 589 | ||
| Fiserv Inc. | 3.200% | 7/1/26 | 355 | 386 | ||
| 9 | Fiserv Inc. | 1.625% | 7/1/30 | 1,125 | 1,445 | |
| 10 | Fiserv Inc. | 3.000% | 7/1/31 | 775 | 1,182 | |
| 9 | General Mills Inc. | 0.450% | 1/15/26 | 1,275 | 1,535 | |
| General Motors Co. | 4.200% | 10/1/27 | 475 | 532 | ||
| General Motors Co. | 5.000% | 10/1/28 | 935 | 1,093 | ||
| 1 | Genting New York LLC | 3.300% | 2/15/26 | 1,668 | 1,669 | |
| Georgia Power Co. | 4.300% | 3/15/42 | 860 | 1,023 | ||
| Gilead Sciences Inc. | 2.800% | 10/1/50 | 1,735 | 1,691 | ||
| 2 | Goldman Sachs Group Inc. | 3.272% | 9/29/25 | 1,375 | 1,473 | |
| Goldman Sachs Group Inc. | 1.431% | 3/9/27 | 3,610 | 3,618 | ||
| Goldman Sachs Group Inc. | 2.615% | 4/22/32 | 885 | 912 | ||
| 2 | Goldman Sachs Group Inc. | 2.383% | 7/21/32 | 960 | 971 | |
| 1 | Gray Oak Pipeline LLC | 2.600% | 10/15/25 | 436 | 449 | |
| 1 | Gray Oak Pipeline LLC | 3.450% | 10/15/27 | 70 | 75 | |
| HCA Inc. | 5.250% | 6/15/49 | 575 | 750 | ||
| Healthpeak Properties Inc. | 3.500% | 7/15/29 | 335 | 372 | ||
| Hess Corp. | 7.300% | 8/15/31 | 1,750 | 2,380 | ||
| Hess Corp. | 5.600% | 2/15/41 | 1,245 | 1,554 | ||
| 1 | Hyundai Capital America | 0.800% | 4/3/23 | 1,385 | 1,387 | |
| Coupon | Maturity Date | Face Amount ($000) | Market Value• ($000) | |||
| Intercontinental Exchange Inc. | 1.850% | 9/15/32 | 1,425 | 1,375 | ||
| International Business Machines Corp. | 3.300% | 5/15/26 | 550 | 606 | ||
| International Business Machines Corp. | 1.950% | 5/15/30 | 1,510 | 1,516 | ||
| International Business Machines Corp. | 4.250% | 5/15/49 | 420 | 525 | ||
| International Paper Co. | 4.350% | 8/15/48 | 322 | 404 | ||
| 1 | ITC Holdings Corp. | 2.950% | 5/14/30 | 965 | 1,026 | |
| 2 | John Deere Capital Corp. | 3.450% | 3/13/25 | 985 | 1,077 | |
| 2 | Johnson Controls International plc | 4.950% | 7/2/64 | 692 | 956 | |
| JPMorgan Chase & Co. | 2.580% | 4/22/32 | 1,910 | 1,975 | ||
| 2 | JPMorgan Chase & Co. | 3.964% | 11/15/48 | 975 | 1,157 | |
| 2 | Kaiser Foundation Hospitals | 2.810% | 6/1/41 | 1,200 | 1,237 | |
| Kaiser Foundation Hospitals | 4.875% | 4/1/42 | 45 | 62 | ||
| 1 | KeySpan Gas East Corp. | 2.742% | 8/15/26 | 400 | 421 | |
| Kroger Co. | 4.450% | 2/1/47 | 330 | 402 | ||
| Kroger Co. | 5.400% | 1/15/49 | 290 | 403 | ||
| Lowe's Cos. Inc. | 1.300% | 4/15/28 | 1,845 | 1,811 | ||
| Marsh & McLennan Cos. Inc. | 4.375% | 3/15/29 | 1,010 | 1,187 | ||
| 1 | Marvell Technology Inc. | 2.950% | 4/15/31 | 1,130 | 1,173 | |
| 1 | Massachusetts Mutual Life Insurance Co. | 3.375% | 4/15/50 | 550 | 592 | |
| McCormick & Co. Inc. | 2.500% | 4/15/30 | 180 | 187 | ||
| 2 | McDonald's Corp. | 4.450% | 9/1/48 | 475 | 596 | |
| 2 | McDonald's Corp. | 3.625% | 9/1/49 | 50 | 56 | |
| Memorial Sloan-Kettering Cancer Center | 4.125% | 7/1/52 | 150 | 193 | ||
| Merck & Co. Inc. | 3.400% | 3/7/29 | 545 | 613 | ||
| 2 | Mercy Health | 3.555% | 8/1/27 | 410 | 447 | |
| 2 | Mercy Health | 4.302% | 7/1/28 | 140 | 162 | |
| 1 | Microchip Technology Inc. | 0.972% | 2/15/24 | 1,630 | 1,631 | |
| Microsoft Corp. | 2.921% | 3/17/52 | 1,125 | 1,208 | ||
| MidAmerican Energy Co. | 4.250% | 5/1/46 | 10 | 12 | ||
| 1 | Mid-Atlantic Interstate Transmission LLC | 4.100% | 5/15/28 | 1,385 | 1,570 | |
| 2,6 | Molson Coors International LP | 2.840% | 7/15/23 | 1,875 | 1,530 | |
| 9 | Mondelez International Inc. | 0.250% | 3/17/28 | 975 | 1,151 | |
| 9 | Mondelez International Inc. | 1.375% | 3/17/41 | 910 | 1,075 | |
| 2 | Morgan Stanley | 3.125% | 7/27/26 | 1,850 | 2,007 | |
| 2 | Morgan Stanley | 3.772% | 1/24/29 | 570 | 638 | |
| 9 | Morgan Stanley | 0.497% | 2/7/31 | 1,050 | 1,224 | |
| National Retail Properties Inc. | 3.900% | 6/15/24 | 805 | 868 | ||
| 1 | Nationwide Mutual Insurance Co. | 4.350% | 4/30/50 | 1,330 | 1,520 | |
| NextEra Energy Capital Holdings Inc. | 1.900% | 6/15/28 | 1,120 | 1,135 | ||
| 1 | Niagara Mohawk Power Corp. | 1.960% | 6/27/30 | 985 | 976 | |
| Norfolk Southern Corp. | 2.550% | 11/1/29 | 1,165 | 1,224 | ||
| 1 | Northwestern Mutual Life Insurance Co. | 3.850% | 9/30/47 | 230 | 267 | |
| 1 | Northwestern Mutual Life Insurance Co. | 3.625% | 9/30/59 | 36 | 41 | |
| NVIDIA Corp. | 3.500% | 4/1/40 | 445 | 507 | ||
| 2 | Ochsner LSU Health System of North Louisiana | 2.510% | 5/15/31 | 925 | 927 | |
| 1 | Oglethorpe Power Corp. | 6.191% | 1/1/31 | 210 | 264 | |
| Oglethorpe Power Corp. | 5.050% | 10/1/48 | 161 | 204 | ||
| Oglethorpe Power Corp. | 5.250% | 9/1/50 | 305 | 396 | ||
| Oracle Corp. | 3.400% | 7/8/24 | 575 | 616 | ||
| Oracle Corp. | 3.600% | 4/1/50 | 850 | 887 | ||
| Oracle Corp. | 3.950% | 3/25/51 | 1,505 | 1,668 | ||
| Oracle Corp. | 3.850% | 4/1/60 | 225 | 242 | ||
| Otis Worldwide Corp. | 2.565% | 2/15/30 | 85 | 89 | ||
| Otis Worldwide Corp. | 3.112% | 2/15/40 | 195 | 205 | ||
| PacifiCorp | 2.700% | 9/15/30 | 205 | 217 | ||
| Coupon | Maturity Date | Face Amount ($000) | Market Value• ($000) | |||
| 1 | Pennsylvania Electric Co. | 3.600% | 6/1/29 | 208 | 224 | |
| 1 | Penske Truck Leasing Co. LP | 3.375% | 2/1/22 | 145 | 146 | |
| 1 | Penske Truck Leasing Co. LP | 4.250% | 1/17/23 | 1,405 | 1,476 | |
| 1 | Penske Truck Leasing Co. LP | 2.700% | 11/1/24 | 170 | 179 | |
| 1 | Penske Truck Leasing Co. LP | 3.950% | 3/10/25 | 1,120 | 1,223 | |
| 1 | Penske Truck Leasing Co. LP | 4.000% | 7/15/25 | 180 | 198 | |
| Pfizer Inc. | 1.700% | 5/28/30 | 275 | 275 | ||
| 2 | PNC Bank NA | 3.250% | 1/22/28 | 910 | 1,008 | |
| 2 | Providence St. Joseph Health Obligated Group | 3.930% | 10/1/48 | 225 | 269 | |
| Raytheon Technologies Corp. | 3.950% | 8/16/25 | 285 | 316 | ||
| Raytheon Technologies Corp. | 4.450% | 11/16/38 | 725 | 887 | ||
| 10 | Realty Income Corp. | 1.750% | 7/13/33 | 1,075 | 1,483 | |
| Royalty Pharma plc | 3.300% | 9/2/40 | 315 | 319 | ||
| Royalty Pharma plc | 3.550% | 9/2/50 | 765 | 766 | ||
| 2 | San Diego Gas & Electric Co. | 1.700% | 10/1/30 | 1,360 | 1,324 | |
| 2 | San Diego Gas & Electric Co. | 4.100% | 6/15/49 | 261 | 317 | |
| Santander Holdings USA Inc. | 3.700% | 3/28/22 | 2,400 | 2,437 | ||
| 1 | SBA Tower Trust | 3.448% | 3/15/23 | 675 | 687 | |
| 1 | SBA Tower Trust | 1.884% | 1/15/26 | 245 | 248 | |
| 1 | SBA Tower Trust | 1.631% | 11/15/26 | 540 | 540 | |
| 2 | SCE Recovery Funding LLC | 0.861% | 11/15/31 | 400 | 393 | |
| 2 | SCE Recovery Funding LLC | 1.942% | 5/15/38 | 165 | 162 | |
| 2 | SCE Recovery Funding LLC | 2.510% | 11/15/43 | 95 | 93 | |
| Sempra Energy | 3.250% | 6/15/27 | 1,050 | 1,143 | ||
| Sherwin-Williams Co. | 3.450% | 6/1/27 | 2,055 | 2,272 | ||
| Sierra Pacific Power Co. | 2.600% | 5/1/26 | 149 | 158 | ||
| 2 | Southern California Edison Co. | 3.700% | 8/1/25 | 30 | 33 | |
| 2 | Southern California Edison Co. | 2.950% | 2/1/51 | 790 | 722 | |
| Southern Co. | 4.400% | 7/1/46 | 5 | 6 | ||
| 1 | Sprint Spectrum Co. LLC | 4.738% | 3/20/25 | 755 | 805 | |
| 2 | SSM Health Care Corp. | 3.823% | 6/1/27 | 320 | 362 | |
| Starbucks Corp. | 4.500% | 11/15/48 | 730 | 925 | ||
| Starbucks Corp. | 3.350% | 3/12/50 | 60 | 64 | ||
| 2 | Sutter Health | 2.294% | 8/15/30 | 360 | 369 | |
| Sysco Corp. | 2.400% | 2/15/30 | 1,495 | 1,541 | ||
| 1 | Teachers Insurance & Annuity Association of America | 4.900% | 9/15/44 | 860 | 1,136 | |
| Teledyne Technologies Inc. | 2.250% | 4/1/28 | 985 | 1,013 | ||
| Teledyne Technologies Inc. | 2.750% | 4/1/31 | 790 | 825 | ||
| Thermo Fisher Scientific Inc. | 1.750% | 10/15/28 | 495 | 500 | ||
| T-Mobile USA Inc. | 2.050% | 2/15/28 | 1,975 | 2,009 | ||
| T-Mobile USA Inc. | 4.375% | 4/15/40 | 515 | 603 | ||
| 2 | Toledo Hospital | 5.325% | 11/15/28 | 555 | 639 | |
| Toledo Hospital | 5.750% | 11/15/38 | 205 | 247 | ||
| Trinity Acquisition plc | 4.400% | 3/15/26 | 1,274 | 1,434 | ||
| 2 | Truist Bank | 3.300% | 5/15/26 | 450 | 495 | |
| 2 | Truist Financial Corp. | 3.700% | 6/5/25 | 970 | 1,070 | |
| Union Pacific Corp. | 3.600% | 9/15/37 | 910 | 1,029 | ||
| Union Pacific Corp. | 3.750% | 2/5/70 | 285 | 324 | ||
| 2 | United Airlines Pass-Through Trust Class B Series 2018-1 | 4.600% | 3/1/26 | 54 | 56 | |
| UnitedHealth Group Inc. | 3.850% | 6/15/28 | 820 | 940 | ||
| UnitedHealth Group Inc. | 2.000% | 5/15/30 | 240 | 244 | ||
| UnitedHealth Group Inc. | 4.625% | 7/15/35 | 75 | 95 | ||
| UnitedHealth Group Inc. | 4.200% | 1/15/47 | 65 | 80 | ||
| Coupon | Maturity Date | Face Amount ($000) | Market Value• ($000) | |||
| VEREIT Operating Partnership LP | 3.400% | 1/15/28 | 535 | 584 | ||
| VEREIT Operating Partnership LP | 2.200% | 6/15/28 | 285 | 292 | ||
| VEREIT Operating Partnership LP | 3.100% | 12/15/29 | 830 | 893 | ||
| VEREIT Operating Partnership LP | 2.850% | 12/15/32 | 120 | 127 | ||
| 9 | Verizon Communications Inc. | 1.250% | 4/8/30 | 1,100 | 1,381 | |
| Verizon Communications Inc. | 1.680% | 10/30/30 | 307 | 296 | ||
| 10 | Verizon Communications Inc. | 3.375% | 10/27/36 | 200 | 324 | |
| Verizon Communications Inc. | 4.522% | 9/15/48 | 720 | 907 | ||
| Verizon Communications Inc. | 5.012% | 8/21/54 | 475 | 654 | ||
| Verizon Communications Inc. | 2.987% | 10/30/56 | 185 | 178 | ||
| VF Corp. | 2.800% | 4/23/27 | 185 | 198 | ||
| VF Corp. | 2.950% | 4/23/30 | 1,765 | 1,883 | ||
| 2,6 | Wells Fargo & Co. | 2.975% | 5/19/26 | 625 | 523 | |
| 2 | Wells Fargo & Co. | 4.100% | 6/3/26 | 920 | 1,033 | |
| 2 | Wells Fargo & Co. | 4.300% | 7/22/27 | 275 | 315 | |
| 2 | Wells Fargo & Co. | 2.879% | 10/30/30 | 435 | 463 | |
| 2 | Wells Fargo & Co. | 4.750% | 12/7/46 | 800 | 1,021 | |
| Welltower Inc. | 4.000% | 6/1/25 | 275 | 302 | ||
| 204,995 | ||||||
| Total Corporate Bonds (Cost $352,904) | 368,760 | |||||
| Sovereign Bonds (4.5%) | ||||||
| Australia (0.1%) | ||||||
| 2,11 | Commonwealth of Australia | 2.750% | 11/21/27 | 135 | 110 | |
| 2,11 | Commonwealth of Australia | 2.250% | 5/21/28 | 1,195 | 955 | |
| 2,11 | Commonwealth of Australia | 1.000% | 11/21/31 | 2,175 | 1,562 | |
| 2,627 | ||||||
| Bermuda (0.0%) | ||||||
| 1,2 | Bermuda | 2.375% | 8/20/30 | 200 | 202 | |
| 1,2 | Bermuda | 3.375% | 8/20/50 | 200 | 209 | |
| 411 | ||||||
| Canada (0.4%) | ||||||
| 6 | City of Montreal | 3.150% | 12/1/36 | 750 | 649 | |
| 6 | City of Montreal | 3.500% | 12/1/38 | 410 | 370 | |
| 6 | City of Montreal | 2.400% | 12/1/41 | 1,000 | 764 | |
| 6 | City of Toronto | 3.200% | 8/1/48 | 1,000 | 853 | |
| 6 | Municipal Finance Authority of British Columbia | 4.950% | 12/1/27 | 2,200 | 2,105 | |
| 6 | Province of Ontario | 2.900% | 6/2/28 | 1,910 | 1,652 | |
| 2,12 | Province of Ontario | 0.250% | 6/28/29 | 985 | 1,114 | |
| 6 | Regional Municipality of York | 2.150% | 6/22/31 | 800 | 642 | |
| 8,149 | ||||||
| Chile (0.2%) | ||||||
| 2 | Corp. Nacional del Cobre de Chile | 3.625% | 8/1/27 | 650 | 710 | |
| 2 | Republic of Chile | 2.550% | 7/27/33 | 2,215 | 2,257 | |
| 9 | Republic of Chile | 1.250% | 1/22/51 | 670 | 729 | |
| 3,696 | ||||||
| China (0.1%) | ||||||
| 1,2 | State Grid Overseas Investment BVI Ltd. | 2.750% | 5/4/22 | 2,135 | 2,165 | |
| Colombia (0.1%) | ||||||
| 2 | Republic of Colombia | 4.000% | 2/26/24 | 1,350 | 1,421 | |
| Croatia (0.1%) | ||||||
| 9 | Republic of Croatia | 1.500% | 6/17/31 | 1,815 | 2,297 | |
| Coupon | Maturity Date | Face Amount ($000) | Market Value• ($000) | |||
| Japan (1.2%) | ||||||
| 2,13 | Japan | 0.100% | 3/20/31 | 2,013,000 | 18,443 | |
| 2,13 | Japan | 0.100% | 6/20/31 | 353,200 | 3,233 | |
| 21,676 | ||||||
| Mexico (0.1%) | ||||||
| 2 | United Mexican States | 4.280% | 8/14/41 | 2,210 | 2,370 | |
| Norway (0.1%) | ||||||
| Equinor ASA | 3.000% | 4/6/27 | 1,545 | 1,677 | ||
| Panama (0.2%) | ||||||
| 1,2 | Empresa de Transmision Electrica SA | 5.125% | 5/2/49 | 470 | 539 | |
| 2 | Republic of Panama | 2.252% | 9/29/32 | 2,765 | 2,698 | |
| 3,237 | ||||||
| Qatar (0.2%) | ||||||
| 1 | Qatar Petroleum | 2.250% | 7/12/31 | 820 | 826 | |
| 1 | Qatar Petroleum | 3.125% | 7/12/41 | 685 | 707 | |
| 1,2 | State of Qatar | 3.875% | 4/23/23 | 550 | 581 | |
| 1,2 | State of Qatar | 5.103% | 4/23/48 | 255 | 344 | |
| 1,2 | State of Qatar | 4.400% | 4/16/50 | 780 | 968 | |
| 3,426 | ||||||
| Romania (0.3%) | ||||||
| 1,9 | Republic of Romania | 1.375% | 12/2/29 | 299 | 353 | |
| 2,9 | Republic of Romania | 2.500% | 2/8/30 | 1,225 | 1,547 | |
| 2,9 | Republic of Romania | 3.624% | 5/26/30 | 1,150 | 1,570 | |
| 2,9 | Republic of Romania | 2.124% | 7/16/31 | 725 | 880 | |
| 1,9 | Republic of Romania | 2.000% | 4/14/33 | 410 | 482 | |
| 4,832 | ||||||
| Saudi Arabia (0.2%) | ||||||
| 1,2 | Kingdom of Saudi Arabia | 2.875% | 3/4/23 | 2,020 | 2,088 | |
| 1,2 | Saudi Arabian Oil Co. | 2.875% | 4/16/24 | 500 | 524 | |
| 1,2 | Saudi Arabian Oil Co. | 3.500% | 4/16/29 | 680 | 741 | |
| 3,353 | ||||||
| Singapore (0.0%) | ||||||
| 1,2 | Temasek Financial I Ltd. | 3.625% | 8/1/28 | 510 | 581 | |
| Spain (0.1%) | ||||||
| 1,9 | Kingdom of Spain | 0.600% | 10/31/29 | 1,050 | 1,294 | |
| Supranational (0.8%) | ||||||
| 2,9 | European Union | 0.000% | 7/4/35 | 4,825 | 5,592 | |
| 2,9 | European Union | 0.200% | 6/4/36 | 5,100 | 6,027 | |
| 2,9 | European Union | 0.100% | 10/4/40 | 2,175 | 2,459 | |
| 14,078 | ||||||
| United Arab Emirates (0.1%) | ||||||
| 2 | Emirate of Abu Dhabi | 3.125% | 10/11/27 | 1,235 | 1,368 | |
| United Kingdom (0.2%) | ||||||
| 10 | United Kingdom | 0.625% | 6/7/25 | 700 | 975 | |
| 10 | United Kingdom | 1.250% | 7/22/27 | 655 | 944 | |
| 10 | United Kingdom | 3.500% | 1/22/45 | 735 | 1,513 | |
| 3,432 | ||||||
| Total Sovereign Bonds (Cost $80,213) | 82,090 | |||||
| Coupon | Maturity Date | Face Amount ($000) | Market Value• ($000) | |||
| Taxable Municipal Bonds (0.6%) | ||||||
| United States (0.6%) | ||||||
| Broward County FL Airport System Revenue | 3.477% | 10/1/43 | 100 | 106 | ||
| Chicago IL Transit Authority Sales & Transfer Tax Receipts Revenue | 6.300% | 12/1/21 | 20 | 20 | ||
| Chicago IL Transit Authority Sales & Transfer Tax Receipts Revenue | 6.899% | 12/1/40 | 805 | 1,165 | ||
| Chicago IL Transit Authority Sales & Transfer Tax Receipts Revenue | 6.899% | 12/1/40 | 55 | 79 | ||
| Dallas/Fort Worth International Airport Revenue | 3.089% | 11/1/40 | 90 | 93 | ||
| Foothill-Eastern Transportation Corridor Agency CA Toll Road Revenue | 4.094% | 1/15/49 | 55 | 59 | ||
| 14 | Foothill-Eastern Transportation Corridor Agency CA Toll Road Revenue | 3.924% | 1/15/53 | 405 | 432 | |
| Georgia Municipal Electric Power Authority Revenue | 6.637% | 4/1/57 | 747 | 1,143 | ||
| Grand Parkway Transportation Corp. Texas System Toll Revenue | 3.236% | 10/1/52 | 290 | 301 | ||
| Illinois GO | 5.100% | 6/1/33 | 1,345 | 1,598 | ||
| 15 | Kansas Development Finance Authority Revenue | 2.774% | 5/1/51 | 475 | 475 | |
| 14 | Kansas Development Finance Authority Revenue (Employees Retirement System) | 5.371% | 5/1/26 | 520 | 586 | |
| Massachusetts School Building Authority Dedicated Sales Tax Revenue | 3.395% | 10/15/40 | 175 | 188 | ||
| New York Metropolitan Transportation Authority Revenue (Build America Bonds) | 6.200% | 11/15/26 | 20 | 23 | ||
| New York Metropolitan Transportation Authority Revenue (Build America Bonds) | 6.668% | 11/15/39 | 170 | 248 | ||
| New York Metropolitan Transportation Authority Revenue (Build America Bonds) | 6.814% | 11/15/40 | 805 | 1,185 | ||
| New York Metropolitan Transportation Authority Revenue (Climate Bond Certified) | 5.175% | 11/15/49 | 445 | 613 | ||
| New York State Dormitory Authority Revenue (Personal Income Tax) | 3.110% | 2/15/39 | 285 | 317 | ||
| 16 | Philadelphia PA Authority for Industrial Development Revenue | 6.550% | 10/15/28 | 635 | 828 | |
| Port Authority of New York & New Jersey Revenue | 3.175% | 7/15/60 | 295 | 301 | ||
| Port Authority of New York & New Jersey Revenue | 4.458% | 10/1/62 | 305 | 419 | ||
| Sales Tax Securitization Corp. Illinois Revenue | 4.787% | 1/1/48 | 650 | 838 | ||
| State of Connecticut GO | 2.000% | 7/1/23 | 190 | 196 | ||
| State of Connecticut GO | 5.770% | 3/15/25 | 275 | 324 | ||
| Total Taxable Municipal Bonds (Cost $10,400) | 11,537 | |||||
| Coupon | Shares | Market Value• ($000) | ||||
| Temporary Cash Investments (4.0%) | ||||||
| Money Market Fund (4.0%) | ||||||
| 17 | Vanguard Market Liquidity Fund (Cost $73,278) | 0.068% | 732,990 | 73,299 | ||
| Total Investments (100.7%) (Cost $1,518,281) | 1,837,613 | |||||
| Other Assets and Liabilities—Net (-0.7%) | (13,320) | |||||
| Net Assets (100%) | 1,824,293 | |||||
| Cost is in $000. | |
| • | See Note A in Notes to Financial Statements. |
| * | Non-income-producing security. |
| 1 | Security exempt from registration under Rule 144A of the Securities Act of 1933. Such securities may be sold in transactions exempt from registration, normally to qualified institutional buyers. At August 31, 2021, the aggregate value was $128,285,000, representing 7.0% of net assets. |
| 2 | The average or expected maturity is shorter than the final maturity shown because of the possibility of interim principal payments and prepayments or the possibility of the issue being called. |
| 3 | The issuer was placed under federal conservatorship in September 2008; since that time, its daily operations have been managed by the Federal Housing Finance Agency and it receives capital from the U.S. Treasury, as needed to maintain a positive net worth, in exchange for senior preferred stock. |
| 4 | Includes securities purchased on a when-issued or delayed-delivery basis for which the fund has not taken delivery as of August 31, 2021. |
| 5 | Securities with a value of $963,000 have been segregated as initial margin for open futures contracts. |
| 6 | Face amount denominated in Canadian dollars. |
| 7 | Variable-rate security; rate shown is effective rate at period end. Certain variable-rate securities are not based on a published reference rate and spread but are determined by the issuer or agent based on current market conditions. |
| 8 | Security value determined using significant unobservable inputs. |
| 9 | Face amount denominated in euro. |
| 10 | Face amount denominated in British pounds. |
| 11 | Face amount denominated in Australian dollars. |
| 12 | Face amount denominated in Swiss francs. |
| 13 | Face amount denominated in Japanese yen. |
| 14 | Scheduled principal and interest payments are guaranteed by Assured Guaranty Municipal Corp. |
| 15 | Scheduled principal and interest payments are guaranteed by Build America Mutual Assurance Co. |
| 16 | Scheduled principal and interest payments are guaranteed by National Public Finance Guarantee Corp. |
| 17 | Affiliated money market fund available only to Vanguard funds and certain trusts and accounts managed by Vanguard. Rate shown is the 7-day yield. |
| 1M—1-month. | |
| 3M—3-month. | |
| ADR—American Depositary Receipt. | |
| GO—General Obligation Bond. | |
| LIBOR—London Interbank Offered Rate. | |
| REMICS—Real Estate Mortgage Investment Conduits. | |
| UMBS—Uniform Mortgage-Backed Securities. |
| Futures Contracts | ||||
| ($000) | ||||
| Expiration | Number of Long (Short) Contracts | Notional Amount | Value and Unrealized Appreciation (Depreciation) | |
| Long Futures Contracts | ||||
| 5-Year U.S. Treasury Note | December 2021 | 93 | 11,506 | 22 |
| Euro-Bobl | September 2021 | 72 | 11,475 | 29 |
| Euro-BTP | September 2021 | 11 | 1,991 | 38 |
| Euro-Buxl | September 2021 | 14 | 3,513 | 125 |
| Euro-OAT | September 2021 | 17 | 3,235 | 55 |
| Euro-Schatz | September 2021 | 110 | 14,583 | 15 |
| Long Gilt | December 2021 | 18 | 3,174 | (23) |
| 261 | ||||
| Short Futures Contracts | ||||
| 10-Year U.S. Treasury Note | December 2021 | (220) | (29,360) | (25) |
| Euro-Bund | September 2021 | (85) | (17,609) | (146) |
| Ultra 10-Year U.S. Treasury Note | December 2021 | (138) | (20,426) | (16) |
| (187) | ||||
| 74 | ||||
| Forward Currency Contracts | |||||||
| Contract Settlement Date | Contract Amount (000) | Unrealized Appreciation ($000) | Unrealized (Depreciation) ($000) | ||||
| Counterparty | Receive | Deliver | |||||
| Goldman Sachs International | 9/30/21 | EUR | 5,250 | USD | 6,198 | 5 | — |
| Goldman Sachs International | 9/30/21 | USD | 6,495 | AUD | 8,957 | — | (58) |
| Bank of America, N.A. | 9/30/21 | USD | 405 | AUD | 555 | — | (1) |
| Bank of America, N.A. | 9/29/21 | USD | 13,992 | CAD | 17,721 | — | (53) |
| Bank of America, N.A. | 9/29/21 | AUD | 900 | CAD | 824 | 5 | — |
| Goldman Sachs International | 9/30/21 | USD | 3,052 | CHF | 2,784 | 9 | — |
| J.P. Morgan Securities LLC | 9/30/21 | USD | 125,569 | EUR | 106,852 | — | (671) |
| J.P. Morgan Securities LLC | 9/30/21 | GBP | 2,624 | EUR | 3,065 | — | (13) |
| J.P. Morgan Securities LLC | 9/30/21 | USD | 33,036 | GBP | 24,057 | — | (41) |
| Forward Currency Contracts (continued) | |||||||
| Contract Settlement Date | Contract Amount (000) | Unrealized Appreciation ($000) | Unrealized (Depreciation) ($000) | ||||
| Counterparty | Receive | Deliver | |||||
| J.P. Morgan Securities LLC | 9/30/21 | USD | 20,701 | JPY | 2,272,473 | 39 | — |
| Goldman Sachs International | 9/30/21 | AUD | 4,608 | JPY | 366,900 | 36 | — |
| Bank of America, N.A. | 9/30/21 | GBP | 1,169 | JPY | 176,157 | 6 | — |
| Bank of America, N.A. | 9/30/21 | USD | 529 | SEK | 4,600 | — | (4) |
| Goldman Sachs International | 9/30/21 | USD | 450 | TWD | 12,415 | 2 | — |
| 102 | (841) | ||||||
| AUD—Australian dollar. |
| CAD—Canadian dollar. |
| CHF—Swiss franc. |
| EUR—euro. |
| GBP—British pound. |
| JPY—Japanese yen. |
| SEK—Swedish krona. |
| TWD—Taiwanese dollar. |
| USD—U.S. dollar. |
| ($000s, except shares and per-share amounts) | Amount |
| Assets | |
| Investments in Securities, at Value | |
| Unaffiliated Issuers (Cost $1,445,003) | 1,764,314 |
| Affiliated Issuers (Cost $73,278) | 73,299 |
| Total Investments in Securities | 1,837,613 |
| Investment in Vanguard | 61 |
| Cash | 15 |
| Foreign Currency, at Value (Cost $18,991) | 18,995 |
| Receivables for Investment Securities Sold | 16,053 |
| Receivables for Accrued Income | 6,544 |
| Receivables for Capital Shares Issued | 1,356 |
| Variation Margin Receivable—Futures Contracts | 37 |
| Unrealized Appreciation—Forward Currency Contracts | 102 |
| Total Assets | 1,880,776 |
| Liabilities | |
| Payables for Investment Securities Purchased | 53,760 |
| Payables for Capital Shares Redeemed | 1,219 |
| Payables to Investment Advisor | 534 |
| Payables to Vanguard | 129 |
| Unrealized Depreciation—Forward Currency Contracts | 841 |
| Total Liabilities | 56,483 |
| Net Assets | 1,824,293 |
| At August 31, 2021, net assets consisted of: | |
| Paid-in Capital | 1,478,072 |
| Total Distributable Earnings (Loss) | 346,221 |
| Net Assets | 1,824,293 |
| Investor Shares—Net Assets | |
| Applicable to 9,450,072 outstanding $.001 par value shares of beneficial interest (unlimited authorization) | 247,422 |
| Net Asset Value Per Share—Investor Shares | $26.18 |
| Admiral Shares—Net Assets | |
| Applicable to 48,170,140 outstanding $.001 par value shares of beneficial interest (unlimited authorization) | 1,576,871 |
| Net Asset Value Per Share—Admiral Shares | $32.74 |
| Year Ended August 31, 2021 | |
| ($000) | |
| Investment Income | |
| Income | |
| Dividends1 | 23,097 |
| Interest2 | 9,399 |
| Securities Lending—Net | 30 |
| Total Income | 32,526 |
| Expenses | |
| Investment Advisory Fees—Note B | |
| Basic Fee | 2,317 |
| Performance Adjustment | (414) |
| The Vanguard Group—Note C | |
| Management and Administrative—Investor Shares | 579 |
| Management and Administrative—Admiral Shares | 2,149 |
| Marketing and Distribution—Investor Shares | 18 |
| Marketing and Distribution—Admiral Shares | 52 |
| Custodian Fees | 45 |
| Auditing Fees | 36 |
| Shareholders’ Reports—Investor Shares | 8 |
| Shareholders’ Reports—Admiral Shares | 13 |
| Trustees’ Fees and Expenses | 1 |
| Total Expenses | 4,804 |
| Net Investment Income | 27,722 |
| Realized Net Gain (Loss) | |
| Investment Securities Sold2 | 35,255 |
| Futures Contracts | 142 |
| Forward Currency Contracts | 1,870 |
| Foreign Currencies | 578 |
| Realized Net Gain (Loss) | 37,845 |
| Change in Unrealized Appreciation (Depreciation) | |
| Investment Securities2 | 201,624 |
| Futures Contracts | (94) |
| Forward Currency Contracts | 779 |
| Foreign Currencies | (387) |
| Change in Unrealized Appreciation (Depreciation) | 201,922 |
| Net Increase (Decrease) in Net Assets Resulting from Operations | 267,489 |
| 1 | Dividends are net of foreign withholding taxes of $1,316,000. |
| 2 | Interest income, realized net gain (loss), and change in unrealized appreciation (depreciation) from an affiliated company of the fund were $53,000, less than $1,000, and $1,000, respectively. Purchases and sales are for temporary cash investment purposes. |
| Year Ended August 31, | ||
| 2021 ($000) | 2020 ($000) | |
| Increase (Decrease) in Net Assets | ||
| Operations | ||
| Net Investment Income | 27,722 | 24,282 |
| Realized Net Gain (Loss) | 37,845 | (7,459) |
| Change in Unrealized Appreciation (Depreciation) | 201,922 | 57,999 |
| Net Increase (Decrease) in Net Assets Resulting from Operations | 267,489 | 74,822 |
| Distributions | ||
| Investor Shares | (3,249) | (3,574) |
| Admiral Shares | (22,988) | (19,722) |
| Total Distributions | (26,237) | (23,296) |
| Capital Share Transactions | ||
| Investor Shares | 34,322 | (728) |
| Admiral Shares | 238,122 | 257,012 |
| Net Increase (Decrease) from Capital Share Transactions | 272,444 | 256,284 |
| Total Increase (Decrease) | 513,696 | 307,810 |
| Net Assets | ||
| Beginning of Period | 1,310,597 | 1,002,787 |
| End of Period | 1,824,293 | 1,310,597 |
| Investor Shares | ||||
| For a Share Outstanding Throughout Each Period | Oct. 18, 20171 to August 31, 2018 | Year Ended August 31, | ||
| 2021 | 2020 | 2019 | ||
| Net Asset Value, Beginning of Period | $22.29 | $21.41 | $20.51 | $20.00 |
| Investment Operations | ||||
| Net Investment Income2 | .410 | .430 | .443 | .392 |
| Net Realized and Unrealized Gain (Loss) on Investments | 3.871 | .874 | .920 | .379 |
| Total from Investment Operations | 4.281 | 1.304 | 1.363 | .771 |
| Distributions | ||||
| Dividends from Net Investment Income | (.391) | (.389) | (.426) | (.261) |
| Distributions from Realized Capital Gains | — | (.035) | (.037) | — |
| Total Distributions | (.391) | (.424) | (.463) | (.261) |
| Net Asset Value, End of Period | $26.18 | $22.29 | $21.41 | $20.51 |
| Total Return3 | 19.36% | 6.22% | 6.80% | 3.88% |
| Ratios/Supplemental Data | ||||
| Net Assets, End of Period (Millions) | $247 | $181 | $176 | $172 |
| Ratio of Total Expenses to Average Net Assets4 | 0.42% | 0.44% | 0.46% | 0.46%5,6 |
| Ratio of Net Investment Income to Average Net Assets | 1.68% | 2.01% | 2.19% | 2.32%5 |
| Portfolio Turnover Rate | 68%7 | 58%7 | 54% | 44% |
| 1 | Subscription period for the fund was October 18, 2017, to November 1, 2017, during which time all assets were held in cash. Performance measurement began November 2, 2017, the first business day after the subscription period, at a net asset value of $20.00. |
| 2 | Calculated based on average shares outstanding. |
| 3 | Total returns do not include account service fees that may have applied in the periods shown. Fund prospectuses provide information about any applicable account service fees. |
| 4 | Includes performance-based investment advisory fee increases (decreases) of (0.03%), (0.01%), and 0.01%. Performance-based investment advisory fees did not apply before fiscal year 2019. |
| 5 | Annualized. |
| 6 | The ratio of expenses to average net assets for the period net of reduction from custody fee offset arrangements was 0.45%. |
| 7 | Includes 20% and 10%, respectively, attributable to mortgage-dollar-roll activity. |
| Admiral Shares | ||||
| For a Share Outstanding Throughout Each Period | Oct.18, 20171 to August 31, 2018 | Year Ended August 31, | ||
| 2021 | 2020 | 2019 | ||
| Net Asset Value, Beginning of Period | $27.87 | $26.76 | $25.65 | $25.00 |
| Investment Operations | ||||
| Net Investment Income2 | .554 | .564 | .583 | .511 |
| Net Realized and Unrealized Gain (Loss) on Investments | 4.842 | 1.104 | 1.132 | .480 |
| Total from Investment Operations | 5.396 | 1.668 | 1.715 | .991 |
| Distributions | ||||
| Dividends from Net Investment Income | (.526) | (.514) | (.559) | (.341) |
| Distributions from Realized Capital Gains | — | (.044) | (.046) | — |
| Total Distributions | (.526) | (.558) | (.605) | (.341) |
| Net Asset Value, End of Period | $32.74 | $27.87 | $26.76 | $25.65 |
| Total Return3 | 19.53% | 6.38% | 6.85% | 3.99% |
| Ratios/Supplemental Data | ||||
| Net Assets, End of Period (Millions) | $1,577 | $1,129 | $826 | $715 |
| Ratio of Total Expenses to Average Net Assets4 | 0.29% | 0.34% | 0.36% | 0.36%5,6 |
| Ratio of Net Investment Income to Average Net Assets | 1.81% | 2.11% | 2.29% | 2.42%5 |
| Portfolio Turnover Rate | 68%7 | 58%7 | 54% | 44% |
| 1 | Subscription period for the fund was October 18, 2017, to November 1, 2017, during which time all assets were held in cash. Performance measurement began November 2, 2017, the first business day after the subscription period, at a net asset value of $25.00. |
| 2 | Calculated based on average shares outstanding. |
| 3 | Total returns do not include account service fees that may have applied in the periods shown. Fund prospectuses provide information about any applicable account service fees. |
| 4 | Includes performance-based investment advisory fee increases (decreases) of (0.03%), (0.01%), and 0.01%. Performance-based investment advisory fees did not apply before fiscal year 2019. |
| 5 | Annualized. |
| 6 | The ratio of expenses to average net assets for the period net of reduction from custody fee offset arrangements was 0.35%. |
| 7 | Includes 20% and 10%, respectively, attributable to mortgage-dollar-roll activity. |
| Level 1 ($000) | Level 2 ($000) | Level 3 ($000) | Total ($000) | |
| Investments | ||||
| Assets | ||||
| Common Stocks—North and South America | 714,168 | — | — | 714,168 |
| Common Stocks—Other | 53,262 | 419,941 | — | 473,203 |
| U.S. Government and Agency Obligations | — | 92,104 | — | 92,104 |
| Asset-Backed/Commercial Mortgage-Backed Securities | — | 19,602 | 2,850 | 22,452 |
| Corporate Bonds | — | 368,760 | — | 368,760 |
| Sovereign Bonds | — | 82,090 | — | 82,090 |
| Taxable Municipal Bonds | — | 11,537 | — | 11,537 |
| Temporary Cash Investments | 73,299 | — | — | 73,299 |
| Total | 840,729 | 994,034 | 2,850 | 1,837,613 |
| Derivative Financial Instruments | ||||
| Assets | ||||
| Futures Contracts1 | 284 | — | — | 284 |
| Forward Currency Contracts | — | 102 | — | 102 |
| Total | 284 | 102 | — | 386 |
| Liabilities | ||||
| Futures Contracts1 | 210 | — | — | 210 |
| Forward Currency Contracts | — | 841 | — | 841 |
| Total | 210 | 841 | — | 1,051 |
| 1 | Includes cumulative appreciation (depreciation) on futures contracts and centrally cleared swaps, if any, as reported in the Schedule of Investments. Only current day’s variation margin is reported within the Statement of Assets and Liabilities. |
| Statement of Assets and Liabilities | Interest Rate Contracts ($000) | Foreign Exchange Contracts ($000) | Total ($000) |
| Unrealized Appreciation—Futures Contracts1 | 284 | — | 284 |
| Unrealized Appreciation—Forward Currency Contracts | — | 102 | 102 |
| Total Assets | 284 | 102 | 386 |
| Unrealized Depreciation—Futures Contracts1 | 210 | — | 210 |
| Unrealized Depreciation—Forward Currency Contracts | — | 841 | 841 |
| Total Liabilities | 210 | 841 | 1,051 |
| 1 | Includes cumulative appreciation (depreciation) on futures contracts and centrally cleared swaps, if any, as reported in the Schedule of Investments. Only current day’s variation margin is reported within the Statement of Assets and Liabilities. |
| Realized Net Gain (Loss) on Derivatives | Interest Rate Contracts ($000) | Foreign Exchange Contracts ($000) | Total ($000) |
| Futures Contracts | 142 | — | 142 |
| Forward Currency Contracts | — | 1,870 | 1,870 |
| Realized Net Gain (Loss) on Derivatives | 142 | 1,870 | 2,012 |
| Change in Unrealized Appreciation (Depreciation) on Derivatives | |||
| Futures Contracts | (94) | — | (94) |
| Forward Currency Contracts | — | 779 | 779 |
| Change in Unrealized Appreciation (Depreciation) on Derivatives | (94) | 779 | 685 |
| Amount ($000) | |
| Paid-in Capital | 1,457 |
| Total Distributable Earnings (Loss) | (1,457) |
| Amount ($000) | |
| Undistributed Ordinary Income | 15,875 |
| Undistributed Long-Term Gains | 11,542 |
| Capital Loss Carryforwards | — |
| Qualified Late-Year Losses | — |
| Net Unrealized Gains (Losses) | 318,804 |
| Year Ended August 31, | ||
| 2021 Amount ($000) | 2020 Amount ($000) | |
| Ordinary Income* | 26,237 | 23,296 |
| Long-Term Capital Gains | — | — |
| Total | 26,237 | 23,296 |
| * | Includes short-term capital gains, if any. |
| Amount ($000) | |
| Tax Cost | 1,518,854 |
| Gross Unrealized Appreciation | 336,692 |
| Gross Unrealized Depreciation | (17,933) |
| Net Unrealized Appreciation (Depreciation) | 318,759 |
| Year Ended August 31, | |||||
| 2021 | 2020 | ||||
| Amount ($000) | Shares (000) | Amount ($000) | Shares (000) | ||
| Investor Shares | |||||
| Issued | 101,873 | 4,118 | 69,272 | 3,217 | |
| Issued in Lieu of Cash Distributions | 2,906 | 120 | 3,177 | 151 | |
| Redeemed | (70,457) | (2,920) | (73,177) | (3,475) | |
| Net Increase (Decrease)—Investor Shares | 34,322 | 1,318 | (728) | (107) | |
| Admiral Shares | |||||
| Issued | 498,135 | 16,206 | 572,797 | 21,800 | |
| Issued in Lieu of Cash Distributions | 20,433 | 673 | 17,237 | 659 | |
| Redeemed | (280,446) | (9,226) | (333,022) | (12,820) | |
| Net Increase (Decrease)—Admiral Shares | 238,122 | 7,653 | 257,012 | 9,639 | |
Philadelphia, Pennsylvania
October 20, 2021


| 1 | |
| 2 | |
| 7 | |
| 9 | |
| 12 | |
| 45 |
| • | For the 12 months ended August 31, 2021, Vanguard Global Wellesley Income Fund returned 10.83% for Investor Shares and 10.96% for Admiral Shares. Its composite benchmark index returned 11.45%. |
| • | The global economy rebounded faster than many had expected after the sharp pandemic-induced contraction in the spring of 2020. Countries that have been more successful in containing the virus have generally fared better economically. |
| • | Swift and extensive fiscal and monetary support from policymakers has also been key to the rebound. As the 12-month period reflects the recovery in stocks that followed the sharp contraction, results were excellent. Bond returns were dampened by rising bond yields across much of the developed world, and notably in the United States. |
| • | The fund’s stock portfolio underperformed its benchmark. Relative performance was hampered most by stock selection in financials, consumer discretionary, and energy. By region, North America and the Pacific were the biggest relative detractors. The fixed income portfolio outperformed its benchmark, thanks in part to selection among industrial companies, particularly consumer noncyclical and consumer cyclical. Selection among financial securities detracted. |
| • | The fund regularly uses derivatives to hedge portfolio risks. Its holdings of forward currency contracts had a positive impact on performance over the period. |
| Average Annual Total Returns Periods Ended August 31, 2021 | |||
| One Year | Three Years | Five Years | |
| Stocks | |||
| Russell 1000 Index (Large-caps) | 32.25% | 18.42% | 18.24% |
| Russell 2000 Index (Small-caps) | 47.08 | 10.75 | 14.38 |
| Russell 3000 Index (Broad U.S. market) | 33.04 | 17.85 | 17.97 |
| FTSE All-World ex US Index (International) | 25.74 | 9.82 | 10.23 |
| Bonds | |||
| Bloomberg U.S. Aggregate Bond Index (Broad taxable market) | -0.08% | 5.43% | 3.11% |
| Bloomberg Municipal Bond Index (Broad tax-exempt market) | 3.40 | 5.09 | 3.30 |
| FTSE Three-Month U.S. Treasury Bill Index | 0.06 | 1.20 | 1.13 |
| CPI | |||
| Consumer Price Index | 5.25% | 2.76% | 2.58% |
| • | Based on actual fund return. This section helps you to estimate the actual expenses that you paid over the period. The ”Ending Account Value“ shown is derived from the fund’s actual return, and the third column shows the dollar amount that would have been paid by an investor who started with $1,000 in the fund. You may use the information here, together with the amount you invested, to estimate the expenses that you paid over the period. |
| • | Based on hypothetical 5% yearly return. This section is intended to help you compare your fund‘s costs with those of other mutual funds. It assumes that the fund had a yearly return of 5% before expenses, but that the expense ratio is unchanged. In this case—because the return used is not the fund’s actual return—the results do not apply to your investment. The example is useful in making comparisons because the Securities and Exchange Commission requires all mutual funds to calculate expenses based on a 5% return. You can assess your fund’s costs by comparing this hypothetical example with the hypothetical examples that appear in shareholder reports of other funds. |
| Six Months Ended August 31, 2021 | |||
| Beginning Account Value 2/28/2021 | Ending Account Value 8/31/2021 | Expenses Paid During Period | |
| Based on Actual Fund Return | |||
| Global Wellesley Income Fund | |||
| Investor Shares | $1,000.00 | $1,062.10 | $2.08 |
| AdmiralTM Shares | 1,000.00 | 1,063.10 | 1.30 |
| Based on Hypothetical 5% Yearly Return | |||
| Global Wellesley Income Fund | |||
| Investor Shares | $1,000.00 | $1,023.19 | $2.04 |
| Admiral Shares | 1,000.00 | 1,023.94 | 1.28 |
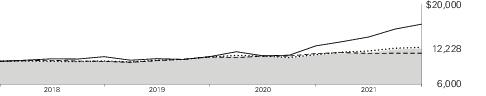
| Average Annual Total Returns Periods Ended August 31, 2021 | ||||
| One Year | Since Inception (11/2/2017) | Final Value of a $10,000 Investment | ||

| Global Wellesley Income Fund Investor Shares | 10.83% | 5.40% | $12,228 |

| Global Wellesley Income Composite Index | 11.45 | 5.86 | 12,437 |

| Bloomberg Global Aggregate Bond Index | 0.52 | 3.51 | 11,412 |

| FTSE Developed Net Tax Index | 30.06 | 14.03 | 16,526 |
| Average Annual Total Returns Periods Ended August 31, 2021 | ||||
| One Year | Since Inception (11/2/2017) | Final Value of a $50,000 Investment | ||
| Global Wellesley Income Fund Admiral Shares | 10.96% | 5.51% | $61,387 | |
| Global Wellesley Income Composite Index | 11.45 | 5.86 | 62,185 | |
| Bloomberg Global Aggregate Bond Index | 0.52 | 3.51 | 57,060 | |
| FTSE Developed Net Tax Index | 30.06 | 14.03 | 82,630 | |
| United States | 49.7% |
| United Kingdom | 8.6 |
| France | 7.1 |
| Japan | 4.9 |
| Canada | 4.9 |
| Switzerland | 3.4 |
| Germany | 2.7 |
| Supranational | 1.5 |
| Norway | 1.4 |
| Australia | 1.4 |
| Ireland | 1.4 |
| Netherlands | 1.4 |
| Cayman Islands | 1.3 |
| Taiwan | 1.2 |
| United Arab Emirates | 1.0 |
| Other | 8.1 |
| Shares | Market Value• ($000) | |||||
| Common Stocks (37.3%) | ||||||
| Australia (0.3%) | ||||||
| Rio Tinto plc | 26,996 | 1,997 | ||||
| Canada (3.2%) | ||||||
| Bank of Nova Scotia | 91,574 | 5,672 | ||||
| Royal Bank of Canada | 44,432 | 4,564 | ||||
| TC Energy Corp. | 93,028 | 4,417 | ||||
| Enbridge Inc. | 95,041 | 3,740 | ||||
| 18,393 | ||||||
| China (0.7%) | ||||||
| ENN Energy Holdings Ltd. | 192,800 | 3,815 | ||||
| France (4.0%) | ||||||
| AXA SA | 227,834 | 6,401 | ||||
| TotalEnergies SE | 104,182 | 4,608 | ||||
| Bureau Veritas SA | 126,533 | 4,205 | ||||
| Vinci SA | 37,157 | 3,987 | ||||
| Nexity SA | 71,525 | 3,694 | ||||
| 22,895 | ||||||
| Germany (0.6%) | ||||||
| Volkswagen AG Preference Shares | 15,574 | 3,704 | ||||
| Greece (0.7%) | ||||||
| Hellenic Telecommunications Organization SA | 193,824 | 3,815 | ||||
| Hong Kong (0.8%) | ||||||
| AIA Group Ltd. | 201,200 | 2,403 | ||||
| * | Sands China Ltd. | 731,600 | 2,350 | |||
| 4,753 | ||||||
| Japan (2.4%) | ||||||
| Tokio Marine Holdings Inc. | 94,500 | 4,624 | ||||
| Mitsubishi UFJ Financial Group Inc. | 637,500 | 3,459 | ||||
| KDDI Corp. | 106,000 | 3,240 | ||||
| Isuzu Motors Ltd. | 189,900 | 2,400 | ||||
| 13,723 | ||||||
| Netherlands (0.6%) | ||||||
| Koninklijke KPN NV | 1,161,807 | 3,722 | ||||
| Norway (0.7%) | ||||||
| DNB Bank ASA | 205,438 | 4,336 | ||||
| Shares | Market Value• ($000) | |||||
| Spain (0.5%) | ||||||
| Industria de Diseno Textil SA | 90,518 | 3,092 | ||||
| Switzerland (2.3%) | ||||||
| Novartis AG (Registered) | 58,765 | 5,435 | ||||
| UBS Group AG (Registered) | 259,857 | 4,335 | ||||
| Nestle SA (Registered) | 26,020 | 3,286 | ||||
| 13,056 | ||||||
| Taiwan (1.1%) | ||||||
| Taiwan Semiconductor Manufacturing Co. Ltd. | 296,000 | 6,493 | ||||
| United Kingdom (3.1%) | ||||||
| AstraZeneca plc | 52,888 | 6,185 | ||||
| BAE Systems plc | 573,388 | 4,480 | ||||
| National Grid plc | 346,200 | 4,478 | ||||
| Standard Chartered plc | 463,772 | 2,892 | ||||
| 18,035 | ||||||
| United States (16.3%) | ||||||
| Pfizer Inc. | 150,022 | 6,912 | ||||
| Philip Morris International Inc. | 63,374 | 6,528 | ||||
| Bank of America Corp. | 151,021 | 6,305 | ||||
| Cisco Systems Inc. | 100,077 | 5,907 | ||||
| Comcast Corp. Class A | 88,431 | 5,366 | ||||
| Anthem Inc. | 13,962 | 5,238 | ||||
| Microsoft Corp. | 16,352 | 4,936 | ||||
| Progressive Corp. | 48,706 | 4,692 | ||||
| Verizon Communications Inc. | 79,273 | 4,360 | ||||
| Duke Energy Corp. | 40,154 | 4,203 | ||||
| Lockheed Martin Corp. | 10,635 | 3,826 | ||||
| Exelon Corp. | 72,991 | 3,578 | ||||
| Texas Instruments Inc. | 18,702 | 3,570 | ||||
| Medtronic plc | 26,277 | 3,507 | ||||
| TJX Cos. Inc. | 47,387 | 3,446 | ||||
| Boston Properties Inc. | 28,054 | 3,170 | ||||
| Chubb Ltd. | 15,029 | 2,764 | ||||
| Kellogg Co. | 43,381 | 2,739 | ||||
| Edison International | 46,288 | 2,677 | ||||
| Home Depot Inc. | 8,120 | 2,649 | ||||
| Medical Properties Trust Inc. | 129,179 | 2,646 | ||||
| FMC Corp. | 27,292 | 2,555 | ||||
| Merck & Co. Inc. | 33,458 | 2,552 | ||||
| 94,126 | ||||||
| Total Common Stocks (Cost $174,673) | 215,955 | |||||
| Coupon | Maturity Date | Face Amount ($000) | ||||
| U.S. Government and Agency Obligations (7.6%) | ||||||
| 1,2 | Fannie Mae Pool | 3.070% | 2/1/25 | 125 | 134 | |
| 1,2 | Fannie Mae REMICS | 2.000% | 9/25/40 | 87 | 89 | |
| 1,2 | Fannie Mae REMICS | 2.500% | 5/25/45–3/25/53 | 685 | 709 | |
| 1,2 | Fannie Mae REMICS | 3.000% | 2/25/49 | 112 | 117 | |
| 1,2 | Fannie Mae REMICS | 3.500% | 6/25/44–2/25/48 | 621 | 656 | |
| 1,2 | Freddie Mac REMICS | 1.750% | 9/15/42 | 924 | 941 | |
| Coupon | Maturity Date | Face Amount ($000) | Market Value• ($000) | |||
| 1,2 | Freddie Mac REMICS | 3.500% | 9/15/40–11/15/40 | 84 | 85 | |
| 1,2 | Freddie Mac REMICS | 4.000% | 12/15/39–8/15/40 | 857 | 931 | |
| 1,3 | Ginnie Mae II Pool | 2.000% | 9/15/51–10/15/51 | 1,175 | 1,198 | |
| 1,3 | Ginnie Mae II Pool | 2.500% | 9/15/51–10/15/51 | 1,225 | 1,269 | |
| 1 | Ginnie Mae REMICS | 2.750% | 9/20/44 | 140 | 144 | |
| 1,2,3 | UMBS Pool | 1.500% | 9/25/36–10/25/36 | 1,000 | 1,015 | |
| 1,2,3 | UMBS Pool | 2.000% | 9/25/36–10/25/51 | 2,600 | 2,640 | |
| 1,2,3 | UMBS Pool | 2.500% | 9/25/36–10/25/51 | 7,150 | 7,419 | |
| 1,2,3 | UMBS Pool | 3.000% | 9/25/51–10/25/51 | 4,100 | 4,287 | |
| United States Treasury Note/Bond | 0.125% | 7/31/23 | 500 | 499 | ||
| United States Treasury Note/Bond | 0.250% | 5/15/24 | 4,475 | 4,462 | ||
| 4 | United States Treasury Note/Bond | 0.375% | 4/15/24–8/15/24 | 3,045 | 3,048 | |
| United States Treasury Note/Bond | 0.625% | 7/31/26 | 740 | 735 | ||
| United States Treasury Note/Bond | 0.750% | 4/30/26 | 1,345 | 1,346 | ||
| United States Treasury Note/Bond | 0.875% | 6/30/26 | 845 | 850 | ||
| United States Treasury Note/Bond | 1.250% | 4/30/28 | 160 | 162 | ||
| United States Treasury Note/Bond | 1.375% | 8/15/50 | 585 | 512 | ||
| United States Treasury Note/Bond | 1.625% | 5/15/31–11/15/50 | 830 | 799 | ||
| United States Treasury Note/Bond | 1.875% | 2/15/41–2/15/51 | 1,420 | 1,418 | ||
| United States Treasury Note/Bond | 2.000% | 8/15/51 | 875 | 891 | ||
| United States Treasury Note/Bond | 2.250% | 5/15/41 | 4,810 | 5,147 | ||
| United States Treasury Note/Bond | 2.375% | 5/15/51 | 2,035 | 2,248 | ||
| Total U.S. Government and Agency Obligations (Cost $43,234) | 43,751 | |||||
| Asset-Backed/Commercial Mortgage-Backed Securities (2.4%) | ||||||
| Bermuda (0.0%) | ||||||
| 1,5 | START Ireland Series 2019-1 | 4.089% | 3/15/44 | 151 | 152 | |
| Canada (0.1%) | ||||||
| 1,5 | Chesapeake Funding II LLC Series 2018-2A | 3.230% | 8/15/30 | 213 | 214 | |
| 1,5,6 | Ford Auto Securitization Trust Series 2019-AA | 2.354% | 6/15/23 | 382 | 305 | |
| 519 | ||||||
| Cayman Islands (1.3%) | ||||||
| 1,3,5,7,8 | BlueMountain CLO XXXII Ltd. Series 2021-32A, 3M USD LIBOR + 1.170% | 1.290% | 10/15/34 | 470 | 470 | |
| 1,5,8 | Columbia Cent CLO 31 Ltd. Series 2021-31A, 3M USD LIBOR + 1.550% | 1.684% | 4/20/34 | 340 | 338 | |
| 1,5,8 | KKR CLO 16 Ltd., 3M USD LIBOR + 1.250% | 1.384% | 1/20/29 | 327 | 327 | |
| 1,3,5,8 | KKR CLO 16 Ltd., 3M USD LIBOR + 1.210% | 1.330% | 10/20/34 | 435 | 435 | |
| 1,5,8 | Madison Park Funding XI Ltd. Series 2013-11A, 3M USD LIBOR + 1.450% | 1.588% | 7/23/29 | 300 | 300 | |
| 1,5,8 | Madison Park Funding XVIII Ltd. Series 2015-18A, 3M USD LIBOR + 1.190% | 1.324% | 10/21/30 | 875 | 875 | |
| 1,5,8 | Madison Park Funding XXX Ltd. Series 2018-30A, 3M USD LIBOR + 0.750% | 0.876% | 4/15/29 | 1,566 | 1,564 | |
| 1,5,8 | Magnetite VII Ltd. Series 2012-7A, 3M USD LIBOR + 0.800% | 0.926% | 1/15/28 | 1,492 | 1,491 | |
| 1,5,8 | Rockland Park CLO Ltd. Series 2021-1A, 3M USD LIBOR + 1.120% | 1.251% | 4/20/34 | 475 | 475 | |
| 1,5,8 | Rockland Park CLO Ltd. Series 2021-1A, 3M USD LIBOR + 1.650% | 1.781% | 4/20/34 | 475 | 475 | |
| 1,3,5,7,8 | RR 18 Ltd. Series 2021-18A, 3M USD LIBOR + 1.600% | 1.720% | 10/15/34 | 350 | 350 | |
| 1,3,5,8 | Sound Point CLO XXXI Ltd. Series 2021-3A, 3M USD LIBOR + 1.650% | 1.770% | 10/25/34 | 250 | 250 | |
| 7,350 | ||||||
| Coupon | Maturity Date | Face Amount ($000) | Market Value• ($000) | |||
| United States (1.0%) | ||||||
| 1,5 | Aligned Data Centers Issuer LLC Series 2021-1A | 1.937% | 8/15/46 | 740 | 743 | |
| 1,5 | Angel Oak Mortgage Trust I LLC Series 2018-3 | 3.649% | 9/25/48 | 121 | 122 | |
| 1,5 | Castlelake Aircraft Structured Trust Series 2019-1A | 3.967% | 4/15/39 | 190 | 190 | |
| 1,5 | CF Hippolyta LLC Series 2020-1 | 1.690% | 7/15/60 | 529 | 540 | |
| 1,5 | DB Master Finance LLC Series 2019-1A | 3.787% | 5/20/49 | 127 | 128 | |
| 1,5 | DB Master Finance LLC Series 2019-1A | 4.021% | 5/20/49 | 113 | 118 | |
| 1,5 | Domino's Pizza Master Issuer LLC Series 2021-1A | 2.662% | 4/25/51 | 314 | 327 | |
| 1,5 | Domino's Pizza Master Issuer LLC Series 2021-1A | 3.151% | 4/25/51 | 439 | 468 | |
| 1 | Ford Credit Auto Lease Trust Series 2021-A | 0.780% | 9/15/25 | 180 | 180 | |
| 1,2,5 | Freddie Mac STACR REMIC Trust Series 2021-DNA1 | 0.700% | 1/25/51 | 230 | 230 | |
| 1,2,8 | Freddie Mac Structured Agency Credit Risk Debt Notes, 1M USD LIBOR + 5.000% | 5.084% | 12/25/28 | 233 | 243 | |
| 1,2,8 | Freddie Mac Structured Agency Credit Risk Debt Notes, 1M USD LIBOR + 2.500% | 2.584% | 3/25/30 | 615 | 629 | |
| 1,5 | GreatAmerica Leasing Receivables Funding LLC Series 2018-1 | 2.830% | 6/17/24 | 59 | 59 | |
| 1 | Seasoned Credit Risk Transfer Trust Series 2019-3 | 3.500% | 10/25/58 | 247 | 266 | |
| 1,5 | SoFi Consumer Loan Program Trust Series 2019-3 | 2.900% | 5/25/28 | 69 | 69 | |
| 1,5 | Taco Bell Funding LLC Series 2021-1A | 1.946% | 8/25/51 | 345 | 346 | |
| 1,5 | Taco Bell Funding LLC Series 2021-1A | 2.294% | 8/25/51 | 315 | 317 | |
| 1,5 | Towd Point Mortgage Trust Series 2018-1 | 3.000% | 1/25/58 | 153 | 155 | |
| 1,5 | Vantage Data Centers Issuer LLC Series 2019-1A | 3.188% | 7/15/44 | 137 | 142 | |
| 1,5 | Vantage Data Centers LLC Series 2020-1A | 1.645% | 9/15/45 | 540 | 539 | |
| 5,811 | ||||||
| Total Asset-Backed/Commercial Mortgage-Backed Securities (Cost $13,725) | 13,832 | |||||
| Corporate Bonds (39.1%) | ||||||
| Australia (0.7%) | ||||||
| 5 | Commonwealth Bank of Australia | 2.688% | 3/11/31 | 1,140 | 1,151 | |
| 5 | National Australia Bank Ltd. | 2.332% | 8/21/30 | 1,065 | 1,042 | |
| 5 | National Australia Bank Ltd. | 2.990% | 5/21/31 | 430 | 442 | |
| 5 | National Australia Bank Ltd. | 3.933% | 8/2/34 | 850 | 927 | |
| 5 | Scentre Group Trust 1 | 3.625% | 1/28/26 | 549 | 600 | |
| 4,162 | ||||||
| Austria (0.1%) | ||||||
| 5 | JAB Holdings BV | 2.200% | 11/23/30 | 260 | 257 | |
| 5 | JAB Holdings BV | 3.750% | 5/28/51 | 500 | 553 | |
| 810 | ||||||
| Belgium (0.3%) | ||||||
| 1 | Anheuser-Busch Cos. LLC | 4.900% | 2/1/46 | 700 | 894 | |
| 1,9 | Anheuser-Busch InBev SA/NV | 2.000% | 3/17/28 | 167 | 221 | |
| Anheuser-Busch InBev Worldwide Inc. | 4.375% | 4/15/38 | 480 | 574 | ||
| 1,689 | ||||||
| Canada (0.7%) | ||||||
| 6 | Bank of Montreal | 2.850% | 3/6/24 | 1,890 | 1,564 | |
| 1,6 | Bell Telephone Co. of Canada or Bell Canada | 3.350% | 3/22/23 | 950 | 777 | |
| Coupon | Maturity Date | Face Amount ($000) | Market Value• ($000) | |||
| Fortis Inc. | 3.055% | 10/4/26 | 625 | 674 | ||
| Nutrien Ltd. | 4.125% | 3/15/35 | 750 | 867 | ||
| 3,882 | ||||||
| Denmark (0.8%) | ||||||
| 1,9 | Danfoss Finance I BV | 0.375% | 10/28/28 | 775 | 918 | |
| 9 | Danske Bank A/S | 0.500% | 8/27/25 | 1,650 | 1,972 | |
| 5 | Danske Bank A/S | 1.621% | 9/11/26 | 875 | 880 | |
| 1,10 | Danske Bank A/S | 2.250% | 1/14/28 | 560 | 793 | |
| 4,563 | ||||||
| France (2.9%) | ||||||
| 1,9 | Airbus SE | 2.375% | 4/7/32 | 475 | 656 | |
| 1,9 | Airbus SE | 2.375% | 6/9/40 | 300 | 418 | |
| 1,9 | AXA SA | 5.125% | 7/4/43 | 750 | 967 | |
| 5 | BNP Paribas SA | 2.819% | 11/19/25 | 360 | 378 | |
| 5 | BNP Paribas SA | 2.219% | 6/9/26 | 770 | 793 | |
| 1,9 | BNP Paribas SA | 0.125% | 9/4/26 | 400 | 472 | |
| 9 | BNP Paribas SA | 0.500% | 9/1/28 | 900 | 1,070 | |
| 1,9 | BPCE SA | 1.125% | 1/18/23 | 900 | 1,083 | |
| 1,9 | BPCE SA | 0.500% | 9/15/27 | 1,600 | 1,906 | |
| 5 | BPCE SA | 3.250% | 1/11/28 | 500 | 546 | |
| 9 | Cie de Saint-Gobain | 2.375% | 10/4/27 | 700 | 944 | |
| 1,9 | Credit Mutuel Arkea SA | 1.625% | 4/15/26 | 1,100 | 1,383 | |
| 5 | Danone SA | 2.947% | 11/2/26 | 285 | 307 | |
| 1,9 | Engie SA | 0.000% | 3/4/27 | 1,000 | 1,180 | |
| 1,9 | Orange SA | 1.000% | 5/12/25 | 1,200 | 1,475 | |
| 1,9 | RCI Banque SA | 0.750% | 9/26/22 | 625 | 744 | |
| 1,9 | RCI Banque SA | 1.375% | 3/8/24 | 575 | 701 | |
| 1,9 | RCI Banque SA | 1.625% | 4/11/25 | 1,375 | 1,700 | |
| 16,723 | ||||||
| Germany (2.0%) | ||||||
| 5 | Bayer US Finance II LLC | 4.250% | 12/15/25 | 660 | 734 | |
| 5 | Bayer US Finance LLC | 3.375% | 10/8/24 | 765 | 818 | |
| 1,10 | E.ON International Finance BV | 4.750% | 1/31/34 | 100 | 178 | |
| 1,10 | E.ON International Finance BV | 5.875% | 10/30/37 | 200 | 410 | |
| 1,9 | Vantage Towers AG | 0.375% | 3/31/27 | 200 | 238 | |
| 1,9 | Vantage Towers AG | 0.750% | 3/31/30 | 1,100 | 1,318 | |
| 1,10 | Volkswagen Financial Services NV | 0.875% | 2/20/25 | 400 | 548 | |
| 5 | Volkswagen Group of America Finance LLC | 3.350% | 5/13/25 | 200 | 215 | |
| 1,9 | Volkswagen International Finance NV | 1.500% | 1/21/41 | 200 | 237 | |
| 1,9 | Volkswagen Leasing GmbH | 2.625% | 1/15/24 | 525 | 660 | |
| 1,9 | Volkswagen Leasing GmbH | 1.375% | 1/20/25 | 1,825 | 2,251 | |
| 1,9 | Volkswagen Leasing GmbH | 0.625% | 7/19/29 | 825 | 979 | |
| 1,9 | Vonovia Finance BV | 1.000% | 7/9/30 | 100 | 123 | |
| 1,9 | Vonovia Finance BV | 1.625% | 10/7/39 | 400 | 491 | |
| 9 | Wintershall Dea Finance BV | 0.840% | 9/25/25 | 900 | 1,086 | |
| 9 | Wintershall Dea Finance BV | 1.823% | 9/25/31 | 900 | 1,126 | |
| 11,412 | ||||||
| Ireland (1.3%) | ||||||
| AerCap Ireland Capital DAC | 4.625% | 10/15/27 | 880 | 981 | ||
| AerCap Ireland Capital DAC | 3.875% | 1/23/28 | 1,515 | 1,624 | ||
| 5 | Avolon Holdings Funding Ltd. | 2.125% | 2/21/26 | 260 | 259 | |
| 9 | CRH Finance DAC | 3.125% | 4/3/23 | 1,177 | 1,464 | |
| Coupon | Maturity Date | Face Amount ($000) | Market Value• ($000) | |||
| 1,9 | CRH SMW Finance DAC | 1.250% | 11/5/26 | 800 | 1,004 | |
| 5 | Park Aerospace Holdings Ltd. | 5.500% | 2/15/24 | 2,072 | 2,273 | |
| 7,605 | ||||||
| Italy (0.8%) | ||||||
| 5 | Enel Finance International NV | 3.625% | 5/25/27 | 1,870 | 2,079 | |
| 1,9 | Enel Finance International NV | 0.500% | 6/17/30 | 800 | 954 | |
| 5 | UniCredit SpA | 1.982% | 6/3/27 | 900 | 902 | |
| 5 | UniCredit SpA | 3.127% | 6/3/32 | 645 | 658 | |
| 4,593 | ||||||
| Japan (0.1%) | ||||||
| 5 | NTT Finance Corp. | 1.162% | 4/3/26 | 700 | 700 | |
| Takeda Pharmaceutical Co. Ltd. | 3.025% | 7/9/40 | 200 | 205 | ||
| 905 | ||||||
| Netherlands (0.7%) | ||||||
| 5 | Cooperatieve Rabobank UA | 1.106% | 2/24/27 | 530 | 526 | |
| 1,10 | Cooperatieve Rabobank UA | 4.625% | 5/23/29 | 100 | 164 | |
| 9 | Euronext NV | 1.125% | 6/12/29 | 675 | 845 | |
| 9 | ING Groep NV | 0.250% | 2/18/29 | 1,700 | 1,984 | |
| Shell International Finance BV | 4.000% | 5/10/46 | 275 | 328 | ||
| 3,847 | ||||||
| Norway (0.4%) | ||||||
| 1,9 | Aker BP ASA | 1.125% | 5/12/29 | 1,090 | 1,324 | |
| 5 | Aker BP ASA | 4.000% | 1/15/31 | 725 | 799 | |
| 2,123 | ||||||
| South Korea (0.0%) | ||||||
| 5 | SK Telecom Co. Ltd. | 3.750% | 4/16/23 | 200 | 210 | |
| Spain (0.2%) | ||||||
| Telefonica Emisiones SA | 4.665% | 3/6/38 | 845 | 1,003 | ||
| Switzerland (1.0%) | ||||||
| 5 | Alcon Finance Corp. | 3.000% | 9/23/29 | 1,005 | 1,071 | |
| 1,9 | Credit Suisse Group AG | 1.250% | 7/17/25 | 600 | 730 | |
| 5 | Credit Suisse Group AG | 3.091% | 5/14/32 | 2,115 | 2,206 | |
| 5 | UBS Group AG | 1.494% | 8/10/27 | 875 | 874 | |
| 9 | UBS Group AG | 0.250% | 2/24/28 | 950 | 1,122 | |
| 6,003 | ||||||
| United Arab Emirates (0.7%) | ||||||
| 5 | DAE Funding LLC | 1.550% | 8/1/24 | 1,125 | 1,123 | |
| 5 | Galaxy Pipeline Assets Bidco Ltd. | 2.160% | 3/31/34 | 3,020 | 3,009 | |
| 4,132 | ||||||
| United Kingdom (4.8%) | ||||||
| 5 | Ashtead Capital Inc. | 2.450% | 8/12/31 | 1,030 | 1,024 | |
| AstraZeneca plc | 4.000% | 1/17/29 | 720 | 831 | ||
| 1,9 | Barclays plc | 1.375% | 1/24/26 | 1,000 | 1,230 | |
| 1 | Barclays plc | 4.972% | 5/16/29 | 1,415 | 1,663 | |
| Barclays plc | 2.645% | 6/24/31 | 480 | 489 | ||
| BAT Capital Corp. | 3.557% | 8/15/27 | 1,210 | 1,310 | ||
| 1,6 | BP Capital Markets plc | 3.470% | 5/15/25 | 1,325 | 1,128 | |
| 9 | BP Capital Markets plc | 1.104% | 11/15/34 | 525 | 632 | |
| 5 | CK Hutchison International 17 II Ltd. | 2.750% | 3/29/23 | 975 | 1,009 | |
| 1,10 | CPUK Finance Ltd. | 3.588% | 8/28/25 | 1,200 | 1,784 | |
| 1,9 | FCE Bank plc | 0.869% | 9/13/21 | 500 | 590 | |
| 1,10 | Heathrow Funding Ltd. | 2.750% | 10/13/29 | 700 | 1,005 | |
| Coupon | Maturity Date | Face Amount ($000) | Market Value• ($000) | |||
| 1,10 | Heathrow Funding Ltd. | 2.750% | 8/9/49 | 150 | 208 | |
| 8 | HSBC Holdings plc, 3M USD LIBOR + 1.000% | 1.124% | 5/18/24 | 255 | 258 | |
| 1,10 | HSBC Holdings plc | 2.256% | 11/13/26 | 1,725 | 2,455 | |
| HSBC Holdings plc | 1.589% | 5/24/27 | 420 | 421 | ||
| 10 | HSBC Holdings plc | 1.750% | 7/24/27 | 1,095 | 1,519 | |
| HSBC Holdings plc | 2.206% | 8/17/29 | 770 | 777 | ||
| HSBC Holdings plc | 2.804% | 5/24/32 | 210 | 217 | ||
| 5 | LSEGA Financing plc | 2.500% | 4/6/31 | 1,205 | 1,243 | |
| 1,9 | Natwest Group plc | 1.750% | 3/2/26 | 2,075 | 2,584 | |
| 10 | Natwest Group plc | 3.622% | 8/14/30 | 875 | 1,284 | |
| Prudential plc | 3.125% | 4/14/30 | 430 | 469 | ||
| 5 | Standard Chartered plc | 2.744% | 9/10/22 | 905 | 905 | |
| 5 | Standard Chartered plc | 0.991% | 1/12/25 | 530 | 529 | |
| 1,9 | Vodafone Group plc | 1.625% | 11/24/30 | 1,825 | 2,370 | |
| 27,934 | ||||||
| United States (21.6%) | ||||||
| AbbVie Inc. | 3.800% | 3/15/25 | 550 | 600 | ||
| AbbVie Inc. | 4.050% | 11/21/39 | 210 | 246 | ||
| AbbVie Inc. | 4.750% | 3/15/45 | 275 | 347 | ||
| AbbVie Inc. | 4.250% | 11/21/49 | 340 | 413 | ||
| 1 | Alabama Power Co. | 4.300% | 7/15/48 | 275 | 347 | |
| 10 | American Honda Finance Corp. | 0.750% | 11/25/26 | 1,235 | 1,673 | |
| 9 | American International Group Inc. | 1.500% | 6/8/23 | 875 | 1,059 | |
| American International Group Inc. | 4.250% | 3/15/29 | 1,255 | 1,452 | ||
| American International Group Inc. | 3.400% | 6/30/30 | 645 | 710 | ||
| American Tower Corp. | 5.000% | 2/15/24 | 200 | 220 | ||
| American Tower Corp. | 4.400% | 2/15/26 | 325 | 366 | ||
| 9 | American Tower Corp. | 0.450% | 1/15/27 | 1,860 | 2,212 | |
| Amgen Inc. | 2.770% | 9/1/53 | 290 | 278 | ||
| Anthem Inc. | 2.550% | 3/15/31 | 990 | 1,030 | ||
| 9 | AT&T Inc. | 2.050% | 5/19/32 | 300 | 397 | |
| 9 | AT&T Inc. | 3.150% | 9/4/36 | 250 | 363 | |
| 9 | AT&T Inc. | 2.600% | 5/19/38 | 275 | 376 | |
| AT&T Inc. | 3.300% | 2/1/52 | 525 | 523 | ||
| 5 | AT&T Inc. | 3.500% | 9/15/53 | 1,172 | 1,203 | |
| 5 | Athene Global Funding | 2.500% | 3/24/28 | 1,475 | 1,526 | |
| Bank of America Corp. | 1.734% | 7/22/27 | 785 | 796 | ||
| 1 | Bank of America Corp. | 3.593% | 7/21/28 | 1,550 | 1,714 | |
| 1 | Bank of America Corp. | 4.271% | 7/23/29 | 980 | 1,126 | |
| 1 | Bank of America Corp. | 2.496% | 2/13/31 | 300 | 308 | |
| Bank of America Corp. | 2.687% | 4/22/32 | 690 | 718 | ||
| Bank of America Corp. | 2.299% | 7/21/32 | 725 | 729 | ||
| Bank of America Corp. | 3.311% | 4/22/42 | 215 | 232 | ||
| 9 | Becton Dickinson Euro Finance Sarl | 0.334% | 8/13/28 | 410 | 484 | |
| Boeing Co. | 1.433% | 2/4/24 | 540 | 541 | ||
| Boeing Co. | 2.196% | 2/4/26 | 680 | 685 | ||
| Boeing Co. | 3.250% | 3/1/28 | 567 | 598 | ||
| Boeing Co. | 3.450% | 11/1/28 | 175 | 187 | ||
| 1 | Bon Secours Mercy Health Inc. | 2.095% | 6/1/31 | 275 | 276 | |
| 9 | Booking Holdings Inc. | 0.100% | 3/8/25 | 140 | 166 | |
| 9 | Booking Holdings Inc. | 0.500% | 3/8/28 | 225 | 271 | |
| 9 | BorgWarner Inc. | 1.000% | 5/19/31 | 515 | 619 | |
| 5 | Boston Gas Co. | 3.001% | 8/1/29 | 105 | 111 | |
| Boston Scientific Corp. | 4.000% | 3/1/29 | 55 | 63 | ||
| Boston Scientific Corp. | 4.550% | 3/1/39 | 550 | 678 | ||
| Coupon | Maturity Date | Face Amount ($000) | Market Value• ($000) | |||
| Brixmor Operating Partnership LP | 2.500% | 8/16/31 | 475 | 477 | ||
| Broadcom Inc. | 4.700% | 4/15/25 | 1,190 | 1,332 | ||
| 5 | Brooklyn Union Gas Co. | 4.273% | 3/15/48 | 760 | 881 | |
| 5 | Cargill Inc. | 4.760% | 11/23/45 | 275 | 370 | |
| Charter Communications Operating LLC | 5.050% | 3/30/29 | 435 | 515 | ||
| Charter Communications Operating LLC | 2.300% | 2/1/32 | 1,205 | 1,175 | ||
| Charter Communications Operating LLC | 6.384% | 10/23/35 | 305 | 407 | ||
| Charter Communications Operating LLC | 5.375% | 5/1/47 | 55 | 68 | ||
| Charter Communications Operating LLC | 5.125% | 7/1/49 | 47 | 57 | ||
| Charter Communications Operating LLC | 4.800% | 3/1/50 | 60 | 70 | ||
| Charter Communications Operating LLC | 3.700% | 4/1/51 | 40 | 40 | ||
| Cigna Corp. | 4.375% | 10/15/28 | 435 | 508 | ||
| Cigna Corp. | 2.400% | 3/15/30 | 220 | 227 | ||
| 1 | Citigroup Inc. | 3.520% | 10/27/28 | 1,105 | 1,214 | |
| Cleco Corporate Holdings LLC | 3.743% | 5/1/26 | 675 | 737 | ||
| Cleco Corporate Holdings LLC | 3.375% | 9/15/29 | 270 | 282 | ||
| Comcast Corp. | 3.950% | 10/15/25 | 255 | 284 | ||
| Comcast Corp. | 6.500% | 11/15/35 | 156 | 228 | ||
| Comcast Corp. | 4.000% | 3/1/48 | 20 | 24 | ||
| 5 | Comcast Corp. | 2.887% | 11/1/51 | 1,406 | 1,400 | |
| Comcast Corp. | 4.049% | 11/1/52 | 6 | 7 | ||
| Comcast Corp. | 2.650% | 8/15/62 | 130 | 121 | ||
| 5 | Comcast Corp. | 2.987% | 11/1/63 | 4 | 4 | |
| CommonSpirit Health | 4.200% | 8/1/23 | 895 | 954 | ||
| CommonSpirit Health | 3.347% | 10/1/29 | 145 | 157 | ||
| CommonSpirit Health | 4.187% | 10/1/49 | 175 | 204 | ||
| Conagra Brands Inc. | 1.375% | 11/1/27 | 420 | 412 | ||
| Conagra Brands Inc. | 5.300% | 11/1/38 | 600 | 776 | ||
| Constellation Brands Inc. | 2.875% | 5/1/30 | 90 | 95 | ||
| 5 | Cox Communications Inc. | 3.500% | 8/15/27 | 1,255 | 1,384 | |
| Crown Castle International Corp. | 2.100% | 4/1/31 | 1,695 | 1,661 | ||
| CSX Corp. | 4.300% | 3/1/48 | 405 | 499 | ||
| CVS Health Corp. | 2.875% | 6/1/26 | 1,000 | 1,074 | ||
| CVS Health Corp. | 4.300% | 3/25/28 | 96 | 111 | ||
| Dignity Health | 3.812% | 11/1/24 | 659 | 712 | ||
| Dignity Health | 4.500% | 11/1/42 | 202 | 244 | ||
| Discovery Communications LLC | 3.625% | 5/15/30 | 565 | 620 | ||
| Discovery Communications LLC | 4.650% | 5/15/50 | 532 | 630 | ||
| Discovery Communications LLC | 4.000% | 9/15/55 | 288 | 309 | ||
| Dominion Energy South Carolina Inc. | 6.625% | 2/1/32 | 156 | 219 | ||
| Dominion Energy South Carolina Inc. | 5.300% | 5/15/33 | 129 | 170 | ||
| Dominion Energy South Carolina Inc. | 5.450% | 2/1/41 | 250 | 348 | ||
| Dominion Energy South Carolina Inc. | 4.600% | 6/15/43 | 280 | 361 | ||
| Duke Energy Corp. | 2.550% | 6/15/31 | 530 | 545 | ||
| Duke Energy Progress LLC | 4.200% | 8/15/45 | 350 | 427 | ||
| 5 | Eastern Gas Transmission & Storage Inc. | 4.600% | 12/15/44 | 625 | 761 | |
| Energy Transfer LP | 4.900% | 3/15/35 | 975 | 1,123 | ||
| 5 | Equitable Financial Life Global Funding | 1.400% | 7/7/25 | 100 | 101 | |
| 5 | Equitable Financial Life Global Funding | 1.300% | 7/12/26 | 600 | 600 | |
| 5 | Equitable Financial Life Global Funding | 1.400% | 8/27/27 | 565 | 563 | |
| 5 | ERAC USA Finance LLC | 3.300% | 12/1/26 | 235 | 257 | |
| 5 | ERAC USA Finance LLC | 4.500% | 2/15/45 | 295 | 366 | |
| 1 | Evergy Metro Inc. | 2.250% | 6/1/30 | 180 | 184 | |
| Exxon Mobil Corp. | 2.275% | 8/16/26 | 865 | 912 | ||
| FedEx Corp. | 4.100% | 2/1/45 | 65 | 75 | ||
| Coupon | Maturity Date | Face Amount ($000) | Market Value• ($000) | |||
| FedEx Corp. | 4.750% | 11/15/45 | 187 | 236 | ||
| FedEx Corp. | 4.550% | 4/1/46 | 95 | 117 | ||
| FedEx Corp. | 4.050% | 2/15/48 | 28 | 33 | ||
| FedEx Corp. | 4.950% | 10/17/48 | 175 | 230 | ||
| 9 | Fidelity National Information Services Inc. | 1.500% | 5/21/27 | 1,405 | 1,773 | |
| Fiserv Inc. | 3.200% | 7/1/26 | 320 | 348 | ||
| 9 | Fiserv Inc. | 1.625% | 7/1/30 | 750 | 963 | |
| 10 | Fiserv Inc. | 3.000% | 7/1/31 | 525 | 801 | |
| 9 | General Mills Inc. | 0.450% | 1/15/26 | 900 | 1,083 | |
| General Motors Co. | 4.200% | 10/1/27 | 550 | 616 | ||
| General Motors Co. | 5.000% | 10/1/28 | 1,095 | 1,280 | ||
| 5 | Genting New York LLC | 3.300% | 2/15/26 | 1,002 | 1,003 | |
| Georgia Power Co. | 4.300% | 3/15/42 | 500 | 595 | ||
| 1 | Georgia Power Co. | 3.700% | 1/30/50 | 35 | 39 | |
| Gilead Sciences Inc. | 4.600% | 9/1/35 | 420 | 518 | ||
| Gilead Sciences Inc. | 2.800% | 10/1/50 | 670 | 653 | ||
| 1 | Goldman Sachs Group Inc. | 3.272% | 9/29/25 | 1,425 | 1,527 | |
| Goldman Sachs Group Inc. | 1.431% | 3/9/27 | 1,310 | 1,313 | ||
| 1 | Goldman Sachs Group Inc. | 3.814% | 4/23/29 | 235 | 263 | |
| 1 | Goldman Sachs Group Inc. | 4.223% | 5/1/29 | 285 | 327 | |
| Goldman Sachs Group Inc. | 2.615% | 4/22/32 | 420 | 433 | ||
| 1 | Goldman Sachs Group Inc. | 2.383% | 7/21/32 | 545 | 551 | |
| 5 | Gray Oak Pipeline LLC | 2.600% | 10/15/25 | 291 | 300 | |
| 5 | Gray Oak Pipeline LLC | 3.450% | 10/15/27 | 45 | 48 | |
| Hess Corp. | 4.300% | 4/1/27 | 810 | 900 | ||
| Hess Corp. | 7.300% | 8/15/31 | 925 | 1,258 | ||
| Hess Corp. | 5.600% | 2/15/41 | 515 | 643 | ||
| 5 | Hyundai Capital America | 0.800% | 4/3/23 | 830 | 831 | |
| Intercontinental Exchange Inc. | 1.850% | 9/15/32 | 975 | 941 | ||
| International Business Machines Corp. | 3.300% | 5/15/26 | 500 | 550 | ||
| International Business Machines Corp. | 1.950% | 5/15/30 | 570 | 572 | ||
| International Business Machines Corp. | 4.250% | 5/15/49 | 315 | 394 | ||
| 5 | ITC Holdings Corp. | 2.950% | 5/14/30 | 690 | 734 | |
| JPMorgan Chase & Co. | 2.580% | 4/22/32 | 1,225 | 1,267 | ||
| 1 | JPMorgan Chase & Co. | 3.964% | 11/15/48 | 500 | 593 | |
| 1 | Kaiser Foundation Hospitals | 2.810% | 6/1/41 | 710 | 732 | |
| Kaiser Foundation Hospitals | 4.875% | 4/1/42 | 55 | 75 | ||
| 5 | KeySpan Gas East Corp. | 2.742% | 8/15/26 | 500 | 526 | |
| Kroger Co. | 4.450% | 2/1/47 | 220 | 268 | ||
| Kroger Co. | 5.400% | 1/15/49 | 195 | 271 | ||
| Marsh & McLennan Cos. Inc. | 4.375% | 3/15/29 | 705 | 829 | ||
| 5 | Marvell Technology Inc. | 2.950% | 4/15/31 | 680 | 706 | |
| 5 | Massachusetts Mutual Life Insurance Co. | 3.375% | 4/15/50 | 140 | 151 | |
| McCormick & Co. Inc. | 2.500% | 4/15/30 | 140 | 145 | ||
| 1 | McDonald's Corp. | 4.450% | 9/1/48 | 250 | 314 | |
| 1 | McDonald's Corp. | 3.625% | 9/1/49 | 40 | 45 | |
| Merck & Co. Inc. | 3.400% | 3/7/29 | 500 | 562 | ||
| 1 | Mercy Health | 3.555% | 8/1/27 | 535 | 583 | |
| 5 | Microchip Technology Inc. | 0.972% | 2/15/24 | 1,080 | 1,080 | |
| Microsoft Corp. | 2.921% | 3/17/52 | 650 | 698 | ||
| 5 | Mid-Atlantic Interstate Transmission LLC | 4.100% | 5/15/28 | 913 | 1,035 | |
| 1,6 | Molson Coors International LP | 2.840% | 7/15/23 | 1,825 | 1,489 | |
| 9 | Mondelez International Inc. | 0.250% | 3/17/28 | 605 | 714 | |
| 9 | Mondelez International Inc. | 1.375% | 3/17/41 | 525 | 620 | |
| 1 | Morgan Stanley | 3.125% | 7/27/26 | 2,100 | 2,278 | |
| Coupon | Maturity Date | Face Amount ($000) | Market Value• ($000) | |||
| 1 | Morgan Stanley | 3.772% | 1/24/29 | 175 | 196 | |
| 9 | Morgan Stanley | 0.497% | 2/7/31 | 675 | 787 | |
| National Retail Properties Inc. | 3.900% | 6/15/24 | 400 | 431 | ||
| 5 | Nationwide Mutual Insurance Co. | 4.350% | 4/30/50 | 890 | 1,017 | |
| NextEra Energy Capital Holdings Inc. | 1.900% | 6/15/28 | 665 | 674 | ||
| 5 | Niagara Mohawk Power Corp. | 1.960% | 6/27/30 | 670 | 664 | |
| Norfolk Southern Corp. | 2.550% | 11/1/29 | 915 | 962 | ||
| 5 | Northwestern Mutual Life Insurance Co. | 3.850% | 9/30/47 | 280 | 325 | |
| 5 | Northwestern Mutual Life Insurance Co. | 3.625% | 9/30/59 | 12 | 14 | |
| 1 | Ochsner LSU Health System of North Louisiana | 2.510% | 5/15/31 | 545 | 546 | |
| 5 | Oglethorpe Power Corp. | 6.191% | 1/1/31 | 285 | 359 | |
| Oglethorpe Power Corp. | 4.550% | 6/1/44 | 20 | 23 | ||
| Oglethorpe Power Corp. | 4.250% | 4/1/46 | 81 | 92 | ||
| Oglethorpe Power Corp. | 5.250% | 9/1/50 | 190 | 247 | ||
| Oracle Corp. | 2.875% | 3/25/31 | 1,015 | 1,069 | ||
| Oracle Corp. | 4.000% | 11/15/47 | 265 | 291 | ||
| Oracle Corp. | 3.600% | 4/1/50 | 390 | 407 | ||
| Oracle Corp. | 3.950% | 3/25/51 | 340 | 377 | ||
| Oracle Corp. | 3.850% | 4/1/60 | 145 | 156 | ||
| Otis Worldwide Corp. | 2.565% | 2/15/30 | 65 | 68 | ||
| Otis Worldwide Corp. | 3.112% | 2/15/40 | 140 | 147 | ||
| PacifiCorp | 2.700% | 9/15/30 | 160 | 170 | ||
| 5 | Pennsylvania Electric Co. | 3.600% | 6/1/29 | 124 | 134 | |
| 5 | Penske Truck Leasing Co. LP | 4.250% | 1/17/23 | 1,125 | 1,182 | |
| 5 | Penske Truck Leasing Co. LP | 2.700% | 11/1/24 | 180 | 189 | |
| 5 | Penske Truck Leasing Co. LP | 3.950% | 3/10/25 | 740 | 808 | |
| 5 | Penske Truck Leasing Co. LP | 4.000% | 7/15/25 | 140 | 154 | |
| Pfizer Inc. | 1.700% | 5/28/30 | 195 | 195 | ||
| 1 | PNC Bank NA | 3.250% | 1/22/28 | 600 | 665 | |
| 1 | Providence St. Joseph Health Obligated Group | 3.930% | 10/1/48 | 245 | 293 | |
| Raytheon Technologies Corp. | 3.950% | 8/16/25 | 310 | 344 | ||
| Raytheon Technologies Corp. | 4.450% | 11/16/38 | 550 | 673 | ||
| 10 | Realty Income Corp. | 1.750% | 7/13/33 | 635 | 876 | |
| Royalty Pharma plc | 3.300% | 9/2/40 | 210 | 213 | ||
| Royalty Pharma plc | 3.550% | 9/2/50 | 505 | 506 | ||
| 1 | San Diego Gas & Electric Co. | 1.700% | 10/1/30 | 710 | 691 | |
| 1 | San Diego Gas & Electric Co. | 4.100% | 6/15/49 | 174 | 211 | |
| 5 | SBA Tower Trust | 3.448% | 3/15/23 | 755 | 769 | |
| 5 | SBA Tower Trust | 1.884% | 1/15/26 | 110 | 111 | |
| 5 | SBA Tower Trust | 1.631% | 11/15/26 | 270 | 270 | |
| 1 | SCE Recovery Funding LLC | 0.861% | 11/15/31 | 250 | 246 | |
| 1 | SCE Recovery Funding LLC | 1.942% | 5/15/38 | 105 | 103 | |
| 1 | SCE Recovery Funding LLC | 2.510% | 11/15/43 | 60 | 59 | |
| Sempra Energy | 3.250% | 6/15/27 | 1,000 | 1,089 | ||
| Sierra Pacific Power Co. | 2.600% | 5/1/26 | 180 | 191 | ||
| 1 | Southern California Edison Co. | 3.700% | 8/1/25 | 30 | 33 | |
| 1 | Southern California Edison Co. | 2.950% | 2/1/51 | 515 | 470 | |
| 5 | Sprint Spectrum Co. LLC | 4.738% | 3/20/25 | 1,031 | 1,100 | |
| 1 | SSM Health Care Corp. | 3.823% | 6/1/27 | 380 | 429 | |
| Starbucks Corp. | 4.500% | 11/15/48 | 335 | 425 | ||
| Starbucks Corp. | 3.350% | 3/12/50 | 90 | 96 | ||
| 5 | Teachers Insurance & Annuity Association of America | 4.900% | 9/15/44 | 635 | 839 | |
| Teledyne Technologies Inc. | 2.750% | 4/1/31 | 490 | 511 | ||
| Thermo Fisher Scientific Inc. | 1.750% | 10/15/28 | 290 | 293 | ||
| Coupon | Maturity Date | Face Amount ($000) | Market Value• ($000) | |||
| T-Mobile USA Inc. | 2.050% | 2/15/28 | 1,185 | 1,205 | ||
| T-Mobile USA Inc. | 4.375% | 4/15/40 | 270 | 316 | ||
| 1 | Toledo Hospital | 5.325% | 11/15/28 | 410 | 472 | |
| Toledo Hospital | 5.750% | 11/15/38 | 150 | 181 | ||
| Trinity Acquisition plc | 4.400% | 3/15/26 | 888 | 1,000 | ||
| 1 | Truist Bank | 3.300% | 5/15/26 | 975 | 1,072 | |
| Union Pacific Corp. | 3.750% | 2/5/70 | 190 | 216 | ||
| 1 | United Airlines Pass-Through Trust Class B Series 2018-1 | 4.600% | 3/1/26 | 58 | 60 | |
| UnitedHealth Group Inc. | 3.850% | 6/15/28 | 415 | 476 | ||
| UnitedHealth Group Inc. | 2.000% | 5/15/30 | 215 | 219 | ||
| UnitedHealth Group Inc. | 4.625% | 7/15/35 | 90 | 114 | ||
| VEREIT Operating Partnership LP | 3.400% | 1/15/28 | 365 | 399 | ||
| VEREIT Operating Partnership LP | 2.200% | 6/15/28 | 185 | 190 | ||
| VEREIT Operating Partnership LP | 3.100% | 12/15/29 | 550 | 592 | ||
| VEREIT Operating Partnership LP | 2.850% | 12/15/32 | 80 | 85 | ||
| 9 | Verizon Communications Inc. | 1.250% | 4/8/30 | 750 | 942 | |
| 10 | Verizon Communications Inc. | 3.375% | 10/27/36 | 175 | 283 | |
| Verizon Communications Inc. | 4.522% | 9/15/48 | 390 | 491 | ||
| Verizon Communications Inc. | 5.012% | 8/21/54 | 380 | 523 | ||
| VF Corp. | 2.800% | 4/23/27 | 145 | 155 | ||
| VF Corp. | 2.950% | 4/23/30 | 875 | 934 | ||
| 1,6 | Wells Fargo & Co. | 2.975% | 5/19/26 | 600 | 502 | |
| 1 | Wells Fargo & Co. | 4.300% | 7/22/27 | 325 | 373 | |
| 1 | Wells Fargo & Co. | 4.750% | 12/7/46 | 700 | 893 | |
| Welltower Inc. | 4.000% | 6/1/25 | 325 | 357 | ||
| 125,019 | ||||||
| Total Corporate Bonds (Cost $216,047) | 226,615 | |||||
| Sovereign Bonds (8.3%) | ||||||
| Australia (0.3%) | ||||||
| 1,11 | Commonwealth of Australia | 2.750% | 11/21/27 | 160 | 131 | |
| 1,11 | Commonwealth of Australia | 2.250% | 5/21/28 | 870 | 695 | |
| 1,11 | Commonwealth of Australia | 1.000% | 11/21/31 | 955 | 686 | |
| 1,512 | ||||||
| Bermuda (0.0%) | ||||||
| 5 | Bermuda | 2.375% | 8/20/30 | 200 | 202 | |
| Canada (0.8%) | ||||||
| 6 | City of Montreal | 3.500% | 12/1/38 | 910 | 822 | |
| 6 | City of Toronto | 3.200% | 8/1/48 | 1,000 | 853 | |
| 6 | Municipal Finance Authority of British Columbia | 4.950% | 12/1/27 | 600 | 574 | |
| 6 | Province of Ontario | 2.900% | 6/2/28 | 815 | 705 | |
| 1,12 | Province of Ontario | 0.250% | 6/28/29 | 1,075 | 1,216 | |
| 6 | Regional Municipality of York | 2.150% | 6/22/31 | 500 | 401 | |
| 4,571 | ||||||
| Chile (0.4%) | ||||||
| 1 | Corp. Nacional del Cobre de Chile | 3.625% | 8/1/27 | 800 | 874 | |
| 1 | Republic of Chile | 2.550% | 7/27/33 | 1,215 | 1,238 | |
| 9 | Republic of Chile | 1.250% | 1/22/51 | 435 | 473 | |
| 2,585 | ||||||
| China (0.2%) | ||||||
| 5 | State Grid Overseas Investment BVI Ltd. | 2.750% | 5/4/22 | 1,110 | 1,126 | |
| Coupon | Maturity Date | Face Amount ($000) | Market Value• ($000) | |||
| Colombia (0.2%) | ||||||
| 1 | Republic of Colombia | 4.000% | 2/26/24 | 1,045 | 1,100 | |
| Croatia (0.2%) | ||||||
| 9 | Republic of Croatia | 1.500% | 6/17/31 | 1,125 | 1,424 | |
| Japan (2.2%) | ||||||
| 1,13 | Japan | 0.100% | 3/20/31 | 1,191,300 | 10,915 | |
| 1,13 | Japan | 0.100% | 6/20/31 | 200,100 | 1,831 | |
| 12,746 | ||||||
| Mexico (0.2%) | ||||||
| 1 | United Mexican States | 4.280% | 8/14/41 | 1,325 | 1,421 | |
| Norway (0.2%) | ||||||
| Equinor ASA | 3.000% | 4/6/27 | 1,215 | 1,319 | ||
| Panama (0.3%) | ||||||
| 5 | Empresa de Transmision Electrica SA | 5.125% | 5/2/49 | 415 | 476 | |
| 1 | Republic of Panama | 2.252% | 9/29/32 | 995 | 971 | |
| 1,447 | ||||||
| Qatar (0.4%) | ||||||
| 5 | Qatar Petroleum | 2.250% | 7/12/31 | 480 | 484 | |
| 5 | Qatar Petroleum | 3.125% | 7/12/41 | 405 | 418 | |
| 5 | State of Qatar | 3.875% | 4/23/23 | 785 | 830 | |
| 5 | State of Qatar | 5.103% | 4/23/48 | 285 | 384 | |
| 5 | State of Qatar | 4.400% | 4/16/50 | 205 | 254 | |
| 2,370 | ||||||
| Romania (0.5%) | ||||||
| 5,9 | Republic of Romania | 1.375% | 12/2/29 | 199 | 235 | |
| 1,9 | Republic of Romania | 2.500% | 2/8/30 | 850 | 1,073 | |
| 1,9 | Republic of Romania | 3.624% | 5/26/30 | 500 | 683 | |
| 1,9 | Republic of Romania | 2.124% | 7/16/31 | 475 | 576 | |
| 5,9 | Republic of Romania | 2.000% | 4/14/33 | 245 | 288 | |
| 2,855 | ||||||
| Saudi Arabia (0.1%) | ||||||
| 5 | Saudi Arabian Oil Co. | 3.500% | 4/16/29 | 585 | 637 | |
| Spain (0.2%) | ||||||
| 5,9 | Kingdom of Spain | 0.600% | 10/31/29 | 775 | 955 | |
| Supranational (1.4%) | ||||||
| 1,9 | European Union | 0.000% | 7/4/35 | 2,850 | 3,303 | |
| 1,9 | European Union | 0.200% | 6/4/36 | 3,025 | 3,575 | |
| 1,9 | European Union | 0.100% | 10/4/40 | 1,300 | 1,470 | |
| 8,348 | ||||||
| United Arab Emirates (0.3%) | ||||||
| 1 | Emirate of Abu Dhabi | 3.125% | 10/11/27 | 1,435 | 1,589 | |
| United Kingdom (0.4%) | ||||||
| 10 | United Kingdom | 3.500% | 1/22/45 | 990 | 2,038 | |
| Total Sovereign Bonds (Cost $46,760) | 48,245 | |||||
| Taxable Municipal Bonds (1.4%) | ||||||
| United States (1.4%) | ||||||
| Broward County FL Airport System Revenue | 3.477% | 10/1/43 | 80 | 85 | ||
| Chicago IL Transit Authority Sales & Transfer Tax Receipts Revenue | 6.300% | 12/1/21 | 25 | 25 | ||
| Coupon | Maturity Date | Face Amount ($000) | Market Value• ($000) | |||
| Chicago IL Transit Authority Sales & Transfer Tax Receipts Revenue | 6.899% | 12/1/40 | 645 | 933 | ||
| Chicago IL Transit Authority Sales & Transfer Tax Receipts Revenue | 6.899% | 12/1/40 | 40 | 58 | ||
| Dallas/Fort Worth International Airport Revenue | 3.089% | 11/1/40 | 60 | 63 | ||
| Foothill-Eastern Transportation Corridor Agency CA Toll Road Revenue | 4.094% | 1/15/49 | 45 | 48 | ||
| 14 | Foothill-Eastern Transportation Corridor Agency CA Toll Road Revenue | 3.924% | 1/15/53 | 315 | 336 | |
| Georgia Municipal Electric Power Authority Revenue | 6.637% | 4/1/57 | 478 | 731 | ||
| Grand Parkway Transportation Corp. Texas System Toll Revenue | 3.236% | 10/1/52 | 210 | 218 | ||
| Illinois GO | 5.100% | 6/1/33 | 855 | 1,016 | ||
| 14 | Kansas Development Finance Authority Revenue (Employees Retirement System) | 5.371% | 5/1/26 | 645 | 727 | |
| New York Metropolitan Transportation Authority Revenue (Build America Bonds) | 6.200% | 11/15/26 | 15 | 17 | ||
| New York Metropolitan Transportation Authority Revenue (Build America Bonds) | 6.668% | 11/15/39 | 155 | 226 | ||
| New York Metropolitan Transportation Authority Revenue (Build America Bonds) | 6.814% | 11/15/40 | 380 | 559 | ||
| New York Metropolitan Transportation Authority Revenue (Climate Bond Certified) | 5.175% | 11/15/49 | 315 | 434 | ||
| New York State Dormitory Authority Revenue (Personal Income Tax) | 3.110% | 2/15/39 | 210 | 234 | ||
| 15 | Philadelphia PA Authority for Industrial Development Revenue | 6.550% | 10/15/28 | 525 | 685 | |
| Port Authority of New York & New Jersey Revenue | 3.175% | 7/15/60 | 440 | 450 | ||
| Sales Tax Securitization Corp. Illinois Revenue | 4.787% | 1/1/48 | 545 | 702 | ||
| State of Connecticut GO | 2.000% | 7/1/23 | 135 | 139 | ||
| State of Connecticut GO | 5.770% | 3/15/25 | 250 | 294 | ||
| Total Taxable Municipal Bonds (Cost $7,113) | 7,980 | |||||
| Coupon | Shares | Market Value• ($000) | ||||
| Temporary Cash Investments (5.4%) | ||||||
| Money Market Fund (5.4%) | ||||||
| 16 | Vanguard Market Liquidity Fund (Cost $31,177) | 0.068% | 311,775 | 31,177 | ||
| Total Investments (101.5%) (Cost $532,729) | 587,555 | |||||
| Other Assets and Liabilities—Net (-1.5%) | (8,571) | |||||
| Net Assets (100%) | 578,984 | |||||
| Cost is in $000. | |
| • | See Note A in Notes to Financial Statements. |
| * | Non-income-producing security. |
| 1 | The average or expected maturity is shorter than the final maturity shown because of the possibility of interim principal payments and prepayments or the possibility of the issue being called. |
| 2 | The issuer was placed under federal conservatorship in September 2008; since that time, its daily operations have been managed by the Federal Housing Finance Agency and it receives capital from the U.S. Treasury, as needed to maintain a positive net worth, in exchange for senior preferred stock. |
| 3 | Includes securities purchased on a when-issued or delayed-delivery basis for which the fund has not taken delivery as of August 31, 2021. |
| 4 | Securities with a value of $657,000 have been segregated as initial margin for open futures contracts. |
| 5 | Security exempt from registration under Rule 144A of the Securities Act of 1933. Such securities may be sold in transactions exempt from registration, normally to qualified institutional buyers. At August 31, 2021, the aggregate value was $73,721,000, representing 12.7% of net assets. |
| 6 | Face amount denominated in Canadian dollars. |
| 7 | Security value determined using significant unobservable inputs. |
| 8 | Variable-rate security; rate shown is effective rate at period end. Certain variable-rate securities are not based on a published reference rate and spread but are determined by the issuer or agent based on current market conditions. |
| 9 | Face amount denominated in euro. |
| 10 | Face amount denominated in British pounds. |
| 11 | Face amount denominated in Australian dollars. |
| 12 | Face amount denominated in Swiss francs. |
| 13 | Face amount denominated in Japanese yen. |
| 14 | Scheduled principal and interest payments are guaranteed by Assured Guaranty Municipal Corp. |
| 15 | Scheduled principal and interest payments are guaranteed by National Public Finance Guarantee Corp. |
| 16 | Affiliated money market fund available only to Vanguard funds and certain trusts and accounts managed by Vanguard. Rate shown is the 7-day yield. |
| 1M—1-month. | |
| 3M—3-month. | |
| GO—General Obligation Bond. | |
| LIBOR—London Interbank Offered Rate. | |
| REMICS—Real Estate Mortgage Investment Conduits. | |
| UMBS—Uniform Mortgage-Backed Securities. |
| Futures Contracts | ||||
| ($000) | ||||
| Expiration | Number of Long (Short) Contracts | Notional Amount | Value and Unrealized Appreciation (Depreciation) | |
| Long Futures Contracts | ||||
| 5-Year U.S. Treasury Note | December 2021 | 97 | 12,001 | 23 |
| Euro-Bobl | September 2021 | 31 | 4,940 | 20 |
| Euro-BTP | September 2021 | 7 | 1,267 | 24 |
| Euro-Buxl | September 2021 | 10 | 2,509 | 82 |
| Euro-OAT | September 2021 | 10 | 1,903 | 32 |
| Euro-Schatz | September 2021 | 65 | 8,617 | 9 |
| 190 | ||||
| Short Futures Contracts | ||||
| 10-Year U.S. Treasury Note | December 2021 | (210) | (28,025) | (23) |
| Euro-Bund | September 2021 | (61) | (12,637) | (118) |
| Long Gilt | December 2021 | (5) | (881) | 6 |
| Ultra 10-Year U.S. Treasury Note | December 2021 | (72) | (10,657) | (8) |
| (143) | ||||
| 47 | ||||
| Forward Currency Contracts | |||||||
| Contract Settlement Date | Contract Amount (000) | Unrealized Appreciation ($000) | Unrealized (Depreciation) ($000) | ||||
| Counterparty | Receive | Deliver | |||||
| J.P. Morgan Securities LLC | 9/29/21 | CAD | 1,260 | USD | 992 | 7 | — |
| Goldman Sachs International | 9/30/21 | EUR | 2,116 | USD | 2,498 | 2 | — |
| Goldman Sachs International | 9/30/21 | USD | 5,114 | AUD | 7,052 | — | (46) |
| Bank of America, N.A. | 9/29/21 | USD | 11,585 | CAD | 14,673 | — | (44) |
| Goldman Sachs International | 9/30/21 | USD | 1,668 | CHF | 1,522 | 5 | — |
| J.P. Morgan Securities LLC | 9/30/21 | USD | 77,588 | EUR | 66,023 | — | (415) |
| J.P. Morgan Securities LLC | 9/30/21 | USD | 15,775 | GBP | 11,489 | — | (22) |
| Goldman Sachs International | 9/30/21 | AUD | 1,970 | GBP | 1,042 | 9 | — |
| J.P. Morgan Securities LLC | 9/30/21 | EUR | 285 | GBP | 244 | 1 | — |
| Bank of America, N.A. | 9/30/21 | USD | 261 | HKD | 2,030 | — | — |
| Forward Currency Contracts (continued) | |||||||
| Contract Settlement Date | Contract Amount (000) | Unrealized Appreciation ($000) | Unrealized (Depreciation) ($000) | ||||
| Counterparty | Receive | Deliver | |||||
| J.P. Morgan Securities LLC | 9/30/21 | USD | 11,043 | JPY | 1,212,257 | 21 | — |
| Goldman Sachs International | 9/30/21 | AUD | 2,630 | JPY | 209,400 | 20 | — |
| Bank of America, N.A. | 9/30/21 | GBP | 432 | JPY | 65,000 | 2 | — |
| 67 | (527) | ||||||
| AUD—Australian dollar. |
| CAD—Canadian dollar. |
| CHF—Swiss franc. |
| EUR—euro. |
| GBP—British pound. |
| HKD—Hong Kong dollar. |
| JPY—Japanese yen. |
| USD—U.S. dollar. |
| ($000s, except shares and per-share amounts) | Amount |
| Assets | |
| Investments in Securities, at Value | |
| Unaffiliated Issuers (Cost $501,552) | 556,378 |
| Affiliated Issuers (Cost $31,177) | 31,177 |
| Total Investments in Securities | 587,555 |
| Investment in Vanguard | 19 |
| Cash | 9 |
| Foreign Currency, at Value (Cost $8,666) | 8,669 |
| Receivables for Investment Securities Sold | 8,676 |
| Receivables for Accrued Income | 2,993 |
| Receivables for Capital Shares Issued | 638 |
| Variation Margin Receivable—Futures Contracts | 42 |
| Unrealized Appreciation—Forward Currency Contracts | 67 |
| Total Assets | 608,668 |
| Liabilities | |
| Payables for Investment Securities Purchased | 28,703 |
| Payables for Capital Shares Redeemed | 262 |
| Payables to Investment Advisor | 150 |
| Payables to Vanguard | 42 |
| Unrealized Depreciation—Forward Currency Contracts | 527 |
| Total Liabilities | 29,684 |
| Net Assets | 578,984 |
| Statement of Assets and Liabilities (continued) | |
| At August 31, 2021, net assets consisted of: | |
| ($000s, except shares and per-share amounts) | Amount |
| Paid-in Capital | 534,370 |
| Total Distributable Earnings (Loss) | 44,614 |
| Net Assets | 578,984 |
| Investor Shares—Net Assets | |
| Applicable to 4,116,942 outstanding $.001 par value shares of beneficial interest (unlimited authorization) | 91,484 |
| Net Asset Value Per Share—Investor Shares | $22.22 |
| Admiral Shares—Net Assets | |
| Applicable to 17,546,332 outstanding $.001 par value shares of beneficial interest (unlimited authorization) | 487,500 |
| Net Asset Value Per Share—Admiral Shares | $27.78 |
| Year Ended August 31, 2021 | |
| ($000) | |
| Investment Income | |
| Income | |
| Dividends1 | 6,553 |
| Interest2 | 6,309 |
| Securities Lending—Net | 8 |
| Total Income | 12,870 |
| Expenses | |
| Investment Advisory Fees—Note B | |
| Basic Fee | 619 |
| Performance Adjustment | (75) |
| The Vanguard Group—Note C | |
| Management and Administrative—Investor Shares | 230 |
| Management and Administrative—Admiral Shares | 658 |
| Marketing and Distribution—Investor Shares | 8 |
| Marketing and Distribution—Admiral Shares | 19 |
| Custodian Fees | 29 |
| Auditing Fees | 33 |
| Shareholders’ Reports—Investor Shares | 4 |
| Shareholders’ Reports—Admiral Shares | 4 |
| Trustees’ Fees and Expenses | 1 |
| Total Expenses | 1,530 |
| Net Investment Income | 11,340 |
| Realized Net Gain (Loss) | |
| Investment Securities Sold2 | 10,674 |
| Futures Contracts | (136) |
| Forward Currency Contracts | 702 |
| Foreign Currencies | 522 |
| Realized Net Gain (Loss) | 11,762 |
| Change in Unrealized Appreciation (Depreciation) | |
| Investment Securities2 | 29,307 |
| Futures Contracts | (73) |
| Forward Currency Contracts | 645 |
| Foreign Currencies | (219) |
| Change in Unrealized Appreciation (Depreciation) | 29,660 |
| Net Increase (Decrease) in Net Assets Resulting from Operations | 52,762 |
| 1 | Dividends are net of foreign withholding taxes of $550,000. |
| 2 | Interest income, realized net gain (loss), and change in unrealized appreciation (depreciation) from an affiliated company of the fund were $20,000, less than $1,000, and less than $1,000, respectively. Purchases and sales are for temporary cash investment purposes. |
| Year Ended August 31, | ||
| 2021 ($000) | 2020 ($000) | |
| Increase (Decrease) in Net Assets | ||
| Operations | ||
| Net Investment Income | 11,340 | 11,025 |
| Realized Net Gain (Loss) | 11,762 | (9,178) |
| Change in Unrealized Appreciation (Depreciation) | 29,660 | 11,303 |
| Net Increase (Decrease) in Net Assets Resulting from Operations | 52,762 | 13,150 |
| Distributions | ||
| Investor Shares | (1,540) | (1,891) |
| Admiral Shares | (8,376) | (9,124) |
| Total Distributions | (9,916) | (11,015) |
| Capital Share Transactions | ||
| Investor Shares | 3,358 | (4,268) |
| Admiral Shares | 62,852 | 7,647 |
| Net Increase (Decrease) from Capital Share Transactions | 66,210 | 3,379 |
| Total Increase (Decrease) | 109,056 | 5,514 |
| Net Assets | ||
| Beginning of Period | 469,928 | 464,414 |
| End of Period | 578,984 | 469,928 |
| Investor Shares | ||||
| For a Share Outstanding Throughout Each Period | Oct. 18, 20171 to August 31, 2018 | Year Ended August 31, | ||
| 2021 | 2020 | 2019 | ||
| Net Asset Value, Beginning of Period | $20.42 | $20.16 | $19.87 | $20.00 |
| Investment Operations | ||||
| Net Investment Income2 | .446 | .453 | .513 | .443 |
| Net Realized and Unrealized Gain (Loss) on Investments | 1.747 | .263 | .529 | (.269) |
| Total from Investment Operations | 2.193 | .716 | 1.042 | .174 |
| Distributions | ||||
| Dividends from Net Investment Income | (.393) | (.456) | (.473) | (.304) |
| Distributions from Realized Capital Gains | — | — | (.279) | — |
| Total Distributions | (.393) | (.456) | (.752) | (.304) |
| Net Asset Value, End of Period | $22.22 | $20.42 | $20.16 | $19.87 |
| Total Return3 | 10.83% | 3.66% | 5.50% | 0.88% |
| Ratios/Supplemental Data | ||||
| Net Assets, End of Period (Millions) | $91 | $81 | $85 | $93 |
| Ratio of Total Expenses to Average Net Assets4 | 0.41% | 0.41% | 0.42% | 0.43%5,6 |
| Ratio of Net Investment Income to Average Net Assets | 2.09% | 2.27% | 2.63% | 2.68%5 |
| Portfolio Turnover Rate | 99%7 | 72%7 | 90% | 39% |
| 1 | Subscription period for the fund was October 18, 2017, to November 1, 2017, during which time all assets were held in cash. Performance measurement began November 2, 2017, the first business day after the subscription period, at a net asset value of $20.00. |
| 2 | Calculated based on average shares outstanding. |
| 3 | Total returns do not include account service fees that may have applied in the periods shown. Fund prospectuses provide information about any applicable account service fees. |
| 4 | Includes performance-based investment advisory fee increases (decreases) of (0.01%), (0.01%), and (0.01%). Performance-based investment advisory fees did not apply before fiscal year 2019. |
| 5 | Annualized. |
| 6 | The ratio of expenses to average net assets for the period net of reduction from custody fee offset arrangements was 0.42%. |
| 7 | Includes 33% and 1%, respectively, attributable to mortgage-dollar-roll activity. |
| Admiral Shares | ||||
| For a Share Outstanding Throughout Each Period | Oct. 18, 20171 to August 31, 2018 | Year Ended August 31, | ||
| 2021 | 2020 | 2019 | ||
| Net Asset Value, Beginning of Period | $25.53 | $25.20 | $24.84 | $25.00 |
| Investment Operations | ||||
| Net Investment Income2 | .594 | .592 | .666 | .577 |
| Net Realized and Unrealized Gain (Loss) on Investments | 2.178 | .334 | .658 | (.341) |
| Total from Investment Operations | 2.772 | .926 | 1.324 | .236 |
| Distributions | ||||
| Dividends from Net Investment Income | (.522) | (.596) | (.616) | (.396) |
| Distributions from Realized Capital Gains | — | — | (.348) | — |
| Total Distributions | (.522) | (.596) | (.964) | (.396) |
| Net Asset Value, End of Period | $27.78 | $25.53 | $25.20 | $24.84 |
| Total Return3 | 10.96% | 3.79% | 5.60% | 0.96% |
| Ratios/Supplemental Data | ||||
| Net Assets, End of Period (Millions) | $488 | $389 | $379 | $408 |
| Ratio of Total Expenses to Average Net Assets4 | 0.28% | 0.31% | 0.32% | 0.33%5,6 |
| Ratio of Net Investment Income to Average Net Assets | 2.22% | 2.37% | 2.73% | 2.78%5 |
| Portfolio Turnover Rate | 99%7 | 72%7 | 90% | 39% |
| 1 | Subscription period for the fund was October 18, 2017, to November 1, 2017, during which time all assets were held in cash. Performance measurement began November 2, 2017, the first business day after the subscription period, at a net asset value of $25.00. |
| 2 | Calculated based on average shares outstanding. |
| 3 | Total returns do not include account service fees that may have applied in the periods shown. Fund prospectuses provide information about any applicable account service fees. |
| 4 | Includes performance-based investment advisory fee increases (decreases) of (0.01%), (0.01%), and (0.01%). Performance-based investment advisory fees did not apply before fiscal year 2019. |
| 5 | Annualized. |
| 6 | The ratio of expenses to average net assets for the period net of reduction from custody fee offset arrangements was 0.32%. |
| 7 | Includes 33% and 1%, respectively, attributable to mortgage-dollar-roll activity. |
| Level 1 ($000) | Level 2 ($000) | Level 3 ($000) | Total ($000) | |
| Investments | ||||
| Assets | ||||
| Common Stocks—North and South America | 112,519 | — | — | 112,519 |
| Common Stocks—Other | — | 103,436 | — | 103,436 |
| U.S. Government and Agency Obligations | — | 43,751 | — | 43,751 |
| Asset-Backed/Commercial Mortgage-Backed Securities | — | 13,012 | 820 | 13,832 |
| Corporate Bonds | — | 226,615 | — | 226,615 |
| Sovereign Bonds | — | 48,245 | — | 48,245 |
| Taxable Municipal Bonds | — | 7,980 | — | 7,980 |
| Temporary Cash Investments | 31,177 | — | — | 31,177 |
| Total | 143,696 | 443,039 | 820 | 587,555 |
| Derivative Financial Instruments | ||||
| Assets | ||||
| Futures Contracts1 | 196 | — | — | 196 |
| Forward Currency Contracts | — | 67 | — | 67 |
| Total | 196 | 67 | — | 263 |
| Liabilities | ||||
| Futures Contracts1 | 149 | — | — | 149 |
| Forward Currency Contracts | — | 527 | — | 527 |
| Total | 149 | 527 | — | 676 |
| 1 | Includes cumulative appreciation (depreciation) on futures contracts and centrally cleared swaps, if any, as reported in the Schedule of Investments. Only current day’s variation margin is reported within the Statement of Assets and Liabilities. |
| Statement of Assets and Liabilities | Interest Rate Contracts ($000) | Foreign Exchange Contracts ($000) | Total ($000) |
| Unrealized Appreciation—Futures Contracts1 | 196 | — | 196 |
| Unrealized Appreciation—Forward Currency Contracts | — | 67 | 67 |
| Total Assets | 196 | 67 | 263 |
| Unrealized Depreciation—Futures Contracts1 | 149 | — | 149 |
| Unrealized Depreciation—Forward Currency Contracts | — | 527 | 527 |
| Total Liabilities | 149 | 527 | 676 |
| 1 | Includes cumulative appreciation (depreciation) on futures contracts and centrally cleared swaps, if any, as reported in the Schedule of Investments. Only current day’s variation margin is reported within the Statement of Assets and Liabilities. |
| Realized Net Gain (Loss) on Derivatives | Interest Rate Contracts ($000) | Foreign Exchange Contracts ($000) | Total ($000) |
| Futures Contracts | (136) | — | (136) |
| Forward Currency Contracts | — | 702 | 702 |
| Realized Net Gain (Loss) on Derivatives | (136) | 702 | 566 |
| Change in Unrealized Appreciation (Depreciation) on Derivatives | |||
| Futures Contracts | (73) | — | (73) |
| Forward Currency Contracts | — | 645 | 645 |
| Change in Unrealized Appreciation (Depreciation) on Derivatives | (73) | 645 | 572 |
| Amount ($000) | |
| Undistributed Ordinary Income | 4,308 |
| Undistributed Long-Term Gains | — |
| Capital Loss Carryforwards | (13,979) |
| Qualified Late-Year Losses | — |
| Net Unrealized Gains (Losses) | 54,285 |
| Year Ended August 31, | ||
| 2021 Amount ($000) | 2020 Amount ($000) | |
| Ordinary Income* | 9,916 | 11,015 |
| Long-Term Capital Gains | — | — |
| Total | 9,916 | 11,015 |
| * | Includes short-term capital gains, if any. |
| Amount ($000) | |
| Tax Cost | 533,287 |
| Gross Unrealized Appreciation | 58,817 |
| Gross Unrealized Depreciation | (4,549) |
| Net Unrealized Appreciation (Depreciation) | 54,268 |
| Year Ended August 31, | |||||
| 2021 | 2020 | ||||
| Amount ($000) | Shares (000) | Amount ($000) | Shares (000) | ||
| Investor Shares | |||||
| Issued | 37,147 | 1,733 | 34,659 | 1,733 | |
| Issued in Lieu of Cash Distributions | 1,323 | 62 | 1,619 | 82 | |
| Redeemed | (35,112) | (1,653) | (40,546) | (2,058) | |
| Net Increase (Decrease)—Investor Shares | 3,358 | 142 | (4,268) | (243) | |
| Admiral Shares | |||||
| Issued | 169,389 | 6,323 | 164,236 | 6,588 | |
| Issued in Lieu of Cash Distributions | 7,025 | 263 | 7,760 | 316 | |
| Redeemed | (113,562) | (4,268) | (164,349) | (6,729) | |
| Net Increase (Decrease)—Admiral Shares | 62,852 | 2,318 | 7,647 | 175 | |
Philadelphia, Pennsylvania
October 20, 2021


| 1 | |
| 2 | |
| 4 | |
| 7 | |
| 35 | |
| 37 |
| • | Vanguard ESG U.S. Stock ETF returned 32.41% based on net asset value for the 12 months ended August 31, 2021, in line with the expense-free 32.57% return of its benchmark. |
| • | The global economy rebounded faster than many had expected after the sharp pandemic-induced contraction in the spring of 2020. Countries that have been more successful in containing the virus have generally fared better economically. Swift and extensive fiscal and monetary support from policymakers has also been key to the rebound. |
| • | As the 12 months under review reflect the recovery in stocks following the sharp downturn at the start of the pandemic, results were excellent. |
| • | All 11 industry sectors in the fund’s benchmark index posted double-digit gains. Financials turned in an outstanding performance of over 50%. Technology, which accounts for the largest slice of the index, also performed very well and contributed the most to return. Consumer staples, telecommunications, and utilities returned the least. |
| Average Annual Total Returns Periods Ended August 31, 2021 | |||
| One Year | Three Years | Five Years | |
| Stocks | |||
| Russell 1000 Index (Large-caps) | 32.25% | 18.42% | 18.24% |
| Russell 2000 Index (Small-caps) | 47.08 | 10.75 | 14.38 |
| Russell 3000 Index (Broad U.S. market) | 33.04 | 17.85 | 17.97 |
| FTSE All-World ex US Index (International) | 25.74 | 9.82 | 10.23 |
| Bonds | |||
| Bloomberg U.S. Aggregate Bond Index (Broad taxable market) | -0.08% | 5.43% | 3.11% |
| Bloomberg Municipal Bond Index (Broad tax-exempt market) | 3.40 | 5.09 | 3.30 |
| FTSE Three-Month U.S. Treasury Bill Index | 0.06 | 1.20 | 1.13 |
| CPI | |||
| Consumer Price Index | 5.25% | 2.76% | 2.58% |
| • | Based on actual fund return. This section helps you to estimate the actual expenses that you paid over the period. The ”Ending Account Value“ shown is derived from the fund’s actual return, and the third column shows the dollar amount that would have been paid by an investor who started with $1,000 in the fund. You may use the information here, together with the amount you invested, to estimate the expenses that you paid over the period. |
| • | Based on hypothetical 5% yearly return. This section is intended to help you compare your fund‘s costs with those of other mutual funds. It assumes that the fund had a yearly return of 5% before expenses, but that the expense ratio is unchanged. In this case—because the return used is not the fund’s actual return—the results do not apply to your investment. The example is useful in making comparisons because the Securities and Exchange Commission requires all mutual funds to calculate expenses based on a 5% return. You can assess your fund’s costs by comparing this hypothetical example with the hypothetical examples that appear in shareholder reports of other funds. |
| Six Months Ended August 31, 2021 | |||
| ESG U.S. Stock ETF | Beginning Account Value 2/28/2021 | Ending Account Value 8/31/2021 | Expenses Paid During Period |
| Based on Actual Fund Return | $1,000.00 | $1,186.10 | $0.44 |
| Based on Hypothetical 5% Yearly Return | 1,000.00 | 1,024.80 | 0.41 |
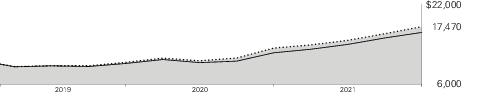
| Average Annual Total Returns Periods Ended August 31, 2021 | ||||
| One Year | Since Inception (9/18/2018) | Final Value of a $10,000 Investment | ||

| ESG U.S. Stock ETF Net Asset Value | 32.41% | 20.81% | $17,470 |
| ESG U.S. Stock ETF Market Price | 32.27 | 20.82 | 17,472 | |

| FTSE US All Cap Choice Index | 32.57 | 20.95 | 17,529 |

| Dow Jones U.S. Total Stock Market Float Adjusted Index | 33.32 | 18.16 | 16,363 |
| Cumulative Returns of ETF Shares: September 18, 2018, Through August 31, 2021 | ||
| One Year | Since Inception (9/18/2018) | |
| ESG U.S. Stock ETF Market Price | 32.27% | 74.72% |
| ESG U.S. Stock ETF Net Asset Value | 32.41 | 74.70 |
| FTSE US All Cap Choice Index | 32.57 | 75.29 |
| Basic Materials | 1.9% |
| Consumer Discretionary | 16.7 |
| Consumer Staples | 4.5 |
| Energy | 0.2 |
| Financials | 10.8 |
| Health Care | 13.9 |
| Industrials | 11.4 |
| Real Estate | 3.8 |
| Technology | 32.2 |
| Telecommunications | 3.4 |
| Utilities | 1.2 |
| Futures Contracts | ||||
| ($000) | ||||
| Expiration | Number of Long (Short) Contracts | Notional Amount | Value and Unrealized Appreciation (Depreciation) | |
| Long Futures Contracts | ||||
| E-mini S&P 500 Index | September 2021 | 72 | 16,274 | 535 |
| ($000s, except shares and per-share amounts) | Amount |
| Assets | |
| Investments in Securities, at Value | |
| Unaffiliated Issuers (Cost $4,065,610) | 5,245,275 |
| Affiliated Issuers (Cost $12,873) | 12,873 |
| Total Investments in Securities | 5,258,148 |
| Investment in Vanguard | 165 |
| Cash Collateral Pledged—Futures Contracts | 733 |
| Receivables for Investment Securities Sold | 60 |
| Receivables for Accrued Income | 3,706 |
| Receivables for Capital Shares Issued | 4 |
| Total Assets | 5,262,816 |
| Liabilities | |
| Due to Custodian | 129 |
| Payables for Investment Securities Purchased | 3 |
| Collateral for Securities on Loan | 3,268 |
| Payables to Vanguard | 2 |
| Variation Margin Payable—Futures Contracts | 14 |
| Total Liabilities | 3,416 |
| Net Assets | 5,259,400 |
| At August 31, 2021, net assets consisted of: | |
| Paid-in Capital | 4,106,316 |
| Total Distributable Earnings (Loss) | 1,153,084 |
| Net Assets | 5,259,400 |
| Net Assets | |
| Applicable to 62,300,000 outstanding $.001 par value shares of beneficial interest (unlimited authorization) | 5,259,400 |
| Net Asset Value Per Share | $84.42 |
| Year Ended August 31, 2021 | |
| ($000) | |
| Investment Income | |
| Income | |
| Dividends | 44,845 |
| Interest1 | 4 |
| Securities Lending—Net | 72 |
| Total Income | 44,921 |
| Expenses | |
| The Vanguard Group—Note B | |
| Investment Advisory Services | 530 |
| Management and Administrative | 2,425 |
| Marketing and Distribution | 152 |
| Custodian Fees | 67 |
| Auditing Fees | 30 |
| Shareholders’ Reports | 48 |
| Trustees’ Fees and Expenses | 1 |
| Total Expenses | 3,253 |
| Net Investment Income | 41,668 |
| Realized Net Gain (Loss) | |
| Investment Securities Sold1,2 | 212,843 |
| Futures Contracts | 1,326 |
| Realized Net Gain (Loss) | 214,169 |
| Change in Unrealized Appreciation (Depreciation) | |
| Investment Securities1 | 782,855 |
| Futures Contracts | 316 |
| Change in Unrealized Appreciation (Depreciation) | 783,171 |
| Net Increase (Decrease) in Net Assets Resulting from Operations | 1,039,008 |
| 1 | Interest income, realized net gain (loss), and change in unrealized appreciation (depreciation) from an affiliated company of the fund were $4,000, less than $1,000, and less than $1,000, respectively. Purchases and sales are for temporary cash investment purposes. |
| 2 | Includes $229,866,000 of net gain (loss) resulting from in-kind redemptions. |
| Year Ended August 31, | ||
| 2021 ($000) | 2020 ($000) | |
| Increase (Decrease) in Net Assets | ||
| Operations | ||
| Net Investment Income | 41,668 | 17,157 |
| Realized Net Gain (Loss) | 214,169 | (16,325) |
| Change in Unrealized Appreciation (Depreciation) | 783,171 | 366,944 |
| Net Increase (Decrease) in Net Assets Resulting from Operations | 1,039,008 | 367,776 |
| Distributions | ||
| Total Distributions | (34,446) | (14,177) |
| Capital Share Transactions | ||
| Issued | 2,829,322 | 1,046,350 |
| Issued in Lieu of Cash Distributions | — | — |
| Redeemed | (548,827) | (20,140) |
| Net Increase (Decrease) from Capital Share Transactions | 2,280,495 | 1,026,210 |
| Total Increase (Decrease) | 3,285,057 | 1,379,809 |
| Net Assets | ||
| Beginning of Period | 1,974,343 | 594,534 |
| End of Period | 5,259,400 | 1,974,343 |
| For a Share Outstanding Throughout Each Period | September 18, 20181 to August 31, 2019 | Year Ended August 31, | |
| 2021 | 2020 | ||
| Net Asset Value, Beginning of Period | $64.47 | $51.25 | $50.00 |
| Investment Operations | |||
| Net Investment Income2 | .873 | .846 | .792 |
| Net Realized and Unrealized Gain (Loss) on Investments | 19.844 | 13.146 | .868 |
| Total from Investment Operations | 20.717 | 13.992 | 1.660 |
| Distributions | |||
| Dividends from Net Investment Income | (.767) | (.772) | (.410) |
| Distributions from Realized Capital Gains | — | — | — |
| Total Distributions | (.767) | (.772) | (.410) |
| Net Asset Value, End of Period | $84.42 | $64.47 | $51.25 |
| Total Return | 32.41% | 27.60% | 3.40% |
| Ratios/Supplemental Data | |||
| Net Assets, End of Period (Millions) | $5,259 | $1,974 | $595 |
| Ratio of Total Expenses to Average Net Assets | 0.09% | 0.12% | 0.12%3 |
| Ratio of Net Investment Income to Average Net Assets | 1.18% | 1.54% | 1.67%3 |
| Portfolio Turnover Rate4 | 6% | 6% | 6% |
| 1 | Inception. |
| 2 | Calculated based on average shares outstanding. |
| 3 | Annualized. |
| 4 | Excludes the value of portfolio securities received or delivered as a result of in-kind purchases or redemptions of the fund’s capital shares, including ETF Creation Units. |
| Level 1 ($000) | Level 2 ($000) | Level 3 ($000) | Total ($000) | |
| Investments | ||||
| Assets | ||||
| Common Stocks | 5,243,950 | — | 1,325 | 5,245,275 |
| Temporary Cash Investments | 12,873 | — | — | 12,873 |
| Total | 5,256,823 | — | 1,325 | 5,258,148 |
| Derivative Financial Instruments | ||||
| Assets | ||||
| Futures Contracts1 | 535 | — | — | 535 |
| 1 | Includes cumulative appreciation (depreciation) on futures contracts and centrally cleared swaps, if any, as reported in the Schedule of Investments. Only current day’s variation margin is reported within the Statement of Assets and Liabilities. |
| Amount ($000) | |
| Paid-in Capital | 229,881 |
| Total Distributable Earnings (Loss) | (229,881) |
| Amount ($000) | |
| Undistributed Ordinary Income | 12,192 |
| Undistributed Long-Term Gains | — |
| Capital Loss Carryforwards | (36,022) |
| Qualified Late-Year Losses | — |
| Net Unrealized Gains (Losses) | 1,176,914 |
| Year Ended August 31, | ||
| 2021 Amount ($000) | 2020 Amount ($000) | |
| Ordinary Income* | 34,446 | 14,177 |
| Long-Term Capital Gains | — | — |
| Total | 34,446 | 14,177 |
| * | Includes short-term capital gains, if any. |
| Amount ($000) | |
| Tax Cost | 4,081,234 |
| Gross Unrealized Appreciation | 1,233,464 |
| Gross Unrealized Depreciation | (56,550) |
| Net Unrealized Appreciation (Depreciation) | 1,176,914 |
| Year Ended August 31, | ||||
| 2021 Shares (000) | 2020 Shares (000) | |||
| Issued | 39,175 | 19,400 | ||
| Issued in Lieu of Cash Distributions | — | — | ||
| Redeemed | (7,500) | (375) | ||
| Net Increase (Decrease) in Shares Outstanding | 31,675 | 19,025 | ||
Philadelphia, Pennsylvania
October 18, 2021


| 1 | |
| 2 | |
| 4 | |
| 7 | |
| 95 | |
| 97 |
| • | Vanguard ESG International Stock ETF returned 25.45% (based on net asset value) for the 12 months ended August 31, 2021, roughly in line with the expense-free 25.67% return of its benchmark index. |
| • | The global economy rebounded faster than many had expected after the sharp pandemic-induced contraction in the spring of 2020. Countries that have been more successful in containing the virus have generally fared better economically. Swift and extensive fiscal and monetary support from policymakers has also been key to the rebound. |
| • | With the 12 months under review reflecting the recovery in stocks that followed the sharp downturn at the start of the pandemic, the fund’s results were excellent. |
| • | For the fund’s benchmark, all 11 industry sectors posted positive returns. Technology and financials returned more than 35%. Consumer staples, telecommunications, and health care lagged. |
| • | Canada and a number of European countries, including the Netherlands and Sweden, were among the index’s top performers. Two Asian heavyweights—Japan and especially China—underperformed. |
| Average Annual Total Returns Periods Ended August 31, 2021 | |||
| One Year | Three Years | Five Years | |
| Stocks | |||
| Russell 1000 Index (Large-caps) | 32.25% | 18.42% | 18.24% |
| Russell 2000 Index (Small-caps) | 47.08 | 10.75 | 14.38 |
| Russell 3000 Index (Broad U.S. market) | 33.04 | 17.85 | 17.97 |
| FTSE All-World ex US Index (International) | 25.74 | 9.82 | 10.23 |
| Bonds | |||
| Bloomberg U.S. Aggregate Bond Index (Broad taxable market) | -0.08% | 5.43% | 3.11% |
| Bloomberg Municipal Bond Index (Broad tax-exempt market) | 3.40 | 5.09 | 3.30 |
| FTSE Three-Month U.S. Treasury Bill Index | 0.06 | 1.20 | 1.13 |
| CPI | |||
| Consumer Price Index | 5.25% | 2.76% | 2.58% |
| • | Based on actual fund return. This section helps you to estimate the actual expenses that you paid over the period. The ”Ending Account Value“ shown is derived from the fund’s actual return, and the third column shows the dollar amount that would have been paid by an investor who started with $1,000 in the fund. You may use the information here, together with the amount you invested, to estimate the expenses that you paid over the period. |
| • | Based on hypothetical 5% yearly return. This section is intended to help you compare your fund‘s costs with those of other mutual funds. It assumes that the fund had a yearly return of 5% before expenses, but that the expense ratio is unchanged. In this case—because the return used is not the fund’s actual return—the results do not apply to your investment. The example is useful in making comparisons because the Securities and Exchange Commission requires all mutual funds to calculate expenses based on a 5% return. You can assess your fund’s costs by comparing this hypothetical example with the hypothetical examples that appear in shareholder reports of other funds. |
| Six Months Ended August 31, 2021 | |||
| ESG International Stock ETF | Beginning Account Value 2/28/2021 | Ending Account Value 8/31/2021 | Expenses Paid During Period |
| Based on Actual Fund Return | $1,000.00 | $1,074.10 | $0.52 |
| Based on Hypothetical 5% Yearly Return | 1,000.00 | 1,024.70 | 0.51 |
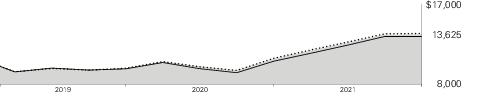
| Average Annual Total Returns Periods Ended August 31, 2021 | ||||
| One Year | Since Inception (9/18/2018) | Final Value of a $10,000 Investment | ||

| ESG International Stock ETF Net Asset Value | 25.45% | 11.05% | $13,625 |
| ESG International Stock ETF Market Price | 25.36 | 11.08 | 13,633 | |

| FTSE Global All Cap ex US Choice Index | 25.67 | 11.29 | 13,711 |

| FTSE Global All Cap ex US Index | 26.45 | 10.35 | 13,373 |
| Cumulative Returns of ETF Shares: September 18, 2018, Through August 31, 2021 | ||
| One Year | Since Inception (9/18/2018) | |
| ESG International Stock ETF Market Price | 25.36% | 36.33% |
| ESG International Stock ETF Net Asset Value | 25.45 | 36.25 |
| FTSE Global All Cap ex US Choice Index | 25.67 | 37.11 |
| Japan | 16.8% |
| China | 10.3 |
| United Kingdom | 8.4 |
| Canada | 6.8 |
| Taiwan | 5.9 |
| Switzerland | 5.7 |
| Germany | 5.3 |
| Australia | 5.0 |
| France | 4.5 |
| South Korea | 4.1 |
| Netherlands | 3.6 |
| India | 3.4 |
| Sweden | 2.6 |
| Hong Kong | 2.1 |
| Denmark | 1.8 |
| Brazil | 1.5 |
| Italy | 1.3 |
| South Africa | 1.1 |
| Spain | 1.0 |
| Other | 8.8 |
| Shares | Market Value• ($000) | |||||
| Temporary Cash Investments (0.6%) | ||||||
| Money Market Fund (0.6%) | ||||||
| 4,5 | Vanguard Market Liquidity Fund, 0.068% (Cost $15,384) | 153,841 | 15,384 | |||
| Total Investments (99.8%) (Cost $2,125,224) | 2,555,185 | |||||
| Other Assets and Liabilities—Net (0.2%) | 5,643 | |||||
| Net Assets (100%) | 2,560,828 | |||||
| Cost is in $000. | |
| • | See Note A in Notes to Financial Statements. |
| * | Non-income-producing security. |
| 1 | Security exempt from registration under Rule 144A of the Securities Act of 1933. Such securities may be sold in transactions exempt from registration, normally to qualified institutional buyers. At August 31, 2021, the aggregate value was $92,511,000, representing 3.6% of net assets. |
| 2 | Security value determined using significant unobservable inputs. |
| 3 | Includes partial security positions on loan to broker-dealers. The total value of securities on loan is $1,978,000. |
| 4 | Affiliated money market fund available only to Vanguard funds and certain trusts and accounts managed by Vanguard. Rate shown is the 7-day yield. |
| 5 | Collateral of $2,104,000 was received for securities on loan. |
| ADR—American Depositary Receipt. | |
| FDR—Fiduciary Depositary Receipt. | |
| GDR—Global Depositary Receipt. | |
| NVDR—Non-Voting Depositary Receipt. | |
| REIT—Real Estate Investment Trust. |
| Futures Contracts | ||||
| ($000) | ||||
| Expiration | Number of Long (Short) Contracts | Notional Amount | Value and Unrealized Appreciation (Depreciation) | |
| Long Futures Contracts | ||||
| MSCI EAFE Index | September 2021 | 68 | 7,995 | 73 |
| MSCI Emerging Market Index | September 2021 | 190 | 12,343 | (147) |
| (74) | ||||
| Forward Currency Contracts | |||||||
| Contract Settlement Date | Contract Amount (000) | Unrealized Appreciation ($000) | Unrealized (Depreciation) ($000) | ||||
| Counterparty | Receive | Deliver | |||||
| BNP Paribas | 9/15/21 | INR | 107,647 | USD | 1,456 | 17 | — |
| BNP Paribas | 9/15/21 | USD | 555 | JPY | 60,771 | 2 | — |
| 19 | — | ||||||
| INR—Indian rupee. |
| JPY—Japanese yen. |
| USD—U.S. dollar. |
| ($000s, except shares and per-share amounts) | Amount |
| Assets | |
| Investments in Securities, at Value | |
| Unaffiliated Issuers (Cost $2,109,840) | 2,539,801 |
| Affiliated Issuers (Cost $15,384) | 15,384 |
| Total Investments in Securities | 2,555,185 |
| Investment in Vanguard | 80 |
| Cash | 11 |
| Foreign Currency, at Value (Cost $4,780) | 4,776 |
| Cash Collateral Pledged—Futures Contracts | 1,110 |
| Receivables for Investment Securities Sold | 5 |
| Receivables for Accrued Income | 5,207 |
| Variation Margin Receivable—Futures Contracts | 173 |
| Unrealized Appreciation—Forward Currency Contracts | 19 |
| Total Assets | 2,566,566 |
| Liabilities | |
| Payables for Investment Securities Purchased | 976 |
| Collateral for Securities on Loan | 2,104 |
| Payables to Vanguard | 1 |
| Deferred Foreign Capital Gains Taxes | 2,657 |
| Total Liabilities | 5,738 |
| Net Assets | 2,560,828 |
| At August 31, 2021, net assets consisted of: | |
| Paid-in Capital | 2,133,198 |
| Total Distributable Earnings (Loss) | 427,630 |
| Net Assets | 2,560,828 |
| Net Assets | |
| Applicable to 39,800,000 outstanding $.001 par value shares of beneficial interest (unlimited authorization) | 2,560,828 |
| Net Asset Value Per Share | $64.34 |
| Year Ended August 31, 2021 | |
| ($000) | |
| Investment Income | |
| Income | |
| Dividends1 | 41,388 |
| Interest2 | 4 |
| Securities Lending—Net | 201 |
| Total Income | 41,593 |
| Expenses | |
| The Vanguard Group—Note B | |
| Investment Advisory Services | 276 |
| Management and Administrative | 1,419 |
| Marketing and Distribution | 79 |
| Custodian Fees | 359 |
| Auditing Fees | 43 |
| Shareholders’ Reports | 31 |
| Trustees’ Fees and Expenses | 1 |
| Total Expenses | 2,208 |
| Net Investment Income | 39,385 |
| Realized Net Gain (Loss) | |
| Investment Securities Sold2 | 4,698 |
| Futures Contracts | 1,846 |
| Forward Currency Contracts | 54 |
| Foreign Currencies | (56) |
| Realized Net Gain (Loss) | 6,542 |
| Change in Unrealized Appreciation (Depreciation) | |
| Investment Securities2,3 | 329,358 |
| Futures Contracts | (110) |
| Forward Currency Contracts | 25 |
| Foreign Currencies | (40) |
| Change in Unrealized Appreciation (Depreciation) | 329,233 |
| Net Increase (Decrease) in Net Assets Resulting from Operations | 375,160 |
| 1 | Dividends are net of foreign withholding taxes of $4,572,000. |
| 2 | Interest income, realized net gain (loss), and change in unrealized appreciation (depreciation) from an affiliated company of the fund were $4,000, less than $1,000, and ($1,000), respectively. Purchases and sales are for temporary cash investment purposes. |
| 3 | The change in unrealized appreciation (depreciation) is net of the change in deferred foreign capital gains taxes of $2,486,000. |
| Year Ended August 31, | ||
| 2021 ($000) | 2020 ($000) | |
| Increase (Decrease) in Net Assets | ||
| Operations | ||
| Net Investment Income | 39,385 | 18,028 |
| Realized Net Gain (Loss) | 6,542 | (12,482) |
| Change in Unrealized Appreciation (Depreciation) | 329,233 | 101,315 |
| Net Increase (Decrease) in Net Assets Resulting from Operations | 375,160 | 106,861 |
| Distributions | ||
| Total Distributions | (37,086) | (14,331) |
| Capital Share Transactions | ||
| Issued | 1,017,922 | 693,888 |
| Issued in Lieu of Cash Distributions | — | — |
| Redeemed | — | — |
| Net Increase (Decrease) from Capital Share Transactions | 1,017,922 | 693,888 |
| Total Increase (Decrease) | 1,355,996 | 786,418 |
| Net Assets | ||
| Beginning of Period | 1,204,832 | 418,414 |
| End of Period | 2,560,828 | 1,204,832 |
| For a Share Outstanding Throughout Each Period | September 18, 20181 to August 31, 2019 | Year Ended August 31, | |
| 2021 | 2020 | ||
| Net Asset Value, Beginning of Period | $52.38 | $48.09 | $50.00 |
| Investment Operations | |||
| Net Investment Income2 | 1.295 | 1.192 | 1.529 |
| Net Realized and Unrealized Gain (Loss) on Investments | 11.907 | 4.138 | (2.714) |
| Total from Investment Operations | 13.202 | 5.330 | (1.185) |
| Distributions | |||
| Dividends from Net Investment Income | (1.242) | (1.040) | (.725) |
| Distributions from Realized Capital Gains | — | — | — |
| Total Distributions | (1.242) | (1.040) | (.725) |
| Net Asset Value, End of Period | $64.34 | $52.38 | $48.09 |
| Total Return | 25.45% | 11.23% | -2.36% |
| Ratios/Supplemental Data | |||
| Net Assets, End of Period (Millions) | $2,561 | $1,205 | $418 |
| Ratio of Total Expenses to Average Net Assets | 0.12% | 0.15% | 0.17%3,4 |
| Ratio of Net Investment Income to Average Net Assets | 2.14% | 2.45% | 3.30%3 |
| Portfolio Turnover Rate5 | 7% | 12% | 22% |
| 1 | Inception. |
| 2 | Calculated based on average shares outstanding. |
| 3 | Annualized. |
| 4 | The ratio of expenses to average net assets for the period net of reduction from custody fee offset arrangements was 0.15%. |
| 5 | Excludes the value of portfolio securities received or delivered as a result of in-kind purchases or redemptions of the fund’s capital shares, including ETF Creation Units. |
| Level 1 ($000) | Level 2 ($000) | Level 3 ($000) | Total ($000) | |
| Investments | ||||
| Assets | ||||
| Common Stocks—North and South America | 226,793 | 5,810 | — | 232,603 |
| Common Stocks—Other | 38,765 | 2,267,079 | 1,354 | 2,307,198 |
| Temporary Cash Investments | 15,384 | — | — | 15,384 |
| Total | 280,942 | 2,272,889 | 1,354 | 2,555,185 |
| Derivative Financial Instruments | ||||
| Assets | ||||
| Futures Contracts1 | 73 | — | — | 73 |
| Forward Currency Contracts | — | 19 | — | 19 |
| Total | 73 | 19 | — | 92 |
| Liabilities | ||||
| Futures Contracts1 | 147 | — | — | 147 |
| 1 | Includes cumulative appreciation (depreciation) on futures contracts and centrally cleared swaps, if any, as reported in the Schedule of Investments. Only current day’s variation margin is reported within the Statement of Assets and Liabilities. |
| Statement of Assets and Liabilities | Equity Contracts ($000) | Foreign Exchange Contracts ($000) | Total ($000) |
| Unrealized Appreciation—Futures Contracts1 | 73 | — | 73 |
| Unrealized Appreciation—Forward Currency Contracts | — | 19 | 19 |
| Total Assets | 73 | 19 | 92 |
| Unrealized Depreciation—Futures Contracts1 | 147 | — | 147 |
| Unrealized Depreciation—Forward Currency Contracts | — | — | — |
| Total Liabilities | 147 | — | 147 |
| 1 | Includes cumulative appreciation (depreciation) on futures contracts and centrally cleared swaps, if any, as reported in the Schedule of Investments. Only current day’s variation margin is reported within the Statement of Assets and Liabilities. |
| Realized Net Gain (Loss) on Derivatives | Equity Contracts ($000) | Foreign Exchange Contracts ($000) | Total ($000) |
| Futures Contracts | 1,846 | — | 1,846 |
| Forward Currency Contracts | — | 54 | 54 |
| Realized Net Gain (Loss) on Derivatives | 1,846 | 54 | 1,900 |
| Change in Unrealized Appreciation (Depreciation) on Derivatives | |||
| Futures Contracts | (110) | — | (110) |
| Forward Currency Contracts | — | 25 | 25 |
| Change in Unrealized Appreciation (Depreciation) on Derivatives | (110) | 25 | (85) |
| Amount ($000) | |
| Undistributed Ordinary Income | 19,648 |
| Undistributed Long-Term Gains | — |
| Capital Loss Carryforwards | (8,598) |
| Qualified Late-Year Losses | — |
| Net Unrealized Gains (Losses) | 416,580 |
| Year Ended August 31, | ||
| 2021 Amount ($000) | 2020 Amount ($000) | |
| Ordinary Income* | 37,086 | 14,331 |
| Long-Term Capital Gains | — | — |
| Total | 37,086 | 14,331 |
| * | Includes short-term capital gains, if any. |
| Amount ($000) | |
| Tax Cost | 2,135,976 |
| Gross Unrealized Appreciation | 527,697 |
| Gross Unrealized Depreciation | (108,488) |
| Net Unrealized Appreciation (Depreciation) | 419,209 |
| Year Ended August 31, | ||||
| 2021 Shares (000) | 2020 Shares (000) | |||
| Issued | 16,800 | 14,300 | ||
| Issued in Lieu of Cash Distributions | — | — | ||
| Redeemed | — | — | ||
| Net Increase (Decrease) in Shares Outstanding | 16,800 | 14,300 | ||
Philadelphia, Pennsylvania
October 18, 2021


| 1 | |
| 2 | |
| 4 | |
| 6 | |
| 57 | |
| 59 |
| • | From its inception on September 22, 2020, to August 31, 2021, Vanguard ESG U.S. Corporate Bond ETF returned 1.20%, a performance roughly in line with the 1.29% return of its benchmark index. |
| • | The global economy rebounded faster during the ETF’s fiscal year than many had expected after the sharp pandemic-induced contraction in the spring of 2020. Countries that have been more successful in containing the virus have generally fared better economically. Swift and extensive fiscal and monetary support from policymakers has also been key to the rebound. |
| • | Bond returns for the period were dampened by rising yields across much of the developed world, notably in the United States. |
| • | For the fund’s benchmark index, bonds issued by financial institutions outperformed those of industrial and utility companies. By credit quality, lower-rated corporate bonds generally outperformed higher-rated ones, and by maturity, results were mixed. |
| Average Annual Total Returns Periods Ended August 31, 2021 | |||
| One Year | Three Years | Five Years | |
| Stocks | |||
| Russell 1000 Index (Large-caps) | 32.25% | 18.42% | 18.24% |
| Russell 2000 Index (Small-caps) | 47.08 | 10.75 | 14.38 |
| Russell 3000 Index (Broad U.S. market) | 33.04 | 17.85 | 17.97 |
| FTSE All-World ex US Index (International) | 25.74 | 9.82 | 10.23 |
| Bonds | |||
| Bloomberg U.S. Aggregate Bond Index (Broad taxable market) | -0.08% | 5.43% | 3.11% |
| Bloomberg Municipal Bond Index (Broad tax-exempt market) | 3.40 | 5.09 | 3.30 |
| FTSE Three-Month U.S. Treasury Bill Index | 0.06 | 1.20 | 1.13 |
| CPI | |||
| Consumer Price Index | 5.25% | 2.76% | 2.58% |
| • | Based on actual fund return. This section helps you to estimate the actual expenses that you paid over the period. The ”Ending Account Value“ shown is derived from the fund’s actual return, and the third column shows the dollar amount that would have been paid by an investor who started with $1,000 in the fund. You may use the information here, together with the amount you invested, to estimate the expenses that you paid over the period. |
| • | Based on hypothetical 5% yearly return. This section is intended to help you compare your fund‘s costs with those of other mutual funds. It assumes that the fund had a yearly return of 5% before expenses, but that the expense ratio is unchanged. In this case—because the return used is not the fund’s actual return—the results do not apply to your investment. The example is useful in making comparisons because the Securities and Exchange Commission requires all mutual funds to calculate expenses based on a 5% return. You can assess your fund’s costs by comparing this hypothetical example with the hypothetical examples that appear in shareholder reports of other funds. |
| Six Months Ended August 31, 2021 | |||
| ESG U.S. Corporate Bond ETF | Beginning Account Value 2/28/2021 | Ending Account Value 8/31/2021 | Expenses Paid During Period |
| Based on Actual Fund Return | $1,000.00 | $1,026.30 | $0.61 |
| Based on Hypothetical 5% Yearly Return | 1,000.00 | 1,024.60 | 0.61 |
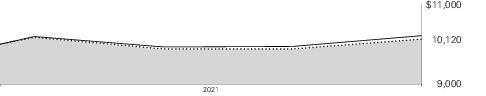
| Total Returns Period Ended August 31, 2021 | |||
| Since Inception (9/22/2020) | Final Value of a $10,000 Investment | ||

| ESG U.S. Corporate Bond ETF Net Asset Value | 1.20% | $10,120 |
| ESG U.S. Corporate Bond ETF Market Price | 1.25 | 10,125 | |

| Bloomberg MSCI US Corporate SRI Select Index | 1.29 | 10,129 |

| Bloomberg U.S. Corporate Bond Index | 2.14 | 10,214 |
| Corporate Bonds – Communications | 14.9% |
| Corporate Bonds – Consumer Discretionary | 6.6 |
| Corporate Bonds – Consumer Staples | 3.6 |
| Corporate Bonds – Financials | 38.9 |
| Corporate Bonds – Health Care | 16.0 |
| Corporate Bonds – Industrials | 2.5 |
| Corporate Bonds – Materials | 1.5 |
| Corporate Bonds – Real Estate | 1.9 |
| Corporate Bonds – Technology | 13.9 |
| Corporate Bonds – Utilities | 0.1 |
| U.S. Government and Agency Obligations | 0.1 |
| Coupon | Maturity Date | Face Amount ($000) | Market Value• ($000) | |||
| U.S. Government and Agency Obligations (0.0%) | ||||||
| U.S. Government Securities (0.0%) | ||||||
| United States Treasury Note/Bond (Cost $118) | 1.875% | 2/15/51 | 120 | 119 | ||
| Corporate Bonds (99.0%) | ||||||
| Communications (14.7%) | ||||||
| Activision Blizzard Inc. | 3.400% | 9/15/26 | 60 | 66 | ||
| Activision Blizzard Inc. | 2.500% | 9/15/50 | 85 | 76 | ||
| Alphabet Inc. | 3.375% | 2/25/24 | 90 | 97 | ||
| Alphabet Inc. | 0.450% | 8/15/25 | 50 | 50 | ||
| Alphabet Inc. | 1.998% | 8/15/26 | 120 | 126 | ||
| Alphabet Inc. | 0.800% | 8/15/27 | 110 | 108 | ||
| Alphabet Inc. | 1.100% | 8/15/30 | 195 | 187 | ||
| Alphabet Inc. | 1.900% | 8/15/40 | 70 | 65 | ||
| Alphabet Inc. | 2.050% | 8/15/50 | 156 | 142 | ||
| Alphabet Inc. | 2.250% | 8/15/60 | 90 | 82 | ||
| America Movil SAB de CV | 3.625% | 4/22/29 | 95 | 105 | ||
| America Movil SAB de CV | 2.875% | 5/7/30 | 65 | 69 | ||
| America Movil SAB de CV | 6.125% | 3/30/40 | 160 | 230 | ||
| America Movil SAB de CV | 4.375% | 7/16/42 | 45 | 55 | ||
| America Movil SAB de CV | 4.375% | 4/22/49 | 120 | 151 | ||
| AT&T Inc. | 2.625% | 12/1/22 | 30 | 31 | ||
| AT&T Inc. | 0.900% | 3/25/24 | 60 | 60 | ||
| AT&T Inc. | 4.450% | 4/1/24 | 25 | 27 | ||
| AT&T Inc. | 3.400% | 5/15/25 | 250 | 271 | ||
| AT&T Inc. | 4.125% | 2/17/26 | 200 | 224 | ||
| AT&T Inc. | 1.700% | 3/25/26 | 240 | 243 | ||
| AT&T Inc. | 3.800% | 2/15/27 | 100 | 112 | ||
| AT&T Inc. | 4.250% | 3/1/27 | 50 | 57 | ||
| AT&T Inc. | 2.300% | 6/1/27 | 160 | 167 | ||
| AT&T Inc. | 1.650% | 2/1/28 | 65 | 65 | ||
| 1 | AT&T Inc. | 4.100% | 2/15/28 | 110 | 126 | |
| AT&T Inc. | 4.350% | 3/1/29 | 100 | 116 | ||
| 1 | AT&T Inc. | 4.300% | 2/15/30 | 245 | 285 | |
| AT&T Inc. | 2.750% | 6/1/31 | 135 | 141 | ||
| AT&T Inc. | 2.250% | 2/1/32 | 75 | 75 | ||
| 2 | AT&T Inc. | 2.550% | 12/1/33 | 50 | 50 | |
| AT&T Inc. | 4.500% | 5/15/35 | 65 | 77 | ||
| AT&T Inc. | 5.250% | 3/1/37 | 70 | 89 | ||
| AT&T Inc. | 4.850% | 3/1/39 | 134 | 164 | ||
| AT&T Inc. | 5.350% | 9/1/40 | 105 | 136 | ||
| AT&T Inc. | 3.500% | 6/1/41 | 195 | 206 | ||
| Coupon | Maturity Date | Face Amount ($000) | Market Value• ($000) | |||
| AT&T Inc. | 4.300% | 12/15/42 | 50 | 58 | ||
| AT&T Inc. | 3.100% | 2/1/43 | 180 | 179 | ||
| AT&T Inc. | 4.350% | 6/15/45 | 85 | 98 | ||
| AT&T Inc. | 4.750% | 5/15/46 | 125 | 153 | ||
| AT&T Inc. | 5.650% | 2/15/47 | 90 | 123 | ||
| AT&T Inc. | 4.500% | 3/9/48 | 200 | 238 | ||
| AT&T Inc. | 4.550% | 3/9/49 | 250 | 300 | ||
| AT&T Inc. | 5.150% | 2/15/50 | 125 | 162 | ||
| AT&T Inc. | 3.650% | 6/1/51 | 150 | 159 | ||
| AT&T Inc. | 3.300% | 2/1/52 | 130 | 129 | ||
| 2 | AT&T Inc. | 3.500% | 9/15/53 | 430 | 441 | |
| 2 | AT&T Inc. | 3.550% | 9/15/55 | 395 | 404 | |
| 2 | AT&T Inc. | 3.800% | 12/1/57 | 142 | 151 | |
| 2 | AT&T Inc. | 3.650% | 9/15/59 | 185 | 190 | |
| AT&T Inc. | 3.850% | 6/1/60 | 125 | 133 | ||
| AT&T Inc. | 3.500% | 2/1/61 | 98 | 97 | ||
| Bell Telephone Co. of Canada or Bell Canada | 4.464% | 4/1/48 | 65 | 81 | ||
| Booking Holdings Inc. | 3.600% | 6/1/26 | 50 | 55 | ||
| Booking Holdings Inc. | 4.625% | 4/13/30 | 110 | 132 | ||
| British Telecommunications plc | 9.625% | 12/15/30 | 145 | 224 | ||
| 1 | Charter Communications Operating LLC | 4.500% | 2/1/24 | 50 | 54 | |
| Charter Communications Operating LLC | 4.908% | 7/23/25 | 125 | 142 | ||
| Charter Communications Operating LLC | 3.750% | 2/15/28 | 75 | 83 | ||
| Charter Communications Operating LLC | 4.200% | 3/15/28 | 125 | 141 | ||
| Charter Communications Operating LLC | 5.050% | 3/30/29 | 145 | 172 | ||
| Charter Communications Operating LLC | 2.800% | 4/1/31 | 175 | 179 | ||
| Charter Communications Operating LLC | 2.300% | 2/1/32 | 100 | 98 | ||
| Charter Communications Operating LLC | 6.384% | 10/23/35 | 145 | 194 | ||
| Charter Communications Operating LLC | 5.375% | 4/1/38 | 115 | 142 | ||
| Charter Communications Operating LLC | 3.500% | 6/1/41 | 130 | 131 | ||
| Charter Communications Operating LLC | 6.484% | 10/23/45 | 235 | 328 | ||
| Charter Communications Operating LLC | 5.375% | 5/1/47 | 95 | 117 | ||
| Charter Communications Operating LLC | 5.750% | 4/1/48 | 78 | 101 | ||
| Charter Communications Operating LLC | 5.125% | 7/1/49 | 50 | 60 | ||
| Charter Communications Operating LLC | 4.800% | 3/1/50 | 120 | 141 | ||
| Charter Communications Operating LLC | 3.700% | 4/1/51 | 140 | 141 | ||
| Charter Communications Operating LLC | 3.900% | 6/1/52 | 95 | 98 | ||
| Charter Communications Operating LLC | 3.850% | 4/1/61 | 160 | 159 | ||
| Charter Communications Operating LLC | 4.400% | 12/1/61 | 50 | 55 | ||
| Comcast Cable Communications Holdings Inc. | 9.455% | 11/15/22 | 65 | 72 | ||
| Comcast Corp. | 3.600% | 3/1/24 | 65 | 70 | ||
| Comcast Corp. | 3.700% | 4/15/24 | 185 | 200 | ||
| Comcast Corp. | 3.375% | 2/15/25 | 125 | 135 | ||
| Comcast Corp. | 3.375% | 8/15/25 | 25 | 27 | ||
| Comcast Corp. | 3.950% | 10/15/25 | 215 | 240 | ||
| Comcast Corp. | 3.150% | 3/1/26 | 150 | 163 | ||
| Comcast Corp. | 2.350% | 1/15/27 | 110 | 116 | ||
| Comcast Corp. | 3.300% | 2/1/27 | 100 | 110 | ||
| Comcast Corp. | 3.150% | 2/15/28 | 25 | 27 | ||
| Comcast Corp. | 3.550% | 5/1/28 | 125 | 140 | ||
| Comcast Corp. | 4.150% | 10/15/28 | 100 | 116 | ||
| Comcast Corp. | 2.650% | 2/1/30 | 180 | 190 | ||
| Comcast Corp. | 3.400% | 4/1/30 | 25 | 28 | ||
| Comcast Corp. | 4.250% | 10/15/30 | 145 | 171 | ||
| Comcast Corp. | 1.950% | 1/15/31 | 75 | 75 | ||
| Coupon | Maturity Date | Face Amount ($000) | Market Value• ($000) | |||
| Comcast Corp. | 1.500% | 2/15/31 | 25 | 24 | ||
| Comcast Corp. | 4.250% | 1/15/33 | 75 | 90 | ||
| Comcast Corp. | 7.050% | 3/15/33 | 75 | 110 | ||
| Comcast Corp. | 4.200% | 8/15/34 | 125 | 149 | ||
| Comcast Corp. | 4.400% | 8/15/35 | 65 | 79 | ||
| Comcast Corp. | 6.500% | 11/15/35 | 21 | 31 | ||
| Comcast Corp. | 3.200% | 7/15/36 | 85 | 93 | ||
| Comcast Corp. | 3.900% | 3/1/38 | 60 | 70 | ||
| Comcast Corp. | 4.600% | 10/15/38 | 40 | 50 | ||
| Comcast Corp. | 3.250% | 11/1/39 | 70 | 76 | ||
| Comcast Corp. | 3.750% | 4/1/40 | 115 | 132 | ||
| Comcast Corp. | 3.400% | 7/15/46 | 75 | 82 | ||
| Comcast Corp. | 4.000% | 8/15/47 | 180 | 213 | ||
| Comcast Corp. | 3.969% | 11/1/47 | 120 | 141 | ||
| Comcast Corp. | 4.000% | 3/1/48 | 140 | 166 | ||
| Comcast Corp. | 4.700% | 10/15/48 | 38 | 50 | ||
| Comcast Corp. | 3.999% | 11/1/49 | 225 | 268 | ||
| Comcast Corp. | 3.450% | 2/1/50 | 35 | 38 | ||
| Comcast Corp. | 2.800% | 1/15/51 | 52 | 51 | ||
| 2 | Comcast Corp. | 2.887% | 11/1/51 | 224 | 223 | |
| Comcast Corp. | 2.450% | 8/15/52 | 200 | 184 | ||
| 2 | Comcast Corp. | 2.937% | 11/1/56 | 282 | 279 | |
| Comcast Corp. | 4.950% | 10/15/58 | 30 | 43 | ||
| Comcast Corp. | 2.650% | 8/15/62 | 105 | 97 | ||
| 2 | Comcast Corp. | 2.987% | 11/1/63 | 258 | 254 | |
| Deutsche Telekom International Finance BV | 8.750% | 6/15/30 | 245 | 369 | ||
| Discovery Communications LLC | 2.950% | 3/20/23 | 68 | 70 | ||
| Discovery Communications LLC | 3.950% | 3/20/28 | 125 | 140 | ||
| Discovery Communications LLC | 4.125% | 5/15/29 | 85 | 96 | ||
| Discovery Communications LLC | 3.625% | 5/15/30 | 5 | 5 | ||
| Discovery Communications LLC | 5.200% | 9/20/47 | 115 | 145 | ||
| Discovery Communications LLC | 5.300% | 5/15/49 | 85 | 109 | ||
| Discovery Communications LLC | 4.650% | 5/15/50 | 35 | 41 | ||
| Discovery Communications LLC | 4.000% | 9/15/55 | 40 | 43 | ||
| Electronic Arts Inc. | 1.850% | 2/15/31 | 35 | 34 | ||
| Electronic Arts Inc. | 2.950% | 2/15/51 | 60 | 59 | ||
| Expedia Group Inc. | 3.800% | 2/15/28 | 120 | 129 | ||
| Expedia Group Inc. | 3.250% | 2/15/30 | 100 | 104 | ||
| Fox Corp. | 4.030% | 1/25/24 | 15 | 16 | ||
| Fox Corp. | 4.709% | 1/25/29 | 190 | 224 | ||
| Fox Corp. | 5.476% | 1/25/39 | 125 | 162 | ||
| Fox Corp. | 5.576% | 1/25/49 | 53 | 73 | ||
| Grupo Televisa SAB | 5.250% | 5/24/49 | 100 | 132 | ||
| Omnicom Group Inc. | 3.650% | 11/1/24 | 140 | 152 | ||
| Omnicom Group Inc. | 3.600% | 4/15/26 | 40 | 44 | ||
| Omnicom Group Inc. | 2.600% | 8/1/31 | 50 | 52 | ||
| Orange SA | 9.000% | 3/1/31 | 159 | 251 | ||
| Orange SA | 5.375% | 1/13/42 | 25 | 34 | ||
| Orange SA | 5.500% | 2/6/44 | 65 | 91 | ||
| Rogers Communications Inc. | 4.100% | 10/1/23 | 80 | 85 | ||
| Rogers Communications Inc. | 5.000% | 3/15/44 | 30 | 38 | ||
| Rogers Communications Inc. | 4.300% | 2/15/48 | 30 | 35 | ||
| Rogers Communications Inc. | 4.350% | 5/1/49 | 95 | 111 | ||
| Rogers Communications Inc. | 3.700% | 11/15/49 | 85 | 91 | ||
| Telefonica Emisiones SA | 4.103% | 3/8/27 | 150 | 169 | ||
| Coupon | Maturity Date | Face Amount ($000) | Market Value• ($000) | |||
| Telefonica Emisiones SA | 7.045% | 6/20/36 | 130 | 189 | ||
| Telefonica Emisiones SA | 4.665% | 3/6/38 | 90 | 107 | ||
| Telefonica Emisiones SA | 5.213% | 3/8/47 | 95 | 120 | ||
| Telefonica Emisiones SA | 4.895% | 3/6/48 | 60 | 73 | ||
| Telefonica Emisiones SA | 5.520% | 3/1/49 | 35 | 46 | ||
| Telefonica Europe BV | 8.250% | 9/15/30 | 115 | 168 | ||
| TELUS Corp. | 4.600% | 11/16/48 | 60 | 77 | ||
| Time Warner Cable LLC | 6.550% | 5/1/37 | 90 | 123 | ||
| Time Warner Cable LLC | 6.750% | 6/15/39 | 80 | 112 | ||
| Time Warner Cable LLC | 5.875% | 11/15/40 | 115 | 148 | ||
| Time Warner Cable LLC | 5.500% | 9/1/41 | 65 | 81 | ||
| Time Warner Cable LLC | 4.500% | 9/15/42 | 115 | 129 | ||
| Time Warner Entertainment Co. LP | 8.375% | 3/15/23 | 85 | 95 | ||
| Time Warner Entertainment Co. LP | 8.375% | 7/15/33 | 95 | 142 | ||
| T-Mobile USA Inc. | 3.500% | 4/15/25 | 170 | 184 | ||
| T-Mobile USA Inc. | 1.500% | 2/15/26 | 175 | 176 | ||
| T-Mobile USA Inc. | 3.750% | 4/15/27 | 195 | 216 | ||
| T-Mobile USA Inc. | 2.050% | 2/15/28 | 105 | 107 | ||
| T-Mobile USA Inc. | 3.875% | 4/15/30 | 325 | 364 | ||
| T-Mobile USA Inc. | 2.550% | 2/15/31 | 200 | 204 | ||
| T-Mobile USA Inc. | 2.250% | 11/15/31 | 35 | 35 | ||
| T-Mobile USA Inc. | 4.375% | 4/15/40 | 75 | 88 | ||
| T-Mobile USA Inc. | 3.000% | 2/15/41 | 95 | 94 | ||
| T-Mobile USA Inc. | 4.500% | 4/15/50 | 205 | 246 | ||
| T-Mobile USA Inc. | 3.300% | 2/15/51 | 185 | 186 | ||
| 2 | T-Mobile USA Inc. | 3.400% | 10/15/52 | 75 | 76 | |
| T-Mobile USA Inc. | 3.600% | 11/15/60 | 80 | 82 | ||
| 1 | TWDC Enterprises 18 Corp. | 2.350% | 12/1/22 | 85 | 87 | |
| 1 | TWDC Enterprises 18 Corp. | 3.150% | 9/17/25 | 80 | 87 | |
| 1 | TWDC Enterprises 18 Corp. | 2.950% | 6/15/27 | 45 | 49 | |
| 1 | TWDC Enterprises 18 Corp. | 4.125% | 6/1/44 | 45 | 55 | |
| VeriSign Inc. | 2.700% | 6/15/31 | 10 | 10 | ||
| Verizon Communications Inc. | 0.750% | 3/22/24 | 25 | 25 | ||
| Verizon Communications Inc. | 3.500% | 11/1/24 | 205 | 222 | ||
| Verizon Communications Inc. | 3.376% | 2/15/25 | 170 | 184 | ||
| Verizon Communications Inc. | 0.850% | 11/20/25 | 100 | 99 | ||
| Verizon Communications Inc. | 1.450% | 3/20/26 | 280 | 284 | ||
| Verizon Communications Inc. | 2.625% | 8/15/26 | 105 | 112 | ||
| Verizon Communications Inc. | 4.125% | 3/16/27 | 225 | 257 | ||
| Verizon Communications Inc. | 3.000% | 3/22/27 | 105 | 114 | ||
| Verizon Communications Inc. | 2.100% | 3/22/28 | 250 | 257 | ||
| Verizon Communications Inc. | 4.329% | 9/21/28 | 195 | 227 | ||
| Verizon Communications Inc. | 4.016% | 12/3/29 | 215 | 248 | ||
| Verizon Communications Inc. | 3.150% | 3/22/30 | 125 | 135 | ||
| Verizon Communications Inc. | 1.500% | 9/18/30 | 90 | 87 | ||
| Verizon Communications Inc. | 1.680% | 10/30/30 | 100 | 97 | ||
| Verizon Communications Inc. | 1.750% | 1/20/31 | 50 | 48 | ||
| Verizon Communications Inc. | 2.550% | 3/21/31 | 230 | 238 | ||
| Verizon Communications Inc. | 4.500% | 8/10/33 | 70 | 85 | ||
| Verizon Communications Inc. | 4.400% | 11/1/34 | 152 | 183 | ||
| Verizon Communications Inc. | 4.272% | 1/15/36 | 105 | 125 | ||
| Verizon Communications Inc. | 5.250% | 3/16/37 | 100 | 132 | ||
| Verizon Communications Inc. | 2.650% | 11/20/40 | 200 | 194 | ||
| Verizon Communications Inc. | 3.400% | 3/22/41 | 130 | 139 | ||
| Verizon Communications Inc. | 4.125% | 8/15/46 | 105 | 123 | ||
| Coupon | Maturity Date | Face Amount ($000) | Market Value• ($000) | |||
| Verizon Communications Inc. | 4.862% | 8/21/46 | 226 | 295 | ||
| Verizon Communications Inc. | 4.522% | 9/15/48 | 215 | 271 | ||
| Verizon Communications Inc. | 5.012% | 4/15/49 | 125 | 167 | ||
| Verizon Communications Inc. | 4.000% | 3/22/50 | 170 | 198 | ||
| Verizon Communications Inc. | 2.875% | 11/20/50 | 195 | 188 | ||
| Verizon Communications Inc. | 3.550% | 3/22/51 | 300 | 326 | ||
| Verizon Communications Inc. | 4.672% | 3/15/55 | 120 | 156 | ||
| Verizon Communications Inc. | 2.987% | 10/30/56 | 160 | 154 | ||
| Verizon Communications Inc. | 3.000% | 11/20/60 | 235 | 226 | ||
| Verizon Communications Inc. | 3.700% | 3/22/61 | 210 | 231 | ||
| ViacomCBS Inc. | 4.750% | 5/15/25 | 85 | 96 | ||
| ViacomCBS Inc. | 4.000% | 1/15/26 | 35 | 39 | ||
| ViacomCBS Inc. | 7.875% | 7/30/30 | 90 | 128 | ||
| ViacomCBS Inc. | 4.950% | 1/15/31 | 100 | 121 | ||
| ViacomCBS Inc. | 4.200% | 5/19/32 | 110 | 127 | ||
| ViacomCBS Inc. | 6.875% | 4/30/36 | 100 | 144 | ||
| ViacomCBS Inc. | 4.375% | 3/15/43 | 60 | 70 | ||
| ViacomCBS Inc. | 5.850% | 9/1/43 | 40 | 55 | ||
| ViacomCBS Inc. | 4.950% | 5/19/50 | 25 | 32 | ||
| Vodafone Group plc | 3.750% | 1/16/24 | 108 | 116 | ||
| Vodafone Group plc | 4.125% | 5/30/25 | 110 | 122 | ||
| Vodafone Group plc | 4.375% | 5/30/28 | 75 | 87 | ||
| Vodafone Group plc | 6.150% | 2/27/37 | 115 | 161 | ||
| Vodafone Group plc | 5.000% | 5/30/38 | 50 | 64 | ||
| Vodafone Group plc | 4.375% | 2/19/43 | 65 | 77 | ||
| Vodafone Group plc | 5.250% | 5/30/48 | 220 | 293 | ||
| Vodafone Group plc | 4.875% | 6/19/49 | 90 | 115 | ||
| Vodafone Group plc | 4.250% | 9/17/50 | 90 | 106 | ||
| Walt Disney Co. | 3.000% | 9/15/22 | 115 | 118 | ||
| Walt Disney Co. | 1.750% | 8/30/24 | 120 | 124 | ||
| Walt Disney Co. | 3.350% | 3/24/25 | 50 | 54 | ||
| Walt Disney Co. | 1.750% | 1/13/26 | 25 | 26 | ||
| Walt Disney Co. | 2.200% | 1/13/28 | 105 | 109 | ||
| Walt Disney Co. | 2.000% | 9/1/29 | 65 | 66 | ||
| Walt Disney Co. | 3.800% | 3/22/30 | 105 | 121 | ||
| Walt Disney Co. | 2.650% | 1/13/31 | 140 | 149 | ||
| Walt Disney Co. | 6.200% | 12/15/34 | 70 | 99 | ||
| Walt Disney Co. | 6.400% | 12/15/35 | 125 | 184 | ||
| Walt Disney Co. | 6.650% | 11/15/37 | 60 | 92 | ||
| Walt Disney Co. | 3.500% | 5/13/40 | 125 | 141 | ||
| Walt Disney Co. | 4.700% | 3/23/50 | 85 | 114 | ||
| Walt Disney Co. | 3.600% | 1/13/51 | 235 | 272 | ||
| Walt Disney Co. | 3.800% | 5/13/60 | 90 | 108 | ||
| Weibo Corp. | 3.500% | 7/5/24 | 75 | 79 | ||
| Weibo Corp. | 3.375% | 7/8/30 | 10 | 10 | ||
| WPP Finance 2010 | 3.750% | 9/19/24 | 45 | 49 | ||
| 32,002 | ||||||
| Consumer Discretionary (6.6%) | ||||||
| Alibaba Group Holding Ltd. | 3.600% | 11/28/24 | 100 | 108 | ||
| Alibaba Group Holding Ltd. | 3.400% | 12/6/27 | 35 | 38 | ||
| Alibaba Group Holding Ltd. | 2.125% | 2/9/31 | 105 | 103 | ||
| Alibaba Group Holding Ltd. | 4.000% | 12/6/37 | 115 | 129 | ||
| Alibaba Group Holding Ltd. | 2.700% | 2/9/41 | 160 | 152 | ||
| Alibaba Group Holding Ltd. | 4.200% | 12/6/47 | 85 | 98 | ||
| Alibaba Group Holding Ltd. | 3.150% | 2/9/51 | 45 | 44 | ||
| Coupon | Maturity Date | Face Amount ($000) | Market Value• ($000) | |||
| Alibaba Group Holding Ltd. | 4.400% | 12/6/57 | 80 | 95 | ||
| Amazon.com Inc. | 2.500% | 11/29/22 | 140 | 143 | ||
| Amazon.com Inc. | 2.400% | 2/22/23 | 150 | 155 | ||
| Amazon.com Inc. | 0.450% | 5/12/24 | 170 | 170 | ||
| Amazon.com Inc. | 2.800% | 8/22/24 | 105 | 112 | ||
| Amazon.com Inc. | 3.800% | 12/5/24 | 50 | 55 | ||
| Amazon.com Inc. | 0.800% | 6/3/25 | 65 | 65 | ||
| Amazon.com Inc. | 1.000% | 5/12/26 | 130 | 131 | ||
| Amazon.com Inc. | 1.200% | 6/3/27 | 130 | 130 | ||
| Amazon.com Inc. | 3.150% | 8/22/27 | 240 | 266 | ||
| Amazon.com Inc. | 1.650% | 5/12/28 | 20 | 20 | ||
| Amazon.com Inc. | 1.500% | 6/3/30 | 190 | 187 | ||
| Amazon.com Inc. | 2.100% | 5/12/31 | 145 | 149 | ||
| Amazon.com Inc. | 4.800% | 12/5/34 | 80 | 104 | ||
| Amazon.com Inc. | 3.875% | 8/22/37 | 190 | 227 | ||
| Amazon.com Inc. | 2.875% | 5/12/41 | 20 | 21 | ||
| Amazon.com Inc. | 4.950% | 12/5/44 | 205 | 282 | ||
| Amazon.com Inc. | 4.050% | 8/22/47 | 200 | 247 | ||
| Amazon.com Inc. | 2.500% | 6/3/50 | 145 | 139 | ||
| Amazon.com Inc. | 3.100% | 5/12/51 | 165 | 178 | ||
| Amazon.com Inc. | 4.250% | 8/22/57 | 150 | 195 | ||
| Amazon.com Inc. | 2.700% | 6/3/60 | 153 | 148 | ||
| Amazon.com Inc. | 3.250% | 5/12/61 | 75 | 82 | ||
| 1 | American Honda Finance Corp. | 2.050% | 1/10/23 | 20 | 20 | |
| 1 | American Honda Finance Corp. | 1.950% | 5/10/23 | 20 | 21 | |
| 1 | American Honda Finance Corp. | 0.875% | 7/7/23 | 120 | 121 | |
| 1 | American Honda Finance Corp. | 0.650% | 9/8/23 | 65 | 65 | |
| 1 | American Honda Finance Corp. | 1.200% | 7/8/25 | 45 | 45 | |
| 1 | American Honda Finance Corp. | 2.000% | 3/24/28 | 110 | 113 | |
| AutoZone Inc. | 4.000% | 4/15/30 | 75 | 86 | ||
| BorgWarner Inc. | 2.650% | 7/1/27 | 65 | 69 | ||
| Daimler Finance North America LLC | 8.500% | 1/18/31 | 106 | 162 | ||
| eBay Inc. | 2.750% | 1/30/23 | 25 | 26 | ||
| eBay Inc. | 3.450% | 8/1/24 | 10 | 11 | ||
| eBay Inc. | 1.900% | 3/11/25 | 35 | 36 | ||
| eBay Inc. | 1.400% | 5/10/26 | 30 | 30 | ||
| eBay Inc. | 3.600% | 6/5/27 | 70 | 78 | ||
| eBay Inc. | 2.700% | 3/11/30 | 70 | 73 | ||
| eBay Inc. | 2.600% | 5/10/31 | 35 | 36 | ||
| eBay Inc. | 4.000% | 7/15/42 | 62 | 71 | ||
| eBay Inc. | 3.650% | 5/10/51 | 40 | 44 | ||
| General Motors Co. | 4.875% | 10/2/23 | 50 | 54 | ||
| General Motors Co. | 6.125% | 10/1/25 | 70 | 83 | ||
| General Motors Co. | 4.200% | 10/1/27 | 145 | 162 | ||
| General Motors Co. | 6.800% | 10/1/27 | 150 | 189 | ||
| General Motors Co. | 5.000% | 10/1/28 | 100 | 117 | ||
| General Motors Co. | 5.000% | 4/1/35 | 45 | 54 | ||
| General Motors Co. | 6.600% | 4/1/36 | 25 | 34 | ||
| General Motors Co. | 5.150% | 4/1/38 | 20 | 24 | ||
| General Motors Co. | 6.250% | 10/2/43 | 120 | 164 | ||
| General Motors Co. | 5.200% | 4/1/45 | 100 | 124 | ||
| General Motors Co. | 6.750% | 4/1/46 | 60 | 87 | ||
| General Motors Co. | 5.400% | 4/1/48 | 75 | 95 | ||
| General Motors Co. | 5.950% | 4/1/49 | 10 | 14 | ||
| General Motors Financial Co. Inc. | 5.200% | 3/20/23 | 110 | 117 | ||
| Coupon | Maturity Date | Face Amount ($000) | Market Value• ($000) | |||
| General Motors Financial Co. Inc. | 3.700% | 5/9/23 | 75 | 78 | ||
| General Motors Financial Co. Inc. | 5.100% | 1/17/24 | 50 | 55 | ||
| General Motors Financial Co. Inc. | 1.050% | 3/8/24 | 160 | 161 | ||
| General Motors Financial Co. Inc. | 3.950% | 4/13/24 | 42 | 45 | ||
| General Motors Financial Co. Inc. | 3.500% | 11/7/24 | 50 | 54 | ||
| General Motors Financial Co. Inc. | 4.000% | 1/15/25 | 100 | 109 | ||
| General Motors Financial Co. Inc. | 2.900% | 2/26/25 | 75 | 79 | ||
| General Motors Financial Co. Inc. | 4.350% | 4/9/25 | 25 | 28 | ||
| General Motors Financial Co. Inc. | 2.750% | 6/20/25 | 25 | 26 | ||
| General Motors Financial Co. Inc. | 4.300% | 7/13/25 | 75 | 83 | ||
| General Motors Financial Co. Inc. | 5.250% | 3/1/26 | 125 | 144 | ||
| General Motors Financial Co. Inc. | 1.500% | 6/10/26 | 100 | 100 | ||
| General Motors Financial Co. Inc. | 4.000% | 10/6/26 | 105 | 116 | ||
| General Motors Financial Co. Inc. | 4.350% | 1/17/27 | 85 | 96 | ||
| General Motors Financial Co. Inc. | 2.700% | 8/20/27 | 40 | 42 | ||
| General Motors Financial Co. Inc. | 3.600% | 6/21/30 | 65 | 71 | ||
| Hasbro Inc. | 3.900% | 11/19/29 | 55 | 61 | ||
| Home Depot Inc. | 2.700% | 4/1/23 | 45 | 46 | ||
| Home Depot Inc. | 3.750% | 2/15/24 | 150 | 161 | ||
| Home Depot Inc. | 3.350% | 9/15/25 | 75 | 82 | ||
| Home Depot Inc. | 3.000% | 4/1/26 | 50 | 54 | ||
| Home Depot Inc. | 2.125% | 9/15/26 | 100 | 105 | ||
| Home Depot Inc. | 2.500% | 4/15/27 | 75 | 80 | ||
| Home Depot Inc. | 3.900% | 12/6/28 | 80 | 93 | ||
| Home Depot Inc. | 2.950% | 6/15/29 | 65 | 71 | ||
| Home Depot Inc. | 2.700% | 4/15/30 | 140 | 150 | ||
| Home Depot Inc. | 1.375% | 3/15/31 | 50 | 48 | ||
| Home Depot Inc. | 5.875% | 12/16/36 | 59 | 85 | ||
| Home Depot Inc. | 3.300% | 4/15/40 | 66 | 73 | ||
| Home Depot Inc. | 5.950% | 4/1/41 | 15 | 22 | ||
| Home Depot Inc. | 4.200% | 4/1/43 | 20 | 25 | ||
| Home Depot Inc. | 4.400% | 3/15/45 | 85 | 109 | ||
| Home Depot Inc. | 4.250% | 4/1/46 | 105 | 132 | ||
| Home Depot Inc. | 3.900% | 6/15/47 | 75 | 90 | ||
| Home Depot Inc. | 4.500% | 12/6/48 | 135 | 177 | ||
| Home Depot Inc. | 3.125% | 12/15/49 | 110 | 118 | ||
| Home Depot Inc. | 3.350% | 4/15/50 | 115 | 128 | ||
| Home Depot Inc. | 3.500% | 9/15/56 | 140 | 160 | ||
| Lear Corp. | 3.800% | 9/15/27 | 45 | 50 | ||
| Lennar Corp. | 4.750% | 11/29/27 | 85 | 99 | ||
| Lowe's Cos. Inc. | 3.375% | 9/15/25 | 15 | 16 | ||
| Lowe's Cos. Inc. | 2.500% | 4/15/26 | 150 | 159 | ||
| Lowe's Cos. Inc. | 1.300% | 4/15/28 | 25 | 25 | ||
| Lowe's Cos. Inc. | 3.650% | 4/5/29 | 126 | 141 | ||
| Lowe's Cos. Inc. | 4.500% | 4/15/30 | 15 | 18 | ||
| Lowe's Cos. Inc. | 1.700% | 10/15/30 | 70 | 68 | ||
| Lowe's Cos. Inc. | 2.625% | 4/1/31 | 110 | 115 | ||
| Lowe's Cos. Inc. | 3.700% | 4/15/46 | 80 | 89 | ||
| Lowe's Cos. Inc. | 4.050% | 5/3/47 | 90 | 105 | ||
| Lowe's Cos. Inc. | 3.000% | 10/15/50 | 105 | 105 | ||
| Magna International Inc. | 3.625% | 6/15/24 | 50 | 54 | ||
| Magna International Inc. | 2.450% | 6/15/30 | 40 | 41 | ||
| 1 | Marriott International Inc. | 5.750% | 5/1/25 | 105 | 121 | |
| 1 | Marriott International Inc. | 3.125% | 6/15/26 | 60 | 64 | |
| 1 | Marriott International Inc. | 4.625% | 6/15/30 | 105 | 121 | |
| Coupon | Maturity Date | Face Amount ($000) | Market Value• ($000) | |||
| 1 | Marriott International Inc. | 2.850% | 4/15/31 | 15 | 15 | |
| 1 | Marriott International Inc. | 3.500% | 10/15/32 | 55 | 59 | |
| 1 | McDonald's Corp. | 3.700% | 1/30/26 | 25 | 28 | |
| 1 | McDonald's Corp. | 3.500% | 3/1/27 | 50 | 55 | |
| 1 | McDonald's Corp. | 3.500% | 7/1/27 | 55 | 61 | |
| 1 | McDonald's Corp. | 3.800% | 4/1/28 | 110 | 124 | |
| 1 | McDonald's Corp. | 2.625% | 9/1/29 | 194 | 205 | |
| 1 | McDonald's Corp. | 2.125% | 3/1/30 | 50 | 51 | |
| 1 | McDonald's Corp. | 4.700% | 12/9/35 | 95 | 119 | |
| 1 | McDonald's Corp. | 6.300% | 10/15/37 | 50 | 72 | |
| 1 | McDonald's Corp. | 6.300% | 3/1/38 | 95 | 138 | |
| 1 | McDonald's Corp. | 4.875% | 12/9/45 | 50 | 66 | |
| 1 | McDonald's Corp. | 4.450% | 3/1/47 | 100 | 125 | |
| 1 | McDonald's Corp. | 4.450% | 9/1/48 | 42 | 53 | |
| 1 | McDonald's Corp. | 3.625% | 9/1/49 | 40 | 45 | |
| 1 | McDonald's Corp. | 4.200% | 4/1/50 | 10 | 12 | |
| NIKE Inc. | 2.400% | 3/27/25 | 10 | 11 | ||
| NIKE Inc. | 2.375% | 11/1/26 | 115 | 123 | ||
| NIKE Inc. | 2.750% | 3/27/27 | 59 | 64 | ||
| NIKE Inc. | 2.850% | 3/27/30 | 45 | 49 | ||
| NIKE Inc. | 3.250% | 3/27/40 | 95 | 106 | ||
| NIKE Inc. | 3.375% | 3/27/50 | 128 | 147 | ||
| Nordstrom Inc. | 5.000% | 1/15/44 | 40 | 40 | ||
| NVR Inc. | 3.000% | 5/15/30 | 62 | 66 | ||
| O'Reilly Automotive Inc. | 3.600% | 9/1/27 | 60 | 67 | ||
| Ralph Lauren Corp. | 2.950% | 6/15/30 | 50 | 54 | ||
| Stanley Black & Decker Inc. | 2.300% | 3/15/30 | 40 | 42 | ||
| Stanley Black & Decker Inc. | 2.750% | 11/15/50 | 30 | 30 | ||
| 1 | Stanley Black & Decker Inc. | 4.000% | 3/15/60 | 85 | 91 | |
| Starbucks Corp. | 3.100% | 3/1/23 | 80 | 83 | ||
| Starbucks Corp. | 3.800% | 8/15/25 | 50 | 55 | ||
| Starbucks Corp. | 4.000% | 11/15/28 | 70 | 81 | ||
| Starbucks Corp. | 3.550% | 8/15/29 | 55 | 62 | ||
| Starbucks Corp. | 2.250% | 3/12/30 | 50 | 51 | ||
| Starbucks Corp. | 2.550% | 11/15/30 | 45 | 47 | ||
| Starbucks Corp. | 4.500% | 11/15/48 | 50 | 63 | ||
| Starbucks Corp. | 4.450% | 8/15/49 | 75 | 95 | ||
| Starbucks Corp. | 3.500% | 11/15/50 | 70 | 77 | ||
| Stellantis NV | 5.250% | 4/15/23 | 95 | 102 | ||
| TJX Cos. Inc. | 2.250% | 9/15/26 | 160 | 169 | ||
| VF Corp. | 2.400% | 4/23/25 | 80 | 84 | ||
| VF Corp. | 2.950% | 4/23/30 | 35 | 37 | ||
| 14,270 | ||||||
| Consumer Staples (3.6%) | ||||||
| Archer-Daniels-Midland Co. | 2.500% | 8/11/26 | 115 | 122 | ||
| Archer-Daniels-Midland Co. | 3.250% | 3/27/30 | 35 | 39 | ||
| Bunge Ltd. Finance Corp. | 2.750% | 5/14/31 | 10 | 10 | ||
| Campbell Soup Co. | 3.950% | 3/15/25 | 110 | 121 | ||
| Campbell Soup Co. | 4.150% | 3/15/28 | 35 | 40 | ||
| Coca-Cola Co. | 1.750% | 9/6/24 | 45 | 47 | ||
| Coca-Cola Co. | 3.375% | 3/25/27 | 70 | 78 | ||
| Coca-Cola Co. | 1.450% | 6/1/27 | 25 | 25 | ||
| Coca-Cola Co. | 1.500% | 3/5/28 | 100 | 101 | ||
| Coca-Cola Co. | 1.000% | 3/15/28 | 120 | 117 | ||
| Coca-Cola Co. | 2.125% | 9/6/29 | 60 | 62 | ||
| Coupon | Maturity Date | Face Amount ($000) | Market Value• ($000) | |||
| Coca-Cola Co. | 3.450% | 3/25/30 | 90 | 102 | ||
| Coca-Cola Co. | 1.650% | 6/1/30 | 65 | 64 | ||
| Coca-Cola Co. | 2.000% | 3/5/31 | 85 | 87 | ||
| Coca-Cola Co. | 1.375% | 3/15/31 | 20 | 19 | ||
| Coca-Cola Co. | 2.250% | 1/5/32 | 115 | 119 | ||
| Coca-Cola Co. | 2.500% | 6/1/40 | 130 | 130 | ||
| Coca-Cola Co. | 2.875% | 5/5/41 | 30 | 32 | ||
| Coca-Cola Co. | 2.600% | 6/1/50 | 58 | 57 | ||
| Coca-Cola Co. | 3.000% | 3/5/51 | 75 | 80 | ||
| Coca-Cola Co. | 2.500% | 3/15/51 | 75 | 73 | ||
| Coca-Cola Co. | 2.750% | 6/1/60 | 100 | 101 | ||
| Conagra Brands Inc. | 4.300% | 5/1/24 | 65 | 71 | ||
| Conagra Brands Inc. | 4.600% | 11/1/25 | 125 | 141 | ||
| Conagra Brands Inc. | 1.375% | 11/1/27 | 25 | 25 | ||
| Conagra Brands Inc. | 4.850% | 11/1/28 | 50 | 60 | ||
| Conagra Brands Inc. | 5.300% | 11/1/38 | 40 | 52 | ||
| Conagra Brands Inc. | 5.400% | 11/1/48 | 65 | 89 | ||
| Dollar General Corp. | 3.250% | 4/15/23 | 85 | 88 | ||
| Dollar General Corp. | 3.500% | 4/3/30 | 60 | 67 | ||
| Dollar Tree Inc. | 3.700% | 5/15/23 | 95 | 100 | ||
| Dollar Tree Inc. | 4.000% | 5/15/25 | 55 | 60 | ||
| Dollar Tree Inc. | 4.200% | 5/15/28 | 50 | 57 | ||
| General Mills Inc. | 3.700% | 10/17/23 | 75 | 80 | ||
| General Mills Inc. | 4.000% | 4/17/25 | 60 | 66 | ||
| General Mills Inc. | 4.200% | 4/17/28 | 60 | 69 | ||
| General Mills Inc. | 2.875% | 4/15/30 | 85 | 91 | ||
| Hormel Foods Corp. | 0.650% | 6/3/24 | 50 | 50 | ||
| Hormel Foods Corp. | 1.800% | 6/11/30 | 40 | 40 | ||
| J M Smucker Co. | 3.500% | 3/15/25 | 60 | 65 | ||
| Kellogg Co. | 3.250% | 4/1/26 | 60 | 66 | ||
| Keurig Dr Pepper Inc. | 4.057% | 5/25/23 | 13 | 14 | ||
| Keurig Dr Pepper Inc. | 4.417% | 5/25/25 | 85 | 95 | ||
| Keurig Dr Pepper Inc. | 4.597% | 5/25/28 | 145 | 170 | ||
| Keurig Dr Pepper Inc. | 3.200% | 5/1/30 | 60 | 65 | ||
| Keurig Dr Pepper Inc. | 3.800% | 5/1/50 | 30 | 34 | ||
| Kimberly-Clark Corp. | 3.100% | 3/26/30 | 70 | 78 | ||
| McCormick & Co. Inc. | 3.400% | 8/15/27 | 50 | 56 | ||
| Mead Johnson Nutrition Co. | 4.125% | 11/15/25 | 136 | 153 | ||
| Mondelez International Inc. | 1.500% | 5/4/25 | 95 | 97 | ||
| Mondelez International Inc. | 2.750% | 4/13/30 | 25 | 26 | ||
| Mondelez International Inc. | 2.625% | 9/4/50 | 105 | 100 | ||
| PepsiCo Inc. | 2.750% | 3/1/23 | 85 | 88 | ||
| PepsiCo Inc. | 0.400% | 10/7/23 | 85 | 85 | ||
| PepsiCo Inc. | 3.600% | 3/1/24 | 21 | 22 | ||
| PepsiCo Inc. | 2.250% | 3/19/25 | 75 | 79 | ||
| PepsiCo Inc. | 2.750% | 4/30/25 | 100 | 107 | ||
| PepsiCo Inc. | 2.375% | 10/6/26 | 80 | 86 | ||
| PepsiCo Inc. | 3.000% | 10/15/27 | 75 | 83 | ||
| PepsiCo Inc. | 2.625% | 7/29/29 | 80 | 86 | ||
| PepsiCo Inc. | 2.750% | 3/19/30 | 90 | 98 | ||
| PepsiCo Inc. | 1.625% | 5/1/30 | 50 | 50 | ||
| PepsiCo Inc. | 3.500% | 3/19/40 | 50 | 57 | ||
| PepsiCo Inc. | 4.000% | 3/5/42 | 50 | 61 | ||
| PepsiCo Inc. | 4.450% | 4/14/46 | 100 | 131 | ||
| PepsiCo Inc. | 3.450% | 10/6/46 | 110 | 125 | ||
| Coupon | Maturity Date | Face Amount ($000) | Market Value• ($000) | |||
| PepsiCo Inc. | 3.375% | 7/29/49 | 90 | 102 | ||
| PepsiCo Inc. | 3.625% | 3/19/50 | 80 | 95 | ||
| PepsiCo Inc. | 3.875% | 3/19/60 | 93 | 117 | ||
| Procter & Gamble Co. | 3.100% | 8/15/23 | 40 | 42 | ||
| Procter & Gamble Co. | 0.550% | 10/29/25 | 160 | 159 | ||
| Procter & Gamble Co. | 2.450% | 11/3/26 | 135 | 145 | ||
| Procter & Gamble Co. | 2.850% | 8/11/27 | 5 | 5 | ||
| Procter & Gamble Co. | 3.000% | 3/25/30 | 65 | 72 | ||
| Procter & Gamble Co. | 1.200% | 10/29/30 | 75 | 72 | ||
| Sysco Corp. | 5.650% | 4/1/25 | 35 | 40 | ||
| Sysco Corp. | 3.750% | 10/1/25 | 25 | 27 | ||
| Sysco Corp. | 3.300% | 7/15/26 | 110 | 120 | ||
| Sysco Corp. | 3.250% | 7/15/27 | 75 | 82 | ||
| Sysco Corp. | 5.950% | 4/1/30 | 17 | 22 | ||
| Sysco Corp. | 6.600% | 4/1/50 | 100 | 160 | ||
| Target Corp. | 3.500% | 7/1/24 | 55 | 60 | ||
| Target Corp. | 2.250% | 4/15/25 | 75 | 79 | ||
| Target Corp. | 2.500% | 4/15/26 | 35 | 38 | ||
| Target Corp. | 3.375% | 4/15/29 | 175 | 197 | ||
| Target Corp. | 2.350% | 2/15/30 | 10 | 11 | ||
| Target Corp. | 4.000% | 7/1/42 | 45 | 57 | ||
| Tyson Foods Inc. | 3.950% | 8/15/24 | 57 | 62 | ||
| Tyson Foods Inc. | 4.000% | 3/1/26 | 5 | 6 | ||
| Tyson Foods Inc. | 3.550% | 6/2/27 | 110 | 123 | ||
| Tyson Foods Inc. | 4.550% | 6/2/47 | 25 | 31 | ||
| Tyson Foods Inc. | 5.100% | 9/28/48 | 115 | 157 | ||
| Unilever Capital Corp. | 2.600% | 5/5/24 | 25 | 26 | ||
| Unilever Capital Corp. | 2.900% | 5/5/27 | 55 | 60 | ||
| Unilever Capital Corp. | 3.500% | 3/22/28 | 20 | 22 | ||
| Unilever Capital Corp. | 2.125% | 9/6/29 | 125 | 129 | ||
| Unilever Capital Corp. | 5.900% | 11/15/32 | 130 | 180 | ||
| Walgreens Boots Alliance Inc. | 3.800% | 11/18/24 | 35 | 38 | ||
| Walgreens Boots Alliance Inc. | 3.450% | 6/1/26 | 75 | 82 | ||
| Walgreens Boots Alliance Inc. | 4.800% | 11/18/44 | 85 | 105 | ||
| Walgreens Boots Alliance Inc. | 4.100% | 4/15/50 | 25 | 28 | ||
| 7,760 | ||||||
| Financials (38.5%) | ||||||
| 1 | Aegon NV | 5.500% | 4/11/48 | 10 | 12 | |
| AerCap Ireland Capital DAC | 4.500% | 9/15/23 | 20 | 21 | ||
| AerCap Ireland Capital DAC | 4.875% | 1/16/24 | 25 | 27 | ||
| AerCap Ireland Capital DAC | 3.150% | 2/15/24 | 50 | 52 | ||
| AerCap Ireland Capital DAC | 2.875% | 8/14/24 | 165 | 172 | ||
| AerCap Ireland Capital DAC | 6.500% | 7/15/25 | 125 | 146 | ||
| AerCap Ireland Capital DAC | 3.650% | 7/21/27 | 100 | 106 | ||
| Aflac Inc. | 3.625% | 11/15/24 | 70 | 77 | ||
| Aflac Inc. | 3.600% | 4/1/30 | 95 | 108 | ||
| Air Lease Corp. | 3.000% | 9/15/23 | 45 | 47 | ||
| 1 | Air Lease Corp. | 0.700% | 2/15/24 | 10 | 10 | |
| 1 | Air Lease Corp. | 2.300% | 2/1/25 | 25 | 26 | |
| 1 | Air Lease Corp. | 2.875% | 1/15/26 | 25 | 26 | |
| 1 | Air Lease Corp. | 3.750% | 6/1/26 | 175 | 191 | |
| Air Lease Corp. | 3.125% | 12/1/30 | 70 | 72 | ||
| Ally Financial Inc. | 3.050% | 6/5/23 | 100 | 104 | ||
| Ally Financial Inc. | 1.450% | 10/2/23 | 40 | 41 | ||
| Ally Financial Inc. | 3.875% | 5/21/24 | 60 | 65 | ||
| Coupon | Maturity Date | Face Amount ($000) | Market Value• ($000) | |||
| Ally Financial Inc. | 5.800% | 5/1/25 | 160 | 185 | ||
| 1 | Ally Financial Inc. | 8.000% | 11/1/31 | 93 | 136 | |
| American Express Co. | 2.650% | 12/2/22 | 73 | 75 | ||
| American Express Co. | 3.400% | 2/27/23 | 85 | 89 | ||
| American Express Co. | 3.700% | 8/3/23 | 45 | 48 | ||
| American Express Co. | 3.400% | 2/22/24 | 100 | 107 | ||
| American Express Co. | 2.500% | 7/30/24 | 90 | 95 | ||
| American Express Co. | 3.000% | 10/30/24 | 120 | 129 | ||
| American Express Co. | 4.200% | 11/6/25 | 25 | 28 | ||
| American Express Co. | 3.125% | 5/20/26 | 90 | 98 | ||
| American Express Co. | 4.050% | 12/3/42 | 105 | 128 | ||
| 1 | American Express Credit Corp. | 3.300% | 5/3/27 | 60 | 66 | |
| American International Group Inc. | 4.125% | 2/15/24 | 25 | 27 | ||
| American International Group Inc. | 2.500% | 6/30/25 | 110 | 116 | ||
| American International Group Inc. | 3.750% | 7/10/25 | 20 | 22 | ||
| American International Group Inc. | 3.900% | 4/1/26 | 135 | 150 | ||
| American International Group Inc. | 4.200% | 4/1/28 | 75 | 86 | ||
| American International Group Inc. | 3.400% | 6/30/30 | 65 | 72 | ||
| American International Group Inc. | 3.875% | 1/15/35 | 85 | 97 | ||
| American International Group Inc. | 6.250% | 5/1/36 | 60 | 84 | ||
| American International Group Inc. | 4.500% | 7/16/44 | 60 | 74 | ||
| American International Group Inc. | 4.800% | 7/10/45 | 10 | 13 | ||
| American International Group Inc. | 4.750% | 4/1/48 | 135 | 176 | ||
| 1 | American International Group Inc. | 5.750% | 4/1/48 | 10 | 12 | |
| American International Group Inc. | 4.375% | 1/15/55 | 105 | 132 | ||
| Ameriprise Financial Inc. | 4.000% | 10/15/23 | 60 | 65 | ||
| Aon Corp. | 3.750% | 5/2/29 | 10 | 11 | ||
| Aon Corp. | 2.800% | 5/15/30 | 95 | 101 | ||
| Aon plc | 3.875% | 12/15/25 | 25 | 28 | ||
| Arch Capital Group Ltd. | 3.635% | 6/30/50 | 65 | 72 | ||
| Arthur J Gallagher & Co. | 3.500% | 5/20/51 | 35 | 38 | ||
| Athene Holding Ltd. | 4.125% | 1/12/28 | 140 | 157 | ||
| 1 | Australia & New Zealand Banking Group Ltd. | 2.625% | 11/9/22 | 75 | 77 | |
| 1 | Australia & New Zealand Banking Group Ltd. | 2.050% | 11/21/22 | 85 | 87 | |
| 1 | Australia & New Zealand Banking Group Ltd. | 3.700% | 11/16/25 | 75 | 84 | |
| AXA SA | 8.600% | 12/15/30 | 30 | 45 | ||
| Banco Bilbao Vizcaya Argentaria SA | 0.875% | 9/18/23 | 25 | 25 | ||
| Banco Bilbao Vizcaya Argentaria SA | 1.125% | 9/18/25 | 70 | 70 | ||
| Banco Santander SA | 3.125% | 2/23/23 | 105 | 109 | ||
| Banco Santander SA | 3.848% | 4/12/23 | 110 | 116 | ||
| Banco Santander SA | 2.706% | 6/27/24 | 130 | 137 | ||
| Banco Santander SA | 2.746% | 5/28/25 | 110 | 116 | ||
| Banco Santander SA | 5.179% | 11/19/25 | 60 | 69 | ||
| Banco Santander SA | 4.250% | 4/11/27 | 160 | 181 | ||
| Banco Santander SA | 3.800% | 2/23/28 | 65 | 72 | ||
| Banco Santander SA | 4.379% | 4/12/28 | 25 | 29 | ||
| Banco Santander SA | 3.306% | 6/27/29 | 10 | 11 | ||
| Banco Santander SA | 3.490% | 5/28/30 | 155 | 169 | ||
| Banco Santander SA | 2.749% | 12/3/30 | 25 | 25 | ||
| 1 | Bank of America Corp. | 2.503% | 10/21/22 | 70 | 70 | |
| 1 | Bank of America Corp. | 3.300% | 1/11/23 | 301 | 313 | |
| Bank of America Corp. | 4.100% | 7/24/23 | 150 | 161 | ||
| 1 | Bank of America Corp. | 3.004% | 12/20/23 | 260 | 268 | |
| 1 | Bank of America Corp. | 4.125% | 1/22/24 | 185 | 201 | |
| 1 | Bank of America Corp. | 3.550% | 3/5/24 | 230 | 240 | |
| Coupon | Maturity Date | Face Amount ($000) | Market Value• ($000) | |||
| 1 | Bank of America Corp. | 4.000% | 4/1/24 | 75 | 82 | |
| 1 | Bank of America Corp. | 1.486% | 5/19/24 | 50 | 51 | |
| 1 | Bank of America Corp. | 0.523% | 6/14/24 | 50 | 50 | |
| 1 | Bank of America Corp. | 3.864% | 7/23/24 | 100 | 106 | |
| 1 | Bank of America Corp. | 4.200% | 8/26/24 | 285 | 313 | |
| 1 | Bank of America Corp. | 0.810% | 10/24/24 | 175 | 176 | |
| 1 | Bank of America Corp. | 4.000% | 1/22/25 | 140 | 153 | |
| 1 | Bank of America Corp. | 3.458% | 3/15/25 | 50 | 53 | |
| 1 | Bank of America Corp. | 3.950% | 4/21/25 | 150 | 164 | |
| Bank of America Corp. | 0.976% | 4/22/25 | 75 | 75 | ||
| 1 | Bank of America Corp. | 3.875% | 8/1/25 | 80 | 89 | |
| 1 | Bank of America Corp. | 0.981% | 9/25/25 | 125 | 125 | |
| 1 | Bank of America Corp. | 3.093% | 10/1/25 | 50 | 53 | |
| 1 | Bank of America Corp. | 2.456% | 10/22/25 | 175 | 183 | |
| 1 | Bank of America Corp. | 3.366% | 1/23/26 | 50 | 54 | |
| 1 | Bank of America Corp. | 2.015% | 2/13/26 | 180 | 185 | |
| 1 | Bank of America Corp. | 4.450% | 3/3/26 | 100 | 113 | |
| 1 | Bank of America Corp. | 3.500% | 4/19/26 | 150 | 165 | |
| 1 | Bank of America Corp. | 1.319% | 6/19/26 | 235 | 236 | |
| 1 | Bank of America Corp. | 4.250% | 10/22/26 | 133 | 151 | |
| 1 | Bank of America Corp. | 1.197% | 10/24/26 | 225 | 224 | |
| 1 | Bank of America Corp. | 1.658% | 3/11/27 | 50 | 51 | |
| 1 | Bank of America Corp. | 3.559% | 4/23/27 | 225 | 247 | |
| Bank of America Corp. | 1.734% | 7/22/27 | 270 | 274 | ||
| 1 | Bank of America Corp. | 3.248% | 10/21/27 | 75 | 82 | |
| 1 | Bank of America Corp. | 4.183% | 11/25/27 | 150 | 169 | |
| 1 | Bank of America Corp. | 3.824% | 1/20/28 | 160 | 178 | |
| 1 | Bank of America Corp. | 3.705% | 4/24/28 | 75 | 83 | |
| 1 | Bank of America Corp. | 3.593% | 7/21/28 | 75 | 83 | |
| 1 | Bank of America Corp. | 3.419% | 12/20/28 | 263 | 289 | |
| 1 | Bank of America Corp. | 3.970% | 3/5/29 | 255 | 287 | |
| 1 | Bank of America Corp. | 2.087% | 6/14/29 | 100 | 102 | |
| 1 | Bank of America Corp. | 4.271% | 7/23/29 | 188 | 216 | |
| 1 | Bank of America Corp. | 3.974% | 2/7/30 | 210 | 238 | |
| 1 | Bank of America Corp. | 3.194% | 7/23/30 | 150 | 162 | |
| 1 | Bank of America Corp. | 2.884% | 10/22/30 | 125 | 132 | |
| 1 | Bank of America Corp. | 2.496% | 2/13/31 | 265 | 272 | |
| 1 | Bank of America Corp. | 2.592% | 4/29/31 | 125 | 129 | |
| 1 | Bank of America Corp. | 1.898% | 7/23/31 | 205 | 201 | |
| 1 | Bank of America Corp. | 1.922% | 10/24/31 | 200 | 196 | |
| 1 | Bank of America Corp. | 2.651% | 3/11/32 | 165 | 171 | |
| Bank of America Corp. | 2.687% | 4/22/32 | 200 | 208 | ||
| Bank of America Corp. | 2.299% | 7/21/32 | 95 | 96 | ||
| Bank of America Corp. | 6.110% | 1/29/37 | 155 | 213 | ||
| 1 | Bank of America Corp. | 4.244% | 4/24/38 | 110 | 130 | |
| Bank of America Corp. | 7.750% | 5/14/38 | 170 | 269 | ||
| 1 | Bank of America Corp. | 4.078% | 4/23/40 | 10 | 12 | |
| 1 | Bank of America Corp. | 2.676% | 6/19/41 | 240 | 236 | |
| 1 | Bank of America Corp. | 5.875% | 2/7/42 | 60 | 88 | |
| Bank of America Corp. | 3.311% | 4/22/42 | 165 | 178 | ||
| 1 | Bank of America Corp. | 5.000% | 1/21/44 | 50 | 67 | |
| 1 | Bank of America Corp. | 4.443% | 1/20/48 | 100 | 126 | |
| 1 | Bank of America Corp. | 3.946% | 1/23/49 | 55 | 65 | |
| 1 | Bank of America Corp. | 4.330% | 3/15/50 | 255 | 319 | |
| 1 | Bank of America Corp. | 4.083% | 3/20/51 | 245 | 296 | |
| Coupon | Maturity Date | Face Amount ($000) | Market Value• ($000) | |||
| 1 | Bank of America Corp. | 2.831% | 10/24/51 | 55 | 54 | |
| 1 | Bank of America Corp. | 3.483% | 3/13/52 | 185 | 205 | |
| Bank of America Corp. | 2.972% | 7/21/52 | 95 | 96 | ||
| 1 | Bank of America NA | 6.000% | 10/15/36 | 195 | 272 | |
| 1 | Bank of Montreal | 2.350% | 9/11/22 | 50 | 51 | |
| 1 | Bank of Montreal | 2.550% | 11/6/22 | 50 | 51 | |
| Bank of Montreal | 0.450% | 12/8/23 | 105 | 105 | ||
| 1 | Bank of Montreal | 3.300% | 2/5/24 | 75 | 80 | |
| 1 | Bank of Montreal | 2.500% | 6/28/24 | 25 | 26 | |
| 1 | Bank of Montreal | 0.625% | 7/9/24 | 75 | 75 | |
| 1 | Bank of Montreal | 1.850% | 5/1/25 | 95 | 98 | |
| 1 | Bank of Montreal | 4.338% | 10/5/28 | 74 | 79 | |
| 1 | Bank of Montreal | 3.803% | 12/15/32 | 85 | 94 | |
| 1 | Bank of New York Mellon Corp. | 1.850% | 1/27/23 | 95 | 97 | |
| 1 | Bank of New York Mellon Corp. | 2.950% | 1/29/23 | 100 | 104 | |
| 1 | Bank of New York Mellon Corp. | 3.500% | 4/28/23 | 25 | 26 | |
| 1 | Bank of New York Mellon Corp. | 2.200% | 8/16/23 | 86 | 89 | |
| 1 | Bank of New York Mellon Corp. | 0.350% | 12/7/23 | 50 | 50 | |
| 1 | Bank of New York Mellon Corp. | 2.100% | 10/24/24 | 20 | 21 | |
| 1 | Bank of New York Mellon Corp. | 3.000% | 2/24/25 | 50 | 54 | |
| 1 | Bank of New York Mellon Corp. | 1.600% | 4/24/25 | 135 | 139 | |
| 1 | Bank of New York Mellon Corp. | 2.800% | 5/4/26 | 20 | 22 | |
| 1 | Bank of New York Mellon Corp. | 3.250% | 5/16/27 | 80 | 88 | |
| 1 | Bank of New York Mellon Corp. | 3.400% | 1/29/28 | 79 | 88 | |
| 1 | Bank of New York Mellon Corp. | 3.442% | 2/7/28 | 15 | 17 | |
| 1 | Bank of New York Mellon Corp. | 3.850% | 4/28/28 | 35 | 40 | |
| 1 | Bank of New York Mellon Corp. | 3.300% | 8/23/29 | 20 | 22 | |
| Bank of Nova Scotia | 2.000% | 11/15/22 | 70 | 71 | ||
| Bank of Nova Scotia | 1.950% | 2/1/23 | 115 | 118 | ||
| Bank of Nova Scotia | 1.625% | 5/1/23 | 150 | 153 | ||
| Bank of Nova Scotia | 3.400% | 2/11/24 | 90 | 96 | ||
| Bank of Nova Scotia | 0.650% | 7/31/24 | 35 | 35 | ||
| Bank of Nova Scotia | 2.200% | 2/3/25 | 75 | 78 | ||
| Bank of Nova Scotia | 1.300% | 6/11/25 | 25 | 25 | ||
| Bank of Nova Scotia | 4.500% | 12/16/25 | 15 | 17 | ||
| Bank of Nova Scotia | 1.050% | 3/2/26 | 80 | 80 | ||
| Bank of Nova Scotia | 1.350% | 6/24/26 | 65 | 66 | ||
| Bank of Nova Scotia | 2.700% | 8/3/26 | 90 | 96 | ||
| Barclays plc | 3.684% | 1/10/23 | 10 | 10 | ||
| 1 | Barclays plc | 4.338% | 5/16/24 | 50 | 53 | |
| Barclays plc | 4.375% | 9/11/24 | 275 | 300 | ||
| Barclays plc | 3.650% | 3/16/25 | 50 | 54 | ||
| 1 | Barclays plc | 3.932% | 5/7/25 | 60 | 65 | |
| Barclays plc | 4.375% | 1/12/26 | 165 | 186 | ||
| 1 | Barclays plc | 2.852% | 5/7/26 | 50 | 53 | |
| Barclays plc | 5.200% | 5/12/26 | 179 | 206 | ||
| Barclays plc | 4.337% | 1/10/28 | 25 | 28 | ||
| Barclays plc | 4.836% | 5/9/28 | 90 | 102 | ||
| 1 | Barclays plc | 4.972% | 5/16/29 | 155 | 182 | |
| 1 | Barclays plc | 5.088% | 6/20/30 | 50 | 58 | |
| Barclays plc | 2.645% | 6/24/31 | 100 | 102 | ||
| Barclays plc | 2.667% | 3/10/32 | 85 | 86 | ||
| Barclays plc | 3.564% | 9/23/35 | 45 | 47 | ||
| Barclays plc | 5.250% | 8/17/45 | 115 | 156 | ||
| Barclays plc | 4.950% | 1/10/47 | 65 | 86 | ||
| Coupon | Maturity Date | Face Amount ($000) | Market Value• ($000) | |||
| BlackRock Inc. | 3.500% | 3/18/24 | 45 | 49 | ||
| BlackRock Inc. | 3.250% | 4/30/29 | 50 | 56 | ||
| BlackRock Inc. | 2.400% | 4/30/30 | 83 | 87 | ||
| BlackRock Inc. | 1.900% | 1/28/31 | 55 | 55 | ||
| 1 | BNP Paribas SA | 3.250% | 3/3/23 | 80 | 84 | |
| 1 | BNP Paribas SA | 4.250% | 10/15/24 | 115 | 126 | |
| BPCE SA | 4.000% | 4/15/24 | 95 | 104 | ||
| Brighthouse Financial Inc. | 3.700% | 6/22/27 | 89 | 98 | ||
| Brighthouse Financial Inc. | 4.700% | 6/22/47 | 55 | 62 | ||
| Canadian Imperial Bank of Commerce | 0.950% | 6/23/23 | 10 | 10 | ||
| 1 | Canadian Imperial Bank of Commerce | 3.500% | 9/13/23 | 80 | 85 | |
| Canadian Imperial Bank of Commerce | 0.500% | 12/14/23 | 25 | 25 | ||
| Canadian Imperial Bank of Commerce | 3.100% | 4/2/24 | 135 | 143 | ||
| Canadian Imperial Bank of Commerce | 2.250% | 1/28/25 | 75 | 78 | ||
| Canadian Imperial Bank of Commerce | 1.250% | 6/22/26 | 50 | 50 | ||
| Capital One Bank USA NA | 3.375% | 2/15/23 | 25 | 26 | ||
| Capital One Financial Corp. | 3.200% | 1/30/23 | 105 | 109 | ||
| Capital One Financial Corp. | 2.600% | 5/11/23 | 50 | 52 | ||
| Capital One Financial Corp. | 3.500% | 6/15/23 | 25 | 26 | ||
| Capital One Financial Corp. | 3.900% | 1/29/24 | 15 | 16 | ||
| Capital One Financial Corp. | 3.750% | 4/24/24 | 15 | 16 | ||
| Capital One Financial Corp. | 3.300% | 10/30/24 | 125 | 134 | ||
| Capital One Financial Corp. | 3.200% | 2/5/25 | 100 | 108 | ||
| Capital One Financial Corp. | 4.250% | 4/30/25 | 10 | 11 | ||
| Capital One Financial Corp. | 4.200% | 10/29/25 | 105 | 117 | ||
| Capital One Financial Corp. | 3.750% | 7/28/26 | 70 | 77 | ||
| Capital One Financial Corp. | 3.750% | 3/9/27 | 40 | 45 | ||
| Capital One Financial Corp. | 3.650% | 5/11/27 | 45 | 50 | ||
| Capital One Financial Corp. | 3.800% | 1/31/28 | 160 | 180 | ||
| Capital One Financial Corp. | 2.359% | 7/29/32 | 50 | 50 | ||
| Charles Schwab Corp. | 2.650% | 1/25/23 | 75 | 77 | ||
| Charles Schwab Corp. | 0.750% | 3/18/24 | 70 | 70 | ||
| Charles Schwab Corp. | 3.850% | 5/21/25 | 20 | 22 | ||
| Charles Schwab Corp. | 0.900% | 3/11/26 | 75 | 75 | ||
| Charles Schwab Corp. | 1.150% | 5/13/26 | 125 | 126 | ||
| Charles Schwab Corp. | 2.000% | 3/20/28 | 110 | 113 | ||
| Charles Schwab Corp. | 1.650% | 3/11/31 | 50 | 49 | ||
| Charles Schwab Corp. | 2.300% | 5/13/31 | 25 | 26 | ||
| Chubb Corp. | 6.000% | 5/11/37 | 60 | 88 | ||
| Chubb INA Holdings Inc. | 2.875% | 11/3/22 | 105 | 108 | ||
| Chubb INA Holdings Inc. | 3.150% | 3/15/25 | 25 | 27 | ||
| Chubb INA Holdings Inc. | 3.350% | 5/3/26 | 145 | 159 | ||
| Chubb INA Holdings Inc. | 1.375% | 9/15/30 | 50 | 48 | ||
| Chubb INA Holdings Inc. | 4.350% | 11/3/45 | 70 | 90 | ||
| CI Financial Corp. | 3.200% | 12/17/30 | 30 | 31 | ||
| CI Financial Corp. | 4.100% | 6/15/51 | 50 | 54 | ||
| 1 | Citibank NA | 3.650% | 1/23/24 | 20 | 21 | |
| Citigroup Inc. | 2.700% | 10/27/22 | 110 | 113 | ||
| Citigroup Inc. | 3.500% | 5/15/23 | 125 | 131 | ||
| Citigroup Inc. | 3.875% | 10/25/23 | 175 | 188 | ||
| 1 | Citigroup Inc. | 1.678% | 5/15/24 | 160 | 163 | |
| 1 | Citigroup Inc. | 4.044% | 6/1/24 | 110 | 117 | |
| Citigroup Inc. | 4.000% | 8/5/24 | 65 | 71 | ||
| Citigroup Inc. | 0.776% | 10/30/24 | 60 | 60 | ||
| Citigroup Inc. | 3.875% | 3/26/25 | 100 | 109 | ||
| Coupon | Maturity Date | Face Amount ($000) | Market Value• ($000) | |||
| 1 | Citigroup Inc. | 3.352% | 4/24/25 | 135 | 144 | |
| Citigroup Inc. | 3.300% | 4/27/25 | 100 | 108 | ||
| Citigroup Inc. | 0.981% | 5/1/25 | 100 | 100 | ||
| Citigroup Inc. | 4.400% | 6/10/25 | 75 | 84 | ||
| Citigroup Inc. | 5.500% | 9/13/25 | 125 | 145 | ||
| Citigroup Inc. | 3.700% | 1/12/26 | 200 | 221 | ||
| Citigroup Inc. | 4.600% | 3/9/26 | 75 | 85 | ||
| 1 | Citigroup Inc. | 3.106% | 4/8/26 | 175 | 187 | |
| Citigroup Inc. | 3.400% | 5/1/26 | 175 | 192 | ||
| Citigroup Inc. | 3.200% | 10/21/26 | 190 | 207 | ||
| Citigroup Inc. | 4.300% | 11/20/26 | 75 | 85 | ||
| Citigroup Inc. | 1.122% | 1/28/27 | 25 | 25 | ||
| Citigroup Inc. | 1.462% | 6/9/27 | 50 | 50 | ||
| Citigroup Inc. | 4.450% | 9/29/27 | 265 | 304 | ||
| 1 | Citigroup Inc. | 3.887% | 1/10/28 | 40 | 45 | |
| 1 | Citigroup Inc. | 3.668% | 7/24/28 | 110 | 122 | |
| Citigroup Inc. | 4.125% | 7/25/28 | 100 | 113 | ||
| 1 | Citigroup Inc. | 3.520% | 10/27/28 | 180 | 198 | |
| 1 | Citigroup Inc. | 4.075% | 4/23/29 | 75 | 85 | |
| 1 | Citigroup Inc. | 3.980% | 3/20/30 | 150 | 171 | |
| 1 | Citigroup Inc. | 2.976% | 11/5/30 | 225 | 240 | |
| 1 | Citigroup Inc. | 2.666% | 1/29/31 | 200 | 208 | |
| 1 | Citigroup Inc. | 4.412% | 3/31/31 | 215 | 252 | |
| 1 | Citigroup Inc. | 2.572% | 6/3/31 | 120 | 124 | |
| Citigroup Inc. | 6.625% | 6/15/32 | 65 | 89 | ||
| 1 | Citigroup Inc. | 3.878% | 1/24/39 | 6 | 7 | |
| Citigroup Inc. | 8.125% | 7/15/39 | 137 | 236 | ||
| 1 | Citigroup Inc. | 5.316% | 3/26/41 | 120 | 162 | |
| Citigroup Inc. | 5.875% | 1/30/42 | 150 | 217 | ||
| Citigroup Inc. | 6.675% | 9/13/43 | 50 | 78 | ||
| Citigroup Inc. | 5.300% | 5/6/44 | 110 | 149 | ||
| Citigroup Inc. | 4.650% | 7/30/45 | 95 | 124 | ||
| Citigroup Inc. | 4.750% | 5/18/46 | 50 | 64 | ||
| 1 | Citigroup Inc. | 4.281% | 4/24/48 | 25 | 32 | |
| Citigroup Inc. | 4.650% | 7/23/48 | 100 | 133 | ||
| 1 | Citizens Bank NA | 2.250% | 4/28/25 | 85 | 89 | |
| Citizens Financial Group Inc. | 3.250% | 4/30/30 | 60 | 65 | ||
| CME Group Inc. | 3.000% | 3/15/25 | 75 | 80 | ||
| CME Group Inc. | 5.300% | 9/15/43 | 43 | 62 | ||
| Comerica Inc. | 3.700% | 7/31/23 | 60 | 64 | ||
| Cooperatieve Rabobank UA | 3.950% | 11/9/22 | 110 | 115 | ||
| Cooperatieve Rabobank UA | 2.750% | 1/10/23 | 90 | 93 | ||
| Cooperatieve Rabobank UA | 4.625% | 12/1/23 | 150 | 163 | ||
| Cooperatieve Rabobank UA | 0.375% | 1/12/24 | 75 | 75 | ||
| Cooperatieve Rabobank UA | 4.375% | 8/4/25 | 35 | 39 | ||
| 1 | Cooperatieve Rabobank UA | 3.750% | 7/21/26 | 50 | 55 | |
| 1 | Cooperatieve Rabobank UA | 5.250% | 5/24/41 | 105 | 148 | |
| Cooperatieve Rabobank UA | 5.750% | 12/1/43 | 135 | 192 | ||
| Cooperatieve Rabobank UA | 5.250% | 8/4/45 | 25 | 34 | ||
| Credit Suisse AG | 1.000% | 5/5/23 | 200 | 202 | ||
| 1 | Credit Suisse AG | 3.625% | 9/9/24 | 285 | 309 | |
| Credit Suisse AG | 2.950% | 4/9/25 | 45 | 48 | ||
| Credit Suisse Group AG | 3.800% | 6/9/23 | 65 | 69 | ||
| Credit Suisse Group AG | 3.750% | 3/26/25 | 25 | 27 | ||
| Credit Suisse Group AG | 4.550% | 4/17/26 | 195 | 221 | ||
| Coupon | Maturity Date | Face Amount ($000) | Market Value• ($000) | |||
| Credit Suisse Group AG | 4.875% | 5/15/45 | 105 | 135 | ||
| Credit Suisse Group Funding Guernsey Ltd. | 3.800% | 9/15/22 | 105 | 109 | ||
| 1 | Deutsche Bank AG | 3.300% | 11/16/22 | 100 | 103 | |
| Deutsche Bank AG | 3.950% | 2/27/23 | 75 | 79 | ||
| 1 | Deutsche Bank AG | 3.700% | 5/30/24 | 170 | 182 | |
| 1 | Deutsche Bank AG | 2.222% | 9/18/24 | 115 | 118 | |
| Deutsche Bank AG | 1.447% | 4/1/25 | 100 | 101 | ||
| 1 | Deutsche Bank AG | 3.961% | 11/26/25 | 40 | 43 | |
| Deutsche Bank AG | 1.686% | 3/19/26 | 80 | 81 | ||
| Deutsche Bank AG | 2.129% | 11/24/26 | 45 | 46 | ||
| 1 | Deutsche Bank AG | 3.547% | 9/18/31 | 185 | 200 | |
| 1 | Discover Bank | 3.350% | 2/6/23 | 30 | 31 | |
| Discover Bank | 2.450% | 9/12/24 | 115 | 120 | ||
| 1 | Discover Bank | 3.450% | 7/27/26 | 150 | 164 | |
| 1 | Discover Bank | 4.650% | 9/13/28 | 115 | 135 | |
| Discover Financial Services | 4.100% | 2/9/27 | 50 | 56 | ||
| Equitable Holdings Inc. | 4.350% | 4/20/28 | 127 | 146 | ||
| Equitable Holdings Inc. | 5.000% | 4/20/48 | 86 | 112 | ||
| Everest Reinsurance Holdings Inc. | 3.500% | 10/15/50 | 45 | 49 | ||
| Fifth Third Bancorp | 3.650% | 1/25/24 | 25 | 27 | ||
| Fifth Third Bancorp | 2.375% | 1/28/25 | 100 | 105 | ||
| Fifth Third Bancorp | 2.550% | 5/5/27 | 50 | 53 | ||
| Fifth Third Bancorp | 8.250% | 3/1/38 | 55 | 93 | ||
| 1 | Fifth Third Bank NA | 3.950% | 7/28/25 | 135 | 151 | |
| 1 | Fifth Third Bank NA | 3.850% | 3/15/26 | 25 | 28 | |
| Franklin Resources Inc. | 1.600% | 10/30/30 | 50 | 48 | ||
| Global Payments Inc. | 2.650% | 2/15/25 | 2 | 2 | ||
| Global Payments Inc. | 4.800% | 4/1/26 | 65 | 74 | ||
| Global Payments Inc. | 3.200% | 8/15/29 | 75 | 81 | ||
| Global Payments Inc. | 2.900% | 5/15/30 | 65 | 68 | ||
| Global Payments Inc. | 4.150% | 8/15/49 | 75 | 86 | ||
| Goldman Sachs Capital I | 6.345% | 2/15/34 | 35 | 50 | ||
| Goldman Sachs Group Inc. | 3.625% | 1/22/23 | 115 | 120 | ||
| 1 | Goldman Sachs Group Inc. | 0.481% | 1/27/23 | 50 | 50 | |
| Goldman Sachs Group Inc. | 3.200% | 2/23/23 | 50 | 52 | ||
| 1 | Goldman Sachs Group Inc. | 0.627% | 11/17/23 | 200 | 200 | |
| Goldman Sachs Group Inc. | 3.625% | 2/20/24 | 200 | 214 | ||
| Goldman Sachs Group Inc. | 4.000% | 3/3/24 | 300 | 325 | ||
| Goldman Sachs Group Inc. | 0.673% | 3/8/24 | 170 | 170 | ||
| 1 | Goldman Sachs Group Inc. | 3.850% | 7/8/24 | 150 | 162 | |
| 1 | Goldman Sachs Group Inc. | 0.657% | 9/10/24 | 50 | 50 | |
| Goldman Sachs Group Inc. | 3.500% | 1/23/25 | 73 | 79 | ||
| Goldman Sachs Group Inc. | 3.500% | 4/1/25 | 124 | 134 | ||
| Goldman Sachs Group Inc. | 3.750% | 5/22/25 | 110 | 120 | ||
| 1 | Goldman Sachs Group Inc. | 3.272% | 9/29/25 | 125 | 134 | |
| Goldman Sachs Group Inc. | 4.250% | 10/21/25 | 75 | 84 | ||
| Goldman Sachs Group Inc. | 0.855% | 2/12/26 | 30 | 30 | ||
| Goldman Sachs Group Inc. | 3.750% | 2/25/26 | 150 | 166 | ||
| Goldman Sachs Group Inc. | 3.500% | 11/16/26 | 147 | 160 | ||
| 1 | Goldman Sachs Group Inc. | 1.093% | 12/9/26 | 75 | 74 | |
| Goldman Sachs Group Inc. | 5.950% | 1/15/27 | 50 | 61 | ||
| Goldman Sachs Group Inc. | 3.850% | 1/26/27 | 215 | 238 | ||
| Goldman Sachs Group Inc. | 1.431% | 3/9/27 | 145 | 145 | ||
| Goldman Sachs Group Inc. | 1.542% | 9/10/27 | 150 | 151 | ||
| 1 | Goldman Sachs Group Inc. | 3.691% | 6/5/28 | 180 | 200 | |
| Coupon | Maturity Date | Face Amount ($000) | Market Value• ($000) | |||
| 1 | Goldman Sachs Group Inc. | 3.814% | 4/23/29 | 200 | 224 | |
| 1 | Goldman Sachs Group Inc. | 4.223% | 5/1/29 | 148 | 170 | |
| Goldman Sachs Group Inc. | 2.600% | 2/7/30 | 100 | 104 | ||
| Goldman Sachs Group Inc. | 3.800% | 3/15/30 | 110 | 124 | ||
| Goldman Sachs Group Inc. | 1.992% | 1/27/32 | 190 | 186 | ||
| Goldman Sachs Group Inc. | 2.615% | 4/22/32 | 50 | 52 | ||
| 1 | Goldman Sachs Group Inc. | 2.383% | 7/21/32 | 195 | 197 | |
| Goldman Sachs Group Inc. | 6.125% | 2/15/33 | 135 | 183 | ||
| Goldman Sachs Group Inc. | 6.750% | 10/1/37 | 165 | 241 | ||
| 1 | Goldman Sachs Group Inc. | 4.017% | 10/31/38 | 170 | 199 | |
| 1 | Goldman Sachs Group Inc. | 4.411% | 4/23/39 | 125 | 153 | |
| Goldman Sachs Group Inc. | 6.250% | 2/1/41 | 275 | 409 | ||
| Goldman Sachs Group Inc. | 3.210% | 4/22/42 | 50 | 53 | ||
| Goldman Sachs Group Inc. | 2.908% | 7/21/42 | 30 | 30 | ||
| 1 | Goldman Sachs Group Inc. | 4.800% | 7/8/44 | 155 | 202 | |
| Goldman Sachs Group Inc. | 5.150% | 5/22/45 | 145 | 194 | ||
| Goldman Sachs Group Inc. | 4.750% | 10/21/45 | 120 | 158 | ||
| Hartford Financial Services Group Inc. | 3.600% | 8/19/49 | 50 | 56 | ||
| HSBC Holdings plc | 3.600% | 5/25/23 | 195 | 206 | ||
| 1 | HSBC Holdings plc | 3.033% | 11/22/23 | 150 | 155 | |
| HSBC Holdings plc | 4.250% | 3/14/24 | 55 | 59 | ||
| 1 | HSBC Holdings plc | 3.950% | 5/18/24 | 75 | 79 | |
| 1 | HSBC Holdings plc | 3.803% | 3/11/25 | 225 | 241 | |
| HSBC Holdings plc | 0.976% | 5/24/25 | 100 | 100 | ||
| HSBC Holdings plc | 4.250% | 8/18/25 | 50 | 55 | ||
| 1 | HSBC Holdings plc | 2.633% | 11/7/25 | 100 | 105 | |
| HSBC Holdings plc | 4.300% | 3/8/26 | 100 | 113 | ||
| 1 | HSBC Holdings plc | 1.645% | 4/18/26 | 75 | 76 | |
| HSBC Holdings plc | 3.900% | 5/25/26 | 125 | 139 | ||
| 1 | HSBC Holdings plc | 2.099% | 6/4/26 | 50 | 51 | |
| 1 | HSBC Holdings plc | 4.292% | 9/12/26 | 175 | 194 | |
| HSBC Holdings plc | 4.375% | 11/23/26 | 65 | 73 | ||
| HSBC Holdings plc | 1.589% | 5/24/27 | 155 | 156 | ||
| 1 | HSBC Holdings plc | 4.041% | 3/13/28 | 75 | 84 | |
| 1 | HSBC Holdings plc | 2.013% | 9/22/28 | 125 | 126 | |
| 1 | HSBC Holdings plc | 4.583% | 6/19/29 | 195 | 225 | |
| HSBC Holdings plc | 4.950% | 3/31/30 | 195 | 236 | ||
| 1 | HSBC Holdings plc | 3.973% | 5/22/30 | 210 | 236 | |
| 1 | HSBC Holdings plc | 2.848% | 6/4/31 | 85 | 89 | |
| 1 | HSBC Holdings plc | 2.357% | 8/18/31 | 50 | 50 | |
| HSBC Holdings plc | 2.804% | 5/24/32 | 100 | 103 | ||
| HSBC Holdings plc | 6.500% | 5/2/36 | 110 | 153 | ||
| HSBC Holdings plc | 6.500% | 9/15/37 | 45 | 63 | ||
| HSBC Holdings plc | 6.800% | 6/1/38 | 160 | 231 | ||
| HSBC Holdings plc | 6.100% | 1/14/42 | 115 | 170 | ||
| HSBC Holdings plc | 5.250% | 3/14/44 | 102 | 135 | ||
| HSBC USA Inc. | 3.500% | 6/23/24 | 140 | 151 | ||
| Huntington Bancshares Inc. | 2.625% | 8/6/24 | 50 | 53 | ||
| Huntington Bancshares Inc. | 2.550% | 2/4/30 | 85 | 89 | ||
| 1 | Huntington National Bank | 3.550% | 10/6/23 | 85 | 90 | |
| ING Groep NV | 4.100% | 10/2/23 | 85 | 91 | ||
| ING Groep NV | 3.550% | 4/9/24 | 100 | 107 | ||
| ING Groep NV | 3.950% | 3/29/27 | 120 | 135 | ||
| ING Groep NV | 1.726% | 4/1/27 | 50 | 51 | ||
| ING Groep NV | 4.550% | 10/2/28 | 60 | 71 | ||
| Coupon | Maturity Date | Face Amount ($000) | Market Value• ($000) | |||
| ING Groep NV | 4.050% | 4/9/29 | 25 | 29 | ||
| ING Groep NV | 2.727% | 4/1/32 | 50 | 52 | ||
| Intercontinental Exchange Inc. | 4.000% | 10/15/23 | 35 | 38 | ||
| Intercontinental Exchange Inc. | 3.750% | 12/1/25 | 70 | 77 | ||
| Intercontinental Exchange Inc. | 2.100% | 6/15/30 | 45 | 45 | ||
| Intercontinental Exchange Inc. | 1.850% | 9/15/32 | 145 | 140 | ||
| Intercontinental Exchange Inc. | 2.650% | 9/15/40 | 25 | 24 | ||
| Intercontinental Exchange Inc. | 4.250% | 9/21/48 | 100 | 122 | ||
| Intercontinental Exchange Inc. | 3.000% | 6/15/50 | 65 | 66 | ||
| Intercontinental Exchange Inc. | 3.000% | 9/15/60 | 80 | 79 | ||
| JPMorgan Chase & Co. | 3.250% | 9/23/22 | 130 | 134 | ||
| JPMorgan Chase & Co. | 2.972% | 1/15/23 | 85 | 86 | ||
| JPMorgan Chase & Co. | 3.200% | 1/25/23 | 120 | 125 | ||
| JPMorgan Chase & Co. | 3.375% | 5/1/23 | 210 | 220 | ||
| JPMorgan Chase & Co. | 2.700% | 5/18/23 | 114 | 118 | ||
| JPMorgan Chase & Co. | 3.875% | 2/1/24 | 215 | 232 | ||
| JPMorgan Chase & Co. | 0.697% | 3/16/24 | 140 | 140 | ||
| 1 | JPMorgan Chase & Co. | 3.559% | 4/23/24 | 110 | 116 | |
| 1 | JPMorgan Chase & Co. | 1.514% | 6/1/24 | 200 | 204 | |
| 1 | JPMorgan Chase & Co. | 3.797% | 7/23/24 | 340 | 361 | |
| JPMorgan Chase & Co. | 3.875% | 9/10/24 | 50 | 54 | ||
| 1 | JPMorgan Chase & Co. | 0.653% | 9/16/24 | 50 | 50 | |
| 1 | JPMorgan Chase & Co. | 4.023% | 12/5/24 | 225 | 242 | |
| JPMorgan Chase & Co. | 3.125% | 1/23/25 | 125 | 134 | ||
| JPMorgan Chase & Co. | 0.563% | 2/16/25 | 30 | 30 | ||
| 1 | JPMorgan Chase & Co. | 3.220% | 3/1/25 | 165 | 175 | |
| JPMorgan Chase & Co. | 3.900% | 7/15/25 | 375 | 413 | ||
| 1 | JPMorgan Chase & Co. | 2.301% | 10/15/25 | 75 | 78 | |
| 1 | JPMorgan Chase & Co. | 2.005% | 3/13/26 | 80 | 83 | |
| JPMorgan Chase & Co. | 3.300% | 4/1/26 | 350 | 382 | ||
| 1 | JPMorgan Chase & Co. | 2.083% | 4/22/26 | 260 | 269 | |
| JPMorgan Chase & Co. | 3.200% | 6/15/26 | 100 | 109 | ||
| JPMorgan Chase & Co. | 2.950% | 10/1/26 | 250 | 270 | ||
| JPMorgan Chase & Co. | 1.045% | 11/19/26 | 255 | 253 | ||
| JPMorgan Chase & Co. | 4.125% | 12/15/26 | 30 | 34 | ||
| 1 | JPMorgan Chase & Co. | 3.960% | 1/29/27 | 95 | 106 | |
| JPMorgan Chase & Co. | 1.040% | 2/4/27 | 60 | 59 | ||
| JPMorgan Chase & Co. | 1.578% | 4/22/27 | 50 | 50 | ||
| JPMorgan Chase & Co. | 3.625% | 12/1/27 | 60 | 66 | ||
| 1 | JPMorgan Chase & Co. | 3.782% | 2/1/28 | 130 | 145 | |
| 1 | JPMorgan Chase & Co. | 3.540% | 5/1/28 | 130 | 143 | |
| 1 | JPMorgan Chase & Co. | 2.182% | 6/1/28 | 100 | 103 | |
| 1 | JPMorgan Chase & Co. | 3.509% | 1/23/29 | 125 | 138 | |
| 1 | JPMorgan Chase & Co. | 4.005% | 4/23/29 | 155 | 176 | |
| 1 | JPMorgan Chase & Co. | 4.203% | 7/23/29 | 160 | 184 | |
| 1 | JPMorgan Chase & Co. | 4.452% | 12/5/29 | 130 | 152 | |
| 1 | JPMorgan Chase & Co. | 3.702% | 5/6/30 | 165 | 185 | |
| 1 | JPMorgan Chase & Co. | 2.739% | 10/15/30 | 115 | 121 | |
| 1 | JPMorgan Chase & Co. | 4.493% | 3/24/31 | 245 | 291 | |
| 1 | JPMorgan Chase & Co. | 2.522% | 4/22/31 | 150 | 155 | |
| 1 | JPMorgan Chase & Co. | 2.956% | 5/13/31 | 100 | 106 | |
| JPMorgan Chase & Co. | 1.764% | 11/19/31 | 65 | 63 | ||
| JPMorgan Chase & Co. | 1.953% | 2/4/32 | 300 | 295 | ||
| JPMorgan Chase & Co. | 2.580% | 4/22/32 | 115 | 119 | ||
| JPMorgan Chase & Co. | 6.400% | 5/15/38 | 227 | 337 | ||
| Coupon | Maturity Date | Face Amount ($000) | Market Value• ($000) | |||
| 1 | JPMorgan Chase & Co. | 3.882% | 7/24/38 | 50 | 58 | |
| JPMorgan Chase & Co. | 5.500% | 10/15/40 | 165 | 229 | ||
| 1 | JPMorgan Chase & Co. | 3.109% | 4/22/41 | 70 | 74 | |
| JPMorgan Chase & Co. | 5.600% | 7/15/41 | 175 | 246 | ||
| JPMorgan Chase & Co. | 2.525% | 11/19/41 | 40 | 39 | ||
| JPMorgan Chase & Co. | 5.400% | 1/6/42 | 125 | 175 | ||
| JPMorgan Chase & Co. | 5.625% | 8/16/43 | 75 | 106 | ||
| JPMorgan Chase & Co. | 4.850% | 2/1/44 | 130 | 173 | ||
| JPMorgan Chase & Co. | 4.950% | 6/1/45 | 55 | 74 | ||
| 1 | JPMorgan Chase & Co. | 4.260% | 2/22/48 | 135 | 167 | |
| 1 | JPMorgan Chase & Co. | 4.032% | 7/24/48 | 100 | 119 | |
| 1 | JPMorgan Chase & Co. | 3.964% | 11/15/48 | 210 | 249 | |
| 1 | JPMorgan Chase & Co. | 3.897% | 1/23/49 | 180 | 211 | |
| 1 | JPMorgan Chase & Co. | 3.109% | 4/22/51 | 62 | 65 | |
| JPMorgan Chase & Co. | 3.328% | 4/22/52 | 150 | 163 | ||
| 1 | KeyBank NA | 2.300% | 9/14/22 | 90 | 92 | |
| 1 | KeyBank NA | 0.423% | 1/3/24 | 50 | 50 | |
| 1 | KeyBank NA | 0.433% | 6/14/24 | 50 | 50 | |
| 1 | KeyBank NA | 3.300% | 6/1/25 | 90 | 98 | |
| 1 | KeyCorp | 2.250% | 4/6/27 | 45 | 47 | |
| 1 | KeyCorp | 4.100% | 4/30/28 | 25 | 29 | |
| 1 | KeyCorp | 2.550% | 10/1/29 | 25 | 26 | |
| Lloyds Banking Group plc | 4.050% | 8/16/23 | 100 | 107 | ||
| 1 | Lloyds Banking Group plc | 2.907% | 11/7/23 | 160 | 164 | |
| Lloyds Banking Group plc | 3.900% | 3/12/24 | 75 | 81 | ||
| Lloyds Banking Group plc | 4.500% | 11/4/24 | 25 | 28 | ||
| 1 | Lloyds Banking Group plc | 3.870% | 7/9/25 | 75 | 81 | |
| Lloyds Banking Group plc | 4.582% | 12/10/25 | 100 | 113 | ||
| 1 | Lloyds Banking Group plc | 2.438% | 2/5/26 | 80 | 83 | |
| Lloyds Banking Group plc | 4.650% | 3/24/26 | 150 | 170 | ||
| Lloyds Banking Group plc | 3.750% | 1/11/27 | 50 | 55 | ||
| Lloyds Banking Group plc | 4.375% | 3/22/28 | 120 | 138 | ||
| Lloyds Banking Group plc | 4.550% | 8/16/28 | 105 | 123 | ||
| 1 | Lloyds Banking Group plc | 3.574% | 11/7/28 | 25 | 27 | |
| Lloyds Banking Group plc | 5.300% | 12/1/45 | 50 | 67 | ||
| Lloyds Banking Group plc | 4.344% | 1/9/48 | 75 | 90 | ||
| 1 | Manufacturers & Traders Trust Co. | 2.900% | 2/6/25 | 150 | 160 | |
| Marsh & McLennan Cos. Inc. | 3.875% | 3/15/24 | 95 | 103 | ||
| Marsh & McLennan Cos. Inc. | 4.375% | 3/15/29 | 90 | 106 | ||
| Marsh & McLennan Cos. Inc. | 2.250% | 11/15/30 | 105 | 108 | ||
| Marsh & McLennan Cos. Inc. | 4.900% | 3/15/49 | 40 | 55 | ||
| Mastercard Inc. | 3.375% | 4/1/24 | 70 | 75 | ||
| Mastercard Inc. | 2.950% | 11/21/26 | 60 | 66 | ||
| Mastercard Inc. | 3.300% | 3/26/27 | 65 | 72 | ||
| Mastercard Inc. | 3.350% | 3/26/30 | 145 | 164 | ||
| Mastercard Inc. | 3.650% | 6/1/49 | 95 | 112 | ||
| Mastercard Inc. | 3.850% | 3/26/50 | 85 | 104 | ||
| 1 | MetLife Inc. | 4.368% | 9/15/23 | 100 | 108 | |
| MetLife Inc. | 3.600% | 4/10/24 | 10 | 11 | ||
| MetLife Inc. | 4.550% | 3/23/30 | 115 | 138 | ||
| MetLife Inc. | 5.700% | 6/15/35 | 90 | 125 | ||
| 1 | MetLife Inc. | 6.400% | 12/15/36 | 70 | 90 | |
| MetLife Inc. | 5.875% | 2/6/41 | 20 | 29 | ||
| MetLife Inc. | 4.125% | 8/13/42 | 30 | 36 | ||
| MetLife Inc. | 4.875% | 11/13/43 | 85 | 114 | ||
| Coupon | Maturity Date | Face Amount ($000) | Market Value• ($000) | |||
| MetLife Inc. | 4.050% | 3/1/45 | 50 | 61 | ||
| MetLife Inc. | 4.600% | 5/13/46 | 60 | 79 | ||
| Mitsubishi UFJ Financial Group Inc. | 3.455% | 3/2/23 | 160 | 167 | ||
| Mitsubishi UFJ Financial Group Inc. | 3.761% | 7/26/23 | 105 | 112 | ||
| Mitsubishi UFJ Financial Group Inc. | 3.407% | 3/7/24 | 75 | 80 | ||
| Mitsubishi UFJ Financial Group Inc. | 2.801% | 7/18/24 | 100 | 106 | ||
| 1 | Mitsubishi UFJ Financial Group Inc. | 0.848% | 9/15/24 | 100 | 100 | |
| Mitsubishi UFJ Financial Group Inc. | 2.193% | 2/25/25 | 175 | 182 | ||
| Mitsubishi UFJ Financial Group Inc. | 3.777% | 3/2/25 | 18 | 20 | ||
| Mitsubishi UFJ Financial Group Inc. | 1.412% | 7/17/25 | 175 | 177 | ||
| Mitsubishi UFJ Financial Group Inc. | 3.850% | 3/1/26 | 70 | 78 | ||
| Mitsubishi UFJ Financial Group Inc. | 2.757% | 9/13/26 | 25 | 27 | ||
| Mitsubishi UFJ Financial Group Inc. | 1.538% | 7/20/27 | 200 | 201 | ||
| Mitsubishi UFJ Financial Group Inc. | 3.287% | 7/25/27 | 50 | 55 | ||
| Mitsubishi UFJ Financial Group Inc. | 3.961% | 3/2/28 | 45 | 51 | ||
| Mitsubishi UFJ Financial Group Inc. | 3.741% | 3/7/29 | 150 | 169 | ||
| Mitsubishi UFJ Financial Group Inc. | 3.195% | 7/18/29 | 50 | 54 | ||
| Mitsubishi UFJ Financial Group Inc. | 2.559% | 2/25/30 | 175 | 182 | ||
| Mitsubishi UFJ Financial Group Inc. | 2.048% | 7/17/30 | 150 | 150 | ||
| Mitsubishi UFJ Financial Group Inc. | 2.309% | 7/20/32 | 120 | 121 | ||
| Mitsubishi UFJ Financial Group Inc. | 3.751% | 7/18/39 | 95 | 109 | ||
| Mizuho Financial Group Inc. | 2.601% | 9/11/22 | 60 | 61 | ||
| Mizuho Financial Group Inc. | 3.549% | 3/5/23 | 100 | 105 | ||
| 1 | Mizuho Financial Group Inc. | 1.241% | 7/10/24 | 125 | 126 | |
| 1 | Mizuho Financial Group Inc. | 2.226% | 5/25/26 | 45 | 47 | |
| Mizuho Financial Group Inc. | 1.234% | 5/22/27 | 100 | 99 | ||
| Mizuho Financial Group Inc. | 3.170% | 9/11/27 | 50 | 54 | ||
| Mizuho Financial Group Inc. | 4.018% | 3/5/28 | 45 | 52 | ||
| 1 | Mizuho Financial Group Inc. | 4.254% | 9/11/29 | 45 | 52 | |
| 1 | Mizuho Financial Group Inc. | 3.153% | 7/16/30 | 100 | 108 | |
| 1 | Mizuho Financial Group Inc. | 2.201% | 7/10/31 | 110 | 110 | |
| 1 | Mizuho Financial Group Inc. | 1.979% | 9/8/31 | 25 | 25 | |
| Morgan Stanley | 4.875% | 11/1/22 | 285 | 300 | ||
| 1 | Morgan Stanley | 3.125% | 1/23/23 | 50 | 52 | |
| 1 | Morgan Stanley | 3.750% | 2/25/23 | 185 | 194 | |
| 1 | Morgan Stanley | 4.100% | 5/22/23 | 100 | 106 | |
| 1 | Morgan Stanley | 0.560% | 11/10/23 | 100 | 100 | |
| 1 | Morgan Stanley | 0.529% | 1/25/24 | 185 | 185 | |
| 1 | Morgan Stanley | 3.737% | 4/24/24 | 265 | 279 | |
| 1 | Morgan Stanley | 3.875% | 4/29/24 | 75 | 81 | |
| 1 | Morgan Stanley | 3.700% | 10/23/24 | 100 | 109 | |
| Morgan Stanley | 0.790% | 5/30/25 | 200 | 200 | ||
| 1 | Morgan Stanley | 2.720% | 7/22/25 | 150 | 158 | |
| 1 | Morgan Stanley | 4.000% | 7/23/25 | 100 | 111 | |
| 1 | Morgan Stanley | 0.864% | 10/21/25 | 50 | 50 | |
| Morgan Stanley | 5.000% | 11/24/25 | 100 | 115 | ||
| 1 | Morgan Stanley | 3.875% | 1/27/26 | 150 | 167 | |
| 1 | Morgan Stanley | 2.188% | 4/28/26 | 250 | 260 | |
| 1 | Morgan Stanley | 3.125% | 7/27/26 | 470 | 510 | |
| 1 | Morgan Stanley | 4.350% | 9/8/26 | 225 | 256 | |
| Morgan Stanley | 0.985% | 12/10/26 | 225 | 222 | ||
| Morgan Stanley | 3.625% | 1/20/27 | 226 | 251 | ||
| Morgan Stanley | 3.950% | 4/23/27 | 200 | 225 | ||
| 1 | Morgan Stanley | 3.591% | 7/22/28 | 165 | 183 | |
| 1 | Morgan Stanley | 3.772% | 1/24/29 | 170 | 190 | |
| Coupon | Maturity Date | Face Amount ($000) | Market Value• ($000) | |||
| 1 | Morgan Stanley | 4.431% | 1/23/30 | 220 | 257 | |
| 1 | Morgan Stanley | 2.699% | 1/22/31 | 155 | 162 | |
| 1 | Morgan Stanley | 3.622% | 4/1/31 | 225 | 252 | |
| 1 | Morgan Stanley | 1.794% | 2/13/32 | 35 | 34 | |
| Morgan Stanley | 7.250% | 4/1/32 | 125 | 183 | ||
| 1 | Morgan Stanley | 1.928% | 4/28/32 | 25 | 24 | |
| 1 | Morgan Stanley | 3.971% | 7/22/38 | 175 | 205 | |
| 1 | Morgan Stanley | 4.457% | 4/22/39 | 10 | 12 | |
| Morgan Stanley | 6.375% | 7/24/42 | 180 | 278 | ||
| Morgan Stanley | 4.300% | 1/27/45 | 225 | 280 | ||
| Morgan Stanley | 4.375% | 1/22/47 | 145 | 183 | ||
| 1 | Morgan Stanley | 5.597% | 3/24/51 | 125 | 189 | |
| 1 | Morgan Stanley | 2.802% | 1/25/52 | 140 | 140 | |
| National Australia Bank Ltd. | 1.875% | 12/13/22 | 100 | 102 | ||
| National Australia Bank Ltd. | 3.000% | 1/20/23 | 35 | 36 | ||
| National Australia Bank Ltd. | 3.625% | 6/20/23 | 100 | 106 | ||
| National Australia Bank Ltd. | 3.375% | 1/14/26 | 25 | 28 | ||
| 1 | National Australia Bank Ltd. | 2.500% | 7/12/26 | 93 | 99 | |
| 1 | National Bank of Canada | 2.100% | 2/1/23 | 100 | 102 | |
| Natwest Group plc | 6.125% | 12/15/22 | 45 | 48 | ||
| Natwest Group plc | 3.875% | 9/12/23 | 75 | 80 | ||
| Natwest Group plc | 6.000% | 12/19/23 | 54 | 60 | ||
| Natwest Group plc | 5.125% | 5/28/24 | 35 | 39 | ||
| 1 | Natwest Group plc | 4.519% | 6/25/24 | 50 | 53 | |
| 1 | Natwest Group plc | 4.269% | 3/22/25 | 125 | 135 | |
| Natwest Group plc | 4.800% | 4/5/26 | 150 | 172 | ||
| 1 | Natwest Group plc | 3.073% | 5/22/28 | 80 | 85 | |
| 1 | Natwest Group plc | 4.892% | 5/18/29 | 40 | 47 | |
| 1 | Natwest Group plc | 3.754% | 11/1/29 | 135 | 144 | |
| 1 | Natwest Group plc | 5.076% | 1/27/30 | 190 | 228 | |
| 1 | Natwest Group plc | 4.445% | 5/8/30 | 25 | 29 | |
| 1 | Natwest Group plc | 3.032% | 11/28/35 | 50 | 50 | |
| Nomura Holdings Inc. | 2.648% | 1/16/25 | 75 | 79 | ||
| Nomura Holdings Inc. | 1.851% | 7/16/25 | 125 | 128 | ||
| Nomura Holdings Inc. | 3.103% | 1/16/30 | 65 | 69 | ||
| Nomura Holdings Inc. | 2.679% | 7/16/30 | 115 | 117 | ||
| Nomura Holdings Inc. | 2.608% | 7/14/31 | 100 | 101 | ||
| Northern Trust Corp. | 3.950% | 10/30/25 | 75 | 85 | ||
| Northern Trust Corp. | 1.950% | 5/1/30 | 90 | 92 | ||
| PayPal Holdings Inc. | 2.200% | 9/26/22 | 120 | 122 | ||
| PayPal Holdings Inc. | 1.350% | 6/1/23 | 60 | 61 | ||
| PayPal Holdings Inc. | 2.400% | 10/1/24 | 20 | 21 | ||
| PayPal Holdings Inc. | 1.650% | 6/1/25 | 25 | 26 | ||
| PayPal Holdings Inc. | 2.650% | 10/1/26 | 75 | 81 | ||
| PayPal Holdings Inc. | 2.850% | 10/1/29 | 70 | 76 | ||
| PayPal Holdings Inc. | 2.300% | 6/1/30 | 25 | 26 | ||
| PayPal Holdings Inc. | 3.250% | 6/1/50 | 80 | 88 | ||
| 1 | PNC Bank NA | 2.700% | 11/1/22 | 25 | 26 | |
| 1 | PNC Bank NA | 2.950% | 1/30/23 | 75 | 78 | |
| 1 | PNC Bank NA | 3.500% | 6/8/23 | 15 | 16 | |
| 1 | PNC Bank NA | 2.950% | 2/23/25 | 70 | 75 | |
| 1 | PNC Bank NA | 3.100% | 10/25/27 | 50 | 55 | |
| 1 | PNC Bank NA | 4.050% | 7/26/28 | 90 | 104 | |
| 1 | PNC Bank NA | 2.700% | 10/22/29 | 100 | 107 | |
| PNC Financial Services Group Inc. | 3.500% | 1/23/24 | 45 | 48 | ||
| Coupon | Maturity Date | Face Amount ($000) | Market Value• ($000) | |||
| PNC Financial Services Group Inc. | 3.900% | 4/29/24 | 45 | 49 | ||
| PNC Financial Services Group Inc. | 2.600% | 7/23/26 | 25 | 27 | ||
| PNC Financial Services Group Inc. | 3.150% | 5/19/27 | 110 | 121 | ||
| PNC Financial Services Group Inc. | 3.450% | 4/23/29 | 170 | 190 | ||
| PNC Financial Services Group Inc. | 2.550% | 1/22/30 | 15 | 16 | ||
| Progressive Corp. | 4.125% | 4/15/47 | 85 | 106 | ||
| 1 | Prudential Financial Inc. | 5.700% | 12/14/36 | 125 | 173 | |
| 1 | Prudential Financial Inc. | 5.625% | 6/15/43 | 65 | 69 | |
| 1 | Prudential Financial Inc. | 5.375% | 5/15/45 | 25 | 28 | |
| 1 | Prudential Financial Inc. | 4.500% | 9/15/47 | 50 | 55 | |
| Prudential Financial Inc. | 3.905% | 12/7/47 | 45 | 53 | ||
| 1 | Prudential Financial Inc. | 5.700% | 9/15/48 | 75 | 88 | |
| Prudential Financial Inc. | 3.935% | 12/7/49 | 75 | 90 | ||
| 1 | Prudential Financial Inc. | 4.350% | 2/25/50 | 70 | 90 | |
| 1 | Prudential Financial Inc. | 3.700% | 10/1/50 | 40 | 42 | |
| 1 | Prudential Financial Inc. | 3.700% | 3/13/51 | 50 | 58 | |
| Prudential plc | 3.125% | 4/14/30 | 65 | 71 | ||
| Raymond James Financial Inc. | 4.950% | 7/15/46 | 35 | 46 | ||
| Raymond James Financial Inc. | 3.750% | 4/1/51 | 60 | 68 | ||
| Regions Financial Corp. | 2.250% | 5/18/25 | 75 | 78 | ||
| 1 | Royal Bank of Canada | 1.950% | 1/17/23 | 60 | 61 | |
| 1 | Royal Bank of Canada | 1.600% | 4/17/23 | 85 | 87 | |
| 1 | Royal Bank of Canada | 3.700% | 10/5/23 | 125 | 134 | |
| 1 | Royal Bank of Canada | 0.500% | 10/26/23 | 120 | 120 | |
| 1 | Royal Bank of Canada | 0.425% | 1/19/24 | 75 | 75 | |
| 1 | Royal Bank of Canada | 2.550% | 7/16/24 | 50 | 53 | |
| 1 | Royal Bank of Canada | 2.250% | 11/1/24 | 185 | 194 | |
| 1 | Royal Bank of Canada | 1.150% | 6/10/25 | 100 | 101 | |
| 1 | Royal Bank of Canada | 0.875% | 1/20/26 | 130 | 129 | |
| 1 | Royal Bank of Canada | 4.650% | 1/27/26 | 40 | 46 | |
| Royal Bank of Canada | 1.200% | 4/27/26 | 30 | 30 | ||
| Santander Holdings USA Inc. | 3.400% | 1/18/23 | 135 | 140 | ||
| Santander Holdings USA Inc. | 4.500% | 7/17/25 | 20 | 22 | ||
| Santander Holdings USA Inc. | 3.244% | 10/5/26 | 110 | 118 | ||
| Santander Holdings USA Inc. | 4.400% | 7/13/27 | 115 | 130 | ||
| Santander UK Group Holdings plc | 3.571% | 1/10/23 | 100 | 101 | ||
| 1 | Santander UK Group Holdings plc | 3.373% | 1/5/24 | 120 | 124 | |
| Santander UK Group Holdings plc | 1.089% | 3/15/25 | 30 | 30 | ||
| 1 | Santander UK Group Holdings plc | 3.823% | 11/3/28 | 115 | 127 | |
| Santander UK plc | 4.000% | 3/13/24 | 120 | 130 | ||
| State Street Corp. | 3.100% | 5/15/23 | 45 | 47 | ||
| State Street Corp. | 3.700% | 11/20/23 | 95 | 102 | ||
| State Street Corp. | 3.300% | 12/16/24 | 75 | 81 | ||
| State Street Corp. | 3.550% | 8/18/25 | 25 | 28 | ||
| 1 | State Street Corp. | 2.354% | 11/1/25 | 50 | 53 | |
| State Street Corp. | 2.650% | 5/19/26 | 35 | 38 | ||
| State Street Corp. | 2.400% | 1/24/30 | 120 | 126 | ||
| State Street Corp. | 2.200% | 3/3/31 | 25 | 26 | ||
| Sumitomo Mitsui Financial Group Inc. | 2.778% | 10/18/22 | 50 | 51 | ||
| Sumitomo Mitsui Financial Group Inc. | 3.102% | 1/17/23 | 200 | 208 | ||
| Sumitomo Mitsui Financial Group Inc. | 3.748% | 7/19/23 | 135 | 143 | ||
| Sumitomo Mitsui Financial Group Inc. | 3.936% | 10/16/23 | 150 | 161 | ||
| Sumitomo Mitsui Financial Group Inc. | 2.696% | 7/16/24 | 25 | 26 | ||
| Sumitomo Mitsui Financial Group Inc. | 2.448% | 9/27/24 | 50 | 52 | ||
| Sumitomo Mitsui Financial Group Inc. | 2.348% | 1/15/25 | 50 | 52 | ||
| Coupon | Maturity Date | Face Amount ($000) | Market Value• ($000) | |||
| Sumitomo Mitsui Financial Group Inc. | 1.474% | 7/8/25 | 50 | 51 | ||
| Sumitomo Mitsui Financial Group Inc. | 3.784% | 3/9/26 | 95 | 106 | ||
| Sumitomo Mitsui Financial Group Inc. | 2.632% | 7/14/26 | 75 | 80 | ||
| Sumitomo Mitsui Financial Group Inc. | 3.010% | 10/19/26 | 70 | 76 | ||
| Sumitomo Mitsui Financial Group Inc. | 3.446% | 1/11/27 | 60 | 66 | ||
| Sumitomo Mitsui Financial Group Inc. | 3.364% | 7/12/27 | 50 | 55 | ||
| Sumitomo Mitsui Financial Group Inc. | 3.352% | 10/18/27 | 100 | 110 | ||
| Sumitomo Mitsui Financial Group Inc. | 3.040% | 7/16/29 | 125 | 134 | ||
| Sumitomo Mitsui Financial Group Inc. | 2.750% | 1/15/30 | 75 | 79 | ||
| Sumitomo Mitsui Financial Group Inc. | 2.130% | 7/8/30 | 145 | 146 | ||
| Sumitomo Mitsui Financial Group Inc. | 2.142% | 9/23/30 | 160 | 157 | ||
| 1 | Svenska Handelsbanken AB | 3.900% | 11/20/23 | 170 | 183 | |
| Synchrony Financial | 4.250% | 8/15/24 | 75 | 81 | ||
| Synchrony Financial | 3.950% | 12/1/27 | 55 | 61 | ||
| TD Ameritrade Holding Corp. | 3.300% | 4/1/27 | 45 | 50 | ||
| 1 | Toronto-Dominion Bank | 1.900% | 12/1/22 | 105 | 107 | |
| 1 | Toronto-Dominion Bank | 0.250% | 1/6/23 | 110 | 110 | |
| 1 | Toronto-Dominion Bank | 0.750% | 6/12/23 | 135 | 136 | |
| 1 | Toronto-Dominion Bank | 3.500% | 7/19/23 | 175 | 186 | |
| 1 | Toronto-Dominion Bank | 0.450% | 9/11/23 | 50 | 50 | |
| Toronto-Dominion Bank | 0.550% | 3/4/24 | 165 | 165 | ||
| 1 | Toronto-Dominion Bank | 3.250% | 3/11/24 | 110 | 117 | |
| 1 | Toronto-Dominion Bank | 2.650% | 6/12/24 | 25 | 26 | |
| 1 | Toronto-Dominion Bank | 1.150% | 6/12/25 | 40 | 40 | |
| 1 | Toronto-Dominion Bank | 0.750% | 1/6/26 | 130 | 129 | |
| 1 | Toronto-Dominion Bank | 3.625% | 9/15/31 | 25 | 28 | |
| 1 | Travelers Cos. Inc. | 6.250% | 6/15/37 | 30 | 44 | |
| Travelers Cos. Inc. | 5.350% | 11/1/40 | 65 | 92 | ||
| Travelers Cos. Inc. | 3.050% | 6/8/51 | 35 | 38 | ||
| 1 | Truist Bank | 1.250% | 3/9/23 | 75 | 76 | |
| 1 | Truist Bank | 3.200% | 4/1/24 | 75 | 80 | |
| 1 | Truist Bank | 2.150% | 12/6/24 | 100 | 105 | |
| 1 | Truist Bank | 3.625% | 9/16/25 | 25 | 28 | |
| 1 | Truist Bank | 3.800% | 10/30/26 | 55 | 62 | |
| 1 | Truist Bank | 2.636% | 9/17/29 | 85 | 89 | |
| 1 | Truist Bank | 2.250% | 3/11/30 | 165 | 169 | |
| 1 | Truist Financial Corp. | 2.200% | 3/16/23 | 75 | 77 | |
| 1 | Truist Financial Corp. | 3.750% | 12/6/23 | 25 | 27 | |
| 1 | Truist Financial Corp. | 2.500% | 8/1/24 | 105 | 111 | |
| 1 | Truist Financial Corp. | 2.850% | 10/26/24 | 125 | 133 | |
| 1 | Truist Financial Corp. | 1.267% | 3/2/27 | 105 | 105 | |
| 1 | Truist Financial Corp. | 1.125% | 8/3/27 | 75 | 74 | |
| 1 | Truist Financial Corp. | 1.887% | 6/7/29 | 25 | 25 | |
| 1 | Truist Financial Corp. | 1.950% | 6/5/30 | 50 | 51 | |
| 1 | US Bancorp | 3.700% | 1/30/24 | 40 | 43 | |
| US Bancorp | 3.375% | 2/5/24 | 70 | 75 | ||
| US Bancorp | 2.400% | 7/30/24 | 100 | 105 | ||
| 1 | US Bancorp | 3.600% | 9/11/24 | 70 | 76 | |
| US Bancorp | 1.450% | 5/12/25 | 75 | 77 | ||
| 1 | US Bancorp | 3.950% | 11/17/25 | 125 | 140 | |
| 1 | US Bancorp | 3.100% | 4/27/26 | 25 | 27 | |
| 1 | US Bancorp | 2.375% | 7/22/26 | 20 | 21 | |
| 1 | US Bancorp | 3.150% | 4/27/27 | 70 | 77 | |
| 1 | US Bancorp | 3.900% | 4/26/28 | 70 | 81 | |
| 1 | US Bancorp | 3.000% | 7/30/29 | 70 | 76 | |
| Coupon | Maturity Date | Face Amount ($000) | Market Value• ($000) | |||
| 1 | US Bancorp | 1.375% | 7/22/30 | 103 | 100 | |
| US Bank NA | 1.950% | 1/9/23 | 75 | 77 | ||
| 1 | US Bank NA | 2.850% | 1/23/23 | 95 | 98 | |
| 1 | US Bank NA | 3.400% | 7/24/23 | 20 | 21 | |
| 1 | US Bank NA | 2.800% | 1/27/25 | 35 | 37 | |
| Visa Inc. | 2.800% | 12/14/22 | 220 | 226 | ||
| Visa Inc. | 3.150% | 12/14/25 | 110 | 120 | ||
| Visa Inc. | 1.900% | 4/15/27 | 150 | 156 | ||
| Visa Inc. | 2.750% | 9/15/27 | 25 | 27 | ||
| Visa Inc. | 2.050% | 4/15/30 | 140 | 144 | ||
| Visa Inc. | 1.100% | 2/15/31 | 50 | 48 | ||
| Visa Inc. | 4.150% | 12/14/35 | 55 | 68 | ||
| Visa Inc. | 4.300% | 12/14/45 | 210 | 269 | ||
| Visa Inc. | 3.650% | 9/15/47 | 100 | 118 | ||
| Visa Inc. | 2.000% | 8/15/50 | 70 | 62 | ||
| Westpac Banking Corp. | 2.750% | 1/11/23 | 110 | 114 | ||
| Westpac Banking Corp. | 2.000% | 1/13/23 | 50 | 51 | ||
| Westpac Banking Corp. | 3.650% | 5/15/23 | 50 | 53 | ||
| Westpac Banking Corp. | 3.300% | 2/26/24 | 20 | 21 | ||
| Westpac Banking Corp. | 2.850% | 5/13/26 | 125 | 136 | ||
| Westpac Banking Corp. | 1.150% | 6/3/26 | 50 | 50 | ||
| Westpac Banking Corp. | 2.700% | 8/19/26 | 50 | 54 | ||
| Westpac Banking Corp. | 3.350% | 3/8/27 | 160 | 178 | ||
| Westpac Banking Corp. | 3.400% | 1/25/28 | 50 | 56 | ||
| Westpac Banking Corp. | 2.650% | 1/16/30 | 15 | 16 | ||
| 1 | Westpac Banking Corp. | 2.894% | 2/4/30 | 25 | 26 | |
| 1 | Westpac Banking Corp. | 4.322% | 11/23/31 | 180 | 200 | |
| Westpac Banking Corp. | 4.110% | 7/24/34 | 75 | 83 | ||
| Westpac Banking Corp. | 2.668% | 11/15/35 | 70 | 69 | ||
| Westpac Banking Corp. | 4.421% | 7/24/39 | 110 | 132 | ||
| 83,540 | ||||||
| Health Care (15.8%) | ||||||
| Abbott Laboratories | 3.400% | 11/30/23 | 125 | 133 | ||
| Abbott Laboratories | 2.950% | 3/15/25 | 50 | 54 | ||
| Abbott Laboratories | 3.750% | 11/30/26 | 85 | 96 | ||
| 3 | Abbott Laboratories | 4.750% | 11/30/36 | 135 | 175 | |
| Abbott Laboratories | 4.900% | 11/30/46 | 185 | 257 | ||
| AbbVie Inc. | 3.250% | 10/1/22 | 155 | 159 | ||
| AbbVie Inc. | 2.900% | 11/6/22 | 150 | 154 | ||
| AbbVie Inc. | 3.200% | 11/6/22 | 75 | 77 | ||
| AbbVie Inc. | 2.300% | 11/21/22 | 70 | 72 | ||
| AbbVie Inc. | 3.750% | 11/14/23 | 150 | 160 | ||
| AbbVie Inc. | 3.850% | 6/15/24 | 125 | 135 | ||
| AbbVie Inc. | 2.600% | 11/21/24 | 275 | 290 | ||
| AbbVie Inc. | 3.800% | 3/15/25 | 100 | 109 | ||
| AbbVie Inc. | 3.600% | 5/14/25 | 297 | 323 | ||
| AbbVie Inc. | 3.200% | 5/14/26 | 165 | 179 | ||
| AbbVie Inc. | 2.950% | 11/21/26 | 175 | 189 | ||
| AbbVie Inc. | 4.250% | 11/14/28 | 50 | 58 | ||
| AbbVie Inc. | 3.200% | 11/21/29 | 175 | 191 | ||
| AbbVie Inc. | 4.550% | 3/15/35 | 145 | 176 | ||
| AbbVie Inc. | 4.500% | 5/14/35 | 210 | 255 | ||
| AbbVie Inc. | 4.300% | 5/14/36 | 110 | 131 | ||
| AbbVie Inc. | 4.050% | 11/21/39 | 25 | 29 | ||
| AbbVie Inc. | 4.400% | 11/6/42 | 175 | 213 | ||
| Coupon | Maturity Date | Face Amount ($000) | Market Value• ($000) | |||
| AbbVie Inc. | 4.850% | 6/15/44 | 75 | 96 | ||
| AbbVie Inc. | 4.750% | 3/15/45 | 125 | 157 | ||
| AbbVie Inc. | 4.700% | 5/14/45 | 205 | 258 | ||
| AbbVie Inc. | 4.450% | 5/14/46 | 150 | 184 | ||
| AbbVie Inc. | 4.875% | 11/14/48 | 120 | 157 | ||
| AbbVie Inc. | 4.250% | 11/21/49 | 255 | 310 | ||
| Aetna Inc. | 2.750% | 11/15/22 | 60 | 61 | ||
| Aetna Inc. | 2.800% | 6/15/23 | 20 | 21 | ||
| Aetna Inc. | 3.500% | 11/15/24 | 50 | 54 | ||
| Aetna Inc. | 6.625% | 6/15/36 | 70 | 102 | ||
| Aetna Inc. | 3.875% | 8/15/47 | 55 | 62 | ||
| Agilent Technologies Inc. | 2.300% | 3/12/31 | 55 | 56 | ||
| AmerisourceBergen Corp. | 0.737% | 3/15/23 | 120 | 120 | ||
| AmerisourceBergen Corp. | 3.450% | 12/15/27 | 55 | 60 | ||
| AmerisourceBergen Corp. | 2.700% | 3/15/31 | 100 | 104 | ||
| Amgen Inc. | 2.250% | 8/19/23 | 50 | 52 | ||
| Amgen Inc. | 3.625% | 5/22/24 | 50 | 54 | ||
| Amgen Inc. | 3.125% | 5/1/25 | 15 | 16 | ||
| Amgen Inc. | 2.600% | 8/19/26 | 40 | 43 | ||
| Amgen Inc. | 2.200% | 2/21/27 | 80 | 83 | ||
| Amgen Inc. | 1.650% | 8/15/28 | 50 | 50 | ||
| Amgen Inc. | 2.450% | 2/21/30 | 120 | 124 | ||
| Amgen Inc. | 2.300% | 2/25/31 | 135 | 138 | ||
| Amgen Inc. | 2.000% | 1/15/32 | 50 | 49 | ||
| Amgen Inc. | 3.150% | 2/21/40 | 115 | 120 | ||
| Amgen Inc. | 2.800% | 8/15/41 | 50 | 49 | ||
| Amgen Inc. | 4.400% | 5/1/45 | 125 | 152 | ||
| Amgen Inc. | 4.563% | 6/15/48 | 100 | 126 | ||
| Amgen Inc. | 3.375% | 2/21/50 | 150 | 159 | ||
| Amgen Inc. | 4.663% | 6/15/51 | 150 | 195 | ||
| Amgen Inc. | 3.000% | 1/15/52 | 50 | 50 | ||
| Amgen Inc. | 2.770% | 9/1/53 | 130 | 125 | ||
| Anthem Inc. | 3.300% | 1/15/23 | 30 | 31 | ||
| Anthem Inc. | 3.500% | 8/15/24 | 75 | 81 | ||
| Anthem Inc. | 3.350% | 12/1/24 | 50 | 54 | ||
| Anthem Inc. | 2.375% | 1/15/25 | 200 | 209 | ||
| Anthem Inc. | 3.650% | 12/1/27 | 122 | 137 | ||
| Anthem Inc. | 4.101% | 3/1/28 | 5 | 6 | ||
| Anthem Inc. | 2.875% | 9/15/29 | 70 | 75 | ||
| Anthem Inc. | 2.250% | 5/15/30 | 135 | 137 | ||
| Anthem Inc. | 4.625% | 5/15/42 | 80 | 100 | ||
| Anthem Inc. | 4.650% | 1/15/43 | 50 | 63 | ||
| Anthem Inc. | 4.650% | 8/15/44 | 15 | 19 | ||
| Anthem Inc. | 4.375% | 12/1/47 | 135 | 167 | ||
| Anthem Inc. | 4.550% | 3/1/48 | 30 | 38 | ||
| Anthem Inc. | 3.700% | 9/15/49 | 90 | 102 | ||
| Anthem Inc. | 3.125% | 5/15/50 | 80 | 83 | ||
| Astrazeneca Finance LLC | 0.700% | 5/28/24 | 60 | 60 | ||
| Astrazeneca Finance LLC | 1.200% | 5/28/26 | 45 | 45 | ||
| Astrazeneca Finance LLC | 1.750% | 5/28/28 | 45 | 46 | ||
| Astrazeneca Finance LLC | 2.250% | 5/28/31 | 45 | 46 | ||
| AstraZeneca plc | 0.300% | 5/26/23 | 45 | 45 | ||
| AstraZeneca plc | 3.500% | 8/17/23 | 20 | 21 | ||
| AstraZeneca plc | 3.375% | 11/16/25 | 135 | 148 | ||
| AstraZeneca plc | 0.700% | 4/8/26 | 100 | 98 | ||
| Coupon | Maturity Date | Face Amount ($000) | Market Value• ($000) | |||
| AstraZeneca plc | 3.125% | 6/12/27 | 115 | 126 | ||
| AstraZeneca plc | 4.000% | 1/17/29 | 100 | 115 | ||
| AstraZeneca plc | 1.375% | 8/6/30 | 70 | 67 | ||
| AstraZeneca plc | 6.450% | 9/15/37 | 160 | 241 | ||
| AstraZeneca plc | 4.000% | 9/18/42 | 60 | 73 | ||
| AstraZeneca plc | 4.375% | 11/16/45 | 75 | 97 | ||
| AstraZeneca plc | 4.375% | 8/17/48 | 47 | 61 | ||
| AstraZeneca plc | 3.000% | 5/28/51 | 35 | 37 | ||
| Baxalta Inc. | 4.000% | 6/23/25 | 20 | 22 | ||
| Baxter International Inc. | 2.600% | 8/15/26 | 46 | 49 | ||
| Becton Dickinson & Co. | 3.363% | 6/6/24 | 32 | 34 | ||
| Becton Dickinson & Co. | 3.700% | 6/6/27 | 94 | 105 | ||
| Becton Dickinson & Co. | 2.823% | 5/20/30 | 120 | 127 | ||
| Becton Dickinson & Co. | 1.957% | 2/11/31 | 50 | 49 | ||
| Becton Dickinson & Co. | 4.669% | 6/6/47 | 90 | 114 | ||
| Becton Dickinson & Co. | 3.794% | 5/20/50 | 85 | 96 | ||
| Biogen Inc. | 3.625% | 9/15/22 | 75 | 78 | ||
| Biogen Inc. | 4.050% | 9/15/25 | 30 | 33 | ||
| Biogen Inc. | 2.250% | 5/1/30 | 165 | 167 | ||
| Biogen Inc. | 3.150% | 5/1/50 | 125 | 124 | ||
| Boston Scientific Corp. | 3.450% | 3/1/24 | 25 | 27 | ||
| Boston Scientific Corp. | 3.750% | 3/1/26 | 70 | 77 | ||
| Boston Scientific Corp. | 4.000% | 3/1/29 | 50 | 57 | ||
| Boston Scientific Corp. | 2.650% | 6/1/30 | 25 | 26 | ||
| Boston Scientific Corp. | 4.550% | 3/1/39 | 40 | 49 | ||
| Boston Scientific Corp. | 4.700% | 3/1/49 | 71 | 92 | ||
| Bristol-Myers Squibb Co. | 3.250% | 2/20/23 | 100 | 104 | ||
| Bristol-Myers Squibb Co. | 0.537% | 11/13/23 | 130 | 130 | ||
| Bristol-Myers Squibb Co. | 2.900% | 7/26/24 | 115 | 123 | ||
| Bristol-Myers Squibb Co. | 3.875% | 8/15/25 | 145 | 161 | ||
| Bristol-Myers Squibb Co. | 0.750% | 11/13/25 | 100 | 100 | ||
| Bristol-Myers Squibb Co. | 3.200% | 6/15/26 | 40 | 44 | ||
| Bristol-Myers Squibb Co. | 3.450% | 11/15/27 | 130 | 146 | ||
| Bristol-Myers Squibb Co. | 3.900% | 2/20/28 | 75 | 86 | ||
| Bristol-Myers Squibb Co. | 3.400% | 7/26/29 | 130 | 146 | ||
| Bristol-Myers Squibb Co. | 1.450% | 11/13/30 | 115 | 112 | ||
| Bristol-Myers Squibb Co. | 4.125% | 6/15/39 | 130 | 158 | ||
| Bristol-Myers Squibb Co. | 2.350% | 11/13/40 | 75 | 73 | ||
| Bristol-Myers Squibb Co. | 5.000% | 8/15/45 | 114 | 157 | ||
| Bristol-Myers Squibb Co. | 4.350% | 11/15/47 | 120 | 153 | ||
| Bristol-Myers Squibb Co. | 4.550% | 2/20/48 | 155 | 204 | ||
| Bristol-Myers Squibb Co. | 4.250% | 10/26/49 | 120 | 153 | ||
| Bristol-Myers Squibb Co. | 2.550% | 11/13/50 | 105 | 102 | ||
| Cardinal Health Inc. | 3.079% | 6/15/24 | 50 | 53 | ||
| Cardinal Health Inc. | 3.410% | 6/15/27 | 45 | 49 | ||
| 1 | Cigna Corp. | 3.000% | 7/15/23 | 100 | 104 | |
| Cigna Corp. | 3.750% | 7/15/23 | 76 | 80 | ||
| 1 | Cigna Corp. | 3.250% | 4/15/25 | 85 | 91 | |
| Cigna Corp. | 4.125% | 11/15/25 | 75 | 84 | ||
| 1 | Cigna Corp. | 4.500% | 2/25/26 | 150 | 170 | |
| 1 | Cigna Corp. | 3.400% | 3/1/27 | 75 | 83 | |
| Cigna Corp. | 4.375% | 10/15/28 | 35 | 41 | ||
| Cigna Corp. | 2.400% | 3/15/30 | 86 | 89 | ||
| Cigna Corp. | 2.375% | 3/15/31 | 180 | 185 | ||
| Cigna Corp. | 4.800% | 8/15/38 | 95 | 119 | ||
| Coupon | Maturity Date | Face Amount ($000) | Market Value• ($000) | |||
| Cigna Corp. | 3.200% | 3/15/40 | 55 | 58 | ||
| 1 | Cigna Corp. | 4.800% | 7/15/46 | 135 | 173 | |
| 1 | Cigna Corp. | 3.875% | 10/15/47 | 50 | 57 | |
| Cigna Corp. | 4.900% | 12/15/48 | 90 | 118 | ||
| Cigna Corp. | 3.400% | 3/15/50 | 135 | 144 | ||
| Cigna Corp. | 3.400% | 3/15/51 | 80 | 85 | ||
| CVS Health Corp. | 2.750% | 12/1/22 | 200 | 205 | ||
| CVS Health Corp. | 3.700% | 3/9/23 | 90 | 94 | ||
| CVS Health Corp. | 2.625% | 8/15/24 | 10 | 11 | ||
| CVS Health Corp. | 3.875% | 7/20/25 | 300 | 330 | ||
| CVS Health Corp. | 2.875% | 6/1/26 | 50 | 54 | ||
| CVS Health Corp. | 3.000% | 8/15/26 | 125 | 135 | ||
| CVS Health Corp. | 3.625% | 4/1/27 | 200 | 222 | ||
| CVS Health Corp. | 1.300% | 8/21/27 | 25 | 25 | ||
| CVS Health Corp. | 4.300% | 3/25/28 | 55 | 63 | ||
| CVS Health Corp. | 3.250% | 8/15/29 | 140 | 153 | ||
| CVS Health Corp. | 3.750% | 4/1/30 | 50 | 56 | ||
| CVS Health Corp. | 1.750% | 8/21/30 | 80 | 78 | ||
| CVS Health Corp. | 4.780% | 3/25/38 | 260 | 323 | ||
| CVS Health Corp. | 4.125% | 4/1/40 | 75 | 88 | ||
| CVS Health Corp. | 2.700% | 8/21/40 | 25 | 25 | ||
| CVS Health Corp. | 5.300% | 12/5/43 | 125 | 168 | ||
| CVS Health Corp. | 5.125% | 7/20/45 | 190 | 251 | ||
| CVS Health Corp. | 5.050% | 3/25/48 | 475 | 628 | ||
| CVS Health Corp. | 4.250% | 4/1/50 | 110 | 134 | ||
| Danaher Corp. | 2.600% | 10/1/50 | 25 | 24 | ||
| DENTSPLY SIRONA Inc. | 3.250% | 6/1/30 | 45 | 49 | ||
| DH Europe Finance II Sarl | 2.600% | 11/15/29 | 110 | 116 | ||
| DH Europe Finance II Sarl | 3.250% | 11/15/39 | 80 | 87 | ||
| DH Europe Finance II Sarl | 3.400% | 11/15/49 | 25 | 28 | ||
| Eli Lilly & Co. | 3.375% | 3/15/29 | 165 | 186 | ||
| Eli Lilly & Co. | 3.950% | 3/15/49 | 25 | 31 | ||
| Eli Lilly & Co. | 2.250% | 5/15/50 | 35 | 32 | ||
| Eli Lilly & Co. | 4.150% | 3/15/59 | 20 | 26 | ||
| Eli Lilly & Co. | 2.500% | 9/15/60 | 100 | 94 | ||
| Gilead Sciences Inc. | 3.250% | 9/1/22 | 50 | 51 | ||
| Gilead Sciences Inc. | 2.500% | 9/1/23 | 60 | 62 | ||
| Gilead Sciences Inc. | 3.700% | 4/1/24 | 175 | 188 | ||
| Gilead Sciences Inc. | 3.500% | 2/1/25 | 100 | 108 | ||
| Gilead Sciences Inc. | 3.650% | 3/1/26 | 25 | 28 | ||
| Gilead Sciences Inc. | 2.950% | 3/1/27 | 125 | 135 | ||
| Gilead Sciences Inc. | 1.200% | 10/1/27 | 35 | 34 | ||
| Gilead Sciences Inc. | 1.650% | 10/1/30 | 135 | 132 | ||
| Gilead Sciences Inc. | 4.600% | 9/1/35 | 20 | 25 | ||
| Gilead Sciences Inc. | 4.000% | 9/1/36 | 110 | 129 | ||
| Gilead Sciences Inc. | 2.600% | 10/1/40 | 20 | 19 | ||
| Gilead Sciences Inc. | 5.650% | 12/1/41 | 40 | 56 | ||
| Gilead Sciences Inc. | 4.800% | 4/1/44 | 60 | 77 | ||
| Gilead Sciences Inc. | 4.500% | 2/1/45 | 110 | 136 | ||
| Gilead Sciences Inc. | 4.750% | 3/1/46 | 120 | 154 | ||
| Gilead Sciences Inc. | 4.150% | 3/1/47 | 115 | 138 | ||
| Gilead Sciences Inc. | 2.800% | 10/1/50 | 95 | 93 | ||
| GlaxoSmithKline Capital Inc. | 2.800% | 3/18/23 | 90 | 93 | ||
| GlaxoSmithKline Capital Inc. | 3.375% | 5/15/23 | 75 | 79 | ||
| GlaxoSmithKline Capital Inc. | 3.625% | 5/15/25 | 50 | 55 | ||
| Coupon | Maturity Date | Face Amount ($000) | Market Value• ($000) | |||
| GlaxoSmithKline Capital Inc. | 3.875% | 5/15/28 | 105 | 121 | ||
| GlaxoSmithKline Capital Inc. | 6.375% | 5/15/38 | 160 | 241 | ||
| GlaxoSmithKline Capital plc | 0.534% | 10/1/23 | 60 | 60 | ||
| GlaxoSmithKline Capital plc | 3.000% | 6/1/24 | 35 | 37 | ||
| GlaxoSmithKline Capital plc | 3.375% | 6/1/29 | 75 | 84 | ||
| HCA Inc. | 4.750% | 5/1/23 | 125 | 133 | ||
| HCA Inc. | 5.000% | 3/15/24 | 145 | 160 | ||
| HCA Inc. | 5.250% | 4/15/25 | 50 | 57 | ||
| HCA Inc. | 5.250% | 6/15/26 | 85 | 98 | ||
| HCA Inc. | 4.500% | 2/15/27 | 75 | 85 | ||
| HCA Inc. | 4.125% | 6/15/29 | 75 | 85 | ||
| HCA Inc. | 2.375% | 7/15/31 | 45 | 45 | ||
| HCA Inc. | 5.125% | 6/15/39 | 25 | 31 | ||
| HCA Inc. | 5.500% | 6/15/47 | 90 | 119 | ||
| HCA Inc. | 5.250% | 6/15/49 | 145 | 189 | ||
| HCA Inc. | 3.500% | 7/15/51 | 85 | 87 | ||
| Humana Inc. | 0.650% | 8/3/23 | 75 | 75 | ||
| Humana Inc. | 1.350% | 2/3/27 | 35 | 35 | ||
| Humana Inc. | 2.150% | 2/3/32 | 10 | 10 | ||
| Humana Inc. | 4.950% | 10/1/44 | 58 | 76 | ||
| Johnson & Johnson | 2.625% | 1/15/25 | 25 | 27 | ||
| Johnson & Johnson | 0.550% | 9/1/25 | 100 | 99 | ||
| Johnson & Johnson | 2.450% | 3/1/26 | 125 | 133 | ||
| Johnson & Johnson | 2.950% | 3/3/27 | 105 | 115 | ||
| Johnson & Johnson | 2.900% | 1/15/28 | 120 | 131 | ||
| Johnson & Johnson | 1.300% | 9/1/30 | 125 | 122 | ||
| Johnson & Johnson | 3.550% | 3/1/36 | 50 | 59 | ||
| Johnson & Johnson | 3.625% | 3/3/37 | 150 | 176 | ||
| Johnson & Johnson | 5.950% | 8/15/37 | 70 | 103 | ||
| Johnson & Johnson | 2.100% | 9/1/40 | 50 | 48 | ||
| Johnson & Johnson | 3.700% | 3/1/46 | 120 | 145 | ||
| Johnson & Johnson | 3.500% | 1/15/48 | 80 | 95 | ||
| Johnson & Johnson | 2.250% | 9/1/50 | 60 | 58 | ||
| Johnson & Johnson | 2.450% | 9/1/60 | 75 | 73 | ||
| Laboratory Corp. of America Holdings | 3.600% | 2/1/25 | 60 | 65 | ||
| Laboratory Corp. of America Holdings | 4.700% | 2/1/45 | 50 | 62 | ||
| McKesson Corp. | 3.796% | 3/15/24 | 35 | 38 | ||
| Medtronic Inc. | 3.500% | 3/15/25 | 127 | 139 | ||
| Medtronic Inc. | 4.375% | 3/15/35 | 100 | 125 | ||
| Medtronic Inc. | 4.625% | 3/15/45 | 110 | 147 | ||
| Merck & Co. Inc. | 2.400% | 9/15/22 | 80 | 81 | ||
| Merck & Co. Inc. | 2.800% | 5/18/23 | 115 | 120 | ||
| Merck & Co. Inc. | 2.900% | 3/7/24 | 50 | 53 | ||
| Merck & Co. Inc. | 2.750% | 2/10/25 | 80 | 85 | ||
| Merck & Co. Inc. | 0.750% | 2/24/26 | 135 | 134 | ||
| Merck & Co. Inc. | 3.400% | 3/7/29 | 55 | 62 | ||
| Merck & Co. Inc. | 1.450% | 6/24/30 | 20 | 20 | ||
| Merck & Co. Inc. | 3.900% | 3/7/39 | 85 | 101 | ||
| Merck & Co. Inc. | 2.350% | 6/24/40 | 115 | 113 | ||
| Merck & Co. Inc. | 4.150% | 5/18/43 | 45 | 56 | ||
| Merck & Co. Inc. | 3.700% | 2/10/45 | 100 | 117 | ||
| Merck & Co. Inc. | 4.000% | 3/7/49 | 75 | 93 | ||
| Merck & Co. Inc. | 2.450% | 6/24/50 | 95 | 91 | ||
| Mylan Inc. | 4.550% | 4/15/28 | 25 | 29 | ||
| Mylan Inc. | 5.200% | 4/15/48 | 130 | 162 | ||
| Coupon | Maturity Date | Face Amount ($000) | Market Value• ($000) | |||
| Novartis Capital Corp. | 2.400% | 9/21/22 | 25 | 26 | ||
| Novartis Capital Corp. | 3.400% | 5/6/24 | 105 | 113 | ||
| Novartis Capital Corp. | 3.000% | 11/20/25 | 40 | 43 | ||
| Novartis Capital Corp. | 2.000% | 2/14/27 | 85 | 89 | ||
| Novartis Capital Corp. | 3.100% | 5/17/27 | 100 | 110 | ||
| Novartis Capital Corp. | 2.200% | 8/14/30 | 175 | 182 | ||
| Novartis Capital Corp. | 4.400% | 5/6/44 | 125 | 163 | ||
| Novartis Capital Corp. | 4.000% | 11/20/45 | 65 | 80 | ||
| Novartis Capital Corp. | 2.750% | 8/14/50 | 45 | 47 | ||
| PerkinElmer Inc. | 3.300% | 9/15/29 | 55 | 60 | ||
| Perrigo Finance Unlimited Co. | 3.150% | 6/15/30 | 50 | 52 | ||
| Pfizer Inc. | 3.000% | 6/15/23 | 60 | 63 | ||
| Pfizer Inc. | 3.200% | 9/15/23 | 100 | 106 | ||
| Pfizer Inc. | 2.950% | 3/15/24 | 75 | 80 | ||
| Pfizer Inc. | 3.400% | 5/15/24 | 100 | 108 | ||
| Pfizer Inc. | 0.800% | 5/28/25 | 50 | 50 | ||
| Pfizer Inc. | 2.750% | 6/3/26 | 110 | 119 | ||
| Pfizer Inc. | 3.000% | 12/15/26 | 25 | 28 | ||
| Pfizer Inc. | 3.600% | 9/15/28 | 70 | 80 | ||
| Pfizer Inc. | 3.450% | 3/15/29 | 100 | 113 | ||
| Pfizer Inc. | 2.625% | 4/1/30 | 83 | 89 | ||
| Pfizer Inc. | 1.750% | 8/18/31 | 50 | 50 | ||
| Pfizer Inc. | 7.200% | 3/15/39 | 25 | 41 | ||
| Pfizer Inc. | 2.550% | 5/28/40 | 110 | 112 | ||
| Pfizer Inc. | 4.300% | 6/15/43 | 125 | 158 | ||
| Pfizer Inc. | 4.400% | 5/15/44 | 40 | 51 | ||
| Pfizer Inc. | 4.125% | 12/15/46 | 75 | 94 | ||
| Pfizer Inc. | 4.200% | 9/15/48 | 135 | 171 | ||
| Pfizer Inc. | 4.000% | 3/15/49 | 25 | 31 | ||
| Pfizer Inc. | 2.700% | 5/28/50 | 110 | 111 | ||
| Quest Diagnostics Inc. | 2.950% | 6/30/30 | 60 | 64 | ||
| Regeneron Pharmaceuticals Inc. | 1.750% | 9/15/30 | 110 | 106 | ||
| Regeneron Pharmaceuticals Inc. | 2.800% | 9/15/50 | 20 | 19 | ||
| Royalty Pharma plc | 0.750% | 9/2/23 | 103 | 103 | ||
| Royalty Pharma plc | 1.200% | 9/2/25 | 50 | 50 | ||
| Royalty Pharma plc | 1.750% | 9/2/27 | 35 | 35 | ||
| Royalty Pharma plc | 3.300% | 9/2/40 | 20 | 20 | ||
| Royalty Pharma plc | 3.550% | 9/2/50 | 55 | 55 | ||
| Sanofi | 3.625% | 6/19/28 | 90 | 103 | ||
| Shire Acquisitions Investments Ireland DAC | 2.875% | 9/23/23 | 155 | 162 | ||
| Shire Acquisitions Investments Ireland DAC | 3.200% | 9/23/26 | 90 | 98 | ||
| Smith & Nephew plc | 2.032% | 10/14/30 | 75 | 74 | ||
| Stryker Corp. | 3.375% | 11/1/25 | 110 | 120 | ||
| Stryker Corp. | 3.500% | 3/15/26 | 25 | 27 | ||
| Stryker Corp. | 1.950% | 6/15/30 | 10 | 10 | ||
| Stryker Corp. | 4.625% | 3/15/46 | 75 | 98 | ||
| Takeda Pharmaceutical Co. Ltd. | 4.400% | 11/26/23 | 45 | 49 | ||
| Takeda Pharmaceutical Co. Ltd. | 5.000% | 11/26/28 | 180 | 217 | ||
| Takeda Pharmaceutical Co. Ltd. | 2.050% | 3/31/30 | 225 | 224 | ||
| Takeda Pharmaceutical Co. Ltd. | 3.025% | 7/9/40 | 95 | 98 | ||
| Takeda Pharmaceutical Co. Ltd. | 3.175% | 7/9/50 | 100 | 104 | ||
| Takeda Pharmaceutical Co. Ltd. | 3.375% | 7/9/60 | 60 | 64 | ||
| Thermo Fisher Scientific Inc. | 4.133% | 3/25/25 | 85 | 94 | ||
| Thermo Fisher Scientific Inc. | 2.950% | 9/19/26 | 75 | 81 | ||
| Thermo Fisher Scientific Inc. | 3.200% | 8/15/27 | 6 | 7 | ||
| Coupon | Maturity Date | Face Amount ($000) | Market Value• ($000) | |||
| Thermo Fisher Scientific Inc. | 4.497% | 3/25/30 | 120 | 143 | ||
| Thermo Fisher Scientific Inc. | 2.800% | 10/15/41 | 125 | 128 | ||
| Thermo Fisher Scientific Inc. | 4.100% | 8/15/47 | 35 | 43 | ||
| UnitedHealth Group Inc. | 2.375% | 10/15/22 | 40 | 41 | ||
| UnitedHealth Group Inc. | 2.875% | 3/15/23 | 25 | 26 | ||
| UnitedHealth Group Inc. | 3.500% | 6/15/23 | 25 | 26 | ||
| UnitedHealth Group Inc. | 3.500% | 2/15/24 | 120 | 129 | ||
| UnitedHealth Group Inc. | 2.375% | 8/15/24 | 50 | 53 | ||
| UnitedHealth Group Inc. | 3.750% | 7/15/25 | 80 | 89 | ||
| UnitedHealth Group Inc. | 3.100% | 3/15/26 | 50 | 55 | ||
| UnitedHealth Group Inc. | 1.150% | 5/15/26 | 50 | 50 | ||
| UnitedHealth Group Inc. | 2.950% | 10/15/27 | 100 | 110 | ||
| UnitedHealth Group Inc. | 3.850% | 6/15/28 | 75 | 86 | ||
| UnitedHealth Group Inc. | 3.875% | 12/15/28 | 65 | 75 | ||
| UnitedHealth Group Inc. | 2.875% | 8/15/29 | 75 | 81 | ||
| UnitedHealth Group Inc. | 2.000% | 5/15/30 | 150 | 153 | ||
| UnitedHealth Group Inc. | 2.300% | 5/15/31 | 50 | 52 | ||
| UnitedHealth Group Inc. | 4.625% | 7/15/35 | 60 | 76 | ||
| UnitedHealth Group Inc. | 5.800% | 3/15/36 | 57 | 81 | ||
| UnitedHealth Group Inc. | 6.875% | 2/15/38 | 135 | 210 | ||
| UnitedHealth Group Inc. | 3.500% | 8/15/39 | 25 | 28 | ||
| UnitedHealth Group Inc. | 4.250% | 3/15/43 | 25 | 31 | ||
| UnitedHealth Group Inc. | 4.750% | 7/15/45 | 85 | 113 | ||
| UnitedHealth Group Inc. | 4.200% | 1/15/47 | 115 | 142 | ||
| UnitedHealth Group Inc. | 3.750% | 10/15/47 | 75 | 88 | ||
| UnitedHealth Group Inc. | 4.250% | 6/15/48 | 160 | 202 | ||
| UnitedHealth Group Inc. | 4.450% | 12/15/48 | 110 | 143 | ||
| UnitedHealth Group Inc. | 3.700% | 8/15/49 | 30 | 35 | ||
| UnitedHealth Group Inc. | 2.900% | 5/15/50 | 50 | 52 | ||
| UnitedHealth Group Inc. | 3.250% | 5/15/51 | 50 | 55 | ||
| UnitedHealth Group Inc. | 3.875% | 8/15/59 | 50 | 60 | ||
| UnitedHealth Group Inc. | 3.125% | 5/15/60 | 55 | 58 | ||
| 2 | Universal Health Services Inc. | 2.650% | 10/15/30 | 55 | 56 | |
| Utah Acquisition Sub Inc. | 3.950% | 6/15/26 | 115 | 127 | ||
| Utah Acquisition Sub Inc. | 5.250% | 6/15/46 | 55 | 68 | ||
| 2 | Viatris Inc. | 1.650% | 6/22/25 | 150 | 152 | |
| 2 | Viatris Inc. | 2.300% | 6/22/27 | 40 | 41 | |
| 2 | Viatris Inc. | 2.700% | 6/22/30 | 40 | 41 | |
| 2 | Viatris Inc. | 3.850% | 6/22/40 | 45 | 49 | |
| 2 | Viatris Inc. | 4.000% | 6/22/50 | 75 | 82 | |
| Wyeth LLC | 6.500% | 2/1/34 | 120 | 175 | ||
| Wyeth LLC | 5.950% | 4/1/37 | 85 | 122 | ||
| Zimmer Biomet Holdings Inc. | 3.550% | 4/1/25 | 140 | 151 | ||
| Zimmer Biomet Holdings Inc. | 3.550% | 3/20/30 | 60 | 66 | ||
| Zoetis Inc. | 3.250% | 2/1/23 | 70 | 72 | ||
| Zoetis Inc. | 3.000% | 9/12/27 | 75 | 81 | ||
| Zoetis Inc. | 2.000% | 5/15/30 | 10 | 10 | ||
| Zoetis Inc. | 4.700% | 2/1/43 | 95 | 123 | ||
| 34,336 | ||||||
| Industrials (2.5%) | ||||||
| 1 | 3M Co. | 3.250% | 2/14/24 | 25 | 27 | |
| 3M Co. | 2.000% | 2/14/25 | 10 | 10 | ||
| 3M Co. | 2.875% | 10/15/27 | 45 | 49 | ||
| 1 | 3M Co. | 3.375% | 3/1/29 | 50 | 56 | |
| 3M Co. | 2.375% | 8/26/29 | 100 | 105 | ||
| Coupon | Maturity Date | Face Amount ($000) | Market Value• ($000) | |||
| 1 | 3M Co. | 4.000% | 9/14/48 | 60 | 74 | |
| 3M Co. | 3.250% | 8/26/49 | 50 | 55 | ||
| Amphenol Corp. | 2.800% | 2/15/30 | 55 | 58 | ||
| Carrier Global Corp. | 2.242% | 2/15/25 | 180 | 187 | ||
| Carrier Global Corp. | 2.493% | 2/15/27 | 125 | 132 | ||
| Carrier Global Corp. | 2.722% | 2/15/30 | 120 | 126 | ||
| Carrier Global Corp. | 3.377% | 4/5/40 | 50 | 54 | ||
| Carrier Global Corp. | 3.577% | 4/5/50 | 160 | 174 | ||
| 1 | Caterpillar Financial Services Corp. | 1.900% | 9/6/22 | 15 | 15 | |
| 1 | Caterpillar Financial Services Corp. | 1.950% | 11/18/22 | 150 | 153 | |
| Caterpillar Financial Services Corp. | 0.250% | 3/1/23 | 60 | 60 | ||
| Caterpillar Financial Services Corp. | 0.650% | 7/7/23 | 25 | 25 | ||
| 1 | Caterpillar Financial Services Corp. | 0.450% | 9/14/23 | 25 | 25 | |
| 1 | Caterpillar Financial Services Corp. | 2.150% | 11/8/24 | 115 | 121 | |
| 1 | Caterpillar Financial Services Corp. | 0.800% | 11/13/25 | 35 | 35 | |
| 1 | Caterpillar Financial Services Corp. | 1.100% | 9/14/27 | 95 | 95 | |
| Caterpillar Inc. | 3.400% | 5/15/24 | 20 | 21 | ||
| Caterpillar Inc. | 2.600% | 4/9/30 | 45 | 48 | ||
| Caterpillar Inc. | 5.200% | 5/27/41 | 30 | 42 | ||
| Caterpillar Inc. | 3.803% | 8/15/42 | 145 | 174 | ||
| Caterpillar Inc. | 3.250% | 9/19/49 | 55 | 61 | ||
| Caterpillar Inc. | 3.250% | 4/9/50 | 45 | 50 | ||
| Cummins Inc. | 1.500% | 9/1/30 | 55 | 53 | ||
| Deere & Co. | 3.900% | 6/9/42 | 65 | 79 | ||
| Deere & Co. | 3.750% | 4/15/50 | 65 | 79 | ||
| Eaton Corp. | 2.750% | 11/2/22 | 125 | 129 | ||
| Eaton Corp. | 4.150% | 11/2/42 | 50 | 60 | ||
| FedEx Corp. | 3.250% | 4/1/26 | 45 | 49 | ||
| FedEx Corp. | 3.100% | 8/5/29 | 45 | 49 | ||
| FedEx Corp. | 4.250% | 5/15/30 | 105 | 123 | ||
| FedEx Corp. | 3.250% | 5/15/41 | 20 | 21 | ||
| FedEx Corp. | 5.100% | 1/15/44 | 50 | 65 | ||
| FedEx Corp. | 4.750% | 11/15/45 | 100 | 126 | ||
| FedEx Corp. | 4.550% | 4/1/46 | 95 | 117 | ||
| FedEx Corp. | 4.050% | 2/15/48 | 35 | 41 | ||
| FedEx Corp. | 4.950% | 10/17/48 | 75 | 99 | ||
| FedEx Corp. | 5.250% | 5/15/50 | 75 | 104 | ||
| Fortive Corp. | 3.150% | 6/15/26 | 35 | 38 | ||
| Illinois Tool Works Inc. | 2.650% | 11/15/26 | 120 | 129 | ||
| Illinois Tool Works Inc. | 3.900% | 9/1/42 | 45 | 54 | ||
| 1 | John Deere Capital Corp. | 2.800% | 3/6/23 | 60 | 62 | |
| 1 | John Deere Capital Corp. | 0.450% | 1/17/24 | 60 | 60 | |
| 1 | John Deere Capital Corp. | 3.450% | 3/13/25 | 45 | 49 | |
| 1 | John Deere Capital Corp. | 0.700% | 1/15/26 | 50 | 50 | |
| Otis Worldwide Corp. | 2.056% | 4/5/25 | 98 | 102 | ||
| Otis Worldwide Corp. | 2.565% | 2/15/30 | 75 | 78 | ||
| Parker-Hannifin Corp. | 3.250% | 6/14/29 | 20 | 22 | ||
| Parker-Hannifin Corp. | 4.000% | 6/14/49 | 74 | 87 | ||
| Republic Services Inc. | 2.500% | 8/15/24 | 30 | 32 | ||
| Republic Services Inc. | 3.950% | 5/15/28 | 95 | 108 | ||
| Republic Services Inc. | 1.750% | 2/15/32 | 20 | 19 | ||
| Southwest Airlines Co. | 4.750% | 5/4/23 | 10 | 11 | ||
| Southwest Airlines Co. | 5.250% | 5/4/25 | 45 | 51 | ||
| Southwest Airlines Co. | 5.125% | 6/15/27 | 160 | 187 | ||
| Trane Technologies Luxembourg Finance SA | 3.800% | 3/21/29 | 40 | 45 | ||
| Coupon | Maturity Date | Face Amount ($000) | Market Value• ($000) | |||
| United Parcel Service Inc. | 2.450% | 10/1/22 | 20 | 20 | ||
| United Parcel Service Inc. | 2.500% | 4/1/23 | 50 | 52 | ||
| United Parcel Service Inc. | 3.900% | 4/1/25 | 14 | 15 | ||
| United Parcel Service Inc. | 3.050% | 11/15/27 | 65 | 72 | ||
| United Parcel Service Inc. | 3.400% | 3/15/29 | 72 | 81 | ||
| United Parcel Service Inc. | 4.450% | 4/1/30 | 67 | 81 | ||
| United Parcel Service Inc. | 6.200% | 1/15/38 | 85 | 127 | ||
| United Parcel Service Inc. | 3.750% | 11/15/47 | 20 | 24 | ||
| United Parcel Service Inc. | 4.250% | 3/15/49 | 25 | 32 | ||
| United Parcel Service Inc. | 5.300% | 4/1/50 | 130 | 193 | ||
| Waste Management Inc. | 3.150% | 11/15/27 | 25 | 27 | ||
| Waste Management Inc. | 1.500% | 3/15/31 | 60 | 58 | ||
| Westinghouse Air Brake Technologies Corp. | 3.450% | 11/15/26 | 65 | 70 | ||
| Westinghouse Air Brake Technologies Corp. | 4.950% | 9/15/28 | 70 | 82 | ||
| WW Grainger Inc. | 4.600% | 6/15/45 | 55 | 72 | ||
| 5,416 | ||||||
| Materials (1.5%) | ||||||
| Air Products and Chemicals Inc. | 2.050% | 5/15/30 | 90 | 93 | ||
| Air Products and Chemicals Inc. | 2.800% | 5/15/50 | 45 | 46 | ||
| 2 | Berry Global Inc. | 0.950% | 2/15/24 | 145 | 145 | |
| 2 | Berry Global Inc. | 1.570% | 1/15/26 | 10 | 10 | |
| Carlisle Cos. Inc. | 2.750% | 3/1/30 | 50 | 52 | ||
| CF Industries Inc. | 3.450% | 6/1/23 | 45 | 47 | ||
| CF Industries Inc. | 5.150% | 3/15/34 | 45 | 56 | ||
| CF Industries Inc. | 4.950% | 6/1/43 | 45 | 56 | ||
| CF Industries Inc. | 5.375% | 3/15/44 | 45 | 58 | ||
| Dow Chemical Co. | 7.375% | 11/1/29 | 45 | 63 | ||
| Dow Chemical Co. | 2.100% | 11/15/30 | 15 | 15 | ||
| Dow Chemical Co. | 9.400% | 5/15/39 | 15 | 27 | ||
| Dow Chemical Co. | 5.250% | 11/15/41 | 135 | 178 | ||
| Dow Chemical Co. | 4.375% | 11/15/42 | 140 | 169 | ||
| Dow Chemical Co. | 5.550% | 11/30/48 | 35 | 50 | ||
| DuPont de Nemours Inc. | 4.205% | 11/15/23 | 85 | 92 | ||
| DuPont de Nemours Inc. | 4.493% | 11/15/25 | 95 | 107 | ||
| DuPont de Nemours Inc. | 4.725% | 11/15/28 | 125 | 149 | ||
| DuPont de Nemours Inc. | 5.319% | 11/15/38 | 100 | 132 | ||
| DuPont de Nemours Inc. | 5.419% | 11/15/48 | 120 | 170 | ||
| Eagle Materials Inc. | 2.500% | 7/1/31 | 10 | 10 | ||
| Eastman Chemical Co. | 4.650% | 10/15/44 | 30 | 37 | ||
| Huntsman International LLC | 4.500% | 5/1/29 | 45 | 52 | ||
| International Flavors & Fragrances Inc. | 5.000% | 9/26/48 | 45 | 60 | ||
| Martin Marietta Materials Inc. | 2.400% | 7/15/31 | 70 | 72 | ||
| Martin Marietta Materials Inc. | 3.200% | 7/15/51 | 40 | 41 | ||
| Mosaic Co. | 4.250% | 11/15/23 | 135 | 144 | ||
| Newmont Corp. | 2.250% | 10/1/30 | 60 | 60 | ||
| Newmont Corp. | 6.250% | 10/1/39 | 35 | 51 | ||
| Newmont Corp. | 4.875% | 3/15/42 | 100 | 128 | ||
| Nutrien Ltd. | 4.200% | 4/1/29 | 55 | 63 | ||
| Nutrien Ltd. | 5.000% | 4/1/49 | 29 | 39 | ||
| PPG Industries Inc. | 3.750% | 3/15/28 | 45 | 51 | ||
| Rio Tinto Alcan Inc. | 6.125% | 12/15/33 | 10 | 14 | ||
| Sherwin-Williams Co. | 3.450% | 6/1/27 | 110 | 122 | ||
| Sherwin-Williams Co. | 2.950% | 8/15/29 | 49 | 53 | ||
| Sherwin-Williams Co. | 4.500% | 6/1/47 | 70 | 88 | ||
| Suzano Austria GmbH | 6.000% | 1/15/29 | 190 | 227 | ||
| Coupon | Maturity Date | Face Amount ($000) | Market Value• ($000) | |||
| Suzano Austria GmbH | 5.000% | 1/15/30 | 100 | 114 | ||
| Vulcan Materials Co. | 3.500% | 6/1/30 | 40 | 45 | ||
| WRKCo Inc. | 4.900% | 3/15/29 | 85 | 102 | ||
| 3,288 | ||||||
| Real Estate (1.9%) | ||||||
| Alexandria Real Estate Equities Inc. | 3.375% | 8/15/31 | 35 | 39 | ||
| Alexandria Real Estate Equities Inc. | 2.000% | 5/18/32 | 70 | 69 | ||
| Alexandria Real Estate Equities Inc. | 1.875% | 2/1/33 | 128 | 123 | ||
| Alexandria Real Estate Equities Inc. | 3.000% | 5/18/51 | 25 | 25 | ||
| American Tower Corp. | 3.500% | 1/31/23 | 35 | 37 | ||
| American Tower Corp. | 5.000% | 2/15/24 | 25 | 28 | ||
| American Tower Corp. | 4.000% | 6/1/25 | 50 | 55 | ||
| American Tower Corp. | 3.375% | 10/15/26 | 60 | 65 | ||
| American Tower Corp. | 2.750% | 1/15/27 | 35 | 37 | ||
| American Tower Corp. | 3.550% | 7/15/27 | 95 | 104 | ||
| American Tower Corp. | 3.800% | 8/15/29 | 50 | 56 | ||
| American Tower Corp. | 2.900% | 1/15/30 | 30 | 32 | ||
| American Tower Corp. | 2.100% | 6/15/30 | 125 | 124 | ||
| American Tower Corp. | 1.875% | 10/15/30 | 60 | 58 | ||
| American Tower Corp. | 3.100% | 6/15/50 | 40 | 40 | ||
| Boston Properties LP | 3.850% | 2/1/23 | 30 | 31 | ||
| Boston Properties LP | 3.200% | 1/15/25 | 20 | 21 | ||
| Boston Properties LP | 3.650% | 2/1/26 | 95 | 105 | ||
| Boston Properties LP | 2.750% | 10/1/26 | 45 | 48 | ||
| Boston Properties LP | 3.400% | 6/21/29 | 113 | 124 | ||
| Boston Properties LP | 3.250% | 1/30/31 | 100 | 108 | ||
| Brixmor Operating Partnership LP | 4.125% | 5/15/29 | 15 | 17 | ||
| Brixmor Operating Partnership LP | 4.050% | 7/1/30 | 80 | 91 | ||
| Camden Property Trust | 2.800% | 5/15/30 | 80 | 85 | ||
| CC Holdings GS V LLC | 3.849% | 4/15/23 | 15 | 16 | ||
| Crown Castle International Corp. | 3.150% | 7/15/23 | 70 | 73 | ||
| Crown Castle International Corp. | 3.200% | 9/1/24 | 20 | 21 | ||
| Crown Castle International Corp. | 4.450% | 2/15/26 | 50 | 56 | ||
| Crown Castle International Corp. | 3.700% | 6/15/26 | 95 | 105 | ||
| Crown Castle International Corp. | 3.650% | 9/1/27 | 60 | 66 | ||
| Crown Castle International Corp. | 3.800% | 2/15/28 | 115 | 128 | ||
| Crown Castle International Corp. | 3.300% | 7/1/30 | 135 | 146 | ||
| Crown Castle International Corp. | 2.250% | 1/15/31 | 5 | 5 | ||
| Crown Castle International Corp. | 2.900% | 4/1/41 | 75 | 74 | ||
| Crown Castle International Corp. | 3.250% | 1/15/51 | 62 | 63 | ||
| Digital Realty Trust LP | 3.700% | 8/15/27 | 10 | 11 | ||
| Digital Realty Trust LP | 3.600% | 7/1/29 | 95 | 106 | ||
| Equinix Inc. | 2.625% | 11/18/24 | 115 | 121 | ||
| Equinix Inc. | 3.200% | 11/18/29 | 85 | 92 | ||
| Equinix Inc. | 2.150% | 7/15/30 | 70 | 70 | ||
| ERP Operating LP | 4.500% | 7/1/44 | 45 | 58 | ||
| GLP Capital LP | 5.250% | 6/1/25 | 35 | 39 | ||
| GLP Capital LP | 5.375% | 4/15/26 | 30 | 34 | ||
| GLP Capital LP | 5.300% | 1/15/29 | 70 | 82 | ||
| Healthcare Trust of America Holdings LP | 2.000% | 3/15/31 | 50 | 49 | ||
| Healthpeak Properties Inc. | 3.000% | 1/15/30 | 75 | 80 | ||
| 1 | Host Hotels & Resorts LP | 3.500% | 9/15/30 | 42 | 44 | |
| Prologis LP | 2.250% | 4/15/30 | 80 | 82 | ||
| Prologis LP | 1.250% | 10/15/30 | 20 | 19 | ||
| Realty Income Corp. | 4.650% | 8/1/23 | 50 | 53 | ||
| Coupon | Maturity Date | Face Amount ($000) | Market Value• ($000) | |||
| Realty Income Corp. | 3.250% | 1/15/31 | 65 | 72 | ||
| Simon Property Group LP | 3.375% | 10/1/24 | 20 | 21 | ||
| Simon Property Group LP | 3.500% | 9/1/25 | 35 | 38 | ||
| Simon Property Group LP | 3.300% | 1/15/26 | 100 | 108 | ||
| Simon Property Group LP | 3.250% | 11/30/26 | 30 | 33 | ||
| Simon Property Group LP | 3.375% | 6/15/27 | 35 | 38 | ||
| Simon Property Group LP | 3.375% | 12/1/27 | 110 | 121 | ||
| Simon Property Group LP | 2.450% | 9/13/29 | 115 | 119 | ||
| Simon Property Group LP | 2.650% | 7/15/30 | 50 | 52 | ||
| Simon Property Group LP | 3.250% | 9/13/49 | 68 | 70 | ||
| Simon Property Group LP | 3.800% | 7/15/50 | 40 | 45 | ||
| Ventas Realty LP | 4.400% | 1/15/29 | 35 | 40 | ||
| Welltower Inc. | 3.625% | 3/15/24 | 15 | 16 | ||
| Welltower Inc. | 4.000% | 6/1/25 | 6 | 7 | ||
| Welltower Inc. | 4.250% | 4/15/28 | 60 | 69 | ||
| Welltower Inc. | 3.100% | 1/15/30 | 115 | 123 | ||
| 4,187 | ||||||
| Technology (13.8%) | ||||||
| Adobe Inc. | 3.250% | 2/1/25 | 150 | 162 | ||
| Adobe Inc. | 2.150% | 2/1/27 | 50 | 53 | ||
| Adobe Inc. | 2.300% | 2/1/30 | 35 | 37 | ||
| Analog Devices Inc. | 3.900% | 12/15/25 | 130 | 145 | ||
| Analog Devices Inc. | 3.500% | 12/5/26 | 15 | 17 | ||
| Apple Inc. | 1.700% | 9/11/22 | 40 | 41 | ||
| Apple Inc. | 2.100% | 9/12/22 | 100 | 102 | ||
| Apple Inc. | 2.400% | 1/13/23 | 175 | 180 | ||
| Apple Inc. | 2.850% | 2/23/23 | 150 | 155 | ||
| Apple Inc. | 2.400% | 5/3/23 | 225 | 233 | ||
| Apple Inc. | 0.750% | 5/11/23 | 75 | 76 | ||
| Apple Inc. | 3.000% | 2/9/24 | 100 | 106 | ||
| Apple Inc. | 3.450% | 5/6/24 | 75 | 81 | ||
| Apple Inc. | 2.850% | 5/11/24 | 38 | 40 | ||
| Apple Inc. | 1.800% | 9/11/24 | 100 | 104 | ||
| Apple Inc. | 2.750% | 1/13/25 | 100 | 106 | ||
| Apple Inc. | 2.500% | 2/9/25 | 100 | 106 | ||
| Apple Inc. | 3.200% | 5/13/25 | 25 | 27 | ||
| Apple Inc. | 0.550% | 8/20/25 | 125 | 124 | ||
| Apple Inc. | 0.700% | 2/8/26 | 80 | 80 | ||
| Apple Inc. | 3.250% | 2/23/26 | 390 | 427 | ||
| Apple Inc. | 2.450% | 8/4/26 | 175 | 187 | ||
| Apple Inc. | 2.050% | 9/11/26 | 75 | 79 | ||
| Apple Inc. | 3.350% | 2/9/27 | 230 | 256 | ||
| Apple Inc. | 3.200% | 5/11/27 | 125 | 138 | ||
| Apple Inc. | 3.000% | 6/20/27 | 110 | 121 | ||
| Apple Inc. | 2.900% | 9/12/27 | 200 | 218 | ||
| Apple Inc. | 3.000% | 11/13/27 | 20 | 22 | ||
| Apple Inc. | 1.400% | 8/5/28 | 110 | 110 | ||
| Apple Inc. | 2.200% | 9/11/29 | 50 | 52 | ||
| Apple Inc. | 1.650% | 5/11/30 | 100 | 100 | ||
| Apple Inc. | 1.250% | 8/20/30 | 25 | 24 | ||
| Apple Inc. | 1.650% | 2/8/31 | 220 | 218 | ||
| Apple Inc. | 1.700% | 8/5/31 | 50 | 50 | ||
| Apple Inc. | 4.500% | 2/23/36 | 153 | 194 | ||
| Apple Inc. | 3.850% | 5/4/43 | 200 | 239 | ||
| Apple Inc. | 4.450% | 5/6/44 | 25 | 32 | ||
| Coupon | Maturity Date | Face Amount ($000) | Market Value• ($000) | |||
| Apple Inc. | 4.375% | 5/13/45 | 110 | 141 | ||
| Apple Inc. | 4.650% | 2/23/46 | 155 | 207 | ||
| Apple Inc. | 3.850% | 8/4/46 | 155 | 185 | ||
| Apple Inc. | 4.250% | 2/9/47 | 100 | 126 | ||
| Apple Inc. | 3.750% | 9/12/47 | 105 | 124 | ||
| Apple Inc. | 3.750% | 11/13/47 | 150 | 177 | ||
| Apple Inc. | 2.950% | 9/11/49 | 50 | 52 | ||
| Apple Inc. | 2.650% | 5/11/50 | 145 | 144 | ||
| Apple Inc. | 2.400% | 8/20/50 | 130 | 123 | ||
| Apple Inc. | 2.650% | 2/8/51 | 155 | 153 | ||
| Apple Inc. | 2.700% | 8/5/51 | 85 | 85 | ||
| Apple Inc. | 2.550% | 8/20/60 | 100 | 94 | ||
| Apple Inc. | 2.800% | 2/8/61 | 145 | 143 | ||
| Apple Inc. | 2.850% | 8/5/61 | 70 | 70 | ||
| Applied Materials Inc. | 3.300% | 4/1/27 | 91 | 101 | ||
| Applied Materials Inc. | 1.750% | 6/1/30 | 20 | 20 | ||
| Applied Materials Inc. | 4.350% | 4/1/47 | 55 | 70 | ||
| Applied Materials Inc. | 2.750% | 6/1/50 | 90 | 90 | ||
| Automatic Data Processing Inc. | 3.375% | 9/15/25 | 80 | 88 | ||
| Automatic Data Processing Inc. | 1.700% | 5/15/28 | 70 | 71 | ||
| Automatic Data Processing Inc. | 1.250% | 9/1/30 | 70 | 67 | ||
| Broadcom Corp. | 3.625% | 1/15/24 | 75 | 80 | ||
| Broadcom Corp. | 3.875% | 1/15/27 | 300 | 331 | ||
| Broadcom Corp. | 3.500% | 1/15/28 | 70 | 76 | ||
| Broadcom Inc. | 4.700% | 4/15/25 | 50 | 56 | ||
| Broadcom Inc. | 3.150% | 11/15/25 | 62 | 66 | ||
| Broadcom Inc. | 4.250% | 4/15/26 | 130 | 145 | ||
| Broadcom Inc. | 3.459% | 9/15/26 | 40 | 43 | ||
| 2 | Broadcom Inc. | 1.950% | 2/15/28 | 50 | 50 | |
| Broadcom Inc. | 4.110% | 9/15/28 | 160 | 180 | ||
| Broadcom Inc. | 4.750% | 4/15/29 | 100 | 116 | ||
| Broadcom Inc. | 5.000% | 4/15/30 | 105 | 125 | ||
| Broadcom Inc. | 4.150% | 11/15/30 | 75 | 84 | ||
| 2 | Broadcom Inc. | 2.450% | 2/15/31 | 250 | 248 | |
| Broadcom Inc. | 4.300% | 11/15/32 | 175 | 200 | ||
| 2 | Broadcom Inc. | 2.600% | 2/15/33 | 55 | 54 | |
| 2 | Broadcom Inc. | 3.419% | 4/15/33 | 38 | 40 | |
| 2 | Broadcom Inc. | 3.469% | 4/15/34 | 70 | 74 | |
| 2 | Broadcom Inc. | 3.500% | 2/15/41 | 205 | 210 | |
| 2 | Broadcom Inc. | 3.750% | 2/15/51 | 165 | 172 | |
| Broadridge Financial Solutions Inc. | 2.900% | 12/1/29 | 50 | 53 | ||
| Broadridge Financial Solutions Inc. | 2.600% | 5/1/31 | 60 | 62 | ||
| Cintas Corp. No. 2 | 3.700% | 4/1/27 | 95 | 107 | ||
| Cisco Systems Inc. | 2.200% | 9/20/23 | 60 | 62 | ||
| Cisco Systems Inc. | 3.625% | 3/4/24 | 75 | 81 | ||
| Cisco Systems Inc. | 2.950% | 2/28/26 | 50 | 55 | ||
| Cisco Systems Inc. | 2.500% | 9/20/26 | 95 | 102 | ||
| Cisco Systems Inc. | 5.900% | 2/15/39 | 100 | 146 | ||
| Cisco Systems Inc. | 5.500% | 1/15/40 | 105 | 149 | ||
| Citrix Systems Inc. | 1.250% | 3/1/26 | 35 | 35 | ||
| Citrix Systems Inc. | 4.500% | 12/1/27 | 70 | 80 | ||
| Citrix Systems Inc. | 3.300% | 3/1/30 | 25 | 26 | ||
| Corning Inc. | 4.375% | 11/15/57 | 100 | 123 | ||
| Corning Inc. | 5.450% | 11/15/79 | 20 | 28 | ||
| Dell International LLC | 5.450% | 6/15/23 | 260 | 280 | ||
| Coupon | Maturity Date | Face Amount ($000) | Market Value• ($000) | |||
| Dell International LLC | 4.000% | 7/15/24 | 5 | 5 | ||
| Dell International LLC | 5.850% | 7/15/25 | 25 | 29 | ||
| Dell International LLC | 6.020% | 6/15/26 | 205 | 245 | ||
| Dell International LLC | 4.900% | 10/1/26 | 167 | 193 | ||
| Dell International LLC | 5.300% | 10/1/29 | 85 | 103 | ||
| Dell International LLC | 8.100% | 7/15/36 | 54 | 83 | ||
| Dell International LLC | 8.350% | 7/15/46 | 122 | 201 | ||
| Equifax Inc. | 2.600% | 12/1/24 | 85 | 89 | ||
| Equifax Inc. | 2.350% | 9/15/31 | 50 | 50 | ||
| Fidelity National Information Services Inc. | 0.375% | 3/1/23 | 25 | 25 | ||
| Fidelity National Information Services Inc. | 0.600% | 3/1/24 | 125 | 125 | ||
| Fidelity National Information Services Inc. | 1.150% | 3/1/26 | 105 | 105 | ||
| Fidelity National Information Services Inc. | 1.650% | 3/1/28 | 75 | 75 | ||
| Fidelity National Information Services Inc. | 2.250% | 3/1/31 | 40 | 40 | ||
| Fidelity National Information Services Inc. | 3.100% | 3/1/41 | 60 | 62 | ||
| Fiserv Inc. | 3.800% | 10/1/23 | 130 | 139 | ||
| Fiserv Inc. | 2.750% | 7/1/24 | 75 | 79 | ||
| Fiserv Inc. | 3.850% | 6/1/25 | 30 | 33 | ||
| Fiserv Inc. | 3.200% | 7/1/26 | 135 | 147 | ||
| Fiserv Inc. | 2.250% | 6/1/27 | 55 | 57 | ||
| Fiserv Inc. | 4.200% | 10/1/28 | 60 | 69 | ||
| Fiserv Inc. | 3.500% | 7/1/29 | 55 | 61 | ||
| Fiserv Inc. | 2.650% | 6/1/30 | 90 | 93 | ||
| Fiserv Inc. | 4.400% | 7/1/49 | 152 | 186 | ||
| Hewlett Packard Enterprise Co. | 4.400% | 10/15/22 | 110 | 114 | ||
| Hewlett Packard Enterprise Co. | 2.250% | 4/1/23 | 150 | 154 | ||
| Hewlett Packard Enterprise Co. | 4.450% | 10/2/23 | 25 | 27 | ||
| Hewlett Packard Enterprise Co. | 1.450% | 4/1/24 | 20 | 20 | ||
| Hewlett Packard Enterprise Co. | 4.650% | 10/1/24 | 25 | 28 | ||
| Hewlett Packard Enterprise Co. | 4.900% | 10/15/25 | 165 | 188 | ||
| Hewlett Packard Enterprise Co. | 1.750% | 4/1/26 | 50 | 51 | ||
| Hewlett Packard Enterprise Co. | 6.350% | 10/15/45 | 80 | 111 | ||
| HP Inc. | 2.200% | 6/17/25 | 95 | 99 | ||
| 2 | HP Inc. | 1.450% | 6/17/26 | 45 | 45 | |
| HP Inc. | 3.000% | 6/17/27 | 40 | 43 | ||
| HP Inc. | 3.400% | 6/17/30 | 40 | 43 | ||
| 2 | HP Inc. | 2.650% | 6/17/31 | 10 | 10 | |
| HP Inc. | 6.000% | 9/15/41 | 73 | 96 | ||
| Intel Corp. | 2.700% | 12/15/22 | 110 | 113 | ||
| Intel Corp. | 2.875% | 5/11/24 | 25 | 27 | ||
| Intel Corp. | 3.400% | 3/25/25 | 25 | 27 | ||
| Intel Corp. | 3.700% | 7/29/25 | 150 | 165 | ||
| Intel Corp. | 2.600% | 5/19/26 | 25 | 27 | ||
| Intel Corp. | 3.750% | 3/25/27 | 55 | 62 | ||
| Intel Corp. | 3.150% | 5/11/27 | 130 | 143 | ||
| Intel Corp. | 1.600% | 8/12/28 | 55 | 55 | ||
| Intel Corp. | 2.450% | 11/15/29 | 150 | 158 | ||
| Intel Corp. | 3.900% | 3/25/30 | 85 | 99 | ||
| Intel Corp. | 2.000% | 8/12/31 | 85 | 85 | ||
| Intel Corp. | 4.000% | 12/15/32 | 35 | 42 | ||
| Intel Corp. | 4.600% | 3/25/40 | 50 | 64 | ||
| Intel Corp. | 2.800% | 8/12/41 | 40 | 41 | ||
| Intel Corp. | 4.800% | 10/1/41 | 25 | 33 | ||
| Intel Corp. | 4.900% | 7/29/45 | 25 | 33 | ||
| Intel Corp. | 4.100% | 5/11/47 | 105 | 127 | ||
| Coupon | Maturity Date | Face Amount ($000) | Market Value• ($000) | |||
| Intel Corp. | 3.734% | 12/8/47 | 150 | 172 | ||
| Intel Corp. | 3.250% | 11/15/49 | 225 | 240 | ||
| Intel Corp. | 4.750% | 3/25/50 | 70 | 94 | ||
| Intel Corp. | 3.050% | 8/12/51 | 70 | 72 | ||
| Intel Corp. | 3.100% | 2/15/60 | 40 | 41 | ||
| Intel Corp. | 4.950% | 3/25/60 | 35 | 49 | ||
| Intel Corp. | 3.200% | 8/12/61 | 40 | 41 | ||
| International Business Machines Corp. | 2.875% | 11/9/22 | 125 | 129 | ||
| International Business Machines Corp. | 3.375% | 8/1/23 | 50 | 53 | ||
| International Business Machines Corp. | 3.625% | 2/12/24 | 110 | 118 | ||
| International Business Machines Corp. | 3.000% | 5/15/24 | 115 | 122 | ||
| International Business Machines Corp. | 3.450% | 2/19/26 | 163 | 180 | ||
| International Business Machines Corp. | 3.300% | 5/15/26 | 85 | 94 | ||
| International Business Machines Corp. | 1.700% | 5/15/27 | 55 | 56 | ||
| International Business Machines Corp. | 3.500% | 5/15/29 | 110 | 123 | ||
| International Business Machines Corp. | 1.950% | 5/15/30 | 125 | 125 | ||
| International Business Machines Corp. | 4.150% | 5/15/39 | 100 | 120 | ||
| International Business Machines Corp. | 4.000% | 6/20/42 | 45 | 53 | ||
| International Business Machines Corp. | 4.250% | 5/15/49 | 155 | 194 | ||
| International Business Machines Corp. | 2.950% | 5/15/50 | 80 | 81 | ||
| KLA Corp. | 4.650% | 11/1/24 | 40 | 44 | ||
| KLA Corp. | 4.100% | 3/15/29 | 125 | 144 | ||
| KLA Corp. | 3.300% | 3/1/50 | 20 | 22 | ||
| Lam Research Corp. | 3.750% | 3/15/26 | 65 | 73 | ||
| Lam Research Corp. | 4.000% | 3/15/29 | 100 | 116 | ||
| Lam Research Corp. | 1.900% | 6/15/30 | 15 | 15 | ||
| Lam Research Corp. | 4.875% | 3/15/49 | 55 | 76 | ||
| Lam Research Corp. | 2.875% | 6/15/50 | 25 | 26 | ||
| 2 | Marvell Technology Inc. | 2.450% | 4/15/28 | 10 | 10 | |
| 2 | Marvell Technology Inc. | 2.950% | 4/15/31 | 60 | 62 | |
| Microchip Technology Inc. | 4.333% | 6/1/23 | 80 | 85 | ||
| Micron Technology Inc. | 4.185% | 2/15/27 | 55 | 62 | ||
| Micron Technology Inc. | 4.663% | 2/15/30 | 85 | 100 | ||
| Microsoft Corp. | 2.650% | 11/3/22 | 25 | 26 | ||
| Microsoft Corp. | 2.125% | 11/15/22 | 80 | 82 | ||
| Microsoft Corp. | 2.375% | 5/1/23 | 100 | 103 | ||
| Microsoft Corp. | 2.000% | 8/8/23 | 25 | 26 | ||
| Microsoft Corp. | 3.625% | 12/15/23 | 55 | 59 | ||
| Microsoft Corp. | 2.875% | 2/6/24 | 150 | 158 | ||
| Microsoft Corp. | 2.700% | 2/12/25 | 105 | 112 | ||
| Microsoft Corp. | 3.125% | 11/3/25 | 175 | 191 | ||
| Microsoft Corp. | 2.400% | 8/8/26 | 210 | 225 | ||
| Microsoft Corp. | 3.300% | 2/6/27 | 250 | 279 | ||
| Microsoft Corp. | 3.500% | 2/12/35 | 95 | 112 | ||
| Microsoft Corp. | 3.450% | 8/8/36 | 155 | 181 | ||
| Microsoft Corp. | 4.100% | 2/6/37 | 5 | 6 | ||
| Microsoft Corp. | 4.450% | 11/3/45 | 25 | 34 | ||
| Microsoft Corp. | 3.700% | 8/8/46 | 101 | 123 | ||
| Microsoft Corp. | 2.525% | 6/1/50 | 325 | 324 | ||
| Microsoft Corp. | 2.921% | 3/17/52 | 369 | 396 | ||
| Microsoft Corp. | 4.500% | 2/6/57 | 85 | 121 | ||
| Microsoft Corp. | 2.675% | 6/1/60 | 155 | 156 | ||
| Microsoft Corp. | 3.041% | 3/17/62 | 205 | 223 | ||
| Motorola Solutions Inc. | 4.600% | 5/23/29 | 75 | 88 | ||
| Motorola Solutions Inc. | 2.300% | 11/15/30 | 25 | 25 | ||
| Coupon | Maturity Date | Face Amount ($000) | Market Value• ($000) | |||
| Motorola Solutions Inc. | 2.750% | 5/24/31 | 50 | 52 | ||
| NetApp Inc. | 1.875% | 6/22/25 | 45 | 46 | ||
| NVIDIA Corp. | 0.309% | 6/15/23 | 10 | 10 | ||
| NVIDIA Corp. | 0.584% | 6/14/24 | 60 | 60 | ||
| NVIDIA Corp. | 3.200% | 9/16/26 | 140 | 154 | ||
| NVIDIA Corp. | 2.850% | 4/1/30 | 75 | 81 | ||
| NVIDIA Corp. | 2.000% | 6/15/31 | 60 | 61 | ||
| NVIDIA Corp. | 3.500% | 4/1/40 | 30 | 34 | ||
| NVIDIA Corp. | 3.500% | 4/1/50 | 145 | 166 | ||
| 2 | NXP BV | 4.875% | 3/1/24 | 10 | 11 | |
| 2 | NXP BV | 3.875% | 6/18/26 | 65 | 72 | |
| 2 | NXP BV | 4.300% | 6/18/29 | 95 | 109 | |
| 2 | NXP BV | 3.400% | 5/1/30 | 130 | 143 | |
| 2 | NXP BV | 2.500% | 5/11/31 | 50 | 51 | |
| 2 | NXP BV | 3.250% | 5/11/41 | 20 | 21 | |
| Oracle Corp. | 2.500% | 10/15/22 | 138 | 141 | ||
| Oracle Corp. | 2.625% | 2/15/23 | 100 | 103 | ||
| Oracle Corp. | 3.625% | 7/15/23 | 150 | 159 | ||
| Oracle Corp. | 2.400% | 9/15/23 | 76 | 79 | ||
| Oracle Corp. | 3.400% | 7/8/24 | 25 | 27 | ||
| Oracle Corp. | 2.950% | 11/15/24 | 50 | 53 | ||
| Oracle Corp. | 2.500% | 4/1/25 | 205 | 215 | ||
| Oracle Corp. | 2.950% | 5/15/25 | 130 | 138 | ||
| Oracle Corp. | 1.650% | 3/25/26 | 105 | 107 | ||
| Oracle Corp. | 2.650% | 7/15/26 | 195 | 207 | ||
| Oracle Corp. | 2.800% | 4/1/27 | 225 | 240 | ||
| Oracle Corp. | 3.250% | 11/15/27 | 175 | 191 | ||
| Oracle Corp. | 2.300% | 3/25/28 | 100 | 103 | ||
| Oracle Corp. | 2.950% | 4/1/30 | 135 | 143 | ||
| Oracle Corp. | 2.875% | 3/25/31 | 140 | 147 | ||
| Oracle Corp. | 4.300% | 7/8/34 | 150 | 175 | ||
| Oracle Corp. | 3.900% | 5/15/35 | 35 | 39 | ||
| Oracle Corp. | 3.850% | 7/15/36 | 85 | 94 | ||
| Oracle Corp. | 3.800% | 11/15/37 | 120 | 132 | ||
| Oracle Corp. | 6.500% | 4/15/38 | 115 | 164 | ||
| Oracle Corp. | 6.125% | 7/8/39 | 75 | 104 | ||
| Oracle Corp. | 3.600% | 4/1/40 | 215 | 229 | ||
| Oracle Corp. | 5.375% | 7/15/40 | 190 | 246 | ||
| Oracle Corp. | 3.650% | 3/25/41 | 85 | 91 | ||
| Oracle Corp. | 4.500% | 7/8/44 | 25 | 30 | ||
| Oracle Corp. | 4.125% | 5/15/45 | 45 | 51 | ||
| Oracle Corp. | 4.000% | 7/15/46 | 180 | 198 | ||
| Oracle Corp. | 4.000% | 11/15/47 | 130 | 143 | ||
| Oracle Corp. | 3.600% | 4/1/50 | 256 | 267 | ||
| Oracle Corp. | 3.950% | 3/25/51 | 245 | 272 | ||
| Oracle Corp. | 4.375% | 5/15/55 | 160 | 188 | ||
| Oracle Corp. | 3.850% | 4/1/60 | 220 | 237 | ||
| QUALCOMM Inc. | 2.600% | 1/30/23 | 100 | 103 | ||
| QUALCOMM Inc. | 2.900% | 5/20/24 | 25 | 27 | ||
| QUALCOMM Inc. | 3.450% | 5/20/25 | 75 | 82 | ||
| QUALCOMM Inc. | 3.250% | 5/20/27 | 72 | 80 | ||
| QUALCOMM Inc. | 2.150% | 5/20/30 | 225 | 230 | ||
| QUALCOMM Inc. | 4.650% | 5/20/35 | 50 | 64 | ||
| QUALCOMM Inc. | 4.800% | 5/20/45 | 80 | 107 | ||
| QUALCOMM Inc. | 4.300% | 5/20/47 | 45 | 57 | ||
| Coupon | Maturity Date | Face Amount ($000) | Market Value• ($000) | |||
| QUALCOMM Inc. | 3.250% | 5/20/50 | 105 | 115 | ||
| Quanta Services Inc. | 2.900% | 10/1/30 | 60 | 63 | ||
| RELX Capital Inc. | 4.000% | 3/18/29 | 35 | 40 | ||
| RELX Capital Inc. | 3.000% | 5/22/30 | 75 | 80 | ||
| Roper Technologies Inc. | 4.200% | 9/15/28 | 55 | 63 | ||
| Roper Technologies Inc. | 1.750% | 2/15/31 | 75 | 73 | ||
| salesforce.com Inc. | 3.250% | 4/11/23 | 120 | 125 | ||
| salesforce.com Inc. | 0.625% | 7/15/24 | 50 | 50 | ||
| salesforce.com Inc. | 3.700% | 4/11/28 | 115 | 131 | ||
| salesforce.com Inc. | 1.500% | 7/15/28 | 45 | 45 | ||
| salesforce.com Inc. | 1.950% | 7/15/31 | 70 | 71 | ||
| salesforce.com Inc. | 2.700% | 7/15/41 | 60 | 61 | ||
| salesforce.com Inc. | 2.900% | 7/15/51 | 95 | 98 | ||
| salesforce.com Inc. | 3.050% | 7/15/61 | 85 | 89 | ||
| ServiceNow Inc. | 1.400% | 9/1/30 | 88 | 84 | ||
| Texas Instruments Inc. | 1.375% | 3/12/25 | 60 | 61 | ||
| Texas Instruments Inc. | 2.250% | 9/4/29 | 95 | 99 | ||
| Texas Instruments Inc. | 1.750% | 5/4/30 | 50 | 50 | ||
| Texas Instruments Inc. | 3.875% | 3/15/39 | 20 | 24 | ||
| Texas Instruments Inc. | 4.150% | 5/15/48 | 90 | 114 | ||
| Verisk Analytics Inc. | 4.000% | 6/15/25 | 71 | 78 | ||
| VMware Inc. | 0.600% | 8/15/23 | 50 | 50 | ||
| VMware Inc. | 1.400% | 8/15/26 | 85 | 85 | ||
| VMware Inc. | 3.900% | 8/21/27 | 135 | 151 | ||
| VMware Inc. | 1.800% | 8/15/28 | 35 | 35 | ||
| VMware Inc. | 4.700% | 5/15/30 | 110 | 131 | ||
| Xilinx Inc. | 2.950% | 6/1/24 | 50 | 53 | ||
| Xilinx Inc. | 2.375% | 6/1/30 | 85 | 87 | ||
| 29,918 | ||||||
| Utilities (0.1%) | ||||||
| American Water Capital Corp. | 6.593% | 10/15/37 | 52 | 78 | ||
| American Water Capital Corp. | 3.750% | 9/1/47 | 35 | 40 | ||
| 118 | ||||||
| Total Corporate Bonds (Cost $213,163) | 214,835 | |||||
| Total Investments (99.0%) (Cost $213,281) | 214,954 | |||||
| Other Assets and Liabilities—Net (1.0%) | 2,141 | |||||
| Net Assets (100%) | 217,095 | |||||
| Cost is in $000. |
| • | See Note A in Notes to Financial Statements. |
| 1 | The average or expected maturity is shorter than the final maturity shown because of the possibility of interim principal payments and prepayments or the possibility of the issue being called. |
| 2 | Security exempt from registration under Rule 144A of the Securities Act of 1933. Such securities may be sold in transactions exempt from registration, normally to qualified institutional buyers. At August 31, 2021, the aggregate value was $4,026,000, representing 1.9% of net assets. |
| 3 | Securities with a value of $33,000 have been segregated as initial margin for open futures contracts. |
| Futures Contracts | ||||
| ($000) | ||||
| Expiration | Number of Long (Short) Contracts | Notional Amount | Value and Unrealized Appreciation (Depreciation) | |
| Long Futures Contracts | ||||
| 2-Year U.S. Treasury Note | December 2021 | 4 | 881 | — |
| 5-Year U.S. Treasury Note | December 2021 | 4 | 495 | 1 |
| Long U.S. Treasury Bond | December 2021 | 1 | 163 | 1 |
| Ultra 10-Year U.S. Treasury Note | December 2021 | 8 | 1,184 | 2 |
| 4 | ||||
| Short Futures Contracts | ||||
| 10-Year U.S. Treasury Note | December 2021 | (7) | (934) | — |
| Ultra Long U.S. Treasury Bond | December 2021 | (3) | (592) | 2 |
| 2 | ||||
| 6 | ||||
| ($000s, except shares and per-share amounts) | Amount |
| Assets | |
| Investments in Securities, at Value—Unaffiliated Issuers (Cost $213,281) | 214,954 |
| Investment in Vanguard | 6 |
| Cash | 585 |
| Receivables for Investment Securities Sold | 1,294 |
| Receivables for Accrued Income | 1,855 |
| Variation Margin Receivable—Futures Contracts | 3 |
| Total Assets | 218,697 |
| Liabilities | |
| Payables for Investment Securities Purchased | 1,591 |
| Payables to Vanguard | 11 |
| Total Liabilities | 1,602 |
| Net Assets | 217,095 |
| At August 31, 2021, net assets consisted of: | |
| Paid-in Capital | 215,199 |
| Total Distributable Earnings (Loss) | 1,896 |
| Net Assets | 217,095 |
| Net Assets | |
| Applicable to 2,900,000 outstanding $.001 par value shares of beneficial interest (unlimited authorization) | 217,095 |
| Net Asset Value Per Share | $74.86 |
| September 22, 20201 to August 31, 2021 | |
| ($000) | |
| Investment Income | |
| Income | |
| Interest | 2,124 |
| Total Income | 2,124 |
| Expenses | |
| The Vanguard Group—Note B | |
| Investment Advisory Services | 2 |
| Management and Administrative | 80 |
| Marketing and Distribution | 4 |
| Custodian Fees | 10 |
| Auditing Fees | 36 |
| Shareholders’ Reports | 5 |
| Trustees’ Fees and Expenses | — |
| Total Expenses | 137 |
| Net Investment Income | 1,987 |
| Realized Net Gain (Loss) | |
| Investment Securities Sold | (95) |
| Futures Contracts | (2) |
| Realized Net Gain (Loss) | (97) |
| Change in Unrealized Appreciation (Depreciation) | |
| Investment Securities | 1,673 |
| Futures Contracts | 6 |
| Change in Unrealized Appreciation (Depreciation) | 1,679 |
| Net Increase (Decrease) in Net Assets Resulting from Operations | 3,569 |
| 1 | Inception. |
| September 22, 20201 to August 31, 2021 | |
| ($000) | |
| Increase (Decrease) in Net Assets | |
| Operations | |
| Net Investment Income | 1,987 |
| Realized Net Gain (Loss) | (97) |
| Change in Unrealized Appreciation (Depreciation) | 1,679 |
| Net Increase (Decrease) in Net Assets Resulting from Operations | 3,569 |
| Distributions | |
| Total Distributions | (1,673) |
| Capital Share Transactions | |
| Issued | 215,199 |
| Issued in Lieu of Cash Distributions | — |
| Redeemed | — |
| Net Increase (Decrease) from Capital Share Transactions | 215,199 |
| Total Increase (Decrease) | 217,095 |
| Net Assets | |
| Beginning of Period | — |
| End of Period | 217,095 |
| 1 | Inception. |
| September 22, 20201 to August 31, 2021 | |
| For a Share Outstanding Throughout the Period | |
| Net Asset Value, Beginning of Period | $75.00 |
| Investment Operations | |
| Net Investment Income2 | 1.211 |
| Net Realized and Unrealized Gain (Loss) on Investments | (.330) |
| Total from Investment Operations | .881 |
| Distributions | |
| Dividends from Net Investment Income | (1.021) |
| Distributions from Realized Capital Gains | — |
| Total Distributions | (1.021) |
| Net Asset Value, End of Period | $74.86 |
| Total Return | 1.20% |
| Ratios/Supplemental Data | |
| Net Assets, End of Period (Millions) | $217 |
| Ratio of Total Expenses to Average Net Assets | 0.12%3 |
| Ratio of Net Investment Income to Average Net Assets | 1.74%3 |
| Portfolio Turnover Rate4 | 24% |
| 1 | Inception. |
| 2 | Calculated based on average shares outstanding. |
| 3 | Annualized. |
| 4 | Excludes the value of portfolio securities received or delivered as a result of in-kind purchases or redemptions of the fund’s capital shares, including ETF Creation Units. |
| Level 1 ($000) | Level 2 ($000) | Level 3 ($000) | Total ($000) | |
| Investments | ||||
| Assets | ||||
| U.S. Government and Agency Obligations | — | 119 | — | 119 |
| Corporate Bonds | — | 214,835 | — | 214,835 |
| Total | — | 214,954 | — | 214,954 |
| Derivative Financial Instruments | ||||
| Assets | ||||
| Futures Contracts1 | 6 | — | — | 6 |
| Liabilities | ||||
| Futures Contracts1 | — | — | — | — |
| 1 | Includes cumulative appreciation (depreciation) on futures contracts and centrally cleared swaps, if any, as reported in the Schedule of Investments. Only current day’s variation margin is reported within the Statement of Assets and Liabilities. |
| Amount ($000) | |
| Undistributed Ordinary Income | 314 |
| Undistributed Long-Term Gains | — |
| Capital Loss Carryforwards | (88) |
| Qualified Late-Year Losses | — |
| Net Unrealized Gains (Losses) | 1,670 |
| Period Ended August 31, 2021 | |
| Amount ($000) | |
| Ordinary Income* | 1,673 |
| Long-Term Capital Gains | — |
| Total | 1,673 |
| * | Includes short-term capital gains, if any. |
| Amount ($000) | |
| Tax Cost | 213,284 |
| Gross Unrealized Appreciation | 2,817 |
| Gross Unrealized Depreciation | (1,147) |
| Net Unrealized Appreciation (Depreciation) | 1,670 |
| September 22, 20201 to August 31, 2021 | |
| Shares (000) | |
| Issued | 2,900 |
| Issued in Lieu of Cash Distributions | — |
| Redeemed | — |
| Net Increase (Decrease) in Shares Outstanding | 2,900 |
| 1 | Inception. |
Philadelphia, Pennsylvania
October 20, 2021

Item 2: Code of Ethics.
The Registrant has adopted a code of ethics that applies to the Registrant’s principal executive officer, principal financial officer, principal accounting officer or controller or persons performing similar functions. The Code of Ethics was amended during the reporting period covered by this report to make certain technical, non-material changes.
Item 3: Audit Committee Financial Expert.
All members of the Audit Committee have been determined by the Registrant’s Board of Trustees to be Audit Committee Financial Experts and to be independent: F. Joseph Loughrey, Mark Loughridge, Sarah Bloom Raskin, and Peter F. Volanakis.
Item 4: Principal Accountant Fees and Services.
| (a) | Audit Fees. |
Audit Fees of the Registrant.
Fiscal Year Ended August 31, 2021: $687,000
Fiscal Year Ended August 31, 2020: $720,000
Aggregate Audit Fees of Registered Investment Companies in the Vanguard Group.
Fiscal Year Ended August 31, 2021: $11,244,694
Fiscal Year Ended August 31, 2020: $10,761,407
Includes fees billed in connection with audits of the Registrant, other registered investment companies in the Vanguard complex, The Vanguard Group, Inc., and Vanguard Marketing Corporation.
| (b) | Audit-Related Fees. |
Fiscal Year Ended August 31, 2021: $2,955,181
Fiscal Year Ended August 31, 2020: $2,915,863
Includes fees billed in connection with assurance and related services provided to the Registrant, other registered investment companies in the Vanguard complex, The Vanguard Group, Inc., and Vanguard Marketing Corporation.
| (c) | Tax Fees. |
Fiscal Year Ended August 31, 2021: $2,047,574
Fiscal Year Ended August 31, 2020: $247,168
Includes fees billed in connection with tax compliance, planning, and advice services provided to the Registrant, other registered investment companies in the Vanguard complex, The Vanguard Group, Inc., and Vanguard Marketing Corporation.
| (d) | All Other Fees. |
Fiscal Year Ended August 31, 2021: $280,000
Fiscal Year Ended August 31, 2020: $115,000
Includes fees billed for services related to tax reported information provided to the Registrant, other registered investment companies in the Vanguard complex, The Vanguard Group, Inc., and Vanguard Marketing Corporation.
(e) (1) Pre-Approval Policies. The policy of the Registrant’s Audit Committee is to consider, and, if appropriate, approve before the principal accountant is engaged for such services, all specific audit and non-audit services provided to: the Registrant, other registered investment companies in the Vanguard complex, The Vanguard Group, Inc., and entities controlled by The Vanguard Group, Inc. that provide ongoing services to the Registrant. In making a determination, the Audit Committee considers whether the services are consistent with maintaining the principal accountant’s independence.
In the event of a contingency situation in which the principal accountant is needed to provide services in between scheduled Audit Committee meetings, the Chairman of the Audit Committee would be called on to consider and, if appropriate, pre-approve audit or permitted non-audit services in an amount sufficient to complete services through the next Audit Committee meeting, and to determine if such services would be consistent with maintaining the accountant’s independence. At the next scheduled Audit Committee meeting, services and fees would be presented to the Audit Committee for formal consideration, and, if appropriate, approval by the entire Audit Committee. The Audit Committee would again consider whether such services and fees are consistent with maintaining the principal accountant’s independence.
The Registrant’s Audit Committee is informed at least annually of all audit and non-audit services provided by the principal accountant to the Vanguard complex, whether such services are provided to: the Registrant, other registered investment companies in the Vanguard complex, The Vanguard Group, Inc., or other entities controlled by The Vanguard Group, Inc. that provide ongoing services to the Registrant.
(2) No percentage of the principal accountant’s fees or services were approved pursuant to the waiver provision of paragraph (c)(7)(i)(C) of Rule 2-01 of Regulation S-X.
(f) For the most recent fiscal year, over 50% of the hours worked under the principal accountant’s engagement were not performed by persons other than full-time, permanent employees of the principal accountant.
(g) Aggregate Non-Audit Fees.
Fiscal Year Ended August 31, 2021: $2,327,574
Fiscal Year Ended August 31, 2020: $362,168
Includes fees billed for non-audit services provided to the Registrant, other registered investment companies in the Vanguard complex, The Vanguard Group, Inc., and Vanguard Marketing Corporation.
(h) For the most recent fiscal year, the Audit Committee has determined that the provision of all non-audit services was consistent with maintaining the principal accountant’s independence.
Item 5: Audit Committee of Listed Registrants.
The Registrant is a listed issuer as defined in rule 10A-3 under the Securities Exchange Act of 1934 (“Exchange Act”). The Registrant has a separately-designated standing audit committee established in accordance with Section 3(a)(58)(A) of the Exchange Act. The Registrant’s audit committee members are: F. Joseph Loughrey, Mark Loughridge, Sarah Bloom Raskin, and Peter F. Volanakis.
Item 6: Investments.
Not applicable. The complete schedule of investments is included as part of the report to shareholders filed under Item 1 of this Form.
Item 7: Disclosure of Proxy Voting Policies and Procedures for Closed-End Management Investment Companies.
Not applicable.
Item 8: Portfolio Managers of Closed-End Management Investment Companies.
Not applicable.
Item 9: Purchase of Equity Securities by Closed-End Management Investment Company and Affiliated Purchasers.
Not applicable.
Item 10: Submission of Matters to a Vote of Security Holders.
Not applicable.
Item 11: Controls and Procedures.
(a) Disclosure Controls and Procedures. The Principal Executive and Financial Officers concluded that the Registrant’s Disclosure Controls and Procedures are effective based on their evaluation of the Disclosure Controls and Procedures as of a date within 90 days of the filing date of this report.
(b) Internal Control Over Financial Reporting. There were no significant changes in the Registrant’s Internal Control Over Financial Reporting or in other factors that could significantly affect this control subsequent to the date of the evaluation, including any corrective actions with regard to significant deficiencies and material weaknesses.
Item 12: Disclosure of Securities Lending Activities for Closed-End Management Investment Companies.
Not applicable.
Item 13: Exhibits.
| (a)(1) | Code of Ethics filed herewith. |
| (a)(2) | Certifications filed herewith. |
| (b) | Certifications field herewith. |
Pursuant to the requirements of the Securities Exchange Act of 1934 and the Investment Company Act of 1940, the registrant has duly caused this report to be signed on its behalf by the undersigned, thereunto duly authorized.
| VANGUARD WORLD FUND | ||
| BY: | /s/ MORTIMER J. BUCKLEY* | |
| MORTIMER J. BUCKLEY | ||
| CHIEF EXECUTIVE OFFICER | ||
Date: October 20, 2021
Pursuant to the requirements of the Securities Exchange Act of 1934 and the Investment Company Act of 1940, this report has been signed below by the following persons on behalf of the registrant and in the capacities and on the dates indicated.
| VANGUARD WORLD FUND | ||
| BY: | /s/ MORTIMER J. BUCKLEY* | |
| MORTIMER J. BUCKLEY | ||
| CHIEF EXECUTIVE OFFICER | ||
| Date: October 20, 2021 | ||
| VANGUARD WORLD FUND | ||
| BY: | /s/ CHRISTINE BUCHANAN* | |
| CHRISTINE BUCHANAN | ||
| CHIEF FINANCIAL OFFICER | ||
Date: October 20, 2021
* By: /s/ Anne E. Robinson
Anne E. Robinson, pursuant to a Power of Attorney filed on October 12, 2021 (see File Number 33-23444), and a Power of Attorney filed on August 26, 2021 (see file Number 811-02652), Incorporated by Reference.