Exhibit 1
INCORPORATION OF DOCUMENTS BY REFERENCE
This document is the Republic of Italy’s Annual Report on Form 18-K (“Annual Report”) under the U.S. Securities Exchange Act of 1934 for the fiscal year ended December 31, 2012. All amendments to the Annual Report filed by the Republic of Italy on Form 18-K following the date hereof shall be incorporated by reference into this document. Any statement contained herein, or deemed to be incorporated by reference herein, shall be deemed to be modified or superseded for purposes of this document to the extent that a statement contained herein or in any other subsequently filed document that also is or is deemed to be incorporated by reference herein modifies or supersedes such statement. Any statement so modified or superseded shall not be deemed, except as so modified or superseded, to constitute a part of this document.
FORWARD-LOOKING STATEMENTS
As required by Form 18-K, the Republic of Italy’s most recent budget is filed as an exhibit to this Annual Report. In addition, other Italian Government budgetary papers may from time to time be filed as exhibits to amendments to this Annual Report. This Annual Report, any amendments hereto and exhibits hereto contain or may contain budgetary papers or other forward-looking statements that are not historical facts, including statements about the Italian Government’s beliefs and expectations for the forthcoming budget period. Forward-looking statements can generally be identified by the use of terms such as “will”, “may”, “could”, “should”, “would”, “expect”, “intend”, “estimate”, “anticipate”, “believe”, “continue”, “project” or other similar terms. Those statements are or will be based on plans, estimates and projections that are current only as of the original date of release by the Italian Government of those budgetary papers and speak only as of the date they are so made. The information included in those budgetary papers may also have changed since that date. In addition, these budgets are prepared for government planning purposes, not as future predictions, and actual results may differ and have in fact differed, in some cases materially, from results contemplated by the budgets or other forward-looking statements. Therefore, you should not rely on the information in those budgetary papers or forward-looking statements. If the information included or incorporated by reference in this Annual Report differs from the information in those budgetary papers or forward-looking statements, you should consider only the most current information included in this Annual Report, any amendments hereto and exhibits hereto. Certain figures regarding prior fiscal years have been updated to reflect more recent data that were not previously available. You should read all the information in this Annual Report.
v
TABLE OF CONTENTS
| Summary Information |
1 | |||
| Republic of Italy |
4 | |||
| Area and Population |
4 | |||
| Government and Political Parties |
6 | |||
| The European Union |
7 | |||
| Membership of International Organizations |
9 | |||
| The Italian Economy |
10 | |||
| General |
10 | |||
| Measures to Address the Global Financial and Economic Crisis |
12 | |||
| EU Measures to Address the Eurocrisis |
14 | |||
| Gross Domestic Product |
17 | |||
| Principal Sectors of the Economy |
19 | |||
| Role of the Government in the Economy |
19 | |||
| Services |
19 | |||
| Employment and Labor |
23 | |||
| Prices and Wages |
24 | |||
| Monetary System |
27 | |||
| Monetary Policy |
27 | |||
| Exchange Rate Policy |
30 | |||
| Banking Regulation |
30 | |||
| Measures to assess the robustness of Italian Banking System |
35 | |||
| Credit Allocation |
35 | |||
| Exchange Controls |
35 | |||
| The External Sector of the Economy |
37 | |||
| Foreign Trade |
37 | |||
| Geographic Distribution of Trade |
39 | |||
| Balance of Payments |
40 | |||
| Reserves and Exchange Rates |
43 | |||
| Public Finance |
45 | |||
| The Budget Process |
45 | |||
| European Economic and Monetary Union |
45 | |||
| Accounting Methodology |
47 | |||
| Measures of Fiscal Balance |
47 | |||
| The 2012 Economic and Financial Document |
49 | |||
| The Update of the 2012 Economic and Financial Document |
51 | |||
| The 2013 Economic and Financial Document |
53 | |||
| The Update of the 2013 Economic and Financial Document |
55 | |||
| Revenues and Expenditures |
56 | |||
| Expenditures |
58 | |||
| Revenues |
58 | |||
| Government Enterprises |
60 | |||
| Public Debt |
61 | |||
| General |
61 | |||
| Summary of Internal Debt |
64 | |||
| Summary of External Debt |
65 | |||
| Debt Record |
66 | |||
| Tables and Supplementary Information |
67 | |||
vi
Except as otherwise specified, all amounts are expressed in euro (“euro” or “€”). With the implementation of the third stage of European Economic and Monetary Union on January 1, 1999, the exchange rate between the euro and Italian lire (“lira” or “lire”) was irrevocably fixed at Lit. 1,936.27 per €1.00. The euro was introduced as a physical currency on January 1, 2002 and on February 28, 2002 the lira ceased to be legal tender in Italy and was withdrawn from the financial system. For additional information concerning the exchange rate of the euro against the U.S. dollar and certain other currencies, see “External Sector of the Economy—Reserves and Exchange Rates—U.S. Dollar/Euro Exchange Rate”. We make no representation that the euro amounts referred to in this Annual Report could have been converted into U.S. dollars at any particular rate.
vii
Defined Terms and Conventions
We use terms in this Annual Report that may not be familiar to you. These terms are commonly used to refer to economic concepts that are discussed in this Annual Report. Set forth below are some of the terms used in this Annual Report.
| • | Gross domestic product, or GDP, means the total value of products and services produced inside a country during the relevant period. |
| • | Gross national product, or GNP, means GDP plus income earned by a country’s nationals from products produced, services rendered and capital invested outside the home country, less income earned inside the home country by non-nationals. |
| • | Imports and Exports. Imports are goods brought into a country from a foreign country for trade or sale. Exports are goods taken out of a country for trade or sale abroad. Data on imports and exports included in this Annual Report are derived from customs documents for non-European Union countries and data supplied by other Member States of the European Union. |
| • | The unemployment rate is calculated as the ratio of the members of the labor force who register with local employment agencies as being unemployed to the total labor force. “Labor force” means people employed and people over the age of 15 looking for a job. The reference population used to calculate the Italian labor force in this Annual Report consists of all household members present and resident in Italy and registered with local authorities. |
| • | The inflation rate is measured by the year-on-year percentage change in the general retail price index, unless otherwise specified. The European Union harmonized consumer price index (“HICP”) is calculated on the basis of a weighted basket of goods and services taking into account all families resident in a given territory. Year-on-year rates are calculated by comparing the average of the twelve monthly indices for the later period against the average of the twelve monthly indices for the prior period. |
| • | Net borrowing, or government deficit, is consolidated revenues minus consolidated expenditures of the general government. This is the principal measure of fiscal balance for countries participating in the European Economic and Monetary Union and is calculated in accordance with the EU Protocol on Excessive Deficit Procedure, which implements the European System of Accounts (“ESA95”). |
| • | Net borrowing-to-GDP or deficit-to-GDP means the ratio of net borrowing or government deficit to nominal GDP. |
| • | Debt-to-GDP means the ratio of public debt to nominal GDP. Public debt includes debt incurred by the central government (including Treasury securities and borrowings), regional and other local government, public social security agencies and other public agencies. |
| • | Primary balance is net borrowing less interest payments and other borrowing costs of the general government. The primary balance is used to measure the effect of discretionary actions taken to control expenditures and increase revenues. |
Unless otherwise indicated, we have expressed:
| • | all annual rates of growth as average annual compounded rates; |
| • | all rates of growth or percentage changes in financial data in constant prices adjusted for inflation; and |
| • | all financial data in current prices. |
Amounts included in this Annual Report are normally rounded. In particular, amounts stated as a percentage are normally rounded to the first decimal place. Totals in certain tables in this Annual Report may differ from the sum of the individual items in such tables due to rounding.
Information Sources
The source for most of the financial and demographic statistics for Italy included in this Annual Report is data prepared by Istituto Nazionale di Statistica, or ISTAT, an independent Italian public agency that produces statistical information regarding Italy (including GDP data), in particular financial and demographic statistics for Italy published in the Annual Report of ISTAT dated May 22, 2013 and appendices thereto (together the “2013 ISTAT Annual Report”) and elaborations on such data and other data published in the Annual Report of the Bank of Italy (Banca d’Italia, Italy’s central bank) dated May 31, 2013 and appendices thereto (together the “2013 Bank of Italy Annual Report”). We also include in this Annual Report information published by the Statistical Office of the European Communities or Eurostat.
viii
Certain other financial and statistical information contained in this Annual Report has been derived from other Italian Government sources, including the economic and financial document of 2013 (Documento di Economia e Finanza 2012), dated April 10, 2013 (the “2013 Economic and Financial Document”), which includes the 2013 stability programme (the “2013 Stability Programme”) attached as Exhibit 2 to this Annual Report and the 2013 national reform programme (the “2013 National Reform Programme”) attached as Exhibit 3 to this Annual Report, and the update of the economic and financial document of 2013 (Nota di Aggiornamento del Documento di Economia e Finanza 2013), dated September 20, 2013 (the “Update of the 2013 Economic and Financial Document”) attached as Exhibit 4 to this Annual Report.
Revised National Accounts
In 1999, ISTAT introduced a new system of national accounts in accordance with the new European System of Accounts (ESA95) as set forth in European Union Regulation 2223/1996. This system was intended to contribute to the harmonization of the accounting framework, concepts and definitions within the European Union. Under ESA95, all European Union countries apply a uniform methodology and present their results on a common calendar. Both state sector accounting and public sector accounting transactions are recorded on an accrual basis. Since introducing the ESA95 accounting system, ISTAT has published revisions to the national system of accounts, including replacing its methodology for calculating real growth, which had been based on a fixed base index, with a methodology linking real growth between consecutive time periods, or a chain-linked index. As a result of this change in methodology, all “real” revenue and expenditure figures included in this document differ from and are not comparable to data published in earlier documents filed by Italy with the United States Securities and Exchange Commission, or SEC, prior to March 12, 2007. In addition, certain data relating to the years 2000-2010 which was previously presented at purchasing power parity with 2000 prices have been restated and are now presented at purchasing power parity with 2005 prices. For additional information regarding the restatement of data from previous fiscal years, see “Public Finance—Accounting Methodology”.
The general government revenues and expenditure figures in this Annual Report reflect consolidated revenues and expenditures for the public sector, which is the broadest aggregate for which data is available.
All references herein to “Italy,” the “State” or the “Republic” are to the Republic of Italy, all references herein to the “Government” are to the central government of the Republic of Italy and all references to the “general government” are collectively to the central government and local government sectors and social security funds (those institutions whose principal activity is to provide social benefits), but exclude government owned corporations. In addition, all references herein to the “Ministry of Economy and Finance”, to the “MEF” and to the “Treasury” are interchangeable and refer to the Ministry of Economy and Finance.
ix
SUMMARY INFORMATION
The following summary is qualified in its entirety by, and should be read in conjunction with, the more detailed information appearing elsewhere in this Annual Report, any amendments hereto and annexes hereto.
Gross Domestic Product: According to International Monetary Fund estimates, the economy of Italy, as measured by 2012 GDP (at current prices in U.S. dollars), is the eighth largest in the world. In 2012, Italy’s real GDP decreased by 2.4 per cent, compared to a 0.4 per cent increase in 2011. In the last ten years, Italy’s GDP growth rate has generally been lower than the average GDP growth rate of the euro area. The growth gap between other euro area countries and Italy in the past decade reflects the persistence of several medium and long-term factors, including the difficulties in fully integrating southern Italian regions into the more dynamic economy of northern and central Italy, unfavorable export specialization in traditional goods, inadequate infrastructure, the incomplete liberalization process and insufficient flexibility of national markets. For additional information with respect to Italy’s GDP, see “The Italian Economy—Gross Domestic Product”. In order to address the financial and economic crisis, from 2008 up to 2013, the Government enacted legislation providing for measures aimed at stimulating the economy and stabilizing the Italian financial system. For additional information on the measures enacted by the Government to stimulate the economy and stabilize the Italian financial system, see “The Italian Economy”, Exhibit 2—2013 Stability Programme and Exhibit 4—Update of the 2013 Economic and Financial Document.
The European Economic and Monetary Union: Italy is a signatory of the Treaty on European Union of 1992, also known as the “Maastricht Treaty,” which established the European Economic and Monetary Union, or EMU, culminating in the introduction of a single currency. Eleven member countries, including Italy, met the government deficit, inflation, exchange rate and interest rate requirements of the Maastricht Treaty and were included in the first group of countries to join the EMU on January 1, 1999. On that date, conversion from each EMU member’s old national currency into the euro was irrevocably fixed and the euro became legal tender. The euro was introduced in physical form in the countries participating in the EMU on January 1, 2002 and replaced national notes and coins entirely on February 28, 2002. On January 4, 1999, the noon buying rate for the euro as reported by the European Central Bank (the “Noon Buying Rate”) was €1 for US$1.1812. On September 30, 2013, the European Central Bank (“ECB”) exchange reference rate was €1 for $1.3505. For additional information regarding the historic dollar/euro exchange rate, see “The External Sector of the Economy—Reserves and Exchange Rates”.
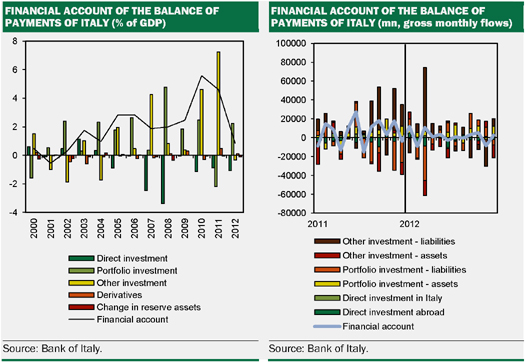
Foreign Trade: Over half of Italy’s exports and imports involve other European Union countries. Italy’s main exports are manufactured goods, including industrial machinery, office machinery, automobiles, clothing, shoes and textiles. Since 2004, Italy’s balance of payments has recorded current account deficits. The deficit on Italy’s external current account in 2012 was €8.4 billion or 0.5 per cent of GDP, the lowest level since 2004, compared to €48.3 billion or 3.1 per cent of GDP in 2011.
Inflation: In 2012, consumer prices in Italy increased at an annual rate of 3.3 per cent measured by the harmonized EU consumer price index (HICP), compared to 2.9 per cent in 2011.
Public Finance: Italy has historically experienced substantial government deficits and high public debt. Countries participating in the EMU are required to reduce “excessive deficits”, adopting budgetary balance as a medium-term objective, and to reduce public debt. Italy recorded net borrowing amounts as a percentage of GDP higher than the 3.0 per cent ratio imposed by the Maastricht Treaty in 2001 and each year during 2003-2006 and 2009-2011. As set out in the Update of the 2013 Economic and Financial Document, Italy’s deficit-to-GDP ratio was 3.0 per cent in 2012 and its debt-to-GDP ratio (gross of euro area financial support) was 127.0 per cent in 2012. For additional information with respect to Italy’s debt-to-GDP, see “The Italian Economy”, “Public Finance”, Exhibit 2—2013 Stability Programme and Exhibit 4—Update of the 2013 Economic and Financial Document.
Eurocrisis: The global financial system began showing signs of disruption in the summer of 2007 and its condition quickly deteriorated following the bankruptcies of several major international financial institutions in the summer of 2008. Its condition continued to deteriorate and caused major disruptions in global financial markets, including unsustainably low levels of liquidity and funding sources (which resulted in high funding costs, historically high credit spreads, volatile and unsustainable capital markets and declining asset values). Many countries acted to combat deteriorating economic conditions, including borrowing in order to support troubled financial and other institutions and adopting other measures to stimulate their economies, which actions led to the credit ratings of various countries to be reduced. The first to be directly affected was Iceland in 2008, followed by Greece, Ireland and Portugal in 2010 and Spain and Italy in 2011. Such reductions to sovereign credit ratings, compounded by the existing recessionary global economy, made it difficult, or in
1
certain instances impossible, for many European countries to access the capital markets to satisfy their funding needs. Such difficulties led to further reductions in sovereign credit ratings and the need for such countries to receive financial support from third parties, including from other countries and the financial support mechanisms adopted by the European Union. In particular, beginning in 2010, Greece, Ireland and Portugal began receiving financial assistance in the form of direct and indirect loans from EU member states. Such conditions have persisted through the date of this Annual Report. For additional information on the measures that the European Union and Italy have taken to address the Eurocrisis, see “The Italian Economy”, Exhibit 2—2013 Stability Programme and Exhibit 3—2013 National Reform Programme.
During 2012, several measures have been adopted to relieve the eurocrisis. In February 2012, EU Member States established the European Stability Mechanism (ESM), which has a large lending capacity, to help preserve the financial stability of Europe’s Monetary Union by providing assistance to Eurozone countries. See “The Italian Economy—EU Measures to Address the Eurocrisis—The ESM”. In September 2012, the ECB stated that investors’ fears over the reversibility of the Euro are unfounded because the ECB is strongly committed to maintaining the singleness of the monetary policy among Eurozone countries, including through Outright Monetary Transactions, in order to address severe distortions in government bond markets. The ECB stated that these steps have been and will continue to be taken within the ECB mandate to maintain price stability over the medium term.
If the eurocrisis were to deepen or extend, the EU Member States may determine further reforms in order to manage the crisis. A prolonged crisis in Europe or a new crisis in Italy could make the refinancing of debt by Italy more expensive.
The Italian Political System: Italy is a democratic republic. Italy is a civil law jurisdiction, with judicial power vested in ordinary courts, administrative courts and courts of accounts. The Government operates under a Constitution that provides for a division of powers among Parliament, the executive branch and the judiciary. Parliament comprises a Senate and a Chamber of Deputies. The executive branch consists of a Council of Ministers selected and headed by a Prime Minister. The Prime Minister is appointed by the President of the Republic and the Prime Minister’s government is confirmed by Parliament. The general Parliamentary elections held on February 24 and 25, 2013 resulted in no party or coalition having a majority of both the Chamber of Deputies and the Senate. The center-left coalition, led by Mr. Pier Luigi Bersani, obtained the highest number of votes on a national level for the elections of the Chamber of Deputies and therefore was awarded with the majority of seats in the Chamber of Deputies. No political party or coalition obtained an absolute majority of seats in the Senate. On April 24, 2013, Mr. Enrico Letta, a representative of the center-left coalition, was appointed to form a new government, which was sworn in on April 28, 2013. On April 29 and 30, 2013, Prime Minister Letta’s government received the confidence vote of the Parliament.
2013 Developments: Law decree n. 35/2013 (converted into law on June 6, 2013) enacted a series of measures aimed at allowing the public administration to accelerate the payments of certain trade payables (overdue as of December 31, 2012) in order to stimulate economic growth. The decree authorized payments due to enterprises, cooperatives and professionals for a total of up to €40 billion, which has been subsequently increased by additional €7.2 billion through Law decree 102/2013. The injection of liquidity achieved through such acceleration is intended to have a positive effect on GDP growth, consumption and investments. For additional information on these measures, see Exhibit 2—2013 Stability Programme, Exhibit 3—2013 National Reform Programme and Exhibit 4—Update of the 2013 Economic and Financial Document.
Law decree n. 69/2013 (Decreto del Fare) (converted into law on August 9, 2013) enacted a new package of urgent measures aimed at stimulating the Italian economy, including, among other things, provisions aimed at facilitating access to credit by small and medium sized companies, measures aimed at developing infrastructure (such as the “European corridors” and certain railway services for approximately €2 billion), rules aimed at bureaucracy and tax simplification, rules aimed at enhancing the efficiency of the justice system, rules aimed at enhancing the digitalization of the public administration (the “Italian Digital Agenda”) and measures concerning education.
In October 2013, the Government approved the draft stability law for 2014 and the draft budget law for 2014/2016. These bills (disegni di legge) have been submitted to the Italian Parliament for discussion and approval. In particular, the draft stability law for 2014 includes measures aimed at sustaining economic growth and increasing employment through, inter alia, a decrease of taxes applicable to individuals and enterprises (including taxes on labor cost), the allocation of financial resources for certain strategic investments (mainly infrastructural) and the reduction of public expenditure.
In addition, the draft stability law for 2014 proposes the introduction of a new service tax to cover costs of services provided by local administrations (including waste management) to be levied by municipalities against real estate properties located in Italy which, with respect to primary residences (prima casa), shall replace the current real property tax (Imposta Municipale Unitaria or IMU)
2
Ratings of the Republic of Italy’s Indebtedness: As of the date hereof, the Republic of Italy’s long-term credit is rated BBB with negative outlook by Standard & Poor’s, BBB+ with negative outlook by Fitch Ratings and Baa2 with negative outlook by Moody’s.
3
REPUBLIC OF ITALY
Area and Population
Geography. The Republic of Italy is situated in south central Europe on a peninsula approximately 1,120 kilometers (696 miles) long and includes the islands of Sicily and Sardinia in the Mediterranean Sea and numerous smaller islands. To the north, Italy borders on France, Switzerland, Austria and Slovenia along the Alps, and to the east, west and south it is surrounded by the Mediterranean Sea. Italy’s total area is approximately 301,300 square kilometers (116,336 square miles), and it has 7,375 kilometers (4,582 miles) of coastline. The independent States of San Marino and Vatican City, whose combined area is approximately 61 square kilometers (24 square miles), are located within the same geographic area. The Apennine Mountains running along the peninsula and the Alps north of the peninsula give much of Italy a rugged terrain.
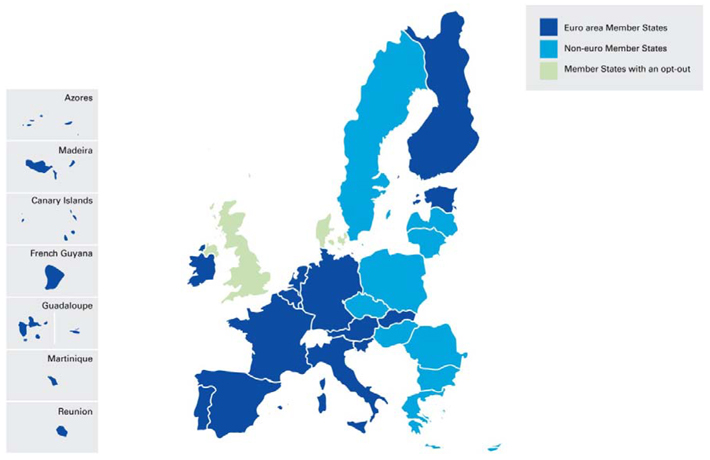
The following is a map of the European Union and the countries, including Italy, within the Euro area.
4
The following is a map of Italy.
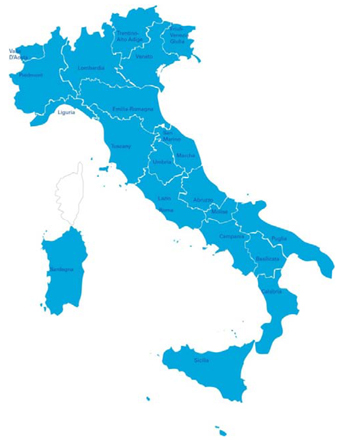
Population. According to ISTAT data, as of December 31, 2012, Italy’s resident population was estimated to be approximately 59.685 million, accounting for approximately 12.1 per cent of the EU population. Italy is the fourth most populated country in the EU after Germany, France and the United Kingdom. According to ISTAT data, as of December 31, 2012, the six regions in the southern part of the peninsula together with Sicily and Sardinia, known as the Mezzogiorno, had a population of approximately 20.6 million. As of the same date, northern and central Italy had a population of approximately 27.3 million and 11.6 million, respectively.
As of January 1, 2012, the breakdown of the resident population by age group was as follows:
| • | under 20 | 17.9 | % | |||
| • | 20 to 39 | 24.9 | % | |||
| • | 40 to 59 | 29.4 | % | |||
| • | 60 and over | 27.8 | % |
Source: ISTAT
Italy’s fertility rate is one of the lowest in the world, while life expectancy for Italians is among the highest in the world. Because population growth has been low in recent years, the average age of the population is increasing.
Rome, the capital of Italy and its largest city, is situated near the western coast approximately halfway down the peninsula, and had a population of approximately 2.6 million as of December 31, 2011. The next largest cities are Milan, with a population of approximately 1.2 million, Naples, with approximately 0.95 million, and Turin, with approximately 0.9 million. In 2011, approximately 68.0 per cent of Italy’s population lived in urban areas. Based on ISTAT data, as of December 31, 2011, population density is approximately 197.4 persons per square kilometer.
Like other EU countries, Italy has experienced significant immigration in recent years, particularly from North Africa and Eastern European countries. According to ISTAT data, in 2012, there were approximately 4.3 million foreigners holding permits to live in Italy, an 8.3 per cent increase from the previous year. Immigration legislation has been the subject of intense political debate since the early 1990s. Italy has tightened its immigration laws in the past decade and initiated bilateral agreements with several countries for
5
cooperation in identifying illegal immigrants. In addition to measures aimed at controlling illegal immigration, the Government has also introduced measures aimed at regularizing the position of illegal immigrants. While these legislative efforts have resulted in the regularization of large numbers of illegal immigrants, Italy continues to have high numbers of foreigners living in Italy illegally.
Government and Political Parties
Italy was originally a loose-knit collection of city-states, most of which united into one kingdom in 1861. It has been a democratic republic since 1946. The Government operates under a Constitution, originally adopted in 1948, that provides for a division of powers among the legislative, executive and judicial branches.
The Legislative Branch. Parliament consists of a Chamber of Deputies, with 630 elected members, and a Senate, with 315 elected members and a small number of life Senators, consisting of former Presidents of the Republic and prominent individuals appointed by the President. The Chamber of Deputies and the Senate share equally and have substantially the same legislative power. Any statute must be approved by both assemblies before being enacted. Except for life Senators, members of Parliament are elected for five years by direct universal adult suffrage, although elections have been held more frequently in the past because the instability of multi-party coalitions has led to premature dissolutions of Parliament.
The Executive Branch. The head of State is the President, elected for a seven-year term by an electoral college that includes the members of Parliament and 58 regional delegates. The current President, Giorgio Napolitano, was originally elected in 2006 and re-elected for a second term. The next presidential election will occur in the spring of 2020. The President has the power to appoint the Prime Minister and to dissolve Parliament. The Constitution also grants the President the power to appoint one-third of the members of the Constitutional Court, to call general elections and to command the armed forces. The President nominates and Parliament confirms the Prime Minister, who is the effective head of Government. The Council of Ministers is appointed by the President on the Prime Minister’s advice. The Prime Minister and Council of Ministers answer to both houses of Parliament and must resign if one of the houses of Parliament passes a vote of no confidence in the administration.
The Judicial Branch. Italy is a civil law jurisdiction. Judicial power is vested in ordinary courts, administrative courts and courts of accounts. The highest ordinary court is the Corte di Cassazione in Rome, where judgments of lower courts of local jurisdiction may be appealed. The highest of the administrative courts, which hear claims against the State and local entities, is the Consiglio di Stato in Rome. The Corte dei Conti in Rome supervises the preparation of, and adjudicates, the State budget of Italy. There is also a Constitutional Court (Corte Costituzionale) that does not exercise general judicial powers, but adjudicates conflicts among the other branches of government and determines the constitutionality of statutes. Criminal matters are within the jurisdiction of the criminal law divisions of ordinary courts, which consist of magistrates who either act as judges in criminal trials or are responsible for investigating and prosecuting criminal cases.
Political Parties. The main political parties are grouped into four coalitions: (i) a center-right coalition led by Il Popolo delle Libertá (in the person of Mr. Silvio Berlusconi), (ii) a center-left coalition led by the Partito Democratico (in the person of Mr. Guglielmo Epifani), (iii) a center coalition led by Scelta Civica con Monti per l’Italia (in the person of Mr. Mario Monti) and (iv) the non-aligned party named Movimento 5 Stelle Beppegrillo.It (in the person of Mr. Giuseppe Piero Grillo).
The general Parliamentary elections held in February 2013 resulted in no party or coalition having a majority of both the Chamber of Deputies and the Senate. The center-left coalition, led by Mr. Pier Luigi Bersani, obtained the highest number of votes on a national level for the elections of the Chamber of Deputies and therefore was awarded the majority of seats in the Chamber of Deputies. No political party or coalition obtained an absolute majority of seats in the Senate.
On April 24, 2013, President Napolitano appointed Mr. Enrico Letta, a member of the center-left coalition, to form a new government and Mr. Letta was sworn in as Prime Minister on April 28, 2013. The new government is composed of members from and supported by the center-left coalition, the center-right coalition and the center coalition. On April 29 and 30, 2013, Prime Minister Letta’s government received the confidence vote of the Parliament
Elections. Except for a brief period, since Italy became a democratic republic in 1946 no one party has been able to command an overall majority in Parliament, and, as a result, Italy has a long history of weak coalition governments. In 1993, Parliament adopted a partial “first past the post” voting system for the election of 75 per cent of the members of both the Senate and the Chamber of Deputies. Under this system, the candidate receiving the largest number of votes in a single district wins. The remaining 25 per cent are elected through a proportional representation system. In the Chamber of Deputies, only parties that receive 4 per cent
6
of the total vote on a nationwide basis are eligible for the seats elected by proportional representation. These modifications of the voting system have resulted in a significantly smaller number of Parliamentary seats held by parties with relatively small shares of the popular vote. Historically, however, government stability has depended on the larger parties’ coalitions with smaller parties.
In December 2005, a new law was enacted modifying the voting system for the Chamber of Deputies and the Senate. In the Chamber of Deputies and in the Senate, the electorate votes for lists of candidates presented by the multiparty coalitions and individual parties. Seats in the Chamber of Deputies are awarded based on the number of votes obtained by each list, provided that multiparty coalitions and individual parties are not eligible for any seat unless they attain at least 10 per cent and 4 per cent of the total votes, respectively. Seats in the Senate are also awarded based on the number of votes obtained by each list, but the minimum per cent of the total votes to be attained by multiparty coalitions and individual parties are determined on a regional basis. In order to ensure government stability, if the winning coalition does not obtain at least 340 seats in the Chamber of Deputies, it is automatically awarded as many seats as it needs to reach 340 seats. In the Senate, the award for the winning coalition is determined on a regional basis. This modified voting system was utilized for the first time in the general elections in April 2006.
Regional and Local Governments. Italy is divided into 20 regions containing 110 provinces. The Italian Constitution reserves certain functions, including police services, education and other local services, for the regional and local governments. Following a Constitutional reform passed by Parliament in 2001, additional legislative and executive powers were transferred to the regions. Legislative competence that historically had belonged exclusively to Parliament was transferred in certain areas (including foreign trade, health and safety, ports and airports, transport network and energy production and distribution) to a regime of shared responsibility whereby the national government promulgates legislation defining fundamental principles and the regions promulgate implementing legislation. Furthermore, as to all areas that are neither subject to the exclusive competence of Parliament nor in a regime of shared responsibility between Parliament and the regions, exclusive regional competence is conferred to a region upon its request, subject to Parliamentary approval. In 2009, Italy adopted legislation that is designed to increase the fiscal autonomy of regional and local governments. The reform is expected to come fully into effect by 2016. Under the new system, lower levels of government will be able to levy their own taxes and will have a share in central tax revenues, including income tax and value added tax. Under the new system, a “standard cost” for public services such as health, education, welfare and public transport will be determined to set budgets for local governments. A fund will be made available to local governments that incur government deficits and convergence plans will be set up for local governments that record significant government deficits in consecutive years.
The Italian Constitution grants special status to five regions (Sicily, Sardinia, Trentino-Alto Adige, Friuli-Venezia Giulia and Valle d’Aosta) providing them with additional legislative and executive powers.
Referenda. An important feature of Italy’s Constitution is the right to hold a referendum to abrogate laws passed by Parliament. Upon approval, a referendum has the legal effect of annulling legislation to which it relates. A referendum can be held at the request of 500,000 signatories or five regional councils but cannot be held on matters relating to taxation, the State budget, the ratification of international treaties or judicial amnesties. In order for a referendum to be approved, a majority of the Italian voting population must vote in the referendum and a majority of such voters must vote in favor of the referendum.
The European Union
Italy is a founding member of the European Economic Community, which now forms part of the European Union. Italy is one of the 28 current members of the EU together with Austria, Belgium, Bulgaria, Croatia, Cyprus, the Czech Republic, Denmark, Estonia, Finland, France, Germany, Greece, Hungary, Ireland, Latvia, Lithuania, Luxembourg, Malta, The Netherlands, Poland, Portugal, Romania, Slovakia, Slovenia, Spain, Sweden and the United Kingdom. The EU had an estimated population of approximately 506.8 million as of January 1, 2012.
The European Union is currently negotiating the terms and conditions of accession to the EU of the following candidate countries: the Former Yugoslav Republic of Macedonia, Montenegro, Iceland and Turkey.
The EU Member States have agreed to delegate sovereignty for certain matters to independent institutions that represent the interests of the union as a whole, its Member States and its citizens. Set forth below is a summary description of the main EU institutions and their role in the European Union.
The Council of the EU. The Council of the EU (the “EU Council”), is the EU’s main decision-making body. It meets in different compositions by bringing together, on a regular basis, ministers of
7
the Member States to decide on matters such as foreign affairs, finance, education and telecommunications. When the EU Council meets to address economic and financial affairs, it is referred to as ECOFIN (“ECOFIN”). The EU Council mainly exercises, together with the European Parliament, the European Union’s legislative function and promulgates:
| • | regulations, which are EU laws directly applicable in Member States; |
| • | directives, which set forth guidelines that Member States are required to enact by promulgating national laws; and |
| • | decisions, through which the EU Council implements EU policies. |
The EU Council also coordinates the broad economic policies of the Member States and concludes, on behalf of the EU, international agreements with one or more Member States or international organizations. In addition, the EU Council:
| • | shares budgetary authority with the European Parliament; |
| • | makes the decisions necessary for framing and implementing a common foreign and security policy; and |
| • | coordinates the activities of Member States and adopts measures in the field of police and judicial cooperation in criminal matters. |
Decisions of the EU Council are made by vote. Each Member State’s voting power is largely based on the size of its population. The following are the number of votes each Member State can cast:
| • | Germany, France, Italy and the United Kingdom each have 29 votes; |
| • | Spain and Poland each have 27 votes; |
| • | Romania has 14 votes; |
| • | the Netherlands has 13 votes; |
| • | Belgium, the Czech Republic, Greece, Hungary and Portugal each have 12 votes; |
| • | Austria, Bulgaria and Sweden each have 10 votes; |
| • | Denmark, Croatia, Ireland, Lithuania, Slovakia and Finland each have 7 votes; |
| • | Cyprus, Estonia, Latvia, Luxembourg and Slovenia each have 4 votes; and |
| • | Malta has 3 votes. |
Generally, decisions of the EU Council are made by qualified majority, which is achieved if:
| • | a majority of Member States (in certain cases, a two-thirds majority of Member States) approves the decision; |
| • | a number of votes representing at least 73.9 per cent of all votes is cast in favor of the decision; and |
| • | a Member State may ask for confirmation that the votes in favor represent at least 62 per cent of the total population of the European Union. |
Commencing on October 1, 2014, pursuant to changes enacted by the Treaty of Lisbon, the voting rules for the EU Council will change, increasing the required majority to 55 per cent of Member States (72 per cent in certain cases) and 65 per cent of the population, and permitting four Member States to block a proposal.
The European Parliament. The European Parliament is elected every five years by direct universal suffrage. The European Parliament has three essential functions:
| • | it shares with the EU Council the power to adopt directives, regulations and decisions; |
| • | it shares budgetary authority with the EU Council and can therefore influence EU spending; and |
| • | it approves the nomination of Commissioners, has the right to censure the Commission and exercises political supervision over all the EU institutions. |
8
Following the election held in 2009 and the accession of Croatia in July 2013, each Member State was allocated the following number of seats in Parliament:
The European Commission. The European Commission (the “Commission”), upholds the interests of the EU as a whole and has the right to initiate draft legislation by presenting legislative proposals to the European Parliament and Council. Currently, the European Commission consists of 28 members, one appointed by each Member State for five-year terms.
Court of Justice. The Court of Justice ensures that community law is uniformly interpreted and effectively applied. It has jurisdiction in disputes involving Member States, EU institutions, businesses and individuals. A Court of First Instance has been attached to it since 1989.
Other Institutions. Other institutions that play a significant role in the European Union are:
| • | the European Central Bank, which is responsible for defining and implementing a single monetary policy in the euro area; |
| • | the Court of Auditors, which checks that all the European Union’s revenue has been received and that all its expenditures have been incurred in a lawful and regular manner and oversees the financial management of the EU budget; and |
| • | the European Investment Bank, which is the European Union’s financial institution, supporting EU objectives by providing long-term financing for specific capital projects. |
Membership of International Organizations
Italy is also a member of the North Atlantic Treaty Organization (NATO), as well as many other regional and international organizations, including the United Nations and many of its affiliated agencies. Italy is one of the Group of Eight (G-8) industrialized nations, together with the United States, Japan, Germany, France, the United Kingdom, Canada and Russia, and a member of the Organization for Economic Co-operation and Development (OECD), the World Trade Organization (WTO), the International Monetary Fund (IMF), the International Bank for Reconstruction and Development (World Bank), the European Bank for Reconstruction and Development (EBRD) and other regional development banks.
9
THE ITALIAN ECONOMY
General
According to IMF data, the Italian economy, as measured by 2012 GDP (at current prices in U.S. dollars), is the eighth largest in the world after the United States, Japan, Germany, the People’s Republic of China, the United Kingdom, France and Brazil.
The Italian economy developed rapidly in the period following World War II as large-scale, technologically advanced industries flourished along with more traditional agricultural and industrial enterprises. Between 1960 and 1974, Italian GDP, adjusted for changes in prices, or “real GDP,” grew by an average of 5.2 per cent per year. As a result of the 1973-74 oil price shocks and the accompanying worldwide recession, output declined by 2.1 per cent in 1975, but between 1976 and 1980 real GDP again grew by an average rate of approximately 4 per cent per year. During this period, however, the economy experienced higher inflation, driven in part by wage inflation and high levels of borrowing by the Government. For the 1980s as a whole, real GDP growth in Italy averaged 2.4 per cent per year.
Italy’s economic growth slowed down substantially in the 1990s. Tighter fiscal policy, which followed the lira’s suspension from the Exchange Rate Mechanism in September 1992, led Italy’s economy into recession in 1993. The economy recovered in 1994; however, Italy’s GDP grew at a modest pace, an average of 1.6 per cent per year from 1996 through 1999, lagging behind those of other major European countries. The growth gap between other EMU countries and Italy since the mid-1990s reflects the persistence of several medium and long-term factors, including the difficulties in fully integrating southern Italian regions into the more dynamic economy of northern and central Italy, unfavorable export specialization in traditional goods, inadequate infrastructure, the incomplete liberalization process and insufficient flexibility of national markets, the slowness of the recovery in economic activity is due to shortcomings in the Italian productive economy that make it fragile in the new competitive environment. These deficiencies depend both on factors internal to firms, such as small size and the limitations of exclusive family control and on external factors, such as insufficient infrastructure, high tax rates combined with widespread tax evasion, an uncertain and complex regulatory framework and long administrative procedures. Some lack of competition is adversely affecting the service sector in particular.
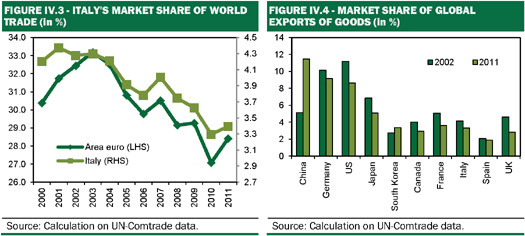
Over the seven-year period from 2000 to 2007, average annual GDP growth in Italy equaled 1.5 per cent compared to the average annual GDP growth of the euro area of 2.5 per cent.
The table below shows the annual percentage change in real GDP growth for Italy and the EU, including Italy, for the period 2000 through 2007.
Annual Per Cent Change in Real GDP (2000-2007)
| 2000 | 2001 | 2002 | 2003 | 2004 | 2005 | 2006 | 2007 | |||||||||||||||||||||||||
| Italy |
3.7 | 1.9 | 0.5 | 0.0 | 1.7 | 0.9 | 2.2 | 1.7 | ||||||||||||||||||||||||
| EU area(1) |
3.9 | 2.1 | 1.3 | 1.5 | 2.6 | 2.2 | 3.4 | 3.2 | ||||||||||||||||||||||||
| (1) | The EU area represents the 28 countries participating in the European Union. |
Source: Eurostat.
The table below shows the annual percentage change in real GDP growth for Italy and the countries participating in the EU and in the EMU, including Italy, for the period 2008 through 2011.
Annual Per Cent Change in Real GDP (2008-2012)
| 2008 | 2009 | 2010 | 2011 | 2012 | ||||||||||||||||
| Italy |
(1.2 | ) | (5.5 | ) | 1.7 | 0.4 | (2.4 | ) | ||||||||||||
| EU area(1) |
0.4 | (4.5 | ) | 2.1 | 1.6 | (0.4 | ) | |||||||||||||
| Euro area(2) |
0.4 | (4.4 | ) | 2.0 | 1.4 | (0.6 | ) | |||||||||||||
| (1) | The EU area represents the 28 countries participating in the European Union. |
| (2) | The Euro area represents the 17 countries participating in the European Monetary Union. |
Source: Bank of Italy and Eurostat.
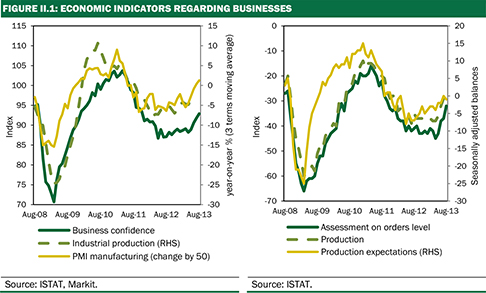
In 2008, as a result of the global financial and economic crisis, Italy’s real GDP decreased by 1.2 per cent mainly as a result of a steep decline in exports. Italy also recorded a decrease in domestic private consumption, largely attributable to the stagnation of Italian families’ purchasing power (the rise in nominal salaries was offset by inflation) and increasing propensity to save, and a decrease in gross fixed investments, especially in machinery and equipment and real estate. The uncertainty resulting from the financial crisis and its long-term effects seriously affected consumer and business confidence and played a major role in the reduction of spending and investment.
10
In 2009, Italy’s real GDP decreased by 5.5 per cent. A moderate recovery began in the second half of the year, mainly because of improved exports. In the same period, the industrial sector returned to moderate growth and the decline in the services sector came to a halt, but the decline in the construction sector continued. Domestic demand remained weak. Spending on capital goods, although increasing slightly in the second half of 2009 in response to tax incentives for purchases of machinery and equipment, was dampened by spare capacity and uncertainty about growth. The decline in consumer spending generally worsened, despite the measures introduced to support purchases of certain durable goods. Signs of an easing in the decline of the real property market appeared towards the end of 2009.
In 2010, the Italian economy grew and real GDP increased by 1.7 per cent compared to 2009. Domestic demand sustained the recovery. Private consumption contributed to the GDP growth by approximately 0.6 per cent, fixed investment contributed to the GDP growth by approximately 0.5 per cent and an increase in inventories contributed to the GDP growth by approximately 0.7 per cent. Net exports provided a negative contribution to GDP growth by approximately 0.4 per cent. The deterioration reflects the position on merchandise trade, which turned negative last year after being broadly in balance in 2009. It was largely due to only two sectors: energy raw materials, whose deficit grew mainly because of the rise in oil prices, and electronic apparatus, where the major factor was the significant increase in imports of photovoltaic cells.
In 2011, Italy’s real GDP grew by 0.4 per cent compared to 2010. Private consumption contributed to GDP growth by 0.1 per cent and net exports contributed to GDP growth by 1.4 per cent while fixed investment negatively contributed to GDP growth by 0.4 per cent. The growth in merchandise exports in 2011 was mainly due to sales to non-EU countries, particularly sales of machinery and equipment, basic metals and other metal products. Good export performances were also recorded by traditional products, pharmaceuticals and electronic products.
In 2012, Italy’s GDP decreased by 2.4 per cent compared to 2011. The decrease in real GDP in 2012 was due to an 8.0 per cent decrease in gross fixed investment, a 3.9 per cent decrease in total consumption and a 7.7 per cent decrease in imports, partly offset by a 2.3 per cent increase in exports.
The Government has historically experienced substantial government deficits. Among other factors, this is largely attributable to high levels of social spending and the fact that social services and other non-market activities of the central and local governments account for a relatively significant percentage of total employment as well as high interest expense resulting from the size of Italy’s public debt. Countries participating in the European Economic and Monetary Union are required to reduce “excessive deficits” and adopt budgetary balance as a medium-term objective. For additional information on the budget and financial planning process, see “Public Finance—Measures of Fiscal Balance” and “Public Finance—Revenues and Expenditures”.
A longstanding objective of the Government has been to control Italy’s debt-to-GDP ratio. Italy’s debt-to-GDP ratio increased in 2012 to 124.3 per cent net of euro area financial support and 127.0 per cent gross of euro area financial support, reflecting the gap of 6.5 per cent between the average cost of debt and the expansion of nominal GDP and to the financial support provided to EMU countries, only partly offset by the primary surplus of 2.5 per cent. The debt-to-GDP ratio in 2012 was above the forecasts indicated in the September 20, 2012 update of the 2012 Economic and Financial Document. Compared to the forecast, the negative difference of 0.6 per cent was mainly due to an increased public sector borrowing requirement, which was €12 billion higher than the forecast made in September. According to Italy’s most recent projections, Italy’s debt-to-GDP ratio (gross of euro area financial support and of the effects of the acceleration of payments due by the public administration) is expected to be 133.0 per cent in 2013, 133.2 per cent in 2014, 130.5 per cent in 2015 and 127.1 per cent in 2016. For additional information on Italy’s forecasts for its debt-to-GDP ratio, see “Public Finance—The 2013 Economic and Financial Document”, Exhibit 2—2013 Stability Programme and Exhibit 4—Update of the 2013 Economic and Financial Document.
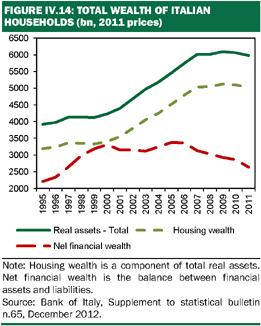
Historically, Italy has had a high but declining savings rate, calculated as a percentage of gross national disposable income, which measures aggregate income of a country’s citizens after providing for capital consumption (the replacement value of capital used up in the process of production). Private sector savings as a percentage of gross national disposable income averaged 19.6 per cent in the period from 1999 to 2008. Private sector savings as a percentage of gross national disposable income was 12.0 per cent in 2011 and decreased to 11.4 per cent in 2012. Because of the historically high savings rate, the Government has been able to raise large amounts of funds through issuances of Treasury securities in the domestic market, with limited recourse to external financing. As at December 31, 2012, the internal debt and the external debt were 96.32 per cent and 3.68 per cent, respectively, of the total debt.
11
The Italian economy is characterized by significant regional disparities, with the level of economic development of southern Italy well below that of northern and central Italy. The per capita GDP of southern Italy, also known as the Mezzogiorno, is significantly lower than that of the rest of Italy. The marked regional divide in Italy is also evidenced by significantly higher unemployment in the Mezzogiorno. For additional information on Italian employment, see “—Employment and Labor”.
Inflation, as measured by the European Union harmonized consumer price index (HICP) was 3.3 per cent in 2012. For additional information on inflation, see “—Prices and Wages”.
Measures to Address the Global Financial and Economic Crisis
In each of 2009, 2010, 2011 and 2012, the Government acted to limit the effects of the global crisis, support the economy and facilitate its recovery. The Government also injected significant liquidity into the financial system by accelerating payment of past debts and reducing the accrual of tax refunds.
Measures adopted in 2009, 2010 and 2011
During the years 2009, 2010 and 2011, the Government adopted a series of measures aimed at increasing Government revenues, reducing Government spending, fighting tax evasion, sustaining the economic and financial growth of Italy, achieving the financing targets adopted by the EU and balancing the general government’s budget. The main reforms adopted by the Government in those years were introduced by (i) Law No. 102 of August 3, 2009, (ii) Law No. 122 of July 31, 2010, (iii) Law No. 111 of July 15, 2011 and (iv) Law No. 148 of September 14, 2011. For additional information on these measures, see Exhibit 2—2013 Stability Programme and Exhibit 3—2013 National Reform Programme.
The measures adopted by the Government in 2009, 2010 and 2011 consisted of, inter alia:
| • | tax measures, including an increase of the ordinary value-added tax (“VAT”) rate from 20 per cent to 21 per cent, an increase of the capital gains tax rate on financial instruments from 12.5 per cent to 20 per cent, with the exception of public debt instruments, which remain subject to a capital gains tax of 12.5 per cent and an additional 3 per cent tax on income exceeding €300,000; |
| • | reforms intended to reduce government spending, including Government expenditure cuts, simplifying general governmental structures, implementing a public spending review, reforming the tax and welfare systems and commencing the process to amend the Constitution to introduce a balanced budget rule; |
| • | measures to fight tax evasion, including a limit to the permissible amount of cash transactions to €2,500 or less and imposing harsher penalties for the payment of professional services without proper invoicing; and |
| • | reforms to enhance potential growth, including a reduction of bureaucratic obstacles for business organizations and the allowance of more flexible labor contracts. |
In November 2011, the Italian Parliament adopted the stability law for 2012 through Law No. 183 of November 12, 2011 and the budget law for 2012/2014 through Law No. 184 of November 12, 2011. These laws implemented several of the austerity measures previously adopted, including, among other things, reduced funding for Ministries, rules for disposing of public real estate and other measures to incentivize financial and economic growth and public deficit reduction. For additional information on the Italian budget and financial planning process, see “Public Finance—The Budget Process”.
In December 2011, the Government enacted additional measures through Law No. 214 of December 22, 2011, which consisted of, inter alia:
| • | tax measures, including a new real property tax (Imposta Municipale Unitaria or IMU) on real estate located in Italy, which will also be levied against primary residences (prima casa), further increases and adjustments to VAT rates and an increase of excise taxes on fuels; |
| • | reforms intended to reduce government spending, including changes to retirement eligibility requirements intended to align the retirement eligibility age with the average projected life span of the population and gradually equalize the retirement eligibility ages of both males and females; |
| • | measures to fight tax evasion, including strengthened investigative powers of tax authorities, new rules requiring financial intermediaries to transmit certain information with respect to customer accounts to the tax authorities and a further reduction of the permissible amount of cash transactions to €1,000 or less; and |
12
| • | reforms to enhance potential growth, including the introduction of new incentives such as an economic growth aid (ACE) that provides for a reduction of income taxes that is proportionate to the notional yield of new capital invested in a business, a reduction of labor taxes (particularly with respect to women and young workers), the establishment of policies intended to increase the employment of women and young workers and the introduction of regulations aimed at liberalizing commerce. |
Measures adopted in 2012
The Government continued adopting measures to address the global financial and economic crisis in 2012. In April 2012, Italy amended its Constitution to include a balanced budget requirement, pursuant to which the general government will be required to operate under balanced budgets beginning in fiscal year 2014. In addition, in September 2012, Italy announced its commitment to reach, within 2013, a balanced budget and reduce its public debt by increasing the primary surplus.
The main measures adopted by the Government in 2012 were introduced through (i) Law No. 27 of March 24, 2012; (ii) Law No. 35 of April 4, 2012; (iii) Law No. 92 of June 28, 2012; (iv) Law No. 134 of August 7, 2012; (v) Law No. 135 of August 7, 2012 and (vi) Law Decree No. 179 of October 18, 2012, the latter of which has been submitted to the Italian Parliament for conversion into law. For additional information on these reforms, see Exhibit 2—2013 Stability Programme and Exhibit 3—2013 National Reform Programme.
The measures adopted by the Government in 2012 consisted of, inter alia:
| • | tax measures, including a deferral of the scheduled increase of the VAT rate; |
| • | reforms intended to reduce government spending, including reduced funding to political groups and political appointees at the regional level, a reduction of the number of regional counselors, increased financial controls, various measures intended to rationalize and streamline bureaucratic processes and administrative structures and the strengthening of centralized purchasing systems; and |
| • | reforms to enhance potential growth, including measures to foster the development and growth of companies engaged in the construction and management of infrastructure and other public works, eliminate bureaucratic obstacles for professionals and entrepreneurs, facilitate access to capital markets for non-listed companies, amendments to bankruptcy laws and civil procedure, new rules and incentives for start-up companies and measures aimed at reducing labor costs and attracting increased foreign direct investment. |
On December 24, 2012, the Italian Parliament approved the stability law for 2013 through Law No. 228 of December 24, 2012 and approved the budget law for 2013/2015 through Law No. 229 of December 24, 2012, which includes measures aimed at achieving a structurally balanced budget in 2013 while increasing productivity, reducing public expenditure and intervening on certain tax regimes applicable to personal income and financial instruments. In addition, on the same date, the Italian Parliament enacted a law to implement the Constitutional balanced budget requirement through Law No. 243 of December 24, 2012 (“Law No. 243”). Law No. 243 will enter into force starting from fiscal year 2014.
Measures adopted in 2013
Law decree n. 35/2013 (converted into law on June 6, 2013) enacted a series of measures aimed at allowing the public administration to accelerate the payments of certain trade payables (overdue as of December 31, 2012) in order to stimulate economic growth. The decree authorized payments due to enterprises, cooperatives and professionals for a total of up to €40 billion, which has been subsequently increased by additional €7.2 billion through Law decree 102/2013. The injection of liquidity achieved through such acceleration is intended to have a positive effect on GDP growth, consumption and investments. For additional information on these measures, see Exhibit 2—2013 Stability Programme, Exhibit 3—2013 National Reform Programme and Exhibit 4—Update of the 2013 Economic and Financial Document.
Law decree n. 69/2013 (Decreto del Fare) (converted into law on August 9, 2013) enacted a new package of urgent measures aimed at stimulating the Italian economy, including, among other things, provisions aimed at facilitating access to credit by small and medium sized companies, measures aimed at developing infrastructure (such as the “European corridors” and certain railway services for approximately €2 billion), rules aimed at bureaucracy and tax simplification, rules aimed at enhancing the efficiency of the justice system, rules aimed at enhancing the digitalization of the public administration (the “Italian Digital Agenda”) and measures concerning education.
13
As a consequence of the fiscal measures adopted in 2012, on October 1, 2013, the VAT rate increased from 21 per cent to 22 per cent.
In October 2013, the Government approved the draft stability law for 2014 and the draft budget law for 2014/2016. These bills (disegni di legge) have been submitted to the Italian Parliament for discussion and approval. In particular, the draft stability law for 2014 includes measures aimed at sustaining economic growth and increasing employment through, inter alia, a decrease of taxes applicable to individuals and enterprises (including taxes on labor cost), the allocation of financial resources for certain strategic investments (mainly infrastructural) and the reduction of public expenditure.
In addition, the draft stability law for 2014 proposes the introduction of a new service tax to cover costs of services provided by local administrations (including waste management) to be levied by municipalities against real estate properties located in Italy which, with respect to primary residences (prima casa), shall replace the current real property tax (Imposta Municipale Unitaria or IMU).
EU Measures to Address the Eurocrisis
The global financial system began showing signs of disruption in the summer of 2007 and its condition quickly deteriorated following the bankruptcies of several major international financial institutions in the summer of 2008. Its condition continued to deteriorate and caused major disruptions in global financial markets, including unsustainably low levels of liquidity and funding sources (which resulted in high funding costs, historically high credit spreads, volatile and unsustainable capital markets and declining asset values). Many countries acted to combat deteriorating economic conditions, including borrowing in order to support troubled financial and other institutions and adopting other measures to stimulate their economies, which actions led to the credit ratings of various countries to be reduced. The first to be directly affected was Iceland in 2008 followed by Greece, Ireland and Portugal in 2010 and Spain and Italy in 2011. Such reductions to sovereign credit ratings, compounded by the existing recessionary global economy, made it difficult, or in certain instances impossible, for many European countries to access the capital markets to satisfy their funding needs. Such difficulties led to further reductions in sovereign credit ratings and the need for such countries to receive financial support from third parties, including from other countries and the financial support mechanisms adopted by the European Union. In particular, beginning in 2010, Greece, Ireland and Portugal began receiving financial assistance in the form of direct and indirect loans from EU member states. Such conditions have persisted through the date of this Annual Report. For additional information on the measures that the European Union have taken to address the Eurocrisis, see Exhibit 2—2013 Stability Programme.
The Stability and Growth Pact and the Euro Plus Pact. In March 2011, the EU Council adopted measures to respond to the economic crisis, requiring all Member States to include a multi-annual consolidation plan including specific deficit, revenue and expenditure targets and an implementation strategy and timeline in their stability or convergence programmes prepared pursuant to their existing responsibilities under the Stability and Growth Pact of 1998. For additional information on the Stability and Growth Pact of 1998, see “Public Finance—European Economic and Monetary Union”. Member States were also required to include structural reforms in their national reform programmes prepared in connection with the European Semester. For additional information on national reform programmes and the European Semester, see “Public Finance—The Budget Process”.
In addition, an agreement named the Euro Plus Pact (the “Pact”) was agreed to by the heads of government of the euro area and joined by Bulgaria, Denmark, Latvia, Lithuania, Poland and Romania (and remains open for other EU Member States to join). The Pact aimed at a closer coordination of policies for economic convergence and requires the heads of government to set common objectives in each chosen policy area and to make annual concrete national commitments. More specific objectives of the Pact are to stimulate competitiveness and employment, to enhance the sustainability of public finances and to reinforce financial stability. Italy has committed together with the other EU Member States to confirm and develop its economic policy based on the Pact and to conform and articulate its national political documentation and process based on the Pact. For additional information on Italy’s budget and financial planning process, see “Public Finance—The Budget Process”.
Financial Assistance to EU Member States. In early 2010, the EU member states began to take steps to provide financial assistance to troubled European Member States. As Greece slipped into a deep recession and came close to defaulting on financial obligations, in May of 2010 the EU provided, on a coordinated bilateral basis, a first round of loans to Greece through a three-year plan (2010 to 2013) for a total commitment of €80 billion. Italy’s portion of the total commitment equaled €14.7 billion. Of the €80 billion, €21 billion was disbursed in 2010 and €31.9 billion in 2011. At the same time the International Monetary Fund (the “IMF”) undertook to provide Greece with an additional €30 billion in loans, €10.5 billion of which was lent in 2010 and €9.6 billion in 2011. As of December 31, 2011, Italy’s exposure to Greece through direct loans was just over €10 billion.
14
The EFSF. In June 2010, the EU member states created the European Financial Stability Facility (the “EFSF”) whose objective is to “preserve financial stability of Europe’s monetary union by providing temporary assistance to euro area Member States”. In order to fund any such assistance the EFSF has the capacity to issue bonds or other debt instruments in the financial markets. Such debt is guaranteed by each Member State on a several basis based on each Member State’s participation in the ECB’s share capital. Initially the extent of the guarantees (and therefore of the facility itself) was capped at €440 billion. Italy’s participation in the EFSF is approximately 18 per cent. Pursuant to a ruling of Eurostat, financings granted by the EFSF cause an increase of public debt of the countries participating in the financing, based on their participation in the ECB’s share capital.
The EFSF financings are combined with those from the European Financial Stabilization Mechanism (the “EFSM”), a €60 billion facility organized by the European Commission, and additional financings from the IMF. The EFSM allows the European Commission to borrow in financial markets on behalf of the Union and then lend the proceeds to the beneficiary Member State. All interest and loan principal is repaid by the beneficiary Member State via the European Commission. The EU budget guarantees the repayment of the bonds in case of the default by the borrower. The EFSF, EFSM and IMF can only act after a request for support is made by a euro area Member State and a country program has been negotiated with the European Commission and the IMF. As a result, any financial assistance by the EFSF, EFSM and IMF to a country in need is linked to strict policy conditions. The EFSF and EFSM may only grant new financings until June 2013; after this date, only existing financings may be administered. During 2011, the EFSM began issuing bonds backed by EU budgetary resources in order to finance the loan package agreed in November 2010 in favor of Ireland and the loan package agreed in May 2011 in favor of Portugal. The EFSM issued approximately €28 billion in bonds in 2011 in order to provide loans of 13.9 billion to Ireland and €14.1 billion to Portugal. Also during 2011, the EFSF issued approximately €18 billion of securities in order to grant loans of €7.6 billion to Ireland and €6.9 billion to Portugal. In addition to the loans provided by the EFSM and the EFSF, the IMF made loans of €12.5 billion to Ireland and €13 billion to Portugal.
A set of measures designed to increase the EFSF’s capacity were approved during the course of 2011: (a) the guarantees provided by the euro area countries were raised from €440 billion to €780 billion; (b) the facility was authorized to make purchases of Member States’ government bonds in the primary and secondary markets; (c) it was authorized to take action under precautionary programmes and to finance the recapitalization of financial institutions; and (d) it will be allowed to use the leverage options offered by granting partial risk protection on new government bond issues by euro area countries and/or by setting up one or more vehicles to raise funds from investors and financial institutions. In early 2012, Greece, having enacted the budget and other reform measures required by the EU, reached a further agreement with the European Commission, the ECB and IMF for a second round of financial support, which consisted of €138 billion in loans from the IMF and the EFSF over the period 2012 to 2016. This second round of financial support differed from the package Greece received in May 2010, in that it received loans directly from the EFSF rather than directly from Member States. In May 2012, Greece had received approximately €72.9 billion from the EFSF. Greece also received an additional €1.7 billion from the IMF.
Also in 2012, the EFSF provided financial support for Ireland and Portugal. Ireland received €13.8 billion, of which €4.6 billion came from the EFSF while the EFSM provided €4.5 billion and the IMF provided €3.6 billion. Ireland also received bilateral loans directly from the United Kingdom and Denmark for a further €1 billion. Portugal received €14.3 billion, of which €6 billion came from the EFSM, €2.7 billion from the EFSF and €5.6 billion from the IMF.
The ESM. From July 2013, the European Stability Mechanism (“ESM”), a facility with lending capacity of €500 billion, will assume the role of the EFSF and the EFSM. The ESM will have a subscribed capital of €700 billion, of which €80 billion will be paid-in capital provided by the euro area Member States and €620 billion will be committed callable capital and guarantees from euro area Member States, who will commit to maintain a minimum 15 per cent ratio of paid-in capital to outstanding amount of ESM issuances in the transitional phase from 2013 to 2017. Italy’s maximum commitment to the ESM will be approximately €125.3 billion. The ESM will grant financings to requesting countries in the euro area under strict conditions and following a debt sustainability analysis.
On February 2, 2012, a number of revisions were made to the treaty instituting the ESM. Its entry into force was brought forward by one year, to July 2012, and the voting rules were amended to allow decisions to be taken by a qualified majority of 85 per cent in certain circumstances. This majority rule can be invoked in
15
place of the requirement of unanimous decisions if the European Commission and the ECB determine that financial assistance measures need to be taken urgently and in the interests of the euro area’s financial and economic stability. Furthermore, as in the case of the EFSF, the ESM has additional means available to it to support countries in difficulty: it can purchase member countries’ government bonds, both directly or on the secondary market, and is allowed greater flexibility in its direct purchases of government bonds; it can take action under precautionary programmes; and it can finance the recapitalization of financial institutions. Finally, in order to strengthen investors’ confidence in the new arrangements, on March 30, 2012 the EU announced that the ESM’s endowment capital would be paid up by 2014 instead of 2017 as originally planned. Payment will be made in five installments, two in 2012, two in 2013 and the last in the first half of 2014. It was also agreed that as of July 2012 the ESM will become the main instrument for financing new support packages. The EFSF will continue to operate until existing financing arrangements terminate and it will be allowed to finance new projects until halfway through next year. From the middle of 2014, the ESM will have a total lending capacity of €500 billion. While the EU had anticipated that the ESM would be operational in July 2012, complications in the ratification of the treaty establishing the ESM led to delays. In particular, Germany’s Federal Constitutional Court took into consideration whether Germany could ratify the treaty in compliance with its constitution. On September 12, 2012, the German Federal Constitutional Court ruled that Germany could ratify the treaty, so long as the treaty was amended slightly to make it clear that the contribution of a Member State could not be increased “without the prior agreement of each Member State and with due regard to national procedures”. The EU finance ministers agreed to an “interpretive declaration” to this effect on September 27, 2012. The Board of Governors of the ESM met for the first time on October 8, 2012 and has become the main European instrument for financing new support programmes.
Collective Action Clauses. Following recommendations of the International Monetary Fund and the release of a draft model form of collective action clause, Italy introduced a form of collective action clause into the documentation of all of its New York law governed bonds issued since June 16, 2003.
The rights of bondholders have generally been individual rather than collective. As a result of each bondholder having individual rights, the restructuring or amending of a bond would legally have to be negotiated with each bondholder individually and any one bondholder that did not agree with restructuring or amendment terms could refuse to accept such terms or “hold out” for better terms thereby delaying the restructuring or amendment process and potentially forcing an issuer into costly litigation. These risks increase as the bondholder base is more geographically dispersed or is comprised of both individual and institutional investors.
In an effort to minimize these risks, issuers began including so-called collective action clauses into their bond documentation. These collective action clauses are intended to minimize the risk that one or a few “hold out” bondholders delay a restructuring or amendment where a majority of the other bondholders favor the terms of the restructuring or amendment, by permitting a qualified majority of the bondholders to accept the terms and bind the entire bondholder base to such terms.
The treaty instituting the ESM, as revised on February 2, 2012 (and ratified by Italy through Law No. 116 of July 23, 2012), required that all new government debt securities with a maturity of more than one year, issued on or after January 1, 2013, include the same collective action clauses as other countries in the Eurozone (the “EU Collective Action Clauses”). These standardized clauses for all euro area Member States, as set out in the document “Common Terms of Reference” dated February 17, 2012 developed and agreed by the European Economic and Financial Committee (EFC) and published on the EU Commissions website, allow a qualified majority of creditors to agree on certain “reserved matter modifications” to the most important terms and conditions of the bonds of a single series (including the financial terms) that are binding for all the holders of the bonds of that series with either (i) the affirmative vote of the holders of at least 75 per cent represented at a meeting or (ii) a written resolution signed by or on behalf of holders of at least 66 2/3 per cent of the aggregate principal amount of the outstanding bonds of that series and the consent of the Issuer. The EU Collective Action Clauses also include an aggregation clause enabling a majority of bondholders across multiple bond issues to agree on certain “reserved matter modifications” to the most important terms and conditions of all outstanding series of bonds (including the financial terms) that are binding for the holders of all outstanding series of bonds with (1) either (i) the affirmative vote of all holders of at least 75 per cent represented at separate meetings or (ii) a written resolution signed by or on behalf of all holders of at least 66 2/3 per cent of the aggregate principal amount of all outstanding series of bonds (taken in the aggregate) and (2) either (i) the affirmative vote of the holders of more than 66 2/3 per cent represented at a meeting or (ii) a written resolution signed by or on behalf of holders of more than 50 per cent of the aggregate principal amount of each outstanding series of bonds (taken individually) and the consent of the Issuer (so called “Cross Series Modification Clauses”). Italy, as all EU member states, has included the EU Collective Action Clauses and the Cross Series
16
Modification Clauses in the documentation of all new bonds issued since January 1, 2013. For additional information regarding Italy’s implementation of EU Collective Action Clauses, see “Public Debt—Summary of External Debt”.
Gross Domestic Product
In 2008, Italy’s real GDP decreased by 1.2 per cent. The fall in real GDP recorded in 2008 was driven by a significant decline in exports coupled with a contraction in domestic demand and gross fixed investment reflecting weakening consumer and business confidence resulting from the global financial and economic crisis.
In 2009, Italy’s real GDP decreased by 5.5 per cent. A moderate recovery began in the second half of the year, mainly because of improved exports. In the same period, the industrial sector returned to moderate growth, the decline in the services sector came to a halt, but the decline in the construction sector continued.
In 2010, Italy’s real GDP increased by 1.7 per cent (mainly due to the severely weakened international macro economy resulting from a combination of external forces), which was 0.1 per cent better than the official forecast.
In 2011, Italy’s GDP grew by 0.4 per cent compared to 2010 (mainly due to the increase recorded in net exports).
In 2012, Italy’s GDP decreased by 2.4 per cent compared to 2011. Private consumption negatively contributed to the GDP growth by 2.6 per cent and net exports contributed to GDP growth by 3.0 per cent while fixed investment negatively contributed to GDP growth by 1.5 per cent.
An improvement in the long-term outlook for recovery in GDP growth depends on the successful adoption of government-designed policies to:
| • | promote investment in infrastructure and strategic geographic areas; |
| • | foster market liberalization and reduce administrative bureaucratic charges and procedures; |
| • | reduce the tax burden; |
| • | preserve the private sector purchasing power; and |
| • | undertake structural measures to contain the growth of government expenditure. |
The following table sets forth information relating to nominal (unadjusted for changing prices) GDP and real GDP and expenditures for the periods indicated.
GDP Summary
| 2008 | 2009 | 2010 | 2011 | 2012 | ||||||||||||||||
| Nominal GDP (€ in millions) |
1,575,144 | 1,519,695 | 1,551,886 | 1,578,497 | 1,565,916 | |||||||||||||||
| Real GDP (€ in millions)(1) |
1,475,412 | 1,394,347 | 1,418,376 | 1,423,674 | 1,389,948 | |||||||||||||||
| Real GDP % change |
(1.2 | ) | (5.5 | ) | 1.7 | 0.4 | (2.4 | ) | ||||||||||||
| Population (in thousands) |
60,045 | 60,340 | 60,626 | 59,394 | 59,685 | |||||||||||||||
| (1) | Constant euro with purchasing power equal to the average for 2005. |
Source: Bank of Italy and ISTAT.
Private Sector Consumption. Consumer households’ contraction in spending reflected the weakness of real disposable income, down by 4.8 per cent in 2012. In nominal terms, the income of consumer households decreased by 2.2 per cent, mainly due to the drop in self-employment income net of social contributions (decreased by 8.2 per cent), which was in turn due to the 6.1 per cent decrease in income per standard self-employed labor unit.
After stagnating on average for three years, household spending decreased by 4.3 per cent in 2012; more than half of such decrease was due to the impact on disposable income of the budget adjustment measures, the unfavorable trend in employment, and the deterioration of the economic situation. All the main expenditure components decreased; purchases of durable goods decreased by 12.7 per cent, in particular spending on furniture and transport equipment. New car registrations decreased for the fifth consecutive year, falling 20 per cent to 1.4 million, being a 30-year low. Purchases of semi-durable goods, mainly clothing and footwear, also decreased by 9.4 per cent, after stagnating in 2011. Consumption of non-durables declined by 4.5 per cent (of which spending on food by 3.0 per cent). Purchases of services slightly decreased by 1.4 per cent, after an increase of 1.6 per cent in 2011, as spending on housing and healthcare held up relatively well.
17
Private sector consumption represented 60 per cent of GDP in 2012 and 60.1 per cent of GDP in 2011. In 2012, it accounted for a 4.3 per cent decrease, compared to a 0.1 per cent increase in 2011. Private sector consumption, in the euro area, decreased by 1.3 per cent in 2012. The contribution to GDP growth in Italy was negative for 2.6 per cent in 2012, compared to a positive contribution of 0.1 per cent in 2011.
Public Sector Consumption. Public sector consumption, or the expenditure on goods and services by the general government, decreased by 2.9 per cent in 2012, compared to a 1.2 per cent decrease in 2011. In 2012, public sector consumption represented 20.7 per cent of real GDP and 21.5 per cent in 2011. The contribution to GDP growth was negative of 0.6 per cent in 2012 compared to a negative contribution of 0.1 per cent in 2011.
Gross Fixed Investment. Gross fixed investment decreased by 8 per cent in 2012, compared to a 1.8 per cent decrease in 2011. The decrease in gross fixed investment in 2012 was significant for machinery, equipment, transport equipment and intangibles (decreased by 9.9 per cent), while construction investment decreased by 6.2 per cent. The fall in investment reflected the unfavorable conditions of finance, ample unutilized capacity and uncertain demand prospects. In 2012, the investment rate declined to 18.3 per cent of GDP. Net of depreciation and amortization, investment spending was virtually nil in 2012, falling to 0.2 per cent of GDP, more than five percentage points lower than the average for the five years preceding the 2008-09 recession. The contraction in construction investment in 2012 had the same impact on residential and non-residential building (6.8 and 6.4 per cent respectively), and in both segments the decline eased in the second half. In 2012, the number of house sales recorded a significant decrease of 25.8 per cent. House prices decreased by 2.7 per cent (5.5 per cent in real terms), bringing the total downward correction from the 2007 peak to 11.0 per cent. In 2012, gross fixed investment represented 18.3 per cent of real GDP and its decrease negatively contributed to real GDP growth by1.5 per cent compared to a negative contribution of 0.4 per cent in 2011.
Net Exports. Exports of goods and services grew by 2.3 per cent in volume in 2012, with merchandise exports growing by 2.4 per cent; this was a much slower rate of increase than in 2011 (5.9 per cent). The slowdown reflected the easing of world trade growth from 6.0 to 2.5 per cent. Italy’s world market share decreased to 2.7 per cent at current prices and exchange rates. Even though structural factors limited the competitiveness of domestic Italian firms, between 2011 and 2012, the competitiveness of Italian goods, measured on the basis of manufacturing producer prices, improved by more than 2 percentage points. In 2012, imports of goods and services decreased by 7.7 per cent in volume terms, mainly due to the contraction of investment and the slowdown in exports, which are the demand components with the most substantial input of imports. For additional information on Italy’s exports and imports, see “The External Sector of the Economy—Foreign Trade”.
Strategic Infrastructure Projects. Italy’s economic infrastructure is still significantly underdeveloped compared to other major European countries.
Italy adopted legislation in 2001 (the “Strategic Infrastructure Law”) providing the Government with special powers to plan and realize those infrastructure projects considered to be of strategic importance for the growth and modernization of the country, particularly the Mezzogiorno. The Strategic Infrastructure Law is aimed at simplifying the administrative process necessary to award contracts in connection with strategic infrastructure projects and increase the proportion of privately financed projects.
Consistent with the existing policies and in furtherance of the Pact, Italy’s 2012 Economic and Financial Document confirms the Government’s commitment to implement several structural reforms and pursue a substantial infrastructure program. In the last decade, beginning with the Strategic Infrastructure Law, progress was made in the planning of public works, starting to overcome historical weakness linked to long procedures due to overlapping powers and responsibilities among different levels of government. From 1990 through 2010, general government investment expenditure averaged 2.4 per cent of GDP in Italy, just below the euro area average of 2.5 per cent. Italy’s outlay was less than that of France (3.2 per cent) but more than that of Germany (1.9 per cent) and the United Kingdom (1.8 per cent).
General government expenditure for investments between 2000 and 2009 was, on average, equal to 2.3 per cent of GDP, and in 2011 and 2012 it was equal to 2.0 per cent and 1.9 per cent of GDP, respectively.
In addition, Law decree n. 69/2013 (Decreto del Fare) (converted into law on August 9, 2013) enacted a new package of measures aimed at, inter alia, developing infrastructure (such as the European corridors and certain railway services) for approximately €2 billion.
18
Principal Sectors of the Economy
In 2012, value added in real terms decreased by 2.0 per cent as compared to 2011. The decrease was mainly driven by decreases in construction of 6.3 per cent, in agriculture, fishing and forestry of 4.4 per cent, in industry of 3.5 per cent (of which manufacturing decreased by 3.9 per cent) and in services of 1.2 per cent, in each case, in real terms. The decrease in services was driven by a decrease of 2.0 per cent in commerce, transport, storage and hotels and restaurants, of 1.9 per cent in information and communication services, of 1.7 per cent in professional, scientific and technical services and public administration and support services and of 1.7 per cent in defense, education, healthcare and other social services, slightly offset by increases of 1.2 per cent in arts, entertainment and recreation and repairs of household goods and other services and of 0.3 per cent in financial and monetary intermediation services, in each case, in real terms.
The following table sets forth value added by sector and the percentage of such sector of the total value added at purchasing power parity with 2005 prices.
Value Added by Sector
| 2008 | 2009 | 2010 | 2011 | 2012 | ||||||||||||||||||||||||||||||||||||
| € in millions |
% of Total |
€ in millions |
% of Total |
€ in millions |
% of Total |
€ in millions |
% of Total |
€ in millions |
% of Total |
|||||||||||||||||||||||||||||||
| Agriculture, fishing and forestry |
28,729 | 2.2 | 28,007 | 2.2 | 27,952 | 2.2 | 28,006 | 2.2 | 26,760 | 2.1 | ||||||||||||||||||||||||||||||
| Industry |
271,375 | 20.4 | 230,422 | 18.4 | 244,266 | 19.1 | 247,120 | 19.3 | 238,536 | 19.0 | ||||||||||||||||||||||||||||||
| of which: manufacturing |
238,470 | 17.9 | 198,986 | 15.9 | 214,249 | 16.8 | 216,430 | 16.9 | 207,914 | 16.5 | ||||||||||||||||||||||||||||||
| Construction |
80,021 | 6.0 | 73,300 | 5.8 | 71,018 | 5.6 | 68,585 | 5.3 | 64,261 | 5.1 | ||||||||||||||||||||||||||||||
| Services |
948,978 | 71.4 | 923,239 | 73.6 | 933,527 | 73.1 | 939,761 | 73.2 | 928,306 | 73.8 | ||||||||||||||||||||||||||||||
| Commerce, repairs and goods for the home |
149,964 | 11.3 | 132,276 | 10.5 | 139,370 | 10.9 | 141,048 | 11.0 | 138,788 | 11.0 | ||||||||||||||||||||||||||||||
| Hotels and restaurants |
54,889 | 4.1 | 53,867 | 4.3 | 54,228 | 4.2 | 55,573 | 4.3 | 55,809 | 4.4 | ||||||||||||||||||||||||||||||
| Transport, storage and communications |
133,668 | 10.1 | 130,844 | 10.4 | 132,089 | 10.3 | 130,820 | 10.2 | 126,260 | 10.0 | ||||||||||||||||||||||||||||||
| Financial and monetary intermediation |
72,842 | 5.5 | 75,759 | 6.0 | 79,027 | 6.2 | 79,393 | 6.2 | 79,666 | 6.3 | ||||||||||||||||||||||||||||||
| Various services to families and businesses |
276,659 | 20.8 | 268,457 | 21.4 | 267,105 | 20.9 | 270,214 | 21.1 | 268,287 | 21.3 | ||||||||||||||||||||||||||||||
| Public administration |
83,998 | 6.3 | 84,381 | 6.7 | 83,984 | 6.6 | 83,598 | 6.5 | 82,042 | 6.5 | ||||||||||||||||||||||||||||||
| Education |
61,524 | 4.6 | 61,258 | 4.9 | 60,941 | 4.8 | 60,862 | 4.7 | 60,806 | 4.8 | ||||||||||||||||||||||||||||||
| Healthcare and other social services |
71,869 | 5.4 | 72,721 | 5.8 | 72,768 | 5.7 | 73,059 | 5.7 | 70,966 | 5.6 | ||||||||||||||||||||||||||||||
| Other public, social and personal services |
30,735 | 2.3 |
|
3 0,182 |
|
2.4 | 30,792 | 2.4 | 31,887 | 2.5 | 32,085 | 2.6 | ||||||||||||||||||||||||||||
| Domestic services to families and civil unions |
13,082 | 1.0 | 13,330 | 1.1 | 13,451 | 1.1 | 13,470 | 1.0 | 13,788 | 1.1 | ||||||||||||||||||||||||||||||
|
|
|
|
|
|
|
|
|
|
|
|
|
|
|
|
|
|
|
|
|
|||||||||||||||||||||
| Value added at market prices |
1,329,002 | 100.0 | 1,254,718 | 100.0 | 1,276,477 | 100.0 | 1,282,962 | 100.0 | 1,257,144 | 100.0 | ||||||||||||||||||||||||||||||
|
|
|
|
|
|
|
|
|
|
|
|
|
|
|
|
|
|
|
|
|
|||||||||||||||||||||
| (1) | Value added in this table is calculated by reference to prices of products and services, excluding any taxes on any such products. |
Source: Bank of Italy.
Role of the Government in the Economy
Until the early 1990’s, State-owned enterprises played a significant role in the Italian economy. The State participated in the energy, banking, shipping, transportation and communications industries, among others, and owned or controlled approximately 45 per cent of the Italian industrial and services sector and 80 per cent of the banking sector. As a result of the implementation of its privatization program, which started in 1992 and was completed in 2009, the State exited completely the insurance, banking, telecommunications and tobacco sectors and significantly reduced its interest in the energy sector (principally through sales of shareholdings in ENI S.p.A. (“ENI”) and ENEL S.p.A. (“ENEL”) and in the defense sector (principally through sales of shareholdings in Finmeccanica S.p.A.). For additional information on the role of the Government in the Italian economy, see “Monetary System—Banking Regulation—Structure of the Banking Industry” and “Public Finance—Government Enterprises”.
Services
Transport. Italy’s transport sector has been relatively fast-growing and, during the period from 1980 to 1996, grew at more than twice the rate of industrial production growth. The expansion of the transport sector was largely the result of trade integration with European markets. Historically, motorways and railways have been controlled, directly and indirectly, by the Government, and railways in particular have posted large financial losses. In recent years, many of these enterprises have been restructured in order to place them on a sounder financial footing and/or have been privatized.
Roadways are the dominant mode of transportation in Italy. The road network includes, among others, municipal roads that are managed and maintained by local authorities, roads outside municipal areas that are managed and maintained by the State Road Board (“ANAS”) and a system of toll highways that in part are managed and maintained by several concessionaries, the largest of which is controlled by Autostrade S.p.A. (“Autostrade”), which was privatized in 1999.
19
Italy’s railway network is small in relation to its population and land area. Approximately 30 per cent of the network carries 80 per cent of the traffic, resulting in congestion and under-utilization of large parts of the network. At December 31, 2012, there were 24,277 kilometers of railroad track, of which a large majority are controlled by State-owned railways, with the remainder controlled by private firms operating under concession from the Government. In 2011 (date for which data are available), Italian railways carried 19.7 billion tons-km of freight, compared to 18.6 in 2010 and recorded 45.9 billion passengers-km, to 43.3 in 2010.
In response to EU directives and the intervention by the Italian Antitrust Authority (Autorità Garante della Concorrenza e del Mercato), since March 1999 Italy has been implementing a plan aimed at preparing Italy’s railways for competition. Italy liberalized railway transportation by creating two separate legal entities wholly owned by Ferrovie dello Stato Italiane S.p.A. (“FS”): Trenitalia S.p.A., managing the transportation services business, and Rete Ferroviaria Italiana S.p.A. (“RFI”), managing railway infrastructure components and the efficiency, safety and technological development of the network.
In 1992, the Italian State railway company was converted from a public law entity into a commercial State-owned corporation, FS, with greater autonomy over investment, decision-making and management. In 2012, FS’s revenues amounted to €8,228 million compared to €8,264 million in 2011 and its net profit equaled €381 million compared to €285 million in 2011.
Projects for the construction of new high-speed train systems (Treno ad alta velocità or “TAV”) linking the principal urban centers of Italy with one another and with neighboring European countries, as well as other infrastructure projects designed to upgrade the railway network, are under way or, in some cases, have been completed. The corridors of Milano-Bologna-Rome-Naples and Milano-Novara have been completed. Starting from the end of April 2012, Nuovo Trasporto Viaggiatori S.p.A. brought competition to FS through “Italo”, another high-speed train that started serving the Milano-Bologna-Rome-Naples corridor.
Alitalia, which used to be Italy’s national airline, was sold in 2008 and as a result Italy no longer owns an interest in any air carrier.
Communications. In 1997, the Italian Parliament enacted legislation to reform the telecommunications market to promote competition in accordance with EU directives. This legislation permits companies to operate in all sectors of the telecommunications market, including radio, television and telephone, subject to certain antitrust limitations, and provides for the appointment of a supervisory authority. The Italian Telecommunication Authority (Autorità per le Garanzie nelle Comunicazioni, or “AGCOM”), consists of eight members appointed by the Italian Parliament and a president appointed by the Government. It is responsible for issuing licenses and has the power to regulate tariffs and impose fines and other sanctions. Each fixed and mobile telephony operator must obtain an individual license, which is valid for 15 years and is renewable.
Italy’s telecommunications market is one of the largest in Europe. At December 31, 2011, the ratio of total active mobile telephone lines to Italy’s population was approximately 195 per cent. The telecommunications market was deregulated in January 1998 and while Telecom Italia, which was privatized in 1997, remains the largest operator, it is facing increasing competition from new operators that have been granted licenses for national and local telephone services. Competition among telecommunications operators has resulted in lower charges and a wider range of services offered. In January 2000, access to local loop telephony was liberalized. Telecom Italia Mobile (“TIM”) remains the largest mobile operator, followed by Vodafone Italia (controlled by the Vodafone Group), Wind, Fastweb, H3G and BT Italia.
Internet and personal computer penetration rates in Italy have grown substantially in recent years. The ratio of personal computers to households increased from 58.8 per cent in 2011 to 59.3 per cent in 2012, while the percentage of households having an internet connection increased from 54.5 per cent in 2011 to 55.5 per cent in 2012 and the percentage of households having a broadband connection increased from 45.8 per cent in 2011 to 48.6 per cent in 2012.
Tourism. Tourism is an important sector of the Italian economy. In 2012, tourism revenues, net of amounts spent by Italians traveling abroad, were approximately €11.5 billion. Spending by Italian tourists abroad in 2012 decreased by 0.3 per cent, compared to an increase of 0.8 per cent in 2011.
Financial Services. The percentage of domestic investment of households allocated to Italian shares and investment fund units amounted to approximately 23.4 per cent at the end of 2012, compared to 22.4 per cent in 2011. Historically, a significant portion of Italy’s domestic investment has been in public debt.
20
The general Italian share price index increased by 10 per cent in 2012 compared with an average increase of 15 per cent in the main euro-area index. The pattern over the year paralleled the sovereign debt crisis. After rising in the early part of the year, share prices turned down in March and then rose again from the end of July onwards following the announcement by the President of the ECB that European authorities were determined to dispel fears about the reversibility of the monetary union.
Italian household indebtedness as a percentage of disposable income rose slightly from 65 per cent at the end of 2011 to 66 per cent at the end of 2012, which is a fairly low level by international standards. Lending to residents by banks operating in Italy, decreased by 0.5 per cent in 2012 compared with an increase of 3.4 per cent in 2011. For additional information on the Italian banking system, see “Monetary System—Banking Regulation”.
Manufacturing
In 2012, the manufacturing sector represented 15.5 per cent of GDP and 17.7 per cent of total employment. In 2012, manufacturing output decreased by 3.9 per cent from 2011, compared to a 1.0 per cent increase in 2011 from 2010.
Italy has compensated for its lack of natural resources by specializing in transformation and processing industries. Italy’s principal manufacturing industries include metal products, precision instruments and machinery, textiles, leather products and clothing, wood and wood products, paper and paper products, food and tobacco, chemical and pharmaceutical products and transport equipment, including motor vehicles.
The number of large manufacturing companies in Italy is small in comparison to other European Union countries. The most significant include Fiat (automobiles and other transportation equipment), Finmeccanica (defense, aeronautics, helicopters and space), Riva (Steel), Luxottica (eyeglasses), Pirelli (tires and industrial rubber products) and Barilla (food). These companies export a large proportion of their output and have significant market shares in their respective product markets in Europe.
Much of Italy’s industrial output is produced by small and medium-sized firms, which also account for much of the economic growth over the past 20 years. These firms are especially active in light industries (including the manufacture of textiles, clothing, food, shoes and paper), where they have been innovators, and export a significant share of their production. The profit margins of large manufacturing firms, however, have generally been higher than those of their smaller counterparts. Various government programs (in addition to EU programs) to support small firms provide, among other things, for loans, grants, tax allowances and support to venture capital entities.
Traditionally, investments in research and development (“R&D”) have been very limited in Italy. Total and corporate R&D spending has continued to be proportionally lower in Italy than in other industrialized countries, reflecting the Italian industry’s persistent difficulty in closing the technology gap with other advanced economies. Total R&D spending in Italy was 1.3 per cent of GDP in 2011 (the most recent year for which data is available), compared to 2.8 per cent in Germany and 1.9 per cent in the EU.
The following table shows the growth by sector of indexed industrial production for the years indicated.
Industrial Production by Sector (Index: 2010 = 100)
| 2008 | 2009 | 2010 | 2011 | 2012 | ||||||||||||||||
| Food and tobacco |
99.1 | 98.1 | 100.0 | 98.1 | 97.5 | |||||||||||||||
| Textiles, clothing and leather |
106.2 | 94.3 | 100.0 | 96.4 | 89.3 | |||||||||||||||
| Wood, paper and printing |
114.9 | 98.4 | 100.0 | 97.9 | 89.1 | |||||||||||||||
| Coke and refinery |
106.9 | 96.7 | 100.0 | 96.1 | 90.4 | |||||||||||||||
| Chemical products |
106.8 | 92.8 | 100.0 | 96.1 | 91.3 | |||||||||||||||
| Pharmaceutical products |
98.9 | 98.8 | 100.0 | 100.6 | 99.8 | |||||||||||||||
| Rubber, plastic materials and non-ferrous minerals |
123.1 | 97.7 | 100.0 | 100.1 | 91.3 | |||||||||||||||
| Metals and ferrous products |
129.0 | 91.0 | 100.0 | 104.5 | 96.6 | |||||||||||||||
| Electronic and optic materials |
103.2 | 92.6 | 100.0 | 96.6 | 87.6 | |||||||||||||||
| Electric appliances for households |
122.2 | 87.5 | 100.0 | 94.4 | 83.3 | |||||||||||||||
| Machinery and equipment |
128.2 | 85.6 | 100.0 | 108.0 | 104.0 | |||||||||||||||
| Transport means |
126.8 | 94.5 | 100.0 | 98.3 | 87.9 | |||||||||||||||
| Other industrial products |
107.9 | 91.2 | 100.0 | 102.4 | 93.1 | |||||||||||||||
| Aggregate Index |
115 | 93.5 | 100.0 | 100.3 | 94.2 | |||||||||||||||
|
|
|
|
|
|
|
|
|
|
|
|||||||||||
Source: Bank of Italy.
21
Energy Consumption
Energy consumption, measured in terms of millions of tons of oil equivalent, or “MTOE”, decreased by 3.5 per cent in 2012 compared to a decrease of approximately 2 per cent in 2011. In 2012 (in MTOE), oil represented 35.8 per cent of Italy’s energy consumption compared to 37.5 per cent in 2011, natural gas represented 34.5 per cent of Italy’s energy consumption compared to 34.6 per cent in 2011, renewable energy resources represented 15.1 per cent of Italy’s energy consumption compared to 13.3 per cent in 2011, solid combustibles represented 9.3 per cent of Italy’s energy consumption compared to 9 per cent in 2011, and net imported electricity represented 5.3 per cent of Italy’s energy consumption compared to 5.5 per cent in 2011. In 2012, Italy’s production (in MTOE) of oil, natural gas, renewable energy and solid combustibles represented over 20 per cent of the national energy consumption; the remaining approximately 80 per cent was represented by imports, mainly of oil and natural gas. (Source: Terna S.p.A. and Autorita per l’Energia Elettrica e il Gas.)
The Italian energy sector is governed by regulations that aim to promote competition at the production, transport and sales level. The Electricity and Gas Authority (Autorità per l’Energia Elettrica e il Gas) regulates electricity and natural gas activities, with the aim of promoting competition and service quality; it has significant powers, including the power to establish tariffs. Italy’s domestic energy industry includes several major companies in which the Government holds an interest.
ENI is the largest oil and gas company in Italy and is engaged in the exploration, development and production of oil and natural gas in Italy and abroad, the refining and distribution of petroleum products, petrochemical products, the supply, transmission and distribution of natural gas and oil field services contracting and engineering. As of December 2012, the Ministry of Economy and Finance held approximately 4.34 per cent of the share capital of ENI directly and 25.76 per cent through Cassa Depositi e Prestiti S.p.A. (“CDP”). ENI is a profitable public company and pays dividends regularly. While several companies operate in the gas distribution market, during 2009 natural gas sales by ENI accounted for approximately 51 per cent of domestic consumption.
ENEL is the largest electricity company in Italy and is engaged principally in the generation, importation and distribution of electricity. As of December 2012, the Ministry of Economy and Finance held approximately 31.24 per cent of ENEL’s share capital directly. ENEL is a profitable public company and pays dividends regularly.
CDP is a privately held corporation in which the Ministry of Economy and Finance owns approximately 80.1 per cent of the share capital. CDP is engaged in the financing of investments in the public sector, i.e., of the state, the regions, the provinces and the city administrations and other public bodies. For additional information regarding CDP, see “Public Debt—Public Debt Management”. CDP also holds approximately 30 per cent of the share capital of Terna S.p.A. (“Terna”). Formerly owned by ENEL, Terna is a profitable public company that pays dividends regularly, which owns and operates a major portion of the transmission assets of Italy’s national electricity grid.
Construction
In 2012, construction represented 9.8 per cent of GDP and 7.2 per cent of total employment. Investment in construction (characterized, as in the past, by more persistent cyclical fluctuation), continued to contract in all sectors of the economy. Housing transactions, which had declined by over 25 per cent during the recession, dropped by 25.8 per cent, continuing the downward trend that began after the peak in 2006. House prices decreased by 2.7 per cent; in real terms the decline was 5.5 per cent, bringing the total downward correction from the 2007 peak to 11.0 per cent. Investment in non-residential construction decreased by 8.8 per cent in 2012, continuing the downtrend under way since 2007, partly due to the poor performance of public works as a result of tight budget constraints.
Agriculture, Fishing and Forestry
In 2012, agriculture, fishing and forestry decreased by 4.4 per cent compared to 2011 and accounted for 2.0 per cent of GDP and 3.8 per cent of total employment. Agriculture’s share of Italian GDP has generally declined with the growth of industrial output since the 1960s. Italy’s average farm size remains less than half the European Union average. Italy is a net importer of all categories of food except fruits and vegetables. The principal crops are wheat (including the durum wheat used to make pasta), maize, olives, grapes and tomatoes. Cereals are grown principally in the Po valley in the north and in the southeastern plains, olives are grown principally in central and southern Italy and grapes are grown throughout the country.
22
Employment and Labor
General. Job creation has been and continues to be a key objective of the Government. Employment, as measured by the average number of standard labor units employed during the year, decreased by approximately 1.1 per cent in 2012 after increasing 0.1 per cent in 2011. A standard labor unit is the amount of work undertaken by a full-time employee over the year and is used to measure the amount of work employed to produce goods and services.
The unemployment rate in Italy was 10.7 per cent in 2012, an increase of 2.3 per cent compared to 8.4 per cent 2011. In the euro area, the average unemployment rate was 11.4 per cent in 2012 compared to 10.2 per cent in 2011. The participation rate (i.e. the rate of employment for the Italian population between the ages of 15 and 64) was 63.7 per cent in 2012 compared to 62.2 per cent in 2011.
The following table shows the change in total employment, labor market participation rate and unemployment rate for each of the periods indicated.
Employment
| 2008 | 2009 | 2010 | 2011 | 2012 | ||||||||||||||||
| Employment in standard labor units (% change on prior year) |
(0.3 | ) | (2.9 | ) | (0.7 | ) | 0.1 | (1.1 | ) | |||||||||||
| Participation rate (%)(1) |
63.0 | 62.4 | 62.2 | 62.2 | 63.7 | |||||||||||||||
| Unemployment rate (%)(2) |
6.7 | 7.8 | 8.4 | 8.4 | 10.7 | |||||||||||||||
| (1) | Participation rate is the rate of employment for the population between the ages of 15 and 64. |
| (2) | Unemployment rate does not include workers paid by Cassa Integrazione Guadagni, or Wage Supplementation Fund, which compensates workers who are temporarily laid off or who have had their hours cut. |
Source: Bank of Italy.
Employment by sector. In 2012, approximately 70.1 per cent were employed in the service sector, 19 per cent were employed in the industrial sector (excluding construction), 7.2 per cent were employed in the construction sector and 3.8 per cent were employed in the agriculture, fishing and forestry sector.
Employment by geographic area and gender. Unemployment in southern Italy has been persistently higher than in northern and central Italy. The unemployment rate in northern and central Italy was 8 per cent, evidencing an increase of 1.7 percentage points compared to 2011. In southern Italy, unemployment increased from 13.6 per cent in 2011 to 17.2 in 2012. In 2012, the unemployment rate of females in Italy was 11.9 per cent, an increase of 2.3 percentage points compared to 2011. In 2012, the unemployment rate of males in Italy was 9.9 per cent, an increase of 2.3 percentage points compared to 2011. The participation rate of women increased from 48.5 per cent in 2000 to 53.5 per cent in 2012, while the participation rate of men increased from 73.6 per cent in 2000 to 73.9 per cent in 2012.
Employment of the population between the ages 15-24. The unemployment rate of the population in Italy between ages of 15-24 increased steadily from 21.3 per cent in 2008 to 35.3 per cent in 2012 (an increase of 6.2 per cent compared to 2011). The unemployment rate of the population between ages of 15-24 in the euro area increased from 16.0 per cent in 2008 to 23.1 per cent in 2012.
The following table shows the unemployment rate of the population between ages of 15-24 in Italy and the euro area for the periods provided.
Unemployment of the Population aged 15-24 (2008-2012)
| 2008 | 2009 | 2010 | 2011 | 2012 | ||||||||||||||||
| Italy |
21.3 | 25.4 | 27.8 | 29.1 | 35.3 | |||||||||||||||
| Euro area(1) |
16.0 | 20.3 | 20.9 | 20.8 | 23.1 | |||||||||||||||
| (1) | The euro area represents the countries participating in the EMU, including Italy. |
Source: Eurostat and Istat.
Government programs and regulatory framework. The Government has adopted a number of programs aimed at correcting the imbalances in employment, particularly between southern Italy and the rest of the country, and reducing unemployment. Recently, as part of the stimulus packages for the economy, during 2008-2012, additional measures and incentives were adopted. For additional information on these measures and incentives, see “—Measures to Address the Global Financial and Economic Crisis”, Exhibit 2—2013 Stability Programme and Exhibit 3—2013 National Reform Programme.
Through the Cassa Integrazione Guadagni (“CIG”), or Wage Supplementation Fund, the Government guarantees a portion of the wages of workers in the industrial sector that are temporarily laid off or who have had their working hours reduced. Workers laid off permanently as a consequence of restructuring or
23
other collective redundancies are entitled to receive unemployment compensation for a period of 24 months, which is extendable for up to three years for workers nearing retirement age. The number of hours of work paid through CIG increased from 974 million in 2011 to approximately 1,090 million in 2012. As in previous years, protracted uncertainty prompted firms to take the precaution of applying for more hours than they actually used. Nevertheless, firms actually used less than half of the total benefit hours authorized by the Istituto Nazionale Previdenza Sociale (“INPS”) (in line with the 49 per cent recorded in 2011).
Prices and Wages
Wages. Unit labor costs have historically been lower in Italy, on average, than in most other European countries. This is due to lower average earnings per employee, combined with lower productivity levels.
Actual earnings per full-time equivalent employee slowed for the second year running, from 1.3 to 1.0 per cent in nominal terms for the entire economy, the lowest rate since 1993. The slowdown was accounted for by the private sector (where gains decreased from 2.0 per cent to 1.6 per cent), with wage growth in industry excluding construction (decreasing from 2.6 per cent to 2.1 per cent), private services (decreasing from 1.4 per cent to 1.1 per cent) and in construction (decreasing from 2.9 per cent to 2.1 per cent). Wage growth mandated by industry-wide collective bargaining agreements signed in 2011 were generally in line, adjusted for the recouping of inflation during previous contracts, with the rise in the price index. Unit labor costs increased by 20 per cent in 2012 after increasing by 0.9 per cent in 2011. In 2012, unit labor costs rose by 3.6 per cent in industry excluding construction and rose by 2.4 per cent in the private sector.
Prices. The European Union harmonized consumer price index (HICP) reflects the change in price of a basket of goods and services taking into account all families resident in a given territory. In 2012, the inflation rate in the euro area as measured by the European Union harmonized consumer price index (HICP) was 3.3 per cent, compared to 2.9 per cent in 2010. Since Italy’s entry into the EMU in 1999, monetary policy decisions are made for all euro zone countries by the European Central Bank. For additional information on monetary policy in the euro zone, see “Monetary System—Monetary Policy”.
Inflation in Italy, as measured by the index of consumer prices for the entire resident population, increased from an average of 2.8 per cent in 2011 to 3.0 per cent in 2012, owing entirely to higher indirect taxes. Energy goods registered the largest price increases, averaging 13.9 per cent for the year compared with 11.3 per cent in 2011. The acceleration was due entirely to the increases in indirect taxes on fuels enacted in 2011. Italian inflation, net of this component, due to energy costs and measured by the GDP deflator, increased from 1.3 per cent in 2011 to 1.6 per cent in 2012.
The following table illustrates trends in prices and wages for the periods indicated.
Prices and Wages (in %)
| 2008 | 2009 | 2010 | 2011 | 2012 | ||||||||||||||||
| Cost of Living Index(1) |
3.2 | 0.7 | 1.6 | 2.7 | 3.0 | |||||||||||||||
| EU Harmonized Consumer Price Index(1) |
3.5 | 0.8 | 1.6 | 2.9 | 3.3 | |||||||||||||||
| Core Inflation Index(2) |
2.8 | 1.6 | 1.5 | 1.9 | 1.7 | |||||||||||||||
| Change in unit labor costs(3) |
4.9 | 5.7 | (0.7 | ) | 0.8 | 1.8 | ||||||||||||||
| (1) | The cost of living index reflects the change in price of a basket of goods and services (net of tobacco) typically purchased by non-farming families headed by an employee. It differs from the harmonized consumer price index in that the cost of living index is smaller in scope. |
| (2) | The basket of goods and services used to measure the core inflation index is equivalent to the harmonized consumer price index basket less energy, unprocessed food, alcohol and tobacco products. |
| (3) | Unit labor costs are per capita wages reduced by productivity gains. |
Source: Bank of Italy.
Social Welfare System
Italy has a comprehensive social welfare system, including public health, public education and pension, disability and unemployment benefits programs, most of which are administered by the Government or by local authorities receiving Government funding. These social services are funded in part by contributions from employers and employees and in part from general tax revenues. They represent the largest single government expenditure. For additional information on Government revenues and expenditures, see “Public Finance—Revenues and Expenditures”.
Social benefits in cash include expenditures for pensions, disability and unemployment benefits. The two principal social security agencies for private sector employees, INPS and the Istituto Nazionale
24
Assicurazioni e Infortuni sul Lavoro (“INAIL”), provide old-age pensions and temporary and permanent disability compensation for all the employees of the private sector and their qualified dependents and coverage for accidents in the workplace or permanent disability as a consequence of employment for workers of the industrial and agricultural sectors and for certain service sector employees. The social security entity for government employees, the Istituto Nazionale di Previdenza per i Dipendenti dell’Amministrazione Pubblica (“INPDAP”), provides similar services.
Old-age pensions in Italy, as in much of the developed world, continue to present a significant structural fiscal problem. Controlling pension spending is a particularly important Government objective given Italy’s aging population. Beginning in 1992, the Government adopted several measures designed to control the growth of pension expenditures. The Government adopted additional pension reforms in 1995, 2004 and 2007. Then in each of 2009, 2010 and 2011, the Government adopted further reforms of the pension system. For additional information on these pension reforms, see Exhibit 2—2013 Stability Programme and Exhibit 3—2013 National Reform Programme. The new rules introduced by these reforms significantly change the pension system, contributing to improving the pension system’s sustainability in the medium to long-term and guaranteeing greater equity among generations.
| • | In July 2009, the Italian Parliament adopted a law to equalize the pension age of men and women in the public sector. This law gradually raised the retirement age of women employed in the public sector from 60 to 65. From 2010, the retirement age of women would increase to 61, and then it would increase by one year every two years until 2018 when the retirement age of both men and women working for the public sector would be 65. Until the end of 2009, women were able to retire at 60 and men at 65. The law also contemplated a revision every five years with effect from 2015 to the retirement age of men and women in both the public and private sectors, in order to reflect any increase in the average length of life expectancy as certified by ISTAT. |
| • | Law Decree No. 78 of 2010 increased the age requirement for women working in the public sector from 60 in 2009 to 61 years for 2010-2011 and set 2012 as the year that the retirement age for men and women working in the public sector will converge at 65. Law Decree No. 78 of 2010 also provides that pension benefits for all new retirees will be deferred 12 months for employees and 18 months for self-employed individuals. Law Decree No. 78 of 2010 permits early retirement when (i) a person has made pension contributions for at least 40 years (without regard to the person’s age) or (ii) when a person has made pension contributions for at least 35 years and is at least 60 years old as of 2010 or 62 years old as of 2013 in the case of employees, or 61 years old as of 2010 or 63 years old as of 2013 in the case of self-employed individuals. The age requirement is reduced by one year if the worker has made contributions for at least 36 years. Law Decree No. 78 of 2010 requires that age requirements be adjusted every three years consistent with changes to the average life expectancy at the age of 65 as determined by ISTAT. |
| • | Law Decree No. 98 of 2011 and Law Decree No. 138 of 2011 further increased age requirements. From 2014, the age requirement of women working in the private sector will be gradually increased from 60 to 65 so as to align it with that of men by 2026. For pensioners seeking early retirement that have made 40 years of pension contributions, regardless of age requirements, new measures establish a further postponement of receiving early retirement benefits. |
On June 28, 2012, the Government approved Law No. 92 of June 28, 2012, which included reforms aimed at reducing labor costs. In particular, the reforms aim to create a dynamic, flexible and inclusive labor market, i.e. one that is able to contribute to the economic and social development of Italy and stimulate competitiveness and job creation. The most significant of these reforms include:
| • | the reform of employment termination programs (ammortizzatori sociali). Starting from January 1, 2013, the Social Insurance for Labor (Assicurazione Sociale per l’Impiego) will begin to provide, under certain conditions, workers that have lost their jobs with unemployment benefits (indennità di disoccupazione); |
| • | the promotion of increased labor flexibility with amendments to article 18 of Law No. 300 of May 20, 1970, as subsequently amended, which would increase the circumstances under which employers could lay off employees for economic reasons; |
| • | amendments to certain types of employment contracts (e.g., fixed duration and apprenticeship/training employment contracts) in order to contribute to increased job creation, particularly in the case of young people, and to eliminate the diversity among such kinds of employment contracts; and |
| • | the reorganization of labor court procedures, in order to reduce the duration of trials. |
25
These reforms aim to create an inclusive and dynamic labor market that can support high levels of employment and high quality jobs through, inter alia, encouraging more stable employment relationships and reaffirming the importance of permanent employment contracts (contratti a tempo indeterminato) as the common form of employment relationship.
The following table shows the public expenditure for pensions as a percentage of GDP based upon the implementation of the various reforms mentioned above.
Pension Expenditure (as a % of GDP)
| 2010 | 2015 | 2020 | 2025 | 2030 | 2035 | 2040 | 2045 | 2050 | 2055 | 2060 | ||||||||||||||||||||||||||||||||||
| Current Legislation |
15.3 | 16.1 | 15.6 | 15.2 | 15.2 | 15.8 | 16.1 | 16.3 | 15.9 | 15.1 | 14.6 | |||||||||||||||||||||||||||||||||
Source: Ministry of Economy and Finance
26
MONETARY SYSTEM
The Italian financial system consists of banking institutions such as commercial banks, leasing companies, factoring companies and household finance companies, as well as non-bank financial intermediaries such as investment funds, portfolio management companies, securities investment firms, insurance companies and pension funds.
Monetary Policy
The Eurosystem and the European System of Central Banks. As of January 1, 1999, which marked the beginning of Stage III of the European Economic and Monetary Union, the 11 countries joining the EMU officially adopted the euro, and the Eurosystem became responsible for conducting a single monetary policy. Greece and Slovenia joined the EMU on January 1, 2001 and January 1, 2007, respectively. Cyprus and Malta joined the EMU on January 1, 2008 and Slovakia on January 1, 2009. Estonia adopted the euro beginning on January 1, 2011.
The European System of Central Banks (“ESCB”) consists of the ECB, established on June 1, 1998, and the national central banks of the EU Member States. The Eurosystem consists of the 17 national central banks in the euro area and the ECB. So long as there are EU Member States that have not yet adopted the euro (currently Bulgaria, the Czech Republic, Denmark, Hungary, Latvia, Lithuania, Poland, Romania, Sweden and the United Kingdom), there will be a distinction between the 17-country Eurosystem and the 28-country ESCB. The ten national central banks of non-participating countries do not take part in the decision-making of the single monetary policy; they maintain their own national currencies and conduct their own monetary policies. The Bank of Italy, as a member of the Eurosystem, participates in Eurosystem decision-making.
The Eurosystem is principally responsible for:
| • | defining and implementing the monetary policy of the euro area, including fixing rates on the main refinancing lending facility (regular liquidity-providing reverse transactions with a weekly frequency and a maturity of two weeks, executed by the national central banks on the basis of standard tenders), the marginal lending facility (overnight liquidity facility provided to members of the Eurosystem by the national central banks against eligible assets, usually with no credit limits or other restrictions on access to credit) and the deposit facility (overnight deposit facility with the national central banks available to members of the Eurosystem, usually with no deposit limits or other restrictions); |
| • | conducting foreign exchange operations and holding and managing the official foreign reserves of the euro area countries; |
| • | issuing banknotes in the euro area; |
| • | promoting the smooth operation of payment systems; and |
| • | cooperating in the supervision of credit institutions and the stability of the financial system. |
The ESCB is governed by the decision-making bodies of the ECB which are:
| • | the Executive Board, composed of the President, Vice-President and four other members, responsible for implementing the monetary policy formulated by the Governing Council; |
| • | the Governing Council, composed of the six members of the Executive Board and the governors of the 17 national central banks, in charge of implementing the tasks assigned to the Eurosystem and formulating the euro area’s monetary policy; and |
| • | the General Council, composed of the President and the Vice-President of the ECB and the governors of the 28 national central banks of the EU Member States. The General Council contributes to the advisory functions of the ECB and will remain in existence as long as there are EU Member States that have not adopted the euro. |
The ECB is independent of the national central banks and the governments of the Member States and has its own budget, independent of that of the EU; its capital is not funded by the EU but has been subscribed and paid up by the national central banks of the Member States that have adopted the euro, pro-rated to the GDP and population of each such Member State. The ECB has exclusive authority for the issuance of currency within the euro area. As of July 1, 2013, the ECB had subscribed capital of approximately €10.8 billion and paid up capital of approximately €7.5 billion.
27
On December 16, 2010, the ECB decided to increase its subscribed capital to the current amount, following an assessment of the adequacy of statutory capital conducted in 2009. The capital increase was deemed appropriate by the ECB in view of increased volatility in foreign exchange rates, interest rates and gold prices as well as credit risk. At December 31, 2012, the Bank of Italy had subscribed for approximately €1.3 billion, fully paid up, based on the capital key used to calculate each of the euro area national central banks’ subscription to the capital of the ECB, which in the case of Italy is equal to 12.5 per cent.
The Bank of Italy. The Bank of Italy, founded in 1893, is the banker to the Treasury and had historically been the lender of last resort for Italian banks prior to the onset of the European sovereign debt crisis. It supervises and regulates the Italian banking industry and operates services for the banking industry as a whole. It also supervises and regulates non-bank financial intermediaries. At December 31, 2012, the Bank of Italy had assets of approximately €609 billion, held gold in the amount of approximately €99.4 billion (including gold receivables) and reserves of approximately €22.5 billion.
The ECB’s Monetary Policy. The primary objective of the ESCB is to preserve the euro’s purchasing power and consequently to maintain price stability in the euro area. In October 1998, the Governing Council announced the ECB monetary strategy and provided a quantitative definition of price stability, which has been defined as an annual increase in the European Union harmonized consumer price index (HICP) for the euro area of below 2 per cent. Despite short-term volatility, price stability is to be maintained over the medium term. Moreover, in order to assess the outlook for price developments and the risks for future price stability, a two-pillar approach was adopted by the ECB: monetary analysis and economic analysis.
The first pillar, monetary analysis, focuses on a longer term horizon than the economic analysis. It mainly serves as a means of cross-checking, from a medium to long-term perspective, the short to medium-term indications for monetary policy coming from the economic analysis. Monetary analysis assigns a prominent role to money supply, the growth rate of which is measured through three monetary aggregates, a narrow monetary aggregate (M1), an intermediate monetary aggregate (M2) and a broad monetary aggregate (M3). These aggregates differ with regard to the degree of liquidity of the assets they include. M1 comprises currency (banknotes and coins) and overnight deposits, which can immediately be converted into currency or used for cashless payments. M2 comprises M1 and deposits with an agreed maturity of up to and including two years or redeemable at a period of notice of up to and including three months. These deposits can be converted into M1 components, subject to certain restrictions such as the need for advance notice, penalties and fees. M3 comprises M2 as well as repurchase agreements, debt securities of up to two years, money market fund shares and money market paper. These additional instruments have a higher degree of liquidity and price certainty, which make them close substitutes for deposits. As a result, M3 is less affected by substitution between various liquid asset categories and is more stable than narrower (M1 and M2) money.
In December 1998, the Governing Council set the first quantitative reference value for M3 growth, at an annual growth rate of 4.5 per cent. This reference value was confirmed by the Governing Council in 1999, 2000, 2001 and 2002. On May 8, 2003, the Governing Council decided to stop its practice of reviewing the reference value annually, given its long-term nature.
The second pillar consists of a broad assessment of the outlook for price developments and the risks to price stability in the euro area and is made in parallel with the analysis of M3 growth in relation to its reference value. This assessment encompasses a wide range of financial market and other economic indicators, including developments in overall output, demand and labor market conditions, a broad range of price and cost indicators, fiscal policy and the balance of payments for the euro area as well as the production and review of macroeconomic projections.
Based on a thorough analysis of the information provided by the two pillars of its strategy, the Governing Council determines monetary policy aiming at price stability over the medium term.
The ECB’s monetary and exchange rate policy is aimed at supporting general and economic policies in order to achieve the economic objectives of the EU, including sustainable growth and a high level of employment without prejudice to the objective of price stability.
ECB Money Supply and Credit. In 2008, as a result of lower interest rates and investor preference for liquid assets, the growth in the M3 money supply in the euro area diminished steadily to a twelve-month rate of 5.1 per cent in March 2009. In 2009, the twelve-month rate of growth in the M3 monetary aggregate diminished steadily and from the final part of the year was negative for the first time since the launch of the third phase of European Monetary Union (-0.3 per cent in December and -0.1 per cent in March 2010, compared with 7.6 per cent growth at the end of 2008). The slowdown reflected reallocation from the less liquid monetary assets included in M3 towards long-term securities in a context characterized by a steep yield
28
curve. Households gradually reduced the rate at which they were accumulating deposits included in M3, while non-financial companies began rebuilding reserves of liquidity from the second half onwards, in concomitance with the gradual improvement in the economic outlook. The M3 growth rate declined to 1.7 per cent in December 2010. The twelve-month rate of growth of bank loans to the private sector, which held steady at around 2.8 per cent through October 2011, fell rapidly in the last two months of the year to 1.3 per cent in December 2011 and remained at that level in the first quarter of 2012 (1.2 per cent in March 2012). This pattern reflects the trend in lending to households and above all to non-financial corporations, whose three-month growth rate began declining rapidly in the third quarter of 2011 and turned negative in December 2011 (-2.5 per cent on a seasonally adjusted annual basis) before recovering in March 2012. The three-month rate of growth of loans to households also diminished in the course of 2011 but remained positive (1.3 per cent in December 2011).
The twelve-month rate of growth in the M3 money was very modest throughout 2011, falling to 1.5 per cent in December 2011. The persistently slow expansion of the money supply reflects the contraction in the countries that were most severely affected by financial tensions, with declining bank deposits of firms as credit conditions tightened, a reduction in collateralized interbank transactions through central counterparties and, in some countries, a shift of funds from monetary to other financial assets. In those countries least affected by the financial crisis, however, M3 expanded.
The behavior of the broad monetary aggregate M3 and of its components during 2012 was affected by the weakness of economic activity and by portfolio shifts in response to the decline in yields. M3’s rate of expansion rose, though remaining moderate (3.5 per cent in December, as against 1.6 per cent at the end of 2011). The acceleration chiefly involved very-short-term deposits, whose growth was sustained by a strong preference for liquidity on the part of all money-holding sectors in a setting of low interest rates and acute uncertainty on the financial markets. The disparity of national contributions to the growth of euro-area M3 diminished markedly in the final part of 2012, due to the gradual recovery in the money supply in the countries most exposed to the crisis, where it had contracted sharply in the preceding months.
ECB Interest Rates. As a result of the global economic slowdown in 2001 and the weakness of the economy in the euro area in 2002 and the first half of 2003, the Governing Council progressively lowered interest rates by a total of 275 basis points, with interest rates on minimum bid rate on main refinancing operations, marginal lending and deposit facilities reaching 2.00 per cent, 3.00 per cent and 1.00 per cent, respectively, in June 2003. These rates remained unchanged until December 2005. The Governing Council of the ECB determined that given the euro area’s monetary and credit growth, upside risks to price stability over the medium term prevailed. The euro area experienced sustained economic growth from 2006 through the first quarter of 2008 and the Governing Council raised interest rates on several occasions during 2006, 2007 and 2008, with interest rates on minimum bid rate on main refinancing operations, marginal lending and deposit facilities reaching 4.25 per cent, 5.25 per cent and 3.25 per cent, respectively, in July 2008. During the last quarter of 2008 and the first half of 2009, as a result of the crisis in the banking system, the recession in the global economy and diminishing inflation, the Governing Council reduced interest rates on several occasions, with interest rates on minimum bid rate on main refinancing operations, marginal lending and deposit facilities reaching 1.00 per cent, 1.75 per cent and 0.25 per cent, respectively, in May 2009. In April 2011 and again in July 2011, the Governing Council, having considered that the pace of monetary expansion was gradually recovering, while monetary liquidity remained ample and could accommodate price pressures, lowered the interest rates, with interest rates on minimum bid rate on main refinancing operations, marginal lending and deposit facilities reaching 1.50 per cent, 2.25 per cent and 0.75 per cent, respectively. In November 2011, December 2011, July 2012 and again in May 2013, the Governing Council lowered the interest rates, with interest rates on minimum bid rate on main refinancing operations, marginal lending and deposit facilities reaching 0.50 per cent, 1.00 per cent and 0.00 per cent, respectively. The Governing Council explained that these reductions in key ECB interest rates were the result of inflationary pressures dampening further as several of the previously identified downside risks to the euro area growth outlook materialized.
29
The following table shows the movement in the interest rate on main refinancing operations and on marginal lending and deposit facilities from 2008 to the date of this Annual Report.
| Main Refinancing Operations | ||||||||||||||||
| Effective date |
Deposit Facility % interest rate |
Fixed rate tenders |
Variable rate tenders – minimum bid rate |
Marginal lending facility % interest rate |
||||||||||||
| 2008 |
||||||||||||||||
| July 9 |
3.25 | — | 4.25 | 5.25 | ||||||||||||
| October 8 |
2.75 | — | — | 4.75 | ||||||||||||
| October 9 |
3.25 | — | — | 4.25 | ||||||||||||
| October 15 |
3.25 | 3.75 | — | 4.25 | ||||||||||||
| November 12 |
2.75 | 3.25 | — | 3.75 | ||||||||||||
| December 10 |
2.00 | 2.50 | — | 3.00 | ||||||||||||
|
|
|
|
|
|
|
|
|
|||||||||
| 2009 |
||||||||||||||||
| January 21 |
1.00 | 2.00 | — | 3.00 | ||||||||||||
| March 11 |
0.50 | 1.50 | — | 2.50 | ||||||||||||
| April 8 |
0.25 | 1.25 | — | 2.25 | ||||||||||||
| May 13 |
0.25 | 1.00 | — | 1.75 | ||||||||||||
|
|
|
|
|
|
|
|
|
|||||||||
| 2010 |
||||||||||||||||
| — |
— | — | — | — | ||||||||||||
| 2011 |
||||||||||||||||
| April 13 |
0.50 | 1.25 | — | 2.00 | ||||||||||||
| July 13 |
0.75 | 1.50 | — | 2.25 | ||||||||||||
| November 9 |
0.50 | 1.25 | — | 2.00 | ||||||||||||
| December 14 |
0.25 | 1.00 | 1.75 | |||||||||||||
|
|
|
|
|
|
|
|
|
|||||||||
| 2012 |
||||||||||||||||
| July 11 |
0.00 | 0.75 | — | 1.50 | ||||||||||||
|
|
|
|
|
|
|
|
|
|||||||||
| 2013 |
||||||||||||||||
| May 8 |
0.00 | 0.50 | — | 1.00 | ||||||||||||
|
|
|
|
|
|
|
|
|
|||||||||
Source: European Central Bank
Exchange Rate Policy
Under the Maastricht Treaty, the ECB and ECOFIN are responsible for foreign exchange rate policy. The EU Council formulates the general orientation of exchange rate policy, either on the recommendation of the Commission, following consultation with the ECB, or on the recommendation of the ECB. However, the EU Council’s general orientation cannot conflict with the ECB’s primary objective of maintaining price stability. The ECB has exclusive authority for effecting transactions in foreign exchange markets.
Banking Regulation
Regulatory Framework. Italian banks fall into one of the following categories:
| • | joint stock banks; or |
| • | co-operative banks. |
Pursuant to the principle of “home country control”, non-Italian EU banks may carry out banking activities and activities subject to “mutual recognition” in Italy within the framework set out by EU Directive No. 2006/48/EC and Directive No. 2006/49/EC (collectively known as Capital Requirements Directive, or CRD 1), as amended by Directive 2009/27/EC, Directive 2009/83/EC and Directive 2009/111/EC (collectively known as CRD 2), and by Directive 2010/76/EU (known as CRD 3). Under the principle of “home country control”, a non-Italian EU bank remains subject to the regulation of its home-country supervisory authorities. It may carry out in Italy those activities described in the aforesaid directives that it is permitted to carry out in its home country, provided the Bank of Italy is informed by the entity supervising the non-Italian EU bank. Subject to certain authorization requirements, non-EU banks may also carry out banking activities in Italy.
30
Deregulation and Rationalization of the Italian Banking Industry. Historically, the Italian banking industry was highly fragmented and characterized by high levels of State ownership and influence. During the 1980s, Italian banking and European Community authorities began a process of deregulation. The principal components of deregulation at the European level are set forth in EU Directives and provide for:
| • | the free movement of capital among member countries; |
| • | the easing of restrictions on new branch openings; |
| • | the range of domestic and international services that banks are able to offer throughout the European Union; and |
| • | the elimination of limitations on annual lending volumes and loan maturities. |
The effect of the deregulation, in the context of the implementation of the EU Directives, has been a significant increase in competition in the Italian banking industry in virtually all bank and bank-related services.
The Consolidated Banking Law. In 1993, the Consolidated Banking Law consolidated most Italian banking legislation into one statute. Provisions in the Consolidated Banking Law relate, inter alia, to the role of supervisory authorities, the definition of banking and related activities, the authorization of banking activities, the scope of banking supervision, special bankruptcy procedures for banks and the supervision of financial companies. Banking activities may be performed by banks, without any restriction as to the type of bank. Furthermore, subject to their respective bylaws and applicable regulations, banks may engage in all the business activities that are integral to banking.
The Draghi Law. The Draghi Law (Legislative Decree No. 58 of February 24, 1998) entered into force in 1998 and introduced a comprehensive regulation of investment services, securities markets and publicly traded companies. While the Draghi Law did not significantly amend Italian legislation governing the banking industry, it is generally applicable to Italian publicly traded companies and it has implemented the EU directives on securities. In particular, the Draghi Law introduced a comprehensive regulation of investment services and collective investment management which applies to banks, investment firms and asset managers.
Directive 2004/39/EC - The Markets in Financial Instruments EU Directive (MiFID). The MiFID came into force on November 1, 2007, replacing the existing Investment Services Directive (Directive 93/22/EEC). The purpose of the MiFID is to harmonize rules governing the operation of regulated markets. The MiFID resulted in significant changes to the regulation of financial instruments and widened the range of investment services and activities that firms can offer in EU Member States other than their home state. In addition, the MiFID:
| • | provides for tailored disclosure requirements, depending on the level of sophistication of investors; |
| • | establishes detailed standards for fair dealings and fair negotiations between investment firms and investors; |
| • | introduces the operation of multilateral trading facilities as a new core investment service; and |
| • | extends the scope of the definition of financial instruments to include commodity derivatives, credit derivatives and swap agreements. |
The MiFID also sets out detailed requirements governing the organization of investment firms and their conduct of business.
Further to the implementation of the MiFID in Italy, the Italian Stock Exchange Commission (“Consob”) and the Bank of Italy adopted a joint regulation coordinating their respective supervisory competences with regard to the Italian financial markets and the institutions operating in those markets.
Supervision. Supervisory authorities, in accordance with the Consolidated Banking Law, include the Inter-Ministerial Committee for Credit and Savings (Comitato Interministeriale per il Credito e il Risparmio, or “CICR”), the Ministry of Economy and Finance and the Bank of Italy. The principal objectives of supervision are to ensure the sound and prudent management of the institutions subject to supervision and the overall stability, efficiency and competitiveness of the financial system.
The CICR. The CICR is composed of the Minister of Economy and Finance who acts as chairman, the Minister of International Trade, the Minister of Agriculture and Forest Policies, the Minister of Economic Development, the Minister of Infrastructure, the Minister of Transportation and the Minister of EU Policies. The Governor of the Bank of Italy, although not a member of the CICR, attends all meetings of the CICR but does not have the right to vote at such meetings. Where provided for by the law, the CICR establishes general guidelines that the Bank of Italy must follow when adopting regulations applicable to supervised entities.
31
The Ministry of Economy and Finance. The Ministry of Economy and Finance has certain powers in relation to banking and financial activities. It sets eligibility standards to be met by holders of equity interests in the share capital of a bank and the level of professional experience required of directors and executives of banks and other financial intermediaries. The Ministry of Economy and Finance may, in cases of urgency, adopt measures that are generally within the sphere of CICR’s powers and may also issue decrees that subject banks and other supervised entities to mandatory liquidation (liquidazione coatta amministrativa) or extraordinary management (amministrazione straordinaria), upon the proposal of the Bank of Italy.
The Bank of Italy. The Bank of Italy supervises banks and certain other financial intermediaries through its regulatory powers (in accordance with the guidelines issued by the CICR). The Consolidated Banking Law identifies four main areas of oversight: capital requirements, risk management, acquisitions of participations, administrative and accounting organization and internal controls, and public disclosure requirements. The Bank of Italy also regulates other fields, such as transparency in banking and financial transactions of banks and financial intermediaries, international payments, money laundering and terrorism financing. The Bank of Italy supervises banks and other supervised entities by, inter alia, authorizing the acquisition of shareholdings in banks in excess of certain thresholds and exercising off-site and on-site supervision. Certain acquisitions by non-EU entities based in jurisdictions that do not contemplate reciprocal rights by Italian banks to purchase banks based in those jurisdictions, may be denied by the President of the Council of Ministers, upon prior notice to the Bank of Italy.
On-site visits carried out by the Bank of Italy may be either “general” or “special” (directed toward specific aspects of banking activity). Matters covered by an on-site visit include the accuracy of reported data, compliance with banking laws and regulations, organizational aspects and conformity with a bank’s own bylaws.
The Bank of Italy requires all banks to report periodic statistical information related to all components of their non-consolidated balance sheet and consolidated accounts. Other data reviewed by the Bank of Italy include minutes of meetings of each bank’s board of directors. Banks are also required to submit any other data or documentation that the Bank of Italy may request.
In addition to its supervisory role, the Bank of Italy – as the Italian Central Bank – performs monetary policy functions by participating in the ESCB, and acts as treasurer to the Ministry of Economy and Finance. It also operates services for the banking industry as a whole, most notably the Credit Register (Centrale dei Rischi), a central information database on credit risk.
On December 28, 2005, a new law was introduced to modify the competences and organization of the Bank of Italy. In particular, while prior to the reform the Governor was appointed for an indefinite term, in accordance with the new legal framework, the Governor of the Bank of Italy is now appointed for a 6 year term, and may be reappointed only once. In addition, the new law transferred most of the competences of the Bank of Italy regarding competition in the banking sector to the Antitrust Authority, although joint clearance of the Bank of Italy and the Antitrust Authority is required in cases of mergers and acquisitions.
Reserve Requirements. Pursuant to ECB, ESCB and EU regulations, each Italian bank must deposit with the Bank of Italy an interest-bearing reserve expressed as a percentage of its total overnight deposits, deposits with an agreed maturity of up to and including two years, deposits redeemable at notice of up to and including two years and debt securities with an original maturity of up to and including two years.
Risk-Based Capital Requirements and Solvency Ratios. Capital adequacy requirements are mainly governed by CRD 1, as amended by CRD 2 and CRD 3, the Consolidated Banking Law, CICR Regulations and other implementing regulations issued by the Bank of Italy (Nuove disposizioni di vigilanza prudenziale per le banche). CRD 1 aligns European legislation with international standards on capital by implementing the international framework commonly known as the Basel II Accord. CRD 2 updates and refines CRD 1 by strengthening the EU regulatory framework and introducing rules on large exposures, derogations from prudential requirements, treatment of hybrid capital instruments, capital requirements and risk management for securitization positions, and new rules clarifying the supervisory framework for crisis management and establishing colleges for enhancing supervision. CRD 3 introduces rules on capital requirements for the trading book and for re-securitizations, and the supervisory review of remuneration policies.
Under the implementing regulations of the Bank of Italy, Italian banks are required to maintain certain ratios of regulatory capital to risk-weighted assets. Italian banks’ capital consists of Tier I capital and
32
Tier II capital. Tier I capital includes a) paid up share capital; b) reserves, including the share premium account; c) innovative and non-innovative capital instruments; d) net income for the period; and e) positive Tier I capital prudential filters, less f) own shares; g) goodwill; h) intangible assets; i) value adjustments of accounts receivable; j) losses carried forward and losses for the current financial year; k) regulatory value adjustments of the trading book; l) other negative items; and m) negative Tier I capital prudential filters. Tier II capital includes a) tangible asset valuation reserves; b) innovative and non-innovative capital instruments not eligible for inclusion in Tier I capital; c) hybrid capital instruments and Tier II subordinated liabilities; d) net gains on equity investment; e) any excess of value adjustments and provisions over expected loss amounts (for banks using internal ratings-based systems), f) other positive items; and g) positive Tier II capital prudential filters, less h) net losses on equity investment; i) other negative items; and j) negative Tier II capital prudential filters.
A new set of rules governing supervision and risk management of the banking sector, commonly referred to as Basel III, has been developed and is expected to gradually enter into force beginning in 2013. These measures aim at improving the banking sector’s ability to absorb shocks arising from financial and economic stress, improving risk management and governance and strengthening banks’ transparency and disclosure and will generally have the effect of limiting the instruments that will qualify as regulatory capital and increasing the amount of capital required. The Basel III rules will be implemented gradually with full enforcement by 2019. Basel III will require banks to meet certain minimum capital ratios, which will be phased in starting in 2013. In addition, Basel III provides additional rules on liquidity by requiring that banks meet a liquidity coverage ratio and a net stable funding ratio and rules on leverage by requiring that banks meet a leverage ratio. In January 2013, the original proposal with respect to the liquidity requirements was reviewed; the phasing-in of the liquidity coverage ratio will take place in a gradual manner (with an annual increase of 10 per cent), starting in 2015; and the definition of high quality liquid assets was expanded to include lower quality corporate securities, equities and residential mortgage backed securities.
The Basel III framework will be implemented in the EU through the Capital Requirements Directive (“CRD IV”) and the Capital Requirements Regulation (“CRR”). The CRD IV and the CRR were formally adopted by the European Council on 20 June 2013 and published in the Official Journal on 27 June 2013. They are expected to enter into force by 1 January 2014.
Risk Concentration Limitations. The provisions of CRD1, as amended by CRD 2, on the monitoring and control of exposures of credit institutions, limit a bank’s exposure to any single risk. The Bank of Italy has issued implementing regulations which require stand-alone banks and banking groups to limit each risk position to no more than 25 per cent of supervisory capital and their exposures to any single customer or group of related customers to 25 per cent of the bank’s regulatory capital. Under specific conditions, for exposures to related or connected parties, the credit risk position may overcome the 25 per cent of supervisory capital limit.
Banks belonging to banking groups shall be subject to an individual limit of 40 per cent of their supervisory capital provided that the group to which they belong complies with the above limits at the consolidated level. The exception is therefore not applicable to Italian banks that do not belong to a banking group and are reference undertakings.
Equity Participations by Banks. Prior approval of the Bank of Italy is required for any equity investments by a bank in other banks or financial or insurance companies: (1) exceeding 10 per cent of the regulatory capital of the acquiring bank; (2) exceeding 10 per cent or 20 per cent of the share capital of the bank or financial or insurance company being acquired; or (3) resulting in the control of the share capital of the bank or financial or insurance company being acquired. Investments by stand-alone banks or by banking groups in insurance companies exceeding in the aggregate 40 per cent of the acquiror’s regulatory capital (and 60 per cent of the regulatory capital, in case of the single bank included in the banking group) are not permitted.
The acquisition by banks and banking groups of shareholdings in non-financial companies is subject to certain limitations. Aggregate shareholdings in non-financial companies purchased by banks and banking groups cannot exceed 15 per cent of the acquiring bank’s regulatory capital. Banks and banking groups may not acquire shareholdings in any single non-financial company exceeding 3 per cent of the acquiring bank’s regulatory capital; they may be authorized to effect such investments in accordance with less stringent limitations, provided that they meet specific criteria. Pursuant to the principle of separation of the banking sector from the industrial sector, investments in non-financial companies cannot exceed 15 per cent of the share capital of the acquired company. Acquisitions of shareholdings exceeding such limit may be authorized provided the value of the shareholding does not exceed 1 per cent of the regulatory capital of the acquirer. The excess above 15% limit must not exceed 1 per cent of the regulatory capital of the acquirer.
33
Deposit Insurance. The Interbank Fund (Fondo Interbancario di Tutela dei Depositi) was established in 1987 by a group consisting of the principal Italian banks to protect depositors against the risk of bank insolvency and the loss of deposited funds. The Interbank Fund assists banks that are declared insolvent or are subject to temporary financial difficulties.
Participation in the Interbank Fund is compulsory for all Italian banks. The Interbank Fund intervenes when a bank is either in administrative management or mandatory liquidation. In the event of administrative management, the Interbank Fund may make payments to support the business of the bank, which may take the form of debt financing or taking an equity stake in the bank. In the case of mandatory liquidation, the Interbank Fund guarantees the refund of deposits to banking customers up to a maximum of €100,000 per depositor per bank. The guarantee does not cover customer deposit instruments in bearer form, deposits by financial and insurance companies and by collective investment vehicles and deposits by bank managers and executives with the bank that employs them.
Structure of the Banking Industry. Italy had 706 banks at December 31, 2012, compared to 740 at December 31, 2011. Italian banks’ presence abroad is significant, especially of the two largest banking groups in euro area countries. At the end of 2012, there were 24 subsidiaries of foreign companies and banks operating in Italy, two of which appear among the top 10 banking groups, with a market share of 8.4 per cent of total assets. At the end of 2012, the 78 branches of foreign banks not included in Italian banking groups held 7.7 per cent of system assets, compared with 8.2 per cent in 2011; 37 foreign investors – mainly from EU countries – had shareholdings of over 5 per cent in 48 banks. During 2012, seven new banks began to operate (two limited company banks, one mutual bank and four branches of foreign banks). Forty-one banks closed as a result of 35 mergers, takeovers or asset transfers (largely due to reorganization within banking groups), five liquidations and the conversion of a bank into a financial company. The number of banking groups fell by two to 75.
According to the Bank of Italy, in 2012, the five largest groups (UniCredit, Intesa Sanpaolo, MPS, Banco Popolare and Unione di Banche Italiane) held 49.4 per cent of the assets of the banks and financial companies operating in Italy. Another 15 large groups and banks held 24.2 per cent. The 78 branches of foreign banks accounted for 7.7 per cent, as did the 31 small banks; the 482 minor banks held 11.0 per cent.
The ownership structure of the banking sector has undergone substantial change since 1992, reflecting significant privatizations through 1998. Since 1999, the Italian banking sector has experienced significant consolidation. This process has accelerated in recent years, resulting in the formation of Italian banking groups of international standing, such as Intesa Sanpaolo and UniCredit. In 2005, Dutch bank ABN Amro acquired Banca Antonveneta, which was the first successful takeover of a listed Italian bank by a non-Italian bank. In 2006, French bank BNP Paribas acquired Banca Nazionale del Lavoro, the sixth largest Italian bank by deposits at the time of the acquisition. In 2007, Banca Intesa merged with Sanpaolo IMI, creating the Intesa Sanpaolo Group. In the same year, Capitalia merged into UniCredit, creating one of the largest financial services organizations in Europe. In May 2008, Monte Dei Paschi di Siena completed the acquisition of Banca Antonveneta from Banco Santander.
Capitalization. In 2012, the Italian banking system’s capital position improved. At the end of the year, consolidated regulatory capital amounted to €235 billion, a 1.3 per cent decrease compared to the end of 2011. In 2012, Tier 1 capital rose by €5 billion to €189 billion, mainly as a result of the capital increase carried out by one of the five largest banking groups. Supplementary capital decreased by 13.4 per cent to €51 billion, due to the non-renewal and buy-backs of hybrid instruments by the largest banking groups. The increase in core Tier I capital offset the impact of the stricter capital definition introduced by CRD 2 and the guidelines of the Committee of European Banking Supervisors, which entered into force in December 2010. Under the new rules, core Tier I capital may no longer include shares bearing privileges in loss sharing and dividend distribution, such as preferred shares (they may still be included in Tier I capital as hybrid instruments). The contribution of new resources more than offset the losses incurred in 2012. The risk-weighted assets decreased by more than 7 per cent due to the introduction of internal models for calculating capital requirements by some large groups and the gradual extension of their perimeter as well as to the shift in the composition of portfolios to assets attracting lower capital charges; those of the first five banking groups decreased by 11.3 per cent compared to 2011.
Capital strengthening and the reduction of risk-weighted assets led to an increase in capital ratios compared with the end of 2011. Taking into account the issue by Banca Monte dei Paschi di Siena of €4.071 billion in securities subscribed by the Ministry for the Economy and Finance in February 2013, the core Tier 1 ratio rose by a 1.4 per cent to 10.7 per cent and the Tier I ratio rose by 1.1 per cent to 11.1 per cent. The total capital ratio gained 0.8 points to 13.8 per cent. The capital ratios of the two largest Italian banking groups
34
continue to converge with those of a sample of eleven large European banks comparable in terms of business model and size. At the end of 2012, the Tier 1 ratio of the European sample averaged 13.3 per cent compared with 11.7 per cent for the two largest Italian banking groups.
In 2012 Italian banks continued to adapt to the new capital adequacy requirements envisaged by the Basel III rules, though their progress was slower than in 2011.
Bad Debts. Bad debts increased by 14.9 per cent in 2012 to €152,590 million, compared to €132,788 million in 2011. As a percentage of total loans, bad debts increased from 6.2 per cent in 2011 to 7.2 per cent in 2012.
Measures to assess the robustness of Italian Banking System
In order to stabilize the banking system and protect private savings, the Government has enacted measures, which, among other things, allow the Ministry of Economy and Finance to support the recapitalization of Italian banks by subscribing financial instruments and guaranteeing share capital increases, to provide a state guarantee on funds granted by the Bank of Italy to banks needing emergency liquidity and, in addition to the existing domestic bank deposit guaranty, to guarantee in full all Italian bank deposits. The measures adopted in Italy to preserve the stability of the financial system are aimed at protecting savers and maintaining adequate levels of bank liquidity and capitalization.
The Bank of Italy periodically conducts stress tests to assess the banking system’s ability to operate in adverse situations. The test conducted in May of 2010 for the whole Italian banking system analyzed the evolution of credit quality in the two years 2010-11 assuming worsened macroeconomic conditions (the adverse scenario hypothesizes that the Italian economy is hit by shocks to world trade that restrict exports; further, the risk premium on the interbank market increases with a tightening of credit supply policies, leading to a weakening of domestic demand; the macroeconomic effects are amplified by an increase in precautionary saving, exacerbating the decline in household spending; real GDP growth in the two years 2010-11 is lower by a total of 3 percentage points than the forecasts compiled by Consensus Economics). The stress tests showed that capital ratios of all banking groups considered (the largest five groups) would remain well above the minimal regulatory requirements under the adverse macroeconomic conditions. A similar stress test was conducted in July 2011, whose results were scrutinized by the Bank of Italy before a peer review and quality assurance process was conducted by EBA staff with a team of experts from national supervisory authorities, the ECB and the European Systemic Risk Board. The 2011 stress tests showed that capital ratios of all Italian banking groups considered (the largest five groups) would remain well above the minimal regulatory requirements under the adverse macroeconomic conditions.
An IMF mission visited Italy during 14-31 January and 12-26 March 2013, to conduct an assessment under the IMF’s Financial Sector Assessment Program (“FSAP”). The FSAP’s results suggested that the Italian banking system as a whole appeared to be well capitalized and that it should be able to withstand both a scenario of concentrated shocks and one of protracted slow growth, thanks to the banks’ strong capital position and ECB liquidity support. In its statement the IMF stated that the substantial capital buffers over regulatory minima built in recent years would offset most of the losses generated by an adverse macroeconomic scenario, even taking into account the phase-in of Basel III requirements, but that under such scenarios, the system would find its buffers depleted, and that market liquidity shocks can be absorbed by the substantial amounts of available collateral.
Credit Allocation
The Italian credit system has changed substantially during the past decade. Banking institutions have faced increased competition from other forms of intermediation, principally securities markets.
During 2012, lending activity, including repos and bad debts, decreased by 0.2 per cent, compared to a 1.9 per cent increase in 2011. The decrease in the Mezzogiorno was equal to 1.4 per cent compared to a 3.4 per cent increase in 2011, whereas in the central and northern regions the growth rate was equal to zero compared to a 1.7 per cent increase in 2011.
Exchange Controls
Following the complete liberalization of capital movements in the European Union in 1990, all exchange controls in Italy were abolished. Residents and non-residents of Italy may make any investments, divestments and other transactions that entail a transfer of assets to or from Italy, subject only to limited reporting, record-keeping and disclosure requirements referred to below. In particular, residents of Italy may hold foreign currency and foreign securities of any kind, within and outside Italy, while non-residents may invest in Italian securities without restriction and may export from Italy cash, instruments of credit or payment and securities, whether in foreign currency or euro, representing interest, dividends, other asset distributions and the proceeds of dispositions.
35
Italian legislation contains certain requirements regarding the reporting and record-keeping of movements of capital and the declaration in annual tax returns of investments or financial assets held or transferred abroad. Breach of certain requirements may result in the imposition of administrative fines or criminal penalties. In recent years, Italy allowed illegal holdings of foreign assets to be disclosed against payment of a (less burdensome) fine; this is commonly known as Tax Shield (Scudo Fiscale).
36
THE EXTERNAL SECTOR OF THE ECONOMY
Foreign Trade
Italy is fully integrated into the European and world economies, with imports and exports in 2012 equal to 28.6 and 30.2 per cent of real GDP, respectively. Since the trade surplus recorded in 2003, Italy has recorded trade deficits from 2004 until 2011. Italy’s merchandise exports have suffered from competition with Asian products, reflecting higher prices of Italian products, the improving quality of non-Italian products and the increased commercial presence and improved services offered by non-Italian companies in EU countries. Moreover, Italy’s specialization in more traditional merchandise is unable to meet the increased demand for high-technology products characterizing the expansion of world trade. In 2012, Italy’s trade balance was a surplus of approximately €11 billion, evidencing a significant increase over the deficit of €25.5 billion in 2011.
The following table illustrates Italy’s exports and imports for the periods indicated. Export amounts do not include insurance and freight costs and only include the costs associated with delivering and loading the goods for delivery. This is frequently referred to as “free on board” or “fob”. Import amounts include all costs, insurance and freight, frequently referred to as “cif”. A fob valuation includes the transaction value of the goods and the value of services performed to deliver the goods to the border of the exporting country; in a cif valuation, the value of the services performed to deliver the goods from the border of the exporting country to the border of the importing country is also included.
37
Foreign Trade (cif-fob)
| 2008 | 2009 | 2010 | 2011 | 2012 | ||||||||||||||||
| (€ in millions) | ||||||||||||||||||||
| Exports (fob)(1) |
||||||||||||||||||||
| Agriculture, forestry and fishing |
5,354 | 4,614 | 5,614 | 5,800 | 5,791 | |||||||||||||||
| Extractive industries |
1,707 | 1,024 | 1,165 | 1,276 | 1,451 | |||||||||||||||
| Manufactured products |
350,599 | 277,069 | 322,685 | 360,102 | 373,228 | |||||||||||||||
| Food, beverage and tobacco products |
20,907 | 20,031 | 22,179 | 24,419 | 26,059 | |||||||||||||||
| Textiles, leather products, clothing, accessories |
40,912 | 33,093 | 37,339 | 41,979 | 43,064 | |||||||||||||||
| Wood, wood products, paper, printing |
7,136 | 6,157 | 7,151 | 7,503 | 7,628 | |||||||||||||||
| Coke and refined oil products |
15,440 | 9,301 | 14,794 | 16,845 | 20,513 | |||||||||||||||
| Chemical substances and products |
22,217 | 17,856 | 22,575 | 24,925 | 25,331 | |||||||||||||||
| Pharmaceutical, chemical-medical, botanical products |
11,938 | 12,151 | 13,973 | 15,314 | 17,227 | |||||||||||||||
| Rubber, plastic, non-metallic mineral products |
22,435 | 18,208 | 20,854 | 22,516 | 22,574 | |||||||||||||||
| Base metal, metal (non-machine) products |
45,342 | 32,273 | 39,350 | 48,386 | 50,779 | |||||||||||||||
| Computers, electronic and optical devices |
11,355 | 9,650 | 11,604 | 12,935 | 12,599 | |||||||||||||||
| Electrical equipment |
21,839 | 17,261 | 19,380 | 20,309 | 19,936 | |||||||||||||||
| Machines and other non-classified products |
71,024 | 55,014 | 60,061 | 68,447 | 70,483 | |||||||||||||||
| Transportation means |
39,422 | 29,501 | 34,507 | 36,518 | 36,142 | |||||||||||||||
| Products from other manufacturing activities |
20,633 | 16,572 | 18,918 | 20,006 | 20,893 | |||||||||||||||
| Electrical energy, gas, steam, air conditioning |
366 | 433 | 277 | 276 | 255 | |||||||||||||||
| Products from waste treatment and recycling |
1,134 | 874 | 1,395 | 1,488 | 1,740 | |||||||||||||||
| Other products |
9,856 | 7,719 | 6,211 | 6,962 | 7,260 | |||||||||||||||
|
|
|
|
|
|
|
|
|
|
|
|||||||||||
| Total exports |
369,016 | 291,733 | 337,346 | 375,904 | 389,725 | |||||||||||||||
|
|
|
|
|
|
|
|
|
|
|
|||||||||||
| Imports (cif)(1) |
||||||||||||||||||||
| Agriculture, forestry and fishing |
10,874 | 9,706 | 11,123 | 13,013 | 12,291 | |||||||||||||||
| Extractive industries |
68,882 | 44,951 | 59,005 | 69,151 | 74,111 | |||||||||||||||
| Manufactured products |
287,887 | 230,989 | 284,833 | 305,410 | 279,056 | |||||||||||||||
| Food, beverage and tobacco products |
24,343 | 22,653 | 25,320 | 27,497 | 27,242 | |||||||||||||||
| Textiles, leather products, clothing, accessories |
24,718 | 21,842 | 25,960 | 28,876 | 26,478 | |||||||||||||||
| Wood, wood products, paper, printing |
9,897 | 7,952 | 9,991 | 10,158 | 9,220 | |||||||||||||||
| Coke and refined oil products |
8,442 | 5,841 | 8,550 | 10,077 | 10,577 | |||||||||||||||
| Chemical substances and products |
32,196 | 25,807 | 32,122 | 36,476 | 35,627 | |||||||||||||||
| Pharmaceutical, chemical-medical, botanical products |
14,666 | 16,185 | 17,344 | 19,187 | 19,737 | |||||||||||||||
| Rubber, plastic, non-metallic mineral products |
10,999 | 9,367 | 11,312 | 12,404 | 11,490 | |||||||||||||||
| Base metal, metal (non-machine) products |
44,407 | 24,704 | 36,107 | 42,468 | 37,753 | |||||||||||||||
| Computers, electronic and optical devices |
24,648 | 22,853 | 33,871 | 30,904 | 24,667 | |||||||||||||||
| Electrical equipment |
12,689 | 10,495 | 13,292 | 13,839 | 13,291 | |||||||||||||||
| Machines and other non-classified products |
26,806 | 18,866 | 22,416 | 24,138 | 22,502 | |||||||||||||||
| Transportation means |
44,316 | 35,464 | 37,901 | 38,334 | 30,213 | |||||||||||||||
| Products from other manufacturing activities |
9,762 | 8,960 | 10,647 | 11,051 | 10,260 | |||||||||||||||
| Electrical energy, gas, steam, air conditioning |
2,284 | 2,876 | 2,659 | 2,980 | 2,613 | |||||||||||||||
| Products from waste treatment and recycling |
4,056 | 2,052 | 3,902 | 5,254 | 5,006 | |||||||||||||||
| Other products |
8,067 | 7,034 | 5,868 | 5,622 | 5,684 | |||||||||||||||
|
|
|
|
|
|
|
|
|
|
|
|||||||||||
| Total imports |
382,050 | 297,609 | 367,390 | 401,428 | 378,759 | |||||||||||||||
|
|
|
|
|
|
|
|
|
|
|
|||||||||||
| Trade balance |
(13,034 | ) | (5,876 | ) | (30,044 | ) | (25,524 | ) | 10,966 | |||||||||||
|
|
|
|
|
|
|
|
|
|
|
|||||||||||
| (1) | At current prices. |
Source: ISTAT.
The Italian economy relies heavily on foreign sources for energy and other natural resources and Italy is a net importer of chemical and pharmaceutical products, agricultural and food industry products, paper, printing and publishing products, wood and wood products, metals and metal products, electric and precision machinery and transport equipment, food, beverage and tobacco products.
Of all the major European countries, Italy is one of the most heavily dependent on imports of energy. Italy’s trade balance remains vulnerable to fluctuations in oil prices, given the high proportion of energy imports. The energy deficit increased again, rising to a new historical peak of 3.9 per cent of GDP, due to the rise in oil prices.
38
In 2012, exports of goods and services increased by 2.3 per cent in real terms compared to a 5.9 per cent increase in 2011, reflecting the easing of world trade growth from 6.0 to 2.5 per cent. Exports of goods, which account for more than 80 per cent of Italy’s total exports, increased by 1.9 per cent in 2012, compared to a 6.8 per cent increase recorded in 2011. The main factor in the slowdown was the drop in sales to euro-area countries (which account for 40.5 per cent of the total), where demand declined. However, exports benefited from the recovery in international trade outside the euro area, where Italy’s sales growth outpaced potential demand in the three years 2010-12.
During 2012, imports of goods and services in real terms decreased by 7.7 per cent (8.3 per cent for goods) compared to 2011, mainly due to the contraction of investment and the slowdown in exports, which are the demand components with the most substantial input of imports. At nominal values, Italy’s imports decreased by 5.6 per cent.
Geographic Distribution of Trade
As a member of the European Union, Italy enjoys free access to the markets of the other EU Member States and applies the external tariff common to all EU countries. During the past several years, EU countries have made significant progress in reducing non-tariff barriers such as technical standards and other administrative barriers to trade amongst themselves, and Italy has incorporated into its national law most of the EU directives on trade and other matters. With the accession of new members, the EU has come to encompass many of Italy’s most important central and eastern European trading partners. The following tables show the distribution of Italy’s trade for the periods indicated.
Distribution of Trade (cif-fob) - Exports
| 2008 | 2009 | 2010 | 2011 | 2012 | ||||||||||||||||
| (€ in millions) | ||||||||||||||||||||
| Exports (fob)(1) |
||||||||||||||||||||
| Total EU |
217,210 | 168,064 | 193,389 | 210,666 | 209,214 | |||||||||||||||
| of which |
||||||||||||||||||||
| EMU |
163,848 | 128,738 | 147,365 | 160,214 | 157,785 | |||||||||||||||
| of which |
||||||||||||||||||||
| Austria |
8,803 | 6,961 | 8,002 | 8,724 | 8,630 | |||||||||||||||
| Belgium |
9,931 | 8,032 | 8,678 | 9,633 | 10,300 | |||||||||||||||
| France |
41,459 | 33,984 | 39,237 | 43,593 | 43,169 | |||||||||||||||
| Germany |
47,110 | 36,942 | 43,867 | 49,267 | 48,713 | |||||||||||||||
| Netherlands |
8,678 | 7,111 | 8,368 | 9,119 | 9,269 | |||||||||||||||
| Spain |
24,123 | 16,680 | 19,595 | 19,890 | 18,291 | |||||||||||||||
| Poland |
9,774 | 7,922 | 8,553 | 9,418 | 9,213 | |||||||||||||||
| United Kingdom |
19,327 | 14,953 | 17,576 | 17,542 | 18,964 | |||||||||||||||
| China |
6,432 | 6,629 | 8,609 | 9,996 | 9,003 | |||||||||||||||
| Japan |
4,251 | 3,714 | 4,011 | 4,732 | 5,637 | |||||||||||||||
| OPEC countries |
21,380 | 17,816 | 17,949 | 17,724 | 22,079 | |||||||||||||||
| Russia |
10,468 | 6,432 | 7,906 | 9,305 | 9,993 | |||||||||||||||
| Switzerland |
14,425 | 13,563 | 15,823 | 20,640 | 22,878 | |||||||||||||||
| Turkey |
7,502 | 5,652 | 8,029 | 9,634 | 10,618 | |||||||||||||||
| United States |
23,028 | 17,099 | 20,329 | 22,831 | 26,656 | |||||||||||||||
|
Other(2) |
64,320 | 52,764 | 61,301 | 70,376 | 73,647 | |||||||||||||||
|
|
|
|
|
|
|
|
|
|
|
|||||||||||
| Total |
369,016 | 291,733 | 337,346 | 375,904 | 389,725 | |||||||||||||||
|
|
|
|
|
|
|
|
|
|
|
|||||||||||
| (1) | At current prices. |
| (2) | Other represents all other countries and/or regions with whom Italy trades; none of such countries or regions accounts for a material amount. |
Source: ISTAT.
39
Distribution of Trade (cif-fob) - Imports
| 2008 | 2009 | 2010 | 2011 | 2012 | ||||||||||||||||
| (€ in millions) | ||||||||||||||||||||
| Imports (fob)(1) |
||||||||||||||||||||
| Total EU |
208,784 | 170,868 | 201,364 | 215,728 | 200,314 | |||||||||||||||
| of which |
||||||||||||||||||||
| EMU |
169,840 | 137,807 | 163,797 | 174,070 | 161,727 | |||||||||||||||
| of which |
||||||||||||||||||||
| Austria |
8,999 | 7,189 | 8,452 | 9,439 | 8,839 | |||||||||||||||
| Belgium |
14,201 | 11,955 | 13,359 | 14,568 | 14,381 | |||||||||||||||
| France |
32,873 | 26,353 | 32,171 | 33,603 | 31,318 | |||||||||||||||
| Germany |
61,186 | 49,701 | 58,986 | 62,388 | 55,219 | |||||||||||||||
| Netherlands |
20,519 | 16,918 | 19,965 | 21,037 | 20,388 | |||||||||||||||
| Spain |
16,633 | 13,141 | 16,737 | 18,111 | 16,848 | |||||||||||||||
| Poland |
6,708 | 6,638 | 7,222 | 7,518 | 7,125 | |||||||||||||||
| United Kingdom |
11,897 | 9,817 | 10,012 | 10,943 | 9,554 | |||||||||||||||
| China |
23,606 | 19,334 | 28,789 | 29,574 | 24,695 | |||||||||||||||
| Japan |
5,018 | 3,899 | 4,288 | 4,218 | 3,191 | |||||||||||||||
| OPEC countries |
42,679 | 24,943 | 34,957 | 34,317 | 41,082 | |||||||||||||||
| Russia |
16,089 | 12,142 | 14,633 | 16,904 | 18,331 | |||||||||||||||
| Switzerland |
11,256 | 10,427 | 10,203 | 11,294 | 11,018 | |||||||||||||||
| Turkey |
5,583 | 4,423 | 5,158 | 5,979 | 5,257 | |||||||||||||||
| United States |
11,683 | 9,463 | 11,139 | 13,026 | 12,666 | |||||||||||||||
|
Other(2) |
57,532 | 42,110 | 56,859 | 70,388 | 62,205 | |||||||||||||||
|
|
|
|
|
|
|
|
|
|
|
|||||||||||
| Total |
382,050 | 297,609 | 367,390 | 401,428 | 378,759 | |||||||||||||||
|
|
|
|
|
|
|
|
|
|
|
|||||||||||
| (1) | At current prices. |
| (2) | Other represents all other countries and/or regions with whom Italy trades; none of which country or region represents a material amount. |
Source: ISTAT.
As in the previous year, during 2012 over half of Italian trade was with other EU countries, with approximately 53.7 per cent of Italian exports and 52.8 per cent of imports attributable to trade with EU countries. Germany remains Italy’s single most important trade partner and in 2012 supplied 14.57 per cent of Italian imports and purchased 12.49 per cent of Italian exports.
In 2012, Italy’s trade balance with EU countries was positive, with a surplus of approximately €8.9 billion. This result was due to a decrease in imports larger than the decrease in exports. The deficit with Germany was halved in 2012 owing to the drop in imports of motor vehicles, photovoltaic cells and machinery and equipment, decreasing to €6.5 billion, and the surplus with France increased to €11.85 billion.
The improvement in the trade balance was the result of surpluses both with the other EU countries (€10.4 billion compared with a deficit of €2.7 billion in 2011) and with non-EU countries (€7.5 billion against a deficit of €14.7 billion).
However, Italian exports to non-EU countries increased while exports to EU countries decreased and imports from EU countries decreased more than imports from non-EU countries.
With respect to non-EU countries, the increase in the trade surplus with the United States was fostered by the euro’s depreciation against the dollar and the growth in US domestic demand. The trade balance with China, with which Italy has its widest bilateral deficit, also improved.
In 2012, Italy recorded an increase in exports of 3.7 per cent over 2011, even though it recorded a decrease in Italian exports to Eurozone countries of 1.5 per cent compared to 2011; in particular, exports to Italy’s three largest Eurozone trading partners Germany, France and Spain decreased by 1.1 per cent, 1.0 per cent and 8.1 per cent, respectively in 2012. The increase in Italian exports resulted from a sharp increase in exports to non-EU countries of 9.2 per cent in 2012 compared to 2011 (an increase of 7.8 per cent net of energy exports compared to 2011), in part due to a 24.6 per cent increase in exports to OPEC countries, a 16.8 per cent increase in exports to the United States and a 19.1 per cent increase in exports to Japan.
Balance of Payments
The balance of payments tabulates the credit and debit transactions of a country with foreign countries and international institutions for a specific period. Transactions are divided into three broad groups: current account, capital account and financial account. The current account is made up of: (1) trade in goods (visible trade) and (2) invisible trade, which consists of trade in services, income from profits and interest earned
40
on overseas assets, net of those paid abroad, and net capital transfers to international institutions, principally the European Union. The capital account primarily comprises net capital transfers from international institutions, principally the European Union. The financial account is made up of items such as the inward and outward flow of money for direct investment, investment in debt and equity portfolios, international grants and loans and changes in the official reserves.
In 2010, the gathering and compilation system of the balance of payments and foreign financial position of Italy was deeply innovated with the abandonment of bank settlement reporting. The integration of international markets increased the complexity of transactions, which affected the reliability of gathering systems based on bank payments. Models of data collection based on direct gathering with entities involved in international exchanges are now preferred, the use of sample analysis was extended and the banks’ obligation of statistical reporting on behalf of clients was almost entirely eliminated. The new system is based on various sources: (a) census-based collections, such as statistical reports of entities subject to oversight by the Bank of Italy; (b) administrative data collected by other institutions for compliance purposes; and (c) sample-based investigations, in particular with non-financial and insurance businesses. Reports of flux and amount are required for financial transactions.
The following table illustrates the balance of payments of Italy for the periods indicated.
Balance of Payments
| 2009 | 2010 | 2011 | 2012 | |||||||||||||
| (€ in millions) | ||||||||||||||||
| Current Account(1) |
(30,173 | ) | (54,516 | ) | (48,259 | ) | (8,428 | ) | ||||||||
| Goods |
823 | (20,918 | ) | (17,377 | ) | 17,835 | ||||||||||
| Exports |
292,335 | 337,920 | 376,566 | 390,392 | ||||||||||||
| Imports |
291,512 | 358,838 | 393,943 | 372,557 | ||||||||||||
| Services |
(8,435 | ) | (9,218 | ) | (5,671 | ) | (741 | ) | ||||||||
| Exports |
67,798 | 73,967 | 77,378 | 81,829 | ||||||||||||
| Imports |
76,233 | 83,184 | 83,049 | 82,570 | ||||||||||||
| Income |
(10,406 | ) | (8,289 | ) | (9,376 | ) | (10,065 | ) | ||||||||
| Inflows |
57,729 | 55,885 | 61,051 | 52,574 | ||||||||||||
| Outflows |
68,135 | 64,174 | 70,427 | 62,639 | ||||||||||||
| Transfers |
(12,155 | ) | (16,091 | ) | (15,836 | ) | (15,456 | ) | ||||||||
| EU Institutions |
(6,982 | ) | (10,109 | ) | (10,448 | ) | (9,623 | ) | ||||||||
|
|
|
|
|
|
|
|
|
|||||||||
| Capital Account(1) |
(89 | ) | (556 | ) | 648 | 3,839 | ||||||||||
| Intangible assets |
(578 | ) | (706 | ) | (407 | ) | 1,723 | |||||||||
| Transfers |
489 | 150 | 1,055 | 2,116 | ||||||||||||
| EU Institutions |
1,627 | 1,486 | 2,741 | 3,167 | ||||||||||||
|
|
|
|
|
|
|
|
|
|||||||||
| Financial Account(1) |
37,335 | 86,749 | 72,845 | 7,678 | ||||||||||||
| Direct investment |
(863 | ) | (17,726 | ) | (13,887 | ) | (10,691 | ) | ||||||||
| Abroad |
(15,315 | ) | (24,656 | ) | (38,578 | ) | (23,159 | ) | ||||||||
| In Italy |
14,452 | 6,930 | 24,691 | 12,468 | ||||||||||||
| Portfolio investment |
28,061 | 38,468 | (34,361 | ) | 29,234 | |||||||||||
| Assets |
(38,541 | ) | (31,285 | ) | 35,630 | 61,504 | ||||||||||
| Liabilities |
66,602 | 69,753 | (69,991 | ) | (32,270 | ) | ||||||||||
| Financial Derivatives |
4,332 | (4,734 | ) | 7,493 | (424 | ) | ||||||||||
| Other investment |
5,725 | 71,775 | 114,541 | (8,980 | ) | |||||||||||
| Change in official reserves |
80 | (1,034 | ) | (941 | ) | (1,461 | ) | |||||||||
|
|
|
|
|
|
|
|
|
|||||||||
| Errors and omissions |
(7,073 | ) | (31,678 | ) | (25,233 | ) | (3,088 | ) | ||||||||
| (1) | At current prices. |
Source: Bank of Italy.
Current Account
Italy has had a current account deficit since 2000, which in 2012 amounted to €8.4 billion or 0.5 per cent of GDP, evidencing a significant improvement compared to €48.3 billion or 3.1 per cent of GDP in 2011. The improvement, which was achieved despite the slight deterioration in the energy balance, reflected the resilience of exports and the reduction in imports due to weak domestic demand.
Visible Trade. Italy’s fob-fob trade deficit increased to 1.1 per cent of GDP in 2012 from a deficit of the same level in 2011. The improvement was attributable to the non-energy component, the surplus on which almost doubled to 5.1 per cent of GDP. By contrast, the increase in the euro prices of oil caused a further slight deterioration in the energy deficit, which reached 3.9 per cent of GDP.
41
Invisible Trade. The deficit in services decreased to €0.7 billion in 2012, compared to €5.7 billion in 2011. The surplus on travel increased further, to €11.5 billion, benefiting as in the previous year from increased receipts and substantially stationary outlays. The deficit in transport services in 2012 decreased to €8.1 billion due to the decline in merchandise imports.
Income. In 2012, the deficit on the income account was basically unchanged at €10.1 billion, against €9.4 billion in 2011. For portfolio investment, which accounted for almost all of the deficit on investment income, there was a reduction in both inflows and outflows, reflecting the decrease in foreign assets and liabilities in the last two years. Direct investment income also declined owing to the contraction in firms’ profits. By contrast, the surplus on labor income increased by €1.1 billion thanks to the larger receipts of cross-border workers and a reduction in outflows to non-resident workers.
Current Transfers. The deficit recorded in current transfers as virtually stationary with respect to 2011 at €15.5 billion. Workers’ remittances abroad, which almost doubled between 2005 and 2011 with the large rise in the number of foreigners, fell to €6.8 billion, compared with €7.4 billion in the previous year. Contributory factors were the decline in the employment rate among foreign workers and the recession in Italy.
Capital Account
Italy’s capital account, which accounts for transactions in intangible assets, recorded a surplus of €3.8 billion (compared €0.6 billion in 2011), mainly due to the improvement in the balance on intangible assets, which benefited from the export of carbon emission rights. In 2012, the surplus on capital account vis-à-vis the EU institutions amounted to €3.2 billion.
Financial Account and the Net External Position
In 2012, the financial account surplus decreased to €7.7 billion from €72.8 billion in 2011. The financial account showed that, at the end of 2012, Italy’s net external debtor position amounted to €387.8 billion, or 24.8 per cent of GDP, compared with €326.2 billion in 201. The increase, only a small part of which was attributable to the modest inflows in the financial account (€7.7 billion), reflects above all the negative contribution of valuation adjustments (€53.9 billion).
Direct Investment. After picking up in the previous two years, Italian direct investment abroad declined to €23.2 billion, compared with €38.6 billion in 2011. The contraction was sharpest in the category of non-bank intra-group loans, which had recorded particularly large outflows the year before. Inward direct investment also decreased, from €24.7 billion to €12.5 billion, reflecting market uncertainty; signs of a recovery only appeared towards the end of the year. Overall, the balance of direct investment recorded net outflows of €10.7 billion in 2012.
The following table shows total direct investment abroad by Italian entities and total direct investment in Italy by foreign entities for the periods indicated.
Direct Investment by Country(1)
| 2008 | 2009 | 2010 | 2011 | 2012 | ||||||||||||||||
| (€ in millions) | ||||||||||||||||||||
| Direct investment abroad |
||||||||||||||||||||
| Netherlands |
(1,454 | ) | 3,760 | 756 | 1,127 | 4,976 | ||||||||||||||
| Luxembourg |
(25,348 | ) | (14,519 | ) | 14,227 | 14,376 | (986 | ) | ||||||||||||
| United States |
1,598 | 5,204 | 1,230 | 1,945 | 737 | |||||||||||||||
| United Kingdom |
2,177 | 3,094 | (213 | ) | 1,967 | 413 | ||||||||||||||
| France |
38,820 | 3,705 | 597 | (451 | ) | (182 | ) | |||||||||||||
| Switzerland |
(2,679 | ) | 707 | 1,317 | (309 | ) | 127 | |||||||||||||
| Germany |
3,537 | 992 | (1,692 | ) | 1,509 | (358 | ) | |||||||||||||
| Spain |
1,724 | 6,958 | (11,076 | ) | 570 | 3,246 | ||||||||||||||
| Brazil |
894 | 351 | (71 | ) | 141 | 365 | ||||||||||||||
| Belgium |
1,335 | 5,674 | (506 | ) | 1,874 | 765 | ||||||||||||||
| Argentina |
106 | 68 | 26 | 259 | 149 | |||||||||||||||
| Sweden |
(1,067 | ) | 82 | 196 | 168 | 293 | ||||||||||||||
| Other |
26,097 | (759 | ) | 19,861 | 15,400 | 13,611 | ||||||||||||||
|
|
|
|
|
|
|
|
|
|
|
|||||||||||
| Total |
45,740 | 15,317 | 24,652 | 38,576 | 23,156 | |||||||||||||||
|
|
|
|
|
|
|
|
|
|
|
|||||||||||
42
| 2008 | 2009 | 2010 | 2011 | 2012 | ||||||||||||||||
| (€ in millions) | ||||||||||||||||||||
| Direct investment in Italy |
||||||||||||||||||||
| Netherlands |
(3,377 | ) | 3,634 | (7,952 | ) | 4,251 | 2,782 | |||||||||||||
| Luxembourg |
9,979 | 1,276 | 634 | (1,369 | ) | 2,077 | ||||||||||||||
| United States |
2,139 | 270 | 2,180 | 896 | 181 | |||||||||||||||
| United Kingdom |
1,610 | 2,526 | 3,067 | 4,309 | 275 | |||||||||||||||
| France |
(31,477 | ) | 5,652 | 3,271 | 13,519 | 1,753 | ||||||||||||||
| Switzerland |
1,523 | (389 | ) | 1,564 | 3 | 323 | ||||||||||||||
| Germany |
3,340 | 2,365 | (114 | ) | (99 | ) | 754 | |||||||||||||
| Spain |
818 | (325 | ) | 728 | 910 | 572 | ||||||||||||||
| Brazil |
248 | 113 | 99 | 42 | 42 | |||||||||||||||
| Belgium |
465 | 4,534 | (973 | ) | 2,525 | 2,295 | ||||||||||||||
| Argentina |
53 | 60 | 28 | 30 | 38 | |||||||||||||||
| Sweden |
990 | (1,521 | ) | 117 | (1,030 | ) | (129 | ) | ||||||||||||
| Other |
6,285 | (3,744 | ) | 4,282 | 705 | 1,505 | ||||||||||||||
|
|
|
|
|
|
|
|
|
|
|
|||||||||||
| Total |
(7,404 | ) | 14,451 | 6,931 | 24,692 | 12,468 | ||||||||||||||
|
|
|
|
|
|
|
|
|
|
|
|||||||||||
| (1) | Figures do not include real estate investment, investments made by Italian banks abroad and investments made by foreign entities in Italian banks. |
Source: ISTAT and National Institute for International Trade.
Portfolio Investment. In 2012, the balance of portfolio investment returned to register net inflows of €29.2 billion. Large disposals of foreign securities by Italian residents amounting to €61.5 billion more than offset those of Italian securities by international investors of €32.3 billion. Continuing the trend that began in 2011 with the worsening of the sovereign debt crisis, residents (mainly households, banks and insurance companies) greatly scaled back their exposure in foreign debt instruments, reflecting the shift of portfolio composition towards Italian securities and, in the case of households, the reduction in holdings of debt securities. Disposals (for the greater part consisting of the non-renewal of securities maturing during the year) were mainly of bonds issued by banks and other financial intermediaries and of government securities of the leading Euro area countries. There was an increase in purchases of equities and investment fund units, partly due to households’ growing preference for foreign funds over Italian ones.
The large disposals of Italian government securities by non-residents that had begun in the middle of 2011 continued through the first quarter of 2012. Purchases of government securities picked up from the summer onwards, including for medium and long-term maturities, as financial market conditions slowly improved in response to the measures taken by the Eurosystem and to the narrowing of interest rate spreads on Italian government securities. Foreign investors showed renewed interest also in equities and corporate bonds. In 2012, net investments in equities amounted to €16.1 billion; net disposals of debt instruments totaled €48.4 billion but, excluding the first quarter of the year, there were net purchases for €12.3 billion.
Other investment. The “other investment” relating to the banking sector saw a net outflow of €58.7 billion, largely due to the decrease in foreign liabilities. Contributory factors were the funding difficulties on the international interbank market and the reduction in intra-group loans to Italian branches of foreign banks in connection with the policies enacted to balance assets and liabilities on a national basis. Under “other investment”, attributable to the Bank of Italy, there was a net inflow of €62.6 billion, compared with €194.8 billion in 2011, in relation to the Trans-European Automated Real-Time Gross Settlement Express Transfer (“TARGET2”) payments system balance (the euro-area central banks’ positions in the TARGET2 payment system).
Errors and Omissions. In 2012, the item “errors and omissions” amounted to -€3.1 billion which is a value extremely low compared to historical standards. The amount recorded in the errors and omissions account typically reflects unreported international transactions, such as unreported funds transferred abroad by Italian residents and exporters’ unreported payments by non-residents to accounts held abroad.
Reserves and Exchange Rates
On January 1, 1999, eleven European countries, including Italy, adopted the euro as their new national currency. At that time, the conversion rate between the lira and the euro was irrevocably fixed at Lit. 1,936.27 per euro. Prior to 1999, the exchange rate of the lira against other euro constituent currencies was subject to market fluctuation. The euro was introduced as a physical currency on January 1, 2002. On February 28, 2002, the lira ceased to be legal tender in Italy and was withdrawn from the financial system.
43
The following table sets forth, for the periods indicated, certain information regarding the U.S. Dollar/Euro reference rate, as reported by the European Central Bank, expressed in U.S. dollar per euro.
US Dollar/Euro Exchange Rate
| Period |
Period End |
Yearly Average Rate(1) |
High | Low | ||||||||||||
| (U.S.$ per €1.00) | ||||||||||||||||
| 1999 |
1.0046 | 1.0588 | 1.1789 | 1.0015 | ||||||||||||
| 2000 |
0.9305 | 0.9194 | 1.0388 | 0.8252 | ||||||||||||
| 2001 |
0.8813 | 0.8917 | 0.9545 | 0.8384 | ||||||||||||
| 2002 |
1.0487 | 0.9511 | 1.0487 | 0.8578 | ||||||||||||
| 2003 |
1.2630 | 1.1418 | 1.2630 | 1.0377 | ||||||||||||
| 2004 |
1.3621 | 1.2462 | 1.3633 | 1.1802 | ||||||||||||
| 2005 |
1.1797 | 1.2490 | 1.3507 | 1.1667 | ||||||||||||
| 2006 |
1.317 | 1.2630 | 1.3331 | 1.1826 | ||||||||||||
| 2007 |
1.4721 | 1.3797 | 1.4874 | 1.2893 | ||||||||||||
| 2008 |
1.3917 | 1.4726 | 1.599 | 1.246 | ||||||||||||
| 2009 |
1.4406 | 1.3963 | 1.5074 | 1.2591 | ||||||||||||
| 2010 |
1.3362 | 1.3207 | 1.4563 | 1.1942 | ||||||||||||
| 2011 |
1.2939 | 1.3920 | 1.4882 | 1.2889 | ||||||||||||
| 2012 |
1.3194 | 1.2848 | 1.3453 | 1.2088 | ||||||||||||
| (1) | Average of the reference rates for the last business day of each month in the period. |
Source: European Central Bank.
The following table sets forth information relating to euro exchange rates for certain other major currencies for the periods indicated.
Euro Exchange Rates
| Yearly Average Rate(1) per €1.00 | ||||||||||||||||||||
| 2008 | 2009 | 2010 | 2011 | 2012 | ||||||||||||||||
| Japanese Yen |
151.53 | 130.63 | 115.26 | 110.96 | 102.49 | |||||||||||||||
| British Pound |
0.8026 | 0.8810 | 0.8560 | 0.86788 | 0.81087 | |||||||||||||||
| Swiss Franc |
1.5786 | 1.5076 | 1.3700 | 1.2326 | 1.2053 | |||||||||||||||
| Norwegian Kroner |
8.2858 | 8.6892 | 8.0034 | 7.7934 | 7.4751 | |||||||||||||||
| Czech Koruna |
25.039 | 26.495 | 25.263 | 24.590 | 25.149 | |||||||||||||||
| (1) | Average of the reference rates for the last business day of each month in the period. |
Source: European Central Bank
In 2012, official reserves increased to €137.7 billion from €133.9 billion in 2011. At the end of 2012, the contribution of the Bank of Italy to the reserves of the European Central Bank was stable at approximately €7.2 billion.
At December 31, 2012, gold and net foreign currency assets were worth €132.6 billion, compared with €128.5 billion a year earlier. The increase mainly reflected the rise in the price of gold (up by 3.64 per cent, leading to an increase of €3.5 billion in the value of the stock, which was stationary in volume).
The following table illustrates the official reserves of Italy as at the end of each of the periods indicated.
Official Reserves
| 2008 | 2009 | 2010 | 2011 | 2012 | ||||||||||||||||
| (€ in billion) | ||||||||||||||||||||
|
Gold(1) |
49.0 | 60.4 | 83.2 | 95.9 | 99.4 | |||||||||||||||
| Special Drawing Rights |
0.2 | 6.5 | 7.2 | 7.1 | 7.2 | |||||||||||||||
| Total position with IMF |
1.1 | 1.3 | 1.9 | 4.5 | 4.7 | |||||||||||||||
| Net foreign exchange |
25.4 | 24.0 | 26.7 | 26.4 | 26.4 | |||||||||||||||
|
|
|
|
|
|
|
|
|
|
|
|||||||||||
| Total reserves |
75.6 | 92.2 | 118.9 | 133.9 | 137.7 | |||||||||||||||
|
|
|
|
|
|
|
|
|
|
|
|||||||||||
| (1) | Valued at market exchange rates and prices. |
Source: Bank of Italy.
44
PUBLIC FINANCE
The Budget Process
The Government’s fiscal year is the calendar year. The budget and financial planning process of the Government is governed by Law No. 196 of 2009, as amended by Law No. 39 of 2011.
Budget Process. The budget process complies with European requirements, whose principal aim is to allow the EU to review all Member States’ budgetary policies and reform strategies simultaneously. The first “European Semester” begins in January, when the Commission prepares its annual report on economic development, containing strategic proposals for the EU economy. In March, the EU Council, based on the Commission’s report (after consulting the Economic and Financial Committee), identifies the main economic targets and strategies of the EU and the euro area and provides strategic guidance on policies. In April, the Member States, taking the EU Council’s guidelines into account, provide to the Commission their medium-term budgetary strategies and reforms by submitting their updated stability programmes and national reform programmes. In June or July, the EU Council, on a recommendation from the Commission, delivers an opinion on each of the updated programs and, if it considers that their objectives and contents should be strengthened, invites the Member State concerned to adjust its program. In the following months, each Member State, taking into account the decisions and requests of the Commission and the EU Council, adopts its new budget and measures to meet said requests.
Consistent with the European Semester, the Government submits to the Parliament, by April 10th, the Economic and Financial Document (Documento di economia e Finanza or “EFD”), which consists of three sections: (i) the stability programme, which establishes public finance targets; (ii) the analysis and tendencies in public finance, which contains data and information regarding the prior fiscal year, any discrepancies from previous program documents, and projections for at least the three following years; and (iii) the national reform programme, which sets forth the country’s priorities and main structural reforms to be effected. Following Parliament’s approval of the EFD, the stability programme and the national reform programme are submitted to the EU Council and the Commission by April 30th. Following the EU Council’s review, by September 20th, the Government submits to Parliament an update note to the EFD, which provides updates to the macroeconomic and financial projections and program targets contained in an EFD and incorporates any requests of the EU Council.
Subsequently, the Government submits to the Parliament, by October 15th, the final budgetary package, which consists of the Legge di Bilancio (“Budget Law”) and the Legge di Stabilità (“Stability Law”). The Budget Law authorizes general government revenues and expenditures for the upcoming three-year period. The Stability Law includes legal and financial measures for the three-year period covered by the Budget Law, implementing the budget and the targets contemplated in an EFD. The Ministry of Economy and Finance (“MEF”) submits to the Parliament by April of the subsequent year the Report on the General Economic Situation of the Country, which details the performance of the Italian economy of the previous year.
Approval of financial year. In addition, by May 31st of the subsequent year, the MEF is required to submit the “Rendiconto Generale dello Stato” (the “Rendiconto”) to the Court of Auditors (Corte dei Conti). The Rendiconto contains the statement of income and the balance sheet of the Republic of Italy for the previous fiscal year. The Corte dei Conti verifies that the Rendiconto is consistent with the budget provisions contained in the Budget Law of the previous year. Upon completion of the Corte dei Conti’s review, the MEF submits the Rendiconto to the Parliament by June 30th for approval.
European Economic and Monetary Union
Under the terms of the Maastricht Treaty, Member States participating in the EMU, or “Participating States”, are required to avoid excessive government deficits. In particular, they are required to maintain:
| • | a government deficit, or net borrowing, that does not exceed three per cent of GDP, unless the excess is exceptional and temporary and the actual deficit remains close to the three per cent ceiling; and |
| • | a gross accumulated public debt that does not exceed 60 per cent of GDP or is declining at a satisfactory pace toward this reference value. |
For additional information on Italy’s status under these covenants, see “The Italian Economy—Measures to Address the Global Financial and Economic Crisis” and “—The 2012 Economic and Financial Document”.
45
Although Italy’s public debt exceeded 60 per cent of GDP in 1998, Italy was included in the first group of countries to join the EMU on January 1, 1999 on the basis that public debt was declining at a satisfactory pace toward the 60 per cent reference value.
In order to ensure the ongoing convergence of the economies participating in the EMU, to consolidate the single market and maintain price stability, effective on July 1, 1998, the Participating States agreed to a Stability and Growth Pact (the “SGP”). The SGP is an agreement among the Participating States aimed at clarifying the Maastricht Treaty’s provisions for an excessive deficit procedure and strengthening the surveillance and co-ordination of economic policies. The SGP also calls on Participating States to target budgetary positions aimed at a balance or surplus in order to adjust for potential adverse fluctuations, while keeping the overall government deficit below a reference value of 3 per cent of GDP.
Under SGP regulations, Participating States are required to submit each year a stability programme and non-participating Member States are required to submit a convergence programme. These programs cover the current year, the preceding year and as at least the three following years and are required to set forth:
| • | projections for a medium-term budgetary objective (a country-specific target which, for Participating States having adopted the euro, must fall within one per cent of GDP and balance or surplus, net of one-off and temporary measures) and the adjustment path towards this objective, including information on expenditure and revenue ratios and on their main components; |
| • | the main assumptions about expected economic developments and the variables (and related assumptions) that are relevant to the realization of the stability programme such as government investment expenditure, real GDP growth, employment and inflation; |
| • | the budgetary strategy and other economic policy measures to achieve the medium-term budgetary objective comprising detailed cost-benefit analysis of major structural reforms having direct cost-saving effects and concrete indications on the budgetary strategy for the following year; |
| • | an analysis of how changes in the main economic assumptions would affect the budgetary and debt position, indicating the underlying assumptions about how revenues and expenditures are projected to react to variations in economic variables; and |
| • | if applicable, the reasons for a deviation from the adjustment path towards the budgetary objective. |
Based on assessments by the Commission and the Economic and Financial Committee, the EU Council delivers an opinion on whether:
| • | the economic assumptions on which the program is based are plausible; |
| • | the adjustment path toward the budgetary objective is appropriate; and |
| • | the measures being taken and/or proposed are sufficient to achieve the medium-term budgetary objective. |
The EU Council can issue recommendations to the Participating State to take the necessary adjustment measures to reduce an excessive deficit. When assessing the adjustment path taken by Participating States, the EU Council will examine whether the Participating State concerned pursued the annual improvement of its cyclically adjusted balance, net of one-off and other temporary measures, with 0.5 per cent of GDP as a benchmark. When defining the adjustment path for those Participating States that have not yet reached the respective budgetary objective, or in allowing those that have already reached it to temporarily depart from it, the EU Council will take into account structural reforms which have long-term cost-saving effects, implementation of certain pension reforms and whether higher adjustment effort is made in economic “good times”. If the Participating State repeatedly fails to comply with the EU Council’s recommendations, the EU Council may require the Participating State to make a non-interest-bearing deposit equal to the sum of:
| • | 0.2 per cent of the Participating State’s GDP, and |
| • | one tenth of the difference between the government deficit as a percentage of GDP in the preceding year and the reference value of 3 per cent of GDP. |
This deposit may be increased in subsequent years if the Participating State fails to comply with the EU Council’s recommendations, up to a maximum of 0.5 per cent of GDP, and may be converted into a fine if the excessive deficit has not been corrected within two years after the decision to require the Participating State to make the deposit. In addition to requiring a non-interest-bearing deposit, in the event of repeated non-compliance with its recommendations, the EU Council may require the Participating State to publish
46
additional information, to be specified by the EU Council, before issuing bonds and securities and invite the European Investment Bank to reconsider its lending policy towards the Participating State. If the Participating State has taken effective action in compliance with the recommendation, but unexpected adverse economic events with major unfavorable consequences for government finances occur after the adoption of that recommendation, the EU Council may adopt a revised recommendation, which may extend the deadline for correction of the excessive deficit by one year.
Accounting Methodology
Pursuant to Law No. 196 of 2009, Italy utilizes the system of “general government accounting”. European Union countries are required to use general government accounting for purposes of financial reporting. EUROSTAT is the European Union entity responsible for decisions with respect to the application of such general government accounting criteria. General government accounting includes revenues and expenditures from both central and local government and from social security funds, or those institutions whose principal activity is to provide social benefits. Italy utilizes general government accounting on both an accrual and cash-basis.
ESA 95 National Accounts. In 1999, ISTAT introduced a new system of national accounts in accordance with the new European System of Accounts (ESA95) as set forth in European Union Regulation 2223/1996. This system was intended to contribute to the harmonization of the accounting framework, concepts and definitions within the European Union. Under ESA95, all European Union countries apply a uniform methodology and present their results on a common calendar.
In December 2005, ISTAT published general revisions to the national system of accounts reflecting amendments to ESA95 set forth in the European Union Regulations 351/2002 and 2103/2005. These revisions included: (i) a new methodology to evaluate the amortization of movable and fixed assets, (ii) a new accounting treatment for financial intermediary services, (iii) revisions to the methodology for calculating general government and investment expenditure, and (iv) the introduction of a new accounting system for a portion of social security contribution on an accrual basis.
In connection with the revisions to the national accounting system of December 2005, ISTAT replaced its methodology for calculating real growth, which had been based on a fixed base index, with a methodology linking real growth between consecutive time periods, or a chain-linked index. One of the effects of using chain indices is that other than for the first year in the chain, component measures will no longer aggregate to totals. Also, as a result of this change in methodology, all “real” revenue and expenditure figures included in this document differ from and are not comparable to data published in earlier documents filed by Italy with the SEC prior to March 12, 2007. The general government revenues and expenditure figures in this Annual Report reflect consolidated revenues and expenditures for the public sector, which is the broadest aggregate for which data is available.
On March 2, 2012, ISTAT published ordinary revisions to date for the years 2009 to 2011 along with the publication of the estimates for the 2011 accounts. These estimates, among other things, include the downward revision of GDP for 2009 due to a sharper decrease in investments in machinery and equipment with respect to the previously published estimate. Economic growth for 2010 was revised upward resulting in a more positive variation in investment in machinery and equipment against a downward revision in the construction sector. For additional information on the National Accounts, see Exhibit 2—2013 Stability Programme.
On October 4, 2012, ISTAT published ordinary revisions to date for the years 2010 to 2011 along with the publication of the revised estimates for the 2011 accounts. These revised estimates, among other things, included a marginal downward revision of GDP for 2011 and 2010 of €561 million and €83 million, respectively, with respect to the previously published estimate. In each year revisions had no effect on the GDP growth rate previously published.
Measures of Fiscal Balance
Italy reports its fiscal balance using two principal methods:
| • | Net borrowing, or government deficit, which is consolidated revenues less consolidated expenditures of the general government. This is the principal measure of fiscal balance, and is calculated in accordance with European Union accounting requirements. Italy also reports its structural net borrowing, which is a measure, calculated in accordance with methods adopted by the Commission, of the level of net borrowing after the effects of the business cycle have been taken into account. Structural net borrowing assumes that the output gap, which measures how much the economy is outperforming or underperforming its actual capacity, is zero. As there can be no precise measure of the output gap, there can be no precise measure of the structural government deficit. Accordingly, the structural net borrowing figures shown in this document are necessarily estimates. |
47
| • | Primary balance, which is consolidated revenues less consolidated expenditures of the general government excluding interest payments and other borrowing costs of the general government. The primary balance is used to measure the effect of discretionary actions taken to control expenditures and increase revenues. |
The table below shows selected public finance indicators for the periods indicated.
Selected Public Finance Indicators(*)
| 2008 | 2009 | 2010 | 2011 | 2012 | ||||||||||||||||
| (€ in millions, except percentages) | ||||||||||||||||||||
| General government expenditure(1) |
774,596 | 798,436 | 792,884 | 796,080 | 801,082 | |||||||||||||||
| General government expenditure, as a percentage of GDP |
49.2 | 52.5 | 51.1 | 50.4 | 51.2 | |||||||||||||||
| General government revenues |
731,896 | 714,833 | 723,617 | 736,064 | 753,449 | |||||||||||||||
| General government revenues, as a percentage of GDP |
46.5 | 47.0 | 46.6 | 46.6 | 48.1 | |||||||||||||||
| Net borrowing |
(42,700 | ) | (83,603 | ) | (69,267 | ) | (60,016 | ) | (47,633 | ) | ||||||||||
| Net borrowing, as a percentage of GDP |
(2.7 | ) | (5.5 | ) | (4.5 | ) | (3.8 | ) | (3.0 | ) | ||||||||||
| Primary balance |
38,612 | (12,740 | ) | 1,886 | 18,335 | 39,084 | ||||||||||||||
| Primary balance, as a percentage of GDP |
2.5 | (0.8 | ) | 0.1 | 1.2 | 2.5 | ||||||||||||||
| Public debt(2) |
1,671,001 | 1,769,254 | 1,851,252 | 1,907,392 | 1,988,629 | |||||||||||||||
| Public debt as a percentage of GDP(2) |
106.1 | 116.4 | 119.3 | 120.8 | 127.0 | |||||||||||||||
| GDP (nominal value) |
1,575,144 | 1,519,695 | 1,551,886 | 1,578,497 | 1,565,916 | |||||||||||||||
| (*) | Figures have been restated on the basis of data published in the 2013 Bank of Italy Annual Report and the 2013 ISTAT Annual Report. For additional information on restating data from Italy’s national accounts, see “—ESA 95 National Accounts”. |
| (1) | Includes revenues from the divestiture of state-owned real estate (deducted from capital expenditures). |
| (2) | Figures for 2010, 2011 and 2012 are gross of euro area financial support. |
Source: ISTAT and Bank of Italy.
Large net borrowing requirements and high levels of public debt were features of the Italian economy until the early 1990s. In accordance with the Maastricht Treaty, the reduction of net borrowing and public debt became a national priority for Italy. Italy gradually reduced its net borrowing as a percentage of GDP below the three per cent threshold set by the Maastricht Treaty; Italy’s net borrowing as a percentage of GDP was 2.7 per cent in 2008 and increased to 5.5 per cent in 2009 mainly as a result of the slowdown in growth of current revenues and in the second half of 2009 the EU started an excessive deficit procedure against Italy. In 2010, 2011 and 2012, net borrowing as a percentage of GDP decreased to 4.5 per cent and 3.8 per cent and 3.0 per cent, respectively, due to lower expenditure relative to the GDP and higher tax revenues relative to the GDP.
The debt-to-GDP ratio increased to 106.1 per cent in 2008, mainly due to the slowdown in growth of nominal GDP, an increase in the valuation of securities indexed to inflation and an increase in public debt issues the proceeds of which were used to fund measures taken by the Government to address the global economic crisis of 2008. The ratio of debt-to-GDP in 2009 was 116.4 per cent, mainly due to a large decrease in GDP. In 2010, the debt-to-GDP ratio increased to 119 per cent net of euro area financial support and 119.3 per cent gross of euro area financial support; this was mainly due to upward revisions to the borrowing requirement made during 2010 although the final borrowing requirement for 2010 was 20 per cent lower than forecasted. In 2011, the debt-to-GDP ratio increased to 120 per cent net of euro area financial support and 120.8 per cent gross of euro area financial support; this was mainly due to the gap between the average cost of debt and the expansion of nominal GDP, only partly offset by the primary surplus of 1 percentage point and the factors that affect net borrowing but not debt. Italy’s debt-to-GDP ratio increased in 2012 to 124.3 per cent net of euro area financial support and 127.0 per cent gross of euro area financial support, reflecting the gap of 6.5 per cent between the average cost of debt and the expansion of nominal GDP and to the financial support provided to EMU countries, only partly offset by the primary surplus of 2.5 per cent. The debt-to-GDP ratio in 2012 was above the forecasts indicated in the September 20, 2012 update of the 2012 Economic and Financial Document. Compared to the forecast, the negative difference of 0.6 per cent was mainly due to an increased public sector borrowing requirement, which was €12 billion higher than the forecast made in September 2012.
48
Since 1999, the Government has taken steps to lengthen the average maturity of debt and reduce the variable rate portion that, together with the introduction of the single currency, made Government debt less sensitive to variations in short-term interest rates and exchange rates. Consistent with the past, the Government’s debt management policy in 2012 was to limit exposure to market risks, mainly interest rate and refinancing risks. For additional information on Italy’s debt-to-GDP ratio, see “Public Debt” and Exhibit 2—2013 Stability Programme.
The 2012 Economic and Financial Document
In April 2012, Italy submitted to the EU its 2012 Economic and Financial Document, which included the 2012 Stability Programme and the 2012 National Reform Programme. The 2012 Economic and Financial Document was updated on September 20, 2012.
The 2012 Stability Programme. The 2012 Stability Programme confirmed Italy’s commitment to introduce a binding budget discipline into its Constitution, to reach within 2014 a level close to a balanced budget and to reduce the public debt by increasing the primary surplus.
The table below presents the main public finance objectives included in the 2012 Stability Programme.
Public Finance Objectives (in % of GDP)
| 2012 Stability Programme |
2011(1) | 2012 | 2013 | 2014 | 2015 | |||||||||||||||
| Net Borrowing |
(3.9 | ) | (1.7 | ) | (0.5 | ) | (0.1 | ) | 0.0 | |||||||||||
| Net Structural Borrowing |
(3.6 | ) | (0.4 | ) | 0.6 | 0.6 | 0.4 | |||||||||||||
| Structural Change |
0.0 | (3.2 | ) | (1.0 | ) | 0.0 | 0.2 | |||||||||||||
| Public Debt, gross of euro area financial support |
120.1 | 123.4 | 121.5 | 118.2 | 114.4 | |||||||||||||||
| Public Debt, net of euro area financial support |
119.2 | 120.3 | 117.9 | 114.5 | 110.8 | |||||||||||||||
| Primary Balance |
1.0 | 3.6 | 4.9 | 5.5 | 5.7 | |||||||||||||||
| (1) | Preliminary year-end data for 2011 presented in the 2012 Stability Programme. |
Source: Ministry of Economy and Finance.
The table below sets out the macroeconomic forecasts prepared by the Republic of Italy through 2015 in connection with the 2012 Stability Programme.
Macroeconomic Forecasts (in %)
| 2012 Stability Programme |
2011 | 2012 | 2013 | 2014 | 2015 | |||||||||||||||
| Real GDP |
0.4 | (1.2 | ) | 0.5 | 1.0 | 1.2 | ||||||||||||||
| Nominal GDP |
1.7 | 0.5 | 2.4 | 2.8 | 3.2 | |||||||||||||||
| Private consumption |
0.2 | (1.7 | ) | 0.2 | 0.5 | 0.7 | ||||||||||||||
| Public consumption |
(0.9 | ) | (0.8 | ) | (1.1 | ) | (0.3 | ) | 0.2 | |||||||||||
| Gross fixed investment |
(1.9 | ) | (3.5 | ) | 1.7 | 2.5 | 2.8 | |||||||||||||
| Inventories (% of GDP) |
(0.5 | ) | (0.3 | ) | 0.1 | 0.0 | 0.0 | |||||||||||||
| Exports of goods and services |
5.6 | 1.2 | 2.6 | 4.2 | 4.6 | |||||||||||||||
| Imports of goods and services |
0.4 | (2.3 | ) | 2.2 | 3.6 | 3.9 | ||||||||||||||
| Domestic demand |
(0.4 | ) | (1.8 | ) | 0.2 | 0.7 | 1.0 | |||||||||||||
| Change in inventories |
(0.5 | ) | (0.3 | ) | 0.1 | 0.0 | 0.0 | |||||||||||||
| Net exports |
1.4 | 1.0 | 0.1 | 0.2 | 0.3 | |||||||||||||||
Source: Ministry of Economy and Finance.
49
The 2012 National Reform Programme. As part of the 2012 National Reform Programme, the Government confirmed its existing policies and objectives set out in its 2011 National Reform Programme and identified eight policy areas where structural reform is necessary and as well as the measures that have been taken in order to achieve the objectives of Euro 2020. These areas are (i) Containment of Public Expenditure, (ii) Fiscal Federalism, (iii) Product Market, Competition and Administrative Efficiency, (iv) Labor and Pensions, (v) Innovation and Human Capital, (vi) Support to Businesses, (vii) Energy and Environment and (viii) Financial System. For additional information on the reform measures adopted in connection with the 2012 National Reform Programme, see “The Italian Economy—Measures to Address the Global Financial and Economic Crisis”.
The table below shows the impact of the measures contained in the 2012 National Reform Programme in terms of expenditure cuts/additions or revenue decreases/additions for each of the eight policy areas described above for the years 2011 to 2014.
Financial Impact of the 2012 National Reform Programme
| 2012 National Reform Programme |
2011 | 2012 | 2013 | 2014 | ||||||||||||
| (€ in millions) | ||||||||||||||||
| Containment of Public Expenditure |
||||||||||||||||
| Additional revenues |
700.0 | 21,467.6 | 33,224.6 | 35,181.9 | ||||||||||||
| Expenditure cuts |
26.2 | 7,537.0 | 8,535.9 | 10,459.7 | ||||||||||||
| Additional expenditure |
107.0 | 104.5 | 2.5 | 2.5 | ||||||||||||
|
|
|
|
|
|
|
|
|
|||||||||
| Fiscal Federalism |
||||||||||||||||
| Additional revenues |
0.0 | 9,032.4 | 9,167.4 | 9,167.4 | ||||||||||||
| Expenditure cuts |
0.0 | 1,627.4 | 2,762.4 | 3,162.4 | ||||||||||||
| Decrease in revenues |
5.0 | 5.0 | 5.0 | 0.0 | ||||||||||||
|
|
|
|
|
|
|
|
|
|||||||||
| Product Market, Competition and Administrative Efficiency |
||||||||||||||||
| Additional revenues |
0.0 | 0.0 | 68.0 | 0.0 | ||||||||||||
| Expenditure cuts |
0.0 | 0.0 | 16.2 | 16.2 | ||||||||||||
| Decrease in revenues |
45.0 | 90.0 | 90.0 | 34.0 | ||||||||||||
| Additional expenditure |
636.1 | 648.1 | 637.1 | 401.1 | ||||||||||||
|
|
|
|
|
|
|
|
|
|||||||||
| Labor and Pensions |
||||||||||||||||
| Additional revenues |
0.0 | 1,471.0 | 1,830.0 | 2,110.0 | ||||||||||||
| Expenditure cuts |
0.0 | 2,643.0 | 8,433.0 | 10,432.0 | ||||||||||||
| Decrease in revenues |
0.0 | 3,333.2 | 5,939.1 | 5,055.5 | ||||||||||||
| Additional expenditure |
1,053.0 | 1,260.0 | 300.0 | 300.0 | ||||||||||||
|
|
|
|
|
|
|
|
|
|||||||||
| Innovation and Human Capital |
||||||||||||||||
| Additional revenues |
0.0 | 285.4 | 285.4 | 285.4 | ||||||||||||
| Decrease in revenues |
90.0 | 90.0 | 90.0 | 0.0 | ||||||||||||
| Additional expenditure |
110.0 | 991.8 | 560.2 | 404.0 | ||||||||||||
|
|
|
|
|
|
|
|
|
|||||||||
| Support to Businesses |
||||||||||||||||
| Additional revenues |
0.0 | 0.0 | 82.8 | 100.1 | ||||||||||||
| Decrease in revenues |
14.0 | 985.7 | 1,487.3 | 2,944.0 | ||||||||||||
| Additional expenditure |
0.0 | 3,935.0 | 235.0 | 235.0 | ||||||||||||
|
|
|
|
|
|
|
|
|
|||||||||
| Energy and Environment |
||||||||||||||||
| Additional revenues |
0.0 | 125.6 | 411.5 | 8.2 | ||||||||||||
| Additional expenditure |
18.7 | 4.0 | 15.8 | 20.9 | ||||||||||||
|
|
|
|
|
|
|
|
|
|||||||||
| Financial System |
||||||||||||||||
| Decrease in revenues |
0.0 | 14.3 | 26.5 | 21.3 | ||||||||||||
| Additional expenditure |
0.0 | 287.6 | 325.1 | 321.7 | ||||||||||||
|
|
|
|
|
|
|
|
|
|||||||||
Source: Ministry of Economy and Finance
50
The table below shows the anticipated impact of the recent measures taken by the Government in connection with the 2012 National Reform Programme on key economic indicators of the Republic of Italy’s growth through 2020.
2012 National Reform Programme’s Impact on the Republic of Italy’s Growth
| 2012 National Reform Programme |
2012 | 2013 | 2014 | 2015 | 2020 | |||||||||||||||
| GDP |
0.2 | 0.4 | 0.7 | 0.9 | 2.4 | |||||||||||||||
| Consumption expenditure |
0.1 | 0.1 | 0.2 | 0.3 | 1.1 | |||||||||||||||
| Gross capital formation |
0.5 | 1.1 | 1.6 | 2.0 | 3.9 | |||||||||||||||
| Employment |
0.2 | 0.2 | 0.2 | 0.1 | 0.1 | |||||||||||||||
Source: Ministry of Economy and Finance.
The Balanced Budget Constitutional Amendment. In April 2012, Italy amended its Constitution to include a binding budget discipline, pursuant to which the general government will be required to operate under balanced budgets beginning in fiscal year 2014.
The Update of the 2012 Economic and Financial Document. In September 2012, Italy published its Update of the 2012 Economic and Financial Document, which included revised projections and forecasts given the continued worsening of the economic situation and the increased tensions resulting from the European sovereign debt crisis.
The table below presents the main public finance objectives included in the Update of the 2012 Economic and Financial Document.
Public Finance Objectives (in % of GDP)
| Update of the 2012 Economic and Financial Document |
2011(1) | 2012 | 2013 | 2014 | 2015 | |||||||||||||||
| Net Borrowing |
(3.9 | ) | (2.6 | ) | (1.8 | ) | (1.5 | ) | (1.3 | ) | ||||||||||
| Net Structural Borrowing |
(3.6 | ) | (0.9 | ) | 0.0 | (0.2 | ) | (0.4 | ) | |||||||||||
| Structural Change |
0.0 | (2.8 | ) | (0.9 | ) | 0.3 | 0.2 | |||||||||||||
| Public Debt, gross of euro area financial support |
120.7 | 126.4 | 126.1 | 123.1 | 119.9 | |||||||||||||||
| Public Debt, net of euro area financial support |
119.9 | 123.3 | 122.3 | 119.3 | 116.1 | |||||||||||||||
| Primary Balance |
1.0 | 2.9 | 3.8 | 4.4 | 4.8 | |||||||||||||||
| (1) | Preliminary year-end data for 2011 presented in the Update of the 2012 Economic and Financial Document. |
Source: Ministry of Economy and Finance.
The table below presents macroeconomic forecasts prepared by the Republic of Italy through 2015 in connection with the Update of the 2012 Economic and Financial Document.
Macroeconomic Forecasts (in %)
| Update of the 2012 Economic and Financial Document |
2011 | 2012 | 2013 | 2014 | 2015 | |||||||||||||||
| Real GDP |
0.4 | (2.4 | ) | (0.2 | ) | 1.1 | 1.3 | |||||||||||||
| Nominal GDP |
1.7 | (1.0 | ) | 1.2 | 3.0 | 3.2 | ||||||||||||||
| Private consumption |
0.2 | (3.3 | ) | (0.5 | ) | 0.6 | 0.8 | |||||||||||||
| Public consumption |
(0.9 | ) | (0.6 | ) | (1.4 | ) | (0.5 | ) | 0.2 | |||||||||||
| Gross fixed investment |
(1.9 | ) | (8.3 | ) | 0.1 | 2.6 | 2.8 | |||||||||||||
| Exports of goods and services |
5.6 | 1.2 | 2.4 | 3.9 | 4.2 | |||||||||||||||
| Imports of goods and services |
0.4 | (6.9 | ) | 1.7 | 3.5 | 3.9 | ||||||||||||||
| Domestic demand |
(0.4 | ) | (3.6 | ) | (0.6 | ) | 0.7 | 1 | ||||||||||||
| Change in inventories |
(0.5 | ) | (0.9 | ) | 0.1 | 0.1 | 0 | |||||||||||||
| Net exports |
1.4 | 2.3 | 0.2 | 0.2 | 0.2 | |||||||||||||||
Source: Ministry of Economy and Finance.
51
The following table compares the main finance indicators included in the 2012 Stability Programme and the Update of the 2012 Economic and Financial Document.
Main Finance Indicators - 2012 Economic and Financial Document
v. Update of the 2012 Economic and Financial Document
| 2011 | 2012 | 2013 | 2014 | 2015 | ||||||||||||||||
| GDP growth rate |
||||||||||||||||||||
| 2012 Economic and Financial Document(1) |
0.4 | (1.2 | ) | 0.5 | 1.0 | 1.2 | ||||||||||||||
| Update of the 2012 Economic and Financial Document(2) |
0.4 | (2.4 | ) | (0.2 | ) | 1.1 | 1.3 | |||||||||||||
|
|
|
|
|
|
|
|
|
|
|
|||||||||||
| Difference |
0.0 | (1.2 | ) | (0.7 | ) | 0.1 | 0.1 | |||||||||||||
|
|
|
|
|
|
|
|
|
|
|
|||||||||||
| Net Borrowing, as a % of GDP |
||||||||||||||||||||
| 2012 Economic and Financial Document(1) |
(3.9 | ) | (1.7 | ) | (0.5 | ) | (0.1 | ) | 0.0 | |||||||||||
| Update of the 2012 Economic and Financial Document(2) |
(3.9 | ) | (2.6 | ) | (1.8 | ) | (1.5 | ) | (1.3 | ) | ||||||||||
|
|
|
|
|
|
|
|
|
|
|
|||||||||||
| Difference |
0.0 | (0.9 | ) | (1.3 | ) | (1.4 | ) | (1.3 | ) | |||||||||||
|
|
|
|
|
|
|
|
|
|
|
|||||||||||
| Public Debt, as a % of GDP |
||||||||||||||||||||
| 2012 Economic and Financial Document, gross of euro area financial support(1) |
120.1 | 123.4 | 121.5 | 118.2 | 114.4 | |||||||||||||||
| Update of the 2012 Economic and Financial Document, gross of euro area financial support(2) |
120.7 | 126.4 | 126.1 | 123.1 | 119.9 | |||||||||||||||
|
|
|
|
|
|
|
|
|
|
|
|||||||||||
| Difference |
0.6 | 3.0 | 4.6 | 4.9 | 5.5 | |||||||||||||||
|
|
|
|
|
|
|
|
|
|
|
|||||||||||
| (1) | Preliminary year-end data for 2011 presented in the 2012 Economic and Financial Document. |
| (2) | Preliminary year-end data for 2011 presented in the Update of the 2012 Economic and Financial Document. |
Source: Ministry of Economy and Finance.
The EU Council’s policy recommendations to Italy for the period 2012-2013.
As part of the European semester process, in July 2012, the EU Council, acting through ECOFIN, issued specific recommendations to Italy, based on assessments of Italy’s macroeconomic and fiscal situation as outlined in the 2012 Stability Programme and the 2012 National Reform Programme. ECOFIN recommended that Italy take action over the period 2012-2013 to:
| • | Implement the budgetary strategy as planned, and ensure that the excessive deficit is corrected in 2012. Ensure the planned structural primary surpluses so as to put the debt-to-GDP ratio on a declining path by 2013. Ensure adequate progress towards the medium-term objective, while meeting the expenditure benchmark and making sufficient progress towards compliance with the debt reduction benchmark; |
| • | Ensure that the specification in the implementing legislation of the key features of the balanced budget rule set out in the Constitution, including appropriate coordination across levels of government, is consistent with the EU framework. Pursue a durable improvement of the efficiency and quality of public expenditure through the planned spending review and the implementation of the 2011 Cohesion Action Plan leading to improving the absorption and management of EU funds, in particular in the South of Italy; |
| • | Take further action to address youth unemployment, including by improving the labor-market relevance of education and facilitating transition to work, also through incentives for business start-ups and for hiring employees. Enforce nation-wide recognition of skills and qualifications to promote labor mobility. Take measures to reduce tertiary education dropout rates and fight early school leaving; |
| • | Adopt the labor market reform as a priority to tackle the segmentation of the labor market and establish an integrated unemployment benefit scheme. Take further action to incentivize labor market participation of women, in particular through the provision of childcare and elderly care. Monitor and if needed reinforce the implementation of the new wage setting framework in order to contribute to the alignment of wage growth and productivity at sector and company level; |
| • | Pursue the fight against tax evasion. Pursue the shadow economy and undeclared work, for instance by stepping up checks and controls. Take measures to reduce the scope of tax exemptions, allowances and reduced VAT rates and simplify the tax code. Take further action to shift the tax burden away from capital and labor to property and consumption as well as environment; |
| • | Take further measures to improve market access in network industries, as well as infrastructure capacity and interconnections. Simplify further the regulatory framework for businesses and enhance administrative capacity. Improve access to financial instruments, in particular equity, to finance growing businesses and innovation. Implement the planned reorganization of the civil justice system, and promote the use of alternative dispute settlement mechanisms. |
52
The 2013 Economic and Financial Document
In April 2013, Italy submitted to the EU its 2013 Economic and Financial Document, which included the 2013 Stability Programme and the 2013 National Reform Programme.
The 2013 Stability Programme. The 2013 Stability Programme confirmed Italy’s commitment reach a balanced budget in structural terms in 2013 and to reduce the public debt by increasing the primary surplus. The table below presents the main public finance objectives included in the 2013 Stability Programme
Public Finance Objectives (in % of GDP)
| 2013 Stability Programme |
2011 | 2012 | 2013 | 2014 | 2015 | 2016 | 2017 | |||||||||||||||||||||
| Net Borrowing |
(3.8 | ) | (3.0 | ) | (2.9 | ) | (1.8 | ) | (1.5 | ) | (0.9 | ) | (0.4 | ) | ||||||||||||||
| Net Structural Borrowing |
(3.5 | ) | (1.2 | ) | 0.0 | 0.4 | 0.0 | 0.0 | 0.0 | |||||||||||||||||||
| Structural Change |
(0.2 | ) | (2.3 | ) | (1.1 | ) | (0.4 | ) | 0.4 | 0.0 | 0.0 | |||||||||||||||||
| Public Debt, gross of euro area financial support |
120.8 | 127.0 | 130.4 | 129.0 | 125.5 | 121.4 | 117.3 | |||||||||||||||||||||
| Public Debt, net of euro area financial support |
120.0 | 124.3 | 126.9 | 125.2 | 121.8 | 117.8 | 113.8 | |||||||||||||||||||||
| Primary Balance |
1.2 | 2.5 | 2.4 | 3.8 | 4.3 | 5.1 | 5.7 | |||||||||||||||||||||
Source: Ministry of Economy and Finance.
The table below sets out the macroeconomic forecasts prepared by the Republic of Italy through 2017 in connection with the 2013 Stability Programme.
Macroeconomic Forecasts (in %)
| 2013 Stability Programme |
2012 | 2013 | 2014 | 2015 | 2016 | 2017 | ||||||||||||||||||
| Real GDP |
(2.4 | ) | (1.3 | ) | 1.3 | 1.5 | 1.3 | 1.4 | ||||||||||||||||
| Nominal GDP |
(0.8 | ) | 0.5 | 3.2 | 3.3 | 3.2 | 3.2 | |||||||||||||||||
| Private consumption |
(4.3 | ) | (1.7 | ) | 1.4 | 1.1 | 1.1 | 1.2 | ||||||||||||||||
| Public consumption |
(2.9 | ) | (1.7 | ) | (0.4 | ) | 0.7 | 0.3 | 0.1 | |||||||||||||||
| Gross fixed investment |
(8.0 | ) | (2.6 | ) | 4.1 | 3.2 | 2.6 | 2.4 | ||||||||||||||||
| Inventories (% of GDP) |
(0.6 | ) | (0.1 | ) | 0.1 | 0.1 | 0.0 | 0.0 | ||||||||||||||||
| Exports of goods and services |
2.3 | 2.2 | 3.3 | 4.1 | 4.0 | 3.9 | ||||||||||||||||||
| Imports of goods and services |
(7.7 | ) | (0.3 | ) | 4.7 | 4.4 | 4.1 | 3.8 | ||||||||||||||||
| Domestic demand |
(4.8 | ) | (1.9 | ) | 1.4 | 1.3 | 1.2 | 1.2 | ||||||||||||||||
| Change in inventories |
(0.6 | ) | (0.1 | ) | 0.1 | 0.1 | 0.0 | 0.0 | ||||||||||||||||
| Net exports |
3.0 | 0.7 | (0.2 | ) | 0.1 | 0.1 | 0.1 | |||||||||||||||||
Source: Ministry of Economy and Finance.
The 2013 National Reform Programme. As part of the 2013 National Reform Programme, the Government identified nine policy areas where structural reform is necessary and as well as the measures that have been taken in order to achieve the objectives of Euro 2020. These areas are (i) Containment of Public Expenditure, (ii) Administrative Efficiency, (iii) Infrastructure and Development, (iv) Product Market, Competition and Administrative Efficiency, (v) Labor and Pensions, (vi) Innovation and Human Capital, (vii) Support to Businesses, (viii) Energy and Environment and (ix) Financial System.
53
The table below shows the impact of the measures contained in the 2013 National Reform Programme in terms of expenditure cuts/additions or revenue decreases/additions for each of the nine policy areas described above for the years 2012 to 2017.
Financial Impact of the 2013 National Reform Programme
| 2013 National Reform Programme |
2012 | 2013 | 2014 | 2015 | 2016 | 2017 | ||||||||||||||||||
| (€ in millions) | ||||||||||||||||||||||||
| Containment of Public Expenditure |
||||||||||||||||||||||||
| Additional revenues |
30.0 | 1,971.7 | 2,250.9 | 2,325.9 | 1,988.2 | 1,988.2 | ||||||||||||||||||
| Decrease in revenues |
0.0 | 562.4 | 586.4 | 568.4 | 568.4 | 562.4 | ||||||||||||||||||
| Expenditure cuts |
0.0 | 7,391.3 | 7,906.1 | 8,098.1 | 7,135.8 | 7,100.8 | ||||||||||||||||||
| Additional expenditure |
0.0 | 588.0 | 0.0 | 0.0 | 0.0 | 0.0 | ||||||||||||||||||
|
|
|
|
|
|
|
|
|
|
|
|
|
|||||||||||||
| Administrative Efficiency |
||||||||||||||||||||||||
| Additional expenditure |
0.0 | 10.0 | 0.0 | 0.0 | 0.0 | 0.0 | ||||||||||||||||||
|
|
|
|
|
|
|
|
|
|
|
|
|
|||||||||||||
| Infrastructure and Development |
||||||||||||||||||||||||
| Decrease in revenues |
4.2 | 4.2 | 4.2 | 4.2 | 4.2 | 4.2 | ||||||||||||||||||
| Additional expenditure |
70.0 | 320.0 | 70.0 | 70.0 | 70.0 | 70.0 | ||||||||||||||||||
|
|
|
|
|
|
|
|
|
|
|
|
|
|||||||||||||
| Product Market, Competition and Administrative Efficiency |
||||||||||||||||||||||||
| Decrease in revenues |
0.0 | 8.8 | 8.8 | 8.8 | 8.8 | 8.8 | ||||||||||||||||||
|
|
|
|
|
|
|
|
|
|
|
|
|
|||||||||||||
| Labor and Pensions |
||||||||||||||||||||||||
| Additional revenues |
0.0 | 988.0 | 1,554.0 | 1,800.0 | 1,800.0 | 1,400.0 | ||||||||||||||||||
| Decrease in revenues |
0.0 | 940.8 | 1,349.1 | 1,205.7 | 0.0 | 0.0 | ||||||||||||||||||
| Additional expenditure |
0.0 | 3492.0 | 4,266.0 | 3,877.0 | 3,831.0 | 3,422.0 | ||||||||||||||||||
|
|
|
|
|
|
|
|
|
|
|
|
|
|||||||||||||
| Innovation and Human Capital |
||||||||||||||||||||||||
| Additional expenditure |
0.0 | 278.6 | 169.4 | 109.4 | 108.1 | 108.1 | ||||||||||||||||||
|
|
|
|
|
|
|
|
|
|
|
|
|
|||||||||||||
| Support to Businesses |
||||||||||||||||||||||||
| Additional revenues |
0.0 | 0.0 | 0.0 | 32.8 | 0.0 | 28.4 | ||||||||||||||||||
| Decrease in revenues |
0.0 | 77.3 | 149.5 | 120.7 | 120.7 | 111.6 | ||||||||||||||||||
| Additional expenditure |
0.0 | 667.3 | 453.0 | 506.9 | 496.7 | 496.7 | ||||||||||||||||||
|
|
|
|
|
|
|
|
|
|
|
|
|
|||||||||||||
| Energy and Environment |
||||||||||||||||||||||||
| Additional expenditure |
0.0 | 0.2 | 5.2 | 10.2 | 10.0 | 10.0 | ||||||||||||||||||
|
|
|
|
|
|
|
|
|
|
|
|
|
|||||||||||||
| Financial System |
||||||||||||||||||||||||
| Decrease in revenues |
0.0 | 10.8 | 7.9 | 9.4 | 11.0 | 12.6 | ||||||||||||||||||
| Additional expenditure |
0.0 | 1,617.0 | 0.0 | 0.0 | 0.0 | 0.0 | ||||||||||||||||||
|
|
|
|
|
|
|
|
|
|
|
|
|
|||||||||||||
Source: Ministry of Economy and Finance
The following table compares the main finance indicators included in the 2012 Stability Programme and the 2013 Stability Programme.
Main Finance Indicators - 2012 Stability Programme v. 2013 Stability Programme
| 2012 | 2013 | 2014 | 2015 | |||||||||||||
| GDP growth rate |
||||||||||||||||
| 2012 Stability Programme |
(1.2 | ) | 0.5 | 1.0 | 1.2 | |||||||||||
| 2013 Stability Programme |
(2.4 | ) | (1.3 | ) | 1.3 | 1.5 | ||||||||||
|
|
|
|
|
|
|
|
|
|||||||||
| Difference |
(1.2 | ) | (1.8 | ) | 0.3 | 0.3 | ||||||||||
|
|
|
|
|
|
|
|
|
|||||||||
| Net Borrowing, as a % of GDP |
||||||||||||||||
| 2012 Stability Programme |
(1.7 | ) | (0.5 | ) | (0.1 | ) | 0.0 | |||||||||
| 2013 Stability Programme |
(3.0 | ) | (2.9 | ) | (1.8 | ) | (1.5 | ) | ||||||||
|
|
|
|
|
|
|
|
|
|||||||||
| Difference |
(1.3 | ) | (2.4 | ) | (1.7 | ) | (1.5 | ) | ||||||||
|
|
|
|
|
|
|
|
|
|||||||||
| Public Debt, as a % of GDP |
||||||||||||||||
| 2012 Stability Programme |
123.4 | 121.5 | 118.2 | 114.4 | ||||||||||||
| 2013 Stability Programme, gross of euro area financial support |
127.0 | 130.4 | 129.0 | 125.5 | ||||||||||||
|
|
|
|
|
|
|
|
|
|||||||||
| Difference |
3.6 | 8.9 | 10.8 | 11.1 | ||||||||||||
|
|
|
|
|
|
|
|
|
|||||||||
Source: Ministry of Economy and Finance.
54
The Update of the 2013 Economic and Financial Document. In September 2013, Italy published its Update of the 2013 Economic and Financial Document, which included revised projections and forecasts given the continued worsening of the economic situation in Italy and the increased tensions resulting from the European sovereign debt crisis.
The table below presents the main public finance objectives included in the Update of the 2013 Economic and Financial Document.
Public Finance Objectives (in % of GDP)
| Update of the 2013 Economic and Financial Document |
2012(1) | 2013 | 2014 | 2015 | 2016 | |||||||||||||||
| Net Borrowing |
(3.0 | ) | (3.1 | ) | (2.3 | ) | (1.8 | ) | (1.2 | ) | ||||||||||
| Net Structural Borrowing |
(1.3 | ) | (0.5 | ) | (0.1 | ) | (0.2 | ) | (0.5 | ) | ||||||||||
| Structural Change |
(2.3 | ) | (0.7 | ) | (0.4 | ) | 0.1 | 0.2 | ||||||||||||
| Public Debt, gross of euro area financial support and acceleration of payments due by the public administration |
127.0 | 133.0 | 133.2 | 130.5 | 127.1 | |||||||||||||||
| Public Debt, net of euro area financial support |
124.3 | 129.5 | 129.4 | 126.8 | 123.5 | |||||||||||||||
| Public Debt, net of euro area financial support and acceleration of payments due by the public administration |
124.3 | 127.7 | 126.3 | 123.8 | 120.6 | |||||||||||||||
| Primary Balance |
2.5 | 2.3 | 3.0 | 3.5 | 4.1 | |||||||||||||||
| (1) | Preliminary year-end data for 2012 presented in the Update of the 2013 Economic and Financial Document. |
Source: Ministry of Economy and Finance.
The table below presents macroeconomic forecasts prepared by the Republic of Italy through 2016 in connection with the Update of the 2013 Economic and Financial Document.
Macroeconomic Forecasts (in %)
| Update of the 2013 Economic and Financial Document |
2012 | 2013 | 2014 | 2015 | 2016 | |||||||||||||||
| Real GDP |
(2.4 | ) | (1.7 | ) | 1.0 | 1.7 | 1.8 | |||||||||||||
| Nominal GDP |
(0.8 | ) | (0.5 | ) | 2.9 | 3.6 | 3.5 | |||||||||||||
| Private consumption |
(4.3 | ) | (2.5 | ) | 0.5 | 1.1 | 1.5 | |||||||||||||
| Public consumption |
(2.9 | ) | (0.3 | ) | (0.1 | ) | 0.7 | 0.3 | ||||||||||||
| Gross fixed investment |
(8.0 | ) | (5.3 | ) | 2.0 | 3.6 | 3.8 | |||||||||||||
| Exports of goods and services |
2.3 | 0.2 | 4.2 | 4.5 | 4.4 | |||||||||||||||
| Imports of goods and services |
(7.7 | ) | (2.9 | ) | 4.2 | 4.8 | 4.5 | |||||||||||||
| Domestic demand |
(4.8 | ) | (2.5 | ) | 0.6 | 1.4 | 1.6 | |||||||||||||
| Change in inventories |
(0.6 | ) | 0.0 | 0.2 | 0.2 | 0.0 | ||||||||||||||
| Net exports |
3.0 | 0.9 | 0.2 | 0.1 | 0.1 | |||||||||||||||
Source: Ministry of Economy and Finance.
The following table compares the main finance indicators included in the 2013 Stability Programme and the Update of the 2013 Economic and Financial Document.
Main Finance Indicators - 2013 Economic and Financial Document
v. Update of the 2013 Economic and Financial Document
| 2012 | 2013 | 2014 | 2015 | 2016 | ||||||||||||||||
| GDP growth rate |
||||||||||||||||||||
| 2013 Economic and Financial Document(1) |
(2.4 | ) | (1.3 | ) | 1.3 | 1.5 | 1.3 | |||||||||||||
| Update of the 2013 Economic and Financial Document(2) |
(2.4 | ) | (1.7 | ) | 1.0 | 1.7 | 1.8 | |||||||||||||
|
|
|
|
|
|
|
|
|
|
|
|||||||||||
| Difference |
0.0 | (0.4 | ) | (0.3 | ) | 0.2 | 0.5 | |||||||||||||
|
|
|
|
|
|
|
|
|
|
|
|||||||||||
| Net Borrowing (updated policy scenario), as a % of GDP |
||||||||||||||||||||
| 2013 Economic and Financial Document(1) |
(3.0 | ) | (2.9 | ) | (1.8 | ) | (1.5 | ) | (0.9 | ) | ||||||||||
| Update of the 2013 Economic and Financial Document(2) |
(3.0 | ) | (3.0 | ) | (2.5 | ) | (1.6 | ) | (0.8 | ) | ||||||||||
|
|
|
|
|
|
|
|
|
|
|
|||||||||||
| Difference |
0.0 | (0.1 | ) | (0.7 | ) | (0.1 | ) | 0.1 | ||||||||||||
|
|
|
|
|
|
|
|
|
|
|
|||||||||||
| Public Debt (updated policy scenario), as a % of GDP |
||||||||||||||||||||
| 2013 Economic and Financial Document, gross of euro area financial support and acceleration of payments due by the public administration(1) |
127.0 | 130.4 | 129.0 | 125.5 | 121.4 | |||||||||||||||
| Update of the 2013 Economic and Financial Document, gross of euro area financial support and acceleration of payments due by the public administration(2) |
127.0 | 132.9 | 132.8 | 129.4 | 125.0 | |||||||||||||||
|
|
|
|
|
|
|
|
|
|
|
|||||||||||
| Difference |
0.0 | 2.5 | 3.8 | 3.9 | 3.6 | |||||||||||||||
|
|
|
|
|
|
|
|
|
|
|
|||||||||||
| (1) | Preliminary year-end data for 2012 presented in the 2013 Economic and Financial Document. |
| (2) | Preliminary year-end data for 2012 presented in the Update of the 2013 Economic and Financial Document. |
Source: Ministry of Economy and Finance.
55
The EU Council’s policy recommendations to Italy for the period 2013-2014.
As part of the European semester process, in July 2013, the EU Council, acting through ECOFIN, issued specific recommendations to Italy, based on assessments of Italy’s macroeconomic and fiscal situation as outlined in the 2013 Stability Programme and the 2013 National Reform Programme. ECOFIN recommended that Italy take action over the period 2013-2014 to:
| • | Ensure that the deficit remains below 3% of GDP in 2013, by fully implementing the measures adopted by the Italian government. Pursue the structural adjustment at an appropriate pace and through growth-friendly fiscal consolidation so as to achieve and maintain the medium-term objective as from 2014. Achieve the planned structural primary surpluses in order to put the very high debt-to-GDP ratio on a steadily declining path. Continue pursuing a durable improvement of the efficiency and quality of public expenditure by fully implementing the measures adopted in 2012 and taking the effort forward through regular in depth spending reviews at all levels of government; |
| • | Ensure timely implementation of on-going reforms by swiftly adopting the necessary enacting legislation, following it up with concrete delivery at all levels of government and with all relevant stakeholders, and monitoring impact. Reinforce the efficiency of public administration and improve coordination between layers of government. Simplify the administrative and regulatory framework for citizens and business and reduce the duration of case-handling and the high levels of litigation in civil justice, including by fostering out-of-court settlement procedures. Strengthen the legal framework for the repression of corruption, including by revising the rules governing limitation periods. Adopt structural measures to improve the management of EU funds in the southern regions with regard to the 2014-2020 programming period; |
| • | Extend good corporate governance practices to the whole banking sector conducive to higher efficiency and profitability to support the flow of credit to productive activities. Take forward the on-going work as regards asset-quality screening across the banking sector and facilitate the resolution of non-performing loans on banks’ balance sheets. Promote further the development of capital markets to diversify and enhance firms’ access to finance, especially into equity, and in turn foster their innovation capacity and growth; |
| • | Ensure the effective implementation of the labor market and wage setting reforms to allow better alignment of wages to productivity. Take further action to foster labor market participation, especially of women and young people. Strengthen vocational education and training, ensure more efficient public employment services and improve career and counseling services for tertiary students. Reduce financial disincentives for second earners to work and improve the provision of care, especially child and long-term care, and out-of-school services. Step up efforts to prevent early school leaving. Improve school quality and outcomes, also by enhancing teachers’ professional development and diversifying career development. Ensure effectiveness of social transfers, notably through better targeting of benefits, especially for low-income households with children; |
| • | Shift the tax burden from labor and capital to consumption, property and the environment in a budgetary neutral manner. To this purpose, review the scope of VAT exemptions and reduced rates and of direct tax expenditures, and reform the cadastral system to align the tax base of recurrent immovable property to market values. Pursue the fight against tax evasion, improve tax compliance and take decisive steps against the shadow economy and undeclared work; and |
| • | Ensure the proper implementation of the measures aiming at market opening in the services sector. Remove remaining restrictions in professional services and foster market access for instance in the provision of local public services where the use of public procurement should be advanced (instead of direct concessions). Pursue deployment of the measures taken to improve market access conditions in network industries, in particular by setting- up the Transport Authority as a priority. Upgrade infrastructure capacity with focus on energy interconnections, intermodal transport and high-speed broadband in telecommunications, also with a view to tackling the North-South disparities. |
Revenues and Expenditures
The following table sets forth general government revenues and expenditures and certain other key public finance measures for the periods indicated. This data is prepared on an accrual basis. The table does not include revenues from privatizations, which are deposited into a special fund for the repayment of Treasury
56
outstanding securities and cannot be used to finance current expenditures. While proceeds from privatizations do not affect the primary balance, they contribute to a decrease in the public debt and consequently the debt-to-GDP ratio.
General Government Revenues and Expenditures
| 2008 | 2009 | 2010 | 2011 | 2012 | ||||||||||||||||
| (€ in millions) | ||||||||||||||||||||
| Expenditures |
||||||||||||||||||||
| Compensation of employees |
169,666 | 171,050 | 172,002 | 169,209 | 165,366 | |||||||||||||||
| Intermediate consumption |
84,287 | 89,676 | 90,177 | 91,222 | 89,068 | |||||||||||||||
| Market purchases of social benefits in kind |
42,780 | 44,716 | 45,549 | 44,657 | 43,211 | |||||||||||||||
| Social benefits in cash |
277,183 | 291,495 | 298,418 | 304,262 | 311,413 | |||||||||||||||
| Subsidies to firms |
16,107 | 16,743 | 17,412 | 16,461 | 15,842 | |||||||||||||||
| Interest payments |
81,312 | 70,863 | 71,153 | 78,351 | 86,717 | |||||||||||||||
| Other expenditures |
44,052 | 46,959 | 46,390 | 43,802 | 41,638 | |||||||||||||||
|
|
|
|
|
|
|
|
|
|
|
|||||||||||
| Total current expenditure |
715,387 | 731,502 | 741,101 | 747,964 | 753,255 | |||||||||||||||
|
|
|
|
|
|
|
|
|
|
|
|||||||||||
| Gross fixed investment |
35,316 | 38,404 | 32,509 | 31,175 | 29,199 | |||||||||||||||
| Investment grants |
22,338 | 24,310 | 17,850 | 18,507 | 17,487 | |||||||||||||||
| Other capital expenditures |
1,555 | 4,220 | 1,424 | (1,566 | ) | 1,141 | ||||||||||||||
|
|
|
|
|
|
|
|
|
|
|
|||||||||||
| Total capital account expenditure |
59,209 | 66,934 | 51,783 | 48,116 | 47,827 | |||||||||||||||
|
|
|
|
|
|
|
|
|
|
|
|||||||||||
| Total expenditure |
774,596 | 798,436 | 792,884 | 796,080 | 801,082 | |||||||||||||||
|
|
|
|
|
|
|
|
|
|
|
|||||||||||
| as a percentage of GDP |
49.2 | 52.5 | 51.1 | 50.4 | 51.2 | |||||||||||||||
|
|
|
|
|
|
|
|
|
|
|
|||||||||||
| Deficit on current account (surplus -) |
(12,537 | ) | 32,303 | 24,619 | 23,234 | 6,148 | ||||||||||||||
|
|
|
|
|
|
|
|
|
|
|
|||||||||||
| Net borrowing |
(42,700 | ) | (83,603 | ) | (69,267 | ) | (60,016 | ) | (47,633 | ) | ||||||||||
|
|
|
|
|
|
|
|
|
|
|
|||||||||||
| as a percentage of GDP |
(2.7 | ) | (5.5 | ) | (4.5 | ) | (3.8 | ) | (3.0 | ) | ||||||||||
| Revenues |
||||||||||||||||||||
| Direct taxes |
239,644 | 221,995 | 226,076 | 225,926 | 237,235 | |||||||||||||||
| Indirect taxes |
215,842 | 206,403 | 217,883 | 222,080 | 233,554 | |||||||||||||||
| Actual social security contributions |
211,931 | 208,373 | 209,266 | 212,701 | 212,422 | |||||||||||||||
| Imputed social security contributions |
3,878 | 4,182 | 4,135 | 4,262 | 4,247 | |||||||||||||||
| Income from capital |
9,742 | 8,607 | 8,585 | 10,542 | 9,328 | |||||||||||||||
| Other revenue |
46,887 | 49,639 | 50,537 | 49,219 | 50,321 | |||||||||||||||
|
|
|
|
|
|
|
|
|
|
|
|||||||||||
| Total current revenue |
727,924 | 699,199 | 716,482 | 724,730 | 747,107 | |||||||||||||||
|
|
|
|
|
|
|
|
|
|
|
|||||||||||
| Capital taxes |
488 | 12,256 | 3,497 | 6,981 | 1,375 | |||||||||||||||
| Other capital revenue |
3,484 | 3,378 | 3,638 | 4,353 | 4,967 | |||||||||||||||
|
|
|
|
|
|
|
|
|
|
|
|||||||||||
| Total capital revenue |
3,972 | 15,634 | 7,135 | 11,334 | 6,342 | |||||||||||||||
|
|
|
|
|
|
|
|
|
|
|
|||||||||||
| Total revenue |
731,896 | 714,833 | 723,617 | 736,064 | 753,449 | |||||||||||||||
|
|
|
|
|
|
|
|
|
|
|
|||||||||||
| as a percentage of GDP |
46.5 | 47.0 | 46.6 | 46.6 | 48.1 | |||||||||||||||
|
|
|
|
|
|
|
|
|
|
|
|||||||||||
| Primary balance |
38,612 | (12,740 | ) | 1,886 | 18,335 | 39,084 | ||||||||||||||
|
|
|
|
|
|
|
|
|
|
|
|||||||||||
| as a percentage of GDP |
2.5 | (0.8 | ) | 0.1 | 1.2 | 2.5 | ||||||||||||||
Source: ISTAT and Bank of Italy
General government revenue increased by 2.4 per cent or €17.4 billion in 2012, buoyed by the effects of the 2011 and 2012 budgets. Without taking into account the additional revenue attributable to these measures (about €31 billion), revenue diminished by approximately 2 per cent, whereas nominal GDP contracted by 0.8 per cent. The measures introduced in 2011 and 2012 were officially estimated to increase revenue between 2011 and 2012 by approximately €34 billion, of which nearly one third was to come from the early entry into force of the new municipal property tax (IMU) and about €11 billion from the broadening of the property tax base. Tax revenue and social security contributions rose from 42.6 to 44.0 per cent of GDP.
General government expenditures increased by 0.6 per cent in 2012, rising from 50.4 to 51.2 per cent of GDP. The increase was due to the further rapid growth in interest payments, while primary expenditure declined for the third successive year (falling by 0.5 per cent to a level 1.8 per cent below that recorded in 2009).
Italy recorded a current account deficit of approximately €6.1 billion in 2012, compared to a deficit of approximately €23.2 billion in 2011. The decrease in the current account deficit was mainly due to an increase in current revenues of approximately €22.4 billion in 2012, while current expenditure remained relatively stable with an increase of approximately €5 billion.
57
Expenditures
Compensation of employees. Compensation of employees decreased by 2.3 per cent in 2012 compared to a 1.2 per cent decrease in 2011, due to a decrease in the number of employees. Pursuant to Law Decree No. 78 of 2010, wages of public employees for the 2011-2013 three-year period have been frozen at the 2010 level of total compensation, realizing a reduction of expenditure for employee compensation in the public sector by €1.7 billion in 2011, €2.7 billion in 2012 and €3.3 billion in 2013.
Intermediate consumption. Intermediate consumption, which measures the value of the goods and services consumed as inputs by a process of production, decreased by 2.4 per cent in 2012 compared to a 1.2 per cent increase in 2011.
Market purchases of social benefits in kind. Expenditure on social benefits in kind decreased for the second successive year, contracting by 3.2 per cent in 2012 and by 2.0 per cent in 2011. In 2012, expenditure on social benefits in kind was equal to 2.8 per cent of GDP.
Expenditures for public health and education are accounted for under wages and salaries, cost of goods and services and production grants.
Italy has a public health service managed principally by regional governments with funds provided by the Government. Local health units adopt their own budgets, establish targets and monitor budget developments. Ninety per cent of expenditure on social benefits in kind in 2012 related to health care outlays.
Italy has a public education system consisting of elementary, middle and high schools and universities. Attendance at public elementary, middle and high schools is generally without charge to students, while tuition payments based on income level are required to attend public universities.
Social benefits in cash. Social benefits in cash include expenditures for pensions, disability and unemployment benefits. Social benefits in cash increased by 2.4 per cent in 2012 compared to an increase of 2.2 per cent in 2011. The increase in pension expenditure was due to the adjustment for inflation (3.0 per cent, of which 0.4 points was a previous-year balancing item); in 2012, as provided for by the December 2011 package, the adjustment was not applied to pensions more than three times the minimum benefit (about €1,450 per month). On the basis of the data currently available the number of pensions appears to have decreased slightly. The reform of the pension system enacted in December 2011 did not affect the number of new pensions paid because, owing to the retirement interval mechanism, the workers who retired in 2012 had qualified in the previous year and were therefore not subject to the more stringent requirements introduced in December 2011. For additional information relating to government expenditure in connection with the national pension system, see “The Italian Economy—Social Welfare System”, Exhibit 2—2013 Stability Programme and Exhibit 3—2013 National Reform Programme.
Subsidies to firms. Subsidies to firms, which are current payments by the general government to resident producers that are not required to be reimbursed, decreased by 3.8 per cent in 2012 compared to a 5.5 per cent decrease in 2011.
Interest payments. Interest payments by the government increased by €8.4 billion or 10.7 per cent in 2012 as compared to an increase of €0.86 billion or 9.7 per cent in 2011. The ratio of interest payments to nominal GDP was 5.5 per cent and 5.0 per cent in 2012 and 2011, respectively. The weighted average cost of debt, calculated as the ratio of expenditure for interest payments to average amount of debt, was stable at 3.11 per cent in 2012. The average yield on 12-month BOTs (short-term zero-coupon notes) in 2012 was 2.30 per cent, compared to 3.17 per cent in 2011, compared to 1.3 per cent in 2010. The average interest rate on ten-year BTPs (fixed-rate notes) in 2012 was 5.65 per cent, compared to 5.25 per cent in 2011. For additional information on Italy’s public debt, see “Public Debt”.
Other Expenditures. Other expenditures decreased by 2.6 in 2012 compared to a 2.9 per cent decrease in 2011.
Revenues
Taxes. Italy’s tax structure includes taxes imposed at the state and local levels and provides for both direct taxation through income taxes and indirect taxation through a VAT and other transaction-based taxes. Indirect taxes include VAT, excise duties, stamp duties and other taxes levied on expenditures. Income taxes consist of an individual tax levied at progressive rates and a corporate tax levied at a flat rate. Corporations also pay local taxes, and the deductibility of those taxes for income tax purposes has been gradually eliminated over the last years.
58
VAT is imposed on the sale of goods, the rendering of services performed for consideration in connection with business or professions and on all imports of goods or services. In addition to VAT, indirect taxes include customs duties, taxes on real estate and certain personal property, stamp taxes and excise taxes on energy consumption, tobacco and alcoholic beverages.
Italy has entered into bilateral treaties for the avoidance of double taxation with virtually all industrialized countries.
Low taxpayer compliance has been a longstanding concern for the Government, which has adopted measures to increase compliance. Some of these measures are aimed at identifying tax evasion and include systems of cross-checks between the tax authorities and social security agencies, public utilities and others. One of the areas of greatest concern to the Government has been under-reporting of income by self-employed persons and small enterprises. The Government’s efforts to increase tax compliance since 2001 have led to an increase in the general tax base and to an improvement in compliance.
Italy’s fiscal burden, which is the aggregate of direct and indirect tax revenues and social security contributions as a percentage of GDP, rose from 42.6 per cent in 2011 to 44.0 per cent in 2012. This increase was mainly due to the increase in tax revenues, which grew from 28.8 per cent of GDP in 2011 to 30.2 per cent in 2012.
This data is prepared on a cash basis. The following table sets forth the composition of tax revenues for the periods indicated.
Composition of Tax Revenues(1)
| 2008 | 2009 | 2010 | 2011 | 2012 | ||||||||||||||||
| (€ in millions) | ||||||||||||||||||||
| Direct taxes |
||||||||||||||||||||
| Personal income tax |
158,263 | 153,508 | 159,939 | 159,076 | 158,894 | |||||||||||||||
| Corporate income tax |
47,438 | 37,678 | 37,731 | 36,971 | 37.555 | |||||||||||||||
| Investment income taxes |
14,257 | 13,215 | 7,598 | 7,269 | 10,156 | |||||||||||||||
|
Other(2) |
6,183 | 15,963 | 8,556 | 11,313 | 16,321 | |||||||||||||||
|
|
|
|
|
|
|
|
|
|
|
|||||||||||
| Total direct taxes |
226,140 | 220,364 | 213,823 | 214,628 | 222,926 | |||||||||||||||
|
|
|
|
|
|
|
|
|
|
|
|||||||||||
| Indirect taxes |
||||||||||||||||||||
| VAT |
117,444 | 108,727 | 112,891 | 115,608 | 113,023 | |||||||||||||||
| Other transaction-based taxes |
21,396 | 21,054 | 20,846 | 21,328 | 19,381 | |||||||||||||||
| Taxes on production of mineral oil |
20,291 | 20,818 | 19,765 | 20,254 | 24,170 | |||||||||||||||
| Taxes on production of methane gas |
2,469 | 4,360 | 4,169 | 4,604 | 3,799 | |||||||||||||||
| Tax on electricity consumption |
1,326 | 1,286 | 1,244 | 1,236 | 2,525 | |||||||||||||||
| Tax on tobacco consumption |
9,904 | 10,070 | 10,241 | 10,398 | 10,400 | |||||||||||||||
| Taxes on lotto and lotteries |
11,315 | 12,826 | 11,743 | 12,770 | 11,575 | |||||||||||||||
|
Other(2) |
2,033 | 1,947 | 1,957 | 1,959 | 1,931 | |||||||||||||||
|
|
|
|
|
|
|
|
|
|
|
|||||||||||
| Total indirect taxes |
186,178 | 181,089 | 182,856 | 188,157 | 186,805 | |||||||||||||||
|
|
|
|
|
|
|
|
|
|
|
|||||||||||
| Total taxes |
412,318 | 401,453 | 396,679 | 402,785 | 409,730 | |||||||||||||||
|
|
|
|
|
|
|
|
|
|
|
|||||||||||
| (1) | The data presented in this “Composition of Tax Revenues” table does not correspond to the general government direct and indirect tax revenue figures contained in the preceding table entitled “General Government Revenues and Expenditures,” primarily because the “Composition of Tax Revenues” table is prepared on a cash basis while the “General Government Revenues and Expenditures” table is prepared on an accrual basis in accordance with ESA95. Generally, State sector accounting does not include indirect taxes levied by, and certain amounts allocable to, regional and other local governments and entities. However, because this “Composition of Tax Revenues” table is prepared on a cash basis, it reflects tax receipts of entities that are excluded from State sector accounting (such as local government entities) that are collected on their behalf by the State (and subsequently transferred by the State to those entities). |
| (2) | Taxes classified as “other” are non-recurring, therefore highly variable. |
Source: Bank of Italy.
In 2012, direct tax receipts (as reported in the “General Government Revenues and Expenditures” table on a cash basis) increased by 5.6 per cent compared to 2011. General government revenue increased by 2.4 per cent or €17.4 billion in 2012, buoyed by the effects of the 2011 and 2012 budgets. Not counting the additional revenue attributable to these measures (about €31 billion), revenue diminished by about 2 per cent, whereas nominal GDP contracted by 0.8 per cent. The measures introduced in 2011 and 2012 were officially estimated to increase revenue between 2011 and 2012 by about €34 billion, of which nearly one third was to come from the early entry into force of the new municipal property tax (IMU) and about €11 billion from the broadening of the property tax base. The effect of the municipal property tax measures was about €2 billion more than originally estimated, primarily owing to the discretionary rate increases that were made by municipalities but had not been included in the original estimates. By contrast, the revenue produced by the
59
stamp duty measures was about €2.5 billion less than expected (considering both the stamp duty on financial assets reported under the foreign asset disclosure scheme and that connected with financial intermediaries’ periodic notifications to customers). Lastly, the loss of revenue connected with the possibility for firms, subject to some conditions, to convert a part of their accrued tax assets into tax credits was larger than originally expected (more than €2.5 billion, compared with an original estimate of next to nothing).
Actual social security contributions. Actual social security contributions, which consist of payments made for the benefit of employees to insurers, increased by 0.1 per cent in 2012 compared to an increase of 1.3 per cent in 2011.
Imputed social security contributions. Imputed social security contributions, which represent the counterpart to unfunded social benefits paid directly to employees and former employees and other eligible persons without involving an insurance company or autonomous pension fund, and without creating a special fund or segregated reserve for the purpose, decreased by 0.4 per cent in 2012 compared to an increase of 2.6 per cent in 2011.
Income from capital. Income from capital decreased by 11.5 per cent in 2012 compared to an increase of 12.2 per cent in 2011.
Other Revenue. Other revenue increased by 2.2 per cent in 2012 compared to a 1.4 per cent increase in 2011.
Government Enterprises
The following chart summarizes certain basic data regarding the largest companies in which the Government holds an interest, for the periods indicated. The Government currently continues to participate in the election of the respective boards of directors but does not directly participate in the management of these companies.
Largest Government Companies(1)(2)
| Company |
Industry Sector | Per cent
of Government Ownership as of December 31, 2012 |
Total Assets |
Total Liabilities |
Net profit (loss) | |||||||||||||||||||||
| At December 31, | For the year ended December 31, | |||||||||||||||||||||||||
| 2012 | 2012 | 2010 | 2011 | 2012 | ||||||||||||||||||||||
| (€ in millions, except percentages) | ||||||||||||||||||||||||||
| Cassa Depositi e Prestiti S.p.A(3). |
Financial Services | 70.0 | (4) | 328,551 | 307,494 | 2,344 | 2,167 | 2,924 | ||||||||||||||||||
| ENEL S.p.A. |
Electricity | 31.2 | 171,656 | 118,498 | 5,673 | 5,323 | 2,075 | |||||||||||||||||||
| ENI S.p.A. |
Oil and Gas | 30.10 | 139,641 | 76,928 | 7,383 | 7,803 | 8,673 | |||||||||||||||||||
| Ferrovie dello Stato Italiane S.p.A. |
Railroads | 100 | 64,158 | 27,757 | 129 | 285 | 381 | |||||||||||||||||||
| Finmeccanica S.p.A. |
Defense/Aerospace | 30.2 | 30,433 | 26,730 | 557 | (2,306 | ) | (786 | ) | |||||||||||||||||
| Fintecna S.p.A. |
Financial Services | 100 | 6,323 | 3,510 | (418 | ) | 76.5 | 99.2 | ||||||||||||||||||
| Poste Italiane S.p.A. |
Post/Financial Services | 100 | 120,570 | 114,920 | 1,017 | 846 | 1,032 | |||||||||||||||||||
| (1) | Percentages refer to the relevant holding company, while financial data is presented on a consolidated basis. |
| (2) | Including shares indirectly owned by the Government through CDP. |
| (3) | The remaining 30% of CDP was owned by various banking foundations. |
| (4) | Ownership subsequently increased to 80.1 per cent. |
Source: Ministry of Economy and Finance.
60
PUBLIC DEBT
General
Italy’s public debt includes debt incurred by the central Government (including Treasury securities and borrowings), regional and other local government, public social security agencies and other public agencies.
The Treasury manages the public debt and the financial assets of Italy. The Bank of Italy provides technical assistance to the Treasury in connection with auctions for domestic bonds and acts as paying agent for Treasury securities. The Stability Law and the Budget Law authorize the incurrence of debt by the government. For additional information on Italy’s budget and financial planning process and the Stability Law and the Budget Law, see “Public Finance—The Budget Process”.
The following table summarizes Italy’s public debt as of the dates indicated, including debt represented by Treasury securities and liabilities to holders of postal savings.
Total Public Debt(*)
| December 31, | ||||||||||||||||||||
| 2008 | 2009 | 2010 | 2011 | 2012 | ||||||||||||||||
| (€ in millions) | ||||||||||||||||||||
| Debt incurred by the Treasury: |
||||||||||||||||||||
| Internal bonds: |
||||||||||||||||||||
| Short term bonds (BOT)(1) |
147,752 | 140,096 | 130,054 | 131,693 | 151,119 | |||||||||||||||
| Medium- and long-term bonds (initially incurred or issued in Italy) |
1,137,870 | 1,236,446 | 1,324,754 | 1,386,937 | 1,427,338 | |||||||||||||||
|
|
|
|
|
|
|
|
|
|
|
|||||||||||
| Total internal bonds |
1,285,622 | 1,376,542 | 1,454,808 | 1,518,630 | 1,578,457 | |||||||||||||||
|
|
|
|
|
|
|
|
|
|
|
|||||||||||
| Total external bonds (initially incurred or issued outside Italy)(2) |
60,342 | 60,058 | 61,978 | 58,541 | 60,267 | |||||||||||||||
|
|
|
|
|
|
|
|
|
|
|
|||||||||||
| Total Treasury Issues |
1,345,964 | 1,436,600 | 1,516,786 | 1,577,171 | 1,638,724 | |||||||||||||||
|
|
|
|
|
|
|
|
|
|
|
|||||||||||
| Postal savings(3) |
31,492 | 30,004 | 25,196 | 22,079 | 20,932 | |||||||||||||||
| Treasury accounts(4) |
112,925 | 123,518 | 127,485 | 127,840 | 136,627 | |||||||||||||||
| Other debt incurred by: |
||||||||||||||||||||
| FS (bonds and other debt)(5) |
935 | 111 | 15 | — | — | |||||||||||||||
| ISPA (bonds and other debt)(6) |
11,542 | 11,034 | 11,048 | 11,070 | 11,100 | |||||||||||||||
| State sector entities(7) |
54,841 | 51,151 | 50,227 | 49,502 | 73,115 | |||||||||||||||
| Other general government entities |
108,884 | 111,211 | 112,069 | 119,076 | 118,635 | |||||||||||||||
| Total public debt |
1,666,583 | 1,763,629 | 1,842,826 | 1,906,738 | 1,999,136 | |||||||||||||||
|
|
|
|
|
|
|
|
|
|
|
|||||||||||
| as a percentage of GDP |
105.8 | 115.5 | 118.4 | 120.7 | 127.0 | |||||||||||||||
| Liquidity buffer(8) |
-19,072 | -29,711 | -42,310 | -23,361 | -33,501 | |||||||||||||||
|
|
|
|
|
|
|
|
|
|
|
|||||||||||
| Total public debt net of liquidity buffer |
1,647,511 | 1,733,918 | 1,800,516 | 1,883,367 | 1,965,632 | |||||||||||||||
|
|
|
|
|
|
|
|
|
|
|
|||||||||||
| (1) | BOTs (Buoni Ordinari del Tesoro) are short-term, zero-coupon notes with a maturity up to twelve months. |
| (2) | Italy ordinarily enters into currency swap agreements for hedging purposes. The total amount of external bonds shown above takes into account the effect of these arrangements. |
| (3) | Postal savings are demand, short- and medium-term deposit accounts, as well as long-term certificates issued by CDP that may be withdrawn by the account owner prior to maturity with nominal penalties. As of the date of conversion of CDP into a joint stock company in 2003, the Ministry of Economy and Finance has assumed part of the postal savings liabilities as described in detail below. |
| (4) | Treasury accounts are demand, short- and medium-term deposit accounts held by the private sector and by the Treasury on behalf of public companies, such as Fintecna S.p.A. and by companies set up in connection with securitization transactions carried out by the Treasury. |
| (5) | The item includes debt securities issued by Ferrovie dello Stato Italiane S.p.A., or “FS,” the state railway entity and other debt incurred by FS and assumed by the Treasury according to the law in 1996. |
| (6) | The indebtedness of Infrastrutture S.p.A., or “ISPA,” in relation to the TAV project (high-speed railroad infrastructure), is included since 2004, as it is recorded as government debt. More information is provided below. |
| (7) | The item includes all the liabilities incurred by other state sector entities and all the remaining liabilities incurred by the state sector. |
| (8) | The line item “Liquidity buffer” includes all the funds of the Treasury deposited with the Bank of Italy, including the sinking fund, funded by privatization proceeds. For additional information on the “Liquidity Buffer”, see “Monetary System—Monetary Policy”. |
| (*) | Figures in this table and in the paragraph “Public Debt— Discussion of debt-to-GDP ratio” below have not been restated and therefore are not comparable to the figures in the table entitled “Selected Public Finance Indicators” in “Public Finance” and to the figures presented in the paragraphs “The Italian Economy” and “Public Debt”. |
Source: Ministry of Economy and Finance.
Discussion of debt-to-GDP ratio. Since 2008 there has been a gradual increase in Italy’s debt-to-GDP ratio from 105.8 per cent in 2008 to 127.0 per cent in 2012.
61
In 2009, Italy’s debt-to-GDP ratio increased to 115.5 per cent, compared to 105.8 per cent in 2008. Of the total increase of 9.7 per cent, approximately 8.0 per cent reflected the difference between the average cost of the debt (4.3 per cent, calculated as the ratio of interest payments to the size of the debt at the end of the year) and the nominal GDP growth rate (a negative 3 per cent), 0.6 per cent reflected the primary deficit and 1.1 per cent reflected the residual component due to the difference between net borrowing and the change in the debt.
In 2010, the debt-to-GDP ratio was 118.4 per cent compared to 115.5 per cent in 2009. Of the total increase of 2.9 per cent in 2010, 2.3 per cent reflected the difference between the average cost of the debt and the nominal GDP growth rate, 0.1 per cent reflected the primary deficit and 0.5 per cent reflected the residual component due to the difference between net borrowing and the change in the debt.
In 2011, Italy’s debt-to-GDP was 120.7 per cent, compared to 118.4 per cent in 2010. The increase reflected the gap between the average cost of the debt and the expansion of nominal GDP (2.9 per cent), only partly offset by the primary surplus of 1.0 per cent and the factors that affect net borrowing but not debt.
In 2012, Italy’s debt-to-GDP was 127.0 per cent, compared to 120.7 per cent in 2011. The increase reflected the decrease in nominal GDP and the increase in total public debt in 2012. For additional information on the drivers of the decrease in GDP growth, see “Italian Economy—Update for the fiscal year ended December 31, 2012”.
The Government’s latest forecasts of the debt-to-GDP ratio are included in the Update of the 2013 Economic and Financial Document. The table below shows the Government’s forecasts of the debt-to-GDP ratio for the period 2013-2017. For additional information on the Government’s forecasts of the debt-to-GDP ratio, see “Public Finance—The 2013 Economic and Financial Document”, “The Italian Economy”, “Public Debt”, Exhibit 2—2013 Stability Programme and Exhibit 4—Update of the 2013 Economic and Financial Document.
Forecasted Debt-to-GDP Ratios
| Update of the 2013 Economic and Financial Document |
2013 | 2014 | 2015 | 2016 | 2017 | |||||||||||||||
| Public Debt, gross of euro area financial support and acceleration of payments due by the public administration |
133 | 133.2 | 130.5 | 127.1 | 123.2 | |||||||||||||||
| Public Debt, net of euro area financial support |
129.5 | 129.4 | 126.8 | 123.5 | 119.7 | |||||||||||||||
| Public Debt, net of euro area financial support and acceleration of payments due by the public administration |
127.7 | 126.3 | 123.8 | 120.6 | 116.9 | |||||||||||||||
Source: Ministry of Economy and Finance.
Public Debt Management. Although debt management continues to be geared towards lengthening the average residual maturity of public debt, the average maturity of government debt slightly decreased from 6.99 years at the end of 2011 to 6.62 years at the end of 2012.
The Government’s objectives with respect to the management of public debt are to minimize the cost of borrowing in the medium-term and to reduce the volatility of interest payments. In accordance with these objectives, the Treasury has, in the past, gradually increased the proportion of total outstanding Government bonds represented by fixed rate securities, while reducing the proportion of total outstanding Government bonds represented by floating rate and short-term securities to less than one-third.
The table below presents the percentage of total outstanding Government bonds represented by fixed rate securities, the securities indexed to the euro area inflation rate (BTP€i) and floating rate securities as at December 31, 2010, 2011 and 2012.
Breakdown of Total Outstanding Government Bonds (in %)
| December 31, | ||||||||||||
| 2010 | 2011 | 2012 | ||||||||||
| Fixed rate securities |
73.18 | 73.89 | 73.20 | |||||||||
| Securities indexed to the inflation rate (BTP€i+BTP Italia) |
7.11 | 7.97 | 8.30 | |||||||||
| Floating rate securities |
19.70 | 18.14 | 18.50 | |||||||||
|
|
|
|
|
|
|
|||||||
| Total Outstanding Government Bonds |
100 | 100 | 100 | |||||||||
|
|
|
|
|
|
|
|||||||
Source: Ministry of Economy and Finance.
In 2012, as in 2011, the management of public debt was made more difficult both by extreme volatility in financial markets (especially the segment of government securities of the euro area) and the economic downturn. The market performance of Treasury securities during the year was impacted by the second Long Term Refinancing Operation in February for an additional €530 billion, with the participation of 800
62
banks; Italian banks used part of the liquidity to buy government securities, thereby contributing to the reduction of rates and the return to satisfactory liquidity conditions in the secondary market. From early January to early March, rates for one-year maturity securities declined by 260 basis points while interest rates on ten-year-maturity securities went down by about 230 basis points. The return differential with the German Bund declined notably as well, from 530 basis points in early January to 290 basis points in early March for 10-year maturity securities. This trend was strengthened by further fiscal consolidation measures adopted by the Government at the end of 2011 and by the approval at the EU level of the Fiscal Compact.
Market volatility was more intense in March and at the end of July as the impact of the two ECB extraordinary operations abated, and was caused by the problems linked to debt restructuring in Greece and its complex situation of political instability, as well as by Spain’s worsening fiscal scenario and the need for recapitalization programs for the Spanish banking sector. The prices of government bonds fell further, leading to a more costly debt servicing: over the period from early March to mid-July, interest rates went up by about 10 basis points for one-year maturity securities, while for ten-year maturity securities the increase was equal to 90 basis points.
In July, following the commitment by the ECB to secure the survival of the euro and the presentation in early August of the new plan for the purchase of securities (OMT, Outright Monetary Transactions), the government securities of the whole euro area stabilized. In Italy, the spread over the German Bund declined from over 530 basis points at the end of July 2012 to about 235 basis points in November 2013.
Despite this difficult situation in the year, the Treasury succeeded in ensuring a regular and predictable policy in terms of issuance and management of the circulating debt, thereby ensuring an efficient allocation of debt both in terms of costs and consolidation of the risk minimization results at the end of 2011. Italy’s government securities have been placed satisfactorily, both in terms of demand for them and in terms of costs, considering that a large part of placements was done at prices that were basically in line with those of the secondary market.
During the 2013 the primary market of the Italian government debt has been characterised by further improvements in terms of stability, regularity and efficiency in the issuance process, even if in the same period several international and domestic events have been taking place.
The 10 year rate fell from 4,70 % down to below 4%, while rates on 1-year Treasury Bills almost halved from 1,3% to 0,7%, a minimum touched in the very first days of May. The general good market momentum was reflected also in the 4th BTP ITALIA issuance, that was launched during the third week of April. The bond – which is indexed to Italian inflation and has a 4 year maturity— collected more than 17 billion euros in just 2 days, with a wide participation of retail investors to whom it is tailored to.
From early June to mid-July the picture changed quite dramatically, mainly because of the global repricing of risky assets following the decision of the Fed to potentially start tapering its QE activity on Treasury bonds and MBS. In Italy the impact was significant.
After the summer break the market for Italian government bonds found new source of volatility because of potential renovated political instability. The 10 years rate continued to trade around 4,5%, all along the month of September. This also despite some relevant reduction in volatility in the secondary market and the presence of good liquidity conditions.
Only after the positive outcome of the parliamentary confidence vote, the situation on the market improved quite remarkably: absolute level of yield all along the curve start dropping gradually but continuously with the 3 year and the 10 year at 2% and 4.1% respectively.
Against this backdrop the Treasury provided the market with the most important innovation of the year: the new 7 year BTP. The idea of bringing a new liquid point on the curve relied on the three main factors: the ever growing demand for that part of the curve from a wide array of domestic and international investors, the need to reduce the dislocation of the BTP curve due to the pressure on existing bonds with that residual maturity, the goal of being endowed with a more effective tool to manage the debt average life.
In November the Treasury opened the month with the launch of the fifth BTP ITALIA, whose final size got to more than 22 billion euros, representing the high record as ever.
63
The table below shows the yields on 3-year and 10-year BTPs issued by the Treasury for each quarter of 2011 and 2012 and the first three quarters of 2013.
Quarterly Yields on 3-Year and 10-Year BTPs
| 2011 | 2012 | 2013 | ||||||||||||||||||||||||||||||||||||||||||
| Q1 | Q2 | Q3 | Q4 | Q1 | Q2 | Q3 | Q4 | Q1 | Q2 | Q3 | ||||||||||||||||||||||||||||||||||
| BTP 3-year |
3.16 | 3.36 | 4.16 | 6.06 | 3.84 | 4.36 | 3.73 | 2.66 | 2.22 | 2.21 | 2.56 | |||||||||||||||||||||||||||||||||
| BTP 10-year |
4.79 | 4.79 | 5.27 | 6.57 | 6.05 | 5.68 | 5.97 | 4.88 | 4.54 | 4.23 | 4.48 | |||||||||||||||||||||||||||||||||
Source: Ministry of Economy and Finance
The Government also intends to reduce the public debt through a program of privatization of public real estate assets and companies in which the government holds interests. In November 2012, CDP exercised its option to acquire at market conditions the interests held by the government in SACE, Fintecna and Simest. From December 12, 2003, the date of its conversion from an administrative entity into a joint stock company, CDP is no longer considered part of the general government and its liabilities are no longer accounted for as public debt.
The Government also expects that the envisaged public real estate assets privatization program will result in additional revenues equal to approximately 1.0 per cent of GDP per year. As set out in the Update of the 2013 Economic and Financial Document, the estimated value of all real estate assets of the general government (including land) is currently of approximately €350 billion.
Summary of Internal Debt
Internal debt is debt initially incurred or issued in Italy, regardless of the currency of denomination. Italy’s total internal public debt as at December 31, 2012 was €1,927,148 million, an increase of € 94,992 million from December 31, 2011. The following table summarizes the internal public debt as at December 31 of each of the years indicated.
64
Internal Public Debt
| December 31, | ||||||||||||||||||||
| 2008 | 2009 | 2010 | 2011 | 2012 | ||||||||||||||||
| (€ in millions) | ||||||||||||||||||||
| Debt incurred by the Treasury: |
||||||||||||||||||||
| Short-Term Bonds (BOT)(1) |
147,753 | 140,096 | 130,054 | 131,693 | 151,119 | |||||||||||||||
| Medium- and Long-Term Bonds |
||||||||||||||||||||
|
CTZ(2) |
46,772 | 64,748 | 71,989 | 67,425 | 61,312 | |||||||||||||||
|
CCT(3) |
182,733 | 163,599 | 156,584 | 143,727 | 122,590 | |||||||||||||||
|
BTP(4) |
823,706 | 906,302 | 992,692 | 1,054,675 | 1,094,496 | |||||||||||||||
| BTP€i(5) |
84,659 | 101,797 | 103,489 | 121,110 | 121,829 | |||||||||||||||
| BTP Italia(6) |
— | — | — | — | 27,111 | |||||||||||||||
|
|
|
|
|
|
|
|
|
|
|
|||||||||||
| Total |
1,285,622 | 1,376,542 | 1,454,808 | 1,518,630 | 1,578,457 | |||||||||||||||
|
|
|
|
|
|
|
|
|
|
|
|||||||||||
| Postal savings |
31,492 | 30,004 | 25,196 | 22,079 | 20,932 | |||||||||||||||
| Treasury accounts(7) |
112.925 | 123.518 | 127.485 | 127,840 | 136,627 | |||||||||||||||
| State sector entities |
52,182 | 48,631 | 47,788 | 46,341 | 71,615 | |||||||||||||||
| Other general government entities(8) |
105,519 | 108,886 | 110,836 | 117,766 | 118,516 | |||||||||||||||
|
|
|
|
|
|
|
|
|
|
|
|||||||||||
| Total internal public debt |
1,587,740 | 1,687,581 | 1,766,113 | 1,832,656 | 1,926,148 | |||||||||||||||
|
|
|
|
|
|
|
|
|
|
|
|||||||||||
| Liquidity buffer(9) |
-19,072 | -29,711 | -42,310 | -23,361 | -33,501 | |||||||||||||||
| Total internal public debt net of liquidity buffer |
1,568,668 | 1,657,870 | 1,723,802 | 1,809,215 | 1,892,647 | |||||||||||||||
|
|
|
|
|
|
|
|
|
|
|
|||||||||||
| (1) | BOTs (Buoni Ordinari del Tesoro) are short-term, zero-coupon notes with a maturity up to twelve months. |
| (2) | CTZs (Certificati del Tesoro Zero-Coupon), introduced in 1995, are zero-coupon notes with maturities of eighteen or twenty-four months. |
| (3) | CCTs (Certificati di Credito del Tesoro) are medium- and long-term notes at a variable interest rate with a semiannual coupon. |
| (4) | BTPs (Buoni del Tesoro Poliennali) are medium- and long-term notes that pay a fixed rate of interest, with a semiannual coupon. |
| (5) | BTP€is (inflation-linked BTPs) are medium- and long-term notes with a semiannual coupon. Both the principal amount under the notes and the coupon are indexed to the euro-zone harmonized index of consumer prices, excluding tobacco. |
| (6) | BTPItalia (Italian inflation-linked BTPs) are medium- and long-term notes with a semiannual coupon. Both the principal amount under the notes and the coupon are indexed to the Italian inflation rate, excluding tobacco. These notes were first issued by the Treasury in March 2012. |
| (7) | The line item “Treasury accounts” includes all the funds of the Treasury deposited with the Bank of Italy, including the sinking fund, supplied by privatizations. For additional information, see “Monetary System—Monetary Policy”. |
| (8) | Includes loans and securities issued by local authorities. |
| (9) | All indebtedness included in this line has been treated as funded debt in this “Public Debt” section. A small portion, however, may have had a maturity at issuance of less than one year or may have been incurred or issued abroad. |
Source: Ministry of Economy and Finance.
The following table divides the internal public debt into floating debt and funded debt as at December 31st of each of the years indicated. Floating debt is debt that has a maturity at issuance of less than one year. Funded debt is debt that has a maturity at issuance of one year or more.
Summary of Floating and Funded Internal Debt
| December 31, | ||||||||||||||||||||
| 2008 | 2009 | 2010 | 2011 | 2012 | ||||||||||||||||
| (€ in millions) | ||||||||||||||||||||
| Floating internal debt(1) |
182,488 | 176,575 | 174,256 | 171,643 | 187,760 | |||||||||||||||
| Funded internal debt |
1,405,252 | 1,511,006 | 1,591,857 | 1,661,013 | 1,738,388 | |||||||||||||||
|
|
|
|
|
|
|
|
|
|
|
|||||||||||
| Total internal public debt |
1,587,740 | 1,687,581 | 1,766,113 | 1,832,656 | 1,926,148 | |||||||||||||||
|
|
|
|
|
|
|
|
|
|
|
|||||||||||
| (1) | Includes BOTs with a maturity at issuance of three and six months and postal accounts. |
Source: Ministry of Economy and Finance.
In 2011 and 2012, the ratio of short-term bonds to total debt issued was approximately 6.91 per cent and approximately 7.84 per cent, respectively.
Summary of External Debt
External debt is debt initially incurred or issued outside Italy, regardless of the currency of denomination. Total external public debt as at December 31, 2012 was €73,509 million. Historically Italy has not relied heavily on external debt. The following table summarizes the external public debt as at December 31st of each of the years indicated.
65
Summary of External Debt
| December 31, | ||||||||||||||||||||
| 2008 | 2009 | 2010 | 2011 | 2012 | ||||||||||||||||
| (€ in millions) | ||||||||||||||||||||
| External Treasury Bonds(1) |
60,342 | 60,058 | 61,978 | 58,541 | 60,267 | |||||||||||||||
| FS bonds and loans(2) |
935 | 111 | 15 | 0 | 0 | |||||||||||||||
| ISPA bonds and loans(3) |
11,033 | 10,534 | 11,048 | 11,070 | 9,600 | |||||||||||||||
| State sector entities |
2,659 | 2,520 | 2,439 | 3,161 | 1,500 | |||||||||||||||
| Other general government entities |
3,365 | 2,325 | 1,233 | 1,310 | 2,143 | |||||||||||||||
|
|
|
|
|
|
|
|
|
|
|
|||||||||||
| Total external public debt |
78,334 | 75,547 | 76,713 | 74,082 | 73,509 | |||||||||||||||
|
|
|
|
|
|
|
|
|
|
|
|||||||||||
| (1) | Italy often enters into currency swap agreements in the ordinary course of the management of its debt. The total amount of external bonds shown above takes into account the effect of these arrangements. |
| (2) | Includes FS bonds and other debt incurred by FS outside Italy and assumed by the Treasury by law in 1996. |
| (3) | Includes ISPA’s bonds and other debt, guaranteed by the state, in connection with the financing of the high-speed railway link between Turin, Milan, Rome and Naples. For additional information on ISPA bonds and other debt used to finance high-speed rails, see “—General”. |
Source: Ministry of Economy and Finance.
The following table sets forth a breakdown of the external public debt of the Treasury, by currency, as at December 31 of each of the years indicated. The amounts shown below are nominal values at issuance, before giving effect to currency swaps, and do not include external public debt of other state sector entities and other general government entities. Italy often enters into currency swap agreements in the ordinary course of the management of its debt.
External Debt by Currency
| December 31, | ||||||||||||||||||||
| 2008 | 2009 | 2010 | 2011 | 2012 | ||||||||||||||||
| (in millions) | ||||||||||||||||||||
|
Euro(1) |
20,281 | 20,833 | 21,394 | 22,323 | 21,946 | |||||||||||||||
| British Pounds |
2,150 | 2,150 | 2,450 | 2,450 | 2,450 | |||||||||||||||
| Swiss Francs |
6,500 | 5,500 | 4,000 | 3,000 | 3,000 | |||||||||||||||
| U.S. Dollars(2) |
32,939 | 32,450 | 36,000 | 31,500 | 23,000 | |||||||||||||||
| Japanese Yen |
725,000 | 685,000 | 585,000 | 585,000 | 585,000 | |||||||||||||||
| Norwegian Kroner |
4,000 | 4,000 | 4,000 | 4,000 | 2,000 | |||||||||||||||
| Australian Dollars |
— | — | — | — | — | |||||||||||||||
| Czech Koruna |
7,470 | 7,470 | 7,470 | 7,470 | 7,470 | |||||||||||||||
| (1) | The item does not include the amount of debt incurred in euros by ISPA and guaranteed by the state, which is shown in the previous table. |
| (2) | Until 2008, the item includes US$989 million of debt originally incurred by FS. By the end of 2009 that debt was redeemed. |
Source: Ministry of Economy and Finance.
Italy accesses the international capital markets through a global bond program registered under the United States Securities Act of 1933 on Schedule B (the “Global Bond Programme”), a US$72 billion medium-term note program established in 1998 and a US$15 billion commercial paper program established in 1999 and updated in December of 2011. Italy introduced collective action clauses (CACs) in the documentation of all New York law governed bonds issued after June 16, 2003, including the Global Bond Programme. Italy will include the EU Collective Action Clauses, including Cross Series Modification Clauses, in the documentation of all bonds it issues after January 1, 2013. For additional information regarding Italy’s implementation of EU Collective Action Clauses, see “The Italian Economy—EU Measures to Address the Eurocrisis”.
Debt Record
Since its founding in 1946, the Republic of Italy has never defaulted in the payment of principal or interest on any of its internal or external indebtedness.
66
TABLES AND SUPPLEMENTARY INFORMATION
Floating Internal Debt of the Treasury(1) as of December 31, 2012
| Security |
Interest Rate |
Maturity Date |
Outstanding principal amount |
|||||||||
| (€ in millions) | ||||||||||||
| BOT (3 months) |
various | various | 3,000 | |||||||||
| BOT (6 months) |
various | various | 48,133 | |||||||||
| Postal savings |
floating | none | 20,932 | |||||||||
|
|
|
|||||||||||
| Total floating internal debt of the Treasury |
187,760 | |||||||||||
|
|
|
|||||||||||
| Treasury accounts |
floating | none | 136,627 | |||||||||
|
|
|
|||||||||||
| Total floating internal debt net of Treasury accounts |
1,892,647 | |||||||||||
|
|
|
|||||||||||
| (1) | Floating debt is debt that has a maturity at issuance of less than one year. Funded debt is debt that has a maturity at issuance of one year or more. |
Source: Ministry of Economy and Finance
Funded Internal Debt of the Treasury(1) as of December 31, 2012
| Security |
Interest Rate |
Maturity Date |
Outstanding principal amount |
|||||||||
| (€ in millions) | ||||||||||||
| BOT (12 months) |
various | various | 99,986 | |||||||||
| CTZ |
various | various | 61,312 | |||||||||
| CCT |
various | various | 122,590 | |||||||||
| BTP |
various | various | 1,094,496 | |||||||||
| BTP€I |
various | various | 121,829 | |||||||||
| BTP Italia |
various | various | 27,111 | |||||||||
| Total funded internal debt of the Treasury |
1,527,324 | |||||||||||
|
|
|
|||||||||||
| (1) | Floating debt is debt that has a maturity at issuance of less than one year. Funded debt is debt that has a maturity at issuance of one year or more. |
Source: Ministry of Economy and Finance.
External Bonds of the Treasury as of December 31, 2012
The following table shows the external bonds of the Treasury issued and outstanding as of December 31, 2012.
| Original Currency Nominal Amount |
Interest Rate |
Initial Public Offering Price (%) |
Date of Issue | Maturity Date | Amount Outstanding | Equivalent in Euro |
||||||||||||||
| United States Dollar(1)(*) |
|
|||||||||||||||||||
| $3,500,000,000 |
6.875% | 98.73 | September 27, 1993 | September 27, 2023 | $ | 3,500,000,000 | € | 2,652,720,934 | ||||||||||||
| $2,000,000,000 |
4.375% | 99.69 | February 27, 2003 | June 15, 2013 | $ | 2,000,000,000 | € | 1,515,840,534 | ||||||||||||
| $2,000,000,000 |
5.375% | 98.44 | February 27, 2003 | June 15, 2033 | $ | 2,000,000,000 | € | 1,515,840,534 | ||||||||||||
| $4,000,000,000 |
4.50% | 99.41 | January 21, 2005 | January 21, 2015 | $ | 4,000,000,000 | € | 3,031,681,067 | ||||||||||||
| $2,000,000,000 |
4.75% | 99.34 | January 25, 2006 | January 25, 2016 | $ | 2,000,000,000 | € | 1,515,840,534 | ||||||||||||
| $3,000,000,000 |
5.25% | 99.85 | September 20, 2006 | September 20, 2016 | $ | 3,000,000,000 | € | 2,273,760,800 | ||||||||||||
| $2,000,000,000 |
5.38% | 99.37 | June 12, 2007 | June 12, 2017 | $ | 2,000,000,000 | € | 1,515,840,534 | ||||||||||||
| $2,500,000,000 |
3.13% | 99.672 | January 26, 2010 | January 26, 2015 | $ | 2,500,000,000 | € | 1,894,800,667 | ||||||||||||
| $2,000,000,000 |
2.13% | 99.74 | September 16, 2010 | September 16, 2013 | $ | 2,000,000,000 | € | 1,515,840,534 | ||||||||||||
|
|
|
|
|
|||||||||||||||||
| $ | 24,500,000,000 | € | 17,432,166,136 | |||||||||||||||||
|
|
|
|
|
|||||||||||||||||
|
Euro(2) |
||||||||||||||||||||
| €60,000,000 |
libor 3m -16 b.p. | 99.61 | October 8, 1998 | October 8, 2018 | € | 60,000,000 | € | 60,000,000 | ||||||||||||
| €300,000,000 |
|
((1+0.86*TEC10)^0.25)- 1;floor3%su86(3) %*TEC10 |
|
101.43 | October 15, 1998 | October 15, 2018 | € | 300,000,000 | € | 300,000,000 | ||||||||||
| €1,000,000,000 |
4.00% | 99.95 | May 6, 1999 | May 6, 2019 | € | 1,000,000,000 | € | 1,000,000,000 | ||||||||||||
| €1,000,000,000 |
|
80%*CMS30Y; floor:4.25% |
|
101.60 | June 28, 1999 | June 28, 2029 | € | 905,000,000 | € | 905,000,000 | ||||||||||
| €1,000,000,000 |
|
CMS30Y- 0.91%;Floor:0.00% |
|
100.75 | August 30, 1999 | August 30, 2019 | € | 1,000,000,000 | € | 1,000,000,000 | ||||||||||
67
| Original Currency Nominal Amount |
Interest Rate |
Initial Public Offering Price (%) |
Date of Issue | Maturity Date | Amount Outstanding | Equivalent in Euro |
||||||||||||||
| €150,000,000 |
Zero Coupon | 100.00 | February 20, 2001 | February 19, 2031 | €150,000,000 | €150,000,000 | ||||||||||||||
| €3,000,000,000 |
5.750% | 100.04 | July 25, 2001 | July 25, 2016 | €3,000,000,000 | €3,000,000,000 | ||||||||||||||
| €150,000,000 |
|
84.5% CMS 10Y |
|
100.00 | April 26, 2004 | April 26, 2019 | €150,000,000 | €150,000,000 | ||||||||||||
| €300,000,000 |
|
CMS10Y ;cap:6% |
(4) |
100.00 | May 31, 2005 | May 31, 2035 | €300,000,000 | €300,000,000 | ||||||||||||
| €720,000,000 |
3.83% | 100.00 | June 2, 2005 | June 2, 2029 | €720,000,000 | €720,000,000 | ||||||||||||||
| €395,000,000 |
|
3.523% (until 2010) |
(5) |
100.00 | June 2, 2005 | June 2, 2030 | €395,000,000 | €395,000,000 | ||||||||||||
| €200,000,000 |
|
85% *CMS10Y; cap:7,45% |
|
100.00 | June 8, 2005 | June 8, 2020 | €200,000,000 | €200,000,000 | ||||||||||||
| €2,500,000,000 |
|
85% *CMS 10Y; floor 2%; cap 7% |
|
100.00 | June 15, 2005 | June 15, 2020 | €2,500,000,000 | €2,500,000,000 | ||||||||||||
| €300,000,000 |
|
85.5% *CMS 10Y; floor 2%; cap 7% |
|
100.00 | June 28, 2005 | June 28, 2021 | €300,000,000 | €300,000,000 | ||||||||||||
| €200,000,000 |
|
Max {0, Min [10*(CMS10 – CMS2), 6mEuribor + 1.50%)]} |
|
100.00 | November 9, 2005 | November 9, 2025 | €200,000,000 | €200,000,000 | ||||||||||||
| €900,000,000 |
|
6m Euribor + 0.04% |
|
99.38 | March 17, 2006 | March 17, 2021 | €900,000,000 | €900,000,000 | ||||||||||||
| €1,000,000,000 |
|
6m Euribor + 0.60% |
|
99.85 | March 22, 2006 | March 22, 2018 | €1,000,000,000 | €1,000,000,000 | ||||||||||||
| €192,000,000 |
Zero Coupon | 100.00 | March 28, 2006 | March 28, 2036 | €192,000,000 | €192,000,000 | ||||||||||||||
| €300,000,000 |
|
6m Euribor + 0.075% |
|
100.00 | March 30, 2006 | March 29, 2026 | €300,000,000 | €300,000,000 | ||||||||||||
| €215,000,000 |
|
5.07% / 10y CMS |
|
100.00 | May 11, 2006 | May 11, 2026 | €215,000,000 | €215,000,000 | ||||||||||||
| €1,000,000,000 |
|
1.85% Inflation Indexed |
|
99.80 | January 5, 2007 | September 15, 2057 | €1,107,000,000 | €1,107,000,000 | ||||||||||||
| €250,000,000 |
|
2.00% Inflation Indexed |
|
99.02 | March 30, 2007 | September 15, 2062 | €277,000,000 | €277,000,000 | ||||||||||||
| €160,000,000 |
4.49% | 99.86 | April 5, 2007 | April 5, 2027 | €160,000,000 | €160,000,000 | ||||||||||||||
| €500,000,000 |
|
2.20% Inflation Indexed |
|
98.86 | January 23, 2008 | September 15, 2058 | €544,220,000 | €544,220,000 | ||||||||||||
| €258,000,000 |
5.26% | 99.79 | March 16, 2009 | March 16, 2026 | €258,000,000 | €258,000,000 | ||||||||||||||
| €300,000,000 |
3.00% | 99,733 | May 29, 2009 | November 29, 2013 | €300,000,000 | €300,000,000 | ||||||||||||||
| €250,000,000 |
4.85% | 98.50 | June 11, 2010 | June 11, 2060 | €250,000,000 | €250,000,000 | ||||||||||||||
| €125,000,000 |
4.10% | 99.46 | September 6, 2010 | November 1, 2023 | €125,000,000 | €125,000,000 | ||||||||||||||
| €125,000,000 |
4.20% | 99.38 | September 6, 2010 | March 3, 2025 | €125,000,000 | €125,000,000 | ||||||||||||||
| €250,000,000 |
2.75% | 99.85 | November 11, 2010 | November 11, 2018 | €250,000,000 | €250,000,000 | ||||||||||||||
| €125,000,000 |
2.85% | 99.90 | November 22, 2010 | November 22, 2014 | €125,000,000 | €125,000,000 | ||||||||||||||
| €250,000,000 |
3.70% | 99.66 | November 22, 2010 | May 22, 2018 | €250,000,000 | €250,000,000 | ||||||||||||||
| €125,000,000 |
3.75% | 99.89 | November 22, 2010 | September 1, 2018 | €125,000,000 | €125,000,000 | ||||||||||||||
| €150,000,000 |
3.80% | 99.65 | December 23, 2010 | January 23, 2017 | €150,000,000 | €150,000,000 | ||||||||||||||
| €150,000,000 |
4.45% | 99.40 | December 23, 2010 | December 12, 2021 | €150,000,000 | €150,000,000 | ||||||||||||||
| €517,000,000 |
|
2.85% Inflation Indexed |
|
99.482 | January 4, 2011 | September 1, 2022 | €517,000,000 | €517,000,000 | ||||||||||||
| €450,000,000 |
4.45% | 99.59 | February 26, 2011 | August 24, 2020 | €450,000,000 | €450,000,000 | ||||||||||||||
| €2,156,000,000 |
6.58% | 100 | July 1, 2011 | December 31, 2027 | €2,156,000,000 | €2,156,000,000 | ||||||||||||||
| €250,000,000 |
5.00% | 99.196 | September 22, 2011 | September 22, 2017 | €250,000,000 | €250,000,000 | ||||||||||||||
| €230,000,000 |
|
4.20% Inflation Indexed |
|
100 | February 1, 2012 | July 25, 2042 | €230,000,000 | €230,000,000 | ||||||||||||
| €437,500,000 |
3.66% | 100 | February 13, 2012 | December 31, 2026 | €437,500,000 | €437,500,000 | ||||||||||||||
| €300,000,000 |
Zero Coupon | 99.78 | September 25, 2012 | January 25, 2013 | €300,000,000 | €300,000,000 | ||||||||||||||
| €300,000,000 |
Zero Coupon | 99.78 | September 25, 2012 | January 25, 2013 | €300,000,000 | €300,000,000 | ||||||||||||||
| €100,000,000 |
Zero Coupon | 99.71 | October 10, 2012 | February 21, 2013 | €100,000,000 | €100,000,000 | ||||||||||||||
|
|
|
|
|
|||||||||||||||||
| €22,723,720,000 | €22,723,720,000 | |||||||||||||||||||
|
|
|
|
|
|||||||||||||||||
| Euro Ispa Bonds(6) |
|
|||||||||||||||||||
| €1,000,000,000 |
4.50% | 99.387 | February 6, 2004 | July 31, 2014 | €1,000,000,000 | €1,000,000,000 | ||||||||||||||
| €750,000,000 |
|
2.25% Inflation Indexed |
|
99.368 | February 6, 2004 | July 31, 2019 | €900,000,000 | €900,000,000 | ||||||||||||
| €3,250,000,000 |
5.13% | 98.934 | February 6, 2004 | July 31, 2024 | €3,250,000,000 | €3,250,000,000 | ||||||||||||||
| €2,200,000,000 |
5.20% | 105.125 | February 6, 2004 | July 31, 2034 | €2,200,000,000 | €2,200,000,000 | ||||||||||||||
| €850,000,000 |
|
Euribor 12 M + spread 0.23% (amortizing) |
|
100 | March 4, 2005 | July 31, 2045 | €850,000,000 | €850,000,000 | ||||||||||||
| €1,000,000,000 |
|
Euribor 12 M + spread 0.235% (amortizing) |
|
100 | April 25, 2005 | July 31, 2045 | €1,000,000,000 | €1,000,000,000 | ||||||||||||
| €300,000,000 |
|
3.5% (cap at 6.0%) |
|
100 | June 30, 2005 | July 31, 2035 | €300,000,000 | €300,000,000 | ||||||||||||
| €100,000,000 |
|
3.5% (cap at 6.1%) |
|
100 | June 30, 2005 | July 31, 2035 | €100,000,000 | €100,000,000 | ||||||||||||
|
|
|
|
|
|||||||||||||||||
| €9,600,000,000 | €9,600,000,000 | |||||||||||||||||||
|
|
|
|
|
|||||||||||||||||
| Swiss Franc(7)(*) |
|
|||||||||||||||||||
| ChF 2,000,000,000 |
2.50% | 100.09 | February 2, 2005 | March 2, 2015 | ChF 2,000,000,000 | €1,656,726,309 | ||||||||||||||
| ChF 1,000,000,000 |
2.50% | 99.336 | January 30, 2006 | January 30, 2018 | ChF 1,000,000,000 | €828,363,154.4 | ||||||||||||||
|
|
|
|
|
|||||||||||||||||
| ChF 3,000,000,000 | €2,485,089,463 | |||||||||||||||||||
|
|
|
|
|
|||||||||||||||||
68
| Original Currency Nominal Amount |
Interest Rate |
Initial Public Offering Price (%) |
Date of Issue | Maturity Date | Amount Outstanding | Equivalent in Euro |
||||||||||||||
| Pound Sterling(8)(*) |
||||||||||||||||||||
| £400,000,000 |
10.50% | 100.875 | April 28, 1989 | April 28, 2014 | £400,000,000 | €490,136,012.7 | ||||||||||||||
| £1,500,000,000 |
6.00% | 98.565 | August 4, 1998 | August 4, 2028 | £1,500,000,000 | €1,838,010,048 | ||||||||||||||
| £250,000,000 |
5.25% | 99.476 | July 29, 2004 | December 7, 2034 | £250,000,000 | €306,335,008 | ||||||||||||||
| £300,000,000 |
|
3m Gbp Libor + 0,45 bp % |
|
100.00 | April 28, 2010 | April 28, 2015 | £300,000,000 | €367,602,009.6 | ||||||||||||
|
|
|
|
|
|||||||||||||||||
| £2,450,000,000 | €3,002,083,078 | |||||||||||||||||||
|
|
|
|
|
|||||||||||||||||
| Norwegian Kroner(9)(*) |
|
|||||||||||||||||||
| NOK 2,000,000,000 |
4.34% | 100.00 | June 23, 2003 | June 23, 2015 | NOK 2,000,000,000 | €272,171,794.8 | ||||||||||||||
|
|
|
|
|
|||||||||||||||||
| NOK 2,000,000,000 | €272,171,794.8 | |||||||||||||||||||
|
|
|
|
|
|||||||||||||||||
| Japanese Yen(10)(*) |
||||||||||||||||||||
| ¥125,000,000,000 |
5.50% | 100.00 | December 15, 1994 | December 15, 2014 | ¥125,000,000,000 | €1,100,255,259 | ||||||||||||||
| ¥125,000,000,000 |
4.50% | 100.00 | June 8, 1995 | June 8, 2015 | ¥125,000,000,000 | €1,100,255,259 | ||||||||||||||
| ¥100,000,000,000 |
3.70% | 100.00 | November 14, 1996 | November 14, 2016 |
¥100,000,000,000 | €880,204,207.4 | ||||||||||||||
| ¥100,000,000,000 |
3.45% | 99.80 | March 24, 1997 | March 24, 2017 | ¥100,000,000,000 | €880,204,207.4 | ||||||||||||||
| ¥25,000,000,000 |
2.87% | 100.00 | May 18, 2006 | May 18, 2036 | ¥25,000,000,000 | €220,051,051.8 | ||||||||||||||
| ¥50,000,000,000 |
|
3mJpy libor +12 bp% |
|
100.00 | April 24, 2008 | April 24, 2018 | ¥50,000,000,000 | €440,102,103.7 | ||||||||||||
| ¥30,000,000,000 |
|
3m Jpy libor +40 bp% |
|
100.00 | July 8, 2009 | July 8, 2019 | ¥30,000,000,000 | €264,061,262.2 | ||||||||||||
| ¥30,000,000,000 |
|
3m Jpy libor +37 bp% |
|
100.00 | September 18, 2009 | September 18, 2019 |
¥30,000,000,000 | €264,061,262.2 | ||||||||||||
|
|
|
|
|
|||||||||||||||||
| ¥585,000,000,000 | €5,149,194,613 | |||||||||||||||||||
|
|
|
|
|
|||||||||||||||||
| Czech Koruna(11)(*) |
|
|||||||||||||||||||
| CZK 2,490,000,000 |
4.36% | 100.00 | October 3, 2007 | October 3, 2017 | CZK 2,490,000,000 | €99,002,027.75 | ||||||||||||||
| CZK 2,490,000,000 |
4.40% | 100.00 | October 3, 2007 | October 3, 2019 | CZK 2,490,000,000 | €99,002,027.75 | ||||||||||||||
| CZK 2,490,000,000 |
4.41% | 100.00 | October 3, 2007 | October 3, 2019 | CZK 2,490,000,000 | €99,002,027.75 | ||||||||||||||
|
|
|
|
|
|||||||||||||||||
| CZK 7,470,000,000 | €297,006,083.3 | |||||||||||||||||||
|
|
|
|
|
|||||||||||||||||
| TOTAL OUTSTANDING |
€60,961,431,169 | |||||||||||||||||||
|
|
|
|||||||||||||||||||
| (1) | U.S. dollar amounts have been converted into euro at $1.3194/€1.00, the exchange rate prevailing at Dec. 31, 2012. |
| (2) | External debt denominated in currencies of countries that have adopted the euro have been converted into euro at the fixed rate at which those currencies were converted into euro upon their issuing countries becoming members of the European Monetary Union. |
| (3) | Starting from 2004 the bonds pay interest at the fixed rate of 3.965%. |
| (4) | 12mEuribor+0.10% from May 2005 to May 2007; CMS10Y from June 2007 to 2035. |
| (5) | After 2010, the bonds will yield a floating rate calculated as follows: 3.523% + 3 * Min [ Max (3.50%—rate swap 20Y; 0.0%); 1.50%] |
| (6) | Bonds issued by Infrastrutture S.p.A. |
| (7) | Swiss Franc amounts have been converted into euro at ChF1.2072/€1.00, the exchange rate prevailing at Dec. 31, 2012. |
| (8) | Pounds Sterling amounts have been converted into euro at £0.81610/€1.00, the exchange rate prevailing at Dec. 31, 2012. |
| (9) | Norwegian Kroner amounts have been converted into euro at NOK7.3483/€1.00, the exchange rate prevailing at Dec. 31, 2012. |
| (10) | Japanese Yen amounts have been converted into euro at ¥113.61/€1.00, the exchange rate prevailing at Dec. 31, 2012. |
| (11) | Czech Koruna amounts have been converted into euro at C25.151/€1.00, the exchange rate prevailing at Dec. 31, 2012. |
| (*) | The above exchange rates are based on the official exchange rates of the Bank of Italy. |
Source: Ministry of Economy and Finance
| As of December 31, 2012 | ||||||||
| Currency |
Before Swap | After Swap | ||||||
| US Dollars |
34.46 | % | 2.87 | % | ||||
|
Euro(1) |
43.39 | % | 97.13 | % | ||||
| Swiss Francs |
4.91 | % | — | |||||
| Pounds Sterling |
5.93 | % | — | |||||
| Norwegian Kroner |
0.54 | % | — | |||||
| Japanese Yen |
10.18 | % | — | |||||
| Czech Koruna |
0.59 | % | — | |||||
|
|
|
|
|
|||||
| Total External Bonds (€ in million) |
50,583 | 49,903 | ||||||
|
|
|
|
|
|||||
| (1) | Excluding Euro ISPA Bonds. |
Source: Ministry of Economy and Finance
69
External Bonds of the Treasury as of September 30, 2013
The following table shows the external bonds of the Treasury issued and outstanding as of September 30, 2013.
| Original Currency Nominal Amount |
Interest Rate | Initial Public Offering Price (%) |
Date of Issue | Maturity Date | Amount Outstanding | Equivalent in Euro |
||||||||||||||
| United States Dollar(1)(*) |
|
|||||||||||||||||||
| $3,500,000,000 |
6.875% | 98.73 | September 27, 1993 | September 27, 2023 | $3,500,000,000 | €2,591,632,729 | ||||||||||||||
| $2,000,000,000 |
5.375% | 98.44 | February 27, 2003 | June 15, 2033 | $2,000,000,000 | €1,480,932,988 | ||||||||||||||
| $4,000,000,000 |
4.50% | 99.41 | January 21, 2005 | January 21, 2015 | $4,000,000,000 | €2,961,865,976 | ||||||||||||||
| $2,000,000,000 |
4.75% | 99.34 | January 25, 2006 | January 25, 2016 | $2,000,000,000 | €1,480,932,988 | ||||||||||||||
| $3,000,000,000 |
5.25% | 99.85 | September 20, 2006 | September 20, 2016 | $3,000,000,000 | €2,221,399,482 | ||||||||||||||
| $2,000,000,000 |
5.38% | 99.37 | June 12, 2007 | June 12, 2017 | $2,000,000,000 | €1,480,932,988 | ||||||||||||||
| $2,500,000,000 |
3.13% | 99.672 | January 26, 2010 | January 26, 2015 | $2,500,000,000 | €1,851,166,235 | ||||||||||||||
|
|
|
|
|
|||||||||||||||||
| $19,000,000,000 | €14,068,863,384 | |||||||||||||||||||
|
|
|
|
|
|||||||||||||||||
| Euro(2) |
|
|||||||||||||||||||
| €60,000,000 |
Floating | 99.61 | October 8, 1998 | October 8, 2018 | €60,000,000 | €60,000,000 | ||||||||||||||
| €300,000,000 |
Floating | 101.43 | October 15, 1998 | October 15, 2018 | €300,000,000 | €300,000,000 | ||||||||||||||
| €1,000,000,000 |
Floating | 99.95 | May 6, 1999 | May 6, 2019 | €1,000,000,000 | €1,000,000,000 | ||||||||||||||
| €1,000,000,000 |
Floating | 101.60 | June 28, 1999 | June 28, 2029 | €905,000,000 | €905,000,000 | ||||||||||||||
| €1,000,000,000 |
Floating | 100.75 | August 30, 1999 | August 30, 2019 | €1,000,000,000 | €1,000,000,000 | ||||||||||||||
| €150,000,000 |
Zero Coupon | 100.00 | February 20, 2001 | February 19, 2031 | €150,000,000 | €150,000,000 | ||||||||||||||
| €3,000,000,000 |
5.750% | 100.04 | July 25, 2001 | July 25, 2016 | €3,000,000,000 | €3,000,000,000 | ||||||||||||||
| €150,000,000 |
Floating | 100.00 | April 26, 2004 | April 26, 2019 | €150,000,000 | €150,000,000 | ||||||||||||||
| €300,000,000 |
Floating | 100.00 | May 31, 2005 | May 31, 2035 | €300,000,000 | €300,000,000 | ||||||||||||||
| €720,000,000 |
3.83% | 100.00 | June 2, 2005 | June 2, 2029 | €720,000,000 | €720,000,000 | ||||||||||||||
| €395,000,000 |
3.75% | 100.00 | June 2, 2005 | June 2, 2030 | €395,000,000 | €395,000,000 | ||||||||||||||
| €200,000,000 |
Floating | 100.00 | June 8, 2005 | June 8, 2020 | €200,000,000 | €200,000,000 | ||||||||||||||
| €2,500,000,000 |
Floating | 100.00 | June 15, 2005 | June 15, 2020 | €2,500,000,000 | €2,500,000,000 | ||||||||||||||
| €300,000,000 |
Floating | 100.00 | June 28, 2005 | June 28, 2021 | €300,000,000 | €300,000,000 | ||||||||||||||
| €200,000,000 |
Floating | 100.00 | November 9, 2005 | November 9, 2025 | €200,000,000 | €200,000,000 | ||||||||||||||
| €900,000,000 |
Floating | 99.38 | March 17, 2006 | March 17, 2021 | €900,000,000 | €900,000,000 | ||||||||||||||
| €1,000,000,000 |
Floating | 99.85 | March 22, 2006 | March 22, 2018 | €1,000,000,000 | €1,000,000,000 | ||||||||||||||
| €192,000,000 |
4.425% | 100.00 | March 28, 2006 | March 28, 2036 | €192,000,000 | €192,000,000 | ||||||||||||||
| €300,000,000 |
Floating | 100.00 | March 30, 2006 | March 29, 2026 | €300,000,000 | €300,000,000 | ||||||||||||||
| €215,000,000 |
Floating | 100.00 | May 11, 2006 | May 11, 2026 | €215,000,000 | €215,000,000 | ||||||||||||||
| €1,000,000,000 |
|
1.85% Inflation Indexed |
|
99.80 | January 5, 2007 | September 15, 2057 | €1,136,000,000 | €1,136,000,000 | ||||||||||||
| €250,000,000 |
|
2.00% Inflation Indexed |
|
99.02 | March 30, 2007 | September 15, 2062 | €284,000,000 | €284,000,000 | ||||||||||||
| €160,000,000 |
4.49% | 99.86 | April 5, 2007 | April 5, 2027 | €160,000,000 | €160,000,000 | ||||||||||||||
| €500,000,000 |
|
2.20% Inflation Indexed |
|
98.86 | January 23, 2008 | September 15, 2058 | €558,000,000 | €558,000,000 | ||||||||||||
| €258,000,000 |
5.26% | 99.79 | March 16, 2009 | March 16, 2026 | €258,000,000 | €258,000,000 | ||||||||||||||
| €300,000,000 |
3.00% | 99,733 | May 29, 2009 | November 29, 2013 | €300,000,000 | €300,000,000 | ||||||||||||||
| €250,000,000 |
4.85% | 98.50 | June 11, 2010 | June 11, 2060 | €250,000,000 | €250,000,000 | ||||||||||||||
| €125,000,000 |
4.10% | 99.46 | September 6, 2010 | November 1, 2023 | €125,000,000 | €125,000,000 | ||||||||||||||
| €125,000,000 |
4.20% | 99.38 | September 6, 2010 | March 3, 2025 | €125,000,000 | €125,000,000 | ||||||||||||||
| €250,000,000 |
Floating | 99.85 | November 11, 2010 | November 11, 2018 | €250,000,000 | €250,000,000 | ||||||||||||||
| €125,000,000 |
2.85% | 99.90 | November 22, 2010 | November 22, 2014 | €125,000,000 | €125,000,000 | ||||||||||||||
| €250,000,000 |
3.70% | 99.66 | November 22, 2010 | May 22, 2018 | €250,000,000 | €250,000,000 | ||||||||||||||
| €125,000,000 |
3.75% | 99.89 | November 22, 2010 | September 1, 2018 | €125,000,000 | €125,000,000 | ||||||||||||||
| €150,000,000 |
3.80% | 99.65 | December 23, 2010 | January 23, 2017 | €150,000,000 | €150,000,000 | ||||||||||||||
| €150,000,000 |
4.45% | 99.40 | December 23, 2010 | December 12, 2021 | €150,000,000 | €150,000,000 | ||||||||||||||
| €517,000,000 |
|
2.85% Inflation Indexed |
|
99.482 | January 4, 2011 | September 1, 2022 | €531,000,000 | €531,000,000 | ||||||||||||
| €450,000,000 |
4.45% | 99.59 | February 26, 2011 | August 24, 2020 | €450,000,000 | €450,000,000 | ||||||||||||||
| €2,156,000,000 |
6.51% | 100 | July 1, 2011 | December 31, 2027 | €2,091,000,000 | €2,091,000,000 | ||||||||||||||
| €250,000,000 |
5.00% | 99.196 | September 22, 2011 | September 22, 2017 | €250,000,000 | €250,000,000 | ||||||||||||||
| €230,000,000 |
|
4.20% Inflation Indexed |
|
100 | February 1, 2012 | July 25, 2042 | €237,000,000 | €237,000,000 | ||||||||||||
| €437,500,000 |
3.444% | 100 | February 13, 2012 | December 31, 2026 | €322,000,000 | €322,000,000 | ||||||||||||||
| €500,000,000 |
4.75% | 99.854 | May 28, 2013 | May 28, 2063 | €500,000,000 | €500,000,000 | ||||||||||||||
| €500,000,000 |
5.050% | 99.526 | September 11, 2013 | September 11, 2053 | €500,000,000 | €500,000,000 | ||||||||||||||
|
|
|
|
|
|||||||||||||||||
| €22,915,000,000 | €22,915,000,000 | |||||||||||||||||||
|
|
|
|
|
|||||||||||||||||
| Euro Ispa Bonds(3) |
|
|||||||||||||||||||
| €1,000,000,000 |
4.50% | 99.387 | February 6, 2004 | July 31, 2014 | €1,000,000,000 | €1,000,000,000 | ||||||||||||||
| €750,000,000 |
|
2.25% Inflation Indexed |
|
99.368 | February 6, 2004 | July 31, 2019 | €906,000,000 | €906,000,000 | ||||||||||||
| €3,250,000,000 |
5.13% | 98.934 | February 6, 2004 | July 31, 2024 | €3,250,000,000 | €3,250,000,000 | ||||||||||||||
| €2,200,000,000 |
5.20% | 105.125 | February 6, 2004 | July 31, 2034 | €2,200,000,000 | €2,200,000,000 | ||||||||||||||
| €850,000,000 |
Floating | 100 | March 4, 2005 | July 31, 2045 | €850,000,000 | €850,000,000 | ||||||||||||||
| €1,000,000,000 |
Floating | 100 | April 25, 2005 | July 31, 2045 | €1,000,000,000 | €1,000,000,000 | ||||||||||||||
| €300,000,000 |
Floating | 100 | June 30, 2005 | July 31, 2035 | €300,000,000 | €300,000,000 | ||||||||||||||
| €100,000,000 |
Floating | 100 | June 30, 2005 | July 31, 2035 | €100,000,000 | €100,000,000 | ||||||||||||||
|
|
|
|
|
|||||||||||||||||
| €9,606,000,000 | €9,606,000,000 | |||||||||||||||||||
|
|
|
|
|
|||||||||||||||||
70
| Original Currency Nominal Amount |
Interest Rate |
Initial Public Offering Price (%) |
Date of Issue | Maturity Date | Amount Outstanding | Equivalent in Euro |
||||||||||||||
| Swiss Franc(4)(*) |
|
|||||||||||||||||||
| ChF 2,000,000,000 |
2.50% | 100.09 | February 2, 2005 | March 2, 2015 | ChF 2,000,000,000 | €1,635,991,820 | ||||||||||||||
| ChF 1,000,000,000 |
2.50% | 99.336 | January 30, 2006 | January 30, 2018 | ChF 1,000,000,000 | €817,995,910 | ||||||||||||||
|
|
|
|
|
|||||||||||||||||
| ChF 3,000,000,000 | € | 2,453,987,730 | ||||||||||||||||||
|
|
|
|
|
|||||||||||||||||
| Pound Sterling(5)(*) |
|
|||||||||||||||||||
| £400,000,000 |
10.50% | 100.875 | April 28, 1989 | April 28, 2014 | £400,000,000 | €478,440,285 | ||||||||||||||
| £1,500,000,000 |
6.00% | 98.565 | August 4, 1998 | August 4, 2028 | £1,500,000,000 | €1,794,151,068 | ||||||||||||||
| £250,000,000 |
5.25% | 99.476 | July 29, 2004 | December 7, 2034 | £250,000,000 | €299,025,178 | ||||||||||||||
| £300,000,000 |
Floating | 100.00 | April 28, 2010 | April 28, 2015 | £300,000,000 | €358,830,214 | ||||||||||||||
|
|
|
|
|
|||||||||||||||||
| £2,450,000,000 | € | 2,930,446,744 | ||||||||||||||||||
|
|
|
|
|
|||||||||||||||||
| Norwegian Kroner(6)(*) |
|
|||||||||||||||||||
| NOK 2,000,000,000 |
4.34% | 100.00 | June 23, 2003 | June 23, 2015 | NOK 2,000,000,000 | €246,487,552 | ||||||||||||||
|
|
|
|
|
|||||||||||||||||
| NOK 2,000,000,000 | € | 246,487,552 | ||||||||||||||||||
|
|
|
|
|
|||||||||||||||||
| Japanese Yen(7)(*) |
|
|||||||||||||||||||
| ¥125,000,000,000 |
5.50% | 100.00 | December 15, 1994 | December 15, 2014 | ¥125,000,000,000 | €948,550,615 | ||||||||||||||
| ¥125,000,000,000 |
4.50% | 100.00 | June 8, 1995 | June 8, 2015 | ¥125,000,000,000 | €948,550,615 | ||||||||||||||
| ¥100,000,000,000 |
3.70% | 100.00 | November 14, 1996 | November 14, 2016 | ¥100,000,000,000 | €758,840,492 | ||||||||||||||
| ¥100,000,000,000 |
3.45% | 99.80 | March 24, 1997 | March 24, 2017 | ¥100,000,000,000 | €758,840,492 | ||||||||||||||
| ¥25,000,000,000 |
2.87% | 100.00 | May 18, 2006 | May 18, 2036 | ¥25,000,000,000 | €189,710,123 | ||||||||||||||
| ¥50,000,000,000 |
Floating | 100.00 | April 24, 2008 | April 24, 2018 | ¥50,000,000,000 | €379,420,246 | ||||||||||||||
| ¥30,000,000,000 |
Floating | 100.00 | July 8, 2009 | July 8, 2019 | ¥30,000,000,000 | €227,652,148 | ||||||||||||||
| ¥30,000,000,000 |
Floating | 100.00 | September 18, 2009 | September 18, 2019 | ¥30,000,000,000 | €227,652,148 | ||||||||||||||
|
|
|
|
|
|||||||||||||||||
| ¥585,000,000,000 | € | 4,439,216,879 | ||||||||||||||||||
|
|
|
|
|
|||||||||||||||||
| Czech Koruna(8)(*) |
|
|||||||||||||||||||
| CZK 2,490,000,000 |
4.36% | 100.00 | October 3, 2007 | October 3, 2017 | CZK 2,490,000,000 | €96,774,194 | ||||||||||||||
| CZK 2,490,000,000 |
4.40% | 100.00 | October 3, 2007 | October 3, 2019 | CZK 2,490,000,000 | €96,774,194 | ||||||||||||||
| CZK 2,490,000,000 |
4.41% | 100.00 | October 3, 2007 | October 3, 2019 | CZK 2,490,000,000 | €96,774,194 | ||||||||||||||
|
|
|
|
|
|||||||||||||||||
| CZK 7,470,000,000 | € | 290,322,582 | ||||||||||||||||||
|
|
|
|
|
|||||||||||||||||
| TOTAL OUTSTANDING |
|
€56,950,324,871 | ||||||||||||||||||
|
|
|
|||||||||||||||||||
| (1) | U.S. dollar amounts have been converted into euro at $1.3505/€1.00, the exchange rate prevailing at September 30, 2013. |
| (2) | External debt denominated in currencies of countries that have adopted the euro have been converted into euro at the fixed rate at which those currencies were converted into euro upon their issuing countries becoming members of the European Monetary Union. |
| (3) | Bonds issued by Infrastrutture S.p.A. |
| (4) | Swiss Franc amounts have been converted into euro at ChF1.2225/€1.00, the exchange rate prevailing at September 30, 2013. |
| (5) | Pounds Sterling amounts have been converted into euro at £0.83605/€1.00, the exchange rate prevailing at September 30, 2013. |
| (6) | Norwegian Kroner amounts have been converted into euro at NOK8.1140/€1.00, the exchange rate prevailing at September 30, 2013. |
| (7) | Japanese Yen amounts have been converted into euro at ¥131.78/€1.00, the exchange rate prevailing at September 30, 2013. |
| (8) | Czech Koruna amounts have been converted into euro at C25.730/€1.00, the exchange rate prevailing at September 30, 2013. |
| (*) | The above exchange rates are based on the official exchange rates of the Bank of Italy. |
71