EX-99.2
Strategic Actions to Maximize
Shareholder Value January 26, 2016 AIG is requesting confidential treatment and the information is being submitted pursuant to 12 U.S.C. § 1828(x). AIG does not waive its rights with respect to any privileged documents. Further, these documents
contain confidential and proprietary commercial and financial information and trade secrets and, accordingly, are exempt from disclosure under the Freedom of Information Act. AIG requests that it be notified pursuant to FRBNY policy if the FRBNY is
requested to disclose any information that AIG has shared with the FRBNY and further requests that it be afforded an opportunity to object to disclosure. AIG further requests that any other U.S., State or non-U.S. regulator that receives these
documents keep them confidential pursuant to its respective freedom of information laws and regulations (or similar legal requirements). AIG requests that it be notified if such regulator is requested to disclose information contained in these
documents and requests that it be afforded an opportunity to object to disclosure. Please send notification of requests for disclosure to AIG at 175 Water Street, New York, New York, 10038, Attn: Corporate Secretary. If you are not the intended
recipient of these materials, you are hereby notified that any copying, distribution or use of any of its contents is strictly prohibited and you are requested to destroy these materials immediately and notify AIG at the address above or by
telephone at (212) 770-7000. Exhibit 99.2

Cautionary Statement Regarding Forward
Looking Information and Other Matters This document and the remarks made within this presentation include, and officers and representatives of American International Group, Inc. (AIG) may from time to time make, projections, goals, assumptions and
statements that may constitute “forward-looking statements” within the meaning of the Private Securities Litigation Reform Act of 1995. These projections, goals, assumptions and statements are not historical facts but instead represent
only AIG’s belief regarding future events, many of which, by their nature, are inherently uncertain and outside AIG’s control. These projections, goals, assumptions and statements include statements preceded by, followed by or including
words such as “will,” “believe,” “anticipate,” “expect,” “intend,” “plan,” “view,” “target,” "goal" or “estimate.” It is possible that
AIG’s actual results and financial condition will differ, possibly materially, from the results and financial condition indicated in these projections, goals, assumptions and statements. Factors that could cause AIG’s actual results to
differ, possibly materially, from those in the specific projections, goals, assumptions and statements include: changes in market conditions; the occurrence of catastrophic events, both natural and man-made; significant legal proceedings; the timing
and applicable requirements of any new regulatory framework to which AIG is subject as a nonbank systemically important financial institution and as a global systemically important insurer; concentrations in AIG’s investment portfolios;
actions by credit rating agencies; judgments concerning casualty insurance underwriting and insurance liabilities; judgments concerning the recognition of deferred tax assets; judgments concerning estimated restructuring charges and estimated cost
savings; completion of the year end audit process; and such other factors discussed in Part I, Item 2. Management’s Discussion and Analysis of Financial Condition and Results of Operations (MD&A) and Part II, Item 1A. Risk Factors in
AIG’s Quarterly Report on Form 10-Q for the quarterly period ended September 30, 2015, Part I, Item 2. MD&A in AIG’s Quarterly Report on Form 10-Q for the quarterly period ended June 30, 2015, Part I, Item 2. MD&A in AIG’s
Quarterly Report on Form 10-Q for the quarterly period ended March 31, 2015 and Part I, Item 1A. Risk Factors and Part II, Item 7. MD&A in AIG’s Annual Report on Form 10-K for the year ended December 31, 2014. AIG is not under any
obligation (and expressly disclaims any obligation) to update or alter any projections, goals, assumptions or other statements, whether written or oral, that may be made from time to time, whether as a result of new information, future events or
otherwise. This document and the remarks made orally may also contain certain non-GAAP financial measures. The reconciliation of such measures to the most comparable GAAP measures in accordance with Regulation G is included in the Appendix to this
presentation. Nothing in this presentation or in any oral statements made in connection with this presentation is intended to constitute, nor shall it be deemed to constitute, an offer of any securities for sale or the solicitation of an offer to
purchase any securities in any jurisdiction.

Vision for AIG “Today, AIG
announces steps to narrow its focus, improve its financial performance, and return capital to shareholders. While we take these steps to maximize shareholder value, we continue to think holistically about all of our stakeholders. Importantly, we are
committed to being our clients’ most valued insurer.” Peter D. Hancock, President and CEO “AIG is committed to serving all its stakeholders by: i) delivering first quartile total shareholder return to its shareholders, ii)
providing risk expertise and dependable long-term balance sheet strength for its customers, iii) having a culture of strict adherence to both the letter and spirit of regulatory requirements; and iv) maintaining an environment that attracts and
retains world class employees.” “Over the past several years, AIG has had superior total shareholder returns, and tens of billions of dollars have been unlocked for shareholders. The Board and management are committed to continuing to
deliver shareholder value.” Douglas M. Steenland, Non-Executive Chairman

AIG Announces Actions to Create a
Leaner, More Profitable and Focused Insurer 2016-2017 Board Approved Actions Return at least $25 bn of capital to shareholders Pursue an active divestiture program, including initially the 19.9% IPO of UGC as first step towards full separation and
sale of AIG Advisor Group, while preserving the value of deferred tax assets Could consider separation of even larger modular business units of the Commercial and Consumer segments over time with deferred tax asset (DTA) utilization, contingent on
improvements in the credit risk profile and operating performance Strategic Actions Reorganizing operating model into “modular”, self-contained business units to enhance transparency and accountability, driving performance improvement
and strategic flexibility over time Introduce new Legacy Portfolio, including the 28% capital allocated, to enhance transparency and highlight the progress to over 10% ROE by 2017 for Operating Portfolio Organizational Changes Reduce firmwide
general operating expenses (GOE) (1) by $1.6 bn Improve Commercial P&C accident year loss ratio (1) by 6 points Operating Improvements Notes: (1) Non-GAAP financial measure. See appendix.

Return Significant Capital to Our
Shareholders in 2016-2017 Projected Sources for 2016-2017 Capital Return Goal ($ bn) Return at least $25 bn of capital to shareholders through dividends and share repurchases Capital return goal can be achieved notwithstanding strengthening of
reserves in 4Q’15 (3) (4) Notes: (1) Dividends and tax-sharing payments (including monetization of deferred tax asset) to Parent, net of Parent operating expenses, debt interest expense, and capital contributions. (2) Includes 19.9% IPO of
UGC. (3) Series of reinsurance transactions on certain books of life insurance liabilities in process. (4) Contingent on improvements in operating performance and interest coverage. (5) Plan to monetize a significant portion of our hedge fund
investments to reduce capital charges and increase projected distributions. (5) (1) (2)
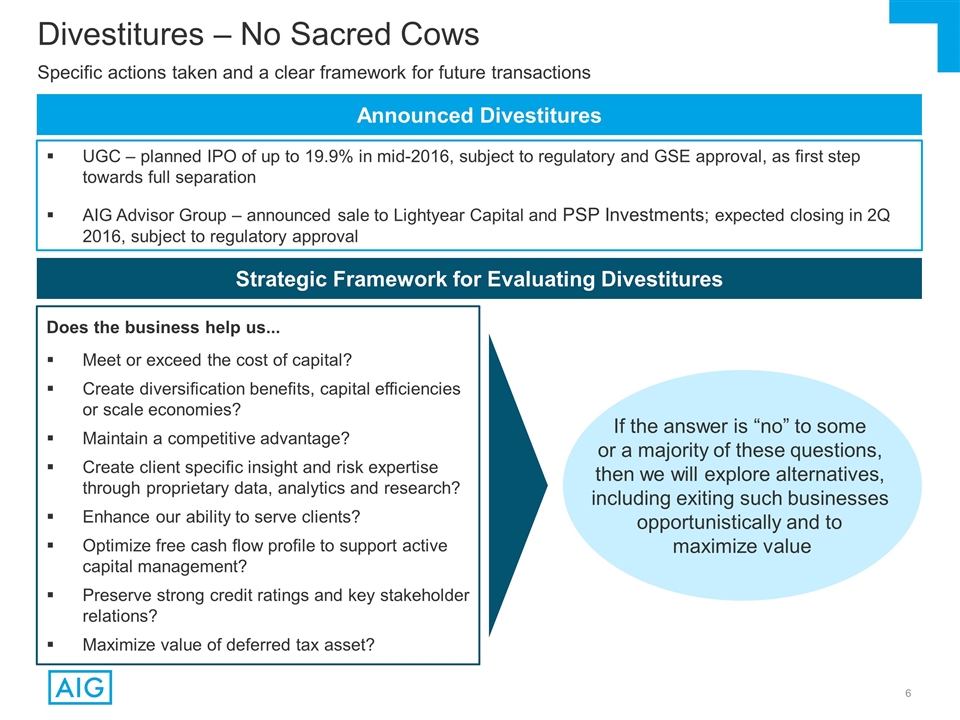
UGC – planned IPO of up to 19.9%
in mid-2016, subject to regulatory and GSE approval, as first step towards full separation AIG Advisor Group – announced sale to Lightyear Capital and PSP Investments; expected closing in 2Q 2016, subject to regulatory approval Divestitures
– No Sacred Cows Announced Divestitures Does the business help us... Meet or exceed the cost of capital? Create diversification benefits, capital efficiencies or scale economies? Maintain a competitive advantage? Create client specific insight
and risk expertise through proprietary data, analytics and research? Enhance our ability to serve clients? Optimize free cash flow profile to support active capital management? Preserve strong credit ratings and key stakeholder relations? Maximize
value of deferred tax asset? Strategic Framework for Evaluating Divestitures Specific actions taken and a clear framework for future transactions If the answer is “no” to some or a majority of these questions, then we will explore
alternatives, including exiting such businesses opportunistically and to maximize value

Substantial Expense Reductions Reduce
GOE by an additional ~$1.6 bn by 2017 (~$1.4 bn net of reinvestments), while preserving our focus on customers and strong controls Gross reductions represent 14% of 2015 GOE over two-year period Operating GOE (1) ($ bn) Selected 2016-2017 Actions
Continue to consolidate activities and de-layer Increase utilization of shared services and outsourcing Continue to move operations to lower-cost locations Further increase automation ~$1.6 bn expense reduction Notes: (1) Non-GAAP financial measure.
See appendix. $11.1 – 11.2

Specific Actions to Improve Commercial
P&C Loss Ratio Recent investments in systems and analytic tools enable us to pursue more aggressive initiatives Expand and optimize the use of reinsurance and other risk mitigating strategies Address unprofitable single and two-product clients
Accelerate micro-segmentation of risks using internal and external data Exit or remediate targeted sub-segments of underperforming portfolios Narrow geographic footprint while continuing to maintain and improve multinational capabilities Accident
year loss ratio (1) improvement of 4 points by 2016 and cumulative 6 points by 2017 Notes: (1) Non-GAAP financial measure. See appendix.
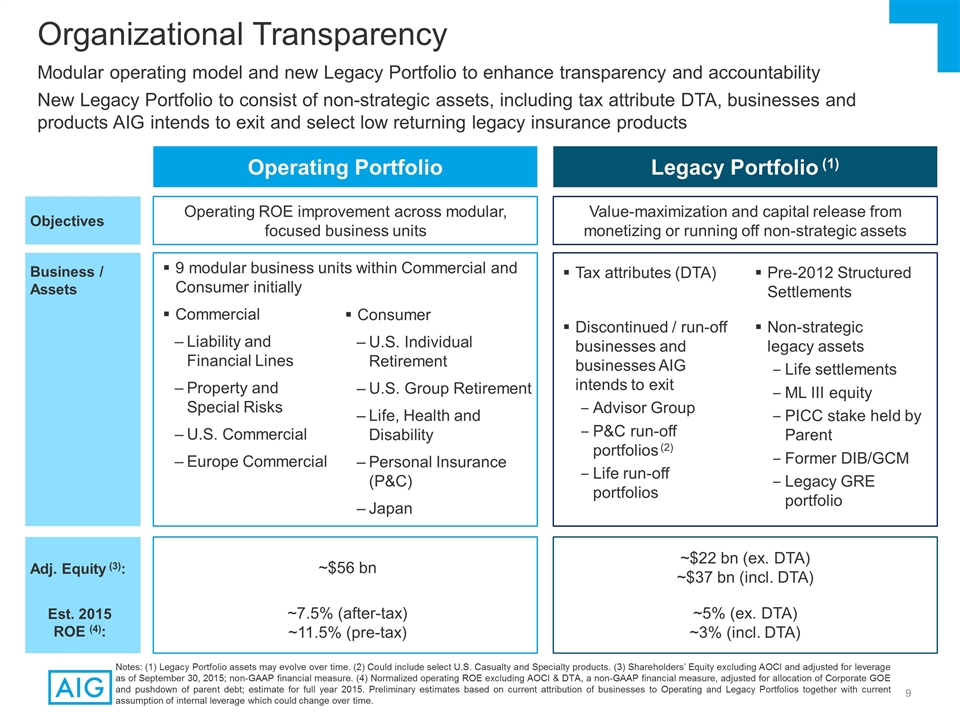
Organizational Transparency Operating
Portfolio Legacy Portfolio (1) Objectives Value-maximization and capital release from monetizing or running off non-strategic assets Operating ROE improvement across modular, focused business units Notes: (1) Legacy Portfolio assets may evolve over
time. (2) Could include select U.S. Casualty and Specialty products. (3) Shareholders’ Equity excluding AOCI and adjusted for leverage as of September 30, 2015; non-GAAP financial measure. (4) Normalized operating ROE excluding AOCI & DTA,
a non-GAAP financial measure, adjusted for allocation of Corporate GOE and pushdown of parent debt; estimate for full year 2015. Preliminary estimates based on current attribution of businesses to Operating and Legacy Portfolios together with
current assumption of internal leverage which could change over time. Modular operating model and new Legacy Portfolio to enhance transparency and accountability New Legacy Portfolio to consist of non-strategic assets, including tax attribute DTA,
businesses and products AIG intends to exit and select low returning legacy insurance products Business / Assets Tax attributes (DTA) Discontinued / run-off businesses and businesses AIG intends to exit Advisor Group P&C run-off portfolios (2)
Life run-off portfolios Pre-2012 Structured Settlements Non-strategic legacy assets Life settlements ML III equity PICC stake held by Parent Former DIB/GCM Legacy GRE portfolio 9 modular business units within Commercial and Consumer initially
Commercial Liability and Financial Lines Property and Special Risks U.S. Commercial Europe Commercial Consumer U.S. Individual Retirement U.S. Group Retirement Life, Health and Disability Personal Insurance (P&C) Japan Adj. Equity (3): ~7.5%
(after-tax) ~11.5% (pre-tax) ~5% (ex. DTA) ~3% (incl. DTA) Est. 2015 ROE (4): ~$56 bn ~$22 bn (ex. DTA) ~$37 bn (incl. DTA)

Clear and Achievable Financial
Targets Operating Portfolio Legacy Portfolio (1) Consolidated ~$14 bn ~$23 bn 10.3 - 10.7% 9.3 - 9.7% ~9% 8.4 - 8.9% (2) (2) Notes: (1) Legacy Portfolio assets may evolve over time. (2) Normalized operating ROE excluding AOCI & DTA, a non-GAAP
financial measure. Operating Portfolio normalized operating ROE adjusted for allocation of Corporate GOE and pushdown of parent debt. See appendix. (3) Average Shareholders’ Equity excluding AOCI & DTA and adjusted for the allocation of
Corporate GOE and pushdown of parent debt to the Operating Portfolio; non-GAAP financial measure. (2) (2) Consolidated Operating ROE of ~9% by 2017, reflecting 10.3 - 10.7% in the Operating Portfolio Legacy Portfolio (1) is a source of capital
release totaling ~$9 bn by 2017 (3) (3)

Our Actions Maximize Value for
Shareholders A near-term break-up of AIG would detract from shareholder value Less capital would be available for distribution to shareholders because of loss of diversification benefits Loss of value from DTA, including ability to utilize foreign
tax credits Non-bank SIFI designation not currently a binding capital constraint and designation does not impose significant incremental compliance costs 2016-2017 Strategic Plan Maximizes Value for Shareholders Strategic Actions Organizational
Changes Operating Improvements Capital return Divestitures Modular operating model Legacy Portfolio GOE reductions Commercial P&C underwriting

Appendix – Supporting
Materials General Operating Expense ReductionsPage 13 Commercial Insurance – Operating ActionsPage 14 Consumer Insurance – Operating ActionsPage 15 Legacy Portfolio – BackgroundPage 16 Allocation of Shareholders' Equity to
Operating and Legacy BusinessesPage 17 Capital Position and FrameworkPage 18 Additional P&C Reserve DetailPages 19-21 Diversification Represents an Import Source of Value for AIG’s ShareholdersPage 22 DTAs are an Important Source of
Liquidity and Capital Supporting Capital Management Page 23 Impact of Potential Separation on DTA Page 24 AIG’s Regulatory EnvironmentPage 25 AIG’s Risk ProfilePage 26 2015 Short- and Long-Term Incentive Compensation Page 27 Strong
Alignment Across OrganizationPage 28 Potential Risks to Meeting Our ObjectivesPage 29

Actions have been announced or are
planned to drive Operating GOE reductions General Operating Expense Reductions Action Taken to Date or Currently Underway Will Start Being Realized in Early 2016 Reduced staff by ~300 of top 1,400 employees, ~$250 mm annual run rate savings
beginning in Q1 2016 Additional staff reductions planned in 2016 will generate at least ~$250 mm in additional run-rate savings Froze the pension plan, ~$100 mm annual savings Migrated ~1,300 employees to shared services centers in lower-labor-cost
geographies since 2014. More planned for 2016, which is expected to increase the total to ~6,300 Consolidated policy offerings in Japan and aligning distribution channels in the US 2016 Quarterly Expense Trends Annualized Total Direct Compensation
(1) …driven primarily by people-related expenses, the largest component of Operating GOE Actions are projected to impact expense trends throughout the year… $6.3 bn $5.7 bn $5.3 bn Notes: (1) Total annualized fixed and variable
compensation including benefits. $2.8B $2.6B Quarterly Average

Client Focus Refine our focus on
client segmentation Successful execution in these areas and other AIG-wide initiatives expected to produce the following benefits by 2017: ~+$1.2 bn PTOI Accident year loss ratio (1) improvement of 6 points Portfolio “Exits” Exit or
remediate targeted sub-segments of underperforming portfolios Reinsurance Expand current utilization of reinsurance and other risk mitigating strategies to further enhance capital efficiencies Risk Selection Accelerate micro-segmentation to improve
the quality of remaining risks Commercial Insurance – Operating Actions Actions to sharpen Commercial focus will improve profitability Maintain and Improve Take Action Grow Geographic Footprint Narrow geographic footprint while continuing to
maintain and improve multinational capabilities Commercial GPW for Clients Purchasing at Least One U.S. Casualty Policy Notes: (1) Non-GAAP financial measure. See appendix.

Actions to sharpen Consumer focus
will improve profitability Leverage Successes Japan Reinsurance Expand on successes in High Net Worth and Service businesses Reduce Footprint Successful execution in these areas and other AIG-wide initiatives expected to produce the following
benefit by 2017: ~+$0.8 bn PTOI 2010A 2015A 2017E Individual 71 62 15 Group 81 66 35 Number of Countries Selling Personal Insurance Reduce Personal Insurance footprint to 15 countries for individual products Expand reinsurance utilization for
inefficient segments of U.S. Life business Achieve a large majority of benefits from transformation of Japan U.S. Retirement Absorb impact of proposed DOL(1) rules; invest in most attractive post-DOL opportunities across the market Consumer
Insurance – Operating Actions Notes: (1) Department of Labor.
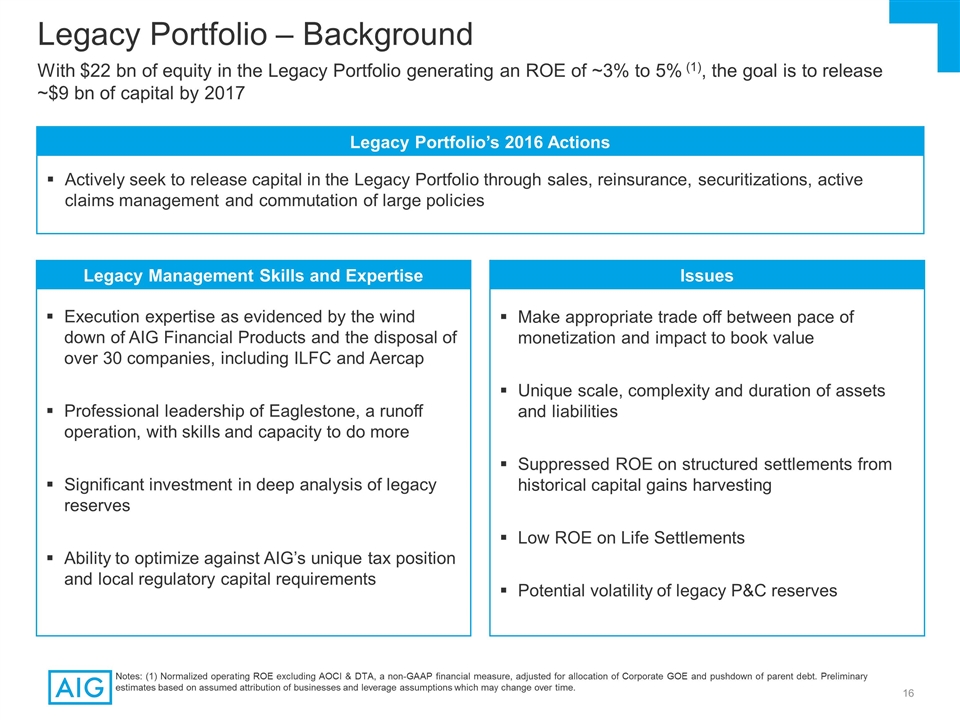
With $22 bn of equity in the Legacy
Portfolio generating an ROE of ~3% to 5% (1), the goal is to release ~$9 bn of capital by 2017 Legacy Management Skills and Expertise Issues Execution expertise as evidenced by the wind down of AIG Financial Products and the disposal of over 30
companies, including ILFC and Aercap Professional leadership of Eaglestone, a runoff operation, with skills and capacity to do more Significant investment in deep analysis of legacy reserves Ability to optimize against AIG’s unique tax
position and local regulatory capital requirements Make appropriate trade off between pace of monetization and impact to book value Unique scale, complexity and duration of assets and liabilities Suppressed ROE on structured settlements from
historical capital gains harvesting Low ROE on Life Settlements Potential volatility of legacy P&C reserves Legacy Portfolio’s 2016 Actions Actively seek to release capital in the Legacy Portfolio through sales, reinsurance,
securitizations, active claims management and commutation of large policies Legacy Portfolio – Background Notes: (1) Normalized operating ROE excluding AOCI & DTA, a non-GAAP financial measure, adjusted for allocation of Corporate GOE and
pushdown of parent debt. Preliminary estimates based on assumed attribution of businesses and leverage assumptions which may change over time.

Allocation of Shareholders' Equity
to Operating and Legacy Portfolios Operating Portfolio – Shareholders' Equity Excluding AOCI ($ bn) Legacy Portfolio – Shareholders' Equity Excluding AOCI ($ bn) (1) (2) (1) (2) (3) Notes: (1) September 30, 2015 AIG Shareholders’
Equity (excluding AOCI) as reported in the 3rd quarter Financial Supplement. (2) Levers the operating portfolio to 20% for Non-life and 25% for Life (calculated as Financial Debt + Hybrid Debt / Total Capital) by transferring in a portion of parent
financial debt. (3) Represents U.S. tax attributes related to net operating loss and foreign tax credit carryforwards. Amounts are estimates based on projections of full year attribute utilization.

Capital Position and Framework We
manage leverage, coverage and liquidity at the Parent and the operating subsidiaries to target levels while meeting the constraints from multiple regulatory and rating agencies Business Unit Capital / Liquidity ($ bn) Capital / Liquidity Targets 3Q
2015 Target Comment P&C U.S. Pool RBC (1) 401% 400 - 420% In range L&R RBC (1)(2) 497% 425 - 470% Moving into range in 2016/2017 Debt to Total Capital 16.8% 20 - 25% Move up as operating income increases to support fixed charge coverage
ratio Parent liquidity assets $11 bn $6 - 8 bn Covers annual operating cash flow, dividends, interest and contingent capital needs Insurance Company Regimes (3) Rating Agencies Consolidated Company Regulator NAIC across 50 states Japan UK Canada
Moody’s S&P A.M. Best Federal Reserve IAIS / FSB Regime RBC SMR Solvency II MCT Local Capital by Legal Entity Consol. Model BCAR TBD BCR / HLA / ICS Notes: (1) Estimated for 3Q 2015. The inclusion of RBC measures is intended solely for the
information of investors and is not intended for the purpose of ranking any insurance company or for use in connection with any marketing, advertising or promotional activities. (2) Excludes AGC Life for 3Q 2015. (3) Not a fully inclusive list of
regulators; regimes include countries where AIG has the largest operations.

AIG continues to broaden and enhance
methods and assumptions to better inform the Company’s best estimate for reserves with the objective of mitigating the degree of volatility around the selected best estimate. Of the $3.6 billion reserve strengthening: 35% is attributable to
accident years 2004 and prior Reflects significant deterioration in certain class action claims that have complex coverage issues Updates to industry asbestos-related assumptions impacted the run-off portfolio 41% is attributable to accident years
2011-2014 After a reserve strengthening of $400 million, Financial Lines and International Casualty remain above AIG’s current profitability targets U.S. and Canada Casualty represents $1 billion of the reserve strengthening Approximately half
relates to updated assumptions informed by AIG’s current view of the trend for older accident years The other half is primarily attributable to a higher number of severe losses ($ in Billions) Fourth Quarter 2015 Prior Year Development AIG
strengthened Non-Life reserves by $3.6 bn, or 6% of its $58.3 bn (1) carried reserves as of September 30, 2015. Accident years 2005-2014 represent $2.3 bn, resulting in an increase in the overall accident year loss ratio in this period by 0.7
points on average Notes: (1) Includes Mortgage Guaranty. (2) Run-off contains retained asbestos and environmental exposures as well as other run-off divisions. All Other is predominantly International Casualty business. (2) (2)

Reduced exposure in long-tailed U.S.
Casualty will assist in reducing reserve estimation volatility. U.S. Casualty Actions Related to Prior Year Development AIG has taken significant actions to mitigate U.S. Casualty exposures since 2011, and in 2016 AIG has aggressively accelerated
the pace of remediation and exits from targeted underperforming sub-segments NPE AY LR Adjusted for Prior Year Development (3Q15) AY LR Adjusted for Prior Year Development (4Q15) Notes: (1) Accident year loss ratio adjusted for prior year
development represents reported accident year loss ratios adjusted to exclude catastrophe losses and reflect prior year development in the appropriate accident year. The 3Q15 ratios are based on prior year development through September 30, 2015,
while the 4Q15 ratio reflects development for the full year including the fourth quarter strengthening. U.S. Casualty Actions: 2011-2015 Reduced writings in U.S. Casualty by 30%, shifting the mix of business toward shorter tail exposures Exited
substantially all stand-alone excess workers’ compensation, one of the highest risk lines of business Achieved aggregate rate change of +20% since 2011 Transferred $1.5 billion of reserves on runoff business to Eaglestone for active runoff and
capital management since the initial transfer U.S. Casualty Actions in Progress: 2016-2017 Cease writing business in targeted sub-segments of underperforming portfolios Aggressive underwriting remediation, including revisiting rates, terms and
conditions in underperforming portfolios Continue to enhance and enforce loss mitigation actions U.S. Casualty Accident Year Loss Ratio Adjusted for Prior Year Development (1)

Continued Improvement in AIG
Commercial Accident Year Loss Ratio AIG’s Commercial Accident Year Loss Ratio improvement trajectory continues despite the reserve strengthening. Total Commercial Accident Year Loss Ratio Adjusted for Prior Year Development (1) Notes: (1)
Accident year loss ratio adjusted for prior year development represents reported accident year loss ratios adjusted to exclude catastrophe losses and reflect prior year development in the appropriate accident year. The 3Q15 ratios are based on prior
year development through September 30, 2015, while the 4Q15 ratio reflects development for the full year including the fourth quarter strengthening. 21

Diversification Represents an
Important Source of Value for AIG’s Shareholders Shareholders have much more to lose from underestimating diversification benefits than to gain from actions that reduce diversification such as separating AIG’s businesses Insurance is by
its nature a risk aggregation business To ensure that clients have confidence buying new insurance – and having their claims paid – an insurer must carefully manage risk Three principal tools to manage this risk: (1) diversification, (2)
reinsurance and (3) conservative reserve and capital levels The costs, benefits and practicality of each method is a function of the size and duration of the underlying risks Given its history, AIG has a unique portfolio of risks including large and
long duration casualty P&C exposures Regulators play an important role ensuring companies prudently manage risk on behalf of policyholders Ability to veto strategies that endanger policyholders, including limiting dividends from regulated
insurance companies AIG actively utilizes reinsurance, however diversification has been a more practical and cost effective way to manage risk Following dramatic actions to reduce overall risk since 2008, U.S. life and retirement remains the most
sizable source of diversification for our long-term casualty P&C risks Separating life & retirement would remove this important source of diversification and negatively impact shareholder value In order to prudently manage risk on behalf of
all its stakeholders following a separation, AIG would need to purchase significantly more reinsurance (at a high cost) and/or hold more equity capital in our insurance companies – reducing both ROE and the amount of capital returned to
shareholders Based on internal estimates, the recent IAIS Insurance Capital Standard field test and S&P’s capital model, the capital diversification benefit between AIG’s Life and Non-Life businesses is between $5bn and $10bn
Standardized models indicate sizable quantitative diversification benefits, but do not fully capture the qualitative benefits given the scale and nature of AIG's portfolio This cost from the loss of diversification benefit is in addition to the
significant tax friction associated with a separation

DTAs are an Important Source of
Liquidity and Capital Supporting Capital Management Tax attribute DTAs are principally composed of net operating loss deductions (NOLs) and credits for foreign taxes paid (FTCs) As of 12/31/15, AIG estimates that it has tax attribute DTAs totaling
approximately $16.7 bn, including $5.3 bn relating to FTCs and $11.4 bn relating to NOLs AIG is actively pursuing strategies to protect the value of the DTA and accelerate the use of FTCs before they expire NOLs are first applied to 100% of non-life
taxable income and up to 35% of life taxable income Thereafter, the tax on the remaining life taxable income can be offset by FTCs Annual FTC utilization is limited by foreign source income and current year FTCs are utilized before any carryovers
AIG estimates that the tax attribute DTAs will be utilized over the next 6 to 7 years, and all prior to any expiration (1) Based upon business strategies and planning, AIG expects ~$2.0-2.5 bn FTC utilization over the next 2 years (1) Utilization of
Tax Attributes Key Facts Notes: (1) This forecast is based on assumptions about the timing of implementation and size of business and tax strategies, future macroeconomic and AIG-specific conditions and events, and other matters. To the extent
actual experience differs or strategies are implemented or abandoned, AIG’s taxes and the timing of utilization of AIG’s tax attributes could be materially affected.
Impact of Potential Separation on
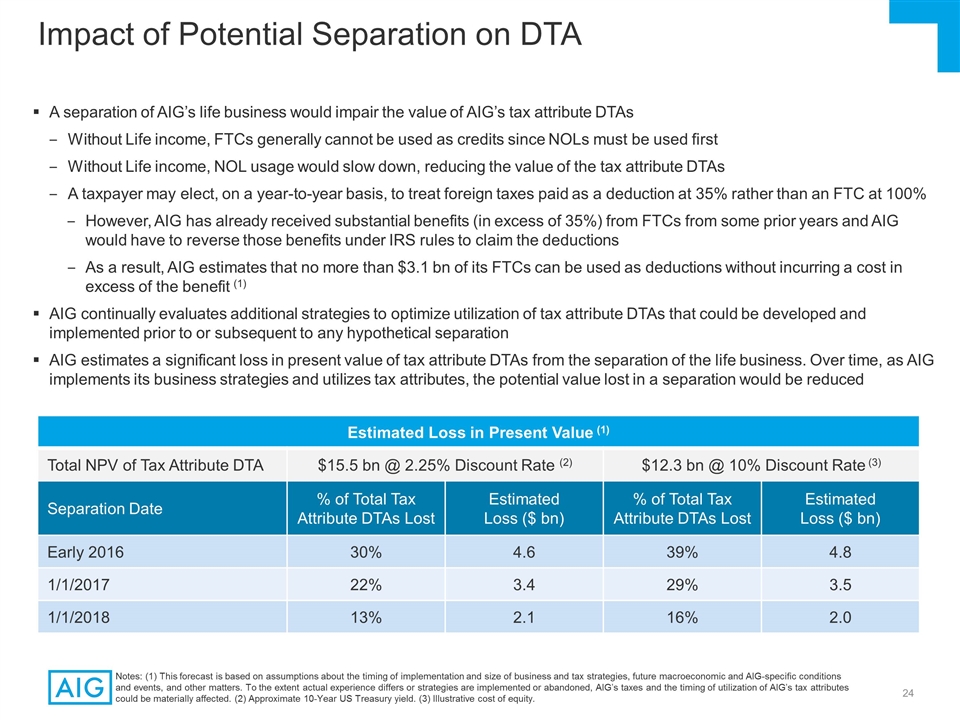
DTA A separation of AIG’s life business would impair the value of AIG’s tax attribute DTAs Without Life income, FTCs generally cannot be used as credits since NOLs must be used first Without Life income, NOL usage would slow down,
reducing the value of the tax attribute DTAs A taxpayer may elect, on a year-to-year basis, to treat foreign taxes paid as a deduction at 35% rather than an FTC at 100% However, AIG has already received substantial benefits (in excess of 35%) from
FTCs from some prior years and AIG would have to reverse those benefits under IRS rules to claim the deductions As a result, AIG estimates that no more than $3.1 bn of its FTCs can be used as deductions without incurring a cost in excess of the
benefit (1) AIG continually evaluates additional strategies to optimize utilization of tax attribute DTAs that could be developed and implemented prior to or subsequent to any hypothetical separation AIG estimates a significant loss in present value
of tax attribute DTAs from the separation of the life business. Over time, as AIG implements its business strategies and utilizes tax attributes, the potential value lost in a separation would be reduced Notes: (1) This forecast is based on
assumptions about the timing of implementation and size of business and tax strategies, future macroeconomic and AIG-specific conditions and events, and other matters. To the extent actual experience differs or strategies are implemented or
abandoned, AIG’s taxes and the timing of utilization of AIG’s tax attributes could be materially affected. (2) Approximate 10-Year US Treasury yield. (3) Illustrative cost of equity. Estimated Loss in Present Value (1) Total NPV of Tax
Attribute DTA $15.5 bn @ 2.25% Discount Rate (2) $12.3 bn @ 10% Discount Rate (3) Separation Date % of Total Tax Attribute DTAs Lost Estimated Loss ($ bn) % of Total Tax Attribute DTAs Lost Estimated Loss ($ bn) Early 2016 30% 4.6 39% 4.8 1/1/2017
22% 3.4 29% 3.5 1/1/2018 13% 2.1 16% 2.0
AIG’s Regulatory Environment
Global insurance enterprises are subject to group-wide consolidated supervision by one of its primary regulators. Therefore, even if AIG were no longer designated as a non-bank SIFI, it would still be subject to the remaining layers of regulation
AIG is regulated by the Federal Reserve as a non-bank SIFI under Dodd-Frank and certain other federal agencies, by the insurance departments of 50 U.S. states and the District of Columbia, and by the insurance and financial conduct regulators in
over 80 non-U.S. jurisdictions In addition, AIG has been designated as a global systemically important insurer (G-SII) by the Financial Stability Board and qualifies as an internationally active insurance group subject to certain international
prudential standards, including evolving capital standards Designation as a non-bank SIFI or G-SIl is based not only on size but also on complexity, activities, and interconnectedness with and perceived impact on the global financial
infrastructure

AIG’s Risk Profile Total
Assets ($ bn) Total Gross Notional Derivatives ($ bn) (1) Leverage Ratio (x) (2) VA Assets / Total Equity (3) Notes: Figures are as of Sep 30, 2015. (1) Calculated as sum of the gross notional amounts of derivative assets and liabilities. AIG data
includes derivatives for portfolio hedging purposes. (2) Calculated as Total Assets ex. Separate Account Assets / Shareholders’ Equity. (3) Calculation based on: Total VA Assets as reported in J.P. Morgan 12/1/15 Equity Research report divided
by Total Equity. AIG has a lower risk profile than other non-bank SIFIs across key metrics
2015 Short- and Long-Term Incentive
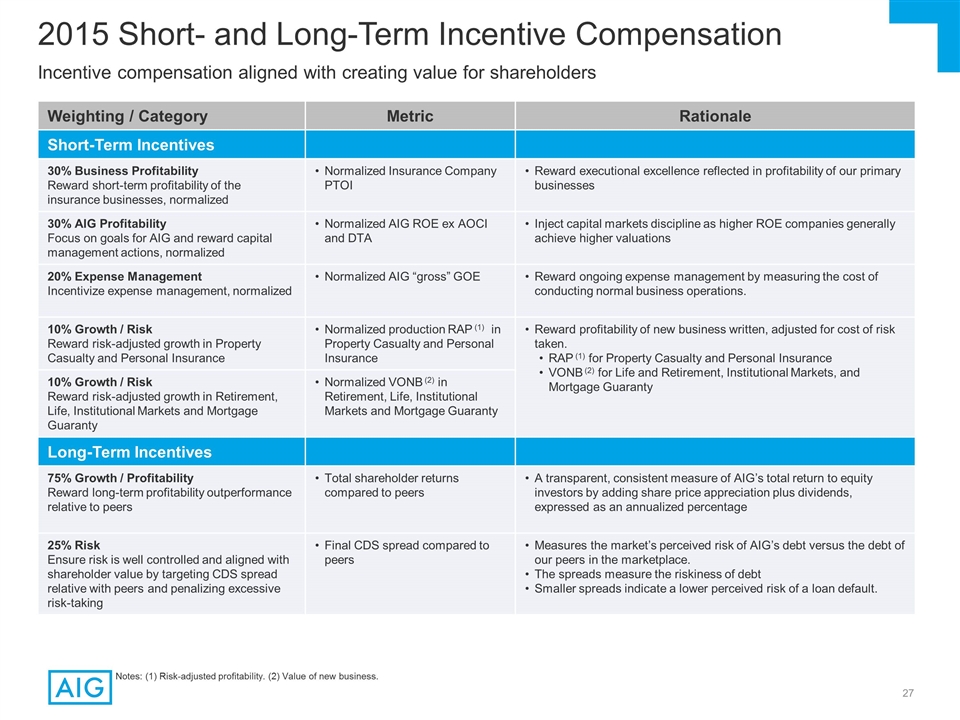
Compensation Weighting / Category Metric Rationale Short-Term Incentives 30% Business Profitability Reward short-term profitability of the insurance businesses, normalized Normalized Insurance Company PTOI Reward executional excellence reflected in
profitability of our primary businesses 30% AIG Profitability Focus on goals for AIG and reward capital management actions, normalized Normalized AIG ROE ex AOCI and DTA Inject capital markets discipline as higher ROE companies generally achieve
higher valuations 20% Expense Management Incentivize expense management, normalized Normalized AIG “gross” GOE Reward ongoing expense management by measuring the cost of conducting normal business operations. 10% Growth / Risk Reward
risk-adjusted growth in Property Casualty and Personal Insurance Normalized production RAP (1) in Property Casualty and Personal Insurance Reward profitability of new business written, adjusted for cost of risk taken. RAP (1) for Property Casualty
and Personal Insurance VONB (2) for Life and Retirement, Institutional Markets, and Mortgage Guaranty 10% Growth / Risk Reward risk-adjusted growth in Retirement, Life, Institutional Markets and Mortgage Guaranty Normalized VONB (2) in Retirement,
Life, Institutional Markets and Mortgage Guaranty Long-Term Incentives 75% Growth / Profitability Reward long-term profitability outperformance relative to peers Total shareholder returns compared to peers A transparent, consistent measure of
AIG’s total return to equity investors by adding share price appreciation plus dividends, expressed as an annualized percentage 25% Risk Ensure risk is well controlled and aligned with shareholder value by targeting CDS spread relative with
peers and penalizing excessive risk-taking Final CDS spread compared to peers Measures the market’s perceived risk of AIG’s debt versus the debt of our peers in the marketplace. The spreads measure the riskiness of debt Smaller spreads
indicate a lower perceived risk of a loan default. Incentive compensation aligned with creating value for shareholders Notes: (1) Risk-adjusted profitability. (2) Value of new business.
Strong Alignment Across Organization
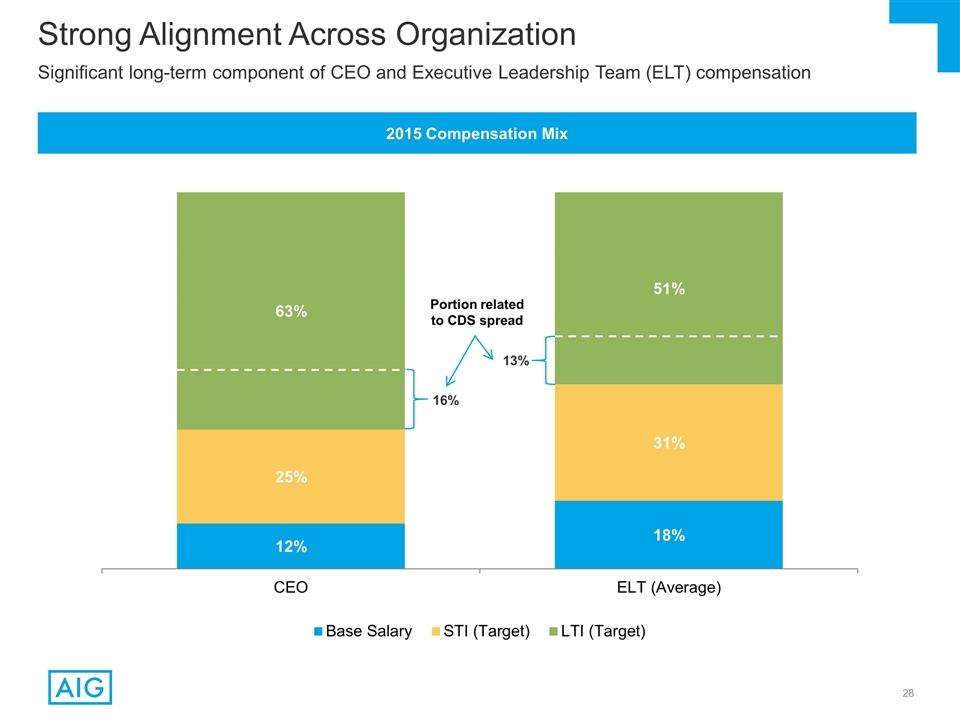
2015 Compensation Mix Significant long-term component of CEO and Executive Leadership Team (ELT) compensation 16% 13%
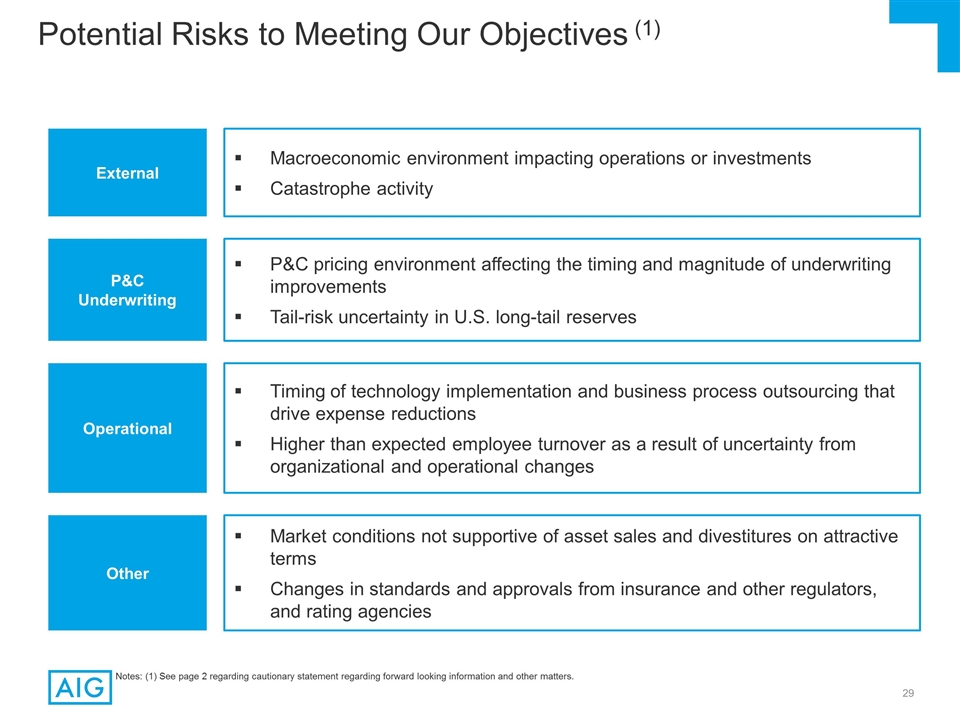
Potential Risks to Meeting Our
Objectives (1) Macroeconomic environment impacting operations or investments Catastrophe activity External P&C Underwriting P&C pricing environment affecting the timing and magnitude of underwriting improvements Tail-risk uncertainty in U.S.
long-tail reserves Operational Timing of technology implementation and business process outsourcing that drive expense reductions Higher than expected employee turnover as a result of uncertainty from organizational and operational changes Other
Market conditions not supportive of asset sales and divestitures on attractive terms Changes in standards and approvals from insurance and other regulators, and rating agencies Notes: (1) See page 2 regarding cautionary statement regarding forward
looking information and other matters.

Board and Governance

George L. Miles Director Since 2005
Highly Engaged and Balanced Board with Substantial & Diverse Expertise Necessary to Evaluate and Oversee Strategic Action Plan W. Don Cornwell Director Since 2011 Peter R. Fisher Director Since 2014 John H. Fitzpatrick Director Since 2011
William G. Jurgensen Director Since 2013 Christopher S. Lynch Director Since 2009 Henry S. Miller Director Since 2010 Robert S. Miller Director Since 2009 Linda A. Mills Director Since 2015 Suzanne Nora Johnson Director Since 2008 Ronald A.
Rittenmeyer Director Since 2010 Douglas M. Steenland Independent Chairman Director Since 2009 Theresa M. Stone Director Since 2013 Peter D. Hancock Director Since 2014 Board of Directors Key Attributes Deep experience in business transformations and
strategic restructurings Experience managing large, complex, international institutions Strong risk oversight and management experience High level of financial and accounting expertise Highly relevant global consumer, commercial and industrial
backgrounds Professional Experience Insurance and reinsurance Financial services, banking industry and asset management Operations Information technology Regulatory markets, government, academia and research Public company accounting Board
Composition Aligned with Business Needs

Peter D. Hancock, President and CEO
Douglas Dachille, Chief Investment Officer Philip Fasano, Chief Information Officer Martha Gallo, Chief Auditor Kevin Hogan, CEO, Consumer Jeffrey Hurd, EVP Transformation, Human Resources, and Administration Seraina Maag, CEO, Regional Management
& Operations Thomas Russo, General Counsel Sid Sankaran, Chief Risk Officer (1) Robert S. Schimek, CEO Commercial Brian Schreiber, Chief Strategy Officer Recognized authority on risk management, who has focused entire 30-year career on financial
services Spent 20+ years at JPMorgan, established Global Derivatives Group, ran Global Fixed Income and Global Credit portfolio, served as CFO and Chief Risk Officer Proven leader in financial services and investments, with 25+ years in
creating asset management solutions and a deep understanding of client liabilities Prior to AIG, was Chief Investment Officer and Co-Founder of First Principles Capital Management LLC Information technology leader, who has served as CIO of
several high-profile financial services firms over 30 years Prior to AIG, was CIO of Kaiser Permanente Business leader and change agent with 30+ years in operations, technology, finance, and risk management Prior to AIG, held executive roles at
JPMorgan Chase including Head of Compliance and Regulatory Management, and General Auditor Insurance leader with 30+ years providing property casualty, life, and retirement solutions to consumers worldwide Prior to returning to AIG, was CEO of
Global Life, Zurich Insurance Group Leader in executing transformative organizational change Has been with AIG for 18 years, leveraging expertise in legal, compliance, administration, M&A, and human resources Financial services expert who has
held leadership roles in insurance and banking Prior to AIG, served as Chief Executive of North American Property & Casualty for XL Group Legal strategist and thought leader on financial market issues, who has authored 70+ articles on financial
market regulation Prior to AIG, was General Counsel of Lehman Brothers and a senior partner at Cadwalader, Wickersham &Taft Financial services expert with deep background in capital, actuarial, risk, strategy and performance management Prior to
AIG, was a partner in the Finance and Risk practice at Oliver Wyman Financial Services Financial services expert who has held various leadership roles at AIG, including managing the two largest commercial insurance markets, the U.S. and U.K. Prior
to AIG, was a partner at Deloitte & Touche, serving financial institution clients such as MetLife, The Prudential, and Merrill Lynch for 18 years M&A and strategy expert, who was instrumental in designing and executing plan to repay U.S.
government investment in AIG Most recently, was Deputy Chief Investment Officer and also served as AIG Global Treasurer David Herzog, Chief Financial Officer (1) Chief Financial Officer until the filing of AIG’s 2015 Form 10-K Experience in
insurance financial and operations leadership, specializing in life companies David has been with AIG for 15 years; named CFO in 2008 AIG’s Executive Leadership Team Notes: (1) David Herzog is Chief Financial Officer until the filing of
AIG’s 2015 Form 10-K, at which time Sid Sankaran will succeed him and Alessa Quane will become Chief Risk Officer.
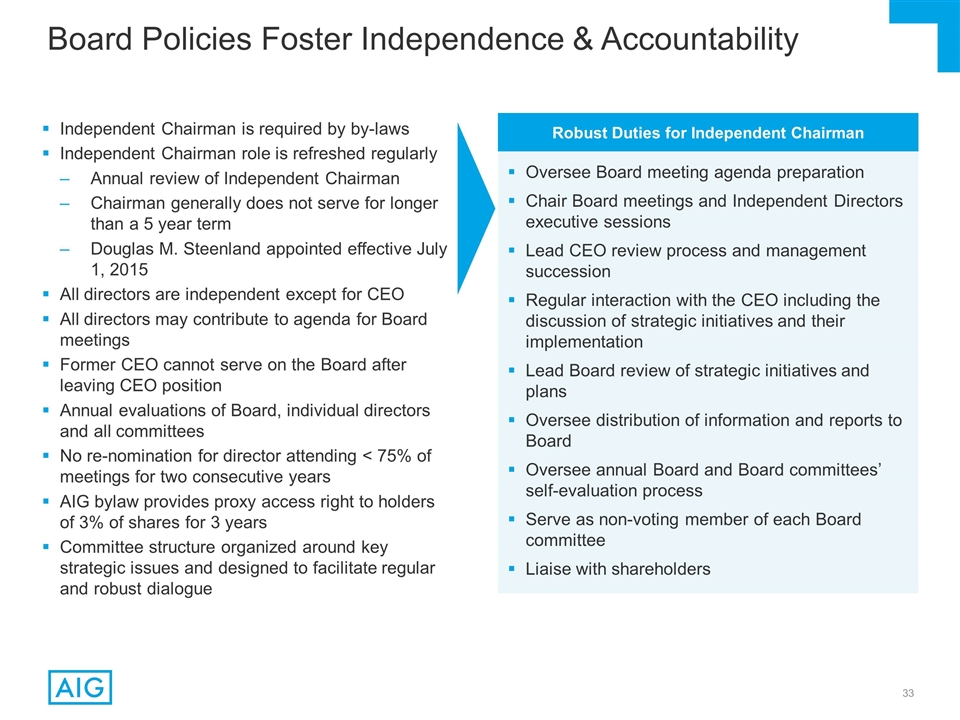
Robust Duties for Independent
Chairman Oversee Board meeting agenda preparation Chair Board meetings and Independent Directors executive sessions Lead CEO review process and management succession Regular interaction with the CEO including the discussion of strategic initiatives
and their implementation Lead Board review of strategic initiatives and plans Oversee distribution of information and reports to Board Oversee annual Board and Board committees’ self-evaluation process Serve as non-voting member of each Board
committee Liaise with shareholders Independent Chairman is required by by-laws Independent Chairman role is refreshed regularly Annual review of Independent Chairman Chairman generally does not serve for longer than a 5 year term Douglas M.
Steenland appointed effective July 1, 2015 All directors are independent except for CEO All directors may contribute to agenda for Board meetings Former CEO cannot serve on the Board after leaving CEO position Annual evaluations of Board, individual
directors and all committees No re-nomination for director attending < 75% of meetings for two consecutive years AIG bylaw provides proxy access right to holders of 3% of shares for 3 years Committee structure organized around key strategic
issues and designed to facilitate regular and robust dialogue Board Policies Foster Independence & Accountability

Committee structure organized around
key strategic issues to oversee management and decision making process Frequent meetings helped to shepherd AIG through crisis period and continue Committee chairs regularly coordinate with one another to ensure appropriate information sharing All
committees provide a summary of significant actions to full Board Risk and Capital Committee and the Audit Committee report to the Board regarding risk management issues Committee meetings scheduled to allow all directors to attend each meeting,
with many directors attending such meetings Each committee conducts annual self assessment and review of Charter Committee Structure Nominating & Corporate Governance Audit Compensation & Management Resources Regulatory, Compliance &
Public Policy Risk & Capital Technology Robust Committee Design to Facilitate Dialogue and Efficiency

John H. Fitzpatrick Mr. Fitzpatrick
has been Chairman of White Oak Global Advisors, an asset management firm lending to small and medium sized companies since September 1, 2015, and Oak Street Management Co., LLC, an insurance / management consulting company, and Oak Family Advisors,
LLC, a registered investment advisor, since 2010. In May 2014, he completed a two-year term as Secretary General of The Geneva Association. From 2006 to 2010, Mr. Fitzpatrick was a partner at Pension Corporation and a director of Pension Insurance
Corporation Ltd. From 1998 to 2006, he was a member of Swiss Re’s Executive Board Committee and served at Swiss Re as Chief Financial Officer, Head of the Life and Health Reinsurance Business Group and Head of Financial Services. From 1996 to
1998, Mr. Fitzpatrick was a partner in insurance private equity firms sponsored by Zurich Financial Services, Credit Suisse and Swiss Re. From 1990 to 1996, Mr. Fitzpatrick served as the Chief Financial Officer and a Director of Kemper Corporation,
a NYSE-listed insurance and financial services organization where he started his career in corporate finance in 1978. From February 2010 until March 2011, Mr. Fitzpatrick was a director of Validus Holdings, Ltd., where he served on the Audit and
Finance Committees. Mr. Fitzpatrick is a Certified Public Accountant and a Chartered Financial Analyst. Peter R. Fisher Mr. Fisher is a Senior Fellow at the Center for Global Business and Government, and also a Senior Lecturer, at the Tuck School of
Business at Dartmouth College, positions he has held since July 2013. Mr. Fisher previously served as an officer of BlackRock, Inc. and certain of its subsidiaries (BlackRock) from 2004 through 2013, as a Senior Managing Director (2010 to 2013) and
a Managing Director (2004 to 2009). While at BlackRock, Mr. Fisher served as Head (2010 to 2013) and as Co-Head (2008 to 2009) of BlackRock’s Fixed Income Portfolio Management Group, overseeing portfolio managers responsible for more than $1
trillion of fixed income client accounts and funds, and as Chairman of BlackRock Asia (2005 to 2007). Mr. Fisher has been a Senior Director of the BlackRock Investment Institute since March 2013, and has served in such capacity as an independent
consultant since January 2014. Prior to joining BlackRock in 2004, Mr. Fisher served as Under Secretary of the U.S. Department of the Treasury for Domestic Finance from 2001 to 2003, and, in that capacity, served on the board of the Securities
Investor Protection Corporation, as a member of the Airline Transportation Stabilization Board and as the U.S. Treasury representative to the Pension Benefit Guaranty Corporation. From 2007 to 2013, Mr. Fisher was a non-executive director of the
Financial Services Authority of the United Kingdom, where he was a member of the Risk Committee. Mr. Fisher also worked at the Federal Reserve Bank of New York from 1985 to 2001, ending his service there as an Executive Vice President and Manager of
the System Open Market Account. W. Don Cornwell Mr. Cornwell is the former Chairman of the Board and Chief Executive Officer of Granite Broadcasting Corporation, serving from 1988 until his retirement in August 2009, and Vice Chairman until December
2009. Mr. Cornwell spent 17 years at Goldman, Sachs & Co. where he served as Chief Operating Officer of the Corporate Finance Department from 1980 to 1988 and Vice President of the Investment Banking Division from 1976 to 1988. Mr. Cornwell is
currently a director of Avon Products, Inc., where he is Chairman of the Finance Committee and a member of the Audit Committee, and Pfizer Inc., where he is Chairman of the Audit Committee and a member of the Compensation, Regulatory and Compliance,
and Science and Technology Committees. Board of Directors Full Professional History

Peter D. Hancock Mr. Hancock has
been AIG’s President and Chief Executive Officer since September 2014, when he also joined the Board of Directors. Previously, he served as AIG’s Executive Vice President—Property and Casualty Insurance and joined AIG in February
2010 as Executive Vice President, Finance, Risk and Investments. From December 2008 to February 2010, Mr. Hancock served as Vice Chairman of KeyCorp, where he was responsible for Key National Banking. Previously, Mr. Hancock co-founded and served as
President of Integrated Finance Limited, an advisory firm specializing in strategic risk management, asset management, and innovative pension solutions. Mr. Hancock also spent 20 years at J.P. Morgan, beginning in 1980, where he established the
Global Derivatives Group, ran the Global Fixed Income business and Global Credit portfolio, and served as the firm’s Chief Financial Officer and Chief Risk Officer. William G. Jurgensen Mr. Jurgensen is the former Chief Executive Officer of
Nationwide Mutual Insurance Company and Nationwide Financial Services, Inc., serving from May 2000 to February 2009. During this time, he also served as director and Chief Executive Officer of several other companies within the Nationwide
enterprise. Prior to his time in the insurance industry, he spent 27 years in the commercial banking industry. Before joining Nationwide, Mr. Jurgensen was an Executive Vice President with BankOne Corporation (now a part of JPMorgan Chase & Co.)
where he was responsible for corporate banking products, including capital markets, international banking and cash management. He managed the merger integration between First Chicago Corporation and NBD Bancorp, Inc. and later was Chief Executive
Officer for First Card, First Chicago’s credit card subsidiary. At First Chicago, he was responsible for retail banking and began his career there as Chief Financial Officer in 1990. Mr. Jurgensen started his banking career at Norwest
Corporation (now a part of Wells Fargo & Company) in 1973. The majority of Mr. Jurgensen’s career has involved capital markets, securities trading and investment activities, with the balance in corporate banking. Mr. Jurgensen has been a
director of ConAgra Foods, Inc. since 2002, where he has served on the Audit Committee and currently serves on the Human Resources and the Nominating, Governance and Public Affairs Committees. He was also a director of The Scotts Miracle-Gro Company
from 2009 to 2013, where he served on the Audit, Finance, and Governance and Nominating Committees. Christopher S. Lynch Mr. Lynch has been an independent consultant since 2007, providing a variety of services to public and privately held financial
intermediaries, including corporate restructuring, risk management, strategy, governance, financial accounting and regulatory reporting and troubled-asset management. Mr. Lynch is the former National Partner in Charge of KPMG LLP’s Financial
Services Line of Business. He held a variety of positions with KPMG from 1979 to 2007, including chairing KPMG’s Americas Financial Services Leadership team and being a member of the Global Financial Services Leadership and the U.S. Industries
Leadership teams. Mr. Lynch has experience as an audit signing partner under Sarbanes Oxley for some of KPMG’s largest financial services clients. He also served as a Partner in KPMG’s National Department of Professional Practice and as
a Practice Fellow at the Financial Accounting Standards Board. Mr. Lynch is a member of the Advisory Board of the Stanford Institute for Economic Policy Research and a member of the National Audit Committee Chair Advisory Council of the National
Association of Corporate Directors. Mr. Lynch is currently Non-Executive Chairman of the Federal Home Loan Mortgage Corporation, where he is also Chairman of the Executive Committee. Board of Directors Full Professional History
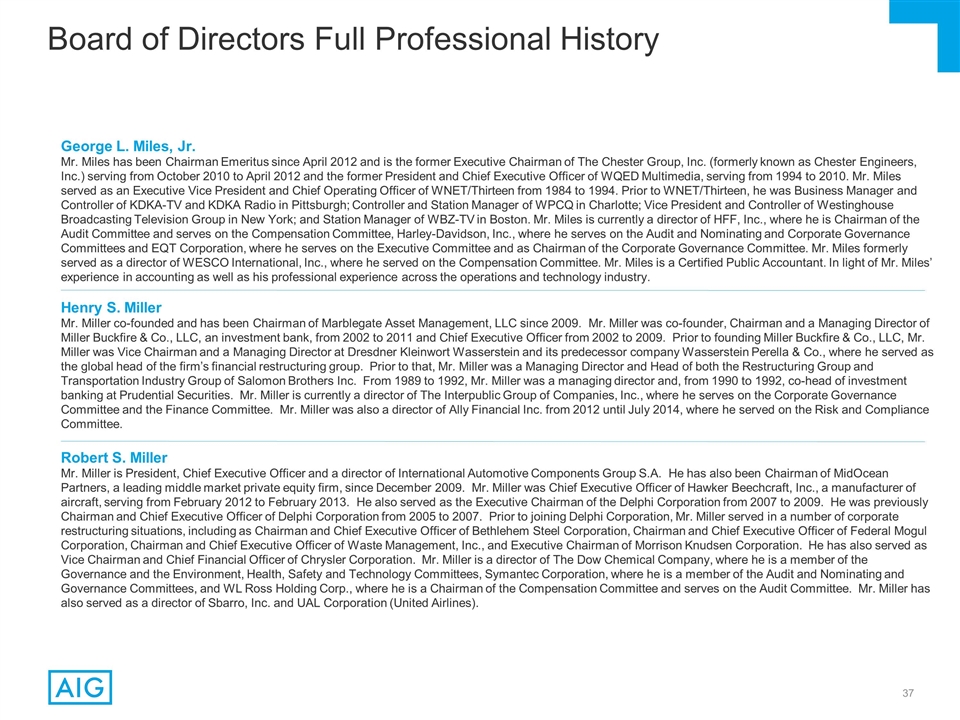
Henry S. Miller Mr. Miller
co-founded and has been Chairman of Marblegate Asset Management, LLC since 2009. Mr. Miller was co-founder, Chairman and a Managing Director of Miller Buckfire & Co., LLC, an investment bank, from 2002 to 2011 and Chief Executive Officer from
2002 to 2009. Prior to founding Miller Buckfire & Co., LLC, Mr. Miller was Vice Chairman and a Managing Director at Dresdner Kleinwort Wasserstein and its predecessor company Wasserstein Perella & Co., where he served as the global head of
the firm’s financial restructuring group. Prior to that, Mr. Miller was a Managing Director and Head of both the Restructuring Group and Transportation Industry Group of Salomon Brothers Inc. From 1989 to 1992, Mr. Miller was a managing
director and, from 1990 to 1992, co-head of investment banking at Prudential Securities. Mr. Miller is currently a director of The Interpublic Group of Companies, Inc., where he serves on the Corporate Governance Committee and the Finance Committee.
Mr. Miller was also a director of Ally Financial Inc. from 2012 until July 2014, where he served on the Risk and Compliance Committee. George L. Miles, Jr. Mr. Miles has been Chairman Emeritus since April 2012 and is the former Executive Chairman of
The Chester Group, Inc. (formerly known as Chester Engineers, Inc.) serving from October 2010 to April 2012 and the former President and Chief Executive Officer of WQED Multimedia, serving from 1994 to 2010. Mr. Miles served as an Executive Vice
President and Chief Operating Officer of WNET/Thirteen from 1984 to 1994. Prior to WNET/Thirteen, he was Business Manager and Controller of KDKA-TV and KDKA Radio in Pittsburgh; Controller and Station Manager of WPCQ in Charlotte; Vice President and
Controller of Westinghouse Broadcasting Television Group in New York; and Station Manager of WBZ-TV in Boston. Mr. Miles is currently a director of HFF, Inc., where he is Chairman of the Audit Committee and serves on the Compensation Committee,
Harley-Davidson, Inc., where he serves on the Audit and Nominating and Corporate Governance Committees and EQT Corporation, where he serves on the Executive Committee and as Chairman of the Corporate Governance Committee. Mr. Miles formerly served
as a director of WESCO International, Inc., where he served on the Compensation Committee. Mr. Miles is a Certified Public Accountant. In light of Mr. Miles’ experience in accounting as well as his professional experience across the operations
and technology industry. Robert S. Miller Mr. Miller is President, Chief Executive Officer and a director of International Automotive Components Group S.A. He has also been Chairman of MidOcean Partners, a leading middle market private equity firm,
since December 2009. Mr. Miller was Chief Executive Officer of Hawker Beechcraft, Inc., a manufacturer of aircraft, serving from February 2012 to February 2013. He also served as the Executive Chairman of the Delphi Corporation from 2007 to 2009. He
was previously Chairman and Chief Executive Officer of Delphi Corporation from 2005 to 2007. Prior to joining Delphi Corporation, Mr. Miller served in a number of corporate restructuring situations, including as Chairman and Chief Executive Officer
of Bethlehem Steel Corporation, Chairman and Chief Executive Officer of Federal Mogul Corporation, Chairman and Chief Executive Officer of Waste Management, Inc., and Executive Chairman of Morrison Knudsen Corporation. He has also served as Vice
Chairman and Chief Financial Officer of Chrysler Corporation. Mr. Miller is a director of The Dow Chemical Company, where he is a member of the Governance and the Environment, Health, Safety and Technology Committees, Symantec Corporation, where he
is a member of the Audit and Nominating and Governance Committees, and WL Ross Holding Corp., where he is a Chairman of the Compensation Committee and serves on the Audit Committee. Mr. Miller has also served as a director of Sbarro, Inc. and UAL
Corporation (United Airlines). Board of Directors Full Professional History
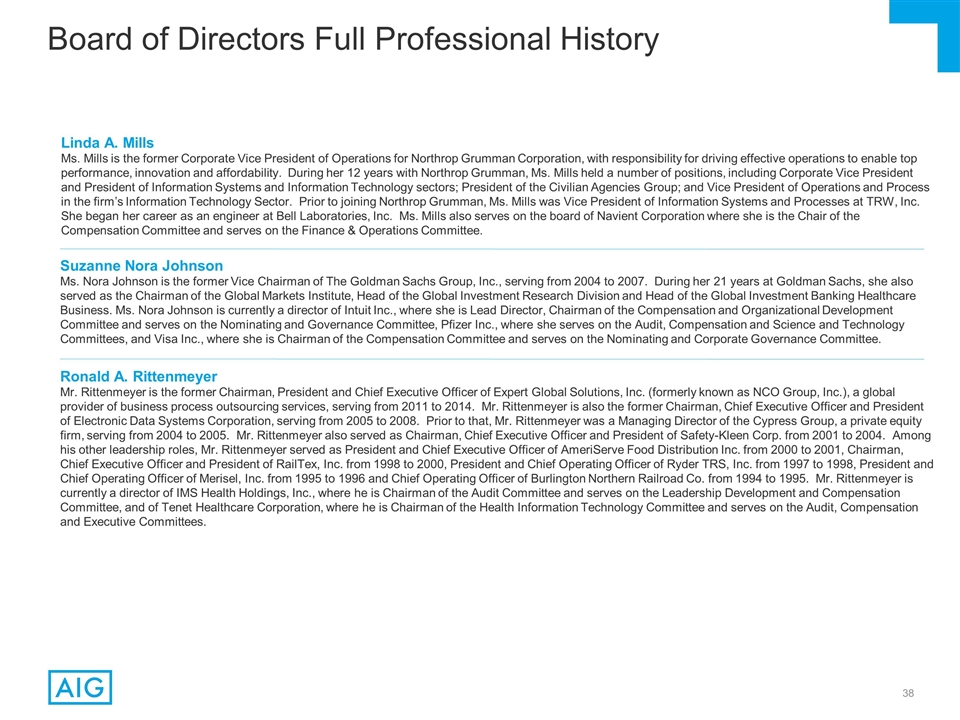
Linda A. Mills Ms. Mills is the
former Corporate Vice President of Operations for Northrop Grumman Corporation, with responsibility for driving effective operations to enable top performance, innovation and affordability. During her 12 years with Northrop Grumman, Ms. Mills held a
number of positions, including Corporate Vice President and President of Information Systems and Information Technology sectors; President of the Civilian Agencies Group; and Vice President of Operations and Process in the firm’s Information
Technology Sector. Prior to joining Northrop Grumman, Ms. Mills was Vice President of Information Systems and Processes at TRW, Inc. She began her career as an engineer at Bell Laboratories, Inc. Ms. Mills also serves on the board of Navient
Corporation where she is the Chair of the Compensation Committee and serves on the Finance & Operations Committee. Suzanne Nora Johnson Ms. Nora Johnson is the former Vice Chairman of The Goldman Sachs Group, Inc., serving from 2004 to 2007.
During her 21 years at Goldman Sachs, she also served as the Chairman of the Global Markets Institute, Head of the Global Investment Research Division and Head of the Global Investment Banking Healthcare Business. Ms. Nora Johnson is currently a
director of Intuit Inc., where she is Lead Director, Chairman of the Compensation and Organizational Development Committee and serves on the Nominating and Governance Committee, Pfizer Inc., where she serves on the Audit, Compensation and Science
and Technology Committees, and Visa Inc., where she is Chairman of the Compensation Committee and serves on the Nominating and Corporate Governance Committee. Ronald A. Rittenmeyer Mr. Rittenmeyer is the former Chairman, President and Chief
Executive Officer of Expert Global Solutions, Inc. (formerly known as NCO Group, Inc.), a global provider of business process outsourcing services, serving from 2011 to 2014. Mr. Rittenmeyer is also the former Chairman, Chief Executive Officer and
President of Electronic Data Systems Corporation, serving from 2005 to 2008. Prior to that, Mr. Rittenmeyer was a Managing Director of the Cypress Group, a private equity firm, serving from 2004 to 2005. Mr. Rittenmeyer also served as Chairman,
Chief Executive Officer and President of Safety-Kleen Corp. from 2001 to 2004. Among his other leadership roles, Mr. Rittenmeyer served as President and Chief Executive Officer of AmeriServe Food Distribution Inc. from 2000 to 2001, Chairman, Chief
Executive Officer and President of RailTex, Inc. from 1998 to 2000, President and Chief Operating Officer of Ryder TRS, Inc. from 1997 to 1998, President and Chief Operating Officer of Merisel, Inc. from 1995 to 1996 and Chief Operating Officer of
Burlington Northern Railroad Co. from 1994 to 1995. Mr. Rittenmeyer is currently a director of IMS Health Holdings, Inc., where he is Chairman of the Audit Committee and serves on the Leadership Development and Compensation Committee, and of Tenet
Healthcare Corporation, where he is Chairman of the Health Information Technology Committee and serves on the Audit, Compensation and Executive Committees. Board of Directors Full Professional History

Theresa M. Stone Ms. Stone is the
former Executive Vice President and Treasurer of the Massachusetts Institute of Technology (MIT), serving from February 2007 until October 2011. In her role as Executive Vice President and Treasurer, Ms. Stone served as MIT’s Chief Financial
Officer and was also responsible for MIT’s operations, including capital projects, campus planning, facilities operations, information technology, environmental health and safety, human resources, medical services and police. Ms. Stone also
served as the Special Assistant to the President of MIT from October 2011 to January 2012. From November 2001 to March 2006, Ms. Stone served as Executive Vice President and Chief Financial Officer of Jefferson-Pilot Corporation (now Lincoln
Financial Group) and, from 1997 to 2006, she also served as President of Jefferson-Pilot Communications. Ms. Stone also served as the President of Chubb Life Insurance Company from 1994 to 1997. From 1990 - 1994, Ms. Stone served as Senior Vice
President - Acquisitions - of The Chubb Corporation, in which role she advised the Chairman and CEO on domestic and international property casualty and life insurance strategy, acquisitions and divestitures. Ms. Stone also served as a director of
the Federal Reserve Bank of Richmond from 2003 to 2007 and as Deputy Chairman from 2005 to 2007. As an investment banker at Morgan Stanley from 1976 - 1990, Ms. Stone advised clients primarily in the insurance and financial services industries on
corporate finance and merger and acquisition transactions. Ms. Stone served as a director of Progress Energy, Inc. from 2005 to 2012, where she served as Chairman of the Audit and Corporate Performance Committee and a member of the Executive,
Finance and Governance Committees. She also served as a director of Duke Energy Corporation during July 2012 following the company’s merger with Progress Energy Inc. Douglas M. Steenland Mr. Steenland is the former Chief Executive Officer of
Northwest Airlines Corporation, serving from 2004 to 2008, and President, serving from 2001 to 2004. Prior to that, he served in a number of Northwest Airlines executive positions after joining Northwest Airlines in 1991, including Executive Vice
President, Chief Corporate Officer and Senior Vice President and General Counsel. Mr. Steenland retired from Northwest Airlines upon its merger with Delta Air Lines, Inc. Prior to joining Northwest Airlines, Mr. Steenland was a senior partner at a
Washington, D.C. law firm that is now part of DLA Piper. Mr. Steenland is currently a director of Travelport Limited, where he serves as Chairman of the Nominating and Corporate Governance Committee, Performance Food Group Company, where he serves
as a member of the Audit Committee and Compensation Committee, and Hilton Worldwide Holdings Inc., where he serves as Chairman of the Audit Committee and a member of the Nominating and Corporate Governance Committee. Mr. Steenland has also served as
a director of Delta Air Lines, Inc., Chrysler Group LLC (now FCA US LLC), where he served as Chairman of the Audit Committee, International Lease Finance Corporation (ILFC), a former AIG subsidiary, now a part of AerCap Holdings N.V., Digital River,
Inc., where he was Chairman of the Compensation Committee and served on the Finance and Nominating and Corporate Governance Committees, and Northwest Airlines Corporation. Board of Directors Full Professional History

Glossary of Non-GAAP Financial
Measures and Non-GAAP Reconciliations

Glossary of Non-GAAP Financial
Measures We use the following operating performance measures because we believe they enhance the understanding of the underlying profitability of continuing operations and trends of our business segments. We believe they also allow for more
meaningful comparisons with our insurance competitors. When we use these measures, reconciliations to the most comparable GAAP measure are provided, on a consolidated basis. Book Value Per Share Excluding Accumulated Other Comprehensive Income
(AOCI), Book Value Per Share Excluding AOCI and Deferred Tax Assets (DTA) and Book Value Per Share Excluding AOCI and DTA and Including Dividend Growth are used to show the amount of our net worth on a per-share basis. We believe these measures are
useful to investors because they eliminate the effect of non-cash items that can fluctuate significantly from period to period, including changes in fair value of our available for sale securities portfolio, foreign currency translation adjustments
and U.S. tax attribute deferred tax assets. Deferred tax assets represent U.S. tax attributes related to net operating loss carryforwards and foreign tax credits. Amounts are estimates based on projections of full year attribute utilization. Book
Value Per Share Excluding AOCI is derived by dividing Total AIG shareholders’ equity, excluding AOCI, by Total common shares outstanding. Book Value Per Share Excluding AOCI and DTA is derived by dividing Total AIG shareholders’ equity,
excluding AOCI and DTA, by Total common shares outstanding. Book Value Per Share Excluding AOCI and DTA and including dividend growth is derived by dividing Total AIG shareholders’ equity, excluding AOCI and DTA and including growth in
dividends to shareholders, by Total common shares outstanding. After-tax operating income attributable to AIG is derived by excluding the following items from net income attributable to AIG: deferred income tax valuation allowance releases and
charges; changes in fair value of fixed maturity securities designated to hedge living benefit liabilities (net of interest expense); changes in benefit reserves and deferred policy acquisition costs (DAC), value of business acquired (VOBA), and
sales inducement assets (SIA) related to net realized capital gains and losses; other income and expense — net, related to Corporate and Other run-off insurance lines; loss on extinguishment of debt; net realized capital gains and losses;
non-qualifying derivative hedging activities, excluding net realized capital gains and losses; income or loss from discontinued operations; Return on Equity – After-tax Operating Income Excluding AOCI and Return on Equity – After-tax
Operating Income Excluding AOCI and DTA are used to show the rate of return on shareholders’ equity. We believe these measures are useful to investors because they eliminate the effect of non-cash items that can fluctuate significantly from
period to period, including changes in fair value of our available for sale securities portfolio, foreign currency translation adjustments and U.S. tax attribute deferred tax assets. Deferred tax assets represent U.S. tax attributes related to net
operating loss carryforwards and foreign tax credits. Amounts are estimates based on projections of full year attribute utilization. Return on Equity – After-tax Operating Income Excluding AOCI is derived by dividing actual or annualized
after-tax operating income attributable to AIG by average AIG shareholders’ equity, excluding average AOCI. Return on Equity – After-tax Operating Income Excluding AOCI and DTA is derived by dividing actual or annualized after-tax
operating income attributable to AIG, by average AIG shareholders’ equity, excluding average AOCI and DTA. AIG income and loss from divested businesses, including: gain on the sale of International Lease Finance Corporation (ILFC); and certain
post-acquisition transaction expenses incurred by AerCap Holdings N.V. (AerCap) in connection with its acquisition of ILFC and the difference between expensing AerCap’s maintenance rights assets over the remaining lease term as compared to the
remaining economic life of the related aircraft and related tax effects; legacy tax adjustments primarily related to certain changes in uncertain tax positions and other tax adjustments; non-operating litigation reserves and settlements; reserve
development related to non-operating run-off insurance business; and restructuring and other costs related to initiatives designed to reduce operating expenses, improve efficiency and simplify our organization.

Normalized Return on Equity,
Excluding AOCI and DTA further adjusts Return on Equity – After-tax Operating Income, excluding AOCI and DTA for the effects of certain volatile or market related items. Normalized Return on Equity, Excluding AOCI and DTA is derived by
excluding the following tax adjusted effects from Return on Equity – After-tax Operating Income, Excluding AOCI and DTA: Catastrophe losses compared to expectations Alternative investment returns compared to expectations DIB/GCM returns
compared to expectations Fair value changes on PICC investments Normalized Return on Equity, Excluding AOCI and DTA – Operating and Legacy Portfolios further adjust Normalized Return on Equity, Excluding AOCI and DTA for the allocation to the
operating businesses of Corporate GOE, Parent Financial Debt and the related Interest Expense. General operating expenses, operating basis, is derived by making the following adjustments to general operating and other expenses: include (i) loss
adjustment expenses, reported as policyholder benefits and losses incurred and (ii) certain investment and other expenses reported as net investment income, and exclude (i) advisory fee expenses, (ii) non-deferrable insurance commissions, (iii)
direct marketing and acquisition expenses, net of deferrals, (iv) non-operating litigation reserves and (v) other expense related to a retroactive reinsurance agreement. We use general operating expenses, operating basis, because we believe it
provides a more meaningful indication of our ordinary course of business operating costs. Glossary of Non-GAAP Financial Measures (continued) Pre-tax operating income: includes both underwriting income and loss and net investment income, but
excludes net realized capital gains and losses, other income and expense — net and non-operating litigation reserves and settlements. Underwriting income and loss is derived by reducing net premiums earned by losses and loss adjustment
expenses incurred, acquisition expenses and general operating expenses. Ratios: We, along with most property and casualty insurance companies, use the loss ratio, the expense ratio and the combined ratio as measures of underwriting performance.
These ratios are relative measurements that describe, for every $100 of net premiums earned, the amount of losses and loss adjustment expenses, and the amount of other underwriting expenses that would be incurred. A combined ratio of less than 100
indicates underwriting income and a combined ratio of over 100 indicates an underwriting loss. The underwriting environment varies across countries and products, as does the degree of litigation activity, all of which affect such ratios. In
addition, investment returns, local taxes, cost of capital, regulation, product type and competition can have an effect on pricing and consequently on profitability as reflected in underwriting income and associated ratios. Accident year loss and
combined ratios, as adjusted: both the accident year loss and combined ratios, as adjusted, exclude catastrophe losses and related reinstatement premiums, prior year development, net of premium adjustments, and the impact of reserve discounting.
Catastrophe losses are generally weather or seismic events having a net impact in excess of $10 million each. Ultimate accident year loss ratio adjusted for prior year development: represents reported accident year loss ratios adjusted to exclude
catastrophe losses and reflect prior year development in the appropriate accident year. The 3Q15 ratios are based on prior year development through September 30, 2015, while the 4Q15 ratio reflects development for the full year including our fourth
quarter strengthening. Normalized production risk-adjusted profitability (RAP): for Property Casualty and Personal Insurance operating segments is the underwriting profit or loss for Property Casualty and Personal Insurance operating segments plus
net investment income, net of the cost of capital. Underwriting profit or loss is based on net premium written during the performance year, estimated ultimate loss ratio adjusted for catastrophic annual average losses, and variable expenses. The net
investment income is imputed based upon the prevailing interest rate environment of the performance year. The cost of capital is the product of the capital deployed and the cost of capital rate. The capital deployed is based on an internal capital
allocation model and reflects the capital needed for the business underwritten during the performance period. The cost of capital rate is derived from an internal capital asset pricing model. This result is adjusted to normalize for the impact of
fluctuations in foreign exchange rates. AIG Commercial Insurance: Property Casualty and Mortgage Guaranty; Consumer Insurance: Personal Insurance Update of actuarial assumptions Net reserve discount change Life insurance IBNR death claim charge
Prior year loss reserve development

Glossary of Non-GAAP Financial
Measures (continued) Pre-tax operating income and loss is derived by excluding the following items from pre-tax income and loss: loss on extinguishment of debt net realized capital gains and losses changes in benefit reserves and DAC, VOBA and SIA
related to net realized capital gains and losses income and loss from divested businesses, including Aircraft Leasing Corporate and Other net gain or loss on sale of divested businesses, including: gain on the sale of ILFC and certain
post-acquisition transaction expenses incurred by AerCap in connection with its acquisition of ILFC and the difference between expensing AerCap’s maintenance rights assets over the remaining lease term as compared to the remaining economic
life of the related aircraft and our share of AerCap’s income taxes non-operating litigation reserves and settlements reserve development related to non-operating run-off insurance business restructuring and other costs related to initiatives
designed to reduce operating expenses, improve efficiency and simplify our organization. Results from discontinued operations are excluded from all of these measures. Commercial Insurance: Institutional Markets; Consumer Insurance: Retirement and
Life Pre-tax operating income is derived by excluding the following items from pre-tax income: changes in fair values of fixed maturity securities designated to hedge living benefit liabilities (net of interest expense); net realized capital gains
and losses; changes in benefit reserves and DAC, VOBA and SIA related to net realized capital gains and losses; non-operating litigation reserves and settlements Premiums and deposits: includes direct and assumed amounts received and earned on
traditional life insurance policies, group benefit policies and life-contingent payout annuities, as well as deposits received on universal life, investment-type annuity contracts and mutual funds. Normalized value of new business (VONB): for
Retirement, Life, Institutional Markets and Mortgage Guaranty operating segments is the sum of (i) with respect to the Retirement, Life and Institutional Markets operating segments, the present value, measured at point of sale, of projected
after-tax statutory profits emerging in the future from new business sold in the period, as adjusted to normalize fixed annuity sales and margins based on indexing fixed annuity sales to the prevailing interest rate environment and (ii) with respect
to the Mortgage Guaranty operating segment, the present value, measured at point of sale, of projected after-tax cash flow profits emerging in the future from new business sold in the period. Acronyms YTD – Year-to-date YoY –
Year-over-year NPW – Net premiums written AUM – Assets under management FX – Foreign exchange AOCI – Accumulated other comprehensive income DTA – Deferred tax assets PYD – Prior year loss reserve development RAP
– Risk-adjusted profitability VONB – Value of new business

Non-GAAP Reconciliations Notes: (1)
Represents transfer of the equity associated with discontinued/run-off businesses (primarily Eaglestone and Life run-off portfolios) and pre-2012 structured settlements to the legacy portfolio. (2) Represents the allocation of financial debt to the
operating portfolio at leverage of 20% for Non-life and 25% for Life (calculated as Financial Debt + Hybrid Debt / Total Capital) by transferring in a portion of parent financial debt. (3) Represents U.S. tax attributes related to net operating loss
carryforwards and foreign tax credits. Amounts are estimates based on projections of full year attribute utilization. Reconciliation of General Operating Expenses ($ in Billions) 2014 2015E Total general operating expenses, Operating basis 11.9 $
11.2 $ Loss adjustment expenses, reported as policyholder benefits and losses incurred (1.7) (1.6) Advisory fee expenses 1.3 1.3 Non-deferrable insurance commissions 0.5 0.5 Direct marketing and acquisition expenses, net of deferrals 0.6 0.7
Investment expenses reported as net investment income (0.1) (0.1) Total general operating and other expenses included in pre-tax operating income 12.6 12.0 Restructuring and other costs - 0.5 Other expense related to retroactive reinsurance
agreement - 0.2 Non-operating litigation reserves 0.5 0.0 Total general operating and other expenses, GAAP basis 13.1 $ 12.8 $ Reconciliation of AIG Shareholders' Equity, Ex. AOCI and DTA Life Non-Life Total Life and ($ in Billions) Insurance
Insurance Non-Life Insurance Corporate As of September 30, 2015 Companies Companies Companies and Other AIG Inc. Total AIG shareholders' equity $35.3 $48.8 $84.1 $14.9 $99.0 Less: Accumulated other comprehensive income (AOCI) (4.4) (2.3) (6.7) 0.2
(6.6) Total AIG shareholders' equity, excluding AOCI 30.9 46.5 77.4 15.1 92.4 Less: Deferred tax assets (DTA) 3 0.0 0.0 0.0 (15.3) (15.3) Total AIG shareholders' equity, excluding AOCI and DTA $30.9 $46.5 $77.4 ($0.2) $77.2 ô ô ô
Reconciliation to Operating and Legacy Portfolio Shareholders' Equity, Ex. AOCI and DTA: Operating Portfolio Legacy Portfolio AIG Inc. Total AIG shareholders' equity, excluding AOCI and DTA $77.4 ($0.2) $77.2 Transfer equity of legacy portfolio 1
(6.2) 6.2 0.0 Push down of Parent debt 2 (15.6) 15.6 0.0 Total AIG shareholders' equity, excluding AOCI and DTA $55.6 $21.5 $77.2


